


The Orifice Meter Gas Measurement - Forgotten Books
123
-
Upload
khangminh22 -
Category
Documents
-
view
1 -
download
0
Transcript of The Orifice Meter Gas Measurement - Forgotten Books


THE
O R IF ICE METER
GAS MEASUREMENT
By
WILL I S C . BROWN!un . Am . S oc. M . E .
MALCOLM B . HALL
Assoc. Mem. Am. Soc. M E .
Errata
PAGE 35 . Third word in sixth line from bo ttomshould read regulator ” instead of regular.
”
PAGE 65 . In Fig . 167 1 the outer record is theDifferential ” and the inner the Static . ”
PAGE 73 . Second paragraph , third line , fourthword should be Static ” instead of Standard .
PAGE 95 . Eighteenth line , page number reference should be “ 97 instead of
FOXBORO ,MAS S .
THE FOXBORO CO . ,IN C .
NE P ON S E‘
I‘
AV E N U E

Copyright, 1 9 2 1
By THE Foxnono Co . , INC.
First edition, !anuary, 1 9 2 1
THE UNIVERSIT! PRESS , CAMBRIDGE , HASS . , U .S .A.

PREFACE
IN resp onse to num erous en!uiries, the manufac turersof th e first comm ercial Orifice Me ter for gasmeasure
m ent have considered it advisable to se t before the
public authentic inform ation relating to orifice coefficients and th eir derivation
,and comp lete details of th e
m echanical construc tion of their own Orifice Meter .
So many business friends have helped the authors inso m any ways to m ake these pages of prac tical service to gas m en that a detailed statement of obligationsis imp ossible ; but their assistance is here gratefullyacknowledged .
While every effort has been m ade to insure the ac
curacy of statem ents , tables, and formulas , the authorsknow how easily m istakes may occur . They will ,therefore
,welcome any criticism or correc tion of errors
or suggestions for the improvem ent o f a future edition .
THE AUTHORS .
!ANUAR! , 1921 .
4 5 6 7 6 9


CONTENTSCHAPTER PAGE1 . HISTOR! OF THE ORIFICE METER
Origin of Foxboro MetersDetermination of E ValueE CurveTheory of the Orifice MeterFlow Formula
DESCRIPTION OF THE ORIFICE METER
Principle of OperationTypes of MetersStandard Differential RangesSpring Type Differential GaugeMercury Float Type Differential GaugeStatic Recording GaugeDevelopment of Helical MovementDevelopment of Diaphragm MovementCombination Differential and Static Recording GaugeStandard Combination RangesClock MovementsFlange UnionOrifice PlatesPiping
INSTALLATION TESTS AND MAINTENANCETypical InstallationsMeter HousesMultiple-Meter InstallationMeters fo r LiquidsInstalling and OperatingTesting Orifice MetersTesting Static RecordersTesting Proport ional Meters with Orifice MeterMaintenance Of Orifice MetersMeter Parts
viii Cantents
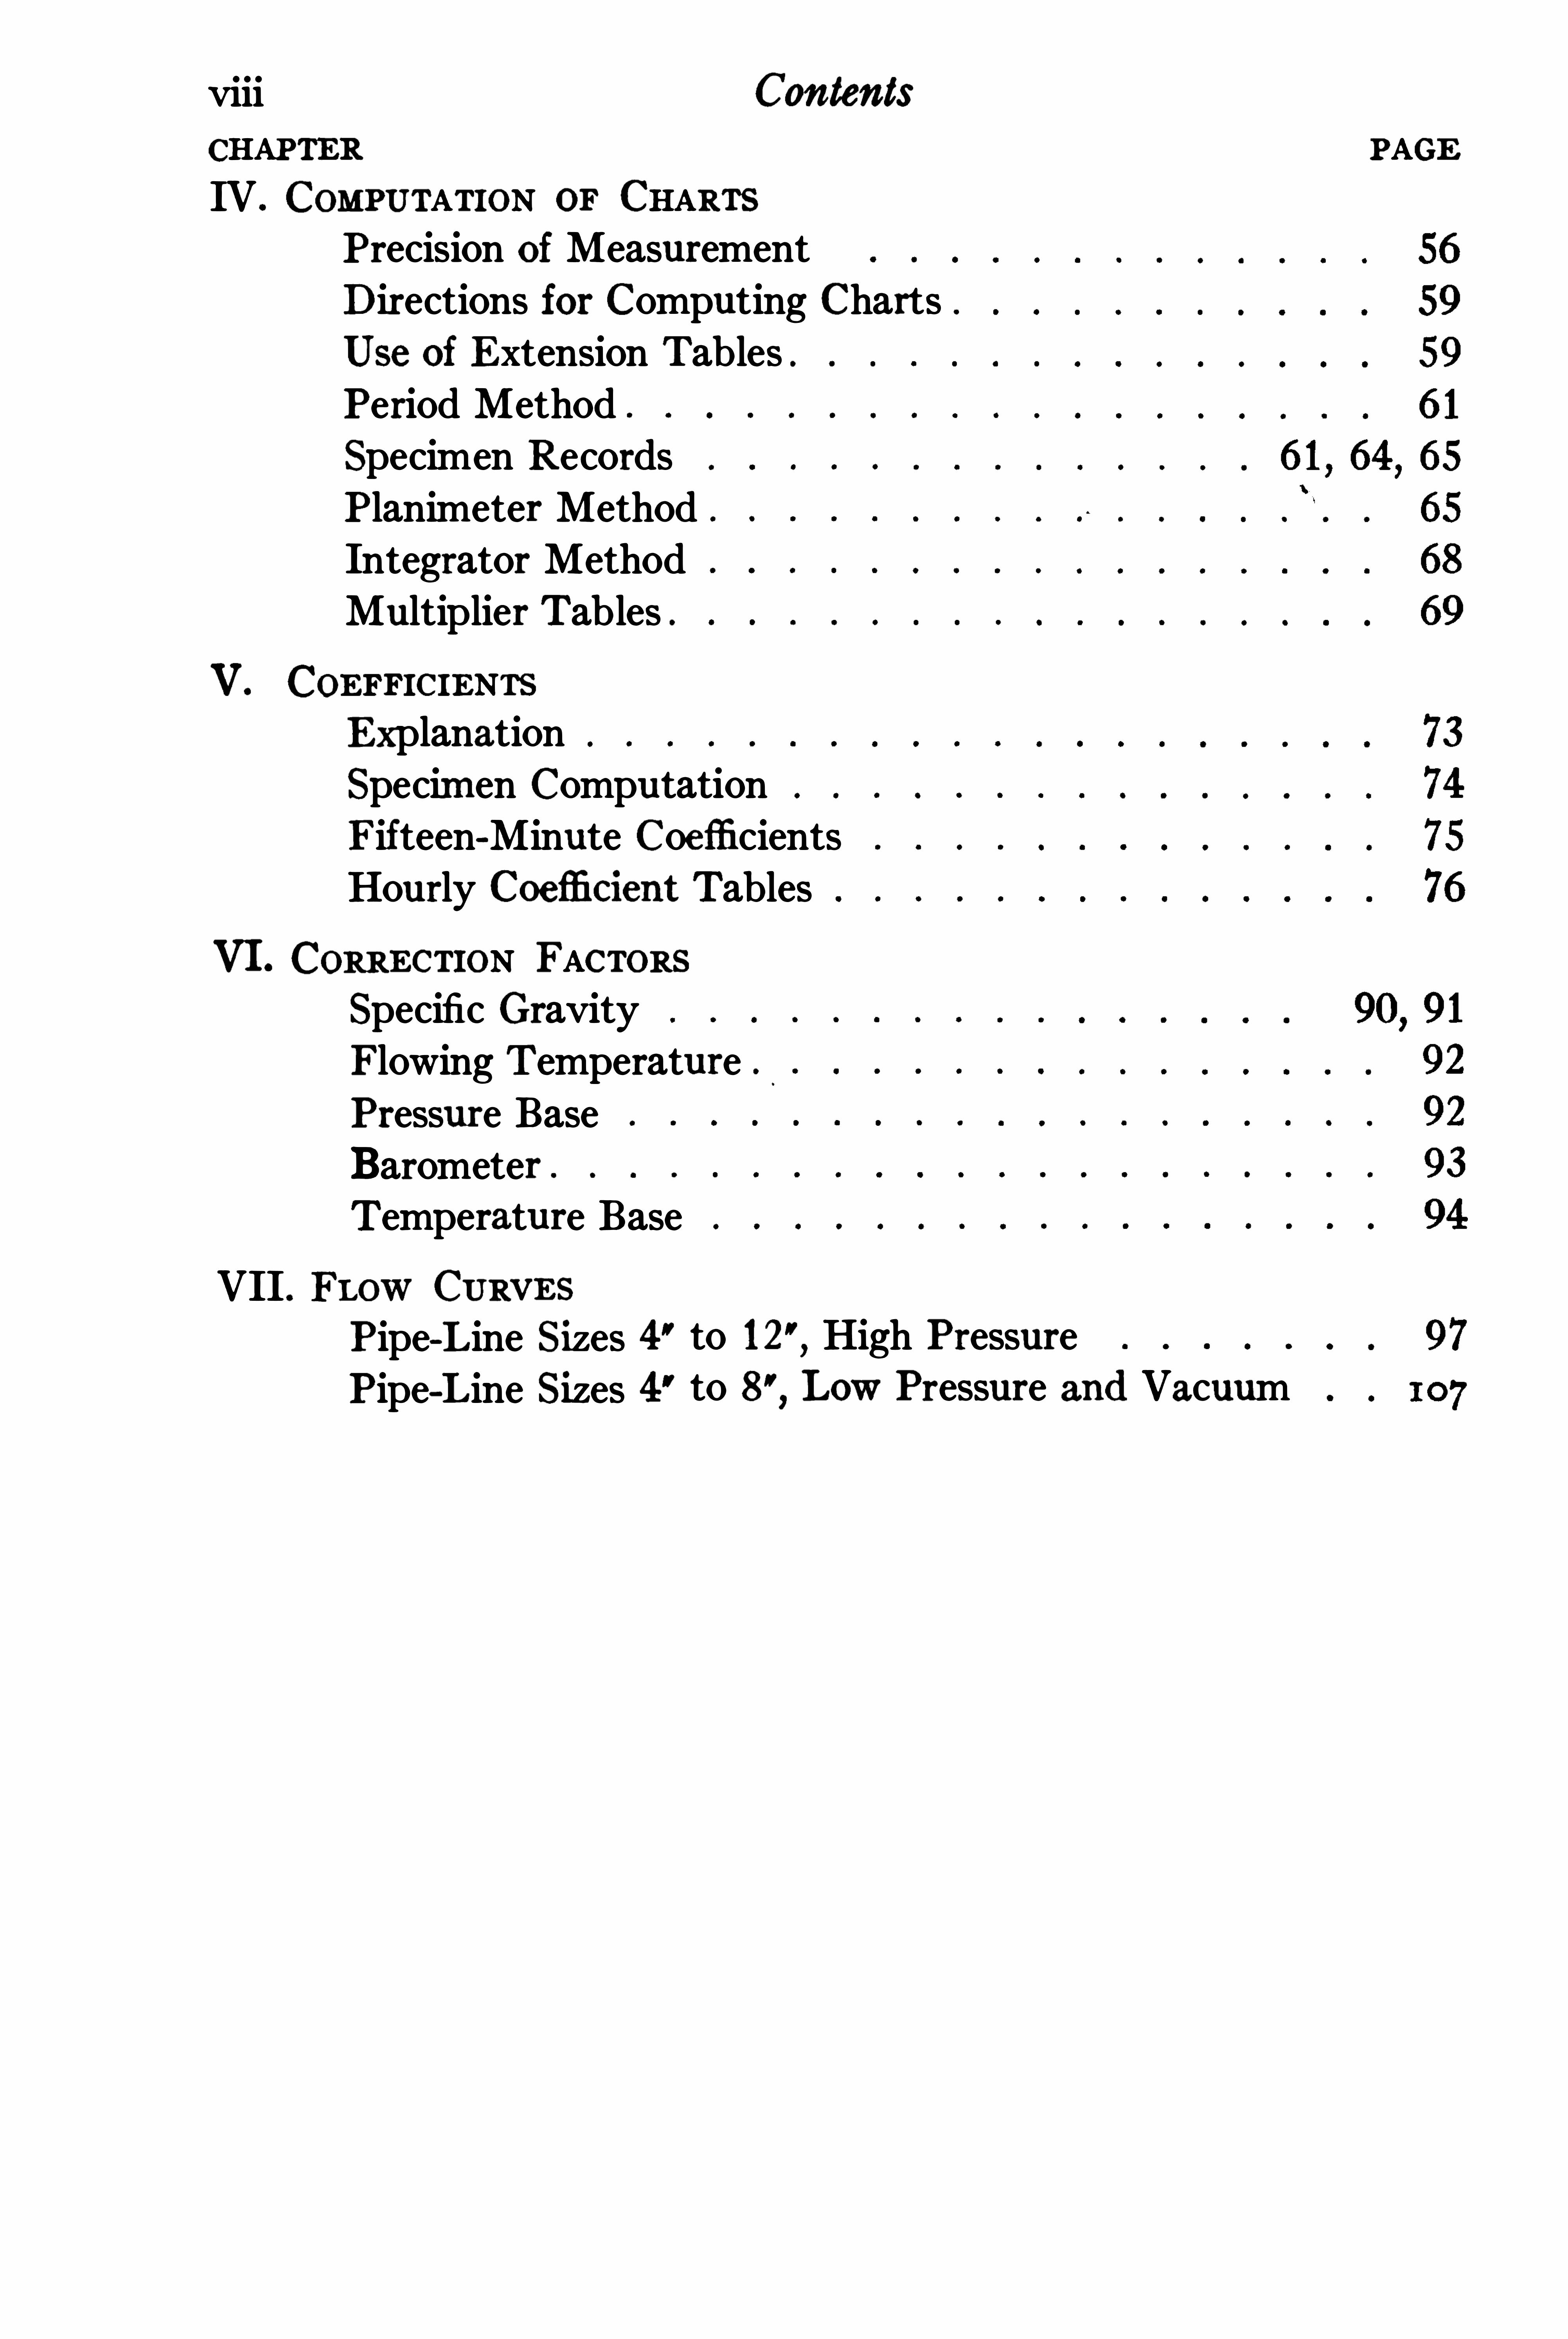
CHAPTER PAGEIV . COMPUTATION OF CHARTS
Precision of MeasurementDirections for Computing ChartsUse of Extension Tables .
Period MethodSpecimen RecordsPlanimeter MethodIntegrator MethodMultiplier Tables .
V. COEFFICIENTSExplanationSpecim en ComputationFifteen-Minute Coe fficientsHourly Coefli cient Tables
VI. CORRECTION FACTORSSpecific GravityFlowing TemperaturePressure BaseBarometer .
Temperature Base
VII . FLOW CURVES
Pipe-Line Sizes 4 ” to High PressurePipe-Line Sizes 4 ' to Low Pressure and Vacuum

HISTOR! OF THE ORIEICE METERB! THOS . R. WE!MOUTH “
for the measurement Of rates of flow Of fluids from vesselsinto the open air
,its use in the case Of closed-pipe flows does
not appear to have been developed until comparatively recent years .The beginning Of the investigation that later resulted in the development of the Foxboro meter occurred in 1904 when Thos . R . Weymouth , Of Oil City, Pa .
,installed a flange union with thin orifice
plates in a line in series with a standard Pitot Tube Of the Towl type ,with the intention Of studying its behavior and developing a simplerate-reading device to be used in measuring boiler fuel . This work wasinterrupted
,however
,and was not resumed until the fall Of 191 1 , when
it was again taken up ,resulting in the development of the device now
known as the Foxboro Orifice Meter.
This meter consists of a flange union of simple design , with a plate,or disc , clamped between the flange faces . The metal of this plate iseither inch orM; inch thick , depending upon the diameter Of orificeand the pipe size of the containing flanges . The orifice is in the centerof the plate and is bored straight through
,perfectly round and with
sharp,clean edges .
The flange union is provided with pressure taps located with theircenters at a fixed distance from the plate
,corresponding with those
for which the meter was originally calibrated .
A recording differential gauge is connected to these pressure taps,
and from the downstream tap a connection is made to a recordingstatic gauge . It is essential that this connection be made to the downstream pressure line for Foxboro Coefficients to apply. This constitutes one Of the principal features of this type of orifice meter
,
for with thi s arrangement the orifice coefficient is more nearlyconstant over a wide range of flows than with any other method of
connection .
The pressure taps are made in the flanges , close to the orifice plate ,for two principal reasons. In
’
the first place,this produces a compact
self-contained meter with the connections always flush with the interior Of the flanges
,and with the assurance that these connections will
always be made properly . In the second place,it permits advanta e
to be taken Of the fact that the pressure difference across the orifice l salways a maximum when measured at the vena contracta
,which is
WHILE the orifice is one Of the oldest known devices used
See reference at end of chap ter.
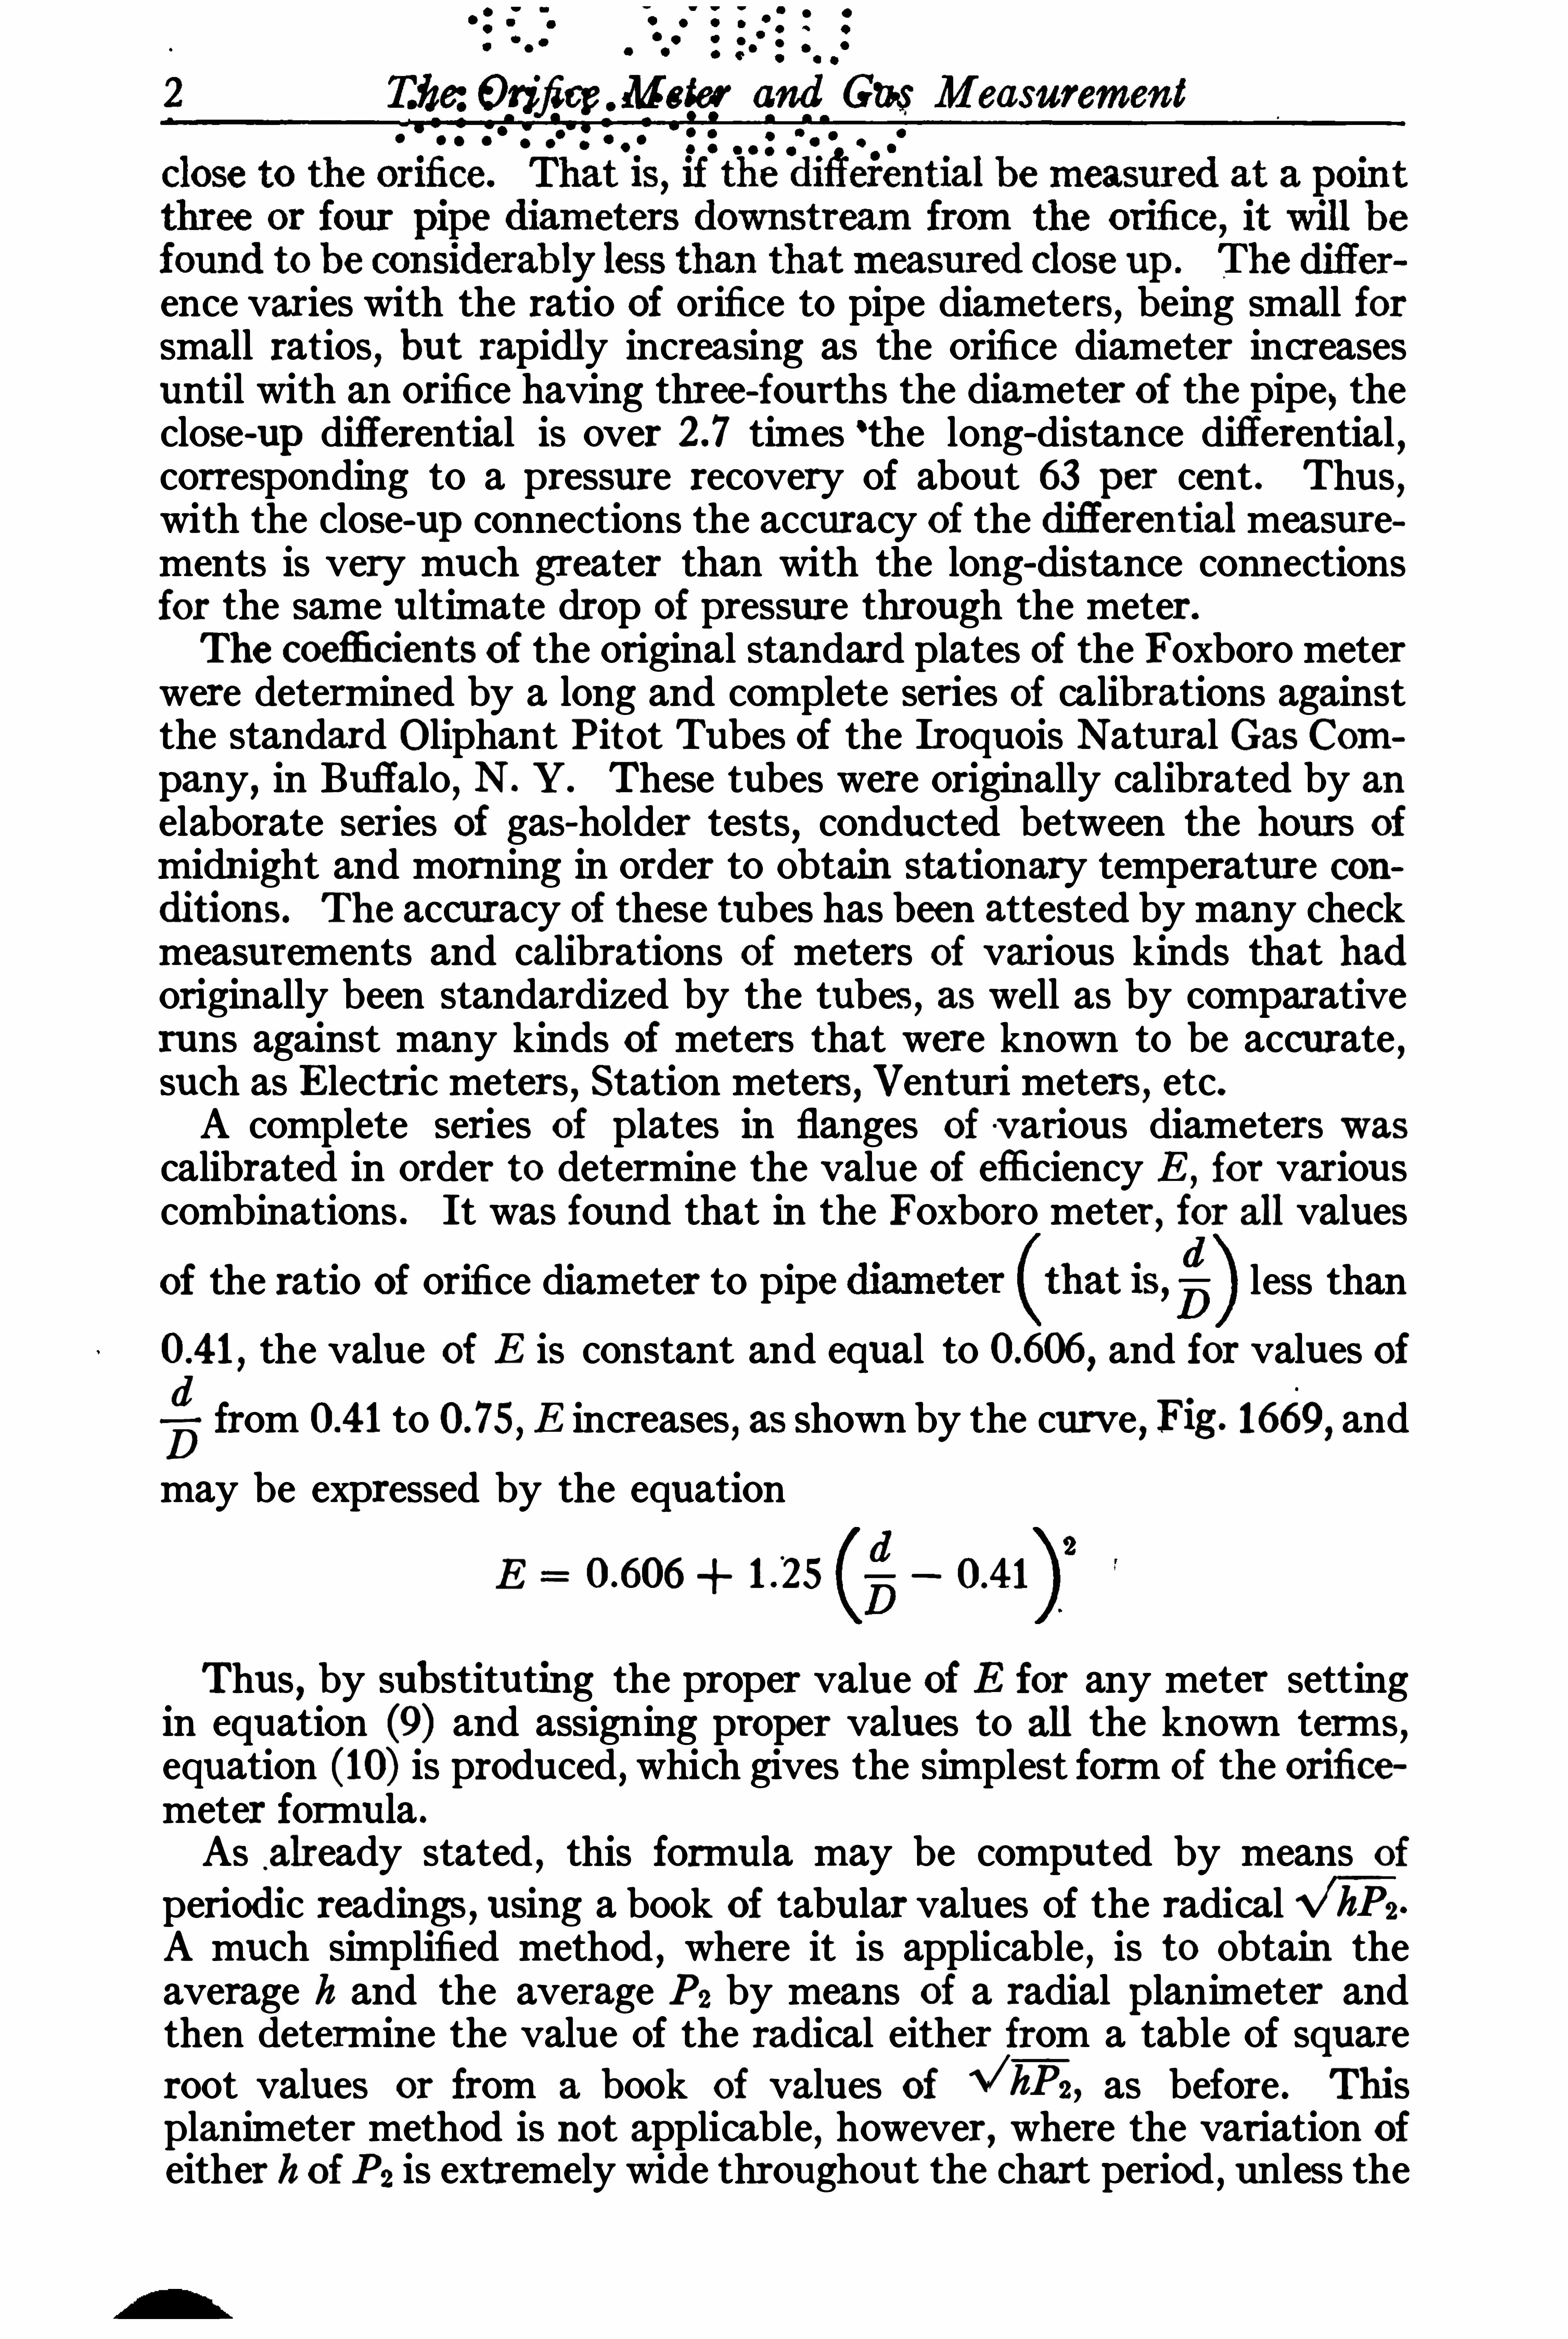
ence varies with the ratio Of orifice to pipe diameters , being small forsmall ratios , but rapidly increasing as the orifice diameter increasesuntil with an orifice having three-fourths the diameter Of the pipe, theclose-up differential is over times ‘the long-distance differential
,
corresponding to a pressure recovery of about 63 p er cent . Thus,
with the close-up connections the accuracy of the diflerential measurements is very much greater than with the long-distance connectionsfor the same ultimate drop Of pressure through the meter.
The coefli cients of the original standard plates of the Foxboro meterwere determined by a long and complete series of calibrations againstthe standard Oliphant Pitot Tubes of the Iroquois Natural Gas Company
,in Buffalo
, N . ! . These tubes were originally calibrated by anelaborate series of gas-holder tests, conducted between the hours ofmidnight and morning in order to Obtain stationary temperature conditions. The accuracy Of these tubes has been attested by many checkmeasurements and calibrations of meters of various kinds that hadoriginally been standardized by the tubes, as well as by comparativeruns against many kinds Of meters that were known to be accurate ,such as Electric meters , Station meters, Venturi meters , etc.A complete series o f plates in flanges of various diameters wascalibrated in order to determine the value o f efficiency E , for variouscombinations . It was found that in the Foxboro meter, for all valuesof the ratio of orifice diameter to pip less than
the value of E is constant and equal to and for values offrom to E increases
,as shown by the curve
, Fig . 1669, andmay be expressed by the equation
E
Thus,by substituting the proper value Of E for any meter setting
in equation (9) and assigning proper values to all the known terms ,equation (10) is produced, which gives the simplest form of the orificemeter formula .
As already stated , this formula may be computed by means o fperiodic readings , using a book of tabular values of the radical V tA much simplified method , where it is applicable , is to Obtain theaverage h and the average P2 by means Of a radial p lanimeter andthen determine the value of the radical either from a table of squareroot values or from a book of values of \/t ,
as before . Thisplanimeter method is no t applicable
,however
,where the variation Of
either h o f P2 is extremely wide throughout the chart period , unless the

Theory of the Orifice Meter 3
period is broken up into sections , each one of which will contain comparatively small variations in differential or pressure . I
The Weymouth square root integrator does away with a large partOf the error of the straight planimeter determination , inasmuch as itgives directly the average of the instantaneous square root values ofh and P , thus reducing the error to that occasioned by multiplyingtogether values of V; and“E which do not strictly correspond .
The Simplest and at the same time most strictly accurate method ofchart computation is by means of the Weymouth compound integrator, which multiplies together the instantaneous values Of It and P2,extracts the square root of the product , and adds together the instantaneous values of V t ,
so that after once going over the pressure and differential charts for any period of the day through whichthey show a registration
,the reading Obtained by the device is
multiplied by a constant , and the result is the quantity of gas thathas passed for the period registered by the charts .
THEOR! OF THE ORIFICE METER
When , as in Fig . 1656, a fluid flows steadily along a horizontalchannel
,of diameter D and cross-sectional area A 1 , in which there is
inserted an orifice , or constriction , of diameter d, the bounding surfaceof the stream assumes the form shown , provided the orifice has a
D ire c t io n
FIG . 1656
sharp entrance edge or is no t shap ed or beveled in any fashion tochange the natural stream-line form of the jet . This jet converges asit passes the plane Of the orifice until a minimum area
,A2 square feet,
is reached , when it again diverges until the walls Of the channel arereached . The space between the stream boundary and the wall Of thechannel neighboring the orifice plate on the downstream side is filledwith fluid in a fairly quiescent state
,forming a container or bounding
channel just as the walls of the pipe might do if tapered out from theorifice diameter to that Of the pipe .When the devi ce is built in accordance with the outline drawing
Fig . 1656 , it is called an Orifice Meter , the essential factors Of whichare the diameter of p ipe , D,
the diameter Of orifice, d, and the pres
The Orifice Meter and Gas Measurement
sures , volumes , temperatures , and densities Of the fluid in the crosssections A 1 and A2.
When a material is supplied to hold the stream-line shape of thefluid jet invar iable, as outlined in Fig . 1656 , the device is termed aVenturi Meter, the essential factors Of which are precisely the sameas for the Orifice Meter, except that the diameter d of the orifice isdisplaced by the diameter of the throat at cross section A2, which inthis case is formed by the walls of the device .In the case of each of these meters it is necessary to add to thetheo retical discharge formula a factor, termed discharge coefficient , orEfliciency , which in the case of the Venturi Meter takes into ac
count the frictional and other losse s , and , in the case o f the OrificeMeter includes not only these factors , but also the effect of the venacontracta , or ratio Of smallest area Of jet (A2) to the area of theorifice corresponding to its diameter d.
These two meters are fundamentally the same , and the formulasderived for one may be applied equally well to the other with properconsideration of the difl erence in efficiencies. Accordingly, in exp ressing the discharge formulas , reference will be made throughout to theOrifice Meter only, wherein the cross section of the stream at itssmallest diameter
,corresponding to A2, wil l be spoken of as the “ jet ”
of the orifice,just as it is designated the throat of the Venturi
Meter.
All pressures,temperatures , etc . , referring to the sections A 1 and A2,
will be indicated by the corresponding subscripts .It is possible to have four conditions Of flow ,
namely(0 ) Where there is no appreciable change in density of the fluid asit passes from the ful l upstream cross se ction of the pipe to the constricted cross section of the orifice , which is the case when an incompressible fluid
,or liquid, is flowing;
(b) In gas flow where the change of state Of the fluid between upstream channel and orifice takes place adiabatically, that is, withoutthe passage of heat to or from the fluid from external sources;(6 ) In gas flow
,where the change Of state takes place iso therrnally ,
that is,with sufi cient heat added to the gas from the outside to main
tain constant temperature ;(d) In gas flow
,where the change of state is neither adiabatic no r
isothermal , but intermediate between them .
In actual practice,the flow is usually under condition (d) although
more nearly adiabatic than isothermal , as a rule. Therefore , in orderto express the rate of flow it is necessary to use a formula closelyapproximating the adiabatic . However, the formulas for conditions(a) , (b) , and (0) will all be given , in order that the relationship s existing among them may be shown .
(a) When an incompressible fluid flows through an orifice meterin a pipe
,there is practically no change in density as the fluid passes
from the pipe to the orifice jet . Consequently both the temperature
Theory of the Orifice Meter 5
and the intrinsic energy may be assumed constant,and the velocity
through the orifice may be exp ressed theoretically by the equationa V 2gh1 , where h is the head producing the velocity change,exp ressed in feet, of a column of the fluid at the density existing inthe orifice, and g is the acceleration due to gravity. In cases wherethe ratio of the diameter of the orifice to that of the ipe is not small ,and the fluid in the pipe has an appreciable velocity (0 1 as it approachesthe orifice , a part of the actual velocity through the orifice is due tothis velocity Of approach, and the efl ective total head producing the
2
velocity 1) through the orifice,instead of being h. is H h.
”
51
;From this expression the general equations of flow of liquids arederived
,and are as follows
in units of volume perV !Munit of time
in units of weight per unit
For most liquids, E may be taken equal to and combined
with the constants ! , and ! m in order to form simplified equations asfollows :
V MRd2 volume units
W NEd’v hG weight units
In the above equations ,d Diameter of orifice
,inches .
D Diameter of pipe, inches .E Efi ciency , or co efi cient Of discharge.h Differential pressure , inches of water head.
G Specific gravity of flowing liquid at temperatureferred to water at 60° F .
! andM are constants for volume units .! w and N are constants for weight units .
1 D4C—
4 m orrecti on factor for velocity
1 ELL
E-4 Of approach,from Table 2.

6 The Orifice Meter and Gas Measurement
TABLE 1 . CONSTANTS M AND N
Values o f M Values of N
For cu . ft . For gal . For lbs .
TABLE 2. CORRECTION FACTORS (R) FOR VELOCIT! OF APPROACH
If velocity of approach be neglected and the factor R be omittedfrom equations (3) and (4) the resulting flow computation will be in
error by less than one-tenth of one per cent for less than by
less than one per cent for less than and by less than two per
cent for less thanWhen a mercury float type differential gauge (which has been
graduated in inches of water for use in measuring air or gas) is usedfor measuring liquids , the mercury should be covered by the liquidbeing measured, and the apparent value of h read on the gauge must
ts to the samething
,the flow
,computed by the observed value of h, must be multi
(b) Under adiabatic conditions , where no energy is added to or
subtracted from the fluid,the increase in velocity required for it to
pass through the orifice must be gained at the expense o f the intrinsic energy Of the fluid itself . In this case there is a change in

Theory of the Orifice Meter 7
density Of the fluid which must be accounted for. For adiabatic flowthe expression for velocity is :
From equation (5) the discharge formula for flow condition (b)becomes
Q 25 15 Ed‘
In equations (5) and (6)Q Cubic feet of gas per hour , based upon T, deg . Fht. ab.
solute,and P 3 lb . per s!. in . absolute .
Emciency .
Diameter of orifice, inches .Absolute temp . (deg . Fht .) Of the standard cu . ft . of gas.
Absolute pressure (1b . sq. in .) o f the standard cu. ft .Of gas .
T1 Absolute temperature Of flowing gas at A 1 (deg . F
G Specific Gravity Of flowing gas (airP 1 and P 2 abs . pressure (lb . sq . in .) at A 1 and A2, respectively.
V1 Specific volume of gas at A 1 (cu . ft . per
g Acceleration due to gravity (ft . per
12 Ratio o f specific heats of gas at constant pressure andconstant volume
,respectively.
(c) Under isothermal conditions , where suflicient heat is suppliedto maintain the Same temperature at A2 as at A 1 , the velocity atA2 IS
2gP 1V1 log.
from which the discharge formula becomes
Q l isoEd"
8 The Orifice Meter and Gas Measurement
It will be observed that excepting for the differing constants,these
formulas are similar in many respects , the last parts only varyingcharacteristically in accordance with the flow conditions assumed .
The denominators under the radical constitute the factor producedby the velocity of approach , and become negligible with a small ratioof orifice to pipe diam eters and a high differential that is, a small
P2value ofP I
This represents the condition of affairs actually encountered inpractice , in which there is more or less interchange of heat betweenthe flowing gas and the pipe or orifice, but not suflicient to maintainisothermal conditions . AS a matter Of fact, the time interval requiredfor the passage of the gas is so small that the departure from adiabaticflow is not great, and equation (6) very nearly represents actual conditions in comm ercial metering . It is found
,however
,that a much
simplified flow formula can be developed , which in combination withthe empirical value Of E described heretofore, will give results wellwithin one per cent , and which probably represent the true flow just asaccurately as the adiabatic formula . This is due to the fact that inorder to keep the loss of pressure within reasonable lim its it is neces
P2
P I
Of the gas in passing through the meter is comparatively negligible,
thus permitting the use Of equation (1 ) as a starting point . This leadsto the following exp ression for flow :
sary to operate with a ratio of SO near that the change in density
When these formulas are evaluated for the same sets of values ofP 1 and P2, it is found that the maximum deviation of formula (9) fromformula (6) is comparatively small for any practical range of operations
,as is shown by Table 1 . Furthermore
,as we stated previously
,
it is probable that the flow is no t strictly adiabatic , although muchmore nearly so than it is isothermal . Accordingly it has been foundpossible, as described , to determine E empirically for equationwhich makes this formula express the true flow with a probable errorOf well under 1 per cent , at the same time permitt ing the use Of anexceedingly simp le formula , adaptable to the employment of integrating devices for the rapid computation of meter records .Formula (9) as used in practice is resolved to the very simple form
wherein the constant C , known as the coefficient , is exp ressed individually for each meter setting and includes all factors dependingUpon orifice dimensions, gas characteristics, and pressure and tem

CHAPTER II
DESCRIPTION OF THE ORIFICEMETER
WO things have been presented in the previous chapter abrief history Of orifice meters and the theory of orifice meters.
The present chapter will Show the connection between the moderntype Of orifice meter and the theory on which it is based and describethe various instruments and fittings used in the construction of anorifice meter.
The orifice meter is constructed upon the principle that by placingin the line an orifice Of smaller diameter than the line itself a greater
velocity will result at the orificethan in the line . This increase invelocity causes a drop in pressureon the downstream side of the plate
,
and this drop in pressure is direct lyrelated to , arid furnishes a measureOf the rate o f flow.
If gas or other fluid is allowed toflow through a wide-Open gate atthe end Of a line
,the differential
pressure‘ at the meter will be at itsmaximum for the particular sizeorifice used . If the gate is closedSlowly
,the differential pressure will
FIG 995 fall off because the amount of fluidDIAGRAMMATIC LA!OUT passing through the orifice is re
ORIFICE METER duced and consequently the velocity at the orifice is reduced . If thegate is entirely closed ,
the pressuresequa l ize on theOpposite sides Of
the orifice. Therei s t h en n o f l owthrough the orifice ,
and consequently no diff erential pressure . This variation in rate offlow is what causes the variation in pressure differences between theupstream and downstream sides Of the orifice , providing the linepressure on the upstream side remains constant .The difference in pressure between the upstream and downstream sides Of the orifice is called the differential pressure , and byObtaining the record of this and o f the pressure Of the fluid after ithas passed through the orifice , we are able to determine the flow .

Description of the Orifice Meter 1 1
Up to the time of the development of the difl erential re
P
cording gauge , there was no FIG . 166 1
Satisfactory means Of record T!PE T M 111 1111
ing the difference in pressbetween the upstreamdownstream sides Of anorifice . U-gauges wereemployed for test work
,
but this meant periodicreadings and constantattention . With the developm ent Of the differential recordinggauge an entirely newpossibil itywasopenedfor a device to measure scientifically and
accurately the flow offluids both gaseousand liquid.
A diagrammaticallayout of the orificemeter is shown in Fig.
995 . It consistsof (A) an instrument for recording the difference in pressureb e tw e e n t h eupstream andd O w n s t r e a msides of the orifice plate ;(B) aninstrument for
r e co rd ing th es t a t i c o r l i n epressures aftert h e g a s h a spassed throughthe orifice ; (CC) an orifice flange union ; (D) an orifice plate and (d s)the connecting pipes between the flange union and the instrument.The arrow indicates the direction Of gas flow.
Foxboro Orifice Meters are of two types .The type most commonly used is the two-instrument meter knownas Type T and shown in Fig . 166 1 . This meter consists Of a 12"diameter mercury, float type difl erential recording gauge and a 10”
12 The Orifice Meter and Gas Measurement
diameter static pressure recording gauge mounted upon a frame withfloor braces and a patented orifice flange union between which isclamped a patented orifice plate . The connection between the instrum ents and flange union is made through a series Of pipes , and,by means Of the valves
,the instruments are cut in or out Of service .
In the Type T meter the records Of the differential and staticpressures are separate . The differential recording instrument islarger in diameter than the static recorder and consequently uses alarger diameter chart.
FIG . 1662. T! PE C METER

Description of the Orifice Meter 13
This type Of meter isparticularly desirable incases where a rapidly fluctuating flow is present , forthe reason that because therecords are separate theycannot be confused
,nor
can they be obliterated byeach other . Furthermore,it is not necessary to use
diff erent-colored inks todistinguish each record , asis the case with the combination meter.
The second type, or combination meter
,is known
as Type C and is Shownin Fig . 1662. It has thestatic recorder movementmounted in the same casewith the differential movement
,so that both records
are made on the samechart . This meter is morecompact than the two
instrument type and isconsequently more easilytransported in the field .
It can be mounted directly on the line pipe byuse Of a saddle and a shortlength Of 2
" supportingpipe .The advantage Of havingboth static and differential 8 9 8 6 3 898 70
records on the same chart is obvious . Although a great many companies prefer this method , just as many others prefer to have therecords on separate charts Of different sizes . Where both recordsare made on the same chart
,inks Of different colors are used to dis
tinguish the records .In the measurement of gas by these meters the differential gaugecharts are graduated in inches Of water and the static pressure gaugecharts in pounds per square inch or inches mercury vacuum .
After careful consideration Of all points involved in the problem of
gas measurement it was decided that only two differential rangeswere necessary to cover all conditions of flow . Consequently themercury float type differential recording gauge was developed in two

14 The Orifice Meter and Gas Measurement
ranges , namely, 0 100 Of water pressure for high-pressure gasmeasurement
,and 0—20 Of water pressure for low-pressure and
vacuum .
Sections Of charts N0 3 . 89863 and 89870 Show these ranges .It would be pertinent
,before discussing the details Of the instru
ment , to exp lain why these two differential ranges are consideredadequate to cover all conditions .From a study Of the theory of orifice meters
,it will be understood
that a high differential pressure means a greater loss in static pressurethrough the orifice than a low differential . This means that if thedifferen tial pressure reads 90” of water
,the loss of static pressure at
the orifice is lbs . per square inch . This loss would be negligibleif the gas were flowing under higher pressure . It m ight not be desirable to have this loss under low-pressure conditions
,consequently
,
the differen tial range Of 0—20 permits Of a full scale record with alow differential pressure . The loss in static pressure at 18" differential is only approximately lbs .
,and it should be noted that the
18" division on chart NO . 89863 corresponds to the 90" division onchart NO . 89870.
Consider the measurement Of casing-head gas under vacuum . Itis desirable to maintain as high a vacuum at the well as conditionswill permit . Flow restrictions must be reduced to a minimum inthe line in order to avoid the necessity Of maintaining an excessivevacuum at the plant with a consequent waste Of power. The frictionalloss due to line and fittings cannot be avoided
,but it is possible to
reduce to a minimum the loss Of vacuum through the meter installation by providing a differential gauge of proper range . The 0—20
”
range permits an appreciable reading to be recorded , which insures anaccurate measurement without excessive loss o f vacuum through theorifice . Perhaps this point may be more clearly understood by thestatement that
,assuming the flowing condi tions constant , the dif
ferential pressure will be reduced as the orifice diameter is increased .
This means that larger orifices are used with the differential rangeof 0—20" than with a differential range Of 0—100 to measure the sameflow in the Same size line .For example
,a differential pressure Of 18 causes a static loss through
the orifice Of only Of mercury,and this means that if the pumps
are turning up 26"vacuum ,the vacuum on the well is approxirnately
but it is a practice in figuring orifice sizes for low-pressurework to compute to a maximum differential of 16 and the average differential will be around 12 This means a loss Of onlymercury vacuum
,or a well pressure Of vacuum
,with a pump
pressure Of 26” vacuum ,assuming that there is no loss due to line
friction .
In establishing a range of 0— 100 Of water for high-pressure gasit is done with the purpose Of covering as wide a variation in flow as
is compatible with accurate measurement . With this range the flow
Difierential Recording Gauge 15
variation ratio can be as great as 5 to 1 with perfect accuracy . Thispermits handling a greater variation Of flow through the same linewith fewer orifice Sizes than with lower differential ranges .
DIFFERENTIAL RECORDING GAUGE
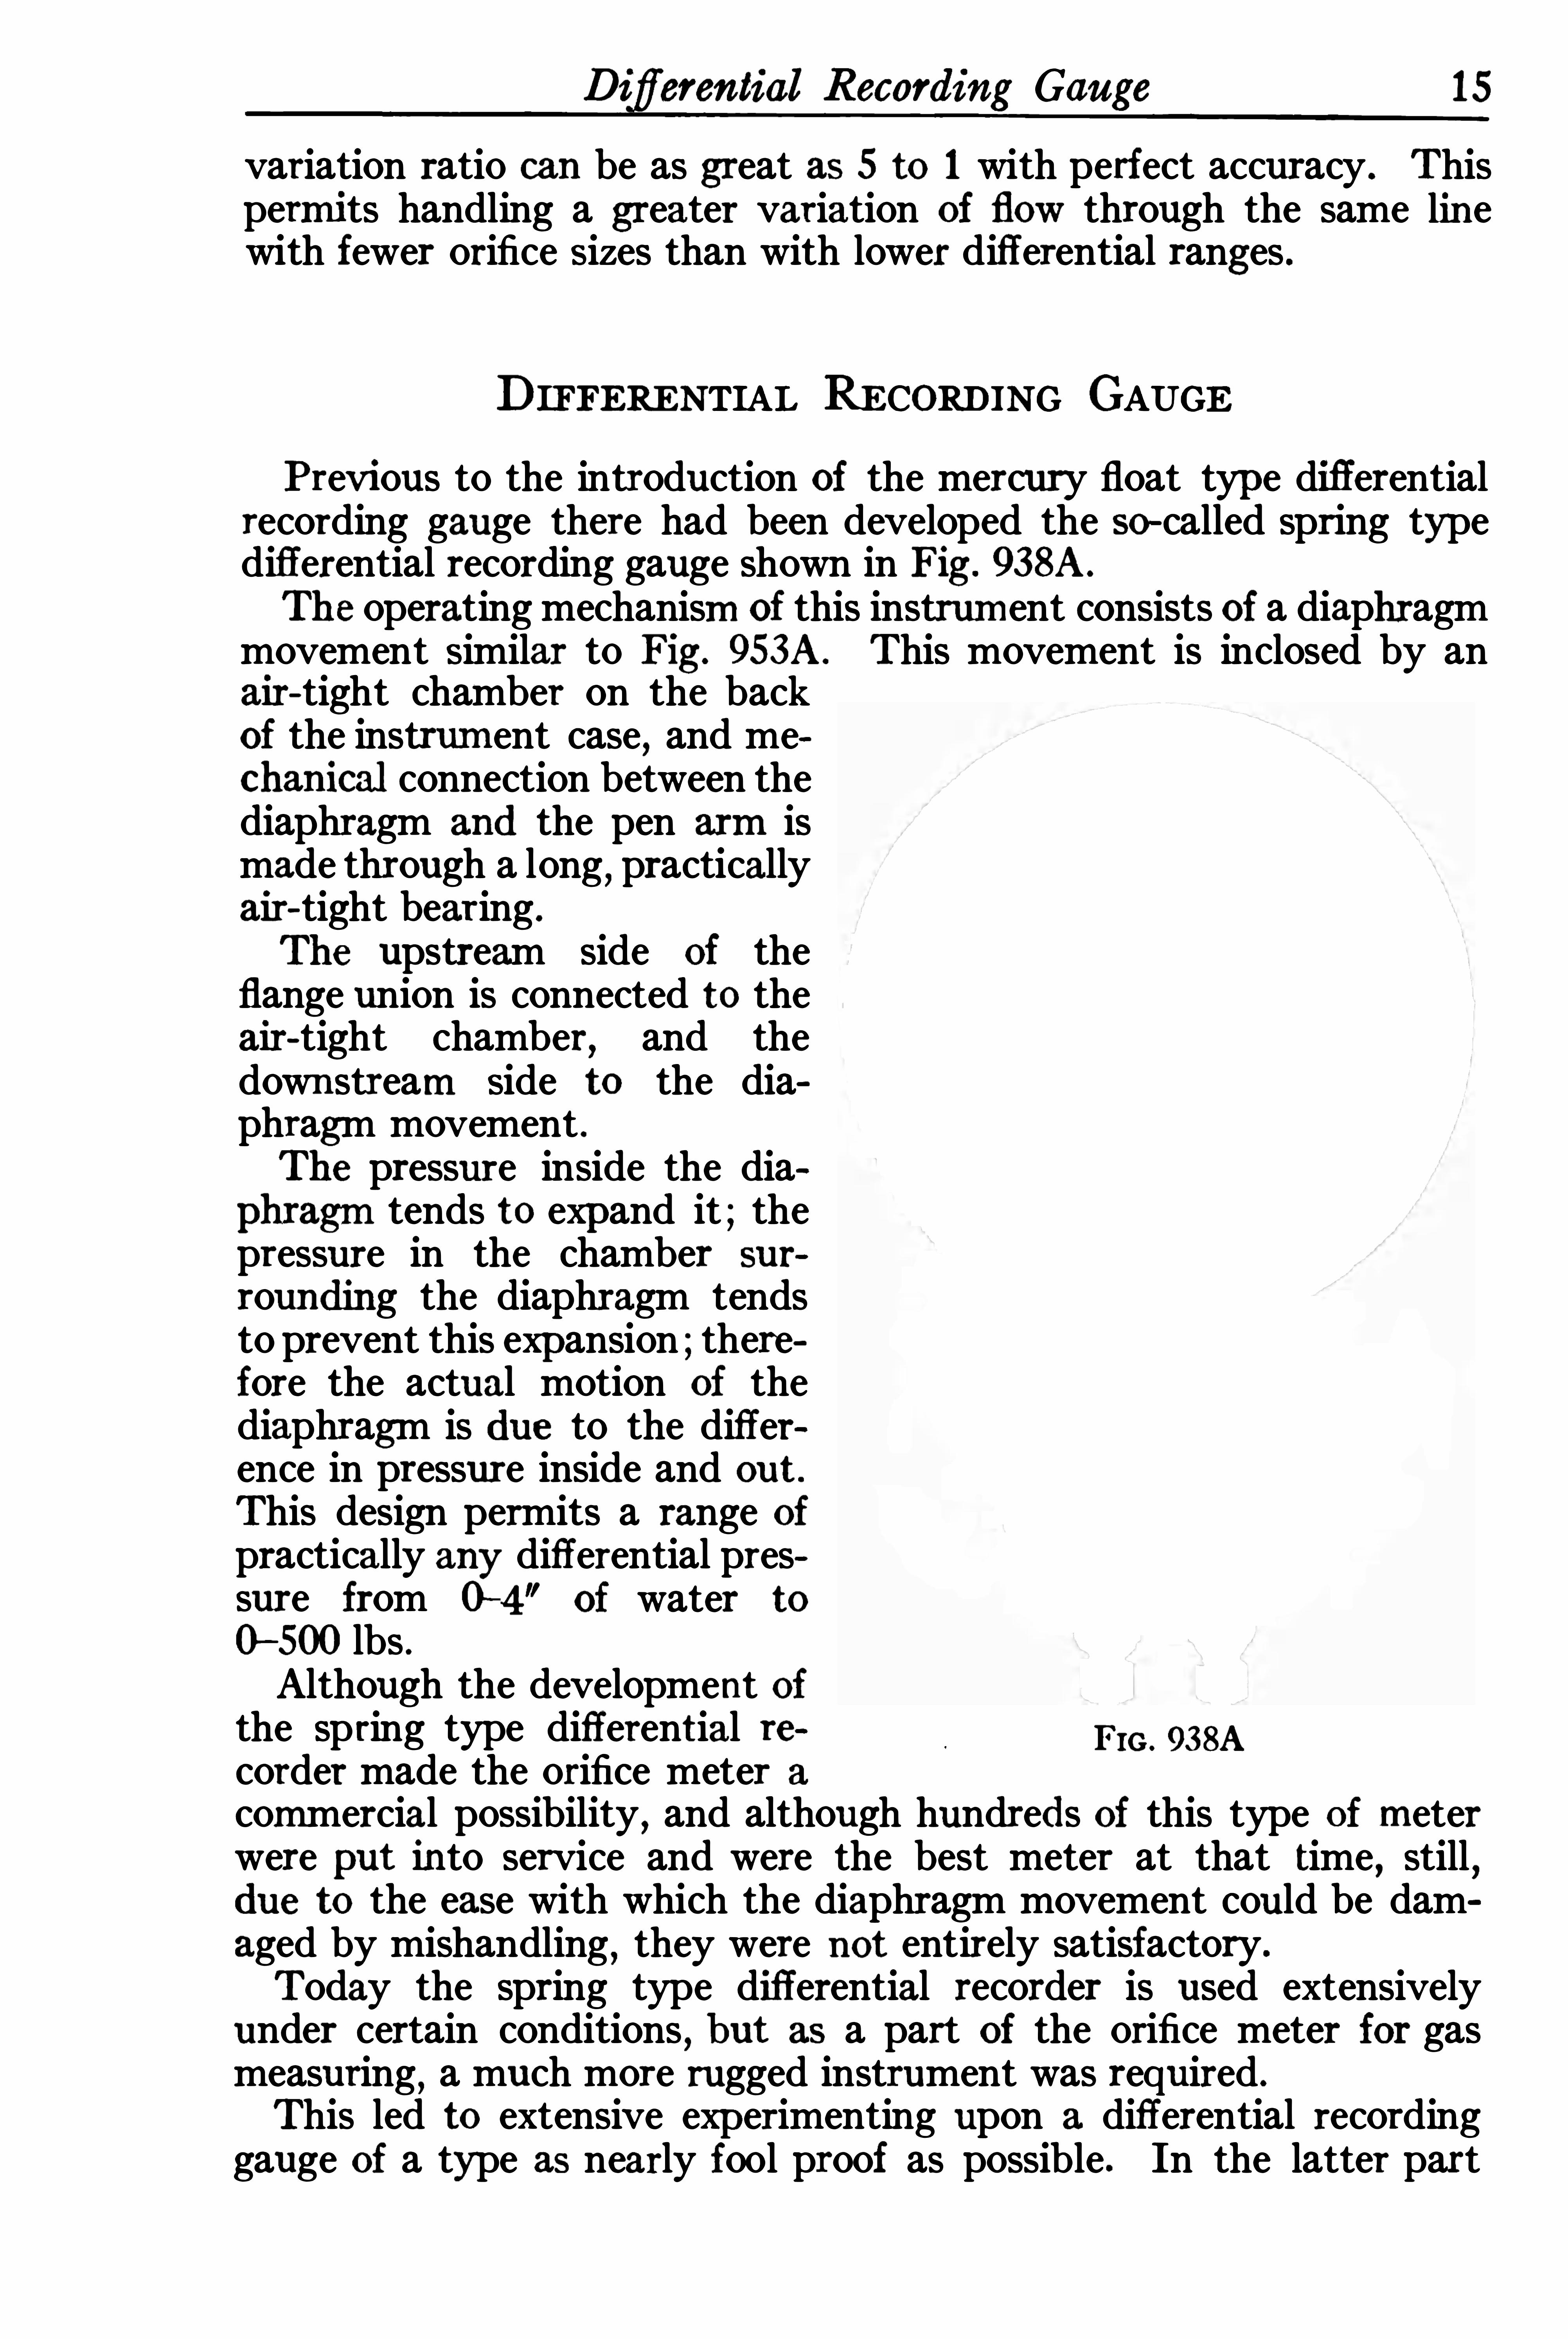
Previous to the introduction of the mercury float typ e differentialrecording gauge there had been developed the so-called spring typedifferential recording gauge shown in Fig . 938A.
The operating mechanism Of this instrument consists of a diaphragmmovement Similar to Fig . 953A . This movement is inclosed by anair-tight chamber on the backof the instrum ent case
,and me
chanical connection between thediaphragm and the pen arm ismade through a long
,practically
air-tight bearing .
The upstream side Of theflange union is connected to theair-tight chamber
,and the
downstream Side to the diaphragm movement .The pressure inside the dia
phragm tends to exp and it ; thepressure in the chamber sur
rounding the diaphragm tendsto prevent this exp ansion ;therefore the actual motion of thediaphragm is due to the difference in pressure inside and out .
This design permits a range Ofpractically any differential pressure from 0—4
"of water to
0—500 lbs .Although the development Ofthe spring type differential re Fro . 9SSA
corder made the orifice meter a
commercial possibility,and although hundreds Of this type o f meter
were put into service and were the best meter at that time , still ,due to the ease with which the diaphragm movement could be damaged by mishandling
,they were not entirely satisfactory.
Today the spring type differential recorder is used extensivelyunder certain conditions
,but as a part Of the orifice meter for gas
measuring,a much more rugged instrument was required.
This led to extensive exp erimenting upon a differential recordinggauge Of a type as nearly fool proof as possible . In the latter part

The Orifice Meter and Gas Measurement
of 191 7 the Foxboro Company brought out the firstmercury float type differential reco rding gauge
equipped with check valves to prevent the mercuryfrom being blown out by over-pressure on
either the high or low-pressure chambers .The first few Of the new instru
ments were put to work in the gasfields under all sorts of conditions
,
and it was but a short tim e beforetheir weaknesses began to develop .
The early instruments were madewith cast-iron differential cham bersbut it was found that because of
the porosity of cast iron and thechance for Sand holes to be present
,
it was considered advisable to makethese chambers of steel . The operation of these instruments was followedcarefully
,and improvements made from
time to time with the idea o f producing an instrument which would suc FIG . 953Acessfully meet all conditions .Today the Foxboro Mercury Float Type Differential Recording
Gauge is unquestionably the best instrument of its type used inconnection with gas measuring . It is rugged , accurate, sensitive, andfool proof and is used with satisfactory results in measuring bothlow-pressure casing-head and high-pressure natural gas. It can alsobe adapted to the measurement of liquids, and a description of thisapplication will be found in Chapter III .
Me rc u
FIG . 1652
The principle upon which the mercury floattype differential recording gauge Operates isthat of a simple U-tube.Reference to Fig . 1652 Shows a drawing of
this U-tube with the mercury at theLe“ . same level in both legs , and both
open to atmospheric pressure at Hand L. If pressure above atmosphere is applied at H ,
the level in that leg will drop andthe level in the L leg will rise , and the difference in level measured in inches will be equalto the pressure applied at H in equivalentinches Of mercury . Now ,
if at the same tim epressure is applied at H ,
an equal pressure isapplied at L ,
the levels will not change ; if thepressure at L is less than the pressure at H ,
the mercury will fall in H and rise in L , and

Difi’
erential Recording Gauge 19
the difference in levels measured in inches will be equal to the difference in applied pressure in equivalent inches of mercury .
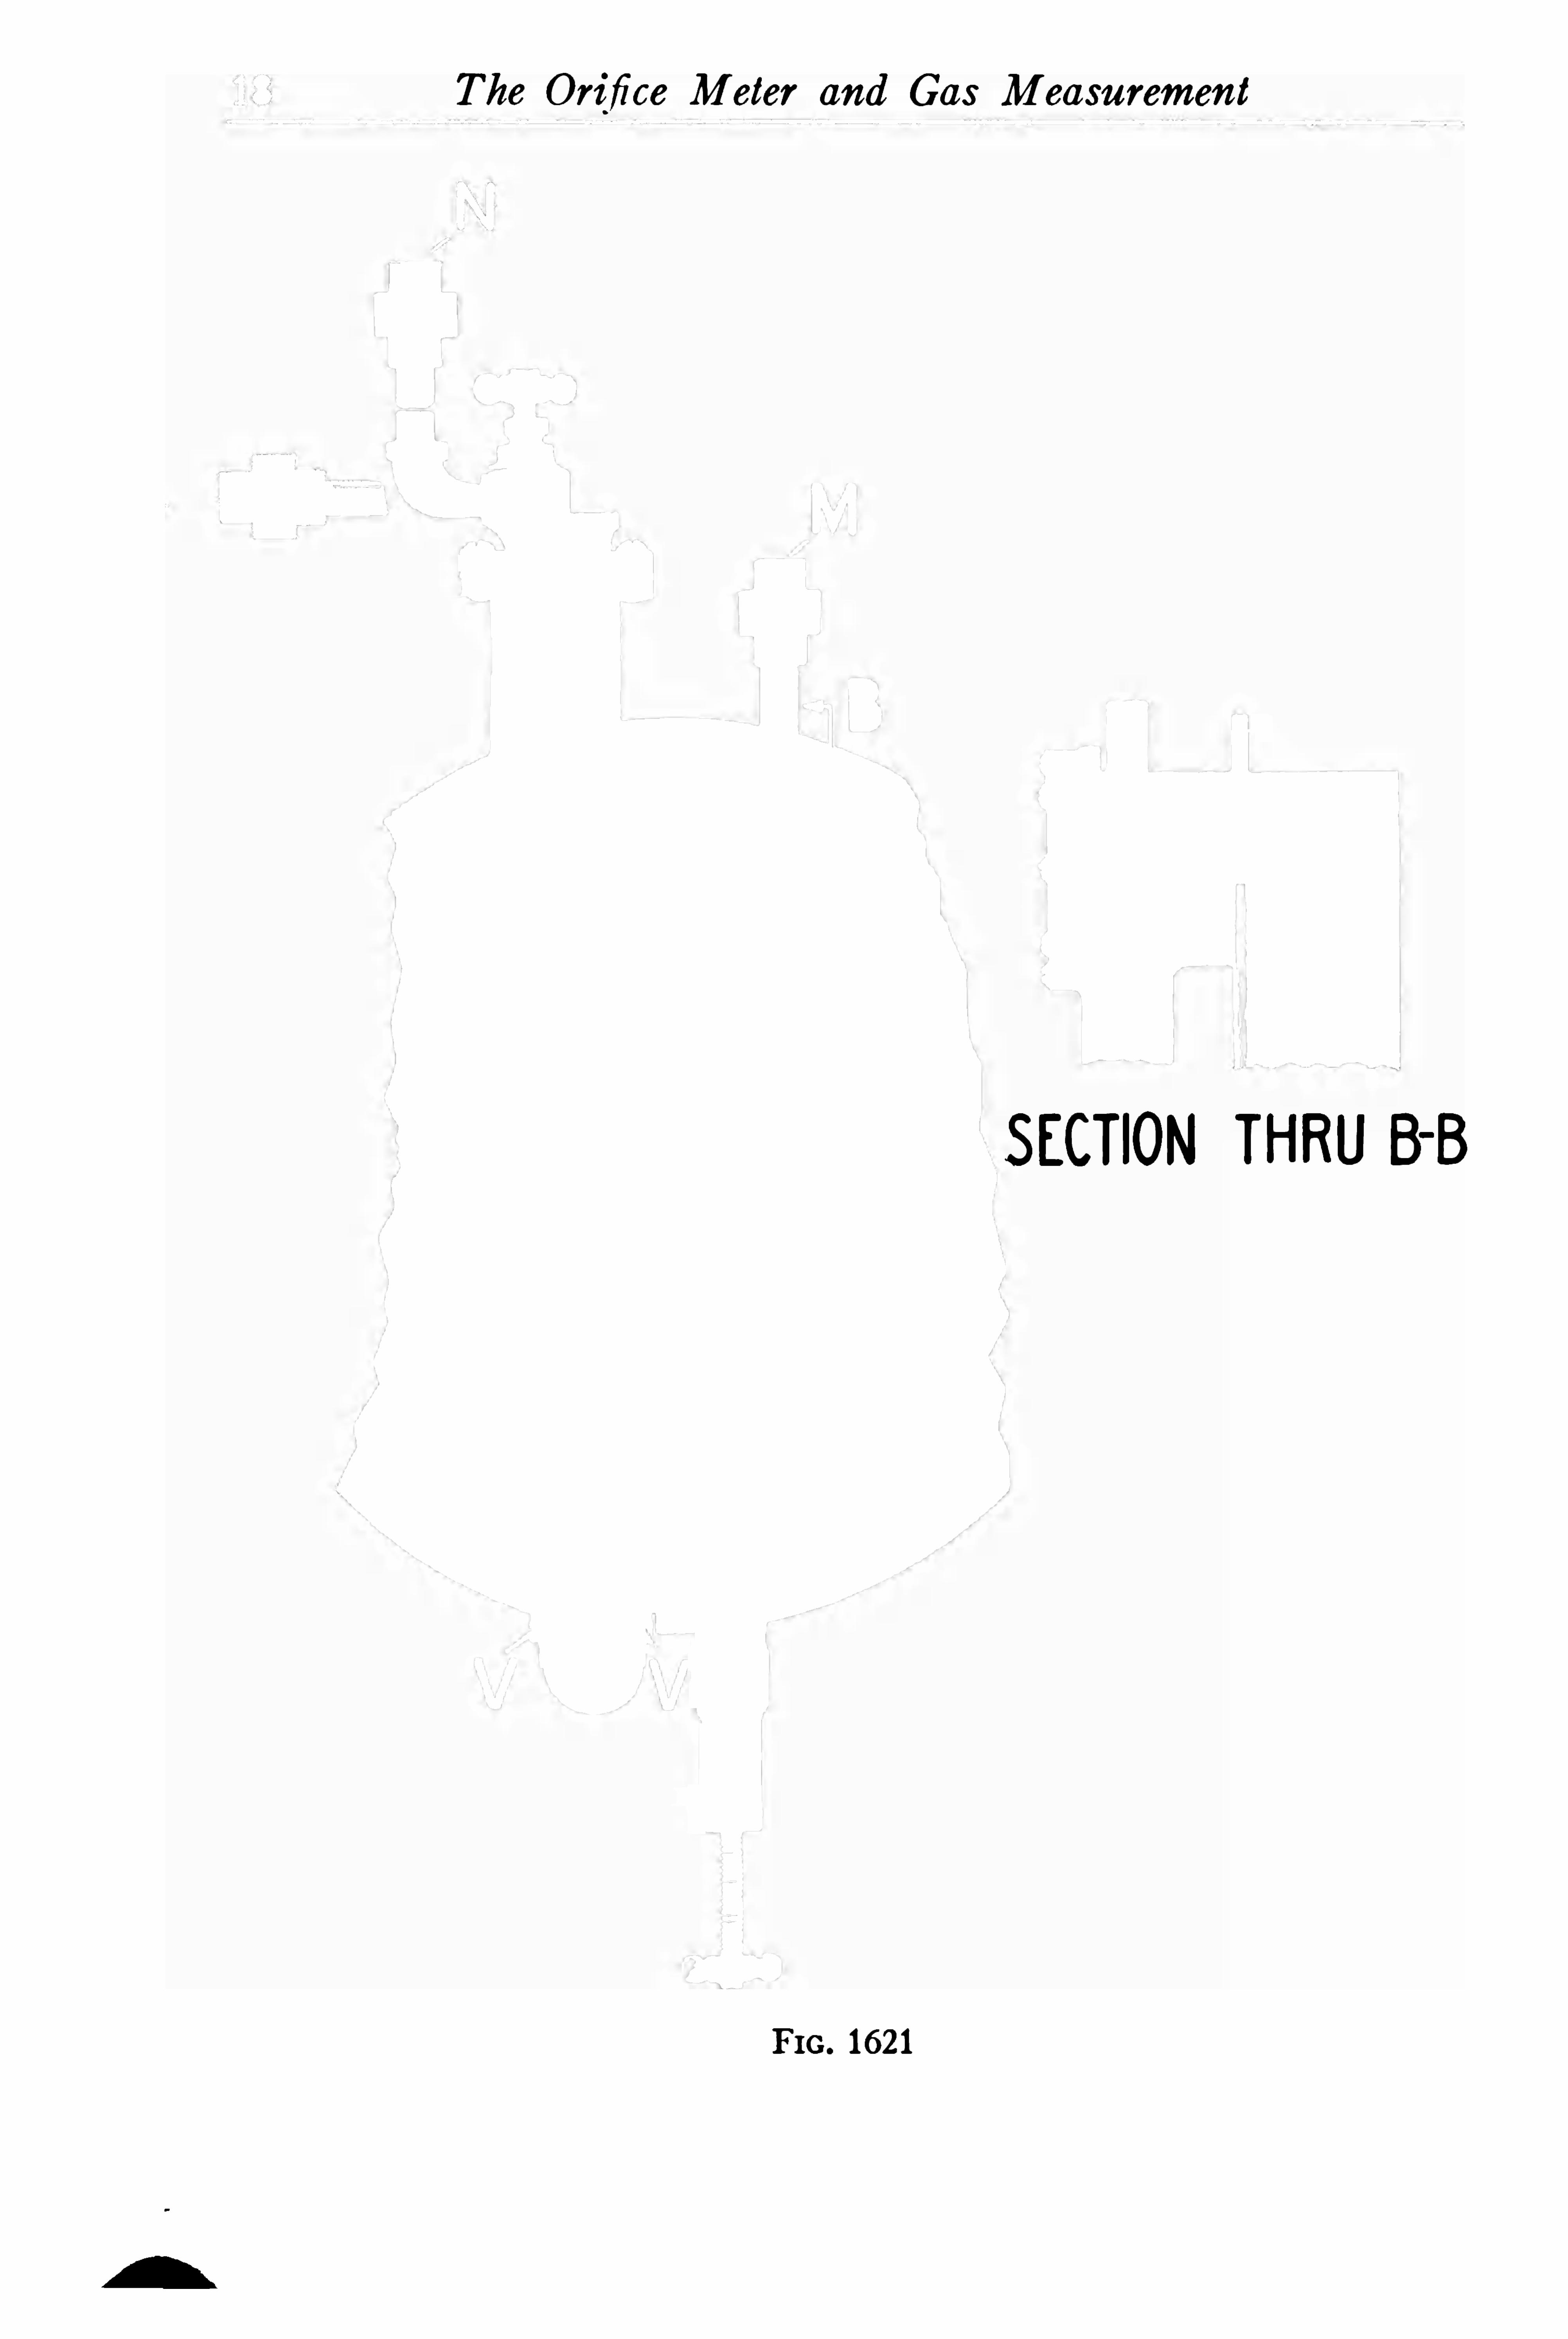
Figs . 1620 and 1621 show sections of the 20" and 100" difl erential chambers respectively, and the analogy of design between theinstrument and the U-tube principle may be readily distinguished .
H is the high-pressure chamber and L the low . Connection betweenthe high-pressure chamber and the upstream side Of the flange unionis made through the union M ,
and between the low-pressure chamberand the downstream side of the flange union through the union N .
As the upstream pressure is greater than the downstream ,the pressure
in H is greater than in L ,consequently the mercury level drops in H
and rises in L .
The specific gravity or density Of mercury is such that most metalswill float upon it . This characteristic is employed in the mercuryfloat type instruments by using a s teel float in the H chamber. Thisfloat rises and falls with a change in mercury level . By means of amechanical connection this motion is transmitted to the pen arm .
The connection between the high and low chamber is made througha U section in each leg of which is a steel check float CC . On thebottom stem Of the floats are valves W . The buoyancy of thesefloats is such that the valves always remain Off the valve seat aslong as the velocity Of flow of mercury back and forth is normal . If
,
however,an excessive pressure is applied suddenly in either Of the
chambers H and L , there is a tendency fo r the mercury to be forcedrapidly out of the chamber to which the excess pressure is applied .
This sudden increase in the velocity Of the mercury overcomes thebuoyancy Of the float and causes it to be depressed until the valveseats and cuts Off the flow . The valve remains seated during the timethe excess pressure is applied, and when the pressure is relieved , thefloat rises and the mercury again flows normally. This en tire Operationis very nearly instantaneous , consequently no mercury is blown fromthe instrument .The volumes of the chambers are so proportioned and the amount
Of mercury used is such that the pen cannot run more than slightlybeyond the maximum range Of the instrument
,even though the flow
Of gas may be sufficient to cause a differential pressure greater thanthe range Of the instrument . This feature is particularly valuablebecause the instrum en t cannot be injured by over-capacity service .The calibration Of the mercury float type differential gauge
,al
though very delicate , is accomplished in a simple manner.
It will be seen from Figs . 1620 and 1621 that there is a strip Of
metal in the L chamber . These strips are shown in detail on pages 50and 5 1 part numbers 5407 and 7839 and are known as calibrationsticks . As the mercury rises in the L chamber a certain amount isdisplaced by the volume of the stick , and this displacement has adirect bearing upon the leve l Of the mercury . This displacement iscontrolled by shaping the stick . Each instrument is calibrated in

20 The Orifice Meter and Gas Measurement
this manner and the calibration sticks are no t interchangeable exceptby coincidence . The shaping of the sticks as desired makes it possible for the pen to follow the scale more closely than commercialaccuracy requires , and no instrument can get out Of calibration nuless mercury is added or removed . From the foregoing it will beunderstood more fully why the statement is made in Chapter III under“Testing and Adjusting ” that it is impossible to adjust the instrument higher or lower by bending the pen arm at the friction joint .The calibration stick is shaped to give such displacement Of mercuryas to cause the pen to be at definite points on the chart when themercury is at certain levels in the chamber , and if the pen does notregister properly
,it is due to loss or addition o f mercury. This would
cause a difference in displacement which can be corrected only byrestoring the mercury to its former level .As a matter of convenience the Foxboro Mercury Float Type Dif
ferential Recording Gauge has been SO designed that it can be loadedwith mercury and transported without danger of leaking . This isaccomplished by means Of valves R and S shown in Figs . 1593 and1594 . Both these valves are closed tigh tly before the instrumentsare shipped .
By reference to Figs . 1620 and 1621 it will be seen that as valve Sis screwed up the stem comes in contact with the lower end Of thefloat stern in the H chamber. The upper end Of the float stem isbeveled , and as the float is forced up by the stem Of valve S thebeveled end of the float stem bears tightly against a hardened-steelseat in the upper section of the H chamber. At the same tim e theextreme top end of the rod connecting the float stem with the penarm Operating lever engages a slot in the bracket above it
,and the
entire mechanism is held securely against motion in transit .In putting the meter into Operation it is essential that the S valvebe Opened to its full capacity
,SO that the seat on the end o f the valve
stem will come tightly against the seat in the stem chamber and thusprevent mercury from escaping under pressure .Details of the parts used in the 20"and 100"gauges will be found in
Figs . 1586 and 1587 on pages 50 and 5 1 .
STATIC RECORDING GAUGE
An essential factor in the correct measurement Of a gaseous fluid bymeans Of the orifice system is an accurate knowledge Of static pressures . Here again it is necessary to employ a reliable instrument .It was but a simple step from the Old Bourdon spring indicatinggauge to a Bourdon spring recording gauge
, but it remained forEdgar H . Bristol to develop successfully the helical form of tubeabout twenty-six years ago .
President of The Foxboro Company .
S tatic Recording Gauge 21
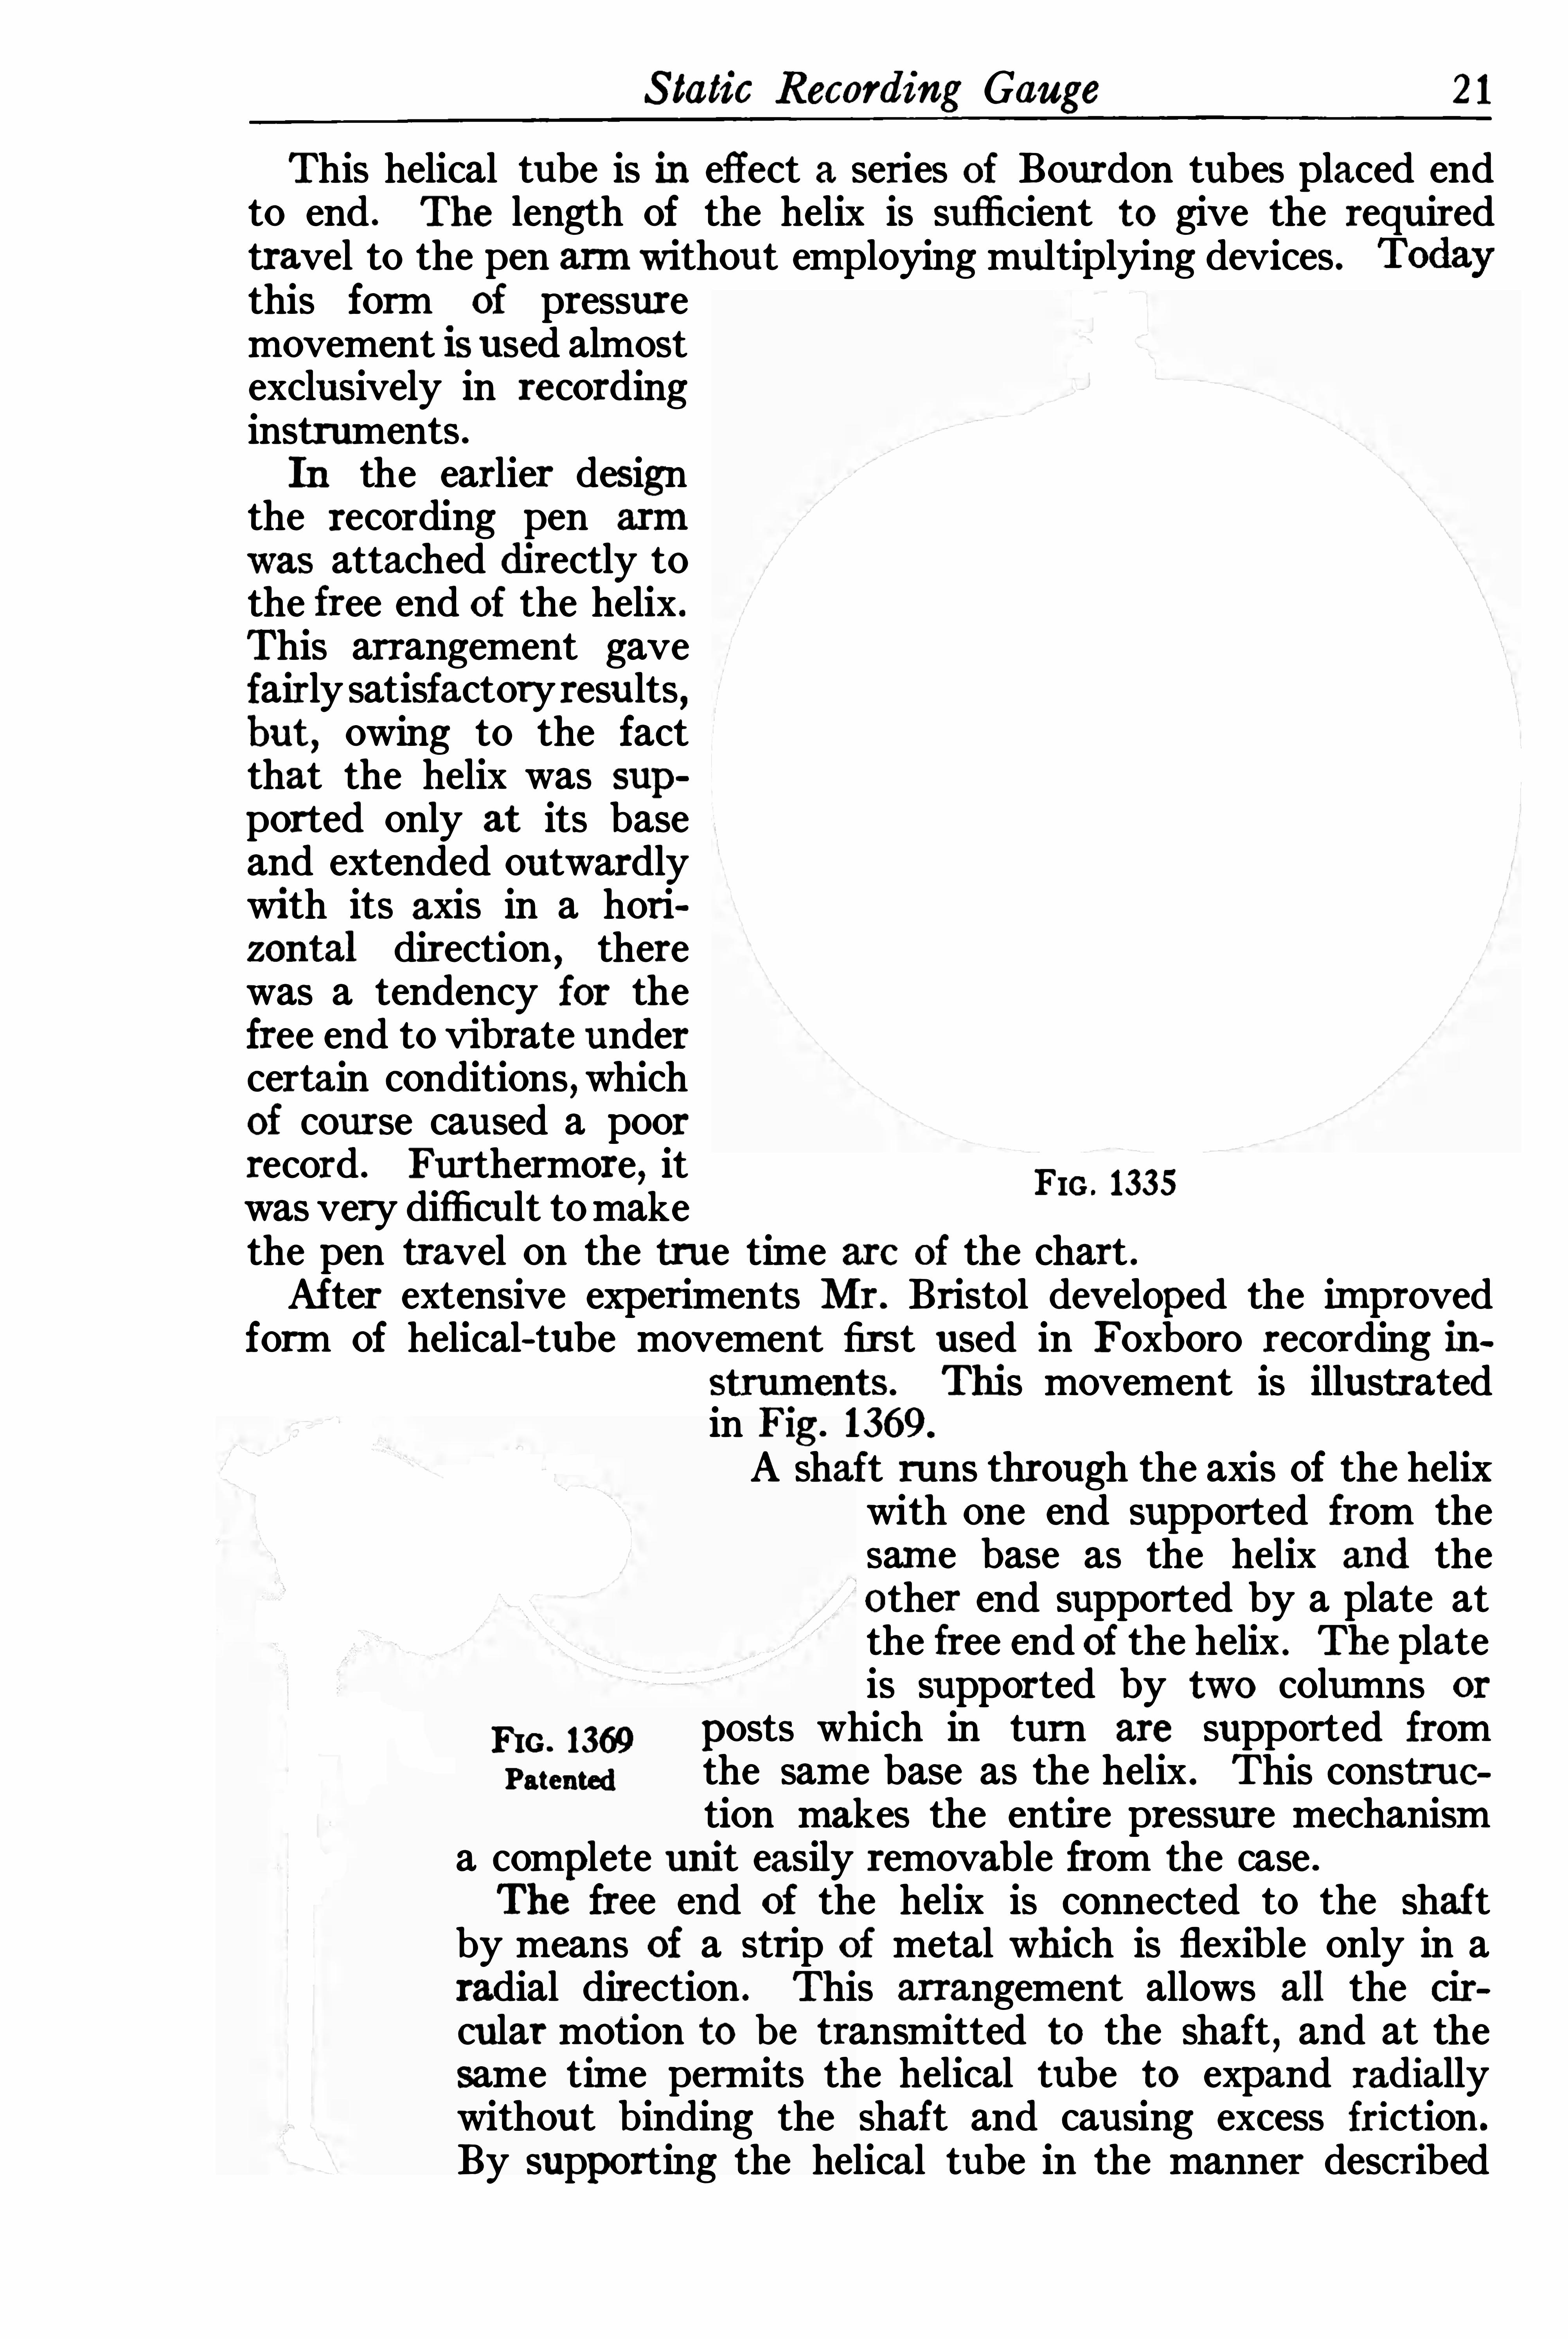
This helical tube is in effect a series of Bourdon tubes placed endto end . The length of the helix is sufficient to give the requiredtravel to the pen arm without employing multiplying devices .this form Of pressuremovement isused almostexclusively in recordinginstruments .In the earlier designthe recording pen arm
was attached directly tothe free end Of the helix .This arrangement gavefairly satisfactoryresults ,but , owing to the factthat the helix was supported only at its baseand extended outwardlywith its axis in a horizontal direction , therewas a tendency for thefree end to vibrate undercertain conditions ,whichOf course caused a poorrecord . Furthermore, itwas very difficult tomake Fm ' 1335
the pen travel on the true time are of the chart .After extensive experiments Mr. Bristol developed the improvedform of helical-tube movement first used in Foxboro recording in
strum ents. This movement is illustratedin Fig . 1369.
A shaft runs through the axis of the helixwith One end supported from thesame base as the helix and theo ther end supported by a plate atthe free end Of the helix . The plateis supported by two columns or
Fro . 1369 posts which in turn are supported fromp atenwd the same base as the helix . This construe
tion makes the entire pressure mechanisma complete unit easily removable from the case .The free end of the helix is connected to the shaf tby means Of a strip o f metal which is flexible only in aradial direction . This arrangement allows all the cir
culat motion to be transmitted to the shaft,and at the
same time permits the helical tube to expand radiallywithout binding the shaft and causing excess friction .
By supporting the helical tube in the manner described

22 The Orifice Meter and Gas Measurement
the effect Of vibration is eliminated . This results in a rugged,sen
sitive,and accurate movement with no parts subjected to wear.
The bracket carrying the pen arm is fastened to the shaft . Thisarrangement allows the pen arm to rotate about a fixed axis
,which
insures correct pen travel over the time arc on the chart .The helical-tube movement is applicable to pressures from 15 to
800 lbs . p er square inch .
Conditions at times may make it necessary to employ a recordinggauge Of a range higher than 800 lbs . In such instances the instru
ment is equipped with a large steelBourdon tube movement similar to
that used in hydraulic indicatinggauges.In the measurement Of low-pressuregases a recording gauge is used with aso—called diaphragm tube movement .The original diaphragm movement
was developed at about the sametime as the helical tube, and like thehelical tube the ear ly designs wereproduced with the pen arm attacheddirectly to the outside diaphragm .
Here also was an opportunity for improvement
,and it remained for Ben
net B . Bristol and Edgar H . Bristolto develop the improved form of
diaphragm tube shown in Fig . 1396
Fm . 1396 and first used on Foxboro low-pressureand vacuum recording instruments .
The diaphragm tube consists of a series Of metal diaphragms builtup in the form Of a bellows . The applied pressure tends to elongatethis tube
,and the resulting motion of one edge of the tube is multi
plied by restraining the motion Oi the other edge through the mediumOf small metal helical springs shown in the illustration . The introduction Of these small restraining springs has made it possible toObtain the required amount of motion with a reduced number of
diaphragm s and has resulted in a much more compact and ruggedmovement . This is one of the features that has made it possible tomaintain a standard design of round-case instrum ent . Another decided advantage Of this compact diaphragm tube is its relativelysmall internal volume
,which means a much quicker response to
pressure changes than the diaphragm tubes employing a greaternumber of diaphragm s .The lateral motion of the diaphragm tube is communicated to a
shaft similar to that used in the helical-tube movement . This lateralmotion is translated into a rotary motion of the shaft through a series
Treasurer o f The Foxboro Company .
Combination Difierential Recorder 23
Of simple levers . The pen-arm bracket is aflixed to the shaft in amanner sim ilar to the helical-tube movement .Occasionally, under severe service conditions , the static recording
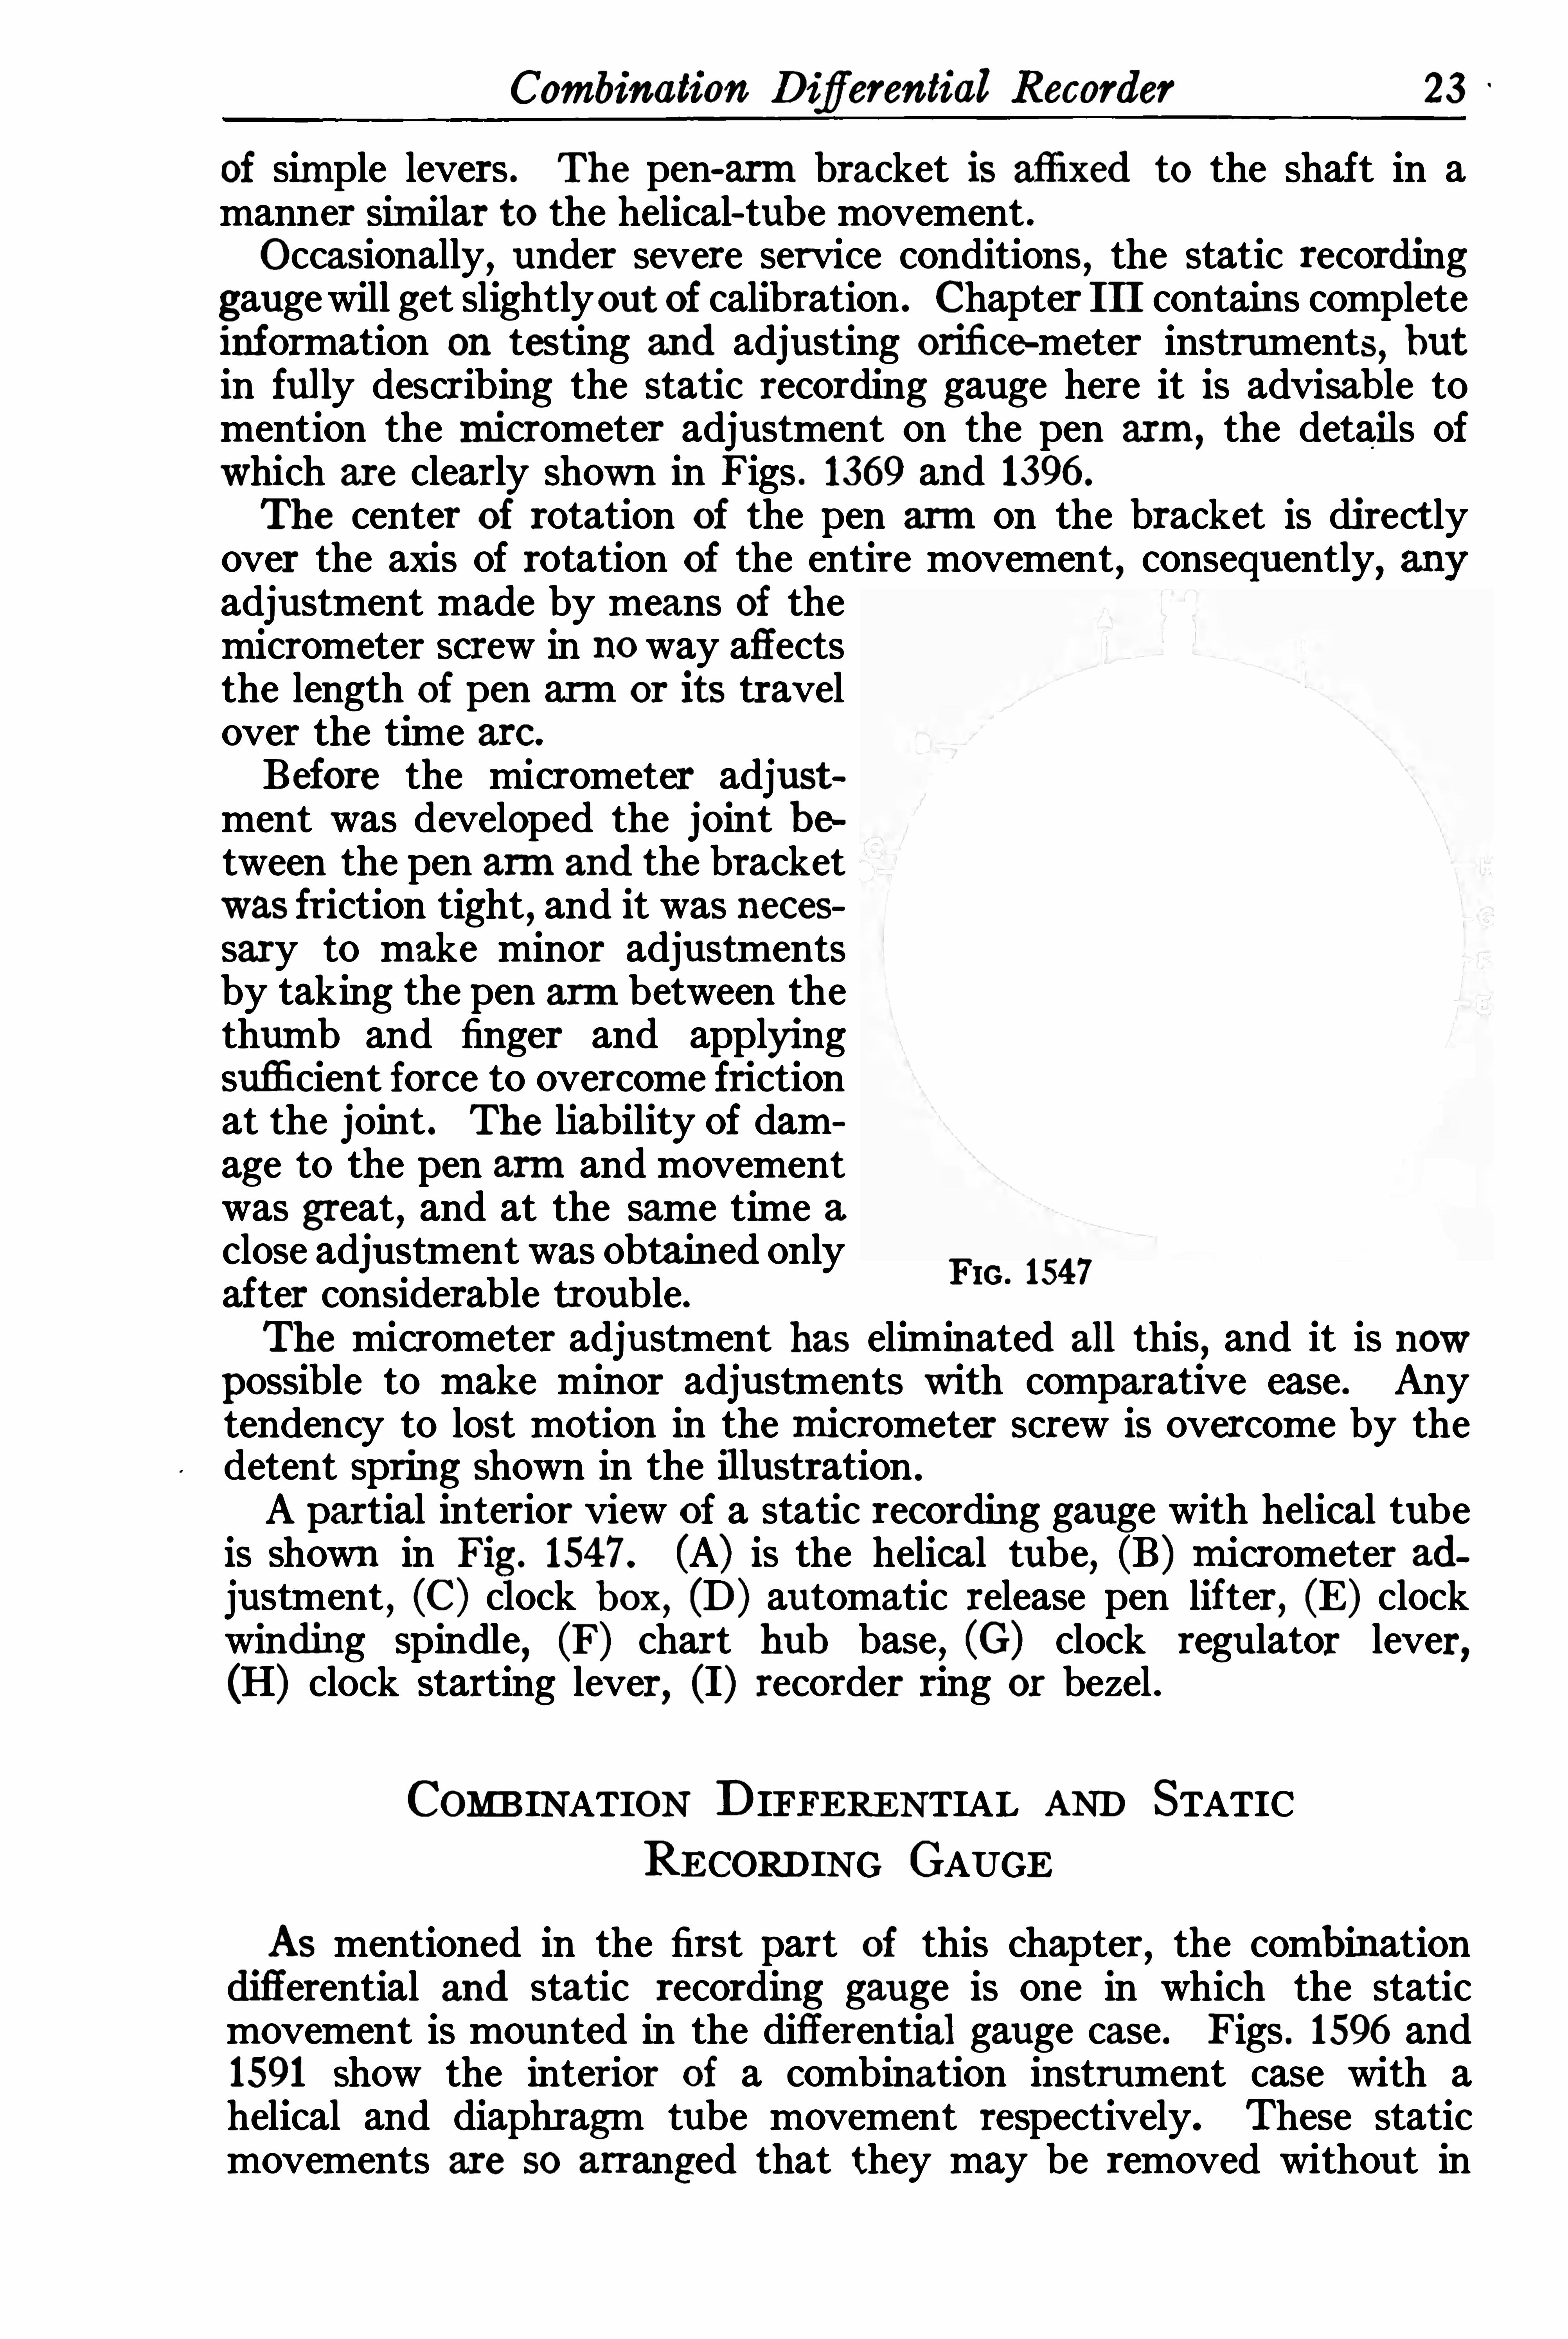
gaugewill get slightlyout Of calibration . Chapter III contains completeinformation on testing and adjusting orifice-meter instruments, butin fully describing the static recording gauge here it is advisable tomention the micrometer adjustment on the pen arm , the details ofwhich are clearly shown in Figs . 1369 and 1396 .
The center of rotation of the pen arm on the bracket is direct lyover the axis of rotation of the entire movement, consequently,adjustment made by means Of themicrometer screw in no way affectsthe length of pen arm or its travelover the time arc .
Before the micrometer adjustment was developed the joint between the pen arm and the bracketwas friction tight, and it was necessary to make minor adjustmentsby taking the pen arm between thethumb and finger and applyingsufficient force to overcome frictionat the joint . The liability of damage to the pen arm and movementwas great, and at the same time aclose adjustment was obtained only
F 154 7after considerable trouble. m '
The micrometer adjustment has eliminated all this,and it is now
possible to make minor adjustments with comparative ease. Anytendency to lost motion in the micrometer screw is overcome by thedetent spring shown in the illustration .
A partial interior view o f a static recording gauge with helical tubeis shown in Fig . 154 7 . (A) is the helical tube, (B) m icrometer adjustment , (C) clock box, (D) automatic release pen lifter, (E) clockwinding spindle, (F) chart hub base, (G) clock regulator lever,(H) clock starting lever, (I) recorder ring or bezel .
COMBINATION DIFFERENTIAL AND STATICRECORDING GAUGE
As mentioned in the first part of this chapter,the combination
differential and static recording gauge is one in which the staticmovement is mounted in the differential gauge case. Figs . 1596 and1591 Show the interior o f a combination instrument case with ahelical and diaphragm tube movement respectively. These staticmovements are so arranged that they may be removed without in
24 The Orifice Meter and Gas Measurement
FIG . 1 596
FIG 1591

26 The Orifice Meter and Gas Measurement
28 The Orifice Meter and Gas Measurement
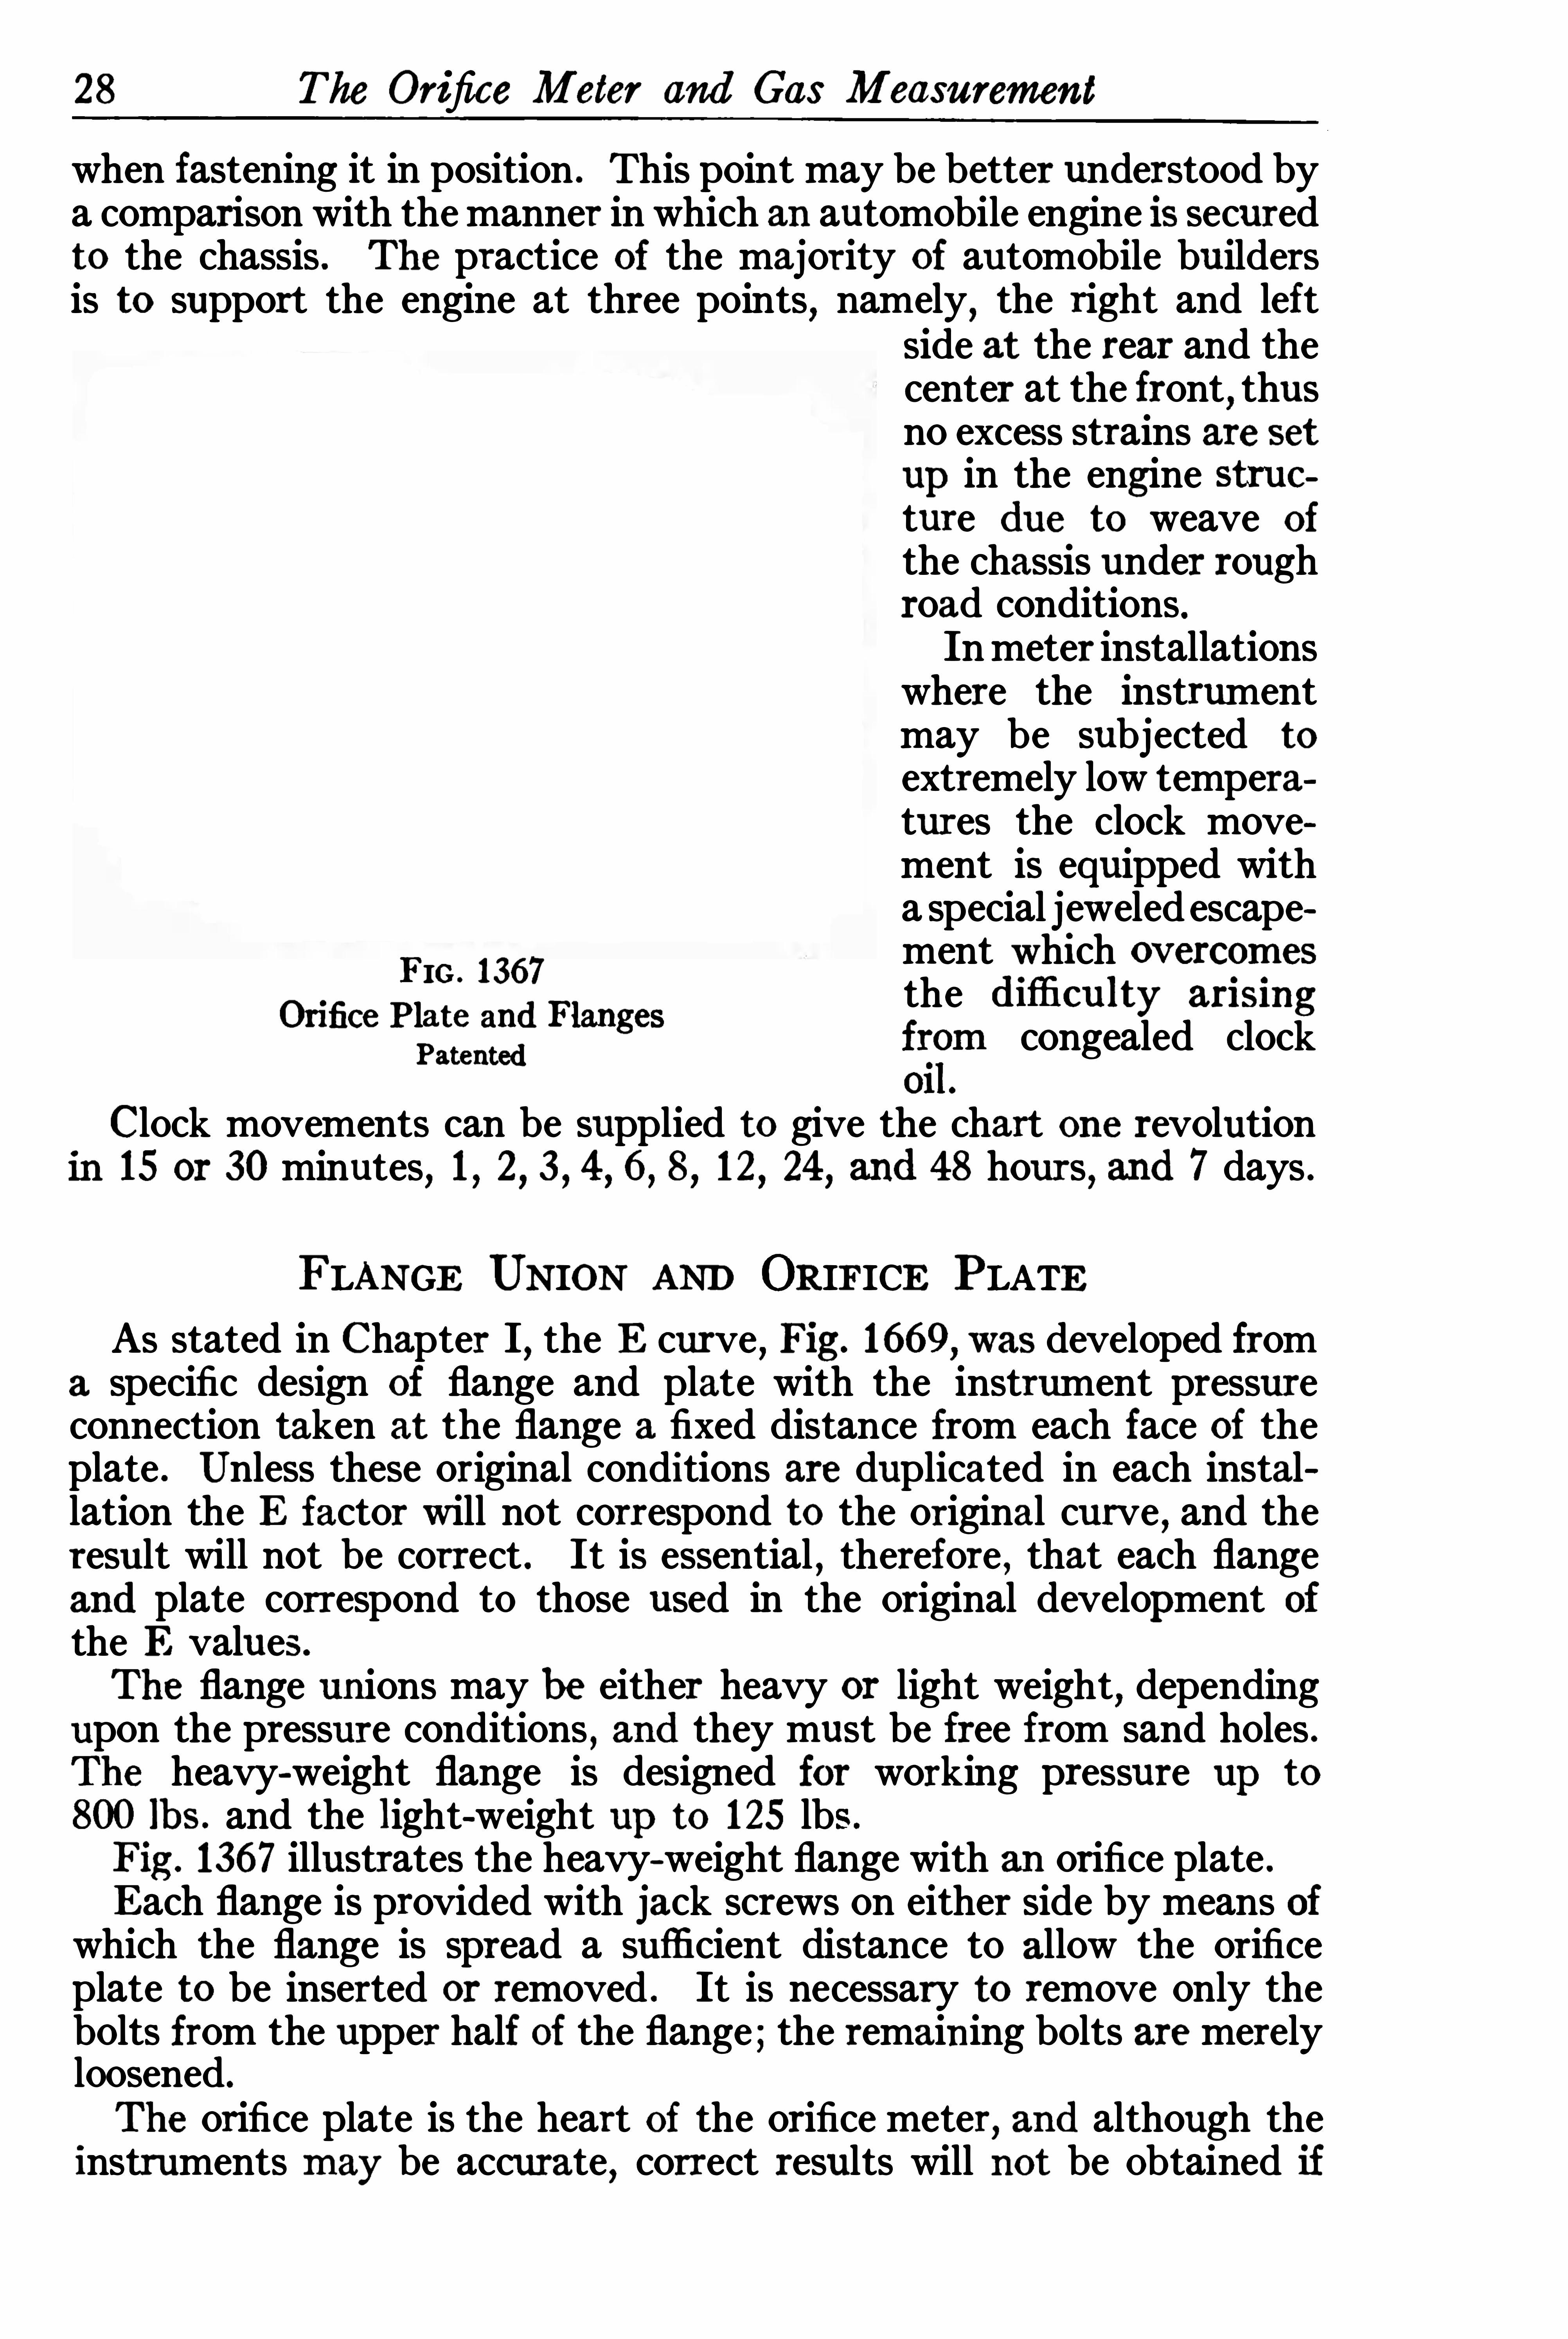
when fastening it in position . This point may be better understood bya comparison with the manner in which an automobile engine is securedto the chassis . The practice Of the majority of automobile buildersis to support the engine at three points
,namely
,the right and left
side at the rear and thecenter at the front
,thus
no excess strains are setup in the engine structure due to weave o f
the chassis under roughroad conditions.Inmeter installationswhere the instrumentmay be subjected to
extremely low temperatures the clock movement is equipped witha special jeweled escape
Fm . 1367ment which overcpmes
Orifice Plate and Flangesthe dlfliculty arISIng
p atentedfr
pm congealed clock
0 1
Clock movements can be supplied to give the chart one revolutionin 15 or 30 minutes, 1 , 2, 3 , 4 , 6 , 8, 12, 24 , and 48 hours, and 7 days .
FLANGE UNION AND ORIFICE PLATEAs stated in Chapter I
,the E curve
,Fig . 1669
,was developed from
a specific design of flange and plate with the instrument pressureconnection taken at the flange a fixed distance from each face Of theplate . Unless these original conditions are duplicated in each installation the E factor will not correspond to the original curve , and theresult will not be correct . It is essential , therefore , that each flangeand plate correspond to those used in the original development ofthe E values.
The flange unions may be either heavy or light weight, dependingupon the pressure conditions
,and they must be free from sand holes .
The heavy-weight flange is designed for working pressure Up to
800 lbs . and the light-weight up to 125 lbFig . 1367 illustrates the heavy-weight flange with an orifice plate .Each flange is provided with jack screws on either side by means ofwhich the flange is spread a sufficient distance to allow the orificeplate to be inserted or removed . It is necessary to remove only thebolts from the upper half of the flange;the remaining bolts are merelyloosened.
The orifice plate is the heart of the orifice meter,and although the
instruments may be accurate, correct results will no t be Obtained if
Flanges , Orifice P lates, and P iping
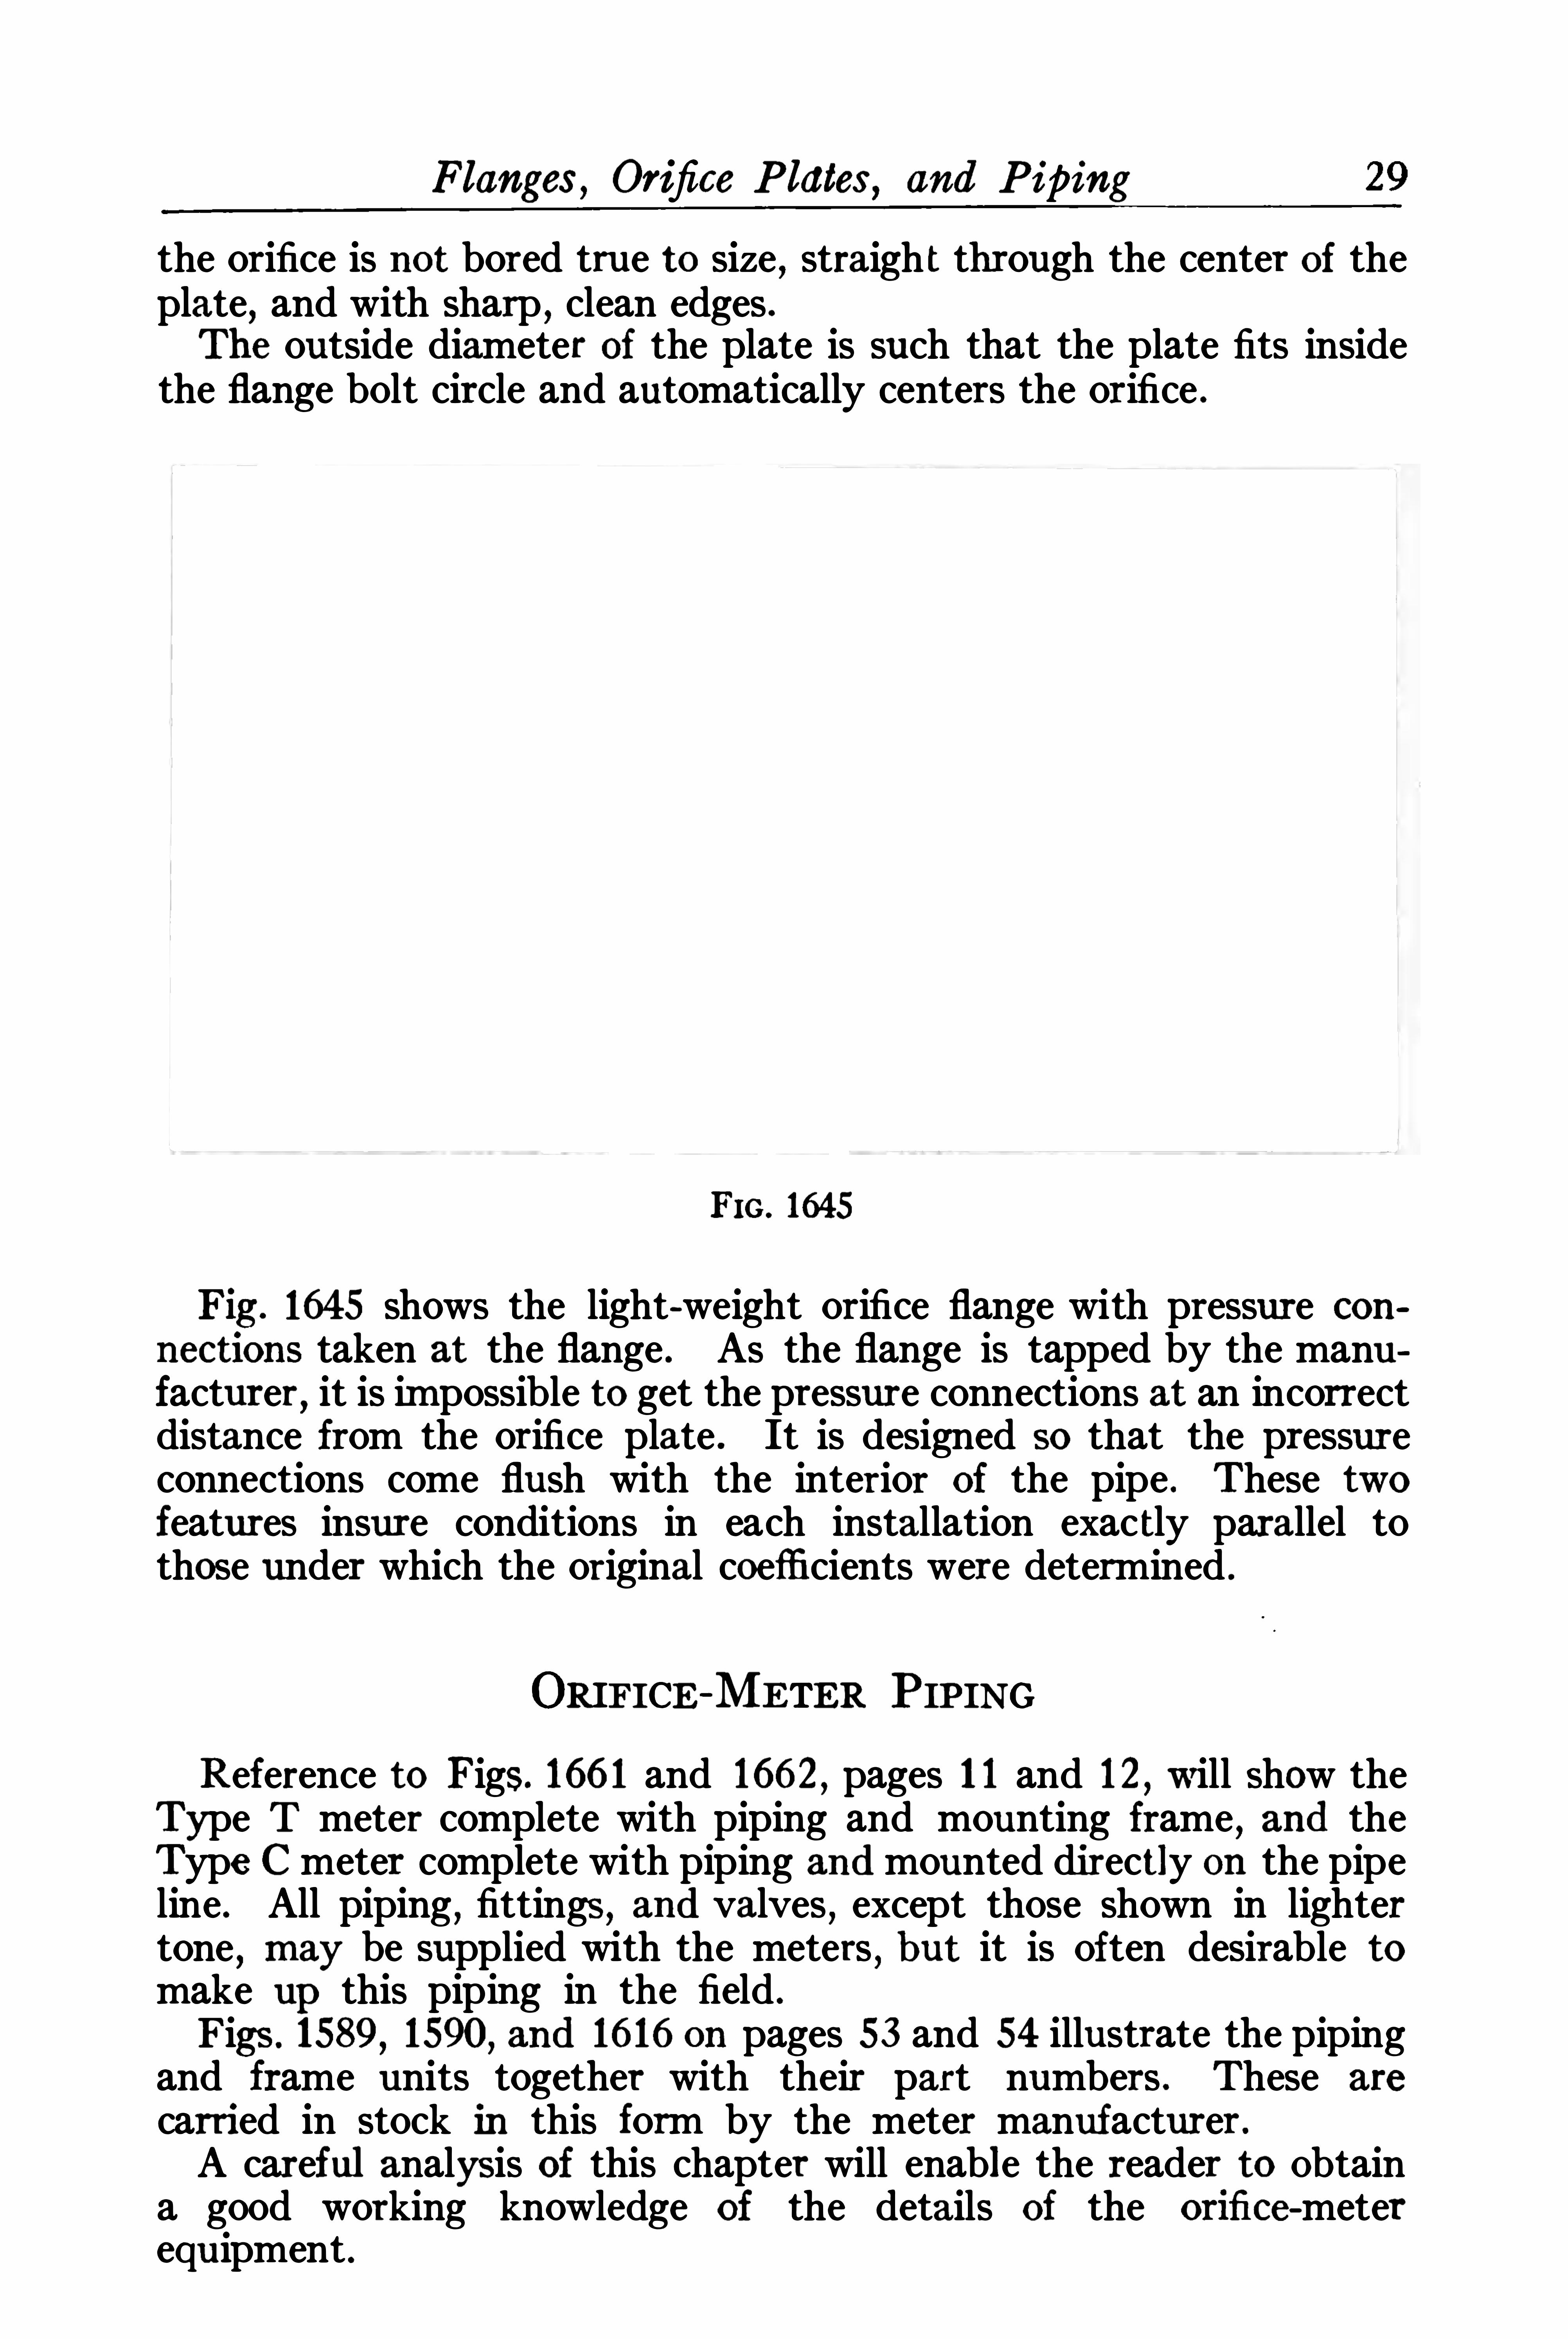
the orifice is no t bored true to size , straigh t through the center of theplate, and with sharp , clean edges .The outside diameter Of the plate is such that the plate fits insidethe flange bolt circle and automatically centers the orifice .
FIG . 1645
Fig . 1645 shows the light-weight orifice flange with pressure connections taken at the flange . As the flange is tapped by the manufacturer
,it is impossible to get the pressure connections at an incorrect
distance from the orifice plate . It is designed so that the pressureconnections come flush with the interior of the pipe . These twofeatures insure conditions in each installation exactly parallel tothose under which the original coefficients were determined .
ORIFICE-METER PIPING
Reference to Figs. 166 1 and 1662,pages 1 1 and 12
,will Show the
Type T meter complete with piping and mounting frame , and theType C meter complete with piping andmounted directly on the pipeline . All piping
,fittings
,and valves
,except those shown in lighter
tone , may be supplied with the meters , but it is Often desirable tomake up this piping in the field .
Figs . 1589 , 1590, and 1616 on pages 53 and 54 illustrate the pipingand frame units together with their part numbers . These are
carried in stock in this form by the meter manufacturer .
A careful analysis of this chapter will enable the reader to Obtaina good working knowledge of the details of the orifice-meterequipment .
CHAPTER III
INSTALLATION,TEST
,AND
MAINTENANCE
N order to give the reader a clear understanding Of an orifice
meter installation and the relation of the component parts,sev
eral photographs and drawings have been reproduced .
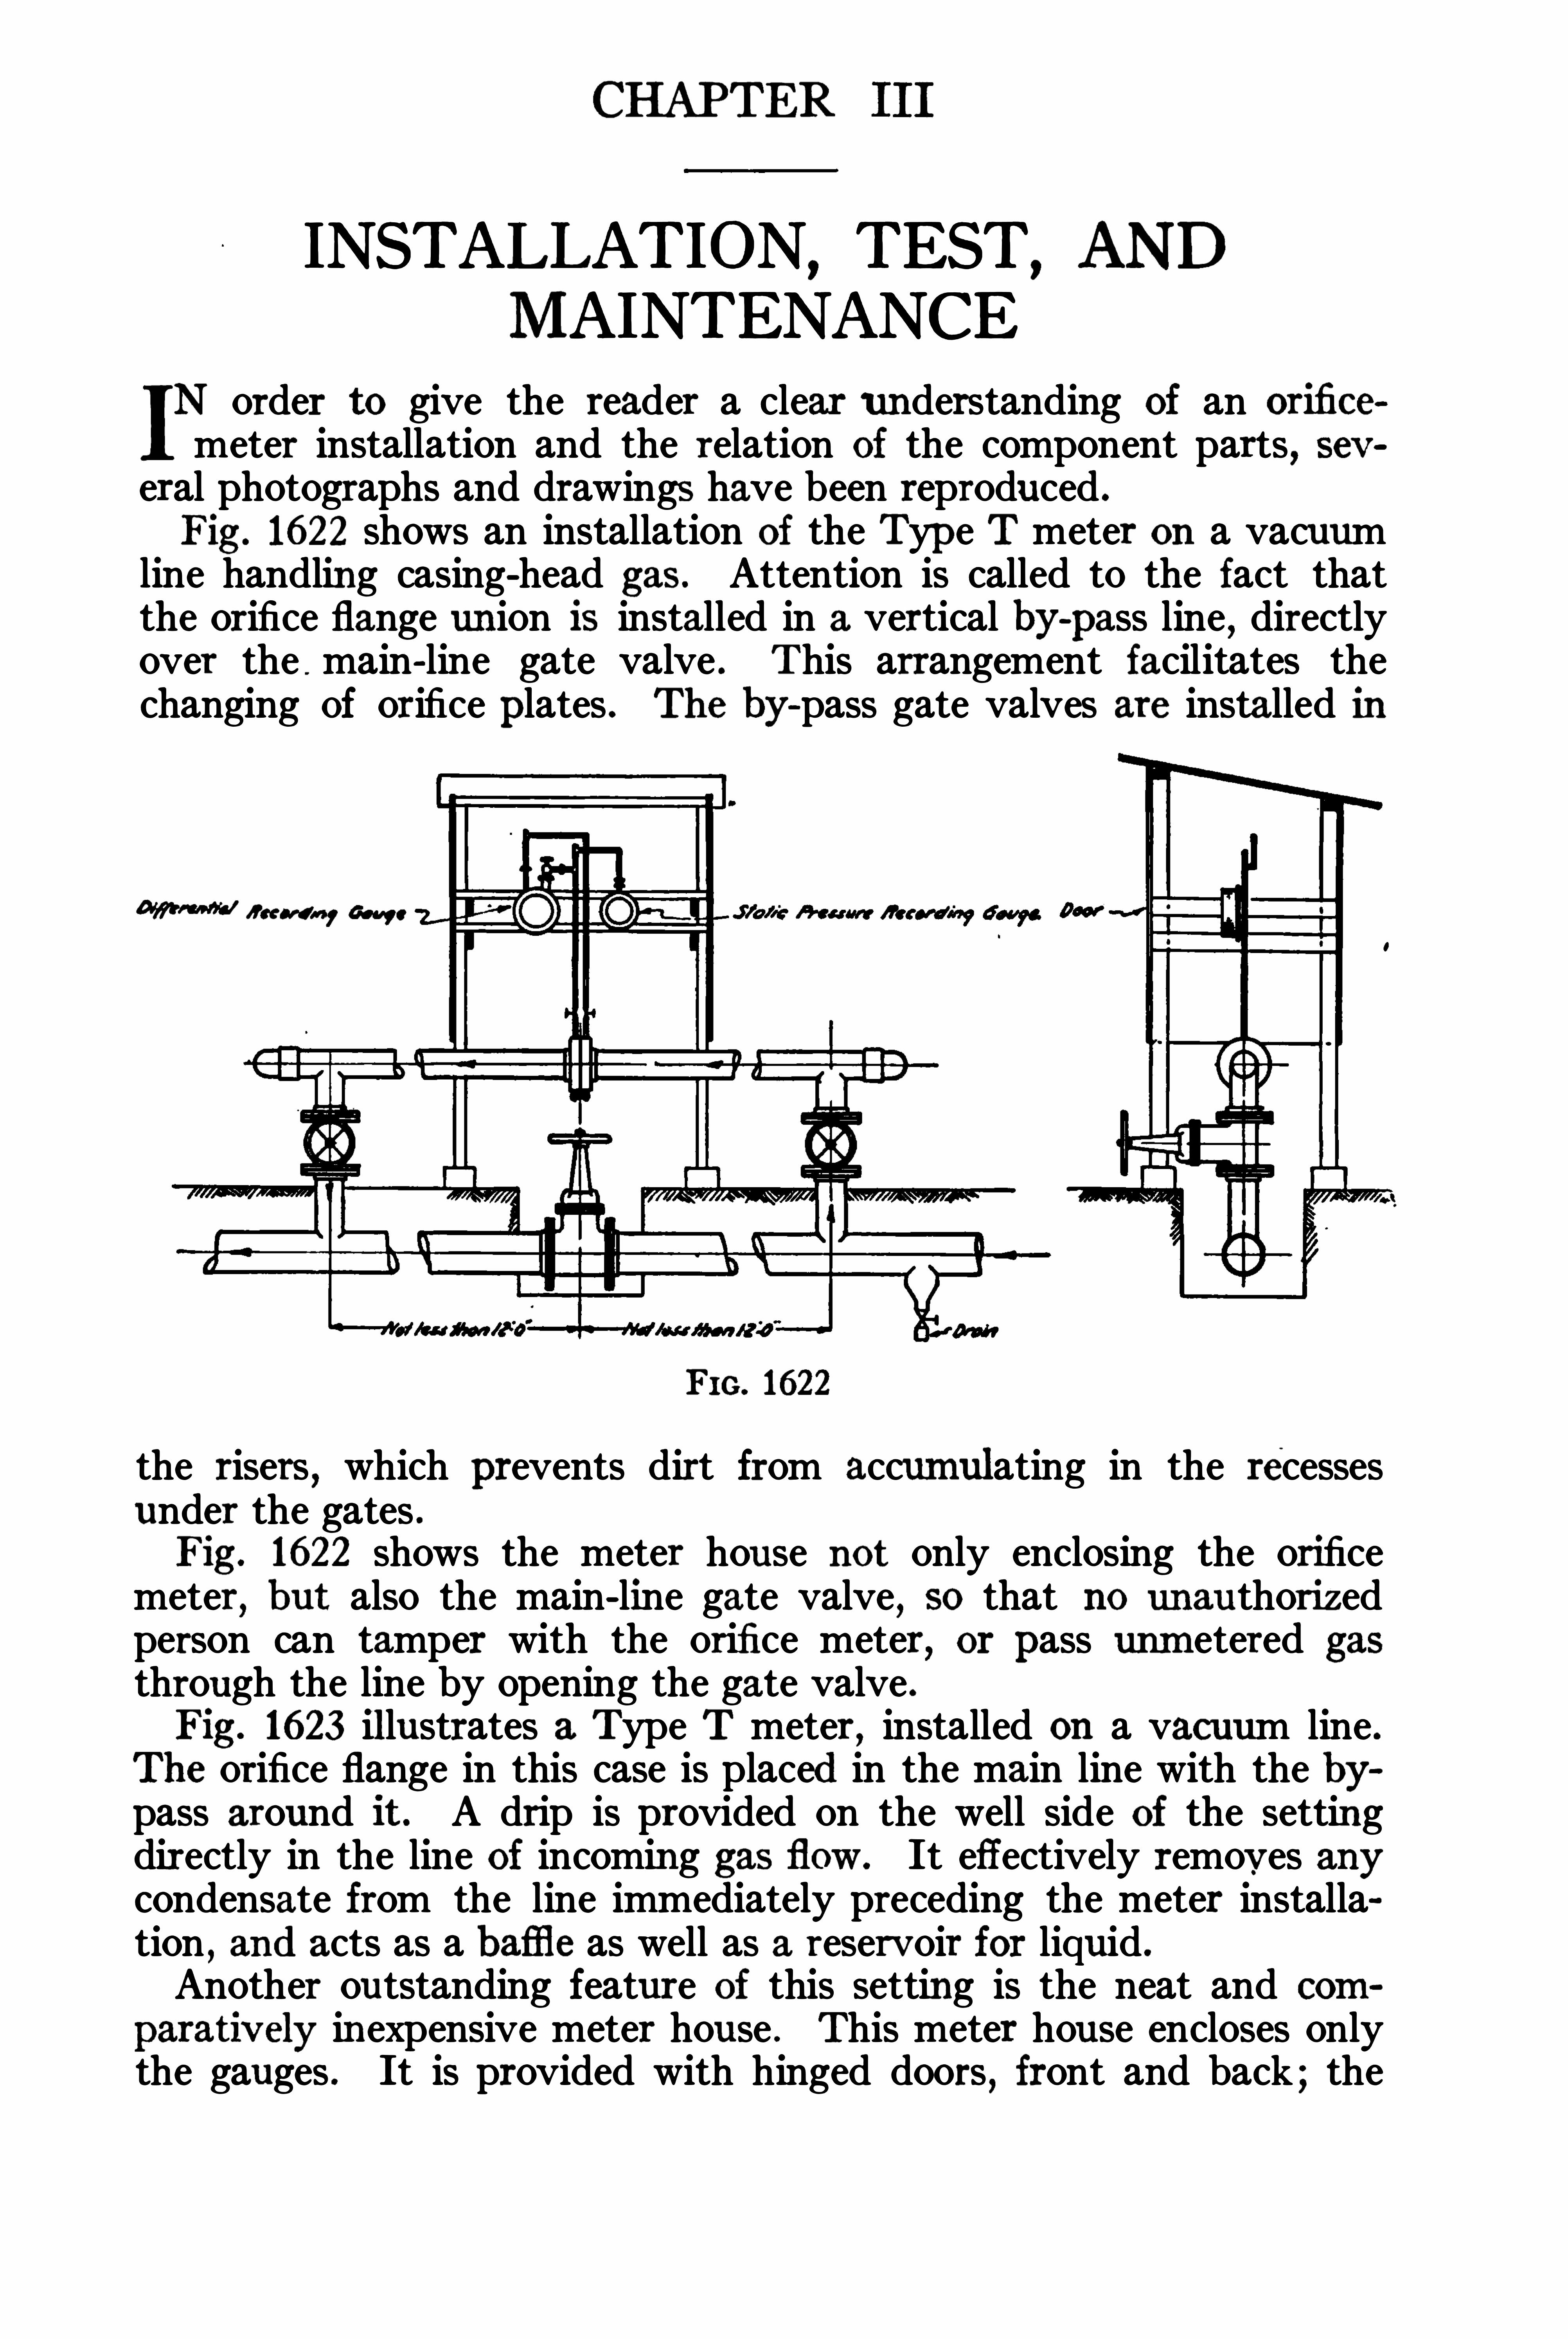
Fig . 1622 shows an installation of the Typ e T meter on a vacuumline handling casing-head gas. Attention is called to the fact thatthe orifice flange union is installed in a vertical by-
pass line , directlyover the . main-line gate valve . This arrangement facilitates thechanging Of orifice p lates . The by
-pass gate valves are installed in
W l a w ” , M y.
FIG. 1622
the risers,which prevents dirt from accumulating in the recesses
under the gates .Fig . 1622 shows the meter house no t only enclosing the orificemeter
, but also the main-line gate valve, so that no unauthorizedperson can tamper with the orifice meter, or pass unm etered gasthrough the line by opening the gate valve .Fig . 1623 il lustrates a Type T meter, installed on a vacuum line.
The orifice flange in this case is placed in the main line with the bypass around it . A drip is provided on the well side Of the settingdirectly in the line Of incoming gas flow. It effectively removes anycondensate from the line immediately preceding the meter installation
,and acts as a baflie as well as a reservoir for liquid .
Another outstanding feature of this setting is the neat and com
paratively inexpensive meter house . This meter house encloses onlythe gauges . It is provided with hinged doors
,front and back ; the
Typical Installations
w uuauaas a no wars 3mmM 1 33 5 I sy a u as am noon
$9 3 8 u m m 9 200 001 ” VO 7
PLUM 0m m “ OL'W M
as “ 8 0 00 3 4 1 9 0 4 4 0 3 018 .
3 1
32 The Orifice Meter and Gas Measurement
front door only is opened for the daily changing of charts,but for
testing or adjusting Of the meter both doors may be opened .
Figs . 1646 and 164 7 illustrate an installation Of the Type C meter.
This particular meter measures wet casing-head gas pumped from a
FIG. 1646
FIG . 1647
field vacuum station to the main compression gaso lene plant . The
piping layout is similar to the setting shown in Fig . 1622.
The meter house is large enough to enclose only the gauge and itspiping . It may be Opened both front and back for changing chartsor adjusting meter . This type Of meter house eliminates the neces

34 The Orifice Meter and Gas Measurement
Typical Installations 35
MULTIPLE-METER INSTALLATIONConservatively speaking , a Single orifice will handle a varying flowwhen the maximum flow does no t exceed four and one-half times theminimum . In other words
,a meter handling a minimum flow of
cubic feet daily will also handle cubic feet daily at theame static pressure without changing the orifice size .Occasionally in measuring gas to a town or to some industrial plantthe peak consumption is so far in excess Of the minimum or average flowthat a single meter will no t satisfactorily answer the purpose . Whenthis condition is present
,a multiple-meter installation is advisable .
In Fig . 1628 is shown a two-meter installation of this type. The
FIG . 1629
complete set-up consists of a suitable pipe manifold,two orifice
meters,and a differential regulator .
Before going further with a description Of the setting,it might be
well to describe briefly the differential regulator . It is a balancedtype regulator with a single diaphragm Operating the valve . The
diaphragm chamber is tapped above and below the diaphragm for
the differential pressure connections . The regulator arm is providedwith a rolling weight
,which
,because of its automatic change in
position with the movement Of the arm above or below the horizontal,
insures quick Opening or closing Of the balanced valve . The movementOf the regula! arm is controlled by the differential on the diaphragm .
The regirlator l s installed In the line with the secondary meter .
In a mul tiple-meter installation the primary or pilot meter isalways in service whether the flow Of gas be large or small . If thequantity Of gas is small , the secondary meter will be out of actionbecause the regulator valve will be closed . As the flow increases and
36 The Orifice Meter and Gas Measurement
FIG . 1630
finally approaches thecapacity limit of theprirnary meter, the differential pressure actingon the regulator dia
phragm will cause thevalve to trip open . Thisopening action is madepositive by the rollingweight . The secondarymeter will then automatically be put intoservice
,thus taking care
of the excess flow . If,
when both meters are inservice
,the flow should
decrease,the secondary
meter will go out Of ac
tion when the differentialreading on the primarymeter reaches a predeterm in edpo int . The high
and low readings can beset by adjusting theweight-stops on the regulator arm .
Multiple-meter installations,however
,are not limited to two
meters . Any number of meters may be used , depending on the flow
FIG . 163 1

Installing and Operating 3 7
variation . It is necessary to use only one differential regulator lessthan the number Of meters and arrange the pipe manifold accordingly .
Figs . 1629 , 1630, and 163 1 are photographs Of good mul tiple-meterinstallations .
ORIFICE METERS FOR LIQUIDSThe mercury float type differential gauge has been used success
fully in connection with the measurement Of Oil and other non
corrosive liquids . Coeffi cients have been , determ ined for theseconditions
,and their derivation will be found in Chapter I .
A static gauge record is not required as a factor in determiningliquid flows
,because a liquid is incompressible
,and its volume does
no t change under a varying static head .
The installation for this application is similar to that for gas withthis exception : the piping should be arranged with small reservoirsmade of 2” pipe tees in each leg of the connecting pipe , directly abovethe recorder . These reservoirs should be on the same level to insurean equal head Of liquid on both legs of the differential chamber.
Before putting such a meter into operation the 14 ” plug in the topof the H chamber and plug V in the L chamber should be opened toallow air to escape as the liquid is run into the piping .
INSTALLING AND OPERATING INSTRUCTION SRefer to Figs. 1593 and 1663
When the float type differential recording gauges are shipped,
the valves R and S are closed to prevent leakage Of mercury . Thesevalves must not be Opened until after the installation is made .Both the Type T and Type C meters may be installed a considerable distance from the flange if necessary . Several installations havebeen made in the Mid-Continent Field with from 100 to 150 feet between the meter instruments and the flanges .The orifice flange union should be screwed into the pipe line with alength of straight pipe equal to at least ten diameters on the inletand outlet sides Of the union . This pipe must be Of the same size asthat for which the union is tapped ; that is , no reducers should beused at the union . The union may be installed at any angle , butcare must be taken that the tapped holes shall be in such a position that dirt or liquid carried by gas will not settle in them .
The flange union should always,where possible
,be installed in
such a manner that the plate maybe changed readily when necessary,due to seasonal variations in the rate Of flow . With this end in view
,
gates should be placed at not less than ten pipe diameters each sideof the flange union . In installations where orifice plates must bechanged without interruption Of the flow Of gas, a by
-pass line witha gate in it Should be provided around the flange union and the gatesin the main line .
38 The Orifice Meter and Gas Measurement
The orifice plate should be placed between the faces of the flangeunion with the handle projecting on the side that will be Of easiestaccess for reading the data plate . Thin gaskets are used againstboth sides of the plate . They are in place when the flange is shippedfrom the factory . It may be necessary
,however
,renew these
FIG. 1593

Installing and Operating 39
gaskets occasionally in the field,in which case care should be taken that
they never extend inside the cored opening within the flange union .
Before making connections between flange union and unions O—O ,
see thatValves B
, C ,and D are closed and
Valves AA are Open .
All valves turn to the right to close and are needle valves .Connection between the flange union and the unions O—O is madein a manner sim ilar to that shown in the figures . The arrow indicates the direction Of gas flow . The upstream or high side of theflange union is to be connected to the union 0 on the valve B side;
FIG. 1663
40 The Orifice Meter and Gas Measurement
the downstream or low side of the flange union is to be connectedto the union 0 on the valve C side .It should be noted that the static pressure gauge connection comes
off the downstream or low side Of the flange union .
The only piping necessary to supply in the field when the regularmeter piping is furnished is nipples Of such lengths as to locatethe instrum ents at the desired elevation .
Care Should be taken in making up piping that all joints are ah
so lutely gas tight . They should be tested for leaks with a soap -andwater solution .
Place Meter in Service as follows
Valves at flange union should be closed . Open valve R at leastthree or four complete turns .
Open valve S slowly, being careful to note that pen arm movesoutward from chart hub toward zero point . If
, after turningvalve S several times , the pen does no t move, tap the instrument lightly ; this action should cause the pen arm to moveoutward as valve S is opened farther. Continue Openingvalve S until it reaches stop (20 to 25 turns) and is firm lyseated . Remove the hand wheel from valve S after instrument is in Operation .
See that all valves in pressure lines are closed except needlevalves AA
,which must be Opened .
Turn gas into meter line and let it flow through the orifice.
2. To Place Instruments in Operation
In Fig . 1593 : Open valves EE . In Fig . 1593 or 1663 : Openvalve B very slowly , permitting the pressure to build up ,through the by-pass valves AA ,
on both sides of the difl erential gauge and on the static pressure gauge.When the pressure has risen to its full value , Open valve C .
When the pressure is fully applied , Slowly close valves AA ,be
ing careful to watch the indications of the differential gaugeto see that the size of plate instal led is sufliciently large tomeasure the gas without throwing the pen beyond its range .
After valves AA are tightly closed , open valve D . If any gas isleaking through valves AA ,
it can be detected at D .
Valve D should remain Open .
If it is found that the orifice is too small , the pressure must be ShutOff and a plate with a larger orifice substituted .
TESTING ORIFICE METERSAlthough the orifice type of meter is the Simplest , it requires in
telligent care if the best resul ts are to be Obtained . It is the purp ose

42 The Orifice Meter and Gas Measurement
The general method employedfor testing differential gauges isby the use Of aU gauge
,Fig . 137 1
,
or manometer. This U gauge isconnected to the meter piping bymeans of pipe or heavy rubberhose . The pressure or vacuum of
the gas line may be used to establish a differential reading betweenthe atmosphere and the pipe linesimultaneously on both the Ugauge and the differential recording gauge . If the diff erential recording gauge is correct
,the U
gauge should agree at all pointson the scale . It should have aslightly greater range than thedifferential recorder to be tested .
In comparing the registrationsOf a mercury float type differential recording gauge against astandard water column; allow
Fm. 137 1 ance should be made for the timerequired to bring the parts Of the
recording gauge to a balance at each reading . In otherwords,if thema
nom eter goes from 0 to 50 inches of water almost instantaneously,the
pressure should be held at this point for several seconds , in order thatthe recorder
,which has a dampened action
,may arrive at its true regis
tration . This act ion can be speeded up by tapping the gauge slightly .
While a U gauge employing water as a measuring medium 18 rathercumbersome to carry in the field
,it gives a closer reading than the
mercury U gauge , due to its magnified scale .Types T and C meters are supplied with the proper ranges formeasuring gas either under pressure or vacuum . The following paragraphs outline the method Of testing both types under either condition .
T under Pressure
Referring to Fig . 1593 :
(1 ) Put meter out of service by closing valve D ,Opening valves
AA,and closing valves B and C .
(2) Remove plugs at X and T . Connect a U gauge of suitablerange into the fitting from which plug T is removed .
(3) Open valve B slightly until the hissing sound of escapinggas is heard at X
,or until a reading of 4% Of the chart
range is indicated by both the recorder and the U gauge (4”on a 100” gauge
,or 0.8
” on a 20” gauge) .

Testing Orifice Meters 43
(4 ) Start closing either of the valves A,thus causing pressure
to be built up in the high-pressure side of the differentialgauge . By further closing the valve a differential reading upto the
'
full range of the chart can be secured with a corresponding reading indicated on the U gauge .
If the recorder reads low in comparison with the test gauge , draw Off
enough mercury to correct . If the recorder reads high , add mercury .
Type T under Vacuum
Referring to Fig. 1593 :
1 ) Put meter out Of service by closing valve D ,opening valves
AA,and closing valves B and C .
(2) Remove plugs at X and T . Connect a U gauge of suitablerange into the fitting from which plug X is removed .
(3) Open valve C slightly until the hissing sound Of air isheard being drawn into the meter piping at T
,or until a
reading of 4% Of the chart range is indicated by both therecorder and the U gauge (4” on a 100"gauge, or on a(4 ) Start closing either of the valves A
,thus causing a greater
vacuum to be created on the low side Of the differential gauge .By further closing the valve a differential reading up to thefull range of the gauge can be secured with a correspondingreading indicated on the U gauge .
If the recorder reads low in comparison with the test gauge,
draw Off enough mercury to correct . If the recorder readshigh
,add mercury .
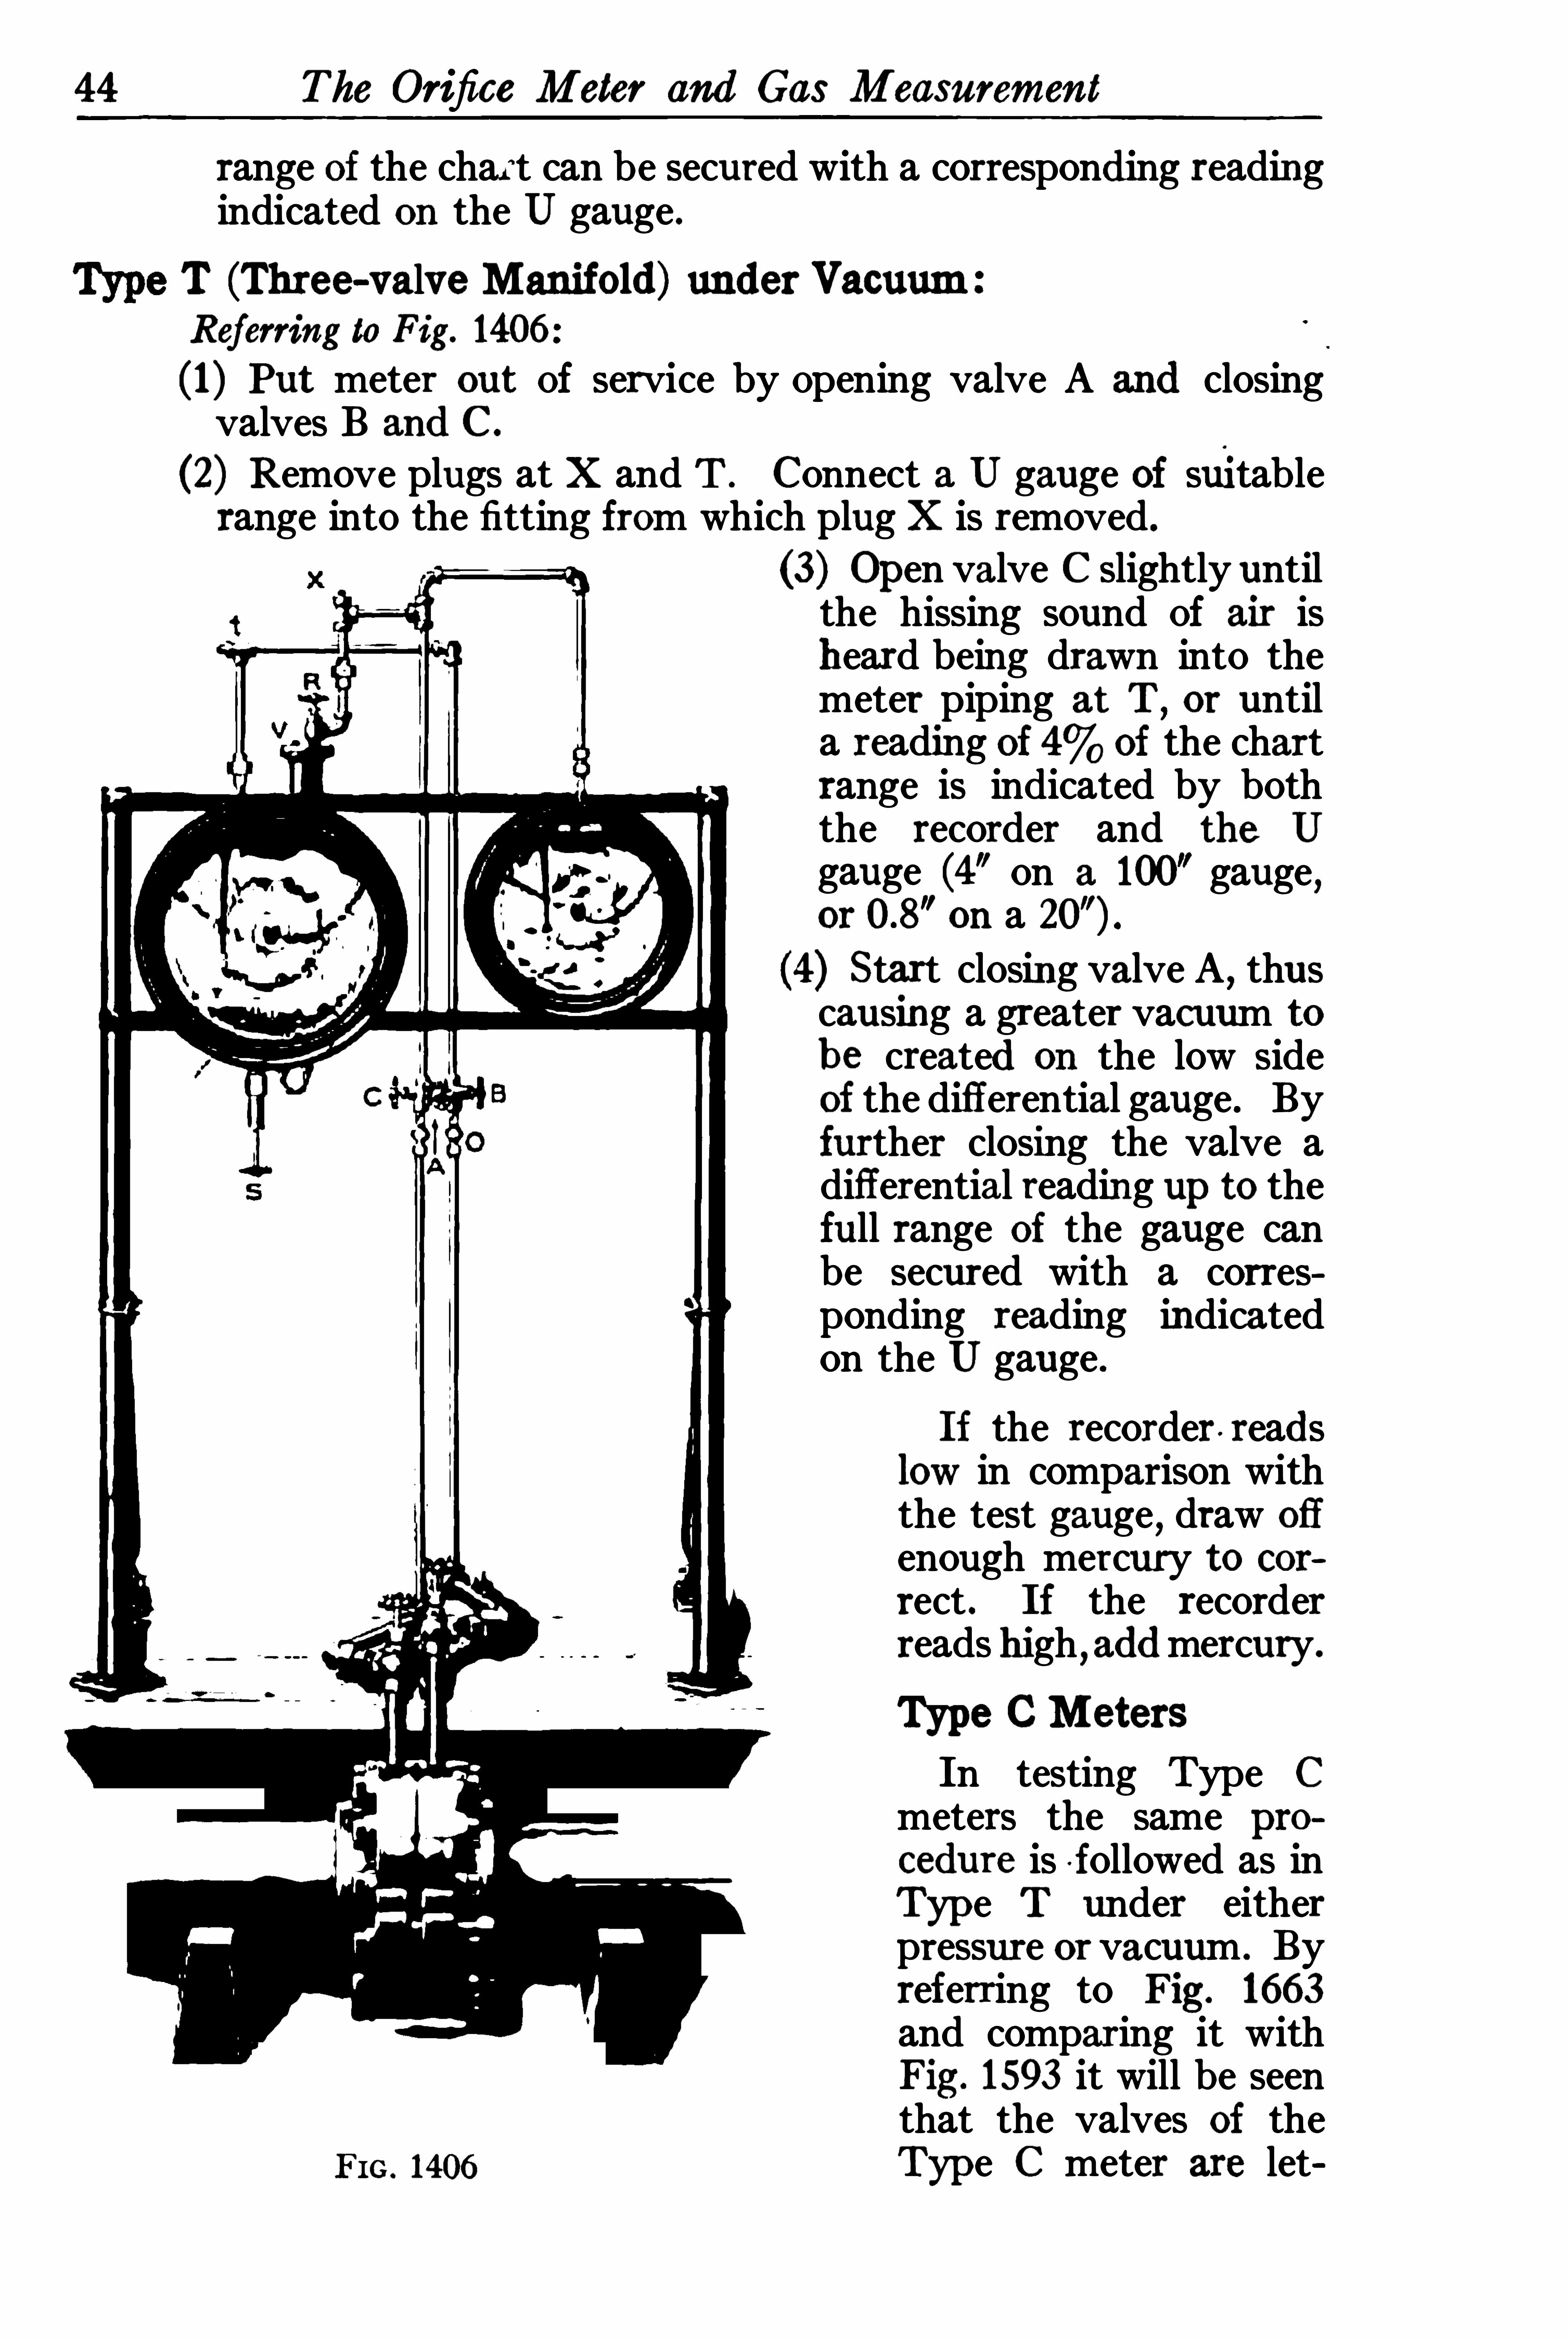
The earlier Type T meters were equipped with a three-valve manifold , as illustrated in Fig . 1406 . The following instructions cover thetesting of the meter with this type of manifo ld .
T (Three-valve Manifold) under PressureReferring to Fig . 1406 :
(1 ) Put meter out Of service by Opening valve A and closingvalves B and C .
(2) Remove plugs X and T . Connect a U gauge Of suitablerange into the fitting from which plug T is removed .
(3) Open valve B slightly until the hissing sound Of escapinggas is heard at X ,
or until a reading Of 4% Of the chartrange is indicated by both the recorder and the U gauge (4”on a 100" gauge
,or on a 20” gauge) .
(4) Start closing valve A ,thus causing pressure to be built
up in the high-pressure side of the differential gauge . Byfurther closing the valve a differential reading up to the full
44 The Orifice Meter and Gas Measurement
range Of the chart can be secured with a corresponding readingindicated on the U gauge .
T (Thre e-valve Manifold) under VacuumReferring to Fig. 1406 :
(1 ) Put meter out Of service by Opening valve A and closingvalves B and C .
(2) Remove plugs at X and T . Connect a U gauge Of sui tablerange into the fitting from which plug X is removed.
FIG . 1406
(3) Open valve C slightly untilthe hissing sound Of air isheard being drawn into themeter piping at T
,or until
a reading Of 4% of the chartrange is indicated by boththe recorder and the U
gauge (4” on a 100 gauge,
or on a(4) Start closing valve A ,
thuscausing a greater vacuum to
be created on the low sideOf the differential gauge. Byfurther closing the valve adifferential reading up to thefull range of the gauge canbe secured with a corresponding reading indicatedon the U gauge.
If the recorder . readslow in comparison withthe test gauge
,draw off
enough mercury to cor
rect . If the recorderreads high
,addmercury.
Type CMeters
In testing Type Cmeters the same procedure is f ollowed as inTyp e T under eitherpressure or vacuum . Byreferring to Fig . 1663
and comparing it withFig . 1593 it will be seenthat the valves Of theTyp e C meter are let
Testing Orifice Meters 45
tered to correspond with those on the Type T meter. Thereforefollow the instructions under Type T and apply them to Type C .
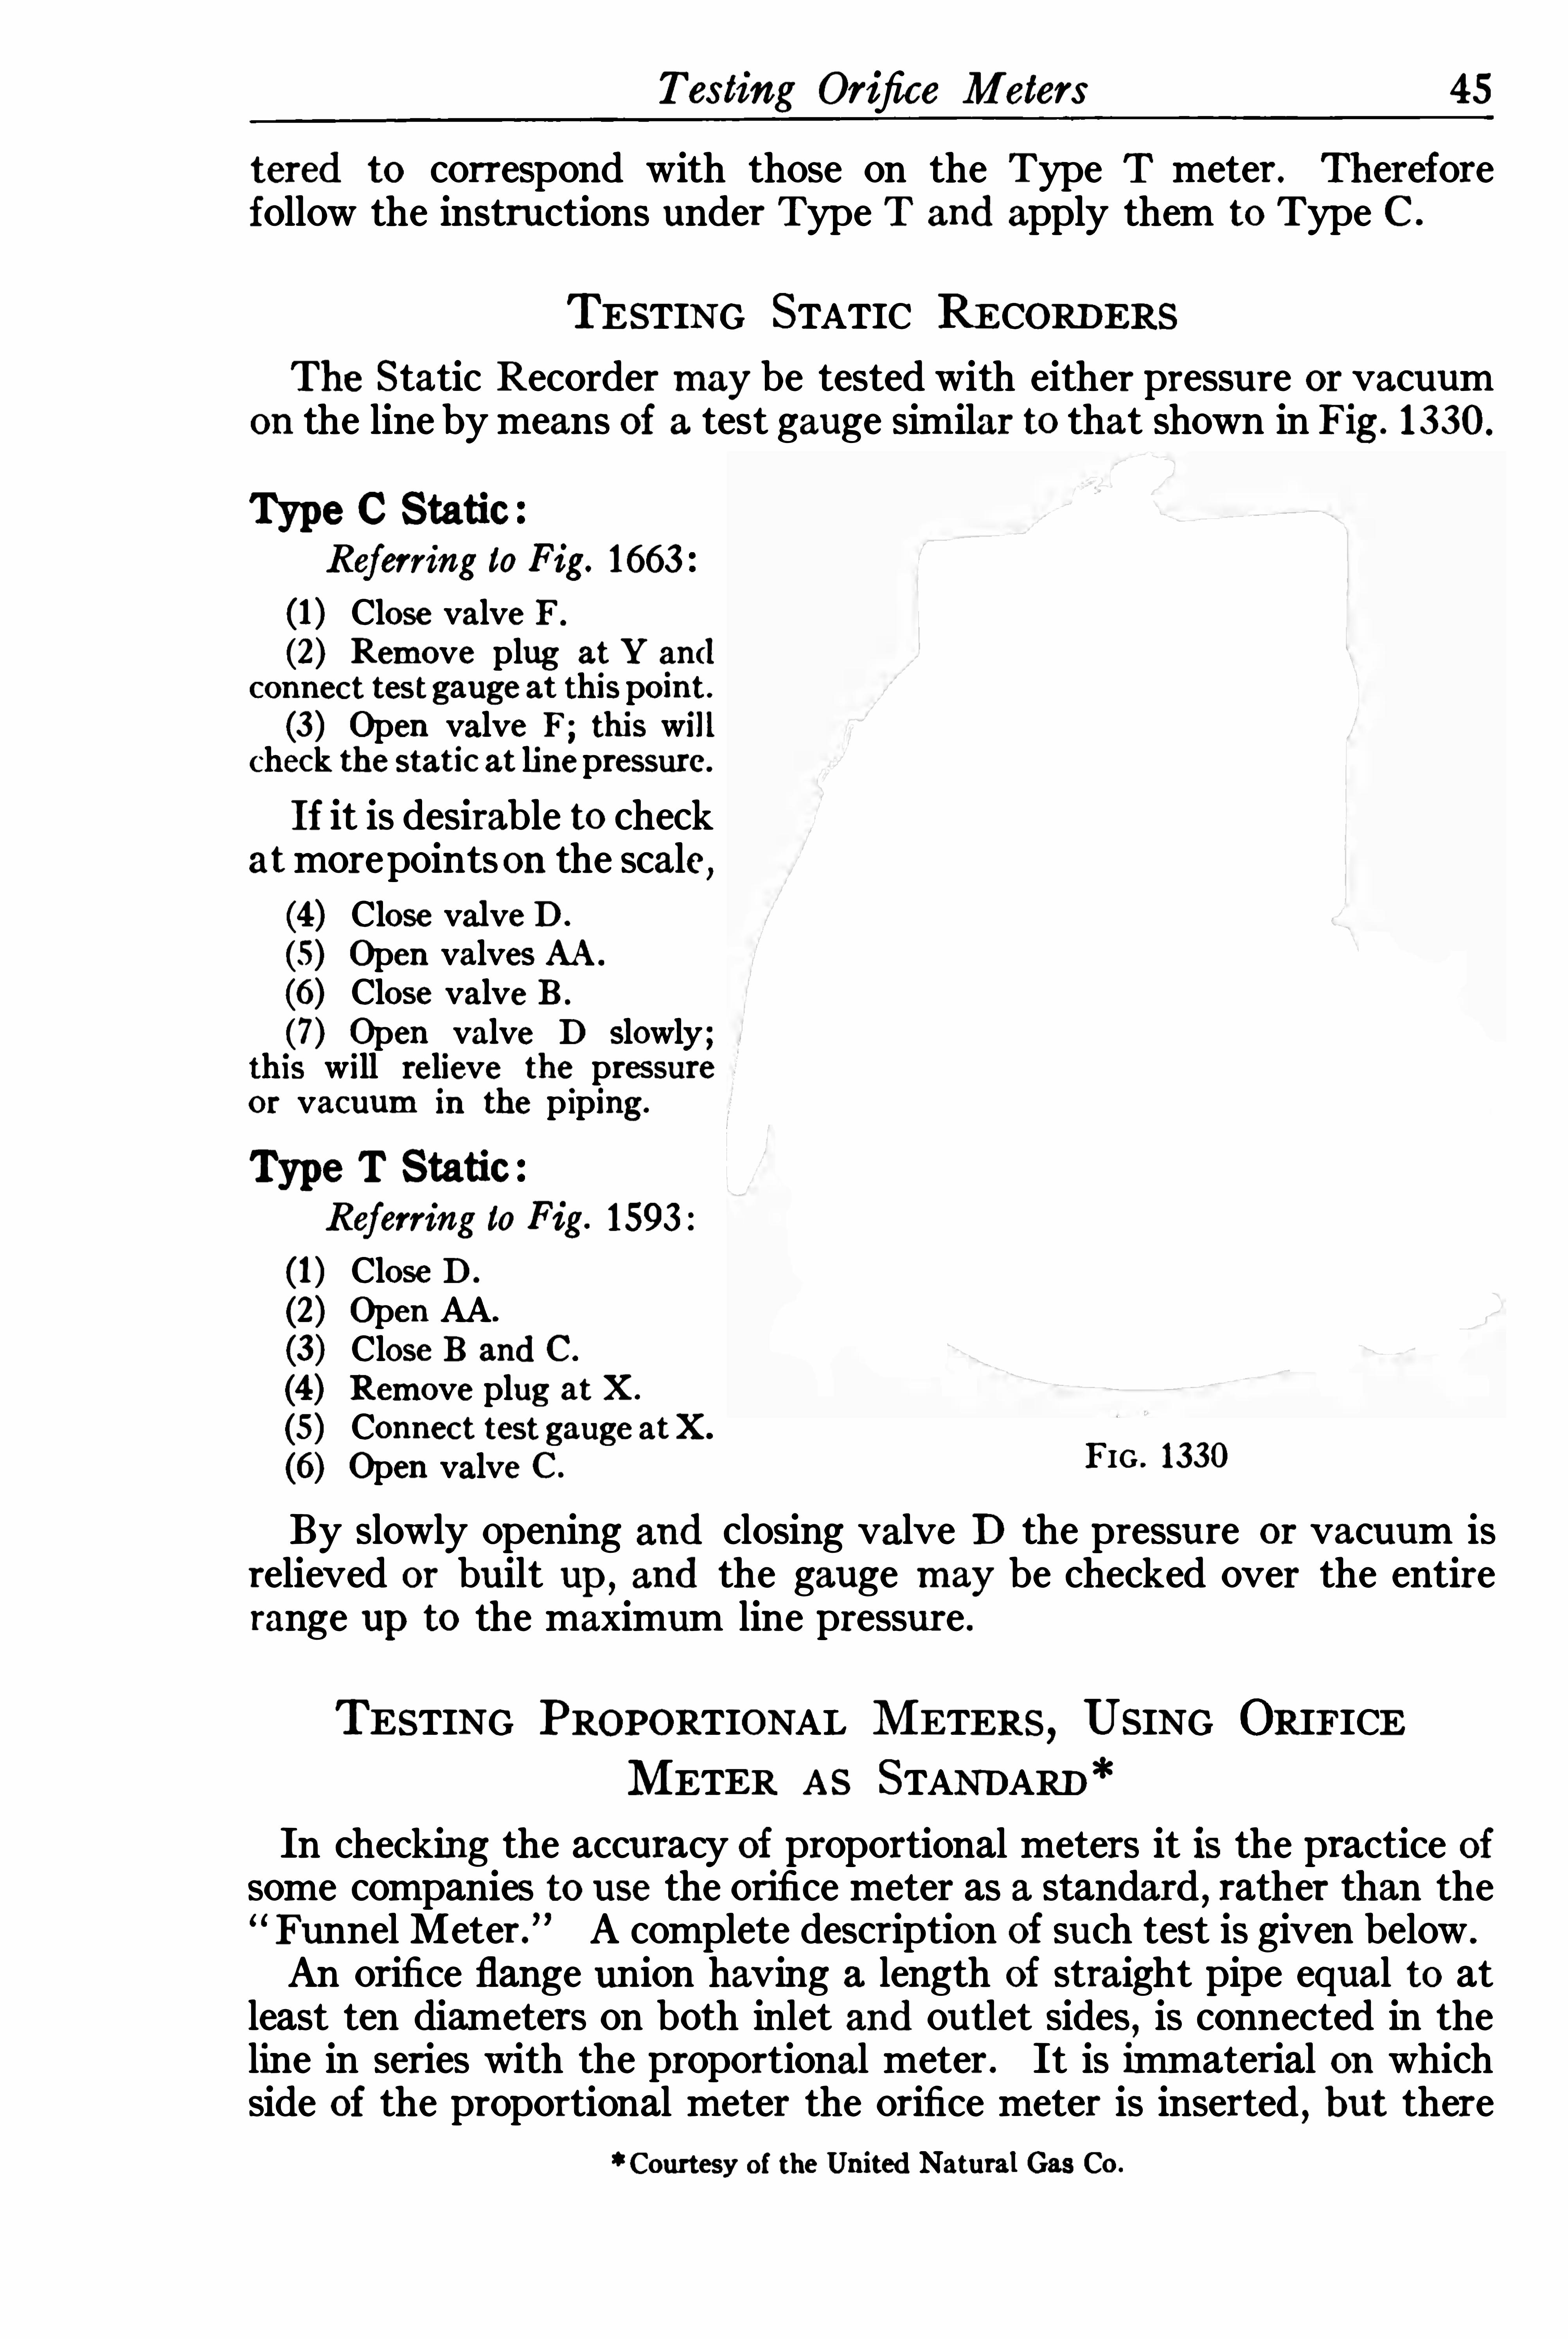
TESTING STATIC RECORDERSThe Static Recorder may be tested with either pressure or vacuum
on the line by means Of a test gauge similar to that shown in Fig . 1 330.
Type C Static
Referring to Fig. 1663
(1 ) Close valve F .
(2) Remove plug at ! and
connect test gauge at thispo int .
(3 ) Open valve F; this willcheck the static at line pressure .
If it is desirable to checkatmorepoints on the scale ,(4 ) Close val ve D .
(5) Open valves AA.
(6) Close valve B .
(7) Open valve D slowly;this will re lieve the pressureo r vacuum in the piping .
Type T Static
Referring to Fig. 1593 :
(1 ) Close D .
(2) Open AA.
(3) Close B and C .
(4 ) Remove plug at X.
(5 ) Connect test gauge atX.
(6) Open valve C .
FIG . 1330
By slowly Opening and closing valve D the pressure or vacuum isrelieved or built up , and the gauge m ay be checked over the entirerange up to the maximum line pressure .
TE STING PROPORTIONAL METERS , USING ORIFICEMETER AS STANDARD!
In checking the accuracy of proportional meters it is the practice Ofsome companies to use the orifice meter as a standard , rather than theFunnel Meter.
” A complete description Of such test is given below .
An orifice flange union having a length Of straight pipe equal to atleast ten diameters on both inlet and outlet sides
,is connected in the
line in series with the proportional meter. It is immaterial on whichside of the proportional meter the orifice meter is inserted
, but there! Courtesy o f the United Natural Gas Co .

46 The Orifice Meter and Gas Measurement
must be no outlet or connection between the two meters in order thatprecisely the same quantity of gas may pass through both meters inseries . A diff erential water U gauge , capable of standing the staticpressure in the line , is connected with its two legs to the two taps in theorifice flange union . A calibrated static pressure or mercury column
,
depending upon the pressure in the line , is connected to the line leadingfrom the downstream side Of the orifice union to the diff erential watercolumn . A thermometer is inserted in a cup in the line , preferablybetween the two meters
,to ascertain the temperature of the flowing
gas . The orifice flange union is to contain an orifice plate Of propersize to give a reading Of at least ten inches Of water on the differentialgauge with the minimum rate of flow at which the proportional meteris to be tested . If the maximum rate of flow requires a larger plate
,
this can readily be inserted . The atmospheric pressure at the time Ofthe test is ascertained by means of an aneroid barometer
,and the
specific gravity of the gas measured must be determined by anyapproved method . The quantity Of gas measured by the two metersis computed on the basis Of pounds absolute storage pressureand a storage temperature equal to the temperature of the gas flowingin the line . The difference in the quantities indicated by the twometers , divided by that shown by the orifice meter, is the percentageerror of the proportional meter ; or in other words , the error is equalto the quotient of the gas measured by the proportional meterdivided by that measured by the orifice meter less 1 .
To Test
With a stop watch note the time in seconds and fractions Of asecond required to pass 1000 (or 100) cubic feet through the meter, asregistered on the dial . After starting the watch
,and while the gas
is passing through the meter,note in regular order the pressure of the
gas passing through the meter, the diff erential reading on the watercolumn
,and the static pressure on the orifice meter . Make as
many Of these readings as possible in the time required for the gas topass through the proportional meter. This will give an average Ofconditions during the test . After stopping the watch
,note the tem
p erature Of the gas flowing through the line and the atmosphericpressure indicated by the barometer . Care should be taken to holdthe pressure and flow as nearly constant as possible during these tests .The averages of all Observations should then be Obtained , and thecomputation of results made as follows :Let S the time in seconds re!uired for the passage of 1000 (or 100) cubic feet
o f gas through the proportional meter.
abso lute pressure in the propo rtional meter the static gauge pressurethe pressure of the atmosphere .
the abso lute storage pressure base of measurement pounds pers!uare inch .
Qm the !uantity of gas passing p er hour through the proportional meter,based on the flowing temperature o f the gas and P 3 .

Maintenance of Orifice Meters
Q , the !uantity o f gas passing per hour through the orifice me ter based on
the actual flowing temperature o f the gas and P 3 .
the hourly coeflicient o f the orifice plate based on .644 gravity , lbs.
abso lute sto rage pressure , 40° F. flowing temperature and 50°F. sto rage
temperature .
abso lute flowing temperature in degrees Fahrenheit .specific gravity of gas; air 1 .
difl'
erential water head in inches.
abso lute pressure o f gas in orifice meter static gauge pressureatmospheric pressure .
Then Dial Rate 1000 (or 100)
Qm 1000 (or 100) (or
hP C
ErrorOm Qo
QmPer cent Error
Q01) 100
The results of a series of tests are best computed by tabulating thedata Obtained during the test on a sheet of paper with columns provided for the quantities to be ascertained by computation , Similar totlfe form indicated below :
FIG. 1659
MAINTENANCE OF ORIFICE METERSThe orifice meter, like any other piece Of machinery, needs reason
able attention,and this is dependent upon the service under which
the meter is operating .
The sirnp licity of the float typ e differential gauge constructionmakes it possible to take apart and clean the instrument with comparatively little trouble , and in the interest of better service it isrecommended that this be done periodically by a competent person .
The following pages are devoted to definite instructions for cleaning , repairing , and replacement of parts
,together with half-tone cuts
of the separate units and their corresponding part numbers . Thesenumbers should be used in ordering parts .

48 The Orifice Meter and Gas Measurement
Cleaning Float Type Recorder
Refer to Figs. 1586 and 1587 .
After putting instrument out of serv1ce , break unions at theinstrum ent .
From the back Of instrumentRemove chamber cap part No . 5 159 . Remove U p in ,
part NO .
1 1896 , from top of float shaft .Using a 12” shank screw driver with 14 ” blade, remove screwsholding upper and lower chambers together. This allows theentire differential chamber unit, part NO . 6436 or 7835 to beremoved
,leaving part NO . 6433 or 7834 attached to case.
Use care in handl ing the removed unit,so that mercury will
not be spilled . Take out the float part NO . 7642. Pour themercury into a glass container . Remove cover part NO .
5 196 o r 7790 from L chamber. The valve R,
filling plug V,
and calibration stick are all attached to this cover.
Remove check valve assembly,part N0 . 12139
,using extreme
care no t to get the check floats interchanged,as they are
each ground to their respective seats and must be replaced intheir original positions .
Clean the differential chamber carefully with gasolene and wipeout .
Reassemble carefully.
In replacing check valve assembly use care to see that the upperstem Of the check floats is properly in serted in the centerhole of the bearing inside the tubes . These bearings not onlyhave a center hole to guide the check float stem , but alsohave Openings around the center hole to permit the mercuryto pass through
,and unless care is used , it is possible to insert
the stem into the wrong hole and cause trouble .
Replace Bearing and Shaft
Part No . 1 1557,Figs . 1586 and 1587 . Part No . 1 1914 , Fig. 1595 .
From back of instrumentRemove chamber cap ,
part NO . 5 159.
Remove plug,part NO . 10200
,on top Of chamber , part NO .
6433 or 7834 .
Insert screw driver through plug hole and loosen screws onshaft clamp
,part NO . 5487 or 7856 .
From front of instrument :Remove chart disc .Remove top plate , part NO . 6214 , Figs . 1586 and 1587 , or ifthis meter is a Type C ,
first remove screw A , Shown in Fig .
1596 or 1591,page 24
,then in the following order remove
parts NOS . 8991, 12325 , 1 2322, and 12319 .
50 The Orifice Meter and Gas Measurement
FIG . 1586
20”FLOAT T!PE DIFFERENTIAL RECORDER
Diff erential Chamber Parts
Meter P arts
FIG . 1587
100”FLOAT T! PE DIFFERENTIAL RECORDER
Diflerential Chamber Parts
5 1
52 The Orifice Meter and Gas Measurement
FIG . 1595
COMBINATION DIFFERENTIAL AND STATIC RECORDERMovement Parts

Meter Parts
"6 2 7
(above)
FIG . 1590
C METER PIPING
FIG. 1589
T! PE T METER PIPING
53
54 The Orifice Meter and Gas Measurement

Meter P arts
FIG . 1649
DIFFERENTIAL CHAMBER AND MOVEMENT PARTS FOR SPRING T! PEDIFFERENTIAL RECORDER
55

CHAPTER IV
COMPUTATION OF CHARTS
EFORE taking up the details of the process involved in computing charts , let us briefly consider a point which
,when
thoroughly understood,will reduce to a minimum the time of fig
uring charts .It is common practice in chart computing work
,to carry the re
sults Of each step to five,six
,or seven places of figures . For example :
cu . ft . The Operator believes that because those sevenfigures
,or digits
,as they are known mathematically
,are the correct
result of the final operation in computing , they must repre sent theactual amount of gas passed by the meter in question . However
,
this is no t true,for the result could be set down as cu . ft .
and be just as accurate an indication Of the quantity Of gas as theformer number. This latter number contains only four significantfigures
,and the following paragraphs
,under Precision ofMeasurement ,
will exp lain why it is a waste of time , and why the results are no moreaccurate if a greater number of significant figures are used , than thea ttainable accuracy of the result warrants .
PRECISION OF MEASUREMENTA significant figure is any digit (including zero) used to denote the
amount of the quantity in the place in which it stands ;but when zerois used to locate the decimal point it is no t significant . Thus in thenumber the first two zeros are not significant figures . Thatbetween the 2 and the 6 denotes a quantity and is therefore significant .The zero following the 6 indicates that the measurement is sufficientlyaccurate to indicate that the quantity in the place in which it standsis nearer to zero than to any other number, and is therefore significant .In the number the last three zeros may or may not be significant , depending upon whether or not the quantities represented bythese places Of figures were measured . If they are retained merelyto indicate the position of the decimal point , as -is usually the case(except in abstract numbers) they are not significant .From a study of the princIp les of significant figures (Computation
Rules,by Silas W . Holman) it will be Observed that an accuracy Of
one p er cent or better in the final result Of any computation involvingthe multiplication Of less than twenty factors , may be assured by theuse of four significant figures . It will also be seen that in any multiplication o r division
,the percentage accuracy of the product or quotient
cannot exceed that Of the factor whose percentage accuracy is least ;

58 The Orifice Meter and Gas Measurement
The diflerential (h) may be read directly to one inch or to twoinches, depending upon the total range of chart graduation of thegauge, and by estimation Of tenths may be determined to one or twotenths of an inch respectively. If the minimum differential is teninches or higher (obtained by proper selection of orifice sizes) , thepercentage error of observation of this quantity may be lim ited toone or two per cent . There may also be an error due to slight inaccuracies in the gauge, amounting to a maximum of one-half percent . Inasmuch , however, as the average diflerential will usually beconsiderably higher than ten inches
,the total error due to these two
sources should never exceed one per cent with an ultimate effectupon the result of one-half of one per cent .The static pressure is made up of two quantities ;the reading of thestatic gauge pressure and the atm ospheric pressure , or barometricreading . The gauge reading can be determined to one per cent, o rlb . at atmospheric pressure
,o r to 1 lb . at 100 lbs . pressure . If
the atmospheric pressure is determined by actual barometer readings,
it can be read to one-tenth per cent, o r lh .,and therefore will
have little or no effect upon the error of the static pressure determination . If, however, as is usually the case , the average barometric pressure for a given location is assumed and added to the static pressure,the maximum deviation of the actual barometer from the assumedaverage may be as much as lb . p er sq . in . Thus the totalmaximum combined error in the static pressure determination underthis condition may be as much as lb . p er sq . in .
,or 2 per cent at
atmospheric pressure; or it may be lbs. p er sq . in . or one percent at 100 lbs. static . The average error over a period of time , however, would be considerably less than this and may safely be takenas one per cent with an ultimate effect upon the result of one-halfp er cent .From the foregoing discussion it is seen that no one factor in the
orifice-meter formula can produce a percentage error in the resultgreater than one-half of one p er cent maximum ,
and the averageeff ect should be considerably ‘ less than this . It would also be rare ifthe errors of the various factors did not tend to neutralize each otherto a certain extent, so that the accumulated error in the result shouldnever exceed one per cent and will usually be less than one-halfper cent .Therefore , in all computations for the orifice meter, it is desirableto use four places of significant figures, for the rejection error bycasting ofl all places above four cannot possibly in troduce an errorof computation as great as the uncertainty of the data . On the otherhand , the use of more than four places is worse than useless . It addsnothing to the accuracy of the result
,although increasing materially
the labor of computing,and the liability of mistakes . The use Of
five places instead of four nearly doubles the labor, and using sixplaces instead of four nearly trebles it.

Directions for Computing Results 59
For the reasons outlined above, all tables of constants or factorsto be used in orifice-meter computations should be carried to four,and only four, places of significant figures .
DIRECTIONS FOR COMPUTING RESULTS
The simplified formula for gas flow , as shown in Chapter I, is
in whichQ quantity of gas (cu. ft .) flowing for any given period .
C coeffi cient for the same period .
h average differential pressure for that period .
P average absolute static pressure for that period .
Chapter V contains a complete description of the coeflicient C ,to
gether with a set of tables giving the hourly coefficient correspondingto various orifice sizes .The square root Of the values of h and P ,
as indicated in the foregoing equation
,must be determined as a part of the computation
,
but in order to facilitate this step , reference can be made to a set ofmultiplier tables at the end of this chapter. These tables containthe values of the square root Of h and P .
One more step which saves labor in computing is the use of Ex
tension Tables .A part Of a page from a commonly used extension book is shown in
Fig . 1674 on the next page. The cut has been arranged with thecenter sections of the page removed , in order to bring the figuresmore nearly to full size . The figures shown are approximately twothirds size, and the actual size of a page is 9 X 16 .
The extension is the product of the square root of h and P,or the
product of the multipliers of h and P,found in the multiplier tables
at the end of this chapter.
The commonly used extension books are so arranged that eachpage contains the extensions for either one or five static pressures.In the foregoing illustration the page is one static pressure
,namely
144 lbs . The differential pressures are the figures in the verticalcolumns under H and in the horizontal columns at the top and bo t
tom oi the page . With this arrangement,extensions may be found
for differential pressures each tenth Of an inch,although it is unneces
sary to figure the differential pressures closer than of an inchor the static pressures closer than single pounds.
The use of these Ext ension Tables eliminates the necessity Of multip lying together the values for h and P ,
found in the multipliertables
,and by further confining the extension values to four signifi
cant figures the amount Of labor involved is min imized .
The process of determining the flow of gas is therefore simplified tomultiplying the hourly coefficient by the total extension .

Directions for Computing Results 6 1
There are three methods o f computing orifice-meter charts .(a) The
“Period ”
or inspection method,in which the differential
and static pressures are observed for each fif teen-minute or hourlyperiod .
(6) The Planimeter method , in which the a verage differential andstatic pressures are obtained by means of a radial planimeter.
(c) The Integrator method, in which both records are averaged atthe same tim e and the average extension read directly from the dialsof an integrating machine .
(a) PERIOD METHODCase I. When gas is passing for full twenty-four hours and charts
are readable for the entire period .
This may be handled in either one of two ways . The readings for each fif teen-m inute or hourly period may be se t downdirectly on the chart , together with their corresponding extensions
,as shown in Fig . 1672
,or entered on a tabular form sim ilar

62 The Orifice Meter and Gas Measurement
to Form I . In either case extreme care must be used to see
that the differential and static readings are taken for corresponding periods.The total of the extensions in either Figs. 1672 or Form I is
Reduced to four significant figures this amount becomes 1629. If this is multiplied by an assumed hourly co
efficient o f 300, the result is which is the daily flow of
gas in cubic feet .Case II. When gas is passing for twenty-four hours , but for any
reason the charts are not readable fo r the entire period .
Directions for Computing Results 63
It is customary to assume the average hourly flow for thereadable period as average for the twenty-four hours. Read thedifferential and static for as many corresponding readable hourlyperiods as possible . Add their extensions . Multiply this sum
by 24 and divide by the number of hourly periods fo r whichreadable values were Obtained . Multiply this result by thehourly coefl‘icient of the plate used , andthe product will be the number of cu.
ft . of gas passed in twenty-four hours.
Case III . When gas is passing for onlya portion Of twenty-four hours .
When readable values of both h andP may be Obtained for each hourlyperiod during which gas is flowing
,the procedure is exactly as in
Case I . The sum Of the extensions for the number of periods Fro . 1 192involved
,multiplied by the hourly
co eflicient , will give the flow o f gas fo r that time .When readable values cannot be Obtained fo r each period ofactual flow
,proceed as in Case II
,except that the sum of the
extensions of the corresponding readable values should be multip lied by the number of hours during which gas was actuallypassing
,and divided by the number o f hourly periods for which
readable values were Obtained . This result,multiplied by the
hourly co eflicient , wi ll give the quantity of gas passed during theactual time of flow .
Occasionally the records run so uniform that the average for theentire period may be determined at a glance without introducing aserious error. Such records are shown in Fig . 1670 on next page.The average static pressure is 144 lbs . the average differential
,
The extension for these values is Assuming the hourly coefficient to be then X cu . ft . of gas p erhour, which , multiplied by 24 , gives cu . ft . of gas per day .
Charts of this type may also be computed by means of a RadialPlanimeter, a popular model of which is shown in Fig . 1 192.
Although considerable time can be saved by the use of a Planimeter,
the Operator should have a thorough understanding of its applicationto flow meter chart computation . It is designed to give the averageradius of the records , andwhen this result is referred to a rating tableor chart plot fo r the particular range involved
,the average unit of
pressure is detennined.
In the case o f gas flow measurement an equation of the second poweris involved , consequently the square root Of the values o f h and P mustbe Obtained . If the records vary widely
,they should be divided into
sections covering the high,low
,and possibly the intermediate periods.

64 The Orifice Meter and Gas Measurement
Fig . 167 1 (on next page) shows a Type C meter record in whichthe differen tial pressure has a high period from p . In . toa . m .
, and a low period from a . m . to p . m . In using aPlanimeter on a record o f this type the high and low periods should betreated separately.
In the interests of accurate measurement the reason for this procedure should be explained .
FIG . 1670
Referring to Fig . 167 1,the average for the high period is approximately 72, and for the low period approxirnately 38 . If the entire
record were averaged at one operation by a Planimeter, the result '
would be 55 , and the square root of 55 is If, however, theperiods were averaged separately and the average square root determined
,the results would be the square root of 72 plus the
square root of 38 o r divided by 2, which would giveThe error in this particular case is not very large , but it would
increase rapidly as the difference between the high and low periods
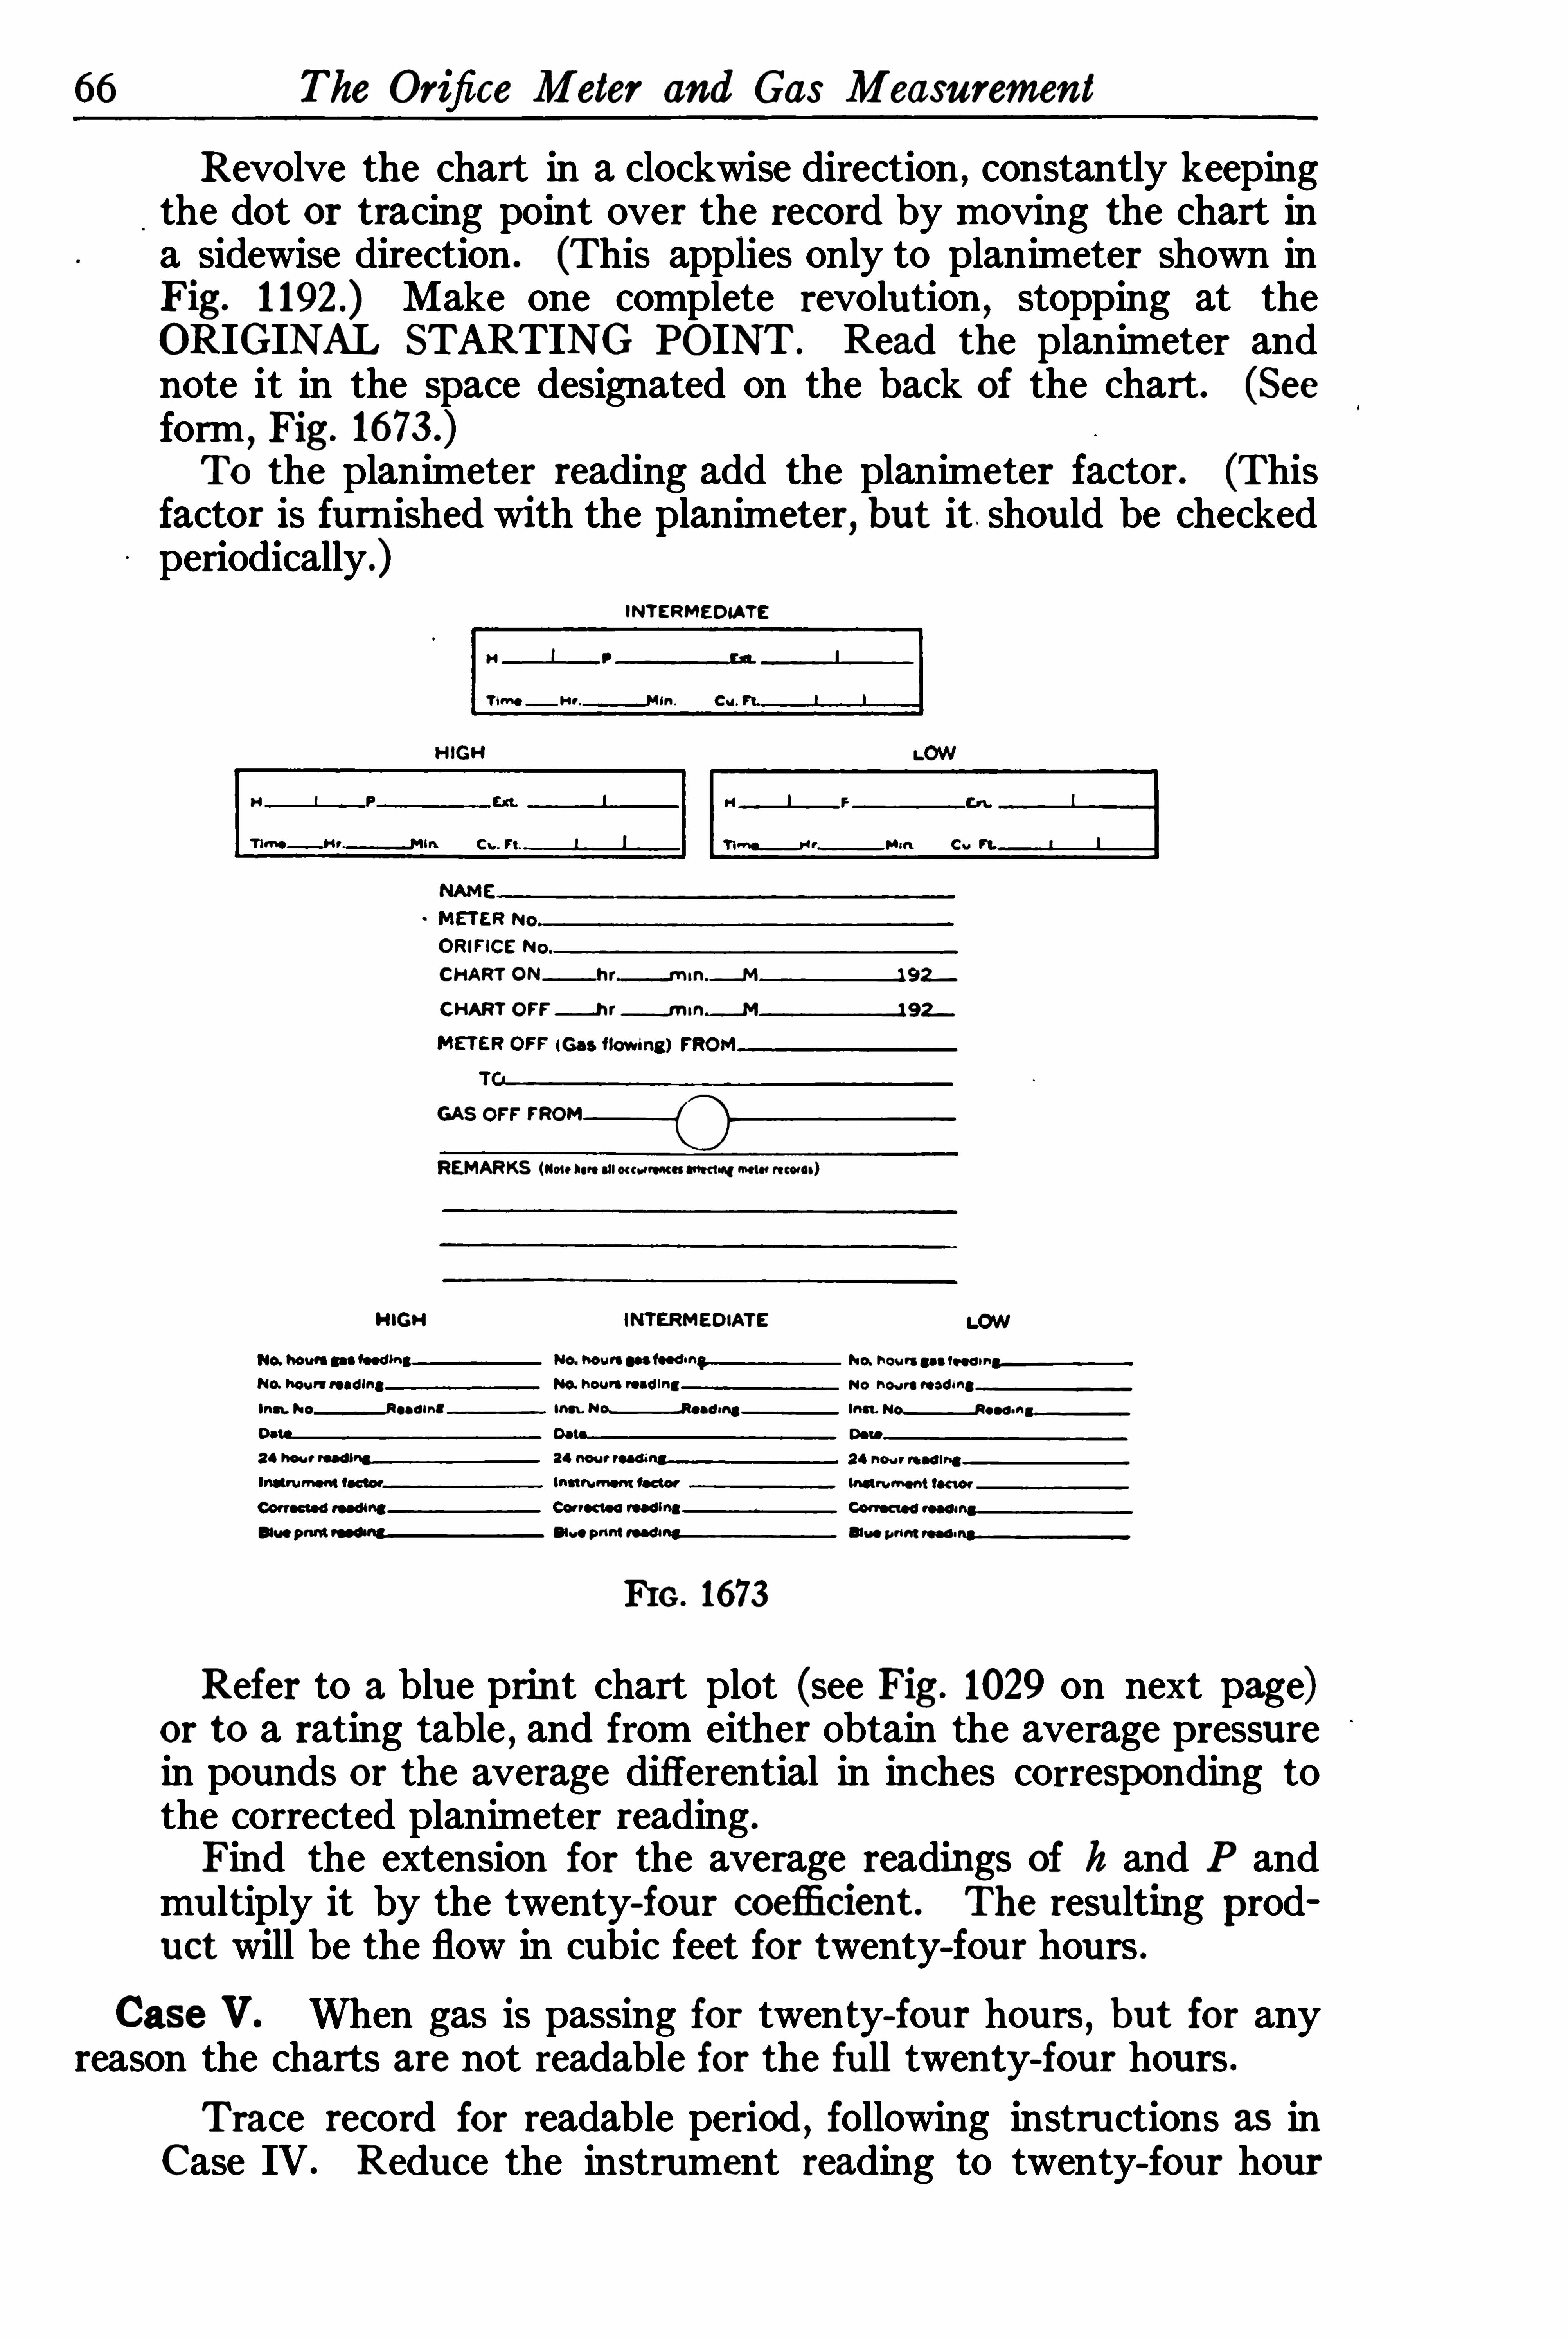
66 The Orifice Meter and Gas Measurement
Revolve the chart in a clockwise direction , constantly keepingthe dot or tracing point over the record by moving the chart ina sidewise direction . (This applies only to planimeter shown inFig . Make one complete revolution , stopping at theORIGINAL STARTING POINT . Read the planimeter andnote it in the space designated on the back of the chart. (Seeform
,Fig .
To the planimeter reading add the planimeter factor. (Thisfactor is furnished with the planimeter, but it should be checkedperiodically.)
INTERMEDMTE
CHART ON
CHART OFF_h r
GAS o rr
REMAR! S (“o ni on all ocean-msm m.mm records)
HIGN INTERMEDIATE
No h au l.n ad fn.
Inn . ccc cc 3 mm. Inn .
24 he a r reading
FIG . 1673
Refer to a blue print chart plot (see Fig . 1029 on next page)or to a rating table
,and from either Obtain the average pressure
in pounds or the average differential in inches corresponding tothe corrected planimeter reading .
Find the extension fo r the average readings of h and P andmultiply it by the twenty-four coefli cient . The resulting product will be the flow in cubic feet for twenty-four hours .
Case V. When gas is passing for twenty-four hours , but for anyreason the charts are not readable for the full twenty-four hours .
Trace record for readable period , following instructions as inCase IV . Reduce the instrument reading to twenty-four hour
Directions for Computing Results 6 7
equivalent before adding the instrum ent factor,by multiplying
it by a number Obtained from Table A (on next page) corresponding to the actual time period during which record is readable.Then add the instrument factor and proceed as in Case IV.
FIG . 1029
Case VI. When gas is passing for a portion of twenty-four hours .Trace the record ; reduce to a twenty-four hour reading , andproceed as in the foregoing paragraphs until the extension isObtained . Multiply the extension by the hourly coefficient, andthe product will be the cubic feet of gas passing for one hour.
Multiply this amount by the number of hours gas is passing,and
the result will be the number Of cubic feet of gas passing for thatnumber of hours .It may happen that the record will not be readable for thesame number of hours that gas is passing . In that case, findthe average pressure and flow fo r the number Of hours that thechart is readable and proceed as outlined above until the number of cubic feet p er hour is Obtained. Multiply this amountby the number Of hours gas is actually passing
,irrespective of
the number of hours of reading used to obtain the average hand P .

68 The Orifice Meter and Gas Measurement
(c) INTEGRATOR METHODThe Weymouth Compound Integrator is a very ingenious deviceby means of whi ch the time required to compute charts is greatlyreduced . In its present form it is applicable only to the Type Tmeter records
,or where the differential and static records are on
separate charts .It is operated by two persons simultaneously ; one tracing the
diflerential record and controlling the motor speed, and the othertracing the static record . The reading after completion is theaverage extension or the value of x/hP which , if multiplied by thecoeflicient
,gives the quantity o f gas passed for that period .
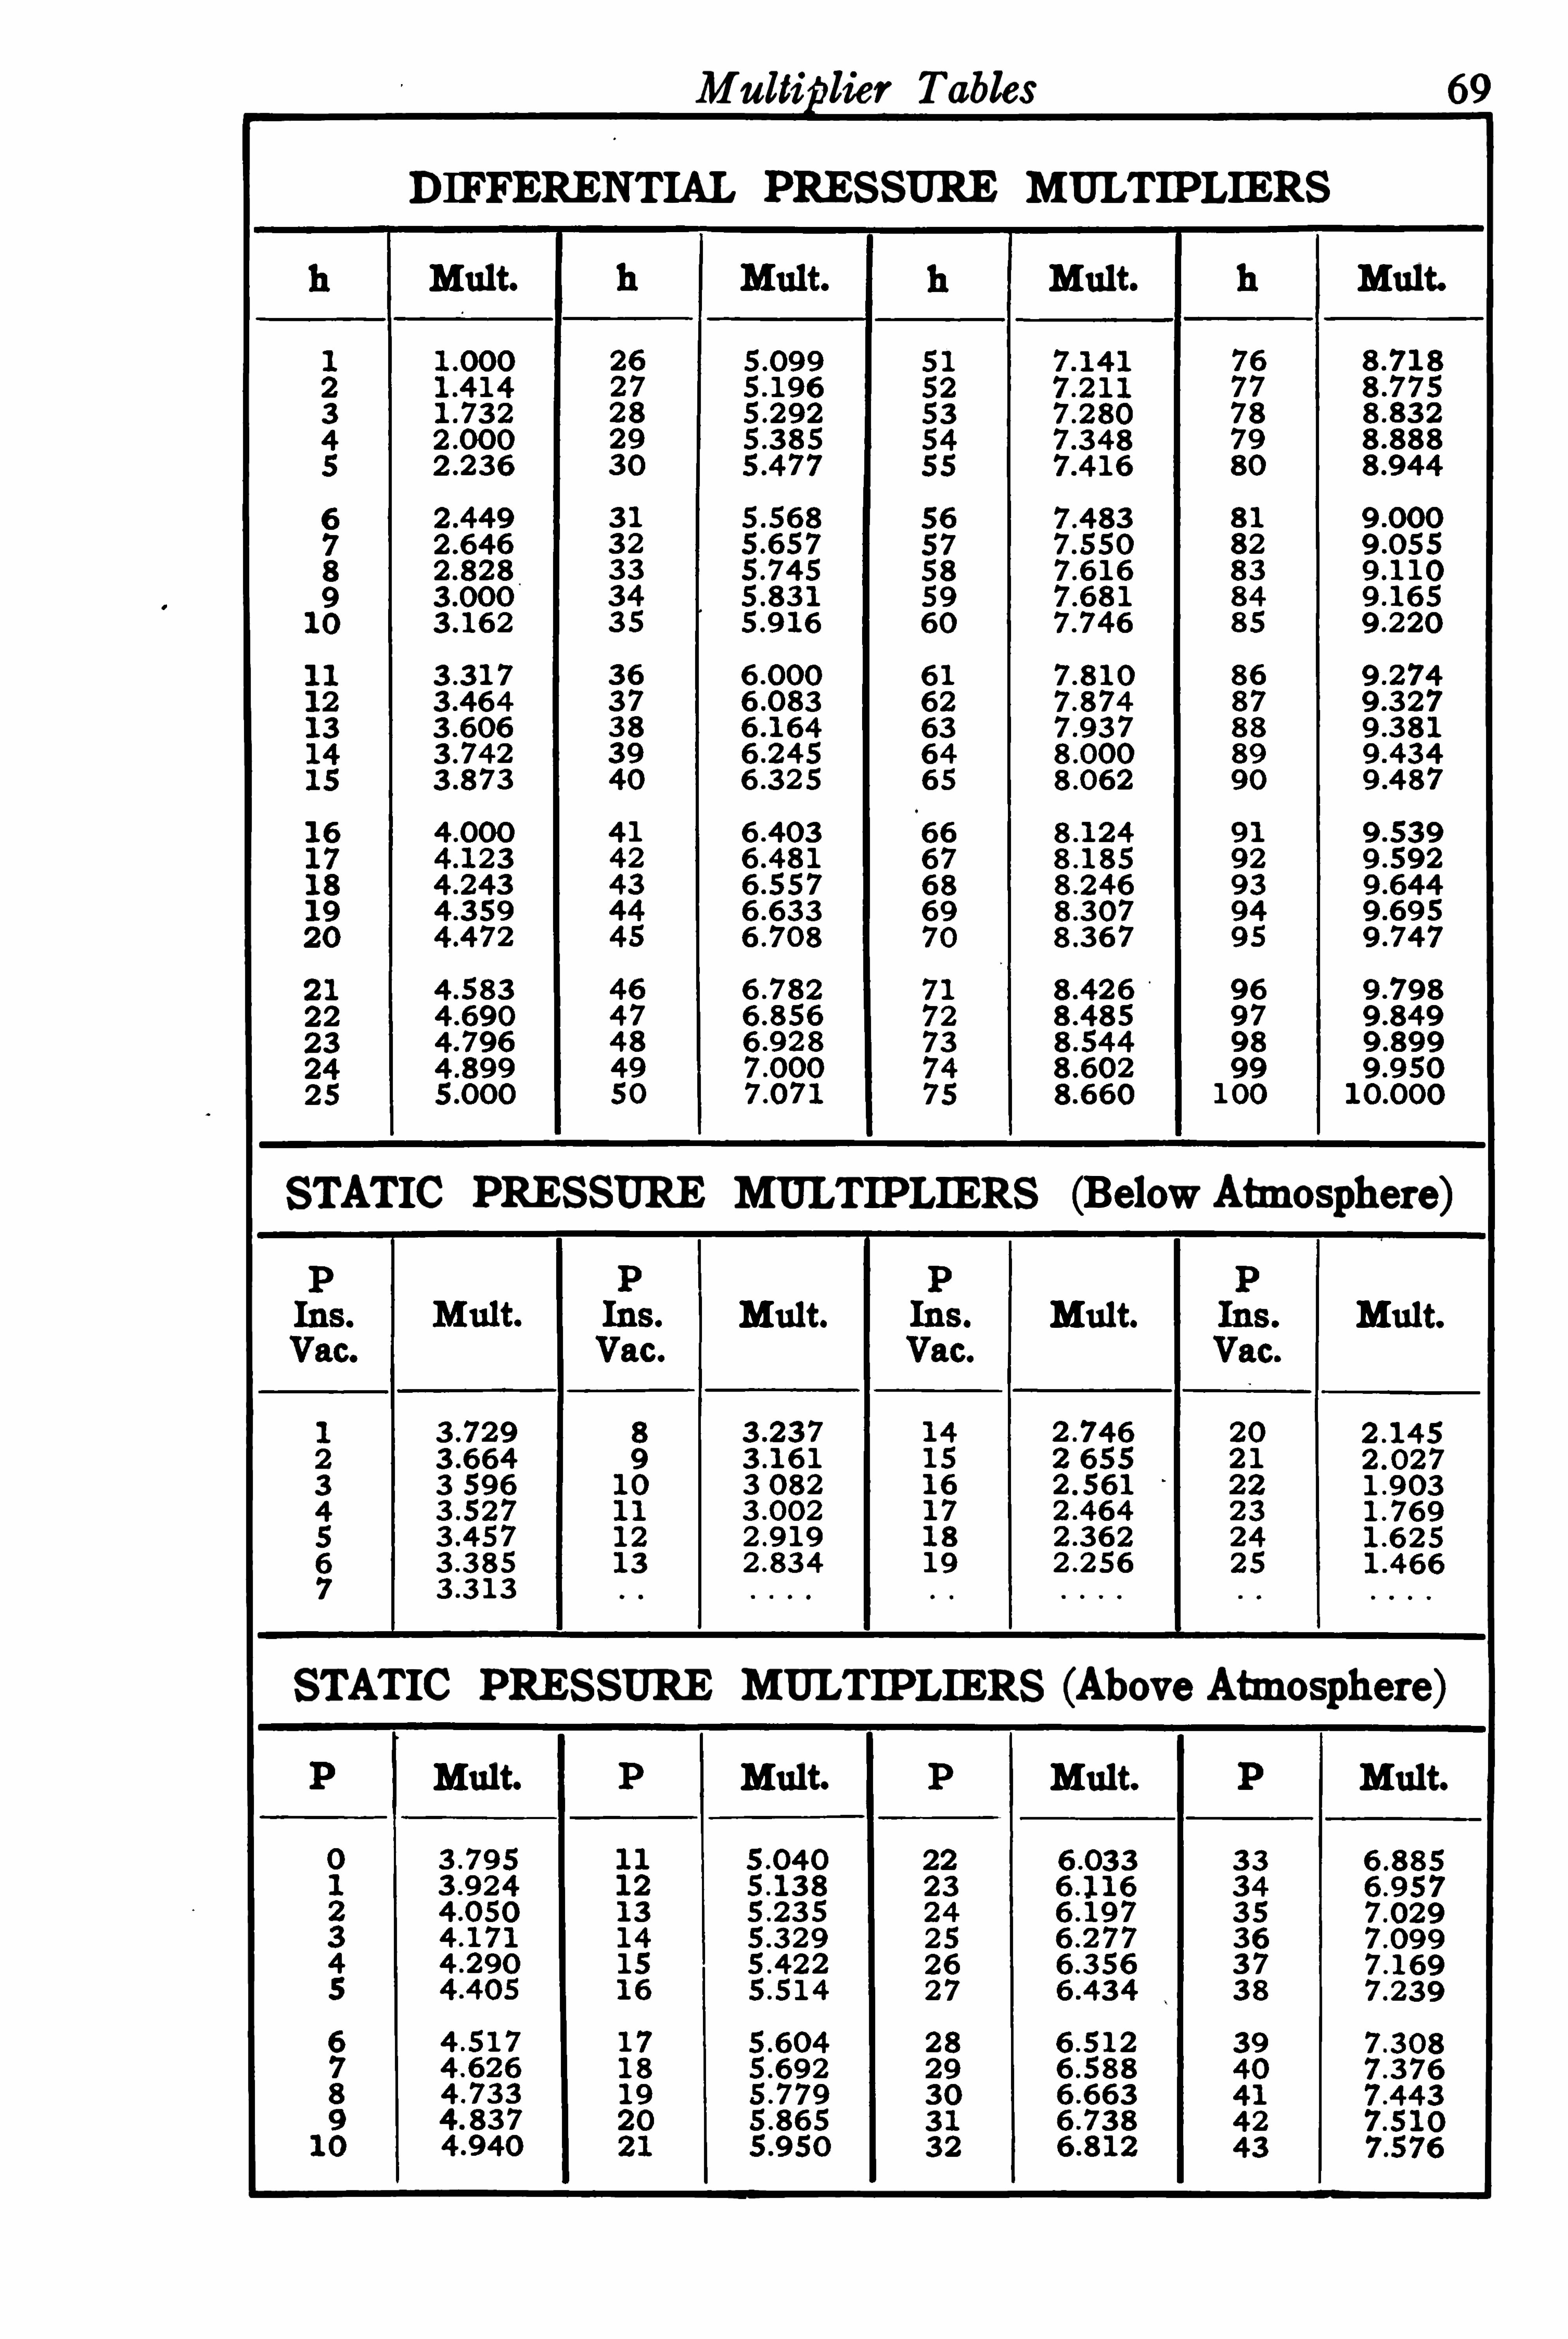
Mulli rlief Tables 69
DIFFERENTIAL PRESSURE MULTIPLIERS
Mul t. Mul t. Mul t.
STATIC PRESSURE MULTIPLIERS (Below Atmosphere )
Mult. Mult. Mult.
STATIC PRESSURE MULTIPLIERS (Above Atmosphere )
Mul t. Mul t. Mul t. Mul t.
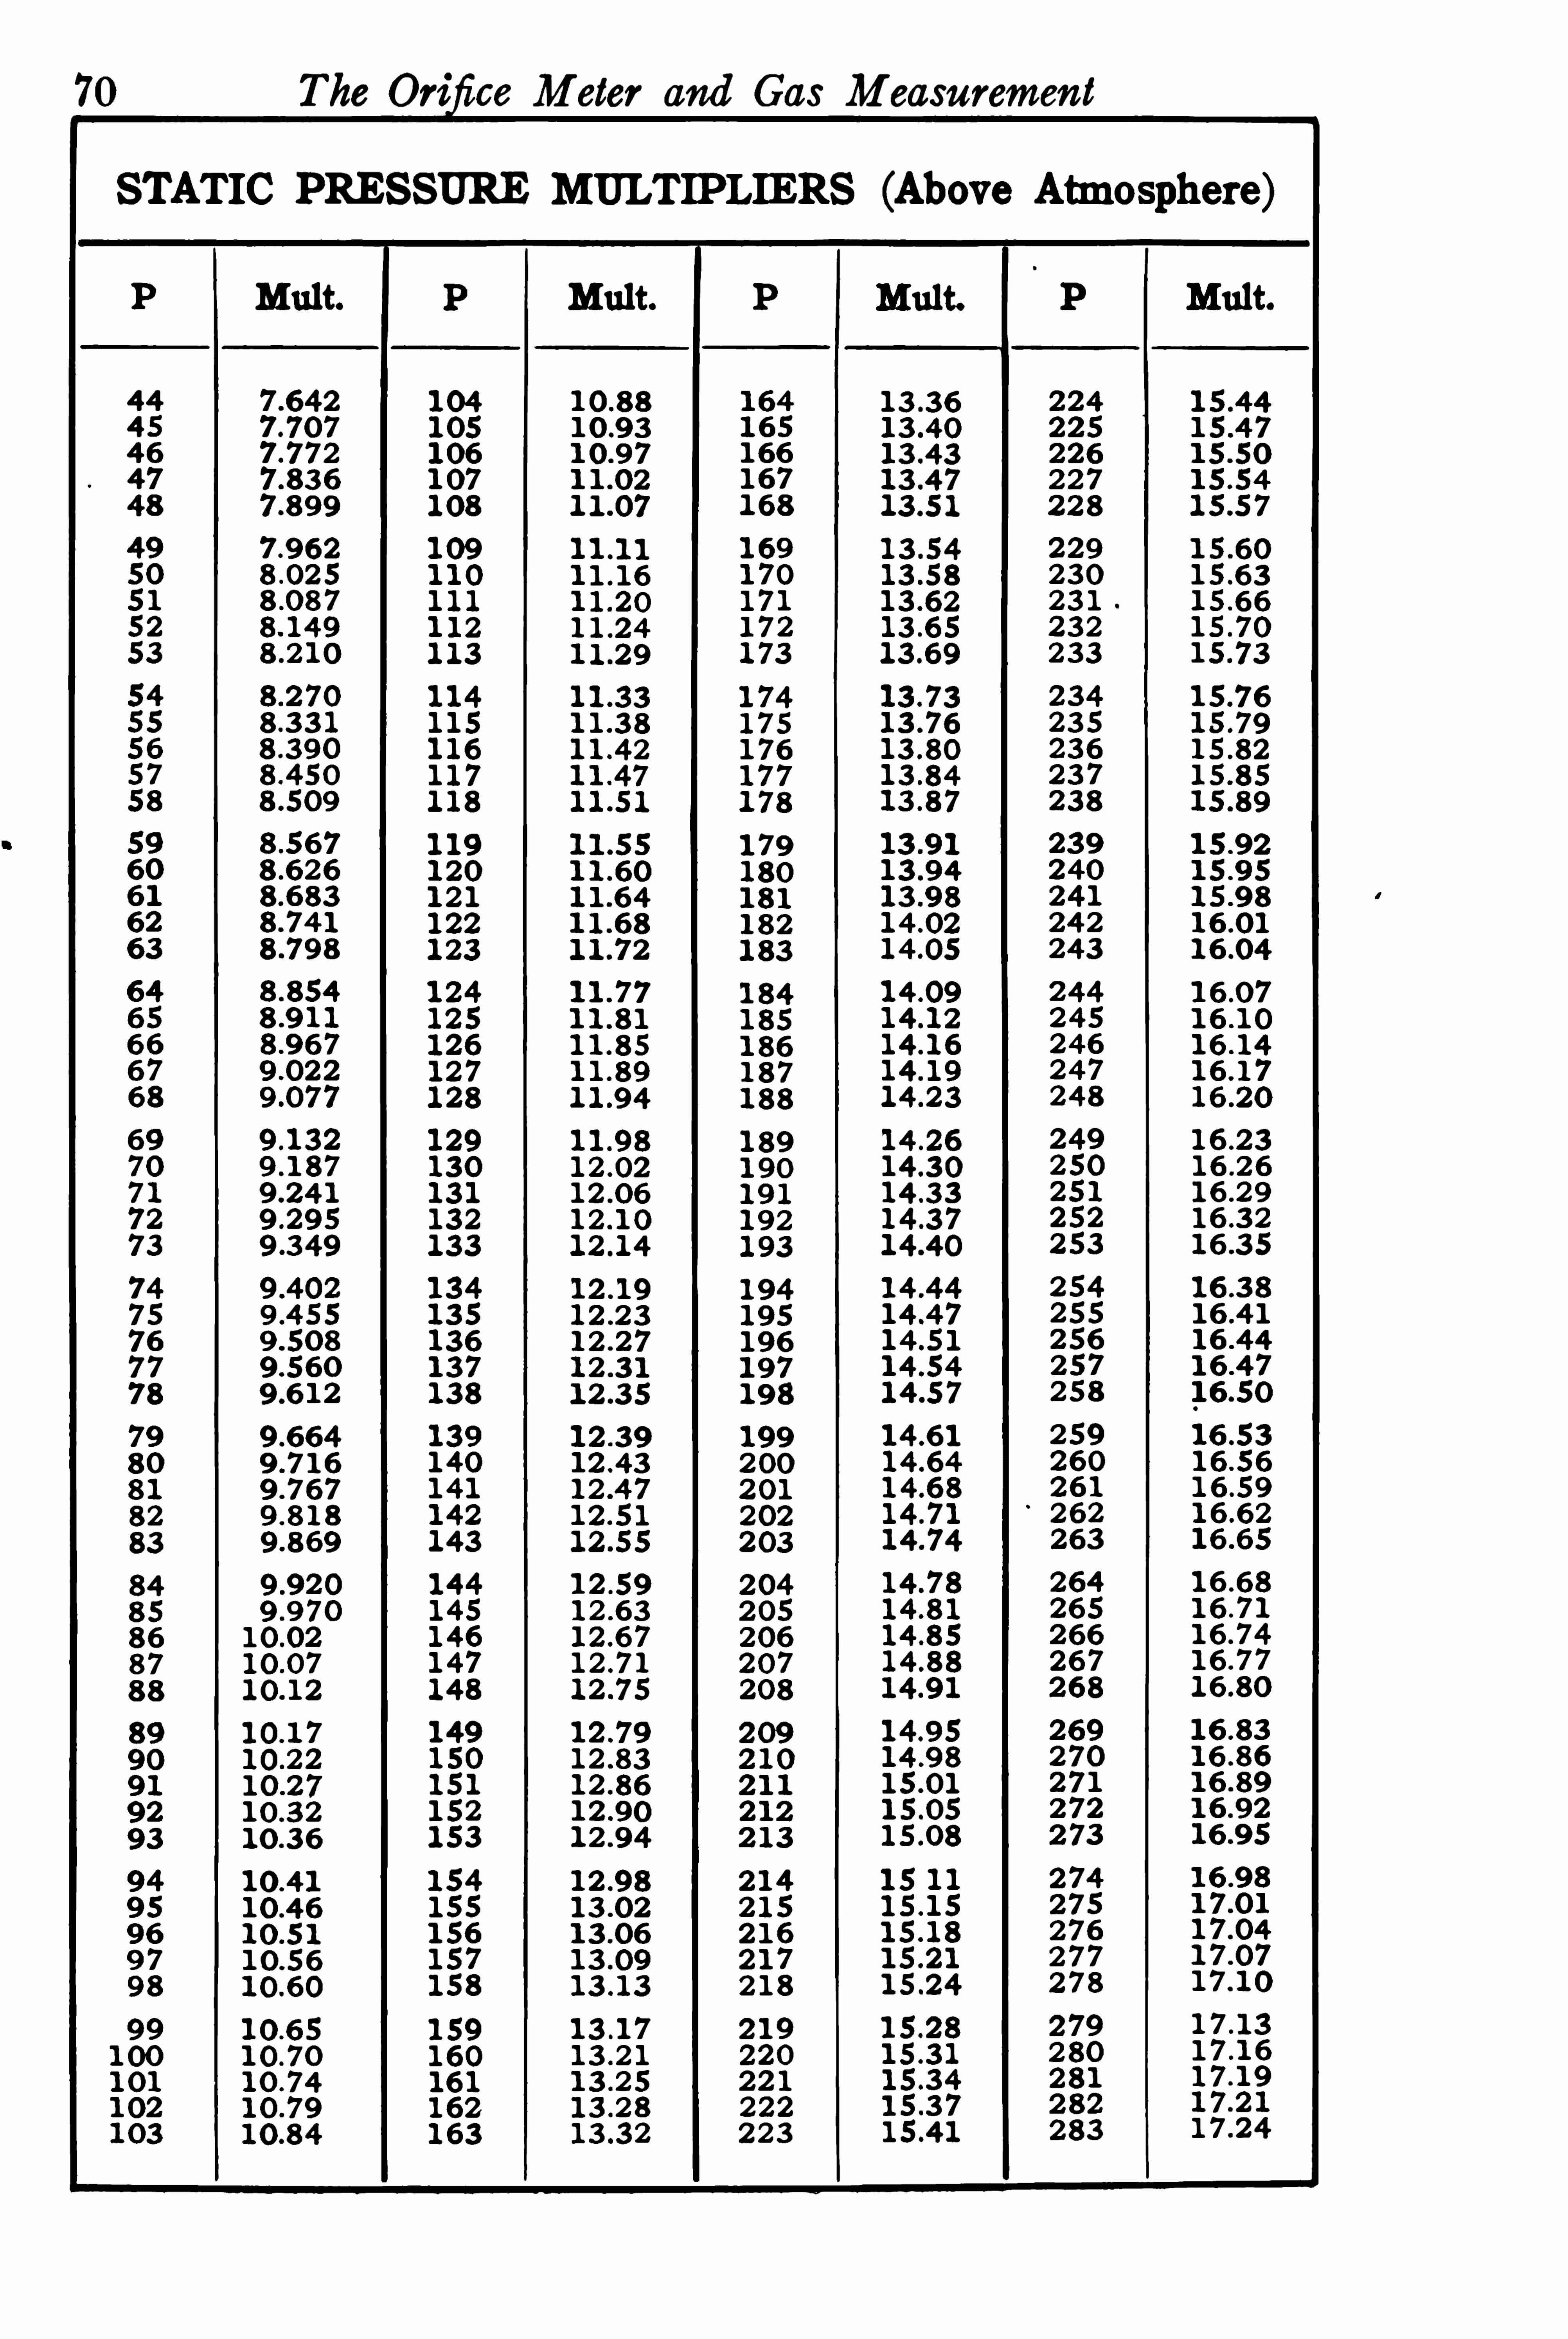
70 The Ori cc Meter and Gas Measurement
STATIC PRESSURE MULTIPLIERS (Above Atmosphere )
Mult. Mult.

7 1
STATIC PRESSURE MULTIPLIERS (Above Atmosphere )
MULTIPLIER TABLES FOR LOW RANGE DIFFERENTIALAND VACUUM STATIC PRESSURES
Difierential Pre ssure Multipliers1—20 inches of water in tenths inches
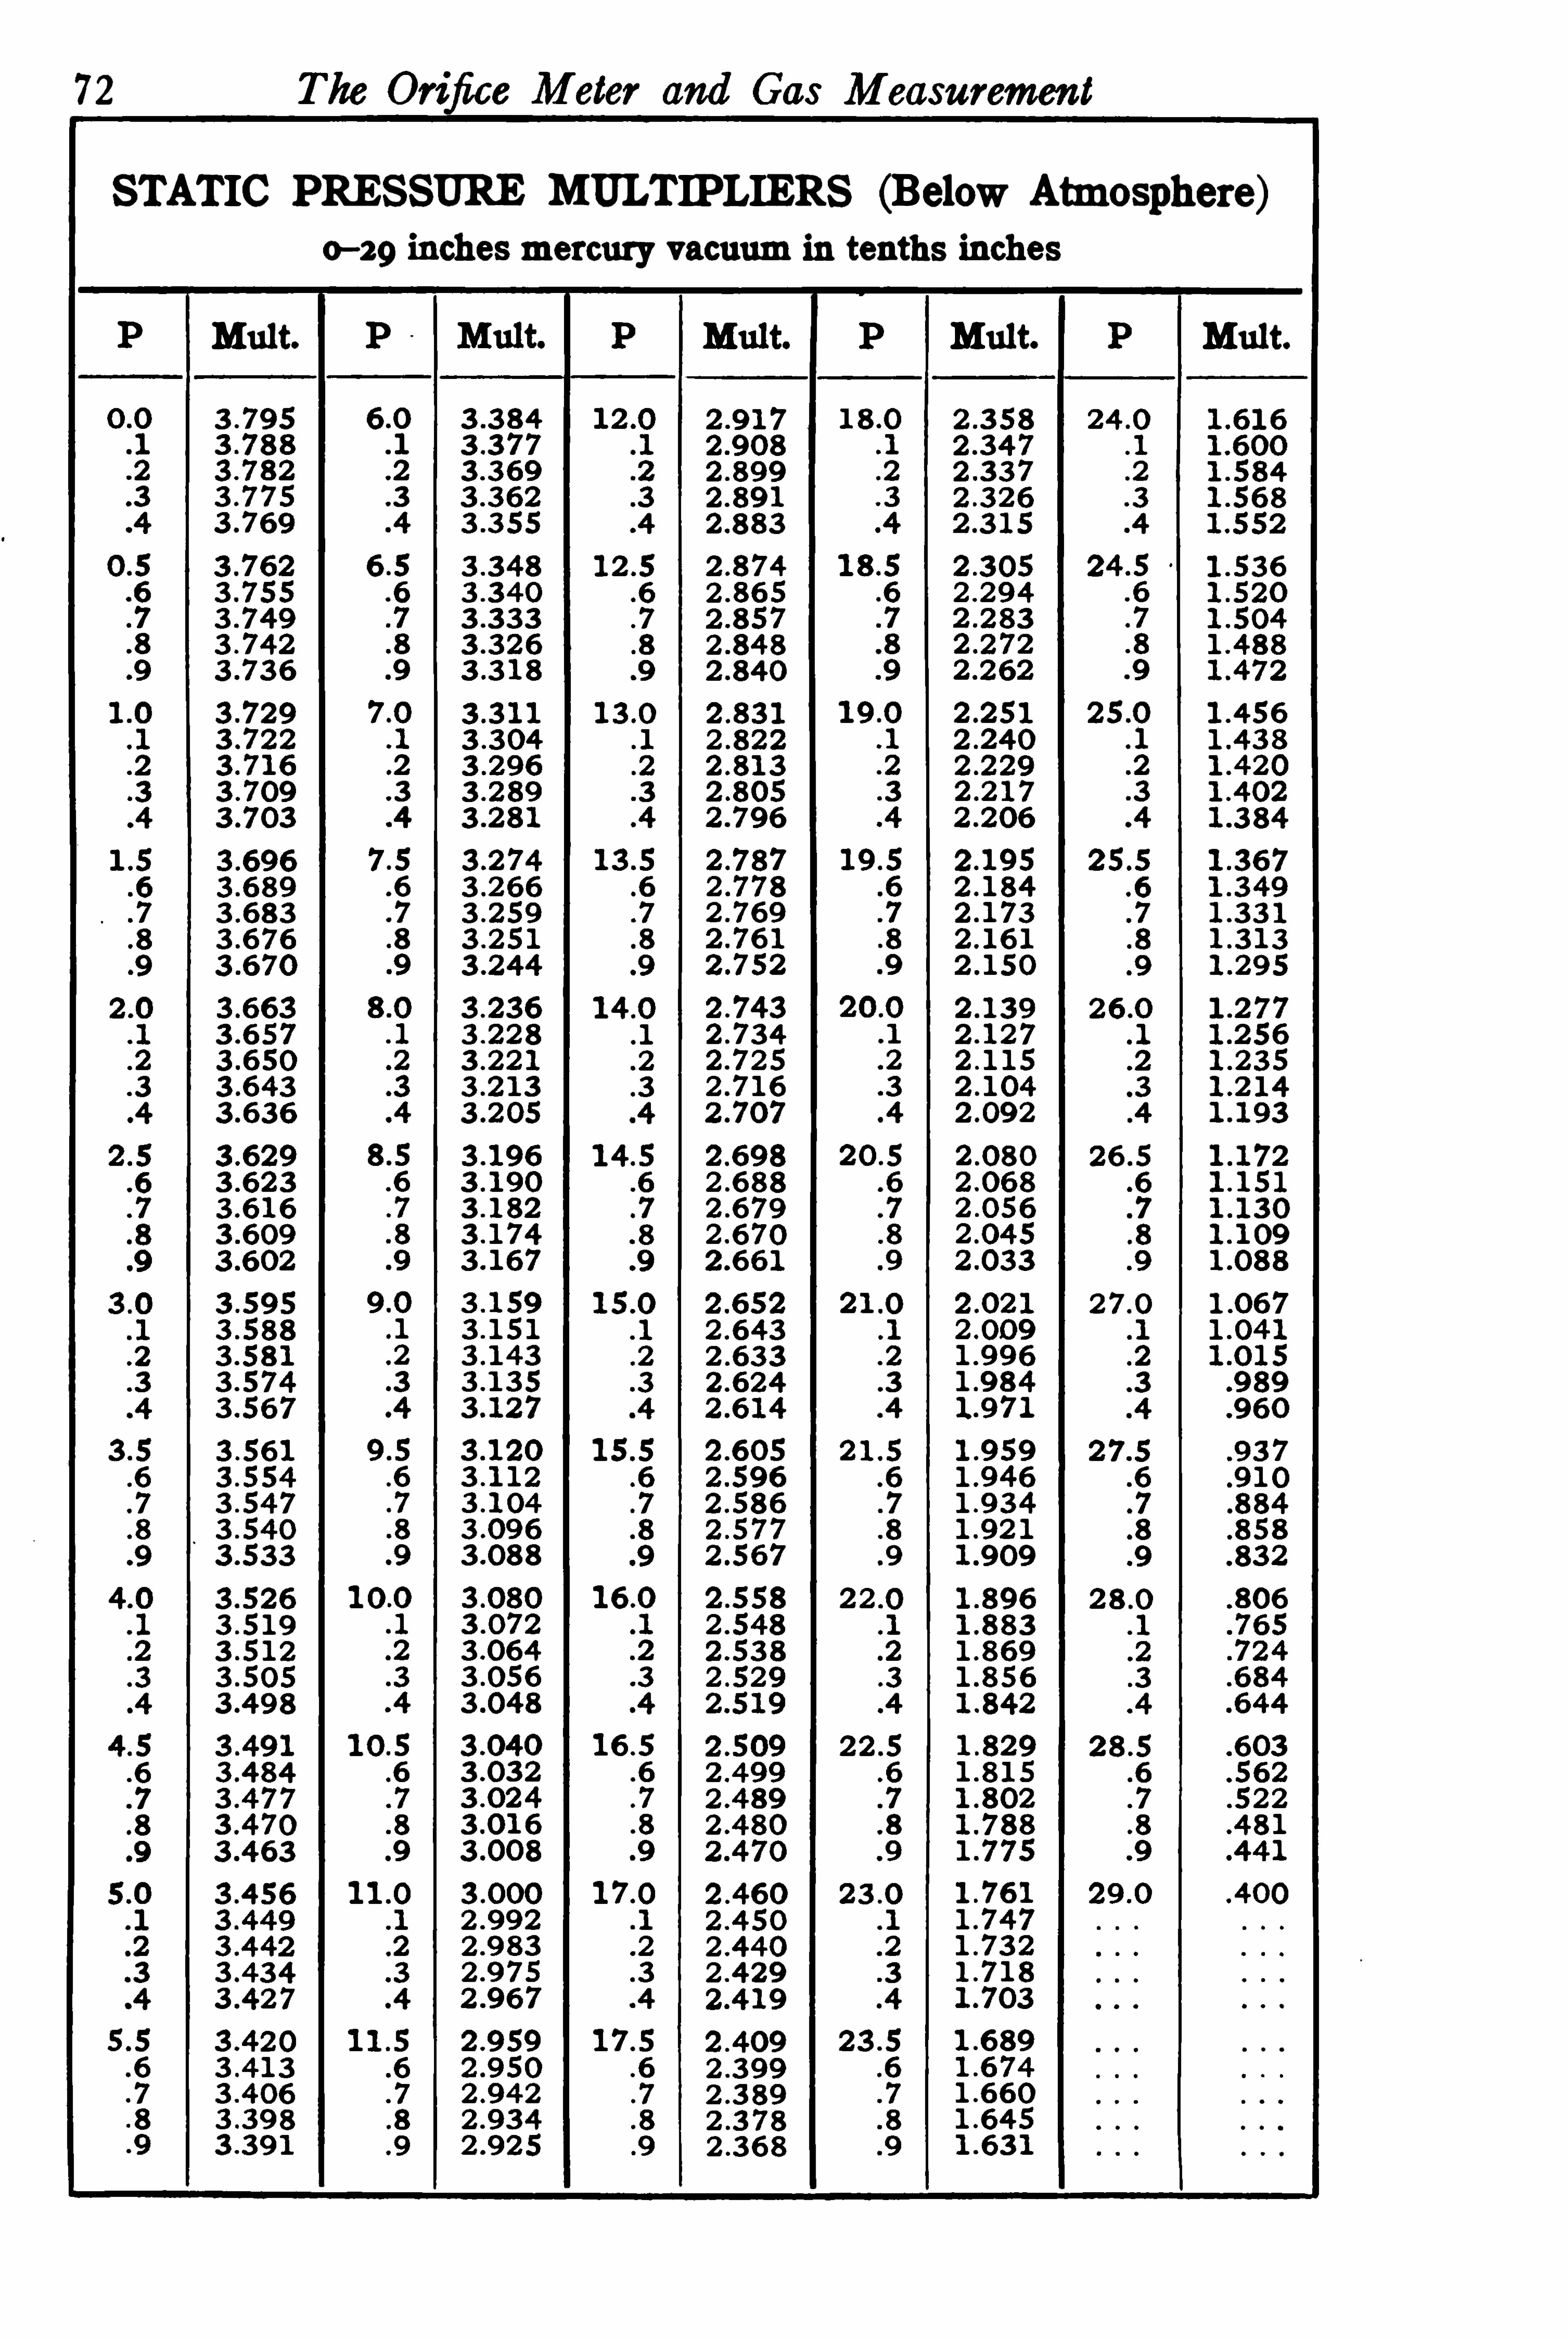
72
STATIC PRESSURE MULTIPLIERS (Below Atmosphere )o—zg inches mercury vacuum in tenths inches
Mult. Mult. Mult.

74 The Orifice Meter and Gas Measurement
In o rder to familiarize the reader with the method o f figuring hourlycoefi cients, we give below a concrete example .Assum e the following conditions :
Size Line (D) 6
Size Orifice (d)Spec . Gravity (G) .600
Press . Base (P 3 ) 4 oz.Temp . Base (TB ) 60
Temp . Flow (T 60
BarometerHourly Coefficient C
As previously stated , all factors involving temperature and pressureare computed from an absolute base . This means that 460 must beadded to the temperatures , making , in this particular example , 520.
The Pressure Base is brought to an absolute value by adding to it theBarometric Pressure . In this case the Pressure Base is assumed as
4 oz.,which is equivalent to .250 lbs . and this value added to the
Barometric Pressure of gives
The formula is C 218.44 Ed2
The first step is to find the value of E . This is found from the EI
curve, Fig . 1669,page 2
,after determining the value Of i .
D
d
D 6
Now substituting actual numerical values in the above equation(1 ) we get :
C X .6088 X X
.4583,hence E .6088 .
To solve this equation by arithmetic involves considerable work,
which may be eliminated by using logarithms or a computing-machine .To a reader
,however
,who is not familiar with higher mathematics
the following will show the arithmetical solution .
The first step is to reduce the factor under the radical to a simp ler
520X .600 3 12, .003205 , V .003205 .0566 (3)
The next step is to reduce to a decimal equivalent bydivision .
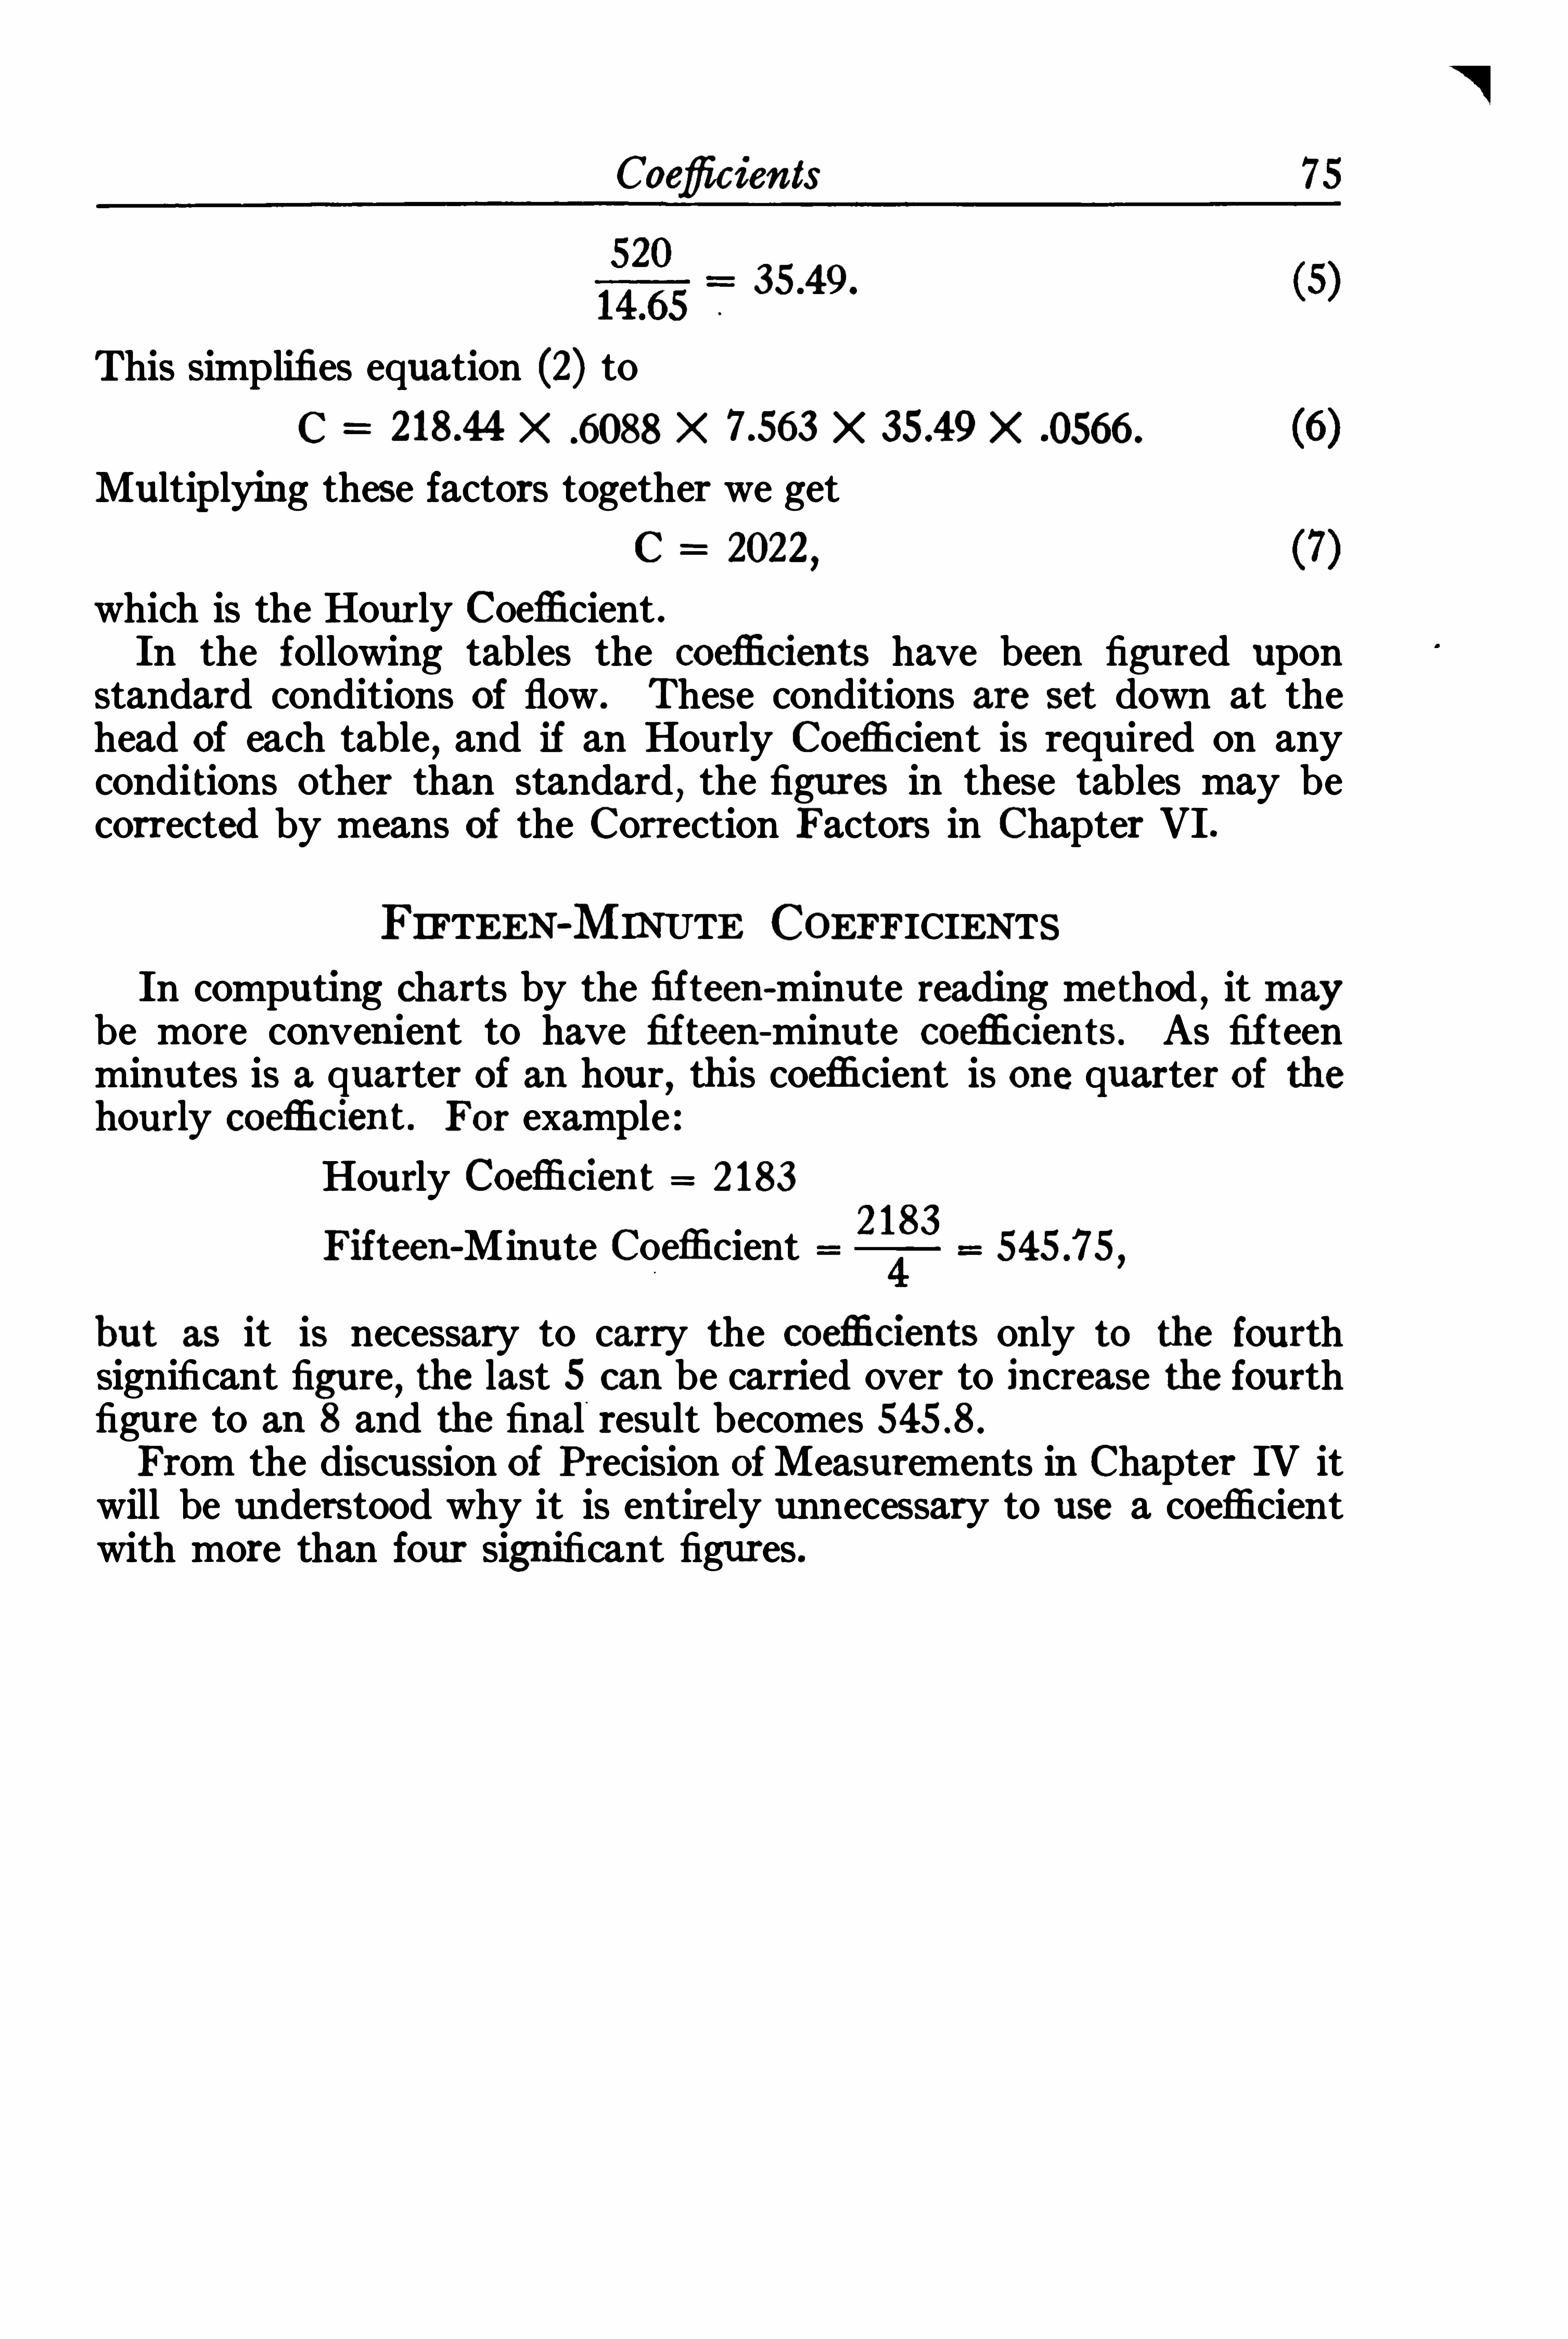
Coefl‘icients
This simplifies equation (2) toC X .6088 X X X 0566 .
Multip lying these factors together we getC 2022
,
which is the Hourly Coefficient .In the following tables the coeflicients have been figured uponstandard conditions of flow . These conditions are set down at thehead of each table , and if an Hourly Coefficient is required on anyconditions other than standard , the figures in these tables may becorrected by means of the Correction Factors in Chapter VI .
FIFTEEN-MINUTE COEFFICIENTSIn computing charts by the fifteen-minute reading method
,it may
be more convenient to have fif teen-minute coefi cients. As fif teenminutes is a quarter of an hour
,thi s coefficient is one quarter o f the
hourly coefi cient . For example :Hourly Coefli cient 2183
Fifteen-Minute Coefficient
but as it is necessary to carry the coefi cients only to the fourthSignificant figure, the last 5 can be carried over to increase the fourthfigure to an 8 and the final result becomesFrom the discussion Of Precision ofMeasurements in Chapter IV itwill be understood why it is entirely unnecessary to use a coefficientwith more than four significant figures .


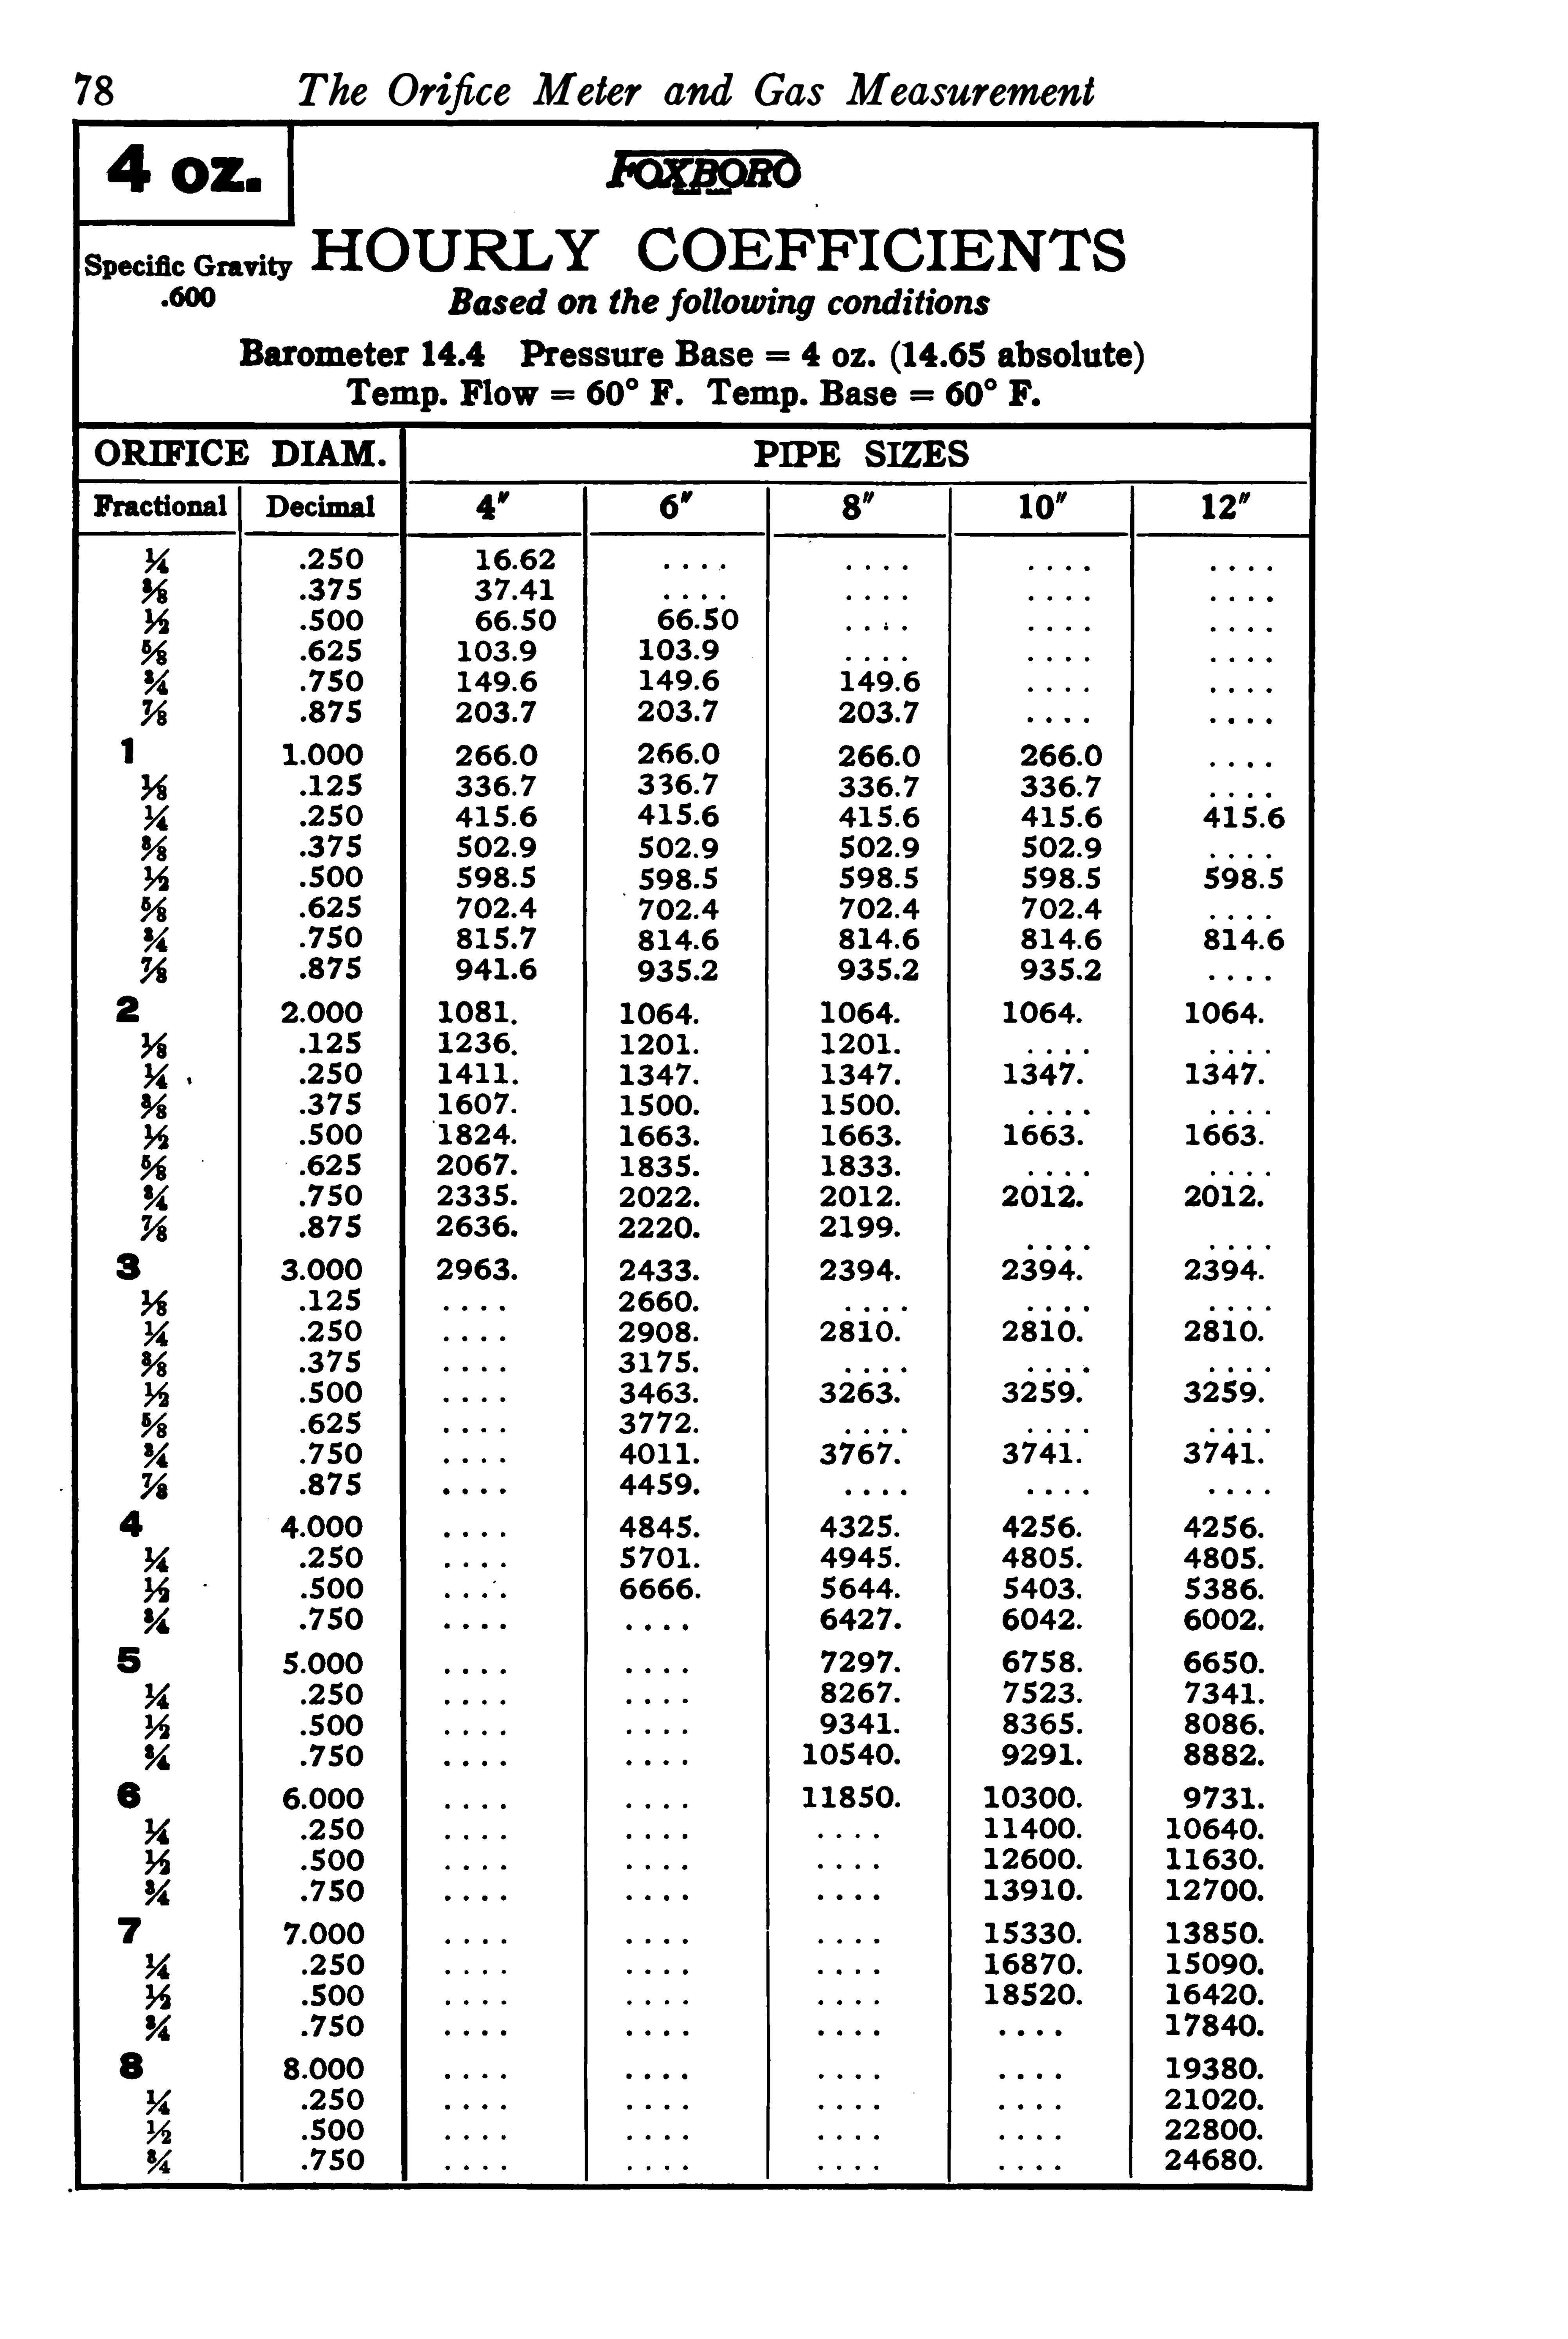
78 The Orifice Meter and Gas Measurement
PIPE SI!ESDecimal
1 06 4 .
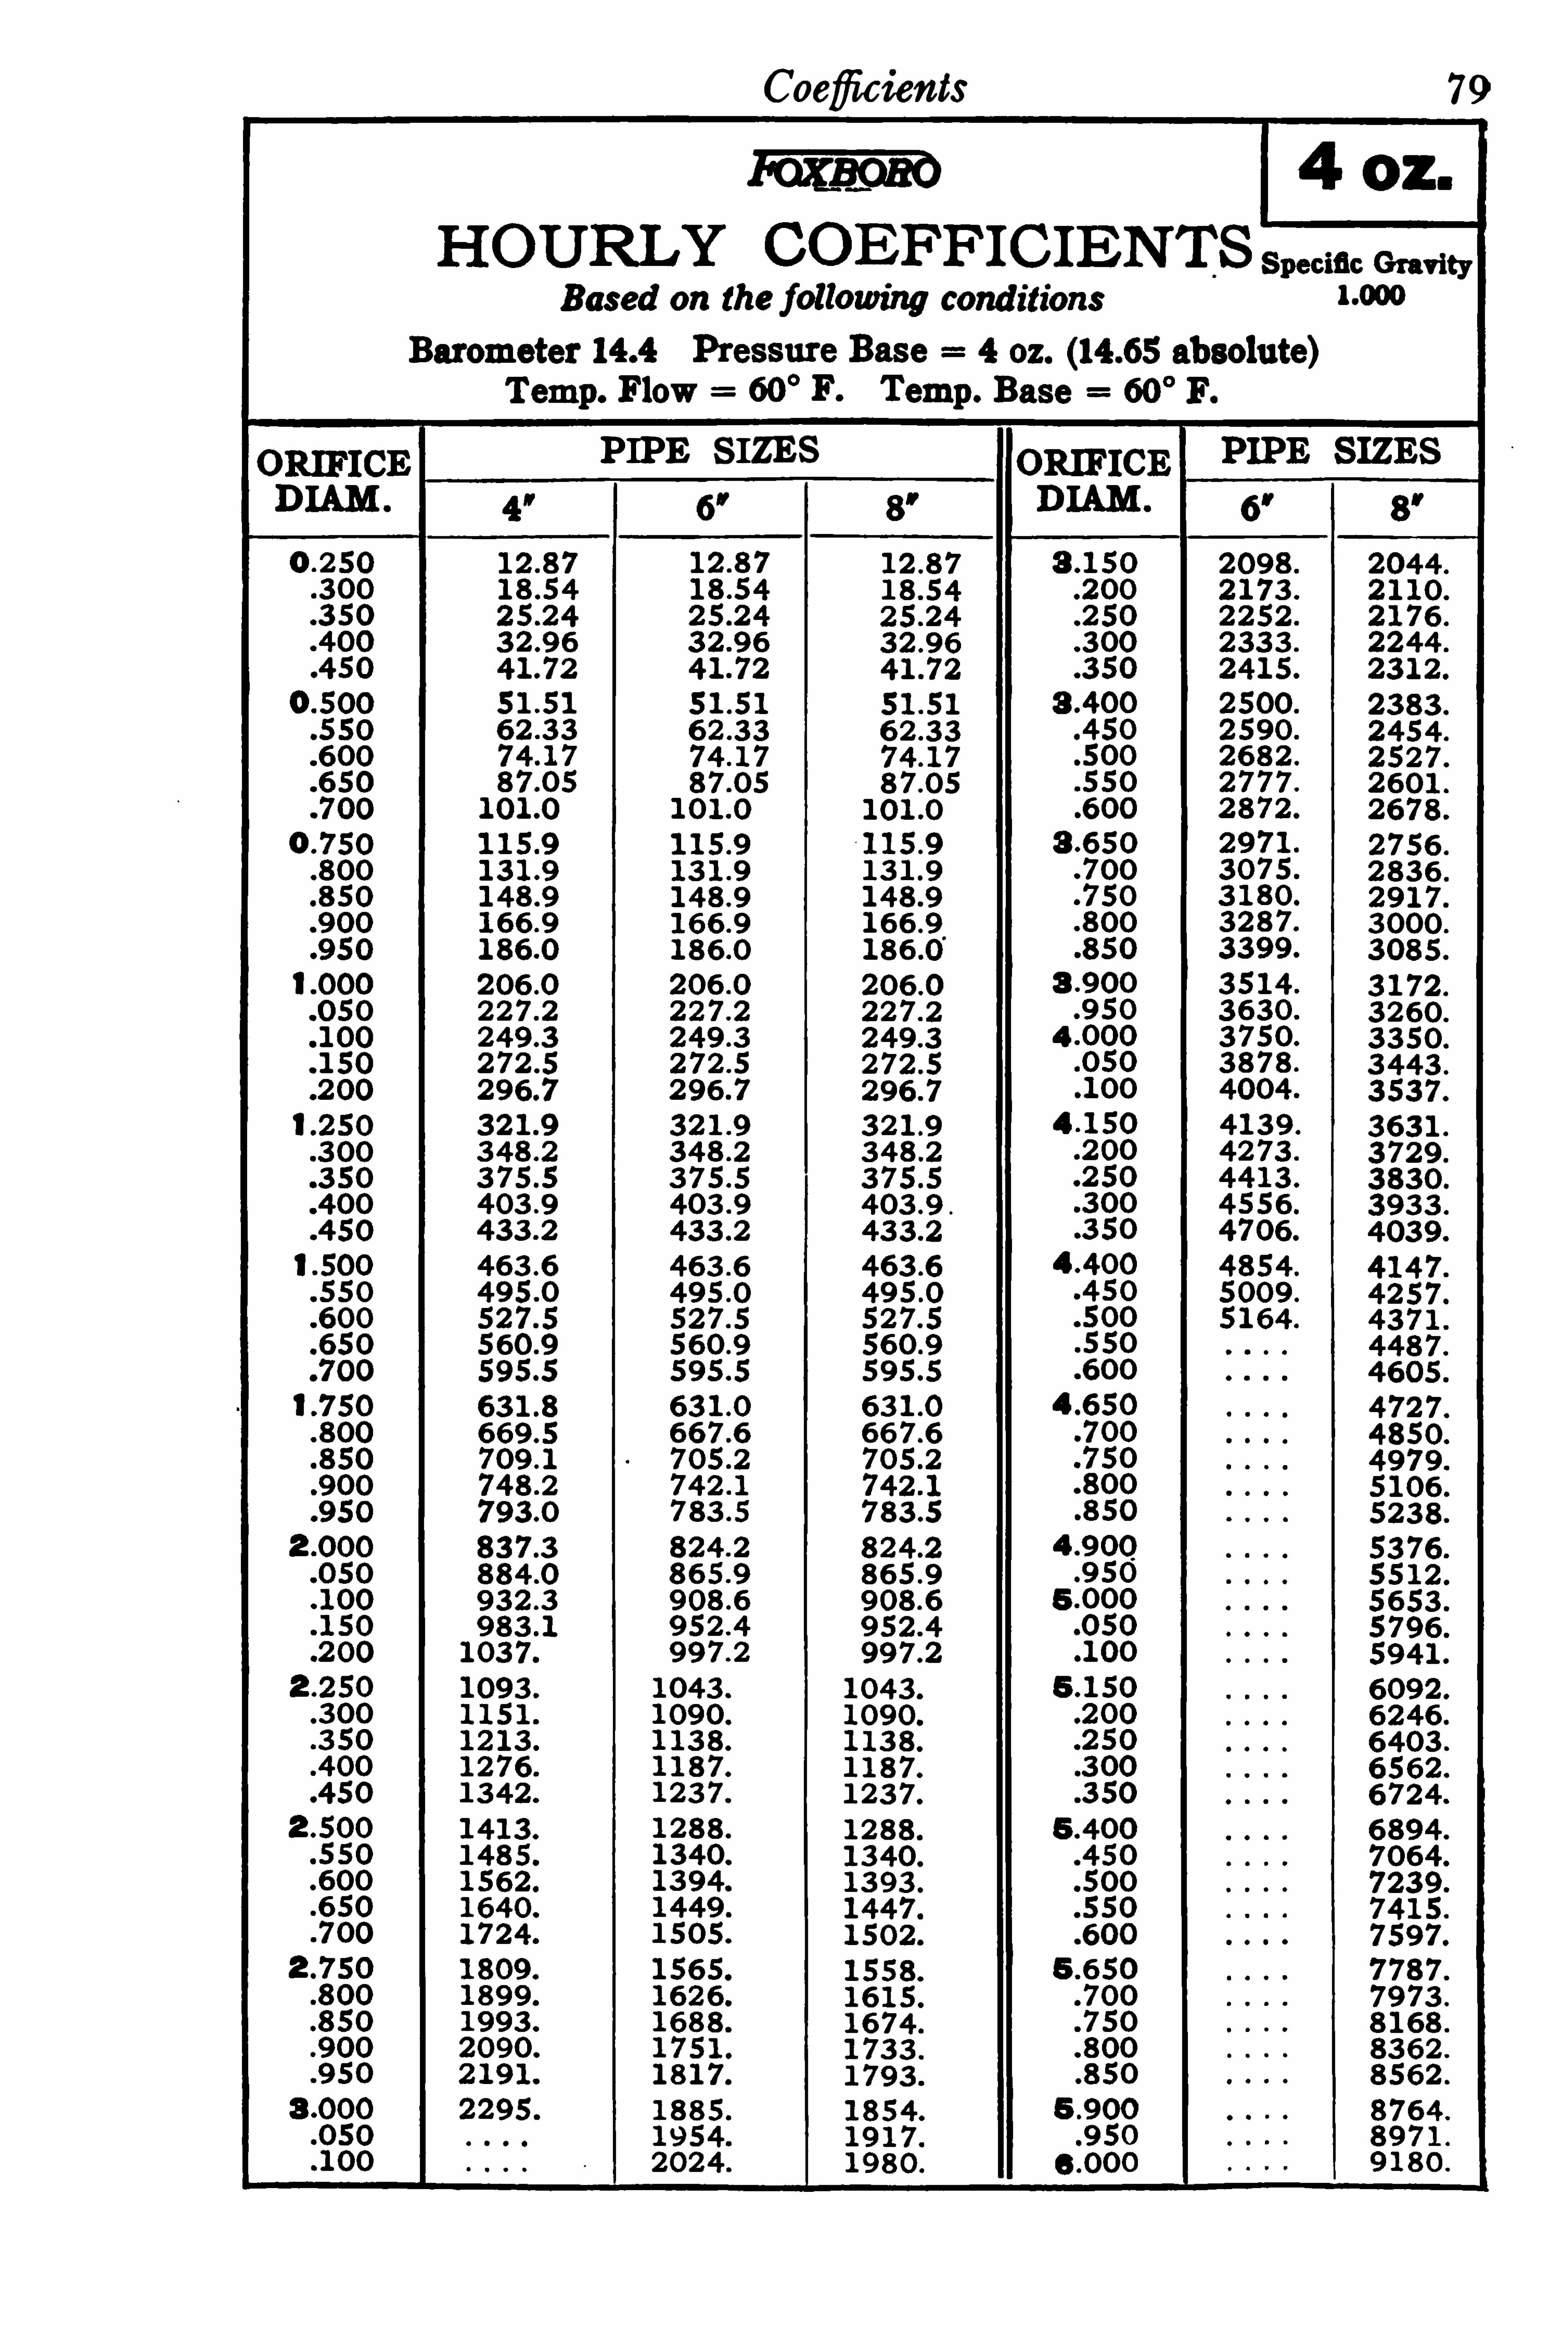
Coeficients
PIPE S I!ESV
79
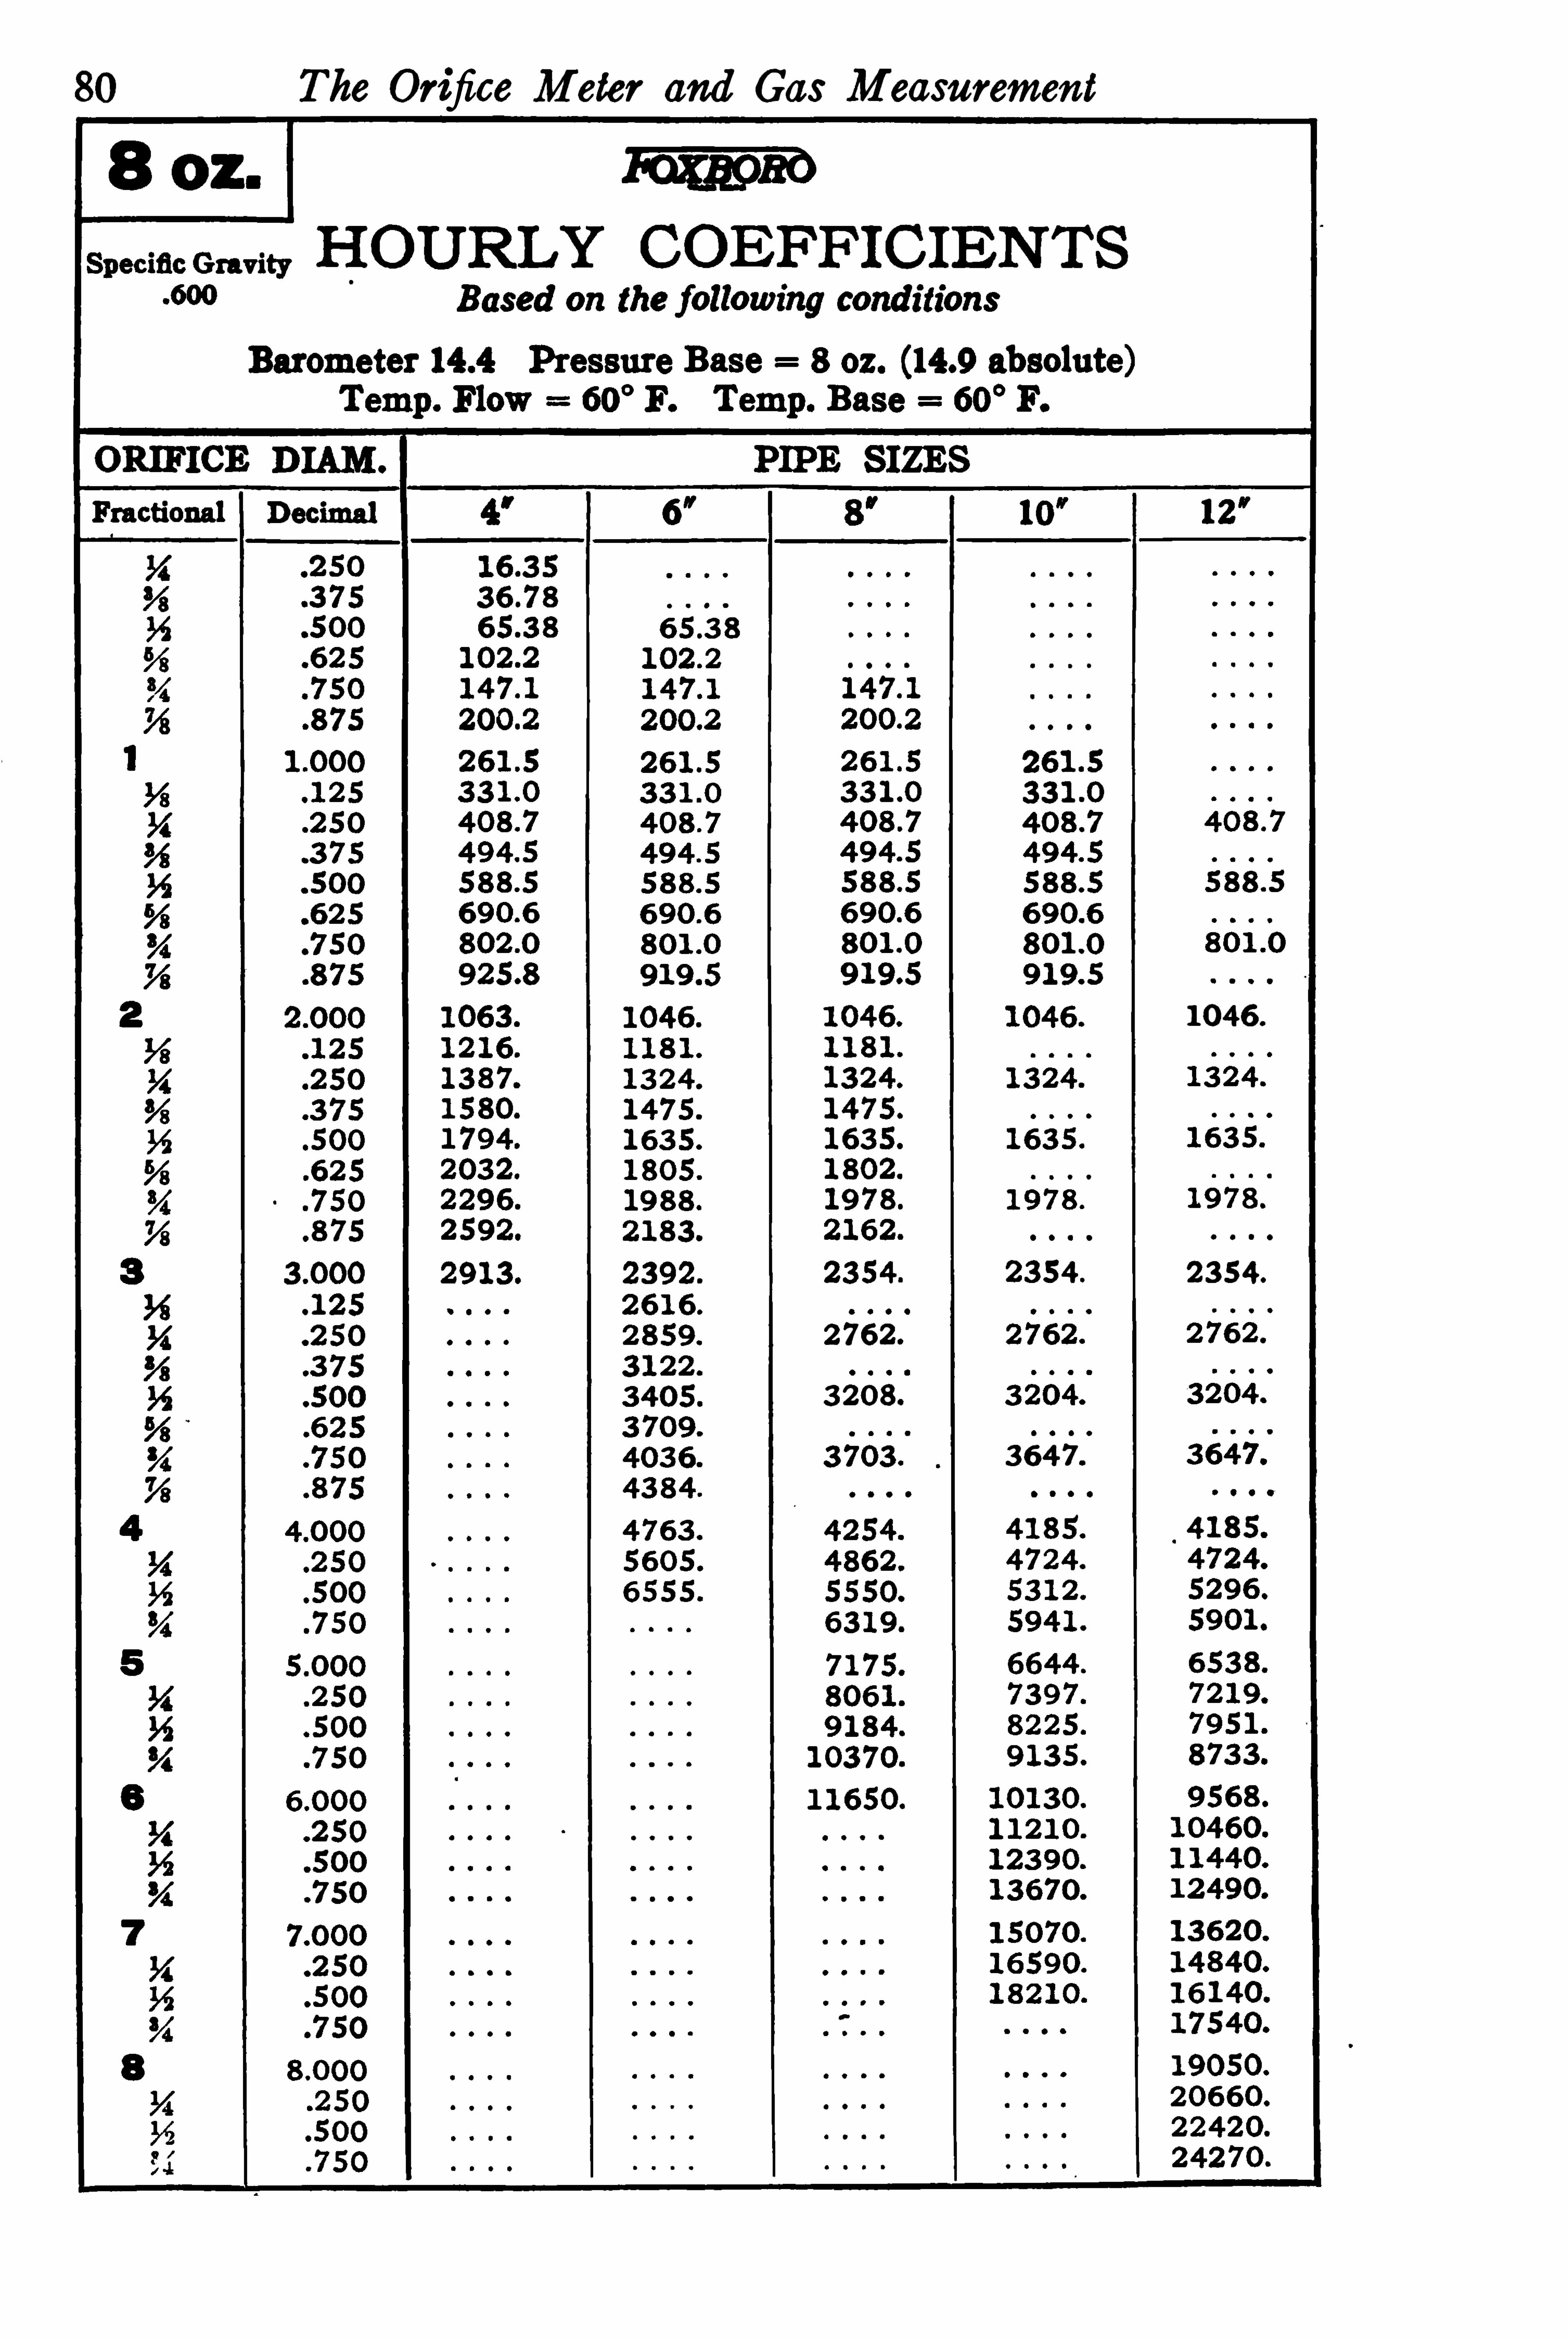
80 The Orifice Meter and Gas Measurement
1 04 6 .
23 5 4 23 5 4 .
27 62
3 208.
3 6 4 7 .
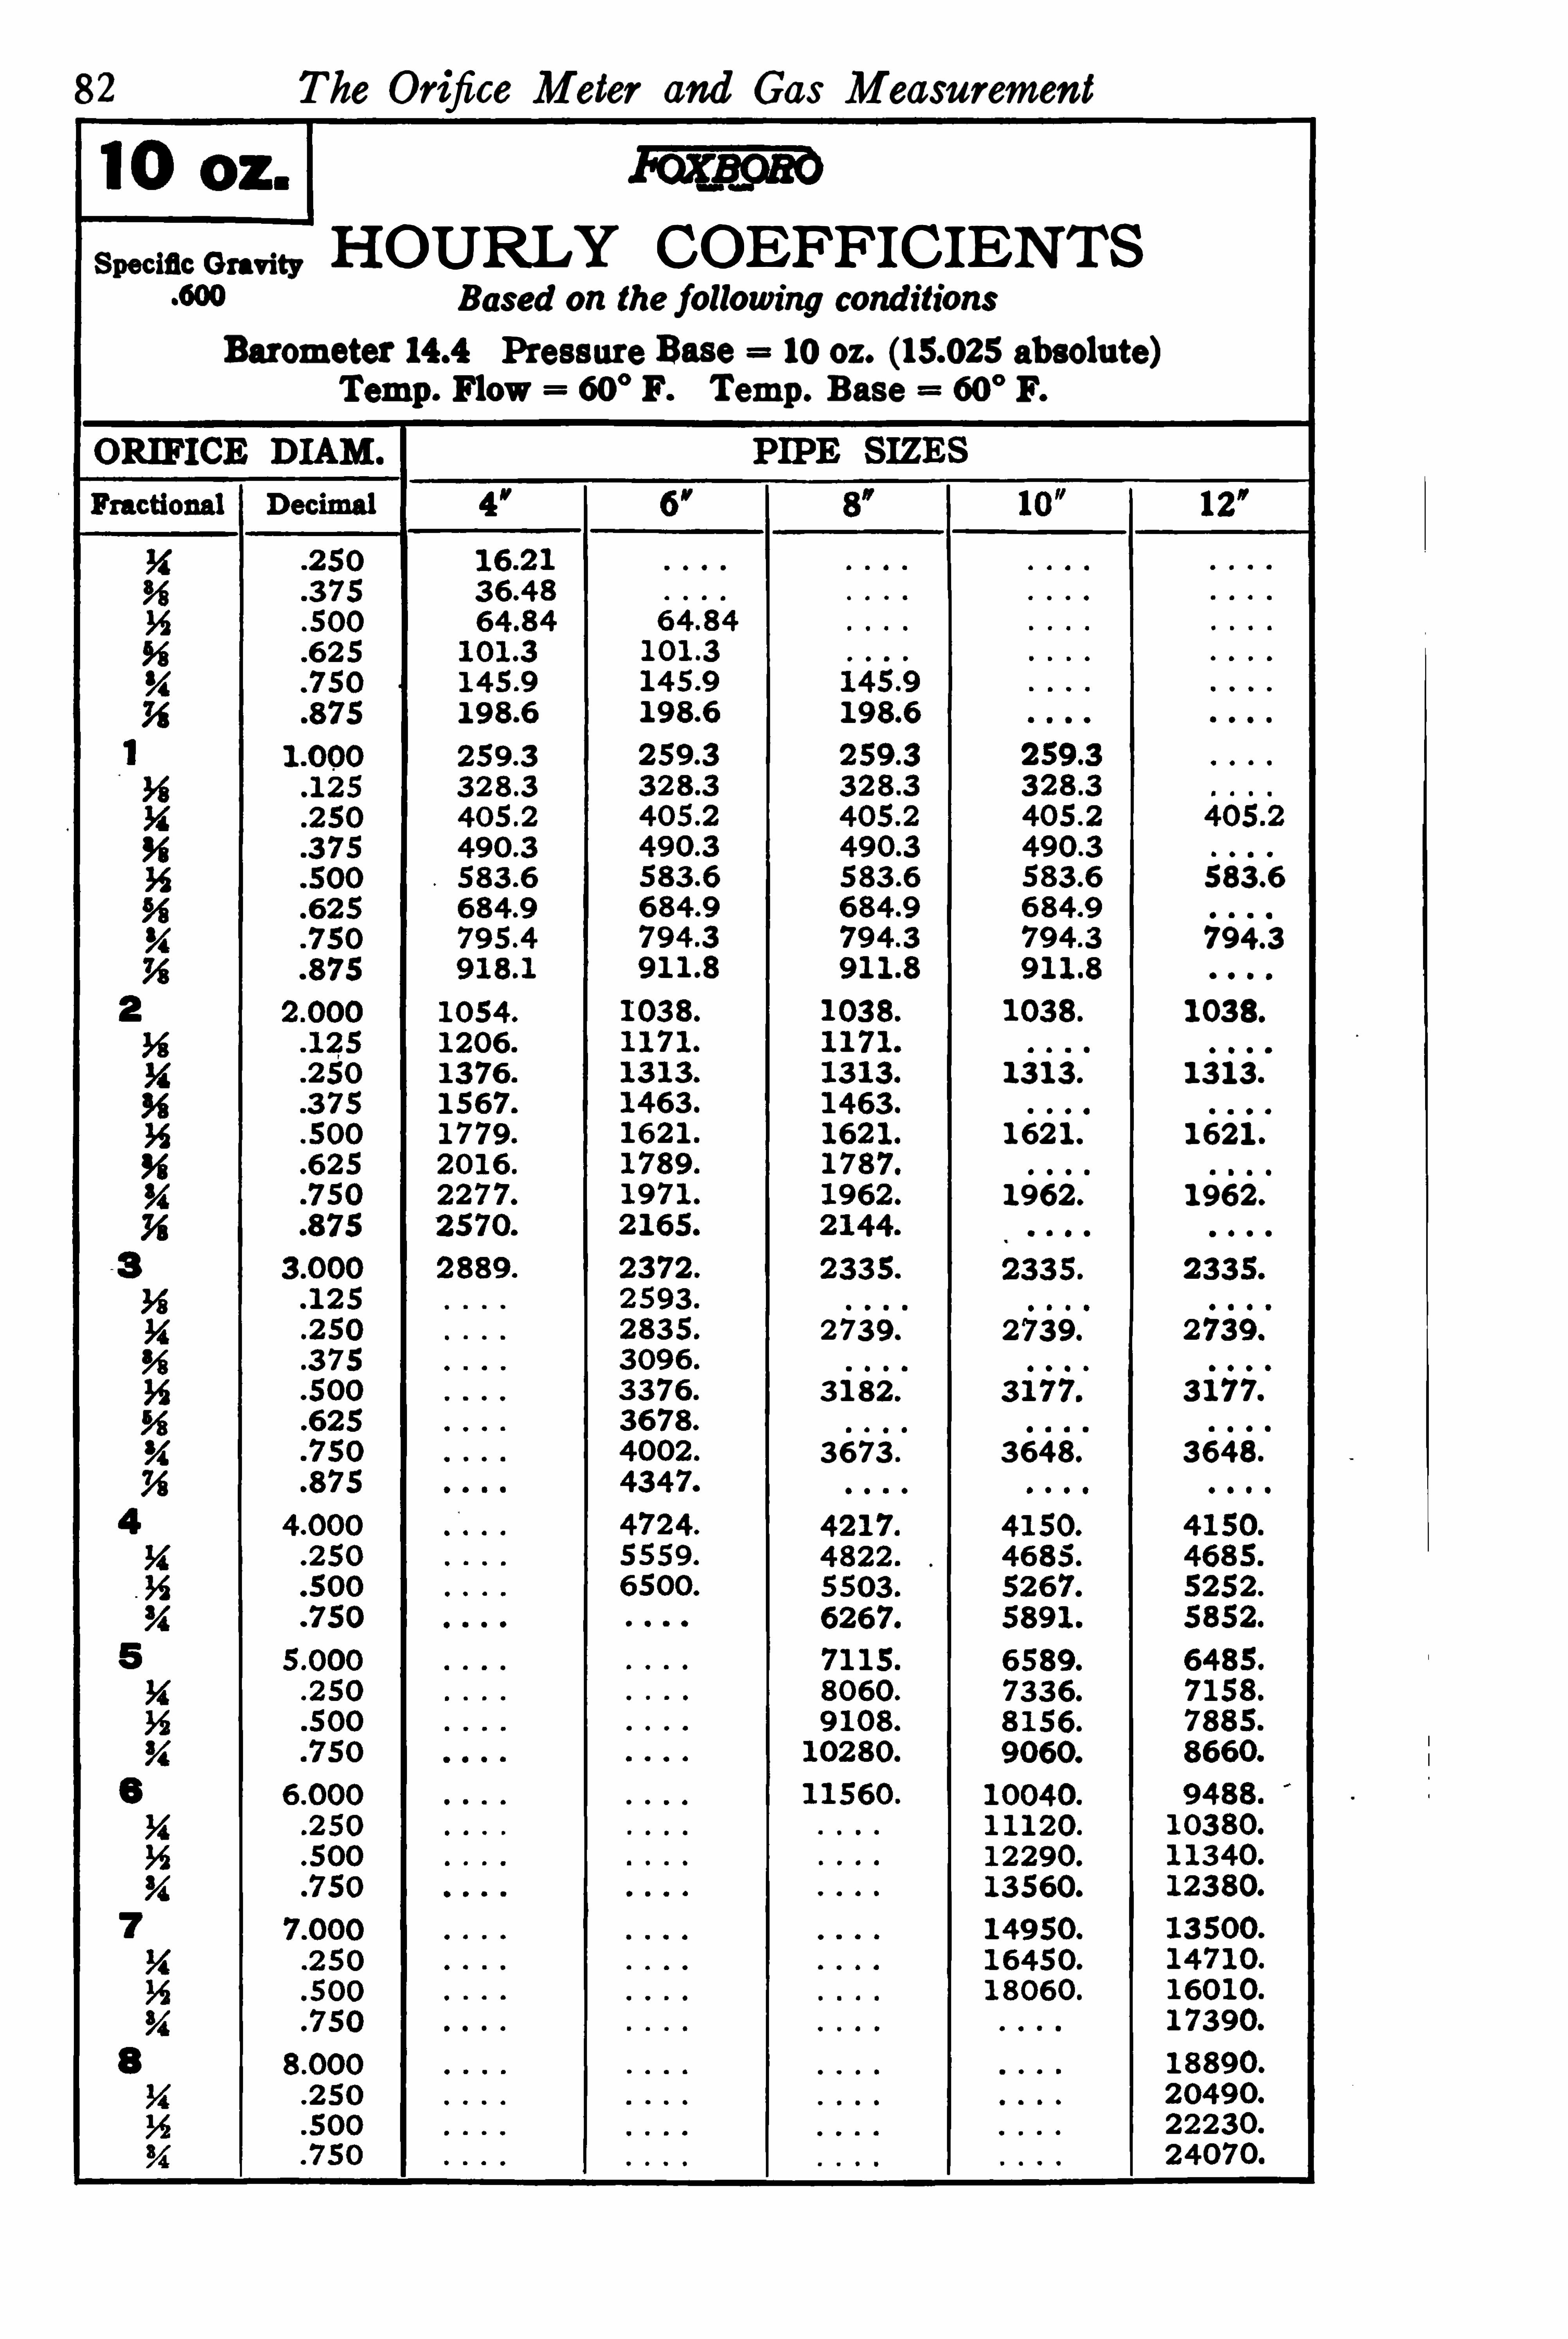
82
3 1m m.Gm “, HOURL! COEFFICIENTSBased on the following conditions
Barometer Pressure Base 10 oz. absolute )Temp . Flow 60
°F. Temp . Base 60
°F.
2 7 3 9
3 1 82
3 6 7 3 .
The Orifice Meter and Gas Measurement
1 3 1 3
1 62 1
1 962.
27 3 9
3 6 4 8 .
583 6
7 94 43
1 03 8
1 3 1 3
1 621
1 962.
3 1 7 7
3 64 8 .
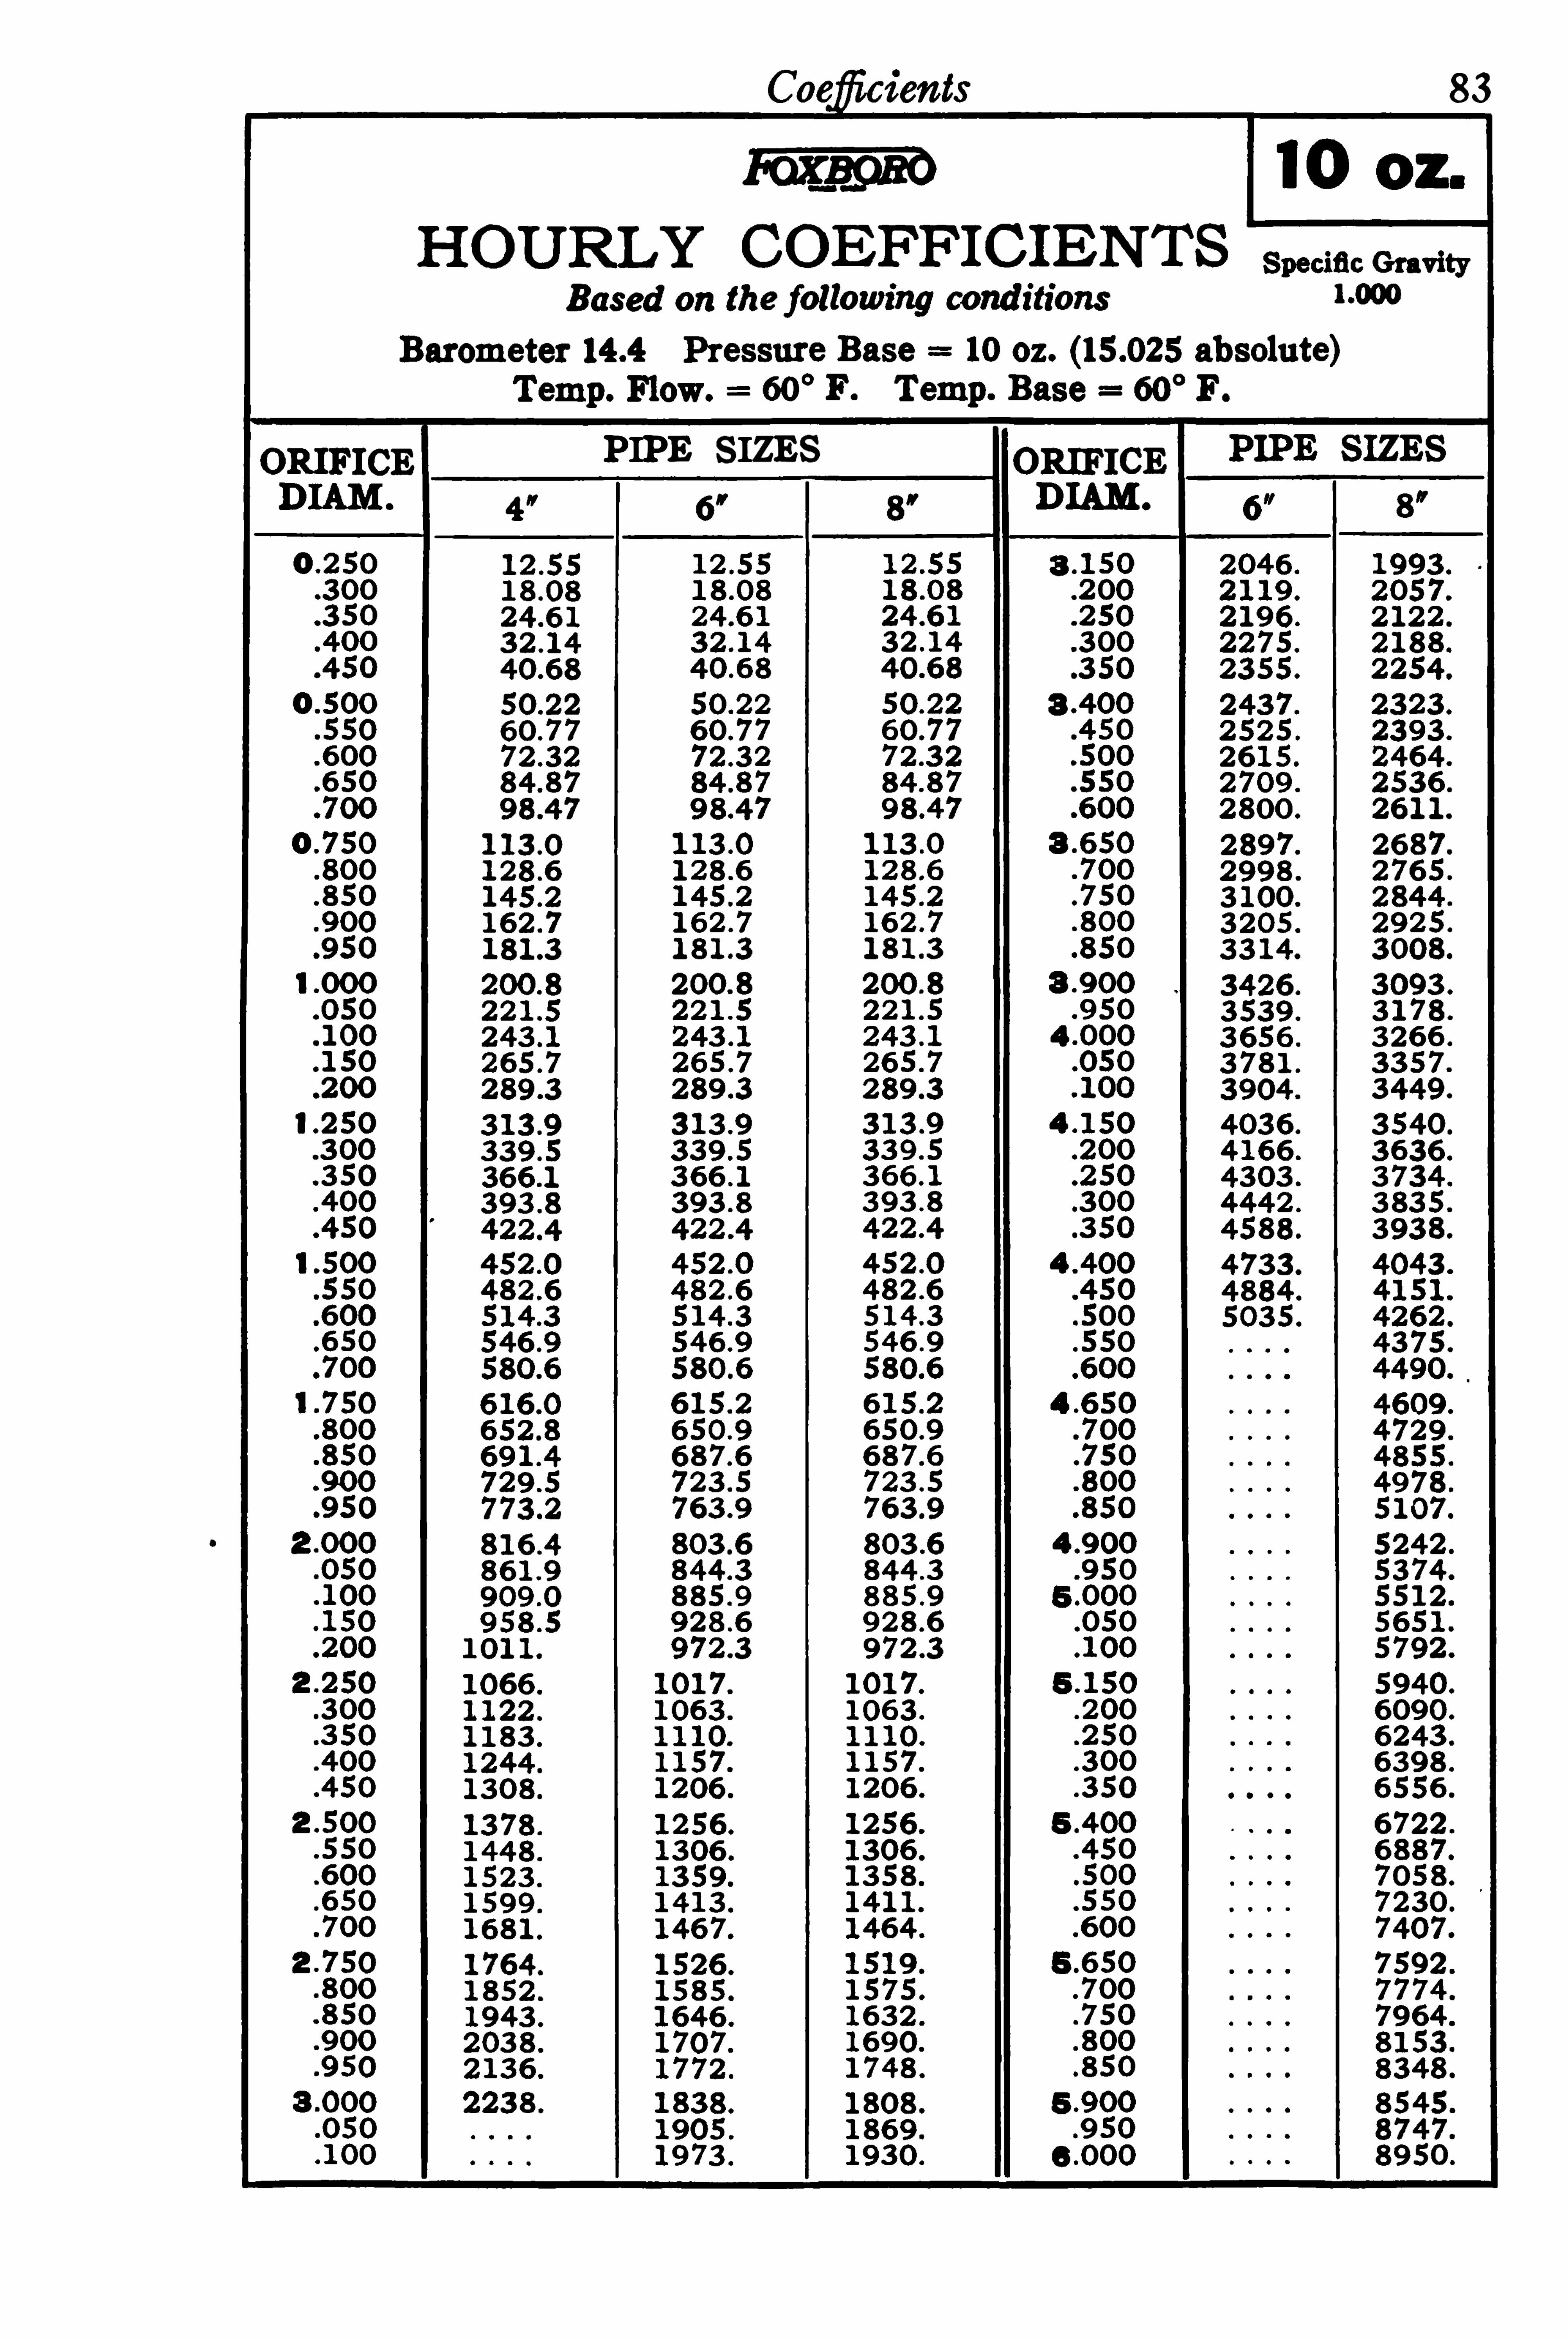
PIPE SI!ES
83

84 The Orifice Meter and Gas Measurement
Ikmhmn
1 0 1 3 .
1 28 1 .
1 9 1 4 .
22 7 8 . 227 8
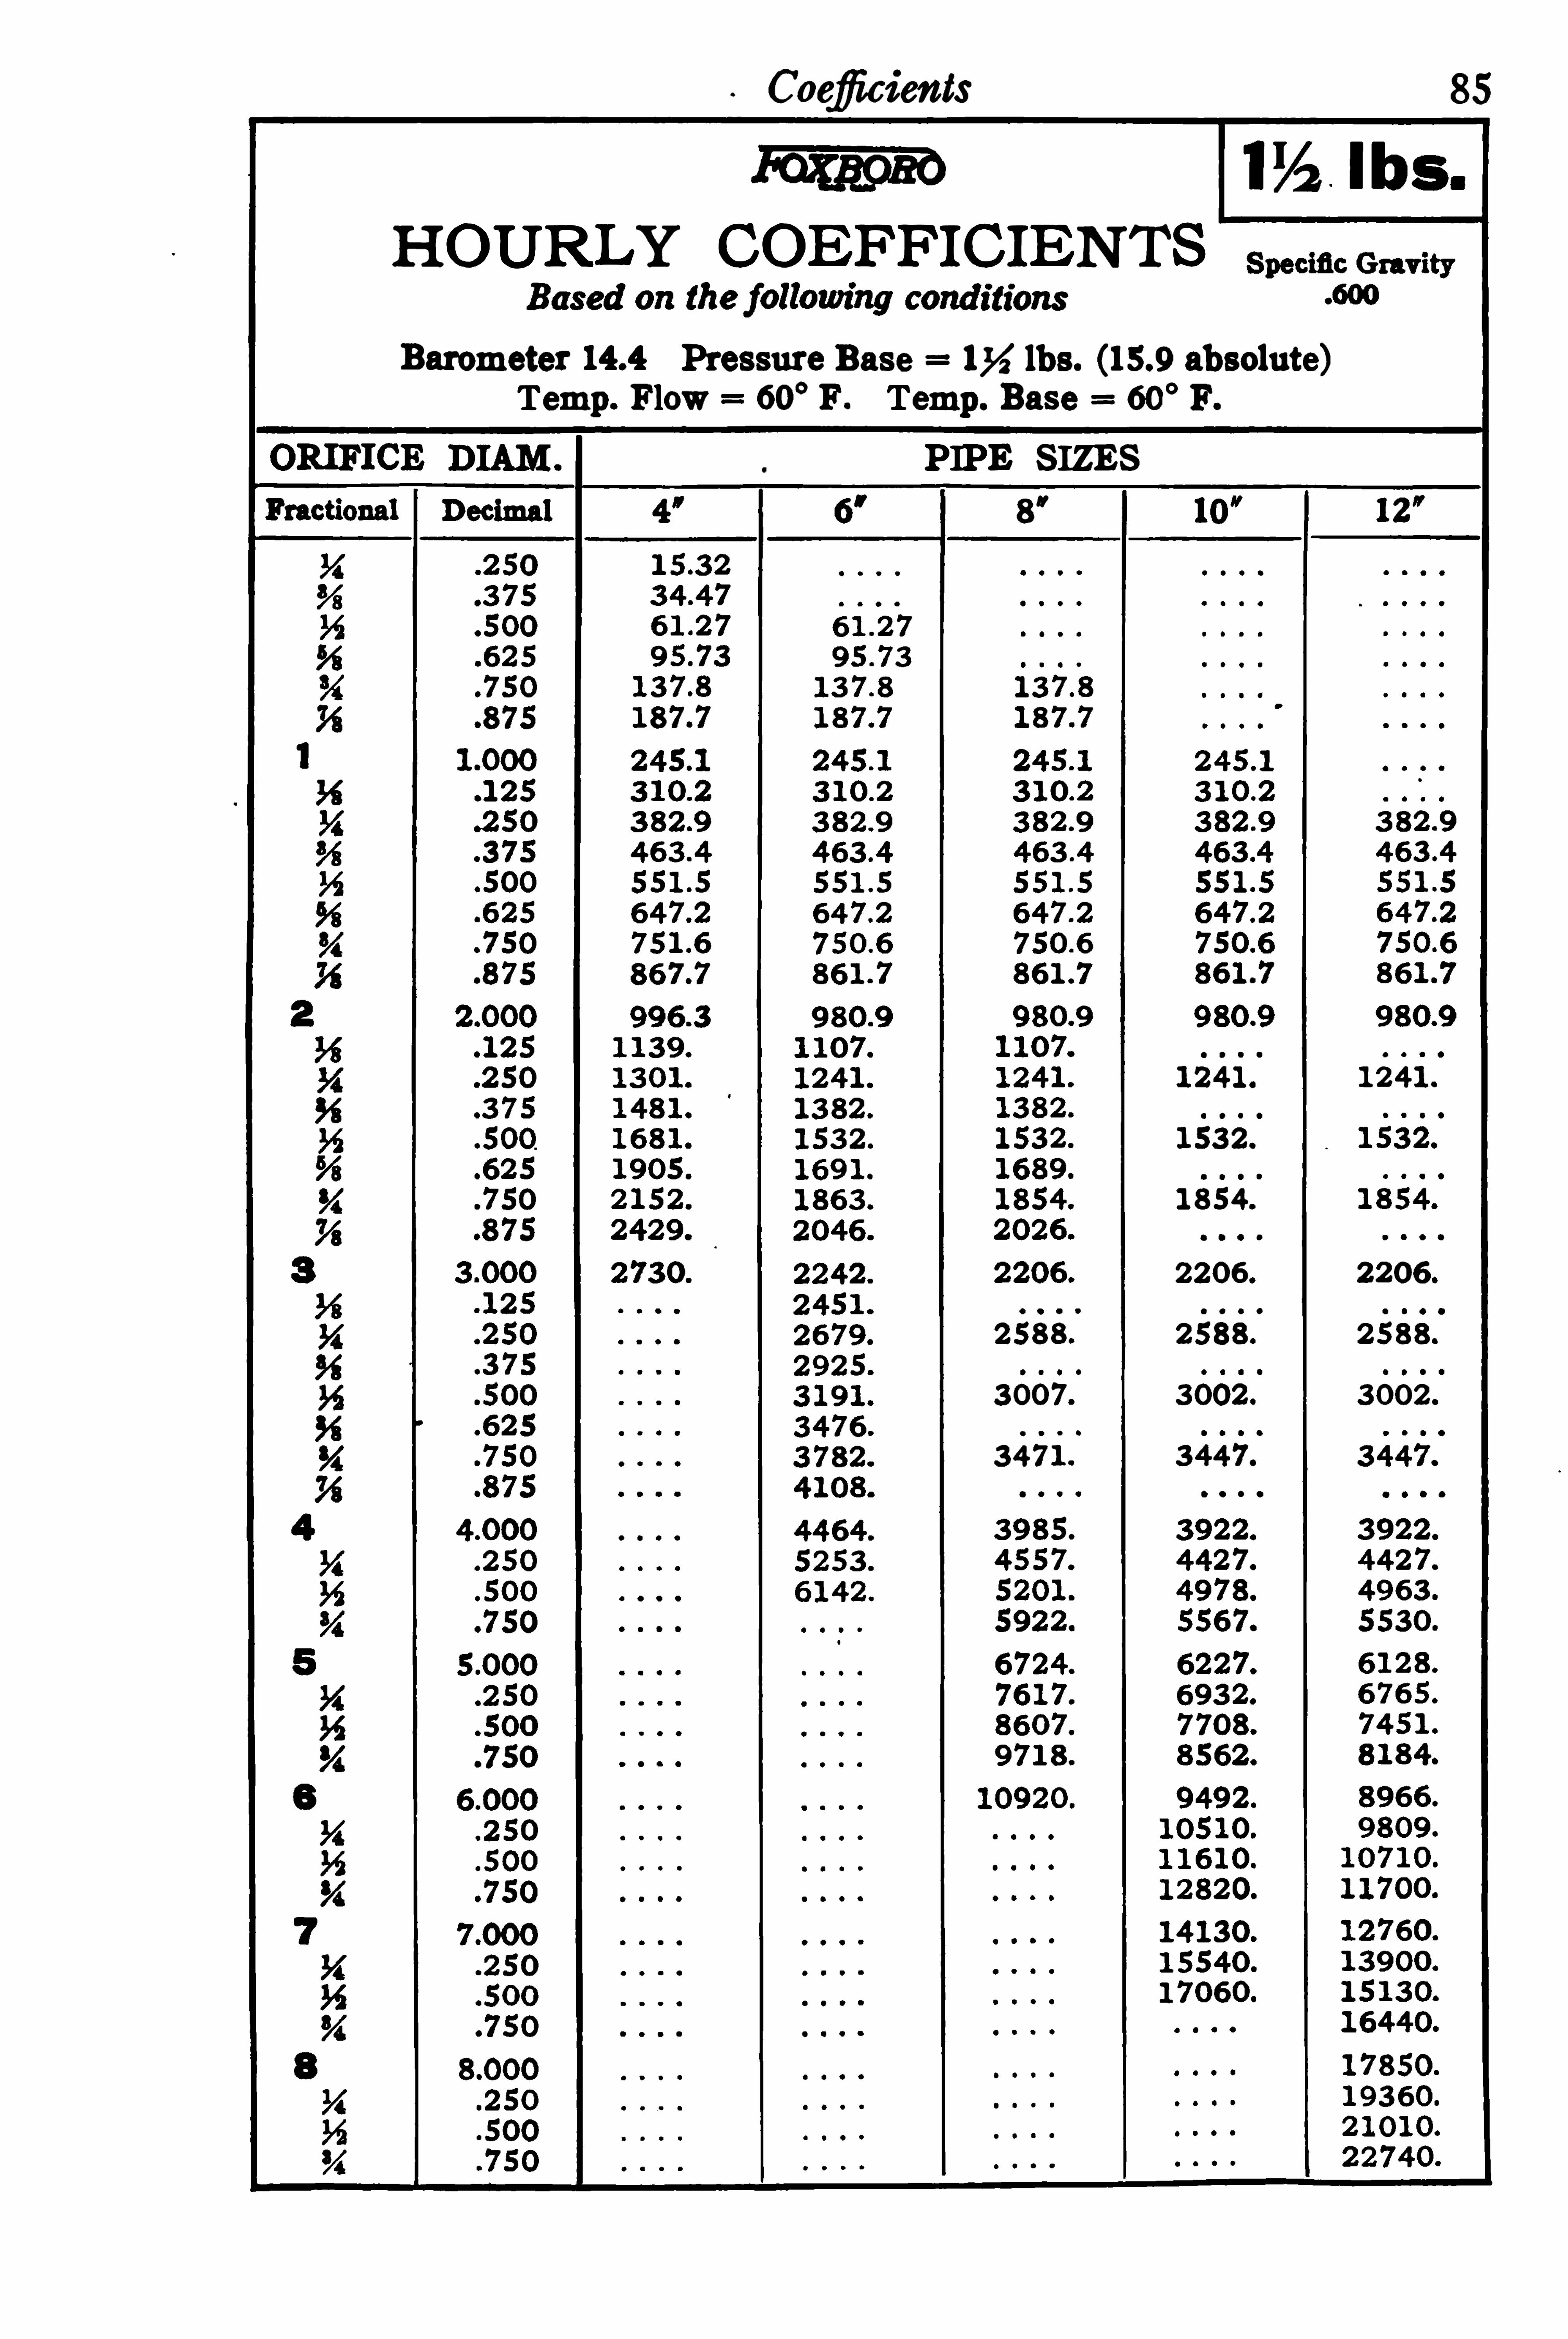
Cflwgfiunents
HOURL! COEFFICIENTS
Barometer Pressure Base 154 lbs. absolute )Temp . Flow 60
°F. Temp. Base 60
°F.
PIPE SI!ES80
2588
3 007
3 4 7 1:
1 24 1
1 53 2
1 85 4 .
2206
25 88
3 002
3 4 4 7 .
1241
2206
2 5 88
3 002
85

86 The Orifice Meter and Gas Measurement
HOURL! COEFFICIENTSBased on the fo llowing conditions
Barometer Pressure Base 2 lbs. absolute )Temp. Flow 60
°F. Temp . Base 60
°F.
2 1 3 9 .
9 5 1 1 )
2 1 3 9 .

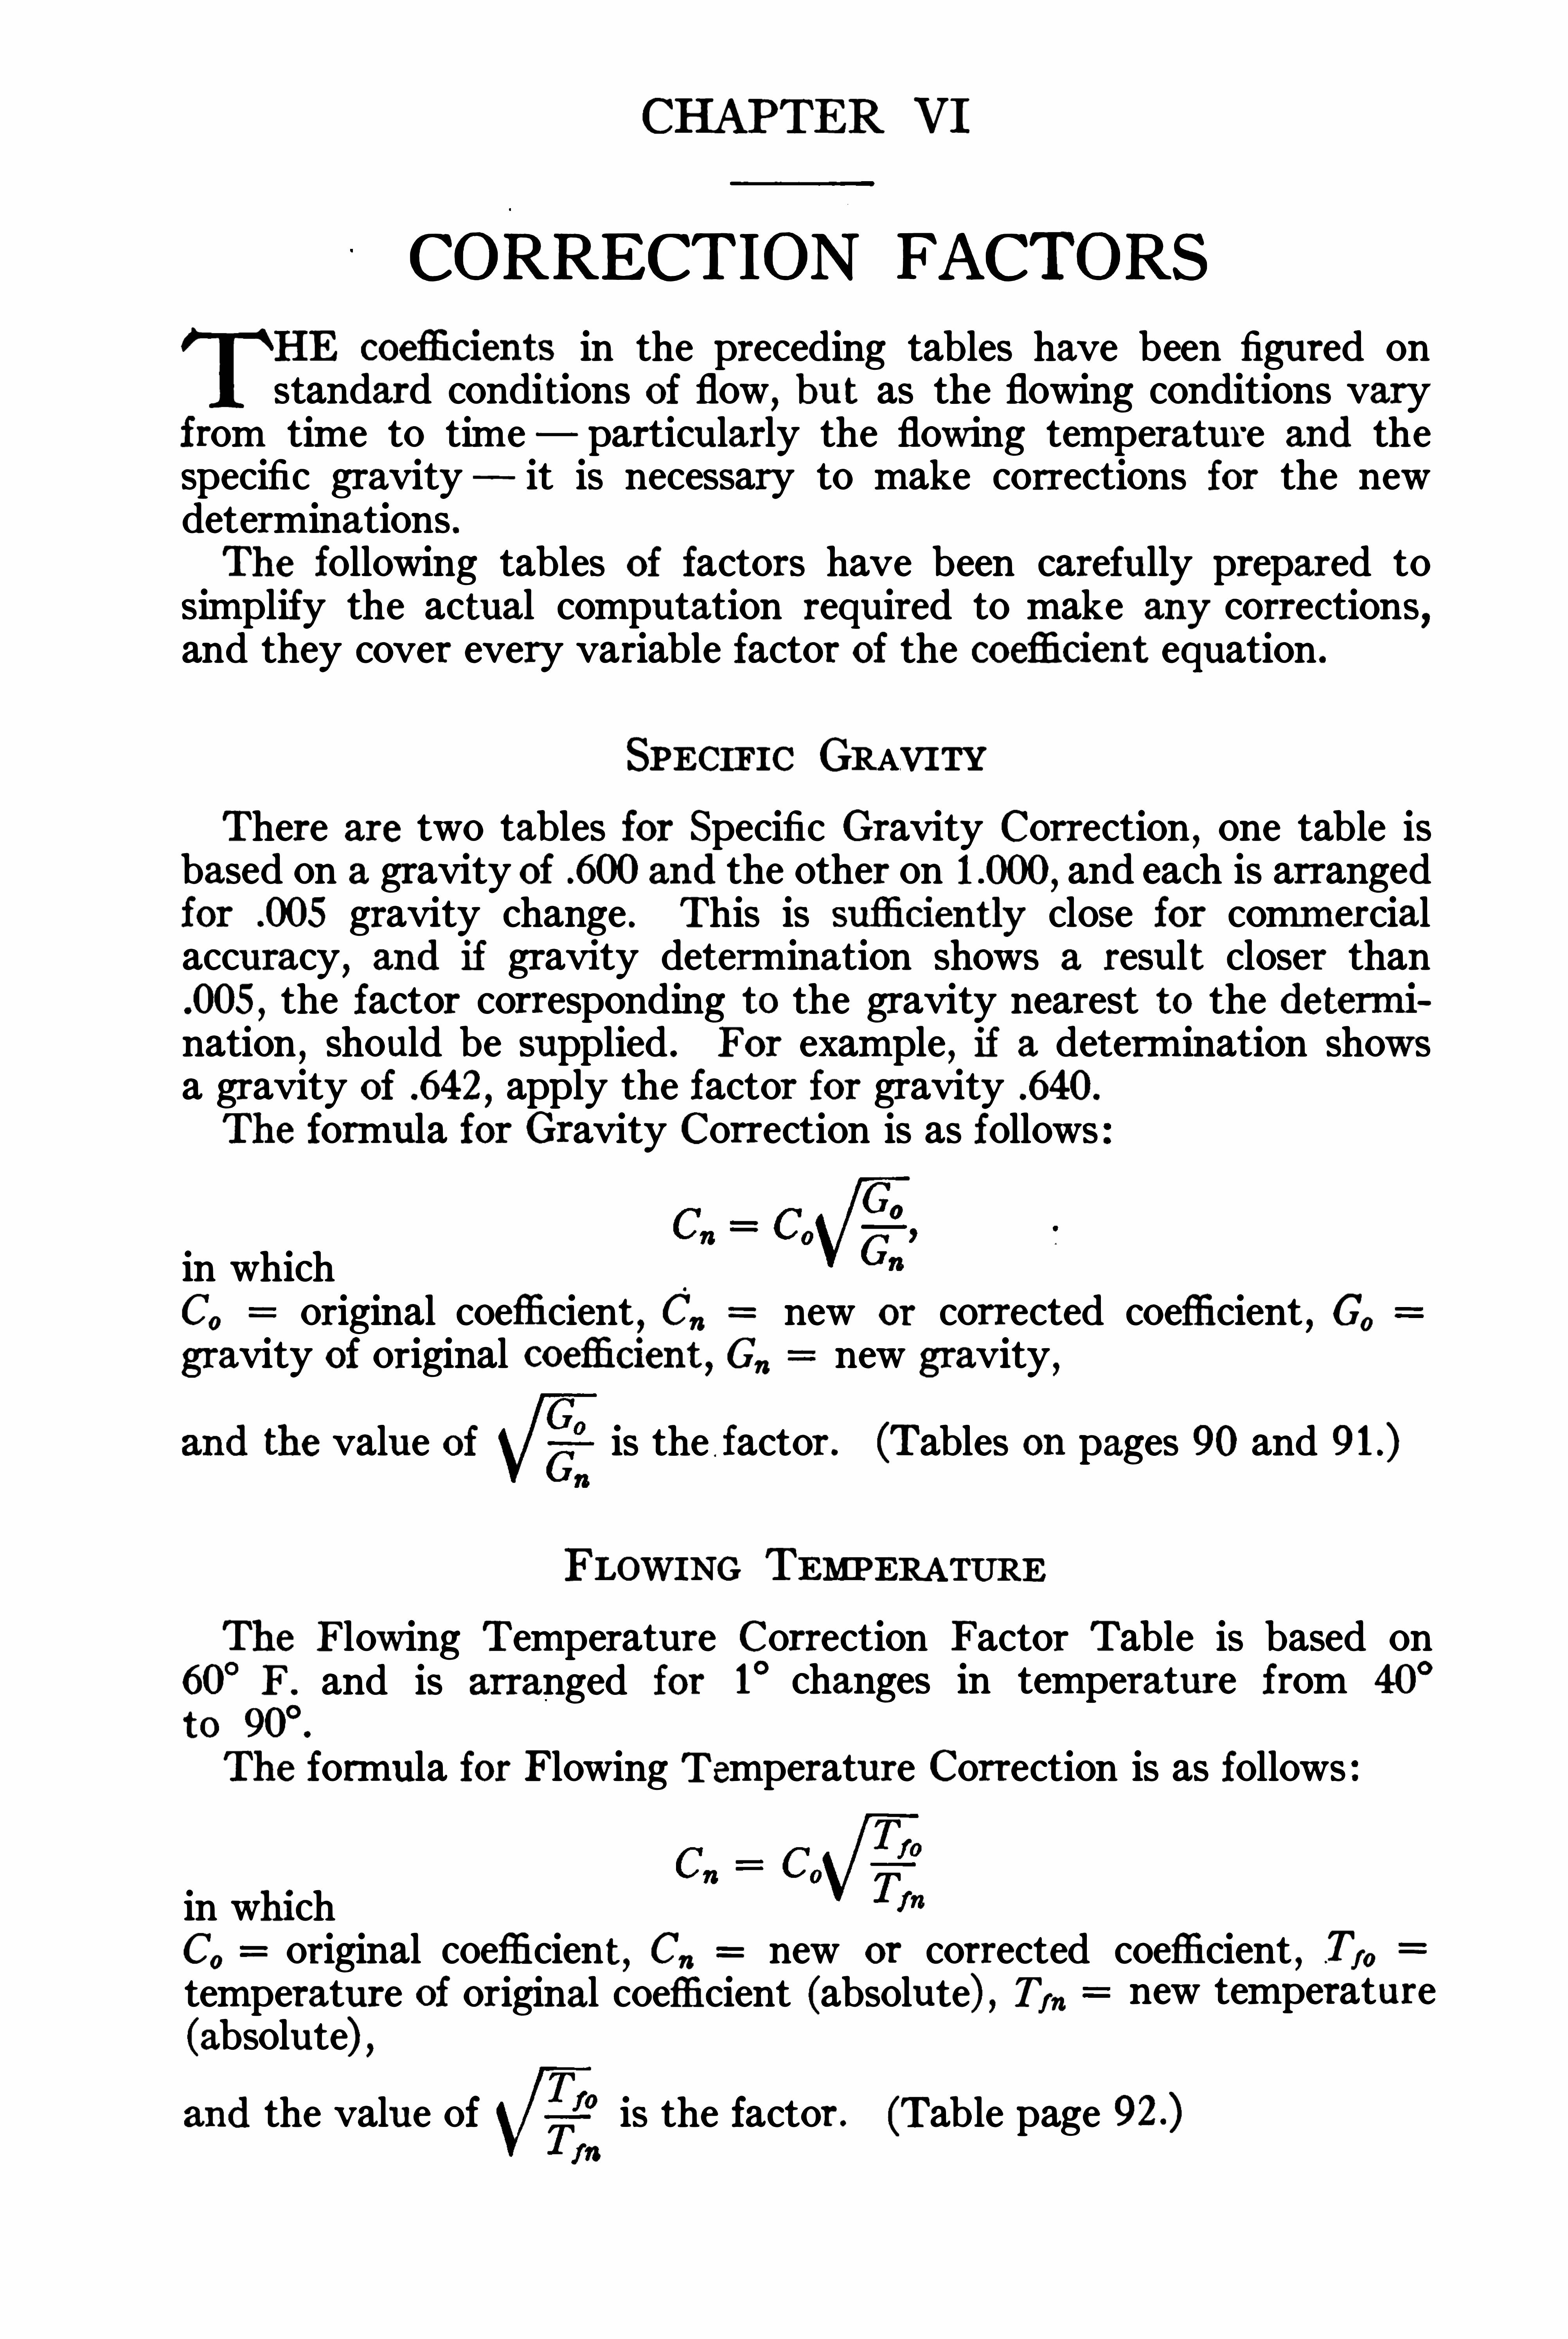
CHAPTER VI
CORRECTION FACTORS
HE coefli cients in the preceding tables have been figured onstandard conditions Of flow
,but as the flowing conditions vary
from time to time particularly the flowing temperature and thespecific gravity it is necessary to make corrections for the newdeterminations .The following tables Of factors have been carefully prepared tosimplify the actual computation required to make any corrections,and they cover every variable factor of the co eflicient equation .
SPECIFIC GRAVIT!
There are two tables for Specific Gravity Correction , one table isbased on a gravity Of .600 and the other on and each is arrangedfor .005 gravity change . This is sufliciently close for comm ercialaccuracy
,and if gravity determination shows a result closer than
.005,the factor corresponding to the gravity nearest to the de termi
nation,should be supplied . For example
,if a determination shows
a gravity Of .642,apply the factor for gravity .640.
The formula for Gravity Correction is as follows
in whichC0 original coefficient
, C, new or corrected coefficient,Go
gravity of original coefli cient , G” new gravity ,
and the value Of is the factor . (Tables on pages 90 and
FLOWING TEMPERATURE
The Flowing Temperature Correction Factor Table is based on60
°
F . and is arranged for 1° changes in temperature from 40
°
to
The formula for Flowing Temperature Correction is as follows :
in whichC, original coeffi cient
, C”new or corrected coefficient , Tm
temperature Of original coefficient (absolute) , Tm new temperature(absolute) ,and the value of is the factor . (Table page

90 The Ori cc Meter and Gas Measurement
SPECIFIC GRAVIT! (G) CORRECTION FACTORS
Base
SpecificFactor Factor Factor
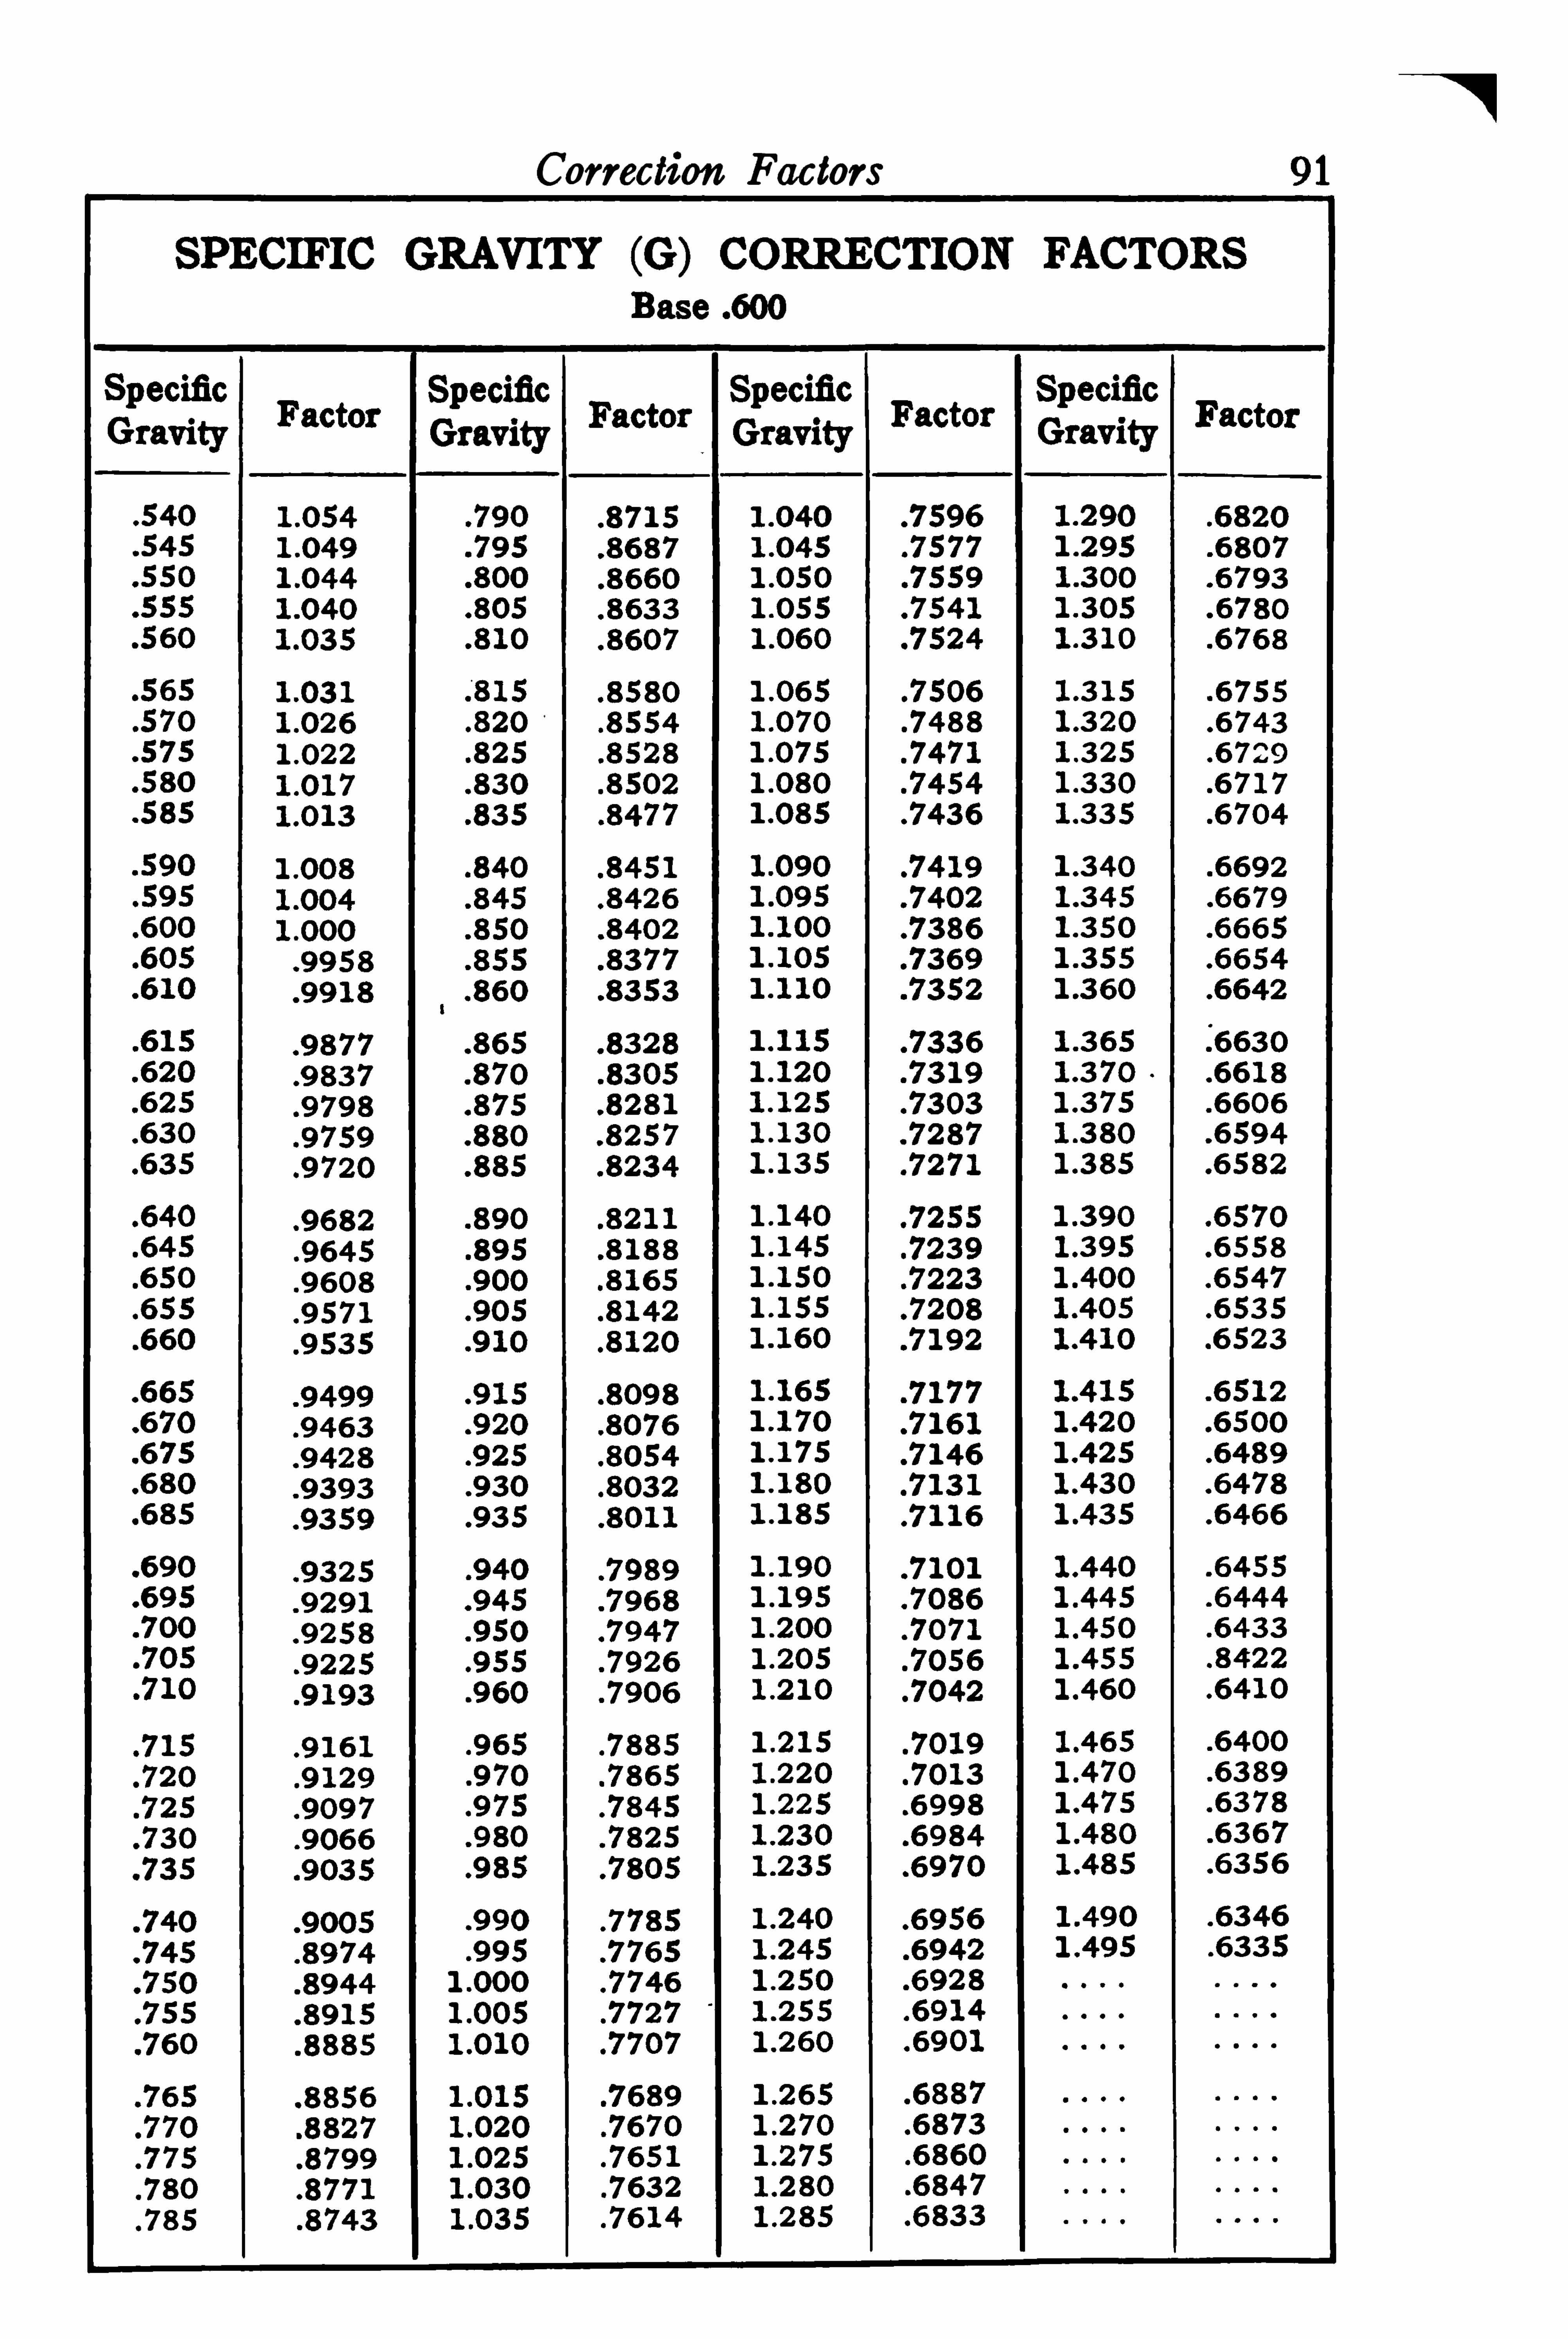

92 The Ori e Meter and Gas Measurement
FLOWING TEMPERATURE (Ti) CORRECTION FACTORS
Base 60 deg . Fahr .
Factor Factor Factor
To correct an hourly coefi cient that is on a flowing temperature base o f
60°to any flowing temperature within the range o f the above table , mul tiply
that coefficient by the factor corresponding to the new flowing tempe rature .
If the hourly coefficient is on any flowing tempe rature base o ther thanfind the hourly coefficient on a base o f 60
°from the coemcient tables and
multiply this coeflicient by the factor corresponding to the new flowingtemperature in the table above .
PRESSURE BASE (P11) CORRECTION FACTORSBase 4 oz.
Barometer
Factor Factor Factor
(3 lbs . ) 48
To correct an hourly coefficient for any pressure base find the hourly coefficient corresponding to the same orifice diam e ter in the 4 oz. coefficient
tables. Multiply the coeflicient thus found by the factor in the table abovecorresponding to the new pressure base .
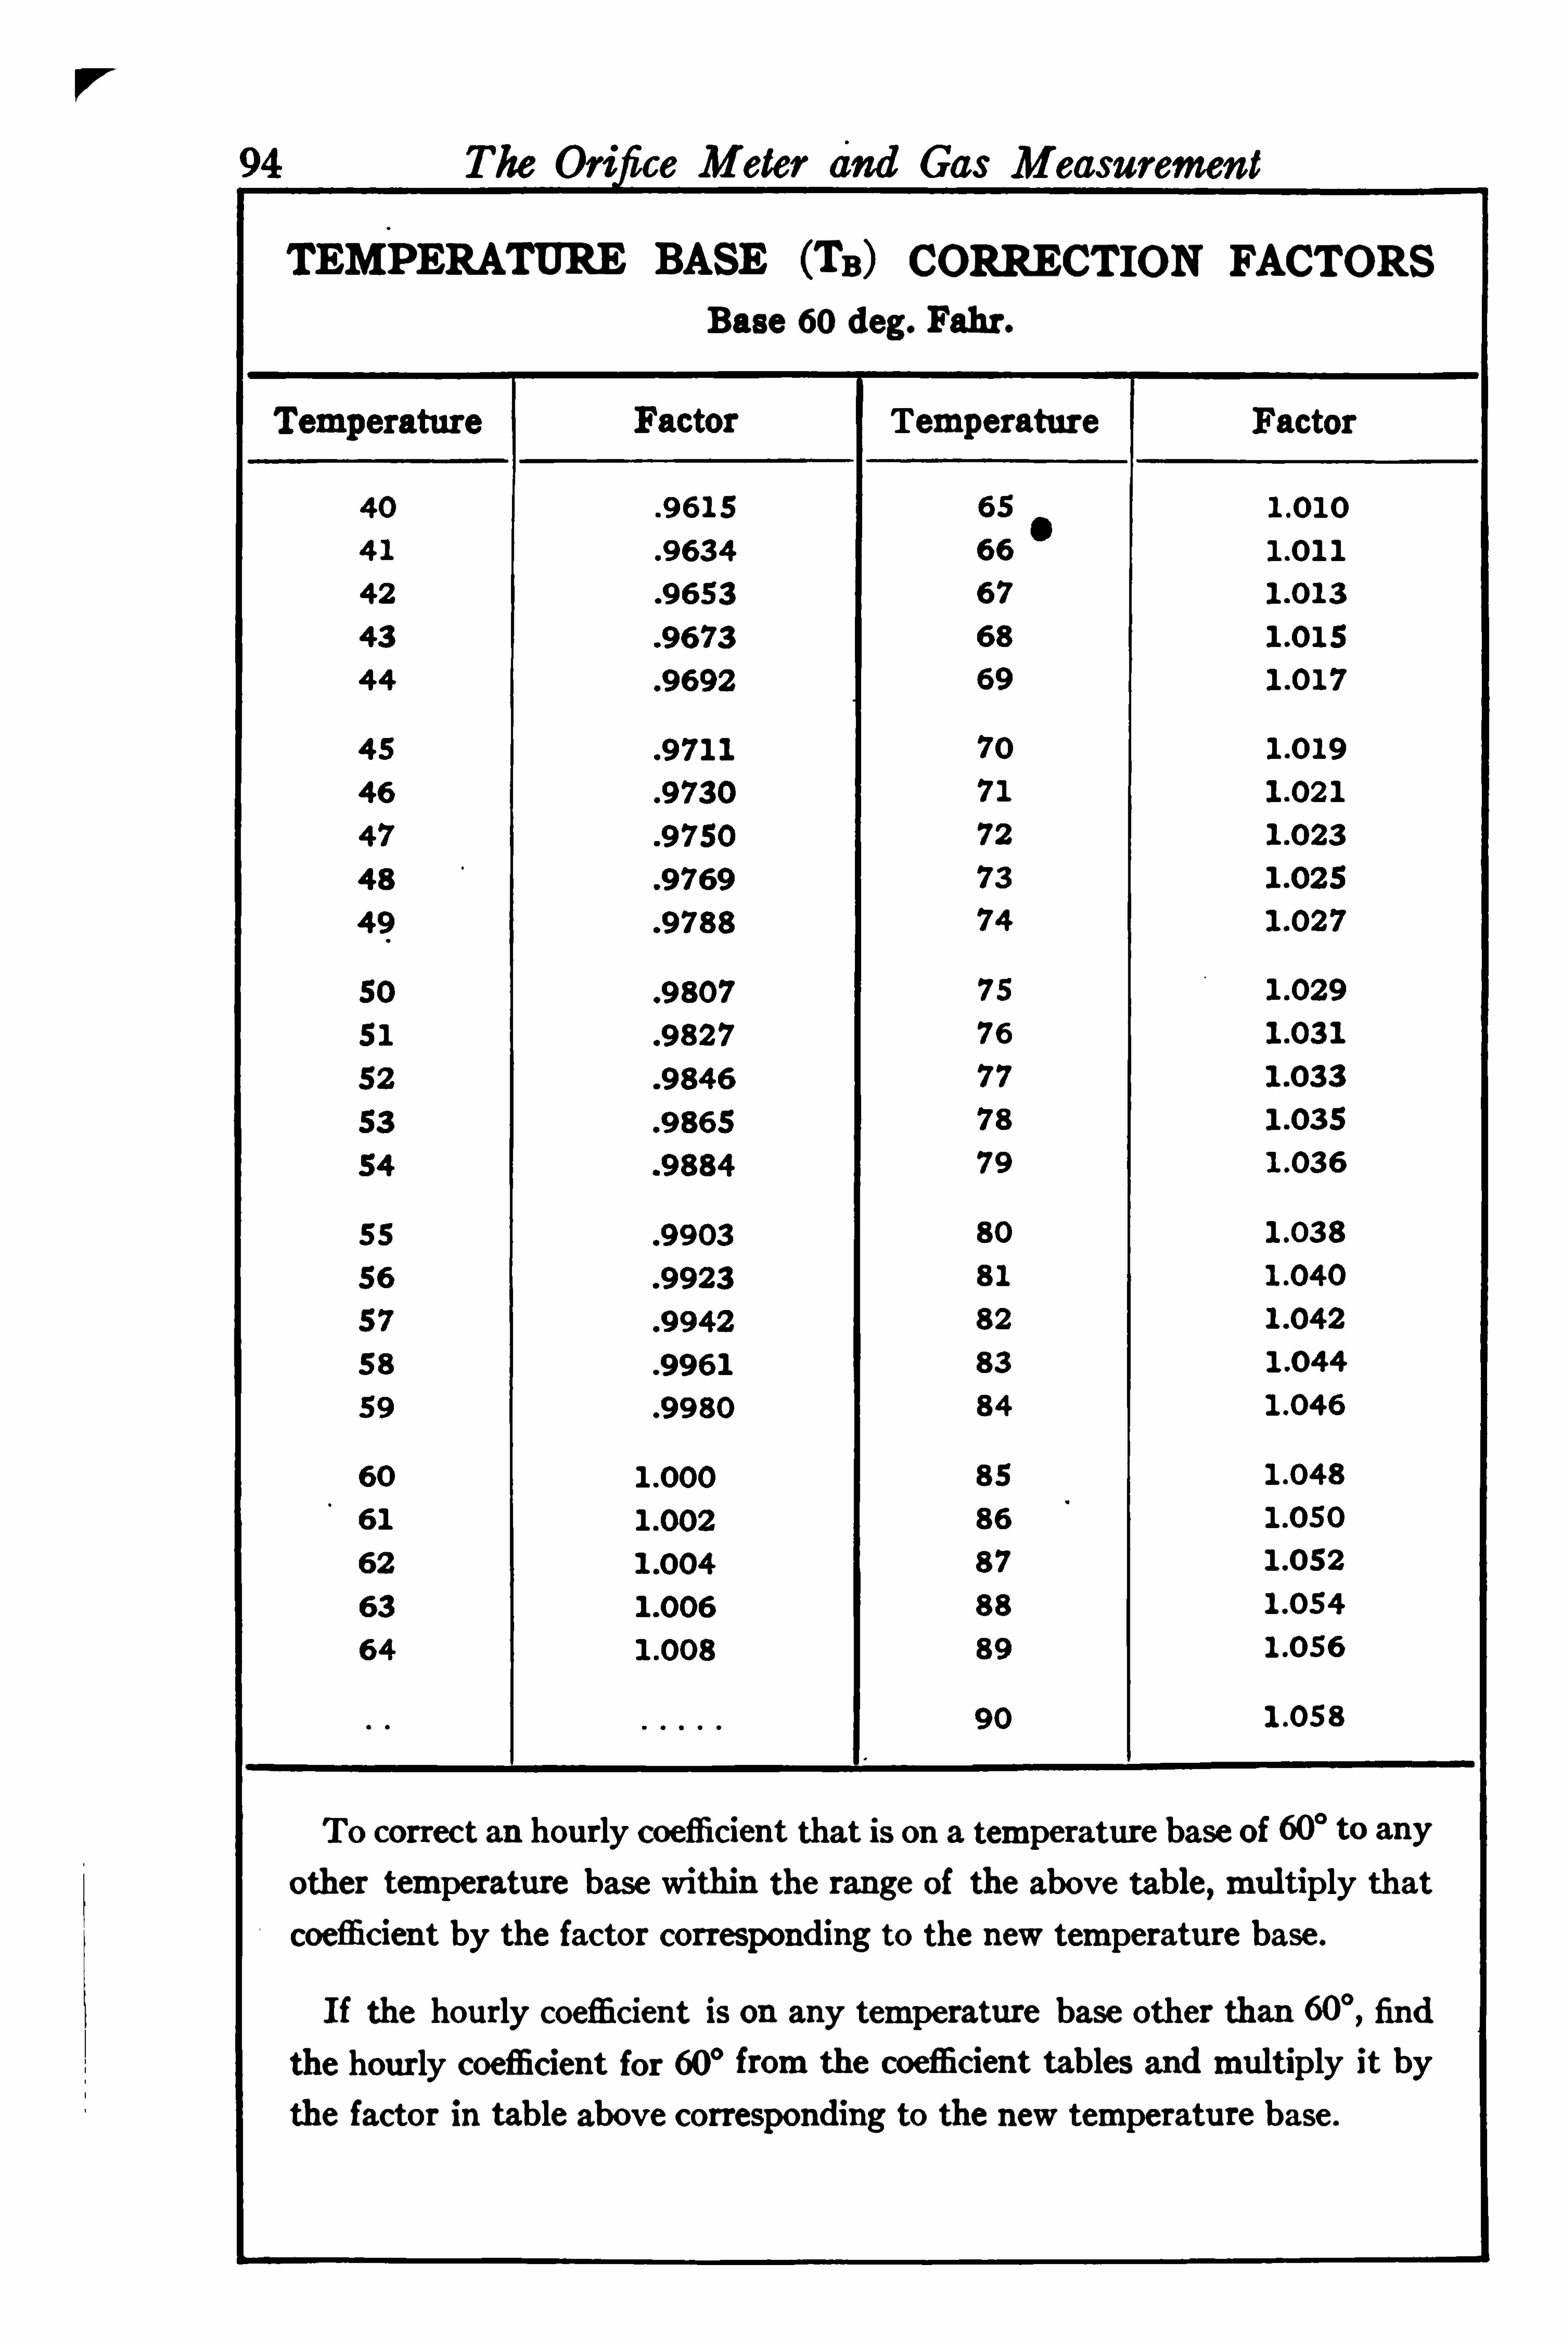
TEMPERATURE BASE (TB) CORRECTION FACTORS
Base 60 deg . Fahr.
Temperature
To correct an hourly coeflicient that is on a temperature base of 60° to anyo ther temperature base within the range o f the above table , multiply thatcoeflicient by the factor corresponding to the new temperature base .
If the hourly coefficient is on any temperature base o ther than find
the hourly coeflicient for 60° from the coefficient tables and multiply it bythe factor in table above corresponding to the new temperature base .
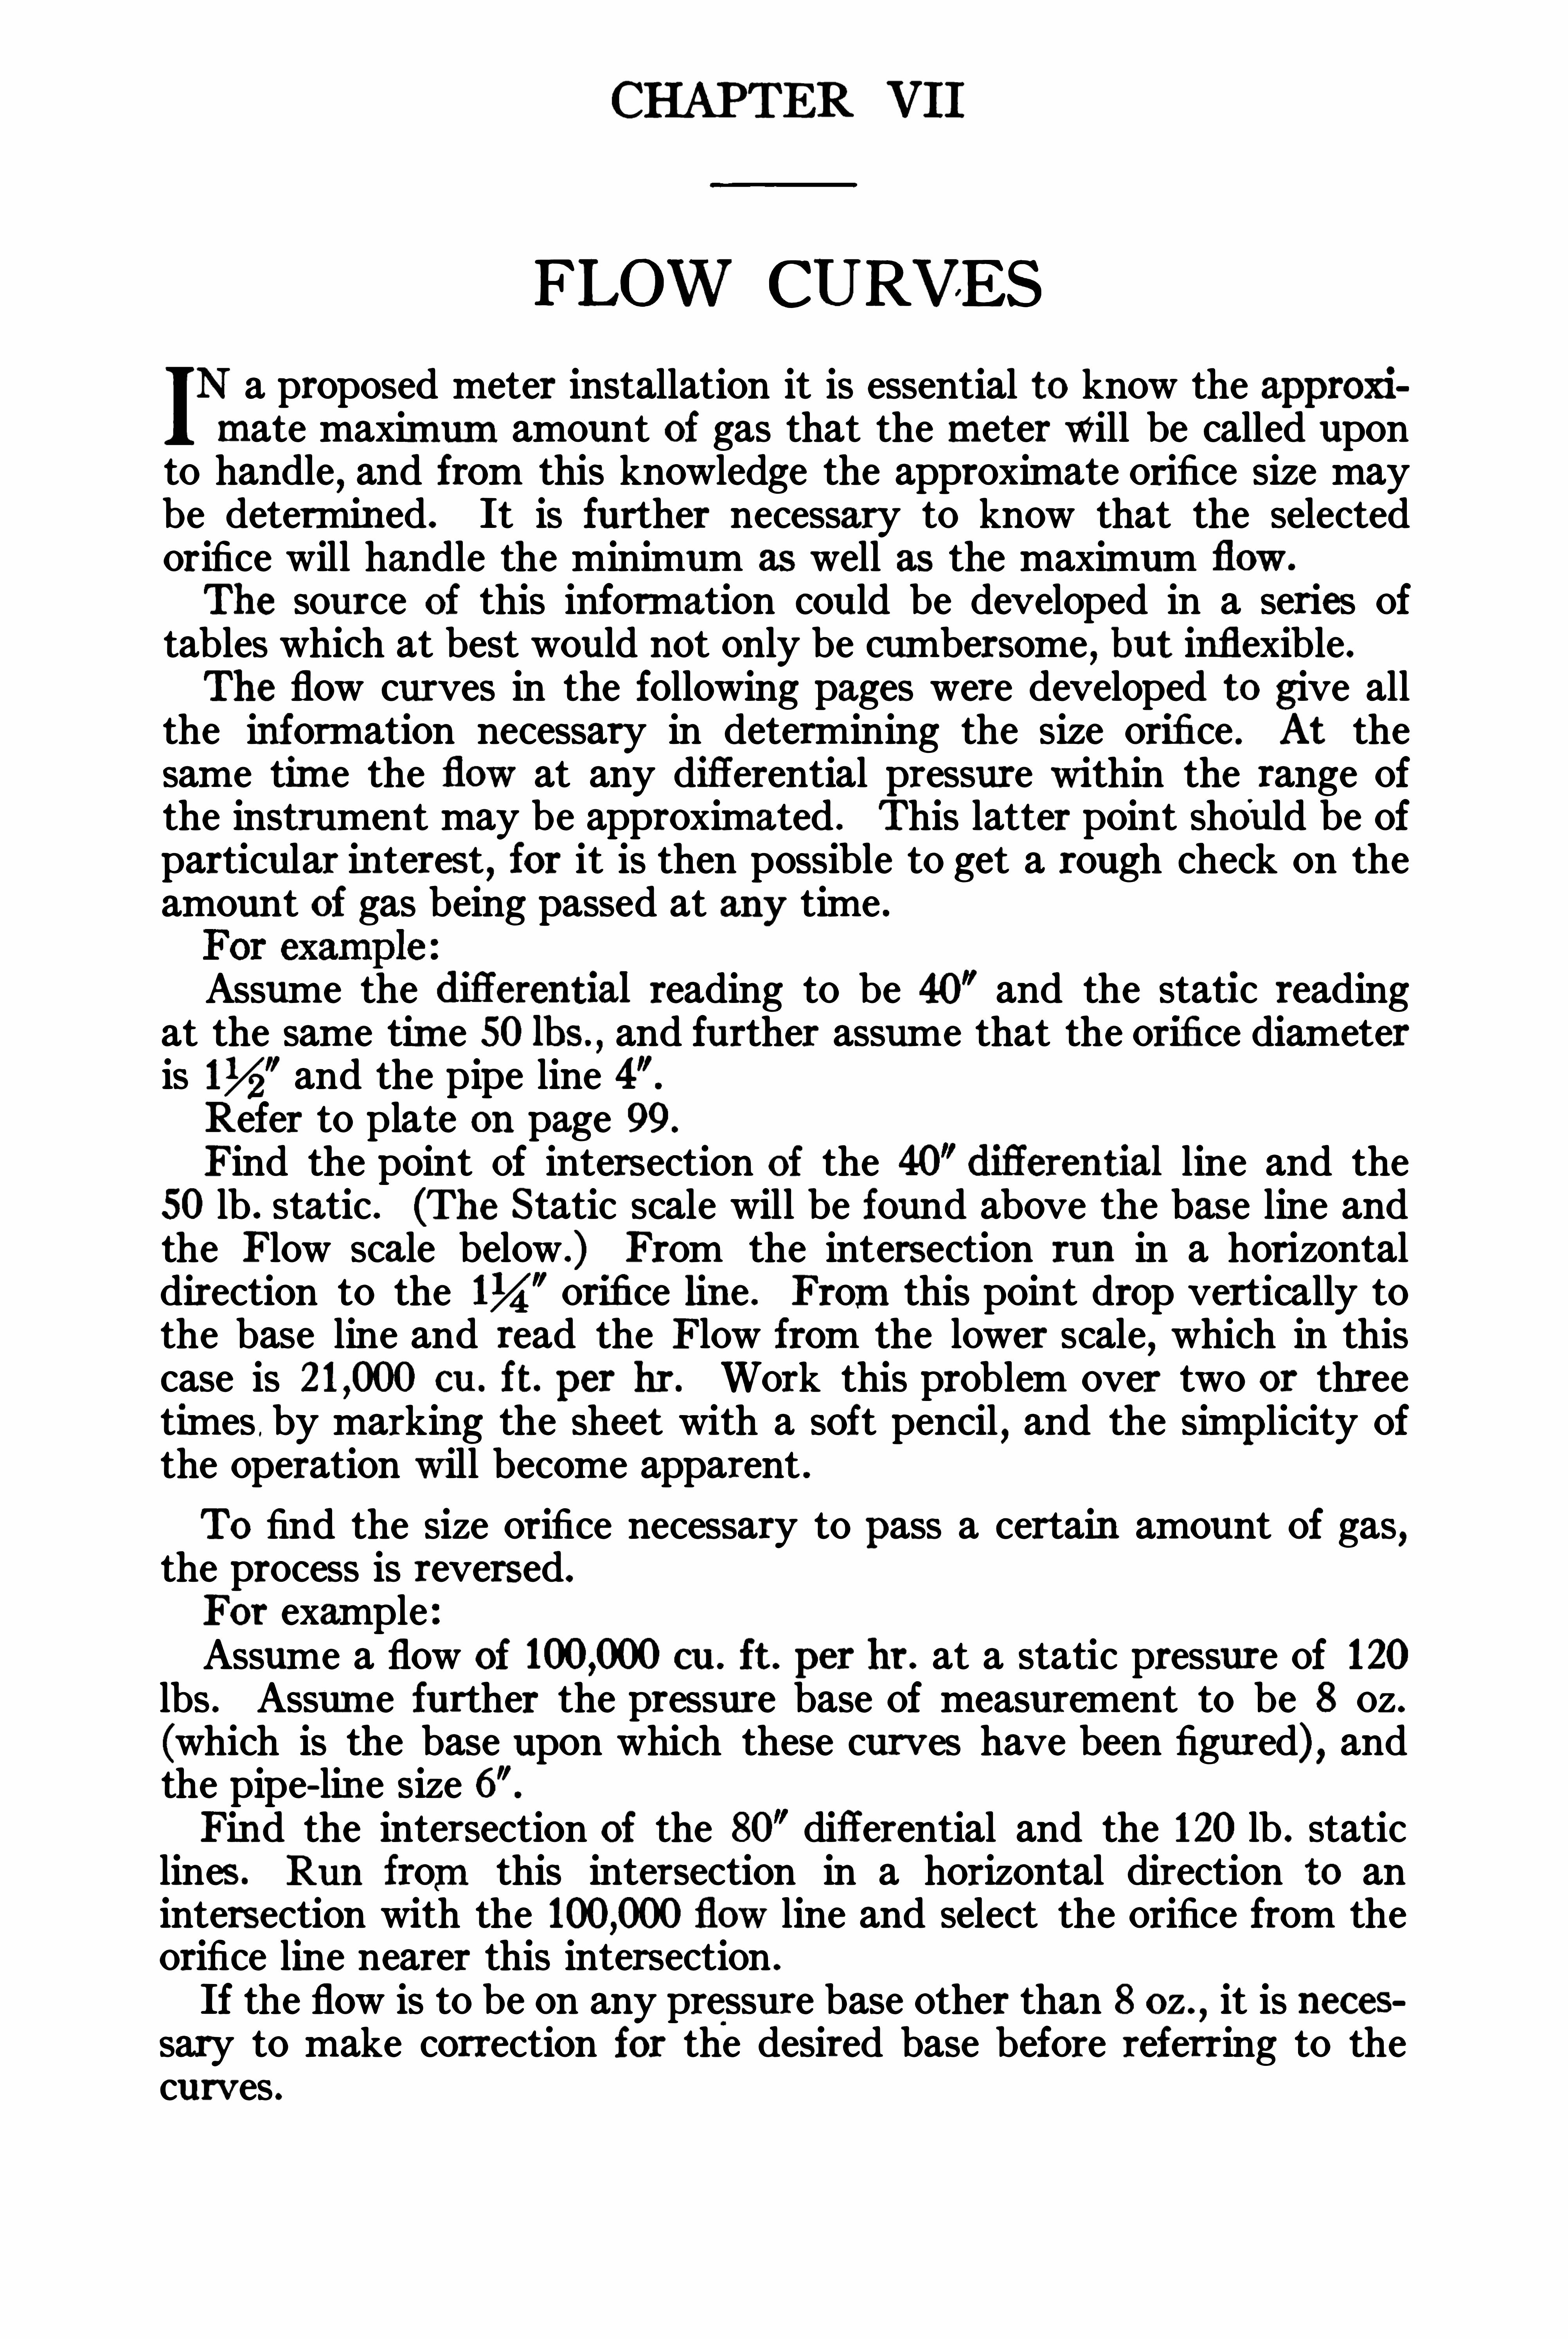
CHAPTER VII
FLOW CURVES
N a proposed meter installation it is essential to know the approximate maximum amount o i gas that the meter will be called upon
to handle,and from this knowledge the approximate orifice size may
be determined. It is further necessary to know that the selectedorifice will handle the minimum as well as the maximum flow.
The source of this information could be developed in a series oftables which at best would not only be cumbersome
,but infl exible.
The flow curves in the following pages were developed to give allthe information necessary in determining the size orifice . At thesame tim e the flow at any diff erential pressure within the range ofthe instrument may be approximated . This latter point should be ofparticular interest
,for it is then possible to get a rough check on the
amount of gas being passed at any time .
Assume the difl erential reading to be 40” and the static readingat the same tim e 50 1bs.
,and further assume that the orifice diameter
is and the pipe lineRefer to plate on page 99.
Find the point Of intersection of the 40 diflerential line and the50 lb . static . (The Static scale will be found above the base line andthe Flow scale below .) From the intersection run in a horizontaldirection to the orifice line . From this point drop vertically tothe base line and read the Flow from the lower scale
,which in this
case is cu . ft. per hr. Work this problem over two or threetimes . by marking the sheet with a soft pencil , and the simp licity ofthe operation will become apparent .To find the size orifice necessary to pass a certain amount of gas,the process is reversed.
For exampleAssume a flow of cu . ft . per hr . at a static pressure of 120lbs . Assum e further the pressure base of measurement to be 8 oz .(which is the base upon which these curves have been figured) , andthe pipe-line sizeFind the intersection of the 80 differential and the 120 lb . staticlines. Run from this intersection in a horizontal direction to anintersection with the flow line and select the orifice from theorifice line nearer this intersection .
If the flow is to be on any pressure base other than 8 oz.,it is neces
sary to make correction for the desired base before referring to thecurves .

96 The Orifice Meter and Gas Measurement
For example :Assume the flow to be cu . ft .
,on a 16 oz . base .
Refer to Pressure Base Correction Factors,page 92. The factor
for 16 oz . is .95 15 . The assumed flow must be divided by .95 15 ,which will give the flow on a 4 oz. base ; then multiply this result bythe factor fo r 8 oz . base The flow is now corrected for an
8 oz . base , and the size orifice may be determined as outlined in aprevious paragraph .
There is one point in particular to be considered in determiningthe size orifice required . If the flow is to be fairly uniform
,a difieren
tial should be assumed,covering approximately the middl e of the
scale,which on a 100"range would be and on a 20” range 10” or
otherwise use 80” and 16” respectively for 100" and 20” ranges .In order to determine the minimum and maximum capacity of anorifice
,proceed in the following manner :
Refer to plate on page 108 .
Assum e a maximum differential o f 16 and min imum of a staticof 10
” mercury vacuum and an orifice OfFrom the intersection of the 10” static and 16 diflerential line runhorizontally to the orifice line
,then drop vertically to the
base line and the maximum flow at 16” differential will be foundas cu . ft . per hr. From the intersection Of the 10” static andthe 2" difl erential line run horizontally to the orifice line
,then
drop vertically to the base line,and the minimum flow at 2” difier
ential wil l be found as 3450 cu . ft . p er hr.
If,after an orifice plate is installed
,it is found that the diflerential
is too small,the size orifice necessary to give approximately the de
sired difierential may be determined from the flow curves in thefollowing mannerAssume that an orifice creates a diff erential of only and thedesired differential is approximatelyFind the intersection o f the orifice line with the 10 difl erential
line ; run vertically from this point of intersection to the 50” difl erential line
,and find the orifice line nearer this last point.
The flexibility of these curves will be better appreciated the morethey are used .


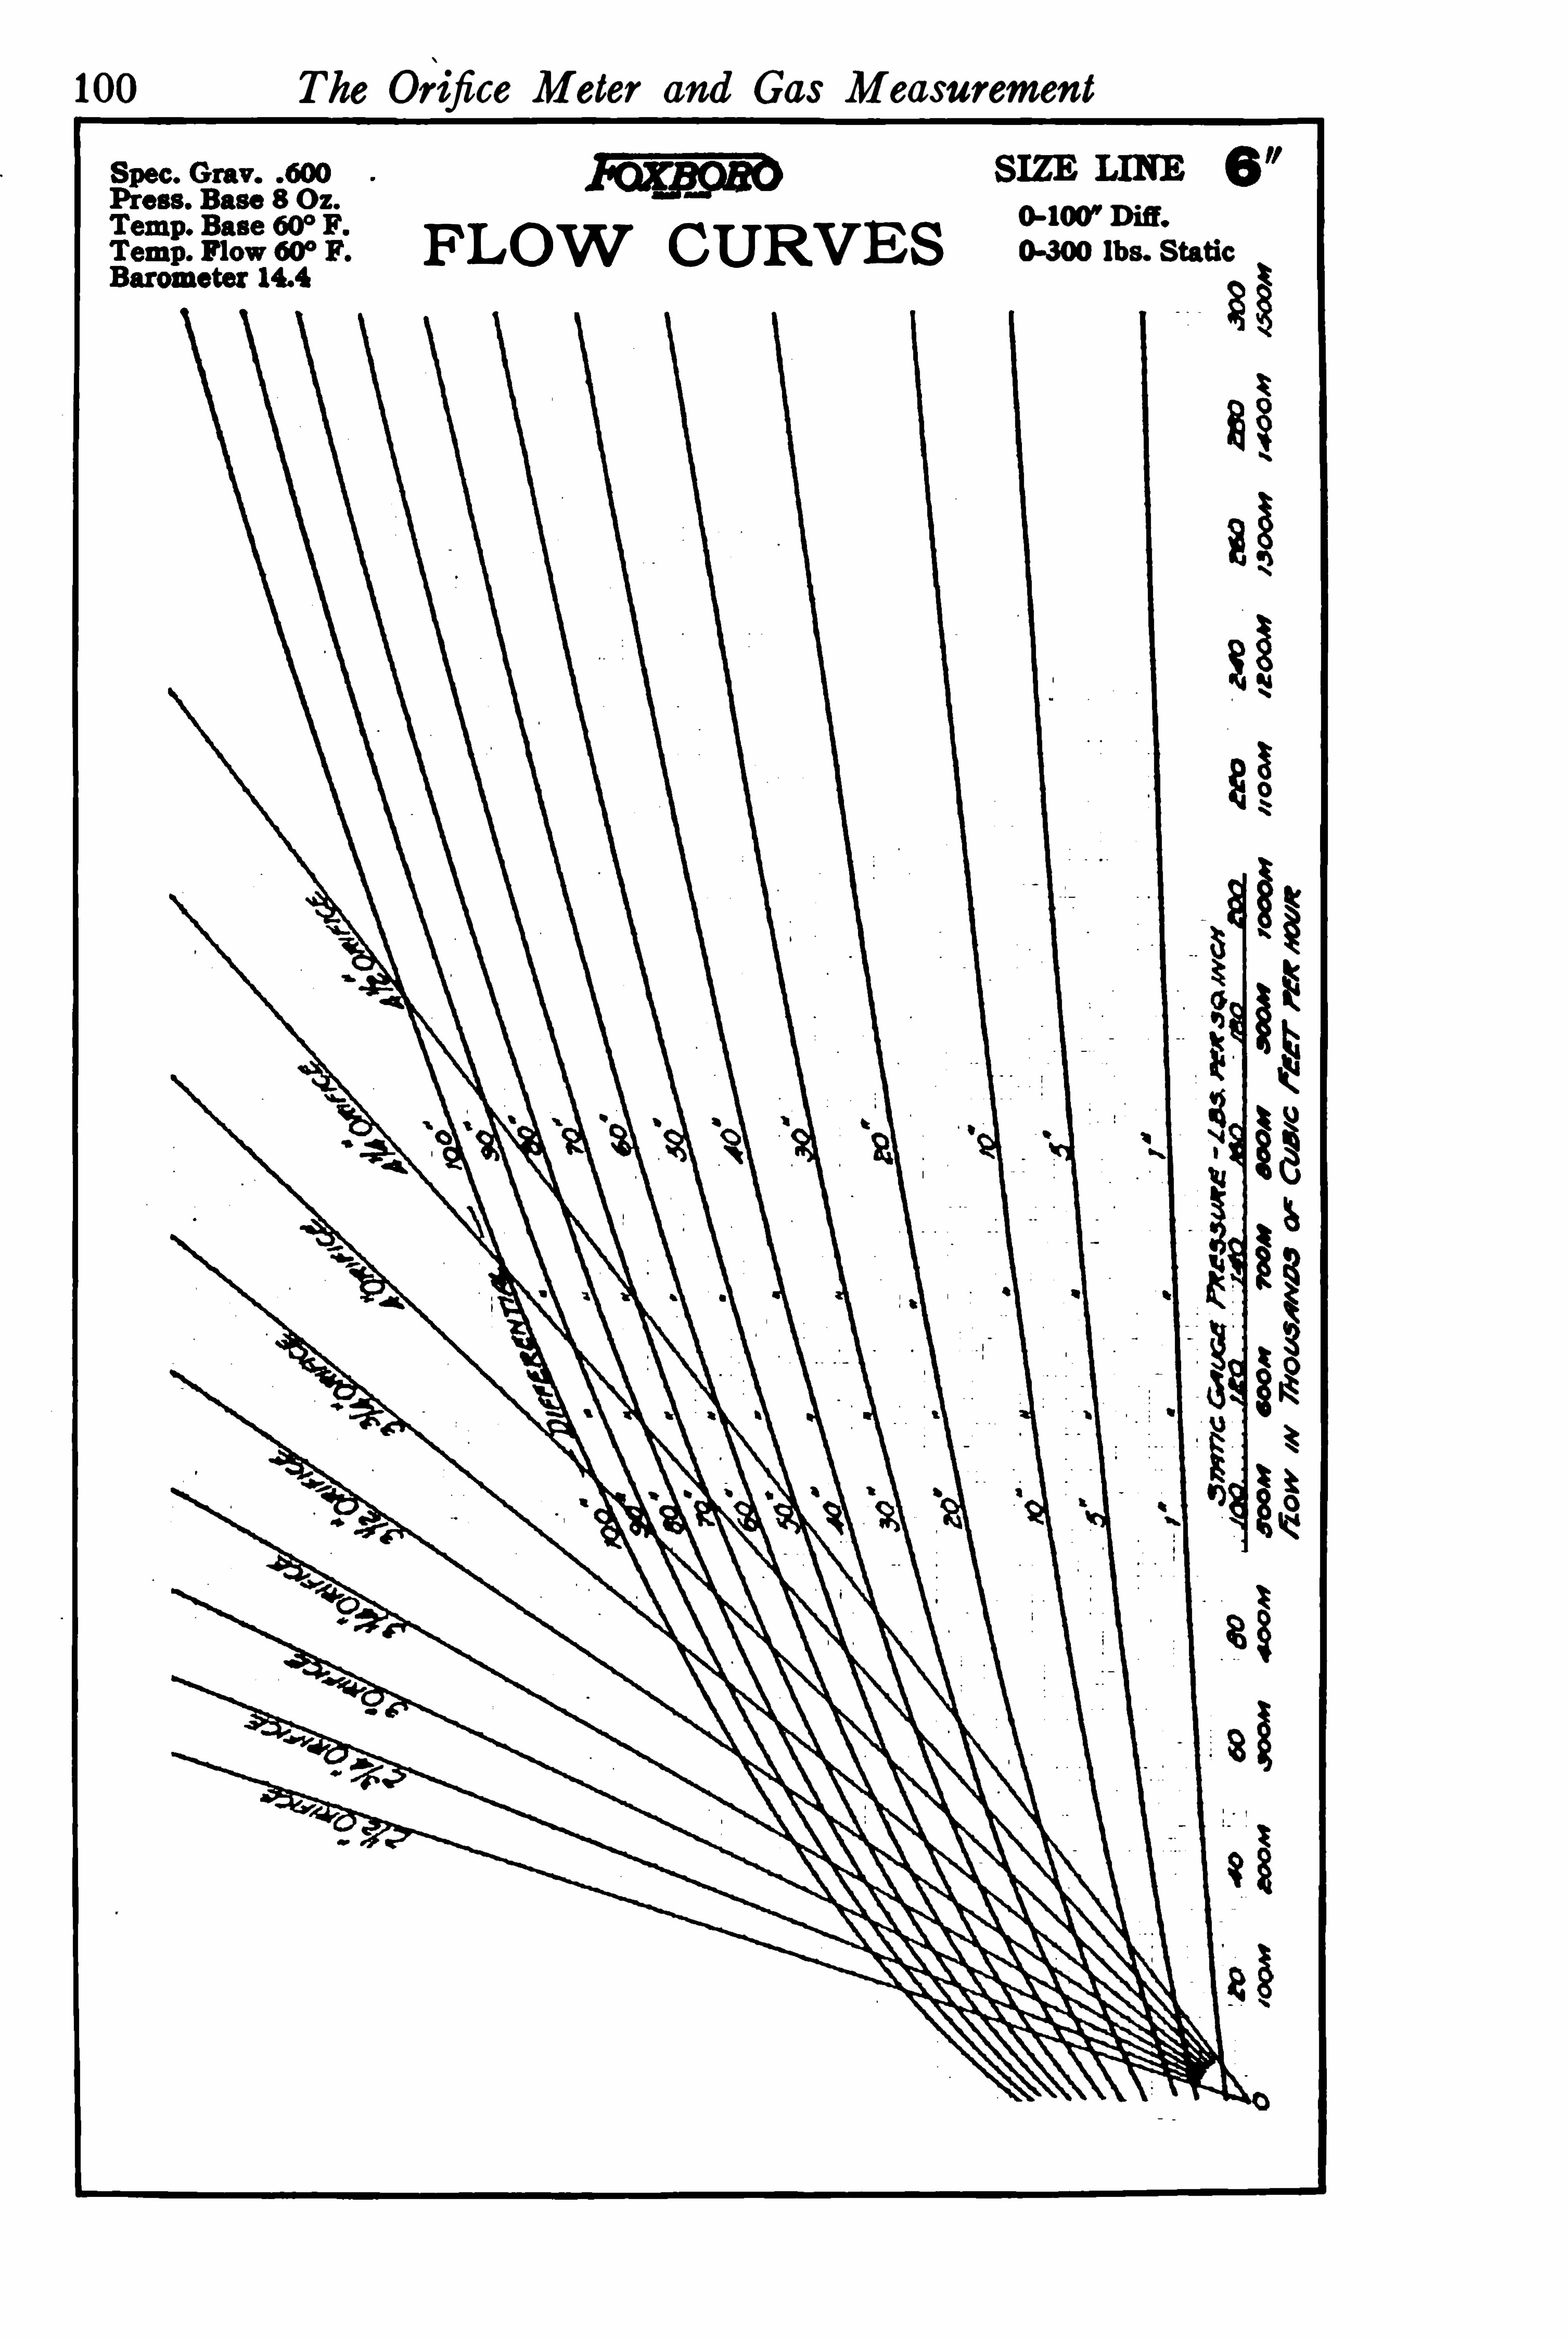
100 The Orifice Meter and Gas Measurement
8 Oz.
M
FLOW CURVES
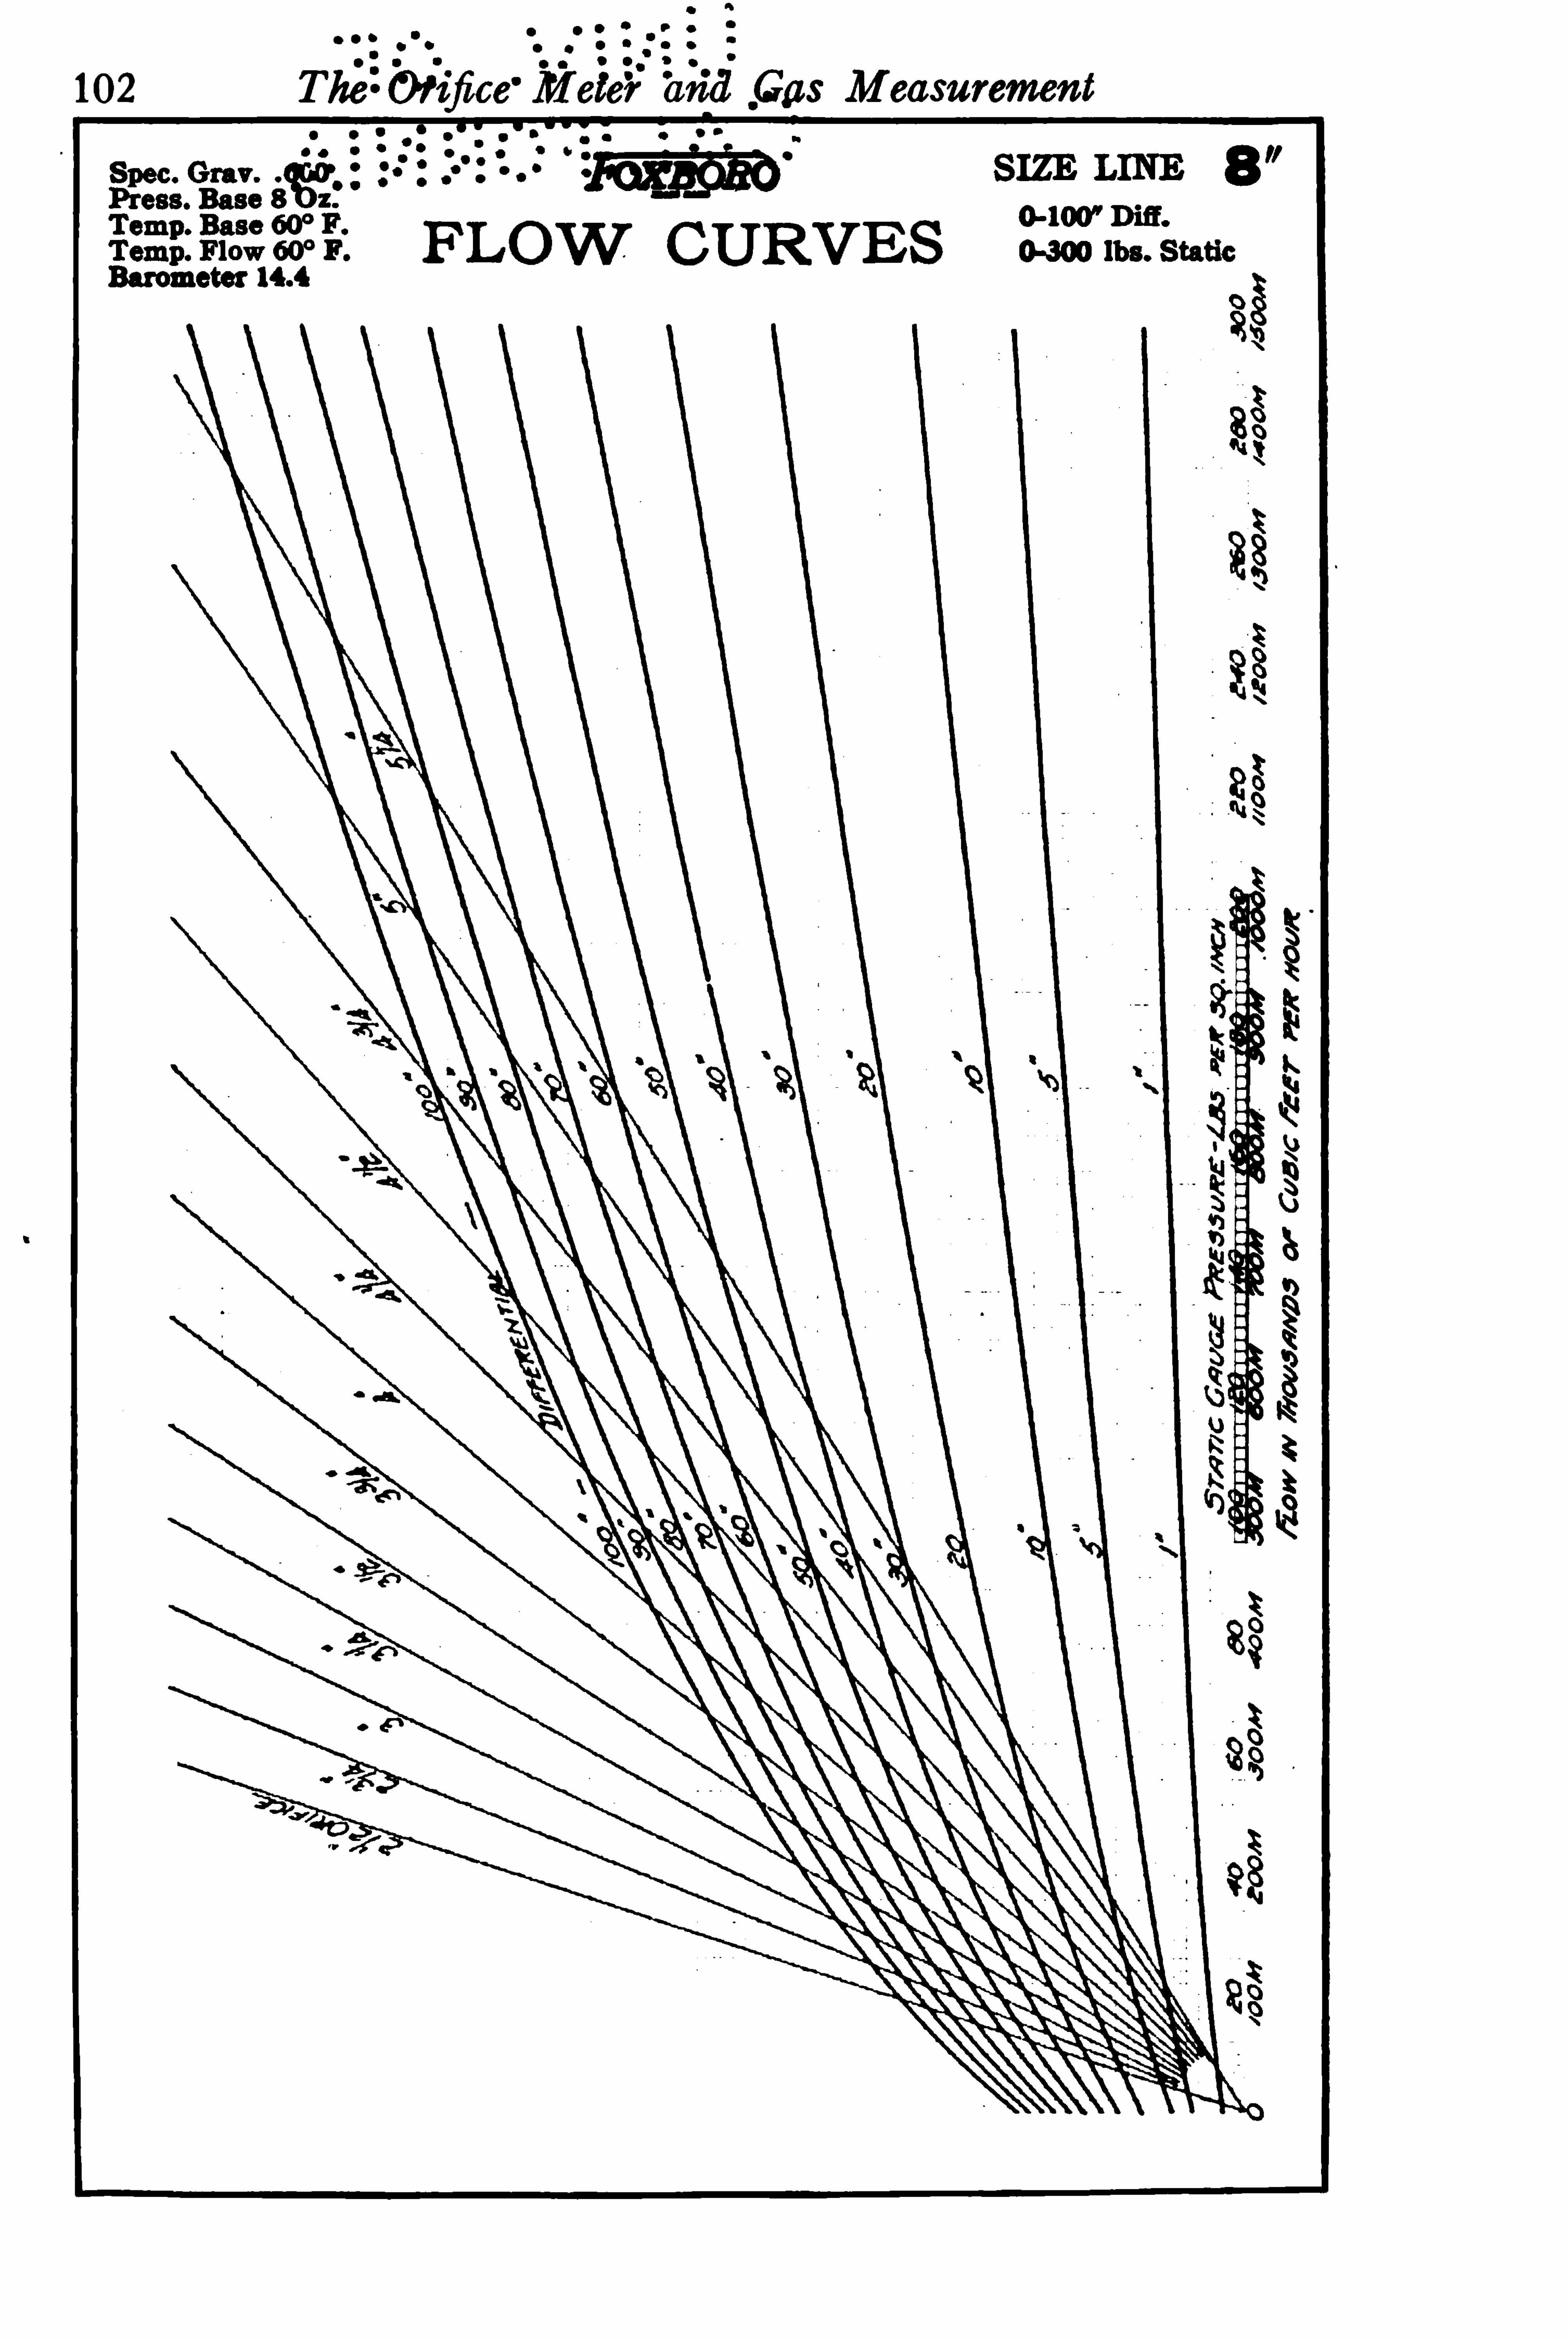
Flow Curves 105
S I!E LINE 100"
o-mor Dis.
FLOW CURVESurometer
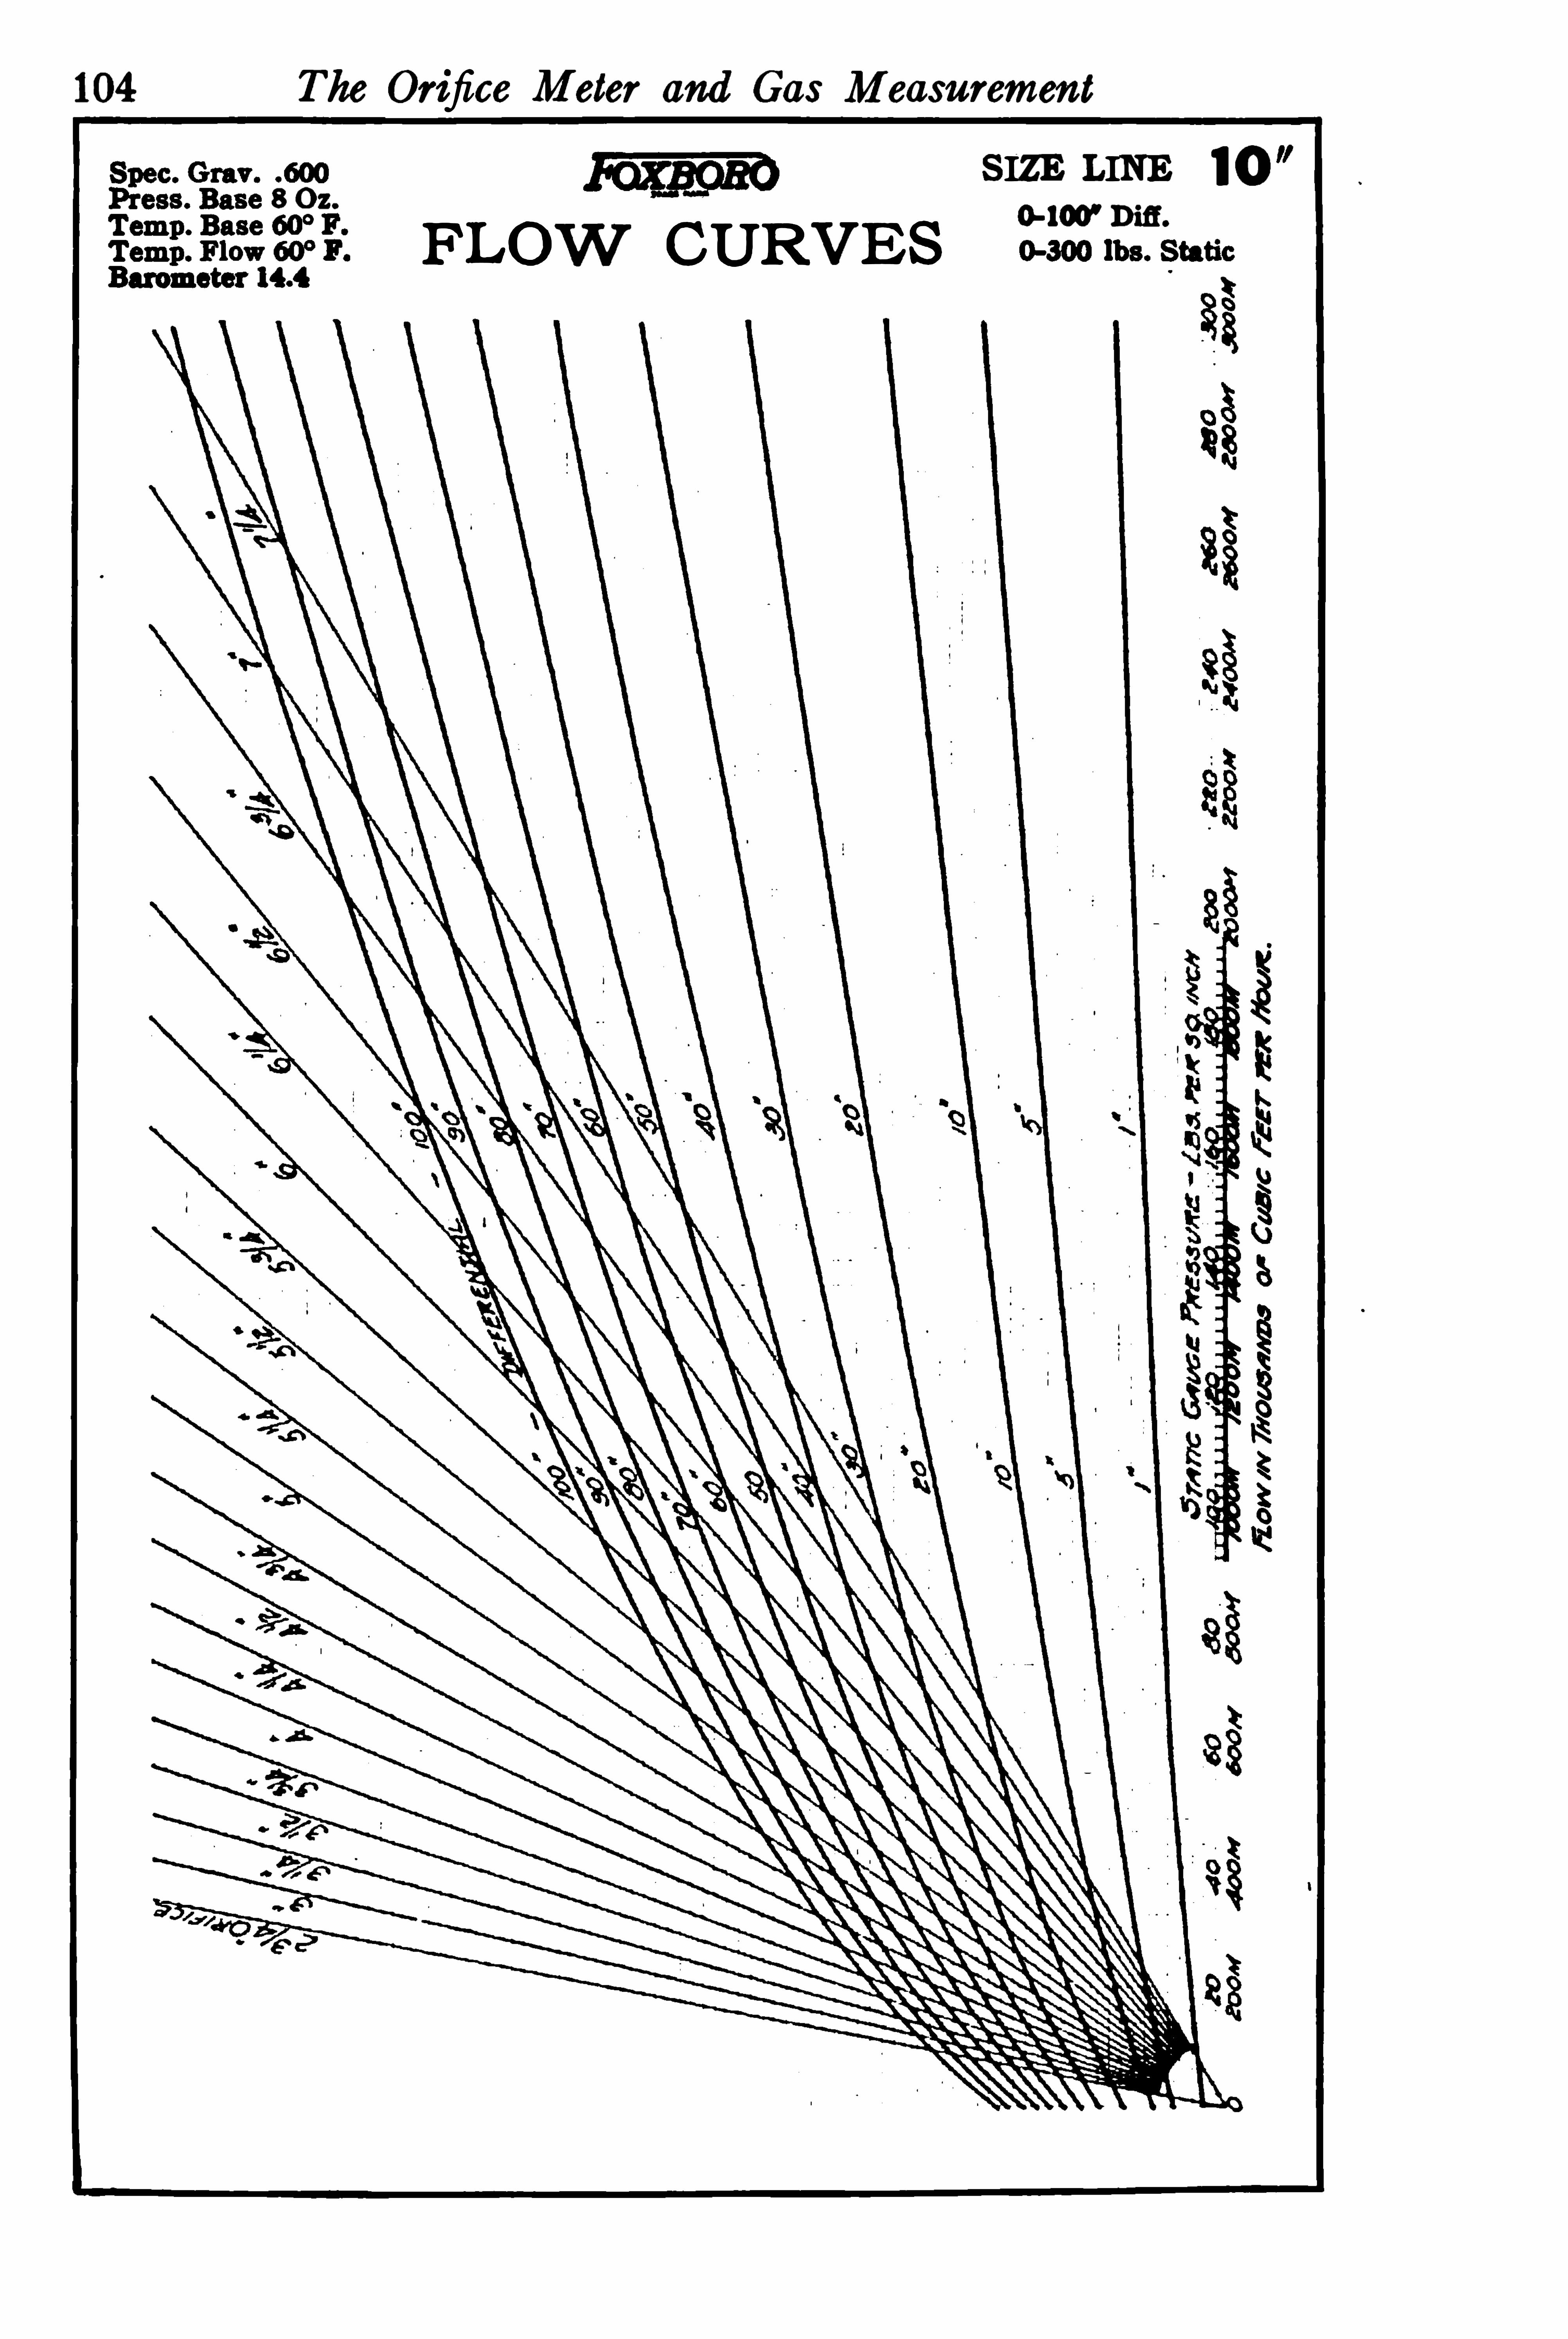
104 The Orifice Meter and Gas Measurement
SI!E LINE 108 0"
0 400!ms .
FLOW CURVES

06 The Orifice Meter and Gas Measurement
it“ . Grav. SI!E LINE 12ess. Base 8 Oz.
0-100'Difl .
igfigiffiififi fl FLOW CURVES 04 00 lbs. StaticBarometer

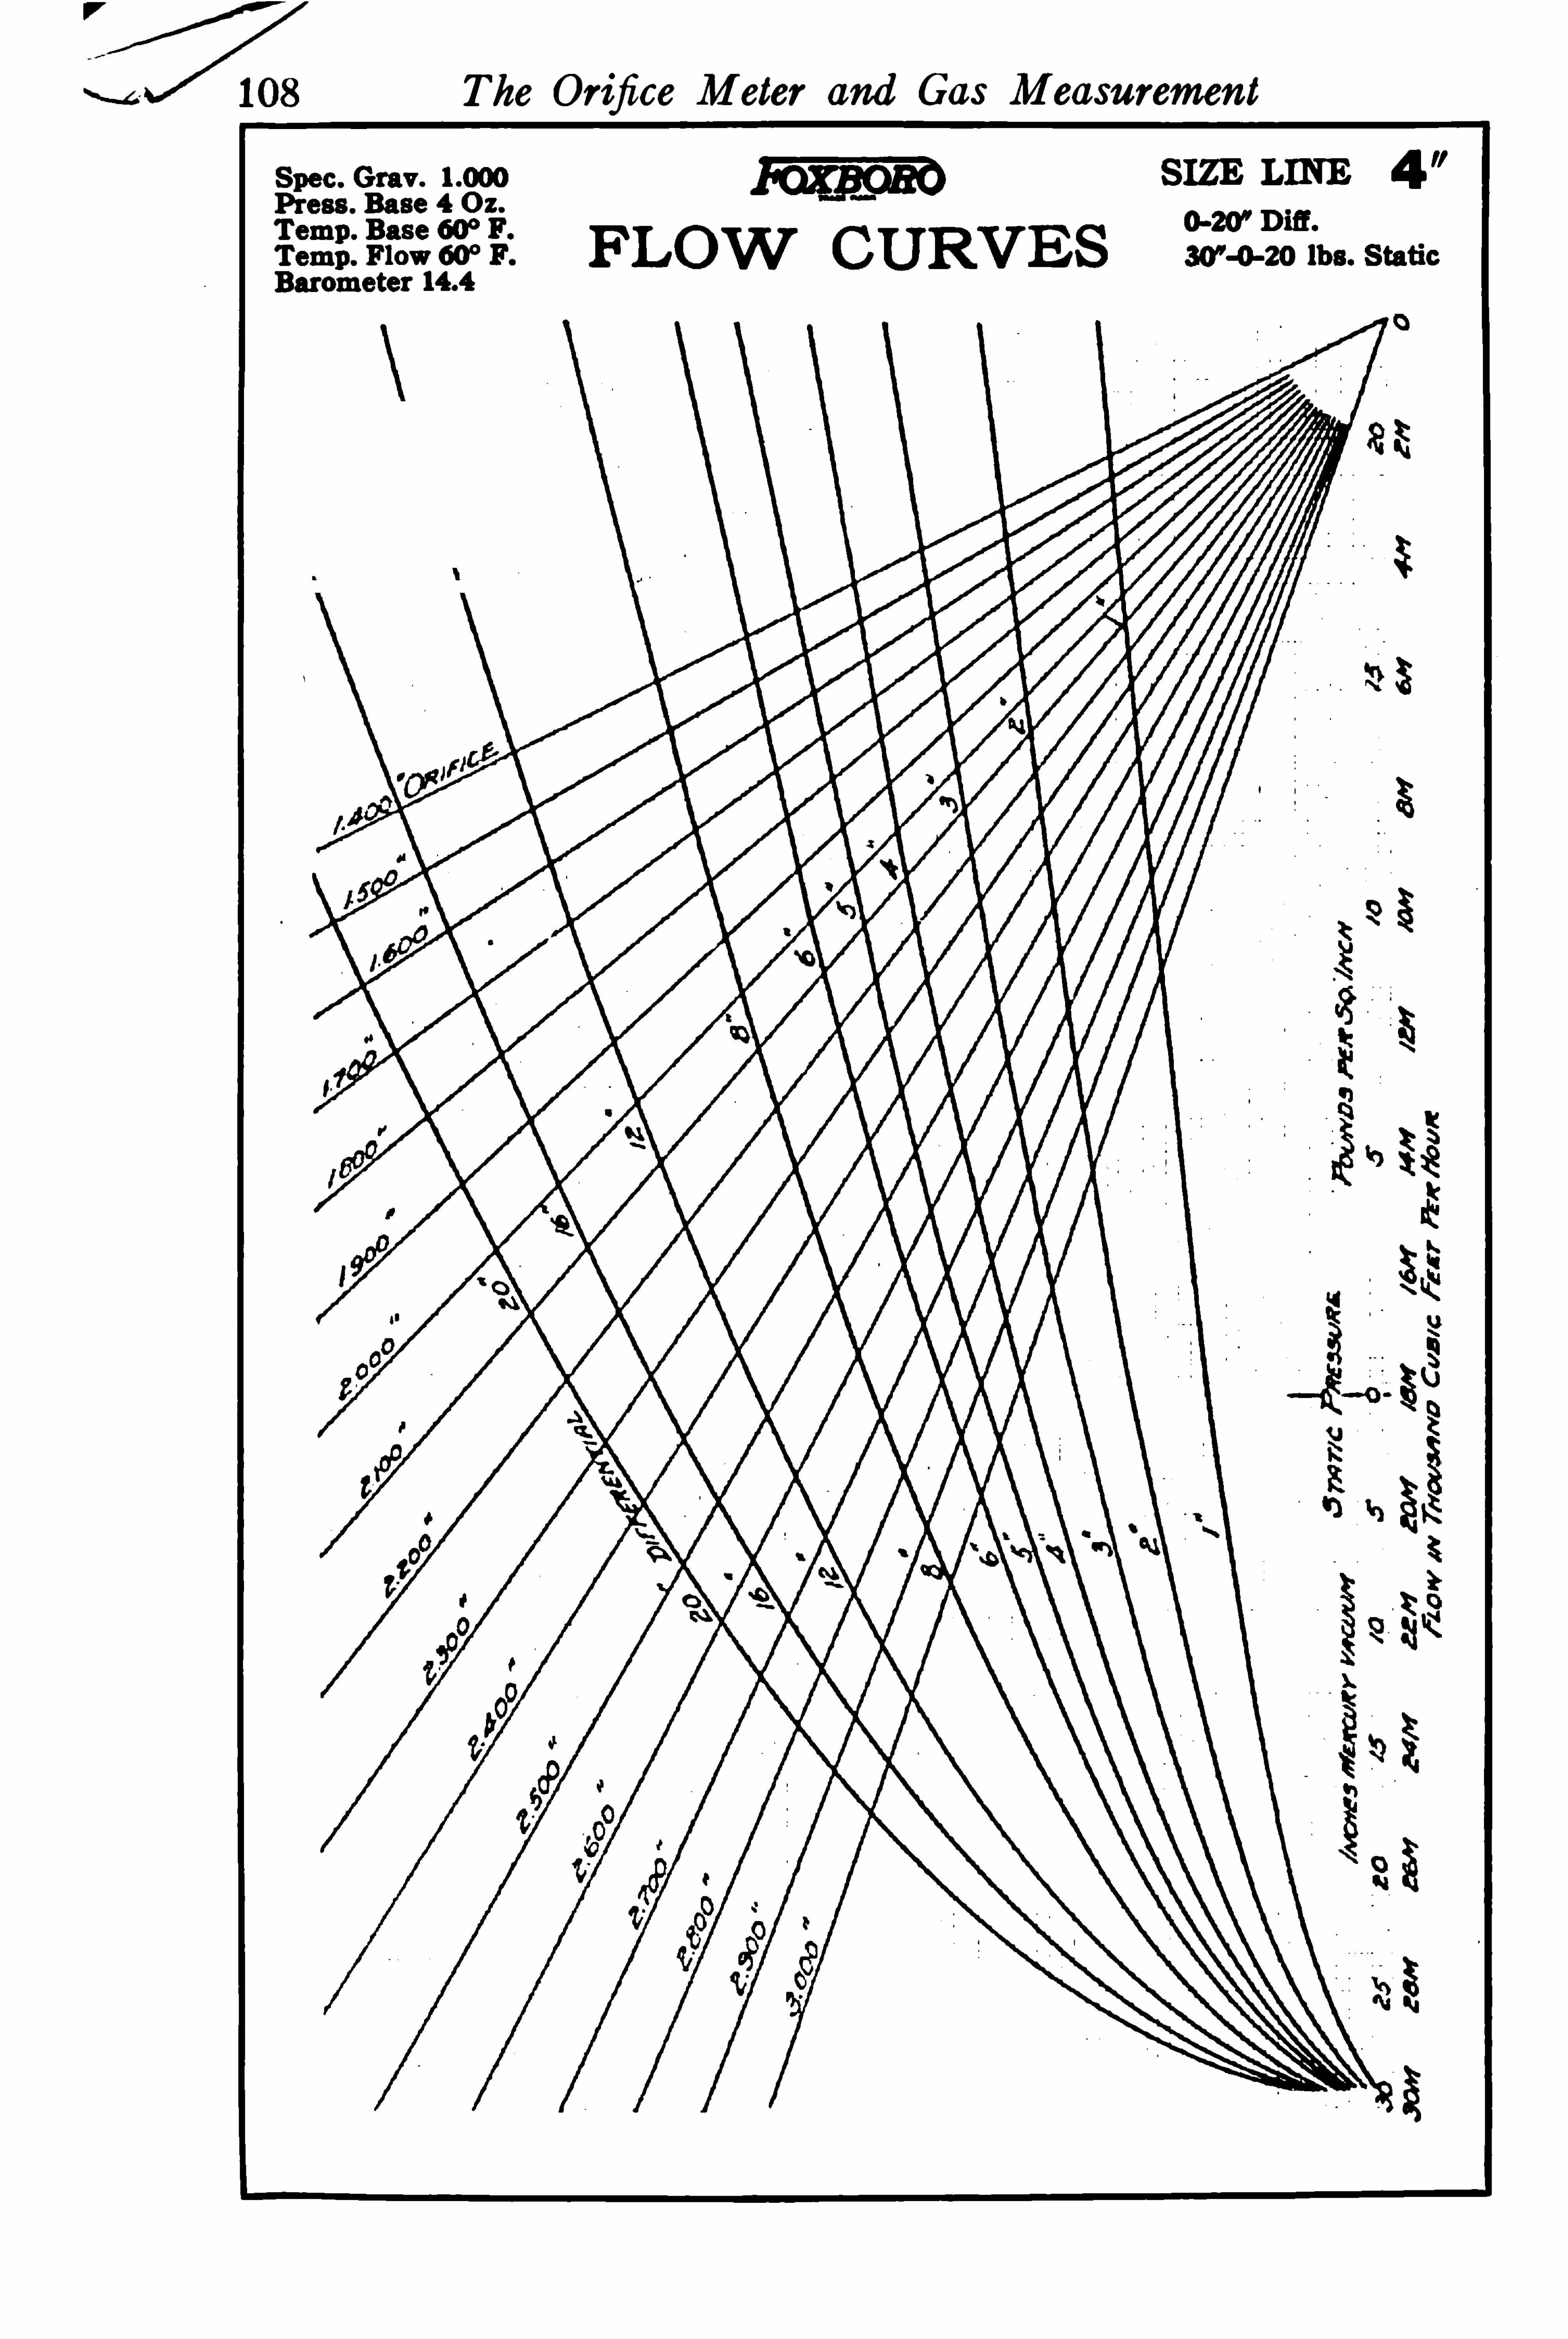
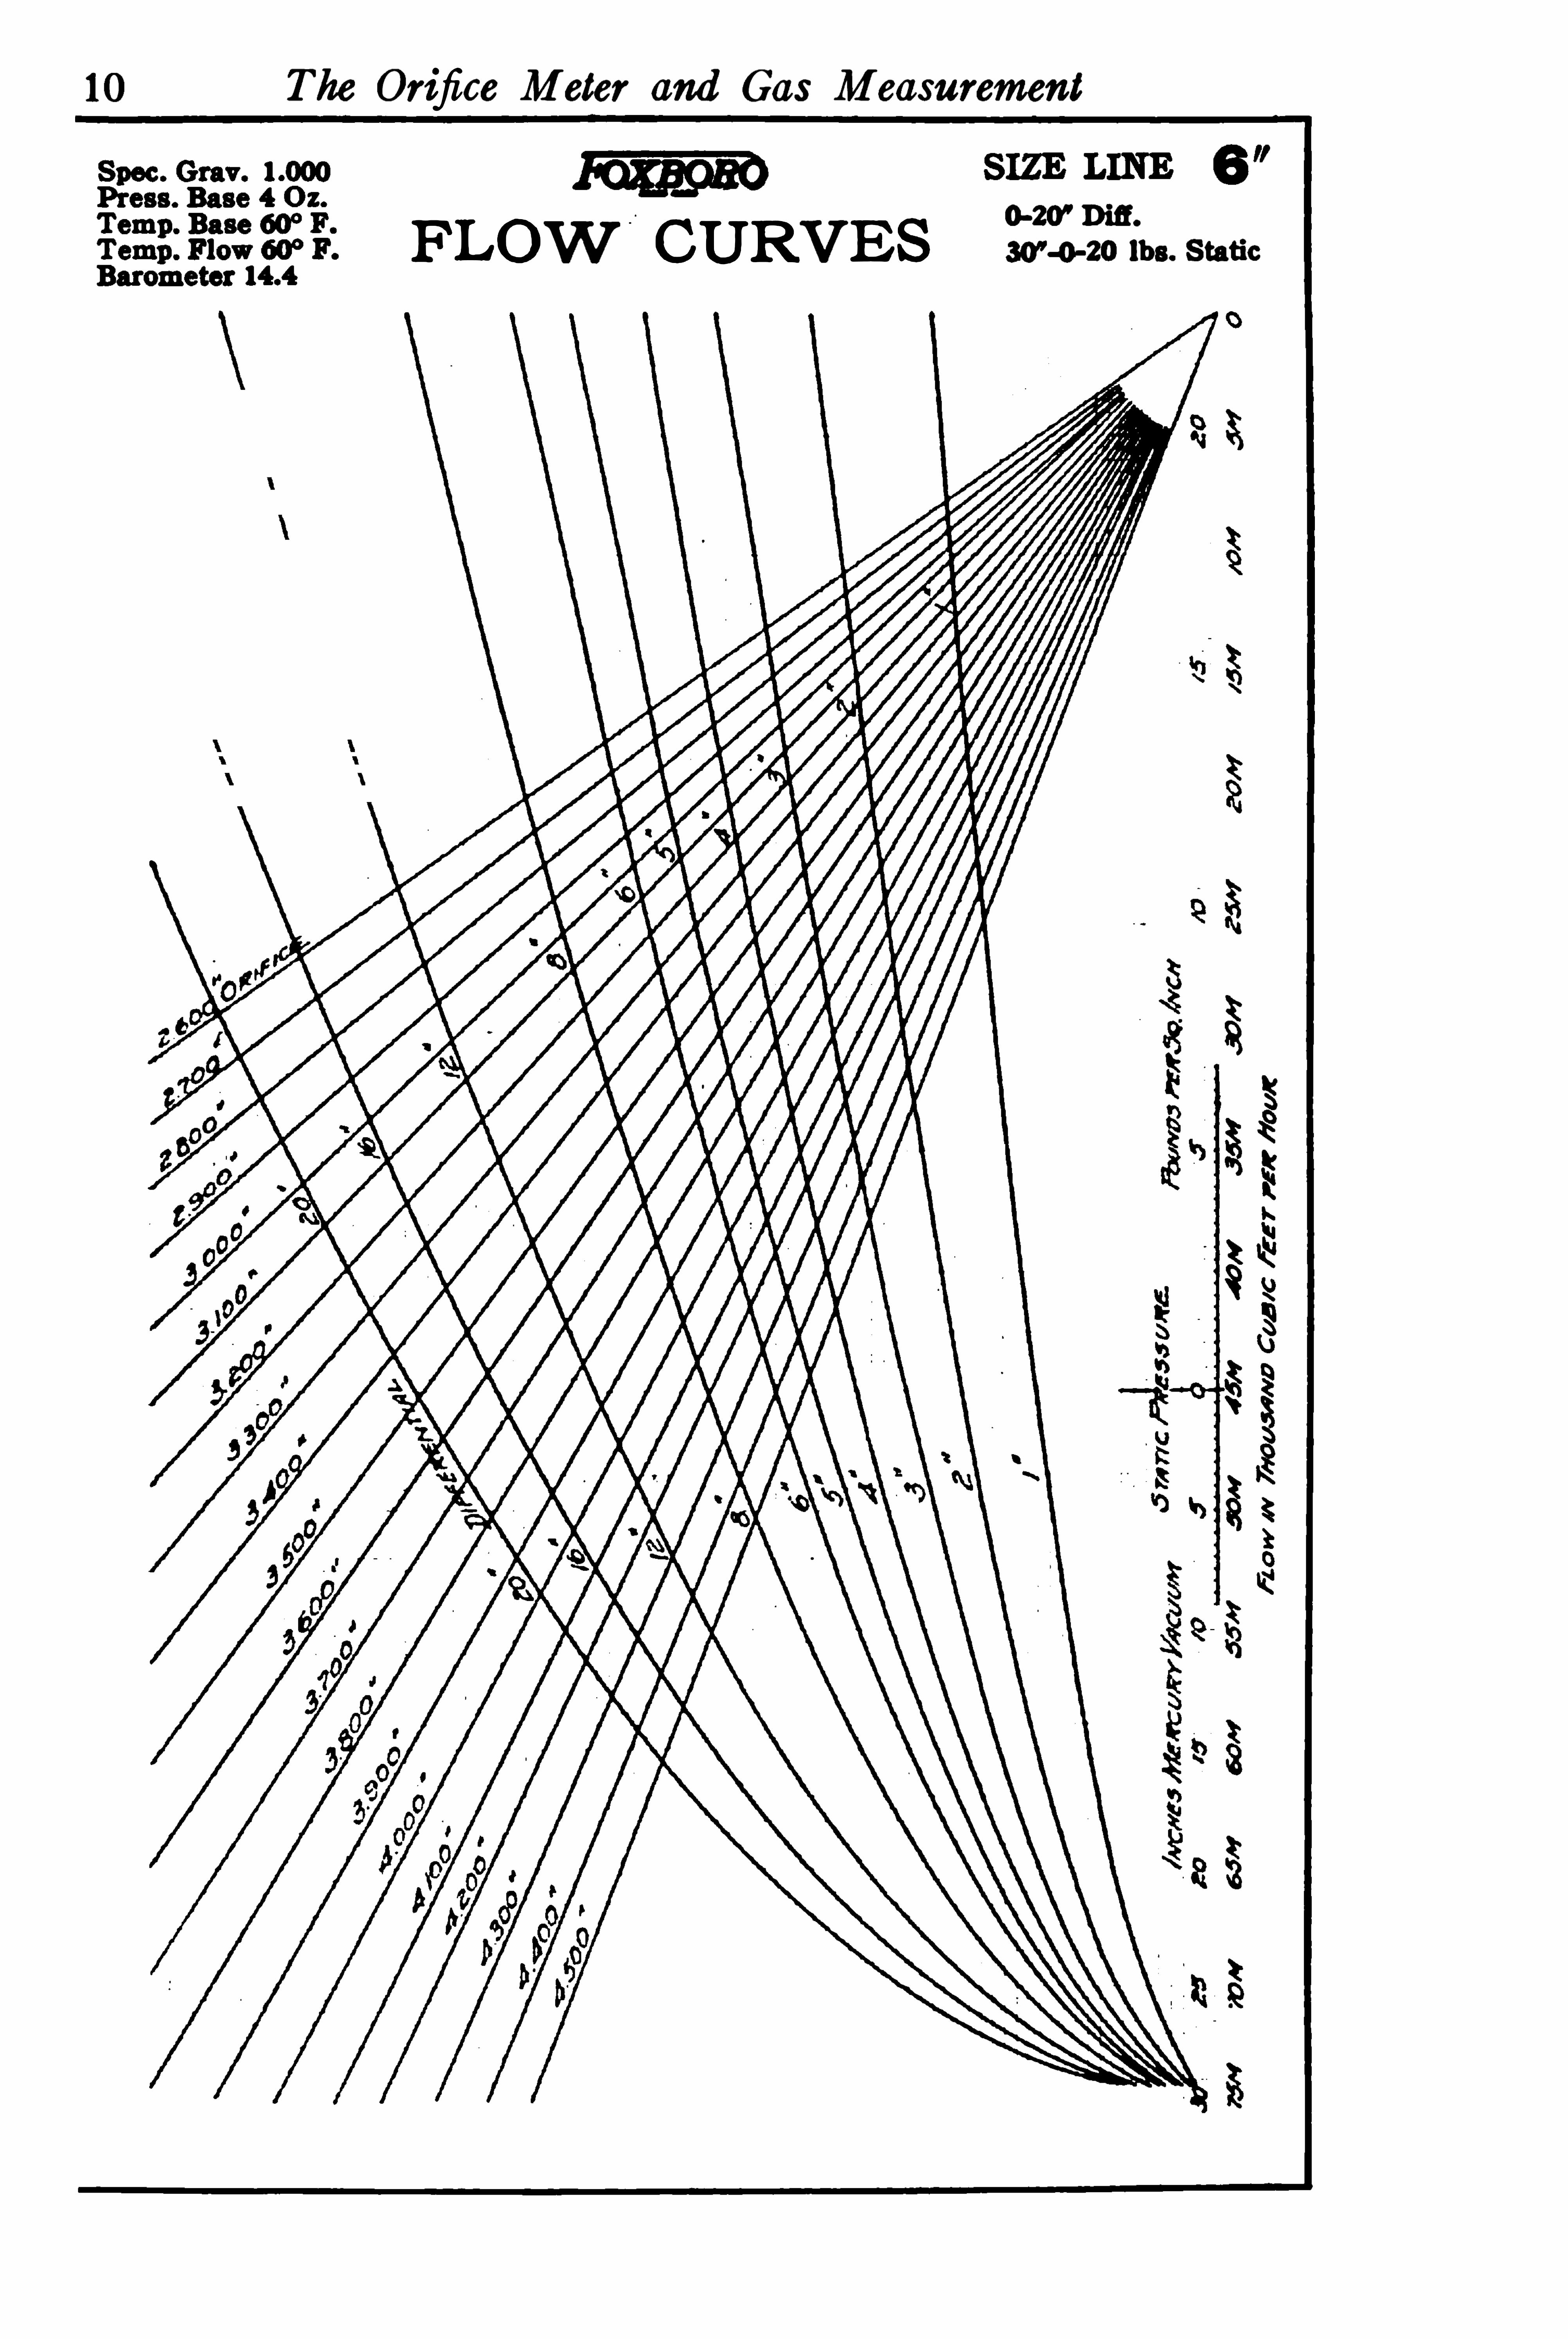
10 The Orifice Meter and Gas Measurement
0-20’ Difi.
FLOW CURVES ech o-20 lbs. S tatic
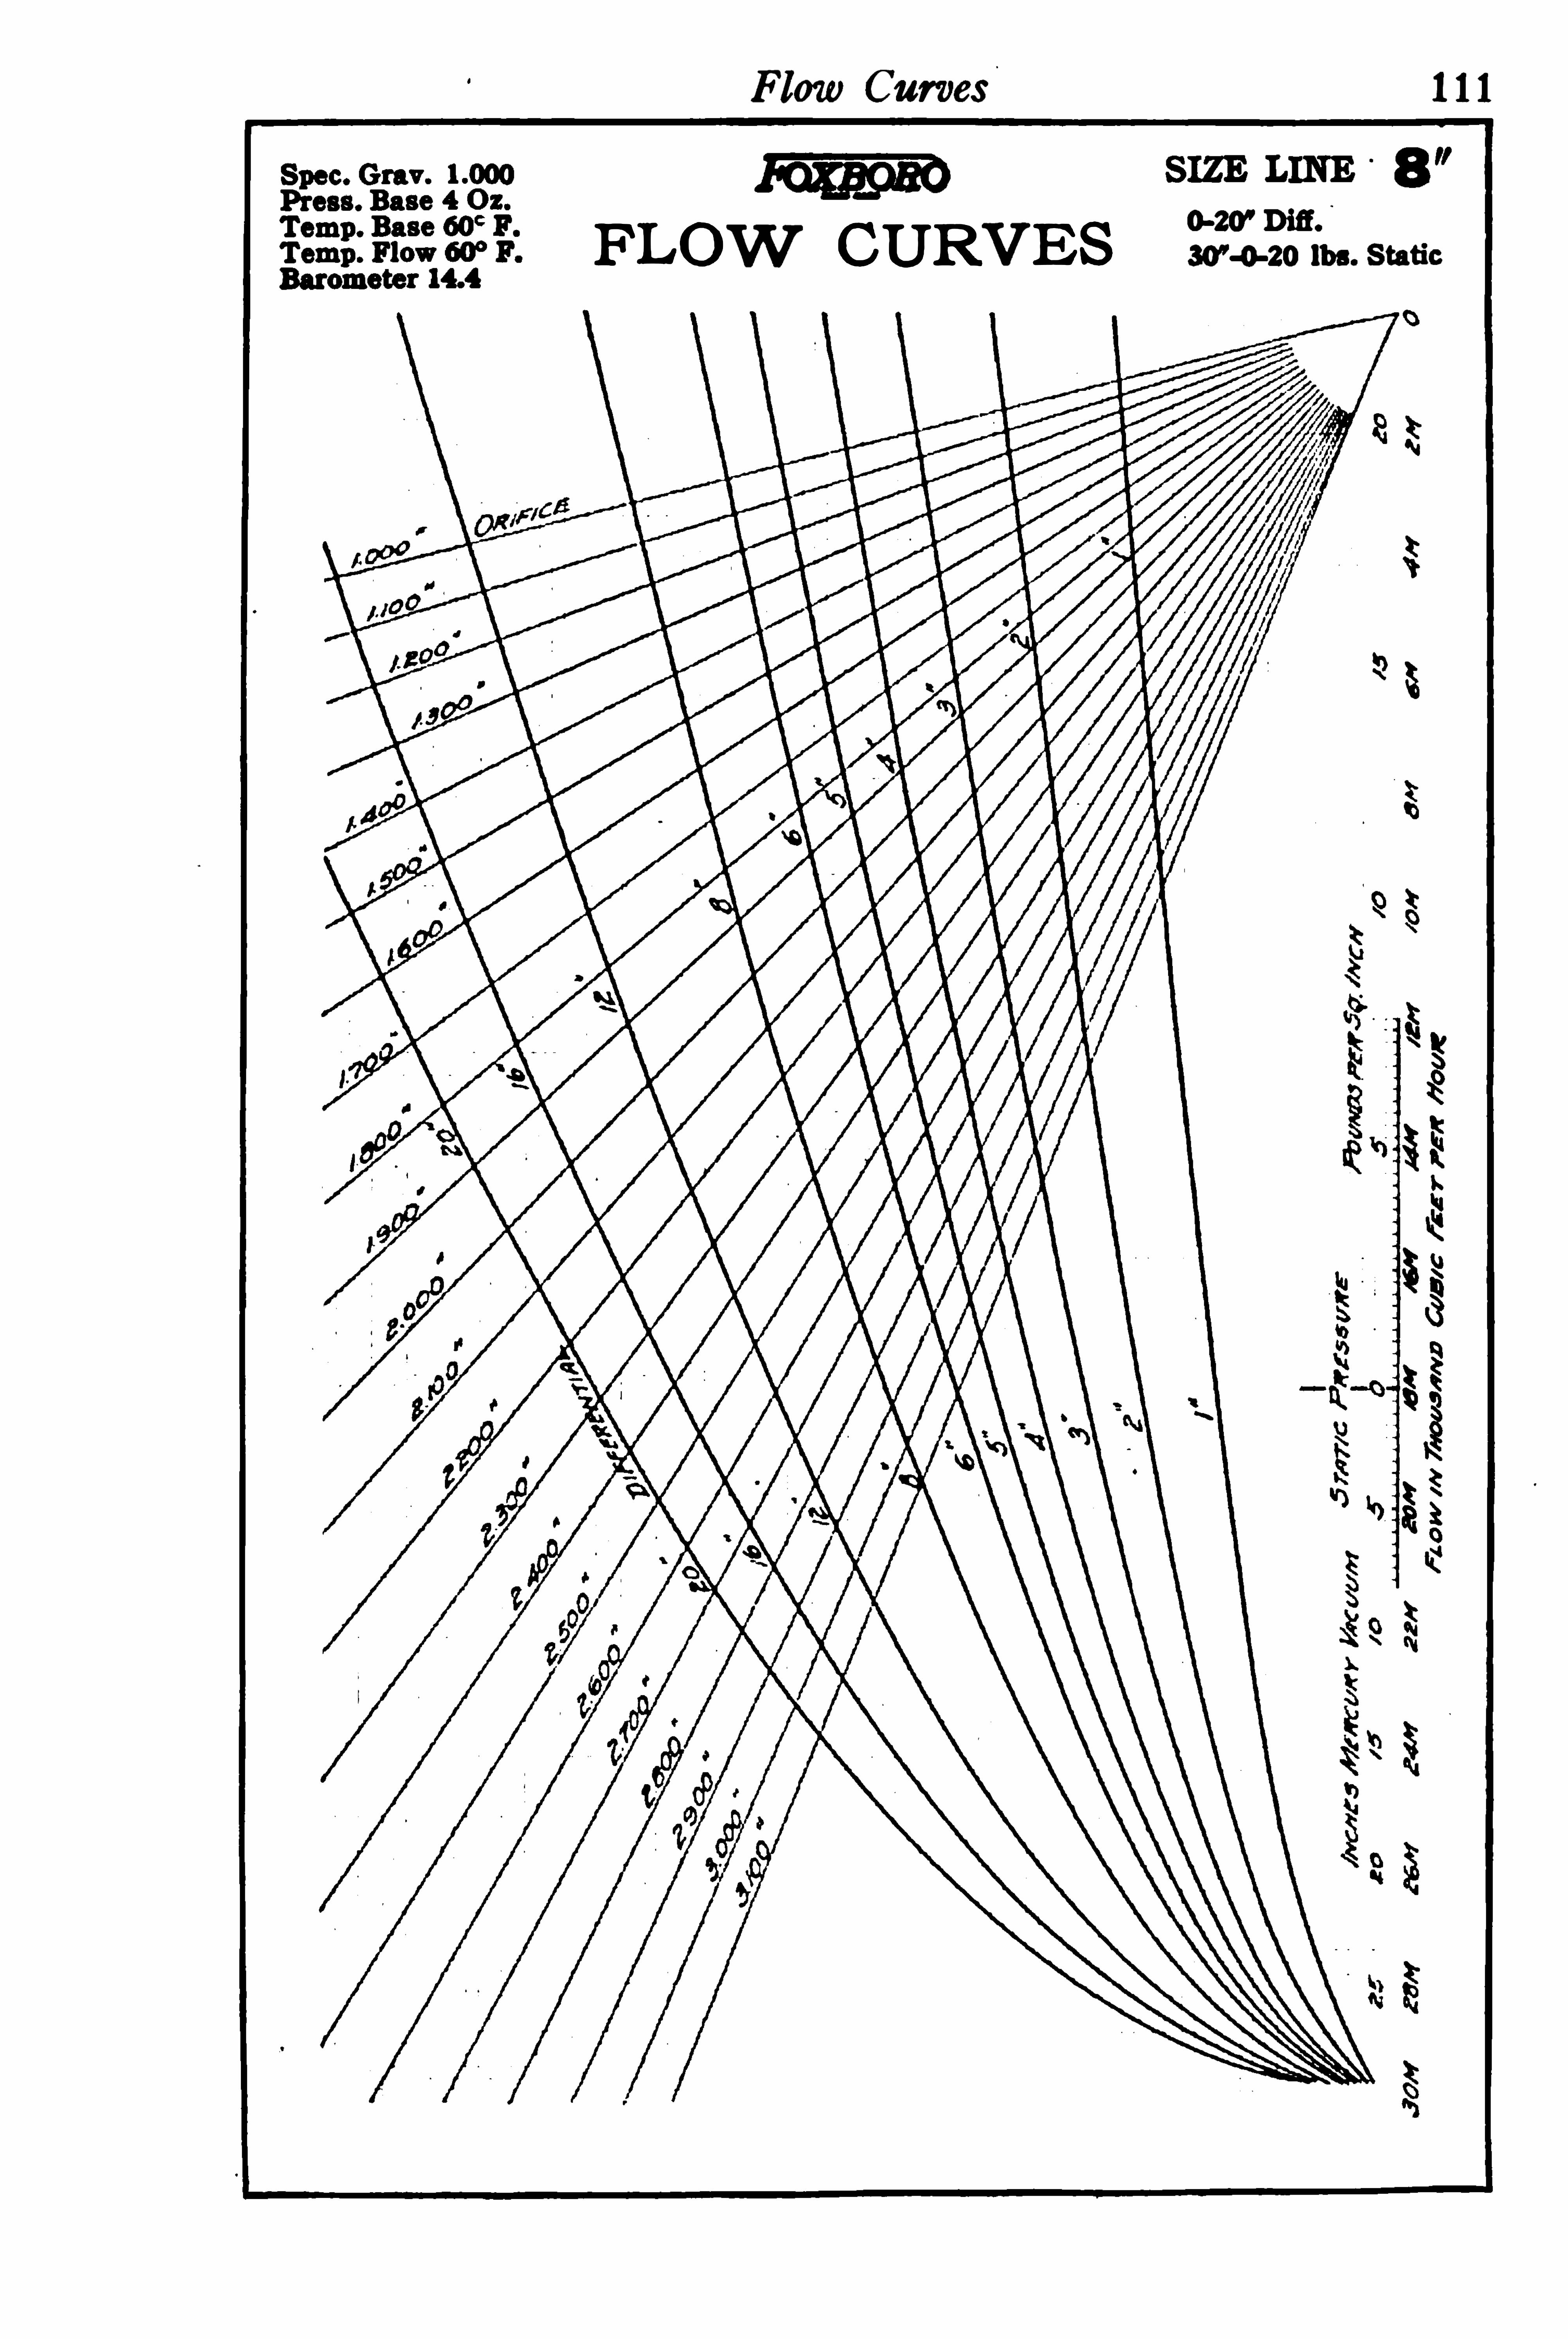
Flow Curves 1 1 1
FLOW CURVES
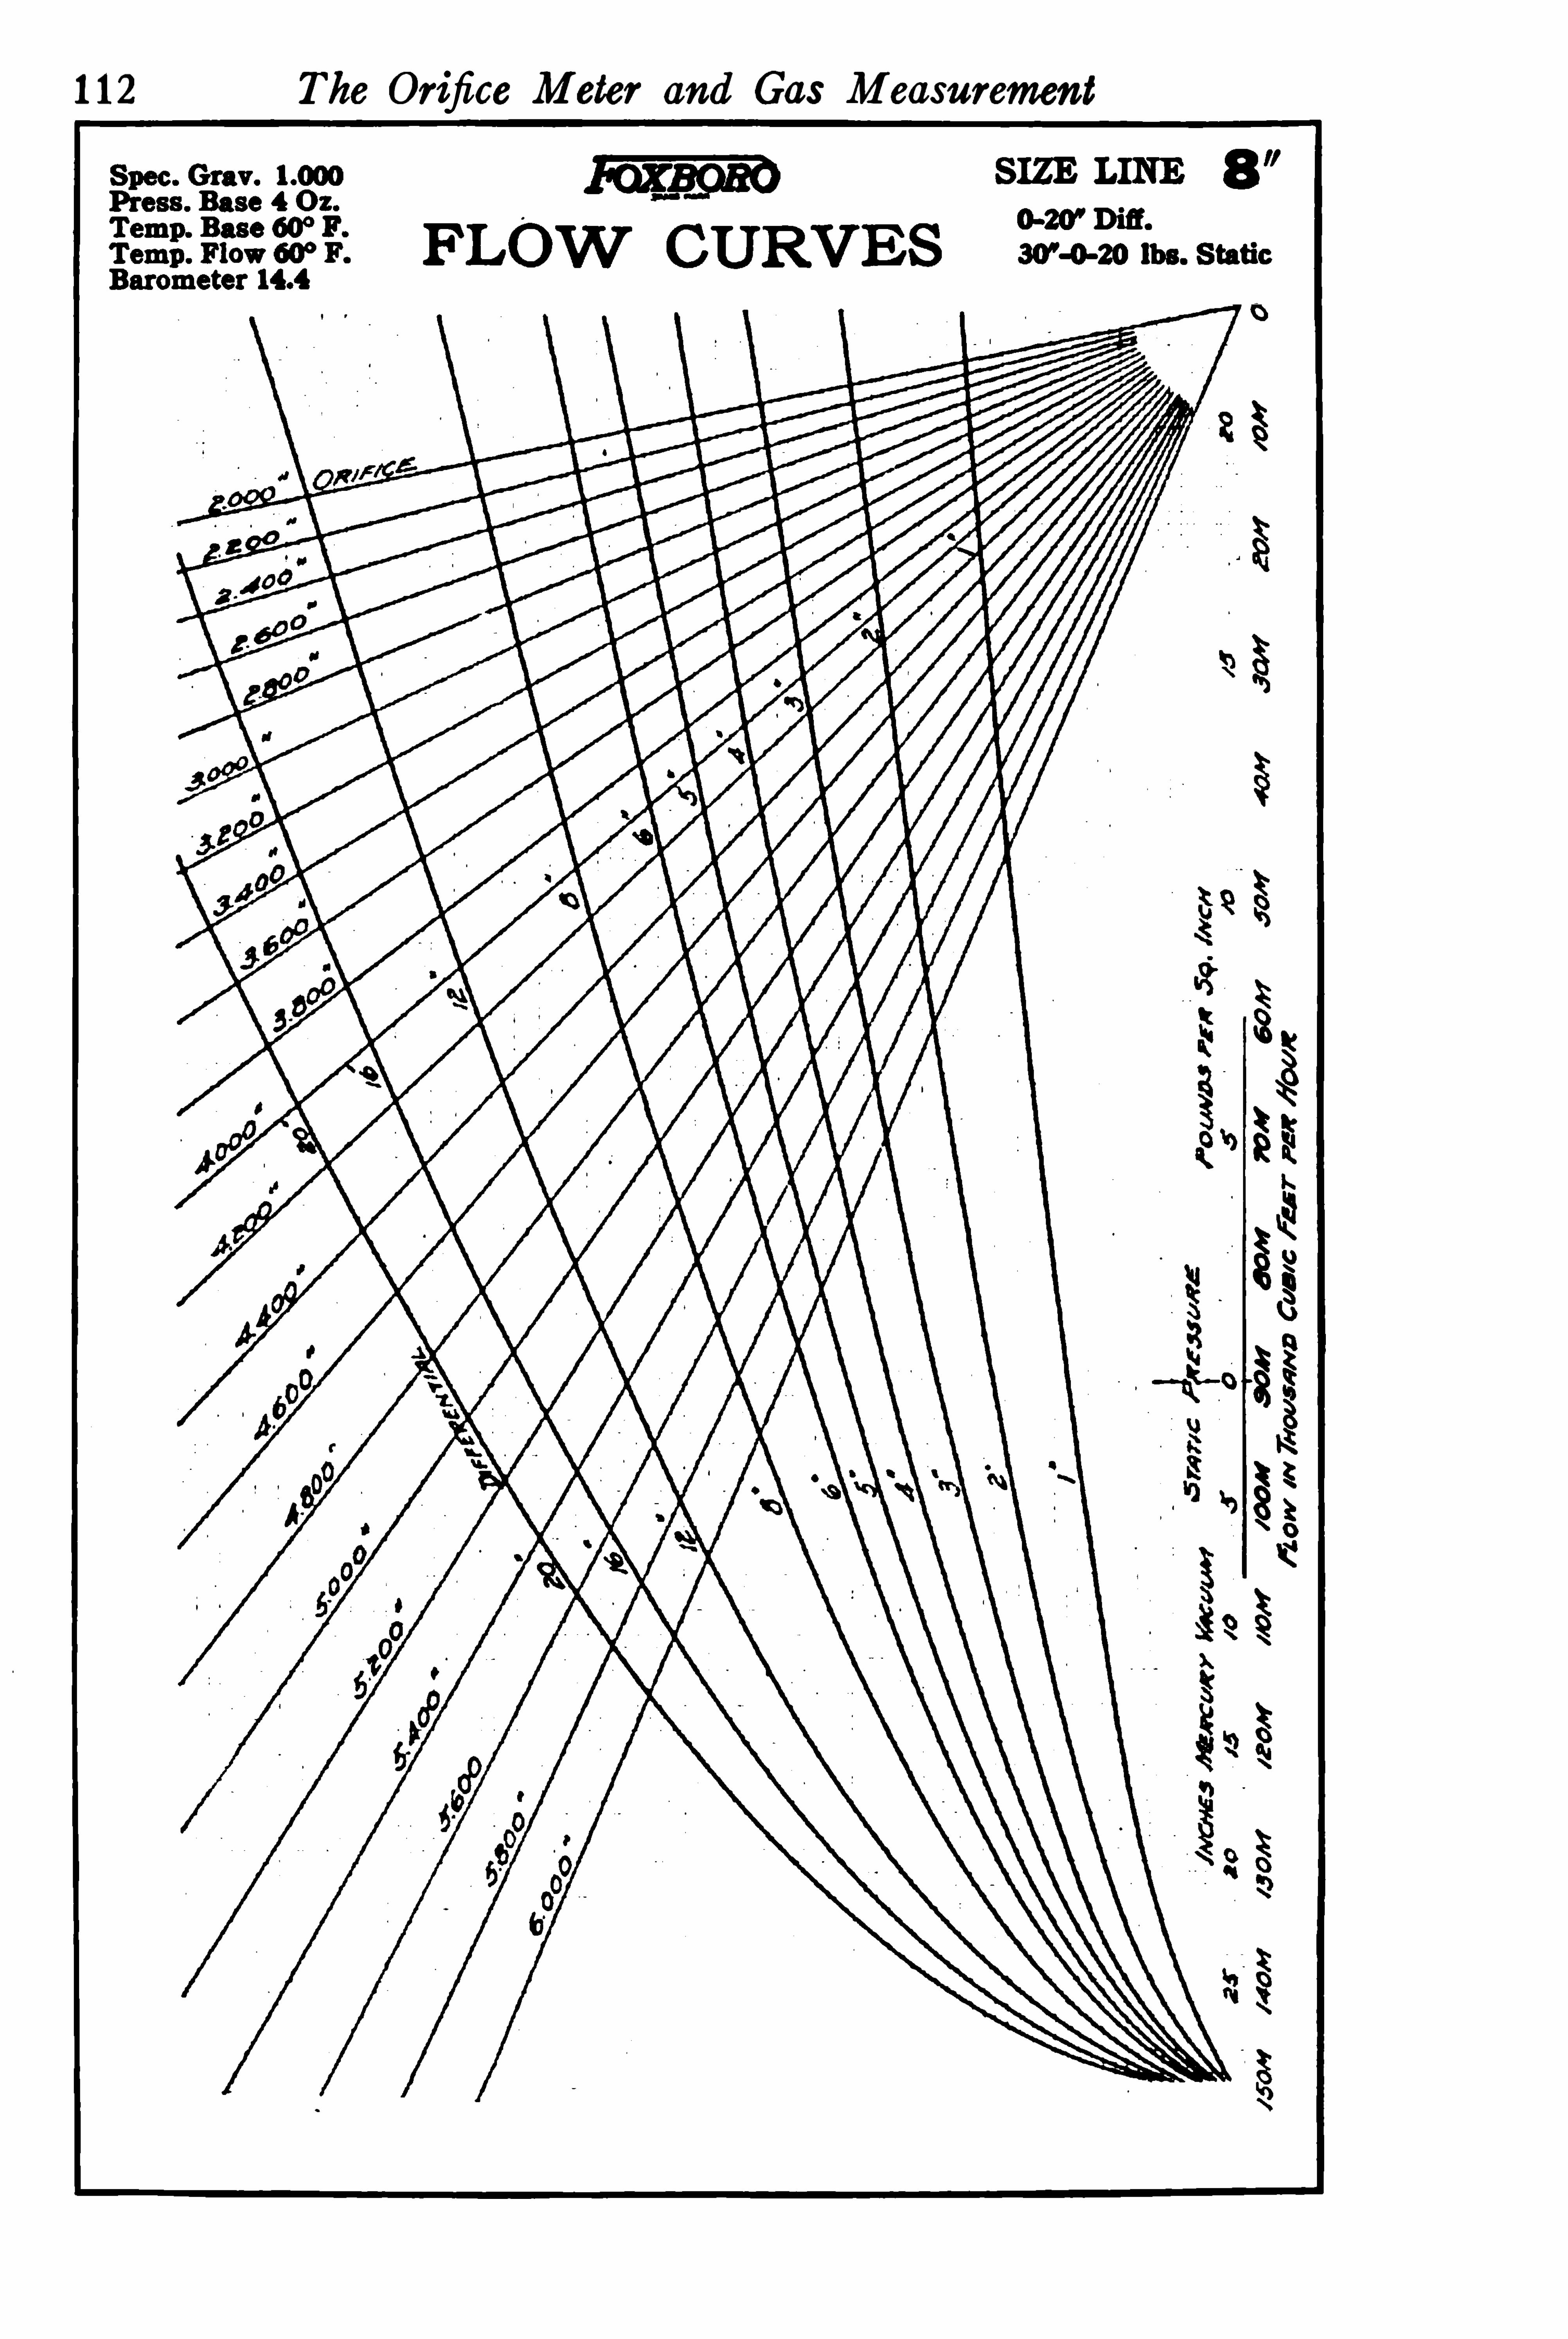
1 12 The Orifice Meter and Gas Measurement
RETURNTO the c irculation desk Of anyUniversity Of Ca lifornia Lib ra ry
or to theNORTHERN REGIONAL LIBRAR! FACILIT!Bldg . 400, Ric hmond Field StationUniversity Of Ca liforniaRic hmond , CA 94804 -4698
ALLBOO !SMA! BERECALLEDAFTER 7 DA!S2-month loans may be renewed by ca lling(5 10) 642-6753l -ye a r loans may be rec ha rged by b ring ingbooks to NRLFRenewa ls and rec ha rges may be made 4days p rior to due date .
DUEAS STAMPEDBELOW
!UL23 1939
121 1 1) ( 1