Discharge coefficients of orifice-type restrictor for aerostatic bearings
10
Tribology International 40 (2007) 512–521 Discharge coefficients of orifice-type restrictor for aerostatic bearings G. Belforte, T. Raparelli , V. Viktorov, A. Trivella Department of Mechanics, Politecnico di Torino10129, Torino, Italy Received 30 January 2005; received in revised form 11 May 2006; accepted 15 May 2006 Available online 12 July 2006 Abstract The paper describes an experimental study conducted in order to determine the supply hole discharge coefficients of externally pressurized gas bearings. Tests were carried out on annular orifices and simple orifices with feed pocket. Air consumption and pressure distributions were measured as a function of supply pressure and air gap height for several different orifice and pocket sizes. Discharge coefficients were approximated by an experimental formula based on the Reynolds number and feeding systems geometry. r 2006 Elsevier Ltd. All rights reserved. Keywords: Air bearing; Annular orifice; Simple orifice; Discharge coefficient; Feed pocket 1. Introduction In calculating the behavior of externally pressurized gas bearings, the flow characteristics and downstream pres- sures of the feeding system must be known [1,2]. The feeding system often consists of holes of varying shape. Fig. 1 shows two classic solutions: the annular orifice (Fig. 1a) and the simple orifice with feed pocket (Fig. 1b). The flow through these systems is a complicated phenom- ena, and no effective formula yet exists for estimating it. Many researchers have attempted to solve the problem using different methods. A good discussion of these attempts and of the methods utilized is provided in [3]. In this paper, the lumped parameter method is used, as it is a useful design expedient despite certain limitations. The basic approach of this method is to consider that the supply hole behaves as a nozzle. In this case, the mass flow rate G through the orifice is given by G ¼ C d G t , (1) where G t is the ideal theoretical flow rate (isentropic expansion) through an ideal nozzle and C d is the discharge coefficient. The difficulty lies in determining the value of the discharge coefficient, which varies with both geometry and flow parameters. Many researchers have used a single number (usually ranging from 0.6 to 0.8) as C d [4–7], while others have used empirical formulas [8–10]. In both cases, formulas and numbers are derived, and thus are valid, in very limited range. In this paper we propose, considering also the partial results obtained in previous preliminary works [11,12] an experimental formula of discharge coefficients valid both for annular orifice and simple orifice with feed pocket. The formula is a function of the Reynolds number and the geometric parameters. 2. Test bench and pads under test A test bench was constructed which made it possible to measure the static load capacity, pressure distribution and air consumption of flat aerostatic pads with supply systems of this type as a function of the air gap. A cross sectional view of the bench is shown in Fig. 2. The bench frame consists of a base (1), three columns (2) and a crossmember (3). The air gap is established between the pad under test (4) and the stationary bearing member (14). The height of the air gap is determined by moving the pad (4) vertically, and is measured by micrometric transducers (6). Pad movement is accomplished by means of a screw (7) controlled by handwheel (8), pushrod (9) and ball (10) housed in plate (5), which is positively connected to the pad ARTICLE IN PRESS www.elsevier.com/locate/triboint 0301-679X/$ - see front matter r 2006 Elsevier Ltd. All rights reserved. doi:10.1016/j.triboint.2006.05.003 Corresponding author. Tel.: +39 011 5646929; fax: +39 011 5646999. E-mail address: [email protected] (T. Raparelli).
-
Upload
independent -
Category
Documents
-
view
2 -
download
0
Transcript of Discharge coefficients of orifice-type restrictor for aerostatic bearings

Tribology International 40 (2007) 512–521
Discharge coefficients of orifice-type restrictor for aerostatic bearings
G. Belforte, T. Raparelli�, V. Viktorov, A. Trivella
Department of Mechanics, Politecnico di Torino10129, Torino, Italy
Received 30 January 2005; received in revised form 11 May 2006; accepted 15 May 2006
Available online 12 July 2006
Abstract
The paper describes an experimental study conducted in order to determine the supply hole discharge coefficients of externally
pressurized gas bearings. Tests were carried out on annular orifices and simple orifices with feed pocket. Air consumption and pressure
distributions were measured as a function of supply pressure and air gap height for several different orifice and pocket sizes. Discharge
coefficients were approximated by an experimental formula based on the Reynolds number and feeding systems geometry.
r 2006 Elsevier Ltd. All rights reserved.
Keywords: Air bearing; Annular orifice; Simple orifice; Discharge coefficient; Feed pocket
1. Introduction
In calculating the behavior of externally pressurized gasbearings, the flow characteristics and downstream pres-sures of the feeding system must be known [1,2]. Thefeeding system often consists of holes of varying shape.Fig. 1 shows two classic solutions: the annular orifice(Fig. 1a) and the simple orifice with feed pocket (Fig. 1b).The flow through these systems is a complicated phenom-ena, and no effective formula yet exists for estimating it.Many researchers have attempted to solve the problemusing different methods. A good discussion of theseattempts and of the methods utilized is provided in [3].
In this paper, the lumped parameter method is used, as itis a useful design expedient despite certain limitations. Thebasic approach of this method is to consider that thesupply hole behaves as a nozzle. In this case, the mass flowrate G through the orifice is given by
G ¼ CdGt, (1)
where Gt is the ideal theoretical flow rate (isentropicexpansion) through an ideal nozzle and Cd is the dischargecoefficient. The difficulty lies in determining the value ofthe discharge coefficient, which varies with both geometry
and flow parameters. Many researchers have used a singlenumber (usually ranging from 0.6 to 0.8) as Cd [4–7], whileothers have used empirical formulas [8–10]. In both cases,formulas and numbers are derived, and thus are valid, invery limited range. In this paper we propose, consideringalso the partial results obtained in previous preliminaryworks [11,12] an experimental formula of dischargecoefficients valid both for annular orifice and simple orificewith feed pocket. The formula is a function of the Reynoldsnumber and the geometric parameters.
2. Test bench and pads under test
A test bench was constructed which made it possible tomeasure the static load capacity, pressure distribution andair consumption of flat aerostatic pads with supply systemsof this type as a function of the air gap. A cross sectionalview of the bench is shown in Fig. 2.The bench frame consists of a base (1), three columns (2)
and a crossmember (3). The air gap is established betweenthe pad under test (4) and the stationary bearing member(14). The height of the air gap is determined by moving thepad (4) vertically, and is measured by micrometrictransducers (6).Pad movement is accomplished by means of a screw (7)
controlled by handwheel (8), pushrod (9) and ball (10)housed in plate (5), which is positively connected to the pad
ARTICLE IN PRESS
www.elsevier.com/locate/triboint
0301-679X/$ - see front matter r 2006 Elsevier Ltd. All rights reserved.
doi:10.1016/j.triboint.2006.05.003
�Corresponding author. Tel.: +39011 5646929; fax: +39 011 5646999.
E-mail address: [email protected] (T. Raparelli).
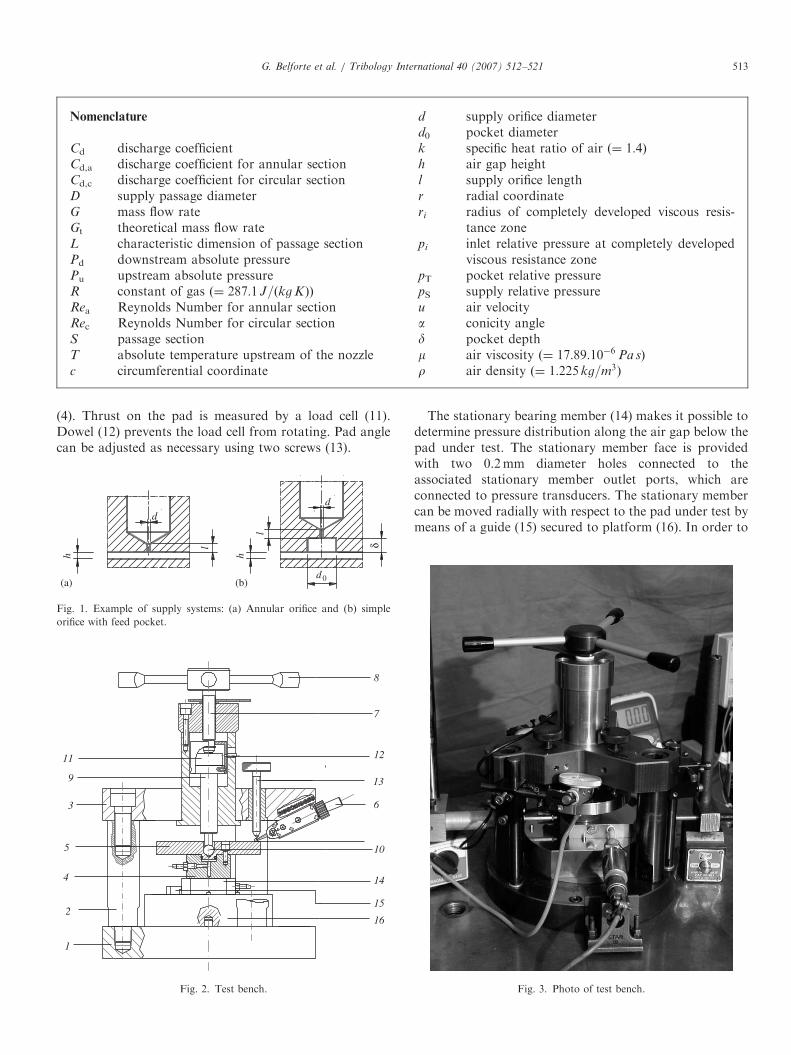
(4). Thrust on the pad is measured by a load cell (11).Dowel (12) prevents the load cell from rotating. Pad anglecan be adjusted as necessary using two screws (13).
The stationary bearing member (14) makes it possible todetermine pressure distribution along the air gap below thepad under test. The stationary member face is providedwith two 0.2mm diameter holes connected to theassociated stationary member outlet ports, which areconnected to pressure transducers. The stationary membercan be moved radially with respect to the pad under test bymeans of a guide (15) secured to platform (16). In order to
ARTICLE IN PRESS
Nomenclature
Cd discharge coefficientCd,a discharge coefficient for annular sectionCd,c discharge coefficient for circular sectionD supply passage diameterG mass flow rateGt theoretical mass flow rateL characteristic dimension of passage sectionPd downstream absolute pressurePu upstream absolute pressureR constant of gas ð¼ 287:1 J=ðkg KÞÞ
Rea Reynolds Number for annular sectionRec Reynolds Number for circular sectionS passage sectionT absolute temperature upstream of the nozzlec circumferential coordinate
d supply orifice diameterd0 pocket diameterk specific heat ratio of air ð¼ 1:4Þh air gap heightl supply orifice lengthr radial coordinateri radius of completely developed viscous resis-
tance zonepi inlet relative pressure at completely developed
viscous resistance zonepT pocket relative pressurepS supply relative pressureu air velocitya conicity angled pocket depthm air viscosity ð¼ 17:89:10�6 Pa sÞ
r air density ð¼ 1:225 kg=m3Þ
l
h
d
(a)d0
l
h
(b)
δ
d
Fig. 1. Example of supply systems: (a) Annular orifice and (b) simple
orifice with feed pocket.
3
4
5
7
8
9
10
11 12
13
14
15
1
216
6
Fig. 2. Test bench. Fig. 3. Photo of test bench.
G. Belforte et al. / Tribology International 40 (2007) 512–521 513
ARTICLE IN PRESS
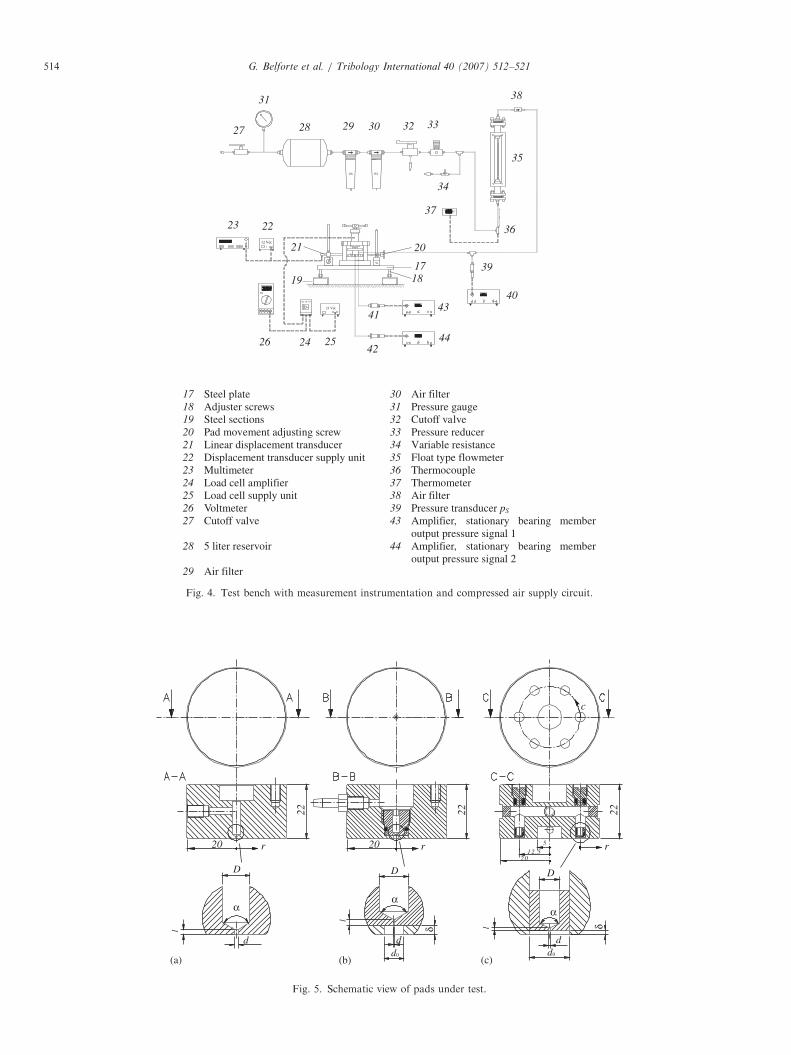
Fig. 4. Test bench with measurement instrumentation and compressed air supply circuit.
l
d
(a)
α
l
d
(b)d
α
δ
20
D
r
22
D
20 r
d(c)
l
d
δ
α
D
2012.5
5
22
r
22
c
Fig. 5. Schematic view of pads under test.
G. Belforte et al. / Tribology International 40 (2007) 512–521514
perform measurements in different radial directions, theplatform (16) can be rotated around the pad axis. Aphotograph of the test bench is shown in Fig. 3.
Fig. 4 shows the measurement instrumentation con-nected to the test bench and the compressed air supplycircuit.
3. Pads under test
One type of pads (‘‘a’’) was constructed for the annularorifice supply system and two types (‘‘b’’, ‘‘c’’) wereconstructed for the simple orifice with feed pocket. Allpads had the same outside dimensions, viz., diameter40mm and height 22mm (Fig. 5). For each pad supply holediameter and length were represented by d and l,respectively, while supply passage diameter and conicalangle were represented by D and a.
For the type ‘‘a’’ seven cylindrical pads were constructedfrom anodized aluminum. The center of each pad featuresan orifice the dimensions of which are detailed in Table 1.
For types ‘‘b’’ and ‘‘c’’ two cylindrical stainless steel padswere constructed respectively. Interchangeable metal in-serts can be installed on both pads. The orifices under testwere machined in the inserts. For type ‘‘b’’, inserts werescrewed into the center of the pad. For type ‘‘c’’ pads, sixinserts were equally spaced around the circular face. Feedpockets were cylindrical, with depth d and diameter d0. Asinserts are interchangeable, different sizes of supply holecan be tested for both pad types. Feed pocket dimensions,on the other hand, are invariable for type ‘‘b’’ pads, whilepocket depth can be varied on type ‘‘b’’ pads by bondingthe insert at different heights. Geometries of the inserts
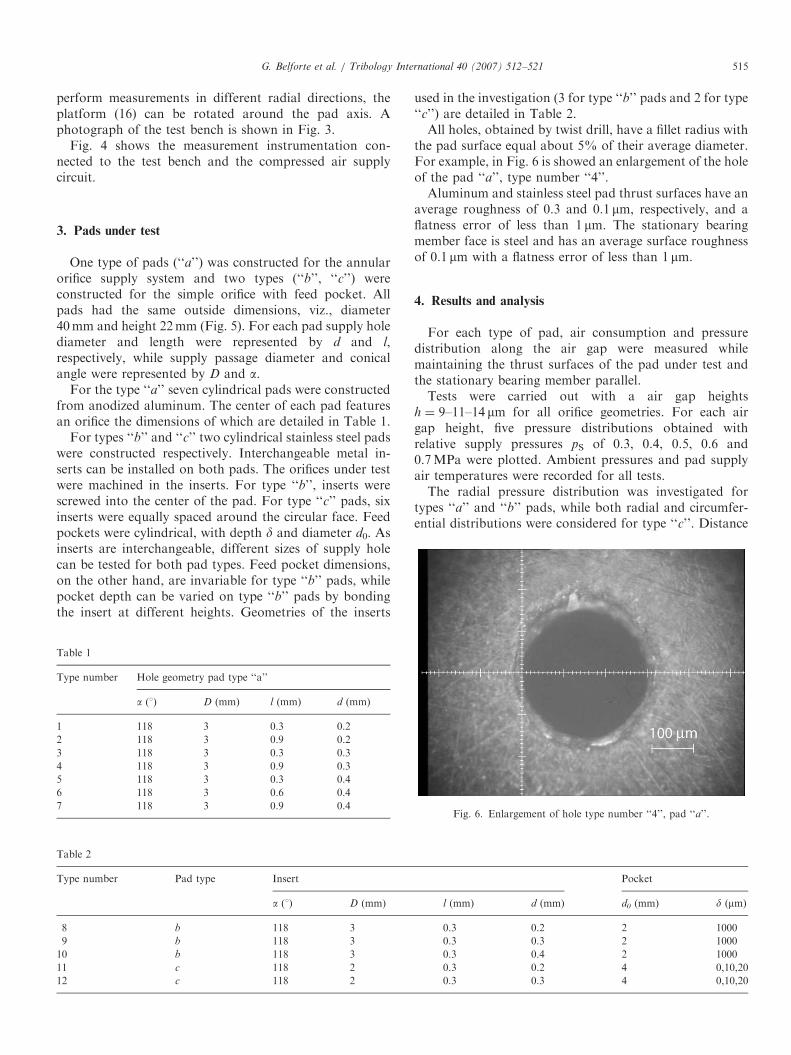
used in the investigation (3 for type ‘‘b’’ pads and 2 for type‘‘c’’) are detailed in Table 2.All holes, obtained by twist drill, have a fillet radius with
the pad surface equal about 5% of their average diameter.For example, in Fig. 6 is showed an enlargement of the holeof the pad ‘‘a’’, type number ‘‘4’’.Aluminum and stainless steel pad thrust surfaces have an
average roughness of 0.3 and 0.1 mm, respectively, and aflatness error of less than 1 mm. The stationary bearingmember face is steel and has an average surface roughnessof 0.1 mm with a flatness error of less than 1 mm.
4. Results and analysis
For each type of pad, air consumption and pressuredistribution along the air gap were measured whilemaintaining the thrust surfaces of the pad under test andthe stationary bearing member parallel.Tests were carried out with a air gap heights
h ¼ 9–11–14 mm for all orifice geometries. For each airgap height, five pressure distributions obtained withrelative supply pressures pS of 0.3, 0.4, 0.5, 0.6 and0.7MPa were plotted. Ambient pressures and pad supplyair temperatures were recorded for all tests.The radial pressure distribution was investigated for
types ‘‘a’’ and ‘‘b’’ pads, while both radial and circumfer-ential distributions were considered for type ‘‘c’’. Distance
ARTICLE IN PRESS
Table 2
Type number Pad type Insert Pocket
a (1) D (mm) l (mm) d (mm) d0 (mm) d (mm)
8 b 118 3 0.3 0.2 2 1000
9 b 118 3 0.3 0.3 2 1000
10 b 118 3 0.3 0.4 2 1000
11 c 118 2 0.3 0.2 4 0,10,20
12 c 118 2 0.3 0.3 4 0,10,20
Table 1
Type number Hole geometry pad type ‘‘a’’
a (1) D (mm) l (mm) d (mm)
1 118 3 0.3 0.2
2 118 3 0.9 0.2
3 118 3 0.3 0.3
4 118 3 0.9 0.3
5 118 3 0.3 0.4
6 118 3 0.6 0.4
7 118 3 0.9 0.4Fig. 6. Enlargement of hole type number ‘‘4’’, pad ‘‘a’’.
G. Belforte et al. / Tribology International 40 (2007) 512–521 515
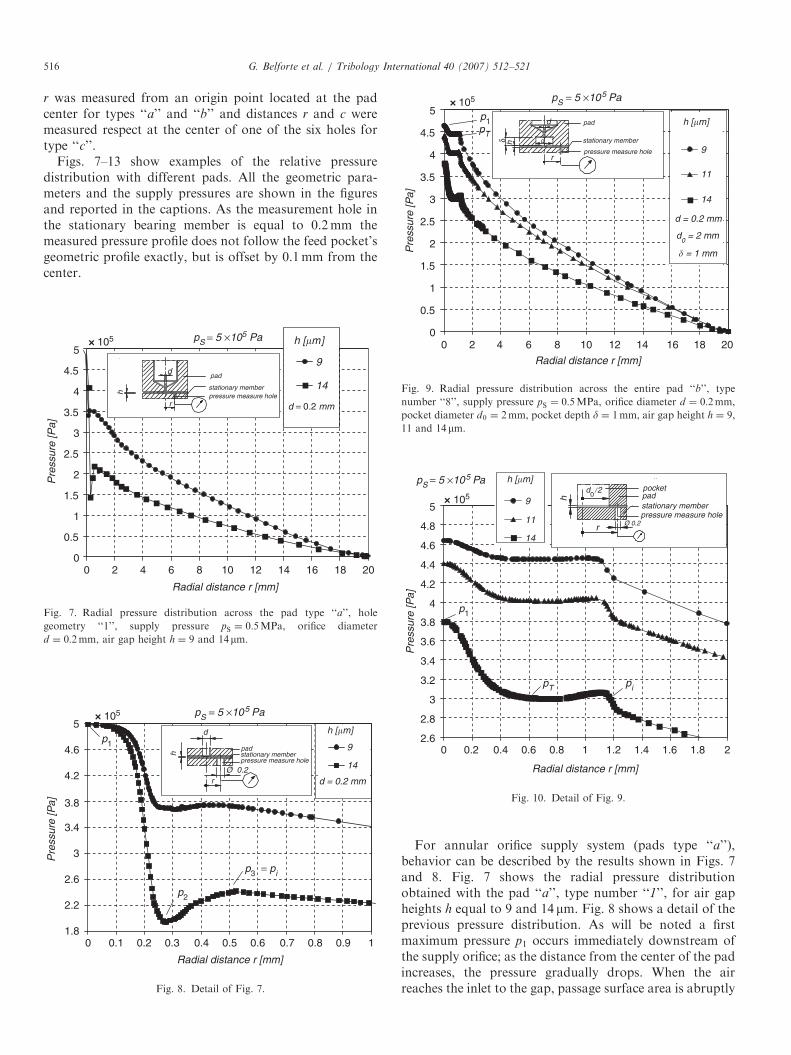
r was measured from an origin point located at the padcenter for types ‘‘a’’ and ‘‘b’’ and distances r and c weremeasured respect at the center of one of the six holes fortype ‘‘c’’.
Figs. 7–13 show examples of the relative pressuredistribution with different pads. All the geometric para-meters and the supply pressures are shown in the figuresand reported in the captions. As the measurement hole inthe stationary bearing member is equal to 0.2mm themeasured pressure profile does not follow the feed pocket’sgeometric profile exactly, but is offset by 0.1mm from thecenter.
For annular orifice supply system (pads type ‘‘a’’),behavior can be described by the results shown in Figs. 7and 8. Fig. 7 shows the radial pressure distributionobtained with the pad ‘‘a’’, type number ‘‘1’’, for air gapheights h equal to 9 and 14 mm. Fig. 8 shows a detail of theprevious pressure distribution. As will be noted a firstmaximum pressure p1 occurs immediately downstream ofthe supply orifice; as the distance from the center of the padincreases, the pressure gradually drops. When the airreaches the inlet to the gap, passage surface area is abruptly
ARTICLE IN PRESS
0
0.5
1
1.5
2
2.5
3
3.5
4
4.5
5
0 2 4 6 8 10 12 14 16 18 20
Pre
ssur
e [P
a]
pS = 5 ×10⁵ Pa h [�m]105×
d = 0.2 mm
h
d
stationary member
pad
pressure measure holer
Radial distance r [mm]
9
14
Fig. 7. Radial pressure distribution across the pad type ‘‘a’’, hole
geometry ‘‘1’’, supply pressure pS ¼ 0:5MPa, orifice diameter
d ¼ 0:2mm, air gap height h ¼ 9 and 14mm.
1.8
2.2
2.6
3
3.4
3.8
4.2
4.6
5
0 0.1 0.2 0.3 0.4 0.5 0.6 0.7 0.8 0.9 1
Pre
ssur
e [P
a]
14
h [�m]
d = 0.2 mm
105×
p2
p1
p3 = pi
d
h
Ø 0.2r
Radial distance r [mm]
pS = 5 ×10⁵ Pa
padstationary member pressure measure hole
9
Fig. 8. Detail of Fig. 7.
0
0.5
1
1.5
2
2.5
3
3.5
4
4.5
5
0 2 4 86 10 12 14 16 18 20
Pre
ssur
e [P
a]
d0 = 2 mm
d = 0.2 mm
p1pT
r
h d0
δ
d
stationary member
pad
pressure measure hole
Radial distance r [mm]
14
11
h [�m]
9
� = 1 mm
Fig. 9. Radial pressure distribution across the entire pad ‘‘b’’, type
number ‘‘8’’, supply pressure pS ¼ 0:5MPa, orifice diameter d ¼ 0:2mm,
pocket diameter d0 ¼ 2mm, pocket depth d ¼ 1mm, air gap height h ¼ 9,
11 and 14 mm.
2.6
2.8
3
3.2
3.4
3.6
3.8
4
4.2
4.4
4.6
4.8
5
0 0.2 0.4 0.6 0.8 1 1.2 1.4 1.6 1.8 2
Pre
ssur
e [P
a]
105×
pS = 5 ×10⁵ Pa
p1
pT pi
h
pressure measure holestationary memberpad
r
d0
/2 pocket
Ø 0.2
Radial distance r [mm]
14
11
h [�m]
9
Fig. 10. Detail of Fig. 9.
G. Belforte et al. / Tribology International 40 (2007) 512–521516

reduced and the flow is determined by inertia phenomena:pressure drops first to a minimum local value p2 and thenincreases to a maximum local value p3. This phenomenon iscalled pressure depression [10–13]. As the air flowcontinues through the gap, the viscous friction forcesbecome increasingly predominant, transforming it inlaminar flow. Defining ri the radius at which the distributedviscous resistance zone is completely developed and pi thecorresponding pressure, for these type of supply systems itresults pi ¼ p3. For all the cases experimentally considered
for pads type ‘‘a’’, the local maximum values of p3 arepositioned around radius ri ranging from 0.45 to 0.8mm,which depends on the orifice diameter d and the gap heighth. Results obtained showed that the radius ri may beapproximated by the following equation:
ri ¼d
2þ 40 h (2)
or in dimensionless form:
r̄i ¼ r̄þ 40, (3)
where r̄i ¼ ri=h; r̄ ¼ d=2h.For simple orifices with feed pocket (pads type ‘‘b’’, ‘‘c’’),
behavior can be described by the results shown inFigs. 9–13.For very deep pockets (d ¼ 1mm, pad type ‘‘b’’), an
example of total radial pressure distribution across the padtype ‘‘8’’, with supply pressure pS equal to 0.5MPa, and airgap heights h equal to 9, 11 and 14 mm is shown in Fig. 9.A detail of the pressure distribution in the area adjacent tothe supply orifice is shown in Fig. 10. Maximum pressurep1 occurs immediately downstream of the supply orifice. Asthe distance from the center of the pad increases, thepressure gradually drops until it reaches a nearly constantlevel then rises slightly ahead of the inlet section of the airgap. The value of pressure pT in the pocket is measured atthe point where pressure distribution has zero slope. Whenthe air reaches the inlet to the gap, passage surface area isabruptly reduced, and pressure drops abruptly to the valuepi measured just after the gap inlet. Then the pressuregradual drops again as viscous friction forces becomepredominant.
ARTICLE IN PRESS
00 1 2 3 4 5 6 7
0.4
0.8
1.2
1.6
2
2.4
2.8
3.2
3.6
4
8
Radial distance r [mm]
Pre
ssur
e [P
a]
d0 = 4 mm
d = 0.2 mm
h = 11 �m� = 20 �m
δ
d
d0
h
r
stationary member
pad
pressure measure hole
Fig. 11. Radial pressure distribution across pad ‘‘c’’, type number ‘‘11’’,
supply pressure pS ¼ 0:4MPa, orifice diameter d ¼ 0:2mm, pocket
diameter d0 ¼ 4mm, pocket depth d ¼ 20mm, air gap height h ¼ 11mm.
0.5
1
1.5
2
2.5
3
3.5
4
4.5
5
1 2 3 4 5 6
Circumferential distance c [mm]
Pre
ssur
e [P
a]
14 20
9 10
14 10
]m[
h
µ ]m[µδ
δ h
d0/2
d
stationary memberpressure measure hole
c
insertpad
1.25
Ø 0.2
105× pS = 5 ×10⁵ Pa
Fig. 12. Circumferential pressure distribution across pad ‘‘c’’, type
number ‘‘11’’, supply pressure pS ¼ 0:5MPa, orifice diameter
d ¼ 0:2mm, pocket diameter d0 ¼ 4mm, pocket depth d ¼ 10 and
20mm, air gap height h ¼ 9 and 14mm.
0
1
2
3
4
5
0 1 2 53 4 6
Pre
ssur
e [P
a]
Radial distrib.
Circumferentialdistrib. hδ
rd
0 /2
d 12.5
r
stationary memberpressure measure hole
c
Distance [mm]
insert pad
Ø 0.2
h = 9 �m
d0 = 4 mm
d = 0.3 mm
� = 20 �m
Fig. 13. Radial and circumferential pressure distribution across pad ‘‘c’’,
type number ‘‘12’’, supply pressure pS ¼ 0:5MPa, orifice diameter
d ¼ 0:3mm, pocket diameter d0 ¼ 4mm, pocket depth d ¼ 20mm, air
gap height h ¼ 9mm.
G. Belforte et al. / Tribology International 40 (2007) 512–521 517

For shallow pockets (d ¼ 10 mm and 20 mm, pad type‘‘c’’) the behavior of the pressure distribution is similar tothat one of deep pockets. Figs. 11 and 12 show examples ofpressure distributions in the area adjacent to one of the sixorifices of the pad type ‘‘11’’. In particular, Fig. 11 showsthe radial pressure distributions measured with supplypressure pS equal to 0.4MPa, pocket depth d equal to20 mm and air gap heights h equal to 11 mm; Fig. 12 showsthe circumferential pressure distribution with supplypressure pS equal to 0.5MPa, pocket depth d equal to 10and 20 mm and air gap heights h equal to 9 and 11 mm. Forpad type ‘‘c’’ positioning the pressure measurement holebelow the orifice under test proved to be difficult.Consequently, certain cases such as those shown inFig. 11 exhibited no pressure peak p1 in the pocket, whereonly the value pT was recorded.
For all the cases experimentally considered for annularorifices (pads type ‘‘b’’, ‘‘c’’), it can be seen that thebehavior of the distribution of pressure depends, beyondfrom h and d, also strongly from d. If dXh (Figs. 10, 11), auniform pressure is reached in the pocket, whereas if doh
(Fig. 12), the pocket’s resistive effect predominates over thecapacitive effect, and there is a slight reduction in thepressure along the pocket. In practice, this reduction isnegligible by comparison with the pressure drop in the airgap, as the dimensions of the pocket are so much smallerthan those of the pad. If d� h the reduction in thepressure along the pocket is not negligible and the resultsare similar to the ones of the feeding system with annularorifice. Moreover for pad type ‘‘c’’ a comparison of allradial and circumferential pressure distributions indicatesthat they exhibit a sufficient degree of axial symmetry withrespect to the orifice axis; an example is shown in Fig. 13.
In order to evaluate discharge coefficients, all the padsystems considered in the investigation can be approxi-mated by a simpler pneumatic systems consisting of somelumped resistances in series: the hole resistance, the gapinlet resistance and the viscous resistance along the gap.
For the annular orifice the hole resistance and the gapinlet resistance can be group in a single resistance whichcause pressure drops pS � pi. In this case we can define adischarge coefficient Cd,c for the pressure drops pS � pi
considering the supply orifice circular section of diameter d
as the air passage section.For the simple orifices with feed pocket the hole
resistance and the gap inlet resistance are independentand cause pressure drops pS � pT and pT � pi, respectively.It is thus possible to distinguish between two dischargecoefficients, one for each of the two localized pressuredrops. Discharge coefficient Cd,c for the first pressure droppS � pT is calculated considering, likewise for the annularorifice systems, the supply orifice’s circular section ofdiameter d as the air passage section. Discharge coefficientCd,a for the second pressure drop pT � pi is calculated bytaking the annular section of height h and diameter d0 asthe passage section. Both discharge coefficients must bedefined if the pocket is sufficiently deep (d420 mm); if it is
not (dp20mm), pT ffi pi and we can neglect the pressuredrop at the gap inlet section, defining only coefficient Cd,c.The theoretical air-flow rate through each lumped
resistance is given by
Gt ¼ SPu
ffiffiffiffiffiffiffiffiffiffiffiffiffiffiffiffiffiffiffiffiffiffiffiffiffiffiffiffiffiffiffiffiffiffiffiffiffiffiffiffiffiffiffiffiffiffiffiffiffiffiffiffiffiffiffiffiffiffiffiffiffiffiffiffiffiffiffiffiffiffiffiffiffiffik
k � 1
Pd
Pu
� �2=k
�Pd
Pu
� �ðkþ1Þ=k" #
2
RT
vuutif
Pd
PuX0:528,
Gt ¼ SPu
ffiffiffiffiffiffiffiffiffiffiffiffiffiffiffiffiffiffiffiffiffiffiffiffiffiffiffiffiffiffiffiffiffiffiffiffiffiffiffiffiffiffiffiffiffiffiffiffiffiffiffiffiffiffiffiffi2
k þ 1
� �2=ðk�1Þk
k þ 1
� �2
RT
sif
Pd
Puo0:528,
ð4Þ
where Pu and Pd are the resistances’ upstream anddownstream absolute pressures, T is the absolute tempera-ture upstream of the nozzle, S is the passage section area,R ¼ 287:1 J=ðkgKÞ is the air constant, and k ¼ 1:4 is thespecific heat ratio of air at constant pressure and volume.As Gt and G are known, the values of Cd,c and Cd,a were
calculated using Eq. (1).In order to allow for the effect of geometric parameters
and flow conditions on system operation, we defined Cd,c
and Cd,a as a function of the Reynolds number Re.Considering the characteristic dimension to be diameter
d for the circular passage section, and height h for theannular passage section, the Reynolds numbers for the twosections are, respectively,
Rec ¼rud
m¼
4G
pdm; Rea ¼
ruh
m¼
G
pd0m, (5)
where r, u and m are, respectively, the density, velocity anddynamic viscosity of air.
ARTICLE IN PRESS
0.05
0.1
0.15
0.2
0.25
0.3
0.35
0.4
0 2000 4000 6000 8000Rec
Cd,
c
0.2 0.3 9
0.2 0.3 11
0.2 0.3 14
0.2 0.9
0.9
0.9
0.9
0.9
0.9
0.9
9
0.2 11
0.2 14
0.3 9
0.3 11
0.3
0.3
0.3
0.3 14
0.3 9
0.3 11
0.3
0.3
14
0.4
0.4
0.4
0.4
0.4
0.4
0.3 11
14
0.6
0.6
0.6
9
11
14
11
[mm] [mm] [�m]
d l h
Fig. 14. Experimental values for Cd,c versus Rec for obtained for the pads
type ‘‘a’’.
G. Belforte et al. / Tribology International 40 (2007) 512–521518
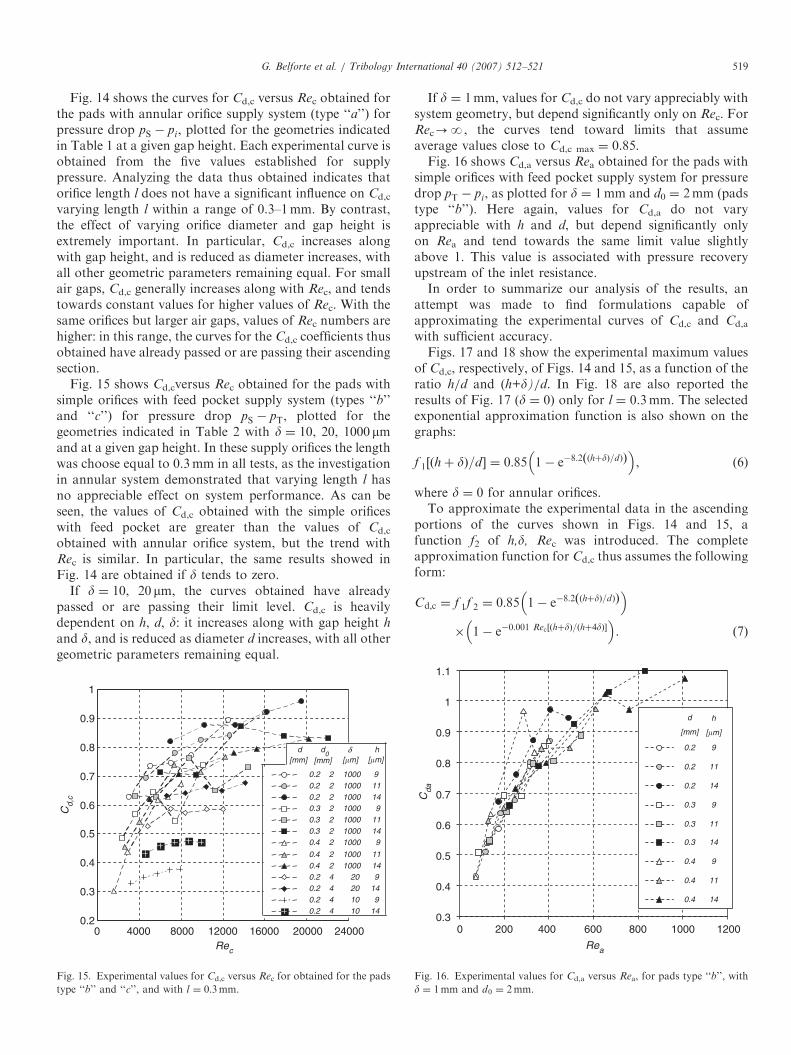
Fig. 14 shows the curves for Cd,c versus Rec obtained forthe pads with annular orifice supply system (type ‘‘a’’) forpressure drop pS � pi, plotted for the geometries indicatedin Table 1 at a given gap height. Each experimental curve isobtained from the five values established for supplypressure. Analyzing the data thus obtained indicates thatorifice length l does not have a significant influence on Cd,c
varying length l within a range of 0.3–1mm. By contrast,the effect of varying orifice diameter and gap height isextremely important. In particular, Cd,c increases alongwith gap height, and is reduced as diameter increases, withall other geometric parameters remaining equal. For smallair gaps, Cd,c generally increases along with Rec, and tendstowards constant values for higher values of Rec. With thesame orifices but larger air gaps, values of Rec numbers arehigher: in this range, the curves for the Cd,c coefficients thusobtained have already passed or are passing their ascendingsection.
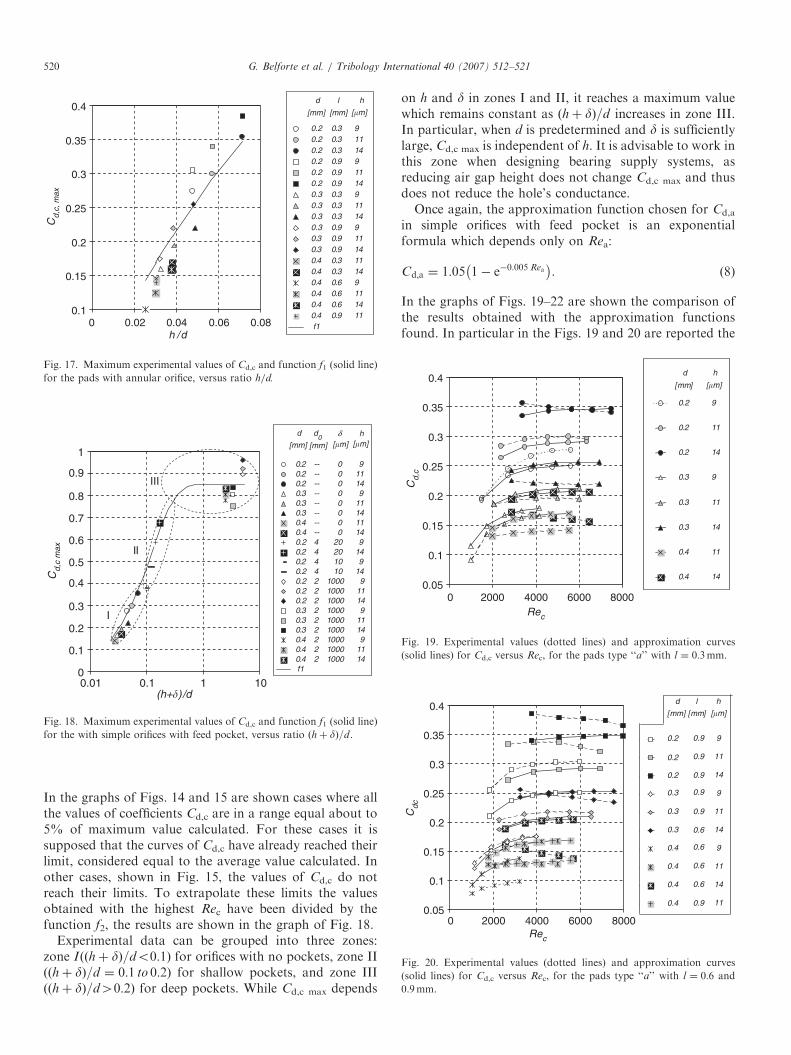
Fig. 15 shows Cd,cversus Rec obtained for the pads withsimple orifices with feed pocket supply system (types ‘‘b’’and ‘‘c’’) for pressure drop pS � pT, plotted for thegeometries indicated in Table 2 with d ¼ 10, 20, 1000 mmand at a given gap height. In these supply orifices the lengthwas choose equal to 0.3mm in all tests, as the investigationin annular system demonstrated that varying length l hasno appreciable effect on system performance. As can beseen, the values of Cd,c obtained with the simple orificeswith feed pocket are greater than the values of Cd,c
obtained with annular orifice system, but the trend withRec is similar. In particular, the same results showed inFig. 14 are obtained if d tends to zero.
If d ¼ 10, 20 mm, the curves obtained have alreadypassed or are passing their limit level. Cd,c is heavilydependent on h, d, d: it increases along with gap height h
and d, and is reduced as diameter d increases, with all othergeometric parameters remaining equal.
If d ¼ 1mm, values for Cd,c do not vary appreciably withsystem geometry, but depend significantly only on Rec. ForRec-N, the curves tend toward limits that assumeaverage values close to Cd,c max ¼ 0.85.Fig. 16 shows Cd,a versus Rea obtained for the pads with
simple orifices with feed pocket supply system for pressuredrop pT � pi, as plotted for d ¼ 1mm and d0 ¼ 2mm (padstype ‘‘b’’). Here again, values for Cd,a do not varyappreciable with h and d, but depend significantly onlyon Rea and tend towards the same limit value slightlyabove 1. This value is associated with pressure recoveryupstream of the inlet resistance.In order to summarize our analysis of the results, an
attempt was made to find formulations capable ofapproximating the experimental curves of Cd,c and Cd,a
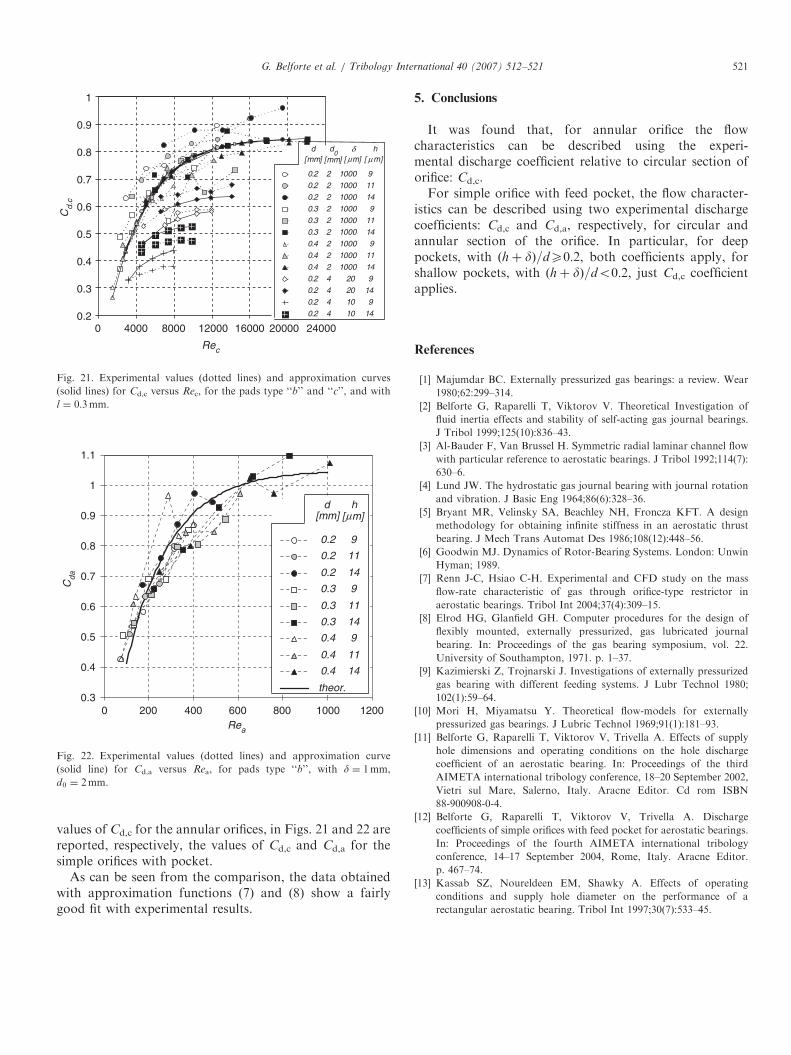
with sufficient accuracy.Figs. 17 and 18 show the experimental maximum values
of Cd,c, respectively, of Figs. 14 and 15, as a function of theratio h/d and (h+d)/d. In Fig. 18 are also reported theresults of Fig. 17 (d ¼ 0) only for l ¼ 0.3mm. The selectedexponential approximation function is also shown on thegraphs:
f 1½ðhþ dÞ=d� ¼ 0:85 1� e�8:2 ðhþdÞ=dÞð Þ� �
, (6)
where d ¼ 0 for annular orifices.To approximate the experimental data in the ascending
portions of the curves shown in Figs. 14 and 15, afunction f2 of h,d, Rec was introduced. The completeapproximation function for Cd,c thus assumes the followingform:
Cd;c ¼ f 1f 2 ¼ 0:85 1� e�8:2 ðhþdÞ=dÞð Þ� �
� 1� e�0:001 Rec½ðhþdÞ=ðhþ4dÞ�� �
. ð7Þ
ARTICLE IN PRESS
0.2
0.3
0.4
0.5
0.6
0.7
0.8
0.9
1
0 4000 8000 12000 16000 20000 24000Rec
Cd,
c
d
0.2 2 1000 90.2 2 1000 110.2 2 1000 140.3 2 1000 90.3 2 1000 110.3 2 1000 140.4 2 1000 9
0.4 2 1000 110.4 2 1000 140.2 4 20 90.2 4 20 140.2 4 10 90.2 4 10 14
[�m]δ
[�m]h
[mm]d
0[mm]
Fig. 15. Experimental values for Cd,c versus Rec for obtained for the pads
type ‘‘b’’ and ‘‘c’’, and with l ¼ 0:3mm.
0.3
0.4
0.5
0.6
0.7
0.8
0.9
1
1.1
0 200 400 600 800 1000 1200
Rea
Cda
0.2 9
0.2 11
0.2 14
0.3 9
0.3 11
0.3 14
0.4 9
0.4 11
0.4 14
[mm]
d
[�m]
h
Fig. 16. Experimental values for Cd,a versus Rea, for pads type ‘‘b’’, with
d ¼ 1mm and d0 ¼ 2mm.
G. Belforte et al. / Tribology International 40 (2007) 512–521 519
In the graphs of Figs. 14 and 15 are shown cases where allthe values of coefficients Cd,c are in a range equal about to5% of maximum value calculated. For these cases it issupposed that the curves of Cd,c have already reached theirlimit, considered equal to the average value calculated. Inother cases, shown in Fig. 15, the values of Cd,c do notreach their limits. To extrapolate these limits the valuesobtained with the highest Rec have been divided by thefunction f2, the results are shown in the graph of Fig. 18.
Experimental data can be grouped into three zones:zone Iððhþ dÞ=do0:1Þ for orifices with no pockets, zone IIððhþ dÞ=d ¼ 0:1 to 0:2Þ for shallow pockets, and zone IIIððhþ dÞ=d40:2Þ for deep pockets. While Cd,c max depends
on h and d in zones I and II, it reaches a maximum valuewhich remains constant as ðhþ dÞ=d increases in zone III.In particular, when d is predetermined and d is sufficientlylarge, Cd,c max is independent of h. It is advisable to work inthis zone when designing bearing supply systems, asreducing air gap height does not change Cd,c max and thusdoes not reduce the hole’s conductance.Once again, the approximation function chosen for Cd,a
in simple orifices with feed pocket is an exponentialformula which depends only on Rea:
Cd;a ¼ 1:05 1� e�0:005 Rea� �
. (8)
In the graphs of Figs. 19–22 are shown the comparison ofthe results obtained with the approximation functionsfound. In particular in the Figs. 19 and 20 are reported the
ARTICLE IN PRESS
0.1
0.15
0.2
0.25
0.3
0.35
0.4
0 0.02 0.04 0.06 0.08
Cd,
c, m
ax
0.2 0.3 90.2 0.3 110.2 0.3 140.2 0.9 90.2 0.9 110.2 0.9 140.3 0.3 90.3 0.3 110.3 0.3 140.3 0.9 90.3 0.9 110.3 0.9 140.4 0.3 110.4 0.3 140.4 0.6 90.4 0.6 110.4 0.6 140.4 0.9 11f1
[mm]
d
[mm]
l
[�m]
h
h /d
Fig. 17. Maximum experimental values of Cd,c and function f1 (solid line)
for the pads with annular orifice, versus ratio h/d.
0
0.1
0.2
0.3
0.4
0.5
0.6
0.7
0.8
0.9
1
0.01 0.1 1 10
Cd,
c m
ax
0.2 -- 0 90.2 -- 0 110.2 -- 0 140.3 -- 0 90.3 -- 0 110.3 -- 0 140.4 -- 0 110.4 -- 0 140.2 4 20 90.2 4 20 140.2 4 10 90.2 4 10 140.2 2 1000 90.2 2 1000 110.2 2 1000 140.3 2 1000 90.3 2 1000 110.3 2 1000 140.4 2 1000 90.4 2 1000 110.4 2 1000 14f1
δ hd0
I
II
III
d
(h+�)/d
[mm] [mm] [�m] [�m]
Fig. 18. Maximum experimental values of Cd,c and function f1 (solid line)
for the with simple orifices with feed pocket, versus ratio ðhþ dÞ=d.
0.05
0.1
0.15
0.2
0.25
0.3
0.35
0.4
0 2000 4000 6000 8000Rec
Cd,
c0.2 9
0.2 11
0.2 14
0.3 9
0.3 11
0.3 14
0.4 11
0.4 14
]mm[
d
[�m]
h
Fig. 19. Experimental values (dotted lines) and approximation curves
(solid lines) for Cd,c versus Rec, for the pads type ‘‘a’’ with l ¼ 0:3mm.
0.05
0.1
0.15
0.2
0.25
0.3
0.35
0.4
0 2000 4000 6000 8000Rec
Cdc
0.2
0.2
0.2
9
0.9
0.9
0.9
0.9
0.9
0.9
11
14
9
0.3
0.3
11
0.3 14
0.4 9
0.4 11
0.4
0.4
14
11
mm][
d
]mm[
l
[�m]
h
0.6
0.6
0.6
0.6
Fig. 20. Experimental values (dotted lines) and approximation curves
(solid lines) for Cd,c versus Rec, for the pads type ‘‘a’’ with l ¼ 0:6 and
0.9mm.
G. Belforte et al. / Tribology International 40 (2007) 512–521520
values of Cd,c for the annular orifices, in Figs. 21 and 22 arereported, respectively, the values of Cd,c and Cd,a for thesimple orifices with pocket.
As can be seen from the comparison, the data obtainedwith approximation functions (7) and (8) show a fairlygood fit with experimental results.
5. Conclusions
It was found that, for annular orifice the flowcharacteristics can be described using the experi-mental discharge coefficient relative to circular section oforifice: Cd,c.For simple orifice with feed pocket, the flow character-
istics can be described using two experimental dischargecoefficients: Cd,c and Cd,a, respectively, for circular andannular section of the orifice. In particular, for deeppockets, with ðhþ dÞ=dX0:2, both coefficients apply, forshallow pockets, with ðhþ dÞ=do0:2, just Cd,c coefficientapplies.
References
[1] Majumdar BC. Externally pressurized gas bearings: a review. Wear
1980;62:299–314.
[2] Belforte G, Raparelli T, Viktorov V. Theoretical Investigation of
fluid inertia effects and stability of self-acting gas journal bearings.
J Tribol 1999;125(10):836–43.
[3] Al-Bauder F, Van Brussel H. Symmetric radial laminar channel flow
with particular reference to aerostatic bearings. J Tribol 1992;114(7):
630–6.
[4] Lund JW. The hydrostatic gas journal bearing with journal rotation
and vibration. J Basic Eng 1964;86(6):328–36.
[5] Bryant MR, Velinsky SA, Beachley NH, Froncza KFT. A design
methodology for obtaining infinite stiffness in an aerostatic thrust
bearing. J Mech Trans Automat Des 1986;108(12):448–56.
[6] Goodwin MJ. Dynamics of Rotor-Bearing Systems. London: Unwin
Hyman; 1989.
[7] Renn J-C, Hsiao C-H. Experimental and CFD study on the mass
flow-rate characteristic of gas through orifice-type restrictor in
aerostatic bearings. Tribol Int 2004;37(4):309–15.
[8] Elrod HG, Glanfield GH. Computer procedures for the design of
flexibly mounted, externally pressurized, gas lubricated journal
bearing. In: Proceedings of the gas bearing symposium, vol. 22.
University of Southampton, 1971. p. 1–37.
[9] Kazimierski Z, Trojnarski J. Investigations of externally pressurized
gas bearing with different feeding systems. J Lubr Technol 1980;
102(1):59–64.
[10] Mori H, Miyamatsu Y. Theoretical flow-models for externally
pressurized gas bearings. J Lubric Technol 1969;91(1):181–93.
[11] Belforte G, Raparelli T, Viktorov V, Trivella A. Effects of supply
hole dimensions and operating conditions on the hole discharge
coefficient of an aerostatic bearing. In: Proceedings of the third
AIMETA international tribology conference, 18–20 September 2002,
Vietri sul Mare, Salerno, Italy. Aracne Editor. Cd rom ISBN
88-900908-0-4.
[12] Belforte G, Raparelli T, Viktorov V, Trivella A. Discharge
coefficients of simple orifices with feed pocket for aerostatic bearings.
In: Proceedings of the fourth AIMETA international tribology
conference, 14–17 September 2004, Rome, Italy. Aracne Editor.
p. 467–74.
[13] Kassab SZ, Noureldeen EM, Shawky A. Effects of operating
conditions and supply hole diameter on the performance of a
rectangular aerostatic bearing. Tribol Int 1997;30(7):533–45.
ARTICLE IN PRESS
0.2
0.3
0.4
0.5
0.6
0.7
0.8
0.9
1
0 4000 8000 12000 16000 20000 24000
Rec
Cd.
c
0.2 2 1000 9
0.2 2 1000 11
0.2 2 1000 14
0.3 2 1000 9
0.3 2 1000 11
0.3 2 1000 14
0.4 2 1000 9
0.4 2 1000 11
0.4 2 1000 14
0.2 4 20 9
0.2 4 20 14
0.2 4 10 9
0.2 4 10 14
]mm[d
]m[h
µ]mm[d
0]m[ µ
δ
Fig. 21. Experimental values (dotted lines) and approximation curves
(solid lines) for Cd,c versus Rec, for the pads type ‘‘b’’ and ‘‘c’’, and with
l ¼ 0:3mm.
0.3
0.4
0.5
0.6
0.7
0.8
0.9
1
1.1
0 200 400 600 800 1000 1200Rea
Cda
0.2 9
0.2 11
0.2 14
0.3 9
0.3 11
0.3 14
0.4 9
0.4 11
0.4 14
theor.
[mm]d
]m[h
µ
Fig. 22. Experimental values (dotted lines) and approximation curve
(solid line) for Cd,a versus Rea, for pads type ‘‘b’’, with d ¼ 1mm,
d0 ¼ 2mm.
G. Belforte et al. / Tribology International 40 (2007) 512–521 521