Characterising the fish habitats of the Recherche Archipelago

Tm
SGMa
b
c
d
e
f
g
h
a
ARRA
KTEEEFE
1
ta1t
h0
Ecological Modelling 312 (2015) 91–101
Contents lists available at ScienceDirect
Ecological Modelling
journa l h om epa ge: www.elsev ier .com/ locate /eco lmodel
he mosaic of habitats of the Seine estuary: Insights from food-webodelling and network analysis
amuele Tecchioa,∗, Armonie Tous Riusa, Jean-Claude Dauvinb, Jérémy Lobryc,éraldine Lassallec, Jocelyne Morind, Nicolas Bacqe, Marie Cachera f, Aurélie Chaalali a,g,aria Ching Villanuevah, Nathalie Niquil a
Normandie Université UNICAEN, UMR BOREA (MNHN, UPMC, CNRS-7208, IRD-207), CS 14032, 14000 Caen, FranceNormandie Université UNICAEN, UMR M2C (UCBN, UR, CNRS-6143), 24 rue des Tilleuls, 14000 Caen Cedex, FranceIRSTEA, UR EABX (Aquatic Ecosystems and Global Changes), 50 avenue de Verdun, 33612 Cestas Cedex, FranceIFREMER, avenue du Général de Gaulle, 14520 Port-en-Bessin, FranceGroupement d’Intérêt Public “Seine-Aval”, 115 boulevard de l’Europe, 76100 Rouen, FranceIFREMER, Laboratoire Ressources Halieutiques, 150 quai Gambetta, BP 699, 62321 Boulogne sur Mer, FranceIFREMER, Fisheries Ecology and Modeling Department, 44311 Nantes Cedex 3, FranceIFREMER, Laboratoire de Biologie Halieutique, Pointe du Diable, BP 70, 29280 Plouzané, France
r t i c l e i n f o
rticle history:eceived 30 January 2015eceived in revised form 19 May 2015ccepted 23 May 2015
eywords:rophic networkstuarycological network analysiscopath with Ecosimood webcosystem health indicators
a b s t r a c t
Ecological network analysis was applied in the Seine estuary ecosystem, northern France, integratingecological data from the years 1996 to 2002. The Ecopath with Ecosim (EwE) approach was used to modelthe trophic flows in 6 spatial compartments leading to 6 distinct EwE models: the navigation channel andthe two channel flanks in the estuary proper, and 3 marine habitats in the eastern Seine Bay. Each modelincluded 12 consumer groups, 2 primary producers, and one detritus group. Ecological network analy-sis was performed, including a set of indices, keystoneness, and trophic spectrum analysis to describethe contribution of the 6 habitats to the Seine estuary ecosystem functioning. Results showed that thetwo habitats with a functioning most related to a stressed state were the northern and central naviga-tion channels, where building works and constant maritime traffic are considered major anthropogenicstressors. The strong top-down control highlighted in the other 4 habitats was not present in the cen-tral channel, showing instead (i) a change in keystone roles in the ecosystem towards sediment-based,lower trophic levels, and (ii) a higher system omnivory. The southern channel evidenced the highestsystem activity (total system throughput), the higher trophic specialisation (low system omnivory), andthe lowest indication of stress (low cycling and relative redundancy). Marine habitats showed higher
fish biomass proportions and higher transfer efficiencies per trophic levels than the estuarine habitats,with a transition area between the two that presented intermediate ecosystem structure. The modellingof separate habitats permitted disclosing each one’s response to the different pressures, based on theira priori knowledge. Network indices, although non-monotonously, responded to these differences andseem a promising operational tool to define the ecological status of transitional water ecosystems.© 2015 Elsevier B.V. All rights reserved.
. Introduction
Estuaries are at the interface of marine and freshwater ecosys-ems, and are usually characterised by high human activities and,
ccordingly, by high levels of anthropogenic pressure (Fairbridge,980; McLusky and Elliott, 2004). At the same time, they are amonghe most productive water ecosystems, of extreme importance∗ Corresponding author. Tel.: +33 231565102.E-mail address: [email protected] (S. Tecchio).
ttp://dx.doi.org/10.1016/j.ecolmodel.2015.05.026304-3800/© 2015 Elsevier B.V. All rights reserved.
for biogeochemical cycles and for marine resources exploitation(Wilson, 2002). The importance of studying the effects of anthro-pogenic impact on estuarine ecosystems has increased in the lastdecade, especially in light of the Water Framework Directive, whichmandates achieving “good environmental status” of all Europeanwater bodies by 2015–2021. However, the methods for evaluatingenvironmental status are varied, addressing the issue at different
scales (i.e. from populations to ecosystems), while a standardisedmethodology is still under discussion.The Estuarine Quality Paradox refers to the issue of discern-ing human-driven stress in estuarine ecosystems, which are by

9 l Mod
b(dt(oapbtAtcmaahtus2
Ftipefi(iwatthlcni(ocfic(
btr(pb–smsCeti(nhidw
2 S. Tecchio et al. / Ecologica
aseline subject to high levels of natural environmental stressDauvin, 2007; Elliott and Quintino, 2007). Stress, in this context, isefined as a modification of ecosystem processes due to a responseo an extended pressure from an external event or variable changeOdum, 1985). The paradox was identified particularly in the usef benthic community indicators, which are based on biodiversityssessments (Dauvin and Ruellet, 2009). In addition, the com-lexity of an estuary calls for a comprehensive consideration ofoth its internal dynamics and its ecological connections withhe proximal marine biota (Able, 2005; Vinagre and Costa, 2014).
possible solution is the application of the ecosystem approacho ecological analysis, by which all species in the system areonsidered together, along with all flows and processes. Food-webodelling uses a series of linear equations to estimate values of
ll carbon flows occurring in a natural system, which can then benalysed with Ecological Network Analysis (ENA) indicators. Theolistic ENA indices derived from food-web models were showno partially discriminate natural from human pressures, and theirse has been successfully applied in estuaries around Europeaneas (Baird and Ulanowicz, 1993; Christian et al., 2005; Lobry et al.,008; Patrício and Marques, 2006).
The Seine estuary is a mega-tidal estuary located in northernrance, the third largest estuarine ecosystem in the country afterhe Gironde and Loire along the French Atlantic coast, dischargingts waters into the English Channel (Meybeck et al., 1998). Anthro-ogenic pressures in the forms of water pollutants, landscapengineering, bridges and port building works, have all been identi-ed as major shapers of the Seine estuary macrofauna assemblagesDauvin et al., 2008, 2010). The Seine is the most polluted rivern France, receiving human pressures from a highly-industrialised
atershed, with important agricultural activities and inhabited bypproximately 17 million people. The Seine estuary represents aypical estuarine ecosystem, highly stressed both by natural fluc-uations and anthropogenic pressures, while at the same timeosting high levels of productivity (Dauvin and Desroy, 2005). A
arge part of the mouth of the estuary is included in a Natura2000ommon interest area of the European Union and in a nationalatural reserve; however, no particular restrictions are in effect
n the area. In addition, a new expansion of the Le Havre harbourPort2000) was built in recent years, further eroding the surfacef intertidal zones and increasing maritime traffic. Using ecologi-al quality indicators, a previous assessment provided no definitendings on ecological status and concluded on the inability of dis-riminating between human pressures and habitat characteristicsBlanchet et al., 2008).
Various modelling efforts related to the English Channel haveeen performed over the years. In 2003, a first estimation of therophic flows and biomasses in the Seine estuary was published,epresenting the state of the coastal system in the years 1996–1999Rybarczyk and Elkaïm, 2003). Their results showed a highly-roductive ecosystem, far from ecological maturity as indicatedy network analysis – an indication of stress (Christensen, 1995)
and more dependent than other estuaries on external sourcesuch as river discharge. Rybarczyk et al. (2003) applied the sameodelling approach in the Bay of Somme, another large estuarine
ystem along the French coast of the eastern part of the Englishhannel. Another inverse modelling effort studied the whole east-rn English Channel, finding a dominance of benthic carnivores inhe food web, and evidences of differences in ecosystem function-ng when the sediment benthic habitats were taken into accountGarcia et al., 2011). In particular, productivity and biological rich-ess of estuaries were related to the capacity of their mosaic of
abitats to perform functions essential to the life cycles of speciesnhabiting them (McLusky and Elliott, 2004). However, a moreetailed analysis of the various habitats forming the Seine estuary,orking at the ecosystem scale, has not been performed to date.
elling 312 (2015) 91–101
Moreover, the use and applicability of ENA to discern natural fromanthropogenic stress, and thus their capability of circumventingthe Estuarine Quality Paradox, although promising, has not beenunequivocally demonstrated yet (Niquil et al., 2012).
In this work, we first describe the set up and balancing of 6food-web models for different habitats of the Seine estuary, north-ern France, using the Ecopath with Ecosim approach. Modelling anecosystem as a mosaic of habitats has been infrequently attempted(Baird et al., 2007; Vinagre and Costa, 2014). Then, we perform ENAon the resulting flow webs, to: (a) analyse the contribution of habi-tats and their key roles to the Seine estuary functioning, and (b)discuss the goodness of fit of ENA indices to environmental andanthropogenic stress and their use for ecosystem health manage-ment. This second objective is timely to recent European Unioncalls on assessing the applicability of ENA as ecosystem health indi-cators, considering the particular situation and scale of the Seineestuary as a case-study.
2. Materials and methods
2.1. Study area
The Seine estuary and the adjacent western part of the Seine Baywere split into 6 spatial compartments, which were modelled sep-arately (Fig. 1). Within the downstream part of the estuary proper,we identified three estuarine habitats, i.e. the northern channel(Fosse Nord, FN), the southern channel (Fosse Sud, FS) and the centralnavigation channel (Chenal, CH). Extending into the eastern SeineBay, we identified 3 other spatial marine compartments based ontheir sediment composition and benthic habitat type (E4, E14, andE2), following guidelines by the European Union Nature Informa-tion System (EUNIS classification of benthic habitats). Due to thegeneral current regimes in the Bay, and as the discharge plume ofthe Seine river flows primarily adjacent to the southern coast, themarine habitats under its influence were mainly E4 and E14, whilethe E2 was considered the habitat under the least influence of theplume (Salomon and Breton, 1991). We will refer to “habitats” fromnow on as the modelled spatial compartments, which representhomogenous zones from the hydro-sedimentary and salinity pointsof view. To better disclose this, we identified and summarised thelevels of external pressures on each of the 6 habitats, by using aqualitative scale that ranged from − (no impact) to +++ (very highimpact), according to both a literature review and the expert judge-ment of J.C. Dauvin.
The construction of the Le Havre harbour extension, calledPort2000, started in the year 2002 and finished in 2005. As ourobjective was to exclude the impact of the harbour construction,which will be evaluated at a later date, models were set up rep-resenting the condition of each spatial compartment in the yearsbefore Port2000 construction, i.e. 1996–2002, for which an exten-sive dataset is available. The qualitative recollection of data abovedescribed was also relative on the same period.
2.2. Modelling approach
We used the Ecopath with Ecosim approach and software to esti-mate the carbon flows in the food webs. Ecopath is a mass-balance,single-solution model that uses linear equations to estimate flowsbetween a number of functional groups established a priori(Christensen and Walters, 2004). Each group is parameterised with,at least, its biomass (B, gC m−2), its production rate over biomass
(P/B, year−1), its consumption rate over biomass (Q/B, year−1), itsassimilation efficiency (or excretion rate, U/Q), and the interactionswith its prey and predators in the form of a diet matrix (DC), whichalso establishes the identity of the trophic flows (Christensen and
S. Tecchio et al. / Ecological Modelling 312 (2015) 91–101 93
ith baS
PsWplcd
B
Q
acittfT
gr(dtfiaca(
Fig. 1. Map of the study area in the Seine estuary, northern France, wource: Le Havre and Rouen port authorities, SHOM, and GIP Seine-Aval.
auly, 1992). Two linear equations for each functional group areolved to ensure mass and energy balance (Fig. 2) (Christensen and
alters, 2004). Eq. (1) expresses production (P) as a function ofredation, fishing mortality (Y), net migration (E), biomass accumu-
ation (BA), and natural mortality. Eq. (2) ensures energy balance,alculating consumption of the ith group (Q) as the sum of its pro-uction, respiration (R), and excretion (U).(
P
B
)i=
∑j
Bj
(Q
B
)jDCij + Yi + Ei + BAi + Bi
(P
B
)i(1 − EEi) (1)
i = Pi + Ri + Ui (2)
The models were considered at steady state, thus biomassccumulations and net migration rates were considered negligibleompared to the rest of the flows and were set to zero. Each modelncluded 15 functional groups, including one detritus group andwo primary producers, i.e. phytoplankton and microphytoben-hos. Consumer groups included bacteria, zooplankton, meiofauna,our benthic invertebrates groups, four fish groups, and seabirds.he groups were represented in all habitats to allow comparability.
Tables 1 and 2 show the input parameters used for all functionalroups in the 6 habitats. Production, consumption, and excretionates were obtained from literature, or from empirical equationsPauly, 1980; Pauly et al., 1993) when data were available. All sourceata used for obtaining model parameters are listed in Supplemen-ary Material Table 1. The maximum level of detail was available forsh and benthic invertebrates groups, as source data for biomasses
nd diets was compiled from a series of past research projectsonducted in the area. Biomasses of fishes, which were generallyvailable as wet weight (g m−2), were converted to carbon contentgC m−2) using a conversion factor of 0.11 from Oguz et al. (2008).thymetry and showing the subdivision of the six modelled habitats.
For benthic invertebrates, biomasses were converted from ash-freedry weight to carbon content using a conversion factor of 0.518(Brey, 2001).
We also summarised the quality of source data for biomasses,P/B, Q/B, and diet compositions into the Pedigree routine, which cal-culates a value between 0 and 1 related to the overall quality of thedata (with 0 indicating that data is of low quality, and 1 indicatingthat data is highly precise and fully rooted in local studies).
All models had to be manually and slightly modified in theirinput data to equalise the mass balances. The balancing approachwas top-down, starting modifications from top predators downto the lowest trophic levels. Balancing was performed taking intoaccount the quality of source data as described by the Pedigree.When modifications had to be made, diet compositions were var-ied before other parameters. Each model was considered balancedwhen: (a) it did not violate mass balance, i.e. all EE were <1, (b)it did not violate energy balance, and (c) metabolic coefficientswere reasonably within the known limits for each group (res-piration/biomass ratio of 1–10 for fishes, and food-conversionefficiencies in the range 0.1–0.3 for consumers in general).
2.3. Network analysis
After models were balanced, the trophic level (TL) of each func-tional group (i) was calculated as the weighted average of thetrophic levels of its prey (j), according to:
TLi = 1 +N∑
j=1
DCijTLj (3)

94 S. Tecchio et al. / Ecological Modelling 312 (2015) 91–101
Table 1Biomass values, and production, consumption, and assimilation rates for the 6 modelled ecosystems after balancing. When a range is given, it means that values were changedduring balancing and between models according to general species composition. Biomass values estimated by the model are indicated in bold.
Biomass (gC m−2) P/B (year−1) Q/B (year−1) U/Q
CH FN FS E4 E14 E2
1 Seabirds 0.633 0.633 0.633 0.300 0.300 0.300 0.013 0.325 0.202 Fish, piscivores 0.019 0.055 0.057 0.143 0.103 0.264 0.480–0.587 3.50 0.203 Fish, planktivores 0.040 0.075 0.027 0.043 0.026 0.032 0.800–0.960 6.70 0.204 Fish, benthos feeders 0.012 0.038 0.230 0.560 0.244 0.554 1.360 7.83 0.205 Fish, endobenthic feeders 0.015 0.035 0.045 0.141 0.123 0.175 1.038–1.280 4.57 0.206 Benthic predators 0.155 11.150 8.530 5.950 5.230 2.202 1.19–1.40 5.95–7.00 0.207 Benthic filter feeders 0.442 1.900 15.087 3.580 3.810 8.710 1.04–1.12 5.21–5.34 0.308 Benthic deposit feeders 0.146 1.760 3.850 6.134 6.134 4.255 1.56–1.76 7.85 0.309 Suprabenthos 2.208 2.380 3.700 4.320 6.290 7.160 5.95–6.60 27–33 0.30
10 Meiofauna 0.427 0.119 0.400 0.377 0.402 0.167 12–16 60–75 0.3011 Zooplankton 1.720 1.720 1.850 1.720 1.720 1.620 38.4–52.5 128–150 0.4012 Bacteria 1.020 2.800 2.800 2.800 1.910 0.600 26.8–125 53.5–250 0.35
0.2.
19.
aa
wetsaatg(A(pAc
gtaspi
l
TCi
13 Microphytobenthos 0.094 1.725 1.720
14 Phytoplankton 3.300 1.126 1.470
15 Detritus 19.000 19.000 19.000
nd considering primary producers and detritus groups as having base TL of 1.
Ecological network analysis (ENA) was performed directlyithin the EwE software, using the network analysis plugin. For
ach habitat, we calculated the sum of all flows (T.., gC m−2 y−1),he sum of all consumption flows, the sum of all exports, theum of all respirations, and the sum of all flows to detritus. Welso calculated the proportion between biomass of fish groupsnd biomass of invertebrate groups, considering as invertebrateshe megabenthic, macrobenthic (suprabenthos), and meiofaunaroups. The ENA indices calculated were the total transfer efficiencyTE, Lindeman, 1942), the Finn’s Cycling Index (FCI) and the relatedverage Path Length (APL, Finn, 1980), the System Omnivory Index
SOI, Libralato, 2008), and the relative Redundancy (R/C) as theroportion of redundant flows in the network, derived from thescendency theory (Ulanowicz, 1986, 2009). The formulae used foralculations are described in Supplementary Material Table 2.
The keystoneness index was calculated for each functionalroup and model, according to the formula by Libralato et al. (2006),o study potential differences in key roles between habitats. Thisnalysis uses the mixed trophic impact matrix to calculate an indexummarising the impact that a minimal variation of biomass of a
articular group would have on the biomasses of the other groupsn the system.The smoothed continuous distribution of biomass by trophic
evel was also calculated for each habitat, once all biomasses and
able 2ommon diet matrix used as input for the 6 modelled habitats. Diets, which are presented
n each model.
Prey Predator
1 2 3 4 5
1 Seabirds2 Fish, piscivores 0.0503 Fish, planktivores 0.050 0.3004 Fish, benthos feeders 0.100 0.020 0.0405 Fish, endobenthic feeders 0.140 0.0206 Benthic predators 0.100 0.280 0.010 0.280 0.07 Benthic filter feeders 0.100 0.040 0.050 0.28 Benthic deposit feeders 0.100 0.060 0.090 0.310 0.29 Suprabenthos 0.080 0.165 0.100 0.1
10 Meiofauna 0.040 0.011 Zooplankton 0.355 0.070 0.012 Bacteria
13 Microphytobenthos
14 Phytoplankton 0.300
15 Detritus 0.150 0.1Import 0.600
309 0.374 0.384 33–35220 3.240 1.627 150000 19.000 19.000
trophic levels were estimated by the balanced models. The TL-biomass graph, which considers trophic levels starting from 2, isuseful to identify the levels of trophic build-up in each habitat,and it can also be used as a coarse detector of ecosystem stress(Gascuel et al., 2005). To check the effective trophic position of themost important groups in the system, we added a novel decomposi-tion spectrum using a TL-keystoneness diagram, based on the samerationale as the biomass trophic spectrum for its interpretation.
3. Results
3.1. Quality of data and parameterisation
The calculated Pedigree index for all models was 0.635, at thehighest range of values reported in literature (Morissette, 2007).This was mostly due to the biomass data sources, which wereobtained from local, highly replicated, and detailed samplings,and diet compositions of fish and macrobenthic groups that cameprimarily from stomach content studies in the English Channel(Supplementary Material Table 1).
In the majority of cases, biomasses were integrated and did notneed to be estimated by the model to the exception of habitats
where microphytobenthos was supposed to be present only in areduced area and for which no stock data was available. As such,the biomass of microphytobenthos was estimated by the modelby using a fixed ecotrophic efficiency, EE = 0.99. These biomassby predator (columns) and sum to 1, were slightly modified to balance the equations
6 7 8 9 10 11 12
7090 0.25060 0.12050 0.180 0.10060 0.250 0.050 0.05020 0.050 0.100 0.050 0.400 0.050
0.050 0.100 0.0500.050 0.100 0.200 0.200 0.100
0.600 0.100 0.100 0.650 0.10050 0.100 0.100 0.500 0.300 0.700 0.350 0.520
0.380

S. Tecchio et al. / Ecological Modelling 312 (2015) 91–101 95
Fig. 2. Conceptual diagram explaining how Ecopath splits the production flows intotah
ewaeapw
3
safcsopi
to(
he energy balance, and how the various functional groups (represented by the pies)re connected, as production for a prey is consumption for a predator. In our work,arvest (Y in Eq. (1)) was assumed zero.
stimates were always considerably lower than in other areashere field biomasses were measured, confirming the initial
ssumption of reduced prevalence. More generally, as biomassstimations are obtained from the mass balance equations, thisccordance between assumption and estimation suggests a correctarameterisation of the predatory flows through the whole foodeb.
.2. Ecosystem flow structure
Trophic levels (TL) ranged from 1.0 to a maximum of 4.1, repre-ented in all models by fish piscivores that can be thus considereds top predators in the area (Figs. 3 and 4). Also at the top of theood webs were seabirds, which however acquired a large per-entage of their diet from external sources. Trophic levels variedlightly between habitats, maintaining however the same rankrder between functional groups. This shows that the balancingrocedures did not change the relative importance of prey/predator
nteractions introduced with the diet matrix.
The majority of the functional groups maintained approximatelyhe same omnivory between habitats, with the widest variations inmnivory index between habitats shown by the benthic predators0.11–0.52). The groups with the highest omnivory were seabirds,
Fig. 3. Flows and biomasses of the three estuarine habitats (CH, FN, FS). Flows valuesby diet are indicated by the colour scale, while group biomasses are logarithmicallyproportional to the area of their respective circles. Groups are vertically positionedby their calculated trophic level.

96 S. Tecchio et al. / Ecological Modelling 312 (2015) 91–101
Fig. 4. Flows and biomasses of the three marine habitats (E4, E14, E2). Flows valuesby diet are indicated by the colour scale, while group biomasses are logarithmicallyproportional to the area of their respective circles. Groups are vertically positionedby their calculated trophic level.
Fig. 5. Continuous trophic analysis of (a) biomass and (b) keystoneness, by trophiclevels, for the six modelled habitats of the Seine Bay. Grey rectangles indicate theposition of peaks identified in (a) as second-order consumers, and are repeated in
(b) for reference. The first grey bar represents the peak of second-order consumersin estuarine habitats and the second one the peak in marine habitats.fish planktivores, and fish benthos feeders, while the most spe-cialised groups in terms of trophic habits were fish piscivores and,to a lesser degree, benthic deposit feeders (Supplementary Mate-rial Table 3). Meiofauna also showed low omnivory, due to themfeeding mainly on detrital sources.
In terms of ENA overall indices, the total ecosystem activity(measured with the sum of all flows, T..) was the highest in thesouthern channel, mainly due to high values of export and flowsto detritus (Table 3). The rest of the habitats had comparable activ-ity levels, ranging from 1161 to 1826 gC m−2 y−1. The net systemproduction and the ratio of primary production over total biomasswere however the lowest in the southern channel, suggesting a lessefficient utilisation of the inputted production, compared to theother modelled areas. The highest production over total biomassratio was found in the central navigation channel, where the totalbiomass was the lowest.
The ratio of fish biomass over invertebrate biomass was reduced
in the estuarine zones compared to the marine zones, with val-ues ranging 1.14–1.48 in the former while ranging 2.27–4.56 inthe Seine Bay. The total transfer efficiency (TE) between discrete
S. Tecchio et al. / Ecological Modelling 312 (2015) 91–101 97
Table 3General system statistics and ecological network analysis (ENA) indices of the 6 modelled ecosystems in the Seine Bay.
CH FN FS E4 E14 E2
Model area (km2) 24 25 28 270 232 90Sum of all consumption (g m−2 y−1) 413.05 575.62 706.82 633.78 703.92 697.84Sum of all exports (g m−2 y−1) 123.14 100.81 1681.98 183.34 300.59 84.54Sum of all respiratory flows (g m−2 y−1) 123.14 188.65 257.83 220.56 258.82 232.21Sum of all flows into detritus (g m−2 y−1) 535.92 295.98 1938.30 417.92 563.11 356.79Total system throughput (T..) (g m−2 y−1) 1469.04 1161.05 4584.92 1455.60 1826.44 1371.39Sum of all production (g m−2 y−1) 635.75 417.10 492.31 541.72 707.27 483.24Calculated total net primary production 498.10 229.34 280.70 343.82 499.31 256.71Total primary production/total respiration 2.59 1.22 1.09 1.56 1.93 1.11Net system production (g m−2 y−1) 374.97 40.70 22.87 123.26 240.50 24.50Total primary production/total biomass 48.68 8.99 6.95 12.02 16.68 9.15Total biomass/total throughput 0.007 0.022 0.009 0.020 0.016 0.020Total biomass (excluding detritus) (g m−2) 10.23 25.52 40.40 28.60 29.94 28.05Fish biomass/invertebrate biomass (%) 1.48 1.17 1.14 4.36 2.27 4.56Total transfer efficiency (%) 4.50 5.20 6.80 9.10 7.40 9.90System Omnivory index (SOI) 0.184 0.193 0.160 0.186 0.177 0.160
4
1135
taTtc
lEhcotltwwltFbat0
3
bihttttcdatsat−nts
Finn’s cycling index (FCI) (% of T..) 8.52 18.9Average path length (APL) 2.825 4.0Relative redundancy (R/C) 0.556 0.5
rophic levels behaved similarly, with the estuarine zones (CH, FN,nd FS) having overall lower efficiencies than the 3 marine habitats.he mean TE for the estuarine habitats was 5.50 ± 1.17%, while inhe marine habitats it was 8.80 ± 1.27%. Zooming on the southernhannel, its TE was 6.8%, the highest of the 3 estuarine habitats.
The system omnivory index (SOI) ranged 0.160–0.193, at theower end of the range for marine ecosystems of the northernurope (0.14–0.36, Mackinson and Daskalov, 2007). Omnivory wasighest in the FN, was lowest in the FS and E2 habitats, and showedomparable intermediate values in the other habitats. High systemmnivory in FN was mainly caused by high omnivory of ben-hic predators, while the lower SOI in FS and E2 were caused byower contributions of benthic filter feeders and benthic preda-ors, respectively. Finn’s cycling index (FCI) was the index with theidest range between habitats. FCI ranged from 3.65% to 20.65%,ith the highest values present in the E2 and FN sites, while being
owest in the FS. The average path length, which is calculated usinghe same logic as FCI, showed again higher values in the E2 andN while being the lowest in the FS; path length in general rangedetween 2.63 and 4.33. The relative redundancy index evidenced
single habitat, FS, which showed the lowest value (0.380) whilehe rest of the habitats with values comprised between 0.535 and.590, presenting more than half of their flow paths in parallel.
.3. Ecological roles
Trophic spectrum of biomass showed differences mainlyetween the estuarine and the marine zones, with the latter show-
ng biomass peaks at approximately one quarter of trophic leveligher than the estuarine systems (Fig. 5a). The biomass peak ofhe second-order consumers was located at TL 2.75–2.95 for thehree estuarine habitats, whereas it was visible at TL 3.05–3.15 forhe marine habitats. These peaks were mainly produced by inver-ebrate benthic predators, in all habitats but the CH, where it wasaused by increased biomass of suprabenthos (mainly due to theecapod Palaemon longirostris). The peaks for top predators werelso shifted towards the same direction, but more overlapped dueo their reduced contribution in biomass. The highest levels of key-toneness were concentrated in all habitats in a peak at TL = 2.5,nd at TL > 3.5 (Fig. 5b). Between these two peaks, the CH habi-at behaved differently from all others, decreasing only down to
0.3. The biomass peak of second-order consumers was thereforeot reflected in a higher trophic impact of their components overhe rest of the food web, as the peaks of the two spectra did notuperpose.3.65 13.86 11.23 20.652.634 3.604 3.265 4.3300.380 0.580 0.590 0.542
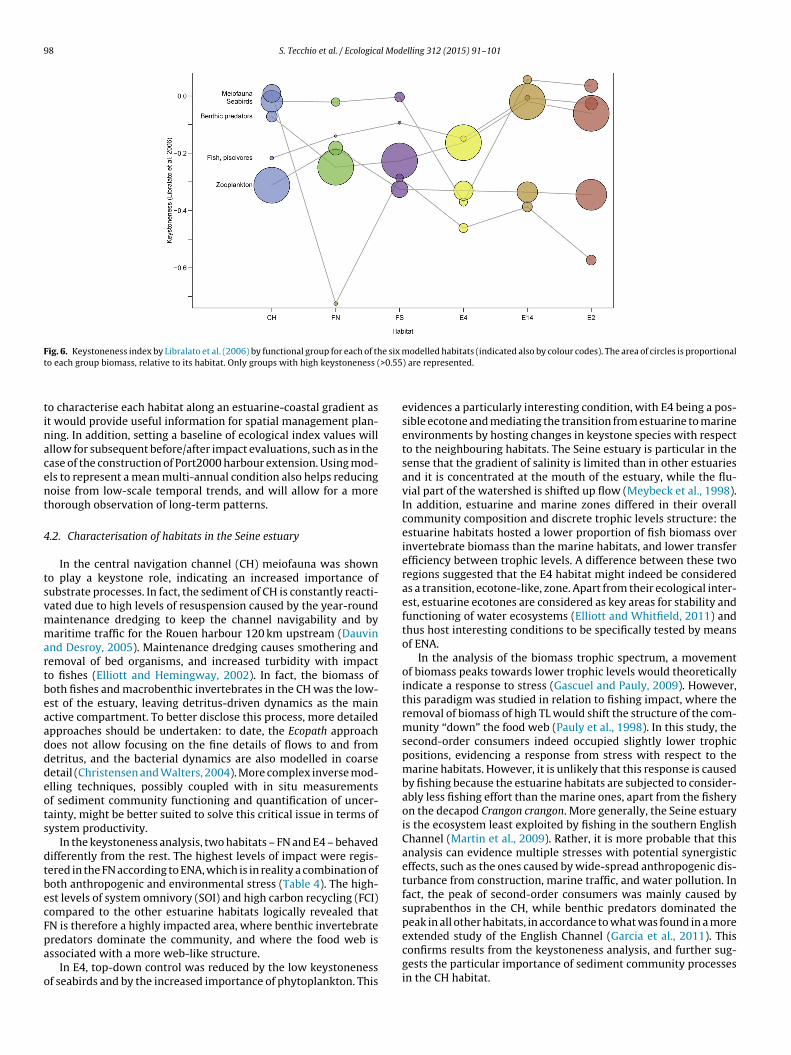
Keystoneness patterns showed variations between the differ-ent food webs (Fig. 6). Fish piscivores were always present at thehighest positions in all 6 habitats, along with seabirds. Seabirdshad the highest keystoneness in all habitats except E4, where theystand considerably lower, and CH, where they had similar posi-tion as meiofauna. The northern channel (FN) had also zooplanktonand phytoplankton occupying the third and fourth position, respec-tively, following seabirds and fish piscivores.
In the marine habitats, key roles were subject to wider varia-tions, and benthic predators showed high keystoneness. However,they appeared as structuring species rather than keystone, due totheir high biomass in all three habitats. This was especially evidentin E4, where benthic predators dominated the biomass along withbenthic deposit feeders, and both showed high values of keystone-ness.
4. Discussion
4.1. Advantages and limitations of the models
The usefulness of comparing snapshot ecosystem models, repre-senting different habitats of a same biogeographical region, becameevident over the last decade (Baeta et al., 2011; Baird et al., 2007;Lassalle et al., 2013; Patrício et al., 2004). In this study, we presentedthe most updated and comprehensive modelling effort for the Seineestuary food web. The models were rooted in high-quality sourcedata as evidenced by the high Pedigree value, compared to liter-ature, and by the consistent estimates of the missing biomasses.Also, by studying a continuum of estuarine and marine habitats (inthe proximity of the Seine Bay) this approach provided one of thefirst insights of the differences between food-web structure andfunction along the estuarine-coastal gradient, from which futurestudies of inter-habitat connectivity through flows of energy willbe possible.
The sampling programmes used as biomass source data focusedparticularly on benthic megafauna and fishes. Small-sized trophicgroups, such as bacteria, microphytobenthos, and meiofauna, weremainly parameterised using data from other models of the samearea or of similar regions (see Supplementary Table 1). However,the same pattern of knowledge was available for all six habitats,thus permitting relevant comparisons between them.
Estuarine and marine habitats are known to have ostensiblydifferent abiotic conditions between them and, following from it,different community structures and functions (Fairbridge, 1980;Heip and Herman, 1995; Wilson, 2002). For this reason, it is pivotal
98 S. Tecchio et al. / Ecological Modelling 312 (2015) 91–101
F e six mt >0.55
tinacent
4
tsvmmartbeaadddeots
dtbecFpa
o
ig. 6. Keystoneness index by Libralato et al. (2006) by functional group for each of tho each group biomass, relative to its habitat. Only groups with high keystoneness (
o characterise each habitat along an estuarine-coastal gradient ast would provide useful information for spatial management plan-ing. In addition, setting a baseline of ecological index values willllow for subsequent before/after impact evaluations, such as in thease of the construction of Port2000 harbour extension. Using mod-ls to represent a mean multi-annual condition also helps reducingoise from low-scale temporal trends, and will allow for a morehorough observation of long-term patterns.
.2. Characterisation of habitats in the Seine estuary
In the central navigation channel (CH) meiofauna was showno play a keystone role, indicating an increased importance ofubstrate processes. In fact, the sediment of CH is constantly reacti-ated due to high levels of resuspension caused by the year-roundaintenance dredging to keep the channel navigability and byaritime traffic for the Rouen harbour 120 km upstream (Dauvin
nd Desroy, 2005). Maintenance dredging causes smothering andemoval of bed organisms, and increased turbidity with impacto fishes (Elliott and Hemingway, 2002). In fact, the biomass ofoth fishes and macrobenthic invertebrates in the CH was the low-st of the estuary, leaving detritus-driven dynamics as the mainctive compartment. To better disclose this process, more detailedpproaches should be undertaken: to date, the Ecopath approachoes not allow focusing on the fine details of flows to and frometritus, and the bacterial dynamics are also modelled in coarseetail (Christensen and Walters, 2004). More complex inverse mod-lling techniques, possibly coupled with in situ measurementsf sediment community functioning and quantification of uncer-ainty, might be better suited to solve this critical issue in terms ofystem productivity.
In the keystoneness analysis, two habitats – FN and E4 – behavedifferently from the rest. The highest levels of impact were regis-ered in the FN according to ENA, which is in reality a combination ofoth anthropogenic and environmental stress (Table 4). The high-st levels of system omnivory (SOI) and high carbon recycling (FCI)ompared to the other estuarine habitats logically revealed thatN is therefore a highly impacted area, where benthic invertebrate
redators dominate the community, and where the food web isssociated with a more web-like structure.In E4, top-down control was reduced by the low keystonenessf seabirds and by the increased importance of phytoplankton. This
odelled habitats (indicated also by colour codes). The area of circles is proportional) are represented.
evidences a particularly interesting condition, with E4 being a pos-sible ecotone and mediating the transition from estuarine to marineenvironments by hosting changes in keystone species with respectto the neighbouring habitats. The Seine estuary is particular in thesense that the gradient of salinity is limited than in other estuariesand it is concentrated at the mouth of the estuary, while the flu-vial part of the watershed is shifted up flow (Meybeck et al., 1998).In addition, estuarine and marine zones differed in their overallcommunity composition and discrete trophic levels structure: theestuarine habitats hosted a lower proportion of fish biomass overinvertebrate biomass than the marine habitats, and lower transferefficiency between trophic levels. A difference between these tworegions suggested that the E4 habitat might indeed be consideredas a transition, ecotone-like, zone. Apart from their ecological inter-est, estuarine ecotones are considered as key areas for stability andfunctioning of water ecosystems (Elliott and Whitfield, 2011) andthus host interesting conditions to be specifically tested by meansof ENA.
In the analysis of the biomass trophic spectrum, a movementof biomass peaks towards lower trophic levels would theoreticallyindicate a response to stress (Gascuel and Pauly, 2009). However,this paradigm was studied in relation to fishing impact, where theremoval of biomass of high TL would shift the structure of the com-munity “down” the food web (Pauly et al., 1998). In this study, thesecond-order consumers indeed occupied slightly lower trophicpositions, evidencing a response from stress with respect to themarine habitats. However, it is unlikely that this response is causedby fishing because the estuarine habitats are subjected to consider-ably less fishing effort than the marine ones, apart from the fisheryon the decapod Crangon crangon. More generally, the Seine estuaryis the ecosystem least exploited by fishing in the southern EnglishChannel (Martin et al., 2009). Rather, it is more probable that thisanalysis can evidence multiple stresses with potential synergisticeffects, such as the ones caused by wide-spread anthropogenic dis-turbance from construction, marine traffic, and water pollution. Infact, the peak of second-order consumers was mainly caused bysuprabenthos in the CH, while benthic predators dominated thepeak in all other habitats, in accordance to what was found in a more
extended study of the English Channel (Garcia et al., 2011). Thisconfirms results from the keystoneness analysis, and further sug-gests the particular importance of sediment community processesin the CH habitat.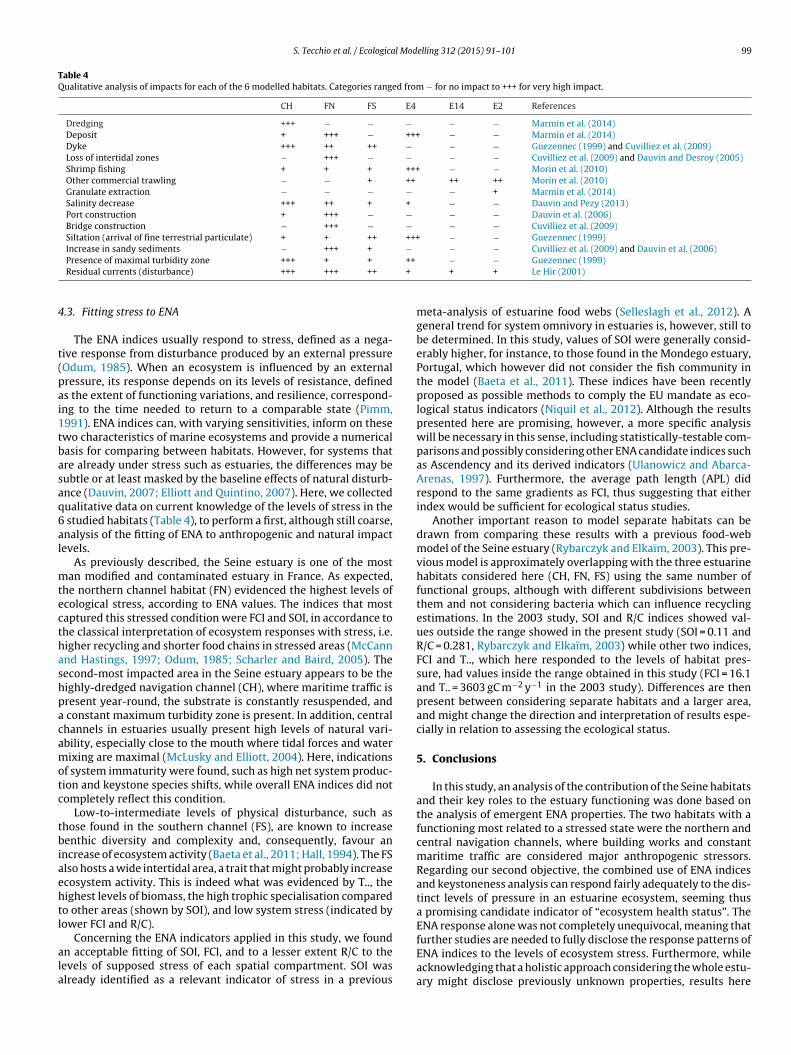
S. Tecchio et al. / Ecological Modelling 312 (2015) 91–101 99
Table 4Qualitative analysis of impacts for each of the 6 modelled habitats. Categories ranged from − for no impact to +++ for very high impact.
CH FN FS E4 E14 E2 References
Dredging +++ − − − − − Marmin et al. (2014)Deposit + +++ − +++ − − Marmin et al. (2014)Dyke +++ ++ ++ − − − Guezennec (1999) and Cuvilliez et al. (2009)Loss of intertidal zones − +++ − − − − Cuvilliez et al. (2009) and Dauvin and Desroy (2005)Shrimp fishing + + + +++ − − Morin et al. (2010)Other commercial trawling − − + ++ ++ ++ Morin et al. (2010)Granulate extraction − − − − − + Marmin et al. (2014)Salinity decrease +++ ++ + + − − Dauvin and Pezy (2013)Port construction + +++ − − − − Dauvin et al. (2006)Bridge construction − +++ − − − − Cuvilliez et al. (2009)Siltation (arrival of fine terrestrial particulate) + + ++ +++ − − Guezennec (1999)Increase in sandy sediments − +++ + − − − Cuvilliez et al. (2009) and Dauvin et al. (2006)
++
+
4
t(pai1tbasaq6al
mtecthashpacamotc
tbiaehtl
ala
Presence of maximal turbidity zone +++ + +
Residual currents (disturbance) +++ +++ ++
.3. Fitting stress to ENA
The ENA indices usually respond to stress, defined as a nega-ive response from disturbance produced by an external pressureOdum, 1985). When an ecosystem is influenced by an externalressure, its response depends on its levels of resistance, defineds the extent of functioning variations, and resilience, correspond-ng to the time needed to return to a comparable state (Pimm,991). ENA indices can, with varying sensitivities, inform on thesewo characteristics of marine ecosystems and provide a numericalasis for comparing between habitats. However, for systems thatre already under stress such as estuaries, the differences may beubtle or at least masked by the baseline effects of natural disturb-nce (Dauvin, 2007; Elliott and Quintino, 2007). Here, we collectedualitative data on current knowledge of the levels of stress in the
studied habitats (Table 4), to perform a first, although still coarse,nalysis of the fitting of ENA to anthropogenic and natural impactevels.
As previously described, the Seine estuary is one of the mostan modified and contaminated estuary in France. As expected,
he northern channel habitat (FN) evidenced the highest levels ofcological stress, according to ENA values. The indices that mostaptured this stressed condition were FCI and SOI, in accordance tohe classical interpretation of ecosystem responses with stress, i.e.igher recycling and shorter food chains in stressed areas (McCannnd Hastings, 1997; Odum, 1985; Scharler and Baird, 2005). Theecond-most impacted area in the Seine estuary appears to be theighly-dredged navigation channel (CH), where maritime traffic isresent year-round, the substrate is constantly resuspended, and
constant maximum turbidity zone is present. In addition, centralhannels in estuaries usually present high levels of natural vari-bility, especially close to the mouth where tidal forces and waterixing are maximal (McLusky and Elliott, 2004). Here, indications
f system immaturity were found, such as high net system produc-ion and keystone species shifts, while overall ENA indices did notompletely reflect this condition.
Low-to-intermediate levels of physical disturbance, such ashose found in the southern channel (FS), are known to increaseenthic diversity and complexity and, consequently, favour an
ncrease of ecosystem activity (Baeta et al., 2011; Hall, 1994). The FSlso hosts a wide intertidal area, a trait that might probably increasecosystem activity. This is indeed what was evidenced by T.., theighest levels of biomass, the high trophic specialisation comparedo other areas (shown by SOI), and low system stress (indicated byower FCI and R/C).
Concerning the ENA indicators applied in this study, we foundn acceptable fitting of SOI, FCI, and to a lesser extent R/C to theevels of supposed stress of each spatial compartment. SOI waslready identified as a relevant indicator of stress in a previous
− − Guezennec (1999)+ + Le Hir (2001)
meta-analysis of estuarine food webs (Selleslagh et al., 2012). Ageneral trend for system omnivory in estuaries is, however, still tobe determined. In this study, values of SOI were generally consid-erably higher, for instance, to those found in the Mondego estuary,Portugal, which however did not consider the fish community inthe model (Baeta et al., 2011). These indices have been recentlyproposed as possible methods to comply the EU mandate as eco-logical status indicators (Niquil et al., 2012). Although the resultspresented here are promising, however, a more specific analysiswill be necessary in this sense, including statistically-testable com-parisons and possibly considering other ENA candidate indices suchas Ascendency and its derived indicators (Ulanowicz and Abarca-Arenas, 1997). Furthermore, the average path length (APL) didrespond to the same gradients as FCI, thus suggesting that eitherindex would be sufficient for ecological status studies.
Another important reason to model separate habitats can bedrawn from comparing these results with a previous food-webmodel of the Seine estuary (Rybarczyk and Elkaïm, 2003). This pre-vious model is approximately overlapping with the three estuarinehabitats considered here (CH, FN, FS) using the same number offunctional groups, although with different subdivisions betweenthem and not considering bacteria which can influence recyclingestimations. In the 2003 study, SOI and R/C indices showed val-ues outside the range showed in the present study (SOI = 0.11 andR/C = 0.281, Rybarczyk and Elkaïm, 2003) while other two indices,FCI and T.., which here responded to the levels of habitat pres-sure, had values inside the range obtained in this study (FCI = 16.1and T.. = 3603 gC m−2 y−1 in the 2003 study). Differences are thenpresent between considering separate habitats and a larger area,and might change the direction and interpretation of results espe-cially in relation to assessing the ecological status.
5. Conclusions
In this study, an analysis of the contribution of the Seine habitatsand their key roles to the estuary functioning was done based onthe analysis of emergent ENA properties. The two habitats with afunctioning most related to a stressed state were the northern andcentral navigation channels, where building works and constantmaritime traffic are considered major anthropogenic stressors.Regarding our second objective, the combined use of ENA indicesand keystoneness analysis can respond fairly adequately to the dis-tinct levels of pressure in an estuarine ecosystem, seeming thusa promising candidate indicator of “ecosystem health status”. TheENA response alone was not completely unequivocal, meaning that
further studies are needed to fully disclose the response patterns ofENA indices to the levels of ecosystem stress. Furthermore, whileacknowledging that a holistic approach considering the whole estu-ary might disclose previously unknown properties, results here
1 l Mod
pdwtis
A
StaLe(W(BP
A
t0
R
A
B
B
B
B
B
C
C
C
C
C
D
D
D
D
D
D
00 S. Tecchio et al. / Ecologica
oint to a spatial complexity of the Seine estuary ecosystem, whereistinct habitats present distinct emergent traits. In the frame-ork of assessing environmental status of ecosystems subject to
he European Union Water Framework Directive, we argue forncluding the habitat-level spatial observation when planning con-ervation strategies.
cknowledgements
This work was funded by the project ANTROPOSEINE (G.I.P.eine-Aval, 5th programme, France). We also acknowledge, forheir help in compiling the dataset and for giving specific expertdvices: Aurore Raoux (UMR BOREA Caen), Chloé Dancie (CSLNe Havre), Philippe Riou and Mathilde Schapira (IFREMER Port-n-Bessin), Anik Brind’Amour (IFREMER Nantes), Bruno ErnandeIFREMER Boulogne-sur-Mer), Sami Souissi (Station Marine de
imereux), Sandrine Alizier (UMR LOG Wimereux), Stella MarminUMR M2C Caen), Franck Gentil and Eric Thiébaut (Stationiologique de Roscoff), Nicolas Desroy (IFREMER Dinard), and theort Authorities of Le Havre and Rouen.
ppendix A. Supplementary data
Supplementary data associated with this article can be found, inhe online version, at http://dx.doi.org/10.1016/j.ecolmodel.2015.5.026
eferences
ble, K.W., 2005. A re-examination of fish estuarine dependence: evidence for con-nectivity between estuarine and ocean habitats. Est. Coast. Shelf Sci. 64, 5–17.
aeta, A., Niquil, N., Marques, J.C., Patrício, J., 2011. Modelling the effects of eutro-phication, mitigation measures and an extreme flood event on estuarine benthicfood webs. Ecol. Model. 222, 1209–1221.
aird, D., Asmus, H., Asmus, R., 2007. Trophic dynamics of eight intertidal commu-nities of the Sylt-Rømø Bight ecosystem, northern Wadden Sea. Mar. Ecol. Prog.Ser. 351, 25–41.
aird, D., Ulanowicz, R.E., 1993. Comparative study on the trophic structure, cyclingand ecosystem properties of four tidal estuaries. Mar. Ecol. Prog. Ser. 99,221–237.
lanchet, H., Lavesque, N., Ruellet, T., Dauvin, J.-C., Sauriau, P.G., Desroy, N., Desclaux,C., Leconte, M., Bachelet, G., Janson, A.-L., Bessineton, C., Duhamel, S., Jourde, J.,Mayot, S., Simon, S., de Montaudouin, X., 2008. Use of biotic indices in semi-enclosed coastal ecosystems and transitional waters habitats – implications forthe implementation of the European Water Framework Directive. Ecol. Indic. 8,360–372.
rey, T., 2001. Population Dynamics in Benthic Invertebrates. A Virtual Handbook.http://thomas-brey.de/science/virtualhandbook
hristensen, V., 1995. Ecosystem maturity – towards quantification. Ecol. Model. 77,3–32.
hristensen, V., Pauly, D., 1992. ECOPATH II – a software for balancing steady-state ecosystem models and calculating network characteristics. Ecol. Model.61, 169–185.
hristensen, V., Walters, C.J., 2004. Ecopath with ecosim: methods, capabilities andlimitations. Ecol. Model. 172, 109–139.
hristian, R.R., Baird, D., Luczkovich, J., Johnson, J.C., Scharler, U.M., Ulanowicz, R.E.,2005. Role of network analysis in comparative ecosystem ecology of estuaries.In: Belgrano, A., Scharler, U.M., Dunne, J., Ulanowicz, R.E. (Eds.), Aquatic FoodWebs. Oxford University Press, Oxford, UK, pp. 25–40.
uvilliez, A., Deloffre, J., Lafite, R., Bessineton, C., 2009. Morphological responses ofan estuarine intertidal mudflat to constructions since 1978 to 2005: the Seineestuary (France). Geomorphology 104, 165–174.
auvin, J.-C., 2007. Paradox of estuarine quality: benthic indicators and indices,consensus or debate for the future. Mar. Pollut. Bull. 55, 271–281.
auvin, J.-C., Alizier, S., Vallet, C., Ruellet, T., 2010. Does the Port 2000 harbour con-struction have an effect on the Seine estuary suprabenthic community? Est.Coast. Shelf Sci. 86, 42–50.
auvin, J.-C., Desroy, N., 2005. The food web in the lower part of the Seine estuary:a synthesis of existing knowledge. Hydrobiologia 540, 13–27.
auvin, J.-C., Fisson, C., Garnier, J., Lafite, R., Ruellet, T., Billen, G., Deloffre, J., Verney,R., 2008. A report card and quality indicators for the Seine estuary: from scientificapproach to operational tool. Mar. Pollut. Bull. 57, 187–208.
auvin, J.-C., Pezy, J.-P., 2013. Long-term changes of the Seine estuary suprabenthos(1996–2012). J. Exp. Mar. Biol. Ecol. 448, 93–103.
auvin, J.-C., Ruellet, T., 2009. The estuarine quality paradox: is it possible to definean ecological quality status for specific modified and naturally stressed estuarineecosystems? Mar. Pollut. Bull. 59, 38–47.
elling 312 (2015) 91–101
Dauvin, J.C., Desroy, N., Janson, A.L., Vallet, C., Duhamel, S., 2006. Recent changes ofestuarine benthic and suprabenthic communities in response to harbour infras-tructural development. Mar. Pollut. Bull. 53, 80–90.
Elliott, M., Hemingway, K. (Eds.), 2002. Fishes in Estuaries. Blackwell Science, Oxford,636 pp.
Elliott, M., Quintino, V., 2007. The estuarine quality paradox environmental homeo-stasis and the difficulty of detecting anthropogenic stress in naturally stressedareas. Mar. Pollut. Bull. 54, 640–645.
Elliott, M., Whitfield, A.K., 2011. Challenging paradigms in estuarine ecology andmanagement. Est. Coast. Shelf Sci. 94, 306–314.
Fairbridge, R., 1980. The estuary: its definition and geodynamic cycle. In: Olausson,E., Cato, I. (Eds.), Chemistry and Geochemistry of Estuaries. John Wiley and Sons,New York, pp. 1–35.
Finn, J.T., 1980. Flow analysis of models of the Hubbard Brook ecosystem. Ecology61, 562–571.
Garcia, C., Chardy, P., Dewarumez, J.-M., Dauvin, J.-C., 2011. Assessment of benthicecosystem functioning through trophic web modelling: the example of the east-ern basin of the English Channel and the Southern Bight of the North Sea. Mar.Ecol. 32 (Suppl. 1), 72–86.
Gascuel, D., Bozec, Y.-M., Chassot, E., Colomb, A., Laurans, M., 2005. The trophicspectrum: theory and application as an ecosystem indicator. ICES J. Mar. Sci. 62,443–452.
Gascuel, D., Pauly, D., 2009. EcoTroph: modelling marine ecosystem functioning andimpact of fishing. Ecol. Model. 220, 2885–2898.
Guezennec, L., 1999. Seine Aval: un estuaire et ses problèmes. Seine-Aval ScientificReport 1.1, France., pp. 29.
Hall, J.S., 1994. Physical disturbance and marine benthic communities: life in uncon-solidated sediments. Oceanogr. Mar. Biol. Annu. Rev. 32, 179–239.
Heip, C.H.R., Herman, P.M.J., 1995. Major biological processes in European tidalestuaries. Hydrobiologia 311, 1–266.
Lassalle, G., Lobry, J., Le Loc’h, F., Mackinson, S., Sanchez, F., Tomczak, M.T., Niquil,N., 2013. Ecosystem status and functioning: searching for rules of thumb usingan intersite comparison of food-web models of Northeast Atlantic continentalshelves. ICES J. Mar. Sci. 70, 135–149.
Le Hir, P., 2001. Courants, vagues et marées: les mouvements de l’eau. Seine-AvalScientific Report 1.2, France, 32 pp.
Libralato, S., 2008. System omnivory index. In: Jørgensen, S.E., Fath, B.D. (Eds.),Ecological Indicators. Encyclopedia of Ecology, vol. 4. Elsevier, Oxford, pp.3472–3477.
Libralato, S., Christensen, V., Pauly, D., 2006. A method for identifying keystonespecies in food web models. Ecol. Model. 195, 153–171.
Lindeman, R.L., 1942. The trophic-dynamic aspect of ecology. Ecology 23,399–417.
Lobry, J., David, V., Pasquaud, S., Lepage, M., Sautour, B., Rochard, E., 2008. Diver-sity and stability of an estuarine trophic network. Mar. Ecol. Prog. Ser. 358,13–25.
Mackinson, S., Daskalov, G., 2007. An Ecosystem Model of the North Sea to Supportan Ecosystem Approach to Fisheries Management: Description and Parameter-isation, Science Series Technical Report. Cefas Lowestoft, pp. 142.
Marmin, S., Dauvin, J.C., Lesueur, P., 2014. Collaborative approach for harbourdredged sediment management in the Bay of Seine (France). Ocean Coast. Man-age. 102, 328–339.
Martin, C.S., Carpentier, A., Vaz, S., Coppin, F., Curet, L., Dauvin, J.-C., Delavenne, J.,Dewarumez, J.-M., Dupuis, L., Engelhard, G., Ernande, B., Foveau, A., Garcia, C.,Gardel, L., Harrop, S., Just, R., Koubbi, P., Lauria, V., Meaden, G.J., Morin, J., Ota,Y., Rostiaux, E., Smith, R., Spilmont, N., Vérin, Y., Villanueva, C., Warembourg,C., 2009. The Channel habitat atlas for marine resource management (CHARM):an aid for planning and decision-making in an area under strong anthropogenicpressure. Aquat. Living Resour. 22, 499–508.
McCann, K.S., Hastings, A., 1997. Re-evaluating the omnivory–stability relationshipin food webs. Proc. R. Soc. B 264, 1249–1254.
McLusky, D.S., Elliott, M., 2004. The Estuarine Ecosystem: Ecology, Threats and Man-agement. Oxford University Press, USA, New York, pp. 214.
Meybeck, M., de Marsily, G., Fustec, É. (Eds.), 1998. La Seine en son bass fonction-nement écologique d’un système fluvial anthropisé. Elsevier, Paris, 749 pp.
Morin, J., Duhamel, S., De Roton, G., 2010. Poissons, habitats & ressources halieu-tiques: cas de l’estuaire de la Seine. Seine-Aval Scientific Report 2.5, France, 75pp.
Morissette, L., 2007. Complexity, Cost and Quality of Ecosystem Models and TheirImpact on Resilience: A Comparative Analysis, with Emphasis on Marine Mam-mals and the Gulf of St. Laurence Zoology. University of British Columbia,Vancouver BC, Canada.
Niquil, N., Chaumillon, E., Johnson, G.A., Bertin, X., Grami, B., David, V., Bacher, C.,Asmus, H., Baird, D., Asmus, R., 2012. The effect of physical drivers on ecosystemindices derived from ecological network analysis: comparison across estuarineecosystems. Est. Coast. Shelf Sci. 108, 132–143.
Odum, E.P., 1985. Trends expected in stressed ecosystems. BioScience 35, 419–422.Oguz, T., Fach, B., Salihoglu, B., 2008. A coupled plankton-anchovy population
dynamics model assessing nonlinear controls of anchovy and gelatinousbiomass in the Black Sea. Mar. Ecol. Prog. Ser. 369, 229–256.
Patrício, J., Marques, J.C., 2006. Mass balanced models of the food web in three areas
along a gradient of eutrophication symptoms in the south arm of the Mondegoestuary (Portugal). Ecol. Model. 197, 21–34.Patrício, J., Ulanowicz, R.E., Pardal, M.A., Marques, J.C., 2004. Ascendency as an eco-logical indicator: a case study of estuarine pulse eutrophication. Est. Coast. ShelfSci. 60, 23–35.

l Mod
P
P
P
P
R
R
S
structure and function. Ecol. Model. 95, 1–10.Vinagre, C., Costa, M.J., 2014. Estuarine-coastal gradient in food web network struc-
S. Tecchio et al. / Ecologica
auly, D., 1980. On the interrelationships between natural mortality, growth param-eters, and mean environmental temperature in 175 fish stocks. ICES J. Mar. Sci.39, 175–192.
auly, D., Christensen, V., Dalsgaard, J., Froese, R., Torres Jr., F., 1998. Fishing downmarine food webs. Science 279, 860–863.
auly, D., Soriano-Bartz, M., Palomares, M.L.D., 1993. Improved construction,parametrization and interpretation of steady-state ecosystem models. In: Chris-tensen, V., Pauly, D. (Eds.), Trophic Models of Aquatic ecosystems ICLARMconference Proceedings, vol. 26, pp. 1–13.
imm, S.L., 1991. The Balance of Nature? Ecological Issues in the Conservation ofSpecies and Communities. The University of Chicago Press, London, 434 pp.
ybarczyk, H., Elkaïm, B., 2003. An analysis of the trophic network of a macrotidalestuary: the Seine estuary (Eastern Channel, Normandy France). Est. Coast. ShelfSci. 58, 775–791.
ybarczyk, H., Elkaïm, B., Ochs, L., Loquet, N., 2003. Analysis of the trophic networkof a macrotidal ecosystem: the Bay of Somme (Eastern Channel). Est. Coast. ShelfSci. 58, 405–421.
alomon, J.C., Breton, M., 1991. Courants résiduels de marée dans la Manche.Oceanol. Acta 14, 47.
elling 312 (2015) 91–101 101
Scharler, U.M., Baird, D., 2005. A comparison of selected ecosystem attributes ofthree South African estuaries with different freshwater inflow regimes, usingnetwork analysis. J. Mar. Syst. 56, 283–308.
Selleslagh, J., Lobry, J., Amara, R., Brylinski, J.-M., Boët, P., 2012. Trophic functioningof estuarine ecosystems along a gradient of anthropogenic pressures: a Frenchcase study with emphasis on a small and low impacted estuary. Est. Coast. ShelfSci. 112, 73–85.
Ulanowicz, R.E., 1986. Growth and Development: Ecosystems Phenomenology.Springer-Verlag, New York, USA.
Ulanowicz, R.E., 2009. The dual nature of ecosystem dynamics. Ecol. Model. 220,1886–1892.
Ulanowicz, R.E., Abarca-Arenas, L.G., 1997. An informational synthesis of ecosystem
ture and properties. Mar. Ecol. Prog. Ser. 503, 11–21.Wilson, J.G., 2002. Productivity, fisheries and aquaculture in temperate estuaries.
Est. Coast. Shelf Sci. 55, 953–968.
Copyright © 2022 FDOKUMEN