The management of deep vein thrombosis: the Autar DVT risk assessment scale re-visited
11
The management of deep vein thrombosis: the Autar DVT risk assessment scale re-visited Ricky Autar Deep vein thrombosis (DVT) is a precursor of potentially fatal pulmonary embolism (PE). The Autar DVT scale (1994) was developed to assess patient risk and enable the application of the most effective prophylaxis. The scale is composed of seven categories of risk factors derived from Virchow’s triad. The DVT scale was re-evaluated on 150 patients across three distinct clinical specialities to allow for generalisation of the findings. Five reproducibility studies achieved total percentage agreement of between 91 and 98%, j values within 0.88–0.95 and intra-class correlation coefficients of 0.94–0.99, confirming the consistency of the instrument. A receiver operating characteristic (ROC) curve was constructed to determine the optimal predictive accuracy of the scale and a cut-off score of 11 yielded approximately 70% sensitivity. Partially completed data from two patients were excluded from the sensitivity analysis of the DVT scale. Out of the 148 (78%) 115 patients were correctly predicted. However, the predictive accuracy of the DVT scale was partially masked by the 50% of patients who were recipient of some proven venous thromboprophylaxis. c 2003 Elsevier Science Ltd. All rights reserved. Editor’s comment The risk of thromboembolism in orthopaedic patients continues to be significant. This study adds to the evidence supporting the efficacy of risk assessment tools and in particular the Autar DVT risk assessment chart. In such a complex area as thromboprophylaxis, evidence about the nature and specifics of risk assessment is never going to be conclusive and completely trustworthy. However, this work adds positively to previous research. PD KEY WORDS: deep vein thrombosis, risk assessment, thromboprophylaxis, thromboembolism INTRODUCTION Deep vein thrombosis (DVT) is a silent killer (Autar 1996a). It is a serious threat to recovery from surgery and is the third most common vascular disease, after ischaemic heart disease and stroke (Anands et al. 1998, Turpie 1997). Data from epidemiological studies suggests that the annual frequency of DVT in the general population is approximately 160 per 100,000 (Anderson et al. 1991, Linblad et al. 1991, Nordstrom et al. 1992). DVT crosses all clini- cal specialities (Table 1). DVT is mostly pre- ventable and national and international consensus groups on venous thromboprophy- laxis (International Consensus Statement 1997, 2001, NIH 1986, THRiFT 1992, 1998) have all recommended that hospital patients should be assessed for clinical risk factors and an overall risk of thromboembolism. Patients should then receive prophylaxis according to their risk categories. ORIGINAL ARTICLE Ricky Autar PhD, MSc, BA(Hons) RGN, RMN, Dip N, RNT, Cert ED Principal Lecturer, De Montfort University, Leicester, UK. Correspondence to: Ricky Autar Principal Lecturer, De Montfort University, School of Nursing and Midwifery, Charles Frears Campus, 266, London Road, Leicester LE2 1RQ, UK. Tel.: +116-201-3945; E-mail: [email protected] Journal of Orthopaedic Nursing (2003) 7, 114–124 C 2003 Elsevier Science Ltd. All rights reserved. doi:10.1016/S1361-3111(03)00051-7
-
Upload
independent -
Category
Documents
-
view
1 -
download
0
Transcript of The management of deep vein thrombosis: the Autar DVT risk assessment scale re-visited
A R T I C L E
Ricky AutarPhD, MSc, BA(Hons) RGN,RMN, Dip N, RNT, Cert EDPrincipal Lecturer, DeMontfort University, Leicester,UK.
Correspondence to:Ricky AutarPrincipal Lecturer,De Montfort University,School of Nursing andMidwifery, Charles FrearsCampus, 266, London Road,Leicester LE2 1RQ, UK.Tel.: +116-201-3945;E-mail: [email protected]
Journal of Orthopaedic Nursing (2003)
doi:10.1016/S1361-3111(03)00051-7
O R I G I N A L
The management ofdeep vein thrombosis:the Autar DVT riskassessment scalere-visited
Ricky Autar
Deep vein thrombosis (DVT) is a precursor of potentially fatal pulmonary embolism
(PE). The Autar DVT scale (1994) was developed to assess patient risk and enable the
application of the most effective prophylaxis. The scale is composed of seven categories
of risk factors derived from Virchow’s triad. The DVT scale was re-evaluated on 150
patients across three distinct clinical specialities to allow for generalisation of the
findings. Five reproducibility studies achieved total percentage agreement of between
91 and 98%, j values within 0.88–0.95 and intra-class correlation coefficients of
0.94–0.99, confirming the consistency of the instrument. A receiver operating
characteristic (ROC) curve was constructed to determine the optimal predictive
accuracy of the scale and a cut-off score of 11 yielded approximately 70% sensitivity.
Partially completed data from two patients were excluded from the sensitivity analysis
of the DVT scale. Out of the 148 (78%) 115 patients were correctly predicted. However,
the predictive accuracy of the DVT scale was partially masked by the 50% of patients
who were recipient of some proven venous thromboprophylaxis.�c 2003 Elsevier Science Ltd. All rights reserved.
Editor’s commentThe risk of thromboembolism in orthopaedic patients continues to be significant. This study adds to the evidencesupporting the efficacy of risk assessment tools and in particular the Autar DVT risk assessment chart. In such acomplex area as thromboprophylaxis, evidence about the nature and specifics of risk assessment is never going to beconclusive and completely trustworthy. However, this work adds positively to previous research.
PD
KEY WORDS: deep vein thrombosis, risk assessment, thromboprophylaxis, thromboembolism
INTRODUCTION
Deep vein thrombosis (DVT) is a silent killer
(Autar 1996a). It is a serious threat to recovery
from surgery and is the third most common
vascular disease, after ischaemic heart disease
and stroke (Anands et al. 1998, Turpie 1997).
Data from epidemiological studies suggests that
the annual frequency of DVT in the general
population is approximately 160 per 100,000
(Anderson et al. 1991, Linblad et al. 1991,
7, 114–124 C 2003 Elsevier Science Ltd. All rights reserved.
Nordstrom et al. 1992). DVT crosses all clini-
cal specialities (Table 1). DVT is mostly pre-
ventable and national and international
consensus groups on venous thromboprophy-
laxis (International Consensus Statement 1997,
2001, NIH 1986, THRiFT 1992, 1998) have all
recommended that hospital patients should be
assessed for clinical risk factors and an overall
risk of thromboembolism. Patients should then
receive prophylaxis according to their risk
categories.
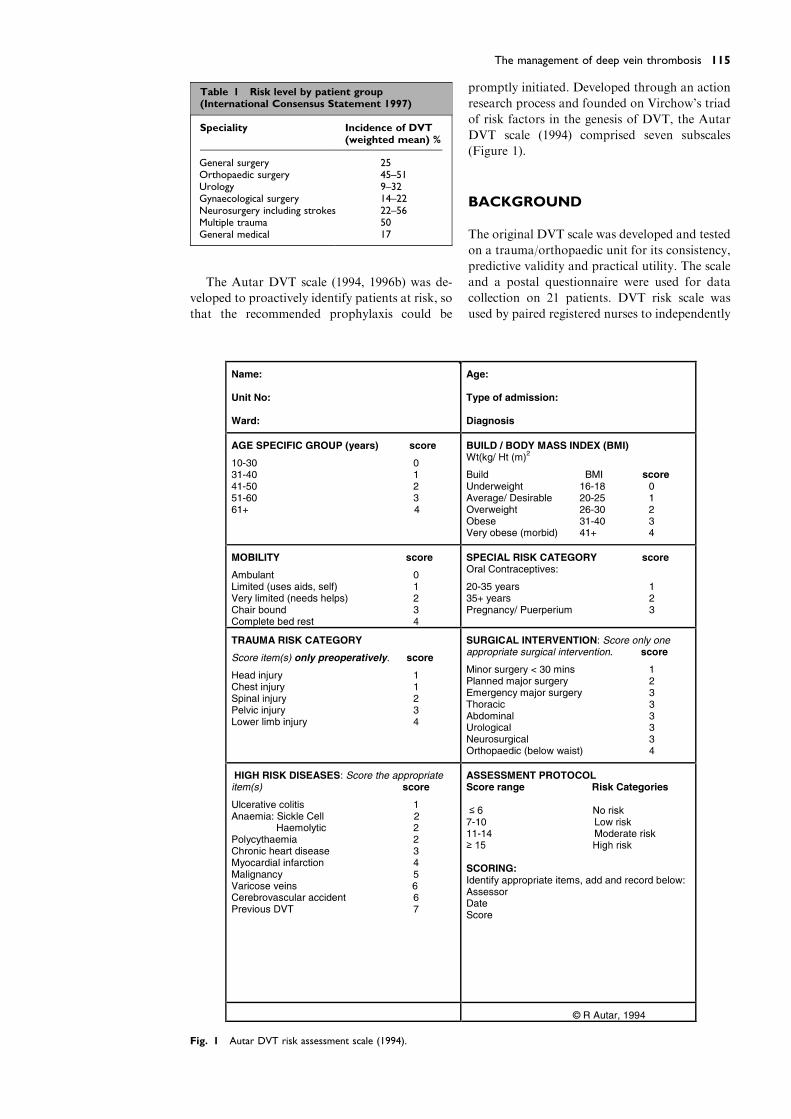
Table 1 Risk level by patient group(International Consensus Statement 1997)
Speciality Incidence of DVT(weighted mean) %
General surgery 25Orthopaedic surgery 45–51Urology 9–32Gynaecological surgery 14–22Neurosurgery including strokes 22–56Multiple trauma 50General medical 17
115The management of deep vein thrombosis
The Autar DVT scale (1994, 1996b) was de-
veloped to proactively identify patients at risk, so
that the recommended prophylaxis could be
Fig. 1 Autar DVT risk assessment scale (1994).
promptly initiated. Developed through an action
research process and founded on Virchow’s triad
of risk factors in the genesis of DVT, the Autar
DVT scale (1994) comprised seven subscales
(Figure 1).
BACKGROUND
The original DVT scale was developed and tested
on a trauma/orthopaedic unit for its consistency,
predictive validity and practical utility. The scale
and a postal questionnaire were used for data
collection on 21 patients. DVT risk scale was
used by paired registered nurses to independently
Journal of Orthopaedic Nursing116
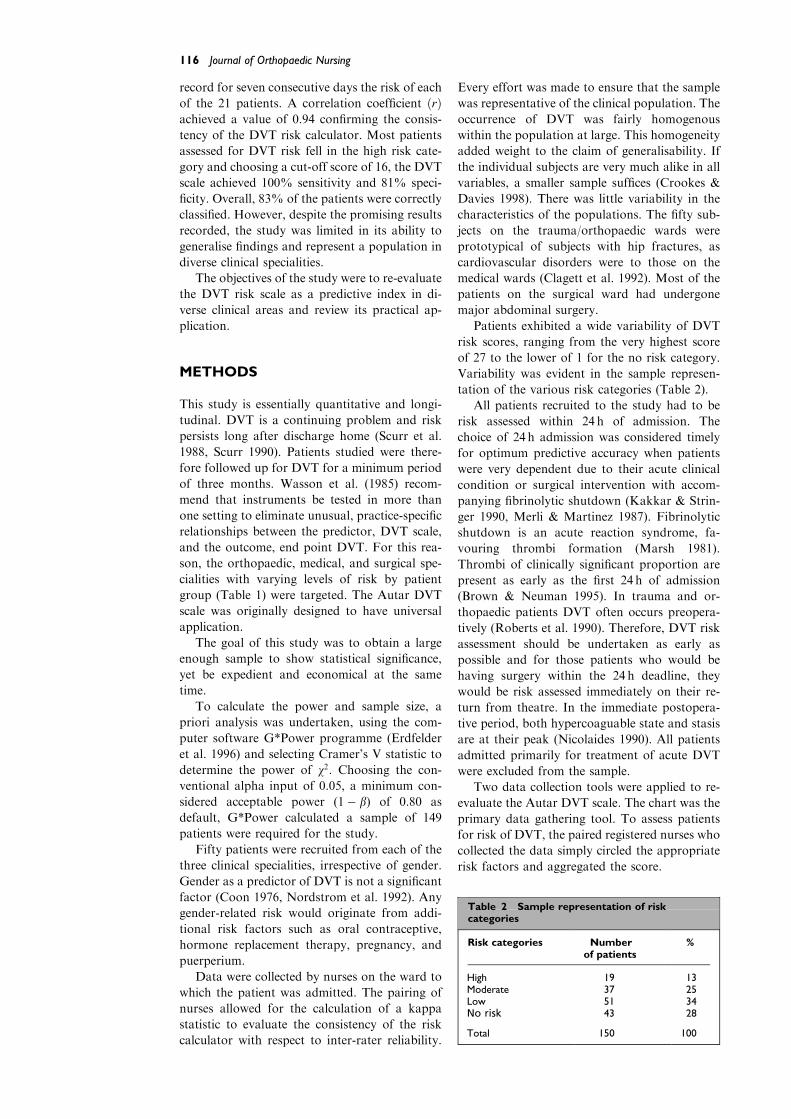
record for seven consecutive days the risk of each
of the 21 patients. A correlation coefficient ðrÞachieved a value of 0.94 confirming the consis-
tency of the DVT risk calculator. Most patients
assessed for DVT risk fell in the high risk cate-
gory and choosing a cut-off score of 16, the DVT
scale achieved 100% sensitivity and 81% speci-
ficity. Overall, 83% of the patients were correctly
classified. However, despite the promising results
recorded, the study was limited in its ability to
generalise findings and represent a population in
diverse clinical specialities.
The objectives of the study were to re-evaluate
the DVT risk scale as a predictive index in di-
verse clinical areas and review its practical ap-
plication.
Table 2 Sample representation of riskcategories
Risk categories Numberof patients
%
High 19 13Moderate 37 25Low 51 34No risk 43 28
Total 150 100
METHODS
This study is essentially quantitative and longi-
tudinal. DVT is a continuing problem and risk
persists long after discharge home (Scurr et al.
1988, Scurr 1990). Patients studied were there-
fore followed up for DVT for a minimum period
of three months. Wasson et al. (1985) recom-
mend that instruments be tested in more than
one setting to eliminate unusual, practice-specific
relationships between the predictor, DVT scale,
and the outcome, end point DVT. For this rea-
son, the orthopaedic, medical, and surgical spe-
cialities with varying levels of risk by patient
group (Table 1) were targeted. The Autar DVT
scale was originally designed to have universal
application.
The goal of this study was to obtain a large
enough sample to show statistical significance,
yet be expedient and economical at the same
time.
To calculate the power and sample size, a
priori analysis was undertaken, using the com-
puter software G*Power programme (Erdfelder
et al. 1996) and selecting Cramer’s V statistic to
determine the power of v2. Choosing the con-
ventional alpha input of 0.05, a minimum con-
sidered acceptable power (1� b) of 0.80 as
default, G*Power calculated a sample of 149
patients were required for the study.
Fifty patients were recruited from each of the
three clinical specialities, irrespective of gender.
Gender as a predictor of DVT is not a significant
factor (Coon 1976, Nordstrom et al. 1992). Any
gender-related risk would originate from addi-
tional risk factors such as oral contraceptive,
hormone replacement therapy, pregnancy, and
puerperium.
Data were collected by nurses on the ward to
which the patient was admitted. The pairing of
nurses allowed for the calculation of a kappa
statistic to evaluate the consistency of the risk
calculator with respect to inter-rater reliability.
Every effort was made to ensure that the sample
was representative of the clinical population. The
occurrence of DVT was fairly homogenous
within the population at large. This homogeneity
added weight to the claim of generalisability. If
the individual subjects are very much alike in all
variables, a smaller sample suffices (Crookes &
Davies 1998). There was little variability in the
characteristics of the populations. The fifty sub-
jects on the trauma/orthopaedic wards were
prototypical of subjects with hip fractures, as
cardiovascular disorders were to those on the
medical wards (Clagett et al. 1992). Most of the
patients on the surgical ward had undergone
major abdominal surgery.
Patients exhibited a wide variability of DVT
risk scores, ranging from the very highest score
of 27 to the lower of 1 for the no risk category.
Variability was evident in the sample represen-
tation of the various risk categories (Table 2).
All patients recruited to the study had to be
risk assessed within 24 h of admission. The
choice of 24 h admission was considered timely
for optimum predictive accuracy when patients
were very dependent due to their acute clinical
condition or surgical intervention with accom-
panying fibrinolytic shutdown (Kakkar & Strin-
ger 1990, Merli & Martinez 1987). Fibrinolytic
shutdown is an acute reaction syndrome, fa-
vouring thrombi formation (Marsh 1981).
Thrombi of clinically significant proportion are
present as early as the first 24 h of admission
(Brown & Neuman 1995). In trauma and or-
thopaedic patients DVT often occurs preopera-
tively (Roberts et al. 1990). Therefore, DVT risk
assessment should be undertaken as early as
possible and for those patients who would be
having surgery within the 24 h deadline, they
would be risk assessed immediately on their re-
turn from theatre. In the immediate postopera-
tive period, both hypercoaguable state and stasis
are at their peak (Nicolaides 1990). All patients
admitted primarily for treatment of acute DVT
were excluded from the sample.
Two data collection tools were applied to re-
evaluate the Autar DVT scale. The chart was the
primary data gathering tool. To assess patients
for risk of DVT, the paired registered nurses who
collected the data simply circled the appropriate
risk factors and aggregated the score.
117The management of deep vein thrombosis
A postal Likert-type questionnaire was used
to measure the practical utility of the DVT scale.
The postal questionnaire comprised 29 items
conveniently split into two sections. Section one
addressed the biographical data of the partici-
pating nursing staff, in relation to their profes-
sional experience and competence. This
biographical data was used as a basis for ex-
plaining similarities and differences in responses
to the items in section two. In section two, spe-
cific questions evaluated the clarity of the inde-
pendent variables in the subscales and the
practical application of the DVT risk calculator.
Both closed and open questions were used, so
that the strength of one would offset the weak-
ness of the other (Parahoo 1997).
RESULTS
Reliability of the DVT scale
Data gathered independently and simultaneously
by paired registered nurses from the 150 patients
were analysed to evaluate the inter-rater and
overall reliability of the DVT risk assessment
scale. Estimates of reliability computed by dif-
ferent procedures for the same instrument are
not identical (Polit 1996). Therefore, to com-
municate the inter-rater variability in the data
captured for the establishment of the consistency
of the DVT scale, three measures of equivalence
were applied: total percentage agreement ðT%Þ,kappa statistic ðjÞ, and intra-class correlation
coefficients (ICC). Percentage agreement was
calculated using the following equation
Number of agreement
Number of agreement and disagreement� 100
¼ ðT%Þ:
One major criticism of T% agreement is that it
does not take into account the varying contri-
bution of chance agreements to observed agree-
ment rate. Some of the agreement between raters
can be accounted for by chance alone. To offset
the limitation of T% agreement, kappa statistic
(Cohen 1960) was applied to the same data. The
advantage of the j coefficient over percentage
agreement is its correction or adjustment for the
amount of agreement expected to occur by
chance. It is symbolically expressed as
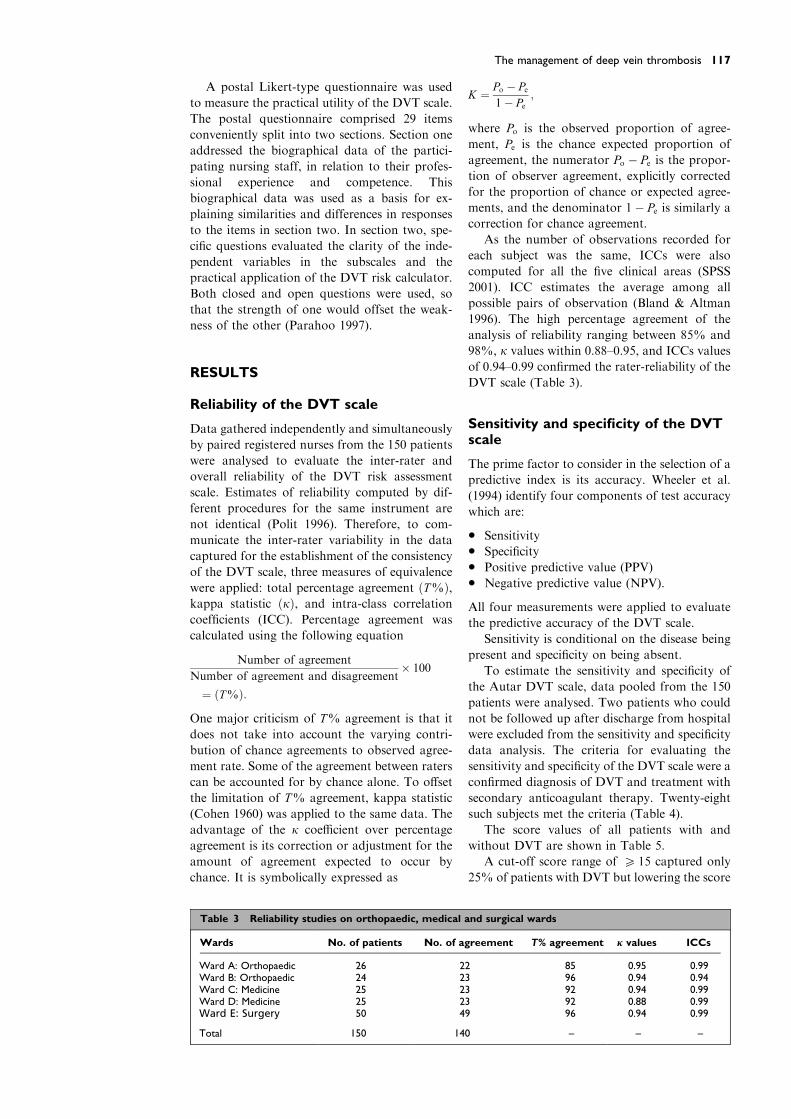
Table 3 Reliability studies on orthopaedic, medical
Wards No. of patients No. of a
Ward A: Orthopaedic 26 2Ward B: Orthopaedic 24 2Ward C: Medicine 25 2Ward D: Medicine 25 2Ward E: Surgery 50 4
Total 150 14
K ¼ Po � Pe1� Pe
;
where Po is the observed proportion of agree-
ment, Pe is the chance expected proportion of
agreement, the numerator Po � Pe is the propor-tion of observer agreement, explicitly corrected
for the proportion of chance or expected agree-
ments, and the denominator 1� Pe is similarly acorrection for chance agreement.
As the number of observations recorded for
each subject was the same, ICCs were also
computed for all the five clinical areas (SPSS
2001). ICC estimates the average among all
possible pairs of observation (Bland & Altman
1996). The high percentage agreement of the
analysis of reliability ranging between 85% and
98%, j values within 0.88–0.95, and ICCs values
of 0.94–0.99 confirmed the rater-reliability of the
DVT scale (Table 3).
Sensitivity and specificity of the DVTscale
The prime factor to consider in the selection of a
predictive index is its accuracy. Wheeler et al.
(1994) identify four components of test accuracy
which are:
• Sensitivity
• Specificity
• Positive predictive value (PPV)
• Negative predictive value (NPV).
All four measurements were applied to evaluate
the predictive accuracy of the DVT scale.
Sensitivity is conditional on the disease being
present and specificity on being absent.
To estimate the sensitivity and specificity of
the Autar DVT scale, data pooled from the 150
patients were analysed. Two patients who could
not be followed up after discharge from hospital
were excluded from the sensitivity and specificity
data analysis. The criteria for evaluating the
sensitivity and specificity of the DVT scale were a
confirmed diagnosis of DVT and treatment with
secondary anticoagulant therapy. Twenty-eight
such subjects met the criteria (Table 4).
The score values of all patients with and
without DVT are shown in Table 5.
A cut-off score range of P 15 captured only
25% of patients with DVT but lowering the score
and surgical wards
greement T% agreement j values ICCs
2 85 0.95 0.993 96 0.94 0.943 92 0.94 0.993 92 0.88 0.999 96 0.94 0.99
0 – – –

Table 4 Prevalence of DVT in the three clinical specialities
Speciality No. of patients No. with DVT %
Orthopaedic trauma 50 8 16Medical 50 12 24Surgical 48 8 17
Total 148 28 19
Table 5 Score values of patients with andwithout DVT
% DVTpresent (n)
DVTrisk score
% DVTabsent (n)
0 (0) 1 2 (2)0 (0) 2 2 (2)0 (0) 4 7 (8)7 (2) 5 12 (14)7 (2) 6 10 (12)3.5 (1) 7 5 (6)
11 (3) 8 9 (11)3.5 (1) 9 11 (13)0 (0) 10 13 (15)
11 (3) 11 9 (11)11 (3) 12 4 (5)14 (4) 13 7 (8)7 (2) 14 1 (1)7 (2) 15 2.5 (3)7 (2) 16 2.5 (3)3.5 (1) 17 2 (2)0 (0) 19 1 (1)3.5 (1) 20 2 (2)3.5 (1) 26 0 (0)0 (0) 27 1 (1)
100 (28) 100 (120)
Journal of Orthopaedic Nursing118
range to P 11 captured 68% of patients with the
condition.
The four possible indicators of accuracy were
therefore influenced by the chosen cut-off values
and initially an absolute cut-off range of P 15
was applied. True positives (TP) are those which
are predicted positive and have the disease. Se-
ven patients were correctly classified as true
positives. False positives (FP) are those who are
incorrectly predicted to have the disease when
Table 6 Sensitivity and specificity of absolute scores
DVT present
Score P 15 A 7 TPScore O 14 C 21FN
Total 28Sensitivity : a
aþc� 100 ¼ 7
7þ21� 100 ¼ 25%
Specificity : dbþd
� 100 ¼ 10812þ108
� 100 ¼ 90%
Table 7 Sensitivity and specificity for the four cut-o
Cut-off scores High riskP15 Moderate risk 1
Sensitivity 7/28¼ 25% (12+7)/28¼ 68%Specificity 12/120¼ 10% (12+25)/120¼ 31%1-Specificity 0.90 0.69
they do not. Twelve patients were false positives.
Those who are predicted negative and who do
not have the disease are the true negatives (TN)
and 108 patients were correctly classified. False
negatives (FN) are those subjects who are pre-
dicted negative for the disease but contracted it.
Twenty-one false negatives were recorded.
Test accuracy is defined as the number of true
positive and true negative divided by the number
of patients studied (Wheeler et al. 1994). Overall,
the DVT scale correctly predicted 115 patients (7
TP+108 TN/148¼ 78%) and misclassified 33
patients (22%).
The sensitivity and specificity of the absolute
cut-off value is illustrated in the contingency
Table 6.
The sensitivity and specificity of the DVT
scale are dependent on the threshold used and
calculating only one pair of sensitivity and
specificity results provides only a very brief
glimpse of a test performance. On account of this
limitation, the cut-off values of the four risk
categories in the Autar DVT scale assessment
protocol were also calculated (Table 7).
The choice of an 11–14 score range optimised
the predictive potential of the DVT scale and a
sensitivity of 68% was recorded. However, only
19 patients (13%) in the high risk score range
were identified (Table 6).
Although sensitivity and specificity provide
information about the accuracy of the test, they
do not add to the meaning of positive and neg-
ative test results. While sensitivity and specificity
in DVT
DVT absent Total
B 12 FP 19D 108 TN 129
120 148
ff values
1–14 Low risk 7–10 No riskO6
(5+12+7)/28¼ 86% (4+5+12+7)/28¼ 100%(45+25+12)/120¼ 68% (120/120)¼ 100%0.32 0.0

Table 8 Predictive values of DVT scale for absolute score range
Score values DVT present DVT absent Total Predictive values
P15 7 TP 12 FP 19 PPV: 37%O14 21 FN 108 TN 129 NPV: 84%
Total 28 120 148
119The management of deep vein thrombosis
are conditioned by the knowledge of the disease
state, predictive values are conditioned by the
nature of the test result (Essex-Sorlie 1995).
Predictive values were therefore used to
measure the frequency with which the DVT
scale correctly identified those at risk. Positive
predictive values (PPV) are the proportion of
those testing positive or predicted at risk of
DVT, who actually develop DVT. Negative
predictive values (NPV) are the proportion of
those predicted negative that do not have DVT.
PPV and NPV for the absolute score are shown
in Table 8.
Two factors influenced the predictive values of
the instrument: prevalence of DVT and sensitivity
and specificity of the tool. ‘As prevalence falls,
positive predictive valuemust fall alongside it, and
negative predictive value must rise’ (Sackett et al.
1991, p. 88). A fall in PPV (37%) due to low
prevalence of DVT (19%) was associated with a
Fig. 2 Receiver operating characteristics (ROC).
concomitant rise in NPV (84%). Importantly, the
PPV of the DVT scale was masked by 50% of the
patients who were recipient of some form of
known primary venous thromboprophylaxis. In-
terestingly, 39% (11/28) of the patients developed
a DVT at home when active prophylaxis was dis-
continued (Autar 2002).
Receiver operating characteristics
To further optimise the predictive accuracy of
the DVT scale, a receiver operating characteristic
(ROC) curve was constructed. A ROC (Figure 2)
is simply a plot of the true positive rate against
the false positive rate for the given thresholds
(Zweig & Campbell 1993). Using version 11 of
the SPSS package (2001), scores on the 148 pa-
tients were analysed to plot the ROC.
The area under the ROC curve for the above
plot was calculated to be approximately 70%.
Journal of Orthopaedic Nursing120
This means that a randomly selected patient
from the DVT group has a higher DVT risk as-
sessment score than one from the group without
DVT. However, it does not mean that a DVT
occurs with a probability of 0.70 or that DVT is
associated with a positive result 70% of the time.
Data extrapolation from Table 6 and the ROC
curve affirmed that the score of 11 was the op-
timum cut-off point and reduced the amount of
false negatives.
Practical application of the DVT scale
A response rate of 88% (22/25) from the paired
data collection nurses was recorded for the
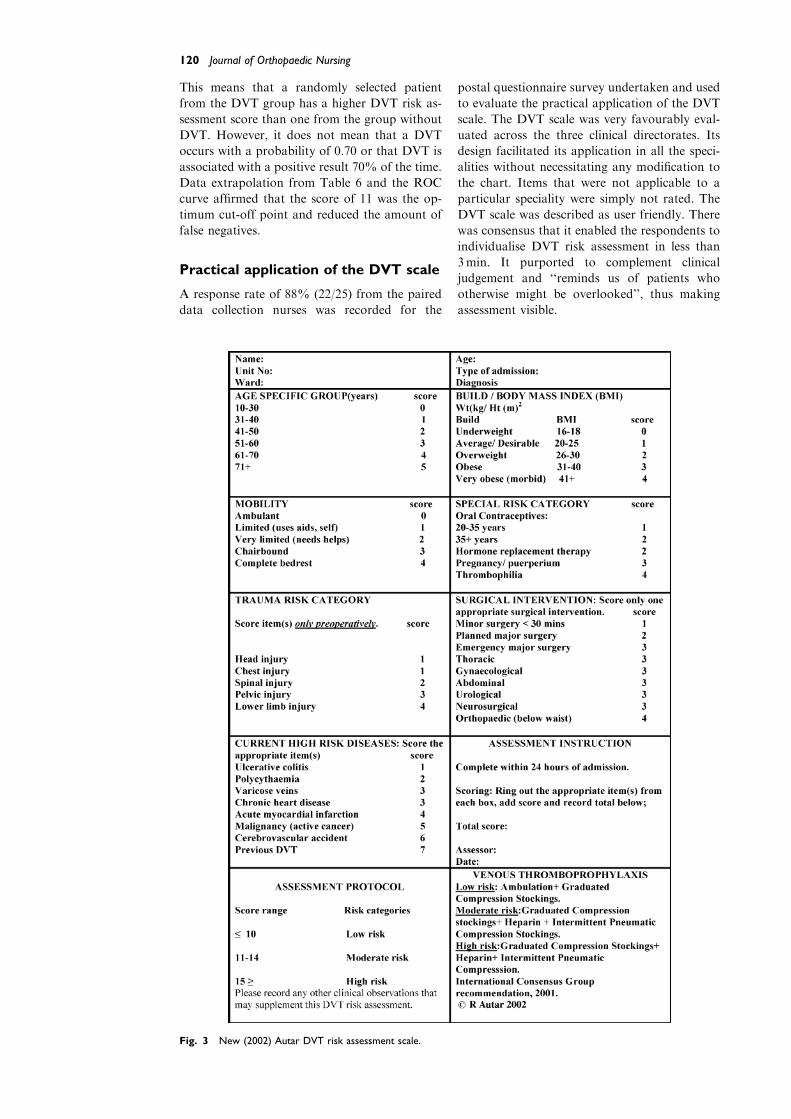
Fig. 3 New (2002) Autar DVT risk assessment scale.
postal questionnaire survey undertaken and used
to evaluate the practical application of the DVT
scale. The DVT scale was very favourably eval-
uated across the three clinical directorates. Its
design facilitated its application in all the speci-
alities without necessitating any modification to
the chart. Items that were not applicable to a
particular speciality were simply not rated. The
DVT scale was described as user friendly. There
was consensus that it enabled the respondents to
individualise DVT risk assessment in less than
3min. It purported to complement clinical
judgement and ‘‘reminds us of patients who
otherwise might be overlooked’’, thus making
assessment visible.
121The management of deep vein thrombosis
DISCUSSION AND CONCLUSION
New findings mandate some changes to the
clinimetric properties of the original DVT
scale, so as to enhance its overall predictive
performance. In the light of the results chan-
ges were made to the DVT subscales (Figure
3).
Age specific group
DVT increases exponentially with advancing
age (Rosendaal 1997). Older people now com-
prise two-thirds of all patients in acute hospital
settings, partly due to the demographic shift but
also due to lack of alternative settings for health
and social care (DoH 2001). A DVT increase in
occurrence of 20% is reported in the 40–60 year
old age range. This doubles between the age of
60 and 70 years and in patients over 70 the
figure trebles (Borrow & Goldson 1981, Caprini
& Natonson 1989). Despite a low risk score
placing them in the no risk category, two
medical patients in the 70–80 age range devel-
oped a DVT and advanced age was the only
significant risk factor. In the age specific sub-
scale, the 51–60 and 61+ age groups were as-
signed risk scores of 3 and 4, respectively.
Relative to the incidence of DVT rising sharply
in the different age groups, it is judged that
elderly patients in the 70–80 age group be re-
cognised as a higher risk group and assigned a
risk score of 5.
Special risk category
HRT
Opinion has been divided on the association
between hormone replacement therapy (HRT)
and venous thromboembolic diseases (THRiFT
1998). At the time of the initial study (Autar
1994) and the launch of this investigation, the
causal association between HRT and DVT was
questionable (Carter 1992, Moore 1976, Notel-
ovitz & Ware 1982).
However, two more recent studies (Daly et al.
1996, Jick et al. 1996) have demonstrated a po-
sitive causal relationship between HRT and
DVT. Perez-Gutthann et al. (1997) conducted a
case control study and concluded an overall
twofold increase of relative risk of venous
thromboembolic diseases associated with the
current use of HRT. Most recently, a rando-
mised controlled trial (Lowe et al. 2000) con-
firmed a two- to fourfold increase of DVT rate in
women taking HRT.
There is now compelling evidence that a
causal relationship between HRT and DVT
exists. HRT is now a new addition to the spe-
cial risk subscale and is assigned a risk score
of 2.
Thrombophilia
Thrombophilia represents a group of abnor-
malities in which patients have recurrent
thrombotic events because of genetic defect(s).
Ninety to ninety-two per cent of patients with
thrombophilia present with DVT (Marlar &
Mastovich 1990). In order to reflect the magni-
tude of this problem, thrombophilia as an inde-
pendent risk factor is included in the special risk
category subscale. Proportional to the degree of
risk relative, thrombophilia is assigned a risk
score of 4.
Surgical intervention category
Appropriately, orthopaedic surgery as an in-
dependent risk factor carries a higher weighted
score of 4 relative to the other types of surgery
in this subscale. Incidence of DVT in ortho-
paedic patients ranges from 50% to 75% (Das
1994). However, this high incidence of DVT in
orthopaedics relates only to patients undergo-
ing below waist surgery such as total hip and
total knee arthroplasties and surgical repair of
fractured femur and tibia and fibula (Geerts
et al. 1994). Incidence of DVT for other
orthopaedic procedures such as upper limb
surgery is not high. Therefore, the variable
‘‘orthopaedic’’ has been explicitly redefined to
‘‘below waist’’ orthopaedic surgery (Figure 3)
to differentiate this from other orthopaedic
surgical procedures carrying little or no risk of
DVT.
Elective major surgery carries an incidence
range of 0.2–2.2% rising to 2.7% for major
emergency surgery (Coon 1976, Kakkar et al.
1970). In order to make the distinction between
major surgery and emergency major surgery, the
former is redefined as ‘‘planned major surgery’’,
to highlight the difference in risk.
High risk diseases subscale
Specifically, clinical conditions such as sickle cell
anaemia, haemolytic anaemia, varicose veins,
and cerebrovascular accident as risk factors for
DVT need re-examination, in the light of new
evidence.
Sickle cell anaemia and haemolytic anaemia
Current data on sickle cell anaemia and haemo-
lytic anaemia do not lend conviction to the view
that they are associative risk factors. Sickle cell
anaemia and haemolytic anaemia have been im-
plicated in earlier literature for the reason of
restricted blood flow and the release of cell
breakdown products. In sickle cell anaemia
thrombi occur frequently in the microcirculation,
but there is no recorded evidence that it causes
DVT (Bell & Simon 1982).
Journal of Orthopaedic Nursing122
Haemolytic anaemia has also been previously
implicated yet, there is no evidence to support
any direct causal association with DVT (Belcher
1993). Early publications linking sickle cell
anaemia and haemolytic anaemia to DVT, due
to increased blood viscosity may have been
speculative (Serjeant 1992). In the absence of
new evidence, sickle cell anaemia and haemolytic
anaemia have been now deleted from the sub-
scale, as they are of no predictive value.
Varicose veins
Consistent with its high ranking by the European
Consensus Group (1991) and THRiFT (1992),
varicose veins as a DVT risk factor were assigned
a high risk score of 6 (Autar 1994).
Recent debate on varicose vein as a DVT
covariate is not disputed but challenged in rela-
tion to the nature of its association. Several in-
vestigators have utilised varicose veins as an
independent covariate in their predictive indices
to identify patients at risk of DVT (Clayton et al.
1976, Crandon et al. 1980, Lowe et al. 1982,
Nicolaides & Irving 1975). However, many vas-
cular surgeons (Agu 1999, Campbell & Riddler
1995, Campbell 1996) are now challenging this
clinical view. They claim the assumption that
DVT is an independent risk factor is derived
from a lack of understanding of the differences
between the deep and superficial veins of the
lower limbs. This scepticism is evident in a survey
of venous thromboprophylaxis for varicose vein
surgery. Only 29% of vascular surgeons consider
varicose veins as a high risk covariate, necessi-
tating primary prevention (Campbell & Ridler
1995).
Current literature on varicose veins is con-
troversial. The studies showing a relationship
between DVT and varicose veins were under-
taken in patients who had major abdominal
surgery and invited criticism. Varicose veins may
have coexisted incidentally with major abdomi-
nal surgery, advancing age and obesity as addi-
tive factors to cause DVT. In a study of 1231
patients, Anderson and Wheeler (1995) reported
a DVT incidence of only 5.8% due to varicose
veins.
The retention of the high risk score of 6 for
varicose veins over predicts risk, is unjustified
and its original risk score is re-graded to 3.
Myocardial infarction
Postal questionnaire feedback from the paired
date collection nurses highlighted concerns in
relation to the variable ‘‘myocardial infarction’’.
It was deemed to be ambiguous and inclined to
confuse interpretation as either an acute episode
or a past medical history could be included. In-
cidence of DVT in acute myocardial infarction
ranges between 20% and 40% but a previous
myocardial infarction does not (Carter et al.
1987). Aptly, this clinical variable has been re-
defined to ‘‘acute myocardial infarction’’ to em-
phasise an acute event and its immediate
potential for causing DVT.
CVA and previous DVT
CVA and a previous DVT are very well recog-
nised high risk diseases in the causation of DVT,
each associated with a risk score of 7 (Autar
1994). The incidence of DVT ranges between
42% and 60% for CVA (Brunner & Suddarth
1992, Kamal 1987). In patients with a previous
history of DVT, the recurrence of an episode is
between 48% and 68% (Dalen et al. 1986). An
even higher risk was reported by Samama et al.
(1993) for patients with previous DVT. There is
now a strong consensus that previous DVT
predisposes to the recurrence of the condition
and is the highest risk factor in the causation of
DVT (Anderson & Wheeler 1995, Nordstrom
et al. 1992, Samama et al. 1993).
Previous DVT is a higher risk than CVA and
is capped at the risk score of 7. CVA is assigned a
revised of 6 and in this way, the small difference
in the risk associated with these conditions is
maintained.
The DVT risk assessment protocol
The DVT risk assessment strategy (Autar 1994)
places patients into one of the four risk catego-
ries: no risk, low, moderate, and high risk. It is
important to identify those at risk and differen-
tiate them from those who are not so that the
limited resources can be targeted most effectively
(Anthony 1999, Autar 1998). Hence a no risk
category was incorporated into the assessment
protocol.
In reality, all patients by virtue of admission
for investigation or treatment should be regarded
as at risk. A DVT incidence of 11% for patients
with no risk factors present was reported by
Anderson and Wheeler (1995). This was evident
in the data obtained on the medical unit. Two
patients on the medical ward developed DVT
despite having a low score of less than 6, which
placed them in the no risk category. It is there-
fore prudent to err on the side of caution and
assume all patients are at risk. Consequently, the
four risk categories of the DVT scale have been
reviewed to three risk categories (Figure 3). The
removal of the no risk category from the as-
sessment protocol places the low risk category
into a wider risk score range of less than 10 and
resolves any problem of spurious precision be-
tween the no and low risk categories. The other
risk score ranges of 11–14 and P 15 are main-
tained to identify the moderate and high
risk categories, respectively. This modified risk
123The management of deep vein thrombosis
assessment protocol is also consistent with the
recommended antithrombotic assessment strat-
egy (International Consensus Group 1997, 2001).
The Autar DVT scale relies on routine data
gathered on admission, allowing for a prompt
DVT risk assessment and timely intervention. As
with the universally recognised Glasgow coma
scale, the Autar DVT scale can be applied by
nurses and doctors alike and also other health
care professionals. The use of computers pro-
grammed with logistic regression formulas, as
devised by Janssen et al. (1987) is technology for
the future. Until artificial intelligence is readily
available for carrying out bedside assessment,
paper and pencil assessment tools as the DVT
scale, remain the most effective method of pre-
dicting risk and guiding decision making.
REFERENCES
Agu O (1999) Deep vein thrombosis: a risky business.
Further correspondence. British Journal of Theatre
Nursing 9(7): 290–291
Anands SS, Wells PS, Hunt D, et al. (1998) Does the
patient have deep vein thrombosis? Journal of the
American Medical Association 279(14): 1094–1099
Anderson FA, Wheeler HB, Goldberg RJ, et al. (1991) A
population-based perspective of the hospital incidence
and case fatality rates of deep vein thrombosis and
pulmonary embolism: the Worcester DVT study.
Archives of Internal Medicine 151: 933–938
Anderson FA, Wheeler HB (1995) Venous
thromboembolism: risk factors and prophylaxis.
Clinics in Chest Medicine 16(2): 235–251
Anthony D (1999) Understanding Advanced Statistics. A
Guide for Nurses and Health Care Researchers,
Churchill Livingstone, Edinburgh
Autar R (1994) Nursing Assessment of Clients at risk of
DVT: the Autar DVT scale. Unpublished MSc
dissertation. University of Central England.
Birmingham, England
Autar R (1996a) Deep Vein Thrombosis: The Silent Killer.
Quay Books. Mark Allen Publishing, Wiltshire
Autar R (1996b) Nursing assessment of clients at risk of
deep vein thrombosis (DVT): the Autar DVT scale.
Journal of Advanced Nursing 23: 763–770
Autar R (1998) Calculating patients’ risk of deep
vein thrombosis. British Journal of Nursing 1(1):
7–12
Autar R (2002) Advancing clinical practice in the
management of Deep Vein Thrombosis (DVT). The
Autar DVT scale revalidated. PhD thesis. De
Montfort University, Leicester
Belcher AE (1993) Blood disorders. Mosby’s Clinical
Nursing Sciences. Philadelphia
Bell WR, Simon TL (1982) Current status of pulmonary
thromboembolic disease: pathophysiology, diagnosis,
prevention, and treatment. Curriculum in cardiology.
American Heart Journal: 239–262
Bland MJ, Altman DG (1996) Measurement error and
correlation coefficients. British Medical Journal 313:
245–251
Borrow M, Goldson H (1981) Post-operative venous
thrombosis: evaluation of five methods of treatment.
American Journal of Surgery 141: 245–251
Brown DC, Neuman RD (1995) Orthopaedic Secrets.
Hanley, Belfus Inc, Philadelphia
Brunner L, Suddarth D (1992) The Textbook of Adult
Nursing. Chapman & Hall, London
Campbell WB, Ridler BMF (1995) Varicose vein surgery
and deep vein thrombosis. British Journal of Surgery
82: 1494–1497
Campbell B (1996) Thrombosis, phlebitis and varicose
veins. British Medical Journal 312: 198–199
Caprini JA, Natonson RA (1989) Postoperative deep
vein thrombosis: current clinical considerations.
Seminars in Thrombosis and Hemostasis 15(3):
244–249
Carter CJ, Gent M, Leclerc JR (1987) The epidemiology
of venous thrombosis. In: Colman RW, Hirsh J,
Marder VJ, Salzman EW (eds) Hemostasis and
Thrombosis: Basic Principles and Clinical Practice,
second ed. JB Lippincott Company, Philadelphia
Carter CJ (1992) Thrombosis in relation to oral
contraceptives and hormone replacement therapy. In:
Greer IA, Turpie AGG, Forbes CD (eds)
Haemostasis and Thrombosis in Obstetrics and
Gynaecology. Chapman and Hall, London, pp.
371–385
Clagett GP, Anderson FA, Levine MN, Salzman E,
Wheeler HB (1992) Prevention of venous
thromboembolism. Chest 102(4): 391S–407S
Clayton JK, Anderson JA, McNicol GP (1976)
Preoperative prediction of postoperative deep vein
thrombosis. British Medical Journal 2: 910–912
Cohen JA (1960) A coefficient of agreement for nominal
scales. Educational and Psychological Bulletin 20:
37–46
Coon WW (1976) Epidemiology of venous
thromboembolism. Annals of Surgery 186(2): 149–164
Crandon AJ, Peel KR, Anderson JA, Thompson V,
McNicol GP (1980) Post-operative deep vein
thrombosis: identifying high risk patients. British
Medical Journal 7: 343–344
Crookes P, Davies S (1998) Research into Practice.
Bailliere Tindall, London
Dalen JE, Paraskos JA, Ockene IS, et al. (1986) Venous
thromboembolism. Scope of the problem.
Chest(Suppl): 371S–373S
Daly E, Vessey MP, Painter R, et al. (1996) Risk of venous
thromboembolism in users of hormone replacement
therapy. Lancet 348: 977–980
Das SK (1994) Venous thrombosis and pulmonary
embolism. Surgery: 217–223
DoH (2001) National Service Framework for Older
People. HMSO, London
Erdfelder E, Faul F, Buchner A (1996) G Power: a general
power analysis programme. In: Behaviour Research
Methods, Instruments and Computer, 28. Heinrich
Heine University, Dussuldorf, pp. 1–11
Essex-Sorlie D (1995) Medical Biostatics and
Epidemiology, first ed Prentice Hall International Inc,
London
European Consensus Statement (1991) Prevention of
venous thromboembolism. Med-Orion Publishing,
London
Geerts WH, Code KI, Jay RM, et al. (1994) A prospective
study of venous thromboembolism after major
trauma. The New England Journal of Medicine
331(24): 1601–1606
International Consensus Statement (1997) Prevention of
venous thromboembolism. Med-Orion Publishing
Company, London
International Consensus Statement (2001) Prevention of
venous thromboembolism. International Angiology
20(1): 1–37
Janssen HF, Schachner J, Hubbard J, et al. (1987) The risk
of deep venous thrombosis: a computerised
epidemiologic approach. Surgery 101(2): 205–212
Journal of Orthopaedic Nursing124
Jick H, Derby IE, Myers MW (1996) Risk of hospital
admission for idiopathic venous thromboembolism
among users of post menopausal oestrogens. Lancet
248: 981–983
Kakkar VV, Howe C, Nicolaides AN, Renney JTG, Clark
MB (1970) Deep vein thrombosis of the legs. Is there a
high risk group? American Journal of Surgery 120:
527–530
Kakkar VV, Stringer MD (1990) Prophylaxis of venous
thromboembolism. World Journal of Surgery 14:
670–678
Kamal A (1987) Cerebro-Vascular Disease and its
Management. Wolfe Medical Publication, London
Lindblad B, Sternby NH, Bergqvist D (1991) Incidence of
venous thromboembolism verified by necropsy over
30 years. British Medical Journal 302: 709–711
Lowe GD, McArdle BM, Carter DC, et al. (1982)
Prediction and selective prophylaxis of venous
thrombosis in elective gastro-intestinal surgery.
Lancet 1: 409–412
Lowe GD, Woodward M, Vessey MP, et al. (2000)
Thrombotic variables and risk of idiopathic venous
thromboembolism in women aged 45–64 years.
Relationships to hormonal replacement therapy.
Thrombosis and Haemostasis 83(4): 530–535
Marlar RA, Mastovitch S (1990) Hereditary protein C
deficiency. A review of the genetics, clinical
presentation, diagnosis and treatment. Blood
Coagulation Fibrinolysis 1: 319–330
Marsh N, 1981. In: Fibrinolysis. Wiley, Chichester, pp.
10–45
Merli GJ, Martinez J (1987) Prophylaxis for deep vein
thrombosis and pulmonary embolism in surgical
patients. Medical Clinics of North America 71:
377–397
Moore B (1976) Sequential mestranol and novethisterone
in the treatment of climateric syndrome. Postgraduate
Medical Journal 52(6): 39–47
National Institutes of Health (1986) Consensus
development conference on the prevention of venous
thrombosis and pulmonary embolism. Journal of the
American Medical Association 25(b): 744–749
Nicolaides AN, Irving D (1975) Clinical factors and the
risk of deep venous thrombosis. In: Nicolaides AN
(ed) Thromboembolism Aetiology. Advances in
Prevention and Management. MTP, Lancaster, pp.
193–204
Nicolaides AN (1990) Benefits of prophylaxis in general
surgery. Acta Chirurgica Scandinavica 556(Suppl):
25–29
Nordstrom M, Linblad B, Berqvist D, Kjellstrom (1992)
A prospective study of the incidence of deep vein
thrombosis within a defined urban population.
Journal of Internal Medicine 232: 155–160
Notelovitz M, Ware M (1982) Coagulation risk with post
menopausal oestrogen therapy. In: Studd JWW (ed)
Progress in Obstetrics and Gynaecology, vol. 2.
Churchill Livingstone, Edinburgh, pp. 228–240
Parahoo K (1997) Nursing Research. Principles, Process
and Issues. Macmillan Press, London
Perez-Gutthann S, Rodriguez G, Castellsagne J, et al.
(1997) Hormone replacement and risk of venous
thromboembolism. British Medical Journal 314:
796–800
Polit DE (1996) Data Analysis and Statistics for Nursing
Research. Appleton and Lange, Conneticut
Roberts TS, Nelson CL, Barnes L, et al. (1990) the
preoperative prevalence and postoperative
incidence of thromboembolism in patients with hip
fractures treated with dextran prophylaxis.
Clinical Orthopaedics and Related Research 255:
198–203
Rosendaal FR (1997) Thrombosis in the young:
epidemiology and risk factors. A focus on
venous thrombosis. Thrombosis and Haemostasis
78(1): 1–6
Sackett D, Haynes RB, Guyatt GH, Tugwell P (1991)
Clinical Epidemiology. A Basic Science for Clinical
Medicine, second ed Little, Brown and Company,
Toronto
Samama MM, Simmoneau G, Wainstein JP (1993) Sirius
study. Epidemiology of risk factors of deep venous
thrombosis (DVT) of the lower limbs in community
practice. Thrombosis Haemostasis 69: 763
Scurr JB, Coleridge-Smith PD, Hasty JB (1988) Deep vein
thrombosis: a continuing problem. British Medical
Journal 297: 28
Scurr JH (1990) How long after surgery does risk of
thromboembolism persists? Acta Chirurgica
Scandinavica 556(Suppl): 22–24
Serjeant GR, 1992. In: Sickle Cell Disease, second ed.
Oxford University Press, Oxford, pp. 117–119
SPSS 11.0 (2001) Application Guide. SPSS Inc., Chicago
THRiFT (1992) Risk of and Prophylaxis for Venous
Thromboembolism in Hospital Patients. British
Medical Journal 305: 567–574
THRiFT (1998) Risk of and Prophylaxis for Venous
Thromboembolism in Hospital Patients. Phlebology
13: 87–97
Turpie AGG (1997) Low molecular weight heparin: from
the bench to the orthopaedic patients.
Orthopedics(February): 10–13
Wasson JH, Sox HC, Neff RK, et al. (1985) Clinical
prediction rules. The New England Journal of
Medicine 313(13): 793–799
Wheeler HB, Hirsh J, Wells P, et al. (1994) Diagnostic
tests for deep vein thrombosis. Archives of Internal
Medicine 154: 1921–1928
Zweig MH, Campbell G (1993) Receiver operating
characteristic (ROC) plots: a fundamental evaluation
tool in clinical medicine. Clinical Chemistry 39(4):
561–577