The link between innovation and productivity in Estonia's services sector
34
University of Tartu Faculty of Economics and Business Administration THE LINK BETWEEN INNOVATION AND PRODUCTIVITY IN ESTONIAN SERVICE SECTOR Jaan Masso, Priit Vahter Tartu 2011
-
Upload
independent -
Category
Documents
-
view
0 -
download
0
Transcript of The link between innovation and productivity in Estonia's services sector

University of Tartu Faculty of Economics and Business Administration
THE LINK BETWEEN INNOVATION AND PRODUCTIVITY IN ESTONIAN SERVICE
SECTOR
Jaan Masso, Priit Vahter
Tartu 2011

The Link between Innovation and Productivity 2
ISSN-L 1406-5967 ISSN 1736-8995
ISBN 978-9985-4-0621-2 The University of Tartu FEBA
www.mtk.ut.ee/research/workingpapers
Jaan Masso, Priit Vahter 3
The Link between Innovation and Productivity in Estonia’s Service Sectors
Jaan Masso, Priit Vahter∗
Abstract
The emerging literature on the characteristics of innovation processes in the service sector has paid relatively little attention to the links between innovation and productivity. In this paper we investigate how the innovation-productivity relationship differs across various sub-branches of the service sector. For the analysis we use the CDM structural model consisting of equations for innovation expenditures, innovation output, productivity and exports. We use data from the community innovation surveys for Estonia. We show that innovation is associated with increased productivity in the service sector. The results indicate surprisingly that the effect of innovation on productivity is stronger in the less knowledge-intensive service sectors, despite the lower frequency of innovative activities and the results of earlier literature. Non-technological innovation only plays a positive role in some specifications, despite its expected importance especially among the service firms. An additional positive channel of the effects of innovation on productivity may function through increased exports.
JEL Classification: O31, O33, L80
Keywords: innovation, services, productivity.
∗ Jaan Masso, Senior Research Fellow, University of Tartu, Faculty of Economics and Business Administration
Narva Rd. 4–110, Tartu, 51009, Estonia. E-mail: [email protected] Priit Vahter, Research Fellow, Faculty of Economics and Business Administration, University of Tartu, Estonia; Research Fellow, Birmingham Business School, University of Birmingham, UK. E-mail: [email protected]; [email protected] The authors acknowledge financial support from the Ministry of Education and Research of the Republic of Estonia target financed project no. SF0180037s08 and Estonian Science Foundation grant no. 8311. We are grateful to Jaanika Meriküll and Tõnu Roolaht for their comments.

The Link between Innovation and Productivity 4
1. INTRODUCTION AND LITERATURE REVIEW
Economic literature has recognized innovation and technological change as the main driver of long-run growth and development. Traditionally, the literature on the economics of innovation has focused more on manufacturing industry. Service sectors have often been regarded as laggards in innovation processes (OECD 2009) and passive adopters of technologies developed in other sectors, or as “supplier dominated” according to the taxonomy of sectors by Pavitt (1984). Still, the number of papers on innovation in service sectors has been growing. See, for example, Gallouj and Savona (2009) for a literature review.
The growth in the number papers in this field is also related to the increased availability of firm level data from the service sector, such as the inclusion of services in the Community Innovation Survey since its second wave. The literature has focused on a number of questions, such as how innovation processes in services differ from those in manufacturing in terms of knowledge sourcing, forms of protection of intellectual property (Tether and Massini 2007), R&D expenditure and determinants of innovation output (Arundel et al. 2007, Leiponen 2008; Mothe and Nguyen Thi 2010), and how various taxonomies of the different service industries can be formed based on the nature of the innovation processes (Soete and Miozzo 1989; Evangelista 2002; Innovation in services 2010). There has been less attention on the links between innovation and firm performance, and in particular, productivity in services1. This has possibly been affected by the perception that services have experienced lower productivity growth than the manufacturing industry (see e.g. Baily and Zitzewitz 2001), which dates back to the discussion of Baumol’s cost-disease. However, enhancing GDP growth by fostering productivity improvements in the service and retail sectors is considered increasingly important (van Ark et al. 2008, Haskel and Sadun 2009). In the European context, faster productivity growth in market services is especially needed to avoid a further widening of the productivity gap with the US (van Ark et al. 2008).2 Thus, it pays to study the experience and peculiarities of the innovation process in these EU countries that have witnessed high productivity growth in the service sector.
In this paper we investigate the relationship of various forms of innovation, both technological and non-technological, with the productivity of service sector firms using the European Community Innovation Survey (hereinafter CIS) data for Estonia, a small open Central and Eastern European (CEE) economy. The rather small number of studies on the innovation-productivity link in services means that we contribute to the literature by adding evidence from a catching-up economy to existing studies on highly developed countries. In post-communist catching-up economies the share of the service sector in the economy is likely to increase faster than in highly developed countries, as services were relatively underdeveloped in command economies. Due to the initial development gap it was easier to introduce the latest technologies; for example, in banking the stage of using cheques was skipped with the immediate introduction of electronic banking services (Luštšik 2003).
1 The few exceptions include the studies by Mairesse and Robin (2008), Lopes and Godinho (2005), Stelios and
Aristotelis (2008) and Love and Roper (2010). 2 According to van Ark et al. (2008), the productivity slowdown in the EU15 compared to the US since the middle of the 1990s has been mostly due to slower productivity growth in retail and wholesale trade, finance, and business services in the EU.

Jaan Masso, Priit Vahter 5
The data for Estonia shows that in some sub-sectors, service firms have been even more innovative than manufacturing enterprises.3 Estonian service firms have produced several innovative solutions in the areas of ICT, internet-banking, software development and mobile-communications. See for example Högselius (2005) for a thorough study of innovation in the Estonian services sector. Our study is novel also because it considers the various taxonomies of the service sector. These taxonomies are based on the perceived differences of innovation processes, the amount of resources devoted to innovation activities, knowledge sources, cooperation patterns and innovation outputs in order to consider potential differences across various branches of the service sector (Evangelista and Savona 2002). The taxonomies we use are standard Eurostat classifications for knowledge intensive (KIS) and less-knowledge intensive services (less-KIS), and the classification by Soete and Miozzo (1989) that divides services into three groups: supplier-dominated, scale-intensive and science-based.
The data we use for the study, the CIS, is a regular survey undertaken in the counties of the EU. It provides a unique tool for investigating the innovation process within and across countries. Since its second wave (covering 1996–1998) it has also included service sector firms. We use data from three CIS surveys in Estonia: these are CIS3 (1998–2000), CIS4 (years 2002–2004) and CIS2006 (2004–2006). The combination of the different waves of the survey into a panel enables us to have a significant number of observations in various service sub-sectors, whereas services have usually been under-represented in the innovation surveys4. The CIS data is matched with financial data from the Estonian Business Register in order construct various measures of productivity, including the years not covered by the CIS survey. In addition, the data includes non-technological innovation like organizational and marketing innovations that are often considered particularly important for services.
The standard model used in the literature to study the determinants and effects of innovation is the three-stage Crépon, Duguet and Mairesse model (CDM, 1998). The first stage of the model explains the determinants of innovation inputs (e.g. spending on R&D, etc). The second stage of the model links innovation inputs with innovation outputs (e.g. indicators of process and product innovation, or the sales generated by new products). The last stage links measures of firms’ innovation output with performance indicators of firms. We estimate a version of the CDM model developed by Griffith et al. (2006) that uses product and process innovation dummy variables as the measures of innovation output5. That way we can investigate how the role of different determinants and barriers to the innovation process in services differs from the manufacturing industry.6 Earlier studies that have estimated the CDM model using data from the service sector in Western European countries include, for example, the study by Robin and Mairesse (2008) based on CIS data from France, the study by Lööf and Heshmati (2006) on Sweden, whereas other studies (Love et al. 2010, Mansury
3 In CIS4, the percentage of innovative firms was 48 per cent in manufacturing and 51 per cent in the services. According to the anonymized Eurostat CIS4 data, Estonia was the only country along with Portugal and Germany where services were found to be more innovative than the manufacturing enterprises. 4 According to the anonymized Eurostat CIS4 data, the share of services firms varied from 24 per cent in Slovakia to 55 per cent in Latvia. 5 We have estimated a similar specification in an earlier paper for the Estonian manufacturing industry (Masso and Vahter 2008). 6 For example, earlier papers from Western and Southern Europe (Robin and Mairesse 2008 for France, Lopes and Godinho 2005 for Portugal, Stelios and Aristotelis 2008 for Greece) have shown that R&D is less important as an innovation input in the service sector than in manufacturing. Mairesse and Robin (2008) showed that the effect of R&D investments on innovation in the French services sector for 2002–2004 was about 4 times smaller than in the manufacturing industry. Therefore, we also use a broader measure – ‘innovation expenditure’ as an innovation input measure in estimating the CDM model.

The Link between Innovation and Productivity 6
and Love 2008) have estimated productivity equations either separately using OLS or the second stage of the Heckman two-stage regression.
By now there is increasing interest in the study of innovation in service sectors. The relatively scarce empirical literature on innovation in services may appear surprising, given that in most developed countries this sector accounts for a rather high and growing share of employment and value added7, and has made a greater contribution to GDP growth than manufacturing and other industries. As mentioned earlier, part of the explanation for this is that service sector firms have traditionally been considered less likely to innovate and as passive users of technologies produced. Still, here we need to consider the huge diversity within the service sector. It includes also highly innovative and knowledge intensive branches, like software development, telecommunications and financial intermediation.
Services sector has several specific characteristics, compared to manufacturing. For instance, services are often co-produced with clients (or their production and consumption are inseparable), are non-storable and non-durable. In the case of many services there are limited possibilities for the standardisation of production and distribution processes (Innovation in services 2010). Because services are often consumer-specific, it is more difficult to differentiate between service innovations and service variations (Tether 2005). There are differences in the sources of relevant knowledge; for example, the OECD (2009) argues that service sector innovation relies more intensively on obtaining knowledge from outside sources (e.g. clients, suppliers and competitors) and through collaboration compared to the manufacturing industry. Arundel et al. (2007) document that while manufacturing firms use universities and research institutes less often as cooperation partners, universities are much more valued by KIS.
Innovation in services is often related to changes in the organization (organizational innovations) and the use of information and communication technologies (Harrison 2008; Polder et al. 2009; Mothe and Nguyen Thi 2010). Leiponen (2008) summarizes evidence from various sources showing that R&D in services is carried out more by informal teams, it is less institutionalized and it is carried out on a more ad-hoc basis. R&D expenditure is not closely correlated with innovation output in services. In-house training could compensate for formal R&D activities in service firms, as the innovation activities in services rely more on people’s skills. Services firms also differ from manufacturing firms in the lower use of both formal and strategic forms of protection. At the same time, the strategic forms are relatively more important for them than the formal ones (Tether and Massini 2007). Despite these differences, Evangelista (2000) argues that there is convergence between manufacturing and services in innovation input and organizational models.
Gallouj and Savona (2009) summarize that the literature on innovation in services distinguishes between a technologist or assimilation approach (that innovation in services is the adoption and use of technology), service oriented or differentiation approach (that highlights the specificities in the service product and production processes) and integrative or synthesizing approach (that, given the trend of convergence between manufactured goods and services8, tries to develop a common conceptual framework). On the other hand, Mothe and
7 For example, in OECD countries the service sector accounts for more than 70 per cent of employment and value added. 8 For instance, Hill (1999) has argued that the traditional distinction between goods and services does not correspond to the classification between tangible and intangible products because of the growing group of intangible products (things recorded on paper, firms, tapes etc); thus, the classification for products and services should be replaced with a three-class taxonomy that includes tangible goods, intangible goods and services.
Jaan Masso, Priit Vahter 7
Nguyen Thi (2010) distinguish between a demarcation approach (service innovation requires specific theories), assimilation approach (services are similar to manufacturing) and a synthesis approach (innovation can occur both in services and manufacturing).
While the literature on innovation in services is not too small, relatively little attention has been paid to the effects of innovation on the economic performance of firms, either in terms of productivity, employment or other variables. Among the few earlier papers that have investigated the impact of innovation on productivity in the service sector relative to manufacturing, Stelios and Aristotelis (2009) found that innovation is frequent in knowledge intensive business services and that (product) innovation is strongly correlated with higher productivity. As in manufacturing, the main determinant of innovation is formal knowledge resulting from R&D or from acquisitions of equipment, patents or licenses. However, the role of R&D as an input in the innovation process in the entire service sector is on average usually much lower than in the manufacturing industry. That follows from the fact that in services R&D is often carried out on a more informal basis (Leiponen 2008). Robin and Mairesse (2008) find based on data from the French CIS4 that the effect of product or process innovation on labour productivity was approximately 4 times higher in services compared to manufacturing. The study by Lööf and Heshmati (2006) using data from Sweden shows that the relationship between innovation input and output, as well as the relationship between innovation output and firm performance, was strikingly similar in manufacturing and services. Love et al. (2010) using data from Northern Ireland document that innovation had no direct effect on firm productivity, but it had an indirect positive effect through exports. Cainelli et
al. (2006) by exploiting CIS2 and System of Enterprise Accounts data find that an innovation dummy variable and different types of innovation expenditures (especially on ICT) had a positive correlation with productivity, and that the link between innovation and productivity is a self-enforcing one. Mansury and Love (2008) observe for a small sample of US business service firms (SIC code 73) that innovation had a positive effect on sales and employment growth, but not on productivity. Musolesi and Huiban (2010) learn from the French CIS3 that in knowledge intensive business services product innovation had a strong effect on productivity, and process innovation or non-technological innovation did not. One standard caveat is that there are a multitude of difficulties in measuring innovation and measuring the productivity and performance of firms in the service sector; in particular, the difficulty in defining and measuring production output and input. See for example, Baily and Zitzewitz (2001) or Diewert (2001) for detailed analysis of measurement problems9. These difficulties do not mean that we should be satisfied only with case study analysis or descriptive statistics. Despite the potential measurement errors, the study of the innovation process using standardised quantitative methods yields information that case studies cannot provide.
The rest of the paper is structured as follows. Section 2 provides an overview of the data together with some preliminary descriptive analysis. Section 3 introduces our methodological approach. Section 4 presents the results of the econometric estimations. The last section concludes together with a discussion of the results and their implications for economic policy and the study of innovation in services.
9 Griliches (1992) argues that the problem of output measurement in the service sector can be related to the difficulties in defining the content or nature of the service transaction, the involvement of user in the service output, and difficulties in detecting the quality changes in services.

The Link between Innovation and Productivity 8
2. METHODOLOGY
For our econometric analysis we use the system of equations known as the CDM model, based on the seminal paper by Crepon, Duguet, Mairesse (1998) that models the relationship between innovation inputs and innovation outputs (patents, sales of new products, the presence of new products or processes). A growing body of literature has emerged using the CDM model, and now also includes cross-country studies (e.g. the OECD (2009) study that covers a long list of OECD countries). The majority of papers have so far used the model where the innovation output is measured in terms of the shares of new products in total sales and the knowledge |production function and production function are estimated only based on the data of innovative enterprises (see e.g. Lööf et al. 2006). Here we use a version of the model that uses indicator variables for product and process innovation as innovation output, and the model is estimated for all firms, not just innovative ones (Griffith et al. 2006). The reason to use data from all firms is that all firms exert some innovation effort, although not all firms report the innovation effort. The model is given by the following 4 equations:
( 1)
≤+=
>+==
cXgif
cXgifg
iii
iii
000*0
000*0
01
0
1
εβ
εβ
( 2)
=
=+==
00
1111*
i
iiii
i
gif
gifxrr
εβ
(3) [ ] [ ] [ ][ ] [ ] [ ]iiipcsii
iiipdtii
xrpcspcs
xrpdtpdt
322*
222*
Pr0*Pr1Pr
Pr0*Pr1Pr
εβα
εβα
++=>==
++=>==.
(4) ( ) ( )1,0,,, 444,
∈++==⋅=∑ lkxlpcskpdtIq ii
lk
iTi εβα
where *ig is the latent innovation decision variable and ig is the indicator variable that equals
1 if firms report innovation expenditures. The two variables, ir and *ir are respectively the
observed and latent innovation expenditure intensity variables. Variables ipdt and ipcs
denote innovation output variables; these are indicator (dummy) variables for product and process innovation. Variable iq is the log of productivity (sales per employee or value added
per employee). The vectors iiii xxxx 4310 ,,, include the variables explaining innovation
decisions, the intensity of innovation expenditure, innovation output and productivity respectively. The α ’s and β ’s are the vectors of parameters. Error terms i0ε and i1ε are
assumed to follow a joint normal distribution with a zero mean. Equations (1) and (2) are estimated jointly as a generalized Tobit. We assume that error terms i2ε and i3ε follow a
multivariate normal distribution and the equations in (3) are estimated jointly as bivariate probit models (Polder et al. 2009 also used trivariate probit models), which accounts for the potential that the use of different types of innovations is related at firm level. The final equation is estimated using least squares and the innovation output variables are instrumented in order to try to account for the endogeneity of the innovation input variables. Three key explanatory variables are included there; these are the predicted probabilities for combinations of the presence of product and process innovation denoted as BP(1,0), BP(0,1) and BP(1,1). These denote, respectively, the cases when a firm has i) product innovation, but no process

Jaan Masso, Priit Vahter 9
innovation; ii) no product innovation, but has process innovation; iii) has both product and process innovation. The combination BP(0,0), denoting that the firm has no product or process innovation, is used as the reference category and is excluded from the regression due to multicollinearity (similarly to Polder et al. 2009).
The previous literature based on the CDM model, using data from various countries and mainly from the manufacturing industry, has established which variables tend to be significant in these models (see e.g. OECD 2009). So, we exploit the variables used in earlier studies and our main emphasis will be on studying the extent to which the links differ between services and manufacturing and between different sub-branches of services (knowledge-intensive and less knowledge intensive services). Equation (1) models the decision to innovate. There the explanatory variables are the following: dummies for international competition, a dummy for belonging to an enterprise group (note that here foreign owned firms belong to a group by definition), formal protection and public funding, as well as firm size measured as the log of the number of employees. Innovation expenditure in equation (2) is explained by the aforementioned dummies, the dummy variable for engagement in innovation cooperation, variables for sources of information, innovation strategies (offensive, defensive, cost-reduction, production flexibility, following Lööf and Heshmati 2006) and various obstacles to innovation. In our analysis the dummy variable indicating the use of an offensive strategy is equal to 1 if reducing unit costs, quality improvement or entry into new markets is of high importance for the firm. The dummy variable indicating the use of a defensive strategy is equal to 1 if the reduction of the firm’s environmental impact and meeting regulatory requirements is of high importance for the firm. The dummy variable indicating the use of a cost reduction strategy is equal to 1 if lowering the costs of production inputs is of high importance. The dummy variable indicating an orientation towards production flexibility is equal to 1 if improving the flexibility of service provision is of high importance for the firm.
The innovation output, the dependent variable in Equation (3), is explained using the predicted innovation expenditure from the previous stage in the CDM model, the dummy for formal protection, the public funding dummy, firm size and the various main sources of information for innovation (sources within the firm, competitors, customers and suppliers). Following Leiponen (2008), we have also included in the regressions a variable measuring the number of different information sources used; that is, the “breadth” of different innovation sources. This variable is included because multiple sources of information could ensure the success of the innovation process and make it possible to combine knowledge from different sources that complement each other. The final productivity Equation (4) explains labour productivity with capital intensity, a dummy for exports, three aforementioned predicted values for the combinations of product and process innovation, dummy variables for organizational and marketing innovation, and the log number of employees as a proxy for firm size.
The CDM model is widely used, but may not be very informative on exactly how the innovation outputs are transformed into performance improvements in firms. One significant channel that may show the effects of innovation (esp. product innovation) is through the effect on exports. This includes the effect on entry into export markets and the intensity of export activities (see Love et al. 2010). In order to investigate this issue we augment the standard CDM model with an alternative last stage equation: (5) iiiTi xtE 333 εβα ++= .

The Link between Innovation and Productivity 10
This equation is otherwise similar to the productivity Equation (4) in the CDM model. Only the dependent variable is different. The dependent variable iE is either an exports dummy
(equal to 1 if the firm engages in exports, otherwise 0) or the firm’s export growth variable. The innovation indicators on the right hand side of Equation (5) are the fitted values from the Equation (3). A somewhat similar relationship between innovation and exports has been, for example, previously estimated by Love et al. (2010) based on UK CIS data. However, they do not estimate the instrumented version of the equation (5). Therefore, their results show simple correlations between exporting and innovation. Provided the instrumental variables (from equation (3)) are valid, our results may point to the effects of innovation on exports. However, this interpretation of regression coefficients relies on the restrictive assumptions that investments in innovation inputs can be seen as valid instruments for innovation indicators in equation (5); that is, that R&D and other innovation inputs affect the exports and performance of firms only through their effects on innovation outputs: indicators of product and process innovation, etc. This may be too restrictive an assumption.
Here we study the differences in the relationship between innovation and performance in different types of services sectors. At first we concentrate on the distinction between the KIS and less-KIS sectors. The standard Eurostat definition of KIS and less-KIS sectors was first introduced by Eurostat in 1995 (Miles et al. 1995)10. Previously, this taxonomy has also been used in the study of data from Greece by Stelios and Aristotelis (2009). Within the NACE 1.1 classification system the following industries are defined as knowledge-intensive service sectors: water transport (NACE code 61), air transport (62), post and telecommunications (64), financial intermediation (65), insurance (66), activities auxiliary to financial intermediation (67), real estate activities (70), renting of machinery and equipment (71), computer and related activities (72), research and development (73) and other business activities (74). The remaining service sectors are defined as less-KIS industries (these include thus, wholesale and retail trade (50-52), hotels and restaurants (55), land transport (60), and supporting and auxiliary transport activities (63))11. Previous studies have shown that KIS have an important role in the innovation system. Technology-related KIS industries are among the most innovative in the economy (Miles 2005). Also, they play important roles in the innovation process of their client firms.
Next, we investigate whether there are differences in the links between innovation and performance in sectors defined by a popular and widely cited classification by Soete and Miozzo (1989). This classification attempts to divide the initial Pavitt’s (1984) category of supplier dominated sectors, which initially included the whole service sector, into more detailed categories, in particular supplier dominated, scale intensive and science based sectors. In their classification, a large share of firms remains in the supplier dominated category, including personal services, but also public and social services (note that public services are not included in our study). These sectors tend to be characterised by weak R&D, and innovations stem mainly from input from suppliers.
10 The characteristics of the KIS are that they rely intensively on professional knowledge, they provide services to other firms and public organizations (rather than consumers) and they are important sources of knowledge (e.g. facilitate knowledge processes in other companies) or use knowledge in the production of intermediate services (Muller and Doloreux 2007; Smedlund and Toivonen 2007). 11 Often a more narrow definition of KIS is used that only includes the NACE sectors 72 (computer and related activities), 73 (research and development) and 74 (other business activities) (Muller and Doloreux 2007).

Jaan Masso, Priit Vahter 11
Soete and Miozzo (1989) also add new categories. The first addition includes scale and network intensive sectors. These are sectors that depend heavily on large physical networks and information networks, and are characterised by large firms. Sectors that rely heavily on information networks are the financial services sector, and insurance and communication intensive sectors like consulting. These sectors depend heavily on ICT and tend to have more of their own innovation activities than supplier dominated industries. Sectors that rely heavily on physical networks are the transport sector and wholesale. The science-based service sector is an additional type; it includes software development and various specialized business services. These sectors invest heavily in the innovation process. Empirical studies have mostly confirmed the usefulness of the Soete and Miozzo classification.12 While recently additional taxonomies have been suggested13, the sectors in these various taxonomies overlap each other to a significant extent.
3. DATA AND DESCRIPTIVE STATISTICS
Related earlier studies in the service sector have mostly used CIS2, CIS3 or CIS4 survey data and have been based on developed countries. There is a lack of studies on developing and (post) transition countries. Here we use Estonia’s data from CIS4 (2002–2004) and the CIS2006 survey wave (2004–2006). For our econometric analysis all three CIS surveys are pooled into one 3-wave panel. This way we can guarantee that there are enough observations to estimate the CDM model separately for different types of services. However, we have investigated the same model based on each individual CIS wave as well and compared these results with the pooled model; these results were mostly similar to the baseline presented in the paper. The CIS3 data includes 3 161 firms, CIS4 data includes 1 747 and CIS2006 1 924. Our analysis concentrates on service sector enterprises, and in the two surveys there are respectively 1 473, 604 and 687 service firms, and among them 593, 243 and 281 KIS firms. In our analysis of the links between innovation and firm performance; that is, in the last stage of the CDM model, we combine the innovation surveys with the firms’ financial data from the Estonian Business Register. These additional variables have been used to calculate the productivity indicators for the firms.
Table 1 and 2 present the mean values of some innovation indicators for various service industries. As expected, knowledge-intensive service industries are more innovative than the less knowledge-intensive services according to all indicators, and lag less behind the 12 For instance, Camacho and Rodriguez (2008) find when using the data from Spain that the features identified by Soete and Miozzo (1989) are mostly there: firms in the supplier dominated group mostly perform poorly, in scale intensive physical network groups many firms rely on the acquisition of machinery and equipment, and the science based group includes the most innovative firms that are in active cooperation with universities. 13 Evangelista (2002) has proposed a taxonomy that distinguishes between technology users (traditional branches of services that devote relatively limited resources to innovation and are technologically dependent on external suppliers), science and technology based sectors (R&D, engineering, technical consultancy, that are the most innovate service sectors, involved in intensive innovation cooperation) and ICT users (invest heavily in software, largest share of innovation expenditures are on software development and acquisition, final users, competitors and consultancy firms are important sources of information). The report Innovation in services… (2007) offers another typology of services – problem solvers (that solve the problems of their customers, mostly various branches in the NACE classification “Professional, scientific and technical activities”), assisting services (easy to standardize services, like security and cleaning), distributive services (that facilitate interaction across customers, like transport, financial intermediation, telecommunication; further divided into manual and digital distributive services) and leisure services (that stimulate the emotions, perceptions and spiritual experience of customers). The calculations using the Norwegian data confirm that product innovations dominated among problem solvers and leisure providers, while process innovations among assisting services. Both types of innovations were highest among digital distributive services.
The Link between Innovation and Productivity 12
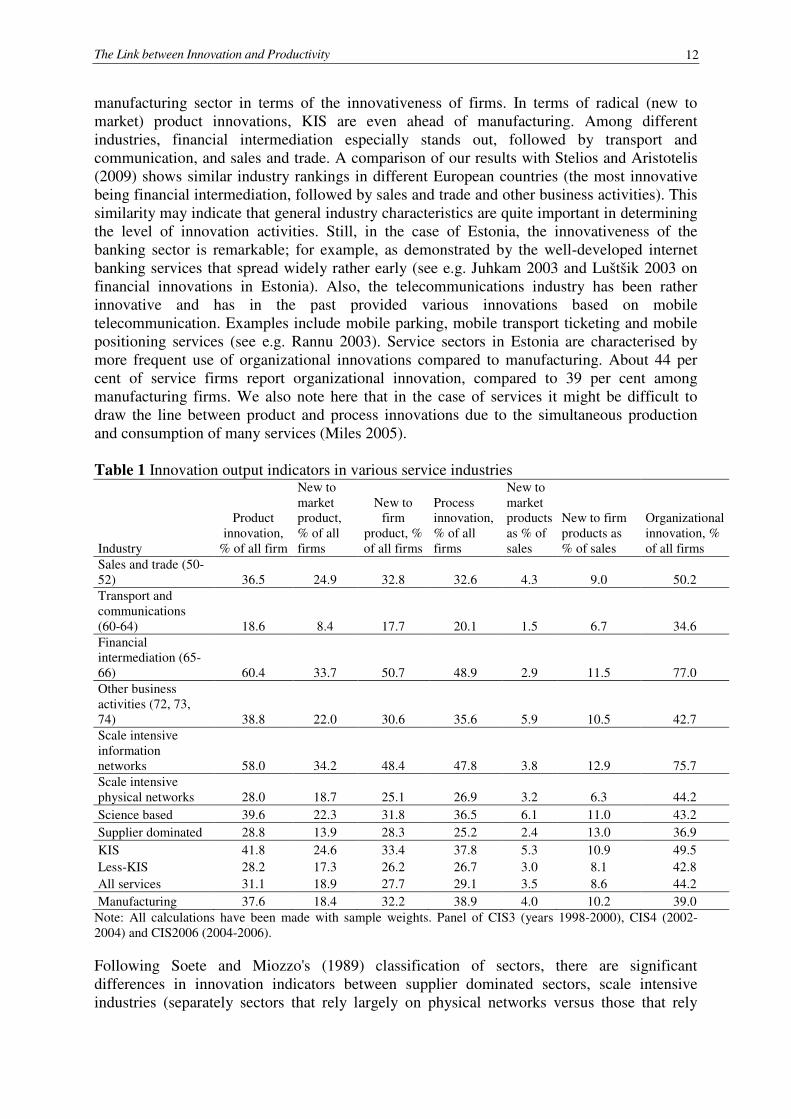
manufacturing sector in terms of the innovativeness of firms. In terms of radical (new to market) product innovations, KIS are even ahead of manufacturing. Among different industries, financial intermediation especially stands out, followed by transport and communication, and sales and trade. A comparison of our results with Stelios and Aristotelis (2009) shows similar industry rankings in different European countries (the most innovative being financial intermediation, followed by sales and trade and other business activities). This similarity may indicate that general industry characteristics are quite important in determining the level of innovation activities. Still, in the case of Estonia, the innovativeness of the banking sector is remarkable; for example, as demonstrated by the well-developed internet banking services that spread widely rather early (see e.g. Juhkam 2003 and Luštšik 2003 on financial innovations in Estonia). Also, the telecommunications industry has been rather innovative and has in the past provided various innovations based on mobile telecommunication. Examples include mobile parking, mobile transport ticketing and mobile positioning services (see e.g. Rannu 2003). Service sectors in Estonia are characterised by more frequent use of organizational innovations compared to manufacturing. About 44 per cent of service firms report organizational innovation, compared to 39 per cent among manufacturing firms. We also note here that in the case of services it might be difficult to draw the line between product and process innovations due to the simultaneous production and consumption of many services (Miles 2005).
Table 1 Innovation output indicators in various service industries
Industry
Product innovation,
% of all firm
New to market product, % of all firms
New to firm
product, % of all firms
Process innovation, % of all firms
New to market products as % of sales
New to firm products as % of sales
Organizational innovation, % of all firms
Sales and trade (50-52) 36.5 24.9 32.8 32.6 4.3 9.0 50.2 Transport and communications (60-64) 18.6 8.4 17.7 20.1 1.5 6.7 34.6 Financial intermediation (65-66) 60.4 33.7 50.7 48.9 2.9 11.5 77.0 Other business activities (72, 73, 74) 38.8 22.0 30.6 35.6 5.9 10.5 42.7 Scale intensive information networks 58.0 34.2 48.4 47.8 3.8 12.9 75.7 Scale intensive physical networks 28.0 18.7 25.1 26.9 3.2 6.3 44.2
Science based 39.6 22.3 31.8 36.5 6.1 11.0 43.2
Supplier dominated 28.8 13.9 28.3 25.2 2.4 13.0 36.9
KIS 41.8 24.6 33.4 37.8 5.3 10.9 49.5 Less-KIS 28.2 17.3 26.2 26.7 3.0 8.1 42.8 All services 31.1 18.9 27.7 29.1 3.5 8.6 44.2
Manufacturing 37.6 18.4 32.2 38.9 4.0 10.2 39.0 Note: All calculations have been made with sample weights. Panel of CIS3 (years 1998-2000), CIS4 (2002-2004) and CIS2006 (2004-2006).
Following Soete and Miozzo's (1989) classification of sectors, there are significant differences in innovation indicators between supplier dominated sectors, scale intensive industries (separately sectors that rely largely on physical networks versus those that rely
Jaan Masso, Priit Vahter 13
more on information networks) and science based industries. The most innovative sectors are the scale intensive ones that rely on information networks. The second rank in the case of several innovation indicators belongs to science based sectors. In the case of product, process and organizational innovation, information network intensive industries have the highest values. About 58 per cent of these firms engage in product innovation and 48 per cent in process innovation, 76 per cent in organizational changes. In the science based industries, the shares of product and process innovators are respectively at 39 and 37 per cent of all firms in this group. The corresponding figure in the case of organizational innovation is 43 per cent. Notably, the highest share of new to the market products in sales figures is in science based services, at 6 per cent of sales, which is 1.5 times more than the average in manufacturing firms.
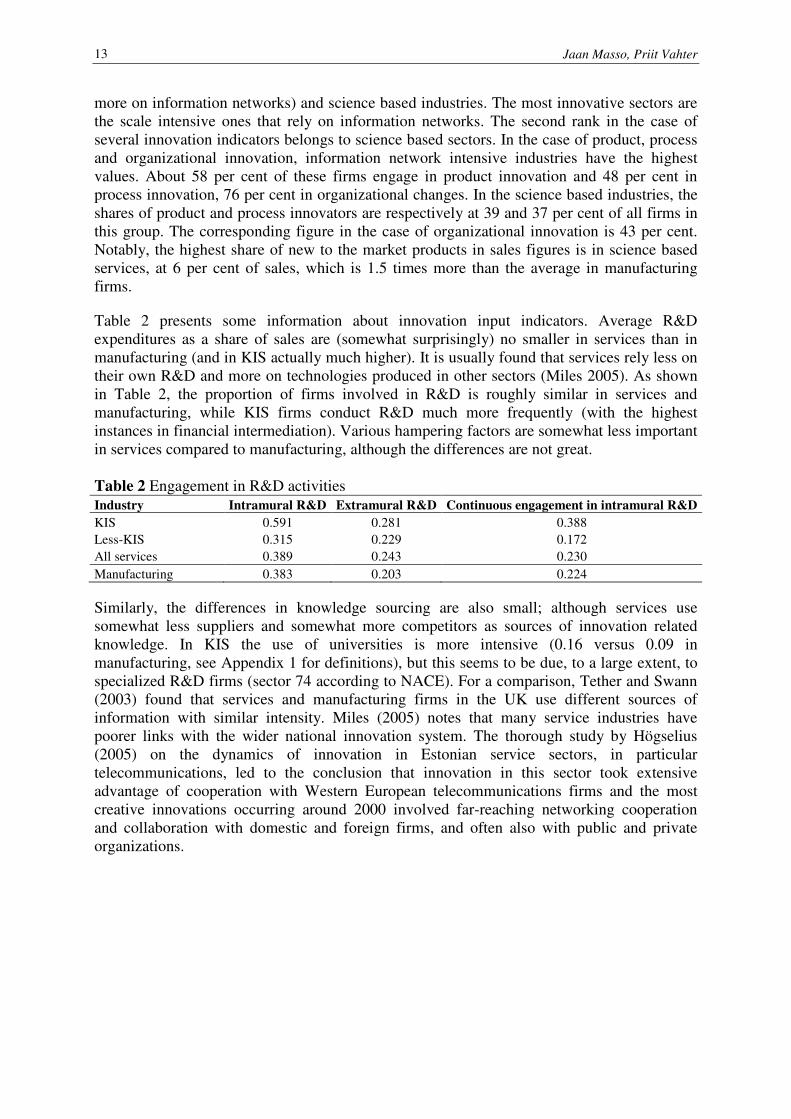
Table 2 presents some information about innovation input indicators. Average R&D expenditures as a share of sales are (somewhat surprisingly) no smaller in services than in manufacturing (and in KIS actually much higher). It is usually found that services rely less on their own R&D and more on technologies produced in other sectors (Miles 2005). As shown in Table 2, the proportion of firms involved in R&D is roughly similar in services and manufacturing, while KIS firms conduct R&D much more frequently (with the highest instances in financial intermediation). Various hampering factors are somewhat less important in services compared to manufacturing, although the differences are not great. Table 2 Engagement in R&D activities
Industry Intramural R&D Extramural R&D Continuous engagement in intramural R&D
KIS 0.591 0.281 0.388 Less-KIS 0.315 0.229 0.172 All services 0.389 0.243 0.230
Manufacturing 0.383 0.203 0.224
Similarly, the differences in knowledge sourcing are also small; although services use somewhat less suppliers and somewhat more competitors as sources of innovation related knowledge. In KIS the use of universities is more intensive (0.16 versus 0.09 in manufacturing, see Appendix 1 for definitions), but this seems to be due, to a large extent, to specialized R&D firms (sector 74 according to NACE). For a comparison, Tether and Swann (2003) found that services and manufacturing firms in the UK use different sources of information with similar intensity. Miles (2005) notes that many service industries have poorer links with the wider national innovation system. The thorough study by Högselius (2005) on the dynamics of innovation in Estonian service sectors, in particular telecommunications, led to the conclusion that innovation in this sector took extensive advantage of cooperation with Western European telecommunications firms and the most creative innovations occurring around 2000 involved far-reaching networking cooperation and collaboration with domestic and foreign firms, and often also with public and private organizations.

The Link between Innovation and Productivity 14
Table 3 Average labour productivity measured as the value added per employee in thousands of EUR on the basis of firm innovativeness
Industry Innovative (No/Yes)
New to market
product New
product New
process Product and
process Organizational
innovation
Marketing innovation
KIS No 23.5 22.6 24.2 24.5 22.7 24.0
Yes 34.2 31.9 29.5 31.3 29.9 30.8
Less-KIS
No 18.1 18.6 19.1 19.0 18.1 18.3
Yes 24.8 21.7 20.5 22.3 20.8 21.5
All services
No 19.1 19.3 20.0 19.9 19.0 19.4
Yes 27.1 24.4 22.8 24.8 22.7 23.2 Note: Labour productivity is measured for the last year of the respective survey (e.g. 2004 in the case of CIS4 and 2006 in the case of CIS2006).
In the services sector, innovative firms have about 20–40 per cent higher levels of productivity either because innovation increases productivity or more productive firms innovate more often (see Table 3). One exception is organizational innovation where the higher productivity of innovators is not robust across different productivity measures. In knowledge intensive services the positive correlation between productivity and innovation seems to be stronger than in other services, with the exception of process innovation. The link between productivity and innovation is strongest in financial intermediation, followed by retail and wholesale trade, while in transport and communications the effect is rather weak. If we look at the productivity growth rates of service firms, the innovative firms in Estonia usually have faster productivity growth. However, this does not hold in the case of organizational innovation. Again, in all cases these differences are larger in knowledge intensive services than elsewhere in services.
4. RESULTS
The findings from estimating a version of the CDM model that links innovation inputs with innovation outputs and the productivity of firms based on service sector data from Estonia are shown in Tables 4–10. Among these, Tables 6–10 show the effects of different types of innovation on productivity in various service sectors.
Innovation decision and intensity
In Table 4, we present the findings from the first stage of the CDM model. The selection equation for engaging in innovation activities is shown separately for different types of industries in the upper part of Table 4. There, the dependent variable is a dummy indicating whether a firm invests in innovation inputs or not. The lower part of the table shows the results of estimating an investment intensity equation, conditional on the decision to innovate.

Jaan Masso, Priit Vahter 15
Table 4 Innovation expenditure equation
Variables Manufacturing Services KIS Less-KIS
Dep. var=Innovation expenditure dummy
Foreign ownership dummy 0.067 0.092 0.033 0.089
(2.85)*** (3.30)*** (0.68) (2.76)*** International competition 0.155 0.005 0.014 0.088 (7.60)*** (0.23) (0.35) (1.07) Domestic group 0.075 0.065 0.009 0.054 (2.88)*** (2.41)** (0.21) (1.66)* Formal protection 0.293 0.252 0.242 0.212 (11.52)*** (8.28)*** (5.33)*** (5.32)*** Public funding 0.537 0.612 0.493 0.683 (16.76)*** (13.56)*** (7.26)*** (10.97)***
Log number of employees 0.081 0.072 0.106 0.05
(9.33)*** (8.36)*** (7.76)*** (4.73)*** Rho 0.000 0.000 .0004 .1677 3239 2247 933 1314
F-test: industry dummies -4167.480 -2570.288 -1242.902 -1285.915 Number of obs. 0.067 0.092 0.033 0.089 Log likelihood (2.85)*** (3.30)*** (0.68) (2.76)*** Dep. var=Log (Innovation expenditure) Group 0.152 0.04 -0.093 0.012
(3.88)*** (0.87) (-1.09) (0.23) International competition 0.407 0.114 0.176 0.181
(6.37)*** (1.67)* (1.31) (2.32)** Formal protection 0.679 0.512 0.687 0.242
(7.97)*** (5.21)*** (4.18)*** (2.18)*** Public funding 1.466 1.691 1.959 1.449
(9.72)*** (6.64)*** (6.76)*** (3.66)***
Engaged in innovation cooperation 0.029 0.139 0.172 0.087 (0.78) (3.66)*** (2.68)*** (1.93)*
Offensive (proactive) strategy 0.087 0.206 0.210 0.195 (2.31)** (4.97)*** (3.04)*** (3.99)***
Defensive strategy 0.018 -0.03 -0.059 -0.046 (0.39) (-0.60) (-0.71) (-0.76)
Cost-reduction strategy 0.004 0.03 0.119 -0.023 (0.08) (0.57) (1.24) (-0.34)
Production flexibility 0.145 0.005 0.021 -0.019 (3.29)*** (0.11) (0.26) (-0.33)
Lack of appropriate sources of finance -0.107 -0.107 -0.043 -0.114
(-1.83)* (-1.61) (-0.39) (-1.40)
Innovation cost too high 0.031 0.066 0.075 0.046 (0.55) (1.04) (0.71) (0.60)
Lack of qualified personnel -0.065 -0.012 -0.032 -0.01 (-1.10) (-0.19) (-0.31) (-0.13)
Lack of information on technology -0.039 -0.014 -0.16 0.072 (-0.53) (-0.17) (-1.19) (0.73)
Lack of information on markets 0.051 0.032 0.143 -0.054 (0.78) (0.44) (1.24) (-0.59)
F-test: industry dummies 0.000 0.000 0.000 .0005 Notes. * significant at 10%; ** significant at 5%; *** significant at 1%. Industry dummies have been included in regression equations. The numbers reported are the marginal effects, and the corresponding z-statistics are in parentheses.
The Link between Innovation and Productivity 16
We find that on average in the service sector the use of measures of formal protection (patents, licences, trademarks) and receiving public funding are positively correlated with both the firm’s decision to invest in innovation activities and the decision about how much to invest. Also, larger firm size is associated with the increased probability of investing in innovation inputs (as in other services studies – e.g. Stelios and Aristotelis 2009). Larger exposure to international competition, as measured by the export orientation of the firm, is associated with greater innovation expenditure, but not with the binary choice of whether to invest in innovation inputs or not (while earlier studies of services found that important also for both – e.g. Stelios and Aristotelis 2009 and Robin and Mairesse 2008).
In Estonia’s case the role of public funding is even larger among service sector firms than in manufacturing. An increase in public funding by 1 per cent is associated with a 1.69 per cent increase in spending on innovation by the firm (provided that the firm is already investing in innovation activities). The corresponding figure from manufacturing is 1.47. Public funding also had positive effects on innovation expenditure in a study by Griffith et al. (2008) using a similar modelling strategy and manufacturing firm data from the UK, Germany, Spain and France. For France, Robin and Mairesse (2008) distinguished funding from the EU and national sources, and found that only EU funding was associated with R&D expenditures in manufacturing, while in services only funding from national sources was associated with R&D expenditures. Using similar public funding variables, Stelios and Aristotelis (2009) found national funding to be important in all services, and EU funding in KIS, while Polder et
al. (2009) found both variables to be significant in both manufacturing and services.
Being a member of a foreign or local corporation has a significant effect on the probability of investing in innovation activities (see Table 4) in the case of both manufacturing and services. However, in the service sector there appears to be no effect from membership of an enterprise group on the size of innovation expenditure by the firm. Based on our estimated CDM model, innovation related cooperation between firms appears to be an important determinant of investments in innovation in service sectors, both KIS and less-KIS, but not in the manufacturing industry. Note that broad industry-specific fixed effects have been taken into account in these regressions by the inclusion of industry dummies. Hence, coefficients show intra-sector correlations between each explanatory variable and the dependent variable. The significant role of innovation related cooperation with other firms, and the difference from the manufacturing industry in this respect, is not surprising. In the service sector, the delivery and output of the service depends on customer participation in this process (Gallouj and Savona 2009).
Concerning different innovation strategy variables, the degree of attention to production flexibility (this binary variable is equal to 1 if production flexibility is an important aim) appears to be a relevant factor of innovation investment only in manufacturing, but not in services. On the other hand, having an offensive (proactive) strategy (i.e. reducing unit costs, quality improvement, entry into new markets) in the innovation process of the firm appears to be much more important for the service sectors (especially less KIS sectors), even stronger than for manufacturing. A further breakdown according to the categories of Soete and Miozzo (1989), showed similarly the highest parameter values for scale intensive and supplier-dominated sectors, and smaller for science based ones14. An offensive strategy having a strong positive correlation with expenditures is mostly in line with the results of Lööf et al. (2001) for the manufacturing sector in Norway and Sweden. 14 We could not estimate the model for the fourth category, scale-intensive information networks, due to the
relatively small number of firms in this group.
Jaan Masso, Priit Vahter 17
None of the indicators of obstacles to innovation (see Table 4) has a strong or significant effect on innovation investments in the service sector. Previous studies from many other countries often find that the presence of various hampering factors is actually positively associated with the intensity of innovation investments (Stelios and Aristotelis 2009 for the service sector in Greece, Knell 2008, OECD 2009, etc). At first glance, their results may seem counter intuitive. However, OECD (2009) and Knell (2008) argue that these results may simply reflect the fact that innovative firms may be more aware of innovation obstacles, and thus, more likely to report these hampering factors as important for the firm.
Once we compare the determinants of innovation investments in the KIS and less-KIS sectors, it is obvious from Table 4 that there are some differences. The formal protection of knowledge-based assets is, as expected, very important for KIS sectors, but considered unimportant for less KIS sectors like hotels and restaurants, retail and wholesale trade or various land transport sectors. The role of formal protection (patents, trademarks) is even higher for firms active in KIS sectors than for manufacturing producers. In addition to the protection of intellectual property, there are differences in the role played by international competition and size of firms. The effect of firm size on the probability that a firm will engage in innovation activities is larger in KIS sectors.
Knowledge production function
Table 5 outlines the results of the estimation of the knowledge production function, with dummy variables for product or process innovation used as dependent variables. The coefficients in the table show marginal effects of explanatory variables, estimated at the sample mean. As evident from the results, and as expected, innovation output is determined to a significant extent by investments in innovation inputs. The predicted values for innovation investments are obtained from the previous stage of the CDM model – the innovation expenditure equation. We find that in the case of product innovation, the effects of innovation investments are of comparable magnitude to the manufacturing industry. In the case of process innovation the effect of innovation expenditure is especially large in less-KIS sectors. Surprisingly, it is not statistically significant in KIS sectors. Using the industry groups defined by Soete and Miozzo (1989), a positive coefficient of similar size was found in the case of scale intensive networks and supplier dominated sectors, but not in science based sectors. While the smaller impact of innovation expenditure or R&D on innovation in some service sectors is in line with earlier studies (Robin and Mairesse 2008), it is still somewhat unexpected. In Masso and Vahter (2008), the effects of innovation investments have been estimated using a similar model based separately on CIS3 and CIS4 data for the manufacturing industry in Estonia. They also find significant effects of innovation investment on innovation output. Given that it is argued that product innovations are more linked to the technology used and could be more likely to result from formal and internalized R&D activities (Musolesi and Huiban 2010), the lower correlation of innovation expenditures with product innovation in our regressions is unexpected. It has been noted in the literature that in services it is more difficult to make the appropriate amount of innovation investment due to less information for predicting financial returns, which can cause both under- and over-investment in innovation (Voss and Zomerdijk 2007), this may affect the observed link between innovation input and output.
An important finding from Table 5 concerns the role of knowledge flows from other firms and from within the firm itself in its innovation process. Among these, knowledge sourcing from within the enterprise is the most important determinant of both product and process innovation, for both KIS and less-KIS sectors alike. This finding is also robust for other

The Link between Innovation and Productivity 18
specifications of the CDM model. Again, this is one result that is very similar to earlier results based on data from Estonia’s manufacturing industry. One reason for this result is also the relatively high percentage of foreign-owned firms in the sample; multinational enterprises are usually found to rely heavily on their parent companies’ knowledge base and innovation expenditures (see e.g. Dachs et al. 2008).
The magnitude of the effects of the intensity of knowledge sourcing is large. A firm in the service sector that indicates knowledge sourcing from within the firm as being of high importance (see Appendix 1 for definitions) in its innovation process has an 18 per cent higher probability of engaging in product innovation than other firms, the corresponding effect on process innovation is of an even larger magnitude, 23 per cent. In addition to knowledge sourcing from within the firm, knowledge flows from customers and suppliers also play a major role. Learning from competitors is only found to be important in the case of product innovation. Learning from suppliers is found to be important in the case of process innovation. The estimated correlations between knowledge sourcing from suppliers and subsequent process innovation activities are marginally larger in the service sectors than in manufacturing. The magnitude of the effects of knowledge sourcing from clients or suppliers is of comparable size to the effects of knowledge sourcing from within the firm. Based on these results, one cannot argue that innovation in the service sector is more market driven than technology based. For instance, Musolesi and Huiban (2010) also find that among French KIS firms innovation is more driven by technology than the market.
The knowledge flows from clients and suppliers of the firm, and thus their effects on innovation and productivity, may be associated with technology transfer from FDI. A recent paper by Vahter (2010) based on CIS3 and CIS4 data from Estonia shows that indeed FDI entry in a sector is associated with subsequent increases in some knowledge sourcing activities by domestically owned firms. He argues, based on his IV model, that this may be due to the effects of FDI in the form of spillovers. Also, a paper by Crespi et al. (2008) shows a somewhat similar correlation between FDI and indicators of knowledge flows based on CIS3 data from the UK.
The absence of a statistically significant correlation between innovation output and formal protection in Table 5 is in line with earlier CDM model estimates for services in France (Robin and Mairesse 2008) and the general observation that compared to manufacturing firms, service companies use formal forms of protection to a lesser extent (Tether and Massini 2007).15 The insignificant (in the case of product innovation) or negative (in the case of process innovation) dummy for group membership differs from the results of most other papers.
15 At the same time, they are expected to use relatively more strategic forms of protection. Tether and Massini (2007) and Robin and Mairesse (2008) found these to be positively correlated with innovation sales in the French CIS3 data; however, this variable is not available in the Estonian CIS4 and CIS2006 data we are using in this paper.

Jaan Masso, Priit Vahter 19
Table 5 Knowledge production function Variables Product innovation Process innovation
Manufacturing Services KIS Less-KIS Manufacturing Services KIS Less-KIS
Innovation expenditure 0.075 0.042 0.045 0.013 0.054 0.067 0.013 0.093
(2.17)** (1.40) (0.99) (0.37) (1.49) (2.78)*** (0.39) (3.31)***
Export dummy -0.024 -0.021 0.014 -0.026 -0.011 -0.036 0.015 -0.80 (-0.96) (-0.94) (0.36) (-0.85) (-0.46) (-1.67)* (0.42) (-2.51)**
Group -0.03 0.03 0.038 0.032 -0.039 -0.055 -0.096 -0.025 (-1.21) (1.31) (0.82) (1.23) (-1.57) (-2.72)** (-2.53)*** (-1.15)
Formal protection 0.104 0.013 0.01 0.002 -0.071 0.005 0.055 -0.001 (2.98)*** (0.41) (0.19) (0.06) (-2.71)*** (0.18) (1.12) (0.34)
Knowledge sourcing: ... from within the firm or group
0.198 0.176 0.244 0.106 0.051 0.228 0.276 0.196 (5.38)*** (4.13)*** (3.11)*** (2.18)** (1.37) (5.34)*** (3.69)*** (3.96)***
... from Competitors 0.084 0.068 -0.008 0.110 -0.059 -0.019 -0.084 0.032 (1.85)* (1.35) (-0.09) (1.77)* (-1.27) (-0.39) (-1.08) (0.54)
... from Customers 0.216 0.152 0.147 0.164 -0.123*** 0.018 -0.052 0.056 (5.08)*** (3.06)*** (1.75)* (2.70)*** (-2.69) (0.38) (-0.66) (0.98)
... from Suppliers -0.2 -0.042 -0.075 -0.027 0.380 0.321 0.392 0.27 (-5.13)*** (-1.000) (-1.05) (-0.52) (9.8)*** (7.87)*** (5.89)*** (5.46)*** Offensive (proactive) strategy 0.13 0.215 0.194 0.252 0.046 -0.008 0.055 -0.056
(4.42)*** (4.61)*** (3.30)*** (3.40)*** (1.63) (-0.26) (1.08) (-1.92)* Defensive strategy 0.015 0.001 0.07 -0.032 0.06 -0.038 -0.059 -0.011
(0.42) (0.03) (0.88) (-0.86) (1.44) (-1.24) (-1.24) (-0.26) Cost-reduction strategy -0.016 -0.015 0.022 -0.41 0.105 0.136 0.127 0.163
(-0.46) (-0.40) (0.26) (-.90) (2.43)** (2.18)*** (1.40) (1.90)* Production flexibility -0.002 -0.035 0.089 0.03 0.063 0.036 0.074 0.03
(-0.04) (-1.12) (1.65)* (0.66) (1.52) (0.91) (1.11) (0.66)
Breadth of information sources 0.001 -0.01 0.021 -0.016 0.008 -0.01 -0.01 -0.016
(0.016) (-0.59) (0.70) (-0.80) (0.51) (-0.64) (-0.45) (-0.8)
Breadth of objectives 0.063 0.066 0.059 0.029 0.038 0.033 0.037 0.029
(6.12)*** (9.31)*** (4.82)*** (4.06)*** (6.29)*** (5.07)*** (3.26)*** (4.06)***
F-test: industry dummies 0.000 0.000 .0044 .0013 .167 0.000 .0008 .5909 Number of observations 3223 2233 931 1302 3223 2233 931 1302 Log likelihood -1.804 -2.420 -2.514 -2.137 -1884.790 -1165.908 -510.756 -624.175 Notes: * significant at 10%; ** significant at 5%; *** significant at 1%. The marginal effects of each variable at sample means are reported. Industry dummies have been included in regression equations. Firm size variable also included, bit not reported.
The Link between Innovation and Productivity
20
Among other controls, having a proactive strategy with the aim of increasing the range of services provided is highly correlated with the probability of also actually engaging in product/service innovation in service sectors. This result differs from Lööf et al. (2006), where the correlation between a proactive strategy indicator and innovation sales was either insignificant or negative. This is associated with increased process innovation only among KIS sectors, while in all branches a cost-reduction strategy shows an expected positive correlation with process innovation. Also, having a larger number of different innovation objectives is eventually associated with more innovation by the firm (this was similar to Leiponen and Helfat (2010), while Leiponen (2008) did not find a positive correlation with sales of new products, and for services it was even negative), as shown by the positive coefficient of the ‘breadth of objectives’ variable in Table 5. Interestingly, having a larger number of information sources in the innovation process (variable ‘breadth of information sources’) is not eventually associated with more innovation. Therefore, we can conclude that the intensity of knowledge sourcing matters a lot, but not the diversity of knowledge sources used. In the case of the Finnish service sector, Leiponen (2008) found the contrary, that it was the diversity of information sources, but not the diversity of objectives that was associated with more innovation.
Additionally, we find that the effect of firm size is sometimes insignificant; for product innovation in the manufacturing sector it is negative and for process innovation positive. We note here that generally a positive relationship between firm size and innovation propensity is found in the literature, as for example in Musolesi and Huiban (2010).
Productivity equation
The final stage of the CDM model, which relates the labour productivity of firms to their innovation indicators, is shown in Tables 6 – 11. In Table 6 the most standard last stage of the CDM model is given with the dependent variable either the log of sales per employee or the log of value added per employee. Table 7 checks the results if product and process innovation are not included separately, but as one single indicator whether the firm has technological innovation or not. Table 8 provides the results for the log of value added per employee, but for longer time leads. This way we can check the robustness of our findings and can see whether the effects could potentially be different in different periods, whether they increase or decrease with time. Table 9 provides a distinction between different types of service industries based on Soete and Miozzo’s (1989) classification. Table 10 addresses the potentially different effects of radical versus incremental innovations on productivity. Note that as we include the capital-labour ratio as an explanatory variable in the productivity equation, we are in fact estimating the relationship between innovation and total factor productivity (TFP), not labour productivity.

Jaan Masso, Priit Vahter
21
Table 6 Output production function (productivity equation)
Variables Log Sales/employees Log Value added/employees
Services KIS Less-KIS Services KIS Less-KIS
Log Capital intensity
0.176 0.192 0.165 0.136 0.104 0.164 (9.51)*** (6.80)*** (6.65)*** (7.38)*** (3.44)*** (7.27)***
BP(0,1) 0.283 0.282 0.533 0.059 0.315 -0.155 (1.28) (0.93) (1.84)* (0.28) (1.07) (-0.58)
BP(1,0) 0.121 -0.113 0.295 0.407 0.123 0.517
(0.58) (-0.42) (0.98) (2.07)** (0.46) (2.00)** BP(1,1) 0.323 -0.022 0.474 0.226 -0.153 0.441
(3.13)*** (-0.16) (3.09)*** (2.27)** (-1.08) (3.36)*** Organizational innovation
0.083 0.147 0.041 0.072 0.173 0.001 (1.32) (1.61) (0.48) (1.18) (1.86)* (0.02)
Marketing innovation
0.028 0.179 -0.074 -0.026 0.015 -0.103 (0.38) (1.77)* (-0.74) (-0.37) (0.14) (-1.14)
Export dummy (t-2)
0.397 0.378 0.405 0.400 0.314 0.432 (6.85)*** (4.52)*** (5.05)*** (7.13)*** (3.66)*** (6.11)***
Log number of employees
-0.111 -0.017 -0.149 -0.088 0.041 -0.129 (-4.26)*** (-0.39) (-4.46)*** (-3.53)*** (0.90) (-4.45)***
F-test: industry dummies 0.000 0.000 0.000 0.000 0.000 0.000 Observations 959.000 368.000 591.000 737.000 274.000 463.000 R-squared 0.393 0.277 0.431 0.308 0.251 0.279 Notes: Pooled sample of CIS4 and CIS2006. The coefficients are from an instrumental variable regression. Industry dummies, dummies for CIS waves and firm size are included in all regressions. BP are the predicted probabilities from the bivariate probit model; the combinations BP(0/1, 0/1) indicate whether a firm has product and/or process innovation, e.g. BP(1,0) is for a firm with product, but without process innovation. * significant at 10%; ** significant at 5%; *** significant at 1%.
Earlier studies usually show that product innovation is positively associated with the productivity of firms in the service sector. However, this effect tends to be smaller than in the manufacturing industry. The OECD (2009) has implemented a large-scale study based on the CDM approach and CIS data from 18 different countries. Some estimates for 11 countries (9 Western European countries and Australia and New Zealand) are also available about the relationship between product innovation and labour productivity. In most countries the productivity effect of product innovation was larger in the manufacturing sector than in services. In some countries—Australia, Denmark and Finland—product innovation was not statistically significantly associated with the labour productivity of service firms. Recently, Robin and Mairesse (2008) have also investigated similar relationships based on French CIS4 data for service firms. Using cross-section data they find a significant positive correlation for both process and product innovation with productivity in the service sector. In France the effects of both types of innovation are in fact even larger than in the manufacturing industry.
In Estonia’s case we can conclude, based on CIS4 and CIS2006 data, that technological innovation is significantly associated with higher productivity in firms. That finding is not self-evident for the service sector; among the few existing studies on productivity effects in services Mansury and Love (2008) found no effect in the case of US business services. We see positive coefficients for innovation in Table 6, 7 and 8 for the service sector on average and the sub-sample of less-KIS firms. Among the three innovation variables, BP (1,1) is most often significant and positive, indicating a complementarity between process and product innovation in services. For a comparison, Polder et al. (2009), using data from the Netherlands, found this complementarity only in manufacturing, but not in services. Note that there appears no such significant effect in the case of the KIS sector based on our results.
The Link between Innovation and Productivity
22
This contradicts the findings of Stelios and Aristotelis (2009), who found a stronger effect among KIS firms, but is in accordance with Mansury and Love (2008), whose sample of business services are a part of our KIS sample. Given the earlier literature, as summarized by Musolesi and Huiban (2010), the previous studies on the relative effects of product and process innovation on productivity show a high degree of variability. Other factors, such as organizational changes that are new to the firm (see Table 6) seem to be significantly more important for productivity increases in this sector. Generally, the lower importance of organizational innovation compared to technological innovation contradicts the results of some studies on services (e.g. Polder et al. 2009 found that product and process innovation did not have a positive impact without organizational innovations), while Musolesi and Huiban (2010) also found no impact of non-technological innovation in French knowledge intensive services; thus in conclusion, more research is needed in this domain. We found that marketing innovation did not have a positive significant effect on productivity for any of the specifications, although descriptive data (Table 3) showed higher productivity especially for innovative KIS firms.
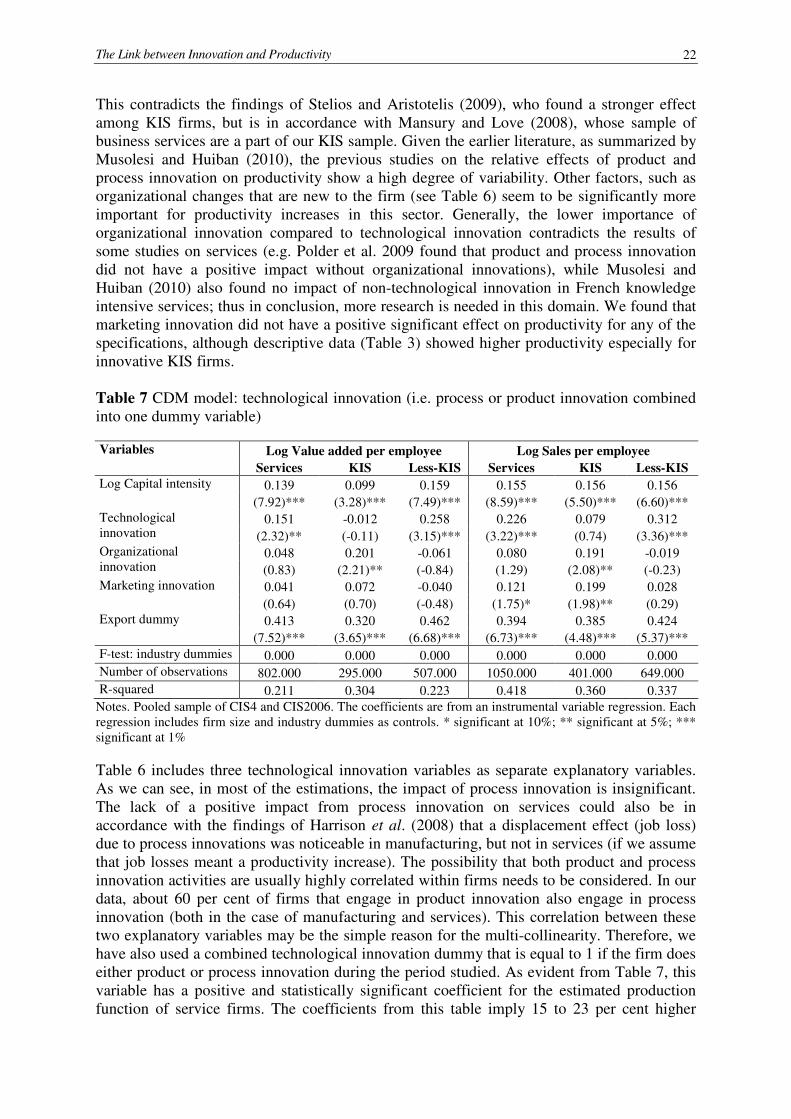
Table 7 CDM model: technological innovation (i.e. process or product innovation combined into one dummy variable) Variables Log Value added per employee Log Sales per employee
Services KIS Less-KIS Services KIS Less-KIS
Log Capital intensity 0.139 0.099 0.159 0.155 0.156 0.156 (7.92)*** (3.28)*** (7.49)*** (8.59)*** (5.50)*** (6.60)***
Technological innovation
0.151 -0.012 0.258 0.226 0.079 0.312 (2.32)** (-0.11) (3.15)*** (3.22)*** (0.74) (3.36)***
Organizational innovation
0.048 0.201 -0.061 0.080 0.191 -0.019 (0.83) (2.21)** (-0.84) (1.29) (2.08)** (-0.23)
Marketing innovation 0.041 0.072 -0.040 0.121 0.199 0.028 (0.64) (0.70) (-0.48) (1.75)* (1.98)** (0.29)
Export dummy 0.413 0.320 0.462 0.394 0.385 0.424 (7.52)*** (3.65)*** (6.68)*** (6.73)*** (4.48)*** (5.37)***
F-test: industry dummies 0.000 0.000 0.000 0.000 0.000 0.000 Number of observations 802.000 295.000 507.000 1050.000 401.000 649.000 R-squared 0.211 0.304 0.223 0.418 0.360 0.337
Notes. Pooled sample of CIS4 and CIS2006. The coefficients are from an instrumental variable regression. Each regression includes firm size and industry dummies as controls. * significant at 10%; ** significant at 5%; *** significant at 1%
Table 6 includes three technological innovation variables as separate explanatory variables. As we can see, in most of the estimations, the impact of process innovation is insignificant. The lack of a positive impact from process innovation on services could also be in accordance with the findings of Harrison et al. (2008) that a displacement effect (job loss) due to process innovations was noticeable in manufacturing, but not in services (if we assume that job losses meant a productivity increase). The possibility that both product and process innovation activities are usually highly correlated within firms needs to be considered. In our data, about 60 per cent of firms that engage in product innovation also engage in process innovation (both in the case of manufacturing and services). This correlation between these two explanatory variables may be the simple reason for the multi-collinearity. Therefore, we have also used a combined technological innovation dummy that is equal to 1 if the firm does either product or process innovation during the period studied. As evident from Table 7, this variable has a positive and statistically significant coefficient for the estimated production function of service firms. The coefficients from this table imply 15 to 23 per cent higher
Jaan Masso, Priit Vahter
23
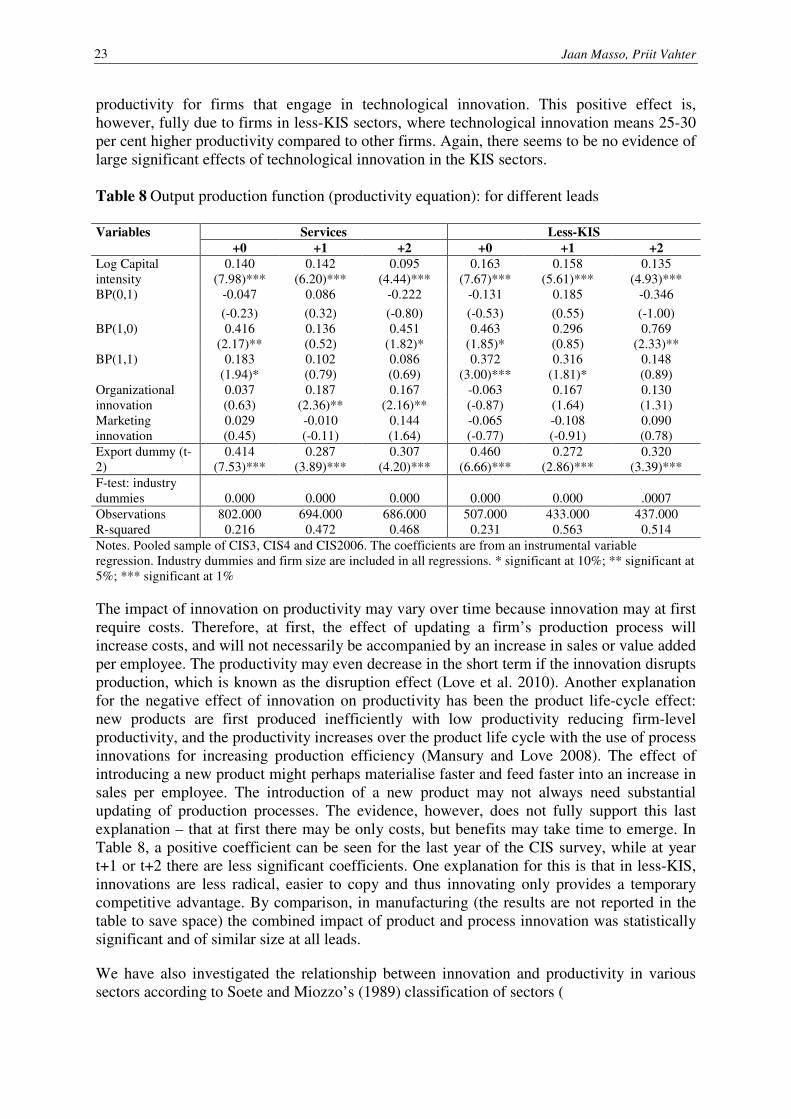
productivity for firms that engage in technological innovation. This positive effect is, however, fully due to firms in less-KIS sectors, where technological innovation means 25-30 per cent higher productivity compared to other firms. Again, there seems to be no evidence of large significant effects of technological innovation in the KIS sectors.
Table 8 Output production function (productivity equation): for different leads Variables Services Less-KIS
+0 +1 +2 +0 +1 +2
Log Capital intensity
0.140 0.142 0.095 0.163 0.158 0.135 (7.98)*** (6.20)*** (4.44)*** (7.67)*** (5.61)*** (4.93)***
BP(0,1) -0.047 0.086 -0.222 -0.131 0.185 -0.346
(-0.23) (0.32) (-0.80) (-0.53) (0.55) (-1.00) BP(1,0) 0.416 0.136 0.451 0.463 0.296 0.769
(2.17)** (0.52) (1.82)* (1.85)* (0.85) (2.33)** BP(1,1) 0.183 0.102 0.086 0.372 0.316 0.148
(1.94)* (0.79) (0.69) (3.00)*** (1.81)* (0.89) Organizational innovation
0.037 0.187 0.167 -0.063 0.167 0.130 (0.63) (2.36)** (2.16)** (-0.87) (1.64) (1.31)
Marketing innovation
0.029 -0.010 0.144 -0.065 -0.108 0.090 (0.45) (-0.11) (1.64) (-0.77) (-0.91) (0.78)
Export dummy (t-2)
0.414 0.287 0.307 0.460 0.272 0.320 (7.53)*** (3.89)*** (4.20)*** (6.66)*** (2.86)*** (3.39)***
F-test: industry dummies 0.000 0.000 0.000 0.000 0.000 .0007 Observations 802.000 694.000 686.000 507.000 433.000 437.000 R-squared 0.216 0.472 0.468 0.231 0.563 0.514 Notes. Pooled sample of CIS3, CIS4 and CIS2006. The coefficients are from an instrumental variable regression. Industry dummies and firm size are included in all regressions. * significant at 10%; ** significant at 5%; *** significant at 1%
The impact of innovation on productivity may vary over time because innovation may at first require costs. Therefore, at first, the effect of updating a firm’s production process will increase costs, and will not necessarily be accompanied by an increase in sales or value added per employee. The productivity may even decrease in the short term if the innovation disrupts production, which is known as the disruption effect (Love et al. 2010). Another explanation for the negative effect of innovation on productivity has been the product life-cycle effect: new products are first produced inefficiently with low productivity reducing firm-level productivity, and the productivity increases over the product life cycle with the use of process innovations for increasing production efficiency (Mansury and Love 2008). The effect of introducing a new product might perhaps materialise faster and feed faster into an increase in sales per employee. The introduction of a new product may not always need substantial updating of production processes. The evidence, however, does not fully support this last explanation – that at first there may be only costs, but benefits may take time to emerge. In Table 8, a positive coefficient can be seen for the last year of the CIS survey, while at year t+1 or t+2 there are less significant coefficients. One explanation for this is that in less-KIS, innovations are less radical, easier to copy and thus innovating only provides a temporary competitive advantage. By comparison, in manufacturing (the results are not reported in the table to save space) the combined impact of product and process innovation was statistically significant and of similar size at all leads.
We have also investigated the relationship between innovation and productivity in various sectors according to Soete and Miozzo’s (1989) classification of sectors (

The Link between Innovation and Productivity
24
Table 9). There appears to be a significant correlation between product innovation and the subsequent higher productivity in supplier dominated sectors. In scale intensive sectors that rely on physical networks, the variable for the co-occurrence of product and process innovation is statistically significant, while in science based services, process innovation (variable BP(0,1)) and organizational innovation have a positive correlation with productivity. Thus, the results are quite variable across sectors.
Table 9 Impact of innovation on productivity in various sub-sectors of services
Variables Log (Sales/employees) Log (Value added/employees)
Scale
intensive
physical
networks
Science
based
Supplier
dominated
Scale
intensive
physical
networks
Science based Supplier
dominated
Log Capital intensity
0.225 0.127 0.054 0.192 0.086 0.109 (7.89)*** (3.91)*** (1.10) (6.82)*** (2.64)*** (3.04)***
BP(0,1) 0.283 0.662 0.267 -0.228 0.653 -0.122
(0.93) (2.62)*** (0.49) (-0.79) (2.74)*** (-0.33) BP(1,0) 0.012 -0.161 1.258 0.387 -0.008 0.985
(0.04) (-0.66) (2.62)*** (1.30) (-0.04) (3.05)*** BP(1,1) 0.300 0.090 1.135 0.362 -0.187 0.232
(1.86)* (0.63) (3.38)*** (2.41)** (-1.29) (1.01) Organizational innovation
0.090 0.202 -0.203 -0.023 0.186 0.104 (1.01) (2.24)** (-0.89) (-0.26) (2.01)** (0.63)
Marketing innovation
-0.004 0.014 -0.393 -0.025 -0.013 -0.262 (-0.04) (0.13) (-1.45) (-0.25) (-0.12) (-1.30)
Export dummy (t-2)
0.316 0.255 0.895 0.409 0.216 0.708 (3.75)*** (2.98)*** (4.63)*** (5.06)*** (2.48)** (5.37)***
F-test: industry dummies 0.000 .0109 .7628 0.000 .0136 .0015 Observations 476.000 246.000 157.000 375.000 192.000 120.000 R-squared 0.489 0.280 0.221 0.307 0.264 0.396 Notes. Pooled sample of CIS4 and CIS2006. The coefficients are from an instrumental variable regression. Industry dummies and firm size are included in all regressions. * significant at 10%; ** significant at 5%; *** significant at 1%.
To check the robustness of the results once more, we also conducted the estimation separately for radical and incremental product innovations; that is, those with product innovations new for the market or only new for the innovating enterprise (using the standard definitions from the CIS questionnaire). As Table 10 shows, the impact on productivity is stronger for new to market products. Now, even among KIS the product innovation dummy for radical innovations is significant. The results were, however, sensitive to specification – when including the variables for non-technological innovation in the regressions, the stronger impact of radical innovations did not show up so clearly. Although the stronger impact of radical innovations might seem to be logical, Lööf et al. (2006) found the impact on productivity to be smaller in the case of radical innovations using a version of the CDM model based on the sales of new products, while Duguet (2006) only found radical innovations to contribute significantly to TFP growth. One issue could be that undertaking more radical innovations involves a higher risk of failure, which, however, does not have an impact on the results in our data.

Jaan Masso, Priit Vahter
25
Table 10 CDM model: radical and incremental innovation – the dependent variable is the log of value added per employee
Services KIS Less-KIS
New to
market
New to
firm
New to
market
New to
firm
New to
market
New to
firm
Log Capital intensity 0.194 0.196 0.170 0.168 0.205 0.207 (14.73)*** (14.75)*** (7.44)*** (7.35)*** (12.64)*** (12.70)***
BP(0,1) 0.004 0.037 -0.127 -0.092 0.205 0.170 (0.03) (0.28) (-0.83) (-0.54) (1.21) (0.93)
BP(1,0) 1.269 0.720 1.072 0.451 1.014 0.574 (4.65)*** (2.92)*** (3.16)*** (1.30) (2.52)** (1.78)*
BP(1,1) 0.212 0.273 0.036 0.114 0.249 0.315 (1.86)* (2.38)** (0.23) (0.66) (1.52) (2.10)**
Export dummy 0.411 0.429 0.343 0.365 0.460 0.473 (10.11)*** (10.54)*** (5.04)*** (5.43)*** (8.82)*** (9.10)***
F-test: industry dummies .0031 .0004 .0005 .0008 .0002 0.000 Number of observations 1633.000 1633.000 617.000 617.000 1016.000 1016.000 R-squared 0.282 0.276 0.281 0.272 0.287 0.284 Notes. Pooled sample of CIS3, CIS4 and CIS2006. The coefficients are from an instrumental variable regression. Industry dummies and firm size are included in all regressions. * significant at 10%; ** significant at 5%; *** significant at 1%.
Among other controls throughout all specifications, exporting is highly correlated with a firm’s productivity indicators. This is an expected result, both based on theory (see Helpman et al. 2004) and empirical evidence (Clerides et al. 1998, etc). Exporters tend to have about 40 per cent higher productivity indicators in Estonia’s service sector, for 2002–2006. This of course need not show the effects of exporting, but may also be due to better firms with higher productivity self-selecting entry into export markets (see Helpman et al. 2004).
Export equations
As a robustness check we have also estimated the last stage of the CDM model based on two alternative dependent variables: an exporter dummy or export growth variable, as outlined in Equation (5) and following the argumentation by Love et al. (2010). The effects of innovation on productivity may also work through the channel of the effects of innovation on exports, whereas exports may potentially be an important determinant of the productivity of firms. As shown in Table 11, we find a strong positive association of process innovation (i.e. variable BP(0,1)) with export growth, but a negative association between product innovation and export growth. The net effect of technological innovation (product and process innovation together, results not reported to save space) on export growth was also positive, especially in KIS sectors. The low value-added content of Estonian exports may be behind the significance of process innovations, while the negative impact of product innovation may show that the success of new products in export markets takes time. However, on the whole, there appears to be no ‘effect’ of innovation on the decision to become an exporter, except the combined effect of product and process innovation in the case of the less-KIS sector. Organizational innovation seems to be highly positively correlated with the probability that the firm engages in exports. Marketing innovation seems to be an important determinant behind improvements in the export growth of firms, especially in the less-KIS sectors.
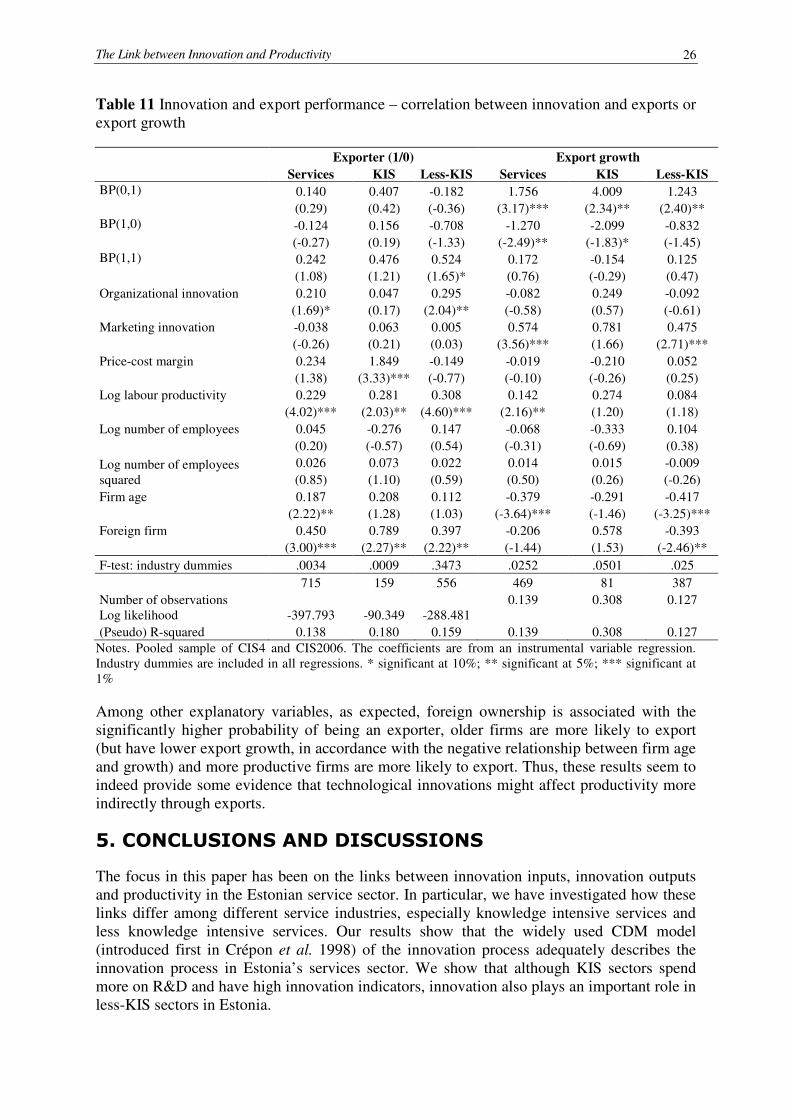
The Link between Innovation and Productivity
26
Table 11 Innovation and export performance – correlation between innovation and exports or export growth
Exporter (1/0) Export growth
Services KIS Less-KIS Services KIS Less-KIS
BP(0,1) 0.140 0.407 -0.182 1.756 4.009 1.243 (0.29) (0.42) (-0.36) (3.17)*** (2.34)** (2.40)**
BP(1,0) -0.124 0.156 -0.708 -1.270 -2.099 -0.832 (-0.27) (0.19) (-1.33) (-2.49)** (-1.83)* (-1.45)
BP(1,1) 0.242 0.476 0.524 0.172 -0.154 0.125 (1.08) (1.21) (1.65)* (0.76) (-0.29) (0.47)
Organizational innovation 0.210 0.047 0.295 -0.082 0.249 -0.092 (1.69)* (0.17) (2.04)** (-0.58) (0.57) (-0.61) Marketing innovation -0.038 0.063 0.005 0.574 0.781 0.475 (-0.26) (0.21) (0.03) (3.56)*** (1.66) (2.71)*** Price-cost margin 0.234 1.849 -0.149 -0.019 -0.210 0.052 (1.38) (3.33)*** (-0.77) (-0.10) (-0.26) (0.25) Log labour productivity 0.229 0.281 0.308 0.142 0.274 0.084 (4.02)*** (2.03)** (4.60)*** (2.16)** (1.20) (1.18) Log number of employees 0.045 -0.276 0.147 -0.068 -0.333 0.104 (0.20) (-0.57) (0.54) (-0.31) (-0.69) (0.38)
Log number of employees squared
0.026 0.073 0.022 0.014 0.015 -0.009 (0.85) (1.10) (0.59) (0.50) (0.26) (-0.26)
Firm age 0.187 0.208 0.112 -0.379 -0.291 -0.417 (2.22)** (1.28) (1.03) (-3.64)*** (-1.46) (-3.25)*** Foreign firm 0.450 0.789 0.397 -0.206 0.578 -0.393 (3.00)*** (2.27)** (2.22)** (-1.44) (1.53) (-2.46)**
F-test: industry dummies .0034 .0009 .3473 .0252 .0501 .025
715 159 556 469 81 387 Number of observations 0.139 0.308 0.127 Log likelihood -397.793 -90.349 -288.481 (Pseudo) R-squared 0.138 0.180 0.159 0.139 0.308 0.127
Notes. Pooled sample of CIS4 and CIS2006. The coefficients are from an instrumental variable regression. Industry dummies are included in all regressions. * significant at 10%; ** significant at 5%; *** significant at 1%
Among other explanatory variables, as expected, foreign ownership is associated with the significantly higher probability of being an exporter, older firms are more likely to export (but have lower export growth, in accordance with the negative relationship between firm age and growth) and more productive firms are more likely to export. Thus, these results seem to indeed provide some evidence that technological innovations might affect productivity more indirectly through exports.
5. CONCLUSIONS AND DISCUSSIONS
The focus in this paper has been on the links between innovation inputs, innovation outputs and productivity in the Estonian service sector. In particular, we have investigated how these links differ among different service industries, especially knowledge intensive services and less knowledge intensive services. Our results show that the widely used CDM model (introduced first in Crépon et al. 1998) of the innovation process adequately describes the innovation process in Estonia’s services sector. We show that although KIS sectors spend more on R&D and have high innovation indicators, innovation also plays an important role in less-KIS sectors in Estonia.
Jaan Masso, Priit Vahter
27
In particular, we find that despite the lower propensity to engage in innovation, the efficiency of turning innovation investments into innovation outputs and these into performance improvements is higher in less-KIS sectors in Estonia. The KIS sectors show remarkably low performance in transforming R&D and innovation investments in general into successful process innovations and these into productivity improvements. There is a strong contrast between lower innovation activities and the higher efficiency of these activities in less-KIS sectors on the one hand, and higher innovation propensity but lower efficiency of innovation investments in KIS sectors on the other. This difference can perhaps be explained as follows. As there is less innovation activity among less-KIS firms, the potential premium in terms of post-innovation profits is higher for a less-KIS firm. The firm can therefore gain temporarily increased (monopoly) profits by innovating, as there are not many competitors in its sector that are capable of similarly investing in innovation and eroding this post-innovation profit of the 1st innovator. However, innovation activities in KIS sectors are more widespread. Therefore, it is more difficult to gain temporary monopolistic profits from innovating in these sectors. There are many other capable firms in the KIS sectors that invest in innovation and can therefore erode the post-innovation profits of previous innovators and competitors.
An issue that may affect our results is the particular period used for the analysis. The years 2002–2006 were characterised by rather strong economic growth (with annual average growth of 8.5%). While economic depression may also deter innovation activities (see e.g. Paunov 2010 on evidence of the impact of the recent global crisis), in the conditions of strong growth firms might be able to increase their sales and productivity even without innovation, by relying on scale effects. This may affect the observed link between innovation and productivity, and may also affect the results differently in different industries.
Another area that potentially could deserve more research in this context is whether the answers to the questions in the CIS questionnaire could be influenced by the sector, so that for example, firms in the high-tech sector are more ready to use the term “innovation” due to a traditional association with high-tech. This could affect the observed statistical relationship. Additional concepts of innovation could be applied, like “delivery innovation” (Miles 1995), or analysis of manufacturing and services firms together and classifying the firms not by sectors but instead by “service products” (Hipp and Grupp 2005). Yet another issue could be how new products are priced relative to old ones; the unavailability of product level price data undermines the estimation of technical productivity. Especially in high-tech sectors (like electronics) the prices of new products decline pretty fast as they mature, while in less KIS services price dynamics could be determined more by other factors.
We find that service sector firms are on average more prone to engage in organizational innovation than firms from the manufacturing industry. However, despite this finding and contrary to the effect of technological innovations, we do not find evidence of a positive relationship between organizational innovation and productivity in service sectors on average. One exception is the KIS sectors, where organizational innovations appear to be much more important as determinants of productivity improvements than elsewhere. Marketing innovations are significant in none of the estimated specifications of the CDM model. These results are in accordance with some of the earlier studies (Musolesi and Huiban 2010), but contradict some others (Polder et al. 2009). The heterogeneity of the results in the literature suggests that more research is needed to evaluate the importance of non-technological innovations in services and to investigate the reasons for the differences in effects across industries and countries. It is clear from our results that differences between

The Link between Innovation and Productivity
28
sectors, innovation indicators and productivity measures need to be carefully considered in the analysis of the effects of innovation.
Concerning the other links in the CDM model, the estimated CDM model confirms that process innovation in firms in the less-KIS sector is positively and significantly related to investment in innovation and also the firm’s intensity of knowledge sourcing activities. In the case of product innovation, no significant correlation with innovation expenditure is found. Though earlier papers have demonstrated the lower importance of R&D for innovation output in services (e.g. Robin and Mairesse (2008), these results are still somewhat surprising. At the same time, average R&D investments as a share of sales are not smaller in the service sector than in manufacturing in Estonia, and are much higher in knowledge intensive service sub-sectors.
Our results show that openness in the innovation process is beneficial for the firm, as also predicted by the popular ‘open innovation’ paradigm introduced to the literature mainly by Chesbrough (2003). The role of different types of knowledge flows from outside and from within the corporation is of similar significance as in the manufacturing industry. Notably, it is more the intensity of knowledge sourcing than the breadth of these activities that matters for performance improvements in our sample of firms. The simultaneous usage of different information sources (or the ‘breadth’ of knowledge sourcing, Laursen and Salter 2006, Leiponen 2008) was not found to be an important determinant of firm performance in services.
Openness to external knowledge in a firm’s innovation has been seen as a vital ingredient in achieving a higher innovation output and better performance in general (Chesbrough 20003; for a literature overview on ‘open innovation’ see also Dahlander and Gann 2010). As such, the variation in openness in innovation could have been expected to be one potential explanation of the varying efficiency of the innovation process in different sectors. However, based on the results in this paper, this does not seem to be the factor that explains the discrepancy between the efficiency of the innovation process in KIS versus non-KIS sectors.
Finally, we note that our results are constrained by potential simultaneity and endogeneity problems. We have here tried to account for some of the endogeneity bias by estimating a 3-stage instrumental variables model. Still, one can argue that a firm’s choice of innovation inputs and its efficiency in turning innovation inputs into innovation outputs is likely to depend on its productivity level and the productivity shocks that it faces. This may bias some of the findings in the CDM model. Our results show correlations between the variables studied, but they may or may not show causal effects. For an estimation of the causal effects, a ‘cleaner’ research setup and identification approach than the standard CDM model is needed. Potential ways to proceed for further research are to search for suitable natural experiments that induce exogenous changes in innovation inputs or the innovation activities of firms so that we could be sure that the causality runs from innovation to productivity and not the other way around.
Jaan Masso, Priit Vahter
29
REFERENCES
Arundel, A., Kanerva, M., Cruysen, A. v., Hollanders, H. (2007) “Innovation Statistics for the European Service Sector”, INNO Metrics 2007 report, Brussels: European Commission, DG Enterprise.
Baily, M. N., Zitzewitz, E. (2001), “Service Sector Productivity Comparisons: Lessons for Measurement”, in New Developments in Productivity Analysis, edited by C. R. Hulten, E. R. Dean, and M. J. Harper, Chicago, NBER and The Chicago University Press, pp. 419–464.
Cainelli, G., Evangelista, R., Savona, M. (2006), “Innovation and Economic Performance in Services”, Cambridge Journal of Economics, Vol. 30, pp. 435–458.
Camacho, J. A, Rodriguez, M. (2008), “Patterns of innovation in the service sector: some insights from the Spanish innovation Survey”, Economics of Innovation and New
Technology, Vo. 17, Issue 5, pp. 459-471. Chesbrough, H. W. (2003), “The era of open innovation”, MIT Sloan Management Review,
Vol. 44, Issue 3, pp. 35-41. Clerides, S. K.; Lach, S. and Tybout, J. R. (1998), “Is Learning by Exporting Important?
Micro-Dynamic Evidence from Colombia, Mexico, and Morocco,” The Quarterly Journal
of Economics, Vol. 113, Issue 3, 903-947. Crépon, B., Duguet, E., Mairesse, J. (1998), “Research, Innovation, and Productivity: an
Econometric Analysis at the Firm Level ”, NBER Working Paper No. 6696. Dachs, B., Ebersberger, B., Lööf, H. (2008), “The Innovative Performance of Foreign-Owned
Enterprises in Small Open Economies”, The Journal of Technology Transfer, Vol. 33, Issue 4, pp. 393-406.
Dahlander, L., Gann, D. M. (2010), “How open is innovation?” Research Policy, Vol. 39, pp. 699-709.
Diewert, E. (2001). “Which (Old) Ideas on Productivity Measurement are Ready to Use?” in , in C. R. Hulten, E. R. Dean and M. J. Harper (Eds.), the New Developments in Productivity
Analysis, Chicago, NBER and The Chicago University Press, pp. 85–102. Duguet, E. (2006), “Innovation height, spill-overs and TFP growth at the firm level: evidence
from French manufacturing”, Economics of Innovation and New Technology, Vol. 15, Issue 4/5, pp. 415-442.
Evangelista, R. (2002), “Sectoral patterns of technological change in services”, Economics of
Innovation and New Technology, Vol. 9, pp. 183-221. Evangelista, R., Savona, M. (2002), The Impact of Innovation on Employment in Services:
Evidence from Italy, International Review of Applied Economics, Vol. 16, No. 3, pp. 309-318.
Gallouj, F., Savona, M. (2009), „Innovation in services: a review of the debate and a research agenda“, Journal of Evolutionary Economics, Vol. 19, pp. 149-172.
Griffith, R., Huergo, E., Mairesse, J., Peters, B. (2006), “Innovation and productivity across four European countries”, Oxford Review of Economic Policy, Vol. 22, pp. 483–498.
Griliches, Z. (1992), “Output measurement in the service sector”, University of Chicago Press, Chicago.
Harrison, R., J. Jaumandreu, J. Mairesse and B. Peters (2008), “Does Innovation Stimulate Employment? A Firm Level Analysis Using Comparable Micro Data from Four European Countries”, NBER working paper No. 14206.
Haskel, J., Sadun, R. (2009), “Regulation and UK Retailing Productivity: Evidence from Micro Data”, CEPR Discussion Paper No. 7140.
Helpman, E., Melitz, M. J., Yeaple, S. R. (2004), ”Export Versus FDI with Heterogenous Firms”, American Economic Review, Vol. 94, Issue 1, pp. 300-316.

The Link between Innovation and Productivity
30
Hill, P. (1999), „Tangibles, intangibles and services: a new taxonomy for the classification of output“, The Canadian Journal of Economics, Vol. 32, pp. 426-446.
Hipp, C., Grupp, H. (2005), “Innovation in service sector: the demand for service-specific measurement concepts and typologies”, Research Policy, Vol. 34, pp. 517-535.
Högselius, P. (2005), “The Dynamics of Innovation in Eastern Europe. Lessons from Estonia”, Cheltenham Northampton (Mass.): Edward Elgar.
Innovation in services: typology, case studies and policy implications. (2006) Econ Analysis, MENON AS, MENON Report No. 1/2006.
Juhkam, A. (2003), „Financial Innovation in Estonia“, PRAXIS Working Paper No. 6. Knell, M., Bloch, C. W., Graversen, E. K., Nås, S. O., Lööf, H., Lehtoranta, O., Squicciarini,
M., Finnbjørnsson, T., Vahter, P., Masso, J. (2008), “Innovation and Growth in the Nordic Economies – IGNOREd final report”. Nordic Innovation Centre.
Laursen, K., Salter, A. J. (2006), “Open for innovation: the role of openness in explaining innovation performance among UK manufacturing firms”, Strategic Management Journal, Vol. 27, pp. 131–150.
Leiponen A., Helfat, C. E. (2010), “Innovation Objectives, Knowledge Sources, and the Benefits of Breadth”, Strategic Management Journal, Vol. 31, pp. 224-236.
Leiponen, A. (2008), “Is service innovation different?”, ETLA Discussion Paper No. 1151. Lööf, H., Heshmati, A. (2006), “On the relationship between innovation and performance: a
sensitivity analysis”, Economics of Innovation and New Technology, Vol. 15, Issue 4, pp. 317–344.
Lööf, H., Heshmati, A., Asplund, R., Nåås, S.-O. (2001), ”Innovation and Performance in Manufacturing Industries: a Comparison of the Nordic Countries”, SSE/EFI Working Paper
Series in Economics and Finance No. 457. Lopes, L. F., Godinho, M. M. (2005), ”Services Innovation and Economic Performance: An
analysis at the firm level”, DRUID Working Paper No. 05–08. Love, J. H., Roper, S., Hewitt-Dundas, N. (2010), „Service Innovation, Embeddedness and
Business Performance“, Regional Studies, Vol. 44, Issue 8, pp. 983-1004. Luštšik, O. (2003), “E-banking in Estonia: reasons and benefits of the rapid growth”,
University of Tartu, Faculty of Economics and Business Administration Working Paper No. 21.
Mansury, M. A., Love, J. H. (2008), “Innovation, productivity and growth in US business services: A firm-level analysis”, Technovation, Vol. 28, pp. 52-62.
Masso, J., Vahter, P. (2008), “Technological Innovation and Productivity in Post-Transition Estonia: Econometric Evidence from Innovation Surveys”, European Journal of
Development Research, 20 (2), 240–261. Miles, I. (1995), “Services innovation: Statistical and Conceptual Issues”. OECD, Paris,
DSTI/EAS/STP/NEST (95) 23. Miles, I. (2005), „Innovation in services“, in J. Fagerberg, D. C. Mowery and R. R. Nelson
(Eds.), The Oxford Handbook of Innovation, Oxford University Press, pp. 434–458. Miles, I., Kastrinos, N., Flanagan, K., Bilderbeek, R., den Hertog, P., Huntink, W. and
Bouman, M. (1995), Knowledge-Intensive Business Services: Users, Carriers and Sources of Innovation, EIMS Publication No. 15, European Innovation Monitoring System, Luxembourg.
Mothe, C., Nguyen Thi, T. U. (2010), “The impact of non-technological innovation on technological innovation: do services differ from manufacturing? An empirical analysis of Luxembourg firms”, CEPS Instead Working Paper No. 2010-01.
Muller, E., Doloreux, D. (2007), “The key dimensions of knowledge-intensive business services (KIBS) analysis: a decade of evolution”, ISI Fraunhofer, Working Papers Firms
and Region No. U1/2007.

Jaan Masso, Priit Vahter
31
Musolesi A., Huiban J. P., (2010), “Innovation and Productivity in Knowledge Intensive Business Services”, Journal of Productivity Analysis, Vol. 34, pp. 63-81.
OECD (2009). Innovation in Firms. A Microeconomic Perspective. Paris, OECD. Paunov, C. (2010), “The Global Crisis and Firms’ Investments in Innovation”, paper for the
4th Conference on Micro Evidence on Innovation in Developing Countries. www.merit.unu.edu/MEIDE/papers/2010/Paunov.pdf
Pavitt, K. (1984), “Sectoral patterns of technical change: towards a taxonomy and theory”, Research Policy, Vol. 13, Issue 6, pp. 343-373.
Polder, M., Leeuwen, G. Van, Mohnen, P, Raymond, W. (2009), „Productivity effects of innovation modes”, Statistics Netherlands discussion paper no. 09033.
Rannu, R. (2003), “Mobile Services in Estonia”, PRAXIS Centre for Policy Studies Policy
Analysis No. 2. Robin, S., Mairesse, J. (2008), „Innovation and productivity: a firm-level analysis for French
manufacturing and services using CIS3 and CIS4 data (1998-2000 and 2002-2004)“, Paper presented at the 25th Celebration Conference 2008 on „Entrepreneurship and innovation – organizations, institutions, systems and regions“, Copenhagen, CBS, Denmark, June 17-20, 2008.
Smedlund, A., Toivonen, M. (2007), “The role of KIBS in the IC development of regional clusters”, Journal of Intellectual Capital, Vol. 8, No. 1, pp. 159-170.
Soete, L., Miozzo, M. (1989), “Trade and development in services: a technological perspective”, MERIT Research Memorandum No. 89-031.
Stelios, K., Aristotelis, S. (2009), “Knowledge-Intensive Services, Innovation and Economic Performance: A Firm-Level Analysis”, Centre for Planning and Economic Research (Greece), mimeo.
Tether, B. S. (2005), “Do Services Innovate (differently?) Insights from the European Innobarometer Survey”, Industry and Innovation, Vol. 12, No. 2, pp. 153-184.
Tether, B. S., Swann, G. M. P. (2003), “Services, Innovation and the Science Base: An investigation into the UK’s ‘System of Innovation’ using evidence from the UK’s Third Community Innovation Survey”, a paper prepared for the “International Workshop on Innovation in Europe: Empirical Studies on Innovation Surveys and Economic Performance.”
Tether, B., Massini, S. (2007), “Services and the information infrastructure”, DTI Occasional
Paper No. 9 Vahter, P., (2010), “Does FDI spur innovation, productivity and knowledge sourcing of
incumbent firms? Evidence from manufacturing industry in Estonia”, University of Nottingham, GEP working paper No. 2010/09.
van Ark, B., O’Mahony, M., Timmer, M. P. (2008), “The productivity gap between Europe and the U.S.: Trends and causes”, Journal of Economic Perspectives, Vol. 22, Issue 1, pp. 25–44
Voss, C., Zomerdijk, L. (2007), “Innovation in Experiential Services – An Empirical View”, in “Innovation in services”, DTI Occasional Paper No. 9, pp. 97-134.
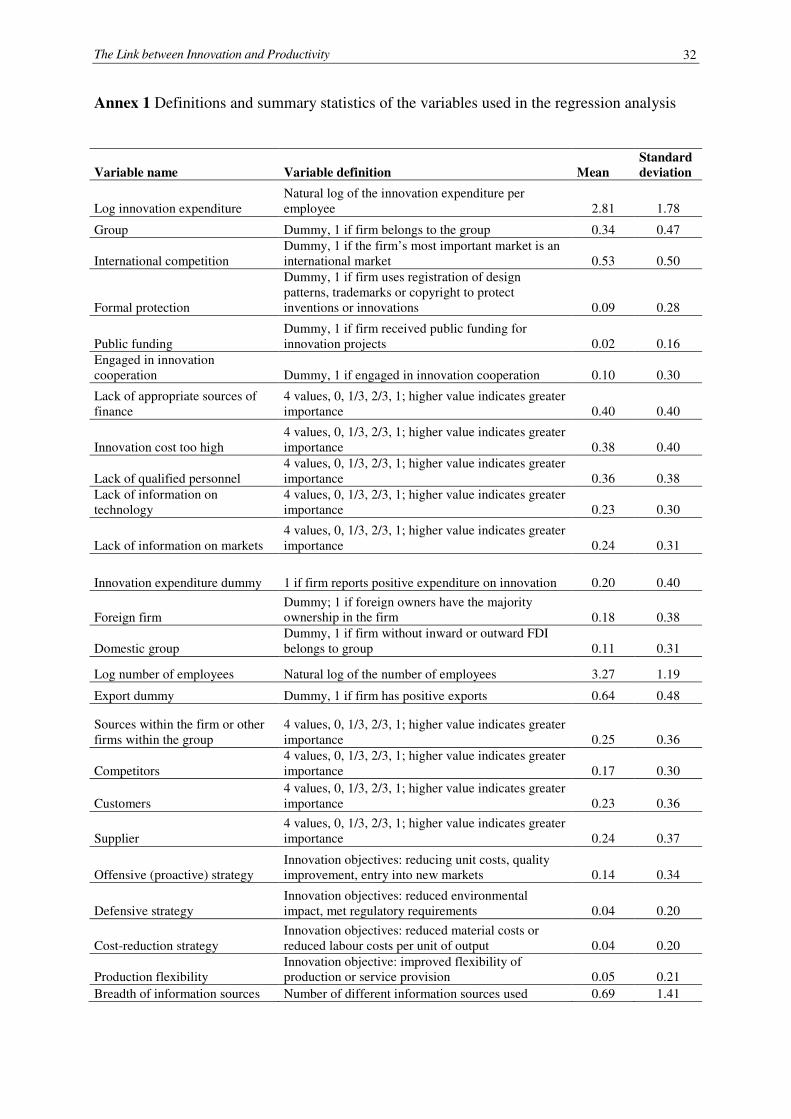
The Link between Innovation and Productivity
32
Annex 1 Definitions and summary statistics of the variables used in the regression analysis
Variable name Variable definition Mean
Standard
deviation
Log innovation expenditure Natural log of the innovation expenditure per employee 2.81 1.78
Group Dummy, 1 if firm belongs to the group 0.34 0.47
International competition Dummy, 1 if the firm’s most important market is an international market 0.53 0.50
Formal protection
Dummy, 1 if firm uses registration of design patterns, trademarks or copyright to protect inventions or innovations 0.09 0.28
Public funding Dummy, 1 if firm received public funding for innovation projects 0.02 0.16
Engaged in innovation cooperation Dummy, 1 if engaged in innovation cooperation 0.10 0.30
Lack of appropriate sources of finance
4 values, 0, 1/3, 2/3, 1; higher value indicates greater importance 0.40 0.40
Innovation cost too high 4 values, 0, 1/3, 2/3, 1; higher value indicates greater importance 0.38 0.40
Lack of qualified personnel 4 values, 0, 1/3, 2/3, 1; higher value indicates greater importance 0.36 0.38
Lack of information on technology
4 values, 0, 1/3, 2/3, 1; higher value indicates greater importance 0.23 0.30
Lack of information on markets 4 values, 0, 1/3, 2/3, 1; higher value indicates greater importance 0.24 0.31
Innovation expenditure dummy 1 if firm reports positive expenditure on innovation 0.20 0.40
Foreign firm Dummy; 1 if foreign owners have the majority ownership in the firm 0.18 0.38
Domestic group Dummy, 1 if firm without inward or outward FDI belongs to group 0.11 0.31
Log number of employees Natural log of the number of employees 3.27 1.19
Export dummy Dummy, 1 if firm has positive exports 0.64 0.48
Sources within the firm or other firms within the group
4 values, 0, 1/3, 2/3, 1; higher value indicates greater importance 0.25 0.36
Competitors 4 values, 0, 1/3, 2/3, 1; higher value indicates greater importance 0.17 0.30
Customers 4 values, 0, 1/3, 2/3, 1; higher value indicates greater importance 0.23 0.36
Supplier 4 values, 0, 1/3, 2/3, 1; higher value indicates greater importance 0.24 0.37
Offensive (proactive) strategy Innovation objectives: reducing unit costs, quality improvement, entry into new markets 0.14 0.34
Defensive strategy Innovation objectives: reduced environmental impact, met regulatory requirements 0.04 0.20
Cost-reduction strategy Innovation objectives: reduced material costs or reduced labour costs per unit of output 0.04 0.20
Production flexibility Innovation objective: improved flexibility of production or service provision 0.05 0.21
Breadth of information sources Number of different information sources used 0.69 1.41

Jaan Masso, Priit Vahter
33
Variable name Variable definition Mean
Standard
deviation
Breadth of objectives Number of different innovation objectives used 0.81 1.74
Log (Sales/employees) Natural log of the deflated sales to the number of employees 12.93 1.19
Log (Value added/employees) Natural log of the deflated value added to the number of employees 12.03 0.97
Log capital intensity Natural log of the ratio of fixed assets per employee 11.11 1.65
Organizational innovation Dummy, 1 if firm reports having introduced organizational innovations 0.450 0.498
Marketing innovation Dummy, 1 if firm reports having introduced marketing innovations 0.304 0.460
New to market product Dummy, 1 if the new products are new to the firm's market 0.092 0.288
New to firm product Dummy, 1 if the new products are new only to the firm 0.126 0.331
New to market products as % of sales Variable in the range from 0 to 100 0.025 0.105 New to firm products as % of sales Variable in the range from 0 to 100 0.050 0.160
Intramural R&D Dummy, 1 if firm has engaged in intramural R&D activities 0.108 0.311
Extramural R&D Dummy, 1 if firm has engaged in extramural R&D activities 0.059 0.236
Continuous R&D engagement 1 if firm reports continuous engagement in intramural R&D activities 0.068 0.252
Note. The monetary values (innovation expenditure, labour productivity) have been deflated by using the sector
level GDP deflators.
The Link between Innovation and Productivity
34
KOKKUVÕTE
Innovatsiooni ja tootlikkuse seosed Eesti teenustesektoris
Innovatsiooniprotsesside eripära teenustesektoris uurinud kirjandus on pööranud suhteliselt vähe tähelepanu innovatsiooni ja tootlikkuse seostele. Käesolevas artiklis me uurime, kuidas innovatsiooni ja tootlikkuse seos varieerub üle erinevate teenustesektori allharude. Analüüsis kasutame me kirjanduses CDM mudeli nime all tuntud struktuurset mudelit, mis koosneb innovatsioonikulutusi, innovatsiooniprotsessi väljundit, tootlikkust ja eksporti kirjeldavatest võrranditest. Analüüsis kasutame me Eesti innovatsiooniuuringute andmeid aastatest 1998-2000 (CIS3), 2002-2004 (CIS4) ja 2004-2006 (CIS 2006). Tulemused näitavad, et teenustesektoris innovatsioon on seotud ettevõtete kasvanud tootlikkusega. Üllatuslikult on innovatsiooni seos tootlikkusega tugevam vähem teadmisteintensiivsetes teenustesektoris, vaatamata sealsele madalamale innovaatilise tegevuse sagedusele. Kuigi mittetehnoloogilised, sealhulgas organisatsioonilised ja turunduslikud, innovatsioonid võiksid olla oodavalt olulised just teenustesektoris, avaldub nende positiivne seos tootlikkusega ainult mõnes hinnatud mudeli spetsifikatsioonis. Innovatsiooni positiivne mõju tootlikkusele võib avalduda ka läbi kasvanud ekspordi. Tulemused näitavad üldiselt niisiis, et innovatsiooni mõjude analüüsis tuleks hoolikalt arvesse võtta erinevusi sektorite, innovatsiooni indikaatorite ja erinevate tootlikkuse näitajate vahel.