The Light Responsive Transcriptome of the Zebrafish: Function and Regulation
15
The Light Responsive Transcriptome of the Zebrafish: Function and Regulation Benjamin D. Weger 1 , Meltem Sahinbas 1 , Georg W. Otto 2¤a , Philipp Mracek 1 , Olivier Armant 1 , Dirk Dolle 3 , Kajori Lahiri 1 , Daniela Vallone 1 , Laurence Ettwiller 3 , Robert Geisler 2¤b , Nicholas S. Foulkes 1 *, Thomas Dickmeis 1 * 1 Institute of Toxicology and Genetics, Karlsruhe Institute of Technology, Eggenstein-Leopoldshafen, Germany, 2 Max-Planck-Institut fu ¨ r Entwicklungsbiologie, Tu ¨ bingen, Germany, 3 Heidelberg Institute of Zoology, University of Heidelberg, Heidelberg, Germany Abstract Most organisms possess circadian clocks that are able to anticipate the day/night cycle and are reset or ‘‘entrained’’ by the ambient light. In the zebrafish, many organs and even cultured cell lines are directly light responsive, allowing for direct entrainment of the clock by light. Here, we have characterized light induced gene transcription in the zebrafish at several organizational levels. Larvae, heart organ cultures and cell cultures were exposed to 1- or 3-hour light pulses, and changes in gene expression were compared with controls kept in the dark. We identified 117 light regulated genes, with the majority being induced and some repressed by light. Cluster analysis groups the genes into five major classes that show regulation at all levels of organization or in different subset combinations. The regulated genes cover a variety of functions, and the analysis of gene ontology categories reveals an enrichment of genes involved in circadian rhythms, stress response and DNA repair, consistent with the exposure to visible wavelengths of light priming cells for UV-induced damage repair. Promoter analysis of the induced genes shows an enrichment of various short sequence motifs, including E- and D-box enhancers that have previously been implicated in light regulation of the zebrafish period2 gene. Heterologous reporter constructs with sequences matching these motifs reveal light regulation of D-box elements in both cells and larvae. Morpholino-mediated knock-down studies of two homologues of the D-box binding factor Tef indicate that these are differentially involved in the cell autonomous light induction in a gene-specific manner. These findings suggest that the mechanisms involved in period2 regulation might represent a more general pathway leading to light induced gene expression. Citation: Weger BD, Sahinbas M, Otto GW, Mracek P, Armant O, et al. (2011) The Light Responsive Transcriptome of the Zebrafish: Function and Regulation. PLoS ONE 6(2): e17080. doi:10.1371/journal.pone.0017080 Editor: Ferenc Mueller, University of Birmingham, United Kingdom Received November 8, 2010; Accepted January 14, 2011; Published February 15, 2011 Copyright: ß 2011 Weger et al. This is an open-access article distributed under the terms of the Creative Commons Attribution License, which permits unrestricted use, distribution, and reproduction in any medium, provided the original author and source are credited. Funding: This work was supported by the Max-Planck-Society (GWO, PM, KL, DV, RG, NSF and TD) and the Karlsruhe Institute of Technology (MS, PM, KL, DV, NSF and TD) as well as by grants from EMBO (TD), DFG (TD and BDW), the Studienstiftung des Deutschen Volkes (MS), the European Commission’s 6th Framework Programme (Contract No LSHG-CT-2003-503496, ZF-MODELS) (GWO and RG) and the EU 6th Framework STREP Project ZF-TOOLS (KL, DV and NSF). The funders had no role in study design, data collection and analysis, decision to publish, or preparation of the manuscript. Competing Interests: The authors have declared that no competing interests exist. * E-mail: [email protected] (NSF); [email protected] (TD) ¤a Current address: The Wellcome Trust Centre for Human Genetics, Oxford, United Kingdom ¤b Current address: Institute of Toxicology and Genetics, Karlsruhe Institute of Technology, Eggenstein-Leopoldshafen, Germany Introduction The ability to perceive sunlight provides animals with many adaptive advantages. Light perception can be used for orientation in the environment, the location of prey and the escape from predators as well as for communication via visual signals. The daily changes in lighting conditions also represent an important time cue for the optimal temporal distribution of activities and physiological processes of the organism, which in turn enhances survival. In this case, environmental lighting signals cooperate with endogenous timers, the most important of which is the circadian clock. Circadian clocks regulate daily changes in physiology in most organisms, ranging from cyanobacteria to humans [1]. These clocks consist of an oscillator mechanism that generates rhythms with a period of roughly 24 hours even in the absence of external cues. Molecularly, the oscillator is composed of proteins participating in a transcription-translation feedback loop (reviewed in [2,3,4]). In vertebrates for example, the transcription factors Clock and Bmal1 activate transcription of the period (per) and cryptochrome (cry) genes via so-called E-box elements in their promoters. The Period and Cryptochrome proteins accumulate in the cytoplasm, re-enter the nucleus and act there to inhibit the transcriptional activity of the Clock-Bmal1 complex. This reduces the transcription of the cry and per genes, hence less protein is made, and the repression is released, so that the cycle can start again. Additional feedback loops and posttranslational modifica- tions are thought to confer the 24 h period of this mechanism and to render it more robust. This molecular clock mechanism is encountered in the neural circadian pacemaker of the brain, the paired suprachiasmatic nucleus (SCN) situated in the hypothala- mus above the optic chiasm, which drives rhythms of behavior and other ‘‘centrally’’ regulated aspects of physiology. However, this clock mechanism is also present in most other tissues of the body, constituting so-called ‘‘peripheral’’ clocks. These clocks govern many aspects of cell and tissue physiology, acting either autonomously or in concert with systemic cues. PLoS ONE | www.plosone.org 1 February 2011 | Volume 6 | Issue 2 | e17080
-
Upload
independent -
Category
Documents
-
view
0 -
download
0
Transcript of The Light Responsive Transcriptome of the Zebrafish: Function and Regulation

The Light Responsive Transcriptome of the Zebrafish:Function and RegulationBenjamin D. Weger1, Meltem Sahinbas1, Georg W. Otto2¤a, Philipp Mracek1, Olivier Armant1, Dirk Dolle3,
Kajori Lahiri1, Daniela Vallone1, Laurence Ettwiller3, Robert Geisler2¤b, Nicholas S. Foulkes1*, Thomas
Dickmeis1*
1 Institute of Toxicology and Genetics, Karlsruhe Institute of Technology, Eggenstein-Leopoldshafen, Germany, 2 Max-Planck-Institut fur Entwicklungsbiologie, Tubingen,
Germany, 3 Heidelberg Institute of Zoology, University of Heidelberg, Heidelberg, Germany
Abstract
Most organisms possess circadian clocks that are able to anticipate the day/night cycle and are reset or ‘‘entrained’’ by theambient light. In the zebrafish, many organs and even cultured cell lines are directly light responsive, allowing for directentrainment of the clock by light. Here, we have characterized light induced gene transcription in the zebrafish at severalorganizational levels. Larvae, heart organ cultures and cell cultures were exposed to 1- or 3-hour light pulses, and changes ingene expression were compared with controls kept in the dark. We identified 117 light regulated genes, with the majoritybeing induced and some repressed by light. Cluster analysis groups the genes into five major classes that show regulationat all levels of organization or in different subset combinations. The regulated genes cover a variety of functions, and theanalysis of gene ontology categories reveals an enrichment of genes involved in circadian rhythms, stress response andDNA repair, consistent with the exposure to visible wavelengths of light priming cells for UV-induced damage repair.Promoter analysis of the induced genes shows an enrichment of various short sequence motifs, including E- and D-boxenhancers that have previously been implicated in light regulation of the zebrafish period2 gene. Heterologous reporterconstructs with sequences matching these motifs reveal light regulation of D-box elements in both cells and larvae.Morpholino-mediated knock-down studies of two homologues of the D-box binding factor Tef indicate that these aredifferentially involved in the cell autonomous light induction in a gene-specific manner. These findings suggest that themechanisms involved in period2 regulation might represent a more general pathway leading to light induced geneexpression.
Citation: Weger BD, Sahinbas M, Otto GW, Mracek P, Armant O, et al. (2011) The Light Responsive Transcriptome of the Zebrafish: Function and Regulation. PLoSONE 6(2): e17080. doi:10.1371/journal.pone.0017080
Editor: Ferenc Mueller, University of Birmingham, United Kingdom
Received November 8, 2010; Accepted January 14, 2011; Published February 15, 2011
Copyright: � 2011 Weger et al. This is an open-access article distributed under the terms of the Creative Commons Attribution License, which permitsunrestricted use, distribution, and reproduction in any medium, provided the original author and source are credited.
Funding: This work was supported by the Max-Planck-Society (GWO, PM, KL, DV, RG, NSF and TD) and the Karlsruhe Institute of Technology (MS, PM, KL, DV, NSFand TD) as well as by grants from EMBO (TD), DFG (TD and BDW), the Studienstiftung des Deutschen Volkes (MS), the European Commission’s 6th FrameworkProgramme (Contract No LSHG-CT-2003-503496, ZF-MODELS) (GWO and RG) and the EU 6th Framework STREP Project ZF-TOOLS (KL, DV and NSF). The fundershad no role in study design, data collection and analysis, decision to publish, or preparation of the manuscript.
Competing Interests: The authors have declared that no competing interests exist.
* E-mail: [email protected] (NSF); [email protected] (TD)
¤a Current address: The Wellcome Trust Centre for Human Genetics, Oxford, United Kingdom¤b Current address: Institute of Toxicology and Genetics, Karlsruhe Institute of Technology, Eggenstein-Leopoldshafen, Germany
Introduction
The ability to perceive sunlight provides animals with many
adaptive advantages. Light perception can be used for orientation in
the environment, the location of prey and the escape from predators
as well as for communication via visual signals. The daily changes in
lighting conditions also represent an important time cue for the
optimal temporal distribution of activities and physiological
processes of the organism, which in turn enhances survival. In this
case, environmental lighting signals cooperate with endogenous
timers, the most important of which is the circadian clock.
Circadian clocks regulate daily changes in physiology in most
organisms, ranging from cyanobacteria to humans [1]. These
clocks consist of an oscillator mechanism that generates rhythms
with a period of roughly 24 hours even in the absence of external
cues. Molecularly, the oscillator is composed of proteins
participating in a transcription-translation feedback loop (reviewed
in [2,3,4]). In vertebrates for example, the transcription factors
Clock and Bmal1 activate transcription of the period (per) and
cryptochrome (cry) genes via so-called E-box elements in their
promoters. The Period and Cryptochrome proteins accumulate
in the cytoplasm, re-enter the nucleus and act there to inhibit the
transcriptional activity of the Clock-Bmal1 complex. This reduces
the transcription of the cry and per genes, hence less protein is
made, and the repression is released, so that the cycle can start
again. Additional feedback loops and posttranslational modifica-
tions are thought to confer the 24 h period of this mechanism and
to render it more robust. This molecular clock mechanism is
encountered in the neural circadian pacemaker of the brain, the
paired suprachiasmatic nucleus (SCN) situated in the hypothala-
mus above the optic chiasm, which drives rhythms of behavior and
other ‘‘centrally’’ regulated aspects of physiology. However, this
clock mechanism is also present in most other tissues of the body,
constituting so-called ‘‘peripheral’’ clocks. These clocks govern
many aspects of cell and tissue physiology, acting either
autonomously or in concert with systemic cues.
PLoS ONE | www.plosone.org 1 February 2011 | Volume 6 | Issue 2 | e17080

The circadian oscillator can be synchronized with (or ‘‘en-
trained’’ to) the environment via a number of different cues,
including temperature, food, various chemical compounds and,
perhaps most pervasively, light. In mammals, a subset of retinal
ganglion cells which are intrinsically photosensitive (so-called
ipRGCs, [5]) projects to the SCN. The opsin photopigment,
melanopsin, is expressed in the ipRGCs and is sufficient for
circadian light responses in the absence of functional rods and cones
[6,7,8]. However, melanopsin knock-out mice still entrain to light-
dark (LD) cycles when rods and cones are present, therefore the
ipRGCs can also transmit light information received through the
rods and cones [9]. Light induced changes in ipRGC activity are
signalled via glutamate and PACAP containing projections to the
neurons of the SCN, leading to acute changes in neuronal activity
and also to gene expression changes mediated by the transcription
factor CREB [10]. Currently poorly defined signals, which might
include hormones such as glucocorticoids, as well as body
temperature changes and the activity of the autonomic nervous
system, then transmit timing information from the SCN to the
peripheral tissue clocks [11,12]. However, under some conditions,
e.g. unnaturally timed feeding schedules [13], peripheral clocks can
be ‘‘decoupled’’ from the SCN clock and run even in antiphase to it,
revealing the principal autonomy of peripheral tissue clocks from
the central pacemaker. Nevertheless, to perceive changes in
environmental lighting conditions, mammalian peripheral clocks
rely upon systemic signals from the SCN.
This is not the case in many other organisms. In Drosophila,
peripheral tissue clocks respond directly to light [14]. Crypto-
chrome, which functions as part of the core clock feedback loop in
mammals, serves as a photopigment in the fruit fly [15]. Strikingly,
direct light responsiveness of peripheral clocks is also encountered
in a vertebrate, the zebrafish. Clock gene expression in zebrafish
organ cultures can be entrained to LD cycles [16], and even single
zebrafish cell culture cells are able to entrain their clocks in
response to light pulses [17,18]. In the absence of light, rhythms in
single cells continue, but drift out of phase with respect to the other
cells, leading to an apparent dampening of the rhythm of the
entire culture. The nature of the photoreceptor mediating this
peripheral light responsiveness is still elusive, although various
candidates have been proposed, including Teleost Multiple Tissue
(TMT-) Opsin and Cryptochromes [19,20]. A more recent study
has implicated specifically the cry1a gene in mediating the effects of
light on the clock. However, Cry1a is hypothesized to act as an
element of the signalling pathway, rather than serving as a light
receptor itself [21]. The expression of several clock genes acutely
responds to light in zebrafish cells, e.g. per1, per2 and cry1a
[17,22,23,24]. Light induced expression of the per2 gene has very
recently been shown to depend on D- and E-box enhancer
elements within its promoter [25]. Strikingly, evidence points to
the signalling pathways mediating light induced clock gene
expression in fish being conserved in mammals, despite the lack
of peripheral photoreception. Fibroblasts transfected with mela-
nopsin become light sensitive and can entrain their clocks in
response to exposure to LD cycles [26,27]. Furthermore, the light
responsive D- and E-box enhancer elements of the per2 gene are
conserved in chicken and mammals, including humans, and a
human promoter fragment containing these elements mediates
light induction of a reporter gene when transfected into zebrafish
cells. One way to interpret these findings would be that, in
mammals, SCN-controlled signals for the entrainment of periph-
eral clocks might have co-opted pathways that formerly acted
downstream of the now lost peripheral light receptor [25].
Interestingly, the direct light reception in peripheral tissues
might affect physiology not only indirectly, via regulating the
clock, but also more directly. For example, one gene that has been
shown to be light inducible already in the early embryo, even
before the clock is running properly, is the DNA repair enzyme
6,4-photolyase/cry5 [28]. This regulation seems likely to have
physiological relevance, since mortality caused by UV treatment
was reduced when zebrafish embryos had been exposed to light
prior to treatment [28]. Similar findings have recently been
reported in the zebrafish z3 cell line [29].
Here, we set out to characterize light induced transcription in
the zebrafish more globally by identifying light responsive genes at
three levels of organization: whole larvae, heart organ cultures and
cell culture cells. We identified a relatively restricted set of 117
regulated genes, the majority (90) being upregulated by light.
Induced genes fell into a variety of functional categories, including
genes involved in circadian clock function, DNA repair, retinal
light reception and metabolism, highlighting the pervasive effects
of light exposure on physiology. Strikingly, examination of the
promoters of the upregulated genes revealed an enrichment for E-
and D-box binding sites, indicating that the role E- and D-box
binding factors play in light induction of the per2 gene might also
extend to many other light responsive genes.
Materials and Methods
Ethics StatementAll zebrafish husbandry and experimental procedures were
performed in accordance with the German animal protection
standards and were approved by the Government of Baden-
Wurttemberg, Regierungsprasidium Karlsruhe, Germany (Akten-
zeichen 35-9185.64).
Raising adult and larval zebrafishAdult zebrafish (Tubingen strain) were raised according to
standard methods [30]. Fertilized eggs were collected within 2 h of
laying, and aliquots of 20 eggs were transferred into 20 ml of E3
buffer in 25-cm2 tissue culture flasks [31]. The flasks were
incubated in a large-volume thermostat-controlled water bath
equipped with an Osram L15W/41-827 light source for 5 days in
constant darkness (DD) at 25uC, then illuminated with an
approximate intensity of 1,200 lux for 1 or 3 h or maintained in
DD before RNA extraction. The intensity of illumination was
measured with a POCKET LUX Illuminance Meter (LMT,
Berlin).
In vitro heart cultureIn vitro heart cultures were carried out essentially as described
before [32]. Briefly, freshly dissected tissue was placed in L15 medium
supplemented with 15% fetal calf serum and with gentamycin
(50 mg/ml) and Pen/Strep (100 units/ml; 100 mg/ml). Organs were
dissected from fish and washed 4 times with medium (10 ml/5
hearts). 5 hearts each were placed into cell culture flasks containing
5 ml of medium and submerged in the water bath in constant
darkness for 4 days, then subjected to the light pulse as performed for
the larvae and finally directly processed for RNA extraction.
Cell culturePAC2 cell culture was carried out essentially as described before
[16,17]. Cells were seeded into 75 cm2 flasks and submerged in
the waterbath in constant darkness for a week before light pulse
treatment and RNA isolation.
RNA isolation and microarray hybridizationTotal RNA was extracted from at least three biological repeat
samples per experimental condition using Trizol RNA isolation
Light Responsive Transcriptome
PLoS ONE | www.plosone.org 2 February 2011 | Volume 6 | Issue 2 | e17080

reagent (GIBCO-BRL) according to the manufacturer’s instruc-
tions. Synthesis and labeling of antisense RNA was performed as
recommended by the array manufacturer, using kits for double-
stranded cDNA synthesis (Invitrogen), for transcription and
labeling of antisense RNA (Enzo Life Sciences) and for probe
purification and hybridization controls (Affymetrix). Samples were
hybridized to the Affymetrix Zebrafish GeneChip, representing
15,617 probes.
Microarray analysisMicroarray hybridization data were analyzed using scripts
written in the statistical programming language R [33] supported
by packages provided by the Bioconductor project [34].
Background correction, normalization and probe set summariza-
tion were performed using the robust multi array algorithm with
background adjustment (gcrma, [35]). Two methods were
employed to detect genes differentially expressed in response to
light exposure. First we used linear models and a moderated t-
statistic from the package limma [36]. Multiple testing correction
was performed using Benjamini and Hochberg false discovery rate
(FDR) [37] and genes with an adjusted p-value of #0.05 were
considered differentially expressed. Secondly, we used the meta-
analysis technique, Rank Product [38], to generate a non-
parametric statistic that detects genes consistently highly ranked
in the comparisons between light exposed and control samples. All
data is MIAME compliant, and raw and normalized data were
stored in the ArrayExpress data base (http://www.ebi.ac.uk/
microarray-as/ae/, accession-no. E-MTAB-381).
Annotations for the differentially expressed genes were retrieved
with the Affymetrix probe set IDs using BioMart version 0.7 [39],
querying the dataset of zebrafish genes based on the genome
release Zv8 in the Ensembl database (release 56). In the cases
where no Ensembl Gene IDs were assigned, we examined the
location of the probe set by BLAST to check whether they were
located 59 or 39 to an annotated gene. If there was a unique
BLAST hit close to a gene annotation, the corresponding Ensembl
Gene ID was assigned to the probe set and marked as a 59 or 39-
hit. The Ensembl Gene IDs were subsequently used to assign the
corresponding ZFIN IDs and Entrez Gene IDs. For some probes,
including the two most highly downregulated ones, no annotated
sequence could be identified in the Zv8 release with either
strategy, and they were therefore excluded from the subsequent
analyses. Where no particular references are given, the gene
description is based on information contained in the NCBI (Gene,
RefSeq and OMIM) and ZFIN databases.
Cluster analysisCluster 3.0 [40] and Java TreeView 1.1.5r2 [41] were used for
cluster analysis. Hierarchical clustering was performed using a
centroid linkage algorithm with an uncentered Pearson correlation
similarity metric. Some genes are hit by several probes that may
fall into two different clusters, with one cluster corresponding to a
subset of expression patterns of the other. When counting the
numbers of genes belonging to each cluster, we counted such genes
only once, in the cluster that included all experimental conditions
where the gene was found to be regulated. For example, xpc is hit
by two probes, Dr.4069.1.A1_at and Dr.19728.1.A11_at.
Dr.4069.1.A1_at belongs to the ‘‘larvae and cells’’ cluster, whereas
Dr.19728.1.A11_at belongs to the ‘‘cells’’ cluster. The gene is thus
counted only once, in the ‘‘larvae and cells’’ cluster.
Gene Ontology (GO) term analysisFor the GO term enrichment analysis we used BinGO 2.4.2 [42],
a plug-in for the Cytoscape 2.7.0 platform [43]. The ontology data
for zebrafish were obtained from the Gene Ontology project (www.
geneontology.org). The GO terms of the light-induced genes were
compared to a gene universe that was restricted to the expressed
genes on the microarrays that could be linked to a ZFIN ID. To
identify statistically significantly overrepresented GO categories, a
hypergeometric test was performed followed by FDR correction
[37]. GO terms with corrected p-values below 0.05 were considered
as significantly enriched.
Human Disease MeSH terms and KEGG pathwayenrichment analysis
The list of human orthologues (Table S4) was derived either from
the corresponding ZFIN human orthologue annotation of the
zebrafish genes or from manually curated reciprocal BLAST hits in
the NCBI non-redundant protein database. In order to find human
diseases linked with the list of human orthologues, we used
LitInspector data for retrieving MeSH terms (Medical Subject
Headings) in the Diseases Category [44]. MeSH terms with an
adjusted p-value less than 0.05 as calculated by a hypergeometric
test and adjusted by a simulated Benjamini and Hochberg FDR
correction of 1000 multiple tests are considered as significantly
enriched in the human orthologues dataset. KEGG pathway
analysis was performed with the ClueGO plugin for Cytoscape [45].
PromoteranalysisWe identified overrepresented motifs in the promoter sequences
of the light induced gene set as follows: Promoter sequences were
retrieved with Gene2Promoter within the Genomatix software
suite. The list of promoters from the upregulated gene set was
manually curated according to transcription start site locations
derived from zebrafish cDNA sequences of the NCBI RefSeq or
EMBL Nucleotide Sequence databases (as well as from our own 59-
RACE data in the case of lonrf1(2of2), cry1a and per2). The genomic
coordinates of the retrieved promoters are shown in Table S2. We
next applied the Trawler-standalone pipeline [46,47] to define
enriched motifs in the promoters of the light induced gene set
against a background that consisted of the promoter sequences from
the entire gene universe used for the GO enrichment analysis (see
above). The location of the obtained motifs in the tested gene set
promoters was visualized by the Motif Align and Search Tool
(MAST) within the MEME software suite [48].
Morpholino oligonucleotide mediated knock-downGene knock-down experiments were performed using morpho-
lino-modified antisense oligonucleotides (MO; Gene Tools): Cells
were electroporated with 10 mM morpholino oligonucleotides
(sequences: Gene Tools standard control MO, 59-ctcttacctcagtta-
caatttata-39; tef1 MO, 59-agtgttctgttcttacagacctgat-39; tef2 MO,
59-tcagctttaatcatctcctaccgtc-39) before transferring them into 6 well
plates. The tef2 MO targets the splice site between Exon 1 and
Intron 1 of tef2, and the tef1 MO targets the boundary of exon 2
and intron 2 of tef1 [25]; knock-down efficiency was evaluated by
RT-PCR. Electroporation was performed at 0.29 kV, 960 mF,
using a Gene Pulser apparatus (Bio-Rad). Transfection efficiency
was determined with a lissamine-tagged fluorescent control
morpholino and found to be 90%. Cells were incubated for 48 h
before a 3-hour light pulse and subsequent RNA isolation.
Quantitative RT-PCRRNA (1 mg) was reverse-transcribed using Oligo(dT) primer or
random primers (Amersham Biosciences and Invitrogen) and
SuperScript III reverse transcriptase (Invitrogen). mRNA levels
were determined by real-time qPCR using the DNA Engine
Light Responsive Transcriptome
PLoS ONE | www.plosone.org 3 February 2011 | Volume 6 | Issue 2 | e17080

Opticon thermocycler (Bio-Rad) or StepOne Plus (Applied
Biosystems) following the manufacturer’s instructions. First-strand
cDNA aliquots from each sample were diluted 206and served as
templates in a PCR reaction consisting of master mix, SYBR
Green I fluorescent dye (Bio-Rad), and 400 nM gene-specific
primers. Copy numbers were normalized using b-actin controls.
Primer sequences are shown in Table S5.
Bioluminescence assaysTo analyze whether the motifs identified by the Trawler
pipeline were able to modulate transcription in a light dependent
manner, oligonucleotides containing the concatemerized motifs
separated by 10 bp spacers were subcloned into pLucMCS
(Stratagene) upstream of the luciferase reporter gene as previously
described ([17], see Table S6 for the oligonucleotide sequences).
Pac2 cells were transiently transfected in 6 well plates with
FuGENE HD (Roche) according to the manufacturer’s protocol.
Cells from each well were transferred after 24 h into 8 wells of 96-
well fluoro-assay plates (ThermoFisher Scientific, Nuncbrand).
The next day, culture medium was replaced with medium
containing 0.5 mM beetle luciferin (Promega) and cells were kept
in darkness for 3 days before being submitted to the light regime
indicated in Figure 6. Bioluminescence was monitored on a
Packard TopCount NXT scintillation counter at 25uC.
For in vivo luciferase monitoring in larvae, the 4x E-box and 6x
D-box constructs were injected into fertilized zebrafish eggs.
Larvae were placed into E3 medium containing 0.5 mM beetle
luciferin and kept under constant darkness for three days, then
placed into a Packard TopCount NXT scintillation counter for
bioluminescence monitoring under the light regime indicated in
Figure 7.
Results and Discussion
Experimental design and global patterns of lightresponsive transcription
To obtain a global picture of genes regulated by light in the
zebrafish, we determined genes that significantly changed their
expression upon a 1- or 3-hour exposure to light in zebrafish cell
cultures, heart cultures and larvae using Affymetrix microarrays
(Figure 1, see Materials and Methods for details of the microarray
analysis). This experimental design was expected to reveal genes
immediately downstream of photoreceptors as well as a second
wave of regulated genes, both at three different levels of
organization: the cell, the organ and the entire animal (Figure 2
and Table S1).
Larvae were raised in constant darkness for 5 days before being
subjected to a light pulse of 1 or 3 hours. Since the circadian clock
is desynchronized in the larvae under these conditions [49,50], we
could examine the effect of the light pulses regardless of the phase
of the clock. Only a few genes (13, namely per2, cry1a, tef1, bhlhe40
[dec1], lonfr1 [2 of 2], si:ch211-195b13.1 [serum/glucocorticoid regulated
kinase 1-like], carboxyl ester lipase, guca1c, and zgc:73369 [CCDC58])
showed upregulation after 1 h of light. However, after 3 h, we
found 74 genes (80 probes) to be up- and 24 genes to be
downregulated in the larvae (Figure 2). Most upregulated genes of
the entire set are encountered in the larvae subset, most likely
reflecting the higher complexity of the organism and a potential
contribution of systemic factors. Also the vast majority of
downregulated genes from the entire set is found only in the
larvae, including ndrg1l, the most strongly downregulated gene in
the entire set.
To examine genes regulated at the organ level, we made use of
the ease with which adult zebrafish hearts can be kept in tissue
culture. The dissected hearts were kept for 4 days in constant
darkness to desynchronize their clocks and then subjected to a 1-
or 3-hour light pulse. Again, we found very few genes (ddb2 and
zorba) regulated after 1 h, and more (12 [14 probes]) regulated
after 3 h (Figure 2). Overlap with the larval set was high, with just
two genes (zorba and clock3) regulated only in the heart culture, but
not in the larvae. Adult hearts are less transparent than the larvae,
thus the lower number of induced genes might also reflect a lower
intensity of light that reaches the cells within the tissue, attenuating
the response.
To examine which genes would be regulated cell autonomously
by the light pulses, we also examined the effect of light exposure on
cells of a zebrafish tissue culture cell line (PAC2 [16]). Cells were
kept in constant darkness for a week prior to the light pulses in
Figure 1. Experimental design of the study. We examined light induced gene expression at three levels of organization: The cell (PAC2 cells), theorgan (cultured hearts) and the organism (larvae). Samples were kept in the dark to desynchronize their clocks before being exposed to a 1 or 3-hourlight pulse or left in the dark as a control. Samples from three biological repeats per treatment and control were hybridized to Affymetrix ZebrafishGeneChips.doi:10.1371/journal.pone.0017080.g001
Light Responsive Transcriptome
PLoS ONE | www.plosone.org 4 February 2011 | Volume 6 | Issue 2 | e17080

order to desynchronize their clocks. We found two genes (lonfr1 [2
of 2] and the novel protein si:ch211-284a13.1) induced after 1 h of
light, while 30 genes (34 probes) were regulated after 3 h (29 [33
probes] upregulated and 1 downregulated, Figure 2). Overall, the
number of regulated genes is lower than in the larvae, but higher
than in the hearts. This may reflect the lower complexity and
higher homogeneity in the cell culture when compared with the
organ and whole organism levels. Only relatively few genes (11 [12
probes]) are specific to the cell culture set, including si:ch211-
284a13.1.
In total, 124 probes corresponding to 117 genes were found to
be regulated, with 27 genes downregulated and 90 (97 probes)
upregulated. 8 genes fit to several probes in the set, namely cry-
DASH, zgc:56136, tef1, per2, xpc, pde6h, ptgds and zgc:153154. We
selected a subset of genes for validation by qPCR. As shown in
Figure 3, the qPCR results correlate well with the chip results
(Spearman r = 0.9009, p,0.0001), indicating a high level of
confidence for the identified gene set.
Cluster analysisHierarchical clustering of the differentially expressed probe set
reveals that most probes fall into one of five categories with similar
regulation (Figure 2): Probes that are upregulated globally (in cells,
hearts and larvae), those upregulated only in larvae and cells, those
upregulated in larvae only or in cells only, and those downreg-
ulated in larvae only. Overall, fewer genes are regulated after just
1 h of light, thus the clusters are mainly determined by the values
attained after 3 h of light. Only very few genes (1-2 each) belong to
other patterns of expression (e.g. up in hearts and cells, in hearts
only, after 1 h only, first up and then down, down in cells only,
down after 1 h only). The largest group of upregulated genes (53)
constitutes the ‘‘larvae only’’ group, while the ‘‘larvae down’’
group contains the vast majority of downregulated genes (24). (The
only downregulated gene not found in the larvae is dbp1, which is
only found in the cell set.) The ‘‘global’’, ‘‘larvae and cells’’ and
‘‘cells only’’ groups each contain a similar number of genes (10, 13
and 10, respectively).
Functional classes of light regulated genesIn order to evaluate which types of functions would be most
prominent in the light regulated gene sets, we performed an
analysis for enrichment of specific Gene Ontology (GO) categories
within the ontologies of ‘‘biological process’’, ‘‘molecular function’’
and ‘‘cellular component’’. The upregulated and the downregu-
lated gene sets were compared with all genes that were present on
the Affymetrix array and were expressed in at least one of the
examined conditions. This controlled for any bias in GO
categories arising from the selection of genes on the chip and
the choice of tissues or cell types examined. Although this analysis
is limited by the currently still incomplete annotation of zebrafish
genes, it allowed us to identify several statistically enriched
functions in our light induced gene set (Table S3). The hierarchical
organization of the three gene ontology fields is shown in Figure 4
(biological process), Figure S1 (molecular function) and Figure S2
(cellular component), together with the significance of enrichment
Figure 2. Cluster analysis of the microarray experiments. Resultsof cluster analysis of the microarray experiments. Upregulatedtranscripts are shown in red, downregulated ones in green, with thecolour intensity indicating the log2 fold change values. Five majorclusters can be identified: globally upregulated, up in larvae and cells,up in larvae only, up in cells only and downregulated in the larvae. Fordetails see text. #, heart specific genes.doi:10.1371/journal.pone.0017080.g002
Light Responsive Transcriptome
PLoS ONE | www.plosone.org 5 February 2011 | Volume 6 | Issue 2 | e17080

in the light induced gene set indicated by colour. In contrast to the
upregulated genes, the downregulated genes appear more
heterogenous with respect to their functions, and indeed no GO
category was found to be enriched in this set (data not shown).
With the caveat that the functions of zebrafish and human
orthologues may have diverged considerably during evolution, we
also made an attempt to exploit the better gene annotation
available for human genes. We identified human orthologues of
our genes (Table S4) and annotated this list with data mining tools.
We mined the set for enriched MeSH disease terms (with
LitInspector) and for KEGG pathways (using ClueGO), thereby
linking these orthologues with human diseases or metabolic and
signalling pathways, respectively. Terms from the two databases
that were statistically enriched in our set are shown in Table S7
and Table S8, together with the corresponding genes.
Circadian clock genesAs expected, we encountered a number of circadian clock genes
among the upregulated genes at all levels of organisation. The GO
analysis reveals that, in the biological process field, categories
related to ‘‘circadian rhythm’’, such as ‘‘regulation of circadian
rhythm’’ and ‘‘photoperiodism’’, are clearly overrepresented
(Figure 4 and Table S3), and also the KEGG search with human
homologues yields ‘‘circadian rhythm’’ as an enriched term (Table
S7). Indeed, the most highly upregulated gene of the entire set is
per2 (induced 30 fold in larvae after 3 h and 23 fold in cells). Also
two other core clock genes are upregulated in both cells and
larvae: cry1a and cry2a. These genes do not appear to be regulated
in the heart 3 h set, potentially indicating differential regulation or
robustness of light responsiveness for different clock genes in
different tissues. Effectively, three other core clock genes appear as
regulated in larvae (bmal2), hearts (clock3) and cells (cry3) only. This
differential regulation might include kinetic aspects: per2 and cry1a
are upregulated already after 1 h in larvae, but not in cells, and the
accessory clock loop gene dec1/bhlh40 appears to be only
transiently upregulated after 1 h in the larvae. Differences in the
response of clock genes to entrainment signals in different tissues
have also been observed in mammals, where e.g. per2 responds
differently to glucocorticoid changes in certain brain regions
(reviewed in [2]). Six of the eight regulated clock genes belong to
the negative limb of the feedback loop, suggesting that the effects
of light on the clock are predominantly mediated via this part of
the oscillator mechanism. In support of this prediction, the GO
term ‘‘transcription repressor activity’’ from the molecular
function field is enriched (Figure S1 and Table S3), again
suggesting that the light input to clock entrainment may act via
transcriptional repressor functions.
DNA repair genesAnother striking set of genes, which includes many of those that
fall into the globally upregulated cluster, has functions linked with
DNA repair. Enriched GO terms in this functional class come
Figure 3. qPCR validation of the microarray results. Graph indicating the correlation of light induced fold change values as determined byRTqPCR (y-axis) and microarray (x-axis) for 24 gene-treatment combinations. Values are given for genes tested in cells (green circles), hearts (purplesquares) and larvae (blue triangles). The correlation is statistically highly significant (Spearman r = 0.9009, p,0.0001).doi:10.1371/journal.pone.0017080.g003
Light Responsive Transcriptome
PLoS ONE | www.plosone.org 6 February 2011 | Volume 6 | Issue 2 | e17080

Light Responsive Transcriptome
PLoS ONE | www.plosone.org 7 February 2011 | Volume 6 | Issue 2 | e17080

both from ‘‘biological process’’ (‘‘response to DNA damage
stimulus’’, ‘‘DNA repair’’, ‘‘cellular DNA metabolic process’’)
and ‘‘molecular function’’ (‘‘DNA photolyase activity’’, ‘‘damaged
DNA binding’’) (Figure 4, Figure S1, Table S3). Consistently, cry5,
also called 6,4 photolyase, has previously been described to be light
induced in the early zebrafish embryo [28] and in zebrafish cell
culture [29]. The function of this enzyme is to repair so-called 6–4
photoproducts created by UV light exposure. Our microarray
results extend this observation to the larvae and adult hearts as
well as to another cell culture line, the PAC2 cell line. Also cry-dash
has been implicated in DNA repair, since cry-dash homologues
from the bacterium Vibrio cholera, the plant Arabidopsis thaliana and
the frog Xenopus laevis have been found to function as photolyases
specific for cyclobutan pyrimidine dimers in single stranded DNA
[51]. Another example is ddb2, which binds to damaged DNA that
has been distorted by bulky lesions or cyclic pyrimidine dimers
generated by exposure to UV light. DDB2 forms part of a complex
with the Xeroderma pigmentosum C (XPC) protein which triggers
nucleotide excision repair (reviewed in [52,53]). Strikingly, xpc
itself is also induced by light in cells and larvae. ddb2 is already
weakly induced in cultured hearts after 1 h of light exposure.
Furthermore, xrcc1 (X-ray repair cross complementing protein 1), which is
induced only in the larvae, is involved both in base excision repair
(reviewed in [54]) and in nucleotide excision repair, suggesting that
a whole set of genes contributing to this pathway is coordinately
regulated by light. This is also reflected by the fact that the
category ‘‘nucleotide excision repair’’ appears as enriched in the
KEGG pathway analysis (Table S7).
Another gene induced in the larvae is dclre1a (DNA cross link repair
1A), which is involved in the repair of interstrand cross-links. Also
the novel protein encoded by zgc:66475 might be related to DNA
repair, as it contains a DNA photolyase class 2 domain, and the
coiled-coil domain-containing protein 58 (ccdc58) gene contains a caffeine
induced death protein 2 domain, which apparently is involved in
caffeine mediated disruption of the DNA replication checkpoint of
the cell cycle. Finally, the LOC570063 gene shows homology to
Xenopus wdr76, the human homologue of which has been shown to
interact with the ubiquitin-ligase Cul4-DDB1, a regulator of DNA
damage response, replication and cell cycle progression [55].
Thus, it appears that a comprehensive set of genes involved in
DNA repair is upregulated by visible light exposure in the
zebrafish. This suggests that DNA damage response pathways are
not only triggered by UV exposure, but that these genes already
respond to visible wavelengths of light, perhaps in an adaptive
response that reflects anticipation of UV exposure under natural
lighting conditions. These findings are consistent with an earlier
report that embryos exposed to light during early development are
more resistant to DNA damaging irradiation as the result of light
driven induction of 6,4 photolyase [28]. Our results suggest that
indeed a whole battery of DNA damage repair related genes forms
part of this light response.
Stress response genesThe DNA repair pathways form part of the cell stress response,
and also other stress related proteins are present in the set, as
further reflected by the enrichment of categories within the field
‘‘response to stress’’ in the GO analysis (Figure 4 and Table S3).
Thus, both the heat shock chaperones hsp90a.2 and hspd1 and their
transcriptional regulator heat shock factor 2, hsf2, are induced in the
larval set. This might indicate at least a partial overlap between the
responses to light signals with those to heat signals. Heat shock
proteins and the Heat shock factor 1 have been implicated in
entrainment of the circadian clock by temperature [56,57], and
our data thus raise the possibility that these two entrainment
signals converge on similar pathways. Heat shock proteins can also
be induced by oxidative stress [58], and interestingly, several genes
involved in the response to oxidative stress are also upregulated.
Thus, zgc:110343 (peroxiredoxin-1) and gclc (glutamate-cysteine ligase,
catalytic subunit) appear as upregulated transcripts in the cells only.
gclc catalyzes a step in glutathione biosynthesis, which is a major
cellular antioxidant, and peroxiredoxin-1 reduces peroxides. In the
larvae, zgc:56005 (oxidative stress induced growth inhibitor 1) is
upregulated, which has been implicated in the regulation of
apoptosis. Interestingly, reactive oxygen species (ROS) generated
by flavin containing proteins upon light exposure have been
suggested as one potential signal mediating light induced gene
expression in the zebrafish [59]. It is tempting to speculate that the
induction of genes involved in buffering ROS might prepare the
organism for the elevated oxidative stress levels generated by
sunlight, but could at the same time function in desensitizing the
light signalling pathway itself via a negative feedback mechanism
that degrades the ROS signals.
Other enriched functional classesHeme metabolism. Quite a number of genes appear to be
involved in various metabolic pathways. A relatively large subset of
these genes functions in the mitochondria. For example, the
ferrochelatase (fech) catalyses the last step in heme biosynthesis on the
inner mitochondrial membrane, and also the mitochondrial
translocator protein (mtso) is involved in heme and steroid
biosynthesis. The KEGG pathway analysis confirms an
enrichment of genes linked with the category ‘‘Porphyrin and
chlorophyll metabolism’’ (Table S7). Heme is also a ligand for the
circadian clock proteins Rev-erba and b, which in turn regulate
transcription of the rate limiting enzyme of heme synthesis [60].
Thus, the possibility emerges that light might also affect the clock
via changes in heme metabolism.
Mitochondrial genes. Several other mitochondrial genes
that are upregulated are involved in the electron transport chain
(cox15 cox17, zgc:163000/succinate dehydrogenase complex assembly factor
2, sdha, sdhb) or have been implicated in apoptosis (LOC557507/
apoptosis-inducing factor (AIF)-like mitochondrion-associated inducer of death
and zgc:112986/presenilins-associated rhomboid-like protein). The
enrichment of the GO categories ‘‘mitochondrial envelope’’ and
‘‘mitochondrial part’’ from the cellular component field (Figure S2
and Table S3) and of ‘‘mitochondrial diseases’’ in the MeSH
analysis (Table S8) lends further support to a link between the light
response and mitochondrial function. This might reflect the
multiple roles mitochondria play in ROS metabolism and in
apoptosis pathways, which both are involved in phototoxicity
processes [61,62,63].
Retinoid binding genes. The Retinol binding proteins rbp4
and rbp4l and the Prostaglandin D2 synthase ptgds [64] (as well as
the very similar zgc:153154) constitute an enriched class of
‘‘retinoid binding’’ in the molecular function GO field (Figure
S1 and Table S3). Since retinaldehydes are the chromophores of
opsin photoreceptors, it is tempting to speculate that these genes
could be involved in opsin turnover. Notably, rbp4l is strongly
Figure 4. Gene Ontology hierarchy and enrichment statistics for the biological process ontology. GO terms within the biological processontology that are significantly enriched (adjusted p#0.05) in the light induced gene set are indicated in colour, with the colour shade correspondingto the enrichment p-value.doi:10.1371/journal.pone.0017080.g004
Light Responsive Transcriptome
PLoS ONE | www.plosone.org 8 February 2011 | Volume 6 | Issue 2 | e17080

expressed in the zebrafish retina (see also below). Interestingly, the
Ptgds enzyme, by way of its product prostaglandin D2, has been
implicated in sleep regulation in mammals, thus linking it with an
important circadian clock regulated process [65].
Transcription factorsMany signalling pathways converge upon transcription factors,
which integrate signalling information for the transcriptional
regulation of downstream target genes. Several transcription factor
genes are represented in the set in addition to those which
constitute elements of the circadian clock feedback loop, including
pknox2 and sall1a (upregulated) as well as sox9b (downregulated).
The most prominent among these is the thyroid embryonic factor 1
(tef1), which is globally upregulated after 3 h and is already
induced after 1 h in the larvae. The tef1 gene, a D-box enhancer
element binding factor, has previously been reported to be light
induced in zebrafish cells and larvae [25]. It was also implicated in
the light induction of per2 in the larval zebrafish pineal gland via
an E- and D-box-containing light responsive element in the per2
promoter. Our observation that tef1 is also induced by light in
adult heart cultures may suggest a more global role for this factor
in mediating light induction (see also below). In addition, another
D-box binding factor, dbp1 [66], is present in the set; however, this
factor appears to be downregulated in the cell samples only.
Genes with unknown functionsMany genes in the set have unknown or still poorly defined
functions. Perhaps the most interesting of these genes is one of the
two paralogues of the LON peptidase N-terminal domain and ring finger 1
gene (provisionally named lonrf1 [2 of 2]). lonrf1 (2 of 2) is
upregulated already after 1 h in both cells and larvae and strongly
increased after 3 h in all three sets. Strikingly, this is the only gene
showing such a strong and robust light induction in the entire set
(thus of 15,617 probes on the microarray). Its close relative lonrf1 (1
of 2) also shows upregulation in all three sets, but only after three
hours. The lonrf1s contain predicted TPR repeat domains, which
have been implicated in protein-protein interactions. They also
contain RING finger domains similar to those found in the rad18
gene, an E3 ubiquitin-protein ligase involved in postreplication
repair of UV-damaged DNA [67]. Furthermore, lonrf1s harbour
Lon protease domains that have been previously found in bacterial
proteases, homologues of which are also found in yeast and human
mitochondria [68]. E. coli lon has been implicated in various
functions, such as radiation resistance and proteolysis of regulatory
proteins. Thus, similarly to rad18, lonrf1s might potentially be
involved in DNA repair, or alternatively they might function as a
ubiquitin ligase or protease. Interestingly, ubiquitin ligases (and
posttranslational regulation in general) have increasingly been
recognized as regulators of core components of the circadian clock
[69,70]. Given the close link between light sensing and the
circadian clock, it is tempting to speculate that they are also
involved in the light input pathway.
Genes expressed in photoreceptive structuresOne set of signalling pathway components upregulated in the
larval set appears to be involved in the light reception cascade of
the dedicated photoreceptors in retina and/or pineal gland, which
are both photoreceptive structures in lower vertebrates: a cone
specific phosphodiesterase 6H (pde6h), a retinal arrestin 3-like gene (arr3l)
and the guanylate cyclase activator 1C (guca1c). According to ZFIN
annotation, also many other genes in our light regulated set are
reported to be expressed specifically or at higher levels in the
retina and/or the pineal gland. These include the upregulated
genes tef1, per2, bhlhe40 (dec1), zgc:109977 (cabp5), rbp4l, sdhb,
hsp90a2, hspd1, hsf2, pknox2, zgc:73369 (ccdc58), zgc:113054,
zgc:85644, and scl25a16 as well as the downregulated ones sox9b,
syt5a, fbxo25, cyp3a65, ppdpfa, ndrg1l, ndrg4 and si:busm1-57f23.1. In
addition, cox17, hsp90a2 and sepw1 are expressed in the lens of the
eye. In further support of a role in eye function for many genes, the
term ‘‘eye diseases’’ is also found enriched in the MeSH database
analysis. The dedicated photoreceptive structures have to strike a
balance between their photoreception function, which requires
efficient exposure of their cells to light, and the protection of these
cells from the damaging side effects of this light exposure [71].
Interestingly, several of the light regulated genes expressed in the
eye appear to be linked to either of these processes. Regulation of
their expression might exploit the pathways of peripheral light
reception, but could also involve more specific mechanisms linked
with dedicated photoreceptor function.
In summary, various functional groups are present in the light
regulated gene set. Prominent are genes involved in the circadian
clock and DNA repair, but also other stress related genes and
genes related to mitochondrial function are to be frequently
represented. A substantial number of the genes is reported to be
expressed in the eye or in the pineal gland, suggesting a potential
link with the dedicated light reception function in these structures.
Light responsive promoter elementsDo the light upregulated genes identified in this study share a
common transcriptional control mechanism? In order to address
this fundamental question we chose to examine the promoters of
the light regulated genes for enriched transcription factor binding
sites and thereby obtain information on the repertoire of light
regulated transcriptional control mechanisms. Thus, we examined
our upregulated gene set using the Trawler analysis tool suite to
determine which short sequence motifs were enriched within
500 bp upstream and 100 bp downstream of the transcription
start site. This promoter region was chosen since the light
responsive element of the per2 gene was found within this region
[25], and also the AP1 elements suggested to mediate light
responsiveness of the cry1a and wee1 genes are located within these
boundaries [24]. The retrieved motifs were then examined for
matches to known transcription factor binding sites. We identified
six motifs that could be found repeatedly when changing
parameters of the Trawler search (Figure 5). Strikingly, the most
robustly overrepresented motifs in our set match E- and D-boxes,
the elements that have previously been implicated in the light
response of the period2 gene [25]. Interestingly, in 44% of the genes
where we could detect Trawler defined E- or D-box matrices, both
E- and D-boxes were present (Figure S3). Some of these E- and D-
box motifs are closely spaced in a manner resembling their
location within the per2 promoter. No AP1 binding sites were
among the enriched promoter motifs, indicating that if they do
participate in the light regulation of certain genes, they do not
seem to play a global role in light regulated transcription.
Minimal E- or D-box enhancer reporter constructsrespond to light in both cells and larvae
Next, we asked whether the enriched motifs would be able to
mediate light induced transcriptional changes in the context of a
heterologous promoter construct. For each motif, we concatemer-
ized four consensus sequences separated by a spacer of 10 bp and
cloned them into a luciferase reporter vector (Table S6). We
transfected PAC2 cells with these constructs, incubated the
transfected cells in constant darkness (DD) for three days to
desynchronize their clocks and then tested them for light induced
luciferase expression by exposing them to a light dark (LD) cycle for
Light Responsive Transcriptome
PLoS ONE | www.plosone.org 9 February 2011 | Volume 6 | Issue 2 | e17080

Figure 5. Enriched sequence motifs as identified by Trawler in the promoters of the light induced gene set. Table indicating positionalweight matrices (PWM), Z scores and hits of the motifs in databases of known transcription factor binding sites (TFBS).doi:10.1371/journal.pone.0017080.g005
Light Responsive Transcriptome
PLoS ONE | www.plosone.org 10 February 2011 | Volume 6 | Issue 2 | e17080

Light Responsive Transcriptome
PLoS ONE | www.plosone.org 11 February 2011 | Volume 6 | Issue 2 | e17080
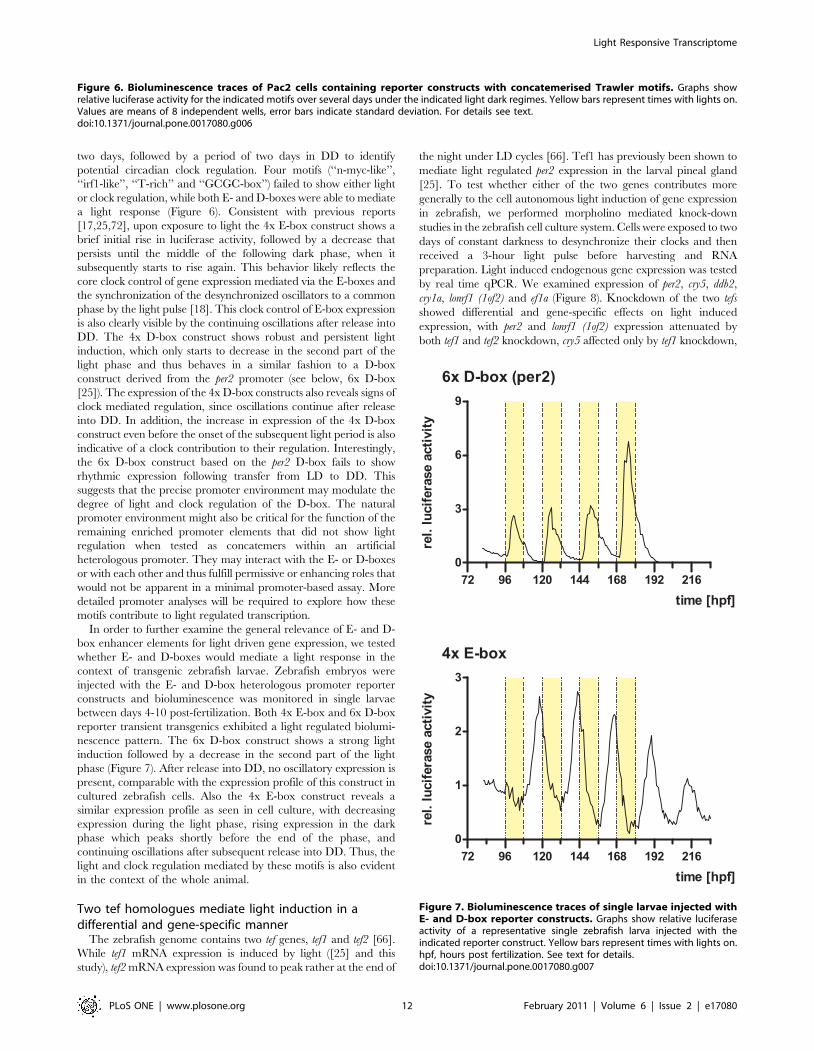
two days, followed by a period of two days in DD to identify
potential circadian clock regulation. Four motifs (‘‘n-myc-like’’,
‘‘irf1-like’’, ‘‘T-rich’’ and ‘‘GCGC-box’’) failed to show either light
or clock regulation, while both E- and D-boxes were able to mediate
a light response (Figure 6). Consistent with previous reports
[17,25,72], upon exposure to light the 4x E-box construct shows a
brief initial rise in luciferase activity, followed by a decrease that
persists until the middle of the following dark phase, when it
subsequently starts to rise again. This behavior likely reflects the
core clock control of gene expression mediated via the E-boxes and
the synchronization of the desynchronized oscillators to a common
phase by the light pulse [18]. This clock control of E-box expression
is also clearly visible by the continuing oscillations after release into
DD. The 4x D-box construct shows robust and persistent light
induction, which only starts to decrease in the second part of the
light phase and thus behaves in a similar fashion to a D-box
construct derived from the per2 promoter (see below, 6x D-box
[25]). The expression of the 4x D-box constructs also reveals signs of
clock mediated regulation, since oscillations continue after release
into DD. In addition, the increase in expression of the 4x D-box
construct even before the onset of the subsequent light period is also
indicative of a clock contribution to their regulation. Interestingly,
the 6x D-box construct based on the per2 D-box fails to show
rhythmic expression following transfer from LD to DD. This
suggests that the precise promoter environment may modulate the
degree of light and clock regulation of the D-box. The natural
promoter environment might also be critical for the function of the
remaining enriched promoter elements that did not show light
regulation when tested as concatemers within an artificial
heterologous promoter. They may interact with the E- or D-boxes
or with each other and thus fulfill permissive or enhancing roles that
would not be apparent in a minimal promoter-based assay. More
detailed promoter analyses will be required to explore how these
motifs contribute to light regulated transcription.
In order to further examine the general relevance of E- and D-
box enhancer elements for light driven gene expression, we tested
whether E- and D-boxes would mediate a light response in the
context of transgenic zebrafish larvae. Zebrafish embryos were
injected with the E- and D-box heterologous promoter reporter
constructs and bioluminescence was monitored in single larvae
between days 4-10 post-fertilization. Both 4x E-box and 6x D-box
reporter transient transgenics exhibited a light regulated biolumi-
nescence pattern. The 6x D-box construct shows a strong light
induction followed by a decrease in the second part of the light
phase (Figure 7). After release into DD, no oscillatory expression is
present, comparable with the expression profile of this construct in
cultured zebrafish cells. Also the 4x E-box construct reveals a
similar expression profile as seen in cell culture, with decreasing
expression during the light phase, rising expression in the dark
phase which peaks shortly before the end of the phase, and
continuing oscillations after subsequent release into DD. Thus, the
light and clock regulation mediated by these motifs is also evident
in the context of the whole animal.
Two tef homologues mediate light induction in adifferential and gene-specific manner
The zebrafish genome contains two tef genes, tef1 and tef2 [66].
While tef1 mRNA expression is induced by light ([25] and this
study), tef2 mRNA expression was found to peak rather at the end of
the night under LD cycles [66]. Tef1 has previously been shown to
mediate light regulated per2 expression in the larval pineal gland
[25]. To test whether either of the two genes contributes more
generally to the cell autonomous light induction of gene expression
in zebrafish, we performed morpholino mediated knock-down
studies in the zebrafish cell culture system. Cells were exposed to two
days of constant darkness to desynchronize their clocks and then
received a 3-hour light pulse before harvesting and RNA
preparation. Light induced endogenous gene expression was tested
by real time qPCR. We examined expression of per2, cry5, ddb2,
cry1a, lonrf1 (1of2) and ef1a (Figure 8). Knockdown of the two tefs
showed differential and gene-specific effects on light induced
expression, with per2 and lonrf1 (1of2) expression attenuated by
both tef1 and tef2 knockdown, cry5 affected only by tef1 knockdown,
Figure 7. Bioluminescence traces of single larvae injected withE- and D-box reporter constructs. Graphs show relative luciferaseactivity of a representative single zebrafish larva injected with theindicated reporter construct. Yellow bars represent times with lights on.hpf, hours post fertilization. See text for details.doi:10.1371/journal.pone.0017080.g007
Figure 6. Bioluminescence traces of Pac2 cells containing reporter constructs with concatemerised Trawler motifs. Graphs showrelative luciferase activity for the indicated motifs over several days under the indicated light dark regimes. Yellow bars represent times with lights on.Values are means of 8 independent wells, error bars indicate standard deviation. For details see text.doi:10.1371/journal.pone.0017080.g006
Light Responsive Transcriptome
PLoS ONE | www.plosone.org 12 February 2011 | Volume 6 | Issue 2 | e17080

and ddb2 and cry1a not affected by knockdown of either tef1 or tef2.
In general, the tef1 knockdown effect appeared more pronounced
than the effect of the tef2 knockdown. Thus, tef1 appears to be not
the only mediator of light induced cell autonomous gene expression
in PAC2 cells. It may act redundantly with other D-box binding
factors, such as tef2, or with other as yet unidentified light signalling
pathways. Together with the overlapping expression patterns of
various D-box binding factors in the zebrafish embryo [66], this also
suggests that the two Tef factors may act differentially in various
tissues. Very recently, tef1 knock-down has been reported to globally
impair light induced gene expression compared with uninjected
controls in 9 hours post fertilization zebrafish embryos that were
raised in constant light [73]. This might reflect dependency of light
induced gene expression on tef1 either in certain tissues, which could
dominate the light induction in whole embryo RNA samples, or
generally after prolonged light exposure. However, in the absence of
a comparison to control morpholino injections, it cannot be
excluded that the morpholino injection itself might have had
unspecific effects which perturbed also the light response.
In summary, our work reveals the light regulated transcriptome
of a vertebrate at three levels of organization. Light regulated
genes are more likely to function in circadian clock regulation,
DNA repair, stress response and mitochondrial processes than
other genes. The coordinated light induction of DNA repair genes,
particularly of the nucleotide excision repair pathway, suggests
that exposure to visible light prepares the animal for the repair of
UV induced damage during the day time. Also the response to
heat and oxidative stress appears to involve such light induced
preparative gene expression. Furthermore, two previously unde-
scribed lon peptidase related genes, the two lonrf1 paralogues, are
pervasively upregulated and might thus play an important role in
the light response. The enrichment of both E- and D-box elements
in the promoters of the light induced genes, which appear together
in about half of the promoters, suggests that the factors involved in
light mediated expression of period2 may be part of a more
widespread mechanism of light induced gene expression. The
enrichment of E-boxes further indicates that the circadian clock and
the light response are closely intertwined and cooperate in the
regulation of many light induced genes. Knock-down studies of D-
box binding Tef factors reveal a gene-specific involvement of tef1
and tef2 in the cell autonomous mediation of the light response.
Thus, it appears that the light regulated gene expression is mediated
by a complex combination of factors that includes the various D-box
binding proteins and the core clock, but might also involve
signalling through the other promoter elements that are enriched
in the promoters of our gene set. This multiple, combinatorial
control might be required to mediate gene- and tissue specific light
responses while at the same time ensuring robustness of the
Figure 8. Morpholino mediated knock down of tef1 and tef2 differentially affects the light response in PAC2 cells. Bar diagramsshowing the expression levels as measured by RTqPCR of the indicated genes under dark control (black) and after a 3-hour light pulse (white) forcontrol morpholino (ctr MO), tef1 morpholino (tef1 MO) and tef2 morpholino (tef2 MO) treated cells. Light induced expression of per2 and lonrf (1of2)is attenuated by both tef1 and tef2 knockdown, cry5 is affected only by tef1 knockdown, and ddb2 and cry1a are affected by neither. ef1a serves ascontrol for a non-light responsive gene. Values represent fold b-actin mRNA levels. Statistical significance of expression differences to the light controlwas determined by an unpaired t test and is indicated as follows: **, p#0.01; *, p#0.05.doi:10.1371/journal.pone.0017080.g008
Light Responsive Transcriptome
PLoS ONE | www.plosone.org 13 February 2011 | Volume 6 | Issue 2 | e17080

response. Further work exploring how the different elements of the
light response interact on endogenous promoters should reveal the
regulatory code underlying light induced gene expression. Striking-
ly, the evolutionary conservation of some of the elements ([25] and
data not shown) in mammals suggests that regulatory principles
involved in light regulated gene expression might be conserved in
the absence of peripheral photoreception. It will be interesting to
determine which endogenous signals act via such elements in
mammals and if they are linked with functions similar to those of the
light induced zebrafish genes.
Supporting Information
Figure S1 Gene Ontology hierarchy and enrichmentstatistics for the molecular function ontology. GO terms
within the molecular function hierarchy that are significantly
enriched (adjusted p#0.05) in the light induced gene set are
indicated in colour, with the colour shade corresponding to the
enrichment p-value.
(PDF)
Figure S2 Gene Ontology hierarchy and enrichmentstatistics for the cellular component ontology. GO terms
within the cellular component hierarchy that are significantly
enriched (adjusted p#0.05) in the light induced gene set are
indicated in colour, with the colour shade corresponding to the
enrichment p-value.
(PDF)
Figure S3 Location of E- and D-box elements in thepromoters of the light induced gene set. The positions of E-
box (light blue boxes) and D-box (dark blue boxes) motifs in the
promoter regions of the light induced gene set are indicated.
Only the instances with a position p-value below 0.0001 as
defined by MAST are shown. 44% of the promoters contain
both elements, frequently closely spaced similar to the
arrangement found in the light responsive module of the per2
promoter.
(PDF)
Table S1 Summary of expression values and geneannotations from the microarray analysis. ‘‘Gene sym-
bol’’ denotes the symbol used throughout the text, the figures
and the tables. ‘‘Gene name (manually)’’ gives the manually
annotated gene name associated with each probe. For each
symbol and name it is indicated from which database the
label was derived. M values denote the mean value of fold up-
or downregulation in log2 format. For each fold change value,
the statistical significance values are given in columns S to
AP.
(XLS)
Table S2 Summary of chromosomal location andannotation of the promoter sequences from the upregu-lated gene set used for the Trawler analysis.
(XLS)
Table S3 Summary of Gene Ontology analysis. This table
summarizes the Gene Ontology analysis results illustrated in
Figure 4, Figure S1 and Figure S2. ‘‘p-value’’ denotes the
significance values of hypergeometric test for the enrichment of
the corresponding GO term, ‘‘corrected p-value’’ denotes the
value after FDR correction.
(XLS)
Table S4 List of human orthologues of the lightregulated gene set.
(XLS)
Table S5 qPCR primer sequences.
(XLS)
Table S6 Sequences of oligonucleotides used for cloningof Trawler motif reporter constructs.
(XLS)
Table S7 Summary of KEGG pathway analysis results
(XLS)
Table S8 Summary of MESH term analysis results
(XLS)
Acknowledgments
We thank Horst Geiger, Andreas Heyd, Elena Kage and Nadine
Leuchtner for technical assistance. We are also grateful to Yoav Gothilf
and Sepand Rastegar for critically reading the manuscript, and to
Masanari Takamiya for discussions.
Author Contributions
Conceived and designed the experiments: BDW MS NSF TD. Performed
the experiments: BDW MS GWO PM KL DV NSF TD. Analyzed the
data: BDW MS GWO DD LE NSF TD. Contributed reagents/materials/
analysis tools: BDW MS GWO RG DD LE OA. Wrote the manuscript:
BDW MS GWO NSF TD.
References
1. Dunlap J, Loros J, DeCoursey P (2004) Chronobiology. Sunderland: Sinauer
Associates.
2. Dickmeis T (2009) Glucocorticoids and the circadian clock. J Endocrinol 200: 3–22.
3. Takahashi JS, Hong HK, Ko CH, McDearmon EL (2008) The genetics of
mammalian circadian order and disorder: implications for physiology anddisease. Nat Rev Genet 9: 764–775.
4. Vallone D, Lahiri K, Dickmeis T, Foulkes NS (2007) Start the clock! Circadian
rhythms and development. Dev Dyn 236: 142–155.
5. Berson DM (2007) Phototransduction in ganglion-cell photoreceptors. PflugersArch 454: 849–855.
6. Peirson SN, Halford S, Foster RG (2009) The evolution of irradiance detection:
melanopsin and the non-visual opsins. Philos Trans R Soc Lond B Biol Sci 364:
2849–2865.
7. Bailes HJ, Lucas RJ (2009) Melanopsin and inner retinal photoreception. CellMol Life Sci.
8. Paul KN, Saafir TB, Tosini G (2009) The role of retinal photoreceptors in the
regulation of circadian rhythms. Rev Endocr Metab Disord.
9. Guler AD, Altimus CM, Ecker JL, Hattar S (2007) Multiple photoreceptorscontribute to nonimage-forming visual functions predominantly through
melanopsin-containing retinal ganglion cells. Cold Spring Harb Symp Quant
Biol 72: 509–515.
10. Kuhlman SJ, McMahon DG (2006) Encoding the ins and outs of circadian
pacemaking. J Biol Rhythms 21: 470–481.
11. Schibler U (2009) The 2008 Pittendrigh/Aschoff lecture: peripheral phasecoordination in the mammalian circadian timing system. J Biol Rhythms 24:
3–15.
12. Kalsbeek A, Palm IF, La Fleur SE, Scheer FA, Perreau-Lenz S, et al. (2006)
SCN outputs and the hypothalamic balance of life. J Biol Rhythms 21: 458–469.
13. Damiola F, Le Minh N, Preitner N, Kornmann B, Fleury-Olela F, et al. (2000)Restricted feeding uncouples circadian oscillators in peripheral tissues from the
central pacemaker in the suprachiasmatic nucleus. Genes Dev 14: 2950–2961.
14. Plautz JD, Kaneko M, Hall JC, Kay SA (1997) Independent photoreceptive
circadian clocks throughout Drosophila. Science 278: 1632–1635.
15. Ozturk N, Song SH, Ozgur S, Selby CP, Morrison L, et al. (2007) Structure andfunction of animal cryptochromes. Cold Spring Harb Symp Quant Biol 72:
119–131.
16. Whitmore D, Foulkes NS, Sassone-Corsi P (2000) Light acts directly on organsand cells in culture to set the vertebrate circadian clock. Nature 404: 87–91.
17. Vallone D, Gondi SB, Whitmore D, Foulkes NS (2004) E-box function in a
period gene repressed by light. Proc Natl Acad Sci U S A 101: 4106–4111.
18. Carr AJ, Whitmore D (2005) Imaging of single light-responsive clock cells reveals
fluctuating free-running periods. Nat Cell Biol 7: 319–321.
Light Responsive Transcriptome
PLoS ONE | www.plosone.org 14 February 2011 | Volume 6 | Issue 2 | e17080
19. Cermakian N, Pando MP, Thompson CL, Pinchak AB, Selby CP, et al. (2002)
Light induction of a vertebrate clock gene involves signaling through blue-lightreceptors and MAP kinases. Curr Biol 12: 844–848.
20. Moutsaki P, Whitmore D, Bellingham J, Sakamoto K, David-Gray ZK, et al.
(2003) Teleost multiple tissue (tmt) opsin: a candidate photopigment regulating
the peripheral clocks of zebrafish? Brain Res Mol Brain Res 112: 135–145.
21. Tamai TK, Young LC, Whitmore D (2007) Light signaling to the zebrafishcircadian clock by Cryptochrome 1a. Proc Natl Acad Sci U S A 104:
14712–14717.
22. Pando MP, Pinchak AB, Cermakian N, Sassone-Corsi P (2001) A cell-basedsystem that recapitulates the dynamic light-dependent regulation of the
vertebrate clock. Proc Natl Acad Sci U S A 98: 10178–10183.
23. Ziv L, Levkovitz S, Toyama R, Falcon J, Gothilf Y (2005) Functionaldevelopment of the zebrafish pineal gland: light-induced expression of period2
is required for onset of the circadian clock. J Neuroendocrinol 17: 314–320.
24. Hirayama J, Cardone L, Doi M, Sassone-Corsi P (2005) Common pathways in
circadian and cell cycle clocks: light-dependent activation of Fos/AP-1 inzebrafish controls CRY-1a and WEE-1. Proc Natl Acad Sci U S A 102:
10194–10199.
25. Vatine G, Vallone D, Appelbaum L, Mracek P, Ben-Moshe Z, et al. (2009) Lightdirects zebrafish period2 expression via conserved D and E boxes. PLoS Biol 7:
e1000223.
26. Ukai H, Kobayashi TJ, Nagano M, Masumoto KH, Sujino M, et al. (2007)
Melanopsin-dependent photo-perturbation reveals desynchronization underly-ing the singularity of mammalian circadian clocks. Nat Cell Biol 9: 1327–1334.
27. Pulivarthy SR, Tanaka N, Welsh DK, De Haro L, Verma IM, et al. (2007)
Reciprocity between phase shifts and amplitude changes in the mammaliancircadian clock. Proc Natl Acad Sci U S A 104: 20356–20361.
28. Tamai TK, Vardhanabhuti V, Foulkes NS, Whitmore D (2004) Early
embryonic light detection improves survival. Curr Biol 14: R104–105.
29. Hirayama J, Miyamura N, Uchida Y, Asaoka Y, Honda R, et al. (2009)Common light signaling pathways controlling DNA repair and circadian clock
entrainment in zebrafish. Cell Cycle 8: 2794–2801.
30. Nusslein-Volhard C, ed (2002) Zebrafish. Oxford: Oxford University Press.
31. Dekens MP, Santoriello C, Vallone D, Grassi G, Whitmore D, et al. (2003) Light
regulates the cell cycle in zebrafish. Curr Biol 13: 2051–2057.
32. Whitmore D, Foulkes NS, Strahle U, Sassone-Corsi P (1998) Zebrafish Clockrhythmic expression reveals independent peripheral circadian oscillators. Nat
Neurosci 1: 701–707.
33. Team RDC (2007) R: A language and environment for statistical computing.
34. Gentleman RC, Carey VJ, Bates DM, Bolstad B, Dettling M, et al. (2004)Bioconductor: open software development for computational biology and
bioinformatics. Genome Biol 5: R80.
35. Wu Z, Irizarry R, Gentleman R, Murillo F, Spencer F (2004) A model basedbackground adjustment for oligonucleotide expression arrays. Johns Hopkins
University, Dept of Biostatistics Workung Papers: page 1.
36. Smyth GK (2004) Linear models and empirical bayes methods for assessing
differential expression in microarray experiments. Stat Appl Genet Mol Biol 3:Article3.
37. Benjamini Y, Hochberg Y (1995) Controlling the False Discovery Rate - a
Practical and Powerful Approach to Multiple Testing. Journal of the RoyalStatistical Society Series B-Methodological 57: 289–300.
38. Breitling R, Armengaud P, Amtmann A, Herzyk P (2004) Rank products: a
simple, yet powerful, new method to detect differentially regulated genes inreplicated microarray experiments. FEBS Lett 573: 83–92.
39. Smedley D, Haider S, Ballester B, Holland R, London D, et al. (2009)
BioMart—biological queries made easy. BMC Genomics 10: 22.
40. de Hoon MJ, Imoto S, Nolan J, Miyano S (2004) Open source clustering
software. Bioinformatics 20: 1453–1454.
41. Saldanha AJ (2004) Java Treeview—extensible visualization of microarray data.Bioinformatics 20: 3246–3248.
42. Maere S, Heymans K, Kuiper M (2005) BiNGO: a Cytoscape plugin to assess
overrepresentation of gene ontology categories in biological networks. Bioinfor-matics 21: 3448–3449.
43. Shannon P, Markiel A, Ozier O, Baliga NS, Wang JT, et al. (2003) Cytoscape: a
software environment for integrated models of biomolecular interactionnetworks. Genome Res 13: 2498–2504.
44. Frisch M, Klocke B, Haltmeier M, Frech K (2009) LitInspector: literature and
signal transduction pathway mining in PubMed abstracts. Nucleic Acids Res 37:
W135–140.
45. Bindea G, Mlecnik B, Hackl H, Charoentong P, Tosolini M, et al. (2009)ClueGO: a Cytoscape plug-in to decipher functionally grouped gene ontology
and pathway annotation networks. Bioinformatics 25: 1091–1093.
46. Haudry Y, Ramialison M, Paten B, Wittbrodt J, Ettwiller L Using
Trawler_standalone to discover overrepresented motifs in DNA and RNAsequences derived from various experiments including chromatin immunopre-
cipitation. Nat Protoc 5: 323–334.
47. Ettwiller L, Paten B, Ramialison M, Birney E, Wittbrodt J (2007) Trawler: denovo regulatory motif discovery pipeline for chromatin immunoprecipitation.
Nat Methods 4: 563–565.48. Bailey TL, Gribskov M (1998) Combining evidence using p-values: application
to sequence homology searches. Bioinformatics 14: 48–54.
49. Kaneko M, Cahill GM (2005) Light-dependent development of circadian geneexpression in transgenic zebrafish. PLoS Biol 3: e34.
50. Dekens MP, Whitmore D (2008) Autonomous onset of the circadian clock in thezebrafish embryo. Embo J 27: 2757–2765.
51. Selby CP, Sancar A (2006) A cryptochrome/photolyase class of enzymes withsingle-stranded DNA-specific photolyase activity. Proc Natl Acad Sci U S A 103:
17696–17700.
52. Herrlich P, Karin M, Weiss C (2008) Supreme EnLIGHTenment: damagerecognition and signaling in the mammalian UV response. Mol Cell 29:
279–290.53. Guo C, Tang TS Friedberg EC SnapShot: nucleotide excision repair. Cell 140:
754–754 e751.
54. Zharkov DO (2008) Base excision DNA repair. Cell Mol Life Sci 65: 1544–1565.55. Higa LA, Wu M, Ye T, Kobayashi R, Sun H, et al. (2006) CUL4-DDB1
ubiquitin ligase interacts with multiple WD40-repeat proteins and regulateshistone methylation. Nat Cell Biol 8: 1277–1283.
56. Kornmann B, Schaad O, Bujard H, Takahashi JS, Schibler U (2007) System-driven and oscillator-dependent circadian transcription in mice with a
conditionally active liver clock. PLoS Biol 5: e34.
57. Reinke H, Saini C, Fleury-Olela F, Dibner C, Benjamin IJ, et al. (2008)Differential display of DNA-binding proteins reveals heat-shock factor 1 as a
circadian transcription factor. Genes Dev 22: 331–345.58. Ahn SG, Thiele DJ (2003) Redox regulation of mammalian heat shock factor 1 is
essential for Hsp gene activation and protection from stress. Genes Dev 17:
516–528.59. Uchida Y, Hirayama J, Nishina H A common origin: signaling similarities in the
regulation of the circadian clock and DNA damage responses. Biol Pharm Bull33: 535–544.
60. Burris TP (2008) Nuclear hormone receptors for heme: REV-ERBalpha andREV-ERBbeta are ligand-regulated components of the mammalian clock. Mol
Endocrinol 22: 1509–1520.
61. Girotti AW, Kriska T (2004) Role of lipid hydroperoxides in photo-oxidativestress signaling. Antioxid Redox Signal 6: 301–310.
62. Circu ML Aw TY Reactive oxygen species, cellular redox systems, andapoptosis. Free Radic Biol Med 48: 749–762.
63. Ryter SW, Kim HP, Hoetzel A, Park JW, Nakahira K, et al. (2007) Mechanisms
of cell death in oxidative stress. Antioxid Redox Signal 9: 49–89.64. Tanaka T, Urade Y, Kimura H, Eguchi N, Nishikawa A, et al. (1997) Lipocalin-
type prostaglandin D synthase (beta-trace) is a newly recognized type of retinoidtransporter. J Biol Chem 272: 15789–15795.
65. Pinzar E, Kanaoka Y, Inui T, Eguchi N, Urade Y, et al. (2000) Prostaglandin Dsynthase gene is involved in the regulation of non-rapid eye movement sleep.
Proc Natl Acad Sci U S A 97: 4903–4907.
66. Ben-Moshe Z, Vatine G, Alon S, Tovin A, Mracek P, et al. (2010) MULTIPLEPAR AND E4BP4 bZIP TRANSCRIPTION FACTORS IN ZEBRAFISH:
DIVERSE SPATIAL AND TEMPORAL EXPRESSION PATTERNS.Chronobiol Int 27: 1509–1531.
67. Huang TT, D’Andrea AD (2006) Regulation of DNA repair by ubiquitylation.
Nat Rev Mol Cell Biol 7: 323–334.68. Lee I, Suzuki CK (2008) Functional mechanics of the ATP-dependent Lon
protease- lessons from endogenous protein and synthetic peptide substrates.Biochim Biophys Acta 1784: 727–735.
69. Mehra A, Baker CL, Loros JJ, Dunlap JC (2009) Post-translational modifications
in circadian rhythms. Trends Biochem Sci 34: 483–490.70. Gallego M, Virshup DM (2007) Post-translational modifications regulate the
ticking of the circadian clock. Nat Rev Mol Cell Biol 8: 139–148.71. Siu TL, Morley JW, Coroneo MT (2008) Toxicology of the retina: advances in
understanding the defence mechanisms and pathogenesis of drug- and light-induced retinopathy. Clin Experiment Ophthalmol 36: 176–185.
72. Lahiri K, Vallone D, Gondi SB, Santoriello C, Dickmeis T, et al. (2005)
Temperature regulates transcription in the zebrafish circadian clock. PLoS Biol3: e351.
73. Gavriouchkina D, Fischer S, Ivacevic T, Stolte J, Benes V, et al. Thyrotrophembryonic factor regulates light-induced transcription of repair genes in
zebrafish embryonic cells. PLoS ONE 5: e12542.
Light Responsive Transcriptome
PLoS ONE | www.plosone.org 15 February 2011 | Volume 6 | Issue 2 | e17080