
Genomewide Expression Analysis in Zebrafish mind bomb Alleles with Pancreas Defects of Different...
15
Genomewide Expression Analysis in Zebrafish mind bomb Alleles with Pancreas Defects of Different Severity Identifies Putative Notch Responsive Genes Ashok Hegde 1 , Nick Chuanxin Qiu 1. , Xuehui Qiu 1. , Steven Hao-Kee Ho 1. , Kenny Qi-Ye Tay 1. , Joshy George 2 , Felicia Soo Lee Ng 3 , Kunde Ramamoorthy Govindarajan 2 , Zhiyuan Gong 4 , Sinnakaruppan Mathavan 2 , Yun-Jin Jiang 1,5,6 * 1 Laboratory of Developmental Signalling and Patterning, Institute of Molecular and Cell Biology, A*STAR (Agency for Science, Technology and Research), Singapore, Singapore, 2 Genome Institute of Singapore, A*STAR (Agency for Science, Technology and Research), Singapore, Singapore, 3 Bioinformatics Institute, A*STAR (Agency for Science, Technology and Research), Singapore, Singapore, 4 Department of Biological Sciences, National University of Singapore, Singapore, Singapore, 5 Department of Biochemistry, National University of Singapore, Singapore, Singapore, 6 School of Biological Sciences, Nanyang Technological University, Singapore, Singapore Background. Notch signaling is an evolutionarily conserved developmental pathway. Zebrafish mind bomb (mib) mutants carry mutations on mib gene, which encodes a RING E3 ligase required for Notch activation via Delta/Jagged ubiquitylation and internalization. Methodology/Principal Findings. We examined the mib mutants for defects in pancreas development using in situ hybridization and GFP expression analysis of pancreas-specific GFP lines, carried out the global gene expression profile analysis of three different mib mutant alleles and validated the microarray data using real-time PCR and fluorescent double in situ hybridization. Our study showed that the mib mutants have diminished exocrine pancreas and this defect was most severe in mib ta52b followed by mib m132 and then mib tfi91 , which is consistent with the compromised Notch activity found in corresponding mib mutant alleles. Global expression profile analysis of mib mutants showed that there is a significant difference in gene expression profile of wt and three mib mutant alleles. There are 91 differentially expressed genes that are common to all three mib alleles. Through detailed analysis of microarray data, we have identified several previously characterized genes and some putative Notch-responsive genes involved in pancreas development. Moreover, results from real-time PCR and fluorescent double in situ hybridization were largely consistent with microarray data. Conclusions/ Significance. This study provides, for the first time, a global gene expression profile in mib mutants generating useful genomic resources and providing an opportunity to identify the function of novel genes involved in Notch signaling and Notch-regulated developmental processes. Citation: Hegde A, Qiu NC, Qiu X, Ho SH-K, Tay KQ-Y, et al (2008) Genomewide Expression Analysis in Zebrafish mind bomb Alleles with Pancreas Defects of Different Severity Identifies Putative Notch Responsive Genes. PLoS ONE 3(1): e1479. doi:10.1371/journal.pone.0001479 INTRODUCTION The Notch pathway is an evolutionarily conserved signal transduc- tion cascade that plays essential roles in a variety of developmental processes, such as pattern formation, cell fate determination and organ formation through local cell-cell interactions (reviewed in [1– 2]). Apart from being important for normal development, Notch signaling is also related to several human congenital diseases, such as T-cell acute lymphoblastic leukemia/lymphoma [3–5], Alagille syndrome [6–8], a late onset neurological disease (CADASIL) [9], and spondylocostal dysostosis [10]. Notch receptor functions as a membrane-bound transcription factor that turns on specific genes in response to physiological cues that trigger ligand binding. Upon functional binding of DSL ( Delta, Serrate/Jagged and Lag-2) transmembrane ligands, the membrane- bound Notch is proteolyzed by TNFa-converting enzyme (TACE), metalloproteases [11] and Presenilin, and the active form–Notch intracellular domain (NICD)–is released [12,13]. The NICD is then translocated to the nucleus [14–17] and binds to the conserved CSL ( CBF1/RBPjk, Su(H) and Lag-1) DNA-binding protein [18,19], which is converted from a transcriptional repressor to activator. This triggers the expression of downstream target genes such as Hes/Her ( hairy/ Enhancer of split related) family of bHLH transcription factors, which in turn modulate the expression of downstream genes and themselves [16,20–26]. Several E3 ligases, such as Mind bomb (Mib), Su(dx), Sel-10, Neuralized, and Deltex, have been shown to modulate the Notch signaling through ubiquitin-dependent protein degradation and/or endocytosis [27,28]. Mib is a ubiquitin ligase that is required cell non-autonomously for Notch signaling and lateral inhibition by controlling Delta protein internalization [27]. Several mutants of zebrafish Notch signaling components, such as after eight (aei)/deltaD, deadly seven (des)/notch1a, beamter (bea)/deltaC, and mind bomb (mib) have been isolated in a large scale screen [24,27,29–32]. In all these mutants, the anterior somites are formed normally but the posterior somites are irregularly formed [29,30,33]. The zebrafish mib2 ortholog was recently cloned [34]. The zebrafish Mib and Mib2 have common and specific Delta substrates [35] and function redundantly [34]. Three different alleles of mib, viz., mib ta52b , mib m132 Academic Editor: Geraldine Butler, University College Dublin, Ireland Received July 26, 2007; Accepted December 11, 2007; Published January 23, 2008 Copyright: ß 2008 Hegde et al. This is an open-access article distributed under the terms of the Creative Commons Attribution License, which permits unrestricted use, distribution, and reproduction in any medium, provided the original author and source are credited. Funding: This work was supported by a joint grant from the Biomedical Research Council of Singapore and Juvenile Diabetes Research Foundation International (BMRC-JDRF, 04/1/50/22/295) and the Biomedical Research Council of A*STAR (Agency for Science, Technology and Research), Singapore. Competing Interests: The authors have declared that no competing interests exist. * To whom correspondence should be addressed. E-mail: [email protected]. edu.sg . These authors contributed equally to this work. PLoS ONE | www.plosone.org 1 January 2008 | Issue 1 | e1479
Transcript of Genomewide Expression Analysis in Zebrafish mind bomb Alleles with Pancreas Defects of Different...

Genomewide Expression Analysis in Zebrafish mindbomb Alleles with Pancreas Defects of Different SeverityIdentifies Putative Notch Responsive GenesAshok Hegde1, Nick Chuanxin Qiu1., Xuehui Qiu1., Steven Hao-Kee Ho1., Kenny Qi-Ye Tay1., Joshy George2, Felicia Soo Lee Ng3, KundeRamamoorthy Govindarajan2, Zhiyuan Gong4, Sinnakaruppan Mathavan2, Yun-Jin Jiang1,5,6*
1 Laboratory of Developmental Signalling and Patterning, Institute of Molecular and Cell Biology, A*STAR (Agency for Science, Technology andResearch), Singapore, Singapore, 2 Genome Institute of Singapore, A*STAR (Agency for Science, Technology and Research), Singapore, Singapore,3 Bioinformatics Institute, A*STAR (Agency for Science, Technology and Research), Singapore, Singapore, 4 Department of Biological Sciences,National University of Singapore, Singapore, Singapore, 5 Department of Biochemistry, National University of Singapore, Singapore, Singapore,6 School of Biological Sciences, Nanyang Technological University, Singapore, Singapore
Background. Notch signaling is an evolutionarily conserved developmental pathway. Zebrafish mind bomb (mib) mutantscarry mutations on mib gene, which encodes a RING E3 ligase required for Notch activation via Delta/Jagged ubiquitylationand internalization. Methodology/Principal Findings. We examined the mib mutants for defects in pancreas developmentusing in situ hybridization and GFP expression analysis of pancreas-specific GFP lines, carried out the global gene expressionprofile analysis of three different mib mutant alleles and validated the microarray data using real-time PCR and fluorescentdouble in situ hybridization. Our study showed that the mib mutants have diminished exocrine pancreas and this defect wasmost severe in mibta52b followed by mibm132 and then mibtfi91, which is consistent with the compromised Notch activity foundin corresponding mib mutant alleles. Global expression profile analysis of mib mutants showed that there is a significantdifference in gene expression profile of wt and three mib mutant alleles. There are 91 differentially expressed genes that arecommon to all three mib alleles. Through detailed analysis of microarray data, we have identified several previouslycharacterized genes and some putative Notch-responsive genes involved in pancreas development. Moreover, results fromreal-time PCR and fluorescent double in situ hybridization were largely consistent with microarray data. Conclusions/
Significance. This study provides, for the first time, a global gene expression profile in mib mutants generating usefulgenomic resources and providing an opportunity to identify the function of novel genes involved in Notch signaling andNotch-regulated developmental processes.
Citation: Hegde A, Qiu NC, Qiu X, Ho SH-K, Tay KQ-Y, et al (2008) Genomewide Expression Analysis in Zebrafish mind bomb Alleles with PancreasDefects of Different Severity Identifies Putative Notch Responsive Genes. PLoS ONE 3(1): e1479. doi:10.1371/journal.pone.0001479
INTRODUCTIONThe Notch pathway is an evolutionarily conserved signal transduc-
tion cascade that plays essential roles in a variety of developmental
processes, such as pattern formation, cell fate determination and
organ formation through local cell-cell interactions (reviewed in [1–
2]). Apart from being important for normal development, Notch
signaling is also related to several human congenital diseases, such as
T-cell acute lymphoblastic leukemia/lymphoma [3–5], Alagille
syndrome [6–8], a late onset neurological disease (CADASIL) [9],
and spondylocostal dysostosis [10].
Notch receptor functions as a membrane-bound transcription
factor that turns on specific genes in response to physiological cues
that trigger ligand binding. Upon functional binding of DSL (Delta,
Serrate/Jagged and Lag-2) transmembrane ligands, the membrane-
bound Notch is proteolyzed by TNFa-converting enzyme (TACE),
metalloproteases [11] and Presenilin, and the active form–Notch
intracellular domain (NICD)–is released [12,13]. The NICD is then
translocated to the nucleus [14–17] and binds to the conserved CSL
(CBF1/RBPjk, Su(H) and Lag-1) DNA-binding protein [18,19],
which is converted from a transcriptional repressor to activator. This
triggers the expression of downstream target genes such as Hes/Her
(hairy/Enhancer of split related) family of bHLH transcription
factors, which in turn modulate the expression of downstream genes
and themselves [16,20–26].
Several E3 ligases, such as Mind bomb (Mib), Su(dx), Sel-10,
Neuralized, and Deltex, have been shown to modulate the Notch
signaling through ubiquitin-dependent protein degradation and/or
endocytosis [27,28]. Mib is a ubiquitin ligase that is required cell
non-autonomously for Notch signaling and lateral inhibition by
controlling Delta protein internalization [27]. Several mutants of
zebrafish Notch signaling components, such as after eight (aei)/deltaD,
deadly seven (des)/notch1a, beamter (bea)/deltaC, and mind bomb (mib) have
been isolated in a large scale screen [24,27,29–32]. In all these
mutants, the anterior somites are formed normally but the posterior
somites are irregularly formed [29,30,33]. The zebrafish mib2
ortholog was recently cloned [34]. The zebrafish Mib and Mib2
have common and specific Delta substrates [35] and function
redundantly [34]. Three different alleles of mib, viz., mibta52b, mibm132
Academic Editor: Geraldine Butler, University College Dublin, Ireland
Received July 26, 2007; Accepted December 11, 2007; Published January 23,2008
Copyright: � 2008 Hegde et al. This is an open-access article distributed underthe terms of the Creative Commons Attribution License, which permitsunrestricted use, distribution, and reproduction in any medium, provided theoriginal author and source are credited.
Funding: This work was supported by a joint grant from the Biomedical ResearchCouncil of Singapore and Juvenile Diabetes Research Foundation International(BMRC-JDRF, 04/1/50/22/295) and the Biomedical Research Council of A*STAR(Agency for Science, Technology and Research), Singapore.
Competing Interests: The authors have declared that no competing interestsexist.
* To whom correspondence should be addressed. E-mail: [email protected]
. These authors contributed equally to this work.
PLoS ONE | www.plosone.org 1 January 2008 | Issue 1 | e1479

and mibtfi91 with descending severity of Notch-dependent phenotypes
have been characterized in our laboratory [34].
Genetic studies in mice [36] and zebrafish [37–40] have shown
that Notch signaling is involved in pancreas development. Mice
deficient in Notch signaling components, Dll1, RBP-jk and Hes1,
have an increase of endocrine pancreatic cells and depletion of
progenitor cells [36,41]. Roles of some of the Notch-related
transcription factors, such as Ngn3 [42,43], Isl1 [44], MafA [45],
Pax4 and Pax6 [46,47], in pancreas development have been
demonstrated. However, the role of differential regulation of
Notch signaling on pancreas development is not well understood.
Microarray is a useful method for genomewide expression
profile analysis [48]. With this approach, several downstream
genes of signaling pathways involved in controlling mouse
pancreas development have been reported [49,50]. Following
the leads from such microarray analysis, a novel transcription
factor, Myt1 [50] has been shown to be involved in pancreas
development. Similarly, Mellitzer et al. also showed that a novel
transcription factor, IA1, is Ngn3-regulated and required for
normal differentiation of endocrine pancreatic cells [51]. High-
density microarrays have been established for zebrafish and
transcriptome profiles during embryogenesis have been docu-
mented [52]. In addition, new target genes involved in sonic
hedgehog signaling pathway has been identified in zebrafish using
microarrays [53]. However, a genomewide analysis of Notch
signaling defective mutants has not been reported.
Hence, we have carried out this study with three major
objectives, viz. (1) to examine the three mib mutant alleles for
pancreas defects and understand the consequence of differential
activation of Notch signaling on pancreas development using in situ
hybridization and pancreas-specific GFP expression analysis, (2) to
identify differentially regulated genes between the wt zebrafish and
three different mib mutant alleles through microarray analysis and
(3) to identify and validate the Notch-responsive genes involved in
pancreas development. Through our present work, we have shown
that the development of exocrine pancreas is diminished in mib
mutants and this defect is most severe in mibta52b followed by that
in mibm132 and mibtfi91. Using microarray analysis, we have
identified several characterized genes, and novel genes/ESTs
potentially involved in pancreas development. Validation of
representative genes with real-time PCR and fluorescent double
in situ hybridization supported the microarray data. Furthermore,
this study has generated useful genomic resources identifying a
number of uncharacterized ESTs/genes that may play a
significant role in Notch-regulated developmental process.
RESULTS
Pancreas defects in mib mutant allelesWe carried out in situ hybridization for four pancreas-specific genes
in mib mutants of 4-day post-fertilization (dpf) and their wild type
(wt) siblings (Figure 1). The expression of exocrine pancreas-
specific genes, elastaseA (Figure 1A and 1A9–1D9) and trypsin
(Figure 1E and 1E9–H9) were diminished in mib mutants. In
comparison to their expression in wt embryos, these two genes
were highly down-regulated in mibta52 followed by those in mibm132
and then mibtfi91, which are less down-regulated. This observation
is in concurrence with the diminished Notch activity in these mib
mutants [34]. We also analyzed the elastaseA-GFP expression in 4-
dpf mib mutants and their wt siblings (Figure 2A–2D). The
elastaseA-GFP expression was diminished in mib mutant alleles in
the same order of decreasing Notch activity in these mutants,
which corroborates our observation shown by in situ hybridization
(Figure 1A and 1A9–1D9).
We further analyzed the expression of three endocrine pancreas-
specific genes, somatostatin (d-cell-specific), insulin (b-cell-specific), and
pdx1 (pancreas progenitor-specific). Levels of somatostatin (Figure 1I
and 1I9–1L9) and insulin (Figure 1M and 1M9–1P9) were slightly
increased in 4-dpf mib mutants. The insulin-GFP (Figure 2E and 2E9–
2H9) and pdx1-GFP (Figure 2I and 2I9–2L9) expression analysis in
mib mutants also showed that these genes are slightly up-regulated
compared to their expression in wt embryos.
Genomewide expression profilingWe carried out the genomewide expression profiling of mib mutants
at three different stages–24-, 48- and 72-hour post-fertilization (hpf).
Through microarray analysis of 72-hpf embryos, we identified 1128
up-regulated and 936 down-regulated genes in mibta52b mutants
(Table S1, q = 0.0); 1464 up-regulated and 2210 down-regulated
genes in mibm132 mutants (Table S2, q = 0.0); and 2081 up-regulated
and 2538 down-regulated genes in mibtfi91 mutants (Table S3,
q = 0.0). Using a PERL script, we further identified the differentially
expressed genes specific to each mutant allele and common to all
three mib mutant alleles (Figure 3). In the list of up-regulated genes,
the numbers of genes specific to mibta52b, mibm132 and mibtfi91 mutant
alleles were 93, 287 and 768, respectively; in the list of down-
regulated genes, the numbers of genes specific to mibta52b, mibm132 and
mibtfi91 alleles were 33, 557 and 874, respectively (Figure 3A and 3B,
Table S5, S6 and S7, q = 0.0 and score(d).4.0). The majority of
these differentially expressed genes were uncharacterized genes or
ESTs (Table 1). There were 91 genes common to all three mib
Figure 1. Expression pattern of pancreas-specific genes at 96 hpf inmib mutants and their wild type (wt) siblings. The RNA probes usedfor in situ hybridization are (A and A9–D9) elastaseA, (E and E9–H9)trypsin, (I and I9–L9) somatostatin and (M and M9–P9) insulin. Thegenotypes are (A, A9, E, E9, I, I9, M and M9) wt, (B9, F9, J9 and N9) mibtfi91,(C9, G9, K9 and O9) mibm132 and (D9, H9, L9 and P9) mibta52b. A9, E9, I9 andM9 are cropped from A, E, I and M, respectively. All panels are lateralviews and anterior to the right.doi:10.1371/journal.pone.0001479.g001
Transcriptome of mib Alleles
PLoS ONE | www.plosone.org 2 January 2008 | Issue 1 | e1479

mutant alleles, of which 31 were up-regulated and 60 were down-
regulated (Figure 3A and 3B, Table 1). Of these 91 genes, only 27
genes were previously characterized and 64 were uncharacterized
genes or ESTs (Table 1, Table S4, q = 0.0 and score(d).4.0). The
cluster tree view showed the expression profile of these 91 genes: the
up-regulated ones were shown in red and the down-regulated ones in
green (Figure 4). We further categorized these 91 common genes
according to their known function or predicted function based on
their homology to mouse and human orthologs (Table S4). Of the 27
characterized genes, there are 6 up-regulated genes, including dab2,
mcl1a, mcl1b, fn1l, ttn and nppa, and 21 down-regulated genes,
including pbx3b, gpm6aa (BI840762), olig2, tfdp2, rpl13, gpm6aa
(BI839927), atp1a1b, fabp7a, gpm6aa (BG306150), fkbp5, gfap, opn1sw1,
opn1sw2, opn1mw1, vsx1, pou50, mdkb, tal1, dla, vamp2 and her4.
Using the same PERL script, we analyzed the 48-hpf time point
data for three mib mutant alleles, and data of 24-hpf, 48-hpf and
72-hpf time points for the mibta52b mutant allele. Numbers of
differentially expressed genes common to all three mutant alleles
or three time points, and specific to each mutant allele or time
point are shown in the Venn diagram (Figure 3C–3F). At 48 hpf,
there are 44 (30 up-regulated and 14 down-regulated) differentially
expressed genes common to all three mutant alleles, and 129 (54 up-
regulated and 75 down-regulated), 124 (44 up-regulated and 80
down-regulated) and 693 (635 up-regulated and 58 down-regulated)
genes specific to mibta52b, mibm132 and mibtfi91 mutant alleles,
respectively (Figure 3C and 3D; Table S8, S9, S10 and S11,
q = 0.0). For mibta52b mutants, there are 61 (32 up-regulated and 29
down-regulated) genes common to all three time points, and 1821
(1128 up-regulated and 693 down-regulated), 49 (14 up-regulated
and 35 down-regulated) and 1851 (930 up-regulated and 921 down-
regulated) genes specific at 24 hpf, 48 hpf and 72 hpf, respectively
(Figure 3E and 3F; Table S12, S13, S14 and S15, q = 0.0).
Functional categoriesWe used the microarray data of three mib mutant alleles (q = 0.0,
score(d).4.0) and the 91 common genes at 72 hpf for functional
analysis. We first searched for the gene ontology and the functional
similarity of their human and mouse orthologs in the Zebrafish
Chip Annotation Database. Then, we classified them into different
functional categories based on their known functions in zebrafish
or in mouse and human orthologs, such as ‘transcription factor/
Figure 3. Venn diagrams show numbers of genes belonging todifferent groups. Differentially expressed genes specific to each mibmutant allele, common between two mutant alleles and common to allthree mutant alleles are (A) up-regulated and (B) down-regulated at 72hpf; and (C) up-regulated and (D) down-regulated at 48 hpf; and genesspecific to each time point, common between two time points andcommon to all three time points are (E) up-regulated and (F) down-regulated in mibta52b mutants. Gene set for the analysis of 72-hpf datawas selected based on the criteria, q = 0.0 and score(d).4.0; and for theanalysis of 48-hpf data and the three time-point data for mibta52b
mutants were both selected based on the criterion, q = 0.0.doi:10.1371/journal.pone.0001479.g003
Figure 2. elastaseA-GFP, insulin-GFP and pdx1-GFP expression in embryos of mib mutant alleles and their wt siblings. Expression of elastaseA-GFP in (A) wt, (B) mibtfi91, (C) mibm132 and (D) mibta52b embryos was analyzed at 96 hpf. Expression of insulin-GFP in (E and E9) wt, (F9) mibtfi91, (G9)mibm132 and (H9) mibta52b embryos was analyzed at 72 hpf. Expression of pdx1-GFP in (I and I9) wt, (J9) mibtfi91, (K9) mibm132 and (L9) mibta52b embryoswas analyzed at 72 hpf. Panels A–D are lateral views and the rest are dorsolateral views, oriented anterior to the right.doi:10.1371/journal.pone.0001479.g002
Table 1. Differentially expressed genes in 72-hpf mib mutantscategorized based on their characterization status.
. . . . . . . . . . . . . . . . . . . . . . . . . . . . . . . . . . . . . . . . . . . . . . . . . . . . . . . . . . . . . . . . . . . . . .
Gene set Characterized genes Uncharacterized genes/ESTs
Up-regulated
Down-regulated
Up-regulated
Down-regulated
mibta52b 51 48 125 97
mibm132 72 380 452 632
mibtfi91 165 426 868 893
Genes common to allmib mutant alleles
6 21 25 39
Gene sets for the analysis were selected based on the criteria: q = 0.0,score(d).4.0.doi:10.1371/journal.pone.0001479.t001..
....
....
....
....
....
....
....
....
....
....
....
..
Transcriptome of mib Alleles
PLoS ONE | www.plosone.org 3 January 2008 | Issue 1 | e1479

nuclear’, ‘signaling’, ‘cell adhesion/matrix’, ‘cell cycle/apoptosis’,
‘transcription factors’, ‘hormone activity’ and ‘structural proteins’.
Finally, we plotted them in a pie chart format either including the
uncharacterized genes and ESTs (Figure 5A–5D) or excluding
them (Figure 5E–5H). The majority (.70%) of the differentially
expressed genes are uncharacterized genes or ESTs (Figure 5A–5D).
Among the genes with known or related functions in the mibta52b data
set, about 35% belong to the category of ‘transcription factor/
nuclear’ related genes and the remaining genes to other categories,
such as ‘transport proteins’ (25%), ‘signaling’ (19%), ‘structural
proteins’ (8.6%), ‘cell adhesion/matrix’ (5.4%), ‘hormone activity’
(4.3%) and ‘cell cycle/apoptosis’ (3.2%) (Figure 5E).
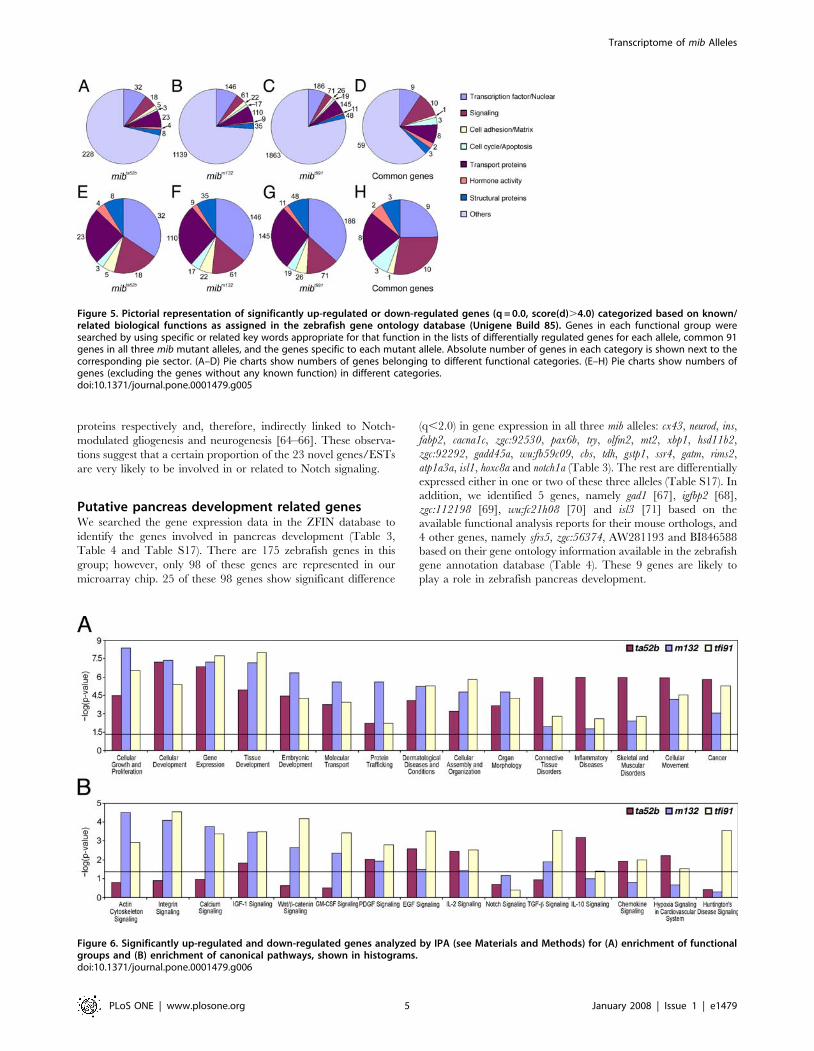
Functional groups and pathway analysis by IPATo further analyze our data set, we used IPA (see Materials and
Methods) to identify functional groups and selected the top 15
ones as significantly enriched for their respective functions
(Figure 6A). The significance of each function (calculated from
negative log of p-value; -log 1.3 is equal to p-0.05) revealed that all
the top 15 functions are highly and significantly enriched in all
three mib alleles. Some of the significantly enriched functions are
‘cellular growth and proliferation’, ‘cellular development’, ‘gene
expression’ and ‘embryonic development’. Genes related to
‘connective tissue disorders’, ‘skeletal muscular disorders’ and
‘cancer’ are significantly enriched in the mibta52b allele.
One of the tools in IPA enables us to identify the enrichment of
genes in selected canonical pathways from the input data set. The
top 15 canonical pathways that are enriched in the mib mutants
include Notch and Wnt signaling pathways (Figure 6B). Genes
related to Wnt signaling were significantly enriched in mibm132 and
mibtfi91 mutants. Notch signaling genes were enriched to a lesser
extent and their enrichment was not significant. Canonical
pathways, such as ‘actin cytoskeleton signaling’, ‘integrin signal-
ing’, ‘calcium signaling’ and ‘TGF-beta signaling’, were enriched
in mibm132 and mibtfi91.
Notch and Wnt/b-catenin signaling were shown to be affected
in mib mutants [27,54,55]. We mapped the genes that are involved
in these two signaling pathways and differentially expressed in
different mib alleles. The genes involved in Notch signaling, such as
dll1, notch1, notch2, hey1 and herp, were down-regulated in one, two
or three mib alleles (Figure S1A). In Wnt/b-catenin signaling, some
genes, such as nlk, cx43, sox2, sox3, sox4, sox9, sox11, tcf7 and hdac1,
were down-regulated in one or three mib alleles; while sox8 and
tab1 were up-regulated (Figure S1B). Few of the genes differed in
the direction of expression change in different mutant alleles. For
example, b-catenin was up-regulated in mibm132 while it was down-
regulated in mibta52b and mibtfi91 (Figure S1B).
Putative Notch signaling related genesAs positive controls of our microarray data, we searched for the
known Notch signaling related genes in our list of differentially
expressed genes. As expected, heyL was up-regulated and dla, her4,
her8a, hes5, hey1, neurod, neurod4, notch1a, notch2 and notch3 were
down-regulated (Table 2). To identify novel genes related to Notch
signaling, we searched for the differentially expressed genes
occurring at least two times in the gene sets common to all three
mib mutant alleles at 72 hpf and 48 hpf, and the gene set common
for the mibta52b mutant allele at 72 hpf, 48 hpf and 24 hpf. We
identified 31 such genes, the majority of which are novel genes or
ESTs (Table S16). Of these 31 genes, only eight genes are
characterized and five of them are known to be directly related to
Notch signaling: olig2 [56], her4 [57], hes5 (also known as her15.1,
[58,59]), dla [60] and nort ([61], BI886648 is 98% identical to
AB259590). Moreover, fn1l (also known as fn1b or fn3), in
conjunction with its homolog, fn1, has been shown to function
cooperatively with Notch signaling via integrina5 in somitogenesis
[62,63]. gfap and gefiltin are glia- and neuron-specific structural
Figure 4. Gene expression profile of 91 differentially expressed(q = 0.0, score(d).4.0) genes (Genbank ID) common to all three mibmutant alleles at 72 hpf. At least two biological repeats and twotechnical repeats were carried out for each mutant allele. Each horizontalstrip represents expression of a single gene. Color in each cell reflects theexpression level of corresponding gene in the respective sample. Theup-regulation is shown in red and the down-regulation in green. Greycells indicate the missing values. The median log2 ratio values fordifferential expression ranged between 24.07 and 3.32. Note: The genesymbols are mentioned instead of Genbank IDs, where the genesymbols corresponding to the Genbank IDs are available in the ZebrafishChip Annotation Database. Three Genbank IDs, BI840762, BI839927 andBG306150, encode the same gene, gpm6aa.doi:10.1371/journal.pone.0001479.g004
Transcriptome of mib Alleles
PLoS ONE | www.plosone.org 4 January 2008 | Issue 1 | e1479
proteins respectively and, therefore, indirectly linked to Notch-
modulated gliogenesis and neurogenesis [64–66]. These observa-
tions suggest that a certain proportion of the 23 novel genes/ESTs
are very likely to be involved in or related to Notch signaling.
Putative pancreas development related genesWe searched the gene expression data in the ZFIN database to
identify the genes involved in pancreas development (Table 3,
Table 4 and Table S17). There are 175 zebrafish genes in this
group; however, only 98 of these genes are represented in our
microarray chip. 25 of these 98 genes show significant difference
(q,2.0) in gene expression in all three mib alleles: cx43, neurod, ins,
fabp2, cacna1c, zgc:92530, pax6b, try, olfm2, mt2, xbp1, hsd11b2,
zgc:92292, gadd45a, wu:fb59c09, cbs, tdh, gstp1, ssr4, gatm, rims2,
atp1a3a, isl1, hoxc8a and notch1a (Table 3). The rest are differentially
expressed either in one or two of these three alleles (Table S17). In
addition, we identified 5 genes, namely gad1 [67], igfbp2 [68],
zgc:112198 [69], wu:fc21h08 [70] and isl3 [71] based on the
available functional analysis reports for their mouse orthologs, and
4 other genes, namely sfrs5, zgc:56374, AW281193 and BI846588
based on their gene ontology information available in the zebrafish
gene annotation database (Table 4). These 9 genes are likely to
play a role in zebrafish pancreas development.
Figure 5. Pictorial representation of significantly up-regulated or down-regulated genes (q = 0.0, score(d).4.0) categorized based on known/related biological functions as assigned in the zebrafish gene ontology database (Unigene Build 85). Genes in each functional group weresearched by using specific or related key words appropriate for that function in the lists of differentially regulated genes for each allele, common 91genes in all three mib mutant alleles, and the genes specific to each mutant allele. Absolute number of genes in each category is shown next to thecorresponding pie sector. (A–D) Pie charts show numbers of genes belonging to different functional categories. (E–H) Pie charts show numbers ofgenes (excluding the genes without any known function) in different categories.doi:10.1371/journal.pone.0001479.g005
Figure 6. Significantly up-regulated and down-regulated genes analyzed by IPA (see Materials and Methods) for (A) enrichment of functionalgroups and (B) enrichment of canonical pathways, shown in histograms.doi:10.1371/journal.pone.0001479.g006
Transcriptome of mib Alleles
PLoS ONE | www.plosone.org 5 January 2008 | Issue 1 | e1479

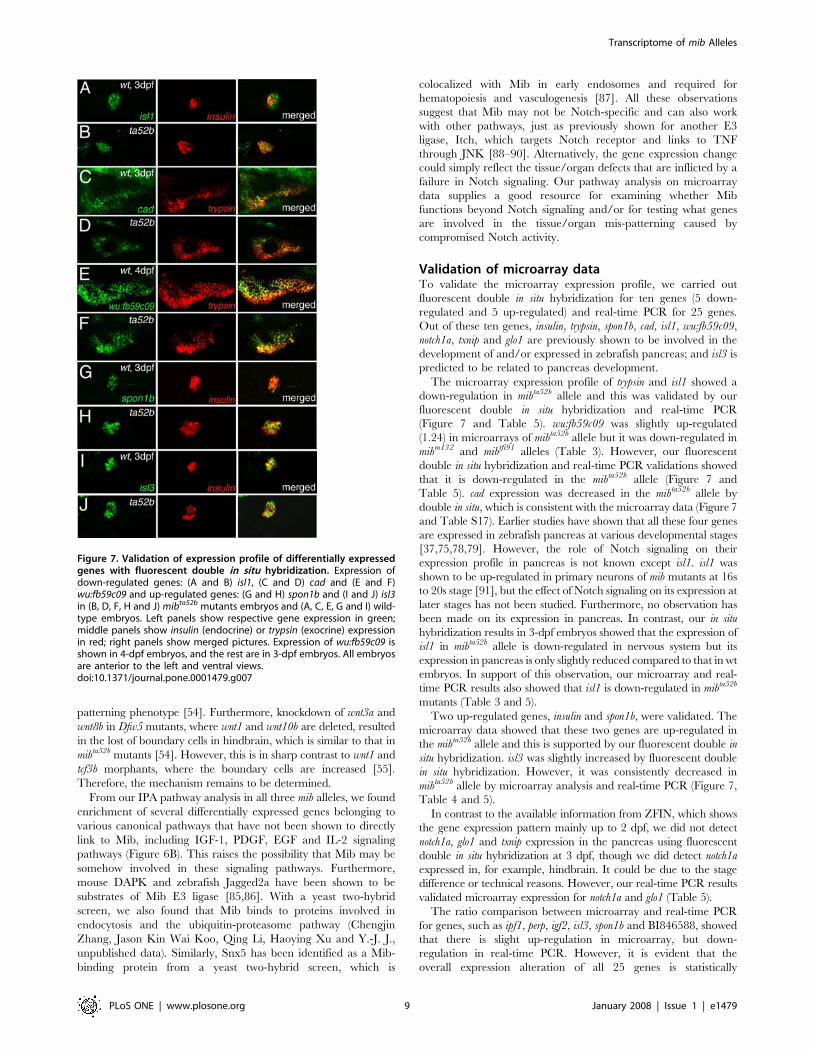
Fluorescent double in situ hybridization validation
of pancreas development related genesTo validate the microarray data for the genes predicted to be related
to or involved in pancreas development, we carried out fluorescent
double in situ hybridization at 3-dpf embryos for five down-regulated
genes: trypsin, isl1, cad, wu:fb59c09 and notch1a, and five up-regulated
genes: insulin, isl3, spon1b, glo1 and txnip (Table 3, Table 4 and Table
S17). Exocrine trypsin and endocrine insulin are predictably down-
and up-regulated, respectively (Figure 7). However, notch1a, glo1 and
txnip were not detected in the pancreas (see Discussion).
Down-regulated genes isl1 encodes a zebrafish insulin gene
enhancer binding protein and it has 81% identity to mouse LIM/
homeodomain transcription factor ISL1 (islet-1). isl1 was expressed
in nervous system, liver (data not shown) and pancreas of 3-dpf
embryos. Our result is similar to that in earlier studies, which showed
that isl1 is expressed in organs such as nervous system, liver and
pancreas at various developmental stages of zebrafish [58,72–77]. Its
expression was strongly diminished in the nervous system (data not
shown) of mibta52b mutants; however, its expression was only slightly
reduced in the endocrine pancreas compared to wt embryos
(Figure 7A and 7B). Our microarray results also showed that isl1 is
down-regulated in mibta52b mutants (Table 3).
cad encodes zebrafish carbamoyl-phosphate synthetase 2.
Microarray analysis showed that cad is down-regulated (Table
S17). cad was expressed in endodermal organs, such as pancreas,
intestine and liver, which is similar to that observed in earlier
reports [78,79]. In mibta52b mutants, cad expression was down-
regulated in all these tissues (Figure 7C and 7D; data not shown).
wu:fb59c09 is a zebrafish EST with significant similarity to a
hypothetical gene, LOC570477. The human ortholog of this gene
is Peroxiredoxin 4 (prx4). In situ hybridization results showed that this
gene is expressed in liver, pancreas, intestine and other
endodermal tissues (data not shown). It was down-regulated in
both endocrine and exocrine pancreas of mibta52b mutants
compared to that in their wt siblings (Figure 7E and 7F).
Up-regulated genes spon1b encodes an extracellular matrix
protein, whose C-terminal contains five repeats identified
previously in Thrombospondin and other proteins implicating in
cell adhesion. Fluorescent double in situ hybridization results
showed that this gene is expressed in endocrine pancreas, similar
to earlier studies [77,79], and was up-regulated in mibta52b mutants
compared to that in their wt siblings (Figure 7G and 7H).
isl3 encodes a zebrafish insulin gene enhancer binding protein
homolog. It has high similarity to human ISL1 transcription
factor, LIM/homeodomain (Islet-1) and ISL2 transcription factor,
LIM/homeodomain (Islet-2). isl3 was expressed in endocrine
pancreas, liver and intestine and its expression was up-regulated in
mibta52b mutants (Figure 7I and 7J; data not shown).
Real-time PCR validation of global expression profileTo further validate the microarray expression profile analysis, we
carried out real-time PCR for 25 genes using the primers listed in
Table S18. All the PCRs yielded the expected 300 base pair products.
The real-time PCR ratios are basically similar to those of microarray
data (Table 5), which confirms the validity of the array data.
We noticed that the results from two methods for few genes are
not consistent. Therefore, to further address this question
statistically, we evaluated the linear relationship between the
microarray ratio (fold change) and the real-time PCR ratio for
mibta52b allele at 72 hpf using Pearson’s correlation coefficient. It
indicates a statistically significant positive correlation between
these two sets of ratios (R = 0.914, R2 = 0.835, p,0.001). This
shows that the two sets of ratios are significantly (positively)
correlated and the data are acceptably reliable [80].
DISCUSSIONmind bomb mutants have compromised Notch activity due to
mutations in the mib gene and serve as a unique resource to study
the role of Notch signaling on various developmental processes
[27,29]. Moreover, there are several mib alleles with different
Table 2. Fold change of expression level in Notch signaling related genes at 72 hpf in three mib alleles.. . . . . . . . . . . . . . . . . . . . . . . . . . . . . . . . . . . . . . . . . . . . . . . . . . . . . . . . . . . . . . . . . . . . . . . . . . . . . . . . . . . . . . . . . . . . . . . . . . . . . . . . . . . . . . . . . . . . . . . . . . . . . . . . . . . . . . . . . . . . . . . . . .
Up-regulated genes
Genbank ID Gene symbol Unigene name Fold change in expression
mibta52b
mibm132
mibtfi91 Average
BE016522 heyL Hairy/enhancer-of-split related with YRPW motif-like 1.2068 1.4207 1.3045 1.3107
Down-regulated genes
Genbank ID Gene symbol Unigene name Fold change in expression
mibta52b
mibm132
mibm132 Average
AI522447 dla DeltaA 0.4577 0.6176 0.6013 0.5589
X97332 her4 Hairy-related 4 0.3598 0.6760 0.5448 0.5268
AY007990 her8a Hairy-related 8a 0.5183 0.9035 0.7119 0.7112
BM072241 hes5 Hairy and enhancer of split 5 (Drosophila) 0.5338 0.6956 0.7143 0.6479
BG985516 hey1 Hairy/enhancer-of-split related with YRPW motif 1 0.8054 1.0734 (q = 8.9) 0.8152 0.8980
AF036148 neurod Neurogenic differentiation 0.4846 0.5223 0.7155 0.5742
AF204240 neurod4 Neurogenic differentiation 4 0.5480 0.5452 0.6423 0.5785
X69088 notch1a Notch homolog 1a 0.8032 0.5803 0.7670 0.7168
U57974 notch2 Notch homolog 2 1.0709 (q = 16.8) 0.7174 0.9704 (q = 12.5) 0.9196
U57975 notch3 Notch homolog 3 0.3863 0.5020 0.6237 0.5040
Genes were selected based on the criterion, q = 0.0. Values in brackets indicate that q values are greater than 2.0.doi:10.1371/journal.pone.0001479.t002..
....
....
....
....
....
....
....
....
....
....
....
....
....
....
....
....
....
....
....
....
.
Transcriptome of mib Alleles
PLoS ONE | www.plosone.org 6 January 2008 | Issue 1 | e1479

genetic severity available [34]. In this study, we have examined the
mib mutants for defects in pancreas development using in situ
hybridization and pancreas-specific GFP expression analyses, and
compared the global expression profile of three mib mutant alleles
and their wt siblings using oligo microarray chips.
mib alleles are unique for studying Notch signalingThe mib mutants have diminished exocrine pancreas development
as evidenced by decrease in elastaseA and trypsin expression. The
mibta52b mutant allele showed maximal decrease in exocrine
pancreas followed by mibm132 and mibtfi91 alleles. This indicates
that there is a dose-dependent response of Notch signaling on
pancreas development, since these alleles have different degree of
compromised Notch activity [34]. Our GFP expression analysis in
elastaseA-GFP lines also showed a similar effect of graded Notch
signaling on pancreas development. Likewise, based on in situ
hybridization results for exocrine pancreas-specific genes, such as
mnr2a, ptf1a and trypsin in mibta52b mutants and DAPT-treated
mibta52b mutants, Zecchin et al. concluded that a blockage of
Notch signaling decreases the number of exocrine pancreatic cells
[40]. Earlier study by Esni et al. also showed the role of Notch
signaling in exocrine pancreas development of zebrafish [37].
The in situ hybridization results for the endocrine pancreas-
specific genes, such as insulin and somatostatin, showed slight
increase in their expression in mib mutant alleles; however, a dose-
dependent response of Notch signaling was not obvious (Figure 1).
The GFP expression analyses in insulin-GFP and pdx1-GFP lines
also showed a slight increase in endocrine pancreas in mib mutant
alleles (Figure 2). Similar to our results, Zecchin et al. also showed
that in mib mutants (mibta52b) there is an increased expression of
insulin and somatostatin [40].
Microarray analysis in mib allelesIn this study, we have used the microarray chips with 16,416
probes, representing 15,800 unique zebrafish genes. Earlier studies
have successfully used this version of microarray chips for
elucidating genes involved in zebrafish embryogenesis [52], liver
tumor progression [81] and Hedgehog signaling [53]. Comparison
of our microarray results for three mib mutant alleles at 72 hpf
showed that the number of differentially expressed genes (q = 0.0,
score(d).4.0) in mibtfi91 allele (2352) is greater than that in mibm132
(1536) and mibta52b (321) alleles (Figure 3A and 3B). Interestingly,
this is inversely related to the severity of their phenotypes, such as
fused somite borders, diminished tail pigmentation, neuronal
Table 3. Expression level of differentially expressed genes (q,2.0) involved in pancreas development at 72 hpf in three mib allelesshown in terms of fold change.
. . . . . . . . . . . . . . . . . . . . . . . . . . . . . . . . . . . . . . . . . . . . . . . . . . . . . . . . . . . . . . . . . . . . . . . . . . . . . . . . . . . . . . . . . . . . . . . . . . . . . . . . . . . . . . . . . . . . . . . . . . . . . . . . . . . . . . . . . . . . . . . . . .
Down-regulated genes
Genbank ID Gene symbol Unigene Name mibta52b mibm132 mibtfi91 Average fold change
AF035481 cx43 Gap junction protein, alpha 1 0.7771 0.5925 0.8182 0.7293
AF036148 neurod Neurogenic differentiation 0.4846 0.5223 0.7155 0.5741
AF180921 fabp2 Fatty acid binding protein 2, intestinal 0.6514 0.7622 0.5752 0.6630
AI601297 pax6b Paired box gene 6b 0.7366 0.7788 0.8862 0.8005
AJ297822 try Trypsin 0.8176 0.8766 0.8712 0.8551
AW115690 olfm2 Olfactomedin 2 0.6421 0.5667 0.8625 0.6904
BG882996 hsd11b2 Hydroxysteroid 11-beta dehydrogenase 2 0.8263 0.9139 0.7796 0.8400
BI896418 gatm Glycine amidinotransferase 0.6641 0.8305 0.6792 0.7246
BI981058 rims2 Regulating synaptic membrane exocytosis 2 0.5887 0.7021 0.9263 0.7390
BM183338 atp1a3a ATPase, Na+/K+ transporting, alpha 3a polypeptide 0.7161 0.7431 0.8743 0.7778
D21135 isl1 Islet1 0.4843 0.8373 0.7885 0.7033
Y14544 hoxc8a Homeo box C8a 0.8644 0.5562 0.7260 0.7155
AI497360 zgc:92530 Zgc:92530 1.1962 0.8602 0.8983 0.9849
AW184187 mt2 Metallothionein 2 1.3597 0.7799 0.8513 0.9970
BI709417 wu:fb59c09 Wu:fb59c09 1.2429 0.6583 0.8936 0.9316
BI882972 gstp1 Glutathione S-transferase pi 0.8352 0.7378 1.1683 0.9138
BI885968 ssr4 Signal sequence receptor, delta 1.2889 0.4576 0.7009 0.8158
X69088 notch1a Notch homolog 1a 0.8032 0.5803 0.7670 0.7168
Up-regulated genes
Genbank ID Gene symbol Unigene Name mibta52b mibm132 mibtfi91 Average fold change
AF305689 cacna1c Calcium channel, voltage-dependent, L type, alpha 1C subunit 1.1653 1.1483 1.0988 1.1375
BI672019 gadd45a Growth arrest and DNA-damage-inducible, alpha 1.1878 1.1591 1.0964 1.1478
BI879550 cbs Cystathionine-beta-synthase 1.6677 1.3112 1.2058 1.3949
AF036326 ins Preproinsulin 1.3530 0.8345 0.8377 1.0084
AY029577 xbp1 X-box binding protein 1 1.3598 0.6465 1.1352 1.0471
BI476180 zgc:92292 Zgc:92292 0.8291 1.1458 1.1390 1.0380
BI882450 tdh L-threonine dehydrogenase 1.8600 1.0871 0.8719 1.2730
doi:10.1371/journal.pone.0001479.t003....
....
....
....
....
....
....
....
....
....
....
....
....
....
....
....
....
....
....
....
....
....
....
....
....
....
....
....
....
....
....
...
Transcriptome of mib Alleles
PLoS ONE | www.plosone.org 7 January 2008 | Issue 1 | e1479

hyperplasia and diminished her4 expression: most severe in mibta52b
allele followed by those in mibm132 and mibtfi91 alleles [34]. So far,
there is no known molecular mechanism to explain this finding.
Future studies need to be focused in this direction.
We observed fewer differentially expressed genes at 48 hpf
compared to that at 72 hpf for all three mib mutant alleles. This is
in concurrence with the phenotypes of these three mib alleles,
which are less obvious at 48 hpf compared to that at 72 hpf [34].
Owing to the large number of differentially expressed genes at
these two time points, we narrowed our focus on the 72-hpf data
set alone. In all three mib mutant alleles at 72 hpf, the majority
(.70%) of the differentially expressed genes are uncharacterized
genes or ESTs. This is because the zebrafish genome annotation
has not been completed and the majority of genes remain as
uncharacterized ESTs. Though a number of differentially
expressed genes have been identified as full-length clones with
ZGC IDs, they still remain unannotated. Gene Ontology (GO)
analysis of differentially expressed genes of mibta52b allele showed
that less than 29% of the genes are characterized, the majority
(35%) of which belong to the category of ‘transcription factors/
nuclear’ followed by the category of ‘signaling molecules’ (19%).
This could be due to the fact that the mib mutants are defective in
Notch signaling, which is one of the fundamental signaling
pathways required for proper development of an organism.
Genes potentially involved in Notch signalingOur microarray data is reliable, because some expected Notch
signaling related genes did appear in the transcriptome, such as
up-regulated heyL and down-regulated dla. Comparison of three
sets of genes (72 hpf and 48 hpf for three mib alleles and 24 hpf, 48
hpf and 72 hpf of the mibta52b allele) showed that there are 31 genes
common to all three gene sets (Table S16). Five of these 31 genes,
namely olig2 [56], her4 [57], hes5 (also known as her15.1, [58,59]),
dla [60] and nort [61], are previously shown to be involved in
Notch signaling. Particularly, based on similar global expression
analyses of notch1a and notch3 morpholino morphants, Tsutsumi
and Itoh showed that nort is a putative noncoding RNA regulated
by Notch signaling in zebrafish [61]. Therefore, it is likely that the
rest of the genes in this group are a part of the Notch connected
network and hence serve as a useful resource to further identify
novel genes working downstream of Notch.
Genes potentially involved in pancreas
developmentAs a major focus of our current study, we searched for the genes
related to pancreas development. As of now, there is no
bioinformatic tool available to classify the zebrafish genes according
to their biological functions. Therefore, we carried out a detailed
manual search for the genes related to pancreas development. Using
the ZFIN in situ hybridization expression database, we found 98
zebrafish genes that have been previously shown to be expressed in
pancreas (Table 3, Table 4 and Table S17). The microarray
expression profile for these genes showed that their expression profile
is significantly different (q,2.0) in at least one of the three mib alleles.
Several genes, such as neurod, isl1 and pax6b [82–84] were formerly
shown to be responsive to Notch signaling in mice.
However, the fold change of expression for each gene is
different in these three alleles. Only 25 out of these 98 zebrafish
genes involved in pancreas development show significant differ-
ence (q,2.0) in expression profile in all three mib alleles. Out of
these 25 genes, only 15 genes show consistent up-regulation (3
genes) or down-regulation (12 genes) in all three alleles. Apart from
these 98 genes, we discovered 9 differentially expressed genes
(Table S19), which are likely to play a role in zebrafish pancreas
development based on their functional homology to mouse and
human orthologs. It is definitely worth addressing in the future.
Is Mib Notch-specific?So far, the experiments have unequivocally proved that Mib is an
essential component of Notch signaling: it ubiquitylates and then
endocytoses Delta with the extracellular part of Notch and therefore
allows the intracellular part of Notch to enter the nucleus in the
receiving cell and activate downstream target genes [27]. There is
also evidence to suggest that Mib may be linked to Wnt signaling.
Riley, et al. showed that heat shock-driven wnt1 expression in mib
mutants leads to a partial rescue of its hindbrain metameric
Table 4. Expression level of differentially expressed genes (q,2.0), predicted to be involved in pancreas development based onfunctional homology, at 72 hpf in three mib alleles shown in terms of fold change.
. . . . . . . . . . . . . . . . . . . . . . . . . . . . . . . . . . . . . . . . . . . . . . . . . . . . . . . . . . . . . . . . . . . . . . . . . . . . . . . . . . . . . . . . . . . . . . . . . . . . . . . . . . . . . . . . . . . . . . . . . . . . . . . . . . . . . . . . . . . . . . . . . .
Down-regulated genes
Genbank ID Gene symbol Unigene Name mibta52b mibm132 mibtfi91 Average fold change
AF017266 gad1 Glutamate decarboxylase 1 0.6482 1.0506 0.6659 0.7882
AF198033 igfbp2 Insulin-like growth factor binding protein 2 0.9955 0.6396 0.7825 0.8059
BI887742 sfrs5 Splicing factor, arginine/serine-rich 5 0.9756 0.4959 0.8615 0.7777
BI533195 wu:fc21h08 Wu:fc21h08 1.3516 0.7193 0.9067 0.9925
BI891976 zgc:56374 Zgc:56374 0.8668 0.6375 0.8464 0.7836
AW281193 Transcribed locus 0.9340 0.7479 0.8379 0.8399
AW282071 zgc:112198 Zgc:112198 0.3908 0.6969 1.2720 0.7866
Up-regulated genes
Genbank ID Gene symbol Unigene Name mibta52b mibm132 mibtfi91 Average fold change
D38454 isl3 Islet3 0.8717 1.2938 1.1984 1.1213
BI846588 Transcribed locus, weakly similar to NP_002572.2pregnancy-associated plasma protein A preproprotein;insulin-like growth factor-dependent IGF binding protein-4protease; aspecific BCL2 ARE-binding protein 2 [Homo sapiens]
2.0230 1.3549 1.5408 1.6396
doi:10.1371/journal.pone.0001479.t004....
....
....
....
....
....
....
....
....
....
....
....
....
....
....
....
....
....
...
Transcriptome of mib Alleles
PLoS ONE | www.plosone.org 8 January 2008 | Issue 1 | e1479
patterning phenotype [54]. Furthermore, knockdown of wnt3a and
wnt8b in Dfw5 mutants, where wnt1 and wnt10b are deleted, resulted
in the lost of boundary cells in hindbrain, which is similar to that in
mibta52b mutants [54]. However, this is in sharp contrast to wnt1 and
tcf3b morphants, where the boundary cells are increased [55].
Therefore, the mechanism remains to be determined.
From our IPA pathway analysis in all three mib alleles, we found
enrichment of several differentially expressed genes belonging to
various canonical pathways that have not been shown to directly
link to Mib, including IGF-1, PDGF, EGF and IL-2 signaling
pathways (Figure 6B). This raises the possibility that Mib may be
somehow involved in these signaling pathways. Furthermore,
mouse DAPK and zebrafish Jagged2a have been shown to be
substrates of Mib E3 ligase [85,86]. With a yeast two-hybrid
screen, we also found that Mib binds to proteins involved in
endocytosis and the ubiquitin-proteasome pathway (Chengjin
Zhang, Jason Kin Wai Koo, Qing Li, Haoying Xu and Y.-J. J.,
unpublished data). Similarly, Snx5 has been identified as a Mib-
binding protein from a yeast two-hybrid screen, which is
colocalized with Mib in early endosomes and required for
hematopoiesis and vasculogenesis [87]. All these observations
suggest that Mib may not be Notch-specific and can also work
with other pathways, just as previously shown for another E3
ligase, Itch, which targets Notch receptor and links to TNF
through JNK [88–90]. Alternatively, the gene expression change
could simply reflect the tissue/organ defects that are inflicted by a
failure in Notch signaling. Our pathway analysis on microarray
data supplies a good resource for examining whether Mib
functions beyond Notch signaling and/or for testing what genes
are involved in the tissue/organ mis-patterning caused by
compromised Notch activity.
Validation of microarray dataTo validate the microarray expression profile, we carried out
fluorescent double in situ hybridization for ten genes (5 down-
regulated and 5 up-regulated) and real-time PCR for 25 genes.
Out of these ten genes, insulin, trypsin, spon1b, cad, isl1, wu:fb59c09,
notch1a, txnip and glo1 are previously shown to be involved in the
development of and/or expressed in zebrafish pancreas; and isl3 is
predicted to be related to pancreas development.
The microarray expression profile of trypsin and isl1 showed a
down-regulation in mibta52b allele and this was validated by our
fluorescent double in situ hybridization and real-time PCR
(Figure 7 and Table 5). wu:fb59c09 was slightly up-regulated
(1.24) in microarrays of mibta52b allele but it was down-regulated in
mibm132 and mibtfi91 alleles (Table 3). However, our fluorescent
double in situ hybridization and real-time PCR validations showed
that it is down-regulated in the mibta52b allele (Figure 7 and
Table 5). cad expression was decreased in the mibta52b allele by
double in situ, which is consistent with the microarray data (Figure 7
and Table S17). Earlier studies have shown that all these four genes
are expressed in zebrafish pancreas at various developmental stages
[37,75,78,79]. However, the role of Notch signaling on their
expression profile in pancreas is not known except isl1. isl1 was
shown to be up-regulated in primary neurons of mib mutants at 16s
to 20s stage [91], but the effect of Notch signaling on its expression at
later stages has not been studied. Furthermore, no observation has
been made on its expression in pancreas. In contrast, our in situ
hybridization results in 3-dpf embryos showed that the expression of
isl1 in mibta52b allele is down-regulated in nervous system but its
expression in pancreas is only slightly reduced compared to that in wt
embryos. In support of this observation, our microarray and real-
time PCR results also showed that isl1 is down-regulated in mibta52b
mutants (Table 3 and 5).
Two up-regulated genes, insulin and spon1b, were validated. The
microarray data showed that these two genes are up-regulated in
the mibta52b allele and this is supported by our fluorescent double in
situ hybridization. isl3 was slightly increased by fluorescent double
in situ hybridization. However, it was consistently decreased in
mibta52b allele by microarray analysis and real-time PCR (Figure 7,
Table 4 and 5).
In contrast to the available information from ZFIN, which shows
the gene expression pattern mainly up to 2 dpf, we did not detect
notch1a, glo1 and txnip expression in the pancreas using fluorescent
double in situ hybridization at 3 dpf, though we did detect notch1a
expressed in, for example, hindbrain. It could be due to the stage
difference or technical reasons. However, our real-time PCR results
validated microarray expression for notch1a and glo1 (Table 5).
The ratio comparison between microarray and real-time PCR
for genes, such as ipf1, perp, igf2, isl3, spon1b and BI846588, showed
that there is slight up-regulation in microarray, but down-
regulation in real-time PCR. However, it is evident that the
overall expression alteration of all 25 genes is statistically
Figure 7. Validation of expression profile of differentially expressedgenes with fluorescent double in situ hybridization. Expression ofdown-regulated genes: (A and B) isl1, (C and D) cad and (E and F)wu:fb59c09 and up-regulated genes: (G and H) spon1b and (I and J) isl3in (B, D, F, H and J) mibta52b mutants embryos and (A, C, E, G and I) wild-type embryos. Left panels show respective gene expression in green;middle panels show insulin (endocrine) or trypsin (exocrine) expressionin red; right panels show merged pictures. Expression of wu:fb59c09 isshown in 4-dpf embryos, and the rest are in 3-dpf embryos. All embryosare anterior to the left and ventral views.doi:10.1371/journal.pone.0001479.g007
Transcriptome of mib Alleles
PLoS ONE | www.plosone.org 9 January 2008 | Issue 1 | e1479

comparable, although the actual fold change values in real-time
PCR and microarray are not always commensurable. Such
variation in values is likely due to the difference in sensitivity
[80]. Nevertheless, our in situ hybridization results are highly
consistent with our microarray profile.
In conclusion, the microarray analyses carried out in this study
provide a useful resource of global gene expression profile of mib
mutants defective in Notch signaling. Functional analysis of
differentially expressed genes will shed light on their role in Notch
signaling and various developmental processes.
MATERIALS AND METHODS
Zebrafish wild type embryos and mind bomb
mutantsWe used AB strain wild type (wt) and three different mib alleles of
different genetic severity, viz., mibta52b, and mibm132, mibtfi91 [34].
mibta52b carries a missense mutation (M1013R) in the C-terminal-
most RING finger domain; mibm132 carries a nonsense mutation
(C785stop) leading to a truncated protein and mibtfi91 contains a
nonsense mutation (Y60stop) [27]. mibta52b and mibm132 are strong
and weak antimorphic alleles, respectively, whereas mibtfi91 is a null
allele [34]. All animal procedures were approved by the Biological
Resource Centre, A*STAR.
Fish maintenance and sample collectionFish were maintained in the IMCB zebrafish facility according to
standard procedures. Crosses were set up in the evening and the
barrier was lifted in the next morning. After half an hour, the
fertilized embryos were collected and maintained at 28.5uC in egg
water supplemented with methylene blue. For microarray
analyses, the wt embryos were collected at 24 hpf, 48 hpf and
72 hpf, snap-frozen in liquid nitrogen and stored at -80uC.
Mutants were separated from their wt siblings and frozen stored in
the same way. At least two independent biological replicates were
taken for each sample. All the samples were collected from the
same cohort of fish to maintain a uniform genetic background.
For whole mount in situ hybridization and GFP analysis, the
fertilized embryos were collected and grown at 28.5uC. Embryos
were transferred to egg water with 0.033% phenylthiourea (PTU),
Table 5. Real-time PCR validation of microarray data.. . . . . . . . . . . . . . . . . . . . . . . . . . . . . . . . . . . . . . . . . . . . . . . . . . . . . . . . . . . . . . . . . . . . . . . . . . . . . . . . . . . . . . . . . . . . . . . . . . . . . . . . . . . . . . . . . . . . . . . . . . . . . . . . . . . . . . . . . . . . . . . . . .
A. Down-regulated genes
Genbank ID Unigene Name Gene symbol Microarray fold change ratio Real-time PCR ratio
AJ297822 Trypsin try 0.81 0.18
D21135 Islet1 isl1 0.48 0.17
X97332 Hairy-related 4 her4 0.35 0.04
U57975 Notch homolog 3 notch3 0.38 0.12
AI522447 DeltaA dla 0.45 0.22
X69088 Notch homolog 1a notch1a 0.80 0.22
AF109373 Opsin 1 (cone pigments), short-wave-sensitive 1 opn1sw1 0.14 0.004
AF017266 Glutamate decarboxylase 1 gad1 0.65 0.25
BI891976 Zgc:56374 zgc:56374 0.86 1.15
AY583322 elastase A 0.89 0.07
AW019843 Somatostatin 1 sst1 0.62 0.13
AW282071 Zgc:112198 zgc:112198 0.39 0.10
AW281193 similar to rat insulinoma gene 0.93 0.49
BI887742 Splicing factor, arginine/serine-rich 5 sfrs5 0.97 0.87
AF198033 Insulin-like growth factor binding protein 2 igfbp2 0.99 0.13
BI709417 Wu:fb59c09 (Danio rerio similar to Peroxiredoxin 4) prx4 0.93" 0.88
B. Up-regulated genes
Genbank ID Unigene Name Gene symbol Microarray fold change ratio Real-time PCR ratio
AB062116 Heat shock cognate 70-kd protein hsp70 5.14 11.55
AF036326 Preproinsulin ins 1.35 1.22
BM183964 Glyoxalase 1 glo1 1.40 1.08
AF036325 Insulin promoter factor 1, homeodomain transcription factor ipf1 1.18 0.20
BI890045 PERP, TP53 apoptosis effector perp 1.66 0.70
BI846588 Transcribed locus, weakly similar to insulin-like growth factor-dependent IGF binding protein-4 protease
2.02 0.48
BI533195 Wu:fc21h08 (Danio rerio insulin-like growth factor 2 precursor) igf2 1.35 0.86
D38454 Islet3 isl3 1.12" 0.19
AB006087 Spondin 1b spon1b 1.28 0.36
The real-time PCR ratio in mibta52b allele at 72 hpf is compared with the microarray data expressed as fold change values. The Genbank ID, Unigene name and Genesymbol were obtained using the Zebrafish Chip Annotation Database, (Unigene Build 85), http://giscompute.gis.a-star.edu.sg/,govind/zebrafish/version2/."Average microarray ratio of three mib mutants.doi:10.1371/journal.pone.0001479.t005..
....
....
....
....
....
....
....
....
....
....
....
....
....
....
....
....
....
....
....
....
....
....
....
....
....
....
....
....
....
....
....
....
....
Transcriptome of mib Alleles
PLoS ONE | www.plosone.org 10 January 2008 | Issue 1 | e1479

which inhibits pigmentation, after 12 hpf and fixed/collected at
appropriate stages.
In situ hybridization and fluorescent double in situ
hybridizationDNA clones for making in situ hybridization probes were obtained
from the Expressed Sequence Tag (EST) clone collection at the
Genome Institute of Singapore (GIS) and the Institute of Molecular
and Cell Biology (IMCB). Whole mount in situ hybridization using
digoxigenin (DIG) (Roche) labeled RNA probes was carried out as
previously reported [92]. Goat anti-DIG antibody conjugated to
alkaline phosphatase (AP) was used for probe detection and NBT-
BCIP was used as the substrate for color development. In situ
hybridized embryos were observed using light microscope and the
photos were taken with Zeiss Imager M1 microscope.
DIG- and fluorescein-labeled probes were generated via
standard protocols. Embryos were proceeded for fluorescent
double in situ hybridization with protocols previously reported
[32,86]. However, the incubation temperature for probes was
changed to 60uC to reduce the background. Photos were taken
with Olympus Fluoview FV1000 microscope.
GFP expression analysisTo screen for defects in pancreas development, we have used three
pancreas-specific GFP transgenic lines, viz., elastaseA-GFP (elaA-
GFP) [93], insulin-GFP and pdx1-GFP lines [94]. These GFP lines
were crossed with the heterozygous mib mutants and the offspring
(F1) were grown until maturity. The F1 siblings carrying mib
mutations were intercrossed to obtain embryos for GFP expression
analysis. Photos were taken with Leica MZ FLIII microscope.
RNA extractionTotal RNA from the frozen embryos was extracted with Trizol
(Gibco BRL) and cleaned with the Qiagen RNeasy mini kit. RNA
quality was determined by gel electrophoresis, and the concentra-
tion was measured with a UV spectrophotometer. To reduce the
bias, we used a common reference RNA for each time point,
which was prepared at one time by extracting RNA from stage-
matched wild type embryos. The RNA extracts were stored at
280uC.
Microarray construction, target preparation and
hybridizationThe zebrafish microarrays were printed at GIS [52]. Oligonucle-
otide probes for this array were designed by Compugen (USA) and
synthesized by Sigma Genesis (USA). For each gene, one 65-mer-
oligonucleotide probe was designed from the 39 region sequence.
Each probe was selected from a sequence segment that is common
to a maximum number of splice variants predicted for each gene.
The arrays contained 16,416 probes, representing 15, 800 unique
zebrafish genes (UniGene build 85). In addition, the arrays also
contained 170 spots representing b-actin gene probes as controls.
The probes were suspended at a concentration of 20 mM in 3X
SSC and spotted onto poly-L-Lysine coated microscope slides
using custom-built DNA microarrayer.
For fluorescent labeling of target cDNAs, 20 mg of total RNA
(10 mg, when the RNA quantity was limited) from reference and
experimental samples were reverse-transcribed in the presence of
Cy3-dUTP and Cy5-dUTP (Amersham Biosciences), respectively.
Labeled target cDNAs were combined, concentrated and
resuspended in DIG EasyHyb (Roche). Hybridizations on
microarray slides were performed at 42uC for 16 h using MAUI
Mixer FL (BioMicro Systems) as explained earlier [52,95]. At least
two independent biological replicates were taken for each sample.
At least two to three independent replicate hybridizations
(technical repeats) were performed for each biological repeat
sample (Table S20).
Scanning, filtering and data normalizationThe arrays were scanned by the GenePix 4000B microarray
scanner (Axon Instruments) to generate 16-bit TIFF image files.
GenePix Pro 4.0 image analysis software (Axon Instruments) was
used to measure the fluorescent signal intensity of the array
features and local background on TIFF images. Only the gene
features with signal background ratio more than 1.5 were used for
analysis. The 16-bit TIFF image files and the gpr files with Cy3
and Cy5 signal intensities were uploaded into the GIS-developed
Microarray Database (mAdb). Median normalization of the
sample and reference channel intensity values was performed
using the intensity-based log ratio median method [96]. The
extracted intensity data from the mAdb database were normalized
by Lowess normalization method and analyzed by modified t-
statistic Significance Analysis of Microarrays (SAM) [97]. The
microarray data files have been submitted to the Gene Expression
Omnibus (GEO) and the accession number is GSE8522.
Gene annotationThe gene annotations were carried out by using the Zebrafish
Chip Annotation Database (MySqL) (UniGene build 85) (http://
giscompute.gis.a-star.edu.sg/,govind/zebrafish/version2) devel-
oped and maintained by GIS. This database contains putative
annotations for the probes in the zebrafish oligonucleotide array.
We queried this database with the Genbank ID to obtain the
following information: (1) Compugen description, (2) Zebrafish
UniGene ID (build 85), (3) Zebrafish UniGene description (build
85), (4) Entrez Gene description, (5) Entrez Gene ID and Gene
symbol, (6) GO term, (7) Locus Link, (8) UniGene protein
similarity and description (mouse and human), (9) Full-length or
assembled sequences, (10) HomoloGene (human and mouse, build
38.1) and (11) chromosomal location of the gene. Full-length
sequences or the longest available gene sequences were obtained
from the NCBI UniGene database (http://www.ncbi.nlm.nih.
gov/sites/entrez?db = unigene&cmd). The Genbank IDs are
referred to as ‘genes’ throughout this article.
Microarray data analysisWe applied Significance Analysis of Microarrays (SAM) [97] to
identify statistically significant genes in each case. Since we have
different number of replicates for different alleles, we used different
thresholds (q = 0.0, score(d).4.0 [this represents that the absolute
value of score(d) is greater than 4.0, namely, |score(d)|.4.0] at 72
hpf; q = 0.0 at 48 hpf; q = 0.0 at 24 hpf) to select similar number of
genes. However, the thresholds we used are all stringent (in every
case the q-value is less than 2) and hence the false discovery rate
(FDR, value expressed in %) in each case does not exceed 5. The
FDR indicates the outcome with which the gene selected to be
differentially expressed by the SAM analysis is likely to be occurring
by chance. The score(d) indicates a statistic parameter, which is
numerator(r) divided by denominator(s+s0) and hence serves as a
cut-off point along with the q value. The numerator(r) value indicates
the actual gene expression change shown as log2 value.
For the analysis of 72-hpf time point data, we selected those
genes with q = 0.0 and scored(d).4.0 from the SAM generated
data for all three mib alleles (Table S1, S2 and S3). The description
for all the gene sets was obtained from the Zebrafish Chip
Transcriptome of mib Alleles
PLoS ONE | www.plosone.org 11 January 2008 | Issue 1 | e1479

Annotation Database [52]. Based on the most recently available
information of the zebrafish gene annotation, these gene sets were
classified as characterized and uncharacterized genes (Table 1).
Furthermore, we manually searched for two sets of genes: one with
functions related to Notch signaling and the other with functions
related to pancreas development (Table 2–4). The expression profile
values (log2) for the genes involved in the Notch pathway and
pancreas development were obtained from the SAM analyzed data
set. The in situ hybridization gene expression data for the genes
related to pancreas development were obtained from the ZFIN
database (http://zfin.org/cgi-bin/webdriver?MIval = aa-xpatselect.
apg). If the gene was previously shown to be involved in pancreas
development, we classified them as the ‘genes involved in pancreas
development’. If there is no functional relationship to zebrafish
pancreas development but only functional homology to the human
or mouse genes related to pancreas development, we classified them
as the ‘genes predicted to be involved in pancreas development’.
A PERL script was used to identify the differentially expressed
(q = 0.0, score(d).4.0) genes (Genbank IDs) that are common
among all three mib alleles (Table S4), between two different alleles
and specific to each allele (Table S5, S6 and S7) at 72 hpf, and to
remove duplicate genes (Genbank IDs), if any. Using this method,
a group of 91 genes common to all three mib alleles were classified
based on their function and characterization status (Table S4).
These 91 genes were hierarchically clustered with TreeView_-
vers_1_60 software [98] and tree view image was generated using
Adobe Illustrator (Fig. 4).
For the analysis of 48-hpf time point data, the gene sets with
q = 0.0 were used. The same PERL script was also used here to find
the common genes and the allele-specific genes (Table S8, S9, S10
and S11). The SAM data (q = 0.0) for the mibta52b on all three time
points (24 hpf, 48 hpf and 72 hpf) were analyzed and queried using
the PERL script to find out the gene sets that are common to all time
points and specific to each time point (Table S12, S13, S14 and S15).
Functional groups and pathway analysisDifferentially expressed genes of three mib mutant alleles were
subjected to Ingenuity Pathways Analysis (IPA) to identify the
enrichment of genes in specific functional groups and pathways
(IPA, Version 4, IngenuityH Systems, http://www.ingenuity.com).
The IPA accepts human UniGene IDs as one of the identifiers for
data upload and analysis. For this reason, the differentially
expressed genes of mib mutants were mapped to their human
homologs using the HomoloGene database and zebrafish
UniGene mapping tool established at the GIS (http://giscom-
pute.gis.a-star.edu.sg/,govind/unigene_db/). Human homologs
of up- and down-regulated genes of the mutants were analyzed by
using IPA tools and the enrichment of functional categories and
canonical pathways with reference to the Ingenuity Pathways
Knowledge Base (IPKB) were documented. Initially, differentially
expressed genes of the three mutant alleles were individually
analyzed. Subsequently, the enrichment patterns were compared
among the mutants to identify the conservation of functional
groups among the mutants.
Using the input data set (human homologs of zebrafish genes
differentially expressed in the mib mutants), IPA identified a set of
genes that are enriched for a particular function or pathway and
the enrichment is represented as ratio. The ratio refers to the
number of input genes associated with each function/pathway
versus the total number of genes (available in IPKB) involved in
that particular function/pathway. The ratios may be affected by
the variations in the total number of input identifiers. In order to
find the significance of enrichment in a particular function, IPA
calculates the significance value based on the measure of
involvement of the gene in the input data set to their respective
molecular functions/signaling pathways. Using the right-tailed
Fisher’s Exact Test, the p-value (significance) is calculated by
comparing the number of user-specified genes of interest that
participate in a given function or pathway, relative to the total
number of occurrences of these genes in all functional/pathway
annotations in the IPKB.
Real-time PCRTo validate the microarray results, we carried out the real-time
PCR for 25 genes and beta-actin gene was used as a reference. The
primers used for amplifying each gene were listed in Table S18.
cDNA was generated using the same purified RNA preparations
from 72-hpf embryos (one biological repeat of wt and two
biological repeats of mibta52b) used in microarray, and two other
biological repeats of reference RNA from 72 hpf and one
biological repeat sample RNA from mibta52b mutants. RT-PCR
was carried out using the LightCyclerH FastStart DNA Master-PLUS SYBR Green kit (Roche) and the Light Cycler machine as
per the instructions of the manufacturer. The products of the RT-
PCR were analyzed on the agarose gel electrophoresis for a single
band of expected size. Relative cDNA amounts were calculated
using the comparative CT method as explained in the real-time
PCR manual of Applied Biosystems and normalized to the
expression of beta-actin.
Analysis of correlation between microarray data and
real-time PCR resultsSubsequent to microarray and real-time PCR data analysis, an
evaluation of linear correlation was performed for a set of 25 genes
(Table 5), and the statistical significance of the correlation was
determined using One-way ANOVA in SPS software. For the
correlation analysis, the data input of the microarray was the fold
change of expression and the data input of the real-time PCR was
the ratio of relative expression for each gene. Both sets of ratios
were obtained from the 72-hpf time point for the mibta52b allele.
SUPPORTING INFORMATION
Table S1 List of significantly expressed genes (q = 0.0) in 72-hpf
ta52b mutants generated with SAM.
Found at: doi:10.1371/journal.pone.0001479.s001 (1.75 MB XLS)
Table S2 List of significantly expressed genes (q = 0.0) in 72-hpf
m132 mutants generated with SAM.
Found at: doi:10.1371/journal.pone.0001479.s002 (3.12 MB XLS)
Table S3 List of significantly expressed genes (q = 0.0) in 72-hpf
tfi91 mutants generated with SAM.
Found at: doi:10.1371/journal.pone.0001479.s003 (3.92 MB XLS)
Table S4 List of significantly expressed genes (q = 0.0, score(d).
4.0) common to all three mib mutant alleles at 72 hpf.
Found at: doi:10.1371/journal.pone.0001479.s004 (0.09 MB XLS)
Table S5 List of significantly expressed genes (q = 0.0, score(d).
4.0) specific to ta52b mutants at 72 hpf.
Found at: doi:10.1371/journal.pone.0001479.s005 (0.09 MB XLS)
Table S6 List of significantly expressed genes (q = 0.0, score(d).
4.0) specific to m132 mutants at 72 hpf.
Found at: doi:10.1371/journal.pone.0001479.s006 (0.52 MB XLS)
Table S7 List of significantly expressed genes (q = 0.0, score(d).
4.0) specific to tfi91 mutants at 72 hpf.
Found at: doi:10.1371/journal.pone.0001479.s007 (0.93 MB XLS)
Transcriptome of mib Alleles
PLoS ONE | www.plosone.org 12 January 2008 | Issue 1 | e1479

Table S8 List of significantly expressed genes (q = 0.0) common
to all three mib mutant alleles at 48 hpf.
Found at: doi:10.1371/journal.pone.0001479.s008 (0.04 MB XLS)
Table S9 List of significantly expressed genes (q = 0.0) specific to
ta52b mutants at 48 hpf.
Found at: doi:10.1371/journal.pone.0001479.s009 (0.08 MB XLS)
Table S10 List of significantly expressed genes (q = 0.0) specific
to m132 mutants at 48 hpf.
Found at: doi:10.1371/journal.pone.0001479.s010 (0.09 MB XLS)
Table S11 List of significantly expressed genes (q = 0.0) specific
to tfi91 mutants at 48 hpf.
Found at: doi:10.1371/journal.pone.0001479.s011 (0.38 MB XLS)
Table S12 List of significantly expressed genes (q = 0.0) common
at all three time points for ta52b mutants.
Found at: doi:10.1371/journal.pone.0001479.s012 (0.05 MB XLS)
Table S13 List of significantly expressed genes (q = 0.0) specific
to 24 hpf time point in ta52b mutants.
Found at: doi:10.1371/journal.pone.0001479.s013 (1.01 MB XLS)
Table S14 List of significantly expressed genes (q = 0.0) specific
to 48 hpf time point in ta52b mutants.
Found at: doi:10.1371/journal.pone.0001479.s014 (0.03 MB XLS)
Table S15 List of significantly expressed genes (q = 0.0) specific
to 72 hpf time point in ta52b mutants.
Found at: doi:10.1371/journal.pone.0001479.s015 (1.07 MB XLS)
Table S16 List of significantly expressed genes (q = 0.0) common
in at least two data sets.
Found at: doi:10.1371/journal.pone.0001479.s016 (0.02 MB XLS)
Table S17 Zebrafish pancreas development related genes.
Found at: doi:10.1371/journal.pone.0001479.s017 (0.02 MB XLS)
Table S18 Sequence of primers used in real-time PCR
validation on microarray data.
Found at: doi:10.1371/journal.pone.0001479.s018 (0.07 MB
DOC)
Table S19 Genes predicted to be related to zebrafish pancreas
development.
Found at: doi:10.1371/journal.pone.0001479.s019 (0.02 MB XLS)
Table S20 Summary of biological and technical repeats.
Found at: doi:10.1371/journal.pone.0001479.s020 (0.01 MB XLS)
Figure S1 Changes of expression levels in the canonical
pathways. (A) The Notch signaling pathway and (B) the Wnt/b-
catenin signaling pathway. The nodes in these pathways are
highlighted with expression data from the m132 data (red: up-
regulated; green: down-regulated). Nodes with a histogram chart
next to it represents gene expression in the i) ta52b, ii) m132 and iii)
tfi91 data set from left to right. (TIF)
Found at: doi:10.1371/journal.pone.0001479.s021 (1.71 MB TIF)
ACKNOWLEDGMENTSWe thank Serene Gek Ping Lee for providing microarray reagents and
protocols and Dr. Shuo Lin for supplying insulin-GFP and pdx1-GFP
transgenic lines.
Author Contributions
Conceived and designed the experiments: YJ AH. Performed the
experiments: AH KT NQ SH XQ. Analyzed the data: KG YJ JG AH
FN SM. Contributed reagents/materials/analysis tools: ZG YJ SM. Wrote
the paper: YJ AH SM.
REFERENCES1. Artavanis-Tsakonas S, Rand MD, Lake RJ (1999) Notch signaling: cell fate
control and signal integration in development. Science 284: 770–776.
2. Pourquie O (2003) The segmentation clock: converting embryonic time into
spatial pattern. Science 301: 328–330.
3. Ellisen LW, Bird J, West DC, Soreng AL, Reynolds TC, et al. (1991) TAN-1, the
human homolog of the Drosophila Notch gene, is broken by chromosomal
translocations in T lymphoblastic neoplasms. Cell 66: 649–661.
4. Yan XQ, Sarmiento U, Sun Y, Huang G, Guo J, et al. (2001) A novel Notch
ligand, Dll4, induces T-cell leukemia/lymphoma when overexpressed in mice by
retroviral-mediated gene transfer. Blood 98: 3793–3799.
5. Thompson BJ, Buonamici S, Sulis ML, Palomero T, Vilimas T, et al. (2007) The
SCFFBW7 ubiquitin ligase complex as a tumor suppressor in T cell leukemia.
J Exp Med 204: 1825–1835.
6. Oda T, Elkahloun AG, Pike BL, Okajima K, Krantz ID, et al. (1997) Mutations
in the human Jagged1 gene are responsible for Alagille syndrome. Nat Genet 16:
235–242.
7. Li L, Krantz ID, Deng Y, Genin A, Banta AB, et al. (1997) Alagille syndrome is
caused by mutations in human Jagged1, which encodes a ligand for Notch1. Nat
Genet 16: 243–251.
8. McDaniell R, Warthen DM, Sanchez-Lara PA, Pai A, Krantz ID, et al. (2006)
NOTCH2 mutations cause Alagille syndrome, a heterogeneous disorder of the
notch signaling pathway. Am J Hum Genet 79: 169–173.
9. Joutel A, Corpechot C, Ducros A, Vahedi K, Chabriat H, et al. (1996) Notch3
mutations in CADASIL, a hereditary adult-onset condition causing stroke and
dementia. Nature 383: 707–710.
10. Bulman MP, Kusumi K, Frayling TM, McKeown C, Garrett C, et al. (2000)
Mutations in the human Delta homologue, DLL3, cause axial skeletal defects in
spondylocostal dysostosis. Nat Genet 24: 438–441.
11. Brou C, Logeat F, Gupta N, Bessia C, LeBail O, et al. (2000) A novel proteolytic
cleavage involved in Notch signaling: the role of the disintegrin-metalloprotease
TACE. Mol Cell 5: 207–216.
12. Fortini ME (2001) Notch and presenilin: a proteolytic mechanism emerges. Curr
Opin Cell Biol 13: 627–634.
13. Kopan R, Goate A (2000) A common enzyme connects notch signaling and
Alzheimer’s disease. Genes Dev 14: 2799–2806.
14. Kidd S, Lieber T, Young MW (1998) Ligand-induced cleavage and regulation of
nuclear entry of Notch in Drosophila melanogaster embryos. Genes Dev 12: 3728–3740.
15. Kopan R, Schroeter EH, Weintraub H, Nye JS (1996) Signal transduction by
activated mNotch: importance of proteolytic processing and its regulation by the
extracellular domain. Proc Natl Acad Sci U S A 93: 1683–1688.
16. Lecourtois M, Schweisguth F (1998) Indirect evidence for Delta-dependent
intracellular processing of Notch in Drosophila embryos. Curr Biol 8: 771–774.
17. Struhl G, Adachi A (1998) Nuclear access and action of Notch in vivo. Cell 93:
649–660.
18. Jarriault S, Brou C, Logeat F, Schroeter EH, Kopan R, et al. (1995) Signalling
downstream of activated mammalian Notch. Nature 377: 355–358.
19. Lu FM, Lux SE (1996) Constitutively active human Notch1 binds to the
transcription factor CBF1 and stimulates transcription through a promoter
containing a CBF1-responsive element. Proc Natl Acad Sci U S A 93:
5663–5667.
20. Mumm JS, Kopan R (2000) Notch signaling: from the outside in. Dev Biol 228:
151–165.
21. Bailey AM, Posakony JW (1995) Suppressor of hairless directly activates
transcription of enhancer of split complex genes in response to Notch receptor
activity. Genes Dev 9: 2609–2622.
22. Bessho Y, Miyoshi G, Sakata R, Kageyama R (2001) Hes7: a bHLH-type
repressor gene regulated by Notch and expressed in the presomitic mesoderm.
Genes Cells 6: 175–185.
23. Hirata H, Yoshiura S, Ohtsuka T, Bessho Y, Harada T, et al. (2002) Oscillatory
expression of the bHLH factor Hes1 regulated by a negative feedback loop.
Science 298: 840–843.
24. Holley SA, Julich D, Rauch GJ, Geisler R, Nusslein-Volhard C (2002) her1 and
the notch pathway function within the oscillator mechanism that regulates
zebrafish somitogenesis. Development 129: 1175–1183.
25. Oates AC, Ho RK (2002) Hairy/E(spl)-related (Her) genes are central components
of the segmentation oscillator and display redundancy with the Delta/Notch
signaling pathway in the formation of anterior segmental boundaries in the
zebrafish. Development 129: 2929–2946.
26. Ohtsuka T, Ishibashi M, Gradwohl G, Nakanishi S, Guillemot F, et al. (1999)
Hes1 and Hes5 as Notch effectors in mammalian neuronal differentiation.
EMBO J 18: 2196–2207.
27. Itoh M, Kim CH, Palardy G, Oda T, Jiang Y-J, et al. (2003) Mind bomb is a
ubiquitin ligase that is essential for efficient activation of Notch signaling by
Delta. Dev Cell 4: 67–82.
Transcriptome of mib Alleles
PLoS ONE | www.plosone.org 13 January 2008 | Issue 1 | e1479

28. Lai EC (2002) Protein degradation: four E3s for the Notch pathway. Curr Biol
12: R74–R78.
29. Jiang Y-J, Brand M, Heisenberg C-P, Beuchle D, Furutani-Seiki M, et al. (1996)
Mutations affecting neurogenesis and brain morphology in the zebrafish, Danio
rerio. Development 123: 205–216.
30. van Eeden FJM, Granato M, Schach U, Brand M, Furutani-Seiki M, et al.
(1996) Mutations affecting somite formation and patterning in the zebrafish
Danio rerio. Development 123: 153–164.
31. Holley SA, Geisler R, Nusslein-Volhard C (2000) Control of her1 expressionduring zebrafish somitogenesis by a Delta-dependent oscillator and an
independent wave-front activity. Genes Dev 14: 1678–1690.
32. Julich D, Lim CH, Round J, Nicolaije C, Schroeder J, et al. (2005) beamter/deltaC
and the role of Notch ligands in the zebrafish somite segmentation, hindbrain
neurogenesis and hypochord differentiation. Dev Biol 286: 391–404.
33. Rida PCG, Le Minh N, Jiang Y-J (2004) A Notch feeling of somite segmentation
and beyond. Dev Biol 265: 2–22.
34. Zhang C, Li Q, Lim C-H, Qiu X, Jiang Y-J (2007) The characterization of
zebrafish antimorphic mib alleles reveals that Mib and Mind bomb-2 (Mib2)
function redundantly. Dev Biol 305: 14–27.
35. Zhang C, Li Q, Jiang Y-J (2007) Zebrafish Mib and Mib2 are mutual E3
ubiquitin ligases with common and specific Delta substrates. J Mol Biol 366:
1115–1128.
36. Apelqvist A, Li H, Sommer L, Beatus P, Anderson DJ, et al. (1999) Notch
signalling controls pancreatic cell differentiation. Nature 400: 877–881.
37. Esni F, Ghosh B, Biankin AV, Lin JW, Albert MA, et al. (2004) Notch inhibits
Ptf1 function and acinar cell differentiation in developing mouse and zebrafish
pancreas. Development 131: 4213–4224.
38. Zecchin E, Mavropoulos A, Devos N, Filippi A, Tiso N, et al. (2004)
Evolutionary conserved role of ptf1a in the specification of exocrine pancreatic
fates. Dev Biol 268: 174–184.
39. Yee NS, Lorent K, Pack M (2005) Exocrine pancreas development in zebrafish.
Dev Biol 284: 84–101.
40. Zecchin E, Filippi A, Biemar F, Tiso N, Pauls S, et al. (2007) Distinct delta and
jagged genes control sequential segregation of pancreatic cell types from precursor
pools in zebrafish. Dev Biol 301: 192–204.
41. Jensen J, Pedersen EE, Galante P, Hald J, Heller RS, et al. (2000) Control of
endodermal endocrine development by Hes-1. Nat Genet 24: 36–44.
42. Gu G, Dubauskaite J, Melton DA (2002) Direct evidence for the pancreatic
lineage: NGN3+ cells are islet progenitors and are distinct from duct progenitors.
Development 129: 2447–2457.
43. Gradwohl G, Dierich A, LeMeur M, Guillemot F (2000) neurogenin3 is required
for the development of the four endocrine cell lineages of the pancreas. Proc Natl
Acad Sci U S A 97: 1607–1611.
44. Pfaff SL, Mendelsohn M, Stewart CL, Edlund T, Jessell TM (1996)
Requirement for LIM homeobox gene Isl1 in motor neuron generation reveals
a motor neuron-dependent step in interneuron differentiation. Cell 84: 309–320.
45. Olbrot M, Rud J, Moss LG, Sharma A (2002) Identification of beta-cell-specific
insulin gene transcription factor RIPE3b1 as mammalian MafA. Proc Natl Acad
Sci U S A 99: 6737–6742.
46. Sosa-Pineda B, Chowdhury K, Torres M, Oliver G, Gruss P (1997) The Pax4
gene is essential for differentiation of insulin-producing beta cells in the
mammalian pancreas. Nature 386: 399–402.
47. St-Onge L, Sosa-Pineda B, Chowdhury K, Mansouri A, Gruss P (1997) Pax6 is
required for differentiation of glucagon-producing alpha-cells in mouse
pancreas. Nature 387: 406–409.
48. Schena M, Heller RA, Theriault TP, Konrad K, Lachenmeier E, et al. (1998)
Microarrays: biotechnology’s discovery platform for functional genomics.
Trends Biotechnol 16: 301–306.
49. Chiang MK, Melton DA (2003) Single-cell transcript analysis of pancreas
development. Dev Cell 4: 383–393.
50. Gu G, Wells JM, Dombkowski D, Preffer F, Aronow B, et al. (2004) Global
expression analysis of gene regulatory pathways during endocrine pancreaticdevelopment. Development 131: 165–179.
51. Mellitzer G, Bonne S, Luco RF, Van De Casteele M, Lenne-Samuel N, et al.
(2006) IA1 is NGN3-dependent and essential for differentiation of the endocrine
pancreas. EMBO J 25: 1344–1352.
52. Mathavan S, Lee SG, Mak A, Miller LD, Murthy KR, et al. (2005)
Transcriptome analysis of zebrafish embryogenesis using microarrays. PLoS
Genet 1: 260–276.
53. Xu J, Srinivas BP, Tay SY, Mak A, Yu X, et al. (2006) Genomewide expression
profiling in the zebrafish embryo identifies target genes regulated by Hedgehog
signaling during vertebrate development. Genetics 174: 735–752.
54. Riley BB, Chiang MY, Storch EM, Heck R, Buckles GR, et al. (2004)
Rhombomere boundaries are Wnt signaling centers that regulate metameric
patterning in the zebrafish hindbrain. Dev Dyn 231: 278–291.
55. Amoyel M, Cheng YC, Jiang Y-J, Wilkinson DG (2005) Wnt1 regulates
neurogenesis and mediates lateral inhibition of boundary cell specification in the
zebrafish hindbrain. Development 132: 775–785.
56. Park HC, Appel B (2003) Delta-Notch signaling regulates oligodendrocyte
specification. Development 130: 3747–3755.
57. Takke C, Dornseifer P, v Weizsacker E, Campos-Ortega JA (1999) her4, a
zebrafish homologue of the Drosophila neurogenic gene E(spl), is a target of
NOTCH signalling. Development 126: 1811–1821.
58. Bae YK, Shimizu T, Hibi M (2005) Patterning of proneuronal and inter-
proneuronal domains by hairy- and enhancer of split-related genes in zebrafish
neuroectoderm. Development 132: 1375–1385.
59. Shankaran SS, Sieger D, Schroter C, Czepe C, Pauly MC, et al. (2007)
Completing the set of h/E(spl) cyclic genes in zebrafish: her12 and her15 reveal
novel modes of expression and contribute to the segmentation clock. Dev Biol
304: 615–632.
60. Appel B, Eisen JS (1998) Regulation of neuronal specification in the zebrafish
spinal cord by Delta function. Development 125: 371–380.
61. Tsutsumi M, Itoh M (2007) Novel transcript nort is a downstream target gene of
the Notch signaling pathway in zebrafish. Gene Expr Patterns 7: 227–232.
62. Julich D, Geisler R, Tubingen 2000 Screen Consortium, Holley SA (2005)
Integrina5 and Delta/Notch signaling have complementary spatiotemporal
requirements during zebrafish somitogenesis. Dev Cell 8: 575–586.
63. Chong S-W, Jiang Y-J (2005) Off limits–integrins holding boundaries in
somitogenesis. Trends Cell Biol 15: 453–457.
64. Irvin DK, Dhaka A, Hicks C, Weinmaster G, Kornblum HI (2003) Extrinsic and
intrinsic factors governing cell fate in cortical progenitor cultures. Dev Neurosci
25: 162–172.
65. Kohyama J, Tokunaga A, Fujita Y, Miyoshi H, Nagai T, et al. (2005)
Visualization of spatiotemporal activation of Notch signaling: live monitoring
and significance in neural development. Dev Biol 286: 311–325.
66. Leake D, Asch WS, Canger AK, Schechter N (1999) Gefiltin in zebrafish
embryos: sequential gene expression of two neurofilament proteins in retinal
ganglion cells. Differentiation 65: 181–189.
67. Mally MI, Cirulli V, Hayek A, Otonkoski T (1996) ICA69 is expressed equally in
the human endocrine and exocrine pancreas. Diabetologia 39: 474–480.
68. Hill DJ, Hogg J, Petrik J, Arany E, Han VK (1999) Cellular distribution and
ontogeny of insulin-like growth factors (IGFs) and IGF binding protein
messenger RNAs and peptides in developing rat pancreas. J Endocrinol 160:
305–317.
69. Pleau JM, Throsby M, Esling A, Dardenne M (1997) Ontogeny of glutamic acid
decarboxylase gene expression in the mouse pancreas. Biochem Biophys Res
Commun 233: 227–230.
70. van Haeften TW, Twickler TB (2004) Insulin-like growth factors and pancreas
beta cells. Eur J Clin Invest 34: 249–255.
71. Lowe AW, Olsen M, Hao Y, Lee SP, Taek Lee K, et al. (2007) Gene expression
patterns in pancreatic tumors, cells and tissues. PLoS ONE 2: e323.
72. Inoue A, Takahashi M, Hatta K, Hotta Y, Okamoto H (1994) Developmental
regulation of islet-1 mRNA expression during neuronal differentiation in
embryonic zebrafish. Dev Dyn 199: 1–11.
73. Hutchinson SA, Eisen JS (2006) Islet1 and Islet2 have equivalent abilities to
promote motoneuron formation and to specify motoneuron subtype identity.
Development 133: 2137–2147.
74. Takamiya M, Campos-Ortega JA (2006) Hedgehog signalling controls zebrafish
neural keel morphogenesis via its level-dependent effects on neurogenesis. Dev
Dyn 235: 978–997.
75. Thisse C, Thisse B (2005) High throughput expression analysis of ZF-models
consortium clones. ZFIN Direct Data Submission.
76. Hans S, Scheer N, Riedl I, v Weizsacker E, Blader P, et al. (2004) her3, a
zebrafish member of the hairy-E(spl) family, is repressed by Notch signalling.
Development 131: 2957–2969.
77. Kim HJ, Schleiffarth JR, Jessurun J, Sumanas S, Petryk A, et al. (2005) Wnt5
signaling in vertebrate pancreas development. BMC Biol 3: 23.
78. Willer GB, Lee VM, Gregg RG, Link BA (2005) Analysis of the zebrafish
perplexed mutation reveals tissue-specific roles for de novo pyrimidine synthesis
during development. Genetics 170: 1827–1837.
79. Thisse B, Pflumio S, Furthauer M, Loppin B, Heyer V, et al. (2001) Expression
of the zebrafish genome during embryogenesis (NIH R01 RR15402). ZFIN
Direct Data Submission.
80. Wang Y, Barbacioru C, Hyland F, Xiao W, Hunkapiller KL, et al. (2006) Large
scale real-time PCR validation on gene expression measurements from twocommercial long-oligonucleotide microarrays. BMC Genomics 7: 59.
81. Lam SH, Winata CL, Tong Y, Korzh S, Lim WS, et al. (2006) Transcriptome
kinetics of arsenic-induced adaptive response in zebrafish liver. Physiol
Genomics 27: 351–361.
82. Jensen J, Heller RS, Funder-Nielsen T, Pedersen EE, Lindsell C, et al. (2000)
Independent development of pancreatic alpha- and beta-cells from neurogenin3-
expressing precursors: a role for the Notch pathway in repression of premature
differentiation. Diabetes 49: 163–176.
83. Habener JF, Kemp DM, Thomas MK (2005) Minireview: transcriptional
regulation in pancreatic development. Endocrinology 146: 1025–1034.
84. Jensen J (2004) Gene regulatory factors in pancreatic development. Dev Dyn
229: 176–200.
85. Jin Y, Blue EK, Dixon S, Shao Z, Gallagher PJ (2002) A death-associated
protein kinase (DAPK)-interacting protein, DIP-1, is an E3 ubiquitin ligase that
promotes tumor necrosis factor-induced apoptosis and regulates the cellular
levels of DAPK. J Biol Chem 277: 46980–46986.
86. Ma M, Jiang Y-J (2007) Jagged2a-Notch signaling mediates cell fate choice in
zebrafish pronephric duct. PLoS Genet 3: e18.
87. Yoo KW, Kim EH, Jung SH, Rhee M, Koo BK, et al. (2006) Snx5, as a Mind
bomb-binding protein, is expressed in hematopoietic and endothelial precursor
cells in zebrafish. FEBS Lett 580: 4409–4416.
Transcriptome of mib Alleles
PLoS ONE | www.plosone.org 14 January 2008 | Issue 1 | e1479
88. Qiu L, Joazeiro C, Fang N, Wang HY, Elly C, et al. (2000) Recognition and
ubiquitination of Notch by Itch, a hect-type E3 ubiquitin ligase. J Biol Chem275: 35734–35737.
89. Matesic LE, Haines DC, Copeland NG, Jenkins NA (2006) Itch genetically
interacts with Notch1 in a mouse autoimmune disease model. Hum Mol Genet15: 3485–3497.
90. Chang L, Kamata H, Solinas G, Luo JL, Maeda S, et al. (2006) The E3ubiquitin ligase Itch couples JNK activation to TNFa-induced cell death by
inducing c-FLIPL turnover. Cell 124: 601–613.
91. Schafer M, Kinzel D, Winkler C (2007) Discontinuous organization andspecification of the lateral floor plate in zebrafish. Dev Biol 301: 117–129.
92. Qiu X, Xu H, Haddon C, Lewis J, Jiang Y-J (2004) Sequence and embryonicexpression of three zebrafish fringe genes, lunatic fringe, radical fringe, and manic
fringe. Dev Dyn 231: 621–630.93. Wan H, Korzh S, Li Z, Mudumana SP, Korzh V, et al. (2006) Analyses of
pancreas development by generation of gfp transgenic zebrafish using an
exocrine pancreas-specific elastaseA gene promoter. Exp Cell Res 312:
1526–1539.
94. Huang H, Liu N, Lin S (2001) Pdx-1 knockdown reduces insulin promoter
activity in zebrafish. Genesis 30: 134–136.
95. Eisen MB, Brown PO (1999) DNA arrays for analysis of gene expression.
Methods Enzymol 303: 179–205.
96. Yang H, Haddad H, Tomas C, Alsaker K, Papoutsakis ET (2003) A segmental
nearest neighbor normalization and gene identification method gives superior
results for DNA-array analysis. Proc Natl Acad Sci U S A 100: 1122–1127.
97. Tusher VG, Tibshirani R, Chu G (2001) Significance analysis of microarrays
applied to the ionizing radiation response. Proc Natl Acad Sci U S A 98:
5116–5121.
98. Eisen MB, Spellman PT, Brown PO, Botstein D (1998) Cluster analysis and
display of genome-wide expression patterns. Proc Natl Acad Sci U S A 95:
14863–14868.
Transcriptome of mib Alleles
PLoS ONE | www.plosone.org 15 January 2008 | Issue 1 | e1479