The Lennard-Jones-Devonshire cell model revisited
9
arXiv:cond-mat/0111240v1 [cond-mat.soft] 13 Nov 2001 The Lennard-Jones–Devonshire cell model revisited James E. Magee Department of Physics and Astronomy, The University of Edinburgh, Edinburgh EH9 3JZ, U.K. Nigel B. Wilding Department of Mathematical Sciences, The University of Liverpool, Liverpool L69 7ZL, U.K. Abstract We reanalyse the cell theory of Lennard-Jones and Devonshire and find that in addition to the critical point originally reported for the 12 -6 potential (and widely quoted in standard textbooks), the model exhibits a further crit- ical point. We show that the latter is actually a more appropriate candidate for liquid-gas criticality than the original critical point. Typeset using REVT E X 1
Transcript of The Lennard-Jones-Devonshire cell model revisited
arX
iv:c
ond-
mat
/011
1240
v1 [
cond
-mat
.sof
t] 1
3 N
ov 2
001
The Lennard-Jones–Devonshire cell model revisited
James E. MageeDepartment of Physics and Astronomy, The University of Edinburgh,
Edinburgh EH9 3JZ, U.K.
Nigel B. WildingDepartment of Mathematical Sciences, The University of Liverpool, Liverpool L69 7ZL, U.K.
Abstract
We reanalyse the cell theory of Lennard-Jones and Devonshire and find
that in addition to the critical point originally reported for the 12−6 potential
(and widely quoted in standard textbooks), the model exhibits a further crit-
ical point. We show that the latter is actually a more appropriate candidate
for liquid-gas criticality than the original critical point.
Typeset using REVTEX
1
I. INTRODUCTION AND BACKGROUND
Lennard-Jones–Devonshire (LJD) cell theory [1–3] is a lattice approximation to the liq-uid state. Historically it was the prototype microscopic model to predict the location ofthe liquid-vapour critical point of a simple fluid and, as such, is widely employed as anintroduction to mean field theory in a number of standard texts and papers [4–6]. It is stillin use today for research applications [7,8].
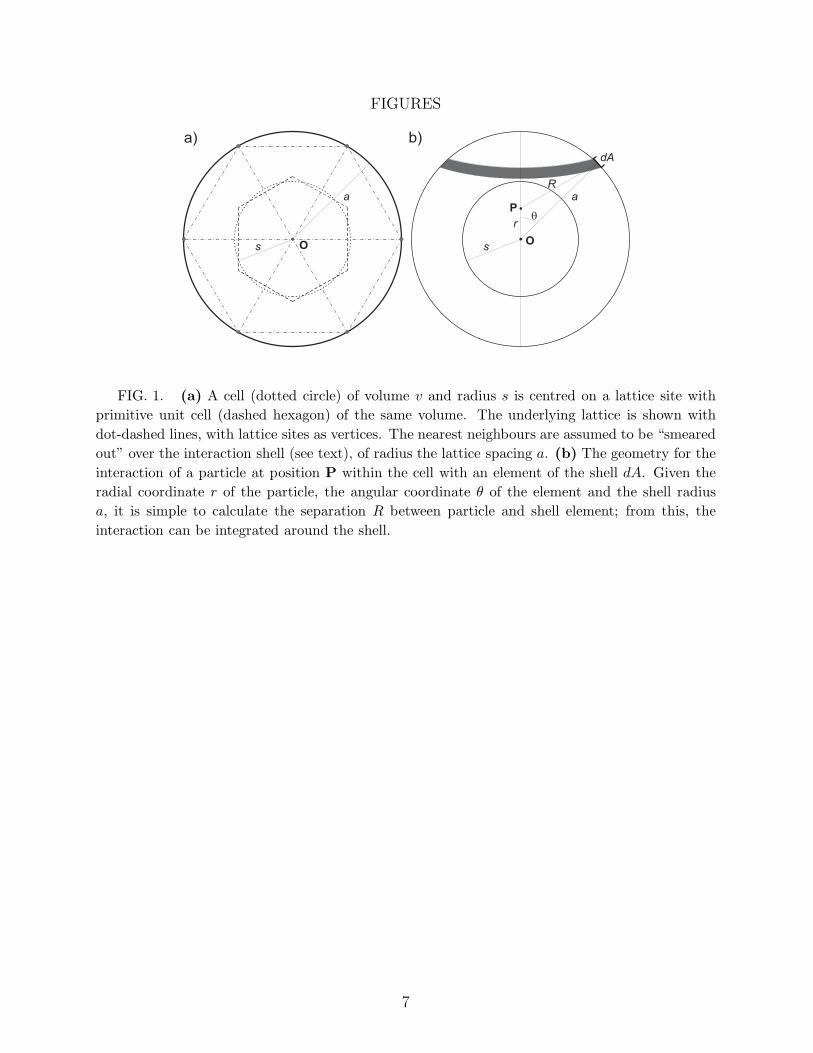
Within the framework of the model, particles are considered to be localised in singlyoccupied “cells”, centred on the sites of a fully occupied lattice (of some prescribed symme-try), within which they move independently. For simplicity, cells are assumed to be spheresof volume v = V/N (the inverse number density) and radius s. A particle is considered tointeract with its c nearest neighbours “smeared” around the surface of a further sphere ofradius a concentric with the cell. The volume of this “interaction sphere” is related to thecell volume by
a3 = γv , (1.1)
where γ is a lattice-dependent constant, chosen so that for a primitive unit cell of volume vthe lattice parameter will be the radius of the interaction shell (see figure 1(a)).
The Helmholtz free energy of the model is given by [1]
A = −NkBT ln vfσc +NE0
2. (1.2)
Here E0 is the “ground state energy” - the energy per particle if all occupied their latticesites; σc is a constant “communal entropy” term1, which attempts to account for the entropylost due to the localisation of particles within cells; and vf is the “free volume”,
vf =∫
ve−(E(r)−E0)/kBT dr , (1.3)
with E(r) the “cell potential” the interaction energy of a particle at a position r within itscell.
Figure 1(b) shows the cell geometry. The radial symmetry of the system allows E(r)to be written in terms of E(r), where r is the radial coordinate of the particle’s positionwithin the cell. Simple trigonometry yields the separation R between the particle at pointP within the cell and an element dA of the shell. If c neighbouring particles are assumedto be smeared over the interaction shell and the interparticle potential is given by u(R), thetotal energy of the particle E(r) is given by
E(r) = c
∫
shell u(R)dA
4πa2, (1.4)
where, for a prescribed cell size, the density enters through the limits on R. One wouldnormally perform this integration numerically with further numerical integration to calculatethe free volume according to eq. 1.3 for a given choice of number density ρ = v−1.
1Reference [1] assigns σc = e, although the exact value chosen for σc has no impact upon phase
coexistence so long as it is independent of volume.
2
LJD used the model described above to calculate the phase diagram for the 12–6 Lennard-Jones (LJ) potential,
u(r) = 4ε
(
σ12
r12−
σ6
r6
)
. (1.5)
They assumed a face centred cubic lattice structure with coordination number c = 12 andgeometrical constant γ =
√2. The value of E(r) (eq. 1.4) was calculated using the potential
of eq. 1.5. However for the calculation of the ground state energy E0 (appearing in eq. 1.2)they used the potential
u(r) = 4ε
(
σ12
r12− 1.2
σ6
r6
)
. (1.6)
Here the attractive part is increased by 20%, with respect to eq. 1.5, which was apparentlymotivated as representing the effects of next and higher nearest neighbour interactions.
For this system, LJD found a critical point at kBTc/ε ≈ 1.3, Pc/ε ≈ 0.6, ρc ≈ 0.56. Theseresults are to be compared with the consensus arising from a number of simulation studies ofcriticality in the LJ fluid, the most recent and sophisticated of which [10] quotes kBTc/ε =1.3120(7), Pc/ε = 0.1279(6), ρc = 0.316(1). That the cell theory apparently predicts thecritical temperature of the LJ fluid to high accuracy has for many years been regarded asits major success [4]. Indeed cell models remained the main method for calculation of liquidequations of state up until the advent of density functional theories [6].
II. METHOD AND RESULTS
We have obtained the cell theory phase diagram of the 12-6 LJ potential in order tocompare with the results of LJD. Our study employed the same model parameters as usedin the original study and was executed as follows.
Using the Romberg method [9], numerical integration was carried out to calculate thecell potential E(r) and thence vf and H (cf. eqns 1.2–1.4). The equation of state in thespace of the pressure P , volume per particle v, and the temperature T was obtained byusing a golden section search [9] to minimise the Gibbs free energy per particle
g(v) = A/N + Pv , (2.1)
with respect to v across a spread of points in P, T space. Within this scheme, first orderphase transitions were located by looking for jumps in v as P and T were varied2. Criticalpoints were estimated as the first point along a phase boundary where no distinct coexistencevolumes could be found.
2 Since the golden section search is vulnerable to finding local minima in g(v), we supplemented
this approach with a Newton-Raphson root-finding algorithm [9], which solves for the coexistence
conditions g(v1) = g(v2), P (v1) = P (v2).
3
The results of implementing this procedure, are shown in figure 2. We find a criticalpoint at kBTc/ε = 1.354, Pc/ǫ = 0.53, ρc = 0.57 which indeed appears to duplicate theoriginal LJD critical point [1]. However, our full phase diagram shows two lines of first ordertransition, meeting at a triple point, both terminating in critical points.
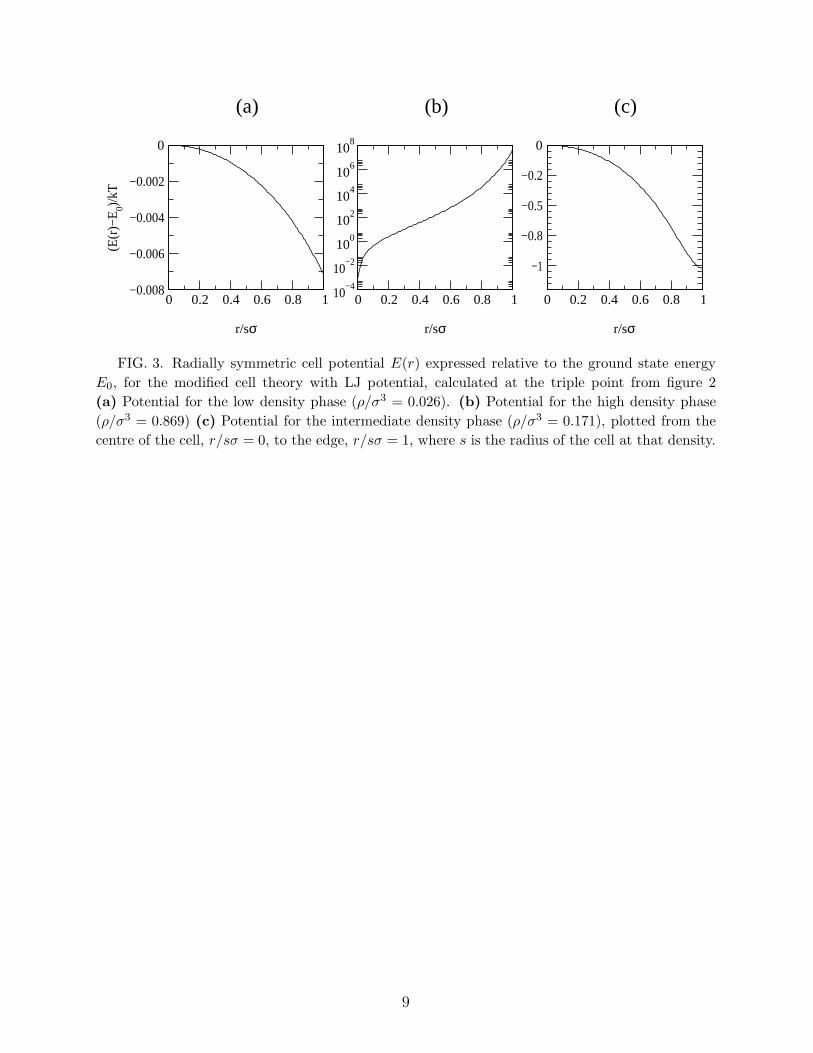
In attempting to identify the phases appearing in figure 2, it should be borne in mindthat the lattice based character of the cell model precludes an accurate representation ofnon-crystalline phases. Accordingly it is not possible to assign unambiguously the physicalnature of the phases. Nevertheless a plausible identification is suggested by the phase diagramitself which, in the region of the triple point, is reminiscent of that for a simple fluid suchas Argon. Above the triple point temperature in such a system, an increase in pressuredrives the system from a gas, to a liquid to a solid. That the same phase assignments arereasonable in the present model is supported by an analysis of their (radially symmetric)cell potential E(r), evaluated at the triple point (kBTc/ε = 1.02, Pc/ǫ = 0.025), which wenow address.
Figure 3(a) shows the cell potential E(r) expressed relative to the ground state energyE0 for the low density phase. This quantity is three orders of magnitude smaller than kBTacross the whole cell, so the low density phase can quite reasonably be interpreted as gas-like.By contrast, the cell potential for the high density phase (figure 3(b)) exhibits a very steepminimum at r = 0, the centre of the cell. Away from the centre, the particles experience thehard core repulsion of their neighbours and the potential energy becomes large and positive.Thus the particle is strongly confined to its lattice site, and the phase can be consideredsolid-like. The cell potential energy for the intermediate density phase is shown in figure3(c). Its form is similar to that of the gas-like phase though the scale is different–there isa broad “hump” in the middle of the cell, of height around kBT . Thus the particle is stillreasonably free within the cell and it seem reasonable to interpret this as a liquid-like phase.With these phase assignments 3, the critical point found by LJD is between a solid-likephase and a liquid-like phase, whilst the other, lower-temperature critical point terminatesa liquid-gas transition at kBTc/ε = 2.17, Pc/ε = 1.221, ρc = 0.104.
III. DISCUSSION AND CONCLUSIONS
We have shown that the original LJD cell theory critical point for the 12-6 potential[1] terminates a line of pseudo solid-liquid coexistence, rather than a liquid-gas transitionas originally postulated. Moreover, we find that the model exhibits a further first ordertransition, which we believe is a more appropriate candidate for the liquid-vapour line thanthat suggested by LJD. It seems likely that LJD overlooked the transition we have foundbecause at the time of their study, numerical integration was extremely labour intensive,
3Hill [4] describes the cell theory without the modified ground state term used by LJD, but quotes
the critical parameters corresponding to a modified system defined in ref. [12]. For the unmodified
system we find cell potentials similar in form to those of fig. 3, so we retain our previous phase
designations. However the critical temperature of the “solid-liquid”-like critical point found by
LJD is reduced to kBTc/ε = 0.82. The effect on the liquid-gas transition is much less pronounced.
4
rendering it difficult to attain the rather low densities at which the gas-like phase appears.Presumably also, the proximity of their critical point temperature to the “real” LJ criticalpoint (estimated at the time from experimental data for Argon), made it tempting to makethe identification they did. In hindsight this agreement can only be regarded as coincidental;one would expect a crude mean field theory such as the cell model to considerably overes-
timate the critical temperature due to the neglect of fluctuations. The new critical pointreported here does indeed do so.
Of course a critical point between a solid-like and liquid-like states (as found by LJD) isan artifact of the cell structure of the model, which imposes long ranged orientational andtranslational order on the liquid where none exists in reality. The inability of cell theory toaccurately represent disordered phases has long been appreciated and several attempts havebeen made to ameliorate this and other shortcomings of the approach. These include zero-and multiple-occupancy of cells (“hole” theories) [4,11]; calculations of interactions withsecond- and higher nearest neighbours (see eg. ref. [12]); use of numerical integration to givemore accurate cell shapes and free volumes [13]; and differing methods for calculating thecell potential (see eg. [7]). However, none of these extensions fully address the underlyinglattice approximation which renders suspect any cell theory equation of state for a liquid -by definition, a disordered state without a lattice. Even hole theories will only be able torepresent a liquid of appreciable density as a highly defective crystal.
Finally we briefly point out implications of our findings for other recent work on celltheory. In ref. [7] a modified cell theory is introduced with the specific intention of engi-neering a freezing transition. This authors state that no such transition exists in the LJDcell theory, in the apparent belief that the critical point of the bare model is liquid-gas incharacter.
In other recent work (which in fact motivated the present study), a cell model has beenemployed to study the phenomenon of the second critical point which is observed in purefluids interacting via so-called core-softened potentials [8]. In such systems liquid-liquidphase separation occurs in addition to liquid-gas coexistence. Clearly in view of our finding,that even the basic cell theory for the 12-6 potential exhibits two critical points, the resultsof such studies should be interpreted with caution. We intend to report in depth on thismatter in a future communication.
ACKNOWLEDGMENTS
The authors thank A.D. Bruce, for helpful advice and discussions.
5
REFERENCES
[1] Lennard-Jones, J.E., Devonshire, A.F., Proc. Roy. Soc. London A163, 53 (1937); ibidA165, 1 (1938).
[2] Kirkwood, J.G., J. Chem. Phys. 18, 380 (1950).[3] Barker, J.A., Lattice Theories of the Liquid State, Pergamon Press (1963).[4] Hill, T.L., Statistical Mechanics - Principles and Selected Applications, McGraw-Hill
(1956) Chapter 8.[5] Fowler R.H., and Guggenheim, E.A. Statistical Thermodynamics for students of physics
and chemistry, Cambridge University Press (1949).[6] Burshtein, A.I.; Introduction to thermodynamics and kinetic theory of matter, Wiley
(New York) (1996).[7] Modarress, H., Ahmadnia, E., and Mansoori, G.A.; J. Chem. Phys. 111, 10236 (1999);
Pourgheysar, P., Mansoori, G.A. and H., Ahmadnia, E.; J. Chem. Phys. 105, 9580(1996).
[8] Sadr-Lahijany, M.R., Scala, A., Buldyrec, S.V., Stanley, H.E.; Phys. Rev. Lett. 81, 4895(1998).
[9] Press, W.H., Teukolsky, S.A., Vetterling, W.T., Flannery, B.P., Numerical Recipes in
C, Cambridge University Press (1992).[10] Potoff, J.J., and Panagiotopoulos, A.Z., J. Chem. Phys. 109 10914 (1998), and refer-
ences therein.[11] Lennard-Jones, J.E., Devonshire, A.F., Proc. Roy. Soc. London A169, 317 (1939).[12] Wentorf, W.H., Buehler, R.H., Hirschfelder, J.O., Curtiss, C.F.; J. Chem. Phys. 18,
1484 (1950).[13] Buehler, R.J., Wentorf, R.H., Hirshfelder, J.O., Curtiss, C.F., J Chem Phys. 19, 61
(1951).
6
FIGURES
FIG. 1. (a) A cell (dotted circle) of volume v and radius s is centred on a lattice site with
primitive unit cell (dashed hexagon) of the same volume. The underlying lattice is shown with
dot-dashed lines, with lattice sites as vertices. The nearest neighbours are assumed to be “smeared
out” over the interaction shell (see text), of radius the lattice spacing a. (b) The geometry for the
interaction of a particle at position P within the cell with an element of the shell dA. Given the
radial coordinate r of the particle, the angular coordinate θ of the element and the shell radius
a, it is simple to calculate the separation R between particle and shell element; from this, the
interaction can be integrated around the shell.
7

0 0.5 1 1.5 2 2.5 3kT/ε
0
0.1
0.2
0.3
0.4
0.5
Pσ3 /ε
0 0.1 0.2 0.3 0.4 0.5 0.6 0.7 0.8 0.9 1ρσ3
0
0.5
1
1.5
2
2.5
3
kT/ε
(a)
(b)
FIG. 2. (a) Projection of the cell theory LJ potential phase diagram in the (ρ, T ) plane
with ρ = v−1. Dots show density points found using the golden section search. Solid lines show
coexistence densities. (b) (P, T ) projection of the same phase diagram. Solid lines indicate lines of
first-order phase transition, filled circles indicate critical points. Note that the lower temperature,
higher pressure critical point is that found by LJD.
8
0 0.2 0.4 0.6 0.8 1
r/sσ
−0.008
−0.006
−0.004
−0.002
0
(E(r
)−E 0)/
kT(a)
0 0.2 0.4 0.6 0.8 1
r/sσ
10−4
10−2
100
102
104
106
108
(b)
0 0.2 0.4 0.6 0.8 1
r/sσ
−1
−0.8
−0.5
−0.2
0
(c)
FIG. 3. Radially symmetric cell potential E(r) expressed relative to the ground state energy
E0, for the modified cell theory with LJ potential, calculated at the triple point from figure 2
(a) Potential for the low density phase (ρ/σ3 = 0.026). (b) Potential for the high density phase
(ρ/σ3 = 0.869) (c) Potential for the intermediate density phase (ρ/σ3 = 0.171), plotted from the
centre of the cell, r/sσ = 0, to the edge, r/sσ = 1, where s is the radius of the cell at that density.
9