The Kinetics of Reduction of Dense Synthetic Nickel Oxide in H 2 -N 2 and H 2 -H 2 O Atmospheres
16
The Kinetics of Reduction of Dense Synthetic Nickel Oxide in H 2 -N 2 and H 2 -H 2 O Atmospheres T. HIDAYAT, M.A. RHAMDHANI, E. JAK, and P.C. HAYES An investigation of the kinetics of reduction of dense synthetic nickel oxide has been carried out in H 2 -N 2 and H 2 -H 2 O mixtures between 500 °C and 1000 °C. The progress of the reduction was followed metallographically by the measurement of the advance of the nickel product layer. The influences of hydrogen partial pressure, hydrogen-steam ratio, and temperature were system- atically investigated in both sets of the mixtures. Increasing hydrogen partial pressure under all conditions investigated results in an increase in the reduction rate. In H 2 -N 2 mixtures and H 2 -H 2 O mixtures with low steam content, the initial reduction rate was found to be first order with respect to hydrogen partial pressure. In both sets of mixtures, it was found that the progress of Ni thickness was not a monotonic function of temperature. A minimum rate of advancement of Ni product was observed between 600 °C and 800 °C, depending on the hydrogen partial pressures and reduction time. The change in reduction behavior is shown to be directly linked to changes in Ni product microstructure. DOI: 10.1007/s11663-008-9212-0 Ó The Minerals, Metals & Materials Society and ASM International 2008 I. INTRODUCTION GASEOUS hydrogen reduction of solid NiO is one of the processes used to produce nickel metal. Gaseous reduction is used industrially in a number of operations. For example, basic nickel carbonate (BNC) is converted to nickel oxide and subsequently to nickel metal compacts in the nickel refinery at BHP Billiton, Yabulu Refinery, Australia. [1] The basic nickel carbonate is prepared from laterite ores and from nickel hydroxide intermediate product using a modified Caron process. The nickel hydroxide is in turn sourced from pressure acid leaching operations at Ravensthorpe, Western Australia. Hydrogen reduction of nickel oxide particles produced through pyrohydrolysis of chloride solutions is also being undertaken at the Goro nickel plant Noumea. [2] Another application of the gaseous hydro- gen reduction of solid NiO can also be found in the preparation of catalysts. [3,4] In the industrial practice, the reducing mixtures can also contain significant proportions of nitrogen gas and steam. The presence of these gases has the effect of altering the chemical rate and thermodynamic driving force of the reduction process. In order to enable improvements in the design and control of industrial processes to be undertaken, a systematic study has been undertaken to investigate the effects of hydrogen partial pressure, hydrogen-steam ratio, and temperature on the kinetics of NiO reduction. The overall reaction for gaseous reduction of nickel oxide with hydrogen can be expressed as follows: NiO ðsÞþ H 2 ðgÞ! Ni ðsÞþ H 2 O ðgÞ ½1 Although this appears superficially to be a simple reaction, the reduction of nickel oxide by hydrogen is a heterogeneous reaction that involves a number of com- plex elementary processes, namely, the following: [5,6] (1) mass transport of reactant and product gases between gas bulk and reacting oxide particle; (2) chemical reactions between reactant and oxygen atoms of the oxide; (3) mass transport of reactants and products in the form of gases, atoms, cations, or anions throughout the particle, including diffusion in condensed phases and porous media; and (4) nucleation and growth of metal product. The factors influencing the rates of elementary pro- cesses and their influence on the overall rate of reduction and morphology are still not completely characterized. The nature of the chemical reaction steps (2) occurring in heterogeneous reactions of this type, and the microstruc- tural changes accompanying them, are not well charac- terized. Chemical reaction substeps can occur on both oxide and metal surfaces, when used in relation to metal compound reaction the latter commonly being referred to as autocatalytic reduction processes. Some of these issues have been discussed in previous studies and reviews. [7–12] Many studies have been undertaken on the gaseous reduction of nickel oxide with hydrogen. A range of particle sizes (100 to 12,000 lm) and sample geome- tries (powder, pellet, and plate) have been used in T. HIDAYAT, Postgraduate Student, E. JAK, Director, and P.C. HAYES, Xstrata Professor of Metallurgical Engineering, are with the Pyrometallurgy Research Centre, The University of Queensland, Brisbane, QLD 4072, Australia. Contact e-mail: taufiq.hidayat. [email protected] M.A. RHAMDHANI, formerly Postdoctoral Research Fellow, with the Pyrometallurgy Research Centre, The University of Queensland, is Lecturer, the Faculty of Engineering and Industrial Sciences, Swinburne University of Technology, Melbourne, VIC 3122, Australia. Manuscript submitted May 18, 2008. Article published online January 6, 2009. METALLURGICAL AND MATERIALS TRANSACTIONS B VOLUME 40B, FEBRUARY 2009—1
-
Upload
independent -
Category
Documents
-
view
1 -
download
0
Transcript of The Kinetics of Reduction of Dense Synthetic Nickel Oxide in H 2 -N 2 and H 2 -H 2 O Atmospheres
The Kinetics of Reduction of Dense Synthetic Nickel Oxidein H2-N2 and H2-H2O Atmospheres
T. HIDAYAT, M.A. RHAMDHANI, E. JAK, and P.C. HAYES
An investigation of the kinetics of reduction of dense synthetic nickel oxide has been carried outin H2-N2 and H2-H2O mixtures between 500 �C and 1000 �C. The progress of the reduction wasfollowed metallographically by the measurement of the advance of the nickel product layer. Theinfluences of hydrogen partial pressure, hydrogen-steam ratio, and temperature were system-atically investigated in both sets of the mixtures. Increasing hydrogen partial pressure under allconditions investigated results in an increase in the reduction rate. In H2-N2 mixtures andH2-H2O mixtures with low steam content, the initial reduction rate was found to be first orderwith respect to hydrogen partial pressure. In both sets of mixtures, it was found that theprogress of Ni thickness was not a monotonic function of temperature. A minimum rate ofadvancement of Ni product was observed between 600 �C and 800 �C, depending on thehydrogen partial pressures and reduction time. The change in reduction behavior is shown to bedirectly linked to changes in Ni product microstructure.
DOI: 10.1007/s11663-008-9212-0� The Minerals, Metals & Materials Society and ASM International 2008
I. INTRODUCTION
GASEOUS hydrogen reduction of solid NiO is oneof the processes used to produce nickel metal. Gaseousreduction is used industrially in a number of operations.For example, basic nickel carbonate (BNC) is convertedto nickel oxide and subsequently to nickel metalcompacts in the nickel refinery at BHP Billiton, YabuluRefinery, Australia.[1] The basic nickel carbonate isprepared from laterite ores and from nickel hydroxideintermediate product using a modified Caron process.The nickel hydroxide is in turn sourced from pressureacid leaching operations at Ravensthorpe, WesternAustralia. Hydrogen reduction of nickel oxide particlesproduced through pyrohydrolysis of chloride solutionsis also being undertaken at the Goro nickel plantNoumea.[2] Another application of the gaseous hydro-gen reduction of solid NiO can also be found in thepreparation of catalysts.[3,4]
In the industrial practice, the reducing mixtures canalso contain significant proportions of nitrogen gas andsteam. The presence of these gases has the effect ofaltering the chemical rate and thermodynamic drivingforce of the reduction process. In order to enableimprovements in the design and control of industrialprocesses to be undertaken, a systematic study has been
undertaken to investigate the effects of hydrogen partialpressure, hydrogen-steam ratio, and temperature on thekinetics of NiO reduction.The overall reaction for gaseous reduction of nickel
oxide with hydrogen can be expressed as follows:
NiO ðsÞ þH2 ðgÞ ! Ni ðsÞ þH2O ðgÞ ½1�
Although this appears superficially to be a simplereaction, the reduction of nickel oxide by hydrogen is aheterogeneous reaction that involves a number of com-plex elementary processes, namely, the following:[5,6]
(1) mass transport of reactant and product gasesbetween gas bulk and reacting oxide particle;
(2) chemical reactions between reactant and oxygenatoms of the oxide;
(3) mass transport of reactants and products in the formof gases, atoms, cations, or anions throughout theparticle, including diffusion in condensed phases andporous media; and
(4) nucleation and growth of metal product.
The factors influencing the rates of elementary pro-cesses and their influence on the overall rate of reductionand morphology are still not completely characterized.The nature of the chemical reaction steps (2) occurring inheterogeneous reactions of this type, and the microstruc-tural changes accompanying them, are not well charac-terized. Chemical reaction substeps can occur on bothoxide and metal surfaces, when used in relation to metalcompound reaction the latter commonly being referred toas autocatalytic reduction processes. Some of these issueshave been discussed in previous studies and reviews.[7–12]
Many studies have been undertaken on the gaseousreduction of nickel oxide with hydrogen. A range ofparticle sizes (100 to 12,000 lm) and sample geome-tries (powder, pellet, and plate) have been used in
T. HIDAYAT, Postgraduate Student, E. JAK, Director, and P.C.HAYES, Xstrata Professor of Metallurgical Engineering, are with thePyrometallurgy Research Centre, The University of Queensland,Brisbane, QLD 4072, Australia. Contact e-mail: [email protected] M.A. RHAMDHANI, formerly PostdoctoralResearch Fellow, with the Pyrometallurgy Research Centre, TheUniversity of Queensland, is Lecturer, the Faculty of Engineering andIndustrial Sciences, Swinburne University of Technology, Melbourne,VIC 3122, Australia.
Manuscript submitted May 18, 2008.Article published online January 6, 2009.
METALLURGICAL AND MATERIALS TRANSACTIONS B VOLUME 40B, FEBRUARY 2009—1
previous studies.[2–4,13–19] The overall progress of nickeloxide reduction in these studies was monitored byvarious techniques, such as thermogravimetric method,neutron transmission method, and X-ray diffractiontechnique. Despite the best efforts of these previousworkers to avoid mass-transfer limitations in theirexperimental design and to control/characterize reac-tion interface geometry, there is clearly no agreementon the intrinsic chemical reaction rates associated withthe reduction conditions.[16]
Recognizing that there is a need to obtain thisinformation, an improved experimental technique forthe investigation of the kinetics of reduction of densesynthetic NiO in H2-N2 and H2-H2O atmospheres usingplatelike samples of known geometry has been devel-oped. This technique was previously used in the inves-tigation of wustite and magnetite reduction.[20,21] Theimportant features of the technique are as follows:
(1) elimination of the gas phase mass-transfer limitationby utilization of very small samples and high lineargas velocities around the sample;
(2) introduction of the small sample directly into thedesired reaction conditions, thus, the sample reachesthe reaction conditions in a fraction of a second; and
(3) preservation of the morphology developed in thesample during the reduction by rapidly quenchingthe partially reduced sample directly into liquidnitrogen.
The progress of the reduction of individual samplesafter reduction for selected reaction times in the presentstudy was monitored by measuring the thickness ofnickel metal product. Systematic investigation of theeffects of hydrogen partial pressure, hydrogen-steamratio, and temperature on the overall rate was achievedby undertaking multiple experiments under a range ofprocess conditions. Examination of the product micro-structure was also conducted at selected conditions andrelated to the kinetics of reduction.
II. EXPERIMENTAL
The method used for the preparation of densesynthetic polycrystalline nickel oxide and the reductionexperiment has previously been described in detail bythe authors.[22] In brief, high purity nickel sheets(99.98 pct Ni, Sigma-Aldrich, NSW, Australia) wereoxidized at 1435 �C for 6 days in air. Each of the oxidesheets was cut to obtain dense NiO samples withdimensions of approximately 2 9 2 9 1 mm.
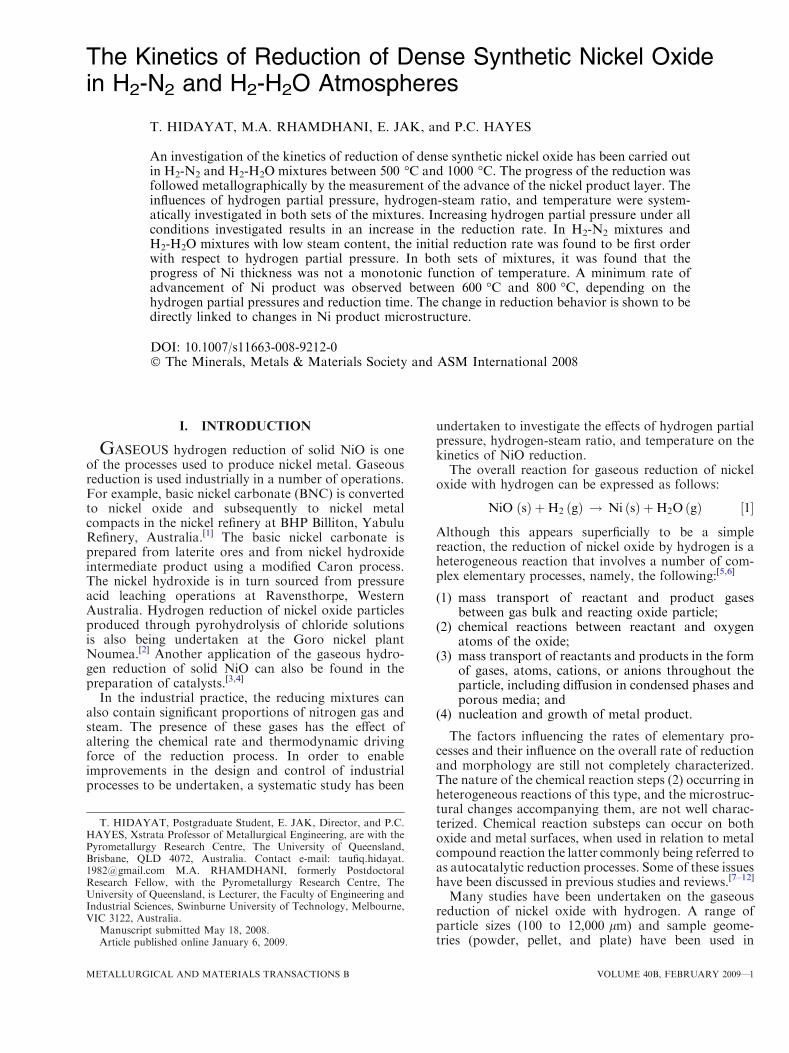
The reductions of the samples were carried out in aspecially designed apparatus shown schematically inFigure 1. The reduction apparatus consists of severalmajor units, i.e., gas burner-preheating (hot-box),reduction furnace, and quenching medium. In thethermally insulated hot-box the gases were heated to300 �C. In the case of reduction in H2-H2O mixtures,this chamber was also used to facilitate the reactionbetween O2 and excess of H2. A burner with a platinumheating element was installed inside the hotbox. Theplatinum heating element was used to ensure continuous
and complete ignition of H2 and O2 gases in the mixingchamber. From this ignition, steam and an excess ofhydrogen gas were produced creating selected ratios ofH2-H2O.In the reduction furnace the reaction between single
dense NiO samples and reducing gas takes place. Thesample was directly introduced into the hot-zone of thereduction furnace through an airlock entrance at the topof the apparatus. The sample falls into the reaction tubeinto a given position on an alumina base attached toan alumina rod. This position is designed to ensuremaximum linear gas velocity over the sample surfaceduring the reaction. After the required reduction periodthe sample was retrieved by lowering the alumina rod.The gap created between the sample holder and theinner reaction tube allows the sample to fall undergravity to the liquid nitrogen quenching medium. Theuse of liquid nitrogen provides both a thermal quenchthrough cooling of the small sample and a chemicalquench by creating a large volume of neutral nitrogengas around the sample. In this way, the morphology ofthe sample formed at temperature is retained withoutchange during rapid cooling to room temperature.By performing reductions using gas mixtures with
various H2-N2 and H2-H2O ratios, the chemical ratesand thermodynamic driving forces of the nickel oxidereduction can be independently controlled; the latter isreflected by the difference of oxygen potential betweenthe oxide/metal phase assemblage and the oxygenpotential of the gas atmosphere. In the system under-study the activities of nickel and nickel oxide are unityrelative to the pure solids. The Gibbs free energy offormation of NiO was taken from the FactSage thermo-dynamic database version 5.5.[23] The changes to thechemical rate was carried out by varying the proportionsof H2-N2, while the changes to the thermodynamicdriving force was carried out by varying the hydrogen tosteam ratio. The flow of each of the gases entering thereduction furnace was controlled by using calibratedpressure differential type flowmeters. A total flow-rate of1000 mL min�1 (1 atm, 25 �C) was applied to minimizethe resistance to the gas phase mass transfer from thebulk gas to the outer surface of the particle.
Fig. 1—Arrangement of reduction apparatus.
2—VOLUME 40B, FEBRUARY 2009 METALLURGICAL AND MATERIALS TRANSACTIONS B
The progress of the reduction reaction was followedby measuring the advance of Ni product layer afterselected reaction times on a series of separate samples.To enable these observations, the cross sections of thepartially reduced samples were prepared using conven-tional metallographic technique, i.e., mounting thesamples at 90 deg to the major axis in acrylic resin,grinding with silicon carbide paper, and polishing usingdiamond paste from 6 to 0.25 lm. The observations ofthe sample cross sections were carried out using opticalmicroscopy OLYMPUS*AX70 and scanning electron
microscopy (SEM) under a backscattered electron modewith Philips XL-30 (Philips is currently part of FEICompany, Hillsboro, OR). For selected conditions,investigation of the product structures was also carriedout using a cold-field emission gun SEM JEOL**
6400F. For the examination under Philips XL-30 andJEOL 6400F, the samples were first coated with Pt usingEiko IB-5 Sputter Coater (Eiko Co. Ltd., Hitachinaka,Japan) for 5 minutes.
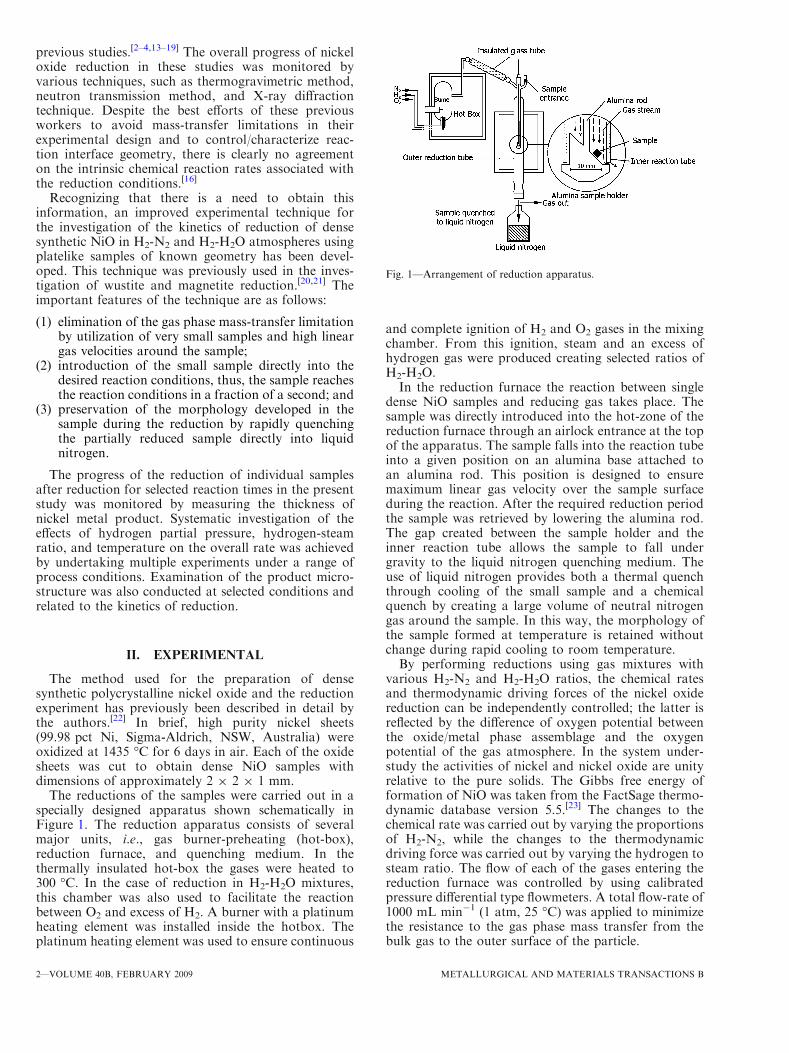
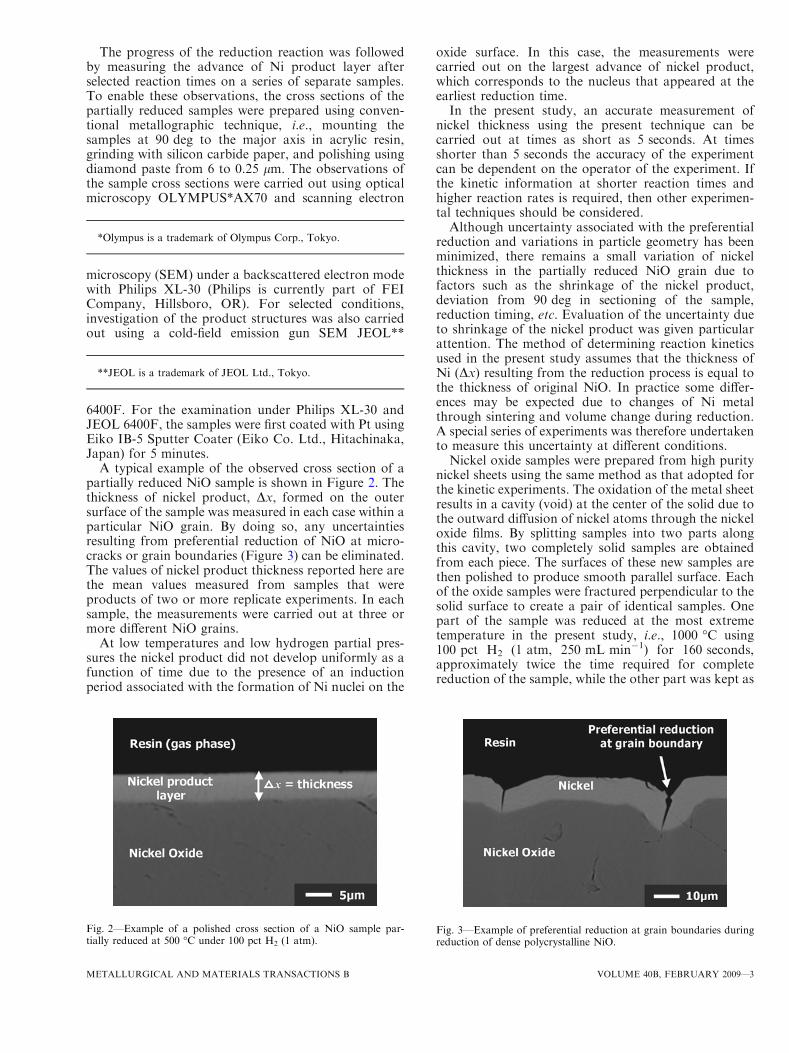
A typical example of the observed cross section of apartially reduced NiO sample is shown in Figure 2. Thethickness of nickel product, Dx, formed on the outersurface of the sample was measured in each case within aparticular NiO grain. By doing so, any uncertaintiesresulting from preferential reduction of NiO at micro-cracks or grain boundaries (Figure 3) can be eliminated.The values of nickel product thickness reported here arethe mean values measured from samples that wereproducts of two or more replicate experiments. In eachsample, the measurements were carried out at three ormore different NiO grains.
At low temperatures and low hydrogen partial pres-sures the nickel product did not develop uniformly as afunction of time due to the presence of an inductionperiod associated with the formation of Ni nuclei on the
oxide surface. In this case, the measurements werecarried out on the largest advance of nickel product,which corresponds to the nucleus that appeared at theearliest reduction time.In the present study, an accurate measurement of
nickel thickness using the present technique can becarried out at times as short as 5 seconds. At timesshorter than 5 seconds the accuracy of the experimentcan be dependent on the operator of the experiment. Ifthe kinetic information at shorter reaction times andhigher reaction rates is required, then other experimen-tal techniques should be considered.Although uncertainty associated with the preferential
reduction and variations in particle geometry has beenminimized, there remains a small variation of nickelthickness in the partially reduced NiO grain due tofactors such as the shrinkage of the nickel product,deviation from 90 deg in sectioning of the sample,reduction timing, etc. Evaluation of the uncertainty dueto shrinkage of the nickel product was given particularattention. The method of determining reaction kineticsused in the present study assumes that the thickness ofNi (Dx) resulting from the reduction process is equal tothe thickness of original NiO. In practice some differ-ences may be expected due to changes of Ni metalthrough sintering and volume change during reduction.A special series of experiments was therefore undertakento measure this uncertainty at different conditions.Nickel oxide samples were prepared from high purity
nickel sheets using the same method as that adopted forthe kinetic experiments. The oxidation of the metal sheetresults in a cavity (void) at the center of the solid due tothe outward diffusion of nickel atoms through the nickeloxide films. By splitting samples into two parts alongthis cavity, two completely solid samples are obtainedfrom each piece. The surfaces of these new samples arethen polished to produce smooth parallel surface. Eachof the oxide samples were fractured perpendicular to thesolid surface to create a pair of identical samples. Onepart of the sample was reduced at the most extremetemperature in the present study, i.e., 1000 �C using100 pct H2 (1 atm, 250 mL min�1) for 160 seconds,approximately twice the time required for completereduction of the sample, while the other part was kept as
Fig. 2—Example of a polished cross section of a NiO sample par-tially reduced at 500 �C under 100 pct H2 (1 atm).
Fig. 3—Example of preferential reduction at grain boundaries duringreduction of dense polycrystalline NiO.
*Olympus is a trademark of Olympus Corp., Tokyo.
**JEOL is a trademark of JEOL Ltd., Tokyo.
METALLURGICAL AND MATERIALS TRANSACTIONS B VOLUME 40B, FEBRUARY 2009—3
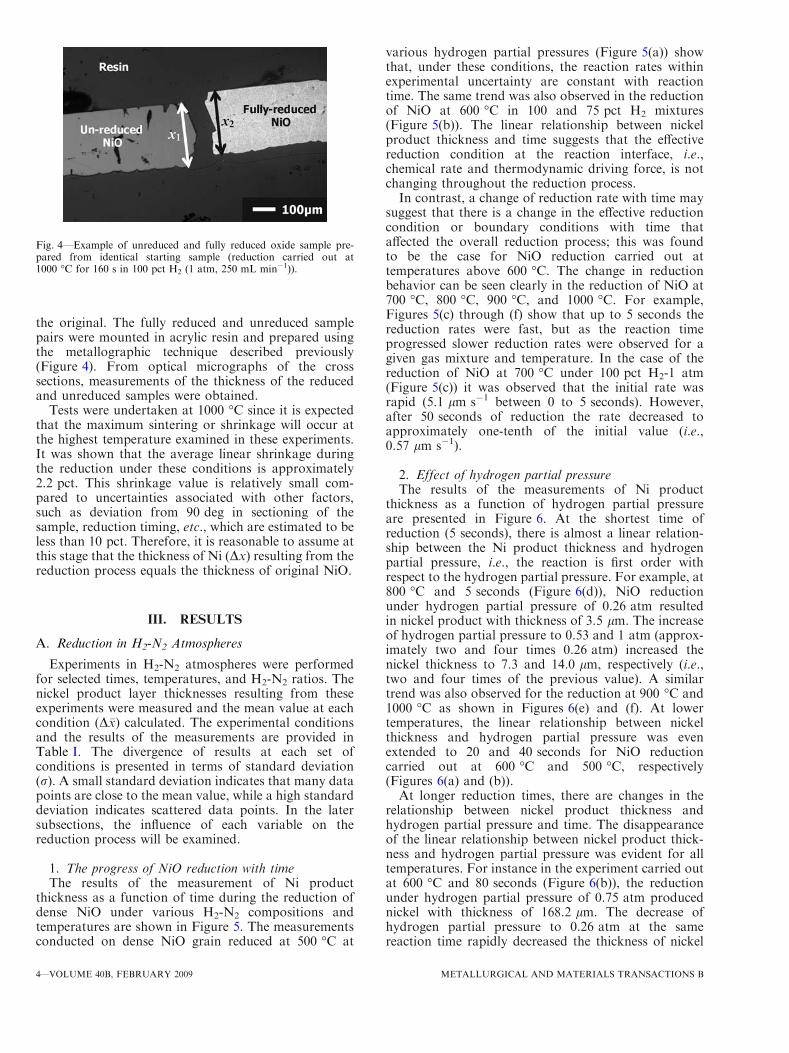
the original. The fully reduced and unreduced samplepairs were mounted in acrylic resin and prepared usingthe metallographic technique described previously(Figure 4). From optical micrographs of the crosssections, measurements of the thickness of the reducedand unreduced samples were obtained.
Tests were undertaken at 1000 �C since it is expectedthat the maximum sintering or shrinkage will occur atthe highest temperature examined in these experiments.It was shown that the average linear shrinkage duringthe reduction under these conditions is approximately2.2 pct. This shrinkage value is relatively small com-pared to uncertainties associated with other factors,such as deviation from 90 deg in sectioning of thesample, reduction timing, etc., which are estimated to beless than 10 pct. Therefore, it is reasonable to assume atthis stage that the thickness of Ni (Dx) resulting from thereduction process equals the thickness of original NiO.
III. RESULTS
A. Reduction in H2-N2 Atmospheres
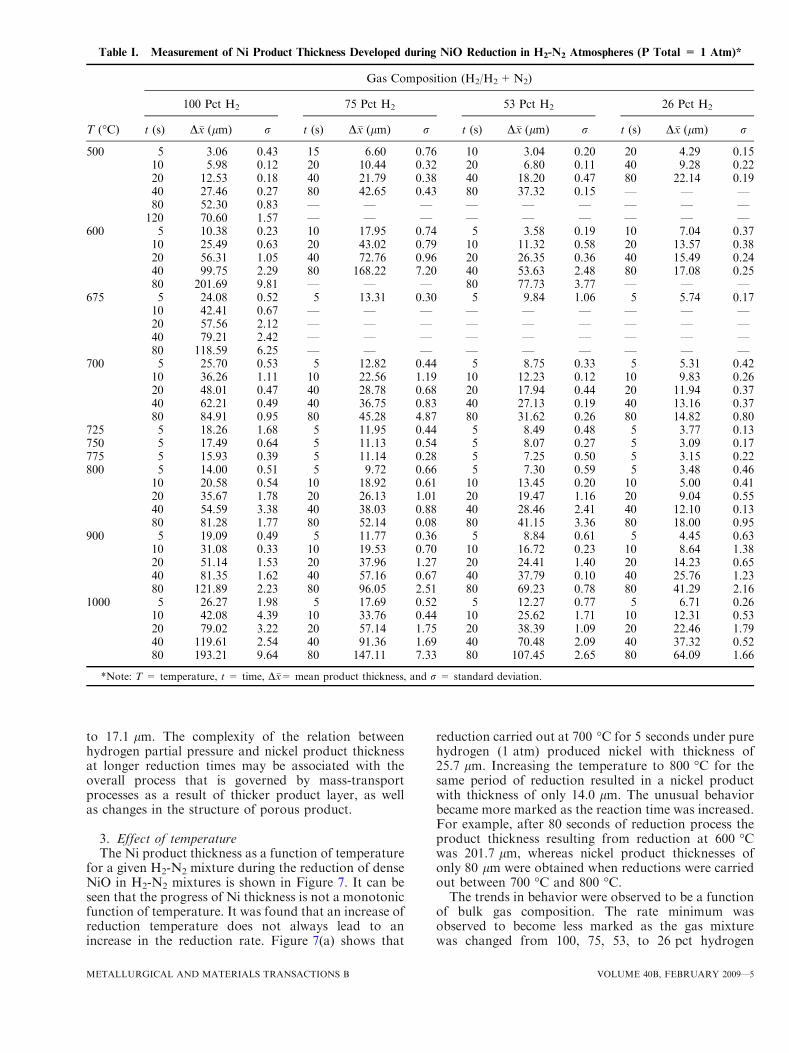
Experiments in H2-N2 atmospheres were performedfor selected times, temperatures, and H2-N2 ratios. Thenickel product layer thicknesses resulting from theseexperiments were measured and the mean value at eachcondition (D�x) calculated. The experimental conditionsand the results of the measurements are provided inTable I. The divergence of results at each set ofconditions is presented in terms of standard deviation(r). A small standard deviation indicates that many datapoints are close to the mean value, while a high standarddeviation indicates scattered data points. In the latersubsections, the influence of each variable on thereduction process will be examined.
1. The progress of NiO reduction with timeThe results of the measurement of Ni product
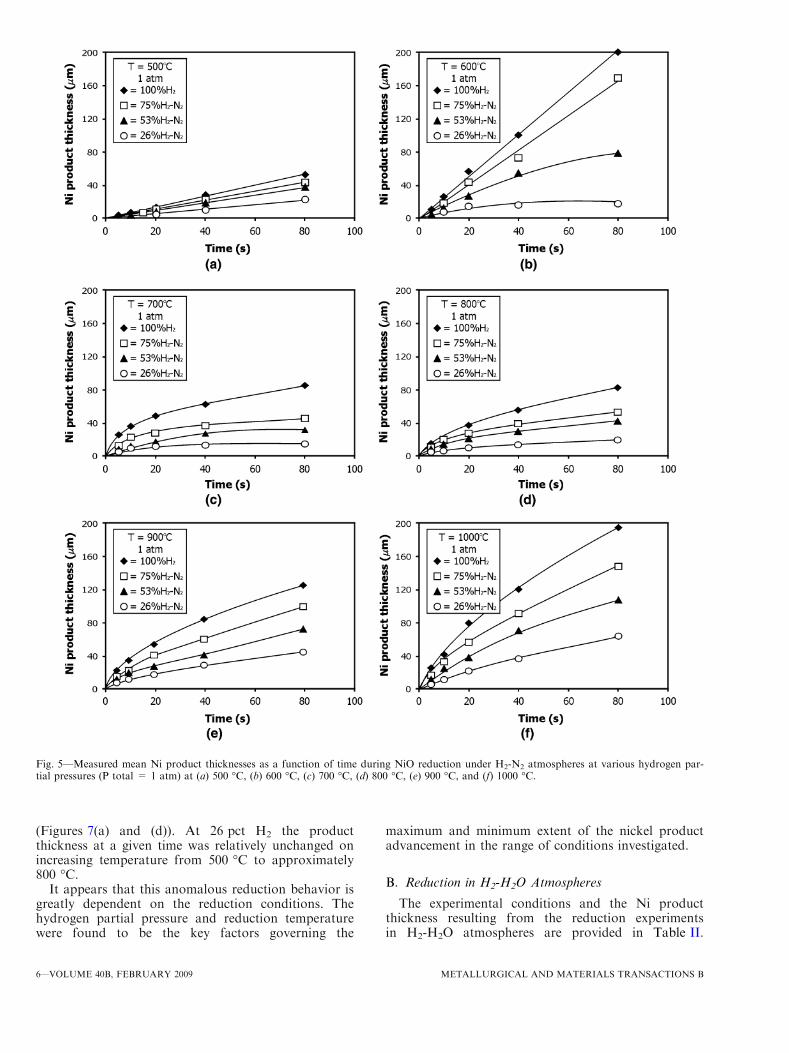
thickness as a function of time during the reduction ofdense NiO under various H2-N2 compositions andtemperatures are shown in Figure 5. The measurementsconducted on dense NiO grain reduced at 500 �C at
various hydrogen partial pressures (Figure 5(a)) showthat, under these conditions, the reaction rates withinexperimental uncertainty are constant with reactiontime. The same trend was also observed in the reductionof NiO at 600 �C in 100 and 75 pct H2 mixtures(Figure 5(b)). The linear relationship between nickelproduct thickness and time suggests that the effectivereduction condition at the reaction interface, i.e.,chemical rate and thermodynamic driving force, is notchanging throughout the reduction process.In contrast, a change of reduction rate with time may
suggest that there is a change in the effective reductioncondition or boundary conditions with time thataffected the overall reduction process; this was foundto be the case for NiO reduction carried out attemperatures above 600 �C. The change in reductionbehavior can be seen clearly in the reduction of NiO at700 �C, 800 �C, 900 �C, and 1000 �C. For example,Figures 5(c) through (f) show that up to 5 seconds thereduction rates were fast, but as the reaction timeprogressed slower reduction rates were observed for agiven gas mixture and temperature. In the case of thereduction of NiO at 700 �C under 100 pct H2-1 atm(Figure 5(c)) it was observed that the initial rate wasrapid (5.1 lm s�1 between 0 to 5 seconds). However,after 50 seconds of reduction the rate decreased toapproximately one-tenth of the initial value (i.e.,0.57 lm s�1).
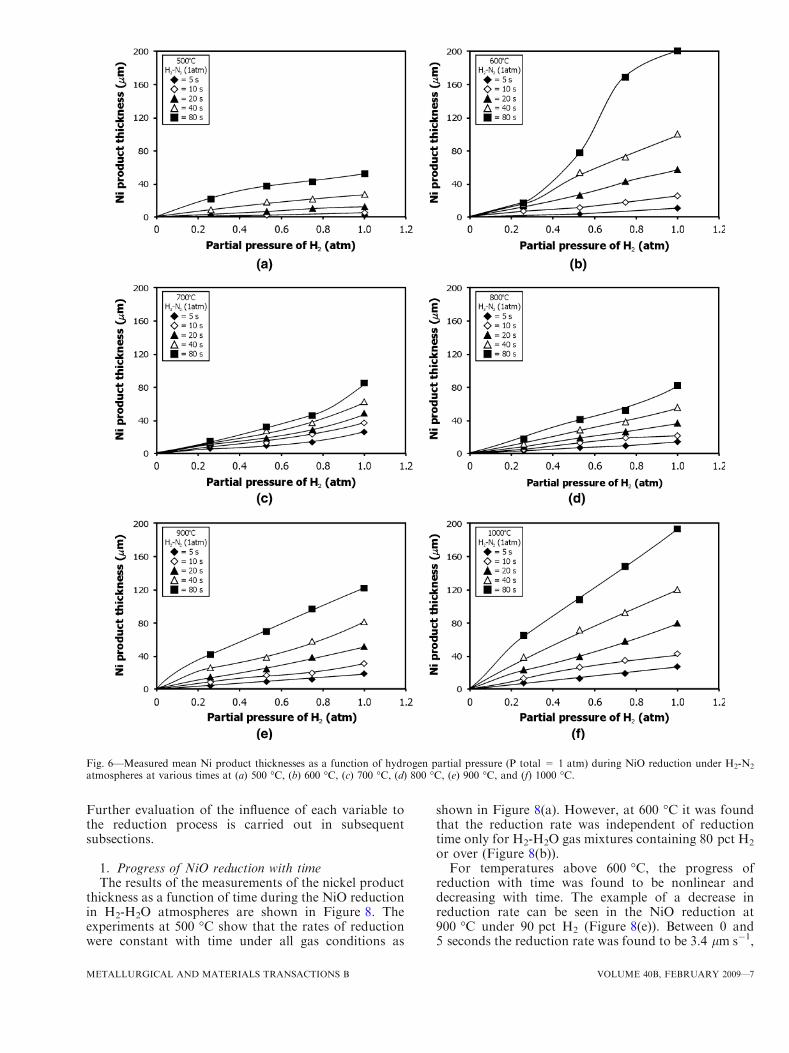
2. Effect of hydrogen partial pressureThe results of the measurements of Ni product
thickness as a function of hydrogen partial pressureare presented in Figure 6. At the shortest time ofreduction (5 seconds), there is almost a linear relation-ship between the Ni product thickness and hydrogenpartial pressure, i.e., the reaction is first order withrespect to the hydrogen partial pressure. For example, at800 �C and 5 seconds (Figure 6(d)), NiO reductionunder hydrogen partial pressure of 0.26 atm resultedin nickel product with thickness of 3.5 lm. The increaseof hydrogen partial pressure to 0.53 and 1 atm (approx-imately two and four times 0.26 atm) increased thenickel thickness to 7.3 and 14.0 lm, respectively (i.e.,two and four times of the previous value). A similartrend was also observed for the reduction at 900 �C and1000 �C as shown in Figures 6(e) and (f). At lowertemperatures, the linear relationship between nickelthickness and hydrogen partial pressure was evenextended to 20 and 40 seconds for NiO reductioncarried out at 600 �C and 500 �C, respectively(Figures 6(a) and (b)).At longer reduction times, there are changes in the
relationship between nickel product thickness andhydrogen partial pressure and time. The disappearanceof the linear relationship between nickel product thick-ness and hydrogen partial pressure was evident for alltemperatures. For instance in the experiment carried outat 600 �C and 80 seconds (Figure 6(b)), the reductionunder hydrogen partial pressure of 0.75 atm producednickel with thickness of 168.2 lm. The decrease ofhydrogen partial pressure to 0.26 atm at the samereaction time rapidly decreased the thickness of nickel
Fig. 4—Example of unreduced and fully reduced oxide sample pre-pared from identical starting sample (reduction carried out at1000 �C for 160 s in 100 pct H2 (1 atm, 250 mL min�1)).
4—VOLUME 40B, FEBRUARY 2009 METALLURGICAL AND MATERIALS TRANSACTIONS B
to 17.1 lm. The complexity of the relation betweenhydrogen partial pressure and nickel product thicknessat longer reduction times may be associated with theoverall process that is governed by mass-transportprocesses as a result of thicker product layer, as wellas changes in the structure of porous product.
3. Effect of temperatureThe Ni product thickness as a function of temperature
for a given H2-N2 mixture during the reduction of denseNiO in H2-N2 mixtures is shown in Figure 7. It can beseen that the progress of Ni thickness is not a monotonicfunction of temperature. It was found that an increase ofreduction temperature does not always lead to anincrease in the reduction rate. Figure 7(a) shows that
reduction carried out at 700 �C for 5 seconds under purehydrogen (1 atm) produced nickel with thickness of25.7 lm. Increasing the temperature to 800 �C for thesame period of reduction resulted in a nickel productwith thickness of only 14.0 lm. The unusual behaviorbecame more marked as the reaction time was increased.For example, after 80 seconds of reduction process theproduct thickness resulting from reduction at 600 �Cwas 201.7 lm, whereas nickel product thicknesses ofonly 80 lm were obtained when reductions were carriedout between 700 �C and 800 �C.The trends in behavior were observed to be a function
of bulk gas composition. The rate minimum wasobserved to become less marked as the gas mixturewas changed from 100, 75, 53, to 26 pct hydrogen
Table I. Measurement of Ni Product Thickness Developed during NiO Reduction in H2-N2 Atmospheres (P Total = 1 Atm)*
T (�C)
Gas Composition (H2/H2+N2)
100 Pct H2 75 Pct H2 53 Pct H2 26 Pct H2
t (s) D�x (lm) r t (s) D�x (lm) r t (s) D�x (lm) r t (s) D�x (lm) r
500 5 3.06 0.43 15 6.60 0.76 10 3.04 0.20 20 4.29 0.1510 5.98 0.12 20 10.44 0.32 20 6.80 0.11 40 9.28 0.2220 12.53 0.18 40 21.79 0.38 40 18.20 0.47 80 22.14 0.1940 27.46 0.27 80 42.65 0.43 80 37.32 0.15 — — —80 52.30 0.83 — — — — — — — — —120 70.60 1.57 — — — — — — — — —
600 5 10.38 0.23 10 17.95 0.74 5 3.58 0.19 10 7.04 0.3710 25.49 0.63 20 43.02 0.79 10 11.32 0.58 20 13.57 0.3820 56.31 1.05 40 72.76 0.96 20 26.35 0.36 40 15.49 0.2440 99.75 2.29 80 168.22 7.20 40 53.63 2.48 80 17.08 0.2580 201.69 9.81 — — — 80 77.73 3.77 — — —
675 5 24.08 0.52 5 13.31 0.30 5 9.84 1.06 5 5.74 0.1710 42.41 0.67 — — — — — — — — —20 57.56 2.12 — — — — — — — — —40 79.21 2.42 — — — — — — — — —80 118.59 6.25 — — — — — — — — —
700 5 25.70 0.53 5 12.82 0.44 5 8.75 0.33 5 5.31 0.4210 36.26 1.11 10 22.56 1.19 10 12.23 0.12 10 9.83 0.2620 48.01 0.47 40 28.78 0.68 20 17.94 0.44 20 11.94 0.3740 62.21 0.49 40 36.75 0.83 40 27.13 0.19 40 13.16 0.3780 84.91 0.95 80 45.28 4.87 80 31.62 0.26 80 14.82 0.80
725 5 18.26 1.68 5 11.95 0.44 5 8.49 0.48 5 3.77 0.13750 5 17.49 0.64 5 11.13 0.54 5 8.07 0.27 5 3.09 0.17775 5 15.93 0.39 5 11.14 0.28 5 7.25 0.50 5 3.15 0.22800 5 14.00 0.51 5 9.72 0.66 5 7.30 0.59 5 3.48 0.46
10 20.58 0.54 10 18.92 0.61 10 13.45 0.20 10 5.00 0.4120 35.67 1.78 20 26.13 1.01 20 19.47 1.16 20 9.04 0.5540 54.59 3.38 40 38.03 0.88 40 28.46 2.41 40 12.10 0.1380 81.28 1.77 80 52.14 0.08 80 41.15 3.36 80 18.00 0.95
900 5 19.09 0.49 5 11.77 0.36 5 8.84 0.61 5 4.45 0.6310 31.08 0.33 10 19.53 0.70 10 16.72 0.23 10 8.64 1.3820 51.14 1.53 20 37.96 1.27 20 24.41 1.40 20 14.23 0.6540 81.35 1.62 40 57.16 0.67 40 37.79 0.10 40 25.76 1.2380 121.89 2.23 80 96.05 2.51 80 69.23 0.78 80 41.29 2.16
1000 5 26.27 1.98 5 17.69 0.52 5 12.27 0.77 5 6.71 0.2610 42.08 4.39 10 33.76 0.44 10 25.62 1.71 10 12.31 0.5320 79.02 3.22 20 57.14 1.75 20 38.39 1.09 20 22.46 1.7940 119.61 2.54 40 91.36 1.69 40 70.48 2.09 40 37.32 0.5280 193.21 9.64 80 147.11 7.33 80 107.45 2.65 80 64.09 1.66
*Note: T = temperature, t = time, D�x= mean product thickness, and r = standard deviation.
METALLURGICAL AND MATERIALS TRANSACTIONS B VOLUME 40B, FEBRUARY 2009—5
(Figures 7(a) and (d)). At 26 pct H2 the productthickness at a given time was relatively unchanged onincreasing temperature from 500 �C to approximately800 �C.
It appears that this anomalous reduction behavior isgreatly dependent on the reduction conditions. Thehydrogen partial pressure and reduction temperaturewere found to be the key factors governing the
maximum and minimum extent of the nickel productadvancement in the range of conditions investigated.
B. Reduction in H2-H2O Atmospheres
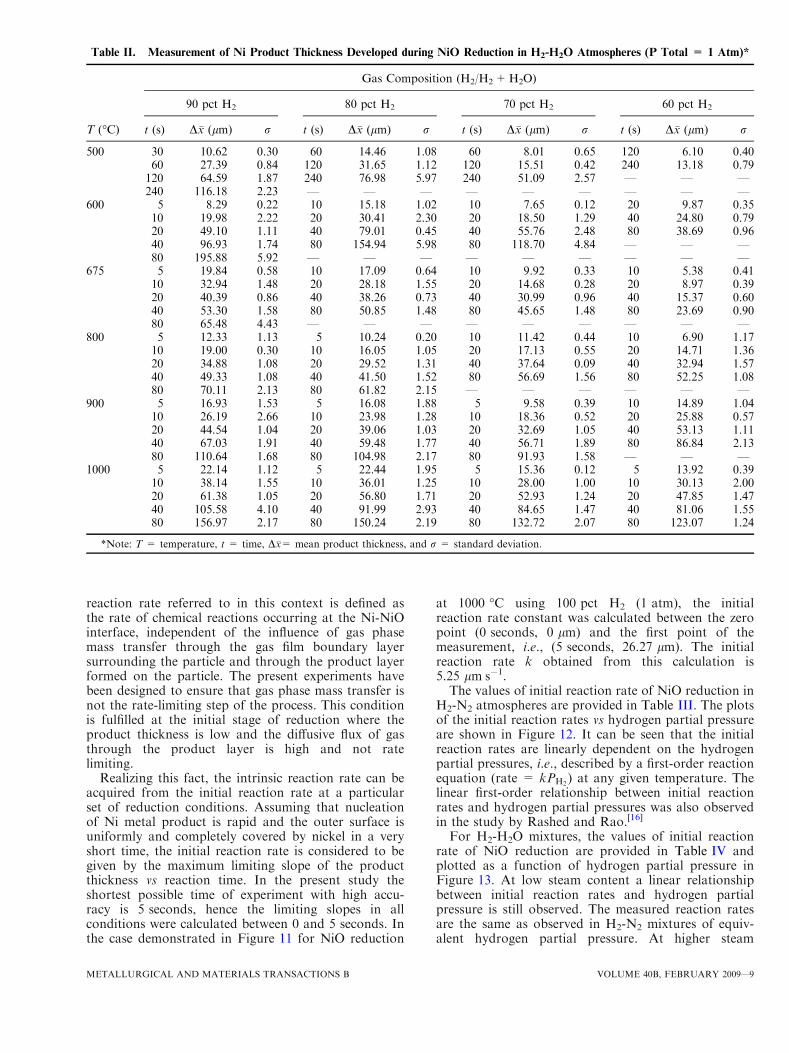
The experimental conditions and the Ni productthickness resulting from the reduction experimentsin H2-H2O atmospheres are provided in Table II.
Fig. 5—Measured mean Ni product thicknesses as a function of time during NiO reduction under H2-N2 atmospheres at various hydrogen par-tial pressures (P total = 1 atm) at (a) 500 �C, (b) 600 �C, (c) 700 �C, (d) 800 �C, (e) 900 �C, and (f) 1000 �C.
6—VOLUME 40B, FEBRUARY 2009 METALLURGICAL AND MATERIALS TRANSACTIONS B
Further evaluation of the influence of each variable tothe reduction process is carried out in subsequentsubsections.
1. Progress of NiO reduction with timeThe results of the measurements of the nickel product
thickness as a function of time during the NiO reductionin H2-H2O atmospheres are shown in Figure 8. Theexperiments at 500 �C show that the rates of reductionwere constant with time under all gas conditions as
shown in Figure 8(a). However, at 600 �C it was foundthat the reduction rate was independent of reductiontime only for H2-H2O gas mixtures containing 80 pct H2
or over (Figure 8(b)).For temperatures above 600 �C, the progress of
reduction with time was found to be nonlinear anddecreasing with time. The example of a decrease inreduction rate can be seen in the NiO reduction at900 �C under 90 pct H2 (Figure 8(e)). Between 0 and5 seconds the reduction rate was found to be 3.4 lmÆs�1,
Fig. 6—Measured mean Ni product thicknesses as a function of hydrogen partial pressure (P total = 1 atm) during NiO reduction under H2-N2
atmospheres at various times at (a) 500 �C, (b) 600 �C, (c) 700 �C, (d) 800 �C, (e) 900 �C, and (f) 1000 �C.
METALLURGICAL AND MATERIALS TRANSACTIONS B VOLUME 40B, FEBRUARY 2009—7
while between 20 and 40 seconds the reduction ratedecreased to 0.7 lmÆs�1.
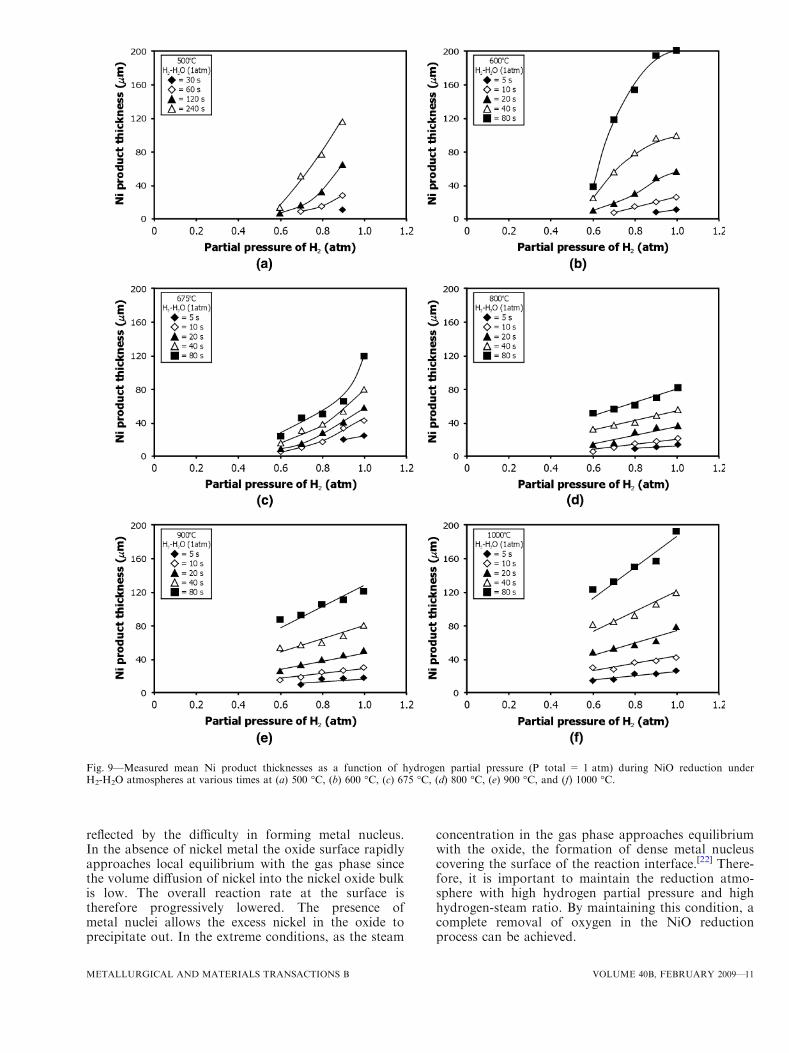
2. Effect of hydrogen partial pressureFigure 9 shows the plots of nickel product thickness
as a function of hydrogen partial pressure in the NiOreduction under H2-H2O mixtures. Below 675 �C a steepnonlinear decrease of the porous nickel product thick-ness with decreasing of hydrogen partial pressure wasobserved. At 500 �C and 240 seconds a 30 pct decreaseof hydrogen partial pressure from 0.9 to 0.6 atmsignificantly decreased the nickel product thickness bya factor of 88 pct, from 116.2 to 13.2 lm (Figure 9(a)).At 600 �C and 80 seconds when the hydrogen partialpressure was lowered from 0.9 to 0.6 atm, the nickelthickness also decreased greatly from 195.9 to 38.7 lm.
In the NiO reduction at 800 �C and above, the nickelproduct thickness appears to decrease linearly withdecreasing hydrogen partial pressure. At 800 �C and80 seconds, the decrease of hydrogen partial pressurefrom 0.9 to 0.6 atm was accompanied by a 30 pct dropof nickel thickness from 70.1 to 52.3 lm (Figure 9(d)). Itmay be concluded that the retardation of the reductionprocess by the presence of steam at high temperatureswas less pronounced than that at lower temperatures,
and may be associated with different rate-limitingprocesses.
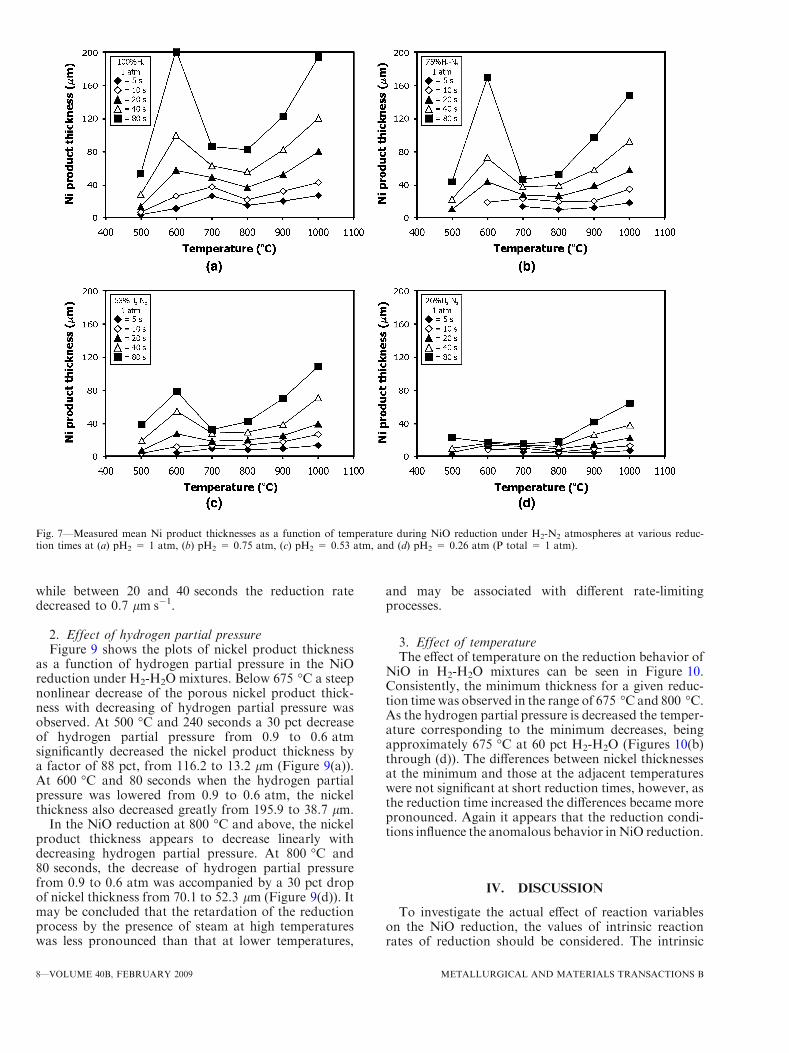
3. Effect of temperatureThe effect of temperature on the reduction behavior of
NiO in H2-H2O mixtures can be seen in Figure 10.Consistently, the minimum thickness for a given reduc-tion time was observed in the range of 675 �C and 800 �C.As the hydrogen partial pressure is decreased the temper-ature corresponding to the minimum decreases, beingapproximately 675 �C at 60 pct H2-H2O (Figures 10(b)through (d)). The differences between nickel thicknessesat the minimum and those at the adjacent temperatureswere not significant at short reduction times, however, asthe reduction time increased the differences became morepronounced. Again it appears that the reduction condi-tions influence the anomalous behavior inNiO reduction.
IV. DISCUSSION
To investigate the actual effect of reaction variableson the NiO reduction, the values of intrinsic reactionrates of reduction should be considered. The intrinsic
Fig. 7—Measured mean Ni product thicknesses as a function of temperature during NiO reduction under H2-N2 atmospheres at various reduc-tion times at (a) pH2 = 1 atm, (b) pH2 = 0.75 atm, (c) pH2 = 0.53 atm, and (d) pH2 = 0.26 atm (P total = 1 atm).
8—VOLUME 40B, FEBRUARY 2009 METALLURGICAL AND MATERIALS TRANSACTIONS B
reaction rate referred to in this context is defined asthe rate of chemical reactions occurring at the Ni-NiOinterface, independent of the influence of gas phasemass transfer through the gas film boundary layersurrounding the particle and through the product layerformed on the particle. The present experiments havebeen designed to ensure that gas phase mass transfer isnot the rate-limiting step of the process. This conditionis fulfilled at the initial stage of reduction where theproduct thickness is low and the diffusive flux of gasthrough the product layer is high and not ratelimiting.
Realizing this fact, the intrinsic reaction rate can beacquired from the initial reaction rate at a particularset of reduction conditions. Assuming that nucleationof Ni metal product is rapid and the outer surface isuniformly and completely covered by nickel in a veryshort time, the initial reaction rate is considered to begiven by the maximum limiting slope of the productthickness vs reaction time. In the present study theshortest possible time of experiment with high accu-racy is 5 seconds, hence the limiting slopes in allconditions were calculated between 0 and 5 seconds. Inthe case demonstrated in Figure 11 for NiO reduction
at 1000 �C using 100 pct H2 (1 atm), the initialreaction rate constant was calculated between the zeropoint (0 seconds, 0 lm) and the first point of themeasurement, i.e., (5 seconds, 26.27 lm). The initialreaction rate k obtained from this calculation is5.25 lmÆs�1.The values of initial reaction rate of NiO reduction in
H2-N2 atmospheres are provided in Table III. The plotsof the initial reaction rates vs hydrogen partial pressureare shown in Figure 12. It can be seen that the initialreaction rates are linearly dependent on the hydrogenpartial pressures, i.e., described by a first-order reactionequation (rate = kPH2
) at any given temperature. Thelinear first-order relationship between initial reactionrates and hydrogen partial pressures was also observedin the study by Rashed and Rao.[16]
For H2-H2O mixtures, the values of initial reactionrate of NiO reduction are provided in Table IV andplotted as a function of hydrogen partial pressure inFigure 13. At low steam content a linear relationshipbetween initial reaction rates and hydrogen partialpressure is still observed. The measured reaction ratesare the same as observed in H2-N2 mixtures of equiv-alent hydrogen partial pressure. At higher steam
Table II. Measurement of Ni Product Thickness Developed during NiO Reduction in H2-H2O Atmospheres (P Total = 1 Atm)*
T (�C)
Gas Composition (H2/H2+H2O)
90 pct H2 80 pct H2 70 pct H2 60 pct H2
t (s) D�x (lm) r t (s) D�x (lm) r t (s) D�x (lm) r t (s) D�x (lm) r
500 30 10.62 0.30 60 14.46 1.08 60 8.01 0.65 120 6.10 0.4060 27.39 0.84 120 31.65 1.12 120 15.51 0.42 240 13.18 0.79120 64.59 1.87 240 76.98 5.97 240 51.09 2.57 — — —240 116.18 2.23 — — — — — — — — —
600 5 8.29 0.22 10 15.18 1.02 10 7.65 0.12 20 9.87 0.3510 19.98 2.22 20 30.41 2.30 20 18.50 1.29 40 24.80 0.7920 49.10 1.11 40 79.01 0.45 40 55.76 2.48 80 38.69 0.9640 96.93 1.74 80 154.94 5.98 80 118.70 4.84 — — —80 195.88 5.92 — — — — — — — — —
675 5 19.84 0.58 10 17.09 0.64 10 9.92 0.33 10 5.38 0.4110 32.94 1.48 20 28.18 1.55 20 14.68 0.28 20 8.97 0.3920 40.39 0.86 40 38.26 0.73 40 30.99 0.96 40 15.37 0.6040 53.30 1.58 80 50.85 1.48 80 45.65 1.48 80 23.69 0.9080 65.48 4.43 — — — — — — — — —
800 5 12.33 1.13 5 10.24 0.20 10 11.42 0.44 10 6.90 1.1710 19.00 0.30 10 16.05 1.05 20 17.13 0.55 20 14.71 1.3620 34.88 1.08 20 29.52 1.31 40 37.64 0.09 40 32.94 1.5740 49.33 1.08 40 41.50 1.52 80 56.69 1.56 80 52.25 1.0880 70.11 2.13 80 61.82 2.15 — — — — — —
900 5 16.93 1.53 5 16.08 1.88 5 9.58 0.39 10 14.89 1.0410 26.19 2.66 10 23.98 1.28 10 18.36 0.52 20 25.88 0.5720 44.54 1.04 20 39.06 1.03 20 32.69 1.05 40 53.13 1.1140 67.03 1.91 40 59.48 1.77 40 56.71 1.89 80 86.84 2.1380 110.64 1.68 80 104.98 2.17 80 91.93 1.58 — — —
1000 5 22.14 1.12 5 22.44 1.95 5 15.36 0.12 5 13.92 0.3910 38.14 1.55 10 36.01 1.25 10 28.00 1.00 10 30.13 2.0020 61.38 1.05 20 56.80 1.71 20 52.93 1.24 20 47.85 1.4740 105.58 4.10 40 91.99 2.93 40 84.65 1.47 40 81.06 1.5580 156.97 2.17 80 150.24 2.19 80 132.72 2.07 80 123.07 1.24
*Note: T = temperature, t = time, D�x= mean product thickness, and r = standard deviation.
METALLURGICAL AND MATERIALS TRANSACTIONS B VOLUME 40B, FEBRUARY 2009—9

content, there was no nickel nuclei formed between0 and 5 seconds. Therefore, the initial reaction ratesdata at steam content greater than 40 pct is notavailable, except for temperatures of 1000 �C. It shouldbe noted that even after long reaction times, after metalnucleation and growth has occurred across the entiresurface, the rates of nickel oxide reduction at lowhydrogen partial pressures are orders of magnitude
slower than at high hydrogen partial pressures, thedecrease in rate is much greater than can be accountedfor by a first-order change in rate with hydrogenpressure. This is a significant observation that hasimportant industrial implications.These observations appear to be explained by two
principal phenomena. In the initial stage of reduction,particularly at low temperatures, the retardation is
Fig. 8—Measured mean Ni product thicknesses as a function of time during NiO reduction under H2-H2O atmospheres at various hydrogenpartial pressures (P total = 1 atm) at (a) 500 �C, (b) 600 �C, (c) 675 �C, (d) 800 �C, (e) 900 �C, and (f) 1000 �C.
10—VOLUME 40B, FEBRUARY 2009 METALLURGICAL AND MATERIALS TRANSACTIONS B
reflected by the difficulty in forming metal nucleus.In the absence of nickel metal the oxide surface rapidlyapproaches local equilibrium with the gas phase sincethe volume diffusion of nickel into the nickel oxide bulkis low. The overall reaction rate at the surface istherefore progressively lowered. The presence ofmetal nuclei allows the excess nickel in the oxide toprecipitate out. In the extreme conditions, as the steam
concentration in the gas phase approaches equilibriumwith the oxide, the formation of dense metal nucleuscovering the surface of the reaction interface.[22] There-fore, it is important to maintain the reduction atmo-sphere with high hydrogen partial pressure and highhydrogen-steam ratio. By maintaining this condition, acomplete removal of oxygen in the NiO reductionprocess can be achieved.
Fig. 9—Measured mean Ni product thicknesses as a function of hydrogen partial pressure (P total = 1 atm) during NiO reduction underH2-H2O atmospheres at various times at (a) 500 �C, (b) 600 �C, (c) 675 �C, (d) 800 �C, (e) 900 �C, and (f) 1000 �C.
METALLURGICAL AND MATERIALS TRANSACTIONS B VOLUME 40B, FEBRUARY 2009—11

Arrhenius plots of the rates of NiO reduction of thepresent and previous results[16,24] at a hydrogen pressureof approximately 1 atm are shown in Figure 14. In thefigure, the NiO reduction rates are presented as flux ofoxygen removal. The original data of Rashed andRao[16] were presented in the form of oxygen flux, while
the rates of the present study and Pluschkell andSarma[24] need to be converted from linear Ni productgrowth rate (lmÆs�1).The flux of oxygen removal is equal with the flux of
NiO consumption by hydrogen gas as shown by thefollowing equation:
�JO ¼ �JNiO ¼�kNiOqNiO
MNiO½2�
where JO is flux of oxygen removal (mol OÆm�2 s�1),JNiO is flux of NiO consumption by hydrogen gas (molOÆm�2 s�1), qNiO is density of NiO (gÆm�3), MNiO ismolecular weight of NiO (gÆmol�1), and kNiO is the rateof NiO consumption (mÆs�1). Assuming that the volumeof the reduced NiO is equal to the volume of Ni pro-duced by the reduction, i.e., there is no significantshrinkage or expansion of Ni product layer (average lin-ear shrinkage equals 2.2 pct), the rate of NiO consump-tion will be equal to the rate of Ni layer advancement.
�kNiO ¼ k ½3�
where k is the rate of Ni layer advancement (mÆs�1).Initial measurements indicate that this assumptionholds over the temperature range and conditions inves-tigated, i.e., 500 �C to 1000 �C, although it has been
Fig. 10—Measured mean Ni product thicknesses as a function of temperature during NiO reduction under H2-H2O atmospheres at variousreduction times at (a) pH2 = 0.9 atm, (b) pH2 = 0.8 atm, (c) pH2 = 0.7 atm, and (d) pH2 = 0.6 atm (P total = 1 atm).
Fig. 11—Example of derivation of initial reaction rate for NiOreduction from the limiting slope of the product thickness vs timeplot (reduction at 1000 �C in 100 pct H2, 1 atm).
12—VOLUME 40B, FEBRUARY 2009 METALLURGICAL AND MATERIALS TRANSACTIONS B
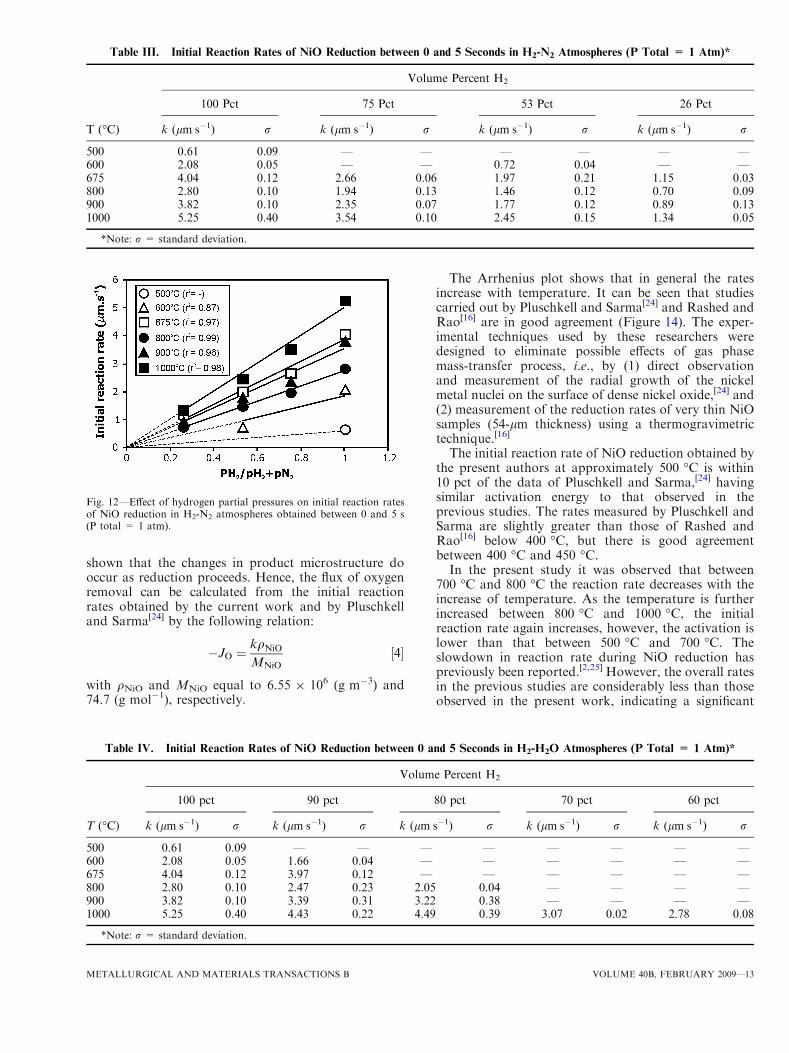
shown that the changes in product microstructure dooccur as reduction proceeds. Hence, the flux of oxygenremoval can be calculated from the initial reactionrates obtained by the current work and by Pluschkelland Sarma[24] by the following relation:
�JO ¼kqNiO
MNiO½4�
with qNiO and MNiO equal to 6.55 9 106 (g m�3) and74.7 (g mol�1), respectively.
The Arrhenius plot shows that in general the ratesincrease with temperature. It can be seen that studiescarried out by Pluschkell and Sarma[24] and Rashed andRao[16] are in good agreement (Figure 14). The exper-imental techniques used by these researchers weredesigned to eliminate possible effects of gas phasemass-transfer process, i.e., by (1) direct observationand measurement of the radial growth of the nickelmetal nuclei on the surface of dense nickel oxide,[24] and(2) measurement of the reduction rates of very thin NiOsamples (54-lm thickness) using a thermogravimetrictechnique.[16]
The initial reaction rate of NiO reduction obtained bythe present authors at approximately 500 �C is within10 pct of the data of Pluschkell and Sarma,[24] havingsimilar activation energy to that observed in theprevious studies. The rates measured by Pluschkell andSarma are slightly greater than those of Rashed andRao[16] below 400 �C, but there is good agreementbetween 400 �C and 450 �C.In the present study it was observed that between
700 �C and 800 �C the reaction rate decreases with theincrease of temperature. As the temperature is furtherincreased between 800 �C and 1000 �C, the initialreaction rate again increases, however, the activation islower than that between 500 �C and 700 �C. Theslowdown in reaction rate during NiO reduction haspreviously been reported.[2,25] However, the overall ratesin the previous studies are considerably less than thoseobserved in the present work, indicating a significant
Table III. Initial Reaction Rates of NiO Reduction between 0 and 5 Seconds in H2-N2 Atmospheres (P Total = 1 Atm)*
T (�C)
Volume Percent H2
100 Pct 75 Pct 53 Pct 26 Pct
k (lmÆs�1) r k (lmÆs�1) r k (lmÆs�1) r k (lmÆs�1) r
500 0.61 0.09 — — — — — —600 2.08 0.05 — — 0.72 0.04 — —675 4.04 0.12 2.66 0.06 1.97 0.21 1.15 0.03800 2.80 0.10 1.94 0.13 1.46 0.12 0.70 0.09900 3.82 0.10 2.35 0.07 1.77 0.12 0.89 0.131000 5.25 0.40 3.54 0.10 2.45 0.15 1.34 0.05
*Note: r = standard deviation.
Fig. 12—Effect of hydrogen partial pressures on initial reaction ratesof NiO reduction in H2-N2 atmospheres obtained between 0 and 5 s(P total = 1 atm).
Table IV. Initial Reaction Rates of NiO Reduction between 0 and 5 Seconds in H2-H2O Atmospheres (P Total = 1 Atm)*
T (�C)
Volume Percent H2
100 pct 90 pct 80 pct 70 pct 60 pct
k (lmÆs�1) r k (lmÆs�1) r k (lmÆs�1) r k (lmÆs�1) r k (lmÆs�1) r
500 0.61 0.09 — — — — — — — —600 2.08 0.05 1.66 0.04 — — — — — —675 4.04 0.12 3.97 0.12 — — — — — —800 2.80 0.10 2.47 0.23 2.05 0.04 — — — —900 3.82 0.10 3.39 0.31 3.22 0.38 — — — —1000 5.25 0.40 4.43 0.22 4.49 0.39 3.07 0.02 2.78 0.08
*Note: r = standard deviation.
METALLURGICAL AND MATERIALS TRANSACTIONS B VOLUME 40B, FEBRUARY 2009—13

contribution of gas phase mass-transfer processes in theearlier work.
Using the Arrhenius equation
k ¼ ko exp � Q
RT
� �½5�
where k, ko, R, T, and Q refer to reaction rate at certaintemperature, frequency factor, gas constant, tempera-ture, and activation energy, respectively, the apparentactivation energies of NiO reduction using 100 pct H2
(1 atm) observed in the present study can be calculated.At temperatures between 500 �C and 700 �C, the appar-ent activation energy of the reduction process is66.6 kJ mol�1, while between 800 �C and 1000 �C, itwas found to be 34.8 kJ mol�1. This indicates that astemperature is increased from 700 �C to 800 �C there isa change in rate-limiting reaction mechanism.
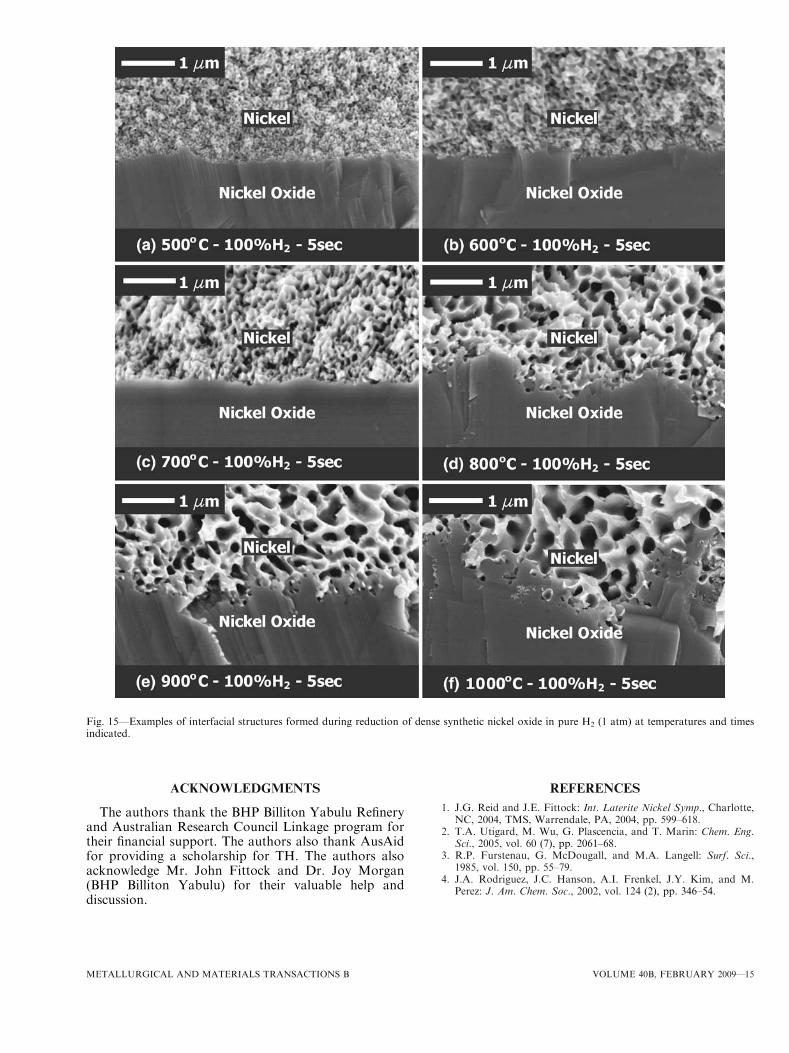
To further investigate this anomalous behavior,examination of microstructures was carried out for theproducts resulting from 5 second reduction of NiOunder 100 pct H2 (1 atm) between 500 �C and 1000 �C.These partially reduced samples were first fracturedusing a scalpel blade, sputter coated with platinum, andthen examined using the SEM (JEOL 6400F). Examplesof microstructures found in these selected samples areprovided in Figure 15.It can be seen that as the result of NiO reduction
between 500 �C and 700 �C, Ni product microstructuresthat consist of very fine continuous pores (less than0.08 lm in diameter), and relatively planar Ni-NiOinterfaces were formed (Figures 15(a) through (c)).However, above 800 �C the Ni product microstructureconsists of coarse nonuniform pore sizes, and irregularNi-NiO interfaces were produced (Figures 15(d)through (f)). In a previous publication by the sameauthors,[22] the first structure was termed a fine porousnickel-planar interfaces, while the second structure isreferred to as a porous nickel-irregular interfacesstructure.The result clearly demonstrates the relation between
the structure of the reduction product and the reactionrate. Bearing in mind that the present data has beenobtained under conditions designed to minimize theresistance due to gas film mass transfer and porousdiffusion in the product layer, this indicates that thechange in reaction mechanism is associated with chem-ical reactions occurring at the reaction interface or mass-transfer processes in the solids. Further detailed andsystematic studies are required to characterize thechanges in product structure and their relationship tothe process conditions to enable these questions to beanswered.
V. CONCLUSIONS
In the present study, the kinetics of nickel oxidereduction have been studied under controlled reactionconditions in H2-N2 and H2-H2O atmospheres. Thefindings of the present study are as follows.
1. Increasing hydrogen partial pressure under all con-ditions investigated results in an increase in rate ofNiO reduction. In H2-N2 atmospheres, the rate is firstorder with respect to hydrogen partial pressure. InH2-H2O atmospheres, this behavior is only observedat high temperature above approximately 675 �C andsteam contents below 20 pct volume H2O.
2. In both of the H2-N2 and H2-H2O gas mixtures, itwas found that the rate of formation of Ni product isnot a simple monotonic function of temperature. Thereaction rates were found to decrease with increasingtemperatures in the range between 600 �C and 800 �Cdepending on the hydrogen partial pressures andreduction times.
3. There is a clear link between the rates of reduction,the nickel product morphology, and the reactionmechanisms occurring at the Ni-NiO interface.
Fig. 13—Effect of hydrogen partial pressures on initial reaction ratesof NiO reduction in H2-H2O atmospheres obtained between 0 and5 s (P total = 1 atm).
Fig. 14—Arrhenius plot of initial reaction rates of NiO reduction(represented in terms of oxygen removal rate) in H2-N2 atmospheresfrom the present results (P total = 1 atm) and results by Rashedand Rao[16] and Pluschkell and Sarma.[24]
14—VOLUME 40B, FEBRUARY 2009 METALLURGICAL AND MATERIALS TRANSACTIONS B
ACKNOWLEDGMENTS
The authors thank the BHP Billiton Yabulu Refineryand Australian Research Council Linkage program fortheir financial support. The authors also thank AusAidfor providing a scholarship for TH. The authors alsoacknowledge Mr. John Fittock and Dr. Joy Morgan(BHP Billiton Yabulu) for their valuable help anddiscussion.
REFERENCES1. J.G. Reid and J.E. Fittock: Int. Laterite Nickel Symp., Charlotte,
NC, 2004, TMS, Warrendale, PA, 2004, pp. 599–618.2. T.A. Utigard, M. Wu, G. Plascencia, and T. Marin: Chem. Eng.
Sci., 2005, vol. 60 (7), pp. 2061–68.3. R.P. Furstenau, G. McDougall, and M.A. Langell: Surf. Sci.,
1985, vol. 150, pp. 55–79.4. J.A. Rodriguez, J.C. Hanson, A.I. Frenkel, J.Y. Kim, and M.
Perez: J. Am. Chem. Soc., 2002, vol. 124 (2), pp. 346–54.
Fig. 15—Examples of interfacial structures formed during reduction of dense synthetic nickel oxide in pure H2 (1 atm) at temperatures and timesindicated.
METALLURGICAL AND MATERIALS TRANSACTIONS B VOLUME 40B, FEBRUARY 2009—15
5. N.J. Themelis and W.H. Gauvin: CIM Bull., 1962, vol. 55 (603),pp. 444–56.
6. C. Wagner: Steelmaking: The Chipman Conf., MIT Press, Ded-ham, MA, 1962, pp. 19–26.
7. B.Z. Ilschner: Metallkd., 1964, vol. 55, pp. 153–62.8. K.J. Best and H.J. Grabke: Phys.Chem., 1971, vol. 75, pp. 524–
32.9. K.R. Lilius: Acta Ploytech. Scand., 1974, vol. 118, pp. 1–17.10. V.V. Boldyrev, M. Bulens, and B. Delmon: The Control of the
Reactivity of Solids: Studies in Surface Science and Catalysis,Elsevier Scientific Publishing Company, Amsterdam, 1979.
11. P.C. Hayes: Metall. Trans. B, 1979, vol. 10B, pp. 211–17.12. P.C. Hayes: Miner. Process. Extr. Metall. Rev., 1992, vol. 8,
pp. 73–94.13. T. Deb Roy and K.P. Abraham: Physical Chemistry of Process
Metallurgy: The Richardson Conf., Institute of Mining and Met-allurgy, London, 1973, pp. 85–93.
14. J.W. Evans, S. Song, and C.E. Leon-Sucre:Metall. Trans. B, 1976,vol. 7B, pp. 55–65.
15. S. Sridhar, D. Sichen, and S. Seetharaman: Z. Metallkd., 1994,vol. 85 (9), pp. 616–20.
16. A.H. Rashed and Y.K. Rao: Chem. Eng. Commun., 1996, vol. 156,pp. 1–30.
17. Y.K. Rao and A.H. Rashed: Trans. Inst. Min. Metall., Sect. C,2001, vol. 110, pp. 1–6.
18. S. Vogel, E. Ustundag, J.C. Hanan, V.W. Yuan, and M.A.M.Bourke: Mater. Sci. Eng., 2002, vol. A333, pp. 1–9.
19. J.T. Richardson, R. Scates, and M.V. Twigg: Appl. Catal., A,2003, vol. 246, pp. 137–50.
20. S.P. Matthew, D.H. St. John, J.V. Hardy, and P.C. Hayes:Metallography, 1985, vol. 17, pp. 367–79.
21. D.H. St. John and P.C. Hayes: Metall. Trans. B, 1982, vol. 13B,pp. 117–24.
22. T. Hidayat, M.A. Rhamdhani, E. Jak, and P. Hayes: Miner. Eng.,2008, vol. 21 (2), pp. 157–66.
23. C.W. Bale, S.A. Degterov, G. Eriksson, K. Hack, R. BenMahfoud, J. Melancon, A.D. Pelton, and S. Petersen: Calphad,2002, vol. 26, pp. 189–228.
24. W. Pluschkell and B.V.C. Sarma: Arch. Eisen., 1974, vol. 45 (1),pp. 23–31.
25. Y. Iida and K. Shimada: Bull. Chem. Soc. Jpn., 1960, vol. 33 (6),pp. 790–93.
16—VOLUME 40B, FEBRUARY 2009 METALLURGICAL AND MATERIALS TRANSACTIONS B
 2](https://static.fdokumen.com/doc/165x107/6333ca3928cb31ef600d6bc8/two-temperature-independent-spinomers-of-the-dinuclear-mniii-compound-mnh-2.jpg)