The kinematics of the large western knot in the halo of the young planetary nebula NGC 6543
13
arXiv:astro-ph/0507204v1 8 Jul 2005 Mon. Not. R. Astron. Soc. 000, 1–13 (2002) Printed 25 January 2014 (MN L A T E X style file v2.2) The kinematics of the large western knot in the halo of the young planetary nebula NGC 6543 Deborah L. Mitchell 1 , ⋆ M. Bryce 1 , J. Meaburn 2 ,J.A.L´opez 2 , M. P. Redman 3 , D. Harman 3 , M. G. Richer 2 and H. Riesgo 2 1 Jodrell Bank Observatory, University of Manchester, Macclesfield SK11 9DL, UK 2 Instituto de Astronom´ ıa, Universidad Nacional Autnoma de M´ exico, Apartado Postal 877, 22800 Ensenada, B.C., M´ exico 3 Department of Physics, National University of Ireland Galway, College Rd., Galway, Ireland. 4 Astrophysics Research Institute, Liverpool John Moores University, Twelve Quays House, Egerton Wharf, CH41 1LD, UK Accepted ... Received... ABSTRACT A detailed analysis is presented of the dominant ionised knot in the halo of the plane- tary nebula NGC 6543. Observations were made at high spectral and spatial resolution of the [O iii] λ5007 ˚ A line using the Manchester echelle spectrometer combined with the 2.1-m San Pedro Martir Telescope. A 20-element multislit was stepped across the field to give almost complete spatial coverage of the large western knot and surrounding halo. The spectra reveal, for the first time, gas flows around the kinematically inert knot. The gas flows are found to have velocities comparable to the sound speed as gas is photo-evaporated off an ionised surface. No evidence is found of fast wind interaction with the knot and we find it likely that the fast wind is still contained in a pressure- driven bubble in the core of the nebula. This rules out the possibility of the knot having its origin in instabilities at the interface of the fast and AGB winds. We suggest that the knot is embedded in the slowly expanding Red Giant wind and that its surfaces are being continually photoionised by the central star. Key words: circumstellar matter – stars: mass-loss – stars: winds, outflows – stars: kinematics – ISM: planetary nebulae: individual: NGC 6543. 1 INTRODUCTION NGC 6543 (RA 17 h 58 m 33. s 4 & Dec+66 ◦ 37 ′ 59. ′′ 0 [J2000.0]) is one of the brightest and most structurally complex plan- etary nebulae (PNe) known. The central star is an 07+WR type, which has a high-speed (1900 kms −1 ) particle wind (Patriarchi & Perinotto 1991). The bright core of the neb- ula appears as two concentric crossed ellipses in projection with their major axes orientated at position angles 25 ◦ and 115 ◦ respectively (Miranda & Solf 1992). Balick et al. (1987) detected two bright polar caps aligned with the major axis of the 25 ◦ ellipse and two twisted jet-like features extending radially outwards from the caps. Balick, Wilson, & Hajian (2001) discovered a series of nine regularly spaced concentric rings around the core of NGC 6543 in archival HST images. The best estimate of distance to NGC 6543 is 1001 ± 269 pc (Reed et al. 1999), which was measured directly from the expansion parallax. The bright core of NGC 6543 is surrounded by a faint, extended, spherical halo (Millikan 1974) of radius 165 arcsec ⋆ E-mail: [email protected] (DLM) (Middlemass, Clegg, & Walsh 1989). Chu, Jacoby, & Arendt (1987) defined NGC 6543 as having a Type I detached halo. The halo has a very filamentary appearance and contains a large, bright, irregularly-shaped knot located 100 arcsec west of the core. The halo of NGC 6543 is unsually bright in [O iii] λ5007 ˚ A (Middlemass et al. 1989) despite the fact that the main PN shell also shows bright [N ii] λ6584 ˚ A emission, suggesting a complex overall structure. Bryce et al. (1992) found the halo to be kinematically inert with a maximum ex- pansion velocity of 4.5 kms −1 , despite its explosive, filamen- tary appearance. They found that both the bright knot and halo are centred on the systemic heliocentric radial velocity of Vsys= -68.5 kms −1 , confirming that the knot and halo are physically linked. An [O iii] λ5007 ˚ A and [N ii] λ6584 ˚ A composite image that features both the halo and core of NGC 6543 is shown in Fig. 1 with the dominant ionised knot being considered here. The bright knot in the halo of NGC 6543 is highly un- usual in that it is relatively large and is a unique feature within the halo. Middlemass, Clegg, & Walsh (1989) cal- culated that the knot has an electron temperature of Te = 14700 K using [O iii]λλ4959 + 5007/4363 line intensity
-
Upload
independent -
Category
Documents
-
view
0 -
download
0
Transcript of The kinematics of the large western knot in the halo of the young planetary nebula NGC 6543
arX
iv:a
stro
-ph/
0507
204v
1 8
Jul
200
5
Mon. Not. R. Astron. Soc. 000, 1–13 (2002) Printed 25 January 2014 (MN LATEX style file v2.2)
The kinematics of the large western knot in the halo of the
young planetary nebula NGC 6543
Deborah L. Mitchell1,⋆ M. Bryce1, J. Meaburn2, J.A. Lopez2 ,
M. P. Redman3, D. Harman3, M. G. Richer2 and H. Riesgo21Jodrell Bank Observatory, University of Manchester, Macclesfield SK11 9DL, UK2Instituto de Astronomıa, Universidad Nacional Autnoma de Mexico, Apartado Postal 877, 22800 Ensenada, B.C., Mexico3Department of Physics, National University of Ireland Galway, College Rd., Galway, Ireland.4Astrophysics Research Institute, Liverpool John Moores University, Twelve Quays House, Egerton Wharf, CH41 1LD, UK
Accepted ... Received...
ABSTRACT
A detailed analysis is presented of the dominant ionised knot in the halo of the plane-tary nebula NGC 6543. Observations were made at high spectral and spatial resolutionof the [O iii] λ5007 A line using the Manchester echelle spectrometer combined with the2.1-m San Pedro Martir Telescope. A 20-element multislit was stepped across the fieldto give almost complete spatial coverage of the large western knot and surroundinghalo.
The spectra reveal, for the first time, gas flows around the kinematically inertknot. The gas flows are found to have velocities comparable to the sound speed as gasis photo-evaporated off an ionised surface. No evidence is found of fast wind interactionwith the knot and we find it likely that the fast wind is still contained in a pressure-driven bubble in the core of the nebula. This rules out the possibility of the knot havingits origin in instabilities at the interface of the fast and AGB winds. We suggest thatthe knot is embedded in the slowly expanding Red Giant wind and that its surfacesare being continually photoionised by the central star.
Key words: circumstellar matter – stars: mass-loss – stars: winds, outflows – stars:kinematics – ISM: planetary nebulae: individual: NGC 6543.
1 INTRODUCTION
NGC 6543 (RA 17h 58m 33.s4 & Dec+66◦ 37′ 59.′′0 [J2000.0])is one of the brightest and most structurally complex plan-etary nebulae (PNe) known. The central star is an 07+WRtype, which has a high-speed (1900 kms−1) particle wind(Patriarchi & Perinotto 1991). The bright core of the neb-ula appears as two concentric crossed ellipses in projectionwith their major axes orientated at position angles 25◦ and115◦ respectively (Miranda & Solf 1992). Balick et al. (1987)detected two bright polar caps aligned with the major axisof the 25◦ ellipse and two twisted jet-like features extendingradially outwards from the caps. Balick, Wilson, & Hajian(2001) discovered a series of nine regularly spaced concentricrings around the core of NGC 6543 in archival HST images.The best estimate of distance to NGC 6543 is 1001 ± 269pc (Reed et al. 1999), which was measured directly from theexpansion parallax.
The bright core of NGC 6543 is surrounded by a faint,extended, spherical halo (Millikan 1974) of radius 165 arcsec
⋆ E-mail: [email protected] (DLM)
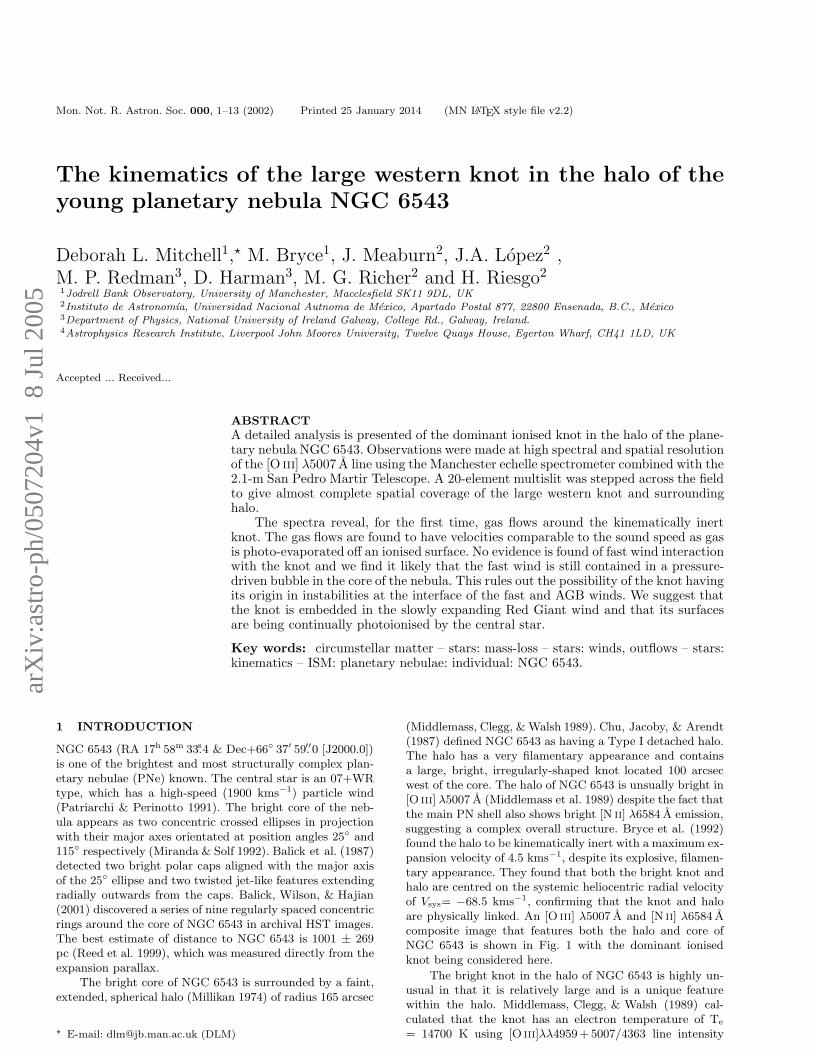
(Middlemass, Clegg, & Walsh 1989). Chu, Jacoby, & Arendt(1987) defined NGC 6543 as having a Type I detached halo.The halo has a very filamentary appearance and containsa large, bright, irregularly-shaped knot located 100 arcsecwest of the core. The halo of NGC 6543 is unsually bright in[O iii] λ5007 A (Middlemass et al. 1989) despite the fact thatthe main PN shell also shows bright [N ii] λ6584 A emission,suggesting a complex overall structure. Bryce et al. (1992)found the halo to be kinematically inert with a maximum ex-pansion velocity of 4.5 kms−1, despite its explosive, filamen-tary appearance. They found that both the bright knot andhalo are centred on the systemic heliocentric radial velocityof Vsys= −68.5 kms−1, confirming that the knot and haloare physically linked. An [O iii] λ5007 A and [N ii] λ6584 Acomposite image that features both the halo and core ofNGC 6543 is shown in Fig. 1 with the dominant ionisedknot being considered here.
The bright knot in the halo of NGC 6543 is highly un-usual in that it is relatively large and is a unique featurewithin the halo. Middlemass, Clegg, & Walsh (1989) cal-culated that the knot has an electron temperature of Te
= 14700 K using [O iii]λλ4959+ 5007/4363 line intensity
2 Deborah L. Mitchell et al.
Figure 1. A composite image showing the core and halo of NGC 6543 taken with the Nordic Optical Telescope. [N ii] λ6584 A is shownin red and [O iii] λ5007 A in blue and green. The image is 385′ by 352′ in extent. North is to the top and east is to the left. The dashedbox outlines the region covered by the multislit (see section 2). The image shows the complex nebula core, which consists of two crossedellipses in projection, and jets protruding from the polar caps of the shell. Also visible is the large, filamentary halo surrounding the coreand the prominent knot in the west. Credit R. Corradi (Isaac Newton Group) and D. Goncalves (Inst. Astrofiscia de Canaries).
ratios. Meaburn et al. (1991) derived a much lower Te of8860±1000 K from observations of the thermal broadeningof the Hα and [N ii] λ6584 A lines. In order to account for thisdiscrepency, a mass-loaded wind model was proposed, whichpredicts that a supersonic stellar wind percolates throughthe clumpy core and mass-loads in the process. The mass-loaded wind then percolates into the halo, which adds heatand raises the temperature of the [O iii] λ5007 A region (butsee section 4.1 for an alternative explanation).
At present, very little is known about the origin of theknot and what physical processes have affected its morphol-ogy since its formation. The low global expansion velocityof the halo, the low turbulence in the bright knot gas andthe evidence that an ionisation front is present on the knotsurface (the [N ii] λ6584 A ridge is displaced from the paral-lel [O iii] λ5007 A one) all suggest that the large knot is thedense relic of the Red Giant wind, now being photoionisedon its surface. The observations to be reported here aim todetermine whether or not this knot, and hence the wholehalo, is subject to the fast wind from the central star; if so,high-speed flows of ablated gas would be expected in thefaint regions in the close vicinity of this knot. For this pur-pose, [O iii] λ5007 A line profiles have been obtained with astepped multi-slit, giving unprecendented spatial coverage,over the whole vicinity of the unusual knot.
2 OBSERVATIONS AND DATA REDUCTION
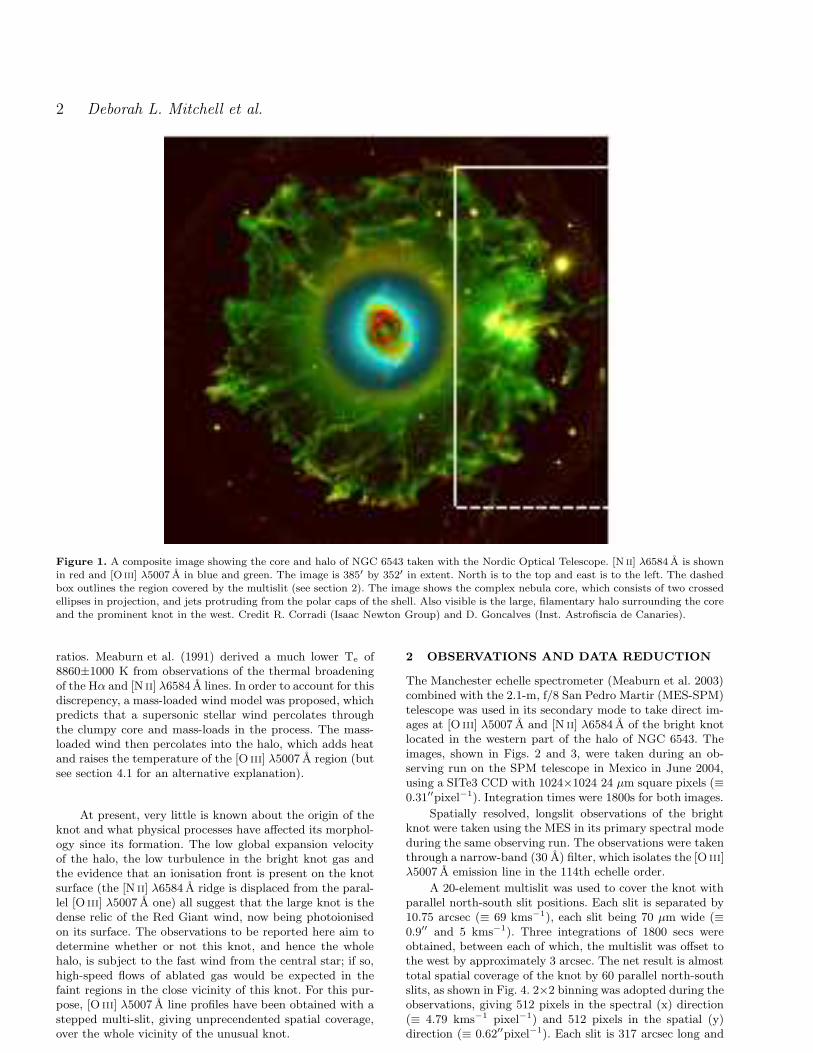
The Manchester echelle spectrometer (Meaburn et al. 2003)combined with the 2.1-m, f/8 San Pedro Martir (MES-SPM)telescope was used in its secondary mode to take direct im-ages at [O iii] λ5007 A and [N ii] λ6584 A of the bright knotlocated in the western part of the halo of NGC 6543. Theimages, shown in Figs. 2 and 3, were taken during an ob-serving run on the SPM telescope in Mexico in June 2004,using a SITe3 CCD with 1024×1024 24 µm square pixels (≡0.31′′pixel−1). Integration times were 1800s for both images.
Spatially resolved, longslit observations of the brightknot were taken using the MES in its primary spectral modeduring the same observing run. The observations were takenthrough a narrow-band (30 A) filter, which isolates the [O iii]λ5007 A emission line in the 114th echelle order.
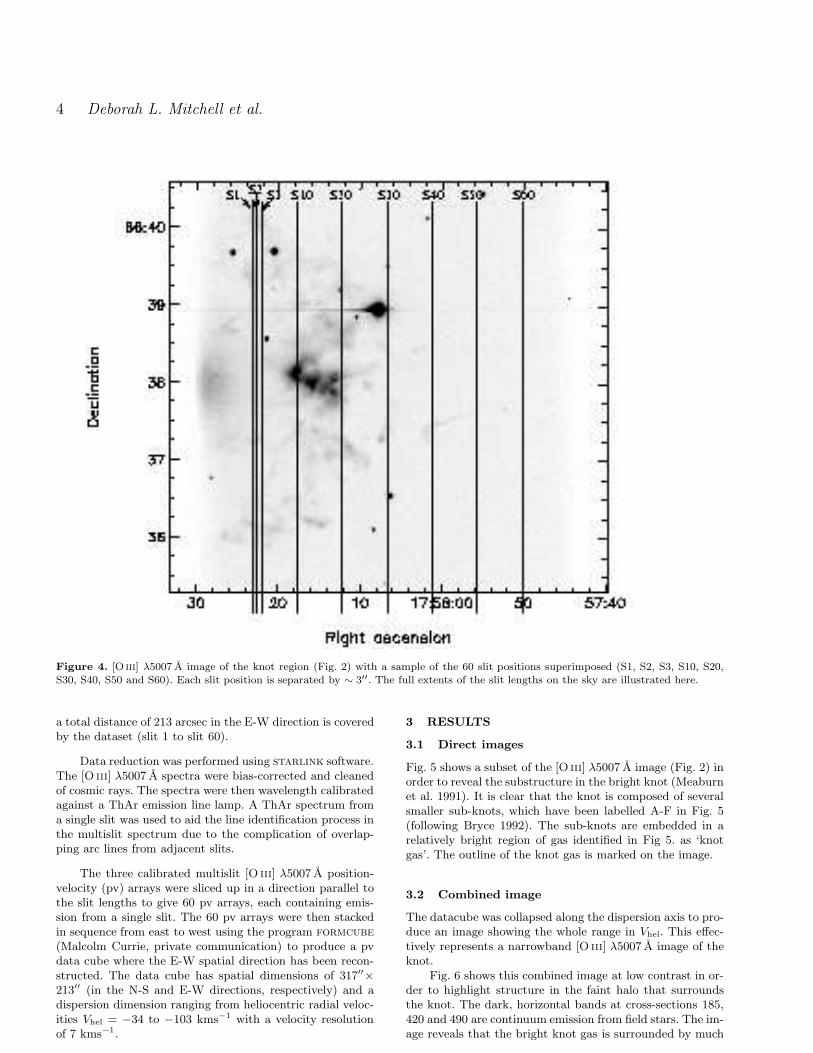
A 20-element multislit was used to cover the knot withparallel north-south slit positions. Each slit is separated by10.75 arcsec (≡ 69 kms−1), each slit being 70 µm wide (≡0.9′′ and 5 kms−1). Three integrations of 1800 secs wereobtained, between each of which, the multislit was offset tothe west by approximately 3 arcsec. The net result is almosttotal spatial coverage of the knot by 60 parallel north-southslits, as shown in Fig. 4. 2×2 binning was adopted during theobservations, giving 512 pixels in the spectral (x) direction(≡ 4.79 kms−1 pixel−1) and 512 pixels in the spatial (y)direction (≡ 0.62′′pixel−1). Each slit is 317 arcsec long and
The kinematics of the large western knot in NGC 6543 3
Figure 2. A narrowband [O iii] λ5007 A image of the western part of the halo of NGC 6543, showing the bright knot around RA17h 58m 16.s0 & Dec+66◦ 37′ 59.′′0 [J2000.0]. The central star of the PN is located 100′′ east of the knot. The star at RA 17h 58m 08.s0 &Dec+66◦ 38′ 55.′′0 is overexposed, which has resulted in horizontal bleeding across the CCD.
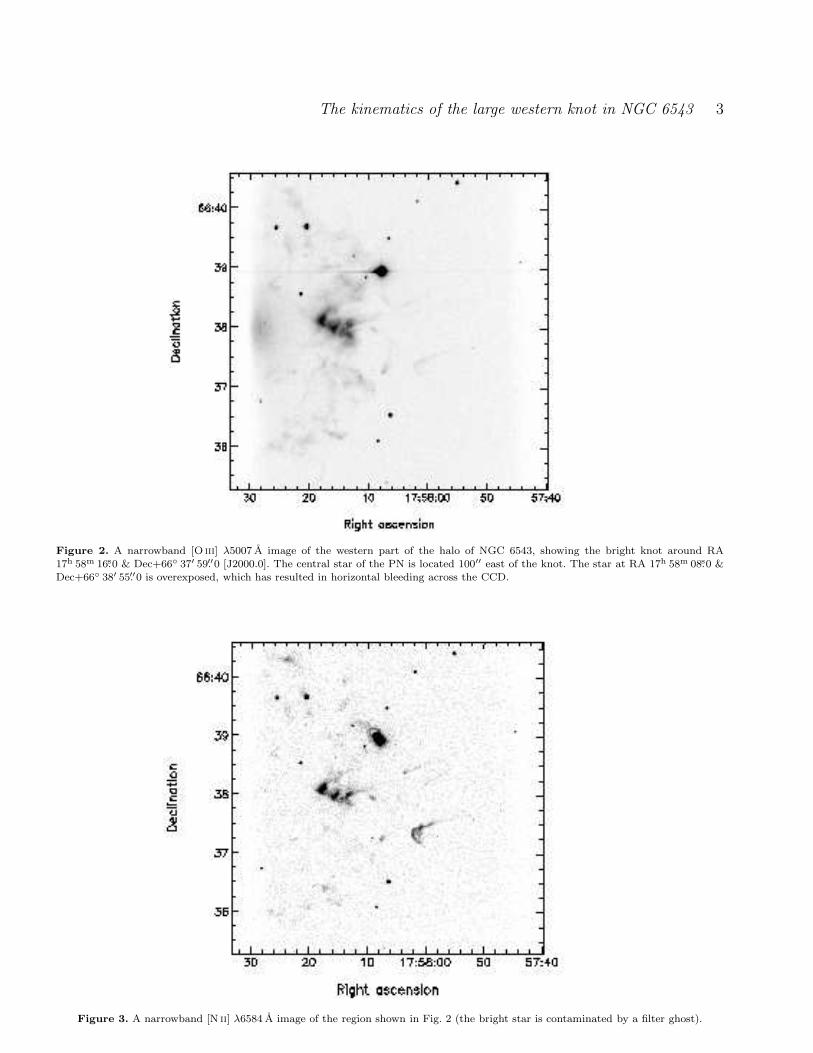
Figure 3. A narrowband [N ii] λ6584 A image of the region shown in Fig. 2 (the bright star is contaminated by a filter ghost).
4 Deborah L. Mitchell et al.
Figure 4. [O iii] λ5007 A image of the knot region (Fig. 2) with a sample of the 60 slit positions superimposed (S1, S2, S3, S10, S20,S30, S40, S50 and S60). Each slit position is separated by ∼ 3′′. The full extents of the slit lengths on the sky are illustrated here.
a total distance of 213 arcsec in the E-W direction is coveredby the dataset (slit 1 to slit 60).
Data reduction was performed using starlink software.The [O iii] λ5007 A spectra were bias-corrected and cleanedof cosmic rays. The spectra were then wavelength calibratedagainst a ThAr emission line lamp. A ThAr spectrum froma single slit was used to aid the line identification process inthe multislit spectrum due to the complication of overlap-ping arc lines from adjacent slits.
The three calibrated multislit [O iii] λ5007 A position-velocity (pv) arrays were sliced up in a direction parallel tothe slit lengths to give 60 pv arrays, each containing emis-sion from a single slit. The 60 pv arrays were then stackedin sequence from east to west using the program formcube
(Malcolm Currie, private communication) to produce a pvdata cube where the E-W spatial direction has been recon-structed. The data cube has spatial dimensions of 317′′
×
213′′ (in the N-S and E-W directions, respectively) and adispersion dimension ranging from heliocentric radial veloc-ities Vhel = −34 to −103 kms−1 with a velocity resolutionof 7 kms−1.
3 RESULTS
3.1 Direct images
Fig. 5 shows a subset of the [O iii] λ5007 A image (Fig. 2) inorder to reveal the substructure in the bright knot (Meaburnet al. 1991). It is clear that the knot is composed of severalsmaller sub-knots, which have been labelled A-F in Fig. 5(following Bryce 1992). The sub-knots are embedded in arelatively bright region of gas identified in Fig 5. as ‘knotgas’. The outline of the knot gas is marked on the image.
3.2 Combined image
The datacube was collapsed along the dispersion axis to pro-duce an image showing the whole range in Vhel. This effec-tively represents a narrowband [O iii] λ5007 A image of theknot.
Fig. 6 shows this combined image at low contrast in or-der to highlight structure in the faint halo that surroundsthe knot. The dark, horizontal bands at cross-sections 185,420 and 490 are continuum emission from field stars. The im-age reveals that the bright knot gas is surrounded by much

The kinematics of the large western knot in NGC 6543 5
Figure 5. An extracted region of the [O iii] λ5007 A image that shows the knot and the faint halo immediately surrounding it. The imageis shown at high-contrast to reveal substructure in the knot. The brightest features (sub-knots) have been labelled A-F. The sub-knotsare embedded in bright ‘knot-gas’ and the boundary between the knot gas and the faint, background halo is outlined on the image.
fainter ‘halo gas’ and the boundary between the two regionsis distinct. The faint halo gas is present both to the northand south of the knot region. The southern emission (cross-sections 120 to 280) has a more filamentary appearance thanthe faint halo gas in the north. A faint plume of gas is lo-cated north of the knot, between cross-sections 360 and 400,labelled G, which is orientated in a north-west direction.Trails of gas appear to emanate from the northern edge ofthe knot, labelled H and I, which have similar orientationsto plume G. Two distinct features lie south-west of the knot,labelled J and K, both of which have a comet-like appear-ance (these features are also clear in Figs. 2 and 3).
3.3 Velocity Slices
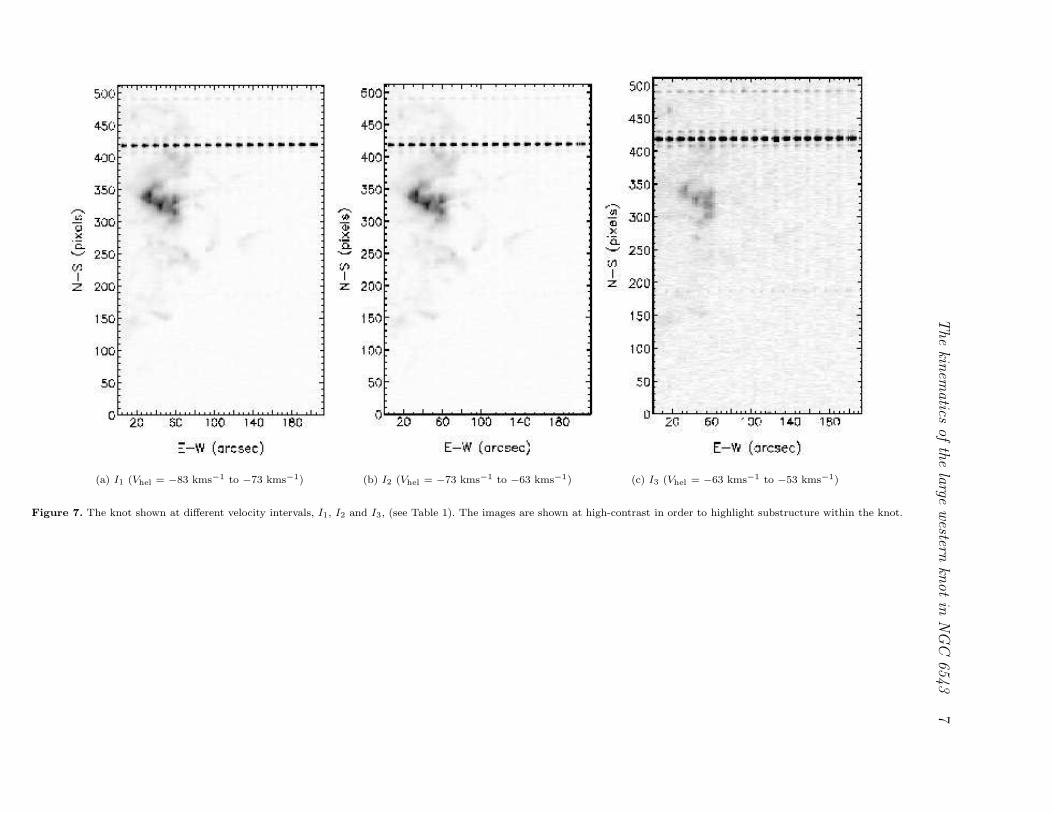
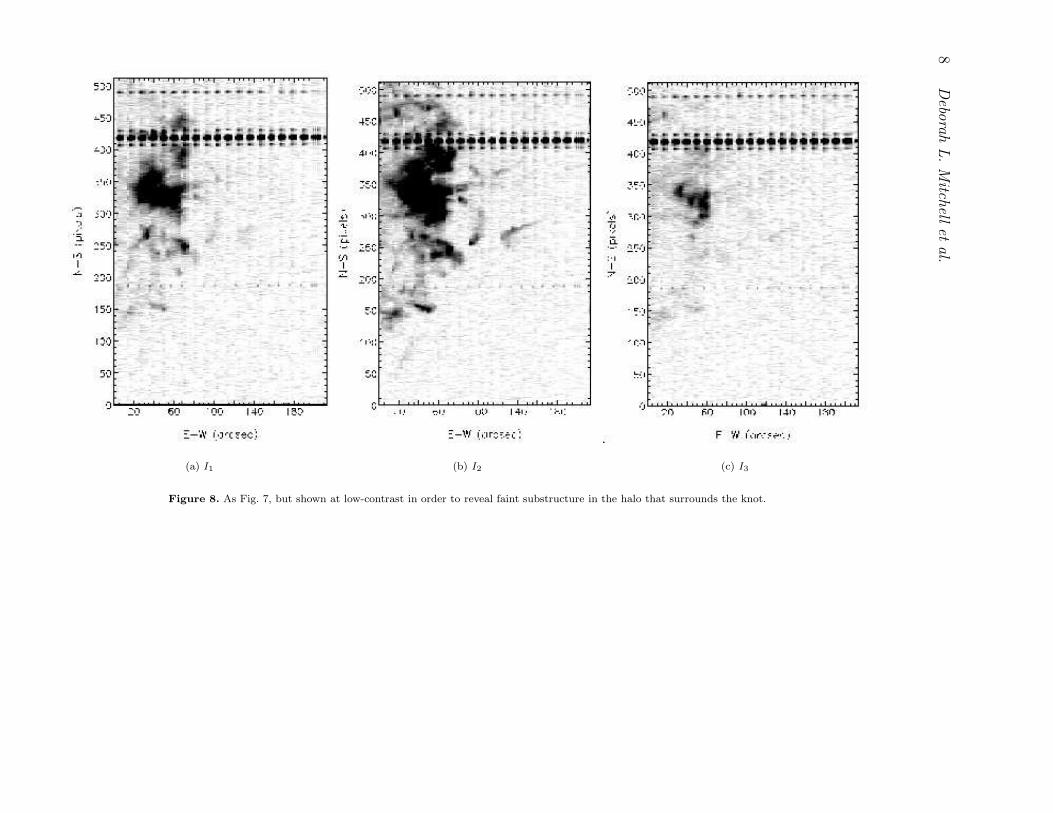
The datacube was sliced up along the dispersion axis to cre-ate radial velocity slices, each of width 10 kms−1. The ve-locity planes within each slice were co-added to create two-dimensional images. The images reveal how the morphologyof the knot varies with Vhel. Emission was detected in threeof the images, I1, I2 and I3, which are shown at high andlow contrast in Figs. 7 and 8, respectively. The high-contrastimages have been normalised with respect to the maximumintensity. Co-ordinates of features within the images are ex-pressed as (NS, EW) pixels and arcsecs, respectively. TheNS axis is expressed in pixels for ease of comparison be-tween Figs. 7, 8, 9 and 10. The velocity ranges covered byeach image are listed in Table 1. Note that I2 is centred onVsys. The images show the following features and trends:

6 Deborah L. Mitchell et al.
Figure 6. The total velocity range of the [O iii] λ5007 A datacube is shown at low-contrast in order to highlight faint structure in thehalo. The N-S extent of the figure is shown in Fig. 1. The slit length of 512 pixels ≡ 317 arcsec. The plume of gas located to the northof the knot has been labelled G; two trails of gas are labelled H and I; the comet-like features in the south-west are labelled J and K.The lines labelled S7, S11, S13 and S17 mark the lengths of slits from which the corresponding Vhel and line width plots are shown inFigs. 9 and 10, respectively. The striped horizonal bands at cross-sections 185, 420 and 490 are continuum features from field stars (if astar hits one slit it appears in this image as though it is in all 20 slits).
The
kinem
atics
ofth
ela
rgewestern
knotin
NG
C6543
7
(a) I1 (Vhel = −83 kms−1 to −73 kms−1) (b) I2 (Vhel = −73 kms−1 to −63 kms−1) (c) I3 (Vhel = −63 kms−1 to −53 kms−1)
Figure 7. The knot shown at different velocity intervals, I1, I2 and I3, (see Table 1). The images are shown at high-contrast in order to highlight substructure within the knot.
8D
ebora
hL.M
itchell
etal.
(a) I1 (b) I2 (c) I3
Figure 8. As Fig. 7, but shown at low-contrast in order to reveal faint substructure in the halo that surrounds the knot.

The kinematics of the large western knot in NGC 6543 9
Image Vmin/kms−1Vmax/kms−1
I1 -83 -73I2 -73 -63I3 -63 -53
Table 1. Ranges in Vhel of the collapsed datacube slices thatcontain [O iii] λ5007 A emission.
(i) Most of the [O iii] λ5007 A emission from the fila-mentary halo surrounding the knot is present in I2 (Fig. 8b).Halo material located to the south of the knot is also visi-ble in I1 (Fig. 8a), whereby the filaments situated at pixel270, 30 arcsecs and pixel 250, 70 arcsecs are particularlybright in this image . In contrast, the halo has virtually nored-shifted component of Vhel: I3 (Fig. 8c) reveals very littlediffuse emission, except for a compact feature at pixel 270,50 arcsecs. The gas in the halo, therefore, has a very narrowvelocity range.
(ii) The knot gas has a large blue-shifted component ofVhel as similar levels of emission are present in I1 and I2.The knot gas surrounding the eastern half of the knot isparticularly bright in I1. The knot gas is completely absentin I3. It appears that the knot gas has a more extensivevelocity range than the faint halo gas.
(iii) Features A - K (Figs. 5 and 6) are all bright in I2
(Fig. 8b). Trails H and I are both present in I1, wherebytrail H is particularly bright around pixel 360, 40 arcsecs(Fig 7a). The comet-like features, F and G, are also faintlypresent in I1, as is the western half of plume G. All of thesefeatures are completely absent, however, in I3.
(iv) Sub-knots A, B and C are much brighter than sub-knots E and F in I1. This suggests that the western side ofthe knot has a higher recessional component of Vhel than theeastern side.
3.4 Line profiles
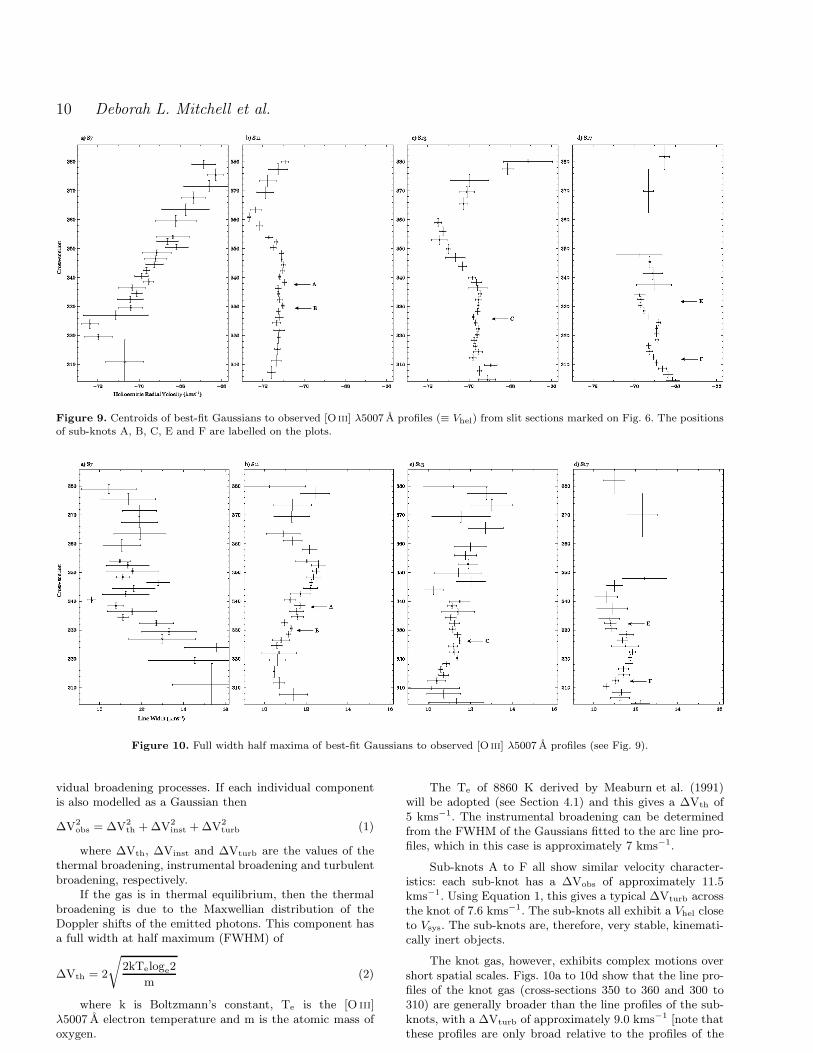
The manual fitting program longslit was used to fit singleGaussian profiles to the [O iii] λ5007 A line profiles from eachslit. The profiles were first binned together into blocks of twoalong the slit length that covered the bright knot and blocksof either three or four along the slit length that covered thesurrounding, faint halo gas, in order to improve the signal-to-noise ratio in each profile. The program was used to produceplots of Vhel and the full width half maxima (FWHM) of thefitted profiles as a function of the slit length. The line profilesare calibrated to ±1 kms−1 in absolute heliocentric velocity.The trends in Vhel from sections of four of the slits that coverthe knot, S7, S11, S13 and S17, are shown in Figs. 9a - 9d(the positions of the slits are marked on Fig. 6). These slitpositions were selected as they exhibit velocity trends thatare representitive of those found at different spatial positionsacross the knot. The corresponding trends in FWHM of thefitted Gaussians are shown in Figs. 10a - 10d. The unit ofcross-section along the y-axis in these figures corresponds toincrements in pixels along the slit length. Note that as Vsys
= −68.5 ± 1.0 kms−1, any Vhel greater than this value willbe considered red-shifted and any Vhel less than this valuewill be considered blue-shifted. The velocity trends observedover each slit are summarised below:
(i) S7: The gas bordering the eastern edge of the knotshows a trend of becoming increasingly red-shifted in anorthwards direction (Fig 9a). The plot of line width againstslit length (Fig. 10a) reveals a region of very inert gas atcross-section 340, which corresponds to the position of theeastern apex of the knot (Fig. 6).
(ii) S11: Sub-knots A and B have very similar values ofVhel, which lie close to Vsys of the knot (Fig. 9b). The knotgas immediately north of sub-knot A (cross-sections 346 -362) shows increasingly blue-shifted velocities in a north-wards direction. A reversal in velocity trend is observed atcross-section 365, whereby the Gaussian profile centres be-come increasingly red-shifted in a northwards direction. Thisreversal in velocity trend corresponds to the transition fromthe knot gas to the fainter gas identified as plume G in Fig. 6.The blue-shifted profiles observed in the knot gas region arebroader than the profiles from the sub-knots and are gen-erally broader than the red-shifted profiles observed in theregion of the faint halo gas (Fig. 10b). The narrowest lineprofiles are associated with the faint halo gas to the southof the knot (cross-section 318).
(iii) S13: The plot of Vhel against slit length for S13
(Fig. 9c) shows very similar trends to that of S11 (Fig. 9b).The emission from sub-knot C (cross-sections 320 - 330) liesat Vsys of the knot. A trend towards blue-shifted velocitiesis observed in the knot gas region north of the knot betweencross-sections 340 - 380. The observed line profiles from thisblue-shifted knot gas are relatively broad (Fig. 10c) withan observed width of approximately 12 kms−1. The fainthalo gas located to the far north (cross-sections 380 - 400)of the field is red-shifted relative to Vsys of the knot. Theline profiles from this faint halo gas are narrower than thosefrom the knot gas.
(iv) S17: Sub-knots E and F correspond to the blue-shifted ‘dips’ (cross-sections 330 and 315, respectively) inFig. 9d. The sub-knots have narrower line profiles than thesurrounding knot gas (Fig. 10d). The emission located southof sub-knot F (cross-sections 300 - 310) shows exceptionalbehaviour in that it is red-shifted relative to the sub-knots.Although this gas appears to be very close to the sub-knotsand therefore we might expect it to constitute part of theknot gas, Fig. 5 shows that this red-shifted region of gas liesjust outside of the knot-gas boundary. This suggests it maybe a line-of-sight effect of a background filament in the halo.
4 DISCUSSION
The plots in Fig. 10 show that all of the observed [O iii]λ5007 A profiles from the knot are very narrow (observedprofile widths generally less than 12.5 kms−1). This supportsthe findings of Bryce et al. (1992), who concluded that boththis prominent knot and the whole halo are kinematicallyinert.
The width of an observed [O iii] λ5007 A emission lineprofile is the result of the combination of several broadeningmechanisms. In this case, the important broadening mecha-nisms are thermal broadening, instrumental broadening andturbulent broadening. The observed line profile can be mod-elled as a Gaussian profile of width ∆Vobs, which is theconvolution of the profiles corresponding to each of the indi-
10 Deborah L. Mitchell et al.
Figure 9. Centroids of best-fit Gaussians to observed [O iii] λ5007 A profiles (≡ Vhel) from slit sections marked on Fig. 6. The positionsof sub-knots A, B, C, E and F are labelled on the plots.
Figure 10. Full width half maxima of best-fit Gaussians to observed [O iii] λ5007 A profiles (see Fig. 9).
vidual broadening processes. If each individual componentis also modelled as a Gaussian then
∆V2obs = ∆V2
th + ∆V2inst + ∆V2
turb (1)
where ∆Vth, ∆Vinst and ∆Vturb are the values of thethermal broadening, instrumental broadening and turbulentbroadening, respectively.
If the gas is in thermal equilibrium, then the thermalbroadening is due to the Maxwellian distribution of theDoppler shifts of the emitted photons. This component hasa full width at half maximum (FWHM) of
∆Vth = 2
√
2kTeloge2
m(2)
where k is Boltzmann’s constant, Te is the [O iii]λ5007 A electron temperature and m is the atomic mass ofoxygen.
The Te of 8860 K derived by Meaburn et al. (1991)will be adopted (see Section 4.1) and this gives a ∆Vth of5 kms−1. The instrumental broadening can be determinedfrom the FWHM of the Gaussians fitted to the arc line pro-files, which in this case is approximately 7 kms−1.
Sub-knots A to F all show similar velocity character-istics: each sub-knot has a ∆Vobs of approximately 11.5kms−1. Using Equation 1, this gives a typical ∆Vturb acrossthe knot of 7.6 kms−1. The sub-knots all exhibit a Vhel closeto Vsys. The sub-knots are, therefore, very stable, kinemati-cally inert objects.
The knot gas, however, exhibits complex motions overshort spatial scales. Figs. 10a to 10d show that the line pro-files of the knot gas (cross-sections 350 to 360 and 300 to310) are generally broader than the line profiles of the sub-knots, with a ∆Vturb of approximately 9.0 kms−1 [note thatthese profiles are only broad relative to the profiles of the
The kinematics of the large western knot in NGC 6543 11
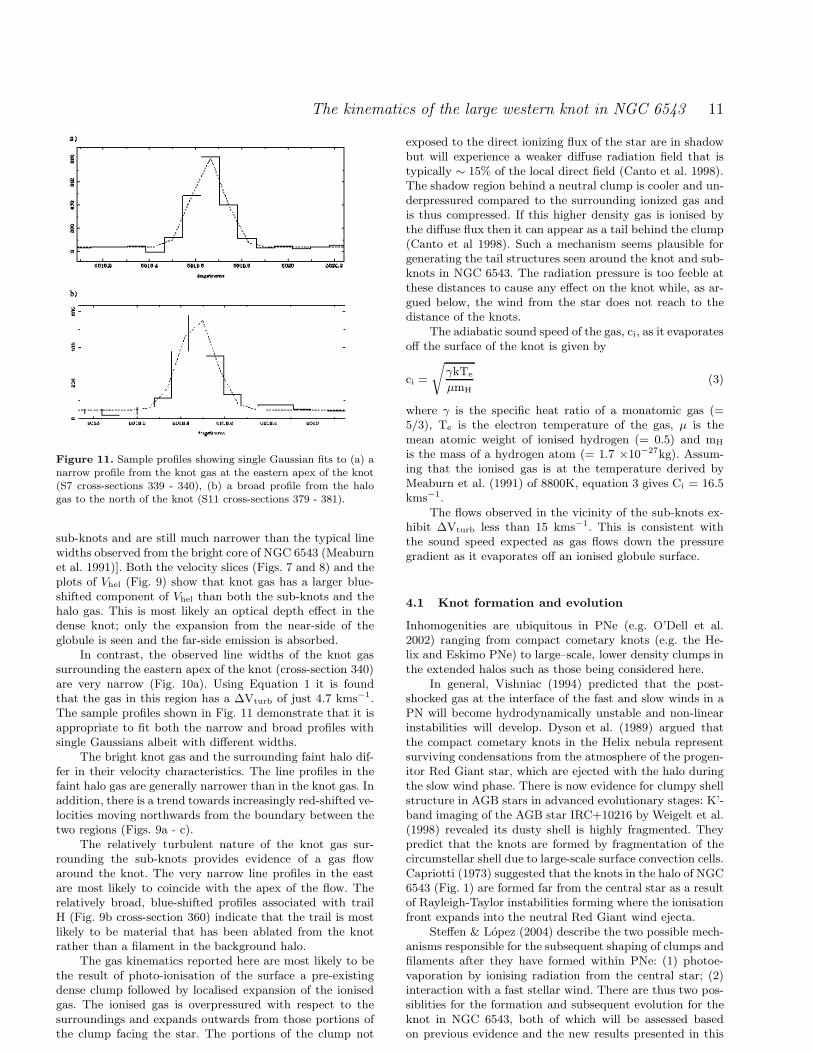
Figure 11. Sample profiles showing single Gaussian fits to (a) anarrow profile from the knot gas at the eastern apex of the knot(S7 cross-sections 339 - 340), (b) a broad profile from the halogas to the north of the knot (S11 cross-sections 379 - 381).
sub-knots and are still much narrower than the typical linewidths observed from the bright core of NGC 6543 (Meaburnet al. 1991)]. Both the velocity slices (Figs. 7 and 8) and theplots of Vhel (Fig. 9) show that knot gas has a larger blue-shifted component of Vhel than both the sub-knots and thehalo gas. This is most likely an optical depth effect in thedense knot; only the expansion from the near-side of theglobule is seen and the far-side emission is absorbed.
In contrast, the observed line widths of the knot gassurrounding the eastern apex of the knot (cross-section 340)are very narrow (Fig. 10a). Using Equation 1 it is foundthat the gas in this region has a ∆Vturb of just 4.7 kms−1.The sample profiles shown in Fig. 11 demonstrate that it isappropriate to fit both the narrow and broad profiles withsingle Gaussians albeit with different widths.
The bright knot gas and the surrounding faint halo dif-fer in their velocity characteristics. The line profiles in thefaint halo gas are generally narrower than in the knot gas. Inaddition, there is a trend towards increasingly red-shifted ve-locities moving northwards from the boundary between thetwo regions (Figs. 9a - c).
The relatively turbulent nature of the knot gas sur-rounding the sub-knots provides evidence of a gas flowaround the knot. The very narrow line profiles in the eastare most likely to coincide with the apex of the flow. Therelatively broad, blue-shifted profiles associated with trailH (Fig. 9b cross-section 360) indicate that the trail is mostlikely to be material that has been ablated from the knotrather than a filament in the background halo.
The gas kinematics reported here are most likely to bethe result of photo-ionisation of the surface a pre-existingdense clump followed by localised expansion of the ionisedgas. The ionised gas is overpressured with respect to thesurroundings and expands outwards from those portions ofthe clump facing the star. The portions of the clump not
exposed to the direct ionizing flux of the star are in shadowbut will experience a weaker diffuse radiation field that istypically ∼ 15% of the local direct field (Canto et al. 1998).The shadow region behind a neutral clump is cooler and un-derpressured compared to the surrounding ionized gas andis thus compressed. If this higher density gas is ionised bythe diffuse flux then it can appear as a tail behind the clump(Canto et al 1998). Such a mechanism seems plausible forgenerating the tail structures seen around the knot and sub-knots in NGC 6543. The radiation pressure is too feeble atthese distances to cause any effect on the knot while, as ar-gued below, the wind from the star does not reach to thedistance of the knots.
The adiabatic sound speed of the gas, ci, as it evaporatesoff the surface of the knot is given by
ci =
√
γkTe
µmH
(3)
where γ is the specific heat ratio of a monatomic gas (=5/3), Te is the electron temperature of the gas, µ is themean atomic weight of ionised hydrogen (= 0.5) and mH
is the mass of a hydrogen atom (= 1.7 ×10⁻²⁷kg). Assum-ing that the ionised gas is at the temperature derived byMeaburn et al. (1991) of 8800K, equation 3 gives Ci = 16.5kms−1.
The flows observed in the vicinity of the sub-knots ex-hibit ∆Vturb less than 15 kms−1. This is consistent withthe sound speed expected as gas flows down the pressuregradient as it evaporates off an ionised globule surface.
4.1 Knot formation and evolution
Inhomogenities are ubiquitous in PNe (e.g. O’Dell et al.2002) ranging from compact cometary knots (e.g. the He-lix and Eskimo PNe) to large–scale, lower density clumps inthe extended halos such as those being considered here.
In general, Vishniac (1994) predicted that the post-shocked gas at the interface of the fast and slow winds in aPN will become hydrodynamically unstable and non-linearinstabilities will develop. Dyson et al. (1989) argued thatthe compact cometary knots in the Helix nebula representsurviving condensations from the atmosphere of the progen-itor Red Giant star, which are ejected with the halo duringthe slow wind phase. There is now evidence for clumpy shellstructure in AGB stars in advanced evolutionary stages: K’-band imaging of the AGB star IRC+10216 by Weigelt et al.(1998) revealed its dusty shell is highly fragmented. Theypredict that the knots are formed by fragmentation of thecircumstellar shell due to large-scale surface convection cells.Capriotti (1973) suggested that the knots in the halo of NGC6543 (Fig. 1) are formed far from the central star as a resultof Rayleigh-Taylor instabilities forming where the ionisationfront expands into the neutral Red Giant wind ejecta.
Steffen & Lopez (2004) describe the two possible mech-anisms responsible for the subsequent shaping of clumps andfilaments after they have formed within PNe: (1) photoe-vaporation by ionising radiation from the central star; (2)interaction with a fast stellar wind. There are thus two pos-siblities for the formation and subsequent evolution for theknot in NGC 6543, both of which will be assessed basedon previous evidence and the new results presented in this
12 Deborah L. Mitchell et al.
paper. Since the flow velocities reported here are clearly sub-sonic with no evidence of any supersonic motions generatedby a fast wind, photoevaporation (Case 1) must dominatethe structure and dynamics. Previously Bryce et al. (1992)measured the global expansion of the whole halo as 6 10kms−1, which is consistent with the expected expansion of aRed Giant wind (Corradi et al. 2003). Clearly we are consid-ering an earlier stage in the mass loss history of the centralstar than the post–AGB phase and the onset of the fastwind.
Until recently, the presence of the fast stellar windin the halo was considered necessary in order to ac-count for the discrepency between the Te derived byMiddlemass, Clegg, & Walsh (1989) and Meaburn et al.(1991), which was originally explained using the mass-loadedwind model (see section 1). However, an alternative expla-nation was proposed by Viegas & Clegg (1994). They wereable to show that if clumps with a density greater than 106
cm−3 are present in a PN, then the [O iii] λ5007 A nebu-lar line is collisionally de-excited instead of undergoing aforbidden transition, and hence the average [O iii]λλ4959+ 5007/4363 line ratio would be higher and the derived Te
overestimated. Clumps in PNe have been found to have cen-tral densities of ∼ 106 cm−3 (Meaburn et al. 1992, Borkowskiet al. 1993, Dopita et al. 1994, Bautista, Pradhan & Oster-brock 1994). It is reasonable to assume, therefore, that theknot in NGC 6543 has a density of the same order of mag-nitude.
In summary, it appears that the fast wind, or even amass–loaded flow driven by the fast wind, is not impingingon this halo knot in NGC 6543. The fast wind remains con-tained in the central pressure driven bubble in the brightAGB superwind that forms the nebular core. The innershock front will stop the fast wind having any effect on theouter halo at the present time. This conclusion rules out thepossibility of the knottiness of the halo being due to insta-bilities between the fast wind and the earlier ejected RedGiant wind since the former has not yet reached the latter.Furthermore, knots formed via Rayleigh-Taylor instabilitiesare predicted to have radially symmetric structures (O’Dellet al. 2002), which is not observed in this case.
4.2 Knot ionization
The ionizing flux of the central star, S∗, can be estimatedfrom the Hβ flux of 2 × 10⁻¹⁰ erg cm−2 s−1 measured byBianchi et al. (1986) using the method described in Oster-brock (1989). This gives S∗ = 2 × 1045 s−1. Using the dis-tance of 1Kpc (Reed et al. 1999) gives that that knot lies at2.5 × 1018 cm from the star and so the flux incident on theknot at this distance is F∗ = S∗/4πR2 = 3× 10⁸ s−1 cm−2.
The ionization balance in a photoevaporating knot isgiven approximately by (Lopez-Martin et al 2001; Henney2001)
F∗ = uni + αn2i h (4)
where u is the expansion of newly ionized material awayfrom the ionization front, ni is the density of the ionizedgas and h ∼ 0.1rclump is the thickness of the ionized layeraround the knot. The first term on the right hand side ofequation 4 is due to the ionization of fresh neutral mate-rial while the second term is due to reionizing recombined
material. For a given local ionizing flux, there is a criticaldensity in the ionized gas that determines which processdominates the absorbtion of ionizing photons. This is im-portant because, as Lopez-Martın et al. (2001) point out,if recombinations dominate then the surface brightness ofan ionized knot matches the incident ionizing flux. If re-combinations are insignificant, then the emission from theclump is much reduced and the clump will appear fainterthan expected from photon balance. Henney (2001) showsthat most photoevaporated flows (proplyds, Eagle pillars,Rosette globules) are recombination dominated unless theionizing flux is small or if the distance of the clump fromthe source is large (Gum globules, Helix knots).
The above arguments suggest a very straightforward ex-planation for the puzzling brightness difference between thebright knot and other halo structures in NGC 6543 (see Fig1). The knot the is densest part of the halo and widespreadrecombinations lead to a large surface brightness; essentiallyall of the incident ionizing photons are absorbed and re-emitted. Meanwhile, the lower density of the other featuresin the halo mean that they are already fully ionized or re-combinations are insignificant. Using the flux value above,F∗ = 3×10⁸ s−1 cm−2 and an ionized layer of 1.5×10¹⁶ cmthen from Figure 1 of Henney (2001), we require that theionized gas around the knot have a density >> 3×102 cm−3
while the other halo features must be less dense than this.It would be interesting to use the [S ii] doublet to measurethe local electron density in the knot and the other halofeatures.
5 CONCLUSIONS
The results presented in this paper reveal for the firsttime the existence of a low-turbulence, low-velocity gas flowaround the most prominent knot in the halo of NGC 6543.The flow velocities observed are comparable to the soundspeed as gas flows down the pressure gradient as it pho-toevaporates off an ionised globule surface. Although it isknown that the fast stellar wind has played an importantrole in shaping the complex core of the Cat’s Eye nebula(Balick & Preston 1987), we find it unlikely that it has per-colated into the halo, as the observed flow velocities are toolow to be the result of an interaction of the fast stellar windwith the knot. We conclude that the fast wind must still becontained in a central pressure-driven bubble. Consequently,the knot cannot have been formed via an instability as thefast wind interacts with the slower Red Giant wind, and it isthus likely that the knot is a relic of the Red Giant wind. Wesuggest that the knot is brighter than other halo structuresbecause it is the only feature dense enough for the ionizingphoton flux to be balanced by recombinations behind theknot ionization front.
The kinematical analysis of the knot in NGC 6543should aid understanding of how these structures form andevolve in general. A natural follow-up to these observationswould be a detailed analysis of the chemical abundances ofthe knot and the dynamical evolution of the sub-knots (A -F) at high spatial resolution.
The kinematics of the large western knot in NGC 6543 13
ACKNOWLEDGMENTS
DLM thanks PPARC for her research studentship. We wouldlike to thank the staff at the San Pedro Martir observatorywho helped with the observations. Thanks also to MalcolmCurrie at Starlink who wrote the program formcube andRomano Corradi for allowing us to use his composite imageof the halo of NGC 6543 (Fig. 1).
REFERENCES
Balick, B., Wilson, J., & Hajian, A. R. 2001, AstronomicalJournal, 121, 354
Balick, B. & Preston, H. L. 1987, Astronomical Journal,94, 958
Balick, B., Owen, R., Bignell, C. R., & Hjellming, R. M.1987, Astronomical Journal, 94, 948
Balick, B. 1987, Astronomical Journal, 94, 671Bautista, M. A., Pradhan, A. K., & Osterbrock, D. E. 1994,The Analysis of Emission Lines, 1
Bianchi, L., Cerrato, S., & Grewing, M. 1986, Astronomyand Astrophysics, 169, 227
Borkowski, K. J., Harrington, J. P., Tsvetanov, Z., & Clegg,R. E. S. 1993, The Astrophysical Journal Letters, 415, L47
Bryce, M., Meaburn, J., Walsh, J. R., & Clegg, R. E. S.1992, Monthly Notices of the Royal Astronomical Society,254, 477
Canto, J., Raga, A., Steffen, W., & Shapiro, P. 1998, As-trophysical Journal, 502, 695
Capriotti, E. R. 1973, Astrophysical Journal, 179, 495Chu, Y., Jacoby, G. H., & Arendt, R. 1987, The Astrophys-ical Journal Supplement Series, 64, 529
Corradi, R. L. M., Sanchez-Blazquez, P., Mellema, G., Gi-ammanco, C., & Schwarz, H. E. 2004, Astronomy andAstrophysics, 417, 637
Corradi, R. L. M., Schonberner, D., Steffen, M., &Perinotto, M. 2003, Monthly Notices of the Royal Astro-nomical Society, 340, 417
Dopita, M. A., et al. 1994, Astrophysical Journal, 426, 150Dyson, J. E., Hartquist, T. W., & Biro, S. 1993, MonthlyNotices of the Royal Astronomical Society, 261, 430
Dyson, J. E., Hartquist, T. W., Pettini, M., & Smith, L. J.1989, Monthly Notices of the Royal Astronomical Society,241, 625
Garcıa-Segura, G., Lopez, J. A., & Franco, J. 2001, Astro-physical Journal, 560, 928
Henney, W. J. 2001, Revista Mexicana de Astronomia yAstrofisica Conference Series, 10, 57
Huggins, P. J. & Mauron, N. 2002, Astronomy and Astro-physics, 393, 273
Lopez-Martın, L., Raga, A. C., Mellema, G., Henney, W. J.,& Canto, J. 2001, Astrophysical Journal, 548, 288
Lopez, J. A., Vazquez, R., & Rodriguez, L. F. 1995, TheAstrophysical Journal Letters, 455, L63
Meaburn, J., Clayton, C. A., Bryce, M., Walsh, J. R., Hol-loway, A. J., & Steffen, W. 1998, Monthly Notices of theRoyal Astronomical Society, 294, 201
Meaburn, J., Walsh, J. R., Clegg, R. E. S., Walton, N. A.,Taylor, D., & Berry, D. S. 1992, Monthly Notices of theRoyal Astronomical Society, 255, 177
Meaburn, J., Nicholson, R., Bryce, M., Dyson, J. E., &
Walsh, J. R. 1991, Monthly Notices of the Royal Astro-nomical Society, 252, 535
Mellema, G., Raga, A. C., Canto, J., Lundqvist, P., Balick,B., Steffen, W., & Noriega-Crespo, A. 1998, Astronomyand Astrophysics, 331, 335
Middlemass, D., Clegg, R. E. S., & Walsh, J. R. 1989,Monthly Notices of the Royal Astronomical Society, 239,1
Miranda, L. F. & Solf, J. 1992, Astronomy and Astro-physics, 260, 397
O’Dell, C. R., Balick, B., Hajian, A. R., Henney, W. J., &Burkert, A. 2002, Astronomical Journal, 123, 3329Osterbrock, D.E. 1989, Astrophysics of Gaseous Nebulaeand Active Galactic Nuclei (Mill Valley: Univ. ScienceBooks)
Patriarchi, P. & Perinotto, M. 1991, Astronomy and As-trophysics, 91, 325
Reed, D. S., Balick, B., Hajian, A. R., Klayton, T. L.,Giovanardi, S., Casertano, S., Panagia, N., & Terzian, Y.1999, Astronomical Journal, 118, 2430
Simis, Y. J. W., Icke, V., & Dominik, C. 2001, Astronomyand Astrophysics, 371, 205
Steffen, W. & Lopez, J. A. 2004, Astrophysical Journal,612, 319
Viegas, S. M. & Clegg, R. E. S. 1994, Monthly Notices ofthe Royal Astronomical Society, 271, 993
Vishniac, E. T. 1994, Astrophysical Journal, 428, 186Weigelt, G., Balega, Y., Bloecker, T., Fleischer, A. J., Os-terbart, R., & Winters, J. M. 1998, Astronomy and As-trophysics, 333, L51