The Journal of Trauma: Injury, Infection and Critical Care
280
February 2007, Volume 62, Issue 2,pp.277-552 Original Articles 277 Head-Injured Patients Who "Talk and Die": The San Diego Perspective. Daniel P. Davis, MD; Mamata Kene, MD; Gary M. Vilke, MD; Michael J. Sise, MD; Frank Kennedy, MD; A Brent Eastman, MD; Thomas Velky, MD; David B. Hoyt, MD 282 Neurologic Outcome of Posttraumatic Refractory Intracranial Hypertension Treated With External Lumbar Drainage. Josep M. Abadal-Centellas, MD; Juan A. Llompart-Pou, MD; Javier Homar-Ramírez, MD; Jon Pérez-Bárcena, MD; Ainhoa Rosselló-Ferrer, MD; Jordi Ibáñez-Juvé, MD, PhD 287 Persistent Intracranial Hypertension Treated by Hypothermic Therapy After Severe Head Injury Might Induce Late-Phase Cerebral Vasospasm. Youichi Yanagawa, PhD, MD; Toshihisa Sakamoto, PhD, MD; Yoshiaki Okada, PhD, MD 292 Effects of Mannitol Bolus Administration on Intracranial Pressure, Cerebral Extracellular Metabolites, and Tissue Oxygenation in Severely Head-Injured Patients. Oliver W. Sakowitz, MD; John F. Stover, MD; Asita S. Sarrafzadeh, MD; Andreas W. Unterberg, MD; Karl L. Kiening, MD 299 Hypertonic Saline Resuscitation: Efficacy May Require Early Treatment in Severely Injured Patients. Naoyuki Hashiguchi, MD; Linda Lum, RN; Elizabeth Romeril, RN; Yu Chen, MD; Linda Yip, PhD; David B. Hoyt, MD; Wolfgang G. Junger, PhD Special Commentary 307 Damage Control Resuscitation: Directly Addressing the Early Coagulopathy of Trauma. John B. Holcomb, MD, FACS; Don Jenkins, MD, FACS; Peter Rhee, MD, FACS; Jay Johannigman, MD, FS, FACS; Peter Mahoney, FRCA, RAMC; Sumeru Mehta, MD; E Darrin Cox, MD, FACS; Michael J. Gehrke, MD; Greg J. Beilman, MD, FACS; Martin Schreiber, MD, FACS; Stephen F. Flaherty, MD, FACS; Kurt W. Grathwohl, MD; Phillip C. Spinella, MD; Jeremy G. Perkins, MD; Alec C. Beekley, MD, FACS; Neil R. McMullin, MD; Myung S. Park, MD, FACS; Ernest A. Gonzalez, MD, FACS; Charles E. Wade, PhD; Michael A. Dubick, PhD; C William Schwab, MD, FACS; Fred A. Moore, MD, FACS; Howard R. Champion, FRCS; David B. Hoyt, MD, FACS; John R. Hess, MD, MPH, FACP Original Articles 311 Administration of Recombinant Factor VIIa Decreases Blood Loss After Blunt Trauma in Noncoagulopathic Pigs. Daniel William Howes, FRCPC; Andrew Stratford, FRCSC; Michael Stirling, FRCSC; Catharine C. Ferri, PhD; Trevor Bardell, MD
-
Upload
khangminh22 -
Category
Documents
-
view
1 -
download
0
Transcript of The Journal of Trauma: Injury, Infection and Critical Care
February 2007, Volume 62, Issue 2,pp.277-552 Original Articles
277 Head-Injured Patients Who "Talk and Die": The San Diego Perspective. Daniel P. Davis, MD; Mamata Kene, MD; Gary M. Vilke, MD; Michael J. Sise, MD; Frank Kennedy, MD; A Brent Eastman, MD; Thomas Velky, MD; David B. Hoyt, MD
282 Neurologic Outcome of Posttraumatic Refractory Intracranial Hypertension Treated With External Lumbar Drainage. Josep M. Abadal-Centellas, MD; Juan A. Llompart-Pou, MD; Javier Homar-Ramírez, MD; Jon Pérez-Bárcena, MD; Ainhoa Rosselló-Ferrer, MD; Jordi Ibáñez-Juvé, MD, PhD
287 Persistent Intracranial Hypertension Treated by Hypothermic Therapy After Severe Head Injury Might Induce Late-Phase Cerebral Vasospasm. Youichi Yanagawa, PhD, MD; Toshihisa Sakamoto, PhD, MD; Yoshiaki Okada, PhD, MD
292 Effects of Mannitol Bolus Administration on Intracranial Pressure, Cerebral Extracellular Metabolites, and Tissue Oxygenation in Severely Head-Injured Patients. Oliver W. Sakowitz, MD; John F. Stover, MD; Asita S. Sarrafzadeh, MD; Andreas W. Unterberg, MD; Karl L. Kiening, MD
299 Hypertonic Saline Resuscitation: Efficacy May Require Early Treatment in Severely Injured Patients. Naoyuki Hashiguchi, MD; Linda Lum, RN; Elizabeth Romeril, RN; Yu Chen, MD; Linda Yip, PhD; David B. Hoyt, MD; Wolfgang G. Junger, PhD
Special Commentary 307 Damage Control Resuscitation: Directly Addressing the Early
Coagulopathy of Trauma. John B. Holcomb, MD, FACS; Don Jenkins, MD, FACS; Peter Rhee, MD, FACS; Jay Johannigman, MD, FS, FACS; Peter Mahoney, FRCA, RAMC; Sumeru Mehta, MD; E Darrin Cox, MD, FACS; Michael J. Gehrke, MD; Greg J. Beilman, MD, FACS; Martin Schreiber, MD, FACS; Stephen F. Flaherty, MD, FACS; Kurt W. Grathwohl, MD; Phillip C. Spinella, MD; Jeremy G. Perkins, MD; Alec C. Beekley, MD, FACS; Neil R. McMullin, MD; Myung S. Park, MD, FACS; Ernest A. Gonzalez, MD, FACS; Charles E. Wade, PhD; Michael A. Dubick, PhD; C William Schwab, MD, FACS; Fred A. Moore, MD, FACS; Howard R. Champion, FRCS; David B. Hoyt, MD, FACS; John R. Hess, MD, MPH, FACP
Original Articles 311 Administration of Recombinant Factor VIIa Decreases Blood
Loss After Blunt Trauma in Noncoagulopathic Pigs. Daniel William Howes, FRCPC; Andrew Stratford, FRCSC; Michael Stirling, FRCSC; Catharine C. Ferri, PhD; Trevor Bardell, MD
316 Ketamine Attenuates Early Lipopolysaccharide-Induced Gastric Dysfunction: Role of Stress-Inducible Phosphoproteins. James W. Suliburk, MD; David W. Mercer, MD
320 Relationship Between Release of [beta]-Endorphin, Cortisol, and Trauma Severity in Children With Blunt Torso and Extremity Trauma. Hamit Okur, MD; Mustafa Küçükaydn, MD; Bülent Hayri Özokutan, MD; Sabahattin Muhtarolu, MD; Ahmet Kazez, MD; Cüneyt Turan, MD
325 Immediate Postoperative Complications of Combined Penetrating Rectal and Bladder Injuries. Paul L. Crispen, MD; Bryan T. Kansas, MD; Paola G. Pieri, MD; Carol Fisher, BA; John P. Gaughan, PhD; Abhijit S. Pathak, MD; Jack H. Mydlo, MD; Amy J. Goldberg, MD
330 Blind Urethral Catheterization in Trauma Patients Suffering From Lower Urinary Tract Injuries. Gil Z. Shlamovitz, MD; Lynne McCullough, MD, FACEP
336 Combination of Arteriovenous Extracorporeal Lung Assist and High-Frequency Oscillatory Ventilation in a Porcine Model of Lavage-Induced Acute Lung Injury: A Randomized Controlled Trial. Joerg Brederlau, MD; Ralf Muellenbach, MD; Markus Kredel, MD; Julian Kuestermann; Martin Anetseder, MD; Clemens Greim, MD; Norbert Roewer, MD
347 Fluoroscopic Imaging Guides of the Posterior Pelvis Pertaining to Iliosacral Screw Placement. Bruce H. Ziran, MD; Ajay D. Wasan, MD; David M. Marks, MD; Steven A. Olson, MD; Michael W. Chapman, MD
357 Percutaneous Transiliac Pelvic Fracture Fixation: Cadaver Feasibility Study and Preliminary Clinical Results. Berton R. Moed, MD; Brian A. Fissel, MD; Gregory Jasey, MD
365 Hip Fractures Among the Elderly: Personal and Contextual Social Factors That Matter. Anne Reimers, BSc; Lucie Laflamme, PhD
370 Timing and Duration of the Initial Pelvic Stabilization After Multiple Trauma in Patients From the German Trauma Registry: Is There an Influence on Outcome? Christian Probst, MD; Tarane Probst, MD; Axel Gaensslen, MD; Christian Krettek, MD; Hans Christoph Pape, MD; the Polytrauma Study Group of the German Trauma Society
378 Long-Term Results in Surgically Treated Acetabular Fractures Through the Posterior Approaches. Triantaphillopoulos Panagiotis, MD; Panagiotopoulos Elias, PhD; Mousafiris Constantinos, PhD; Tyllianakis Minos, PhD; Dimacopoulos Panagiotis, PhD; Lambiris Elias, PhD
383 Biomechanical Analysis of Cervical and Thoracolumbar Spine Motion in Intact and Partially and Completely Unstable Cadaver Spine Models With Kinetic Bed Therapy or Traditional Log Roll. Glenn R. Rechtine, MD; Bryan P. Conrad, MEng; Brook G. Bearden, MD; MaryBeth Horodyski, EdD
389 Cervical Spine Injuries in Pediatric Patients. Patrick Platzer, MD; Manuela Jaindl, MD; Gerhild Thalhammer, MD; Stefan Dittrich, MD; Florian Kutscha-Lissberg, MD; Vilmos Vecsei, MD; Christian Gaebler, MD
397 Time Lapse and Comorbidities Influence Patient Knowledge and Pursuit of Medical Care After Traumatic Splenectomy. Stephanie Mallow Corbett, PharmD; Jill A. Rebuck, PharmD, BCPS; Frederick B. Rogers, MD, FACS; Peter Callas, PhD; Gene Grindlinger, MD, FACS; Steven Desjardins, RRT; James C. Hebert, MD, FACS
404 Craniofacial Trauma in Adolescents: Incidence, Etiology, and Prevention. Giovanni Rocchi, MD; Maria Teresa Fadda, DMD; Tito Matteo Marianetti, MD; Gabriele Reale, MD; Giorgio Iannetti, MD
410 Chronic Posttraumatic Stress Disorder After Facial Injury: A 1-year Prospective Cohort Study. Shirley M. Glynn, PhD; Vivek Shetty, DDS; Karin Elliot-Brown, PhD; Richard Leathers, DDS; Thomas R. Belin, PhD; Jianming Wang, PhD
419 Long-Term Survival of Medicare Patients With Head Injury. Joseph T. Donohue, MD; David E. Clark, MD; Michael A. DeLorenzo, PhD
424 State Trauma Registries: Survey and Update-2004. Karen S. Guice, MD, MPP; Laura D. Cassidy, MS, PhD; N Clay Mann, PhD, MS
436 Statewide Tracking of Crash Victims' Medical System Utilization and Outcomes. Nicholas Mango, BSME; Elizabeth Garthe, MHS
461 Long-Term Multidimensional Functional Consequences of Severe Multiple Injuries Two Years After Trauma: A Prospective Longitudinal Cohort Study. Helene Lundgaard Soberg, MSc; Erik Bautz-Holter, MD, PhD; Olav Roise, MD, PhD; Arnstein Finset, PhD
471 Return to Work After Severe Multiple Injuries: A Multidimensional Approach on Status 1 and 2 Years Postinjury. Helene Lundgaard Soberg, MSc; Arnstein Finset, PhD; Erik Bautz-Holter, MD, PhD; Leiv Sandvik, PhD; Olav Roise, MD, PhD
482 Road Crash Casualties: Characteristics of Police Injury Severity Misclassification. Emmanuelle Amoros, MSc; Jean-Louis Martin, MSc; Mireille Chiron, MD; Bernard Laumon, PhD, MD
491 Canadian Benchmarks in Trauma. Eric Bergeron, MD; Richard Simons, MD; Cassandra Linton, MSc; Fang Yang, MSc; John M. Tallon, MD; Tanya Charyk Stewart, MSc; Nicole de Guia, MHSc; Mary Stephens, MD

498 Trauma Care at Rural Level III Trauma Centers in a State Trauma System. Thomas S. Helling, MD
504 The Effectiveness of Video-Telemedicine for Screening of Patients Requesting Emergency Air Medical Transport (EAMT). Shin-Han Tsai, MD, PhD; Jess Kraus, PhD; Hsueh-Ru Wu, MSN; Wan-Lin Chen, MD; Ming-Fu Chiang, MD, PhD; Li-Hua Lu, MD, MMS; Chia-En Chang, MS; Wen-Ta Chiu, MD, PhD
512 How to Decrease Pedestrian Injuries: Conceptual Evolutions Starting From 137 Crash Tests. Lionel Thollon, PhD; Christian Jammes, MSc; Michel Behr, PhD; Pierre-Jean Arnoux, PhD; Claude Cavallero, Eng; Christian Brunet, MD
Case Report 520 Computed Tomographic Angiography in the Initial Assessment
of Penetrating Extremity Injuries. Kenji Inaba, MD, MS; Felipe Munera, MD; Luis Rivas, MD; Enrique Ginzburg, MD; Mark McKenney, MD
523 Orbital Subperiosteal Hematoma Associated With Subfrontal Extradural Hematoma. Alok K. Sharma, MCh; Batuk D. Diyora, MS; Sanjay G. Shah, MS, DNB; Ajay K. Pandey, MCh; Parag P. Sayal, MBBS; Harshal A. Ingale, MBBS; Ravi Mamidana, MBBS
526 Anterior Spinal Artery Syndrome After Abdominal Stabbing and Resuscitative Thoracotomy. Christopher Aylwin, BSc, MRCS; Nigel Tai, MS, FRCS; Michael Walsh, MS, FRCS
529 A Missed Cervical Cord Injury Caused by a Stab Wound to the Neck. Dilip Sri Nath, MD; Michael D. McGonigal, MD
Procedures & Techniques 532 Ultrasound Guided Hematoma Block: A Novel Use of
Ultrasound in the Traumatized Patient. Chad S. Crystal, MD; Michael A. Miller, MD; Scott E. Young, DO
Review Article 534 Guidelines for the Conduction of Follow-up Studies Measuring
Injury-Related Disability. Ed F. Van Beeck, MD, PhD; Claus F. Larsen, MD, PhD; Ronan A. Lyons, MD, PhD; Willem-Jan Meerding, PhD; Saakje Mulder, PhD; Marie-Louise Essink-Bot, MD, PhD
Departments The Image of Trauma
551 Unusual Rectal Injury by Personal Watercraft. Jakub Szmytkowski, MD; Stanislaw Dabrowiecki, MD, PhD; Malgorzata Makuch-Burzynska, MD
Departments Image of Trauma
552 Shotgun Wounds to the Buttocks, Sacrum, and Rectum. Matthew Moore Carrick, MD; Armand N. Morel, BS; Hoang Q. Pham, MD
Head-Injured Patients Who “Talk and Die”:The San Diego PerspectiveDaniel P. Davis, MD, Mamata Kene, MD, Gary M. Vilke, MD, Michael J. Sise, MD, Frank Kennedy, MD,A. Brent Eastman, MD, Thomas Velky, MD, and David B. Hoyt, MD
Background: Head-injured patientswho “talk and die” are potentially sal-vageable, making their early identificationimportant. This study uses a large, compre-hensive database to explore risk factors forhead-injured patients who deteriorate aftertheir initial presentation.
Methods: Patients with a head Ab-breviated Injury Score (AIS) score of 3�and a preadmission verbal Glasgow ComaScale (GCS) score of 3� were identifiedfrom our county trauma registry during a16-year period. Survivors and nonsurvi-vors were compared with regard to demo-graphics, initial clinical presentation, andvarious risk factors. Logistic regressionwas used to explore the impact of multiplefactors on outcome, including the signifi-cance of a change in GCS score from field
to arrival. In addition, patients were strat-ified by injury severity and hospital day ofdeath to further define the relationshipbetween outcome and multiple clinicalvariables.
Results: A total of 7,443 patientswere identified with head AIS 3� and ver-bal GCS score 3�. Overall mortality was6.1%. About one-third of deaths occurredon the first hospital day, with more thanone-third occurring after hospital day 5.Logistic regression revealed an associationbetween mortality and older age, moreviolent mechanisms of injury (fall, gun-shot wound, pedestrian versus automo-bile), greater injury severity (higher headAIS and Injury Severity Score), lowerGCS score, and hypotension. In addition,mortality was associated with a decrease
in GCS score from field to arrival, the useof anticoagulants, and a diagnosis of pul-monary embolus. Two important groupsof “talk-and-die” patients were identified.Early deaths occurred in younger patientswith more critical extracranial injuries.Anticoagulant use was also an indepen-dent risk factor in these early deaths.Later deaths occurred in older patientswith less significant extracranial inju-ries. Pulmonary embolus also appearedto be an important contributor to latemortality.
Conclusions: More severe injuriesand use of anticoagulants are independentrisk factors for early death in potentiallysalvageable traumatic brain injury pa-tients, whereas older age and pulmonaryembolus are associated with later deaths.
J Trauma. 2007;62:277–281.
Head trauma remains a leading cause of death and dis-ability. Many patients die in the field or shortly afterarrival at the trauma center without regaining con-
sciousness, suggesting a devastating primary brain injury.1–4
Reilly et al. first introduced the term “talk and die” in 1975 todescribe a group of potentially salvageable head-injured pa-tients in whom the primary injury was not so devastating asto destroy higher cognitive function.5 Their ultimate demisewas thought to represent a combination of secondary braininjury as well as other potentially preventable factors.5–9 Forthis reason, patients who talk and die have been the focus ofmultiple studies, most of which were relatively small with
limited ability to identify associated factors.5,6,10–12 Here weuse a large, comprehensive trauma registry to describe ourexperience with talk-and-die patients. The objective of thisanalysis was to identify and characterize risk factors forhead-injured patients who deteriorate after their initialpresentation.
PATIENTS AND METHODSDesign
This was a retrospective, registry-based analysis. Waiverof informed consent was granted by our Investigational Re-view Board.
Trauma SystemSan Diego County includes a population of over 3 mil-
lion in an area of 4,200 square miles. First-responding emer-gency medical services (EMS) units include a paramedic onthe vast majority of calls. In addition, air medical resourcescan be requested at the discretion of ground providers. Adultmajor trauma victims (MTVs), as defined by American Col-lege of Surgeons criteria, are transported by prehospital per-sonnel to one of five designated trauma centers, all of whichare Level I or II.
SubjectsThe primary objective of this analysis was to describe
patients with moderate to severe traumatic brain injury (TBI)
Submitted for publication February 27, 2006.Accepted for publication October 29, 2006.Copyright © 2007 by Lippincott Williams & Wilkins, Inc.From the Departments of Emergency Medicine (D.P.D., M.K.,
G.M.V.) and Surgery (D.B.H.), University of California San Diego; MercyAir Medical Services (D.P.D.); the Department of Surgery, Scripps MercyHospital (M.J.S.); the Department of Surgery, Sharp Memorial Hospital(F.K.); the Department of Surgery, Scripps La Jolla Hospital (B.E.); and theDepartment of Surgery, Palomar Hospital (T.V.); San Diego, CA.
Presented at the 64th Annual Meeting of the American Association forthe Surgery of Trauma, September 22–24, 2005, Atlanta, Georgia.
Address for reprints: Daniel Davis, MD, UCSD Emergency Medicine,200 West Arbor Drive #8676, San Diego, CA 92103-8676; email: [email protected].
DOI: 10.1097/TA.0b013e31802ef4a3
The Journal of TRAUMA� Injury, Infection, and Critical Care
Volume 62 • Number 2 277
who talk at some point during their course but ultimately die.All patients were identified using the San Diego Countytrauma registry from 1987 through 2003. The presence of ahead injury was defined by a head Abbreviated Injury Score(AIS) of 3 or greater, with “talking” defined as having at leastone preadmission verbal Glasgow Coma Scale (GCS) scoreof 3 or greater. These definitions are consistent with theoriginal description of “talk-and-die” patients.5
Data Collection and AnalysisThe San Diego County Trauma Registry includes pre-
hospital and hospital data on all patients fulfilling MajorTrauma Outcome Study (MTOS) criteria, which includedeath or admission to the hospital for greater than 24 hours.Trained quality-assurance nurses abstract clinical data fromhospital medical records and assign AISs for all body systemsusing physician notes, radiographic findings, and coronerreports. Nurses from each of the five adult trauma facilitiesconduct regular quality-improvement meetings to assure stan-dardized definitions across centers. All deaths are reviewedby a trauma physician, and an extensive catalog of compli-cations is maintained for all patients. The following variableswere abstracted from the registry for this analysis: demo-graphics (age, sex), mechanism of injury (assault, fall, founddown, gunshot wound, motor vehicle crash, pedestrian versusautomobile, stab wound), field and arrival systolic bloodpressure, field and arrival GCS score including each of thethree components (eye, verbal, motor), mode of transport (airversus ground), field or emergency department (ED) intuba-tion, trauma resuscitation activation, arrival base deficit, hos-pital length of stay, history of anticoagulant use (warfarin orheparin), inpatient or coroner diagnosis of pulmonary embo-lus, and disposition.
For the primary analysis, survivors and nonsurvivorswere compared with regard to each of the variables definedabove using both univariate statistics (t test and �2) as well aslogistic regression to determine the independent associationof each variable with mortality. Associations were quantifiedusing odds ratios and goodness-of-fit of the multivariate mod-els was verified using the Hosmer-Lemeshow test. The re-gression analysis was repeated after exclusion of penetratingtrauma victims. Finally, patients were stratified by ISS and headAIS and by hospital day of death to identify variables associatedwith early and late mortality. These data were presented descrip-tively. Statistical calculations were performed using StatsDirect(StatsDirect Software, Ashwell, UK).
RESULTSA total of 7,443 patients were identified with a head AIS
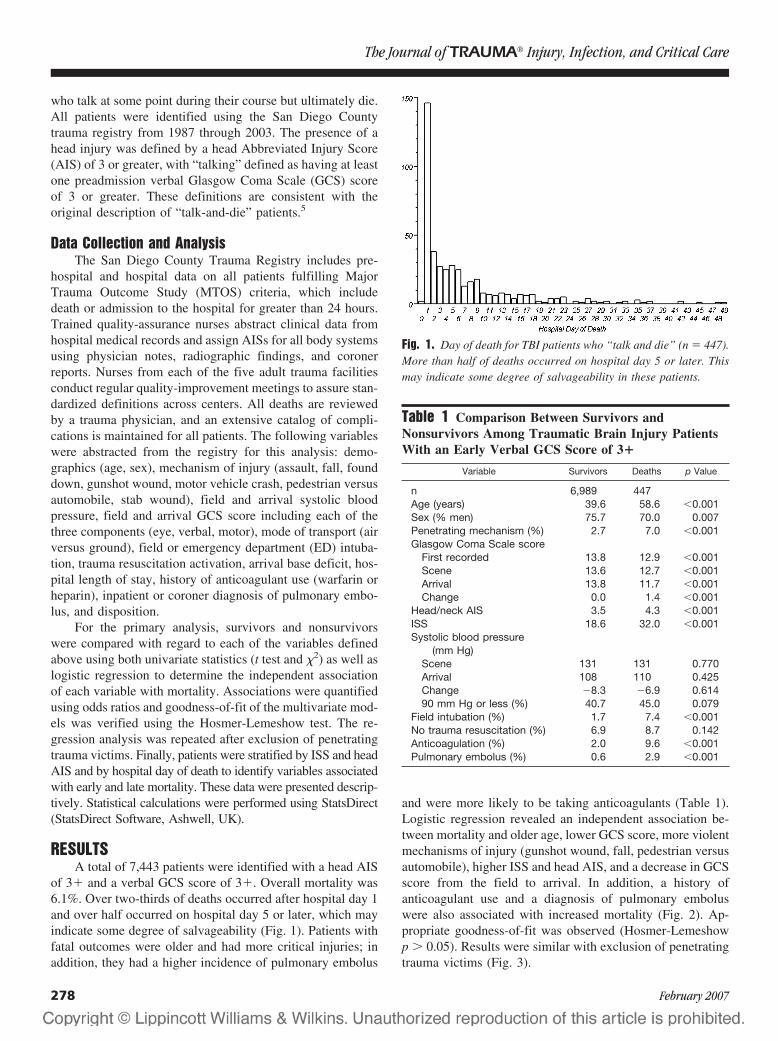
of 3� and a verbal GCS score of 3�. Overall mortality was6.1%. Over two-thirds of deaths occurred after hospital day 1and over half occurred on hospital day 5 or later, which mayindicate some degree of salvageability (Fig. 1). Patients withfatal outcomes were older and had more critical injuries; inaddition, they had a higher incidence of pulmonary embolus
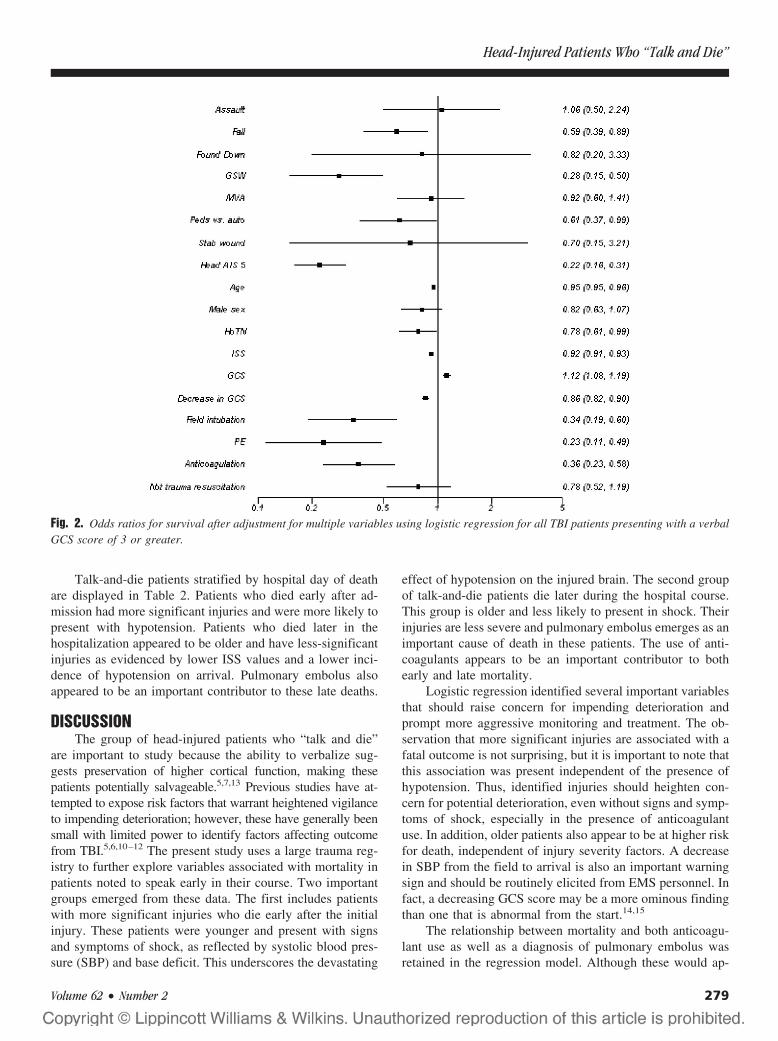
and were more likely to be taking anticoagulants (Table 1).Logistic regression revealed an independent association be-tween mortality and older age, lower GCS score, more violentmechanisms of injury (gunshot wound, fall, pedestrian versusautomobile), higher ISS and head AIS, and a decrease in GCSscore from the field to arrival. In addition, a history ofanticoagulant use and a diagnosis of pulmonary emboluswere also associated with increased mortality (Fig. 2). Ap-propriate goodness-of-fit was observed (Hosmer-Lemeshowp � 0.05). Results were similar with exclusion of penetratingtrauma victims (Fig. 3).
Fig. 1. Day of death for TBI patients who “talk and die” (n � 447).More than half of deaths occurred on hospital day 5 or later. Thismay indicate some degree of salvageability in these patients.
Table 1 Comparison Between Survivors andNonsurvivors Among Traumatic Brain Injury PatientsWith an Early Verbal GCS Score of 3�
Variable Survivors Deaths p Value
n 6,989 447Age (years) 39.6 58.6 �0.001Sex (% men) 75.7 70.0 0.007Penetrating mechanism (%) 2.7 7.0 �0.001Glasgow Coma Scale score
First recorded 13.8 12.9 �0.001Scene 13.6 12.7 �0.001Arrival 13.8 11.7 �0.001Change 0.0 1.4 �0.001
Head/neck AIS 3.5 4.3 �0.001ISS 18.6 32.0 �0.001Systolic blood pressure
(mm Hg)Scene 131 131 0.770Arrival 108 110 0.425Change �8.3 �6.9 0.61490 mm Hg or less (%) 40.7 45.0 0.079
Field intubation (%) 1.7 7.4 �0.001No trauma resuscitation (%) 6.9 8.7 0.142Anticoagulation (%) 2.0 9.6 �0.001Pulmonary embolus (%) 0.6 2.9 �0.001
The Journal of TRAUMA� Injury, Infection, and Critical Care
278 February 2007
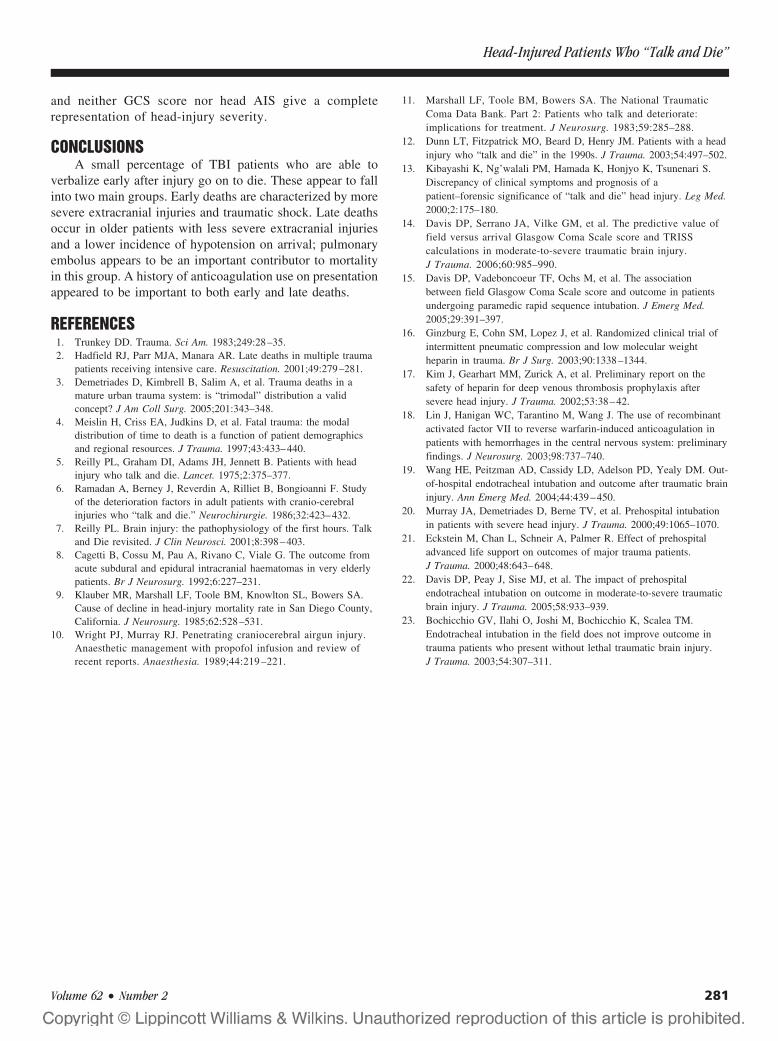
Talk-and-die patients stratified by hospital day of deathare displayed in Table 2. Patients who died early after ad-mission had more significant injuries and were more likely topresent with hypotension. Patients who died later in thehospitalization appeared to be older and have less-significantinjuries as evidenced by lower ISS values and a lower inci-dence of hypotension on arrival. Pulmonary embolus alsoappeared to be an important contributor to these late deaths.
DISCUSSIONThe group of head-injured patients who “talk and die”
are important to study because the ability to verbalize sug-gests preservation of higher cortical function, making thesepatients potentially salvageable.5,7,13 Previous studies have at-tempted to expose risk factors that warrant heightened vigilanceto impending deterioration; however, these have generally beensmall with limited power to identify factors affecting outcomefrom TBI.5,6,10–12 The present study uses a large trauma reg-istry to further explore variables associated with mortality inpatients noted to speak early in their course. Two importantgroups emerged from these data. The first includes patientswith more significant injuries who die early after the initialinjury. These patients were younger and present with signsand symptoms of shock, as reflected by systolic blood pres-sure (SBP) and base deficit. This underscores the devastating
effect of hypotension on the injured brain. The second groupof talk-and-die patients die later during the hospital course.This group is older and less likely to present in shock. Theirinjuries are less severe and pulmonary embolus emerges as animportant cause of death in these patients. The use of anti-coagulants appears to be an important contributor to bothearly and late mortality.
Logistic regression identified several important variablesthat should raise concern for impending deterioration andprompt more aggressive monitoring and treatment. The ob-servation that more significant injuries are associated with afatal outcome is not surprising, but it is important to note thatthis association was present independent of the presence ofhypotension. Thus, identified injuries should heighten con-cern for potential deterioration, even without signs and symp-toms of shock, especially in the presence of anticoagulantuse. In addition, older patients also appear to be at higher riskfor death, independent of injury severity factors. A decreasein SBP from the field to arrival is also an important warningsign and should be routinely elicited from EMS personnel. Infact, a decreasing GCS score may be a more ominous findingthan one that is abnormal from the start.14,15
The relationship between mortality and both anticoagu-lant use as well as a diagnosis of pulmonary embolus wasretained in the regression model. Although these would ap-
Fig. 2. Odds ratios for survival after adjustment for multiple variables using logistic regression for all TBI patients presenting with a verbalGCS score of 3 or greater.
Head-Injured Patients Who “Talk and Die”
Volume 62 • Number 2 279
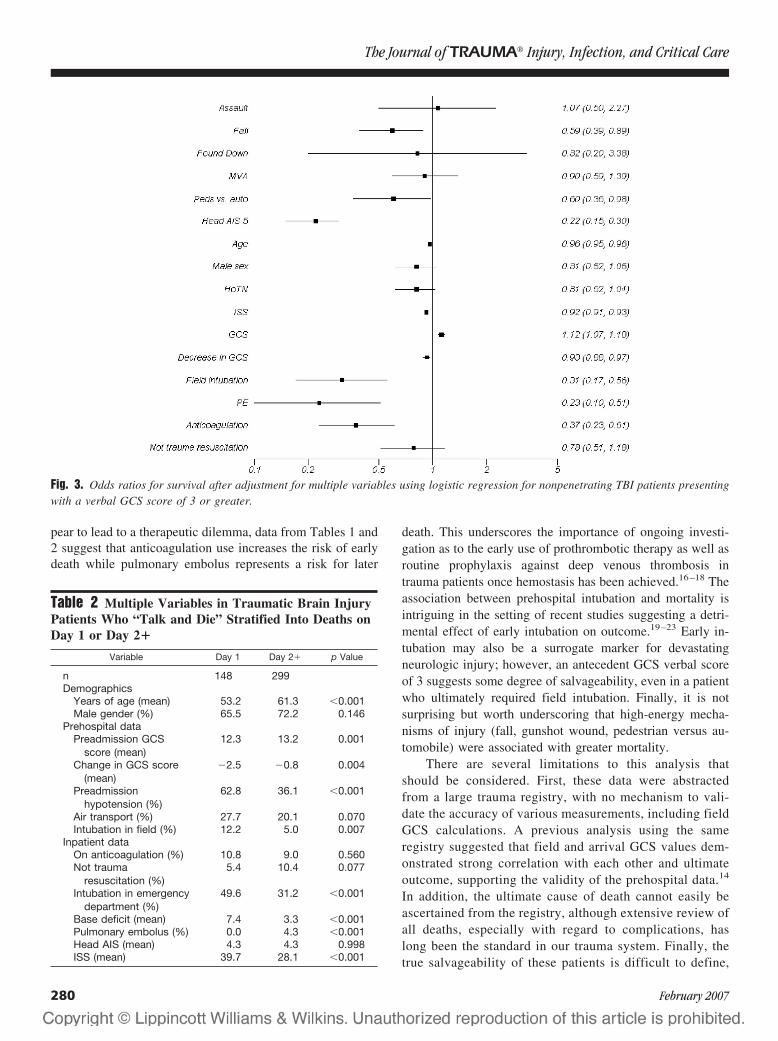
pear to lead to a therapeutic dilemma, data from Tables 1 and2 suggest that anticoagulation use increases the risk of earlydeath while pulmonary embolus represents a risk for later
death. This underscores the importance of ongoing investi-gation as to the early use of prothrombotic therapy as well asroutine prophylaxis against deep venous thrombosis intrauma patients once hemostasis has been achieved.16–18 Theassociation between prehospital intubation and mortality isintriguing in the setting of recent studies suggesting a detri-mental effect of early intubation on outcome.19–23 Early in-tubation may also be a surrogate marker for devastatingneurologic injury; however, an antecedent GCS verbal scoreof 3 suggests some degree of salvageability, even in a patientwho ultimately required field intubation. Finally, it is notsurprising but worth underscoring that high-energy mecha-nisms of injury (fall, gunshot wound, pedestrian versus au-tomobile) were associated with greater mortality.
There are several limitations to this analysis thatshould be considered. First, these data were abstractedfrom a large trauma registry, with no mechanism to vali-date the accuracy of various measurements, including fieldGCS calculations. A previous analysis using the sameregistry suggested that field and arrival GCS values dem-onstrated strong correlation with each other and ultimateoutcome, supporting the validity of the prehospital data.14
In addition, the ultimate cause of death cannot easily beascertained from the registry, although extensive review ofall deaths, especially with regard to complications, haslong been the standard in our trauma system. Finally, thetrue salvageability of these patients is difficult to define,
Fig. 3. Odds ratios for survival after adjustment for multiple variables using logistic regression for nonpenetrating TBI patients presentingwith a verbal GCS score of 3 or greater.
Table 2 Multiple Variables in Traumatic Brain InjuryPatients Who “Talk and Die” Stratified Into Deaths onDay 1 or Day 2�
Variable Day 1 Day 2� p Value
n 148 299Demographics
Years of age (mean) 53.2 61.3 �0.001Male gender (%) 65.5 72.2 0.146
Prehospital dataPreadmission GCS
score (mean)12.3 13.2 0.001
Change in GCS score(mean)
�2.5 �0.8 0.004
Preadmissionhypotension (%)
62.8 36.1 �0.001
Air transport (%) 27.7 20.1 0.070Intubation in field (%) 12.2 5.0 0.007
Inpatient dataOn anticoagulation (%) 10.8 9.0 0.560Not trauma
resuscitation (%)5.4 10.4 0.077
Intubation in emergencydepartment (%)
49.6 31.2 �0.001
Base deficit (mean) 7.4 3.3 �0.001Pulmonary embolus (%) 0.0 4.3 �0.001Head AIS (mean) 4.3 4.3 0.998ISS (mean) 39.7 28.1 �0.001
The Journal of TRAUMA� Injury, Infection, and Critical Care
280 February 2007
and neither GCS score nor head AIS give a completerepresentation of head-injury severity.
CONCLUSIONSA small percentage of TBI patients who are able to
verbalize early after injury go on to die. These appear to fallinto two main groups. Early deaths are characterized by moresevere extracranial injuries and traumatic shock. Late deathsoccur in older patients with less severe extracranial injuriesand a lower incidence of hypotension on arrival; pulmonaryembolus appears to be an important contributor to mortalityin this group. A history of anticoagulation use on presentationappeared to be important to both early and late deaths.
REFERENCES1. Trunkey DD. Trauma. Sci Am. 1983;249:28–35.2. Hadfield RJ, Parr MJA, Manara AR. Late deaths in multiple trauma
patients receiving intensive care. Resuscitation. 2001;49:279–281.3. Demetriades D, Kimbrell B, Salim A, et al. Trauma deaths in a
mature urban trauma system: is “trimodal” distribution a validconcept? J Am Coll Surg. 2005;201:343–348.
4. Meislin H, Criss EA, Judkins D, et al. Fatal trauma: the modaldistribution of time to death is a function of patient demographicsand regional resources. J Trauma. 1997;43:433–440.
5. Reilly PL, Graham DI, Adams JH, Jennett B. Patients with headinjury who talk and die. Lancet. 1975;2:375–377.
6. Ramadan A, Berney J, Reverdin A, Rilliet B, Bongioanni F. Studyof the deterioration factors in adult patients with cranio-cerebralinjuries who “talk and die.” Neurochirurgie. 1986;32:423–432.
7. Reilly PL. Brain injury: the pathophysiology of the first hours. Talkand Die revisited. J Clin Neurosci. 2001;8:398–403.
8. Cagetti B, Cossu M, Pau A, Rivano C, Viale G. The outcome fromacute subdural and epidural intracranial haematomas in very elderlypatients. Br J Neurosurg. 1992;6:227–231.
9. Klauber MR, Marshall LF, Toole BM, Knowlton SL, Bowers SA.Cause of decline in head-injury mortality rate in San Diego County,California. J Neurosurg. 1985;62:528–531.
10. Wright PJ, Murray RJ. Penetrating craniocerebral airgun injury.Anaesthetic management with propofol infusion and review ofrecent reports. Anaesthesia. 1989;44:219 –221.
11. Marshall LF, Toole BM, Bowers SA. The National TraumaticComa Data Bank. Part 2: Patients who talk and deteriorate:implications for treatment. J Neurosurg. 1983;59:285–288.
12. Dunn LT, Fitzpatrick MO, Beard D, Henry JM. Patients with a headinjury who “talk and die” in the 1990s. J Trauma. 2003;54:497–502.
13. Kibayashi K, Ng’walali PM, Hamada K, Honjyo K, Tsunenari S.Discrepancy of clinical symptoms and prognosis of apatient–forensic significance of “talk and die” head injury. Leg Med.2000;2:175–180.
14. Davis DP, Serrano JA, Vilke GM, et al. The predictive value offield versus arrival Glasgow Coma Scale score and TRISScalculations in moderate-to-severe traumatic brain injury.J Trauma. 2006;60:985–990.
15. Davis DP, Vadeboncoeur TF, Ochs M, et al. The associationbetween field Glasgow Coma Scale score and outcome in patientsundergoing paramedic rapid sequence intubation. J Emerg Med.2005;29:391–397.
16. Ginzburg E, Cohn SM, Lopez J, et al. Randomized clinical trial ofintermittent pneumatic compression and low molecular weightheparin in trauma. Br J Surg. 2003;90:1338–1344.
17. Kim J, Gearhart MM, Zurick A, et al. Preliminary report on thesafety of heparin for deep venous thrombosis prophylaxis aftersevere head injury. J Trauma. 2002;53:38–42.
18. Lin J, Hanigan WC, Tarantino M, Wang J. The use of recombinantactivated factor VII to reverse warfarin-induced anticoagulation inpatients with hemorrhages in the central nervous system: preliminaryfindings. J Neurosurg. 2003;98:737–740.
19. Wang HE, Peitzman AD, Cassidy LD, Adelson PD, Yealy DM. Out-of-hospital endotracheal intubation and outcome after traumatic braininjury. Ann Emerg Med. 2004;44:439–450.
20. Murray JA, Demetriades D, Berne TV, et al. Prehospital intubationin patients with severe head injury. J Trauma. 2000;49:1065–1070.
21. Eckstein M, Chan L, Schneir A, Palmer R. Effect of prehospitaladvanced life support on outcomes of major trauma patients.J Trauma. 2000;48:643–648.
22. Davis DP, Peay J, Sise MJ, et al. The impact of prehospitalendotracheal intubation on outcome in moderate-to-severe traumaticbrain injury. J Trauma. 2005;58:933–939.
23. Bochicchio GV, Ilahi O, Joshi M, Bochicchio K, Scalea TM.Endotracheal intubation in the field does not improve outcome intrauma patients who present without lethal traumatic brain injury.J Trauma. 2003;54:307–311.
Head-Injured Patients Who “Talk and Die”
Volume 62 • Number 2 281
Neurologic Outcome of Posttraumatic Refractory IntracranialHypertension Treated With External Lumbar DrainageJosep M. Abadal-Centellas, MD, Juan A. Llompart-Pou, MD, Javier Homar-Ramırez, MD,Jon Perez-Barcena, MD, Ainhoa Rossello-Ferrer, MD, and Jordi Ibanez-Juve, MD, PhD
Background: Refractory intracranialhypertension (ICH) to second level mea-sures after severe traumatic brain injury(TBI) is associated with mortality up to84% to 100%. The use of external lumbardrainage (ELD) has been described inthese patients. We report our experiencewith the use of ELD in 17 cases of refrac-tory ICH after severe TBI.
Methods: In our Level 3 IntensiveCare Unit (ICU) at a university hospital,ICH is treated according to a progressiveapproach following the Brain TraumaFoundation guidelines. When second level
measures fail to control ICH, we use anELD as a rescue therapy if basal cisternsare discernible. Outcome at ICU dis-charge and 6 months after injury wereanalyzed using Glasgow Outcome Scale(GOS).
Results: Mean age was 32.5 � 13.3years. ICH was reduced in all patients.ICP before ELD was 30.9 � 7.9 mm Hgand after ELD 14.1 � 5.9 mm Hg. Fourpatients (24%) had an ICH rebound after5 days of ELD placement and died in theICU. At 6 months after TBI, 13 patients(76%) presented a good outcome (GOS
score of 4 and 5). No patient presentedpupillary changes or cerebrospinal fluidinfection during ELD use.
Conclusion: External lumbar drain-age is an effective and safe procedure totreat refractory ICH when basal cisternsare discernible. Control of refractory ICHwith ELD is associated with an importantreduction of mortality and a good func-tional recovery at 6 months.
Key Words: Traumatic brain injury,Intracranial hypertension, External lum-bar drainage.
J Trauma. 2007;62:282–286.
Traumatic brain injury (TBI) constitutes a significantcause of disability and death, in young adult people, thatis related to the presence of intracranial hypertension
(ICH). Treatment of ICH according to the Brain TraumaFoundation (BTF) guidelines follows a progressive approachthat includes general measures as hemodymamic stabiliza-tion, sedation and relaxation, normothermia and normovol-emia, and first tier measures as ventricular drainage, mannitol,and hypertonic saline. If these measures fail to control intra-cranial pressure (ICP), second line therapies are required,including barbiturate coma, moderate hypothermia, moderatehyperventilation according to jugular bulb saturation values,and decompressive craniectomy.1
Despite these aggressive measures, a significant numberof patients present refractory ICH, which is associated with amortality up to 84% to 100%.1 In the last years, severalmethods not included in the BTF guidelines have been pro-posed as alternatives in the treatment of refractory ICH.Munch et al.2 reported a study in which the placement of anexternal lumbar drainage (ELD) in 23 brain injured patients(TBI and nontraumatic subarachnoid hemorrhage) with re-
fractory ICH produced a significant improvement in ICPcontrol. They discussed the conditions that these patientsmust present for using ELD, confirming preliminary reportsby Willemse et al. in seven patients3 and Levy et al. in apediatric population.4 Recently, Tomosvary et al. reportedsimilar results in 10 adult patients.5
The aim of this report was to describe our experiencewith 17 patients with posttraumatic refractory ICH treatedwith a standardized protocol that included the use of an ELDand its relationship to outcome at intensive care unit (ICU)discharge and at 6 months after TBI.
MATERIALS AND METHODSBetween April 2003 and December 2004, 185 patients
suffering from TBI were admitted in the Level 3 ICU of ouruniversity hospital. Intracranial pressure (ICP) monitoringwas performed using a fiberoptic intraparenchymal device(Camino, Integra NeuroSciences Plainsboro, N.J.) in 68 pa-tients (36.7%). Monroe foramen was used to zero the ICPmonitor. Management of these patients to control ICH wasdone according to a standardized protocol following the BTFguidelines,1 but without the use of a ventriculostomy. In ourcenter, ventriculostomy is infrequently used in TBI patientsbecause of its infectious complications and limited usingtime.6 This can be also considered a normal practice in ourenvironment even when ventricular size allows the placementof a ventriculostomy.7 Twenty-nine (42.6%) of these 68 pa-tients, developed refractory ICH to first tier measures andneeded second level measures (barbiturate coma–EEG burst
Submitted for publication July 12, 2005.Accepted for publication October 5, 2005.Copyright © 2007 by Lippincott Williams & Wilkins, Inc.From the Servicio de Medicina Intensiva, Hospital Universitario Son
Dureta, Palma de Mallorca, Spain.Address for reprints: Juan Antonio Llompart Pou, Servicio de Medicina
Intensiva, Hospital Universitario Son Dureta, C/Andrea Doria n° 55, 07014,Palma de Mallorca (Baleares), Spain; email: [email protected].
DOI: 10.1097/01.ta.0000199422.01949.78
The Journal of TRAUMA� Injury, Infection, and Critical Care
282 February 2007

suppression control, moderate hypothermia, or decompres-sive craniectomy). Refractory ICH was defined as follows1,8:
1. ICP between 20 to 29 mm Hg for 30 minutes, or2. ICP between 30 to 39 mm Hg for 15 minutes, or3. ICP higher than 40 mm Hg for at least 1 minute.
When these measures failed to control ICH we consid-ered placing an external lumbar drainage as a rescue therapyif the inclusion or exclusion criteria described by Munch werepresent.2 A cranial computed tomography (CCT) scan wasperformed in the prior 24 hours to confirm discernible basalcisterns and the absence of any surgical mass. Midline shiftevaluated at third ventricle should be less than 10 mm. Sev-enteen of the 29 patients (58%) fulfilled Munch’s criteria andwere included in the study. Informed consent was obtainedfrom patient’s relatives.
A nontunneled nylon epidural catheter (Portex Limited,Hythe, Kent, Conn.) was introduced through an 18-gaugecurved tip needle into the subarachnoid space at L3–L4 level.Later, we connected the catheter to a sterile collecting system(Dispomedica 22041 Hamburg, Germany). The collectingsystem was fixed at 10 to 15 cm over Monroe foramen.Drainage of cerebrospinal fluid (CSF) was done continuouslywhen ICP raised over 20 mm Hg. If ICP dropped below 10mm Hg, CSF drainage was immediately stopped. When ICPincreased to 15 mm Hg, the drainage system was openedagain. By consensus among the physicians responsible forpatients care, we considered an it excellent response if during24 hours no mannitol or hypertonic saline were used, goodresponse if only 1 to 3 doses of mannitol or hypertonic salinewere used, regular response if 4 to 6 doses were used, and badresponse if we had to use more than 6 doses of mannitol andhypertonic saline. When ICP was considered controlled (ex-cellent or good response) we closed the drainage system for
24 hours and repeated a CCT scan. If there were no newfeatures in CCT scan and ICP could be controlled with firsttier measures we removed the drainage.
Data CollectionDemographic data, pupillary examination, GCS score
after initial resuscitation, Injury Severity Score, and CCTscan findings were recorded in all patients. Patients wereclassified in accordance with Marshall’s classification in ini-tial CCT scan.9 Neurologic outcome at ICU discharge and 6months after head injury was evaluated according to GlasgowOutcome Scale (GOS); 1 � dead, 2 � vegetative state, 3 �severe disability, 4 � moderate disability, 5 � good recovery.10
Complications related to ELD placement were regis-tered. Microbiological analysis of CSF was conducted every48 hours. When ELD was removed, a culture of the distal endcatheter was done as per protocol. Descriptive analyses wereperformed in all cases.
RESULTSPatients demographic and clinical data are summarized
in Table 1. Mean age of the patients was 32.5 � 13.3 years.Thirteen patients were male (76%). Mean ISS was 28.3 � 9.Median GCS score after resuscitation was 8 (range, 4–15).Eight patients had a GCS score after resuscitation rangingfrom 9 to 15 (moderate and mild TBI), but all of themdeteriorated with GCS score 8 or lower in the first 24 hoursafter injury. ELD was placed after a median of 9 days (range,1–16 days). Drainage was active for a median of 7 days(range, 4–15 days). Mean ICP before and 1 hour after place-ment of ELD was 30.9 � 7.9 and 14.1 � 5.9 mm Hg. Initialdrainage of CSF to low ICP as described was 8.0 � 5.7 mL.In all patients, ICP dropped immediately to normal values
Table 1 Demographic and Clinical Data
CaseNumber Age GCS
Score Marshall ELDTime
BarbiturateComa
ModerateHypothermia
ICP mmHg(pre/post)
ELDDuration
Length ofStay
GOS Score inICU
GOS Scoreat 6 mo
1 40 8 2 9 Yes No 35/15 6 40 3 42 20 7 2 14 Yes No 31/17 4 23 3 53 20 7 3 12 Yes No 42/16 7 27 3 44 25 7 3 10 Yes Yes 41/15 9 32 4 45 49 15 NEM 8 Yes No 26/7 6 31 4 56 38 12 2 4 Yes No 29/8 15 19 1 17 69 8 EM 16 No No 26/12 3 27 3 58 43 13 EM 13 Yes Yes 22/12 3 65 4 59 35 10 EM 4 Yes No 28/17 10 21 3 4
10 33 7 4 6 No Yes 40/23 10 16 1 111 17 7 2 1 Yes Yes 51/12 10 11 1 112 19 11 EM 4 Yes No 29/8 6 17 5 513 35 10 2 4 No Yes 24/16 5 35 5 514 29 4 EM 15 No Yes 21/3 4 25 5 515 31 6 EM 10 Yes No 37/13 15 25 1 116 18 13 EM 5 Yes No 30/15 5 29 3 517 34 9 EM 12 No Yes 24/17 8 30 4 5
Marshall TBI, Marshall’s classification; EM, evacuated mass; NEM, nonevacuated mass; ELD time, day of ELD placement after injury; ELDduration, days with ELD active; Length stay, length of stay in ICU; GOS, Glasgow Outcome Scale.
Lumbar Drainage in Refractory Intracranial Hypertension
Volume 62 • Number 2 283
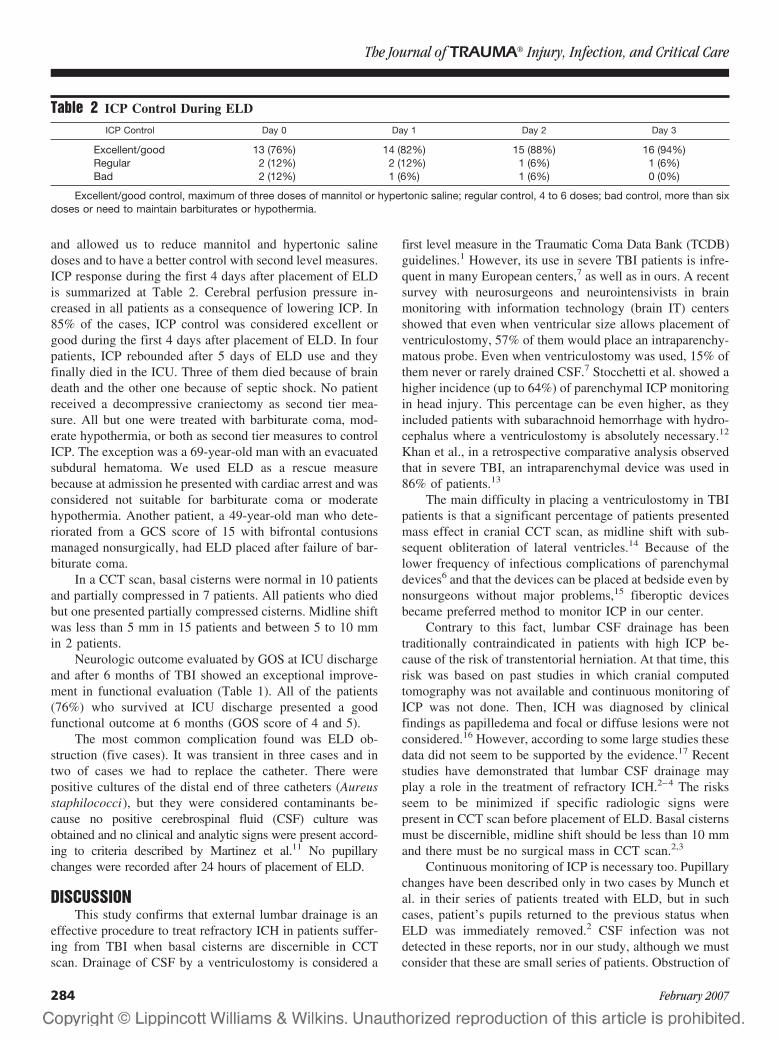
and allowed us to reduce mannitol and hypertonic salinedoses and to have a better control with second level measures.ICP response during the first 4 days after placement of ELDis summarized at Table 2. Cerebral perfusion pressure in-creased in all patients as a consequence of lowering ICP. In85% of the cases, ICP control was considered excellent orgood during the first 4 days after placement of ELD. In fourpatients, ICP rebounded after 5 days of ELD use and theyfinally died in the ICU. Three of them died because of braindeath and the other one because of septic shock. No patientreceived a decompressive craniectomy as second tier mea-sure. All but one were treated with barbiturate coma, mod-erate hypothermia, or both as second tier measures to controlICP. The exception was a 69-year-old man with an evacuatedsubdural hematoma. We used ELD as a rescue measurebecause at admission he presented with cardiac arrest and wasconsidered not suitable for barbiturate coma or moderatehypothermia. Another patient, a 49-year-old man who dete-riorated from a GCS score of 15 with bifrontal contusionsmanaged nonsurgically, had ELD placed after failure of bar-biturate coma.
In a CCT scan, basal cisterns were normal in 10 patientsand partially compressed in 7 patients. All patients who diedbut one presented partially compressed cisterns. Midline shiftwas less than 5 mm in 15 patients and between 5 to 10 mmin 2 patients.
Neurologic outcome evaluated by GOS at ICU dischargeand after 6 months of TBI showed an exceptional improve-ment in functional evaluation (Table 1). All of the patients(76%) who survived at ICU discharge presented a goodfunctional outcome at 6 months (GOS score of 4 and 5).
The most common complication found was ELD ob-struction (five cases). It was transient in three cases and intwo of cases we had to replace the catheter. There werepositive cultures of the distal end of three catheters (Aureusstaphilococci), but they were considered contaminants be-cause no positive cerebrospinal fluid (CSF) culture wasobtained and no clinical and analytic signs were present accord-ing to criteria described by Martinez et al.11 No pupillarychanges were recorded after 24 hours of placement of ELD.
DISCUSSIONThis study confirms that external lumbar drainage is an
effective procedure to treat refractory ICH in patients suffer-ing from TBI when basal cisterns are discernible in CCTscan. Drainage of CSF by a ventriculostomy is considered a
first level measure in the Traumatic Coma Data Bank (TCDB)guidelines.1 However, its use in severe TBI patients is infre-quent in many European centers,7 as well as in ours. A recentsurvey with neurosurgeons and neurointensivists in brainmonitoring with information technology (brain IT) centersshowed that even when ventricular size allows placement ofventriculostomy, 57% of them would place an intraparenchy-matous probe. Even when ventriculostomy was used, 15% ofthem never or rarely drained CSF.7 Stocchetti et al. showed ahigher incidence (up to 64%) of parenchymal ICP monitoringin head injury. This percentage can be even higher, as theyincluded patients with subarachnoid hemorrhage with hydro-cephalus where a ventriculostomy is absolutely necessary.12
Khan et al., in a retrospective comparative analysis observedthat in severe TBI, an intraparenchymal device was used in86% of patients.13
The main difficulty in placing a ventriculostomy in TBIpatients is that a significant percentage of patients presentedmass effect in cranial CCT scan, as midline shift with sub-sequent obliteration of lateral ventricles.14 Because of thelower frequency of infectious complications of parenchymaldevices6 and that the devices can be placed at bedside even bynonsurgeons without major problems,15 fiberoptic devicesbecame preferred method to monitor ICP in our center.
Contrary to this fact, lumbar CSF drainage has beentraditionally contraindicated in patients with high ICP be-cause of the risk of transtentorial herniation. At that time, thisrisk was based on past studies in which cranial computedtomography was not available and continuous monitoring ofICP was not done. Then, ICH was diagnosed by clinicalfindings as papilledema and focal or diffuse lesions were notconsidered.16 However, according to some large studies thesedata did not seem to be supported by the evidence.17 Recentstudies have demonstrated that lumbar CSF drainage mayplay a role in the treatment of refractory ICH.2–4 The risksseem to be minimized if specific radiologic signs werepresent in CCT scan before placement of ELD. Basal cisternsmust be discernible, midline shift should be less than 10 mmand there must be no surgical mass in CCT scan.2,3
Continuous monitoring of ICP is necessary too. Pupillarychanges have been described only in two cases by Munch etal. in their series of patients treated with ELD, but in suchcases, patient’s pupils returned to the previous status whenELD was immediately removed.2 CSF infection was notdetected in these reports, nor in our study, although we mustconsider that these are small series of patients. Obstruction of
Table 2 ICP Control During ELD
ICP Control Day 0 Day 1 Day 2 Day 3
Excellent/good 13 (76%) 14 (82%) 15 (88%) 16 (94%)Regular 2 (12%) 2 (12%) 1 (6%) 1 (6%)Bad 2 (12%) 1 (6%) 1 (6%) 0 (0%)
Excellent/good control, maximum of three doses of mannitol or hypertonic saline; regular control, 4 to 6 doses; bad control, more than sixdoses or need to maintain barbiturates or hypothermia.
The Journal of TRAUMA� Injury, Infection, and Critical Care
284 February 2007

ELD and replacement of the catheter occurred in two of ourcases, but it did not affect management and outcome in thosepatients. We used a drainage catheter that was not specificallydesigned for this use because the current material was notavailable. It may have influenced the obstructions detected inour patients. This incidence of obstruction will be probablylower by using well designed systems for CSF drainage.
An interesting observation is that no patient presentedwith spine injury, which we think that would be a contrain-dication for ELD placement. No significant coagulation dis-orders were found. We think that coagulation conditionsnecessary to place an ELD will not differ from other neuro-surgical procedures.18
The reason why ELD can control refractory ICH hasbeen explained previously. It has been proposed that in thesepatients, CSF accumulates in the basal and spinal compart-ments, because of absorption disorders by secondary obstruc-tion or compression of sagittal sinus. ELD then would actuateas a decompression that results in a CSF shift from the cranialto the spinal compartment, lowering ICP to a limit where aventricular drainage would not reach.2–4 All patients treatedwith ELD, except two patients of Munch’s Study,2,3,5 hadventriculostomy as a first-tier measure to control ICP.
Based on experimental work conducted with animals, ithas been hypothesized that 30% of the total compliance of theCSF system is contributed by the spinal axis.19 In our study,no patient was treated with a ventriculostomy, thus it ispossible that the level of decompression achieved was moreeffective than previously described because of a major accu-mulation of CSF when ELD was used.
We described 17 patients considered to have severe TBIbecause all of them presented a GCS score of 8 or lower after24 hours of brain injury. The cause of deterioration of the 8patients with GCS scores ranging 9 to 15 was contusionrelated edema (3 cases), hemisferic swelling (3 cases), andappearance of delayed intraparenchymatous hematoma (2cases). Hydrocephalus was not observed in any patient whodeteriorated. Our patients presented a good neurologic out-come (GOS score of 4 and 5) at 6 months in 13 cases (76%).Only four patients (24%) presented refractory ICH and died.Three of them presented partially compressed cisterns.Among the patients who died, three needed ELD before day6 after injury. We think that it reflects major severity ofinjury, although the patient with ELD on day 1 after injurydied as a consequence of septic shock when ICH control hadbeen improved. No patients remained in a vegetative state.Our results showed a much better survival rate and quality oflife in patients suffering from refractory ICH to second levelmeasures than the predicted survival rate obtained fromguidelines.1
This study did not compare the use of ventriculostomywith ELD, and we do not know which one would be moreeffective to control refractory ICH. Although this is not alarge study, we think that enough evidence exists to considerELD as an effective procedure to control refractory ICH in
patients with severe TBI after using maximum treatmentdescribed in BTF guidelines,1 and improve outcome of thesepatients. Its role in the pathway of treatment of ICH should bedetermined in randomized controlled studies comparing ELDwith conventional second level measures. We consider thatthe complications related with ELD are insignificant com-pared with conventional second level measures as barbi-turate coma,20 moderate hypothermia,21 or decompressivecraniectomy.22
External lumbar drainage is an effective procedure tocontrol refractory ICH in patients with severe TBI when basalcisterns are discernible. Neurologic outcome in these patientsat 6 months after TBI was much better than expected. Fewcomplications were detected with its use.
REFERENCES1. Bullock R, Randall C, Clifton G, et al. Guidelines for the management
of severe head injury. J Neurotrauma. 1996;13:639–734.2. Munch EC, Bahuf C, Horn P, et al. Therapy of malignant
intracranial hypertension by controlled lumbar cerebrospinal fluiddrainage. Crit Care Med. 2001;29:976–981.
3. Willemse RB, Egeler-Peederman SM. External lumbar drainage inuncontrollable intracranial pressure in adults with severe head injury:a report of seven cases. Acta Neurochir (Suppl). 1998;71:37–39.
4. Levy DI, Rekate HL, Cherny WB, et al. Controlled lumbar drainagein pediatric head injury. J Neurosurg. 1995;83:453–460.
5. Tomosvary A, Mencser Z, Futo J, et al. Preliminary experience withcontrolled lumbar drainage in medically refractory intracranialhypertension. Orv Hetil. 2005;146:159–164.
6. Guyot LL, Dowling C, Dıaz FG, et al. Cerebral monitoring devices:analysis of complications. Acta Neurochir Suppl. 1998;71:47–49.
7. Enbland P, Nilsson P, Chambers I, et al. R3-Survey of traumaticbrain injury management in European Brain IT centres year 2001.Intensive Care Med. 2004;30:1058–1065.
8. Eisenberg HM, Frankowski RF, Contant CF, et al. High-dosebarbiturate control of elevated intracranial pressure in patients withsevere head injury. J Neurosurg. 1988;69:15–23.
9. Marshall LF, Marshall SB, Klauber MR, et al. A new classificationof head injury based on computerized tomography. J Neurosurg.1991;75:S14–S20.
10. Jennet B, Bond M. Assessment of outcome after severe braindamage. Lancet. 1975;2:480–484.
11. Martınez E, Rello J, Coll P. Clinical diagnosis of ventriculostomy-related infections. Lancet. 1994;344:1015–1016.
12. Stocchetti N, Longhi L, Magnoni E, et al. Head injury, subarachnoidhemorrhage and intracranial pressure monitoring in Italy. ActaNeurochir (Wien). 2003;145:761–765.
13. Khan SH, Kureshi IU, Mulgrew T, et al. Comparison ofpercutaneous ventriculostomies and intraparenchymal monitor: aretrospective evaluation of 156 patients. Acta Neurochir Suppl. 1998;71:50–52.
14. Eisenberg HM, Gary HE Jr, Aldrich EF, et al. Initial CT findings in753 patients with severe head injury. A report from the NIHTraumatic Coma Data Bank. J Neurosurg. 1990;73:688–698.
15. Harris CH, Smith RS, Helmer SD, et al. Placement of intracranialpressure monitors by non-neurosurgeons. Am Surg. 2002;68:787–790.
16. Sencer W. The lumbar puncture in the presence of papilledema.J Mt Sinai Hosp NY. 1956;23:808–815.
17. Korein J, Cravioto H, Leicach M. Reevaluation of lumbar puncture:a study of 129 patients with papilledema or intracranialhypertension. Neurology. 1959;9:290–297.
Lumbar Drainage in Refractory Intracranial Hypertension
Volume 62 • Number 2 285
18. Davis JW, Davis IC, Bennink LD, et al. Placement of intracranialpressure monitors: are “normal” coagulation parameters necessary?J Trauma. 2004;57:1173–1177.
19. Shapiro K, Marmarou A, Shulman K. Characterization of clinicalCSF dynamics and neural axis compliance using the pressure-volumeindex: I. The normal pressure-volume index. Ann Neurol. 1980;7:508–514.
20. Perez-Barcena J, Barcelo B, Homar J, et al. Comparison of theeffectiveness of pentobarbital and thiopental in patients withrefractory intracranial hypertension. Preliminary report of 20patients. Neurocirugıa (Astur). 2005;16:5–13.
21. Polderman KH. Application of therapeutic hypothermia in theintensive care unit. Opportunities and pitfalls of a promisingtreatment modality–Part 2: practical aspects and side effects.Intensive Care Med. 2004;30:757–769.
22. Albanese J, Leone M, Alliez JR, et al. Decompressive craniectomyfor severe traumatic brain injury: evaluation of the effects at oneyear. Crit Care Med. 2003;31:2535–2538.
EDITORIAL COMMENTAbadal-Centellas et al. present a series of 17 traumatic
brain injury (TBI) patients in which refractory elevated in-tracranial hypertension (ICH) was managed with lumbardrainage (ELD). This article is a valuable addition to thiscontroversial topic in adult TBI management. Their resultsshow that they were able to control intracranial pressurewithout any of their patients demonstrating signs of brainherniation. The authors describe a useful protocol to draincerebrospinal fluid (CSF) when intracranial pressure (ICP) isover 20 but to hold off draining CSF when the ICP lowers toless than 10. In this series, the authors specifically state thatthey do not use ventricular drainage (EVD) because of theirconcern of an elevated infection and complication rate, aphenomenon they state is present at many European traumacenters. They appropriately cite several other investigatorsthat have also evaluated the potential role for ELD in TBIpatients with increased ICP; Tomosvari et al. (Hungary), andMunch et al. (Germany). These investigators reported onseries of 10 and 23 patients, respectively, in which ELD wasused to control of refractory ICH when basal cisterns werepatent, there was less than 10 mm of shift at the third ven-tricle and no significant mass lesions were seem. In thesestudies, as well as the current study, the Brain Trauma Foun-dation Guidelines are cited and were followed including the
use of barbiturate coma and, on occasion, decompressivecraniectomy.
The use of ELD appears to have somewhat more supportwithin pediatric neurosurgery where ventricular access can beproblematic. The authors cite two pediatric series (Levy andBaldwin). In both series, however, EVD was tried beforeusing ELD. In the pediatric guidelines ELD is reviewed anddiscussed along with EVD as an option level recommenda-tion, which is the lowest level of evidence. They state thatdrainage can be accomplished via a ventriculostomy catheteralone or in combination with a lumbar drain. The addition ofELD should be considered only in the case of refractoryintracranial hypertension with a functioning ventriculostomy,open basal cisterns, and no evidence of a major mass lesionor shift on imaging studies.1
The issue is less clear from a guidelines standpoint inadults. The Brain Trauma Foundation, in its guidelines sub-section on intracranial hypertension management mentions arole for ventricular drainage “when available”. The use ofEVD is neither cited as a specific point for discussion norassigned a specific level of evidence and ELD is not dis-cussed. Although, in general, it would be beneficial to placea ventricular drain first, in centers where this option is notavailable or in which this technology is unfamiliar and there-fore represents a high morbidity procedure, ELD would seemreasonable. Obviously, the most significant concern withELD is the potential for downward brain herniation. Caremust be taken to assure that there is evidence of patent basilarcisterns, no focal mass lesions are present, significant shift isnot present, that the rate of drainage is carefully controlled,and the patients are in a setting with close observation.
John R. Vender, MDMedical College of GeorgiaAugusta, Georgia
REFERENCE1. Adelson PD, Bratton SL, Carney NA. Guidelines for the acute
medical management of severe traumatic brain injury in infants,children, and adolescents. Chapter 10. The role of cerebrospinal fluiddrainage in the treatment of severe pediatric traumatic brain injury.Pediatr Crit Care Med. 2003;4(Suppl):S38–S39.
The Journal of TRAUMA� Injury, Infection, and Critical Care
286 February 2007
Persistent Intracranial Hypertension Treated by HypothermicTherapy After Severe Head Injury Might Induce Late-PhaseCerebral VasospasmYouichi Yanagawa, PhD, MD, Toshihisa Sakamoto, PhD, MD, and Yoshiaki Okada, PhD, MD
Background: Vasospasm caused byintracranial hypertension in head injuryremains controversial.
Methods: Between 1996 and 2004, weprospectively and consecutively performedconventional cerebral angiography for sixpatients with head injuries who showed per-sistent intracranial hypertension (over 20mm Hg for longer than 5 days) despite per-
forming various treatments for intracranialhypertension.
Results: All subjects had a minorhemorrhage at admission, classified asFisher group 2. Five of the six patients hadangiographically confirmed vasospasm,and one of them later developed a cerebralinfarction. Four of the five subjects whoexhibited cerebral vasospasm had under-
gone hypothermic therapy to control theintracranial hypertension.
Conclusion: Our results suggest thatpersistent intracranial hypertension thatis treated by hypothermic therapy may berelated to late phase cerebral vasospasm.
Key Words: Head injury, Intracra-nial hypertension, Vasospasm, Hypother-mic therapy.
J Trauma. 2007;62:287–291.
The cause of cerebral vasospasm in head trauma re-mains unknown. In cases of subarachnoid hemorrhageinduced by rupture of a cerebral aneurysm, the amount
of subarachnoid hemorrhage or the degree of mechanicalinjury to an artery during surgery is considered to berelated to the development of vasospasm.1,2 Factors thathave been implicated in the pathophysiology of vasospasminclude brain natriuretic peptide, endothelins, superoxidefree radicals, protein kinase C, rho kinase, elevation ofintracellular Ca2�, and inflammatory reaction induced bysubarachnoid hemorrhage.3–7 Furthermore, intracranial hy-pertension caused by ruptured cerebral aneurysm is report-edly related to vasospasm.8 In cases of head injury, theamount of subarachnoid hemorrhage has been proven to belinked to the development of vasospasm,9 but the mecha-nism by which vasospasm might be induced by temporalintracranial hypertension remains controversial.10,11 Pa-tients with severe head injury often demonstrate persistentintracranial hypertension.12 However, the influence of per-sistent hypertension on the development of vasospasm insuch patients has not yet been investigated. Complications re-lated to vasospasm affect the outcome of head injury.13,14 Wetherefore prospectively investigated the relationship betweenpersistent intracranial hypertension and vasospasm.
METHODSThis study was approved by the human investigation
committee at National Defense Medical College. Between1996 and 2004, 877 patients with head injury were admit-ted to our department. Of these, 63 patients with a Glas-gow Coma Scale score (GCS) �8 on arrival but withoutfixed dilated pupils underwent intracranial catheterizationto monitor intracranial pressure. After eliminating 25 pa-tients who exhibited brain death within 7 hospital days, weperformed conventional cerebral angiography to evaluatethe status of the cerebral vessels for six consecutive pa-tients who demonstrated persistent intracranial hyperten-sion. The diagnostic criterion for persistent intracranialhypertension was a baseline intracranial pressure over 20mm Hg for at least 5 days despite continuous treatment.The intensive care unit protocol for severe head injury carewas as follows: (1) the head was elevated 30 degrees abovethe horizontal; (2) mean arterial pressure was maintainedat �70 mm Hg, with systolic pressure between 100 and170 mm Hg; (3) mechanical ventilation was used to main-tain PaO2 at 100 to 150 mm Hg and PaCO2 at 30 to 40 mmHg; (4) intravenous infusions of 10% glycerol rangingfrom 600 to 900 mL per day; (5) barbiturates (2 to 6mg/kg/h) were continuously administered; (6) if intracra-nial pressure exceeded 30 mm Hg despite the above strat-egies, hypothermic therapy was applied.
The protocol for hypothermic therapy was as follows: (1)intravenous pancuronium (0.01 to 0.02 mg/kg/h) was contin-uously infused to prevent shivering; (2) core temperature,measured with a urinary bladder balloon catheter, was main-tained between 33° and 34°C using cooling blankets andalcohol applied to the skin of the trunk and extremities; (3)after controlling intracranial pressure at less than 20 mm Hg,patients were rewarmed to 37°C, at a rate of no greater than
Submitted for publication August 22, 2005.Accepted for publication February 22, 2006.Copyright © 2007 by Lippincott Williams & Wilkins, Inc.From the Department of Traumatology and Critical Care Medicine,
National Defense Medical College, Saitama, Japan.Address for reprints: Youichi Yanagawa, Department of Traumaltology
and Critical Care Medicine, NDMC, 3-2 Tokorozawa Saitama, Japan 359-8513; email: [email protected].
DOI: 10.1097/01.ta.0000223023.98182.d9
The Journal of TRAUMA� Injury, Infection, and Critical Care
Volume 62 • Number 2 287
0.1°C per hour and no greater than 1°C per day. If loss ofpupillary light reflex or anisocoria was observed, then re-warming was interrupted. The rewarming process generallytook 3 to 4 days.
In these patients, various variables were analyzed,including initial GCS, Fisher classification regarding theamount of subarachnoid hemorrhage, Trauma Coma DataBank classification of the initial head computed tomogra-phy (CT) scan, frequency of vasospasm, frequency ofcerebral infarction caused by vasospasm, and GlasgowOutcome Score 3 months after admission. Vasospasm wasdiagnosed if either the diameter of the horizontal portionof the middle cerebral artery (M1) was �2 mm or if thediameter of the distal portion of the middle cerebral arteryexceeded that of the M1.
RESULTSTable 1 shows clinically demographic variables of the
subjects (patient 7 is described later). All patients hadminor hemorrhage classified as Fisher group 2. Five of sixpatients exhibited a vasospasm on angiography. Table 2shows the average intracranial pressure from the first toseventh hospital day in each patient. Table 3 provides the
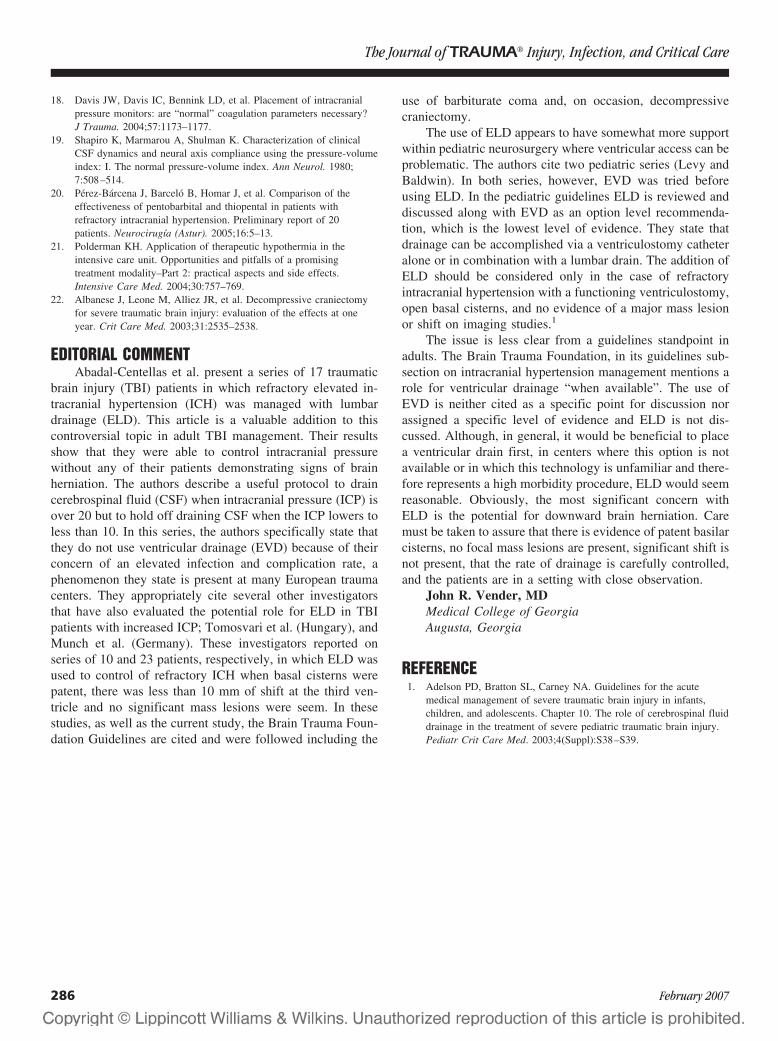
results of angiography and outcome, and Figures 1 to 6show cerebral angiograms for all six patients. Patient 3died from diffuse brain swelling on the 14th hospital day.Four of the five subjects who exhibited cerebral vasospasmhad received hypothermic therapy to control intracranialhypertension. The remaining patient, who did not demon-strate vasospasm, did not undergo hypothermic therapybecause intracranial pressure remained between 20 and 30mm Hg for 5 days. Only one case of symptomatic orasymptomatic vasospasm was identified because all sub-jects had been unconscious for some time when angiogra-phy was performed. This patient, who had the highest averageintracranial pressure (over 40 mm Hg for 5 consecutive days),exhibited anisocoria caused by vasospasm-induced cerebral in-farction after the rewarming phase of hypothermic therapy. Theother subjects did not show any complications related to cerebralinfarction.
A 43-year-old woman (patient 7) with diffuse axonalinjury and persistent intracranial hypertension was treatedwith hypothermic therapy but died on the seventh hospitalday because of brain death. Angiography was not performed.Autopsy revealed complications of sagittal sinus thrombosisand microscopy showed necrosis of the smooth muscles ofthe tunica media (Fig. 7), thus suggesting complications ofvasospasm.15
During the investigation period, among the hospitalizedhead injured patients in our department, only one well-oriented,70-year-old man with a cerebellar contusion, extensive sub-arachnoid hemorrhage in the basal cistern, and intraventricularhemorrhage developed symptomatic vasospasm and cerebralinfarction, which was confirmed by CT on the 12th hospital day.
DISCUSSIONOur results suggest that persistent intracranial hyper-
tension or hypothermic therapy may be related to late
Table 1 Clinically Demographic Variables
Patient 1 2 3 4 5 6 7
Age (years) 18 28 30 38 46 55 43Gender M M M F F M FGlasgow Coma Scale score at admission 5 8 4 5 6 7 6Fisher classification 2 2 2 2 2 2 2Trauma Coma Data Bank classification D E D D D E DInduced hypothermic therapy � � � � � � �
M, male; F, female; D, diffuse brain injury; E, evacuated mass.
Table 2 Average Intracranial Pressure From the Firstto Seventh Day
Patient 1 2 3 4 5 6 7
Day 1 50 50 26 5 22 5 50Day 2 45 40 26 21 23 25 22Day 3 45 25 22 28 22 30 21Day 4 52 30 21 27 21 25 25Day 5 51 30 24 33 27 30 28Day 6 53 25 22 27 25 30 30Day 7 60 25 30 34 28 27 70
All data provided as mm Hg.
Table 3 Results of Angiography and Outcome
Patient 1 2 3 4 5 6 7
Hospital day when angiography was performed 10 7 8 7 7 8Vasospasm on angiogram � � � � � � (�)Cerebral infarction following vasospasm � � � � � �Glasgow Outcome Scale score 4 2 3 5 3 3 5
(�), a vasospasm was confirmed by an autopsy.
The Journal of TRAUMA� Injury, Infection, and Critical Care
288 February 2007
phase cerebral vasospasm. Regarding the frequency ofcerebral vasospasm in head injured patients, Taneda et al.9
reported that 3 (3.0%) of 101 patients with minor sub-arachnoid hemorrhage and 7 (24.1%) of 29 patients withmassive subarachnoid hemorrhage on admission CT scansdeveloped delayed ischemic symptoms and angiographi-cally confirmed severe vasospasm. They concluded thattraumatic subarachnoid hemorrhage, particularly whenmassive, was a predictable indicator of delayed ischemicsymptoms. In contrast, the European Brain InjuryConsortium16 analyzed 1,005 patients with moderate orsevere head injuries and reported that death after traumatic
subarachnoid hemorrhage was related to the severity of theinitial mechanical damage rather than the effects of de-layed vasospasm and secondary ischemic brain damage. Inaddition, in a study of 107 consecutive patients, Zubkov etal.17 reported that posttraumatic vasospasm was detectedby transcranial Doppler in 32 (35.6%) of 90 patients withsevere or moderate head injury, and that none of thepatients with mild head injury exhibited posttraumaticvasospasm. They concluded that GCS at admission wasinversely related to the development of posttraumatic va-sospasm. Chhabra et al.18 also found no statistically sig-nificant correlation between the CT grade of subarachnoidhemorrhage and transcranial Doppler velocities. All pa-
Fig. 1. Cerebral angiogram in patient 1, an 18-year-old man inwhom diffuse axonal injury was treated by hypothermic therapy.Angiography demonstrated severe vasospasm on the 10th hospitalday, which resulted in cerebral infarction.
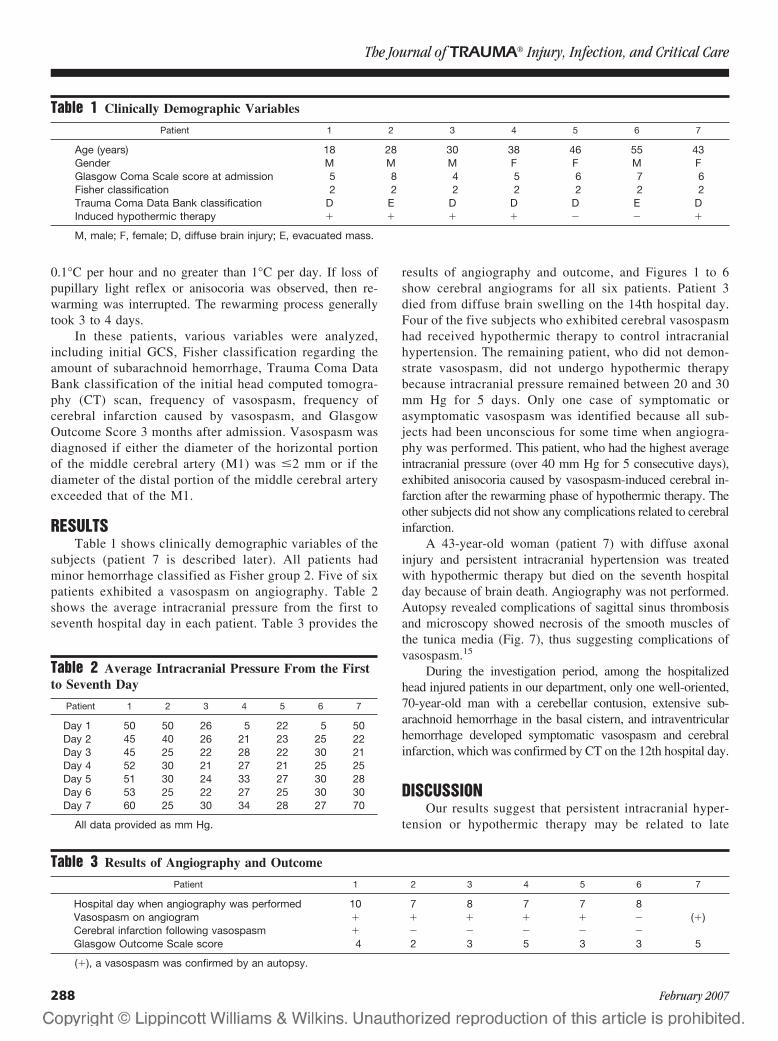
Fig. 2. Cerebral angiogram in patient 2, a 28-year-old man whosustained a cerebral contusion with epidural hematoma. This wastreated surgically, followed by hypothermic therapy. Angiographydemonstrated vasospasm on the seventh hospital day.
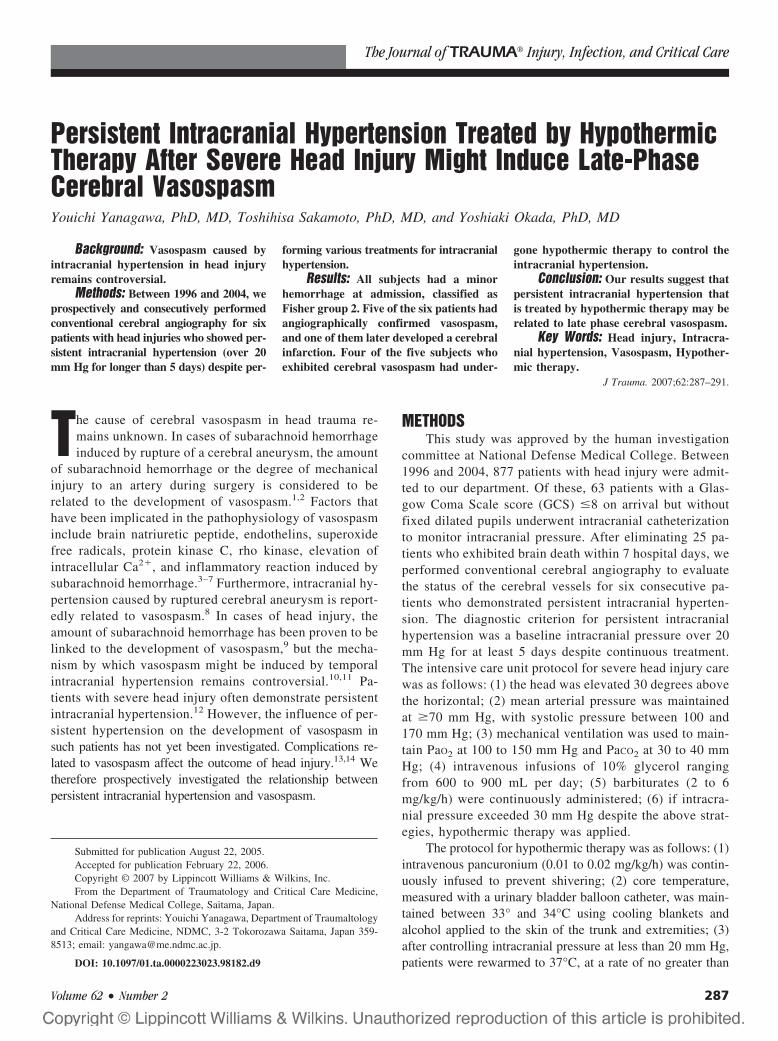
Fig. 3. Cerebral angiogram in patient 3, a 30-year-old man inwhom diffuse axonal injury was treated with hypothermic therapy.Angiography demonstrated vasospasm on the eighth hospital day.
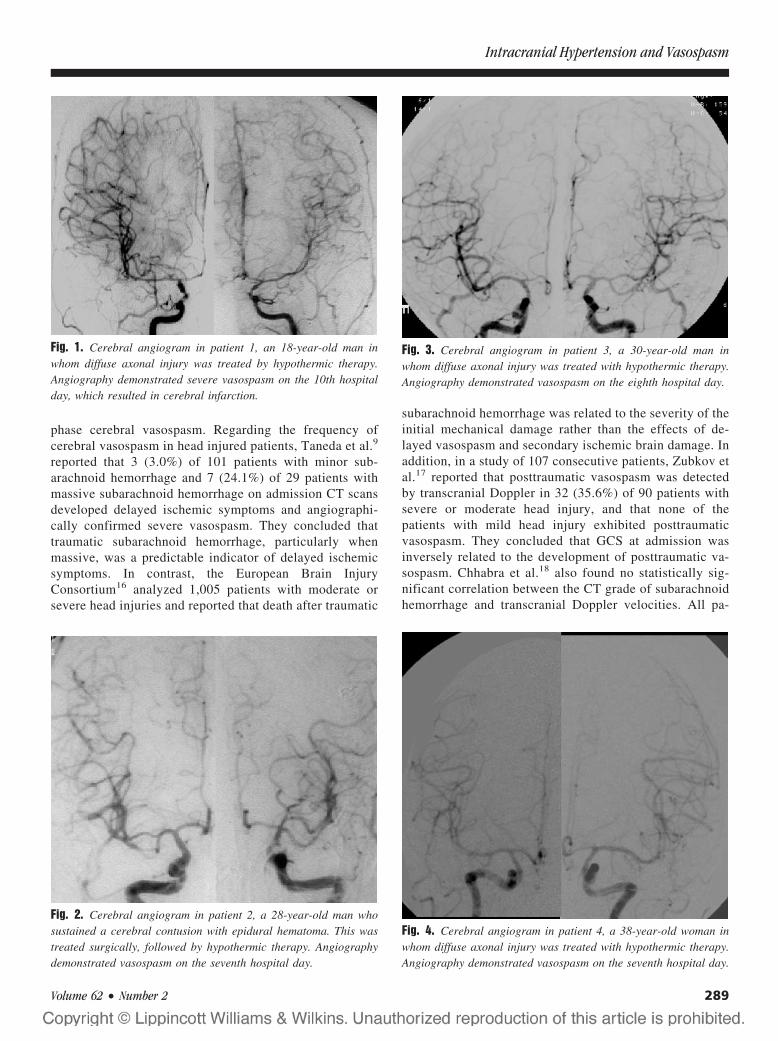
Fig. 4. Cerebral angiogram in patient 4, a 38-year-old woman inwhom diffuse axonal injury was treated with hypothermic therapy.Angiography demonstrated vasospasm on the seventh hospital day.
Intracranial Hypertension and Vasospasm
Volume 62 • Number 2 289

tients with mild head injury had normal transcranial Dopp-ler velocity (�100 cm/sec), whereas transcranial Dopplervelocities of more than 150 cm/sec were seen only in onepatient with severe head injury. Angiographic vasospasmwas found in two patients with severe head injury. Allpatients in the present study had minor subarachnoid hem-orrhage; however, the grade of head injury was assessed as
extremely severe because intracranial hypertension isknown to correlate with severity of head injury. This mightexplain the high frequency (86%) of cerebral vasospasm inthe present series.
Regarding hypotheses to explain the mechanism ofvasospasm induced by persistent intracranial hypertension,Sasaki et al.19 reported that a transient elevation of intra-cranial pressure produced by the cisternal injection ofsaline solution resulted in Horseradish peroxidase leakageat the branching points of the major cerebral arteries.Moreover, extensive disturbance of the blood-arterial wallbarrier is consistently observed in the major cerebral ar-teries after subarachnoid hemorrhage.19 This suggests thatboth subarachnoid clot and elevation of intracranial pressure areimportant factors in the breakdown of the blood-arterial wallbarrier. Sasaki et al. therefore suggested that a disturbance ofarterial permeability in the major cerebral arteries after subarach-noid hemorrhage and intracranial hypertension was probablyinvolved in the pathogenesis of vasospasm.
Weber et al.10 reported a significant correlation be-tween the occurrence of vasospasm detected by transcra-nial Doppler and the quantity of cisternal or intracerebralblood seen on CT; however, they found no correlation withthe GCS at admission, intracranial pressure, or functionaloutcome 6 months after injury. These findings were con-trary to those of the present study and previous reports.17,18
One reason for such a discrepancy might be the limitationof evaluating vasospasm using a transcranial Doppler.Klingelhofer et al.20 reported a decrease in middle cerebralartery flow velocity measured by the transcranial Dopplerduring intracranial hypertension. They suggested that thisphenomenon led to false negatives in the detection ofvasospasm. In contrast, we confirmed vasospasm by con-
Fig. 5. Cerebral angiogram in patient 5, a 46-year-old woman inwhom diffuse axonal injury was treated without hypothermic ther-apy. Angiography demonstrated vasospasm on the seventh hospitalday.
Fig. 6. Cerebral angiogram in patient 6, a 55-year-old man inwhom cerebral contusion with subdural hematoma was treatedsurgically. Angiography did not demonstrate vasospasm on theeighth hospital day.
Fig. 7. Microscopic findings of the middle cerebral artery (patient7; hematoxylin eosin stain, �400). A 43-year-old woman, in whomaxonal injury was treated by hypothermic therapy, died on theseventh hospital day from cerebral venous thrombosis. Microscopydemonstrated necrosis of the smooth muscles of the tunica media,suggesting complications of vasospasm.
The Journal of TRAUMA� Injury, Infection, and Critical Care
290 February 2007
ventional angiography, which is the gold standard for diagnos-ing vasospasm. This difference may explain the discrep-ancy between the findings of these two reports.
Four of five subjects who exhibited angiographic va-sospasm had undergone hypothermic therapy to controlintracranial hypertension. Although hypothermia reducesacute vasospasm after subarachnoid hemorrhage in rats,21
it has a direct vasoconstrictor effect in newborn lambs,22
and a mild dilator effect but a strong constrictor effectduring the rewarming phase in isolated human cerebralarteries.23 Jimbo et al. reported severe and fatal vasospasmafter hypothermic therapy in a head-injured patient similar to thepatients in the present study.24 It therefore seems that the use ofhypothermic therapy to control intracranial hypertension afterhead injury, particularly during the rewarming phase, may berelated to the development of vasospasm.
A limitation of this study was the absence of controls,namely patients with severe head trauma who did not dem-onstrate persistent intracranial hypertension and who did notreceive hypothermic therapy. Such a group would have beenuseful in comparing the frequency of cerebral vasospasm asconfirmed by angiography. Further studies are thus warrantedto determine the relationship between cerebral vasospasm andthe severity or duration of intracranial hypertension in pa-tients with severe head injury.
REFERENCES1. Reilly C, Amidei C, Tolentino J, et al. Clot volume and clearance
rate as independent predictors of vasospasm after aneurysmalsubarachnoid hemorrhage. J Neurosurg. 2004;101:255–261.
2. Rabinstein AA, Pichelmann MA, Friedman JA, et al. Symptomaticvasospasm and outcomes following aneurysmal subarachnoidhemorrhage: a comparison between surgical repair and endovascularcoil occlusion. J Neurosurg. 2003;98:319–325.
3. Sviri GE, Shik V, Raz B, et al. Role of brain natriuretic peptide incerebral vasospasm. Acta Neurochir (Wien). 2003;145:851–860.
4. Tani E, Matsumoto T. Continuous elevation of intracellular Ca2� isessential for the development of cerebral vasospasm. Curr VascPharmacol. 2004;2:13–21.
5. Armstead WM. Endothelins and the role of endothelin antagonists inthe management of posttraumatic vasospasm. Curr Pharm Des.2004;10:2185–2192.
6. Dumont AS, Dumont RJ, Chow MM, et al. Cerebral vasospasm aftersubarachnoid hemorrhage: putative role of inflammation.Neurosurgery. 2003;53:123–133.
7. Janjua N, Mayer SA. Cerebral vasospasm after subarachnoidhemorrhage. Curr Opin Crit Care. 2003;9:113–119.
8. Fukuhara T, Douville CM, Eliott JP, et al. Relationship betweenintracranial pressure and the development of vasospasm afteraneurysmal subarachnoid hemorrhage. Neurol Med Chir (Tokyo).1998;38:710–715.
9. Taneda M, Kataoka K, Akai F, et al. Traumatic subarachnoidhemorrhage as a predictable indicator of delayed ischemicsymptoms. J Neurosurg. 1996;84:762–768.
10. Weber M, Grolimund P, Seiler RW. Evaluation of posttraumaticcerebral blood flow velocities by transcranial Dopplerultrasonography. Neurosurgery. 1990;27:106–112.
11. Martin NA, Doberstein C, Zane C, et al. Posttraumatic cerebralarterial spasm: transcranial Doppler ultrasound, cerebral blood flow,and angiographic findings. J Neurosurg. 1992;77:575–583.
12. Shiozaki T, Sugimoto H, Taneda M, et al. Effect of mildhypothermia on uncontrollable intracranial hypertension after severehead injury. J Neurosurg. 1993;79:363–368.
13. Lee JH, Martin NA, Alsina G, et al. Hemodynamically significantcerebral vasospasm and outcome after head injury: a prospectivestudy. J Neurosurg. 1997;87:221–233.
14. Soustiel JF, Shik V. Posttraumatic basilar artery vasospasm. SurgNeurol. 2004;62:201–206.
15. Hughes JT, Schianchi PM. Cerebral artery spasm. A histologicalstudy of necropsy of the blood vessels in cases of subarachnoidhaemorrhage. J Neurosurg. 1978;48:515–525.
16. Servadei F, Murray GD, Teasdale GM, et al. Traumaticsubarachnoid hemorrhage: demographic and clinical study of 750patients from the European brain injury consortium survey of headinjuries. Neurosurgery. 2002;50:261–267.
17. Zubkov AY, Lewis AI, Raila FA, et al. Risk factors for thedevelopment of post-traumatic cerebral vasospasm. Surg Neurol.2000;53:126–130.
18. Chhabra R, Sharma BS, Gupta SK, et al. Traumatic subarachnoidhaemorrhage: a clinicoradiological and TCD correlation. NeurolIndia. 2001;49:138–143.
19. Sasaki T, Kassell NF, Yamashita M, et al. Barrier disruption in themajor cerebral arteries following experimental subarachnoidhemorrhage. J Neurosurg. 1985;63:433–440.
20. Klingelhofer J, Conrad B, Benecke R, et al. Evaluation ofintracranial pressure from transcranial Doppler studies in cerebraldisease. J Neurol. 1988;235:159–162.
21. Thome C, Schubert G, Piepgras A, et al. Hypothermia reduces acutevasospasm following SAH in rats. Acta Neurochir Suppl. 2001;77:255–258.
22. Speziali G, Russo P, Davis DA, et al. Hypothermia enhancescontractility in cerebral arteries of newborn lambs. J Surg Res. 1994;57:80–84.
23. Sagher O, Huang DL, Webb RC. Induction of hypercontractility inhuman cerebral arteries by rewarming following hypothermia: apossible role for tyrosine kinase. J Neurosurg. 1997;87:431–435.
24. Jimbo H, Dohi K, Nakamura Y, et al. Fatal severe vasospasm due torewarming following hypothermia–case report. Neurol Med Chir(Tokyo). 2000;40:463–466.
EDITORIAL COMMENTThe authors present a series of six consecutive patients with
persistent intracranial hypertension (intracranial pressure �20mm Hg for more than 5 days) who underwent cerebral angiog-raphy out of a cohort of 63 patients with severe head injuryduring an 8-year period. Five of the six patients had angio-graphically confirmed vasospasm. Four of those five patientshad undergone hypothermic therapy as part of their intracra-nial pressure therapy. The authors conclude that late-phasecerebral vasospasm may be a consequence of persistent intracranialhypertension, which is treated by hypothermic therapy.
In this article, the authors note an interesting associationbetween hypothermic treatment of persistent intracranial hy-pertension and cerebral vasospasm. They realize the limita-tions of this uncontrolled consecutive series of patients understudy but, regardless, they bring to light an unexpected pos-sible association. Additionally, they note a relatively lowassociation between head injury and vasospasm in general.
Jack Jallo, MDTemple University School of MedicinePhiladelphia, Pennsylvania
Intracranial Hypertension and Vasospasm
Volume 62 • Number 2 291

Effects of Mannitol Bolus Administration on IntracranialPressure, Cerebral Extracellular Metabolites, and TissueOxygenation in Severely Head-Injured PatientsOliver W. Sakowitz, MD, John F. Stover, MD, Asita S. Sarrafzadeh, MD, Andreas W. Unterberg, MD,and Karl L. Kiening, MD
Background: Osmotic agents arewidely used to lower elevated intracranialpressure (ICP). However, little data areavailable regarding cerebral oxygenationand metabolism in the traumatizedbrains studied under clinical conditions.The present prospective, open-labeledclinical study was designed to investigatewhether administration of mannitol, withthe aim of reducing moderate intracranialhypertension, improves cerebral metabo-lism and oxygenation in patients after se-vere traumatic brain injury (TBI).
Methods: Multimodal cerebral moni-toring (MCM), consisting of intraparenchy-mal ICP, tissue oxygenation (ptiO2), andmicro dialysis measurements was initiatedin six male TBI patients (mean age 45 years;
Glasgow Coma Scale score <9). A total of14 mannitol boli (20%, 0.5g/kg, 20 minutesinfusion time) were administered to treatICP exceeding 20 mm Hg (2.7 kPa). Tem-poral alterations determined by MCM aftermannitol infusions were recorded for 120minutes. Microdialysates were assayed im-mediately for extracellular glucose, lactate,pyruvate, and glutamate concentrations.
Results: Elevated ICP was success-fully treated in all cases. This effect wasmaximal 40 minutes after start of infusion(25 � 6 mm Hg [3.3 � 0.8 kPa] to 17 � 3mm Hg [2.3 � 0.4 kPa], p < 0.05) andlasted up to 100 minutes. Cerebral ptiO2
remained unaffected (21 � 5 mm Hg[2.8 � 0.7 kPa] to 23 � 6 mm Hg [3.1 �0.8 kPa], n.s.). Microdialysate concentra-
tions of all analytes rose unspecifically by10% to 40% from baseline, reaching max-imum concentrations 40 to 60 minutes af-ter start of the infusion.
Conclusions: Mannitol efficiently re-duces increased ICP. At an ICP of up to 30mm Hg [4 kPa] it does not affect cerebraloxygenation. Unspecific increases of ex-tracellular fluid metabolites can be ex-plained by transient osmotic dehydration.Additional mechanisms, such as increasedcerebral perfusion and blood volume,might explain an accelerated return tobaseline.
Key Words: Intracranial pressure,Microdialysis, Multimodal cerebral mon-itoring, Osmotherapy, Traumatic braininjury.
J Trauma. 2007;62:292–298.
Worldwide, traumatic brain injury (TBI) remains aleading cause of disability and death. With an inci-dence of 200 to 400 cases per 100,000, TBI is a
major contributor to socioeconomic costs. Especially thosepatients suffering from severe head injuries requiring pro-longed intensive care and neurosurgical intervention are atrisk for secondary ischemic injuries through hypotension,hypoxia, and intracranial hypertension.1,2
Any increase in intracranial pressure (ICP) can lead tofurther structural and functional impairment owing to its dele-terious effect on the already compromised microcirculation3 andmetabolism4–6 seen after severe TBI.
Ischemic deterioration, however, can both occur withnormal and elevated ICP. Therefore, additional monitoring
techniques, such as polarographic oxygenation measure-ments and microdialysis (MD) in brain tissue, are necessary.Changes in tissue oxygenation have been suggested for amore individualized (targeted) ICP or cerebral perfusion pres-sure (CPP) therapy.7,8 A critical threshold of �10 mm Hg hasbeen determined for the partial pressure of oxygen in braintissue (ptiO2).9
To monitor for impending ischemia and consequent met-abolic disturbance cerebral MD can be used to measurechanges in extracellular concentrations of glucose, lactate,pyruvate, glutamate, and glycerol.10–12 Concurrent monitor-ing of cerebral metabolism and oxygenation also allows studyof treatment measures such as those listed in the Guidelinesfor the Management and Prognosis of Severe TraumaticBrain Injury.13,14
Herein, one of the first-line agents to treat increasedICP is the osmotically active polyalcohol mannitol. De-spite extensive experience with mannitol it still lacks ev-idence of efficacy as concluded by a recent Cochranereview,15 owing among others, to the limited knowledgeregarding the mechanisms by which mannitol exerts itsbeneficial effects in the traumatized brain. Apart from itsantiedematous action, because of a mannitol-induced sub-stantial blood-brain osmotic gradient removing water fromthe parenchyma, several other mechanisms have been at-
Submitted for publication July 5, 2005.Accepted for publication December 12, 2005.Copyright © 2007 by Lippincott Williams & Wilkins, Inc.From the Department of Neurosurgery, University of Heidelberg, Hei-
delberg, Germany (O.W.S., A.W.U., K.L.K.); Division of Surgical IntensiveCare Medicine, University Hospital Zurich, Zurich, Switzerland (J.F.S.);Department of Neurosurgery, Charite—Medical University Berlin, Berlin,Germany (A.S.S.).
Address for reprints: Oliver W. Sakowitz, MD, Department of Neuro-surgery University of Heidelberg, Im Neuenheimer Feld 400 D-69120 Hei-delberg, Germany; email: [email protected].
DOI: 10.1097/01.ta.0000203560.03937.2d
The Journal of TRAUMA� Injury, Infection, and Critical Care
292 February 2007

tributed to the ICP-lowering effects. In this context, man-nitol influences hemorheology leading to vasoconstrictionin case of viscosity autoregulation.16,17 The proposedmechanism is that decreased blood viscosity increases ce-rebral blood flow unless cerebral vasoreactivity is intactand vessels constrict. This conception, however, has notbeen undisputed.18 –20 In the injured brain, the indirecteffect of mannitol on cerebral vessel tone through hydroxyl-radical scavenging complicate the picture.21
The aim of the current study was to monitor changes intissue oxygenation and cerebral metabolism to characterizepharmacokinetic and pharmacodynamic effects of infusedmannitol and thereby shed light on the mechanism of actionof this routinely applied osmotherapeutic agent. In detail, thetemporal profile of these parameters including ICP and CPPwas investigated before, during, and after mannitol adminis-tration in patients suffering from severe TBI.
METHODSPatients and Ethical Concerns
Only patients suffering from a severe TBI with an initialGlasgow Coma Scale (GCS) score of less than 9, in whomICP-monitoring was initiated, were included in the presentstudy. The study protocol and all procedures were approvedby the local ethics committee. Informed consent for invasiveneuromonitoring was obtained from next-of-kin. During allsurgical procedures and medical interventions greatest carewas taken not to interfere with on-going therapy and toguarantee state-of-the-art treatment.
Clinical ManagementAll patients had been intubated and ventilated either
directly at the scene of injury or upon arrival in the emer-gency room. Thereafter a computed tomography (CT) scan ofthe head was obtained. Space occupying mass lesions (�25mL) were evacuated in the operating room. Cranial accessdevices (multilumen bolt) for neuromonitoring sensors werepreferably placed during the same operative procedure. Toensure placement in viable brain tissue the frontal lobe of theless injured hemisphere was chosen. All patients were admit-ted to the Neurosurgical Intensive Care Unit (NICU) andremained sedated using a combination of a benzodiazepine(e.g. midazolam, approximately 7.0 mg/h or 0.09 mg/kg/h)and an opioid (e.g. fentanyl, approximately 0.1 mg/h or0.0012 mg/kg/h). Treatment in the NICU was directed byprotocol based on the guidelines for the treatment of severehead injury.13
General aims were to maintain normal physiologic bal-ance, i.e. normovolemia, normotension, normothermia, andnormoglycemia. To establish a minimum CPP of 70 mm Hg[9.3 kPa], mean arterial pressure (MAP) was usually main-tained above 80 mm Hg [10.7 kPa]. The arterial partialpressure of oxygen (paO2) was elevated to levels above 100mm Hg [13.3 kPa] by increasing the fraction of inspiredoxygen (FiO2) to 0.30 to 0.55 or adjusting the positive end-
exspiratory pressure (PEEP) settings on the ventilator. Nor-movolemia was guided by clinical assessment (peripheraledema, pulmonary congestion). If indicated, isotonic crystal-loids or colloid solutions like albumine or hydroxy-ethylstarch were used. Packed red blood cells were infused tomaintain hemoglobin concentrations above 10 g/dL.
The ICP treatment threshold was 20 mm Hg [2.7 kPa].Once ICP exceeded 20 mm Hg, if present, ventricular cath-eters were used for intermittent drainage of cerebrospinalfluid (CSF). Elevated ICP despite adequate sedation wastreated with moderate hyperventilation (arterial partial pres-sure of carbon dioxide [paCO2] 30–35 mm Hg [4.0–4.7kPa]) and intermittent bolus administration of mannitol (0.3–0.5 g/kg body weight, 4–8 times daily as long as serumosmolarity remained below 320 mosm/l). In cases in whichthese first-line measures failed to normalize ICP, second tiertherapies (e.g. barbiturate coma, decompressive craniectomy)were initiated.
OsmotherapyProvided that serum osmolarity was less than 320 mosm,
mannitol was infused over a central line whenever ICP wasgreater than 20 mm Hg for more than 10 minutes. A bolus of0.5 g/kg mannitol 20% was given during a 20-minute timespan. We obtained prospective data recordings of up to threebolus administrations per patient monitored during days 3 to10 after trauma. There was no coadministration of otherosmotherapeutic agents or diuretics.
Data RecordingAll patients received standard intensive care monitoring,
including MAP, ICP, and CPP. Continuous monitoring datawere digitally sampled at 1/min and recorded in a multimodalmonitoring system. Measurements of endtidal partial pressureof carbon dioxide (ETCO2) (Capnometer model 14360,Hewlett Packard, Waltham, Mass.) and arterial oxygen satu-ration (SaO2) (Pulse oximeter model 1020a, Hewlett Packard)were also obtained in all patients. Arterial blood gases, elec-trolytes, hematocrit, and hemoglobin were sampled and ana-lyzed automatically in the NICU (Rapidlab 800, BayerHealth-care Diagnostics Division, Tarrytown, N.Y.).
All patients had parenchymal ICP monitors even whenusing external ventricular drainage systems, as this procedureallows continuous monitoring of ICP with the benefit ofdraining CSF as a first-line measure to treat intracranialhypertension. Cranial bolt systems were used for fixation andaccess to the frontal lobe of the nonlesioned hemisphere withthe rationale to monitor salvageable tissue at risk. ICP wasmonitored with intraparenchymal tip transducers (Camino-microsensor, Integra Neurosciences, Plainsboro, N.J.; orCodman-microsensor, Godman & Shurtleff, Inc., Raynham,Mass.).
Cerebral Oxygenation and Metabolism After Mannitol
Volume 62 • Number 2 293
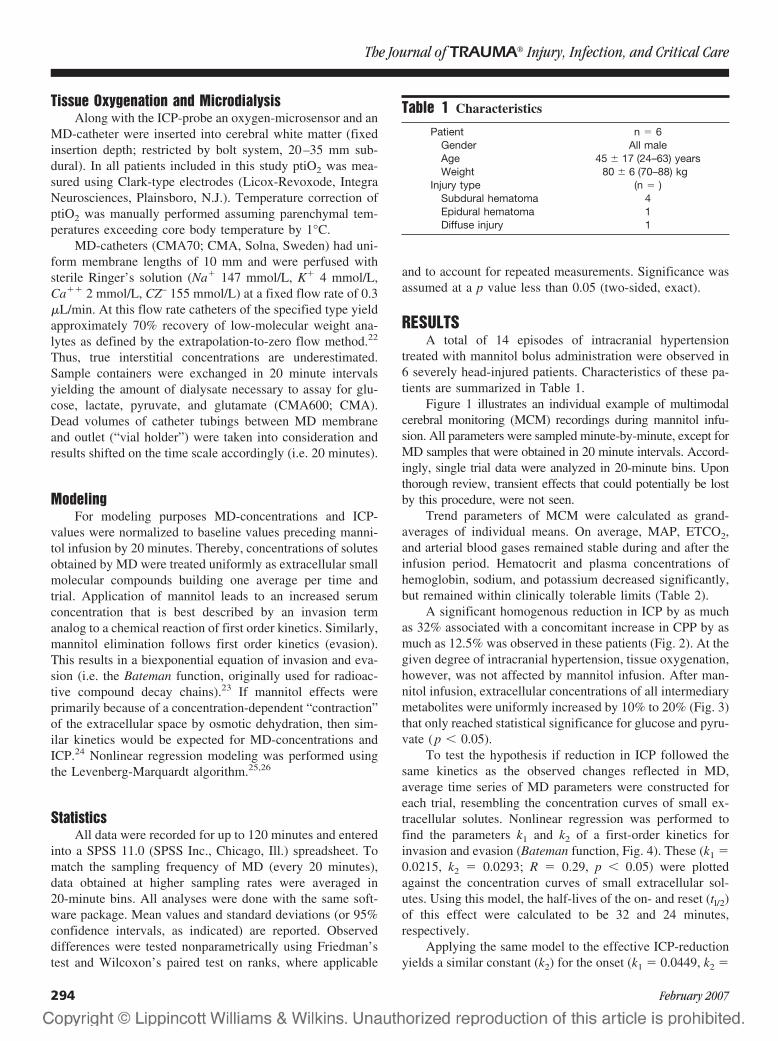
Tissue Oxygenation and MicrodialysisAlong with the ICP-probe an oxygen-microsensor and an
MD-catheter were inserted into cerebral white matter (fixedinsertion depth; restricted by bolt system, 20–35 mm sub-dural). In all patients included in this study ptiO2 was mea-sured using Clark-type electrodes (Licox-Revoxode, IntegraNeurosciences, Plainsboro, N.J.). Temperature correction ofptiO2 was manually performed assuming parenchymal tem-peratures exceeding core body temperature by 1°C.
MD-catheters (CMA70; CMA, Solna, Sweden) had uni-form membrane lengths of 10 mm and were perfused withsterile Ringer’s solution (Na� 147 mmol/L, K� 4 mmol/L,Ca�� 2 mmol/L, CZ– 155 mmol/L) at a fixed flow rate of 0.3�L/min. At this flow rate catheters of the specified type yieldapproximately 70% recovery of low-molecular weight ana-lytes as defined by the extrapolation-to-zero flow method.22
Thus, true interstitial concentrations are underestimated.Sample containers were exchanged in 20 minute intervalsyielding the amount of dialysate necessary to assay for glu-cose, lactate, pyruvate, and glutamate (CMA600; CMA).Dead volumes of catheter tubings between MD membraneand outlet (“vial holder”) were taken into consideration andresults shifted on the time scale accordingly (i.e. 20 minutes).
ModelingFor modeling purposes MD-concentrations and ICP-
values were normalized to baseline values preceding manni-tol infusion by 20 minutes. Thereby, concentrations of solutesobtained by MD were treated uniformly as extracellular smallmolecular compounds building one average per time andtrial. Application of mannitol leads to an increased serumconcentration that is best described by an invasion termanalog to a chemical reaction of first order kinetics. Similarly,mannitol elimination follows first order kinetics (evasion).This results in a biexponential equation of invasion and eva-sion (i.e. the Bateman function, originally used for radioac-tive compound decay chains).23 If mannitol effects wereprimarily because of a concentration-dependent “contraction”of the extracellular space by osmotic dehydration, then sim-ilar kinetics would be expected for MD-concentrations andICP.24 Nonlinear regression modeling was performed usingthe Levenberg-Marquardt algorithm.25,26
StatisticsAll data were recorded for up to 120 minutes and entered
into a SPSS 11.0 (SPSS Inc., Chicago, Ill.) spreadsheet. Tomatch the sampling frequency of MD (every 20 minutes),data obtained at higher sampling rates were averaged in20-minute bins. All analyses were done with the same soft-ware package. Mean values and standard deviations (or 95%confidence intervals, as indicated) are reported. Observeddifferences were tested nonparametrically using Friedman’stest and Wilcoxon’s paired test on ranks, where applicable
and to account for repeated measurements. Significance wasassumed at a p value less than 0.05 (two-sided, exact).
RESULTSA total of 14 episodes of intracranial hypertension
treated with mannitol bolus administration were observed in6 severely head-injured patients. Characteristics of these pa-tients are summarized in Table 1.
Figure 1 illustrates an individual example of multimodalcerebral monitoring (MCM) recordings during mannitol infu-sion. All parameters were sampled minute-by-minute, except forMD samples that were obtained in 20 minute intervals. Accord-ingly, single trial data were analyzed in 20-minute bins. Uponthorough review, transient effects that could potentially be lostby this procedure, were not seen.
Trend parameters of MCM were calculated as grand-averages of individual means. On average, MAP, ETCO2,and arterial blood gases remained stable during and after theinfusion period. Hematocrit and plasma concentrations ofhemoglobin, sodium, and potassium decreased significantly,but remained within clinically tolerable limits (Table 2).
A significant homogenous reduction in ICP by as muchas 32% associated with a concomitant increase in CPP by asmuch as 12.5% was observed in these patients (Fig. 2). At thegiven degree of intracranial hypertension, tissue oxygenation,however, was not affected by mannitol infusion. After man-nitol infusion, extracellular concentrations of all intermediarymetabolites were uniformly increased by 10% to 20% (Fig. 3)that only reached statistical significance for glucose and pyru-vate (p � 0.05).
To test the hypothesis if reduction in ICP followed thesame kinetics as the observed changes reflected in MD,average time series of MD parameters were constructed foreach trial, resembling the concentration curves of small ex-tracellular solutes. Nonlinear regression was performed tofind the parameters k1 and k2 of a first-order kinetics forinvasion and evasion (Bateman function, Fig. 4). These (k1 �0.0215, k2 � 0.0293; R � 0.29, p � 0.05) were plottedagainst the concentration curves of small extracellular sol-utes. Using this model, the half-lives of the on- and reset (tl/2)of this effect were calculated to be 32 and 24 minutes,respectively.
Applying the same model to the effective ICP-reductionyields a similar constant (k2) for the onset (k1 � 0.0449, k2 �
Table 1 Characteristics
Patient n � 6Gender All maleAge 45 � 17 (24–63) yearsWeight 80 � 6 (70–88) kg
Injury type (n � )Subdural hematoma 4Epidural hematoma 1Diffuse injury 1
The Journal of TRAUMA� Injury, Infection, and Critical Care
294 February 2007
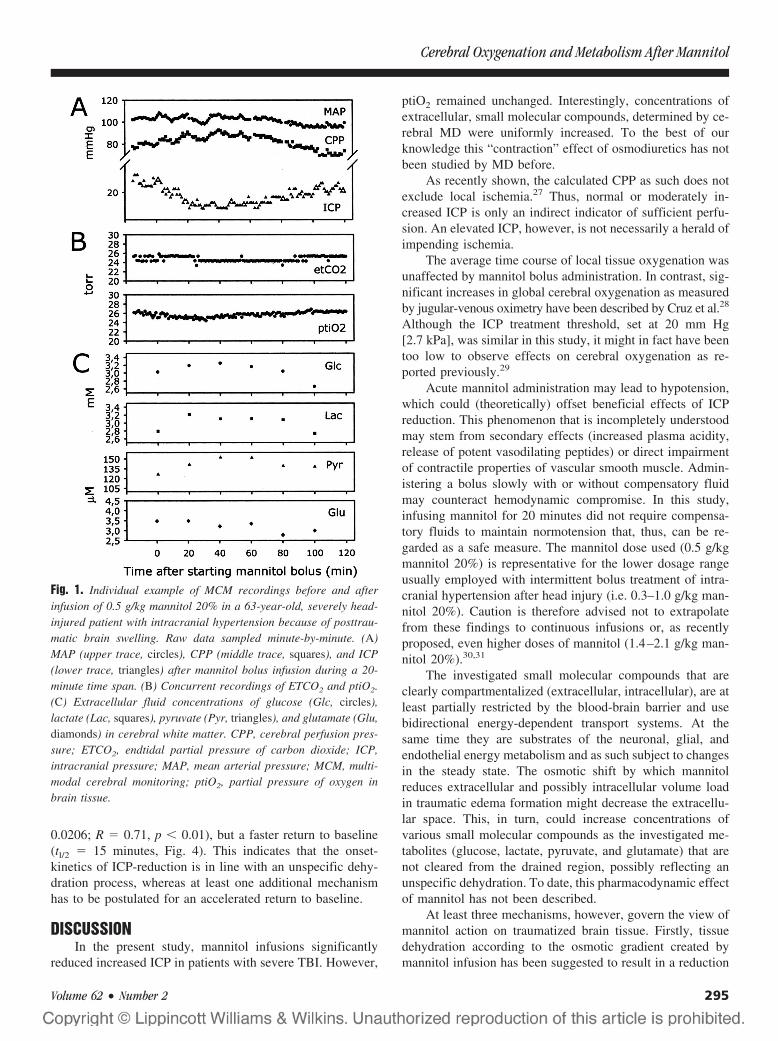
0.0206; R � 0.71, p � 0.01), but a faster return to baseline(tl/2 � 15 minutes, Fig. 4). This indicates that the onset-kinetics of ICP-reduction is in line with an unspecific dehy-dration process, whereas at least one additional mechanismhas to be postulated for an accelerated return to baseline.
DISCUSSIONIn the present study, mannitol infusions significantly
reduced increased ICP in patients with severe TBI. However,
ptiO2 remained unchanged. Interestingly, concentrations ofextracellular, small molecular compounds, determined by ce-rebral MD were uniformly increased. To the best of ourknowledge this “contraction” effect of osmodiuretics has notbeen studied by MD before.
As recently shown, the calculated CPP as such does notexclude local ischemia.27 Thus, normal or moderately in-creased ICP is only an indirect indicator of sufficient perfu-sion. An elevated ICP, however, is not necessarily a herald ofimpending ischemia.
The average time course of local tissue oxygenation wasunaffected by mannitol bolus administration. In contrast, sig-nificant increases in global cerebral oxygenation as measuredby jugular-venous oximetry have been described by Cruz et al.28
Although the ICP treatment threshold, set at 20 mm Hg[2.7 kPa], was similar in this study, it might in fact have beentoo low to observe effects on cerebral oxygenation as re-ported previously.29
Acute mannitol administration may lead to hypotension,which could (theoretically) offset beneficial effects of ICPreduction. This phenomenon that is incompletely understoodmay stem from secondary effects (increased plasma acidity,release of potent vasodilating peptides) or direct impairmentof contractile properties of vascular smooth muscle. Admin-istering a bolus slowly with or without compensatory fluidmay counteract hemodynamic compromise. In this study,infusing mannitol for 20 minutes did not require compensa-tory fluids to maintain normotension that, thus, can be re-garded as a safe measure. The mannitol dose used (0.5 g/kgmannitol 20%) is representative for the lower dosage rangeusually employed with intermittent bolus treatment of intra-cranial hypertension after head injury (i.e. 0.3–1.0 g/kg man-nitol 20%). Caution is therefore advised not to extrapolatefrom these findings to continuous infusions or, as recentlyproposed, even higher doses of mannitol (1.4–2.1 g/kg man-nitol 20%).30,31
The investigated small molecular compounds that areclearly compartmentalized (extracellular, intracellular), are atleast partially restricted by the blood-brain barrier and usebidirectional energy-dependent transport systems. At thesame time they are substrates of the neuronal, glial, andendothelial energy metabolism and as such subject to changesin the steady state. The osmotic shift by which mannitolreduces extracellular and possibly intracellular volume loadin traumatic edema formation might decrease the extracellu-lar space. This, in turn, could increase concentrations ofvarious small molecular compounds as the investigated me-tabolites (glucose, lactate, pyruvate, and glutamate) that arenot cleared from the drained region, possibly reflecting anunspecific dehydration. To date, this pharmacodynamic effectof mannitol has not been described.
At least three mechanisms, however, govern the view ofmannitol action on traumatized brain tissue. Firstly, tissuedehydration according to the osmotic gradient created bymannitol infusion has been suggested to result in a reduction
Fig. 1. Individual example of MCM recordings before and afterinfusion of 0.5 g/kg mannitol 20% in a 63-year-old, severely head-injured patient with intracranial hypertension because of posttrau-matic brain swelling. Raw data sampled minute-by-minute. (A)MAP (upper trace, circles), CPP (middle trace, squares), and ICP(lower trace, triangles) after mannitol bolus infusion during a 20-minute time span. (B) Concurrent recordings of ETCO2 and ptiO2.(C) Extracellular fluid concentrations of glucose (Glc, circles),lactate (Lac, squares), pyruvate (Pyr, triangles), and glutamate (Glu,diamonds) in cerebral white matter. CPP, cerebral perfusion pres-sure; ETCO2, endtidal partial pressure of carbon dioxide; ICP,intracranial pressure; MAP, mean arterial pressure; MCM, multi-modal cerebral monitoring; ptiO2, partial pressure of oxygen inbrain tissue.
Cerebral Oxygenation and Metabolism After Mannitol
Volume 62 • Number 2 295
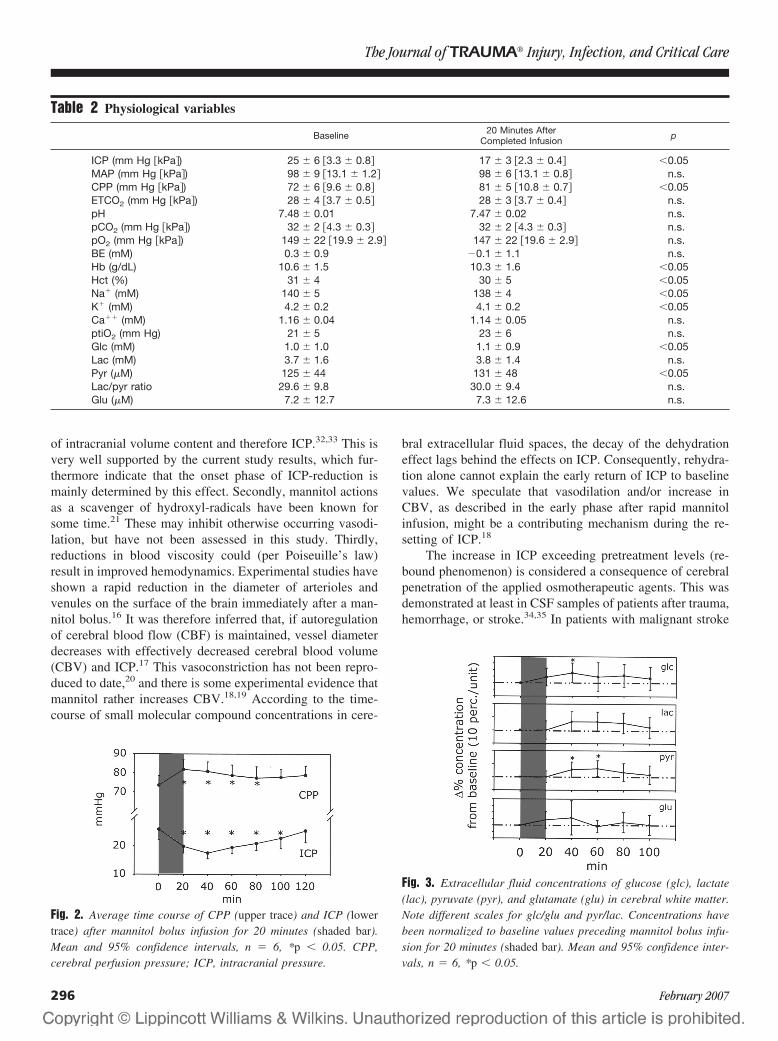
of intracranial volume content and therefore ICP.32,33 This isvery well supported by the current study results, which fur-thermore indicate that the onset phase of ICP-reduction ismainly determined by this effect. Secondly, mannitol actionsas a scavenger of hydroxyl-radicals have been known forsome time.21 These may inhibit otherwise occurring vasodi-lation, but have not been assessed in this study. Thirdly,reductions in blood viscosity could (per Poiseuille’s law)result in improved hemodynamics. Experimental studies haveshown a rapid reduction in the diameter of arterioles andvenules on the surface of the brain immediately after a man-nitol bolus.16 It was therefore inferred that, if autoregulationof cerebral blood flow (CBF) is maintained, vessel diameterdecreases with effectively decreased cerebral blood volume(CBV) and ICP.17 This vasoconstriction has not been repro-duced to date,20 and there is some experimental evidence thatmannitol rather increases CBV.18,19 According to the time-course of small molecular compound concentrations in cere-
bral extracellular fluid spaces, the decay of the dehydrationeffect lags behind the effects on ICP. Consequently, rehydra-tion alone cannot explain the early return of ICP to baselinevalues. We speculate that vasodilation and/or increase inCBV, as described in the early phase after rapid mannitolinfusion, might be a contributing mechanism during the re-setting of ICP.18
The increase in ICP exceeding pretreatment levels (re-bound phenomenon) is considered a consequence of cerebralpenetration of the applied osmotherapeutic agents. This wasdemonstrated at least in CSF samples of patients after trauma,hemorrhage, or stroke.34,35 In patients with malignant stroke
Table 2 Physiological variables
Baseline 20 Minutes AfterCompleted Infusion p
ICP (mm Hg �kPa�) 25 � 6 �3.3 � 0.8� 17 � 3 �2.3 � 0.4� �0.05MAP (mm Hg �kPa�) 98 � 9 �13.1 � 1.2� 98 � 6 �13.1 � 0.8� n.s.CPP (mm Hg �kPa�) 72 � 6 �9.6 � 0.8� 81 � 5 �10.8 � 0.7� �0.05ETCO2 (mm Hg �kPa�) 28 � 4 �3.7 � 0.5� 28 � 3 �3.7 � 0.4� n.s.pH 7.48 � 0.01 7.47 � 0.02 n.s.pCO2 (mm Hg �kPa�) 32 � 2 �4.3 � 0.3� 32 � 2 �4.3 � 0.3� n.s.pO2 (mm Hg �kPa�) 149 � 22 �19.9 � 2.9� 147 � 22 �19.6 � 2.9� n.s.BE (mM) 0.3 � 0.9 �0.1 � 1.1 n.s.Hb (g/dL) 10.6 � 1.5 10.3 � 1.6 �0.05Hct (%) 31 � 4 30 � 5 �0.05Na� (mM) 140 � 5 138 � 4 �0.05K� (mM) 4.2 � 0.2 4.1 � 0.2 �0.05Ca�� (mM) 1.16 � 0.04 1.14 � 0.05 n.s.ptiO2 (mm Hg) 21 � 5 23 � 6 n.s.Glc (mM) 1.0 � 1.0 1.1 � 0.9 �0.05Lac (mM) 3.7 � 1.6 3.8 � 1.4 n.s.Pyr (�M) 125 � 44 131 � 48 �0.05Lac/pyr ratio 29.6 � 9.8 30.0 � 9.4 n.s.Glu (�M) 7.2 � 12.7 7.3 � 12.6 n.s.
Fig. 2. Average time course of CPP (upper trace) and ICP (lowertrace) after mannitol bolus infusion for 20 minutes (shaded bar).Mean and 95% confidence intervals, n � 6, *p � 0.05. CPP,cerebral perfusion pressure; ICP, intracranial pressure.
Fig. 3. Extracellular fluid concentrations of glucose (glc), lactate(lac), pyruvate (pyr), and glutamate (glu) in cerebral white matter.Note different scales for glc/glu and pyr/lac. Concentrations havebeen normalized to baseline values preceding mannitol bolus infu-sion for 20 minutes (shaded bar). Mean and 95% confidence inter-vals, n � 6, *p � 0.05.
The Journal of TRAUMA� Injury, Infection, and Critical Care
296 February 2007

receiving the osmotherapeutic agent glycerol, spilling into thepenumbra was indeed detected by MD.36 In the current studyno rebound phenomenon was observed, but cannot be ruledout completely. Higher flow rates of MD are necessary torecover the amounts of sample necessary for chromatographi-cal analysis of polyalcohols. Additionally, blood-brain barrierdamage by the probe itself might contribute to the penetrationof mannitol.
In the present study measurements were performed in non-lesioned tissue to observe changes in tissue at risk for ischemia.Studying effects of mannitol in areas with a definite blood-brainbarrier damage, such as brain contusions, remains technicallychallenging. Postmortem studies in TBI patients indicate a gra-dient leakage of plasma proteins into the brain surroundingmacroscopic contusions for more than 7 days after injury.37 Atthe same time perfusion characteristics of these areas are un-known and tissue factors, i.e. diffusion characteristics of tissuesdetermining MD recovery, would also vary.38 It is thereforelikely that placing MD catheters in these areas will lead to highlyheterogeneous results.
Finally, if mannitol was to be given for several days aftertrauma, the time point of administration would also be ofinterest. If a rebound did occur, this phenomenon could betime-dependent.
This pilot study is limited by the relatively small numberof observations. More detailed prospective studies employingmonitoring of cerebral oxygenation and metabolism to char-acterize pharmacodynamic effects of osmotherapy after se-vere TBI are necessary. Confounding factors, such as timingof administration, extent of tissue injury at the site of probeimplantation, the underlying ICP level at the time of osmo-therapy, and changes in local cerebral perfusion should beconsidered.
Furthermore, alternative osmotic agents, such as hyper-tonic saline with or without colloid should be studied in asimilar manner.39–41
CONCLUSIONMannitol is an effective treatment option to lower in-
creased ICP. At an ICP of 20 to 30 mm Hg [2.7–4.0 kPa] itdoes not influence cerebral oxygenation. The unspecific in-creases in local extracellular metabolites may be caused byosmotic dehydration. The onset-kinetics of ICP-reduction arein line with this postulated dehydration process, whereasadditional mechanisms, such as increased cerebral perfusion,might explain an accelerated return to baseline.
ACKNOWLEDGMENTSWe thank Dr. C. Berger (Department of Neurology, Heidelberg) for
helpful discussions. This project was funded by the Deutsche Forschungs-gemeinschaft DFG Un56/7-3.
REFERENCES1. Chesnut R, Marshall L, Klauber M, et al. The role of secondary
brain injury in determining outcome from severe head injury.J Trauma. 1993;34:216–222.
2. Jones P, Andrews P, Midgley S, et al. Measuring the burden ofsecondary insults in head-injured patients during intensive care.J Neuro Burg Anesthesiol. 1994;6:4–14.
3. Kirkpatrick P, Smielewski P, Czosnyka M, et al. Continuousmonitoring of cortical perfusion by laser Doppler flowmetry inventilated patients with head injury. J Neurol Neurosurg Psychiatry.1994;57:1382–1388.
4. Goodman J, Valadka A, Gopinath S, et al. Lactate and excitatoryamino acids measured by microdialysis are decreased bypentobarbital coma in head-injured patients. J Neurotrauma. 1996;13:549–556.
5. Zauner A, Doppenberg E, Woodward J, et al. Continuous monitoringof cerebral substrate delivery and clearance: initial experience in 24patients with severe acute brain injuries. Neurosurgery. 1997;41:1082–1091; discussion 1091–1093.
6. Bullock R, Zauner A, Woodward J, et al. Factors affecting excitatoryamino acid release following severe human head injury.J Neurosurg. 1998;89:507–518.
7. Unterberg A, Kiening K, Hartl R, et al. Multimodal monitoring inpatients with head injury: evaluation of the effects of treatment oncerebral oxygenation. J Trauma. 1997;42:S32–37.
8. Robertson C, Valadka A, Hannay H, et al. Prevention of secondaryischemic insults after severe head injury. Crit Care Med. 1999;27:2086–2095.
9. Kiening K, Unterberg A, Bardt T, et al. Monitoring of cerebraloxygenation in patients with severe head injuries: brain tissue pO2
versus jugular vein oxygen saturation. J Neurosurg. 1996;85:751–757.10. Persson L, Hillered L. Chemical monitoring of neurosurgical
intensive care patients using intracerebral microdialysis.J Neurosurg. 1992;76:72–80.
11. Ungerstedt U, Nordstrom C. Microdialysis monitoring of brainbiochemistry during neurointensive care. In: von Wild K, ed.Pathophysiological Principles and Controversies in NeurointensiveCare. Munich: Zuckschwerdt; 1998:83–90.
12. Sarrafzadeh A, Kiening K, Callsen T, et al. Metabolic changesduring impending and manifest cerebral hypoxia in traumatic braininjury. Br J Neurosurg. 2003;17:340–346.
13. Brain Trauma Foundation, American Association of NeurologicalSurgeons, Joint Section on Neurotrauma and Critical Care.
Fig. 4. Average time course of MD parameters (glucose, lactate,pyruvate, glutamate; upper trace) after mannitol bolus infusion for20 minutes (shaded bar). Average time course of ICP on the lowertrace. All variables have been normalized to pretreatment values.Error bars represent means and 95% confidence intervals of n � 14individual trials. These were entered into nonlinear regressionanalysis using a biexponential model function. Curves representthe discrete solutions found for both parameters. ICP, intracra-nial pressure; MD, microdialysis.
Cerebral Oxygenation and Metabolism After Mannitol
Volume 62 • Number 2 297
Guidelines for the management of severe traumatic brain injury.J Neurotrauma. 2000;17:451–627.
14. Brain Trauma Foundation, American Association of NeurologicalSurgeons. Guidelines for the Management of Severe Traumatic BrainInjury: Cerebral Perfusion Pressure. [Online]. www.braintrauma.org/guidelines. Accessed December 1, 2005.
15. Roberts I, Schierhout G, Wakai A. Mannitol for acute traumaticbrain injury. Cochrane Database Syst Rev. 2003;CD001049.
16. Muizelaar J, Wei E, Kontos H, et al. Mannitol causes compensatorycerebral vasoconstriction and vasodilation in response to bloodviscosity changes. J Neurosurg. 1983;59:822–828.
17. Muizelaar J, Lutz H, Becker D. Effect of mannitol on ICP and CBFand correlation with pressure autoregulation in severely head-injuredpatients. J Neurosurg. 1984;61:700–706.
18. Ravussin P, Archer D, Tyler J, et al. Effects of rapid mannitolinfusion on cerebral blood volume: a positron emission tomographicstudy in dogs and man. J Neurosurg. 1986;64:104–113.
19. Inao S, Kuchiwaki H, Wachi A, et al. Effect of mannitol onintracranial pressure-volume status and cerebral haemodynamics inbrain oedema. Acta Neurochir Suppl (Wien). 1990;51:401–403.
20. Gordon E, Nguyen T, Ngai A, et al. Differential effects of alcoholson intracerebral arterioles: ethanol alone causes vasoconstriction.J Cereb Blood Flow Metab. 1995;15:532–538.
21. Rosenblum W. Effects of free radical generation on mouse pialarterioles: probable role of hydroxyl radicals. Am J Physiol. 1983;245:H139–H142
22. Hutchinson P, O’Connell M, Al-Rawi P, et al. Clinical cerebralmicro dialysis: a methodological study. J Neurosurg. 2000;93:37–43.
23. Bateman H. The solution of a system of differential equationsoccurring in the theory of radio-active transformations. ProcCambridge Phil Soc. 1910;15:423–427.
24. Cloyd J, Snyder B, Cleeremans B, et al. Mannitol pharmacokineticsand serum osmolality in dogs and humans. J Pharmacol Exp Ther.1986;236:301–306.
25. Levenberg K. A method for the solution of certain problems in leastsquares. Quart Appl Math. 1944;2:164–168.
26. Marquardt D. An algorithm for least-squares estimation of nonlinearparameters. SIAM J Appl Math. 1963;11:431–441.
27. Coles JP, Fryer TD, Smielewski P, et al. Defining ischemicburden after traumatic brain injury using 150 PET imaging ofcerebral physiology. J Cereb Blood Flow Metab. 2004;24:191–201.
28. Cruz J, Miner M, Allen S, et al. Continuous monitoring of cerebraloxygenation in acute brain injury: injection of mannitol during hyperventilation. J Neurosurg. 1990;73:725–730.
29. Hartl R, Bardt T, Kiening K, et al. Mannitol decreases ICP but doesnot improve brain-tissue pO2 in severely head-injured patients withintracranial hypertension. Acta Neurochir Suppl. 1997;70:40–42
30. Cruz J, Minoja G, Okuchi K. Improving clinical outcomes fromacute subdural hematomas with the emergency preoperativeadministration of high doses of mannitol: a randomized trial.Neurosurgery. 2001;49:864–871.
31. Cruz J, Minoja G, Okuchi K, et al. Successful use of the new high-dose mannitol treatment in patients with Glasgow Coma Scale scoresof 3 and bilateral abnormal pupillary widening: a randomized trial.J Neurosurg. 2004;100:376–383.
32. Cserr H, DePasquale M, Patlak C. Regulation of brain water andelectrolytes during acute hyperosmolality in rats. Am J Physiol.1987;253:F522–529.
33. Rosenberg G, Barrett J, Estrada E, et al. Selective effect of mannitolinduced hyperosmolality on brain interstitial fluid and water contentin white matter. Metab Brain Dis. 1988;3:217–227.
34. Nau R, Desel H, Lassek C, et al. Slow elimination of mannitol fromhuman cerebrospinal fluid. Eur J Clin Pharmacol. 1997;53:271–274
35. Polderman K, van de Kraats G, Dixon J, et al. Increases in spinal fluidosmolarity induced by mannitol. Crit Care Med. 2003;31:584–590.
36. Berger C, Sakowitz OW, Kiening KL, et al. Neurochemicalmonitoring of glycerol therapy in patients with ischemic brainedema. Stroke. 2005;36:e4–e6.
37. Todd N, Graham D. Blood-brain barrier damage in traumatic braincontusions. Acta Neurochir Suppl. 1990;51:296–299
38. Benveniste H, Huttemeier P. Microdialysis-theory and application.Frog Neurobiol. 1990;35:195–215.
39. Freshman S, Battistella F, Matteucci M, et al. Hypertonic saline(7.5%) versus mannitol: a comparison for treatment of acute headinjuries. J Trauma. 1993;35:344–348.
40. Doyle J, Davis D, Hoyt D. The use of hypertonic saline in thetreatment of traumatic brain injury. J Trauma. 2001;50:367–383.
41. Vialet R, Albanese J, Thomachot L, et al. Isovolume hypertonicsolutes (sodium chloride or mannitol) in the treatment of refractoryposttraumatic intracranial hypertension: 2 ml/kg 7.5% saline is moreeffective than 2 ml/kg 20% mannitol. Crit Care Med. 2003;31:1683–1687.
The Journal of TRAUMA� Injury, Infection, and Critical Care
298 February 2007
Hypertonic Saline Resuscitation: Efficacy May Require EarlyTreatment in Severely Injured PatientsNaoyuki Hashiguchi, MD, Linda Lum, RN, Elizabeth Romeril, RN, Yu Chen, MD, Linda Yip, PhD,David B. Hoyt, MD, and Wolfgang G. Junger, PhD
Background: Activation of polymor-phonuclear neutrophils (PMN) is a criticalevent leading to host tissue injury and organdamage after trauma. Hypertonic saline(HS) resuscitation prevents PMN activationin vitro and in animal models. Here, westudied how clinical parameters and timingrequirements influence the efficacy of HS insuppressing PMN activation.
Materials and Methods: Twenty-sixinjured patients and 16 healthy volunteerswere included as study subjects. To studyhow clinical parameters affect the efficacyof HS, whole blood samples from patientswere collected 24 hours after admission,treated with HS and N-formyl-methionyl-leucyl-phenylalanine (fMLP), and PMNoxidative burst and degranulation were
measured using flow cytometry. We stud-ied the effect of timing on the ability of HSto inhibit PMN function by exposing bloodof healthy volunteers to plasma samplesfrom trauma patients before or after theaddition of fMLP and HS.
Results: Age and gender did not sig-nificantly influence the effect of HS onPMN function. The suppressive effect ofclinically relevant HS concentrations (20mmol/L) on PMN oxidative burst corre-lated weakly with Sepsis Severity Score(SSS) and Acute Physiology and ChronicHealth Evaluation II (APACHE II) scorebut not with the Injury Severity Score (ISS)or Multiple Organ Failure score (MOF).There was no correlation between any ofthese clinical scores and degranulation. HS
was significantly less effective in suppress-ing oxidative burst of PMN from patientswith ISS >10, APACHE II >5, MOF >0, orSSS >1 compared with patients with ISS<10, APACHE II <5, MOF � 0, or SSS<1. HS more effectively suppressed PMNactivation when PMN were pretreatmentwith HS, whereas it was less effective onPMN previously primed in vivo or in vitroby adding trauma plasma. HS was ineffec-tive on PMN previously stimulated in vitrowith fMLP.
Conclusions: Our data suggest thatHS resuscitation may prevent PMN acti-vation most effectively when patients aretreated with HS early in the field.
Key Words: Hypertonic saline, Neu-trophils, Trauma patients, Injury severity.
J Trauma. 2007;62:299–306.
In 1980, small-volume resuscitation with hypertonic saline(HS) (4 mL of 7.5% NaCl per kilogram of body weight)was introduced for the treatment of hemorrhagic and trau-
matic shock.1 A series of prospective, randomized, controlledtrials was performed starting in the late 1980s testing HSresuscitation. More than 300 studies have been published inthe last 10 years addressing the use of HS in hemorrhagicshock. In recent years, eight double-blind, randomized trialshave evaluated the use of HS or HS/Dextran solution (HSD)in the prehospital as well as in the emergency departmentsettings. Some of these studies have demonstrated improvedrates of survival in groups receiving HS or HSD.2 Fluidtherapies using HS or HSD benefit from the nearly instanta-
neous mobilization of endogenous fluid along the osmoticgradient from intracellular and extravascular spaces to theintravascular compartment. The required volume of hyper-tonic fluids to maintain circulation is significantly smallerthan that of isotonic fluids.3,4 Because of these beneficialeffects on hemodynamic5 and microcirculatory parameters,6
small-volume resuscitation with HS has gained increasingattention by trauma physicians.
The discovery that osmotic stress, equivalent to the hy-pertonic conditions generated by hypertonic resuscitation,can regulate cellular immune function has fueled renewedinterest in HS resuscitation.7 Wen as well as others, haveshown that HS can reduce polymorphonuclear neutrophil(PMN) function in vitro and in vivo, which correlates with adecrease in inflammation and PMN-mediated tissue damagein animal models of hemorrhagic shock.8,9 There has alsobeen accumulating evidence for the effectiveness of small-volume resuscitation in preventing inflammation and theresulting organ dysfunction after posttraumatic and hemor-rhagic shock.8,10–12 In vitro studies with PMN from healthydonors have shown that hypertonic solutions inhibit PMNactivation effectively when HS is present before or at the timeof PMN stimulation. However, HS lacks significant protec-tive effect and even augments some PMN functions when itis added to previously stimulated cells.13
Clinically, treatment with HS can occur before, during,or after the priming or activation of PMN by trauma and
Submitted for publication June 30, 2005.Accepted for publication April 3, 2006.Copyright © 2007 by Lippincott Williams & Wilkins, Inc.From the University of California San Diego School of Medicine, San
Diego, California.Presented as a poster at the 63rd Annual Meeting of the American
Association for the Surgery of Trauma, September 29–October 2, 2004,Maui, Hawaii.
Supported by National Institutes of General Medical Sciences GrantsR01 GM-51477 and R01 GM-60475 (W.G.J.) and by an Office of NavalResearch Grant N00014-00-1-0851 (W.G.J.).
Address for reprints: Dr. Wolfgang G. Junger, Department of Surgery,Division of Trauma, University of California San Diego School of Medicine,200 West Arbor Drive, San Diego, CA 92103-8236. E-mail: [email protected].
DOI: 10.1097/01.ta.0000222956.88760.33
The Journal of TRAUMA� Injury, Infection, and Critical Care
Volume 62 • Number 2 299
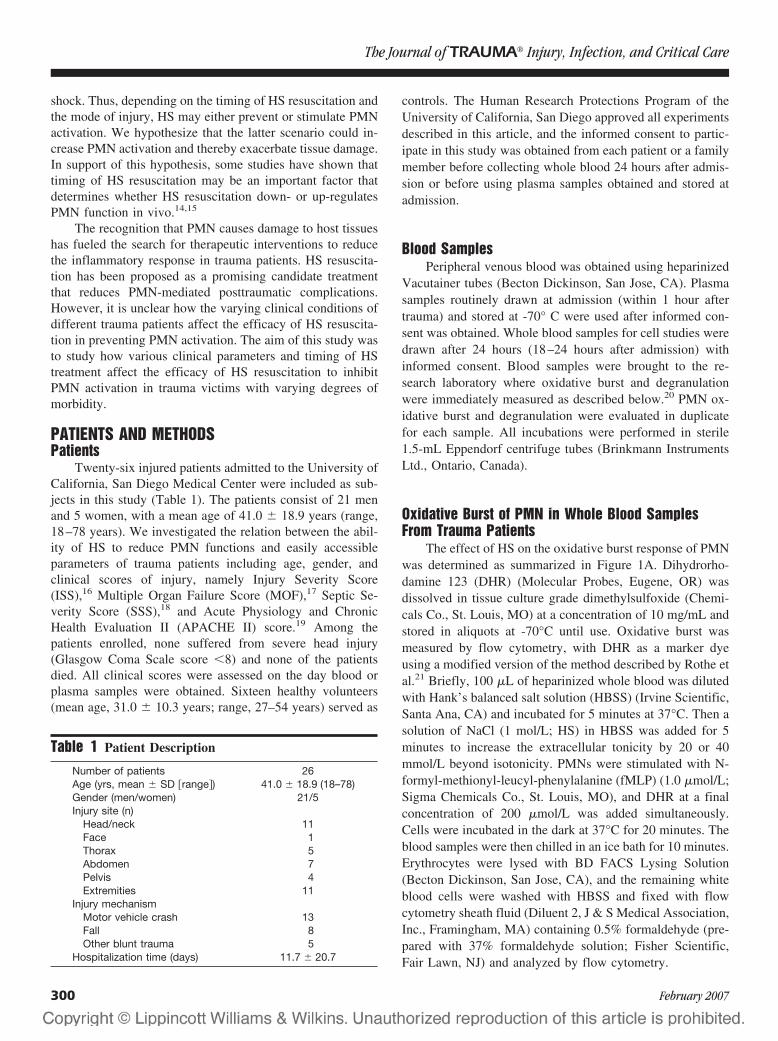
shock. Thus, depending on the timing of HS resuscitation andthe mode of injury, HS may either prevent or stimulate PMNactivation. We hypothesize that the latter scenario could in-crease PMN activation and thereby exacerbate tissue damage.In support of this hypothesis, some studies have shown thattiming of HS resuscitation may be an important factor thatdetermines whether HS resuscitation down- or up-regulatesPMN function in vivo.14,15
The recognition that PMN causes damage to host tissueshas fueled the search for therapeutic interventions to reducethe inflammatory response in trauma patients. HS resuscita-tion has been proposed as a promising candidate treatmentthat reduces PMN-mediated posttraumatic complications.However, it is unclear how the varying clinical conditions ofdifferent trauma patients affect the efficacy of HS resuscita-tion in preventing PMN activation. The aim of this study wasto study how various clinical parameters and timing of HStreatment affect the efficacy of HS resuscitation to inhibitPMN activation in trauma victims with varying degrees ofmorbidity.
PATIENTS AND METHODSPatients
Twenty-six injured patients admitted to the University ofCalifornia, San Diego Medical Center were included as sub-jects in this study (Table 1). The patients consist of 21 menand 5 women, with a mean age of 41.0 � 18.9 years (range,18–78 years). We investigated the relation between the abil-ity of HS to reduce PMN functions and easily accessibleparameters of trauma patients including age, gender, andclinical scores of injury, namely Injury Severity Score(ISS),16 Multiple Organ Failure Score (MOF),17 Septic Se-verity Score (SSS),18 and Acute Physiology and ChronicHealth Evaluation II (APACHE II) score.19 Among thepatients enrolled, none suffered from severe head injury(Glasgow Coma Scale score �8) and none of the patientsdied. All clinical scores were assessed on the day blood orplasma samples were obtained. Sixteen healthy volunteers(mean age, 31.0 � 10.3 years; range, 27–54 years) served as
controls. The Human Research Protections Program of theUniversity of California, San Diego approved all experimentsdescribed in this article, and the informed consent to partic-ipate in this study was obtained from each patient or a familymember before collecting whole blood 24 hours after admis-sion or before using plasma samples obtained and stored atadmission.
Blood SamplesPeripheral venous blood was obtained using heparinized
Vacutainer tubes (Becton Dickinson, San Jose, CA). Plasmasamples routinely drawn at admission (within 1 hour aftertrauma) and stored at -70° C were used after informed con-sent was obtained. Whole blood samples for cell studies weredrawn after 24 hours (18–24 hours after admission) withinformed consent. Blood samples were brought to the re-search laboratory where oxidative burst and degranulationwere immediately measured as described below.20 PMN ox-idative burst and degranulation were evaluated in duplicatefor each sample. All incubations were performed in sterile1.5-mL Eppendorf centrifuge tubes (Brinkmann InstrumentsLtd., Ontario, Canada).
Oxidative Burst of PMN in Whole Blood SamplesFrom Trauma Patients
The effect of HS on the oxidative burst response of PMNwas determined as summarized in Figure 1A. Dihydrorho-damine 123 (DHR) (Molecular Probes, Eugene, OR) wasdissolved in tissue culture grade dimethylsulfoxide (Chemi-cals Co., St. Louis, MO) at a concentration of 10 mg/mL andstored in aliquots at -70°C until use. Oxidative burst wasmeasured by flow cytometry, with DHR as a marker dyeusing a modified version of the method described by Rothe etal.21 Briefly, 100 �L of heparinized whole blood was dilutedwith Hank’s balanced salt solution (HBSS) (Irvine Scientific,Santa Ana, CA) and incubated for 5 minutes at 37°C. Then asolution of NaCl (1 mol/L; HS) in HBSS was added for 5minutes to increase the extracellular tonicity by 20 or 40mmol/L beyond isotonicity. PMNs were stimulated with N-formyl-methionyl-leucyl-phenylalanine (fMLP) (1.0 �mol/L;Sigma Chemicals Co., St. Louis, MO), and DHR at a finalconcentration of 200 �mol/L was added simultaneously.Cells were incubated in the dark at 37°C for 20 minutes. Theblood samples were then chilled in an ice bath for 10 minutes.Erythrocytes were lysed with BD FACS Lysing Solution(Becton Dickinson, San Jose, CA), and the remaining whiteblood cells were washed with HBSS and fixed with flowcytometry sheath fluid (Diluent 2, J & S Medical Association,Inc., Framingham, MA) containing 0.5% formaldehyde (pre-pared with 37% formaldehyde solution; Fisher Scientific,Fair Lawn, NJ) and analyzed by flow cytometry.
Table 1 Patient Description
Number of patients 26Age (yrs, mean � SD �range�) 41.0 � 18.9 (18–78)Gender (men/women) 21/5Injury site (n)
Head/neck 11Face 1Thorax 5Abdomen 7Pelvis 4Extremities 11
Injury mechanismMotor vehicle crash 13Fall 8Other blunt trauma 5
Hospitalization time (days) 11.7 � 20.7
The Journal of TRAUMA� Injury, Infection, and Critical Care
300 February 2007

Degranulation of PMN in Whole Blood Samples FromTrauma Patients
The effect of HS on PMN degranulation was assessed assummarized in Figure 1B. Monoclonal antibodies to CD66b(catalog # 555723) were obtained from Becton DickinsonPharmingen, and fluorescein isothiocyanate-conjugated goatanti-mouse antibodies (Fl-2020, lot# P0423) were obtainedfrom Vector Laboratories, Inc. (Burlingame, CA). All sec-ondary antibodies were diluted 1:10 with HBSS according tothe supplier’s recommendations. The CD66b antibody recog-nizes an epitope present on the membrane of specific gran-ules, which emerge on the cell surface during degranulationand exocytosis. Heparinized whole blood (100 �L) was di-
luted with HBSS, incubated for 5 minutes at 37°C, thentreated with HS for 5 minutes to increase the extracellulartonicity by 20 or 40 mmol/L beyond isotonicity and stimu-lated with 1.0 �mol/L fMLP for 10 minutes. Then, the sam-ples were placed on ice and 2.5 �g/mL CD66b antibody wasadded for 20 minutes, followed by 2.5 �g/mL fluoresceinisothiocyanate-conjugated secondary antibody. After another20 minutes’ incubation in the dark and on ice, erythrocyteswere lysed with lysis solution as described above and theremaining cells were washed with HBSS, fixed with sheathfluid containing 0.5% formaldehyde, and analyzed by flowcytometry.
Estimating Limitations of the Efficacy of HSIn this preliminary study, we attempted to define clinical
conditions that render HS ineffective or that could aggravatePMN responses in trauma patients. For that purpose, wedefined “cut-off points” that identify specific clinical condi-tions (expressed as APACHE II scores, ISS, MOF, and SSS)under which patients could either benefit from or be harmedby treatment with 20 mmol/L HS. These two groups ofpatients were separated based on their PMN responses to invitro HS treatment, and the estimated “cut-off points” weredefined using the Wilcoxon rank sum test to compare bothgroups.
Effect of Timing on Efficacy of HS TreatmentWe investigated the effect of HS on PMN functions by
simulating three different clinical conditions of cell stimula-tion as summarized in Figure 1C through E. Whole bloodsamples of healthy volunteers were treated with HS in theabsence or presence of fMLP; plasma samples drawn fromseverely injured trauma patients (ISS �10, MOF �0, SSS�1, or APACHE II �5) at admission to simulate PMNstimulation and priming, respectively. PMN oxidative burstand degranulation were measured by flow cytometry as de-scribed above.
Flow CytometryOxidative burst and degranulation were analyzed by flow
cytometry using a FACStar instrument (Becton Dickinson)equipped with a Coherent INNOVA 70-2, two-watt, argon-ion water-cooled laser tuned to 488 nm (Coherent Inc., SantaClara, CA) and interfaced to a Hewlett Packard 340 computerequipped with Consort 30 software (Becton Dickinson).Green fluorescence of DHR was measured with the FL1channel that was configured with a 525-nm band-pass emis-sion filter in combination with a 550-nm long-pass dichroicmirror. Instrument calibration was performed before everysession using chicken red blood cells (BioSure, Grass Valley,CA); CaliBRITE beads (Becton Dickinson) were used tocompensate for day-to-day instrument variations. PMN wereidentified on the basis of their forward scatter and side scatterproperties. The PMN were gated to exclude other cell types(lymphocytes, monocytes, erythrocytes, and platelets); de-
Fig. 1. Schematic depiction of the methods used to measure PMNoxidative burst and degranulation (A and B), and method used toassess the effect of timing on the ability of HS to suppress PMNoxidative burst (C–E). (A,B) After 5 minutes of preincubation, wholeblood from trauma patients was treated with HS for 5 minutes,stimulated with 1.0-�M fMLP for 20 minutes in the presence of DHRto measure oxidative burst or for 10 minutes to assess degranulationusing anti-CD66b antibodies. Oxidative burst and degranulationwere analyzed by flow cytometry as described in the text. (C–E)Trauma plasma obtained from severely injured trauma patients(ISS �10, MOF �0, SSS �1, and APACHE II �5 at admission toour hospital) was used to prime PMN in the whole blood of healthyvolunteers. After 5 minutes preincubation, whole blood of healthyvolunteers was stimulated with the plasma of trauma patients ob-tained at admission, treated with HS (20 or 40 mmol/L) and fMLP(1.0 �M) as shown, and oxidative burst was measured by flowcytometry using DHR as an intracellular probe.
Hypertonic Saline Resuscitation of Trauma Patients
Volume 62 • Number 2 301
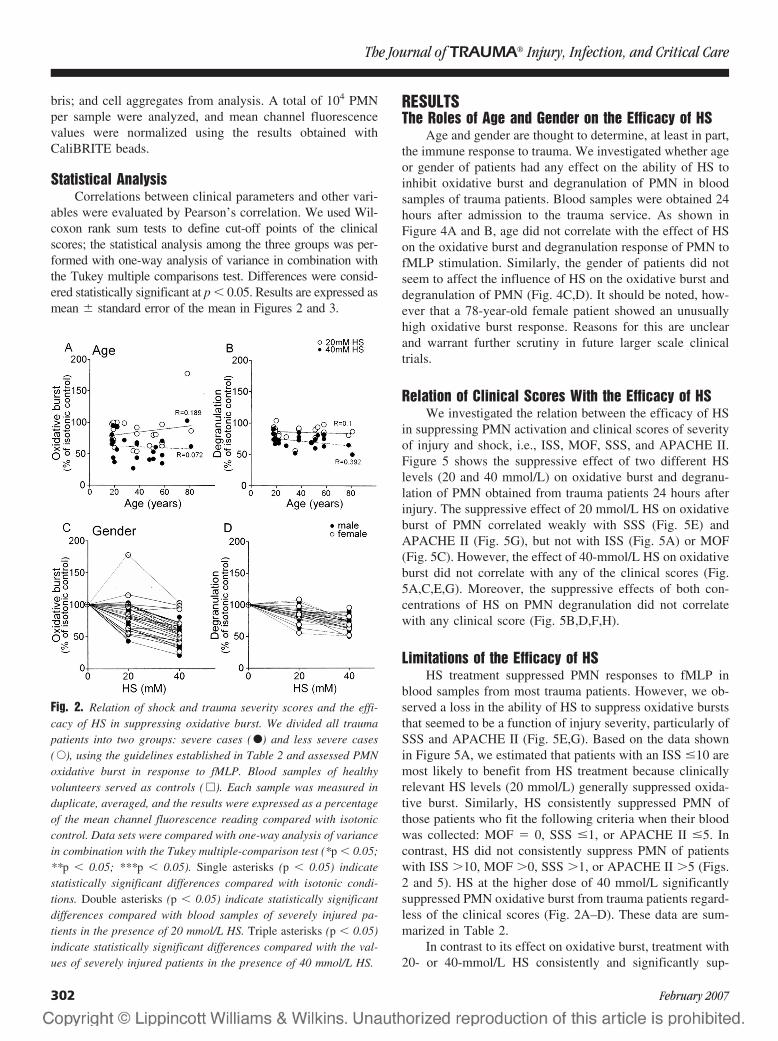
bris; and cell aggregates from analysis. A total of 104 PMNper sample were analyzed, and mean channel fluorescencevalues were normalized using the results obtained withCaliBRITE beads.
Statistical AnalysisCorrelations between clinical parameters and other vari-
ables were evaluated by Pearson’s correlation. We used Wil-coxon rank sum tests to define cut-off points of the clinicalscores; the statistical analysis among the three groups was per-formed with one-way analysis of variance in combination withthe Tukey multiple comparisons test. Differences were consid-ered statistically significant at p � 0.05. Results are expressed asmean � standard error of the mean in Figures 2 and 3.
RESULTSThe Roles of Age and Gender on the Efficacy of HS
Age and gender are thought to determine, at least in part,the immune response to trauma. We investigated whether ageor gender of patients had any effect on the ability of HS toinhibit oxidative burst and degranulation of PMN in bloodsamples of trauma patients. Blood samples were obtained 24hours after admission to the trauma service. As shown inFigure 4A and B, age did not correlate with the effect of HSon the oxidative burst and degranulation response of PMN tofMLP stimulation. Similarly, the gender of patients did notseem to affect the influence of HS on the oxidative burst anddegranulation of PMN (Fig. 4C,D). It should be noted, how-ever that a 78-year-old female patient showed an unusuallyhigh oxidative burst response. Reasons for this are unclearand warrant further scrutiny in future larger scale clinicaltrials.
Relation of Clinical Scores With the Efficacy of HSWe investigated the relation between the efficacy of HS
in suppressing PMN activation and clinical scores of severityof injury and shock, i.e., ISS, MOF, SSS, and APACHE II.Figure 5 shows the suppressive effect of two different HSlevels (20 and 40 mmol/L) on oxidative burst and degranu-lation of PMN obtained from trauma patients 24 hours afterinjury. The suppressive effect of 20 mmol/L HS on oxidativeburst of PMN correlated weakly with SSS (Fig. 5E) andAPACHE II (Fig. 5G), but not with ISS (Fig. 5A) or MOF(Fig. 5C). However, the effect of 40-mmol/L HS on oxidativeburst did not correlate with any of the clinical scores (Fig.5A,C,E,G). Moreover, the suppressive effects of both con-centrations of HS on PMN degranulation did not correlatewith any clinical score (Fig. 5B,D,F,H).
Limitations of the Efficacy of HSHS treatment suppressed PMN responses to fMLP in
blood samples from most trauma patients. However, we ob-served a loss in the ability of HS to suppress oxidative burststhat seemed to be a function of injury severity, particularly ofSSS and APACHE II (Fig. 5E,G). Based on the data shownin Figure 5A, we estimated that patients with an ISS �10 aremost likely to benefit from HS treatment because clinicallyrelevant HS levels (20 mmol/L) generally suppressed oxida-tive burst. Similarly, HS consistently suppressed PMN ofthose patients who fit the following criteria when their bloodwas collected: MOF � 0, SSS �1, or APACHE II �5. Incontrast, HS did not consistently suppress PMN of patientswith ISS �10, MOF �0, SSS �1, or APACHE II �5 (Figs.2 and 5). HS at the higher dose of 40 mmol/L significantlysuppressed PMN oxidative burst from trauma patients regard-less of the clinical scores (Fig. 2A–D). These data are sum-marized in Table 2.
In contrast to its effect on oxidative burst, treatment with20- or 40-mmol/L HS consistently and significantly sup-
Fig. 2. Relation of shock and trauma severity scores and the effi-cacy of HS in suppressing oxidative burst. We divided all traumapatients into two groups: severe cases ( F) and less severe cases( E), using the guidelines established in Table 2 and assessed PMNoxidative burst in response to fMLP. Blood samples of healthyvolunteers served as controls ( �). Each sample was measured induplicate, averaged, and the results were expressed as a percentageof the mean channel fluorescence reading compared with isotoniccontrol. Data sets were compared with one-way analysis of variancein combination with the Tukey multiple-comparison test (*p � 0.05;**p � 0.05; ***p � 0.05). Single asterisks (p � 0.05) indicatestatistically significant differences compared with isotonic condi-tions. Double asterisks (p � 0.05) indicate statistically significantdifferences compared with blood samples of severely injured pa-tients in the presence of 20 mmol/L HS. Triple asterisks (p � 0.05)indicate statistically significant differences compared with the val-ues of severely injured patients in the presence of 40 mmol/L HS.
The Journal of TRAUMA� Injury, Infection, and Critical Care
302 February 2007
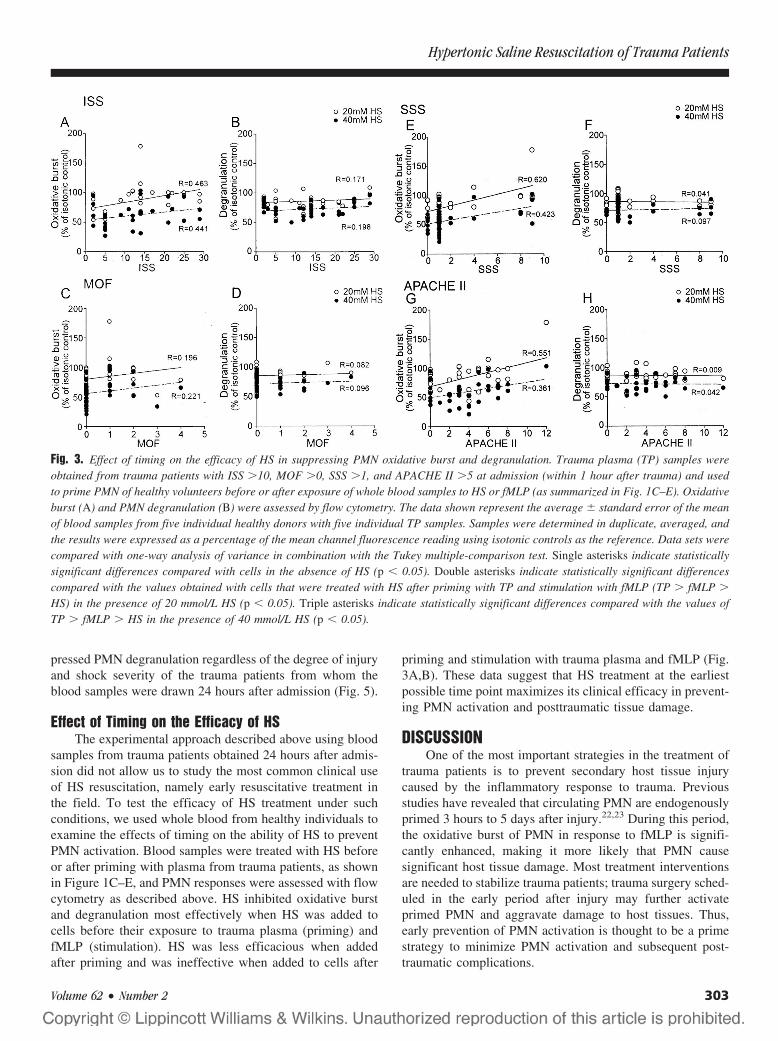
pressed PMN degranulation regardless of the degree of injuryand shock severity of the trauma patients from whom theblood samples were drawn 24 hours after admission (Fig. 5).
Effect of Timing on the Efficacy of HSThe experimental approach described above using blood
samples from trauma patients obtained 24 hours after admis-sion did not allow us to study the most common clinical useof HS resuscitation, namely early resuscitative treatment inthe field. To test the efficacy of HS treatment under suchconditions, we used whole blood from healthy individuals toexamine the effects of timing on the ability of HS to preventPMN activation. Blood samples were treated with HS beforeor after priming with plasma from trauma patients, as shownin Figure 1C–E, and PMN responses were assessed with flowcytometry as described above. HS inhibited oxidative burstand degranulation most effectively when HS was added tocells before their exposure to trauma plasma (priming) andfMLP (stimulation). HS was less efficacious when addedafter priming and was ineffective when added to cells after
priming and stimulation with trauma plasma and fMLP (Fig.3A,B). These data suggest that HS treatment at the earliestpossible time point maximizes its clinical efficacy in prevent-ing PMN activation and posttraumatic tissue damage.
DISCUSSIONOne of the most important strategies in the treatment of
trauma patients is to prevent secondary host tissue injurycaused by the inflammatory response to trauma. Previousstudies have revealed that circulating PMN are endogenouslyprimed 3 hours to 5 days after injury.22,23 During this period,the oxidative burst of PMN in response to fMLP is signifi-cantly enhanced, making it more likely that PMN causesignificant host tissue damage. Most treatment interventionsare needed to stabilize trauma patients; trauma surgery sched-uled in the early period after injury may further activateprimed PMN and aggravate damage to host tissues. Thus,early prevention of PMN activation is thought to be a primestrategy to minimize PMN activation and subsequent post-traumatic complications.
Fig. 3. Effect of timing on the efficacy of HS in suppressing PMN oxidative burst and degranulation. Trauma plasma (TP) samples wereobtained from trauma patients with ISS �10, MOF �0, SSS �1, and APACHE II �5 at admission (within 1 hour after trauma) and usedto prime PMN of healthy volunteers before or after exposure of whole blood samples to HS or fMLP (as summarized in Fig. 1C–E). Oxidativeburst (A) and PMN degranulation (B) were assessed by flow cytometry. The data shown represent the average � standard error of the meanof blood samples from five individual healthy donors with five individual TP samples. Samples were determined in duplicate, averaged, andthe results were expressed as a percentage of the mean channel fluorescence reading using isotonic controls as the reference. Data sets werecompared with one-way analysis of variance in combination with the Tukey multiple-comparison test. Single asterisks indicate statisticallysignificant differences compared with cells in the absence of HS (p � 0.05). Double asterisks indicate statistically significant differencescompared with the values obtained with cells that were treated with HS after priming with TP and stimulation with fMLP (TP � fMLP �
HS) in the presence of 20 mmol/L HS (p � 0.05). Triple asterisks indicate statistically significant differences compared with the values ofTP � fMLP � HS in the presence of 40 mmol/L HS (p � 0.05).
Hypertonic Saline Resuscitation of Trauma Patients
Volume 62 • Number 2 303
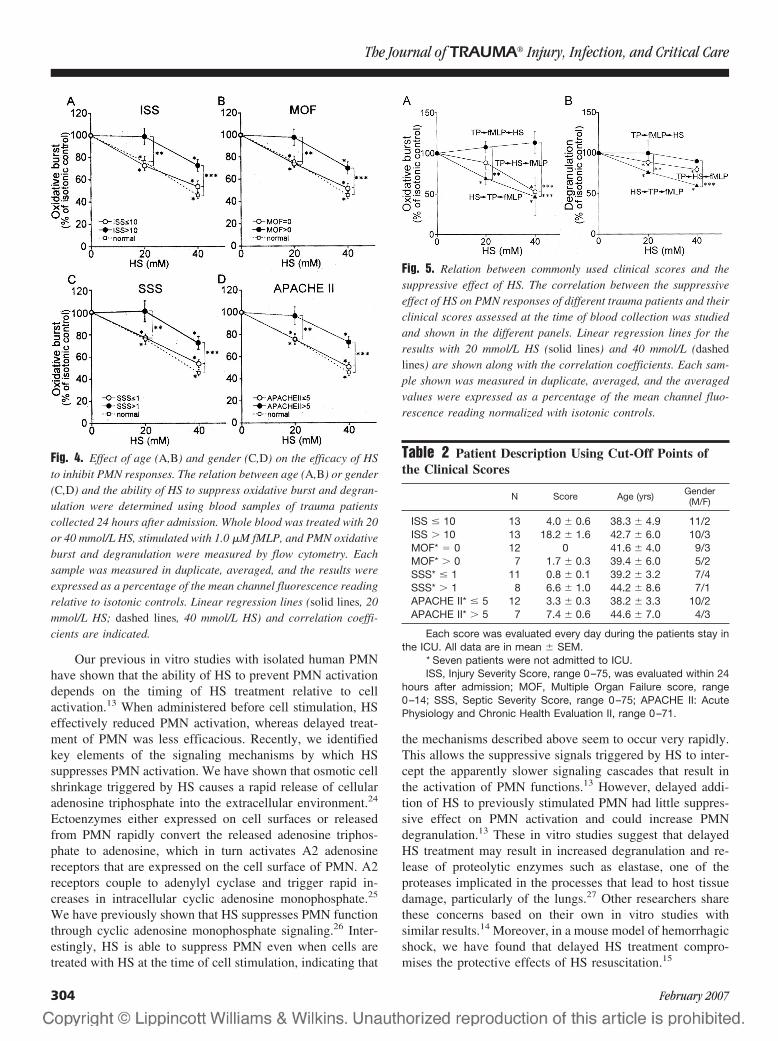
Our previous in vitro studies with isolated human PMNhave shown that the ability of HS to prevent PMN activationdepends on the timing of HS treatment relative to cellactivation.13 When administered before cell stimulation, HSeffectively reduced PMN activation, whereas delayed treat-ment of PMN was less efficacious. Recently, we identifiedkey elements of the signaling mechanisms by which HSsuppresses PMN activation. We have shown that osmotic cellshrinkage triggered by HS causes a rapid release of cellularadenosine triphosphate into the extracellular environment.24
Ectoenzymes either expressed on cell surfaces or releasedfrom PMN rapidly convert the released adenosine triphos-phate to adenosine, which in turn activates A2 adenosinereceptors that are expressed on the cell surface of PMN. A2receptors couple to adenylyl cyclase and trigger rapid in-creases in intracellular cyclic adenosine monophosphate.25
We have previously shown that HS suppresses PMN functionthrough cyclic adenosine monophosphate signaling.26 Inter-estingly, HS is able to suppress PMN even when cells aretreated with HS at the time of cell stimulation, indicating that
the mechanisms described above seem to occur very rapidly.This allows the suppressive signals triggered by HS to inter-cept the apparently slower signaling cascades that result inthe activation of PMN functions.13 However, delayed addi-tion of HS to previously stimulated PMN had little suppres-sive effect on PMN activation and could increase PMNdegranulation.13 These in vitro studies suggest that delayedHS treatment may result in increased degranulation and re-lease of proteolytic enzymes such as elastase, one of theproteases implicated in the processes that lead to host tissuedamage, particularly of the lungs.27 Other researchers sharethese concerns based on their own in vitro studies withsimilar results.14 Moreover, in a mouse model of hemorrhagicshock, we have found that delayed HS treatment compro-mises the protective effects of HS resuscitation.15
Fig. 5. Relation between commonly used clinical scores and thesuppressive effect of HS. The correlation between the suppressiveeffect of HS on PMN responses of different trauma patients and theirclinical scores assessed at the time of blood collection was studiedand shown in the different panels. Linear regression lines for theresults with 20 mmol/L HS (solid lines) and 40 mmol/L (dashedlines) are shown along with the correlation coefficients. Each sam-ple shown was measured in duplicate, averaged, and the averagedvalues were expressed as a percentage of the mean channel fluo-rescence reading normalized with isotonic controls.
Table 2 Patient Description Using Cut-Off Points ofthe Clinical Scores
N Score Age (yrs) Gender(M/F)
ISS � 10 13 4.0 � 0.6 38.3 � 4.9 11/2ISS � 10 13 18.2 � 1.6 42.7 � 6.0 10/3MOF* � 0 12 0 41.6 � 4.0 9/3MOF* � 0 7 1.7 � 0.3 39.4 � 6.0 5/2SSS* � 1 11 0.8 � 0.1 39.2 � 3.2 7/4SSS* � 1 8 6.6 � 1.0 44.2 � 8.6 7/1APACHE II* � 5 12 3.3 � 0.3 38.2 � 3.3 10/2APACHE II* � 5 7 7.4 � 0.6 44.6 � 7.0 4/3
Each score was evaluated every day during the patients stay inthe ICU. All data are in mean � SEM.
* Seven patients were not admitted to ICU.ISS, Injury Severity Score, range 0–75, was evaluated within 24
hours after admission; MOF, Multiple Organ Failure score, range0–14; SSS, Septic Severity Score, range 0–75; APACHE II: AcutePhysiology and Chronic Health Evaluation II, range 0–71.
Fig. 4. Effect of age (A,B) and gender (C,D) on the efficacy of HSto inhibit PMN responses. The relation between age (A,B) or gender(C,D) and the ability of HS to suppress oxidative burst and degran-ulation were determined using blood samples of trauma patientscollected 24 hours after admission. Whole blood was treated with 20or 40 mmol/L HS, stimulated with 1.0 �M fMLP, and PMN oxidativeburst and degranulation were measured by flow cytometry. Eachsample was measured in duplicate, averaged, and the results wereexpressed as a percentage of the mean channel fluorescence readingrelative to isotonic controls. Linear regression lines (solid lines, 20mmol/L HS; dashed lines, 40 mmol/L HS) and correlation coeffi-cients are indicated.
The Journal of TRAUMA� Injury, Infection, and Critical Care
304 February 2007
Taken together, these data suggest that the activationstatus of PMN in trauma victims may determine whether HStreatment can effectively prevent or possibly aggravate tissuedamage. Unfortunately, there are no diagnostic tools avail-able that would allow trauma care providers to assess the stateof inflammation of trauma patients before resuscitative inter-ventions. The goal of the current study was to define clinicaland temporal conditions under which HS treatment mosteffectively prevents PMN activation and to explore possibleclinical situation in which HS treatment could potentiallyaggravate PMN-mediated tissue damage. For that purpose,we studied the relationships between readily accessible clin-ical parameters that could affect PMN responses and theefficacy of HS in suppressing PMN activation.
Using ex vivo experiments with whole blood samplesfrom trauma patients, we found that age and gender did notseem to affect the ability of HS treatment to suppress PMNactivation. However, we observed considerable differences inthe response of PMN to HS treatment in individual patients.In most cases, HS was able to suppress the oxidative burstand degranulation of PMN to fMLP stimulation. In somecases, however, HS treatment was ineffective or increasedPMN responses. We examined if the ability of HS to inhibitPMN might be related to the mode of injury or to the severityof injury or shock. We found that the suppressive potential ofa low concentration of HS appeared to correlate weakly withSSS and APACHE II. Moreover, a very weak correlation mayalso exist with ISS (Fig. 3). Higher HS concentrations (40mmol/L) effectively suppressed PMN responses regardless ofthe degree of injury or shock severity. However, in contrast to20 mmol/L HS, such hypertonicity levels are unlikely toprevail for prolonged periods in the plasma of trauma victims.
Using the findings shown in Figure 2, we divided ourpatient cohort into two groups, one that was likely to benefitfrom HS treatment because of its suppressive effect on PMNresponse, and another group in whom HS treatment was lessbeneficial, where 20 mmol/L HS did not consistently sup-press PMN responses in a reliable and consistent fashion.Using these criteria, we estimated that HS treatment is mosteffective in patients with ISS �10, MOF � 0, SSS �1, orAPACHE II score �5. Although many trauma patients fall inthis group, a large number of very severely injured patientsdo not. In the latter group of patients, PMN priming or partialactivation as a consequence of severe injury may render PMNless susceptible to subsequent inhibition by HS treatment.These data suggest that HS resuscitation may be more potentin suppressing moderately activated PMN (i.e., PMN of lessseverely injured patients) compared with PMN of patientswith severe injuries in which cells are more strongly andrepeatedly activated by multiple mediators released duringthe first 24 hours after injury. This conclusion is consistentwith previous in vitro studies that have shown that the sup-pressive effect of HS on PMN function is decreased withincreasing concentrations of fMLP used to stimulate PMN.13
In the current study, HS was added to blood samplesfrom trauma patients obtained only 24 hours after admissionto the hospital. The findings of this study show that suchdelayed HS treatment of severely injured patients may berisky because HS treatment could enhance PMN responses inextreme cases. However, our data suggest that such riskscould be reduced by administering HS as early as possible orby increasing the hypertonicity level introduced in the circu-lation of trauma patients by altering HS resuscitation proto-cols. The dose of hypertonic fluid, its concentration, and therate of infusion all define the resulting peak hypertonicitylevel and duration that is achieved in the circulation of traumapatients. Thus, these parameters could be modified, withinlimits, to optimize the efficacy of HS in trauma patients.
The use of blood samples drawn from trauma patients forin vitro studies with HS limits our ability to examine thequestion of timing as a determining factor for the efficacy ofHS to prevent PMN activation. Thus, to examine if earliertreatment with HS could improve the efficacy of HS, we usedPMN from healthy volunteers. These cells were exposed toplasma samples from trauma patients before or after treat-ment with HS. We found that 20 mmol/L HS inhibited PMNactivation most effectively when HS was added before thecells were primed with trauma plasma. The effectiveness ofHS diminished when it was used after priming, and HS wasunable to suppress cells when it was added after priming andstimulation with plasma from trauma patients and fMLP,respectively (Fig. 3). These data suggest that early HS treat-ment of patients, ideally immediately in the field, may bemost suitable to inhibit PMN activation, particularly in se-verely injured patients.
It is unclear what mediators in the plasma of traumapatients are responsible for PMN priming and under whatcircumstances PMN activation occurs in trauma patients.Among the priming agents, platelet-activating factor seems toplay a key role.28 Thus, monitoring plasma concentrations ofplatelet-activating factor and similar mediators could be usedin the future to provide individualized fluid intervention todiminish inflammation and prevent tissue damage in differenttrauma patients.
In summary, we found that early treatment with HS appearsto be most effective in inhibiting PMN activation. Later treat-ment, i.e., after admission to the hospital, seems to diminish theefficacy of HS. Under the latter circumstances, the efficacy ofHS treatment seemed to further decrease with increasing degreesof injury severity and shock. Based on our studies, we attemptedto establish crude guidelines to identify populations that wouldbenefit most from HS treatment. However, the fairly smallnumber of patients enrolled in this preliminary study did notallow us to define robust criteria. Future clinical trials withtrauma patients who are resuscitated with HS in the prehospitalsetting are required to fully characterize the efficacy of HS inpreventing PMN activation and tissue damage after trauma. Weare currently planning such additional studies in a large, multi-center trial that is scheduled to commence within a year.
Hypertonic Saline Resuscitation of Trauma Patients
Volume 62 • Number 2 305
REFERENCES1. Velasco IT, Pontieri V, Rocha-e-Silva M, Lopes OU. Hyperosmotic
NaCl and severe hemorrhagic shock. Am J Physiol. 1980;239:H664–H673.
2. Shukla A, Hashiguchi N, Chen Y, Coimbra R, Hoyt DB, JungerWG. Osmotic regulation of cell function and possible clinicalapplications. Shock. 2004;21:391–400.
3. Ogino R. Effects of hypertonic saline and dextran 70 on cardiacdiastolic function after hemorrhagic shock. J Surg Res. 2002;107:27–36.
4. Matsuoka T, Wisner DH. Resuscitation of uncontrolled liverhemorrhage: effects on bleeding, oxygen delivery, and oxygenconsumption. J Trauma. 1996;41:439–445.
5. Walsh JC, Kramer GC. Resuscitation of hypovolemic sheep withhypertonic saline/dextran: the role of dextran. Circ Shock. 1991;34:336–342.
6. Mazzoni MC, Borgstrom P, Intagliette M, Arfors KE. Capillarynarrowing in hemorrhagic shock is rectified by hyperosmoticsaline-dextran reperfusion. Circ Shock. 1990;31:407–418.
7. Junger WG, Liu FC, Loomis WH, Hoyt DB. Hypertonic salineenhances cellular immune function. Circ Shock. 1994;42:190–196.
8. Coimbra R, Hoyt DB, Junger WG, et al. Hypertonic salineresuscitation decreases susceptibility to sepsis followinghemorrhagic shock. J Trauma. 1997;42:602–607.
9. Rizoli SB, Kapus A, Fan J, Li YH, Marshall JC, Rotstein OD.Immunomodulatory effects of hypertonic resuscitation on thedevelopment of lung inflammation following hemorrhagic shock.J Immunol. 1998;161:6288–6296.
10. Coimbra R, Junger WG, Hoyt DB, Liu FC, Loomis WH, Evers MF.Hypertonic saline resuscitation restores hemorrhage-inducedimmunosuppression by decreasing prostaglandin E2 andinterleukin-4 production. J Surg Res. 1996;64:203–209.
11. Angle N, Hoyt DB, Coimbra R, et al. Hypertonic salineresuscitation diminishes lung injury by suppressing neutrophilactivation following hemorrhagic shock. Shock. 1998;9:164–170.
12. Gurfinkel V, Poggetti RS, Fontes B, Novo FCF, Birolini D.Hypertonic saline improves tissue oxygenation and reducessystemic and pulmonary inflammatory response caused byhemorrhagic shock. J Trauma. 2003;54:1137–1145.
13. Junger WG, Hoyt DB, Davis RE, et al. Hypertonicity regulates thefunction of human neutrophils by modulating chemoattractantreceptor signaling and activating mitogen-activated protein kinasep38. J Clin Invest. 1998;101:2768–2779.
14. Ciesla DJ, Moore EE, Zallen G, Biffl WL, Silliman CC. Hypertonicsaline attenuation of polymorphonuclear neutrophil cytotoxicity:timing is everything. J Trauma. 2000;48:388–395.
15. Murao Y, Hoyt DB, Loomis W, et al. Does the timing of hypertonicsaline resuscitation affect its potential to prevent lung damage?Shock. 2000;14:18–23.
16. Baker SP, O’Neill B, Haddon W Jr, Long WB. The injury severityscore: a method for describing patients with multiple injuries andevaluating emergency care. J Trauma. 1974;14:187–96.
17. Goris RJ, te Boekhorst TP, Nuytinck JK, Gimbrere JS. Multiple-organ failure. Generalized autodestructive inflammation? Arch Surg.1985;120:1109–1115.
18. Skau T, Nystrom PO, Carlsson C. Severity of illness in intra-abdominal infection. A comparison of two indexes. Arch Surg. 1985;120:152–158.
19. Knaus WA, Draper EA, Wagner DP, Zimmerman JE. APACHE II:a severity of disease classification system. Crit Care Med. 1985;13:818–829.
20. Hashiguchi N, Chen Y, Rusu C, Hoyt DB, Junger WG. Wholeblood assay to measure oxidative burst and degranulation ofneutrophils for monitoring trauma patients. Eur J Trauma. 2005;4:379–388.
21. Rothe G, Oser A, Valet G. [Dihydrorhodamine 123: a new flowcytometric indicator for respiratory burst activity in neutrophilgranulocytes.] Naturwissenschaften. 1988;75:354–355.
22. Botha AJ, Moore FA, Moore EE, et al. Postinjury neutrophilpriming and activation states: an early vulnerable window. Surgery.1995;118:358–365.
23. Ogura H, Tanaka H, Koh T, et al. Priming, second-hit, andapoptosis in leukocytes from trauma patients. J Trauma. 1999;46:774–783.
24. Chen Y, Shukla A, Namiki S, Insel PA, Junger WG. A putativeosmoreceptor system that controls neutrophil function through therelease of ATP, its conversion to adenosine, and activation of A2adenosine and P2 receptors. J Leukoc Biol. 2004;76:245–253.
25. Fredholm BB, IJzerman AP, Jacobson KA, Klotz KN, LindenJ. International Union of Pharmacology. XXV. Nomenclature andclassification of adenosine receptors. Pharmacol Rev. 2001;53:527–552.
26. Orlic T, Loomis WH, Shreve A, Namiki S, Junger WG.Hypertonicity increases cAMP in PMN and blocks oxidative burstby PKA-dependent and -independent mechanisms. Am J PhysiolCell Physiol. 2002;282:C1261–269.
27. Weiss SJ. Tissue destruction by neutrophils. N Engl J Med. 1989;320:365–376.
28. Botha AJ, Moore FA, Moore EE, Peterson VM, Silliman CC, GoodeAW. Sequential systemic platelet-activating factor and interleukin 8primes neutrophils in patients with trauma at risk of multiple organfailure. Br J Surg. 1996;83:1407–1412.
The Journal of TRAUMA� Injury, Infection, and Critical Care
306 February 2007

Damage Control Resuscitation: Directly Addressing the EarlyCoagulopathy of TraumaJohn B. Holcomb, MD, FACS, Don Jenkins, MD, FACS, Peter Rhee, MD, FACS, Jay Johannigman, MD, FS, FACS,Peter Mahoney, FRCA, RAMC, Sumeru Mehta, MD, E. Darrin Cox, MD, FACS, Michael J. Gehrke, MD,Greg J. Beilman, MD, FACS, Martin Schreiber, MD, FACS, Stephen F. Flaherty, MD, FACS,Kurt W. Grathwohl, MD, Phillip C. Spinella, MD, Jeremy G. Perkins, MD, Alec C. Beekley, MD, FACS,Neil R. McMullin, MD, Myung S. Park, MD, FACS, Ernest A. Gonzalez, MD, FACS, Charles E. Wade, PhD,Michael A. Dubick, PhD, C. William Schwab, MD, FACS, Fred A. Moore, MD, FACS, Howard R. Champion, FRCS,David B. Hoyt, MD, FACS, and John R. Hess, MD, MPH, FACP
J Trauma. 2007;62:307–310.
Rapid progress in trauma care occurs when the results oftranslational research are promptly integrated into clin-ical practice. Experience with a high volume of se-
verely injured casualties expedites the process.1 Historically,these conditions have converged during times of conflict,improving the care of combat casualties and subsequentlythat of civilian trauma patients.1,2
In the most severely injured casualties, we know thatwhen the lethal triad of hypothermia, acidosis, and coagu-lopathy are present, death is imminent.3 Current teaching is toavoid reaching these conditions by using “damage controlsurgery.”4–6 However, conventional resuscitation practice fordamage control focuses on rapid reversal of acidosis andprevention of hypothermia, and surgical techniques focus oncontrolling hemorrhage and contamination. Direct treatmentof coagulopathy has been relatively neglected, viewed as abyproduct of resuscitation, hemodilution, and hypothermia,and delayed by blood banking logistics. Damage controlresuscitation addresses the entire lethal triad immediatelyupon admission to a combat hospital.7,8
By demonstrating that in the severely injured the coagu-lopathy of trauma is present at admission, recent studies have
brought back to light the importance of treating this disorderat an earlier stage.9–12 Reports of lactated Ringer’s solutionand normal saline increasing reperfusion injury and leukocyteadhesion lead one to conclude that the standard crystalloid-based resuscitation guidelines in prehospital trauma life sup-port (PHTLS) and advanced trauma life support (ATLS) mayworsen the presenting acidosis and coagulopathy in severelyinjured trauma patients, and possibly increase ARDS, SIRS,and MOF.13–17 The safety of withholding PRBCs in hemo-dynamically stable patients has been demonstrated,18 and therisks associated with blood transfusion are well described.19,20
Further, massive transfusion in military and civilian casual-ties has been associated with an increased risk of death.21–23
Taken together, these observations suggest that the mostseverely injured may need a resuscitative approach tailoredspecifically to their needs. However, even in the largestcivilian academic trauma centers, patients with injuries at theouter limits of survivability, such as those massively trans-fused with more than 10 units of RBCs in the first 24 hours,are uncommon and constitute only 1% to 2% of the patientpopulation, making it difficult to develop and test new resus-citation concepts.21 Because 7% of combat casualties requiremassive transfusion, we have had just such an opportunity toobserve the effects of new resuscitation strategies in thecombat hospitals of Iraq and Afghanistan.
The military munitions used in Southwest Asia can in-flict severe multisystem injuries on both combatants andcivilians. These patients frequently present to American mil-itary medical personnel shortly after being wounded. Unlikecivilian systems, where treatment of coagulopathy is often lim-ited by standard blood bank logistics, in Iraq we frequently haveimmediate access to PRBCs and thawed AB or A plasma, andrapid access to apheresis platelets, prepooled cryoprecipitate,fresh whole blood, and rFVIIa, as indicated.24–29 Thus, theopportunity to formally evaluate the immediate and directtreatment of the coagulopathy of trauma is available.
Submitted for publication September 22, 2006.Accepted for publication December 20, 2006.Copyright © 2007 by Lippincott Williams & Wilkins, Inc.From the USAISR (J.B.H.), Fort Sam Houston, TX; CENTCOM
Trauma (D.J.), Camp Victory, Iraq; Navy Trauma Training Center (P.R.), LosAngeles, CA; 332nd Expeditionary Medical Group (J.J.), Balad Air Base, Iraq;ADMEM RCDM (P.M.), Birmingham, United Kingdom; Emergency Depart-ment (S.M.), 10th Combat Support Hospital, Baghdad, Iraq; Department ofSurgery (E.D.C.), 10th Combat Support Hospital, Baghdad, Iraq; Chief ofAnesthesia (M.J.G.), 10th Combat Support Hospital, Baghdad, Iraq.
Address for reprints: COL John B. Holcomb, MD, FACS, TraumaConsultant for the Surgeon General, Commander, US Army Institute ofSurgical Research, 3400 Rawley E. Chambers Avenue, Fort Sam Houston,TX 78234-6315; email: [email protected].
DOI: 10.1097/TA.0b013e3180324124
Special Commentary The Journal of TRAUMA� Injury, Infection, and Critical Care
Volume 62 • Number 2 307

The trauma patients who are most severely injured (ap-proximately 10%) also represent the majority of in-hospitaltrauma deaths. Considerable attention has been directed to-ward the technical details of damage control surgery andreversing the acidosis and hypothermia present at admission.Less attention has been directed toward reversing the coagu-lopathy related to blood loss that is present at the same time.Clinical experience in Operation Iraqi Freedom and Opera-tion Enduring Freedom suggests that coagulopathy may bepresent at the time of admission before significant resuscita-tive fluid has been given, as a consequence of acidosis-induced coagulation factor dysfunction, coagulation factorconsumption, and hypothermia-induced failure of platelet ac-tivation. Failure to recognize and immediately address thecoagulopathy found in severely injured patients can be linkedto several factors. Most studies of trauma-induced coagulopa-thy have measured the laboratory changes that happen in theOR or ICU after dilution with crystalloid and PRBCs, andhave concluded that the coagulopathy could be fully ex-plained by the resuscitation and/or hypothermia.30
The goal of shock resuscitation efforts in the past hasbeen largely to support blood pressure and urine output and toreverse the metabolic derangements associated with the isch-emia associated with acute blood loss.31,32 Although thesegoals are obviously important, the studies supporting thisconcept were based on controlled animal hemorrhage studies,and the results were not evaluated in randomized humantrials.33–35 Additionally, the potential benefits of mitigatingischemia-induced reperfusion injury after standard crystalloidresuscitation were not fully recognized.14,36 Furthermore, re-cent resuscitation studies have overlooked the importance ofan integrated and coherent prehospital, ED, OR, and ICUshock resuscitation plan that incorporates intravascular treat-ment of coagulopathy.32,37 Finally, the current generation ofclinicians has been taught to not use plasma as a resuscitationfluid.38 We agree that current standard resuscitation methodsare appropriate policy for the approximately 90% of traumapatients who are not in shock and are hypercoagulable afterinjury.39–42 However, for the approximately 10% of casual-ties who constitute the most seriously injured, are in shockand coagulopathic, and represent the potentially preventablehemorrhagic deaths, liquid plasma may be the optimal resus-citation fluid currently available.43–50
Based on (1) previous civilian clinical studies, (2) therecommendations of an international consensus conferenceon early massive transfusion for trauma,51 and (3) consider-able experience in the current war, we think patients at highrisk for coagulopathy can be readily identified at admissionand prompt simultaneous treatment of hypothermia, acidosis,and coagulopathy initiated. Hypothermia, an independent fac-tor for increased mortality in trauma patients, was an earlierfocus for active prevention and treatment,52–54 but applicationof training and equipment recommendations of the Commit-tee on Tactical Combat Casualty Care and the Joint TheaterTrauma System has made it an uncommon finding.55 Acido-
sis significantly impairs the thrombin generation rates, criti-cal to optimal coagulation function56 and is thus aggressivelymanaged by use of THAM and volume loading with bloodcomponents once hemostasis is obtained, with restoration ofa normal blood lactate, base deficit, or pH as the ultimategoal. Damage control resuscitation as a structured interven-tion begins immediately after rapid initial assessment in theED and progresses through the OR into the ICU. All effortsare directed toward this goal by repeated point of care testingand the use of multiple blood products and drugs readilyavailable in theater, albeit in new ratios and amounts. Com-pared with civilian practice, damage control resuscitationefforts are largely completed in the OR, with little resuscita-tion required in the ICU. Achieving this goal quickly in theOR may allow a shift from limited damage control surgery toearlier definitive surgical interventions, including sophisti-cated limb salvage techniques, and improved outcomes.
In the severely injured casualty, damage control resusci-tation consists of two parts and is initiated within minutes ofarrival in the ED. First, resuscitation is limited to keep bloodpressure at approximately 90 mm Hg, preventing renewedbleeding from recently clotted vessels.15,17,39,57–62 Second,intravascular volume restoration is accomplished by usingthawed plasma as a primary resuscitation fluid in at least a 1:1or 1:2 ratio with PRBCs.8,10,48–50 Our initial clinical experi-ence shows these ratios decrease mortality in similarly in-jured casualties (Borgman MA, et al. unpublished data).Recombinant FVIIa is occasionally used along with the earlyunits of red cells and as required throughout the resuscitation.For casualties who will require continued resuscitation, theblood bank is notified to activate the massive transfusionprotocol and deliver to the operating room 6 units of plasma,6 units of PRBCs, 6 packs of platelets, and 10 units ofcryoprecipitate stored in individual coolers.50 The most se-verely injured of this group also receive fresh warm wholeblood as a resuscitative fluid.47,63 Additional coolers, con-taining the same mix of blood products, are provided asneeded until the massive transfusion order is cancelled. Crys-talloid use is minimized and serves mainly as a drug carrierand to keep lines open between the units of blood products.
In combat casualties requiring major resuscitation(10–40 units of blood products), we have found as little as5 L to 8 L of crystalloid are utilized during the first 24 hours,representing a decrease of at least 50% when compared withcurrent standard resuscitation practices. Using the damagecontrol resuscitation approach, the lack of intraoperative co-agulopathic bleeding has been remarkable, allowing surgeonsto focus on surgical bleeding. Patients treated in this fashionalmost always arrive in the ICU warm, euvolemic, and non-acidotic, with a normal INR and minimal edema. In themajority of patients the abnormalities of the lethal triad areabsent. These patients appear to be easily ventilated and morequickly extubated than patients with similar blood loss treatedwith the standard crystalloid resuscitation volumes and bloodcomponent ratios. These admittedly anecdotal yet compelling
The Journal of TRAUMA� Injury, Infection, and Critical Care
308 February 2007

observations cause us to question further the use of excessivecrystalloid resuscitation and to begin to formulate hypothesesthat can be tested to demonstrate beneficial effects of pre-emptive control of coagulopathy.14
For the first time in US warfare, data for all admittedtrauma casualties in the current conflict in Southwest Asia areentered into a joint theater trauma registry (JTTR).64 A de-ployed combat research team is being sent into theater for thefirst time since Vietnam, operating under the same standardsof IRB approval as practiced in the United States. Datacollected by this team, along with outcome data from theJTTR, will allow an analysis of the effects of resuscitationwith thawed plasma, fresh whole blood, administration ofrFVIIa, and limited crystalloid. Additionally, focused effortwill be required to describe the mechanisms causing the earlycoagulopathy of trauma present at admission. The clinicaleffects and consequences of damage control resuscitation willbe measurable in patient outcomes. We will know if we aresaving more severely injured soldiers, if reducing coagulopa-thy and edema leads to better outcomes, and, ultimately,whether we are creating more blood exposure or less. We willsoon have sufficient data to assess the full benefits of damagecontrol resuscitation in the population of critically injured forwhom it matters most. As in the past, perceptive observation,thoughtful discussion, and insightful analysis concerningmedical care during war from experienced military medics,surgeons, and scientists, in concert with our civilian col-leagues, will generate recommendations for new and im-proved medical practice, with continuous modification asfurther experience, research, and development produce newand relevant information.1,2
REFERENCES1. DeBakey ME. The torch that illuminates: lessons from military
medicine. Mil Med. 1996;161:711–716.2. Pruitt BA Jr. Combat casualty care and surgical progress. Ann Surg.
2006;243:715–729.3. Moore EE, Thomas G. Orr Memorial Lecture. Staged laparotomy for
the hypothermia, acidosis, and coagulopathy syndrome. Am J Surg.1996;172:405–410.
4. Rotondo MF, Zonies DH. The damage control sequence andunderlying logic. Surg Clin North Am. 1997;77:761–777.
5. Schwab CW. Introduction: damage control at the start of 21stcentury. Injury. 2004;35:639–641.
6. Holcomb JB, Helling TS, Hirshberg A. Military, civilian, and ruralapplication of the damage control philosophy. Mil Med. 2001;168:490–493.
7. Hess JR, Holcomb JB, Hoyt DB. Damage control resuscitation: theneed for specific blood products to treat the coagulopathy of trauma.Transfusion. 2006;46:685–686.
8. McMullin NR, Holcomb JB, Sondeen JL. Hemostatic resuscitation. InVincent JL (ed.): Yearbook of Intensive Care and Emergency Medicine2006. Berlin Heidelberg: Springer-Verlag; 2006: pp 265–278.
9. Brohi K, Singh J, Heron M, Coats T. Acute traumatic coagulopathy.J Trauma. 2003;54:1127–1130.
10. Hirshberg A, Dugas M, Banez EI, Scott BG, Wall MJ Jr, MattoxKL. Minimizing dilutional coagulopathy in exsanguinatinghemorrhage: a computer simulation. J Trauma. 2003;54:454–463.
11. MacLeod JB, Lynn M, McKenney MG, Cohn SM, Murtha M. Earlycoagulopathy predicts mortality in trauma. J Trauma. 2003;55:39–44.
12. Faringer PD, Mullins RJ, Johnson RL, Trunkey DD. Bloodcomponent supplementation during massive transfusion of AS-1 redcells in trauma patients. J Trauma. 1993;34:481–487.
13. Coimbra R, Hoyt DB, Junger WG, et al. Hypertonic salineresuscitation decreases susceptibility to sepsis after hemorrhagicshock. J Trauma. 1997;42:602–606; discussion 606–607.
14. Cotton BA, Guy JS, Morris JA Jr, Abumrad NN. The cellular,metabolic, and systemic consequences of aggressive fluidresuscitation strategies. Shock. 2006;26:115–121.
15. Rhee P, Wang D, Ruff P, et al. Human neutrophil activation andincreased adhesion by various resuscitation fluids. Crit Care Med.2000;28:74–78.
16. Ayuste EC, Chen H, Koustova E, et al. Hepatic and pulmonaryapoptosis after hemorrhagic shock in swine can be reduced throughmodifications of conventional Ringer’s solution. J Trauma. 2006;60:52–63.
17. Rhee P, Koustova E, Alam HB. Searching for the optimal resuscitationmethod: recommendations for the initial fluid resuscitation of combatcasualties. J Trauma. 2003;54(Suppl):S52–S62.
18. Hebert PC, Wells G, Blajchman MA, et al. A multicenter,randomized, controlled clinical trial of transfusion requirements incritical care. Transfusion requirements in critical care investigators,Canadian critical care trials group. N Engl J Med. 1999;340:409–417.
19. Sheppard FR, Moore EE, Johnson JL, et al. Transfusion-inducedleukocyte IL-8 gene expression is avoided by the use of humanpolymerized hemoglobin. J Trauma. 2004;57:720–725.
20. Malone DL, Dunne J, Tracy JK, et al. Blood transfusion,independent of shock severity, is associated with worse outcome intrauma. J Trauma. 2003;54:898–905; discussion 905–907.
21. Como JJ, Dutton RP, Scalea TM, Edelman BB, Hess JR. Bloodtransfusion rates in the care of acute trauma. Transfusion. 2004;44:809–813.
22. Eastridge BJ, Owsley J, Sebesta J, et al. Admission physiologycriteria following injury on the battlefield predict medical resourceutilization and patient mortality. J Trauma. 2006;61:820–823.
23. Hoyt DB. A clinical review of bleeding dilemmas in trauma. SeminHematol. 2004;41(Suppl):40–43.
24. Boffard KD, Riou B, Warren B, et al. Recombinant factor VIIa asadjunctive therapy for bleeding control in severely injured traumapatients: two parallel randomized, placebo-controlled, double-blindclinical trials. J Trauma. 2005;59:8–18.
25. Jeroukhimov I, Jewelewicz D, Zaias J, et al. Early injection of high-dose recombinant factor VIIa decreases blood loss and prolongs timefrom injury to death in experimental liver injury. J Trauma. 2002;53:1053–1057.
26. Martinowitz U, Zaarur M, Yaron BL, Blumenfeld A, MartonovitsG. Treating traumatic bleeding in a combat setting: possible roleof recombinant activated factor VII. Mil Med. 2004;169(Suppl):16 –18.
27. McMullin NR, Kauvar DS, Currier HM, et al. The clinical andlaboratory response to recombinant factor VIIa in trauma andsurgical patients with acquired coagulopathy. Curr Surg. 2006;63:246–251.
28. Mohr AM, Holcomb JB, Dutton RP, Duranteau J. Recombinantactivated factor VIIa and hemostasis in critical care: a focus ontrauma. Crit Care. 2005;9(Suppl):S37–S42.
29. Holcomb JB. Use of recombinant activated factor VII to treat theacquired coagulopathy of trauma. J Trauma. 2005;58:1298–1303.
30. Cosgriff N, Moore EE, Sauaia A, et al. Predicting life-threateningcoagulopathy in the massively transfused patient: Hypothermia andacidosis revisited. J Trauma. 1997;42:857–862.
Damage Control Resuscitation
Volume 62 • Number 2 309

31. Davis JW, Parks SN, Kaups KL, Gladen HE, O’Donnell-Nicol S.Admission base deficit predicts transfusion requirements and risk ofcomplications. J Trauma. 1996;41:769–774.
32. Moore FA, McKinley BA, Moore EE, et al. Inflammation and the hostresponse to injury, a large-scale collaborative project: patient-orientedresearch core–standard operating procedures for clinical care. III.Guidelines for shock resuscitation. J Trauma. 2006;61:82–89.
33. Carrico CJ, Canizaro PC, Shires GT. Fluid resuscitation followinginjury: rationale for the use of balanced salt solutions. Crit CareMed. 1976;4:46–54.
34. Moore FD, Shires GT. Moderation. Anesth Analg. 1968;47:506–508.35. McClelland RN, Shires GT, Baxter CR, Coln CD, Carrico CJ.
Balanced salt solution in the treatment of hemorrhagic shock. JAMA.1967;199:830–834.
36. Alam HB, Stanton K, Koustova E, et al. Effect of differentresuscitation strategies on neutrophil activation in a swine model ofhemorrhagic shock. Resuscitation. 2004;60:91–99.
37. Holcomb JB. Methods for improved hemorrhage control. Crit Care.2004;8(Suppl):S57–S60.
38. Practice guidelines for perioperative blood transfusion and adjuvanttherapies: an updated report by the American Society ofAnesthesiologists Task Force on Perioperative Blood Transfusionand Adjuvant Therapies. Anesthesiology. 2006;105:198–208.
39. Burris D, Rhee P, Kaufmann C, et al. Controlled resuscitation foruncontrolled hemorrhagic shock. J Trauma. 1999;46:216–223.
40. Kiraly LN, Differding JA, Enomoto TM, et al. Resuscitation withnormal saline (NS) vs. lactated ringers (LR) modulateshypercoagulability and leads to increased blood loss in uncontrolledhemorrhagic shock swine model. J Trauma. 2006;61:57–65.
41. Watts DD, Trask A, Soeken K, et al. Hypothermic coagulopathy intrauma: effect of varying levels of hypothermia on enzyme speed,platelet function, and fibrinolytic activity. J Trauma. 1998;44:846–854.
42. American College of Surgeons. Advanced Trauma Life Support.Chicago: American College of Surgeons, 1994.
43. Traverso LW, Hollenbach SJ, Bolin RB, Langford MJ, DeGuzmanLR. Fluid resuscitation after an otherwise fatal hemorrhage: II.Colloid solutions. J Trauma. 1986;26:176–182.
44. Traverso LW, Lee WP, Langford MJ. Fluid resuscitation after anotherwise fatal hemorrhage: I. Crystalloid solutions. J Trauma. 1986;26:168–175.
45. Barbee RW, Kline JA, Watts JA. A comparison of resuscitation withpacked red blood cells and whole blood following hemorrhagicshock in canines. Shock. 1999;12:449–453.
46. Mohr R, Goor DA, Yellin A, Moshkovitz Y, Shinfeld A,Martinowitz U. Fresh blood units contain large potent platelets thatimprove hemostasis after open heart operations. Ann Thorac Surg.1992;53:650–654.
47. Repine TB, Perkins JG, Kauvar DS, Blackborne L. The use of freshwhole blood in massive transfusion. J Trauma. 2006;60(Suppl):S59–S69.
48. Ho AM, Dion PW, Cheng CA, et al. A mathematical model forfresh frozen plasma transfusion strategies during major traumaresuscitation with ongoing hemorrhage. Can J Surg. 2005;48:470–478.
49. Ketchum L, Hess JR, Hiippala S. Indications for early fresh frozenplasma, cryoprecipitate, and platelet transfusion in trauma. J Trauma.2006;60(Suppl):S51–S8.
50. Malone DL, Hess JR, Fingerhut A. Massive transfusion practicesaround the globe and a suggestion for a common massive transfusionprotocol. J Trauma. 2006;60(Suppl):S91–S6.
51. Holcomb JB, Hess JR. Early massive trauma transfusion: Currentstate of the art. J Trauma. 2006;60(Suppl):S1–S9.
52. Arthurs Z, Cuadrado D, Beekley A, et al. The impact ofhypothermia on trauma care at the 31st combat support hospital.Am J Surg. 2006;191:610–614.
53. Gentilello LM, Jurkovich GJ, Stark MS, Hassantash SA, O’KeefeGE. Is hypothermia in the victim of major trauma protective orharmful? A randomized, prospective study. Ann Surg. 1997;226:439–447; discussion 447–449.
54. Martin RS, Kilgo PD, Miller PR, et al. Injury-associatedhypothermia: an analysis of the 2004 National Trauma Data Bank.Shock. 2005;24:114–118.
55. Salomone JP, Pons PT, eds. PHTLS Basic and Advanced PrehospitalTrauma Life Support: Military Edition. 6th ed. St. Louis: Mosby;2006.
56. Martini WZ, Pusateri AE, Uscilowicz JM, Delgado AV, HolcombJB. Independent contributions of hypothermia and acidosis tocoagulopathy in swine. J Trauma. 2005;58:1002–1009; discussion1009 –1010.
57. Bickell WH, Wall MJ Jr, Pepe PE, et al. Immediate versus delayedfluid resuscitation for hypotensive patients with penetrating torsoinjuries. N Engl J Med. 1994;331:1105–1109.
58. Cannon WB, Fraser J, Cowell EM. The preventive treatment ofwound shock. JAMA. 1918;70:618–621.
59. Dutton RP, Mackenzie CF, Scalea TM. Hypotensive resuscitationduring active hemorrhage: impact on in-hospital mortality. J Trauma.2002;52:1141–1146.
60. Holcomb JB. Fluid resuscitation in modern combat casualty care:lessons learned from Somalia. J Trauma. 2003;54(Suppl):S46–S51.
61. Sondeen JL, Coppes VG, Holcomb JB. Blood pressure at whichrebleeding occurs after resuscitation in swine with aortic injury.J Trauma. 2003;54(Suppl):S110–S117.
62. Beecher HK. Preparation of battle casualties for surgery. Ann Surg.1945;21:769–792.
63. Kauvar DS, Holcomb JB, Norris GC, Hess JR. Fresh whole bloodtransfusion: a controversial military practice. J Trauma. 2006;61:181–184.
64. Eastridge BJ, Jenkins D, Flaherty S, Schiller H, Holcomb JB.Trauma system development in a theater of war: experiences fromOperation Iraqi Freedom and Operation Enduring Freedom.J Trauma. 2006;61:1366–1373.
The Journal of TRAUMA� Injury, Infection, and Critical Care
310 February 2007
Administration of Recombinant Factor VIIa Decreases BloodLoss After Blunt Trauma in Noncoagulopathic PigsDaniel William Howes, FRCPC, Andrew Stratford, FRCSC, Michael Stirling, FRCSC, Catharine C. Ferri, PhD,and Trevor Bardell, MD
Background: Activated factor VIIcatalyzes the activation of clotting factorsIX and X within the clotting cascade, andhas been used clinically to decrease bleed-ing in patients with hemophilia and otherbleeding disorders. Studies suggest the useof recombinant VIIa (rVIIa) may decreasebleeding after injury in the presence of acoagulopathy, but there is conflicting evi-dence regarding its use in the absence ofcoagulopathy. This study was performedto determine whether a single dose ofrVIIa would reduce blood loss in nonco-agulopathic pigs after blunt trauma.
Methods: Anesthetized pigs were sub-ject to multiple blunt injuries consisting of afemur fracture, liver laceration, and soft-tissue crush injury. Fifteen minutes after thetrauma, pigs were randomized to receive asingle 120 �g/kg dose of rVIIa or placebo.Mean arterial pressure, heart rate, temper-ature, and hematocrit (Hct) were measuredduring a 2-hour period of standardized fluidresuscitation. The primary endpoint wasblood loss.
Results: The degree of trauma in thetwo groups was similar. Animals in thetreated group had a mean blood loss of
19.6 mL/kg (13.5–25.7) versus 30.0 mL/kg(24.8–35.3) in the control group (p �0.037).
Conclusions: A single dose of 120�g/kg of rVIIa can significantly decreaseblood loss in traumatized pigs with no pre-existing coagulopathy. Further studies arerequired to determine the lowest effectivedose of this medication.
Key Words: Recombinant activatedfactor VII, Blunt trauma, Coagulation,Animal model.
J Trauma. 2007;62:311–315.
Recombinant activated factor VII (rVIIa) was originallydeveloped for the treatment of patients with hemophiliawho developed inhibitors to factor VIII and factor IX.1
It has been successfully used in the treatment of plateletdisorders,2 cirrhosis,3,4 and in the prevention of surgicalblood loss.5 It has been shown to reduce mortality and he-matoma volume, as well as improve functional outcomes inpatients with intracerebral hemorrhage.6
Blunt trauma often presents with multiorgan injuries,including liver, spleen, and bowel injuries; fractures; andcrushed soft tissues. There are a number of case reports andsmall case series detailing the use of rVIIa as a last resort inseverely injured patients.7–10 In an animal model of a grade Vliver injury in animals with a coagulopathy induced by apre-existing hypothermia and hemodilution, Schreibner11 andMartinowitz12 both demonstrated a decrease in blood loss inanimals treated with 180 �g/kg. A recent study by Boffard etal. evaluated a total dose of 400 �g/kg rVIIa in severelyinjured patients.13 They found a significant reduction in trans-fusion requirements of patients who had sustained blunt
trauma, although no benefit could be demonstrated in victimsof penetrating trauma.
Earlier work by the Schreiber’s group in a noncoagulo-pathic model failed to show any benefit from treatment.14 Jer-oukhimov, using a different noncoagulopathic model, showeddecreased bleeding and prolonged survival with rVIIa.15
The purpose of our study was to determine the effect ofa single dose of 120 �g/kg of rVIIa on blood loss in nonco-agulopathic pigs after multisystem injuries typical of blunttrauma.
MATERIALS AND METHODSThe study protocol was approved by the Queen’s Uni-
versity Animal Research Ethics Review Board and adheres tothe National Institutes of Heath guidelines for the use oflaboratory animals.
Sixteen common swine (mean weight: 18.9 � 0.7 kg,range: 15.6–24.4 kg) were obtained from a commercialbreeder (Hay Bay Genetics, Ontario, Canada) and maintainedin a common indoor holding area. The sample size was basedon previous experience with the model and financial con-straints. Animals were fasted the night before study entry, butgiven water ad libitum. On the morning of the study, each pigwas given an intramuscular (IM) injection of ketamine (20mg/kg) and transferred to the operating room. Isoflurane wasadministered with oxygen by mask until sufficient relaxationwas achieved for intubation. Once intubated, the isofluranewas maintained at 2%. The animals were closely monitoredand were treated with 1 �g/kg intravenous (IV) fentanyl ifrequired for pain. Normothermia was maintained with warm-ing blankets.
Submitted for publication August 29, 2005.Accepted for publication April 11, 2006.Copyright © 2007 by Lippincott Williams & Wilkins, Inc.From the Department of Emergency Medicine, Faculty of Health Sci-
ences, School of Medicine, Kingston General Hospital, Queens University,Ontario, Canada.
Address for reprints: Daniel W. Howes, FRCPC, 76 Stuart Street,Kingston, Ontario K7L 2V7; email: [email protected].
DOI: 10.1097/01.ta.0000229704.06991.9d
The Journal of TRAUMA� Injury, Infection, and Critical Care
Volume 62 • Number 2 311
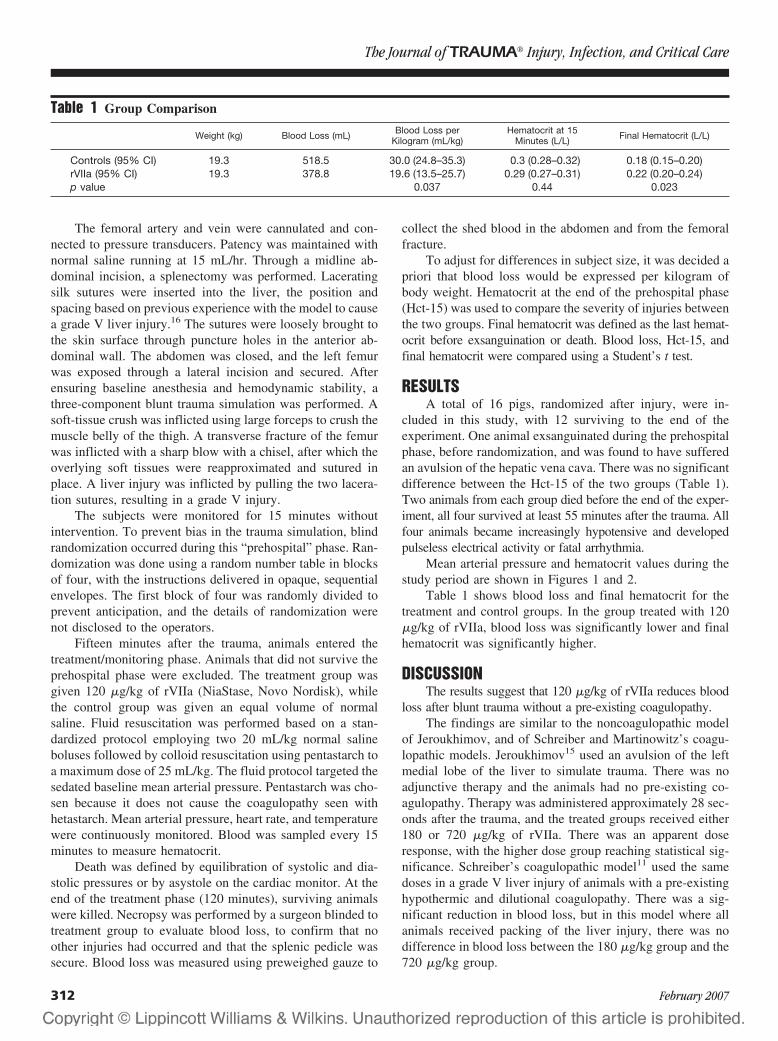
The femoral artery and vein were cannulated and con-nected to pressure transducers. Patency was maintained withnormal saline running at 15 mL/hr. Through a midline ab-dominal incision, a splenectomy was performed. Laceratingsilk sutures were inserted into the liver, the position andspacing based on previous experience with the model to causea grade V liver injury.16 The sutures were loosely brought tothe skin surface through puncture holes in the anterior ab-dominal wall. The abdomen was closed, and the left femurwas exposed through a lateral incision and secured. Afterensuring baseline anesthesia and hemodynamic stability, athree-component blunt trauma simulation was performed. Asoft-tissue crush was inflicted using large forceps to crush themuscle belly of the thigh. A transverse fracture of the femurwas inflicted with a sharp blow with a chisel, after which theoverlying soft tissues were reapproximated and sutured inplace. A liver injury was inflicted by pulling the two lacera-tion sutures, resulting in a grade V injury.
The subjects were monitored for 15 minutes withoutintervention. To prevent bias in the trauma simulation, blindrandomization occurred during this “prehospital” phase. Ran-domization was done using a random number table in blocksof four, with the instructions delivered in opaque, sequentialenvelopes. The first block of four was randomly divided toprevent anticipation, and the details of randomization werenot disclosed to the operators.
Fifteen minutes after the trauma, animals entered thetreatment/monitoring phase. Animals that did not survive theprehospital phase were excluded. The treatment group wasgiven 120 �g/kg of rVIIa (NiaStase, Novo Nordisk), whilethe control group was given an equal volume of normalsaline. Fluid resuscitation was performed based on a stan-dardized protocol employing two 20 mL/kg normal salineboluses followed by colloid resuscitation using pentastarch toa maximum dose of 25 mL/kg. The fluid protocol targeted thesedated baseline mean arterial pressure. Pentastarch was cho-sen because it does not cause the coagulopathy seen withhetastarch. Mean arterial pressure, heart rate, and temperaturewere continuously monitored. Blood was sampled every 15minutes to measure hematocrit.
Death was defined by equilibration of systolic and dia-stolic pressures or by asystole on the cardiac monitor. At theend of the treatment phase (120 minutes), surviving animalswere killed. Necropsy was performed by a surgeon blinded totreatment group to evaluate blood loss, to confirm that noother injuries had occurred and that the splenic pedicle wassecure. Blood loss was measured using preweighed gauze to
collect the shed blood in the abdomen and from the femoralfracture.
To adjust for differences in subject size, it was decided apriori that blood loss would be expressed per kilogram ofbody weight. Hematocrit at the end of the prehospital phase(Hct-15) was used to compare the severity of injuries betweenthe two groups. Final hematocrit was defined as the last hemat-ocrit before exsanguination or death. Blood loss, Hct-15, andfinal hematocrit were compared using a Student’s t test.
RESULTSA total of 16 pigs, randomized after injury, were in-
cluded in this study, with 12 surviving to the end of theexperiment. One animal exsanguinated during the prehospitalphase, before randomization, and was found to have sufferedan avulsion of the hepatic vena cava. There was no significantdifference between the Hct-15 of the two groups (Table 1).Two animals from each group died before the end of the exper-iment, all four survived at least 55 minutes after the trauma. Allfour animals became increasingly hypotensive and developedpulseless electrical activity or fatal arrhythmia.
Mean arterial pressure and hematocrit values during thestudy period are shown in Figures 1 and 2.
Table 1 shows blood loss and final hematocrit for thetreatment and control groups. In the group treated with 120�g/kg of rVIIa, blood loss was significantly lower and finalhematocrit was significantly higher.
DISCUSSIONThe results suggest that 120 �g/kg of rVIIa reduces blood
loss after blunt trauma without a pre-existing coagulopathy.The findings are similar to the noncoagulopathic model
of Jeroukhimov, and of Schreiber and Martinowitz’s coagu-lopathic models. Jeroukhimov15 used an avulsion of the leftmedial lobe of the liver to simulate trauma. There was noadjunctive therapy and the animals had no pre-existing co-agulopathy. Therapy was administered approximately 28 sec-onds after the trauma, and the treated groups received either180 or 720 �g/kg of rVIIa. There was an apparent doseresponse, with the higher dose group reaching statistical sig-nificance. Schreiber’s coagulopathic model11 used the samedoses in a grade V liver injury of animals with a pre-existinghypothermic and dilutional coagulopathy. There was a sig-nificant reduction in blood loss, but in this model where allanimals received packing of the liver injury, there was nodifference in blood loss between the 180 �g/kg group and the720 �g/kg group.
Table 1 Group Comparison
Weight (kg) Blood Loss (mL) Blood Loss perKilogram (mL/kg)
Hematocrit at 15Minutes (L/L) Final Hematocrit (L/L)
Controls (95% CI) 19.3 518.5 30.0 (24.8–35.3) 0.3 (0.28–0.32) 0.18 (0.15–0.20)rVIIa (95% CI) 19.3 378.8 19.6 (13.5–25.7) 0.29 (0.27–0.31) 0.22 (0.20–0.24)p value 0.037 0.44 0.023
The Journal of TRAUMA� Injury, Infection, and Critical Care
312 February 2007
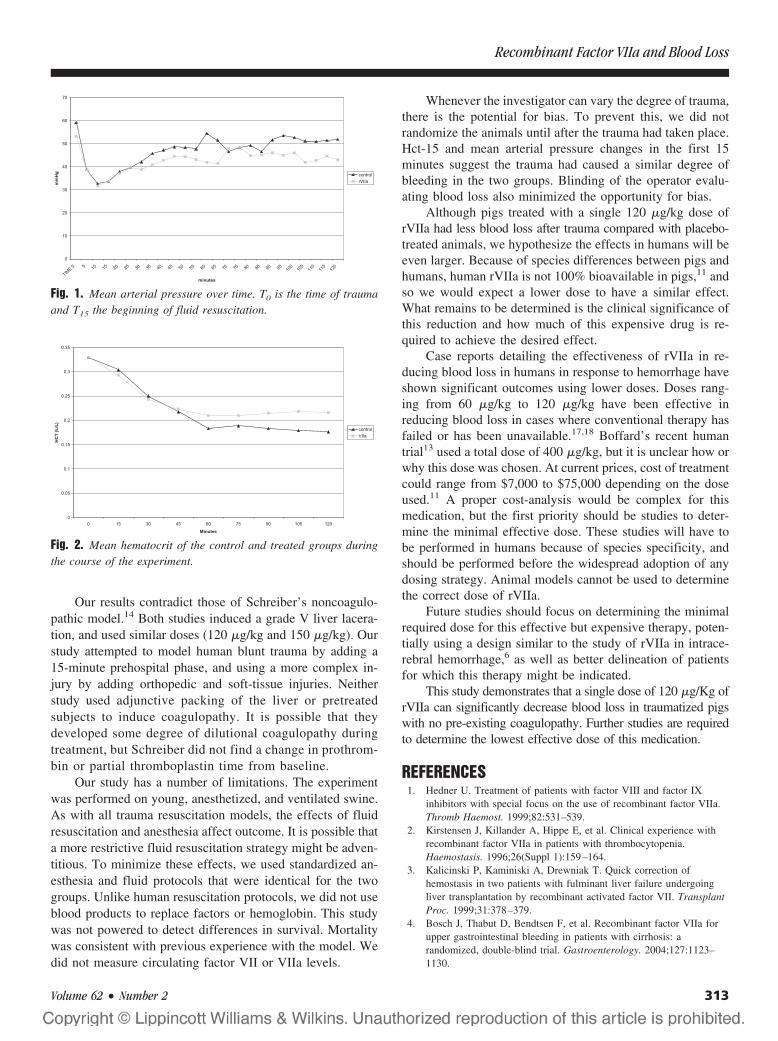
Our results contradict those of Schreiber’s noncoagulo-pathic model.14 Both studies induced a grade V liver lacera-tion, and used similar doses (120 �g/kg and 150 �g/kg). Ourstudy attempted to model human blunt trauma by adding a15-minute prehospital phase, and using a more complex in-jury by adding orthopedic and soft-tissue injuries. Neitherstudy used adjunctive packing of the liver or pretreatedsubjects to induce coagulopathy. It is possible that theydeveloped some degree of dilutional coagulopathy duringtreatment, but Schreiber did not find a change in prothrom-bin or partial thromboplastin time from baseline.
Our study has a number of limitations. The experimentwas performed on young, anesthetized, and ventilated swine.As with all trauma resuscitation models, the effects of fluidresuscitation and anesthesia affect outcome. It is possible thata more restrictive fluid resuscitation strategy might be adven-titious. To minimize these effects, we used standardized an-esthesia and fluid protocols that were identical for the twogroups. Unlike human resuscitation protocols, we did not useblood products to replace factors or hemoglobin. This studywas not powered to detect differences in survival. Mortalitywas consistent with previous experience with the model. Wedid not measure circulating factor VII or VIIa levels.
Whenever the investigator can vary the degree of trauma,there is the potential for bias. To prevent this, we did notrandomize the animals until after the trauma had taken place.Hct-15 and mean arterial pressure changes in the first 15minutes suggest the trauma had caused a similar degree ofbleeding in the two groups. Blinding of the operator evalu-ating blood loss also minimized the opportunity for bias.
Although pigs treated with a single 120 �g/kg dose ofrVIIa had less blood loss after trauma compared with placebo-treated animals, we hypothesize the effects in humans will beeven larger. Because of species differences between pigs andhumans, human rVIIa is not 100% bioavailable in pigs,11 andso we would expect a lower dose to have a similar effect.What remains to be determined is the clinical significance ofthis reduction and how much of this expensive drug is re-quired to achieve the desired effect.
Case reports detailing the effectiveness of rVIIa in re-ducing blood loss in humans in response to hemorrhage haveshown significant outcomes using lower doses. Doses rang-ing from 60 �g/kg to 120 �g/kg have been effective inreducing blood loss in cases where conventional therapy hasfailed or has been unavailable.17,18 Boffard’s recent humantrial13 used a total dose of 400 �g/kg, but it is unclear how orwhy this dose was chosen. At current prices, cost of treatmentcould range from $7,000 to $75,000 depending on the doseused.11 A proper cost-analysis would be complex for thismedication, but the first priority should be studies to deter-mine the minimal effective dose. These studies will have tobe performed in humans because of species specificity, andshould be performed before the widespread adoption of anydosing strategy. Animal models cannot be used to determinethe correct dose of rVIIa.
Future studies should focus on determining the minimalrequired dose for this effective but expensive therapy, poten-tially using a design similar to the study of rVIIa in intrace-rebral hemorrhage,6 as well as better delineation of patientsfor which this therapy might be indicated.
This study demonstrates that a single dose of 120 �g/Kg ofrVIIa can significantly decrease blood loss in traumatized pigswith no pre-existing coagulopathy. Further studies are requiredto determine the lowest effective dose of this medication.
REFERENCES1. Hedner U. Treatment of patients with factor VIII and factor IX
inhibitors with special focus on the use of recombinant factor VIIa.Thromb Haemost. 1999;82:531–539.
2. Kirstensen J, Killander A, Hippe E, et al. Clinical experience withrecombinant factor VIIa in patients with thrombocytopenia.Haemostasis. 1996;26(Suppl 1):159–164.
3. Kalicinski P, Kaminiski A, Drewniak T. Quick correction ofhemostasis in two patients with fulminant liver failure undergoingliver transplantation by recombinant activated factor VII. TransplantProc. 1999;31:378–379.
4. Bosch J, Thabut D, Bendtsen F, et al. Recombinant factor VIIa forupper gastrointestinal bleeding in patients with cirrhosis: arandomized, double-blind trial. Gastroenterology. 2004;127:1123–1130.
Fig. 1. Mean arterial pressure over time. T0 is the time of traumaand T15 the beginning of fluid resuscitation.
Fig. 2. Mean hematocrit of the control and treated groups duringthe course of the experiment.
Recombinant Factor VIIa and Blood Loss
Volume 62 • Number 2 313

5. White B, Ravi N, McHale J, et al. Successful use of recombinantFVIIa (Novoseven) in the management of intractable post surgicalintra-abdominal hemorrhage. Br J Haematol. 1999;107:677–678.
6. Mayer S, Brun N, Begtrup K, et al. Recombinant activated factorVII for acute intracerebral hemorrhage. NEJM. 2005;352:777–785.
7. Lynn M, Jerokhimov I, Jewelewicz D, et al. Early use ofrecombinant factor VIIa improves mean arterial pressure and maypotentially decrease mortality in experimental hemorrhagic shock: apilot study. J Trauma. 2002;52:703–707.
8. Dutton R, McCunn M, Hyder M, et al. Factor VIIa for Correction ofTraumatic Coagulopathy. J Trauma. 2004;57:709–719.
9. Martinowitz U, Kenet G, Segal E, et al. Recombinant activatedfactor VII for adjunctive hemorrhage control in trauma. J Trauma.2001;51:431–438.
10. O’Neill PA, Bluth M, Gloster ES, et al. Successful use of recombinantactivated factor VII for trauma-associated hemorrhage in a patientwithout preexisting coagulopathy. J Trauma. 2002;52:400–405.
11. Schreiber M, Holcomb J, Hedner U, et al. The effect of recombinantfactor VIIa on coagulopathic pigs with grade V liver injuries.J Trauma. 2002;53:252–259.
12. Martinowitz U, Holcomb J, Pasateri A, et al. Intravenous rFVIIaadministered for hemorrhage control in hypothermic coagulopathicswine with grade V liver injuries. J Trauma. 2001;50:721–729.
13. Boffard K, Riou B, Warren B, et al. Recombinant factor VIIa asadjunctive therapy for bleeding control in severely injured traumapatients. Two parallel randomized placebo-controlled, double-blindclinical trials. J Trauma. 2005;59:8–18.
14. Schreiber MA, Holcomb JB, Hedner U, et al. The effect ofrecombinant factor VIIa on noncoagulopathic pigs with grade V liverinjuries. J Am Coll Surg. 2003;196:691–697.
15. Jeroukhimov I, Jewelewicz D, Zaias J, et al. Early injection of high-dose recombinant factor VIIa decreases blood loss and prolongs timefrom injury to death in experimental liver injury. J Trauma. 2002;53:1053–1057.
16. Howes D, Drover J, Brison R. A comparison of aggressive fluidresuscitation versus no fluid resuscitation in an animal model ofblunt trauma. Chest. 1999;116:277S.
17. Conesa V, Navarro-Ruiz A, Barras-Blasco J, et al. Recombinantfactor VIIa is an effective therapy for abdominal surgery and severethrombocytopenia: a case report. Int J Hematol. 2005;81:75–76.
18. Haas T, Innerhofer P, Kuhbacher G, Fries D. Successful reversal ofdeleterious coagulopathy by recombinant factor VIIa. Anesth Analg.2005;100:54–58.
EDITORIAL COMMENTThe authors have demonstrated that the administration of
120 �g/kg recombinant factor VIIa (rVIIa) will reduce bloodloss in a porcine multiple injury model of femur fracture, softtissue crush, and major liver injury when compared with aplacebo control. The timing of rVIIa treatment was designedto mimic the clinic scenario in that there was a 15-minutedelay from the time of liver injury and rVIIa replacement.This hemostatic efficacy was similar to that seen by Boffard andcoworkers who showed, in a randomized multi-institutionaltrial, that 400 �g/kg of rVIIa reduced blood loss after bluntinjury in man compared with a placebo control. The au-thors conclude that this lower dose of rVIIa provides thesame beneficial effect at a cheaper cost; they also suggestthat even smaller doses of rVIIa be tested for their hemo-static effectiveness.
This important suggestion will help move the futurestudy of rVIIa from the realm of magic into the science of
clotting. This transition requires that several questions beanswered. First, how much VIIa is normally available forclotting? There is almost no VIIa normally circulating in theabsence of hemorrhage. Second, how much procoagulant(FVII) is available for rapid conversion to VIIa? The normalFVII concentration is 0.5 to 1.0 �g/ml.1 Using the upper levelof concentration, one can calculate that there are 1,000 �g/Lor 3,000 �g/3L plasma in the normal 70-kg person. Third,how much FVII is present in the interstitial fluid space (IFS)?All coagulation factors are distributed in the IFS with the totalamount equaling that which is present in plasma. FVII has thesmallest molecular weight of all clotting factors and, follow-ing the laws of capillary selectivity, would likely have ahigher total amount than the other larger coagulationproteins.2 For the purpose of this discussion, however, let usassume that there are only 3,000 �g/kg of FVII in the IFS,thus, giving a total amount of 6,000 �g available to convertto VIIa in time of hemorrhage. Fourth, what is the change inmolecular weight and, therefore, concentration when FVIIconverts to VIIa? Because the activation of FVII occurs bythe splitting of a chemical single peptide bond at the Arg152-Ile 153 position without loss of any amino acids, theconcentration of VIIa would be identical to it’s precursorFVII.1 Fifth, how much VIIa is necessary to facilitate clottingin the face of hemorrhage? Clotting will be maintained in thepresence of a single coagulation factor deficiency with 25%of plasma levels.2 Assuming the normal movement of coag-ulation factors from the IFS into the plasma, the 70-kg personwould have approximately 5,000 �g FVII, which can berapidly converted to VIIa in time of hemorrhage. Sixth, doesrVIIa have the same efficacy as VIIa? Presumably yes, lestwe are all being led down the primrose path. Seventh, howmuch rVIIa is being recommended in this report? If onetranslates their dose in pigs to the 70-kg person, they areadministering 11,400 mg of rVIIa. Eighth, how much FVII isavailable in fresh frozen plasma (FFP) for conversion, in timeof need, to VIIa? FVII is a stable factor so that each unit ofFFP would contain 250 �g FVII. Ninth, how much FFPwould be required to provide sufficient FVII to restore coag-ulation in the patient with coagulopathy as a result of adeficiency in FVII? In the absence of continued bleeding, 6units of FFP would provide 1,500 �g of FVII, which wouldpartially replenish the IFS and plasma deficits and increasethe plasma levels of FVII above the critical 25% needed forclotting? Tenth, how much rVIIa would be required to bringabout the same restoration of clotting? The administration of25 �g/kg of rVIIa would more than equal the amount of FVIIachieved with the administration of 6 units of FFP and shouldrestore clotting.
Hopefully, future studies on rVIIa therapy will be moreanalytical not only as it relates to dosing amounts but also asto cost. The readers of subsequent reports want to know whatdose restores normal coagulation without creating a hyper-congealable state and how that dose compares in cost to theadministration of innate FVII, which can be promptly con-
The Journal of TRAUMA� Injury, Infection, and Critical Care
314 February 2007
verted to VIIa in the bleeding patient, after appropriate FFPtherapy.
Charles Lucas, MDDepartment of SurgeryDetroit Receiving HospitalWayne State UniversityDetroit, MI
REFERENCES1. McVey JH, Boswell E, Mumford AD, et al. Factor VII
deficiency and the FVII mutation database. Hum Mut. 2001;17:3–17.
2. Harrigan C, Lucas CE, Ledgerwood AM. The effect of hemorrhagicshock on the clotting cascade in injured patients. J Trauma. 1989;29:1416–1422.
CRASH-2 Trauma Trial Now Open to New Collaborators–Please Spread the Word!The CRASH-2 trial, which is supported by the World Health Organisation, is an international multi-centre randomisedcontrolled trial of the effects of the antifibrinolytic agent tranexamic acid on death and transfusion requirements in traumapatients with significant haemorrhage. It aims to recruit 20,000 patients world-wide. A systematic review of randomised trialsof antifibrinolytics in surgical patients found 89 trials including 8,580 patients. The results showed that antifibrinolytics reducedthe numbers needing transfusion by one third, reduced transfusion volumes by one unit and halved the need for further surgeryto control bleeding. The differences were highly statistically significant. There was also a statistically non-significant reductionin the risk of death (RR � 0.85: 95%CI 0.63 to 1.14) in the treated group. The haemostatic changes after injury are similar tothose after surgery, and so it is important to test the hypothesis that antifibrinolytics may reduce blood loss and mortality aftertrauma. So far, there has been one small trial (70 randomised patients, drug versus placebo: 0 versus 3 deaths) of antifibrino-lytics in trauma, and as a result, there is insufficient evidence to support or refute a clinically important treatment effect.CRASH-2 will resolve this uncertainty.
CRASH-2 recruitment began in May 2005 and is due to be completed in December 2009. To date, over 3,000 patients havebeen recruited at 80 participating hospitals. The remaining 17,000 patients will be recruited over the next 3 years. CRASH-2is already the largest clinical trial in traumatic haemorrhage. However, in order to achieve the trial objectives, many moreparticipating hospitals are required. We invite doctors from around the world to join this international collaboration and in thisway to build the evidence base for trauma care. Please spread the word!
Please visit the trial website to join and for information: www.crash2.Lshtm.ac.uk
REFERENCES1. Henry DA, Moxey AJ, Carless PA, O’Connell D, McClelland B, Henderson KM, Sly K, Laupacis A, Fergusson D. Antifibrinolytic use for
minimising perioperative allogeneic blood transfusion (Cochrane Review). In: The Cochrane Library, Issue 1, 2004. Chichester, UK: John Wiley &Sons, Ltd.
2. Coats T, Roberts I, Shakur H. Antifibrinolytic drugs for acute traumatic injury. (Cochrane Review). In: The Cochrane Library, Issue 3, 2004.Chichester, UK: John Wiley & Sons, Ltd.
Recombinant Factor VIIa and Blood Loss
Volume 62 • Number 2 315
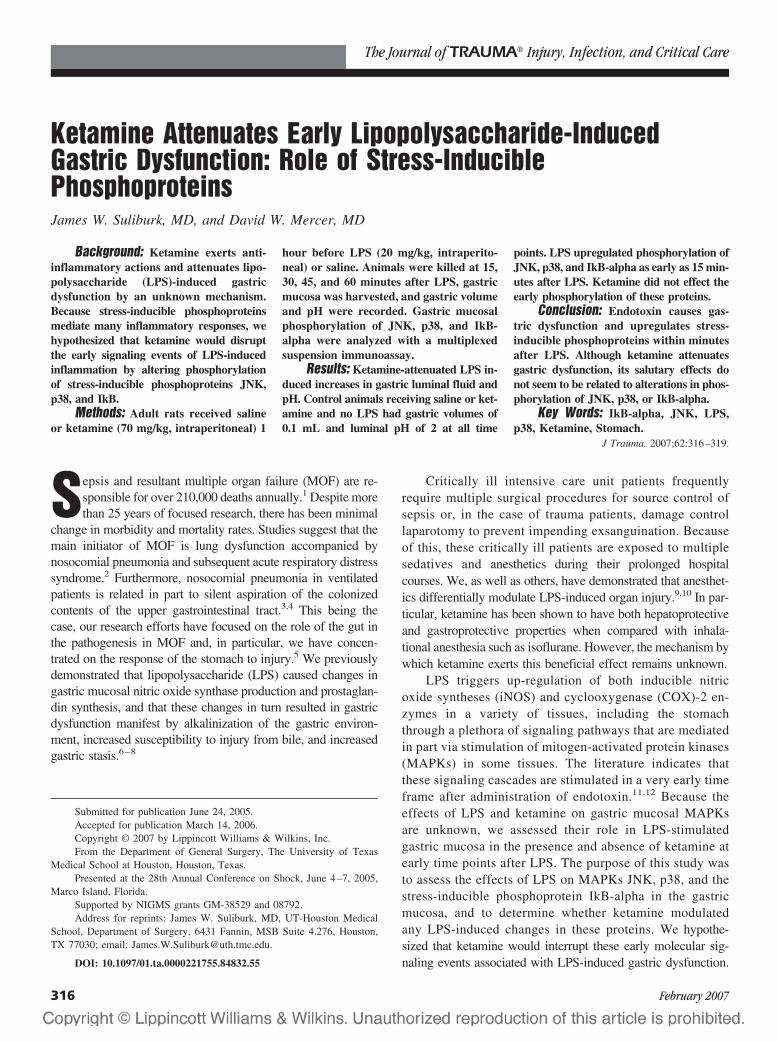
Ketamine Attenuates Early Lipopolysaccharide-InducedGastric Dysfunction: Role of Stress-InduciblePhosphoproteinsJames W. Suliburk, MD, and David W. Mercer, MD
Background: Ketamine exerts anti-inflammatory actions and attenuates lipo-polysaccharide (LPS)-induced gastricdysfunction by an unknown mechanism.Because stress-inducible phosphoproteinsmediate many inflammatory responses, wehypothesized that ketamine would disruptthe early signaling events of LPS-inducedinflammation by altering phosphorylationof stress-inducible phosphoproteins JNK,p38, and IkB.
Methods: Adult rats received salineor ketamine (70 mg/kg, intraperitoneal) 1
hour before LPS (20 mg/kg, intraperito-neal) or saline. Animals were killed at 15,30, 45, and 60 minutes after LPS, gastricmucosa was harvested, and gastric volumeand pH were recorded. Gastric mucosalphosphorylation of JNK, p38, and IkB-alpha were analyzed with a multiplexedsuspension immunoassay.
Results: Ketamine-attenuated LPS in-duced increases in gastric luminal fluid andpH. Control animals receiving saline or ket-amine and no LPS had gastric volumes of0.1 mL and luminal pH of 2 at all time
points. LPS upregulated phosphorylation ofJNK, p38, and IkB-alpha as early as 15 min-utes after LPS. Ketamine did not effect theearly phosphorylation of these proteins.
Conclusion: Endotoxin causes gas-tric dysfunction and upregulates stress-inducible phosphoproteins within minutesafter LPS. Although ketamine attenuatesgastric dysfunction, its salutary effects donot seem to be related to alterations in phos-phorylation of JNK, p38, or IkB-alpha.
Key Words: IkB-alpha, JNK, LPS,p38, Ketamine, Stomach.
J Trauma. 2007;62:316–319.
Sepsis and resultant multiple organ failure (MOF) are re-sponsible for over 210,000 deaths annually.1 Despite morethan 25 years of focused research, there has been minimal
change in morbidity and mortality rates. Studies suggest that themain initiator of MOF is lung dysfunction accompanied bynosocomial pneumonia and subsequent acute respiratory distresssyndrome.2 Furthermore, nosocomial pneumonia in ventilatedpatients is related in part to silent aspiration of the colonizedcontents of the upper gastrointestinal tract.3,4 This being thecase, our research efforts have focused on the role of the gut inthe pathogenesis in MOF and, in particular, we have concen-trated on the response of the stomach to injury.5 We previouslydemonstrated that lipopolysaccharide (LPS) caused changes ingastric mucosal nitric oxide synthase production and prostaglan-din synthesis, and that these changes in turn resulted in gastricdysfunction manifest by alkalinization of the gastric environ-ment, increased susceptibility to injury from bile, and increasedgastric stasis.6–8
Critically ill intensive care unit patients frequentlyrequire multiple surgical procedures for source control ofsepsis or, in the case of trauma patients, damage controllaparotomy to prevent impending exsanguination. Becauseof this, these critically ill patients are exposed to multiplesedatives and anesthetics during their prolonged hospitalcourses. We, as well as others, have demonstrated that anesthet-ics differentially modulate LPS-induced organ injury.9,10 In par-ticular, ketamine has been shown to have both hepatoprotectiveand gastroprotective properties when compared with inhala-tional anesthesia such as isoflurane. However, the mechanism bywhich ketamine exerts this beneficial effect remains unknown.
LPS triggers up-regulation of both inducible nitricoxide syntheses (iNOS) and cyclooxygenase (COX)-2 en-zymes in a variety of tissues, including the stomachthrough a plethora of signaling pathways that are mediatedin part via stimulation of mitogen-activated protein kinases(MAPKs) in some tissues. The literature indicates thatthese signaling cascades are stimulated in a very early timeframe after administration of endotoxin.11,12 Because theeffects of LPS and ketamine on gastric mucosal MAPKsare unknown, we assessed their role in LPS-stimulatedgastric mucosa in the presence and absence of ketamine atearly time points after LPS. The purpose of this study wasto assess the effects of LPS on MAPKs JNK, p38, and thestress-inducible phosphoprotein IkB-alpha in the gastricmucosa, and to determine whether ketamine modulatedany LPS-induced changes in these proteins. We hypothe-sized that ketamine would interrupt these early molecular sig-naling events associated with LPS-induced gastric dysfunction.
Submitted for publication June 24, 2005.Accepted for publication March 14, 2006.Copyright © 2007 by Lippincott Williams & Wilkins, Inc.From the Department of General Surgery, The University of Texas
Medical School at Houston, Houston, Texas.Presented at the 28th Annual Conference on Shock, June 4–7, 2005,
Marco Island, Florida.Supported by NIGMS grants GM-38529 and 08792.Address for reprints: James W. Suliburk, MD, UT-Houston Medical
School, Department of Surgery, 6431 Fannin, MSB Suite 4.276, Houston,TX 77030; email: [email protected].
DOI: 10.1097/01.ta.0000221755.84832.55
The Journal of TRAUMA� Injury, Infection, and Critical Care
316 February 2007
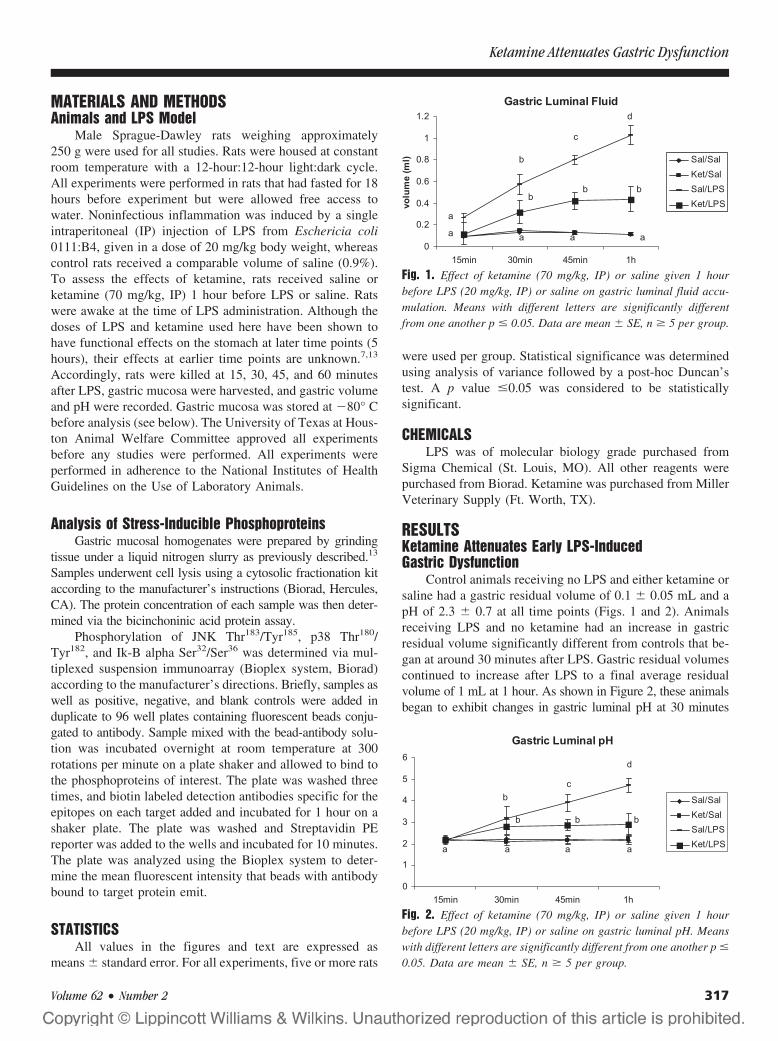
MATERIALS AND METHODSAnimals and LPS Model
Male Sprague-Dawley rats weighing approximately250 g were used for all studies. Rats were housed at constantroom temperature with a 12-hour:12-hour light:dark cycle.All experiments were performed in rats that had fasted for 18hours before experiment but were allowed free access towater. Noninfectious inflammation was induced by a singleintraperitoneal (IP) injection of LPS from Eschericia coli0111:B4, given in a dose of 20 mg/kg body weight, whereascontrol rats received a comparable volume of saline (0.9%).To assess the effects of ketamine, rats received saline orketamine (70 mg/kg, IP) 1 hour before LPS or saline. Ratswere awake at the time of LPS administration. Although thedoses of LPS and ketamine used here have been shown tohave functional effects on the stomach at later time points (5hours), their effects at earlier time points are unknown.7,13
Accordingly, rats were killed at 15, 30, 45, and 60 minutesafter LPS, gastric mucosa were harvested, and gastric volumeand pH were recorded. Gastric mucosa was stored at �80° Cbefore analysis (see below). The University of Texas at Hous-ton Animal Welfare Committee approved all experimentsbefore any studies were performed. All experiments wereperformed in adherence to the National Institutes of HealthGuidelines on the Use of Laboratory Animals.
Analysis of Stress-Inducible PhosphoproteinsGastric mucosal homogenates were prepared by grinding
tissue under a liquid nitrogen slurry as previously described.13
Samples underwent cell lysis using a cytosolic fractionation kitaccording to the manufacturer’s instructions (Biorad, Hercules,CA). The protein concentration of each sample was then deter-mined via the bicinchoninic acid protein assay.
Phosphorylation of JNK Thr183/Tyr185, p38 Thr180/Tyr182, and Ik-B alpha Ser32/Ser36 was determined via mul-tiplexed suspension immunoarray (Bioplex system, Biorad)according to the manufacturer’s directions. Briefly, samples aswell as positive, negative, and blank controls were added induplicate to 96 well plates containing fluorescent beads conju-gated to antibody. Sample mixed with the bead-antibody solu-tion was incubated overnight at room temperature at 300rotations per minute on a plate shaker and allowed to bind tothe phosphoproteins of interest. The plate was washed threetimes, and biotin labeled detection antibodies specific for theepitopes on each target added and incubated for 1 hour on ashaker plate. The plate was washed and Streptavidin PEreporter was added to the wells and incubated for 10 minutes.The plate was analyzed using the Bioplex system to deter-mine the mean fluorescent intensity that beads with antibodybound to target protein emit.
STATISTICSAll values in the figures and text are expressed as
means � standard error. For all experiments, five or more rats
were used per group. Statistical significance was determinedusing analysis of variance followed by a post-hoc Duncan’stest. A p value �0.05 was considered to be statisticallysignificant.
CHEMICALSLPS was of molecular biology grade purchased from
Sigma Chemical (St. Louis, MO). All other reagents werepurchased from Biorad. Ketamine was purchased from MillerVeterinary Supply (Ft. Worth, TX).
RESULTSKetamine Attenuates Early LPS-InducedGastric Dysfunction
Control animals receiving no LPS and either ketamine orsaline had a gastric residual volume of 0.1 � 0.05 mL and apH of 2.3 � 0.7 at all time points (Figs. 1 and 2). Animalsreceiving LPS and no ketamine had an increase in gastricresidual volume significantly different from controls that be-gan at around 30 minutes after LPS. Gastric residual volumescontinued to increase after LPS to a final average residualvolume of 1 mL at 1 hour. As shown in Figure 2, these animalsbegan to exhibit changes in gastric luminal pH at 30 minutes
Fig. 1. Effect of ketamine (70 mg/kg, IP) or saline given 1 hourbefore LPS (20 mg/kg, IP) or saline on gastric luminal fluid accu-mulation. Means with different letters are significantly differentfrom one another p � 0.05. Data are mean � SE, n � 5 per group.
Fig. 2. Effect of ketamine (70 mg/kg, IP) or saline given 1 hourbefore LPS (20 mg/kg, IP) or saline on gastric luminal pH. Meanswith different letters are significantly different from one another p �
0.05. Data are mean � SE, n � 5 per group.
Ketamine Attenuates Gastric Dysfunction
Volume 62 • Number 2 317
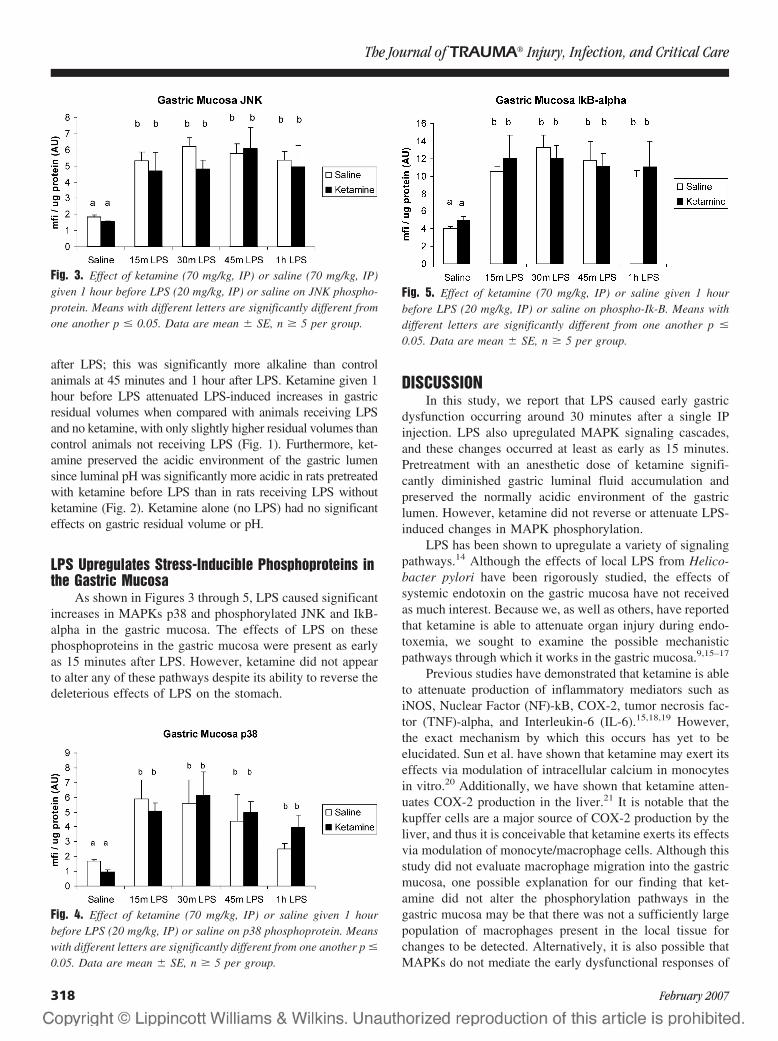
after LPS; this was significantly more alkaline than controlanimals at 45 minutes and 1 hour after LPS. Ketamine given 1hour before LPS attenuated LPS-induced increases in gastricresidual volumes when compared with animals receiving LPSand no ketamine, with only slightly higher residual volumes thancontrol animals not receiving LPS (Fig. 1). Furthermore, ket-amine preserved the acidic environment of the gastric lumensince luminal pH was significantly more acidic in rats pretreatedwith ketamine before LPS than in rats receiving LPS withoutketamine (Fig. 2). Ketamine alone (no LPS) had no significanteffects on gastric residual volume or pH.
LPS Upregulates Stress-Inducible Phosphoproteins inthe Gastric Mucosa
As shown in Figures 3 through 5, LPS caused significantincreases in MAPKs p38 and phosphorylated JNK and IkB-alpha in the gastric mucosa. The effects of LPS on thesephosphoproteins in the gastric mucosa were present as earlyas 15 minutes after LPS. However, ketamine did not appearto alter any of these pathways despite its ability to reverse thedeleterious effects of LPS on the stomach.
DISCUSSIONIn this study, we report that LPS caused early gastric
dysfunction occurring around 30 minutes after a single IPinjection. LPS also upregulated MAPK signaling cascades,and these changes occurred at least as early as 15 minutes.Pretreatment with an anesthetic dose of ketamine signifi-cantly diminished gastric luminal fluid accumulation andpreserved the normally acidic environment of the gastriclumen. However, ketamine did not reverse or attenuate LPS-induced changes in MAPK phosphorylation.
LPS has been shown to upregulate a variety of signalingpathways.14 Although the effects of local LPS from Helico-bacter pylori have been rigorously studied, the effects ofsystemic endotoxin on the gastric mucosa have not receivedas much interest. Because we, as well as others, have reportedthat ketamine is able to attenuate organ injury during endo-toxemia, we sought to examine the possible mechanisticpathways through which it works in the gastric mucosa.9,15–17
Previous studies have demonstrated that ketamine is ableto attenuate production of inflammatory mediators such asiNOS, Nuclear Factor (NF)-kB, COX-2, tumor necrosis fac-tor (TNF)-alpha, and Interleukin-6 (IL-6).15,18,19 However,the exact mechanism by which this occurs has yet to beelucidated. Sun et al. have shown that ketamine may exert itseffects via modulation of intracellular calcium in monocytesin vitro.20 Additionally, we have shown that ketamine atten-uates COX-2 production in the liver.21 It is notable that thekupffer cells are a major source of COX-2 production by theliver, and thus it is conceivable that ketamine exerts its effectsvia modulation of monocyte/macrophage cells. Although thisstudy did not evaluate macrophage migration into the gastricmucosa, one possible explanation for our finding that ket-amine did not alter the phosphorylation pathways in thegastric mucosa may be that there was not a sufficiently largepopulation of macrophages present in the local tissue forchanges to be detected. Alternatively, it is also possible thatMAPKs do not mediate the early dysfunctional responses of
Fig. 3. Effect of ketamine (70 mg/kg, IP) or saline (70 mg/kg, IP)given 1 hour before LPS (20 mg/kg, IP) or saline on JNK phospho-protein. Means with different letters are significantly different fromone another p � 0.05. Data are mean � SE, n � 5 per group.
Fig. 4. Effect of ketamine (70 mg/kg, IP) or saline given 1 hourbefore LPS (20 mg/kg, IP) or saline on p38 phosphoprotein. Meanswith different letters are significantly different from one another p �
0.05. Data are mean � SE, n � 5 per group.
Fig. 5. Effect of ketamine (70 mg/kg, IP) or saline given 1 hourbefore LPS (20 mg/kg, IP) or saline on phospho-Ik-B. Means withdifferent letters are significantly different from one another p �
0.05. Data are mean � SE, n � 5 per group.
The Journal of TRAUMA� Injury, Infection, and Critical Care
318 February 2007
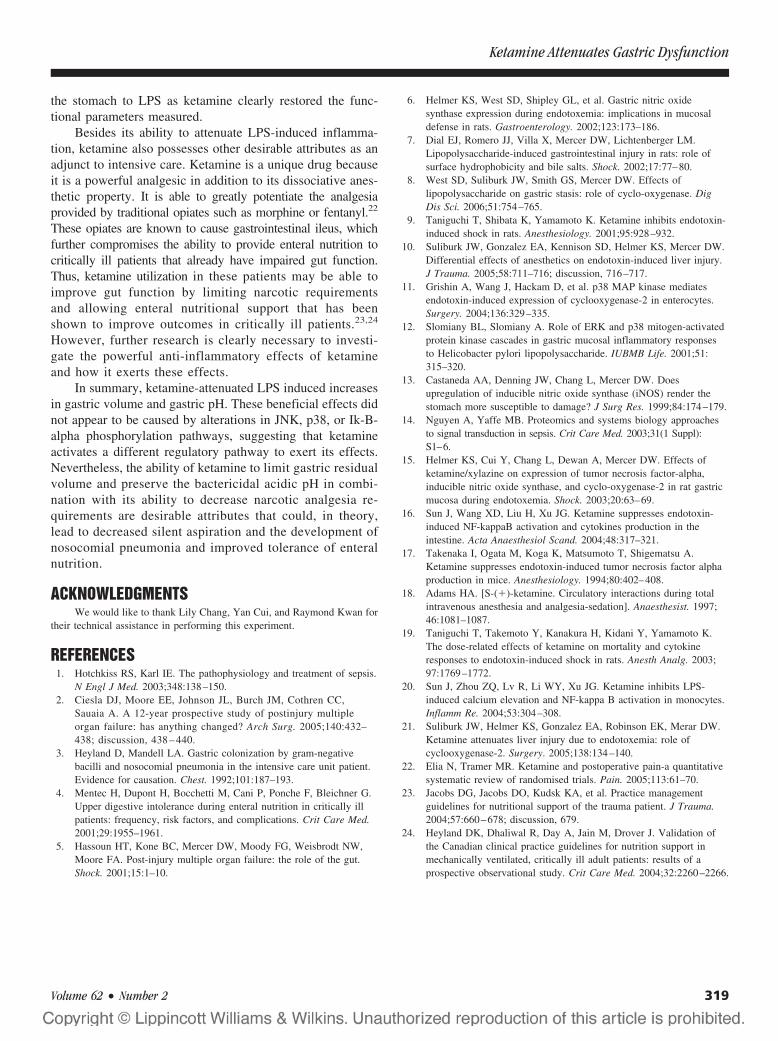
the stomach to LPS as ketamine clearly restored the func-tional parameters measured.
Besides its ability to attenuate LPS-induced inflamma-tion, ketamine also possesses other desirable attributes as anadjunct to intensive care. Ketamine is a unique drug becauseit is a powerful analgesic in addition to its dissociative anes-thetic property. It is able to greatly potentiate the analgesiaprovided by traditional opiates such as morphine or fentanyl.22
These opiates are known to cause gastrointestinal ileus, whichfurther compromises the ability to provide enteral nutrition tocritically ill patients that already have impaired gut function.Thus, ketamine utilization in these patients may be able toimprove gut function by limiting narcotic requirementsand allowing enteral nutritional support that has beenshown to improve outcomes in critically ill patients.23,24
However, further research is clearly necessary to investi-gate the powerful anti-inflammatory effects of ketamineand how it exerts these effects.
In summary, ketamine-attenuated LPS induced increasesin gastric volume and gastric pH. These beneficial effects didnot appear to be caused by alterations in JNK, p38, or Ik-B-alpha phosphorylation pathways, suggesting that ketamineactivates a different regulatory pathway to exert its effects.Nevertheless, the ability of ketamine to limit gastric residualvolume and preserve the bactericidal acidic pH in combi-nation with its ability to decrease narcotic analgesia re-quirements are desirable attributes that could, in theory,lead to decreased silent aspiration and the development ofnosocomial pneumonia and improved tolerance of enteralnutrition.
ACKNOWLEDGMENTSWe would like to thank Lily Chang, Yan Cui, and Raymond Kwan for
their technical assistance in performing this experiment.
REFERENCES1. Hotchkiss RS, Karl IE. The pathophysiology and treatment of sepsis.
N Engl J Med. 2003;348:138–150.2. Ciesla DJ, Moore EE, Johnson JL, Burch JM, Cothren CC,
Sauaia A. A 12-year prospective study of postinjury multipleorgan failure: has anything changed? Arch Surg. 2005;140:432–438; discussion, 438 – 440.
3. Heyland D, Mandell LA. Gastric colonization by gram-negativebacilli and nosocomial pneumonia in the intensive care unit patient.Evidence for causation. Chest. 1992;101:187–193.
4. Mentec H, Dupont H, Bocchetti M, Cani P, Ponche F, Bleichner G.Upper digestive intolerance during enteral nutrition in critically illpatients: frequency, risk factors, and complications. Crit Care Med.2001;29:1955–1961.
5. Hassoun HT, Kone BC, Mercer DW, Moody FG, Weisbrodt NW,Moore FA. Post-injury multiple organ failure: the role of the gut.Shock. 2001;15:1–10.
6. Helmer KS, West SD, Shipley GL, et al. Gastric nitric oxidesynthase expression during endotoxemia: implications in mucosaldefense in rats. Gastroenterology. 2002;123:173–186.
7. Dial EJ, Romero JJ, Villa X, Mercer DW, Lichtenberger LM.Lipopolysaccharide-induced gastrointestinal injury in rats: role ofsurface hydrophobicity and bile salts. Shock. 2002;17:77–80.
8. West SD, Suliburk JW, Smith GS, Mercer DW. Effects oflipopolysaccharide on gastric stasis: role of cyclo-oxygenase. DigDis Sci. 2006;51:754–765.
9. Taniguchi T, Shibata K, Yamamoto K. Ketamine inhibits endotoxin-induced shock in rats. Anesthesiology. 2001;95:928–932.
10. Suliburk JW, Gonzalez EA, Kennison SD, Helmer KS, Mercer DW.Differential effects of anesthetics on endotoxin-induced liver injury.J Trauma. 2005;58:711–716; discussion, 716–717.
11. Grishin A, Wang J, Hackam D, et al. p38 MAP kinase mediatesendotoxin-induced expression of cyclooxygenase-2 in enterocytes.Surgery. 2004;136:329–335.
12. Slomiany BL, Slomiany A. Role of ERK and p38 mitogen-activatedprotein kinase cascades in gastric mucosal inflammatory responsesto Helicobacter pylori lipopolysaccharide. IUBMB Life. 2001;51:315–320.
13. Castaneda AA, Denning JW, Chang L, Mercer DW. Doesupregulation of inducible nitric oxide synthase (iNOS) render thestomach more susceptible to damage? J Surg Res. 1999;84:174–179.
14. Nguyen A, Yaffe MB. Proteomics and systems biology approachesto signal transduction in sepsis. Crit Care Med. 2003;31(1 Suppl):S1–6.
15. Helmer KS, Cui Y, Chang L, Dewan A, Mercer DW. Effects ofketamine/xylazine on expression of tumor necrosis factor-alpha,inducible nitric oxide synthase, and cyclo-oxygenase-2 in rat gastricmucosa during endotoxemia. Shock. 2003;20:63–69.
16. Sun J, Wang XD, Liu H, Xu JG. Ketamine suppresses endotoxin-induced NF-kappaB activation and cytokines production in theintestine. Acta Anaesthesiol Scand. 2004;48:317–321.
17. Takenaka I, Ogata M, Koga K, Matsumoto T, Shigematsu A.Ketamine suppresses endotoxin-induced tumor necrosis factor alphaproduction in mice. Anesthesiology. 1994;80:402–408.
18. Adams HA. [S-(�)-ketamine. Circulatory interactions during totalintravenous anesthesia and analgesia-sedation]. Anaesthesist. 1997;46:1081–1087.
19. Taniguchi T, Takemoto Y, Kanakura H, Kidani Y, Yamamoto K.The dose-related effects of ketamine on mortality and cytokineresponses to endotoxin-induced shock in rats. Anesth Analg. 2003;97:1769–1772.
20. Sun J, Zhou ZQ, Lv R, Li WY, Xu JG. Ketamine inhibits LPS-induced calcium elevation and NF-kappa B activation in monocytes.Inflamm Re. 2004;53:304–308.
21. Suliburk JW, Helmer KS, Gonzalez EA, Robinson EK, Merar DW.Ketamine attenuates liver injury due to endotoxemia: role ofcyclooxygenase-2. Surgery. 2005;138:134–140.
22. Elia N, Tramer MR. Ketamine and postoperative pain-a quantitativesystematic review of randomised trials. Pain. 2005;113:61–70.
23. Jacobs DG, Jacobs DO, Kudsk KA, et al. Practice managementguidelines for nutritional support of the trauma patient. J Trauma.2004;57:660–678; discussion, 679.
24. Heyland DK, Dhaliwal R, Day A, Jain M, Drover J. Validation ofthe Canadian clinical practice guidelines for nutrition support inmechanically ventilated, critically ill adult patients: results of aprospective observational study. Crit Care Med. 2004;32:2260–2266.
Ketamine Attenuates Gastric Dysfunction
Volume 62 • Number 2 319
Relationship Between Release of �-Endorphin, Cortisol,and Trauma Severity in Children With Blunt Torso andExtremity TraumaHamit Okur, MD, Mustafa Kucukaydın, MD, Bulent Hayri Ozokutan, MD, Sabahattin Muhtaroglu, MD,Ahmet Kazez, MD, and Cuneyt Turan, MD
Purpose: To determine the levels of�-endorphin and cortisol in childrenwith multiple injuries and to determinewhether there is any difference betweenand compare the severity of trauma and�-endorphin and cortisol release as cal-culated using Pediatric Trauma Score(PTS).
Methods: During a 10-month period,80 children with multiple injuries admit-ted to a University Hospital’s PediatricSurgery Department were studied. Bloodsamples were obtained immediately at ad-mission and a PTS of each patient wascalculated. The correlation between PTS
and hormonal values were searched. Thechildren were classified into two groupsaccording to their PTS. Group 1 had PTS>8 and group 2 had PTS <8. The twogroups were also compared with respectto their �-endorphin and cortisol values.
Results: There was a linear correla-tion between �-endorphin and cortisolvalues and the injury severity. The levelswere higher in the patients with more se-vere injuries. There were 60 patients ingroup 1 and 20 patients in group 2. Theirages were 9.2 � 4.1 and 9.7 � 4.2 years,respectively (p > 0.05). The mean PTS forgroup 1 patients was 11 � 0.8 and for
group 2 patients was 7.4 � 1.2 (p < 0.001).The mean plasma �-endorphin concentra-tions were 124.4 � 114.4 pg/mL in group 1patients and 261.6 � 231.2 pg/mL in group2 (p < 0.001). The respective plasma cortisolconcentrations in the two groups were22.5 � 10.3 �g/dL and 30.8 � 17.2 �g/dL(p < 0.05), respectively.
Conclusions: The results of thisstudy show that the plasma �-endorphinand cortisol levels are elevated in childrenafter blunt trauma and the degree of ele-vation is related to the injury severity.
Key Words: Trauma, Pediatric, Stressresponse, Endorphin, Cortisol.
J Trauma. 2007;62:320–324.
Despite recent advances in prevention and treatment,trauma remains the leading cause of death among chil-dren. Traffic crashes are the most common cause in
almost all age groups.1 Patients with multiple injuries are atrisk for the development of multisystem organ failure (MOF).Increased concentrations and activity of some cytokines andother mediators are thought to be responsible for the MOFdevelopment.2–5 It is now known how endorphins play a rolein the pathogenesis of shock.6–8 Because of their potentopiate effects, they have the potential of producing importantcardiopulmonary perturbations, including bradycardia, hypo-tension, and respiratory depression. Recent evidence suggeststhat �-endorphin is released concomitantly with adrenocorti-cotropic hormone during stress and/or trauma. It is also likelythat the mobilization and release of �-endorphin is triggeredby many of the same environmental stimuli known to activate
the hypothalamic-pituitary-adrenal axis. Elevated serum en-dorphin and cortisol levels were observed in animals andhumans subjected to major stress.9,10 However, we could notdetect any study that investigated the relationship of endor-phins and cortisol in traumatized children. This study wasundertaken to measure the plasma �-endorphin and cortisollevels in children after blunt trauma and to determine whetherthere is any difference between the severity of trauma and the�-endorphin and cortisol changes as calculated using Pediat-ric Trauma Score (PTS).11
PATIENTS AND METHODSApproval for this study was obtained from the University
Research and Ethics Committees. During a 10-month period,all patients admitted to the university hospital after blunttrauma serious enough to warrant at least a 24-hour hospital-ization were studied prospectively. Patients with penetratingtrauma and those in which the time interval from injury toadmission was more than 180 minutes were excluded. Pa-tients who received analgesics before being evaluated by ourtrauma team were also excluded. Patients who underwentendotracheal intubation were not included into this studybecause they needed some sedative and neuromuscular block-ing agents to optimize conditions for intubation. Severe cen-tral nervous system injuries and comatose patients whoneeded emergency intubation and resuscitation also were notincluded. Patient demographics, nature and severity of theinjury, and admission clinical data were registered. Injury
Submitted for publication October 18, 2005.Accepted for publication March 24, 2006.Copyright © 2007 by Lippincott Williams & Wilkins, Inc.From the Department of Paediatric Surgery (H.O., M.K., C.T.) and the
Department of Biochemistry (S.M.), Erciyes University School of Medicine,Kayseri; the Department of Paediatric Surgery, Gaziantep University Schoolof Medicine (B.H.O.), Gaziantep; the Department of Paediatric Surgery,Fırat University School of Medicine (A.K.), Elazıg, Turkey.
Address for reprints: Prof. Hamit Okur, Erciyes Universitesi Tıp Fakul-tesi Cocuk Cerrahisi Anabilim Dalı, 38039, Kayseri, Turkey. E-mail:[email protected].
DOI: 10.1097/01.ta.0000222714.91463.a3
The Journal of TRAUMA� Injury, Infection, and Critical Care
320 February 2007
severity was assessed using the PTS (Table 1). Children witha PTS of 8 or less are considered severely injured and shouldbe transported to and treated in a pediatric trauma center.Patients were classified into two groups according to theirPTS: group 1 had PTS �8 and group 2 had PTS �8.
Blood samples were immediately obtained at admissionand analyzed for �-endorphin and cortisol levels as well asstandard laboratory tests. Plasma samples for �-endorphinwere collected in plastic tubes containing ethylenediaminetet-raacetic and aprotinin (Trasylol) and stored at �70° C forsubsequent assay. Radioimmunoassay study was used tomeasure plasma concentrations of cortisol (Cortisol RIA kit,Amerlex, Amersham, UK) and �-endorphin (Nichols Insti-tute Diagnostics BV, Wijchen, The Netherlands). The refer-ence value for �-endorphin was below 126 pg/mL, with amean value of 29 pg/mL. The reference value for cortisol wasbetween 3 and 24 �g/dL.
The correlation between the entire range of PTS and thelevels of �-endorphin and cortisol were investigated usingregression analysis. The two groups were also compared withrespect to their �-endorphin and cortisol values. Data arepresented as mean values � standard deviation, and p valuesof 0.05 or less were considered statistically significant.
RESULTSDuring a 10-month period, 80 pediatric trauma patients
were included in this study. The mean age was 9.3 � 3.9years (range, 5 months to 16 years). There were 51 boys and29 girls. There were 60 patients in group 1, and 20 patients ingroup 2. The most frequent cause of trauma was motorvehicle crash and fall in both groups. Demographic data,causes of injury, injury sites, and clinical characteristics ofeach group are listed in Tables 2 and 3. Comparison of ageand time elapsed from injury until arrival at the hospitalrevealed no statistical differences between the two groups.
The PTS for group 1 patients ranged from 9 to 12, witha mean of 11 � 0.8. Patients in group 2 had a mean PTS of7.4 � 1.2, with a range of 4 to 8. The mean PTS values of thetwo groups had a statistically significant difference (p � 0.001).The mean plasma �-endorphin concentrations were 124.4 �114.4 pg/mL (range, 17.5–790.9) in group 1 patients and261.6 � 231.2 pg/mL (range, 38.0–765.1) in group 2 pa-tients. The difference was statistically significant (p �0.001). The mean plasma cortisol concentrations in the two
groups were 22.5 � 10.3 �g/dL (range, 13.0–56.3 �g/dL)and 30.8 � 17.2 �g/dL (range, 21.1–93.1 �g/dL), respec-tively; the difference was also significant (p � 0.05). Serum�-endorphin and cortisol values were significantly correlatedwith measures indicating the severity of injury. In otherwords, lower �-endorphin and cortisol levels were associatedwith higher PTS values. Patients in group 1 had higher initialblood pressure levels and lower heart rates. There were sig-nificant differences between the two groups in blood pres-sures (p � 0.01) and heart rates (p � 0.01) at admission(Table 2). Decreased systolic blood pressure was among thefactors that yielded a low PTS in group 2 patients.
The �-endorphin and cortisol values were compared withthe entire range of PTS using regression analysis, and thecorrelation was found for these two hormones. The resultswere greater in more severely injured children than in lessseverely injured ones (Figs. 1 and 2).
Thirteen patients in group 1 and 15 patients in group 2required urgent or emergency surgical intervention (laparotomy,tube thoracostomy, orthopedic or urologic procedures, or com-binations) (Table 4). Surgically treated patients in both groups
Table 1 Pediatric Trauma Score (11)
ComponentCategory
�2 �1 �1
Size (kg) �20 10–20 �10Airway Normal Maintainable UnmaintainableSystolic blood pressure (mm Hg) �90 90–50 �50Central nervous system Awake Obtunded/loss of consciousness Coma/decerebrateSoft tissue injury None Minor Major/penetratingSkeletal None Closed fracture Open/multiple fractures
Table 2 Clinical Characteristics of the Two Groups
Group 1(PTS �8)
Group 2(PTS �8)
Mean age (years) 9.2 � 3.9 9.7 � 4.2Gender (n)
Boys 41 10Girls 19 10
Mechanism of injury (n)Motor vehicle crash,
pedestrian18 8
Motor vehicle crash,occupant
15 7
Falls 20 2Bicycle 3 2Others 2 1
Time elapsed from injury toarrival (min)
135.8 � 53.2 131.4 � 49.7
Initial systolic bloodpressure (mm Hg)
98.3 � 8.1 68.9 � 17.6*
Initial heart rate (beats/min) 108.1 � 18.6 127.7 � 32.2*Pediatric trauma score 11 � 0.8 7.4 � 1.2*Length of hospital stay (days) 7.22 � 6 14.5 � 13.7*
Values are expressed as mean � standard deviation.* p � 0.01.
�-Endorphin, Cortisol, and Trauma Severity
Volume 62 • Number 2 321

were also compared according to the hormonal values. Themean plasma �-endorphin concentrations for surgically treatedpatients were 115.6 � 103.7 pg/mL in group 1 and 278.3 �
233.7 pg/mL in group 2 (p � 0.05). The mean plasma cortisolconcentrations for the surgically treated patients in the twogroups were 21.6 � 6.4 �g/dL and 34.2 � 19.1 �g/dL, respec-tively, and the difference was also significant (p � 0.05). One ofthe children in group 2 with a PTS of 4 died because of MOF.
DISCUSSIONHormonal responses to stress and critical illnesses such
as trauma, burns, and septic shock have been described inadults. The stress response to injury is mediated through thehypothalamus and is mainly characterized by the release ofcatabolic hormones such as catecholamines, glucocorticoids,growth hormone, glucagons, and the suppression of insulinsecretion. These hormonal changes are responsible for met-abolic changes leading to catabolism, substrate mobilization,and immunologic alterations.9,12 It is well known that �-endorphin and cortisol are released concomitantly in responseto stressful stimuli. The secretion of cortisol in stress may beclosely interrelated to endorphin release. Elevated serum en-dorphin and cortisol levels were observed in animals andhumans subjected to major stress.8–10 However, no previousstudy addresses the relationship between trauma and plasmalevels of endorphins and cortisol. The present study showsthat there is a simultaneous increase in plasma �-endorphinand cortisol levels in pediatric trauma patients.
Table 3 Injury Sites and Patient Characteristics
Group 1(PTS �8)
Group 2(PTS �8)
Open wound (n)Minor 2 —Major 2 —
Skeletal (n)Closed fracture 6 1Open/multiple fractures 1 3Pelvic fracture 6 8
Thorax (n)Hemothorax 3 2Pneumothorax — 1Contusion 1 3
Abdomen (n)Liver 8 3Spleen 7 5Pancreas 1 1Stomach — 1Bowel 1 2
Genitourinary (n)Kidney 6 2Bladder 2 1Urethra 3 1
Fig. 1. Correlation between �-endorphin levels and PTS in 80 patients. There is an inverse correlation between PTS and �-endrophin values.Comparison by regression analysis (Y � �0.009 � 11.58�; R2 � 0.41; p � 0.001).
The Journal of TRAUMA� Injury, Infection, and Critical Care
322 February 2007
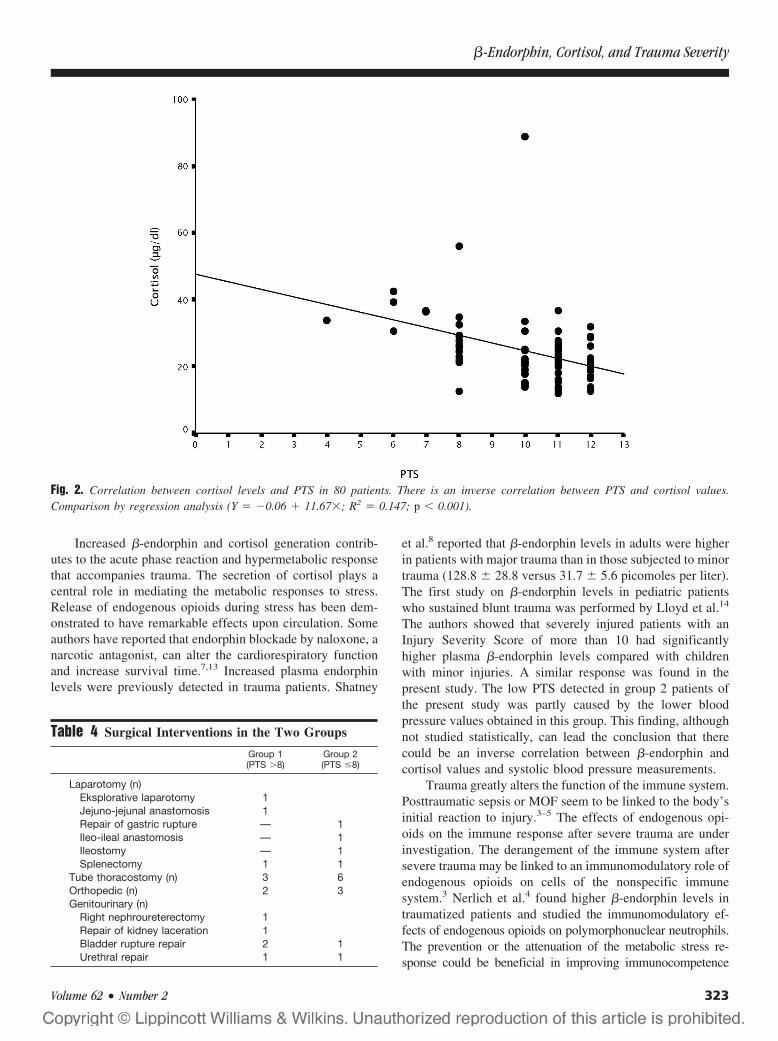
Increased �-endorphin and cortisol generation contrib-utes to the acute phase reaction and hypermetabolic responsethat accompanies trauma. The secretion of cortisol plays acentral role in mediating the metabolic responses to stress.Release of endogenous opioids during stress has been dem-onstrated to have remarkable effects upon circulation. Someauthors have reported that endorphin blockade by naloxone, anarcotic antagonist, can alter the cardiorespiratory functionand increase survival time.7,13 Increased plasma endorphinlevels were previously detected in trauma patients. Shatney
et al.8 reported that �-endorphin levels in adults were higherin patients with major trauma than in those subjected to minortrauma (128.8 � 28.8 versus 31.7 � 5.6 picomoles per liter).The first study on �-endorphin levels in pediatric patientswho sustained blunt trauma was performed by Lloyd et al.14
The authors showed that severely injured patients with anInjury Severity Score of more than 10 had significantlyhigher plasma �-endorphin levels compared with childrenwith minor injuries. A similar response was found in thepresent study. The low PTS detected in group 2 patients ofthe present study was partly caused by the lower bloodpressure values obtained in this group. This finding, althoughnot studied statistically, can lead the conclusion that therecould be an inverse correlation between �-endorphin andcortisol values and systolic blood pressure measurements.
Trauma greatly alters the function of the immune system.Posttraumatic sepsis or MOF seem to be linked to the body’sinitial reaction to injury.3–5 The effects of endogenous opi-oids on the immune response after severe trauma are underinvestigation. The derangement of the immune system aftersevere trauma may be linked to an immunomodulatory role ofendogenous opioids on cells of the nonspecific immunesystem.3 Nerlich et al.4 found higher �-endorphin levels intraumatized patients and studied the immunomodulatory ef-fects of endogenous opioids on polymorphonuclear neutrophils.The prevention or the attenuation of the metabolic stress re-sponse could be beneficial in improving immunocompetence
Fig. 2. Correlation between cortisol levels and PTS in 80 patients. There is an inverse correlation between PTS and cortisol values.Comparison by regression analysis (Y � �0.06 � 11.67�; R2 � 0.147; p � 0.001).
Table 4 Surgical Interventions in the Two Groups
Group 1(PTS �8)
Group 2(PTS �8)
Laparotomy (n)Eksplorative laparotomy 1Jejuno-jejunal anastomosis 1Repair of gastric rupture — 1Ileo-ileal anastomosis — 1Ileostomy — 1Splenectomy 1 1
Tube thoracostomy (n) 3 6Orthopedic (n) 2 3Genitourinary (n)
Right nephroureterectomy 1Repair of kidney laceration 1Bladder rupture repair 2 1Urethral repair 1 1
�-Endorphin, Cortisol, and Trauma Severity
Volume 62 • Number 2 323
and minimizing complications after major trauma so that anearlier return to normal health could be achieved.3,4,15,16
Several different injury severity scoring scales have beenused to assist in determining the triage of patients and also toimprove the prognosis.11,17 The PTS, which was developedby Tepas et al., is among the generally accepted methods fortriage.18,19 This scale takes into account the size of the child,the status of the airway, the central nervous system, and thesystolic blood pressure, as well as the presence of an openwound and the extent of a skeletal injury. PTS demands thatchildren with a score of 8 or less should be transported to andtreated in a pediatric trauma center. PTS classification per-formed in the present study demonstrated that group 2 pa-tients (PTS �8) had higher levels of �-endorphin and cortisolthan in group 1 patients (PTS �8).
The results of this study show that plasma �-endorphinand cortisol levels are elevated in children after trauma andthe degree of elevation is related to the magnitude of thetrauma. The raised �-endorphin and cortisol levels couldreflect part of the stress response subsequent to trauma.
REFERENCES1. Haller JA. Emergency medical services for children: what is the
pediatric surgeon’s role? Pediatrics. 1987;79:576–581.2. Harris BH, Gelfand JA. The immune response to trauma. Semin
Pediatr Surg. 1995;4:77–82.3. Mannick JA. Trauma, sepsis and immune defects. In: Faist E,
Meakins J, Schildberg FW, eds. Host defense dysfunction in Trauma,Shock and Sepsis. Berlin: Springer, 1993;15–21.
4. Nerlich ML, Holch M, Stalp M, et al. Neuropeptide levels early aftertrauma: immunomodulatory effects? J Trauma. 1994;37:759–768.
5. Svoboda P, Kantorova I, Ochmann J. Dynamics of interleukin 1,2,and 6 and tumor necrosis factor alpha in multiple trauma patients.J Trauma. 1994;36:336–340.
6. Gurll NJ, Vargish T, Reynolds DG, et al. Opiate receptors andendorphins in the pathophysiology of hemorrhagic shock. Surgery.1980;89:364–369.
7. Holaday JW, Faden AI. Naloxone reversal of endotoxin hypotensionsuggests role of endorphins in shock. Nature. 1978;275:450–451.
8. Shatney CH, Cohen RM, Cohen MR. Endogenous opioid activity inclinical hemorrhagic shock. Surg Gynecol Obstet. 1985;160:547–551.
9. Anand KJS. The stress response to surgical trauma: fromphysiological basis to therapeutic implications. Prog Food Nutr Sci.1986;10:67–132.
10. Okur H, Kucukaydın M, Muhtaroglu S, et al. Effects of bupivacaineinfiltration on beta-endorphin and cortisol release and postoperativepain following inguinal herniorrhaphy in children. Pediatr Surg Int.1996;11:41–44.
11. Tepas JJ, Mollitt DL, Talbert JL, et al. The pediatric trauma score asa predictor of injury severity in the injured child. J Pediatr Surg1987;22:14–18.
12. Eyer SD, Micon LT, Konstantinides FN, et al. Early enteral feedingdoes not attenuate metabolic response after blunt trauma. J Trauma.1993;34:639–644.
13. Albert SA, Shires GT III, Illner H, Shires GT. Effects of naloxone inhemorrhagic shock. Surg Gynecol Obstet. 1982;155:326–332.
14. Lloyd DA, Teich S, Rowe MI. Serum endorphin levels in injuredchildren. Surg Gynecol Obstet. 1991;172:449–452.
15. Bessey PQ, Lowe KA. Early hormonal changes affect the catabolicresponse to trauma. Ann Surg. 1993;218:476–489.
16. Plank LD, Hill GL. Sequential metabolic changes followinginduction of systemic inflammatory response in patients with severesepsis or major blunt trauma. World J Surg. 2000;24:630–638.
17. Hannan EL, Farrell LS, Meaker PS, Cooper A. Predicting inpatientmortality for pediatric trauma patients with blunt injuries: a betteralternative. J Pediatr Surg. 2000;35:155–159.
18. Paar O, Kasperk R. The significance of multiple trauma in children.Eur J Pediatr Surg. 1992;2:345–347.
19. Yurt RW. Triage, initial assessment, and early treatment of thepediatric trauma patient. Pediatr Clin N Am. 1992;39:1083–1091.
EDITORIAL COMMENTDr. Okur and colleagues present fascinating data that
may provide a glimpse of future care of severely injuredpatients of all ages. The clear relationship between injuryseverity as manifest by a clinical triage scoring system andmetabolic derangement as defined by elevation of serum�-endorphins and cortisol validate the PTS as a triage tool.Biomarkers affirm what has been previously established byclinical observation. Review of the distribution of injurytypes listed for both groups likewise reinforces the cumula-tive effect of multisystem injury. What is interesting aboutthis study is not its validation of a clinical triage tool, butrather its introduction of the use of acute phase biomarkers todefine injury severity and imply both prognosis and resourceutilization. A glimpse into the future suggests that trendanalysis and computed area under the curve of these and otherbiomarkers will not only define initial injury severity, butmay also track the process of recovery. They may even reflectthe results of various therapeutic interventions, thereby sup-porting clinical trials and determination of best practice.
The authors’ selection of biomarkers is also of interest.Cortisol ubiquitously reflects the stimulation of a stress re-sponse. �-endorphin, however, is the intrinsic modulator thatsustains the stressed organism by ameliorating the stress re-sponse and, in cases of overwhelming stress, blunting responseas the organism fails. Cortisol is stimulated by adrenocortico-tropic hormone, which is cleaved from pro-opiomalanocortin.Pro-opiomalanocortin is produced in the pituitary gland and inthe arcuate nucleus of the hypothalamus. Its other cleavageproduct is �-endorphin. The elevation of both of these biomar-kers thus reflects activation of the same biochemical pathway.Because plasma �-endorphin released by the pituitary does notreadily cross the blood-brain barrier, the central nervous systemeffect of �-endorphin is primarily related to that elaborated bythe hypothalamus. Plasma endorphin levels are thus an indirectreflection of what is happening in the brain. Since both cortisoland �-endorphin appear to reflect severity of injury from differ-ent perspectives, they may also reflect the effect of proper andtimely therapy. This is exciting work that should be validatedwith a larger study. It may be the harbinger of a new level ofprecision in understanding and treating the injured child.
Joseph J. Tepas III, MDUniversity of Florida Health Science CenterGainesville, Florida
The Journal of TRAUMA� Injury, Infection, and Critical Care
324 February 2007
Immediate Postoperative Complications of CombinedPenetrating Rectal and Bladder InjuriesPaul L. Crispen, MD, Bryan T. Kansas, MD, Paola G. Pieri, MD, Carol Fisher, BA, John P. Gaughan, PhD,Abhijit S. Pathak, MD, Jack H. Mydlo, MD, and Amy J. Goldberg, MD
Background: Combined penetratingtrauma involving the rectum and bladderhas been associated with increased post-operative morbidity. Specific complica-tions resulting from these injuries includecolovesical fistula, urinoma, and abscessformation.
Methods: A retrospective review ofTemple University Hospital trauma data-base was performed. Patients were cate-gorized by having an isolated rectal (n �29), isolated bladder (n � 16), or com-bined injury (n � 24). Records were re-viewed for sex, age, site of injury, locationof rectal and bladder injuries, operativeintervention, fistula formation, urinomaformation, abscess formation, time to uri-
nary catheter removal, length of intensivecare unit stay, and length of hospital stay.
Results: Patient sex and age did notdiffer significantly between groups, norwas there a significant difference in loca-tion of rectal injury between groups. Pre-sacral drainage was utilized in all patientswith extraperitoneal injuries. Fecal diver-sion was performed in all patients, excepttwo with intraperitoneal rectal injuries.Omental flap interposition between rectaland bladder injuries was utilized in onepatient. No significant difference was notedin immediate postoperative complicationsbetween groups including fistula, uri-noma, and abscess formation. However,all cases of colovesical fistula (n � 2) and
urinoma (n � 2) formation were noted inthose patients with rectal and posteriorbladder injuries.
Conclusions: Combined rectal andbladder injuries were not associated withan increase in immediate postoperativecomplications compared with isolatedrectal and bladder injuries. However,postoperative fistula and urinoma forma-tion occurred only in patients with a com-bined rectal and posterior bladder injury.Consequently, these patients may benefitfrom omental flap interposition betweeninjuries to decrease fistula and urinomaformation.
Key Words: Rectal, Bladder, Postop-erative complications.
J Trauma. 2007;62:325–329.
Injuries sustained from transpelvic gunshots are challeng-ing to manage because of complex pelvic anatomy andmultiple-organ system involvement.1 Treatment of multi-
ple pelvic injuries resulting from a gunshot injury will oftenrequire complex reconstruction, which can lead to a greaterpotential for postoperative complications. Because combinedpenetrating rectal and bladder injuries resulting from gunshotwounds are uncommon, the complications associated with therepair of combined injuries are not well defined.
Although the treatment of bladder injuries is wellestablished,2–4 the treatment of penetrating rectal injuriescontinues to evolve. Combat injuries during World War IIand the Vietnam War advocated the role of fecal diversion,rectal wound repair, distal rectal washout (DRWO), and pre-sacral drainage. The implementation of this approach greatlyreduced the morbidity and mortality associated with rectal
injuries obtained in combat. However, modern series review-ing civilian casualties, resulting from less destructive projec-tiles, have questioned the need for DRWO and presacraldrainage.5–7 Although DRWO and presacral drainage wereimplemented to decrease infectious complications, some sur-geons think these procedures may actually increase the risk ofinfection.8
Combined injuries involving the rectum and bladder maypredispose patients to an increased rate and/or specific post-operative complications. Theoretically the close proximity ofthe repair sites may lead to impaired wound healing, with acomplication of one repair site affecting the healing of theother repair site. A previous report has suggested an increasedrate of postoperative complications in patients with combinedrectal and urinary injuries.9
To date, there is no consensus regarding the managementof combined rectal and bladder injuries, nor is there evidenceto support that they be managed differently from isolatedinjuries. Potential complications specific to these injuriesinclude the development of rectovesical fistula, urinomas,and pelvic abscess. To determine whether the treatment ofcombined rectal and bladder injuries is associated with in-creased morbidity, and to evaluate if location of rectal orbladder injuries are associated with increased postoperativecomplications, we reviewed and compared the managementand outcomes of patients with isolated rectal and bladderinjuries to patients with combined injuries at an urban LevelI trauma center.
Submitted for publication June 3, 2005.Accepted for publication May 25, 2006.Copyright © 2007 by Lippincott Williams & Wilkins, Inc.From the Departments of Urology (P.L.C., B.T.K., J.H.M.), Surgery
(P.G.P., A.S.P., A.J.G.), and Biostatistics (J.P.G.), Temple University Schoolof Medicine, Philadelphia, PA.
Presented at the Philadelphia Urologic Society Resident Essay Com-petition, April 2005, Philadelphia, PA.
Address for reprints: Paul L. Crispen, MD, Department of Urology,Temple University Hospital, 3400 North Broad Street, Philadelphia, PA19140; email: [email protected].
DOI: 10.1097/01.ta.0000231767.20289.bc
The Journal of TRAUMA� Injury, Infection, and Critical Care
Volume 62 • Number 2 325
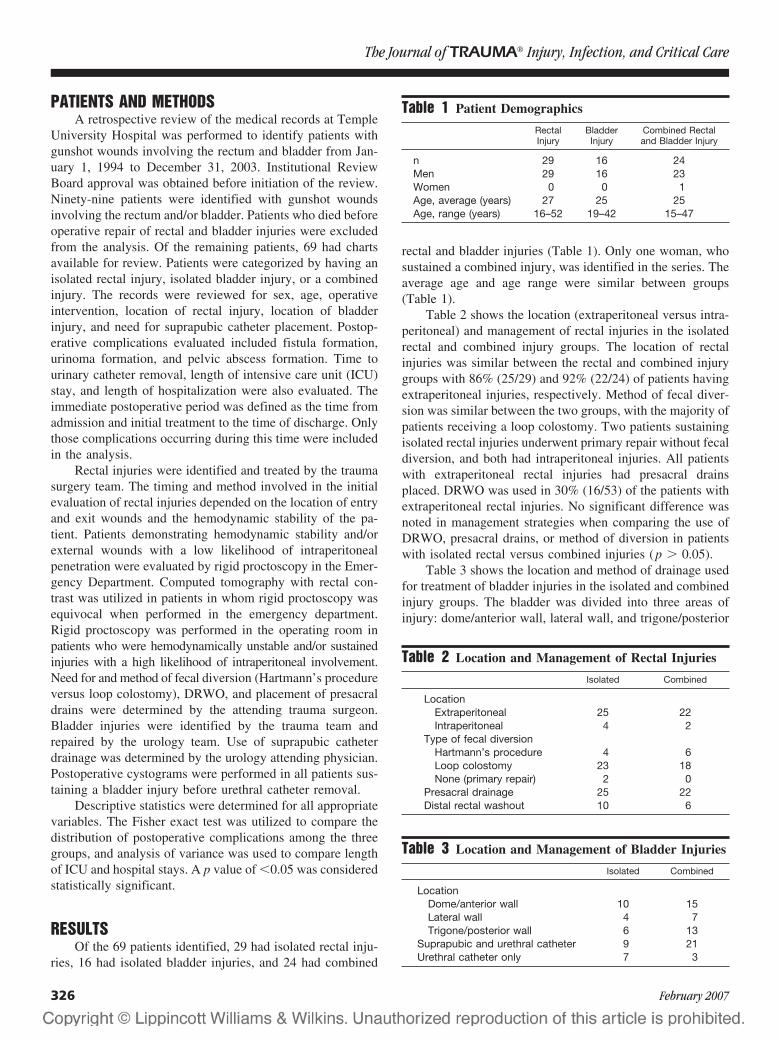
PATIENTS AND METHODSA retrospective review of the medical records at Temple
University Hospital was performed to identify patients withgunshot wounds involving the rectum and bladder from Jan-uary 1, 1994 to December 31, 2003. Institutional ReviewBoard approval was obtained before initiation of the review.Ninety-nine patients were identified with gunshot woundsinvolving the rectum and/or bladder. Patients who died beforeoperative repair of rectal and bladder injuries were excludedfrom the analysis. Of the remaining patients, 69 had chartsavailable for review. Patients were categorized by having anisolated rectal injury, isolated bladder injury, or a combinedinjury. The records were reviewed for sex, age, operativeintervention, location of rectal injury, location of bladderinjury, and need for suprapubic catheter placement. Postop-erative complications evaluated included fistula formation,urinoma formation, and pelvic abscess formation. Time tourinary catheter removal, length of intensive care unit (ICU)stay, and length of hospitalization were also evaluated. Theimmediate postoperative period was defined as the time fromadmission and initial treatment to the time of discharge. Onlythose complications occurring during this time were includedin the analysis.
Rectal injuries were identified and treated by the traumasurgery team. The timing and method involved in the initialevaluation of rectal injuries depended on the location of entryand exit wounds and the hemodynamic stability of the pa-tient. Patients demonstrating hemodynamic stability and/orexternal wounds with a low likelihood of intraperitonealpenetration were evaluated by rigid proctoscopy in the Emer-gency Department. Computed tomography with rectal con-trast was utilized in patients in whom rigid proctoscopy wasequivocal when performed in the emergency department.Rigid proctoscopy was performed in the operating room inpatients who were hemodynamically unstable and/or sustainedinjuries with a high likelihood of intraperitoneal involvement.Need for and method of fecal diversion (Hartmann’s procedureversus loop colostomy), DRWO, and placement of presacraldrains were determined by the attending trauma surgeon.Bladder injuries were identified by the trauma team andrepaired by the urology team. Use of suprapubic catheterdrainage was determined by the urology attending physician.Postoperative cystograms were performed in all patients sus-taining a bladder injury before urethral catheter removal.
Descriptive statistics were determined for all appropriatevariables. The Fisher exact test was utilized to compare thedistribution of postoperative complications among the threegroups, and analysis of variance was used to compare lengthof ICU and hospital stays. A p value of �0.05 was consideredstatistically significant.
RESULTSOf the 69 patients identified, 29 had isolated rectal inju-
ries, 16 had isolated bladder injuries, and 24 had combined
rectal and bladder injuries (Table 1). Only one woman, whosustained a combined injury, was identified in the series. Theaverage age and age range were similar between groups(Table 1).
Table 2 shows the location (extraperitoneal versus intra-peritoneal) and management of rectal injuries in the isolatedrectal and combined injury groups. The location of rectalinjuries was similar between the rectal and combined injurygroups with 86% (25/29) and 92% (22/24) of patients havingextraperitoneal injuries, respectively. Method of fecal diver-sion was similar between the two groups, with the majority ofpatients receiving a loop colostomy. Two patients sustainingisolated rectal injuries underwent primary repair without fecaldiversion, and both had intraperitoneal injuries. All patientswith extraperitoneal rectal injuries had presacral drainsplaced. DRWO was used in 30% (16/53) of the patients withextraperitoneal rectal injuries. No significant difference wasnoted in management strategies when comparing the use ofDRWO, presacral drains, or method of diversion in patientswith isolated rectal versus combined injuries (p � 0.05).
Table 3 shows the location and method of drainage usedfor treatment of bladder injuries in the isolated and combinedinjury groups. The bladder was divided into three areas ofinjury: dome/anterior wall, lateral wall, and trigone/posterior
Table 1 Patient Demographics
RectalInjury
BladderInjury
Combined Rectaland Bladder Injury
n 29 16 24Men 29 16 23Women 0 0 1Age, average (years) 27 25 25Age, range (years) 16–52 19–42 15–47
Table 2 Location and Management of Rectal Injuries
Isolated Combined
LocationExtraperitoneal 25 22Intraperitoneal 4 2
Type of fecal diversionHartmann’s procedure 4 6Loop colostomy 23 18None (primary repair) 2 0
Presacral drainage 25 22Distal rectal washout 10 6
Table 3 Location and Management of Bladder Injuries
Isolated Combined
LocationDome/anterior wall 10 15Lateral wall 4 7Trigone/posterior wall 6 13
Suprapubic and urethral catheter 9 21Urethral catheter only 7 3
The Journal of TRAUMA� Injury, Infection, and Critical Care
326 February 2007

wall. There was no significant difference in bladder injurylocation between isolated bladder and combined injurygroups. There was a trend toward increased use of suprapubiccatheters in the combined injury group 88% (21/24) com-pared with the isolated injury group 56% (9/16; p � 0.059).All patients with bladder injuries maintained a urethral cath-eter regardless of suprapubic catheter placement.
Immediate postoperative complications by category ofinjury are listed in Table 4. Postoperative fistula and urinomaformation were only noted in the combined injury group, butno statistical significance was found between groups (p �0.17). Fistula and urinoma formation were noted during post-operative cystograms before urethral catheter removal. Bothurinomas were discovered on postoperative day 10, whereasthe two postoperative fistulas were noted on postoperativedays 10 and 11. All patients developing a fistula or urinomahad a posterior bladder injury and were managed with both aurethral and suprapubic catheter. None of the patients whodeveloped a postoperative fistula or urinoma underwentDRWO during the initial surgical procedure. However, theincidence of fistula and urinoma formation was not signifi-cantly different in combined injury patients who did notundergo DRWO compared with patients in which DRWOwas performed during the initial surgical procedure (p �0.54). To determine whether posterior bladder injuries influ-enced the rate of postoperative complications in the combinedinjury group, the combined injury group was divided into twogroups based upon the presence or absence of a posteriorbladder injury. No statistically significant difference wasnoted between groups with respect to either fistula formation(p � 0.48) or urinoma formation (p � 0.48). Suprapubiccatheter placement did not decrease fistula or urinoma for-mation in patients sustaining isolated bladder or combinedinjuries (p � 1.00). Pelvic abscess formation was noted intwo patients, both occurring in the isolated rectal injurygroup. Computed tomography scan diagnosed both patientswith pelvic abscesses on postoperative days 9 and 12, respec-tively. One of these patients had an intraperitoneal rectalinjury which was repaired primarily without fecal diversion;the second patient sustained an extraperitoneal injury and wasinitially treated with a diverting colostomy only. Time tourinary catheter removal was similar between the isolatedbladder and combined injury groups (10.9 � 5.2 days versus11.0 � 4.2 days, p � 0.95). Length of ICU stay and length oftotal hospitalization were compared between the three injurygroups (Table 5). No statistically significant difference wasnoted for ICU stay (p � 0.67) or hospital stay (p � 0.30).
DISCUSSIONTreatment standards for the surgical management of
combined penetrating rectal and bladder injuries remain un-defined. Similarly, the occurrence of postoperative compli-cations in this patient population is not well established. Ourexperience with 24 combined rectal and bladder injuries is thelargest series to date, and it is the first to directly comparepostoperative complications of isolated injuries to combinedinjuries. Standard surgical management of isolated rectal andbladder injuries were used to treat combined injuries. Nodifference was noted in the development of immediate post-operative complications in patients with isolated rectal, iso-lated bladder, and combined injuries in this series. However,fistula and urinoma formation only developed in patients withcombined rectal and posterior bladder injuries.
The overall postoperative complication rates in our entirepatient population was relatively low when compared withpreviously published reports that examined isolated rectal andbladder injuries. The observed rate of rectovesical fistulaformation and abscess formation in our series was 4% (2/53)each, in patients sustaining a rectal injury. These results arewithin the range reported by Gonzalez et al. in their discus-sion of postoperative complications in patients with penetrat-ing rectal injuries.6 In their review, abscess and rectal fistulaformation developed in 0% to 27% and 0% to 18% of pa-tients, respectively.
The overall occurrence of postoperative urinoma forma-tion in our series was 5% (2/40) from the isolated bladder andcombined injury groups. This rate is also consistent with thepercentage of urinomas noted in prior reported series, whichranged from 0% to 5%.10,11 In our series, suprapubic catheterdrainage of bladder injury did not decrease the risk of post-operative complications in patients with isolated bladder orcombined injuries. This finding is also in agreement withother studies,10,12 suggesting that suprapubic catheter useshould be reserved for cases in which long term catheteriza-tion is anticipated and/or repair is extensive or incomplete.4
The postoperative complication rates noted in our com-bined injury patients were observed to be lower than thosepreviously reported in the literature. Franko et al. reportedtheir experience with 17 combined rectal and genitourinaryinjuries.9 In their series, a significant rate of postoperativecomplications was noted. Overall abscess formation occurredin 18%, and rectovesical or rectourethral fistula in 24% ofpatients. In those patients whose genitourinary injury waslimited to the bladder, the incidence of fistula formation was
Table 4 Immediate Postoperative Complications
Rectal Bladder Combined p Value*
Fistula formation 0 0 2 0.17Urinoma formation 0 0 2 0.17Abscess formation 2 0 0 0.17
* Fisher exact test.
Table 5 Length of ICU and Hospital Stay
IsolatedRectal
IsolatedBladder Combined p Value*
ICU (days) 2.3 � 4.8 3.1 � 7.1 3.7 � 5.6 0.67Hospital (days) 11.2 � 6.6 10.8 � 7.7 14.6 � 11.6 0.30
Data are means � standard deviations.* Fisher exact test.
Combined Penetrating Rectal and Bladder Injuries
Volume 62 • Number 2 327
15%. All cases of fistula formation were noted as long-termcomplications, but the actual length of follow up and time tofistula development were not defined. The authors correlatedthese complications with failure to perform presacral drain-age, DRWO, rectal wound repair, and interposition of wellvascularized tissue between the rectal and genitourinarywounds. In another series, Velmahos et al. noted a 33% rateof bladder injuries associated with extraperitoneal rectal gun-shot wounds.5 Of the 10 patients in this series with combinedinjuries, 20% developed postoperative fistulae (one rectoves-ical and one rectocutaneous). The use of presacral drains andrectal wound repair in this study demonstrated a trend towarddecreased postoperative complication rate in patients withcombined injuries, but did not reach statistical significance.The observed high rate of postoperative fistula formation incombined rectal and bladder injuries led the authors to advo-cate the interposition of an omental flap between the rectaland bladder repair sites.
Only one patient in our series with a combined injury hadan omental flap placed between repair sites. This patient hadan extraperitoneal rectal injury, anterior and posterior bladderinjuries, and no postoperative complications. The four pa-tients with combined injuries in our series who developed apostoperative fistula or urinoma had posterior bladder injuriesand did not have omental flap interpositions between injurysites. It is intuitive to predict that patients with combinedinjuries involving the posterior bladder would be at increasedrisk of fistula and/or urinoma formation and may benefit fromomental flap interposition secondary to close proximity of therepair sites.
Omental flap interposition has been well describedand utilized in pelvic surgery involving both gastrointes-tinal and genitourinary reconstruction.13 Proposed benefitsof omental grafts when used in colorectal surgery includeassistance in local wound healing and decreased septiccomplications.14 The rich lymphatic and vascular supplyof the omentum make it an ideal soft-tissue graft. Toestablish a well-vascularized graft, knowledge of the com-mon anatomic variants of the omental vasculature is nec-essary. Blood supply can be maintained by using either theright or left gastroepiploic artery as the main vasculartributary. Once adequate graft length has been established,interposition of the graft can be performed separating therectal and bladder injuries. Care should be taken to avoidtension or torsion of graft as it is positioned into the pelvis.Although the theory and practice of omental interpositionis widely accepted, to date there is no conclusive evidenceto support or refute its utility in pelvic surgery.15
The value of presacral drains in penetrating rectal traumais controversial. Routine use of presacral drains in the man-agement of penetrating rectal trauma was implemented in anattempt to decrease postoperative soft-tissue infections. Sev-eral contemporary studies have investigated the efficacy androle of presacral drain placement in extraperitoneal gunshotwounds, none of which demonstrated a significant de-
crease in postoperative infection with their placement.5–7
The need for presacral drainage is particularly questionedwhen the rectal injury has been primarily repaired.8 Addi-tional criticism of presacral drainage includes the need foran additional incision, dissection of a potentially unin-vaded space, and the need for intraoperative patientrepositioning.5 All patients in our series with extraperito-neal rectal injuries had presacral drains placed. Becausepresacral drainage was utilized in all patients with extra-peritoneal rectal injuries, the influence of presacral drain-age could not be investigated.
There are several limitations of our study that may haveinfluenced our results. First it is a retrospective review, andthe duration of follow up in our series was limited to the timefrom admission to discharge. Complications developing afterthis time may have significantly altered our findings. This isa major limitation of the present study and introducessignificant bias to our reported rate of fistula and urinomaformation, especially in patients who will ultimately de-velop fistulas or urinomas after urethral catheter removal.Additionally, the surgical approach utilized in managingcombined and isolated injuries was not standardized, whichmakes the interpretation of incidence of complications diffi-cult to accurately interpret. Furthermore, although our seriesis the largest to date, the sample size remains small leading toa potentially underpowered study, especially when makingcomparisons between isolated and combined injuries. Lastly,size and or severity of rectal injury was not considered, whichmay have appreciably influenced the incidence of postoper-ative complications in our population. To accurately deter-mine whether combined rectal and posterior bladder injurieshave a higher rate of fistula and urinoma formation, and ifomental flap interposition is beneficial in this setting, a ran-domized prospective study comparing patients with com-bined injuries being treated with or without omental flapinterposition would be necessary. Nonetheless, our seriessuggests that patients with combined rectal and posteriorbladder injuries are at increased risk for postoperative fistulaand urinoma formation.
CONCLUSIONSIn our series, patients sustaining combined penetrating
injuries to the rectum and bladder did not have an increasedrate of immediate postoperative complications compared withisolated injuries. All cases of postoperative fistula and uri-noma formation occurred in patients with combined rectaland posterior bladder injuries. Our study design did not per-mit the assessment of presacral drainage, nor omental flapinterposition in the prevention of postoperative fistula orurinoma formation. Further randomized studies are needed tofully evaluate the efficacy of presacral drainage and omentalflap interposition in patients with combined rectal and blad-der injuries.
The Journal of TRAUMA� Injury, Infection, and Critical Care
328 February 2007
REFERENCES1. Duncan AO, Phillips TF, Scalea TM, et al. Management of
transpelvic gunshot wounds. J Trauma. 1989;29:1335–1340.2. Baniel J, Schein M. The management of penetrating trauma to the
urinary tract. J Am Coll Surg. 1994;178:417–25.3. Carroll PR, McAnnich JW. Major bladder trauma: mechanisms of
injury and a unified method of diagnosis and repair. J Urology.1984;132:254–257.
4. Gomez RG, Ceballos L, Coburn M, et al. Consensus statement onbladder injuries. BJU. 2004;94:27–32.
5. Velmahos GC, Gomez H, Falabella A, et al. Operative Managementof Civilian Rectal Gunshot Wounds: Simpler Is Better. WorldJ Surg. 2000;24:114–118.
6. Gonzalez RP, Falimirski ME, Holevar MR. The Role of PresacralDrainage in the Management of Penetrating Rectal Injuries.J Trauma. 1998;45:656–661.
7. McGrath V, Fabian TC, Croce MA, et al. Rectal Trauma: ManagementBased on Anatomic Distinctions. Am Surg. 1998;12:1136–1141.
8. Maxwell RA, Fabian TC. Current Management of Colon Trauma.World J Surg. 2003;27:632–639.
9. Franko ER, Ivatury RR, Schwalb DM. Combined Penetrating Rectaland Genitourinary Injuries: A Challenge in Management. J Trauma.1993;34:347–353.
10. Parry NG, Rozycki GS, Feliciano DV, et al. Traumatic Rupture ofthe Urinary Bladder: Is the Suprapubic Tube Necessary? J Trauma.2003;54:431–436.
11. Corriere JN, Sandler CM. Management of the Ruptured Bladder:Seven Years of Experience with 111 Cases. J Trauma. 1986;26:830–833.
12. Volpe MA, Pachter EM, Scalea TM, et al. Is There a Differencein Outcome When Treating Traumatic Intraperitoneal BladderRupture With or Without a Suprapubic Tube? J Urol. 1999;161:1103–1105.
13. Topor B, Acland RD, Kolodko V, et al. Omental Transposition forLow Pelvic Anastomoses. Am J Surg. 2001;182:460–464.
14. Wein AJ, Malloy TR, Greenberg SH, et al. Omental Transposition asan Aid in Genitourinary Reconstructive Procedures. J Trauma. 1980;20:473–477.
15. O’Leary DP. Use of the Greater Omentum in Colorectal Surgery.Dis Colon Rectum. 1999;42:533–538.
Combined Penetrating Rectal and Bladder Injuries
Volume 62 • Number 2 329
Blind Urethral Catheterization in Trauma Patients SufferingFrom Lower Urinary Tract InjuriesGil Z. Shlamovitz, MD and Lynne McCullough, MD, FACEP
Objectives: The goals of our studywere to review all cases of urethral andbladder trauma that presented to the Uni-versity of California, Los Angeles (UCLA)Medical Center between January 1998 andAugust 2005 and determine (1) the clinicalcharacteristics of patients with urethraland/or bladder injuries as well as the sensi-tivities of those clinical characteristics; (2)whether or not a blind attempt to insert aurethral catheter was performed; and (3)whether there is any evidence that a blindattempt to insert a urethral catheter wors-ened the initial urinary tract injury.
Methods: This is a retrospective chartreview.
Results: The study cohort comprised46 patients with a mean age of 30 years,including 36 men (78.2%) and 10 women
(21.8%). Bladder tears were found in 33patients, 10 patients had urethral lacera-tions, and 3 patients had combined blad-der and urethral lacerations. The mostsensitive finding for urinary bladder orurethral injury was the presence of grosshematuria in the urethral catheter (100%,95% confidence interval [CI] 0.63–0.89).Blinded insertion of a urethral catheterwas attempted in 30 (90.9%, 95% CI0.75–0.98) patients who suffered from uri-nary bladder injury, 6 (50%, 95% CI0.26–0.87) patients who suffered fromurethral injury and 1 (33%, 95% CI 0.0–0.9) patient who suffered from a combinedurinary bladder and urethral injuries. Wedid not find evidence that a blind attemptto insert a urethral catheter worsened theinitial urinary injury.
Conclusion: Gross hematuria in theurethral catheter was the most sensitive signfor the presence of a urethral or urinarybladder injury in our study cohort, and of-ten the only sign of such an injury. Wefound no evidence that a blind attempt toinsert a urethral catheter in patients suffer-ing from urethral and or urinary bladderinjuries worsened the initial injury. Largerstudies will be needed to determine thesafety of blind urethral catheterization inpatients that are suspected to suffer from alower urological trauma. It is our opinionthat the current guidelines should be revisedto better reflect the current knowledge,technologies, and clinical practice.
Key Words: Blind urethral catheter-ization, Urethral trauma, Urinary bladdertrauma, Pelvic fractures, Urinary trauma.
J Trauma. 2007;62:330–335.
Trauma patients accounted for 40,194,000 emergency de-partment visits in the United States during 2003. Ofthose, 1,855,000 were diagnosed with injuries involving
the torso and 325,000 (0.008%) had a primary diagnosis ofpelvic or urogenital injuries.1 The reported association oflower urinary tract injuries with pelvic fractures ranges from7% to 16%.2–6
Current guidelines recommend placement of a urinarycatheter as part of the initial resuscitation phase of traumapatients to provide continuous hemodynamic monitoring.7–12
Advanced trauma life support guidelines consider any of thefollowing as indicators of possible urethral injury and a con-traindication for transurethral urinary catheterization: (1)blood at the urethral meatus; (2) perineal ecchymosis; (3)blood in the scrotum; (4) high-riding or nonpalpable prostate;or (5) pelvic fracture. Current guidelines advocate that aretrograde urethrogram (RUG) should follow any of the pre-viously mentioned findings and that when a urethral injury is
discovered, urethral catheterization should be avoided andurological consultation requested. Cystostomy (suprapubictube) is the recommended method for urinary bladder decom-pression and urinary output monitoring in this subgroup ofpatients.4,7,9–11,13 Other authors suggest that a single attemptat gentle passage of a urethral catheter can be safely per-formed in cases of partial anterior urethral lacerations be-cause significant worsening of the injury by a solitary gentleattempt at catheterization is unlikely.8,12,14–16 Our PubMedsearch of the medical literature failed to find any evidencethat a blind attempt to insert a urethral catheter was everreported to worsen an initial urinary injury.
ImportanceEmergency medicine physicians and trauma surgeons
frequently face a clinical dilemma when treating trauma pa-tients that have a radiologically proven pelvic fracture or amechanism of injury that is suspicious for urethral or urinarybladder injury but that lack the clinical signs of a lowerurinary tract injury. Should a retrograde urethrogram be per-formed immediately in the emergency department or shouldpriority be given to potentially life-threatening injuries usingcomputed tomography (CT) or other diagnostic modalities?Should patients be sent to the CT scanner or the angiographysuite without attempting to drain the bladder while intrave-nous fluids are being given? Is the risk of missing and/ordelaying the diagnosis of a ruptured urinary bladder lower
Submitted for publication November 4, 2005.Accepted for publication February 13, 2006.Copyright © 2007 by Lippincott Williams & Wilkins, Inc.From the Department of Emergency Medicine, UCLA Medical Center,
David Geffen School of Medicine, Los Angeles, California.Address for correspondence: Gil Z. Shlamovitz, Department of Emer-
gency Medicine, UCLA Medical Center, 924 Westwood Boulevard Suite300, Los Angeles, CA 90095; email: [email protected].
DOI: 10.1097/01.ta.0000221768.68614.36
The Journal of TRAUMA� Injury, Infection, and Critical Care
330 February 2007
than the risk of complicating a partial urethral injury bypassing a urethral catheter? In cases where a RUG or acystogram demonstrates extravasation of contrast material,can the extravasated contrast interfere with the interventionalradiologist’s attempt to control retroperitoneal bleeding?These questions are not addressed by the current guidelinesand are left to the individual clinician to answer.
Goals of This StudyThe goals of our study were to review all cases of
urethral and bladder trauma that were primarily treated in theemergency department of the University of California, LosAngeles (UCLA) Medical Center between January 1998 andAugust 2005. We wanted to determine (1) the clinical char-acteristics of patients with urethral and/or bladder injuries; (2)whether or not a blind attempt to insert a urethral catheter wasperformed; and (3) whether there is any evidence that a blindattempt to insert a urethral catheter worsened the initial uri-nary tract injury.
MATERIALS AND METHODSStudy Design
This is a chart review study of trauma patients sufferingfrom urethral and/or urinary bladder injuries that were pri-marily treated in the UCLA Emergency Medicine Centerbetween January 1998 and August 2005. The study protocolwas approved by the UCLA Institutional Review Board.
SettingUCLA Medical Center is an academic Level I trauma
center with an annual census of 40,000 emergency departmentvisits and about 1,000 trauma patients who require activation ofthe trauma team. The initial assessment and treatment of traumapatients in the UCLA Medical Center is provided by both emer-gency medicine physicians and surgeons working together withpredefined roles and responsibilities.
Selection of ParticipantsThe UCLA Medical Center trauma registry database was
used to generate a list of all patients that were diagnosed witheither urethral or urinary bladder injuries between January1998 and August 2005.
Exclusion CriteriaOf the 68 patients identified for the study, 22 were
excluded. Six patients were excluded because we were unableto find any documentation of urethral and/or urinary bladdertrauma and six patients were excluded because they wereprimarily seen in other hospitals and subsequently transferredto UCLA Medical Center for a higher level of care. Fivepatients were excluded because they were immediately takento the operating room (“red-lined”) without completion of thesecondary survey, and five patients were excluded becausethey were diagnosed with an iatrogenic urethral injury (ure-thral catheter accidentally pulled out in the in-patient setting).
Data Collection and ProcessingThe patients list that was generated from the trauma
registry database was used to access the medical recordsusing the UCLA online medical records system. The clinicaldocuments were reviewed for each patient and the informa-tion was abstracted using a standardized abstraction form.The clinical documents used included emergency departmentcharts, trauma surgery admission notes, emergency depart-ment nursing trauma flow sheets, operation reports, proce-dure notes, consultations notes, progress notes, radiologyreports, and discharge summaries.
When a variable was missing from the chart it wasrecorded as “unknown”. For example, in the absence of adocumentation of blood at the urethral meatus, we did notassume its absence but recorded it as “unknown”. Whenmedical notes differed from each other we chose the onesdocumenting an intervention or finding. For example, whenone note documented “Foley was not inserted” and the otherdocumented “Insertion of a 16 Fr. Foley was attempted butaborted because of resistance”, we chose the latter and doc-umented that an attempt was made to insert a Foley catheter.
The authors (G.Z.S., L.M.) who were also the data ab-stractors were not blind to the goals of this study. Inter-raterreliability was assessed using kappa statistics for the “attemptto insert a urethral catheter variable” and was found to be 0.84.
Definitions of Key VariablesUrethral Injury
We defined a urethral injury as radiologic finding ofcontrast extravasation during a retrograde urethrogram, or asan operative finding of a urethral laceration. We defined aurinary bladder injury as radiologic finding of contrast ex-travasation during a plain film or CT cystogram, or as anoperative finding of a urinary bladder laceration. Documen-tation of a “high riding prostate” or “nonpalpable prostate”was considered as a positive finding for this variable. Docu-mentation of gross blood at the urethral meatus before aninsertion of a urethral catheter was considered as a positivefinding for this variable. Documentation of any sign of ex-ternal genital or perineal injury was considered as a positivefinding for perineal or external genital hematoma/laceration,including abrasion, hematoma, laceration, and avulsion. Ra-diologic evidence of a pelvic fracture on a plain film pelvicradiograph taken in the resuscitation suite during the initialassessment was considered as a positive finding for thisvariable. Documentation of the urethral catheter drainage asbloody, gross blood, or bright red was considered as a posi-tive finding for gross blood in urethral catheter. Documen-tation of an attempt to insert a urethral catheter or a placementof a urethral catheter in the emergency department was con-sidered as positive finding for blinded insertion of a urethralcatheter. We considered any of the following as evidence thata urethral catheterization induced worsening of the initialurinary injury: (1) documentation of such a causality in the
Blind Urethral Catheterization in Trauma Patients
Volume 62 • Number 2 331
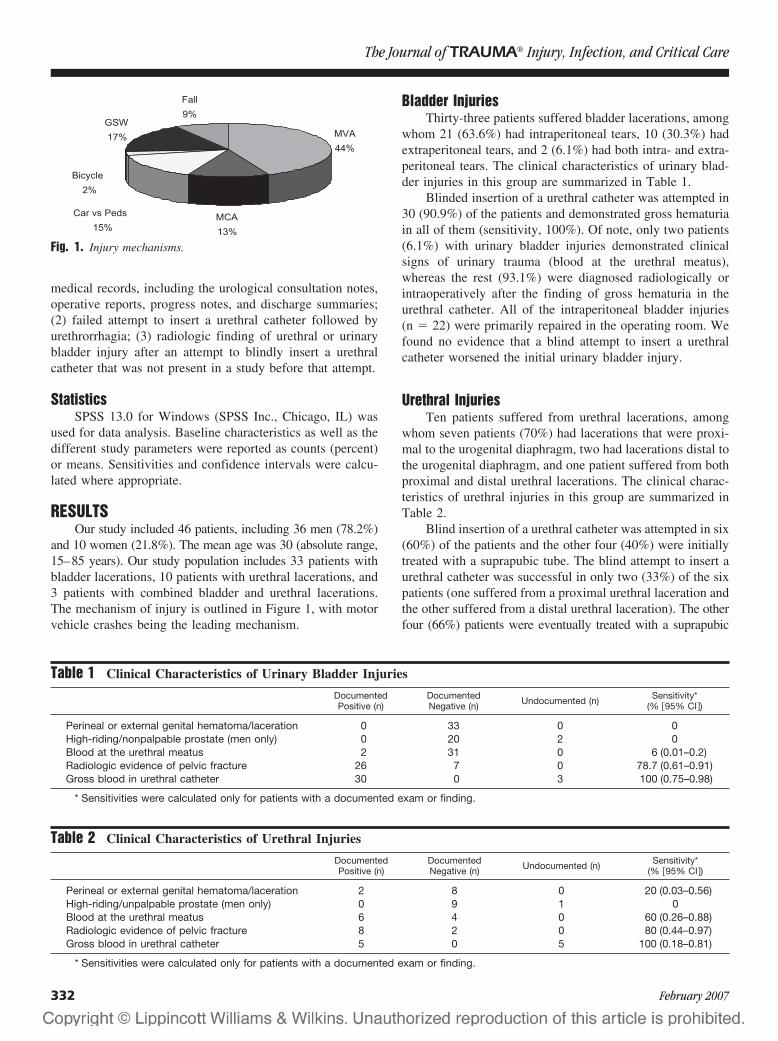
medical records, including the urological consultation notes,operative reports, progress notes, and discharge summaries;(2) failed attempt to insert a urethral catheter followed byurethrorrhagia; (3) radiologic finding of urethral or urinarybladder injury after an attempt to blindly insert a urethralcatheter that was not present in a study before that attempt.
StatisticsSPSS 13.0 for Windows (SPSS Inc., Chicago, IL) was
used for data analysis. Baseline characteristics as well as thedifferent study parameters were reported as counts (percent)or means. Sensitivities and confidence intervals were calcu-lated where appropriate.
RESULTSOur study included 46 patients, including 36 men (78.2%)
and 10 women (21.8%). The mean age was 30 (absolute range,15–85 years). Our study population includes 33 patients withbladder lacerations, 10 patients with urethral lacerations, and3 patients with combined bladder and urethral lacerations.The mechanism of injury is outlined in Figure 1, with motorvehicle crashes being the leading mechanism.
Bladder InjuriesThirty-three patients suffered bladder lacerations, among
whom 21 (63.6%) had intraperitoneal tears, 10 (30.3%) hadextraperitoneal tears, and 2 (6.1%) had both intra- and extra-peritoneal tears. The clinical characteristics of urinary blad-der injuries in this group are summarized in Table 1.
Blinded insertion of a urethral catheter was attempted in30 (90.9%) of the patients and demonstrated gross hematuriain all of them (sensitivity, 100%). Of note, only two patients(6.1%) with urinary bladder injuries demonstrated clinicalsigns of urinary trauma (blood at the urethral meatus),whereas the rest (93.1%) were diagnosed radiologically orintraoperatively after the finding of gross hematuria in theurethral catheter. All of the intraperitoneal bladder injuries(n � 22) were primarily repaired in the operating room. Wefound no evidence that a blind attempt to insert a urethralcatheter worsened the initial urinary bladder injury.
Urethral InjuriesTen patients suffered from urethral lacerations, among
whom seven patients (70%) had lacerations that were proxi-mal to the urogenital diaphragm, two had lacerations distal tothe urogenital diaphragm, and one patient suffered from bothproximal and distal urethral lacerations. The clinical charac-teristics of urethral injuries in this group are summarized inTable 2.
Blind insertion of a urethral catheter was attempted in six(60%) of the patients and the other four (40%) were initiallytreated with a suprapubic tube. The blind attempt to insert aurethral catheter was successful in only two (33%) of the sixpatients (one suffered from a proximal urethral laceration andthe other suffered from a distal urethral laceration). The otherfour (66%) patients were eventually treated with a suprapubic
Table 1 Clinical Characteristics of Urinary Bladder Injuries
DocumentedPositive (n)
DocumentedNegative (n) Undocumented (n) Sensitivity*
(% �95% CI�)
Perineal or external genital hematoma/laceration 0 33 0 0High-riding/nonpalpable prostate (men only) 0 20 2 0Blood at the urethral meatus 2 31 0 6 (0.01–0.2)Radiologic evidence of pelvic fracture 26 7 0 78.7 (0.61–0.91)Gross blood in urethral catheter 30 0 3 100 (0.75–0.98)
* Sensitivities were calculated only for patients with a documented exam or finding.
Table 2 Clinical Characteristics of Urethral Injuries
DocumentedPositive (n)
DocumentedNegative (n) Undocumented (n) Sensitivity*
(% �95% CI�)
Perineal or external genital hematoma/laceration 2 8 0 20 (0.03–0.56)High-riding/unpalpable prostate (men only) 0 9 1 0Blood at the urethral meatus 6 4 0 60 (0.26–0.88)Radiologic evidence of pelvic fracture 8 2 0 80 (0.44–0.97)Gross blood in urethral catheter 5 0 5 100 (0.18–0.81)
* Sensitivities were calculated only for patients with a documented exam or finding.
Fig. 1. Injury mechanisms.
The Journal of TRAUMA� Injury, Infection, and Critical Care
332 February 2007

tube. Five of the six Foley insertion attempts were during theinitial assessment in the emergency department and were fol-lowed by a retrograde/over-the-catheter urethrogram, whereasone was attempted after an emergency department RUG thatdemonstrated a partial tear. We found no evidence that a blindattempt to insert a urethral catheter worsened the initial urethralinjury.
Combined Urethral and Urinary Bladder InjuriesThree patients suffered from combined urethral and uri-
nary bladder injuries. Two patients suffered a proximal ure-thral laceration and one patient had a distal urethral laceration.Two patients had intraperitoneal urinary bladder lacerations andone patient had an extraperitoneal urinary bladder laceration.The clinical characteristics of combined urethral and urinarybladder injuries are summarized in Table 3.
Blinded insertion of a urethral catheter was attempted inone patient (33%); it was successful. This patient was foundto have a proximal urethral laceration and an intraperitonealurinary bladder laceration and was taken to the operatingroom for repair of his urinary bladder. We found no evidencethat a blind attempt to insert a urethral catheter worsened theinitial combined urethral and urinary bladder injuries.
LIMITATIONSThere are several limitations to our study. An ideal study
of the safety of urethral catheterization in trauma patients willinclude imaging studies of the urinary tract before and afterplacement of a urethral catheter, with assessment of whetherthe initial injury was worsened by the catheterization attempt.Given our study design was a retrospective chart review, wewere unable to objectively determine the timing and extent ofthe urinary injuries before and after the urethral catheteriza-tion. We had to rely on documentation (or lack of) suggestingcausality between the attempt to insert a urethral catheter andworsening of the initial urinary injury.
Our study population was too small to accurately deter-mine the frequencies and sensitivities of the various signs ofurinary injuries. Most previously published case series ofpatients with urinary trauma were of smaller size but showedsensitivities similar to those found in our study. The smallnumber of patients attributes to the very wide confidenceintervals of most of our findings.
It is very likely that some patients who suffered urinaryinjuries were never diagnosed, and consequentially were notincluded in our study. We had no way to identify thosepatients and can only speculate that they had no signs of suchinjuries, therefore further decreasing the sensitivities reportedin our study.
As a chart review study, a potential threat to the validityof our findings is missing data in the written charts. Missingdata can be a result of a lack of or inaccurate documentation,or even an intentional exclusion of information from thechart. Fortunately, all of our study parameters were docu-mented in most charts, with the exception of only a few cases(see Tables 1, 2, and 3). We have excluded those “unknown”cases from our sensitivities calculations, possibly contribut-ing to overestimation of our reported sensitivities. However,we think that the missing data would be unlikely to alter ourconclusions.
DISCUSSIONOur study demonstrated that the “classic” signs of lower
urinary trauma (meatal blood, perineal or genital injuries, ora high-riding prostate) are frequently absent and have verylow sensitivity for the presence of a lower urinary tract injury.Those findings, as well as the high sensitivity that we found forgross hematuria in the urethral catheter (�100%) for lowerurinary injuries, are consistent with previous studies.2,17
Some authors, including those of the current advancedtrauma life support guidelines, speculate that a blind urethralcatheterization might convert a partial urethral rupture into acomplete transection; be passed easily into the bladder, de-laying the diagnosis of a partial urethral rupture; or exit theurethra to lie in the periprostatic region, worsening the extentof the initial injury.4,10,13,18 As we mentioned earlier, wewere unable to find any case reports or other basis for thosespeculations in the medical literature.
Other authors recommend immediate or early catheter-ization of the traumatized urethra to reestablish continuityand obviate urethral closure.14–16 The high rates of urethralstricture formation, incontinence, and impotence that are as-sociated with primary surgical repair of the damagedurethra2,4,8,14,18 have never been shown after a blind attemptof urethral catheterization. In our study population, blindinsertion of a urethral catheter was attempted in 90.9% ofpatients who suffered from urinary bladder injury, 60% of
Table 3 Clinical Characteristics of Combined Urethral and Urinary Bladder Injuries
DocumentedPositive (n)
DocumentedNegative (n) Undocumented (n) Sensitivity*
(% �95% CI�)
Perineal or external genital hematoma/laceration 1 2 0 33 (0.01–0.91)High-riding/unpalpable prostate (men only) 0 2 1 0Blood at the urethral meatus 2 1 0 66 (0.09–0.99)Radiologic evidence of pelvic fracture 3 0 0 100Gross blood in urethral catheter 1 0 2 100 (0.008–0.9)
* Sensitivities were calculated only for patients with a documented exam or finding.
Blind Urethral Catheterization in Trauma Patients
Volume 62 • Number 2 333

patients who suffered from urethral injury, and 33% of pa-tients who suffered from combined urinary bladder and ure-thral injuries. We found no evidence of a blind attempt toinsert a urethral catheter worsening the initial lower urinaryinjury in our study cohort. Larger studies will be needed todetermine the safety of blind urethral catheterization in pa-tients that are suspected to suffer from a lower urologicaltrauma.
It is our opinion that the current guidelines should berevised to better reflect the current knowledge, technologies,and clinical practice. Our recommendations for the manage-ment of patients with suspected lower urinary injuries can befound in Table 4.
REFERENCES1. McCaig LF, Burt CW. National Hospital Ambulatory Medical Care
Survey: 2003 emergency department summary. Advance data fromvital and health statistics, no. 358. Hyattsville, MD: National Centerfor Health Statistics; 2005.
2. Fallon B, Wendt JC, Hawtrey CE. Urological injury and assessmentin patients with fractured pelvis. J Urol. 1984;131:712–714.
3. Hochberg E, Stone NN. Bladder rupture associated with pelvicfracture due to blunt trauma. Urology. 1993;41:531–533.
4. Koraitim MM. Pelvic fracture urethral injuries: the unresolvedcontroversy. J Urol. 1999;161:1433–1441.
5. Palmer JK, Benson GS, Corriere JN Jr. Diagnosis and initialmanagement of urological injuries associated with 200 consecutivepelvic fractures. J Urol. 1983;130:712–714.
6. Sandler CM, Hall JT, Rodriguez MB, Corriere JN Jr. Bladder injuryin blunt pelvic trauma. Radiology. 1986;158:633–638.
7. American College of Surgeons. Initial assessment and management.In: Advanced Trauma Life Support for Doctors, 7th ed. AmericanCollege of Surgeons; 2004:18–19.
8. Coburn M. Genitourinary trauma. In: Moore EE, ed. Trauma,5th ed. New York: McGraw-Hill; 2004:804–849.
9. Cornwell EE. Initial approach to trauma. In: Tintinalli JE, ed.Emergency Medicine-A Comprehensive Study Guide, 6th ed.New York: McGraw-Hill; 2004:1537–1541.
10. Fredrick Levy GDK. Genitourinary trauma. In: Tintinalli JE, ed.Emergency Medicine-A Comprehensive Study Guide, 6th ed.New York: McGraw-Hill; 2004:1622–1628.
11. Parks SN. Initial assessment. In: Moore EE, ed. Trauma, 5th ed.New York: McGraw-Hill; 2004:159–175.
12. Schneider RE. Genitourinary system. In: Rosen P, ed. EmergencyMedicine Concepts and Clinical Practice, 5th ed. St. Louis: Mosby;2002:436–455.
13. Turner-Warwick R. A personal view of the immediate management ofpelvic fracture urethral injuries. Urol Clin North Am. 1977;4:81–93.
14. Al-Ali IH, Husain I. Disrupting injuries of the membranous urethra-the case for early surgery and catheter splinting. Br J Urol. 1983;55:716–720.
15. Andrich DE, Greenwell TJ, Mundy AR. Treatment of pelvicfracture-related urethral trauma: a survey of current practice in theUK. BJU Int. 2005;96:127–130.
16. Herschorn S, Thijssen A, Radomski SB. The value of immediate orearly catheterization of the traumatized posterior urethra. J Urol.1992;148:1428–1431.
17. Ziran BH, Chamberlin E, Shuler FD, Shah M. Delays anddifficulties in the diagnosis of lower urologic injuries in the contextof pelvic fractures. J Trauma. 2005;58:533–537.
18. Elliott DS, Barrett DM. Long-term follow-up and evaluation ofprimary realignment of posterior urethral disruptions. J Urol. 1997;157:814–816.
EDITORIAL COMMENTUrethral catheter insertion in the presence of pelvic
fracture has always been a dilemma for those providinginitial patient care. Guidelines thus far have been some-what ambiguous. Shlamovitz and McCullough report asmall cohort of patients with bladder or urethral lacera-tions in whom blind catheterization was attempted in 90%and 60% of patients, respectively. Gross hematuria was thesingle best indicator of urologic injury in both groups, with100% sensitivity.
Bladder lacerations create no obstacle to catheter pas-sage, and gross hematuria is known to be present in 99.9% ofbladder ruptures from blunt trauma. Urethral lacerations arethe area of greater concern because blind catheter passagemay result in an increased complication rate. In the presentreport, only 10 patients had urethral injuries, and only 6 hadblood at the urethral meatus. In these six, catheter passagewas successful in only two. These small numbers do notprovide enough information to establish guidelines. It is true
Table 4 Authors’ Recommendations for theManagement of Trauma Patients With SuspectedLower Urinary Tract Injuries
Hemodynamically Stable PatientsIn the hemodynamically stable patient who presents with meatal
blood or urethrorrhagia, retrograde urethrogram should beperformed in the emergency department. If the urethrogramdemonstrates a normal appearing urethra, a urethral cathetershould be inserted and a plain film cystogram or a CTcystogram should follow. A urologist should be consulted forthe management of all urinary injuries, with the understandingthat a urethral catheter might be used to treat partial urethrallacerations.
Hemodynamically Unstable/Multiply Injured PatientsIn the multiply injured or the hemodynamically unstable patient,
we think that a gentle attempt to pass a urethral catheter canbe safely attempted using the standard technique. Of note, theballoon should not be inflated until the catheter’s hub hasreached the urethral meatus and return of urine has beenobserved. A successful urinary bladder catheterization will aidin the decompression of a distended bladder that might becausing the patient’s discomfort, will provide informationregarding the presence of gross blood in the urine raising thesuspicion for an underlying urinary injury, will providecontinuous urine output monitoring, and function as a contrastadministration route for CT or plain film cystography. At a latertime retrograde urethrogram can be easily performed by usinga 4–5Fr feeding tube that is inserted along side the urinarycatheter to inject the contrast material. In institutions whereinterventional radiology is utilized for embolization ofretroperitoneal bleeding, we suggest that cystograms andurethrograms will not be performed until the presence of suchbleedings has been excluded, because extravasation ofcontrast agents into the peritoneal cavity might interfere withangiography. When the clinician makes a decision to place apercutaneous suprapubic cystostomy tube, we suggest thatultrasound be used to verify the presence and location of theurinary bladder.
The Journal of TRAUMA� Injury, Infection, and Critical Care
334 February 2007

that the authors did not note worsening of the urethral injuryafter unsuccessful blind catheterization; however, they didnot know the extent of injury before the attempt.
Guidelines for initial evaluation of a pelvic fracture withpossible urethral rupture remain unclear. At our institution,we initially attempt to pass a catheter in patients with pelvicfractures who do not have blood at the urethral meatus or aperineal hematoma. If this is not successful, a retrogradeurethrogram is obtained. Blood at the urethral meatus or
perineal hematoma on initial evaluation prompts a RUG be-fore any attempt at urethral catheterization. Using theseguidelines, we have not recognized any urethral complica-tions, even though catheterization has occasionally been at-tempted in patients found to have urethral rupture who had nosigns to suggest injury.
Jack W. McAninch, MD, FACSSan Francisco General HospitalSan Francisco, California
Blind Urethral Catheterization in Trauma Patients
Volume 62 • Number 2 335
Combination of Arteriovenous Extracorporeal Lung Assistand High-Frequency Oscillatory Ventilation in a PorcineModel of Lavage-Induced Acute Lung Injury: A RandomizedControlled TrialJoerg Brederlau, MD, Ralf Muellenbach, MD, Markus Kredel, MD, Julian Kuestermann,Martin Anetseder, MD, Clemens Greim, MD, and Norbert Roewer, MD
Background: To compare the com-bined effects of arteriovenous extracorporeallung assist (AV-ECLA) and high-frequencyoscillatory ventilation (HFOV) on pulmo-nary gas exchange, hemodynamics, andrespiratory parameters in a lavage-induced porcine lung injury model.
Methods: A prospective, randomizedanimal study. Saline lung lavage was per-formed in 33 healthy female pigs, weigh-ing 52 � 4.1 kg (mean � SD), until thePaO2 decreased to 53 � 8 mm Hg. After astabilization period of 60 minutes, the an-imals were randomly assigned to fourgroups: group 1, pressure-controlled ven-
tilation (PCV) with a tidal volume of 6mL/kg; group 2, PCV with a tidal volumeof 6 mL/kg and AV-ECLA; group 3,HFOV; group 4, HFOV and AV-ECLA.In groups 2 and 4, the femoral artery andvein were cannulated and a low-resistancemembrane lung was interposed. After iso-lated evaluation of AV-ECLA, the mean air-way pressure was increased by 3 cm H2Ofrom 16 to 34 cm H2O every 20 minutes,accompanied by blood gas analyses andmeasurements of respiratory and hemody-namic variables.
Results: Only in AV-ECLA–treatedanimals was normocapnia achieved. No
significant increase of PaO2 attributable toAV-ECLA alone was detected. Mean air-way pressure augmentation resulted in asignificant increase in PaO2 in all groups.Peak inspiratory pressure was signifi-cantly lower in HFOV-treated animals.
Conclusions: The combination ofAV-ECLA and HFOV resulted in normo-capnia and comparable PaO2, although asmaller ventilator pressure amplitude wasapplied. Long-term animal studies areneeded to assess whether this approachresults in further lung protection.
Key Words: ARDS, HFOV, AV-ECLA, Animal study.
J Trauma. 2007;62:336–346.
Prevention of irreversible hypoxemic damage is thefirst aim in the treatment of patients with acute res-piratory distress syndrome (ARDS). Arterial oxygen-
ation can often be improved, either by single measures ora combination of treatment modalities. Lung-protectiveventilation strategies focus on three findings. (1) Ventila-tion with a reduced tidal volume (VT) of 6 mL/kg was thefirst intervention that reduced 28-day mortality in patientswith ARDS.1 (2) Alveolar recruitment and maintenance oflung volume can be achieved by sufficient levels of posi-tive endexpiratory pressure (PEEP).2 (3) The amount ofpulmonary and systemic cytokine release and dysfunctionof peripheral organs can be ameliorated by ventilation withreduced VT.3,4
The ability to control the PaCO2 with the least possibleventilator pressure amplitude might result in further lungprotection.5 However, VT reduction increases the risk ofhypercapnia, which can cause aggravation of the pulmonaryinflammatory response.6 Even though permissive hypercap-nia does not increase mortality and might even have benefi-cial effects, such as improvements in tissue oxygenation7 orlung protection from reperfusion injury,8 there are clinicalsituations in which hypercapnia is contraindicated, e.g., inpatients with severe head injury and increased intracranialpressure.9 In addition, hypercapnia can cause cardiac arrhyth-mias, rises in pulmonary arterial pressure, impairment ofrenal function and cardiac contractility, increases in pulmo-nary shunt fraction,10 and inhibition of plasma membranewound resealing in ventilator-injured lungs.11 Therefore, amultimodal treatment approach resulting not only in reversalof hypoxia but also normocapnia might be beneficial.
Arteriovenous extracorporeal lung assist (AV-ECLA)consists of a heparin-coated, low-resistance membrane lung,interposed into an arteriovenous shunt between the femoralartery and vein. Thereby an extracorporeal blood pump withits medical and technical problems can be avoided. Systemicheparinization is not required.12 AV-ECLA eliminates 95%of the body’s CO2 production.13,14 Influence on arterialoxygenation is minimal. Limiting factors are the oxygen-carrying capacity of the arterial blood and the maximal blood
Submitted for publication October 20, 2005.Accepted for publication February 22, 2006.Copyright © 2007 by Lippincott Williams & Wilkins, Inc.From the Klinik und Poliklinik fur Anasthesiologie, Universitatsklini-
kum Wurzburg (J.B., R.M.M.K., M.A., N.R.) and the Universitat Wurzburg(J.K.), Wurzburg, Germany; the Klinik fur Anasthesiologie, Intensiv- undNotfallmedizin (C.G.), Klinikum Fulda, Germany.
Address for reprints: Jorg Brederlau, MD, Klinik und Poliklinik fur Anas-thesiologie, Zentrum Operative Medizin, Universitatsklinikum Wurzburg, Ob-erdurrbacher Str. 6, D-97080 Wurzburg, Germany; email: [email protected].
DOI: 10.1097/01.ta.0000221667.32598.71
The Journal of TRAUMA� Injury, Infection, and Critical Care
336 February 2007

flow rate through the membrane lung, which peaks at 30% ofcardiac output.15 Nevertheless, early clinical observationsreported improvements in oxygenation.16
Because AV-ECLA provides effective CO2 elimination,dissociation of ventilation (AV-ECLA) and oxygenation (res-pirator) is possible. Therefore, the optimal lung-protectiveventilator strategy to be combined with AV-ECLA needs tobe defined. Promoting the concept of “lung rest”, high-frequency oscillatory ventilation (HFOV) might be ideal,especially in individuals with poor pulmonary complianceand high airway pressures.17,18 HFOV means application of aconstant mean airway pressure (Pmean) with a superimposedsmall VT at a high respiratory rate. In animal models, HFOVreduced the pulmonary and systemic inflammatory responsewith the same or better oxygenation and pulmonary compli-ance than conventional ventilation.19–21 However, in manyadults with ARDS, normocapnia was not achievable withHFOV alone.22–24
The objective of our study was to evaluate the combinedeffects of AV-ECLA and HFOV on gas exchange, hemody-namics, and respiratory parameters in adult pigs with severelavage-induced acute lung injury. We tested the followinghypotheses:
1. AV-ECLA will induce normocapnia.2. Pmean augmentation will cause equal increases in PaO2
independent of HFOV or conventional lung protectiveventilation.
MATERIALS AND METHODSAnimals
The study was conducted in accordance with the Na-tional Institutes of Health guidelines for ethical animal re-search and was approved by the Laboratory Animal Care andUse Committee of the District of Unterfranken, Germany.The experiments were performed in 33 healthy Pietrain pigs,all negative for the malignant hyperthermia gene. The ani-mals were 14 to 18 weeks old, with a mean (�SD) bodyweight of 52.1 � 4.1 kg.
Experimental PreparationThe animals were fasted for 24 hours without limiting
water access. Before instrumentation, the animals were se-dated with intramuscular ketamine (10 mg/kg), xylazine hy-drochloride (1 mg/kg), and atropine (25 �g/kg) and placedsupine on an operating table armed with a heating pad toprovide core temperature stability (37.5 � 0.8°C). Anesthesiawas induced with an intravenous bolus of sodium thiopental(5 mg/kg) using an auricular vein. The trachea was orallyintubated with a cuffed, 8.0-mm ID Edgar endotracheal tube(Rueschelit, Ruesch, Kernen, Germany), providing an addi-tional lumen embedded in the tube’s inner wall for trachealpressure monitoring. Anesthesia and complete muscle relax-ation were maintained with intravenous infusion of ketamine
(2 mg/kg/h), midazolam (0.5 mg/kg/h), fentanyl (0.01 mg/kg/h), and vecuronium (0.1 mg/kg/h).
The animals were mechanically ventilated with a Servo900C ventilator (Siemens-Elema AB, Solna, Sweden) in thePCV mode with a positive end-expiratory pressure (PEEP) of5 cm H2O, an inspiratory to expiratory ratio (I:E) of 1:1, anda fraction of inspired oxygen (FIO2) of 1.0. A VT of 6 mL/kgand a respiratory rate (RR) of 25 to 30 breath/minute wereapplied, resulting in normocapnia.
After a 500-mL bolus of balanced electrolyte solution, acontinuous infusion was given at a rate of 2 to 6 mL/kg/h,aiming at a pulmonary artery occlusion pressure (PCWP) of10 to 15 mm Hg and a urinary production rate of 1 to 2 mL/kgbody weight per hour. Continuous electrocardiography (Ser-vomed, Hellige, Freiburg, Germany), pulsoxymetry, capnog-raphy, and distal tracheal pressure monitoring (SM8050,Draeger, Luebeck, Germany) were performed.
Two grams Cefotiam were administered intravenously.After systemic heparinization (300 U/kg, Liquemin, Roche,Reinach, Switzerland), arterial and central venous accesswere established transcutaneously using ultrasound guidance(SonoSite 180 Plus, SonoSite Inc., Botell, WA). Activatedclotting time (ACT II, Medtronic, Minneapolis, MN) wasmeasured hourly and maintained between 300 and 500 sec-onds with heparin bolus injections as needed. The left carotidartery was cannulated with a 20-gauge catheter (Vygon,Ecouen, France). The right internal jugular vein was cannu-lated with a 9-French introducer sheath (Arrow, Reading, PA)and a 7.5-French flow-directed thermodilution pulmonaryartery catheter (831F75, Edwards Lifescience, Irvine, CA)was advanced into the pulmonary artery under transducedpressure guidance.
In the two AV-ECLA-groups, the right femoral arterywas cannulated with a 15-French wire and the left femoralvein with a 17-French wire reinforced, flexible, low-resistancecannula (Novalung, Hechingen, Germany). A low-resistancemembrane gas exchanger (Novalung) was primed with hep-arinized normal saline (150 mL) and connected to the femoralcannulas. The extracorporeal circuit was afterward occludedwith tubing clamps.
Hemodynamic, Ventilatory, and Blood GasMeasurements
For hemodynamic monitoring, pressure transducers ref-erenced to atmospheric pressure at the mid-thoracic level(Combitrans, Braun, Melsungen, Germany) and a modularmonitor system (Servomed, Hellige, Freiburg i. Br., Ger-many) were used. Mean arterial pressure (MAP), mean pul-monary artery pressure (MPAP), central venous pressure,and PCWP were transduced. Heart rate was traced by theelectrocardiogram.
Trifold injections of 10-mL aliquots of ice cold salineinto the right atrium at random phases of different respiratorycycles were used for pulmonary artery catheter-based cardiacoutput measurements (Explorer, Edwards Lifescience, Irvine,
AV-ECLA and HFOV in ARDS
Volume 62 • Number 2 337
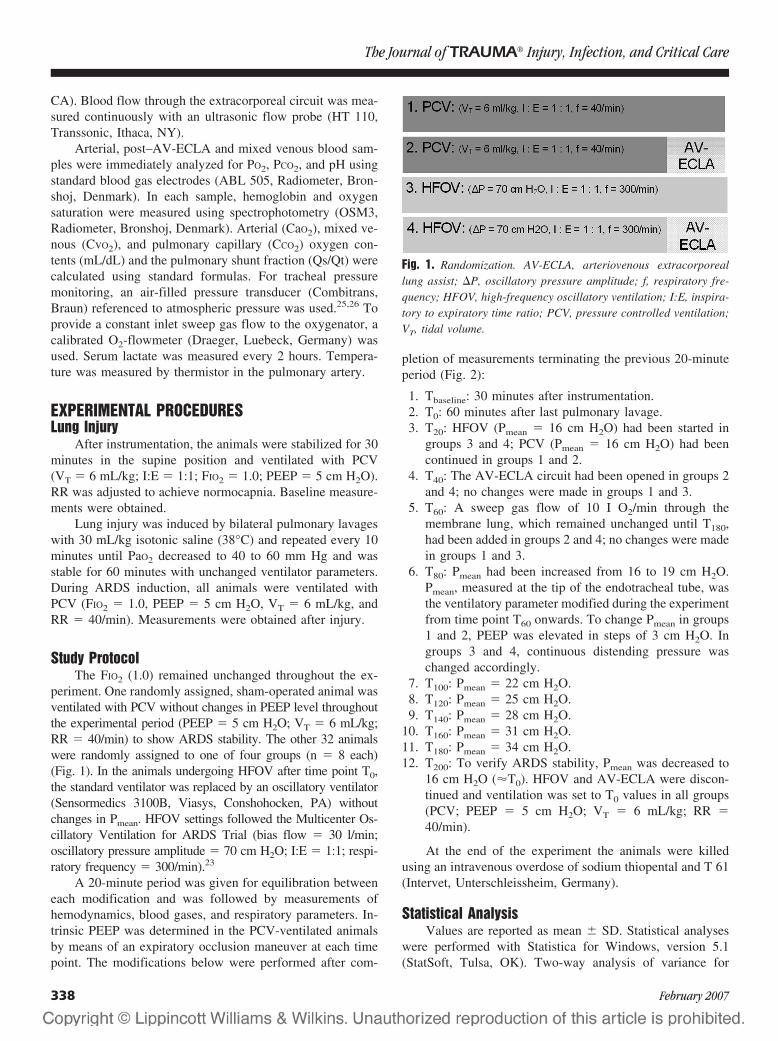
CA). Blood flow through the extracorporeal circuit was mea-sured continuously with an ultrasonic flow probe (HT 110,Transsonic, Ithaca, NY).
Arterial, post–AV-ECLA and mixed venous blood sam-ples were immediately analyzed for PO2, PCO2, and pH usingstandard blood gas electrodes (ABL 505, Radiometer, Bron-shoj, Denmark). In each sample, hemoglobin and oxygensaturation were measured using spectrophotometry (OSM3,Radiometer, Bronshoj, Denmark). Arterial (CaO2), mixed ve-nous (CvO2), and pulmonary capillary (CCO2) oxygen con-tents (mL/dL) and the pulmonary shunt fraction (Qs/Qt) werecalculated using standard formulas. For tracheal pressuremonitoring, an air-filled pressure transducer (Combitrans,Braun) referenced to atmospheric pressure was used.25,26 Toprovide a constant inlet sweep gas flow to the oxygenator, acalibrated O2-flowmeter (Draeger, Luebeck, Germany) wasused. Serum lactate was measured every 2 hours. Tempera-ture was measured by thermistor in the pulmonary artery.
EXPERIMENTAL PROCEDURESLung Injury
After instrumentation, the animals were stabilized for 30minutes in the supine position and ventilated with PCV(VT � 6 mL/kg; I:E � 1:1; FIO2 � 1.0; PEEP � 5 cm H2O).RR was adjusted to achieve normocapnia. Baseline measure-ments were obtained.
Lung injury was induced by bilateral pulmonary lavageswith 30 mL/kg isotonic saline (38°C) and repeated every 10minutes until PaO2 decreased to 40 to 60 mm Hg and wasstable for 60 minutes with unchanged ventilator parameters.During ARDS induction, all animals were ventilated withPCV (FIO2 � 1.0, PEEP � 5 cm H2O, VT � 6 mL/kg, andRR � 40/min). Measurements were obtained after injury.
Study ProtocolThe FIO2 (1.0) remained unchanged throughout the ex-
periment. One randomly assigned, sham-operated animal wasventilated with PCV without changes in PEEP level throughoutthe experimental period (PEEP � 5 cm H2O; VT � 6 mL/kg;RR � 40/min) to show ARDS stability. The other 32 animalswere randomly assigned to one of four groups (n � 8 each)(Fig. 1). In the animals undergoing HFOV after time point T0,the standard ventilator was replaced by an oscillatory ventilator(Sensormedics 3100B, Viasys, Conshohocken, PA) withoutchanges in Pmean. HFOV settings followed the Multicenter Os-cillatory Ventilation for ARDS Trial (bias flow � 30 l/min;oscillatory pressure amplitude � 70 cm H2O; I:E � 1:1; respi-ratory frequency � 300/min).23
A 20-minute period was given for equilibration betweeneach modification and was followed by measurements ofhemodynamics, blood gases, and respiratory parameters. In-trinsic PEEP was determined in the PCV-ventilated animalsby means of an expiratory occlusion maneuver at each timepoint. The modifications below were performed after com-
pletion of measurements terminating the previous 20-minuteperiod (Fig. 2):
1. Tbaseline: 30 minutes after instrumentation.2. T0: 60 minutes after last pulmonary lavage.3. T20: HFOV (Pmean � 16 cm H2O) had been started in
groups 3 and 4; PCV (Pmean � 16 cm H2O) had beencontinued in groups 1 and 2.
4. T40: The AV-ECLA circuit had been opened in groups 2and 4; no changes were made in groups 1 and 3.
5. T60: A sweep gas flow of 10 I O2/min through themembrane lung, which remained unchanged until T180,had been added in groups 2 and 4; no changes were madein groups 1 and 3.
6. T80: Pmean had been increased from 16 to 19 cm H2O.Pmean, measured at the tip of the endotracheal tube, wasthe ventilatory parameter modified during the experimentfrom time point T60 onwards. To change Pmean in groups1 and 2, PEEP was elevated in steps of 3 cm H2O. Ingroups 3 and 4, continuous distending pressure waschanged accordingly.
7. T100: Pmean � 22 cm H2O.8. T120: Pmean � 25 cm H2O.9. T140: Pmean � 28 cm H2O.
10. T160: Pmean � 31 cm H2O.11. T180: Pmean � 34 cm H2O.12. T200: To verify ARDS stability, Pmean was decreased to
16 cm H2O (�T0). HFOV and AV-ECLA were discon-tinued and ventilation was set to T0 values in all groups(PCV; PEEP � 5 cm H2O; VT � 6 mL/kg; RR �40/min).
At the end of the experiment the animals were killedusing an intravenous overdose of sodium thiopental and T 61(Intervet, Unterschleissheim, Germany).
Statistical AnalysisValues are reported as mean � SD. Statistical analyses
were performed with Statistica for Windows, version 5.1(StatSoft, Tulsa, OK). Two-way analysis of variance for
Fig. 1. Randomization. AV-ECLA, arteriovenous extracorporeallung assist; �P, oscillatory pressure amplitude; f, respiratory fre-quency; HFOV, high-frequency oscillatory ventilation; I:E, inspira-tory to expiratory time ratio; PCV, pressure controlled ventilation;VT, tidal volume.
The Journal of TRAUMA� Injury, Infection, and Critical Care
338 February 2007

repeated measurements with the factors mode and time wereused for data analysis. Tukey’s post hoc test was used forcomparison of significant analysis of variance results withinand between the groups. Data of the first measurement set(Tbaseline) were only compared with data of the second mea-surement set (T0). p values less than 0.05 were consideredsignificant.
RESULTSDetailed data regarding hemodynamics, blood gases, and
respiratory parameters are presented in Tables 1 and 2. Thedata from T60 to T180 (incremental Pmean-trial) are presentedseparately (Table 2). PaCO2, PaO2, peak inspiratory pressure(PIP), and cardiac output (CO) changes are displayed inFigures 3 through 6.
Lung InjuryData are average values of all animals (mean � SD). All
animals survived the study period. Acute lung injury wasinduced in each animal by means of repeated lung lavages(18 � 2), with significant changes (p � 0.05) in PaO2, PaCO2,Pmean, PIP, Qs/Qt, and CO. PaO2 decreased from 626 � 40 to53 � 8 mm Hg; PaCO2 increased from 42 � 3 to 73 � 13 mmHg; Pmean increased from 11.3 � 1.2 to 16 � 1.2 cm H2O;PIP increased from 18.5 � 2.6 to 28.7 � 3.0 cm H2O; Qs/Qtincreased from 3 � 2% to 62 � 8%; CO increased from3.0 � 0.4 to 5.8 � 1.2 l/min. No significant differences weredetected between the groups for the parameters tested at timepoints Tbaseline and T0. There were no significant differencesbetween the four groups and the sham-operated animal. Re-duction of Pmean to the T0 level (T200) combined with PCV atT0 ventilator settings and termination of AV-ECLA in thetwo AV-ECLA groups resulted in immediate significant in-creases in CO and Qs/Qt to T0 values in all groups, withoutsignificant differences between the groups. Accordingly,
PaO2 decreased whereas PaCO2 increased significantly to T0
levels. (Table 1, Figs. 3 through 6).
Hemodynamics and Volume StatusThe animals received 2,655 � 157 mL of a balanced
electrolyte solution without significant differences betweenthe groups. Total urine production during the experimentalperiod was 758 � 73 mL without significant differencesbetween the groups. CO remained stable from T0 to T60 in allgroups. Declamping the AV-ECLA circuit after T20 did notinfluence CO. With increasing Pmean, a significant decrease inCO occurred, reaching its minimum at T180. No significantdifferences between the groups were detected. IncreasingPmean resulted in a significant heart rate reduction in allgroups without significant differences between the groups.Although MAP did not change in groups 3 and 4, a signifi-cant decline from T60 to T180 occurred in groups 1 and 2.MPAP and CVP increased from T60 to T180 in all groupssignificantly; MPAP was significantly higher in groups 3 and4. No significant changes in PCWP occurred during Pmean
augmentation (Tables 1 and 2, Fig. 6).
Pulmonary Gas ExchangeDeclamping the AV-ECLA circuit after T20 affected nei-
ther PaO2 and PaCO2, nor did it affect Qs/Qt. Adding an O2
sweep gas flow of 10 L/min after T40 resulted in an imme-diate and significant reduction of PaCO2 in groups 2 and 4without a significant rise in PaO2, although mixed venousoxygen saturation (SvO2) increased significantly. Normocap-nia was maintained from T60 to T180 in groups 2 and 4,whereas groups 1 and 3 remained hypercapnic. PaCO2 wassignificantly higher in group 3 from T140 to T180 comparedwith all other groups. Oxygenation improved significantly,with rising Pmean in all groups without differences betweenthe groups, except at T120, where PaO2 was significantly
Fig. 2. Experimental protocol. Tbaseline: 30 minutes after instrumentation. T0: 60 minutes after last pulmonary lavage. T20: HFOV (Pmean �
16 cm H2O) started in groups 3 and 4; PCV (Pmean � 16 cm H2O) continued in groups 1 and 2. T40: AV-ECLA circuit opened in groups2 and 4. T60: sweep gas flow 10 I O2/min through membrane lung. T80: Pmean increased from 16 to 19 cm H2O. T100: Pmean � 22 cm H2O.T120: Pmean � 25 cm H2O. T140: Pmean � 28 cm H2O. T160: Pmean � 31 cm H2O. T180: Pmean � 34 cm H2O. T200: Pmean � 16 cm H2O (�T0);PCV in all groups with HFOV and AV-ECLA discontinued.
AV-ECLA and HFOV in ARDS
Volume 62 • Number 2 339

higher in group 3 than in all other groups (Table 2, Figs. 3and 4).
Function of AV-ECLAAV-ECLA blood flow was constant in groups 2 and 4,
with 1.06 � 0.14 L/min from T40 to T180 without significantdifferences between the two groups. The AV-ECLA bloodflow/CO ratio increased continuously from 18% at T40 to33% at T180. Blood gas analysis directly behind the mem-
brane lung revealed no significant changes between groups2 and 4 or within the two groups for PO2 (691 � 27 mmHg) and PCO2 (17 � 2.5 mm Hg). Serum lactate was lessthan 1.5 mg/dL in all animals during the whole experimen-tal period.
Respiratory ParametersPeak inspiratory pressure increased significantly in all
groups with rising Pmean, but was significantly lower in
Table 1 Hemodynamic and Metabolic Data
Group Tbaseline T0 T20 T40 T60 T180 T200
pH PCV 7.41 � 0.06 7.17 � 0.06 7.17 � 0.06 7.17 � 0.06 7.17 � 0.06 7.19 � 0.03 7.2 � 0.11PCV�AV-ECLA 7.41 � 0.04 7.18 � 0.07 7.18 � 0.07 7.18 � 0.07 7.33 � 0.08 7.39 � 0.07 7.24 � 0.08
HFOV 7.43 � 0.04 7.11 � 0.12 7.15 � 0.08 7.15 � 0.08 7.15 � 0.08 7.14 � 0.12 7.16 � 0.11HFOV�AV-ECLA 7.44 � 0.03 7.18 � 0.06 7.21 � 0.06 7.21 � 0.08 7.32 � 0.07 7.38 � 0.07 7.21 � 0.05
Sham 7.40 7.19 7.18 7.19 7.17 7.19 7.19Qs/Qt (ratio) PCV 0.02 � 0.03 0.63 � 0.06 0.62 � 0.08 0.62 � 0.08 0.62 � 0.08 0.16 � 0.12* 0.65 � 0.1*�
PCV�AV-ECLA 0.05 � 0.03 0.59 � 0.07 0.59 � 0.07 0.62 � 0.11 0.68 � 0.08 0.21 � 0.12* 0.55 � 0.09*HFOV 0.01 � 0.03 0.65 � 0.14 0.56 � 0.12 0.56 � 0.12 0.56 � 0.12 0.14 � 0.09* 0.65 � 0.09*�
HFOV�AV-ECLA 0.02 � 0.02 0.6 � 0.05 0.64 � 0.08 0.65 � 0.07 0.67 � 0.1 0.23 � 0.15* 0.47 � 0.13*†
Sham 0.01 0.62 0.53 0.63 0.65 0.54 0.59HR (bpm) PCV 81 � 15 78 � 12 78 � 12 78 � 12 78 � 12 61 � 8 80 � 21
PCV�AV-ECLA 74 � 10 58 � 20§ 58 � 20§� 74 � 17 72 � 12 66 � 15 74 � 13HFOV 86 � 17 90 � 13 80 � 14 80 � 14 81 � 14 76 � 20 79 � 18
HFOV�AV-ECLA 76 � 17 73 � 9 86 � 4 92 � 9 85 � 11 76 � 3 78 � 13Sham 70 95 93 92 93 88 88
MAP (mm Hg) PCV 85 � 12 85 � 8 85 � 8 85 � 8 85 � 8 77 � 6 90 � 17PCV�AV-ECLA 86 � 7 89 � 13 89 � 13 81 � 9 88 � 17 76 � 14 96 � 14*
HFOV 80 � 12 88 � 11 81 � 11 81 � 11 81 � 11 84 � 9 84 � 4HFOV�AV-ECLA 87 � 17 96 � 15 86 � 9 77 � 9 86 � 13 78 � 11 93 � 14
Sham 78 80 78 80 80 82 82MPAP (mm Hg) PCV 20 � 3 27 � 4 27 � 3� 27 � 3 27 � 3 36 � 4* 33 � 10
PCV�AV-ECLA 19 � 3 27 � 6 27 � 6� 28 � 8 25 � 6§ 31 � 5§ 35 � 8†
HFOV 23 � 5 32 � 5 33 � 6 33 � 6 33 � 6 38 � 4 33 � 5HFOV�AV-ECLA 21 � 5 30 � 5 35 � 5 32 � 4 28 � 5 36 � 3* 33 � 6
Sham 18 40 39 38 38 38 38CVP (mm Hg) PCV 6.5 � 1.2 8.1 � 2.8 8.1 � 2.8 8.1 � 2.8 8.1 � 2.8 14.3 � 3.2*‡ 10.1 � 3.4*
PCV�AV-ECLA 6.1 � 2.9 5.4 � 2.7§ 5.4 � 2.7§ 5.6 � 2.1§ 6.4 � 2§ 10.4 � 3.9*§� 7 � 1.9*HFOV 6.6 � 1.2 8.9 � 2.2 9.6 � 2.3� 9.6 � 2.3 9.6 � 2.3 14.3 � 1* 9.3 � 1.3*
HFOV�AV-ECLA 6 � 0.9 6.9 � 2.1 6.4 � 2 6.6 � 1.2 7.8 � 1.8 13.8 � 2.3* 8.1 � 2.2*Sham 5 8 4 4 4 6 5
PCWP (mm Hg) PCV 10.4 � 2.3 9.8 � 2.5 9.8 � 2.5 9.8 � 2.5 9.8 � 2.5 16.3 � 2.1* 11.1 � 2.4*PCV�AV-ECLA 7 � 1.3 7.5 � 2.6 7.5 � 2.6 7.6 � 2.7 9.3 � 3.2 13.8 � 1.4* 8.9 � 1.4*
HFOV 9.3 � 2.2 9.8 � 3.5 10.9 � 3.6 10.9 � 3.6 10.9 � 3.6 15 � 1.7* 10.6 � 3.2*HFOV�AV-ECLA 8.6 � 1.8 9.3 � 2.2 9.3 � 1.8 7.8 � 0.7 9.4 � 1.5 13.8 � 1.4* 9.4 � 1.8*
Sham 7 8 8 8 8 8 7SgvO2 (%) PCV 82 � 6 48 � 16 47 � 16� 47 � 16 47 � 16‡ 72 � 4* 42 � 19*
PCV�AV-ECLA 80 � 9 45 � 10 § 45 � 10 50 � 14 72 � 7* 77 � 6 38 � 15*HFOV 79 � 9 63 � 9 57 � 8� 57 � 8� 57 � 8 76 � 3* 54 � 10*
HFOV�AV-ECLA 84 � 3 46 � 13 28 � 11* 36 � 13 55 � 16* 74 � 6* 52 � 10*Sham 78 51 59 65 64 66 65
Data are shown as mean � SD.Two-way analysis of variance with repeated measurements (Tukey’s honest significant difference - post hoc test): * p � 0.05 versus TT-20;
† p � 0.05 T200 versus T0.Comparison between groups (T0–T200): ‡ p � 0.05 versus PCV�AV-ECLA; § p � 0.05 versus HFOV; � p � 0.05 versus HFOV�AV-ECLA.AV-ECLA, arteriovenous extracorporeal lung assist; CVP, central venous pressure; HFOV, high frequency oscillatory ventilation; HR, heart
rate; MAP, mean arterial pressure; MPAP, mean pulmonary artery pressure; PCV, pressure controlled ventilation; PCWP, pulmonary capillarywedge pressure; Qs/Qt, pulmonary shunt fraction; Sham, Sham operated animal; SgvO2, mixed venous oxygen saturation; Tbaseline, data atbaseline; T0, data after injury; T20, data at randomization; T40 and T60, data during stepwise evaluation of AV-ECLA; T180, data at end ofPmean-augmentation; T200, data at end of experiment.
The Journal of TRAUMA� Injury, Infection, and Critical Care
340 February 2007

groups 3 and 4 from T20 to T180 (Fig. 5). Intrinsic PEEP ingroups 1 and 2 was always less than 1 cm H2O.
DISCUSSIONThe study was designed to evaluate the combined effects
of two innovative treatment modalities, AV-ECLA andHFOV, in an adult large-animal model of ARDS. The majorfindings of our prospective, randomized, controlled study areas follows: (1) AV-ECLA resulted in normocapnia within awide AV-ECLA blood flow/CO ratio (18% to 33%); (2)normocapnia was not achievable without AV-ECLA; (3) AV-
ECLA did not increase PaO2; (4) AV-ECLA did not affectcardiac output; (5) rising Pmean resulted in comparable in-creases in PaO2 independent of PCV or HFOV; and (6) PIPwas significantly lower in HFOV-treated animals, therebyreducing the ventilator pressure amplitude.
AV-ECLA (T60–T180) reduced PaCO2 to normocapnicvalues immediately, which was not achievable with HFOV orPCV alone. We knew from pilot experiments that CO2 elim-ination with PCV is maximal in these pigs with the RR(40/min) chosen. In the HFOV group, reduction of the RRcould have improved ventilation but also mask the advan-
Table 2 Hemodynamic and Metabolic Data During Pmean-Augmentation (T60–T180)
Group T60 T80 T100 T120 T140 T160 T180
pH PCV 7.17 � 0.06 7.2 � 0.04 7.22 � 0.04 7.22 � 0.06 7.21 � 0.03 7.22 � 0.06 7.19 � 0.03PCV�AV-ECLA 7.33 � 0.08 7.37 � 0.08 7.4 � 0.08 7.4 � 0.08 7.39 � 0.08 7.39 � 0.08 7.39 � 0.07
HFOV 7.15 � 0.08 7.19 � 0.09 7.22 � 0.08 7.21 � 0.1 7.15 � 0.12 7.15 � 0.12 7.14 � 0.12 §
HFOV�AV-ECLA 7.32 � 0.07 7.38 � 0.04 7.39 � 0.05 7.36 � 0.07 7.35 � 0.06 7.38 � 0.04 7.38 � 0.07Sham 7.17 7.16 7.16 7.19 7.19 7.2 7.19
Qs/Qt (ratio) PCV 0.62 � 0.08 0.56 � 0.11 0.43 � 0.15 0.41 � 0.14 0.27 � 0.11 0.21 � 0.12 0.16 � 0.12 *PCV�AV-ECLA 0.68 � 0.08 0.6 � 0.12 0.56 � 0.13 0.46 � 0.18 0.36 � 0.21 0.27 � 0.18 0.21 � 0.12 *
HFOV 0.56 � 0.12 0.49 � 0.15 0.39 � 0.21 0.31 � 0.24 0.22 � 0.19 0.17 � 0.14 0.14 � 0.09 *HFOV�AV-ECLA 0.67 � 0.1 0.61 � 0.13 0.45 � 0.19 0.35 � 0.15 0.29 � 0.17 0.25 � 0.14 0.23 � 0.15 *
Sham 0.65 0.58 0.58 0.58 0.57 0.54 0.54HR (bpm) PCV 78 � 12 76 � 15 65 � 11 67 � 7 67 � 15 62 � 8 61 � 8 *
PCV�AV-ECLA 72 � 12 74 � 13 70 � 16 70 � 14 67 � 15 68 � 15 66 � 15HFOV 81 � 14 79 � 17 76 � 17 80 � 20 74 � 17 68 � 12 76 � 20 *
HFOV�AV-ECLA 85 � 11 81 � 6 77 � 13 77 � 11 74 � 7 70 � 9 76 � 3 *Sham 93 93 90 88 86 89 88
MAP (mm Hg) PCV 85 � 8 77 � 10 83 � 7 86 � 5 85 � 7 84 � 8 77 � 6 *PCV�AV-ECLA 88 � 17 88 � 17 86 � 12 82 � 18 84 � 19 78 � 16 76 � 14 *
HFOV 81 � 11 81 � 7 85 � 8 83 � 5 83 � 5 82 � 5 84 � 9HFOV�AV-ECLA 86 � 13 87 � 15 85 � 14 83 � 11 82 � 11 82 � 12 78 � 11
Sham 80 80 78 79 82 82 82MPAP (mm Hg) PCV 27 � 3 27 � 3 28 � 5 28 � 2 28 � 3 31 � 3 36 � 4 *‡
PCV�AV-ECLA 25 � 6 27 � 6 27 � 4 28 � 4 30 � 4 30 � 4 31 � 5 *‡§
HFOV 33 � 6 32 � 6 34 � 5 37 � 6 38 � 4 39 � 4 38 � 4 *HFOV�AV-ECLA 28 � 5 32 � 5 32 � 4 33 � 3 35 � 2 34 � 2 36 � 3 *
Sham 38 37 36 38 38 38 38CVP (mm Hg) PCV 8.1 � 2.8 9 � 0.9 11,1 � 1,6 11,9 � 1,6 12 � 1,9 13.3 � 2.3 14.3 � 3.2 *†
PCV�AV-ECLA 6.4 � 2 7.4 � 3.2 7.3 � 2.1 8.4 � 2.4 9.4 � 3.4 9.5 � 3.6 10.4 � 3.9 *‡
HFOV 9.6 � 2.3 9.9 � 2.6 11,6 � 2.7 12 � 2.3 13.6 � 0.9 13.8 � 0.9 14.3 � 1 *HFOV�AV-ECLA 7.8 � 1,8 7.9 � 1,2 7.5 � 1,5 9.6 � 1,9 10.9 � 1,1 12.6 � 2 13.8 � 2.3 *
Sham 4 4 6 6 6 6 5PCWP (mm Hg) PCV 9.8 � 2.5 10.6 � 0.7 12.9 � 2.1 12 � 1,3 13.3 � 1,3 15,5 � 1,7 16.3 � 2.1 *
PCV�AV-ECLA 9.3 � 3.2 9.9 � 1,9 9.9 � 2.1 11 � 2.5 12.8 � 2.1 12.9 � 2 13.8 � 1,4 *HFOV 10.9 � 3.6 12 � 2.9 12.1 � 2.4 12.4 � 1,8 14.1 � 2.2 14.9 � 1,8 15 � 1,7 *
HFOV�AV-ECLA 9.4 � 1,5 10.1 � 1,9 10.5 � 1,4 11,8 � 1 12 � 0.9 13.8 � 1,4 13.8 � 1,4 *Sham 8 8 8 8 8 8 7
SgvO2 (%) PCV 47 � 16 51 � 14 58 � 10 67 � 8 70 � 6 69 � 5 72 � 4 *†
PCV�AV-ECLA 72 � 7 71 � 8 74 � 10 76 � 8 78 � 6 76 � 10 77 � 6HFOV 57 � 8 62 � 11 65 � 10 69 � 6 72 � 3 75 � 2 76 � 3 *
HFOV�AV-ECLA 55 � 16 64 � 12 61 � 12 67 � 13 71 � 6 75 � 4 74 � 6 *Sham 64 64 64 65 66 66 65
Data are shown as mean � SD.One-way analysis of variance with repeated measurements: *p � 0.05, effect of time within one group (T60 to T180).Two-way analysis of variance with repeated measurements (Tukey’s honest significant difference - post hoc test); comparison between
groups (T60–T180): † p � 0.05 versus PCV�AV-ECLA; ‡ p � 0.05 versus HFOV; § p � 0.05 versus HFOV�AV-ECLA.AV-ECLA, arteriovenous extracorporeal lung assist; CVP, central venous pressure; HFOV, high frequency oscillatory ventilation; HR, heart
rate; MAP, mean arterial pressure; MPAP, mean pulmonary artery pressure; PCV, pressure controlled ventilation; PCWP, pulmonary capillarywedge pressure; Qs/Qt, pulmonary shunt fraction; Sham, Sham-operated animal; SgvO2, mixed venous oxygen saturation.
AV-ECLA and HFOV in ARDS
Volume 62 • Number 2 341
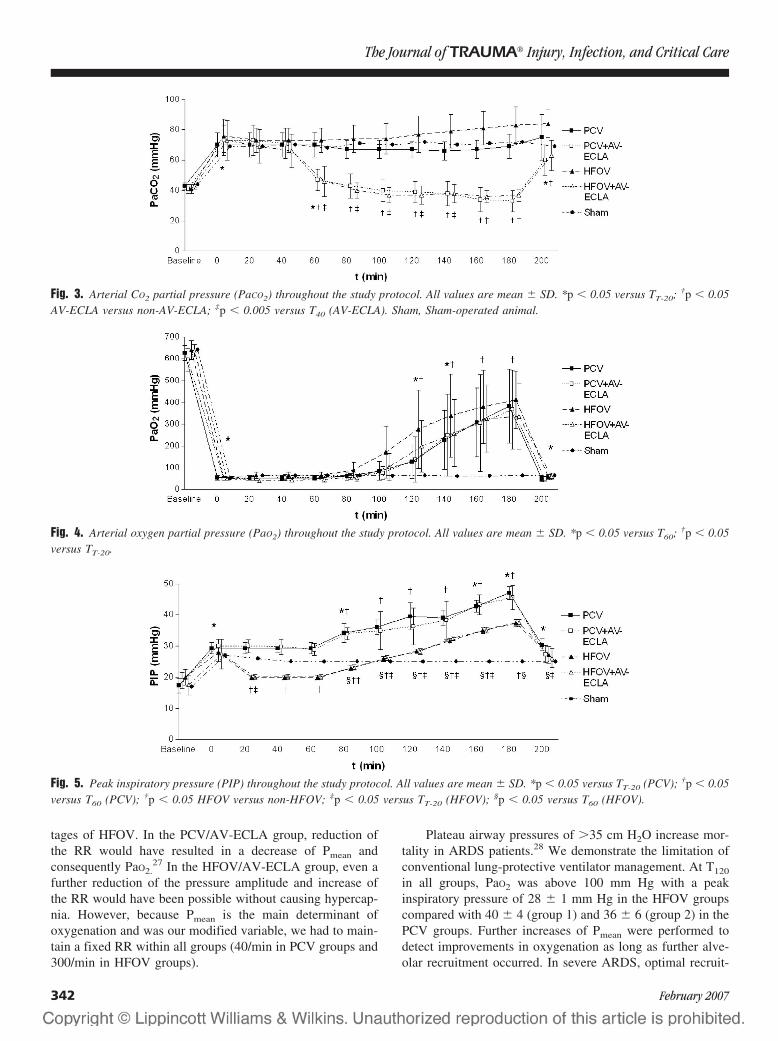
tages of HFOV. In the PCV/AV-ECLA group, reduction ofthe RR would have resulted in a decrease of Pmean andconsequently PaO2.
27 In the HFOV/AV-ECLA group, even afurther reduction of the pressure amplitude and increase ofthe RR would have been possible without causing hypercap-nia. However, because Pmean is the main determinant ofoxygenation and was our modified variable, we had to main-tain a fixed RR within all groups (40/min in PCV groups and300/min in HFOV groups).
Plateau airway pressures of �35 cm H2O increase mor-tality in ARDS patients.28 We demonstrate the limitation ofconventional lung-protective ventilator management. At T120
in all groups, PaO2 was above 100 mm Hg with a peakinspiratory pressure of 28 � 1 mm Hg in the HFOV groupscompared with 40 � 4 (group 1) and 36 � 6 (group 2) in thePCV groups. Further increases of Pmean were performed todetect improvements in oxygenation as long as further alve-olar recruitment occurred. In severe ARDS, optimal recruit-
Fig. 3. Arterial CO2 partial pressure (PaCO2) throughout the study protocol. All values are mean � SD. *p � 0.05 versus TT-20; †p � 0.05AV-ECLA versus non-AV-ECLA; ‡p � 0.005 versus T40 (AV-ECLA). Sham, Sham-operated animal.
Fig. 4. Arterial oxygen partial pressure (PaO2) throughout the study protocol. All values are mean � SD. *p � 0.05 versus T60; †p � 0.05versus TT-20.
Fig. 5. Peak inspiratory pressure (PIP) throughout the study protocol. All values are mean � SD. *p � 0.05 versus TT-20 (PCV); †p � 0.05versus T60 (PCV); †p � 0.05 HFOV versus non-HFOV; ‡p � 0.05 versus TT-20 (HFOV); §p � 0.05 versus T60 (HFOV).
The Journal of TRAUMA� Injury, Infection, and Critical Care
342 February 2007
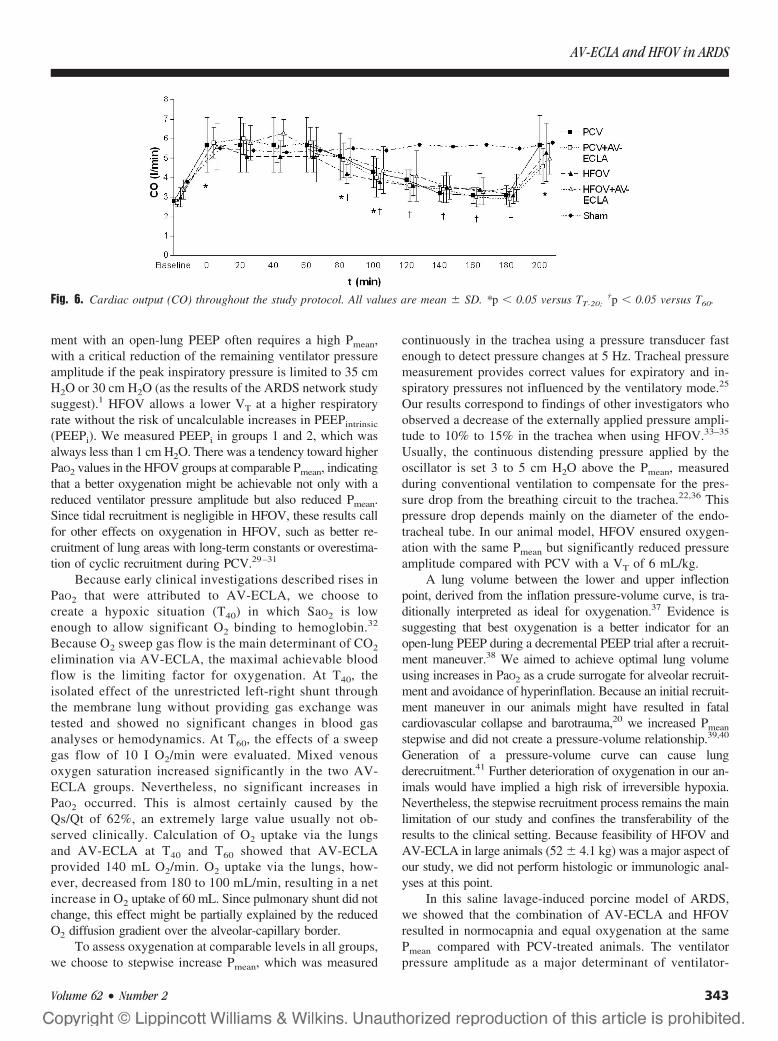
ment with an open-lung PEEP often requires a high Pmean,with a critical reduction of the remaining ventilator pressureamplitude if the peak inspiratory pressure is limited to 35 cmH2O or 30 cm H2O (as the results of the ARDS network studysuggest).1 HFOV allows a lower VT at a higher respiratoryrate without the risk of uncalculable increases in PEEPintrinsic
(PEEPi). We measured PEEPi in groups 1 and 2, which wasalways less than 1 cm H2O. There was a tendency toward higherPaO2 values in the HFOV groups at comparable Pmean, indicatingthat a better oxygenation might be achievable not only with areduced ventilator pressure amplitude but also reduced Pmean.Since tidal recruitment is negligible in HFOV, these results callfor other effects on oxygenation in HFOV, such as better re-cruitment of lung areas with long-term constants or overestima-tion of cyclic recruitment during PCV.29–31
Because early clinical investigations described rises inPaO2 that were attributed to AV-ECLA, we choose tocreate a hypoxic situation (T40) in which SaO2 is lowenough to allow significant O2 binding to hemoglobin.32
Because O2 sweep gas flow is the main determinant of CO2
elimination via AV-ECLA, the maximal achievable bloodflow is the limiting factor for oxygenation. At T40, theisolated effect of the unrestricted left-right shunt throughthe membrane lung without providing gas exchange wastested and showed no significant changes in blood gasanalyses or hemodynamics. At T60, the effects of a sweepgas flow of 10 I O2/min were evaluated. Mixed venousoxygen saturation increased significantly in the two AV-ECLA groups. Nevertheless, no significant increases inPaO2 occurred. This is almost certainly caused by theQs/Qt of 62%, an extremely large value usually not ob-served clinically. Calculation of O2 uptake via the lungsand AV-ECLA at T40 and T60 showed that AV-ECLAprovided 140 mL O2/min. O2 uptake via the lungs, how-ever, decreased from 180 to 100 mL/min, resulting in a netincrease in O2 uptake of 60 mL. Since pulmonary shunt did notchange, this effect might be partially explained by the reducedO2 diffusion gradient over the alveolar-capillary border.
To assess oxygenation at comparable levels in all groups,we choose to stepwise increase Pmean, which was measured
continuously in the trachea using a pressure transducer fastenough to detect pressure changes at 5 Hz. Tracheal pressuremeasurement provides correct values for expiratory and in-spiratory pressures not influenced by the ventilatory mode.25
Our results correspond to findings of other investigators whoobserved a decrease of the externally applied pressure ampli-tude to 10% to 15% in the trachea when using HFOV.33–35
Usually, the continuous distending pressure applied by theoscillator is set 3 to 5 cm H2O above the Pmean, measuredduring conventional ventilation to compensate for the pres-sure drop from the breathing circuit to the trachea.22,36 Thispressure drop depends mainly on the diameter of the endo-tracheal tube. In our animal model, HFOV ensured oxygen-ation with the same Pmean but significantly reduced pressureamplitude compared with PCV with a VT of 6 mL/kg.
A lung volume between the lower and upper inflectionpoint, derived from the inflation pressure-volume curve, is tra-ditionally interpreted as ideal for oxygenation.37 Evidence issuggesting that best oxygenation is a better indicator for anopen-lung PEEP during a decremental PEEP trial after a recruit-ment maneuver.38 We aimed to achieve optimal lung volumeusing increases in PaO2 as a crude surrogate for alveolar recruit-ment and avoidance of hyperinflation. Because an initial recruit-ment maneuver in our animals might have resulted in fatalcardiovascular collapse and barotrauma,20 we increased Pmean
stepwise and did not create a pressure-volume relationship.39,40
Generation of a pressure-volume curve can cause lungderecruitment.41 Further deterioration of oxygenation in our an-imals would have implied a high risk of irreversible hypoxia.Nevertheless, the stepwise recruitment process remains the mainlimitation of our study and confines the transferability of theresults to the clinical setting. Because feasibility of HFOV andAV-ECLA in large animals (52 � 4.1 kg) was a major aspect ofour study, we did not perform histologic or immunologic anal-yses at this point.
In this saline lavage-induced porcine model of ARDS,we showed that the combination of AV-ECLA and HFOVresulted in normocapnia and equal oxygenation at the samePmean compared with PCV-treated animals. The ventilatorpressure amplitude as a major determinant of ventilator-
Fig. 6. Cardiac output (CO) throughout the study protocol. All values are mean � SD. *p � 0.05 versus TT-20;†p � 0.05 versus T60.
AV-ECLA and HFOV in ARDS
Volume 62 • Number 2 343
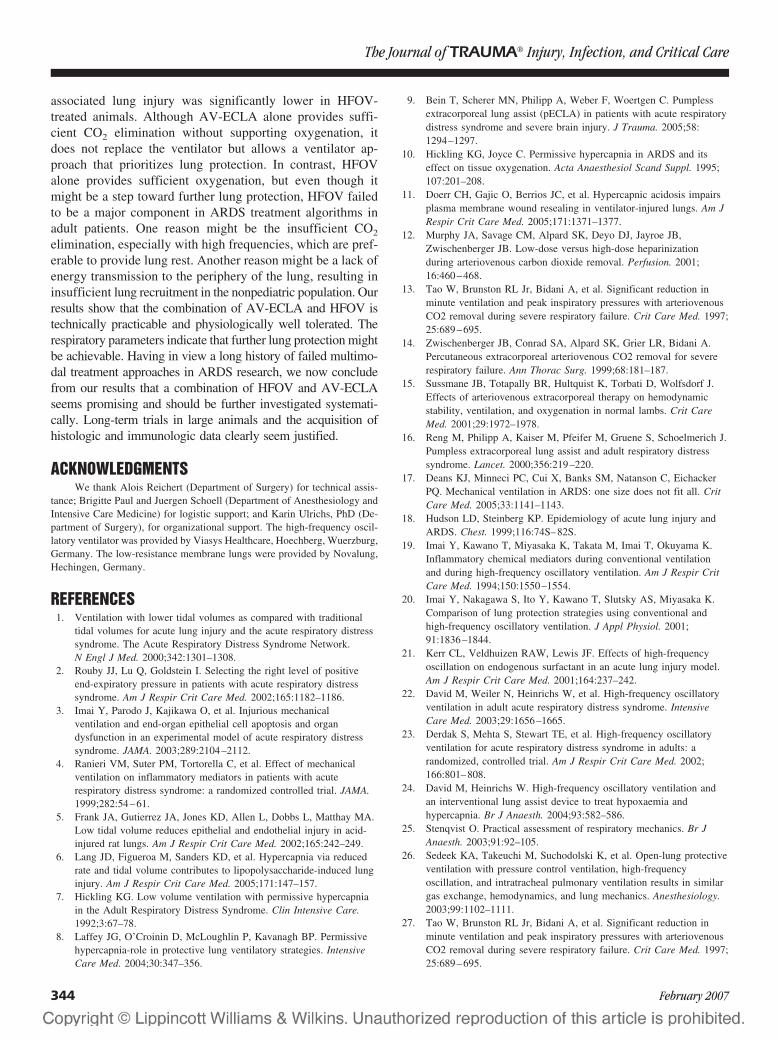
associated lung injury was significantly lower in HFOV-treated animals. Although AV-ECLA alone provides suffi-cient CO2 elimination without supporting oxygenation, itdoes not replace the ventilator but allows a ventilator ap-proach that prioritizes lung protection. In contrast, HFOValone provides sufficient oxygenation, but even though itmight be a step toward further lung protection, HFOV failedto be a major component in ARDS treatment algorithms inadult patients. One reason might be the insufficient CO2
elimination, especially with high frequencies, which are pref-erable to provide lung rest. Another reason might be a lack ofenergy transmission to the periphery of the lung, resulting ininsufficient lung recruitment in the nonpediatric population. Ourresults show that the combination of AV-ECLA and HFOV istechnically practicable and physiologically well tolerated. Therespiratory parameters indicate that further lung protection mightbe achievable. Having in view a long history of failed multimo-dal treatment approaches in ARDS research, we now concludefrom our results that a combination of HFOV and AV-ECLAseems promising and should be further investigated systemati-cally. Long-term trials in large animals and the acquisition ofhistologic and immunologic data clearly seem justified.
ACKNOWLEDGMENTSWe thank Alois Reichert (Department of Surgery) for technical assis-
tance; Brigitte Paul and Juergen Schoell (Department of Anesthesiology andIntensive Care Medicine) for logistic support; and Karin Ulrichs, PhD (De-partment of Surgery), for organizational support. The high-frequency oscil-latory ventilator was provided by Viasys Healthcare, Hoechberg, Wuerzburg,Germany. The low-resistance membrane lungs were provided by Novalung,Hechingen, Germany.
REFERENCES1. Ventilation with lower tidal volumes as compared with traditional
tidal volumes for acute lung injury and the acute respiratory distresssyndrome. The Acute Respiratory Distress Syndrome Network.N Engl J Med. 2000;342:1301–1308.
2. Rouby JJ, Lu Q, Goldstein I. Selecting the right level of positiveend-expiratory pressure in patients with acute respiratory distresssyndrome. Am J Respir Crit Care Med. 2002;165:1182–1186.
3. Imai Y, Parodo J, Kajikawa O, et al. Injurious mechanicalventilation and end-organ epithelial cell apoptosis and organdysfunction in an experimental model of acute respiratory distresssyndrome. JAMA. 2003;289:2104–2112.
4. Ranieri VM, Suter PM, Tortorella C, et al. Effect of mechanicalventilation on inflammatory mediators in patients with acuterespiratory distress syndrome: a randomized controlled trial. JAMA.1999;282:54–61.
5. Frank JA, Gutierrez JA, Jones KD, Allen L, Dobbs L, Matthay MA.Low tidal volume reduces epithelial and endothelial injury in acid-injured rat lungs. Am J Respir Crit Care Med. 2002;165:242–249.
6. Lang JD, Figueroa M, Sanders KD, et al. Hypercapnia via reducedrate and tidal volume contributes to lipopolysaccharide-induced lunginjury. Am J Respir Crit Care Med. 2005;171:147–157.
7. Hickling KG. Low volume ventilation with permissive hypercapniain the Adult Respiratory Distress Syndrome. Clin Intensive Care.1992;3:67–78.
8. Laffey JG, O’Croinin D, McLoughlin P, Kavanagh BP. Permissivehypercapnia-role in protective lung ventilatory strategies. IntensiveCare Med. 2004;30:347–356.
9. Bein T, Scherer MN, Philipp A, Weber F, Woertgen C. Pumplessextracorporeal lung assist (pECLA) in patients with acute respiratorydistress syndrome and severe brain injury. J Trauma. 2005;58:1294–1297.
10. Hickling KG, Joyce C. Permissive hypercapnia in ARDS and itseffect on tissue oxygenation. Acta Anaesthesiol Scand Suppl. 1995;107:201–208.
11. Doerr CH, Gajic O, Berrios JC, et al. Hypercapnic acidosis impairsplasma membrane wound resealing in ventilator-injured lungs. Am JRespir Crit Care Med. 2005;171:1371–1377.
12. Murphy JA, Savage CM, Alpard SK, Deyo DJ, Jayroe JB,Zwischenberger JB. Low-dose versus high-dose heparinizationduring arteriovenous carbon dioxide removal. Perfusion. 2001;16:460–468.
13. Tao W, Brunston RL Jr, Bidani A, et al. Significant reduction inminute ventilation and peak inspiratory pressures with arteriovenousCO2 removal during severe respiratory failure. Crit Care Med. 1997;25:689–695.
14. Zwischenberger JB, Conrad SA, Alpard SK, Grier LR, Bidani A.Percutaneous extracorporeal arteriovenous CO2 removal for severerespiratory failure. Ann Thorac Surg. 1999;68:181–187.
15. Sussmane JB, Totapally BR, Hultquist K, Torbati D, Wolfsdorf J.Effects of arteriovenous extracorporeal therapy on hemodynamicstability, ventilation, and oxygenation in normal lambs. Crit CareMed. 2001;29:1972–1978.
16. Reng M, Philipp A, Kaiser M, Pfeifer M, Gruene S, Schoelmerich J.Pumpless extracorporeal lung assist and adult respiratory distresssyndrome. Lancet. 2000;356:219–220.
17. Deans KJ, Minneci PC, Cui X, Banks SM, Natanson C, EichackerPQ. Mechanical ventilation in ARDS: one size does not fit all. CritCare Med. 2005;33:1141–1143.
18. Hudson LD, Steinberg KP. Epidemiology of acute lung injury andARDS. Chest. 1999;116:74S–82S.
19. Imai Y, Kawano T, Miyasaka K, Takata M, Imai T, Okuyama K.Inflammatory chemical mediators during conventional ventilationand during high-frequency oscillatory ventilation. Am J Respir CritCare Med. 1994;150:1550–1554.
20. Imai Y, Nakagawa S, Ito Y, Kawano T, Slutsky AS, Miyasaka K.Comparison of lung protection strategies using conventional andhigh-frequency oscillatory ventilation. J Appl Physiol. 2001;91:1836–1844.
21. Kerr CL, Veldhuizen RAW, Lewis JF. Effects of high-frequencyoscillation on endogenous surfactant in an acute lung injury model.Am J Respir Crit Care Med. 2001;164:237–242.
22. David M, Weiler N, Heinrichs W, et al. High-frequency oscillatoryventilation in adult acute respiratory distress syndrome. IntensiveCare Med. 2003;29:1656–1665.
23. Derdak S, Mehta S, Stewart TE, et al. High-frequency oscillatoryventilation for acute respiratory distress syndrome in adults: arandomized, controlled trial. Am J Respir Crit Care Med. 2002;166:801–808.
24. David M, Heinrichs W. High-frequency oscillatory ventilation andan interventional lung assist device to treat hypoxaemia andhypercapnia. Br J Anaesth. 2004;93:582–586.
25. Stenqvist O. Practical assessment of respiratory mechanics. Br JAnaesth. 2003;91:92–105.
26. Sedeek KA, Takeuchi M, Suchodolski K, et al. Open-lung protectiveventilation with pressure control ventilation, high-frequencyoscillation, and intratracheal pulmonary ventilation results in similargas exchange, hemodynamics, and lung mechanics. Anesthesiology.2003;99:1102–1111.
27. Tao W, Brunston RL Jr, Bidani A, et al. Significant reduction inminute ventilation and peak inspiratory pressures with arteriovenousCO2 removal during severe respiratory failure. Crit Care Med. 1997;25:689–695.
The Journal of TRAUMA� Injury, Infection, and Critical Care
344 February 2007
28. Esteban A, Anzueto A, Frutos F, et al. Characteristics and outcomesin adult patients receiving mechanical ventilation: a 28-dayinternational study. JAMA. 2002;287:345–355.
29. Fort P, Farmer C, Westerman J, et al. High-frequency oscillatoryventilation for adult respiratory distress syndrome-a pilot study. CritCare Med. 1997;25:937–947.
30. Froese A. High-frequency oscillatory ventilation for adult respiratorydistress syndrome: let’s get it right this time! Crit Care Med. 1997;25:906–908.
31. Baumgardner JE, Markstaller K, Pfeiffer B, Doebrich M, Otto CM.Effects of respiratory rate, plateau pressure, and positive end-expiratory pressure on PaO2 oscillations after saline lavage. Am JRespir Crit Care Med. 2002;166:1556–1562.
32. Reng M, Philipp A, Kaiser M, Pfeifer M, Gruene S, Schoelmerich J.Pumpless extracorporeal lung assist and adult respiratory distresssyndrome. Lancet. 2000;356:219–220.
33. Derdak S. High-frequency oscillatory ventilation for acuterespiratory distress syndrome in adult patients. Crit Care Med. 2003;31:S317–S323.
34. Fort P, Farmer C, Westerman J, et al. High-frequency oscillatoryventilation for adult respiratory distress syndrome-a pilot study. CritCare Med. 1997;25:937–947.
35. Pillow JJ, Wilkinson MH, Neil HL, Ramsden CA. In vitroperformance characteristics of high-frequency oscillatory ventilators.Am J Respir Crit Care Med. 2001;164:1019–1024.
36. Doctor A, Mazzoni MC, DelBalzo U, DiCanzio J, Arnold JH. High-frequency oscillatory ventilation of the perfluorocarbon-filled lung:preliminary results in an animal model of acute lung injury. CritCare Med. 1999;27:2500–2507.
37. McCulloch PR, Forkert PG, Froese AB. Lung volume maintenanceprevents lung injury during high frequency oscillatory ventilation insurfactant-deficient rabbits. Am Rev Respir Dis. 1988;137:1185–1192.
38. Hickling KG. Best compliance during a decremental, but notincremental, positive end-expiratory pressure trial is related to open-lung positive end-expiratory pressure: a mathematical model of acuterespiratory distress syndrome lungs. Am J Respir Crit Care Med.2001;163:69–78.
39. Luecke T, Meinhardt JP, Herrmann P, Weisser G, Pelosi P, QuintelM. Setting mean airway pressure during high-frequency oscillatoryventilation according to the static pressure-volume curve insurfactant-deficient lung injury: a computed tomography study.Anesthesiology. 2003;99:1313–1322.
40. Rimensberger PC, Cox PN, Frndova H, Bryan AC. The open lungduring small tidal volume ventilation: concepts of recruitment and“optimal” positive end-expiratory pressure. Crit Care Med. 1999;27:1946–1952.
41. Henzler D, Mahnken A, Dembinski R, Waskowiak B, Rossaint R,Kuhlen R. Repeated generation of the pulmonary pressure-volumecurve may lead to derecruitment in experimental lung injury.Intensive Care Med. 2005;31:302–310.
EDITORIAL COMMENTBrederlau and coworkers have carefully evaluated combi-
nations of extracorporeal removal of CO2 and titration of peakairway pressure in comparisons of pressure control ventilationand high-frequency oscillation treatment for a lavage model ofacute lung injury. PIP was reduced with high-frequency oscil-lation and extracorporeal CO2 removal was effective with eitherhigh-frequency or conventional ventilation. Extracorporeal CO2
removal and high-frequency oscillation are proposed as a viablecombination of therapies to reduce ventilator-induced lung in-jury during management of acute respiratory failure. How do
these results fit with contemporary goals in reduction ofventilator-induced lung injury?
A “two-hit” hypothesis is a plausible explanation for thepathogenesis of ventilator-induced lung injury. Inflammatoryand mechanical signaling requires an initial physiologic ormechanical stress (first hit) followed by a second or severalcofactors, which magnify the signaling process favoring mul-tiorgan injury. In this study, a lavage lung injury model isprovided, followed by two ventilator strategies. Althoughventilation to comparable clinical endpoints are achieved,inflammatory mediators and histology are unavailable to re-flect pulmonary changes and confirm which pair of “hits” isless dangerous.
In the largest clinical trial of ventilator strategy in acutelung injury, smaller tidal volumes were associated with re-duced mortality. Although this result was widely attributed tolower tidal volume, pooled data analysis demonstrated apositive correlation between plateau pressure and mortalityrate, which was linear and without an obvious breakpoint.1
Such an association does not confirm plateau pressure as thekey causative variable in ventilator-induced lung injury, but itdoes imply that the work of these authors to limit peakpressure is important. Unfortunately, the ventilator modesemployed in this study do not permit effective direct com-parison of plateau or alveolar pressure.
The second objective in this study, control of hypercap-nia, is more controversial, at least from the standpoint of lungprotection. Hypercapnia has been protective in lung injurymodels and may preserve lung mechanics, attenuate pulmo-nary inflammation, and reduce free radical mediated injury.There is increasing evidence that the beneficial effects ofhypercapnic acidosis in acute lung injury relate to gradedintracellular acidosis rather than elevated PaCO2, per se. Thus,the risks associated with hypercapnia may be overestimatedby these authors.2,3
Additional opportunities to modulate pulmonary re-sponse to mechanical ventilation are suggested by recentanimal work. Broccard and coworkers4 have demonstratedthat manipulation of pulmonary blood flow and vascularpressure influence the severity of pulmonary response to anunchanging adverse pattern of ventilation.4 Higher precapil-lary pressure increases damage resulting from a given venti-latory protocol. This was confirmed by studies building avascular pressure gradient using negative pressure ventilationby Dreyfuss and Saumon.5 Thus, pulmonary hemodynamicsmay be an important though poorly understood cofactor inpulmonary response to mechanical ventilation. The clinicianshould consider all possible reduction in demand for bothventilation and cardiac output in the ventilated patient withcritical lung injury.
Finally, thermal preconditioning may be lung protectivein the setting of injurious ventilation but, consistent withpreclinical and clinical studies in cerebral stress states, heat
AV-ECLA and HFOV in ARDS
Volume 62 • Number 2 345

exposure occurring simultaneously with high-pressure venti-lation accentuates rather than attenuates lung injury.6
David Dries, MSE, MDRegions HospitalSt. Paul, MinnesotaJohn F. Perry, Jr. ProfessorUniversity of MinnesotaMinneapolis, Minnesota
REFERENCES1. The ARDS Network. Ventilation with lower tidal volumes as compared
with traditional tidal volumes for acute lung injury and the acuterespiratory distress syndrome. N Engl J Med. 2000;342:1301–1308.
2. Laffey JG, Tanaka M, Engelberts D, et al. Therapeutic hypercapniareduces pulmonary and systemic injury following in vivo lungreperfusion. Am J Respir Crit Care Med. 2000;162:2287–2294.
3. Laffey G, Engelberts D, Kavanagh BP. Buffering hypercapnicacidosis worsens acute lung injury. Am J Respir Crit Care Med.2000;161:141–146.
4. Broccard AF, Vannay C, Feihl F, et al. Impact of low pulmonaryvascular pressure on ventilator-induced lung injury. Crit Care Med.2002;30:2183–2190.
5. Dreyfuss D, Saumon G. Ventilator-induced lung injury: Lessonsfrom experimental studies. Am J Respir Crit Care Med. 1998;157:294–323.
6. Suzuki S, Hotchkiss JR, Takahashi T, et al. Effect of core bodytemperature on ventilator-induced lung injury. Crit Care Med. 2004;32:144–149.
The Journal of TRAUMA� Injury, Infection, and Critical Care
346 February 2007
Fluoroscopic Imaging Guides of the Posterior PelvisPertaining to Iliosacral Screw PlacementBruce H. Ziran, MD, Ajay D. Wasan, MD, David M. Marks, MD, Steven A. Olson, MD, andMichael W. Chapman, MD
Background: This study correlatesanatomic landmarks with radiographicdensities and radiolucencies of the poste-rior pelvis, which assists in percutaneousiliosacral screw placement.
Methods: Radio-opaque markerswere placed on selected surfaces of cadav-eric specimens and rotated under a fluo-roscopic beam. Identified surfaces weredescribed with angular measurements andanatomic characteristics.
Results: The anterior border of the S1body is not parallel to the anterior border ofthe S1 ala. The anterior surface of the S1 alais found on the inlet view (�49°) by thesuperimposition of the S1 and S2 alar
ridges. Superior surface of the S1 ala is dif-ficult to visualize fluoroscopically because ofthe highly oblique outlet angle required byfluoroscopy (�80°). The superior ridge ofthe S1 foramen can best be seen during anoutlet view when the projection of the supe-rior pubic symphysis is superimposed on theS2 foraminal image. Posterior bony sur-faces of the ilium, foraminal region ofsacrum, and sacral body are difficult toidentify, as are the bony surfaces of thesacral foramina. During screw place-ment, the narrowest area of bone occursin the sacral foraminal region.
Conclusions: Use of predeterminedangles for inlet and outlet views may not
provide optimal visualization of relevantbony landmarks during iliosacral screw in-sertion. Because of variable sacral morphol-ogies and lumbosacral lordosis, we proposeusing inherent landmarks to help visu-alize important landmarks during screwplacement. Altering the fluoroscopic angleto superimpose the anterior S1 and S2 alaropacities allows the best visualization of theanterior boundary of the S1 ala. The supe-rior bony surface of the S1 foramen is bestvisualized on the outlet view.
Key Words: Fluoroscopic images,Posterior pelvis, Iliosacral screws, Osse-ous landmarks.
J Trauma. 2007;62:347–356.
Iliosacral screw fixation has become a popular techniquefor treating unstable injuries of the pelvis that involve theposterior ring.1–7 In this procedure, one or two large
screws (6.5–7.3 mm diameter) are inserted under fluoro-scopic guidance through the ilium, across the sacroiliac ar-ticulation, and into the superior sacral vertebral bodies usingpercutaneous or open techniques. There is limited publishedinformation on the fluoroscopic guides used for iliosacralscrew placement. Previous literature recommends use of stan-dard lateral, anterior-posterior, and inlet/outlet (approxi-mately 40–50 degrees from the anterior-posterior direction)images, or by using superimposition of sacral bodies oren-face viewing of neural foramina.8–12 However, these recom-mendations do not account for variances in sacral morphology,lumbosacral lordosis, or soft-tissue obscuration. Furthermore,there are no studies that attempt to correlate the osseous land-marks with their corresponding fluoroscopic images. Addition-
ally, poor fluoroscopic image quality coupled with thepotential misinterpretation of the osseous anatomy on thefluoroscopic monitor can result in complications such asmalpositioned screws or injury to adjacent neurovascularstructures.5,13–15
Although the osteology of the sacrum has been charac-terized, we have not found a study that correlated the ana-tomic landmarks of the posterior pelvis to their correspondingfluoroscopic images.16,17 Because of individual variation inposterior pelvis morphology and alignment, proper fluoro-scopic visualization of pertinent structures requires correla-tion of radiographic findings to osseous anatomy, and willrequire adjusting the angle of the X-ray beam to optimallyview each patient’s pertinent anatomy. The boundaries of thesacral foraminal region during screw placement are the su-perior and anterior S1 ala, the superior bony surface of the S1foramen, and the anterior spinal canal. Safe screw placementis usually dependent on accurately identifying the criticalboundaries of this volume of bone fluoroscopically. Althoughthere are studies that characterize the computed tomographyof this volume of bone used for iliosacral screwplacement,18–21 there is reference only to the iliac cortical den-sity or alar slope on the lateral view when utilizing intraoperativefluoroscopy.7 The purpose of the present study is to associateanatomic landmarks with their corresponding fluoroscopic im-ages and to provide a guide for accurately visualizing specificimportant landmarks pertinent to the placement of iliosacralscrews into the S1 body.
Submitted for publication September 23, 2005.Accepted for publication March 24, 2006.Copyright © 2007 by Lippincott Williams & Wilkins, Inc.From the Department of Orthopaedic Surgery, St. Elizabeth Health
Center (B.H.Z.), Youngstown, OH; the Department of Orthopaedic Surgery,University of California, Davis (A.D.W., S.A.O., M.W.C.), Sacramento, CA;and the Duke University Medical Center (D.M.M.), Durham, NC.
Address for reprints: Bruce H. Ziran, MD, Director of Trauma, North-east Ohio Universities College of Medicine, St. Elizabeth Health Center,1044 Belmont Avenue, Youngstown, OH 44501-1790; email: [email protected].
DOI: 10.1097/01.ta.0000229789.18211.85
The Journal of TRAUMA� Injury, Infection, and Critical Care
Volume 62 • Number 2 347
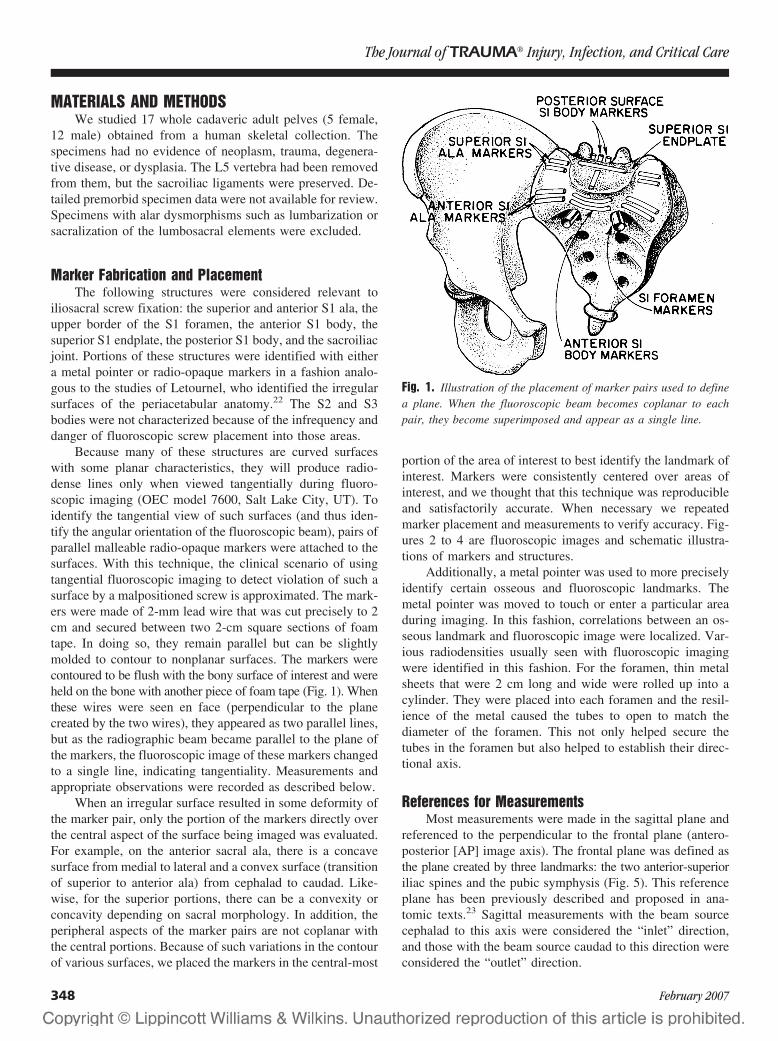
MATERIALS AND METHODSWe studied 17 whole cadaveric adult pelves (5 female,
12 male) obtained from a human skeletal collection. Thespecimens had no evidence of neoplasm, trauma, degenera-tive disease, or dysplasia. The L5 vertebra had been removedfrom them, but the sacroiliac ligaments were preserved. De-tailed premorbid specimen data were not available for review.Specimens with alar dysmorphisms such as lumbarization orsacralization of the lumbosacral elements were excluded.
Marker Fabrication and PlacementThe following structures were considered relevant to
iliosacral screw fixation: the superior and anterior S1 ala, theupper border of the S1 foramen, the anterior S1 body, thesuperior S1 endplate, the posterior S1 body, and the sacroiliacjoint. Portions of these structures were identified with eithera metal pointer or radio-opaque markers in a fashion analo-gous to the studies of Letournel, who identified the irregularsurfaces of the periacetabular anatomy.22 The S2 and S3bodies were not characterized because of the infrequency anddanger of fluoroscopic screw placement into those areas.
Because many of these structures are curved surfaceswith some planar characteristics, they will produce radio-dense lines only when viewed tangentially during fluoro-scopic imaging (OEC model 7600, Salt Lake City, UT). Toidentify the tangential view of such surfaces (and thus iden-tify the angular orientation of the fluoroscopic beam), pairs ofparallel malleable radio-opaque markers were attached to thesurfaces. With this technique, the clinical scenario of usingtangential fluoroscopic imaging to detect violation of such asurface by a malpositioned screw is approximated. The mark-ers were made of 2-mm lead wire that was cut precisely to 2cm and secured between two 2-cm square sections of foamtape. In doing so, they remain parallel but can be slightlymolded to contour to nonplanar surfaces. The markers werecontoured to be flush with the bony surface of interest and wereheld on the bone with another piece of foam tape (Fig. 1). Whenthese wires were seen en face (perpendicular to the planecreated by the two wires), they appeared as two parallel lines,but as the radiographic beam became parallel to the plane ofthe markers, the fluoroscopic image of these markers changedto a single line, indicating tangentiality. Measurements andappropriate observations were recorded as described below.
When an irregular surface resulted in some deformity ofthe marker pair, only the portion of the markers directly overthe central aspect of the surface being imaged was evaluated.For example, on the anterior sacral ala, there is a concavesurface from medial to lateral and a convex surface (transitionof superior to anterior ala) from cephalad to caudad. Like-wise, for the superior portions, there can be a convexity orconcavity depending on sacral morphology. In addition, theperipheral aspects of the marker pairs are not coplanar withthe central portions. Because of such variations in the contourof various surfaces, we placed the markers in the central-most
portion of the area of interest to best identify the landmark ofinterest. Markers were consistently centered over areas ofinterest, and we thought that this technique was reproducibleand satisfactorily accurate. When necessary we repeatedmarker placement and measurements to verify accuracy. Fig-ures 2 to 4 are fluoroscopic images and schematic illustra-tions of markers and structures.
Additionally, a metal pointer was used to more preciselyidentify certain osseous and fluoroscopic landmarks. Themetal pointer was moved to touch or enter a particular areaduring imaging. In this fashion, correlations between an os-seous landmark and fluoroscopic image were localized. Var-ious radiodensities usually seen with fluoroscopic imagingwere identified in this fashion. For the foramen, thin metalsheets that were 2 cm long and wide were rolled up into acylinder. They were placed into each foramen and the resil-ience of the metal caused the tubes to open to match thediameter of the foramen. This not only helped secure thetubes in the foramen but also helped to establish their direc-tional axis.
References for MeasurementsMost measurements were made in the sagittal plane and
referenced to the perpendicular to the frontal plane (antero-posterior [AP] image axis). The frontal plane was defined asthe plane created by three landmarks: the two anterior-superioriliac spines and the pubic symphysis (Fig. 5). This referenceplane has been previously described and proposed in ana-tomic texts.23 Sagittal measurements with the beam sourcecephalad to this axis were considered the “inlet” direction,and those with the beam source caudad to this direction wereconsidered the “outlet” direction.
Fig. 1. Illustration of the placement of marker pairs used to definea plane. When the fluoroscopic beam becomes coplanar to eachpair, they become superimposed and appear as a single line.
The Journal of TRAUMA� Injury, Infection, and Critical Care
348 February 2007

Two structures, the superior S1 ala and the superioraspect of S1 foramen, had oblique components to their ori-entation and were therefore described relative to the sacrum.These structures were referenced off the superior S1 endplate(Fig. 6). Using the superior S1 endplate as a reference, asacral reference was devised that allowed such measurementsto be described easier. For example, there is a “frontal” planeof the sacrum as well as the “sagittal”. Although not theanatomic frontal plane described previously, the measure-ments are easier to understand in relation to the sacrum thanto the pelvis. This description was used for landmarks such asthe superior cortex of the S1 ala and sacroiliac joint orienta-tion near the area also known as the iliac cortical density onthe lateral view.
Fluoroscopic EvaluationEach pelvis was securely mounted in a radiolucent Plexi-
glas mounting apparatus that allowed uniaxial rotation abouta transverse axis of the pelvis. The pelves were secured with
external fixation pins placed into the iliac wings and posteriorsuperior spines (Fig. 7). A radiolucent piece of Plexiglas wassecured to make contact with the anterior superior iliac spinesand pubic tubercles (parallel to the frontal plane). The pelveswere adjusted in the frame so that the axis of rotation was atthe level of the sciatic notch for each specimen. Angularmeasurements were made with a metal goniometer with 1-de-gree increments securely mounted to the apparatus. Each pelviswas calibrated so that a true anterior-posterior image registeredas 0 degrees (in inlet or outlet angulation). When the pelves wererotated in the frame during fluoroscopy, the goniometer wouldmeasure the corresponding inlet or outlet angle.
During testing, the specimen was rotated in the apparatusunder live fluoroscopy with markers attached to differentlocations. When the marker pairs became superimposed toappear as a single line, the angular value of the pelvis in theframe for that respective osseous structure was measured withthe goniometer mounted to the apparatus. The superimpositionof the markers represents the tangency of the fluoroscopic beam
Fig. 2. (A) Inlet image from monitor showing the angular diver-gence of the anterior S1 ala from the midline, occurring when theanterior alar markers are superimposed and approximate a straightline. (B) Schematic illustration of the image shown in A, clarifyingstructures and details.
Fig. 3. (A) Outlet image from monitor showing the slope of thesuperior sacral ala in the frontal plane resulting when superior alarmarkers are superimposed and approximately a straight line. (B)Schematic illustration of the image shown in A, clarifying structuresand details.
Fluoroscopic Imaging, Iliosacral Screw Placement
Volume 62 • Number 2 349

with the osseous surface. This technique was used for all struc-tures that could be measured with sagittal plane rotations of thepelvis and was the main focus of the study.
Other structures with oblique orientations that couldnot be easily identified in the pelvic reference system weremeasured using the sacral reference system as describedpreviously. Measurements that were clinically relevant weregenerally those measurable in the sagittal and transverseplanes and were reported below. During the part of the studywhere a pointer was used, the following fluoroscopic lines
Fig. 5. The pelvic system: the anterior-to-posterior direction is or-thogonal to the plane created by the anterior superior iliac spinesand the pubic symphysis.
Fig. 6. The sacral system is based on the superior endplate of thefirst sacral vertebra. The transverse plane is parallel to the firstsacral endplate, and both other planes are orthogonal to the axial.
Fig. 4. (A) Angular divergence of the S1 foramen from the midline.(B) Schematic illustration of image shown in A, clarifying structuresand details.
The Journal of TRAUMA� Injury, Infection, and Critical Care
350 February 2007
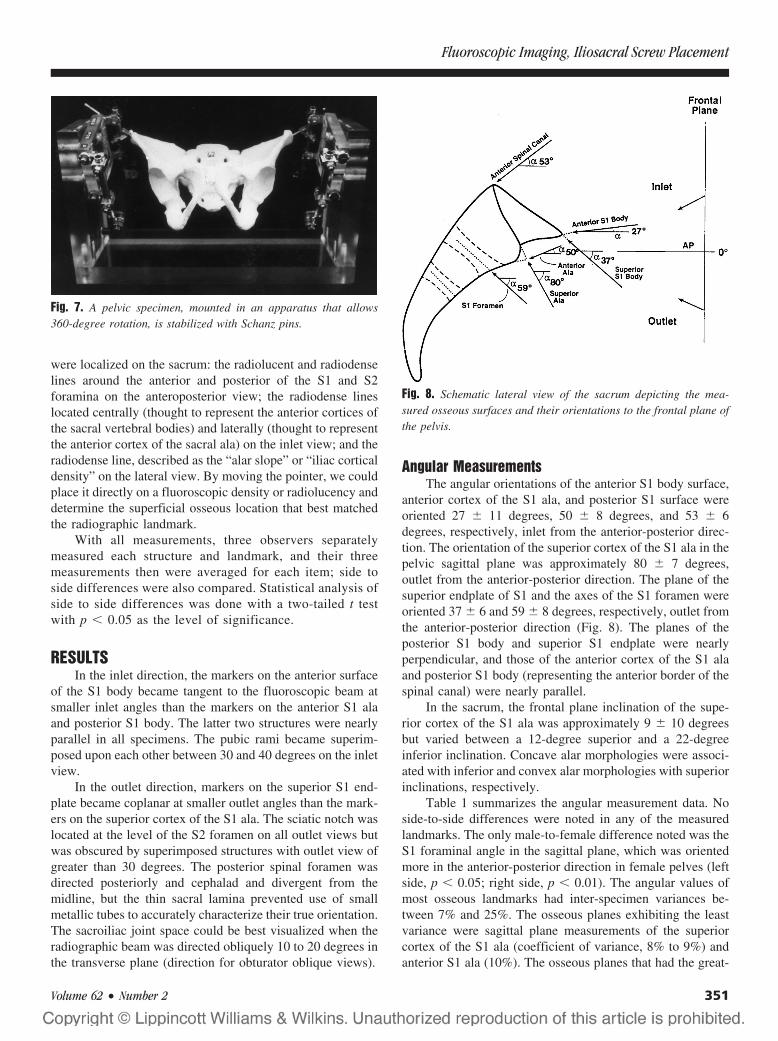
were localized on the sacrum: the radiolucent and radiodenselines around the anterior and posterior of the S1 and S2foramina on the anteroposterior view; the radiodense lineslocated centrally (thought to represent the anterior cortices ofthe sacral vertebral bodies) and laterally (thought to representthe anterior cortex of the sacral ala) on the inlet view; and theradiodense line, described as the “alar slope” or “iliac corticaldensity” on the lateral view. By moving the pointer, we couldplace it directly on a fluoroscopic density or radiolucency anddetermine the superficial osseous location that best matchedthe radiographic landmark.
With all measurements, three observers separatelymeasured each structure and landmark, and their threemeasurements then were averaged for each item; side toside differences were also compared. Statistical analysis ofside to side differences was done with a two-tailed t testwith p � 0.05 as the level of significance.
RESULTSIn the inlet direction, the markers on the anterior surface
of the S1 body became tangent to the fluoroscopic beam atsmaller inlet angles than the markers on the anterior S1 alaand posterior S1 body. The latter two structures were nearlyparallel in all specimens. The pubic rami became superim-posed upon each other between 30 and 40 degrees on the inletview.
In the outlet direction, markers on the superior S1 end-plate became coplanar at smaller outlet angles than the mark-ers on the superior cortex of the S1 ala. The sciatic notch waslocated at the level of the S2 foramen on all outlet views butwas obscured by superimposed structures with outlet view ofgreater than 30 degrees. The posterior spinal foramen wasdirected posteriorly and cephalad and divergent from themidline, but the thin sacral lamina prevented use of smallmetallic tubes to accurately characterize their true orientation.The sacroiliac joint space could be best visualized when theradiographic beam was directed obliquely 10 to 20 degrees inthe transverse plane (direction for obturator oblique views).
Angular MeasurementsThe angular orientations of the anterior S1 body surface,
anterior cortex of the S1 ala, and posterior S1 surface wereoriented 27 � 11 degrees, 50 � 8 degrees, and 53 � 6degrees, respectively, inlet from the anterior-posterior direc-tion. The orientation of the superior cortex of the S1 ala in thepelvic sagittal plane was approximately 80 � 7 degrees,outlet from the anterior-posterior direction. The plane of thesuperior endplate of S1 and the axes of the S1 foramen wereoriented 37 � 6 and 59 � 8 degrees, respectively, outlet fromthe anterior-posterior direction (Fig. 8). The planes of theposterior S1 body and superior S1 endplate were nearlyperpendicular, and those of the anterior cortex of the S1 alaand posterior S1 body (representing the anterior border of thespinal canal) were nearly parallel.
In the sacrum, the frontal plane inclination of the supe-rior cortex of the S1 ala was approximately 9 � 10 degreesbut varied between a 12-degree superior and a 22-degreeinferior inclination. Concave alar morphologies were associ-ated with inferior and convex alar morphologies with superiorinclinations, respectively.
Table 1 summarizes the angular measurement data. Noside-to-side differences were noted in any of the measuredlandmarks. The only male-to-female difference noted was theS1 foraminal angle in the sagittal plane, which was orientedmore in the anterior-posterior direction in female pelves (leftside, p � 0.05; right side, p � 0.01). The angular values ofmost osseous landmarks had inter-specimen variances be-tween 7% and 25%. The osseous planes exhibiting the leastvariance were sagittal plane measurements of the superiorcortex of the S1 ala (coefficient of variance, 8% to 9%) andanterior S1 ala (10%). The osseous planes that had the great-
Fig. 7. A pelvic specimen, mounted in an apparatus that allows360-degree rotation, is stabilized with Schanz pins.
Fig. 8. Schematic lateral view of the sacrum depicting the mea-sured osseous surfaces and their orientations to the frontal plane ofthe pelvis.
Fluoroscopic Imaging, Iliosacral Screw Placement
Volume 62 • Number 2 351
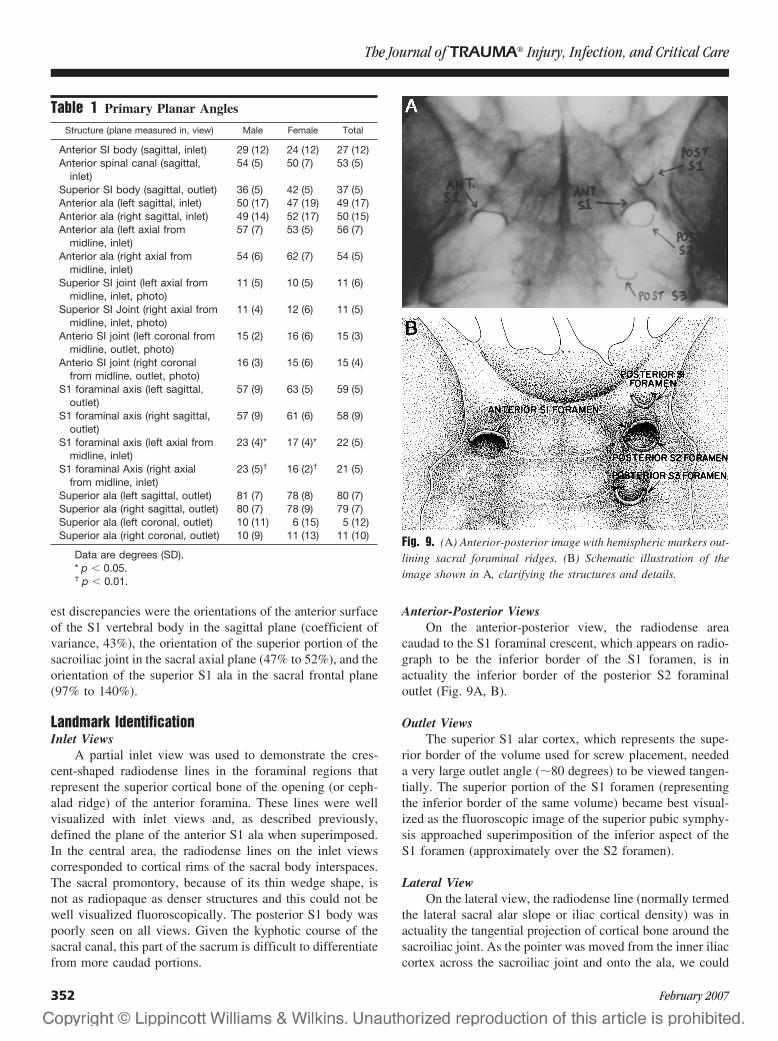
est discrepancies were the orientations of the anterior surfaceof the S1 vertebral body in the sagittal plane (coefficient ofvariance, 43%), the orientation of the superior portion of thesacroiliac joint in the sacral axial plane (47% to 52%), and theorientation of the superior S1 ala in the sacral frontal plane(97% to 140%).
Landmark IdentificationInlet Views
A partial inlet view was used to demonstrate the cres-cent-shaped radiodense lines in the foraminal regions thatrepresent the superior cortical bone of the opening (or ceph-alad ridge) of the anterior foramina. These lines were wellvisualized with inlet views and, as described previously,defined the plane of the anterior S1 ala when superimposed.In the central area, the radiodense lines on the inlet viewscorresponded to cortical rims of the sacral body interspaces.The sacral promontory, because of its thin wedge shape, isnot as radiopaque as denser structures and this could not bewell visualized fluoroscopically. The posterior S1 body waspoorly seen on all views. Given the kyphotic course of thesacral canal, this part of the sacrum is difficult to differentiatefrom more caudad portions.
Anterior-Posterior ViewsOn the anterior-posterior view, the radiodense area
caudad to the S1 foraminal crescent, which appears on radio-graph to be the inferior border of the S1 foramen, is inactuality the inferior border of the posterior S2 foraminaloutlet (Fig. 9A, B).
Outlet ViewsThe superior S1 alar cortex, which represents the supe-
rior border of the volume used for screw placement, neededa very large outlet angle (�80 degrees) to be viewed tangen-tially. The superior portion of the S1 foramen (representingthe inferior border of the same volume) became best visual-ized as the fluoroscopic image of the superior pubic symphy-sis approached superimposition of the inferior aspect of theS1 foramen (approximately over the S2 foramen).
Lateral ViewOn the lateral view, the radiodense line (normally termed
the lateral sacral alar slope or iliac cortical density) was inactuality the tangential projection of cortical bone around thesacroiliac joint. As the pointer was moved from the inner iliaccortex across the sacroiliac joint and onto the ala, we could
Table 1 Primary Planar Angles
Structure (plane measured in, view) Male Female Total
Anterior SI body (sagittal, inlet) 29 (12) 24 (12) 27 (12)Anterior spinal canal (sagittal,
inlet)54 (5) 50 (7) 53 (5)
Superior SI body (sagittal, outlet) 36 (5) 42 (5) 37 (5)Anterior ala (left sagittal, inlet) 50 (17) 47 (19) 49 (17)Anterior ala (right sagittal, inlet) 49 (14) 52 (17) 50 (15)Anterior ala (left axial from
midline, inlet)57 (7) 53 (5) 56 (7)
Anterior ala (right axial frommidline, inlet)
54 (6) 62 (7) 54 (5)
Superior SI joint (left axial frommidline, inlet, photo)
11 (5) 10 (5) 11 (6)
Superior SI Joint (right axial frommidline, inlet, photo)
11 (4) 12 (6) 11 (5)
Anterio SI joint (left coronal frommidline, outlet, photo)
15 (2) 16 (6) 15 (3)
Anterio SI joint (right coronalfrom midline, outlet, photo)
16 (3) 15 (6) 15 (4)
S1 foraminal axis (left sagittal,outlet)
57 (9) 63 (5) 59 (5)
S1 foraminal axis (right sagittal,outlet)
57 (9) 61 (6) 58 (9)
S1 foraminal axis (left axial frommidline, inlet)
23 (4)* 17 (4)* 22 (5)
S1 foraminal Axis (right axialfrom midline, inlet)
23 (5)† 16 (2)† 21 (5)
Superior ala (left sagittal, outlet) 81 (7) 78 (8) 80 (7)Superior ala (right sagittal, outlet) 80 (7) 78 (9) 79 (7)Superior ala (left coronal, outlet) 10 (11) 6 (15) 5 (12)Superior ala (right coronal, outlet) 10 (9) 11 (13) 11 (10)
Data are degrees (SD).* p � 0.05.† p � 0.01.
Fig. 9. (A) Anterior-posterior image with hemispheric markers out-lining sacral foraminal ridges. (B) Schematic illustration of theimage shown in A, clarifying the structures and details.
The Journal of TRAUMA� Injury, Infection, and Critical Care
352 February 2007
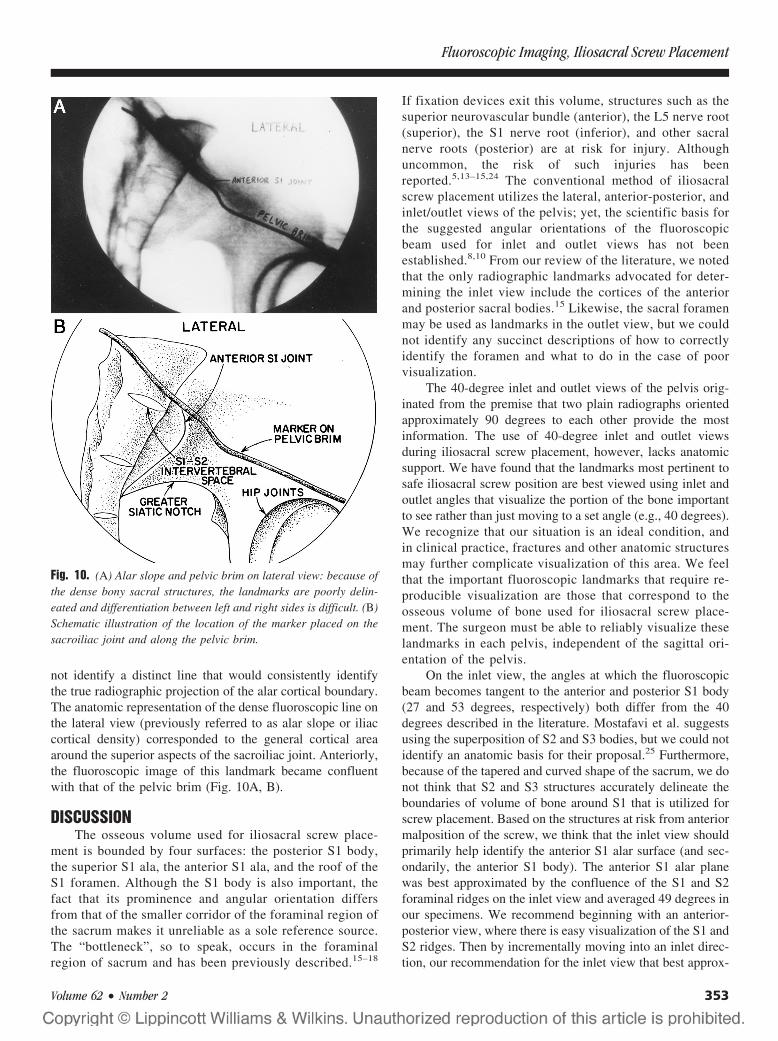
not identify a distinct line that would consistently identifythe true radiographic projection of the alar cortical boundary.The anatomic representation of the dense fluoroscopic line onthe lateral view (previously referred to as alar slope or iliaccortical density) corresponded to the general cortical areaaround the superior aspects of the sacroiliac joint. Anteriorly,the fluoroscopic image of this landmark became confluentwith that of the pelvic brim (Fig. 10A, B).
DISCUSSIONThe osseous volume used for iliosacral screw place-
ment is bounded by four surfaces: the posterior S1 body,the superior S1 ala, the anterior S1 ala, and the roof of theS1 foramen. Although the S1 body is also important, thefact that its prominence and angular orientation differsfrom that of the smaller corridor of the foraminal region ofthe sacrum makes it unreliable as a sole reference source.The “bottleneck”, so to speak, occurs in the foraminalregion of sacrum and has been previously described.15–18
If fixation devices exit this volume, structures such as thesuperior neurovascular bundle (anterior), the L5 nerve root(superior), the S1 nerve root (inferior), and other sacralnerve roots (posterior) are at risk for injury. Althoughuncommon, the risk of such injuries has beenreported.5,13–15,24 The conventional method of iliosacralscrew placement utilizes the lateral, anterior-posterior, andinlet/outlet views of the pelvis; yet, the scientific basis forthe suggested angular orientations of the fluoroscopicbeam used for inlet and outlet views has not beenestablished.8,10 From our review of the literature, we notedthat the only radiographic landmarks advocated for deter-mining the inlet view include the cortices of the anteriorand posterior sacral bodies.15 Likewise, the sacral foramenmay be used as landmarks in the outlet view, but we couldnot identify any succinct descriptions of how to correctlyidentify the foramen and what to do in the case of poorvisualization.
The 40-degree inlet and outlet views of the pelvis orig-inated from the premise that two plain radiographs orientedapproximately 90 degrees to each other provide the mostinformation. The use of 40-degree inlet and outlet viewsduring iliosacral screw placement, however, lacks anatomicsupport. We have found that the landmarks most pertinent tosafe iliosacral screw position are best viewed using inlet andoutlet angles that visualize the portion of the bone importantto see rather than just moving to a set angle (e.g., 40 degrees).We recognize that our situation is an ideal condition, andin clinical practice, fractures and other anatomic structuresmay further complicate visualization of this area. We feelthat the important fluoroscopic landmarks that require re-producible visualization are those that correspond to theosseous volume of bone used for iliosacral screw place-ment. The surgeon must be able to reliably visualize theselandmarks in each pelvis, independent of the sagittal ori-entation of the pelvis.
On the inlet view, the angles at which the fluoroscopicbeam becomes tangent to the anterior and posterior S1 body(27 and 53 degrees, respectively) both differ from the 40degrees described in the literature. Mostafavi et al. suggestsusing the superposition of S2 and S3 bodies, but we could notidentify an anatomic basis for their proposal.25 Furthermore,because of the tapered and curved shape of the sacrum, we donot think that S2 and S3 structures accurately delineate theboundaries of volume of bone around S1 that is utilized forscrew placement. Based on the structures at risk from anteriormalposition of the screw, we think that the inlet view shouldprimarily help identify the anterior S1 alar surface (and sec-ondarily, the anterior S1 body). The anterior S1 alar planewas best approximated by the confluence of the S1 and S2foraminal ridges on the inlet view and averaged 49 degrees inour specimens. We recommend beginning with an anterior-posterior view, where there is easy visualization of the S1 andS2 ridges. Then by incrementally moving into an inlet direc-tion, our recommendation for the inlet view that best approx-
Fig. 10. (A) Alar slope and pelvic brim on lateral view: because ofthe dense bony sacral structures, the landmarks are poorly delin-eated and differentiation between left and right sides is difficult. (B)Schematic illustration of the location of the marker placed on thesacroiliac joint and along the pelvic brim.
Fluoroscopic Imaging, Iliosacral Screw Placement
Volume 62 • Number 2 353

imates the anterior S1 alar cortical boundary is when the S1and S2 foraminal densities super impose. Also, our angularorientations were reported in vitro using a pelvis of fixedorientation, and we recognize that there are in vivo variationsin the actual pelvic tilt. On the outlet view, the criticallandmarks are the S1 foramen, the superior ala, and thesuperior endplate of the S1 vertebral body. The S1 foraminalaxis averaged 59 degrees outlet to the AP direction. This isdifficult to delineate in vivo because of the large outlet anglerequired, and because the foraminal axis does not lie exclu-sively in the sagittal plane and courses obliquely from ante-rior/lateral/inferior to posterior/ medial/superior. The superiorala is visualized at an average of 80 degrees outlet (orienta-tion in the sagittal plane), which, for reasons mentionedpreviously, is not possible to obtain with the fluoroscope inthe clinical setting. Also because of the large variances in thefrontal-plane orientation of the superior ala as well as in thevariable alar morphology, there may be an increased risk thatan iliosacral screw will traverse outside the bony confines ofthe ala and potentially injure the adjacent L5 nerve root.5,15
Nonetheless, because of the difficulties in obtaining anend-on view of the S1 foramen, or an 80-degree outlet viewfor the superior ala, we propose an alternative method todelineate the structures at risk.
We think that the superior portion of S1 foramen is theeasiest structure to identify in the outlet view and can be usedas a reference for screw placement. The superior opening ofthe S1 foramen approximates the inferior boundary of thevolume of bone used for screw placement. This view is bestobtained by starting with an AP view and identifying thedense line representing the S1 foramen. With incrementaloutlet views, this opening of the foramen can frequently beseen to emerge and become more spherical. Subjectively, wefound the best view to be approximately when the symphy-seal image approaches (but does not obscure) the inferior S1foraminal region (S2 foramen). This view was obtained ataround 50 degrees outlet in our in vitro model. We caution,however, that just as with the inlet view, variations in pelvictilt or the lumbosacral junction would make use of suchpredetermined angles less reliable in vivo, and that usinginnate landmarks is preferred. If the trajectory of the fixationdevice is superior to the S1 foramen on the outlet view, andwithin the alar confines on the inlet view, then it is unlikelyto violate the anterior or posterior neurovascular structures.
The lateral radiographic view is a key view and has beenrecommended to determine the starting point of iliosacralscrew fixation on the outer ilium, but it is difficult to obtainand interpret.6 Because of the potential superimposition ofcontralateral structures and soft tissues, this region can bevery difficult to discern in vivo, especially in overweightpatients. We found that the best method to obtain a lateralview is to superimpose radiographic images of the sciaticnotches. The sclerotic line coursing anterior-inferiorly hasbeen termed the iliac cortical density or sacral alar slope.7 Ithas been recommended that the screw insertion point begin
inferior and posterior to this radiographic density. Previouslythought by some to represent the area between the sacroiliacjoint and lateral S1 body, we found that this line is not aspecific and narrow area, nor a true representation of the iliacor sacral alar cortical boundaries, especially if the surface isirregular in shape. Because radiographic projections arebased on the confluence and densities of bone, a convex orconcave surface would not image as a dense radiographicline. Likewise, the complex orientation of the sacral ala doesnot have a surface that is parallel to a laterally directedradiographic beam. Even small adjustments of the beam willonly identify small regions of tangential bone and would notbe enough to clearly outline the entirety of the sacral ala.Thus, we feel that the fluoroscopic line, called the iliaccortical density or alar slope, represents the general areaaround the sacroiliac joint and is represented by the conflu-ence of cortical and cancellous bone around the sacroiliacjoint. Although not precise, this is the best approximation ofthe alar cortex on the lateral view.
By beginning an entry point inferior and posterior tothis line on the outer ilium, we think the risk of superior/anterior cortical penetration (and injury to the L5 nerveroot) is minimized if the screw is directed properly. It ispossible that in a very concave shaped S1 ala, the L5 nerveroot would also lie inferior and posterior to this landmark,and would thus be at risk for injury by allowing a screw toenter the ilium, exit the ala medial to the sacroiliac joint(despite appearing to be appropriately placed relative tothe alar slope), skirt along the surface of the S1 ala (wherethe L5 nerve roots lies), and then re-enter the S1 body. Atany time, however, the advocated fluoroscopic viewswould not give any indication of this aberrance. We wouldtherefore caution that iliosacral screw placement in pa-tients with dysplastic sacra might be dangerous when usingfluoroscopic guidance alone. Other techniques such ascomputed tomographic guidance or evoked potentials maybe useful in such situations.2,14,20,24 Furthermore, the useof proprioceptive feedback from passing of the drill canhelp confirm that one is intraosseous. Excessive resistancemay indicate a cortical boundary (i.e., foraminal wall oralar cortex) and lack of resistance may indicate an ex-traosseous position of the drill tip.
The present study was done in vitro and with relativelyfew specimens, and although there was little variabilityamong the specimens, the wide availability of human ana-tomic specimens is limited and results in limitations inherentto such studies. The presence of soft-tissue injury and varia-tions of body habitus would affect the ability to visualize thestructures reported. Most importantly, the presence of frac-ture and displacement would significantly affect fluoroscopicvisualization. It is because of these problems that we under-took this study in an effort to provide a method of outliningthe necessary pelvic structures to aid in the safe placement ofiliosacral screws. We did not try to characterize all pelvicstructures, as our intent was to only describe the landmarks of
The Journal of TRAUMA� Injury, Infection, and Critical Care
354 February 2007
the bony volume used for iliosacral screw placement. None-theless, this study does identify innate relationships that maybe useful in clinical practice.
CONCLUSIONSOur findings indicate that the standard fluoroscopic
views—such as 40 degrees inlet and 40 degrees outlet—donot consistently provide accurate views of the osseous struc-tures required for safe iliosacral screw placement. It is im-portant to note that the value of standard AP views forimaging critical structures is of limited value (especially inviewing S1 foramen). We found that the best inlet view isobtained by incrementally moving from an AP view in theinlet direction, until the radiodense images of the S1 and S2foraminal ridges (anterior border of the S1 alar root) aresuperimposed. The best outlet view is obtained by optimizingan image of the superior ridge of the S1 foramen. By movingfrom an AP view in the outlet direction, the radiodense imageof the S1 foramen is followed. As the image of the symphysisapproaches this landmark, an image of the S1 foramen canusually be seen. Most importantly, the lateral view helpsidentify the superior and anterior sacroiliac joint area (previ-ously referred to as the iliac cortical density or alar slope).The entry point for the screw on the lateral ilium should beposterior to this line, and proprioceptive feedback that helpsconfirm intraosseous trajectory should be utilized. Althoughwe have been using this method clinically for some time, andwe think that the method is easily obtained, reproducible, andanatomically based, the application of such information mustbe cautiously used in the clinical setting and should beweighed against the surgeon’s abilities and experience.
APPENDIXMeasurements of complex and obliquely oriented struc-
tures were made by referencing the S1 superior endplate asthe transverse plane of the sacrum. Planes orthogonal to thisplane defined the frontal and sagittal plane of the sacrum.Obviously the sagittal planes for both the sacrum and thepelvis are coplanar. Two structures (S1 ala and S1 foramen)had complex oblique components to their orientation. For thetransverse components (anterior S1 ala and S1 foramen), theirorientation was measured from a midline reference that wasapplicable in all sagittal rotations. The transverse measure-ments were made from fluoroscopic images taken when thestructures tangential orientation was obtained. For example,the transverse orientation of the anterior parts of the S1 alawas measured when the pelvis was rotated so that the markerson the anterior ala indicated tangency. In this image, the angleof the ala from the sagittal plane was recorded (Fig. 2A, B).The orientations of the foramen were recorded when thefluoroscopic beam was orthogonal to the axis of the foramen.The angle from the sagittal plane in this view determined thetransverse orientation of the foramen. The caudad orientationof the foramen was established by rotating the specimens inthe outlet direction until the axis of the tubes was parallel to
the transverse axis. Then the specimen was rotated 90 degreesto this in the inlet direction to give a top view of the foramen,and this divergence of the axis of the tubes from the midlineestablished the medial to lateral divergence of the foramen(Fig. 4A, B).
For the frontal component of the superior S1 ala, thesuperior S1 endplate was used as a reference. As done for theanterior ala, we first obtained a true outlet view (as wedescribed) that identified the tangent to the superior S1 alarsurface in the sagittal plane. From here, the frontal compo-nent is measured relative to the superior S1 endplate. Theplanar markers on the superior alar surface, now superim-posed, project a line that is sloped medial to lateral and usedto define the frontal orientation of the superior alar surface.Recognizing that this surface may be slightly concave orconvex, a line connecting the sacral-alar junction to the lat-eral extent of the markers was used to approximate thissurface. As mentioned before, this measurement is in theplane thought of as the “frontal” plane of the sacrum. Al-though not the “anatomic” frontal plane, the measurementsare easier to understand in relation to this sacral referencesystem as opposed to the pelvic system (Fig. 6). Figure 8 isa schematic representation of the measurements described inFigures 2 through 4. Note that Figure 2 represents an inletview and Figure 3 represents an outlet view.
REFERENCES1. Matta J, Saucedo T. Internal fixation of pelvic ring fractures. Clin
Orthop. 1989;242:83–97.2. Nelson DW, Duwelius PJ. CT guided fixation of sacral fractures and
sacroiliac joint disruptions. Radiology. 1991;180:527–532.3. Routt ML, Kregor PJ, Simonian PT, Mayo KA. Early results of
percutaneous iliosacral screws placed with the patients in the supineposition. J Orthop Trauma. 1995;3:207–214.
4. Routt ML, Simonian PT. Closed reduction and percutaneous skeletalfixation of sacral fractures. Clin Orthop. 1996;8:121–128.
5. Routt ML, Simonian PT. Iliosacral screw fixation: earlycomplications of the percutaneous technique. J Orthop Trauma.1997;11:584–589.
6. Routt ML, Jones CB, Harding SP, Mirza SK. Percutaneousstabilization of U-shaped sacral fractures using iliosacral screws:technique and early results. J Orthop Trauma. 2001;15:238–246.
7. Routt ML, Simonian PT, Agnew SG, Mann FA. Radiographicrecognition of the sacral alar slope for optimal placement ofiliosacral screws: a cadaveric and clinical study. J Orthop Trauma.1996;10:171–177.
8. Baque P, Trojani C, Delotte J, et al. Anatomical consequences of“open-book” pelvic ring disruption. A cadaver experimental study.Surg Radiol Anat. 2005;27:487–490.
9. Resnik CS, Stackhouse DJ, Shanmuganathan K, Young JR.Diagnosis of pelvic fractures in patients with acute pelvic trauma:efficacy of plain radiographs. Am J Roentg. 1992;158:109–112.
10. Tile M. Fractures of the Pelvis and Acetabulum. 2nd Ed.Philadelphia: Lippincott Williams and Wilkins; 1995.
11. Xu R, Ebraheim NB, Douglas K, Yeasting RA. The projection of thelateral sacral mass on the outer table of the posterior ilium. Spine.1996;21:790–795.
12. Xu R, Ebraheim NB, Robke JK, Yeasting RA. Radiologic evaluationof iliosacral screw placement. Spine. 1996;21:582–588.
Fluoroscopic Imaging, Iliosacral Screw Placement
Volume 62 • Number 2 355
13. Ebraheim NA, Haman SP, Xu R, et al. The lumbosacral nerves inrelation to dorsal s1 screw placement and their locations on plainradiographs. Orthop. 2000;23:245–247.
14. Moed BR, Ahmada BK, Craig JG, et al. Intraoperative monitoringwith stimulus evoked electromyography during placement ofiliosacral screws: an initial clinical study. J Bone and Joint Surg Am.1998;80:537–546.
15. Templeman D, Schmidt A, Freese J, Weisman I. Proximity ofiliosacral screws to neurovascular structures after internal fixation.Clin Orthop. 1996;329:194–198.
16. Amongero ME, Wilber JH. Upper sacral morphology and its relationto sacroiliac screw fixation. Orthopaedic Trans. 1995;19:435.
17. Ebraheim NA, Rongming X, Biyani A, Nadaua MC. Morphologicconsideration of the first sacral pedicle for iliosacral screwplacement. Spine. 1997;22:841–846.
18. Carlson DA, Scheid DK, Maar DC, et al. Safe placement of s1 ands2 iliosacral screw: The “vestibule” concept. J Orthop Trauma.2000;14:4.
19. Day CS, Prayson MJ, Shuler TE, et al. Transacral versus modifiedpelvic landmarks for percutaneous iliosacral screw placement - acomputed tomography analysis and cadaveric study. Am J Orthop.2000;9:16–21.
20. Tonetti J, Carrat L, Lavellee S, et al. Percutaneous iliosacral screwplacement using image guided techniques. Clin Orthop. 1998;354:103–110.
21. Noojin FK, Malkani AL, Haikal L, et al. Cross-sectional geometryof the sacral ala for safe insertion of iliosacral lag screws: acomputed tomography model. J Orthop Trauma. 2000;14:31–35.
22. LeTournel E, Judet R. Fractures of the Acetabulum. New York:Springer-Verlag; 1981.
23. Mcollum DE, Gray WJ. Dislocation after total hip arthroplasty:causes and prevention. Clin Orthop. 1990;261:159–170.
24. Webb LX, de Araujo W, Donofrio P, et al. Electromyographymonitoring for percutaneous placement of iliosacral screws. J OrthopTrauma. 2000;14:4.
25. Mostafavi H, Tornetta P. Radiographic evaluation of the pelvis. ClinOrthop. 1996;329:6–14.
EDITORIAL COMMENTThe three-dimensional anatomy of the pelvis is difficult
to visualize with two-dimensional radiography. This studyassists pelvic surgeons in placing iliosacral screws by pro-viding a better understanding of what we see fluoroscopicallyduring surgery. The authors used radiodense markers andpointers to correlate anatomic landmarks with radiographicdensity and lucency in cadaveric pelvises. The fluoroscopicbeam was moved to define the orientation of tangential bonysurfaces in critical areas.
The authors discovered several important points. First, it isnot safe to use predetermined inlet and outlet angles to view thepelvis, as there will be variation in sacral morphology andlumbosacral lordosis between individuals. Second, the anteriorborder of the sacral ala is not parallel to the anterior border of theS1 body. Surprisingly, it is nearly parallel to the posterior borderof the S1 body. Third, several areas (i.e., the posterior S1 body,the superior sacral ala, and the posterior foraminal region of S1)are difficult to visualize fluoroscopically.
In their discussion, Ziran et al. emphasize that by incremen-tally moving the fluoroscopic angle, the surgeon can obtainmodified inlet and outlet views that will best display the bonysurfaces that must not be violated by guidewires or screws.Although these concepts may already be understood by experi-enced pelvic surgeons, the data and documentation providedserve to strengthen the foundation of available knowledge. Thus,this study is an important reference for all pelvic surgeons.
John Gorczyca, MDUniversity of Rochester School of MedicineRochester, New York
The Journal of TRAUMA� Injury, Infection, and Critical Care
356 February 2007
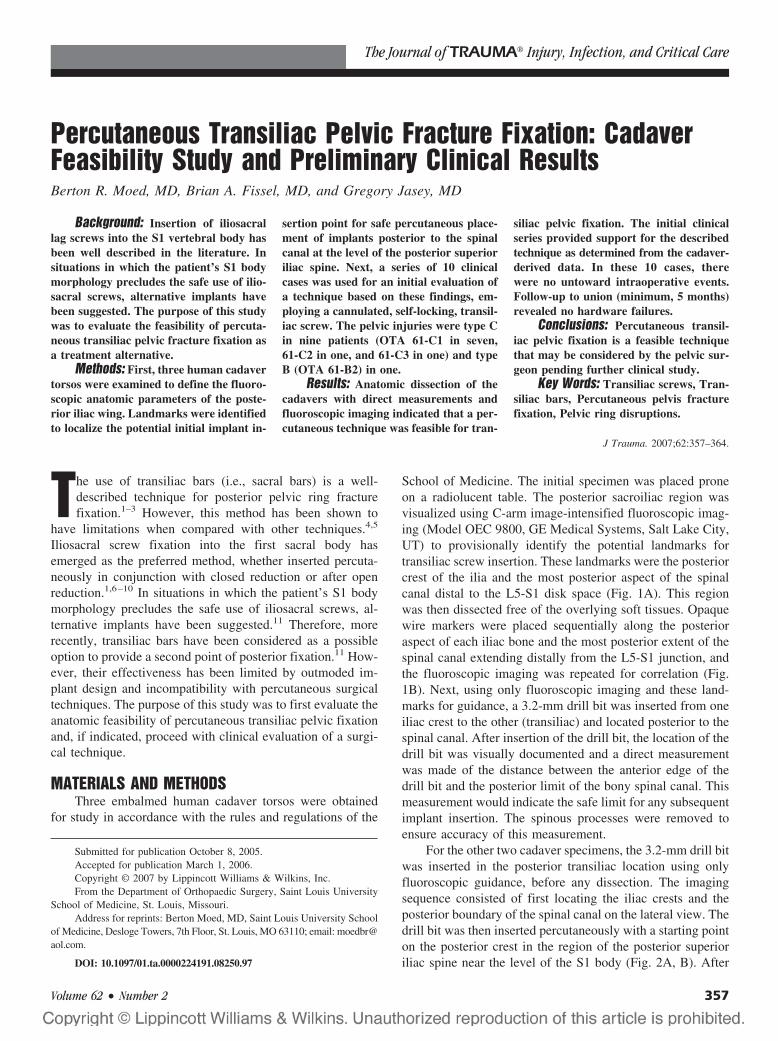
Percutaneous Transiliac Pelvic Fracture Fixation: CadaverFeasibility Study and Preliminary Clinical ResultsBerton R. Moed, MD, Brian A. Fissel, MD, and Gregory Jasey, MD
Background: Insertion of iliosacrallag screws into the S1 vertebral body hasbeen well described in the literature. Insituations in which the patient’s S1 bodymorphology precludes the safe use of ilio-sacral screws, alternative implants havebeen suggested. The purpose of this studywas to evaluate the feasibility of percuta-neous transiliac pelvic fracture fixation asa treatment alternative.
Methods: First, three human cadavertorsos were examined to define the fluoro-scopic anatomic parameters of the poste-rior iliac wing. Landmarks were identifiedto localize the potential initial implant in-
sertion point for safe percutaneous place-ment of implants posterior to the spinalcanal at the level of the posterior superioriliac spine. Next, a series of 10 clinicalcases was used for an initial evaluation ofa technique based on these findings, em-ploying a cannulated, self-locking, transil-iac screw. The pelvic injuries were type Cin nine patients (OTA 61-C1 in seven,61-C2 in one, and 61-C3 in one) and typeB (OTA 61-B2) in one.
Results: Anatomic dissection of thecadavers with direct measurements andfluoroscopic imaging indicated that a per-cutaneous technique was feasible for tran-
siliac pelvic fixation. The initial clinicalseries provided support for the describedtechnique as determined from the cadaver-derived data. In these 10 cases, therewere no untoward intraoperative events.Follow-up to union (minimum, 5 months)revealed no hardware failures.
Conclusions: Percutaneous transil-iac pelvic fixation is a feasible techniquethat may be considered by the pelvic sur-geon pending further clinical study.
Key Words: Transiliac screws, Tran-siliac bars, Percutaneous pelvis fracturefixation, Pelvic ring disruptions.
J Trauma. 2007;62:357–364.
The use of transiliac bars (i.e., sacral bars) is a well-described technique for posterior pelvic ring fracturefixation.1–3 However, this method has been shown to
have limitations when compared with other techniques.4,5
Iliosacral screw fixation into the first sacral body hasemerged as the preferred method, whether inserted percuta-neously in conjunction with closed reduction or after openreduction.1,6–10 In situations in which the patient’s S1 bodymorphology precludes the safe use of iliosacral screws, al-ternative implants have been suggested.11 Therefore, morerecently, transiliac bars have been considered as a possibleoption to provide a second point of posterior fixation.11 How-ever, their effectiveness has been limited by outmoded im-plant design and incompatibility with percutaneous surgicaltechniques. The purpose of this study was to first evaluate theanatomic feasibility of percutaneous transiliac pelvic fixationand, if indicated, proceed with clinical evaluation of a surgi-cal technique.
MATERIALS AND METHODSThree embalmed human cadaver torsos were obtained
for study in accordance with the rules and regulations of the
School of Medicine. The initial specimen was placed proneon a radiolucent table. The posterior sacroiliac region wasvisualized using C-arm image-intensified fluoroscopic imag-ing (Model OEC 9800, GE Medical Systems, Salt Lake City,UT) to provisionally identify the potential landmarks fortransiliac screw insertion. These landmarks were the posteriorcrest of the ilia and the most posterior aspect of the spinalcanal distal to the L5-S1 disk space (Fig. 1A). This regionwas then dissected free of the overlying soft tissues. Opaquewire markers were placed sequentially along the posterioraspect of each iliac bone and the most posterior extent of thespinal canal extending distally from the L5-S1 junction, andthe fluoroscopic imaging was repeated for correlation (Fig.1B). Next, using only fluoroscopic imaging and these land-marks for guidance, a 3.2-mm drill bit was inserted from oneiliac crest to the other (transiliac) and located posterior to thespinal canal. After insertion of the drill bit, the location of thedrill bit was visually documented and a direct measurementwas made of the distance between the anterior edge of thedrill bit and the posterior limit of the bony spinal canal. Thismeasurement would indicate the safe limit for any subsequentimplant insertion. The spinous processes were removed toensure accuracy of this measurement.
For the other two cadaver specimens, the 3.2-mm drill bitwas inserted in the posterior transiliac location using onlyfluoroscopic guidance, before any dissection. The imagingsequence consisted of first locating the iliac crests and theposterior boundary of the spinal canal on the lateral view. Thedrill bit was then inserted percutaneously with a starting pointon the posterior crest in the region of the posterior superioriliac spine near the level of the S1 body (Fig. 2A, B). After
Submitted for publication October 8, 2005.Accepted for publication March 1, 2006.Copyright © 2007 by Lippincott Williams & Wilkins, Inc.From the Department of Orthopaedic Surgery, Saint Louis University
School of Medicine, St. Louis, Missouri.Address for reprints: Berton Moed, MD, Saint Louis University School
of Medicine, Desloge Towers, 7th Floor, St. Louis, MO 63110; email: [email protected].
DOI: 10.1097/01.ta.0000224191.08250.97
The Journal of TRAUMA� Injury, Infection, and Critical Care
Volume 62 • Number 2 357

the drill bit was felt to pass through the ilium, sequentialimaging (alternating between the lateral, inlet, and outletviews) was used until the drill bit was felt to pass through thecontralateral ilium. The drill bit was then advanced throughthe contralateral soft tissues and out through the skin. Finalanteroposterior (AP), inlet, outlet, and lateral fluoroscopicimages were obtained. The posterior soft tissues were dis-sected and the spinous processes removed to visually deter-mine the location of the drill bit relative to the iliac crests andposterior sacrum (Fig. 3A, B).
RESULTSSuccessful transiliac insertion of the drill bit with satis-
factory purchase in both iliac crests, safely posterior to thespinal canal, was accomplished in all three cadaver samples.An appropriate starting point on the ilium and the posteriorextent of the spinal canal was located fluoroscopically in allthree cadavers and then visually verified. The previouslydefined “safe limit” (the distance between the anterior edge of
the drill bit and the posterior limit of the bony spinal canal)was 8 mm, 9 mm, and 11 mm for the three specimens,averaging 9.7 mm. The drill bit was completely containedwithin the ilium in all specimens, with no less than 1.5 cm ofsurrounding bone (Fig. 3B).
CLINICAL CASE SERIESMaterials
During this study period, a pelvic fracture managementprotocol was in effect that included an initial radiographicevaluation consisting of AP, inlet, and outlet plain pelvicradiographs, as well as two-dimensional computerized to-mography (CT) of the pelvis with 3-mm slice thickness. Aftereither closed or open reduction, iliosacral screw fixation intothe S1 body was the fixation method of choice for unstabledisruptions of the posterior pelvic ring. Those patients withinadequate space available for at least two points of iliosacralscrew fixation (into the S1 body, S2 body, or combinationthereof) as determined by the preoperative studies or made
Fig. 1. Lateral fluoroscopic views obtained on the initial cadaver torso specimen (A) before dissection showing the iliac crests (white dots)and the posterior aspect of the spinal canal ( black dots) and ( B) after dissection and placement of wire markers on these areas.
Fig. 2. Lateral fluoroscopic views obtained on the subsequent cadaver torso specimen (A) during initial targeting with the drill bit and ( B)after drill bit insertion.
The Journal of TRAUMA� Injury, Infection, and Critical Care
358 February 2007
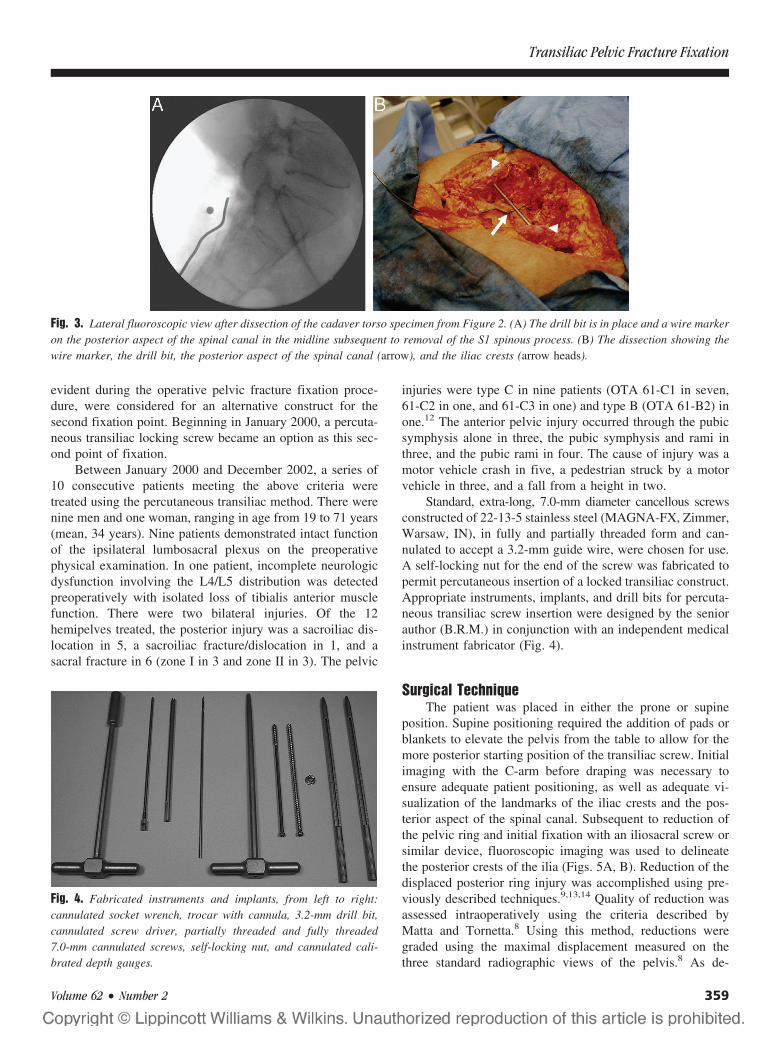
evident during the operative pelvic fracture fixation proce-dure, were considered for an alternative construct for thesecond fixation point. Beginning in January 2000, a percuta-neous transiliac locking screw became an option as this sec-ond point of fixation.
Between January 2000 and December 2002, a series of10 consecutive patients meeting the above criteria weretreated using the percutaneous transiliac method. There werenine men and one woman, ranging in age from 19 to 71 years(mean, 34 years). Nine patients demonstrated intact functionof the ipsilateral lumbosacral plexus on the preoperativephysical examination. In one patient, incomplete neurologicdysfunction involving the L4/L5 distribution was detectedpreoperatively with isolated loss of tibialis anterior musclefunction. There were two bilateral injuries. Of the 12hemipelves treated, the posterior injury was a sacroiliac dis-location in 5, a sacroiliac fracture/dislocation in 1, and asacral fracture in 6 (zone I in 3 and zone II in 3). The pelvic
injuries were type C in nine patients (OTA 61-C1 in seven,61-C2 in one, and 61-C3 in one) and type B (OTA 61-B2) inone.12 The anterior pelvic injury occurred through the pubicsymphysis alone in three, the pubic symphysis and rami inthree, and the pubic rami in four. The cause of injury was amotor vehicle crash in five, a pedestrian struck by a motorvehicle in three, and a fall from a height in two.
Standard, extra-long, 7.0-mm diameter cancellous screwsconstructed of 22-13-5 stainless steel (MAGNA-FX, Zimmer,Warsaw, IN), in fully and partially threaded form and can-nulated to accept a 3.2-mm guide wire, were chosen for use.A self-locking nut for the end of the screw was fabricated topermit percutaneous insertion of a locked transiliac construct.Appropriate instruments, implants, and drill bits for percuta-neous transiliac screw insertion were designed by the seniorauthor (B.R.M.) in conjunction with an independent medicalinstrument fabricator (Fig. 4).
Surgical TechniqueThe patient was placed in either the prone or supine
position. Supine positioning required the addition of pads orblankets to elevate the pelvis from the table to allow for themore posterior starting position of the transiliac screw. Initialimaging with the C-arm before draping was necessary toensure adequate patient positioning, as well as adequate vi-sualization of the landmarks of the iliac crests and the pos-terior aspect of the spinal canal. Subsequent to reduction ofthe pelvic ring and initial fixation with an iliosacral screw orsimilar device, fluoroscopic imaging was used to delineatethe posterior crests of the ilia (Figs. 5A, B). Reduction of thedisplaced posterior ring injury was accomplished using pre-viously described techniques.9,13,14 Quality of reduction wasassessed intraoperatively using the criteria described byMatta and Tornetta.8 Using this method, reductions weregraded using the maximal displacement measured on thethree standard radiographic views of the pelvis.8 As de-
Fig. 4. Fabricated instruments and implants, from left to right:cannulated socket wrench, trocar with cannula, 3.2-mm drill bit,cannulated screw driver, partially threaded and fully threaded7.0-mm cannulated screws, self-locking nut, and cannulated cali-brated depth gauges.
Fig. 3. Lateral fluoroscopic view after dissection of the cadaver torso specimen from Figure 2. (A) The drill bit is in place and a wire markeron the posterior aspect of the spinal canal in the midline subsequent to removal of the S1 spinous process. (B) The dissection showing thewire marker, the drill bit, the posterior aspect of the spinal canal (arrow), and the iliac crests (arrow heads).
Transiliac Pelvic Fracture Fixation
Volume 62 • Number 2 359
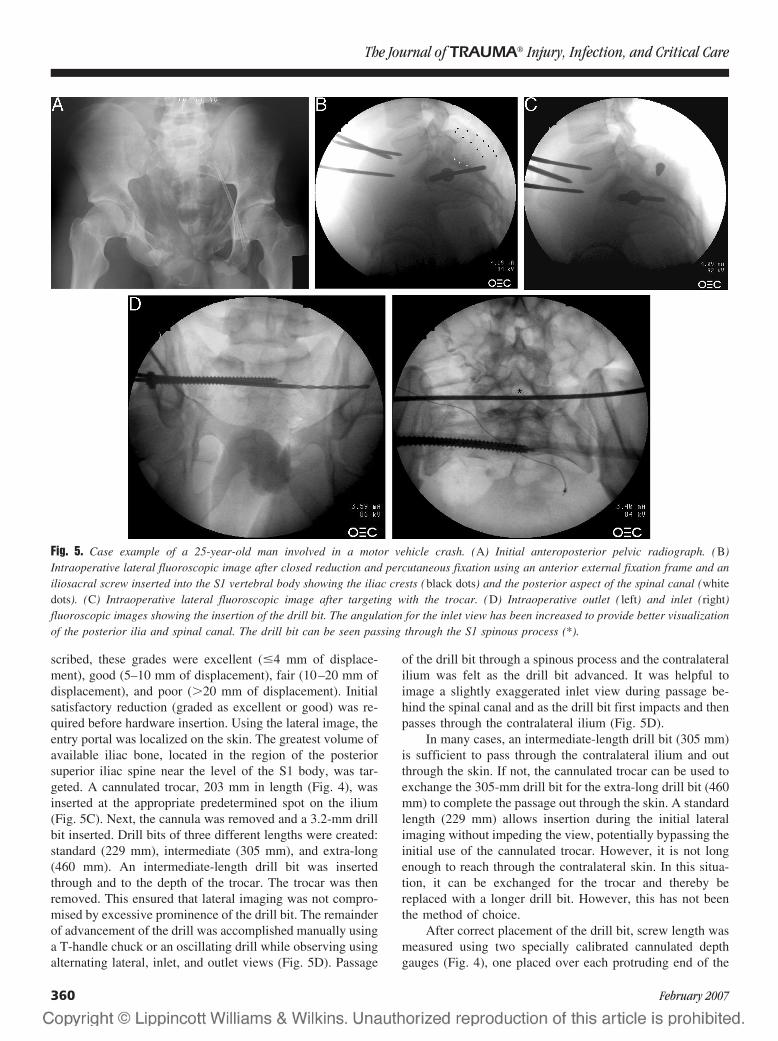
scribed, these grades were excellent (�4 mm of displace-ment), good (5–10 mm of displacement), fair (10–20 mm ofdisplacement), and poor (�20 mm of displacement). Initialsatisfactory reduction (graded as excellent or good) was re-quired before hardware insertion. Using the lateral image, theentry portal was localized on the skin. The greatest volume ofavailable iliac bone, located in the region of the posteriorsuperior iliac spine near the level of the S1 body, was tar-geted. A cannulated trocar, 203 mm in length (Fig. 4), wasinserted at the appropriate predetermined spot on the ilium(Fig. 5C). Next, the cannula was removed and a 3.2-mm drillbit inserted. Drill bits of three different lengths were created:standard (229 mm), intermediate (305 mm), and extra-long(460 mm). An intermediate-length drill bit was insertedthrough and to the depth of the trocar. The trocar was thenremoved. This ensured that lateral imaging was not compro-mised by excessive prominence of the drill bit. The remainderof advancement of the drill was accomplished manually usinga T-handle chuck or an oscillating drill while observing usingalternating lateral, inlet, and outlet views (Fig. 5D). Passage
of the drill bit through a spinous process and the contralateralilium was felt as the drill bit advanced. It was helpful toimage a slightly exaggerated inlet view during passage be-hind the spinal canal and as the drill bit first impacts and thenpasses through the contralateral ilium (Fig. 5D).
In many cases, an intermediate-length drill bit (305 mm)is sufficient to pass through the contralateral ilium and outthrough the skin. If not, the cannulated trocar can be used toexchange the 305-mm drill bit for the extra-long drill bit (460mm) to complete the passage out through the skin. A standardlength (229 mm) allows insertion during the initial lateralimaging without impeding the view, potentially bypassing theinitial use of the cannulated trocar. However, it is not longenough to reach through the contralateral skin. In this situa-tion, it can be exchanged for the trocar and thereby bereplaced with a longer drill bit. However, this has not beenthe method of choice.
After correct placement of the drill bit, screw length wasmeasured using two specially calibrated cannulated depthgauges (Fig. 4), one placed over each protruding end of the
Fig. 5. Case example of a 25-year-old man involved in a motor vehicle crash. (A) Initial anteroposterior pelvic radiograph. (B)Intraoperative lateral fluoroscopic image after closed reduction and percutaneous fixation using an anterior external fixation frame and aniliosacral screw inserted into the S1 vertebral body showing the iliac crests (black dots) and the posterior aspect of the spinal canal (whitedots). (C) Intraoperative lateral fluoroscopic image after targeting with the trocar. (D) Intraoperative outlet ( left) and inlet (right)fluoroscopic images showing the insertion of the drill bit. The angulation for the inlet view has been increased to provide better visualizationof the posterior ilia and spinal canal. The drill bit can be seen passing through the S1 spinous process (*).
The Journal of TRAUMA� Injury, Infection, and Critical Care
360 February 2007
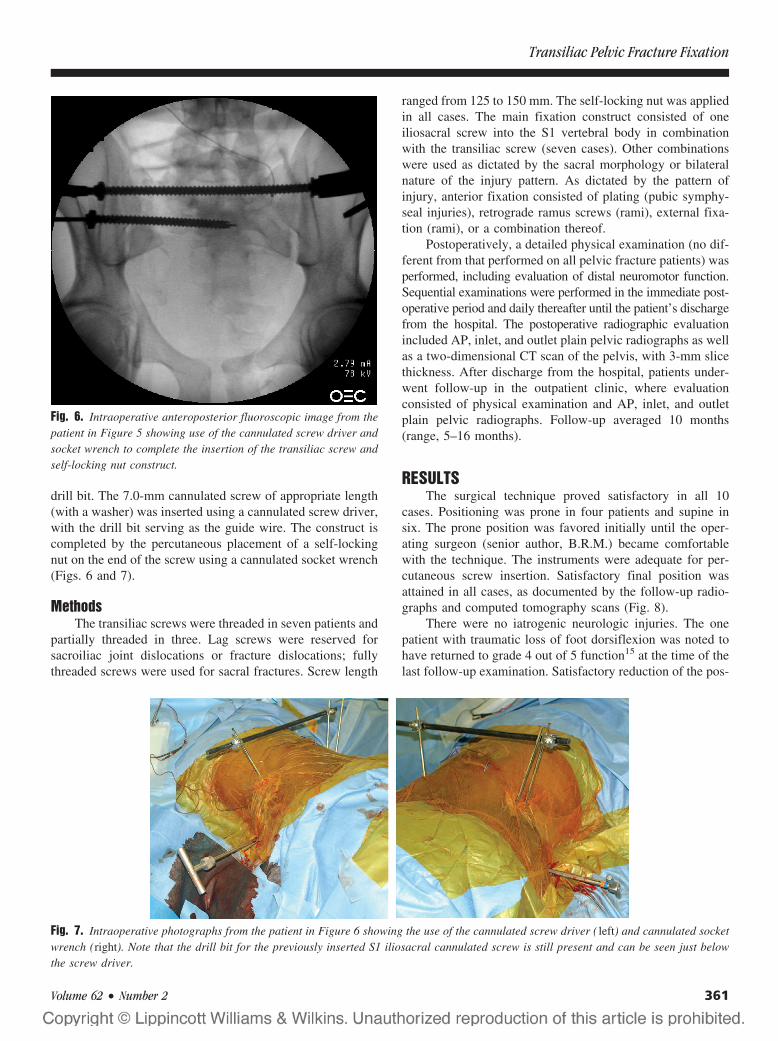
drill bit. The 7.0-mm cannulated screw of appropriate length(with a washer) was inserted using a cannulated screw driver,with the drill bit serving as the guide wire. The construct iscompleted by the percutaneous placement of a self-lockingnut on the end of the screw using a cannulated socket wrench(Figs. 6 and 7).
MethodsThe transiliac screws were threaded in seven patients and
partially threaded in three. Lag screws were reserved forsacroiliac joint dislocations or fracture dislocations; fullythreaded screws were used for sacral fractures. Screw length
ranged from 125 to 150 mm. The self-locking nut was appliedin all cases. The main fixation construct consisted of oneiliosacral screw into the S1 vertebral body in combinationwith the transiliac screw (seven cases). Other combinationswere used as dictated by the sacral morphology or bilateralnature of the injury pattern. As dictated by the pattern ofinjury, anterior fixation consisted of plating (pubic symphy-seal injuries), retrograde ramus screws (rami), external fixa-tion (rami), or a combination thereof.
Postoperatively, a detailed physical examination (no dif-ferent from that performed on all pelvic fracture patients) wasperformed, including evaluation of distal neuromotor function.Sequential examinations were performed in the immediate post-operative period and daily thereafter until the patient’s dischargefrom the hospital. The postoperative radiographic evaluationincluded AP, inlet, and outlet plain pelvic radiographs as wellas a two-dimensional CT scan of the pelvis, with 3-mm slicethickness. After discharge from the hospital, patients under-went follow-up in the outpatient clinic, where evaluationconsisted of physical examination and AP, inlet, and outletplain pelvic radiographs. Follow-up averaged 10 months(range, 5–16 months).
RESULTSThe surgical technique proved satisfactory in all 10
cases. Positioning was prone in four patients and supine insix. The prone position was favored initially until the oper-ating surgeon (senior author, B.R.M.) became comfortablewith the technique. The instruments were adequate for per-cutaneous screw insertion. Satisfactory final position wasattained in all cases, as documented by the follow-up radio-graphs and computed tomography scans (Fig. 8).
There were no iatrogenic neurologic injuries. The onepatient with traumatic loss of foot dorsiflexion was noted tohave returned to grade 4 out of 5 function15 at the time of thelast follow-up examination. Satisfactory reduction of the pos-
Fig. 6. Intraoperative anteroposterior fluoroscopic image from thepatient in Figure 5 showing use of the cannulated screw driver andsocket wrench to complete the insertion of the transiliac screw andself-locking nut construct.
Fig. 7. Intraoperative photographs from the patient in Figure 6 showing the use of the cannulated screw driver ( left) and cannulated socketwrench (right). Note that the drill bit for the previously inserted S1 iliosacral cannulated screw is still present and can be seen just belowthe screw driver.
Transiliac Pelvic Fracture Fixation
Volume 62 • Number 2 361
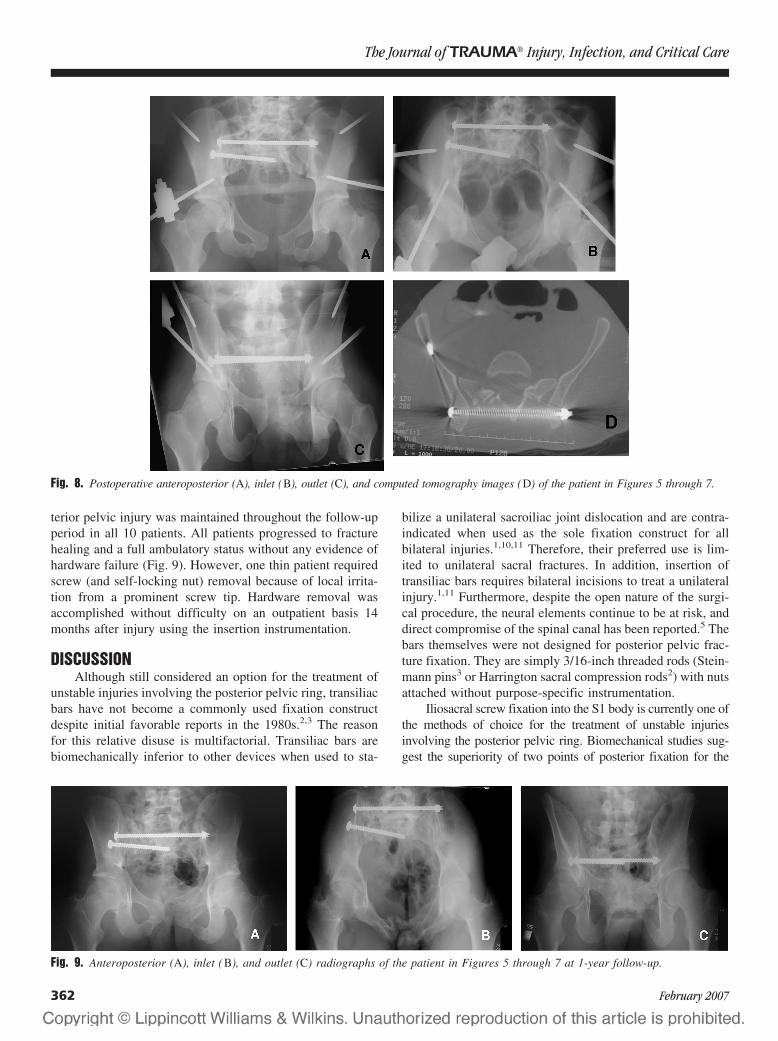
terior pelvic injury was maintained throughout the follow-upperiod in all 10 patients. All patients progressed to fracturehealing and a full ambulatory status without any evidence ofhardware failure (Fig. 9). However, one thin patient requiredscrew (and self-locking nut) removal because of local irrita-tion from a prominent screw tip. Hardware removal wasaccomplished without difficulty on an outpatient basis 14months after injury using the insertion instrumentation.
DISCUSSIONAlthough still considered an option for the treatment of
unstable injuries involving the posterior pelvic ring, transiliacbars have not become a commonly used fixation constructdespite initial favorable reports in the 1980s.2,3 The reasonfor this relative disuse is multifactorial. Transiliac bars arebiomechanically inferior to other devices when used to sta-
bilize a unilateral sacroiliac joint dislocation and are contra-indicated when used as the sole fixation construct for allbilateral injuries.1,10,11 Therefore, their preferred use is lim-ited to unilateral sacral fractures. In addition, insertion oftransiliac bars requires bilateral incisions to treat a unilateralinjury.1,11 Furthermore, despite the open nature of the surgi-cal procedure, the neural elements continue to be at risk, anddirect compromise of the spinal canal has been reported.5 Thebars themselves were not designed for posterior pelvic frac-ture fixation. They are simply 3/16-inch threaded rods (Stein-mann pins3 or Harrington sacral compression rods2) with nutsattached without purpose-specific instrumentation.
Iliosacral screw fixation into the S1 body is currently one ofthe methods of choice for the treatment of unstable injuriesinvolving the posterior pelvic ring. Biomechanical studies sug-gest the superiority of two points of posterior fixation for the
Fig. 8. Postoperative anteroposterior (A), inlet (B), outlet (C), and computed tomography images (D) of the patient in Figures 5 through 7.
Fig. 9. Anteroposterior (A), inlet (B), and outlet (C) radiographs of the patient in Figures 5 through 7 at 1-year follow-up.
The Journal of TRAUMA� Injury, Infection, and Critical Care
362 February 2007
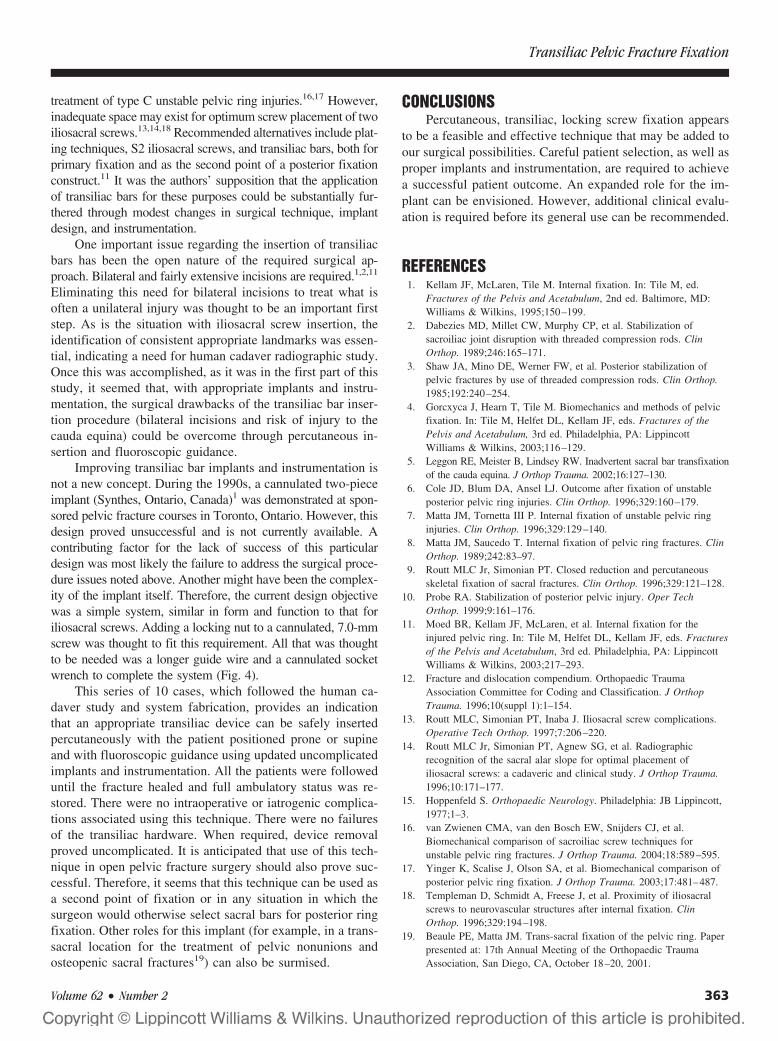
treatment of type C unstable pelvic ring injuries.16,17 However,inadequate space may exist for optimum screw placement of twoiliosacral screws.13,14,18 Recommended alternatives include plat-ing techniques, S2 iliosacral screws, and transiliac bars, both forprimary fixation and as the second point of a posterior fixationconstruct.11 It was the authors’ supposition that the applicationof transiliac bars for these purposes could be substantially fur-thered through modest changes in surgical technique, implantdesign, and instrumentation.
One important issue regarding the insertion of transiliacbars has been the open nature of the required surgical ap-proach. Bilateral and fairly extensive incisions are required.1,2,11
Eliminating this need for bilateral incisions to treat what isoften a unilateral injury was thought to be an important firststep. As is the situation with iliosacral screw insertion, theidentification of consistent appropriate landmarks was essen-tial, indicating a need for human cadaver radiographic study.Once this was accomplished, as it was in the first part of thisstudy, it seemed that, with appropriate implants and instru-mentation, the surgical drawbacks of the transiliac bar inser-tion procedure (bilateral incisions and risk of injury to thecauda equina) could be overcome through percutaneous in-sertion and fluoroscopic guidance.
Improving transiliac bar implants and instrumentation isnot a new concept. During the 1990s, a cannulated two-pieceimplant (Synthes, Ontario, Canada)1 was demonstrated at spon-sored pelvic fracture courses in Toronto, Ontario. However, thisdesign proved unsuccessful and is not currently available. Acontributing factor for the lack of success of this particulardesign was most likely the failure to address the surgical proce-dure issues noted above. Another might have been the complex-ity of the implant itself. Therefore, the current design objectivewas a simple system, similar in form and function to that foriliosacral screws. Adding a locking nut to a cannulated, 7.0-mmscrew was thought to fit this requirement. All that was thoughtto be needed was a longer guide wire and a cannulated socketwrench to complete the system (Fig. 4).
This series of 10 cases, which followed the human ca-daver study and system fabrication, provides an indicationthat an appropriate transiliac device can be safely insertedpercutaneously with the patient positioned prone or supineand with fluoroscopic guidance using updated uncomplicatedimplants and instrumentation. All the patients were followeduntil the fracture healed and full ambulatory status was re-stored. There were no intraoperative or iatrogenic complica-tions associated using this technique. There were no failuresof the transiliac hardware. When required, device removalproved uncomplicated. It is anticipated that use of this tech-nique in open pelvic fracture surgery should also prove suc-cessful. Therefore, it seems that this technique can be used asa second point of fixation or in any situation in which thesurgeon would otherwise select sacral bars for posterior ringfixation. Other roles for this implant (for example, in a trans-sacral location for the treatment of pelvic nonunions andosteopenic sacral fractures19) can also be surmised.
CONCLUSIONSPercutaneous, transiliac, locking screw fixation appears
to be a feasible and effective technique that may be added toour surgical possibilities. Careful patient selection, as well asproper implants and instrumentation, are required to achievea successful patient outcome. An expanded role for the im-plant can be envisioned. However, additional clinical evalu-ation is required before its general use can be recommended.
REFERENCES1. Kellam JF, McLaren, Tile M. Internal fixation. In: Tile M, ed.
Fractures of the Pelvis and Acetabulum, 2nd ed. Baltimore, MD:Williams & Wilkins, 1995;150–199.
2. Dabezies MD, Millet CW, Murphy CP, et al. Stabilization ofsacroiliac joint disruption with threaded compression rods. ClinOrthop. 1989;246:165–171.
3. Shaw JA, Mino DE, Werner FW, et al. Posterior stabilization ofpelvic fractures by use of threaded compression rods. Clin Orthop.1985;192:240–254.
4. Gorcxyca J, Hearn T, Tile M. Biomechanics and methods of pelvicfixation. In: Tile M, Helfet DL, Kellam JF, eds. Fractures of thePelvis and Acetabulum, 3rd ed. Philadelphia, PA: LippincottWilliams & Wilkins, 2003;116–129.
5. Leggon RE, Meister B, Lindsey RW. Inadvertent sacral bar transfixationof the cauda equina. J Orthop Trauma. 2002;16:127–130.
6. Cole JD, Blum DA, Ansel LJ. Outcome after fixation of unstableposterior pelvic ring injuries. Clin Orthop. 1996;329:160–179.
7. Matta JM, Tornetta III P. Internal fixation of unstable pelvic ringinjuries. Clin Orthop. 1996;329:129–140.
8. Matta JM, Saucedo T. Internal fixation of pelvic ring fractures. ClinOrthop. 1989;242:83–97.
9. Routt MLC Jr, Simonian PT. Closed reduction and percutaneousskeletal fixation of sacral fractures. Clin Orthop. 1996;329:121–128.
10. Probe RA. Stabilization of posterior pelvic injury. Oper TechOrthop. 1999;9:161–176.
11. Moed BR, Kellam JF, McLaren, et al. Internal fixation for theinjured pelvic ring. In: Tile M, Helfet DL, Kellam JF, eds. Fracturesof the Pelvis and Acetabulum, 3rd ed. Philadelphia, PA: LippincottWilliams & Wilkins, 2003;217–293.
12. Fracture and dislocation compendium. Orthopaedic TraumaAssociation Committee for Coding and Classification. J OrthopTrauma. 1996;10(suppl 1):1–154.
13. Routt MLC, Simonian PT, Inaba J. Iliosacral screw complications.Operative Tech Orthop. 1997;7:206–220.
14. Routt MLC Jr, Simonian PT, Agnew SG, et al. Radiographicrecognition of the sacral alar slope for optimal placement ofiliosacral screws: a cadaveric and clinical study. J Orthop Trauma.1996;10:171–177.
15. Hoppenfeld S. Orthopaedic Neurology. Philadelphia: JB Lippincott,1977;1–3.
16. van Zwienen CMA, van den Bosch EW, Snijders CJ, et al.Biomechanical comparison of sacroiliac screw techniques forunstable pelvic ring fractures. J Orthop Trauma. 2004;18:589–595.
17. Yinger K, Scalise J, Olson SA, et al. Biomechanical comparison ofposterior pelvic ring fixation. J Orthop Trauma. 2003;17:481–487.
18. Templeman D, Schmidt A, Freese J, et al. Proximity of iliosacralscrews to neurovascular structures after internal fixation. ClinOrthop. 1996;329:194–198.
19. Beaule PE, Matta JM. Trans-sacral fixation of the pelvic ring. Paperpresented at: 17th Annual Meeting of the Orthopaedic TraumaAssociation, San Diego, CA, October 18–20, 2001.
Transiliac Pelvic Fracture Fixation
Volume 62 • Number 2 363
EDITORIAL COMMENTThe authors have conceived and executed an elegant
approach to fixation for a discrete subgroup of patients withposterior pelvic ring injuries. The article carefully delineatesa technique of percutaneous extrasacral fixation for patientsin whom a unilateral unstable pelvic injury may be safelyaddressed. This option becomes of practical significancewhen traditional contraindications for more familiar tech-niques are present, including sacral dysmorphology, sacralfracture comminution with altered radiographic landmarks, orthe presence of inadequate sacral space for two points ofstable iliosacral screw fixation.
The benefits of this technique are the limited surgicalapproach for percutaneous insertion, the broad margin ofsafety for anatomic placement of the devices, and the feasi-bility of both supine and prone patient positioning for inser-tion. The article details a small but illustrative patient cohortin whom the results were satisfactory.
The purpose of the article is to describe the techniqueusing radiologic and cadaveric evidence to define the safetyof percutaneous insertion of the device(s). The authors are tobe commended for an investigation with a defined goal and arational, comprehensive approach to substantiating their find-ings. In their hands, application of the technique in selectedclinical instances provided satisfactory results and can beconsidered as a viable option in appropriate clinical settings.
We live in an era in which minimally invasive surgeryseems more attractive to both surgeon and patient (witnessthe smaller incisions that are replacing more traditional, ex-tensile approaches). Whether considering total hip arthro-plasty or pelvic fixation, we must not lose sight of the goal oftreatment: satisfactory position of the implant in relation tothe anatomic structures at the completion of the procedure.With consideration of unstable posterior pelvic ring fractures,the authors have clearly stated the importance of obtainingreduction before fixation. I would only echo that criticalconcept: percutaneous fixation as a technique alone will notachieve reduction in pelvic injuries with three-dimensionalmalpositioning. The relative ease and wide margin for safeapplication of this technique make it very attractive but, asthe authors have stated, the practitioner must still perform andmaintain a satisfactory reduction as a separate step beforedefinitive fixation. With this in mind, I think this publicationwill add a valuable tool to surgeons who regularly treatcomplex pelvic ring injuries.
R. Bruce Simpson, MDState University of New York Upstate Health Sciences
CenterSyracuse, New York
EDITORIAL COMMENTThis article by Moed and Jasey represents an interesting
surgical technique for the percutaneous or minimally invasive
approach to the fixation of pelvic ring injuries. The conceptsand technical aspects of this article are not being debated. Infact, I think that the work done so far is excellent and has thepotential to be a very valid technique in a specific group ofpelvic ring injuries. However, my concern is with the intro-duction of new technology, new treatment methods, or newsurgical approaches before they have been validated andtested. In Archives of Surgery in 1931, volumes 23 on page17,715, Smith Peterson commented that “a great responsibil-ity rests on the surgeon who introduces a new method oftreatment. The desire to have a new idea published is so greatthat the originator is often led astray, and the method isbroadcast before it has been proven worthwhile and beforethe technique has been perfected.” Smith Peterson’s state-ment is my concern as well. When is it appropriate to intro-duce a new surgical approach or technique to the surgicalcommunity? How many cases and how many cadaver expo-sures and dissections need to be done? Moed and Jasey reportpreliminary clinical results based on 10 patients. Are 10patients adequate to demonstrate all the significant individualpatient variations that might compromise this technique?They also base their work on examination of only threehuman cadaver torsos. Again, is this enough for them to takethe chance to move this procedure into the clinical realm?
This article would be much stronger if a clinical prospec-tive study of perhaps 50 or 100 cases were done usingmultiple surgeons. This would remove the bias of the origi-nator of the procedure, who is always able to do the pro-cedure better than anyone else would. As with most newprocedures, the addition of more cases would bring out theareas of concern that have yet to be addressed. It is wellknown that, in drug studies or even studies regarding newsurgical techniques and implants, the more cases included inthe study, the more problems that are discovered. Knowledgeof these problems and finding solutions to them make pro-cedures safer and more reliable. A larger study would avoiddiscrediting this very good technique prematurely.
I think that it is too early to inform the surgicalcommunity that they may use this technique because weare unaware of any of the potential complications thatcould exist. I do not doubt that this is an excellent proce-dure and has been developed by superb surgeons who areextremely competent in pelvic fracture surgery. However,remember Smith Peterson and that the surgeons introduc-ing new technology may be clouded by their interest andinappropriate enthusiasm to inform the world too soon ofwhat they have found.
James Kellam, MDDepartment of Orthopaedic SurgeryCarolinas Medical CenterCharlotte, North Carolina
The Journal of TRAUMA� Injury, Infection, and Critical Care
364 February 2007
Hip Fractures Among the Elderly: Personal and ContextualSocial Factors That MatterAnne Reimers, BSc, and Lucie Laflamme, PhD
Background: There is evidence of in-dependent neighborhood effects on therisk of hip fracture among the elderly.This study builds on earlier investigationsand measures the crude and adjusted ef-fects of individual personal- and area-based social attributes on hip fracture.
Methods: The study is cross-sectionaland register-based, and covers all peopleaged 65 or older living in the Stockholmmetropolitan area during 1993 to 1995. Itcombines individual data from hospital in-patient registers, population data fromcensus records, and area-based (parish)data from the Stockholm County’s regis-
ters. Marital status (married or not),country of birth (three categories), andtwo area-based compositional indexes (so-cial status and economic deprivation,each split into three levels) were consid-ered. Both age adjusted odds ratios andodds adjusted for all other variableswere compiled.
Results: The age adjusted effects ofindividual marital status, country of birth,and area-based social status are consider-able and not much affected by the otherexposures, to the detriment of marriedmen and women, Swedish-born men andwomen, and those men and women living
in parishes characterized by average andhigh social status. By contrast, after ad-justment, the odds of men and womenliving in average and high socioeconomicdeprivation lose significance.
Conclusions: The attributes of bothpeople and places may contribute to a bet-ter understanding of the occurrence of hipfractures among the elderly. The effects ofindividual marital status, country of birth,and social status of the living area arenoticeably robust.
Key Words: Health equity, Injuries,Gender, Material wealth.
J Trauma. 2007;62:365–369.
Although the health of elderly people is improving inmany parts of the world,1,2 fall injuries are developinginto a major public health burden.3,4 With an increasing
proportion of elderly people worldwide, increases in the oc-currence of hip fractures are expected.1–3 However, the prob-lem is not uniformly distributed across countries2,3,5 but ismore prevalent in northern Europe, primarily in the Nordiccountries, including Finland, Norway, and Sweden.3,5,6
Hip fractures are not randomly distributed across socialgroups within countries either. In Sweden, apart from theexpected age and gender differences, recent studies revealthat, after adjustment for age, there is less risk for hip fractureamong male and female citizens from other countries com-pared with the Swedish-born elderly.6–11 This contrasts withthe fact that the foreign-born elderly generally have poorerhealth than their Swedish counterparts.12,13
A first set of explanations for this may be related toindividual constitutional differences between groups of el-derly. The health status and injury proneness of older peoplecan be influenced by contextual factors related to the physicalor psychosocial environment both proximal and distal to
them.14–21 For example, in a study conducted in the Stock-holm metropolitan area, it has been observed that, with allcountries aggregated, elderly people living alone show asignificantly increased risk of sustaining a hip fracture thanthose who are married or cohabiting.22,23 There is also evi-dence of independent neighborhood effects on the risk of falland hip fracture among the elderly.21,24–26
This study builds on earlier investigations in Stockholm11,22
and simultaneously considers individual and contextual socialattributes. The aim is to measure their crude and adjustedeffects on the hip-fracture risk faced by the elderly.
Key Points● The effects of individual marital status, country of birth,
and social status of the living area are robust among bothelderly men and women.
● After adjustment, the odds of hip fracture among theunmarried elderly remain more than twice as high for menand nearly three times as high for women compared with themarried elderly.
● After adjustment, the odds of hip fracture among theforeign-born remain significantly lower than that of theSwedish-born.
● Not all aspects of the distal social and socioeconomiccontext impact the risk of hip fracture to the same extent. Theeffect of the social status of the parish is significant and quiterobust, but that of material deprivation is not. This is verylikely because of some confounding effects embedded in theother parameters studied.
Submitted for publication October 10, 2005.Accepted for publication March 17, 2006.Copyright © 2007 by Lippincott Williams & Wilkins, Inc.From the Karolinska Institutet, Division of Social Medicine, Depart-
ment of Public Health Sciences (A.R., L.L), and Stockholm County Council,Department of Epidemiology (A.R.), Stockholm, Sweden.
Address for reprints: Anne Reimers, Stockholm County Council, De-partment of Epidemiology, Norrbacka, SE-171 76 Stockholm, Sweden;email: [email protected].
DOI: 10.1097/01.ta.0000221669.26191.59
The Journal of TRAUMA� Injury, Infection, and Critical Care
Volume 62 • Number 2 365
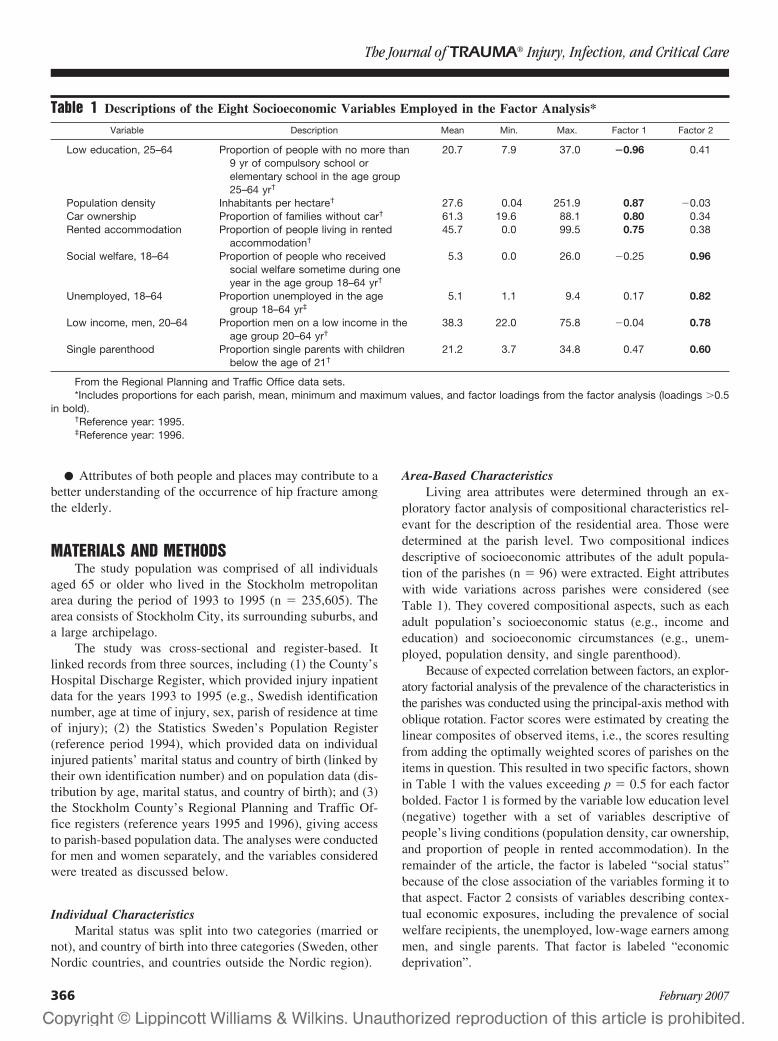
● Attributes of both people and places may contribute to abetter understanding of the occurrence of hip fracture amongthe elderly.
MATERIALS AND METHODSThe study population was comprised of all individuals
aged 65 or older who lived in the Stockholm metropolitanarea during the period of 1993 to 1995 (n � 235,605). Thearea consists of Stockholm City, its surrounding suburbs, anda large archipelago.
The study was cross-sectional and register-based. Itlinked records from three sources, including (1) the County’sHospital Discharge Register, which provided injury inpatientdata for the years 1993 to 1995 (e.g., Swedish identificationnumber, age at time of injury, sex, parish of residence at timeof injury); (2) the Statistics Sweden’s Population Register(reference period 1994), which provided data on individualinjured patients’ marital status and country of birth (linked bytheir own identification number) and on population data (dis-tribution by age, marital status, and country of birth); and (3)the Stockholm County’s Regional Planning and Traffic Of-fice registers (reference years 1995 and 1996), giving accessto parish-based population data. The analyses were conductedfor men and women separately, and the variables consideredwere treated as discussed below.
Individual CharacteristicsMarital status was split into two categories (married or
not), and country of birth into three categories (Sweden, otherNordic countries, and countries outside the Nordic region).
Area-Based CharacteristicsLiving area attributes were determined through an ex-
ploratory factor analysis of compositional characteristics rel-evant for the description of the residential area. Those weredetermined at the parish level. Two compositional indicesdescriptive of socioeconomic attributes of the adult popula-tion of the parishes (n � 96) were extracted. Eight attributeswith wide variations across parishes were considered (seeTable 1). They covered compositional aspects, such as eachadult population’s socioeconomic status (e.g., income andeducation) and socioeconomic circumstances (e.g., unem-ployed, population density, and single parenthood).
Because of expected correlation between factors, an explor-atory factorial analysis of the prevalence of the characteristics inthe parishes was conducted using the principal-axis method withoblique rotation. Factor scores were estimated by creating thelinear composites of observed items, i.e., the scores resultingfrom adding the optimally weighted scores of parishes on theitems in question. This resulted in two specific factors, shownin Table 1 with the values exceeding p � 0.5 for each factorbolded. Factor 1 is formed by the variable low education level(negative) together with a set of variables descriptive ofpeople’s living conditions (population density, car ownership,and proportion of people in rented accommodation). In theremainder of the article, the factor is labeled “social status”because of the close association of the variables forming it tothat aspect. Factor 2 consists of variables describing contex-tual economic exposures, including the prevalence of socialwelfare recipients, the unemployed, low-wage earners amongmen, and single parents. That factor is labeled “economicdeprivation”.
Table 1 Descriptions of the Eight Socioeconomic Variables Employed in the Factor Analysis*
Variable Description Mean Min. Max. Factor 1 Factor 2
Low education, 25–64 Proportion of people with no more than9 yr of compulsory school orelementary school in the age group25–64 yr†
20.7 7.9 37.0 �0.96 0.41
Population density Inhabitants per hectare† 27.6 0.04 251.9 0.87 �0.03Car ownership Proportion of families without car† 61.3 19.6 88.1 0.80 0.34Rented accommodation Proportion of people living in rented
accommodation†45.7 0.0 99.5 0.75 0.38
Social welfare, 18–64 Proportion of people who receivedsocial welfare sometime during oneyear in the age group 18–64 yr†
5.3 0.0 26.0 �0.25 0.96
Unemployed, 18–64 Proportion unemployed in the agegroup 18–64 yr‡
5.1 1.1 9.4 0.17 0.82
Low income, men, 20–64 Proportion men on a low income in theage group 20–64 yr†
38.3 22.0 75.8 �0.04 0.78
Single parenthood Proportion single parents with childrenbelow the age of 21†
21.2 3.7 34.8 0.47 0.60
From the Regional Planning and Traffic Office data sets.*Includes proportions for each parish, mean, minimum and maximum values, and factor loadings from the factor analysis (loadings �0.5
in bold).†Reference year: 1995.‡Reference year: 1996.
The Journal of TRAUMA� Injury, Infection, and Critical Care
366 February 2007
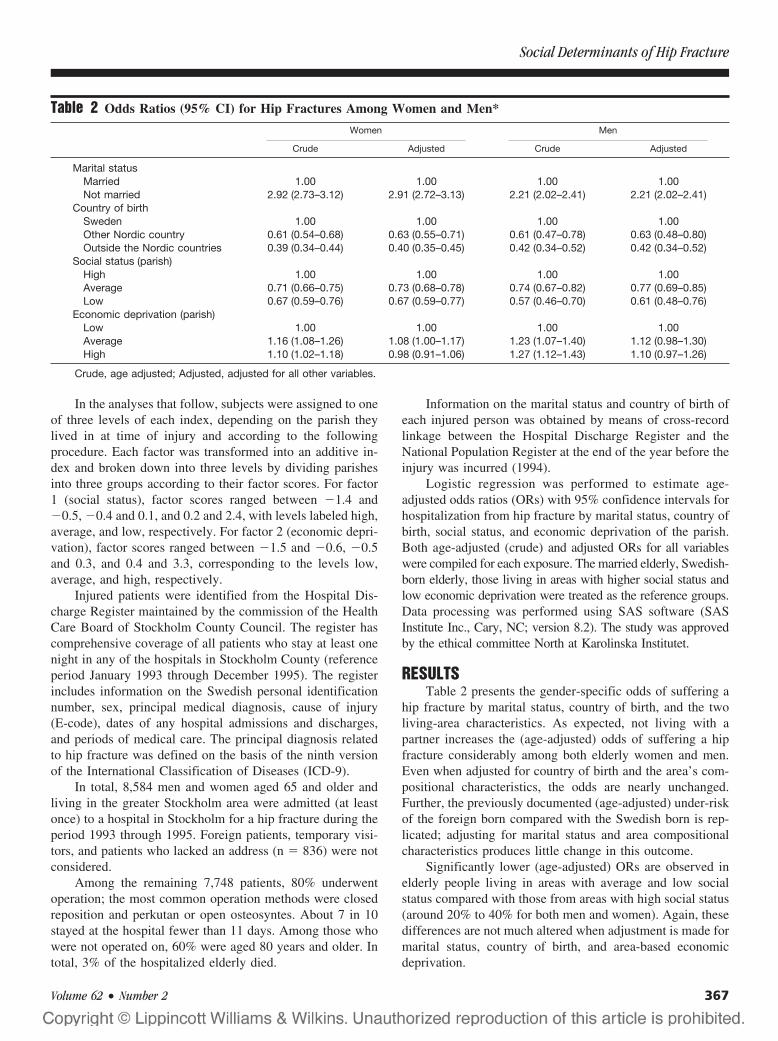
In the analyses that follow, subjects were assigned to oneof three levels of each index, depending on the parish theylived in at time of injury and according to the followingprocedure. Each factor was transformed into an additive in-dex and broken down into three levels by dividing parishesinto three groups according to their factor scores. For factor1 (social status), factor scores ranged between �1.4 and�0.5, �0.4 and 0.1, and 0.2 and 2.4, with levels labeled high,average, and low, respectively. For factor 2 (economic depri-vation), factor scores ranged between �1.5 and �0.6, �0.5and 0.3, and 0.4 and 3.3, corresponding to the levels low,average, and high, respectively.
Injured patients were identified from the Hospital Dis-charge Register maintained by the commission of the HealthCare Board of Stockholm County Council. The register hascomprehensive coverage of all patients who stay at least onenight in any of the hospitals in Stockholm County (referenceperiod January 1993 through December 1995). The registerincludes information on the Swedish personal identificationnumber, sex, principal medical diagnosis, cause of injury(E-code), dates of any hospital admissions and discharges,and periods of medical care. The principal diagnosis relatedto hip fracture was defined on the basis of the ninth versionof the International Classification of Diseases (ICD-9).
In total, 8,584 men and women aged 65 and older andliving in the greater Stockholm area were admitted (at leastonce) to a hospital in Stockholm for a hip fracture during theperiod 1993 through 1995. Foreign patients, temporary visi-tors, and patients who lacked an address (n � 836) were notconsidered.
Among the remaining 7,748 patients, 80% underwentoperation; the most common operation methods were closedreposition and perkutan or open osteosyntes. About 7 in 10stayed at the hospital fewer than 11 days. Among those whowere not operated on, 60% were aged 80 years and older. Intotal, 3% of the hospitalized elderly died.
Information on the marital status and country of birth ofeach injured person was obtained by means of cross-recordlinkage between the Hospital Discharge Register and theNational Population Register at the end of the year before theinjury was incurred (1994).
Logistic regression was performed to estimate age-adjusted odds ratios (ORs) with 95% confidence intervals forhospitalization from hip fracture by marital status, country ofbirth, social status, and economic deprivation of the parish.Both age-adjusted (crude) and adjusted ORs for all variableswere compiled for each exposure. The married elderly, Swedish-born elderly, those living in areas with higher social status andlow economic deprivation were treated as the reference groups.Data processing was performed using SAS software (SASInstitute Inc., Cary, NC; version 8.2). The study was approvedby the ethical committee North at Karolinska Institutet.
RESULTSTable 2 presents the gender-specific odds of suffering a
hip fracture by marital status, country of birth, and the twoliving-area characteristics. As expected, not living with apartner increases the (age-adjusted) odds of suffering a hipfracture considerably among both elderly women and men.Even when adjusted for country of birth and the area’s com-positional characteristics, the odds are nearly unchanged.Further, the previously documented (age-adjusted) under-riskof the foreign born compared with the Swedish born is rep-licated; adjusting for marital status and area compositionalcharacteristics produces little change in this outcome.
Significantly lower (age-adjusted) ORs are observed inelderly people living in areas with average and low socialstatus compared with those from areas with high social status(around 20% to 40% for both men and women). Again, thesedifferences are not much altered when adjustment is made formarital status, country of birth, and area-based economicdeprivation.
Table 2 Odds Ratios (95% CI) for Hip Fractures Among Women and Men*
Women Men
Crude Adjusted Crude Adjusted
Marital statusMarried 1.00 1.00 1.00 1.00Not married 2.92 (2.73–3.12) 2.91 (2.72–3.13) 2.21 (2.02–2.41) 2.21 (2.02–2.41)
Country of birthSweden 1.00 1.00 1.00 1.00Other Nordic country 0.61 (0.54–0.68) 0.63 (0.55–0.71) 0.61 (0.47–0.78) 0.63 (0.48–0.80)Outside the Nordic countries 0.39 (0.34–0.44) 0.40 (0.35–0.45) 0.42 (0.34–0.52) 0.42 (0.34–0.52)
Social status (parish)High 1.00 1.00 1.00 1.00Average 0.71 (0.66–0.75) 0.73 (0.68–0.78) 0.74 (0.67–0.82) 0.77 (0.69–0.85)Low 0.67 (0.59–0.76) 0.67 (0.59–0.77) 0.57 (0.46–0.70) 0.61 (0.48–0.76)
Economic deprivation (parish)Low 1.00 1.00 1.00 1.00Average 1.16 (1.08–1.26) 1.08 (1.00–1.17) 1.23 (1.07–1.40) 1.12 (0.98–1.30)High 1.10 (1.02–1.18) 0.98 (0.91–1.06) 1.27 (1.12–1.43) 1.10 (0.97–1.26)
Crude, age adjusted; Adjusted, adjusted for all other variables.
Social Determinants of Hip Fracture
Volume 62 • Number 2 367
Further, the (age-adjusted) effect of economic depriva-tion of the living area is significant for both women and men.Women from average and high deprivation areas register16% and 10% more hip fractures, respectively, and menregister 23% and 27% more hip fractures, respectively. Thosedifferences lose significance after adjustments for the otherexposures.
DISCUSSIONMain Findings
This study addressed the risk of hip fracture sustained bythe elderly in a country (and a part of the world) where theproblem is a significant public health burden. The resultssuggest that one’s context of living, both proximal (e.g.,marital status) and distal (e.g., the social status of one’sparish), may play a significant role in the causal pathway ofhip fractures among the elderly.
The protective effect of the “proximal” factor (beingmarried), already observed in an earlier study,22 proves to bequite robust among both elderly men and women. The oddsare more than twice as high among men and nearly threetimes as high among women. Their country of birth or theparish where they live does not modify the expected role ofexplanatory factors like less favorable social networks, men-tal health, and health habits among the unmarried.22,23 Thedifference in the size of the odds for men and women may beattributable to both the higher vulnerability among womenand the amount of care received; some studies suggest thatelderly men receive more health care at home than do elderlywomen.22
Likewise, the effect of country of birth previouslyobserved11 also proves to be quite robust. This, unlike maritalstatus, is not the case for other health outcomes or even forolder people’s self-rated health.12,13 However, whether thedifference is a constitutional or a lifestyle-related one isuncertain.3,5,6 If differences in lifestyle come into play, whichis plausible, then place of residence could offer some under-standing of what older people actually do in their neighbor-hood and whether this differs from one type of area toanother. Undeniably, Stockholm is quite segregated ethni-cally, and economically, and the foreign-born elderly liveunder different circumstances. The citizens from other Nordiccountries are no exception.
That the nature of a living area is of importance for thehealth of the elderly in general and their risk of injury inparticular16,24 has been shown in other studies. Yet the resultsfor hip fracture are inconsistent.25 Our study reveals twoimportant things. First, not all aspects of the distal social andsocioeconomic context impact the risk of hip fracture to thesame extent. The loss of significance in the case of economicdeprivation is very likely caused by some confounding effectsembedded in the other parameters studied. Second, andmaybe most noteworthy, excess risk of hip fracture is foundamong older people living in more well-off neighborhoods.This a priori surprising effect may be one of increased expo-
sure in those areas, because of better individual (e.g., house-hold conditions) and collective (e.g., available services andtheir quality) living conditions. Other parameters may includeamount of space, interior and exterior design (including stair-cases), product quality, and so on. In Stockholm County, weknow, for instance, that many elderly people with a lowincome live in an apartment comprising one room andkitchen, whereas those with a higher income have eitherlarger apartments or residential houses of their own.22,23
LimitationsA strength of this register-based study is the excellent pop-
ulation coverage of the data. This is true even for the HospitalDischarge Register, in which missing data are rare (estimatedto range between 1% and 2%). In addition, the possibility ofdifferences between parishes with regard to the likelihood ofkeeping an injured elderly person in the hospital after a hipfracture is negligible. Also, validity studies show that diag-noses may be wrong in about 10% of cases.
There is, however, some ambiguity in the data. In par-ticular, marital status may be misclassified for some patientsbecause it is measured at one fixed point in time (end of1994) and not at the time of injury. The people studied wereaged 65 years and older, and the tendency for them to loosea partner is considerably larger than that of getting a partnerduring the study period. Because of that, there may be slightlymore unmarried than married people included in the data. Inthis event, there would be an underestimation of the alreadyconsiderable odds measured. Also, the problem may be moreimportant among the younger elderly than among the older,but since we have age standardized, we think the results arequite reliable.
Furthermore, we do not know how long the foreign-bornhave lived in Sweden. Accordingly, it is unclear how great achange has taken place since their arrival in Sweden thatmight be related to either reduced or increased injury risk. Wealso do not know whether elderly people from a differentcountry of origin have similar living circumstances inside thehome or have similar residence conditions, a factor withdocumented impact on hip fracture.3
It is also important to note that, because parishes mayvary in size, some factors may mask or dilute the size of theeffects measured. As a representation of living area, a parishmay constitute a larger and more heterogeneous populationthan a neighborhood. Further studies at a lower level ofaggregation are needed.
Perhaps most importantly, the study is silent regarding themechanisms underlying the social patterning of hip fractureinjuries among the elderly. In particular, other context-relatedrisk factors not considered may have an aggravating effect onthe risk of hip fracture injuries in groups already at high risk.
CONCLUSIONThe study highlights that attributes of both people and
places may contribute to a better understanding of the occur-
The Journal of TRAUMA� Injury, Infection, and Critical Care
368 February 2007

rence of hip fractures among the elderly. The effects ofindividual marital status, country of birth, and the socialstatus of the living area are noticeably robust. The effects ofarea-based economic deprivation are not straightforward,probably because of confounding compositional attributes ofthe parishes.
REFERENCES1. Schwartz AV, Nevitt MC, Brown BW, et al. Increased falling as a
risk factor for fracture among older women. The study ofosteoporotic fractures. Am J Epidemiol. 2005;161:180–185.
2. Johnell O, Kanis JA. An estimate of the worldwide prevalence,mortality and disability associated with hip fracture. OsteoporosisInt. 2004;897–902.
3. Luukinen H, Herala M, Koski K, et al. Rapid increase of fall-relatedsevere injuries with age among older people: a population-basedstudy. J Am Geriatr Soc. 1999;47:1451–1452.
4. Cummings SR, Melton LJ. Epidemiology and outcomes ofosteoporotic fractures. The Lancet. 2002;359:1761–1767.
5. Ismail AA, Pye SR, Cockerill WC, et al. Incidence of limb fractureacross Europe: results from the European prospective osteoporosisstudy (EPOS). Osteoporosis Int. 2002;13:565–571.
6. Johnell O, Gullberg B, Allander E, et al. The apparent incidence ofhip fracture in Europe: a study of national register sources. MEDOSStudy Group. Osteoporosis Int. 1992;2:298–302.
7. WHO Study Group, Geneve. Assessment of fracture risk and itsapplication to screening for postmenopausal osteoporosis. TechnicalReports Series No. 843; 1990.
8. Rogmark C, Sernbo I, Johnell O, et al. Incidence of hip fractures inMalmo, Sweden, 1992–1995. A trend-break. Acta OrthopaedicaScand. 1999;70:19–22.
9. Lofman O, Berglund K, Larsson L, et al. Changes in hip fractureepidemiology: redistribution between ages, genders and fracturetypes. Osteoporosis Int. 2002;13:18–25.
10. Thorngren KG, Hommel A, Norrman PO, et al. Epidemiology offemoral neck fractures. Injury. 2002;33:SC1–SC7.
11. Furugren L, Laflamme L. Hip fractures among the elderly: differentperspectives on the significance of country of birth. Scand J PublicHealth. 2006 (in press).
12. Sundquist J, Johansson SE. The influence of country of birth onmortality from all causes and cardiovascular disease in Sweden1979–1993. Int J Epidemiol. 1997;26:279–287.
13. Sweden’s National Institute of Public Health. [Significance ofcountry of birth. A report on health among immigrant groups inSweden.] Rapport 2002:29. Stockholm: Sweden’s National Instituteof Public Health; 2002.
14. Cubbin C, LeClere FB, Smith GS. Socioeconomic status and injurymortality: Individual and neighbourhood determinants. J EpidemiolComm Health. 2000;54:517–524.
15. Borrell C, Rodriguez M, Ferrando J, et al. Role of individual andcontextual effects in injury mortality: new evidence from small areaanalysis. Inj Prev. 2002;8:297–302.
16. Borrell LN, Diez Roux AV, Rose K, et al. Neighbourhoodcharacteristics and mortality in the Atherosclerosis Risk inCommunities Study. Int J Epidemiol. 2004;33:398–407.
17. Bent KN. Culturally interpreting environment as determinant andexperience of health. J Transcultural Nursing. 2003;14:305–312.
18. Dunn JR, Hayes MV. Social inequality, population health, andhousing: a study of two Vancouver neighbourhoods. Soc Sci Med.2000;51:563–587.
19. Chandola T. Social class differences in mortality using the new UKnational statistics socio-economic classification. Soc Sci Med. 2000;50:641–649.
20. Martikainen P, Kauppinen TM, Valkonen T. Effects of thecharacteristics of neighbourhoods and the characteristics of peopleon cause specific mortality: register based follow-up study of 252000 men. J Epidemiol Comm Health. 2003;57:210–217.
21. Huisman M, Kunst AE, Andersen O, et al. Socioeconomicinequalities in mortality among elderly people in 11 Europeanpopulations. J Epidemiol Comm Health. 2004;58:468–475.
22. Hokby A, Reimers A, Laflamme L. Hip fractures among the elderly.Do marital status and type of residence matter? Public Health. 2003;117:196–201.
23. Farahmand BY, Person P-G, Michaelsson K, et al. Socioeconomicstatus, marital status and hip fracture: A population based case-control study. Osteoporosis Int. 2000;11:803–808.
24. Diez Roux AV, Borrell LN, Haan M, et al. Neighbourhoodenvironments and mortality in an elderly cohort: results from thecardiovascular health study. J Epidemiol Comm Health. 2004;58:917–923.
25. Kannus P, Parkkari J, Niemi S, et al. Fall-induced deaths amongelderly people. Am J Publ Health. 2005;95:422–424.
26. Bacon WE, Hadden WC. Occurrence of hip fractures andsocioeconomic position. J Aging Health. 2000;12:193–203.
Social Determinants of Hip Fracture
Volume 62 • Number 2 369

Timing and Duration of the Initial Pelvic Stabilization AfterMultiple Trauma in Patients From the German TraumaRegistry: Is There an Influence on Outcome?Christian Probst, MD, Tarane Probst, MD, Axel Gaensslen, MD, Christian Krettek, MD,Hans Christoph Pape, MD, and the Polytrauma Study Group of the German Trauma Society
Background: There is an ongoing de-bate about the systemic burden of earlydefinitive fracture stabilization in multi-ply injured patients. In patients with ex-tremity fractures, the benefit of limitedinitial surgery has been examined. In thisretrospective analysis, we assessed whetherdifferences in outcome can be attributed tothe degree of initial surgery in polytraumapatients with pelvic-ring fractures.
Methods: Multiply injured patientsof the German Trauma Registry (InjurySeverity Score [ISS] >16) with pelvic-ringfractures in need of surgery were analyzedfor independent effects of the durationand the timing of the initial surgical sta-bilization of the pelvis. We compared
three subgroups according to duration (D)[short (S): <1 hour; intermediate (I): 1–3hours; and long (L): >3 hours] and timing(T) [early (E): day 0; intermediate (I):days 1–3; and late (L): day >3]. In addi-tion, a subgroup analysis dependent oninjury severity was performed. Statisticsincluded analysis of variance, post-hocTukey test, �2 test, Student’s t test, withsignificance at p < 0.05.
Results: Demographic data and injuryseverity were comparable between thegroups. The duration of surgery was associ-ated with a higher rate of liver failure(group D-S: 6%; D-I: 17%; D-L: 28%; p �0.028). The timing of surgery was associatedwith a higher rate of renal failure (T-E:
17%; T-I: 3%; T-L: 5%; p � 0.021), mul-tiorgan failure (T-E: 27%; T-I: 23%; T-L:13%; p � 0.024) and mortality (T-E: 18%;T-I: 19%; T-L: 4%; p � 0.019). There wasimproved mortality, lower rates of multior-gan failure, and sepsis in patients withhigher ISS for procedures less than 3 hours.
Conclusions: In our retrospectiveanalysis, both initial short as well as de-layed surgery were associated with alower rate of organ failure and mortalityin multiply injured patients (ISS >16).This is especially supported for patientswith high ISS.
Key Words: Polytrauma, Damagecontrol, Pelvic fracture, Multiple injuries,Outcome.
J Trauma. 2007;62:370–377.
The “two-hit” theory for trauma patients indicates that thelikelihood of developing posttraumatic complications isincreased if several adverse impacts such as hemorrhage,
infection, or surgery occur sequentially. In a multiply injuredpatient, the initial trauma represents the first unavoidabledamage (first hit). Surgery, although essential for hemorrhagecontrol and/or fracture stabilization, may represent a secondhit. Thus, the degree of a second hit can be influenced bythe surgeon’s decision.1,2 It has been convincingly dem-onstrated that the damage control strategy minimizes thesecond trauma of orthopedic surgery.1,2 This concept wasdeveloped by general surgeons about a decade ago for themanagement of abdominal injuries after blunt trauma.3,4
Since then, many authors have advocated limiting theextent of the initial surgery for blunt trauma and perform-
ing intensive care treatment after hemorrhage control hasbeen achieved.2,5,6 Likewise, clinical studies have demon-strated an increased incidence of multiple organ failure(MOF) after an initial surgery of long duration. Mean-while, the damage control strategy has been adopted bytraumatologists to treat extremity fractures.1,7,8
Pelvic fractures represent a common diagnosis in se-verely injured patients9–13 and the presence of an unstablepelvic fracture is an indicator for increased mortality.9,14–16
The overall mortality of pelvic trauma is reported to be ashigh as 50%,11,17–19 and pelvic hemorrhage is reported to beamong the most common causes of death in patients withblunt multiple trauma.10,20 Therefore, the management ofthese patients continues to be a challenge.19,21,22
In Europe, the options for orthopedic stabilizationusually are definitive osteosynthesis or temporary emer-gency stabilization using the pelvic C clamp or an exter-nal fixateur. The latter may also be used for definitivetreatment, or both may be changed to internal plateosteosynthesis.22 The indication for angiography variesbetween different centers.
In theory, pelvic fractures should mimic a severe bloodloss as in abdominal trauma more closely than extremityfractures do. Therefore, we investigated whether the conceptof damage control orthopedics could also be successfullyapplied to pelvic fractures in the multiply injured patient.
Submitted for publication August 28, 2005.Accepted for publication July 31, 2006.Copyright © 2007 by Lippincott Williams & Wilkins, Inc.From the Department of Trauma Surgery (C.P., T.P., A.G., C.K.),
Hannover Medical School, Hannover, Germany; and the Department ofOrthopaedic Surgery (C.P.), Division of Traumatology, University of Pitts-burgh, Pittsburgh, PA.
Address for reprints: Dr. Christian Probst, Unfallchirurgische Klinik,Medizinische Hochschule Hannover, Carl-Neuberg-Strasse 1, 30625 Han-nover, Germany; email: [email protected].
DOI: 10.1097/TA.0b013e31802efaee
The Journal of TRAUMA� Injury, Infection, and Critical Care
370 February 2007
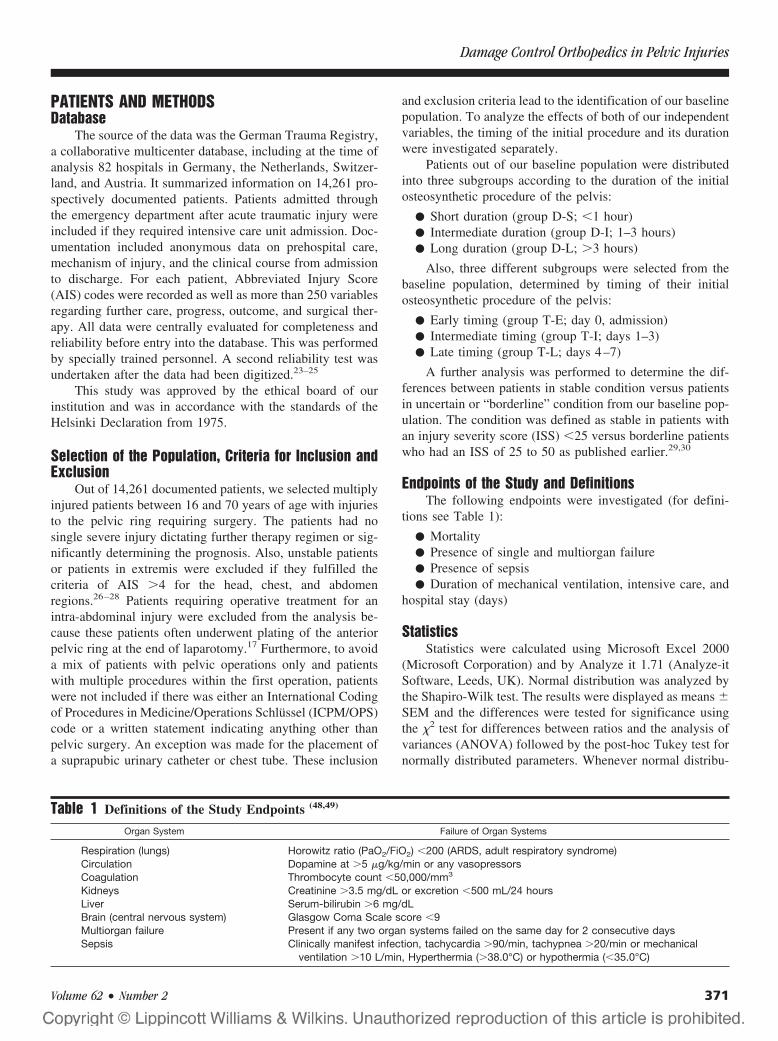
PATIENTS AND METHODSDatabase
The source of the data was the German Trauma Registry,a collaborative multicenter database, including at the time ofanalysis 82 hospitals in Germany, the Netherlands, Switzer-land, and Austria. It summarized information on 14,261 pro-spectively documented patients. Patients admitted throughthe emergency department after acute traumatic injury wereincluded if they required intensive care unit admission. Doc-umentation included anonymous data on prehospital care,mechanism of injury, and the clinical course from admissionto discharge. For each patient, Abbreviated Injury Score(AIS) codes were recorded as well as more than 250 variablesregarding further care, progress, outcome, and surgical ther-apy. All data were centrally evaluated for completeness andreliability before entry into the database. This was performedby specially trained personnel. A second reliability test wasundertaken after the data had been digitized.23–25
This study was approved by the ethical board of ourinstitution and was in accordance with the standards of theHelsinki Declaration from 1975.
Selection of the Population, Criteria for Inclusion andExclusion
Out of 14,261 documented patients, we selected multiplyinjured patients between 16 and 70 years of age with injuriesto the pelvic ring requiring surgery. The patients had nosingle severe injury dictating further therapy regimen or sig-nificantly determining the prognosis. Also, unstable patientsor patients in extremis were excluded if they fulfilled thecriteria of AIS �4 for the head, chest, and abdomenregions.26–28 Patients requiring operative treatment for anintra-abdominal injury were excluded from the analysis be-cause these patients often underwent plating of the anteriorpelvic ring at the end of laparotomy.17 Furthermore, to avoida mix of patients with pelvic operations only and patientswith multiple procedures within the first operation, patientswere not included if there was either an International Codingof Procedures in Medicine/Operations Schlussel (ICPM/OPS)code or a written statement indicating anything other thanpelvic surgery. An exception was made for the placement ofa suprapubic urinary catheter or chest tube. These inclusion
and exclusion criteria lead to the identification of our baselinepopulation. To analyze the effects of both of our independentvariables, the timing of the initial procedure and its durationwere investigated separately.
Patients out of our baseline population were distributedinto three subgroups according to the duration of the initialosteosynthetic procedure of the pelvis:
● Short duration (group D-S; �1 hour)● Intermediate duration (group D-I; 1–3 hours)● Long duration (group D-L; �3 hours)
Also, three different subgroups were selected from thebaseline population, determined by timing of their initialosteosynthetic procedure of the pelvis:
● Early timing (group T-E; day 0, admission)● Intermediate timing (group T-I; days 1–3)● Late timing (group T-L; days 4–7)
A further analysis was performed to determine the dif-ferences between patients in stable condition versus patientsin uncertain or “borderline” condition from our baseline pop-ulation. The condition was defined as stable in patients withan injury severity score (ISS) �25 versus borderline patientswho had an ISS of 25 to 50 as published earlier.29,30
Endpoints of the Study and DefinitionsThe following endpoints were investigated (for defini-
tions see Table 1):
● Mortality● Presence of single and multiorgan failure● Presence of sepsis● Duration of mechanical ventilation, intensive care, and
hospital stay (days)
StatisticsStatistics were calculated using Microsoft Excel 2000
(Microsoft Corporation) and by Analyze it 1.71 (Analyze-itSoftware, Leeds, UK). Normal distribution was analyzed bythe Shapiro-Wilk test. The results were displayed as means �SEM and the differences were tested for significance usingthe �2 test for differences between ratios and the analysis ofvariances (ANOVA) followed by the post-hoc Tukey test fornormally distributed parameters. Whenever normal distribu-
Table 1 Definitions of the Study Endpoints (48,49)
Organ System Failure of Organ Systems
Respiration (lungs) Horowitz ratio (PaO2/FiO2) �200 (ARDS, adult respiratory syndrome)Circulation Dopamine at �5 �g/kg/min or any vasopressorsCoagulation Thrombocyte count �50,000/mm3
Kidneys Creatinine �3.5 mg/dL or excretion �500 mL/24 hoursLiver Serum-bilirubin �6 mg/dLBrain (central nervous system) Glasgow Coma Scale score �9Multiorgan failure Present if any two organ systems failed on the same day for 2 consecutive daysSepsis Clinically manifest infection, tachycardia �90/min, tachypnea �20/min or mechanical
ventilation �10 L/min, Hyperthermia (�38.0°C) or hypothermia (�35.0°C)
Damage Control Orthopedics in Pelvic Injuries
Volume 62 • Number 2 371
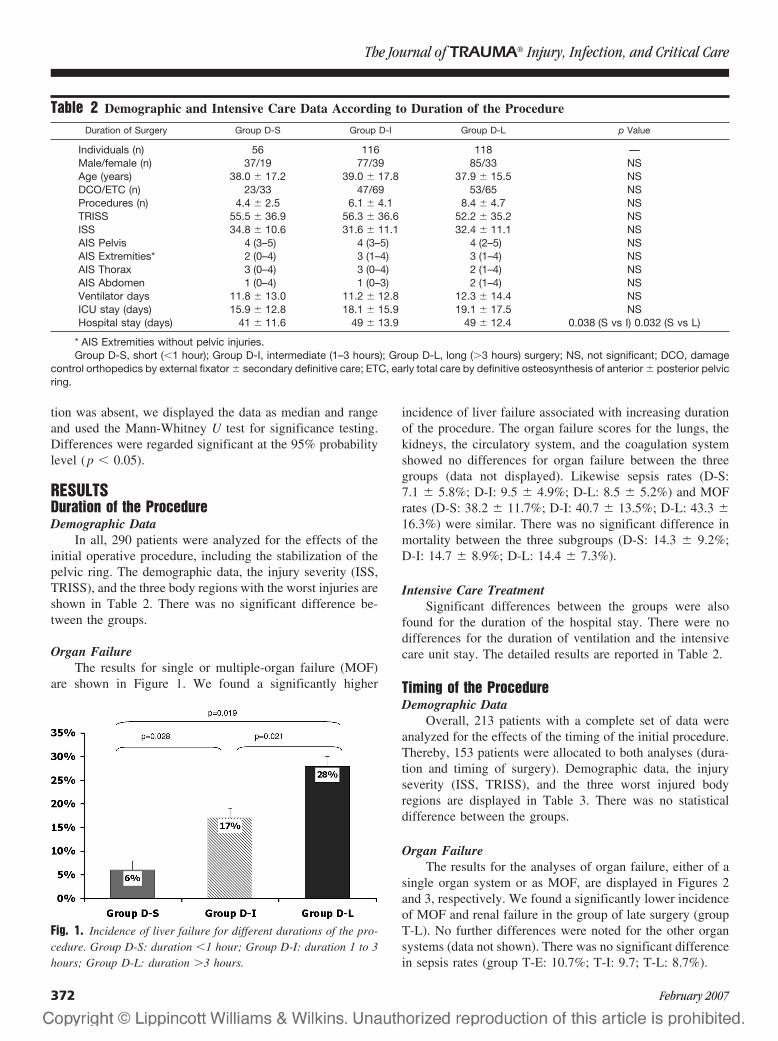
tion was absent, we displayed the data as median and rangeand used the Mann-Whitney U test for significance testing.Differences were regarded significant at the 95% probabilitylevel (p � 0.05).
RESULTSDuration of the ProcedureDemographic Data
In all, 290 patients were analyzed for the effects of theinitial operative procedure, including the stabilization of thepelvic ring. The demographic data, the injury severity (ISS,TRISS), and the three body regions with the worst injuries areshown in Table 2. There was no significant difference be-tween the groups.
Organ FailureThe results for single or multiple-organ failure (MOF)
are shown in Figure 1. We found a significantly higher
incidence of liver failure associated with increasing durationof the procedure. The organ failure scores for the lungs, thekidneys, the circulatory system, and the coagulation systemshowed no differences for organ failure between the threegroups (data not displayed). Likewise sepsis rates (D-S:7.1 � 5.8%; D-I: 9.5 � 4.9%; D-L: 8.5 � 5.2%) and MOFrates (D-S: 38.2 � 11.7%; D-I: 40.7 � 13.5%; D-L: 43.3 �16.3%) were similar. There was no significant difference inmortality between the three subgroups (D-S: 14.3 � 9.2%;D-I: 14.7 � 8.9%; D-L: 14.4 � 7.3%).
Intensive Care TreatmentSignificant differences between the groups were also
found for the duration of the hospital stay. There were nodifferences for the duration of ventilation and the intensivecare unit stay. The detailed results are reported in Table 2.
Timing of the ProcedureDemographic Data
Overall, 213 patients with a complete set of data wereanalyzed for the effects of the timing of the initial procedure.Thereby, 153 patients were allocated to both analyses (dura-tion and timing of surgery). Demographic data, the injuryseverity (ISS, TRISS), and the three worst injured bodyregions are displayed in Table 3. There was no statisticaldifference between the groups.
Organ FailureThe results for the analyses of organ failure, either of a
single organ system or as MOF, are displayed in Figures 2and 3, respectively. We found a significantly lower incidenceof MOF and renal failure in the group of late surgery (groupT-L). No further differences were noted for the other organsystems (data not shown). There was no significant differencein sepsis rates (group T-E: 10.7%; T-I: 9.7; T-L: 8.7%).
Table 2 Demographic and Intensive Care Data According to Duration of the Procedure
Duration of Surgery Group D-S Group D-I Group D-L p Value
Individuals (n) 56 116 118 —Male/female (n) 37/19 77/39 85/33 NSAge (years) 38.0 � 17.2 39.0 � 17.8 37.9 � 15.5 NSDCO/ETC (n) 23/33 47/69 53/65 NSProcedures (n) 4.4 � 2.5 6.1 � 4.1 8.4 � 4.7 NSTRISS 55.5 � 36.9 56.3 � 36.6 52.2 � 35.2 NSISS 34.8 � 10.6 31.6 � 11.1 32.4 � 11.1 NSAIS Pelvis 4 (3–5) 4 (3–5) 4 (2–5) NSAIS Extremities* 2 (0–4) 3 (1–4) 3 (1–4) NSAIS Thorax 3 (0–4) 3 (0–4) 2 (1–4) NSAIS Abdomen 1 (0–4) 1 (0–3) 2 (1–4) NSVentilator days 11.8 � 13.0 11.2 � 12.8 12.3 � 14.4 NSICU stay (days) 15.9 � 12.8 18.1 � 15.9 19.1 � 17.5 NSHospital stay (days) 41 � 11.6 49 � 13.9 49 � 12.4 0.038 (S vs I) 0.032 (S vs L)
* AIS Extremities without pelvic injuries.Group D-S, short (�1 hour); Group D-I, intermediate (1–3 hours); Group D-L, long (�3 hours) surgery; NS, not significant; DCO, damage
control orthopedics by external fixator � secondary definitive care; ETC, early total care by definitive osteosynthesis of anterior � posterior pelvicring.
Fig. 1. Incidence of liver failure for different durations of the pro-cedure. Group D-S: duration �1 hour; Group D-I: duration 1 to 3hours; Group D-L: duration �3 hours.
The Journal of TRAUMA� Injury, Infection, and Critical Care
372 February 2007
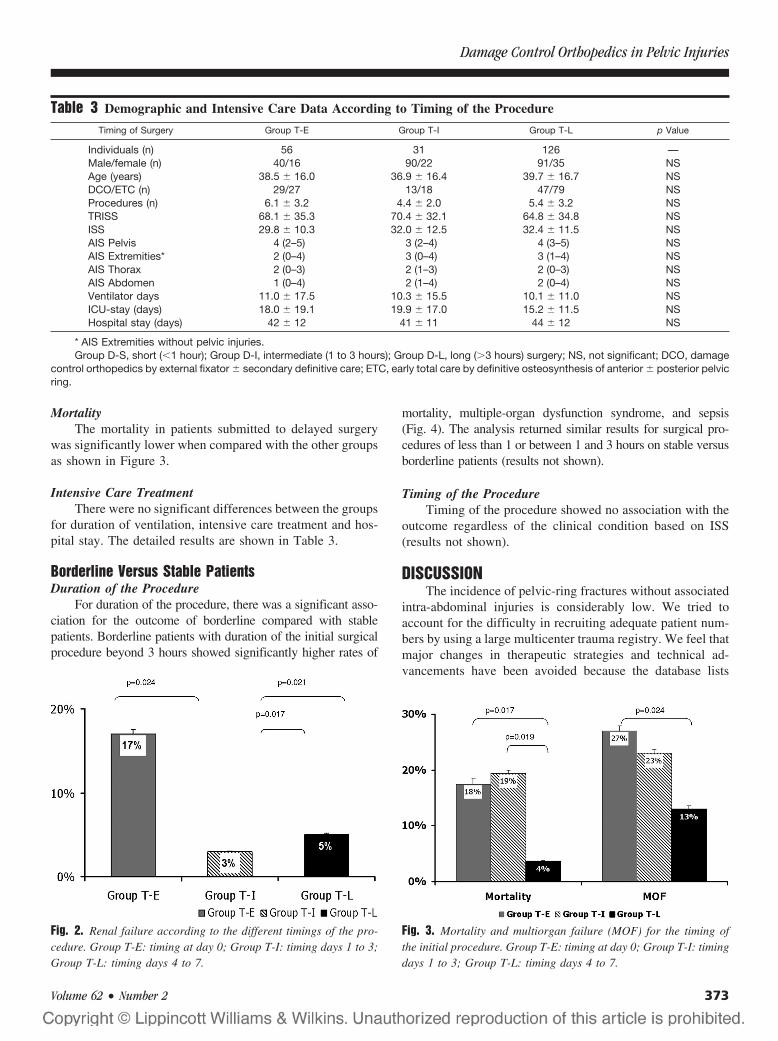
MortalityThe mortality in patients submitted to delayed surgery
was significantly lower when compared with the other groupsas shown in Figure 3.
Intensive Care TreatmentThere were no significant differences between the groups
for duration of ventilation, intensive care treatment and hos-pital stay. The detailed results are shown in Table 3.
Borderline Versus Stable PatientsDuration of the Procedure
For duration of the procedure, there was a significant asso-ciation for the outcome of borderline compared with stablepatients. Borderline patients with duration of the initial surgicalprocedure beyond 3 hours showed significantly higher rates of
mortality, multiple-organ dysfunction syndrome, and sepsis(Fig. 4). The analysis returned similar results for surgical pro-cedures of less than 1 or between 1 and 3 hours on stable versusborderline patients (results not shown).
Timing of the ProcedureTiming of the procedure showed no association with the
outcome regardless of the clinical condition based on ISS(results not shown).
DISCUSSIONThe incidence of pelvic-ring fractures without associated
intra-abdominal injuries is considerably low. We tried toaccount for the difficulty in recruiting adequate patient num-bers by using a large multicenter trauma registry. We feel thatmajor changes in therapeutic strategies and technical ad-vancements have been avoided because the database lists
Table 3 Demographic and Intensive Care Data According to Timing of the Procedure
Timing of Surgery Group T-E Group T-I Group T-L p Value
Individuals (n) 56 31 126 —Male/female (n) 40/16 90/22 91/35 NSAge (years) 38.5 � 16.0 36.9 � 16.4 39.7 � 16.7 NSDCO/ETC (n) 29/27 13/18 47/79 NSProcedures (n) 6.1 � 3.2 4.4 � 2.0 5.4 � 3.2 NSTRISS 68.1 � 35.3 70.4 � 32.1 64.8 � 34.8 NSISS 29.8 � 10.3 32.0 � 12.5 32.4 � 11.5 NSAIS Pelvis 4 (2–5) 3 (2–4) 4 (3–5) NSAIS Extremities* 2 (0–4) 3 (0–4) 3 (1–4) NSAIS Thorax 2 (0–3) 2 (1–3) 2 (0–3) NSAIS Abdomen 1 (0–4) 2 (1–4) 2 (0–4) NSVentilator days 11.0 � 17.5 10.3 � 15.5 10.1 � 11.0 NSICU-stay (days) 18.0 � 19.1 19.9 � 17.0 15.2 � 11.5 NSHospital stay (days) 42 � 12 41 � 11 44 � 12 NS
* AIS Extremities without pelvic injuries.Group D-S, short (�1 hour); Group D-I, intermediate (1 to 3 hours); Group D-L, long (�3 hours) surgery; NS, not significant; DCO, damage
control orthopedics by external fixator � secondary definitive care; ETC, early total care by definitive osteosynthesis of anterior � posterior pelvicring.
Fig. 2. Renal failure according to the different timings of the pro-cedure. Group T-E: timing at day 0; Group T-I: timing days 1 to 3;Group T-L: timing days 4 to 7.
Fig. 3. Mortality and multiorgan failure (MOF) for the timing ofthe initial procedure. Group T-E: timing at day 0; Group T-I: timingdays 1 to 3; Group T-L: timing days 4 to 7.
Damage Control Orthopedics in Pelvic Injuries
Volume 62 • Number 2 373
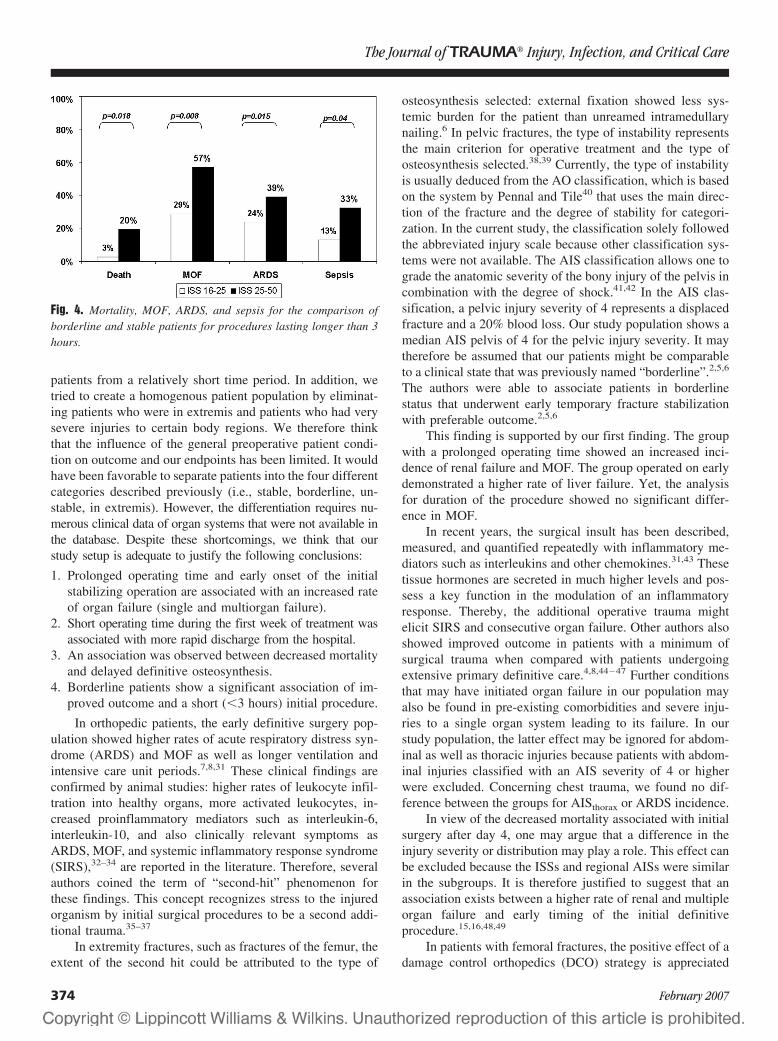
patients from a relatively short time period. In addition, wetried to create a homogenous patient population by eliminat-ing patients who were in extremis and patients who had verysevere injuries to certain body regions. We therefore thinkthat the influence of the general preoperative patient condi-tion on outcome and our endpoints has been limited. It wouldhave been favorable to separate patients into the four differentcategories described previously (i.e., stable, borderline, un-stable, in extremis). However, the differentiation requires nu-merous clinical data of organ systems that were not available inthe database. Despite these shortcomings, we think that ourstudy setup is adequate to justify the following conclusions:
1. Prolonged operating time and early onset of the initialstabilizing operation are associated with an increased rateof organ failure (single and multiorgan failure).
2. Short operating time during the first week of treatment wasassociated with more rapid discharge from the hospital.
3. An association was observed between decreased mortalityand delayed definitive osteosynthesis.
4. Borderline patients show a significant association of im-proved outcome and a short (�3 hours) initial procedure.
In orthopedic patients, the early definitive surgery pop-ulation showed higher rates of acute respiratory distress syn-drome (ARDS) and MOF as well as longer ventilation andintensive care unit periods.7,8,31 These clinical findings areconfirmed by animal studies: higher rates of leukocyte infil-tration into healthy organs, more activated leukocytes, in-creased proinflammatory mediators such as interleukin-6,interleukin-10, and also clinically relevant symptoms asARDS, MOF, and systemic inflammatory response syndrome(SIRS),32–34 are reported in the literature. Therefore, severalauthors coined the term of “second-hit” phenomenon forthese findings. This concept recognizes stress to the injuredorganism by initial surgical procedures to be a second addi-tional trauma.35–37
In extremity fractures, such as fractures of the femur, theextent of the second hit could be attributed to the type of
osteosynthesis selected: external fixation showed less sys-temic burden for the patient than unreamed intramedullarynailing.6 In pelvic fractures, the type of instability representsthe main criterion for operative treatment and the type ofosteosynthesis selected.38,39 Currently, the type of instabilityis usually deduced from the AO classification, which is basedon the system by Pennal and Tile40 that uses the main direc-tion of the fracture and the degree of stability for categori-zation. In the current study, the classification solely followedthe abbreviated injury scale because other classification sys-tems were not available. The AIS classification allows one tograde the anatomic severity of the bony injury of the pelvis incombination with the degree of shock.41,42 In the AIS clas-sification, a pelvic injury severity of 4 represents a displacedfracture and a 20% blood loss. Our study population shows amedian AIS pelvis of 4 for the pelvic injury severity. It maytherefore be assumed that our patients might be comparableto a clinical state that was previously named “borderline”.2,5,6
The authors were able to associate patients in borderlinestatus that underwent early temporary fracture stabilizationwith preferable outcome.2,5,6
This finding is supported by our first finding. The groupwith a prolonged operating time showed an increased inci-dence of renal failure and MOF. The group operated on earlydemonstrated a higher rate of liver failure. Yet, the analysisfor duration of the procedure showed no significant differ-ence in MOF.
In recent years, the surgical insult has been described,measured, and quantified repeatedly with inflammatory me-diators such as interleukins and other chemokines.31,43 Thesetissue hormones are secreted in much higher levels and pos-sess a key function in the modulation of an inflammatoryresponse. Thereby, the additional operative trauma mightelicit SIRS and consecutive organ failure. Other authors alsoshowed improved outcome in patients with a minimum ofsurgical trauma when compared with patients undergoingextensive primary definitive care.4,8,44–47 Further conditionsthat may have initiated organ failure in our population mayalso be found in pre-existing comorbidities and severe inju-ries to a single organ system leading to its failure. In ourstudy population, the latter effect may be ignored for abdom-inal as well as thoracic injuries because patients with abdom-inal injuries classified with an AIS severity of 4 or higherwere excluded. Concerning chest trauma, we found no dif-ference between the groups for AISthorax or ARDS incidence.
In view of the decreased mortality associated with initialsurgery after day 4, one may argue that a difference in theinjury severity or distribution may play a role. This effect canbe excluded because the ISSs and regional AISs were similarin the subgroups. It is therefore justified to suggest that anassociation exists between a higher rate of renal and multipleorgan failure and early timing of the initial definitiveprocedure.15,16,48,49
In patients with femoral fractures, the positive effect of adamage control orthopedics (DCO) strategy is appreciated
Fig. 4. Mortality, MOF, ARDS, and sepsis for the comparison ofborderline and stable patients for procedures lasting longer than 3hours.
The Journal of TRAUMA� Injury, Infection, and Critical Care
374 February 2007

mostly in those who were in uncertain (borderline) or criticalcondition. We have tried to separate our patient population toallow a similar focused investigation. Based on previousinvestigations, we used the ISS to separate stable patientsfrom potentially unstable patients.29,30 Patients undergoingprolonged pelvic stabilization demonstrated similar problemsas previously published polytrauma patients undergoing pro-longed femoral fracture stabilization.29,30 The vulnerability ofthese patients to the additional surgical burden is stressed byour findings.
CONCLUSIONIn summary, the current investigation suggests that the
application of damage control approach to pelvic ring frac-tures in severely injured patients may be of value. In patientswho had a short initial operating time and who were defini-tively stabilized more than 3 days after the trauma, there arepositive effects such as fewer blood transfusions, lower ratesof organ failure, and MOF. There is a lower mortality rate forlate timing of the procedure. Borderline patients especiallysuffer from the negative consequences of prolonged surgery.
ACKNOWLEDGMENTMembers of the Polytrauma-Group of the German Trauma Society
(DGU): Barth F., Bonk A.D., Bouillon B., Frink M., Grote S., Grotz M.,Hering M., Huber-Wagner S., Kanz K.G., Kleiner H.-M., Krettek C., KuhneC., Kumpf L., Lackner C., Ledendecker K., Lefering R., Lindhorst E., MarziI., Meyer H., Muller S., Mutschler W., Nast-Kolb D., Neugebauer E.,Oestern H.J., Paffrath T., Pape H.C., Probst C., Qvick M., Raum M., RixenD., Ruchholtz S., Sauerland S., Schweigkofler U., Seekamp A., Simon R.,Steitz O., Tjardes T., Walcher F., Waydhas C., Westhoff J., Wittke M.
Participants in the Trauma Registry: Universitatsklinik der RWTHAachen, Zentralklinikum Augsburg, Kreiskrankenhaus Bad Hersfeld,Charite - Campus Virchow-Klinikum Berlin, Martin-Luther-Krankenhaus Ber-lin, Klinikum Berlin-Buch, BG-Unfallklinik Berlin-Mahrzahn, KrankenanstaltenGilead Bielefeld, BG-Klinik Bochum Bergmannsheil, Knappschaftskranken-haus der Ruhr-Universitat Bochum, Friedrich-Wilhelms-Universitat Bonn, Zen-tralkrankenhaus Sankt-Jurgen-Straße Bremen, Zentralkrankenhaus Bremen Ost,Klinikum Bremerhaven-Reinkenheide, Allgemeines Krankenhaus Celle, Klini-kum Chemnitz, Klinikum Dessau, Klinikum Lippe-Detmold, KrankenhausDresden-Neustadt, Technische Universitat Dresden, Krankenhaus Dresden-Friedrichstadt, Heinrich-Heine-Universitat Dusseldorf, Klinikum Erfurt, Kreisk-rankenhaus Eschwege, Universitatsklinikum Essen, Evang. KrankenhausLutherhaus Essen, BG Unfallklinik Frankfurt/Main, UniversitatsklinikFrankfurt/Main, Klinikum Frankfurt/Oder, Klinikum Furth, Johanniter-Krankenhaus Geesthacht, Stadtisches Klinikum Gorlitz, Klinik an EichertGoppingen, Georg-August-Universitat Gottingen, Universitat Graz (Os-terreich), Allg. Unfallvericherungsanstalt Graz (Osterreich), Kreiskran-kenhaus Grevenbroich, Universitatsklinik Groningen (Niederlande),Kreiskrankenhaus Gummersbach, BG-Unfallkrankenhaus Hamburg,Kreiskrankenhaus Hameln, Medizinische Hochschule Hannover, Kran-kenhaus Hannover-Nordstadt, Friederikenstift Hannover, Ev. Kranken-haus Hattingen, Orthopad. Universitatsklinik Heidelberg, St. BernwardKrankenhaus Hildesheim, Universitat des Saarlandes Homburg/Saar,Waldviertel Klinikum Horn (Osterreich), LKH Judenburg-Knittelfeld(Osterreich), Stadt. Klinikum Karlsruhe, Christian- Albrechts-UniversitatKiel, Chirurgischer Lehrstuhl der Universitat zu Koln, Stadt. KlinikumKoln-Merheim, Allg. off. Krankenhaus Krems/Donau (Osterreich), Stadt.Klinikum St. Georg Leipzig, Universitat Leipzig, Ev. Krankenhaus Leng-erich, Allg. offentl. Krankenhaus Linz (Osterreich), Ev. KrankenhausLippstadt, Universitatsklinikum Lubeck, BG Unfallklinik Ludwigshafen,
St.-Marien-Hospital Lunen, Krankenhaus Altstadt, Stadt. Klinikum Magdeburg,Otto-von-Guericke-Universitat Magdeburg, Johannes-Gutenberg-UniversitatMainz, Universitatsklinikum Mannheim, Universitat Marburg, Klinikum Min-den, Krankenhaus Maria Hilf Monchengladbach, Klinikum Großhadern derLMU Munchen, Klinikum Innenstadt der LMU Munchen, Stadt. Kran-kenhaus Munchen-Harlaching, Westfalische Wilhelms-Universitat Mun-ster, BG-Unfallklinik Murnau, Lukaskrankenhaus der Stadt. KlinikenNeuss, Marienhospital Osnabruck, Vogtland Klinikum Plauen, KlinikumRemscheid, Klinikum Rosenheim, Sana-Krankenhaus Rugen, St. Johanns-Spital-Landeskrankenhaus Salzburg (Osterr.), Diakonissenkrankenhaus SchwabischHall, Kreiskrankenhaus Soltau, Johanniter-Krankenhaus der Altmark Stendal,Kreiskrankenhaus Traunstein, BG-Unfallklinik Tubingen, Bundeswehrkranken-haus Ulm, Universitatsklinik Ulm, Klinikum der Stadt Villingen-Schwenningen,Klinikum Weiden/Opfz., Asklepios Kreiskrankenhaus Weißenfels, DonauspitalWien (Osterreich), Ferdinand-Sauerbruch-Klinikum Wuppertal, Julius-Maximilians-Universitat Wurzburg, Universitatsspital ETH Zurich (Schweiz),Rettungsstelle Zusmarshausen.
REFERENCES1. Hildebrand F, Giannoudis P, Kretteck C, Pape HC. Damage control:
extremities. Injury. 2004;35:678–689.2. Pape HC, Giannoudis P, Krettek C. The timing of fracture treatment
in polytrauma patients: relevance of damage control orthopedicsurgery. Am J Surg. 2002;183:622–629.
3. Rotondo MF, Schwab CW, McGonigal MD, et al. “Damagecontrol”: an approach for improved survival in exsanguinatingpenetrating abdominal injury. J Trauma. 1993;35:375–382.
4. Rotondo MF, Zonies DH. The damage control sequence andunderlying logic. Surg Clin N Am. 1997;77:761–777.
5. Flohe S, Lendemans S, Schade FU, Kreuzfelder E, Waydhas C.Influence of surgical intervention in the immune response ofseverely injured patients. Intensive Care Med. 2004;30:96–102.
6. Taeger G, Ruchholtz S, Zettl R, Waydhas C, Nast-Kolb D. Primaryexternal fixation with consecutive procedural modification inpolytrauma [German]. Unfallchirurg. 2002;105:315–321.
7. Pape HC, Hildebrand F, Pertschy S, et al. Changes in themanagement of femoral shaft fractures in polytrauma patients: fromearly total care to damage control orthopedic surgery. J OrthopTrauma. 2004;18:S13–S22.
8. Pape HC, Grimme K, Van GM, et al. Impact of intramedullaryinstrumentation versus damage control for femoral fractures onimmunoinflammatory parameters: prospective randomized analysisby the EPOFF Study Group. J Trauma. 2003;55:7–13.
9. Euler E, Nast-Kolb D, Schweiberer L. Acetabular and pelvicfractures in multiple trauma [German]. Orthopade. 1997;26:354–359.
10. Pohlemann T, Tscherne H, Baumgartel F, et al. Pelvic fractures:epidemiology, therapy and long-term outcome. Overview of themulticenter study of the Pelvis Study Group [German].Unfallchirurg. 1996;99:160–167.
11. Siegmeth A, Mullner T, Kukla C, Vecsei V. Associated injuries insevere pelvic trauma [German]. Unfallchirurg. 2000;103:572–581.
12. Varney M, Fischer I, Becker H, Derra E, Roher HD. Additionalintra-abdominal injuries in multiple-traumatized patients with pelvicfractures. Difficulties in diagnosis and therapy [German]. AktuelleTraumatologie. 1990;20:226–230.
13. Gansslen A, Pohlemann T, Paul C, Lobenhoffer P, Tscherne H.Epidemiology of pelvic ring injuries. Injury. 1996;27:S1–S20.
14. Draijer F, Egbers HJ, Havemann D, Zimmermann M. Results offollow-up of conservatively and surgically treated injuries of thepelvic ring within the scope of a prospective study [German].Unfallchirurg. 1995;98:355–360.
15. Pohlemann T, Gansslen A, Schellwald O, Culemann U, Tscherne H.Outcome after pelvic ring injuries. Injury. 1996;27:B31–B38.
Damage Control Orthopedics in Pelvic Injuries
Volume 62 • Number 2 375
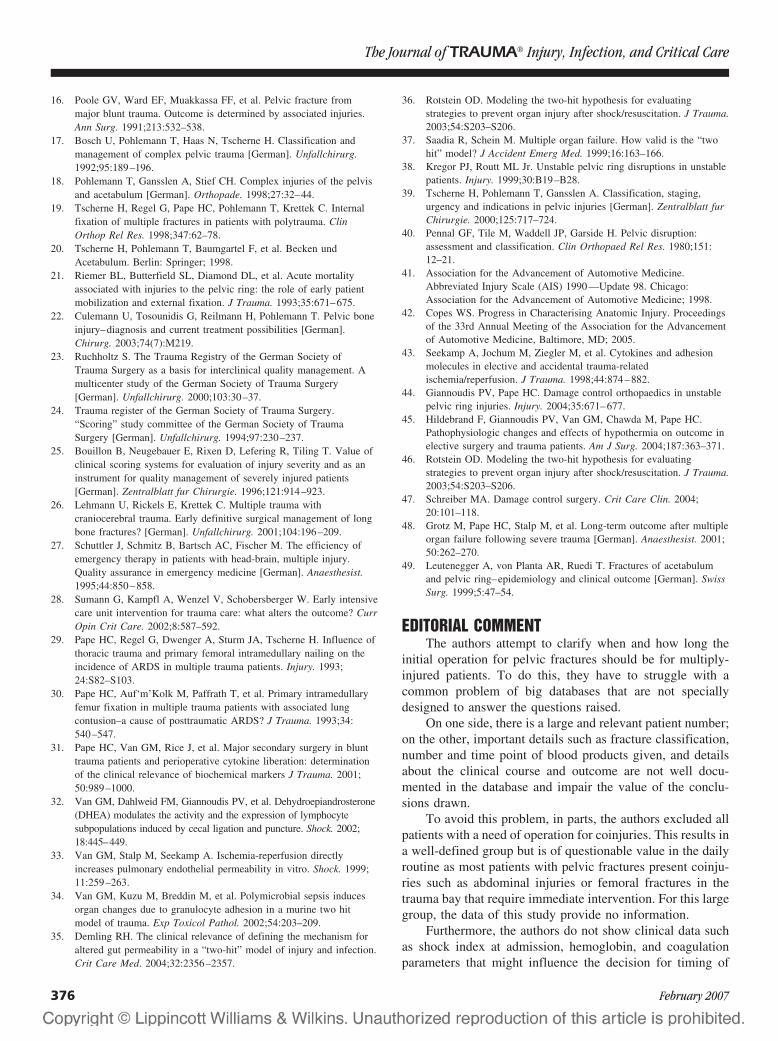
16. Poole GV, Ward EF, Muakkassa FF, et al. Pelvic fracture frommajor blunt trauma. Outcome is determined by associated injuries.Ann Surg. 1991;213:532–538.
17. Bosch U, Pohlemann T, Haas N, Tscherne H. Classification andmanagement of complex pelvic trauma [German]. Unfallchirurg.1992;95:189–196.
18. Pohlemann T, Gansslen A, Stief CH. Complex injuries of the pelvisand acetabulum [German]. Orthopade. 1998;27:32–44.
19. Tscherne H, Regel G, Pape HC, Pohlemann T, Krettek C. Internalfixation of multiple fractures in patients with polytrauma. ClinOrthop Rel Res. 1998;347:62–78.
20. Tscherne H, Pohlemann T, Baumgartel F, et al. Becken undAcetabulum. Berlin: Springer; 1998.
21. Riemer BL, Butterfield SL, Diamond DL, et al. Acute mortalityassociated with injuries to the pelvic ring: the role of early patientmobilization and external fixation. J Trauma. 1993;35:671–675.
22. Culemann U, Tosounidis G, Reilmann H, Pohlemann T. Pelvic boneinjury–diagnosis and current treatment possibilities [German].Chirurg. 2003;74(7):M219.
23. Ruchholtz S. The Trauma Registry of the German Society ofTrauma Surgery as a basis for interclinical quality management. Amulticenter study of the German Society of Trauma Surgery[German]. Unfallchirurg. 2000;103:30–37.
24. Trauma register of the German Society of Trauma Surgery.“Scoring” study committee of the German Society of TraumaSurgery [German]. Unfallchirurg. 1994;97:230–237.
25. Bouillon B, Neugebauer E, Rixen D, Lefering R, Tiling T. Value ofclinical scoring systems for evaluation of injury severity and as aninstrument for quality management of severely injured patients[German]. Zentralblatt fur Chirurgie. 1996;121:914–923.
26. Lehmann U, Rickels E, Krettek C. Multiple trauma withcraniocerebral trauma. Early definitive surgical management of longbone fractures? [German]. Unfallchirurg. 2001;104:196–209.
27. Schuttler J, Schmitz B, Bartsch AC, Fischer M. The efficiency ofemergency therapy in patients with head-brain, multiple injury.Quality assurance in emergency medicine [German]. Anaesthesist.1995;44:850–858.
28. Sumann G, Kampfl A, Wenzel V, Schobersberger W. Early intensivecare unit intervention for trauma care: what alters the outcome? CurrOpin Crit Care. 2002;8:587–592.
29. Pape HC, Regel G, Dwenger A, Sturm JA, Tscherne H. Influence ofthoracic trauma and primary femoral intramedullary nailing on theincidence of ARDS in multiple trauma patients. Injury. 1993;24:S82–S103.
30. Pape HC, Auf‘m’Kolk M, Paffrath T, et al. Primary intramedullaryfemur fixation in multiple trauma patients with associated lungcontusion–a cause of posttraumatic ARDS? J Trauma. 1993;34:540–547.
31. Pape HC, Van GM, Rice J, et al. Major secondary surgery in blunttrauma patients and perioperative cytokine liberation: determinationof the clinical relevance of biochemical markers J Trauma. 2001;50:989–1000.
32. Van GM, Dahlweid FM, Giannoudis PV, et al. Dehydroepiandrosterone(DHEA) modulates the activity and the expression of lymphocytesubpopulations induced by cecal ligation and puncture. Shock. 2002;18:445–449.
33. Van GM, Stalp M, Seekamp A. Ischemia-reperfusion directlyincreases pulmonary endothelial permeability in vitro. Shock. 1999;11:259–263.
34. Van GM, Kuzu M, Breddin M, et al. Polymicrobial sepsis inducesorgan changes due to granulocyte adhesion in a murine two hitmodel of trauma. Exp Toxicol Pathol. 2002;54:203–209.
35. Demling RH. The clinical relevance of defining the mechanism foraltered gut permeability in a “two-hit” model of injury and infection.Crit Care Med. 2004;32:2356–2357.
36. Rotstein OD. Modeling the two-hit hypothesis for evaluatingstrategies to prevent organ injury after shock/resuscitation. J Trauma.2003;54:S203–S206.
37. Saadia R, Schein M. Multiple organ failure. How valid is the “twohit” model? J Accident Emerg Med. 1999;16:163–166.
38. Kregor PJ, Routt ML Jr. Unstable pelvic ring disruptions in unstablepatients. Injury. 1999;30:B19–B28.
39. Tscherne H, Pohlemann T, Gansslen A. Classification, staging,urgency and indications in pelvic injuries [German]. Zentralblatt furChirurgie. 2000;125:717–724.
40. Pennal GF, Tile M, Waddell JP, Garside H. Pelvic disruption:assessment and classification. Clin Orthopaed Rel Res. 1980;151:12–21.
41. Association for the Advancement of Automotive Medicine.Abbreviated Injury Scale (AIS) 1990—Update 98. Chicago:Association for the Advancement of Automotive Medicine; 1998.
42. Copes WS. Progress in Characterising Anatomic Injury. Proceedingsof the 33rd Annual Meeting of the Association for the Advancementof Automotive Medicine, Baltimore, MD; 2005.
43. Seekamp A, Jochum M, Ziegler M, et al. Cytokines and adhesionmolecules in elective and accidental trauma-relatedischemia/reperfusion. J Trauma. 1998;44:874–882.
44. Giannoudis PV, Pape HC. Damage control orthopaedics in unstablepelvic ring injuries. Injury. 2004;35:671–677.
45. Hildebrand F, Giannoudis PV, Van GM, Chawda M, Pape HC.Pathophysiologic changes and effects of hypothermia on outcome inelective surgery and trauma patients. Am J Surg. 2004;187:363–371.
46. Rotstein OD. Modeling the two-hit hypothesis for evaluatingstrategies to prevent organ injury after shock/resuscitation. J Trauma.2003;54:S203–S206.
47. Schreiber MA. Damage control surgery. Crit Care Clin. 2004;20:101–118.
48. Grotz M, Pape HC, Stalp M, et al. Long-term outcome after multipleorgan failure following severe trauma [German]. Anaesthesist. 2001;50:262–270.
49. Leutenegger A, von Planta AR, Ruedi T. Fractures of acetabulumand pelvic ring–epidemiology and clinical outcome [German]. SwissSurg. 1999;5:47–54.
EDITORIAL COMMENTThe authors attempt to clarify when and how long the
initial operation for pelvic fractures should be for multiply-injured patients. To do this, they have to struggle with acommon problem of big databases that are not speciallydesigned to answer the questions raised.
On one side, there is a large and relevant patient number;on the other, important details such as fracture classification,number and time point of blood products given, and detailsabout the clinical course and outcome are not well docu-mented in the database and impair the value of the conclu-sions drawn.
To avoid this problem, in parts, the authors excluded allpatients with a need of operation for coinjuries. This results ina well-defined group but is of questionable value in the dailyroutine as most patients with pelvic fractures present coinju-ries such as abdominal injuries or femoral fractures in thetrauma bay that require immediate intervention. For this largegroup, the data of this study provide no information.
Furthermore, the authors do not show clinical data suchas shock index at admission, hemoglobin, and coagulationparameters that might influence the decision for timing of
The Journal of TRAUMA� Injury, Infection, and Critical Care
376 February 2007

operation and maybe also the duration. Despite the argumen-tation that differences between patient groups can be ex-cluded by similar ISS and regional AIS points, it is wellproven that these pure anatomical scores have a very limitedability to compare a precise clinical situation. A patient withsignificant hemorrhagic shock as a result of a dislocatedopen-book fracture that needs immediate intervention is ex-pected to face more postoperative problems than a patient
with a nonsignificantly dislocated instable C-type fracturethat can be operated on in a delayed fashion.
Despite those limitations, this study supports previousfindings and hits the bias of most readers that it is notbeneficial to operate initially longer than 3 hours on a pelvisof a severely injured patient.
Christian Schinkel, MDRuhr-University Bochum, Germany
Damage Control Orthopedics in Pelvic Injuries
Volume 62 • Number 2 377
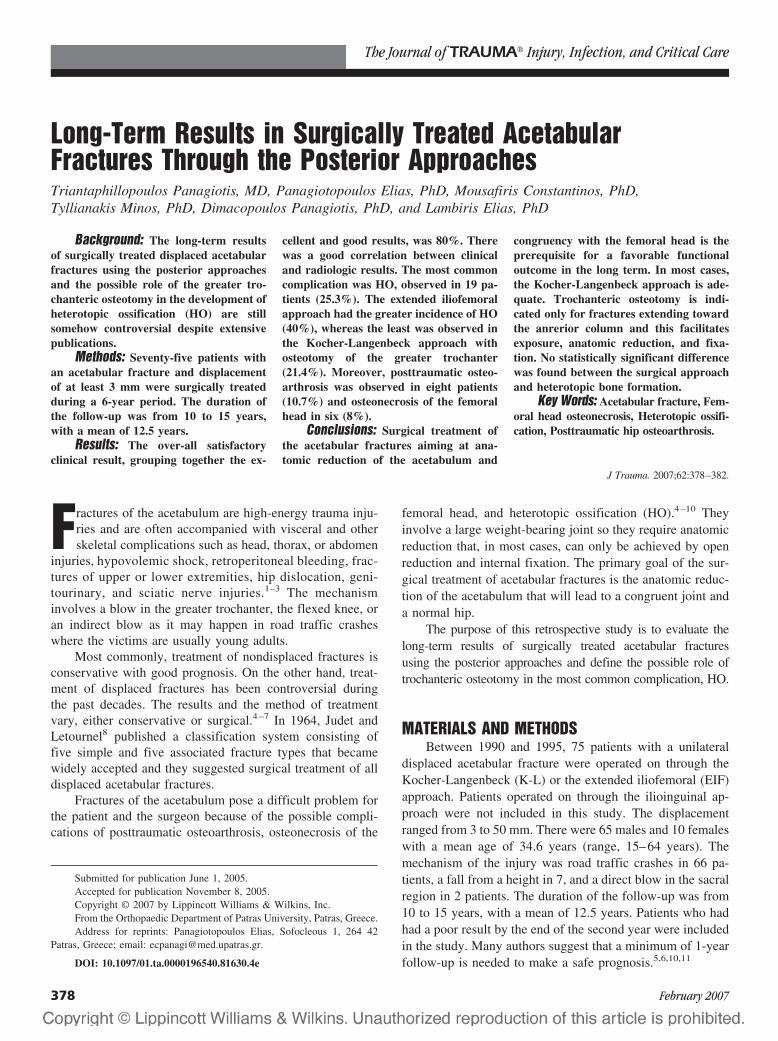
Long-Term Results in Surgically Treated AcetabularFractures Through the Posterior ApproachesTriantaphillopoulos Panagiotis, MD, Panagiotopoulos Elias, PhD, Mousafiris Constantinos, PhD,Tyllianakis Minos, PhD, Dimacopoulos Panagiotis, PhD, and Lambiris Elias, PhD
Background: The long-term resultsof surgically treated displaced acetabularfractures using the posterior approachesand the possible role of the greater tro-chanteric osteotomy in the development ofheterotopic ossification (HO) are stillsomehow controversial despite extensivepublications.
Methods: Seventy-five patients withan acetabular fracture and displacementof at least 3 mm were surgically treatedduring a 6-year period. The duration ofthe follow-up was from 10 to 15 years,with a mean of 12.5 years.
Results: The over-all satisfactoryclinical result, grouping together the ex-
cellent and good results, was 80%. Therewas a good correlation between clinicaland radiologic results. The most commoncomplication was HO, observed in 19 pa-tients (25.3%). The extended iliofemoralapproach had the greater incidence of HO(40%), whereas the least was observed inthe Kocher-Langenbeck approach withosteotomy of the greater trochanter(21.4%). Moreover, posttraumatic osteo-arthrosis was observed in eight patients(10.7%) and osteonecrosis of the femoralhead in six (8%).
Conclusions: Surgical treatment ofthe acetabular fractures aiming at ana-tomic reduction of the acetabulum and
congruency with the femoral head is theprerequisite for a favorable functionaloutcome in the long term. In most cases,the Kocher-Langenbeck approach is ade-quate. Trochanteric osteotomy is indi-cated only for fractures extending towardthe anrerior column and this facilitatesexposure, anatomic reduction, and fixa-tion. No statistically significant differencewas found between the surgical approachand heterotopic bone formation.
Key Words: Acetabular fracture, Fem-oral head osteonecrosis, Heterotopic ossifi-cation, Posttraumatic hip osteoarthrosis.
J Trauma. 2007;62:378–382.
Fractures of the acetabulum are high-energy trauma inju-ries and are often accompanied with visceral and otherskeletal complications such as head, thorax, or abdomen
injuries, hypovolemic shock, retroperitoneal bleeding, frac-tures of upper or lower extremities, hip dislocation, geni-tourinary, and sciatic nerve injuries.1–3 The mechanisminvolves a blow in the greater trochanter, the flexed knee, oran indirect blow as it may happen in road traffic crasheswhere the victims are usually young adults.
Most commonly, treatment of nondisplaced fractures isconservative with good prognosis. On the other hand, treat-ment of displaced fractures has been controversial duringthe past decades. The results and the method of treatmentvary, either conservative or surgical.4–7 In 1964, Judet andLetournel8 published a classification system consisting offive simple and five associated fracture types that becamewidely accepted and they suggested surgical treatment of alldisplaced acetabular fractures.
Fractures of the acetabulum pose a difficult problem forthe patient and the surgeon because of the possible compli-cations of posttraumatic osteoarthrosis, osteonecrosis of the
femoral head, and heterotopic ossification (HO).4–10 Theyinvolve a large weight-bearing joint so they require anatomicreduction that, in most cases, can only be achieved by openreduction and internal fixation. The primary goal of the sur-gical treatment of acetabular fractures is the anatomic reduc-tion of the acetabulum that will lead to a congruent joint anda normal hip.
The purpose of this retrospective study is to evaluate thelong-term results of surgically treated acetabular fracturesusing the posterior approaches and define the possible role oftrochanteric osteotomy in the most common complication, HO.
MATERIALS AND METHODSBetween 1990 and 1995, 75 patients with a unilateral
displaced acetabular fracture were operated on through theKocher-Langenbeck (K-L) or the extended iliofemoral (EIF)approach. Patients operated on through the ilioinguinal ap-proach were not included in this study. The displacementranged from 3 to 50 mm. There were 65 males and 10 femaleswith a mean age of 34.6 years (range, 15–64 years). Themechanism of the injury was road traffic crashes in 66 pa-tients, a fall from a height in 7, and a direct blow in the sacralregion in 2 patients. The duration of the follow-up was from10 to 15 years, with a mean of 12.5 years. Patients who hadhad a poor result by the end of the second year were includedin the study. Many authors suggest that a minimum of 1-yearfollow-up is needed to make a safe prognosis.5,6,10,11
Submitted for publication June 1, 2005.Accepted for publication November 8, 2005.Copyright © 2007 by Lippincott Williams & Wilkins, Inc.From the Orthopaedic Department of Patras University, Patras, Greece.Address for reprints: Panagiotopoulos Elias, Sofocleous 1, 264 42
Patras, Greece; email: [email protected].
DOI: 10.1097/01.ta.0000196540.81630.4e
The Journal of TRAUMA� Injury, Infection, and Critical Care
378 February 2007
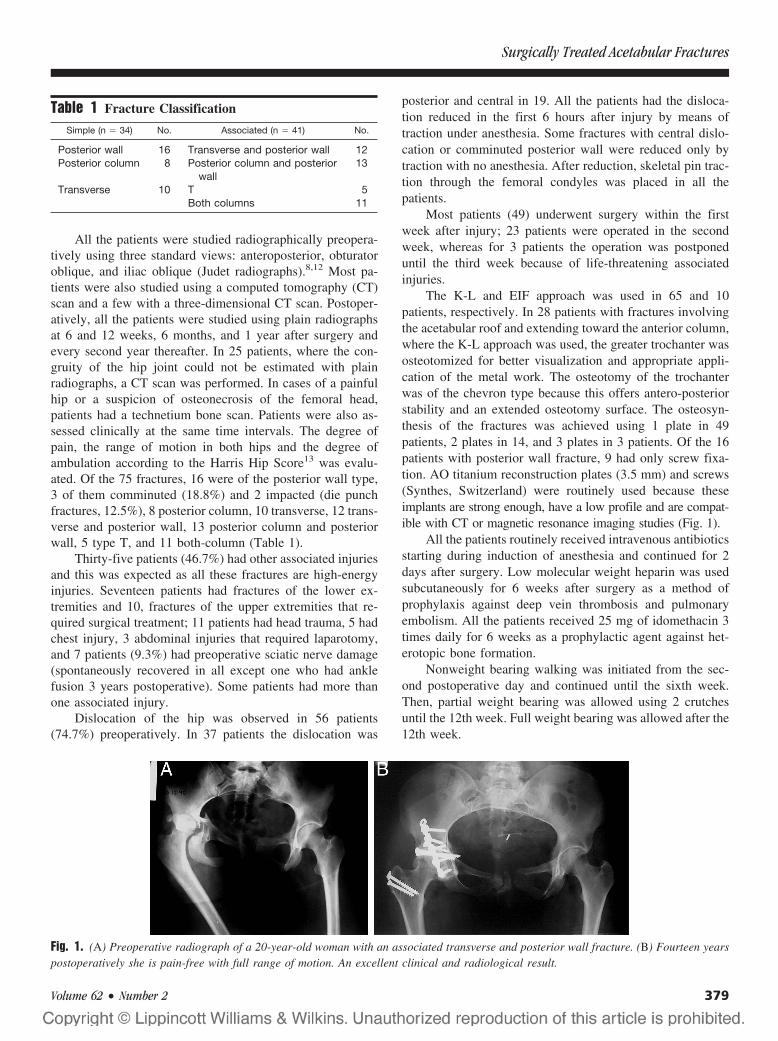
All the patients were studied radiographically preopera-tively using three standard views: anteroposterior, obturatoroblique, and iliac oblique (Judet radiographs).8,12 Most pa-tients were also studied using a computed tomography (CT)scan and a few with a three-dimensional CT scan. Postoper-atively, all the patients were studied using plain radiographsat 6 and 12 weeks, 6 months, and 1 year after surgery andevery second year thereafter. In 25 patients, where the con-gruity of the hip joint could not be estimated with plainradiographs, a CT scan was performed. In cases of a painfulhip or a suspicion of osteonecrosis of the femoral head,patients had a technetium bone scan. Patients were also as-sessed clinically at the same time intervals. The degree ofpain, the range of motion in both hips and the degree ofambulation according to the Harris Hip Score13 was evalu-ated. Of the 75 fractures, 16 were of the posterior wall type,3 of them comminuted (18.8%) and 2 impacted (die punchfractures, 12.5%), 8 posterior column, 10 transverse, 12 trans-verse and posterior wall, 13 posterior column and posteriorwall, 5 type T, and 11 both-column (Table 1).
Thirty-five patients (46.7%) had other associated injuriesand this was expected as all these fractures are high-energyinjuries. Seventeen patients had fractures of the lower ex-tremities and 10, fractures of the upper extremities that re-quired surgical treatment; 11 patients had head trauma, 5 hadchest injury, 3 abdominal injuries that required laparotomy,and 7 patients (9.3%) had preoperative sciatic nerve damage(spontaneously recovered in all except one who had anklefusion 3 years postoperative). Some patients had more thanone associated injury.
Dislocation of the hip was observed in 56 patients(74.7%) preoperatively. In 37 patients the dislocation was
posterior and central in 19. All the patients had the disloca-tion reduced in the first 6 hours after injury by means oftraction under anesthesia. Some fractures with central dislo-cation or comminuted posterior wall were reduced only bytraction with no anesthesia. After reduction, skeletal pin trac-tion through the femoral condyles was placed in all thepatients.
Most patients (49) underwent surgery within the firstweek after injury; 23 patients were operated in the secondweek, whereas for 3 patients the operation was postponeduntil the third week because of life-threatening associatedinjuries.
The K-L and EIF approach was used in 65 and 10patients, respectively. In 28 patients with fractures involvingthe acetabular roof and extending toward the anterior column,where the K-L approach was used, the greater trochanter wasosteotomized for better visualization and appropriate appli-cation of the metal work. The osteotomy of the trochanterwas of the chevron type because this offers antero-posteriorstability and an extended osteotomy surface. The osteosyn-thesis of the fractures was achieved using 1 plate in 49patients, 2 plates in 14, and 3 plates in 3 patients. Of the 16patients with posterior wall fracture, 9 had only screw fixa-tion. AO titanium reconstruction plates (3.5 mm) and screws(Synthes, Switzerland) were routinely used because theseimplants are strong enough, have a low profile and are compat-ible with CT or magnetic resonance imaging studies (Fig. 1).
All the patients routinely received intravenous antibioticsstarting during induction of anesthesia and continued for 2days after surgery. Low molecular weight heparin was usedsubcutaneously for 6 weeks after surgery as a method ofprophylaxis against deep vein thrombosis and pulmonaryembolism. All the patients received 25 mg of idomethacin 3times daily for 6 weeks as a prophylactic agent against het-erotopic bone formation.
Nonweight bearing walking was initiated from the sec-ond postoperative day and continued until the sixth week.Then, partial weight bearing was allowed using 2 crutchesuntil the 12th week. Full weight bearing was allowed after the12th week.
Table 1 Fracture Classification
Simple (n � 34) No. Associated (n � 41) No.
Posterior wall 16 Transverse and posterior wall 12Posterior column 8 Posterior column and posterior
wall13
Transverse 10 T 5Both columns 11
Fig. 1. (A) Preoperative radiograph of a 20-year-old woman with an associated transverse and posterior wall fracture. (B) Fourteen yearspostoperatively she is pain-free with full range of motion. An excellent clinical and radiological result.
Surgically Treated Acetabular Fractures
Volume 62 • Number 2 379
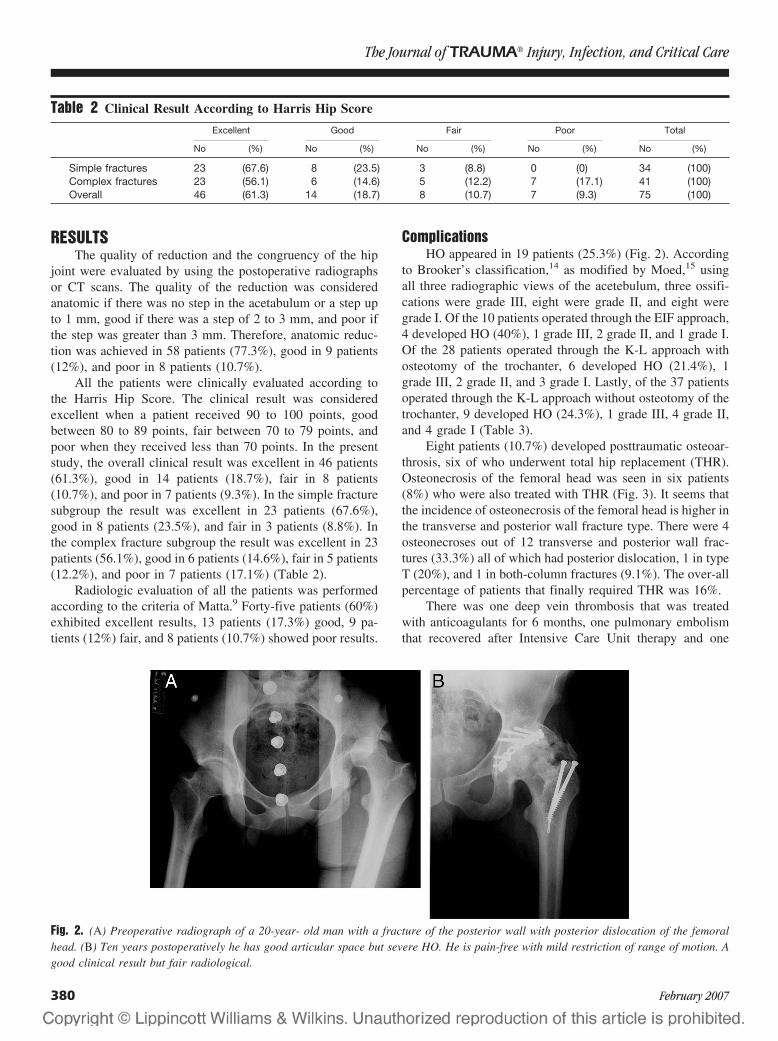
RESULTSThe quality of reduction and the congruency of the hip
joint were evaluated by using the postoperative radiographsor CT scans. The quality of the reduction was consideredanatomic if there was no step in the acetabulum or a step upto 1 mm, good if there was a step of 2 to 3 mm, and poor ifthe step was greater than 3 mm. Therefore, anatomic reduc-tion was achieved in 58 patients (77.3%), good in 9 patients(12%), and poor in 8 patients (10.7%).
All the patients were clinically evaluated according tothe Harris Hip Score. The clinical result was consideredexcellent when a patient received 90 to 100 points, goodbetween 80 to 89 points, fair between 70 to 79 points, andpoor when they received less than 70 points. In the presentstudy, the overall clinical result was excellent in 46 patients(61.3%), good in 14 patients (18.7%), fair in 8 patients(10.7%), and poor in 7 patients (9.3%). In the simple fracturesubgroup the result was excellent in 23 patients (67.6%),good in 8 patients (23.5%), and fair in 3 patients (8.8%). Inthe complex fracture subgroup the result was excellent in 23patients (56.1%), good in 6 patients (14.6%), fair in 5 patients(12.2%), and poor in 7 patients (17.1%) (Table 2).
Radiologic evaluation of all the patients was performedaccording to the criteria of Matta.9 Forty-five patients (60%)exhibited excellent results, 13 patients (17.3%) good, 9 pa-tients (12%) fair, and 8 patients (10.7%) showed poor results.
ComplicationsHO appeared in 19 patients (25.3%) (Fig. 2). According
to Brooker’s classification,14 as modified by Moed,15 usingall three radiographic views of the acetebulum, three ossifi-cations were grade III, eight were grade II, and eight weregrade I. Of the 10 patients operated through the EIF approach,4 developed HO (40%), 1 grade III, 2 grade II, and 1 grade I.Of the 28 patients operated through the K-L approach withosteotomy of the trochanter, 6 developed HO (21.4%), 1grade III, 2 grade II, and 3 grade I. Lastly, of the 37 patientsoperated through the K-L approach without osteotomy of thetrochanter, 9 developed HO (24.3%), 1 grade III, 4 grade II,and 4 grade I (Table 3).
Eight patients (10.7%) developed posttraumatic osteoar-throsis, six of who underwent total hip replacement (THR).Osteonecrosis of the femoral head was seen in six patients(8%) who were also treated with THR (Fig. 3). It seems thatthe incidence of osteonecrosis of the femoral head is higher inthe transverse and posterior wall fracture type. There were 4osteonecroses out of 12 transverse and posterior wall frac-tures (33.3%) all of which had posterior dislocation, 1 in typeT (20%), and 1 in both-column fractures (9.1%). The over-allpercentage of patients that finally required THR was 16%.
There was one deep vein thrombosis that was treatedwith anticoagulants for 6 months, one pulmonary embolismthat recovered after Intensive Care Unit therapy and one
Fig. 2. (A) Preoperative radiograph of a 20-year- old man with a fracture of the posterior wall with posterior dislocation of the femoralhead. (B) Ten years postoperatively he has good articular space but severe HO. He is pain-free with mild restriction of range of motion. Agood clinical result but fair radiological.
Table 2 Clinical Result According to Harris Hip Score
Excellent Good Fair Poor Total
No (%) No (%) No (%) No (%) No (%)
Simple fractures 23 (67.6) 8 (23.5) 3 (8.8) 0 (0) 34 (100)Complex fractures 23 (56.1) 6 (14.6) 5 (12.2) 7 (17.1) 41 (100)Overall 46 (61.3) 14 (18.7) 8 (10.7) 7 (9.3) 75 (100)
The Journal of TRAUMA� Injury, Infection, and Critical Care
380 February 2007
nonunion of the greater trochanter. In this patient the methodof osteosynthesis of the greater trochanter was changed fromtension band to osteosynthesis with two 6.5-mm cancellousscrews with which union of the trochanter was achieved.
Postoperative sciatic nerve palsy was seen in a patientwhere the sciatic nerve was captured in the heterotopic bone.He was operated on, the nerve released, and he recoveredincompletely. Of the seven patients with preoperative sciaticnerve damage, one patient underwent ankle arthrodesis fortroublesome equinus deformity, one woman had incom-plete recovery, and the remaining five had complete grad-ual recovery.
DISCUSSIONThe clinical and radiologic result is closely correlated
with the quality of the reduction, as other authors havefound.2,3,10,11,16 In this study all the patients with an anatomicreduction had excellent or good clinical result. Of the ninepatients with postreduction step of 2 to 3 mm, the clinicalresult was good in three and fair in six. Of the eight patientswith poor reduction, two had a fair clinical result and six hadpoor. This undoubtedly means that anatomic reduction should
be the aim in all cases. The results, as it was expected, werebetter in simple fractures than in complex ones, such as Ttype or both-column fractures. In the pure posterior wallfractures, three were comminuted and two were impacted (diepunch fractures). The comminuted ones were meticulouslyreconstructed whereas the impacted ones were restored aftereffective cancellous bone support harvested from the greatertrochanter. In this series, the postoperative evaluation of re-duction was performed using mainly the Judet views. Onlyone-third of the patients had postoperative CT scans, whichmeans that the rate of anatomic or good reductions wouldprobably have been lower if all the patients had been studiedwith a CT scan postoperatively, because of its higher sensi-tivity in detecting intra-articular steps.16
The high percentage of HO in our series is noteworthyand this is consistent with other published series that rangefrom 7% to 58%.1,10,17–21 The high incidence of HO may, atleast in part, be enhanced by the osteotomy of the greatertrochanter.17 However, other authors have doubted thisfinding.22 No significant correlation between the amount ofHO and clinical outcome was found and this is also reportedby other authors.1 In only one patient the HO was clinicallysignificant. He was the patient whose sciatic nerve was cap-tured in the heterotopic bone. The highest incidence of HOwas found in the EIF approach, probably because this approachwas used for more complex and higher energy fractures withmore soft tissue damage and required more stripping at surgery,and the lowest in the K-L with osteotomy of the trochanter. Astatistical analysis was run using the �2 test. The differencesbetween the amount of HO and approach used were not foundto be statistically significant. The number of patients in thisseries is not significant enough to make definitive conclu-sions in this issue and further studies with a larger number of
Table 3 Heterotopic Ossification and Approach Used
ApproachHO* Grade Total
I II III IV No. (%)
K-L† (n � 37) 4 4 1 0 9 (24.3)K-L � osteotomy
(n � 28)3 2 1 0 6 (21.4)
Extended iliofemoral(n � 10)
1 2 1 0 4 (40)
* Heterotopic ossification.† Kocher-Langenbeck.
Fig. 3. (A) Preoperative radiograph of a 41-year-old man with a transverse and posterior wall fracture with posterior dislocation of thefemoral head. (B) Eleven months postoperatively he has developed severe osteonecrosis of the femoral head with collapse. (C) He eventuallyhad total hip replacement. A poor clinical result.
Surgically Treated Acetabular Fractures
Volume 62 • Number 2 381

patients are needed. In this series, the osteotomy of thetrochanter didn’t increase the amount of HO. This may beexplained by the lesser traction and hypoxia to the abductormuscles when an osteotomy of the trochanter is performed.
It is likely that the incidence of osteonecrosis of thefemoral head is higher in the associated transverse and pos-terior wall fracture with posterior dislocation.12 The overallincidence of osteonecrosis of the femoral head (8%) is judgedhigh as compared with 3% or 4% reported by otherauthors.2,12 However, this may be because of the presence ofmore high-energy fractures in those we studied. In a recentmeta-analysis of 3,670 surgically treated displaced acetabularfractures the incidence of osteonecrosis of the femoral headwas 9.2% for patients with posterior dislocation, whereas forpatients who did not have a posterior dislocation it was 5%.23
In the present study, 80% satisfactory clinical results arereported in a mean follow-up of 12.5 years. Poor clinicalresults were found in 9.3%, whereas others report as high as43%.17,24 An explanation of this may be the fact that in mostseries these fractures were fixed by surgeons with differentlevels of experience.
In conclusion, surgical treatment of acetabular fracturesto achieve anatomic reduction of the acetabulum and congru-ency with the femoral head is the ultimate goal for excellentfunctional outcome in the long term. Complications such asposttraumatic osteoarthrosis and HO can mainly be avoidedby meticulous surgical technique, low profile paramagneticmetal work application, and an experienced surgical team. Inmost cases the K-L approach is adequate. Trochanteric osteot-omy is indicated only for fractures extending toward the anteriorcolumn and it facilitates exposure, anatomic reduction, and fix-ation. No statistically significant difference was found betweenthe surgical approach and the heterotopic bone formation.
REFERENCES1. Liebergall M, Mosheiff R, Low J, et al. Acetabular fractures.
Clinical outcome of surgical treatment. Clin Orthop Related Res.1999;366:205–216.
2. Matta JM. Fractures of the acetabulum: accuracy of reduction andclinical results in patients managed operatively within tree weeksafter the injury. J Bone Joint Surg [Am]. 1996;78-A:1632–1645.
3. Pantazopoulos T, Mousafiris C. Surgical treatment of centralacetabular fractures. Clin Orthop Related Res. 1989;246:57–64.
4. Carnesale PG, Stewart MI, Barnes SN. Acetabular disruption andcentral fracture-dislocation of the hip. J Bone Joint Surg [Am]. 1975;57:1054–1059.
5. Epstein HC. Posterior fracture-dislocation of the hip. Long termfollow-up. J Bone Joint Surg [Am]. 1974;56-A:1103.
6. Rowe CR, Lowell D. Prognosis of fractures of the acetabulum.J Bone Joint Surg [Am]. 1961;43-A:30–59.
7. Tipton WW, D’Ambrosia RD, Ryle GP. Non-operative managementof central fracture dislocations of the hip. J Bone Joint Surg [Am].1975;57:888–893.
8. Judet R, Judet J, Letournel E. Fractures of the acetabulum:classification and surgical approaches for open reduction. J BoneJoint Surg [Am]. 1964;46-A:1615–1647.
9. Matta JM, Anderson LM, Epstein HC, Hendricks P. Fractures of theacetabulum. A retrospective analysis. Clin Orthop Related Res.1986;205:230–240.
10. Matta JM, Merritt PO. Displaced acetabular fractures. Clin OrthopRelated Res. 1988;230:83–97.
11. Pennal GF, Davidson J, Garside H, Plewes J. Results of treatment ofacetabular fractures. Clin Orthop Related Res. 1980;151:115–123.
12. Letournel E, Judet R. Fractures of the acetabulum. New York:Springer-Verlag; 1981.
13. Harris WH. Traumatic arthritis of the hip after dislocation andacetabular fractures: treatment by mold arthroplasty. An end-resultstudy using a new method of result evaluation. J Bone Joint Surg[Am]. 1969;51:737–755.
14. Brooker AF, Bowerman JW, Robinson RA, Riley LH. Ectopicossification following total hip replacement. J Bone Joint Surg [Am].1973;55:1629–1632.
15. Moed BR, Smith ST. Three-view radiographic assessment ofheterotopic ossification after acetabular fracture surgery. J OrthopTrauma. 1996;10:93–98.
16. Moed BR, Willson Carr SE, Gruson KI, Watson JT, Craig JG.Computed tomographic assessment of fractures of the posterior wallof the acetabulum after operative treatment. J Bone Joint Surg [Am].2003;85:512–522.
17. Kaempffe FA, Bone LB, Border JR. Open reduction and internalfixation of acetabular fractures: heterotopic ossification and othercomplications of treatment. J Orthop Trauma. 1991;5:439–445.
18. Kebaish AS, Roy A, Rennie W. Displaced acetabular fractures: long-term follow-up. J Trauma. 1991;31:1539–1542.
19. Mayo KA. Open reduction and internal fixation of fractures of theacetabulum. Results in 163 fractures. Clin Orthop Related Res. 1994;305:31–37.
20. Oransky M, Sanquinetti C. Surgical treatment of displaced acetabularfractures: results of 50 consecutive cases. J Orthop Trauma. 1993;7:28–32.
21. Ridder VA, Lange S, Kingma L, Hogervost M. Results of 75consecutive patients with an acetabular fracture. Clin Orthop RelatedRes. 1994;305:53–57.
22. Bray TJ, Esser M, Fulkerson L. Osteotomy of the trochanter in openreduction and internal fixation of acetabular fractures. J Bone JointSurg [Am]. 1987;69-A:711–717.
23. Giannoudis PV, Grotz MRW, Papakostidis C, Dinopoulos H.Operative treatment of displaced acetabular fractures. A meta-analysis. J Bone Joint Surg [Br]. 2005;87-B:2–9.
24. Wright R, Barrett K, Christie MJ, Johnson KD. Acetabular fractures:long-term follow-up of open reduction and internal fixation.J Orthop Trauma. 1994;8:397–403.
The Journal of TRAUMA� Injury, Infection, and Critical Care
382 February 2007

Biomechanical Analysis of Cervical and ThoracolumbarSpine Motion in Intact and Partially and CompletelyUnstable Cadaver Spine Models With Kinetic Bed Therapyor Traditional Log RollGlenn R. Rechtine, MD, Bryan P. Conrad, MEng, Brook G. Bearden, MD, and MaryBeth Horodyski, EdD
Background: The main comorbidi-ties associated with spinal cord injury pa-tients are secondary to immobilization.Kinetic bed therapy is used currently toreduce the complications associated withimmobilization, but the effect on the un-stable spine has not been quantified. Thepurpose of this study was to compare themotion in the cervical and thoracolumbarspine when cadavers with spinal instabil-ities are log rolled (LR) on a standardhospital bed or rotated on a RotoRest ki-netic treatment table (KTT).
Methods: Cervical and lumbar insta-bilities were created surgically in threeembalmed cadavers. An electromagnetictracking device was used to measure thethree-dimensional segmental motion gen-erated at C5 to C6 and T12 to L2 duringLR and KTT treatments.
Results: In both the cervical and lum-bar spine, significantly more motion was ob-served during LR than KTT treatment.
Conclusions: We found that in ca-davers with severely unstable cervicalspine, rotation using a KTT produced less
flexion and lateral bending than the LR.Also, in cadavers with severely unstablelumbar spine, treatment with the KTTproduced less axial rotation than the LR.Currently, we think that the best way toimmobilize the spine while still allowingtherapeutic motion is through the use of aKTT.
Key Words: Spine injury, Rotobed,Motion analysis.
J Trauma. 2007;62:383–388.
Over the years, researchers have reported that the maincomorbidities associated with spinal cord injury (SCI)patients are secondary to the immobilization required
for treating these injuries. Complications from immobiliza-tion involve the pulmonary, hematologic, renal, and integu-mentary systems.1–7
Kinetic bed therapy is currently used to lessen the com-plications associated with immobilization.1,8–16 The first ro-tating bed was the Stryker frame bed.17 The Stryker frame hashad poor success with the control of spinal motion in unstableinjuries. Stauffer documented multiple cases of redislocationof the spine upon turning these patients.18 Other beds such asthe Circoelectric bed and the Egerton Stoke-Mandeville Bedhave been used in the immobilization of patient with SCI.Today, the standard of care for patients in need of kinetictherapy is the RotoRest bed.
No previous studies have quantified the actual amount ofmotion that is generated in the patient’s cervical or lumbar
spine during rotation on the kinetic bed or during the manuallog-rolling maneuver. The purpose of our study was to com-pare the motion generated when cadavers with varying de-grees of cervical and lumbar instability are log rolled (LR) ona standard hospital bed or rotated on a kinetic treatment table(KTT) (RotoRest Delta, Kinetic Concepts, Inc). Our hypoth-esis was that, because of the intrinsic support structure andthe slow, controlled movements, rotation on the KTT wouldresult in less overall perturbation to the unstable spine thanthe traditional LR maneuver.
MATERIALS AND METHODSThree whole-body embalmed cadavers obtained from the
Anatomic Board of the State of Florida were used in thisinvestigation. Each cadaver was fitted with an Aspen cervicalcollar (Aspen Medical Products, Long Beach, CA). Cervicaland lumbar instabilities were created surgically. The cadaverswere tested at three levels of stability: intact state, partialinstability, and global instability. The global instability isintended to model a severely unstable spine; that is, one inwhich the absence of normal structural support allows suffi-cient excess movement to endanger the spinal cord in a livingpatient. In the cervical spine, a partial instability was createdby transecting the posterior ligaments at the C5 to C6 leveland the global injury condition was created by also disruptingthe anterior longitudinal ligament and disk. In the lumbarspine, a partial instability was created by performing an L1corpectomy through a lateral incision. A complete lumbar
Submitted for publication August 4, 2005.Accepted for publication March 16, 2006.Copyright © 2007 by Lippincott Williams & Wilkins, Inc.From the Department of Orthopaedics (G.R.R.), University of Roch-
ester, Rochester, NY; and the Department of Orthopaedics and Rehabilitation(B.P.C., B.G.B., M.H.), University of Florida, Gainesville FL.
Presented at the Annual Meeting of the American Spinal Injury Associa-tion, May 14–16, 2004, Denver, Colorado.
Address for reprints: Glenn R. Rechtine, MD, University of Rochester,Department of Orthopaedics, 601 Elmwood Ave. Box 665, Rochester, NY14642; email: [email protected].
DOI: 10.1097/01.ta.0000225924.12465.e6
The Journal of TRAUMA� Injury, Infection, and Critical Care
Volume 62 • Number 2 383

instability was created by transecting the posterior ligamentsat the T12 to L2 levels.
The order of testing each cadaver was intact, with partial,and then with global instability. After intact testing, partialinstabilities were created in the cervical and lumbar spine,and data were collected using four sensors (two in cervicaland two in lumbar) during each trial. Finally, both globalinstabilities were created and data were collected a third time.
The research team included medical doctors and inves-tigators who have conducted research in the past with bothembalmed and fresh cadavers. They noted that the cadavershad approximately normal flexibility during testing in theintact state. It was their observation that the embalmingprocess had not resulted in a qualitative difference in theflexibility of the cadavers.
A repeated measures study design was used, with allcadavers being tested twice on a kinetic treatment table(KTT) (RotoRest Delta, Kinetic Concepts, Inc.) and logrolled (LR) twice on a standard hospital bed (Hill-Rom, Inc.,Batesville, IN).
A Fastrak electromagnetic tracking motion analysis de-vice (Polhemus Inc., Colchester, VT) was used to measurethe three-dimensional segmental motion, flexion/extension,lateral bending, and axial rotation generated at C5 to C6 andT12 to L2 during LR and KTT treatments. Sensors wereattached on the anterior body of the vertebrae above andbelow the instability (Fig. 1). The Fastrak device uses elec-tromagnetic fields to establish the three-dimensional positionand orientation of its sensors. This system consists of atransmitter that emits an electromagnetic field and four sen-sors with embedded orthogonal coils that detect position andorientation, which are recorded on a personal computer forprocessing. The manufacturer’s literature reports the staticaccuracy of the system is 0.08 cm for the sensor positions and0.153 degrees for rotation as long as the receivers are within81 cm of the source. A study by Mannion and Troke19 found
a test-retest reliability of R � 0.82, which was essentially thesame as the CA6000 Spine Motion Analyser.
Before testing on the KTT, each cadaver was positionedon it and supported according to the manufacturer’s recom-mended technique. The KTT was rotated to 40 degrees ineach direction (Fig. 2). The LR maneuver was performed bytwo persons who were trained in the hospital log-roll proce-dure. Those performing the LR were instructed to perform theprocedure using the same technique as would be appliedclinically. The global rotation of the cadavers during LRrotation was measured with the Fastrak. It was documentedthat during LR maneuver, cadavers were turned between�43 � 7 degrees and �38 � 10 degrees.
For statistical analysis, the range of motion for anglesabout each axis were analyzed by multivariate analysis ofvariance with repeated measures, with flexion, axial rotation,and lateral bending as the dependent variables and bed andinstability as grouping factors. Significance was set at a pvalue of 0.05 or less.
RESULTSCervical
When examined by degree of instability (Table 1), sig-nificant differences were observed in the cervical spine in
Fig. 1. Sensors attached to C5 and C6 for data collection. Re-printed with permission from Spine 2004;29:E136.
Fig. 2. Example of cadaver secured onto KTT (RotoRest Delta).
Table 1 Cervical Spine Range of Motion for VaryingDegrees of Instability
DependentVariable Instability Mean Standard
Error
95%Confidence
Interval
Flexion Normal 1.42 0.16 1.08–1.75Partial 1.06 0.16 0.74–1.38Complete 3.58 0.16 3.26–3.91
Axial rotation Normal 1.55 0.23 1.08–2.02Partial 1.95 0.22 1.50–2.40Complete 2.07 0.22 1.62–2.52
Lateral bending Normal 0.72 0.21 0.28–1.16Partial 0.71 0.20 0.29–1.13Complete 2.58 0.20 2.16–3.00
The Journal of TRAUMA� Injury, Infection, and Critical Care
384 February 2007

flexion (p � 0.001) and lateral bending (p � 0.001), but notin axial rotation (p � 0.246). Post-hoc analysis revealed thatnormal and partial instability conditions were equivalent forflexion and lateral bending, but significantly more motionoccurred in the presence of the complete instability.
When technique was considered, LR was noted to pro-duce significantly more motion than the rotation on the KTTin both flexion and lateral bending (p � 0.001 in both cases;Figs. 3 and 4). There was not a significant difference in axialrotation between KTT and LR treatments (p � 0.118). Fur-ther, a statistical interaction was observed between the tech-nique and instability variables for all directions of motion.This interaction suggests that the combination of log rollinga subject with a complete instability has an additional dele-terious effect.
LumbarWhen movement in the lumbar spine was examined by
degree of instability (Table 2), significant differences wereobserved in the axial rotation (p � 0.001) and lateral bending(p � 0.021), but not in flexion (p � 0.897). Post-hoc analysisrevealed that both the partial and complete instability allowedsignificantly more axial rotation than the normal condition.For lateral bending, normal and partial instability conditionswere equivalent with significantly more motion occurring inthe complete instability condition.
When technique was considered, there was significantlymore axial rotation motion during LR than during KTT ro-tation (p � 0.001; Figs. 5 and 6). However, LR resulted insignificantly less lateral bending than KTT treatment (p �0.001). There was no difference in flexion between the twogroups (p � 0.123). A significant interaction between treat-ment and instability was observed for axial rotation motion(p � 0.001), meaning there was an additional negative effectassociated with the combination of log rolling and completeinstability. With increasingly instability in the cadaver model,greater motion was observed in the lumbar spine for axialrotation and lateral bending, whereas flexion remained rela-tively stable.
Fig. 3. Cervical spine motion by treatment technique for intactspine condition.
Fig. 4. Cervical spine motion by treatment technique for completeinstability.
Fig. 5. Lumbar spine motion by treatment technique for intact spinecondition.
Table 2 Lumbar Spine Range of Motion for VaryingDegrees of Instability
DependentVariable Instability Mean Standard
Error
95%Confidence
Interval
Flexion Normal 2.13 0.22 1.68–2.59Partial 2.16 0.21 1.72–2.59Complete 2.27 0.21 1.83–2.70
Axial rotation Normal 1.12 0.54 0.02–2.22Partial 3.80 0.51 2.76–4.85Complete 4.57 0.51 3.52–5.62
Lateral bending Normal 2.12 0.20 1.70–2.54Partial 2.06 0.19 1.66–2.46Complete 2.80 0.19 2.40–3.20
Fig. 6. Lumbar spine motion by treatment technique for completeinstability.
Spine Motion During Rotation Therapy
Volume 62 • Number 2 385

DISCUSSIONNumerous studies have reported on the value of kinetic
therapy in mitigating respiratory and pulmonary complica-tions associated with prolonged bed rest. However, none haveattempted to document the amount of spinal motion thatoccurs during kinetic therapy. Our study was designed todetermine whether the KTT generates less spinal motion thanthe traditional log-rolling procedure. The major findings ofthe study are (1) in the severely unstable cervical spine,rotation with the KTT produces less flexion and lateral bend-ing than the LR maneuver; and (2), in the severely unstablelumbar spine, treatment with the KTT produces less axialrotation than the LR. Based on these findings, we think thatcaution should be taken at all times when manually logrolling a patient with an unstable spine.
Previous studies performed in our lab20 have demon-strated that cervical collars alone are not sufficient to com-pletely restrict motion in an unstable spine. Even with the useof a cervical collar, the LR procedure resulted in significantlygreater flexion and lateral bending motion in a severelyunstable cervical spine injury compared with the KTT. How-ever, through the use of adjustable head and shoulder sup-ports in addition to a cervical collar, the KTT is able tosubstantially decrease the amount of motion in the cervicalspine during kinetic therapy. Even so, the use of KTT doesnot eliminate the need for immediate surgical stabilization ofglobal cervical spine injuries. We think that it is imperativethat surgery be performed as soon as the patient is medicallystable. In addition, the patient should be moved on and off theKTT as little as possible before surgical stabilization is ac-complished. After stabilization, cervical spine immobilizationis no longer required, and the patient can be placed on otherhospital beds.
The RotoRest kinetic therapy bed has been evaluatedpreviously in a number of clinical studies; but, to our knowl-
edge, this is the first in vitro biomechanical investigation ofthis bed. Excellent results in preventing pulmonary compli-cations have been reported for the use of the RotoRestbed.4,9,10,13,15,16,21,22 Green et al.2 reviewed 162 patientstreated with the RotoRest bed and reported only 9 cases ofpneumonia, of which all resolved. The cohort reviewed byGreen et al. demonstrated no deterioration of neurologicfunction and no fracture site pain. Rechtine et al.10 alsoreported results with use of the RotoRest bed. They compared117 patients with unstable thoracolumbar fractures treatedwith surgery and early mobilization to 118 patients treatedwith 6 weeks of immobilization in a RotoRest bed. This studyresulted in no significant differences in the development ofdecubitus, deep vein thrombosis, pulmonary embolism, ormortality between the two groups.
Previous studies have used radiographic evaluation todocument the amount of spinal motion associated with KTT,Stryker frame, and log-roll treatment.8,23 McGuire et al.24
have described the potential motion that can occur in theunstable lumbar spine during the log-roll maneuver. Theirgroup used anteroposterior and lateral radiographs to docu-ment up to 2.1 cm of anteroposterior displacement and 30degrees of angulation in a severely unstable thoracolumbarspine (L1–L2) during LR.24 In a separate study, McGuire etal.8 reported minimal lumbar spine movement rotating a ca-daver on a KTT using a static (X-ray) model. However,McGuire was limited to one specimen and only one type ofinstability.
By using radiographs to evaluate spine motion, onlydiscrete points in time can be captured. Measurements maynot reflect the true extent to which the spine actually moved.Our method of dynamic motion analysis allows the continu-ous collection of data during the entire cycle of bed turningand, therefore, captures the full range of motion experiencedby the spine.
Fig. 7. Lumbar axial rotation generated during LR and KTT for the same subject (complete instability), plotted on the same time scale. Noticethe large and abrupt changes in axial rotation caused by log rolling. Similar qualitative differences between KTT and LR were observed inboth the cervical and lumbar spine.
The Journal of TRAUMA� Injury, Infection, and Critical Care
386 February 2007
The Fastrak measurement system has been used for morethan a decade to measure joint position sense25,26 and spinalrotation27 in vivo. A previous study from this laboratory usedthe Fastrak to assess spinal movement in cadavers with anunstable cervical spine being moved using the lift-and-slidetechnique and the log-roll maneuver.28 A few of the otherways the Fastrak system has been used are to measure rangeof motion in ankylosing spondylitis,29 to assess movement ofthe spine in patients with low back pain,30 as part of ascreening system for scoliosis,31 and to study position senseand range of motion in whiplash patients.32
The L1 corpectomy injury model we have created ismeant to simulate a lumbar burst fracture generally associatedwith a flexion injury. The log-roll procedure would not beexpected to produce large lumbar motions in the sagittalplane; therefore, it is not surprising that there were no sig-nificant differences between the log roll and KTT treatmentsfor flexion (Figs. 5 and 6). Because the log-roll procedure isperformed by rotating the subject about the longitudinal axisof the body, one would expect the largest motions to beobserved in axial rotation. This is especially true because themajor instability we created disrupted most of the anatomicstructures that would restrict axial rotations.
During LR, the lateral side of the cadaver was always incontact with the surface of the bed, which helped support thelumbar spine and prevent bending. In the KTT, the surface ofthe bed rotated with the cadaver. Lateral support was depen-dent on the side railing system and how well the cadaver waspacked into the bed. We suspect that the increased lateralbending lumbar motion observed in the KTT compared withthe LR was a result of settling between the cadavers and theside rails during rotation, especially at peak rotation angles.However, the increase in lateral bending motion from thenormal condition to major instability is small (1 degree) andis likely to be insignificant clinically.
The motion generated by each technique was qualitativelydifferent (Fig. 7). The motion generated by the KTT was slowand consistent. The motion during the LR procedure was rapidand abrupt. KTT motion occurred at a rate of 40 degrees/min,whereas the same amount of motion occurred in approximately5 sec during the log-roll maneuver. The suddenness of the LRmotion could have negative sequela for the spine-injured patientthat this study did not address.
Our recommendations are that the KTT be utilized for evenshort-term immobilization of the spine. Even during the interimbefore surgery can be performed, it is advisable that the patientbe placed on KTT. While the KTT and LR have both beenshown to prevent skin breakdown,22,33,34 only the KTT has beenshown to provide pulmonary benefits.1,4,5,9,11,21,24,35,36 An in-jured spine is more susceptible to all motion; therefore, everyeffort should be made to minimize the number of times a patientwith a spinal injury is moved. When it is absolutely necessary tomove a patient, such as to prevent comorbidities associated withextended time spent immobilized in a bed, the spine should beprotected to the fullest extent possible. Currently, we think that
the best way to immobilize the spine while still allowing ther-apeutic motion is through the use of a KTT.
ACKNOWLEDGMENTSThis work was partially supported by a research grant from Kinetic
Concepts. We thank Joanne Clarke for editorial assistance.
REFERENCES1. Nelson LD, Choi SC. Kinetic therapy in critically ill trauma patients.
Clin Intensive Care. 1992;3:248–252.2. Green BA, Green KL, Klose KJ. Kinetic therapy for spinal cord
injury. Spine. 1983;8:722–728.3. Bellamy R, Pitts FW, Stauffer ES. Respiratory complications in
traumatic quadriplegia. Analysis of 20 years’ experience.J Neurosurg. 1973;39:596–600.
4. Wang JY, Chuang PY, Lin CJ, et al. Continuous lateral rotationaltherapy in the medical intensive care unit. J Formos Med Assoc.2003;102:788–792.
5. Kirschenbaum L, Azzi E, Sfeir T, et al. Effect of continuous lateralrotational therapy on the prevalence of ventilator-associatedpneumonia in patients requiring long-term ventilatory care. Crit CareMed. 2002;30:1983–1986.
6. Whiteman K, Nachtmann L, Kramer D, et al. Effects of continuouslateral rotation therapy on pulmonary complications in livertransplant patients. Am J Crit Care. 1995;4:133–139.
7. Keane FX. Pain and cervical traction variation during manualturning [proceedings]. Paraplegia. 1978;15:343–348.
8. McGuire RA, Green BA, Eismont FJ, et al. Comparison of stabilityprovided to the unstable spine by the kinetic therapy table and theStryker frame. Neurosurgery. 1988;22:842–845.
9. Trammell TR, Reed DB, Goodwin CB. Controlled mobilization ofpatients undergoing reconstructive spinal surgery: preliminarycomparison of the kinetic therapy table vs the Foster frame.Orthopedics. 1985;8:1489–1491.
10. Rechtine GR 2nd, Cahill D, Chrin AM. Treatment of thoracolumbartrauma: comparison of complications of operative versusnonoperative treatment. J Spinal Disord. 1999;12:406–409.
11. Schimmel L, Civetta JM, Kirby RR. A new mechanical method toinfluence pulmonary perfusion in critically ill patients. Crit CareMed. 1977;5:277–279.
12. Brackett TO, Condon N. Comparison of the wedge turning frameand kinetic treatment table in the acute care of spinal cord injurypatients. Surg Neurol. 1984;22:53–56.
13. Gentilello L, Thompson DA, Tonnesen AS, et al. Effect of a rotatingbed on the incidence of pulmonary complications in critically illpatients. Crit Care Med. 1988;16:783–786.
14. Borkowski C. A comparison of pulmonary complications in spinalcord-injured patients treated with two modes of spinalimmobilization. J Neurosci Nurs. 1989;21:79–85.
15. Demarest GB, Schmidt-Nowara WW, Vance LW, et al. Use of thekinetic treatment table to prevent the pulmonary complications ofmultiple trauma. West J Med. 1989;150:35–38.
16. Clemmer TP, Green S, Ziegler B, et al. Effectiveness of the kinetictreatment table for preventing and treating pulmonary complicationsin severely head-injured patients. Crit Care Med. 1990;18:614–617.
17. Stryker H. A device for turning the frame patient. JAMA. 1939;113:1731–1732.
18. Stauffer ES. Complications associated with the use of the circularelectrical turning frame. J Bone Joint Surg Am. 1975;57:711–713.
19. Mannion A, Troke M. A comparison of two motion analysis devicesused in the measurement of lumbar spine mobility. Clin Biomech(Bristol, Avon). 1999;14:612–619.
20. Rechtine GR, Del Rossi G, Conrad BP, et al. Motion generated in theunstable spine during hospital bed transfers. J Trauma. 2004;57:609–612.
Spine Motion During Rotation Therapy
Volume 62 • Number 2 387
21. Staudinger T, Kofler J, Mullner M, et al. Comparison of pronepositioning and continuous rotation of patients with adult respiratorydistress syndrome: results of a pilot study. Crit Care Med. 2001;29:51–56.
22. Green BA, Green KL, Klose KJ. Kinetic nursing for acute spinalcord injury patients. Paraplegia. 1980;18:181–186.
23. McGuire RA, Degnan G, Amundson GM. Evaluation of currentextrication orthoses in immobilization of the unstable cervical spine.Spine. 1990;15:1064–1067.
24. McGuire RA, Neville S, Green BA, et al. Spinal instability and thelog-rolling maneuver. J Trauma. 1987;27:525–531.
25. Maffey-Ward L, Jull G, Wellington L. Toward a clinical test oflumbar spine kinesthesia. J Orthop Sports Phys Ther. 1996;24:354–358.
26. Swinkels A, Dolan P. Regional assessment of joint position sense inthe spine. Spine. 1998;23:590–597.
27. Willems JM, Jull GA, Ng JK-F. An. in vivo study of the primaryand coupled rotation of the thoracic spine. Clin Biomech. 1996;11:311–316.
28. Del Rossi G, Horodyski MB, Heffernan TP, et al. Spine-boardtransfer techniques and the unstable cervical spine. Spine. 2004;29:E134–E138.
29. Jordon K, Haywood KL, Dziedzic K, et al. Assessment of the 3-dimensional Fastrak measurement system in measuring range ofmotion in ankylosing spondylitis. J Rheumatol. 2004;31:2207–2215.
30. Barrett CJ, Singer KP, Day R. Assessment of combined movementsof the lumbar spine in asymptomatic and low back pain subjectsusing a three- dimensional electromagnetic tracking system. ManTher. 1999;4:94–99.
31. Rahmatalla A, Chockalingam N, Dangerfield P, et al. Movementanalysis of scoliotic subjects using Fastrak. Stud Health TechnolInform. 2002;91:62–66.
32. Armstrong BS, McNair PJ, Williams M. Head and neck positionsense in whiplash patients and healthy individuals and the effect ofthe cranio-cervical flexion action. Clin Biomech. 2005;20:675–684.
33. Hartman MB, Chrin AM, Rechtine GR. Non-operative treatment ofthoracolumbar fractures. Paraplegia. 1995;33:73–76.
34. Seiler WO, Allen S, Stahelin HB. Influence of the 30 degreeslaterally inclined position and the ‘super-soft’ 3-piece mattress onskin oxygen tension on areas of maximum pressure–implications forpressure sore prevention. Gerontology. 1986;32:158–166.
35. Martin AH. Should continuous lateral rotation therapy replacemanual turning? Nurs Manage. 2001;32:41–45.
36. Davis K Jr, Johannigman JA, Campbell RS, et al. The acute effectsof body position strategies and respiratory therapy in paralyzedpatients with acute lung injury. Crit Care. 2001;5:81–87.
EDITORIAL COMMENTThe multiply injured patient, particularly a patient with
head or spinal cord injury, has special needs. It is the duty of
the physician and the system to avoid harm to the patient orfurther deterioration of the spinal cord function. Immobilizedpatients such as patients with head and spinal cord injury orpatients on a ventilator are susceptible to decubitus ulcers andpulmonary complications. Manual log-roll technique is tradi-tionally used to avoid these complications. Log-roll techniquehas significant disadvantage in obese and multiple-traumapatients, it relies on expertise of the staff, and may not bedone according to the protocol. To master the technique,individuals dealing with these patients will need special train-ing and expertise.
In the present study the authors found that when they usekinetic bed therapy, stress on the spine was less. The cadaverspecimen was rotated 40 degrees in each direction and motionat cervical and lumbar spine was detected by sensors. Motionof the unstable spine was less. This motion is controlled byautomatic rotation and this method of management may be asgood as or better than log-roll technique.
The study has limitations. They used cadavers and sam-ple size was small. The technique needs to be adequatelysupervised by the health care professional to ensure that thetechnique is done appropriately for that particular patient.
Several studies have shown that the 40-degree rotationby the kinetic bed therapy reduces intensive care unit stay andpulmonary complications.1–4 This is another advantage ofkinetic bed therapy. However, one must be cautious not toincrease rotation angle because an unstable spine may dete-riorate especially in multiple trauma patients.
Nabil A. Ebraheim, MDMedical University of OhioToledo, Ohio
REFERENCES1. Pape HC, Regel G, Borgmann W, et al. The effect of kinetic
positioning on lung function and pulmonary haemodynamics inposttraumatic ARDS: A clinical study. Injury. 1994;25:51–57.
2. Fink MP, Helsmoortel CM, Stein KL, et al. The efficacy of anoscillating bed in the prevention of the lower respiratory tractinfection in critically ill victims of blunt trauma. Chest. 1992;97:132–137.
3. Nelson LD, Choi SC. Kinetic therapy in critically ill trauma patients.Clin Intensive Care. 1992;3:248–252.
4. Green BA, Green KL, Klose KJ. Kinetic therapy for spinal cordinjury. Spine. 1983;8:722–728.
The Journal of TRAUMA� Injury, Infection, and Critical Care
388 February 2007
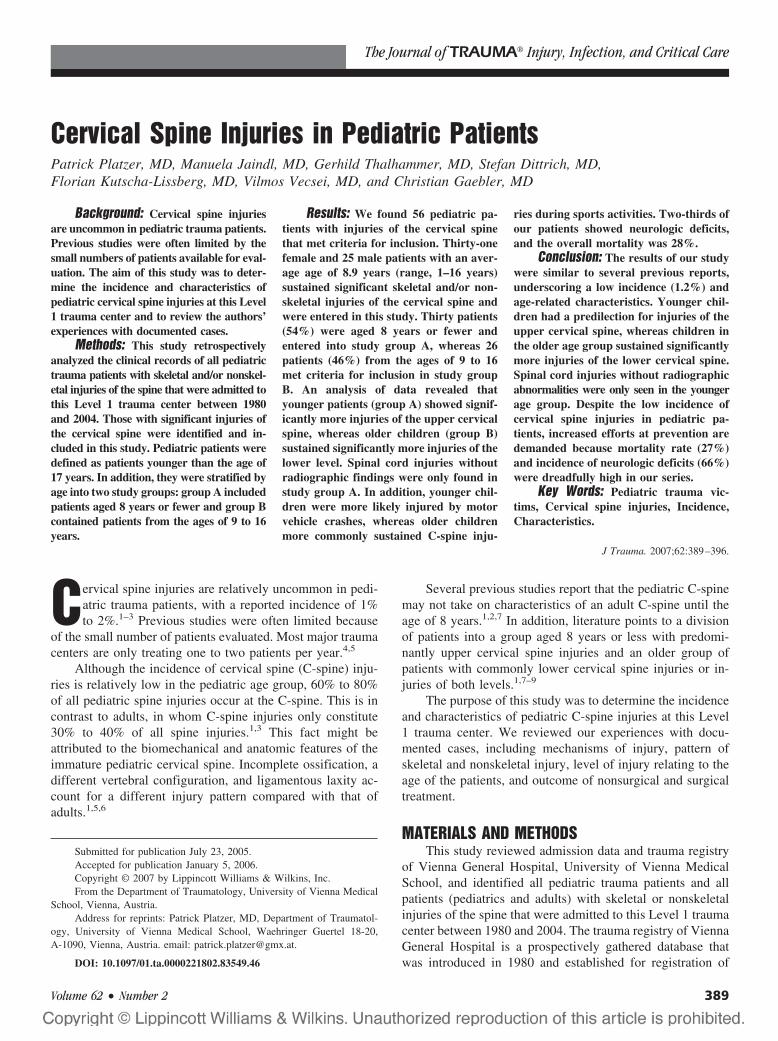
Cervical Spine Injuries in Pediatric PatientsPatrick Platzer, MD, Manuela Jaindl, MD, Gerhild Thalhammer, MD, Stefan Dittrich, MD,Florian Kutscha-Lissberg, MD, Vilmos Vecsei, MD, and Christian Gaebler, MD
Background: Cervical spine injuriesare uncommon in pediatric trauma patients.Previous studies were often limited by thesmall numbers of patients available for eval-uation. The aim of this study was to deter-mine the incidence and characteristics ofpediatric cervical spine injuries at this Level1 trauma center and to review the authors’experiences with documented cases.
Methods: This study retrospectivelyanalyzed the clinical records of all pediatrictrauma patients with skeletal and/or nonskel-etal injuries of the spine that were admitted tothis Level 1 trauma center between 1980and 2004. Those with significant injuries ofthe cervical spine were identified and in-cluded in this study. Pediatric patients weredefined as patients younger than the age of17 years. In addition, they were stratified byage into two study groups: group A includedpatients aged 8 years or fewer and group Bcontained patients from the ages of 9 to 16years.
Results: We found 56 pediatric pa-tients with injuries of the cervical spinethat met criteria for inclusion. Thirty-onefemale and 25 male patients with an aver-age age of 8.9 years (range, 1–16 years)sustained significant skeletal and/or non-skeletal injuries of the cervical spine andwere entered in this study. Thirty patients(54%) were aged 8 years or fewer andentered into study group A, whereas 26patients (46%) from the ages of 9 to 16met criteria for inclusion in study groupB. An analysis of data revealed thatyounger patients (group A) showed signif-icantly more injuries of the upper cervicalspine, whereas older children (group B)sustained significantly more injuries of thelower level. Spinal cord injuries withoutradiographic findings were only found instudy group A. In addition, younger chil-dren were more likely injured by motorvehicle crashes, whereas older childrenmore commonly sustained C-spine inju-
ries during sports activities. Two-thirds ofour patients showed neurologic deficits,and the overall mortality was 28%.
Conclusion: The results of our studywere similar to several previous reports,underscoring a low incidence (1.2%) andage-related characteristics. Younger chil-dren had a predilection for injuries of theupper cervical spine, whereas children inthe older age group sustained significantlymore injuries of the lower cervical spine.Spinal cord injuries without radiographicabnormalities were only seen in the youngerage group. Despite the low incidence ofcervical spine injuries in pediatric pa-tients, increased efforts at prevention aredemanded because mortality rate (27%)and incidence of neurologic deficits (66%)were dreadfully high in our series.
Key Words: Pediatric trauma vic-tims, Cervical spine injuries, Incidence,Characteristics.
J Trauma. 2007;62:389–396.
Cervical spine injuries are relatively uncommon in pedi-atric trauma patients, with a reported incidence of 1%to 2%.1–3 Previous studies were often limited because
of the small number of patients evaluated. Most major traumacenters are only treating one to two patients per year.4,5
Although the incidence of cervical spine (C-spine) inju-ries is relatively low in the pediatric age group, 60% to 80%of all pediatric spine injuries occur at the C-spine. This is incontrast to adults, in whom C-spine injuries only constitute30% to 40% of all spine injuries.1,3 This fact might beattributed to the biomechanical and anatomic features of theimmature pediatric cervical spine. Incomplete ossification, adifferent vertebral configuration, and ligamentous laxity ac-count for a different injury pattern compared with that ofadults.1,5,6
Several previous studies report that the pediatric C-spinemay not take on characteristics of an adult C-spine until theage of 8 years.1,2,7 In addition, literature points to a divisionof patients into a group aged 8 years or less with predomi-nantly upper cervical spine injuries and an older group ofpatients with commonly lower cervical spine injuries or in-juries of both levels.1,7–9
The purpose of this study was to determine the incidenceand characteristics of pediatric C-spine injuries at this Level1 trauma center. We reviewed our experiences with docu-mented cases, including mechanisms of injury, pattern ofskeletal and nonskeletal injury, level of injury relating to theage of the patients, and outcome of nonsurgical and surgicaltreatment.
MATERIALS AND METHODSThis study reviewed admission data and trauma registry
of Vienna General Hospital, University of Vienna MedicalSchool, and identified all pediatric trauma patients and allpatients (pediatrics and adults) with skeletal or nonskeletalinjuries of the spine that were admitted to this Level 1 traumacenter between 1980 and 2004. The trauma registry of ViennaGeneral Hospital is a prospectively gathered database thatwas introduced in 1980 and established for registration of
Submitted for publication July 23, 2005.Accepted for publication January 5, 2006.Copyright © 2007 by Lippincott Williams & Wilkins, Inc.From the Department of Traumatology, University of Vienna Medical
School, Vienna, Austria.Address for reprints: Patrick Platzer, MD, Department of Traumatol-
ogy, University of Vienna Medical School, Waehringer Guertel 18-20,A-1090, Vienna, Austria. email: [email protected].
DOI: 10.1097/01.ta.0000221802.83549.46
The Journal of TRAUMA� Injury, Infection, and Critical Care
Volume 62 • Number 2 389
injury characteristics (type, mechanism, etc.) and demo-graphic data of trauma patients.
Pediatric patients with significant injuries of the C-spine(fractures, dislocations, discoligamentary lesions, and/or spi-nal cord injuries) were sorted and their dataset was examinedfor completeness and accuracy. According to our inclusioncriteria, patients with complete sets of collected data and whowere younger than the age 17 were finally enrolled in thisstudy. Collected data included age, gender, mechanism ofinjury, pattern and level of injury, radiologic assessment ofthe C-spine, clinical findings, presence of neurologic deficits,associated injuries, delays in diagnosis, nonsurgical and sur-gical treatment, functional outcome, and mortality rate of thepatients. As this period spans more than 2 decades and data-base technology has changed over the years, completenessand accuracy of presented data may be subject to slightdivergences.
Pediatric patients were stratified by age into two studygroups. Group A included patients aged 8 years or fewer, andgroup B contained patients from the ages of 9 to 16. Age-related separation at that point was mainly based on skeletalmaturation of the C-spine, following existing literature thatindicates an age-related anatomic division of pediatric cervi-cal injuries at an age of 8 or 9 years.1,4,5,7–9
Skeletal and discoligamentary injuries were diagnosedby standard radiographs (anterioposterior, lateral, and open-mouth) or by further radiologic examination (functionalflexion/extension views, computed tomography [CT] scan,magnetic resonance imaging [MRI], etc.) as indicated by thestandard views or by clinical suspicion. Spinal cord injurieswere diagnosed either by radiographic evidence (MRI) or byprolonged appearance (more than 72 hours) of significantneurologic deficits without any radiographic abnormalities.Standard X-rays and CT scans were performed routinelyduring the whole period, but MRI was not introduced forclinical use until 1984. Injuries of the upper C-spine weredefined as those involving C1 and C2; injuries of the lowerC-spine were determined as those from C3 to C7.
Exclusion criteria for this study contain patients withincomplete data sets and patients with penetrating mecha-nisms of injury or congenital cervical spine anomalies. Anincomplete data set was determined when pertinent clinical orradiographic data (e.g., documents of clinical findings, radio-graphs, radiographic results, etc.) were missing.
Statistical AnalysisFor statistical analysis, categorical variables (such as level
of injury, etc.) were compared between study groups using �2
analysis, and quantitative data were compared using Student’s ttest. Statistical significance was defined as p � 0.05.
RESULTSFrom a database of 4,616 pediatric trauma victims that
were identified by a review of admission data and the traumaregistry of Vienna General Hospital, an analysis of clinical
records revealed that we had 151 pediatric patients withsignificant injuries of the spine during the 25-year period.Sixty-two (1.3%) patients were identified with an injury ofthe cervical spine. Six of them were excluded from this studybecause their dataset was incomplete.
Fifty-six patients (31 female and 25 male) with an aver-age age of 8.9 years (range, 1 to 16 years) met criteria forinclusion and were finally enrolled in this series. Thirtypatients (54%) were aged 8 years or fewer and entered intostudy group A. The average age of this group was 5.4 yearswith a range from 1 to 8 years. Twenty-four of those 30patients (80%) showed skeletal injuries of the C-spine. In 20of the patients, the skeletal injury involved the upper C-spine,2 patients had an injury of the lower C-spine, and another 2patients sustained injuries at both levels. Ten of the patientswith skeletal injuries showed significant neurologic deficitsand were submitted to surgical stabilization. The other 14patients were treated conservatively by a rigid cervical collar.
Six patients (20%) in group A sustained a spinal cordinjury without radiographic findings of skeletal or discoliga-mentary injuries. Two of them had characteristic findings ofa cord in lesion (signs of contusion and hematoma) on MRI;4 patients showed significant motor and sensory neurologicdeficits for more than 72 hours and, therefore, met criteria forinclusion into this study. All of them were treated conserva-tively and neurologic deficits resolved completely.
Twenty-six patients (46%) from the age of 9 to 16 wereentered into study group B. The average age of this group was13.4 years, with a range from 9 to 16 years. All 26 patients(100%) sustained skeletal injuries of the cervical spine.Twenty of them had an injury of the lower cervical spine, fourpatients sustained an injury of the upper cervical spine, and twopatients showed a combined injury of both levels.
Eighteen patients in this study group underwent an op-eration. Fourteen of the patients showed neurologic deficitsduring primary trauma evaluation, with a complete recoveryafter surgical stabilization. Eight patients were treated con-servatively either by a rigid cervical collar (n � 7) or by ahalo brace (n � 1).
Level and Type of InjuryLevel of injury revealed 24 patients (43%) with injuries
of the upper C-spine and 22 patients (44%) with injuries ofthe lower C-spine. Four patients (7%) had a combined injuryof the upper and lower C-spine and six patients (11%)showed an injury of the spinal cord without radiographicfindings of skeletal or discoligamentary injuries.
Statistical analysis revealed that in younger patients(group A), skeletal injuries of the upper C-spine were signif-icantly higher than injuries of the lower C-spine (p � 0.05),whereas in the older age group (group B), injuries of thelower C-spine were significantly more common than injuriesof the upper level (p � 0.05) (Fig. 1).
Types of injury included fractures of the C-spine in 21patients (37%), fractures with dislocation in 25 patients
The Journal of TRAUMA� Injury, Infection, and Critical Care
390 February 2007

(45%), discoligamentary injuries in 4 patients (7%), and spi-nal cord injuries without radiographic findings of skeletal ordiscoligamentary injuries in 6 patients (11%).
Statistical analysis showed that spinal cord injuries with-out radiographic findings were only found in study group A.Skeletal injuries (fractures and fractures with dislocation)were found equally in both study groups without any statis-tical significance (Fig. 2).
Mechanism of InjuryClinical records showed several mechanisms of injury:
the injuries resulted from car or motorcycle crashes in 41%(n � 23), pedestrian accidents in 14% (n � 8), jumps intoshallow water in 11% (n � 6), other sports-related injuries in30% (n � 17), and from falls in 4% (n � 2) (Fig. 3).
Statistical analysis showed that patients of the youngerage group (group A) were mostly injured in car or motorcyclecrashes (as passenger or pedestrian) (n � 21), whereas pa-tients of the older age group (group B) were significantlymore often injured during sports (including jumps into shal-low water) (n � 20; p � 0.05).
Diagnostic Studies and Associated InjuriesSkeletal and discoligamentary C-spine injuries were di-
agnosed by standard radiographs (by a cross-table lateralview or a three-view cervical spine series) in 10 patients andby further radiologic examination (CT scan, MRI) in 40patients. Further radiologic assessment was performed asindicated by the standard views or by clinical suspicion.
Fig. 1. Level of injury.
Fig. 2. Types of injury.
Fig. 3. Mechanisms of injury.
Cervical Spine Injuries in Pediatric Patients
Volume 62 • Number 2 391

In six patients, spinal cord injuries were diagnosed with-out radiographic findings of skeletal or discoligamentary in-juries. Diagnosis of those cervical spinal cord injuries wasmade by MRI in 2 patients and by appearance of significantmotor and sensory neurologic deficits persisting for morethan 72 hours in 4 patients.
Delays in diagnosis occurred in two patients (4%). Sig-nificant C-spine injuries were missed because of incompleteand inadequate sets of radiographs. In both cases, only alateral view with poor technical quality was made duringinitial evaluation because both patients were at a critical stateand primary examination focused on other severe injuries.One patient died because of a severe abdominal trauma withrupture of liver and spleen, and correct diagnosis was made atautopsy. In the other patient, correct diagnosis was made witha CT scan within 48 hours after the patient had complainedabout severe neck pain. A change of treatment was necessaryand the patient subsequently underwent surgical stabilization.
Thirty-two patients (57%) sustained significant concom-itant injuries whereas 24 patients (44%) had isolated injuriesof the C-spine. Head injuries were found to be the mostcommonly associated injuries in pediatric patients with C-spine injuries; 19 of them (59%) sustained severe concomi-tant injuries of the head. Eleven patients showed an isolatedconcomitant injury of the head whereas eight patients hadassociated injury of the head combined with other severeinjuries.
Further concomitant injuries were seen in 12 patients.Five patients showed a severe thoracic, abdominal, or pelvictrauma; two patients had significant injuries of the limbs; andanother five patients sustained a combination of multiplesevere injuries. The average Injury Severity Score for pedi-atric patients with C-spine injuries and significant concomi-tant injuries was 44 points.
Surgical and Nonsurgical TreatmentTwenty-two patients (39%) were treated conservatively,
either by a rigid cervical collar (n � 21) or by a halo brace(n � 1). Thirty-four patients (61%) underwent an operation.Sixteen patients underwent anterior spinal fusion, nine hadposterior spinal fusion, and another nine underwent bothanterior and posterior spinal fusion. Statistical analysisshowed that surgical treatment was significantly higher inolder patients (group B) than in younger children (group A)(p � 0.05), whereas conservative treatment was more com-monly found in study group A.
Clinical Findings, Neurologic Deficits, and OutcomeCharacteristic clinical signs referring to a suspected C-
spine injury were seen in 25 patients (45%) during the initialtrauma evaluation. The patients complained about severeneck pain and tenderness when palpated. They all showedmuscular spasm on active motion and neck paresthesias. Inthe other 31 patients (55%), a careful physical examinationwas not possible. Twenty-three of them were unconscious or
unresponsive during initial assessment and eight of themwere too young for the medical personnel to distinguishprotest of pain versus fright.
The overall incidence of neurologic deficits was 66%(n � 37). Six patients showed motor deficits, 3 patientsincurred sensory deficits, and 20 patients had motor andsensory deficits. Eight patients (14%) showed a completetetraplegia. American Spinal Injury Association (ASIA)grades for spinal cord injuries were provided to presentseverity distribution and outlook on recovery of neurologicfunction (see Table 1). In 27 patients, neurologic deficits werediagnosed during primary trauma evaluation; in 10 cases, defi-cits were found after the patient regained consciousness. Thirty-three of the patients with neurologic deficits showed significantskeletal or discoligamentous injuries of the C-spine. In 19 ofthose patients, the level of skeletal or discoligamentous injurywas divergent to the level of suspected cord injury, whereas in14 patients, injury of the skeletal integrity and spinal cord dam-age were found to be on the same C-spine level. In 25 patientswith neurologic findings, we saw a complete recovery of neu-rologic function. In 12 cases, either neurologic deficits resolvedincompletely (n � 3) or patients had died during hospital stay(n � 9) (see Table 1).
Twenty-five patients (45%) required intensive care treat-ment. The average intensive care unit length of stay was 23.9days. Fifteen patients (27%) died: 4 because of the C-spineinjury and 11 as a result of a multiple injuries or a concom-itant severe head injury.
DISCUSSIONThe current study presents a 25-year experience with
pediatric trauma patients who sustained significant C-spineinjuries. The results of our study are similar to several pre-vious reports underscoring a low incidence and age-relatedcharacteristics.1–12
The incidence of pediatric C-spine injuries in our studywas 1.3% and, like many other major trauma centers, we onlytreated about two patients per year. However, in relation tothe number of pediatric patients with spine injuries at anylevel, only 37% showed an injury of the C-spine. This is incontrast to current data in literature, reporting that 60% to80% of all pediatric spine injuries occur at the C-spinelevel.1,3 Our percentage is consistent with the percentage ofadults in whom C-spine injuries only constitute 30% to 40%of all spine injuries.
Table 1 ASIA Grades for Spinal Cord Injuries andRecovery of Neurologic Function
ASIA Grade Patients (n) Recovery Status Patients (n)
A 8 No recovery 9B 2 Incomplete recovery 3C 10 Complete recovery 25D 15E 2
The Journal of TRAUMA� Injury, Infection, and Critical Care
392 February 2007
The most common mechanisms of C-spine injuries weremotor vehicle crashes and sports-related injuries. Our obser-vation that younger children were more likely injured bymotor vehicle crashes whereas older children more com-monly sustained C-spine injuries during sports activities wassimilar to previous studies.1,2,5 Seventy percent of the pa-tients aged 8 years or fewer were injured in motor vehiclecrashes as a passenger or pedestrian, whereas 77% of thepatients from the ages of 9 to 16 were injured during sportsor recreation.
The results of our study confirm that younger childrenhave a predilection for injuries of the upper C-spine.1–5,7,10,11
In addition, our data also underscores that C-spine injurieswithout radiographic abnormalities typically present inyounger childhood after a high-energy impact.1,7,12 Eighty-three percent of the patients with skeletal injuries aged 8years or fewer showed an injury of the upper C-spine. Onlyfour patients in the younger age group sustained a skeletalinjury of the lower C-spine or a combined injury of bothlevels.
That younger children have a predilection for C-spineinjuries at the upper level might be attributed to the biome-chanical and anatomic features of the immature pediatricC-spine.1,5,6 Incomplete ossification, a different vertebralconfiguration, and ligamentous laxity account for a differentinjury pattern compared with that of adults. Previous studieshave reported that the C-spine of younger children may nottake on characteristics of an adult C-spine until the age of 8or 9 years.1,2,7 Young children have proportionally largerheads with an underdeveloped neck musculature and are thusmore susceptible to hyperflexion-extension injuries. In addi-tion, the greater head-to-body ratio causes torque and accel-eration stress to occur higher in the C-spine. The fulcrum ofcervical motion is much higher (C2–C3) in young childrenthan in adolescents and adults (C5–C6). Finally, the articu-lating facet joints in young children are more horizontallyoriented, leading to greater spine mobility and less stability,which is also responsible for the relatively high incidence ofC-spine injuries without radiographic abnormalities in thatage group.1,2,8,13 With the exception of four skeletal injuriesat the lower C-spine level in the younger age group, we haveno reasons to challenge this theory.
Eleven percent of the patients had C-spine injuries with-out radiographic findings of skeletal or discoligamentary ab-normalities. This injury usually occurs in about 15% to 25%of all pediatric C-spine injuries and is specific to youngerchildren.1,7,12,14 It is extremely rare in adolescents and adults.In our study, this injury type was only present in the youngerage group (100%).
The mechanism of C-spine injuries without radiographicfindings of skeletal or discoligamentary abnormalities in-volves transient vertebral displacement, with subsequent re-alignment to a normal configuration resulting in a damagedspinal cord with a normal-appearing vertebral column. Thistype of injury occurs when the cord is stretched, torn, or
contused because of the ligamentous laxity of the developingspine in the younger age group.1,12
The results of our study also showed that the older agegroup had a significant predilection for injuries at the lowerC-spine. Seventy-seven percent of the patients aged 9 to 16had skeletal injuries at the lower C-spine level. Only sixpatients in the older age group had an injury of the upperC-spine or a combined injury at both levels. Current data inthe literature is controversial regarding this issue. Severalstudies report an equal number of upper and lower C-spineinjuries in older children and adolescents, whereas otherstudies point to predominantly lower C-spine injuries in theolder age group.1,2,5–7,15
Biomechanical and anatomic changes might attribute to ahigher incidence of lower C-spine injuries in adolescents andadults. As children grow and mature, the fulcrum of cervicalmotion moves from the upper to the lower level and theC-spine becomes more like that of an adult. The neck mus-culature becomes stronger and the size of the head becomesrelatively smaller. The articulating facet joints become morevertical and the vertebral bodies finally mature and ossify,which provides less mobility and more stability.1,7,16
A retrospective analysis of C-spine injuries in adultsrevealed that 38% had an injury of the upper level, 60%sustained an injury of the lower level, and 2% showed inju-ries of both levels in the same period (1980–2004). As in theolder age group of pediatric patients, lower C-spine injurieswere diagnosed more commonly than injuries of the upperlevel, although the difference was not as obvious.
Neurologic disability related to pediatric C-spine injurieswere commonly seen in the current study. The overall inci-dence of neurologic deficits was 66%. This is contrary tocurrent data in the literature that reports that neurologic se-quelae are rather uncommon in the pediatric age group.1,2,4
Three-fourths of our patients with neurologic findingsshowed incomplete deficits, whereas one-fourth sustained acomplete neurologic injury. The distribution of incompleteand complete neurologic deficits between children in theyounger age group and older children was similar, suggestingthat anatomic differences may not play a dominant role indeveloping neurologic symptoms.4
We saw a complete recovery of neurologic function in68% of the patients with neurologic findings. The results ofour study also revealed that children with complete spinalcord injuries were at a significantly greater risk of death, witha mortality rate of 75%. Fortunately, this subgroup repre-sented a smaller fraction of those with C-spine injuries. Themortality rate in pediatric patients with C-spine injuries isusually high and often related to concomitant head injuries, ashas been reported in the literature.1,4,6 In our series, we had amortality rate of 27%. More than two-thirds of those childrenhad significant concomitant head injuries or other severeinjuries when they were admitted.
Despite the low incidence of C-spine injuries in chil-dren and adolescents, further efforts at prevention of those
Cervical Spine Injuries in Pediatric Patients
Volume 62 • Number 2 393
injuries are demanded because mortality rate and incidenceof neurologic deficits are dreadfully high in our series. Asseveral studies have previously reported, C-spine injuriesmostly result from motor vehicle crashes in younger chil-dren, with the majority of victims unrestrained or re-strained improperly.2,4,5,7 In the older age group, youthfulabandon during sports and recreation is often responsiblefor pediatric C-spine trauma.2,4 Prevention of those poten-tially disastrous injuries should be directed toward eachage group and parental supervision should be encouraged.The consequent use of seatbelts and car seats may help toprevent C-spine injuries sustained by infants. Institution ofsafer sports rules and equipment, as well increased warn-ings of risks, may aid in injury prevention in adolescents.2
Additionally, to avoid delays in diagnosis that may leadto permanent disability or death, C-spine precautions and acareful evaluation of the C-spine by clinical and radiographicmeans seem to be integral in the care of any injured child witha significant mechanism of injury. Regular C-spine immobi-lization before transport and radiologic evaluation of theC-spine in pediatric trauma victims have been the subject ofextensive debate.2,4 The routine use of C-spine radiographs inchildren without clinical findings and the role of furtherradiologic examination (CT and MRI) in patients with sig-nificant mechanism of injury or clinically suspected C-spineinjuries are controversial and may vary from center to center.In our unit, we regard a three-view C-spine series as theminimum needed to clear the C-spine in children with clinicalfindings of the neck. Further radiologic examinations (CTand MRI) are indicated in trauma victims with significantmechanism of injury, particularly when they are unrespon-sive, as well as in patients with clinically suspected C-spineinjuries. Based on the rate of C-spine injuries without radio-graphic abnormalities, children with an altered mental stateand significant trauma history should be assumed to have acervical cord injury and, therefore, remain in C-spine precau-tions until proven otherwise by objective clinical and neuro-logic examination.4 Particularly in the younger age group, thehigher incidence of ligamentous injuries must be taken intoaccount.
CONCLUSIONThe incidence of C-spine injuries in pediatric patients
was low (1.2%), as had been reported in literature. Youngerchildren had a predilection for injuries of the upper C-spine,whereas older children and adolescents sustained signifi-cantly more injuries of the lower C-spine. Spinal cord injurieswithout radiographic abnormalities were only seen inyounger children. In contrast to current data in the literature,we saw a high incidence of neurologic deficits (66%) relatedto C-spine injuries. The overall mortality rate of pediatrictrauma victims with C-spine injuries was 27%, and in mostcases related to concomitant head injuries or other severeinjuries. Despite the low incidence of C-spine injuries in
children, increased efforts at prevention are demanded be-cause those injuries may lead to tragic consequences for thepatients.
REFERENCES1. Kokoska ER, Keller MS, Rallo MC, et al. Characteristics of
pediatric cervical spine injuries. J Pediatr Surg. 2001;36:100–105.2. Baker C, Kadish H, Schunk JE. Evaluation of pediatric cervical
spine injuries. Am J Emerg Med. 1999;17:230–234.3. Dietrich AM, Ginn-Pease ME, Bartkowski HM, et al. Pediatric
cervical spine fractures: predominantly subtle presentation. J PediatrSurg. 1991;26:995–1000.
4. Patel JC, Tepas III JJ, Mollit DL, et al. Pediatric cervical spineinjuries: defining the disease. J Pediatr Surg. 2001;36:373–376.
5. Finch GD, Barnes MJ. Major cervical spine injuries in children andadolescents. J Pediatr Orthop. 1998;18:811–814.
6. Partrick DA, Bensard DD, Moore EE, et al. Cervical spine trauma inthe injured child: a tragic injury with potential for salvageablefunctional outcome. J Pediatr Surg. 2000;35:1571–1575.
7. Givens TG, Polley KA, Smith GF, et al. Pediatric cervical spineinjury: a three-year experience. J Trauma. 1996;41:310–314.
8. Bohn D, Armstrong D, Becker L, et al. Cervical spine injuries inchildren. J Trauma. 1990;30:463–469.
9. Hill SA, Miller CA, Kosnik EJ, et al. Pediatric neck injuries: aclinical study. J Neurosurg. 1984;60:700–706.
10. Lui TN, Lee ST, Wong CW, et al. C1–C2 fracture-dislocations inchildren and adolescents. J Trauma. 1996;40:408–411.
11. McGory BJ, Klassen RA, Chao EYS, et al. Acute fractures anddislocations of the cervical spine in children and adolescents. J BoneJoint Surg (Am). 1993;75:988–995.
12. Manary MJ, Jaffe DM. Cervical spine injuries in children. PediatrAnn. 1996;25:423–428.
13. Evans DL, Bethem D. Cervical spine injuries in children. J PediatrOrthop. 1989;9:563–568.
14. Dickmann CA, Rekate HL, Sonntag VKH, et al. Pediatric spinaltrauma: vertebral column and spinal cord injuries in children.Pediatr Neurosci. 1989;15:237–256.
15. Birney TJ, Hanley EW. Traumatic cervical spine injuries inchildhood and adolescence. Spine. 1989;14:1277–1282.
16. Nitecki S, Moir CR. Predictive factors in the outcome of traumaticcervical spine fracture in children. J Pediatr Surg. 1994;29:1409–1411.
EDITORIAL COMMENTPediatric spine trauma remains a remarkably incom-
pletely understood injury entity. Causes for this deficit havebeen well described and primarily revolve around infrequentincidence, radiographic uncertainty, and unsystematic treat-ment paradigms.1
The observation that pediatric spine trauma fortunatelyremains an infrequent occurrence is reiterated in this study byPlatzer and colleagues. Using a retrospective study designcovering a 25-year period at a major, central European, Level1, urban trauma center, the authors found, on average, slightlymore than two patients per year admitted with C-spine traumarequiring hospitalization (2.48 patients/year). These numbersare remarkably similar to our own experience (52 patientswithin 13 years; 4 patients/year), which inherently leads to apaucity of familiarity and thus introduces the danger of ren-dering unsystematic approaches to trauma care.2 Pediatric
The Journal of TRAUMA� Injury, Infection, and Critical Care
394 February 2007
trauma patients pose a further challenge to examining physi-cians because of their highly variable ability to participate inthe clinical examination and their unpredictable radiographicskeletal appearance because of differing levels of maturity.The study by Platzer et al. again confirms that patientsyounger than 8 years of age constitute half of the skeletallyimmature patients with C-spine injuries and are affected bydistinctly different C-spine injuries as compared with theirolder cohort.2,3,4 Propagating factors consist of their propor-tionally larger head-to-torso size ratio and the increased riskof occult ligament injuries in the presence of incompletelyossified bony structure. This constellation also renders thesepatients more vulnerable to sustaining spinal cord injurywithout obvious structural injury. Similar to previous publi-cations, Platzer and colleagues also confirmed an importantage/injury correlation by identifying a strong preponderanceof upper C-spine injuries for the age group younger than 8years of age. Even in an adult population, normative mea-surements of the upper C-spine remain less well understoodwhen compared with those of the subaxial spine. Thus, it isprobably safe to assume that these same anatomic relation-ships in the immature and nonossified upper C-spine intrauma victims younger than 8 years of age would be difficultto assess accurately and consistently, particularly because ofits rare occurrence.4,5
Missed spine injuries are a feared complication in pedi-atric trauma management. The authors of this study, however,reported a relatively low incidence (2 of 56 patients; 4%),with positive association found in patients with multiple in-juries and an impaired systematic work-up. In contrast, otherstudies have reported a higher incidence (24%) of missedinjuries in patients �8 years of age and an incidence of 15%for patients older than 8 years.2,3 This lower incidence pub-lished by Platzer and colleagues may be a reflection of theretrospective nature of their study and the use of differentsearch criteria, and as such could represent an inadvertentunder-reporting. Nevertheless, the rate of concurrent non-spinal injuries (57%) and the absence of clinical findings ofC-spine trauma in 55% in this cohort population underscoresthe importance of implementing an effective diagnostic algo-rithm to minimize the clearly present risk of missing poten-tially serious spinal injuries in patients affected by manydistracting factors.
Aside from underscoring previously published epidemio-logic injury data in this very vulnerable population, this studyhas merit in reporting on outcomes of neurologically injuredpediatric patients and mortality rates. The mortality rate of anoverall 27% (15 of 56) likely reflects the injury severity andinherent vulnerability of this study population. A reported inci-dence of neurologic injuries of 66% (37 of 56 patients) is alsoconsiderably higher than that of other similar publications; thismay reflect a selection bias because of referral patterns to thestudy site. An improvement rate of over 75% for patients withspinal cord injuries may suggest a greater potential for neuralrecovery in younger patients compared with a maturer spinal
cord injury population. Sadly, this study does not provide dif-ferentiated information pertaining to functional neurologicscores using, for instance, an ASIA motor score, data on thetiming of direct or indirect spinal cord decompression, and theseverity of spinal cord injury on an MRI scan relative to recov-ery potential to allow for meaningful concrete treatmentrecommendations.6 Similarly, references made about the type ofsurgical technique and outcomes such as alignment and eventualstability are too vague to provide concrete treatment recommen-dations beyond generalities.
Furthermore, the authors missed the opportunity to reporton the sensitivity of CT scanning to their plain radiographswhen identifying both primary and secondary spinal injuries.As scanning technology continues to improve (multi detectorcomputed tomography [MCDT], 64-slice technique, etc.), thepediatric trauma patient population will undoubtedly followthe lead of their adult counterparts in receiving “panscan-ning” (with reconstruction views), particularly when an as-sociated head injury is present (as was the case in 59% ofpatients in this study).
In our opinion, the main purpose of this study was toprovide an impetus to revisit the subject of pediatric spineclearance and effective treatment. Suggestions made for anadult population, consisting of identification of an at-riskpopulation and implementation of an effective diagnosticpathway based on presence of a number of clinical orradiographic findings, should be seriously considered forpediatric trauma victims on a systematic basis.7,8 Specifi-cally, patients in a very young age group who are incapableof participating in a meaningful interactive evaluation be-cause of a variety of reasons (cognitive impairment oremotional distress) may benefit from early fluoroscopy,using traction, and flexion-extension evaluation by an ex-perienced examiner to assess for ligamentous instability,rather than proceeding with MRI scanning and its associ-ated management needs (including intubation) and resultantoccasional diagnostic ambiguity with regards to ligamentoussignal abnormalities.8 Further, pooling of relevant data througha multicenter effort for a prolonged period of time may providemore meaningful epidemiologic data for the development offuture trauma care algorithms for pediatric spinal injuries.
Jens R. Chapman, MDHarborview Medical CenterUniversity of WashingtonSeattle, WashingtonMitch B. Harris, MDBrigham and Womens’ HospitalHarvard School of MedicineBoston, Massachusetts
REFERENCES1. Reynolds R. Pediatric spinal injury. Curr Opin Pediatr. 2000;12:
67–71.2. Avellino AM, Mann FA, Grady MS, Chapman JR, Ellenbogen RG,
Alden TD, Mirza SK. Childs Nerv Syst. 2005;21:122–127.
Cervical Spine Injuries in Pediatric Patients
Volume 62 • Number 2 395
3. Ruge JR, Sinson GP, McLone DG, Cerullo LJ. Pediatric spinalinjury: the very young. J Neurosurg. 1988;68:25–30.
4. Ghatan S, Newell DW, Grady MS, et al. Severe posttraumaticcraniocervical instability in the very young. Report of three cases.J Neurosurg. 2004;101:102–107.
5. Deliganis AV, Mann FA, Grady MS. Rapid diagnosis and treatment of atraumatic atlantooccipital dissociation. AJR Am J Roentgenol. 1998;171:986.
6. International Standards for Neurological Classification of Spinal CordInjury, 6th ed. Chicago, IL: American Spinal Injury Association, 2000.
7. Blackmore CC, Emerson SS, Mann FA, Koepsell TD. Cervical spineimaging in patients with trauma: determination of fracture risk tooptimize use. Radiology. 1999;211:759–765.
8. Harris MB, Kronlage SC, Carboni PA, et al. Evaluation of thecervical spine in the polytrauma patient. Spine. 2000;25;2884–2892.
The Journal of TRAUMA� Injury, Infection, and Critical Care
396 February 2007

Time Lapse and Comorbidities Influence Patient Knowledgeand Pursuit of Medical Care After Traumatic SplenectomyStephanie Mallow Corbett, PharmD, Jill A. Rebuck, PharmD, BCPS, Frederick B. Rogers, MD, FACS,Peter Callas, PhD, Gene Grindlinger, MD, FACS, Steven Desjardins, RRT, and James C. Hebert, MD, FACS
Background: There is insufficientknowledge of infectious risk in patientsafter splenectomy; minimal data existsspecifically for trauma patients. Thisstudy evaluated patient knowledge andpractices regarding infection risk aftertraumatic splenectomy. Our hypothesiswas that patients with poor knowledgeregarding their asplenic state would beless likely to pursue medical care in theevent of an illness than those with goodknowledge.
Methods: Non-randomized, cohortstudy of all posttraumatic splenectomypatients <11 years after injury in 2 ru-ral trauma centers. Patients received avalidated questionnaire; weighted re-sponses determined knowledge about in-fection risks and appropriate follow-upactions.
Results: Fifty-four percent of pa-tients responded to the questionnaire.Overall, 47% of responders were identi-fied as having adequate knowledge re-garding infectious risk, and only 28%would pursue appropriate medical care.Of patients with adequate knowledge,42% were more likely to pursue appropri-ate care versus 15% of patients with inad-equate knowledge (p � 0.06). Patientswith adequate knowledge were morelikely to receive an annual influenza vac-cine (p � 0.03) and contact their providerwith fewer symptoms (p � 0.03). Logisticregression revealed significant interac-tions between knowledge and presence ofcomorbidities (p � 0.04). Focusing on pa-tients with poor knowledge and absence ofcomorbidities, none would engage in ap-propriate action in the event of illness
(p < 0.01). A longer time since injury, >3years, was associated with a diminishedlikelihood of appropriate action (p �0.03). The relationship between knowl-edge and action was not accounted for byother potential confounders.
Conclusions: Trauma patients retainminimal knowledge about infection riskafter splenectomy and are not likely topursue appropriate medical care. Timesince injury negatively influences patientactions. Healthcare providers must bemore proactive to develop new strategiesin educating these patients, particularlythose without comorbidities and thosegreater than 3 years postsplenectomy.
Key Words: Multiple trauma, Sple-nectomy, Questionnaires, Patient education,Vaccination.
J Trauma. 2007;62:397–403.
Posttraumatic splenectomy has varied practice patternsamong trauma surgeons because of the lack of scientificdata.1 It is agreed that patients should be vaccinated
with pneumococcal vaccine because of the risk of severeinfection, but opinion varies on vaccination timing, patienteducation, and the need for revaccination regardless ofCenters of Disease Control and trauma literaturerecommendations.1,2 Although the incidence of developingsevere infection appears to be low, it has been reported that
splenectomy secondary to trauma results in an 8.6-fold in-crease risk, which far exceeds that of the general populationand is associated with a high mortality.3–8 However, it isunclear whether vaccination or revaccination decreases therisk of severe infection.1,9–23 There is no literature that sup-ports that trauma patients who are vaccinated after splenec-tomy have a risk of infection similar to patients with an intactspleen; that is, vaccination has not been proven to protectthese patients from infection in the same manner as an intactspleen. There are numerous case reports of splenectomizedpatients who have died of pneumoncoccal infection of thesame capsular type included in the vaccine.1,19,24–29 Vacci-nation and education of these patients is important, and manystudies have found that improvements can be made.1,6,7,30–36
Ensuring that patients understand their risk of infectionand how to maintain good health poses a dilemma. Previousstudies have reported that 60% to 70% of all asplenic patientsare either unaware or have insufficient knowledge of infec-tious risk.34–36 Trauma patients are likely to comprise amajority of this population because their surgery was emer-gent, with no preoperative time for education about the risksassociated with splenectomy. Furthermore, the trauma patientmay not fully comprehend the complexity of the asplenicstate upon hospital discharge because of multiple factors,including acute stress disorder or posttraumatic stress disor-
Submitted for publication June 9, 2005.Accepted for publication January 19, 2006.Copyright © 2007 by Lippincott Williams & Wilkins, Inc.From the Department of Surgery, Division of Trauma/Critical Care,
University of Vermont College of Medicine (S.M.C., J.A.R., F.B.R.) andDepartment of Surgery, Division of General Surgery (J.C.H.), and Depart-ment of Mathematics and Statistics, University of Vermont (P.C.), Burling-ton, Vermont; Department of Pharmacotherapy, Fletcher Allen Health Care(S.M.C., J.A.R.); and the Department of Surgery, Division of Trauma/Critical Care, Maine Medical Center (G.G., S.D.), Portland, Maine.
Supported, in part, by the Society of Critical Care Medicine, ClinicalPharmacy & Pharmacology Section, Ortho-Biotech Fellowship Grant anddepartmental funds.
Address for reprints: Jill A. Rebuck, PharmD, BCPS, Fletcher AllenHealth Care, Department of Pharmacotherapy, 111 Colchester Avenue, Bur-lington, VT 05401; email: [email protected].
DOI: 10.1097/01.ta.0000209615.23378.a8
The Journal of TRAUMA� Injury, Infection, and Critical Care
Volume 62 • Number 2 397
der, severity of injuries, and analgesic and sedationmedication.37–45 Finally, although trauma patients are treatedby surgeons in the hospital, further follow-up is expected tooccur with primary care physicians (PCP). Literature empha-sizes the importance of enhanced education to postsplenec-tomy patients, but is it true that increasing education willimprove compliance with prophylactic measures and pursuitof medical care?1,6–8,30–36 It is essential to evaluate thetrauma patient’s comprehension of risk with regard to infec-tion and the need for medical consultation in case of illness,to determine whether a correlation exists between knowledgeof the current asplenic state and prophylactic measures at-tained. In addition, it is important to recognize patient char-acteristics that might influence pursuit of medical care. Thisstudy evaluated the postsplenectomy trauma patient to deter-mine knowledge with regard to the asplenic state. In addition,pursuit of medical care was evaluated to determine whetherpatients who have enhanced knowledge of their conditionwere more likely to seek medical expertise in the event ofillness, and what characteristics might influence patient ac-tion. We hypothesized that patients with poor knowledgeregarding their asplenic state would be less likely to pursuemedical care in the event of an illness than those with goodknowledge.
METHODSStudy Population
This was a nonrandomized, multi-institutional, cohortstudy that utilized a patient questionnaire to evaluate knowl-edge and pursuit of medical care in postsplenectomy traumapatients. All trauma patients at 2 rural trauma centers whounderwent splenectomy because of acute injuries sustainedsecondary to a traumatic injury during an 11-year period(1993–2003) were evaluated. Identification of patients wasconducted via a computerized trauma registry actively main-tained by the trauma division in each institution. This studywas approved with procural of informed consent via a coverletter describing the study and requesting patient participa-tion, as required by the Committee on Human Research.
Inclusion or Exclusion CriteriaPatients were included if their current age was at least 18
years, if they were hospitalized at a participating regionaltrauma center during the study period and required a sple-nectomy procedure secondary to a traumatic event. Patientswere excluded for the following reasons: if they declinedparticipation; if death occurred because discharge with nofurther medical information available from next-of-kin; ifguardianship was appointed because of a concomitant medi-cal condition, such as severe head injury or mental retardationthat limited the patient’s ability to independently completethe questionnaire; or if they relocated leaving no currentaddress or contact information.
Data CollectionDemographic and trauma-related data were obtained via
the trauma registry. The date and cause of traumatic event,type of injuries sustained, Injury Severity Score (ISS), date ofsplenectomy procedure and date of hospital discharge relatedto splenectomy were among trauma-related variables col-lected. Based on standard of practice at each institution,patients received written information and were counseled bya trauma nurse or resident before hospital discharge withregard to infectious risk and caring for themselves postsple-nectomy; documentation of consultation is placed in the med-ical record and communicated with the patient’s primary carephysician. Administration of pneumococcal, Haemophilus in-fluenzae, and meningococcal vaccinations were standardpractice at both institutions during the study period evaluated.
QuestionnaireQuestionnaire Design
The questionnaire had 26 questions designed to evaluatethe trauma patient’s knowledge of the risk of postsplenec-tomy infection and the measures taken to maintain an optimalstate of health. A number value was assigned to the questionsasked. Six questions, some with multiple parts, on the ques-tionnaire comprised a total of 20 points and the answers werereflective of patient knowledge. Patients with a score of 14 orgreater were defined as possessing “adequate” knowledge oftheir condition, whereas patients who scored less than 14were characterized as having “inadequate” knowledge oftheir condition based on a modified version of the studyperformed by Hegarty et al.34 Similarly, 8 questions, somewith multiple parts, asked about how a patient pursued med-ical care, and these questions were assigned a point value,with a maximum of 15 points, based on the appropriatenessof their response as it pertained to published guidelines forasplenic patients. Patients who achieved a score of eight orgreater were classified as having good pursuit of medicalcare, whereas those scoring less than eight were classified ashaving poor judgment of what medical attention is required tomaintain good health.
Questionnaire AdministrationThe questionnaire was reviewed and critiqued by a bio-
statistician and basic and clinical scientists trained in surveytechnique. Every attempt was made to simplify terminologyto be comprehensible at an eighth grade level, and to removeleading questions and potential bias. Validation of the ques-tionnaire before study initiation occurred in 10 patients whopreviously required a splenectomy secondary to a hemato-logic disease to focus on appropriate comprehension level ofthe patient to the question being asked. Revisions to thequestionnaire were completed based on patient feedback toimprove ease, flow, and comprehension before studying thetrauma postsplenectomy population. Once validated, patientsmeeting inclusion were mailed the questionnaire and a per-
The Journal of TRAUMA� Injury, Infection, and Critical Care
398 February 2007
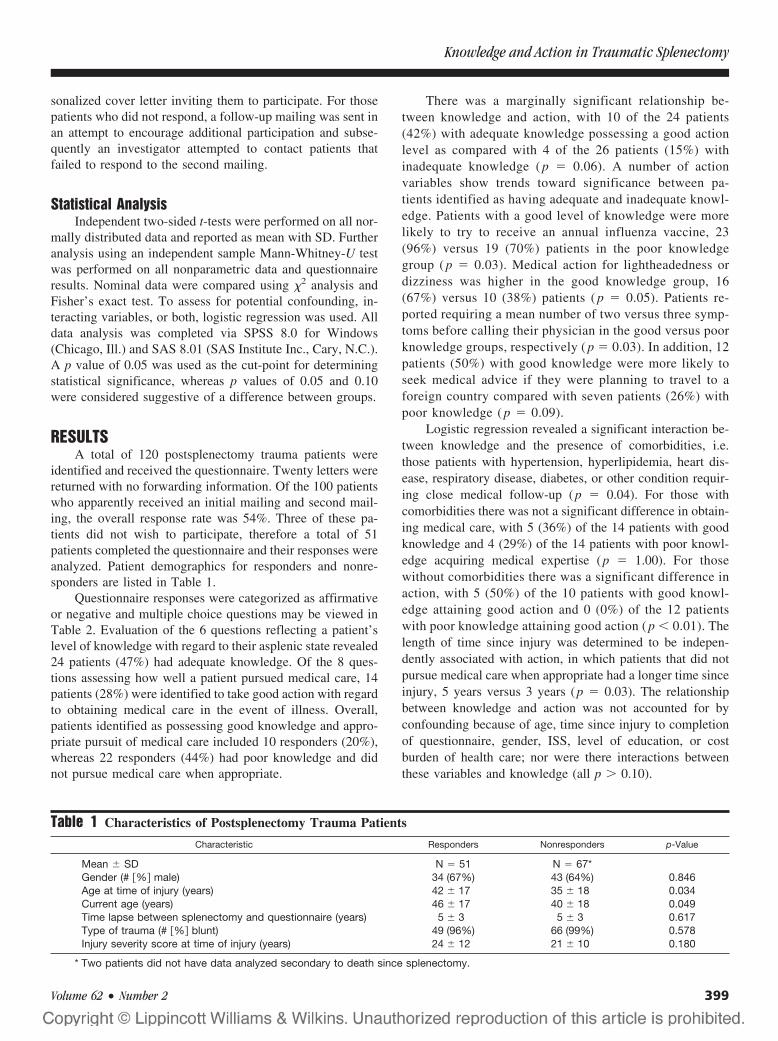
sonalized cover letter inviting them to participate. For thosepatients who did not respond, a follow-up mailing was sent inan attempt to encourage additional participation and subse-quently an investigator attempted to contact patients thatfailed to respond to the second mailing.
Statistical AnalysisIndependent two-sided t-tests were performed on all nor-
mally distributed data and reported as mean with SD. Furtheranalysis using an independent sample Mann-Whitney-U testwas performed on all nonparametric data and questionnaireresults. Nominal data were compared using �2 analysis andFisher’s exact test. To assess for potential confounding, in-teracting variables, or both, logistic regression was used. Alldata analysis was completed via SPSS 8.0 for Windows(Chicago, Ill.) and SAS 8.01 (SAS Institute Inc., Cary, N.C.).A p value of 0.05 was used as the cut-point for determiningstatistical significance, whereas p values of 0.05 and 0.10were considered suggestive of a difference between groups.
RESULTSA total of 120 postsplenectomy trauma patients were
identified and received the questionnaire. Twenty letters werereturned with no forwarding information. Of the 100 patientswho apparently received an initial mailing and second mail-ing, the overall response rate was 54%. Three of these pa-tients did not wish to participate, therefore a total of 51patients completed the questionnaire and their responses wereanalyzed. Patient demographics for responders and nonre-sponders are listed in Table 1.
Questionnaire responses were categorized as affirmativeor negative and multiple choice questions may be viewed inTable 2. Evaluation of the 6 questions reflecting a patient’slevel of knowledge with regard to their asplenic state revealed24 patients (47%) had adequate knowledge. Of the 8 ques-tions assessing how well a patient pursued medical care, 14patients (28%) were identified to take good action with regardto obtaining medical care in the event of illness. Overall,patients identified as possessing good knowledge and appro-priate pursuit of medical care included 10 responders (20%),whereas 22 responders (44%) had poor knowledge and didnot pursue medical care when appropriate.
There was a marginally significant relationship be-tween knowledge and action, with 10 of the 24 patients(42%) with adequate knowledge possessing a good actionlevel as compared with 4 of the 26 patients (15%) withinadequate knowledge ( p � 0.06). A number of actionvariables show trends toward significance between pa-tients identified as having adequate and inadequate knowl-edge. Patients with a good level of knowledge were morelikely to try to receive an annual influenza vaccine, 23(96%) versus 19 (70%) patients in the poor knowledgegroup ( p � 0.03). Medical action for lightheadedness ordizziness was higher in the good knowledge group, 16(67%) versus 10 (38%) patients ( p � 0.05). Patients re-ported requiring a mean number of two versus three symp-toms before calling their physician in the good versus poorknowledge groups, respectively ( p � 0.03). In addition, 12patients (50%) with good knowledge were more likely toseek medical advice if they were planning to travel to aforeign country compared with seven patients (26%) withpoor knowledge ( p � 0.09).
Logistic regression revealed a significant interaction be-tween knowledge and the presence of comorbidities, i.e.those patients with hypertension, hyperlipidemia, heart dis-ease, respiratory disease, diabetes, or other condition requir-ing close medical follow-up (p � 0.04). For those withcomorbidities there was not a significant difference in obtain-ing medical care, with 5 (36%) of the 14 patients with goodknowledge and 4 (29%) of the 14 patients with poor knowl-edge acquiring medical expertise (p � 1.00). For thosewithout comorbidities there was a significant difference inaction, with 5 (50%) of the 10 patients with good knowl-edge attaining good action and 0 (0%) of the 12 patientswith poor knowledge attaining good action ( p � 0.01). Thelength of time since injury was determined to be indepen-dently associated with action, in which patients that did notpursue medical care when appropriate had a longer time sinceinjury, 5 years versus 3 years (p � 0.03). The relationshipbetween knowledge and action was not accounted for byconfounding because of age, time since injury to completionof questionnaire, gender, ISS, level of education, or costburden of health care; nor were there interactions betweenthese variables and knowledge (all p � 0.10).
Table 1 Characteristics of Postsplenectomy Trauma Patients
Characteristic Responders Nonresponders p-Value
Mean � SD N � 51 N � 67*Gender (# �%� male) 34 (67%) 43 (64%) 0.846Age at time of injury (years) 42 � 17 35 � 18 0.034Current age (years) 46 � 17 40 � 18 0.049Time lapse between splenectomy and questionnaire (years) 5 � 3 5 � 3 0.617Type of trauma (# �%� blunt) 49 (96%) 66 (99%) 0.578Injury severity score at time of injury (years) 24 � 12 21 � 10 0.180
* Two patients did not have data analyzed secondary to death since splenectomy.
Knowledge and Action in Traumatic Splenectomy
Volume 62 • Number 2 399
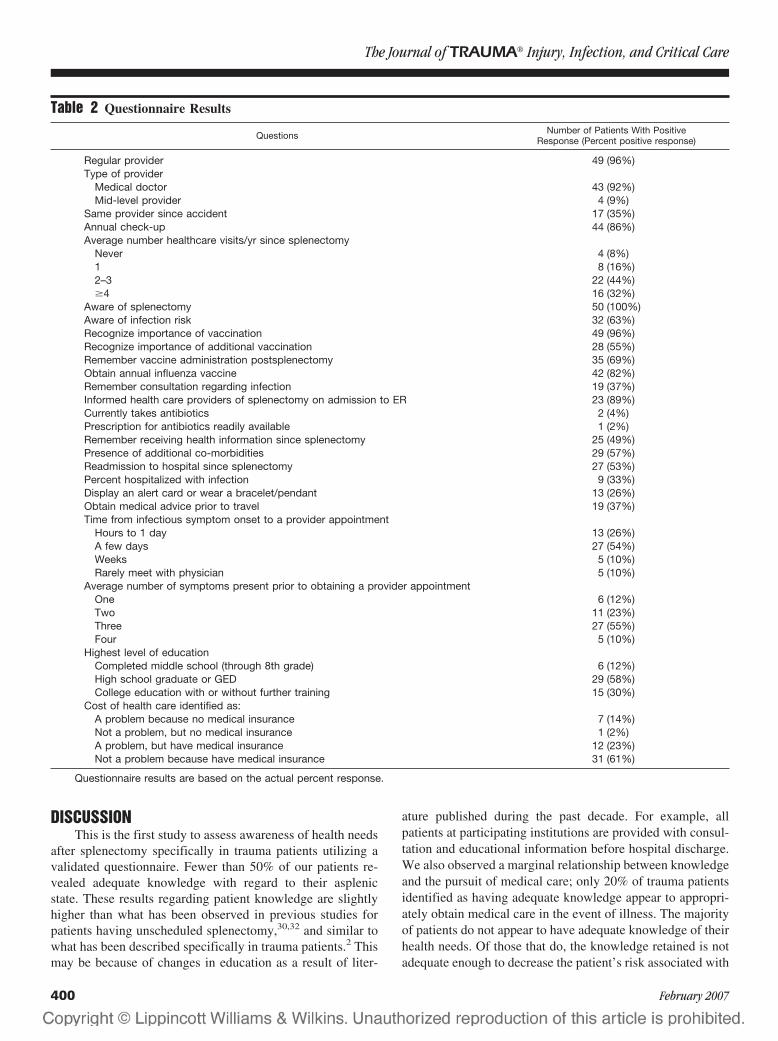
DISCUSSIONThis is the first study to assess awareness of health needs
after splenectomy specifically in trauma patients utilizing avalidated questionnaire. Fewer than 50% of our patients re-vealed adequate knowledge with regard to their asplenicstate. These results regarding patient knowledge are slightlyhigher than what has been observed in previous studies forpatients having unscheduled splenectomy,30,32 and similar towhat has been described specifically in trauma patients.2 Thismay be because of changes in education as a result of liter-
ature published during the past decade. For example, allpatients at participating institutions are provided with consul-tation and educational information before hospital discharge.We also observed a marginal relationship between knowledgeand the pursuit of medical care; only 20% of trauma patientsidentified as having adequate knowledge appear to appropri-ately obtain medical care in the event of illness. The majorityof patients do not appear to have adequate knowledge of theirhealth needs. Of those that do, the knowledge retained is notadequate enough to decrease the patient’s risk associated with
Table 2 Questionnaire Results
Questions Number of Patients With PositiveResponse (Percent positive response)
Regular provider 49 (96%)Type of provider
Medical doctor 43 (92%)Mid-level provider 4 (9%)
Same provider since accident 17 (35%)Annual check-up 44 (86%)Average number healthcare visits/yr since splenectomy
Never 4 (8%)1 8 (16%)2–3 22 (44%)�4 16 (32%)
Aware of splenectomy 50 (100%)Aware of infection risk 32 (63%)Recognize importance of vaccination 49 (96%)Recognize importance of additional vaccination 28 (55%)Remember vaccine administration postsplenectomy 35 (69%)Obtain annual influenza vaccine 42 (82%)Remember consultation regarding infection 19 (37%)Informed health care providers of splenectomy on admission to ER 23 (89%)Currently takes antibiotics 2 (4%)Prescription for antibiotics readily available 1 (2%)Remember receiving health information since splenectomy 25 (49%)Presence of additional co-morbidities 29 (57%)Readmission to hospital since splenectomy 27 (53%)Percent hospitalized with infection 9 (33%)Display an alert card or wear a bracelet/pendant 13 (26%)Obtain medical advice prior to travel 19 (37%)Time from infectious symptom onset to a provider appointment
Hours to 1 day 13 (26%)A few days 27 (54%)Weeks 5 (10%)Rarely meet with physician 5 (10%)
Average number of symptoms present prior to obtaining a provider appointmentOne 6 (12%)Two 11 (23%)Three 27 (55%)Four 5 (10%)
Highest level of educationCompleted middle school (through 8th grade) 6 (12%)High school graduate or GED 29 (58%)College education with or without further training 15 (30%)
Cost of health care identified as:A problem because no medical insurance 7 (14%)Not a problem, but no medical insurance 1 (2%)A problem, but have medical insurance 12 (23%)Not a problem because have medical insurance 31 (61%)
Questionnaire results are based on the actual percent response.
The Journal of TRAUMA� Injury, Infection, and Critical Care
400 February 2007
severe infection. This raises serious concern about how toimprove not only patient knowledge, but also patient com-pliance with medical care.
Overall results indicate that only 75% of patients areaware of an increased risk of infection. Although the risk ofsevere infection is low, the mortality is high and it is impor-tant that patients are aware of this risk and seek medical carewhen symptoms arise. It is apparent that patients do notunderstand this risk, given that three or more symptoms for aprolonged period of time are required by the majority ofpatients before pursuing medical attention. We observed thatpatients with good knowledge were more likely to get anannual influenza vaccine, seek medical care if lightheaded ordizzy, or if they had a few signs and symptoms of infection,and obtain medical advice for travel outside the UnitedStates. However, despite current practice and the observedincrease in knowledge, overall results of this study are inad-equate. Recognizing asplenic patients at admission to thehospital may also pose a challenge, as only 26% of respond-ers admitted to carrying a card or wearing a bracelet orpendant to alert health care providers that they are asplenic,and of patients readmitted to the emergency department, only89% informed providers of their asplenic state.
Time since splenectomy was independently associatedwith pursuit of medical care. Generally patients receive ver-bal and written educational information with regard to theirrisk for infection during hospitalization at the time vaccina-tion occurs.6,8,35,46–50 This is a problem in the trauma popu-lation, as these patients may be preoccupied with injuries,emotional stress, or sedation and pain medications, all ofwhich may affect their ability to understand and retain hos-pital events.37–45 Importantly, Hegarty reported patientscounseled by trauma surgeons appeared to have less knowl-edge of their condition.30 Pertinent postsplenectomy informa-tion pamphlets provided at the hospital, if received, are oftenmisplaced or discarded, or the patient may have developeddissociation or forgotten the advice discussed regarding theasplenic state and risk of infection despite appropriateconsultation.37–45 Additional follow-up is expected to occurwith the PCP, who may not be fully aware of the recommen-dations or the importance of follow-up.30 Studies based onretrospective chart evaluation and surveys of PCP, traumasurgeons, and postsplenectomy patients have reported thatimprovements in patient education and vaccination status areurgently needed.1,6–8,30–36 Previous recommendations adviserevaccination and reeducation between 2 and 6 years aftersplenectomy.2 We determined that trauma patients who were3 years postsplenectomy were more likely to take good actionin the event of illness, compared with those more than 3 yearsafter surgery. Based on these findings, reeducation shouldoccur 3 years postsplenectomy to maintain the patients’ levelof knowledge and improve compliance with medical care.
Most patients recognized the need for immunization aftersplenectomy, but considerably fewer realized that revaccina-tion with pneumococcal vaccination was necessary. This may
be in part because of the fact that revaccination with pneu-mococcal vaccine has only been recommended since the early1990s,2,19–23,51–53 and literature regarding safety and efficacyof revaccination in trauma patients was not published until1995.2 Thus, some of the patients that had splenectomy be-fore this time may not have been advised to obtain a boostervaccination and have not received any additional informationsince the time of their splenectomy; other patients may notrecall the need for revaccination and may not be remindedbecause of loss of follow-up in an otherwise healthy individ-ual. The latter is further supported by our findings indicatingthat trauma patients with no additional comorbidities, whoaccounted for 43% of our responding population, were morelikely to pursue medical care appropriately when they havegood knowledge regarding their asplenic state. Those withoutcomorbidities with poor knowledge, however, have ex-tremely poor action in the event of illness. Targeting patientswith no additional comorbidities may be an appropriate goal,as these patients do not routinely seek medical care, and aremore likely to relocate and get lost to follow-up.
Formulation of an action plan for all trauma surgeonsbased on these finding is important to improve patient knowl-edge and compliance. Increased responsibility on the partof the trauma team may be necessary to prevent loss offollow-up or reliance on PCPs to follow up with our patients.However, this approach may be argued against, as it placesincreased burden on the trauma team, which should be re-lieved by the PCP. The issue that arises is that the patientswith no other health problems are the ones that do not obtainmedical care in the event of illness, possibly because they donot require routine health check-ups or do not have a regularPCP to follow up with; thus, these patients may get lost toappropriate follow-up. One potential solution is to activelymaintain a splenic registry to identify all patients based ondate of splenectomy. The registry should include the patient’sname and contact information; an additional contact shouldbe obtained to allow for locating patients that may havemoved since their splenectomy. Access to such a registry,which could be maintained by a trauma nurse, would allowfor follow-up, which should ideally occur every 3 years.Follow-up may include a letter and pamphlet of informationregarding the asplenic state and the measures that should betaken to maintain and improve the patient’s quality of care. Inaddition, this registry would allow for identification and con-tact of patients requiring revaccination.
It is important to recognize the limitations associatedwith this study. Before this study there were no validatedquestionnaires available to evaluate patient knowledge andtendency to obtain medical care in relation to splenectomy. Inan attempt to study this relationship, a questionnaire wasdeveloped and critiqued by statisticians and trained scientiststo reduce potential bias. The breakpoints for designationbetween groups did not leave a separation; therefore, there isa potential that one question may have affected whether apatient was in a particular group. However, the weighted
Knowledge and Action in Traumatic Splenectomy
Volume 62 • Number 2 401

questions were determined a priori based on what the inves-tigators thought the patients should know and what deter-mined appropriate action with regard to the asplenic state. Aswith any questionnaire, the potential for nonresponse bias andmeasurement bias must be considered. In an attempt to over-come nonresponse bias, patients received an initial andsecond mailing in addition to a follow-up phone call toincrease participation. Because of some complications atone of the institutions, a second mailing and follow-upphone conversation was not performed. In addition, avail-able covariates were closely investigated to determinewhether a particular subset of patients were under- orover-represented. Validation and scrutiny of the question-naire in patients that have undergone splenectomy second-ary to hematologic disease was conducted in an attempt toreduce the potential for measurement bias.
Only 42% (51 out of 120) of the patients constituted theusable data set, therefore in an attempt to evaluate if thepopulation that responded were representative, we comparedthe epidemiologic data to those that did not respond andfound no significant difference between groups with the ex-ception of age. The nonresponders were significantly youngerthan the responders, which we think further emphasizes thenotion that we need to be more proactive with patients with-out comorbidities, including but not limited to those youngotherwise healthy individuals. Regardless, the number of pa-tients represented in this study is small when compared withthe number of splenectomies performed and should be con-sidered when applying the results to a larger population.Finally, although it is standard care that every patient in bothinstitutions receives written information and appropriatecounseling, we cannot be confident that this occurred in everysituation during the 11 year period. We also are unable toverify that a PCP, when available, was always communicatedwith regarding the new asplenic state of their patient.
CONCLUSIONKnowledge regarding splenectomy in trauma patients is
poor despite in-hospital consultation and education. In addi-tion, poor knowledge appears to be partially correlated withobtaining medical consultation in the event of illness. Thetime since injury is independently associated with appropriatepursuit of medical care, and appears to decline after 3 yearspostsplenectomy. In addition, patients are less likely to obtainmedical care with a poor knowledge base in the absence ofcomorbidities. Thus, young otherwise healthy individualsshould be a primary target for follow-up.
REFERENCES1. Shatz DV. Vaccination practices among North American trauma
surgeons in splenectomy for trauma. J Trauma. 2002;53:950–956.2. Rutherford EJ, Livengood J, Higginbotham M, et al. Efficacy and
safety of pneumococcal revaccination after splenectomy for trauma.J Trauma. 1995;39:448–452.
3. Singer DB. Postsplenectomy sepsis. In: Rosenberg HS, Bolande RP,eds. Perspectives in Pediatric Pathology. Chicago, IL: Year BookMedical Publishers; 1973;285–311.
4. Cullingford GL, Watkins DN, Watts ADJ, et al. Severe latepostsplenectomy infection. Br J Surg. 1991;78:716–721.
5. Lynch AM, Kapila R. Overwhelming postsplenectomy infection.Infect Dis Clin North Am. 1996;10:693–707.
6. Waghorn DJ. Overwhelming infection in asplenic patients: currentbest practice preventable measures are not being followed. J ClinPath. 2001;54:214–218.
7. Waghorn DJ, Mayon-White RT. A study of 42 episodes ofoverwhelming post-splenectomy infection: is current guidance forasplenic individuals being followed? J Infect. 1977;35:289 –294.
8. Davidson RN, Wall RA. Prevention and management ofinfections in patients without a spleen. Clin Microbiol Infect.2001;7:657– 660.
9. Hebert JC. Pneumococcal vaccine improves pulmonary clearance oflive pneumoccoci after splenectomy. J Surg Res. 1989;47:283–287.
10. Pneumovax 23 (Peumococcal Vaccine Polyvalent) Package Insert.West Point, PA; Merck & Co., Inc.; 1986.
11. Schreiber MA, Pusateri AE, Veit BC, et al. Timing of vaccinationdoes not affect antibody response or survival after pneumoccocalchallenge in splenectomized rats. J Trauma. 1998;45:692– 699.
12. Shatz DV, Schinsky MF, Pais LB, et al. Immune responses ofsplenectomized trauma patients to the 23-valent pneumococcalpolysaccharide vaccine at 1 versus 7 versus 14 days aftersplenectomy. J Trauma. 1998;44:760–766.
13. Shatz DV, Romero-Steiner S, Elie CM, et al. Antibody responses inpostsplenectomy trauma patients receiving the 23-valentpneumococcal polysaccharide vaccine at 14 versus 28 dayspostoperatively. J Trauma. 2002;53:1037–1042.
14. Caplan ES, Boltansky H, Snyder MJ, et al. Response of traumatizedsplenectomized patients to immediate vaccination with polyvalentpneumococcal vaccine. J Trauma. 1983;23:801–805.
15. Werner AM, Katner HP, Vogel R, et al. Delayed vaccination doesnot improve antibody responses in splenectomized rats experiencinghypovolemic shock. Am Surg. 2001;67:834–838.
16. Hebert JC. Immunization with heat-killed pneumococci, but notpneumococcal capsular polysaccharides improves survival insplenectomized mice. J Trauma. 1987;42:19–23.
17. Hebert JC, Gamelli RL, Dickerman JD, et al. Lack of protection bypneumococcal vaccine after splenectomy in mice challenged withaerosolized pneumococci. J Trauma. 1983;23:1–6.
18. Breukels MA, Zandvoort A, Van Den Dobbelsteen GPJM, et al.Pneumococcal conjugate vaccine overcome splenic dependency ofantibody response to pneumococcal polysaccharides. Infect Immun.2001;69:7583–7587.
19. Centers for Disease Control and Prevention. Update on adultimmunization recommendations of the immunization practicesadvisory committee (ACIP). MMWR. 1991;40(No. RR-12):1–52.
20. Grimfors G, Soderqvist M, Holm G, et al. A longitudinal study ofclass and subclass antibody response to pneumococcal vaccination insplenectomized individuals with special reference to patients withHodgkin’s disease. Eur J Haematol. 1990;45:101–108.
21. Vella PP, McLean AA, Woodhour AF, et al. Persistence ofpneumococcal antibodies in human subjects following vaccination.Proc Soc Exp Bilo Med. 1980;164:435–438.
22. Butler JC, Brieiman RF, Campbell JF, et al. Pneumococcalpolysaccharide vaccine efficacy. JAMA. 1993;270:1826–1831.
23. Gardner P, Schaffner W. Immunization of adults. N Engl J Med.1993;328:1252–1258.
24. Overturf GD, Field R, Edmonds R. Death from Type 6pneumococcal septicemia in a vaccinated child with sickle celldisease. N Engl J Med. 1979;300:143.
The Journal of TRAUMA� Injury, Infection, and Critical Care
402 February 2007

25. Giebink GS, Schiffman G, Krivit W, et al. Vaccine-typepneumococcal pneumonia: occurrence after vaccination in anasplenic patient. JAMA. 1979;241:2736–2737.
26. Ahonkhai VI, Landesman SH, Fikrig SM, et al. Failure ofpneumococcal vaccine in children with sickle cell disease. N EnglJ Med. 1979;301:26–27.
27. Machesky KK, Cushing RD. Overwhelming postsplenectomyinfection in a patient with penicillin-resistant streptococcuspneumoniae. Arch Fam Med. 1998;7:178–180.
28. Nielson LJ, Pedersen KF, Ellegaard J. Failure of pneumococcalvaccination in a splenectomized child. Acta Paediatr. 1982;71:331–333.
29. Schlaeffer F, Rosenheck S, Baumgarten-Kleiner A, et al.Pneumococcal infections among immunized and splenectomizedpatients in Israel. J Infect. 1985;10:38–42.
30. Brigden ML, Pattullo A, Brown G. Practicing physician’s knowledgeand patterns of practice regarding the asplenic state: the need forimproved education and practical checklist. J Canadien de chirurgie.2001;44:210–216.
31. Brigden ML, Pattullo A, Brown G. Pneumococcal vaccineadministration associated with splenectomy: the need for improvededucation, documentation and the use of a practical checklist. Am JHematology. 2000;65:25–29.
32. Cummins A, Millership S. Local review of the provision ofprophylaxis and advice to patients without functioning spleens.Commun Dis Public Health. 2001;4:144–145.
33. Kind EA, Craft C, Fowles JB, et al. Pneumococcal vaccineadministration associated with splenectomy: missed opportunities.AJIC. 1998;26:418–422.
34. Hegarty PK, Tan B, O’Sullivan R, et al. Prevention ofpostsplenectomy sepsis: how much do patients know? Hematol J.2000;1:357–359.
35. Rasmussen C, Ejstrud P, Hansen J, et al. Asplenic patients’knowledge of prophylactic measures against severe infection. CID.1997;25:738.
36. White KS, Covington D, Churchill P, et al. Patient awareness ofhealth precautions after splenectomy. Am J Infect Control. 1991;19:36–41.
37. Bower GH, Sivers H. Cognitive impact of traumatic events. DevPsychopathol. 1998;10:625–653.
38. Krikorian R, Layton BS. Implicit memory in posttraumatic stressdisorder with amnesia for the traumatic event. J NeuropsychiatryClin Neurosci. 1998;10:359–362.
39. Moulds ML, Bryant RA. Directed forgetting in acute stress disorder.J Abnorm Psychol. 2002;111:175–179.
40. Stuss DT, Binns MA, Carruth FG, et al. The acute period ofrecovery from traumatic brain injury: posttraumatic amnesia orposttraumatic confusional state? J Neurosurg. 1999;90:635–643.
41. Ursano RJ, Fullerton CS. Posttraumatic stress disorder: cerebellarregulation of psychological, interpersonal, and biological responsesto trauma? Psychiatry. 1999;62:325–328.
42. Vakil E, Oded Y. Comparison between three memory tests: cuedrecall, priming and saving closed-head injured patients and controls.J Clin Exp Neuropsychol. 2003;25:274–282.
43. Van der Kolk BA. The body keeps the score: memory and theevolving psychobiology of posttraumatic stress. Harv RevPsychiatry. 1994;1:253–265.
44. Van der Kolk BA, Fisler R. Dissociation and the fragmentary natureof traumatic memories overview and exploratory study. J TraumaStress. 1995;8:505–525.
45. Van der Kolk BA, Pelcovitz D, Roth S, et al. Dissociation,somatization, and affect dysregulation: the complexity of adaptationto trauma. Am J Psychiatry. 1996;153:83–93.
46. Anonymous. Guidelines for the prevention and treatment of infectionin patients with an absent or dysfunctional spleen. BMJ. 1996;312:430–434.
47. Brigden ML, Pattullo AL. Prevention and management ofoverwhelming postsplenectomy infection: an update. Crit Care Med.1999;27:836–842.
48. Sumaraju V, Smith LG, Smith SM. Infectious complications inasplenic hosts. Infect Dis Clin North Am. 2001;15:551–565.
49. Williams DN, Kaur B. Postsplenectomy care: strategies to decreasethe risk of infection. Postgrad Med. 1996;100:195–198, 201, 205.
50. Davies JM, Barnes R, Milligan D. Update of guidelines for theprevention and treatment of infection in patients with an absent ordysfunctional spleen. Clin Med. 2002;2:440–443.
51. Konradsen HB, Henricksen J. The need for revaccination 10 yearsafter primary pneumococcal vaccination in splenectomized adults.Scand J Infect Dis. 1991;23:397.
52. Konradsen HB, Nielson JL, Pedersen FK, et al. Antibody persistencein splenectomized adults after pneumococcal vaccination. ScandJ Infect Dis. 1990;22:725–727.
53. Konradsen HB, Pedersen FK, Henrichsen J. Pneumococcalrevaccination in splenectomized children. Pediatr Infect Dis J. 1990;9:258.
Knowledge and Action in Traumatic Splenectomy
Volume 62 • Number 2 403
Craniofacial Trauma in Adolescents: Incidence, Etiology,and PreventionGiovanni Rocchi, MD, Maria Teresa Fadda, DMD, Tito Matteo Marianetti, MD, Gabriele Reale, MD,and Giorgio Iannetti, MD
Background: The lack of a commonagreement on the precise meaning of theterm “adolescence” makes it difficult tointerpret the literature regarding frac-tures in this age group.
Methods: The records of all patientswith craniofacial trauma admitted to theDivision of Maxillo-Facial Surgery of theRome “La Sapienza” University Hospitalbetween February 2001 and August 2004were reviewed retrospectively. Besides theanatomical site of the fracture, the au-thors also reviewed in the group of ado-lescent fractures the cause, complications,
and the safety devices employed and theireffectiveness.
Results: Of 601 patients admittedafter facial or craniofacial fractures, 96were between 11 and 19 (15.97%). Themost frequent cause of fracture in this agegroup was motorcycle crash (39/96), fol-lowed by car crash (26/96), sporting acci-dent (15/96), attacks (11/96), microcarcrash (2/96), accidental fall (2/96), andfirearm trauma (1/96). Only three patientswearing a full-face helmet suffered facialfractures; the most severe fractures withneurosurgical complications occurred in
patients without a helmet; the majority offacial fractures occurred in patients wear-ing an open-face helmet.
Conclusions: It is universally agreedthat the primary cause of fracture is roadcollisions and, although car crashes pre-vail in all other age groups, motorcyclecrashes are more frequent in adolescents.It is necessary to emphasize the need forprotective devices capable of avoiding notonly neurosurgical complications but alsomaxillofacial fractures (full-face helmet).
J Trauma. 2007;62:404–409.
The lack of a common agreement on the precise meaningof the term “adolescence” makes it difficult to interpretthe literature regarding fractures in this age group be-
cause some authors include adolescent patients in studiesregarding pediatric patients, whereas others group them to-gether with adults. In fact, the term “child” used in theEnglish-speaking literature is a generic term that often com-prises youths up to the age of 18 or 19 years. For example,Posnick et al.1 included patients up to the age of 18 years intheir study, although they dealt with pediatric fractures andreported a lower incidence of fractures in the 13- to 18-yearage group than in the 6- to 12-year one; however, this findingcannot be considered reliable because the referral institutionwas a pediatric hospital. This demonstrates how difficult it isto extrapolate epidemiologic data regarding fractures in ado-lescents from the English-speaking literature.
Adolescence can be defined as the period of transitionfrom the social status of child to that of adult: its duration,nature, and meaning may vary between different cultures,within a single cultural environment or between one socialgroup and another. Owing to the myriad of morphologic,
physiologic, and sexual changes that occur, this period of lifeis extremely delicate. Some authors2 also define a transitionalperiod between infancy and adolescence classified as “pre-adolescence,” which occurs between 10 and 14 years of age.Although some psychologists have also made a distinctionbetween a “first” (11 to 14 years of age) and a “second”adolescence (15 to 18 years of age)3, the majority of authorsagree that the period of adolescence should be consideredfrom 11 to 19 years of age.4
To establish the incidence of craniofacial fractures inadolescence, several published studies whose data did notrefer to exclusively pediatric institutions, and in which it waspossible to distinguish patients ranging from 11 to 19 years,were selected.
Bamjee et al.5 studied a total of 4,000 patients, 326 ofwhom were under 18 years of age. Of these, 70% belonged tothe 13- to 18-year age group with a male:female ratio of2.7:1. The most frequent site of the fracture was the mandible(69%) with involvement of the angle, parasymphysis, body,and condyle in decreasing order: this was followed by thedental-alveolar processes, the zygomatic bone, the orbit, andthe maxillary bone. Although the last three fracture sites arenot frequent in adolescent age, in the study described theyoccurred almost exclusively in this age group in comparisonto the pediatric one.
In their study, Sherick et al.6 took into considerationpatients aged between 2 and 18 years, although 50 of 62 ofthese were aged between 10 and 18 years. The most commonsites of fracture were the mandible (38%), the nasofrontoeth-moidal region (35%), the mediofacial region (17%), and theorbits (10%). Such a high incidence of nasofrontoethmoidal
Submitted for publication June 25, 2005.Accepted for publication October 14, 2005.Copyright © 2007 by Lippincott Williams & Wilkins, Inc.From the Departments of Neurosurgery (G.R.) and Maxillofacial Sur-
gery (T.F.M., M.M.T., G.R., G.I.), University of Rome “La Sapienza,”Rome, Italy.
Address for reprints: Marianetti Tito Matteo, Viale delle provincie, 55Int. 18 00162 Rome, Italy; email: [email protected].
DOI: 10.1097/01.ta.0000197627.05242.a4
The Journal of TRAUMA� Injury, Infection, and Critical Care
404 February 2007

fractures is because of the fact that, as emphasized by Posnickin his discussion of this article, all fractures of the nasal boneswere included.
Remi et al.7 performed a study with the aim of reviewingall mandibular fractures in pediatric age, but 16 of the totalnumber of 18 “children” considered were aged between 10and 18. These authors observed an increase in the incidenceof mandibular fractures proportional to the increase in age ofthe patients examined and attributed the cause for this notonly to the different stage of development of the mandible butalso to the differences in the lifestyle of adolescents in com-parison with children, namely a greater number of sportingand other outdoor activities.
The study published by Muraoka and Nakai8 providesepidemiologic data regarding the adolescent age group: pa-tients aged between 10 and 19 represented the second mostfrequently affected age group for facial trauma (30.4%) fol-lowing the 20- to 29-year age group (33.1%). Another in-teresting observation is the brusque increase between thepercentage of traumas in infantile age (4.4%) and that inadolescents (30.4%).
Lastly, the review published by Haug and Foss4 demon-strates the following: (1) that the incidence of facial traumasin patients aged younger than 16 years oscillates among thedifferent studies and is considered from 1% to 14.7%, (2) thatthere is a universally higher incidence of males (53.7% to80%), and (3) that the most frequent fracture site is themandible (15% to 86%), followed by the medial third (8% to54%) and the superior third (12% to 45%) of the face.
From the published data, it is apparent that such animportant topic as craniofacial traumas in adolescents has sofar been addressed in a varying, nonspecific manner eventhough they have by far the highest incidence in this agegroup in which growth of the facial bones is not entirelycomplete.
Hence, the aim of our study is to concentrate on cranio-facial fractures in adolescents to define their true incidenceand cause and to identify possible means of prevention.
MATERIALS AND METHODSOur study included all patients with craniofacial trauma
admitted to the Division of Maxillo-Facial Surgery betweenFebruary 2001 and August 2004. The incidence of fracturesin each decade of life was calculated and it was establishedthat patients aged between 11 and 19 would be classified as“adolescents.”
The fracture site was classified into three groups: (1) frac-tures of the frontal bones, subdivided into two groups accordingto whether the anterior or posterior wall of the frontal sinus wasinvolved, (2) fractures of the orbito-maxillo-zygomatic block,with a subgroup for blowout type fractures; and (3) mandibularfractures, subdivided into fractures of the condyle, the ramus, theangle, the body, the parasymphysis, and the symphysis.
Besides the anatomic site of the fracture, the data exam-ined in the group of adolescent fractures also took into ac-
count cause, complications, the coexistence of other fracturesof orthopedic nature, any associated neurosurgical problems,the geographical origin of the patient in relation to the causeof the trauma, and the safety devices employed and theireffectiveness.
Patients were further subdivided into two groups: (a)those who had received immediate treatment in our divisionwithin a week of the traumatic event; and (b) patients whohad been surgically treated elsewhere and then referred to usor those in whom primary treatment had not been performedeither because of misdiagnosis or to the poor general condi-tion of the patient.
RESULTSBetween February 2001 and August 2004, a total of 601
patients with facial or craniofacial fractures were admitted tothe Division of Maxillo-Facial Surgery of the Rome “LaSapienza” University Hospital. Their age distribution was asfollows (Fig. 1): 7 patients aged between 0 to 10 years(1.16%), 96 patients between 11 and 19 years (15.97%), 214patients between 20 and 30 years (35.61%), 127 between 31and 40 years (21.13%), 58 between 41 and 50 years (9.65%),45 between 51 and 60 years (7.49%), 36 between 61 and 70years (5.99%) and 18 patients aged over 70 years (2.99%).Range was 3 to 81 years.
Of the total number of patients, 112 were female and 499male (male:female � 4.5:1), whereas in the group of 96adolescents, 72 were male and 24 were female (male:female � 3:1). In this group of patients, the total number offractures was 138 (Fig. 2). There were 11 frontal fractures(8% of the total) and in 7 of these the posterior wall of the
Fig. 1. Occurrence of fractures according to age group. (Bars, leftto right, correspond with legend, top to bottom.)
Craniofacial Trauma in Adolescents
Volume 62 • Number 2 405
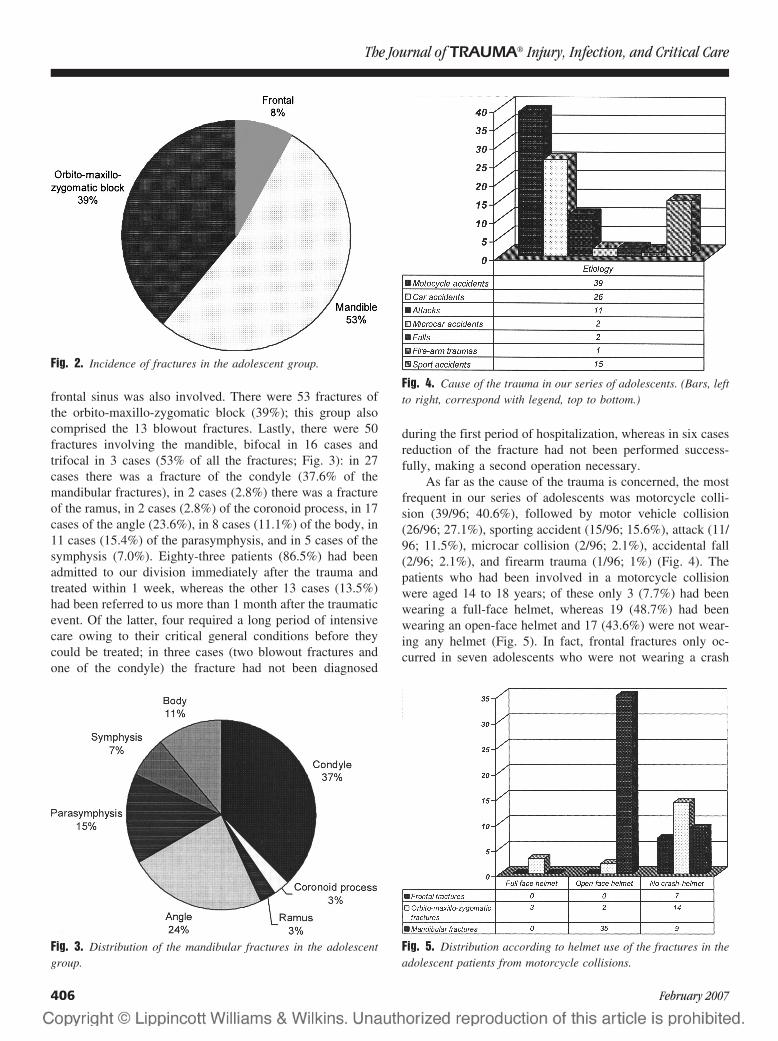
frontal sinus was also involved. There were 53 fractures ofthe orbito-maxillo-zygomatic block (39%); this group alsocomprised the 13 blowout fractures. Lastly, there were 50fractures involving the mandible, bifocal in 16 cases andtrifocal in 3 cases (53% of all the fractures; Fig. 3): in 27cases there was a fracture of the condyle (37.6% of themandibular fractures), in 2 cases (2.8%) there was a fractureof the ramus, in 2 cases (2.8%) of the coronoid process, in 17cases of the angle (23.6%), in 8 cases (11.1%) of the body, in11 cases (15.4%) of the parasymphysis, and in 5 cases of thesymphysis (7.0%). Eighty-three patients (86.5%) had beenadmitted to our division immediately after the trauma andtreated within 1 week, whereas the other 13 cases (13.5%)had been referred to us more than 1 month after the traumaticevent. Of the latter, four required a long period of intensivecare owing to their critical general conditions before theycould be treated; in three cases (two blowout fractures andone of the condyle) the fracture had not been diagnosed
during the first period of hospitalization, whereas in six casesreduction of the fracture had not been performed success-fully, making a second operation necessary.
As far as the cause of the trauma is concerned, the mostfrequent in our series of adolescents was motorcycle colli-sion (39/96; 40.6%), followed by motor vehicle collision(26/96; 27.1%), sporting accident (15/96; 15.6%), attack (11/96; 11.5%), microcar collision (2/96; 2.1%), accidental fall(2/96; 2.1%), and firearm trauma (1/96; 1%) (Fig. 4). Thepatients who had been involved in a motorcycle collisionwere aged 14 to 18 years; of these only 3 (7.7%) had beenwearing a full-face helmet, whereas 19 (48.7%) had beenwearing an open-face helmet and 17 (43.6%) were not wear-ing any helmet (Fig. 5). In fact, frontal fractures only oc-curred in seven adolescents who were not wearing a crash
Fig. 2. Incidence of fractures in the adolescent group.
Fig. 3. Distribution of the mandibular fractures in the adolescentgroup.
Fig. 4. Cause of the trauma in our series of adolescents. (Bars, leftto right, correspond with legend, top to bottom.)
Fig. 5. Distribution according to helmet use of the fractures in theadolescent patients from motorcycle collisions.
The Journal of TRAUMA� Injury, Infection, and Critical Care
406 February 2007

helmet: in four of them, only the anterior wall of the frontalsinus was involved, in the other three, the posterior wall wasinvolved. Among the 17 patients not wearing a helmet, therewere also 14 fractures of the orbito-maxillo-zygomatic blockand 9 mandibular fractures (4 of the condyle, 2 of the para-symphysis, 1 of the angle, 1 of the ramus, and 1 of thesymphysis). In the patients who were wearing an open-facehelmet, the type of fractures were as follows: no cases offrontal fracture, 2 fractures of the orbito-maxillo-zygomaticblock, and 35 mandibular fractures (13 condylar, 1 of thecoronoid process, 10 of the angle, 4 of the body, 4 of theparasymphysis, and 3 of the symphysis). Lastly, in the threepatients who were wearing a full-face helmet, there were alsothree fractures of the orbito-maxillo-zygomatic block.
Of the 26 patients involved in road collisions, 15 hadbeen driving at the time (aged 18 to 19 years), whereas theother 11 had been passengers. These patients presented withfour frontal fractures, involving both the anterior and poste-rior wall; 18 fractures of the orbito-maxillo-zygomatic block;and 9 mandibular fractures (1 of the condyle, 1 of the man-dibular body, 2 of the angle, 2 of the parasymphysis, and 1 ofthe symphysis). On the basis of the data available, it was notpossible to establish whether the patients were wearing aseatbelt at the time of the collision.
Sporting accidents were the cause of facial fractures in15 of our 96 adolescent patients: 9 occurred playing football,4 while riding a bicycle, and 2 while playing volleyball.
In 11 patients, the fracture was the result of an attack: thevictims were 4 Romanian and 2 Polish adolescents. Thisfinding is far less significant than the one that emerges froman analysis of the percentage of traumas caused by attacks onthe patients aged between 20 and 30 years in which, out of atotal of 214 fractures, 70 were caused by attacks; of these, 50were non-Italians (25 Romanian, 17 Polish, 2 Russian, and 2Chinese).
In the group of 96 adolescents, the craniofacial fracturewas associated with an orthopedic fracture in 22 cases (2femoral fractures, 1 of the rotula, 4 of the carpal bones, 3 ofthe shoulder bone, 10 of the ribs, and 2 of the scapulae).There were neurosurgical complications in seven patientswith a fracture of the posterior wall of the frontal sinus:subarachnoid hemorrhage in three, frontotemporal hematomain one, and cerebrospinal fluid rhinorrhea in three. Thesepatients were operated on by a multispecialty team consistingof maxillofacial surgeons and neurosurgeons.
DISCUSSIONAdolescence can be considered as a period of transition
from childhood to adulthood, also in terms of maxillary-facialdevelopment. The craniofacial ratio passes from 8:1 in earlyinfancy to 3:2 at 13 years of age and to 2:1 in adulthood.1,9–11
The frontal sinuses, maxillary and sphenoidal, are only rudi-mental in childhood and reach their full development inadolescent age. The lower craniofacial ratio in adolescents in
comparison with children is reflected in the lower incidenceof fractures and cranial lesions in the former.
McGraw and Cole12 found 88% of cranial lesions inchildren under 5 years versus 34% in patients aged between12 and 16 years. Development of the neurocranium and theupper third of the face occurs earlier than that of the middleand lower thirds: as early as 2 years of age, the cranial suturesclose and the orbits are 90% formed. The frontal sinuses arewell developed by the age of 7 to 8 years but only reach fullgrowth after puberty.4
The importance of the development of the frontal sinusesis crucial for explaining the different patterns of fracturebetween pediatric and adult patients. In fact, the frontal sinusacts as an “airbag,” protecting the anterior cranial fossa in theevent of trauma. Mouzakes et al.11 utilized an interferometricelectronic model to evaluate the capability of the orbit todissipate the energy resulting from the trauma in both adultsand children. They drew the conclusion that in adults, mainlyas a result of the presence of the frontal sinuses, the skullbetter dissipates energy and minimizes posttraumatic skeletaldistortion; on the contrary, the child’s skull, because of theabsence of the frontal sinuses and the greater elasticity of thebone tissue, permits considerable skeletal distortion of the orbitalwalls. In clinical terms, this means a higher frequency of frac-tures of the orbital roof in pediatric age (with or without fracturesof the upper orbital rim).13,14
The peak incidence of orbital roof fractures occurs be-tween 3 and 5 years of age and diminishes in direct propor-tion to age progression.13 On the contrary, the opposite trendcan be observed in fractures of the lower third of the face:these are fairly rare in the first years of life and then graduallyincrease with age to reach a peak incidence around 17 yearsof age.7 On the other hand, they account for just 13% ofmaxillofacial fractures in the age group between 0 and 5years, 37% between 6 and 10 years, and more than 50%between 11 and 16 years.9 Fractures of the middle third of theface6 are even rarer in the first years of life and progressivelyincrease in frequency from pediatric age to adolescence.6
These differences in the incidence of the various types offractures in the different age groups reflects the diversity ofthe skeletal proportions during the various phases of maxil-lofacial development. In fact, at 6 years of age the inferiorthird of the face has only reached 60% of its final size anddevelopment of the middle third is even slower because of thelate pneumatization of the maxillary sinus.9 The progressivegrowth of the maxillary, zygomatic, and mandibular bones inearly adolescence explains the higher incidence of fracturesof the middle and lower thirds of the face in adolescentpatients in comparison to pediatric ones.
The findings of our study agree with those reported inthe literature: fractures of the lower and middle thirds of theface are very frequent in adolescents, with an incidence of52% and 55%, respectively, in the 96 adolescent patients ofour series.
Craniofacial Trauma in Adolescents
Volume 62 • Number 2 407

The different lifestyle of adolescents with respect tochildren, characterized by a greater participation in sportingand other outdoor activities coupled with a growing desire forindependence and new experiences typical of the psycholog-ical passage toward adulthood, help to explain the high in-crease in the incidence of traumas in this age group togetherwith a significant change in the cause of the trauma.
Vanderas and Papagiannoulis14 performed a prospectivestudy regarding the incidence of craniofacial traumas inyouths aged 9 to 11 years to evaluate the relationship betweenthe levels of urinary catecholamines and the incidence ofdental-facial traumas. They concluded that a statistically sig-nificant correlation exists between facial traumas and theamount of epinephrin in the urine. Higher levels of cat-echolamines might therefore be responsible for the greatervivacity and unsettledness in these youths, which result in agreater exposure to dangerous situations.
As far as cause is concerned, the majority of authorsagree that road collisions are the primary cause of fractures inboth pediatric and adolescent age groups.1,4,6,8 As early as1943, motor vehicle collisions were reported to be the mostfrequent cause of facial fractures.6 Accidental falls representthe second most frequent cause of craniofacial fractures ininfancy, because at this age head trauma is favored by thelarger size of the head in proportion to the body in compar-ison to adults.15 In adolescents, the second most frequentcause of trauma consists of sporting accidents or bodilyviolence (fights or sexual assault).1,5,6 Sporting accidentscover all types of sport: bicycle accidents, a sport in whichadolescents do not usually wear head or chin protection,7
basketball, baseball, hockey, soccer, skiing, and snowboard-ing. Shorter et al.16,17 performed specific studies on lesionsfrom skiing or snowboarding in children and adolescents andcame to the conclusion that craniofacial fractures are lessfrequent and less severe in snowboarding in comparison toskiing.
In some studies, the most frequent cause of craniofacialfractures was reported to be violence (assault, fights, andfirearms)5. This finding clearly demonstrates that the dataregarding the incidence and cause of fractures must be inter-preted in the light of the specific situation in which the datahas been collected. For example, in the study performed bySherick et al.18 on a vast patient population in a nonurbanenvironment, there were no firearm fractures at all, whereasin other statistics regarding the American population agedbetween 12 and 18 years, these are often quoted as being thesecond most frequent cause of fracture. These authors alsoobserved that males represent 92% of patients with fracturesfrom involvement in fights, 62% of those caused by roadcollisions, and 62% of those related to sporting activities.
Our data regarding the cause of the fractures was inaccordance with that described in the literature: the mostfrequent cause of fracture was motorcycle collisions (40.6%),followed by motor vehicle collisions (27.1%), sporting acci-dents (15.6%), assaults (11.5%), accidental falls (2.1%), mi-
crocar collisions (2.1%), and firearm accidents (1.0%). Itshould be emphasized that in our case series as well, causevaried according to the population examined; in fact, thepercentage of fractures consequent to physical assault in-creased considerably when immigrant populations were con-sidered, a finding already observed in adolescent patients butfar more noticeable in the age group between 30 and 40 years.
Although high-velocity motor vehicle collisions increasewith age, fractures caused by falls gradually decrease aspatients pass from infancy to adolescence.1 Nontypical causesof fracture in infancy and adolescence are often described ascase reports in the literature. La Frentz et al.19 described thecase of a child who had fallen on a pen that penetrated theorbit as far as the sphenoidal sinus. In the case described byOrbay et al.,20 a knife had penetrated the cheek of a 15-year-old boy and had reached as far as the contralateral opticnerve. Even more unusual is the description of a 15-year-oldin whom a strongbow arrow had penetrated through themouth as far as the occipital bone.21
In our case series, motor vehicle and motorcycle colli-sions were the primary cause of craniofacial fractures inadolescents. Nowadays, road collisions are one of the prin-cipal problems in terms of both healthcare and health eco-nomics representing, with a total of 1 million victims eachyear worldwide, the primary cause of death in the 15- to44-year age group in industrialized countries.22 In Italy, therewere 190,031 road crashes and 6,226 deaths in 1997 and235,142 crashes with 6,682 deaths in 2001 (Italian Institute ofStatistics). Road collisions are more frequent in NorthernItaly than in Central and Southern Italy and cause moreadolescent deaths in this area (62 deaths/100,000 adolescents)than in the others (48 deaths/100,000 adolescents). Data pro-vided by the Italian Institute of Statistics shows that in the 14-to 17-year age group, there is a predominance of motorcyclecollisions, whereas from the age of 18 years, mortality causedby motor vehicle collisions brusquely increases (21/100,000).
These figures triggered the recently introduced preven-tive strategies such as obligatory use of crash helmets andsafety belts. The data available did not allow us to establishhow many people were wearing seatbelts at the time of impactin our study. In the study performed by Murphy et al.23, aclear correlation was identified between facial fractures inadolescents and failing to wear seatbelts. It was demonstratedthat, in children, seatbelts may cause severe abdominal le-sions because the iliac crest is not well-developed until theage of 10 years and cannot therefore act as a point of contactfor a seatbelt; on the contrary, in adolescents their use isstrongly recommended.6,23 Another point to bear in mind isthat, at 14 years of age, adolescents can drive a microcar:therefore, the campaign to promote the use of seatbelts shouldinclude these vehicles too. In fact, the companies that producethese vehicles judge them to be safe at a speed not exceeding45 km/hour: as a matter of fact, the adolescents who drivethem often modify their technical characteristics so that theycan reach a speed almost double this safety limit. Children
The Journal of TRAUMA� Injury, Infection, and Critical Care
408 February 2007
also more frequently fall victim to the explosion of airbagsthan do adolescents; in some cases of low-speed crashes thesecan be fatal.24
To evaluate the efficacy of the new crash-helmet law, asurvey was performed (Crash-helmet Project 2000) involving 58local health authorities throughout Italy (26 in Northern, 11 inCentral and 20 in Southern Italy). The results of this study provethat use of crash helmets has consistently increased, reachingmore than 95% in Northern and Central Italy. In Southern Italy,although crash-helmet use has increased more than fourfold, it isstill only about 60%. A comparison between the period beforethe introduction of the law (February and March) and thatimmediately following it (April, May, and June) showed amarked decrease in emergency admissions (�40%). In par-ticular, emergency admissions with a diagnosis of craniofaciallesion went down by 75%, the number of cases requiring hos-pitalization went down by 48%, whereas hospitalization requir-ing a neurosurgical ward decreased by 79%.25
However, facial fractures did not diminish in the sameway as neurosurgical lesions: this is partially attributable tothe widespread use of open-face helmets that do not protectthe facial bones (the mandible in particular) as well as full-face helmets. Our findings emphasize this concept: only threepatients wearing a full-face helmet suffered facial fractures;the most severe fractures with neurosurgical complicationsoccurred in patients without a crash helmet; and the majorityof facial fractures occurred in patients wearing an open-facehelmet. In fact, although this type of helmet did protect thepatients we treated from frontal fractures, they did not offerany protection from mandibular fractures, the majority ofwhich were plurifragmental. Although it has been suggestedthat removal of a full-face helmet may cause cervical spinecomplications, especially in patients with multiple traumas,our experience leads us to recommend use of this device.
In conclusion, our findings show that adolescents are thethird most frequently affected age group for craniofacialfractures, behind 20- to 30-year-olds and 31- to 40-year-olds.It is universally agreed that the primary cause of fracture isroad collisions and although motor vehicle collisions prevailin all the other age groups, motorcycle crashes are morefrequent in adolescents. Hence, it is necessary to emphasizethe need for protective devices capable of avoiding not onlyneurosurgical complications but also maxillofacial fractures(full-face helmet).
It is also essential that, when possible, patients be treatedas soon as possible after trauma because the cosmetic andfunctional results obtainable once the fracture lines have setincorrectly are not comparable to those achieved by earlytreatment. Last but not least, the importance of a multispe-cialty team made up of anesthetists, maxillofacial surgeons,and neurosurgeons, able to guarantee the best possible man-agement of the polytraumatized craniofacial patient, cannotbe overestimated.
REFERENCES1. Posnick JC, Wells M, Pron GE. Pediatric facial fractures: evolving
patterns of treatment. J Oral Maxillofac Surg. 1993;51:836–844.2. Blair AW, Burton WH. Growth and development of the
preadolescent. New York: Appleton; 1951.3. Blos P. The adolescent passage. New York: International
Universities Press; 1979.4. Haug RH, Foss J. Maxillofacial injuries in the pediatric patient. Oral
Surg Oral Med Oral Pathol Oral Radiol Endod. 2000;90:126–134.5. Bamjee Y, Lownie JF, Cleaton-Jones PE, Lownie MA. Maxillofacial
injuries in a group of South Africans under 18 years of age.Br J Oral Maxillofac Surg. 1996;34:298–302.
6. Kaban LB. Diagnosis and treatment of fractures of the facial bonesin children 1943–1993. J Oral Maxillofac Surg. 1993;51:722–729.
7. Remi M, Christine MC, Gael P, et al. Mandibular fractures inchildren long term results. Int J Ped Otorhinolaryngol. 2003:25–30.
8. Muraoka M, Nakai Y. Twenty years of statistics and observation offacial bone fracture. Acta Otolaryngol (Stockh). 1998;Suppl 538:261–265.
9. Spota A, Taloni A, Lovaglio A, et al. Traumi maxillofacciali in etapediatrica. Minerva Stomatol. 1999;48:15–21.
10. Becelli R, Renzi G, Frati R, et al. Le fratture maxillofacciali neipazienti in eta di crescita. Minerva Pediatr. 1998;50:121–126.
11. Mouzakes J, Koltai PJ, Simkulet MD, et al. Evaluation of orbitalstress dissipation in pediatric and adult skulls using electronicspeckle pattern interferometry. Arch Otolaryngol Head Neck Surg.1999;125:765–773.
12. McGraw BL, Cole RR. Pediatric maxillofacial trauma. Age-relatedvariations in injury. Arch Otolaryngol Head and Neck Surg. 1990;116:41.
13. Haug RH, Van Sickels JE, Jenkins WS. Demographics and treatmentoptions for orbital roof fractures. Oral Surg Oral Med Oral Pathol OralRadiol Endod. 2002;93:238–245.
14. Vanderas AP, Papagiannoulis L. Urinary catecholamine levels andincidence of dentofacial injuries in children: a 2-year prospectivestudy. Endod Dent Traumatol. 2000;16:222–228.
15. Lallier M, Bouchard S, St.Vit D, et al. Falls from heights amongchildren: a retrospective review. J Pediatr Surg. 1999;34:1060–1063.
16. Shorter NA, Jensen PE, Harmon BJ, et al. Skiing injuries in childrenand adolescents. J Trauma: Injury, Infection, and Critical Care.1996;40:997–1001.
17. Shorter NA, Mooney DP, Harmon BJ. Snowboarding injuries inchildren and adolescents. Am J Emerg Med. 1999;17:261–263.
18. Sherick DG, Buchman SR, Patel PP. Pediatric facial fractures: ademographic analysis outside an urban environment. Ann Plast Surg.1997;38:578–585.
19. LaFrentz JR, Mair EA, Casler JD. Craniofacial ballpoint pen injury:endoscopic management. Ann Otol Rhinol Laryngol. 2000;109:119–122.
20. Orbay AS, Uysal OA, Iyigun O, et al. Unusual penetratingfaciocranial injury caused by a knife: a case report. J Cranio-Maxillofacial Surg. 1997;25:278–281.
21. Franklin GA, Lukan JK. Self-inflicted crossbow injury to the head.J Trauma. 2002;52:1009.
22. OMS. Annuaire de statistiques sanitaires mondiales. Available at:http//:www.who.int/violence_injury_prevention. Accessed March 20,2005.
23. Murphy RX, Birmingham LK, Okunski WJ, et al. Influence ofrestraining devices on patterns of pediatric facial trauma in motorvehicle collisions. Plast Reconstr Surg. 2001;107:34–37.
24. Grisoni ER, Pillai SB, Volsko TA, et al. Pediatric airbag injuries: theOhio experience. J Pediatr Surg. 2000;35, 2:160–163.
25. Giustini M, Taggi F. Impatto di una legge estesa a tutti sull’uso delcasco e gli incidenti tra i ciclomotoristi in Italia nel 2000. BEN-Notiziario ISS 2001;6:14.
Craniofacial Trauma in Adolescents
Volume 62 • Number 2 409

Chronic Posttraumatic Stress Disorder After Facial Injury:A 1-year Prospective Cohort StudyShirley M. Glynn, PhD, Vivek Shetty, DDS, Karin Elliot-Brown, PhD, Richard Leathers, DDS,Thomas R. Belin, PhD, and Jianming Wang, PhD
Background: This study examinedthe prevalence, severity, and predictors ofpersistent traumatic stress symptoms insocioeconomically disadvantaged adultsafter orofacial injury.
Methods: A 1-year prospective studyof 336 socioeconomically disadvantagedadults treated for orofacial injury at aLevel I trauma center was conducted.Univariate analyses were performed onearly measures of injury characteristics,prior trauma exposure, coping resources,and psychosocial functioning to selectpotential predictors of 1-year posttrau-matic stress disorder (PTSD) scores; in-dependence of variable contribution wasthen evaluated in multiple regressionanalyses.
Results: A substantial number ofpatients (23%) continued to experiencesignificant PTSD symptomatology at 12months. Predictors of PTSD symptoms at12 months included current and lifetimemental health and social service needs,lifetime social service use, prior traumaexposure, sum of stressful life events in theyear preceding injury, patient report ofpain severity and inadequate social supportat 10 days postdischarge, and PTSD scoresat 1 month. One-month PTSD symptoms,unmet social service need, and need formore instrumental and emotional supportwere independent predictors of 12-monthPTSD outcomes. Limitations includeloss to follow up, use of self-report mea-sures, and the possibility of additional
traumatization in the follow-up year in-fluencing symptom levels.
Conclusions: Many socioeconomi-cally disadvantaged adults manifest nega-tive psychological outcomes even 1 yearafter an orofacial injury. Poor social sup-port and unmet social service needs imme-diately after the injury, as well as highPTSD symptoms at 1 month postinjury,are strongly associated with the risk ofdeveloping chronic PTSD. The surgicalmanagement of orofacial injuries in disad-vantaged individuals should integrate casemanagement that addresses psychosocialsequelae and patient service needs.
Key Words: Orofacial injury, Trauma,Posttraumatic stress disorder, Chronic.
J Trauma. 2007;62:410–418.
Advanced medical trauma care systems are very adept attreating the physical consequences of injury; however,the psychological aspects of the injury are rarely ad-
dressed. Beyond the bodily injury, the traumatic event canelicit a range of subjective reactions including anxiety, de-pression, unwanted experiencing of the event, hyperarousal,and a persistent sense of current threat.1–3 The acute stressreaction can overwhelm the individual’s ability to cope andleaves that person feeling emotionally, cognitively, and phys-ically overwhelmed. Even after the traumatic event is over,the person’s reaction to it may not end, and significant sub-sets of trauma patients continue to experience psychological
disturbances that are recalcitrant and severe enough to meetthe diagnostic criteria for posttraumatic stress disorder(PTSD).4,5 Essential Diagnostic and Statistical Manual ofMental Disorders (DSM)-IV diagnostic criterion for PTSDinclude exposure to an event that threatens life or physicalintegrity (criterion A) resulting in the symptom clusters re-lated to reexperiencing the traumatic event (criterion B),avoidance and emotional numbing (criterion C), and hyper-arousal (criterion D) along with an impairment in social andoccupational functioning.6
Designed initially to explain the psychological problemsfacing combat veterans and torture victims, PTSD has cometo be recognized as one of the more common and disablingconsequences of physical injury. A variety of traumatic stres-sors including interpersonal violence,7 accidents,8 and rapeand physical assault have been linked to development ofPTSD. Recent investigations suggest that injuries to the facialregion may place the patient at particular risk for developingPTSD because of the face’s centrality to physical and socio-psychological functioning.9–12 The face, with its visibilityand uniquely individualized features, largely defines an indi-vidual’s perceptions of self-image and identity. Conse-quently, adjustment to a facial injury and attendant physicaldisabilities can be more troublesome than an extremityinjury.13 In our cohort of 336 adult patients with orofacialinjury, 25% evidenced symptoms consistent with PTSD at the4- to 6-week follow-up14 and depression, phobic anxiety, and
Submitted for publication September 19, 2005.Accepted for publication April 12, 2006.Copyright © 2007 by Lippincott Williams & Wilkins, Inc.From the Department of Psychiatry and Biobehavioral Sciences
(S.M.G.), the Section of Oral and Maxillofacial Surgery (V.S.), the Depart-ment of Biostatistics and Psychiatry and Biobehavioral Sciences (T.R.B.),and the Facial Injury Research Center (J.M.W.), University of California LosAngeles; the Department of Social Work (K.E.-B.), College of Health andHuman Services, California State University; and the Department of Oral andMaxillofacial Surgery (R.L.), Charles Drew University; Los Angeles, CA.
Supported by grant P50/DE-10598 from the National Institute of Den-tal and Craniofacial Research and conducted by the University of CaliforniaLos Angeles Facial Injury Research Center.
Address for reprints: Shirley M. Glynn, VAGLAHS at West LA, 11301Wilshire Blvd. (B151J), Los Angeles, CA 90073; email: [email protected].
DOI: 10.1097/01.ta.0000231556.05899.b0
The Journal of TRAUMA� Injury, Infection, and Critical Care
410 February 2007
obsessive-impulsive tendency were common.15 Our findingscorroborate investigations by other researchers who havereported acute posttraumatic stress symptoms in 27% to 41%of orofacial injury patients.
Although the acute posttraumatic symptomatology maygradually abate, in a significant subset of traumatized indi-viduals, the psychological reaction can develop into chronicPTSD.16 Researchers have identified several personal andenvironmental factors that increase the risk of exposure totraumatic events and heighten susceptibility to the develop-ment of PTSD.17,18 Putative risk factors include being male,socioeconomically disadvantaged, low education, and behav-ioral and substance use problems. These risk factors areconsistent with the profile of many patients seeking care forassaultive orofacial injury at our public hospitals. Hence,there is a great need to expand the care of facial injuries invulnerable populations to include consideration of evolvingpsychosocial sequelae and to investigate and quantify thesedifficulties. Understanding the relative impact of these bio-psychosocial factors and how they mitigate or exacerbate thestress of injury is an important first step toward providingcomprehensive care and developing targeted interventions forthese individuals. In particular, insights into the developmentof PTSD chronicity in orofacial injury survivors will provideclinicians with opportunities to identify injury survivors atrisk for poor psychological outcomes and provide adjunctivetreatment to facilitate emotional recovery.
As an initial step toward developing a comprehensivecare paradigm, we set out to document the prevalence ofchronic psychological morbidity in a group of orofacial injurypatients presenting for care at an urban, inner-city, Level Itrauma center. Using a prospective study design, utilizingrepeated assessments at multiple time points during a year,we had three goals for this investigation. First, we sought todetermine the severity of traumatic stress symptoms in thepatient cohort at 12 months after facial injury. Second, wesought to identify predictors of high levels of traumatic stressat 1 year postinjury. Based on a review of the literature, wefocused on six potential domains of chronic PTSD predictors:(1) sociodemographics, (2) psychological difficulties beforethe trauma, (3) prior traumatic exposure, (4) exposure char-acteristics from the facial injury, (5) resources available in theearly recovery phase, and (6) acute PTSD symptoms at 1month. We hypothesized, following from our prior researchand other published findings, that being female,14,19 priorhistory of psychological disturbance,14,17,20 prior history oftraumatic exposure,21 severity of the injury,18,21 limited so-cial support,14,15 and high levels of PTSD symptoms in theearly recovery phase18,21 would all increase the probabilitythat traumatized individuals develop chronic PTSD. Finally,we conducted analyses to determine the rates of likelychronic (longer than 3 months) PTSD cases after orofacialinjury, as reflected in self-reports of symptoms scored forprobable PTSD clinical diagnosis.
PATIENTS AND METHODSSetting
Our study cohort of 336 patients was recruited from thepool of adult patients presenting with orofacial injuries to aLevel I trauma center in Los Angeles between August 1996and May 2001. Although the spectrum of injury included themouth, mandible, midfacial, and frontal regions, patientsneeded to have at least one fracture involving the mandible tobe eligible for the study. All patients had a similar spectrumof injury severity; patients with severe injuries such as avul-sive gunshot injuries were excluded. Patients with alteredmental status attributable to head injuries or who were men-tally incompetent were also excluded, as were patients whowere unable or unwilling to return for follow-up care. Thestudy procedures were approved by local institutional reviewboards and informed consent was obtained from participants.Depending on the judgment of the attending surgeon, themandible fractures were treated with either maxillomandibu-lar fixation (MMF) for 4 to 5 weeks or rigid internal fixation(RIF) utilizing bone plates and screws and return to functionwithin 3 to 4 days postsurgery. Concomitant to the surgicaltreatment, consenting patients were interviewed by researchstaff using structured questionnaires that included items re-garding sociodemographic characteristics and various psy-chosocial measures. In addition to baseline data collected atthe time of admission and discharge, four postdischarge pa-tient surveys were administered at the various recall appoint-ments. The first survey was conducted within 10 days ofhospital discharge; the second at the 1-month recall appoint-ment, the third approximately 6 months postdischarge, andthe fourth approximately 1 year postdischarge.
MeasuresThe surveys were orally administered, fully structured self-
report questionnaires read by trained lay research assistants.
Injury Characteristics and Substance UseFacial injury characteristics were abstracted from surgi-
cal records using the classification taxonomy described byShetty et al.22 Information on constituent fracture variablesincluding fracture type, location, occlusion, soft-tissue in-volvement, infection, and interfragmentary displacement wascollected in a standardized format, assigned empiricalweights, and subsequently transformed into a composite fa-cial injury severity score. Information was collected on thecircumstances leading to the injury and the use of drugs oralcohol at the time of injury. In addition, patient reports ofpain ratings were also collected at each interview.
Patients who admitted current alcohol use were admin-istered the CAGE questionnaire23 at the time of discharge.Recommended by the National Institute on Alcohol Abuseand Alcoholism24 as a rapid screen for alcohol use, the CAGEquestionnaire is widely used in primary care settings based onits sensitivity and specificity for identifying problem drinking
Orofacial Injury and Chronic PTSD
Volume 62 • Number 2 411
and alcohol dependence.25 The CAGE acronym derives fromthe first letter of key words from each of the four questionsthat inquire about the patient’s efforts to cut down on drink-ing, being angry when people comment about their drinking,feeling guilty after drinking, and taking an alcoholic eye-opener in the morning. Any positive response suggests prob-lem drinking and a positive response to two or more suggestsproblem drinking and alcohol dependence.
We used the Mental Health Inventory 5-Item Question-naire (MHI-5)26 to gauge distress from the orofacial injury atthe time of discharge from hospital. The MHI-5 is a five-itemscale that assesses general mood or affect, including depression,anxiety, and positive well-being. The index runs from 0 to 100,with lower score indicating greater psychological distress.
Psychological Difficulties Before InjuryWe used the Service Use and Adjustment Problem
Screen (SUAPS)27 at 10 days postdischarge to assess for ahistory of service use and mental health problems. TheSUAPS is a brief self-report screening tool that includes 11items focusing on mental health and social service use andproblems: mental health problems, suicide attempts, alcoholuse problems, drug use problems, impairment, problems withthe law, problems with employment (fired or laid off), schoolexpulsion or multiple suspensions, mental health and sub-stance abuse treatment, and homelessness. Items are summedto provide scales indexing: (1) self-identified mental healthneed, (2) self-identified social service need, and (3) anyservice use, both currently (past year) and cumulatively (life-time). We used lifetime and current mental health need andlifetime social service need and use as our measures ofpsychological difficulties before the injury.
Prior Traumatic ExposureAt the 10-day follow-up visit, we administered the Post-
traumatic Disorder Scale (PDS)28 to assess lifetime traumaticexposure before the facial injury and existing PTSD fromprior traumatic exposure. The structure and content of thePDS mirror the DSM-IV5 diagnostic criteria for PTSD and ithas good psychometric properties, construct validity, andconcordance with diagnoses established through semistruc-tured clinical interviews. The self-report scale includes itemsassessing objective and subjective responses to the circum-stances of the traumatic injury, symptom severity, and likelyPTSD diagnosis resulting from the injury. To accommodatetime constraints of a trauma care setting, the 12 categories oflifetime traumatic exposure were combined into 7 conceptualcategories (e.g., serious accident, natural disaster, assault[including sexual assault], imprisonment, life-threatening ill-ness, witnessing sudden or violent death, other life threat).
To assess significant life events experienced by patientsin the year before the injury, we administered the SocialReadjustment Rating Scale (SRRS)29 at the 10-day follow-upvisit. One of the most widely cited measurement instrumentsin the stress literature, the self-report SRSS is based on the
premise that change in one’s life can increase stress levelsand make one more susceptible to illness and mental healthproblems. This scale uses a variety of life events rated on ascale of 0 to 100, with death of spouse at 100, being the moststressful of the events on the scale. The values of all theexperienced events are then added together to provide a totalstress score.
Coping Resources Available in the Recovery PhaseWe used self-reported current social service need and use
from the SUAPS (described above) as measures of socioeco-nomic instability at 10 days postdischarge. Patients’ percep-tions of available social support were further clarified usingthe sum of three relevant items (“enough friends,” “closecontact,” “count on someone”) from the Medical OutcomeStudy29 short-form (SF-36) administered at discharge.30 Highscores indicate more perceived support, with a maximumscore of 3. At 10 days postdischarge, single items were askedon the availability of emotional support, the adequacy ofemotional support, the need for instrumental task assistance,and the adequacy of that task assistance.
Acute PTSD Symptoms From the Orofacial InjuryAt the 1 month follow-up visit, we assessed the patients
for PTSD symptomatology using the PDS.28 Endorsement ofthe 17 symptoms linked to the injury reflected the objectiveand subjective responses to the facial injury.
Chronic (12-Month) PTSD Symptoms From theOrofacial Injury
At the 12-month follow-up visit, we assessed the objec-tive and subjective responses to the facial injury, and likelyPTSD diagnosis from the facial injury by utilizing the PDSdescribed above.
Data AnalysisThe primary objectives of this article were to establish
the levels of traumatic symptoms 1 year after a facial injuryand to identify predictors of high rates of PTSD symptoms 1year after the trauma. The sum of the 17 PTSD items mea-sured by the 12-month PDS was utilized as the primarydependent measure; for a secondary analyses, likely positive/negative PTSD diagnostic classifications were made utilizingsymptom levels, reports of immediate terror, helplessness, orperceived life threat at the time of the event, and a subsequentdecline in role functioning, as specified by Foa.28
First, the sample was characterized. Second, patterns inmissing data were evaluated, utilizing t tests for continuousvariables (corrected for heterogeneous group variance if nec-essary) and �2 for categorical variables. Third, absolute levelsof PDS symptoms were determined. Fourth, univariate anal-yses of the relation of the predictor variables to levels ofPTSD symptoms were conducted, utilizing t tests (correctedfor heterogeneous group variance if necessary) for categoricaldata, bivariate correlations for continuous variables, and
The Journal of TRAUMA� Injury, Infection, and Critical Care
412 February 2007
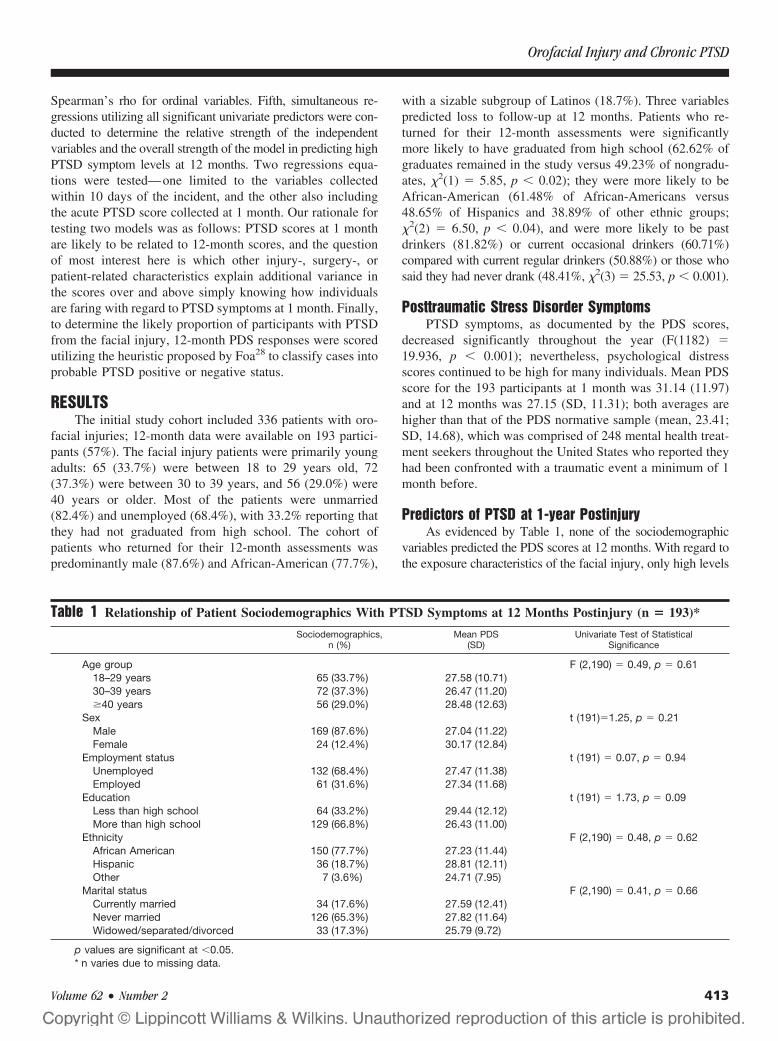
Spearman’s rho for ordinal variables. Fifth, simultaneous re-gressions utilizing all significant univariate predictors were con-ducted to determine the relative strength of the independentvariables and the overall strength of the model in predicting highPTSD symptom levels at 12 months. Two regressions equa-tions were tested—one limited to the variables collectedwithin 10 days of the incident, and the other also includingthe acute PTSD score collected at 1 month. Our rationale fortesting two models was as follows: PTSD scores at 1 monthare likely to be related to 12-month scores, and the questionof most interest here is which other injury-, surgery-, orpatient-related characteristics explain additional variance inthe scores over and above simply knowing how individualsare faring with regard to PTSD symptoms at 1 month. Finally,to determine the likely proportion of participants with PTSDfrom the facial injury, 12-month PDS responses were scoredutilizing the heuristic proposed by Foa28 to classify cases intoprobable PTSD positive or negative status.
RESULTSThe initial study cohort included 336 patients with oro-
facial injuries; 12-month data were available on 193 partici-pants (57%). The facial injury patients were primarily youngadults: 65 (33.7%) were between 18 to 29 years old, 72(37.3%) were between 30 to 39 years, and 56 (29.0%) were40 years or older. Most of the patients were unmarried(82.4%) and unemployed (68.4%), with 33.2% reporting thatthey had not graduated from high school. The cohort ofpatients who returned for their 12-month assessments waspredominantly male (87.6%) and African-American (77.7%),
with a sizable subgroup of Latinos (18.7%). Three variablespredicted loss to follow-up at 12 months. Patients who re-turned for their 12-month assessments were significantlymore likely to have graduated from high school (62.62% ofgraduates remained in the study versus 49.23% of nongradu-ates, �2(1) � 5.85, p � 0.02); they were more likely to beAfrican-American (61.48% of African-Americans versus48.65% of Hispanics and 38.89% of other ethnic groups;�2(2) � 6.50, p � 0.04), and were more likely to be pastdrinkers (81.82%) or current occasional drinkers (60.71%)compared with current regular drinkers (50.88%) or those whosaid they had never drank (48.41%, �2(3) � 25.53, p � 0.001).
Posttraumatic Stress Disorder SymptomsPTSD symptoms, as documented by the PDS scores,
decreased significantly throughout the year (F(1182) �19.936, p � 0.001); nevertheless, psychological distressscores continued to be high for many individuals. Mean PDSscore for the 193 participants at 1 month was 31.14 (11.97)and at 12 months was 27.15 (SD, 11.31); both averages arehigher than that of the PDS normative sample (mean, 23.41;SD, 14.68), which was comprised of 248 mental health treat-ment seekers throughout the United States who reported theyhad been confronted with a traumatic event a minimum of 1month before.
Predictors of PTSD at 1-year PostinjuryAs evidenced by Table 1, none of the sociodemographic
variables predicted the PDS scores at 12 months. With regard tothe exposure characteristics of the facial injury, only high levels
Table 1 Relationship of Patient Sociodemographics With PTSD Symptoms at 12 Months Postinjury (n � 193)*
Sociodemographics,n (%)
Mean PDS(SD)
Univariate Test of StatisticalSignificance
Age group F (2,190) � 0.49, p � 0.6118–29 years 65 (33.7%) 27.58 (10.71)30–39 years 72 (37.3%) 26.47 (11.20)�40 years 56 (29.0%) 28.48 (12.63)
Sex t (191)�1.25, p � 0.21Male 169 (87.6%) 27.04 (11.22)Female 24 (12.4%) 30.17 (12.84)
Employment status t (191) � 0.07, p � 0.94Unemployed 132 (68.4%) 27.47 (11.38)Employed 61 (31.6%) 27.34 (11.68)
Education t (191) � 1.73, p � 0.09Less than high school 64 (33.2%) 29.44 (12.12)More than high school 129 (66.8%) 26.43 (11.00)
Ethnicity F (2,190) � 0.48, p � 0.62African American 150 (77.7%) 27.23 (11.44)Hispanic 36 (18.7%) 28.81 (12.11)Other 7 (3.6%) 24.71 (7.95)
Marital status F (2,190) � 0.41, p � 0.66Currently married 34 (17.6%) 27.59 (12.41)Never married 126 (65.3%) 27.82 (11.64)Widowed/separated/divorced 33 (17.3%) 25.79 (9.72)
p values are significant at �0.05.* n varies due to missing data.
Orofacial Injury and Chronic PTSD
Volume 62 • Number 2 413
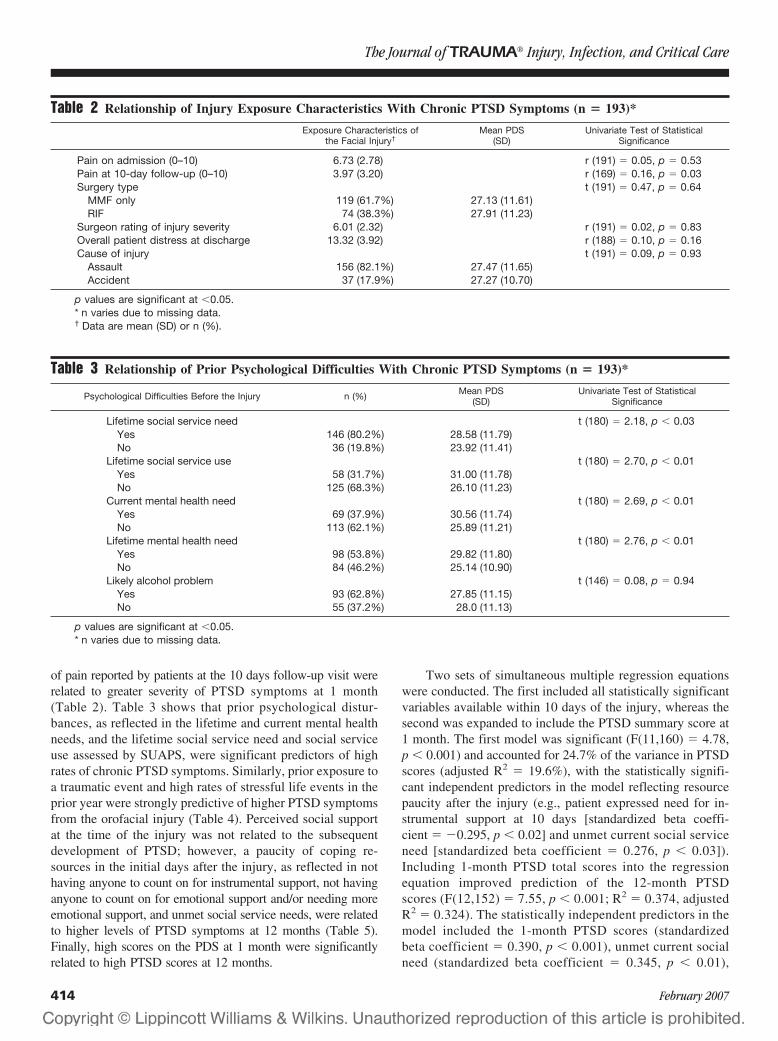
of pain reported by patients at the 10 days follow-up visit wererelated to greater severity of PTSD symptoms at 1 month(Table 2). Table 3 shows that prior psychological distur-bances, as reflected in the lifetime and current mental healthneeds, and the lifetime social service need and social serviceuse assessed by SUAPS, were significant predictors of highrates of chronic PTSD symptoms. Similarly, prior exposure toa traumatic event and high rates of stressful life events in theprior year were strongly predictive of higher PTSD symptomsfrom the orofacial injury (Table 4). Perceived social supportat the time of the injury was not related to the subsequentdevelopment of PTSD; however, a paucity of coping re-sources in the initial days after the injury, as reflected in nothaving anyone to count on for instrumental support, not havinganyone to count on for emotional support and/or needing moreemotional support, and unmet social service needs, were relatedto higher levels of PTSD symptoms at 12 months (Table 5).Finally, high scores on the PDS at 1 month were significantlyrelated to high PTSD scores at 12 months.
Two sets of simultaneous multiple regression equationswere conducted. The first included all statistically significantvariables available within 10 days of the injury, whereas thesecond was expanded to include the PTSD summary score at1 month. The first model was significant (F(11,160) � 4.78,p � 0.001) and accounted for 24.7% of the variance in PTSDscores (adjusted R2 � 19.6%), with the statistically signifi-cant independent predictors in the model reflecting resourcepaucity after the injury (e.g., patient expressed need for in-strumental support at 10 days [standardized beta coeffi-cient � �0.295, p � 0.02] and unmet current social serviceneed [standardized beta coefficient � 0.276, p � 0.03]).Including 1-month PTSD total scores into the regressionequation improved prediction of the 12-month PTSDscores (F(12,152) � 7.55, p � 0.001; R2 � 0.374, adjustedR2 � 0.324). The statistically independent predictors in themodel included the 1-month PTSD scores (standardizedbeta coefficient � 0.390, p � 0.001), unmet current socialneed (standardized beta coefficient � 0.345, p � 0.01),
Table 2 Relationship of Injury Exposure Characteristics With Chronic PTSD Symptoms (n � 193)*
Exposure Characteristics ofthe Facial Injury†
Mean PDS(SD)
Univariate Test of StatisticalSignificance
Pain on admission (0–10) 6.73 (2.78) r (191) � 0.05, p � 0.53Pain at 10-day follow-up (0–10) 3.97 (3.20) r (169) � 0.16, p � 0.03Surgery type t (191) � 0.47, p � 0.64
MMF only 119 (61.7%) 27.13 (11.61)RIF 74 (38.3%) 27.91 (11.23)
Surgeon rating of injury severity 6.01 (2.32) r (191) � 0.02, p � 0.83Overall patient distress at discharge 13.32 (3.92) r (188) � 0.10, p � 0.16Cause of injury t (191) � 0.09, p � 0.93
Assault 156 (82.1%) 27.47 (11.65)Accident 37 (17.9%) 27.27 (10.70)
p values are significant at �0.05.* n varies due to missing data.† Data are mean (SD) or n (%).
Table 3 Relationship of Prior Psychological Difficulties With Chronic PTSD Symptoms (n � 193)*
Psychological Difficulties Before the Injury n (%) Mean PDS(SD)
Univariate Test of StatisticalSignificance
Lifetime social service need t (180) � 2.18, p � 0.03Yes 146 (80.2%) 28.58 (11.79)No 36 (19.8%) 23.92 (11.41)
Lifetime social service use t (180) � 2.70, p � 0.01Yes 58 (31.7%) 31.00 (11.78)No 125 (68.3%) 26.10 (11.23)
Current mental health need t (180) � 2.69, p � 0.01Yes 69 (37.9%) 30.56 (11.74)No 113 (62.1%) 25.89 (11.21)
Lifetime mental health need t (180) � 2.76, p � 0.01Yes 98 (53.8%) 29.82 (11.80)No 84 (46.2%) 25.14 (10.90)
Likely alcohol problem t (146) � 0.08, p � 0.94Yes 93 (62.8%) 27.85 (11.15)No 55 (37.2%) 28.0 (11.13)
p values are significant at �0.05.* n varies due to missing data.
The Journal of TRAUMA� Injury, Infection, and Critical Care
414 February 2007
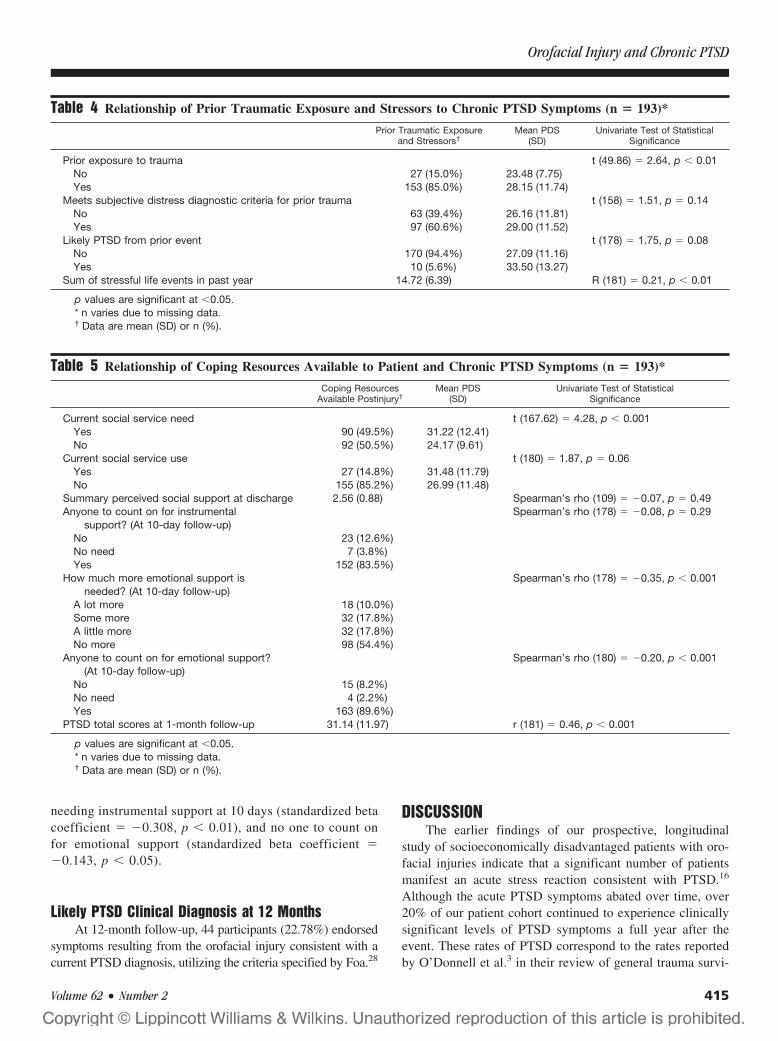
needing instrumental support at 10 days (standardized betacoefficient � �0.308, p � 0.01), and no one to count onfor emotional support (standardized beta coefficient ��0.143, p � 0.05).
Likely PTSD Clinical Diagnosis at 12 MonthsAt 12-month follow-up, 44 participants (22.78%) endorsed
symptoms resulting from the orofacial injury consistent with acurrent PTSD diagnosis, utilizing the criteria specified by Foa.28
DISCUSSIONThe earlier findings of our prospective, longitudinal
study of socioeconomically disadvantaged patients with oro-facial injuries indicate that a significant number of patientsmanifest an acute stress reaction consistent with PTSD.16
Although the acute PTSD symptoms abated over time, over20% of our patient cohort continued to experience clinicallysignificant levels of PTSD symptoms a full year after theevent. These rates of PTSD correspond to the rates reportedby O’Donnell et al.3 in their review of general trauma survi-
Table 4 Relationship of Prior Traumatic Exposure and Stressors to Chronic PTSD Symptoms (n � 193)*
Prior Traumatic Exposureand Stressors†
Mean PDS(SD)
Univariate Test of StatisticalSignificance
Prior exposure to trauma t (49.86) � 2.64, p � 0.01No 27 (15.0%) 23.48 (7.75)Yes 153 (85.0%) 28.15 (11.74)
Meets subjective distress diagnostic criteria for prior trauma t (158) � 1.51, p � 0.14No 63 (39.4%) 26.16 (11.81)Yes 97 (60.6%) 29.00 (11.52)
Likely PTSD from prior event t (178) � 1.75, p � 0.08No 170 (94.4%) 27.09 (11.16)Yes 10 (5.6%) 33.50 (13.27)
Sum of stressful life events in past year 14.72 (6.39) R (181) � 0.21, p � 0.01
p values are significant at �0.05.* n varies due to missing data.† Data are mean (SD) or n (%).
Table 5 Relationship of Coping Resources Available to Patient and Chronic PTSD Symptoms (n � 193)*
Coping ResourcesAvailable Postinjury†
Mean PDS(SD)
Univariate Test of StatisticalSignificance
Current social service need t (167.62) � 4.28, p � 0.001Yes 90 (49.5%) 31.22 (12.41)No 92 (50.5%) 24.17 (9.61)
Current social service use t (180) � 1.87, p � 0.06Yes 27 (14.8%) 31.48 (11.79)No 155 (85.2%) 26.99 (11.48)
Summary perceived social support at discharge 2.56 (0.88) Spearman’s rho (109) � �0.07, p � 0.49Anyone to count on for instrumental
support? (At 10-day follow-up)Spearman’s rho (178) � �0.08, p � 0.29
No 23 (12.6%)No need 7 (3.8%)Yes 152 (83.5%)
How much more emotional support isneeded? (At 10-day follow-up)
Spearman’s rho (178) � �0.35, p � 0.001
A lot more 18 (10.0%)Some more 32 (17.8%)A little more 32 (17.8%)No more 98 (54.4%)
Anyone to count on for emotional support?(At 10-day follow-up)
Spearman’s rho (180) � �0.20, p � 0.001
No 15 (8.2%)No need 4 (2.2%)Yes 163 (89.6%)
PTSD total scores at 1-month follow-up 31.14 (11.97) r (181) � 0.46, p � 0.001
p values are significant at �0.05.* n varies due to missing data.† Data are mean (SD) or n (%).
Orofacial Injury and Chronic PTSD
Volume 62 • Number 2 415

vors, and emphasize two important themes. First, a signifi-cant minority of high-risk patients with orofacial injury willdevelop chronic PTSD symptoms that can impact their func-tional status, long after their physical injury has resolved. Sec-ond, discriminating between patients who will suffer transientstress reactions and those who will continue to experiencestress reactions that will develop into long-term psychologi-cal disorders poses a diagnostic challenge to the surgeon.Accurately identifying the subset of orofacial injury patientswho are likely to develop long-term psychopathology is im-portant because these patients are the ones who may benefitmost from early intervention strategies.
Our investigation suggests that patient self-reports ofpsychosocial symptoms and resources during the early recov-ery phase can serve as markers of individuals who are at riskof developing chronic PTSD. In contrast to studies of generaltrauma patients,31–33 the patient demographics, the degree ofinjury severity, or type of surgical treatment instituted did notpredict the development of poor psychological outcomes inour patient sample. To some extent, these discordant findingsmay reflect the homogeneity of our study participants; pri-marily adult males treated at an inner-city hospital for acomparable range of injuries and band of injury severity.However, the development of chronic PTSD in our facialinjury cohort was related to scarcity of resources in the earlypostinjury phase and a high level of acute PTSD symptoms.Both of these will be discussed in turn.
Our findings on the role of a positive recovery environ-ment are noteworthy. Those with high levels of current socialservice need (e.g., housing, financial assistance, unemploy-ment) and/or lacking social support during the early recoveryphase had the worst psychological outcomes. Importantly, itwas not general social support judged at discharge, but eval-uated with regard to specific (potentially unmet) postinjuryneed 10 days later that was an important predictor of subse-quent PTSD. The findings emphasizing the importance ofsocial support in recovery from trauma are mirrored inBrewin et al.’s34 meta-analysis of pretrauma, posttrauma, andtrauma exposure variables predicting PTSD. Of the 14 likelyvariables (e.g., prior psychological problems, demographics)considered, Brewin et al. found that social support had thelargest weighted effect size (mean r � 0.40) in predictingPTSD outcomes. It is difficult to conclude the directionalityof the relationship between social support and developmentof PTSD, however. That is, do problems in support during theearly recovery period after the incident cause subsequentdistress, or do these problems reflect some pre-existing (as yetunidentified) individual characteristic, which also presages pooroutcome? Certainly, recovery from an orofacial injury is ademanding, often anxiety-provoking task and it is not sur-prising that those having difficulty meeting their basic needsand lacking the assistance of others would continue to expe-rience psychological difficulties, even after their physicalrecovery was concluded. Along a similar theme, Yap andDevilly35 wrote a fascinating article on the complicated role
of perceived social support in recovery from crime victim-ization. They note that social support may often play a mod-erating role in the acute recovery phase, with those havinggreater support faring better. However, they propose that,over time, trauma-related psychological distress and symp-toms (e.g., avoidance, irritability, feelings of detachment)may erode relationships and thus social support may come tomediate the relation between victimization and long-termpsychological outcomes. More work is clearly needed inunderstanding the role of social support in recovery fromtrauma. In the interim, for those lacking support, cliniciansmay be able to help fill this void. Some have suggested thatmore frequent visits to caring medical professionals in the 2weeks subsequent to a traumatic injury may promote morepositive recoveries.36 Our results indicate that problem-solv-ing about ways to help patients obtain practical assistanceduring the initial recovery phase may be especially critical.
The association between acute and chronic PTSD symp-toms levels is a robust finding in a number of survivorsamples.37,38 Although the reason for this relationship is unclear,some have argued that the early hyperarousal symptoms (irrita-bility, exaggerated startle response, sleep difficulties) of acutePTSD prompt avoidance responses, which then serve to inhibitthe natural extinction of the association between trauma-relatedstimuli and symptom responses.39 Rather than being diminishedover time, the psychological symptoms worsen. Other notablepredictors of chronic PTSD symptoms in our patient cohort werea prior exposure to trauma, a self-identified prior history ofmental health problems, and patient reports of high pain levels inthe early follow-up period. Screening for these conditions duringthe early recovery phase after an orofacial injury can set thestage for targeted interventions. For example, standardized ques-tionnaires such as the PDS can be used to screen for high levelsof acute PTSD symptoms and identify individuals in need ofprophylactic referrals to mental health professionals for focaltreatment.
The strengths of this study should be noted. In compar-ison to other reports that have focused on the development ofPTSD in patients with facial injuries, we have a large samplethat was followed for an extended period. This study had aprospective, repeated measures design, involved extensivebaseline psychosocial assessments, utilized a Level I traumasetting and included a sociodemographic spectrum represen-tative of trauma patients treated at many inner-city hospitals.Most of the psychosocial instruments utilized were standard-ized and relevant to the time constraints of an acute-caresetting. The limitations of the study also merit mention. First,PTSD symptoms and status were rated based on responses toself-report instruments, rather than diagnostic interviews.Characteristic of studies conducted within the context of abusy trauma center, we were forced to weigh the benefits ofcollecting self-report data from a relatively large sampleagainst the limitations in data interpretation accruing fromthis method of data collection. Clearly, a replication of ourstudy using interview assessments would be a valuable addi-
The Journal of TRAUMA� Injury, Infection, and Critical Care
416 February 2007
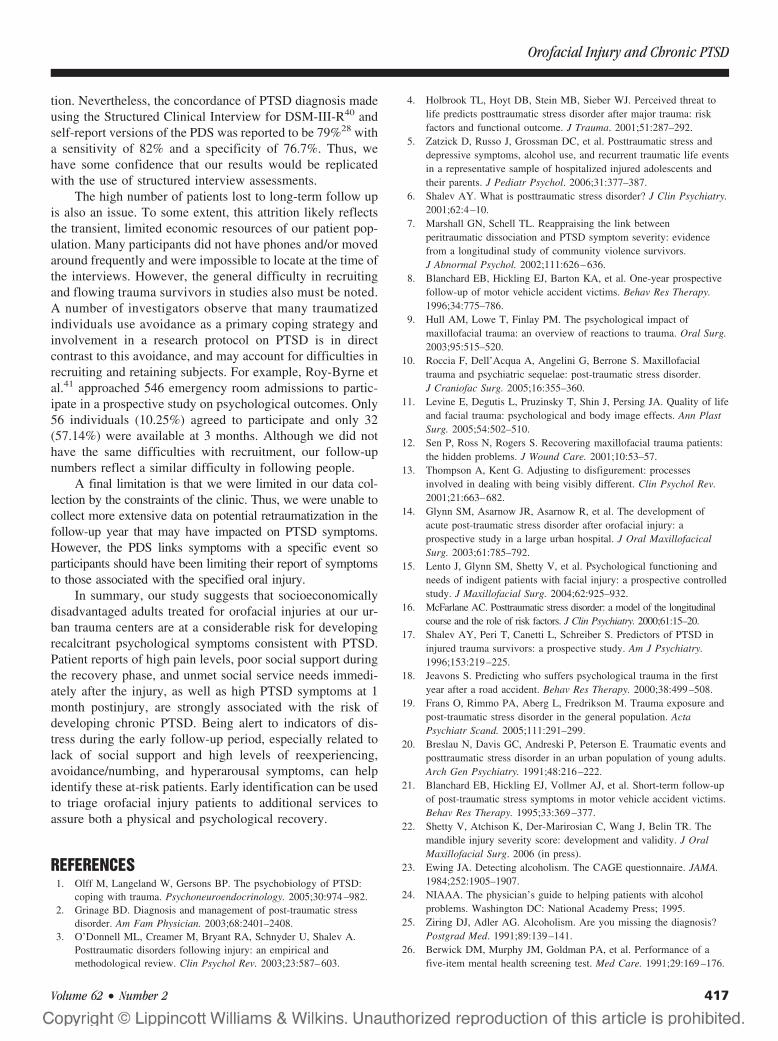
tion. Nevertheless, the concordance of PTSD diagnosis madeusing the Structured Clinical Interview for DSM-III-R40 andself-report versions of the PDS was reported to be 79%28 witha sensitivity of 82% and a specificity of 76.7%. Thus, wehave some confidence that our results would be replicatedwith the use of structured interview assessments.
The high number of patients lost to long-term follow upis also an issue. To some extent, this attrition likely reflectsthe transient, limited economic resources of our patient pop-ulation. Many participants did not have phones and/or movedaround frequently and were impossible to locate at the time ofthe interviews. However, the general difficulty in recruitingand flowing trauma survivors in studies also must be noted.A number of investigators observe that many traumatizedindividuals use avoidance as a primary coping strategy andinvolvement in a research protocol on PTSD is in directcontrast to this avoidance, and may account for difficulties inrecruiting and retaining subjects. For example, Roy-Byrne etal.41 approached 546 emergency room admissions to partic-ipate in a prospective study on psychological outcomes. Only56 individuals (10.25%) agreed to participate and only 32(57.14%) were available at 3 months. Although we did nothave the same difficulties with recruitment, our follow-upnumbers reflect a similar difficulty in following people.
A final limitation is that we were limited in our data col-lection by the constraints of the clinic. Thus, we were unable tocollect more extensive data on potential retraumatization in thefollow-up year that may have impacted on PTSD symptoms.However, the PDS links symptoms with a specific event soparticipants should have been limiting their report of symptomsto those associated with the specified oral injury.
In summary, our study suggests that socioeconomicallydisadvantaged adults treated for orofacial injuries at our ur-ban trauma centers are at a considerable risk for developingrecalcitrant psychological symptoms consistent with PTSD.Patient reports of high pain levels, poor social support duringthe recovery phase, and unmet social service needs immedi-ately after the injury, as well as high PTSD symptoms at 1month postinjury, are strongly associated with the risk ofdeveloping chronic PTSD. Being alert to indicators of dis-tress during the early follow-up period, especially related tolack of social support and high levels of reexperiencing,avoidance/numbing, and hyperarousal symptoms, can helpidentify these at-risk patients. Early identification can be usedto triage orofacial injury patients to additional services toassure both a physical and psychological recovery.
REFERENCES1. Olff M, Langeland W, Gersons BP. The psychobiology of PTSD:
coping with trauma. Psychoneuroendocrinology. 2005;30:974–982.2. Grinage BD. Diagnosis and management of post-traumatic stress
disorder. Am Fam Physician. 2003;68:2401–2408.3. O’Donnell ML, Creamer M, Bryant RA, Schnyder U, Shalev A.
Posttraumatic disorders following injury: an empirical andmethodological review. Clin Psychol Rev. 2003;23:587–603.
4. Holbrook TL, Hoyt DB, Stein MB, Sieber WJ. Perceived threat tolife predicts posttraumatic stress disorder after major trauma: riskfactors and functional outcome. J Trauma. 2001;51:287–292.
5. Zatzick D, Russo J, Grossman DC, et al. Posttraumatic stress anddepressive symptoms, alcohol use, and recurrent traumatic life eventsin a representative sample of hospitalized injured adolescents andtheir parents. J Pediatr Psychol. 2006;31:377–387.
6. Shalev AY. What is posttraumatic stress disorder? J Clin Psychiatry.2001;62:4–10.
7. Marshall GN, Schell TL. Reappraising the link betweenperitraumatic dissociation and PTSD symptom severity: evidencefrom a longitudinal study of community violence survivors.J Abnormal Psychol. 2002;111:626–636.
8. Blanchard EB, Hickling EJ, Barton KA, et al. One-year prospectivefollow-up of motor vehicle accident victims. Behav Res Therapy.1996;34:775–786.
9. Hull AM, Lowe T, Finlay PM. The psychological impact ofmaxillofacial trauma: an overview of reactions to trauma. Oral Surg.2003;95:515–520.
10. Roccia F, Dell’Acqua A, Angelini G, Berrone S. Maxillofacialtrauma and psychiatric sequelae: post-traumatic stress disorder.J Craniofac Surg. 2005;16:355–360.
11. Levine E, Degutis L, Pruzinsky T, Shin J, Persing JA. Quality of lifeand facial trauma: psychological and body image effects. Ann PlastSurg. 2005;54:502–510.
12. Sen P, Ross N, Rogers S. Recovering maxillofacial trauma patients:the hidden problems. J Wound Care. 2001;10:53–57.
13. Thompson A, Kent G. Adjusting to disfigurement: processesinvolved in dealing with being visibly different. Clin Psychol Rev.2001;21:663–682.
14. Glynn SM, Asarnow JR, Asarnow R, et al. The development ofacute post-traumatic stress disorder after orofacial injury: aprospective study in a large urban hospital. J Oral MaxillofacicalSurg. 2003;61:785–792.
15. Lento J, Glynn SM, Shetty V, et al. Psychological functioning andneeds of indigent patients with facial injury: a prospective controlledstudy. J Maxillofacial Surg. 2004;62:925–932.
16. McFarlane AC. Posttraumatic stress disorder: a model of the longitudinalcourse and the role of risk factors. J Clin Psychiatry. 2000;61:15–20.
17. Shalev AY, Peri T, Canetti L, Schreiber S. Predictors of PTSD ininjured trauma survivors: a prospective study. Am J Psychiatry.1996;153:219–225.
18. Jeavons S. Predicting who suffers psychological trauma in the firstyear after a road accident. Behav Res Therapy. 2000;38:499–508.
19. Frans O, Rimmo PA, Aberg L, Fredrikson M. Trauma exposure andpost-traumatic stress disorder in the general population. ActaPsychiatr Scand. 2005;111:291–299.
20. Breslau N, Davis GC, Andreski P, Peterson E. Traumatic events andposttraumatic stress disorder in an urban population of young adults.Arch Gen Psychiatry. 1991;48:216–222.
21. Blanchard EB, Hickling EJ, Vollmer AJ, et al. Short-term follow-upof post-traumatic stress symptoms in motor vehicle accident victims.Behav Res Therapy. 1995;33:369–377.
22. Shetty V, Atchison K, Der-Marirosian C, Wang J, Belin TR. Themandible injury severity score: development and validity. J OralMaxillofacial Surg. 2006 (in press).
23. Ewing JA. Detecting alcoholism. The CAGE questionnaire. JAMA.1984;252:1905–1907.
24. NIAAA. The physician’s guide to helping patients with alcoholproblems. Washington DC: National Academy Press; 1995.
25. Ziring DJ, Adler AG. Alcoholism. Are you missing the diagnosis?Postgrad Med. 1991;89:139–141.
26. Berwick DM, Murphy JM, Goldman PA, et al. Performance of afive-item mental health screening test. Med Care. 1991;29:169–176.
Orofacial Injury and Chronic PTSD
Volume 62 • Number 2 417
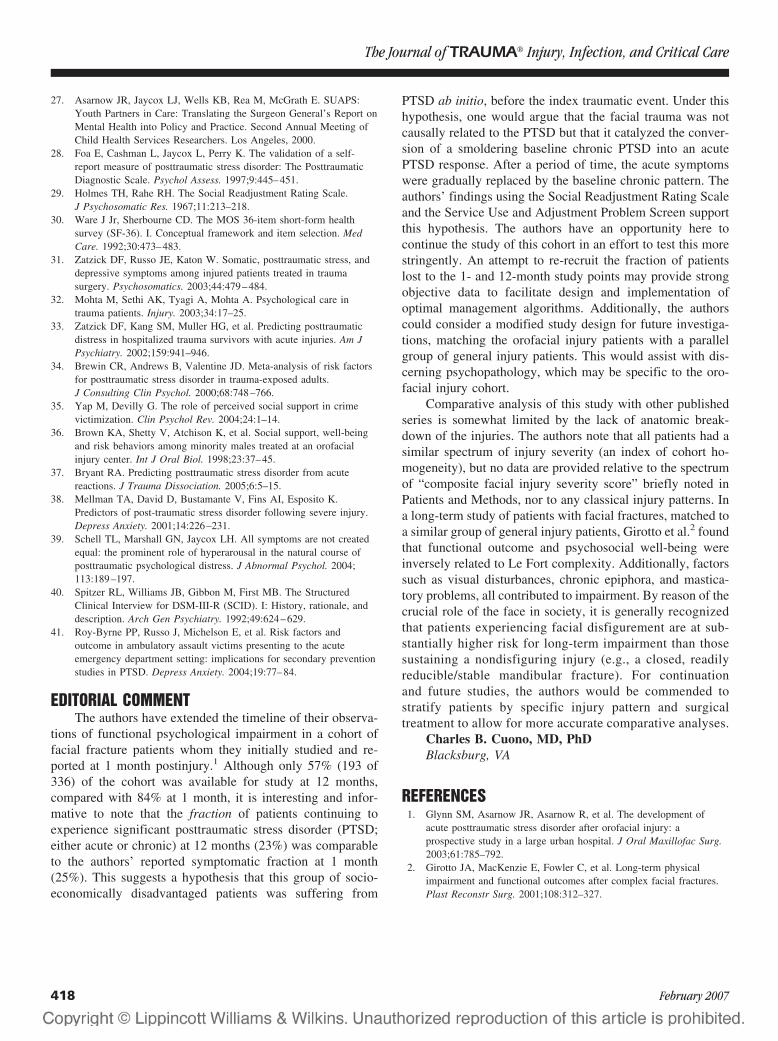
27. Asarnow JR, Jaycox LJ, Wells KB, Rea M, McGrath E. SUAPS:Youth Partners in Care: Translating the Surgeon General’s Report onMental Health into Policy and Practice. Second Annual Meeting ofChild Health Services Researchers. Los Angeles, 2000.
28. Foa E, Cashman L, Jaycox L, Perry K. The validation of a self-report measure of posttraumatic stress disorder: The PosttraumaticDiagnostic Scale. Psychol Assess. 1997;9:445–451.
29. Holmes TH, Rahe RH. The Social Readjustment Rating Scale.J Psychosomatic Res. 1967;11:213–218.
30. Ware J Jr, Sherbourne CD. The MOS 36-item short-form healthsurvey (SF-36). I. Conceptual framework and item selection. MedCare. 1992;30:473–483.
31. Zatzick DF, Russo JE, Katon W. Somatic, posttraumatic stress, anddepressive symptoms among injured patients treated in traumasurgery. Psychosomatics. 2003;44:479–484.
32. Mohta M, Sethi AK, Tyagi A, Mohta A. Psychological care intrauma patients. Injury. 2003;34:17–25.
33. Zatzick DF, Kang SM, Muller HG, et al. Predicting posttraumaticdistress in hospitalized trauma survivors with acute injuries. Am JPsychiatry. 2002;159:941–946.
34. Brewin CR, Andrews B, Valentine JD. Meta-analysis of risk factorsfor posttraumatic stress disorder in trauma-exposed adults.J Consulting Clin Psychol. 2000;68:748–766.
35. Yap M, Devilly G. The role of perceived social support in crimevictimization. Clin Psychol Rev. 2004;24:1–14.
36. Brown KA, Shetty V, Atchison K, et al. Social support, well-beingand risk behaviors among minority males treated at an orofacialinjury center. Int J Oral Biol. 1998;23:37–45.
37. Bryant RA. Predicting posttraumatic stress disorder from acutereactions. J Trauma Dissociation. 2005;6:5–15.
38. Mellman TA, David D, Bustamante V, Fins AI, Esposito K.Predictors of post-traumatic stress disorder following severe injury.Depress Anxiety. 2001;14:226–231.
39. Schell TL, Marshall GN, Jaycox LH. All symptoms are not createdequal: the prominent role of hyperarousal in the natural course ofposttraumatic psychological distress. J Abnormal Psychol. 2004;113:189–197.
40. Spitzer RL, Williams JB, Gibbon M, First MB. The StructuredClinical Interview for DSM-III-R (SCID). I: History, rationale, anddescription. Arch Gen Psychiatry. 1992;49:624–629.
41. Roy-Byrne PP, Russo J, Michelson E, et al. Risk factors andoutcome in ambulatory assault victims presenting to the acuteemergency department setting: implications for secondary preventionstudies in PTSD. Depress Anxiety. 2004;19:77–84.
EDITORIAL COMMENTThe authors have extended the timeline of their observa-
tions of functional psychological impairment in a cohort offacial fracture patients whom they initially studied and re-ported at 1 month postinjury.1 Although only 57% (193 of336) of the cohort was available for study at 12 months,compared with 84% at 1 month, it is interesting and infor-mative to note that the fraction of patients continuing toexperience significant posttraumatic stress disorder (PTSD;either acute or chronic) at 12 months (23%) was comparableto the authors’ reported symptomatic fraction at 1 month(25%). This suggests a hypothesis that this group of socio-economically disadvantaged patients was suffering from
PTSD ab initio, before the index traumatic event. Under thishypothesis, one would argue that the facial trauma was notcausally related to the PTSD but that it catalyzed the conver-sion of a smoldering baseline chronic PTSD into an acutePTSD response. After a period of time, the acute symptomswere gradually replaced by the baseline chronic pattern. Theauthors’ findings using the Social Readjustment Rating Scaleand the Service Use and Adjustment Problem Screen supportthis hypothesis. The authors have an opportunity here tocontinue the study of this cohort in an effort to test this morestringently. An attempt to re-recruit the fraction of patientslost to the 1- and 12-month study points may provide strongobjective data to facilitate design and implementation ofoptimal management algorithms. Additionally, the authorscould consider a modified study design for future investiga-tions, matching the orofacial injury patients with a parallelgroup of general injury patients. This would assist with dis-cerning psychopathology, which may be specific to the oro-facial injury cohort.
Comparative analysis of this study with other publishedseries is somewhat limited by the lack of anatomic break-down of the injuries. The authors note that all patients had asimilar spectrum of injury severity (an index of cohort ho-mogeneity), but no data are provided relative to the spectrumof “composite facial injury severity score” briefly noted inPatients and Methods, nor to any classical injury patterns. Ina long-term study of patients with facial fractures, matched toa similar group of general injury patients, Girotto et al.2 foundthat functional outcome and psychosocial well-being wereinversely related to Le Fort complexity. Additionally, factorssuch as visual disturbances, chronic epiphora, and mastica-tory problems, all contributed to impairment. By reason of thecrucial role of the face in society, it is generally recognizedthat patients experiencing facial disfigurement are at sub-stantially higher risk for long-term impairment than thosesustaining a nondisfiguring injury (e.g., a closed, readilyreducible/stable mandibular fracture). For continuationand future studies, the authors would be commended tostratify patients by specific injury pattern and surgicaltreatment to allow for more accurate comparative analyses.
Charles B. Cuono, MD, PhDBlacksburg, VA
REFERENCES1. Glynn SM, Asarnow JR, Asarnow R, et al. The development of
acute posttraumatic stress disorder after orofacial injury: aprospective study in a large urban hospital. J Oral Maxillofac Surg.2003;61:785–792.
2. Girotto JA, MacKenzie E, Fowler C, et al. Long-term physicalimpairment and functional outcomes after complex facial fractures.Plast Reconstr Surg. 2001;108:312–327.
The Journal of TRAUMA� Injury, Infection, and Critical Care
418 February 2007
Long-Term Survival of Medicare Patients With Head InjuryJoseph T. Donohue, MD, David E. Clark, MD, and Michael A. DeLorenzo, PhD
Background: An increasing numberof older patients are being hospitalized withtraumatic brain injury (TBI). Knowledge oftheir expected long-term survival may beuseful in making clinical decisions.
Methods: Patients age 65 or olderadmitted for the first time with head in-jury (ICD-9 800–804 or 850–854) during1999 were identified in a complete na-tional sample of fee-for-service Medicarehospitalization and denominator data. Caseswere categorized by age, sex, maximum Ab-breviated Injury Score (AISmax), and
Charlson comorbidity score. Survival wasdetermined at hospital discharge, and(using the denominator file) at 1, 6, 12,and 24 months after the initial hospitaladmission.
Results: For all cases (n � 30,684), thehospital mortality was 14.3%, but was cu-mulatively 19.75%, 30.5%, 36.1%, and44.9% at successive times up to 24 months.Long-term mortality was higher with in-creased age, comorbidity, or AISmax, andhigher in men. These effects persisted withmultivariate logistic regression analysis and
were used to construct a simplified predic-tion score for clinical use.
Conclusions: The mortality for olderpatients with TBI is much higher than foran uninjured control population. The rel-ative risk for death remains elevated afterhospital discharge and for at least 2 years.Awareness of the expected prognosis mayhelp family members and health care pro-viders make appropriate clinical decisionsduring acute hospitalization.
Key Words: Traumatic brain injury,Survival, Aged.
J Trauma. 2007;62:419–423.
In the year 2000, there were 35 million people in the UnitedStates aged 65 or older, representing 12% of the popula-tion. By the year 2030, an estimated 70.3 million people
65 and older will comprise 20% of the United States popu-lation. As the population ages, the number of older patientswith injuries will increase, requiring increasing resources fortheir medical treatment.
Although many studies have been published regardingthe association between advanced age and mortality afterinjury, the results are conflicting. Advanced age has beenshown by many investigators to be a predictor of poor out-come in trauma patients,1–8 although others have assertedthat the association is not significant.9–11 The goal of ourstudy was to determine whether advanced age affected thelong-term survival of patients with a traumatic brain injury(TBI).
METHODSInstitutional Review Boards at the Maine Medical
Center and the Harvard School of Public Health judgedthis study to be exempt from review. The Centers for
Medicare and Medicaid Services (CMS) approved the useof its data in this article.
Medicare Provider Analysis and Review (MedPAR)and Denominator files for 1998 through 2000 were ob-tained from CMS through a cooperative arrangement withthe Center for the Clinical Evaluative Sciences at Dart-mouth Medical School. Records for analysis selected fromthe MedPAR file contained hospital discharge abstractssummarizing acute care inpatient stays for all fee-for-service beneficiaries of Medicare hospitalization insur-ance. Discharge records from 1999 and 2000 were used toselect 1999 admissions. Records for each discharge con-tained hospital utilization and outcome data, with up to 10International Classification of Diseases, Ninth Revision,Clinical Modification (ICD-9-CM) discharge diagnoses.TBI were defined as those with principal ICD-9 diagnosiscodes 800 – 804 or 850 – 854.
A person’s first acute-care hospital admission for TBI in1999 was considered an incident case. MedPAR records werematched to beneficiary information in the Medicare denom-inator file. This file contained data on all beneficiaries for1999 through 2001, combining beneficiary entitlement statusinformation from the Social Security Administration andmanaged care enrollment information. The denominator file(that included a unique beneficiary identifier, date of birth,and date of death) was used to calculate age at admission andvital status at various times after hospital discharge.
Commercially available software (ICDMAP-90, Tri-Analytics, Baltimore, Md.) mapped each diagnosis code toone of six body regions and six levels of Abbreviated InjuryScore (AIS) when possible, then calculated the maximumAIS in each body region and the maximum AIS overall(AISmax).12 AIS is intended to classify the severity of inju-ries based on clinical experience (1 � minor; 2 � moderate;
Submitted for publication June 14, 2005.Accepted for publication February 22, 2006.Copyright © 2007 by Lippincott Williams & Wilkins, Inc.From the Maine Medical Center, Portland ME; Harvard Injury Control
Research Center, Boston Massachusetts.Presented in part as a poster at the American Public Health Association,
Washington DC, November 2004.Supported by Grant #R49/CCR115279-04 from the National Center for
Injury Prevention and Control. Its contents reflect the views of the authors,but not necessarily the NCIPC or CDC.
Address for reprints: David E. Clark, MD, 887 Congress Street, Port-land, ME 04102; email: [email protected].
DOI: 10.1097/01.ta.0000219286.88179.18
The Journal of TRAUMA� Injury, Infection, and Critical Care
Volume 62 • Number 2 419
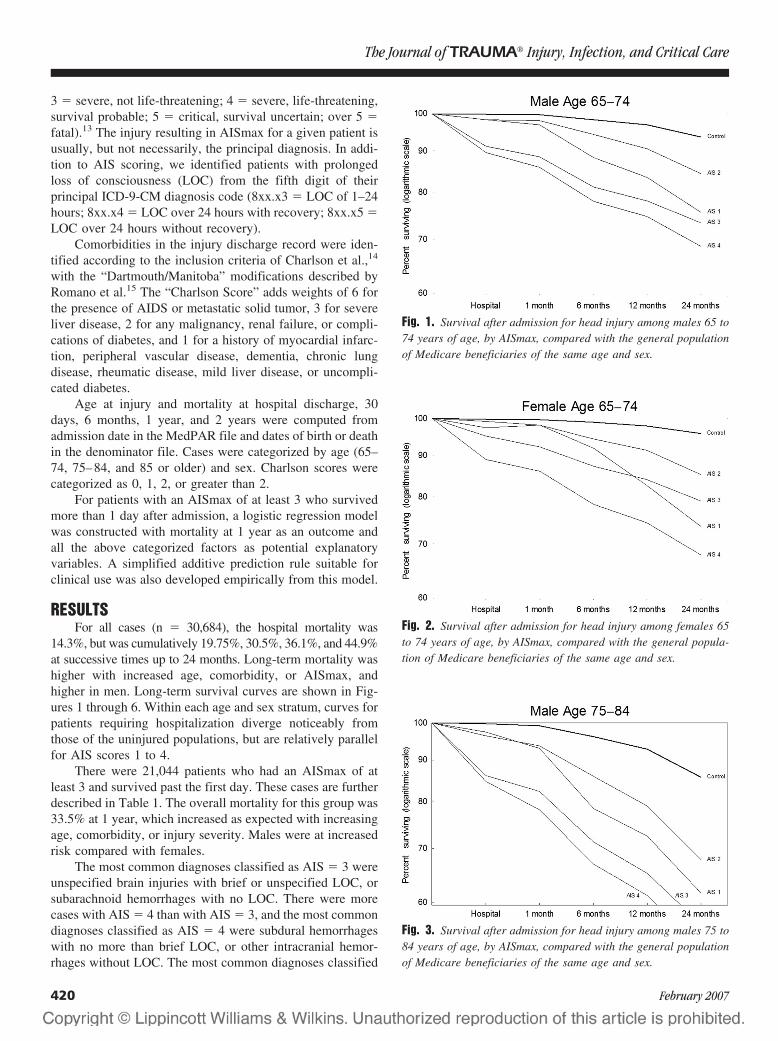
3 � severe, not life-threatening; 4 � severe, life-threatening,survival probable; 5 � critical, survival uncertain; over 5 �fatal).13 The injury resulting in AISmax for a given patient isusually, but not necessarily, the principal diagnosis. In addi-tion to AIS scoring, we identified patients with prolongedloss of consciousness (LOC) from the fifth digit of theirprincipal ICD-9-CM diagnosis code (8xx.x3 � LOC of 1–24hours; 8xx.x4 � LOC over 24 hours with recovery; 8xx.x5 �LOC over 24 hours without recovery).
Comorbidities in the injury discharge record were iden-tified according to the inclusion criteria of Charlson et al.,14
with the “Dartmouth/Manitoba” modifications described byRomano et al.15 The “Charlson Score” adds weights of 6 forthe presence of AIDS or metastatic solid tumor, 3 for severeliver disease, 2 for any malignancy, renal failure, or compli-cations of diabetes, and 1 for a history of myocardial infarc-tion, peripheral vascular disease, dementia, chronic lungdisease, rheumatic disease, mild liver disease, or uncompli-cated diabetes.
Age at injury and mortality at hospital discharge, 30days, 6 months, 1 year, and 2 years were computed fromadmission date in the MedPAR file and dates of birth or deathin the denominator file. Cases were categorized by age (65–74, 75–84, and 85 or older) and sex. Charlson scores werecategorized as 0, 1, 2, or greater than 2.
For patients with an AISmax of at least 3 who survivedmore than 1 day after admission, a logistic regression modelwas constructed with mortality at 1 year as an outcome andall the above categorized factors as potential explanatoryvariables. A simplified additive prediction rule suitable forclinical use was also developed empirically from this model.
RESULTSFor all cases (n � 30,684), the hospital mortality was
14.3%, but was cumulatively 19.75%, 30.5%, 36.1%, and 44.9%at successive times up to 24 months. Long-term mortality washigher with increased age, comorbidity, or AISmax, andhigher in men. Long-term survival curves are shown in Fig-ures 1 through 6. Within each age and sex stratum, curves forpatients requiring hospitalization diverge noticeably fromthose of the uninjured populations, but are relatively parallelfor AIS scores 1 to 4.
There were 21,044 patients who had an AISmax of atleast 3 and survived past the first day. These cases are furtherdescribed in Table 1. The overall mortality for this group was33.5% at 1 year, which increased as expected with increasingage, comorbidity, or injury severity. Males were at increasedrisk compared with females.
The most common diagnoses classified as AIS � 3 wereunspecified brain injuries with brief or unspecified LOC, orsubarachnoid hemorrhages with no LOC. There were morecases with AIS � 4 than with AIS � 3, and the most commondiagnoses classified as AIS � 4 were subdural hemorrhageswith no more than brief LOC, or other intracranial hemor-rhages without LOC. The most common diagnoses classified
Fig. 1. Survival after admission for head injury among males 65 to74 years of age, by AISmax, compared with the general populationof Medicare beneficiaries of the same age and sex.
Fig. 2. Survival after admission for head injury among females 65to 74 years of age, by AISmax, compared with the general popula-tion of Medicare beneficiaries of the same age and sex.
Fig. 3. Survival after admission for head injury among males 75 to84 years of age, by AISmax, compared with the general populationof Medicare beneficiaries of the same age and sex.
The Journal of TRAUMA� Injury, Infection, and Critical Care
420 February 2007
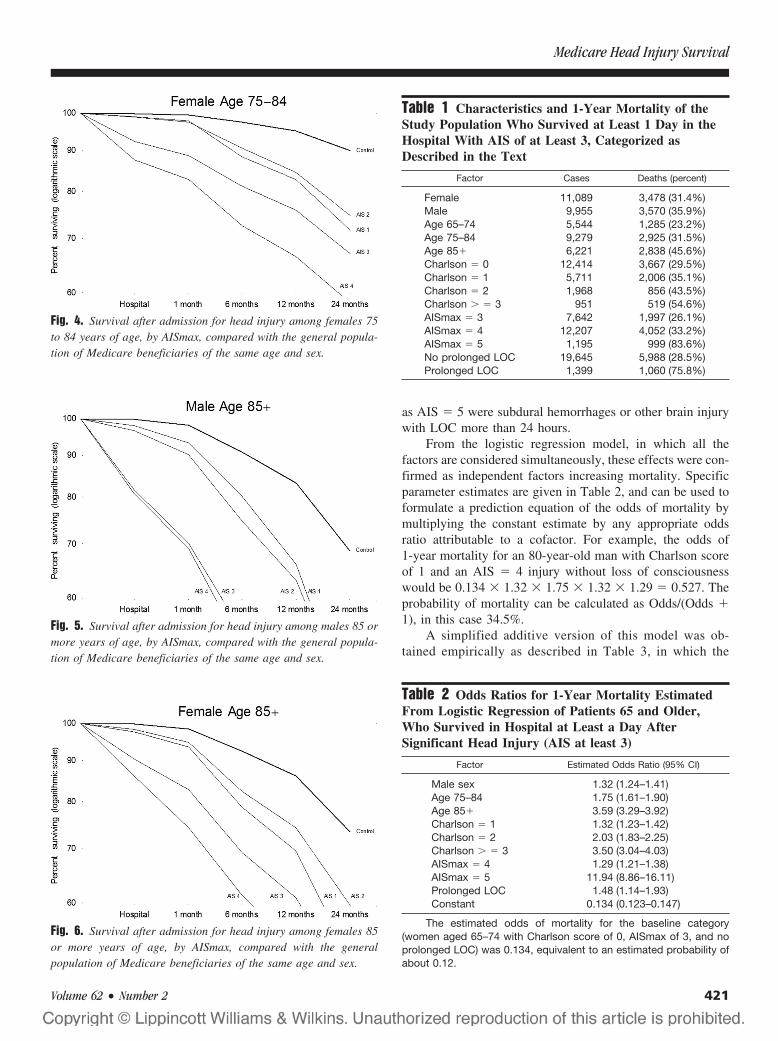
as AIS � 5 were subdural hemorrhages or other brain injurywith LOC more than 24 hours.
From the logistic regression model, in which all thefactors are considered simultaneously, these effects were con-firmed as independent factors increasing mortality. Specificparameter estimates are given in Table 2, and can be used toformulate a prediction equation of the odds of mortality bymultiplying the constant estimate by any appropriate oddsratio attributable to a cofactor. For example, the odds of1-year mortality for an 80-year-old man with Charlson scoreof 1 and an AIS � 4 injury without loss of consciousnesswould be 0.134 � 1.32 � 1.75 � 1.32 � 1.29 � 0.527. Theprobability of mortality can be calculated as Odds/(Odds �1), in this case 34.5%.
A simplified additive version of this model was ob-tained empirically as described in Table 3, in which the
Fig. 4. Survival after admission for head injury among females 75to 84 years of age, by AISmax, compared with the general popula-tion of Medicare beneficiaries of the same age and sex.
Fig. 5. Survival after admission for head injury among males 85 ormore years of age, by AISmax, compared with the general popula-tion of Medicare beneficiaries of the same age and sex.
Fig. 6. Survival after admission for head injury among females 85or more years of age, by AISmax, compared with the generalpopulation of Medicare beneficiaries of the same age and sex.
Table 1 Characteristics and 1-Year Mortality of theStudy Population Who Survived at Least 1 Day in theHospital With AIS of at Least 3, Categorized asDescribed in the Text
Factor Cases Deaths (percent)
Female 11,089 3,478 (31.4%)Male 9,955 3,570 (35.9%)Age 65–74 5,544 1,285 (23.2%)Age 75–84 9,279 2,925 (31.5%)Age 85� 6,221 2,838 (45.6%)Charlson � 0 12,414 3,667 (29.5%)Charlson � 1 5,711 2,006 (35.1%)Charlson � 2 1,968 856 (43.5%)Charlson � � 3 951 519 (54.6%)AISmax � 3 7,642 1,997 (26.1%)AISmax � 4 12,207 4,052 (33.2%)AISmax � 5 1,195 999 (83.6%)No prolonged LOC 19,645 5,988 (28.5%)Prolonged LOC 1,399 1,060 (75.8%)
Table 2 Odds Ratios for 1-Year Mortality EstimatedFrom Logistic Regression of Patients 65 and Older,Who Survived in Hospital at Least a Day AfterSignificant Head Injury (AIS at least 3)
Factor Estimated Odds Ratio (95% CI)
Male sex 1.32 (1.24–1.41)Age 75–84 1.75 (1.61–1.90)Age 85� 3.59 (3.29–3.92)Charlson � 1 1.32 (1.23–1.42)Charlson � 2 2.03 (1.83–2.25)Charlson � � 3 3.50 (3.04–4.03)AISmax � 4 1.29 (1.21–1.38)AISmax � 5 11.94 (8.86–16.11)Prolonged LOC 1.48 (1.14–1.93)Constant 0.134 (0.123–0.147)
The estimated odds of mortality for the baseline category(women aged 65–74 with Charlson score of 0, AISmax of 3, and noprolonged LOC) was 0.134, equivalent to an estimated probability ofabout 0.12.
Medicare Head Injury Survival
Volume 62 • Number 2 421
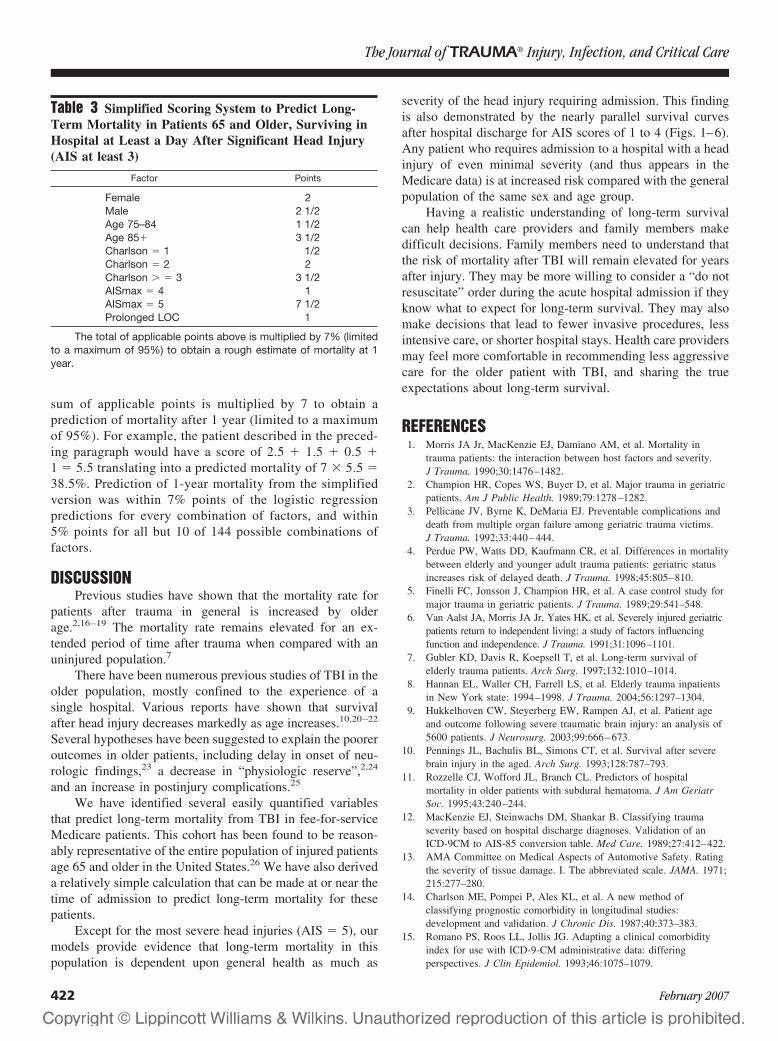
sum of applicable points is multiplied by 7 to obtain aprediction of mortality after 1 year (limited to a maximumof 95%). For example, the patient described in the preced-ing paragraph would have a score of 2.5 � 1.5 � 0.5 �1 � 5.5 translating into a predicted mortality of 7 � 5.5 �38.5%. Prediction of 1-year mortality from the simplifiedversion was within 7% points of the logistic regressionpredictions for every combination of factors, and within5% points for all but 10 of 144 possible combinations offactors.
DISCUSSIONPrevious studies have shown that the mortality rate for
patients after trauma in general is increased by olderage.2,16–19 The mortality rate remains elevated for an ex-tended period of time after trauma when compared with anuninjured population.7
There have been numerous previous studies of TBI in theolder population, mostly confined to the experience of asingle hospital. Various reports have shown that survivalafter head injury decreases markedly as age increases.10,20–22
Several hypotheses have been suggested to explain the pooreroutcomes in older patients, including delay in onset of neu-rologic findings,23 a decrease in “physiologic reserve”,2,24
and an increase in postinjury complications.25
We have identified several easily quantified variablesthat predict long-term mortality from TBI in fee-for-serviceMedicare patients. This cohort has been found to be reason-ably representative of the entire population of injured patientsage 65 and older in the United States.26 We have also deriveda relatively simple calculation that can be made at or near thetime of admission to predict long-term mortality for thesepatients.
Except for the most severe head injuries (AIS � 5), ourmodels provide evidence that long-term mortality in thispopulation is dependent upon general health as much as
severity of the head injury requiring admission. This findingis also demonstrated by the nearly parallel survival curvesafter hospital discharge for AIS scores of 1 to 4 (Figs. 1–6).Any patient who requires admission to a hospital with a headinjury of even minimal severity (and thus appears in theMedicare data) is at increased risk compared with the generalpopulation of the same sex and age group.
Having a realistic understanding of long-term survivalcan help health care providers and family members makedifficult decisions. Family members need to understand thatthe risk of mortality after TBI will remain elevated for yearsafter injury. They may be more willing to consider a “do notresuscitate” order during the acute hospital admission if theyknow what to expect for long-term survival. They may alsomake decisions that lead to fewer invasive procedures, lessintensive care, or shorter hospital stays. Health care providersmay feel more comfortable in recommending less aggressivecare for the older patient with TBI, and sharing the trueexpectations about long-term survival.
REFERENCES1. Morris JA Jr, MacKenzie EJ, Damiano AM, et al. Mortality in
trauma patients: the interaction between host factors and severity.J Trauma. 1990;30:1476–1482.
2. Champion HR, Copes WS, Buyer D, et al. Major trauma in geriatricpatients. Am J Public Health. 1989;79:1278–1282.
3. Pellicane JV, Byrne K, DeMaria EJ. Preventable complications anddeath from multiple organ failure among geriatric trauma victims.J Trauma. 1992;33:440–444.
4. Perdue PW, Watts DD, Kaufmann CR, et al. Differences in mortalitybetween elderly and younger adult trauma patients: geriatric statusincreases risk of delayed death. J Trauma. 1998;45:805–810.
5. Finelli FC, Jonsson J, Champion HR, et al. A case control study formajor trauma in geriatric patients. J Trauma. 1989;29:541–548.
6. Van Aalst JA, Morris JA Jr, Yates HK, et al. Severely injured geriatricpatients return to independent living: a study of factors influencingfunction and independence. J Trauma. 1991;31:1096–1101.
7. Gubler KD, Davis R, Koepsell T, et al. Long-term survival ofelderly trauma patients. Arch Surg. 1997;132:1010–1014.
8. Hannan EL, Waller CH, Farrell LS, et al. Elderly trauma inpatientsin New York state: 1994–1998. J Trauma. 2004;56:1297–1304.
9. Hukkelhoven CW, Steyerberg EW, Rampen AJ, et al. Patient ageand outcome following severe traumatic brain injury: an analysis of5600 patients. J Neurosurg. 2003;99:666–673.
10. Pennings JL, Bachulis BL, Simons CT, et al. Survival after severebrain injury in the aged. Arch Surg. 1993;128:787–793.
11. Rozzelle CJ, Wofford JL, Branch CL. Predictors of hospitalmortality in older patients with subdural hematoma. J Am GeriatrSoc. 1995;43:240–244.
12. MacKenzie EJ, Steinwachs DM, Shankar B. Classifying traumaseverity based on hospital discharge diagnoses. Validation of anICD-9CM to AIS-85 conversion table. Med Care. 1989;27:412–422.
13. AMA Committee on Medical Aspects of Automotive Safety. Ratingthe severity of tissue damage. I. The abbreviated scale. JAMA. 1971;215:277–280.
14. Charlson ME, Pompei P, Ales KL, et al. A new method ofclassifying prognostic comorbidity in longitudinal studies:development and validation. J Chronic Dis. 1987;40:373–383.
15. Romano PS, Roos LL, Jollis JG. Adapting a clinical comorbidityindex for use with ICD-9-CM administrative data: differingperspectives. J Clin Epidemiol. 1993;46:1075–1079.
Table 3 Simplified Scoring System to Predict Long-Term Mortality in Patients 65 and Older, Surviving inHospital at Least a Day After Significant Head Injury(AIS at least 3)
Factor Points
Female 2Male 2 1/2Age 75–84 1 1/2Age 85� 3 1/2Charlson � 1 1/2Charlson � 2 2Charlson � � 3 3 1/2AISmax � 4 1AISmax � 5 7 1/2Prolonged LOC 1
The total of applicable points above is multiplied by 7% (limitedto a maximum of 95%) to obtain a rough estimate of mortality at 1year.
The Journal of TRAUMA� Injury, Infection, and Critical Care
422 February 2007

16. Grossman MD, Miller D, Scaff DW, et al. When is an elder old?Effect of preexisting conditions on mortality in geriatric trauma.J Trauma. 2002;52:242–246.
17. DeMaria EJ, Kenney PR, Merriam MA, et al. Survival after traumain geriatric patients. Ann Surg. 1987;206:738–743.
18. Oreskovich MR, Howard JD, Copass MK, et al. Geriatric trauma:injury patterns and outcome. J Trauma. 1984;24:565–572.
19. Van der Sluis CK, Klasen HJ, Eisma WH, et al. Major trauma inyoung and old: what is the difference? J Trauma. 1996;40:78–82.
20. Clark DE, DeLorenzo MA, Lucas FL, et al. Epidemiology andshort-term outcomes of injured Medicare patients. J Am Geriatr Soc.2004;52:2023–2030.
21. Amacher AL, Bybee DE. Toleration of head injury by the elderly.Neurosurgery. 1987;20:954–958.
22. Alberico AM, Ward JD, Choi SC, et al. Outcome after severehead injury. Relationship to mass lesions, diffuse injury, and ICPcourse in pediatric and adult patients. J Neurosurg. 1987;67:648 –656.
23. Nagurney JT, Borczuk P, Thomas SH. Elder patients with closedhead trauma: a comparison with nonelder patients. Acad Emerg Med.1998;5:678–684.
24. Osler T, Hales K, Baack B, et al. Trauma in the elderly. Am J Surg.1988;156:537–543.
25. Smith DP, Enderson BL, Maull KI. Trauma in the elderly:determinants of outcome. South Med J. 1990;83:171–177.
26. Clark DE, DeLorenzo MA, Lucas FL, et al. Injuries among olderAmericans with and without Medicare. Am J Public Health. 2005;95:273–278.
Medicare Head Injury Survival
Volume 62 • Number 2 423
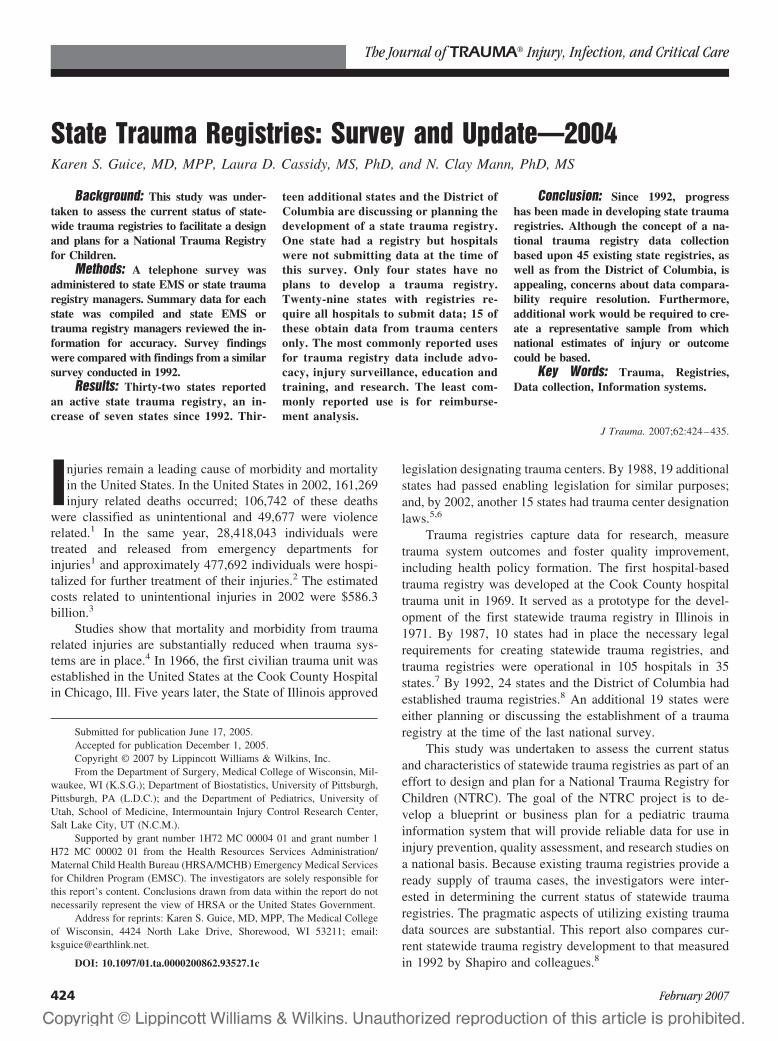
State Trauma Registries: Survey and Update—2004Karen S. Guice, MD, MPP, Laura D. Cassidy, MS, PhD, and N. Clay Mann, PhD, MS
Background: This study was under-taken to assess the current status of state-wide trauma registries to facilitate a designand plans for a National Trauma Registryfor Children.
Methods: A telephone survey wasadministered to state EMS or state traumaregistry managers. Summary data for eachstate was compiled and state EMS ortrauma registry managers reviewed the in-formation for accuracy. Survey findingswere compared with findings from a similarsurvey conducted in 1992.
Results: Thirty-two states reportedan active state trauma registry, an in-crease of seven states since 1992. Thir-
teen additional states and the District ofColumbia are discussing or planning thedevelopment of a state trauma registry.One state had a registry but hospitalswere not submitting data at the time ofthis survey. Only four states have noplans to develop a trauma registry.Twenty-nine states with registries re-quire all hospitals to submit data; 15 ofthese obtain data from trauma centersonly. The most commonly reported usesfor trauma registry data include advo-cacy, injury surveillance, education andtraining, and research. The least com-monly reported use is for reimburse-ment analysis.
Conclusion: Since 1992, progresshas been made in developing state traumaregistries. Although the concept of a na-tional trauma registry data collectionbased upon 45 existing state registries, aswell as from the District of Columbia, isappealing, concerns about data compara-bility require resolution. Furthermore,additional work would be required to cre-ate a representative sample from whichnational estimates of injury or outcomecould be based.
Key Words: Trauma, Registries,Data collection, Information systems.
J Trauma. 2007;62:424–435.
Injuries remain a leading cause of morbidity and mortalityin the United States. In the United States in 2002, 161,269injury related deaths occurred; 106,742 of these deaths
were classified as unintentional and 49,677 were violencerelated.1 In the same year, 28,418,043 individuals weretreated and released from emergency departments forinjuries1 and approximately 477,692 individuals were hospi-talized for further treatment of their injuries.2 The estimatedcosts related to unintentional injuries in 2002 were $586.3billion.3
Studies show that mortality and morbidity from traumarelated injuries are substantially reduced when trauma sys-tems are in place.4 In 1966, the first civilian trauma unit wasestablished in the United States at the Cook County Hospitalin Chicago, Ill. Five years later, the State of Illinois approved
legislation designating trauma centers. By 1988, 19 additionalstates had passed enabling legislation for similar purposes;and, by 2002, another 15 states had trauma center designationlaws.5,6
Trauma registries capture data for research, measuretrauma system outcomes and foster quality improvement,including health policy formation. The first hospital-basedtrauma registry was developed at the Cook County hospitaltrauma unit in 1969. It served as a prototype for the devel-opment of the first statewide trauma registry in Illinois in1971. By 1987, 10 states had in place the necessary legalrequirements for creating statewide trauma registries, andtrauma registries were operational in 105 hospitals in 35states.7 By 1992, 24 states and the District of Columbia hadestablished trauma registries.8 An additional 19 states wereeither planning or discussing the establishment of a traumaregistry at the time of the last national survey.
This study was undertaken to assess the current statusand characteristics of statewide trauma registries as part of aneffort to design and plan for a National Trauma Registry forChildren (NTRC). The goal of the NTRC project is to de-velop a blueprint or business plan for a pediatric traumainformation system that will provide reliable data for use ininjury prevention, quality assessment, and research studies ona national basis. Because existing trauma registries provide aready supply of trauma cases, the investigators were inter-ested in determining the current status of statewide traumaregistries. The pragmatic aspects of utilizing existing traumadata sources are substantial. This report also compares cur-rent statewide trauma registry development to that measuredin 1992 by Shapiro and colleagues.8
Submitted for publication June 17, 2005.Accepted for publication December 1, 2005.Copyright © 2007 by Lippincott Williams & Wilkins, Inc.From the Department of Surgery, Medical College of Wisconsin, Mil-
waukee, WI (K.S.G.); Department of Biostatistics, University of Pittsburgh,Pittsburgh, PA (L.D.C.); and the Department of Pediatrics, University ofUtah, School of Medicine, Intermountain Injury Control Research Center,Salt Lake City, UT (N.C.M.).
Supported by grant number 1H72 MC 00004 01 and grant number 1H72 MC 00002 01 from the Health Resources Services Administration/Maternal Child Health Bureau (HRSA/MCHB) Emergency Medical Servicesfor Children Program (EMSC). The investigators are solely responsible forthis report’s content. Conclusions drawn from data within the report do notnecessarily represent the view of HRSA or the United States Government.
Address for reprints: Karen S. Guice, MD, MPP, The Medical Collegeof Wisconsin, 4424 North Lake Drive, Shorewood, WI 53211; email:[email protected].
DOI: 10.1097/01.ta.0000200862.93527.1c
The Journal of TRAUMA� Injury, Infection, and Critical Care
424 February 2007
MATERIALS AND METHODSSurvey questions were developed based upon the 1992
survey8 with additional questions to address new and supple-mental areas of interest. The survey questionnaire was re-viewed by members of the NTRC Project’s Advisory Councilfor clarity and content (see Appendix for Council member-ship and survey questionnaire). State EMS or trauma registrypersonnel were interviewed by telephone during the springand summer of 2003 by a single individual (KG). Follow-upcalls and electronic communications were conducted to clar-ify particular points or to obtain additional information. Writ-ten summaries of each state’s trauma system and registryinformation based on the interview were sent to state person-nel for comment or correction. Data were compiled into adraft report that was provided to state EMS and registrypersonnel for a final review and comment. A listing of alldata elements collected by each state trauma registry, as wellas registry inclusion and exclusion criteria, was also obtained.
Data elements from all state trauma registries weremapped to a master listing of data elements and workingdefinitions. State data dictionaries were used whenever pos-sible. Similarly, inclusion and exclusion criteria were mappedto a master listing of criteria.
RESULTSThirty-two of the 50 (64%) states reported the presence
of a state-wide trauma registry (Table 1). Thirteen states, aswell as the District of Columbia, reported that discussions orplans to develop a state-wide trauma registry were inprogress. One state, South Carolina, maintained a traumaregistry; however, hospitals were not actively submitting dataat the time of this survey. Only four states reported that theyhad no plans to develop a statewide registry. Responsesobtained from the 32 functioning state trauma registries formthe basis of this report.
Hospitals are mandated to submit data in 27 (54%) statesand 5 (10%) states request hospitals to voluntarily submitdata (Table 1). Of the 27 states with mandatory data submis-sion, 11 (41%) require data submission from all acute carehospitals within the state. Thirteen (48%) states require datasubmission from only the designated trauma centers withinthe state. Three states, Iowa, Kansas, and Mississippi, requiredata reporting from hospitals meeting specific definitions.Iowa requires all “resource regional and area trauma centers”to report data; Kansas requires all hospitals caring for traumapatients to report data; and Mississippi requires data submis-sion from “participating hospitals”. Ohio is the only state thatrequires data reporting from all acute care hospitals andrehabilitation facilities.
The five states requesting voluntary data submissionfrom hospitals include Alabama, Arkansas, Minnesota, Mon-tana, and South Dakota (Table 1). Alabama requests datasubmission from all acute care hospitals. Arkansas requestsdata submission from designated trauma centers only. Min-
nesota obtains voluntarily submitted data from all designatedtrauma centers and utilizes UB92 data submitted by all acutecare hospitals to the Minnesota Hospital Association. (TheUB92 form, mandated for Medicare patients, has been widelyaccepted as the industry standard for billing.) Montana ob-tains voluntarily submitted data from nine trauma centers inthe state that have hospital trauma registries. South Dakotaobtains data voluntarily submitted from five trauma centersthat have hospital trauma registries.
Twenty-eight states (88%) use state employees for staff-ing related to the state trauma registry. Of the remaining four,New York’s trauma registry is operated by the State Univer-sity of New York’s University at Albany’s School of PublicHealth with monitoring by the New York State Department ofHealth. North Carolina’s trauma registry is managed under acontract with the University of North Carolina at Chapel Hill.Pennsylvania’s trauma registry is managed by the Pennsyl-vania Trauma Systems Foundation, a private organization.Utah’s trauma registry is managed under a contract with theIntermountain Injury Control Research Center at the Univer-sity of Utah.
Three states (10%), Illinois, Ohio, and Texas, have re-cently moved to a Web-based trauma registry system. Mostother states use a commercially available client-based soft-ware package (Table 1). Case submission frequency to thestate trauma registry is quite variable (Table 1). Fourteen(44%) of the state trauma registries collect data quarterly.Virginia collects data quarterly if it can be submitted elec-tronically, otherwise data are submitted using paper formsand the frequency of submission is more variable. Alaskacollects data monthly from larger hospitals and quarterlyfrom smaller hospitals. Four states request that data be sub-mitted after a patient is discharged from the hospital. Oregonand Texas require data submission within 90 days of hospitaldischarge. Illinois requires reporting 60 days after hospitaldischarge whereas Iowa requires data submission 90 daysafter the quarter. Connecticut collects data semiannually.
States reported a variety of uses for their trauma registrydata. Definitions of these use categories are listed in Table 2.Figure 1 shows the distribution of functions for the traumaregistries and Table 3 shows registry functions by state andcategory. A majority of states (84%) use their data for advo-cacy and injury surveillance and 26 states (81%) report usingdata for education or training purposes, and for research.Twenty-five states (78%) create reports for hospitals submit-ting data; 24 states (75%) create reports for various stateagencies; and 23 states (72%) use the data for quality assur-ance and improvement activities. Twenty-two states (69%)use the data for trauma center accreditation/certification/des-ignation, whereas 21 (66%) states use the data to betterallocate resources. Auditing, federal reports, caseload verifi-cation, and reimbursement were not widely reported uses forregistry data.
Data linkage is a powerful tool that combines multipledata sources through a unique identifier or through probabi-
Survey and Update State of Trauma Registries
Volume 62 • Number 2 425
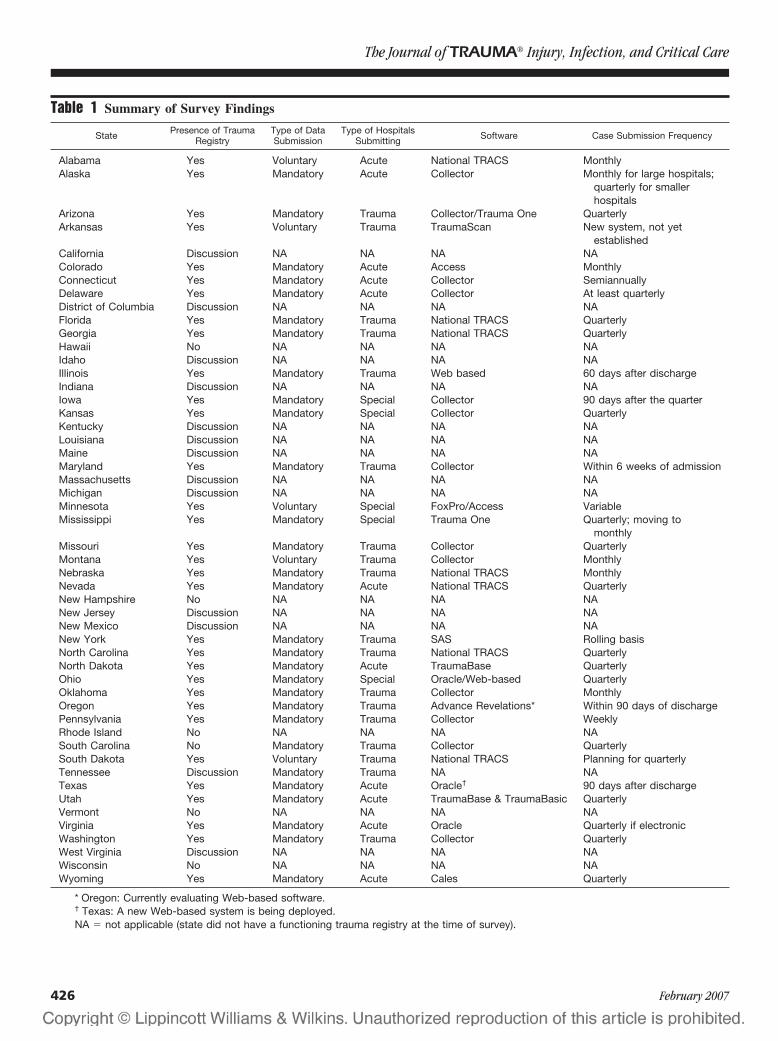
Table 1 Summary of Survey Findings
State Presence of TraumaRegistry
Type of DataSubmission
Type of HospitalsSubmitting Software Case Submission Frequency
Alabama Yes Voluntary Acute National TRACS MonthlyAlaska Yes Mandatory Acute Collector Monthly for large hospitals;
quarterly for smallerhospitals
Arizona Yes Mandatory Trauma Collector/Trauma One QuarterlyArkansas Yes Voluntary Trauma TraumaScan New system, not yet
establishedCalifornia Discussion NA NA NA NAColorado Yes Mandatory Acute Access MonthlyConnecticut Yes Mandatory Acute Collector SemiannuallyDelaware Yes Mandatory Acute Collector At least quarterlyDistrict of Columbia Discussion NA NA NA NAFlorida Yes Mandatory Trauma National TRACS QuarterlyGeorgia Yes Mandatory Trauma National TRACS QuarterlyHawaii No NA NA NA NAIdaho Discussion NA NA NA NAIllinois Yes Mandatory Trauma Web based 60 days after dischargeIndiana Discussion NA NA NA NAIowa Yes Mandatory Special Collector 90 days after the quarterKansas Yes Mandatory Special Collector QuarterlyKentucky Discussion NA NA NA NALouisiana Discussion NA NA NA NAMaine Discussion NA NA NA NAMaryland Yes Mandatory Trauma Collector Within 6 weeks of admissionMassachusetts Discussion NA NA NA NAMichigan Discussion NA NA NA NAMinnesota Yes Voluntary Special FoxPro/Access VariableMississippi Yes Mandatory Special Trauma One Quarterly; moving to
monthlyMissouri Yes Mandatory Trauma Collector QuarterlyMontana Yes Voluntary Trauma Collector MonthlyNebraska Yes Mandatory Trauma National TRACS MonthlyNevada Yes Mandatory Acute National TRACS QuarterlyNew Hampshire No NA NA NA NANew Jersey Discussion NA NA NA NANew Mexico Discussion NA NA NA NANew York Yes Mandatory Trauma SAS Rolling basisNorth Carolina Yes Mandatory Trauma National TRACS QuarterlyNorth Dakota Yes Mandatory Acute TraumaBase QuarterlyOhio Yes Mandatory Special Oracle/Web-based QuarterlyOklahoma Yes Mandatory Trauma Collector MonthlyOregon Yes Mandatory Trauma Advance Revelations* Within 90 days of dischargePennsylvania Yes Mandatory Trauma Collector WeeklyRhode Island No NA NA NA NASouth Carolina No Mandatory Trauma Collector QuarterlySouth Dakota Yes Voluntary Trauma National TRACS Planning for quarterlyTennessee Discussion Mandatory Trauma NA NATexas Yes Mandatory Acute Oracle† 90 days after dischargeUtah Yes Mandatory Acute TraumaBase & TraumaBasic QuarterlyVermont No NA NA NA NAVirginia Yes Mandatory Acute Oracle Quarterly if electronicWashington Yes Mandatory Trauma Collector QuarterlyWest Virginia Discussion NA NA NA NAWisconsin No NA NA NA NAWyoming Yes Mandatory Acute Cales Quarterly
* Oregon: Currently evaluating Web-based software.† Texas: A new Web-based system is being deployed.NA � not applicable (state did not have a functioning trauma registry at the time of survey).
The Journal of TRAUMA� Injury, Infection, and Critical Care
426 February 2007
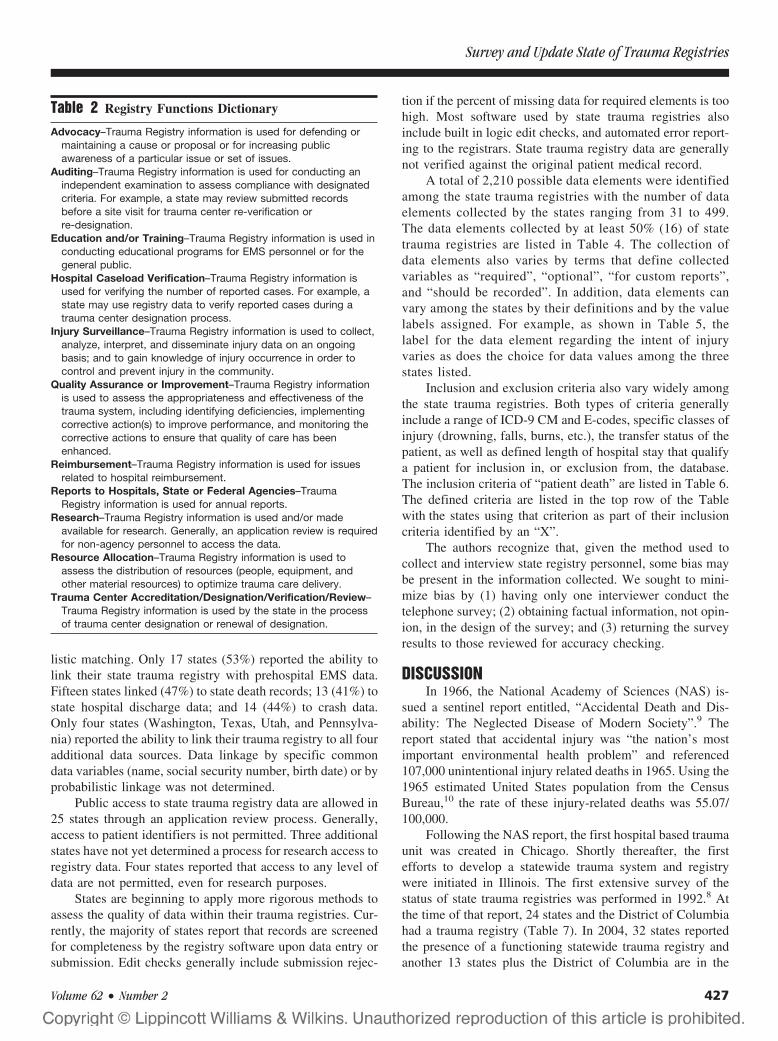
listic matching. Only 17 states (53%) reported the ability tolink their state trauma registry with prehospital EMS data.Fifteen states linked (47%) to state death records; 13 (41%) tostate hospital discharge data; and 14 (44%) to crash data.Only four states (Washington, Texas, Utah, and Pennsylva-nia) reported the ability to link their trauma registry to all fouradditional data sources. Data linkage by specific commondata variables (name, social security number, birth date) or byprobabilistic linkage was not determined.
Public access to state trauma registry data are allowed in25 states through an application review process. Generally,access to patient identifiers is not permitted. Three additionalstates have not yet determined a process for research access toregistry data. Four states reported that access to any level ofdata are not permitted, even for research purposes.
States are beginning to apply more rigorous methods toassess the quality of data within their trauma registries. Cur-rently, the majority of states report that records are screenedfor completeness by the registry software upon data entry orsubmission. Edit checks generally include submission rejec-
tion if the percent of missing data for required elements is toohigh. Most software used by state trauma registries alsoinclude built in logic edit checks, and automated error report-ing to the registrars. State trauma registry data are generallynot verified against the original patient medical record.
A total of 2,210 possible data elements were identifiedamong the state trauma registries with the number of dataelements collected by the states ranging from 31 to 499.The data elements collected by at least 50% (16) of statetrauma registries are listed in Table 4. The collection ofdata elements also varies by terms that define collectedvariables as “required”, “optional”, “for custom reports”,and “should be recorded”. In addition, data elements canvary among the states by their definitions and by the valuelabels assigned. For example, as shown in Table 5, thelabel for the data element regarding the intent of injuryvaries as does the choice for data values among the threestates listed.
Inclusion and exclusion criteria also vary widely amongthe state trauma registries. Both types of criteria generallyinclude a range of ICD-9 CM and E-codes, specific classes ofinjury (drowning, falls, burns, etc.), the transfer status of thepatient, as well as defined length of hospital stay that qualifya patient for inclusion in, or exclusion from, the database.The inclusion criteria of “patient death” are listed in Table 6.The defined criteria are listed in the top row of the Tablewith the states using that criterion as part of their inclusioncriteria identified by an “X”.
The authors recognize that, given the method used tocollect and interview state registry personnel, some bias maybe present in the information collected. We sought to mini-mize bias by (1) having only one interviewer conduct thetelephone survey; (2) obtaining factual information, not opin-ion, in the design of the survey; and (3) returning the surveyresults to those reviewed for accuracy checking.
DISCUSSIONIn 1966, the National Academy of Sciences (NAS) is-
sued a sentinel report entitled, “Accidental Death and Dis-ability: The Neglected Disease of Modern Society”.9 Thereport stated that accidental injury was “the nation’s mostimportant environmental health problem” and referenced107,000 unintentional injury related deaths in 1965. Using the1965 estimated United States population from the CensusBureau,10 the rate of these injury-related deaths was 55.07/100,000.
Following the NAS report, the first hospital based traumaunit was created in Chicago. Shortly thereafter, the firstefforts to develop a statewide trauma system and registrywere initiated in Illinois. The first extensive survey of thestatus of state trauma registries was performed in 1992.8 Atthe time of that report, 24 states and the District of Columbiahad a trauma registry (Table 7). In 2004, 32 states reportedthe presence of a functioning statewide trauma registry andanother 13 states plus the District of Columbia are in the
Table 2 Registry Functions Dictionary
Advocacy–Trauma Registry information is used for defending ormaintaining a cause or proposal or for increasing publicawareness of a particular issue or set of issues.
Auditing–Trauma Registry information is used for conducting anindependent examination to assess compliance with designatedcriteria. For example, a state may review submitted recordsbefore a site visit for trauma center re-verification orre-designation.
Education and/or Training–Trauma Registry information is used inconducting educational programs for EMS personnel or for thegeneral public.
Hospital Caseload Verification–Trauma Registry information isused for verifying the number of reported cases. For example, astate may use registry data to verify reported cases during atrauma center designation process.
Injury Surveillance–Trauma Registry information is used to collect,analyze, interpret, and disseminate injury data on an ongoingbasis; and to gain knowledge of injury occurrence in order tocontrol and prevent injury in the community.
Quality Assurance or Improvement–Trauma Registry informationis used to assess the appropriateness and effectiveness of thetrauma system, including identifying deficiencies, implementingcorrective action(s) to improve performance, and monitoring thecorrective actions to ensure that quality of care has beenenhanced.
Reimbursement–Trauma Registry information is used for issuesrelated to hospital reimbursement.
Reports to Hospitals, State or Federal Agencies–TraumaRegistry information is used for annual reports.
Research–Trauma Registry information is used and/or madeavailable for research. Generally, an application review is requiredfor non-agency personnel to access the data.
Resource Allocation–Trauma Registry information is used toassess the distribution of resources (people, equipment, andother material resources) to optimize trauma care delivery.
Trauma Center Accreditation/Designation/Verification/Review–Trauma Registry information is used by the state in the processof trauma center designation or renewal of designation.
Survey and Update State of Trauma Registries
Volume 62 • Number 2 427
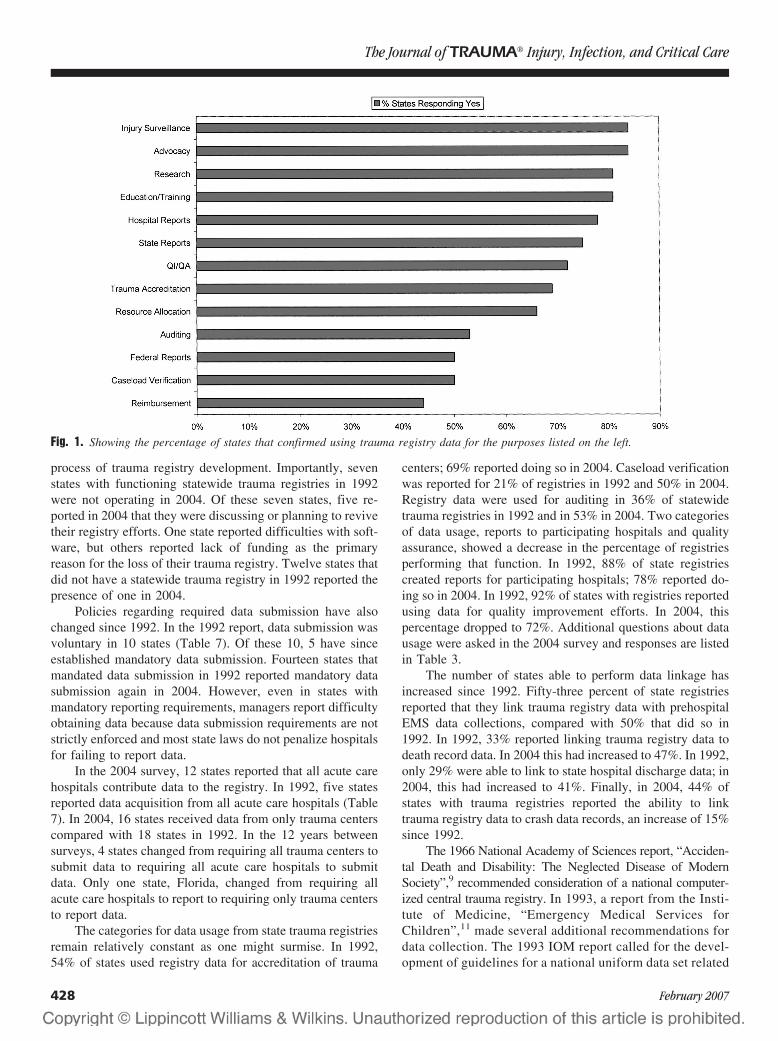
process of trauma registry development. Importantly, sevenstates with functioning statewide trauma registries in 1992were not operating in 2004. Of these seven states, five re-ported in 2004 that they were discussing or planning to revivetheir registry efforts. One state reported difficulties with soft-ware, but others reported lack of funding as the primaryreason for the loss of their trauma registry. Twelve states thatdid not have a statewide trauma registry in 1992 reported thepresence of one in 2004.
Policies regarding required data submission have alsochanged since 1992. In the 1992 report, data submission wasvoluntary in 10 states (Table 7). Of these 10, 5 have sinceestablished mandatory data submission. Fourteen states thatmandated data submission in 1992 reported mandatory datasubmission again in 2004. However, even in states withmandatory reporting requirements, managers report difficultyobtaining data because data submission requirements are notstrictly enforced and most state laws do not penalize hospitalsfor failing to report data.
In the 2004 survey, 12 states reported that all acute carehospitals contribute data to the registry. In 1992, five statesreported data acquisition from all acute care hospitals (Table7). In 2004, 16 states received data from only trauma centerscompared with 18 states in 1992. In the 12 years betweensurveys, 4 states changed from requiring all trauma centers tosubmit data to requiring all acute care hospitals to submitdata. Only one state, Florida, changed from requiring allacute care hospitals to report to requiring only trauma centersto report data.
The categories for data usage from state trauma registriesremain relatively constant as one might surmise. In 1992,54% of states used registry data for accreditation of trauma
centers; 69% reported doing so in 2004. Caseload verificationwas reported for 21% of registries in 1992 and 50% in 2004.Registry data were used for auditing in 36% of statewidetrauma registries in 1992 and in 53% in 2004. Two categoriesof data usage, reports to participating hospitals and qualityassurance, showed a decrease in the percentage of registriesperforming that function. In 1992, 88% of state registriescreated reports for participating hospitals; 78% reported do-ing so in 2004. In 1992, 92% of states with registries reportedusing data for quality improvement efforts. In 2004, thispercentage dropped to 72%. Additional questions about datausage were asked in the 2004 survey and responses are listedin Table 3.
The number of states able to perform data linkage hasincreased since 1992. Fifty-three percent of state registriesreported that they link trauma registry data with prehospitalEMS data collections, compared with 50% that did so in1992. In 1992, 33% reported linking trauma registry data todeath record data. In 2004 this had increased to 47%. In 1992,only 29% were able to link to state hospital discharge data; in2004, this had increased to 41%. Finally, in 2004, 44% ofstates with trauma registries reported the ability to linktrauma registry data to crash data records, an increase of 15%since 1992.
The 1966 National Academy of Sciences report, “Acciden-tal Death and Disability: The Neglected Disease of ModernSociety”,9 recommended consideration of a national computer-ized central trauma registry. In 1993, a report from the Insti-tute of Medicine, “Emergency Medical Services forChildren”,11 made several additional recommendations fordata collection. The 1993 IOM report called for the devel-opment of guidelines for a national uniform data set related
Fig. 1. Showing the percentage of states that confirmed using trauma registry data for the purposes listed on the left.
The Journal of TRAUMA� Injury, Infection, and Critical Care
428 February 2007
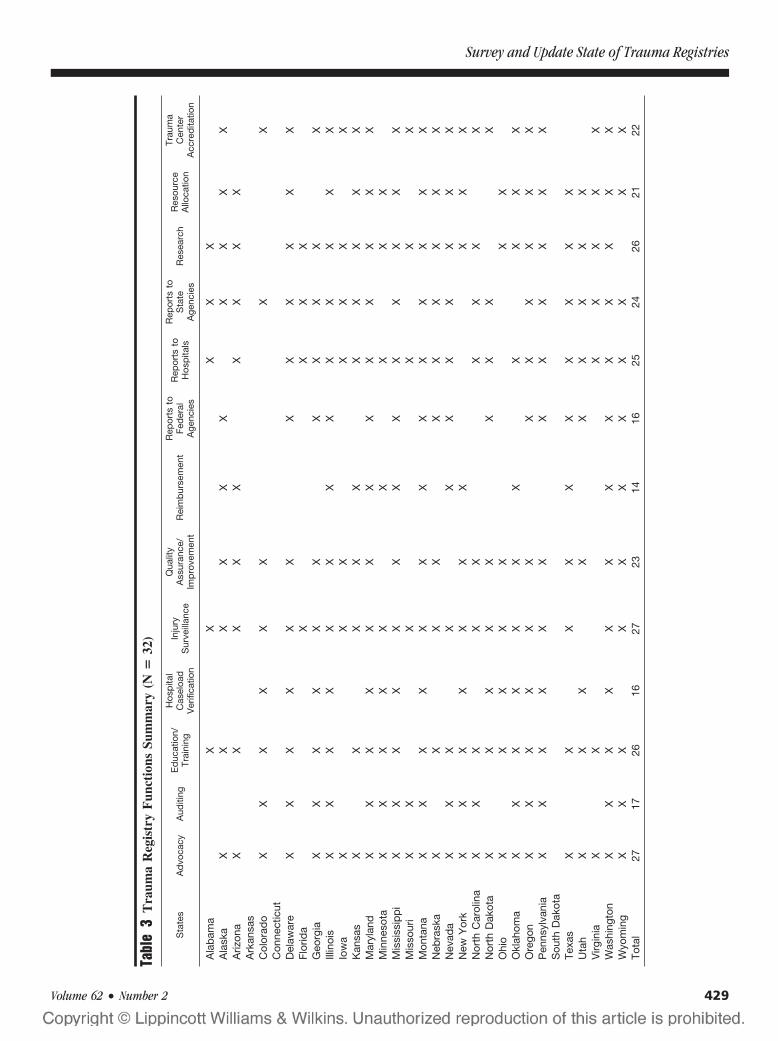
Tabl
e3
Tra
uma
Reg
istr
yF
unct
ions
Sum
mar
y(N
�32
)
Sta
tes
Ad
voca
cyA
uditi
ngE
duc
atio
n/Tr
aini
ng
Hos
pita
lC
asel
oad
Ver
ifica
tion
Inju
ryS
urve
illan
ce
Qua
lity
Ass
uran
ce/
Imp
rove
men
tR
eim
bur
sem
ent
Rep
orts
toFe
der
alA
genc
ies
Rep
orts
toH
osp
itals
Rep
orts
toS
tate
Age
ncie
sR
esea
rch
Res
ourc
eA
lloca
tion
Trau
ma
Cen
ter
Acc
red
itatio
n
Ala
bam
aX
XX
XX
Ala
ska
XX
XX
XX
XX
XX
Ariz
ona
XX
XX
XX
XX
XA
rkan
sas
Col
orad
oX
XX
XX
XX
XC
onne
ctic
utD
elaw
are
XX
XX
XX
XX
XX
XX
Flor
ida
XX
XX
Geo
rgia
XX
XX
XX
XX
XX
XIll
inoi
sX
XX
XX
XX
XX
XX
XX
Iow
aX
XX
XX
XX
Kan
sas
XX
XX
XX
XX
XX
Mar
ylan
dX
XX
XX
XX
XX
XX
XX
Min
neso
taX
XX
XX
XX
XX
Mis
siss
ipp
iX
XX
XX
XX
XX
XX
XX
Mis
sour
iX
XX
XX
XM
onta
naX
XX
XX
XX
XX
XX
XX
Neb
rask
aX
XX
XX
XX
XX
XN
evad
aX
XX
XX
XX
XX
XX
New
Yor
kX
XX
XX
XX
XX
XN
orth
Car
olin
aX
XX
XX
XX
XX
Nor
thD
akot
aX
XX
XX
XX
XX
Ohi
oX
XX
XX
XX
Okl
ahom
aX
XX
XX
XX
XX
XX
Ore
gon
XX
XX
XX
XX
XX
XX
Pen
nsyl
vani
aX
XX
XX
XX
XX
XX
XS
outh
Dak
ota
Texa
sX
XX
XX
XX
XX
XU
tah
XX
XX
XX
XX
XV
irgin
iaX
XX
XX
XX
Was
hing
ton
XX
XX
XX
XX
XX
XX
XW
yom
ing
XX
XX
XX
XX
XX
XTo
tal
2717
2616
2723
1416
2524
2621
22
Survey and Update State of Trauma Registries
Volume 62 • Number 2 429
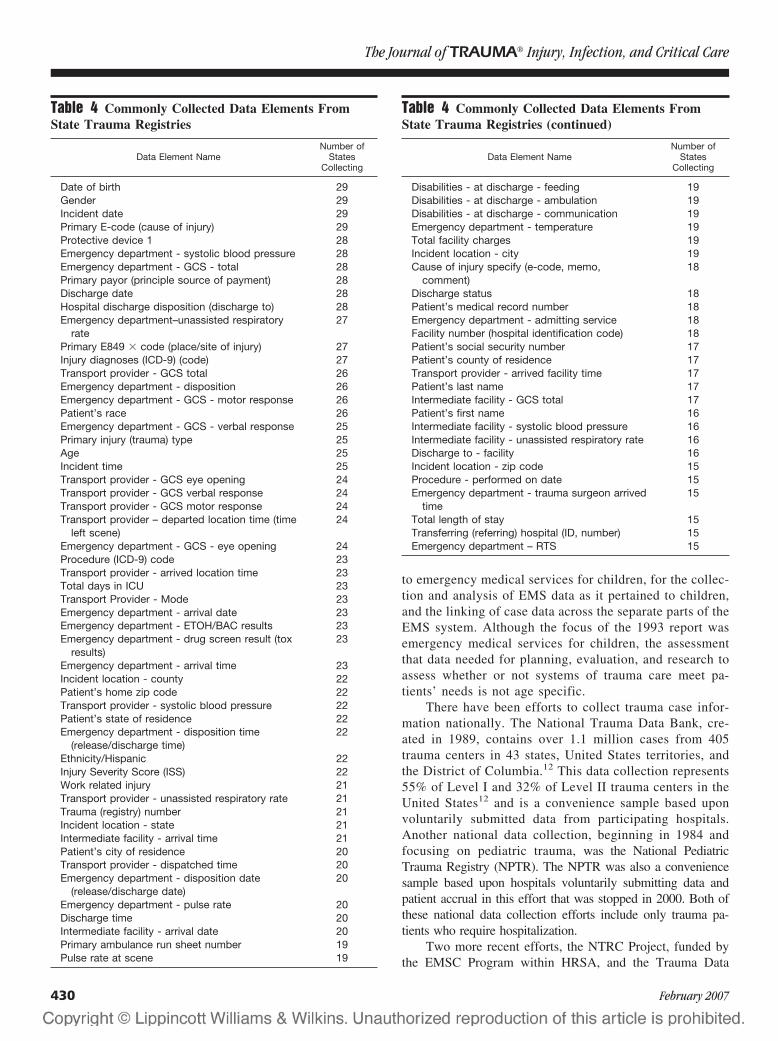
to emergency medical services for children, for the collec-tion and analysis of EMS data as it pertained to children,and the linking of case data across the separate parts of theEMS system. Although the focus of the 1993 report wasemergency medical services for children, the assessmentthat data needed for planning, evaluation, and research toassess whether or not systems of trauma care meet pa-tients’ needs is not age specific.
There have been efforts to collect trauma case infor-mation nationally. The National Trauma Data Bank, cre-ated in 1989, contains over 1.1 million cases from 405trauma centers in 43 states, United States territories, andthe District of Columbia.12 This data collection represents55% of Level I and 32% of Level II trauma centers in theUnited States12 and is a convenience sample based uponvoluntarily submitted data from participating hospitals.Another national data collection, beginning in 1984 andfocusing on pediatric trauma, was the National PediatricTrauma Registry (NPTR). The NPTR was also a conveniencesample based upon hospitals voluntarily submitting data andpatient accrual in this effort that was stopped in 2000. Both ofthese national data collection efforts include only trauma pa-tients who require hospitalization.
Two more recent efforts, the NTRC Project, funded bythe EMSC Program within HRSA, and the Trauma Data
Table 4 Commonly Collected Data Elements FromState Trauma Registries
Data Element NameNumber of
StatesCollecting
Date of birth 29Gender 29Incident date 29Primary E-code (cause of injury) 29Protective device 1 28Emergency department - systolic blood pressure 28Emergency department - GCS - total 28Primary payor (principle source of payment) 28Discharge date 28Hospital discharge disposition (discharge to) 28Emergency department–unassisted respiratory
rate27
Primary E849 � code (place/site of injury) 27Injury diagnoses (ICD-9) (code) 27Transport provider - GCS total 26Emergency department - disposition 26Emergency department - GCS - motor response 26Patient’s race 26Emergency department - GCS - verbal response 25Primary injury (trauma) type 25Age 25Incident time 25Transport provider - GCS eye opening 24Transport provider - GCS verbal response 24Transport provider - GCS motor response 24Transport provider – departed location time (time
left scene)24
Emergency department - GCS - eye opening 24Procedure (ICD-9) code 23Transport provider - arrived location time 23Total days in ICU 23Transport Provider - Mode 23Emergency department - arrival date 23Emergency department - ETOH/BAC results 23Emergency department - drug screen result (tox
results)23
Emergency department - arrival time 23Incident location - county 22Patient’s home zip code 22Transport provider - systolic blood pressure 22Patient’s state of residence 22Emergency department - disposition time
(release/discharge time)22
Ethnicity/Hispanic 22Injury Severity Score (ISS) 22Work related injury 21Transport provider - unassisted respiratory rate 21Trauma (registry) number 21Incident location - state 21Intermediate facility - arrival time 21Patient’s city of residence 20Transport provider - dispatched time 20Emergency department - disposition date
(release/discharge date)20
Emergency department - pulse rate 20Discharge time 20Intermediate facility - arrival date 20Primary ambulance run sheet number 19Pulse rate at scene 19
Table 4 Commonly Collected Data Elements FromState Trauma Registries (continued)
Data Element NameNumber of
StatesCollecting
Disabilities - at discharge - feeding 19Disabilities - at discharge - ambulation 19Disabilities - at discharge - communication 19Emergency department - temperature 19Total facility charges 19Incident location - city 19Cause of injury specify (e-code, memo,
comment)18
Discharge status 18Patient’s medical record number 18Emergency department - admitting service 18Facility number (hospital identification code) 18Patient’s social security number 17Patient’s county of residence 17Transport provider - arrived facility time 17Patient’s last name 17Intermediate facility - GCS total 17Patient’s first name 16Intermediate facility - systolic blood pressure 16Intermediate facility - unassisted respiratory rate 16Discharge to - facility 16Incident location - zip code 15Procedure - performed on date 15Emergency department - trauma surgeon arrived
time15
Total length of stay 15Transferring (referring) hospital (ID, number) 15Emergency department – RTS 15
The Journal of TRAUMA� Injury, Infection, and Critical Care
430 February 2007
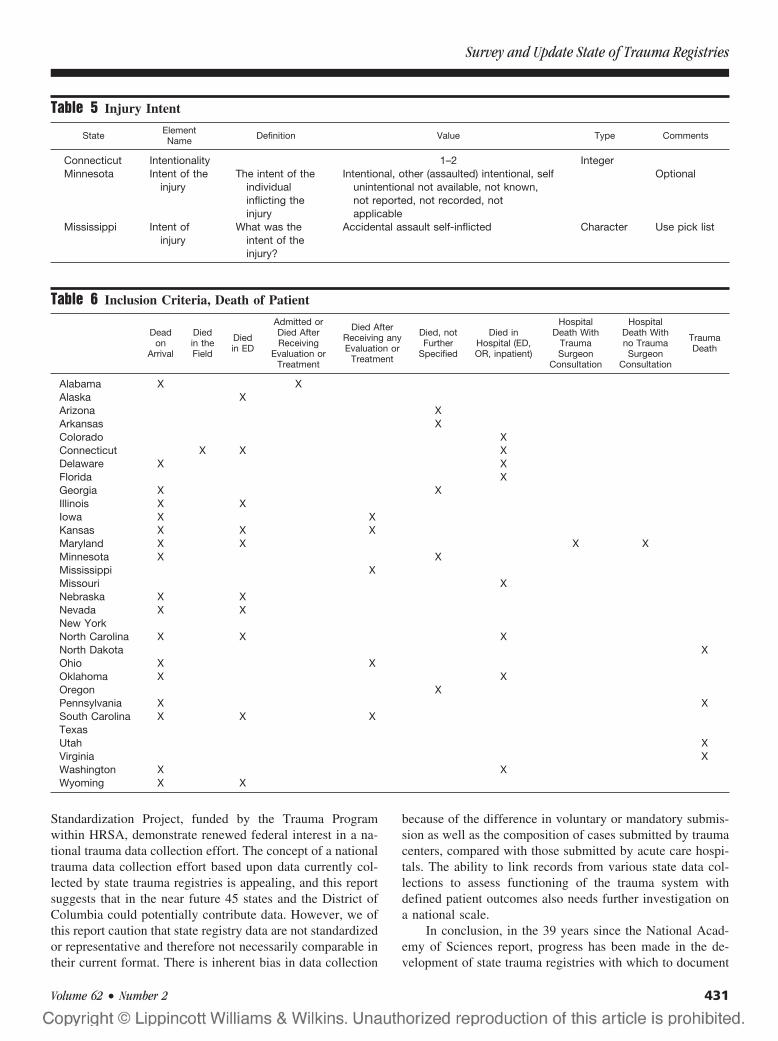
Standardization Project, funded by the Trauma Programwithin HRSA, demonstrate renewed federal interest in a na-tional trauma data collection effort. The concept of a nationaltrauma data collection effort based upon data currently col-lected by state trauma registries is appealing, and this reportsuggests that in the near future 45 states and the District ofColumbia could potentially contribute data. However, we ofthis report caution that state registry data are not standardizedor representative and therefore not necessarily comparable intheir current format. There is inherent bias in data collection
because of the difference in voluntary or mandatory submis-sion as well as the composition of cases submitted by traumacenters, compared with those submitted by acute care hospi-tals. The ability to link records from various state data col-lections to assess functioning of the trauma system withdefined patient outcomes also needs further investigation ona national scale.
In conclusion, in the 39 years since the National Acad-emy of Sciences report, progress has been made in the de-velopment of state trauma registries with which to document
Table 5 Injury Intent
State ElementName Definition Value Type Comments
Connecticut Intentionality 1–2 IntegerMinnesota Intent of the
injuryThe intent of the
individualinflicting theinjury
Intentional, other (assaulted) intentional, selfunintentional not available, not known,not reported, not recorded, notapplicable
Optional
Mississippi Intent ofinjury
What was theintent of theinjury?
Accidental assault self-inflicted Character Use pick list
Table 6 Inclusion Criteria, Death of Patient
Deadon
Arrival
Diedin theField
Diedin ED
Admitted orDied AfterReceiving
Evaluation orTreatment
Died AfterReceiving anyEvaluation or
Treatment
Died, notFurther
Specified
Died inHospital (ED,OR, inpatient)
HospitalDeath With
TraumaSurgeon
Consultation
HospitalDeath Withno TraumaSurgeon
Consultation
TraumaDeath
Alabama X XAlaska XArizona XArkansas XColorado XConnecticut X X XDelaware X XFlorida XGeorgia X XIllinois X XIowa X XKansas X X XMaryland X X X XMinnesota X XMississippi XMissouri XNebraska X XNevada X XNew YorkNorth Carolina X X XNorth Dakota XOhio X XOklahoma X XOregon XPennsylvania X XSouth Carolina X X XTexasUtah XVirginia XWashington X XWyoming X X
Survey and Update State of Trauma Registries
Volume 62 • Number 2 431
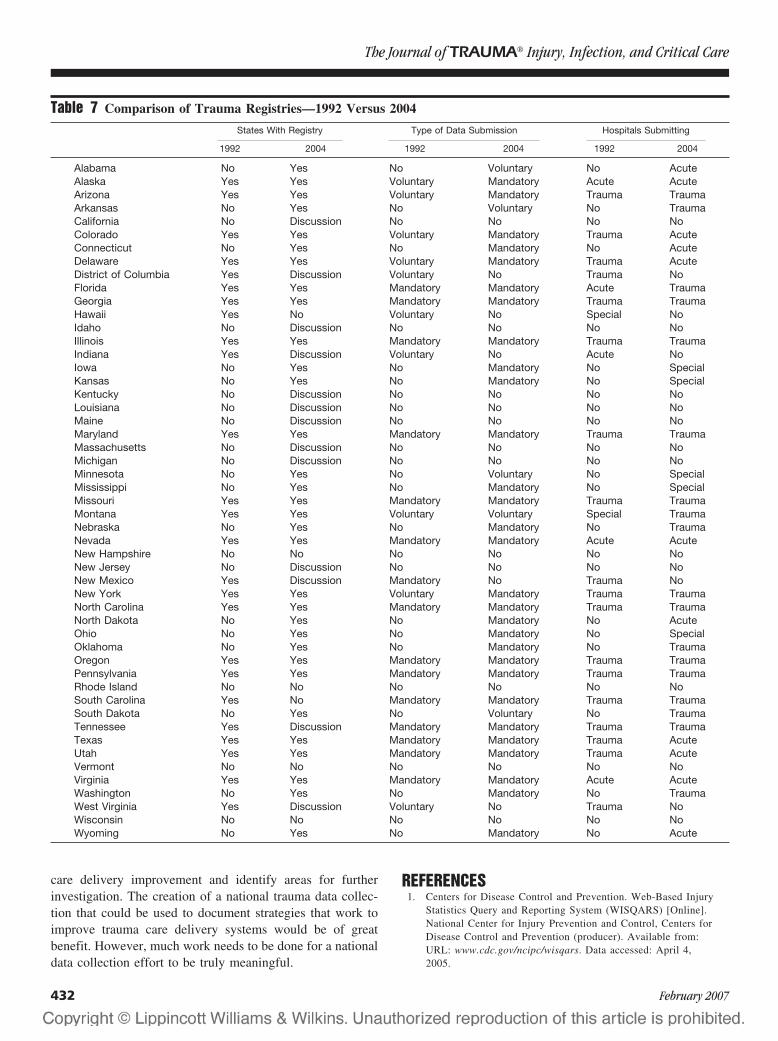
care delivery improvement and identify areas for furtherinvestigation. The creation of a national trauma data collec-tion that could be used to document strategies that work toimprove trauma care delivery systems would be of greatbenefit. However, much work needs to be done for a nationaldata collection effort to be truly meaningful.
REFERENCES1. Centers for Disease Control and Prevention. Web-Based Injury
Statistics Query and Reporting System (WISQARS) [Online].National Center for Injury Prevention and Control, Centers forDisease Control and Prevention (producer). Available from:URL: www.cdc.gov/ncipc/wisqars. Data accessed: April 4,2005.
Table 7 Comparison of Trauma Registries—1992 Versus 2004
States With Registry Type of Data Submission Hospitals Submitting
1992 2004 1992 2004 1992 2004
Alabama No Yes No Voluntary No AcuteAlaska Yes Yes Voluntary Mandatory Acute AcuteArizona Yes Yes Voluntary Mandatory Trauma TraumaArkansas No Yes No Voluntary No TraumaCalifornia No Discussion No No No NoColorado Yes Yes Voluntary Mandatory Trauma AcuteConnecticut No Yes No Mandatory No AcuteDelaware Yes Yes Voluntary Mandatory Trauma AcuteDistrict of Columbia Yes Discussion Voluntary No Trauma NoFlorida Yes Yes Mandatory Mandatory Acute TraumaGeorgia Yes Yes Mandatory Mandatory Trauma TraumaHawaii Yes No Voluntary No Special NoIdaho No Discussion No No No NoIllinois Yes Yes Mandatory Mandatory Trauma TraumaIndiana Yes Discussion Voluntary No Acute NoIowa No Yes No Mandatory No SpecialKansas No Yes No Mandatory No SpecialKentucky No Discussion No No No NoLouisiana No Discussion No No No NoMaine No Discussion No No No NoMaryland Yes Yes Mandatory Mandatory Trauma TraumaMassachusetts No Discussion No No No NoMichigan No Discussion No No No NoMinnesota No Yes No Voluntary No SpecialMississippi No Yes No Mandatory No SpecialMissouri Yes Yes Mandatory Mandatory Trauma TraumaMontana Yes Yes Voluntary Voluntary Special TraumaNebraska No Yes No Mandatory No TraumaNevada Yes Yes Mandatory Mandatory Acute AcuteNew Hampshire No No No No No NoNew Jersey No Discussion No No No NoNew Mexico Yes Discussion Mandatory No Trauma NoNew York Yes Yes Voluntary Mandatory Trauma TraumaNorth Carolina Yes Yes Mandatory Mandatory Trauma TraumaNorth Dakota No Yes No Mandatory No AcuteOhio No Yes No Mandatory No SpecialOklahoma No Yes No Mandatory No TraumaOregon Yes Yes Mandatory Mandatory Trauma TraumaPennsylvania Yes Yes Mandatory Mandatory Trauma TraumaRhode Island No No No No No NoSouth Carolina Yes No Mandatory Mandatory Trauma TraumaSouth Dakota No Yes No Voluntary No TraumaTennessee Yes Discussion Mandatory Mandatory Trauma TraumaTexas Yes Yes Mandatory Mandatory Trauma AcuteUtah Yes Yes Mandatory Mandatory Trauma AcuteVermont No No No No No NoVirginia Yes Yes Mandatory Mandatory Acute AcuteWashington No Yes No Mandatory No TraumaWest Virginia Yes Discussion Voluntary No Trauma NoWisconsin No No No No No NoWyoming No Yes No Mandatory No Acute
The Journal of TRAUMA� Injury, Infection, and Critical Care
432 February 2007
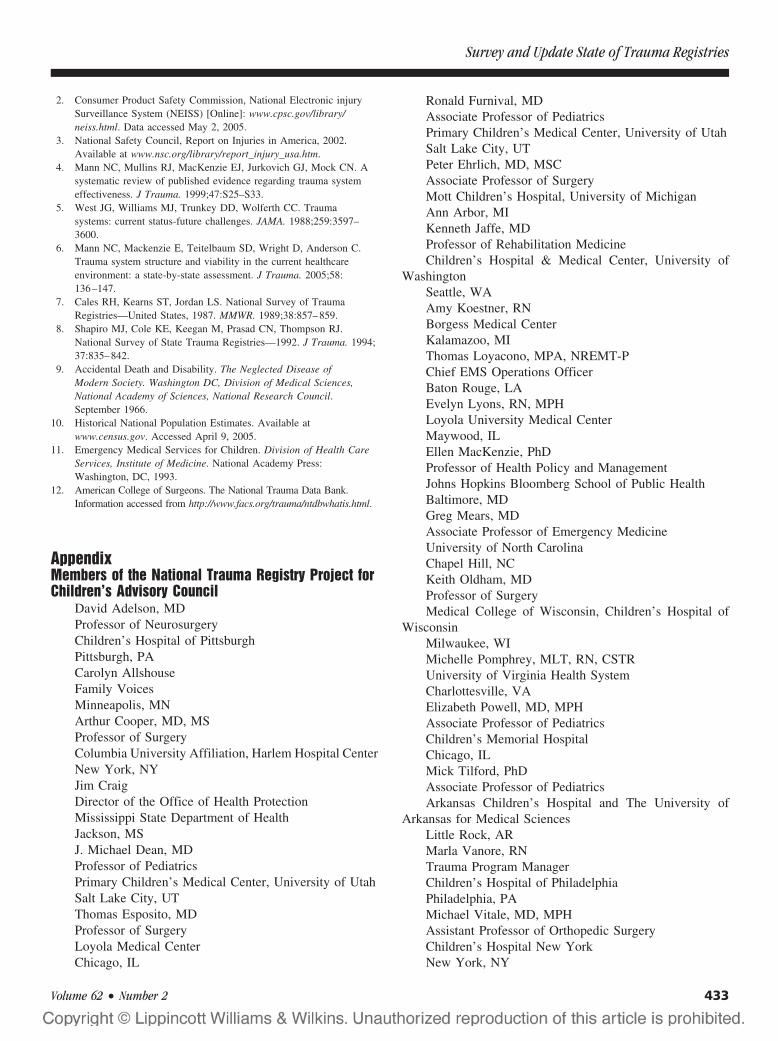
2. Consumer Product Safety Commission, National Electronic injurySurveillance System (NEISS) [Online]: www.cpsc.gov/library/neiss.html. Data accessed May 2, 2005.
3. National Safety Council, Report on Injuries in America, 2002.Available at www.nsc.org/library/report_injury_usa.htm.
4. Mann NC, Mullins RJ, MacKenzie EJ, Jurkovich GJ, Mock CN. Asystematic review of published evidence regarding trauma systemeffectiveness. J Trauma. 1999;47:S25–S33.
5. West JG, Williams MJ, Trunkey DD, Wolferth CC. Traumasystems: current status-future challenges. JAMA. 1988;259:3597–3600.
6. Mann NC, Mackenzie E, Teitelbaum SD, Wright D, Anderson C.Trauma system structure and viability in the current healthcareenvironment: a state-by-state assessment. J Trauma. 2005;58:136–147.
7. Cales RH, Kearns ST, Jordan LS. National Survey of TraumaRegistries—United States, 1987. MMWR. 1989;38:857–859.
8. Shapiro MJ, Cole KE, Keegan M, Prasad CN, Thompson RJ.National Survey of State Trauma Registries—1992. J Trauma. 1994;37:835–842.
9. Accidental Death and Disability. The Neglected Disease ofModern Society. Washington DC, Division of Medical Sciences,National Academy of Sciences, National Research Council.September 1966.
10. Historical National Population Estimates. Available atwww.census.gov. Accessed April 9, 2005.
11. Emergency Medical Services for Children. Division of Health CareServices, Institute of Medicine. National Academy Press:Washington, DC, 1993.
12. American College of Surgeons. The National Trauma Data Bank.Information accessed from http://www.facs.org/trauma/ntdbwhatis.html.
AppendixMembers of the National Trauma Registry Project forChildren’s Advisory Council
David Adelson, MDProfessor of NeurosurgeryChildren’s Hospital of PittsburghPittsburgh, PACarolyn AllshouseFamily VoicesMinneapolis, MNArthur Cooper, MD, MSProfessor of SurgeryColumbia University Affiliation, Harlem Hospital CenterNew York, NYJim CraigDirector of the Office of Health ProtectionMississippi State Department of HealthJackson, MSJ. Michael Dean, MDProfessor of PediatricsPrimary Children’s Medical Center, University of UtahSalt Lake City, UTThomas Esposito, MDProfessor of SurgeryLoyola Medical CenterChicago, IL
Ronald Furnival, MDAssociate Professor of PediatricsPrimary Children’s Medical Center, University of UtahSalt Lake City, UTPeter Ehrlich, MD, MSCAssociate Professor of SurgeryMott Children’s Hospital, University of MichiganAnn Arbor, MIKenneth Jaffe, MDProfessor of Rehabilitation MedicineChildren’s Hospital & Medical Center, University of
WashingtonSeattle, WAAmy Koestner, RNBorgess Medical CenterKalamazoo, MIThomas Loyacono, MPA, NREMT-PChief EMS Operations OfficerBaton Rouge, LAEvelyn Lyons, RN, MPHLoyola University Medical CenterMaywood, ILEllen MacKenzie, PhDProfessor of Health Policy and ManagementJohns Hopkins Bloomberg School of Public HealthBaltimore, MDGreg Mears, MDAssociate Professor of Emergency MedicineUniversity of North CarolinaChapel Hill, NCKeith Oldham, MDProfessor of SurgeryMedical College of Wisconsin, Children’s Hospital of
WisconsinMilwaukee, WIMichelle Pomphrey, MLT, RN, CSTRUniversity of Virginia Health SystemCharlottesville, VAElizabeth Powell, MD, MPHAssociate Professor of PediatricsChildren’s Memorial HospitalChicago, ILMick Tilford, PhDAssociate Professor of PediatricsArkansas Children’s Hospital and The University of
Arkansas for Medical SciencesLittle Rock, ARMarla Vanore, RNTrauma Program ManagerChildren’s Hospital of PhiladelphiaPhiladelphia, PAMichael Vitale, MD, MPHAssistant Professor of Orthopedic SurgeryChildren’s Hospital New YorkNew York, NY
Survey and Update State of Trauma Registries
Volume 62 • Number 2 433
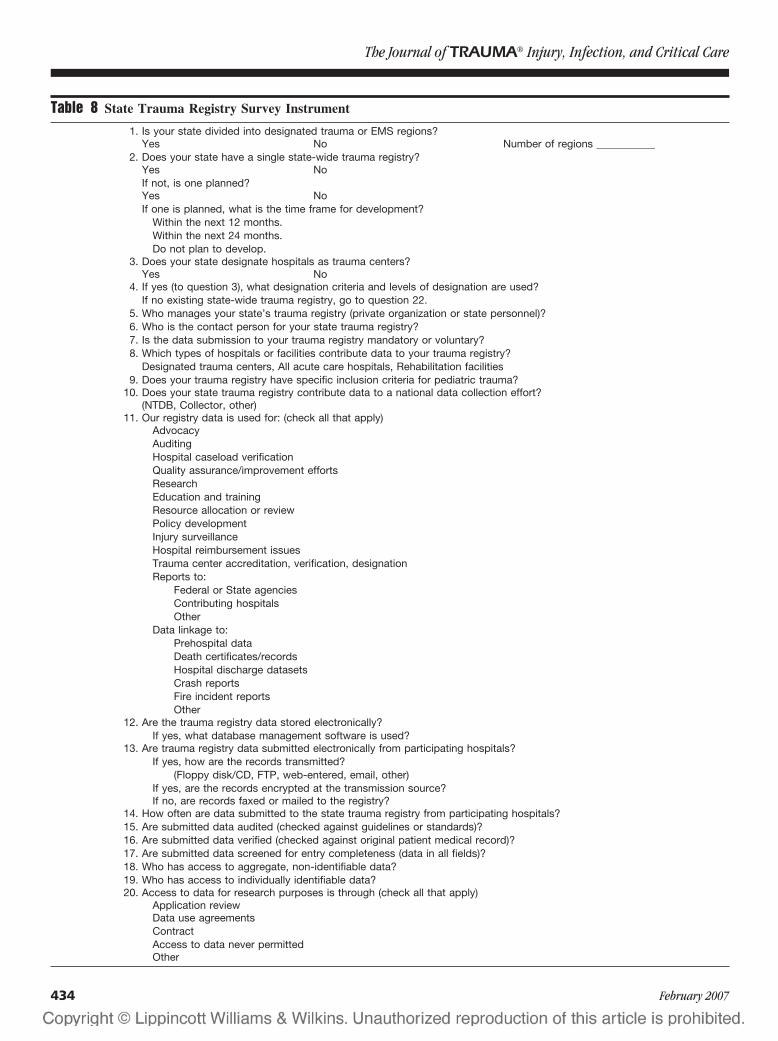
Table 8 State Trauma Registry Survey Instrument
1. Is your state divided into designated trauma or EMS regions?Yes No Number of regions ___________
2. Does your state have a single state-wide trauma registry?Yes NoIf not, is one planned?Yes NoIf one is planned, what is the time frame for development?
Within the next 12 months.Within the next 24 months.Do not plan to develop.
3. Does your state designate hospitals as trauma centers?Yes No
4. If yes (to question 3), what designation criteria and levels of designation are used?If no existing state-wide trauma registry, go to question 22.
5. Who manages your state’s trauma registry (private organization or state personnel)?6. Who is the contact person for your state trauma registry?7. Is the data submission to your trauma registry mandatory or voluntary?8. Which types of hospitals or facilities contribute data to your trauma registry?
Designated trauma centers, All acute care hospitals, Rehabilitation facilities9. Does your trauma registry have specific inclusion criteria for pediatric trauma?
10. Does your state trauma registry contribute data to a national data collection effort?(NTDB, Collector, other)
11. Our registry data is used for: (check all that apply)AdvocacyAuditingHospital caseload verificationQuality assurance/improvement effortsResearchEducation and trainingResource allocation or reviewPolicy developmentInjury surveillanceHospital reimbursement issuesTrauma center accreditation, verification, designationReports to:
Federal or State agenciesContributing hospitalsOther
Data linkage to:Prehospital dataDeath certificates/recordsHospital discharge datasetsCrash reportsFire incident reportsOther
12. Are the trauma registry data stored electronically?If yes, what database management software is used?
13. Are trauma registry data submitted electronically from participating hospitals?If yes, how are the records transmitted?
(Floppy disk/CD, FTP, web-entered, email, other)If yes, are the records encrypted at the transmission source?If no, are records faxed or mailed to the registry?
14. How often are data submitted to the state trauma registry from participating hospitals?15. Are submitted data audited (checked against guidelines or standards)?16. Are submitted data verified (checked against original patient medical record)?17. Are submitted data screened for entry completeness (data in all fields)?18. Who has access to aggregate, non-identifiable data?19. Who has access to individually identifiable data?20. Access to data for research purposes is through (check all that apply)
Application reviewData use agreementsContractAccess to data never permittedOther
The Journal of TRAUMA� Injury, Infection, and Critical Care
434 February 2007

Table 8 State Trauma Registry Survey Instrument (continued)
21. Protection of confidential health information is mandated by state law that is more stringent that thatproscribed under HIPAA.
Yes No OtherAdditional question to ask if state does not have an existing state trauma registry.
22. If we were to develop a registry, data would be used for: (check all that apply)AdvocacyAuditingHospital caseload verificationQuality assurance/improvement effortsResearchEducation and trainingResource allocation or reviewPolicy developmentInjury surveillanceHospital reimbursement issuesTrauma center accreditation, verification, designationReports to:
Federal or State agenciesContributing hospitalsOther
Data linkage to:Prehospital dataDeath certificates/recordsHospital discharge datasetsCrash reportsFire incident reportsOther
Survey and Update State of Trauma Registries
Volume 62 • Number 2 435
Statewide Tracking of Crash Victims’ Medical SystemUtilization and OutcomesNicholas Mango, BSME, and Elizabeth Garthe, MHS
Background: For the study year, thestate of Massachusetts had the lowest fatalmotor vehicle crash rate in the nation. Thestate was interested in exploring new ap-proaches to save additional lives. The studygoal was to determine the potential forMassachusetts’s medical system to reducefatalities through alternative utilization ofexisting transport methods, treatment hos-pital types, and victim pathways.
Methods: This was a 1-year retro-spective statewide population-based studyof all persons involved in a trafficway mo-tor vehicle crash in which at least oneperson died within 30 days. Database link-age was used to track the pathway andoutcome of every involved victim from thecrash scene, including air medical andground ambulance utilization, communityor trauma center treatment, and interho-spital transfers; air and trauma center(TC) scene triage levels were computedretrospectively. All crash and hospital lo-
cations were geomapped and confoundingfactors were included.
Results: Air and ground scene trans-ports to TCs were underutilized by 7:1and 4.5:1, respectively. No request was themajor reason for air underutilization. Un-derutilization was associated with reducedlived-to-died ratio (L/D) by pathway of upto 10:1. Statewide, air transport to Level Itrauma centers had both the highest (1.0,scene) and lowest L/Ds (0.6, interfacility).A 4.5:1 difference in L/D was associatedwith fulfilled versus unfulfilled air re-quests. By emergency medical serviceregion, L/D varied by nearly 3:1 and uti-lization of scene air and TC transports by5:1 and 4:1. Victim helicopter emergencymedical services transport to a TC with anInjury Severity Score >19 was identifiedas critical and was associated with L/Ddifferences of 3.7:1. The paradox of lowerL/D for scene air transports to TCs occur-ring simultaneously with higher overall
system L/D was observed and explained.System-based L/D differences of 1.8:1were observed associated with increases inappropriate triage. Results that explainthe “golden hour” effect are shown anddiscussed.
Conclusion: Appropriate scene triagedecision-making and the resulting victimpathways are associated with systemwideL/D increases of 1.8:1. On that basis, poten-tially 53 to 90 lives in this study (13% to22% of the statewide total) could have beensaved.
Key Words: Automatic crash notifica-tion, American College of Surgeons, Airmedical, Census, Event data recorder,Emergency medical services, Golden hour,Fatal Analysis Reporting System, Helicop-ter emergency medical services, Index event,Linkage, Lived to died, Level I, Outcome,Patient, Pathways, Population based, State-wide, Trauma, Trauma center, Triage,Utilization.
J Trauma. 2007;62:436–460.
Approximately 40,000 fatal motor vehicle crashes(MVCs) occur in the United States each year. Thecrashes produce 60,000 seriously or fatally injured vic-
tims, which the medical system has the opportunity to treatand to save.1,2
Massachusetts has had the lowest MVC death rate in thenation for multiple years; in 1996, the state’s rate was less thanhalf the U.S. rate: 6.8 versus 15.8 per 100,000 population.1
Massachusetts’s crash death rate was similar to Sweden, whichis among the lowest in the world.3
The Massachusetts Governor’s Highway Safety Bureau(GHSB) was interested in learning if crash deaths could befurther reduced by enhancing medical system response. Un-der the auspices of the Massachusetts Department of PublicHealth (DPH), the GHSB, and statewide Helicopter Utiliza-tion Review Committee (HURC), this study was begun toaddress that question by identifying medical system utiliza-tion and victim outcomes.
The study uses an “index event” approach; the pathwaysof all victims resulting from a fatal MVC event are trackedthrough the medical system (vehicle occupants, pedestrians,cyclists, etc.). By using an event defined outside the medicalsystem, nondeployment of parts of the system can be ob-served. This is a critical factor in producing an accurate state-wide picture. We think this is the first use of the index eventapproach to study the day-to-day functioning of a state’s medicalsystem. Other studies have used a similar approach to describemedical response to solitary, nonrecurring events.4
The study includes a census of fatal crashes for 1 year,1996. The number of fatal crashes in this study is equivalentto those collected each year by the National Highway Traffic
Submitted for publication April 25, 2005.Accepted for publication March 9, 2006.Copyright © 2007 by Lippincott Williams & Wilkins, Inc.From the Health and Safety Research, Inc., Marblehead, MA.Presented in part to the Massachusetts Committee on Trauma, Heli-
copter Utilization Review Committee, State Trauma System Committee,Governor’s Highway Safety Bureau, Mass Geographic Information Service,the 2003 and 2004 Air Medical Transport Conference, and the TrafficRecords Forum.
Funded by the State of Massachusetts, including the Governor’s High-way Safety Bureau, the Department of Public Health Bureau of HealthQuality Management, and the Office of Emergency Medical Services; and agrant from the Anderson/Wish foundation.
Address for reprints: Nicholas Mango, BSME, 5 Bessom Street, Suite246, Marblehead, MA 01945; email: [email protected].
DOI: 10.1097/01.ta.0000224616.04273.43
The Journal of TRAUMA� Injury, Infection, and Critical Care
436 February 2007

Safety Administration (NHTSA) in their national Crashwor-thiness Data System (CDS). CDS is a stratified sample data-base used by the NHTSA to study occupant injuries on anationwide basis and to help create regulations to governvehicle safety.5
The study group also includes 20% of the statewideannual volume of urgent/emergent MVC inpatient crash vic-tims with Injury Severity Score (ISS) �19 (E codes 810–819), computed from statewide hospital discharges recordsusing a computerized severity mapping method (ICDMAP-90). ISS�19 is a severity level identified in this study as keyto the effective use of scene air medical transport.
Since the study year, Massachusetts fatality rate (per100,000 population) and the absolute number of MVC fatal-ities have risen 14%.6 On that basis, we think that the findingsfrom this study continue to be applicable.
PATIENTS AND METHODMedical System Overview
Massachusetts is approximately 200 miles from east towest and 100 miles north to south, with an area of 8,300square miles and a population of about 6 million people(Fig. 1).7 It includes the islands of Nantucket and Martha’sVineyard. For the study year, there were about 300 public andprivate advanced life support (ALS)/basic life support (BLS)
ambulance services and two helicopter emergency medicalservices (HEMS), each affiliated with American College ofSurgeons (ACS) Level I trauma centers (TCs), operating atotal of four helicopters.8 The state’s hospital system includedseven ACS Level I trauma centers, no Level II or III centers,and 80 other acute care hospitals.9 There was no statewidetrauma system or registry and no statewide triage guidelineswere in effect.
Study DesignThe goal of the study was to examine ways to save lives
from MVCs. For 1996, 106,359 police-reported MVCs oc-curred (Table 1).10 Using multiple data sources, MVCs thatoccurred on public roads where at least one person wasconfirmed dead within 30 days were selected. The selected392 crashes shown in Table 1 (with 415 deaths and 940 totalvictims) comprise a statewide population-based census offatal MVCs for the study year. They contain every MVCfatality the medical system had an opportunity to save thatyear (per official state counts).
Using data linkage with up to seven data sources, thepathway of each person through the medical system wasdetermined. The pathways are associated with the resourcesutilized for each patient (such as HEMS versus ground trans-port), the hospital level (TC or non-TC), the time from the
Fig. 1. Massachusetts fatal crash locations in 1996: 392 crashes (dots), 74 utilized acute care hospitals (small open circles), the utilized traumacenter locations (shown with 10-mile radius rings), the 5 EMS region boundaries, and the 4 bases used by the two HEMS services (flags).
Statewide Medical System Utilization
Volume 62 • Number 2 437
crash to final treatment (because direct scene to TC transportsare shown to be shorter than paths that include several treat-ment locations and interfacility transports) and other factors(such as the level of interventions and treatment availableduring transport and at the treatment locations). The path-ways represent combinations of factors that can be associatedwith victim outcome.
The assembled data allowed analysis by crash character-istics and location, transport information, hospital level, andoutcome, in addition to other measures. Patient transfers wereincluded. More than 500 variables were available for analysisfor those persons treated as inpatients. The extent and depthof data used, the detailed quality and completeness reviewsand the complex linkage and analysis resulted in the fullstudy requiring more than 3 years to complete. A number ofthe components of the study, including the unification of theHEMS data, the accurate geomapping of all statewide fatalcrashes, the compilation of diverse data sources, the index eventmethodology, and the complex data linkage structure, were firstsfor the state. Specific verifications, such as confirmation offatalities, took up to 2 years to resolve. At the time the studybegan, 1996 was the most recent year of data available.
Data SourcesThe fatal crashes were identified using electronic and
paper records from the statewide Registry of Motor Vehicles(RMV), the NHTSA’s Fatal Analysis Reporting System(FARS) database and FARS Analyst files, the MassachusettsRegistry of Vital Records and Statistics (VS), the Massachu-setts Office of the Chief Medical Examiner (ME) (although theautopsy reports themselves were not made available), as well asVital Statistics offices in neighboring states.2,10,11 The latterwere necessary for victims transported to out-of-state hospitals.
Statewide HEMS data were assembled from data ob-tained from the Massachusetts Department of Public Health(MDPH), Office of Emergency Medical Services.12 State-wide emergency department data did not exist. The statewideinpatient hospital data obtained were from the Massachusetts
Division of Health Care Finance and Policy (DHCFP).9 Crashlocations developed by us were cross checked, when required,through cooperation with the MassHighway Department andwith some data from MassGIS. Centralized statewide groundtransport data did not exist; MDPH wrote individual letters ofinquiry to the involved ground services to obtain the paperground run data collected. Extensive cooperation was receivedfrom numerous government agencies and EMS providers listedin the Acknowledgments. Additional details about the datasources are available in a prior article.13
Data Organization, Completeness, and LinkageTo make the data as complete as possible, basic crash,
person, and vehicle data for each of the 392 crashes werereviewed, reconciled, and recoded (as needed) from the pri-mary sources. Missing or suspect data were corrected for thenumber of persons involved, demographics, vehicles, re-straint use, and other factors. This resulted in less than 1%unknown data for key variables in the overall “All CrashVictims” group described in the Results.
The state’s HEMS data were in three different formats;to effectively use the data we developed a standard set ofdefinitions, converted the data, and merged it into that uni-form format.13 The data for the entire state, (including allmedical and trauma transports) had to be processed before therequests, missions, and transports associated with this studycould be identified. As a result, it was necessary to processthe 4,000 records for all Massachusetts-based HEMS trans-ports to identify the less than 100 associated with this study.Using other sources, we included all transports of studyvictims by out-of-state HEMS services, which were not in-cluded in the Massachusetts HEMS data.
The HEMS data did not uniformly distinguish between“scene,” “modified scene,” and “interfacility” transports.Generally, HEMS scene transports originate at or near thecrash scene and the victim is transported directly to a treat-ment location. An interfacility transport occurs when a vic-tim, who was previously transported from the scene andadmitted as an inpatient at one treatment location, is subse-quently picked up by HEMS and transported to another treat-ment location. Modified scene transports occur when thevictim is transported to a local hospital, where they are notadmitted as inpatients, but may be treated in the emergencydepartment (ED). With the data available (as there was nostatewide ED data for the study year), it was not possible todetermine whether or not nine modified scene victims mighthave been treated in EDs close to the pickup location. Forthose nine victims, we chose between scene and interfacilitybased on time from crash to final treatment. Victims withcrash to final treatment times of less than 2 hours wereincluded as scene transports; longer times were included asinterfacility. The 2-hour dividing point was chosen based onthe times observed for the other victims, where the EDtreatment status was known, as reported in the Results. In-
Table 1 Massachusetts Motor Vehicle Crashes,CY 1996 Population for Rates: 6.6 Million
Crash Type Number of Crashes Number of Victims
Operator- and police-reported crashes, allinjury levels
187,963 217,373
Police-reported crashes,all injury levels
106,359 126,547
Police-reported crashes,maximum of seriousinjury
3,286 3,852
Police-reported,maximum of fatalinjury within 30 days
392 415 fatal(940 all severity levels)
From the State Registry of Motor Vehicles and study’s linkeddata set.
The Journal of TRAUMA� Injury, Infection, and Critical Care
438 February 2007

formation on statewide HEMS operations for the study yearis included in an earlier article.14
State multiple-cause-of-death data (50,000 records) wereused in the study.11 Deaths were confirmed using a Massa-chusetts or out-of-state death certificate or by a medicalexaminer (ME) report. About 1% of previously reportedfatalities could not be confirmed and those crashes were notincluded in the study group.
ACS trauma center level information for in-state hospitalswas confirmed by direct requests from the MDPH. We obtainedTC level information for the few out-of-state locations thatreceived victims. Because there were no Level II or III centers inthe state, all trauma centers (TCs) in this study are ACS Level I.
Although MDPH made efforts to obtain ground patientcare reports on all those persons identified as being trans-ported by ground, slightly more than 50% could not belocated. This resulted in missing scene vital sign data forvictims and ground transport time information, the impact ofwhich is discussed later. The data obtained was included inthe linkage, but was insufficient to produce reliable results forground ALS/BLS utilization. However, by using the time ofthe crash and HEMS data, it was possible to analyze crash totreatment times for all HEMS transports.
Two years of DHCFP hospital inpatient data (about750,000 records/year) were reformatted for use.9 DHCFPsupplied the underlying information for all licensed acutecare hospitals.
The project used a unique linkage approach we developedfor another statewide project. The approach reinforces the link-age variables in a way that iterates toward “direct” matches ofthe linkage variables. Cases that ultimately did not directlymatch, but were suspected of matching based on the accumu-lated information were individually reviewed. Special data runs,completed by the involved state agencies using additional data,were used to verify if a direct match existed. The process wasrepeated until all possible direct matches were found. The studyrequired more than 100 times the accuracy-confidence levelproduct normally employed in statewide MVC linkage projectssuch as NHTSA’s CODES.15
The study comprises a census of events, not a sample.Each of the 106,359 MVCs, 1,500,000 inpatient discharges,4,000 HEMS records, and 50,000 deaths involved in thestudy were screened (by electronic and/or manual means) toidentify the members of the study census group. Population-based rates can derived from the results.
Statistical AnalysisThe study presents descriptive statistics including fre-
quencies, percentage distributions, means, and the victimlived-to-died rate ratio (L/D) by pathway to describe thecharacteristics, utilization patterns, and outcomes of the studypopulation. The study follows the state’s Registry of VitalRecords and Statistics practice of cautious use of population-based rates for census data when cell counts are less than five.16
Analysis GroupingsAll Crash Victims (n � 940 Victims, 392 Crashes)
All pathways begin with the crash event. This groupincludes all the victims who were involved in the studycrashes, regardless of injury level or outcome. It includesvictims with no injury or low levels of injury not requiringEMS transport to a medical facility, as well as the seriously andfatally injured. The All Crash Victims group provides an overallview of the crash event; results for this group are presented first.All other analysis groups are derived from this group.
Two Approaches to Identify Seriously Injured VictimsAt the scene there are two severity measures available for
all victims: the Police injury severity rating (KABCOU, asdefined in Table 2) and the study-assigned scene triage level(defined later in this Methods section). To identify the mostseverely injured crash victims who were the most likely candi-dates for HEMS transport and/or TC treatment, it is necessary touse one of these two measures. This is because many victimsnever receive medical treatment, and for those victims no otherseverity information is available. We present results for both theKABCOU-based group and the triage-based group.
The results shown later include all the victims in each ofthese groups. However, the L/D ratios for these groups differas a result of the way victims are included in the L/D calcu-lation. For the KABCOU group the L/D results we discuss donot include victims who were dead at the scene (DAS; nottransported). This is because based on the KABCOU scorealone, there is no rationale to suggest these victims qualifiedfor transport. Patients who were dead on arrival (DOAs) werealso not included in the KABCOU group L/D calculationsbecause we identified situations where deceased victimscould not be declared dead at the scene and bodies were takento a hospital morgue. This type of situation occurs more oftenwith ground transports than HEMS. KABCOU data alone didnot allow these situations to be reliably separated from trueDOAs. Had we included the DAS and DOAs, the groundtransport L/D ratios would have been decreased relative to theHEMS L/Ds for the KABCOU group.
However, the triage-based group L/D results include allvictims who met triage (including DAS and DOA) becausetheir triage level provides a rationale for their inclusion. We
Table 2 KABCOU Police Injury Scale
Severity LevelDescription Number of
VictimsAlpha Numeric
K 4 Killed 415A 3 Incapacitating injury 156B 2 Nonincapacitating injury 107C 1 No visible injury but complaint
of pain64
O 0 Not injured 187U 9 Unknown if injured 11
Total All levels 940
Statewide Medical System Utilization
Volume 62 • Number 2 439
think that triage analysis must include those victims to avoidconfounding situations. (This issue is more fully addressed inthe Results and Discussion sections.) The consequence of thetwo different computations are two slightly different viewpoints;the KABCOU group pathway L/D results are generally lowerthan the same results computed using the triage group.
KABCOU-Based Victim GroupsSeriously and Fatally Injured (n � 571 Victims). These arevictims with KABCOU severity levels of K � Killed(value � 4) and A � Incapacitating (value � 3) (Table 2). Itis the most concise group of seriously injured victims that canbe identified using that system. We were aware from priorwork that Massachusetts’s police accurately recorded whichpersons had injuries requiring transport to a hospital, a find-ing reaffirmed by this study.17,18 (This may not be true inother states.) The Serious and Fatal group has greater than99% data completeness for key variables. Triage level is notconsidered in the KABCOU group analyses. The KABCOU-based seriously and fatally injured group is the basis for theresults presented later in Tables 8 and 9.
The Serious and Fatal group contains 156 seriously(KABCOU A � Incapacitating) and 415 fatally injured crashvictims. The fatally injured include those who die at any timeand at any location, starting with the scene and ending 30days after the crash. Seriously injured persons were identifiedusing the assessment made by the police at the scene.Inpatients (n � 197). The Inpatient group is a subset of theSerious and Fatal Group, and results using this group arepresented later in Table 10. (Again, this might not be truein a state with less accurate police KABCOU ratings.)None of the victims at lower injury levels matched toinpatient records. The Inpatient group was used to deter-mine whether different injury severity levels, preexistingconditions, complications, or other characteristics mightexplain any differences observed in outcomes. Inpatientdischarge diagnosis codes were used to identify preexist-ing conditions and complications as described by Morrisand the ACS, respectively.19,20 To estimate injury severityuniformly across all the hospitals (most without traumaregistries) ICD-9-CM injury discharge diagnosis codeswere converted to Abbreviated Injury Scale (AIS) and ISSscores using a mapping methodology (ICDMAP-90).21–23
AIS-90 codes and ISS scores were calculated using theICDMAP’s high range.23,24 This approach avoided theproblems associated with the use of different severitysoftware programs noted by Lucas or different versions ofAIS noted by the authors.25,26 However, there are limita-tions to the AIS and ICDMAP that are exacerbated whenused on a severely injured population (as in this article).This is discussed later in this article and was the topic ofour presentation at a national conference.27
Triage-Based Victim Group (n � 940)This is the alternative to grouping victims by KABCOU
level. Triage levels and scores were computed for the All
Crash Victims group (n � 940) to identify over- and under-utilization of TC and HEMS resources and to determinewhether the pathways victims followed were related to theirtriage levels or scores. The advantage of the group is that,because it is based on scene triage levels, it is possible tomake direct assessments of potential over- or underutilizationof resources. The disadvantage is that the retrospective com-putation of triage levels is quite complex. The triage-basedgroup is the basis for the results presented later in Triage Tables11 and 12, the HEMS Request and Times Tables 13 and 14, andthe System Comparison Table 15. The guidelines used and themethods of computation are covered in detail in the followingsections.
We determined the triage level for the two guidelinesbelow for every crash victim:
1. HEMS Triage Guideline: The triage guideline developedby the State for HEMS transport to a specialty center bythe Statewide Helicopter Utilization Review Committee(HURC).28
2. TC Triage Guideline: A guideline for triage to a TC basedon the above, similar to the TC triage guideline laterdeveloped by the State Trauma System plan, drafted in2000 and approved in 2002.28 Both air and ground trans-ports to TCs are included.
It is important to note that although parts of these twoguidelines may have been operational during the studyyear, neither had been officially adopted by the state. Wehave retrospectively applied them to determine whetherthey might help explain the observed flows of victimsthrough the pathways and identify possible over- or un-derutilization of trauma system resources. Consequently,our results illustrate what occurred in the absence of state-wide guidelines.
The guidelines contain four major headings (Table 3):Operational Conditions, Patient Conditions, Special Condi-tions, and Exclusions. Listed under each condition are itsindividual triage factors. The air and TC columns indicate towhich guideline(s) the factors apply. Note that the Opera-tional Conditions are only used by the HEMS guideline. OnlyLevel I ACS TCs existed in the state during the study year; asa result, triage to Level II and III TCs was not applicable.Determining Triage Level. Available electronic and paperinformation was reviewed to determine triage results for eachvictim. For each guideline, victims received one of the fol-lowing four triage levels:
1. Qualified2. Considered3. Not a candidate for the resource4. In addition, a victim could meet the factors to be “Qual-
ified” or “Considered”, but also meet one of the twoexclusion factors (EX-1 or EX-2). These victims are notcandidates for the resource.
The Journal of TRAUMA� Injury, Infection, and Critical Care
440 February 2007
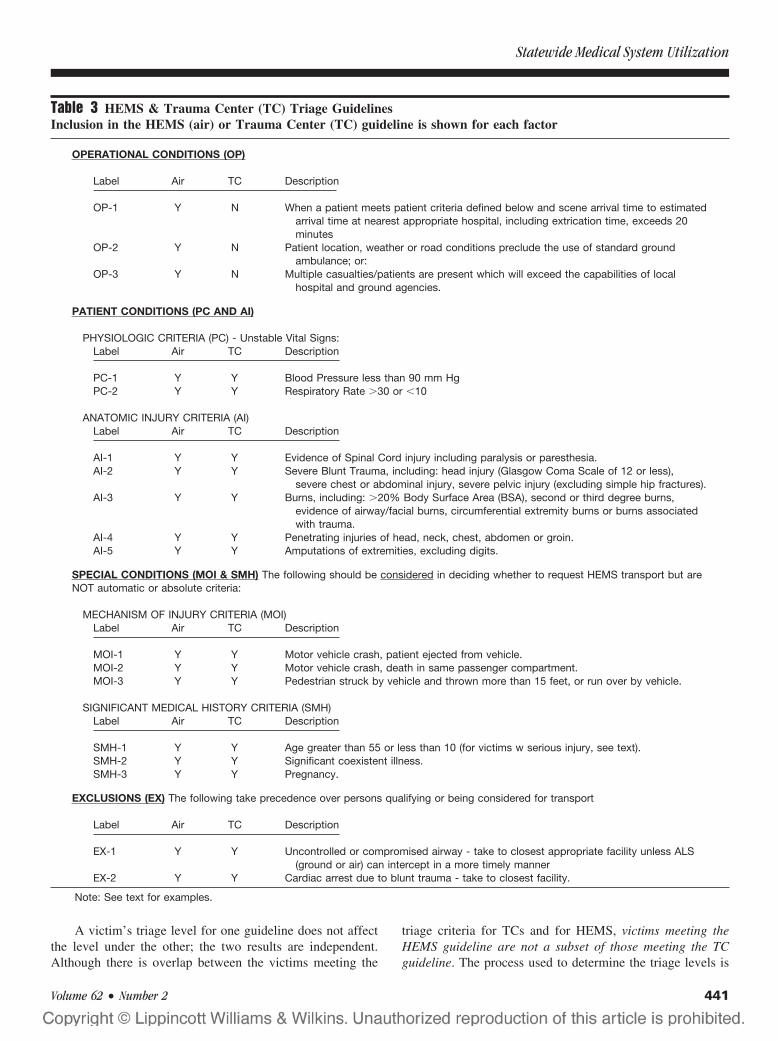
A victim’s triage level for one guideline does not affectthe level under the other; the two results are independent.Although there is overlap between the victims meeting the
triage criteria for TCs and for HEMS, victims meeting theHEMS guideline are not a subset of those meeting the TCguideline. The process used to determine the triage levels is
Table 3 HEMS & Trauma Center (TC) Triage GuidelinesInclusion in the HEMS (air) or Trauma Center (TC) guideline is shown for each factor
OPERATIONAL CONDITIONS (OP)
Label Air TC Description
OP-1 Y N When a patient meets patient criteria defined below and scene arrival time to estimatedarrival time at nearest appropriate hospital, including extrication time, exceeds 20minutes
OP-2 Y N Patient location, weather or road conditions preclude the use of standard groundambulance; or:
OP-3 Y N Multiple casualties/patients are present which will exceed the capabilities of localhospital and ground agencies.
PATIENT CONDITIONS (PC AND AI)
PHYSIOLOGIC CRITERIA (PC) - Unstable Vital Signs:Label Air TC Description
PC-1 Y Y Blood Pressure less than 90 mm HgPC-2 Y Y Respiratory Rate �30 or �10
ANATOMIC INJURY CRITERIA (AI)Label Air TC Description
AI-1 Y Y Evidence of Spinal Cord injury including paralysis or paresthesia.AI-2 Y Y Severe Blunt Trauma, including: head injury (Glasgow Coma Scale of 12 or less),
severe chest or abdominal injury, severe pelvic injury (excluding simple hip fractures).AI-3 Y Y Burns, including: �20% Body Surface Area (BSA), second or third degree burns,
evidence of airway/facial burns, circumferential extremity burns or burns associatedwith trauma.
AI-4 Y Y Penetrating injuries of head, neck, chest, abdomen or groin.AI-5 Y Y Amputations of extremities, excluding digits.
SPECIAL CONDITIONS (MOI & SMH) The following should be considered in deciding whether to request HEMS transport but areNOT automatic or absolute criteria:
MECHANISM OF INJURY CRITERIA (MOI)Label Air TC Description
MOI-1 Y Y Motor vehicle crash, patient ejected from vehicle.MOI-2 Y Y Motor vehicle crash, death in same passenger compartment.MOI-3 Y Y Pedestrian struck by vehicle and thrown more than 15 feet, or run over by vehicle.
SIGNIFICANT MEDICAL HISTORY CRITERIA (SMH)Label Air TC Description
SMH-1 Y Y Age greater than 55 or less than 10 (for victims w serious injury, see text).SMH-2 Y Y Significant coexistent illness.SMH-3 Y Y Pregnancy.
EXCLUSIONS (EX) The following take precedence over persons qualifying or being considered for transport
Label Air TC Description
EX-1 Y Y Uncontrolled or compromised airway - take to closest appropriate facility unless ALS(ground or air) can intercept in a more timely manner
EX-2 Y Y Cardiac arrest due to blunt trauma - take to closest facility.
Note: See text for examples.
Statewide Medical System Utilization
Volume 62 • Number 2 441

shown in Table 4 (HEMS) and Table 5 (TC). Further expla-nation and examples are provided in the “HEMS versus TCTriage” section below.Computing the Triage Score. In addition to the triage level,an overall triage score was computed, which represents thetotal number of triage criteria met for each victim. Each triagecriteria met counts as one point, except the OP-1 criteriaunder the HEMS guideline, which is not counted by itself;only the associated Patient Conditions are counted. Thisavoids “double counting” and makes the scores for the HEMSand TC guidelines comparable. The maximum points for eachcondition group are shown in Table 6. Some criteria aremutually exclusive, so the number of possible points is lessthan the total number of criteria.
The minimum score to qualify under either guideline isone point. Additional points for qualifying victims indicate
Table 4 Determining a Victim’s HEMS Triage Level
Table 5 Determining a Victim’s TC Triage Level
The Journal of TRAUMA� Injury, Infection, and Critical Care
442 February 2007
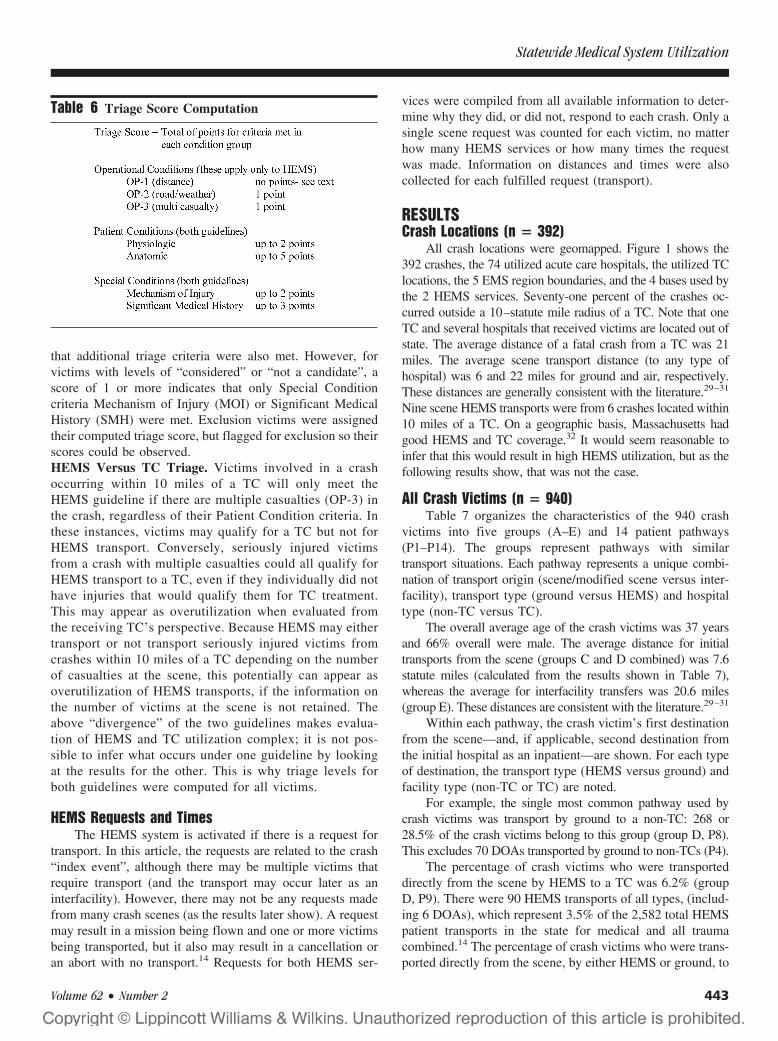
that additional triage criteria were also met. However, forvictims with levels of “considered” or “not a candidate”, ascore of 1 or more indicates that only Special Conditioncriteria Mechanism of Injury (MOI) or Significant MedicalHistory (SMH) were met. Exclusion victims were assignedtheir computed triage score, but flagged for exclusion so theirscores could be observed.HEMS Versus TC Triage. Victims involved in a crashoccurring within 10 miles of a TC will only meet theHEMS guideline if there are multiple casualties (OP-3) inthe crash, regardless of their Patient Condition criteria. Inthese instances, victims may qualify for a TC but not forHEMS transport. Conversely, seriously injured victimsfrom a crash with multiple casualties could all qualify forHEMS transport to a TC, even if they individually did nothave injuries that would qualify them for TC treatment.This may appear as overutilization when evaluated fromthe receiving TC’s perspective. Because HEMS may eithertransport or not transport seriously injured victims fromcrashes within 10 miles of a TC depending on the numberof casualties at the scene, this potentially can appear asoverutilization of HEMS transports, if the information onthe number of victims at the scene is not retained. Theabove “divergence” of the two guidelines makes evalua-tion of HEMS and TC utilization complex; it is not pos-sible to infer what occurs under one guideline by lookingat the results for the other. This is why triage levels forboth guidelines were computed for all victims.
HEMS Requests and TimesThe HEMS system is activated if there is a request for
transport. In this article, the requests are related to the crash“index event”, although there may be multiple victims thatrequire transport (and the transport may occur later as aninterfacility). However, there may not be any requests madefrom many crash scenes (as the results later show). A requestmay result in a mission being flown and one or more victimsbeing transported, but it also may result in a cancellation oran abort with no transport.14 Requests for both HEMS ser-
vices were compiled from all available information to deter-mine why they did, or did not, respond to each crash. Only asingle scene request was counted for each victim, no matterhow many HEMS services or how many times the requestwas made. Information on distances and times were alsocollected for each fulfilled request (transport).
RESULTSCrash Locations (n � 392)
All crash locations were geomapped. Figure 1 shows the392 crashes, the 74 utilized acute care hospitals, the utilized TClocations, the 5 EMS region boundaries, and the 4 bases used bythe 2 HEMS services. Seventy-one percent of the crashes oc-curred outside a 10–statute mile radius of a TC. Note that oneTC and several hospitals that received victims are located out ofstate. The average distance of a fatal crash from a TC was 21miles. The average scene transport distance (to any type ofhospital) was 6 and 22 miles for ground and air, respectively.These distances are generally consistent with the literature.29–31
Nine scene HEMS transports were from 6 crashes located within10 miles of a TC. On a geographic basis, Massachusetts hadgood HEMS and TC coverage.32 It would seem reasonable toinfer that this would result in high HEMS utilization, but as thefollowing results show, that was not the case.
All Crash Victims (n � 940)Table 7 organizes the characteristics of the 940 crash
victims into five groups (A–E) and 14 patient pathways(P1–P14). The groups represent pathways with similartransport situations. Each pathway represents a unique combi-nation of transport origin (scene/modified scene versus inter-facility), transport type (ground versus HEMS) and hospitaltype (non-TC versus TC).
The overall average age of the crash victims was 37 yearsand 66% overall were male. The average distance for initialtransports from the scene (groups C and D combined) was 7.6statute miles (calculated from the results shown in Table 7),whereas the average for interfacility transfers was 20.6 miles(group E). These distances are consistent with the literature.29–31
Within each pathway, the crash victim’s first destinationfrom the scene—and, if applicable, second destination fromthe initial hospital as an inpatient—are shown. For each typeof destination, the transport type (HEMS versus ground) andfacility type (non-TC or TC) are noted.
For example, the single most common pathway used bycrash victims was transport by ground to a non-TC: 268 or28.5% of the crash victims belong to this group (group D, P8).This excludes 70 DOAs transported by ground to non-TCs (P4).
The percentage of crash victims who were transporteddirectly from the scene by HEMS to a TC was 6.2% (groupD, P9). There were 90 HEMS transports of all types, (includ-ing 6 DOAs), which represent 3.5% of the 2,582 total HEMSpatient transports in the state for medical and all traumacombined.14 The percentage of crash victims who were trans-ported directly from the scene, by either HEMS or ground, to
Table 6 Triage Score Computation
Statewide Medical System Utilization
Volume 62 • Number 2 443
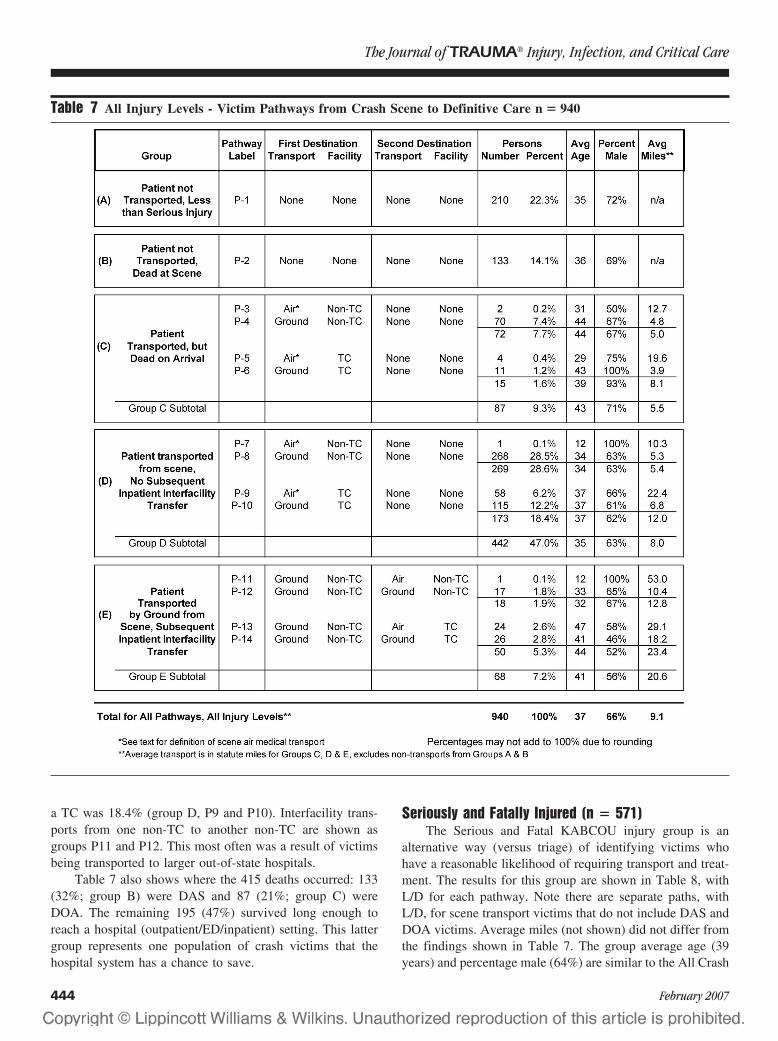
a TC was 18.4% (group D, P9 and P10). Interfacility trans-ports from one non-TC to another non-TC are shown asgroups P11 and P12. This most often was a result of victimsbeing transported to larger out-of-state hospitals.
Table 7 also shows where the 415 deaths occurred: 133(32%; group B) were DAS and 87 (21%; group C) wereDOA. The remaining 195 (47%) survived long enough toreach a hospital (outpatient/ED/inpatient) setting. This lattergroup represents one population of crash victims that thehospital system has a chance to save.
Seriously and Fatally Injured (n � 571)The Serious and Fatal KABCOU injury group is an
alternative way (versus triage) of identifying victims whohave a reasonable likelihood of requiring transport and treat-ment. The results for this group are shown in Table 8, withL/D for each pathway. Note there are separate paths, withL/D, for scene transport victims that do not include DAS andDOA victims. Average miles (not shown) did not differ fromthe findings shown in Table 7. The group average age (39years) and percentage male (64%) are similar to the All Crash
Table 7 All Injury Levels - Victim Pathways from Crash Scene to Definitive Care n � 940
The Journal of TRAUMA� Injury, Infection, and Critical Care
444 February 2007
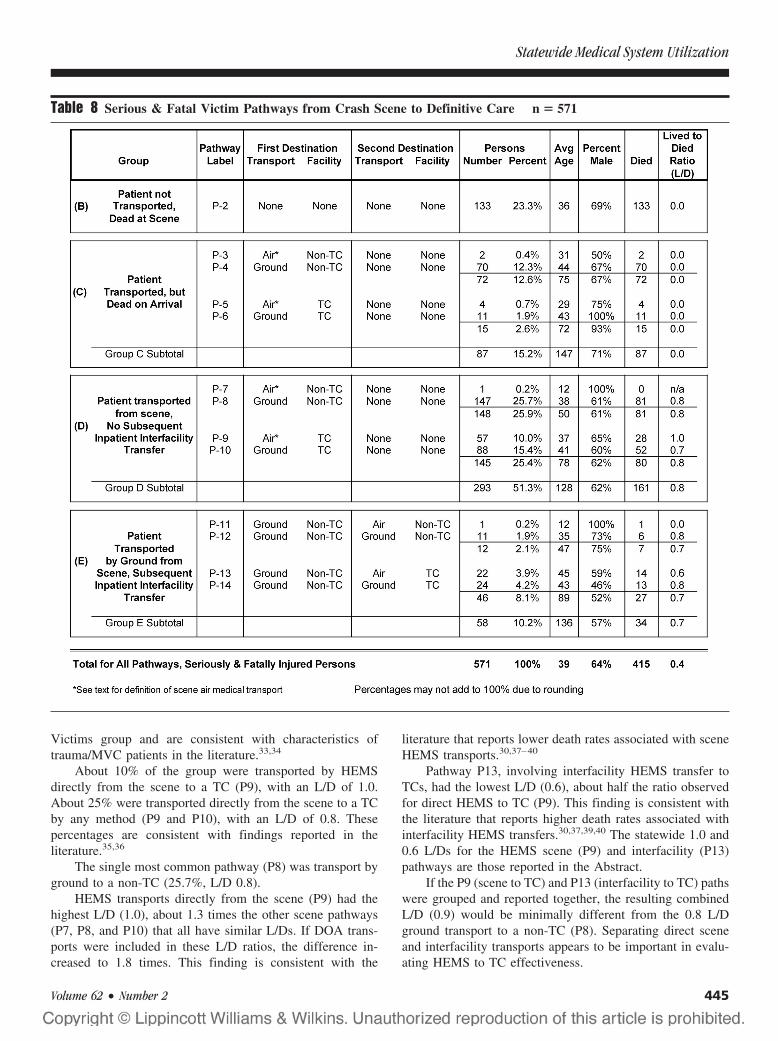
Victims group and are consistent with characteristics oftrauma/MVC patients in the literature.33,34
About 10% of the group were transported by HEMSdirectly from the scene to a TC (P9), with an L/D of 1.0.About 25% were transported directly from the scene to a TCby any method (P9 and P10), with an L/D of 0.8. Thesepercentages are consistent with findings reported in theliterature.35,36
The single most common pathway (P8) was transport byground to a non-TC (25.7%, L/D 0.8).
HEMS transports directly from the scene (P9) had thehighest L/D (1.0), about 1.3 times the other scene pathways(P7, P8, and P10) that all have similar L/Ds. If DOA trans-ports were included in these L/D ratios, the difference in-creased to 1.8 times. This finding is consistent with the
literature that reports lower death rates associated with sceneHEMS transports.30,37–40
Pathway P13, involving interfacility HEMS transfer toTCs, had the lowest L/D (0.6), about half the ratio observedfor direct HEMS to TC (P9). This finding is consistent withthe literature that reports higher death rates associated withinterfacility HEMS transfers.30,37,39,40 The statewide 1.0 and0.6 L/Ds for the HEMS scene (P9) and interfacility (P13)pathways are those reported in the Abstract.
If the P9 (scene to TC) and P13 (interfacility to TC) pathswere grouped and reported together, the resulting combinedL/D (0.9) would be minimally different from the 0.8 L/Dground transport to a non-TC (P8). Separating direct sceneand interfacility transports appears to be important in evalu-ating HEMS to TC effectiveness.
Table 8 Serious & Fatal Victim Pathways from Crash Scene to Definitive Care n � 571
Statewide Medical System Utilization
Volume 62 • Number 2 445
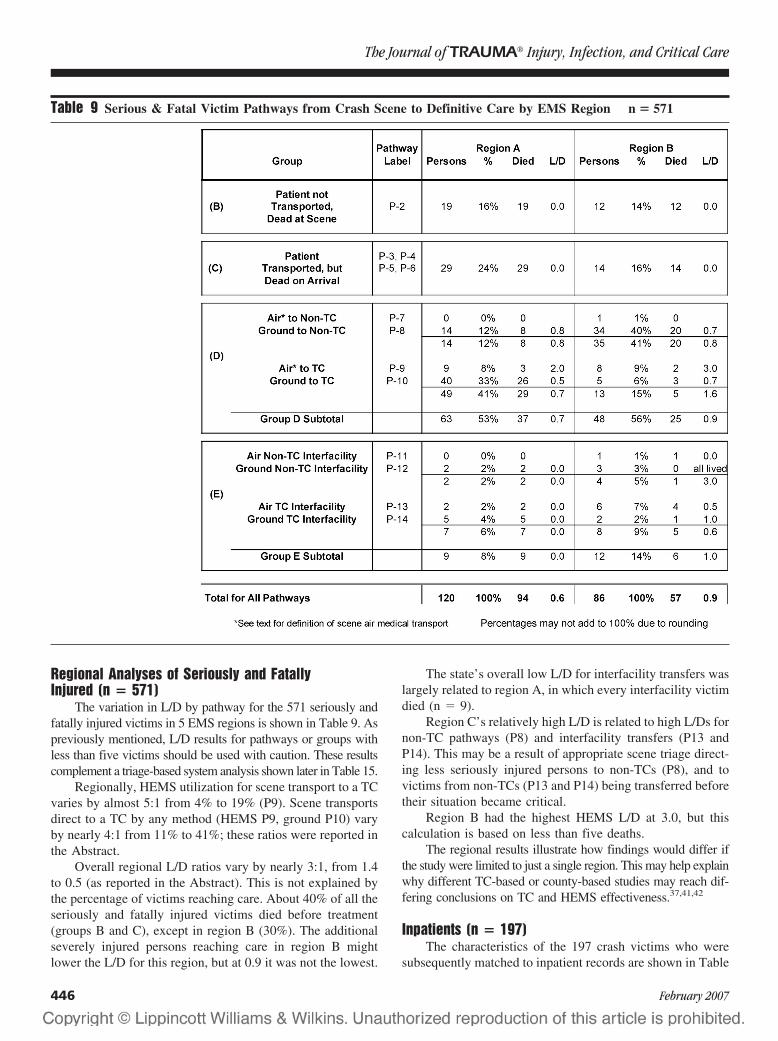
Regional Analyses of Seriously and FatallyInjured (n � 571)
The variation in L/D by pathway for the 571 seriously andfatally injured victims in 5 EMS regions is shown in Table 9. Aspreviously mentioned, L/D results for pathways or groups withless than five victims should be used with caution. These resultscomplement a triage-based system analysis shown later in Table 15.
Regionally, HEMS utilization for scene transport to a TCvaries by almost 5:1 from 4% to 19% (P9). Scene transportsdirect to a TC by any method (HEMS P9, ground P10) varyby nearly 4:1 from 11% to 41%; these ratios were reported inthe Abstract.
Overall regional L/D ratios vary by nearly 3:1, from 1.4to 0.5 (as reported in the Abstract). This is not explained bythe percentage of victims reaching care. About 40% of all theseriously and fatally injured victims died before treatment(groups B and C), except in region B (30%). The additionalseverely injured persons reaching care in region B mightlower the L/D for this region, but at 0.9 it was not the lowest.
The state’s overall low L/D for interfacility transfers waslargely related to region A, in which every interfacility victimdied (n � 9).
Region C’s relatively high L/D is related to high L/Ds fornon-TC pathways (P8) and interfacility transfers (P13 andP14). This may be a result of appropriate scene triage direct-ing less seriously injured persons to non-TCs (P8), and tovictims from non-TCs (P13 and P14) being transferred beforetheir situation became critical.
Region B had the highest HEMS L/D at 3.0, but thiscalculation is based on less than five deaths.
The regional results illustrate how findings would differ ifthe study were limited to just a single region. This may help explainwhy different TC-based or county-based studies may reach dif-fering conclusions on TC and HEMS effectiveness.37,41,42
Inpatients (n � 197)The characteristics of the 197 crash victims who were
subsequently matched to inpatient records are shown in Table
Table 9 Serious & Fatal Victim Pathways from Crash Scene to Definitive Care by EMS Region n � 571
The Journal of TRAUMA� Injury, Infection, and Critical Care
446 February 2007
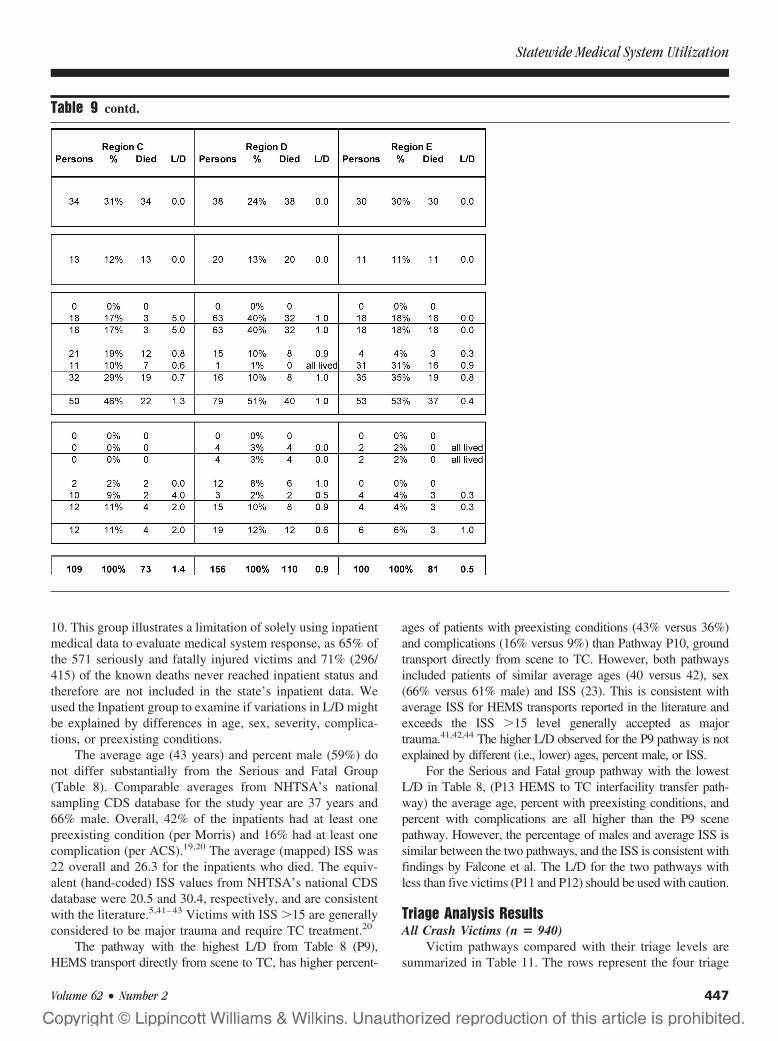
10. This group illustrates a limitation of solely using inpatientmedical data to evaluate medical system response, as 65% ofthe 571 seriously and fatally injured victims and 71% (296/415) of the known deaths never reached inpatient status andtherefore are not included in the state’s inpatient data. Weused the Inpatient group to examine if variations in L/D mightbe explained by differences in age, sex, severity, complica-tions, or preexisting conditions.
The average age (43 years) and percent male (59%) donot differ substantially from the Serious and Fatal Group(Table 8). Comparable averages from NHTSA’s nationalsampling CDS database for the study year are 37 years and66% male. Overall, 42% of the inpatients had at least onepreexisting condition (per Morris) and 16% had at least onecomplication (per ACS).19,20 The average (mapped) ISS was22 overall and 26.3 for the inpatients who died. The equiv-alent (hand-coded) ISS values from NHTSA’s national CDSdatabase were 20.5 and 30.4, respectively, and are consistentwith the literature.5,41–43 Victims with ISS �15 are generallyconsidered to be major trauma and require TC treatment.20
The pathway with the highest L/D from Table 8 (P9),HEMS transport directly from scene to TC, has higher percent-
ages of patients with preexisting conditions (43% versus 36%)and complications (16% versus 9%) than Pathway P10, groundtransport directly from scene to TC. However, both pathwaysincluded patients of similar average ages (40 versus 42), sex(66% versus 61% male) and ISS (23). This is consistent withaverage ISS for HEMS transports reported in the literature andexceeds the ISS �15 level generally accepted as majortrauma.41,42,44 The higher L/D observed for the P9 pathway is notexplained by different (i.e., lower) ages, percent male, or ISS.
For the Serious and Fatal group pathway with the lowestL/D in Table 8, (P13 HEMS to TC interfacility transfer path-way) the average age, percent with preexisting conditions, andpercent with complications are all higher than the P9 scenepathway. However, the percentage of males and average ISS issimilar between the two pathways, and the ISS is consistent withfindings by Falcone et al. The L/D for the two pathways withless than five victims (P11 and P12) should be used with caution.
Triage Analysis ResultsAll Crash Victims (n � 940)
Victim pathways compared with their triage levels aresummarized in Table 11. The rows represent the four triage
Table 9 contd.
Statewide Medical System Utilization
Volume 62 • Number 2 447
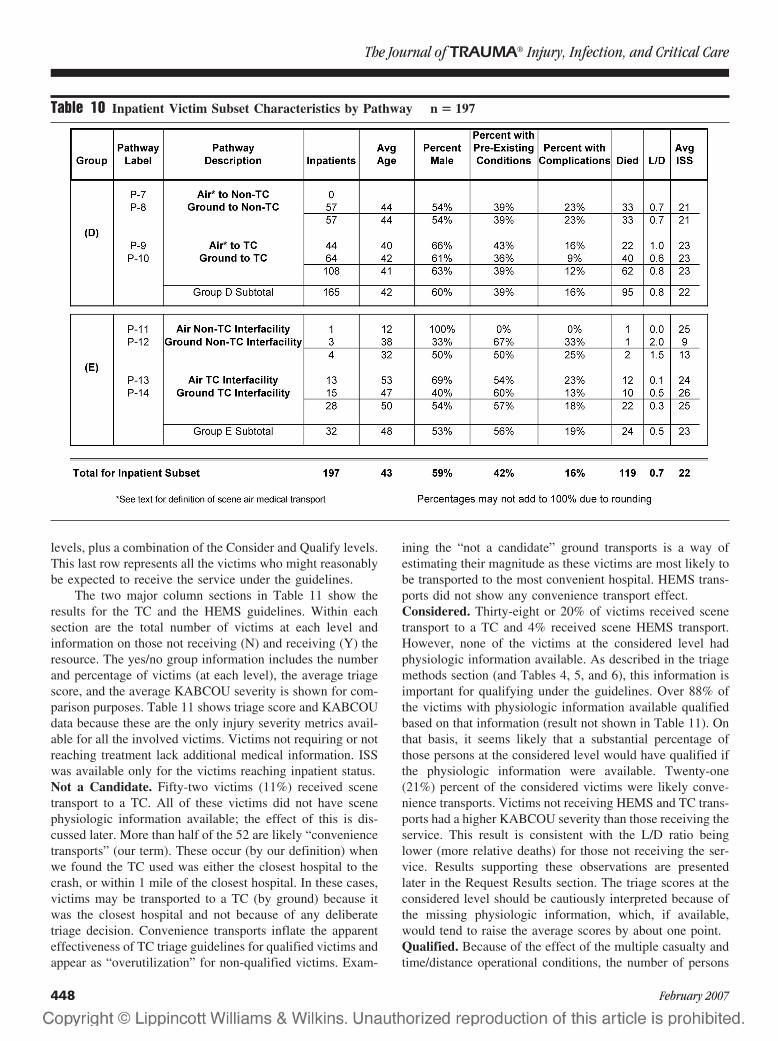
levels, plus a combination of the Consider and Qualify levels.This last row represents all the victims who might reasonablybe expected to receive the service under the guidelines.
The two major column sections in Table 11 show theresults for the TC and the HEMS guidelines. Within eachsection are the total number of victims at each level andinformation on those not receiving (N) and receiving (Y) theresource. The yes/no group information includes the numberand percentage of victims (at each level), the average triagescore, and the average KABCOU severity is shown for com-parison purposes. Table 11 shows triage score and KABCOUdata because these are the only injury severity metrics avail-able for all the involved victims. Victims not requiring or notreaching treatment lack additional medical information. ISSwas available only for the victims reaching inpatient status.Not a Candidate. Fifty-two victims (11%) received scenetransport to a TC. All of these victims did not have scenephysiologic information available; the effect of this is dis-cussed later. More than half of the 52 are likely “conveniencetransports” (our term). These occur (by our definition) whenwe found the TC used was either the closest hospital to thecrash, or within 1 mile of the closest hospital. In these cases,victims may be transported to a TC (by ground) because itwas the closest hospital and not because of any deliberatetriage decision. Convenience transports inflate the apparenteffectiveness of TC triage guidelines for qualified victims andappear as “overutilization” for non-qualified victims. Exam-
ining the “not a candidate” ground transports is a way ofestimating their magnitude as these victims are most likely tobe transported to the most convenient hospital. HEMS trans-ports did not show any convenience transport effect.Considered. Thirty-eight or 20% of victims received scenetransport to a TC and 4% received scene HEMS transport.However, none of the victims at the considered level hadphysiologic information available. As described in the triagemethods section (and Tables 4, 5, and 6), this information isimportant for qualifying under the guidelines. Over 88% ofthe victims with physiologic information available qualifiedbased on that information (result not shown in Table 11). Onthat basis, it seems likely that a substantial percentage ofthose persons at the considered level would have qualified ifthe physiologic information were available. Twenty-one(21%) percent of the considered victims were likely conve-nience transports. Victims not receiving HEMS and TC trans-ports had a higher KABCOU severity than those receiving theservice. This result is consistent with the L/D ratio beinglower (more relative deaths) for those not receiving the ser-vice. Results supporting these observations are presentedlater in the Request Results section. The triage scores at theconsidered level should be cautiously interpreted because ofthe missing physiologic information, which, if available,would tend to raise the average scores by about one point.Qualified. Because of the effect of the multiple casualty andtime/distance operational conditions, the number of persons
Table 10 Inpatient Victim Subset Characteristics by Pathway n � 197
The Journal of TRAUMA� Injury, Infection, and Critical Care
448 February 2007

qualifying for HEMS (n � 309) exceeds those qualifying fora TC (n � 258). The percentage of victims receiving scene TCtransport is 38% (with about one third of those subject to con-venience transports) and 17% for scene HEMS transport. Thesepercentages become closer if an adjustment is made for the TCground convenience transports. This would reduce the TC per-centage to 25% versus 17% for HEMS. The average triagescores for victims receiving air or TC are almost 2.5 times theminimum level needed to qualify under the guidelines. Themaximum triage score for any victim (not shown in Table 11)was 6 points.Exclusion. All these victims died; none received HEMS orTC transport from the scene.
Results for Victims Receiving and Not Receiving ResourceOn a statewide basis, the transport decision for qualify-
ing victims shown in Table 11 did not appear to be related toeither KABCOU severity or triage score, the only two sever-ity metrics available for all victims.
Table 12 shows the L/D ratios for the Qualified levelvictims shown in Table 11. Victims who qualified for TC or
HEMS transport and received it had relative L/D ratios 2.4and 1.7 times those victims who qualified for those resourcesbut who did not receive the resource (Table 12).
The lower relative ratio (1.7) for HEMS (vs. 2.4 forTC) may be expected because of the additional victimsincluded under the operational conditions, who are likely
Table 11 All Victims - Scene Trauma Center and Scene Air Medical Transport by Triage Level n � 940
Table 12 Lived-to-Died Ratios for Qualifying Victimsfor Victims Receiving Versus Not Receiving the Service
Victims Qualifying atScene For:
Lived-to-Died RatioRelative
RatioServiceReceived (Yes)
Service NotReceived (No)
Transport to a TC L/D � 0.40 L/D � 0.17 2.4HEMS to a TC L/D � 1.04 L/D � 0.62 1.7
These results include all victims who qualified whether dead atthe scene or on arrival. We think that a triage analysis must include allthe victims, and especially those who died before reaching treatment.However, if the dead at scene and on arrival transports were re-moved, the L/D for all the groups would increase, and because moredead-on-arrival patients are transported by ground than by air, therelative L/D ratios shown above are reduced by 15%.
Statewide Medical System Utilization
Volume 62 • Number 2 449
not to be as seriously injured as the victims qualifyingunder the TC guideline. More of these less severely injuredvictims survive even when they do not receive the HEMStransport (L/D 0.62), thereby lowering the relative L/Dratio (1.04/0.62).
The results in Tables 11 and 12 permit an estimate of thepotential to save lives. Victims who qualified but did notreceive scene transport to a TC had a 2.4 times lower L/Dratio than those who did receive transport (Table 12). If the160 victims who qualified but did not receive transport hadreceived the transport (Table 11) and the L/D for this groupwas increased to the 2.4:1 shown in the results, potentially 90lives a year would be saved (this represents 22% of the state’s415 fatalities). As previously mentioned in the Methods sec-tion, this calculation includes DAS and DOA victims if theyqualified under triage. We reviewed the multiple cause ofdeath ICD-9 injury data for all decedents and identified 37DAS victims who qualified but had “catastrophic” injuries.If these victims were excluded the potential is reduced to53 victims (13% of the statewide fatalities). This 13% to22% range for potential lives saved was reported in theAbstract. However, we think DAS and DOA victims needto be included in triage and TC evaluation (see Discussionsection). Transports of catastrophically injured victimswho neither die at the scene or on arrival do occur andshould not be excluded because they “should have been”DAS. In this study, two victims with ISS of 75 were transportedand were not DOA.
An analysis to identify “false-negative” cases wasconducted by locating inpatient victims with ISS �15 whodid not qualify under either triage guideline (and were notexclusions). For the HEMS guideline, there were 26 vic-tims with an ISS �15 who did not qualify. Twenty-fiveof the 26 did not qualify because of the distance/timecriteria, which is per the design of the guideline. Theremaining victim (ISS 29) was missing all physiologicdata, and the anatomic injuries did not match the guidelinerequirements.
For the TC guideline, 21 victims with ISS �15 did notqualify. All of these victims were missing physiologic data,and their anatomic injuries did not match the guidelinerequirements for transport.
For the combination of the consider plus qualify group atthe bottom of Table 11, 30% of victims received scenetransport to a TC and 14% received scene HEMS transport.Correcting the TC transports for the 28% possible “conve-nience transports” (Table 11 footnotes) reduces the TC trans-ports from 30% to 22% (30 � 0.72). These 22% and 14%utilization numbers are used for the basis of the 4.5:1 (1/0.22)and 7:1 (1/0.14) underutilization reported in the Abstract.
HEMS Request ResultsTable 13 shows request data for both crashes and vic-
tims. The crash column shows the number and percentage ofall crashes. The victims column includes the number, percent,
and L/D ratio for the victims from those crashes involved inHEMS requests.
Forty-eight (12%) of the crashes had fulfilled HEMSrequests for one or more victims. In 39 additional crashes,there were unfulfilled requests for 48 more victims. Therelative L/D ratio for the fulfilled versus unfulfilled groupswas 4.5: 1 (0.9/0.2 as reported in the Abstract). The majorreason victims were not transported when a request was madewas weather. Examination of the data for the 48 unfulfilledrequest victims showed that, contrary to what might be ex-pected, 92% were not subsequently transported to a TC fromthe scene. The majority of the remaining 8% of victims whodid reach a TC did so via an ambulance requested by, or runby, the HEMS services.
The major reason HEMS did not transport victims wasthe absence of a request to do so. This occurred for 248 (63%)of the crashes where at least one victim had a triage level ofqualify or consider.
An analysis of the number of helicopters responding toeach crash and the number of victims transported in eachhelicopter was also conducted. (These data are not shown inTable 13.) The average number of victims transported perhelicopter was 1.0. Each crash involved an average of 1.7victims at the qualified or considered triage levels.
HEMS Transport Time ResultsTransport time information was available only for
HEMS transports because of limitations in the hospital andground ambulance data collected by the state. Averages ofkey HEMS times—both cumulative relative to the time of thecrash and incremental—are shown in Table 14 for scene andinterfacility transports. Because of the study’s “indexevent” methodology, it is possible to observe the actualcrash-to-request time, which would otherwise be unknown.The crash-to-request starts with police notification, andincludes the time for EMS to be notified, arrive at thescene, assess the situation, and officially request an HEMStransport. For scene transports, the crash-to-request time is16 minutes or about 3 times the often-discussed request-to-lift time.32
The average time for “victim arrival at final destination”(66 minutes) reflects the total time from the time of the crashuntil the victim reached the landing pad at the final destina-tion. Hospitals with remote landing pads have an additionaltime period before the victim reaches their door; this couldnot be uniformly identified in the data. However, we did notobserve any difference in L/D for groups of hospitals withand without remote pads.
As discussed earlier (Tables 7, 8, 9, and 10), the averageair interfacility transport L/D ratio was lower than for scene.On an average basis, L/D is higher when the victim’s timefrom crash to final destination is shorter (scene transports)rather than longer (interfacility transports; Table 14). Wediscuss the relevance of this result to the “golden hour”concept in the Discussion section. However, examining the
The Journal of TRAUMA� Injury, Infection, and Critical Care
450 February 2007

victims within each of the scene and interfacility groups showedthat the L/D within each group was not consistently associatedwith shorter times to final treatment. Time alone did not explainwhy some transport victims died while others, with equal orlower ISS on the same pathway, survived. This issue is ad-dressed in the following “System Analysis Results” section.
The longest time from a crash to an interfacility requestwas 7 hours, so all victims following interfacility pathwaysreached final treatment in a fraction of a day. The averagetime from crash to final destination for HEMS interfacilitytransports (175 minutes) was 2.7 times (175/66) that of thescene transports.
A sharp demarcation between scene and interfacilitycrash to final destination times was evident in the data. All
HEMS transport victims transported from the scene arrived atthe final treatment destination in less than 2 hours after thecrash. No HEMS interfacility transport victim arrived at thefinal destination earlier than 2 hours after the crash. On thisbasis, the 2-hour point was used to distinguish between sceneand interfacility status for nine modified scene transports asmentioned in the Methods section.
The helicopter available time indicates when the helicop-ter was available for the next transport. The difference be-tween this time and the request time (99 � 16 � 83 minutesfor an average scene cycle time) sets an upper bound on thenumber of missions a helicopter could fly per day, and howmany helicopters and crews are necessary to maintain an aver-age specified response time as the system approaches saturation.
Table 13 Scene Air Medical Requests by Crash and Related Air TransportsFor all Crashes n � 392, and for Victims with a Scene Air Medical Request n � 113
Notes:1. Includes victims from Groups other than those transported from the scene by air. This includes those receiving later interfacility
transports, if there was an unfulfilled scene air transport request.2. Four of the 48 victims were taken from the Scene to a TC by ground. An additional 13 initially went to a non-TC, then were transferred
interfacility to a TC. The remaining 31 were not taken to a TC.3. One non-transport occurred due to in-flight weather, others prior to aircraft lift-off.4. About half of the 14 Victims expired prior to & about half after the helicopter lifted or started the mission.5. L/D is different than shown in Table 7 due to inclusion of DOA transports P-3 & P-5.
Statewide Medical System Utilization
Volume 62 • Number 2 451
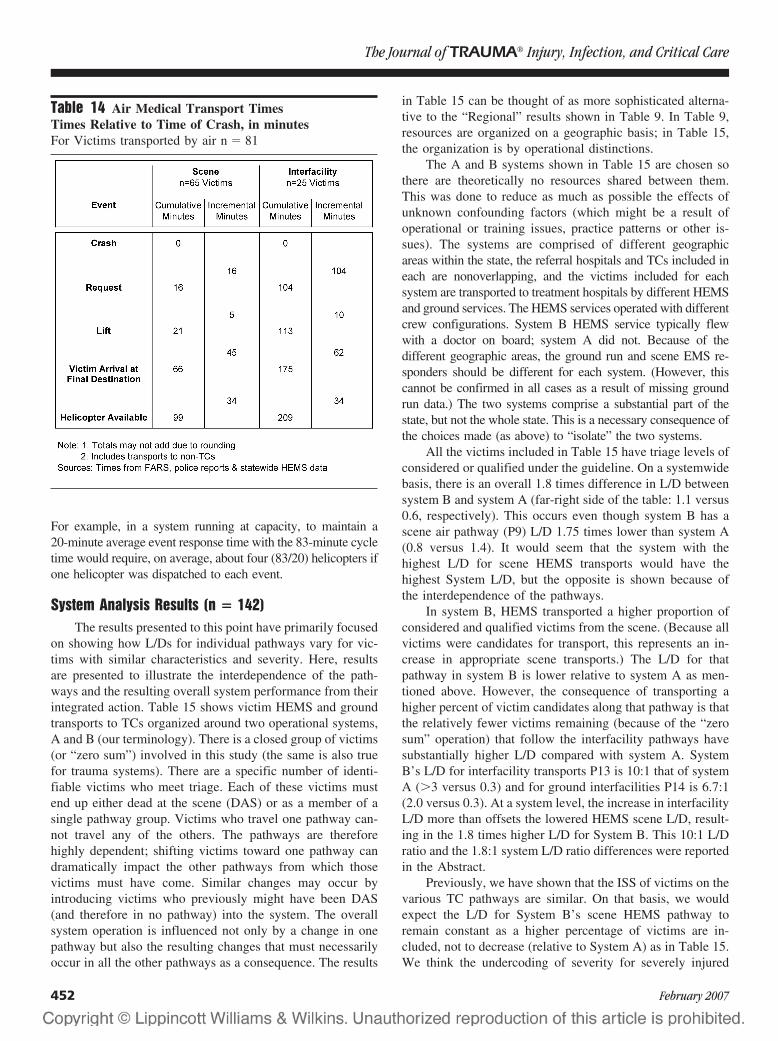
For example, in a system running at capacity, to maintain a20-minute average event response time with the 83-minute cycletime would require, on average, about four (83/20) helicopters ifone helicopter was dispatched to each event.
System Analysis Results (n � 142)The results presented to this point have primarily focused
on showing how L/Ds for individual pathways vary for vic-tims with similar characteristics and severity. Here, resultsare presented to illustrate the interdependence of the path-ways and the resulting overall system performance from theirintegrated action. Table 15 shows victim HEMS and groundtransports to TCs organized around two operational systems,A and B (our terminology). There is a closed group of victims(or “zero sum”) involved in this study (the same is also truefor trauma systems). There are a specific number of identi-fiable victims who meet triage. Each of these victims mustend up either dead at the scene (DAS) or as a member of asingle pathway group. Victims who travel one pathway can-not travel any of the others. The pathways are thereforehighly dependent; shifting victims toward one pathway candramatically impact the other pathways from which thosevictims must have come. Similar changes may occur byintroducing victims who previously might have been DAS(and therefore in no pathway) into the system. The overallsystem operation is influenced not only by a change in onepathway but also the resulting changes that must necessarilyoccur in all the other pathways as a consequence. The results
in Table 15 can be thought of as more sophisticated alterna-tive to the “Regional” results shown in Table 9. In Table 9,resources are organized on a geographic basis; in Table 15,the organization is by operational distinctions.
The A and B systems shown in Table 15 are chosen sothere are theoretically no resources shared between them.This was done to reduce as much as possible the effects ofunknown confounding factors (which might be a result ofoperational or training issues, practice patterns or other is-sues). The systems are comprised of different geographicareas within the state, the referral hospitals and TCs included ineach are nonoverlapping, and the victims included for eachsystem are transported to treatment hospitals by different HEMSand ground services. The HEMS services operated with differentcrew configurations. System B HEMS service typically flewwith a doctor on board; system A did not. Because of thedifferent geographic areas, the ground run and scene EMS re-sponders should be different for each system. (However, thiscannot be confirmed in all cases as a result of missing groundrun data.) The two systems comprise a substantial part of thestate, but not the whole state. This is a necessary consequence ofthe choices made (as above) to “isolate” the two systems.
All the victims included in Table 15 have triage levels ofconsidered or qualified under the guideline. On a systemwidebasis, there is an overall 1.8 times difference in L/D betweensystem B and system A (far-right side of the table: 1.1 versus0.6, respectively). This occurs even though system B has ascene air pathway (P9) L/D 1.75 times lower than system A(0.8 versus 1.4). It would seem that the system with thehighest L/D for scene HEMS transports would have thehighest System L/D, but the opposite is shown because ofthe interdependence of the pathways.
In system B, HEMS transported a higher proportion ofconsidered and qualified victims from the scene. (Because allvictims were candidates for transport, this represents an in-crease in appropriate scene transports.) The L/D for thatpathway in system B is lower relative to system A as men-tioned above. However, the consequence of transporting ahigher percent of victim candidates along that pathway is thatthe relatively fewer victims remaining (because of the “zerosum” operation) that follow the interfacility pathways havesubstantially higher L/D compared with system A. SystemB’s L/D for interfacility transports P13 is 10:1 that of systemA (�3 versus 0.3) and for ground interfacilities P14 is 6.7:1(2.0 versus 0.3). At a system level, the increase in interfacilityL/D more than offsets the lowered HEMS scene L/D, result-ing in the 1.8 times higher L/D for System B. This 10:1 L/Dratio and the 1.8:1 system L/D ratio differences were reportedin the Abstract.
Previously, we have shown that the ISS of victims on thevarious TC pathways are similar. On that basis, we wouldexpect the L/D for System B’s scene HEMS pathway toremain constant as a higher percentage of victims are in-cluded, not to decrease (relative to System A) as in Table 15.We think the undercoding of severity for severely injured
Table 14 Air Medical Transport TimesTimes Relative to Time of Crash, in minutesFor Victims transported by air n � 81
The Journal of TRAUMA� Injury, Infection, and Critical Care
452 February 2007
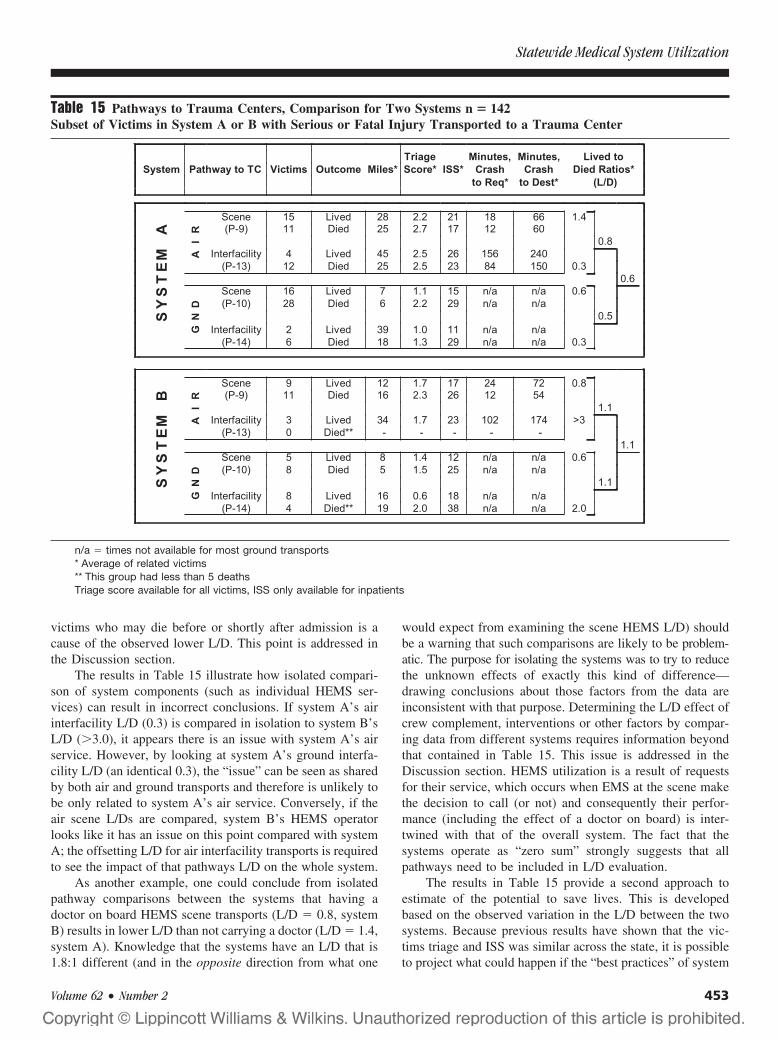
victims who may die before or shortly after admission is acause of the observed lower L/D. This point is addressed inthe Discussion section.
The results in Table 15 illustrate how isolated compari-son of system components (such as individual HEMS ser-vices) can result in incorrect conclusions. If system A’s airinterfacility L/D (0.3) is compared in isolation to system B’sL/D (�3.0), it appears there is an issue with system A’s airservice. However, by looking at system A’s ground interfa-cility L/D (an identical 0.3), the “issue” can be seen as sharedby both air and ground transports and therefore is unlikely tobe only related to system A’s air service. Conversely, if theair scene L/Ds are compared, system B’s HEMS operatorlooks like it has an issue on this point compared with systemA; the offsetting L/D for air interfacility transports is requiredto see the impact of that pathways L/D on the whole system.
As another example, one could conclude from isolatedpathway comparisons between the systems that having adoctor on board HEMS scene transports (L/D � 0.8, systemB) results in lower L/D than not carrying a doctor (L/D � 1.4,system A). Knowledge that the systems have an L/D that is1.8:1 different (and in the opposite direction from what one
would expect from examining the scene HEMS L/D) shouldbe a warning that such comparisons are likely to be problem-atic. The purpose for isolating the systems was to try to reducethe unknown effects of exactly this kind of difference—drawing conclusions about those factors from the data areinconsistent with that purpose. Determining the L/D effect ofcrew complement, interventions or other factors by compar-ing data from different systems requires information beyondthat contained in Table 15. This issue is addressed in theDiscussion section. HEMS utilization is a result of requestsfor their service, which occurs when EMS at the scene makethe decision to call (or not) and consequently their perfor-mance (including the effect of a doctor on board) is inter-twined with that of the overall system. The fact that thesystems operate as “zero sum” strongly suggests that allpathways need to be included in L/D evaluation.
The results in Table 15 provide a second approach toestimate of the potential to save lives. This is developedbased on the observed variation in the L/D between the twosystems. Because previous results have shown that the vic-tims triage and ISS was similar across the state, it is possibleto project what could happen if the “best practices” of system
Table 15 Pathways to Trauma Centers, Comparison for Two Systems n � 142Subset of Victims in System A or B with Serious or Fatal Injury Transported to a Trauma Center
n/a � times not available for most ground transports* Average of related victims** This group had less than 5 deathsTriage score available for all victims, ISS only available for inpatients
Statewide Medical System Utilization
Volume 62 • Number 2 453

B were adopted statewide using its systemwide L/D of 1.1.For the 258 victims at the TC “qualified” triage level (Table11), 51 lived and 207 died (these individual numbers are notshown in Table 11, only the KABCOU average of 3.8 ([(51 �3) � (207 � 4)] / 258). If the 1.1 L/D of system B wereapplied to all these victims, the result would be 135 victimswho lived and 123 who died (L/D � 1.1 � 135/123). Theactual number of victims who lived was 51, so an additional84 lives (84 � 135 � 51) could potentially be saved. The 84victims are equivalent to 20% of the total statewide fatalities(84/415). If that number is adjusted for the 37 catastrophicinjury victims mentioned earlier, the result is 47 (84 � 37)victims and 11%. Conversely, the number of potential livessaved would be increased if the “considered” victims wereincluded in the above calculations. Access to ME autopsydata (in addition to the vital statistics MCOD dataset wealready used to identify catastrophically injured victims) isneeded to further confirm that these potentials to save livesare supported by the victims’ detailed injury information.This second estimate is similar to the 13% to 22% computedearlier based on triage data.
ISS Level Indicated for Scene HEMS TransportThe data in Table 15 suggest that a mapped ISS of 19 is
a critical point for the appropriate use of scene HEMS to aTC. This value is reached by computing the average ISS andthe related pathway L/Ds for two groups. The first groupconsists of victims who went by air from the scene to a TCand lived, and establishes an ISS level at which victimssurvive. The second group consists of victims who did not goto a TC from the scene, but who later were transported to aTC via air or ground interfacility and died. This latter groupestablishes the ISS for nonsurvival if victims are not trans-ported via air from the scene. The pathways related to airscene transports and air and ground interfacility transportsprovide a measure of the L/D difference between transportingand not transporting along the pathways related to the aboveISS levels.
Based on the above, an average ISS of 19.5, was calcu-lated for the 24 victims (15 � 9) who went by air and livedusing the survivor victims from system A and B’s P9 sceneHEMS pathways.
An average ISS of 25 was calculated for the 18 victims(12 � 6) who did not receive scene air transport and diedusing the nonsurvivor victims from system B’s P13 and P14air and ground interfacility paths.
From the above, at an average ISS of 19.5, victimstransported directly from the scene survive (and their relatedpathway L/D is 1.1). At an average ISS of 25, victims whoare not transported by air from the scene die (and their relatedpathway L/D is 0.3). Mathematically, the L/D ratio for thevictims with average ISS � 19 who lived and ISS � 25 whodied is infinite because all victims lived at 19 and all died at25. A more conservative estimate can be obtained for thechange in L/D by using the ratio of the related pathway L/Ds.
The overall L/D for the scene air pathways is 1.1 ([15 �9]/[11 � 11]). The overall L/D for the interfacility pathwaysis 0.3 ([4 � 2]/[12 � 6]). The estimate of the change in L/Dis therefore 3.7:1 (1.1/0.3). By using all the victims in therelated pathways (as shown above), we think the increase inL/D of 3.7:1 mentioned in the Abstract associated withHEMS transport at ISS � 19 is conservative.
The ISS � 19 level is based on ICDMAP-90 compileddata. Hand-coded ISS tends to be higher than mapped ISS, sothat the above effect could appear at higher values in thatdata.21,23
DISCUSSIONThe study illustrates how strongly scene triage influences
overall trauma system L/D. Ideally, pathways would be de-veloped, including specific interventions, transport methods,and treatment locations through scientific study to optimizeL/D for patients with specific injuries and conditions. Triageguidelines would be based on directing victims along thosepathways. Some pathways would have low L/D because ofthe severity of their patient mix, whereas others would havehigh L/D; the overall result, however, would be the lowestpossible systemwide L/D utilizing the existing resources andtechnology. In this study, however, we did not develop nordid we attempt to “optimize” (for L/D) the two triage guide-lines we used. Nonetheless, Table 15 shows that when ahigher percentage of victims traveled pathways associatedwith appropriate use of these guidelines, a systemwide L/D1.8 times higher was observed. It seems plausible that en-hanced guidelines could further increase this L/D. We thinkthe demonstration of the influence of appropriate scene triageand victim pathways on pathway and systemwide L/D is themost compelling result of the study.
A related finding is the apparent paradox that lived-to-died ratios for air scene transports to TCs (and therefore theL/Ds of their associated TCs) must decrease in order foroverall system L/D to increase. The operation of a traumasystem’s pathways is similar in concept to a balance beamwithin unequal arms: a lower L/D for the victims appropri-ately triaged along the scene pathways to TCs can be morethan offset by the resulting higher L/Ds for the remainingvictims appropriately triaged via the non-TC and interfacilitypathways. All pathways must be considered during systemevaluation—not just scene to TC—because of the “zero sum”nature of the whole system. It appears to us that, theoretically,the highest systemwide L/D occurs when appropriate triageplaces victims such that there are no deaths on all the non-TCand interfacility pathways, and all the deaths occur on scenepathways ending at TCs. System B in Table 15 illustrates atangible example of this point. The study illustrates thatcomparing isolated system component L/Ds (i.e., TCs versusnon-TCs or air versus ground transports) can lead to conclu-sions promoting “corrective” actions diametrically oppositewhat is actually needed to enhance overall system L/D. Forexample, in Table 15, system B might stop HEMS transports
The Journal of TRAUMA� Injury, Infection, and Critical Care
454 February 2007
of some victims because that pathway’s L/D was higher thansystem A. This would leave those victims—because of thezero sum—to follow other pathways, all of which have lowerL/D then scene HEMS, and the overall system L/D woulddecrease similar to the data shown for system A. In thisregard, we suggest that interfacility transport L/D ratio beused as an indicator for TC and trauma system evaluation; ifthe interfacility L/D is less than the scene L/D, attention toscene triage is indicated.
Because trauma systems are “zero sum,” their evaluationalso needs to include the victims who were dead at the scene.This group is left out of Table 15 because ME autopsyrecords were not available to this study, despite very signif-icant efforts to obtain them. (We understand access to MEautopsy records is also an issue in other states.) A highpercentage of victims died at the scene or were dead onarrival. ME autopsy data contains injury information, beyondthat available to this study through the Multiple Cause ofDeath file, which could permit both enhanced estimates ofoverall injury severity and appropriate triage. Although thisdata could not be included in this study, it should be a priorityfor future studies as it is the final part of the “zero sum”. Ifscene deaths are not included in TC evaluation, enhance-ments in EMS that produce transports of victims who previ-ously would have been dead at the scene will result in lowerL/Ds for the centers accepting these victims. This is becausethese victims were “off the page” when they were dead at thescene; they were never counted as deaths during systemevaluation. As EMS transports “pick up” a percentage ofthese victims the L/D for the TC system will fall becausethese victims are likely to be severely injured and a relativelyhigh percent will die. However, if the system L/D evaluationincludes the dead at scene victims, it will correctly show thatthe L/D is increasing as these victims are “picked up” becausesome of the victims are being saved, when previously they alldied. Without accounting for scene deaths during evaluation,TC systems have a negative incentive to accept these “addi-tional” victims because their “apparent” death rates will in-crease. An extreme example would be a community in whichnearly all deaths occurred at the scene. An associated TCwould have a low death rate because almost no victimsreached its doors. Increasing the transports to this TC willraise its death rate but lower the rate for the communityoverall.
According to a recent article, the widely referenced con-cept of the “golden hour” may be “urban legend” rather thanscientific fact.45 The average L/D for air scene transports inthis study was 1.7 times higher (all scene to treatment times�2 hours, 66 minute average) than the L/D for the air inter-facility transports (all times �2 hours, 175 minute average).Generally, our results are in keeping with what would beexpected from the “golden hour” concept. This is the firststatewide, population-based study to show quantitative re-sults consistent with the golden hour. However, we think thegolden hour is not the direct cause of the higher L/D but
rather an observation of the time interval that results fromappropriate scene triage decisions and the resulting victimpathways. From the perspective of a TC, victims appropri-ately triaged at the scene and arriving via the direct pathways(scene ground to TC and scene air to TC) will most likelyarrive in less than 2 hours (our HEMS average was 66minutes) and as our data shows these victims have relativelyhigh L/Ds. The victims that travel via indirect paths (air andground interfacilities) arrive more than 2 hours after the event(our HEMS average was 175 minutes) and have lowerL/Ds—up to 10 times lower in our study. The golden houressentially distinguishes between direct and indirect path-ways—and hence appropriate and inappropriate scene tri-age—but it does so by placing an emphasis on time ratherthan directly on appropriate triage. The difference in the crashto TC arrival times of scene and interfacility victims is not ahandful of minutes as might be inferred from the golden hourname. The interfacility patients follow a whole different path:they were treated at another location first and then transporteda second time to the TC. In our study, the average HEMSinterfacility victim arrived at a TC nearly 2 hours later thanthe average HEMS scene victim. Some arrived up to 7 hourslater. Primary emphasis is needed on appropriate scene triagedecision-making to avoid the extra stop the interfacility victimsreceived. Reduced transport times will result from appropriatetriage. The converse—using rapid transport methods (i.e.HEMS) to reduce the transport times for victims already oninterfacility paths—does not appear to be effective because itwas associated with lower L/D in this study.
For victims within the scene HEMS transport group, wedid not observe an association between L/D and reducedtransport time (again contrary to what might be expectedfrom the golden hour). Some scene HEMS victims requiredalmost 2 hours to reach a TC but their outcomes did notappear to be different from scene HEMS victims reachingtreatment in less than 1 hour. Transport speed is not the onlyfactor involved with producing higher L/Ds for HEMS trans-ports. We think, but cannot yet prove, that the interventionsperformed by HEMS at the scene and during scene transports,and the way patients are introduced into care at the finaltreatment location are at least as important to L/D as the sceneto final treatment transport time.
We think this is the first population-based statewidestudy to report an ISS level indicative of the need for sceneHEMS transport and to report the L/D consequence if thattransport is not obtained. The ISS � 19 level we determinedcan be a useful tool for statewide HEMS and TC evaluation.It can be used on ICDMAPPED statewide ED and inpatientdischarge datasets (as the ISS � 15 level for major traumaand TC use has been) to estimate the number and regionallocation of potential HEMS victims, and this can be com-pared with the known number of transports from that regionto obtain an estimate of HEMS underutilization.
Why Massachusetts had the lowest fatality rate in thenation, and one of the lowest in the world, with low TC and
Statewide Medical System Utilization
Volume 62 • Number 2 455
HEMS utilization is open to speculation. In part, utilization ofTCs and HEMS may be lower for all states than previouslythought because underutilization is hard to accurately identifywithout an index event approach and retrospective triageanalysis. We think there are two major factors involved: alow serious injury crash rate to begin with (the group that canturn into fatals) combined the action of the EMS and medicalsystem when crashes do occur. A factor that at first appearsto confound the issue actually contributes to the explanation;Massachusetts has one of the lowest seatbelt use rates in thecountry.46 A report we completed for the State Governor’sHighway Safety Bureau showed the state, in addition to itslow fatal crash rate, also has a low police-reported seriousinjury crash rate.47 This combination partly explains why thestate can simultaneously have a low seatbelt use rate and alow fatality rate. Belt use is not a factor for vehicle occupantsif the vehicle does not crash. There are likely to be a numberof factors that contribute to the low serious and fatal crashrate. We think one of them is the state’s road system. Itappears to have a lower percentage of certain types of roadsand intersections that in other states are associated with highseverity crashes. The mapping of fatal crashes in this studyshowed that relatively few of the fatal crashes occurred on thehigh-speed, highly traveled divided highways. Higher re-ported socioeconomic and education levels, congestion, andother factors may also play a role in the low crash rate.48
When crashes do occur, our data shows that EMS reachesthe crash scenes quickly and a high percentage of victimssurvive to reach treatment. The state has a relatively lowdeath rate for non-MVC trauma as well as MVC trauma(based on vital statistics data) and this is a positive indi-cation for the state’s medical system.48 However, to ourknowledge, no study has conclusively proven the cause ofMassachusetts’s low fatality rate.
We wish to point out that the associations shownbetween victim triage, pathways, and L/D ratios shown bythis study do not imply those factors are the causes of theL/D differences. Extending the study results to other statesor regions requires caution. If the hospitals and transportservices in those areas do not have the same operatingpractices and resources as those in Massachusetts, it ispossible that factors included in our pathways and contrib-uting to our results may not be in place in those areas.Isolating the cause(s) of the L/D differences is therefore animportant goal for a future study. However, this will not besimple because of the complex system level interactionsillustrated in Table 15. Attempting to conclusively deter-mine, for example, which HEMS crew composition orwhich ALS/HEMS interventions are the cause of higherL/D in the presence of systemwide issues already associ-ated with substantial L/D differences will be difficult. Itwill require, at the very least, additional information fromall the transport services and treatment hospitals andhigher study complexity.
The following sections address specific issues related tothe results presented in the article.
Issues With Calculation of SeverityAs well as including all crashes with fatalities, the study
comprises 20% of the statewide inpatient MVC trauma caseswith ISS �19; this implies the other 80% of MVC victimswith similar ISS levels lived. This ratio is in agreement withthe published probability of survival value for ISS � 19(about 80%).49 However, for the victims who died as inpa-tients in this study, we have identified factors that cause thesystematic undercoding of mapped ISS. We recently pre-sented on this issue.27 The undercoding is a result of acombination of issues with the ICDMAP-90, the AIS, theunavailability of ME autopsy reports, and is exacerbated byvictims who die shortly after admission for whom test resultsto confirm injuries are often unavailable. The overall conse-quence is that the ISS of the victims who died shortly afterreaching treatment is substantially undercoded (up to 25points), whereas those who lived (with more available diag-nostic results) are more accurately coded and have relativelyhigher ISS. For the study group, when we calculated proba-bility of death versus ISS, it did not increase (as would beexpected) over the ISS range of ISS 22 to 50. This effect ofundercoding the ISS of victims who die has a substantialimpact on evaluating the effectiveness of TCs and traumasystems, as it makes the victims who die at TCs look lessseverely injured relative to those who are treated at non-TCSand survive. We think this study’s unique population ofseverely injured victims made this phenomenon detectible.This issue warrants further study and attention.
Triage DiscussionWe think that naturally occurring referral patterns were
the reason that victims did not receive TC and HEMS trans-port until their triage scores were (on average) 2.5 timesgreater than the minimum level specified by the study guide-lines. The impact was substantial underutilization associatedwith lower L/D. The results suggest that statewide TC andHEMS guidelines, and related ongoing evaluation, are neededif triage at or near the minimum level of the guidelines isdesired.
This study demonstrated that determining triage leveland score retrospectively requires complex linkage of multi-ple databases, and complex identification of medical historyfactors and complications beyond the scope of what cantypically be justified for ongoing system evaluation. Evalua-tion is greatly simplified if the calculated triage level, score,and the underlying criteria met are available for each victimtreated by EMS. These data are needed whether the victim istransported or not because knowing why a transport did notoccur is equally important to knowing why one did occur.Identical triage data are needed from all providers. Triagedata collected only by ALS or HEMS is a “one hand clap-ping” evaluation situation if the same data are unavailable
The Journal of TRAUMA� Injury, Infection, and Critical Care
456 February 2007
from other responders (because of the systemwide “zerosum”). The large number and diverse nature of EMS provid-ers from whom data are needed makes the absolute minimumdataset required for accurate triage highly desirable. Collect-ing this triage information is also the only practical way todistinguish the ground “convenience transports” identified inthis study from actual triage.
In this study, the missing scene physiologic data for allthe “considered” victims appears to have prevented many ofthem from reaching the “qualified” level. Appropriate victimtriage (and later evaluation) under the guidelines is highlydependent on physiologic data; without it, the qualifyingcriteria are cut in half to just the anatomic criteria. There is no“data redundancy” built into typical triage guidelines, includ-ing the two we used in this study. Victims with missingphysiologic data and high ISS who did not qualify wereidentified in this study and were caused by anatomic injuriesnot specifically listed in the guidelines. These cases could beaddressed via adding more anatomic criteria to “plug thegaps,” but carried to an extreme this would result in a com-plicated guideline that was too unwieldy to use. A simpleguideline based on the minimum dataset is attractive; how-ever, in that case the critical anatomic and physiologic datamust be collected for the guideline to be effective.
Our study illustrates how triage conflicts can arise ifguidelines employ different criteria. Victims could arrive at aTC under the HEMS guideline, but not be qualified to bethere if they were evaluated at the TC under the TC guideline.There are accepted rationales for including the factors thatcaused this confounding—the HEMS Operational Conditionsof multiple casualty, time/distance, and weather—but whentransports occur under these conditions they need to be care-fully documented or they will appear as overutilization whenevaluated later, especially if the original decision for thetransport is not recorded. An alternative solution would be toadd the HEMS Operational Conditions to the TC guideline tomake it identical to the HEMS guideline.
HEMS Request DiscussionAs mentioned earlier, from its geographic TC and HEMS
coverage, one might conclude Massachusetts would havehigh HEMS utilization, but the opposite was shown by thisstudy.32 We think geographic coverage must be adequate tomake HEMS requests tenable compared with other transportmethods; however, once that point is reached, utilization ishighly dependent on developing a volume of appropriatescene requests. If request volume is established first, HEMSbases can be established or geographically relocated to pro-vide the best response times given the resources available.The opposite may not be cost effective or successful.
On the basis of the triage guideline used, HEMS utiliza-tion could have been increased at least five times beforereaching full utilization. To reach the ACS-stated level of50% overtriage (a level set to avoid undertriage to TCs), afactor of 7.5 times would be required.20 There are substantial
ramifications for HEMS resources if their responses to MVCsare increased to full utilization per the triage guideline used inthis study. For the study group alone, HEMS would receiverequests to 248 additional study crashes (versus 87)—a three-fold increase. However, more than 248 additional missionswould be required because of the ratio of victims per heli-copter. About 400 total missions would be necessary to trans-port the 1.7 candidate victims per crash if one victim werecarried per helicopter. This is approximately a fivefold in-crease in transports. If we extrapolate from the study group toall MVCs (using as a proxy the five times ratio of ISS �19victims mentioned in the Introduction), HEMS MVC scenemissions would reach 2,100 per year (248 � 1.7 � 5). Thisvolume is nearly equal to the 2,582 total transports (for allmedical and trauma reasons) flown during the study year andis 23 times the 90 transports that occurred in this study.14 Iftwo helicopters were dispatched to each crash (for the aver-age 1.7 victims), the request latency for simultaneous crasheswould increase twofold unless twice as many helicopterswere available. This suggests that helicopter configurationsdesigned to effectively transport two victims from MVCscenes would be desirable from both a latency and missioncount standpoint if full HEMS utilization for MVC crashes iscontemplated.
When HEMS scene requests were unfulfilled, the in-volved victims were almost never transported to TCs byground and their L/D was low. Weather was the major reasonfor the unfulfilled requests. Only one of the flights in thestudy was noted as conducted under instrument flight rules. Itis possible that enhancements in helicopters, training, andoperational practices could permit additional flights withoutcompromising safety. Meanwhile, we suggest that HEMSguidelines be modified to encourage the transport of unful-filled request victims to TCs by alternate means.
Triage Use of Vehicle Event Data Recorder andAutomatic Crash Notification
The impact of scene triage on victim L/D and the lowobserved rates of triage suggest that additional sources ofquantitative information to enhance, and bolster, scene decision-making are desirable. We think that if vehicle event datarecorder (EDR) data were available via passive Radio Fre-quency Identification (RFID) transponders to EMS personnelat the scene, it could provide unbiased quantitative MOI,crash severity, and probability of serious injury informationfor this purpose.50–52 Tens of millions of private vehicles arecurrently equipped with EDRs (although many owners arenot aware of this).52 Quantitative crash severity informationfrom EDRs could complement scene anatomic and physio-logic measurements and help triage guidelines to be moreprecise. RFID transponders are inexpensive single chip de-vices (�$1) that require no battery (power is derived from theradio waves broadcast from the unit used to interrogate thetransponder).53 They are in widespread use in auto keyless doorsystems, gasoline, and subway fare cards, inventory tracking
Statewide Medical System Utilization
Volume 62 • Number 2 457

systems, and other consumer and industrial applications.53 How-ever, the present or proposed NHTSA, Society of AutomotiveEngineers (SAE) and Institute of Electrical and Electronics En-gineers (IEEE) EDR standards do not currently specify thatEDRs contain the RFID technology necessary for scene EMSuse of the data.54–56 The EDR data downloading methods in-cluded in the above standards, which require multiple electricalcables, connectors, and adapters (varying by vehicle make andmodel) are too cumbersome and time consuming for practicalreal time use by EMS at the scene.
ACN is a technology whereby the vehicle autonomouslyrequests help via the cellular system in the event of a crash,typically when an airbag deploys. Relatively few vehicles (com-pared with EDR) are equipped with ACN. In an article related tothis one, we reported that 6% of the crashes in the study groupwould appear to benefit from ACN notification.57 This is similarto the findings of others.58 The majority of crashes were appar-ently reported quickly via other means, as reflected in the 16minute average scene HEMS request time. Since the study year,the proliferation of cell phones and increased cellular coveragehave likely further reduced the crashes that would benefit fromACN. Unless all victims in a crash are unconscious, one victimis likely to use their cell phone to call for assistance (setting asideany witnesses with cell phones). Individual victim cell phonesmay survive more often than a vehicle-based ACN systembecause each has its own power supply (the vehicle battery maybe damaged in the crash) and its own antenna (the vehicleantenna can be damaged in a rollover). In remote locationslacking cellular coverage, ACN, just like a cell phone, cannot beused for crash notification. In Massachusetts, the State Policereceive all cellular 911 calls. This is more direct than the waysome other state’s public safety answering points (PSAP) func-tion. An officer involved with the fatal crash unit commented tous that crash notification was not a major issue for the state andthat cell phones have shortened notification time to the extentthat sometimes the sound of (multicar) crashes could even beheard in the background of the calls for assistance. ACN mayhave more benefit in other states.59
A recent announcement by General Motors indicates thatan enhanced version of their ACN system can transmit somecrash severity information to a central location along with thecrash notification. This enhancement does not effect the lim-itations on ACN previously discussed but this crash severityinformation could be used to enhance triage guidelines for thesmall percentage of vehicles equipped with the system. How-ever, the impact would be dramatically expanded if the in-formation could also be read out of any vehicle by EMS at thescene per the earlier discussion of scene use of EDR data.
HEMS AutolaunchWithin the HEMS community, the concept of “auto-
launching” an HEMS mission in response to an ACN call isbeing discussed. This appears to offer a solution for the 63%of the crashes in Table 13 where there were no requests.However, there are several problematic issues with the con-
cept. First, there are many airbag deployments and thereforeif a high percentage of vehicles were equipped with ACN,there would be many calls. Using NHTSA’s CDS nationalstatistical sampling database of motor vehicle crashes, wecalculate that for the nation in 2003 there were 750,000(�13% at 95% confidence) airbag deployment crashes in-cluding 1.6 million victims.5 An estimate for Massachusetts(based on the above and the relative populations) is 17,000airbag deployment crashes, each of which would potentiallygenerate a request. This is more than 6 times the total state-wide study year volume of HEMS transports for medical andall trauma reasons combined.
In the purest form of autolaunch, HEMS is dispatchedbased only on automated information; this approach, if used,is likely to result in a large false-positive launch rate. At aminimum, the physiologic and anatomic data, which our studyshowed were essential to the triage guidelines, would notbe present. Using National Automotive Sampling System-Crashworthiness Data System (NASS CDS) again, we calcu-late that 1% of the 1.6 million victims in airbag deploymentcrashes have ISS of 19 and above, and therefore are candi-dates for scene HEMS transport per the findings of this study.It is not clear how auto launch will distinguish betweenthis 1% and the remaining 99% of victims in the crashesthat have also generated requests because of airbag de-ployment. Even an algorithm that was correct 95% of thetime—if one existed—would have a 5% error, meaning thatroughly 5 out of every 100 auto requests would be identifiedas needing a transport. However NASS-CDS indicates thatonly 1% or 1 out of 100 auto requests would actually requirea transport for a victim with ISS � 19. False launch rateswould increase costs and take aircraft out of service for othervalid requests. If automated HEMS requests are accepted, itwould also seem that launching based on calls from thegeneral public would be necessary because the majority ofvehicles would not be equipped with ACN in the near future.Not responding to requests from victims in non-ACNequipped vehicles could be difficult to justify, if responsesare launched for victims occupying ACN-equipped vehicles.
Autolaunch also does not take into consideration theauthority of the local responders who, in many states, controlthe crash scene. Massachusetts has 351 towns, nearly everyone with its own responders, in addition to the multiple StatePolice barracks. These responders control the crash scene.We think that working with these scene commanders toencourage requests when appropriate may be more produc-tive than calling a helicopter into their jurisdiction withouttheir consultation. It would also have the benefit of a lowerfalse-positive launch rate because anatomic and physiologicdata would be available from the scene responders.
In states with long flight distances, autolaunch couldreduce the time from the crash event to helicopter arrival overthe pickup location, although the other segment times in-volved with the transport would not be impacted. However, iftrained EMS responders do not arrive at the crash scene
The Journal of TRAUMA� Injury, Infection, and Critical Care
458 February 2007

before the helicopter, HEMS could be faced with landing atan uncontrolled location containing unknown hazards, whichcould pose safety risks. Analysis of autolaunch is needed toidentify the extent of the requests it would generate, methodsto avoid false-positive launches, required resources, costs,and effectiveness. Based on our study, we do not think au-tolaunch would be a priority for handling MVC victims inMassachusetts.
In conclusion, to date, this study has resulted in severalstatewide changes. It demonstrated the need for a statewideEmergency Department data set. We developed a cost-effective methodology to obtain this data and designed andconducted a regional demonstration pilot.60 It was subse-quently implemented by the state. The lack of uniformity inthe HEMS data highlighted issues that resulted in DPH re-questing that we draft a HEMS data standard for the state.This study proved the ability to accurately link multiple statedata sources and thereby influenced the design developed forthe state’s trauma system. The study also demonstrated thatstatewide, HEMS was not overutilized and a reduction ortermination of HEMS operations, which had been discussed,was not pursued by the state.
Future WorkWe are interested in replicating and enhancing the study
in other areas to determine its extensibility and to compareresults. It would be interesting to validate the effectiveness ofthe pathways identified in this study at full utilization througha population-based operational trial. The study methodologyis also ideally suited to a joint US/European study to deter-mine the advantages and disadvantages of their differentapproaches to the scene care and transport of MVC victims.We are also interested in applying the study methodology toother index events, including cardiac events and falls.
ACKNOWLEDGMENTSWe thank the following for their cooperation with this study: the
Governor’s Highway Safety Bureau, the Department of Public Health Bu-reau of Health Quality Management, Department of Public Health Office ofEmergency Medical Services, the Registry of Motor Vehicles, the HEMSservices Boston MedFlight and UMass LifeFlight, the Massachusetts FARSAnalyst for NHTSA, the Helicopter Utilization Review Committee, theDepartment of Public Health Division of Vital Statistics, and the Division ofHealth Care Finance and Policy.
REFERENCES1. Traffic Safety Fact Sheets, 1996 and 2003. Department of
Transportation, National Highway Transportation SafetyAdministration, Fatal Analysis Reporting System. Available at:http://www-nrd.nhtsa.dot.gov/pdf/nrd-30/NCSA/TSF96/STD96.pdf2003.available at: www-nrd.nhtsa.dot.gov/pdf/nrd-30/NCSA/TSF2003/809773.pdf. Accessed March 2005.
2. Fatal Analysis Reporting System database. Washington, D.C.:Department of Transportation, National Highway TransportationSafety Administration; 1996.
3. World Health Organization. Atlas of Health in Europe, 2003. Causesof death: Deaths from motor vehicle traffic accidents (rates per
100,000 population by country). Available at: http://www.euro.who.int/Document/E79876.pdf. Accessed March 2005.
4. Maningas PA, Robison M, Mallonee S. The EMS response to theOklahoma City bombing. Prehospital Disaster Med. 1997;12:80–85.
5. National Automotive Sampling System, Crashworthiness DataSystem (NASS-CDS) data base. Washington, DC: Department ofTransportation, National Highway Transportation SafetyAdministration; 2001.
6. Fatality Analysis Reporting System (FARS). US Department ofTransportation, National Highway Traffic Safety Administration,National Center for Statistics and Analysis. Fatalities and FatalityRates by State, 1994–2004. Available at: http://www_fars.nhtsa.dot.gov/finalreport.cfm?title�States&stateid�0&year�2004&title2�Fatalities_and_Fatality_Rates. Accessed October 2005.
7. Massachusetts Facts, Part One: Concise Facts. Population and Area,Boundaries. Citizen Information Service, Secretary of theCommonwealth, Commonwealth of Massachusetts. Available at:http://www.sec.state.ma.us/cis/cismaf/mf1c.htm#top Feb 10 2005.Accessed February 2005.
8. Massachusetts Ambulance Service List. Massachusetts Departmentof Public Health, Office of Emergency Medical Services Web site.Available at: http://www.mass.gov/dph/oems/ambulance/amb_serv_list.pdf. Accessed March 2005.
9. Hospital Case Mix and Charge database. State of Massachusetts,Division of Health Care Finance and Policy; 1996–1998.
10. Police and operator crash report database. State of Massachusetts,Registry of Motor Vehicles; 1996.
11. Statewide mortality database. Massachusetts Department of PublicHealth, Division of Research and Epidemiology, Registry of VitalRecords and Statistics; 1996.
12. Statewide air medical services database. Massachusetts Departmentof Public Health, Bureau of Health Quality Management & Office ofEmergency Medical Services; 1996.
13. Garthe E, Prenney B, Mango N. A regional review of air medical transportsfor fatal level motor vehicle crashes. Air Med J. 2000;19:83–89.
14. Garthe E, Mango NK, Prenney B. Statewide Air Medical Transportsfor Massachusetts. Air Med J. 2002;21:22–28.
15. Results for The Massachusetts Crash Outcome Data Evaluation Project.Available at: http://www-nrd.nhtsa.dot.gov/departments/nrd-30/ncsa/CODES.html#Anchor-CODE-39270. Accessed October 10, 2006.
16. Vital Statistics 1996 report, Appendix, Technical Notes. Available at: http://www.mass.gov/dph/bhsre/death/96/dth96app.htm. Accessed March 2005.
17. Holiday Crash Patterns Report, Statewide: 1997–1999. MassachusettsGovernor’s Highway Safety Bureau, September 2001.
18. Berkshire and Hampden County Crash and Medical Profile Reports:1996. Massachusetts Governor’s Highway Safety Bureau, June 2000.
19. Morris JA, MacKenzie EJ, Edelstein SL. The effect of pre-existingconditions on mortality in trauma patients. JAMA. 1990;263:1942–1946.
20. Committee on Trauma. Resources for Optimal Care of the InjuredPatient. Chicago: American College of Surgeons; 1993.
21. Garthe E. The compatibility between the Abbreviated Injury Scale(AIS-80) and the International Classification of Diseases (ICD-9-CM). Quart J Assoc Adv Automot Med. 1982;4:42–46.
22. MacKenzie E, Garthe E. Compatibility of the ICD-9-CM andabbreviated injury scale (AIS-80) - an update. Quart J Assoc AdvAutomot Med. 1983;5:25–27.
23. MacKenzie EJ, Steinwachs MD, Shankar B. Classifying traumaseverity based on hospital discharge diagnoses: validation of an ICD-9-CM to AIS-85 conversion table. Med Care. 1989;27:412–422.
24. Baker SP, O’Neill B, Haddon W, et al. The injury severity score: amethod for describing patients with multiple injuries and evaluatingemergency care. J Trauma. 1974;14:187–196.
25. Lucas CE, Buechter KJ, Coscia RL, et al. The effect of traumaprogram registry on reported mortality rates. J Trauma. 2001;51:1122–1126.
Statewide Medical System Utilization
Volume 62 • Number 2 459
26. Garthe E, States J, Mango N. Abbreviated injury scale unification:the case for a unified injury system for global use. J Trauma. 1999;47:309–323.
27. Garthe E, Mango N. Issues related to the use of mapped severityin statewide trauma system outcome evaluation. AnnualConference of the Association Advanced Automotive Medicine,September 2005.
28. Massachusetts State Trauma System, SubcommitteeRecommendations. Traumatic Incident Trauma Field Triage Criteriaand Point of Entry Plan for Adult and Pediatric Patients, StatewideTrauma Triage guidelines for Air Medical Services. Available at:http://www.mass.gov/dph/oems/trauma/final.pdf. Accessed March2005.
29. Hansen TB, Dupont G. Treatment of injuries in the county ofRingkobing. 4. Referral and transport of severe traffic accidenttraumas. Ugeskr Laeger. 1992;154:3045–3047.
30. Jacobs LM, Gabram SG, Sztajnkrycer MD, Robinson KJ, Libby MC.Helicopter air medical transport: ten-year outcomes for traumapatients in a New England program. Conn Med. 1999;63:677–682.
31. Rhodes M, Perline R, Aronson J, Rappe A. Field triage for on-scenehelicopter transport. J Trauma. 1986;26:963–969.
32. Branas CC, MacKenzie EJ, Williams JC, et al. Access to traumacenters in the United States. JAMA. 2005;293:2626–2633. IncludingDavis & Wish comment and author reply.
33. Sampalis JS, Denis R, Frechette P, et al. Direct transport to tertiarytrauma centers versus transfer from lower level facilities: impact onmortality and morbidity among patients with major trauma.J Trauma. 1997;43:288–295.
34. Baez AA, Lane PL, Sorondo B, et al. Trauma triage criteria systemcompliance for victims of motor vehicle crashes. Annu Proc AssocAdv Automot Med. 2001;45:269–284.
35. Biewener A, Holch M, Muller U, et al. Effect of logistic andmedical emergency resources on fatal outcome of severe trauma.Unfallchirurg. 2000;103:137–143.
36. Ma MH, MacKenzie EJ, Alcorta R, et al. Compliance withprehospital triage protocols for major trauma patients. J Trauma.1999;46:168–175.
37. Thomas SH. Helicopter emergency medical services transportoutcomes literature: annotated review of articles published 2000–2003. Prehosp Emerg Care. 2004;8:322–333.
38. Thomas SH, Harrison TH, Buras WR, et al. Helicopter transport andblunt trauma mortality: a multicenter trial. J Trauma. 2002;52:136–145.
39. Falcone RE, Herron H, Werman H, et al. Air medical transport ofthe injured patient: scene versus referring hospital. Air Med J. 1998;17:161–165.
40. Mackenzie CF, Shin B, Fisher R, et al. Two-year mortality in 760patients transported by helicopter direct from the road accidentscene. Am Surg. 1979;45:101–108.
41. Baxt WG, Moody P, Cleveland HC, et al. Hospital-based rotorcraftaeromedical emergency care services and trauma mortality: amulticenter study. Ann Emerg Med. 1985;14:859–864.
42. Koury SI, Moorer L, Stone CK, et al. Air vs ground transport andoutcome in trauma patients requiring urgent operative interventions.Prehosp Emerg Care. 1998;2:289–292.
43. Civil ID. Patterns of injury in motor vehicle trauma. N Z Med J.1986;26:99:905–906.
44. Committee on Trauma. Resources for Optimal Care of the InjuredPatient. Chicago: American College of Surgeons; 1993.
45. Lerner EB, Moscati RM. The golden hour: scientific fact or medical“urban legend?” Acad Emerg Med. 2001;8:758–760.
46. Process and Outcome Evaluation of the Buckle Up AmericaInitiatives, May 2001. Report # DOT HS 809 272. Chapter II,Trends in Occupant Restraint Use and Fatalities. Available at: http://
www.nhtsa.dot.gov/people/injury/research/BuckleUp/ii__trends.htm.Accessed October 2005.
47. Comparison of Massachusetts Motor Vehicle Crash Rates to 10States and the Nation. Massachusetts Governor’s Highway SafetyBureau, September 2001.
48. Wigglesworth EC. Do some U.S. states have higher/lower injurymortality rates than others? J Trauma. 2005;58:1144–1149.
49. Champion HR, Copes WS, Sacco WJ, et al. The Major TraumaOutcome Study: establishing national norms for trauma care.J Trauma. 1990;30:1356–1365.
50. Garthe E, Mango N. Emergency Medical Response Use Scenario:Real Time Medical Use of Event Data Recorder (vehicle EDR) Dataat the Scene of Crashes. Working Group on Motor Vehicle Event DataRecorders (MVEDR), May 2003. Available at: http://grouper.ieee.org/groups/1616/131_Emergency_Med_Use_Scenario%20_May_2003_2.ppt.Accessed October 10, 2006.
51. Technical Specifications to Permit Real Time Medical Use of MotorVehicle EDR Data to Save Lives. Available at: http://grouper.ieee.org/groups/1616/66IEEEEDRPresentationJuly182002.pdf. AccessedOctober 2005.
52. Medical Community/Research Support for EDR Variables forEmergency Medical Response Use at the Scene of Crashes.Available at: http://grouper.ieee.org/groups/1616/129_Med_Support_for_EDR_vars_May_2003_RM_rev.ppt. AccessedOctober 2005.
53. Frequently Asked Questions about RFID. Available at: http://www.rfidjournal.com/article/articleview/207. Accessed October 2005.
54. NHTSA Event Data Recorder Program. Research and Developmentsummary report, 2001. Available at: http://www_nrd.nhtsa.dot.gov/departments/nrd_01/summaries/EDR.html. Accessed October 2005.
55. Society of Automotive Engineers Event Data Recorder standards anddraft standards. Available at: http://www.sae.org/servlets/SiteSearch?charset�iso_8859_1&ht�0&qp�%2BTYP%3ASTD&col�portal&qs�&sae_qt1�&qc�&pw�100%2525&ws�0&la�en&qm�0&st�1&nh�25&lk�1&rf�0&oq�&rq�0&si�1&ql�&jsp_name�simplesearch.jsp&qt�%22event�data�recorder%22&x�6&y�6&ofType�STD.Accessed October 2005.
56. Project 1616: Draft Standard Motor Vehicle Event Data Recorders(MVEDRs). Project scope and documents. Available at: http://grouper.ieee.org/groups/1616/home.htm. Accessed October 2005.
57. Garthe E, Mango N. Scene triage criteria associated with fatal crashesand potential for use of Event data recorder (EDR) data. Proceedings ofthe 19th International Technical Conference on the Enhanced Safety ofVehicles, DOT HS 809 823, Paper Number 05–0445. [U.S. Departmentof Transportation, National Highway Traffic Safety Administration Website]. Available at: http://www_nrd.nhtsa.dot.gov/pdf/nrd_01/esv/esv19/05_0445_O.pdf. Accessed August 2005.
58. Clark DE, Cushing BM. Predicted effect of automatic crashnotification on traffic mortality. Accid Anal Prev. 2002;34:507–513.
59. Champion HR, Augenstein JS, Cushing B, et al. Reducing HighwayDeaths and Disabilities with Automatic Wireless Transmission ofSerious Injury Probability Ratings from Crash Recorders toEmergency Medical Services Providers. ESV paper 406. Availableat: http://www.ntsb.gov/events/symp_rec/proceedings/authors/champion.htm. Accessed October 10, 2006.
60. Mango N, Garthe E, Sugarman P. A method to collect multipleyears of regional emergency department visits: an important sourceof injury data presented at the 6th World Conference on InjuryPrevention and Control, Montreal, May 2002. Abstract available at:www.inspq.qc.ca/pdf/publications/129_Trauma2002/(M)ThemesTransversaux-Cross-DisciplinaryThemes.pdf. Accessed October 10,2006.
The Journal of TRAUMA� Injury, Infection, and Critical Care
460 February 2007
Long-Term Multidimensional Functional Consequences ofSevere Multiple Injuries Two Years After Trauma:A Prospective Longitudinal Cohort StudyHelene Lundgaard Soberg, MSc, Erik Bautz-Holter, MD, PhD, Olav Roise, MD, PhD, and Arnstein Finset, PhD
Background: The assessment of out-come after multiple injuries in a rehabilita-tion perspective is increasingly important intrauma research. The purpose of this studywas to assess functioning and quality of lifeafter severe injuries using a prospective co-hort design.
Methods: One hundred and five pa-tients with a New Injury Severity Score>15, aged 18 to 67 years, and admitted to aLevel I trauma center were included consec-utively starting January 2002 through June2003. Outcomes were assessed 6 weeks afterdischarge and 1 and 2 years after injury.Self-reported functioning and quality of lifewas measured by Short Form (SF)-36,
World Health Organization DisabilityAssessment Schedule II (WHODAS II)and a cognitive function scale (COG).
Results: Mean age was 35.3 years(standard deviation [SD], 14.0), 83% weremale. Mean New Injury Severity Score was34.6 (SD, 12.6). Disease burden measured bySF-36 showed scores below the general pop-ulation. Effect sizes showed that the largestdifference was for physical functioning, so-cial functioning, and physical and emotionalrole functioning. The WHODAS II disabil-ity score showed substantially worse func-tioning compared with general populationdata. Profession, injury severity, pain,and physical, cognitive, and social func-
tioning made independent contributionsto WHODAS II 2 years after injury andexplained 69% of the variance of the model.
Conclusions: Long-lasting func-tional problems after multiple injuries af-fect most life domains. Knowledge aboutthe reduced physical, mental, cognitive,social, and role functioning should impactthe rehabilitation services provided for se-verely injured patients, from primarycare to community rehabilitation.
Key Words: Multiple injuries, NewInjury Severity Score, Functional out-come, Rehabilitation, International Clas-sification of Functioning, Disability, andHealth (ICF).
J Trauma. 2007;62:461–470.
Accidental injuries represent the prime reason for earlydeath and acquired disabilities in people below the ageof 45 in the western world.1 However, documentation
of the long-term consequences of multiple injuries in a mul-tidimensional rehabilitation perspective remains insuffi-cient. People who survive multiple injuries suffer frominjury-related problems after hospitalization and primary re-habilitation. The consequences include impairments, activitylimitations, and participation restrictions.2
Young patients with multiple injuries represent a partic-ular challenge for rehabilitation services because they shouldhave several years of productive work ahead as part of ameaningful life. Improved knowledge about the long-termconsequences of multiple injuries is necessary and might alsohave implications for the improvement of rehabilitation services.
This study is part of a larger project where the rehabilitationprocess is studied both in relation to patient functioningand return to work, patient’s expressed problems and reha-bilitation goals, and the community rehabilitation servicesprovided.
Problems with physical functioning, mental health, cog-nitive functioning, social and role functioning, and reducedhealth-related quality of life (HRQL) have been reported inearlier studies.3–8 Injuries to head, extremities, or spinal cordgenerally give more functional problems than do injuries tothe thorax or abdomen.3,9–11
Previous studies are either retrospective or they haveshort follow-up periods.3–8,10,11 Only in some retrospectivereports is patient status and functioning explored for longerthan 1 year.3,12–15 The prospective studies found have afollow-up period of 12 to 18 months.5,6,16 In addition, previ-ous studies may have been hampered with heterogenic patientpopulations with comorbidities such as substance abuseand/or severe mental illness, factors that can complicate therehabilitation process.3,4,11,13,16–18
Consensus reports state that HRQL and multidimensionalfunctional end-points based on patients’ self reports are neces-sary in research after multiple injuries.19,20 Thus, the impact ofthe injuries in a biopsychosocial perspective should be explored.In this perspective, functioning is described within the impair-ments, activities, and participation dimensions of disability andhealth of the International Classification of Functioning, Dis-ability, and Health (ICF).2 To our knowledge, the ICF has not
Submitted for publication November 5, 2005.Accepted for publication April 3, 2006.Copyright © 2007 by Lippincott Williams & Wilkins, Inc.Funded with the aid of EXTRA funds from the Norwegian Foundation
for Health and Rehabilitation.From the Faculty of Medicine, University of Oslo, Department of
Physical Medicine and Rehabilitation (H.L.S., E.B.-H.), Ulleval UniversityHospital; the Faculty of Medicine, University of Oslo, Orthopedic Centre(O.R.), Ulleval University Hospital; and the Department of Behavioral Sci-ences in Medicine (A.F.), University of Oslo, Oslo, Norway.
Address for reprints: Helene L. Soberg, MSc, Department of PhysicalMedicine and Rehabilitation, Ulleval University Hospital, N-0407 Oslo,Norway.
DOI: 10.1097/01.ta.0000222916.30253.ea
The Journal of TRAUMA� Injury, Infection, and Critical Care
Volume 62 • Number 2 461
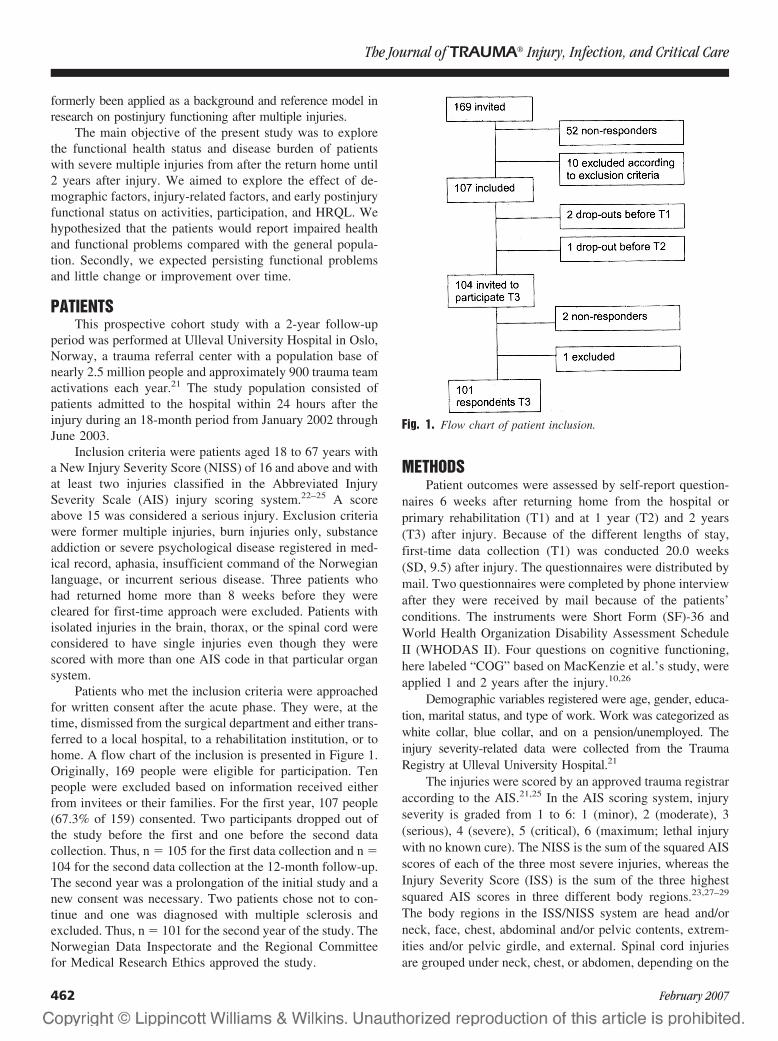
formerly been applied as a background and reference model inresearch on postinjury functioning after multiple injuries.
The main objective of the present study was to explorethe functional health status and disease burden of patientswith severe multiple injuries from after the return home until2 years after injury. We aimed to explore the effect of de-mographic factors, injury-related factors, and early postinjuryfunctional status on activities, participation, and HRQL. Wehypothesized that the patients would report impaired healthand functional problems compared with the general popula-tion. Secondly, we expected persisting functional problemsand little change or improvement over time.
PATIENTSThis prospective cohort study with a 2-year follow-up
period was performed at Ulleval University Hospital in Oslo,Norway, a trauma referral center with a population base ofnearly 2.5 million people and approximately 900 trauma teamactivations each year.21 The study population consisted ofpatients admitted to the hospital within 24 hours after theinjury during an 18-month period from January 2002 throughJune 2003.
Inclusion criteria were patients aged 18 to 67 years witha New Injury Severity Score (NISS) of 16 and above and withat least two injuries classified in the Abbreviated InjurySeverity Scale (AIS) injury scoring system.22–25 A scoreabove 15 was considered a serious injury. Exclusion criteriawere former multiple injuries, burn injuries only, substanceaddiction or severe psychological disease registered in med-ical record, aphasia, insufficient command of the Norwegianlanguage, or incurrent serious disease. Three patients whohad returned home more than 8 weeks before they werecleared for first-time approach were excluded. Patients withisolated injuries in the brain, thorax, or the spinal cord wereconsidered to have single injuries even though they werescored with more than one AIS code in that particular organsystem.
Patients who met the inclusion criteria were approachedfor written consent after the acute phase. They were, at thetime, dismissed from the surgical department and either trans-ferred to a local hospital, to a rehabilitation institution, or tohome. A flow chart of the inclusion is presented in Figure 1.Originally, 169 people were eligible for participation. Tenpeople were excluded based on information received eitherfrom invitees or their families. For the first year, 107 people(67.3% of 159) consented. Two participants dropped out ofthe study before the first and one before the second datacollection. Thus, n � 105 for the first data collection and n �104 for the second data collection at the 12-month follow-up.The second year was a prolongation of the initial study and anew consent was necessary. Two patients chose not to con-tinue and one was diagnosed with multiple sclerosis andexcluded. Thus, n � 101 for the second year of the study. TheNorwegian Data Inspectorate and the Regional Committeefor Medical Research Ethics approved the study.
METHODSPatient outcomes were assessed by self-report question-
naires 6 weeks after returning home from the hospital orprimary rehabilitation (T1) and at 1 year (T2) and 2 years(T3) after injury. Because of the different lengths of stay,first-time data collection (T1) was conducted 20.0 weeks(SD, 9.5) after injury. The questionnaires were distributed bymail. Two questionnaires were completed by phone interviewafter they were received by mail because of the patients’conditions. The instruments were Short Form (SF)-36 andWorld Health Organization Disability Assessment ScheduleII (WHODAS II). Four questions on cognitive functioning,here labeled “COG” based on MacKenzie et al.’s study, wereapplied 1 and 2 years after the injury.10,26
Demographic variables registered were age, gender, educa-tion, marital status, and type of work. Work was categorized aswhite collar, blue collar, and on a pension/unemployed. Theinjury severity-related data were collected from the TraumaRegistry at Ulleval University Hospital.21
The injuries were scored by an approved trauma registraraccording to the AIS.21,25 In the AIS scoring system, injuryseverity is graded from 1 to 6: 1 (minor), 2 (moderate), 3(serious), 4 (severe), 5 (critical), 6 (maximum; lethal injurywith no known cure). The NISS is the sum of the squared AISscores of each of the three most severe injuries, whereas theInjury Severity Score (ISS) is the sum of the three highestsquared AIS scores in three different body regions.23,27–29
The body regions in the ISS/NISS system are head and/orneck, face, chest, abdominal and/or pelvic contents, extrem-ities and/or pelvic girdle, and external. Spinal cord injuriesare grouped under neck, chest, or abdomen, depending on the
Fig. 1. Flow chart of patient inclusion.
The Journal of TRAUMA� Injury, Infection, and Critical Care
462 February 2007

level of the injury.25 The score of the most severe injury waslabeled “maximum AIS”.
Glasgow Coma Scale (GCS) is an ordinal scale from 3 to15 expressing degree of motor, verbal, and eye-opening re-sponse in this study at admission, or at site of injury in caseof prehospital intubation. The GCS score is a sensitive andreliable indicator of degree of traumatic brain injury and isfrequently used in trauma research.30 A score of 3 reflects noresponse whereas a score of 15 reflects normal level ofconsciousness.
The SF-36 is an instrument measuring self-assessedhealth status with scales for physical functioning, role-physicalfunction (RP), bodily pain, general health, vitality, socialfunctioning, role-emotional function (RE), and mental health.The scale range is 0 to 100, worst to best.31,32 Norwegiangeneral population data for SF-36 and for different diseasepopulations were used for comparison.33–36
WHODAS II is a 36-item, self-administered instrumentfor the assessment of functional status in six life domains ona six-point ordinal scale from no difficulty (1) to extremedifficulty/cannot do (6). The domains are understanding andcommunicating, getting around, self care, getting along withpeople, life activities (household activities and work activi-ties), and participation in society. WHODAS II is scored withsubscales and a summary score. The sum score includescognitive functioning and sexual function, items not coveredby the SF-36. The scale range is 0 to 100, best to worst.WHODAS II has showed satisfactory validity and reliabilityqualities. The sensitivity to change has been found similar forSF-36 and WHODAS II.36,37 Population-based norm data areavailable for WHODAS II.38 Only the summary score wasused here.
The COG scale for self-assessed cognitive functioningwas originally developed for another patient group but hasformerly been used in trauma research.10,39 The four itemsconcern how much of the time in the past 4 weeks therespondents have experienced cognitive problems. The re-sponse categories are scored by a six-point ordinal scale from1 (not at all) to 6 (all the time). The scores were converted andthe sum transformed into a 0 to 100 scale, worst to best. TheCOG scale represents a separate factor and is correlated withSF-36’s mental health and RE on a trauma population.10 TheCOG score was dichotomized with a cutoff at 80 for self-reported cognitive problems. This cut-off was chosen becausea score of �80 would occur if all items were scored at leastas “difficulties some of the time”, or if at least one item wasscored with “difficulty all the time”. Patients with asymptom-atic human immunodeficiency virus (HIV) or early acquiredimmunodeficiency syndrome (AIDS)-related complex had amean score �80 on the COG scale.39 Moreover, mean COGscore for the trauma population in MacKenzie et al.’s studywas above 80.10 Because a general population score for COGwas not found, scores were compared with the asymptomaticHIV group and MacKenzie et al.’s trauma group.
In Table 1, the assessment variables in this study arecategorized with respect to the main components of function-ing and disability in the ICF, i.e., as personal factors, bodyfunctions, activities, participation, or environmental factors.Although other alternative categorizations might be consid-ered, we applied the results of linking the SF-36 scales andWHODAS II to the ICF as described by others.36,37,40
Data Analysis and StatisticsDescriptive data are presented by means, standard devi-
ation (SD), and range or by median and interquartile range(IR). Nonparametric statistical analysis was used for data notnormally distributed. Cross-tabulations with �2 tests wereperformed for nominal data. Correlations were analyzed withSpearman’s � or Pearson’s r. For parametric data, t tests andanalysis of variance were used to compare groups; for mul-tiple comparisons, the Bonferroni correction was applied.
For SF-36, the Norwegian population norm scores wereweighted for gender and age to correct for the differencebetween the study population and the Norwegian generalpopulation score. One-sample t tests were performed for eachscale with the weighted population scores as test value. Alsofor COG, one-sample t tests were performed with asymptom-atic HIV scores as test value. Effect sizes (standardized dif-ference scores) were calculated by subtracting the mean scoresof the patients from the reference scores and dividing each scaleby the scales’ standards deviations in the reference populations.The effect sizes were interpreted according to Cohen’s index,
Table 1 Variables and Their Main Correspondence tothe ICF Components
ICF Components Variables
Personal factors AgeGenderMarital statusEducationProfession
Body function/structure/Impairments
Injury severity scores: maximumAIS, ISS, NISS, GCSSF-36: mental health, vitality,bodily pain
Activities/Activity limitations Sf-36: physical functioningCOG: cognitive functioning
WHODAS II sum scoreParticipation/Participation
restrictionSf-36: role–physical, role–emotional,
social functioningWHODAS II sum score
Environmental factors Sick leave and vocationalrehabilitation system/service
Not definable in ICF Length of stay inhospital/rehabilitationSf-36: general health
ICF, International Classification of Functioning, Disability andHealth; AIS, Abbreviate Injury Scale; ISS, Injury Severity Score; NISS,New Injury Severity Score; GCS, Glasgow Coma Scale; SF-36, ShortForm 36; WHODAS II, World Health Organization Disability Assess-ment Schedule II.
Long-Term Consequences of Severe Injuries
Volume 62 • Number 2 463
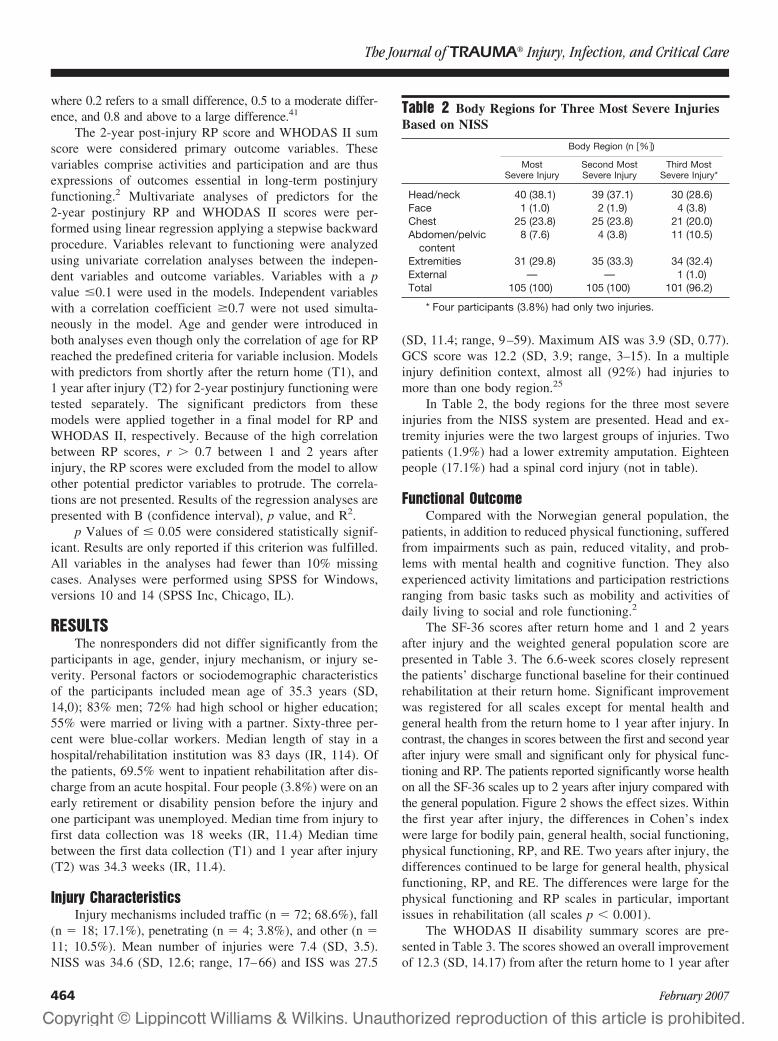
where 0.2 refers to a small difference, 0.5 to a moderate differ-ence, and 0.8 and above to a large difference.41
The 2-year post-injury RP score and WHODAS II sumscore were considered primary outcome variables. Thesevariables comprise activities and participation and are thusexpressions of outcomes essential in long-term postinjuryfunctioning.2 Multivariate analyses of predictors for the2-year postinjury RP and WHODAS II scores were per-formed using linear regression applying a stepwise backwardprocedure. Variables relevant to functioning were analyzedusing univariate correlation analyses between the indepen-dent variables and outcome variables. Variables with a pvalue �0.1 were used in the models. Independent variableswith a correlation coefficient �0.7 were not used simulta-neously in the model. Age and gender were introduced inboth analyses even though only the correlation of age for RPreached the predefined criteria for variable inclusion. Modelswith predictors from shortly after the return home (T1), and1 year after injury (T2) for 2-year postinjury functioning weretested separately. The significant predictors from thesemodels were applied together in a final model for RP andWHODAS II, respectively. Because of the high correlationbetween RP scores, r � 0.7 between 1 and 2 years afterinjury, the RP scores were excluded from the model to allowother potential predictor variables to protrude. The correla-tions are not presented. Results of the regression analyses arepresented with B (confidence interval), p value, and R2.
p Values of � 0.05 were considered statistically signif-icant. Results are only reported if this criterion was fulfilled.All variables in the analyses had fewer than 10% missingcases. Analyses were performed using SPSS for Windows,versions 10 and 14 (SPSS Inc, Chicago, IL).
RESULTSThe nonresponders did not differ significantly from the
participants in age, gender, injury mechanism, or injury se-verity. Personal factors or sociodemographic characteristicsof the participants included mean age of 35.3 years (SD,14,0); 83% men; 72% had high school or higher education;55% were married or living with a partner. Sixty-three per-cent were blue-collar workers. Median length of stay in ahospital/rehabilitation institution was 83 days (IR, 114). Ofthe patients, 69.5% went to inpatient rehabilitation after dis-charge from an acute hospital. Four people (3.8%) were on anearly retirement or disability pension before the injury andone participant was unemployed. Median time from injury tofirst data collection was 18 weeks (IR, 11.4) Median timebetween the first data collection (T1) and 1 year after injury(T2) was 34.3 weeks (IR, 11.4).
Injury CharacteristicsInjury mechanisms included traffic (n � 72; 68.6%), fall
(n � 18; 17.1%), penetrating (n � 4; 3.8%), and other (n �11; 10.5%). Mean number of injuries were 7.4 (SD, 3.5).NISS was 34.6 (SD, 12.6; range, 17–66) and ISS was 27.5
(SD, 11.4; range, 9–59). Maximum AIS was 3.9 (SD, 0.77).GCS score was 12.2 (SD, 3.9; range, 3–15). In a multipleinjury definition context, almost all (92%) had injuries tomore than one body region.25
In Table 2, the body regions for the three most severeinjuries from the NISS system are presented. Head and ex-tremity injuries were the two largest groups of injuries. Twopatients (1.9%) had a lower extremity amputation. Eighteenpeople (17.1%) had a spinal cord injury (not in table).
Functional OutcomeCompared with the Norwegian general population, the
patients, in addition to reduced physical functioning, sufferedfrom impairments such as pain, reduced vitality, and prob-lems with mental health and cognitive function. They alsoexperienced activity limitations and participation restrictionsranging from basic tasks such as mobility and activities ofdaily living to social and role functioning.2
The SF-36 scores after return home and 1 and 2 yearsafter injury and the weighted general population score arepresented in Table 3. The 6.6-week scores closely representthe patients’ discharge functional baseline for their continuedrehabilitation at their return home. Significant improvementwas registered for all scales except for mental health andgeneral health from the return home to 1 year after injury. Incontrast, the changes in scores between the first and second yearafter injury were small and significant only for physical func-tioning and RP. The patients reported significantly worse healthon all the SF-36 scales up to 2 years after injury compared withthe general population. Figure 2 shows the effect sizes. Withinthe first year after injury, the differences in Cohen’s indexwere large for bodily pain, general health, social functioning,physical functioning, RP, and RE. Two years after injury, thedifferences continued to be large for general health, physicalfunctioning, RP, and RE. The differences were large for thephysical functioning and RP scales in particular, importantissues in rehabilitation (all scales p � 0.001).
The WHODAS II disability summary scores are pre-sented in Table 3. The scores showed an overall improvementof 12.3 (SD, 14.17) from after the return home to 1 year after
Table 2 Body Regions for Three Most Severe InjuriesBased on NISS
Body Region (n �%�)
MostSevere Injury
Second MostSevere Injury
Third MostSevere Injury*
Head/neck 40 (38.1) 39 (37.1) 30 (28.6)Face 1 (1.0) 2 (1.9) 4 (3.8)Chest 25 (23.8) 25 (23.8) 21 (20.0)Abdomen/pelvic
content8 (7.6) 4 (3.8) 11 (10.5)
Extremities 31 (29.8) 35 (33.3) 34 (32.4)External — — 1 (1.0)Total 105 (100) 105 (100) 101 (96.2)
* Four participants (3.8%) had only two injuries.
The Journal of TRAUMA� Injury, Infection, and Critical Care
464 February 2007
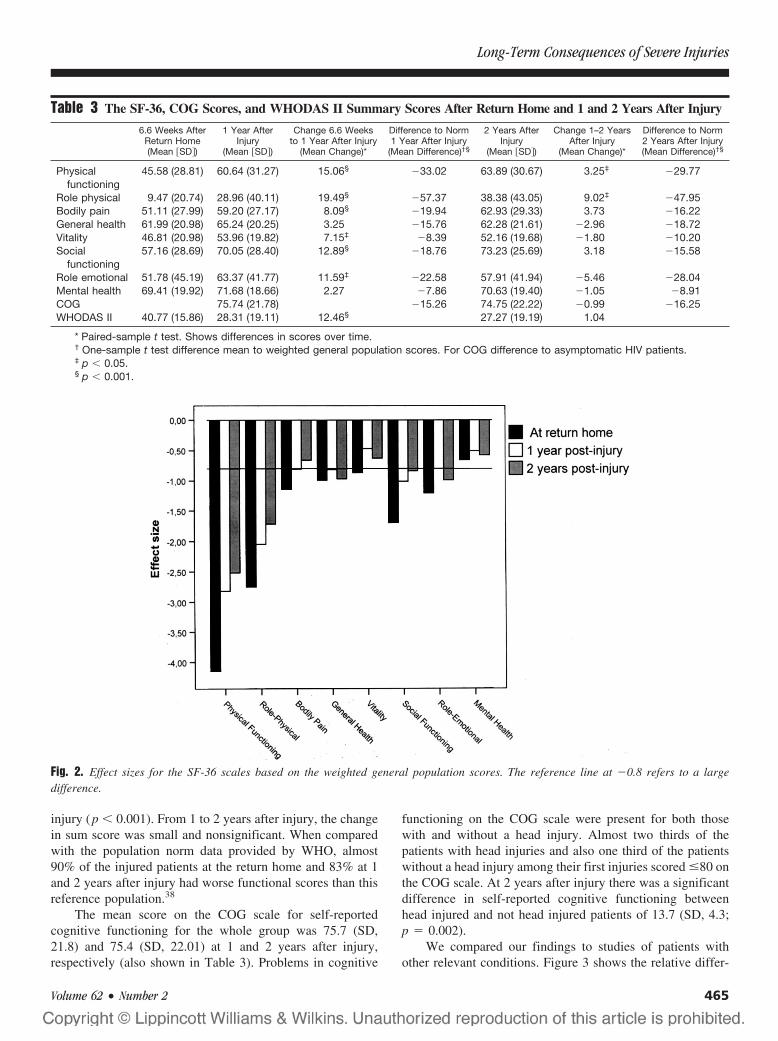
injury (p � 0.001). From 1 to 2 years after injury, the changein sum score was small and nonsignificant. When comparedwith the population norm data provided by WHO, almost90% of the injured patients at the return home and 83% at 1and 2 years after injury had worse functional scores than thisreference population.38
The mean score on the COG scale for self-reportedcognitive functioning for the whole group was 75.7 (SD,21.8) and 75.4 (SD, 22.01) at 1 and 2 years after injury,respectively (also shown in Table 3). Problems in cognitive
functioning on the COG scale were present for both thosewith and without a head injury. Almost two thirds of thepatients with head injuries and also one third of the patientswithout a head injury among their first injuries scored �80 onthe COG scale. At 2 years after injury there was a significantdifference in self-reported cognitive functioning betweenhead injured and not head injured patients of 13.7 (SD, 4.3;p � 0.002).
We compared our findings to studies of patients withother relevant conditions. Figure 3 shows the relative differ-
Fig. 2. Effect sizes for the SF-36 scales based on the weighted general population scores. The reference line at �0.8 refers to a largedifference.
Table 3 The SF-36, COG Scores, and WHODAS II Summary Scores After Return Home and 1 and 2 Years After Injury
6.6 Weeks AfterReturn Home(Mean �SD�)
1 Year AfterInjury
(Mean �SD�)
Change 6.6 Weeksto 1 Year After Injury
(Mean Change)*
Difference to Norm1 Year After Injury
(Mean Difference)†§
2 Years AfterInjury
(Mean �SD�)
Change 1–2 YearsAfter Injury
(Mean Change)*
Difference to Norm2 Years After Injury(Mean Difference)†§
Physicalfunctioning
45.58 (28.81) 60.64 (31.27) 15.06§ �33.02 63.89 (30.67) 3.25‡ �29.77
Role physical 9.47 (20.74) 28.96 (40.11) 19.49§ �57.37 38.38 (43.05) 9.02‡ �47.95Bodily pain 51.11 (27.99) 59.20 (27.17) 8.09§ �19.94 62.93 (29.33) 3.73 �16.22General health 61.99 (20.98) 65.24 (20.25) 3.25 �15.76 62.28 (21.61) �2.96 �18.72Vitality 46.81 (20.98) 53.96 (19.82) 7.15‡ �8.39 52.16 (19.68) �1.80 �10.20Social
functioning57.16 (28.69) 70.05 (28.40) 12.89§ �18.76 73.23 (25.69) 3.18 �15.58
Role emotional 51.78 (45.19) 63.37 (41.77) 11.59‡ �22.58 57.91 (41.94) �5.46 �28.04Mental health 69.41 (19.92) 71.68 (18.66) 2.27 �7.86 70.63 (19.40) �1.05 �8.91COG 75.74 (21.78) �15.26 74.75 (22.22) �0.99 �16.25WHODAS II 40.77 (15.86) 28.31 (19.11) 12.46§ 27.27 (19.19) 1.04
* Paired-sample t test. Shows differences in scores over time.† One-sample t test difference mean to weighted general population scores. For COG difference to asymptomatic HIV patients.‡ p � 0.05.§ p � 0.001.
Long-Term Consequences of Severe Injuries
Volume 62 • Number 2 465
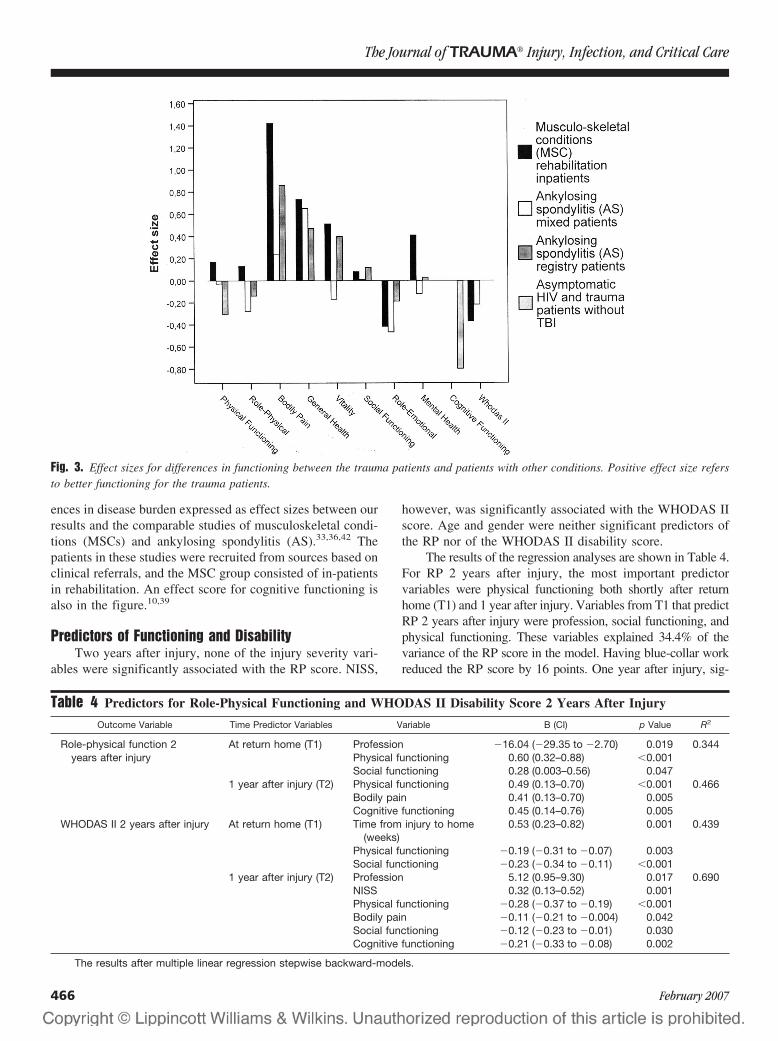
ences in disease burden expressed as effect sizes between ourresults and the comparable studies of musculoskeletal condi-tions (MSCs) and ankylosing spondylitis (AS).33,36,42 Thepatients in these studies were recruited from sources based onclinical referrals, and the MSC group consisted of in-patientsin rehabilitation. An effect score for cognitive functioning isalso in the figure.10,39
Predictors of Functioning and DisabilityTwo years after injury, none of the injury severity vari-
ables were significantly associated with the RP score. NISS,
however, was significantly associated with the WHODAS IIscore. Age and gender were neither significant predictors ofthe RP nor of the WHODAS II disability score.
The results of the regression analyses are shown in Table 4.For RP 2 years after injury, the most important predictorvariables were physical functioning both shortly after returnhome (T1) and 1 year after injury. Variables from T1 that predictRP 2 years after injury were profession, social functioning, andphysical functioning. These variables explained 34.4% of thevariance of the RP score in the model. Having blue-collar workreduced the RP score by 16 points. One year after injury, sig-
Fig. 3. Effect sizes for differences in functioning between the trauma patients and patients with other conditions. Positive effect size refersto better functioning for the trauma patients.
Table 4 Predictors for Role-Physical Functioning and WHODAS II Disability Score 2 Years After Injury
Outcome Variable Time Predictor Variables Variable B (CI) p Value R2
Role-physical function 2years after injury
At return home (T1) Profession �16.04 (�29.35 to �2.70) 0.019 0.344Physical functioning 0.60 (0.32–0.88) �0.001Social functioning 0.28 (0.003–0.56) 0.047
1 year after injury (T2) Physical functioning 0.49 (0.13–0.70) �0.001 0.466Bodily pain 0.41 (0.13–0.70) 0.005Cognitive functioning 0.45 (0.14–0.76) 0.005
WHODAS II 2 years after injury At return home (T1) Time from injury to home(weeks)
0.53 (0.23–0.82) 0.001 0.439
Physical functioning �0.19 (�0.31 to �0.07) 0.003Social functioning �0.23 (�0.34 to �0.11) �0.001
1 year after injury (T2) Profession 5.12 (0.95–9.30) 0.017 0.690NISS 0.32 (0.13–0.52) 0.001Physical functioning �0.28 (�0.37 to �0.19) �0.001Bodily pain �0.11 (�0.21 to �0.004) 0.042Social functioning �0.12 (�0.23 to �0.01) 0.030Cognitive functioning �0.21 (�0.33 to �0.08) 0.002
The results after multiple linear regression stepwise backward-models.
The Journal of TRAUMA� Injury, Infection, and Critical Care
466 February 2007

nificant predictors were bodily pain, physical functioning, andCOG. These variables explained 46.6% of the variance.
For WHODAS II, disability 2 years after injury was asso-ciated with several variables from both shortly after return home(T1) and 1 year after injury. Three variables from T1 remainedsignificantly associated with functioning and disability 2 yearsafter injury. They included time from injury to return home,social functioning, and physical functioning. The variables ex-plained 43.9% of the variance of the WHODAS II score in themodel. Significant predictors in the 1 year after injury modelwere profession, NISS, bodily pain, social functioning, physicalfunctioning, and COG. Having blue-collar work increased theWHODAS II score by 5 points. The variables explained 69.0%of the variance.
In two final models with predictors from both T1 and 1year after injury included for RP and WHODAS II, none ofthe significant T1 variables remained significant. Thus, onlythe 1 year after injury predictors remained significantly as-sociated with RP and WHODAS II score 2 years after injury.
DISCUSSIONThis study confirms the multidimensional and long-last-
ing functional problems multiple injury patients face andclearly indicates that the consequences of multiple injuriesare complex.3,5,6,12,16,43 At 2 years after injury, the gap to thegeneral population is still considerable. In addition to thephysical impairments and activity limitations in mobility andactivities of daily living, reduced cognitive, psychosocial, androle functioning has to be addressed in the rehabilitationprocess. The population included in this study did not differsignificantly from other studies concerning age, gender, ed-ucation, and injury severity.
There is little improvement in functioning between thefirst and second year after injury. One might expect thatsignificant improvement would continue into the second yearafter injury. This was the case only for RP. In addition, therewas a small improvement in physical functioning. Thus, im-proved RP might reflect a better managing of physical roletasks, including work. The majority of the respondents wasblue-collar workers with physically demanding jobs. More-over, younger men are physically active on their leisure time.Others have described loss of outdoor physical activities anda high degree of leisure disability.3,14 The lack of physicalimprovement might cause distress and have a negative impacton social and emotional well being. However, social func-tioning also made independent contributions to the RP andWHODAS II scores. Although there was little change incognitive functioning between 1 and 2 years, the significantlylower scores for the patients with head injuries indicate thatthe impact of cognitive problems emerges over time whenfacing the demands of everyday life.
Compared with the general population, the trauma pa-tients still suffer from impairments 2 years after injury. Thiswas registered directly in mental health, vitality, and bodilypain, and as activity limitations in physical functioning and
cognitive functioning. The SF-36 effect sizes all show largeto moderate differences to the general population, with thelargest differences in general health and in activity and par-ticipation scales of physical functioning, RP, RE, and socialfunctioning.41 Little improvement and reduced functioning andquality of life are in accordance with other studies.3–6,8–10,44
Also, the WHODAS II score showed substantially lowerfunctioning than for the population norm.38 Conclusionsbased on a direct causal relationship between impairments,activities, and participation cannot be made.2 Nonetheless,the patients experience participation restrictions with reducedsocial functioning and role functioning, indicating a gap be-tween their functional ability and environmental demands.The importance of participation and enhanced social and rolefunctioning in rehabilitation is pointed out by others.3,5,45
To shed light on the relative disease burden and on theextent to which our findings are specific to the trauma pop-ulation, we decided to discuss our results against the othergroups. We found studies on patients with MSCs and AS tobe most relevant because of the diversity of diagnoses in theMSC group and the predominance of younger men in the ASgroup.33,36,42,46
According to the WHODAS II scores, the overall diseaseburden seems larger for the trauma patients than what wasreported for the MSC or AS patients in a number ofstudies.33,36,42 Generally, trauma patients seem more dis-abled. Interestingly, the general health scores are better forthe trauma patients. Health perceptions might be relativelyrobust, and change more slowly than one might expect afterhaving experienced such a sudden but long-lasting functionaldecline. However, the trauma patients still experienced someimprovement 2 years after injury, especially in RP. Generalhealth perceptions might decline with time, which mightexplain the lower scores in patients with chronic and/or pro-gressive conditions. Unexpectedly, the patients in our studyseem to have better mental health, vitality, and less bodilypain than has been described for MSC patients.36 Femalegender and higher age might explain the lower scores.34,36,47
In accordance with our expectations, the trauma patientsappear to have more activity limitations and participationrestrictions in physical functioning and RP than that reportedfor the AS patients.33,42,46
There seems to be a particularly consistent lower RE forthe trauma patients compared with what is reported for MSCand AS patients.33,36,46 Reduced RE comparable to our studyhas also been reported in other studies on the traumapopulation.9,48 The lower scores emphasize the impact severeinjuries have on participation and quality of life. The differ-ences in RE might be explained by the sudden onset and lossof function the trauma patients experience. Conditions with aslower onset and/or progression might enable patients tobetter adjust to their functional challenges over time. Thus,the emotional impact of their condition on role functioning inrelation to work or other activities over time might besmaller. Studies of RE on other groups indicate this.46,49,50
Long-Term Consequences of Severe Injuries
Volume 62 • Number 2 467
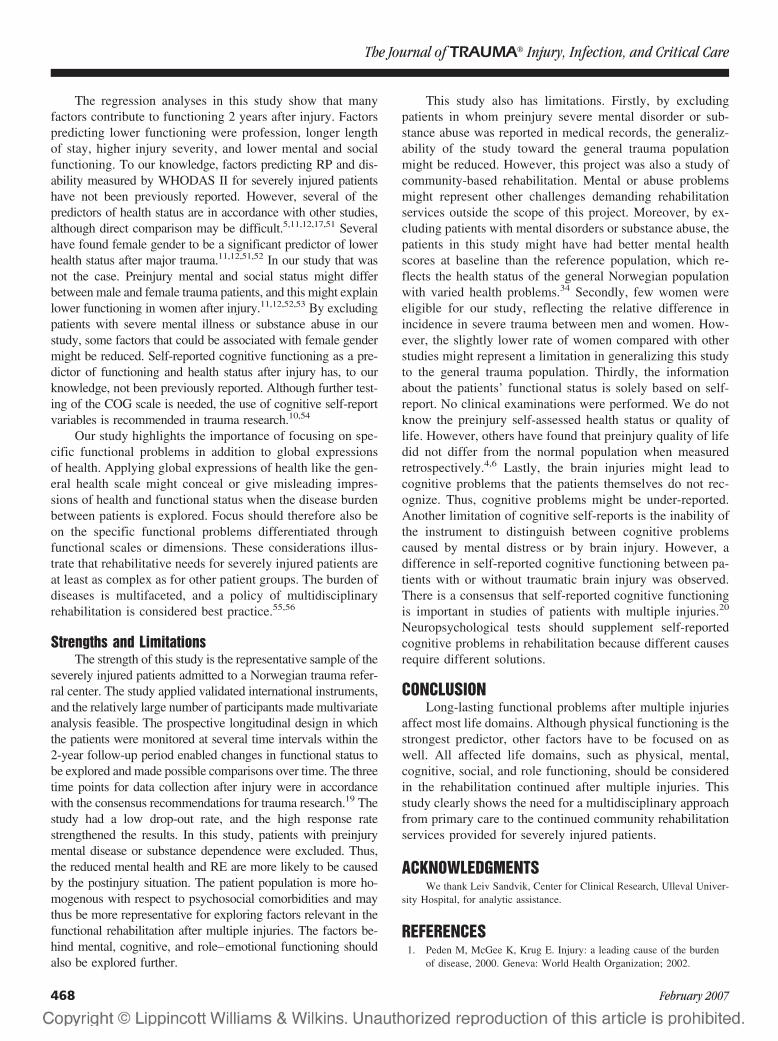
The regression analyses in this study show that manyfactors contribute to functioning 2 years after injury. Factorspredicting lower functioning were profession, longer lengthof stay, higher injury severity, and lower mental and socialfunctioning. To our knowledge, factors predicting RP and dis-ability measured by WHODAS II for severely injured patientshave not been previously reported. However, several of thepredictors of health status are in accordance with other studies,although direct comparison may be difficult.5,11,12,17,51 Severalhave found female gender to be a significant predictor of lowerhealth status after major trauma.11,12,51,52 In our study that wasnot the case. Preinjury mental and social status might differbetween male and female trauma patients, and this might explainlower functioning in women after injury.11,12,52,53 By excludingpatients with severe mental illness or substance abuse in ourstudy, some factors that could be associated with female gendermight be reduced. Self-reported cognitive functioning as a pre-dictor of functioning and health status after injury has, to ourknowledge, not been previously reported. Although further test-ing of the COG scale is needed, the use of cognitive self-reportvariables is recommended in trauma research.10,54
Our study highlights the importance of focusing on spe-cific functional problems in addition to global expressionsof health. Applying global expressions of health like the gen-eral health scale might conceal or give misleading impres-sions of health and functional status when the disease burdenbetween patients is explored. Focus should therefore also beon the specific functional problems differentiated throughfunctional scales or dimensions. These considerations illus-trate that rehabilitative needs for severely injured patients areat least as complex as for other patient groups. The burden ofdiseases is multifaceted, and a policy of multidisciplinaryrehabilitation is considered best practice.55,56
Strengths and LimitationsThe strength of this study is the representative sample of the
severely injured patients admitted to a Norwegian trauma refer-ral center. The study applied validated international instruments,and the relatively large number of participants made multivariateanalysis feasible. The prospective longitudinal design in whichthe patients were monitored at several time intervals within the2-year follow-up period enabled changes in functional status tobe explored and made possible comparisons over time. The threetime points for data collection after injury were in accordancewith the consensus recommendations for trauma research.19 Thestudy had a low drop-out rate, and the high response ratestrengthened the results. In this study, patients with preinjurymental disease or substance dependence were excluded. Thus,the reduced mental health and RE are more likely to be causedby the postinjury situation. The patient population is more ho-mogenous with respect to psychosocial comorbidities and maythus be more representative for exploring factors relevant in thefunctional rehabilitation after multiple injuries. The factors be-hind mental, cognitive, and role–emotional functioning shouldalso be explored further.
This study also has limitations. Firstly, by excludingpatients in whom preinjury severe mental disorder or sub-stance abuse was reported in medical records, the generaliz-ability of the study toward the general trauma populationmight be reduced. However, this project was also a study ofcommunity-based rehabilitation. Mental or abuse problemsmight represent other challenges demanding rehabilitationservices outside the scope of this project. Moreover, by ex-cluding patients with mental disorders or substance abuse, thepatients in this study might have had better mental healthscores at baseline than the reference population, which re-flects the health status of the general Norwegian populationwith varied health problems.34 Secondly, few women wereeligible for our study, reflecting the relative difference inincidence in severe trauma between men and women. How-ever, the slightly lower rate of women compared with otherstudies might represent a limitation in generalizing this studyto the general trauma population. Thirdly, the informationabout the patients’ functional status is solely based on self-report. No clinical examinations were performed. We do notknow the preinjury self-assessed health status or quality oflife. However, others have found that preinjury quality of lifedid not differ from the normal population when measuredretrospectively.4,6 Lastly, the brain injuries might lead tocognitive problems that the patients themselves do not rec-ognize. Thus, cognitive problems might be under-reported.Another limitation of cognitive self-reports is the inability ofthe instrument to distinguish between cognitive problemscaused by mental distress or by brain injury. However, adifference in self-reported cognitive functioning between pa-tients with or without traumatic brain injury was observed.There is a consensus that self-reported cognitive functioningis important in studies of patients with multiple injuries.20
Neuropsychological tests should supplement self-reportedcognitive problems in rehabilitation because different causesrequire different solutions.
CONCLUSIONLong-lasting functional problems after multiple injuries
affect most life domains. Although physical functioning is thestrongest predictor, other factors have to be focused on aswell. All affected life domains, such as physical, mental,cognitive, social, and role functioning, should be consideredin the rehabilitation continued after multiple injuries. Thisstudy clearly shows the need for a multidisciplinary approachfrom primary care to the continued community rehabilitationservices provided for severely injured patients.
ACKNOWLEDGMENTSWe thank Leiv Sandvik, Center for Clinical Research, Ulleval Univer-
sity Hospital, for analytic assistance.
REFERENCES1. Peden M, McGee K, Krug E. Injury: a leading cause of the burden
of disease, 2000. Geneva: World Health Organization; 2002.
The Journal of TRAUMA� Injury, Infection, and Critical Care
468 February 2007
2. World Health Organization. International classification of functioning,disability and health. Geneva: World Health Organization; 2001.
3. Anke AG, Stanghelle JK, Finset A, et al. Long-term prevalence ofimpairments and disabilities after multiple trauma. J Trauma. 1997;42:54–61.
4. Holbrook TL, Anderson JP, Sieber WJ, et al. Outcome after majortrauma: discharge and 6-month follow-up results from the TraumaRecovery Project. J Trauma. 1998;45:315–323.
5. Holbrook TL, Anderson JP, Sieber WJ, et al. Outcome after majortrauma: 12-month and 18-month follow-up results from the TraumaRecovery Project. J Trauma. 1999;46:765–771.
6. Michaels AJ, Michaels CE, Smith JS, et al. Outcome from injury:general health, work status, and satisfaction 12 months after trauma.J Trauma. 2000;48:841–848.
7. Lipper-Gruner M, Wedekind C, Klug N. Functional andpsychosocial outcome one year after severe traumatic brain injuryand early-onset rehabilitation therapy. J Rehabil Med. 2002;34:211–214.
8. Finset A, Anke AW, Hofft E, et al. Cognitive performance inmultiple trauma patients 3 years after injury. Psychosom Med. 1999;61:576–583.
9. Fern KT, Smith JT, Zee B, et al. Trauma patients with multipleextremity injuries: resource utilization and long-term outcome inrelation to injury severity scores. J Trauma. 1998;45:489–494.
10. MacKenzie EJ, McCarthy ML, Ditunno JF, et al. Using the SF-36for characterizing outcome after multiple trauma involving headinjury. J Trauma. 2002;52:527–534.
11. Vles WJ, Steyerberg EW, Essink-Bot ML, et al. Prevalence anddeterminants of disabilities and return to work after major trauma.J Trauma. 2005;58:126–135.
12. Airey CM, Chell SM, Rigby AS, et al. The epidemiology ofdisability and occupation handicap resulting from major traumaticinjury. Disabil Rehabil. 2001;23:509–515.
13. Lehmann U, Pape HC, Seekamp A, et al. Long-term results aftermultiple injuries including severe head injury. Eur J Surg. 1999;165:1116–1120.
14. van der Sluis CK, Eisma WH, Groothoff JW, et al. Long-termphysical, psychological and social consequences of severe injuries.Injury. 1998;29:281–285.
15. Sluys K, Haggmark T, Iselius L. Outcome and quality of life 5 yearsafter major trauma. J Trauma. 2005;59:223–232.
16. Brenneman FD, Redelmeier DA, Boulanger BR, et al. Long-termoutcomes in blunt trauma: who goes back to work? J Trauma. 1997;42:778–781.
17. Meerding WJ, Looman CW, Essink-Bot ML, et al. Distribution anddeterminants of health and work status in a comprehensivepopulation of injury patients. J Trauma. 2004;56:150–161.
18. Michaels AJ, Michaels CE, Moon CH, et al. Psychosocial factorslimit outcomes after trauma. J Trauma. 1998;44:644–648.
19. Bouillon B, Kreder HJ, Eypasch E, et al. Quality of life in patientswith multiple injuries–basic issues, assessment, andrecommendations. Restor Neurol Neurosci. 2002;20:125–134.
20. Neugebauer E, Bouillon B, Bullinger M, et al. Quality of life aftermultiple trauma-summary and recommendations of the consensusconference. Restor Neurol Neurosci. 2002;20:161–167.
21. Ulleval Trauma Registry. Ulleval University Hospital TraumaRegistry. Oslo, Norway: Ulleval University Hospital; 2003.
22. Brenneman FD, Boulanger BR, McLellan BA, et al. Measuringinjury severity: time for a change? J Trauma. 1998;44:580–582.
23. Osler T, Baker SP, Long W. A modification of the injury severityscore that both improves accuracy and simplifies scoring. J Trauma.1997;43:922–925.
24. Tay SY, Sloan EP, Zun L, et al. Comparison of the New InjurySeverity Score and the Injury Severity Score. J Trauma. 2004;56:162–164.
25. Association for the Advancement of Automotive medicine. TheAbbreviated Injury Scale 1990 Revision Update 98. Des Plaines, IL:Association for the Advancement of Automotive Medicine; 1998.
26. Wu AW, Revicki DA, Jacobson D, et al. Evidence for reliability,validity and usefulness of the Medical Outcomes Study HIV HealthSurvey (MOS-HIV). Qual Life Res. 1997;6:481–493.
27. Balogh Z, Offner PJ, Moore EE, et al. NISS predicts postinjurymultiple organ failure better than the ISS. J Trauma. 2000;48:624–627.
28. Baker SP, O’Neill B, Haddon W Jr, et al. The injury severity score:a method for describing patients with multiple injuries andevaluating emergency care. J Trauma. 1974;14:187–196.
29. MacKenzie EJ, Shapiro S, Smith RT, et al. Factors influencingreturn to work following hospitalization for traumatic injury. Am JPublic Health. 1987;77:329–334.
30. Prasad K. The Glasgow Coma Scale: a critical appraisal of itsclinimetric properties. J Clin Epidemiol. 1996;49:755–763.
31. Ware JE, Gandek B, and the IQOLA Project Group. The SF-36Health Survey: Development and use in mental health research andthe IQOLA Project. Int J Ment Health. 1994;23:49–73.
32. Ware JE Jr, Gandek B. Overview of the SF-36 Health Survey andthe International Quality of Life Assessment (IQOLA) Project.J Clin Epidemiol. 1998;51:903–912.
33. Dagfinrud H, Mengshoel AM, Hagen KB, et al. Health status ofpatients with ankylosing spondylitis: a comparison with the generalpopulation. Ann Rheum Dis. 2004;63:1605–1610.
34. Loge JH, Kaasa S. Short form 36 (SF-36) health survey: normativedata from the general Norwegian population. Scand J Soc Med.1998;250–258.
35. Ware JE. SF-36 Health Survey. Manual and Interpretation Guide.Boston, MA: The Health Institute, New England Medical Center;1993.
36. Poesl M. Evaluation of the World Health Organization DisabilityAssessment Schedule II (WHODAS II) [dissertation]. Munich,Germany: Ludwig Maximillian University; 2004.
37. Chwastiak LA, Von Korff M. Disability in depression and backpain: evaluation of the World Health Organization DisabilityAssessment Schedule (WHO DAS II) in a primary care setting.J Clin Epidemiol. 2003;56:507–514.
38. World Health Organization. WHODAS II. 2001. Available at: http://www.who.int. Accessed November 1, 2005.
39. Wu AW, Rubin HR, Mathews WC, et al. A health statusquestionnaire using 30 items from the Medical Outcomes Study.Preliminary validation in persons with early HIV infection. MedCare. 1991;29:786–798.
40. Cieza A, Brocow T, Ustun TB, et al. Linking health-status measuresto the International Classification of Functioning, Disability andHealth. J Rehabil Med. 2002;205–210.
41. Cohen J. Statistical power analysis for the behavioral sciences-theeffect size. Hillsdale, NJ: Lawrence Erlbaum Associates; 1988.
42. van Tubergen A, Landewe R, Heuft-Dorenbosch L, et al.Assessment of disability with the World Health OrganizationDisability Assessment Schedule II in patients with ankylosingspondylitis. Ann Rheum Dis. 2003;62:140–145.
43. Dimopoulou L, Anthi A, Mastora Z, et al. Health-related quality of lifeand disability in survivors of multiple trauma one year after intensivecare unit discharge. Am J Phys Med Rehabil. 2004;83:171–176.
44. van der Sluis CK, ten Duis HJ, Geertzen JH. Multiple injuries: anoverview of the outcome. J Trauma. 1995;38:681–686.
45. Andresen EM, Lollar DJ, Meyers AR. Disability outcomes research:why this supplement, on this topic, at this time? Arch Phys MedRehabil. 2000;81:S1–S4.
46. Chorus AMJ, Miedema HS, Boonen A, et al. Quality of life andwork in patients with rheumatoid arthritis and ankylosing spondylitisof working age. Ann Rheum Dis. 2003;1178–1184.
Long-Term Consequences of Severe Injuries
Volume 62 • Number 2 469
47. Bingefors K, Isacson D. Epidemiology, co-morbidity, and impact onhealth-related quality of life of self-reported headache andmusculoskeletal pain-a gender perspective. Eur J Pain. 2004;8:435–450.
48. Michaels AJ, Madey SM, Krieg JC, et al. Traditional injury scoringunderestimates the relative consequences of orthopedic injury.J Trauma. 2001;50:389–395.
49. Isaksson AK, Ahlstrom G, Gunnarsson LG. Quality of life andimpairment in patients with multiple sclerosis. J Neurol NeurosurgPsychiatry. 2005;76:64–69.
50. Pittock SJ, Mayr WT, McClelland RL, et al. Quality of life isfavorable for most patients with multiple sclerosis: a population-based cohort study. Arch Neurol. 2004;61:679–686.
51. Wagner AK, Hammond FM, Sasser HC, et al. Use of injury severityvariables in determining disability and community integration aftertraumatic brain injury. J Trauma. 2000;49:411–419.
52. Holbrook TL, Hoyt DB, Anderson JP. The importance of gender onoutcome after major trauma: functional and psychologic outcomes inwomen versus men. J Trauma. 2001;50:270–273.
53. Holbrook TL, Hoyt DB. The impact of major trauma: quality-of-lifeoutcomes are worse in women than in men, independent ofmechanism and injury severity. J Trauma. 2004;56:284–290.
54. Bullinger M, Azouvi P, Brooks N, et al. Quality of life in patientswith traumatic brain injury-basic issues, assessment andrecommendations. Restor Neurol Neurosci. 2002;20:111–124.
55. Cicerone KD, Mott T, Azulay J, et al. Community integration andsatisfaction with functioning after intensive cognitive rehabilitation fortraumatic brain injury. Arch Phys Med Rehabil. 2004;85:943–950.
56. Cameron ID. How to manage musculoskeletal conditions: when is‘rehabilitation’ appropriate? Best Pract Res Clin Rheumatol. 2004;18:573–586.
The Journal of TRAUMA� Injury, Infection, and Critical Care
470 February 2007
Return to Work After Severe Multiple Injuries:A Multidimensional Approach on Status 1 and 2Years PostinjuryHelene Lundgaard Soberg, MSc, Arnstein Finset, PhD, Erik Bautz-Holter, MD, PhD,Leiv Sandvik, PhD, and Olav Roise, MD, PhD
Background: The assessment of fac-tors associated with return to work (RTW)after multiple trauma is important intrauma research. Goals in rehabilitationshould comprise RTW. The purpose of thisstudy was to examine the RTW rate andwhich factors predicted RTW for patientswith severe multiple injuries using a pro-spective cohort design.
Methods: In all, 100 patients with aNew Injury Severity Score (NISS) >15,aged 18 to 67 years and admitted to a traumareferral center, were included startingJanuary 2002 through June 2003. Outcomeswere assessed 6 weeks after discharge and1 and 2 years postinjury. Instruments
were the Brief Approach/Avoidance CopingQuestionnaire, Multidimensional HealthLocus of Control, Short Form-36, the WorldHealth Organization Disability AssessmentSchedule II, and a cognitive function scale(COG).
Results: Mean age was 34.5 years(SD 13.5), 83% were male, and 66% wereblue-collar workers. Mean NISS was 35.1(SD 12.7). At 1 year, 28% achieved com-plete RTW, 43% at 2 years. Mean timeback to work was 12.8 months (SD 5.9).Differences between the RTW and not com-plete RTW (NRTW) groups concernedpersonal and demographic variables, andphysical and psychosocial functioning. Sur-
vival analysis showed that risk factors forNRTW were lower education, length of stayin hospital/rehabilitation >20 weeks, andlow social functioning shortly after the re-turn home.
Conclusion: The majority of the pa-tients had not completely returned towork 2 years postinjury. Demographicand injury related factors and social func-tioning were significant predictors ofRTW status.
Key Words: Multiple trauma, Returnto work, Functional outcome, Rehabilita-tion, International Classification of Func-tioning, Disability and Health.
J Trauma. 2007;62:471–481.
Multiple injuries have a negative impact on return towork or education (RTW) as well as on functioningand health-related quality of life (HRQL).1–3 It is
well recognized that goals in the rehabilitation of severelyinjured patients should include RTW. The patients are usuallyyounger and would normally have many years of productivework ahead. Thus rehabilitation aiming at RTW represents aparticular challenge. Improved knowledge about factors in-fluencing RTW status in a long-term multidimensional per-spective is required, and should also have implications for therehabilitation processes.
RTW for patients with multiple injuries has been studiedby several authors. The impact of demographic, injury-
related, and functional factors on RTW has been explored.However, there is a lack of prospective studies with a longerfollow-up period. Most studies we are aware of either haverelatively short follow-up periods or a cross-sectional design.Only three prospective studies that comprise patients withmultiple injuries with a follow-up period of 1 year have beenfound.1,4,5 However, there may be studies with a main focuson other groups of the trauma population such as head injuryvictims with a longer follow-up period.6 In some of theretrospective reports, however, patient functioning and RTWhas been explored for longer than 1 year.7–11
MacKenzie et al. found that 56% of the patients withminor to critical injuries had returned to full-time work 1 yearpostinjury.1 Socioeconomic status and social network wereimportant correlates of employment status. Others have re-ported that patients who had not returned to work had longerlengths of stay and worse functional outcome up to 1 yearpostinjury.3,12 Functional status at discharge predicted futureemployment status, but the extent of the long-term recoverywas underestimated.3 Also reduced mental and cognitivefunctioning was associated with decreased working capacitypostinjury.3,8,13 Blue-collar workers or nonprofessionals hadlower rates of RTW.3,8
In rehabilitation, factors related to the individual’s personalresources are considered important for regaining functioning andparticipation in society.14 However, few researchers have ex-plored the relations between personality factors, coping, and
Submitted for publication April 17, 2006.Accepted for publication August 16, 2006.Copyright © 2007 by Lippincott Williams & Wilkins, Inc.Funded by EXTRA funds from the Norwegian Foundation for Health
and Rehabilitation.From the Faculty of Medicine, University of Oslo, Department of
Physical Medicine and Rehabilitation (H.L.S., E.B.-H.), Ulleval UniversityHospital; the Faculty of Medicine, University of Oslo, Orthopedic Centre(O.R.), Ulleval University Hospital; Center for Clinical Research (L.S.),Ulleval Hospital; and the Department of Behavioral Sciences in Medicine(A.F.), University of Oslo, Oslo, Norway.
Address for Reprints: Helene L. Soberg, MSc, Department of PhysicalMedicine and Rehabilitation, Ulleval University Hospital, N-0407 Oslo,Norway.
DOI: 10.1097/TA.0b013e31802e95f4
The Journal of TRAUMA� Injury, Infection, and Critical Care
Volume 62 • Number 2 471
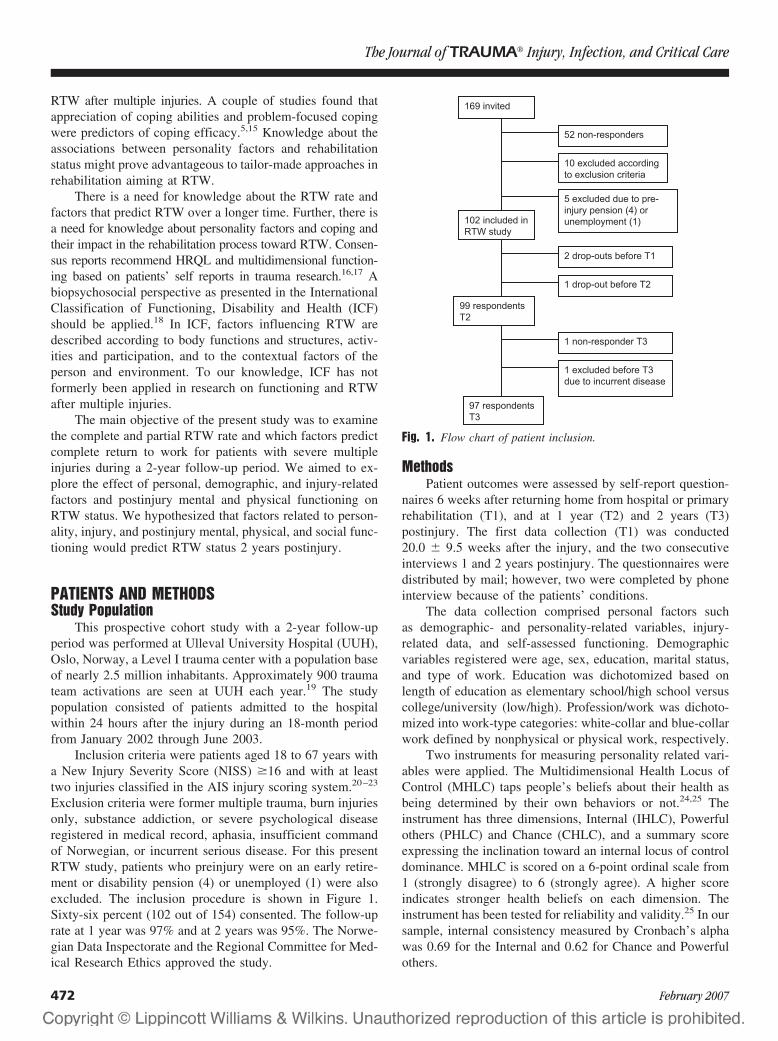
RTW after multiple injuries. A couple of studies found thatappreciation of coping abilities and problem-focused copingwere predictors of coping efficacy.5,15 Knowledge about theassociations between personality factors and rehabilitationstatus might prove advantageous to tailor-made approaches inrehabilitation aiming at RTW.
There is a need for knowledge about the RTW rate andfactors that predict RTW over a longer time. Further, there isa need for knowledge about personality factors and coping andtheir impact in the rehabilitation process toward RTW. Consen-sus reports recommend HRQL and multidimensional function-ing based on patients’ self reports in trauma research.16,17 Abiopsychosocial perspective as presented in the InternationalClassification of Functioning, Disability and Health (ICF)should be applied.18 In ICF, factors influencing RTW aredescribed according to body functions and structures, activ-ities and participation, and to the contextual factors of theperson and environment. To our knowledge, ICF has notformerly been applied in research on functioning and RTWafter multiple injuries.
The main objective of the present study was to examinethe complete and partial RTW rate and which factors predictcomplete return to work for patients with severe multipleinjuries during a 2-year follow-up period. We aimed to ex-plore the effect of personal, demographic, and injury-relatedfactors and postinjury mental and physical functioning onRTW status. We hypothesized that factors related to person-ality, injury, and postinjury mental, physical, and social func-tioning would predict RTW status 2 years postinjury.
PATIENTS AND METHODSStudy Population
This prospective cohort study with a 2-year follow-upperiod was performed at Ulleval University Hospital (UUH),Oslo, Norway, a Level I trauma center with a population baseof nearly 2.5 million inhabitants. Approximately 900 traumateam activations are seen at UUH each year.19 The studypopulation consisted of patients admitted to the hospitalwithin 24 hours after the injury during an 18-month periodfrom January 2002 through June 2003.
Inclusion criteria were patients aged 18 to 67 years witha New Injury Severity Score (NISS) �16 and with at leasttwo injuries classified in the AIS injury scoring system.20–23
Exclusion criteria were former multiple trauma, burn injuriesonly, substance addiction, or severe psychological diseaseregistered in medical record, aphasia, insufficient commandof Norwegian, or incurrent serious disease. For this presentRTW study, patients who preinjury were on an early retire-ment or disability pension (4) or unemployed (1) were alsoexcluded. The inclusion procedure is shown in Figure 1.Sixty-six percent (102 out of 154) consented. The follow-uprate at 1 year was 97% and at 2 years was 95%. The Norwe-gian Data Inspectorate and the Regional Committee for Med-ical Research Ethics approved the study.
MethodsPatient outcomes were assessed by self-report question-
naires 6 weeks after returning home from hospital or primaryrehabilitation (T1), and at 1 year (T2) and 2 years (T3)postinjury. The first data collection (T1) was conducted20.0 � 9.5 weeks after the injury, and the two consecutiveinterviews 1 and 2 years postinjury. The questionnaires weredistributed by mail; however, two were completed by phoneinterview because of the patients’ conditions.
The data collection comprised personal factors suchas demographic- and personality-related variables, injury-related data, and self-assessed functioning. Demographicvariables registered were age, sex, education, marital status,and type of work. Education was dichotomized based onlength of education as elementary school/high school versuscollege/university (low/high). Profession/work was dichoto-mized into work-type categories: white-collar and blue-collarwork defined by nonphysical or physical work, respectively.
Two instruments for measuring personality related vari-ables were applied. The Multidimensional Health Locus ofControl (MHLC) taps people’s beliefs about their health asbeing determined by their own behaviors or not.24,25 Theinstrument has three dimensions, Internal (IHLC), Powerfulothers (PHLC) and Chance (CHLC), and a summary scoreexpressing the inclination toward an internal locus of controldominance. MHLC is scored on a 6-point ordinal scale from1 (strongly disagree) to 6 (strongly agree). A higher scoreindicates stronger health beliefs on each dimension. Theinstrument has been tested for reliability and validity.25 In oursample, internal consistency measured by Cronbach’s alphawas 0.69 for the Internal and 0.62 for Chance and Powerfulothers.
Fig. 1. Flow chart of patient inclusion.
The Journal of TRAUMA� Injury, Infection, and Critical Care
472 February 2007
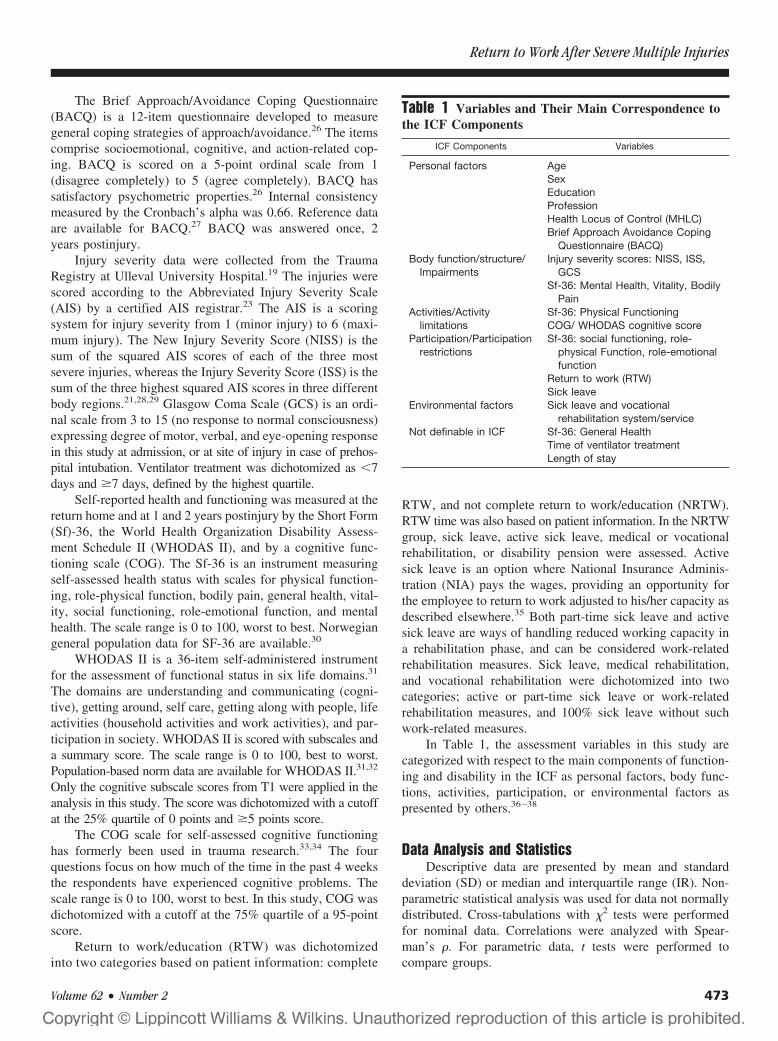
The Brief Approach/Avoidance Coping Questionnaire(BACQ) is a 12-item questionnaire developed to measuregeneral coping strategies of approach/avoidance.26 The itemscomprise socioemotional, cognitive, and action-related cop-ing. BACQ is scored on a 5-point ordinal scale from 1(disagree completely) to 5 (agree completely). BACQ hassatisfactory psychometric properties.26 Internal consistencymeasured by the Cronbach’s alpha was 0.66. Reference dataare available for BACQ.27 BACQ was answered once, 2years postinjury.
Injury severity data were collected from the TraumaRegistry at Ulleval University Hospital.19 The injuries werescored according to the Abbreviated Injury Severity Scale(AIS) by a certified AIS registrar.23 The AIS is a scoringsystem for injury severity from 1 (minor injury) to 6 (maxi-mum injury). The New Injury Severity Score (NISS) is thesum of the squared AIS scores of each of the three mostsevere injuries, whereas the Injury Severity Score (ISS) is thesum of the three highest squared AIS scores in three differentbody regions.21,28,29 Glasgow Coma Scale (GCS) is an ordi-nal scale from 3 to 15 (no response to normal consciousness)expressing degree of motor, verbal, and eye-opening responsein this study at admission, or at site of injury in case of prehos-pital intubation. Ventilator treatment was dichotomized as �7days and �7 days, defined by the highest quartile.
Self-reported health and functioning was measured at thereturn home and at 1 and 2 years postinjury by the Short Form(Sf)-36, the World Health Organization Disability Assess-ment Schedule II (WHODAS II), and by a cognitive func-tioning scale (COG). The Sf-36 is an instrument measuringself-assessed health status with scales for physical function-ing, role-physical function, bodily pain, general health, vital-ity, social functioning, role-emotional function, and mentalhealth. The scale range is 0 to 100, worst to best. Norwegiangeneral population data for SF-36 are available.30
WHODAS II is a 36-item self-administered instrumentfor the assessment of functional status in six life domains.31
The domains are understanding and communicating (cogni-tive), getting around, self care, getting along with people, lifeactivities (household activities and work activities), and par-ticipation in society. WHODAS II is scored with subscales anda summary score. The scale range is 0 to 100, best to worst.Population-based norm data are available for WHODAS II.31,32
Only the cognitive subscale scores from T1 were applied in theanalysis in this study. The score was dichotomized with a cutoffat the 25% quartile of 0 points and �5 points score.
The COG scale for self-assessed cognitive functioninghas formerly been used in trauma research.33,34 The fourquestions focus on how much of the time in the past 4 weeksthe respondents have experienced cognitive problems. Thescale range is 0 to 100, worst to best. In this study, COG wasdichotomized with a cutoff at the 75% quartile of a 95-pointscore.
Return to work/education (RTW) was dichotomizedinto two categories based on patient information: complete
RTW, and not complete return to work/education (NRTW).RTW time was also based on patient information. In the NRTWgroup, sick leave, active sick leave, medical or vocationalrehabilitation, or disability pension were assessed. Activesick leave is an option where National Insurance Adminis-tration (NIA) pays the wages, providing an opportunity forthe employee to return to work adjusted to his/her capacity asdescribed elsewhere.35 Both part-time sick leave and activesick leave are ways of handling reduced working capacity ina rehabilitation phase, and can be considered work-relatedrehabilitation measures. Sick leave, medical rehabilitation,and vocational rehabilitation were dichotomized into twocategories; active or part-time sick leave or work-relatedrehabilitation measures, and 100% sick leave without suchwork-related measures.
In Table 1, the assessment variables in this study arecategorized with respect to the main components of function-ing and disability in the ICF as personal factors, body func-tions, activities, participation, or environmental factors aspresented by others.36–38
Data Analysis and StatisticsDescriptive data are presented by mean and standard
deviation (SD) or median and interquartile range (IR). Non-parametric statistical analysis was used for data not normallydistributed. Cross-tabulations with �2 tests were performedfor nominal data. Correlations were analyzed with Spear-man’s �. For parametric data, t tests were performed tocompare groups.
Table 1 Variables and Their Main Correspondence tothe ICF Components
ICF Components Variables
Personal factors AgeSexEducationProfessionHealth Locus of Control (MHLC)Brief Approach Avoidance Coping
Questionnaire (BACQ)Body function/structure/
ImpairmentsInjury severity scores: NISS, ISS,
GCSSf-36: Mental Health, Vitality, Bodily
PainActivities/Activity
limitationsSf-36: Physical FunctioningCOG/ WHODAS cognitive score
Participation/Participationrestrictions
Sf-36: social functioning, role-physical Function, role-emotionalfunction
Return to work (RTW)Sick leave
Environmental factors Sick leave and vocationalrehabilitation system/service
Not definable in ICF Sf-36: General HealthTime of ventilator treatmentLength of stay
Return to Work After Severe Multiple Injuries
Volume 62 • Number 2 473
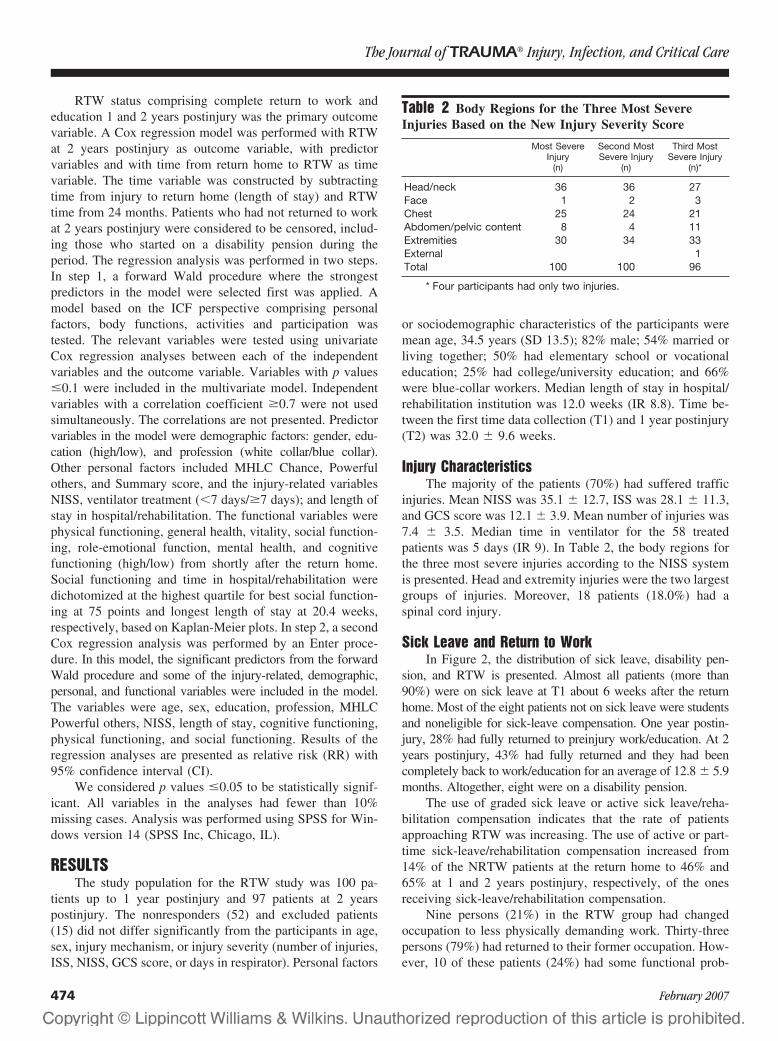
RTW status comprising complete return to work andeducation 1 and 2 years postinjury was the primary outcomevariable. A Cox regression model was performed with RTWat 2 years postinjury as outcome variable, with predictorvariables and with time from return home to RTW as timevariable. The time variable was constructed by subtractingtime from injury to return home (length of stay) and RTWtime from 24 months. Patients who had not returned to workat 2 years postinjury were considered to be censored, includ-ing those who started on a disability pension during theperiod. The regression analysis was performed in two steps.In step 1, a forward Wald procedure where the strongestpredictors in the model were selected first was applied. Amodel based on the ICF perspective comprising personalfactors, body functions, activities and participation wastested. The relevant variables were tested using univariateCox regression analyses between each of the independentvariables and the outcome variable. Variables with p values�0.1 were included in the multivariate model. Independentvariables with a correlation coefficient �0.7 were not usedsimultaneously. The correlations are not presented. Predictorvariables in the model were demographic factors: gender, edu-cation (high/low), and profession (white collar/blue collar).Other personal factors included MHLC Chance, Powerfulothers, and Summary score, and the injury-related variablesNISS, ventilator treatment (�7 days/�7 days); and length ofstay in hospital/rehabilitation. The functional variables werephysical functioning, general health, vitality, social function-ing, role-emotional function, mental health, and cognitivefunctioning (high/low) from shortly after the return home.Social functioning and time in hospital/rehabilitation weredichotomized at the highest quartile for best social function-ing at 75 points and longest length of stay at 20.4 weeks,respectively, based on Kaplan-Meier plots. In step 2, a secondCox regression analysis was performed by an Enter proce-dure. In this model, the significant predictors from the forwardWald procedure and some of the injury-related, demographic,personal, and functional variables were included in the model.The variables were age, sex, education, profession, MHLCPowerful others, NISS, length of stay, cognitive functioning,physical functioning, and social functioning. Results of theregression analyses are presented as relative risk (RR) with95% confidence interval (CI).
We considered p values �0.05 to be statistically signif-icant. All variables in the analyses had fewer than 10%missing cases. Analysis was performed using SPSS for Win-dows version 14 (SPSS Inc, Chicago, IL).
RESULTSThe study population for the RTW study was 100 pa-
tients up to 1 year postinjury and 97 patients at 2 yearspostinjury. The nonresponders (52) and excluded patients(15) did not differ significantly from the participants in age,sex, injury mechanism, or injury severity (number of injuries,ISS, NISS, GCS score, or days in respirator). Personal factors
or sociodemographic characteristics of the participants weremean age, 34.5 years (SD 13.5); 82% male; 54% married orliving together; 50% had elementary school or vocationaleducation; 25% had college/university education; and 66%were blue-collar workers. Median length of stay in hospital/rehabilitation institution was 12.0 weeks (IR 8.8). Time be-tween the first time data collection (T1) and 1 year postinjury(T2) was 32.0 � 9.6 weeks.
Injury CharacteristicsThe majority of the patients (70%) had suffered traffic
injuries. Mean NISS was 35.1 � 12.7, ISS was 28.1 � 11.3,and GCS score was 12.1 � 3.9. Mean number of injuries was7.4 � 3.5. Median time in ventilator for the 58 treatedpatients was 5 days (IR 9). In Table 2, the body regions forthe three most severe injuries according to the NISS systemis presented. Head and extremity injuries were the two largestgroups of injuries. Moreover, 18 patients (18.0%) had aspinal cord injury.
Sick Leave and Return to WorkIn Figure 2, the distribution of sick leave, disability pen-
sion, and RTW is presented. Almost all patients (more than90%) were on sick leave at T1 about 6 weeks after the returnhome. Most of the eight patients not on sick leave were studentsand noneligible for sick-leave compensation. One year postin-jury, 28% had fully returned to preinjury work/education. At 2years postinjury, 43% had fully returned and they had beencompletely back to work/education for an average of 12.8 � 5.9months. Altogether, eight were on a disability pension.
The use of graded sick leave or active sick leave/reha-bilitation compensation indicates that the rate of patientsapproaching RTW was increasing. The use of active or part-time sick-leave/rehabilitation compensation increased from14% of the NRTW patients at the return home to 46% and65% at 1 and 2 years postinjury, respectively, of the onesreceiving sick-leave/rehabilitation compensation.
Nine persons (21%) in the RTW group had changedoccupation to less physically demanding work. Thirty-threepersons (79%) had returned to their former occupation. How-ever, 10 of these patients (24%) had some functional prob-
Table 2 Body Regions for the Three Most SevereInjuries Based on the New Injury Severity Score
Most SevereInjury
(n)
Second MostSevere Injury
(n)
Third MostSevere Injury
(n)*
Head/neck 36 36 27Face 1 2 3Chest 25 24 21Abdomen/pelvic content 8 4 11Extremities 30 34 33External 1Total 100 100 96
* Four participants had only two injuries.
The Journal of TRAUMA� Injury, Infection, and Critical Care
474 February 2007
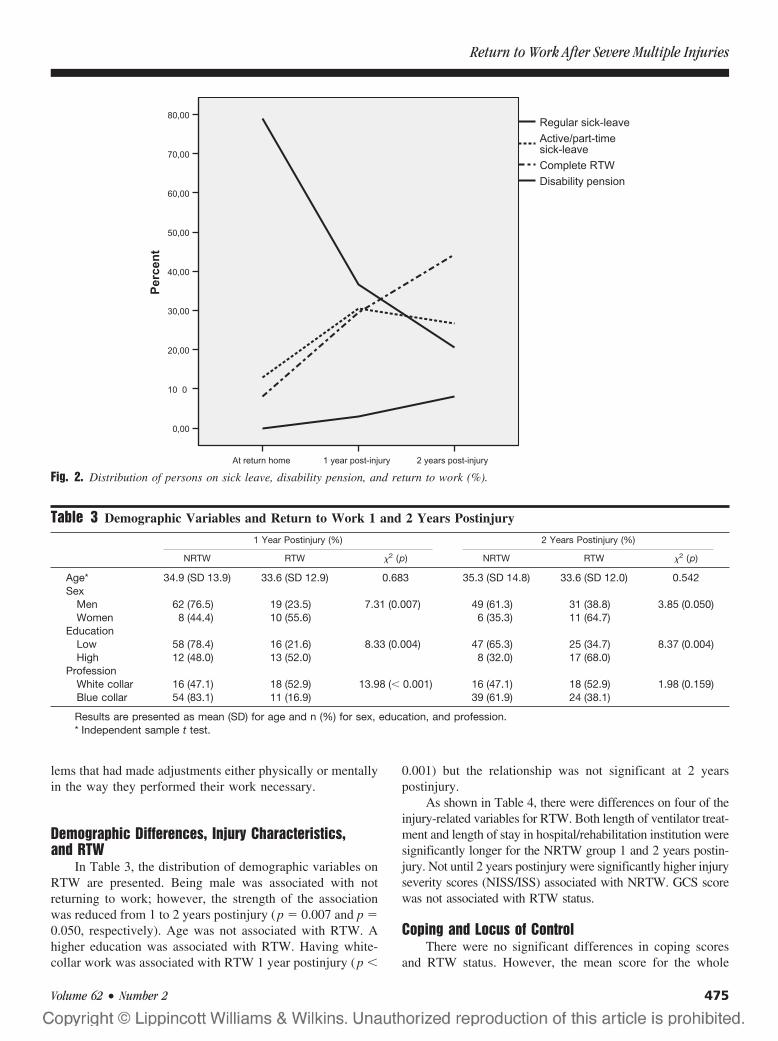
lems that had made adjustments either physically or mentallyin the way they performed their work necessary.
Demographic Differences, Injury Characteristics,and RTW
In Table 3, the distribution of demographic variables onRTW are presented. Being male was associated with notreturning to work; however, the strength of the associationwas reduced from 1 to 2 years postinjury (p � 0.007 and p �0.050, respectively). Age was not associated with RTW. Ahigher education was associated with RTW. Having white-collar work was associated with RTW 1 year postinjury (p �
0.001) but the relationship was not significant at 2 yearspostinjury.
As shown in Table 4, there were differences on four of theinjury-related variables for RTW. Both length of ventilator treat-ment and length of stay in hospital/rehabilitation institution weresignificantly longer for the NRTW group 1 and 2 years postin-jury. Not until 2 years postinjury were significantly higher injuryseverity scores (NISS/ISS) associated with NRTW. GCS scorewas not associated with RTW status.
Coping and Locus of ControlThere were no significant differences in coping scores
and RTW status. However, the mean score for the whole
Fig. 2. Distribution of persons on sick leave, disability pension, and return to work (%).
Table 3 Demographic Variables and Return to Work 1 and 2 Years Postinjury
1 Year Postinjury (%) 2 Years Postinjury (%)
NRTW RTW �2 (p) NRTW RTW �2 (p)
Age* 34.9 (SD 13.9) 33.6 (SD 12.9) 0.683 35.3 (SD 14.8) 33.6 (SD 12.0) 0.542Sex
Men 62 (76.5) 19 (23.5) 7.31 (0.007) 49 (61.3) 31 (38.8) 3.85 (0.050)Women 8 (44.4) 10 (55.6) 6 (35.3) 11 (64.7)
EducationLow 58 (78.4) 16 (21.6) 8.33 (0.004) 47 (65.3) 25 (34.7) 8.37 (0.004)High 12 (48.0) 13 (52.0) 8 (32.0) 17 (68.0)
ProfessionWhite collar 16 (47.1) 18 (52.9) 13.98 (� 0.001) 16 (47.1) 18 (52.9) 1.98 (0.159)Blue collar 54 (83.1) 11 (16.9) 39 (61.9) 24 (38.1)
Results are presented as mean (SD) for age and n (%) for sex, education, and profession.* Independent sample t test.
Return to Work After Severe Multiple Injuries
Volume 62 • Number 2 475
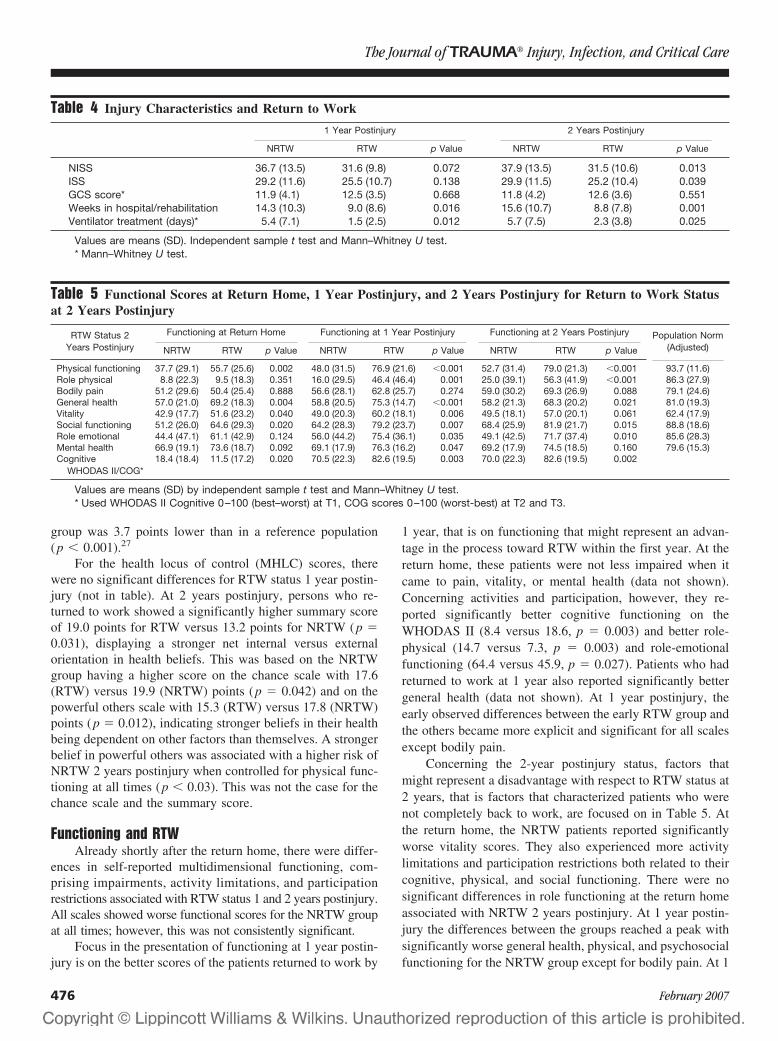
group was 3.7 points lower than in a reference population(p � 0.001).27
For the health locus of control (MHLC) scores, therewere no significant differences for RTW status 1 year postin-jury (not in table). At 2 years postinjury, persons who re-turned to work showed a significantly higher summary scoreof 19.0 points for RTW versus 13.2 points for NRTW (p �0.031), displaying a stronger net internal versus externalorientation in health beliefs. This was based on the NRTWgroup having a higher score on the chance scale with 17.6(RTW) versus 19.9 (NRTW) points (p � 0.042) and on thepowerful others scale with 15.3 (RTW) versus 17.8 (NRTW)points (p � 0.012), indicating stronger beliefs in their healthbeing dependent on other factors than themselves. A strongerbelief in powerful others was associated with a higher risk ofNRTW 2 years postinjury when controlled for physical func-tioning at all times (p � 0.03). This was not the case for thechance scale and the summary score.
Functioning and RTWAlready shortly after the return home, there were differ-
ences in self-reported multidimensional functioning, com-prising impairments, activity limitations, and participationrestrictions associated with RTW status 1 and 2 years postinjury.All scales showed worse functional scores for the NRTW groupat all times; however, this was not consistently significant.
Focus in the presentation of functioning at 1 year postin-jury is on the better scores of the patients returned to work by
1 year, that is on functioning that might represent an advan-tage in the process toward RTW within the first year. At thereturn home, these patients were not less impaired when itcame to pain, vitality, or mental health (data not shown).Concerning activities and participation, however, they re-ported significantly better cognitive functioning on theWHODAS II (8.4 versus 18.6, p � 0.003) and better role-physical (14.7 versus 7.3, p � 0.003) and role-emotionalfunctioning (64.4 versus 45.9, p � 0.027). Patients who hadreturned to work at 1 year also reported significantly bettergeneral health (data not shown). At 1 year postinjury, theearly observed differences between the early RTW group andthe others became more explicit and significant for all scalesexcept bodily pain.
Concerning the 2-year postinjury status, factors thatmight represent a disadvantage with respect to RTW status at2 years, that is factors that characterized patients who werenot completely back to work, are focused on in Table 5. Atthe return home, the NRTW patients reported significantlyworse vitality scores. They also experienced more activitylimitations and participation restrictions both related to theircognitive, physical, and social functioning. There were nosignificant differences in role functioning at the return homeassociated with NRTW 2 years postinjury. At 1 year postin-jury the differences between the groups reached a peak withsignificantly worse general health, physical, and psychosocialfunctioning for the NRTW group except for bodily pain. At 1
Table 4 Injury Characteristics and Return to Work
1 Year Postinjury 2 Years Postinjury
NRTW RTW p Value NRTW RTW p Value
NISS 36.7 (13.5) 31.6 (9.8) 0.072 37.9 (13.5) 31.5 (10.6) 0.013ISS 29.2 (11.6) 25.5 (10.7) 0.138 29.9 (11.5) 25.2 (10.4) 0.039GCS score* 11.9 (4.1) 12.5 (3.5) 0.668 11.8 (4.2) 12.6 (3.6) 0.551Weeks in hospital/rehabilitation 14.3 (10.3) 9.0 (8.6) 0.016 15.6 (10.7) 8.8 (7.8) 0.001Ventilator treatment (days)* 5.4 (7.1) 1.5 (2.5) 0.012 5.7 (7.5) 2.3 (3.8) 0.025
Values are means (SD). Independent sample t test and Mann–Whitney U test.* Mann–Whitney U test.
Table 5 Functional Scores at Return Home, 1 Year Postinjury, and 2 Years Postinjury for Return to Work Statusat 2 Years Postinjury
RTW Status 2Years Postinjury
Functioning at Return Home Functioning at 1 Year Postinjury Functioning at 2 Years Postinjury Population Norm(Adjusted)NRTW RTW p Value NRTW RTW p Value NRTW RTW p Value
Physical functioning 37.7 (29.1) 55.7 (25.6) 0.002 48.0 (31.5) 76.9 (21.6) �0.001 52.7 (31.4) 79.0 (21.3) �0.001 93.7 (11.6)Role physical 8.8 (22.3) 9.5 (18.3) 0.351 16.0 (29.5) 46.4 (46.4) 0.001 25.0 (39.1) 56.3 (41.9) �0.001 86.3 (27.9)Bodily pain 51.2 (29.6) 50.4 (25.4) 0.888 56.6 (28.1) 62.8 (25.7) 0.274 59.0 (30.2) 69.3 (26.9) 0.088 79.1 (24.6)General health 57.0 (21.0) 69.2 (18.3) 0.004 58.8 (20.5) 75.3 (14.7) �0.001 58.2 (21.3) 68.3 (20.2) 0.021 81.0 (19.3)Vitality 42.9 (17.7) 51.6 (23.2) 0.040 49.0 (20.3) 60.2 (18.1) 0.006 49.5 (18.1) 57.0 (20.1) 0.061 62.4 (17.9)Social functioning 51.2 (26.0) 64.6 (29.3) 0.020 64.2 (28.3) 79.2 (23.7) 0.007 68.4 (25.9) 81.9 (21.7) 0.015 88.8 (18.6)Role emotional 44.4 (47.1) 61.1 (42.9) 0.124 56.0 (44.2) 75.4 (36.1) 0.035 49.1 (42.5) 71.7 (37.4) 0.010 85.6 (28.3)Mental health 66.9 (19.1) 73.6 (18.7) 0.092 69.1 (17.9) 76.3 (16.2) 0.047 69.2 (17.9) 74.5 (18.5) 0.160 79.6 (15.3)Cognitive
WHODAS II/COG*18.4 (18.4) 11.5 (17.2) 0.020 70.5 (22.3) 82.6 (19.5) 0.003 70.0 (22.3) 82.6 (19.5) 0.002
Values are means (SD) by independent sample t test and Mann–Whitney U test.* Used WHODAS II Cognitive 0–100 (best–worst) at T1, COG scores 0–100 (worst-best) at T2 and T3.
The Journal of TRAUMA� Injury, Infection, and Critical Care
476 February 2007
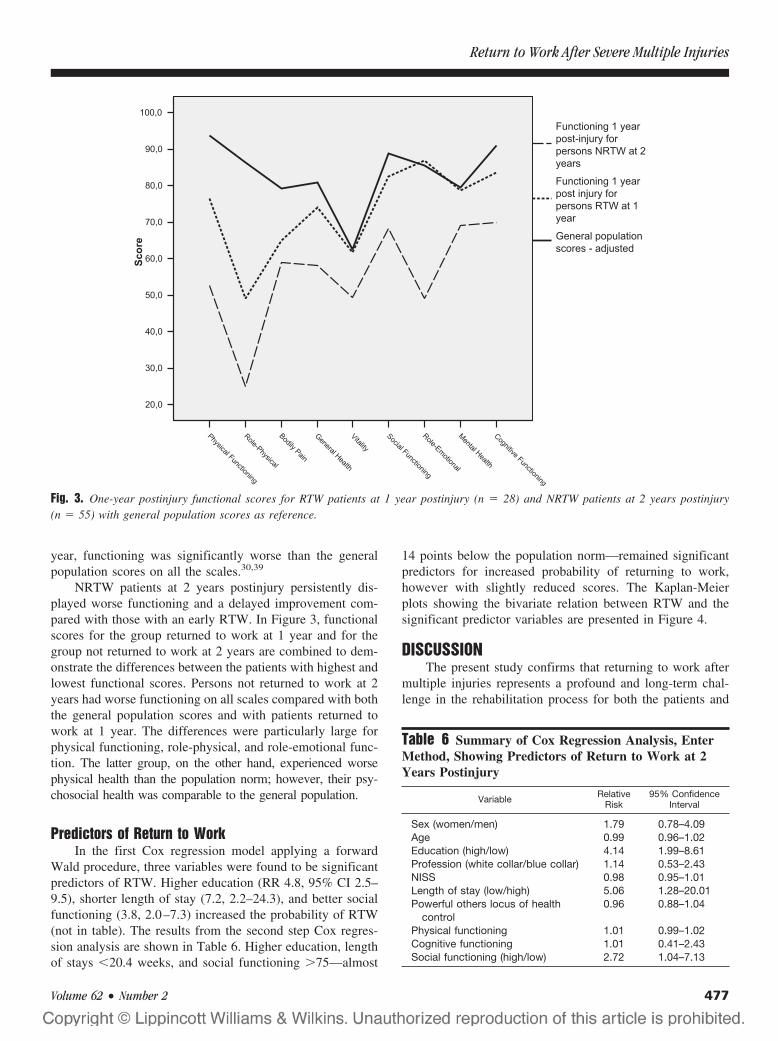
year, functioning was significantly worse than the generalpopulation scores on all the scales.30,39
NRTW patients at 2 years postinjury persistently dis-played worse functioning and a delayed improvement com-pared with those with an early RTW. In Figure 3, functionalscores for the group returned to work at 1 year and for thegroup not returned to work at 2 years are combined to dem-onstrate the differences between the patients with highest andlowest functional scores. Persons not returned to work at 2years had worse functioning on all scales compared with boththe general population scores and with patients returned towork at 1 year. The differences were particularly large forphysical functioning, role-physical, and role-emotional func-tion. The latter group, on the other hand, experienced worsephysical health than the population norm; however, their psy-chosocial health was comparable to the general population.
Predictors of Return to WorkIn the first Cox regression model applying a forward
Wald procedure, three variables were found to be significantpredictors of RTW. Higher education (RR 4.8, 95% CI 2.5–9.5), shorter length of stay (7.2, 2.2–24.3), and better socialfunctioning (3.8, 2.0–7.3) increased the probability of RTW(not in table). The results from the second step Cox regres-sion analysis are shown in Table 6. Higher education, lengthof stays �20.4 weeks, and social functioning �75—almost
14 points below the population norm—remained significantpredictors for increased probability of returning to work,however with slightly reduced scores. The Kaplan-Meierplots showing the bivariate relation between RTW and thesignificant predictor variables are presented in Figure 4.
DISCUSSIONThe present study confirms that returning to work after
multiple injuries represents a profound and long-term chal-lenge in the rehabilitation process for both the patients and
Fig. 3. One-year postinjury functional scores for RTW patients at 1 year postinjury (n � 28) and NRTW patients at 2 years postinjury(n � 55) with general population scores as reference.
Table 6 Summary of Cox Regression Analysis, EnterMethod, Showing Predictors of Return to Work at 2Years Postinjury
Variable RelativeRisk
95% ConfidenceInterval
Sex (women/men) 1.79 0.78–4.09Age 0.99 0.96–1.02Education (high/low) 4.14 1.99–8.61Profession (white collar/blue collar) 1.14 0.53–2.43NISS 0.98 0.95–1.01Length of stay (low/high) 5.06 1.28–20.01Powerful others locus of health
control0.96 0.88–1.04
Physical functioning 1.01 0.99–1.02Cognitive functioning 1.01 0.41–2.43Social functioning (high/low) 2.72 1.04–7.13
Return to Work After Severe Multiple Injuries
Volume 62 • Number 2 477
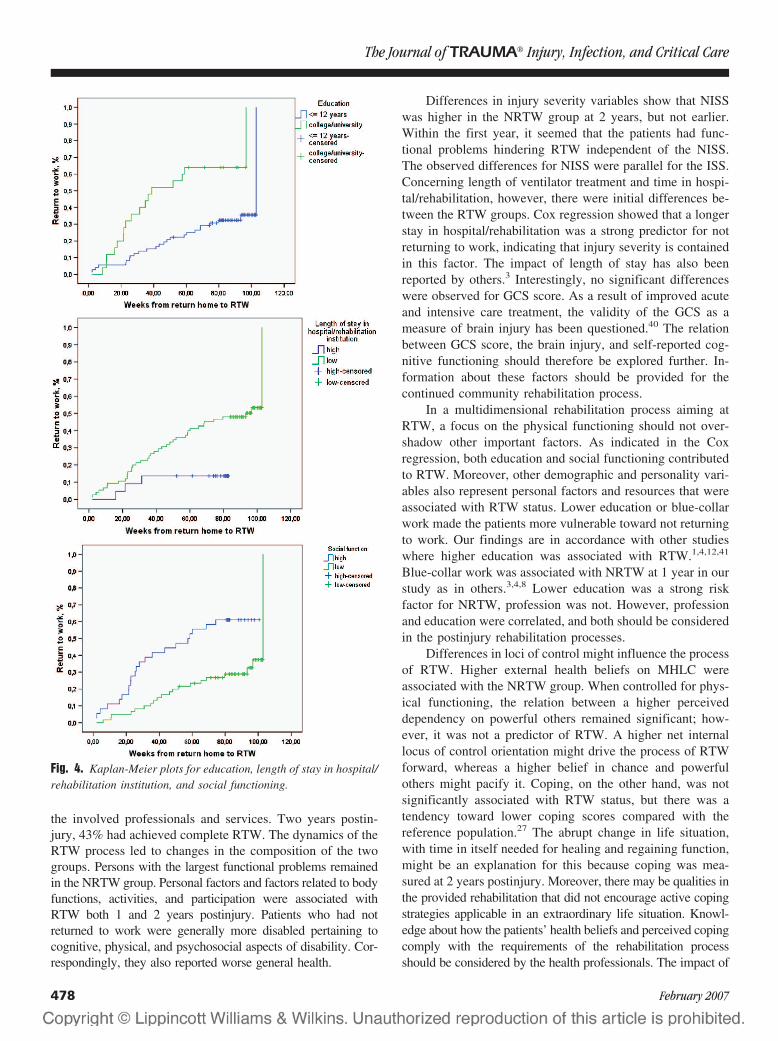
the involved professionals and services. Two years postin-jury, 43% had achieved complete RTW. The dynamics of theRTW process led to changes in the composition of the twogroups. Persons with the largest functional problems remainedin the NRTW group. Personal factors and factors related to bodyfunctions, activities, and participation were associated withRTW both 1 and 2 years postinjury. Patients who had notreturned to work were generally more disabled pertaining tocognitive, physical, and psychosocial aspects of disability. Cor-respondingly, they also reported worse general health.
Differences in injury severity variables show that NISSwas higher in the NRTW group at 2 years, but not earlier.Within the first year, it seemed that the patients had func-tional problems hindering RTW independent of the NISS.The observed differences for NISS were parallel for the ISS.Concerning length of ventilator treatment and time in hospi-tal/rehabilitation, however, there were initial differences be-tween the RTW groups. Cox regression showed that a longerstay in hospital/rehabilitation was a strong predictor for notreturning to work, indicating that injury severity is containedin this factor. The impact of length of stay has also beenreported by others.3 Interestingly, no significant differenceswere observed for GCS score. As a result of improved acuteand intensive care treatment, the validity of the GCS as ameasure of brain injury has been questioned.40 The relationbetween GCS score, the brain injury, and self-reported cog-nitive functioning should therefore be explored further. In-formation about these factors should be provided for thecontinued community rehabilitation process.
In a multidimensional rehabilitation process aiming atRTW, a focus on the physical functioning should not over-shadow other important factors. As indicated in the Coxregression, both education and social functioning contributedto RTW. Moreover, other demographic and personality vari-ables also represent personal factors and resources that wereassociated with RTW status. Lower education or blue-collarwork made the patients more vulnerable toward not returningto work. Our findings are in accordance with other studieswhere higher education was associated with RTW.1,4,12,41
Blue-collar work was associated with NRTW at 1 year in ourstudy as in others.3,4,8 Lower education was a strong riskfactor for NRTW, profession was not. However, professionand education were correlated, and both should be consideredin the postinjury rehabilitation processes.
Differences in loci of control might influence the processof RTW. Higher external health beliefs on MHLC wereassociated with the NRTW group. When controlled for phys-ical functioning, the relation between a higher perceiveddependency on powerful others remained significant; how-ever, it was not a predictor of RTW. A higher net internallocus of control orientation might drive the process of RTWforward, whereas a higher belief in chance and powerfulothers might pacify it. Coping, on the other hand, was notsignificantly associated with RTW status, but there was atendency toward lower coping scores compared with thereference population.27 The abrupt change in life situation,with time in itself needed for healing and regaining function,might be an explanation for this because coping was mea-sured at 2 years postinjury. Moreover, there may be qualities inthe provided rehabilitation that did not encourage active copingstrategies applicable in an extraordinary life situation. Knowl-edge about how the patients’ health beliefs and perceived copingcomply with the requirements of the rehabilitation processshould be considered by the health professionals. The impact of
Fig. 4. Kaplan-Meier plots for education, length of stay in hospital/rehabilitation institution, and social functioning.
The Journal of TRAUMA� Injury, Infection, and Critical Care
478 February 2007

personality factors and coping on rehabilitation and RTW shouldbe explored further in trauma research.
Mental health, cognitive functioning, and vitality belongto body functions and activities affected by the trauma.18
Persons who returned to work tended to have better mentalhealth, but the differences were significant only at 1 yearpostinjury. Nonetheless, the mental health scores for thewhole group were lower than for the general population.30,39
Also when there is no report of preinjury mental illness orsubstance abuse, one should address possible mental healthproblems for a longer time after the injury. For self-reportedcognitive functioning, there were significantly worse scoresfor the NRTW group throughout the 2 years postinjury. ACOG score �95, or all scores below the highest score, wasassociated with NRTW. Cognitive problems can be causedboth by distress and neuropsychological problems.42 To turnthe perspective, one could argue that reporting no cognitiveproblems after sustaining severe multiple injuries might re-flect personal resources that protect against distress and thuspromote RTW. Measures for self-reported cognitive func-tioning are necessary but should be supplemented by neuro-psychological testing.43 Vitality was significantly higher inthe RTW group only in the first year postinjury, implying thatalso persons with lower vitality scores return to work, butmaybe at a later stage. Considering RTW to be a primary goalin rehabilitation, other factors in the total life situation thatmight drain vitality from the individual should if possible bealleviated.
Generally, the patients had long-lasting activity limita-tions as a result of physical problems independent of RTWstatus as shown in a recent article by the group.39 Moreover,the differences in physical functioning remained large be-tween the RTW groups. Significantly worse physical func-tioning characterizes RTW status in other studies aswell.3,4,8,44 Interestingly, unlike in other studies, physicalfunctioning was not a significant predictor of RTW in ourstudy.3,4 Length of stay in hospital/rehabilitation compriseselements of physical functioning, although the correlationwas moderate (not shown). When we removed the length-of-stay variable from the regression model, physical functioningwas still not a significant predictor of RTW (data not shown).Persons completely returned to work did not have less bodilypain than the others.
The most seriously injured remained in the NRTWgroup. They had more participation restrictions because ofphysical and psychosocial problems 2 years postinjury. Thedifferences between the groups were large for role-physicalfunction throughout the first 2 years. The smaller improve-ments in physical functioning and role-physical function forthe NRTW group were in accordance with others.3 Concern-ing role-emotional function, the scores seem to mediate theimpact emotional problems have on RTW status. The differ-ences remained large and indicate a higher degree of emo-tional distress for the NRTW patients. For social functioning,which actually was the only psychosocial variable that re-
mained a significant contributor to RTW in the Cox regres-sion, the differences between the groups were significant andquite unchanged over time. Differences between employed/unemployed parallel to our study have been reportedearlier.3,9 Social functioning can reflect personal resources,social network, and mental, cognitive, and physical function-ing postinjury. MacKenzie et al. found that social networkwas a predictor for RTW after traumatic injury and severelower extremity fracture, injuries which the majority in ourstudy also had suffered.1,4 The Cox regression in our studyshowed that social functioning made an independent contri-bution to RTW after adjustment for mental health, cognitive,and physical functioning.
When compared with the general population, all patientshad significantly lower physical health, displayed in theirphysical functioning, role-physical function, and bodily painon the Sf-36 at 1 year postinjury. For the NRTW group,however, the impact of the injuries also affected their psy-chosocial functioning such as role-emotional and social func-tioning. One should address these issues in a rehabilitationprocess. Psychosocial problems might be present preinjury,be elicited or reinforced by the trauma, or be a secondaryeffect of the physical and/or cognitive impairments and ac-tivity limitations intercorrelated in complex ways.
Strengths and LimitationsThe strength of the present study is the representative sam-
ple of the severely injured patients admitted to a Norwegiantrauma referral center. Further, the study applied validated in-struments and the relatively large number of participants mademultivariate analysis feasible. The prospective longitudinal de-sign where the patients were monitored at several time inter-vals within the 2-year follow-up period enabled changes inRTW status to be explored and made comparisons over timepossible. The three time points for data collection postinjuryare in accordance with the consensus recommendations fortrauma research.16 The study had a low dropout rate, and thehigh response rate strengthens the results. In this study, pa-tients with preinjury mental disease or substance dependencewere excluded. Thus the differences in mental health androle-emotional functioning on RTW were more likely to becaused by the postinjury situation.
This study also has some limitations that have to beconsidered. Firstly, by excluding patients for whom preinjurysevere mental disorder or substance abuse was reported intheir medical record, the generalizability of the study towardthe general trauma population might be reduced. However, inthis study on RTW, severe mental problems or substanceabuse preinjury might represent other challenges in a reha-bilitation process toward complete RTW. Moreover, thesepatients would to a larger extent not be working preinjury,and thus would have been excluded from the RTW analyses.Secondly, the information about the patients’ functional sta-tus and RTW status and time was solely based on self-report.We do not know the preinjury self-assessed health or quality
Return to Work After Severe Multiple Injuries
Volume 62 • Number 2 479

of life. However, others have found that preinjury self-reported quality of life did not differ from the normal popu-lation when measured retrospectively.2,45 Thirdly, the braininjuries might lead to cognitive problems that the patientsthemselves do not acknowledge. Thus cognitive problemsmight be underreported in the questionnaires and emergesome time after RTW. Another limitation of cognitive self-reports is the inability of the instrument to distinguish be-tween cognitive problems caused by mental distress or by thebrain injury. There is a consensus that self-reported cogni-tive functioning is important in studies of patients with mul-tiple injuries.17 Neuropsychological tests should supplementself-reported cognitive problems in rehabilitation because dif-ferent causes require different solutions, especially with re-lation to RTW and cognitive demands in the work situation.
CONCLUSIONTwo years post-injury, 4 out of 10 patients had achieved
complete RTW, and two-thirds of the NRTW group was stillin an active process toward RTW. There were differences inmultidimensional functioning on RTW status throughout thefirst 2 years postinjury. Lower education, length of staylonger than 20 weeks, and lower social functioning were riskfactors for not returning to work. Our hypothesis that thepersonal factors of coping and locus of control would predictRTW was not confirmed in our study. However, factorsinfluencing RTW after severe multiple injuries are complexlyinterrelated, and in addition to injury-related and physical andpsychosocial functioning, personal factors should also beconsidered when tailor-made rehabilitation or treatment plansare designed.
REFERENCES1. MacKenzie EJ, Shapiro S, Smith RT, et al. Factors influencing
return to work following hospitalization for traumatic injury. Am JPublic Health. 1987;77:329–334.
2. Michaels AJ, Michaels CE, Smith JS, et al. Outcome from injury:general health, work status, and satisfaction 12 months after trauma.J Trauma. 2000;48:841–848.
3. Brenneman FD, Redelmeier DA, Boulanger BR, et al. Long-termoutcomes in blunt trauma: who goes back to work? J Trauma. 1997;42:778–781.
4. MacKenzie EJ, Morris JA Jr, Jurkovich GJ, et al. Return to workfollowing injury: the role of economic, social, and job-relatedfactors. Am J Public Health. 1998;88:1630–1637.
5. Schnyder U, Moergeli H, Klaghofer R, et al. Does patient cognitionpredict time off from work after life-threatening accidents? Am JPsychiatry. 2003;160:2025–2031.
6. Dikmen SS, Temkin NR, Machamer JE, et al. Employmentfollowing traumatic head injuries. Arch Neurol. 1994;51:177–186.
7. Airey CM, Chell SM, Rigby AS, et al. The epidemiology ofdisability and occupation handicap resulting from major traumaticinjury. Disabil Rehabil. 2001;23:509–515.
8. Anke AG, Stanghelle JK, Finset A, et al. Long-term prevalence ofimpairments and disabilities after multiple trauma. J Trauma. 1997;42:54–61.
9. Lehmann U, Pape HC, Seekamp A, et al. Long term results aftermultiple injuries including severe head injury. Eur J Surg. 1999;165:1116–1120.
10. Vles WJ, Steyerberg EW, Essink-Bot ML, et al. Prevalence anddeterminants of disabilities and return to work after major trauma.J Trauma. 2005;58:126–135.
11. Hebert JS, Burnham RS. The effect of polytrauma in persons withtraumatic spine injury. A prospective database of spine fractures.Spine. 2000;25:55–60.
12. Meerding WJ, Looman CW, Essink-Bot ML, et al. Distribution anddeterminants of health and work status in a comprehensivepopulation of injury patients. J Trauma. 2004;56:150–161.
13. Michaels AJ, Michaels CE, Moon CH, et al. Psychosocial factorslimit outcomes after trauma. J Trauma. 1998;44:644–648.
14. Whiteneck GG. Measuring what matters: key rehabilitationoutcomes. Arch Phys Med Rehabil. 1994;75:1073–1076.
15. Tsay SL, Halstead MT, McCrone S. Predictors of coping efficacy,negative moods and post-traumatic stress syndrome following majortrauma. Int J Nurs Pract. 2001;7:74–83.
16. Bouillon B, Kreder HJ, Eypasch E, et al. Quality of life in patientswith multiple injuries–basic issues, assessment, andrecommendations. Restor Neurol Neurosci. 2002;20:125–134.
17. Neugebauer E, Bouillon B, Bullinger M, et al. Quality of life aftermultiple trauma–summary and recommendations of the consensusconference. Restor Neurol Neurosci. 2002;20:161–167.
18. World Health Organization. International Classification ofFunctioning, Disability and Health. Geneva: World HealthOrganization; 2001.
19. Ulleval Trauma Registry. Ulleval University Hospital TraumaRegistry; 2002.
20. Brenneman FD, Boulanger BR, McLellan BA, et al. Measuringinjury severity: time for a change? J Trauma. 1998;44:580–582.
21. Osler T, Baker SP, Long W. A modification of the injury severityscore that both improves accuracy and simplifies scoring. J Trauma.1997;43:922–925.
22. Tay SY, Sloan EP, Zun L, et al. Comparison of the New InjurySeverity Score and the Injury Severity Score. J Trauma. 2004;56:162–164.
23. Association for the Advancement of Automotive medicine. TheAbbreviated Injury Scale 1990 Revision Update 98. Des Plaines, IL:Association for the Advancement of Automotive Medicine; 1998.
24. Wallston KA, Wallston BS. Locus of Control and Health. HealthEduc Monogr. 1978;6:107–117.
25. Wallston KA, Wallston BS, DeVellis R. Development of theMultidimensional Health Locus of Control (MHLC) Scales. HealthEduc Monogr. 1978;6:160–170.
26. Finset A, Steine S, Haugli L, et al. The Brief Approach/AvoidanceCoping Questionnaire: Development and validation. Psychol HealthMed. 2002;7:75.
27. Finset A. The Brief Approach/Avoidance Coping Questionnaire; 2003.28. Baker SP, O’Neill B, Haddon W Jr, et al. The injury severity score:
a method for describing patients with multiple injuries andevaluating emergency care. J Trauma. 1974;14:187–196.
29. Balogh Z, Offner PJ, Moore EE, et al. NISS predicts postinjury multipleorgan failure better than the ISS. J Trauma. 2000;48:624–627.
30. Loge JH, Kaasa S. Short form 36 (SF-36) health survey: normativedata from the general Norwegian population. Scand J Soc Med.1998;250–258.
31. World Health Organization. WHODAS II Home Page. Available at:http://www.who.int/icidh/whodas/. Accessed December 5, 2006.
32. World Health Organization. WHODAS II. Available at:www.who.int. Accessed December 5, 2006.
33. Wu AW, Rubin HR, Mathews WC, et al. A health statusquestionnaire using 30 items from the Medical Outcomes Study.Preliminary validation in persons with early HIV infection. MedCare. 1991;29:786–798.
The Journal of TRAUMA� Injury, Infection, and Critical Care
480 February 2007

34. MacKenzie EJ, McCarthy ML, Ditunno JF, et al. Using the SF-36for characterizing outcome after multiple trauma involving headinjury. J Trauma. 2002;52:527–534.
35. Scheel IB, Hagen KB, Herrin J, et al. A call for action. Arandomized controlled trial of two strategies to implement activesick leave for patients with low back pain. Spine. 2002;27:561–566.
36. Poesl M. Evaluation of the World Health Organization DisabilityAssessment Schedule II (WHODAS II)—German Version (Thesis/Dissertation). Munich: Ludwig_Maximillian-University, 2004.
37. Chwastiak LA, Von Korff M. Disability in depression and backpain: evaluation of the World Health Organization DisabilityAssessment Schedule (WHO DAS II) in a primary care setting.J Clin Epidemiol. 2003;56:507–514.
38. Cieza A, Brocow T, Ustun TB, et al. Linking health-status measuresto the International Classification of Functioning, Disability andHealth. J Rehabil Med. 2002;205–210.
39. Soberg HL, Bautz-Holter E, Roise O, et al. Long Term Multi-Dimensional Functional Consequences of Severe Multiple Injuries 2Years After the Accident. A prospective longitudinal cohort study.J Trauma. 2007;62;XXX.
40. Balestreri M, Czosnyka M, Chatfield DA, et al. Predictive valueof Glasgow coma scale after brain trauma: change in trend overthe past ten years. J Neurol Neurosurg Psychiatry. 2004;75:161–162.
41. Wagner AK, Hammond FM, Sasser HC, et al. Return to productiveactivity after traumatic brain injury: relationship with measures ofdisability, handicap, and community integration. Arch Phys MedRehabil. 2002;83:107–114.
42. Finset A, Anke AW, Hofft E, et al. Cognitive performance inmultiple trauma patients 3 years after injury. Psychosom Med. 1999;61:576–583.
43. Bullinger M, Azouvi P, Brooks N, et al. Quality of life in patientswith traumatic brain injury-basic issues, assessment andrecommendations. [Review] [37 refs]. Restorative Neurol Neurosci.2002;111–124.
44. Morris S, Lenihan B, Duddy L, et al. Outcome after musculoskeletaltrauma treated in a regional hospital. J Trauma. 2000;49:461–469.
45. Holbrook TL, Anderson JP, Sieber WJ, et al. Outcome after majortrauma: discharge and 6-month follow-up results from the TraumaRecovery Project. J Trauma. 1998;45:315–323.
Return to Work After Severe Multiple Injuries
Volume 62 • Number 2 481
Road Crash Casualties: Characteristics of Police InjurySeverity MisclassificationEmmanuelle Amoros, MSc, Jean-Louis Martin, MSc, Mireille Chiron, MD, and Bernard Laumon, PhD, MD
Background: In most countries, epi-demiologic knowledge of road crash in-jury is mainly based on police data, asthey very often are the only available dataat the nation-wide level. However theirvalidity is of some concern. We focus hereon the police severity classification of ‘se-rious’ and ‘slight’ casualties in France.We want to know how the police classifi-cation compares with a trauma severityscale, so that we could correctly interpretpolice based studies.
Method: The study is based on theRhone county (population 1.6 million)during the 1997 to 2001 period. Policedata have been linked with a road trauma
registry, so that both police and New In-jury Severity Score (NISS) classificationsare available on 14,342 casualties. The po-lice classification of ‘slight’ and ‘serious’casualties is compared with the registryclassification grouped into NISS 1–15 andNISS 16–75 categories. We conduct mul-tivariate analyses of the probability of po-lice severity misclassification, over andunder-classification, as a function of crashand casualty characteristics.
Results: Kappa is estimated at 0.41;the sensitivity of the police classification is72% and the positive predictive value is35%. Pedestrian and motorcyclist casualtiesare the most likely to be over-classified
(Relative Risk [RR] � 1.4 and RR � 1.2,respectively compared with car occupants).The ‘rural police’ are more likely to over-classify than the other police forces (RR �3.1). Over-classification decreased duringthe 1997 to 2001 period whereas under-classification increased.
Conclusion: These misclassificationcharacteristics must be kept in mind wheninterpreting severity results based on po-lice data. We are working on obtainingunbiased nation-wide estimates of severityfigures.
Key Words: Abbreviated Injury Scale(AIS), Injury severity, Misclassification,Police data, Road trauma registry.
J Trauma. 2007;62:482–490.
In most countries, epidemiologic knowledge of road crashcasualties is mainly based on data collected by the police.Police definition of injury severity is often based on three
categories: fatal casualties, nonfatal serious, and slight casual-ties. The police definition of slight and serious casualties isbased either on hospital admission, hospital stay (length of), typeof injury, medical treatment required (length of), disability towork (length of), or a combination of these.1 Because the policedata often are the only road casualties data available at thenation-wide level, and hence the basis for most epidemiologicknowledge, their quality must be assessed. Some studies2–8 haveanalyzed the validity of the police severity classification, i.e. thepolice classification has been compared with a physician’s im-plementation of the same definition or a very similar one. Otherstudies9–14 have analyzed the discordance between the policeseverity classification and a recognized and internationally usedtrauma classification, based on injury assessment, namely the
Abbreviated Injury Scale (AIS). The overall severity of casual-ties was measured either by the MAIS (Maximum AIS severitycode) or by the ISS (Injury Severity Score). A few studies5,13,15
have further explored whether the discordance between policeand trauma-based classification was related to some casualtyor crash characteristics, such as road user type, gender, orinjury severity itself.
Police severity definition and police organization beingcountry-specific, it is necessary that the quality of policeseverity classification be assessed in every country. InFrance, the police definitions of serious and slight casualtiesare based on the length of hospital stay with a cut-off point at6 days. The validity of the French police classification hasalready been studied; it has been compared with the casual-ties’ actual length of hospital stay in two studies. In the firstone,8 conducted in an overseas territory, La Reunion, sensi-tivity was estimated at 77% and specificity at 61%. In main-land France, in the Rhone county,16 during the 1998 to 2000period, sensitivity was estimated at 68%, positive predictivevalue at 64%, specificity at 95%, and negative predictivevalue at 96%. Some of these values are quite far from 1; thisconfirms what we have been told, namely that the police donot always inquire about the length of hospital stays, as it canbe quite laborious. Instead they quite often evaluate severitydirectly on the crash scene or categorize it using the numberof days of ITT (temporary total incapacity; this is evaluatedby physicians for legal purposes and it is recorded in policereports). Besides, even when length of hospital stay is used,it is not a very good measure of injury severity because it isrelated to characteristics other than severity itself (individual
Submitted for publication June 8, 2005.Accepted for publication December 15, 2005.Copyright © 2007 by Lippincott Williams & Wilkins, Inc.From the Transport, Occupational and Environmental Epidemiology
Research and Surveillance Unit (UMRESTTE UMR-T 9405), joint unit ofthe French National Institute for Transport and Safety Research(INRETS), Bron, F-69500, France; the University of Lyon 1 (UCBL), Lyon,F-69008, France; the French National Institute for Public Health Surveillance(InVS), Lyon, F-69008, France.
Address for reprints: Emmanuelle Amoros, INRETS/UCBL/InVSUMRESTTE 25 Avenue Francois Mitterrand Case 24 69675 Bron Cedex,France; email: [email protected].
DOI: 10.1097/01.ta.0000202546.49273.f9
The Journal of TRAUMA� Injury, Infection, and Critical Care
482 February 2007

ones such as age, comorbidity17 and broader ones such ashospital policy). Therefore, we will not study any further therelationship between police classification and length of hospitalstay. We focus directly on the relationship between the policeseverity classification and injury severity itself, as police classi-fication is what is available at the nation-wide level, and injuryseverity is what we are interested in. We need to know how theyrelate to each other so that we can correctly interpret, in terms ofinjury severity, studies based on police data.
Injury severity is measured here by the New InjurySeverity Score (NISS), based on the widely used and recog-nized trauma scale, the Abbreviated Injury Scale (AIS). Wefurther group NISS scores into two categories, as close aspossible in definition to the police categories of slight andseriously injured, so that we can study discordance betweenthe two classifications. The first part of the article evaluatesthe extent of discordance, or in other words police misclas-sification. The second part identifies and quantifies howmuch police misclassification is related to some crash orcasualty characteristics. More specifically it identifies andquantifies how much some categories of casualties, crashes,or both are more likely to have their severity over or under-classified by the police.
MATERIALS AND METHODSThis study can be achieved thanks to the existence of a
road trauma registry, with which the police data are com-pared. The registry provides a complete injury assessmentcoded with the AIS. The study is conducted on casualtiesidentified as common to the police file and the registry, forwhom both classifications are hence available.
The target population consists of nonfatal casualties fromroad crashes occurring in France. We focus on nonfatal ca-sualties and leave out fatal casualties because fatalities ben-efit from rather reliable figures and rather clear definition.The source population consists of nonfatal casualties fromroad crashes that occurred in the Rhone county, and that havebeen reported by both the police and the Rhone road traumaregistry, during the 1997 to 2001 period. The Rhone countyis a large county of 1.6 million inhabitants; it consists of alarge city, Lyon, its suburbs and a rural area in the north part.The study population includes 14,342 subjects.
Police Traffic Crash DataThe French police are required by law to write a crash
report for every road crash causing at least one casualty. Aroad crash is defined as a crash occurring on the networkopen to public traffic and involving at least one vehicle.Skateboard or roller skate users are considered as pedestriansby the police, and are only considered as road casualties if hitby a vehicle.
The crash report contains detailed information on thecrash; crash environment, conditions, vehicles involved, butinformation on the people involved is limited. The definitionof injury severity of nonfatal casualties is based on the length
of hospital stay; casualties requiring a hospital stay of 6 daysor more are categorized as ‘seriously injured’, whereas casu-alties requiring less than 6 days of hospital stay are catego-rized as ‘slightly injured’.
There are three main police forces in France (whoseFrench names are ‘police’, ‘gendarmerie’ and ‘CompagnieRepublicaine de Securite’) and we wish to check whetherseverity classification differs between those. These three po-lice forces can be named ‘urban police’, ‘rural police’, and‘urban motorways police’ according to their area of control.However, it is not clear-cut, the ‘urban police’ mostly operatein cities of a certain size; the ‘rural police’ mostly operate inrural areas but also in some part of large city suburbs; the‘urban motorways police’ operate on motorways in andaround large cities.
The Rhone Road Trauma RegistryA road trauma registry18,19 has been in use since 1995 in
the Rhone county. The registry is based on the participationof all public and private health care facilities of the countyand its close surroundings that may receive victims of atraffic crash; it includes some 150 health care facilities, fromemergency departments, intensive care units, surgery to re-habilitation departments. It covers all casualties from roadcrashes occurring in the Rhone county that seek care in healthfacilities. Both inpatients and outpatients are registered, i.e.all casualties are registered whether they are hospitalized ornot. This registry has been approved by the French NationalRegistry Committee.
Information collected for every casualty consists of a fewcrash characteristics and of the following casualty character-istics: gender, date of birth, place of residence, hospital stay,hospital transfer if relevant, and injury assessment. For everysubject, injury assessment is based on the whole set of diag-noses provided by the different health services the subject hasgone through. Plain text diagnoses are coded by the registryphysician according to the AIS, 1990 revision. Moreover,each injury is assigned a severity code, ranging from AIS 1(minor) to AIS 6 (currently beyond treatment). The severityof a casualty with multiple injuries can be measured with theMAIS, the ISS,20 or with the NISS,21 and there has been quitesome debate about the choice of severity measure.22–29 TheISS and the NISS take better account of multiple injuries thanthe MAIS, and the NISS has no constraint about accounting onlyfor the worst injuries from different body regions. The NISSseems to correlate better with the probability of survival.21–24
Hence, we choose to use the NISS as the reference measure towhich we will compare the police classification. Nonetheless,we also repeat the analyses with the ISS and with the MAIS tocheck whether the results are sensitive to the chosen AIS-basedseverity scale.
Data LinkageComparison of police severity classification with the
NISS severity classification is conducted on casualties on
Injury Severity Classification of Road Casualties
Volume 62 • Number 2 483

whom both classifications are available, that is to say oncasualties identified as common to both sources. Police andregistry casualty data have been linked using a semi-automatedrecord-linkage procedure.30,31 Linking variables are date andtime of crash, crash location, type of road user, date of birth(only year and month), and gender. The procedure was notfully automated because a major linking variable (crash lo-cation) was left as unformatted free text to avoid losing anyvaluable information.
AnalysisThe first part of the analysis consists of studying the
extent and direction of the discordance between the policeseverity classification and the NISS classification. Firstly,we compute in each NISS category, the proportion ofcasualties that have been classified as ‘seriously injured’by the police. We use five NISS categories, with the choiceof cut-off points corresponding to the jumps in AIS for asingle injury; NISS 1–3, 4 – 8, 9 –15, 16 –24, and 25–75.These are the same as Rosman32 used to group ISS. Sec-ondly, by grouping the NISS scores into two, we estimatethe sensitivity, specificity, and positive and negative pre-dictive values of the police severity classification. Thecut-off point of a NISS of 16 was chosen, corresponding toa single AIS 4 injury, as the closest equivalent, by con-struction, to the police cut-off point defined at 6 days ofhospital stay. This choice is based on the descriptiveanalysis33 of injuries recorded in the Rhone road traumaregistry, which indicates that AIS 3 injuries are most oftendisplaced fractures, and that AIS 4 injuries are most oftenhead injuries and thorax injuries (bilateral lung contusion).The former do not usually lead to 6 days or more ofhospital stay, whereas the latter do. This is supported byanother study34 based on the Rhone trauma registry, whichshows that the median length of hospital stay is 4 daysamong ISS 9 to 15 casualties and 13 days among ISS 16 to24 casualties. Hence, the choice of cut-off point at NISS16, so that the NISS 1 to 15 and NISS 16 to 75 categoriesare the closest equivalent, in terms of definition, to thepolice ‘slight’ and ‘serious’ severity categories. This leadsus to switch terminology from ‘discordance’ to ‘misclas-sification’ and further to ‘over-classification’ and ‘under-classification’. Over-classification is used for NISS 1 to 15casualties classified as ‘seriously injured’ by the police,and under-classification for NISS 16 to 75 casualties clas-sified as ‘slightly injured’ by the police.
The second part of the analysis consists of identifyingcrash and casualty characteristics associated with police se-verity mis-, over-, and under-classification, and quantifyingthe extent of these associations. This is done, respectively, bymodeling (1) the probability of discordance between the twoclassifications, (2) the probability among NISS 16 to 75casualties of being classified as ‘slightly injured’ by thepolice, and (3) the probability among NISS 1 to 15 casualtiesof being classified as ‘seriously injured’ by the police. We
model each of these probabilities as a function of casualty,crash, and police characteristics. Potentially related character-istics that we explore are (1) casualty characteristics: injuryseverity itself (five NISS categories), casualty age (five catego-ries), gender, type of road user; (2) crash characteristics: whetherit involved a (human) third party or not, road type, environment(in-town versus out-of-town, or town size), type of day (begin-ning of the week versus end of the week), light conditions(daylight versus darkness), weather conditions (good versusbad), junction (yes versus no); and lastly (3) external character-istics: calendar year and reporting police force. We first conductunivariate analyses; analyses of the association of each charac-teristic with mis/under/over-classification. In the construction ofthe multivariate model, we consider for inclusion those charac-teristics that are either found relevant in the literature or signif-icant (at the 5% error level) in the univariate analyses. Finally,we keep those that are significantly associated with the outcome,adjusted for the other factors.
To measure the extent of the association of a character-istic with the outcome, we favor relative risks (RR) to oddsratios as they are much easier to interpret. One cannot usehere the usual approximation of RR estimates by odds ratioestimates (easily obtained from logistic regression). The re-quired condition is not satisfied; the outcome being mis-,under-, or over-classification, is not a rare event. In this case,different model-based methods can be used to estimate rela-tive risks35,36; log-binomial, logistic with some transformations,and a modified Poisson regression. We choose the latter i.e.Poisson regression with robust error variance estimation37 andwe conduct it with GENMOD procedure (generalized linearmodels) SAS software (SAS Institute Inc., Cary, NC).35,38
We also provide results in terms of adjusted (standard-ized) probabilities from the final multivariate model. Thesecorrespond to marginal probabilities for a given characteris-tic, if the data were balanced. These probabilities are computedby standardizing the data over the other bias factors (moreprecisely by averaging over levels of the other categorical vari-ables, setting equal weights). This is achieved using least-squares means (LSMEANS) option in GENMOD procedure.
RESULTSIn the Rhone county, during the 1997 to 2001 period, the
police files included 23,080 casualties, the registry 54,661.Record-linkage has lead to 14,974 casualties identified ascommon to both sources. Of these linked casualties, 14,446are categorized as nonfatal casualties (according to the policeclassification). Some 104 (0.7%) casualties are further ex-cluded because of missing NISS (recorded in the registry butwith no or incomplete injury assessment). The study is hencebased on 14,342 subjects.
Discordance Between Police Severityand NISS Classifications
Casualties’ probability of being classified as ‘seriouslyinjured’ by the police in each NISS category is displayed in
The Journal of TRAUMA� Injury, Infection, and Critical Care
484 February 2007
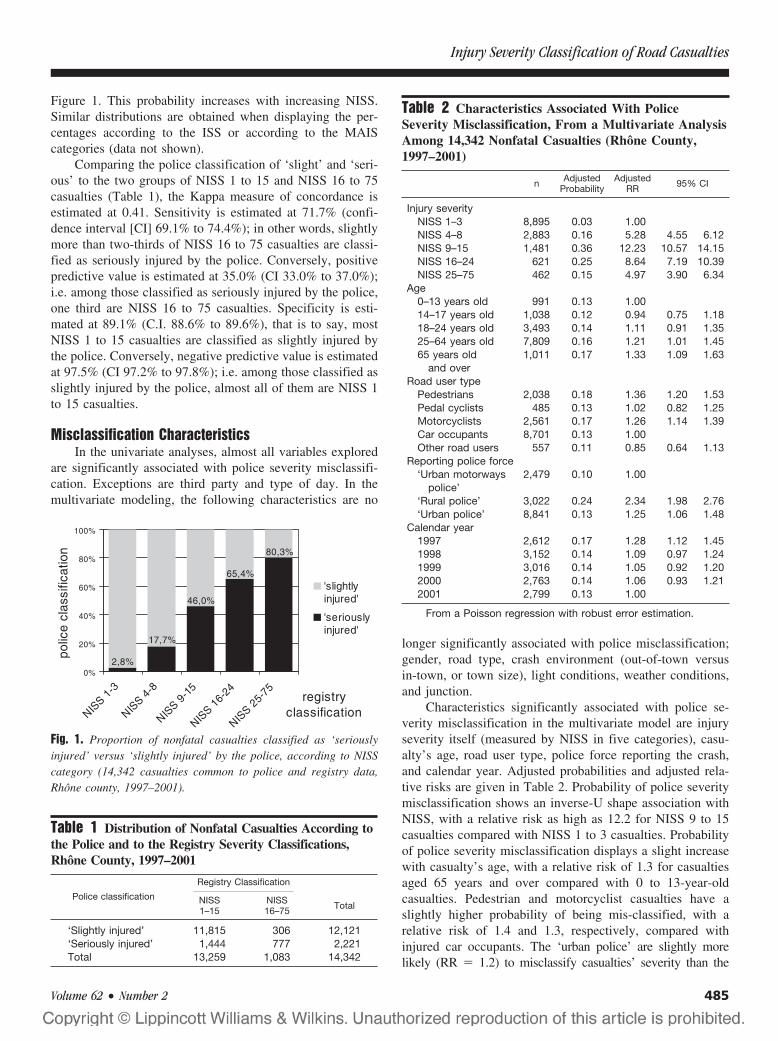
Figure 1. This probability increases with increasing NISS.Similar distributions are obtained when displaying the per-centages according to the ISS or according to the MAIScategories (data not shown).
Comparing the police classification of ‘slight’ and ‘seri-ous’ to the two groups of NISS 1 to 15 and NISS 16 to 75casualties (Table 1), the Kappa measure of concordance isestimated at 0.41. Sensitivity is estimated at 71.7% (confi-dence interval [CI] 69.1% to 74.4%); in other words, slightlymore than two-thirds of NISS 16 to 75 casualties are classi-fied as seriously injured by the police. Conversely, positivepredictive value is estimated at 35.0% (CI 33.0% to 37.0%);i.e. among those classified as seriously injured by the police,one third are NISS 16 to 75 casualties. Specificity is esti-mated at 89.1% (C.I. 88.6% to 89.6%), that is to say, mostNISS 1 to 15 casualties are classified as slightly injured bythe police. Conversely, negative predictive value is estimatedat 97.5% (CI 97.2% to 97.8%); i.e. among those classified asslightly injured by the police, almost all of them are NISS 1to 15 casualties.
Misclassification CharacteristicsIn the univariate analyses, almost all variables explored
are significantly associated with police severity misclassifi-cation. Exceptions are third party and type of day. In themultivariate modeling, the following characteristics are no
longer significantly associated with police misclassification;gender, road type, crash environment (out-of-town versusin-town, or town size), light conditions, weather conditions,and junction.
Characteristics significantly associated with police se-verity misclassification in the multivariate model are injuryseverity itself (measured by NISS in five categories), casu-alty’s age, road user type, police force reporting the crash,and calendar year. Adjusted probabilities and adjusted rela-tive risks are given in Table 2. Probability of police severitymisclassification shows an inverse-U shape association withNISS, with a relative risk as high as 12.2 for NISS 9 to 15casualties compared with NISS 1 to 3 casualties. Probabilityof police severity misclassification displays a slight increasewith casualty’s age, with a relative risk of 1.3 for casualtiesaged 65 years and over compared with 0 to 13-year-oldcasualties. Pedestrian and motorcyclist casualties have aslightly higher probability of being mis-classified, with arelative risk of 1.4 and 1.3, respectively, compared withinjured car occupants. The ‘urban police’ are slightly morelikely (RR � 1.2) to misclassify casualties’ severity than the
Fig. 1. Proportion of nonfatal casualties classified as ‘seriouslyinjured’ versus ‘slightly injured’ by the police, according to NISScategory (14,342 casualties common to police and registry data,Rhone county, 1997–2001).
Table 1 Distribution of Nonfatal Casualties According tothe Police and to the Registry Severity Classifications,Rhône County, 1997–2001
Police classification
Registry Classification
NISS1–15
NISS16–75 Total
‘Slightly injured’ 11,815 306 12,121‘Seriously injured’ 1,444 777 2,221Total 13,259 1,083 14,342
Table 2 Characteristics Associated With PoliceSeverity Misclassification, From a Multivariate AnalysisAmong 14,342 Nonfatal Casualties (Rhône County,1997–2001)
n AdjustedProbability
AdjustedRR 95% CI
Injury severityNISS 1–3 8,895 0.03 1.00NISS 4–8 2,883 0.16 5.28 4.55 6.12NISS 9–15 1,481 0.36 12.23 10.57 14.15NISS 16–24 621 0.25 8.64 7.19 10.39NISS 25–75 462 0.15 4.97 3.90 6.34
Age0–13 years old 991 0.13 1.0014–17 years old 1,038 0.12 0.94 0.75 1.1818–24 years old 3,493 0.14 1.11 0.91 1.3525–64 years old 7,809 0.16 1.21 1.01 1.4565 years old
and over1,011 0.17 1.33 1.09 1.63
Road user typePedestrians 2,038 0.18 1.36 1.20 1.53Pedal cyclists 485 0.13 1.02 0.82 1.25Motorcyclists 2,561 0.17 1.26 1.14 1.39Car occupants 8,701 0.13 1.00Other road users 557 0.11 0.85 0.64 1.13
Reporting police force‘Urban motorways
police’2,479 0.10 1.00
‘Rural police’ 3,022 0.24 2.34 1.98 2.76‘Urban police’ 8,841 0.13 1.25 1.06 1.48
Calendar year1997 2,612 0.17 1.28 1.12 1.451998 3,152 0.14 1.09 0.97 1.241999 3,016 0.14 1.05 0.92 1.202000 2,763 0.14 1.06 0.93 1.212001 2,799 0.13 1.00
From a Poisson regression with robust error estimation.
Injury Severity Classification of Road Casualties
Volume 62 • Number 2 485
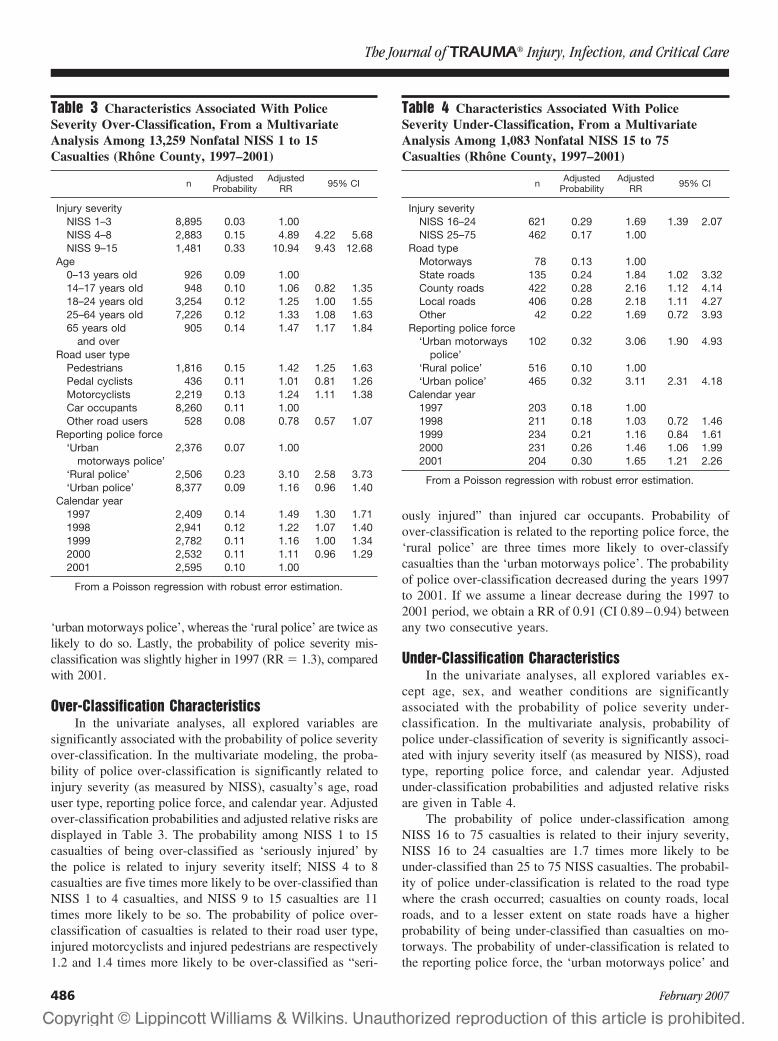
‘urban motorways police’, whereas the ‘rural police’ are twice aslikely to do so. Lastly, the probability of police severity mis-classification was slightly higher in 1997 (RR � 1.3), comparedwith 2001.
Over-Classification CharacteristicsIn the univariate analyses, all explored variables are
significantly associated with the probability of police severityover-classification. In the multivariate modeling, the proba-bility of police over-classification is significantly related toinjury severity (as measured by NISS), casualty’s age, roaduser type, reporting police force, and calendar year. Adjustedover-classification probabilities and adjusted relative risks aredisplayed in Table 3. The probability among NISS 1 to 15casualties of being over-classified as ‘seriously injured’ bythe police is related to injury severity itself; NISS 4 to 8casualties are five times more likely to be over-classified thanNISS 1 to 4 casualties, and NISS 9 to 15 casualties are 11times more likely to be so. The probability of police over-classification of casualties is related to their road user type,injured motorcyclists and injured pedestrians are respectively1.2 and 1.4 times more likely to be over-classified as “seri-
ously injured” than injured car occupants. Probability ofover-classification is related to the reporting police force, the‘rural police’ are three times more likely to over-classifycasualties than the ‘urban motorways police’. The probabilityof police over-classification decreased during the years 1997to 2001. If we assume a linear decrease during the 1997 to2001 period, we obtain a RR of 0.91 (CI 0.89–0.94) betweenany two consecutive years.
Under-Classification CharacteristicsIn the univariate analyses, all explored variables ex-
cept age, sex, and weather conditions are significantlyassociated with the probability of police severity under-classification. In the multivariate analysis, probability ofpolice under-classification of severity is significantly associ-ated with injury severity itself (as measured by NISS), roadtype, reporting police force, and calendar year. Adjustedunder-classification probabilities and adjusted relative risksare given in Table 4.
The probability of police under-classification amongNISS 16 to 75 casualties is related to their injury severity,NISS 16 to 24 casualties are 1.7 times more likely to beunder-classified than 25 to 75 NISS casualties. The probabil-ity of police under-classification is related to the road typewhere the crash occurred; casualties on county roads, localroads, and to a lesser extent on state roads have a higherprobability of being under-classified than casualties on mo-torways. The probability of under-classification is related tothe reporting police force, the ‘urban motorways police’ and
Table 3 Characteristics Associated With PoliceSeverity Over-Classification, From a MultivariateAnalysis Among 13,259 Nonfatal NISS 1 to 15Casualties (Rhône County, 1997–2001)
n AdjustedProbability
AdjustedRR 95% CI
Injury severityNISS 1–3 8,895 0.03 1.00NISS 4–8 2,883 0.15 4.89 4.22 5.68NISS 9–15 1,481 0.33 10.94 9.43 12.68
Age0–13 years old 926 0.09 1.0014–17 years old 948 0.10 1.06 0.82 1.3518–24 years old 3,254 0.12 1.25 1.00 1.5525–64 years old 7,226 0.12 1.33 1.08 1.6365 years old
and over905 0.14 1.47 1.17 1.84
Road user typePedestrians 1,816 0.15 1.42 1.25 1.63Pedal cyclists 436 0.11 1.01 0.81 1.26Motorcyclists 2,219 0.13 1.24 1.11 1.38Car occupants 8,260 0.11 1.00Other road users 528 0.08 0.78 0.57 1.07
Reporting police force‘Urban
motorways police’2,376 0.07 1.00
‘Rural police’ 2,506 0.23 3.10 2.58 3.73‘Urban police’ 8,377 0.09 1.16 0.96 1.40
Calendar year1997 2,409 0.14 1.49 1.30 1.711998 2,941 0.12 1.22 1.07 1.401999 2,782 0.11 1.16 1.00 1.342000 2,532 0.11 1.11 0.96 1.292001 2,595 0.10 1.00
From a Poisson regression with robust error estimation.
Table 4 Characteristics Associated With PoliceSeverity Under-Classification, From a MultivariateAnalysis Among 1,083 Nonfatal NISS 15 to 75Casualties (Rhône County, 1997–2001)
n AdjustedProbability
AdjustedRR 95% CI
Injury severityNISS 16–24 621 0.29 1.69 1.39 2.07NISS 25–75 462 0.17 1.00
Road typeMotorways 78 0.13 1.00State roads 135 0.24 1.84 1.02 3.32County roads 422 0.28 2.16 1.12 4.14Local roads 406 0.28 2.18 1.11 4.27Other 42 0.22 1.69 0.72 3.93
Reporting police force‘Urban motorways
police’102 0.32 3.06 1.90 4.93
‘Rural police’ 516 0.10 1.00‘Urban police’ 465 0.32 3.11 2.31 4.18
Calendar year1997 203 0.18 1.001998 211 0.18 1.03 0.72 1.461999 234 0.21 1.16 0.84 1.612000 231 0.26 1.46 1.06 1.992001 204 0.30 1.65 1.21 2.26
From a Poisson regression with robust error estimation.
The Journal of TRAUMA� Injury, Infection, and Critical Care
486 February 2007

the ‘urban police’ are three times as likely to under-classifycasualties as the ‘rural police’.
The probability of police under-classification increasedduring the years 1997 to 2001. If we assume a linear increaseduring the 1997 to 2001 period, we obtain a RR of 1.15 (CI1.08–1.23) between any two consecutive years. These resultsare adjusted for the other factors, in particular for the NISS.The 25 to 75 NISS category being quite broad, we estimatedthe median NISS in each subgroup of police force, road type,and year; it is very stable across subgroups, from 33.5 to 35.
DISCUSSIONThe first result of the study is the extent of the police
severity misclassification compared with the NISS. It is con-sistent with other countries’ comparisons of police severityclassification with severity measures based on the AIS, usingeither the ISS or the MAIS. A United Kingdom study9 foundthat within the police category of ‘serious’ casualties, aboutone-third are in fact ISS 1 to 4 and another third are ISS 4to 9. A more recent United Kingdom14 study also finds thata third of those classified as ‘serious’ by the police are in factISS 1 to 4. A small United States study12 finds that among 52casualties with ISS �9, half of them were not classified as‘severe’ by the police.
Even though there is some discordance between thepolice and the NISS classifications, there is still a strongassociation between the two, as shown in Figure 1 and in themultivariate models. Casualties at the two ends of the NISSscale, i.e. the most slightly and the most severely injuredcasualties, are less prone to misclassification. This is trivialand expected. The discordance and yet strong associationbetween the police severity classification and the NISS arenot surprising, given the criteria used by the police. Thelength of hospital stay or the number of days of ITT does notmeasure injury severity itself; but they are related to it andhence to the NISS, there is some concordance, though farfrom reaching 100%. When the police evaluate severity onthe crash scene, it is likely that their classification is influ-enced by some broad injury characteristics such as the num-ber of injuries, the region(s) injured, and maybe the type(s) ofinjury so that their classification is related to some extent toinjury severity and hence to the NISS.
Concerning the overall direction of the misclassification,it is rather tempting to compare the numbers of over andunder-classified casualties (respectively, 1,444 and 306 inTable 1) and summarize the issue (and minimize it) by sayingthat globally the police tend to over-estimate severity. How-ever, this is erroneous. One should take into account thepolice under-reporting of casualties. It is inversely related toinjury severity, in France30,39 and in other countries,40 i.e. thelower the severity the lower the probability of being police-reported. This under-reporting pattern means that the numberof NISS 1 to 15 casualties should be multiplied by a muchlarger correcting factor than the number of NISS 16 to 75
casualties, so that it is not possible to make an overall as-sessment of the police severity misclassification.
The second and most important results of the presentstudy are the general crash and casualty characteristics thatthe police severity under- and over-classifications are asso-ciated with. Pedestrians and motorcyclists have a slightlyhigher probability of being over-classified; they are part ofso-called vulnerable road users, that is to say those not pro-tected by a vehicle body, and who, at equal impact force, areexpected to be more seriously injured than four-wheel vehicleoccupants. Hence, it is not surprising that this expected higherseverity plays a role in the police classification of severity. Inan Australian study,15 road user type was not significantlyassociated with the agreement between police classificationand hospital admission (yes or no) but the study was based ononly 406 subjects. Road user type was not explored in theother two similar studies. A French study also based on theRhone county but restricted to 199630 data already found thatpedestrians had a higher probability of being classified as‘seriously injured’ by the police (adjusted for MAIS).
Casualty’s age is associated with a slight increase inover-classification probability. This is not surprising becauseage is a risk factor for both severity and longer hospital stay.17
In the Australian study,15 the age of motor vehicle passengers isinversely associated with the probability of a correct policeclassification. Our result is consistent with this. On the contrary,in the United States study,13 age above 65-years-old shows anegative association with over-statement of injury severity.
There are large discrepancies in severity classification be-tween the three police forces. A United States study3 analyzingthe validity of police crash data found some differences betweenthe state, county, and municipal police agencies. They attributedpart of these to their different areas of control. This has beenexplored in the present study. In the modeling of mis- andover-classification, the variables road type and crash environ-ment (in town versus out of town) are no longer associatedwith police severity classification as soon as the reportingpolice force is also included in the model. In the multivariatemodeling of under-classification, the association with roadtype remains significant. Keeping this association in themodel, the police forces adjusted relative risks are still large.This means that distortions in the classification associatedwith different areas of control (different road types or urbanand rural distribution) explain at most some part but not all ofthe discrepancies in the police forces classification practices.Also, there is no remaining confounding effect of injuryseverity that could explain these discrepancies; we havechecked that the median NISS of the wide NISS 25 to 75subgroup is indeed very stable across police forces. In theUnited Kingdom, differences between police forces in sever-ity classification have also been identified; a study41 hasshown that the extent of variation among police force areas ishigher than the extent of severity variation among differentcrash characteristics (urban and rural combined with day andnight).
Injury Severity Classification of Road Casualties
Volume 62 • Number 2 487
During the time period considered 1997 to 2001, over-classification decreased but at the same time under-classification increased. This can be read as one generaltrend; casualties are more often classified by the police as‘slightly injured’ (in a given NISS category). This mightpartly be because of the overall tendency of reduced lengthof hospital stays because of reduced public hospital funding(and improved medical care and technology). This can onlyaccount for the (probably small) proportion of casualtieswhose severity is classified according to this criteria.
The study has its strengths and limitations. The NISS isnot the gold standard that would perfectly measure the trueinjury severity. The NISS has been chosen as one severityscale based on a widely used and recognized injury assess-ment scale (the AIS) so that we could compare the low-quality police severity classification to it. Analyses have beenreplicated using the ISS or the MAIS so that we have checkedthat the results found were not very sensitive to the severitymeasure (among those based on AIS). The accuracy of theAIS coding of injuries in the registry should be quite good,the registry’s physician has of course been trained in AIScoding; she is also a member of the European Interest Groupon Injury Scaling. NISS scores have to be grouped into twocategories so that discordance between the police and theNISS classifications could be assessed, and it has been fur-ther labeled misclassification and split into under and over-classification. These are simplifications but they are neededand yet informative.
The strength of this study lies mainly in the Rhone roadtrauma registry. This registry is not restricted to a few hos-pitals but it covers all the hospitals of a large county and itsclose surroundings. It includes both inpatients and outpa-tients. Furthermore, the study is based on a 5-year period, andhence on a large number of subjects.
The underlying assumption of the study is that eachpolice force, having a centralized national structure (not re-gional) and receiving centralized instructions, have the sameway of classifying crashes and casualties all over France.Under this assumption, the present study results can be ex-trapolated to the target population of casualties from roadcrashes occurring all over France.
The results found lead to some recommendations in theinterpretation of studies and in the setting up of interventioncampaigns. Severity classification being associated withsome casualty and crash characteristics, the description ofinjury severity of different subgroups (road user types forinstance) can be misleading. This also applies to any corre-lated characteristic such as gender, correlated with road usertype, or urban and rural area; correlated with police force.More generally, the interpretation of any study of severitymust be very cautious. In interpreting French police-baseddata, one should keep in mind that the severity of the follow-ing subgroups is over-estimated: pedestrians and motorcy-clists, older casualties, people injured in areas controlled bythe ‘rural police’. Conversely, the severity of the following
casualties is under-estimated: people injured in areas con-trolled by the ‘urban police’ and ‘urban motorways police’.For instance, it is common knowledge that rural road crashesare more severe than urban ones. In France this knowledge isbased on police data, so that the relative risk between the twotypes of crashes should be corrected with the new piece ofinformation that the ‘rural police’ are three times more likelyto over-classify casualties’ severity than the ‘urban police’.This should be further corrected with under-reporting coeffi-cients as police under-reporting of casualties is related topolice force.39 Also, as there is a trend in the police proba-bility of classifying more often casualties (in a given NISScategory) as slightly injured, we must be very cautious if adecreased severity in police data are observed. Also, we musttake these police severity over- and under-classification intoaccount when setting up intervention campaigns, to choosethe appropriate target groups and conduct a valid evaluationof these campaigns.
All these words of caution about the interpretation ofstudies based on police data raise the issue of obtainingunbiased estimates of severity, on the traffic crash casualtypopulation as a whole, and on different casualty subgroups.This is our next objective. We are working on obtainingnation-wide estimates of the number of slight and seriouscasualties (as measured by the NISS) as a whole, and accord-ing to age, gender, road user type, as well as to estimate thedistribution of injury types. The first step consists of mod-eling the relationship between the registry and the policedata at the Rhone level, identifying and quantifying selec-tion biases39 and classification biases (presented here).Based on these, the next step consists of constructingcorrection factors to be applied to the nation-wide policedata to obtain a nation-wide picture of the road traumaregistry.
ACKNOWLEDGMENTSWe wish to thank the following people for having participated in the
data collection and data entry, as a member of the association for theregistry of road traffic casualties in the Rhone (ARVAC, president Bans-sillon V, director Ndiaye A) or as a member of INRETS-UMRESTTE(Laumon B, scientific consultant for the registry): Ait Idir T, Ait Si SelmiT, Alloatti D, Andrillat M, Artru F, Asencio Y, Assossou I, Auzaneau F,Bages-Limoges F, Bagou G, Balogh C, Banssillon G, Barnier N, Barth X, BassetM, Bec JF, Bejui J, Bel JC, Berard E, Berard J, Bernard JC, Berthet N, BertrandJC, Besson L, Biot B, Biot V, Blanc C, Blanchard J, Bœuf C, Boisson D,Bonjean M, Bost J, Bouchedor C, Bouletreau P, Boyer V, Breda Y, Bret P,Brilland R, Bussery S, Cabet N, Caillot JL, Cannamela A, Caregnato B, CarreM, Catala Y, Chagnon PY, Chantran C, Chardon P, Charnay P, Chatelain P,Chattard S, Chavane H, Chazot G, Chettouane I, Chevreton N, ChevrillonE, Chevrillon S, Chiron M, Chotel P, Cochard P, Combe C, Contamin B,Coppard E, Cot T, Crettenet Z, Cristini A, Dal Gobbo B, De Angelis MP,Decourt L, Delfosse A, Demaziere J, Deruty R, Desjardins G, Dohin B, EmonetA, Escarment J, Eyssette M, Fallavier L, Fanton L, Felten D, Feuglet P, Fifis N,Figura J, Fisher G, Fischer LP, Floccard B, Floret D, Fournier G, FredenucciJF, Freidel M, Gadegbeku B, Galin L, Gaillard P, Gallon M, Garnier N,Garzanti A, Gaussorgues P, Gautheron V, Genevrier M, Gibaud F, Gillet Y,Goubsky A, Granger M, Grattard P, Gueniaud PY, Guenot C, GuignandM, Haddak M, Hamel D, Heckel T, Jacquemard C, Joffre T, Kohler R,
The Journal of TRAUMA� Injury, Infection, and Critical Care
488 February 2007
Lablanche C, Lafont S, Lagier C, Lapierre B, Laplace MC, La Rosa C,Laurent R, Lebel M, Leblay G, Le-Xuan I, Lieutaud T, Lille R, Linne M,Lucas R, Machin B, Maello E, Malicier D, Mangola B, Marduel YN, Marie-Catherine M, Martin JL, Martinand G, Marty F, Messikh C, Meyer F, MeyrandS, Molard S, Morel-Chevillet E, Mioulet E, Minjaud F, Mollet C, Monnet J,Moreno S, Moyen B, Ndiaye A, Neidhart JP, Ngandu E, Ny S, Ould T, PagetP, Paillot JC, Paris D, Patay B, Pauget P, Peillon D, Perrin-Blondeau D,Petit P, Piton JL, Plantier M, Pornon P, Pramayon C, Quelard B, Rezig M,Rigal F, Robert D, Rode G, Romanet JP, Rongieras F, Roset C, RoussonA, Roussouli P, Roux H, Ruhl C, Salamand J, Sametzky P, Sayegh K,Sbraire N, Scappaticci N, Schiele P, Schneider M, Simonet C, Sindou M,Soldner R, Soudain M, Stagnara J, Stamm D, Suc B, Taesch MC, TasseauF, Tell L, Thomas M, Tilhet-Coartet S, Toukou JC, Trifot M, Vallet G,Vancuyck A, Vergnes I, Verney MP, Voiglio EJ, Vourey G, Vuillard J,Westphal M, Willemen L.
REFERENCES1. OCDE-IRTAD. Definitions and Data Availability: Compilation and
Evaluation of A-Level Roads and Hospitalised Victims in OECDCountries-Accident and Injury Definitions. Germany: BASt; 1998.IRTAD special report.
2. Bull JP, Roberts BJ. Road accident statistics: a comparison of policeand hospital information. Accid Anal Prev. 1973;5:45–53.
3. Shinar D, Treat JR, McDonald ST. The validity of police reportedaccident data. Accid Anal Prev. 1983;15:175–191.
4. Barancik J, Fife D. Discrepancies in vehicular crash injury reporting:northeastern Ohio trauma study IV. Accid Anal Prev. 1985;17:147–154.
5. Hansen A, Popkin C, Campbell B, et al. Comparison of Police andPhysician Judgments of Injury Severity and Inebriation in MotorVehicle Crash Victims. In Proceedings of the 35th AnnualConference of the Association for the Advancement of AutomotiveMedicine; 1991:249–260.
6. Rosman DL, Knuiman MW. A comparison of hospital and policeroad injury data. Accid Anal Prev. 1994;26:215–222.
7. Austin K. The identification of mistakes in road accident records:part 2, casualty variables. Accid Anal Prev. 1995;27:277–282.
8. Aptel I, Salmi LR, Masson F, et al. Road accident statistics:discrepancies between police and hospital data in a French island.Accid Anal Prev. 1999;31:101–108.
9. Dove AF, Pearson JC, Weston PA. Data collection from road trafficaccidents. Arch Emerg Med. 1986;3:193–198.
10. Tunbridge R, Everest J. An Assessment of the Under Reporting ofRoad Accident Casualties in Relation to Injury Severity. InProceedings of the International IRCOBI Conference on theBiomechanics of Impact; 1988:101–109.
11. Nordentoft E, Larsen C, Jørgensen H. Færdselsuheldsstatistikkensdækningsgrad [the degree of coverage of traffic accident statistics].Ugeskr Laeger. 1989;151:2808–2811.
12. Agran PF, Castillo DN, Winn DG. Limitations of data compiledfrom police reports on pediatric pedestrian and bicycle motor vehicleevents. Accid Anal Prev. 1990;22:361–370.
13. Farmer CM. Reliability of police-reported information for determiningcrash and injury severity. Traffic Inj Prev. 2003;4:38–44.
14. Morris A, Mackay M, Wodzin E, et al. Some Injury Scaling Issuesin UK Crash Research. In Proceedings of the International IRCOBIConference on the Biomechanics of Impact; 2003:283–291.
15. Lopez DG, Rosman DL, Jelinek GA, et al. Complementing policeroad-crash records with trauma registry data: an initial evaluation.Accid Anal Prev. 2000;32:771–777.
16. Ovieve F. Etude du critere “blesse grave” dans les fichiers BAACdes statistiques officielles des victimes d’accident corporel de lacirculation routiere dans le departement du Rhone [‘seriouslyinjured’ criteria in the police data of road casualties in the Rhone
county]. Lyon: Universite Claude Bernard; 2003. RapportUMRETTE No. 0304.
17. Bergeron E, Lavoie A, Moore L, et al. Comorbidity and age are bothindependent predictors of length of hospitalization in traumapatients. Can J Surg. 2005;48:361–366.
18. Charnay P, Laumon B. Le registre des victimes d’accidents de lacirculation routiere du Rhone [The trauma registry of roadcasualties in the Rhone county]. Bron: INRETS; 2002. RapportUMRETTE No. 0204.
19. Laumon B, Martin JL, Collet P, et al. A French Road AccidentTrauma Registry: First Results. In Proceedings of the 41st AnnualConference of the Association for the Advancement of AutomotiveMedicine; 1997:127–137.
20. Baker S, O’Neill B, Haddon W, et al. The Injury Severity Score: amethod for describing patients with multiple injuries and evaluatingemergency care. J Trauma. 1974;14:187–196.
21. Osler T, Baker S, Long W. A modification of the Injury SeverityScore that both improves accuracy and simplifies scoring. J Trauma.1997;43:922–926.
22. Brenneman F, Boulanger B, McLellan B, et al. Measuring injuryseverity: time for a change? J Trauma. 1998;44:580–582.
23. Frankema S, Steyerberg E, Edwards M, et al. Comparison of currentinjury scales for survival chance estimation: an evaluation comparingthe predictive performance of the ISS, NISS, and AP scores in aDutch local trauma registration. J Trauma. 2005;58:596–604.
24. Lavoie A, Moore L, LeSage N, et al. The New Injury SeverityScore: a more accurate predictor of in-hospital mortality than theInjury Severity Score. J Trauma. 2004;56:1312–1320.
25. Kilgo P, Osler T, Meredith W. The worst injury predicts mortalityoutcome the best: rethinking the role of multiple injuries in traumaoutcome scoring. J Trauma. 2003;55:599–607.
26. Tay S, Sloan E, Zun L, et al. Comparison of the New InjurySeverity Score and the Injury Severity Score. J Trauma. 2004;56:162–164.
27. Sacco W, MacKenzie E, Champion H, et al. Comparison ofalternative methods for assessing Injury Severity based on anatomicdescriptors. J Trauma. 1999;47:441–446.
28. Samin O, Civil I. The New Injury Severity Score versus the InjurySeverity Score in Predicting Patient Outcome: A ComparativeEvaluation on Trauma Service Patients of the Auckland Hospital. InProceedings of the 43rd Annual Conference of the Association forthe Advancement of Automative Medicine; 1999:1–15.
29. Stevenson M, Segui-Gomez M, Lescohier I, et al. An overview ofthe injury severity score and the new injury severity score. Inj Prev.2001;7:10–13.
30. Laumon B, Martin JL. Analyse des biais dans la connaissanceepidemiologique des accidents de la route en France [Bias in theepidemiological knowledge of road crashes in France]. RevEpidemiol Sante Publique. 2002;50:277–285.
31. Clark DE. Practical introduction to record linkage for injuryresearch. Inj Prev. 2004;10:186–191.
32. Rosman DL, Knuiman MW, Ryan GA. An evaluation of road crashinjury severity measures. Accid Anal Prev. 1996;28:163–170.
33. Chiron M, Gadegbeku B, Ndiaye A. Les consequences sanitaires desaccidents de la route [Health outcomes of road crashes]. In: ONISR,ed. La securite routiere en France, bilan de l’annee 2003. Paris: Ladocumentation Francaise; 2004:195–200.
34. Haddak M, Filou C, Ndiaye A, et al. Redefinition des victimesde la route [Towards a new definition of road casualties]. Premierrapport d’etape. Bron: INRETS; 2004. Rapport UMRETTENo. 0405.
35. Spiegelman D, Hertzmark E. Easy SAS calculations for risk orprevalence ratios and differences. Am J Epidemiol. 2005;162:199–200.
Injury Severity Classification of Road Casualties
Volume 62 • Number 2 489

36. Greenland S. Model-based estimation of relative risks and otherepidemiologic measures in studies of common outcomes and in case-control studies. Am J Epidemiol. 2004;160:301–305.
37. Zou G. A modified Poisson regression approach to prospectivestudies with binary data. Am J Epidemiol. 2004;159:702–706.
38. Lindquist K. How to estimate relative risk in SAS using PROCGENMOD for common outcome in cohort studies. May 4, 2004.Available at: http://www.ats.ucla.edu/stat/sas/faq/relative_risk.htm.Accessed December 9, 2004.
39. Amoros E, Martin JL, Laumon B. Under-reporting of roadcrash casualties in France. Accid Anal Prev. 2006;38:627–635.
40. Hvoslef H. Under-Reporting of Road Traffic Accidents Recorded bythe Police at the International Level. Norway: Public RoadsAdministration; 1994. IRTAD special report.
41. Lai PW. Model of injury severity allowing for different grading ofseverity: some applications using the British road accident data.Accid Anal Prev. 1980;12:221–239.
The Journal of TRAUMA� Injury, Infection, and Critical Care
490 February 2007
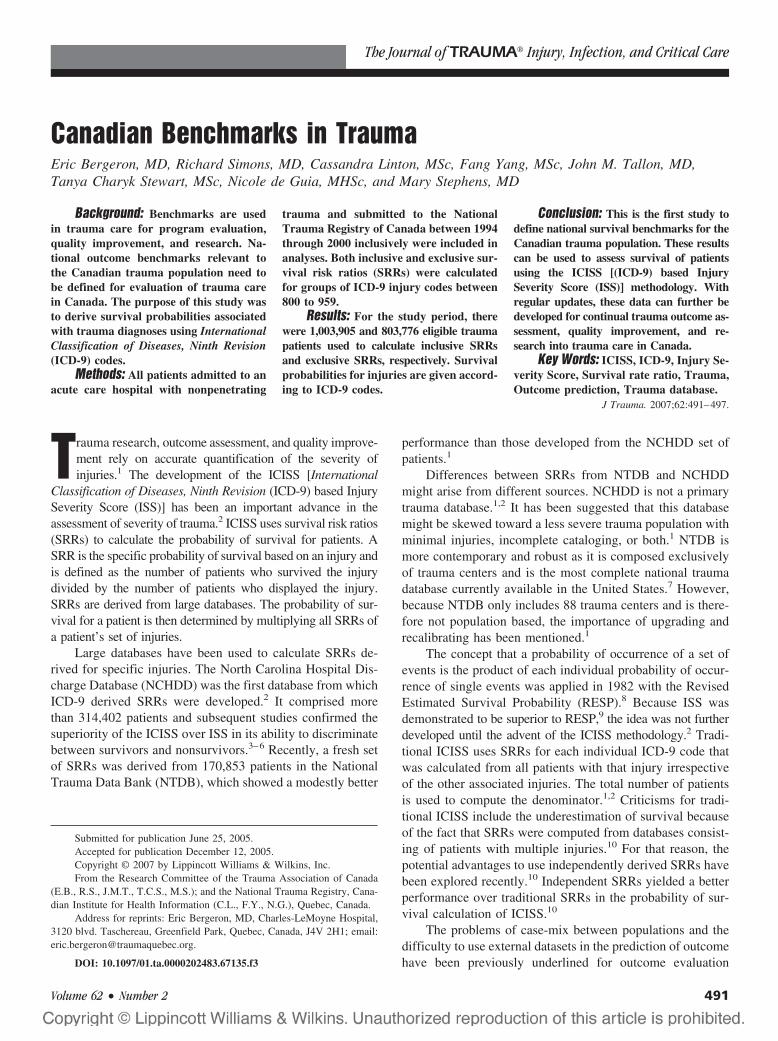
Canadian Benchmarks in TraumaEric Bergeron, MD, Richard Simons, MD, Cassandra Linton, MSc, Fang Yang, MSc, John M. Tallon, MD,Tanya Charyk Stewart, MSc, Nicole de Guia, MHSc, and Mary Stephens, MD
Background: Benchmarks are usedin trauma care for program evaluation,quality improvement, and research. Na-tional outcome benchmarks relevant tothe Canadian trauma population need tobe defined for evaluation of trauma carein Canada. The purpose of this study wasto derive survival probabilities associatedwith trauma diagnoses using InternationalClassification of Diseases, Ninth Revision(ICD-9) codes.
Methods: All patients admitted to anacute care hospital with nonpenetrating
trauma and submitted to the NationalTrauma Registry of Canada between 1994through 2000 inclusively were included inanalyses. Both inclusive and exclusive sur-vival risk ratios (SRRs) were calculatedfor groups of ICD-9 injury codes between800 to 959.
Results: For the study period, therewere 1,003,905 and 803,776 eligible traumapatients used to calculate inclusive SRRsand exclusive SRRs, respectively. Survivalprobabilities for injuries are given accord-ing to ICD-9 codes.
Conclusion: This is the first study todefine national survival benchmarks for theCanadian trauma population. These resultscan be used to assess survival of patientsusing the ICISS [(ICD-9) based InjurySeverity Score (ISS)] methodology. Withregular updates, these data can further bedeveloped for continual trauma outcome as-sessment, quality improvement, and re-search into trauma care in Canada.
Key Words: ICISS, ICD-9, Injury Se-verity Score, Survival rate ratio, Trauma,Outcome prediction, Trauma database.
J Trauma. 2007;62:491–497.
Trauma research, outcome assessment, and quality improve-ment rely on accurate quantification of the severity ofinjuries.1 The development of the ICISS [International
Classification of Diseases, Ninth Revision (ICD-9) based InjurySeverity Score (ISS)] has been an important advance in theassessment of severity of trauma.2 ICISS uses survival risk ratios(SRRs) to calculate the probability of survival for patients. ASRR is the specific probability of survival based on an injury andis defined as the number of patients who survived the injurydivided by the number of patients who displayed the injury.SRRs are derived from large databases. The probability of sur-vival for a patient is then determined by multiplying all SRRs ofa patient’s set of injuries.
Large databases have been used to calculate SRRs de-rived for specific injuries. The North Carolina Hospital Dis-charge Database (NCHDD) was the first database from whichICD-9 derived SRRs were developed.2 It comprised morethan 314,402 patients and subsequent studies confirmed thesuperiority of the ICISS over ISS in its ability to discriminatebetween survivors and nonsurvivors.3–6 Recently, a fresh setof SRRs was derived from 170,853 patients in the NationalTrauma Data Bank (NTDB), which showed a modestly better
performance than those developed from the NCHDD set ofpatients.1
Differences between SRRs from NTDB and NCHDDmight arise from different sources. NCHDD is not a primarytrauma database.1,2 It has been suggested that this databasemight be skewed toward a less severe trauma population withminimal injuries, incomplete cataloging, or both.1 NTDB ismore contemporary and robust as it is composed exclusivelyof trauma centers and is the most complete national traumadatabase currently available in the United States.7 However,because NTDB only includes 88 trauma centers and is there-fore not population based, the importance of upgrading andrecalibrating has been mentioned.1
The concept that a probability of occurrence of a set ofevents is the product of each individual probability of occur-rence of single events was applied in 1982 with the RevisedEstimated Survival Probability (RESP).8 Because ISS wasdemonstrated to be superior to RESP,9 the idea was not furtherdeveloped until the advent of the ICISS methodology.2 Tradi-tional ICISS uses SRRs for each individual ICD-9 code thatwas calculated from all patients with that injury irrespectiveof the other associated injuries. The total number of patientsis used to compute the denominator.1,2 Criticisms for tradi-tional ICISS include the underestimation of survival becauseof the fact that SRRs were computed from databases consist-ing of patients with multiple injuries.10 For that reason, thepotential advantages to use independently derived SRRs havebeen explored recently.10 Independent SRRs yielded a betterperformance over traditional SRRs in the probability of sur-vival calculation of ICISS.10
The problems of case-mix between populations and thedifficulty to use external datasets in the prediction of outcomehave been previously underlined for outcome evaluation
Submitted for publication June 25, 2005.Accepted for publication December 12, 2005.Copyright © 2007 by Lippincott Williams & Wilkins, Inc.From the Research Committee of the Trauma Association of Canada
(E.B., R.S., J.M.T., T.C.S., M.S.); and the National Trauma Registry, Cana-dian Institute for Health Information (C.L., F.Y., N.G.), Quebec, Canada.
Address for reprints: Eric Bergeron, MD, Charles-LeMoyne Hospital,3120 blvd. Taschereau, Greenfield Park, Quebec, Canada, J4V 2H1; email:[email protected].
DOI: 10.1097/01.ta.0000202483.67135.f3
The Journal of TRAUMA� Injury, Infection, and Critical Care
Volume 62 • Number 2 491
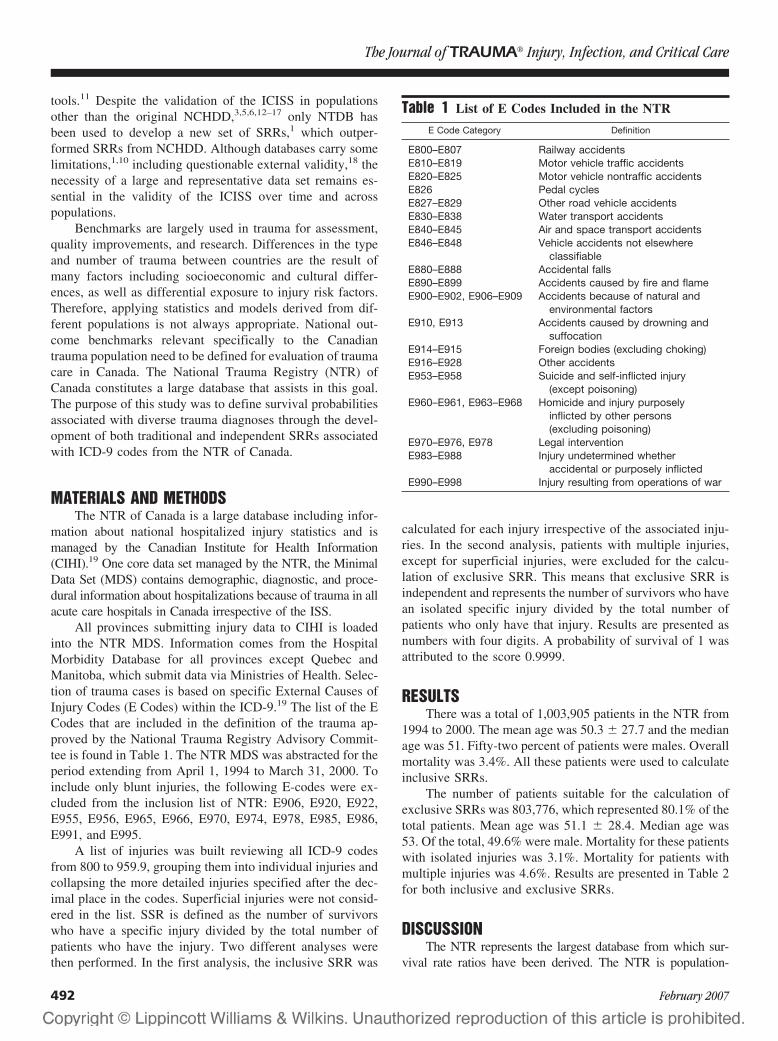
tools.11 Despite the validation of the ICISS in populationsother than the original NCHDD,3,5,6,12–17 only NTDB hasbeen used to develop a new set of SRRs,1 which outper-formed SRRs from NCHDD. Although databases carry somelimitations,1,10 including questionable external validity,18 thenecessity of a large and representative data set remains es-sential in the validity of the ICISS over time and acrosspopulations.
Benchmarks are largely used in trauma for assessment,quality improvements, and research. Differences in the typeand number of trauma between countries are the result ofmany factors including socioeconomic and cultural differ-ences, as well as differential exposure to injury risk factors.Therefore, applying statistics and models derived from dif-ferent populations is not always appropriate. National out-come benchmarks relevant specifically to the Canadiantrauma population need to be defined for evaluation of traumacare in Canada. The National Trauma Registry (NTR) ofCanada constitutes a large database that assists in this goal.The purpose of this study was to define survival probabilitiesassociated with diverse trauma diagnoses through the devel-opment of both traditional and independent SRRs associatedwith ICD-9 codes from the NTR of Canada.
MATERIALS AND METHODSThe NTR of Canada is a large database including infor-
mation about national hospitalized injury statistics and ismanaged by the Canadian Institute for Health Information(CIHI).19 One core data set managed by the NTR, the MinimalData Set (MDS) contains demographic, diagnostic, and proce-dural information about hospitalizations because of trauma in allacute care hospitals in Canada irrespective of the ISS.
All provinces submitting injury data to CIHI is loadedinto the NTR MDS. Information comes from the HospitalMorbidity Database for all provinces except Quebec andManitoba, which submit data via Ministries of Health. Selec-tion of trauma cases is based on specific External Causes ofInjury Codes (E Codes) within the ICD-9.19 The list of the ECodes that are included in the definition of the trauma ap-proved by the National Trauma Registry Advisory Commit-tee is found in Table 1. The NTR MDS was abstracted for theperiod extending from April 1, 1994 to March 31, 2000. Toinclude only blunt injuries, the following E-codes were ex-cluded from the inclusion list of NTR: E906, E920, E922,E955, E956, E965, E966, E970, E974, E978, E985, E986,E991, and E995.
A list of injuries was built reviewing all ICD-9 codesfrom 800 to 959.9, grouping them into individual injuries andcollapsing the more detailed injuries specified after the dec-imal place in the codes. Superficial injuries were not consid-ered in the list. SSR is defined as the number of survivorswho have a specific injury divided by the total number ofpatients who have the injury. Two different analyses werethen performed. In the first analysis, the inclusive SRR was
calculated for each injury irrespective of the associated inju-ries. In the second analysis, patients with multiple injuries,except for superficial injuries, were excluded for the calcu-lation of exclusive SRR. This means that exclusive SRR isindependent and represents the number of survivors who havean isolated specific injury divided by the total number ofpatients who only have that injury. Results are presented asnumbers with four digits. A probability of survival of 1 wasattributed to the score 0.9999.
RESULTSThere was a total of 1,003,905 patients in the NTR from
1994 to 2000. The mean age was 50.3 � 27.7 and the medianage was 51. Fifty-two percent of patients were males. Overallmortality was 3.4%. All these patients were used to calculateinclusive SRRs.
The number of patients suitable for the calculation ofexclusive SRRs was 803,776, which represented 80.1% of thetotal patients. Mean age was 51.1 � 28.4. Median age was53. Of the total, 49.6% were male. Mortality for these patientswith isolated injuries was 3.1%. Mortality for patients withmultiple injuries was 4.6%. Results are presented in Table 2for both inclusive and exclusive SRRs.
DISCUSSIONThe NTR represents the largest database from which sur-
vival rate ratios have been derived. The NTR is population-
Table 1 List of E Codes Included in the NTR
E Code Category Definition
E800–E807 Railway accidentsE810–E819 Motor vehicle traffic accidentsE820–E825 Motor vehicle nontraffic accidentsE826 Pedal cyclesE827–E829 Other road vehicle accidentsE830–E838 Water transport accidentsE840–E845 Air and space transport accidentsE846–E848 Vehicle accidents not elsewhere
classifiableE880–E888 Accidental fallsE890–E899 Accidents caused by fire and flameE900–E902, E906–E909 Accidents because of natural and
environmental factorsE910, E913 Accidents caused by drowning and
suffocationE914–E915 Foreign bodies (excluding choking)E916–E928 Other accidentsE953–E958 Suicide and self-inflicted injury
(except poisoning)E960–E961, E963–E968 Homicide and injury purposely
inflicted by other persons(excluding poisoning)
E970–E976, E978 Legal interventionE983–E988 Injury undetermined whether
accidental or purposely inflictedE990–E998 Injury resulting from operations of war
The Journal of TRAUMA� Injury, Infection, and Critical Care
492 February 2007
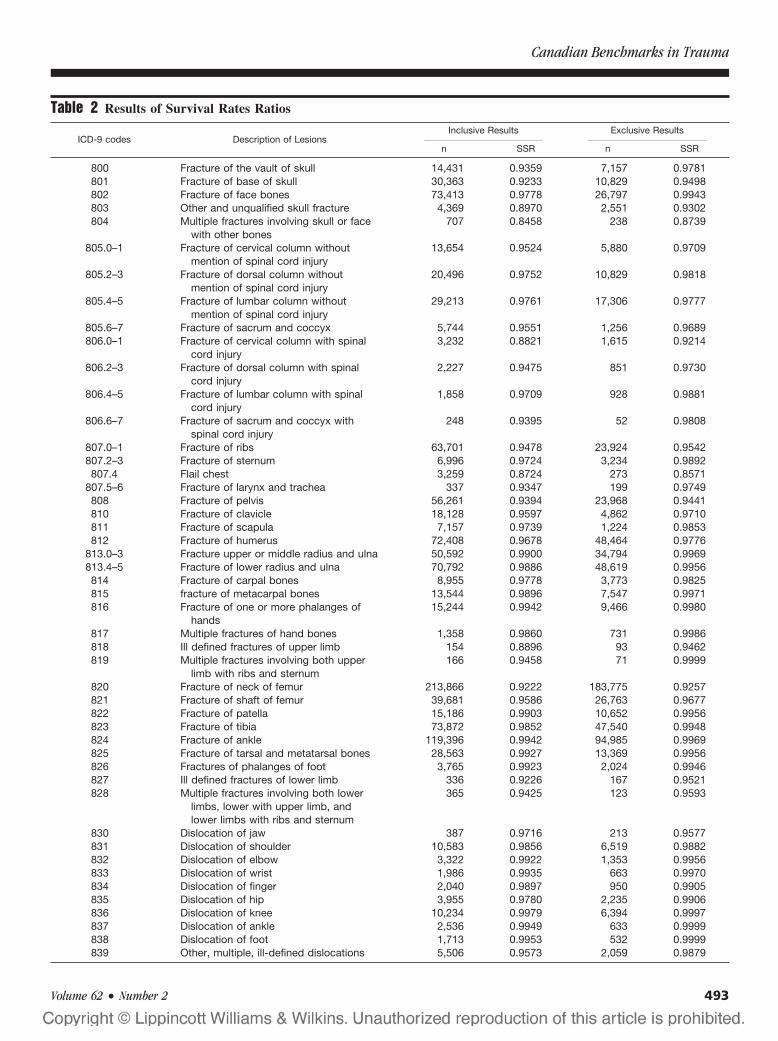
Table 2 Results of Survival Rates Ratios
ICD-9 codes Description of LesionsInclusive Results Exclusive Results
n SSR n SSR
800 Fracture of the vault of skull 14,431 0.9359 7,157 0.9781801 Fracture of base of skull 30,363 0.9233 10,829 0.9498802 Fracture of face bones 73,413 0.9778 26,797 0.9943803 Other and unqualified skull fracture 4,369 0.8970 2,551 0.9302804 Multiple fractures involving skull or face
with other bones707 0.8458 238 0.8739
805.0–1 Fracture of cervical column withoutmention of spinal cord injury
13,654 0.9524 5,880 0.9709
805.2–3 Fracture of dorsal column withoutmention of spinal cord injury
20,496 0.9752 10,829 0.9818
805.4–5 Fracture of lumbar column withoutmention of spinal cord injury
29,213 0.9761 17,306 0.9777
805.6–7 Fracture of sacrum and coccyx 5,744 0.9551 1,256 0.9689806.0–1 Fracture of cervical column with spinal
cord injury3,232 0.8821 1,615 0.9214
806.2–3 Fracture of dorsal column with spinalcord injury
2,227 0.9475 851 0.9730
806.4–5 Fracture of lumbar column with spinalcord injury
1,858 0.9709 928 0.9881
806.6–7 Fracture of sacrum and coccyx withspinal cord injury
248 0.9395 52 0.9808
807.0–1 Fracture of ribs 63,701 0.9478 23,924 0.9542807.2–3 Fracture of sternum 6,996 0.9724 3,234 0.9892807.4 Flail chest 3,259 0.8724 273 0.8571
807.5–6 Fracture of larynx and trachea 337 0.9347 199 0.9749808 Fracture of pelvis 56,261 0.9394 23,968 0.9441810 Fracture of clavicle 18,128 0.9597 4,862 0.9710811 Fracture of scapula 7,157 0.9739 1,224 0.9853812 Fracture of humerus 72,408 0.9678 48,464 0.9776
813.0–3 Fracture upper or middle radius and ulna 50,592 0.9900 34,794 0.9969813.4–5 Fracture of lower radius and ulna 70,792 0.9886 48,619 0.9956814 Fracture of carpal bones 8,955 0.9778 3,773 0.9825815 fracture of metacarpal bones 13,544 0.9896 7,547 0.9971816 Fracture of one or more phalanges of
hands15,244 0.9942 9,466 0.9980
817 Multiple fractures of hand bones 1,358 0.9860 731 0.9986818 Ill defined fractures of upper limb 154 0.8896 93 0.9462819 Multiple fractures involving both upper
limb with ribs and sternum166 0.9458 71 0.9999
820 Fracture of neck of femur 213,866 0.9222 183,775 0.9257821 Fracture of shaft of femur 39,681 0.9586 26,763 0.9677822 Fracture of patella 15,186 0.9903 10,652 0.9956823 Fracture of tibia 73,872 0.9852 47,540 0.9948824 Fracture of ankle 119,396 0.9942 94,985 0.9969825 Fracture of tarsal and metatarsal bones 28,563 0.9927 13,369 0.9956826 Fractures of phalanges of foot 3,765 0.9923 2,024 0.9946827 Ill defined fractures of lower limb 336 0.9226 167 0.9521828 Multiple fractures involving both lower
limbs, lower with upper limb, andlower limbs with ribs and sternum
365 0.9425 123 0.9593
830 Dislocation of jaw 387 0.9716 213 0.9577831 Dislocation of shoulder 10,583 0.9856 6,519 0.9882832 Dislocation of elbow 3,322 0.9922 1,353 0.9956833 Dislocation of wrist 1,986 0.9935 663 0.9970834 Dislocation of finger 2,040 0.9897 950 0.9905835 Dislocation of hip 3,955 0.9780 2,235 0.9906836 Dislocation of knee 10,234 0.9979 6,394 0.9997837 Dislocation of ankle 2,536 0.9949 633 0.9999838 Dislocation of foot 1,713 0.9953 532 0.9999839 Other, multiple, ill-defined dislocations 5,506 0.9573 2,059 0.9879
Canadian Benchmarks in Trauma
Volume 62 • Number 2 493
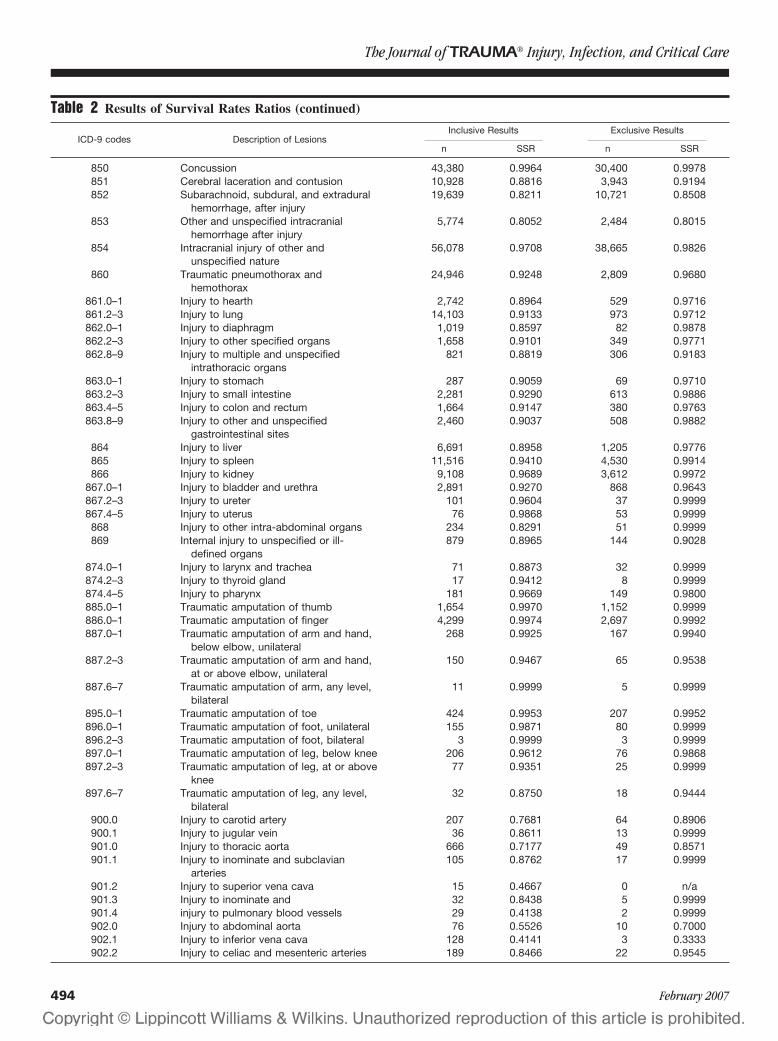
Table 2 Results of Survival Rates Ratios (continued)
ICD-9 codes Description of LesionsInclusive Results Exclusive Results
n SSR n SSR
850 Concussion 43,380 0.9964 30,400 0.9978851 Cerebral laceration and contusion 10,928 0.8816 3,943 0.9194852 Subarachnoid, subdural, and extradural
hemorrhage, after injury19,639 0.8211 10,721 0.8508
853 Other and unspecified intracranialhemorrhage after injury
5,774 0.8052 2,484 0.8015
854 Intracranial injury of other andunspecified nature
56,078 0.9708 38,665 0.9826
860 Traumatic pneumothorax andhemothorax
24,946 0.9248 2,809 0.9680
861.0–1 Injury to hearth 2,742 0.8964 529 0.9716861.2–3 Injury to lung 14,103 0.9133 973 0.9712862.0–1 Injury to diaphragm 1,019 0.8597 82 0.9878862.2–3 Injury to other specified organs 1,658 0.9101 349 0.9771862.8–9 Injury to multiple and unspecified
intrathoracic organs821 0.8819 306 0.9183
863.0–1 Injury to stomach 287 0.9059 69 0.9710863.2–3 Injury to small intestine 2,281 0.9290 613 0.9886863.4–5 Injury to colon and rectum 1,664 0.9147 380 0.9763863.8–9 Injury to other and unspecified
gastrointestinal sites2,460 0.9037 508 0.9882
864 Injury to liver 6,691 0.8958 1,205 0.9776865 Injury to spleen 11,516 0.9410 4,530 0.9914866 Injury to kidney 9,108 0.9689 3,612 0.9972
867.0–1 Injury to bladder and urethra 2,891 0.9270 868 0.9643867.2–3 Injury to ureter 101 0.9604 37 0.9999867.4–5 Injury to uterus 76 0.9868 53 0.9999868 Injury to other intra-abdominal organs 234 0.8291 51 0.9999869 Internal injury to unspecified or ill-
defined organs879 0.8965 144 0.9028
874.0–1 Injury to larynx and trachea 71 0.8873 32 0.9999874.2–3 Injury to thyroid gland 17 0.9412 8 0.9999874.4–5 Injury to pharynx 181 0.9669 149 0.9800885.0–1 Traumatic amputation of thumb 1,654 0.9970 1,152 0.9999886.0–1 Traumatic amputation of finger 4,299 0.9974 2,697 0.9992887.0–1 Traumatic amputation of arm and hand,
below elbow, unilateral268 0.9925 167 0.9940
887.2–3 Traumatic amputation of arm and hand,at or above elbow, unilateral
150 0.9467 65 0.9538
887.6–7 Traumatic amputation of arm, any level,bilateral
11 0.9999 5 0.9999
895.0–1 Traumatic amputation of toe 424 0.9953 207 0.9952896.0–1 Traumatic amputation of foot, unilateral 155 0.9871 80 0.9999896.2–3 Traumatic amputation of foot, bilateral 3 0.9999 3 0.9999897.0–1 Traumatic amputation of leg, below knee 206 0.9612 76 0.9868897.2–3 Traumatic amputation of leg, at or above
knee77 0.9351 25 0.9999
897.6–7 Traumatic amputation of leg, any level,bilateral
32 0.8750 18 0.9444
900.0 Injury to carotid artery 207 0.7681 64 0.8906900.1 Injury to jugular vein 36 0.8611 13 0.9999901.0 Injury to thoracic aorta 666 0.7177 49 0.8571901.1 Injury to inominate and subclavian
arteries105 0.8762 17 0.9999
901.2 Injury to superior vena cava 15 0.4667 0 n/a901.3 Injury to inominate and 32 0.8438 5 0.9999901.4 injury to pulmonary blood vessels 29 0.4138 2 0.9999902.0 Injury to abdominal aorta 76 0.5526 10 0.7000902.1 Injury to inferior vena cava 128 0.4141 3 0.3333902.2 Injury to celiac and mesenteric arteries 189 0.8466 22 0.9545
The Journal of TRAUMA� Injury, Infection, and Critical Care
494 February 2007
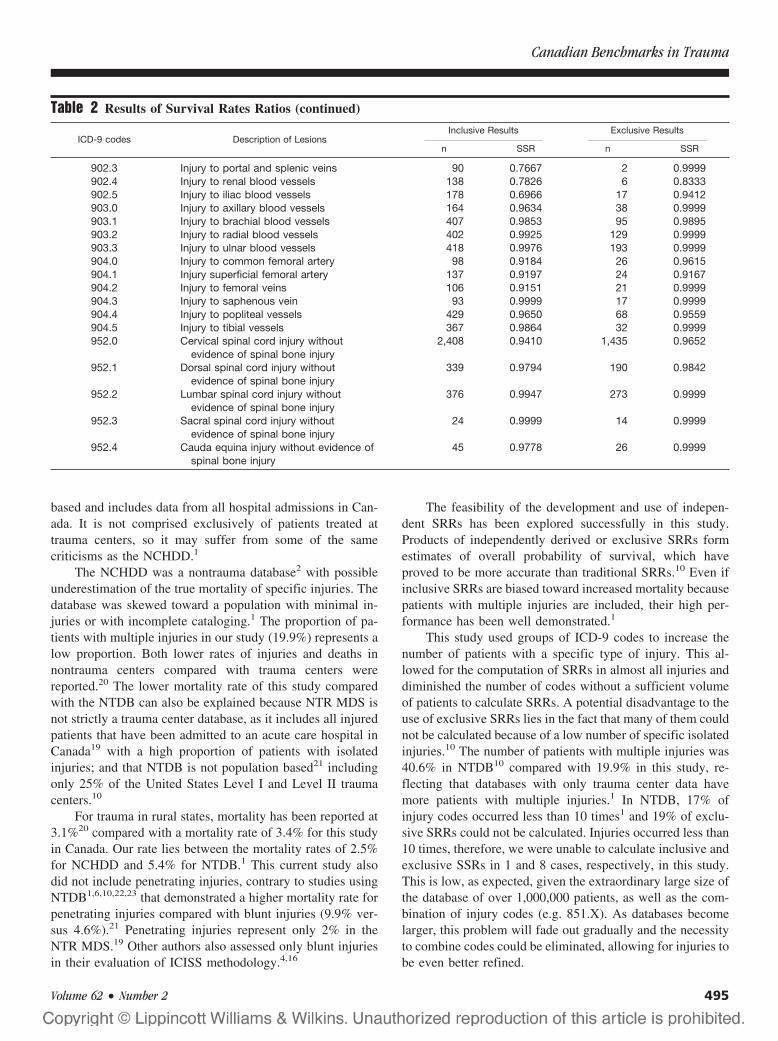
based and includes data from all hospital admissions in Can-ada. It is not comprised exclusively of patients treated attrauma centers, so it may suffer from some of the samecriticisms as the NCHDD.1
The NCHDD was a nontrauma database2 with possibleunderestimation of the true mortality of specific injuries. Thedatabase was skewed toward a population with minimal in-juries or with incomplete cataloging.1 The proportion of pa-tients with multiple injuries in our study (19.9%) represents alow proportion. Both lower rates of injuries and deaths innontrauma centers compared with trauma centers werereported.20 The lower mortality rate of this study comparedwith the NTDB can also be explained because NTR MDS isnot strictly a trauma center database, as it includes all injuredpatients that have been admitted to an acute care hospital inCanada19 with a high proportion of patients with isolatedinjuries; and that NTDB is not population based21 includingonly 25% of the United States Level I and Level II traumacenters.10
For trauma in rural states, mortality has been reported at3.1%20 compared with a mortality rate of 3.4% for this studyin Canada. Our rate lies between the mortality rates of 2.5%for NCHDD and 5.4% for NTDB.1 This current study alsodid not include penetrating injuries, contrary to studies usingNTDB1,6,10,22,23 that demonstrated a higher mortality rate forpenetrating injuries compared with blunt injuries (9.9% ver-sus 4.6%).21 Penetrating injuries represent only 2% in theNTR MDS.19 Other authors also assessed only blunt injuriesin their evaluation of ICISS methodology.4,16
The feasibility of the development and use of indepen-dent SRRs has been explored successfully in this study.Products of independently derived or exclusive SRRs formestimates of overall probability of survival, which haveproved to be more accurate than traditional SRRs.10 Even ifinclusive SRRs are biased toward increased mortality becausepatients with multiple injuries are included, their high per-formance has been well demonstrated.1
This study used groups of ICD-9 codes to increase thenumber of patients with a specific type of injury. This al-lowed for the computation of SRRs in almost all injuries anddiminished the number of codes without a sufficient volumeof patients to calculate SRRs. A potential disadvantage to theuse of exclusive SRRs lies in the fact that many of them couldnot be calculated because of a low number of specific isolatedinjuries.10 The number of patients with multiple injuries was40.6% in NTDB10 compared with 19.9% in this study, re-flecting that databases with only trauma center data havemore patients with multiple injuries.1 In NTDB, 17% ofinjury codes occurred less than 10 times1 and 19% of exclu-sive SRRs could not be calculated. Injuries occurred less than10 times, therefore, we were unable to calculate inclusive andexclusive SSRs in 1 and 8 cases, respectively, in this study.This is low, as expected, given the extraordinary large size ofthe database of over 1,000,000 patients, as well as the com-bination of injury codes (e.g. 851.X). As databases becomelarger, this problem will fade out gradually and the necessityto combine codes could be eliminated, allowing for injuries tobe even better refined.
Table 2 Results of Survival Rates Ratios (continued)
ICD-9 codes Description of LesionsInclusive Results Exclusive Results
n SSR n SSR
902.3 Injury to portal and splenic veins 90 0.7667 2 0.9999902.4 Injury to renal blood vessels 138 0.7826 6 0.8333902.5 Injury to iliac blood vessels 178 0.6966 17 0.9412903.0 Injury to axillary blood vessels 164 0.9634 38 0.9999903.1 Injury to brachial blood vessels 407 0.9853 95 0.9895903.2 Injury to radial blood vessels 402 0.9925 129 0.9999903.3 Injury to ulnar blood vessels 418 0.9976 193 0.9999904.0 Injury to common femoral artery 98 0.9184 26 0.9615904.1 Injury superficial femoral artery 137 0.9197 24 0.9167904.2 Injury to femoral veins 106 0.9151 21 0.9999904.3 Injury to saphenous vein 93 0.9999 17 0.9999904.4 Injury to popliteal vessels 429 0.9650 68 0.9559904.5 Injury to tibial vessels 367 0.9864 32 0.9999952.0 Cervical spinal cord injury without
evidence of spinal bone injury2,408 0.9410 1,435 0.9652
952.1 Dorsal spinal cord injury withoutevidence of spinal bone injury
339 0.9794 190 0.9842
952.2 Lumbar spinal cord injury withoutevidence of spinal bone injury
376 0.9947 273 0.9999
952.3 Sacral spinal cord injury withoutevidence of spinal bone injury
24 0.9999 14 0.9999
952.4 Cauda equina injury without evidence ofspinal bone injury
45 0.9778 26 0.9999
Canadian Benchmarks in Trauma
Volume 62 • Number 2 495
Grouping codes have the negative effect of includinginjuries of all degrees of severity for a specific injury. Forexample, a grade I spleen injury does not carry the sameprognosis as a grade IV injury, but is given the same survivalprobability. This potentially addresses the problem of thecase mix differences between centers. It was not possible toapply a higher level of discrimination of injuries and codes inthe period of study because coding has been subject to vari-ation and does not show the same precision and uniformitythrough the years and between centers.
Another reason for the lack of grading of injuries is that theNTR MDS does not include Abbreviated Injury Scale (AIS) orISS, just diagnosis of injuries. Quantifying injuries with the AISand ISS and improving precision in coding should be an objec-tive of the registry. In addition to applying the ICISS method-ology to the dataset, which is desirable because of the evergrowing evidence of the superior or at least similar performanceof the ICISS methodology 1–4,6,10,12–17,20,24–26, it would allowfor further updating, as is needed, particularly with the advent ofthe ICD-10 coding system,12 or even the exploration of new,innovative outcome evaluation models.
Large databases provide accurate SRRs for trauma re-search.1 ICISS has been shown to be more powerful than ISS,3–6
to be universally available,6 to have easier computation,6,26 tocost less,6,25 and to be easier for calculation.6 The presentstudy includes over one million injured trauma patientsand constitutes the largest database that has publishedSRRs. Because all levels of injury severity are includedand mortality rates remain low, as with other trauma da-tabases that do no include death at the scene or on arrival,this may adversely affect many aspects of the logisticmodel fitting.6 However, the primary goal of this studywas not to apply and validate these data to this databaseitself, but rather to calculate SRRs for specific injuries. Inthat sense, it represents a descriptive study with no testingof hypothesis.
The NTR constitutes a large database currently availablefor trauma research and outcome evaluation. From this study,survival benchmarks for the Canadian trauma populationhave been defined. The survival rate ratios derived from theNTR can now be used for further studies. The next stepshould be to validate these results in the database itself andthen compare inclusive and exclusive SRRs. Questions suchas the applicability of these ratios in other trauma popula-tions, their performance in different level trauma centers, thecomparison of trauma center data with nontrauma center data,and the relevance of including other factors such as age,gender, comorbidity, physiologic predictors, and so forthneeds further exploration in subsequent studies. Additionalrevisions because of upgrading in ICD-10 and AIS codingshould also be addressed in the future. With regular updates,these data can further be developed for continual traumaoutcome assessment, quality improvement, and research intotrauma care in Canada.
REFERENCES1. Meredith JW, Kilgo PD, Osler T. A fresh set of survival risk
ratios derived from incidents in the National Trauma Data Bankfrom which the ICISS may be calculated. J Trauma. 2003;55:924–932.
2. Osler T, Rutledge R, Deis J, et al. ICISS: An internationalclassification of disease-9 based injury severity score. J Trauma.1996;41:380–388.
3. Rutledge R, Osler T, Emery S, et al. The end of the Injury SeverityScore (ISS) and the Trauma and Injury Severity Score (TRISS):ICISS, an International Classification of diseases, Ninth Revision-based prediction tool, outperforms both ISS and TRISS as predictorsof trauma patient survival, hospital charges, and hospital length ofstay. J Trauma. 1998;44:41–49.
4. Hannan EL, Farrell LS, Gorthy SFH, et al. Predictors of mortality inadult patients with injuries in New York State: a comparison of thetrauma and Injury Severity Score (TRISS) and the InternationalClassification of Disease, Ninth Revision-based Injury SeverityScore (ICISS). J Trauma. 1999;47:8–14.
5. Sacco WJ, MacKenzie EJ, Champion H, et al. Comparison ofalternative methods for assessing injury severity based on anatomicdescriptors. J Trauma. 1999;47:441–446.
6. Meredith JW, Evans G, Kilgo PD, et al. A comparison of theabilities of nine scoring algorithms in predicting mortality.J Trauma. 2002;53:621–629.
7. American College of Surgeons, Committee on Trauma. NationalTrauma Data Bank Annual Report. Chicago: American College ofSurgeons; 1999.
8. Levy PS, Goldberg J, Rothrock J. The revised estimated probabilityindex of trauma severity. Public Health Rep. 1982;97:452–249.
9. Goldberg JL, Golberg J, Levy PS, et al. Measuring the severity ofinjury: the validity of the revised estimated survival probabilityindex. J Trauma. 1984;24:420–426.
10. Meredith JW, Kilgo PD, Osler TM. Independently derived survivalrisk ratios yield better estimates of survival than traditional survivalrisk ratios when using the ICISS. J Trauma. 2003;55:933–938.
11. Demetriades D, Chan L, Velmahos GV, et al. TRISS methodology:an inappropriate tool for comparing outcomes between traumacenters. J Am Coll Surg. 2001;193:250–254.
12. Kim Y, Jung KY, Kim CY, et al. Validation of the internationalclassification of diseases 10th edition-based Injury Severity Score(ICISS). J Trauma. 2000;48:280–285.
13. Osler T, Cohen M, Rogers FB, et al. Trauma registry injury codingis superfluous: a comparison of outcome prediction based on traumaregistry international classification of diseases-ninth revision (ICD-9)and hospital information system ICD-9 codes. J Trauma. 1997;43:253–257.
14. Rutledge R, Osler T, Kromhout-Schiro S. Illness severity adjustmentfor outcomes analysis: validation of the ICISS methodology in all821,455 patients hospitalized in North America in 1996. Surgery.1998;124:187–196.
15. Rutledge R, Osler T. The ICD-9-based illness severity score: anew model that outperforms both DRG and APR-DRG aspredictors of survival and resource utilization. J Trauma. 1998;45:791–799.
16. Kim Y, Jung KY. Utility of the international classification ofdiseases injury severity score: detecting preventable deaths andcomparing the performance of emergency medical centers.J Trauma. 2003;54:775–780.
17. Stephenson SCR, Langley JD, Civil ID. Comparing measures ofinjury severity for use with large databases. J Trauma. 2002;53:326–332.
18. Bergeron E, Rossignol M, Osler T, et al. Improving the TRISSmethodology by restructuring age categories and adding comorbidity.J Trauma. 2004;56:760–767.
The Journal of TRAUMA� Injury, Infection, and Critical Care
496 February 2007

19. The Canadian Institute for Health Information. National TraumaRegistry: 2004 report. 2004:5, B1.
20. Rogers FB, Osler TM, Shackford SR, et al. Population-based studyof hospital trauma care in a rural state without a formal traumasystem. J Trauma. 2001;50:409–414.
21. Milham FH, LaMorte WW. Factors associated with mortality intrauma: re-evaluation of the TRISS method using the national traumadata bank. J Trauma. 2004;56:1090–1096.
22. Kilgo PD, Osler TM, Meredith W. The worst injury predictsmortality outcome the best: rethinking the role of multiple injuries intrauma outcome scoring. J Trauma. 2003;55:599–607.
23. Kilgo PD, Meredith JW, Hensberry R, Osler TM. A note on the disjointednature of the injury severity score. J Trauma. 2004;57:479–487.
24. Rutledge R, Hoyt DB, Eastman AB, et al. Comparison of the InjurySeverity Score and ICD-9 diagnosis codes as predictors of outcomein injury: analysis of 44,032 patients. J Trauma. 1997;42:477–489.
25. Osler TM, Rogers FB, Glance LG, et al. Predicting survival, lengthof stay, and cost in the surgical intensive care unit: APACHE IIversus ICISS. J Trauma. 1998;45:234–238.
26. Rutledge R, Osler TM. The ICD-9-based illness severity score: anew model that outperforms both DRG and APR-DRG as predictorsof survival and resource utilization. J Trauma. 1998;45:791–799.
Canadian Benchmarks in Trauma
Volume 62 • Number 2 497
Trauma Care at Rural Level III Trauma Centers in a StateTrauma SystemThomas S. Helling, MD
Background: Although much hasbeen written about the benefits of traumacenter care, most experiences are urbanwith large numbers of patients. Little isknown about the smaller, rural traumacenters and how they function both inde-pendently and as part of a larger traumasystem. The state of Missouri has desig-nated three levels of trauma care. Thecornerstone of rural trauma care is thestate-designated Level III trauma center.These centers are required to have thepresence of a trauma team and traumasurgeon but do not require orthopedicor neurosurgical coverage. The purposeof this retrospective study was to deter-mine how Level III trauma centers com-pared with Level I and Level II centersin the Missouri trauma system and,secondly, how trauma surgeon experi-ence at these centers might shape future
educational efforts to optimize ruraltrauma care.
Methods: During a 2-year period in2002 and 2003, the state trauma registrywas queried on all trauma admissions forcenters in the trauma system. Demograph-ics and patient care outcomes were assessedby level of designation. Trauma admissionsto the Level III centers were examined foracuity, severity, and type of injury. The ex-periences with chest, abdominal, and neuro-logic trauma were examined in detail.
Results: A total of 24,392 patientsfrom 26 trauma centers were examined, in-cluding all eight Level III centers. Acuityand severity of injuries were higher at LevelI and II centers. A total of 2,910 patientswere seen at the 8 Level III centers. Overalldeaths were significantly lower at Level IIIcenters (Level I, 4% versus Level II, 4%versus Level III, 2%, p < 0.001). Numbers
of patients dying within 24 hours were nodifferent among levels of trauma care (LevelI, 37% versus Level II, 30% versus LevelIII, 32%). Among Level III centers 45(1.5%) patients were admitted in shock, and48 (2%) had a Glasgow Coma Scale score<9. Twenty-six patients had a surgical headinjury (7 epidural, 19 subdural hematomas).Twenty-eight patients (1%) needed a chestor abdominal operation. There were 15spleen and 12 liver injuries with an Abbre-viated Injury Score of 4 or 5.
Conclusions: Level III trauma cen-ters performed as expected in a statetrauma system. Acuity and severity wereless as was corresponding mortality. Therewere a paucity of life-threatening head,chest, and abdominal injuries, which pro-vide a challenge to the rural trauma surgeonto maintain necessary skills in managementof these critical injuries.
J Trauma. 2007;62:498–503.
The care of the rural trauma victim is becoming a majorfocus for the American College of Surgeons Committeeon Trauma (ACS COT). Efforts such as the Rural
Trauma Team Development Course are aimed at honing theskills of physicians and other health care providers in ruralcommunities to more effectively and expeditiously treat vic-tims with major injuries. These initiatives are a result of therealization that trauma patients may be more likely to die inrural areas1 and that a significant number of deaths occuroutside urban and suburban communities. In Missouri andelsewhere, one-half or more of deaths from motor vehiclecollisions (MVC) occur in the rural environment.2,3 Althoughthere has been isolated reporting in the literature of theexperience with rural trauma care, less is known than withmore urban populations.4–9 There is even less information
available from Level III centers in the rural area. In devel-oping programs to affect and improve care of the rural traumavictim, it is important to understand the experience of smallrural trauma centers. For example, one should be cognizant ofthe acuity and severity of patients admitted to rural traumacenters and understand the incidence of life-threatening inju-ries to which the rural trauma teams are exposed to tailoreducational efforts. Based on the frequency with which theseproblems are encountered, how should one advise manage-ment of severe neurotrauma or complex orthopedic injuries inthe rural setting? Is the rural general/trauma surgeon capableof providing damage control care to patients suffering life-threatening chest or abdominal injuries?
In an attempt to answer these questions, we have queriedthe Missouri Trauma Registry on Level III trauma center datacollected during a 2-year period. In Missouri the mainstay offormalized trauma care for rural areas is the state-designatedLevel III trauma center. The state designation for Level IIItrauma centers mandates the presence of a trauma surgeonand resuscitation team but does not require the availability ofan orthopedic surgeon or neurosurgeon. Therefore, the re-sponsibility of early care of injured patients may fall solely onthe shoulders of the on-call general (trauma) surgeon. With-out the expanded resources of Level I and II centers andwithout this specialty care, would these rural trauma centers
Submitted for publication May 3, 2005.Accepted for publication October 26, 2005.Copyright © 2007 by Lippincott Williams & Wilkins, Inc.From the Missouri Committee on Trauma and the Department of
Surgery, University of Missouri-Kansas City School of Medicine, KansasCity, MO.
Address for reprints: Thomas S. Helling, MD, Department of Surgery,Conemaugh Memorial Medical Center, 1086 Franklin Street, Jonestown, PA15905; email: [email protected].
DOI: 10.1097/01.ta.0000197671.00818.76
The Journal of TRAUMA� Injury, Infection, and Critical Care
498 February 2007
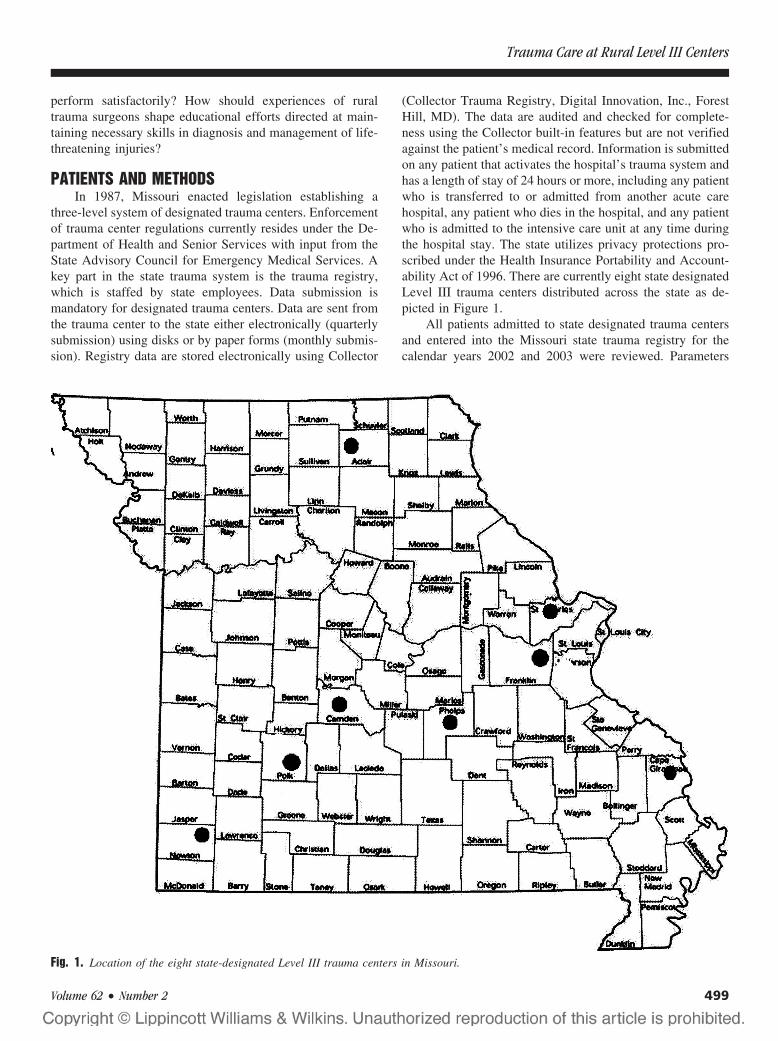
perform satisfactorily? How should experiences of ruraltrauma surgeons shape educational efforts directed at main-taining necessary skills in diagnosis and management of life-threatening injuries?
PATIENTS AND METHODSIn 1987, Missouri enacted legislation establishing a
three-level system of designated trauma centers. Enforcementof trauma center regulations currently resides under the De-partment of Health and Senior Services with input from theState Advisory Council for Emergency Medical Services. Akey part in the state trauma system is the trauma registry,which is staffed by state employees. Data submission ismandatory for designated trauma centers. Data are sent fromthe trauma center to the state either electronically (quarterlysubmission) using disks or by paper forms (monthly submis-sion). Registry data are stored electronically using Collector
(Collector Trauma Registry, Digital Innovation, Inc., ForestHill, MD). The data are audited and checked for complete-ness using the Collector built-in features but are not verifiedagainst the patient’s medical record. Information is submittedon any patient that activates the hospital’s trauma system andhas a length of stay of 24 hours or more, including any patientwho is transferred to or admitted from another acute carehospital, any patient who dies in the hospital, and any patientwho is admitted to the intensive care unit at any time duringthe hospital stay. The state utilizes privacy protections pro-scribed under the Health Insurance Portability and Account-ability Act of 1996. There are currently eight state designatedLevel III trauma centers distributed across the state as de-picted in Figure 1.
All patients admitted to state designated trauma centersand entered into the Missouri state trauma registry for thecalendar years 2002 and 2003 were reviewed. Parameters
Fig. 1. Location of the eight state-designated Level III trauma centers in Missouri.
Trauma Care at Rural Level III Centers
Volume 62 • Number 2 499
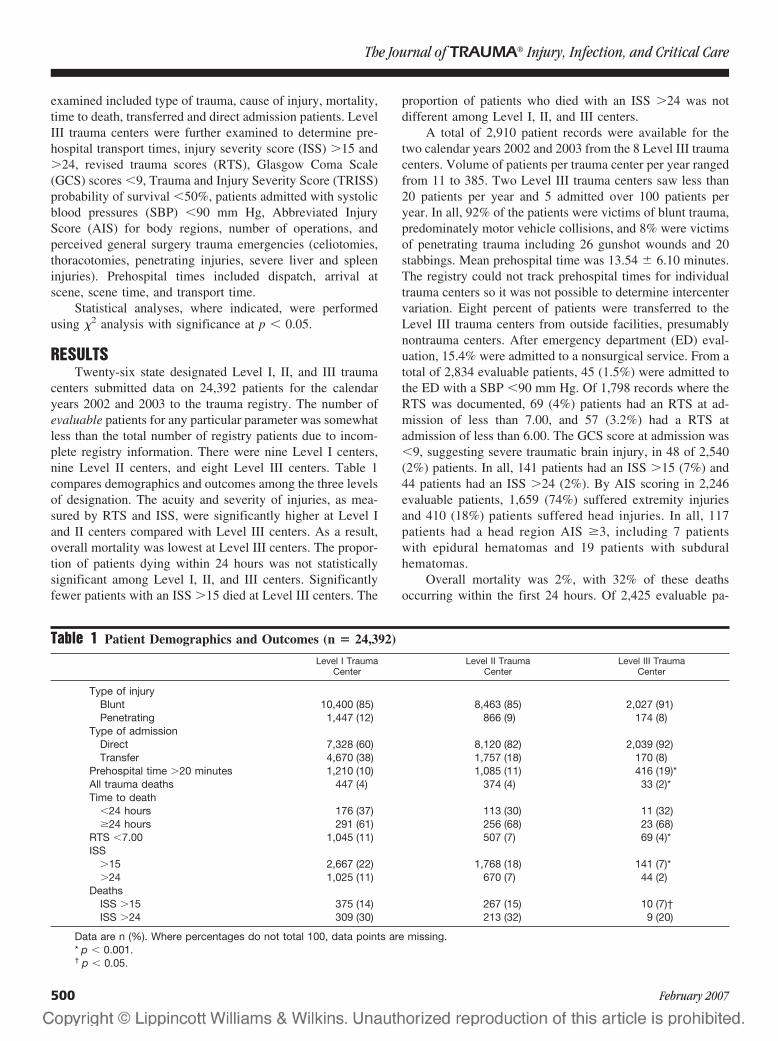
examined included type of trauma, cause of injury, mortality,time to death, transferred and direct admission patients. LevelIII trauma centers were further examined to determine pre-hospital transport times, injury severity score (ISS) �15 and�24, revised trauma scores (RTS), Glasgow Coma Scale(GCS) scores �9, Trauma and Injury Severity Score (TRISS)probability of survival �50%, patients admitted with systolicblood pressures (SBP) �90 mm Hg, Abbreviated InjuryScore (AIS) for body regions, number of operations, andperceived general surgery trauma emergencies (celiotomies,thoracotomies, penetrating injuries, severe liver and spleeninjuries). Prehospital times included dispatch, arrival atscene, scene time, and transport time.
Statistical analyses, where indicated, were performedusing �2 analysis with significance at p � 0.05.
RESULTSTwenty-six state designated Level I, II, and III trauma
centers submitted data on 24,392 patients for the calendaryears 2002 and 2003 to the trauma registry. The number ofevaluable patients for any particular parameter was somewhatless than the total number of registry patients due to incom-plete registry information. There were nine Level I centers,nine Level II centers, and eight Level III centers. Table 1compares demographics and outcomes among the three levelsof designation. The acuity and severity of injuries, as mea-sured by RTS and ISS, were significantly higher at Level Iand II centers compared with Level III centers. As a result,overall mortality was lowest at Level III centers. The propor-tion of patients dying within 24 hours was not statisticallysignificant among Level I, II, and III centers. Significantlyfewer patients with an ISS �15 died at Level III centers. The
proportion of patients who died with an ISS �24 was notdifferent among Level I, II, and III centers.
A total of 2,910 patient records were available for thetwo calendar years 2002 and 2003 from the 8 Level III traumacenters. Volume of patients per trauma center per year rangedfrom 11 to 385. Two Level III trauma centers saw less than20 patients per year and 5 admitted over 100 patients peryear. In all, 92% of the patients were victims of blunt trauma,predominately motor vehicle collisions, and 8% were victimsof penetrating trauma including 26 gunshot wounds and 20stabbings. Mean prehospital time was 13.54 � 6.10 minutes.The registry could not track prehospital times for individualtrauma centers so it was not possible to determine intercentervariation. Eight percent of patients were transferred to theLevel III trauma centers from outside facilities, presumablynontrauma centers. After emergency department (ED) eval-uation, 15.4% were admitted to a nonsurgical service. From atotal of 2,834 evaluable patients, 45 (1.5%) were admitted tothe ED with a SBP �90 mm Hg. Of 1,798 records where theRTS was documented, 69 (4%) patients had an RTS at ad-mission of less than 7.00, and 57 (3.2%) had a RTS atadmission of less than 6.00. The GCS score at admission was�9, suggesting severe traumatic brain injury, in 48 of 2,540(2%) patients. In all, 141 patients had an ISS �15 (7%) and44 patients had an ISS �24 (2%). By AIS scoring in 2,246evaluable patients, 1,659 (74%) suffered extremity injuriesand 410 (18%) patients suffered head injuries. In all, 117patients had a head region AIS �3, including 7 patientswith epidural hematomas and 19 patients with subduralhematomas.
Overall mortality was 2%, with 32% of these deathsoccurring within the first 24 hours. Of 2,425 evaluable pa-
Table 1 Patient Demographics and Outcomes (n � 24,392)
Level I TraumaCenter
Level II TraumaCenter
Level III TraumaCenter
Type of injuryBlunt 10,400 (85) 8,463 (85) 2,027 (91)Penetrating 1,447 (12) 866 (9) 174 (8)
Type of admissionDirect 7,328 (60) 8,120 (82) 2,039 (92)Transfer 4,670 (38) 1,757 (18) 170 (8)
Prehospital time �20 minutes 1,210 (10) 1,085 (11) 416 (19)*All trauma deaths 447 (4) 374 (4) 33 (2)*Time to death
�24 hours 176 (37) 113 (30) 11 (32)�24 hours 291 (61) 256 (68) 23 (68)
RTS �7.00 1,045 (11) 507 (7) 69 (4)*ISS
�15 2,667 (22) 1,768 (18) 141 (7)*�24 1,025 (11) 670 (7) 44 (2)
DeathsISS �15 375 (14) 267 (15) 10 (7)†ISS �24 309 (30) 213 (32) 9 (20)
Data are n (%). Where percentages do not total 100, data points are missing.* p � 0.001.† p � 0.05.
The Journal of TRAUMA� Injury, Infection, and Critical Care
500 February 2007

tients, 20 (0.8%) had a TRISS probability of survival lessthan 50%.
At least one operation was performed on 1,365 of 2,910(47%) patients. Seventy-six patients had 2 operations and 20patients had 3. There were 54 spleen injuries, 15 with an AISof 4 or 5. There were 46 liver injuries, 12 with an AIS of 4 or5. It was not always possible to determine whether an oper-ation was performed for injuries listed. Likely abdominaloperations that occurred based on injury description are listedin Table 2. At least 28 (1%) of 2,910 patients appeared toneed either a chest or abdominal operation for injuriessuffered.
DISCUSSIONAlthough attention has been focused on Level I and II
center outcomes and their role in regional trauma systems,little is known of the contribution of Level III centers to thecare of patients in more rural areas. Surgeons who staff thesehospitals are usually not specifically trauma trained but havestepped forward to provide needed care for their communi-ties. It is here that attention should be directed to addressneeds of hospitals and health care providers in a functioningtrauma system.
The Missouri trauma system is a three-tiered traumasystem with state-designated Level I, II, and III trauma cen-ters. As expected, the nine Level I centers cared for the bulkof trauma victims, including over one-third transferred fromother institutions. Because of their urban location, Level Icenters experienced more penetrating trauma than suburbanor rural centers. Also as expected, the acuity and severity ofinjuries was more pronounced at Level I centers. As a con-sequence, perhaps, overall mortality was significantly less atLevel III centers. Reassuringly, early mortality (within 24hours of admission), possibly reflecting acute care of criti-cally injured patients, was comparable in Level I, II, and IIIcenters. There were also fewer deaths in the more severelyinjured at Level III centers, which was statistically significantfor patients with an ISS �15. This could reflect the fact thatmany seriously injured patients were transferred from LevelIII centers to higher levels of care after admission and stabi-lization and, subsequently, may have died there. Althoughthere was no way to track this from the state trauma registry,such an assumption would reflect favorably on a traumasystem—transfer of seriously injured patients to higher levelsof care.
In less densely populated areas with limited medicalresources, Level III trauma centers are essential to begin theresuscitation and care of trauma victims. The American Col-lege of Surgeons Committee on Trauma states that “Level III[centers] must have the capability to manage the initial careof the majority of injured patients . . . ”10 It could be arguedthat this applies to all trauma patients, not just “the majority”.This means availability of trauma surgeons and quick re-sponse of a resuscitative trauma team. The rural traumasurgeon may be faced with life-threatening injuries that mustbe dealt with expeditiously in an austere setting with respectto technology and health care providers. Despite transferagreements and lines of communication with more compre-hensive centers, a certain amount of damage control surgerymay need to be done first. So, how immediate are thesechallenges in the experience of rural trauma centers? Arevolume and acuity enough to maintain skills necessary totreat catastrophic injuries?
The present retrospective study indicates that the volumeof trauma patients admitted to Missouri Level III centers isvariable, ranging from a relatively few to numbers compara-ble with many Level I and Level II centers. The injuries werepredominately blunt, 92%, which is not too dissimilar fromthat reported by the National Trauma Data Bank (NTDB),90%.11 Acuity, as measured by hypotension at admission,severe traumatic brain injury, or RTS below 7.00, was low,affecting less than 5% of the patient population. Severity ofinjury measured by the ISS was also lower than reported bythe NTDB for all levels of care. Seven percent of Level IIIpatients had an ISS �15 compared with almost 11% reportedby the NTDB and only 2% of Level III patients had an ISS�24 compared with over 8% of NTDB patients.
Table 2 Patients Presumed to Have Had a Chest orAbdominal Operation Based on Injury Description(n � 28)
Injury Type Injury Description
Blunt Splenic rupture, AIS 5Splenic rupture, AIS 4Liver laceration, bile duct, gallbladder injuryRuptured duodenum, pancreas contusionSplenic injury, stomach injurySplenic rupture, AIS 5Small bowel perforation, sigmoid lacerationSmall bowel injurySmall bowel injury with ischemia and necrosisEviscerationSigmoid colon injuryRuptured diaphragm, liver laceration,
pericardial tearSplenic rupture, AIS 5, pancreatic injurySplenic injury, stomach injury, kidney injurySplenic injury, AIS 5Jejunal injurySplenic rupture, AIS 5, liver lacerationLiver laceration, uterus ruptureSplenic rupture, AIS 4Splenic injury, diaphragm rupture, jejunal injury
Penetrating GSW chest, tracheal, esophageal injuriesGSW sigmoid colon, rectumGSW colon, bladder, small bowelGSW liver injuryGSW evisceration, macerated liverGSW left kidney injuryGSW omentum, mesenteryGSW liver, mesentery
AIS, Abbreviated Injury Score; GSW, gunshot wound.
Trauma Care at Rural Level III Centers
Volume 62 • Number 2 501

Prehospital care has been cited as a potential problem forrural trauma patients,12,13 blaming longer response and trans-port times caused by remote locations. Surprisingly, meanprehospital times, including response, scene, and transporttimes, in this study were low. However, there were morepatients at Level III centers than in more urban settings whoseprehospital times exceeded 20 minutes. This probably reflectsthe sometimes remote nature of rural trauma. It was notpossible from the registry to tell whether these delays had anadverse effect on patient care. The only consolation was thatpatients did not die at any higher rate within the first 24 hoursthan at Level I or Level II centers.
Most patients seen at the eight Level III centers hadorthopedic injuries and, although many required operation,the vast majority were orthopedic procedures. Although notperhaps challenging for the trauma surgeon, these patientscan present unique problems for the trauma center. Theirseverity of injury is often underrepresented by the ISS, andthey have been shown to be a resource-intensive group withlengths of hospital stays almost twice that of nonorthopedictrauma patients.14,15 Additionally, multisystem injury is notuncommon in these patients. It should be remembered thatinitial assessment and prioritization of care is the cornerstoneof trauma management, resting largely on the shoulders of thetrauma surgeon, and the occurrence of missed injuries, evenin trauma centers, is a danger. Aaland and Smith,16 reportingfrom a rural trauma center, pointed out that 3% of 1,876patients were found to have missed injuries, including arterialand bowel injuries, from which 34% required operative inter-vention and one patient died. Moreover, daily rounds by trauma-oriented health care providers, specifically trauma surgeons, hasbeen shown to decrease length of stay17 and may have a partic-ularly beneficial effect on this patient population.
Severe traumatic brain injury was uncommon in LevelIII centers yet should be expected in any trauma network. ForLevel III verification/designation, neurosurgery availability isnot required by either ACS COT or Missouri regulations.3,10
Evaluation and initial resuscitation of the brain-injured pa-tient can be done by Advanced Trauma Life Support trainedgeneral surgeons according to guidelines established by theBrain Trauma Foundation.18 Without neurosurgeons on hand,these patients should most appropriately be transferred tohigher levels of care, based on clinical assessment, wheresuch coverage is present, even before computerized tomog-raphy (CT) scanning is done. Immediate life-threatening neu-rosurgical emergencies, consisting of epidural or subduralhematomas were rare, 0.9% or 9 patients in 1,000 admissions.This could present a challenge to the Level III trauma sur-geon. Some19 feel that trauma surgeons should have the capa-bility to perform limited craniotomies for drainage of hemato-mas, realizing that early decompressive treatment isbeneficial.20,21 Ordinarily, this skill set is not available for thepresent day rural trauma surgeon and, with the rarity of suchemergencies in Missouri Level III centers, would not be practi-cal or safe to maintain. It may be more prudent to expeditiously
transfer these patients to neurosurgeons once again based onclinical grounds alone, without delays caused by local CT scan-ning and with proper early resuscitation and stabilization.
The prospect of lifesaving chest or abdominal surgery isa focal point of the rural trauma center. Hemorrhage remainsa major cause of death5,6 and will be encountered by the ruraltrauma surgeon. These patients may be particularly suited todamage control techniques—control of bleeding, stabiliza-tion, and transfer for definitive care. Weinberg andassociates22 have demonstrated the applicability of damagecontrol surgery in the rural environment in salvaging criti-cally injured patients. From Missouri Level III registry infor-mation, it is difficult to determine which operations wereperformed for damage control. There appear to have been 27celiotomies and one thoracotomy in 2,910 patients, an inci-dence of one operation in 100 patients. If one considerspotential candidates for damage control surgery as those witha RTS �6.00 and those with hypotension at admission, asdescribed by others,23,24 there were 3% and 2%, respectively,in this population. In considering massive liver injuries asrequiring damage control, only 12 such patients with liverAIS of 4 or 5 were seen. So, depending on trauma centervolume and number of surgeons taking trauma call, onewould encounter such patients once or twice per year or onceevery few years. It would be difficult to maintain familiaritywith damage control techniques at this frequency withoutconcerted efforts at continuing medical education.
What, then, can be learned from the experience of Mis-souri’s Level III trauma centers? Compared with higher lev-els of care, the Level III centers performed admirably byparameters measured. Although mean prehospital transporttimes were not excessively long, there were a higher propor-tion of transport times over 20 minutes, reflecting the natureof rural trauma. Overall death rates, deaths within 24 hours,and deaths from severe injuries were not statistically differentfrom Level I and Level II experiences. As expected acuity andseverity of injury was lower, reflecting the nature of much blunttrauma—orthopedic and less severe head injuries.
REFERENCES1. Maio RF, Green PE, Becker MP, Burney RE, Compton C. Rural
motor vehicle crash mortality: the role of crash severity and medicalresources. Accid Anal Prev. 1992;24:631–642.
2. Congressional Office of Technology Assessment. Rural EmergencyMedical Services. Special Report. Washington, DC: Office ofTechnology Assessment: 1989. Publication OTA-H-445.
3. Missouri Department of Health and Senior Services. Missouri VitalStatistics 2003.
4. Maio RF, Burney RE, Gregor MA, Baranski MG. A study ofpreventable trauma mortality in rural Michigan. J Trauma. 1996;41:83–90.
5. Rogers FB, Shackford SR, Hoyt DB, et al. Trauma deaths in amature urban versus rural trauma system. Arch Surg. 1997;132:376–382.
6. Esposito TJ, Sanddal ND, Hansen JD, Reynolds S. Analysis ofpreventable trauma deaths and inappropriate trauma care in a ruralstate. J Trauma. 1995;39:955–962.
The Journal of TRAUMA� Injury, Infection, and Critical Care
502 February 2007
7. Mullins RF, Hedges JR, Rowland DJ, et al. Survival of seriouslyinjured patients first treated in rural hospitals. J Trauma. 2002;52:1019–1029.
8. Richardson JD, Cross T, Lee D, et al. Impact of level III verificationon trauma admissions and transfer: comparisons of two ruralhospitals. J Trauma. 1997;42:498–502.
9. Veenema KR, Rodewald LE. Stabilization of rural multiple-traumapatients at level III emergency departments before transfer to level Iregional trauma center. Ann Emerg Med. 1995;25:175–181.
10. Resources for optimal care of the injured patient. Chicago:Committee on Trauma American College of Surgeons, 1999.
11. Nationa Trauma Data Bank Report 2004 Committee on Trauma.Chicago: American College of Surgeons, 2004.
12. Esposito TJ, Maier RV, Rivara FP, et al. The impact of variation intrauma care times: urban versus rural. Prehospital Disaster Med.1995;10:161–166.
13. Grossman DC, Kim A, MacDonald SC, et al. Urban-rural differences inprehospital care of major trauma. J Trauma. 1997;42:723–729.
14. Michaels AJ, Madey SM, Krieg JC, Long WB. Traditional injuryscoring underestimates the relative consequences of orthopedicinjury. J Trauma. 2001;50:389–395.
15. Fern KT, Smith JT, Zee B, et al. Trauma patients with multipleextremity injuries: resource utilization and long-term outcome inrelation to injury severity scores. J Trauma. 1998;45:489 – 494.
16. Aaland MO, Smith K. Delayed diagnosis in a rural trauma center.Surgery. 1996;120:774–778.
17. Dutton RP, Cooper C, Jones A, et al. Daily multidisciplinary roundsshorten length of stay for trauma patients. J Trauma. 2003;55:913–919.
18. Management and Prognosis of Severe Traumatic Brain Injury. NewYork: Brain Trauma Foundation, 2000.
19. Rinker CF, McMurry FG, Groeneweg VR, et al. Emergencycraniotomy in a rural Level III trauma center. J Trauma. 1998;44:984–989.
20. Seelig JM, Becker DP, Miller JD, et al. Traumatic subduralhematomas: major mortality reduction in comatose patients treatedwithin four hours. N Engl J Med. 1981;304:1511–1518.
21. Lobato RD, Rivas JJ, Cordobes F, et al. Acute epidural hematoma:an analysis of factors influencing the outcome of patients undergoingsurgery in coma. J Neurosurg. 1988;68:48–57.
22. Weinberg JA, McKinley K, Petersen SR, et al. Trauma laparotomyin a rural setting before transfer to a regional center: does it savelives? J Trauma. 2003;54:823–826.
23. Asensio JA, Roldan G, Petrone P, et al. Operative management andoutcomes in 103 AAST-OIS grades IV and V complex hepaticinjuries: trauma surgeons still need to operate, but angioembolizationhelps. J Trauma. 2003;54:647–654.
24. Johnson JW, Gracias VH, Schwab CW, et al. Evolution in damagecontrol for exsanguinating penetrating abdominal injury. J Trauma.2001;51:261–269.
Trauma Care at Rural Level III Centers
Volume 62 • Number 2 503

The Effectiveness of Video-Telemedicine forScreening of Patients Requesting Emergency AirMedical Transport (EAMT)Shin-Han Tsai, MD, PhD, Jess Kraus, PhD, Hsueh-Ru Wu, MSN, Wan-Lin Chen, MD,Ming-Fu Chiang, MD, PhD, Li-Hua Lu, MD, MMS, Chia-En Chang, MS, and Wen-Ta Chiu, MD, PhD
Background: Demand for emergencyair medical transport (EAMT) services haveincreased in recent years. However, the highcosts of these services have raised questionson the benefit to patient outcomes. In thisstudy, we evaluate the effectiveness of video-telemedicine for the preflight screening ofpatients for air medical transports.
Method: A prospective cohort study.Medical records of patients transportedfrom the Penghu Islands to Taiwan wereretrospectively collected from November1999 to October 2002 (stage 1). In addi-tion, we collected medical records of pa-tients who were preflight-screened byphysicians using video Web cameras fromNovember 1, 2002 through August 30,2003 (stage 2). The intervention in stage 2included a set of protocols and screening
criteria for EAMT implemented by the Na-tional Aeromedical Consultation Center(NACC). In stage 1, there were no standard-ized protocols or screening guidelines forEAMT. The EAMT system before imple-menting preflight screening and telemedi-cine was mostly based on patient’s requestsand their health condition determined bythe treating medical officers (TMO).
Results: A total of 822 transfers wereincluded in this study. Patient demographicbackgrounds in the two groups were similaron gender, age, disease classification, andtypes of illnesses. Patients in stage 2 weresignificantly older than those in stage 1. In acomparison of flight frequencies betweenthe two stages, the results revealed a 36.2%reduction of EAMT applications in stage 2.The flight approval rate was 91.2%. The
intervention in stage 2 also presented a sig-nificant reduction in cross-zone transport(16.1% to 0.1% to the northern Taiwan re-gion). Within-zone transfers increased from74.9% to 88.3%. Cost analysis showed thatphysician triage in stage 2 resulted in a totalannual savings on EAMTs of US$ 448,986.
Conclusions: This study demonstratesthe physician-assisted preflight screeningusing video-telemedicine significantly re-duced the frequency of unnecessary airmedical transports and consequently ledto reduced costs. Video-telemedicine canbe an essential tool to support physiciansin decision-making for patient screening.
Key Words: Emergency air medicaltransport, Remote island, Physician triage,Telemedicine, Helicopter, Cost analysis.
J Trauma. 2007;62:504–511.
The demand for emergency air medical transport (EAMT)services has increased in recent years. There are increasingnumbers of EAMT programs supported by trauma centers
to provide efficient management of emergency medical care and
better patient outcomes.1–4 However, there are growing num-bers of studies questioning the cost-effectiveness of EAMTservices.5–10 Attempts to reduce costs have been a major con-cern for hospital administrators as well as the third-partypayers.11 A well-defined and integrated triage system has beenwidely suggested for cost-effective management of emergencyair medical transport.3,9,11–15
IMPORTANCEPrevious studies have shown cost effectiveness of tele-
medicine in emergency care.14,16–22 Because of advances incomputer technology, video telemedicine has become popu-lar and available. The use of telemedicine has been widelyaccepted as a cost-effective option in health care, especiallyin remote areas.18,19 Moreover, in a study on the use of tele-medicine, Roth et al. (1998) concluded that prehospital transtele-phonic triage can effectively reduce costs of medical care andthe number of hospital emergency department visits.11 In asimilar study, Haskins and colleagues (2002) reported that tele-medicine resulted in an approximately 15% decrease in ambu-lance transport.23 In the United Kingdom, the first telemedicinelink in Northern Ireland showed a dramatic reduction of patientsreferred to their General Practitioners (GPs) and accident andemergency (A&E) departments.24 A study in Aberdeen also
Submitted for publication June 15, 2005.Accepted for publication February 22, 2006.Copyright © 2007 by Lippincott Williams & Wilkins, Inc.From the Institute of Injury Prevention and Control (S.-H.T., H.-R.W.,
W.-L.C., C.-E.C., W.-T.C.), Department of Neurological Surgery (S.-H.T.,W.-T.C.), and Department of Emergency Medicine (S.-H.T.), Taipei MedicalUniversity-Wan Fang Hospital, Taipei, Taiwan; Injury Prevention ResearchCenter (J.F.K.), University of California Los Angeles, Los Angeles, CA;Division of Neurological Surgery (W.-L.C.), St. Mary’s Hospital, Ilan, Tai-wan; Division of Neurological Surgery (M.-F.C.), Mackay Memorial Hos-pital, Taipei, Taiwan; Department of Emergency Medicine (W.-M.C.),Mackay Memorial Hospital Hsinchu Branch, Hsinchu, Taiwan; and Depart-ment of Emergency Medicine (L.-H.L.), Tong’s MetroHarbor Hospital,Taichung, Taiwan.
Presented, in part, at the 14th World Congress for Disaster and Emer-gency Medicine, May 16–20, 2005, Edinburgh, United Kingdom.
Supported by research funding from the Department of Health, Taiwanfor NACC project (DOH93-TD-M-113-010) and a grant from the NationalHealth Research Institute (NHRI-EX94-9106PN).
Address for reprints: Wen-Ta Chiu, PhD, MD, 250 Wu-Shin Street,Taipei 110, Taiwan; email: [email protected].
DOI: 10.1097/01.ta.0000219285.08974.45
The Journal of TRAUMA� Injury, Infection, and Critical Care
504 February 2007

demonstrated that 58% of patient transfers can be avoided afterthe use of telemedical link.20,24 Other studies have also reportedthe reliability and feasibility of telemedicine in emergency care,especially in rural areas.21,25–27
The geographical limitations in Taiwan and unequal de-velopment of medical manpower and facilities on remoteislands have resulted in a growing need of medical transfersto the main island of Taiwan. A lack of a preflight screeningsystem has resulted in rapid growth of unnecessary flights,which caused increased government expenditures of up to NT$200,000,000 (US$ 6,250,000) each year. The rapid growthof EAMTs and the high costs caused Taiwanese healthcareauthorities to establish a National Aeromedical ConsultationCenter (NACC), a physician-based helicopter control centerfor the preflight screening of patients requesting EAMTservices.28
GOAL OF INVESTIGATIONAlthough there is increasing awareness on cost effective
use of telemedicine in emergency care, little is publishedabout the use of telemedicine in reducing unnecessary airmedical transport. The increase in the use of EAMT programsas well as its high costs has prompted a need to investigate thereal benefit on EAMT. This is the first report to examine theeffectiveness of video-telemedicine to reduce costs by pre-flight screening of EAMT. Our research question is ‘wouldpreflight screening using telemedicine result in the reductionof EAMT and enhance the safety of patient transfers’?
MATERIALS AND METHODSStudy Design and the Selection of Patients
This is a prospective cohort study, which comprised twogroups of research subjects; a historical group before theintervention (stage 1) and a second group who received ascreening protocol, defined as stage 2. Patients in the controlgroup (stage 1) were defined as patients who were air trans-ported from a remote island of Taiwan to the mainlandwithout receiving preflight screening. The patients in theintervention group were those who receive preflight screen-ing by physicians using a protocol containing screening cri-teria, and video-telemedical devices. The study period beganon November 1, 2002 and ran to August 30, 2003.
Participants included patients from Penghu Islands whoreceived EAMT services during the study period. Patientswho took commercial flights to Taiwan without preflightscreening were excluded. Participants who did not meet thetransport criteria were included in the study.
SettingsThe research settings include four sites of wireless local
area network (LAN) located in the emergency departments onthe Penghu Islands connected to one control center located inthe headquarters of National Rescue Command Center inTaipei. The four sites included two district hospitals, Penghu
Military Hospital and Penghu County Hospital, and two re-mote clinics located in two of the outer islands of Penghu.
DefinitionsPenghu Islands
The Penghu Islands comprise archipelago located off thesouthwest coast of Taiwan in the Taiwan Strait. The flyingdistance between the Penghu Islands and Taiwan is approx-imately 200 miles. There were no changes regarding popu-lation, manpower, or medical facilities available in PenghuIslands during the study period.
The National Aeromedical Consultation CenterThe National Aeromedical Consultation Center (NACC)
was established on October 1, 2002. It is a physician-based24-hour control center that coordinates the transport of in-jured or critically ill patients between Taiwan and its sur-rounding islands.28 The main objective of the NACC is toprovide criteria-based preflight screening of patients whorequired air transport from 18 locations nationwide. Currentlythere are 10 senior consultant physicians and a medical di-rector who participate in consultation. All have backgroundsin emergency medicine, neurologic surgery, critical caremedicine, aviation medicine, and “flying doctors” who haveparticipated in EAMT for at least 2 years.
Before the NACC was established, all EAMT serviceswere dispatched without criteria for patients’ qualification.Physicians in referring hospitals made requests to helicoptersfor urgent transport, if, in their opinion, a patient’s conditionsrequired it. Once requested, the helicopter was dispatched inall cases except in extreme nonflying weather conditions.
SafetyCross-strait transport exceeding 250 miles is considered
high risk and unsafe. In some cases, cross-zone flights wereconsidered unnecessary if medical centers within the respon-sible zones had the ability to manage the medical condition.
Unnecessary FlightsFor purposes of this study, unnecessary flight is defined by
the urgency of the patient’s condition. If alternative means oftransport, such as transported by ferry or commercial flights issuitable for transport, the EAMT applications would be rejected.
Standard Operation Procedures for Medical TransportsThe standard operation procedures (SOPs) were de-
signed by a joint committee comprised of a group of expertsincluding representatives from the National Fire Administra-tion (NFA), senior officers from the Department of Health(DOH), and Civil Aeronautics Administration (CAA), as wellas physicians who specialize in emergency medicine, criticalcare, and aviation medicine. Requests for EAMT must bemade by the treating medical officers (TMO) from an islandhospital to the NACC. Physicians communicate using thetele-video system. Furthermore, physicians at the NACC
Video-Telemedicine for Screening of Patients Requesting EAMT
Volume 62 • Number 2 505
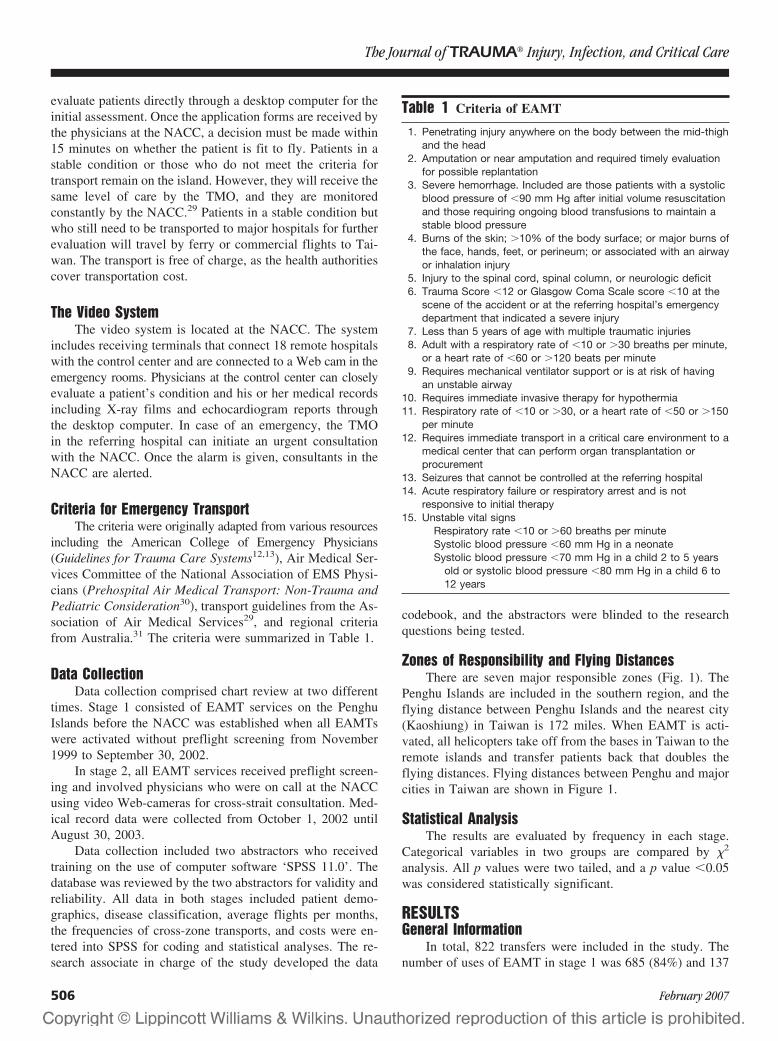
evaluate patients directly through a desktop computer for theinitial assessment. Once the application forms are received bythe physicians at the NACC, a decision must be made within15 minutes on whether the patient is fit to fly. Patients in astable condition or those who do not meet the criteria fortransport remain on the island. However, they will receive thesame level of care by the TMO, and they are monitoredconstantly by the NACC.29 Patients in a stable condition butwho still need to be transported to major hospitals for furtherevaluation will travel by ferry or commercial flights to Tai-wan. The transport is free of charge, as the health authoritiescover transportation cost.
The Video SystemThe video system is located at the NACC. The system
includes receiving terminals that connect 18 remote hospitalswith the control center and are connected to a Web cam in theemergency rooms. Physicians at the control center can closelyevaluate a patient’s condition and his or her medical recordsincluding X-ray films and echocardiogram reports throughthe desktop computer. In case of an emergency, the TMOin the referring hospital can initiate an urgent consultationwith the NACC. Once the alarm is given, consultants in theNACC are alerted.
Criteria for Emergency TransportThe criteria were originally adapted from various resources
including the American College of Emergency Physicians(Guidelines for Trauma Care Systems12,13), Air Medical Ser-vices Committee of the National Association of EMS Physi-cians (Prehospital Air Medical Transport: Non-Trauma andPediatric Consideration30), transport guidelines from the As-sociation of Air Medical Services29, and regional criteriafrom Australia.31 The criteria were summarized in Table 1.
Data CollectionData collection comprised chart review at two different
times. Stage 1 consisted of EAMT services on the PenghuIslands before the NACC was established when all EAMTswere activated without preflight screening from November1999 to September 30, 2002.
In stage 2, all EAMT services received preflight screen-ing and involved physicians who were on call at the NACCusing video Web-cameras for cross-strait consultation. Med-ical record data were collected from October 1, 2002 untilAugust 30, 2003.
Data collection included two abstractors who receivedtraining on the use of computer software ‘SPSS 11.0’. Thedatabase was reviewed by the two abstractors for validity andreliability. All data in both stages included patient demo-graphics, disease classification, average flights per months,the frequencies of cross-zone transports, and costs were en-tered into SPSS for coding and statistical analyses. The re-search associate in charge of the study developed the data
codebook, and the abstractors were blinded to the researchquestions being tested.
Zones of Responsibility and Flying DistancesThere are seven major responsible zones (Fig. 1). The
Penghu Islands are included in the southern region, and theflying distance between Penghu Islands and the nearest city(Kaoshiung) in Taiwan is 172 miles. When EAMT is acti-vated, all helicopters take off from the bases in Taiwan to theremote islands and transfer patients back that doubles theflying distances. Flying distances between Penghu and majorcities in Taiwan are shown in Figure 1.
Statistical AnalysisThe results are evaluated by frequency in each stage.
Categorical variables in two groups are compared by �2
analysis. All p values were two tailed, and a p value �0.05was considered statistically significant.
RESULTSGeneral Information
In total, 822 transfers were included in the study. Thenumber of uses of EAMT in stage 1 was 685 (84%) and 137
Table 1 Criteria of EAMT
1. Penetrating injury anywhere on the body between the mid-thighand the head
2. Amputation or near amputation and required timely evaluationfor possible replantation
3. Severe hemorrhage. Included are those patients with a systolicblood pressure of �90 mm Hg after initial volume resuscitationand those requiring ongoing blood transfusions to maintain astable blood pressure
4. Burns of the skin; �10% of the body surface; or major burns ofthe face, hands, feet, or perineum; or associated with an airwayor inhalation injury
5. Injury to the spinal cord, spinal column, or neurologic deficit6. Trauma Score �12 or Glasgow Coma Scale score �10 at the
scene of the accident or at the referring hospital’s emergencydepartment that indicated a severe injury
7. Less than 5 years of age with multiple traumatic injuries8. Adult with a respiratory rate of �10 or �30 breaths per minute,
or a heart rate of �60 or �120 beats per minute9. Requires mechanical ventilator support or is at risk of having
an unstable airway10. Requires immediate invasive therapy for hypothermia11. Respiratory rate of �10 or �30, or a heart rate of �50 or �150
per minute12. Requires immediate transport in a critical care environment to a
medical center that can perform organ transplantation orprocurement
13. Seizures that cannot be controlled at the referring hospital14. Acute respiratory failure or respiratory arrest and is not
responsive to initial therapy15. Unstable vital signs
Respiratory rate �10 or �60 breaths per minuteSystolic blood pressure �60 mm Hg in a neonateSystolic blood pressure �70 mm Hg in a child 2 to 5 years
old or systolic blood pressure �80 mm Hg in a child 6 to12 years
The Journal of TRAUMA� Injury, Infection, and Critical Care
506 February 2007

(16%) in stage 2. Patient demographic data for the twocohorts were similar regarding gender, age, disease classifi-cation, and types of illnesses (trauma, disease) (Table 2). The
majority of patients were male (65.6%). Over 28% of patientswere between 61 and 75 years of age or between 0 and 15years (18.9%) (Table 3).
The mean age of the total sample group was 47.15 � SD27.53. Patient mean age significantly differed between thegroups. Patient mean age in stage 2 was older (51.7 � 23.47)than those in stage 1 (46.23 � SD 28.21, t � �2.135, p �0.033) (Table 3). The majority of patients had major illnesses(76.6%, n � 630).
Frequencies of EAMTsDuring stage one, 685 flights were activated representing
an average of 19.6 flights per month. In comparison, 137flights were requested in stage two, but only 125 flights wereapproved representing an average of 12.5 flights per month,less than stage one. The reduction rate of flights between twostages was 36.3%.
Responsible Zones and Flight DistancesIn the first stage of this study, about 74.9% of patients
were within-zone transferred to the southern region (Table 4)and 16.1% were transferred to the northern region. We alsofound that one patient (0.1%) was inappropriately transferredto the eastern region, a remote region with limited medical
Fig. 1. EAMT responsible zones and average one-way flight distances to the Penghu Islands.
Table 2 Demographic Information of Subjects in theTwo Stages
Stage 1N � 685 (%)
Stage 2N � 137 (%)
TotalN � 822 (%)
GenderMale 452 (66.0) 87 (63.5) 539 (65.6)Female 233 (34.0) 50 (36.5) 283 (34.4)
Age0–15 142 (20.7) 13 (9.5) 155 (18.9)16–30 74 (10.8) 14 (10.2) 88 (10.7)31–45 74 (10.8) 19 (13.9) 93 (11.3)46–60 103 (15.0) 26 (19.0) 129 (15.7)61–75 188 (27.4) 44 (32.1) 232 (28.2)�76 104 (15.2) 21 (15.3) 125 (15.2)
Illness categoryTrauma 161 (23.5) 31 (22.6) 192 (23.4)Major illnesses 524 (76.5) 106 (77.4) 630 (76.6)
Disease classificationMedical 363 (53) 80 (58) 443 (53.9)Surgical 171 (25) 39 (29) 210 (25.6)Pediatric 137 (20) 12(9) 149 (18.1)OBS/GYN 14 (2) 6 (4) 20 (2.4)
Video-Telemedicine for Screening of Patients Requesting EAMT
Volume 62 • Number 2 507
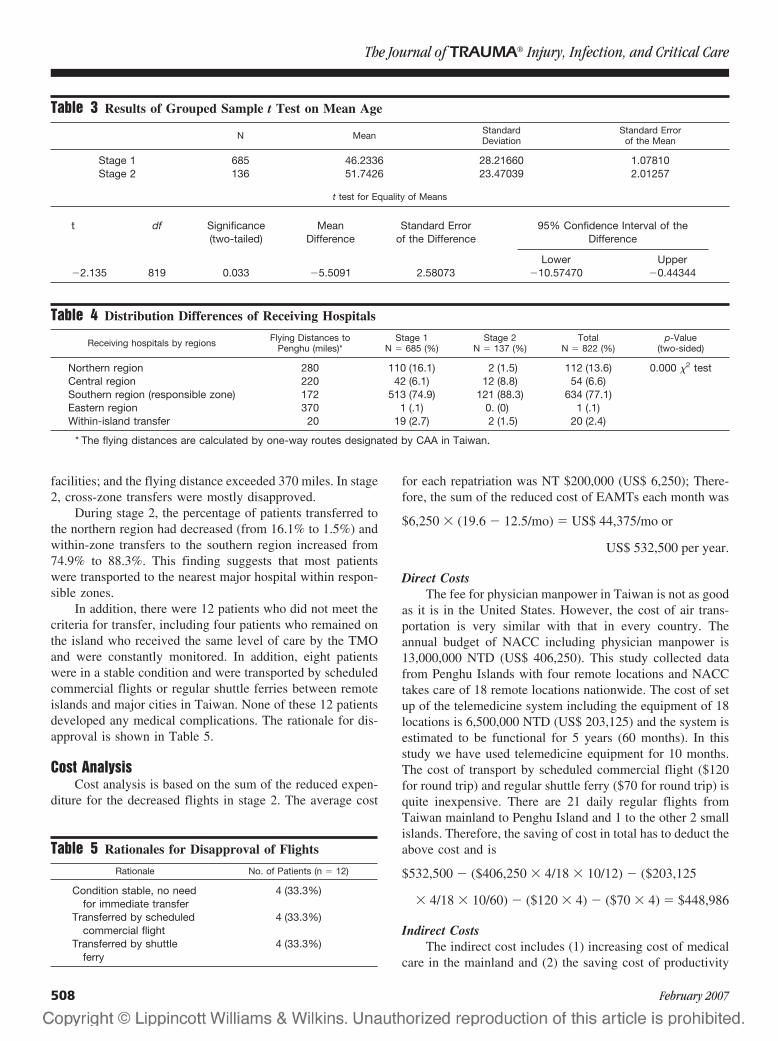
facilities; and the flying distance exceeded 370 miles. In stage2, cross-zone transfers were mostly disapproved.
During stage 2, the percentage of patients transferred tothe northern region had decreased (from 16.1% to 1.5%) andwithin-zone transfers to the southern region increased from74.9% to 88.3%. This finding suggests that most patientswere transported to the nearest major hospital within respon-sible zones.
In addition, there were 12 patients who did not meet thecriteria for transfer, including four patients who remained onthe island who received the same level of care by the TMOand were constantly monitored. In addition, eight patientswere in a stable condition and were transported by scheduledcommercial flights or regular shuttle ferries between remoteislands and major cities in Taiwan. None of these 12 patientsdeveloped any medical complications. The rationale for dis-approval is shown in Table 5.
Cost AnalysisCost analysis is based on the sum of the reduced expen-
diture for the decreased flights in stage 2. The average cost
for each repatriation was NT $200,000 (US$ 6,250); There-fore, the sum of the reduced cost of EAMTs each month was
$6,250 � (19.6 � 12.5/mo) � US$ 44,375/mo or
US$ 532,500 per year.
Direct CostsThe fee for physician manpower in Taiwan is not as good
as it is in the United States. However, the cost of air trans-portation is very similar with that in every country. Theannual budget of NACC including physician manpower is13,000,000 NTD (US$ 406,250). This study collected datafrom Penghu Islands with four remote locations and NACCtakes care of 18 remote locations nationwide. The cost of setup of the telemedicine system including the equipment of 18locations is 6,500,000 NTD (US$ 203,125) and the system isestimated to be functional for 5 years (60 months). In thisstudy we have used telemedicine equipment for 10 months.The cost of transport by scheduled commercial flight ($120for round trip) and regular shuttle ferry ($70 for round trip) isquite inexpensive. There are 21 daily regular flights fromTaiwan mainland to Penghu Island and 1 to the other 2 smallislands. Therefore, the saving of cost in total has to deduct theabove cost and is
$532,500 � ($406,250 � 4/18 � 10/12) � ($203,125
� 4/18 � 10/60) � ($120 � 4) � ($70 � 4) � $448,986
Indirect CostsThe indirect cost includes (1) increasing cost of medical
care in the mainland and (2) the saving cost of productivity
Table 3 Results of Grouped Sample t Test on Mean Age
N Mean StandardDeviation
Standard Errorof the Mean
Stage 1 685 46.2336 28.21660 1.07810Stage 2 136 51.7426 23.47039 2.01257
t test for Equality of Means
t df Significance(two-tailed)
MeanDifference
Standard Errorof the Difference
95% Confidence Interval of theDifference
Lower Upper�2.135 819 0.033 �5.5091 2.58073 �10.57470 �0.44344
Table 4 Distribution Differences of Receiving Hospitals
Receiving hospitals by regions Flying Distances toPenghu (miles)*
Stage 1N � 685 (%)
Stage 2N � 137 (%)
TotalN � 822 (%)
p-Value(two-sided)
Northern region 280 110 (16.1) 2 (1.5) 112 (13.6) 0.000 �2 testCentral region 220 42 (6.1) 12 (8.8) 54 (6.6)Southern region (responsible zone) 172 513 (74.9) 121 (88.3) 634 (77.1)Eastern region 370 1 (.1) 0. (0) 1 (.1)Within-island transfer 20 19 (2.7) 2 (1.5) 20 (2.4)
* The flying distances are calculated by one-way routes designated by CAA in Taiwan.
Table 5 Rationales for Disapproval of Flights
Rationale No. of Patients (n � 12)
Condition stable, no needfor immediate transfer
4 (33.3%)
Transferred by scheduledcommercial flight
4 (33.3%)
Transferred by shuttleferry
4 (33.3%)
The Journal of TRAUMA� Injury, Infection, and Critical Care
508 February 2007
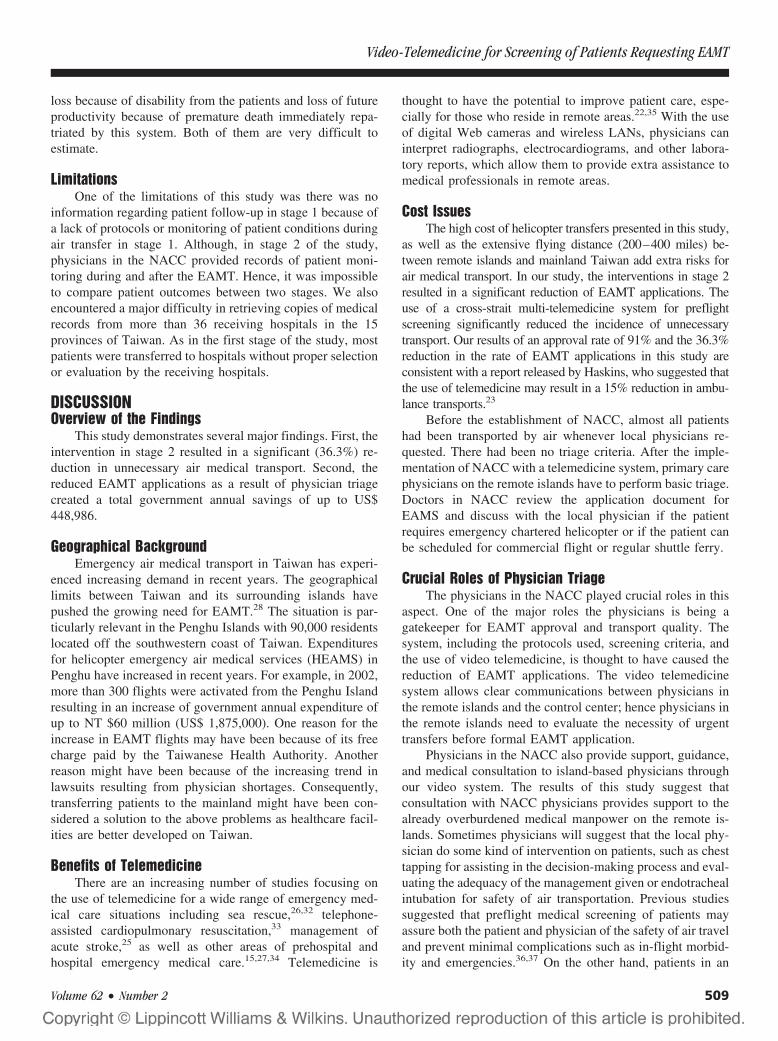
loss because of disability from the patients and loss of futureproductivity because of premature death immediately repa-triated by this system. Both of them are very difficult toestimate.
LimitationsOne of the limitations of this study was there was no
information regarding patient follow-up in stage 1 because ofa lack of protocols or monitoring of patient conditions duringair transfer in stage 1. Although, in stage 2 of the study,physicians in the NACC provided records of patient moni-toring during and after the EAMT. Hence, it was impossibleto compare patient outcomes between two stages. We alsoencountered a major difficulty in retrieving copies of medicalrecords from more than 36 receiving hospitals in the 15provinces of Taiwan. As in the first stage of the study, mostpatients were transferred to hospitals without proper selectionor evaluation by the receiving hospitals.
DISCUSSIONOverview of the Findings
This study demonstrates several major findings. First, theintervention in stage 2 resulted in a significant (36.3%) re-duction in unnecessary air medical transport. Second, thereduced EAMT applications as a result of physician triagecreated a total government annual savings of up to US$448,986.
Geographical BackgroundEmergency air medical transport in Taiwan has experi-
enced increasing demand in recent years. The geographicallimits between Taiwan and its surrounding islands havepushed the growing need for EAMT.28 The situation is par-ticularly relevant in the Penghu Islands with 90,000 residentslocated off the southwestern coast of Taiwan. Expendituresfor helicopter emergency air medical services (HEAMS) inPenghu have increased in recent years. For example, in 2002,more than 300 flights were activated from the Penghu Islandresulting in an increase of government annual expenditure ofup to NT $60 million (US$ 1,875,000). One reason for theincrease in EAMT flights may have been because of its freecharge paid by the Taiwanese Health Authority. Anotherreason might have been because of the increasing trend inlawsuits resulting from physician shortages. Consequently,transferring patients to the mainland might have been con-sidered a solution to the above problems as healthcare facil-ities are better developed on Taiwan.
Benefits of TelemedicineThere are an increasing number of studies focusing on
the use of telemedicine for a wide range of emergency med-ical care situations including sea rescue,26,32 telephone-assisted cardiopulmonary resuscitation,33 management ofacute stroke,25 as well as other areas of prehospital andhospital emergency medical care.15,27,34 Telemedicine is
thought to have the potential to improve patient care, espe-cially for those who reside in remote areas.22,35 With the useof digital Web cameras and wireless LANs, physicians caninterpret radiographs, electrocardiograms, and other labora-tory reports, which allow them to provide extra assistance tomedical professionals in remote areas.
Cost IssuesThe high cost of helicopter transfers presented in this study,
as well as the extensive flying distance (200–400 miles) be-tween remote islands and mainland Taiwan add extra risks forair medical transport. In our study, the interventions in stage 2resulted in a significant reduction of EAMT applications. Theuse of a cross-strait multi-telemedicine system for preflightscreening significantly reduced the incidence of unnecessarytransport. Our results of an approval rate of 91% and the 36.3%reduction in the rate of EAMT applications in this study areconsistent with a report released by Haskins, who suggested thatthe use of telemedicine may result in a 15% reduction in ambu-lance transports.23
Before the establishment of NACC, almost all patientshad been transported by air whenever local physicians re-quested. There had been no triage criteria. After the imple-mentation of NACC with a telemedicine system, primary carephysicians on the remote islands have to perform basic triage.Doctors in NACC review the application document forEAMS and discuss with the local physician if the patientrequires emergency chartered helicopter or if the patient canbe scheduled for commercial flight or regular shuttle ferry.
Crucial Roles of Physician TriageThe physicians in the NACC played crucial roles in this
aspect. One of the major roles the physicians is being agatekeeper for EAMT approval and transport quality. Thesystem, including the protocols used, screening criteria, andthe use of video telemedicine, is thought to have caused thereduction of EAMT applications. The video telemedicinesystem allows clear communications between physicians inthe remote islands and the control center; hence physicians inthe remote islands need to evaluate the necessity of urgenttransfers before formal EAMT application.
Physicians in the NACC also provide support, guidance,and medical consultation to island-based physicians throughour video system. The results of this study suggest thatconsultation with NACC physicians provides support to thealready overburdened medical manpower on the remote is-lands. Sometimes physicians will suggest that the local phy-sician do some kind of intervention on patients, such as chesttapping for assisting in the decision-making process and eval-uating the adequacy of the management given or endotrachealintubation for safety of air transportation. Previous studiessuggested that preflight medical screening of patients mayassure both the patient and physician of the safety of air traveland prevent minimal complications such as in-flight morbid-ity and emergencies.36,37 On the other hand, patients in an
Video-Telemedicine for Screening of Patients Requesting EAMT
Volume 62 • Number 2 509

unstable condition being ground-transported by ambulancecan minimize the chance of second problems such as hypox-emia and the consequent complications that might occur ifthey were transported by air.36
Difference Between NACC With Video-Telemedicineand Telephone With Fax Transmission
Patients who received treatment by physicians on theremote islands do not always have strong confidence. Mostphysicians on remote islands are in general practice and donot have specialized training, such as in neurologic surgery.For example, in the case of head injury, the local physicianand the doctor in the NACC with video link can not onlyexamine the patient simultaneously but also can interpretX ray, computed tomography scan, etc. This significantlyenhanced the confidence of patients and the quality of man-agement. The present study demonstrates that the implemen-tation of this system is beneficial not only in medical care butalso from an economic perspective. It overcomes the lack ofemergent and critical care expertise by extending the avail-ability of physician expertise from Taiwan mainland. Thepatients may have confidence not only in the quality of carebut also feel comfortable because they know that in any kindof situation they will be taken care continuously includingEAMS.
Transferred by Fixed Wing or Groundand Sea Modalities
For the time being, the scheduled commercial flight andregular shuttle ferry do not accept any critical patient. Thereasons are (1) the airlines and boat companies do not like totake the risk of medicolegal problems and (2) the cost of equip-ping aircraft and ferries with stretchers cannot be covered, evenif the family were to buy 10 tickets for each patient.
Follow Up of the PatientsThe eight patients who were transported by commercial
airlines and shuttle ferries with their family had been followedup. All of them were in stable condition and came back to theirhome island and followed in outpatient department (OPD) bylocal physicians.
Our results show that patients requiring EAMT serviceswere mostly elderly with major illnesses. Another benefit ofthe preflight screening is, apart from the benefit of reducingunnecessary transports, every critical patient is ensured ofreceiving sound, efficient, safe, and quality transport to majortertiary hospitals in Taiwan. Physician triage in this studyresulted in fewer cross-zone transfers, and most patients weretransferred to major tertiary medical centers or teaching hospi-tals. Of those who did not meet the criteria for emergencytransfer, alternative forms of transport were arranged. The aboveresults indicate the achievement of safer and better qualityEAMT services in the second stage of this study period.
Dilemmas of Decision MakingThe majority of patients in this study were categorized as
having major illnesses. In our experience, patients with amajor illness, i.e. stroke, ischemia, heart attack, or majorburns, need to be evacuated from the small islands at theearliest possible time. It might be difficult to determinewhether a patient with a minor stroke can safely remain onthe island or requires immediate transfer to more advancedfacilities. This often causes dilemmas in decision making foremergency transfers. In this study, the majority of patientswere aged 61 to 75 years and 0 to 15 years, which suggestsextra caution for possible transfer risks. In addition, the TMOmight insist on an urgent evacuation because of the family’spressure or other factors such as medicolegal problems orpersonnel shortages.
The criteria for air medical transfers also have limita-tions. The American College of Surgeons (1993) states that50% overtriage is necessary to allow 10% undertriage toavoid improper transport of seriously injured patients to hos-pitals other than major trauma centers.38 The objectives of thecriteria are mainly to assist physicians in critical evaluationfor making decisions on patient transfer in a timely way.
In conclusion, physician triage with the use of telemedi-cine significantly reduced the frequency of air medical trans-port. We verified the benefit of telemedicine that permitsphysicians in the control center to make accurate assessmentsand decisions concerning emergency air transport. The resultsof this study further demonstrate the benefits of EAMT pro-tocol and the use of telemedicine for producing potential costsavings, as well as assisting physicians in performing pre-flight screening of patients for safer and much-needed EAMTservices. The reduced costs as well as fewer cross-zone trans-ports suggest an improvement in better-directed transportsand effective management of EAMT services in Taiwan.
ACKNOWLEDGMENTSContributors: SHT and HRW initiated the study. SHT, MFC, WMC,
CCC, and LHL initiate the SOPs and the Guidelines for NACC. SHT andHRW drafted the report. HRW analyzed the data. CEC collected data anddata analysis. SHT, WLC, and WTC interpreted the results and completedthe overall discussion of this study.
REFERENCES1. Kerr W, Kerns T, Bissell R. Differences in mortality rates among
trauma patients transported by helicopter and ambulance inMaryland. Prehospital Disaster Med. 1999;14:159–164.
2. Bureney RE. Efficiency, cost and safety of hospital-based emergencyaeromedical programs. Ann Emerg Med. 1987;16:133–135.
3. Wills VL, Eno L, Walker C, Gani JS. Use of an ambulance-basedhelicopter retrieval service. Aust N Z Surg. 2000;70:506–510.
4. Dewhurst A, Farrar D, Walker C, Mason P, Beven P, GoldstoneJ. Medical repatriation via fixed-wing air ambulance: a review of patientcharacteristics and adverse events. Anaesthesia. 2001;56:882–887.
5. Schiller W, Knox R, Zinnecker H, et al. Effect of helicoptertransport of trauma victims on survival in an urban trauma center.J Trauma. 1988;28:1127–1134.
The Journal of TRAUMA� Injury, Infection, and Critical Care
510 February 2007

6. Chappell V, Mileski W, Wolf S, Gore D. Impact of discontinuing ahospital-based air ambulance service on trauma patient outcomes.J Trauma. 2002;52:486–491.
7. Hotvedt R, Kristiansen I, Forde O, et al. Which groups of patientsbenefit from helicopter evacuation? Lancet. 1996;18:1362–1366.
8. Rosenberg BL, Butz DA, Comstock MC, Taheri PA. Aeromedicalservice: how does it actually contribute to the mission? J Trauma.2002;54:681–688.
9. Shatney CH, Homan SJ, Sherck JP, Ho C-C. The utility ofhelicopter transport of trauma patients from the injury scene in anurban trauma system. J Trauma. 2002;53:817–822.
10. Boyd C, Corse K, Campbell R. Emergency interhospital transport ofthe major trauma patients: air versus ground. J Trauma. 2002;29:789–793.
11. Roth A, Malov N, Carthy Z, et al. Potential reduction of costs andhospital emergency department visits resulting from prehospitaltranstelephonic triage: the Shahal experience in Israel. Clin Cardiol.2000;3:271–276.
12. American College of Emergency Physicians. Guidelines for traumasystems. Ann Emerg Med. 1987;16:459–463.
13. American College of Emergency Physicians. Guidelines for traumacare systems. Ann Emerg Med. 1993;22:1079–1100.
14. Karlsen R, Sjoqvist B. Telemedicine and decision support inemergency ambulances in Uppsala. J Telemed Telecare. 2000;6:1–7.
15. Plischke M, Wolf K, Lison T, Pretschner D. Telemedical support ofprehospital emergency care in mass casualty incidents. Euro J MedRes. 1999;4:394–398.
16. Whitten PS, Mair FS, Haycox A, May CR, Wiliams TL, Hellmich S.Systematic review of cost effectiveness studies of telemedicineinterventions. BMJ. 2002;324:1434–1437.
17. Benger J. A review of telemedicine in accident and emergency: thestory so far. Emerg Med J. 2000;17:157–164.
18. Debnath D. Activity analysis of telemedicine in the UK. PostgradMed J. 2004;80:335–338.
19. Benger J, Noble S, Coast J, Kendall J. The safety and effectivenessof minor injuries telemedicine. BMJ. 2004;21:438–445.
20. Armstrong IJ, Haston WS. Medical decision support for remotegeneral practitioners using telemedicine. J Telemed Telecare. 1997;2:27–34.
21. Meade B, Barnett P. Emergency care in a remote area usinginteractive video technology: a study in prehospital telemedicine.J Telemed Telecare. 2002;8:115–117.
22. Saffle JR, Edelman L, Morris S. Regional air transport of burnpatients: a case for telemedicine? J Trauma. 2004;57:57–64.
23. Haskins P, Ellis D, Mayrose J. Predicted utilization of emergencymedical services telemedicine in decreasing ambulance transports.Prehosp Emerg Care. 2002;6:445–448.
24. Armstrong I, Haston W. An evaluation of telemedical support for aminor treatment centre. J Telemed Telecare. 1996;2:93–99.
25. Handschu R, Littmann R, Reulbach U, et al. Telemedicine inemergency evaluation of acute stroke: interrater agreement in remotevideo examination with a novel multimedia system. Stroke. 2003;34:2842–2846.
26. Patel T. A cost-benefit analysis of the effect of shipboard telemedicinein a selected oceanic region. J Telemedicine Telecare. 2000;6:165–167.
27. Kofos D, Pitetti R, Orr R, Thompson A. Telemedicine in pediatrictransport: a feasibility study. Pediatrics. 1998;102:E58.
28. Tsai SH, Tsang C-M, Wu H-R, et al. Transporting patients withsuspected SARS. Emg Inf Dis. 2003;10:1325–1326.
29. Association of Air Medical Services. Medical Air TransportGuidelines: Criteria for Emergency Air Medical TransportUtilization. 1990[cited on February 22, 2000]. Available from: http://www.providence.org/alaska/lifeguard/guidelines.htm.
30. Air Medical Services Committee of the National Association of EMSPhysicians. Criteria for Prehospital Air Medical Transport: Non-Traumaand Pediatric Considerations. Prehospital Disaster Med. 1994;9:140–141.
31. Department of Human Services. Review of Trauma and EmergencyServices 1999: Final report.[cited on 2005 Feb 22]. Available from:http://www.health.vic.gov.au/trauma/review99.
32. Prina L, Orzai U, Weber R. Evaluation of emergency air evacuation ofcritically ill patients from cruise ships. J Travel Med. 2002;8:285–292.
33. Hauff S, Rea T, Culley L, Kerry F, Becker L, Eisenbery M. Factorsimpeding dispatcher-assisted telephone cardiopulmonaryresuscitation. Ann Emerg Med. 2003;42:731–737.
34. Wang LM, Huang YT, Chern CH, et al. Tele-emergency medicine; theevaluation of Taipei veterans general hospital and Kinmen-granitehospital in Taiwan. Chinese Med J (Taipei). 2001;64:621–628.
35. Hood M. Crisis in the countryside, networking and telemedicine arecrucial for health care facilities in rural America. Health Progress.2004;85:16–19.
36. Gong H, Mark JAL, Cowan MN. Preflight medical screening ofpatients: analysis of health and flight characteristics. Chest. 1993;104:788–794.
37. Lyznicki J, Williams M, Deitchman S, Howe JP Jr, Council onScientific Affairs, American Medical Association. Inflight medicalemergencies. Aviat Space Environ Med. 2000;71:832–838.
38. American College of Surgeons. Resources for Optimal Care of theInjured Patient. Chicago: Committee on Trauma, American Collegeof Surgeons; 1993.
Video-Telemedicine for Screening of Patients Requesting EAMT
Volume 62 • Number 2 511
How to Decrease Pedestrian Injuries: Conceptual EvolutionsStarting From 137 Crash TestsLionel Thollon, PhD, Christian Jammes, MSc, Michel Behr, PhD, Pierre-Jean Arnoux, PhD,Claude Cavallero, Eng, and Christian Brunet, MD
Background: The improvement ofvulnerable users’ protection has becomean essential objective for our society.Injury assessments observed in clinicaltraumatology have led researchers andmanufacturers to understand the mech-anisms involved and to design safe vehi-cles (to reduce the severity of pedestrianinjuries).
Methods: In all, 137 crash tests be-tween 1979 and 2004 with postmortal hu-man subjects (PMHS) were performedat the Laboratory of Applied Biome-chanics to access pedestrian protection.A retrospective analysis of these experi-mental tests, pedestrian/car impacts(full scale or subsystems), performed at
the laboratory is thus proposed. Thisdocument focuses on injury mechanismsinvestigation on the evolution of the ex-perimental approach, as well as on thevehicles’ technological improvements per-formed by car manufacturers.
Results: The analysis of experimen-tal results (injury assessment, kinematics,vehicle deformations, etc.) shows the com-plexity and variety of injury mechanisms.The injury assessment shows the need toimprove lower-limb joints protection, aswell as head and spine segments, becauseof the difficulties of surgical repair ofthese injuries.
Conclusions: Experimental testscontribute to evaluate the automobile
safety evolution in the field of pedestrianprotection. The main induced car im-provements concern considerable effortson vehicle material behavior and their ca-pacity to dissipate energy during shocks(replacement of the convex rigid bumpersby deformable structures, modification ofthe windscreen structure). They also con-cern the suppression of all aggressivestructures for the pedestrian (spare wheelinitially placed on the front part of thevehicle, protection of the heels of wind-screen wiper, etc.).
Key Words: Crash tests, Experimen-tation, Pedestrian, Postmortem humansubject, Injury mechanisms.
J Trauma. 2007;62:512–519.
In the field of impact biomechanics and more particularlyin road users’ protection, 33% of the victims are pedestri-ans, cyclists, and motorcyclists. Nowadays, the protection
of pedestrians against motorized vehicles is an essential pub-lic health concern (new regulation project in progress; FrenchMinistry for Transports).
In France in 2001, 778 pedestrians were killed and17,458 were injured. In 2002, 819 persons were killed(increase of 5.3%) and 16,072 were injured (decrease of7.9%).1 In 61.2% of crashes involving a motorized vehicle,victims are 15 year of age or older. Also, 61.1% of theimpacted pedestrians suffer from lower-limb injuries.2 Thecrash responsibility is attributed to the pedestrian in 50%of the cases and to the driver in approximately 40% of thecases.3
Many crash studies have thus been performed to under-stand the various kinematics observed for this type of shock
and to access involved injury mechanisms.4 The list of pe-destrian impacts can be summarized as follows:
● Frontal impact for the vehicle5,6
● Lateral impact for the pedestrian7–9
● Impacts on the bumper and front part of the vehicle10
● Initially impacted are the tibia and/or the fibula11
● Geometry of the vehicle, in particular the bumper, di-rectly influences the type of injuries12
● Impact speeds are between 5 and 50 km/hour10
● Most involved victims are children and elderly2,11
● Roll-up trajectory (the pedestrian slides on the hood ofthe car)5
It should be noted that the type of trajectory depends onthe position of the pedestrian gravity center (assumed to be atthe level of the hip),13 the bumper shape, the speed, and thepossible deceleration (braking) of the impacting vehicle.
For this loading condition, injuries observed mainly in-volve the head (strong risk of fatal injuries) and the lowerlimbs (no fatalities), as gravity increases with impact speed.
Concerning the head, according to the loading duration,we can define three different types of injury mechanismsdepending on three different types of constraints: impact,impulse, and compression level. In the case of a road pedes-trian struck, injuries as a result of an impact prevail. Cranialinjuries occur in an approximately 5- to 20-ms impact,whereas fractures are generally caused by an impact forceapplied to a very small surface of the skull.14–17
Submitted for publication September 13, 2005.Accepted for publication April 13, 2006.Copyright © 2007 by Lippincott Williams & Wilkins, Inc.From the Laboratoire de Biomecanique Appliquee, INRETS–UMRT24,
Faculte de Medecine Secteur Nord, Marseille, France.Address for reprints: Lionel Thollon, Laboratoire de Biomecanique
Appliquee, INRETS–UMRT24, Faculte de Medecine Secteur Nord, Boule-vard Pierre Dramard, 13916 Marseille, France; email: [email protected].
DOI: 10.1097/01.ta.0000229985.33611.df
The Journal of TRAUMA� Injury, Infection, and Critical Care
512 February 2007
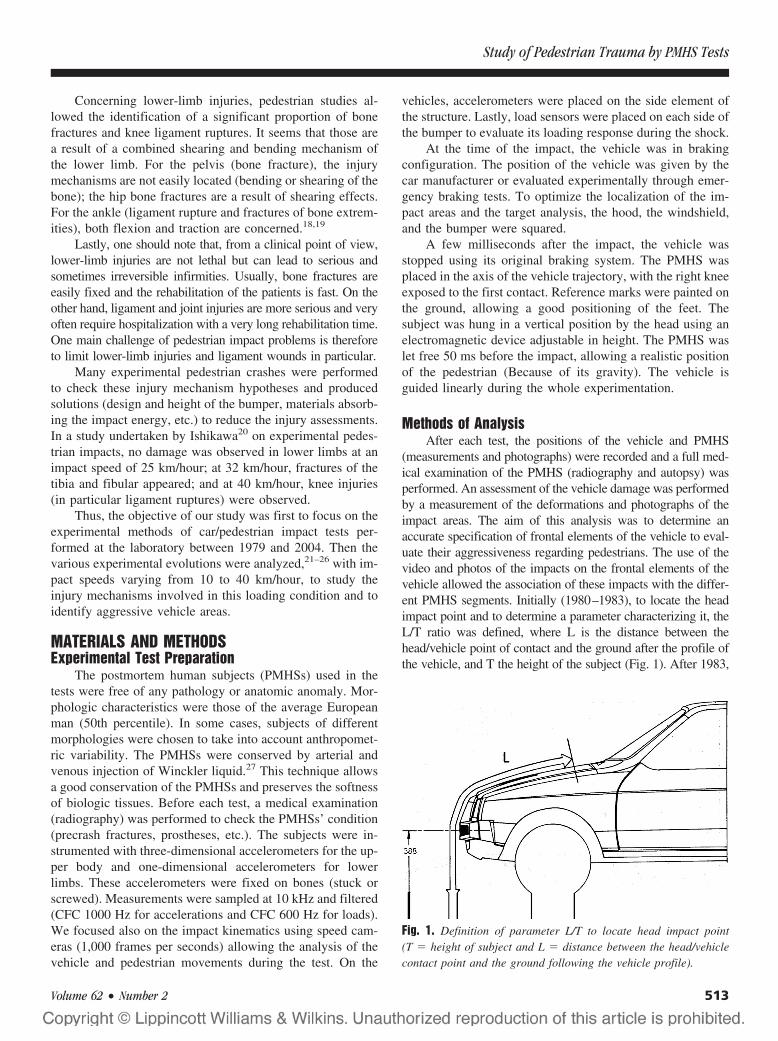
Concerning lower-limb injuries, pedestrian studies al-lowed the identification of a significant proportion of bonefractures and knee ligament ruptures. It seems that those area result of a combined shearing and bending mechanism ofthe lower limb. For the pelvis (bone fracture), the injurymechanisms are not easily located (bending or shearing of thebone); the hip bone fractures are a result of shearing effects.For the ankle (ligament rupture and fractures of bone extrem-ities), both flexion and traction are concerned.18,19
Lastly, one should note that, from a clinical point of view,lower-limb injuries are not lethal but can lead to serious andsometimes irreversible infirmities. Usually, bone fractures areeasily fixed and the rehabilitation of the patients is fast. On theother hand, ligament and joint injuries are more serious and veryoften require hospitalization with a very long rehabilitation time.One main challenge of pedestrian impact problems is thereforeto limit lower-limb injuries and ligament wounds in particular.
Many experimental pedestrian crashes were performedto check these injury mechanism hypotheses and producedsolutions (design and height of the bumper, materials absorb-ing the impact energy, etc.) to reduce the injury assessments.In a study undertaken by Ishikawa20 on experimental pedes-trian impacts, no damage was observed in lower limbs at animpact speed of 25 km/hour; at 32 km/hour, fractures of thetibia and fibular appeared; and at 40 km/hour, knee injuries(in particular ligament ruptures) were observed.
Thus, the objective of our study was first to focus on theexperimental methods of car/pedestrian impact tests per-formed at the laboratory between 1979 and 2004. Then thevarious experimental evolutions were analyzed,21–26 with im-pact speeds varying from 10 to 40 km/hour, to study theinjury mechanisms involved in this loading condition and toidentify aggressive vehicle areas.
MATERIALS AND METHODSExperimental Test Preparation
The postmortem human subjects (PMHSs) used in thetests were free of any pathology or anatomic anomaly. Mor-phologic characteristics were those of the average Europeanman (50th percentile). In some cases, subjects of differentmorphologies were chosen to take into account anthropomet-ric variability. The PMHSs were conserved by arterial andvenous injection of Winckler liquid.27 This technique allowsa good conservation of the PMHSs and preserves the softnessof biologic tissues. Before each test, a medical examination(radiography) was performed to check the PMHSs’ condition(precrash fractures, prostheses, etc.). The subjects were in-strumented with three-dimensional accelerometers for the up-per body and one-dimensional accelerometers for lowerlimbs. These accelerometers were fixed on bones (stuck orscrewed). Measurements were sampled at 10 kHz and filtered(CFC 1000 Hz for accelerations and CFC 600 Hz for loads).We focused also on the impact kinematics using speed cam-eras (1,000 frames per seconds) allowing the analysis of thevehicle and pedestrian movements during the test. On the
vehicles, accelerometers were placed on the side element ofthe structure. Lastly, load sensors were placed on each side ofthe bumper to evaluate its loading response during the shock.
At the time of the impact, the vehicle was in brakingconfiguration. The position of the vehicle was given by thecar manufacturer or evaluated experimentally through emer-gency braking tests. To optimize the localization of the im-pact areas and the target analysis, the hood, the windshield,and the bumper were squared.
A few milliseconds after the impact, the vehicle wasstopped using its original braking system. The PMHS wasplaced in the axis of the vehicle trajectory, with the right kneeexposed to the first contact. Reference marks were painted onthe ground, allowing a good positioning of the feet. Thesubject was hung in a vertical position by the head using anelectromagnetic device adjustable in height. The PMHS waslet free 50 ms before the impact, allowing a realistic positionof the pedestrian (Because of its gravity). The vehicle isguided linearly during the whole experimentation.
Methods of AnalysisAfter each test, the positions of the vehicle and PMHS
(measurements and photographs) were recorded and a full med-ical examination of the PMHS (radiography and autopsy) wasperformed. An assessment of the vehicle damage was performedby a measurement of the deformations and photographs of theimpact areas. The aim of this analysis was to determine anaccurate specification of frontal elements of the vehicle to eval-uate their aggressiveness regarding pedestrians. The use of thevideo and photos of the impacts on the frontal elements of thevehicle allowed the association of these impacts with the differ-ent PMHS segments. Initially (1980–1983), to locate the headimpact point and to determine a parameter characterizing it, theL/T ratio was defined, where L is the distance between thehead/vehicle point of contact and the ground after the profile ofthe vehicle, and T the height of the subject (Fig. 1). After 1983,
Fig. 1. Definition of parameter L/T to locate head impact point(T � height of subject and L � distance between the head/vehiclecontact point and the ground following the vehicle profile).
Study of Pedestrian Trauma by PMHS Tests
Volume 62 • Number 2 513
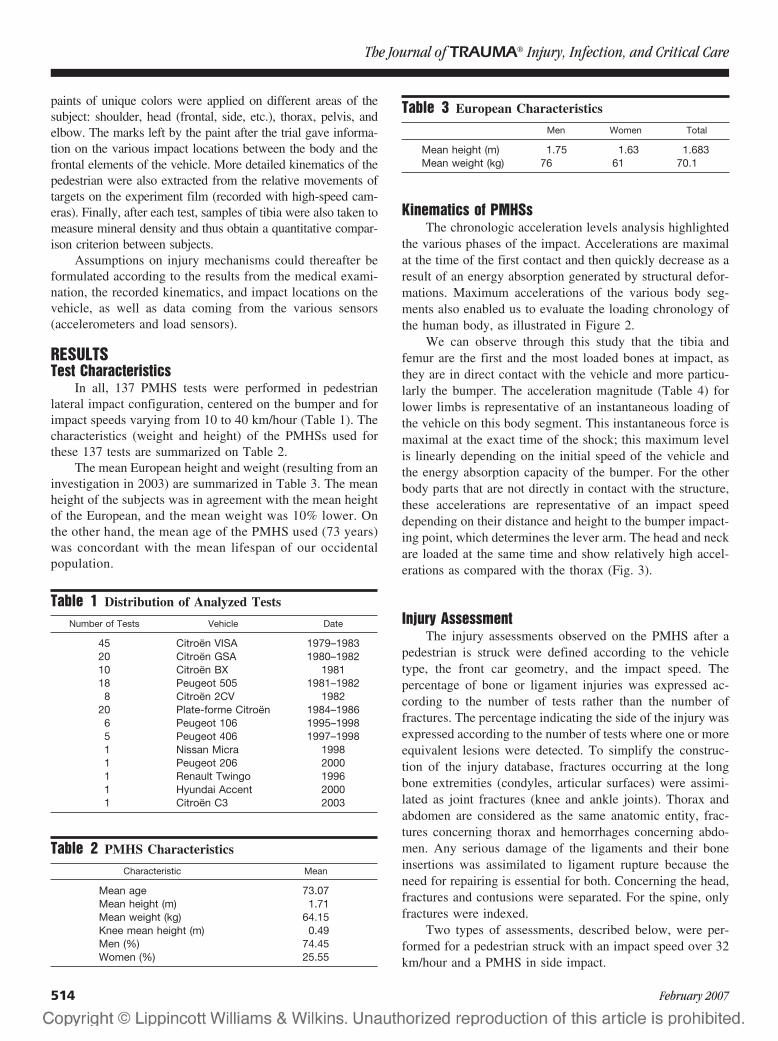
paints of unique colors were applied on different areas of thesubject: shoulder, head (frontal, side, etc.), thorax, pelvis, andelbow. The marks left by the paint after the trial gave informa-tion on the various impact locations between the body and thefrontal elements of the vehicle. More detailed kinematics of thepedestrian were also extracted from the relative movements oftargets on the experiment film (recorded with high-speed cam-eras). Finally, after each test, samples of tibia were also taken tomeasure mineral density and thus obtain a quantitative compar-ison criterion between subjects.
Assumptions on injury mechanisms could thereafter beformulated according to the results from the medical exami-nation, the recorded kinematics, and impact locations on thevehicle, as well as data coming from the various sensors(accelerometers and load sensors).
RESULTSTest Characteristics
In all, 137 PMHS tests were performed in pedestrianlateral impact configuration, centered on the bumper and forimpact speeds varying from 10 to 40 km/hour (Table 1). Thecharacteristics (weight and height) of the PMHSs used forthese 137 tests are summarized on Table 2.
The mean European height and weight (resulting from aninvestigation in 2003) are summarized in Table 3. The meanheight of the subjects was in agreement with the mean heightof the European, and the mean weight was 10% lower. Onthe other hand, the mean age of the PMHS used (73 years)was concordant with the mean lifespan of our occidentalpopulation.
Kinematics of PMHSsThe chronologic acceleration levels analysis highlighted
the various phases of the impact. Accelerations are maximalat the time of the first contact and then quickly decrease as aresult of an energy absorption generated by structural defor-mations. Maximum accelerations of the various body seg-ments also enabled us to evaluate the loading chronology ofthe human body, as illustrated in Figure 2.
We can observe through this study that the tibia andfemur are the first and the most loaded bones at impact, asthey are in direct contact with the vehicle and more particu-larly the bumper. The acceleration magnitude (Table 4) forlower limbs is representative of an instantaneous loading ofthe vehicle on this body segment. This instantaneous force ismaximal at the exact time of the shock; this maximum levelis linearly depending on the initial speed of the vehicle andthe energy absorption capacity of the bumper. For the otherbody parts that are not directly in contact with the structure,these accelerations are representative of an impact speeddepending on their distance and height to the bumper impact-ing point, which determines the lever arm. The head and neckare loaded at the same time and show relatively high accel-erations as compared with the thorax (Fig. 3).
Injury AssessmentThe injury assessments observed on the PMHS after a
pedestrian is struck were defined according to the vehicletype, the front car geometry, and the impact speed. Thepercentage of bone or ligament injuries was expressed ac-cording to the number of tests rather than the number offractures. The percentage indicating the side of the injury wasexpressed according to the number of tests where one or moreequivalent lesions were detected. To simplify the construc-tion of the injury database, fractures occurring at the longbone extremities (condyles, articular surfaces) were assimi-lated as joint fractures (knee and ankle joints). Thorax andabdomen are considered as the same anatomic entity, frac-tures concerning thorax and hemorrhages concerning abdo-men. Any serious damage of the ligaments and their boneinsertions was assimilated to ligament rupture because theneed for repairing is essential for both. Concerning the head,fractures and contusions were separated. For the spine, onlyfractures were indexed.
Two types of assessments, described below, were per-formed for a pedestrian struck with an impact speed over 32km/hour and a PMHS in side impact.
Table 1 Distribution of Analyzed Tests
Number of Tests Vehicle Date
45 Citroën VISA 1979–198320 Citroën GSA 1980–198210 Citroën BX 198118 Peugeot 505 1981–19828 Citroën 2CV 1982
20 Plate-forme Citroën 1984–19866 Peugeot 106 1995–19985 Peugeot 406 1997–19981 Nissan Micra 19981 Peugeot 206 20001 Renault Twingo 19961 Hyundai Accent 20001 Citroën C3 2003
Table 2 PMHS Characteristics
Characteristic Mean
Mean age 73.07Mean height (m) 1.71Mean weight (kg) 64.15Knee mean height (m) 0.49Men (%) 74.45Women (%) 25.55
Table 3 European Characteristics
Men Women Total
Mean height (m) 1.75 1.63 1.683Mean weight (kg) 76 61 70.1
The Journal of TRAUMA� Injury, Infection, and Critical Care
514 February 2007

Global Injury AnalysisThe first global analysis shows that the pedestrian injury
frequency for lower limbs is higher than for the upper body.Indeed, we observe 51%, 53%, and 61% of fractures on thetibia, the knee, and the fibula, respectively, and more than65% of knee ligament ruptures compared with the 15% offracture for the whole upper body.
The thorax is very exposed to rib fractures; we notedfewer injuries for the abdomen (only 15%). Concerning boneinjuries of the head and spine, they do not seem particularlyserious, although it is difficult to evaluate brain and brainstem injuries on PMHSs. Lastly, we observed very few frac-tures of the upper limbs.
Table 5 details the main injuries observed for theseexperimental tests, focusing on the lower limb.
Influence of the Bumper Position on theInjuries Observed
Thereafter, we studied the influence of the impactingpoint position (bumper) on the injuries observed, always foran impact close to 32 km/hour and a pedestrian in sideposition. Concerning the head and thorax, we observed morefractures for an impact point located under the knee, with anincrease of 150% for thoracic bone injuries (Fig. 4).
Concerning lower limbs (in the same configurations), weobserved a significant increase of tibia and fibula fractures forcontact under the knee and little influence of the impactingpoint for the femur, knee, and ankle. Concerning ligamentrupture, we noted a frequency increase for the knee and areduction for the ankle. Thus, a contact point above the kneeseems to be better in protecting the lower limb (Table 6).Nevertheless, the position criterion is to be put out of balance
Fig. 2. Evolution of maximal accelerations of the various anatomic parts (average of all the tests) according to an ascending order on thesubjects.
Fig. 3. Kinematics of the pedestrian struck. (A) knee impact. ( B)Pelvis and elbow impact. (C) Shoulder and head impact. (D) Glidingof the PMHS on the hood of the car.
Table 4 Maximal Values of Accelerations by Body Part(impact speed of 39 km/hour)
Name Maximum
Resultant acceleration head 93.0 g at 119.4 msResultant acceleration neck 120.2 g at 144.5 msResultant acceleration thorax 59.0 g at 83.0 msResultant acceleration pelvis 83.2 g at 21.9 msFemur (uniaxial sensor) 102.6 g at 17.9 msTibia (uniaxial sensor) 143.6 g at 2.9 ms
Study of Pedestrian Trauma by PMHS Tests
Volume 62 • Number 2 515
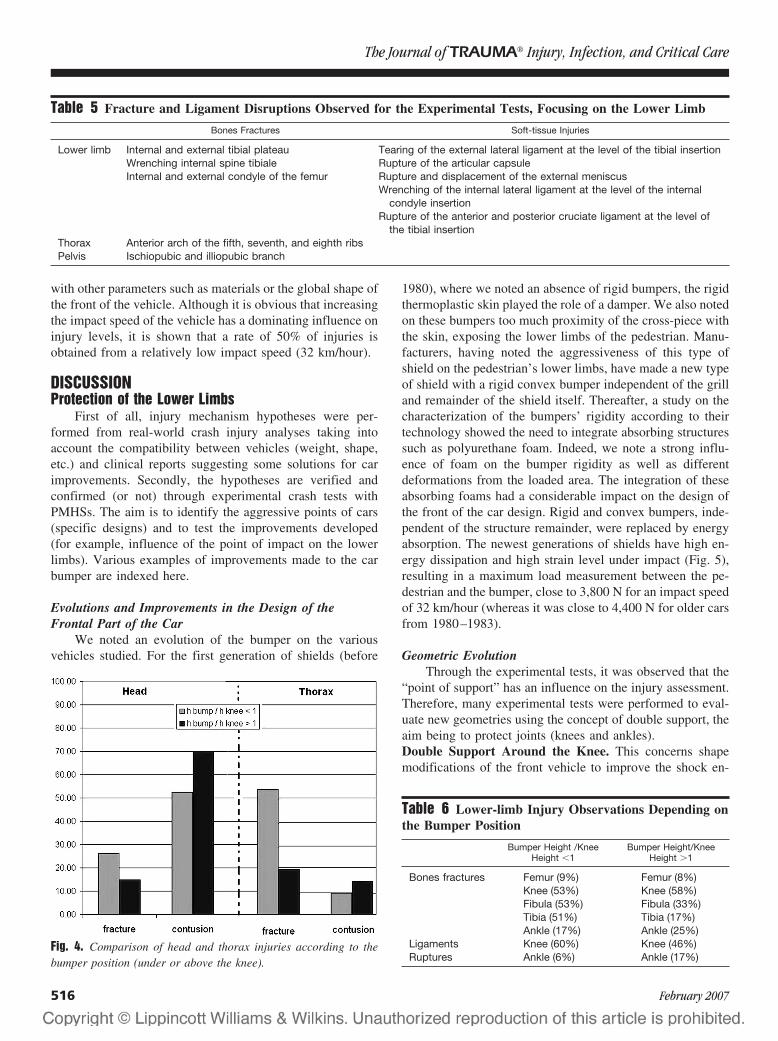
with other parameters such as materials or the global shape ofthe front of the vehicle. Although it is obvious that increasingthe impact speed of the vehicle has a dominating influence oninjury levels, it is shown that a rate of 50% of injuries isobtained from a relatively low impact speed (32 km/hour).
DISCUSSIONProtection of the Lower Limbs
First of all, injury mechanism hypotheses were per-formed from real-world crash injury analyses taking intoaccount the compatibility between vehicles (weight, shape,etc.) and clinical reports suggesting some solutions for carimprovements. Secondly, the hypotheses are verified andconfirmed (or not) through experimental crash tests withPMHSs. The aim is to identify the aggressive points of cars(specific designs) and to test the improvements developed(for example, influence of the point of impact on the lowerlimbs). Various examples of improvements made to the carbumper are indexed here.
Evolutions and Improvements in the Design of theFrontal Part of the Car
We noted an evolution of the bumper on the variousvehicles studied. For the first generation of shields (before
1980), where we noted an absence of rigid bumpers, the rigidthermoplastic skin played the role of a damper. We also notedon these bumpers too much proximity of the cross-piece withthe skin, exposing the lower limbs of the pedestrian. Manu-facturers, having noted the aggressiveness of this type ofshield on the pedestrian’s lower limbs, have made a new typeof shield with a rigid convex bumper independent of the grilland remainder of the shield itself. Thereafter, a study on thecharacterization of the bumpers’ rigidity according to theirtechnology showed the need to integrate absorbing structuressuch as polyurethane foam. Indeed, we note a strong influ-ence of foam on the bumper rigidity as well as differentdeformations from the loaded area. The integration of theseabsorbing foams had a considerable impact on the design ofthe front of the car design. Rigid and convex bumpers, inde-pendent of the structure remainder, were replaced by energyabsorption. The newest generations of shields have high en-ergy dissipation and high strain level under impact (Fig. 5),resulting in a maximum load measurement between the pe-destrian and the bumper, close to 3,800 N for an impact speedof 32 km/hour (whereas it was close to 4,400 N for older carsfrom 1980–1983).
Geometric EvolutionThrough the experimental tests, it was observed that the
“point of support” has an influence on the injury assessment.Therefore, many experimental tests were performed to eval-uate new geometries using the concept of double support, theaim being to protect joints (knees and ankles).Double Support Around the Knee. This concerns shapemodifications of the front vehicle to improve the shock en-
Fig. 4. Comparison of head and thorax injuries according to thebumper position (under or above the knee).
Table 5 Fracture and Ligament Disruptions Observed for the Experimental Tests, Focusing on the Lower Limb
Bones Fractures Soft-tissue Injuries
Lower limb Internal and external tibial plateau Tearing of the external lateral ligament at the level of the tibial insertionWrenching internal spine tibiale Rupture of the articular capsuleInternal and external condyle of the femur Rupture and displacement of the external meniscus
Wrenching of the internal lateral ligament at the level of the internalcondyle insertion
Rupture of the anterior and posterior cruciate ligament at the level ofthe tibial insertion
Thorax Anterior arch of the fifth, seventh, and eighth ribsPelvis Ischiopubic and illiopubic branch
Table 6 Lower-limb Injury Observations Depending onthe Bumper Position
Bumper Height /KneeHeight �1
Bumper Height/KneeHeight �1
Bones fractures Femur (9%) Femur (8%)Knee (53%) Knee (58%)Fibula (53%) Fibula (33%)Tibia (51%) Tibia (17%)Ankle (17%) Ankle (25%)
Ligaments Knee (60%) Knee (46%)Ruptures Ankle (6%) Ankle (17%)
The Journal of TRAUMA� Injury, Infection, and Critical Care
516 February 2007

ergy distribution on the knee. This new shape made it possi-ble to decrease the aggressiveness of the vehicle on the lowerlimbs because of two simultaneous supports around the joint.Indeed, it allows a better distribution of the impact, avoidinga too-strong flexion able to generate serious ligament andbone injuries.Double Tibia Support. In this configuration, a very stronggliding of the leg under the vehicle was observed. Thismovement is one of the main causes of lower-limb injuries.To avoid this kinematic of the foot under the vehicle front,it was decided to modify the shield. The upper part of theshield was preserved in its original configuration (positionand structure of series) and a median part was addedbelow. This is a standard added bumper in reversed posi-tion (Fig. 6). It was noted that the device increases the
number of fractures (inducing two impact points and in-creasing the bone injury assessment) on the lower limbsbut decreases the ligament injuries at the ankles and kneesas it prevents any significant flexion effect of the lowerlimbs.
Upper Part Protection of the Human BodyThis concerns the head, the pelvis, the thorax, and the
abdomen. It is very interesting to optimize the energydissipation and to remove the aggressive areas of thevehicle (heel of windscreen wipers, location of the sparewheel, etc.). The protection of the head is the priority ofthe upper-part segments because it is subjected to themaximum impact acceleration.
Aggressive Areas of the VehicleThe injuries observed during the various experimental
tests point out aggressive areas of the vehicle:
● The contact between the head and the heels of wind-screen wipers generates encephalic penetration injuries.
● The upper part of the hood of the car, not protected,involves facial contusions.
● The spare wheel and the jack laid out under the hood ofthe car limit the vehicle deformations and induce rigid areas,sometimes with perforations of the hood by the jack.
● The rupture of the windshield fixations involves a pen-etration of the pedestrian in the cockpit likely to generateserious injuries to the passengers and/or the pedestrian.
● The new types of windscreens allow the reduction ofmultiple wounds of the face.
Impact Areas and Their Involvements on the FrontalShape of the Vehicle
The deformations and impact areas on the structure wereidentified, making it possible to identify the most relevantones. Thus, the head hits the car hood up to the medium of thewindshield according to the type of the car (family, truck,etc.); this category defines the length and the slope of the carhood (Fig. 7).
For the compact car, we note that the windshield isimpacted in the middle because of the lower length and amore significant slope of the hood compared with a familycar. The head directly impacts the windshield; the deforma-tions of the railing of ventilation and the upper part of the carhood are a result of contact with the upper limbs (usually theelbow) or the thorax. Concerning the middle and lower partof the hood, the most impacted area is the front part of the carhood, a direct contact with the femur or an indirect contactwith the pelvis.
For family cars, with a longer and less inclined hood, theimpacts on the windshield were concentrated downwards. Ingeneral, for an impact speed between 25 and 39 km/hour, thehead is in contact with the bottom of the windshield or therailing of ventilation, with the upper limbs and the thorax
Fig. 5. (A) Old generation of shield (aggressive shape, 1980). ( B)Latest generation of shield (a more smooth shape and less aggres-sive, 2003).
Fig. 6. A new device with a modified car bumper (new bumperadded on the lower part). This new component allowed evaluatingthe effect of double tibia impact.
Study of Pedestrian Trauma by PMHS Tests
Volume 62 • Number 2 517
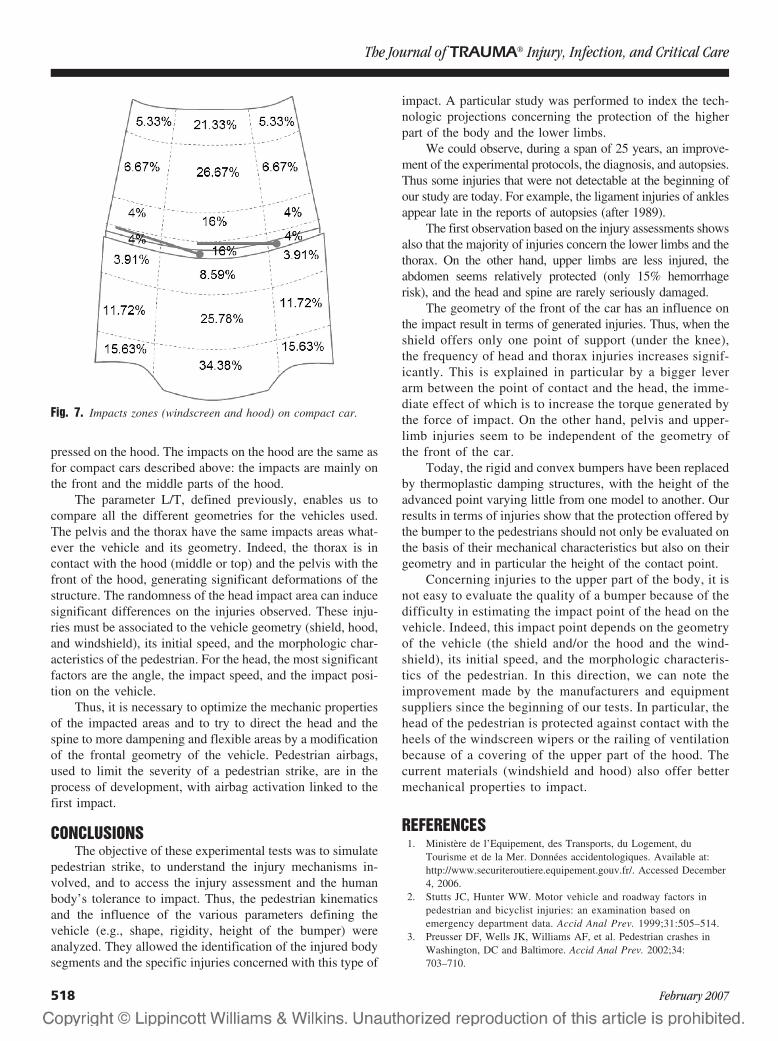
pressed on the hood. The impacts on the hood are the same asfor compact cars described above: the impacts are mainly onthe front and the middle parts of the hood.
The parameter L/T, defined previously, enables us tocompare all the different geometries for the vehicles used.The pelvis and the thorax have the same impacts areas what-ever the vehicle and its geometry. Indeed, the thorax is incontact with the hood (middle or top) and the pelvis with thefront of the hood, generating significant deformations of thestructure. The randomness of the head impact area can inducesignificant differences on the injuries observed. These inju-ries must be associated to the vehicle geometry (shield, hood,and windshield), its initial speed, and the morphologic char-acteristics of the pedestrian. For the head, the most significantfactors are the angle, the impact speed, and the impact posi-tion on the vehicle.
Thus, it is necessary to optimize the mechanic propertiesof the impacted areas and to try to direct the head and thespine to more dampening and flexible areas by a modificationof the frontal geometry of the vehicle. Pedestrian airbags,used to limit the severity of a pedestrian strike, are in theprocess of development, with airbag activation linked to thefirst impact.
CONCLUSIONSThe objective of these experimental tests was to simulate
pedestrian strike, to understand the injury mechanisms in-volved, and to access the injury assessment and the humanbody’s tolerance to impact. Thus, the pedestrian kinematicsand the influence of the various parameters defining thevehicle (e.g., shape, rigidity, height of the bumper) wereanalyzed. They allowed the identification of the injured bodysegments and the specific injuries concerned with this type of
impact. A particular study was performed to index the tech-nologic projections concerning the protection of the higherpart of the body and the lower limbs.
We could observe, during a span of 25 years, an improve-ment of the experimental protocols, the diagnosis, and autopsies.Thus some injuries that were not detectable at the beginning ofour study are today. For example, the ligament injuries of anklesappear late in the reports of autopsies (after 1989).
The first observation based on the injury assessments showsalso that the majority of injuries concern the lower limbs and thethorax. On the other hand, upper limbs are less injured, theabdomen seems relatively protected (only 15% hemorrhagerisk), and the head and spine are rarely seriously damaged.
The geometry of the front of the car has an influence onthe impact result in terms of generated injuries. Thus, when theshield offers only one point of support (under the knee),the frequency of head and thorax injuries increases signif-icantly. This is explained in particular by a bigger leverarm between the point of contact and the head, the imme-diate effect of which is to increase the torque generated bythe force of impact. On the other hand, pelvis and upper-limb injuries seem to be independent of the geometry ofthe front of the car.
Today, the rigid and convex bumpers have been replacedby thermoplastic damping structures, with the height of theadvanced point varying little from one model to another. Ourresults in terms of injuries show that the protection offered bythe bumper to the pedestrians should not only be evaluated onthe basis of their mechanical characteristics but also on theirgeometry and in particular the height of the contact point.
Concerning injuries to the upper part of the body, it isnot easy to evaluate the quality of a bumper because of thedifficulty in estimating the impact point of the head on thevehicle. Indeed, this impact point depends on the geometryof the vehicle (the shield and/or the hood and the wind-shield), its initial speed, and the morphologic characteris-tics of the pedestrian. In this direction, we can note theimprovement made by the manufacturers and equipmentsuppliers since the beginning of our tests. In particular, thehead of the pedestrian is protected against contact with theheels of the windscreen wipers or the railing of ventilationbecause of a covering of the upper part of the hood. Thecurrent materials (windshield and hood) also offer bettermechanical properties to impact.
REFERENCES1. Ministere de l’Equipement, des Transports, du Logement, du
Tourisme et de la Mer. Donnees accidentologiques. Available at:http://www.securiteroutiere.equipement.gouv.fr/. Accessed December4, 2006.
2. Stutts JC, Hunter WW. Motor vehicle and roadway factors inpedestrian and bicyclist injuries: an examination based onemergency department data. Accid Anal Prev. 1999;31:505–514.
3. Preusser DF, Wells JK, Williams AF, et al. Pedestrian crashes inWashington, DC and Baltimore. Accid Anal Prev. 2002;34:703–710.
Fig. 7. Impacts zones (windscreen and hood) on compact car.
The Journal of TRAUMA� Injury, Infection, and Critical Care
518 February 2007

4. Eubanks J, Haight WR. Pedestrian Involved Traffic CollisionReconstruction Methodology. Society of Automotive EngineersConference, SAE. 1992; paper 921591.
5. Ravani B, Brougham D, Mason RT. Pedestrian Post-ImpactKinematics and Injury Patterns. Society of Automotive EngineersConference, SAE. 1981; paper 811024.
6. Berg A, Egelhaaf M, Ebner H-T, et al. Estimation of benefitsresulting from impactor-testing for pedestrian protection. Presentedat the 18th ESV Conference, Japan, May 19–22, 2003.
7. Robertson JS, McLean AJ, Ryan GA. Traffic Accidents in Adelaide,South Australia. Sydney: Australia Road Research Board, 1966.
8. European Experimental Vehicle Committee. Pedestrian InjuryAccidents. Presented at the 9th International Technical Conferenceon Experimental Safety Vehicles, Kyoto, Japan, 1982.
9. European Experimental Vehicle Committee. Improved test methodsto evaluate pedestrian protection afforded by passenger cars.European Experimental Vehicle Committee; 1998. Available athttp://eevc.org/publicdocs/publicdocs.htm
10. International Harmonized Research Activities. Pedestrian SafetyWorking Group; 2001. Available at www-nrd.nhtsa.dot.gov/ihra
11. Bermond F, Cesari D, Alonzo F, et al. Mathematical Simulation ofthe Pedestrian Leg in Lateral Impact. International IrcobiConference on the Biomechanics of Impacts. 1992;61–73.
12. Grzegorz T, Roman M. Knee joint injuries as a reconstructive factors incar-to-pedestrian accidents. Forensic Sci Int. 2001;124:74–82.
13. Konosu A, Ishikawa H, Kant R. Development of computersimulation models for pedestrian subsystem impact tests. JSAEReview. 2000;21:109–115.
14. Anderson RWG, McLean AJ, Kloeden CN, et al. Data collectionanalysis of vehicle factors in relation to pedestrian brain injury.Presented at the 15th International Technical Conference on theEnhanced Safety of Vehicles, Melbourne, Australia, May 13–16,1996.
15. Auer C, Beier G, Schuller E. Intracranial injuries of fatally injuredpedestrians – A contribution to the establishment of tolerance limits.Presented at the International Ircobi Conference on the Biomechanicsof Impacts, Lyon, France, September 21–23, 1994.
16. Okamoto Y, Akiyama A, Nagatomi K, et al. Concept of hooddesign for possible reduction in pedestrian head injury. Presentedat the 14th International Technical Conference on the EnhancedSafety of Vehicles, Munich, May, 1994.
17. Ryan GA, McLean AJ, Vilenius ATS, et al. Head impacts and braininjury in fatally injured pedestrians. Presented at the InternationalConference on the Biomechanics of Impacts, Bron, France,September, 13–15, 1989.
18. Grzegorz T, Roman M. Ankle joint injuries as a reconstructionparameter in car-to-pedestrian accidents. Forensic Sci Int. 2000;118:65–73.
19. Grzegorz T, Roman M. Pelvis and hip injuries as a reconstructivefactors in car-to-pedestrian accidents, Forensic Sci Int. 2001;124:68–73.
20. Ishikawa H, Kajzer J, Schroeder G. Computer Simulation of ImpactResponse of the Human Body in Car-Pedestrian Accidents. Societyof Automotive Engineers Conference, SAE. 1993; paper 933129.
21. Billault P, Berthommier M. Cinematique du pieton heurte par lacitroen visa (position ccmc). Document PSA c4258/21016. 1983.
22. Billault P, Berthommier M. Cinematique du pieton heurte par la 2cvcitroen. Document PSA c4258/20874, 1982.
23. Billault P, Berthommier M. Compatibilite entre pare-chocs etpietons. Document PSA c4258/21178, November 1983–March 1984.
24. Billault P, Berthommier M. Influence du type de vehicule sur lepoint d’impact de la tete sur le vehicule. Document PSAc4258/20996, 1983.
25. Billault P, Berthommier M. Influence du type de vehicule sur lavitesse d’impact de la tete sur le sol. Document PSA c4258/20946,1982.
26. Billault P, Cavallero C, Berthommier M. Influence du type devehicule sur la vitesse d’impact de la tete. Document PSA c4258/20930, 1983.
27. Winckler G. Manuel d’anatomie topographique et fonctionnelle. 2ndEd. Paris, Masson, 1974.
EDITORIAL COMMENTSince the publication of Unsafe at Any Speed by Ralph
Nader1 in the 1960s, there have been enormous improve-ments in the protection of occupants of motor vehicles in-volved in crashes. Numerous technologic innovations such ascrumple zones, pretensioning and load-limiting seatbelts,front and side airbags, and energy-managing steering assem-blies have dramatically improved the survivability of crashes.
Yet many injuries and deaths occur to individuals whostrike or are struck by automobiles including pedestrians,bicyclists, and motorcyclists. The pedestrian obviously rep-resents the maximum in incompatibility between the strikingstructure and the victim. Improvements have been made suchas the removal of bayonet-like hood ornaments and the re-structuring of the front end of automobiles to make them lessaggressive when contacting pedestrians in crash events. Untilrecently, almost no regulations existed that would mandatesafety-optimized vehicle structures to minimize injury anddeath in pedestrian-automobile collisions. A number of initi-atives are in place throughout the world that will regulate carperformance in pedestrian crashes just as occupant protectionhas been increasingly regulated.
This study attempts to add insight into injury mecha-nisms in frontal car-to-pedestrian crashes. These are the mostcommon configurations producing severe injury and death.The authors employ instrumented cadavers emulating variouscollision patterns. The study elucidates a number of mecha-nisms of injury and postulates countermeasures. Studies ofthis sort have been done before, but this one is exceptional,particularly in its monitoring of the impact forces.
To truly improve the injury protection of pedestrians,ongoing studies of injury mechanisms and evaluations ofcountermeasures must occur through these types of stagedcrash tests involving cadavers and anthropometric crash dum-mies, as well as computer simulations and evaluations ofreal-world crashes. This study contributes to this scientificdomain with its quality of design and execution.
Jeffrey S. Augenstein, MDUniversity of Miami Ryder Trauma CenterMiami, FL
REFERENCE1. Nader R. Unsafe at any speed. Massachusetts: Knightsbridge; 1965:
1–365.
Study of Pedestrian Trauma by PMHS Tests
Volume 62 • Number 2 519
Computed Tomographic Angiography in the InitialAssessment of Penetrating Extremity InjuriesKenji Inaba, MD, MS, Felipe Munera, MD, Luis Rivas, MD, Enrique Ginzburg, MD, and Mark McKenney, MD
J Trauma. 2007;62:520–522.
In the evaluation of the injured extremity, catheter-basedangiography has been the gold standard vascular imagingmodality. As computed tomography (CT) technology has
evolved, however, multislice helical computed tomographicangiography (M-CTA) has become an integral part of theinitial assessment of many injured patients.1,2 Driven byadvances in multislice technology, M-CTA has been able toreplace traditional angiography in many imaging situations. Ithas been studied for the vascular evaluation of the neck, lung,thoracoabdominal aorta, kidney,1–7 and now the lower ex-tremity. This case illustrates the state of the art in multislicehelical CT angiography and its role in the initial evaluation ofthe acutely injured extremity.
CASE REPORTA 67-year-old man suffered a single self-inflicted 9-mm
handgun wound at close range to the region of the left knee. Thebullet entered the medial aspect of the left leg above the kneeand exited on the lateral aspect of the leg below the knee. Hearrived by air rescue to the resuscitation area of the RyderTrauma Center 15 minutes after sustaining the injury. He re-mained neurologically intact with a patent airway and vital signswithin normal limits en route. A pressure dressing had beenplaced over the wound by the emergency medical services team.There was minimal blood loss reported at the scene.
Past medical history was significant for a prior gunshotwound to the head and appendectomy.
Primary and secondary surveys revealed no other inju-ries. Vital signs remained within normal limits. The initialblood gas showed a base deficit of -1 and a hematocrit of 30.A tourniquet was applied above the wound and the dressingremoved. Deflation of the tourniquet resulted in no ongoing
bleeding; however, a small, nonexpanding, nonpulsatile he-matoma was present at the entrance wound. Popliteal, dorsa-lis pedis, and posterior tibial pulses were present bilaterally.Ankle brachial index was 1.0 left and 0.9 right. Sensory andmotor examination of the lower extremity was normal.
Plain radiographs demonstrated no fracture or retainedmissile. An M-CTA was obtained. The helical acquisitionwas planned on the basis of a digital scout view of the lowerextremities, starting at the top of the hip joints and ending atthe ankles. Nonionic contrast, (Ioversol Injection USP 68%Optiray 320; Mallinckrodt Inc., St. Louis, MO), was deliv-ered at a rate of 4.5 mL/sec through an 18-gauge catheterplaced in an antecubital vein using a power injector (totalvolume 100 mL). The scan delay was determined using anautomated triggering device that starts injection of contrastmaterial when a threshold attenuation level is reached. Thestudy was obtained using a four channel multi-detector scannerwith a collimation of 3.2 mm with interval reconstruction of 1.6mm. Three-dimensional reconstructions from the set of axialsource images were performed using a standard workstation.
The M-CTA demonstrated a pseudoaneurysm (Fig. 1),1.6 cm maximum diameter, broad neck with no active ex-travasation of contrast, just above the knee joint. Chronicatherosclerotic changes to the anterior tibial artery and tibial-peroneal trunk were also noted. The M-CTA was followed bya left lower extremity arteriogram (Fig. 2) via the left femoralartery approach which confirmed the M-CTA findings (Io-versol Injection USP 68%; Optiray 320, Mallinckrodt Inc., St.Louis, MO; total volume 72 mL).
The patient was brought to the operating room for openexploration of the popliteal artery. The pseudoaneurysm wasidentified. The injured segment was replaced with a reversedsaphenous vein graft. Postoperatively, there was goodarterial flow to the lower extremity. The patient was dis-charged from hospital on postoperative day 5 with intactpulses and normal sensory and motor function of bothlower extremities.
DISCUSSIONCatheter-based angiography has been the gold standard
for vascular evaluation of the injured extremity. It is, how-ever, a time-consuming process requiring a skilled team to beassembled and may not be available at all centers at all times.
Submitted for publication August 26, 2004.Accepted for publication August 3, 2005.Copyright © 2007 by Lippincott Williams & Wilkins, Inc.From the Departments of Surgery (K.I., E.G., M.M.) and Radiology
(F.M., L.R.), Ryder Trauma Center, University of Miami School of Medi-cine, Miami, Florida.
Address for reprints: Kenji Inaba, MD, Division of Trauma Surgeryand Surgical Critical Care, LAC�USC Medical Center, University of South-ern California, 1200 North State Street 10-750, Los Angeles, CA 90033,email: [email protected].
DOI: 10.1097/01.ta.0000196664.68013.82
Case Report The Journal of TRAUMA� Injury, Infection, and Critical Care
520 February 2007
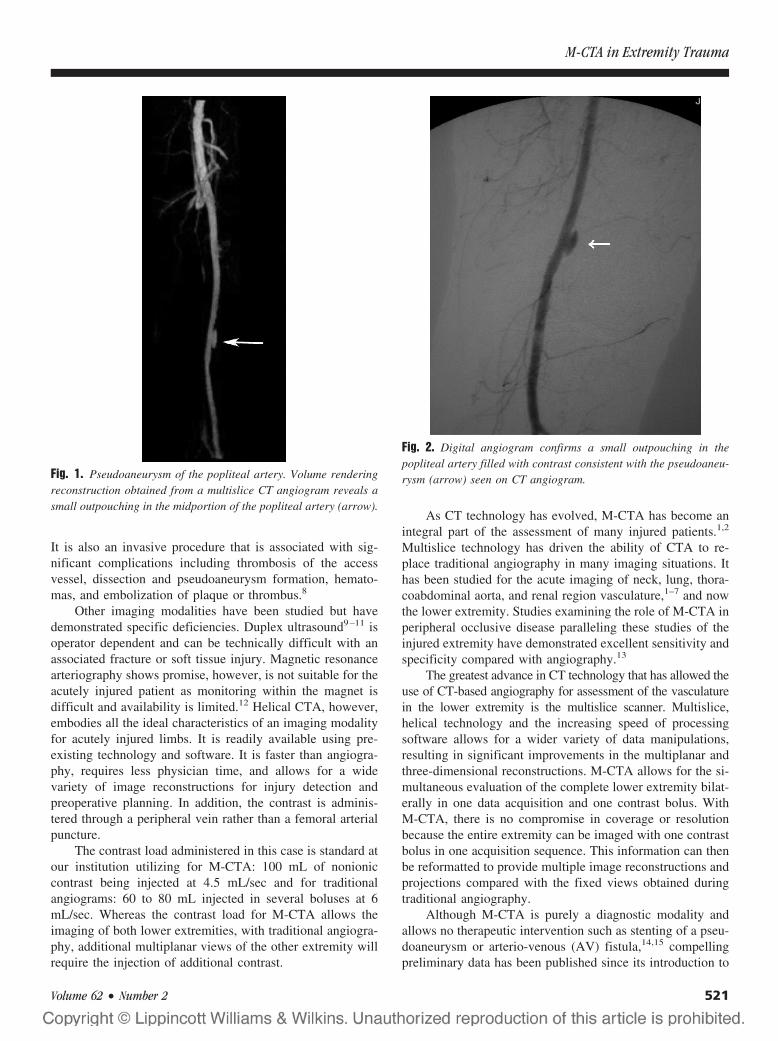
It is also an invasive procedure that is associated with sig-nificant complications including thrombosis of the accessvessel, dissection and pseudoaneurysm formation, hemato-mas, and embolization of plaque or thrombus.8
Other imaging modalities have been studied but havedemonstrated specific deficiencies. Duplex ultrasound9–11 isoperator dependent and can be technically difficult with anassociated fracture or soft tissue injury. Magnetic resonancearteriography shows promise, however, is not suitable for theacutely injured patient as monitoring within the magnet isdifficult and availability is limited.12 Helical CTA, however,embodies all the ideal characteristics of an imaging modalityfor acutely injured limbs. It is readily available using pre-existing technology and software. It is faster than angiogra-phy, requires less physician time, and allows for a widevariety of image reconstructions for injury detection andpreoperative planning. In addition, the contrast is adminis-tered through a peripheral vein rather than a femoral arterialpuncture.
The contrast load administered in this case is standard atour institution utilizing for M-CTA: 100 mL of nonioniccontrast being injected at 4.5 mL/sec and for traditionalangiograms: 60 to 80 mL injected in several boluses at 6mL/sec. Whereas the contrast load for M-CTA allows theimaging of both lower extremities, with traditional angiogra-phy, additional multiplanar views of the other extremity willrequire the injection of additional contrast.
As CT technology has evolved, M-CTA has become anintegral part of the assessment of many injured patients.1,2
Multislice technology has driven the ability of CTA to re-place traditional angiography in many imaging situations. Ithas been studied for the acute imaging of neck, lung, thora-coabdominal aorta, and renal region vasculature,1–7 and nowthe lower extremity. Studies examining the role of M-CTA inperipheral occlusive disease paralleling these studies of theinjured extremity have demonstrated excellent sensitivity andspecificity compared with angiography.13
The greatest advance in CT technology that has allowed theuse of CT-based angiography for assessment of the vasculaturein the lower extremity is the multislice scanner. Multislice,helical technology and the increasing speed of processingsoftware allows for a wider variety of data manipulations,resulting in significant improvements in the multiplanar andthree-dimensional reconstructions. M-CTA allows for the si-multaneous evaluation of the complete lower extremity bilat-erally in one data acquisition and one contrast bolus. WithM-CTA, there is no compromise in coverage or resolutionbecause the entire extremity can be imaged with one contrastbolus in one acquisition sequence. This information can thenbe reformatted to provide multiple image reconstructions andprojections compared with the fixed views obtained duringtraditional angiography.
Although M-CTA is purely a diagnostic modality andallows no therapeutic intervention such as stenting of a pseu-doaneurysm or arterio-venous (AV) fistula,14,15 compellingpreliminary data has been published since its introduction to
Fig. 2. Digital angiogram confirms a small outpouching in thepopliteal artery filled with contrast consistent with the pseudoaneu-rysm (arrow) seen on CT angiogram.Fig. 1. Pseudoaneurysm of the popliteal artery. Volume rendering
reconstruction obtained from a multislice CT angiogram reveals asmall outpouching in the midportion of the popliteal artery (arrow).
M-CTA in Extremity Trauma
Volume 62 • Number 2 521
support its use as the initial screening modality in extremityinjury.
Soto in 199916 published a prospective evaluation of oldertechnology, helical, single-detector CTA in the evaluation ofsuspected extremity vascular injury. Forty-three patients hadCTA evaluation followed by conventional angiography. Ofthe 19 positive studies, 10 had occlusion, 5 had pseudoaneu-rysms, 1 had an AV fistula, and 3 had both pseudoaneurysmand AV fistula. Independent blinded review by two radiolo-gists demonstrated a sensitivity of 90% (95% CI: 80–99) and100% (95% CI: 99–100) for each of the two radiologists,respectively, with a specificity of 100% (95% CI: 99–100)for both. A second study17 again, utilizing single detectorhelical technology, prospectively evaluated CTA utilizing astheir gold standard conventional arteriography or surgicalexploration and clinical follow-up to a mean of 5.2 months(range 3–18 months). Of the 139 patients, metal fragmentsresulted in a noninterpretable scan in 3.6% of cases. In theremaining patients, 61 injuries were detected. The sensitivityand specificity for two separate blinded readings with perfectinterobserver agreement (� � 1.0) was 95.1% (95% CI:85.4–98.7%) and 98.7% (95% CI: 91.9–99.9%) respectively.
As M-CTA technology has become widely available,Busquets in 2004 retrospectively examined a 2-year periodwhere new technology M-CTA was utilized in the evaluationof extremity trauma.18 Ninety-seven M-CTAs (70% blunt)demonstrated 25 abnormalities. There were 21 occlusions, 2pseudoaneurysms, and 2 intimal flaps. All abnormalities wereconfirmed by gold standard evaluation arteriography, sur-gery, or both with a sensitivity of 100%. No unnecessarysurgical explorations were performed. Of the 62 negativeM-CTAs, only 10 had confirmatory negative angiograms.The remainder were followed to discharge with 84% beingfollowed out to 8 � 3.1 months. Asymptomatic nonocclusiveinjuries such as pseudoaneurysms, arteriovenous fistulas, anddissections may have been missed; however, in this series, noclinically detectable injuries were missed by the M-CTA.
M-CTA has the potential to be a fast, accurate, widelyavailable, and noninvasive initial screening examination for theevaluation of the traumatized extremity. Further prospectiveevaluation of M-CTA against the gold standard of catheter-based angiography, taking advantage of ongoing improvementsin multislice technology, is warranted.
REFERENCES1. Novelline RA, Rhea JT, Rao PM, Stuk JL. Helical CT in emergency
radiology. Radiology. 1999;213:321–339.2. Rivas LA, Fishman JE, Munera F, Bajayo DE. Multislice CT in
thoracic trauma. Radiol Clin North Am. 2003;41:599–616.3. Schoepf UJ, Costello P. CT angiography for diagnosis of pulmonary
embolism: state of the art. Radiology. 2004;230:329–337.4. LeBlang SD, Nunez DM. Noninvasive imaging of cervical vascular
injuries. AJR Am J Roentgenol. 2000;174:1269–1278.5. Fishman JE. Imaging of blunt aortic and great vessel trauma.
J Thorac Imaging. 2000;15:97–103.6. Nunez D, Becerra JL, Fuentes D, Pagson S. Traumatic occlusion of
the renal artery: helical CT diagnosis. AJR Am J Roentgenol. 1996;167:777–380.
7. Munera F, Soto JA, Palacio DM, et al. Penetrating neck injuries:helical CT angiography for initial evaluation. Radiology. 2002;224:366–372.
8. AbuRahma AF, Robinson PA, Umstot RK, et al. Complications ofarteriography in a recent series of 707 cases: factors affectingoutcome. Ann Vasc Surg. 1993;7:122–129.
9. Bynoe RP, Miles WS, Bell RM, et al. Noninvasive diagnosis ofvascular trauma by duplex ultrasonography. J Vasc Surg. 1991;14:346–352.
10. Fry WR, Smith RS, Sayers DV, et al. The success of duplexultrasonographic scanning in diagnosis of extremity vascularproximity trauma. Arch Surg. 1993;128:1368–1372.
11. Knudson MM, Lewis FR, Atkinson K, Neuhaus A. The role ofduplex ultrasound arterial imaging in patients with penetratingextremity trauma. Arch Surg. 1993;128:1033–1038.
12. Yaquinto JJ, Harms SE, Siemers PT, et al. Arterial injury frompenetrating trauma: evaluation with single-acquisition fat suppressedMR imaging. AJR Am J Roentgenol. 1992;158:631–633.
13. Rubin GD, Schmidt AJ, Logan LJ, Sofilos MC. Multi-detector rowCT angiography of lower extremity arterial inflow and runoff: initialexperience. Radiology. 2001;221:146–158.
14. Uflacker R, Elliott BM. Percutaneous endoluminal stent-graft repairof an old traumatic femoral arteriovenous fistula. CardiovascIntervent Radiol. 1996;19:120–122.
15. Dorros G, Joseph G. Closure of a popliteal arteriovenous fistulausing an autologous vein-covered Palmaz stent. J Endovasc Surg.1995;2:177–181.
16. Soto JA, Munera F, Cardoso N, Guarin O, Medina S. Diagnosticperformance of helical CT angiography in trauma to large arteries ofthe extremities. J Comput Assist Tomogr. 1999;23:188–196.
17. Soto JA, Munera F, Morales C, et al. Focal arterial injuries of theproximal extremities: helical CT arteriography as the initial methodof diagnosis. Radiology. 2001;218:188–194.
18. Busquets AR, Acosta JA, Colon E, Alejandro K, Rodriguez P.Helical computed tomographic angiography for the diagnosis oftraumatic arterial injuries of the extremities. J Trauma. 2004;56:625–628.
The Journal of TRAUMA� Injury, Infection, and Critical Care
522 February 2007
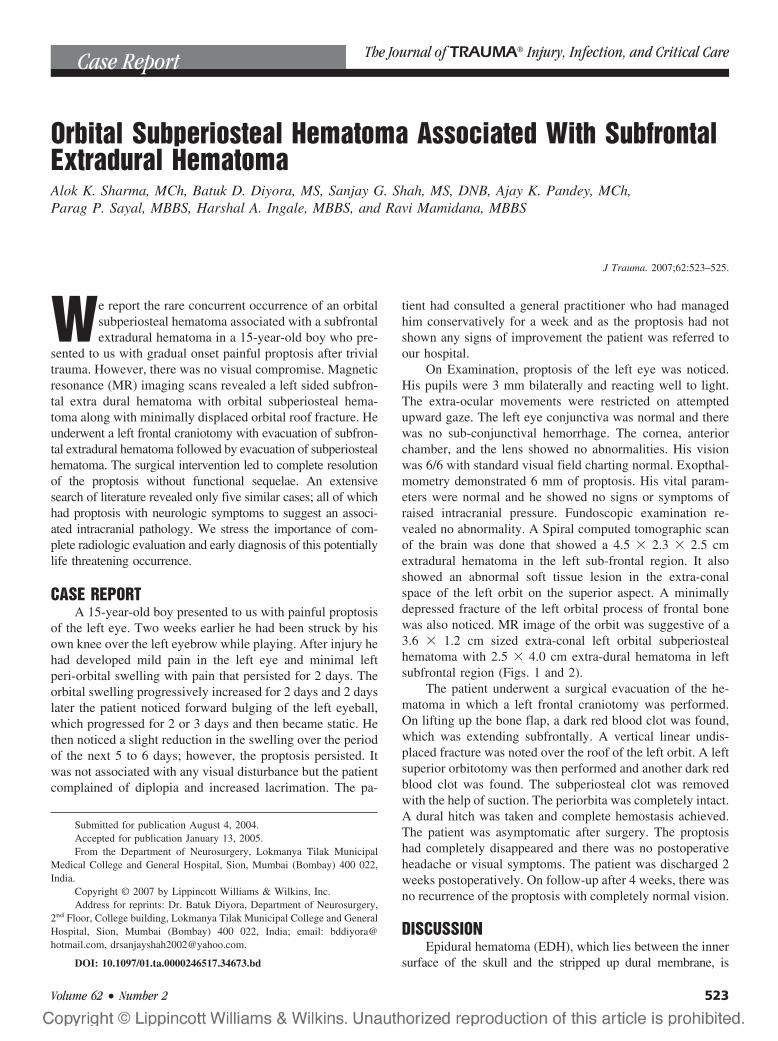
Orbital Subperiosteal Hematoma Associated With SubfrontalExtradural HematomaAlok K. Sharma, MCh, Batuk D. Diyora, MS, Sanjay G. Shah, MS, DNB, Ajay K. Pandey, MCh,Parag P. Sayal, MBBS, Harshal A. Ingale, MBBS, and Ravi Mamidana, MBBS
J Trauma. 2007;62:523–525.
We report the rare concurrent occurrence of an orbitalsubperiosteal hematoma associated with a subfrontalextradural hematoma in a 15-year-old boy who pre-
sented to us with gradual onset painful proptosis after trivialtrauma. However, there was no visual compromise. Magneticresonance (MR) imaging scans revealed a left sided subfron-tal extra dural hematoma with orbital subperiosteal hema-toma along with minimally displaced orbital roof fracture. Heunderwent a left frontal craniotomy with evacuation of subfron-tal extradural hematoma followed by evacuation of subperiostealhematoma. The surgical intervention led to complete resolutionof the proptosis without functional sequelae. An extensivesearch of literature revealed only five similar cases; all of whichhad proptosis with neurologic symptoms to suggest an associ-ated intracranial pathology. We stress the importance of com-plete radiologic evaluation and early diagnosis of this potentiallylife threatening occurrence.
CASE REPORTA 15-year-old boy presented to us with painful proptosis
of the left eye. Two weeks earlier he had been struck by hisown knee over the left eyebrow while playing. After injury hehad developed mild pain in the left eye and minimal leftperi-orbital swelling with pain that persisted for 2 days. Theorbital swelling progressively increased for 2 days and 2 dayslater the patient noticed forward bulging of the left eyeball,which progressed for 2 or 3 days and then became static. Hethen noticed a slight reduction in the swelling over the periodof the next 5 to 6 days; however, the proptosis persisted. Itwas not associated with any visual disturbance but the patientcomplained of diplopia and increased lacrimation. The pa-
tient had consulted a general practitioner who had managedhim conservatively for a week and as the proptosis had notshown any signs of improvement the patient was referred toour hospital.
On Examination, proptosis of the left eye was noticed.His pupils were 3 mm bilaterally and reacting well to light.The extra-ocular movements were restricted on attemptedupward gaze. The left eye conjunctiva was normal and therewas no sub-conjunctival hemorrhage. The cornea, anteriorchamber, and the lens showed no abnormalities. His visionwas 6/6 with standard visual field charting normal. Exopthal-mometry demonstrated 6 mm of proptosis. His vital param-eters were normal and he showed no signs or symptoms ofraised intracranial pressure. Fundoscopic examination re-vealed no abnormality. A Spiral computed tomographic scanof the brain was done that showed a 4.5 � 2.3 � 2.5 cmextradural hematoma in the left sub-frontal region. It alsoshowed an abnormal soft tissue lesion in the extra-conalspace of the left orbit on the superior aspect. A minimallydepressed fracture of the left orbital process of frontal bonewas also noticed. MR image of the orbit was suggestive of a3.6 � 1.2 cm sized extra-conal left orbital subperiostealhematoma with 2.5 � 4.0 cm extra-dural hematoma in leftsubfrontal region (Figs. 1 and 2).
The patient underwent a surgical evacuation of the he-matoma in which a left frontal craniotomy was performed.On lifting up the bone flap, a dark red blood clot was found,which was extending subfrontally. A vertical linear undis-placed fracture was noted over the roof of the left orbit. A leftsuperior orbitotomy was then performed and another dark redblood clot was found. The subperiosteal clot was removedwith the help of suction. The periorbita was completely intact.A dural hitch was taken and complete hemostasis achieved.The patient was asymptomatic after surgery. The proptosishad completely disappeared and there was no postoperativeheadache or visual symptoms. The patient was discharged 2weeks postoperatively. On follow-up after 4 weeks, there wasno recurrence of the proptosis with completely normal vision.
DISCUSSIONEpidural hematoma (EDH), which lies between the inner
surface of the skull and the stripped up dural membrane, is
Submitted for publication August 4, 2004.Accepted for publication January 13, 2005.From the Department of Neurosurgery, Lokmanya Tilak Municipal
Medical College and General Hospital, Sion, Mumbai (Bombay) 400 022,India.
Copyright © 2007 by Lippincott Williams & Wilkins, Inc.Address for reprints: Dr. Batuk Diyora, Department of Neurosurgery,
2nd Floor, College building, Lokmanya Tilak Municipal College and GeneralHospital, Sion, Mumbai (Bombay) 400 022, India; email: [email protected], [email protected].
DOI: 10.1097/01.ta.0000246517.34673.bd
Case Report The Journal of TRAUMA� Injury, Infection, and Critical Care
Volume 62 • Number 2 523
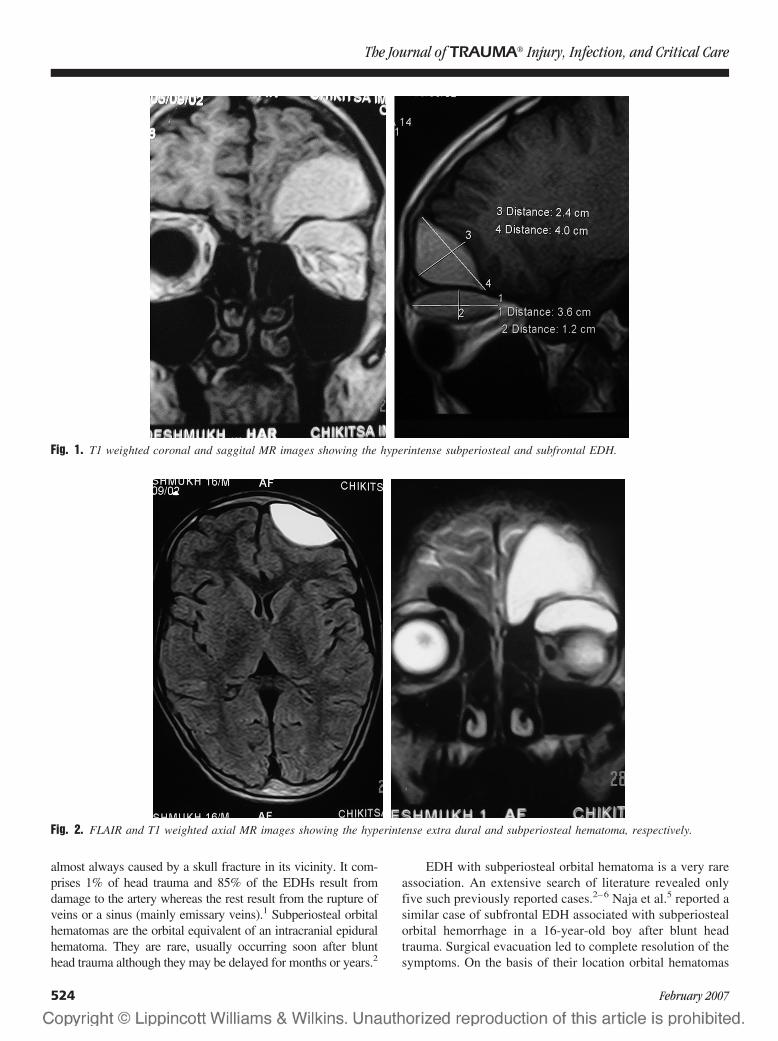
almost always caused by a skull fracture in its vicinity. It com-prises 1% of head trauma and 85% of the EDHs result fromdamage to the artery whereas the rest result from the rupture ofveins or a sinus (mainly emissary veins).1 Subperiosteal orbitalhematomas are the orbital equivalent of an intracranial epiduralhematoma. They are rare, usually occurring soon after blunthead trauma although they may be delayed for months or years.2
EDH with subperiosteal orbital hematoma is a very rareassociation. An extensive search of literature revealed onlyfive such previously reported cases.2–6 Naja et al.5 reported asimilar case of subfrontal EDH associated with subperiostealorbital hemorrhage in a 16-year-old boy after blunt headtrauma. Surgical evacuation led to complete resolution of thesymptoms. On the basis of their location orbital hematomas
Fig. 1. T1 weighted coronal and saggital MR images showing the hyperintense subperiosteal and subfrontal EDH.
Fig. 2. FLAIR and T1 weighted axial MR images showing the hyperintense extra dural and subperiosteal hematoma, respectively.
The Journal of TRAUMA� Injury, Infection, and Critical Care
524 February 2007
are classified as intraorbital or subperiosteal, the former beinga much more frequent occurrence. Space occupying lesions inthe subperiosteal region include tumors (meningioma, lym-phoma, epidermoid, and plasmacytoma), inflammatory le-sions, and hematomas. Subperiosteal hematomas developbetween the bone and the periosteum as a result of tearing ofthe subperiosteal vessels or as an extension of a subgalealhematoma.2,3 These hematomas are most frequently encoun-tered beneath the orbital roof. Fractures of the orbital roof notassociated with blowout injuries of the orbit or orbital rimfractures, as in our case, are unusual.7 The frontal bone formsthe largest continuous concave bony surface. Here the orbitalperiosteum is not firmly adherent to the bone. The periostealattachment is stronger along the suture lines between thebones forming the orbit. Most cases of subperiosteal hema-tomas, as in our case also, have been reported in youngchildren and adolescents. A possible explanation is the looseattachment of the periosteum to the bones in the young.3,8
The periosteal bony connection may grow firmer with age.Subperiosteal hematomas of the orbit are generally an
acute occurrence. However, reports of delayed developmentpostinjury are not uncommon. They are generally causedbecause of blunt head trauma. However, spontaneous occur-rences have been reported after the valsalva maneuver or as acomplication of leukemia, hemophilia, thrombocytopenia,blood dyscrasias, and other hemorrhagic systemic diseases.
Clinically, subperiosteal hematomas present with painfulproptosis. Increase in the intra-orbital volume as a result ofthe subperiosteal hemorrhage and venous congestion becauseof the subfrontal EDH, are the likely reasons for develop-ment of the proptosis. Subperiosteal hemorrhage is rarelyassociated with visual loss.3 However, direct optic nervecompression or retinal dysfunction because of retinal arterycirculation compromise may lead to visual disturbances insuch cases.
The classical presentation of EDH (transient loss of con-sciousness followed by complete recovery, later followed bydilated fixed pupil with unconsciousness) is seen only in 20%of patients.1 Sometimes EDH may present in the chronicstate, being detected only days after the injury. Clinical fea-tures warranting the diagnosis of an EDH after head injurymay develop in a period ranging from less than 1 hour to 14days. However, a normal neurologic examination and normalmental status in the presence of an EDH are extremely rare.6
Isolated subfrontal epidural hematoma is also a relatively rareoccurrence.3 An extra dural hematoma is a life threateningcondition with mortality in children of up to 50%.6 Unlike ourcase wherein the EDH did not manifest symptomaticallydespite its large volume, the previously reported cases of asimilar association between EDH and subperiosteal orbitalhemorrhages had neurologic symptoms in the form of head-ache or mental changes.
MR image and computed tomography (CT) scans are bothvery accurate diagnostic methods for orbital subperiosteal he-matomas. CT scan confers added advantage in the rare scenarioof an associated EDH as in our case. Arteriography can dem-onstrate stretching and inferior displacement of the ophthalmicartery on the affected side.2 Long-term sequelae of subperiostealorbital hematomas include blindness, optic nerve trophy, sec-ondary strabismus, or even permanent exophthalmos.
Management of this condition primarily depends on thesize of the EDH and the neurologic and ocular status of thepatient. In patients with a small frontal EDH and subperios-teal orbital hematoma without any neurologic and ocularsymptoms, the EDH can be managed conservatively. Whenoptic nerve function is compromised, surgical decompressionis necessary. Needle aspiration of the blood from the orbitalhematoma results in an almost immediate cure of all orbitaland ocular problems. However, recent literature suggestsmore definitive surgical therapy particularly in the scenario ofvisual loss or unresponsiveness to mega-dose steroids.3 Alarge subfrontal EDH with subperiosteal hematoma has to besurgically evacuated. Frontal craniotomy with superior orbi-totomy followed by evacuation of the hematomas would bethe ideal treatment for the same.
Although rare, our case highlights the need for ophthal-mologists or physicians to maintain a high degree of sus-picion for EDH in cases of head injury presenting withproptosis, as it is a potentially life threatening conditionparticularly in the young. Also, early recognition and surgicaltreatment of subperiosteal hematoma gives gratifying resultswith complete visual or neurologic recovery in most cases.
REFERENCES1. Greenberg MS. Head trauma. In: Greenberg MS, ed. Handbook of
Neurosurgery, ed 4. Lakeland: Greenberg graphics; 1997:690–747.2. Seigel RS, Williams AG, Hutchison JW, Wolter JR, Carlow TJ,
Rogers DE. Subperiosteal hematomas of the orbit: angiographic andcomputed tomographic diagnosis. Radiology. 1982;143:711–714.
3. O’Neill OR, Delashaw JB, Phillips JP. Subperiosteal hematoma ofthe orbit associated with subfrontal extradural hematoma: casereport. Surg Neurol. 1994;42:308–311.
4. Bourdon EL, Riffaud L, Godey B, Morandi X. Subperiostealhematoma of the orbit associated with a frontal extraduralhematoma. J Fr Ophtalmol. 1999;22:659–661.
5. Naja A, Chellaoui A, Ibahioin K, et al. Subperiosteal hematoma ofthe orbit associated with subfrontal extradural hematoma.Neurochirurgie. 2002;48:101–103.
6. Stewart CR, Salmon JF, Domingo Z, Murray AD. Proptosis as apresenting sign of extradural haematoma. Br J Ophthalmol. 1993;77:179–180.
7. Ruff GL, Riefkohl R, Georgiade GS, Georgiade NG. Facialfractures. In: Wilkins RH, Rangachary SS, eds. Neurosurgery, ed 2.New York: McGraw-Hill; 1996:2763–2772.
8. Dhir SP, Munjal VP, Staneezae N, Jain IS. Subperiosteal hematomaof the orbit. Indian J Ophthalmol. 1982;30:51–52.
Orbital Subperiosteal Hematoma
Volume 62 • Number 2 525
Anterior Spinal Artery Syndrome After Abdominal Stabbingand Resuscitative ThoracotomyChristopher Aylwin, BSc, MRCS, Nigel Tai, MS, FRCS, and Michael Walsh, MS, FRCS
J Trauma. 2007;62:526–528.
Sudden interruption of blood flow in the anterior spinalartery may result in infarction of the anterior and lateralcolumns of the spinal cord, producing a characteristic
pattern of neurologic sequelae termed anterior spinal arterysyndrome (ASAS).1 The syndrome typically arises afterplaque rupture and vessel thrombosis, but may also occur inthe low-flow state of profound shock. The syndrome has alsobeen reported after aortic cross-clamping on patients undergoingaortic aneurysm surgery,2,3 but is rarely observed in traumapatients in the absence of spinal cord injury. We describe a caseof permanent paraplegia resulting from ASAS after resuscitativethoracotomy, aortic cross-clamping, and laparotomy.
CASE REPORTA previously fit and well 35-year-old man was the victim
of an assault, suffering multiple knifed stab wounds to hisneck, chest, abdomen, and back. Treatment was initiated at thescene by a Helicopter Emergency Medical Service (HEMS)physician. The patient was noted to be shocked, with tachycardiaand hypotension, and have a Glasgow Coma Scale (GCS) scoreof 14/15. Supplementary oxygen was supplied via a face-mask;two intravenous lines were established and a 50 mL bolus ofcrystalloid solution given before transfer.
The patient arrived at our institute within 30 minutes ofthe initial emergency call and was immediately intubated andventilated. Chest X-ray revealed no evidence of pneumotho-rax or hemothorax. Focused Assessment by Sonography forTrauma (FAST) was positive for free fluid within the abdom-inal cavity and negative for cardiac tamponade. During re-suscitation the patient continued to exhibit tachycardia andhypotension, although the systolic blood pressure (SBP) didbriefly reach 113 mm Hg toward the end of this phase.
At this point, 35 minutes postarrival, he was transferredto the operating room. On arrival, the patient went into
pulseless electrical activity (PEA) cardiac arrest. Cardio-pulmonary resuscitation (CPR) was immediately com-menced and 1 mg of epinephrine administered. After 1minute, cardiac output was re-established, and an immediateleft anterior thoracotomy was performed. This revealed ap-proximately 2 liters of blood in the left hemithorax, an emptyheart, and two lacerations in the left hemi-diaphragm withblood entering from the abdominal cavity. The descendingaorta was cross-clamped above the diaphragm with immedi-ate improvement of SBP to 140 mm Hg. Laparotomy wasthen performed that revealed a further 1.5 liters of blood inthe abdominal cavity, a laceration at the splenic hilum, alaceration to the upper pole of the left kidney, a laceration tothe greater curvature of the stomach, and three lacerations tothe jejenum. A splenectomy was undertaken and the leftkidney laceration was repaired. At this point the aortic cross-clamp was test-released, but SBP could not be maintainedand it was re-applied. The lacerations to the stomach, jeju-num, and left hemi-diaphragm were repaired and the aorticcross-clamp re-released, with successful maintenance of SBP.Total clamp time was 62 minutes. The splenic bed and leftkidney were packed and the abdomen was left open with aBogota bag. The chest was closed in the standard fashion, andthe rest of the superficial lacerations closed. None of theseencroached on the thoracic or lumbar spinal column.
The patient was then transferred to the Intensive CareUnit for on-going resuscitation and re-warming. He returnedto theater on day 2 postoperative for abdominal closure. Thepostoperative course was hampered by sepsis, superficialwound dehiscence, and a lengthy wean from sedation thatnecessitated tracheostomy.
Absence of lower limb movement was noted 12 dayspostinjury. However, a further 12 days had elapsed before thepatient was sufficiently orientated to facilitate a detailed neu-rologic examination. This revealed a flaccid paralysis of bothlegs, with absent reflexes, but preserved light touch and jointposition sense. Sphincter tone was absent, and the patient wasincontinent of urine and feces. The spinal level of deficit wasdemonstrated to be at T12. A magnetic resonance imaging(MRI) scan of the thoracic and lumbar spine was performed.There was no evidence of cord compression, swelling, orhemorrhage, but a suggestion of signal change within thecentral part of the lower thoracic cord, extending to the conus,
Submitted for publication August 25, 2004.Accepted for publication May 4, 2005.Copyright © 2007 by Lippincott Williams & Wilkins, Inc.From the Trauma Service, Royal London Hospital, Whitechapel, Lon-
don E1 1BB.Address for reprints: Christopher Aylwin, Department of General Sur-
gery, Royal London Hospital, Whitechapel, London E1 1BB, United King-dom; email: [email protected].
DOI: 10.1097/01.ta.0000196528.71124.90
Case Report The Journal of TRAUMA� Injury, Infection, and Critical Care
526 February 2007
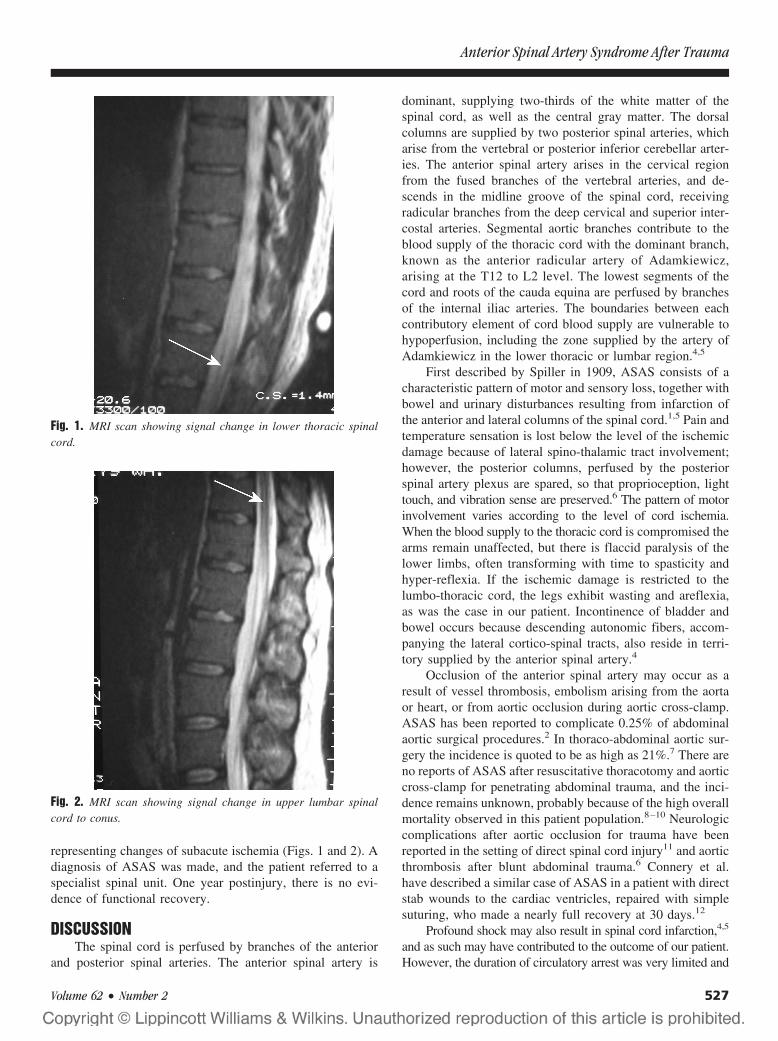
representing changes of subacute ischemia (Figs. 1 and 2). Adiagnosis of ASAS was made, and the patient referred to aspecialist spinal unit. One year postinjury, there is no evi-dence of functional recovery.
DISCUSSIONThe spinal cord is perfused by branches of the anterior
and posterior spinal arteries. The anterior spinal artery is
dominant, supplying two-thirds of the white matter of thespinal cord, as well as the central gray matter. The dorsalcolumns are supplied by two posterior spinal arteries, whicharise from the vertebral or posterior inferior cerebellar arter-ies. The anterior spinal artery arises in the cervical regionfrom the fused branches of the vertebral arteries, and de-scends in the midline groove of the spinal cord, receivingradicular branches from the deep cervical and superior inter-costal arteries. Segmental aortic branches contribute to theblood supply of the thoracic cord with the dominant branch,known as the anterior radicular artery of Adamkiewicz,arising at the T12 to L2 level. The lowest segments of thecord and roots of the cauda equina are perfused by branchesof the internal iliac arteries. The boundaries between eachcontributory element of cord blood supply are vulnerable tohypoperfusion, including the zone supplied by the artery ofAdamkiewicz in the lower thoracic or lumbar region.4,5
First described by Spiller in 1909, ASAS consists of acharacteristic pattern of motor and sensory loss, together withbowel and urinary disturbances resulting from infarction ofthe anterior and lateral columns of the spinal cord.1,5 Pain andtemperature sensation is lost below the level of the ischemicdamage because of lateral spino-thalamic tract involvement;however, the posterior columns, perfused by the posteriorspinal artery plexus are spared, so that proprioception, lighttouch, and vibration sense are preserved.6 The pattern of motorinvolvement varies according to the level of cord ischemia.When the blood supply to the thoracic cord is compromised thearms remain unaffected, but there is flaccid paralysis of thelower limbs, often transforming with time to spasticity andhyper-reflexia. If the ischemic damage is restricted to thelumbo-thoracic cord, the legs exhibit wasting and areflexia,as was the case in our patient. Incontinence of bladder andbowel occurs because descending autonomic fibers, accom-panying the lateral cortico-spinal tracts, also reside in terri-tory supplied by the anterior spinal artery.4
Occlusion of the anterior spinal artery may occur as aresult of vessel thrombosis, embolism arising from the aortaor heart, or from aortic occlusion during aortic cross-clamp.ASAS has been reported to complicate 0.25% of abdominalaortic surgical procedures.2 In thoraco-abdominal aortic sur-gery the incidence is quoted to be as high as 21%.7 There areno reports of ASAS after resuscitative thoracotomy and aorticcross-clamp for penetrating abdominal trauma, and the inci-dence remains unknown, probably because of the high overallmortality observed in this patient population.8–10 Neurologiccomplications after aortic occlusion for trauma have beenreported in the setting of direct spinal cord injury11 and aorticthrombosis after blunt abdominal trauma.6 Connery et al.have described a similar case of ASAS in a patient with directstab wounds to the cardiac ventricles, repaired with simplesuturing, who made a nearly full recovery at 30 days.12
Profound shock may also result in spinal cord infarction,4,5
and as such may have contributed to the outcome of our patient.However, the duration of circulatory arrest was very limited and
Fig. 1. MRI scan showing signal change in lower thoracic spinalcord.
Fig. 2. MRI scan showing signal change in upper lumbar spinalcord to conus.
Anterior Spinal Artery Syndrome After Trauma
Volume 62 • Number 2 527
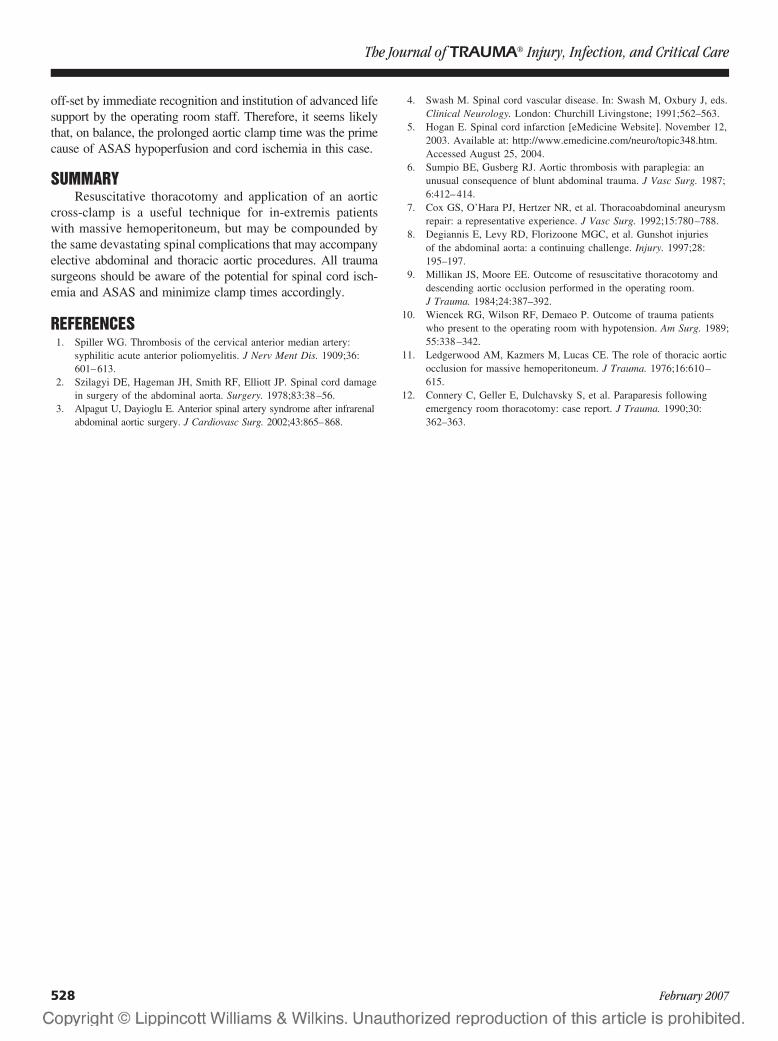
off-set by immediate recognition and institution of advanced lifesupport by the operating room staff. Therefore, it seems likelythat, on balance, the prolonged aortic clamp time was the primecause of ASAS hypoperfusion and cord ischemia in this case.
SUMMARYResuscitative thoracotomy and application of an aortic
cross-clamp is a useful technique for in-extremis patientswith massive hemoperitoneum, but may be compounded bythe same devastating spinal complications that may accompanyelective abdominal and thoracic aortic procedures. All traumasurgeons should be aware of the potential for spinal cord isch-emia and ASAS and minimize clamp times accordingly.
REFERENCES1. Spiller WG. Thrombosis of the cervical anterior median artery:
syphilitic acute anterior poliomyelitis. J Nerv Ment Dis. 1909;36:601–613.
2. Szilagyi DE, Hageman JH, Smith RF, Elliott JP. Spinal cord damagein surgery of the abdominal aorta. Surgery. 1978;83:38–56.
3. Alpagut U, Dayioglu E. Anterior spinal artery syndrome after infrarenalabdominal aortic surgery. J Cardiovasc Surg. 2002;43:865–868.
4. Swash M. Spinal cord vascular disease. In: Swash M, Oxbury J, eds.Clinical Neurology. London: Churchill Livingstone; 1991;562–563.
5. Hogan E. Spinal cord infarction [eMedicine Website]. November 12,2003. Available at: http://www.emedicine.com/neuro/topic348.htm.Accessed August 25, 2004.
6. Sumpio BE, Gusberg RJ. Aortic thrombosis with paraplegia: anunusual consequence of blunt abdominal trauma. J Vasc Surg. 1987;6:412–414.
7. Cox GS, O’Hara PJ, Hertzer NR, et al. Thoracoabdominal aneurysmrepair: a representative experience. J Vasc Surg. 1992;15:780–788.
8. Degiannis E, Levy RD, Florizoone MGC, et al. Gunshot injuriesof the abdominal aorta: a continuing challenge. Injury. 1997;28:195–197.
9. Millikan JS, Moore EE. Outcome of resuscitative thoracotomy anddescending aortic occlusion performed in the operating room.J Trauma. 1984;24:387–392.
10. Wiencek RG, Wilson RF, Demaeo P. Outcome of trauma patientswho present to the operating room with hypotension. Am Surg. 1989;55:338–342.
11. Ledgerwood AM, Kazmers M, Lucas CE. The role of thoracic aorticocclusion for massive hemoperitoneum. J Trauma. 1976;16:610–615.
12. Connery C, Geller E, Dulchavsky S, et al. Paraparesis followingemergency room thoracotomy: case report. J Trauma. 1990;30:362–363.
The Journal of TRAUMA� Injury, Infection, and Critical Care
528 February 2007

A Missed Cervical Cord Injury Caused by a Stab Wound tothe NeckDilip Sri Nath, MD, and Michael D. McGonigal, MD
J Trauma. 2007;62:529–531.
Acute spinal cord injuries are seen in 2.6% of patientswho are evaluated for trauma in North America.1 Mostcommonly, they are a result of motor vehicle crashes,
falls or penetrating trauma secondary to gunshot wounds.Stab wounds, while a common mechanism of spinal cordinjury in South Africa, account for only 1% of all suchinjuries in the United States and Canada.1–3 On initial pre-sentation, patients typically have acute neurologic compro-mise that allows for the appropriate diagnosis to be reached.There have been a few reported cases of delayed presentationof neurologic symptoms and they are usually a result of thepatients not seeking treatment immediately after the eventor because of myelopathy secondary to retained foreignbodies.4,5 This article discusses a case of missed cervical cordinjury in a patient who was stabbed in the neck and did notmanifest evidence of neurologic compromise on initialevaluation.
CASE REPORTA 20-year-old man was attacked and injured with an
unidentified knife by an unknown assailant. He initially sus-tained stab wounds to the abdomen. When he attempted toleave the scene, he was attacked from behind resulting in stabwounds to his right hand, back, and scalp. The patient wasbrought to a Level I Trauma Center for evaluation. At arrival,he was hemodynamically stable with a patent airway but withdiminished breath sounds in the right lung field. Needledecompression followed by a tube thoracostomy was per-formed with resolution of the clinical pneumothorax. Thepatient was conversant and denied a loss of consciousness. Abrief neurologic examination did not reveal any motor orsensory deficits. The abdominal examination revealed a 3 to4 cm superficial laceration in the right upper quadrant and a2 to 3 cm stab wound in the left upper quadrant through
which small bowel had eviscerated. Superficial lacerations 2to 3 cm in length were present on the dorsum of the righthand, back (midline near the T3–T4 level), and scalp (nearthe craniocervical junction).
The patient was taken to the operating room where alaparotomy was performed. Penetrating injuries to the colonwere noted and were repaired primarily given that there wasno gross spillage. A small bowel mesenteric injury wastreated with a segmental resection and primary anastomosis.In addition, a mid-ureteral injury was noted that was repairedprimarily over a stent. Finally, the wounds on the patient’shand, back, and scalp were cleaned, noted to be superficialand closed primarily.
The patient’s postoperative recovery was initially un-eventful. Nearly 4 days after the assault, however, the patientdeveloped progressive left sided weakness and sensory loss.Physical examination revealed slightly diminished (4/5)strength in the left upper extremity, a few sustained clonusand decreased sensation to light touch. There were no neu-rologic abnormalities noted in the ipsilateral lower extremitynor was there any loss of pain, temperature, or proprioceptionsensation on the entire left side. A computed tomographyscan was obtained which revealed a bone fragment from theocciput near the cervical spine in addition to an ill-definedabnormality in the left posterior cord above c2–c3 (Figs. 1and 2). A magnetic resonance image study was performedwhich noted a fluid collection between the spinous process ofc2 and posterior ring of c1 (Fig. 3). Hence, a diagnosis of apseudomeningocele with cord contusion was made.
Given the length of time between the injury and diagno-sis and a lack of acute clinical deterioration, an operativeintervention was not indicated. The patient was administeredsteroids and was soon transferred to a rehabilitation center.He continues to do well in the outpatient setting with nearcomplete neurologic recovery.
DISCUSSIONThe spinal vertebrae are aligned in a manner such that it
is difficult for a penetrating stab wound to cause major injuryto the cord.2,6 With stab wounds at the craniocervical junc-tion, the knife blade is typically deflected by the occipitalbone after traversing the subcutaneous tissue. It slides on theundersurface of the occiput and is directed to the c0–c2
Submitted for publication August 23, 2004.Accepted for publication January 13, 2005.Copyright © 2007 by Lippincott Williams & Wilkins, Inc.From the University of Minnesota (D.S.N.); and the Department of
Surgery, Regions Hospital, St. Paul, Minnesota (M.D.M.).Address for reprints: Michael D. McGonigal, MD, Regions Hospital,
Department of Surgery, 640 Jackson Street, St. Paul, MN 55101-2595; email:[email protected].
DOI: 10.1097/01.ta.0000246915.82367.ff
Case Report The Journal of TRAUMA� Injury, Infection, and Critical Care
Volume 62 • Number 2 529
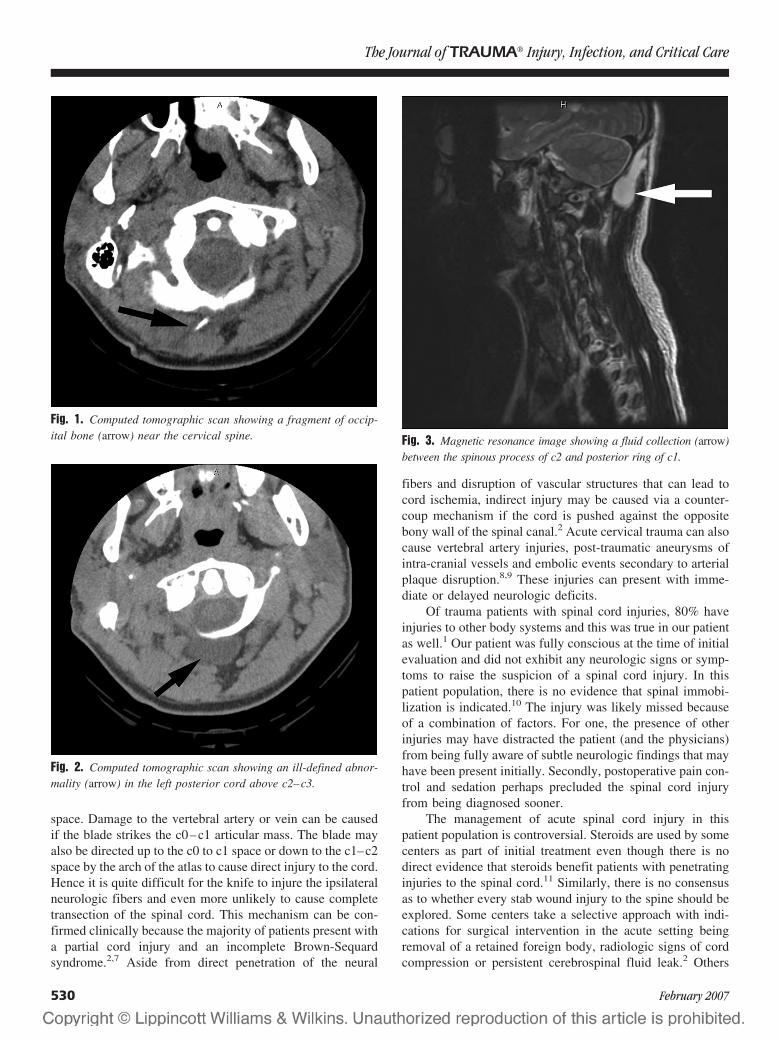
space. Damage to the vertebral artery or vein can be causedif the blade strikes the c0–c1 articular mass. The blade mayalso be directed up to the c0 to c1 space or down to the c1–c2space by the arch of the atlas to cause direct injury to the cord.Hence it is quite difficult for the knife to injure the ipsilateralneurologic fibers and even more unlikely to cause completetransection of the spinal cord. This mechanism can be con-firmed clinically because the majority of patients present witha partial cord injury and an incomplete Brown-Sequardsyndrome.2,7 Aside from direct penetration of the neural
fibers and disruption of vascular structures that can lead tocord ischemia, indirect injury may be caused via a counter-coup mechanism if the cord is pushed against the oppositebony wall of the spinal canal.2 Acute cervical trauma can alsocause vertebral artery injuries, post-traumatic aneurysms ofintra-cranial vessels and embolic events secondary to arterialplaque disruption.8,9 These injuries can present with imme-diate or delayed neurologic deficits.
Of trauma patients with spinal cord injuries, 80% haveinjuries to other body systems and this was true in our patientas well.1 Our patient was fully conscious at the time of initialevaluation and did not exhibit any neurologic signs or symp-toms to raise the suspicion of a spinal cord injury. In thispatient population, there is no evidence that spinal immobi-lization is indicated.10 The injury was likely missed becauseof a combination of factors. For one, the presence of otherinjuries may have distracted the patient (and the physicians)from being fully aware of subtle neurologic findings that mayhave been present initially. Secondly, postoperative pain con-trol and sedation perhaps precluded the spinal cord injuryfrom being diagnosed sooner.
The management of acute spinal cord injury in thispatient population is controversial. Steroids are used by somecenters as part of initial treatment even though there is nodirect evidence that steroids benefit patients with penetratinginjuries to the spinal cord.11 Similarly, there is no consensusas to whether every stab wound injury to the spine should beexplored. Some centers take a selective approach with indi-cations for surgical intervention in the acute setting beingremoval of a retained foreign body, radiologic signs of cordcompression or persistent cerebrospinal fluid leak.2 Others
Fig. 1. Computed tomographic scan showing a fragment of occip-ital bone (arrow) near the cervical spine.
Fig. 2. Computed tomographic scan showing an ill-defined abnor-mality (arrow) in the left posterior cord above c2–c3.
Fig. 3. Magnetic resonance image showing a fluid collection (arrow)between the spinous process of c2 and posterior ring of c1.
The Journal of TRAUMA� Injury, Infection, and Critical Care
530 February 2007
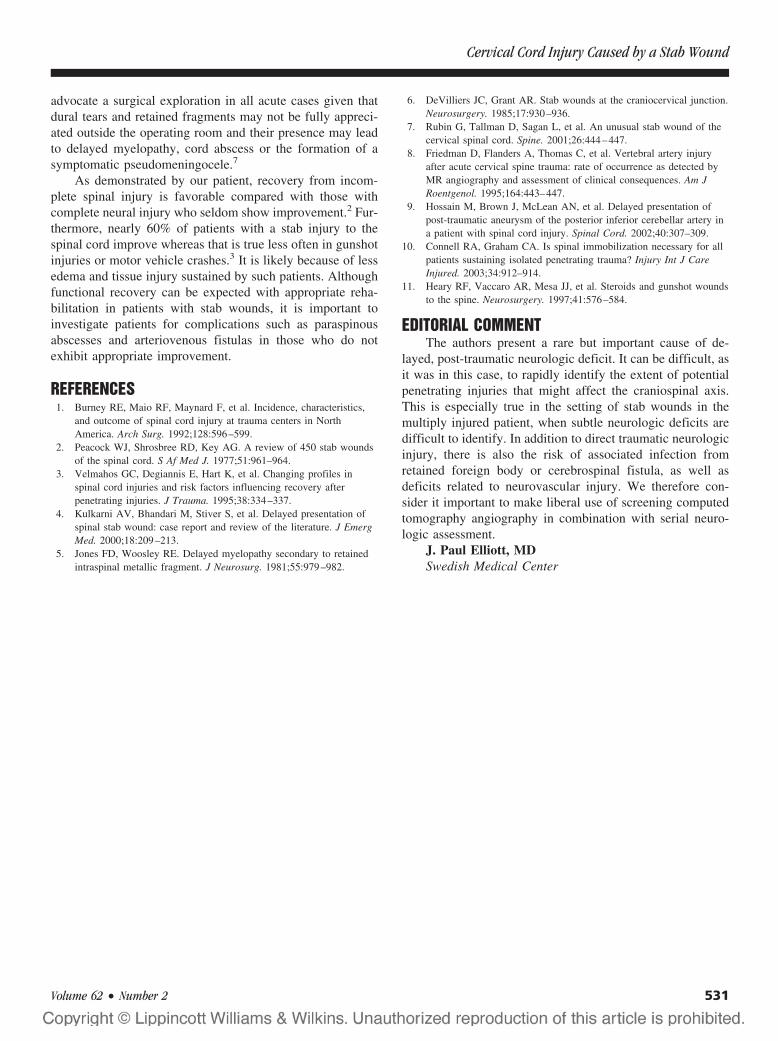
advocate a surgical exploration in all acute cases given thatdural tears and retained fragments may not be fully appreci-ated outside the operating room and their presence may leadto delayed myelopathy, cord abscess or the formation of asymptomatic pseudomeningocele.7
As demonstrated by our patient, recovery from incom-plete spinal injury is favorable compared with those withcomplete neural injury who seldom show improvement.2 Fur-thermore, nearly 60% of patients with a stab injury to thespinal cord improve whereas that is true less often in gunshotinjuries or motor vehicle crashes.3 It is likely because of lessedema and tissue injury sustained by such patients. Althoughfunctional recovery can be expected with appropriate reha-bilitation in patients with stab wounds, it is important toinvestigate patients for complications such as paraspinousabscesses and arteriovenous fistulas in those who do notexhibit appropriate improvement.
REFERENCES1. Burney RE, Maio RF, Maynard F, et al. Incidence, characteristics,
and outcome of spinal cord injury at trauma centers in NorthAmerica. Arch Surg. 1992;128:596–599.
2. Peacock WJ, Shrosbree RD, Key AG. A review of 450 stab woundsof the spinal cord. S Af Med J. 1977;51:961–964.
3. Velmahos GC, Degiannis E, Hart K, et al. Changing profiles inspinal cord injuries and risk factors influencing recovery afterpenetrating injuries. J Trauma. 1995;38:334–337.
4. Kulkarni AV, Bhandari M, Stiver S, et al. Delayed presentation ofspinal stab wound: case report and review of the literature. J EmergMed. 2000;18:209–213.
5. Jones FD, Woosley RE. Delayed myelopathy secondary to retainedintraspinal metallic fragment. J Neurosurg. 1981;55:979–982.
6. DeVilliers JC, Grant AR. Stab wounds at the craniocervical junction.Neurosurgery. 1985;17:930–936.
7. Rubin G, Tallman D, Sagan L, et al. An unusual stab wound of thecervical spinal cord. Spine. 2001;26:444–447.
8. Friedman D, Flanders A, Thomas C, et al. Vertebral artery injuryafter acute cervical spine trauma: rate of occurrence as detected byMR angiography and assessment of clinical consequences. Am JRoentgenol. 1995;164:443–447.
9. Hossain M, Brown J, McLean AN, et al. Delayed presentation ofpost-traumatic aneurysm of the posterior inferior cerebellar artery ina patient with spinal cord injury. Spinal Cord. 2002;40:307–309.
10. Connell RA, Graham CA. Is spinal immobilization necessary for allpatients sustaining isolated penetrating trauma? Injury Int J CareInjured. 2003;34:912–914.
11. Heary RF, Vaccaro AR, Mesa JJ, et al. Steroids and gunshot woundsto the spine. Neurosurgery. 1997;41:576–584.
EDITORIAL COMMENTThe authors present a rare but important cause of de-
layed, post-traumatic neurologic deficit. It can be difficult, asit was in this case, to rapidly identify the extent of potentialpenetrating injuries that might affect the craniospinal axis.This is especially true in the setting of stab wounds in themultiply injured patient, when subtle neurologic deficits aredifficult to identify. In addition to direct traumatic neurologicinjury, there is also the risk of associated infection fromretained foreign body or cerebrospinal fistula, as well asdeficits related to neurovascular injury. We therefore con-sider it important to make liberal use of screening computedtomography angiography in combination with serial neuro-logic assessment.
J. Paul Elliott, MDSwedish Medical Center
Cervical Cord Injury Caused by a Stab Wound
Volume 62 • Number 2 531
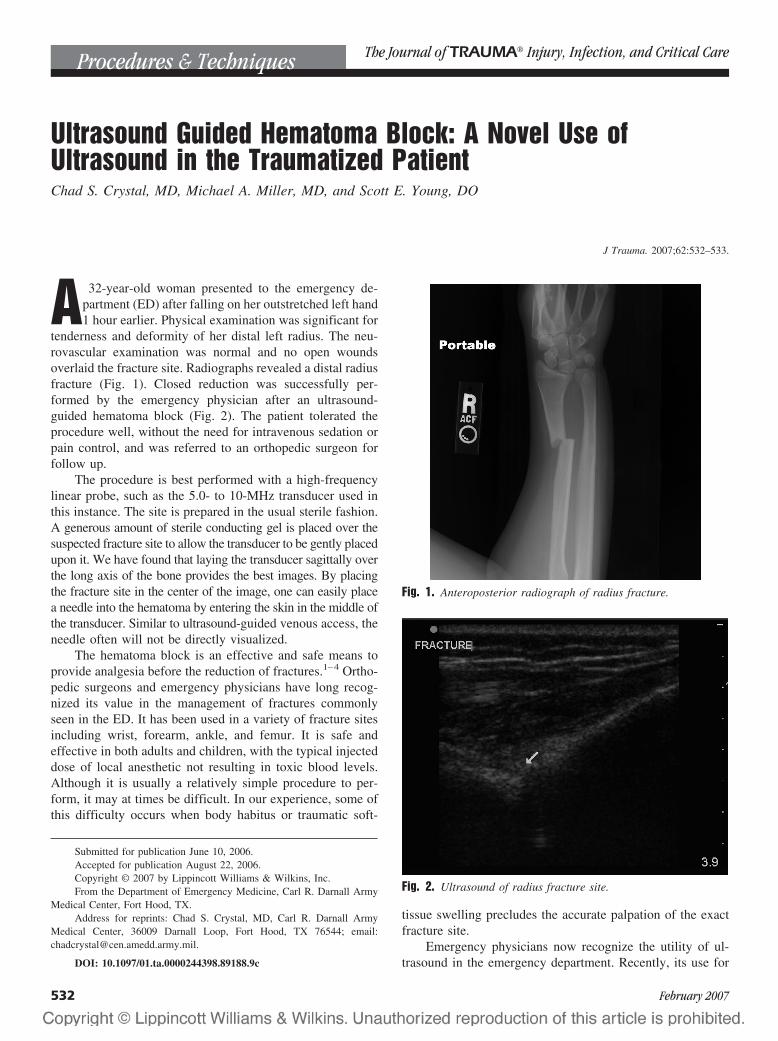
Ultrasound Guided Hematoma Block: A Novel Use ofUltrasound in the Traumatized PatientChad S. Crystal, MD, Michael A. Miller, MD, and Scott E. Young, DO
J Trauma. 2007;62:532–533.
A 32-year-old woman presented to the emergency de-partment (ED) after falling on her outstretched left hand1 hour earlier. Physical examination was significant for
tenderness and deformity of her distal left radius. The neu-rovascular examination was normal and no open woundsoverlaid the fracture site. Radiographs revealed a distal radiusfracture (Fig. 1). Closed reduction was successfully per-formed by the emergency physician after an ultrasound-guided hematoma block (Fig. 2). The patient tolerated theprocedure well, without the need for intravenous sedation orpain control, and was referred to an orthopedic surgeon forfollow up.
The procedure is best performed with a high-frequencylinear probe, such as the 5.0- to 10-MHz transducer used inthis instance. The site is prepared in the usual sterile fashion.A generous amount of sterile conducting gel is placed over thesuspected fracture site to allow the transducer to be gently placedupon it. We have found that laying the transducer sagittally overthe long axis of the bone provides the best images. By placingthe fracture site in the center of the image, one can easily placea needle into the hematoma by entering the skin in the middle ofthe transducer. Similar to ultrasound-guided venous access, theneedle often will not be directly visualized.
The hematoma block is an effective and safe means toprovide analgesia before the reduction of fractures.1–4 Ortho-pedic surgeons and emergency physicians have long recog-nized its value in the management of fractures commonlyseen in the ED. It has been used in a variety of fracture sitesincluding wrist, forearm, ankle, and femur. It is safe andeffective in both adults and children, with the typical injecteddose of local anesthetic not resulting in toxic blood levels.Although it is usually a relatively simple procedure to per-form, it may at times be difficult. In our experience, some ofthis difficulty occurs when body habitus or traumatic soft-
tissue swelling precludes the accurate palpation of the exactfracture site.
Emergency physicians now recognize the utility of ul-trasound in the emergency department. Recently, its use for
Submitted for publication June 10, 2006.Accepted for publication August 22, 2006.Copyright © 2007 by Lippincott Williams & Wilkins, Inc.From the Department of Emergency Medicine, Carl R. Darnall Army
Medical Center, Fort Hood, TX.Address for reprints: Chad S. Crystal, MD, Carl R. Darnall Army
Medical Center, 36009 Darnall Loop, Fort Hood, TX 76544; email:[email protected].
DOI: 10.1097/01.ta.0000244398.89188.9c
Fig. 1. Anteroposterior radiograph of radius fracture.
Fig. 2. Ultrasound of radius fracture site.
Procedures & Techniques The Journal of TRAUMA� Injury, Infection, and Critical Care
532 February 2007
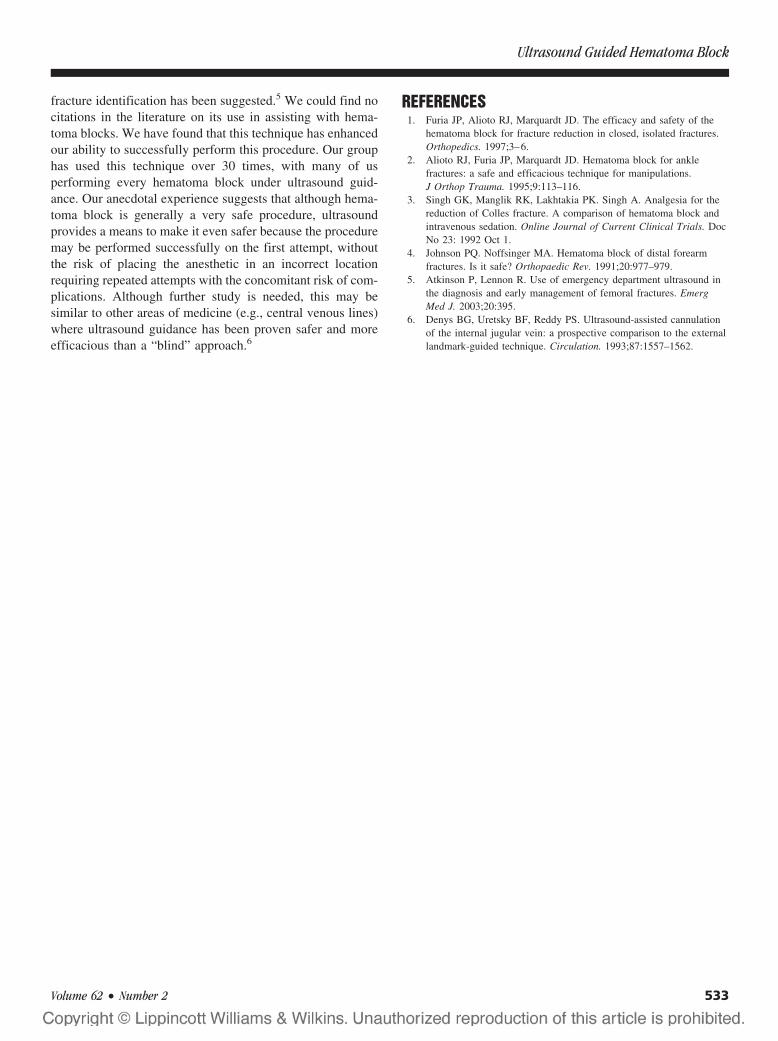
fracture identification has been suggested.5 We could find nocitations in the literature on its use in assisting with hema-toma blocks. We have found that this technique has enhancedour ability to successfully perform this procedure. Our grouphas used this technique over 30 times, with many of usperforming every hematoma block under ultrasound guid-ance. Our anecdotal experience suggests that although hema-toma block is generally a very safe procedure, ultrasoundprovides a means to make it even safer because the proceduremay be performed successfully on the first attempt, withoutthe risk of placing the anesthetic in an incorrect locationrequiring repeated attempts with the concomitant risk of com-plications. Although further study is needed, this may besimilar to other areas of medicine (e.g., central venous lines)where ultrasound guidance has been proven safer and moreefficacious than a “blind” approach.6
REFERENCES1. Furia JP, Alioto RJ, Marquardt JD. The efficacy and safety of the
hematoma block for fracture reduction in closed, isolated fractures.Orthopedics. 1997;3–6.
2. Alioto RJ, Furia JP, Marquardt JD. Hematoma block for anklefractures: a safe and efficacious technique for manipulations.J Orthop Trauma. 1995;9:113–116.
3. Singh GK, Manglik RK, Lakhtakia PK. Singh A. Analgesia for thereduction of Colles fracture. A comparison of hematoma block andintravenous sedation. Online Journal of Current Clinical Trials. DocNo 23: 1992 Oct 1.
4. Johnson PQ. Noffsinger MA. Hematoma block of distal forearmfractures. Is it safe? Orthopaedic Rev. 1991;20:977–979.
5. Atkinson P, Lennon R. Use of emergency department ultrasound inthe diagnosis and early management of femoral fractures. EmergMed J. 2003;20:395.
6. Denys BG, Uretsky BF, Reddy PS. Ultrasound-assisted cannulationof the internal jugular vein: a prospective comparison to the externallandmark-guided technique. Circulation. 1993;87:1557–1562.
Ultrasound Guided Hematoma Block
Volume 62 • Number 2 533
Guidelines for the Conduction of Follow-up StudiesMeasuring Injury-Related DisabilityEd F. Van Beeck, MD, PhD, Claus F. Larsen, MD, PhD, Ronan A. Lyons, MD, PhD,Willem-Jan Meerding, PhD, Saakje Mulder, PhD, and Marie-Louise Essink-Bot, MD, PhD
Background: Scientific knowledge onfunctional outcome after injury is limited.During the past decade, a variety of mea-sures have been used at various momentsin different study populations. Guidelinesare needed to increase comparability be-tween studies.
Methods: A working group of theEuropean Consumer Safety Associationconducted a literature review of empir-ical studies into injury-related disability(1995–2005). We included injury from alllevels of severity and selected studies usinggeneric health status measures with bothshort-term and long-term follow up. The
results were used as input for a consensusprocedure toward the development ofguidelines for defining the study popula-tions, selecting the health status measures,selecting the timings of the assessments,and data collection procedures.
Results: The group reached consen-sus on a common core of health statusmeasures and assessment moments. Thegroup advises to use a combination ofEuroQol-5D and Health Utilities Mark IIIin all studies on injury-related disability.This combination covers all relevanthealth domains, is applicable in all kindsof injury populations and in widely differ-
ent age ranges, provides a link with utilityscores, and has several practical advan-tages (e.g., brevity, availability in differentlanguages). For specific types of injury,the common core may be supplemented byinjury-specific measures. The group ad-vises a common core of assessments at 1, 2,4, and 12 months after injury.
Conclusions: Our guidelines shouldbe tested and may lead to improved andmore consistent epidemiologic data on theincidence, severity, and duration of injury-related disability.
Key Words: Injury, Disability,Guidelines.
J Trauma. 2007;62:534 –550.
Disabilities (i.e., reduced levels of functioning resultingfrom diseases or injuries)1 are increasingly seen as animportant component of a population’s health. This has
been recognized in the field of injury prevention and traumacare,2 where the number of survivors of severe injury hasrapidly risen.3 Moreover, many survivors are young people,whose daily activities may greatly and/or permanently sufferfrom the consequences of trauma.4 However, comparable andrepresentative epidemiologic data on the incidence, severity,and duration of injury-related disabilities are still scarce andincomplete. Most functional outcome studies in this area haveso far focused on adult patients (mostly within the age rangeof 15–64 years) with severe trauma, such as polytrauma,5
traumatic brain injury,6–9 and spinal cord injury.10,11 Only afew studies have been conducted already on the functionaloutcome of (the more severe) childhood injuries.12–14 Thefunctional outcome of injuries among the elderly has so far
mainly been studied for patients with hip fractures,15,16
although some studies on geriatric trauma patients in generalhave been published.17 For many types of injury, however,hardly any empirical disability data are available yet. Inaddition, the available knowledge is difficult to interpret.During the past decades, a variety of measures have beenused, which makes a comparison of the available disabilityestimates rather difficult. Moreover, these studies have fo-cused on a variety of health domains (leading to incompleteinformation) at various moments in a variety of patient pop-ulations (leading to incomparable information). Most of thedisability estimates obtained so far can therefore not be usedto quantify the impact of injury-related disability on popula-tion health.2 Nor do they allow evaluations of the (cost-)effectiveness of injury prevention and/or trauma care. Tostimulate new epidemiologic data collections better fittingthese purposes, the European Consumer Safety Association(ECOSA) has established a working group on injury-relateddisability. This article reports the current progress of thisgroup, which has evaluated the available literature (i.e., em-pirical epidemiologic studies) on postinjury levels of func-tioning, and has developed guidelines for future empiricalwork in this area.
MATERIALS AND METHODSDemarcation of the Subject
The working group aims to develop standards and guide-lines for quantifying the total amount of disability at the
Submitted for publication April 10, 2006.Accepted for publication November 8, 2006.Copyright © 2007 by Lippincott Williams & Wilkins, Inc.From the Department of Public Health (E.F.V.B., W.J.M., M.-L.E.-B.),
Erasmus MC, University Medical Centre Rotterdam, the Netherlands; the De-partment of Orthopaedics (C.F.L.), Hillerod Hospital, Hillerod, Denmark; theSchool of Medicine (R.A.L.), University of Wales, Swansea, United Kingdom;the Consumer Safety Institute (S.M.), Amsterdam, the Netherlands.
Address for reprints: Ed F. van Beeck, MD, PhD, Department of PublicHealth, Erasmus MC, University Medical Centre Rotterdam, PO Box 2040,3000 CA Rotterdam, the Netherlands; email: [email protected].
DOI: 10.1097/TA.0b013e31802e70c7
Review Article The Journal of TRAUMA� Injury, Infection, and Critical Care
534 February 2007

population level. It looks at injury from all causes and fromall levels of injury severity, because even minor injuries maylead to a substantial health burden as a result of their frequentoccurrence.4,18 The working group has adopted the broaddefinition of disability according to the International Classi-fication of Disabilities, Functioning and Health (ICF) of theWorld Health Organization (WHO).1 According to the ICF,disability is an overall term that includes all the negativeaspects of the following four components: body structures(anatomic body parts), body functions (physiologic and psy-chological functions), activities (execution of tasks or actionsby an individual), and participation (involvement in life sit-uations). It should be noted that, unlike the previous termi-nology of the International Classification of Impairments,Disabilities and Handicaps (ICIDH), this current disabilityconcept includes bodily impairments, activity limitations, andrestrictions in social participation. Each of the four compo-nents of the ICF consists of various domains that, in principle,could all be relevant for injury patients.
The working group uses the framework of the ICF toassess whether all relevant health domains for (specificgroups of) injury patients are included, when measuring thefunctional consequences of injury. The choice of a meaning-ful timeframe for measuring disability is a rather difficult butimportant issue. The working group distinguishes the follow-ing phases:
● Acute treatment phase● Rehabilitation phase: increasing personal capacity to-
ward preinjury level of functioning● Adaptation phase: finding a balance between personal
capacity and environmental demand for those that do notreach full recovery to preinjury level of functioning
● Stable end situation: reached when no medical or otherintervention is expected to improve the condition and nofurther major adaptations are likely to occur.
The average length of these phases depends highly on thetype of injury and there may be overlap between phases. Theworking group looks at all postinjury phases, and aims tocollect data on both the stable end situation of injury patientsand the process toward this situation.
It is well known that injuries and their consequences notonly affect the victim, but may have large health effects onother persons as well, such as parents and/or other primarycaregivers.19–21 The working group, however, restricts itswork to the impact on health of the injury patient.
Literature ReviewWe conducted a PubMed search aiming to identify stud-
ies on injury-related disability published since 1995. As ar-gued above, all postinjury phases and all levels of injuryseverity were included. Studies into the health effects onpeople other than the injury victim were excluded. We onlysearched for studies using generic health status measures (i.e.,those that are applicable to all diseases and injuries). The
information collected with generic measures allows straight-forward comparisons with general population norms and withother diseases. Moreover, comparisons of different types ofinjury can be made and some of the measures generate asummary score that can be converted into a composite healthoutcome measure, such as the Disability Adjusted Life Year(DALY).22 Composite health outcome measures combine fa-tal and nonfatal consequences of diseases and injury.
We used queries of the type Injury and SF-36, SF-12,EuroQol (EQ-5D), Health Utilities Index (HUI 2 and HUI3),Quality of Well Being Scale (QWB), Nottingham Health Profile(NHP), Sickness Impact Profile (SIP), Functional IndependenceMeasure (FIM), and WHO Disability Assessment Schedule(WHODAS II). These are generic instruments, includinghealth domains of potential relevance for large groups ofinjury patients. In some studies, injury-specific and/or domain-specific measures were added. We selected studies thatlooked into the consequences of the following injury catego-ries: all injury combined, major trauma, traumatic brain injury,spinal cord injury, hip fractures, other fractures, superficial in-juries and wounds, sprains/strains/dislocations, amputations, andpoisoning. For the studies retrieved, we summarized the char-acteristics of the study population, the study design, the timingof the assessment(s), the instruments used to measure func-tional outcome and their discriminative power and respon-siveness to change, and the main findings. The results of theliterature review were used as input for the consensus proce-dure described below.
Consensus ProcedureThe ECOSA working group on postinjury levels of func-
tioning and disability was established during a worldwideexpert meeting on Measuring the Burden of Injury.23 Thegroup is composed of experts from the fields of traumatology,injury epidemiology, health status measurement, and healtheconomics. It has participants from the Netherlands, Den-mark, and the United Kingdom. In 2002, a draft report con-taining the conceptual framework and working methods usedwas discussed during a first expert meeting and subsequentlyrevised and released on the ECOSA Website (www.ecosa.org). By means of a newsletter, interested researchers andpractitioners were invited to participate in the discussions. In2003 to 2004, the literature review was conducted and, basedon its results, draft guidelines for empirical researches wereconstructed. The guidelines aim to give practical advice ondefining the patient population, selecting the measurementinstrument(s), timing of follow-up, and selecting the method(s)of data acquisition. The draft guidelines were extensivelydebated during an electronic discussion among the groupmembers. This led to revised guidelines, which were releasedon the ECOSA Website and provoked further comments byseveral experts. These were presented and discussed during aworkshop on methods of injury research, which was orga-nized within the framework of the 7th World Conference onInjury Prevention and Control in 2004. In this article, we
Guidelines on Injury-Related Disability
Volume 62 • Number 2 535
present the literature findings and guidelines for the followingcategories of patients: all injuries combined, major trauma,and hip fractures. Traumatic brain injury and spinal cordinjury are not dealt with in this article because they have beenstudied rather frequently and other parties have already pub-lished guidelines on these patient groups.24,25 Superficialinjuries and wounds, sprains/strains/dislocations, amputa-tions, and poisoning are not dealt with because of an almostcomplete lack of empirical data for these injury types. Theheterogeneous group of “other fractures” has been looked atin several studies, but for most types of fractures the numberof studies is still too small to be used as input for guidelinedevelopment.
RESULTSLiterature Review
Population-based studies on injury-related disability arescarce (Table 1). We identified eight studies (being reportedin 10 articles),13,17,18,26–32 which all used different inclusioncriteria for their study population (e.g., different age ranges,trauma center patients versus emergency department [ED]-treated patients), different generic measures (EQ5D, SF-36,QWB, FIM, SIP) for health status measurement, and differenttimings of assessment. Six of the studies used a longitudinaldesign with different periods and timings of follow up.13,18,26–31
All studies looked at heterogeneous patient populations andincluded injuries of different levels of severity. High prevalencesof health problems within and after the first year of injury werea common finding of the studies. Four studies made a compar-ison with general population norms13,17,18,28 showing that, in themedium and long term, injury patients as a group were worse offthan age- and sex-matched reference groups. One study used aninjury-specific measure (FCI) in addition to generic measuresand appeared more sensitive to the loss of cognitive functioningand hand-arm movement.32 Longitudinal studies from theUnited States27,28 and the United Kingdom29,30 showed no fur-ther improvements after 12 months in populations of admittedadult trauma patients. We observed that in populations includingmoderate to low severity injury (ED-treated patients), differentgeneric measures (EQ-5D, SF-36) were able to discriminatebetween the health status of injured patients and noninjuredpersons and between patients with different types of injuries. Aproblem related to moderate- to low-severity injury popu-lations,18,26 however, was the difficulty in acquiring acceptableresponse rates.
Studies on disability in the most severely injured patientsare increasingly conducted. This development started in the1990s, when several studies using self-designed question-naires were executed in several countries.33–37 However, be-fore the new millennium, only one study using a genericinstrument among a selected sample of severely injured pa-tients could be identified.38 But since then, this approach hasincreasingly been applied, as can be derived from Table 2.We identified nine studies38–47 that all aimed at including“major trauma patients”. Most of these studies, however, did
not clearly describe their inclusion criteria in terms of InjurySeverity Score (ISS) cutoff points.
Of the available generic instruments, SF-36/SF-12 hasmost often been applied among major trauma patients.38,40–45
These applications have shown that this instrument enablesdiscrimination between different subgroups and is able topick up changes in health status between discharge and 12-month follow up.
Two studies have used EQ-5D, also showing discrimi-native power and the ability to identify changes in healthstatus.39,47 Five of the studies used a longitudinal design, butall with only one measurement after discharge.38,39,42,43,46
Two studies made a comparison with general populationnorms43,47 showing that, in the long term, major traumapatients were worse off than age- and sex-matched referencegroups. A common finding of all studies was the high prev-alence of disabilities found at follow-up, mostly at 12 or 24months after discharge. One study used an injury-specificinstrument (HASPOC) including a generic instrument (SF-12) and assessments by clinicians. It showed that HASPOC—contrary to SF-12—discriminates between polytrauma andsingle-injury patients.45 Indications were found that, in majortrauma, no further improvements occur after 24 months.47
We identified eight studies looking at the functionalconsequences of hip fractures with generic measures (Ta-ble 3).15,16,48 –53 The majority of these studies dealt with com-munity-dwelling patients (65� years) who were eligible foroperation, and excluded persons with cognitive impairments.Only two studies collected follow-up information from acomprehensive sample of hip-fracture patients without priorexclusions.16,53 Data from patients with cognitive impairmentswere successfully acquired with the help of proxy respondents.Three generic measures have been applied so far among hip-fracture patients: EQ-5D,15,48 SF-36,49–52 and NHP.16,53 In ad-dition, several disease-specific measures have been used. TheCummings hip scale is a functional status scale developed forpatients with hip problems, addressing basic and instrumentalactivities of daily living.54 The Lower Extremity Measure(LEM) is a modification for patients with hip fractures of ameasure that was originally developed for patients undergo-ing preservation surgery for a tumor of an extremity.51 TheOsteoporosis Assessment Questionnaire (OPAQ) is an instru-ment designed to assess the health-related quality of life in alltypes of osteoporotic patients, including patients with hipfractures.55 The literature also shows an interesting applica-tion of the Rehabilitation Activities Profile (RAP).53 This isa 15-item instrument for assessing recovery in rehabilitationmedicine, providing more detailed data on communication,mobility, personal care, and household and leisure activitiesthan the aforementioned generic measures.
The generic and disease-specific measures used so farshowed similar differences between subgroups. All theseinstruments were responsive to changes within the first 3 to 6months after the injury but the disease-specific measures (andthe RAP) showed somewhat greater effect sizes than the
The Journal of TRAUMA� Injury, Infection, and Critical Care
536 February 2007
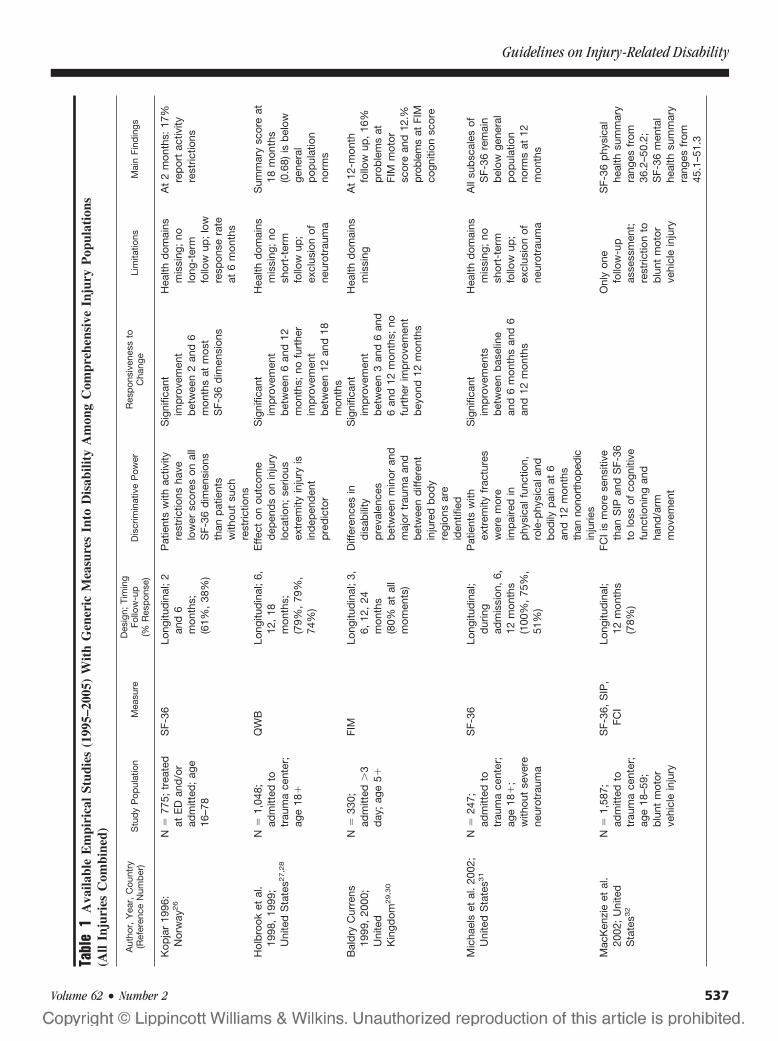
Tabl
e1
Ava
ilabl
eE
mpi
rica
lSt
udie
s(1
995–
2005
)W
ith
Gen
eric
Mea
sure
sIn
toD
isab
ility
Am
ong
Com
preh
ensi
veIn
jury
Pop
ulat
ions
(All
Inju
ries
Com
bine
d)
Aut
hor,
Yea
r,C
ount
ry(R
efer
ence
Num
ber
)S
tud
yP
opul
atio
nM
easu
reD
esig
n;Ti
min
gFo
llow
-up
(%R
esp
onse
)D
iscr
imin
ativ
eP
ower
Res
pon
sive
ness
toC
hang
eLi
mita
tions
Mai
nFi
ndin
gs
Kop
jar
1996
:N
orw
ay26
N�
775;
trea
ted
atE
Dan
d/o
rad
mitt
ed;
age
16–7
8
SF-
36Lo
ngitu
din
al;
2an
d6
mon
ths;
(61%
,38
%)
Pat
ient
sw
ithac
tivity
rest
rictio
nsha
velo
wer
scor
eson
all
SF-
36d
imen
sion
sth
anp
atie
nts
with
out
such
rest
rictio
ns
Sig
nific
ant
imp
rove
men
tb
etw
een
2an
d6
mon
ths
atm
ost
SF-
36d
imen
sion
s
Hea
lthd
omai
nsm
issi
ng;
nolo
ng-t
erm
follo
wup
;lo
wre
spon
sera
teat
6m
onth
s
At
2m
onth
s:17
%re
por
tac
tivity
rest
rictio
ns
Hol
bro
oket
al.
1998
,19
99;
Uni
ted
Sta
tes2
7,2
8
N�
1,04
8;ad
mitt
edto
trau
ma
cent
er;
age
18�
QW
BLo
ngitu
din
al;
6,12
,18
mon
ths;
(79%
,79
%,
74%
)
Eff
ect
onou
tcom
ed
epen
ds
onin
jury
loca
tion;
serio
usex
trem
ityin
jury
isin
dep
end
ent
pre
dic
tor
Sig
nific
ant
imp
rove
men
tb
etw
een
6an
d12
mon
ths;
nofu
rthe
rim
pro
vem
ent
bet
wee
n12
and
18m
onth
s
Hea
lthd
omai
nsm
issi
ng;
nosh
ort-
term
follo
wup
;ex
clus
ion
ofne
urot
raum
a
Sum
mar
ysc
ore
at18
mon
ths
(0.6
8)is
bel
owge
nera
lp
opul
atio
nno
rms
Bal
dry
Cur
rens
1999
,20
00;
Uni
ted
Kin
gdom
29,3
0
N�
330;
adm
itted
�3
day
;ag
e5�
FIM
Long
itud
inal
;3,
6,12
,24
mon
ths
(80%
atal
lm
omen
ts)
Diff
eren
ces
ind
isab
ility
pre
vale
nces
bet
wee
nm
inor
and
maj
ortr
aum
aan
db
etw
een
diff
eren
tin
jure
db
ody
regi
ons
are
iden
tifie
d
Sig
nific
ant
imp
rove
men
tb
etw
een
3an
d6
and
6an
d12
mon
ths;
nofu
rthe
rim
pro
vem
ent
bey
ond
12m
onth
s
Hea
lthd
omai
nsm
issi
ngA
t12
-mon
thfo
llow
up,
16%
pro
ble
ms
atFI
Mm
otor
scor
ean
d12
.%pr
oble
ms
atFI
Mco
gniti
onsc
ore
Mic
hael
set
al.
2002
;U
nite
dS
tate
s31
N�
247;
adm
itted
totr
aum
ace
nter
;ag
e18
�;
with
out
seve
rene
urot
raum
a
SF-
36Lo
ngitu
din
al;
dur
ing
adm
issi
on,
6,12
mon
ths
(100
%,
75%
,51
%)
Pat
ient
sw
ithex
trem
ityfr
actu
res
wer
em
ore
imp
aire
din
phy
sica
lfun
ctio
n,ro
le-p
hysi
cala
ndb
odily
pai
nat
6an
d12
mon
ths
than
nono
rtho
pedi
cin
jurie
s
Sig
nific
ant
imp
rove
men
tsb
etw
een
bas
elin
ean
d6
mon
ths
and
6an
d12
mon
ths
Hea
lthd
omai
nsm
issi
ng;
nosh
ort-
term
follo
wup
;ex
clus
ion
ofne
urot
raum
a
All
sub
scal
esof
SF-
36re
mai
nb
elow
gene
ral
pop
ulat
ion
norm
sat
12m
onth
s
Mac
Ken
zie
etal
.20
02;
Uni
ted
Sta
tes3
2
N�
1,58
7;ad
mitt
edto
trau
ma
cent
er;
age
18–5
9;b
lunt
mot
orve
hicl
ein
jury
SF-
36,
SIP
,FC
ILo
ngitu
din
al;
12m
onth
s(7
8%)
FCI
ism
ore
sens
itive
than
SIP
and
SF-
36to
loss
ofco
gniti
vefu
nctio
ning
and
hand
/arm
mov
emen
t
Onl
yon
efo
llow
-up
asse
ssm
ent;
rest
rictio
nto
blu
ntm
otor
vehi
cle
inju
ry
SF-
36p
hysi
cal
heal
thsu
mm
ary
rang
esfr
om36
.2–5
0.2;
SF-
36m
enta
lhe
alth
sum
mar
yra
nges
from
45.1
–51.
3
Guidelines on Injury-Related Disability
Volume 62 • Number 2 537
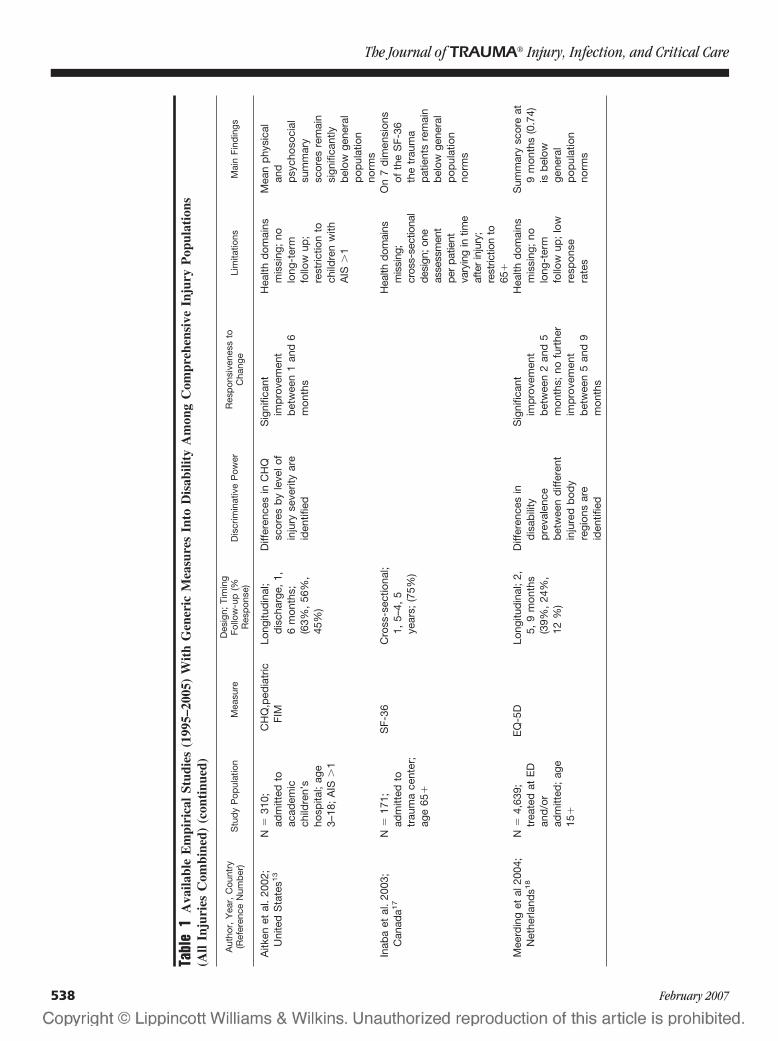
Tabl
e1
Ava
ilabl
eE
mpi
rica
lSt
udie
s(1
995–
2005
)W
ith
Gen
eric
Mea
sure
sIn
toD
isab
ility
Am
ong
Com
preh
ensi
veIn
jury
Pop
ulat
ions
(All
Inju
ries
Com
bine
d)(c
onti
nued
)
Aut
hor,
Yea
r,C
ount
ry(R
efer
ence
Num
ber
)S
tud
yP
opul
atio
nM
easu
reD
esig
n;Ti
min
gFo
llow
-up
(%R
esp
onse
)D
iscr
imin
ativ
eP
ower
Res
pon
sive
ness
toC
hang
eLi
mita
tions
Mai
nFi
ndin
gs
Aitk
enet
al.
2002
;U
nite
dS
tate
s13
N�
310;
adm
itted
toac
adem
icch
ildre
n’s
hosp
ital;
age
3–18
;A
IS�
1
CH
Q,p
edia
tric
FIM
Long
itud
inal
;d
isch
arge
,1,
6m
onth
s;(6
3%,
56%
,45
%)
Diff
eren
ces
inC
HQ
scor
esb
yle
velo
fin
jury
seve
rity
are
iden
tifie
d
Sig
nific
ant
imp
rove
men
tb
etw
een
1an
d6
mon
ths
Hea
lthd
omai
nsm
issi
ng;
nolo
ng-t
erm
follo
wup
;re
stric
tion
toch
ildre
nw
ithA
IS�
1
Mea
np
hysi
cal
and
psy
chos
ocia
lsu
mm
ary
scor
esre
mai
nsi
gnifi
cant
lyb
elow
gene
ral
pop
ulat
ion
norm
sIn
aba
etal
.20
03;
Can
ada1
7N
�17
1;ad
mitt
edto
trau
ma
cent
er;
age
65�
SF-
36C
ross
-sec
tiona
l;1,
5–4,
5ye
ars;
(75%
)
Hea
lthdo
mai
nsm
issi
ng;
cros
s-se
ctio
nal
desi
gn;o
neas
sess
men
tpe
rpa
tient
vary
ing
intim
eaf
ter
inju
ry;
rest
rictio
nto
65�
On
7d
imen
sion
sof
the
SF-
36th
etr
aum
ap
atie
nts
rem
ain
bel
owge
nera
lp
opul
atio
nno
rms
Mee
rdin
get
al20
04;
Net
herla
nds1
8N
�4,
639;
trea
ted
atE
Dan
d/o
rad
mitt
ed;
age
15�
EQ
-5D
Long
itud
inal
;2,
5,9
mon
ths
(39%
,24
%,
12%
)
Diff
eren
ces
ind
isab
ility
pre
vale
nce
bet
wee
nd
iffer
ent
inju
red
bod
yre
gion
sar
eid
entif
ied
Sig
nific
ant
imp
rove
men
tb
etw
een
2an
d5
mon
ths;
nofu
rthe
rim
pro
vem
ent
bet
wee
n5
and
9m
onth
s
Hea
lthd
omai
nsm
issi
ng;
nolo
ng-t
erm
follo
wup
;lo
wre
spon
sera
tes
Sum
mar
ysc
ore
at9
mon
ths
(0.7
4)is
bel
owge
nera
lp
opul
atio
nno
rms
The Journal of TRAUMA� Injury, Infection, and Critical Care
538 February 2007
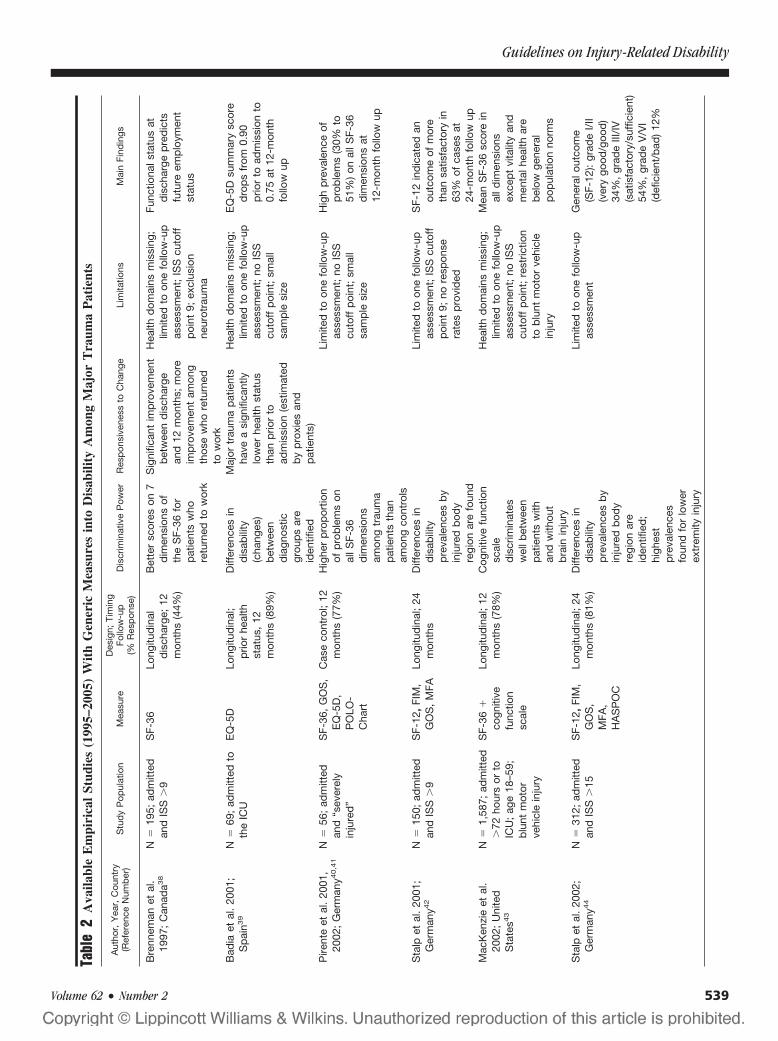
Tabl
e2
Ava
ilabl
eE
mpi
rica
lSt
udie
s(1
995–
2005
)W
ith
Gen
eric
Mea
sure
sin
toD
isab
ility
Am
ong
Maj
orT
raum
aP
atie
nts
Aut
hor,
Yea
r,C
ount
ry(R
efer
ence
Num
ber
)S
tud
yP
opul
atio
nM
easu
reD
esig
n;Ti
min
gFo
llow
-up
(%R
esp
onse
)D
iscr
imin
ativ
eP
ower
Res
pon
sive
ness
toC
hang
eLi
mita
tions
Mai
nFi
ndin
gs
Bre
nnem
anet
al.
1997
;C
anad
a38
N�
195;
adm
itted
and
ISS
�9
SF-
36Lo
ngitu
din
ald
isch
arge
;12
mon
ths
(44%
)
Bet
ter
scor
eson
7d
imen
sion
sof
the
SF-
36fo
rp
atie
nts
who
retu
rned
tow
ork
Sig
nific
ant
imp
rove
men
tb
etw
een
dis
char
gean
d12
mon
ths;
mor
eim
pro
vem
ent
amon
gth
ose
who
retu
rned
tow
ork
Hea
lthd
omai
nsm
issi
ng;
limite
dto
one
follo
w-u
pas
sess
men
t;IS
Scu
toff
poi
nt9;
excl
usio
nne
urot
raum
a
Func
tiona
lsta
tus
atd
isch
arge
pre
dic
tsfu
ture
emp
loym
ent
stat
us
Bad
iaet
al.
2001
;S
pai
n39
N�
69;
adm
itted
toth
eIC
UE
Q-5
DLo
ngitu
din
al;
prio
rhe
alth
stat
us,
12m
onth
s(8
9%)
Diff
eren
ces
ind
isab
ility
(cha
nges
)b
etw
een
dia
gnos
ticgr
oup
sar
eid
entif
ied
Maj
ortr
aum
ap
atie
nts
have
asi
gnifi
cant
lylo
wer
heal
thst
atus
than
prio
rto
adm
issi
on(e
stim
ated
by
pro
xies
and
pat
ient
s)
Hea
lthd
omai
nsm
issi
ng;
limite
dto
one
follo
w-u
pas
sess
men
t;no
ISS
cuto
ffp
oint
;sm
all
sam
ple
size
EQ
-5D
sum
mar
ysc
ore
dro
ps
from
0.90
prio
rto
adm
issi
onto
0.75
at12
-mon
thfo
llow
up
Pire
nte
etal
.20
01,
2002
;G
erm
any4
0,4
1N
�56
;ad
mitt
edan
d“s
ever
ely
inju
red
”
SF-
36,
GO
S,
EQ
-5D
,P
OLO
-C
hart
Cas
eco
ntro
l;12
mon
ths
(77%
)H
ighe
rp
rop
ortio
nof
pro
ble
ms
onal
lSF-
36d
imen
sion
sam
ong
trau
ma
pat
ient
sth
anam
ong
cont
rols
Lim
ited
toon
efo
llow
-up
asse
ssm
ent;
noIS
Scu
toff
poi
nt;
smal
lsa
mp
lesi
ze
Hig
hp
reva
lenc
eof
pro
ble
ms
(30%
to51
%)
onal
lSF-
36d
imen
sion
sat
12-m
onth
follo
wup
Sta
lpet
al.
2001
;G
erm
any4
2N
�15
0;ad
mitt
edan
dIS
S�
9S
F-12
,FI
M,
GO
S,
MFA
Long
itud
inal
;24
mon
ths
Diff
eren
ces
ind
isab
ility
pre
vale
nces
by
inju
red
bod
yre
gion
are
foun
d
Lim
ited
toon
efo
llow
-up
asse
ssm
ent;
ISS
cuto
ffp
oint
9;no
resp
onse
rate
sp
rovi
ded
SF-
12in
dic
ated
anou
tcom
eof
mor
eth
ansa
tisfa
ctor
yin
63%
ofca
ses
at24
-mon
thfo
llow
upM
acK
enzi
eet
al.
2002
;U
nite
dS
tate
s43
N�
1,58
7;ad
mitt
ed�
72ho
urs
orto
ICU
;ag
e18
–59;
blu
ntm
otor
vehi
cle
inju
ry
SF-
36�
cogn
itive
func
tion
scal
e
Long
itud
inal
;12
mon
ths
(78%
)C
ogni
tive
func
tion
scal
ed
iscr
imin
ates
wel
lbet
wee
np
atie
nts
with
and
with
out
bra
inin
jury
Hea
lthd
omai
nsm
issi
ng;
limite
dto
one
follo
w-u
pas
sess
men
t;no
ISS
cuto
ffp
oint
;re
stric
tion
tob
lunt
mot
orve
hicl
ein
jury
Mea
nS
F-36
scor
ein
alld
imen
sion
sex
cep
tvi
talit
yan
dm
enta
lhea
lthar
eb
elow
gene
ral
pop
ulat
ion
norm
s
Sta
lpet
al.
2002
;G
erm
any4
4N
�31
2;ad
mitt
edan
dIS
S�
15S
F-12
,FI
M,
GO
S,
MFA
,H
AS
PO
C
Long
itud
inal
;24
mon
ths
(81%
)D
iffer
ence
sin
dis
abili
typ
reva
lenc
esb
yin
jure
db
ody
regi
onar
eid
entif
ied
;hi
ghes
tp
reva
lenc
esfo
und
for
low
erex
trem
ityin
jury
Lim
ited
toon
efo
llow
-up
asse
ssm
ent
Gen
eral
outc
ome
(SF-
12):
grad
eI/
II(v
ery
good
/goo
d)
34%
,gr
ade
III/I
V(s
atis
fact
ory/
suff
icie
nt)
54%
,gr
ade
V/V
I(d
efic
ient
/bad
)12
%
Guidelines on Injury-Related Disability
Volume 62 • Number 2 539
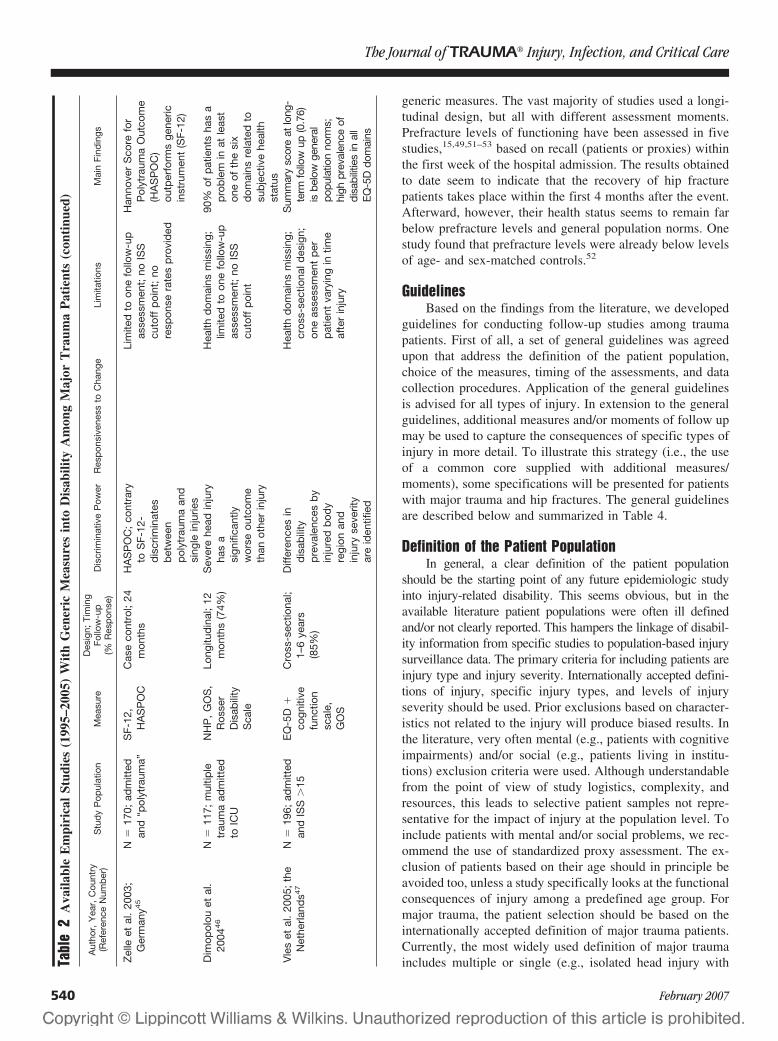
generic measures. The vast majority of studies used a longi-tudinal design, but all with different assessment moments.Prefracture levels of functioning have been assessed in fivestudies,15,49,51–53 based on recall (patients or proxies) withinthe first week of the hospital admission. The results obtainedto date seem to indicate that the recovery of hip fracturepatients takes place within the first 4 months after the event.Afterward, however, their health status seems to remain farbelow prefracture levels and general population norms. Onestudy found that prefracture levels were already below levelsof age- and sex-matched controls.52
GuidelinesBased on the findings from the literature, we developed
guidelines for conducting follow-up studies among traumapatients. First of all, a set of general guidelines was agreedupon that address the definition of the patient population,choice of the measures, timing of the assessments, and datacollection procedures. Application of the general guidelinesis advised for all types of injury. In extension to the generalguidelines, additional measures and/or moments of follow upmay be used to capture the consequences of specific types ofinjury in more detail. To illustrate this strategy (i.e., the useof a common core supplied with additional measures/moments), some specifications will be presented for patientswith major trauma and hip fractures. The general guidelinesare described below and summarized in Table 4.
Definition of the Patient PopulationIn general, a clear definition of the patient population
should be the starting point of any future epidemiologic studyinto injury-related disability. This seems obvious, but in theavailable literature patient populations were often ill definedand/or not clearly reported. This hampers the linkage of disabil-ity information from specific studies to population-based injurysurveillance data. The primary criteria for including patients areinjury type and injury severity. Internationally accepted defini-tions of injury, specific injury types, and levels of injuryseverity should be used. Prior exclusions based on character-istics not related to the injury will produce biased results. Inthe literature, very often mental (e.g., patients with cognitiveimpairments) and/or social (e.g., patients living in institu-tions) exclusion criteria were used. Although understandablefrom the point of view of study logistics, complexity, andresources, this leads to selective patient samples not repre-sentative for the impact of injury at the population level. Toinclude patients with mental and/or social problems, we rec-ommend the use of standardized proxy assessment. The ex-clusion of patients based on their age should in principle beavoided too, unless a study specifically looks at the functionalconsequences of injury among a predefined age group. Formajor trauma, the patient selection should be based on theinternationally accepted definition of major trauma patients.Currently, the most widely used definition of major traumaincludes multiple or single (e.g., isolated head injury withTa
ble
2A
vaila
ble
Em
piri
cal
Stud
ies
(199
5–20
05)
Wit
hG
ener
icM
easu
res
into
Dis
abili
tyA
mon
gM
ajor
Tra
uma
Pat
ient
s(c
onti
nued
)
Aut
hor,
Yea
r,C
ount
ry(R
efer
ence
Num
ber
)S
tud
yP
opul
atio
nM
easu
reD
esig
n;Ti
min
gFo
llow
-up
(%R
esp
onse
)D
iscr
imin
ativ
eP
ower
Res
pon
sive
ness
toC
hang
eLi
mita
tions
Mai
nFi
ndin
gs
Zel
leet
al.
2003
;G
erm
any4
5N
�17
0;ad
mitt
edan
d“p
olyt
raum
a”S
F-12
,H
AS
PO
CC
ase
cont
rol;
24m
onth
sH
AS
PO
C;
cont
rary
toS
F-12
-d
iscr
imin
ates
bet
wee
np
olyt
raum
aan
dsi
ngle
inju
ries
Lim
ited
toon
efo
llow
-up
asse
ssm
ent;
noIS
Scu
toff
poi
nt;
nore
spon
sera
tes
pro
vid
ed
Han
nove
rS
core
for
Pol
ytra
uma
Out
com
e(H
AS
PO
C)
outp
erfo
rms
gene
ricin
stru
men
t(S
F-12
)
Dim
opol
ouet
al.
2004
46
N�
117;
mul
tiple
trau
ma
adm
itted
toIC
U
NH
P,
GO
S,
Ros
ser
Dis
abili
tyS
cale
Long
itud
inal
;12
mon
ths
(74%
)S
ever
ehe
adin
jury
has
asi
gnifi
cant
lyw
orse
outc
ome
than
othe
rin
jury
Hea
lthd
omai
nsm
issi
ng;
limite
dto
one
follo
w-u
pas
sess
men
t;no
ISS
cuto
ffp
oint
90%
ofp
atie
nts
has
ap
rob
lem
inat
leas
ton
eof
the
six
dom
ains
rela
ted
tosu
bje
ctiv
ehe
alth
stat
usV
les
etal
.20
05;
the
Net
herla
nds4
7N
�19
6;ad
mitt
edan
dIS
S�
15E
Q-5
D�
cogn
itive
func
tion
scal
e,G
OS
Cro
ss-s
ectio
nal;
1–6
year
s(8
5%)
Diff
eren
ces
ind
isab
ility
pre
vale
nces
by
inju
red
bod
yre
gion
and
inju
ryse
verit
yar
eid
entif
ied
Hea
lthd
omai
nsm
issi
ng;
cros
s-se
ctio
nald
esig
n;on
eas
sess
men
tp
erp
atie
ntva
ryin
gin
time
afte
rin
jury
Sum
mar
ysc
ore
atlo
ng-
term
follo
wup
(0.7
6)is
belo
wge
nera
lpo
pula
tion
norm
s;hi
ghpr
eval
ence
ofdi
sabi
litie
sin
all
EQ
-5D
dom
ains
The Journal of TRAUMA� Injury, Infection, and Critical Care
540 February 2007

Tabl
e3
Ava
ilabl
eE
mpi
rica
lSt
udie
s(1
985–
1995
)W
ith
Gen
eric
Mea
sure
sIn
toD
isab
ility
Am
ong
Hip
Fra
ctur
eP
atie
nts
Aut
hor,
Yea
r,C
ount
ry(R
efer
ence
Num
ber
)S
tud
yP
opul
atio
nM
easu
reD
esig
n;Ti
min
gFo
llow
-up
(%R
esp
onse
)
Dis
crim
inat
ive
Pow
erR
esp
onsi
vene
ssto
Cha
nge
Lim
itatio
nsM
ain
Find
ings
Tid
erm
ark
etal
.20
02;
Sw
eden
15
N�
72;
65�
;co
mm
unity
dw
ellin
g;“i
nter
nal
fixat
ion”
EQ
-5D
�cl
inic
alfo
llow
upLo
ngitu
din
al;
12–4
8ho
urs,
1w
eek,
4m
onth
s,17
mon
ths
(93%
)
Larg
ed
iffer
ence
sin
EQ
-5D
sum
mar
ysc
ore
atd
iffer
ent
mom
ents
offo
llow
-up
bet
wee
np
atie
nts
with
and
with
out
com
plic
atio
ns
Sig
nific
ant
incr
ease
inE
Q-5
Dsu
mm
ary
scor
eb
etw
een
0an
d4
mon
ths,
follo
wed
by
nofu
rthe
rim
pro
vem
ent
afte
rwar
ds
(and
sign
ifica
ntd
eclin
ein
pat
ient
sw
ithco
mp
licat
ions
)
Exc
lusi
ons
onm
enta
lan
dso
cial
crite
ria;
smal
lsam
ple
size
EQ
-5D
sum
mar
ysc
ore
dec
reas
edfr
om0.
78b
efor
efr
actu
re(b
ased
onre
call)
to0.
59at
4m
onth
san
d0.
51at
17m
onth
s(r
emai
ning
far
bel
owge
nera
lp
opul
atio
nno
rms
of0.
80)
Tid
erm
ark
etal
.20
03;
Sw
eden
48
N�
102;
65�
com
mun
ityd
wel
ling;
oper
ated
EQ
-5D
�cl
inic
alfo
llow
-up
RC
T;in
tern
alfix
atio
nve
rsus
tota
lhip
rep
lace
men
t;4,
12,
24m
onth
s
Red
uctio
nin
EQ
-5D
sum
mar
ysc
ore
sign
ifica
ntly
low
erin
grou
pw
ithto
talh
ipre
pla
cem
ent
Exc
lusi
ons
onm
enta
lan
dso
cial
crite
ria;
smal
lsam
ple
size
:no
resp
onse
rate
sp
rovi
ded
Inte
rnal
fixat
ion
lead
sto
mor
eco
mp
licat
ions
(36%
vers
us4%
)th
anto
talh
ipre
pla
cem
ent
and
wor
sefu
nctio
nal
outc
ome
Pet
erso
net
al.
2002
;U
nite
dS
tate
s49
N�
38;
65�
;co
mm
unity
dw
ellin
g;op
erat
ed�
48ho
urs
SF-
36�
Cum
min
gshi
psc
ale
�cl
inic
alfo
llow
-up
Con
trol
pat
ient
sw
ithin
anR
CT;
2–5
day
s,2,
6,7,
and
12m
onth
s
Mos
tS
F-36
dim
ensi
ons
and
the
Cum
min
gssc
ale
show
edsi
gnifi
cant
imp
rove
men
tb
etw
een
0an
d6,
mon
ths,
but
nofu
rthe
rim
pro
vem
ents
afte
rwar
ds
Exc
lusi
ons
onm
enta
lan
dso
cial
crite
ria;
smal
lsam
ple
size
:no
resp
onse
rate
sp
rovi
ded
Mos
tS
F-36
dim
ensi
ons
and
the
Cum
min
gssc
ale
had
dec
reas
edat
12m
onth
sin
com
par
ison
toth
ep
refr
actu
rest
atus
(bas
edon
reca
ll)an
dre
mai
ned
bel
owge
nera
lpop
ulat
ion
norm
s
Tost
eson
etal
.20
01;
Uni
ted
Sta
tes5
0
N�
67S
F-36
�tim
etr
adeo
ffC
ross
-sec
tiona
l;1–
5ye
ars
pos
tinju
ry;
com
par
ison
bet
wee
ngr
oup
s(n
ofr
actu
re,
vert
ebra
l,hi
p)
Sig
nific
ant
diff
eren
ces
inS
Fp
hysi
cal
com
pon
ent
scor
eb
etw
een
grou
ps;
low
est
scor
efo
rp
atie
nts
with
hip
and
vert
ebra
lfr
actu
re
Exc
lusi
ons
onm
enta
lcr
iteria
;sm
all
sam
ple
size
;cr
oss-
sect
iona
ldes
ign;
one
asse
ssm
ent
per
pat
ient
vary
ing
intim
eaf
ter
inju
ry;
nore
spon
sera
tes
pro
vid
ed
Hip
frac
ture
pat
ient
sha
dsi
gnifi
cant
lylo
wer
QA
LYs
(0.6
3)co
mp
ared
with
vert
ebra
lfra
ctur
es(0
.82)
and
nofr
actu
res
(0.9
1)
Guidelines on Injury-Related Disability
Volume 62 • Number 2 541
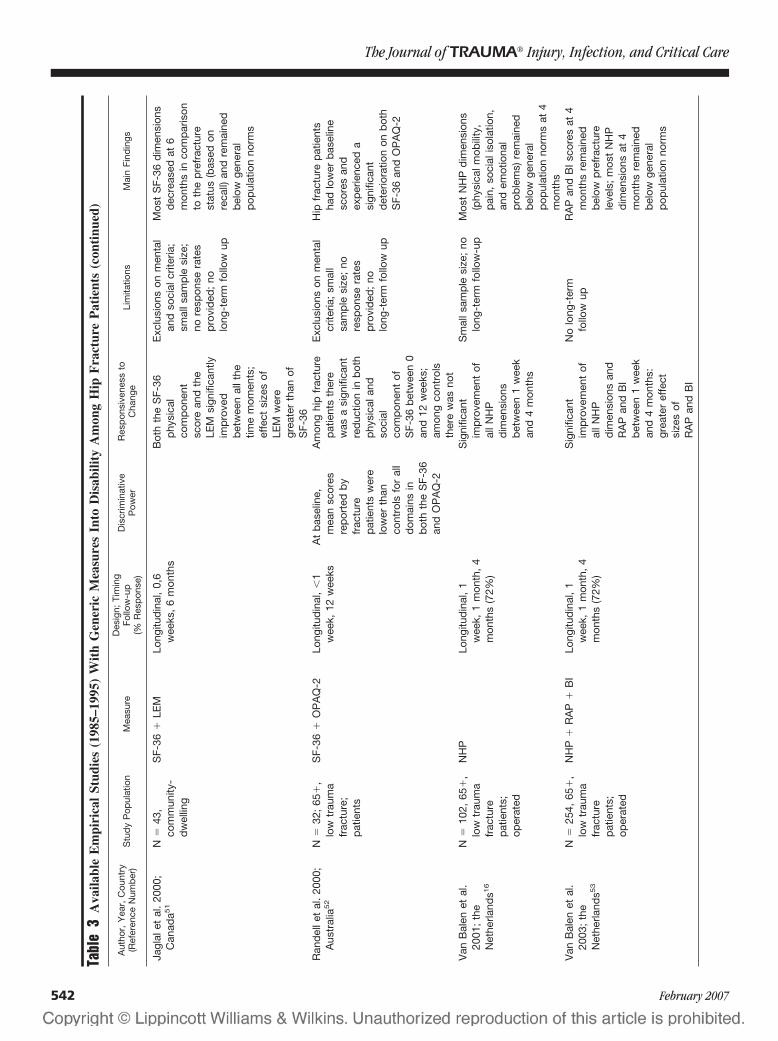
Tabl
e3
Ava
ilabl
eE
mpi
rica
lSt
udie
s(1
985–
1995
)W
ith
Gen
eric
Mea
sure
sIn
toD
isab
ility
Am
ong
Hip
Fra
ctur
eP
atie
nts
(con
tinu
ed)
Aut
hor,
Yea
r,C
ount
ry(R
efer
ence
Num
ber
)S
tud
yP
opul
atio
nM
easu
reD
esig
n;Ti
min
gFo
llow
-up
(%R
esp
onse
)
Dis
crim
inat
ive
Pow
erR
esp
onsi
vene
ssto
Cha
nge
Lim
itatio
nsM
ain
Find
ings
Jagl
alet
al.
2000
;C
anad
a51
N�
43,
com
mun
ity-
dw
ellin
g
SF-
36�
LEM
Long
itud
inal
,0,
6w
eeks
,6
mon
ths
Bot
hth
eS
F-36
phy
sica
lco
mp
onen
tsc
ore
and
the
LEM
sign
ifica
ntly
imp
rove
db
etw
een
allt
hetim
em
omen
ts;
effe
ctsi
zes
ofLE
Mw
ere
grea
ter
than
ofS
F-36
Exc
lusi
ons
onm
enta
lan
dso
cial
crite
ria;
smal
lsam
ple
size
;no
resp
onse
rate
sp
rovi
ded
;no
long
-ter
mfo
llow
up
Mos
tS
F-36
dim
ensi
ons
dec
reas
edat
6m
onth
sin
com
par
ison
toth
ep
refr
actu
rest
atus
(bas
edon
reca
ll)an
dre
mai
ned
bel
owge
nera
lp
opul
atio
nno
rms
Ran
del
let
al.
2000
;A
ustr
alia
52
N�
32;
65�
,lo
wtr
aum
afr
actu
re;
pat
ient
s
SF-
36�
OP
AQ
-2Lo
ngitu
din
al,
�1
wee
k,12
wee
ksA
tb
asel
ine,
mea
nsc
ores
rep
orte
db
yfr
actu
rep
atie
nts
wer
elo
wer
than
cont
rols
for
all
dom
ains
inb
oth
the
SF-
36an
dO
PA
Q-2
Am
ong
hip
frac
ture
pat
ient
sth
ere
was
asi
gnifi
cant
red
uctio
nin
bot
hp
hysi
cala
ndso
cial
com
pon
ent
ofS
F-36
bet
wee
n0
and
12w
eeks
;am
ong
cont
rols
ther
ew
asno
t
Exc
lusi
ons
onm
enta
lcr
iteria
;sm
all
sam
ple
size
;no
resp
onse
rate
sp
rovi
ded
;no
long
-ter
mfo
llow
up
Hip
frac
ture
pat
ient
sha
dlo
wer
bas
elin
esc
ores
and
exp
erie
nced
asi
gnifi
cant
det
erio
ratio
non
bot
hS
F-36
and
OP
AQ
-2
Van
Bal
enet
al.
2001
;th
eN
ethe
rland
s16
N�
102,
65�
,lo
wtr
aum
afr
actu
rep
atie
nts;
oper
ated
NH
PLo
ngitu
din
al,
1w
eek,
1m
onth
,4
mon
ths
(72%
)
Sig
nific
ant
imp
rove
men
tof
allN
HP
dim
ensi
ons
bet
wee
n1
wee
kan
d4
mon
ths
Sm
alls
amp
lesi
ze;
nolo
ng-t
erm
follo
w-u
pM
ost
NH
Pd
imen
sion
s(p
hysi
calm
obili
ty,
pai
n,so
cial
isol
atio
n,an
dem
otio
nal
pro
ble
ms)
rem
aine
db
elow
gene
ral
pop
ulat
ion
norm
sat
4m
onth
sV
anB
alen
etal
.20
03;
the
Net
herla
nds5
3
N�
254,
65�
,lo
wtr
aum
afr
actu
rep
atie
nts;
oper
ated
NH
P�
RA
P�
BI
Long
itud
inal
,1
wee
k,1
mon
th,
4m
onth
s(7
2%)
Sig
nific
ant
imp
rove
men
tof
allN
HP
dim
ensi
ons
and
RA
Pan
dB
Ib
etw
een
1w
eek
and
4m
onth
s:gr
eate
ref
fect
size
sof
RA
Pan
dB
I
No
long
-ter
mfo
llow
upR
AP
and
BI
scor
esat
4m
onth
sre
mai
ned
bel
owp
refr
actu
rele
vels
;m
ost
NH
Pd
imen
sion
sat
4m
onth
sre
mai
ned
bel
owge
nera
lp
opul
atio
nno
rms
The Journal of TRAUMA� Injury, Infection, and Critical Care
542 February 2007
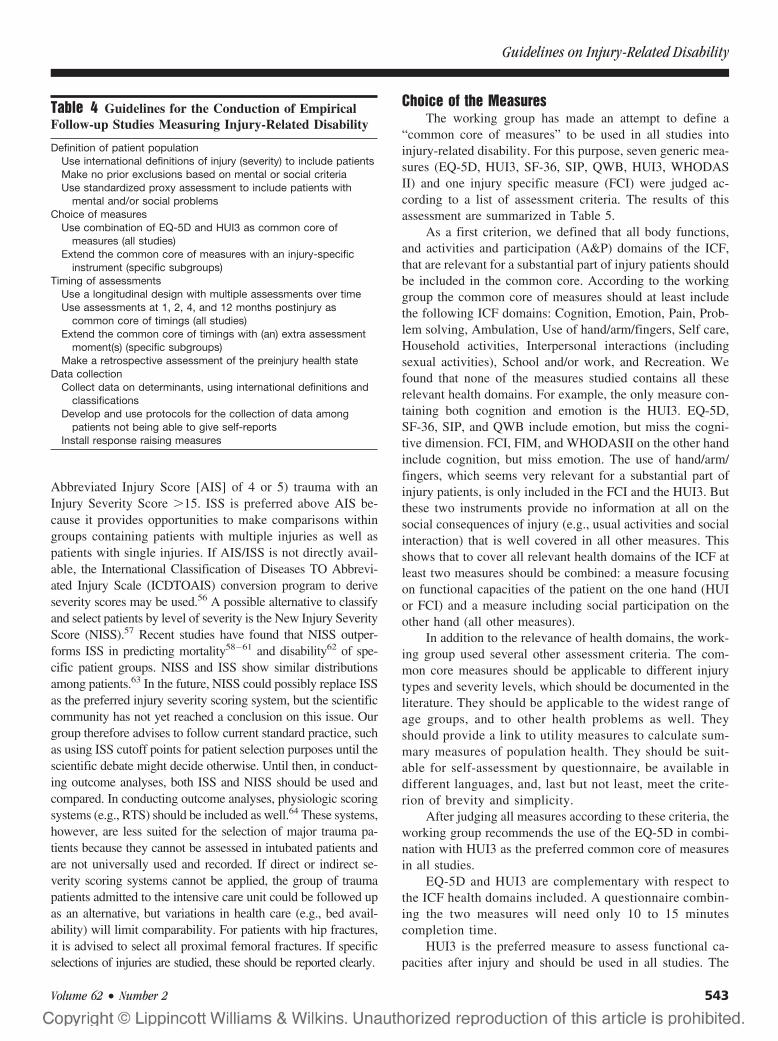
Abbreviated Injury Score [AIS] of 4 or 5) trauma with anInjury Severity Score �15. ISS is preferred above AIS be-cause it provides opportunities to make comparisons withingroups containing patients with multiple injuries as well aspatients with single injuries. If AIS/ISS is not directly avail-able, the International Classification of Diseases TO Abbrevi-ated Injury Scale (ICDTOAIS) conversion program to deriveseverity scores may be used.56 A possible alternative to classifyand select patients by level of severity is the New Injury SeverityScore (NISS).57 Recent studies have found that NISS outper-forms ISS in predicting mortality58–61 and disability62 of spe-cific patient groups. NISS and ISS show similar distributionsamong patients.63 In the future, NISS could possibly replace ISSas the preferred injury severity scoring system, but the scientificcommunity has not yet reached a conclusion on this issue. Ourgroup therefore advises to follow current standard practice, suchas using ISS cutoff points for patient selection purposes until thescientific debate might decide otherwise. Until then, in conduct-ing outcome analyses, both ISS and NISS should be used andcompared. In conducting outcome analyses, physiologic scoringsystems (e.g., RTS) should be included as well.64 These systems,however, are less suited for the selection of major trauma pa-tients because they cannot be assessed in intubated patients andare not universally used and recorded. If direct or indirect se-verity scoring systems cannot be applied, the group of traumapatients admitted to the intensive care unit could be followed upas an alternative, but variations in health care (e.g., bed avail-ability) will limit comparability. For patients with hip fractures,it is advised to select all proximal femoral fractures. If specificselections of injuries are studied, these should be reported clearly.
Choice of the MeasuresThe working group has made an attempt to define a
“common core of measures” to be used in all studies intoinjury-related disability. For this purpose, seven generic mea-sures (EQ-5D, HUI3, SF-36, SIP, QWB, HUI3, WHODASII) and one injury specific measure (FCI) were judged ac-cording to a list of assessment criteria. The results of thisassessment are summarized in Table 5.
As a first criterion, we defined that all body functions,and activities and participation (A&P) domains of the ICF,that are relevant for a substantial part of injury patients shouldbe included in the common core. According to the workinggroup the common core of measures should at least includethe following ICF domains: Cognition, Emotion, Pain, Prob-lem solving, Ambulation, Use of hand/arm/fingers, Self care,Household activities, Interpersonal interactions (includingsexual activities), School and/or work, and Recreation. Wefound that none of the measures studied contains all theserelevant health domains. For example, the only measure con-taining both cognition and emotion is the HUI3. EQ-5D,SF-36, SIP, and QWB include emotion, but miss the cogni-tive dimension. FCI, FIM, and WHODASII on the other handinclude cognition, but miss emotion. The use of hand/arm/fingers, which seems very relevant for a substantial part ofinjury patients, is only included in the FCI and the HUI3. Butthese two instruments provide no information at all on thesocial consequences of injury (e.g., usual activities and socialinteraction) that is well covered in all other measures. Thisshows that to cover all relevant health domains of the ICF atleast two measures should be combined: a measure focusingon functional capacities of the patient on the one hand (HUIor FCI) and a measure including social participation on theother hand (all other measures).
In addition to the relevance of health domains, the work-ing group used several other assessment criteria. The com-mon core measures should be applicable to different injurytypes and severity levels, which should be documented in theliterature. They should be applicable to the widest range ofage groups, and to other health problems as well. Theyshould provide a link to utility measures to calculate sum-mary measures of population health. They should be suit-able for self-assessment by questionnaire, be available indifferent languages, and, last but not least, meet the crite-rion of brevity and simplicity.
After judging all measures according to these criteria, theworking group recommends the use of the EQ-5D in combi-nation with HUI3 as the preferred common core of measuresin all studies.
EQ-5D and HUI3 are complementary with respect tothe ICF health domains included. A questionnaire combin-ing the two measures will need only 10 to 15 minutescompletion time.
HUI3 is the preferred measure to assess functional ca-pacities after injury and should be used in all studies. The
Table 4 Guidelines for the Conduction of EmpiricalFollow-up Studies Measuring Injury-Related Disability
Definition of patient populationUse international definitions of injury (severity) to include patientsMake no prior exclusions based on mental or social criteriaUse standardized proxy assessment to include patients with
mental and/or social problemsChoice of measures
Use combination of EQ-5D and HUI3 as common core ofmeasures (all studies)
Extend the common core of measures with an injury-specificinstrument (specific subgroups)
Timing of assessmentsUse a longitudinal design with multiple assessments over timeUse assessments at 1, 2, 4, and 12 months postinjury as
common core of timings (all studies)Extend the common core of timings with (an) extra assessment
moment(s) (specific subgroups)Make a retrospective assessment of the preinjury health state
Data collectionCollect data on determinants, using international definitions and
classificationsDevelop and use protocols for the collection of data among
patients not being able to give self-reportsInstall response raising measures
Guidelines on Injury-Related Disability
Volume 62 • Number 2 543

Tabl
e5
Ass
essm
ent
ofA
ppro
pria
tene
ssH
ealt
hSt
atus
Mea
sure
sfo
rA
pplic
atio
nto
Inju
ryP
atie
nts
Ass
essm
ent
Crit
eria
EQ
-5D
FCI
FIM
HU
I3S
F-36
SIP
QW
BW
HO
DA
SII
1.In
clus
ion
ofre
leva
nthe
alth
dom
ains
Anx
iety
/dep
ress
ion,
pai
n/d
isco
mfo
rt,
amb
ulat
ion,
self
care
,us
ual
activ
ities
(hou
seho
ld,
scho
ol,
wor
k)
Cog
nitio
n,vi
sion
,he
arin
g,sp
eech
,b
owel
cont
rol,
bla
dd
erco
ntro
l,se
xual
func
tion,
pro
ble
mso
lvin
g,co
mm
unic
atio
n,am
bul
atio
n,b
end
ing/
liftin
g,ha
nd-a
rmm
ovem
ent
Cog
nitio
n,b
owel
cont
rol,
bla
dd
erco
ntro
l,p
rob
lem
solv
ing,
com
mun
icat
ion,
amb
ulat
ion,
eatin
g,gr
oom
ing,
bat
hing
,d
ress
ing,
toile
ting,
soci
alin
tera
ctio
n
Cog
nitio
n,em
otio
n,vi
sion
,he
arin
g,sp
eech
,p
ain,
pro
ble
mso
lvin
g,co
mm
unic
atio
n,am
bul
atio
n,d
exte
rity
(use
ofha
nds
and
finge
rs)
Em
otio
n,p
ain,
amb
ulat
ion,
ben
din
g/lif
ting,
bat
hing
,d
ress
ing,
regu
lar
dai
lyac
tiviti
es(h
ouse
hold
,sc
hool
,w
ork)
,so
cial
activ
ities
Ale
rtne
ss,
emot
ion,
com
mun
icat
ion,
amb
ulat
ion,
eatin
g,se
lfca
re,
hous
ehol
dm
anag
emen
t,w
ork,
soci
alin
tera
ctio
n
Em
otio
n,vi
sion
,he
arin
g,sp
eech
,p
ain,
bow
elp
rob
lem
s,b
lad
der
cont
rol,
urin
ary
pro
ble
ms,
par
alys
is/s
tiffn
ess
extr
emiti
es,
amb
ulat
ion,
ben
din
g/lif
ting,
self
care
,us
ual
activ
ities
(hou
seho
ld,
scho
ol,
wor
k,sp
orts
)
Cog
nitio
n,p
rob
lem
solv
ing,
com
mun
icat
ion,
amb
ulat
ion,
eatin
g,b
athi
ng,
dre
ssin
g,ho
useh
old
man
agem
ent,
soci
alin
tera
ctio
n,se
xual
activ
ities
,sc
hool
,w
ork
2.D
ocum
ente
dap
plic
abili
tyto
inju
ries
ofd
iffer
ent
typ
esan
dse
verit
yle
vels
Doc
umen
ted
app
licab
ility
toco
mp
rehe
nsiv
ein
jury
pop
ulat
ions
,in
clud
ing
min
orin
jury
,m
ajor
trau
ma
and
hip
frac
ture
s
Doc
umen
ted
app
licab
ility
toho
spita
l-ad
mitt
edp
atie
nts
with
blu
ntm
otor
vehi
cle
inju
ryan
dm
ajor
trau
ma
app
licab
ility
tolo
wen
ergy
trau
ma
has
yet
tob
ete
sted
Doc
umen
ted
app
licab
ility
toho
spita
lad
mitt
edp
atie
nts;
app
licab
ility
tolo
w-e
nerg
ytr
aum
aha
sye
tto
be
test
ed
Doc
umen
ted
app
licab
ility
toos
teop
orot
icfr
actu
res
app
licab
ility
toot
her
trau
ma
pop
ulat
ions
has
yet
tob
ete
sted
Doc
umen
ted
app
licab
ility
toco
mp
rehe
nsiv
ein
jury
pop
ulat
ions
,in
clud
ing
min
orin
jury
,ho
spita
l-ad
mitt
edp
atie
nts
with
blu
ntm
otor
vehi
cle
inju
ry,
maj
ortr
aum
aan
dhi
pfr
actu
res
Doc
umen
ted
app
licab
ility
toho
spita
l-ad
mitt
edp
atie
nts
with
blu
ntm
otor
vehi
cle
inju
ryan
dm
ajor
trau
ma;
app
licab
ility
tolo
w-e
nerg
ytr
aum
aha
sye
tto
be
test
ed
Doc
umen
ted
app
licab
ility
toho
spita
l-ad
mitt
edp
atie
nts
app
licab
ility
tolo
w-e
nerg
ytr
aum
aha
sye
tto
be
test
ed
Ap
plic
abili
tyto
inju
ryp
opul
atio
nsha
sye
tto
be
test
ed
3.A
pp
licab
ility
toot
her
heal
thp
rob
lem
s
Yes
No
Yes
Yes
Yes
Yes
Yes
Yes
4.A
pp
licab
ility
toth
ew
ides
tp
ossi
ble
age
rang
es
Ap
plic
able
toch
ildre
n(5
�),
adol
esce
nts,
adul
tsan
dth
eel
der
ly;
for
child
ren
0–4
som
ead
apta
tions
need
ed
Des
igne
dfo
rad
ult
pop
ulat
ions
;p
edia
tric
vers
ion
for
child
ren
Ap
plic
able
toch
ildre
n(5
�),
adol
esce
nts,
adul
tsan
dth
eel
der
ly;
for
child
ren
0–4
ped
iatr
icve
rsio
n(W
EE
FIM
)
Ap
plic
able
toch
ildre
n(5
�),
adol
esce
nts,
adul
ts,
and
the
eld
erly
Ap
plic
able
toad
oles
cent
s,ad
ults
,an
dth
eel
der
ly
Ap
plic
able
toad
oles
cent
s,ad
ults
,an
dth
eel
der
ly
Ap
plic
able
toad
oles
cent
s,ad
ults
,an
dth
eel
der
ly
Ap
plic
able
toad
oles
cent
s,ad
ults
,an
dth
eel
der
ly
5.Li
nkto
utili
tysc
ores
Yes
;b
ased
onhe
alth
stat
eva
luat
ions
by
the
gene
ralU
Kp
opul
atio
n
Yes
;b
ased
onra
tings
from
anU
Sex
per
tp
anel
(n�
114)
;va
lidity
has
tob
ete
sted
No
Yes
;b
ased
onva
luat
ions
by
are
pre
sent
ativ
esa
mp
leof
the
gene
ralU
Sp
opul
atio
n
Yes
;re
cent
lyd
evel
oped
and
lab
eled
SF-
6D;
valid
ityno
tye
tte
sted
ona
larg
esc
ale
No
Yes
;b
ased
onva
luat
ions
by
are
pre
sent
ativ
esa
mp
leof
the
gene
ralU
Sp
opul
atio
n
No
6.S
uita
bili
tyfo
rse
lf-as
sess
men
tY
esY
esN
oY
esY
esY
esY
esY
es
The Journal of TRAUMA� Injury, Infection, and Critical Care
544 February 2007
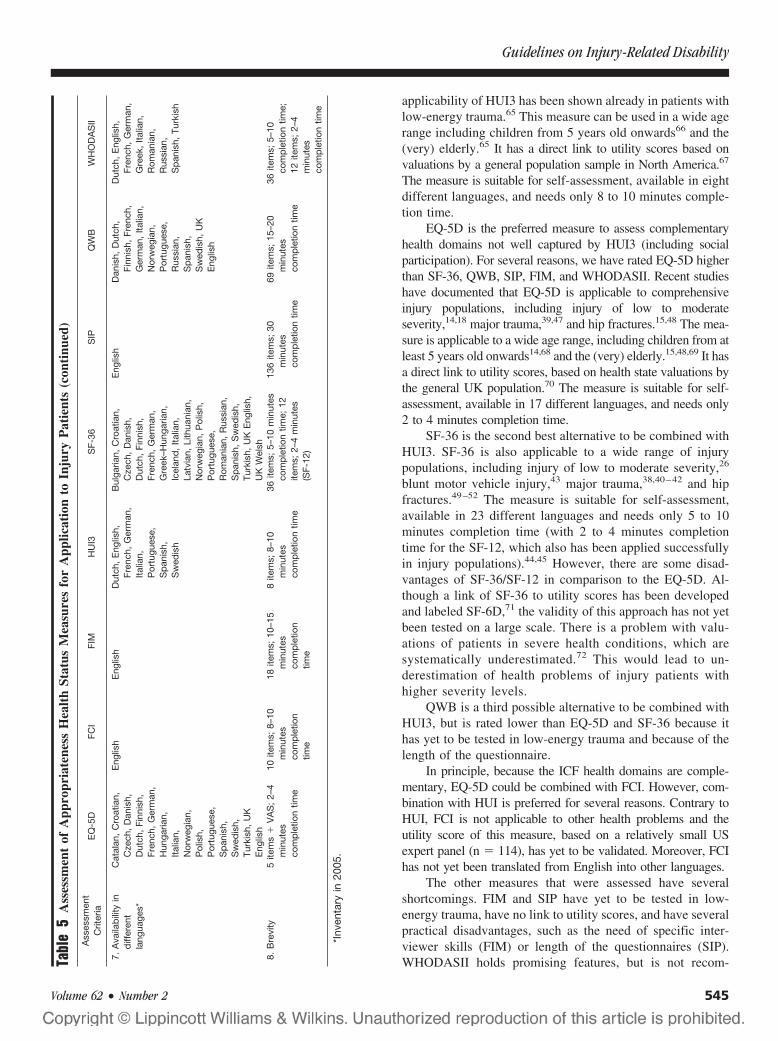
applicability of HUI3 has been shown already in patients withlow-energy trauma.65 This measure can be used in a wide agerange including children from 5 years old onwards66 and the(very) elderly.65 It has a direct link to utility scores based onvaluations by a general population sample in North America.67
The measure is suitable for self-assessment, available in eightdifferent languages, and needs only 8 to 10 minutes comple-tion time.
EQ-5D is the preferred measure to assess complementaryhealth domains not well captured by HUI3 (including socialparticipation). For several reasons, we have rated EQ-5D higherthan SF-36, QWB, SIP, FIM, and WHODASII. Recent studieshave documented that EQ-5D is applicable to comprehensiveinjury populations, including injury of low to moderateseverity,14,18 major trauma,39,47 and hip fractures.15,48 The mea-sure is applicable to a wide age range, including children from atleast 5 years old onwards14,68 and the (very) elderly.15,48,69 It hasa direct link to utility scores, based on health state valuations bythe general UK population.70 The measure is suitable for self-assessment, available in 17 different languages, and needs only2 to 4 minutes completion time.
SF-36 is the second best alternative to be combined withHUI3. SF-36 is also applicable to a wide range of injurypopulations, including injury of low to moderate severity,26
blunt motor vehicle injury,43 major trauma,38,40–42 and hipfractures.49–52 The measure is suitable for self-assessment,available in 23 different languages and needs only 5 to 10minutes completion time (with 2 to 4 minutes completiontime for the SF-12, which also has been applied successfullyin injury populations).44,45 However, there are some disad-vantages of SF-36/SF-12 in comparison to the EQ-5D. Al-though a link of SF-36 to utility scores has been developedand labeled SF-6D,71 the validity of this approach has not yetbeen tested on a large scale. There is a problem with valu-ations of patients in severe health conditions, which aresystematically underestimated.72 This would lead to un-derestimation of health problems of injury patients withhigher severity levels.
QWB is a third possible alternative to be combined withHUI3, but is rated lower than EQ-5D and SF-36 because ithas yet to be tested in low-energy trauma and because of thelength of the questionnaire.
In principle, because the ICF health domains are comple-mentary, EQ-5D could be combined with FCI. However, com-bination with HUI is preferred for several reasons. Contrary toHUI, FCI is not applicable to other health problems and theutility score of this measure, based on a relatively small USexpert panel (n � 114), has yet to be validated. Moreover, FCIhas not yet been translated from English into other languages.
The other measures that were assessed have severalshortcomings. FIM and SIP have yet to be tested in low-energy trauma, have no link to utility scores, and have severalpractical disadvantages, such as the need of specific inter-viewer skills (FIM) or length of the questionnaires (SIP).WHODASII holds promising features, but is not recom-Ta
ble
5A
sses
smen
tof
App
ropr
iate
ness
Hea
lth
Stat
usM
easu
res
for
App
licat
ion
toIn
jury
Pat
ient
s(c
onti
nued
)
Ass
essm
ent
Crit
eria
EQ
-5D
FCI
FIM
HU
I3S
F-36
SIP
QW
BW
HO
DA
SII
7.A
vaila
bili
tyin
diff
eren
tla
ngua
ges*
Cat
alan
,C
roat
ian,
Cze
ch,
Dan
ish,
Dut
ch,
Finn
ish,
Fren
ch,
Ger
man
,H
unga
rian,
Italia
n,N
orw
egia
n,P
olis
h,P
ortu
gues
e,S
pan
ish,
Sw
edis
h,Tu
rkis
h,U
KE
nglis
h
Eng
lish
Eng
lish
Dut
ch,
Eng
lish,
Fren
ch,
Ger
man
,Ita
lian,
Por
tugu
ese,
Sp
anis
h,S
wed
ish
Bul
garia
n,C
roat
ian,
Cze
ch,
Dan
ish,
Dut
ch,
Finn
ish,
Fren
ch,
Ger
man
,G
reek
–Hun
garia
n,Ic
elan
d,
Italia
n,La
tvia
n,Li
thua
nian
,N
orw
egia
n,P
olis
h,P
ortu
gues
e,R
oman
ian,
Rus
sian
,S
pan
ish,
Sw
edis
h,Tu
rkis
h,U
KE
nglis
h,U
KW
elsh
Eng
lish
Dan
ish,
Dut
ch,
Finn
ish,
Fren
ch,
Ger
man
,Ita
lian,
Nor
weg
ian,
Por
tugu
ese,
Rus
sian
,S
pan
ish,
Sw
edis
h,U
KE
nglis
h
Dut
ch,
Eng
lish,
Fren
ch,
Ger
man
,G
reek
,Ita
lian,
Rom
ania
n,R
ussi
an,
Sp
anis
h,Tu
rkis
h
8.B
revi
ty5
item
s�
VA
S;
2–4
min
utes
com
ple
tion
time
10ite
ms;
8–10
min
utes
com
ple
tion
time
18ite
ms;
10–1
5m
inut
esco
mp
letio
ntim
e
8ite
ms;
8–10
min
utes
com
ple
tion
time
36ite
ms;
5–10
min
utes
com
ple
tion
time;
12ite
ms;
2–4
min
utes
(SF-
12)
136
item
s;30
min
utes
com
ple
tion
time
69ite
ms;
15–2
0m
inut
esco
mp
letio
ntim
e
36ite
ms;
5–10
com
ple
tion
time;
12ite
ms;
2–4
min
utes
com
ple
tion
time
*Inv
enta
ryin
2005
.
Guidelines on Injury-Related Disability
Volume 62 • Number 2 545
mended yet because too little is still known about its validity.Moreover, a link to utility scores is missing.
In studies focusing on specific groups of injury patients,the recommended common core of measures may be ex-tended with an injury-specific (or disease-specific) measure,additionally addressing problems that are frequently occur-ring in that specific injury population. The common core ofmeasures (EQ-5D and HUI3) is appropriate for studies fo-cusing on major trauma. However, because many patientswith major trauma suffer from head injuries, additional use ofthe Glasgow Outcome Scale (GOS) is advised. This willallow comparisons of studies on major trauma with specificstudies on traumatic brain injuries. For patients with hipfractures, the common core of measures may be extendedwith an appropriate specific measure, such as the CummingsHip Scale,54 the Lower Extremity Measure,51 and the Osteo-porosis Assessment Questionnaire.55
Timing of the AssessmentsThe working group recommends conducting longitudinal
studies with multiple assessments over time. In this way, bothrecovery patterns and permanent consequences of injury canbe assessed.
Each measurement moment should be representative forone of the four phases of trauma recovery: acute treatmentphase, rehabilitation phase, adaptation phase, and stable endsituation. Standardization of the timings of the assessments is ofequal importance to standardization of the measures used.Therefore, the working group has developed a “common core”of timings as well. The working group is aware that, because ofpractical and/or financial restrictions, it will often be impossibleto do a large series of measurements. All studies, however,should measure at one or more of the assessment momentsadvised below. If possible, a first follow-up measurement isadvised at 1 month (acute treatment phase, range 0–8 weeks).The first 2 months after injury reflect the period of major healtheffects for injury patients of all severity levels, as shown byseveral studies.13–15,18,26,49 Second and third follow-up measure-ments are advised at 2 months (rehabilitation phase, range 1–3months) and 4 months (adaptation phase, range 3–6 months)respectively. The literature shows that for the majority of pa-tients, recovery is mainly occurring within the first half yearafter injury.13–15,18,26–30,49 With measurements at 2 and 4months, this period of recovery is well covered. Finally, it isadvised to do a measurement of the stable end situation at 12months (range 6–24 months). Studies in the United States andUnited Kingdom have shown that comprehensive injury popu-lations show no further recovery after 12 months.28,30 The work-ing group further recommends the retrospective assessment ofpreinjury health status within the first week after the injury, asimplemented in several follow-up studies of patients with hipfractures.15,49,51–53
Longitudinal studies with multiple measurement mo-ments to study recovery patterns of major trauma patients area priority issue because most outcome studies on major
trauma patients have to date been restricted to a single mo-ment of follow-up. The common practice in this field todefine moments of follow-up based on the time since hospitaldischarge should be abandoned. Major trauma patients mayshow further improvement (in particular in social participa-tion) after 12 months.47 Therefore, in studies focusing onmajor trauma, it is recommended to add an extra measure-ment at 24 months to the common core of timings.
Data CollectionWe recommend collecting data on the largest sample of
patients feasible. Comprehensive injury populations needsample sizes of at least 1,000 patients and are preferablystratified with over-representation of the more severe injuries.For injury-specific studies, samples of at least 100 patientsare recommended. We recommend collecting additional dataon possible determinants of disabilities. The following vari-ables are important: age, sex, socioeconomic status, comor-bidity (physical and psychological), complications, and socialsupport. For this purpose, internationally accepted defini-tions, classifications, and measurements should be used. Co-morbidity, for example, can be derived from existingclassifications.73 The partitioning of disability to differentcompeting conditions is very difficult because of the variableseverity of comorbidities. One approach is to measure thepresence of significant preinjury comorbidities by including aquestion in the baseline data collection such as “before yourinjury did you suffer from a disability or long-term healthproblem that limited your normal activities?” Analysis ofchanges in status for those with and without preexistingdisability will help measurement of the injury-related com-ponent. Questions on the use of health services for reasonsother than the injury on a before and after basis are alsohelpful and have been included in the UK Burden of Injuriesstudy that was recently initiated. Protocols should be devel-oped for the collection of data among specific patient groups.Several subgroups of injury patients will not be able to giveself-reports on their health condition. Major examples arepatients with severe head injuries, patients on mechanicalventilation, and patients with cognitive impairments, youngchildren, and psychiatric patients. For these patient groups,the protocols should allow the collection of data with the helpof proxy respondents (parents, partners, or other caregivers ofthe patient). We recommend installing response-raising mea-sures when conducting a follow-up study into injury-relateddisability.74 Without specific measures the risk of low re-sponse rates is high, in particular when injuries of low sever-ity are included.18,26 We recommend sending reminders to allnonrespondents at all moments of follow up. It is furtheradvised to make one person responsible for the collection offollow-up data, such as a medical resident with interest inscientific research. A prerequisite to be met is that ethicalrules about informed consent should be applied.
The Journal of TRAUMA� Injury, Infection, and Critical Care
546 February 2007

DISCUSSIONBased on a review of the literature and a consensus
procedure, we have developed guidelines for the conductionof empirical follow-up studies into injury-related disability.We recommend use of EQ-5D and HUI3 as the common coreof measures in all studies. We advise to conduct longitudinalstudies with multiple assessments over time. In this way, bothrecovery patterns and permanent consequences of injury canbe assessed. As the common core of timings, a series ofmeasurements at 1, 2, 4, and 12 months is recommended. Inextension to the general guidelines, additional measuresand/or moments of follow up may be used to capture theconsequences of specific types of injury. For studies focusingon major trauma, for example, we recommend an additionalfollow-up measurement at 24 months postinjury.
Our group is the first to develop guidelines for measuringinjury-related disability among the complete and heterogeneousscope of injury patients with all levels of severity. Previously,guidelines have been developed by an international groupof experts (the Cologne group 2002) for specific patientgroups, including patients with major trauma.75,76 Similarto our group, EQ-5D was one of the advised measures formajor trauma patients by the Cologne group as well topermit economic analyses. In addition, however, they haverecommended using SF-36 as a validated global quality-of-life measure. We have proposed HUI3 as additionalmeasure instead because of the inclusion of some impor-tant health domains that are missing in both EQ-5D andSF-36: cognition and hand-arm movement. EQ-5D is pre-ferred above SF-36 because the latter measure has beenshown to underestimate the consequences of severe healthconditions,72 which makes the measure less suitable forinjuries of higher severity levels. For similar reasons, thePrevention of Falls Network Europe has recommended toinclude EQ-5D instead of SF-36 in a common outcomedata set for fall injury prevention trials.77 Moreover,EQ-5D can be extended with a question on cognitivefunctioning,78 as applied already in injury patients.14,18,47
The literature has shown variation in utility scores byhealth status measure,79 including variation between EQ-5Dand HUI3.80 Comparative analyses on EQ-5D versus HUI3among injury patients have not yet been conducted. Calcula-tion of both utility scores is therefore advised, providing arange of uncertainty when quantifying the impact of injury onpopulation health.
Similar to the Cologne group, we recommend measuringthe preinjury health status retrospectively and measuring thelong-term consequences at 12 and 24 months postinjury. Adifference between our guidelines and the Cologne group inthe recommended moments of follow-up concerns the firstmonths after injury, where we have advised a larger series ofassessments (at 1, 2, and 4 months contrary to one measure-ment at 3 months by the Cologne group). We recognize thatassessments of major trauma patients during this phase will
often be very difficult. Nevertheless, if feasible, these mea-surements should be conducted to have data for fully quan-tifying injury-related disability and complete estimations ofthe health benefits of prevention and trauma care.
A common core of measures and assessment moments ishighly needed to obtain improved and more consistent scien-tific knowledge on injury-related disability, and is thereforerecommended. However, it is recognized that using a com-mon core of measures and assessment moments may havesome disadvantages for specific groups within the widelyvarying population of injury patients. Owing to a ceilingeffect, EQ-5D and—to a lesser extent—HUI3 are not themost appropriate choices if the main goal of a study is todistinguish between minor levels of impairment.79 But therelevance of this issue in quantifying injury consequences canbe questioned. International research on the most appropriateinjury indicators has already advised restrictions to (varioustypes of) injury at the medium to higher end of the severityspectrum.81–83
In studies focusing on specific types of injury, as ageneral rule, additional measures may be selected in additionto the common core. All health domains that are relevant fora specific patient population should in principle be includedin the set of measures that is used. If not, incomplete disabil-ity information underestimating the impact of injury will becollected. Relevant health domains may be identified byrelating the ICF to specific expert knowledge from the injuryfield. This procedure has, for example, been applied for theselection of measures to assess functional outcome afterburns.84 In this field, the common core of measures may beextended with burn-specific measures to capture specific con-sequences, such as esthetic aspects and interpersonalrelationships.85 Moreover, in this field, measures have beendeveloped and validated that are well tailored to the specificdevelopmental stages of children of different ages.86–88
The common core of measures seems appropriate forchildren ages 5 years and over. EQ-5D has previously beentested among children 5 years and older,65 and a recent studyhas shown good discriminative power and responsiveness tochange among injured children in this age group.14 TheHealth Utilities Index has a pediatric version for childrenaged 5 and older, which has been tested and validated.69
However, several aspects related to measuring injury-relateddisability among children were not extensively dealt with byour working group and are still open to debate. First of all,other measures that could be superior to the EQ-5D andHUI3, such as the Child Health Questionnaire (CHQ),89 areavailable for children aged 5 and older. But the advantagesand disadvantages of the different measures for injured chil-dren are not well established because a comparative studywithin the injury field has still to be conducted. Moreover, thequestion remains how to assess injury-related disabilityamong very young children (0–4 years). For infants aged 1through 4 years, the Infant Toddler Quality of Life Question-naire (CHQ-IT) has been developed.90 This measure was
Guidelines on Injury-Related Disability
Volume 62 • Number 2 547
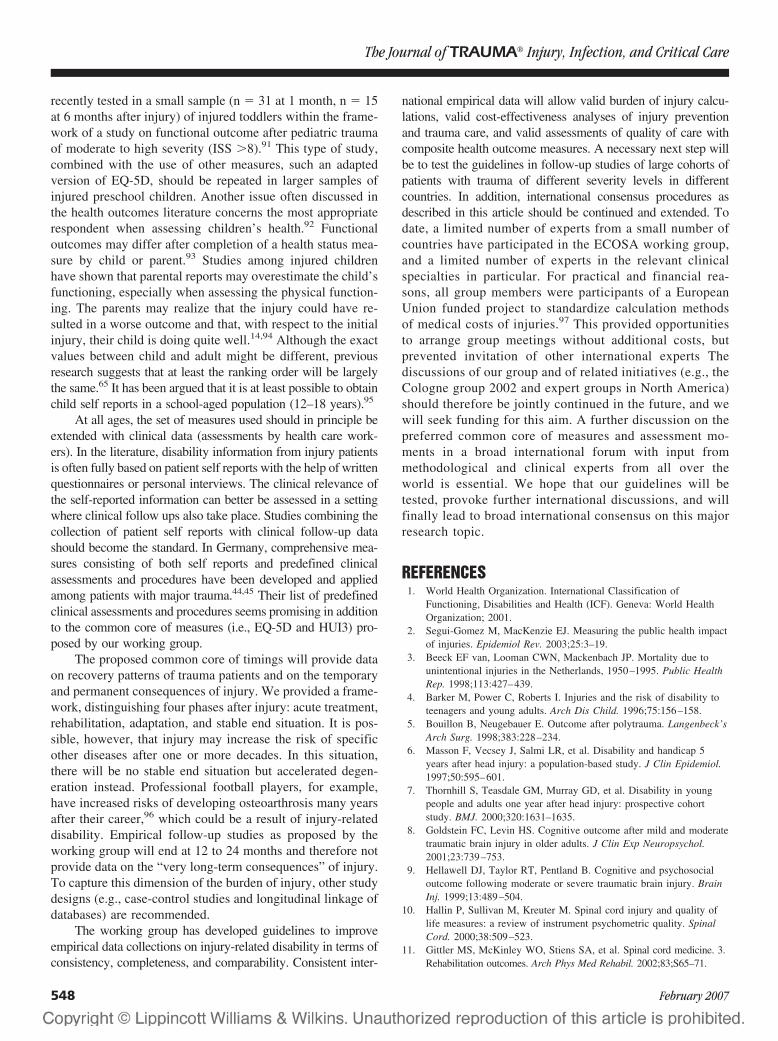
recently tested in a small sample (n � 31 at 1 month, n � 15at 6 months after injury) of injured toddlers within the frame-work of a study on functional outcome after pediatric traumaof moderate to high severity (ISS �8).91 This type of study,combined with the use of other measures, such an adaptedversion of EQ-5D, should be repeated in larger samples ofinjured preschool children. Another issue often discussed inthe health outcomes literature concerns the most appropriaterespondent when assessing children’s health.92 Functionaloutcomes may differ after completion of a health status mea-sure by child or parent.93 Studies among injured childrenhave shown that parental reports may overestimate the child’sfunctioning, especially when assessing the physical function-ing. The parents may realize that the injury could have re-sulted in a worse outcome and that, with respect to the initialinjury, their child is doing quite well.14,94 Although the exactvalues between child and adult might be different, previousresearch suggests that at least the ranking order will be largelythe same.65 It has been argued that it is at least possible to obtainchild self reports in a school-aged population (12–18 years).95
At all ages, the set of measures used should in principle beextended with clinical data (assessments by health care work-ers). In the literature, disability information from injury patientsis often fully based on patient self reports with the help of writtenquestionnaires or personal interviews. The clinical relevance ofthe self-reported information can better be assessed in a settingwhere clinical follow ups also take place. Studies combining thecollection of patient self reports with clinical follow-up datashould become the standard. In Germany, comprehensive mea-sures consisting of both self reports and predefined clinicalassessments and procedures have been developed and appliedamong patients with major trauma.44,45 Their list of predefinedclinical assessments and procedures seems promising in additionto the common core of measures (i.e., EQ-5D and HUI3) pro-posed by our working group.
The proposed common core of timings will provide dataon recovery patterns of trauma patients and on the temporaryand permanent consequences of injury. We provided a frame-work, distinguishing four phases after injury: acute treatment,rehabilitation, adaptation, and stable end situation. It is pos-sible, however, that injury may increase the risk of specificother diseases after one or more decades. In this situation,there will be no stable end situation but accelerated degen-eration instead. Professional football players, for example,have increased risks of developing osteoarthrosis many yearsafter their career,96 which could be a result of injury-relateddisability. Empirical follow-up studies as proposed by theworking group will end at 12 to 24 months and therefore notprovide data on the “very long-term consequences” of injury.To capture this dimension of the burden of injury, other studydesigns (e.g., case-control studies and longitudinal linkage ofdatabases) are recommended.
The working group has developed guidelines to improveempirical data collections on injury-related disability in terms ofconsistency, completeness, and comparability. Consistent inter-
national empirical data will allow valid burden of injury calcu-lations, valid cost-effectiveness analyses of injury preventionand trauma care, and valid assessments of quality of care withcomposite health outcome measures. A necessary next step willbe to test the guidelines in follow-up studies of large cohorts ofpatients with trauma of different severity levels in differentcountries. In addition, international consensus procedures asdescribed in this article should be continued and extended. Todate, a limited number of experts from a small number ofcountries have participated in the ECOSA working group,and a limited number of experts in the relevant clinicalspecialties in particular. For practical and financial rea-sons, all group members were participants of a EuropeanUnion funded project to standardize calculation methodsof medical costs of injuries.97 This provided opportunitiesto arrange group meetings without additional costs, butprevented invitation of other international experts Thediscussions of our group and of related initiatives (e.g., theCologne group 2002 and expert groups in North America)should therefore be jointly continued in the future, and wewill seek funding for this aim. A further discussion on thepreferred common core of measures and assessment mo-ments in a broad international forum with input frommethodological and clinical experts from all over theworld is essential. We hope that our guidelines will betested, provoke further international discussions, and willfinally lead to broad international consensus on this majorresearch topic.
REFERENCES1. World Health Organization. International Classification of
Functioning, Disabilities and Health (ICF). Geneva: World HealthOrganization; 2001.
2. Segui-Gomez M, MacKenzie EJ. Measuring the public health impactof injuries. Epidemiol Rev. 2003;25:3–19.
3. Beeck EF van, Looman CWN, Mackenbach JP. Mortality due tounintentional injuries in the Netherlands, 1950–1995. Public HealthRep. 1998;113:427–439.
4. Barker M, Power C, Roberts I. Injuries and the risk of disability toteenagers and young adults. Arch Dis Child. 1996;75:156–158.
5. Bouillon B, Neugebauer E. Outcome after polytrauma. Langenbeck’sArch Surg. 1998;383:228–234.
6. Masson F, Vecsey J, Salmi LR, et al. Disability and handicap 5years after head injury: a population-based study. J Clin Epidemiol.1997;50:595–601.
7. Thornhill S, Teasdale GM, Murray GD, et al. Disability in youngpeople and adults one year after head injury: prospective cohortstudy. BMJ. 2000;320:1631–1635.
8. Goldstein FC, Levin HS. Cognitive outcome after mild and moderatetraumatic brain injury in older adults. J Clin Exp Neuropsychol.2001;23:739–753.
9. Hellawell DJ, Taylor RT, Pentland B. Cognitive and psychosocialoutcome following moderate or severe traumatic brain injury. BrainInj. 1999;13:489–504.
10. Hallin P, Sullivan M, Kreuter M. Spinal cord injury and quality oflife measures: a review of instrument psychometric quality. SpinalCord. 2000;38:509–523.
11. Gittler MS, McKinley WO, Stiens SA, et al. Spinal cord medicine. 3.Rehabilitation outcomes. Arch Phys Med Rehabil. 2002;83;S65–71.
The Journal of TRAUMA� Injury, Infection, and Critical Care
548 February 2007
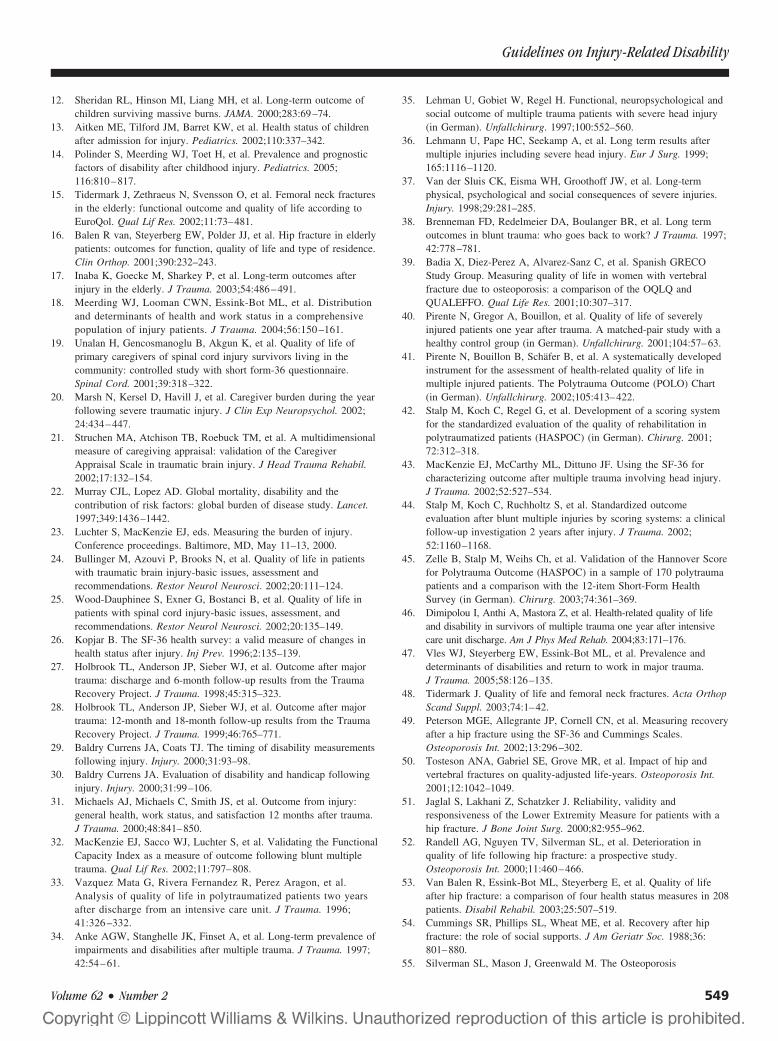
12. Sheridan RL, Hinson MI, Liang MH, et al. Long-term outcome ofchildren surviving massive burns. JAMA. 2000;283:69–74.
13. Aitken ME, Tilford JM, Barret KW, et al. Health status of childrenafter admission for injury. Pediatrics. 2002;110:337–342.
14. Polinder S, Meerding WJ, Toet H, et al. Prevalence and prognosticfactors of disability after childhood injury. Pediatrics. 2005;116:810–817.
15. Tidermark J, Zethraeus N, Svensson O, et al. Femoral neck fracturesin the elderly: functional outcome and quality of life according toEuroQol. Qual Lif Res. 2002;11:73–481.
16. Balen R van, Steyerberg EW, Polder JJ, et al. Hip fracture in elderlypatients: outcomes for function, quality of life and type of residence.Clin Orthop. 2001;390:232–243.
17. Inaba K, Goecke M, Sharkey P, et al. Long-term outcomes afterinjury in the elderly. J Trauma. 2003;54:486–491.
18. Meerding WJ, Looman CWN, Essink-Bot ML, et al. Distributionand determinants of health and work status in a comprehensivepopulation of injury patients. J Trauma. 2004;56:150 –161.
19. Unalan H, Gencosmanoglu B, Akgun K, et al. Quality of life ofprimary caregivers of spinal cord injury survivors living in thecommunity: controlled study with short form-36 questionnaire.Spinal Cord. 2001;39:318–322.
20. Marsh N, Kersel D, Havill J, et al. Caregiver burden during the yearfollowing severe traumatic injury. J Clin Exp Neuropsychol. 2002;24:434–447.
21. Struchen MA, Atchison TB, Roebuck TM, et al. A multidimensionalmeasure of caregiving appraisal: validation of the CaregiverAppraisal Scale in traumatic brain injury. J Head Trauma Rehabil.2002;17:132–154.
22. Murray CJL, Lopez AD. Global mortality, disability and thecontribution of risk factors: global burden of disease study. Lancet.1997;349:1436–1442.
23. Luchter S, MacKenzie EJ, eds. Measuring the burden of injury.Conference proceedings. Baltimore, MD, May 11–13, 2000.
24. Bullinger M, Azouvi P, Brooks N, et al. Quality of life in patientswith traumatic brain injury-basic issues, assessment andrecommendations. Restor Neurol Neurosci. 2002;20:111–124.
25. Wood-Dauphinee S, Exner G, Bostanci B, et al. Quality of life inpatients with spinal cord injury-basic issues, assessment, andrecommendations. Restor Neurol Neurosci. 2002;20:135–149.
26. Kopjar B. The SF-36 health survey: a valid measure of changes inhealth status after injury. Inj Prev. 1996;2:135–139.
27. Holbrook TL, Anderson JP, Sieber WJ, et al. Outcome after majortrauma: discharge and 6-month follow-up results from the TraumaRecovery Project. J Trauma. 1998;45:315–323.
28. Holbrook TL, Anderson JP, Sieber WJ, et al. Outcome after majortrauma: 12-month and 18-month follow-up results from the TraumaRecovery Project. J Trauma. 1999;46:765–771.
29. Baldry Currens JA, Coats TJ. The timing of disability measurementsfollowing injury. Injury. 2000;31:93–98.
30. Baldry Currens JA. Evaluation of disability and handicap followinginjury. Injury. 2000;31:99–106.
31. Michaels AJ, Michaels C, Smith JS, et al. Outcome from injury:general health, work status, and satisfaction 12 months after trauma.J Trauma. 2000;48:841–850.
32. MacKenzie EJ, Sacco WJ, Luchter S, et al. Validating the FunctionalCapacity Index as a measure of outcome following blunt multipletrauma. Qual Lif Res. 2002;11:797–808.
33. Vazquez Mata G, Rivera Fernandez R, Perez Aragon, et al.Analysis of quality of life in polytraumatized patients two yearsafter discharge from an intensive care unit. J Trauma. 1996;41:326 –332.
34. Anke AGW, Stanghelle JK, Finset A, et al. Long-term prevalence ofimpairments and disabilities after multiple trauma. J Trauma. 1997;42:54–61.
35. Lehman U, Gobiet W, Regel H. Functional, neuropsychological andsocial outcome of multiple trauma patients with severe head injury(in German). Unfallchirurg. 1997;100:552–560.
36. Lehmann U, Pape HC, Seekamp A, et al. Long term results aftermultiple injuries including severe head injury. Eur J Surg. 1999;165:1116–1120.
37. Van der Sluis CK, Eisma WH, Groothoff JW, et al. Long-termphysical, psychological and social consequences of severe injuries.Injury. 1998;29:281–285.
38. Brenneman FD, Redelmeier DA, Boulanger BR, et al. Long termoutcomes in blunt trauma: who goes back to work? J Trauma. 1997;42:778–781.
39. Badia X, Diez-Perez A, Alvarez-Sanz C, et al. Spanish GRECOStudy Group. Measuring quality of life in women with vertebralfracture due to osteoporosis: a comparison of the OQLQ andQUALEFFO. Qual Life Res. 2001;10:307–317.
40. Pirente N, Gregor A, Bouillon, et al. Quality of life of severelyinjured patients one year after trauma. A matched-pair study with ahealthy control group (in German). Unfallchirurg. 2001;104:57–63.
41. Pirente N, Bouillon B, Schafer B, et al. A systematically developedinstrument for the assessment of health-related quality of life inmultiple injured patients. The Polytrauma Outcome (POLO) Chart(in German). Unfallchirurg. 2002;105:413–422.
42. Stalp M, Koch C, Regel G, et al. Development of a scoring systemfor the standardized evaluation of the quality of rehabilitation inpolytraumatized patients (HASPOC) (in German). Chirurg. 2001;72:312–318.
43. MacKenzie EJ, McCarthy ML, Dittuno JF. Using the SF-36 forcharacterizing outcome after multiple trauma involving head injury.J Trauma. 2002;52:527–534.
44. Stalp M, Koch C, Ruchholtz S, et al. Standardized outcomeevaluation after blunt multiple injuries by scoring systems: a clinicalfollow-up investigation 2 years after injury. J Trauma. 2002;52:1160–1168.
45. Zelle B, Stalp M, Weihs Ch, et al. Validation of the Hannover Scorefor Polytrauma Outcome (HASPOC) in a sample of 170 polytraumapatients and a comparison with the 12-item Short-Form HealthSurvey (in German). Chirurg. 2003;74:361–369.
46. Dimipolou I, Anthi A, Mastora Z, et al. Health-related quality of lifeand disability in survivors of multiple trauma one year after intensivecare unit discharge. Am J Phys Med Rehab. 2004;83:171–176.
47. Vles WJ, Steyerberg EW, Essink-Bot ML, et al. Prevalence anddeterminants of disabilities and return to work in major trauma.J Trauma. 2005;58:126–135.
48. Tidermark J. Quality of life and femoral neck fractures. Acta OrthopScand Suppl. 2003;74:1–42.
49. Peterson MGE, Allegrante JP, Cornell CN, et al. Measuring recoveryafter a hip fracture using the SF-36 and Cummings Scales.Osteoporosis Int. 2002;13:296–302.
50. Tosteson ANA, Gabriel SE, Grove MR, et al. Impact of hip andvertebral fractures on quality-adjusted life-years. Osteoporosis Int.2001;12:1042–1049.
51. Jaglal S, Lakhani Z, Schatzker J. Reliability, validity andresponsiveness of the Lower Extremity Measure for patients with ahip fracture. J Bone Joint Surg. 2000;82:955–962.
52. Randell AG, Nguyen TV, Silverman SL, et al. Deterioration inquality of life following hip fracture: a prospective study.Osteoporosis Int. 2000;11:460–466.
53. Van Balen R, Essink-Bot ML, Steyerberg E, et al. Quality of lifeafter hip fracture: a comparison of four health status measures in 208patients. Disabil Rehabil. 2003;25:507–519.
54. Cummings SR, Phillips SL, Wheat ME, et al. Recovery after hipfracture: the role of social supports. J Am Geriatr Soc. 1988;36:801–880.
55. Silverman SL, Mason J, Greenwald M. The Osteoporosis
Guidelines on Injury-Related Disability
Volume 62 • Number 2 549
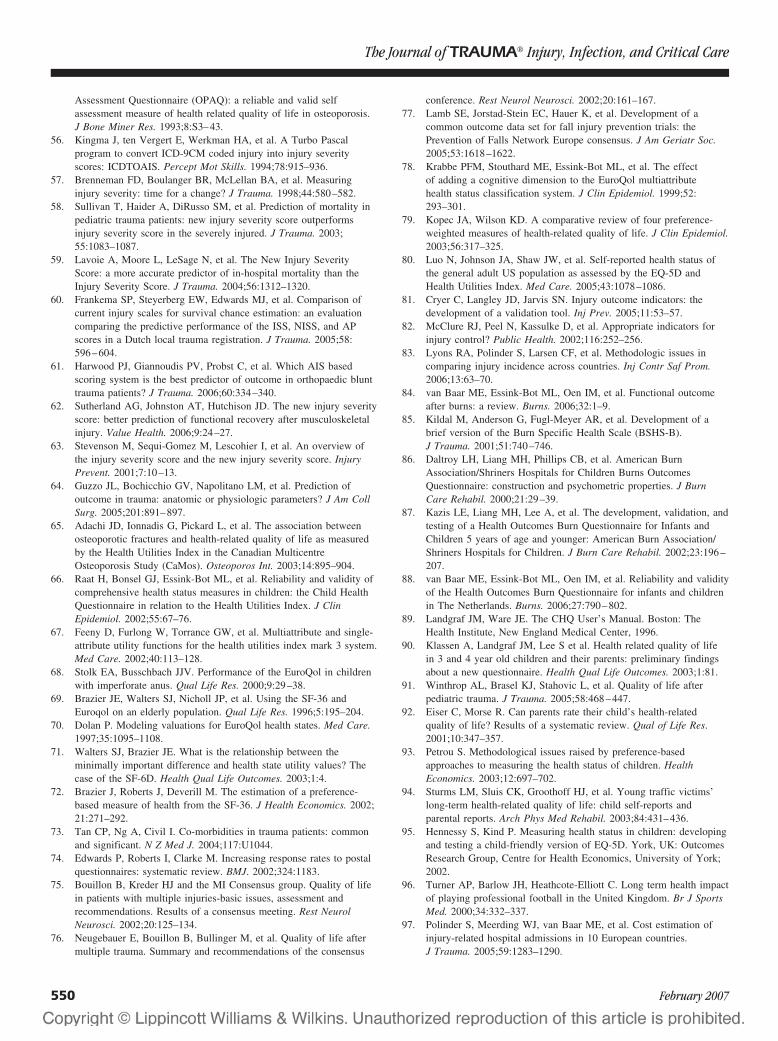
Assessment Questionnaire (OPAQ): a reliable and valid selfassessment measure of health related quality of life in osteoporosis.J Bone Miner Res. 1993;8:S3–43.
56. Kingma J, ten Vergert E, Werkman HA, et al. A Turbo Pascalprogram to convert ICD-9CM coded injury into injury severityscores: ICDTOAIS. Percept Mot Skills. 1994;78:915–936.
57. Brenneman FD, Boulanger BR, McLellan BA, et al. Measuringinjury severity: time for a change? J Trauma. 1998;44:580–582.
58. Sullivan T, Haider A, DiRusso SM, et al. Prediction of mortality inpediatric trauma patients: new injury severity score outperformsinjury severity score in the severely injured. J Trauma. 2003;55:1083–1087.
59. Lavoie A, Moore L, LeSage N, et al. The New Injury SeverityScore: a more accurate predictor of in-hospital mortality than theInjury Severity Score. J Trauma. 2004;56:1312–1320.
60. Frankema SP, Steyerberg EW, Edwards MJ, et al. Comparison ofcurrent injury scales for survival chance estimation: an evaluationcomparing the predictive performance of the ISS, NISS, and APscores in a Dutch local trauma registration. J Trauma. 2005;58:596–604.
61. Harwood PJ, Giannoudis PV, Probst C, et al. Which AIS basedscoring system is the best predictor of outcome in orthopaedic blunttrauma patients? J Trauma. 2006;60:334–340.
62. Sutherland AG, Johnston AT, Hutchison JD. The new injury severityscore: better prediction of functional recovery after musculoskeletalinjury. Value Health. 2006;9:24–27.
63. Stevenson M, Sequi-Gomez M, Lescohier I, et al. An overview ofthe injury severity score and the new injury severity score. InjuryPrevent. 2001;7:10–13.
64. Guzzo JL, Bochicchio GV, Napolitano LM, et al. Prediction ofoutcome in trauma: anatomic or physiologic parameters? J Am CollSurg. 2005;201:891–897.
65. Adachi JD, Ionnadis G, Pickard L, et al. The association betweenosteoporotic fractures and health-related quality of life as measuredby the Health Utilities Index in the Canadian MulticentreOsteoporosis Study (CaMos). Osteoporos Int. 2003;14:895–904.
66. Raat H, Bonsel GJ, Essink-Bot ML, et al. Reliability and validity ofcomprehensive health status measures in children: the Child HealthQuestionnaire in relation to the Health Utilities Index. J ClinEpidemiol. 2002;55:67–76.
67. Feeny D, Furlong W, Torrance GW, et al. Multiattribute and single-attribute utility functions for the health utilities index mark 3 system.Med Care. 2002;40:113–128.
68. Stolk EA, Busschbach JJV. Performance of the EuroQol in childrenwith imperforate anus. Qual Life Res. 2000;9:29–38.
69. Brazier JE, Walters SJ, Nicholl JP, et al. Using the SF-36 andEuroqol on an elderly population. Qual Life Res. 1996;5:195–204.
70. Dolan P. Modeling valuations for EuroQol health states. Med Care.1997;35:1095–1108.
71. Walters SJ, Brazier JE. What is the relationship between theminimally important difference and health state utility values? Thecase of the SF-6D. Health Qual Life Outcomes. 2003;1:4.
72. Brazier J, Roberts J, Deverill M. The estimation of a preference-based measure of health from the SF-36. J Health Economics. 2002;21:271–292.
73. Tan CP, Ng A, Civil I. Co-morbidities in trauma patients: commonand significant. N Z Med J. 2004;117:U1044.
74. Edwards P, Roberts I, Clarke M. Increasing response rates to postalquestionnaires: systematic review. BMJ. 2002;324:1183.
75. Bouillon B, Kreder HJ and the MI Consensus group. Quality of lifein patients with multiple injuries-basic issues, assessment andrecommendations. Results of a consensus meeting. Rest NeurolNeurosci. 2002;20:125–134.
76. Neugebauer E, Bouillon B, Bullinger M, et al. Quality of life aftermultiple trauma. Summary and recommendations of the consensus
conference. Rest Neurol Neurosci. 2002;20:161–167.77. Lamb SE, Jorstad-Stein EC, Hauer K, et al. Development of a
common outcome data set for fall injury prevention trials: thePrevention of Falls Network Europe consensus. J Am Geriatr Soc.2005;53:1618–1622.
78. Krabbe PFM, Stouthard ME, Essink-Bot ML, et al. The effectof adding a cognitive dimension to the EuroQol multiattributehealth status classification system. J Clin Epidemiol. 1999;52:293–301.
79. Kopec JA, Wilson KD. A comparative review of four preference-weighted measures of health-related quality of life. J Clin Epidemiol.2003;56:317–325.
80. Luo N, Johnson JA, Shaw JW, et al. Self-reported health status ofthe general adult US population as assessed by the EQ-5D andHealth Utilities Index. Med Care. 2005;43:1078–1086.
81. Cryer C, Langley JD, Jarvis SN. Injury outcome indicators: thedevelopment of a validation tool. Inj Prev. 2005;11:53–57.
82. McClure RJ, Peel N, Kassulke D, et al. Appropriate indicators forinjury control? Public Health. 2002;116:252–256.
83. Lyons RA, Polinder S, Larsen CF, et al. Methodologic issues incomparing injury incidence across countries. Inj Contr Saf Prom.2006;13:63–70.
84. van Baar ME, Essink-Bot ML, Oen IM, et al. Functional outcomeafter burns: a review. Burns. 2006;32:1–9.
85. Kildal M, Anderson G, Fugl-Meyer AR, et al. Development of abrief version of the Burn Specific Health Scale (BSHS-B).J Trauma. 2001;51:740–746.
86. Daltroy LH, Liang MH, Phillips CB, et al. American BurnAssociation/Shriners Hospitals for Children Burns OutcomesQuestionnaire: construction and psychometric properties. J BurnCare Rehabil. 2000;21:29–39.
87. Kazis LE, Liang MH, Lee A, et al. The development, validation, andtesting of a Health Outcomes Burn Questionnaire for Infants andChildren 5 years of age and younger: American Burn Association/Shriners Hospitals for Children. J Burn Care Rehabil. 2002;23:196–207.
88. van Baar ME, Essink-Bot ML, Oen IM, et al. Reliability and validityof the Health Outcomes Burn Questionnaire for infants and childrenin The Netherlands. Burns. 2006;27:790–802.
89. Landgraf JM, Ware JE. The CHQ User’s Manual. Boston: TheHealth Institute, New England Medical Center, 1996.
90. Klassen A, Landgraf JM, Lee S et al. Health related quality of lifein 3 and 4 year old children and their parents: preliminary findingsabout a new questionnaire. Health Qual Life Outcomes. 2003;1:81.
91. Winthrop AL, Brasel KJ, Stahovic L, et al. Quality of life afterpediatric trauma. J Trauma. 2005;58:468–447.
92. Eiser C, Morse R. Can parents rate their child’s health-relatedquality of life? Results of a systematic review. Qual of Life Res.2001;10:347–357.
93. Petrou S. Methodological issues raised by preference-basedapproaches to measuring the health status of children. HealthEconomics. 2003;12:697–702.
94. Sturms LM, Sluis CK, Groothoff HJ, et al. Young traffic victims’long-term health-related quality of life: child self-reports andparental reports. Arch Phys Med Rehabil. 2003;84:431–436.
95. Hennessy S, Kind P. Measuring health status in children: developingand testing a child-friendly version of EQ-5D. York, UK: OutcomesResearch Group, Centre for Health Economics, University of York;2002.
96. Turner AP, Barlow JH, Heathcote-Elliott C. Long term health impactof playing professional football in the United Kingdom. Br J SportsMed. 2000;34:332–337.
97. Polinder S, Meerding WJ, van Baar ME, et al. Cost estimation ofinjury-related hospital admissions in 10 European countries.J Trauma. 2005;59:1283–1290.
The Journal of TRAUMA� Injury, Infection, and Critical Care
550 February 2007
Unusual Rectal Injury by Personal WatercraftJakub Szmytkowski, MD, Stanislaw Dabrowiecki, MD, PhD, and Malgorzata Makuch-Burzynska, MD
J Trauma. 2007;62:551.
A 34-year-old male passenger slid backwards off the seatof a personal watercraft and hit the water surface withhis buttocks. At admission, the patient complained of
general abdominal pain. Physical examination revealed linearlacerations of the anoderm, located radially around the anus,and peritoneal signs in the lower hypogastric region. Urologicultrasound showed no abnormal findings. Plain supine ab-dominal radiograph revealed the presence of a linear verticalextraintestinal air space along the lateral margin of the rightpsoas muscle (Fig. 1). On the left lateral radiograph thisappeared as two linear vertical air shadows, located anteriorlyto the lumbar spine (Fig. 2). Computed tomography (CT)scan revealed free air in the retroperitoneal space alongsidethe aorta, inferior vena cava, and psoas muscles, mainly onthe left side (Fig. 3). Lower abdominal CT scans displayednumerous air bubbles surrounding the rectum in the presacralspace; longitudinal areas of increased density within the parar-ectal adipose tissue; and thickened pararectal fascia. CT scan-ning with water-soluble contrast identified contrast outside ofthe rectal lumen, a linear strip of contrast in the posterior wallstarting approximately 2 cm above the levator ani level-rectalwall rupture; and also suggestion of anterior rectal wall rupture.Emergency laparotomy revealed a small amount of fluid in theabdominal cavity, inflammatory infiltration of one ileal loop,and a 5-cm long rupture of the parietal peritoneum located left ofthe rectum, just above the rectovesical fossa. A diverting sig-moid colostomy was performed. The postoperative course wasuneventful. Ten weeks after the injury intestinal continuity wasrestored without complication. Two years after the injury, thefunction of the rectum is fully preserved, defecations are painlessand fully controlled. As illustrated by this patient, selected lowlying linear rectal lacerations can be treated by simple diversionof the fecal stream.
Submitted for publication August 1, 2005.Accepted for publication November 16, 2005.Copyright © 2007 by Lippincott Williams & Wilkins, Inc.From the Department of General and Endocrine Surgery (J.S., S.D.),
and the Department of Radiology (M.M.), Nicolaus Copernicus UniversityCollegium Medicum, Bydgoszcz, Poland.
Address for reprints: Jakub Szmytkowski, MD, Department of Generaland Endocrine Surgery University Hospital 9, M.Curie-Skłodowskiej st.85-094 Bydgoszcz, Poland; email: [email protected].
DOI: 10.1097/01.ta.0000198803.53853.39
Fig. 2. Left lateral abdominal X-ray revealing two linear verticalair shadows, located anteriorly to the lumbar spine.
Fig. 3. Abdominal CT scan showing gas alongside the aorta, infe-rior vena cava, and psoas muscles, predominantly on the left side.
Fig. 1. Plain supine abdominal radiograph showing the presence ofa linear vertical extraintestinal air space along the lateral margin ofthe right psoas muscle.
The Image of Trauma The Journal of TRAUMA� Injury, Infection, and Critical Care
Volume 62 • Number 2 551

Shotgun Wounds to the Buttocks, Sacrum, and RectumMatthew Moore Carrick, MD, Armand N. Morel, BS, and Hoang Q. Pham, MD
J Trauma. 2007;62:552.
A29-year-old man presented with a shotgun wound overhis sacrum at close range. Physical examination re-vealed a large soft tissue defect just off the midline over
the buttocks and sacrum (Fig. 1). Gross blood was found onrectal examination. Shock room films showed a wide scatterpattern of the pellets (Fig. 2). The patient was taken to theoperating room for proctoscopy. Proctoscopy revealed mul-tiple rectal mucosal injuries. A diverting loop colostomy wasperformed and the sacral wound was debrided. He was takenback to the operating room once more for a planned furtherdebridement. The patient did well postoperatively.
Shotguns can cause a wide variety of injuries as a resultof a number of variables such as weapon-victim distance,type of weapon, and number of pellets.1 The injuries arecaused by the blast effect as well as soft tissue saturation withmultiple pellets. Because the energy of the blast is dissipatedinto the tissue as the pellets scatter, a permanent cavity iscreated, one much larger than one from a nonfragmentingbullet.2 Proper treatment of these injuries often requires mul-tiple procedures to ensure adequate debridement of devital-ized tissues.
REFERENCES1. Velmahos GC, Safaoui M, Demetriades D. Management of shotgun
wounds: do we need classification systems? Int Surg. 1999;84:99–104.
2. Glezer JA, Minard G, Croce MA, et al. Shotgun wounds to theabdomen. Am Surg. 1993;59:129–132.
Submitted for publication August 3, 2005.Accepted for publication August 11, 2005.Copyright © 2007 by Lippincott Williams & Wilkins, Inc.From the Michael E. DeBakey, Department of Surgery, Baylor College
of Medicine, Houston, Texas.Address for reprints: Matthew Carrick, MD, One Baylor Plaza, Hous-
ton, TX 77030; email: [email protected].
DOI: 10.1097/01.ta.0000195506.45833.f4
Fig. 1. Close range shotgun wound to the buttocks.
Fig. 2. The pellets from the shotgun wound demonstrate a widespread on a pelvis film taken in the shock room.
Image of Trauma The Journal of TRAUMA� Injury, Infection, and Critical Care
552 February 2007