
The Journal of Physical Chemistry 1976 Volume.80 No.7
132
«rag m. / volume 80 MARCH 25 , 1976 NUMBER 7 JPCHAx THE JOURNAL OF MEMBER ’S ERSONAL USE COPY LIBRARY USE PROHIBITED PRIOR TO 1978 PUBLISHED BIWEEKLY BY THE AMERICAN CHEMICAL SOCIETY
-
Upload
khangminh22 -
Category
Documents
-
view
0 -
download
0
Transcript of The Journal of Physical Chemistry 1976 Volume.80 No.7

«rag m .
/ v o l u m e 8 0 M A R C H 2 5 , 1 9 7 6 N U M B E R 7
JPCHAx
T H E J O U R N A L OF
MEMBER’S ERSONAL USE COPY
LIBRARY USE PROHIBITED
PRIOR TO 1978
P U B L I S H E D B I W E E K L Y B Y T H E A M E R I C A N C H E M I C A L S O C I E T Y
T H E J O U R N A L OF
P H Y S I C A L C H E M I S T R Y
BRYCE CRAWFORD, Jr., E d ito r STEPHEN PRAGER, A s s o c ia t e E d ito r•ROBERT W. CARR, Jr., FREDERIC A. VAN-CATLEDGE, A s s is ta n t E d ito r s
EDITORIAL BOARD: C. A. ANGELL (1973-1977), F. C. ANSON (1974-1978),V. A. BLOOMFIELD (1974-1978), J. R. BOLTON (1976-1980), L. M. DORFMAN (1974-1978),H. L. FRIEDMAN (1975-1979), H. L. FRISCH (1976-1980),W. A. GODDARD (1976-1980), E. J. HART (1975-1979), W. J. KAUZMANN (1974-1978),R. L. KAY (1972-1976), D. W. McCLURE (1974-1978), R. M. NOYES (1973-1977),W. B. PERSON (1976-1980), J. C. POLANYI (1976-1980), S. A. RICE (1976-1980),F. S. ROWLAND (1973-1977), R. L. SCOTT (1973-1977), W. A. STEELE (1976-1980),J. B, STOTHERS (1974-1978), W. A. ZISMAN (1972-1976)
Published by theAMERICAN CHEMICAL SOCIETY BOOKS AND JOURNALS DIVISIOND. H. Michael Bowen Director
Editorial Department: Charles R. Bertsch, Head; Marianne C. Brogan, Associate Head; Celia B. McFarland, Joseph E. Yurvati, Assistant Editors
Graphics and Production Department:Bacil Guiley, Head
Research and Development Department: Seldon W. Terrant, Head
Advertising Office: Centcom, Ltd., 50 W. State St., Westport, Conn. 06880.
c Copyright, 1976, by the American Chemical Society. No part of this publication may be reproduced in any form without permission in writing from the American Chemical Society.
Published biweekly by the American Chemical Society at 20th and Northampton Sts., Easton, Pennsylvania 18042. Second class postage paid at Washington, D.C. and at additional mail ng offices.
Editorial InformationInstructions for authors are printed in
the first issue of each volume. Please conform to these instructions when submitting manuscripts.
Manuscripts for publication should be submitted to The ■Journal of Physical Chemistry, Department of Chemistry. University of Minnesota. Minneapolis, Minn. 55455. Correspondence regarding accepted papers and proofs should be directed to the Editorial Department at the ACS Easton address.
Page charges of $60.00 per page are assessed for papers published in this journal. Ability to pay does not affect acceptance or scheduling of papers.
Bulk reprints or photocopies of individual articles are available. For information write to Business Operations, Books and Journals Division at the ACS Washington address.
Requests for permission to reprintshould be directed to Permissions. Books and Journals Division at the ACS Washington address. The American Chemical Society and its Editors assume no responsibility for the statements and opinions advanced by contributors.
Subscription and Business Information1976 Subscription rates— including sur
face postage
U.S. PUASCanada,Foreign
Member $24.00 $29.75 $30.25Nonmember 96.00 101.75 102.25Supplementary
material 15.00 19.00 20.00Air mail and air freight rates are avail
able from Membership & Subscription Services, at the ACS Columbus address.
New and renewal subscriptionsshould be sent with payment to the Office of the Controller at the ACS Washington address. Changes of address must include both old and new addresses with ZIP code and a recent mailing label. Send all address changes to the ACS Columbus address. Please allow six weeks for change to become effective. Claims for missing numbers will not be allowed if loss was due to failure of notice of change of address to be received in the time specified; if claim is
dated (a) North America—more than 90 days beyond issue .date, (b) all other foreign—more than 1 year beyond issue date; or if the reason given is “missing from files” . Hard copy claims are handled at the ACS Columbus address.
Microfiche subscriptions are available at the same rates but are mailed first class to U.S. subscribers, air mail to the rest of the world. Direct all inquiries to Business Operations, Books and Journals Division, at the ACS Washington address or call (202) 872-4444. Single issues in hard copy and/or microfiche are available from Special Issues Sales at the ACS Washington address. Current year $4.75. Back issue rates available from Special Issues Sales. Back volumes are available in hard copy and/or microform. Write to Special Issues Sales at the ACS Washington address for further information. Microfilm editions of ACS periodical publications are available from volume 1 to the present. For further information, contact Special Issues Sales at the ACS Washington address. Supplementary material must be ordered directly from Business Operations, Books and Journals Division, at the ACS Washington address.
Microfiche U.S.PUAS,Canada
OtherForeign
Photocopy $2.50 $3.00 $3.501-7 pages 4.00 5.50 7.008-20 pages 5.00 6.50 8.00
Orders over 20 pages are available only on microfiche, 4 X 6 in.. 24X, negative, silver halide. Orders must state photocopy or microfiche if both are available. Full bibliographic citation including names of all authors and prepayment are required. Prices are subject to change.
American Chemical Society 1155 16th Street, N.W. Washington. D.C. 20036 (202)872-4600
Membri’- * Subscription Service's Americcr, Chemical Société P O. Box 3337 Columbus. Ohio 43210 (614)421-7230
Editorial Department American Chemical Society 20th and Northampton Sts. Easton, Pennsylvania 18042 (215)258-911.
Notice to Authors last printed in the issue of January 1, 1976
T H É J O U R N A L O F
PHYSI CAL C H E MI S T R Y
V o l u m e 8 0 , N u m b e r 7 M a r c h 2 5 , 1 9 7 6
JPCHAx 80(7) 653-778 (1976)
ISSN 0022-3654
Diffusion Theory of Imprisonment of Atomic Resonance Radiation at Low Opacities. . . R. P. Blickensderfer, W. H. Breckenridge,* and Jack Simons 653
On the Stereochemistry of the Bromine for Chlorine Exchange following 79Br(n,7 )80mBr and 82m(80m>gr(rp)82(80)gr in Diastereomeric 2,3-Dichlorobutanes
. . . Ying-yet Su and Hans J. Ache* 659
Electrical Conductivity of the Nickel Oxide-Titanium Dioxide System. . .Jae Shi Choi* and Keu Hong Kim 6 6 6
Hydration Structures for Alkali (+) Ions................Kenneth G. Spears* and Sang Hyung Kim 673 ■
Association of Triethanolamine and Related Ligands with Alkali Metal Ions and Ion Pairs inTetrahydrofuran at 25 ° C ........................................... H. B. Flora, II, and W. R. Gilkerson* 679
Dielectric Studies of Molecular Association. Concentration Dependence of the Dipole Moment of2-, 3-, and 4-Octanol in Solution . . . Colin Campbell, George Brink, and Leslie Glasser* 6 8 6 ■
Linear Dependence Tests for Determination of Number of Chemical Species. . . Edwin H. Lane, Sherril D. Christian,* and Frank Garland 690 ■
On the Microenvironment of Polymers in Solution. I. Properties of Pyridinium Type PolarityReporters in Synthetic Polymers........................................P. Strop, F. Mikes,* and J. Kalal 694
On the Microenvironment of Polymers in Solution. II. Polarity of the PolymerMicroenvironment in Binary Solvents............................... P. Strop, F. Mikes,* and J. Kalal 702
Theory of the Epitaxial Crystallization of Polymers on Alkali Halide Substrates. III.Solvation Effects........................................................... K. A. Mauritz and A. J. Hopfinger* 706
The Mechanism of Pyrene Photoionization in Polar Solvents................................... A. R. Watkins 713
Electronic Absorption and Magnetic Circular Dichroism Spectra of Ferrocene. . .Dennis Nielson, Morris Farmer, and Henry Eyring* 717
pH Dependence of the Ultraviolet and Visible Absorption and the Resonance Raman Spectra of4-Nitro-l,2-benzenediol in Aqueous Solution................E. A. Nothnagel* and R. N. Zitter 722
Electron Spin Resonance Study of Radiation-Induced Radicals from Maleic Anhydride in Irradiated Frozen Solutions
. . . Mitsuharu Fukaya, Hachizo Muto, Kazumi Toriyama, and Machio Iwasaki* 728
Proton Spin-Lattice Relaxation in the Chloroform-Toluene Liquid System. A Contributionto the Elucidation of Dynamic Local Structure . . . . Tadashi Tokuhiro* and K. W. Woo 733
Carboxyl Carbon-13-Proton Three Bond Coupling Constants as an Indicator of Conformation. . .William G. Espersen and R. Bruce Martin* 741
On the Structure of Water Absorbed in Collagen................C. A. J. Hoeve* and S. R. Kakivaya
Electrolyte Viscosities in Sulfolane at 30,40, and 50 °C. . . Antonio Sacco,* Giuseppe Petrella, and Maurizio Castagnolo
Conductance of Binary Asymmetric Electrolytes in Methanol.T. L. Broadwater, T. J. Murphy, and D. F. Evans*
' -2.B-PJ.2519
745
749 ■
753 ■
1A
Binary Liquid Diffusion Prediction in Infinitely Diluted Systems Using the Ultimate VolumeApproach........................................Eli Grushka,* E. J. Kikta, Jr., and H. T. Cullinan, Jr. 757
Adsorption, Desorption, and Permeation of Methoxychlor on SemipermeableMembranes under Osmotic Pumping........................................R. Seevers and M. Deinzer* 761
Field Dissociation Effect, Chemical Relaxation, and Conductance of Tetrabutylammonium Picrate Ion Pairs in Diphenyl Ether
. . .Frans Nauwelaers, Louis Hellemans, and Andre Persoons* 767
Brillouin Spectra of Solutions. IV. Aqueous Magnesium Sulfate........................George A. Miller 775
On the Apparent Symmetry of Cyclohexane........................................................... R. L. Flurry, Jr. 777
Additions and Corrections.......................................................................................................................778
■ Supplementary material for this paper is available separately (consult the masthead page for ordering information); it will also appear following the paper in the microfilm edition
of this journal.* In papers with more than one author, the asterisk indicates the name of the author to
whom inquiries about the paper should be addressed.
AUTHOR INDEX
Ache, H. J., 659
Blickensderfer, R. P.,653
Breckenridge, W. H.,653
Brink, G., 6 8 6
Broadwater, T. L., 753
Campbell, C., 6 8 6
Castagnolo, M., 749 Choi, J. S., 6 6 6
Christian, S. D., 690 Cullinan, H. T., Jr., 757
Deinzer, M., 761
Espersen, W. G., 741
Evans, D. F., 753 Eyring, H., 717
Farmer, M., 717 Flora, H. B„ II, 679 Flurry, R. L., Jr., 777 Fukaya, M., 728
Garland, F., 690 Gilkerson, W. R., 679 Glasser, L., 6 8 6
Grushka, E., 757
Hellemans, L., 767 Hoeve, C. A. J., 745 Hopfinger, A. J., 706
Iwasaki, M., 728
Kakivaya, S. R., 745 Kâlal, J., 694, 702 Kikta, E. J., Jr., 757 Kim, K. H., 6 6 6
Kim, S. H., 673
Lane, E. H., 690
Martin, R. B., 741 Mauritz, K. A., 706 Mikes, F„ 694, 702 Miller, G. A., 775 Murphy, T. J., 753 Muto, H., 728
Nauwelaers, F., 767 Nielson, D., 717 Nothnagel, E. A., 722
Persoons, A., 767 Petrella, G., 749
Sacco, A., 749 Seevers, R., 761 Simons, J., 653 Spears, K. G., 673 Strop, P., 694, 702 Su, Y., 659
Tokuhiro, T , 733 Toriyama, K., 728
Watkins, A. R., 713 Woo,K. W., 733
Zitter, R. N., 722 Zitter, R. N., 722
The Journal o f Physical Chemistry, Voi. 80. No. 7, 1976
T H E J O U R N A L O F
P H Y S I C A L C H E M I S T R YR egistered in U. S. P aten t Office © Copyright, 1976, b y the Am erican Chem ical Society
V O L U M E 80, N U M B E R 7 M A R C H 25, 1976
Diffusion T heory of Im prisonm ent of A to m ic R e so n a n c e R adiation at Low O p acities
R. P. Blickensderfer, W. H. Breckenrldge,*1 and Jack Simons2
Department of Chemistry, University of Utah, Salt Lake City, Utah 84112 (Received October 20, 1975)
Publication costs assisted by the Petroleum Research Fund
The modified diffusion theory of imprisonment of atomic resonance radiation is shown to be valid in the low-opacity region, and is extended to include infinite slab, infinite cylinder, and spherical vessel geometries. Calculations are presented which allow the use of the theory for pure Doppler, pure Lorentz, and Voigt spectral line shapes.
I. IntroductionExperimental investigation of chemical and physical pro
cesses involving fluorescent electronically excited atoms is sometimes complicated by the troublesome phenomenon of radiation imprisonment.3-13 Because of repeated emission and reabsorption of resonance quanta, the “effective” lifetime of an excited atomic state may depend both on the concentration of ground-state atoms and the geometry of the enclosing cell, often in a complicated fashion. With more sensitive detection techniques it is sometimes possible to conduct experiments at extremely low ground-state number densities, where the excited-state lifetime is increased negligibly. More commonly, however, the effects of radiation imprisonment can be reduced but not completely eliminated.3-8 -1 1 ’ 14 Obviously, certain practical optical devices such as lasers also have optimum operating conditions where imprisonment considerations cannot be ignored. A tractable theoretical model of the imprisonment process, which could be applied to experimentally convenient vessel geometries and low absorber opacities, 15 would be useful for determining limiting conditions of negligible imprisonment and for calculating small corrections to lifetimes when sufficiently low atom densities cannot be attained and direct measurements are difficult or impossible.3,4'8-10
In very high opacity situations, for infinite slab or infinite cylinder geometries, the “incoherent scattering” theory of Holstein has been quite successful in predicting apparent lifetimes of Hg(3Pi)-6,8’ u ’ 16 For the high opacity limit, simple analytical approximations are found to be adequate solutions of the Holstein integro-differential equations for radiative transfer.6’7 Van Volkenburgh and Carrington,5 using numerical analysis techniques, have extend
ed the Holstein formulation for an infinite slab to Doppler line-shape systems of intermediate opacity.
For the low-opacity region of interest here, Michael and Yeh8 have pointed out that the earliest treatment of radiation imprisonment (the infinite slab diffusion theory of Milne, 13,17 as modified by Samson13-18) will fit quite successfully the available Hg(3Pi) lifetime data if the width of the slab is identified with the radius of a cylindrical experimental vessel. The success of the Samson modification of the Milne theory rests on the use of a single “equivalent” 8 13 opacity to approximate the more complicated situation in which the scattered (imprisoned) radiation has a spectral distribution related to the absorption coefficient distribution of the ground-state atoms (e.g., for the common case of a pressure-broadened absorption line). Thus the photons are assumed to be incoherently rather than coherently scattered.
Holstein,6 and Biberman, 19 have since shown that the transport equations for incoherently scattered resonance radiation (under Doppler- or dispersion-broadening conditions) cannot properly be solved by assuming the existence of an average absorption coefficient (i.e., a photon mean free path), so that a simple diffusion model is not expected to predict imprisonment lifetimes accurately. However, while it is certainly true that the Samson-Milne treatment is not successful in the very high opacity region of interest to Holstein and Biberman, there is good reason to believe that the simpler diffusion theory can provide an adequate model for low-opacity experimental situations for which the use of an average absorption coefficient, or equivalent opacity, is a less drastic approximation.
In this paper, we: (1) show that the use of an “equiva-
653
654 R. P. Blickensderfer, W. H. Breckeiridge, and J. Simons
lent” opacity is valid in the limit of low absorber opacities, for a variety of line shapes, and therefore justify the use of the Samson-Milne diffusion theory as a very good approximation under such conditions; (2 ) extend the radiation diffusion theory to the geometries of sphere and of infinite cylinder, which may be better approximations to certain experimental vessels than the infinite slab; and (3) calculate equivalent opacities in the low-opacity regime for the following line shapes: (i) pure Doppler broadening, (ii) pure Lorentz (pressure) broadening, and (iii) Voigt broadening (Doppler, Lorentz, and Heisenberg (natural) broadening).
II. The Diffusion ModelWe first treat an idealized two-level atomic system in a
cell under the influence of a weak external source of resonance radiation. The system has a concentration (n) of ground-state atoms of a certain element and a concentration (n *) of atoms in a particular excited state, with n* «n. The absorption coefficient for ground-state atoms and the spectral distribution' of fluorescent radiation from the excited-state atoms are assumed to be constant and nonzero over a narrow range of frequencies which is common to both.
The modified diffusion equation as first derived by Milne13,17 may be written
V2 ( n * + r — ) = 4 k 2r — (1)\ at / at
where (i) V2 is the Laplacian in a coordinate system appropriate to the experimental cell geometry, (ii) r is the natural radiative lifetime of the excited state, and (iii) k is the absorption coefficient (in cm-1) and is directly proportional to n . The dimensionless product of k and an appropriate length characteristic of the vessel is often called the “opacity” or “optical depth” of the system.
Equation 1 can be solved easily for three geometries which may be useful approximations to common experimental cell configurations.
I n f in i t e S la b G e o m e tr y . If the external radiation source is turned off at t = 0 , there is zero inward radiation flux ( /-) at the cell boundary for times i > 0. As shown by Milne this boundary condition, when applied to an infinite slab of thickness l , may be expressed as follows:
/ an*\ 1 d / an*\( n * + T— - l + — --- I[ n * + t -----)V at / 2k dX V at !
After solving eq 1 in rectangular coordinates (which are appropriate to the slab geometry) and then applying the boundary condition (ec 2 ), one finds for the ratio of the so- called “imprisoned” lifetime t \ to the natural lifetime r:
ti/ t = 1 + ( k l / y t f (3)
where y\ is the first root of
tan y = k l/ y (4)
The excited state decay is actually described by a series of exponential terms e ~ t,Tm including all possible roots of eq 4, where rm is the decay time of the mth mode corresponding to the mth root. It is customary to retain only the first term e~i/n, although, as we show later, higher terms may contribute significantly at short times following the initial cutoff of the external radiation source.
I n f in i t e C y l in d e r G e o m e tr y . To solve eq 1 for an infinite cylinder of radius R under conditions of uniform external radiation, the angular and axial terms of the Laplacian may
be ignored since these coordinates will not contribute to net decay. Equation 1 thus may be written
1 a / a \ / * , an *\—— 1[i— )r ar \ a r ) V at I
4 k 2a n *
at(5)
The associated boundary condition expressing the absence of inward light flux for t > 0 is
I ~ ( r = R ) o c ( n * + T ^ , 1 a i an*4— s n * + T2 k o i \
m *\ _
at /0 (6 )
If we assume that n ( r , t ) = F(r)-g(i), the variables may be readily separated to give
d2F ldF— + — + X2f
dr2 "dr0
and
dg(X2 + 4 k 2) r — + X2g = 0 dt .
(7)
(8 )
where X2 is the separation constant. X may be eliminated from the radial eq 7 by substituting x = ,Xr:
d2F 1 dF• + - — + F = 0
dx2 dxThe solution of this equation is the zero-order Bessel function J0(x). The time dependence of n * is obtained from the solution of eq 8
g(i) = exp[“fcri ) ;]The boundary condition (eq 6 ) restricts X to values satisfying
\mR Ji(\ mR ) - 2 k R Jo(\ mR ) = 0 (9)
which follows directly upon substituting the general solution
n * ( r , t ) = t A m J0(Xmr)e~t/Tm (10)m= 1
into eq 6 and making use of the relation Jo'(x) = — Ji(x). The decay times rm in the expansion are given by
'"*t(i+4£ì) - t[ i + 4 © 1 <u>where x m - \mR is the mth root of x Jj(x) — 2 kR J o (x) =O. 20 The amplitudes |Amj are determined by the distribution of excited atoms in the cell at t = 0 (see Appendix).
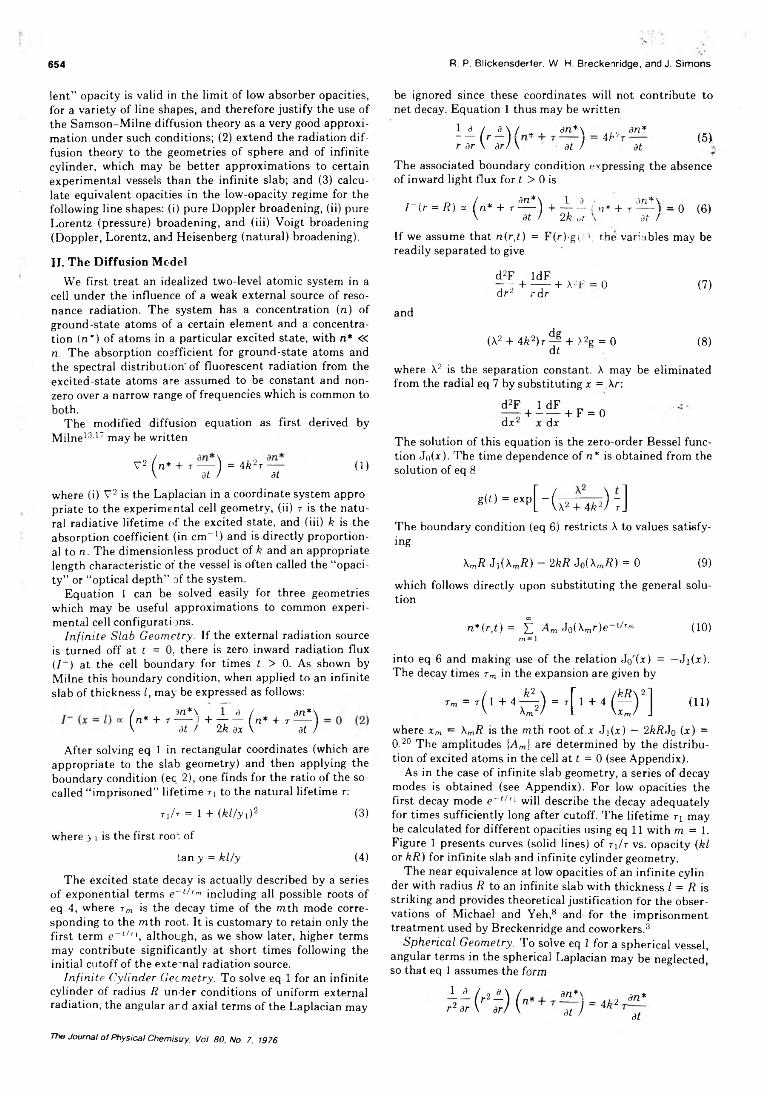
As in the case of infinite slab geometry, a series of decay modes is obtained (see Appendix). For low opacities the first decay mode e ~ t/ri will describe the decay adequately for times sufficiently long after cutoff. The lifetime ri may be calculated for different opacities using eq 1 1 with m = 1 . Figure 1 presents curves (solid lines) of t\ / t v s . opacity (kl or k R ) for infinite slab and infinite cylinder geometry.
The near equivalence at low opacities of an infinite cylinder with radius R to an infinite slab with thickness l = R is striking and provides theoretical justification for the observations of Michael and Yeh,8 and for the imprisonment treatment used by Breckenridge and coworkers.3
S p h e r ic a l G e o m e tr y . To solve eq 1 for a spherical vessel, angular terms in the spherical Laplacian may be neglected, so that eq 1 assumes the fo rm
1 a
r 2 ara n * \
at )= 4 k 2
an*
at
The Journal of Physical Chemisiry, Voi. 80, No. 7, 1976
Diffusion Theory of Imprisonment of Atomic Resonance Radiation 655
kl (kR)
Figure 1. Plots (solid lines) of the “imprisonment" lifetime r r relative to the, natural lifetime t, as a function of equivalent opacity kl 1 (kR) for infinite slab and infinite cylinder vessel geometry. (See . text.) Data points are experimental measurements of Hgi3 ) lifetimes (see text for explanation): (□) ref 21; (A) ref 9; (O) ref 8; (+) ref 10.
Separation of variables (n * ( r , t ) = G(r)-f(i)) leads to a radial equation
d2G 2 dG „^ + 7 3 7 + x2G = 0
(1 2 )
The associated time equation is identical with eq 8 obtained for an infinite cylinder. Equation 12 may be solved by first making the substitution u(r) = rl/2G(r). After some rearrangement the following equation is obtained:
d2u 1 du dr2 r dr u = 0
with x = Xr this simplifies to, d2u du~r~ï + x - — + ( x 2 - V4)u = 0dx dx
which is the differential equation obeyed by the half-integer Bessel function Ji/2<x). Thus u(r) = Ji/2(Xr) and G(r) = r_I/2u(r) = r_ 1/2Jj/2(Xr) = jo(Xr), where jo is the zero-order spherical Bessel function. The general solution is therefore n * ( r , t ) = 2 ” =1 A m jo (Xmr)e_i/Tm which is identical in form with eq 1 0 for an infinite cylinder.
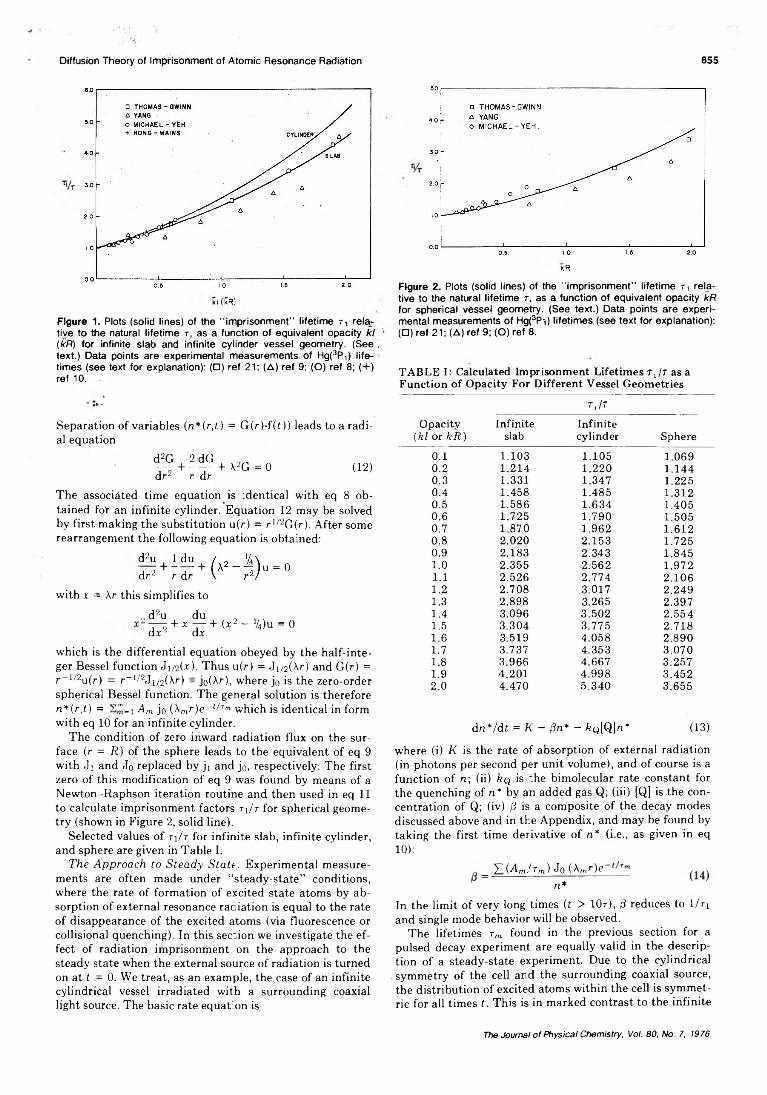
The condition of zero inward radiation flux on the surface (r = R ) of the sphere leads to the equivalent of eq 9 with Ji and Jo replaced by ji and j0, respectively. The first zero of this modification of eq 9 was found by means of a Newton-Raphson iteration routine and then used in eq 11 to calculate imprisonment factors ri/r for spherical geometry (shown in Figure 2, solid line).
Selected values of ri/r for infinite slab, infinite cylinder, and sphere are given in Table I.
T h e A p p r o a c h to S t e a d y S ta te . Experimental measurements are often made under “steady-state” conditions, where the rate of formation of excited state atoms by absorption of external resonance radiation is equal to the rate of disappearance of the excited atoms (via fluorescence or collisional quenching). In this section we investigate the effect of radiation imprisonment on the approach to the steady state when the external source of radiation is turned on at t = 0. We treat, as an example, the case of an infinite cylindrical vessel irradiated with a surrounding coaxial light source. The basic rate equation is
kR
Figure 2. Plots (solid lines) of the "imprisonment” lifetime t 1 relative to the natural lifetime r, as a function of equivalent opacity kR for spherical vessel geometry. (See text.) Data points are experimental measurements of Hg(3Py) lifetimes (see text for explanation): (□) ref 21; (A) ref 9; (O) ref 8.
TABLE I: Calculated Imprisonment Lifetimes t J t as a Function of Opacity For Different Vessel Geometries
tJ t
Opacity (k l or k R )
Infiniteslab
Infinitecylinder Sphere
0 .1 1.103 1.105 1.0690 .2 1.214 1 . 2 2 0 1.1440.3 1.331 1.347 1.2250.4 1.458 1.485 1.3120.5 1.586 1.634 1.4050 .6 1.725 1.790 1.5050.7 1.870 1.962 1.6120 .8 2 .0 2 0 2.153 1.7250.9 2.183 2.343 1.8451 . 0 2.355 2.562 1.9721 . 1 2.526 2.774 2.1061 . 2 2.708 3.017 2.2491.3 2.898 3.265 2.3971.4 3.096 3.502 2.5541.5 3.304 3.775 2.7181 . 6 3.519 4.058 2.8901.7 3.737 4.353 3.0701 .8 3.966 4.667 3.2571.9 4.201 4.998 3.4522 .0 4.470 5.340 3.655
drc*/df = K - @ n* - &Q[Q]n* (13)
where (i) K is the rate of absorption of external radiation (in photons per second per unit volume), and of course is a function of n ; (ii) k q is the bimolecular rate constant for the quenching of n * by an added gas Q; (iii) [Q] is the concentration of Q; (iv) d is a composite of the decay modes discussed above and in the Appendix, and may be found by taking the first time derivative of n * (i.e., as given in eq1 0 ):
I ( 4 / T m)Jo (Xmr)e n *
In the limit of very long times (t > 10r), /3 reduces to 1/n and single mode behavior will be observed.
The lifetimes rm found in the previous section for a pulsed decay experiment are equally valid in the description of a steady-state experiment. Due to the cylindrical
. symmetry of the cell and the surrounding coaxial source, the distribution of excited atoms within the cell is symmetric for all times t . This is in marked contrast to the infinite
The Journal o f Physical Chemistry, Vol. 80, No. 7, 1976
656 R. P Blickensderfer, W. H. Breckenridge, and J. Simons
slab case when only one side is illuminated. As shown by Van Volkenburgh and Carrington5 the resulting asymmetric distribution of excited atoms gives rise to imprisonment factors which not only depend on viewing location but also are different for pulsed and steady-state experiments.
The approach to steady state is therefore provided by the solution of eq 13
(15)For short times (f < r, also depending on the opacity; see Appendix), the rise of n * is not a true exponential, since /3 itself is a function of t. For times sufficiently long that the first mode predominates:
(1 /ri + Aq[Q1) 1
indicating true exponential behavior. When t = °° (thesteady state):
— = — + )2q[Q] (16)n * t i
which is of the familiar Stern-Volmer form. Thus Stern- Volmer quenching measurements at low opacity can be corrected for radiation imprisonment simply by substituting the lowest mode lifetime t\ for the natural lifetime t .
In addition to the surrounding coaxial light source, two other common experimental arrangements need to be considered: (1 ) excitation from a source placed at one end of a long cylindrical cell. In this case the distribution will be axially symmetric if the excitation beam is coaxial with the cell. Hence eq 14 and 15 are valid; (2) excitation lamp placed alongside the cell and parallel to it. This clearly leads to an asymmetric distribution. A special solution of eq 1 2 for this case is required and will lead to a new set of decay times r m.
III. The Use of Equivalent Opacity in the Diffusion Model
The idealized “step-function” atomic absorption and emission line shape adopted in the previous section is of course not observed in nature. For the usual situation at low total pressures, for example, the line-shape spectral function is determined by Doppler broadening13 and is Gaussian:
k„/ k0 = F(co) = e- “ 2 (17)
where k „ is the absorption coefficient at any frequency v\ k 0 is the absorption coefficient at the Doppler line center:
k _ (In 2) 1/2 X02 g2n
4(Ai>D)7r3/2 girwhere g2 and gi are the statistical weights of the upper and lower states, respectively, Xo is the wavelength at the center of the atomic line, and
/2i'o\ / 2 R T In 2\ 1/2
A i/d = V 7 ) { ^ T ~ )
where c is the velocity of light, R is the gas constant, T is the absolute temperature, and M the atomic weight; and w is a convenient frequency variable defined in terms of the Doppler breadth:
r 2 G-^o)-| ( ln 2 ) 1 / 2
L D J
To utilize the simple diffusion model, an “equivalent” opacity h i is defined which an idealized atomic gas must have in order for resonance radiation to be propagated in the same way as the actual Doppler radiation under real conditions. The equivalent opacity for a generalized line shape F(a>) is given by:3 1 3 1 8
^ F(a>) exp[—k 0l F(w)] dw= —— ------------------------------------ (18)
X +coF(w) daj
The right-hand side of eq 18 merely describes the transmission of incoherently scattered atomic radiation with line shape F(w); the probability of light absorption is proportional to F(w), but the intensity of the scattered light also follows an F(w) spectral distribution.
The original criticism of Holstein6 that the use of such an “equivalent” opacity h i is incorrect is based on the v a lid contention that any diffusion theory of radiation imprisonment assumes that the probability of a photon penetrating a certain distance in the atomic gas is given by a single exponential expression, which is true strictly speaking only if the absorption coefficient of the gas varies little over the frequency spectrum of the resonance quantum. That is never exactly true, of course, and Holstein proved that because it is therefore impossible to apply the concept of mean free path of resonance-radiation quanta, any simple kinetic theory of radiation diffusion is bound to be incorrect.
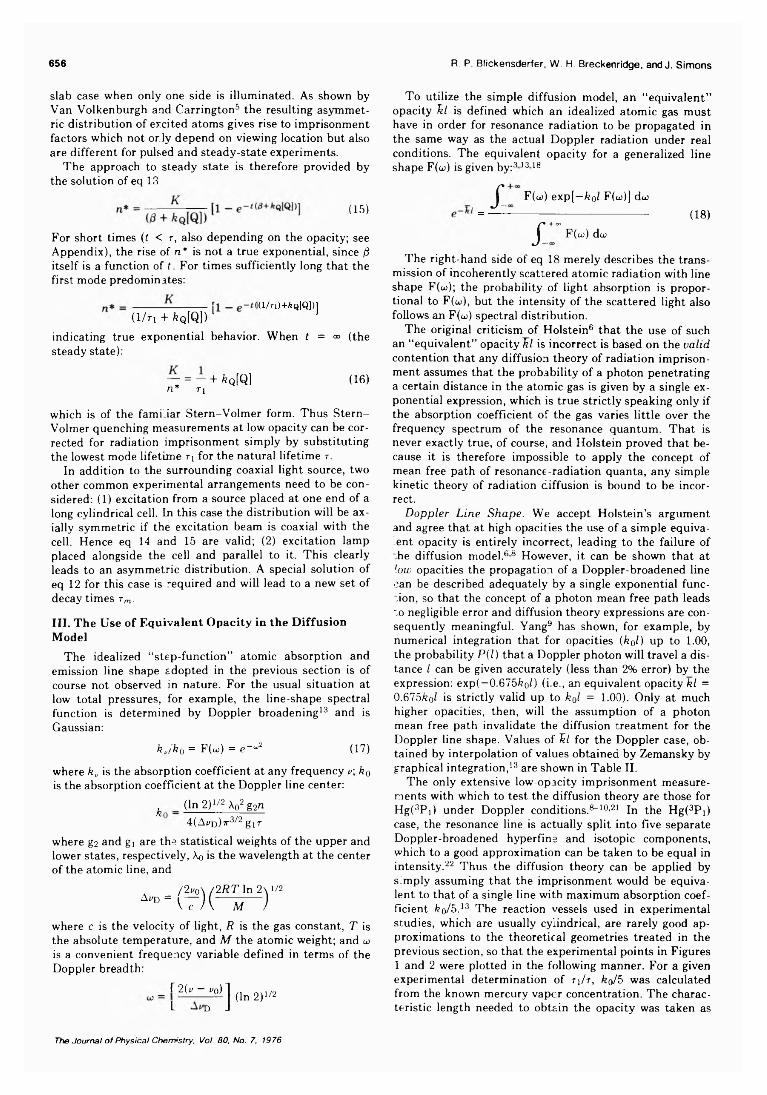
D o p p le r L in e S h a p e . We accept Holstein’s argument and agree that at high opacities the use of a simple equivalent opacity is entirely incorrect, leading to the failure of "he diffusion model.6 8 However, it can be shown that at low opacities the propagation of a Doppler-broadened line can be described adequately by a single exponential function, so that the concept of a photon mean free path leads to negligible error and diffusion theory expressions are consequently meaningful. Yang9 has shown, for example, by numerical integration that for opacities ( k 0l) up to 1 .0 0 , the probability P {1 ) that a Doppler photon will travel a distance l can be given accurately (less than 2% error) by the expression: exp(—0.675&o/) (i.e., an equivalent opacity k l =0.675feol is strictly valid up to kol = 1.00). Only at much higher opacities, then, will the assumption of a photon mean free path invalidate the diffusion treatment for the Doppler line shape. Values of h i for the Doppler case, obtained by interpolation of values obtained by Zemansky by graphical integration, 13 are shown in Table II.
The only extensive low-opacity imprisonment measurements with which to test the diffusion theory are those for Hg(3Pi) under Doppler conditions.8" 10’21 In the Hg(3Pi) case, the resonance line is actually split into five separate Doppler-broadened hyperfine and isotopic components, which to a good approximation can be taken to be equal in intensity. 22 Thus the diffusion theory can be applied by simply assuming that the imprisonment would be equivalent to that of a single line with maximum absorption coefficient &o/5. 13 The reaction vessels used in experimental studies, which are usually cylindrical, are rarely good approximations to the theoretical geometries treated in the previous section, so that the experimental points in Figures 1 and 2 were plotted in the following manner. For a given experimental determination of rj/r, feo/5 was calculated from the known mercury vapcr concentration. The characteristic length needed to obtain the opacity was taken as
The Journal o f Physical Chemistry, Vol. 80, No. 7, 1976
Diffusion Theory of Imprisonment of Atomic Resonance Radiation 657
TABLE II: Equivalent Opacity k l as a Function of Opacity k j for a Doppler-Broadened Atomic Line
feo 1 k l k l/ k0l
0.00 0.00 0.6751.00 0.665 0.6651.50 0.965 0.6432.00 1.241 0.6212.50 1.49 0.5973.00 1.72 0.5723.50 1.92 0.5494.00 2.10 0.526
follows.23 (i) The thickness l of the hypothetical infinite slab or the radius R of the hypothetical infinite cylinder was set equal to the radius of the experimental vessel, (ii) The diameter of the hypothetical sphere was set equal to
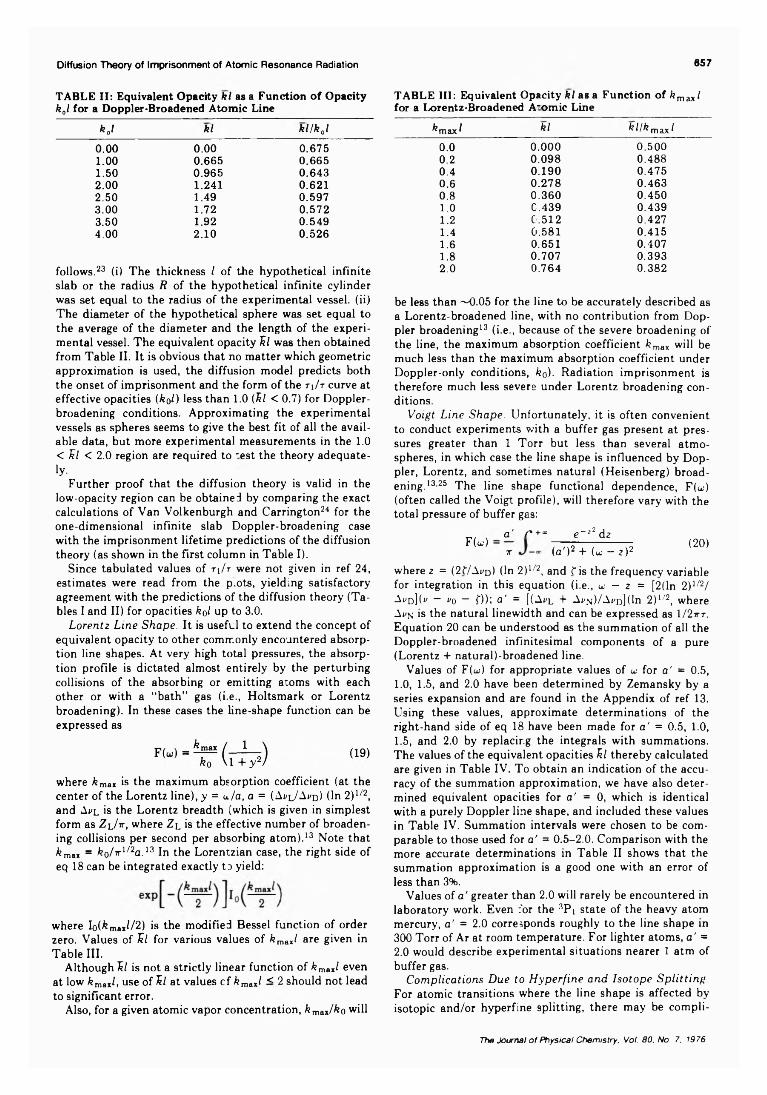
TABLE III: Equivalent Opacity k l as a Function of femax( for a Lorentz-Broadened A'omic Line
femax 1 kl fef/femax!0.0 0.000 0.5000.2 0.098 0.4880.4 0.190 0.4750.6 0.278 0.4630.8 0.360 0.4501.0 C.439 0.4391.2 0.512 0.4271.4 0.581 0.4151.6 0.651 0.4071.8 0.707 0.3932.0 0.764 0.382
be less than ~0.05 for the line to be accurately described as a Lorentz-broadened line, with no contribution from Dop-
the average of the diameter and the length of the experimental vessel. The equivalent opacity k l was then obtained from Table II. It is obvious that no matter which geometric approximation is used, the diffusion model predicts both the onset of imprisonment and the form of the tJ t curve at effective opacities (feol ) less than 1.0 (k l < 0.7) for Doppler- broadening conditions. Approximating the experimental vessels as spheres seems to give the best fit of all the available data, but more experimental measurements in the 1 .0
< k l < 2 .0 region are required to *est the theory adequately-
Further proof that the diffusion theory is valid in the low-opacity region can be obtained by comparing the exact calculations of Van Volkenburgh and Carrington24 for the one-dimensional infinite slab Doppler-broadening case with the imprisonment lifetime predictions of the diffusion theory (as shown in the first column in Table I).
Since tabulated values of t J t were not given in ref 24, estimates were read from the p.ots, yielding satisfactory agreement with the predictions of the diffusion theory (Tables I and II) for opacities kol up to 3.0.
L o r e n tz L in e S h a p e . It is useful to extend the concept of equivalent opacity to other commonly encountered absorption line shapes. At very high total pressures, the absorption profile is dictated almost entirely by the perturbing collisions of the absorbing or emitting atoms with each other or with a “bath” gas (i.e., Holtsmark or Lorentz broadening). In these cases the line-shape function can be expressed as
where femax is the maximum absorption coefficient (at the center of the Lorentz line), y = a /a, a = (Aul/Akd) (In 2)1/2, and Avl is the Lorentz breadth (which is given in simplest form as Z l/ tt, where Zl is the effective number of broadening collisions per second per absorbing atom) . 13 Note that Umax = k 0/ r 1/2a .13 In the Lorentzian case, the right side of eq 18 can be integrated exactly to yield:
pier broadening13 (i.e., because of the severe broadening of the line, the maximum absorption coefficient k max will be much less than the maximum absorption coefficient under Doppler-only conditions, k o ). Radiation imprisonment is therefore much less severe under Lorentz broadening conditions.
V o ig t L in e S h a p e . Unfortunately, it is often convenient to conduct experiments with a buffer gas present at pressures greater than 1 Torr but less than several atmospheres, in which case the line shape is influenced by Doppler, Lorentz, and sometimes natural (Heisenberg) broadening. 13'25 The line shape functional dependence, F(üj) (often called the Voigt profile), will therefore vary with the total pressure of buffer gas:
F(o:) (V r + œ e~*2 dz 7T (a' ) 2 + (a: — z)2 (2 0 )
where z = (2("/Ai/d) (In 2 )1/2, and f is the frequency variable for integration in this equation (i.e., u — z = [2 (ln 2 )1/2/ Ai'd](»' — <*0 — f))l a ' = [(Avl + At'N)/Ai'D](ln 2 )1/2, where Avn is the natural linewidth and can be expressed as 1/27rr. Equation 20 can be understood as the summation of all the Doppler-broadened infinitesimal components of a pure (Lorentz + natural)-broadened line.
Values of F(w) for appropriate values of ui for a ’ = 0.5,1.0, 1.5, and 2.0 have been determined by Zemansky by a series expansion and are found in the Appendix of ref 13. Using these values, approximate determinations of the right-hand side of eq 18 have been made for a ' = 0.5, 1.0,1.5, and 2.0 by replacing the integrals with summations. The values of the equivalent opacities k l thereby calculated are given in Table IV. To obtain an indication of the accuracy of the summation approximation, we have also determined equivalent opacities for a ' = 0 , which is identical with a purely Doppler line shape, and included these values in Table IV. Summation intervals were chosen to be comparable to those used for a ' = 0.5-2.0 . Comparison with the more accurate determinations in Table II shows that the summation approximation is a good one with an error of
where l o (k maxl/2) is the modified Bessel function of order zero. Values of k l for various values of femax( are given in Table III.
Although k l is not a strictly linear function of femax( even at low femax(, use of k l at values cf femax( < 2 should not lead to significant error.
Also, for a given atomic vapor concentration, femax/feo will
less than 3%.Values of a' greater than 2.0 will rarely be encountered in
laboratory work. Even for the 3Pi state of the heavy atom mercury, a ' = 2 .0 corresponds roughly to the line shape in 300 Torr of Ar at room temperature. For lighter atoms, a ’ = 2 .0 would describe experimental situations nearer 1 atm of buffer gas.
C o m p lic a t io n s D u e to H y p e r f in e a n d I s o t o p e S p li t t in g . For atomic transitions where the line shape is affected by isotopic and/or hyperfine splitting, there may be compli-
The Journal o f Physical Chemistry, Vol. 80, No. 7, 1976
658 R. P. Blickensderfer, W. H. Breckenridge, and J. Simons
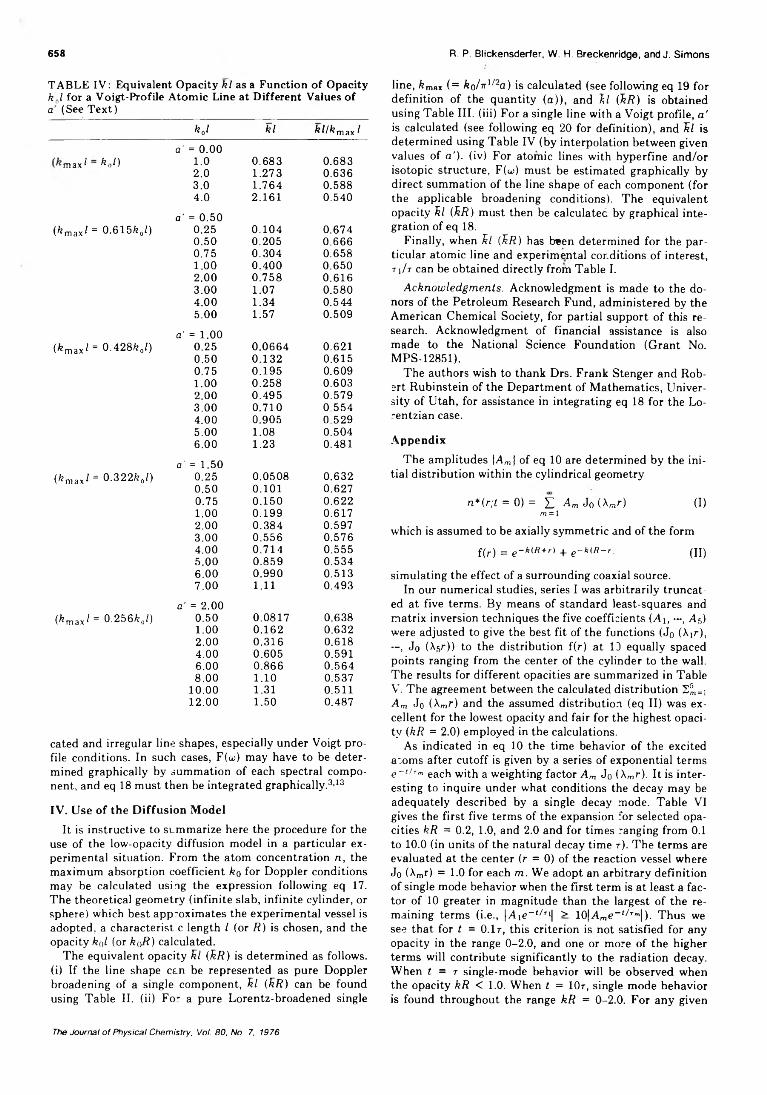
TABLE IV : Equivalent Opacity k l as a Function of Opacity k 0l for a Voigt-Profile Atomic Line at Different Values of a (See Text)
fe„Z k l /^maX J
max *oDa' = 0 .0 0
1 . 0 0.683 0.6832 .0 1.273 0.6363.0 1.764 0.5884.0 2.161 0.540
(fcmaxZ= 0.615fcoZ)o ' = 0.50
0.25 0.104 0.6740.50 0.205 0 .6 6 60.75 0.304 0.6581 . 0 0 0.400 0.6502 .0 0 0.758 0.6163.00 1.07 0.5804.00 1.34 0.5445.00 1.57 0.509
(kmaxl = 0.428V)a' = 1 .0 0
0.25 0.0664 0.6210.50 0.132 0.6150.75 0.195 0.6091 .0 0 0.258 0.6032 .0 0 0.495 0.5793.00 0.710 0.5544.00 0.905 0.5295.00 1.08 0.5046 .0 0 1.23 0.481
(fcmaxZ= 0.322V)a' = 1.50
0.25 0.0508 0.6320.50 0 . 1 0 1 0.6270.75 0.150 0.6221 .0 0 0.199 0.6172 .0 0 0.384 0.5973.00 0.556 0.5764.00 0.714 0.5555.00 0.859 0.5346 .0 0 0.990 0.5137.00 1 . 1 1 0.493
(/¡max/= 0.256V)a' = 2 .0 0
0.50 0.0817 0.6381 .0 0 0.162 0.6322 .0 0 0.316 0.6184.00 0.605 0.5916 .0 0 0 .8 6 6 0.5648 .0 0 1 . 1 0 0.537
1 0 . 0 0 1.31 0.5111 2 . 0 0 1.50 0.487
cated and irregular line shapes, especially under Voigt pro-file conditions. In such cases, F(u;) may have to be deter-mined graphically by summation of each spectral component, and eq 18 must then be integrated graphically.3,13
IV. Use of the Diffusion ModelIt is instructive to summarize here the procedure for the
use of the low-opacity diffusion model in a particular experimental situation. From the atom concentration n , the maximum absorption coefficient k o for Doppler conditions may be calculated using the expression following eq 17. The theoretical geometry (infinite slab, infinite cylinder, or sphere) which best approximates the experimental vessel is adopted, a characterise length Z (or R ) is chosen, and the opacity k 0l (or k(>R) calculated.
The equivalent opacity k l (k R ) is determined as follows,(i) If the line shape can be represented as pure Doppler broadening of a single component, k l (k R ) can be found using Table II. (ii) For a pure Lorentz-broadened single
line, /¡max (= ko/ir1/2a ) is calculated (see following eq 19 for definition of the quantity (a)), and k l (k R ) is obtained using Table III. (iii) For a single line with a Voigt profile, a ' is calculated (see following eq 2 0 for definition), and k l is determined using Table IV (by interpolation between given values of a ') , (iv) For atomic lines with hyperfine and/or isotopic structure, F(w) must be estimated graphically by direct summation of the line shape of each component (for the applicable broadening conditions). The equivalent opacity k l (k R ) must then be calculated by graphical integration of eq 18.
Finally, when k l (k R ) has been determined for the particular atomic line and experimental conditions of interest, ti/ t can be obtained directly from Table I.
A c k n o w le d g m e n ts . Acknowledgment is made to the donors of the Petroleum Research Fund, administered by the American Chemical Society, for partial support of this research. Acknowledgment of financial assistance is also made to the National Science Foundation (Grant No. MPS-12851).
The authors wish to thank Drs. Frank Stenger and Robert Rubinstein of the Department of Mathematics, University of Utah, for assistance in integrating eq 18 for the Lo- rentzian case.
AppendixThe amplitudes \Am \ of eq 10 are determined by the ini
tial distribution within the cylindrical geometry
n * (r ; t = 0) = £ A m J0 (Xmr) (I)m = l
which is assumed to be axially symmetric and of the formf(r) = e -k (R + r) + e - k (R -r : (H)
simulating the effect of a surrounding coaxial source.In our numerical studies, series I was arbitrarily truncat
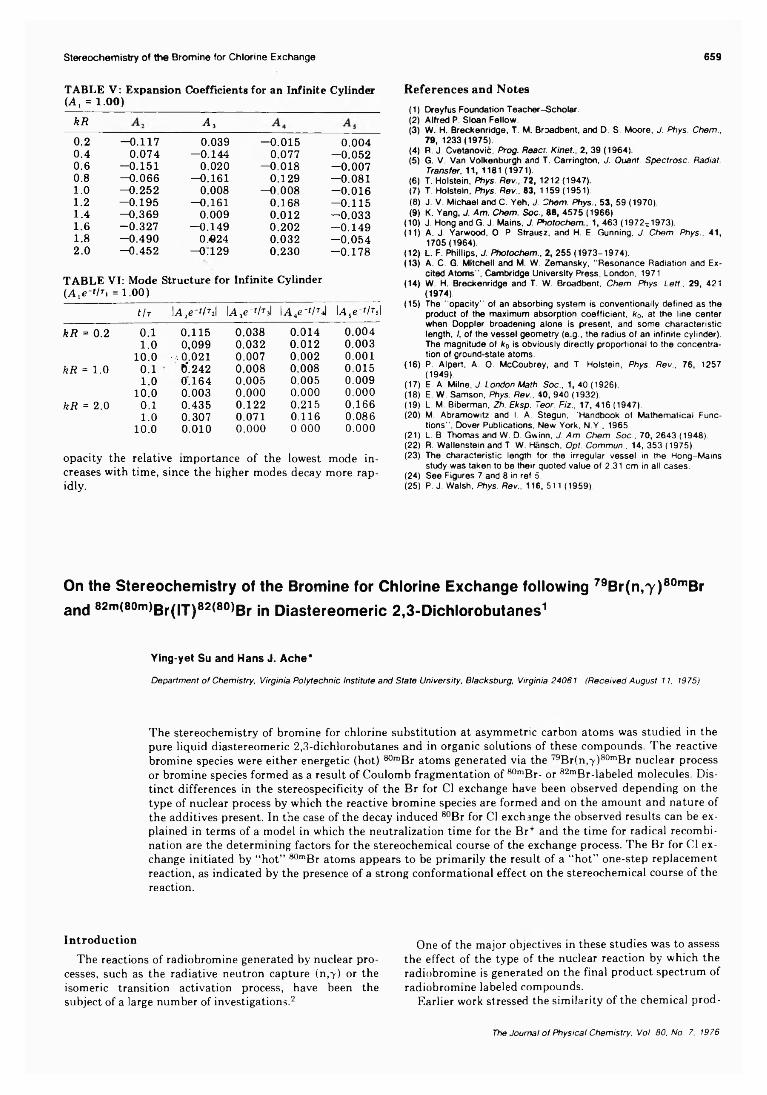
ed at five terms. By means of standard least-squares and matrix inversion techniques the five coefficients (Ai, •••, A5) were adjusted to give the best fit of the functions (Jo (Air), —, Jo (Xsr)) to the distribution f(r) at 13 equally spaced points ranging from the center of the cylinder to the wall. The results for different opacities are summarized in TableV. The agreement between the calculated distribution 2jj,=I A m Jo (Xmr) and the assumed distribution (eq II) was excellent for the lowest opacity and fair for the highest opacity (k R = 2.0) employed in the calculations.
As indicated in eq 10 the time behavior of the excited acorns after cutoff is given by a series of exponential terms e -t/ rm each with a weighting factor A m J0 (Xmr). It is interesting to inquire under what conditions the decay may be adequately described by a single decay mode. Table VI gives the first five terms of the expansion for selected opacities kR = 0.2, 1.0, and 2.0 and for times ranging from 0.1 to 10.0 (in units of the natural decay time r). The terms are evaluated at the center (r = 0 ) of the reaction vessel where Jo (Amr) = 1 .0 for each m . We adopt an arbitrary definition of single mode behavior when the first term is at least a factor of 1 0 greater in magnitude than the largest of the remaining terms (i.e., \A-ie ~ t,T'\ > 10|Ame~i/,Tm|). Thus we see that for t = O.lr, this criterion is not satisfied for any opacity in the range 0- 2 .0 , and one or more of the higher terms will contribute significantly to the radiation decay. When t = t single-mode behavior will be observed when the opacity k R < 1.0. When t = lOr, single mode behavior is found throughout the range k R = 0-2.0. For any given
The Journal o f Physical Chemistry, Vol. 80, No. 7, 1976
Stereochemistry of the Bromine for Chlorine Exchange 659
TABLE V : Expansion Coefficients for an Infinite Cylinder (A, = 1 .0 0 )
k R ¿30.2 -0.117 0.039 —0.015 0.0040.4 0.074 -0.144 0.077 —0.0520.6 -0.151 0.020 -0.018 -0.0070.8 -0.066 -0.161 0.129 -0.0811.0 -0.252 0.008 -0.008 -0.0161.2 -0.195 —0.161 0.168 —0.1151.4 —0.369 0.009 0.012 -0.0331.6 -0.327 —0.149 0.202 -0.1491.8 -0.490 0..624 0.032 -0.0542.0 -0.452 -0.129 0.230 -0.178
TABLE VI: Mode Structure for Infinite Cylinder(A,e- f/r, = 1 .00)
t/r lA2e-f/72| lA3e“f/T:J lA^-'/nl lAse“f/Tsl
k R = 0.2 0.1 0.115 0.038 0.014 0.0041.0 0,099 0.032 0.012 0.003
10.0 ...0.021 0.007 0.002 0.001k R = 1.0 0.1 O'. 242 0.008 0.008 0.015
1.0 0.164 0.005 0.005 0.00910.0 0.003 0.000 0.000 0.000
k R = 2.0 0.1 0.435 0.122 0.215 0.1661.0 0.307 0.071 0.116 0.086
10.0 0.010 0.000 0.000 0.000
opacity the relative importance of the lowest mode increases with time, since the higher modes decay more rapidly.
References and Notes(1) Dreyfus Foundation Teacher-Scholar.(2) Alfred P. Sloan Fellow.(3) W. H. Breckenridge, T. M. Broadbent, and D. S. Moore, J. Phys. Chem.,
79, 1233(1975).(4) R. J. Cvetanovic, Prog. React. Kinet., 2, 39 (1964)(5) G. V. Van Volkenburgh and T, Carrington, J. Quant. Spectrosc. Radiat.
Transfer. 11, 1181 (1971).(6 ) T. Holstein, Phys. Rev., 72, 1212(1947).(7) T. Holstein, Phys. Rev., 83, 1159 (1951).(8) J. V. Michael and C. Yeh, J. Chem. Phys., 53, 59 (1970).(9) K. Yang, J. Am. Chem. Soc., 88, 4575 (1966).
(10) J. Hong and G. J. Mains, J. Photochem, 1, 463 (1972^1973).(11) A. J. Yarwood, 0 . P. Strausz, and H. E. Gunning, J. Chem. Phys., 41,
1705(1964).(12) L. F. Phillips, J. Photochem., 2, 255 (1973-1974).(13) A. C. G. Mitchell and M. W, Zemansky, "Resonance Radiation and Ex
cited Atoms” , Cambridge University Press, London, 1971.(14) W. H. Breckenridge and T. W. Broadbent, Chem. Phys. Lett., 29, 421
(1974).(15) The "opacity" ot an absorbing system is conventionally defined as the
product of the maximum absorption coefficient, k0, at the line center when Doppler broadening alone is present, and some characteristic length, /, of the vessel geometry (e g., the radius of an infinite cylinder). The magnitude of ko is obviously directly proportional to the concentration of ground-state atoms.
(16) P. Alpert, A. 0. McCoubrey, and T. Holstein, Phys. Rev., 76, 1257(1949).
(17) E. A. Milne, J. London Math Soc., 1, 40 (1926).(18) E. W. Samson, Phys. Rev., 40, 940 (1932).(19) L. M. Biberman, Zh. Eksp. Teor. Fiz., 17, 416 (1947).(20) M. Abramowitz and I. A. Stegun, "Handbook of Mathematical Func
tions", Dover Publications, New York, N.Y., 1965.(21) L. B. Thomas and W. D. Gwinn, J. Am. Chem. Soc., 70, 2643 (1948).(22) R. Wallenstein and T. W. Hansch, Opt. Commun.. 14, 353 (1975).(23) The characteristic length for the irregular vessel in the Hong-Mains
study was taken to be their quoted value of 2.31 cm in all cases.(24) See Figures 7 and 8 in ref 5.(25) P. J. Walsh, Phys. Rev., 116, 511 (1959).
On the S tereo ch e m istry of th e B rom ine for C hlorine E x ch a n g e follow ing 7 9 B r(n ,7 ) 80mBr
and 8 2 m(8 0 m)B r(IT)82(80)Br in D iastereom eric 2 ,3 -D ic h lo r o b u ta n e s 1
Ying-yet Su and Hans J. Ache*
Department of Chemistry, Virginia Polytechnic Institute and State University, Blacksburg, Virginia 24061 (Received August 11, 1975)
The stereochemistry of bromine for chlorine substitution at asymmetric carbon atoms was studied in the pure liquid diastereomeric 2,3-dichlorobutanes and in organic solutions of these compounds. The reactive bromine species were either energetic (hot) ^ '“Br atoms generated via the ,9Br(n,7 )80mBr nuclear process or bromine species formed as a result of Coulomb fragmentation of 80mBr- or 82mBr-labeled molecules. Distinct differences in the stereospecificity of the Br for Cl exchange have been observed depending on the type of nuclear process by which the reactive bromine species are formed and on the amount and nature of the additives present. In the case of the decay induced 80Br for Cl exchange the observed results can be explained in terms of a model in which the neutralization time for the Br+ and the time for radical recombination are the determining factors for the stereochemical course of the exchange process. The Br for Cl exchange initiated by “hot” ^ "“Br atoms appears to be primarily the result of a “hot” one-step replacement reaction, as indicated by the presence of a strong conformational effect on the stereochemical course of the reaction.
Introduction
The reactions of radiobromine generated by nuclear processes, such as the radiative neutron capture (n,y) or the isomeric transition activation process, have been the subject of a large number of investigations.2
One of the major objectives in these studies was to assess the effect of the type of the nuclear reaction by which the radiobromine is generated on the final product spectrum of radiobromine labeled compounds.
Earlier work stressed the similarity of the chemical prod
The Journal o f Physical Chemistry, Voi. 80, No. 7, 1976
660 Ying-yet Su ana Hans J. Ache
ucts and total organic yields of radiobromine formed by (n,y) reactions or by isomeric transition (IT) in liquid alkanes or halogenated alkane, which led to the autoradiolysis hypothesis, first suggested by Geissler and Willard.3
More recent findings seem to suggest considerable differences in the product distribution, which emphasize the importance of caging involving radical processes, molecular mechanisms, and the effect of recoil energy associated with the bromine species.
These results have been interpreted in terms of several models, such as Shaw’s thermal spike model,4 Milman’s modified impact on molecule model,5 and Stocklin’s direct replacement with collisional stabilization of caged complex model.6-7 A discussion of the systematica of radiobromine reactions with halomethanes was recently published by Rack et al.8
Important information about the relative role of caging and molecular reactions in the condensed state has been derived from the observation of the stereochemical course of the halogen for halogen exchange as demonstrated by Stocklin et al.7 Thus in the following an attempt has been made to study the effect of the Br formation process on the stereochemistry involved in the Br for Cl exchange in the diastereomeric 2,3-dichlorobutane molecules in order to provide further insight into the dynamics of hot atom and decay induced substitution reaction.
Experimental SectionM a te r ia ls . I2 and CBr4 (purity >98%) were obtained
from Aldrich Chemical Co. Br2 (purity 99.8%) was purchased from J. T. Baker Chemical Co. CF2Br was obtained from Matheson Chemical Co. with a stated purity greater than 99%. All these compounds were used without further purification. The spectraanalyzed solvents (methanol, cyclohexane, and n -pentane) were obtained from Fisher Scientific Co. The solvents were distilled and their purity checked before being used in the experiments.
2,3-Dichlorobutane (DCB) was obtained from Aldrich Chemical Co. The mixture consisting of m e s o - and d ,l- DCB was separated by gas chromatography into the pure meso and racemic forms, using a 8 -m stainless steel column (8 mm i.d.) with 20% DEGS on Chromosorb W (60-80 mesh) at 60 °C and 80 ml of He/min.
E r y t h r o - and f/ireo-2-bromo-3-chlorobutane, which were used as carrier in the gas chromatographic separation of the reaction products, were prepared by stereospecific addition of BrCl to tr a n s - and c i s -2-butene, respectively.
S a m p le P r e p a r a t io n s a n d I r ra d ia tio n . Samples were prepared by introducing I2 (5 mg) as scavenger, CBr4 (9 mg) which provided the bromine source, and the desired amount of m e s o - or d,/-DCB and solvent into quartz ampoules with a volume of about 0.25 ml. Samples were carefully degassed then sealed off and stored in a dark place until irradiation. Neutron activation of the samples was carried out in the VPI & SU nuclear reactor at a neutron flux of 1.6 X 10¹² n cm- 2 s- 1 for 2 min at room temperature, when the samples were used to study the 82Br as 8 0 m(8 0 ) g r fo r ci exchange.
In the study of the decay induced 80Br exchange with DCB, a few milligrams of purified CF380mBr were used as 80Br source as previously described.9 -11 In these experiments the CF:,Br (neutron irradiated for 30 min at 30 °C and 1 .6 X 10- 1 2 n s_1 cm- 2 in the VPI & SU reactor and gas chromatographically purified by using a 3-m Porapak- Q column at room temperature) was transferred to a sam
ple of known composition containing a small amount of I2
as a scavenger and sealed. The samples were kept in the dark for about 40 min at room temperature to permit 89 Br to obtain equilibrium with 80mBr.
S a m p le A n a ly s is . The irradiated sample, as well as those samples containing CFnBr, were transferred to a vial which contained about 1 ml of Na2S0 3 and Na2CC>3 solution, and about 0 .2 ml of CH2C12 with a small amount of carriers. The organic layer was transferred to another vial, washed with distilled water, and finally dried with CaCl2. After drying, the organic products were analyzed by employing gas chromatographic techniques. A 8 -rr. glass (4 mm i.d.) column containing 20% DEGS on Chromosorb W (60-80 mesh) at 70 °C was used to separate e r y t h r o - and t h r e o - 2 - bromo-2 -chlorobutanes.
Radioactivity AssayIn the 82Br experiments the gas chromatographically
separated radioactive products were adsorbed on charcoal tubes directly from the effluent gas stream.11 The activity of the products was measured 3 0 h after irradiation utilizing a well type scintillation counter. In the case of 80Br and 30mBr, the separated products were trapped from the effluent gas stream by bubbling the effluent gas of the gas chromatograph through toluene solutions containing liquid scintillation fluors.9,10 The activities were measured by liquid scintillation spectrometry applying appropriate energy discrimination. When necessary appropriate decay corrections were made. The ratio of retention to inversion was obtained by direct comparison of the total counts observed in the compound with retained configuration to that found in the inverted product.
The total amount of radioactivity observed in the retained and inverted forms was generally about 1 % of the total radioactivity produced by the nuclear process utilized in the particular experiment.
No attempt was made to determine the individual radiochemical yields in each experiment.
A very careful study was carried out to assure that no Br for Br exchange had occurred during the analytical procedures. No evidence for such exchange was found.
Results and DiscussionThe present investigation consisted basically of two se
ries of experiments. In the first series of experiments the stereochemical course of the Br for Cl exchange in 2,3-dichlorobutane was studied by using the 79Br(n,7 )80mBr nuclear process as the source of the reactive Br species, whereas in the second series the activation process was either the 81Br(n,7 )82mBr(IT)82Br or 80mBr(IT)80Br nuclear process.
Since the mechanisms leading to the formation of the reacting Br species and the subsequent Br for Cl exchange are drastically different in each of the two series of experiments their results shall be discussed separately.
A. 79B r ( n , y ) 80mB r. (a) G en e r a l. In the past the results of the stereochemical course of the halogen for halogen substitution in diastereomers in the gas phase, which showed an almost complete lack of inversion of configuration,12-16
have been used as supporting evidence for the Wolfgang impact and inertial model17 for hot halogen substitution. This model postulates a direct replacement process on a time scale comparable to molecular transit, times for the hot atom, i.e., 1 0 - 1 4 to 1 0 - 1 3 s, which would be too short to
The Journal o f Physical Chemistry, Voi. 80, No. 7, 1976
allow the movement of atoms at substituent groups necessary for Walden inversion.
A lower degree of stereospecificity was usually observed in the condensed state12,13 which was attributed to the presence of radical-radical recombination processes in the solvent cage.
If the time scale for the recombination of the radicals in the solvent cage becomes comparable to the time required to achieve planarity these thermal caged radical processes can lead to both retention and inversion of configuration.
Another interpretation for the reduced stereospecificity in condensed systems was given by Stocklin et al.6,7 On the basis of a pronounced conformational effect7 these authors suggested a hot one-step substitution process, proceeding via a collision complex which is collisionally stabilized and has a lifetime sufficiently long to allow inversion of configuration (“direct replacement with collisional stabilization of the caged complex” model).
More recently Root et al.18 suggested that two channels exist for true hot substitution, which may often differ both in stereochemistry and average product residual excitation energy. They further conclude that while the inverting channel for halogen for halogen exchange tends to be inefficient, it does not result in the deposition of a large level of residual excitation in the primary product.
Thus in order to further explore the applicability of these various models to hot halogen for halogen substitution, the ^ B r for Cl exchange with the diastereomeric2,3-dichlorobutanes was studied in the pure liquid state and in solutions of various solvents.
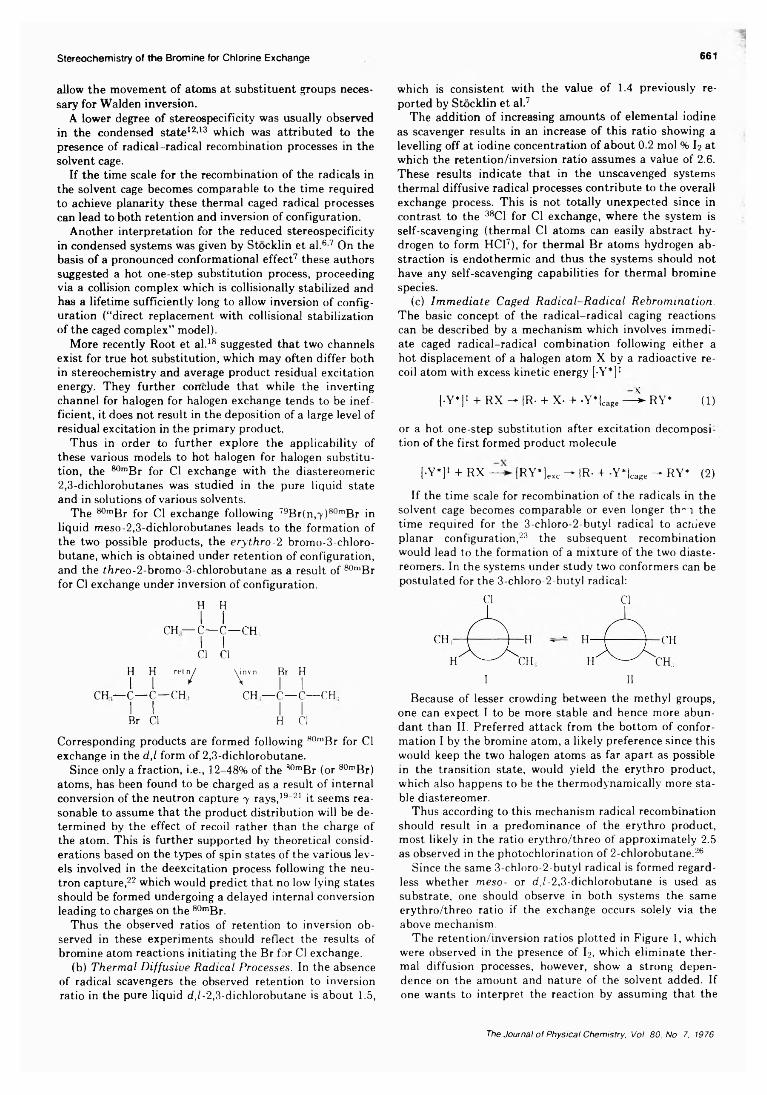
The ^'"Br for Cl exchange following 79Br(n,7 )80mBr in liquid meso-2,3-dichlorobutanes leads to the formation of the two possible products, the e r y t h r o -2 bromo-3-chloro- butane, which is obtained under retention of configuration, and the threo-2-bromo-3-chlorobutane as a result of 80mBr for Cl exchange under inversion of configuration.
H HI I
CH — C— C— CH,I ICl Cl
H H r e in / \ in v n Br HI I / \ I I
CH— C— C— CH, CH— C— C— CH,I I I IBr Cl H Cl
Corresponding products are formed following 80mBr for Cl exchange in the d ,l form of 2,3-dichlorobutane.
Since only a fraction, i.e., 12-48% of the 30mBr (or 80mBr) atoms, has been found to be charged as a result of internal conversion of the neutron capture y rays, 19' 21 it seems reasonable to assume that the product distribution will be determined by the effect of recoil rather than the charge of the atom. This is further supported by theoretical considerations based on the types of spin states of the various levels involved in the deexcitation process following the neutron capture,22 which would predict that no low lying states should be formed undergoing a delayed internal conversion leading to charges on the 80mBr.
Thus the observed ratios of retention to inversion observed in these experiments should reflect the results of bromine atom reactions initiating the Br for Cl exchange.
(b) T h e r m a l D i f fu s iv e R a d ica l P r o c e s s e s . In the absence of radical scavengers the observed retention to inversion ratio in the pure liquid d ,/-2,3-dichlorobutane is about 1.5,
Stereochemistry of the Bromine for Chlorine Exchange
which is consistent with the value of 1.4 previously reported by Stocklin et al.7
The addition of increasing amounts of elemental iodine as scavenger results in an increase of this ratio showing a levelling off at iodine concentration of about 0 .2 mol % I2 at which the retention/inversion ratio assumes a value of 2 .6 . These results indicate that in the unscavenged systems thermal diffusive radical processes contribute to the overall exchange process. This is not totally unexpected since in contrast to the 38C1 for Cl exchange, where the system is self-scavenging (thermal Cl atoms can easily abstract hydrogen to form HC17), for thermal Br atoms hydrogen abstraction is endothermic and thus the systems should not have any self-scavenging capabilities for thermal bromine species.
(c) I m m e d ia t e C a g ed R a d ic a l-R a d ic a l R e b r o m in a tio n . The basic concept of the radical-radical caging reactions can be described by a mechanism which involves immediate caged radical-radical combination following either a hot displacement of a halogen atom X by a radioactive recoil atom with excess kinetic energy [-Y* ] 1
[•Y*]t + RX - ¡R- + X- + -Y*|cage — t RY* (1)
or a hot one-step substitution after excitation decomposition of the first formed product molecule
[•Y* ] 1 + RX — [RY*]exc - |R. + •Y*|cage - RY* (2)
If the time scale for recombination of the radicals in the solvent cage becomes comparable or even longer th- i the time required for the 3-chloro-2-butyl radical to achieve planar configuration,23 the subsequent recombination would lead to the formation of a mixture of the two diaste- reomers. In the systems under study two conformers can be postulated for the 3-chloro-2-butyl radical:
661
I IIBecause of lesser crowding between the methyl groups,
one can expect I to be more stable and hence more abundant than II. Preferred attack from the bottom of conformation I by the bromine atom, a likely preference since this would keep the two halogen atoms as far apart as possible in the transition state, would yield the erythro product, which also happens to be the thermodynamically more stable diastereomer.
Thus according to this mechanism radical recombination should result in a predominance of the erythro product, most likely in the ratio erythro/threo of approximately 2.5 as observed in the photochlorination of 2 -chlorobutane.26
Since the same 3-chloro-2-butyl radical is formed regardless whether m e s o - or d ,(-2,3-dichlorobutane is used as substrate, one should observe in both systems the same erythro/threo ratio if the exchange occurs solely via the above mechanism.
The retention/inversion ratios plotted in Figure 1 , which were observed in the presence of I2, which eliminate thermal diffusion processes, however, show a strong dependence on the amount and nature of the solvent added. If one wants to interpret the reaction by assuming that the
The Journal o f Physical Chemistry. Vol. 80. No. 7. 1976
662 Ying-yet Su and Hans J. Ache
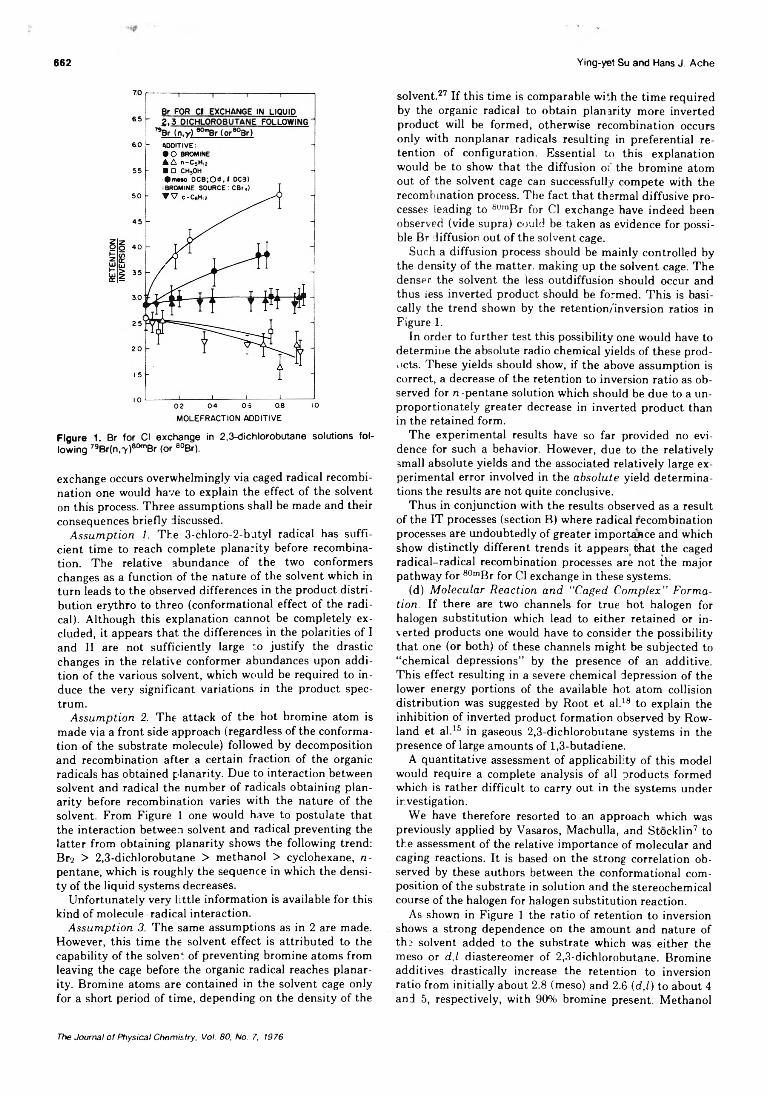
Figure 1. Br for Cl exchange in 2,3-dichlorobutane solutions following 79Br(n,7 )80mBr (or aoBr).
exchange occurs overwhelmingly via caged radical recombination one would have to explain the effect of the solvent on this process. Three assumptions shall be made and their consequences briefly discussed.
A s s u m p t io n 1. The 3-chloro-2-butyl radical has sufficient time to reach complete planarity before recombination. The relative abundance of the two conformers changes as a function of the nature of the solvent which in turn leads to the observed differences in the product distribution erythro to threo (conformational effect of the radical). Although this explanation cannot be completely excluded, it appears that the differences in the polarities of I and II are not sufficiently large to justify the drastic changes in the relative conformer abundances upon addition of the various solvent, which would be required to induce the very significant variations in the product spectrum.
A s s u m p t io n 2. The attack of the hot bromine atom is made via a front side approach (regardless of the conformation of the substrate molecule) followed by decomposition and recombination after a certain fraction of the organic radicals has obtained planarity. Due to interaction between solvent and radical the number of radicals obtaining planarity before recombination varies with the nature of the solvent. From Figure 1 one would have to postulate that the interaction between solvent and radical preventing the latter from obtaining planarity shows the following trend: Br2 > 2,3-dichlorobutane > methanol > cyclohexane, n - pentane, which is roughly the sequence in which the density of the liquid systems decreases.
Unfortunately very little information is available for this kind of molecule-radical interaction.
A s s u m p t io n 3. The same assumptions as in 2 are made. However, this time the solvent effect is attributed to the capability of the solvent of preventing bromine atoms from leaving the cage before the organic radical reaches planarity. Bromine atoms are contained in the solvent cage only for a short period of time, depending on the density of the
solvent.27 If this time is comparable with the time required by the organic radical to obtain planarity more inverted product will be formed, otherwise recombination occurs only with nonplanar radicals resulting in preferential retention of configuration. Essential to this explanation would be to show that the diffusion of the bromine atom out of the solvent cage can successfully compete with the recombination process. The fact that thermal diffusive processes leading to 80mBr for Cl exchange have indeed been observed (vide supra) could be taken as evidence for possible Br diffusion out of the solvent cage.
Such a diffusion process should be mainly controlled by the density of the matter, making up the solvent cage. The denser the solvent the less outdiffusion should occur and thus iess inverted product should be formed. This is basically the trend shown by the retention/'inversion ratios in Figure I.
In order to further test this possibility one would have to determine the absolute radio chemical yields of these products. These yields should show, if the above assumption is correct, a decrease of the retention to inversion ratio as observed for n -pentane solution which should be due to a un- proportionately greater decrease in inverted product than in the retained form.
The experimental results have so far provided no evidence for such a behavior. However, due to the relatively small absolute yields and the associated relatively large experimental error involved in the a b s o lu t e yield determinations the results are not quite conclusive.
Thus in conjunction with the results observed as a result of the IT processes (section B) where radical recombination processes are undoubtedly of greater importance and which show distinctly different trends it appears that the caged radical-radical recombination processes are not the major pathway for 80mBr for Cl exchange in these systems.
(d) M o le c u la r R e a c t io n a n d “ C a g e d C o m p l e x ” F o r m a tion . If there are two channels for true hot halogen for halogen substitution which lead to either retained or inverted products one would have to consider the possibility that one (or both) of these channels might be subjected to “chemical depressions” by the presence of an additive. This effect resulting in a severe chemical depression of the lower energy portions of the available hot atom collision distribution was suggested by Root et al. 18 to explain the inhibition of inverted product formation observed by Rowland et al. 15 in gaseous 2,3-dichlorobutane systems in the presence of large amounts of 1,3-butadiene.
A quantitative assessment of applicability of this model would require a complete analysis of all products formed which is rather difficult to carry out in the systems under investigation.
We have therefore resorted to an approach which was previously applied by Vasaros, Machulla, and Stocklin7 to the assessment of the relative importance of molecular and caging reactions. It is based on the strong correlation observed by these authors between the conformational composition of the substrate in solution and the stereochemical course of the halogen for halogen substitution reaction.
As shown in Figure 1 the ratio of retention to inversion shows a strong dependence on the amount and nature of the solvent added to the substrate which was either the meso or d ,l diastereomer of 2,3-dichlorobutane. Bromine additives drastically increase the retention to inversion ratio from initially about 2.8 (meso) and 2.6 (d ,l ) to about 4 and 5, respectively, with 90% bromine present. Methanol
The Journal o f Physical Chemistry, Vol. 80, No. 7, 1976
Stereochemistry of the Bromine for Chlorine Exchange 663
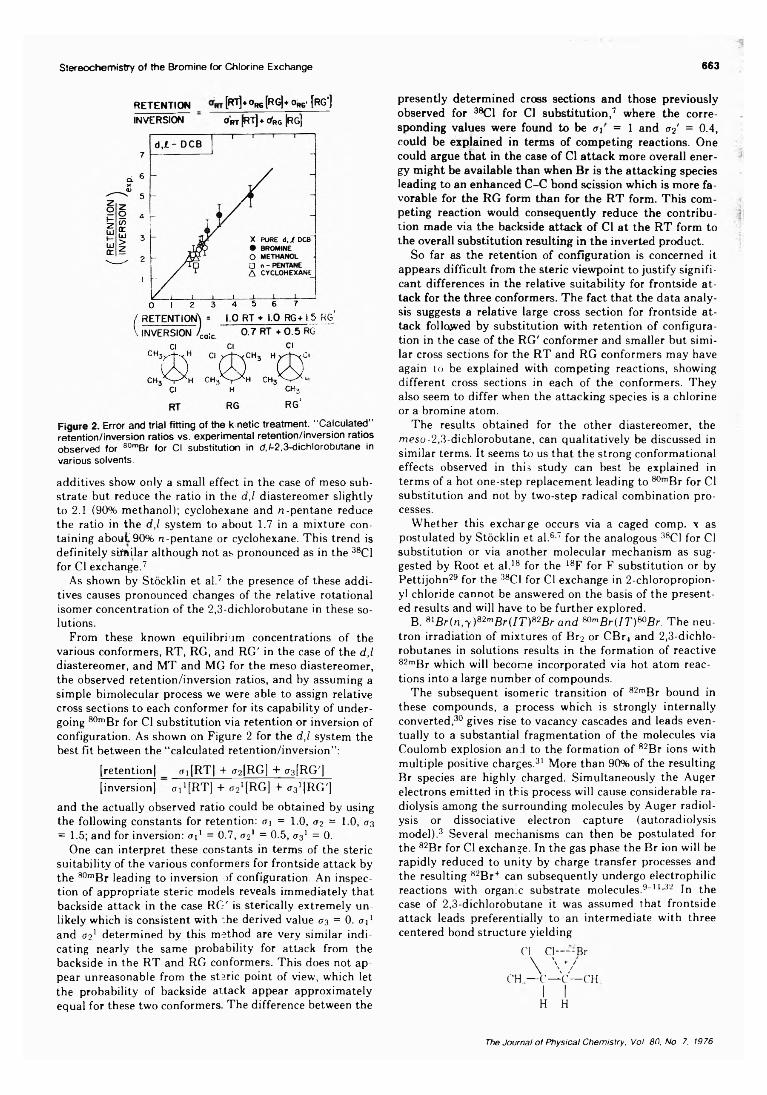
RETENTION [Rt ] * ° rg [KG)* Qrg' [Re*]INVERSION Ort Tj-frfRG |rg]
observed for 80mBr for Cl substitution in d,/-2,3-dichlorobutane in various solvents.
additives show only a small effect in the case of meso substrate but reduce the ratio in the d j diastereomer slightly to 2.1 (90% methanol); cyclohexane and n-pentane reduce the ratio in the d ,l system to about 1.7 in a mixture containing about 90% n-pentane or cyclohexane. This trend is definitely similar although not as pronounced as in the 38C1 for Cl exchange.7
As shown by Stocklin et al.7 the presence of these additives causes pronounced changes of the relative rotational isomer concentration of the 2,3-dichlorobutane in these solutions.
From these known equilibrium concentrations of the various conformers, RT, RG, and RG' in the case of the d ,l diastereomer, and MT and MG for the meso diastereomer, the observed retention/inversion ratios, and by assuming a simple bimolecular process we were able to assign relative cross sections to each conformer for its capability of undergoing 80mBr for Cl substitution via retention or inversion of configuration. As shown on Figure 2 for the d ,l system the best fit between the “calculated retention/inversion”:
[retention) _ <ti[RT] + <72 [ R G ] + f ^ R G ' ]
[inversion] oVJRT] + <72! [RG] + c JRG']and the actually observed ratio could be obtained by using the following constants for retention: a\ = 1 .0 , <r2 = 1 0 , <73
= 1.5; and for inversion: a 1 1 = 0.7, <72* = 0.5, 0 3* = 0.One can interpret these constants in terms of the steric
suitability of the various conformers for frontside attack by the 80mBr leading to inversion of configuration. An inspection of appropriate steric models reveals immediately that backside attack in the case RC-' is sterically extremely unlikely which is consistent with '.he derived value <73 = 0 . 0 3 1
and CT21 determined by this method are very similar indicating nearly the same probability for attack from the backside in the RT and RG conformers. This does not appear unreasonable from the steric point of view, which let the probability of backside attack appear approximately equal for these two conformers. The difference between the
presently determined cross sections and those previously observed for 38C1 for Cl substitution,7 where the corresponding values were found to be a\ = 1 and <72' = 0.4, could be explained in terms of competing reactions. One could argue that in the case of Cl attack more overall energy might be available than when Br is the attacking species leading to an enhanced C-C bond scission which is more favorable for the RG form than for the RT form. This competing reaction would consequently reduce the contribution made via the backside attack of Cl at the RT form to the overall substitution resulting in the inverted product.
So far as the retention of configuration is concerned it appears difficult from the steric viewpoint to justify significant differences in the relative suitability for frontside attack for the three conformers. The fact that the data analysis suggests a relative large cross section for frontside attack followed by substitution with retention of configuration in the case of the RG' conformer and smaller but similar cross sections for the RT and RG conformers may have again to be explained with competing reactions, showing different cross sections in each of the conformers. They also seem to differ when the attacking species is a chlorine or a bromine atom.
The results obtained for the other diastereomer, the m e s o -2,3-dichlorobutane, can qualitatively be discussed in similar terms. It seems to us that the strong conformational effects observed in this study can best be explained in terms of a hot one-step replacement leading to 80mBr for Cl substitution and not by two-step radical combination processes.
Whether this excharge occurs via a caged comp, x as postulated by Stocklin et al.6-7 for the analogous 38C1 for Cl substitution or via another molecular mechanism as suggested by Root et al. 18 for the 18F for F substitution or by Pettijohn29 for the 38C1 for Cl exchange in 2 -chloropropion- yl chloride cannot be answered on the basis of the presented results and will have to be further explored.
B. 81B r ( n , y ) 82mB r ( I T ) S2B r a n d 80mB r ( I T ) S0B r. The neutron irradiation of mixtures of Br2 or CBr4 and 2,3-dichlo- robutanes in solutions results in the formation of reactive 82mBr which will become incorporated via hot atom reactions into a large number of compounds.
The subsequent isomeric transition of 82mBr bound in these compounds, a process which is strongly internally converted,30 gives rise to vacancy cascades and leads eventually to a substantial fragmentation of the molecules via Coulomb explosion and to the formation of 82Br ions with multiple positive charges.31 More than 90% of the resulting Br species are highly charged. Simultaneously the Auger electrons emitted in this process will cause considerable radiolysis among the surrounding molecules by Auger radiolysis or dissociative electron capture (autoradiolysis model) .3 Several mechanisms can then be postulated for the 82Br for Cl exchange. In the gas phase the Br ion will be rapidly reduced to unity by charge transfer processes and the resulting 82Br+ can subsequently undergo electrophilic reactions with organic substrate molecules.9 - 1 13 2 In the case of 2,3-dichlorobutane it was assumed that frontside attack leads preferentially to an intermediate with three centered bond structure yielding
Cl Cl—--Br\ \ 7
CH — C— C— CHI IH H
The Journal o f Physical Chemistry, Vol. 80, No. 7, 1976
664 Ying-yet Su and Hans J. Ache
a substitution product which retains the original configuration. Changes in the retention to inversion have been explained by an excitation racemization mechanism.9
This explanation seems not to be suitable for condensed phase reactions where neutralization by charge exchange is assumed to occur considerably more rapidly, which in turn makes electrophilic substitution very unlikely.2
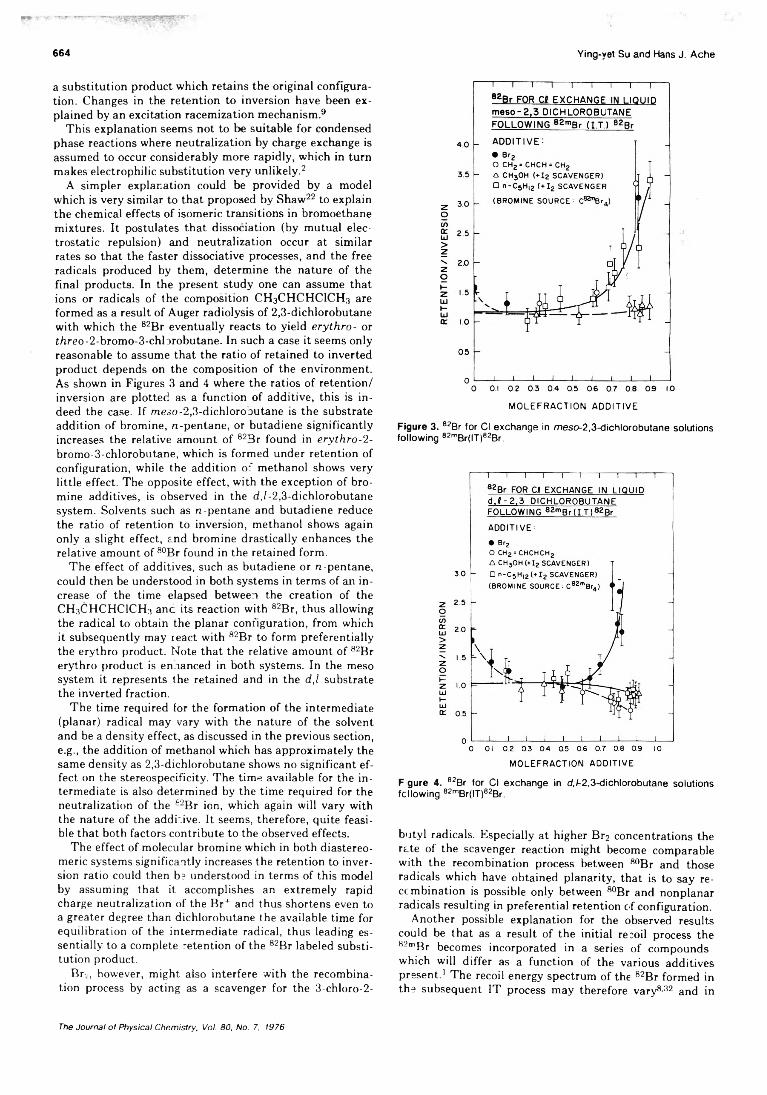
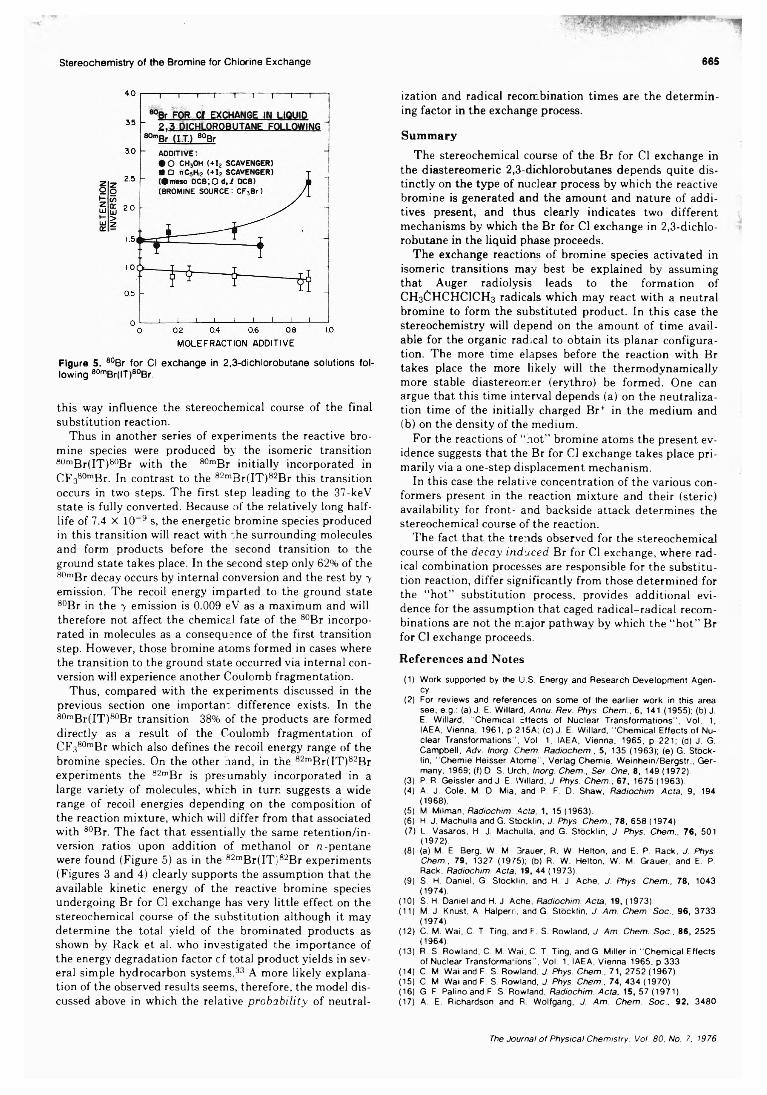
A simpler explanation could be provided by a model which is very similar to that proposed by Shaw22 to explain the chemical effects of isomeric transitions in bromoethane mixtures. It postulates that dissociation (by mutual electrostatic repulsion) and neutralization occur at similar rates so that the faster dissociative processes, and the free radicals produced by them, determine the nature of the final products. In the present study one can assume that ions or radicals of the composition CH3CHCHCICH3 are formed as a result of Auger radiolysis of 2,3-dichlorobutane with which the 82Br eventually reacts to yield e r y t h r o - or f/ireo-2-bromo-3-chlorobutane. In such a case it seems only reasonable to assume that the ratio of retained to inverted product depends on the composition of the environment. As shown in Figures 3 and 4 where the ratios of retention/ inversion are plotted as a function of additive, this is indeed the case. If meso-2,3-dichlorooutane is the substrate addition of bromine, n-pentane, or butadiene significantly increases the relative amount of 82Br found in e r y t h r o - 2 - bromo-3-chlorobutane, which is formed under retention of configuration, while the addition of methanol shows very little effect. The opposite effect, with the exception of bromine additives, is observed in the d ,(-2,3-dichlorobutane system. Solvents such as n-pentane and butadiene reduce the ratio of retention to inversion, methanol shows again only a slight effect, and bromine drastically enhances the relative amount of 80Br found in the retained form.
The effect of additives, such as butadiene or n -pentane, could then be understood in both systems in terms of an increase of the time elapsed between the creation of the CHsCHCHClCH.-j anc its reaction with 82Br, thus allowing the radical to obtain the planar configuration, from which it subsequently may react with 82Br to form preferentially the erythro product. Note that the relative amount of 82Br erythro product is enhanced in both systems. In the meso system it represents the retained and in the d ,l substrate the inverted fraction.
The time required for the formation of the intermediate (planar) radical may vary with the nature of the solvent and be a density effect, as discussed in the previous section, e.g., the addition of methanol which has approximately the same density as 2,3-dichlorobutane shows no significant effect on the stereospecificity. The time available for the intermediate is also determined by the time required for the neutralization of the 62Br ion, which again will vary with the nature of the additive. It seems, therefore, quite feasible that both factors contribute to the observed effects.
The effect of molecular bromine which in both diastereo- meric systems significantly increases the retention to inversion ratio could then be understood in terms of this model by assuming that it accomplishes an extremely rapid charge neutralization of the Br+ and thus shortens even to a greater degree than dichlorobutane the available time for equilibration of the intermediate radical, thus leading essentially to a complete retention of the 82Br labeled substitution product.
Br , however, might also interfere with the recombination process by acting as a scavenger for the 3-chloro-2-
MOLEFRACTION ADDITIVE
Figure 3. 82Br for Cl exchange in meso-2,3-dichlorobutane solutions following 82mBr(IT)e2Br.
F gure 4. 82Br for Cl exchange in d,/-2,3-dichlorobutane solutions following 82mBr(IT)82Br.
butyl radicals. Especially at higher Br2 concentrations the rate of the scavenger reaction might become comparable with the recombination process between 80Br and those radicals which have obtained planarity, that is to say recombination is possible only between 80Br and nonplanar radicals resulting in preferential retention of configuration.
Another possible explanation for the observed results could be that as a result of the initial recoil process the 82mBr becomes incorporated in a series of compounds which will differ as a function of the various additives present. 1 The recoil energy spectrum of the 82Br formed in the subsequent IT process may therefore vary8-32 and in
The Journal of Physical Chemistry, Vol. 80, No. 7, 1976
Stereochemistry of the Bromine for Chlorine Exchange 665
Figure 5. 80Br for Cl exchange in 2,3-dichlorobutane solutions following 80mBr(IT)80Br.
this way influence the stereochemical course of the final substitution reaction.
Thus in another series of experiments the reactive bromine species were produced by the isomeric transition 80mBr(IT)80Br with the 80mBr initially incorporated in Qp380mgr jn contrast to the 82mBr(IT)82Br this transition occurs in two steps. The first step leading to the 37-keV state is fully converted. Because of the relatively long half- life of 7.4 X 10⁻⁹ s, the energetic bromine species produced in this transition will react with The surrounding molecules and form products before the second transition to the ground state takes place. In the second step only 62% of the 80mBr decay occurs by internal conversion and the rest by y emission. The recoil energy imparted to the ground state 80Br in the y emission is 0.009 eV as a maximum and will therefore not affect the chemical fate of the 80Br incorporated in molecules as a consequence of the first transition step. However, those bromine atoms formed in cases where the transition to the ground state occurred via internal conversion will experience another Coulomb fragmentation.
Thus, compared with the experiments discussed in the previous section one important difference exists. In the 8°mBr(IT)80Br transition 38% of the products are formed directly as a result of the Coulomb fragmentation of CF380mgr wh;ch also defines the recoil energy range of the bromine species. On the other nand, in the 82mBr(IT)82Br experiments the 82mBr is presumably incorporated in a large variety of molecules, which in turn suggests a wide range of recoil energies depending on the composition of the reaction mixture, which will differ from that associated with 80Br. The fact that essentially the same retention/in- version ratios upon addition of methanol or n -pentane were found (Figure 5) as in the 82mBr(IT)82Br experiments (Figures 3 and 4) clearly supports the assumption that the available kinetic energy of the reactive bromine species undergoing Br for Cl exchange has very little effect on the stereochemical course of the substitution although it may determine the total yield of the brominated products as shown by Rack et al. who investigated the importance of the energy degradation factor cf total product yields in several simple hydrocarbon systems.33 A more likely explanation of the observed results seems, therefore, the model discussed above in which the relative p r o b a b i l i ty of neutral
SummaryThe stereochemical course of the Br for Cl exchange in
the diastereomeric 2,3-dichlorobutanes depends quite distinctly on the type of nuclear process by which the reactive bromine is generated and the amount and nature of additives present, and thus clearly indicates two different mechanisms by which the Br for Cl exchange in 2,3-dichlorobutane in the liquid phase proceeds.
The exchange reactions of bromine species activated in isomeric transitions may best be explained by assuming that Auger radiolysis leads to the formation of CH3CHCHCICH3 radicals which may react with a neutral bromine to form the substituted product. In this case the stereochemistry will depend on the amount of time available for the organic radical to obtain its planar configuration. The more time elapses before the reaction with Br takes place the more likely will the thermodynamically more stable diastereomer (erythro) be formed. One can argue that this time interval depends (a) on the neutralization time of the initially charged Br+ in the medium and(b) on the density of the medium.
For the reactions of “not” bromine atoms the present evidence suggests that the Br for Cl exchange takes place primarily via a one-step displacement mechanism.
In this case the relative concentration of the various con- formers present in the reaction mixture and their (steric) availability for front- and backside attack determines the stereochemical course of the reaction.
The fact that the trends observed for the stereochemical course of the d e c a y in d u c e d Br for Cl exchange, where radical combination processes are responsible for the substitution reaction, differ significantly from those determined for the “hot” substitution process, provides additional evidence for the assumption that caged radical-radical recombinations are not the major pathway by which the “hot” Br for Cl exchange proceeds.
References and Notes(1) Work supported by the U.S. Energy and Research Development Agen
cy.(2) For reviews and references on some of the earlier work in this area
see, e.g.: (a) J. E. Willard, Annu. Rev. Phys. Chem., 6 , 141 (1955); (b) J.E. Willard, "Chemical Effects of Nuclear Transformations", Vol. 1, IAEA, Vienna, 1961, p 215A; (c) J. E. Willard, "Chemical Effects of Nuclear Transformations” , Vol. 1, IAEA, Vienna, 1965, p 221; (d) J. G. Campbell, Adv. tnorg. Chem. Radiochem., 5, 135 (1963); (e) G. Stock- lin, "Chemie Heisser Atome” , Verlag Chemie, Weinhein/Bergstr., Germany, 1969; (f) D. S. Urch, tnorg. Chem., Ser. One, 8 , 149 (1972).
(3) P. R. Geissler and J. E. Willard, J. Phys. Chem., 67, 1675 (1963).(4) A. J. Cole, M. D. Mia, and P. F. D. Shaw, Radiochim. Acta, 9, 194
(1968).(5) M. Milman, Radiochim. Acta, 1, 15 (1963).(6 ) H. J. Machulla and G. Stbcklin, J. Phys. Chem., 78, 658 (1974).(7) L Vasaros, FI. J. Machulla, and G. Stocklin, J. Phys. Chem., 76, 501
(1972).(8) (a) M. E. Berg. W. M. Grauer, R. W. Flelton, and E. P. Rack, J. Phys.
Chem., 79, 1327 (1975); (b) R. W. Helton, W. M. Grauer, and E. P. Rack, Radiochim. Acta, 19, 44 (1973).
(9) S. H. Daniel, G. Stbcklin, and H. J. Ache, J. Phys. Chem., 78, 1043 (1974).
(10) S. H. Daniel and H. J. Ache, Radiochim. Acta, 19, (1973).(11) M. J. Knust, A. Halpern, and G. Stocklin, J. Am. Chem. Soc., 96, 3733
(1974).(12) C M. Wai, C. T. Ting, and F. S. Rowland, J. Am. Chem. Soc., 8 6 , 2525
(1964).(13) R. S. Rowland, C. M. Wai, C. T. Ting, and G. Miller in "Chemical Effects
of Nuclear Transformations", Vol. 1, IAEA, Vienna 1965, p 333.(14) C. M. Wai and F. S. Rowland, J. Phys. Chem., 71, 2752 (1967).(15) C. M. Wai and F. S. Rowland, J. Phys. Chem., 74, 434 (1970).(16) G. F. Palino and F. S. Rowland, Radiochim. Acta, 15, 57 (1971).(17) A. E. Richardson and R. Wolfgang, J. Am. Chem. Soc., 92, 3480
ization and radical recombination times are the determining factor in the exchange process.
The Journal o f Physical Chemistry, Vol. 80. No. 7, 1976
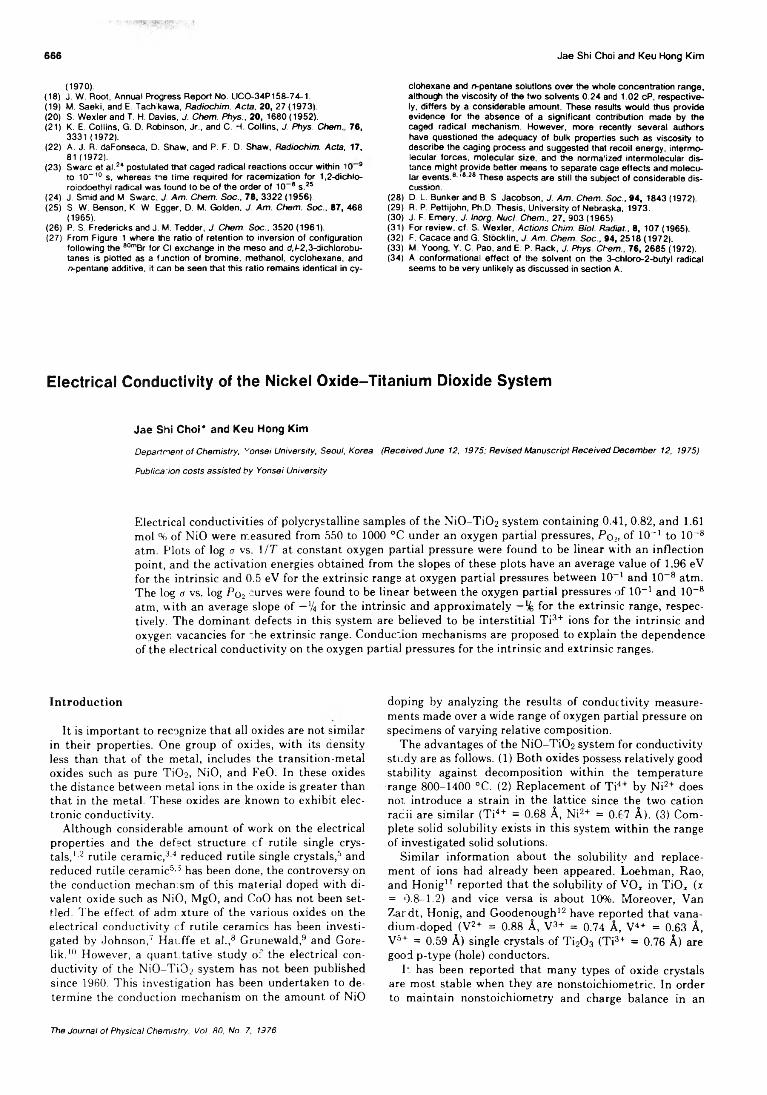
666 Jae Shi Choi and Keu Hong Kim
(1970).(18) J. W. Root, Annual Progress Report No. UCO-34P158-74-1.(19) M. Saeki, and E. Tachikawa, Radiochim. Acta, 20, 27 (1973).(20) S. Wexler and T. H. Davies, J. Chem. Phys., 20, 1680 (1952).(21) K. E. Collins, G. D. Robinson, Jr., and C. H. Collins, J. Phys. Chem. 76,
3331 (1972).(22) A. J. R. daFonseca, D. Shaw, and P. F. D. Shaw, Radiochim. Acta, 17,
81 (1972).(23) Swarc et al.24 postulated that caged radical reactions occur within 10 9
to 10- , ° s, whereas Me time required for racemization for 1,2-dichlo- roiodoethyl radical was found to be of the order of 10 - 8 s .25
(24) J. Smid and M. Swarc, J. Am. Chem. Soc., 78, 3322 (1956).(25) S. W. Benson, K. W. Egger, D. M. Golden, J. Am. Chem. Soc., 87, 468
(1965).(26) P. S. Fredericks and J. M. Tedder, J. Chem. Soc., 3520 (1961).(27) From Figure 1 where the ratio of retention to inversion of configuration
following the SOmBr for Cl exchange in the meso and d,/-2,3-dichlorobu- tanes Is plotted as a function of bromine, methanol, cyclohexane, and n-pentane additive, it can be seen that this ratio remains identical in cy
clohexane and n-pentane solutions over the whole concentration range, although the viscosity of the two solvents 0.24 and 1.02 cP, respectively, differs by a considerable amount. These results would thus provide evidence for the absence of a significant contribution made by the caged radical mechanism. However, more recently several authors have questioned the adequacy of bulk properties such as viscosity to describe the caging process and suggested that recoil energy, Intermo- lecular forces, molecular size, and the norma'lzed intermolecular distance might provide better means to separate cage effects and molecular events.0- '0,28 These aspects are still the subject of considerable discussion.
(28) D. L. Bunker and B. S. Jacobson, J. Am. Chem. Soc., 94, 1843 (1972).(29) R. P. Pettijohn, Ph.D. Thesis, University of Nebraska. 1973.(30) J. F. Emery, J. Inorg. Nucl. Chem., 27, 903 (1965).(31) For review, cf. S Wexler, Actions Chim. Biol. Radiat., 8 , 107 (1965).(32) F. Cacace and G. Stocklin, J. Am. Chem. Soc., 94, 2518 (1972).(33) M. Yoong, Y. C. Pao, and E. P. Rack, J. Phys. Chem., 76, 2685 (1972).(34) A conformational effect of the solvent on the 3-chloro-2-butyl radical
seems to be very unlikely as discussed In section A.
E lectrical Conductivity of th e N ickel O xid e-T ita n iu m D ioxide S y ste m
Jae Shi Choi* and Keu Hong Kim
Department of Chemistry, vonsei University, Seoul, Korea (Received June 12, 1975; Revised Manuscript Received December 12, 1975)
Publicarion costs assisted by Yonsei University
Electrical conductivities of polycrystalline samples of the Ni0 -Ti0 2 system containing 0.41, 0.82, and 1.61 mol % of NiO were measured from 550 to 1000 °C under an oxygen partial pressures, P q ±, of 10' 1 to 1 0 - 8
atm. Plots of log a vs. 1 I T at constant oxygen partial pressure were found to be linear with an inflection point, and the activation energies obtained from the slopes of these plots have an average value of 1.96 eV for the intrinsic and 0.5 eV for the extrinsic range at oxygen partial pressures between 10' 1 and 10- 8 atm. The log <x vs. log P02 curves were found to be linear between the oxygen partial pressures of 10_1 and 10- 8
atm, with an average slope of —lk for the intrinsic and approximately —% for the extrinsic range, respectively. The dominant defects in this system are believed to be interstitial Ti3+ ions for the intrinsic and oxygen vacancies for the extrinsic range. Conduction mechanisms are proposed to explain the dependence of the electrical conductivity on the oxygen partial pressures for the intrinsic and extrinsic ranges.
Introduction
It is important to recognize that all oxides are not similar in their properties. One group of oxides, with its density less than that of the metal, includes the transition-metal oxides such as pure Ti0 2 , NiO, and FeO. In these oxides the distance between metal ions in the oxide is greater than that in the metal. These oxides are known to exhibit electronic conductivity.
Although considerable amount of work on the electrical properties and the defect structure cf rutile single crystals, 1-2 rutile ceramic,3-4 reduced rutile single crystals,5 and reduced rutile ceramic5-3 has been done, the controversy on the conduction mechanism of this material doped with divalent oxide such as NiO, MgO, and CoO has not been settled. The effect of admixture of the various oxides on the electrical conductivity cf rutile ceramics has been investigated by Johnson,7 Hauffe et al. ,8 Grünewald,9 and Gorelik. 10 However, a quantitative study o: the electrical conductivity of the Ni0 -T i0 2 system has not been published since 1960. This investigation has been undertaken to determine the conduction mechanism on the amount of NiO
doping by analyzing the results of conductivity measurements made over a wide range of oxygen partial pressure on specimens of varying relative composition.
The advantages of the NiO-Ti0 2 system for conductivity study are as follows. (1) Both oxides possess relatively good stability against decomposition within the temperature range 800-1400 °C. (2) Replacement of Ti4+ by Ni2+ does not introduce a strain in the lattice since the two cation racii are similar (Ti4+ = 0 .6 8 A, Ni2+ = 0.67 A ). (3) Complete solid solubility exists in this system within the range of investigated solid solutions.
Similar information about the solubility and replacement of ions had already been appeared. Loehman, Rao, and Honig11 reported that the solubility of VO* in TiOx (x = 0.8-1.2) and vice versa is about 10%. Moreover, Van Zar dt, Honig, and Goodenough12 have reported that vanadium-doped (V2+ = 0 .8 8 A, V3+ = 0.74 A, V4+ = 0.63 A, V5+ = 0.59 A ) single crystals of Ti20 3 (Ti3+ = 0.76 A ) are good p-type (hole) conductors.
Iz has been reported that many types of oxide crystals are most stable when they are nonstoichiometric. In order to maintain nonstoichiometry and charge balance in an
The Journal of Physical Chemistry, Vol. 80, No. 7, 1376
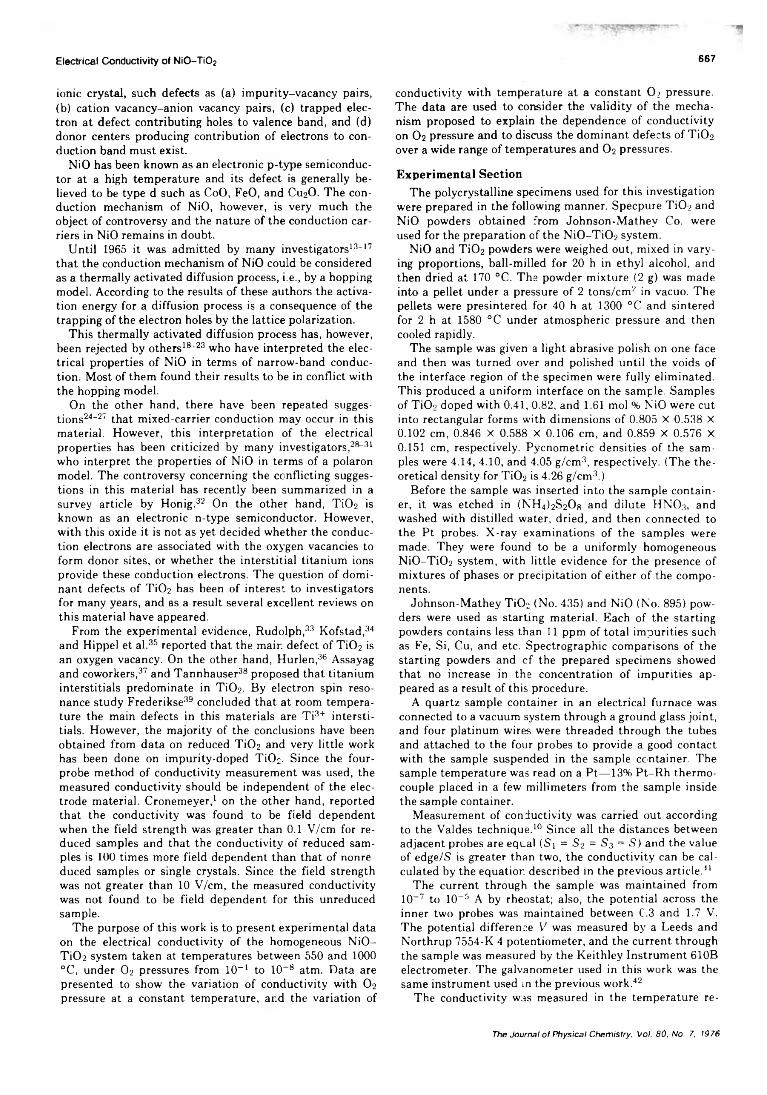
Electrical Conductivity of N i0-T i02 667
ionic crystal, such defects as (a) impurity-vacancy pairs,(b) cation vacancy-anion vacancy pairs, (c) trapped electron at defect contributing holes to valence band, and (d) donor centers producing contribution of electrons to conduction band must exist.
NiO has been known as an electronic p-type semiconductor at a high temperature and its defect is generally believed to be type d such as CoO, FeO, and CU2O. The conduction mechanism of NiO, however, is very much the object of controversy and the nature of the conduction carriers in NiO remains in doubt.
Until 1965 it was admitted by many investigators13-17
that the conduction mechanism of NiO could be considered as a thermally activated diffusion process, i.e., by a hopping model. According to the results of these authors the activation energy for a diffusion process is a consequence of the trapping of the electron holes by the lattice polarization.
This thermally activated diffusion process has, however, been rejected by others18-23 who have interpreted the electrical properties of NiO in terms of narrow-band conduction. Most of them found their results to be in conflict with the hopping model.
On the other hand, there have been repeated suggestions24-27 that mixed-carrier conduction may occur in this material. However, this interpretation of the electrical properties has been criticized by many investigators,28-31
who interpret the properties of NiO in terms of a polaron model. The controversy concerning the conflicting suggestions in this material has recently been summarized in a survey article by Honig.32 On the other hand, TÌO2 is known as an electronic n-type semiconductor. However, with this oxide it is not as yet decided whether the conduction electrons are associated with the oxygen vacancies to form donor sites, or whether the interstitial titanium ions provide these conduction electrons. The question of dominant defects of Ti02 has been of interest to investigators for many years, and as a result several excellent reviews on this material have appeared.
From the experimental evidence, Rudolph,33 Kofstad,34
and Hippel et al.35 reported that the main defect of Ti02 is an oxygen vacancy. On the other hand, Hurlen,36 Assayag and coworkers,37 and Tannhäuser38 proposed that titanium interstitials predominate in Ti02. By electron spin resonance study Frederikse39 concluded that at room temperature the main defects in this materials are Ti3+ interstitials. However, the majority of the conclusions have been obtained from data on reduced Ti02 and very little work has been done on impurity-doped Ti02. Since the four- probe method of conductivity measurement was used, the measured conductivity should be independent of the electrode material. Cronemeyer,1 on the other hand, reported that the conductivity was found to be field dependent when the field strength was greater than 0.1 V/cm for reduced samples and that the conductivity of reduced samples is 1 0 0 times more field dependent than that of nonre- duced samples or single crystals. Since the field strength was not greater than 10 V/cm, the measured conductivity was not found to be field dependent for this unreduced sample.
The purpose of this work is to present experimental data on the electrical conductivity of the homogeneous NiO- Ti02 system taken at temperatures between 550 and 1000 °C, under 0 2 pressures from 10- 1 to 10- 8 atm. Data are presented to show the variation of conductivity with 0 2
pressure at a constant temperature, and the variation of
conductivity with temperature at a constant 0 2 pressure. The data are used to consider the validity of the mechanism proposed to explain the dependence of conductivity on 0 2 pressure and to discuss the dominant defects of Ti02
over a wide range of temperatures and 0 2 pressures.
Experimental SectionThe polycrystalline specimens used for this investigation
were prepared in the following manner. Specpure Ti02 and NiO powders obtained from Johnson-Mathey Co. were used for the preparation of the NiO-Ti02 system.
NiO and Ti02 powders were weighed out, mixed in varying proportions, ball-milled for 2 0 h in ethyl alcohol, and then dried at 170 °C. The powder mixture (2 g) was made into a pellet under a pressure of 2 tons/cm2 in vacuo. The pellets were presintered for 40 h at 1300 °C and sintered for 2 h at 1580 °C under atmospheric pressure and then cooled rapidly.
The sample was given a light abrasive polish on one face and then was turned over and polished until the voids of the interface region of the specimen were fully eliminated. This produced a uniform interface on the sample. Samples of Ti02 doped with 0.41, 0.82, and 1.61 mol % NiO were cut into rectangular forms with dimensions of 0.805 X 0.538 X0.102 cm, 0.846 X 0.588 X 0.106 cm, and 0.859 X 0.576 X0.151 cm, respectively. Pycnometric densities of the samples were 4.14, 4.10, and 4.05 g/cm3, respectively. (The theoretical density for Ti02 is 4.26 g/cm3.)
Before the sample was inserted into the sample container, it was etched in (NH4)2S208 and dilute HN02, and washed with distilled water, dried, and then connected to the Pt probes. X-ray examinations of the samples were made. They were found to be a uniformly homogeneous NiO-Ti02 system, with little evidence for the presence of mixtures of phases or precipitation of either of the components.
Johnson-Mathey Ti02 (No. 435) and NiO (No. 895) powders were used as starting material. Each of the starting powders contains less than 1 1 ppm of total impurities such as Fe, Si, Cu, and etc. Spectrographic comparisons of the starting powders and cf the prepared specimens showed that no increase in the concentration of impurities appeared as a result of this procedure.
A quartz sample container in an electrical furnace was connected to a vacuum system through a ground glass joint, and four platinum wires were threaded through the tubes and attached to the four probes to provide a good contact with the sample suspended in the sample container. The sample temperature was read on a Pt— 13% Pt-Rh thermocouple placed in a few millimeters from the sample inside the sample container.
Measurement of conductivity was carried out according to the Valdes technique. 10 Since all the distances between adjacent probes are equal (Sx = S2 = S3 = S ) and the value of edge/S is greater than two, the conductivity can be calculated by the equation described in the previous article.41
The current through the sample was maintained from 10- 7 to 10- 5 A by rheostat; also, the potential across the inner two probes was maintained between 0.3 and 1.7 V. The potential difference V was measured by a Leeds and Northrup 7554-K 4 potentiometer, and the current through the sample was measured by the Keithley Instrument 610B electrometer. The galvanometer used in this work was the same instrument used in the previous work.42
The conductivity was measured in the temperature re
The Journal of Physical Chemistry, Vo/. 80, No. 7, 1976
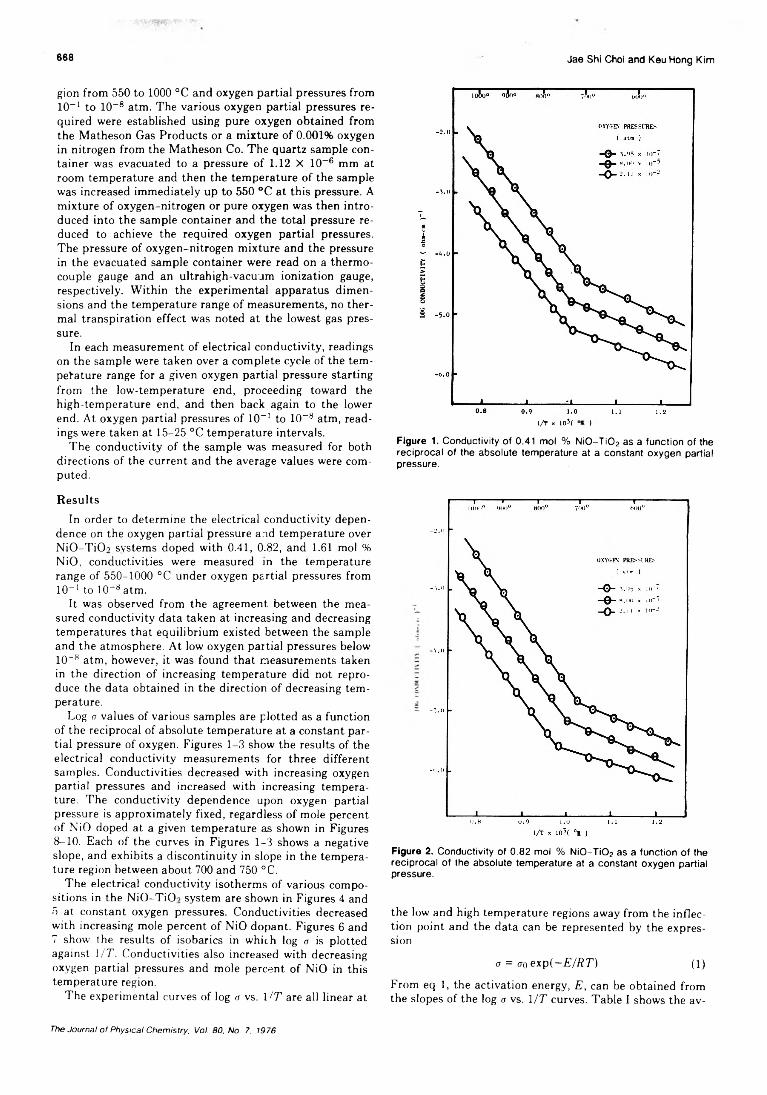
668 Jae Shi Choi and Keu Hong Kim
gion from 550 to 1000 °C and oxygen partial pressures from 10“ 1 to 10~ 8 atm. The various oxygen partial pressures required were established using pure oxygen obtained from the Matheson Gas Products or a mixture of 0.001% oxygen in nitrogen from the Matheson Co. The quartz sample container was evacuated to a pressure of 1.12 X 10- 6 mm at room temperature and then the temperature of the sample was increased immediately up to 550 °C at this pressure. A mixture of oxygen-nitrogen or pure oxygen was then introduced into the sample container and the total pressure reduced to achieve the required oxygen partial pressures. The pressure of oxygen-nitrogen mixture and the pressure in the evacuated sample container were read on a thermocouple gauge and an ultrahigh-vacuum ionization gauge, respectively. Within the experimental apparatus dimensions and the temperature range of measurements, no thermal transpiration effect was noted at the lowest gas pressure.
In each measurement of electrical conductivity, readings on the sample were taken over a complete cycle of the temperature range for a given oxygen partial pressure starting from the low-temperature end, proceeding toward the high-temperature end, and then back again to the lower end. At oxygen partial pressures of 10- 1 to 1 0 ~ 8 atm, readings were taken at 15-25 °C temperature intervals.
The conductivity of the sample was measured for both directions of the current and the average values were computed.
ResultsIn order to determine the electrical conductivity depen
dence on the oxygen partial pressure and temperature over NiO-TiOo systems doped with 0.41, 0.82, and 1.61 mol % NiO, conductivities were measured in the temperature range of 550-1000 °C under oxygen partial pressures from 1 0 ~' to 1 0 - 8 atm.
It was observed from the agreement between the measured conductivity data taken at increasing and decreasing temperatures that equilibrium existed between the sample and the atmosphere. At low oxygen partial pressures below 1 0 ~ 8 atm, however, it was found that measurements taken in the direction of increasing temperature did not reproduce the data obtained in the direction of decreasing temperature.
Log <r values of various samples are plotted as a function of the reciprocal of absolute temperature at a constant partial pressure of oxygen. Figures 1-3 show the results of the electrical conductivity measurements for three different samples. Conductivities decreased with increasing oxygen partial pressures and increased with increasing temperature. The conductivity dependence upon oxygen partial pressure is approximately fixed, regardless of mole percent of NiO doped at a given temperature as shown in Figures8-10. Each of the curves in Figures 1-3 shows a negative slope, and exhibits a discontinuity in slope in the temperature region between about 700 and 750 °C.
The electrical conductivity isotherms of various compositions in the NiO-TiCL system are shown in Figures 4 and 5 at constant oxygen pressures. Conductivities decreased with increasing mole percent of NiO dopant. Figures 6 and 7 show the results of isobarics in which log a is plotted against 1/71 Conductivities also increased with decreasing oxygen partial pressures and mole percent of NiO in this temperature region.
The experimental curves of log a vs. l^T are all linear at
l/T x lo’( )Figure 1. Conductivity of 0.41 mol % NiO-Ti02 as a function of the reciprocal of the absolute temperature at a constant oxygen partial pressure.
Figure 2. Conductivity of 0.82 mol % NiO-Ti02 as a function of the reciprocal of the absolute temperature at a constant oxygen partial pressure.
the low and high temperature regions away from the inflection point and the data can be represented by the expression
a = a0 e x p ( - E / R T ) (1 )
From eq 1 , the activation energy, E , can be obtained from the slopes of the log a vs. l/T curves. Table I shows the av-
The Journal of Physical Chemistry, Voi. 80, No. 7, 1976
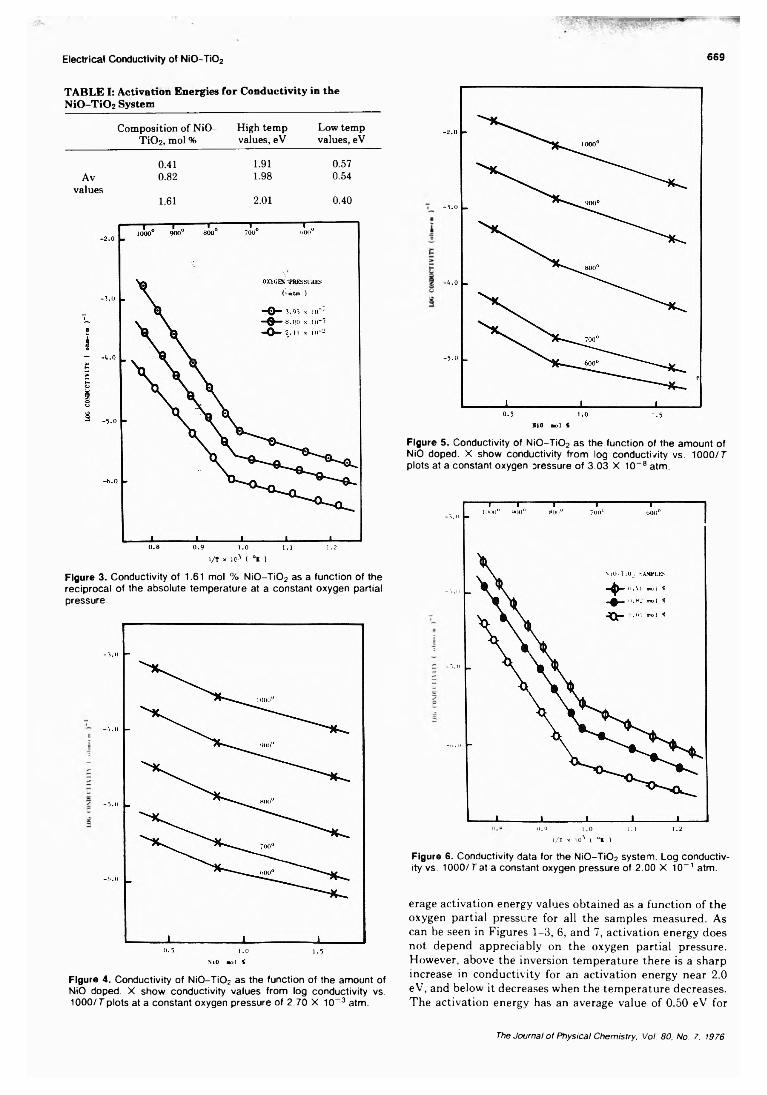
Electrical Conductivity of NiO-Ti02 669
TABLE I: Activation Energies for Conductivity in the NiOTi02 System
Composition of NiO- Ti02, mol %
High temp values, eV
Low temp values, eV
0.41 1.91 0.57Av 0.82 1.98 0.54
values1.61 2.01 0.40
l/T x ID3 ( ° I )
Figure 3. Conductivity of 1.61 moi % N i0 -T i0 2 as a function of the reciprocal of the absolute temperature at a constant oxygen partial pressure.
Figure 4. Conductivity of NiO-Ti02 as the function of the amount of NiO doped. X show conductivity values from log conductivity vs. 1000/7" plots at a constant oxygen pressure of 2.70 X 10- 3 atm.
Figure 5. Conductivity of NiO-Ti02 as the function of the amount of NiO doped. X show conductivity from log conductivity vs. 1000/ T plots at a constant oxygen pressure of 3.03 X 10- 8 atm.
'I.o 1.0 1.1 1.2l /T x 103 ( ° 1 )
Figure 6 . Conductivity data for the NiO-Ti02 system. Log conductivity vs. 1000/7"at a constant oxygen pressure of 2.00 X 10_ 1 atm.
erage activation energy values obtained as a function of the oxygen partial pressure for all the samples measured. As can be seen in Figures 1-3, 6, and 7, activation energy does not depend appreciably on the oxygen partial pressure. However, above the inversion temperature there is a sharp increase in conductivity for an activation energy near 2.0 eV, and below it decreases when the temperature decreases. The activation energy has an average value of 0.50 eV for
The Journal of Physical Chemistry. Vol. 80, No. 7. 1976
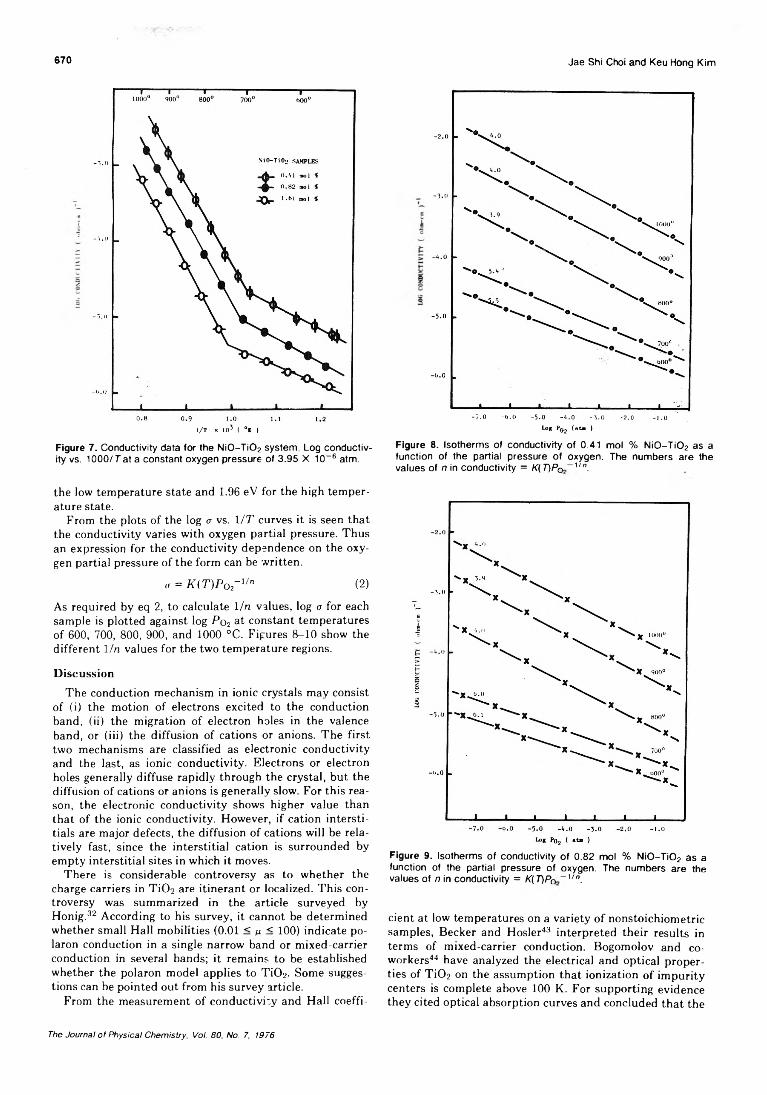
670 Jae Shi Choi and Keu Hong Kim
l/T x 105 ( °I )Figure 7. Conductivity data for the NiO-Ti02 system. Log conductivity vs. 1000/7 at a constant oxygen pressure of 3.95 X 10- 6 atm.
the low temperature state and 1.96 eV for the high temperature state.
From the plots of the log <r vs. l /T curves it is seen that the conductivity varies with oxygen partial pressure. Thus an expression for the conductivity dependence on the oxygen partial pressure of the form can be written.
<r = K(T)Po2~1/n (2)As required by eq 2, to calculate 1 In values, log a for each sample is plotted against log Po2 at constant temperatures of 600, 700, 800, 900, and 1000 °C. Figures 8-10 show the different 1 /n values for the two temperature regions.
DiscussionThe conduction mechanism in ionic crystals may consist
of (i) the motion of electrons excited to the conduction band, (ii) the migration of electron holes in the valence band, or (iii) the diffusion of cations or anions. The first two mechanisms are classified as electronic conductivity and the last, as ionic conductivity. Electrons or electron holes generally diffuse rapidly through the crystal, but the diffusion of cations or anions is generally slow. For this reason, the electronic conductivity shows higher value than that of the ionic conductivity. However, if cation interstitials are major defects, the diffusion of cations will be relatively fast, since the interstitial cation is surrounded by empty interstitial sites in which it moves.
There is considerable controversy as to whether the charge carriers in Ti02 are itinerant or localized. This controversy was summarized in the article surveyed by Honig.32 According to his survey, it cannot be determined whether small Hall mobilities (0.01 < < 100) indicate po- laron conduction in a single narrow band or mixed-carrier conduction in several bands; it remains to be established whether the polaron model applies to TiC>2. Some suggestions can be pointed out from his survey article.
From the measurement of conductivity and Hall coeffi-
-7.0 -b.O -5.0 -4.0 -3.0 -2.0 -1.0Log Pq2 ( a t - )
Figure 8 . Isotherms of conductivity of 0.41 mol % NiO-Ti02 as a function of the partial pressure of oxygen. The numbers are the values of n in conductivity = K(T)P0 ~'l/n.
Figure 9. Isotherms of conductivity of 0.82 mol % NiO-Ti02 as a function of the partial pressure of oxygen. The numbers are the values of n in conductivity = K(T)P0 ~'i,n.
cient at low temperatures on a variety of nonstoichiometric samples, Becker and Hosier43 interpreted their results in terms of mixed-carrier conduction. Bogomolov and coworkers44 have analyzed the electrical and optical properties of T i0 2 on the assumption that ionization of impurity centers is complete above 100 K. For supporting evidence they cited optical absorption curves and concluded that the
The Journal of Physical Chemistry, Vol. 80, No. 7, 1976
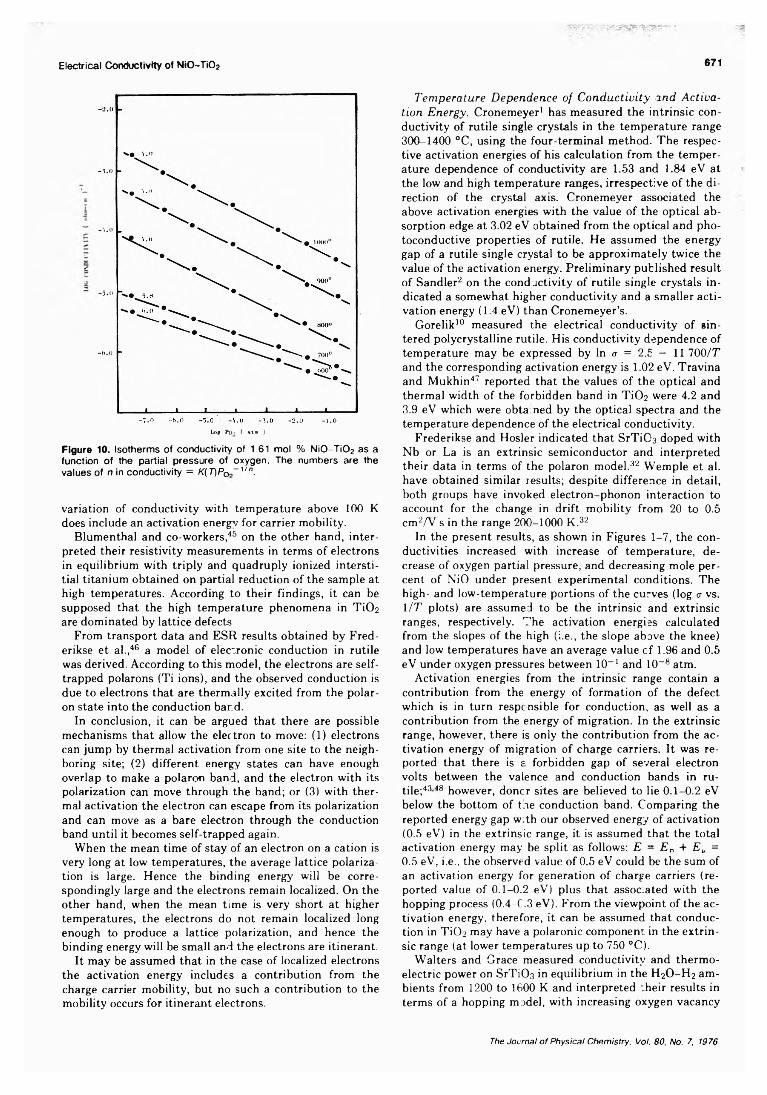
Electrical Conductivity of NiO-Ti02 671
Log Poo ( atm )
Figure 10. Isotherms of conductivity of 1.61 mol % NiO-Ti02 as a function of the partial pressure of oxygen. The numbers are the values of n in conductivity = K(T)P0 ~''ln.
variation of conductivity with temperature above 100 K does include an activation energy for carrier mobility.
Blumenthal and co-workers,45 on the other hand, interpreted their resistivity measurements in terms of electrons in equilibrium with triply and quadruply ionized interstitial titanium obtained on partial reduction of the sample at high temperatures. According to their findings, it can be supposed that the high temperature phenomena in T i0 2 are dominated by lattice defects
From transport data and ESR results obtained by Fred- erikse et al.,46 a model of electronic conduction in rutile was derived. According to this model, the electrons are self- trapped polarons (Ti ions), and the observed conduction is due to electrons that are thermally excited from the polar- on state into the conduction band.
In conclusion, it can be argued that there are possible mechanisms that allow the electron to move: (1 ) electrons can jump by thermal activation from one site to the neighboring site; (2) different energy states can have enough overlap to make a polaron band, and the electron with its polarization can move through the band; or (3) with thermal activation the electron can escape from its polarization and can move as a bare electron through the conduction band until it becomes self-trapped again.
When the mean time of stay of an electron on a cation is very long at low temperatures, the average lattice polarization is large. Hence the binding energy will be correspondingly large and the electrons remain localized. On the other hand, when the mean time is very short at higher temperatures, the electrons do not remain localized long enough to produce a lattice polarization, and hence the binding energy will be small and the electrons are itinerant.
It may be assumed that in the case of localized electrons the activation energy includes a contribution from the charge carrier mobility, but no such a contribution to the mobility occurs for itinerant electrons.
Temperature Dependence of Conductivity and Activation Energy. Cronemeyer1 has measured the intrinsic conductivity of rutile single crystals in the temperature range 300-1400 °C, using the four-terminal method. The respective activation energies of his calculation from the temperature dependence of conductivity are 1.53 and 1.84 eV at the low and high temperature ranges, irrespective of the direction of the crystal axis. Cronemeyer associated the above activation energies with the value of the optical absorption edge at 3.02 eV obtained from the optical and pho- toconductive properties of rutile. He assumed the energy gap of a rutile single crystal to be approximately twice the value of the activation energy. Preliminary published result of Sandler2 on the conductivity of rutile single crystals indicated a somewhat higher conductivity and a smaller activation energy (1.4 eV) than Cronemeyer’s.
Gorelik10 measured the electrical conductivity of sintered polycrystalline rutile. His conductivity dependence of temperature may be expressed by In a = 2.5 — 11 700IT and the corresponding activation energy is 1.02 eV. Travina and Mukhin47 reported that the values of the optical and thermal width of the forbidden band in T i0 2 were 4.2 and3.9 eV which were obtained by the optical spectra and the temperature dependence of the electrical conductivity.
Frederikse and Hosier indicated that SrTiC>3 doped with Nb or La is an extrinsic semiconductor and interpreted their data in terms of the polaron model.32 Wemple et al. have obtained similar results; despite difference in detail, both groups have invoked electron-phonon interaction to account for the change in drift mobility from 20 to 0.5 cm2/V s in the range 200-1000 K .32
In the present results, as shown in Figures 1-7, the conductivities increased with increase of temperature, decrease of oxygen partial pressure, and decreasing mole percent of NiO under present experimental conditions. The high- and low-temperature portions of the curves (log a vs. 1 IT plots) are assumed to be the intrinsic and extrinsic ranges, respectively. The activation energies calculated from the slopes of the high (i.e., the slope above the knee) and low temperatures have an average value cf 1.96 and 0.5 eV under oxygen pressures between 10_1 and 10~8 atm.
Activation energies from the intrinsic range contain a contribution from the energy of formation of the defect which is in turn responsible for conduction, as well as a contribution from the energy of migration. In the extrinsic range, however, there is only the contribution from the activation energy of migration of charge carriers. It was reported that there is a forbidden gap of several electron volts between the valence and conduction bands in rutile;4348 however, donor sites are believed to lie 0.1-0.2 eV below the bottom of the conduction band. Comparing the reported energy gap with our observed energy of activation (0.5 eV) in the extrinsic range, it is assumed that the total activation energy may be split as follows: E = En + Eu =0.5 eV, i.e., the observed value of 0.5 eV could be the sum of an activation energy for generation of charge carriers (reported value of 0.1-0.2 eV) plus that assoc.ated with the hopping process (0.4-C.3 eV). From the viewpoint of the activation energy, therefore, it can be assumed that conduction in T i0 2 may have a polaronic component in the extrinsic range (at lower temperatures up to 750 °C).
Walters and Grace measured conductivity and thermoelectric power on SrTiOs in equilibrium in the H20 -H 2 ambients from 1200 to 1600 K and interpreted their results in terms of a hopping model, with increasing oxygen vacancy
The Journal of Physical Chemistry, Vol. 80, No. 7, 1976
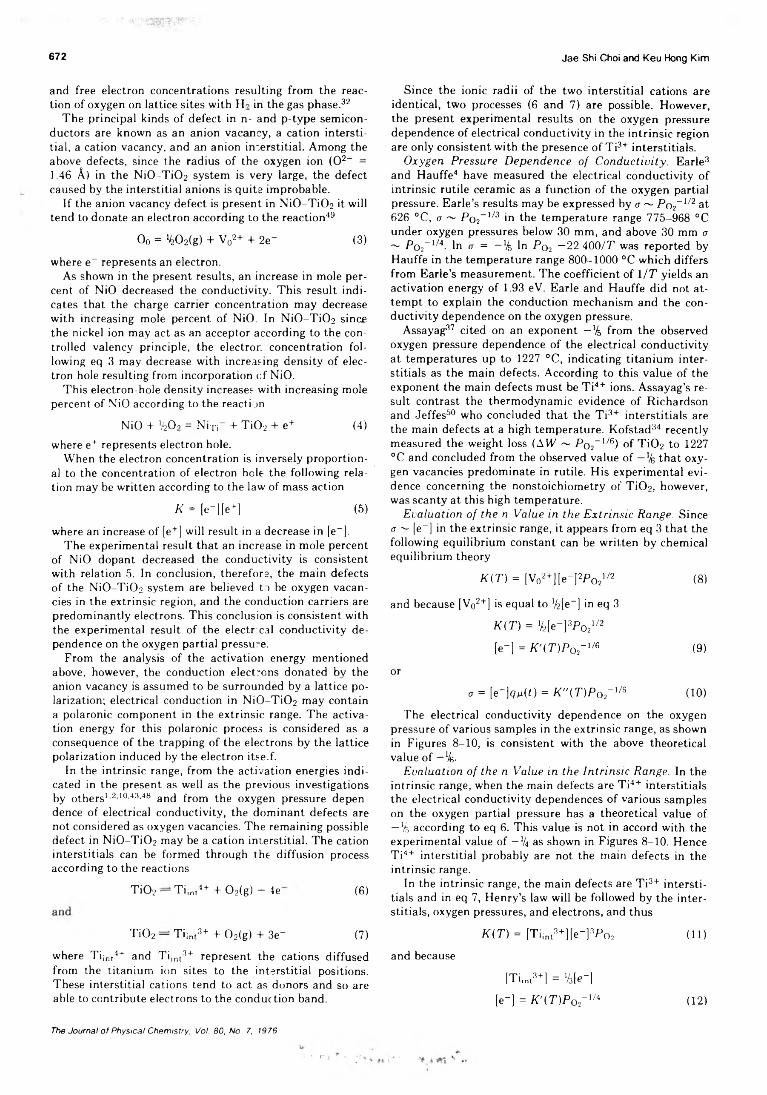
672 Jae Shi Choi and Keu Hong Kim
and free electron concentrations resulting from the reaction of oxygen on lattice sites with H? in the gas phase.32
The principal kinds of defect in n- and p-type semiconductors are known as an anion vacancy, a cation interstitial, a cation vacancy, and an anion interstitial. Among the above defects, since the radius of the oxygen ion (0 2~ =1.46 Á) in the NiO-Ti02 system is very large, the defect caused by the interstitial anions is quite improbable.
If the anion vacancy defect is present in NÍO-TÍO2 it will tend to donate an electron according to the reaction49
Oo = ^ 0 2(g) + V02+ + 2e" (3)
where e_ represents an electron.As shown in the present results, an increase in mole per
cent of NiO decreased the conductivity. This result indicates that the charge carrier concentration may decrease with increasing mole percent of NiO. In N iO-Ti02 since the nickel ion may act as an acceptor according to the controlled valency principle, the electron concentration following eq 3 may decrease with increasing density of electron hole resulting from incorporation cf NiO.
This electron-hole density increases with increasing mole percent of NiO according to the reacti jn
NiO + '¿Oo = Nítí- + T i0 2 + e+ (4)where e+ represents electron hole.
When the electron concentration is inversely proportional to the concentration of electron hole the following relation may be written according to the law of mass action
K = [e_ ][e+] (5)
where an increase of [e+] will result in a decrease in [e—].The experimental result that an increase in mole percent
of NiO dopant decreased the conductivity is consistent with relation 5. In conclusion, therefore, the main defects of the NiO-TiOa system are believed to be oxygen vacancies in the extrinsic region, and the conduction carriers are predominantly electrons. This conclusion is consistent with the experimental result of the electrical conductivity dependence on the oxygen partial pressure.
From the analysis of the activation energy mentioned above, however, the conduction electrons donated by the anion vacancy is assumed to be surrounded by a lattice polarization; electrical conduction in NÍO-TÍO2 may contain a polaronic component in the extrinsic range. The activation energy for this polaronic process is considered as a consequence of the trapping of the electrons by the lattice polarization induced by the electron itse.f.
In the intrinsic range, from the activation energies indicated in the present as well as the previous investigations by others1-2-10-43'48 and from the oxygen pressure dependence of electrical conductivity, the dominant defects are not considered as oxygen vacancies. The remaining possible defect in NiO-Ti02 may be a cation interstitial. The cation interstitials can be formed through the diffusion process according to the reactions
T i02 — Tiint4+ + 0 2(g) - 4e (6)
T i0 2 — Ti¡nt3+ + 0 2(g) + 3e~ (7)where Tiint4+ and Tiint:,+ represent the cations diffused from the titanium ion sites to the interstitial positions. These interstitial cations tend to act as donors and so are able to contribute electrons to the conduction band.
Since the ionic radii of the two interstitial cations are identical, two processes (6 and 7) are possible. However, the present experimental results on the oxygen pressure dependence of electrical conductivity in the intrinsic region are only consistent with the presence of Ti3+ interstitials.
Oxygen Pressure Dependence of Conductivity. Earle3 and Hauffe4 have measured the electrical conductivity of intrinsic rutile ceramic as a function of the oxygen partial pressure. Earle’s results may be expressed by a ~ Po2_1/2 at 626 °C, a ~ Pq2~1/s in the temperature range 775-968 °C under oxygen pressures below 30 mm, and above 30 mm a ~ P o r 1/4- In a = —lk In Po2 —22 400/T was reported by Hauffe in the temperature range 800-1000 °C which differs from Earle’s measurement. The coefficient of 1 IT yields an activation energy of 1.93 eV. Earle and Hauffe did not attempt to explain the conduction mechanism and the conductivity dependence on the oxygen pressure.
Assayag37 cited on an exponent — \ from the observed oxygen pressure dependence of the electrical conductivity at temperatures up to 1227 °C, indicating titanium interstitials as the main defects. According to this value of the exponent the main defects must be Ti4+ ions. Assayag’s result contrast the thermodynamic evidence of Richardson and Jeffes50 who concluded that the Ti3+ interstitials are the main defects at a high temperature. Kofstad34 recently measured the weight loss (AW ~ Po2-I/6) of T i0 2 to 1227 °C and concluded from the observed value of — \ that oxygen vacancies predominate in rutile. His experimental evidence concerning the nonstoichiometry of T i0 2, however, was scanty at this high temperature.
Evaluation of the n Value in the Extrinsic Range. Since a ~ [e_] in the extrinsic range, it appears from eq 3 that the following equilibrium constant can be written by chemical equilibrium theory
K(T) = [V02+][e-]zPo21/2 (8)
and because [Vo2+] is equal to %[e~] in eq 3
K(T) = '¿[e-]3Po21/2
[e-] = K'(T)P02~m (9)
or
a = [e-]qn(t) = K "(T )P o2- 1/S (10)
The electrical conductivity dependence on the oxygen pressure of various samples in the extrinsic range, as shown in Figures 8-10, is consistent with the above theoretical value of — '/s-
Evaluation of the n Value in the Intrinsic Range. In the intrinsic range, when the main defects are Ti4+ interstitials the electrical conductivity dependences of various samples on the oxygen partial pressure has a theoretical value of — xk according to eq 6. This value is not in accord with the experimental value of — \ as shown in Figures 8-10. Hence Ti4+ interstitial probably are not the main defects in the intrinsic range.
In the intrinsic range, the main defects are Ti3+ interstitials and in eq 7, Henry’s law will be followed by the interstitials, oxygen pressures, and electrons, and thus
K(T)= [Tiint3+][e-]3Po2 (11)and because
[Tijnt3+] = %e~\
[e-] = K '(T )P ofm (12)
The Journal of Physical Chemistry, Vol. 80, No. 7, 1976
' P i
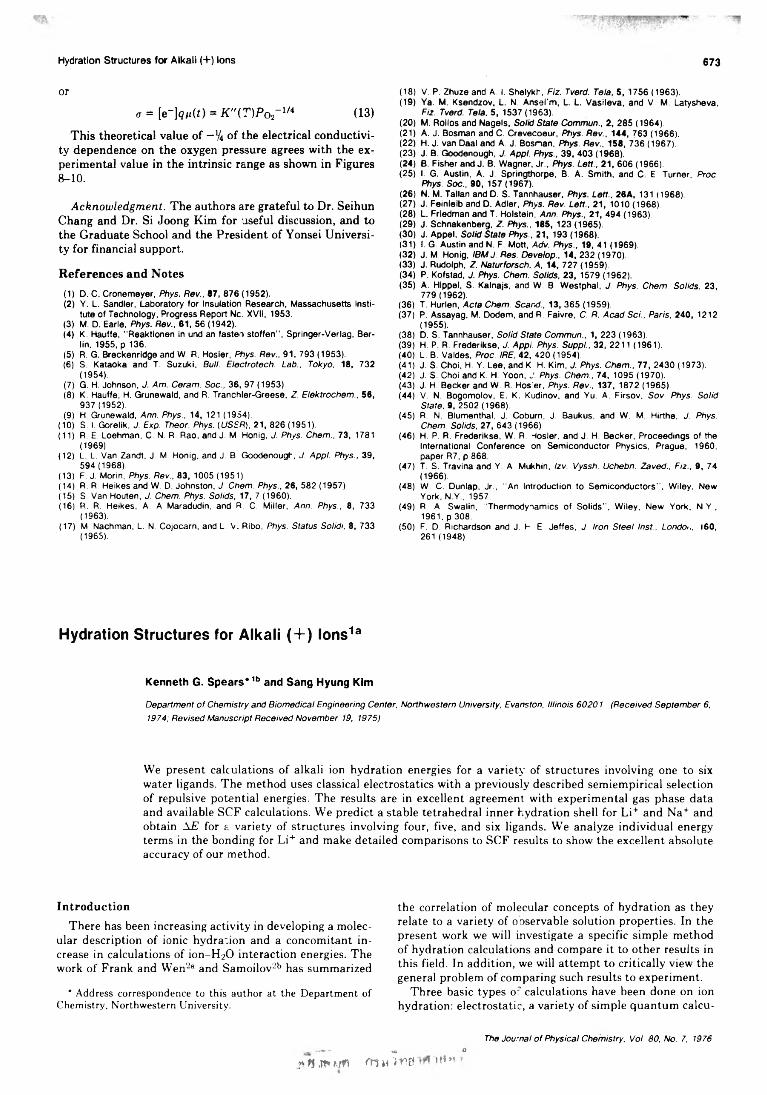
Hydration Structures for Alkali (+) Ions 673
or
«r = [e-]g#i(t) = K " ( T ) P o 2~u4 (13)
This theoretical value of — % of the electrical conductivity dependence on the oxygen pressure agrees with the experimental value in the intrinsic range as shown in Figures8- 10.
Acknowledgment. The authors are grateful to Dr. SeihunChang and Dr. Si Joong Kim for useful discussion, and tothe Graduate School and the President of Yonsei University for financial support.
References and Notes(1) D. C. Cronemeyer, Phys. Rev., 87, 876 (1952).(2) V. L. Sandler, Laboratory for Insulation Research, Massachusetts Insti
tute of Technology, Progress Report Ne. XVII, 1953.(3) M. D. Earle, Phys. Rev., 61, 56 (1942).(4) K. Hauffe, "Reaktionen in und an fasten stoffen", Springer-Verlag, Ber
lin, 1955, p 136.(5) R. G. Breckenridge and W. R. Hosier, Phys. Rev., 91, 793 (1953).(6 ) S. Kataoka and T. Suzuki, Bull. Electrotech. Lab., Tokyo, 18, 732
(1954).(7) G. H. Johnson, J. Am. Ceram. Soc., 36, 97 (1953).(8 ) K. Hauffe, H. Grünewald, and R. Tranchler-Greese, Z. Elektrochem., 56,
937 (1952).(9) H. Grünewald, Ann. Phys., 14, 121 (1954).
(10) S. I. Gorelik, J. Exp. Theor. Phys. (USSR), 21, 826 (1951).(11) R. E. Loehman, C. N. R. Rao, and J. M Honig, J. Phys. Chem., 73, 1781
(1969).(12) L. L. Van Zandt, J. M. Honig, and J. B Goodenough, J. Appl. Phys., 39,
594(1968).(13) F. J. Morin, Phys. Rev., 83, 1005 (1951).(14) R. R. Heikes and W. D. Johnston, J. Chem. Phys., 26, 582 (1957).(15) S. Van Houten, J. Chem. Phys. Solids, 17, 7 (1960).(16) R. R. Heikes, A. A Maradudin, and R. C. Miller, Ann. Phys., 8, 733
(1963).(17) M. Nachman, L. N. Cojocarn, and L. V. Ribo, Phys. Status Solidi. 8 , 733
(1965).
(18) V. P. Zhuze and A. I. ShelykF, Fiz. Tverd. Tela, 5, 1756 (1963).(19) Ya. M. Ksendzov, L. N. Ansel'm, L L. Vasileva, and V. M. Latysheva,
Fiz. Tverd. Tela, 5, 1537 (1963).(20) M. Roilos and Nagels, Solid S tate Commun., 2, 285 (1964).(21) A. J. Bosnian and C. Crevecoeur, Phys. R ev., 144, 763 (1966).(22) H. J. van Daal and A. J. Bosnan, Phys. Rev., 158, 736 (1967).(23) J. B. Goodenough, J. Appl. Phys., 39, 403 (1968).(24) B. Fisher and J. B. Wagner, Jr., Phys. Lett., 21, 606 (1966).(25) I. G. Austin, A. J. Springthorpe, B. A. Smith, and C. E. Turner, Proc.
Phys. Soc., 90, 157 (1967).(26) N. M. Tallan and D. S. Tannhäuser, Phys. Lett., 26A, 131 (1968).(27) J. Feinleib and D. Adler, Phys. Rev. Lett., 21, 1010 (1968).(28) L. Friedman and T. Holstein, Ann. Phys., 21, 494 (1963).(29) J. Schnakenberg, Z. Phys., 185, 123 (1965).(30) J. Appel, Solid S tate Phys., 21, 193 (1968).(31) I. G. Austin and N. F. Mott, Adv. Phys., 19, 41 (1969).(32) J. M. Honig, IB M J. Res. Develop., 14, 232 (1970).(33) J. Rudolph, Z. Naturforsch. A, 14, 727 (1959).(34) P. Kofstad, J. Phys. Chem. Solids, 23, 1579 (1962).(35) A. Hippel, S. Kalnajs, and W. B. Westphal, J. Phys. Chem. Solids, 23,
779 (1962).(36) T. Hurlen, A cta Chem . Scand., 13, 365 (1959).(37) P. Assayag, M. Dodem, and R. Faivre, C. R. A cad Sci., Paris, 240, 1212
(1955).(38) D. S. Tannhauser, Solid S tate Com mun., 1, 223 (1963).(39) H. P. R. Frederlkse, J. Appl. Phys. Suppl., 32, 2211 (1961).(40) L. B. Valdes, Proc. IRE, 42, 420 (1954).(41) J. S. Choi, H. Y. Lee, and K H. Kim, J. Phys. C hem ., 77, 2430 (1973).(42) J. S. Choi and K. H. Yoon, J. Phys. Chem ., TA, 1095 (1970).(43) J. H. Becker and W. R. Hosier, Phys. Rev., 137, 1872 (1965).(44) V. N. Bogomolov, E. K. Kudinov, and Yu. A. Firsov, Sov. Phys. Solid
State, 9, 2502 (1968).(45) R. N. Blumenthal, J. Coburn, J. Baukus, and W. M. Hirthe, J. Phys.
Chem. Solids, 27, 643 (1966).(46) H. P. R. Frederikse, W. R. Hosier, and J. H. Becker, Proceedings of the
International Conference on Semiconductor Physics, Prague, 1960, paper R7, p 868
(47) T. S. Travina and Y. A. Mukhin, Izv. Vyssh. Uchebn. Zaved.. F iz., 9, 74 (1966).
(48) W. C. Dunlap, Jr., "An Introduction to Semiconductors", Wiley, New York, N.Y., 1957.
(49) R. A. Swalin, “ Thermodynamics of Solids", Wiley, New York, N.Y., 1961, p 308.
(50) F. D. Richardson and J. F. E. Jeffes, J. Iron S teel Inst., Londoi., 160 , 261 (1948).
H y d ra tio n S t r u c t u r e s fo r A lk a li ( + ) l o n s 1a
Kenneth G. Spears*1b and Sang Hyung Kim
Department of Chemistry and Biomedical Engineering Center, Northwestern University, Evanston, Illinois 60201 (Received September 6, 1974; Revised Manuscript Received November 19, 1975)
We present calculations of alkali ion hydration energies for a variety of structures involving one to six water ligands. The method uses classical electrostatics with a previously described semiempirical selection of repulsive potential energies. The results are in excellent agreement with experimental gas phase data and available SCF calculations. We predict a stable tetrahedral inner hydration shell for Li+ and Na+ and obtain AE for a variety of structures involving four, five, and six ligands. We analyze individual energy terms in the bonding for Li+ and make detailed comparisons to SCF results to show the excellent absolute accuracy of our method.
IntroductionThere has been increasing activity in developing a molec
ular description of ionic hydration and a concomitant increase in calculations of ion-H20 interaction energies. The work of Frank and Wen2a and Samoilov2b has summarized
* Address correspondence to this author at the Department of Chemistry, Northwestern University.
the correlation of molecular concepts of hydration as they relate to a variety of o oservable solution properties. In the present work we will investigate a specific simple method of hydration calculations and compare it to other results in this field. In addition, we will attempt to critically view the general problem of comparing such results to experiment.
Three basic types o: calculations have been done on ion hydration: electrostatic, a variety of simple quantum calcu-
- » ** n m ufi m u ~i m 1 «* * ■
The Journal of Physical Chemistry, Voi. 80, No. 7, 1976
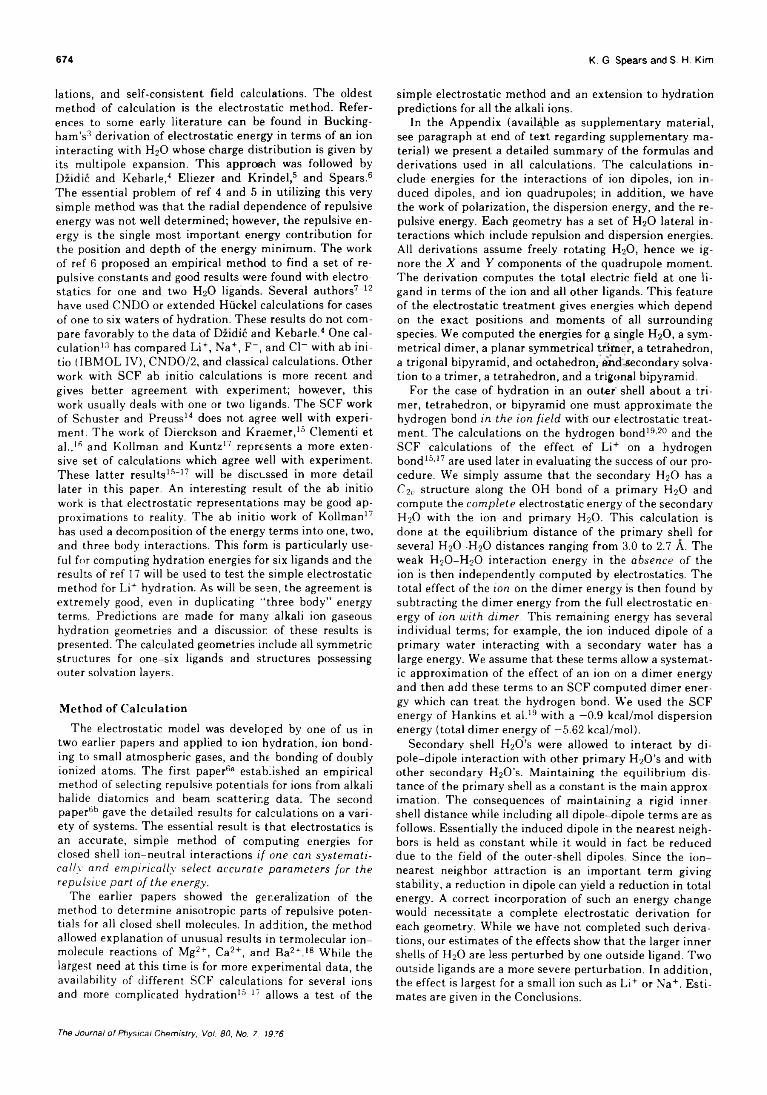
674 K. G. Spears and S. H. Kim
lations, and self-consistent field calculations. The oldest method of calculation is the electrostatic method. References to some early literature can be found in Buckingham’s3 derivation of electrostatic energy in terms of an ion interacting with H2O whose charge distribution is given by its multipole expansion. This approach was followed by Dzidic and Kebarle,4 Eliezer and Krindel,5 and Spears.6 The essential problem of ref 4 and 5 in utilizing this very simple method was that the radial dependence of repulsive energy was not well determined; however, the repulsive energy is the single most important energy contribution for the position and depth of the energy minimum. The work of ref 6 proposed an empirical method to find a set of repulsive constants and good results were found with electrostatics for one and two H2O ligands. Several authors7-12 have used CNDO or extended Hiickel calculations for cases of one to six waters of hydration. These results do not compare favorably to the data of Dzidic and Kebarle.4 One calculation13 has compared Li+, Na+, F~, and Cl“ with ab initio (IBMOL IV), CNDO/2, and classical calculations. Other work with SCF ab initio calculations is more recent and gives better agreement with experiment; however, this work usually deals with one or two ligands. The SCF work of Schuster and Preuss14 does not agree well with experiment. The work of Dierckson and Kraemer,15 Clementi et al.,lfi and Kollman and Kuntz17 represents a more extensive set of calculations which agree well with experiment. These latter results15-17 will be discussed in more detail later in this paper. An interesting result of the ab initio work is that electrostatic representations may be good approximations to reality. The ab initio work of Kollman17 has used a decomposition of the energy terms into one, two, and three body interactions. This form is particularly useful for computing hydration energies for six ligands and the results of ref 17 will be used to test the simple electrostatic method for Li+ hydration. As will be seen, the agreement is extremely good, even in duplicating “ three body” energy terms. Predictions are made for many alkali ion gaseous hydration geometries and a discussion of these results is presented. The calculated geometries include all symmetric structures for one-six ligands and structures possessing outer solvation layers.
Method o f CalculationThe electrostatic model was developed by one of us in
two earlier papers and applied to ion hydration, ion bonding to small atmospheric gases, and the bonding of doubly ionized atoms. The first paper6® established an empirical method of selecting repulsive potentials for ions from alkali halide diatomics and beam scattering data. The second paper66 gave the detailed results for calculations on a variety of systems. The essential result is that electrostatics is an accurate, simple method of computing energies for closed shell ion-neutral interactions if one can systematically and empirically select accurate parameters for the repulsive part of the energy.
The earlier papers showed the generalization of the method to determine anisotropic parts of repulsive potentials for all closed shell molecules. In addition, the method allowed explanation of unusual results in termolecular ion- molecule reactions of Mg2+, Ca2+, and Ba2+.18 While the largest need at this time is for more experimental data, the availability of different SCF calculations for several ions and more complicated hydration15-17 allows a test of the
simple electrostatic method and an extension to hydration predictions for all the alkali ions.
In the Appendix (available as supplementary material, see paragraph at end of text regarding supplementary material) we present a detailed summary of the formulas and derivations used in all calculations. The calculations include energies for the interactions of ion dipoles, ion induced dipoles, and ion quadrupoles; in addition, we have the work of polarization, the dispersion energy, and the repulsive energy. Each geometry has a set of H2O lateral interactions which include repulsion and dispersion energies. All derivations assume freely rotating H2O, hence we ignore the X and Y components of the quadrupole moment. The derivation computes the total electric field at one ligand in terms of the ion and all other ligands. This feature of the electrostatic treatment gives energies which depend on the exact positions and moments of all surrounding species. We computed the energies for a single H2O, a symmetrical dimer, a planar symmetrical trifner, a tetrahedron, a trigonal bipyramid, and octahedron, and secondary solvation to a trimer, a tetrahedron, and a trigonal bipyramid.
For the case of hydration in an outer’ shell about a trimer, tetrahedron, or bipyramid one must approximate the hydrogen bond in the ion field with our electrostatic treatment. The calculations on the hydrogen bond19-20 and the SCF calculations of the effect of Li+ on a hydrogen bond15’17 are used later in evaluating the success of our procedure. We simply assume that the secondary H2O has a C2v structure along the OH bond of a primary H2O and compute the complete electrostatic energy of the secondary H2O with the ion and primary H2O. This calculation is done at the equilibrium distance of the primary shell for several H2O-H 2O distances ranging from 3.0 to 2.7 A. The weak H2O-H2O interaction energy in the absence of the ion is then independently computed by electrostatics. The total effect of the ion on the dimer energy is then found by subtracting the dimer energy from the full electrostatic energy of ion with dimer. This remaining energy has several individual terms; for example, the ion induced dipole of a primary water interacting with a secondary water has a large energy. We assume that these terms allow a systematic approximation of the effect of an ion on a dimer energy and then add these terms to an SCF computed dimer energy which can treat the hydrogen bond. We used the SCF energy of Hankins et al.19 with a —0.9 keal/mol dispersion energy (total dimer energy of —5.62 keal/mol).
Secondary shell H20 ’s were allowed to interact by dipole-dipole interaction with other primary H20 ’s and with other secondary H20 ’s. Maintaining the equilibrium distance of the primary shell as a constant is the main approximation. The consequences of maintaining a rigid inner- shell distance while including all dipole-dipole terms are as follows. Essentially the induced dipole in the nearest neighbors is held as constant while it would in fact be reduced due to the field of the outer-shell dipoles. Since the ion- nearest neighbor attraction is an important term giving stability, a reduction in dipole can yield a reduction in total energy. A correct incorporation of such an energy change would necessitate a complete electrostatic derivation for each geometry. While we have not completed such derivations, our estimates of the effects show that the larger inner shells of H20 are less perturbed by one outside ligand. Two outside ligands are a more severe perturbation. In addition, the effect is largest for a small ion such as Li+ or Na+. Estimates are given in the Conclusions.
The Journal of Physical Chemistry, Vol. 80, No. 7, 1976
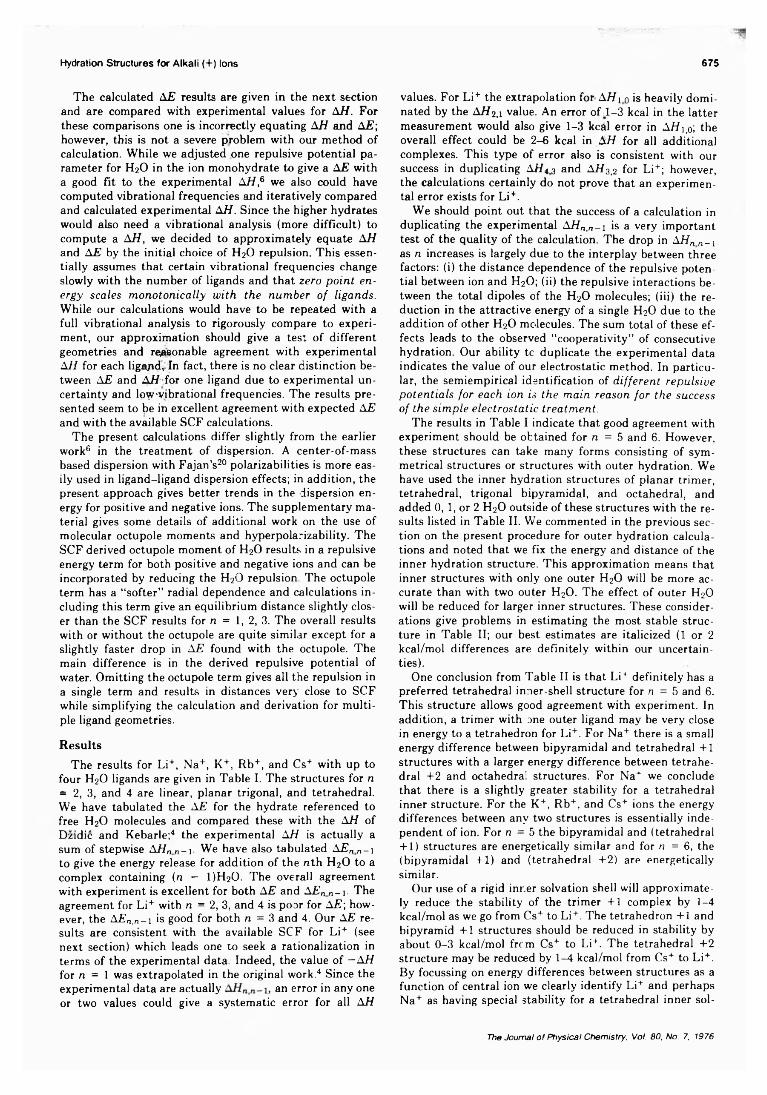
Hydration Structures for Alkali (+) Ions 675
The calculated AE results are given in the next section and are compared with experimental values for AH. For these comparisons one is incorrectly equating AH and AE; however, this is not a severe problem with our method of calculation. While we adjusted one repulsive potential parameter for H2O in the ion monohydrate to give a AE with a good fit to the experimental AH,6 we also could have computed vibrational frequencies and iteratively compared and calculated experimental AH. Since the higher hydrates would also need a vibrational analysis (more difficult) to compute a AH, we decided to approximately equate AH and AE by the initial choice of H2O repulsion. This essentially assumes that certain vibrational frequencies change slowly with the number of ligands and that zero point energy scales monotonically with the number of ligands. While our calculations would have to be repeated with a full vibrational analysis to rigorously compare to experiment, our approximation should give a test of different geometries and reasonable agreement with experimental AH for each ligapd, In fact, there is no clear distinction between AE and AH for one ligand due to experimental uncertainty and low‘vibrational frequencies. The results presented seem to be in excellent agreement with expected AE and with the available SCF calculations.
The present calculations differ slightly from the earlier work6 in the treatment of dispersion. A center-of-mass based dispersion with Fajan’s20 polarizabilities is more easily used in ligand-ligand dispersion effects; in addition, the present approach gives better trends in the dispersion energy for positive and negative ions. The supplementary material gives some details of additional work on the use of molecular octupole moments and hyperpolarizability. The SCF derived octupole moment of H2O results in a repulsive energy term for both positive and negative ions and can be incorporated by reducing the H2O repulsion The octupole term has a “ softer” radial dependence and calculations including this term give an equilibrium distance slightly closer than the SCF results for n = 1, 2, 3. The overall results with or without the octupole are quite similar except for a slightly faster drop in AE found with the octupole. The main difference is in the derived repulsive potential of water. Omitting the octupole term gives all the repulsion in a single term and results in distances very close to SCF while simplifying the calculation and derivation for multiple ligand geometries.
ResultsThe results for Li+, Na+, K+, Rb+, and Cs+ with up to
four H2O ligands are given in Table I. The structures for n = 2, 3, and 4 are linear, planar trigonal, and tetrahedral. We have tabulated the AE for the hydrate referenced to free H2O molecules and compared these with the AH of Dzidic and Kebarle;4 the experimental AH is actually a sum of stepwise AHnn-i. We have also tabulated AEnn-i to give the energy release for addition of the nth H20 to a complex containing (n — 1 )H20. The overall agreement with experiment is excellent for both AE and AEn n-\. The agreement for Li+ with n = 2, 3, and 4 is poor for AE; however, the AEn,n-\ is good for both n = 3 and 4. Our AE results are consistent with the available SCF for Li+ (see next section) which leads one to seek a rationalization in terms of the experimental data Indeed, the value of —AH for n = 1 was extrapolated in the original work.4 Since the experimental data are actually an error in any oneor two values could give a systematic error for all AH
values. For Li+ the extrapolation for AHi 0 is heavily dominated by the AH2,i value. An error of 1-3 kcal in the latter measurement would also give 1-3 kcal error in AH1>0; the overall effect could be 2-6 kcal in AH for all additional complexes. This type of error also is consistent with our success in duplicating AH43 and AH3j2 for Li+; however, the calculations certainly do not prove that an experimental error exists for Li+.
We should point out that the success of a calculation in duplicating the experimental AHn,n-i is a very important test of the quality of the calculation. The drop in AHn n_j as n increases is largely due to the interplay between three factors: (i) the distance dependence of the repulsive potential between ion and H2O; (ii) the repulsive interactions between the total dipoles cf the H20 molecules; (iii) the reduction in the attractive energy of a single H20 due to the addition of other H20 molecules. The sum total of these effects leads to the observed “ cooperativity” of consecutive hydration. Our ability tc duplicate the experimental data indicates the value of our electrostatic method. In particular, the semiempirical identification of different repulsive potentials for each ion is the main reason for the success of the simple electrostatic treatment.
The results in Table I indicate that good agreement with experiment should be obtained for n = 5 and 6. However, these structures can take many forms consisting of symmetrical structures or structures with outer hydration. We have used the inner hydration structures of planar trimer, tetrahedral, trigonal bipyramidal, and octahedral, and added 0, 1, or 2 H20 outside of these structures with the results listed in Table II. We commented in the previous section on the present procedure for outer hydration calculations and noted that we fix the energy and distance of the inner hydration structure. This approximation means that inner structures with only one outer H20 will be more accurate than with two outer H20. The effect of outer H20 will be reduced for larger inner structures. These considerations give problems in estimating the most stable structure in Table II; our best estimates are italicized (1 or 2 kcal/mol differences are definitely within our uncertainties).
One conclusion from Table II is that Li+ definitely has a preferred tetrahedral inner-shell structure for n = 5 and 6. This structure allows good agreement with experiment. In addition, a trimer with one outer ligand may be very close in energy to a tetrahedron for Li+. For Na+ there is a small energy difference between bipyramidal and tetrahedral +1 structures with a larger energy difference between tetrahedral +2 and octahedral structures. For Na+ we conclude that there is a slightly greater stability for a tetrahedral inner structure. For the K+, Rb+, and Cs+ ions the energy differences between any two structures is essentially independent of ion. For n = 5 the bipyramidal and (tetrahedral + 1 ) structures are energetically similar and for n = 6, the (bipyramidal + 1 ) and (tetrahedral + 2) are energetically similar.
Our use of a rigid inner solvation shell will approximately reduce the stability of the trimer +1 complex by 1-4 kcal/mol as we go from Cs+ to Li+. The tetrahedron +1 and bipyramid +1 structures should be reduced in stability by about 0-3 kcal/mol from Cs+ to Li+. The tetrahedral +2 structure may be reduced by 1-4 kcal/mol from Cs+ to Li+. By focussing on energy differences between structures as a function of central ion we clearly identify Li+ and perhaps Na+ as having special stability for a tetrahedral inner sol-
The Journal of Physical Chemistry, Vol. 80, No. 7, 1976
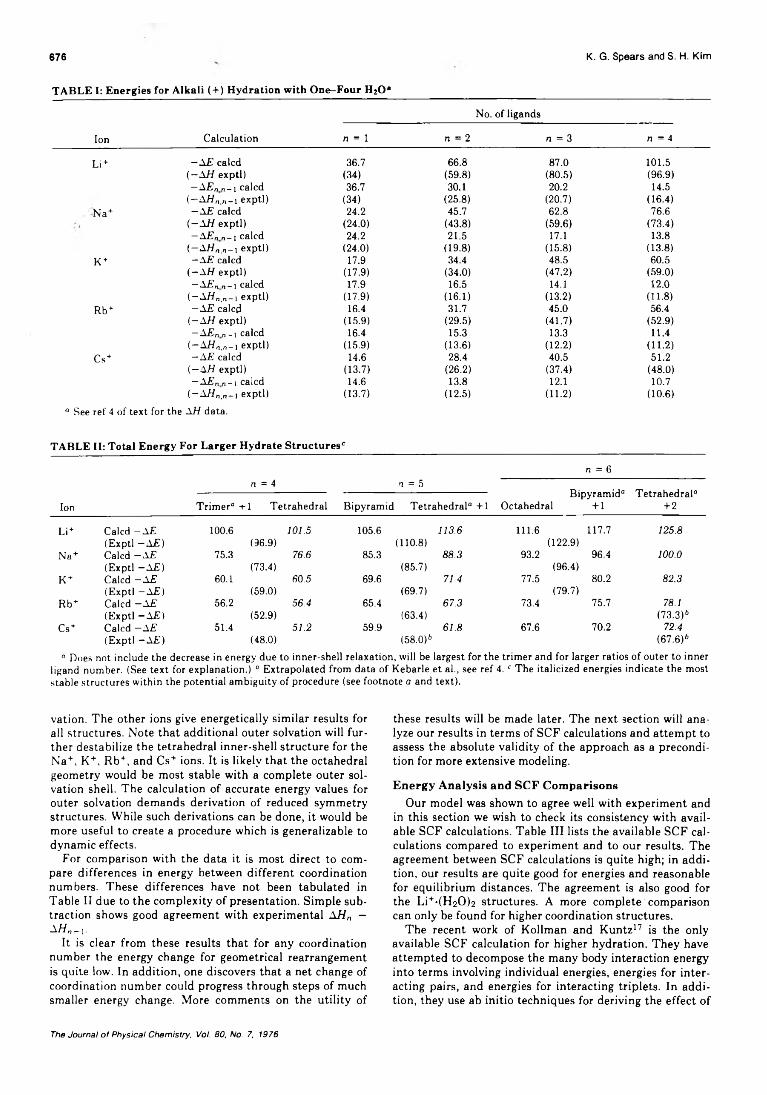
676 K. G. Spears and S. H. Kim
TABLE I: Energies for Alkali (+) Hydration with One-Four H2Oa
Ion Calculation
No. of ligands
n = 1 n = 2 n = 3 n = 4
Li + —AE caled 36.7 66.8 87.0 101.5(-AH exptl) (34) (59.8) (80.5) (96.9)-AE„„_i caled 36.7 30.1 20.2 14.5
(—AH„in_i exptl) (34) (25.8) (20.7) (16.4),. r Na+ —AE caled 24.2 45.7 62.8 76.6
(—AH exptl) (24.0) (43.8) (59.6) (73.4)—A£„ n — i caled 24.2 21.5 17.1 13.8
(-Af/n.n-! exptl) (24.0) (19.8) (15.8) (13.8)K + -A £ caled 17.9 34.4 48.5 60.5
(-AH exptl) (17.9) (34.0) (47.2) (59.0)—A£„ n_i caled 17.9 16.5 14.1 12.0
(—AH„,„-i exptl) (17.9) (16.1) (13.2) (11.8)Rb+ -AE caled 16.4 31.7 45.0 56.4
(—A H exptl) (15.9) (29.5) (41.7) (52.9)- A E n n-\ caled 16.4 15.3 13.3 11.4
( - A H n,n-\ exptl) (15.9) (13.6) (12.2) (11.2)Cs+ —AE caled 14.6 28.4 40.5 51.2
(—AH exptl) (13.7) (26.2) (37.4) (48.0)-AE„„-i caled 14.6 13.8 12.1 10.7
(-AH„iB- i exptl) (13.7) (12.5) (11.2) (10.6)° See ref 4 of text for the AH data.
TABLE II: Total Energy For Larger Hydrate StructuresC
n = 6n = 4 n = 5
Bipyramid“ Tetrahedral“Ion Trimer“ -t-1 Tetrahedral Bipyramid Tetrahedral“ + 1 Octahedral +i +2
Li+ Caled — AE 100.6 101.5 105.6 113.6 111.6 117.7 125.8(Exptl - AE) 06.9) (110.8) (122.9)
Na+ Caled —Æ 75.3 76.6 85.3 88.3 93.2 96.4 100.0(Exptl -AE) (73.4) (85.7) (96.4)
K+ Caled - AE 60.1 60.5 69.6 71.4 77.5 80.2 82.3(Exptl —AE) (59.0) (69.7) (79.7)
Rb+ Caled -AE 56.2 56.4 65.4 67.3 73.4 75.7 78.1(Exptl -AE) (52.9) (63.4) (73.3)6
Cs+ Caled -A£ 51.4 51.2 59.9 61.8 67.6 70.2 72.4(Exptl -AE) (48.0) (58.0)b (67.6)6
“ Does not include the decrease in energy due to inner-shell relaxation, will be largest for the trimer and for larger ratios of outer to innerligand number. (See text for explanation.) “ Extrapolated from data of Kebarle et al., see ref 4. c The italicized energies indicate the most stable structures within the potential ambiguity of procedure (see footnote a and text).
vation. The other ions give energetically similar results for all structures. Note that additional outer solvation will further destabilize the tetrahedral inner-shell structure for the Na+, K+, Rb+, and Cs+ ions. It is likely that the octahedral geometry would be most stable with a complete outer solvation shell. The calculation of accurate energy values for outer solvation demands derivation of reduced symmetry structures. While such derivations can be done, it would be more useful to create a procedure which is generalizable to dynamic effects.
For comparison with the data it is most direct to compare differences in energy between different coordination numbers. These differences have not been tabulated in Table II due to the complexity of presentation. Simple subtraction shows good agreement with experimental AHn — AHn- h
It is clear from these results that for any coordination number the energy change for geometrical rearrangement is quite low. In addition, one discovers that a net change of coordination number could progress through steps of much smaller energy change. More comments on the utility of
these results will be made later. The next section will analyze our results in terms of SCF calculations and attempt to assess the absolute validity of the approach as a precondition for more extensive modeling.
Energy Analysis and SCF ComparisonsOur model was shown to agree well with experiment and
in this section we wish to check its consistency with available SCF calculations. Table III lists the available SCF calculations compared to experiment and to our results. The agreement between SCF calculations is quite high; in addition, our results are quite good for energies and reasonable for equilibrium distances. The agreement is also good for the Li+-(H20)2 structures. A more complete comparison can only be found for higher coordination structures.
The recent work of Kollman and Kuntz17 is the only available SCF calculation for higher hydration. They have attempted to decompose the many body interaction energy into terms involving individual energies, energies for interacting pairs, and energies for interacting triplets. In addition, they use ab initio techniques for deriving the effect of
The Journal of Physical Chemistry, Vol. 80, No. 7, 1976
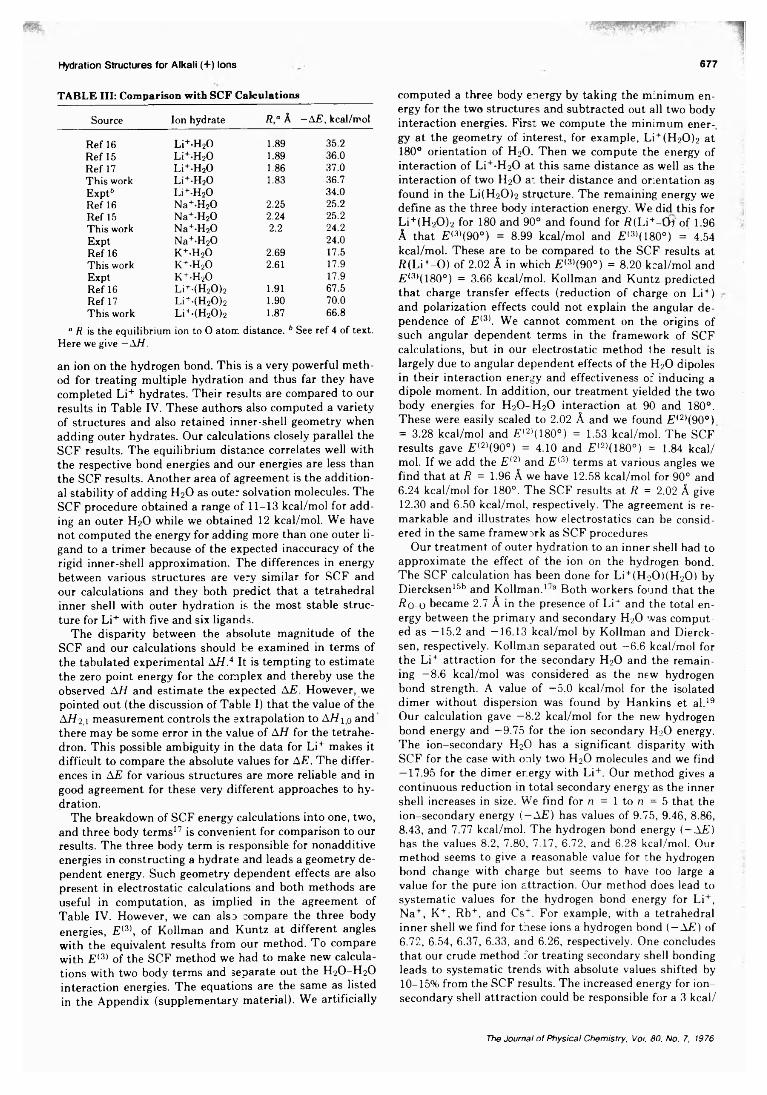
Hydration Structures for Alkali (+) ions 677
TABLE III: Comparison with SCF Calculations
Source Ion hydrate R ° k —A E , kcal/mol
Ref 16 Li+-H20 1.89 35.2Ref 15 Li+-H20 1.89 36.0Ref 17 Li+-H20 1.86 37.0This work Li+-H20 1.83 36.7Expt6 Li+-H20 34.0Ref 16 Na+-H20 2.25 25.2Ref 15 Na+-H20 2.24 25.2This work Na+-H20 2.2 24.2Expt Na+-H20 24.0Ref 16 k +-h2o 2.69 17.5This work k+-h2o 2.61 17.9Expt k +-h2o 17.9Ref 16 Li+-(H20 )2 1.91 67.5Ref 17 Li+-(H20 )2 1.90 70.0This work Li+-(H20 )2 1.87 66.8
a R is the equilibrium ion to 0 atom distance. b See ref 4 of text. Here we give —A H .
an ion on the hydrogen bond. This is a very powerful method for treating multiple hydration and thus far they have completed Li+ hydrates. Their results are compared to our results in Table IV. These authors also computed a variety of structures and also retained inner-shell geometry when adding outer hydrates. Our calculations closely parallel the SCF results. The equilibrium distance correlates well with the respective bond energies and our energies are less than the SCF results. Another area of agreement is the additional stability of adding H20 as outer solvation molecules. The SCF procedure obtained a range of 11-13 kcal/mol for adding an outer H20 while we obtained 12 kcal/mol. We have not computed the energy for adding more than one outer ligand to a trimer because of the expected inaccuracy of the rigid inner-shell approximation. The differences in energy between various structures are very similar for SCF and our calculations and they both predict that a tetrahedral inner shell with outer hydration is the most stable structure for Li+ with five and six ligands.
The disparity between the absolute magnitude of the SCF and our calculations should be examined in terms of the tabulated experimental AH.4 It is tempting to estimate the zero point energy for the complex and thereby use the observed AH and estimate the expected AE. However, we pointed out (the discussion of Table I) that the value of the AH2,1 measurement controls the extrapolation to AHi,o and there may be some error in the value of AH for the tetrahedron. This possible ambiguity in the data for Li+ makes it difficult to compare the absolute values for AE. The differences in AE for various structures are more reliable and in good agreement for these very different approaches to hydration.
The breakdown of SCF energy calculations into one, two, and three body terms17 is convenient for comparison to our results. The three body term is responsible for nonadditive energies in constructing a hydrate and leads a geometry dependent energy. Such geometry dependent effects are also present in electrostatic calculations and both methods are useful in computation, as implied in the agreement of Table IV. However, we can also compare the three body energies, E(3), of Kollman and Kuntz at different angles with the equivalent results from our method. To compare with Ei3) of the SCF method we had to make new calculations with two body terms and separate out the H20 -H 20 interaction energies. The equations are the same as listed in the Appendix (supplementary material). We artificially
computed a three body energy by taking the minimum energy for the two structures and subtracted out all two body interaction energies. First we compute the minimum energy at the geometry of interest, for example, Li+(H20 )2 at 180° orientation of H20. Then we compute the energy of interaction of Li+-H20 at this same distance as well as the interaction of two H20 at their distance and orientation as found in the Li(H20 )2 structure. The remaining energy we define as the three body interaction energy7. We did this for Li+(H20 )2 for 180 and 90° and found for R(Li+-0h of 1.96 A that £ <3)(90°) = 8.99 kcal/mol and £ <3)(180°) = 4.54 kcal/mol. These are to be compared to the SCF results at ft(Li+- 0 ) of 2.02 A in which jE<3)(90°) = 8.20 kcal/mol and f?(3)(180°) = 3.66 kcal/mol. Kollman and Kuntz predicted that charge transfer effects (reduction of charge on Li+) and polarization effects could not explain the angular dependence of £ (3). We cannot comment on the origins of such angular dependent terms in the framework of SCF calculations, but in our electrostatic method the result is largely due to angular dependent effects of the H20 dipoles in their interaction energy and effectiveness of inducing a dipole moment. In addition, our treatment yielded the two body energies for H20 -H 20 interaction at 90 and 180°. These were easily scaled to 2.02 A and we found £ <2)(90°) = 3.28 kcal/mol and £ (2)(180°) = 1.53 kcal/mol. The SCF results gave £ <2)(90°) = 4.10 and £ (2)(180°) = 1.84 kcal/ mol. If we add the £ (2) and E(3) terms at various angles we find that at R = 1.96 A we have 12.58 kcal/mol for 90° and 6.24 kcal/mol for 180°. The SCF results at R = 2.02 A give12.30 and 6.50 kcal/mol, respectively. The agreement is remarkable and illustrates how electrostatics can be considered in the same framework as SCF procedures
Our treatment of outer hydration to an inner shell had to approximate the effect of the ion on the hydrogen bond. The SCF calculation has been done for Li+(H20)(H 20) by Diercksen15b and Kollman.1 ,a Both workers found that the R o-o became 2.7 A in the presence of Li+ and the total energy between the primary and secondary H20 was computed as —15.2 and —16.13 kcal/mol by Kollman and Dierck- sen, respectively. Kollman separated out —6.6 kcal/mol for the Li+ attraction for the secondary H20 and the remaining —8.6 kcal/mol was considered as the new hydrogen bond strength. A value of —5.0 kcal/mol for the isolated dimer without dispersion was found by Hankins et al.19 Our calculation gave —8.2 kcal/mol for the new hydrogen bond energy and —9.75 for the ion secondary H20 energy. The ion-secondary H20 has a significant disparity with SCF for the case with only two H20 molecules and we find — 17.95 for the dimer energy with Li+. Our method gives a continuous reduction in total secondary energy as the inner shell increases in size. We find for n = 1 to n = 5 that the ion-secondary energy {—AE) has values of 9.75, 9.46, 8.86, 8.43, and 7.77 kcal/mol. The hydrogen bond energy {—AE) has the values 8.2, 7.80, 7.17, 6.72, and 6.28 kcal/mol. Our method seems to give a reasonable value for the hydrogen bond change with charge but seems to have too large a value for the pure ion attraction. Our method does lead to systematic values for the hydrogen bond energy for Li+, Na+, K+. Rb+, and Cs+. For example, with a tetrahedral inner shell we find for these ions a hydrogen bond (—AE) of 6.72, 6.54, 6.37, 6.33, and 6.26, respectively. One concludes that our crude method for treating secondary shell bonding leads to systematic trends with absolute values shifted by 10-15% from the SCF results. The increased energy for ionsecondary shell attraction could be responsible for a 3 kcal/
The Journal of Physical Chemistry, Vot. 80, No. 7, 1976
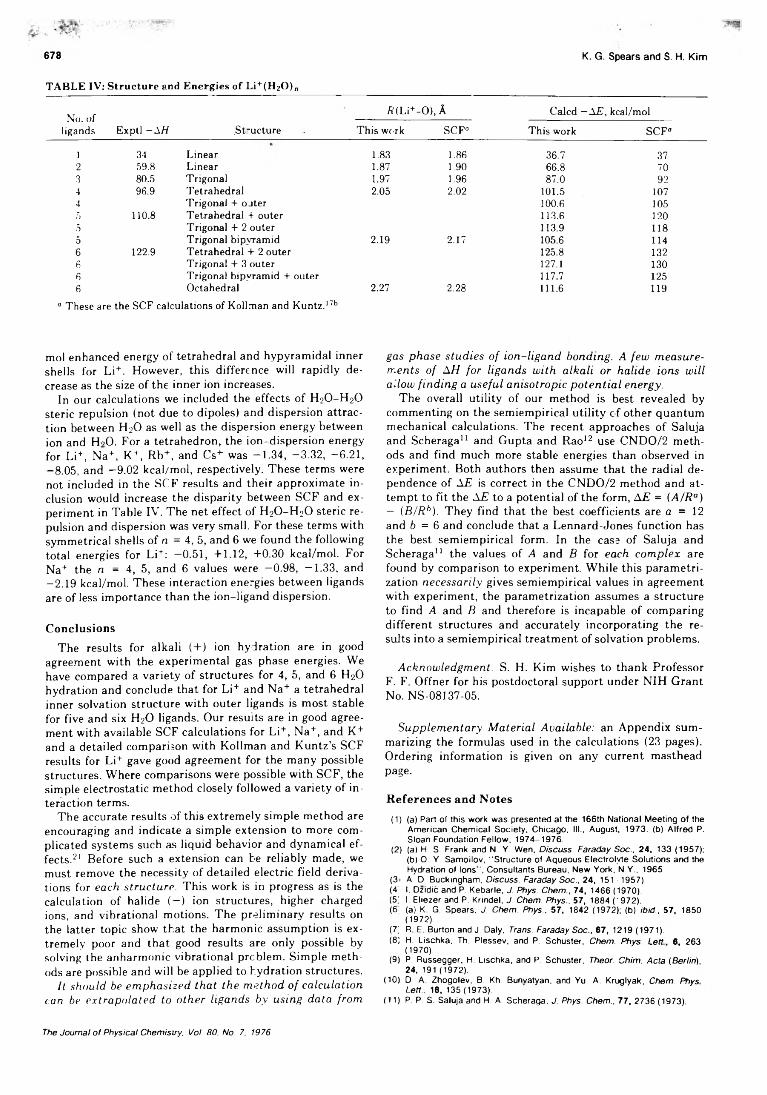
678 K. G. Spears and S. H. Kim
TABLE IV: Structure and Energies of Li+(H20)„
No. of ligands Exptl —AH Structure
ft(Li+-0), Calcd —A E , kcal/molThis work SCF“ This work SCF“
1 34 Linear 1.83 1.86 36.7 372 59.8 Linear 1.87 1.90 66.8 703 80.5 Trigonal 1.97 1.96 87.0 924 96.9 Tetrahedral 2.05 2.02 101.5 1074 Trigonal + ojter 100.6 1055 110.8 Tetrahedral + outer 113.6 1205 Trigonal + 2 outer 113.9 1185 Trigonal bipvramid 2.19 2.17 105.6 1146 122.9 Tetrahedral + 2 outer 125.8 1326 Trigonal + 3 outer 127.1 1306 Trigonal bipyramid + outer 117.7 1256 Octahedral 2.27 2.28 111.6 119
0 These are the SCF calculations of Kollman and Kuntz.17b
mol enhanced energy of tetrahedral and hypyramidal inner shells for Li+. However, this difference will rapidly decrease as the size of the inner ion increases.
In our calculations we included the effects of H2O-H 2O steric repulsion (not due to dipoles) and dispersion attraction between H20 as well as the dispersion energy between ion and HoO. For a tetrahedron, the ion-dispersion energy for Li+, Na+, K+, Rb+, and Cs+ was —1.34, —3.32, —6.21, —8.05, and -9.02 kcal/mol, respectively. These terms were not included in the SCF results and their approximate inclusion would increase the disparity between SCF and experiment in Table IV. The net effect of H2O-H 2O steric repulsion and dispersion was very small. For these terms with symmetrical shells of n = 4, 5, and 6 we found the following total energies for Li+: —0.51, +1.12, +0.30 kcal/mol. For Na+ the n = 4, 5, and 6 values were —0.98, —1.33, and -2.19 kcal/mol. These interaction energies between ligands are of less importance than the ion-ligand dispersion.
ConclusionsThe results for alkali (+) ion hydration are in good
agreement with the experimental gas phase energies. We have compared a variety of structures for 4, 5, and 6 H20 hydration and conclude that for Li+ and Na+ a tetrahedral inner solvation structure with outer ligands is most stable for five and six H2O ligands. Our results are in good agreement with available SCF calculations for Li+, Na+, and K+ and a detailed comparison with Kollman and Kuntz’s SCF results for Li+ gave good agreement for the many possible structures. Where comparisons were possible with SCF, the simple electrostatic method closely followed a variety of interaction terms.
The accurate results of this extremely simple method are encouraging and indicate a simple extension to more complicated systems such as liquid behavior and dynamical effects.21 Before such a extension can be reliably made, we must remove the necessity of detailed electric field derivations for each structure. This work is in progress as is the calculation of halide (—) ion structures, higher charged ions, and vibrational motions. The preliminary results on the latter topic show that the harmonic assumption is extremely poor and that good results are only possible by solving the anharmonic vibrational problem. Simple methods are possible and will be applied to hydration structures.
It should be emphasized that the method of calculation can be extrapolated to other ligands by using data from
gas phase studies of ion-ligand bonding. A few measurements of AH for ligands with alkali or halide ions will allow finding a useful anisotropic potential energy.
The overall utility of our method is best revealed by commenting on the semiempirical utility of other quantum mechanical calculations. The recent approaches of Saluja and Scheraga11 and Gupta and Rao12 use CNDO/2 methods and find much more stable energies than observed in experiment. Both authors then assume that the radial dependence of AE is correct in the CNDO/2 method and attempt to fit the AE to a potential of the form, AE = (A/R° ) — (B/Rh). They find that the best coefficients are a = 12 and 6 = 6 and conclude that a Lennard-Jones function has the best semiempirical form. In the case of Saluja and Scheraga11 the values of A and B for each complex are found by comparison to experiment. While this parametri- zation necessarily gives semiempirical values in agreement with experiment, the parametrization assumes a structure to find A and B and therefore is incapable of comparing different structures and accurately incorporating the results into a semiempirical treatment of solvation problems.
Acknowledgment. S. H. Kim wishes to thank ProfessorF. F. Offner for his postdoctoral support under NIH GrantNo. NS-08137-05.
Supplementary Material Available: an Appendix summarizing the formulas used in the calculations (23 pages). Ordering information is given on any current masthead page.
References and Notes(1) (a) Part ot this work was presented at the 166th National Meeting o f the
Am erican Chemical Society, Chicago, III., August, 1973. (b) A lfred P. Sloan Foundation Fellow, 1974-1976.
(2) (a) H. S. Frank and N. Y. Wen, Discuss. Faraday Soc., 24, 133 (1957); (b) O. Y. Samoilov, "S tructure of Aqueous Electrolyte Solutions and the Hydration of Ions ’, Consultants Bureau, New York, N.Y., 1965.
(3> A. D. Buckingham. Discuss. Faraday Soc.. 24, 151 <1957).(4 I. Dzidic and P. Kebarle, J. Phys. Chem., 74, 1466 (1970).(5' I. Eliezer and P. Krindel, J. Chem. Phys., 57, 1884 ( '9 7 2 ).( 6 (a) K G. Spears. J. Chem. Phys.. 57, 1842 (1972); (b) ibid., 57, 1850
(1972).(7) R E Burton and J. Daly, Trans. Faraday Soc.. 67, 1219 (1971).(8 ) H. Lischka, Th. Plessev, and P. Schuster, Chem. Phys. Lett 6 , 263
(1970).(9) P. Russegger, H. Lischka, and P. Schuster, Theor. Chim. Acta (Berlin),
24, 191 (1972).(10) D. A Zhogolev, B. Kh. Bunvatyan, and Yu. A. Kruglyak, Chem. Phys
Lett.. 18,135 (1973 ).(11) P. P. S. Saluja and H. A. Scheraga, J. Phys. Chem., 77, 2736 (1973).
The Journal of Physical Chemistry, Vol. 80, No. 7, 1976
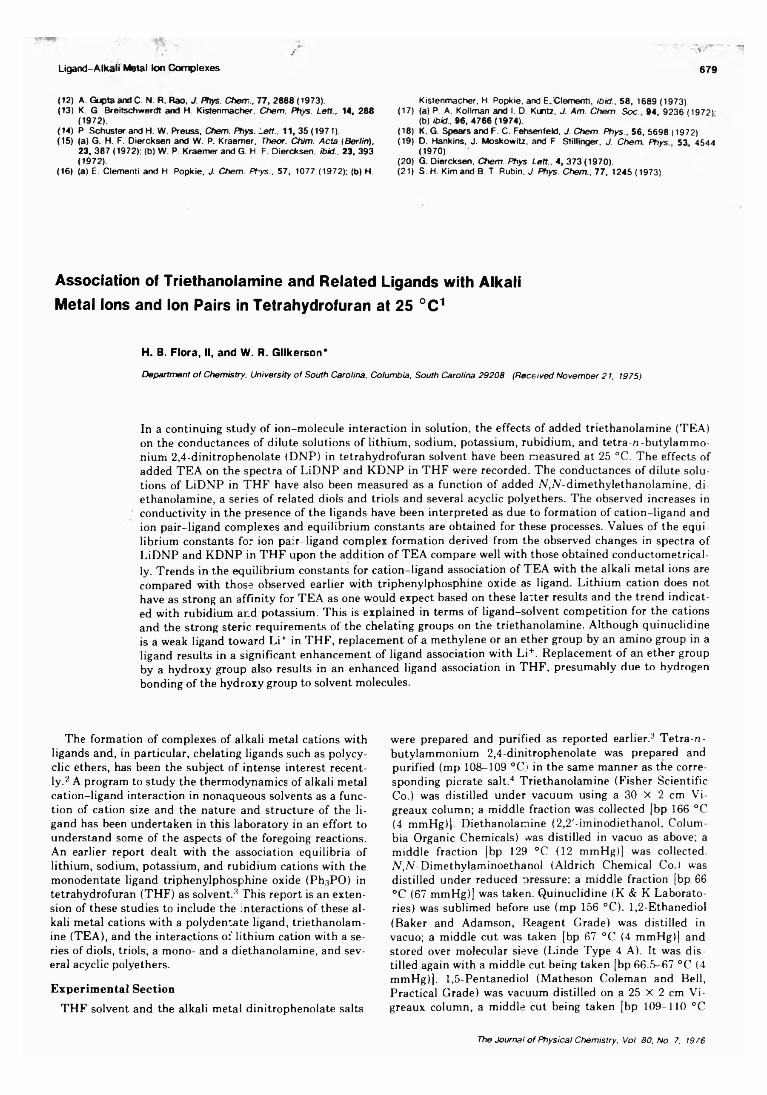
Ligand-Alkali Metal km Complexes 679
(12) A. Gupta and C. N. R. Rao, J. Phys. Chem., 77, 2888 (1973).(13) K. G. Breitschwerdt and H. Kistenmacher. Chem. Phvs. Lett., 14, 288
(1972).(14) P. Schuster and H. W. Preuss, Chem. Phys. Lett.. 11, 35 (1971).(15) (a) G. H. F. Diercksen and W. P. Kraemer, Theor. Chim. Acta (Berlin),
23, 387 (1972); (b) W. P. Kraemer and G. H. F Diercksen, Ibid.. 23, 393 (1972).
(16) (a) E. Clementi and H. Popkie, J. Chem. Phys.. 57, 1077 (1972); (b) H.
Kistenmacher, H. Popkie, and EXIementi, ibid.. 58, 1689 (1973).(17) (a) P. A. Kollman and I. D. Kimtz, J. Am. Chem. Soc 94, 9236 (1972)-
(b) ibid., 96, 4766 (1974).(18) K. G. Spears and F. C. Fehsenfeld, J. Chem. Phys., 56, 5698 (1972).(19) D. Hankins, J. Moskowitz, and F. Stiilinger, J. Chem Phys 53 4 54 4
(1970).(20) G. Diercksen, Chem. Phys. Lett., 4, 373 (1970).(21) S. H. Kim and B. T. Rubin, J. Phys. Chem., 77, 1245 (1973).
A s s o c ia t io n o f T r ie t h a n o la m in e a n d R e la t e d L ig a n d s w ith A lk a li
M e ta l Io n s a n d Ion P a ir s in T e t r a h y d r o fu r a n a t 2 5 ° C 1
H. B. Flora, II, and W. R. Gilkerson*
Department of Chemistry, University of South Carolina, Columbia, South Carolina 29208 (Received November 21, 1975)
In a continuing study of ion-molecule interaction in solution, the effects of added triethanolamine (TEA) on the conductances of dilute solutions of lithium, sodium, potassium, rubidium, and tetra-n-butylammo- nium 2,4-dinitrophenolate (DNP) in tetrahydrofuran solvent have been measured at 25 °C. The effects of added TEA on the spectra of LiDNP and KDNP in THF were recorded. The conductances of dilute solutions of LiDNP in THF have also been measured as a function of added N,JV-dimethylethanolamine, diethanolamine, a series of related diols and triols and several acyclic polyethers. The observed increases in conductivity in the presence of the ligands have been interpreted as due to formation of cation-ligand and ion pair-ligand complexes and equilibrium constants are obtained for these processes. Values of the equilibrium constants for ion pair-ligand complex formation derived from the observed changes in spectra of LiDNP and KDNP in THF upon the addition of TEA compare well with those obtained conductometrically. Trends in the equilibrium constants for cation-ligand association of TEA with the alkali metal ions are compared with those observed earlier with triphenylphosphine oxide as ligand. Lithium cation does not have as strong an affinity for TEA as one would expect based on these latter results and the trend indicated with rubidium and potassium. This is explained in terms of ligand-solvent competition for the cations and the strong steric requirements of the chelating groups on the triethanolamine. Although quinuclidine is a weak ligand toward Li+ in THF, replacement of a methylene or an ether group by an amino group in a ligand results in a significant enhancement of ligand association with Li+. Replacement of an ether group by a hydroxy group also results in an enhanced ligand association in THF, presumably due to hydrogen bonding of the hydroxy group to solvent molecules.
The formation of complexes of alkali metal cations with ligands and, in particular, chelating ligands such as polycyclic ethers, has been the subject of intense interest recently.2 A program to study the thermodynamics of alkali metal cation-ligand interaction in nonaqueous solvents as a function of cation size and the nature and structure of the ligand has been undertaken in this laboratory in an effort to understand some of the aspects of the foregoing reactions. An earlier report dealt with the association equilibria of lithium, sodium, potassium, and rubidium cations with the monodentate ligand triphenylphosphine oxide (Ph.^PO) in tetrahydrofuran (THF) as solvent.3 This report is an extension of these studies to include the interactions of these alkali metal cations with a polydentate ligand, triethanolamine (TEA), and the interactions of lithium cation with a series of diols, triols, a mono- and a diethanolamine, and several acyclic polyethers.
Experimental SectionTHF solvent and the alkali metal dinitrophenolate salts
were prepared and purified as reported earlier.3 Tetra-n- butylammonium 2,4-dinitrophenolate was prepared and purified (mp 108-109 °Ci in the same manner as the corresponding picrate salt.4 Triethanolamine (Fisher Scientific Co.) was distilled under vacuum using a 30 X 2 cm Vi- greaux column; a middle fraction was collected [bp 166 °C (4 mmHg)). Diethanolamine (2,2'-iminodiethanol, Columbia Organic Chemicals) was distilled in vacuo as above; a middle fraction [bp 129 °C (12 mmHg)] was collected.N.N-Dimethylaminoethanol (Aldrich Chemical Co.) was distilled under reduced pressure: a middle fraction [bp 66 °C (67 mmHg)] was taken. Quinuclidine (K & K Laboratories) was sublimed before use (mp 156 °C). 1,2-Ethanediol (Baker and Adamson, Reagent Grade) was distilled in vacuo; a middle cut was taken [bp 67 °C (4 mmHg)] and stored over molecular sieve (Linde Type 4 A). It was distilled again with a middle cut being taken [bp 66.5-67 °C (4 mmHg)]. 1,5-Pentanediol (Matheson Coleman and Bell, Practical Grade) was vacuum distilled on a 25 X 2 cm Vi- greaux column, a middle cut being taken [bp 109-110 °C
The Journal of Physical Chemistry, Vol. 80, No. 7. 1976
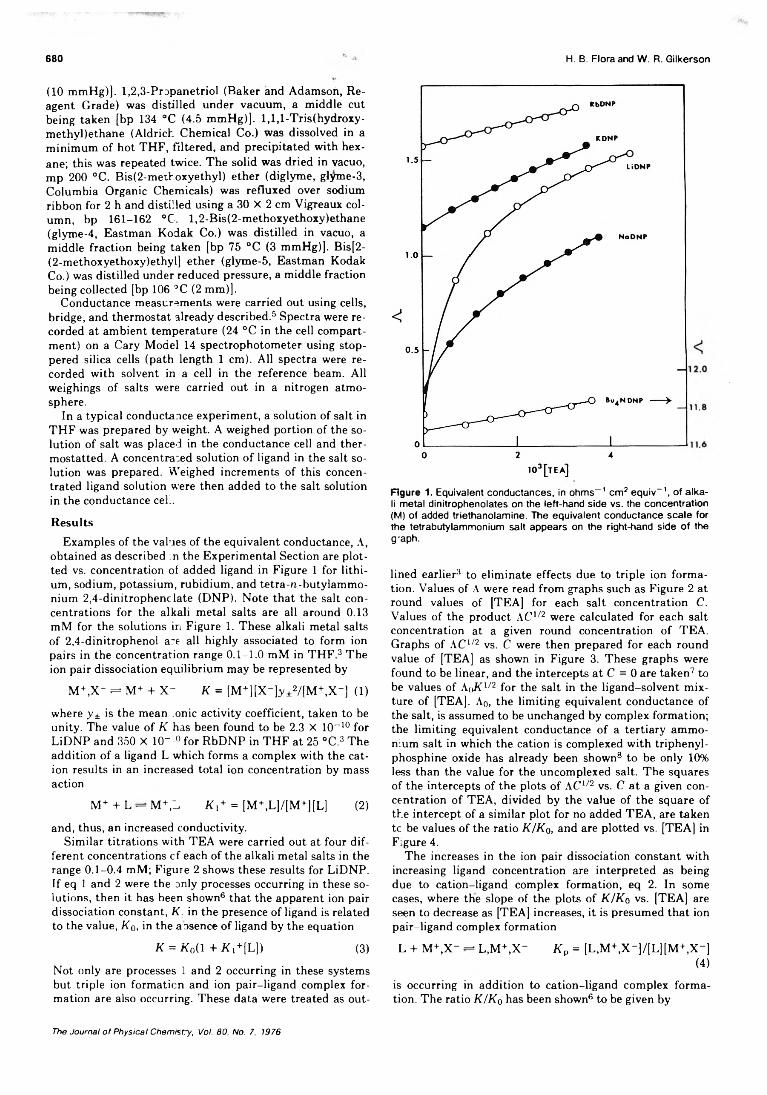
(10 mmHg)]. 1,2,3-Propanetriol (Baker and Adamson, Reagent Grade) was distilled under vacuum, a middle cut being taken [bp 134 °C (4.5 mmHg)]. l,l,l-Tris(hydroxy- methyl)ethane (Aldrich Chemical Co.) was dissolved in a minimum of hot THF, filtered, and precipitated with hexane; this was repeated twice. The solid was dried in vacuo, mp 200 °C. Bis(2-methoxyethyl) ether (diglyme, glyme-3, Columbia Organic Chemicals) was refluxed over sodium ribbon for 2 h and distilled using a 30 X 2 cm Vigreaux column, bp 161-162 °C. l , 2-Bis(2-methoxyethoxy)ethane (glyme-4, Eastman Kodak Co.) was distilled in vacuo, a middle fraction being taken [bp 75 °C (3 mmHg)]. Bis[2- (2-methoxyethoxy)ethyl] ether (glyme-5, Eastman Kodak Co.) was distilled under reduced pressure, a middle fraction being collected [bp 106 °C (2 mm)].
Conductance measurements were carried out using cells, bridge, and thermostat already described.5 Spectra were recorded at ambient temperature (24 °C in the cell compartment) on a Cary Model 14 spectrophotometer using stoppered silica cells (path length 1 cm). All spectra were recorded with solvent in a cell in the reference beam. All weighings of salts were carried out in a nitrogen atmosphere.
In a typical conductance experiment, a solution of salt in THF was prepared by weight. A weighed portion of the solution of salt was placed in the conductance cell and ther- mostatted. A concentrated solution of ligand in the salt solution was prepared. Weighed increments of this concentrated ligand solution were then added to the salt solution in the conductance ceL.
ResultsExamples of the values of the equivalent conductance, A,
obtained as described in the Experimental Section are plotted vs. concentration of added ligand in Figure 1 for lithium, sodium, potassium, rubidium, and tetra-n-butylammo- nium 2,4-dinitrophenclate (DNP). Note that the salt concentrations for the alkali metal salts are all around 0.13 mM for the solutions in Figure 1. These alkali metal salts of 2,4-dinitrophenol are all highly associated to form ion pairs in the concentration range 0.1-1.0 mM in THF.3 The ion pair dissociation equilibrium may be represented by
M +,X - ^ M+ + X - K = [M+][X -]y±2/[M +,X-] (l)
where y± is the mean ionic activity coefficient, taken to be unity. The value of K has been found to be 2.3 X 10⁻¹° for LiDNP and 350 X 10- -° for RbDNP in THF at 25 °C .3 The addition of a ligand L which forms a complex with the cation results in an increased total ion concentration by mass action
M+ + L — M+,L K\+ = [M+,L]/[M+][L] (2)
and, thus, an increased conductivity.Similar titrations with TEA were carried out at four dif
ferent concentrations cf each of the alkali metal salts in the range 0.1-0.4 mM; Figure 2 shows these results for LiDNP. If eq 1 and 2 were the only processes occurring in these solutions, then it has been shown6 that the apparent ion pair dissociation constant, K. in the presence of ligand is related to the value, Ko, in the absence of ligand by the equation
K = K0(l + KSIL]) (3)
Not only are processes 1 and 2 occurring in these systems but triple ion formation and ion pair-ligand complex formation are also occurring. These data were treated as out-
680 H. B. Flora and W. R. Gilkerson
Figure 1. Equivalent conductances, in ohms- 1 cm2 equiv-1 , of alkali metal dinitrophenolates on the left-hand side vs. the concentration (M) of added triethanolamine. The equivalent conductance scale for the tetrabutylammonium salt appears on the right-hand side of the g-aph.
lined earlier3 to eliminate effects due to triple ion formation. Values of A were read from graphs such as Figure 2 at round values of [TEA] for each salt concentration C. Values of the product AC1/2 were calculated for each salt concentration at a given round concentration of TEA. Graphs of AC1/2 vs. C were then prepared for each round value of [TEA] as shown in Figure 3. These graphs were found to be linear, and the intercepts at C = 0 are taken7 to be values of A(lK 1/2 for the salt in the ligand-solvent mixture of [TEA]. Ao, the limiting equivalent conductance of the salt, is assumed to be unchanged by complex formation; the limiting equivalent conductance of a tertiary ammonium salt in which the cation is complexed with triphenyl- phosphine oxide has already been shown8 to be only 10% less than the value for the uncomplexed salt. The squares of the intercepts of the plots of AC172 vs. C at a given concentration of TEA, divided by the value of the square of the intercept of a similar plot for no added TEA, are taken tc be values of the ratio K/Ko, and are plotted vs. [TEA] in Figure 4.
The increases in the ion pair dissociation constant with increasing ligand concentration are interpreted as being due to cation-ligand complex formation, eq 2. In some cases, where the slope of the plots of K/Ko vs. [TEA] are seen to decrease as [TEA] increases, it is presumed that ion pair-ligand complex formation
L + M +,X- — L,M+,X- K p = [L,M+,X-]/[L] [M+,X- ](4)
is occurring in addition to cation-ligand complex formation. The ratio K/Kq has been shown6 to be given by
The Journal of Physical Chemistry, Vol. 80, No. 7, 1976
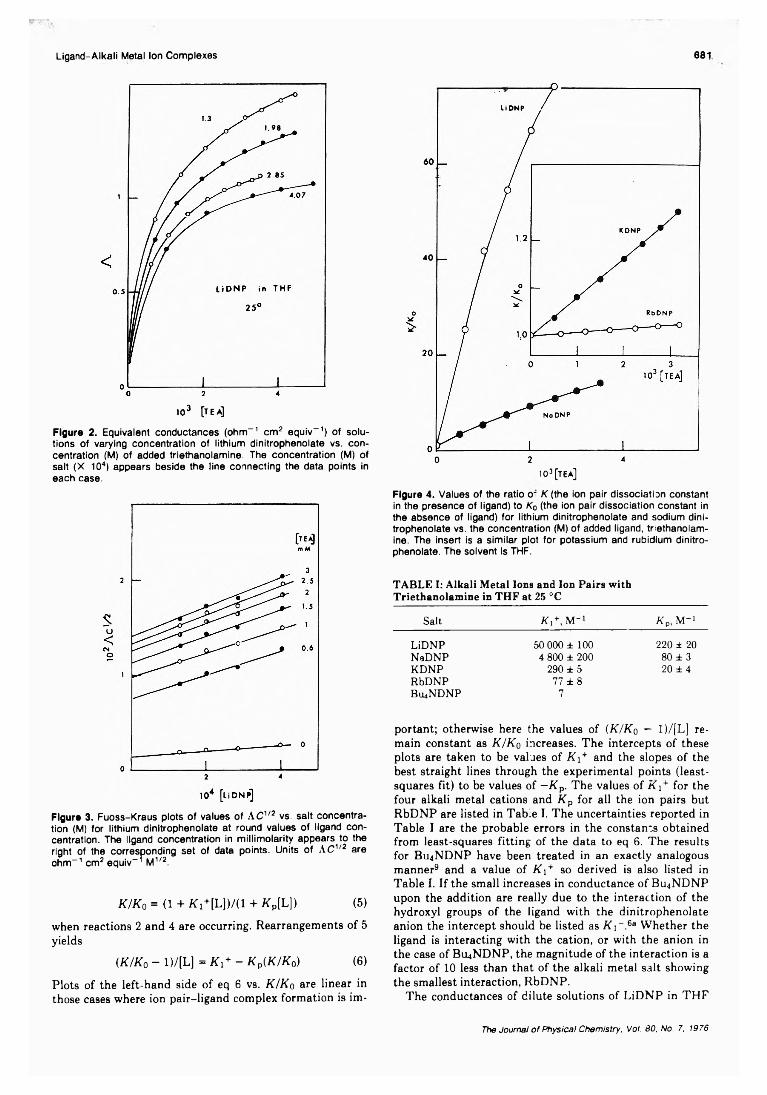
Ligand-Alkali Metal Ion Complexes 681
103 [t e a ]
Figure 2. Equivalent conductances (ohm- 1 cm2 equiv-1 ) of solutions of varying concentration of lithium dinitrophenolate vs. concentration (M) of added triethanolamine. The concentration (M) of salt (X 104) appears beside the line connecting the data points in each case.
Figure 3. Fuoss-Kraus plots of values of AC 1/2 vs. salt concentration (M) for lithium dinitrophenolate at round values of ligand concentration. The ligand concentration in millimolarity appears to the right of the corresponding set of data points. Units of AC 1/2 are ohm- 1 cm2 equiv- 1 M1/2.
K / K 0 = (1 + K'i+[L])/(1 + tfp[L]) (5)
when reactions 2 and 4 are occurring. Rearrangements of 5 yields
( K / K o - 1)/[L] = K S - K P( K / K 0) (6)
Plots of the left-hand side of eq 6 vs. K/Kq are linear in those cases where ion pair-ligand complex formation is im-
io 3[tea]
Figure 4. Values of the ratio o* K (the ion pair dissociation constant in the presence of ligand) to K0 (the ion pair dissociation constant in the absence of ligand) for lithium dinitrophenolate and sodium dinitrophenolate vs. the concentration (M) of added ligand, triethanolamine. The insert is a similar plot for potassium and rubidium dinitrophenolate. The solvent is THF.
TABLE I: Alkali Metal Ions and Ion Pairs with Triethanolamine in THF at 25 °C
Salt Ki+,M- Kp, M-1
LiDNPNaDNPKDNPRbDNPB114NDNP
50 000 ± 100 4 800 ± 200
290 ±5 77 ±8 7
220 ± 20 80 ±3 20 ±4
portant; otherwise here the values of ( K / K q — 1)/[L] remain constant as K / K q increases. The intercepts of these plots are taken to be values of K\+ and the slopes of the best straight lines through the experimental points (least- squares fit) to be values of — Kp. The values of r fi+ for the four alkali metal cations and K p for all the ion pairs but RbDNP are listed in Table I. The uncertainties reported in Table I are the probable errors in the constants obtained from least-squares fitting of the data to eq 6. The results for BU4NDNP have been treated in an exactly analogous manner9 and a value of K i+ so derived is also listed in Table I. If the small increases in conductance of Bu4NDNP upon the addition are really due to the interaction of the hydroxyl groups of the ligand with the dinitrophenolate anion the intercept should be listed as K\~.&a Whether the ligand is interacting with the cation, or with the anion in the case of B114NDNP, the magnitude of the interaction is a factor of 10 less than that of the alkali metal salt showing the smallest interaction, RbDNP.
The conductances of dilute solutions of LiDNP in THF
The Journal of Physical Chemistry, Vol. 80, No. 7, 1976
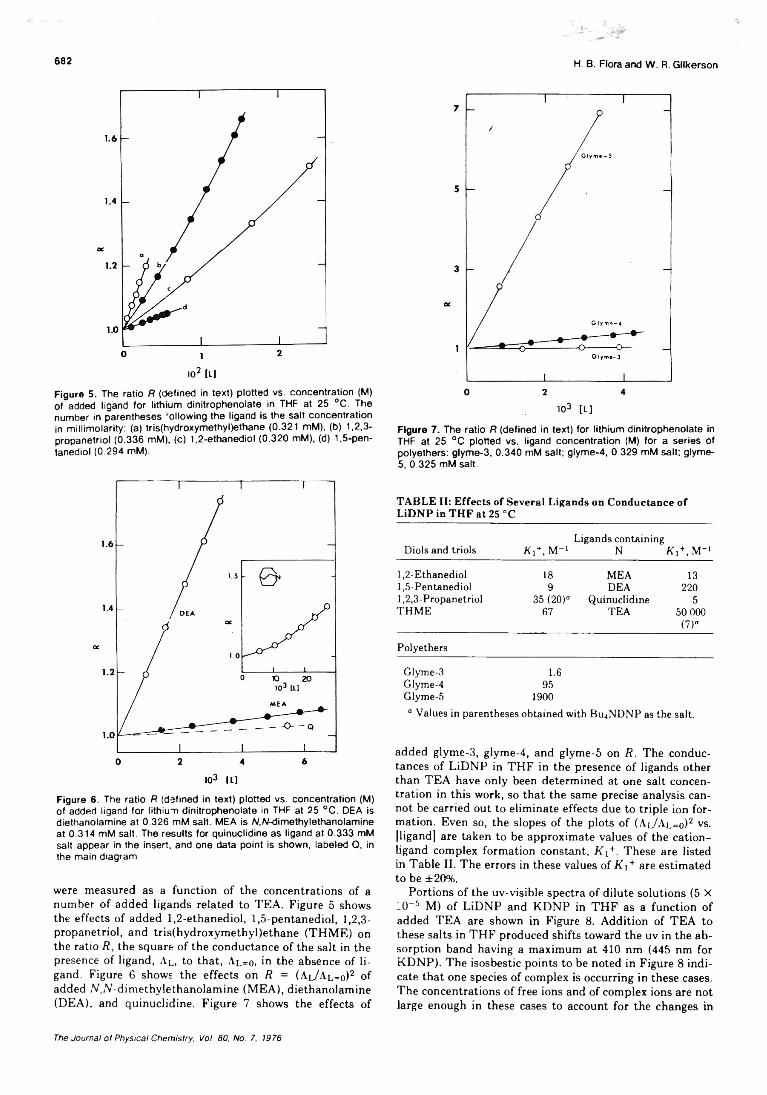
682 H. B. Flora and W. R. Gilkerson
io2 [L]
Figure 5. The ratio R (defined in text) plotted vs. concentration (NI) of added ligand for lithium dinitrophenolate in THF at 25 °C. The number in parentheses -ollowing the ligand is the sait concentration in millimolarity: (a) tris(hydroxymethyl)ethane (0.321 mM), (b) 1,2,3- propanetriol (0.336 mM), (c) 1,2-ethanediol (0.320 mM), (d) 1,5-pen- tanediol (0.294 mM).
Figure 6 . The ratio R (defined in text) plotted vs. concentration (M) of added ligand for lithium dinitrophenolate in THF at 25 °C. DEA is diethanolamine at 0.326 mM salt. MEA is A/,/V-dimethylethanolamine at 0.314 mM salt. The results for quinuclidine as ligand at 0.333 mM salt appear in the insert, and one data point is shown, labeled Q, in the main diagram.
were measured as a function of the concentrations of a number of added ligands related to TEA. Figure 5 shows the effects of added 1,2-ethanediol, 1,5-pentanediol, 1,2,3- propanetriol, and tris(hydroxymethyl)ethane (THME) on the ratio R, the square of the conductance of the salt in the presence of ligand, AL, to that, Al=o, in the absence of ligand. Figure 6 shows the effects on R = (Al/A l=o)2 of added N,./V-dimethylethanolamine (MEA), diethanolamine (DEA), and quinuclidine. Figure 7 shows the effects of
Figure 7. The ratio R (defined in text) for lithium dinitrophenolate in THF at 25 °C plotted vs. ligand concentration (M) for a series of polyethers: glyme-3, 0.340 mM salt; glyme-4, 0.329 mM salt; glyme- 5, 0.325 mM salt.
TABLE II: Effects of Several Ligands on Conductance of LiDNP in THF at 25 °C
Diols and triols K i+ , M-1Ligands containing
N K i+,M -'
1,2-Ethanediol 18 MEA 131,5-Pentanediol 9 DEA 2201,2,3-Propanetriol 35 (20)° Quinuclidine 5THME 67 TEA 50 000
(7)“
Polyethers
Glyme-3 1.6Glyme-4 95Glyme-5 1900“ Values in parentheses obtained with BU4NDNP as the salt.
added glyme-3, glyme-4, and glyme-5 on R. The conductances of LiDNP in THF in the presence of ligands other than TEA have only been determined at one salt concentration in this work, so that the same precise analysis cannot be carried out to eliminate effects due to triple ion formation. Even so, the slopes of the plots of (Al/A l=o)2 vs. [ligand] are taken to be approximate values of the cation- ligand complex formation constant, Ki+. These are listed in Table II. The errors in these values of K\+ are estimated to be ± 20%.
Portions of the uv-visible spectra of dilute solutions (5 X LO-5 M) of LiDNP and KDNP in THF as a function of added TEA are shown in Figure 8. Addition of TEA to these salts in THF produced shifts toward the uv in the absorption band having a maximum at 410 nm (445 nm for KDNP). The isosbestic points to be noted in Figure 8 indicate that one species of complex is occurring in these cases. The concentrations of free ions and of complex ions are not large enough in these cases to account for the changes in
The Journal of Physical Chemistry, Vol. 80, No. 7, 1976
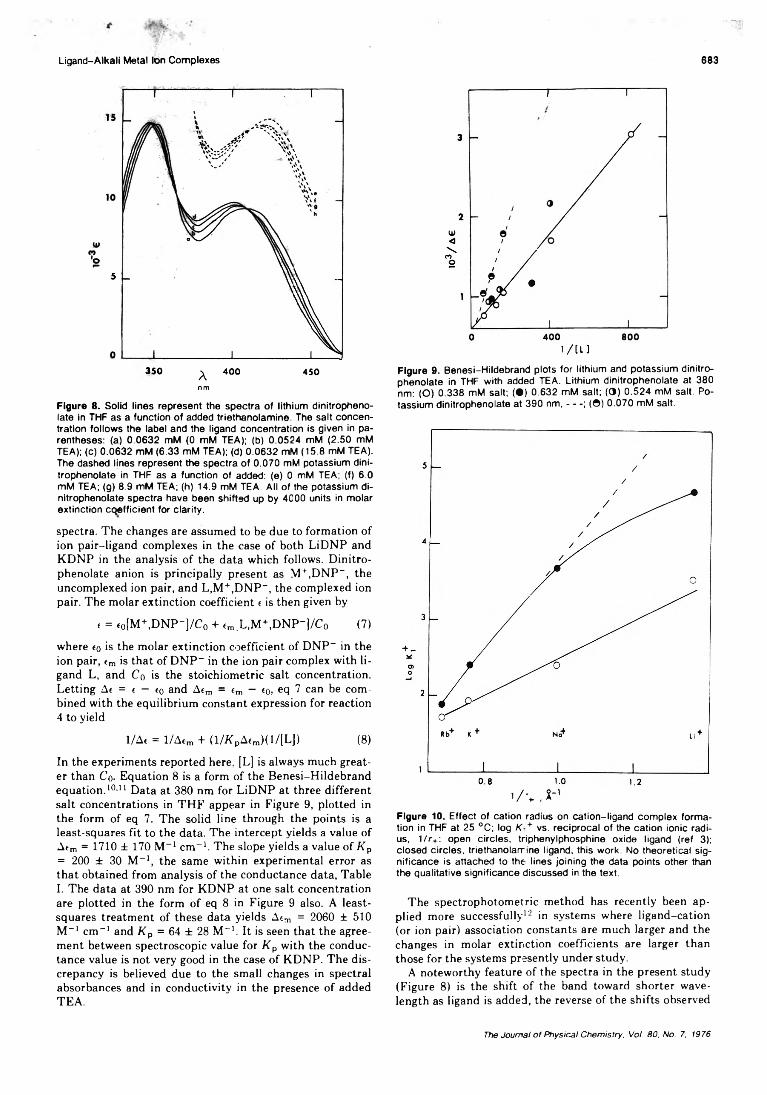
Ligand-Alkali Metal Ion Complexes
350 ^ 400 450nm
Figure 8 . Solid lines represent the spectra of lithium dinitropheno- late in THF as a function of added triethanolamine The salt concentration follows the label and the ligand concentration is given in parentheses: (a) 0.0632 mM (0 mM TEA); (b) 0.0524 mM (2.50 mM TEA); (c) 0.0632 mM (6.33 mM TEA); (d) 0.0632 mM (15.8 mM TEA). The dashed lines represent the spectra of 0.070 mM potassium dini- trophenolate in THF as a function of added: (e) 0 mM TEA; (f) 6.0 mM TEA; (g) 8.9 mM TEA; (h) 14.9 mM TEA. All of the potassium di- nitrophenolate spectra have been shifted up by 4000 units in molar extinction coefficient for clarity.
spectra. The changes are assumed to be due to formation of ion pair-ligand complexes in the case of both LiDNP and KDNP in the analysis of the data which follows. Dinitro- phenolate anion is principally present as M+,DNP~, the uncomplexed ion pair, and L,M+,DNP~, the complexed ion pair. The molar extinction coefficient r is then given by
f = f0[M+,DNP-]/C0 + rm ;L,M+,DNP-]/Co (7)
where to is the molar extinction coefficient of DNP~ in the ion pair, rm is that of DNP- in the ion pair complex with ligand L, and Co is the stoichiometric salt concentration. Letting Ac = e — to and Afm = im — to, eq 7 can be combined with the equilibrium constant expression for reaction 4 to yield
1/At = 1/Aem + (l/K pA«m)(l/[L]) (8)
In the experiments reported here. [L] is always much greater than Co. Equation 8 is a form of the Benesi-Hildebrand equation.10'11 Data at 380 nm for LiDNP at three different salt concentrations in THF appear in Figure 9, plotted in the form of eq 7. The solid line through the points is a least-squares fit to the data. The intercept yields a value of Atm = 1710 ± 170 M-1 cm-1. The slope yields a value of Kp = 200 ± 30 M-1, the same within experimental error as that obtained from analysis of the conductance data, TableI. The data at 390 nm for KDNP at one salt concentration are plotted in the form of eq 8 in Figure 9 also. A least- squares treatment of these data yields A{m = 2060 ± 510 M _1 cm-1 and Kp = 64 ± 28 M-1. It is seen that the agreement between spectroscopic value for Kp with the conductance value is not very good in the case of KDNP. The discrepancy is believed due to the small changes in spectral absorbances and in conductivity in the presence of added TEA.
683
Figure 9. Benesi-Hildebrand plots for lithium and potassium dinitro- phenolate in THF with added TEA. Lithium dinitrophenolate at 380 nm: (O) 0.338 mM salt; ( • ) 0.632 mM salt; (O) 0.524 mM salt. Potassium dinitrophenolate at 390 nm ,-----; (©) 0.070 mM salt.
Figure 10. Effect of cation radius on cation-ligand complex formation in THF at 25 °C; log K + vs. reciprocal of the cation ionic radius, 1/r+: open circles, triphenylphosphine oxide ligand (ref 3); closed circles, triethanolamine ligand, this work. No theoretical significance is attached to the lines joining the data points other than the qualitative significance discussed in the text.
The spectrophotometric method has recently been applied more successfully12 in systems where ligand-cation (or ion pair) association constants are much larger and the changes in molar extinction coefficients are larger than those for the systems presently under study.
A noteworthy feature of the spectra in the present study (Figure 8) is the shift of the band toward shorter wavelength as ligand is added, the reverse of the shifts observed
The Journal of Physical Chemistry, Vol. 80, No. 7, 1976
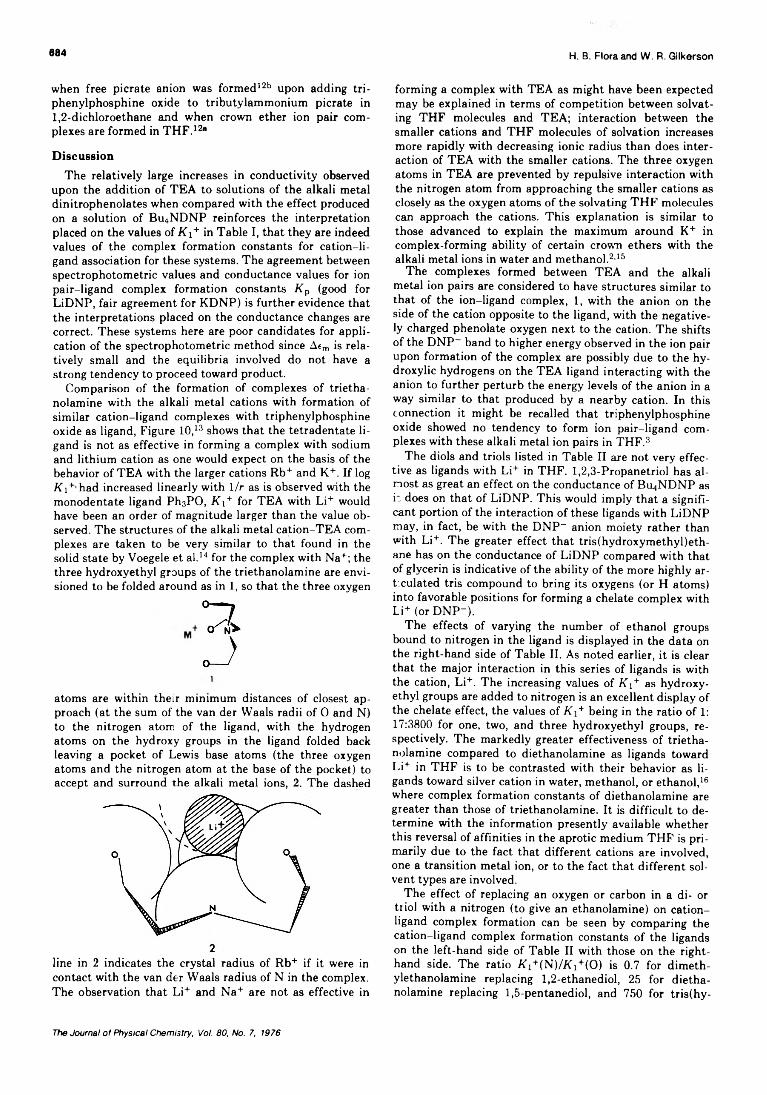
684 H. B. Flora and W. R. Gilkerson
when free picrate anion was formed12b upon adding tri- phenylphosphine oxide to tributylammonium picrate in1 ,2-dichloroethane and when crown ether ion pair complexes are formed in THF.12a
DiscussionThe relatively large increases in conductivity observed
upon the addition of TEA to solutions of the alkali metal dinitrophenolates when compared with the effect produced on a solution of Bu4NDNP reinforces the interpretation placed on the values of K i+ in Table I, that they are indeed values of the complex formation constants for cation-ligand association for these systems. The agreement between spectrophotometric values and conductance values for ion pair-ligand complex formation constants Kp (good for LiDNP, fair agreement for KDNP) is further evidence that the interpretations placed on the conductance changes are correct. These systems here are poor candidates for application of the spectrophotometric method since A«m is relatively small and the equilibria involved do not have a strong tendency to proceed toward product.
Comparison of the formation of complexes of triethanolamine with the alkali metal cations with formation of similar cation-ligand complexes with triphenylphosphine oxide as ligand, Figure 10,13 shows that the tetradentate ligand is not as effective in forming a complex with sodium and lithium cation as one would expect on the basis of the behavior of TEA with the larger cations Rb+ and K+. If log K i+ had increased linearly with 1/r as is observed with the monodentate ligand PhsPO, K i+ for TEA with Li+ would have been an order of magnitude larger than the value observed. The structures of the alkali metal cation-TEA complexes are taken to be very similar to that found in the solid state by Voegele et al.14 for the complex with Na+; the three hydroxyethyl groups of the triethanolamine are envisioned to be folded around as in 1, so that the three oxygen
atoms are within their minimum distances of closest approach (at the sum of the van der Waals radii of 0 and N) to the nitrogen atom of the ligand, with the hydrogen atoms on the hydroxy groups in the ligand folded back leaving a pocket of Lewis base atoms (the three oxygen atoms and the nitrogen atom at the base of the pocket) to accept and surround the alkali metal ions, 2. The dashed
line in 2 indicates the crystal radius of Rb+ if it were in contact with the van der Waals radius of N in the complex. The observation that Li+ and Na+ are not as effective in
forming a complex with TEA as might have been expected may be explained in terms of competition between solvating THF molecules and TEA; interaction between the smaller cations and THF molecules of solvation increases more rapidly with decreasing ionic radius than does interaction of TEA with the smaller cations. The three oxygen atoms in TEA are prevented by repulsive interaction with the nitrogen atom from approaching the smaller cations as closely as the oxygen atoms of the solvating THF molecules can approach the cations. This explanation is similar to those advanced to explain the maximum around K+ in complex-forming ability of certain crown ethers with the alkali metal ions in water and methanol.2'15
The complexes formed between TEA and the alkali metal ion pairs are considered to have structures similar to that of the ion-ligand complex, 1 , with the anion on the side of the cation opposite to the ligand, with the negatively charged phenolate oxygen next to the cation. The shifts of the DNP- band to higher energy observed in the ion pair upon formation of the complex are possibly due to the hy- droxylic hydrogens on the TEA ligand interacting with the anion to further perturb the energy levels of the anion in a way similar to that produced by a nearby cation. In this connection it might be recalled that triphenylphosphine oxide showed no tendency to form ion pair-ligand complexes with these alkali metal ion pairs in THF.3
The diols and triols listed in Table II are not very effective as ligands with Li+ in THF. 1,2,3-Propanetriol has almost as great an effect on the conductance of B114NDNP as h does on that of LiDNP. This would imply that a significant portion of the interaction of these ligands with LiDNP may, in fact, be with the DNP- anion moiety rather than with Li+. The greater effect that tris(hydroxymethyl)eth- ane has on the conductance of LiDNP compared with that of glycerin is indicative of the ability of the more highly articulated tris compound to bring its oxygens (or H atoms) into favorable positions for forming a chelate complex with Li+ (or DNP- ).
The effects of varying the number of ethanol groups bound to nitrogen in the ligand is displayed in the data on the right-hand side of Table II. As noted earlier, it is clear that the major interaction in this series of ligands is with the cation, Li+. The increasing values of K i+ as hydroxyethyl groups are added to nitrogen is an excellent display of the chelate effect, the values of K\+ being in the ratio of 1: 17:3800 for one, two, and three hydroxyethyl groups, respectively. The markedly greater effectiveness of triethanolamine compared to diethanolamine as ligands toward Li+ in THF is to be contrasted with their behavior as ligands toward silver cation in water, methanol, or ethanol,16 where complex formation constants of diethanolamine are greater than those of triethanolamine. It is difficult to determine with the information presently available whether this reversal of affinities in the aprotic medium THF is primarily due to the fact that different cations are involved, one a transition metal ion, or to the fact that different solvent types are involved.
The effect of replacing an oxygen or carbon in a di- or triol with a nitrogen (to give an ethanolamine) on cation- ligand complex formation can be seen by comparing the cation-ligand complex formation constants of the ligands on the left-hand side of Table II with those on the right- hand side. The ratio .K'i+(N )/K i+(0) is 0.7 for dimeth- ylethanolamine replacing 1,2-ethanediol, 25 for diethanolamine replacing 1,5-pentanediol, and 750 for tris(hy-
The Journal of Physical Chemistry, Vol. 80, No. 7, 1976
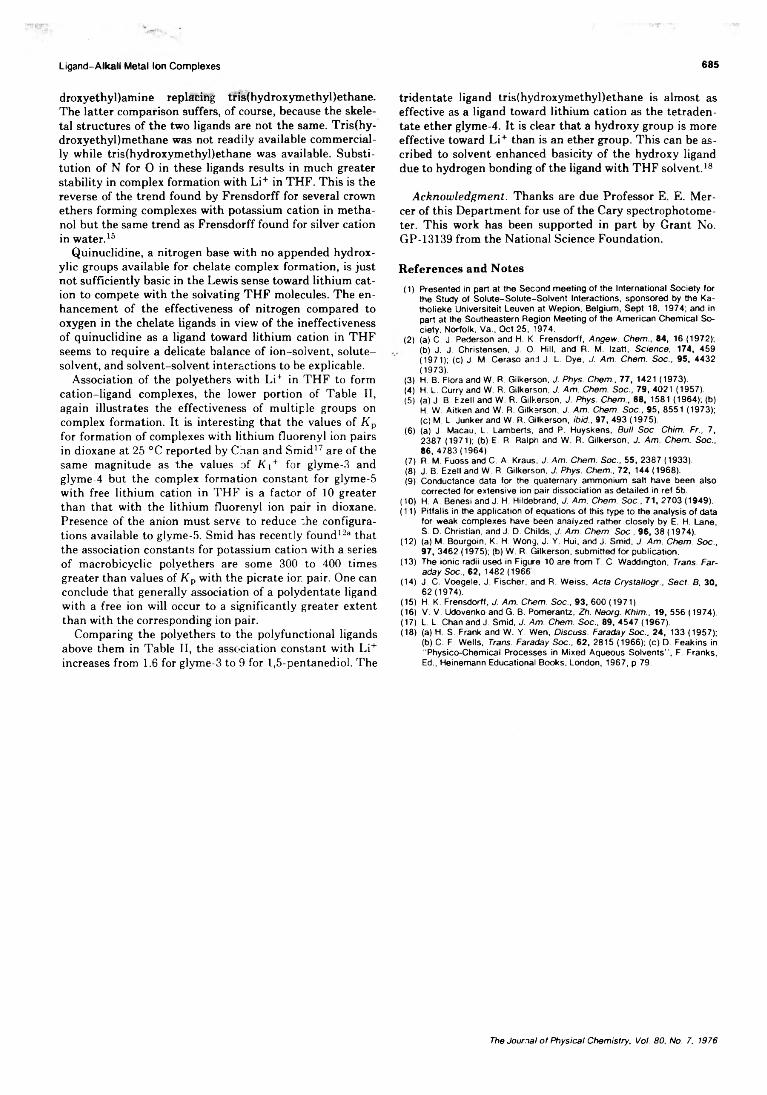
Ligand-Alkali Metal Ion Complexes 685
droxyethyl)amine replacing tris(hydroxymethyl)ethane. The latter comparison suffers, of course, because the skeletal structures of the two ligands are not the same. Tris(hy- droxyethyl)methane was not readily available commercially while tris(hydroxymethyl)ethane was available. Substitution of N for O in these ligands results in much greater stability in complex formation with Li+ in THF. This is the reverse of the trend found by Frensdorff for several crown ethers forming complexes with potassium cation in methanol but the same trend as Frensdorff found for silver cation in water.15
Quinuclidine, a nitrogen base with no appended hydrox- ylic groups available for chelate complex formation, is just not sufficiently basic in the Lewis sense toward lithium cation to compete with the solvating THF molecules. The enhancement of the effectiveness of nitrogen compared to oxygen in the chelate ligands in view of the ineffectiveness of quinuclidine as a ligand toward lithium cation in THF seems to require a delicate balance of ion-solvent, solute- solvent, and solvent-solvent interactions to be explicable.
Association of the polyethers with Li+ in THF to form cation-ligand complexes, the lower portion of Table II, again illustrates the effectiveness of multiple groups on complex formation. It is interesting that the values of Kp for formation of complexes with lithium fluorenyl ion pairs in dioxane at 25 °C reported by Chan and Smid17 are of the same magnitude as the values of K i+ for glyme-3 and glyme-4 but the complex formation constant for glyme-5 with free lithium cation in THF is a factor of 10 greater than that with the lithium fluorenyl ion pair in dioxane. Presence of the anion must serve to reduce 'he configurations available to glyme-5. Smid has recently found123 that the association constants for potassium cation with a series of macrobicyclic polyethers are some 300 to 400 times greater than values of Kp with the picrate ior. pair. One can conclude that generally association of a polydentate ligand with a free ion will occur to a significantly greater extent than with the corresponding ion pair.
Comparing the polyethers to the polyfunctional ligands above them in Table II, the association constant with Li+ increases from 1.6 for glyme-3 to 9 for 1,5-pentanediol. The
tridentate ligand tris(hydroxymethyl)ethane is almost as effective as a ligand toward lithium cation as the tetraden- tate ether glyme-4. It is clear that a hydroxy group is more effective toward Li+ than is an ether group. This can be ascribed to solvent enhanced basicity of the hydroxy ligand due to hydrogen bonding of the ligand with THF solvent.18
Acknowledgment. Thanks are due Professor E. E. Mercer of this Department for use of the Cary spectrophotometer. This work has been supported in part by Grant No. GP-13139 from the National Science Foundation.
References and Notes(1) Presented in part at the Second meeting of the International Society for
the Study of Solute-Solute-Solvent Interactions, sponsored by the Ka- tholieke Universiteit Leuven at Wepion, Belgium, Sept 18, 1974; and in part at the Southeastern Region Meeting of the American Chemical Society, Norfolk, Va., Oct 25, 1974.
(2) (a) C. J. Pederson and H. K. Frensdorff, Angew. Chem., 84, 16 (1972);(b) J. J. Christensen, J. O. Hill, and R. M. Izatt, Science, 174, 459(1971); (c) J. M. Ceraso and J. L. Dye, J. Am. Chem. Soc., 95, 4432(1973).
(3) H. B. Flora and W. R. Gilkerson, J. Phys. Chem., 77, 1421 (1973).(4) H.L. Curry and W. R. Gilkerson, J. Am. Chem. Soc., 79, 4021 (1957).(5) (a) J. B. Ezell and W. R. Gilkerson, J. Phys. Chem., 6 8 , 1581 (1964); (b)
H. W Aitken and W. R. Gilkerson, J. Am. Chem. Soc., 95, 8551 (1973);(c) M. L. Junker and W. R. Gilkerson, ibid., 97, 493 (1975).
(6 ) (a) J. Macau, L. Lamberts, and P. Huyskens, Bull Soc. Chim. Fr„ 7, 2387 (1971); (b) E. R. Ralph and W. R. Gilkerson, J. Am. Chem. Soc., 86,4783(1964).
(7) R. M. Fuoss and C. A. Kraus, J. Am. Chem. Soc., 55, 2387 (1933).(8 ) J. B. Ezell and W. R. Gilkerson, J. Phys. Chem., 72, 144 (1968).(9) Conductance data for the quaternary ammonium salt have been also
corrected for extensive ion pair dissociation as detailed in ref 5b.(10) H. A. Benesi and J. H. Hildebrand, J. Am. Chem. Soc., 71, 2703 (1949).(11) Pitfalls in the application of equations of this type to the analysis of data
for weak complexes have been analyzed rather closely by E. H. Lane, S. D. Christian, and J. D. Childs, J. Am. Chem. Soc., 96, 38 (1974).
(12) (a) M. Bourgoin, K. H. Wong, J. Y. Hui, and J. Smid, J. Am. Chem. Soc., 97, 3462 (1975); (b) W. R. Gilkerson, submitted for publication.
(13) The ionic radii used in Figure 10 are from T. C. Waddington, Trans. Faraday Soc., 62, 1482 (1966 .,
(14) J. C. Voegele, J. Fischer, and R. Weiss, Acta Crystallogr., Sect. B, 30, 62(1974).
(15) H. K. Frensdorff, J. Am. Chem. Soc., 93, 600 (1971).(16) V. V. Udovenko and G. B. Pomerantz, Zh. Neorg. Khim., 19, 556 (1974).(17) L. L. Chan and J. Smid, J. Am. Chem. Soc., 89, 4547 (1967).(18) (a) H. S. Frank and W. Y. Wen, Discuss. Faraday Soc., 24, 133 (1957);
(b) C. F. Wells, Trans. Faraday Soc., 62, 2815 (1966); (c) D. Feakins in "Physico-Chemical Processes in Mixed Aqueous Solvents", F. Franks, Ed., Heinemann Educational Books, London, 1967, p 79.
The Journal of Physical Chemistry, Vol. 80, No. 7, 1976
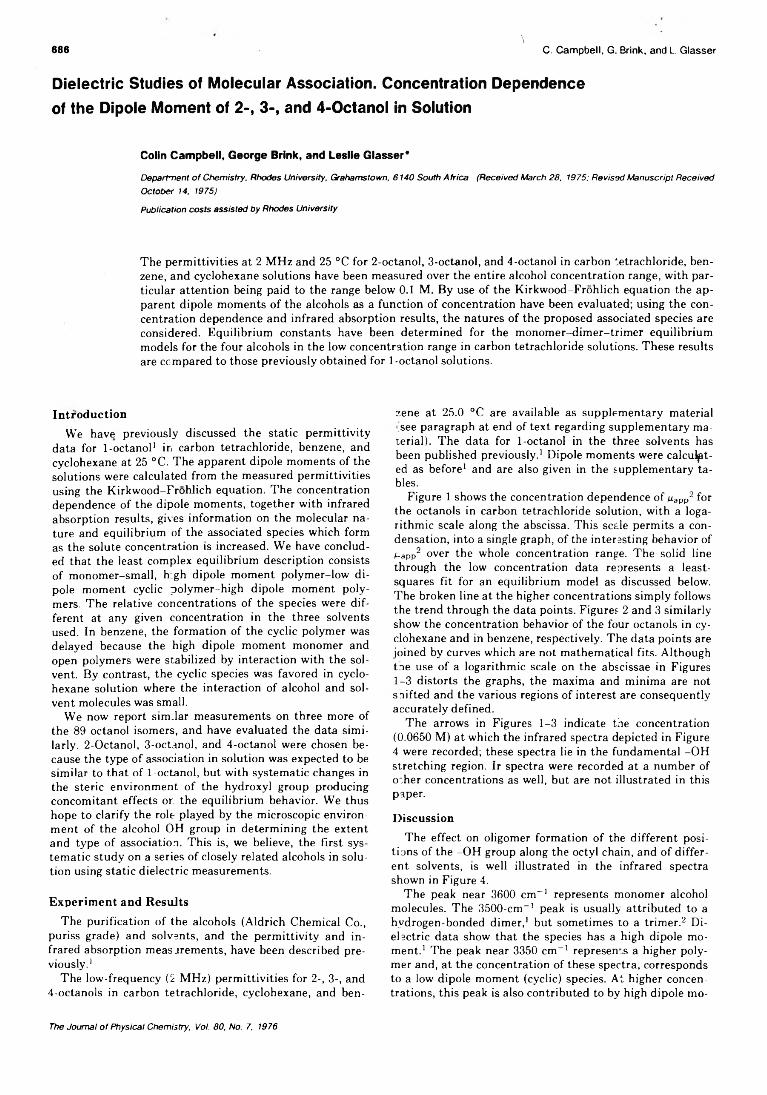
686\
C. Campbell, G. Brink, and L. Glasser
D ie le c t r i c S t u d ie s o f M o le c u la r A s s o c ia t i o n . C o n c e n t r a t io n D e p e n d e n c e
o f t h e D ip o le M o m e n t o f 2 - , 3 - , a n d 4 -O c t a n o l in S o lu t io n
Colin Campbell, George Brink, and Leslie Glasser*
Department of Chemistry, Rhodes University, Grahamstown, 6140 South Africa (Received March 28, 1975; Revised Manuscript Received October 14, 1975)
Publication costs assisted by Rhodes University
The permittivities at 2 MHz and 25 °C for 2-octanol, 3-octanol, and 4-octanol in carbon tetrachloride, benzene, and cyclohexane solutions have been measured over the entire alcohol concentration range, with particular attention being paid to the range below 0.1 M. By use of the Kirkwood-Frohlich equation the apparent dipole moments of the alcohols as a function of concentration have been evaluated; using the concentration dependence and infrared absorption results, the natures of the proposed associated species are considered. Equilibrium constants have been determined for the monomer-dimer-trimer equilibrium models for the four alcohols in the low concentration range in carbon tetrachloride solutions. These results are compared to those previously obtained for 1 -octanol solutions.
IntroductionWe have previously discussed the static permittivity
data for 1 -octanol1 in carbon tetrachloride, benzene, and cyclohexane at 25 °C. The apparent dipole moments of the solutions were calculated from the measured permittivities using the Kirkwood-Frohlich equation. The concentration dependence of the dipole moments, together with infrared absorption results, gives information on the molecular nature and equilibrium of the associated species which form as the solute concentration is increased. We have concluded that the least complex equilibrium description consists of monomer-small, high dipole moment polymer-low dipole moment cyclic polymer-high dipole moment polymers. The relative concentrations of the species were different at any given concentration in the three solvents used. In benzene, the formation of the cyclic polymer was delayed because the high dipole moment monomer and open polymers were stabilized by interaction with the solvent. By contrast, the cyclic species was favored in cyclohexane solution where the interaction of alcohol and solvent molecules was small.
We now report sim.lar measurements on three more of the 89 octanol isomers, and have evaluated the data similarly. 2-Octanol, 3-octanol, and 4-octanol were chosen because the type of association in solution was expected to be similar to that of 1 -octanol, but with systematic changes in the steric environment of the hydroxyl group producing concomitant effects on the equilibrium behavior. We thus hope to clarify the role played by the microscopic environment of the alcohol OH group in determining the extent and type of association. This is, we believe, the first systematic study on a series of closely related alcohols in solution using static dielectric measurements.
Experiment and ResultsThe purification of the alcohols (Aldrich Chemical Co.,
puriss grade) and solvents, and the permittivity and infrared absorption measurements, have been described previously.1
The low-frequency (2 MHz) permittivities for 2-, 3-, and4-octanols in carbon tetrachloride, cyclohexane, and ben
zene at 25.0 °C are available as supplementary material ' see paragraph at end of text regarding supplementary material). The data for 1-octanol in the three solvents has been published previously.1 Dipole moments were calculated as before1 and are also given in the supplementary tables.
Figure 1 shows the concentration dependence of papp2 for the octanols in carbon tetrachloride solution, with a logarithmic scale along the abscissa. This scale permits a condensation, into a single graph, of the interesting behavior of r-app2 over the whole concentration range. The solid line through the low concentration data represents a least- squares fit for an equilibrium model as discussed below. The broken line at the higher concentrations simply follows the trend through the data points. Figures 2 and 3 similarly show the concentration behavior of the four octanols in cyclohexane and in benzene, respectively. The data points are joined by curves which are not mathematical fits. Although tne use of a logarithmic scale on the abscissae in Figures 1-3 distorts the graphs, the maxima and minima are not s lifted and the various regions of interest are consequently accurately defined.
The arrows in Figures 1-3 indicate the concentration (0.0650 M) at which the infrared spectra depicted in Figure 4 were recorded; these spectra lie in the fundamental -OH stretching region. Ir spectra were recorded at a number of other concentrations as well, but are not illustrated in this paper.
DiscussionThe effect on oligomer formation of the different posi
tions of the -OH group along the octyl chain, and of different solvents, is well illustrated in the infrared spectra shown in Figure 4.
The peak near 3600 cm“ 1 represents monomer alcohol molecules. The 3500-cm_1 peak is usually attributed to a hydrogen-bonded dimer,1 but sometimes to a trimer.2 Dielectric data show that the species has a high dipole moment.1 The peak near 3350 cm-1 represents a higher polymer and, at the concentration of these spectra, corresponds to a low dipole moment (cyclic) species. At higher concentrations, this peak is also contributed to by high dipole mo-
The Journal of Physical Chemistry, Vol. 80, No. 7, 1976
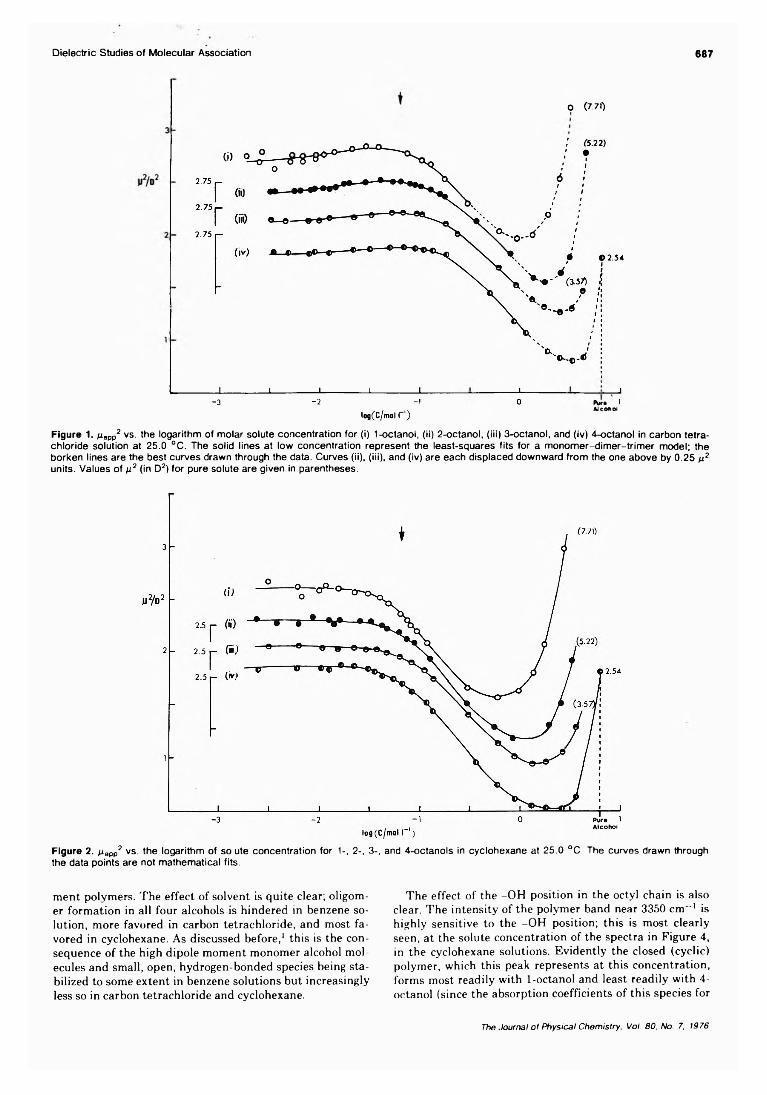
Dielectric Studies of Molecular Association 687
0 (7V1)1
—I__________I---------------- 1---------------- 1__________L-3 -2 - !
log(c/mol r ')PUr*Al cohot
J1
Figure 1. Mapp2 vs. the logarithm of molar solute concentration for (i) 1-octanol, (ii) 2-octanol, (iii) 3-octanol, and (iv) 4-octanol in carbon tetrachloride solution at 25.0 °C. The solid lines at low concentration represent the least-squares fits for a monomer-dimer-trimer model; the borken lines are the best curves drawn through the data. Curves (ii), (iii), and (iv) are each displaced downward from the one above by 0.25 n2 units. Values of n2 (in D2) for pure solute are given in parentheses.
Figure 2. ^ app2 vs. the logarithm of so ute concentration for 1-, 2-, 3-, and 4-octanols in cyclohexane at 25.0 °C. The curves drawn through the data points are not mathematical fits.
ment polymers. The effect of solvent is quite clear; oligomer formation in all four alcohols is hindered in benzene solution, more favored in carbon tetrachloride, and most favored in cyclohexane. As discussed before,1 this is the consequence of the high dipole moment monomer alcohol molecules and small, open, hydrogen-bonded species being stabilized to some extent in benzene solutions but increasingly less so in carbon tetrachloride and cyclohexane.
The effect of the -OH position in the octyl chain is also clear. The intensity of the polymer band near 3350 cm-1 is highly sensitive to the -OH position; this is most clearly seen, at the solute concentration of the spectra in Figure 4, in the cyclohexane solutions. Evidently the closed (cyclic) polymer, which this peak represents at this concentration, forms most readily with 1-octanol and least readily with 4- octanol (since the absorption coefficients of this species for
The Journal of Physical Chemistry, Vol. 80, No. 7, 1976
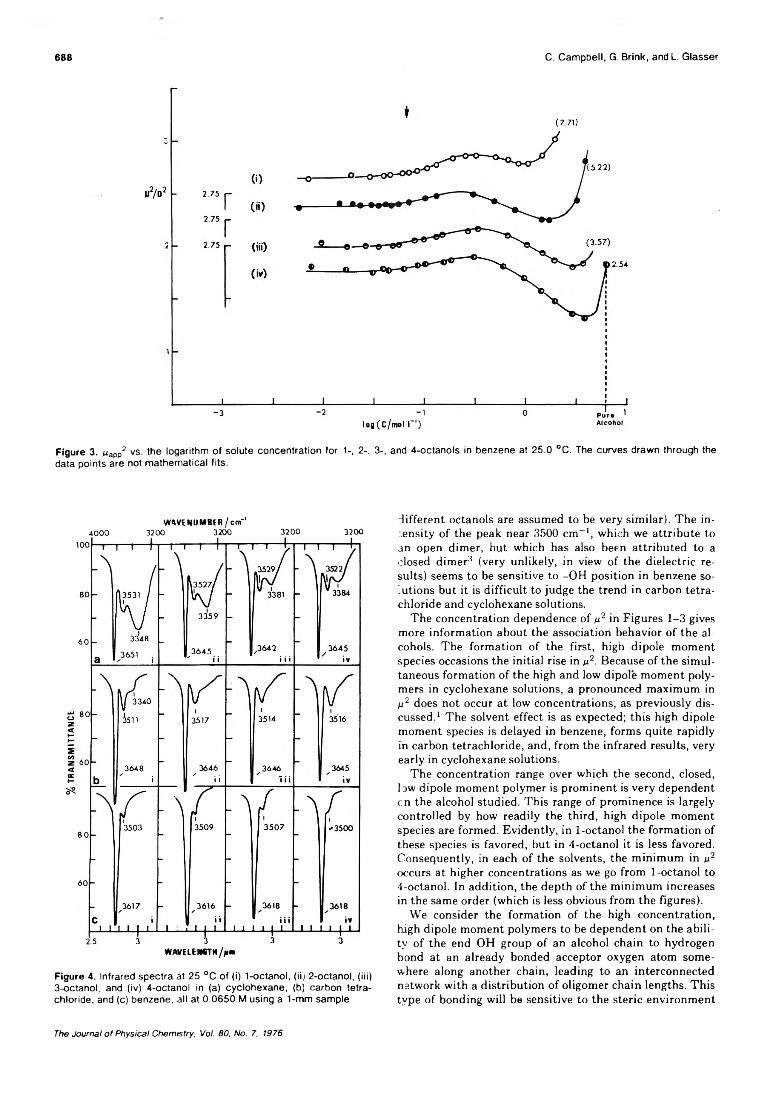
688 C. Campbell, G. Brink, and L. Glasser
Figure 3. Mapp2 VS- the logarithm of solute concentration for 1-, 2-, 3-, and 4-octanols in benzene at 25.0 °C. The curves drawn through the data points are not mathematical fits.
WAVENUMBER / cm"14000 3200 3200 3200 3200
Figure 4. Infrared spectra at 25 °C of (i) 1-octanol, (ii) 2-octanol, (iii) 3-octanol, and (iv) 4-octanol in (a) cyclohexane, (b) carbon tetrachloride, and (c) benzene, all at 0.0650 M using a 1-mm sample.
different octanols are assumed to be very similar). The intensity of the peak near 3500 cm-1, which we attribute to an open dimer, but which has also been attributed to a closed dimer3 (very unlikely, in view of the dielectric results) seems to be sensitive to -OH position in benzene solutions but it is difficult to judge the trend in carbon tetrachloride and cyclohexane solutions.
The concentration dependence of n2 in Figures 1-3 gives more information about the association behavior of the alcohols. The formation of the first, high dipole moment species occasions the initial rise in n2. Because of the simultaneous formation of the high and low dipole moment polymers in cyclohexane solutions, a pronounced maximum inp.2 does not occur at low concentrations, as previously discussed.1 The solvent effect is as expected; this high dipole moment species is delayed in benzene, forms quite rapidly in carbon tetrachloride, and, from the infrared results, very early in cyclohexane solutions.
The concentration range over which the second, closed, low dipole moment polymer is prominent is very dependent cn the alcohol studied. This range of prominence is largely controlled by how readily the third, high dipole moment species are formed. Evidently, in 1-octanol the formation of these species is favored, but in 4-octanol it is less favored. Consequently, in each of the solvents, the minimum in n2 occurs at higher concentrations as we go from 1 -octanol to 4-octanol. In addition, the depth of the minimum increases in the same order (which is less obvious from the figures).
We consider the formation of the high concentration, high dipole moment polymers to be dependent on the ability of the end OH group of an alcohol chain to hydrogen bond at an already bonded acceptor oxygen atom somewhere along another chain, leading to an interconnected network with a distribution of oligomer chain lengths. This type of bonding will be sensitive to the steric environment
The Journal of Physical Chemistry, Vol. 80, No. 7, 1976
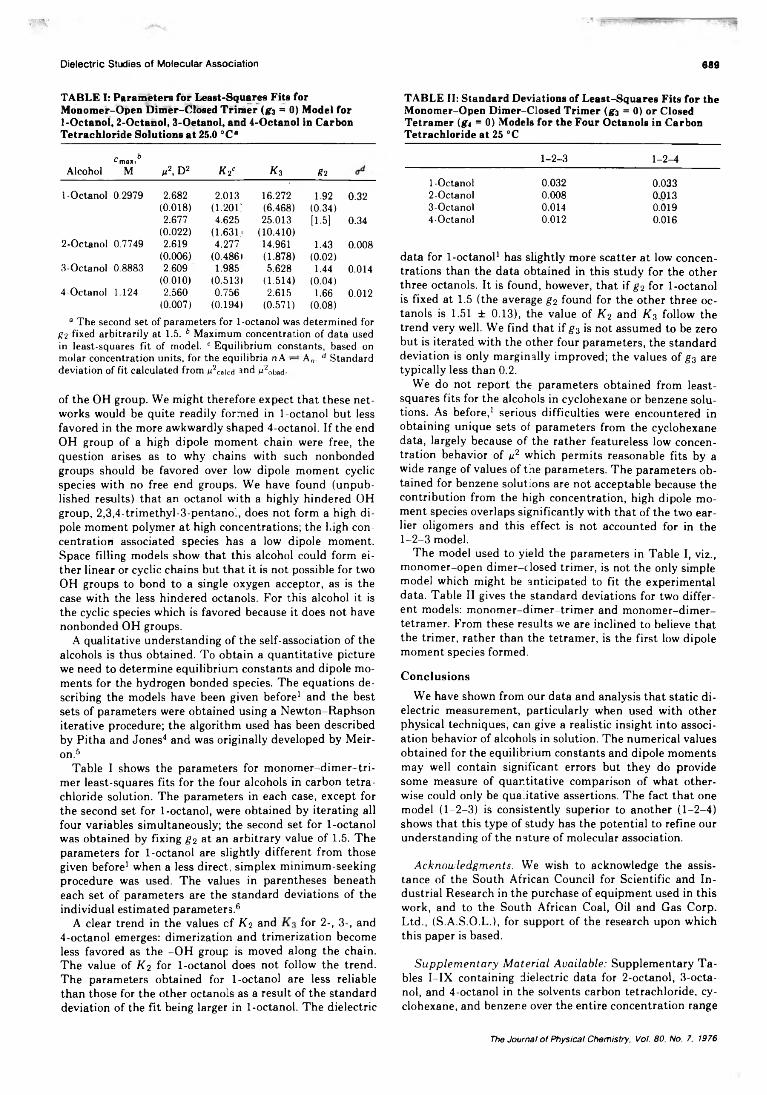
Dielectric Studies of Molecular Association 689
TABLE I: Parameters for Least-Squares Fits for Monomer-Open Dimer-Closed Trimer (g 3 = 0) Model for1-Octanol, 2-Octanol, 3-Oetanol, and 4-Octanol in Carbon Tetrachloride Solutions at 25.0 °Ca
c b L max»Alcohol M e2, D2 k 2c k 3 gì
1-Octanol 0.2979 2.682 2.013 16.272 1.92 0.32(0.018) (I.201: (6.468) (0.34)2.677 4.625 25.013 [1.5] 0.34
(0.022) (1.631 > (10.410)2-Octanol 0.7749 2.619 4.277 14.961 1.43 0.008
(0.006) (0.4861 (1.878) (0.02)3-Octanol 0.8883 2.609 1.985 5.628 1.44 0.014
(0.010) (0.513) (1.514) (0.04)4-Octanol 1.124 2.560 0.756 2.615 1.66 0.012
(0.007) (0.194) (0.571) (0.08)“ The second set of parameters for 1-octanol was determined for
g 2 fixed arbitrarily at 1.5. 6 Maximum concentration of data used in least-squares fit of model. c Equilibrium constants, based on molar concentration units, for the equilibria n A — A„. d Standard deviation of fit calculated from M calcd and M obsd-
of the OH group. We might therefore expect that these networks would be quite readily formed in 1 -octanol but less favored in the more awkwardly shaped 4-octanol. If the end OH group of a high dipole moment chain were free, the question arises as to why chains with such nonbonded groups should be favored over low dipole moment cyclic species with no free end groups. We have found (unpublished results) that an octanol with a highly hindered OH group, 2,3,4-trimethyl-3-pentanol, does not form a high dipole moment polymer at high concentrations; the high concentration associated species has a low dipole moment. Space filling models show that this alcohol could form either linear or cyclic chains but that it is not possible for two OH groups to bond to a single oxygen acceptor, as is the case with the less hindered octanols. For this alcohol it is the cyclic species which is favored because it does not have nonbonded OH groups.
A qualitative understanding of the self-association of the alcohols is thus obtained. To obtain a quantitative picture we need to determine equilibrium constants and dipole moments for the hydrogen bonded species. The equations describing the models have been given before1 and the best sets of parameters were obtained using a Newton-Raphson iterative procedure; the algorithm used has been described by Pitha and Jones4 and was originally developed by Meir- on.5
Table I shows the parameters for monomer-dimer-tri- mer least-squares fits for the four alcohols in carbon tetrachloride solution. The parameters in each case, except for the second set for 1 -octanol, were obtained by iterating all four variables simultaneously; the second set for 1 -octanol was obtained by fixing g2 at an arbitrary value of 1.5. The parameters for 1 -octanol are slightly different from those given before1 when a less direct, simplex minimum-seeking procedure was used. The values in parentheses beneath each set of parameters are the standard deviations of the individual estimated parameters.6
A clear trend in the values of K2 and for 2-, 3-, and 4-octanol emerges: dimerization and trimerization become less favored as the -OH group is moved along the chain. The value of K 2 for 1 -octanol does not follow the trend. The parameters obtained for 1 -octanol are less reliable than those for the other octanols as a result of the standard deviation of the fit being larger in 1-octanol. The dielectric
TABLE II: Standard Deviations of Least-Squares Fits for the Monomer-Open Dimer-Closed Trimer (g 3 = 0) or Closed Tetramer (g j = 0) Models for the Four Octanols in Carbon Tetrachloride at 25 °C
1-2-3 1-2-4
1- Octanol 0.032 0.0332- Octano! 0.008 0.0133- Octanoi 0.014 0.0194- Octano! 0.012 0.016
data for 1 -octanol1 has slightly more scatter at low concentrations than the data obtained in this study for the other three octanols. It is found, however, that if g2 for 1-octanol is fixed at 1.5 (the average £2 found for the other three octanols is 1.51 ± 0.13), the value of K 2 and K 3 follow the trend very well. We find that if g3 is not assumed to be zero but is iterated with the other four parameters, the standard deviation is only marginally improved; the values of £3 are typically less than 0.2.
We do not report the parameters obtained from least- squares fits for the alcohols in cyclohexane or benzene solutions. As before,1 serious difficulties were encountered in obtaining unique sets of parameters from the cyclohexane data, largely because of the rather featureless low concentration behavior of g2 which permits reasonable fits by a wide range of values of the parameters. The parameters obtained for benzene solutions are not acceptable because the contribution from the high concentration, high dipole moment species overlaps significantly with that of the two earlier oligomers and this effect is not accounted for in the1-2-3 model.
The model used to yield the parameters in Table I, viz., monomer-open dimer-dosed trimer, is not the only simple model which might be anticipated to fit the experimental data. Table II gives the standard deviations for two different models: monomer-dimer-trimer and monomer-dimer- tetramer. From these results we are inclined to believe that the trimer, rather than the tetramer, is the first low dipole moment species formed.
ConclusionsWe have shown from our data and analysis that static di
electric measurement, particularly when used with other physical techniques, can give a realistic insight into association behavior of alcohols in solution. The numerical values obtained for the equilibrium constants and dipole moments may well contain significant errors but they do provide some measure of quantitative comparison of what otherwise could only be qualitative assertions. The fact that one model (1-2-3) is consistently superior to another (1-2-4) shows that this type of study has the potential to refine our understanding of the nature of molecular association.
Acknowledgments. We wish to acknowledge the assistance of the South African Council for Scientific and Industrial Research in the purchase of equipment used in this work, and to the South African Coal, Oil and Gas Corp. Ltd., (S.A.S.O.L.), for support of the research upon which this paper is based.
Supplementary Material Available: Supplementary Tables I-IX containing dielectric data for 2-octanol, 3-octa- nol, and 4-octanol in the solvents carbon tetrachloride, cyclohexane, and benzene over the entire concentration range
The Journal of Physical Chemistry. Voi. 80. No. 7, 1976
690 E. H. Lane, S. D. Christian, and F. Garland
at 25.0 °C (9 pages). Ordering information is available on any current masthead page.
References and Notes(1) C. Campbell, G. Brink, and L. Glasser, J. Phys. Chem., 79, 660 (1975).
(2) E. E. Tucker and E. D. Becker, J. Phys. Chem., 77. 1783 (1973).(3) H C. van Ness, J. van Winkle, H. H. Richtol, and H. B. Hollinger, J. Phys.
Chem., 71, 1483 (1967).(4) J. Pitha and R. N. Jones, Can. J. Chem., 44, 3031 ¡1966).(5) J. Meiron, J. Opt. Soc. Am., 55, 1105 (1965).(6 ) Y. Bard, "Nonlinear Parameter Estimation” , Academic Press, New York,
N.Y., 1974, p 207.
L in e a r D e p e n d e n c e T e s t s fo r D e te r m in a t io n o f N u m b e r o f C h e m ic a l S p e c i e s 1
Edwin H. Lane, Sherril D. Christian,*
Department of Chemistry, The University of Oklahoma, Norman, Oklahoma 73069
and Frank Garland
Department of Biomathematics, The Medical Center, University of Alabama in Birmingham, Birmingham, Alabama 35294 (Received July 5, 1974; Revised Manuscript Received December 10, 1975)
Publication costs assisted by the National Science Foundation
A general method is described which employs linear least-squares analysis in determining the number of species contributing to various types of physical results. Spectral, vapor pressure, colligative property, or total concentration data may be used, as well as other types of physical data which are linearly dependent on species concentrations. An advantage of the present approach is the convenience of using weighting factors which take into account errors in the individual measurements. Weighting is particularly important when sets of data of varying type and precision are processed simultaneously. Limitations of methods for number-of-species determinations are discussed. Three examples are given in which the linear dependence method is applied to experimental data.
IntroductionSeveral numerical techniques have been proposed for an
alyzing spectral data to determine the number of absorbing species in solutions of complexes or unknown mixtures. Methods for matrix-rank analysis2’ 7 and factor analysis8 are currently in use for this purpose; in a related technique, two-dimensional linear relations among absorbances at different wavelengths are employed to test for the number of independently absorbing species.9,10
This article describes a general method for using linear dependence tests to determine the number of species which contribute to physical measurements of various types, including spectral, vapor pressure, colligative property, and concentration data. An advantage of the present approach is the convenience with which weighting factors can be used at each stage of the data manipulations when sets of data of varying type and precision are processed simultaneously.
Theory and ProcedureWe assume initially that absorbances have been mea
sured at m wavelengths for a solution containing m chemical species with distinct spectra. We further assume that each species absorbs at at least one of the wavelengths, and that there are no subsets of species for which the absorbances are linearly depencent. If Beer’s law is obeyed by all species at all wavelengths and concentrations, the absorbances may be related to species concentrations (Cj , C2, . . . , Ci,. . . ,Cm) in the following manner:
■4i - «i.iCi + (2,iC2 + • • • + fi.iC, + . . . +
A 2 = Ci|2C i + c2>2C2 + . . . + C,,2C,' + . . . + cm,2Cm
Aj = Cl,,Cl + C2,,'C2 + . . . + tijCi + .. . + tm,jCm
Am Ci,mCi + c2,mC2 + . . . + C¡,rnC; + . . . + Cm,mCm (1 )
The Aj values represent absorbances per unit pathlength measured at various wavelengths, and the c,-,y values are ab- sorptivities for chemical species i at wavelengths j. Equations 1 can be written in matrix notation as
A = EC (2)
where A = \Aj\, E = |e,jj, and C = (C,-|. If E is nonsingular, eq 2 may be rearranged to
E_1A = C
Thus, each of the species concentrations may be expressed in the form
C i = o t jA i + ftA2 + . . . + P iA m (3)
where the constants a;, ft, ■ ■ ■ , Pi are functions of the e.p values. These linear relations can be used to express the absorbance at any other wavelength (i.e., Am+1) as a function of the absorbances at wavelengths 1 to m. Thus
The Journal of Physical Chemistry, Vol. 80, No. 7, 1976
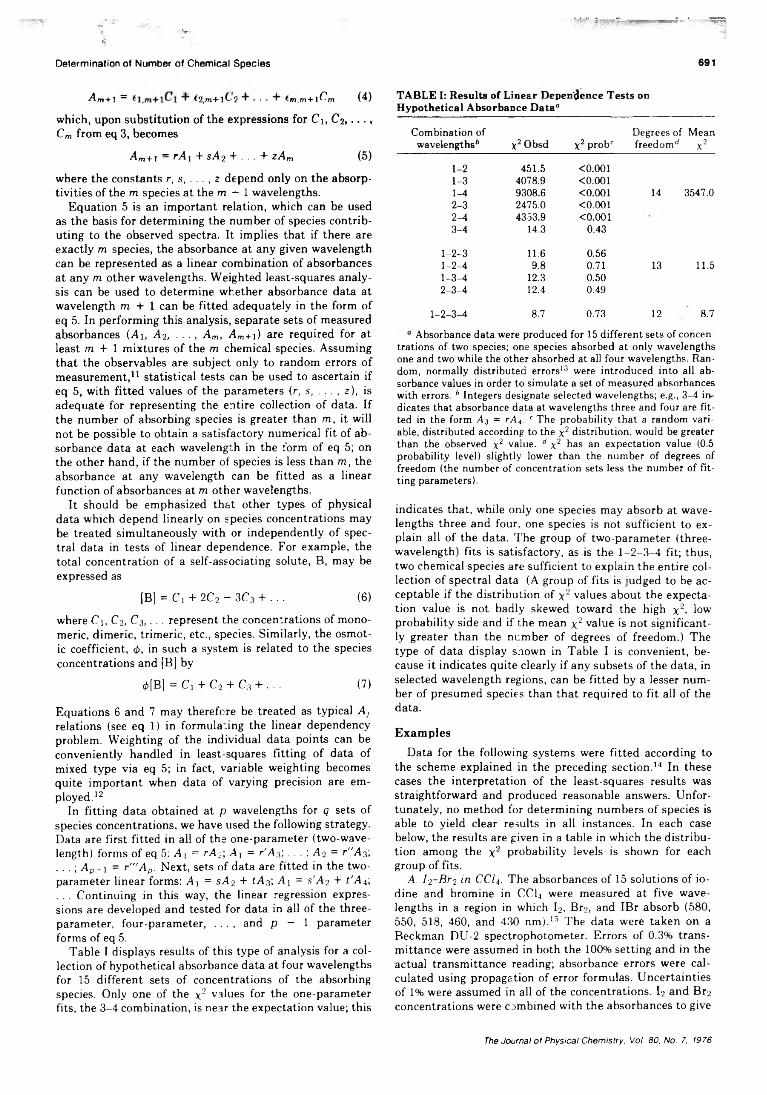
' '»■ “ * '* w»«-J r ' T*52?¡
Determination of Number of Chemical Species
Am+l = ^2,m+lC’2 fm,m+l^m (4)
which, upon substitution of the expressions for Ci, C2, . . . , Cm from eq 3, becomes
Am+i = rAi + sA2 + . . . + zAm (5)
where the constants r, s ........2 depend only on the absorp-tivities of the m species at the m — 1 wavelengths.
Equation 5 is an important relation, which can be used as the basis for determining the number of species contributing to the observed spectra. It implies that if there are exactly m species, the absorbance at any given wavelength can be represented as a linear combination of absorbances at any m other wavelengths. Weighted least-squares analysis can be used to determine whether absorbance data at wavelength m + 1 can be fitted adequately in the form of eq 5. In performing this analysis, separate sets of measured absorbances (Ai, A2, .. ., Am, Am+j) are required for at least m + 1 mixtures of the m chemical species. Assuming that the observables are subject only to random errors of measurement,11 statistical tests can be used to ascertain if eq 5, with fitted values of the parameters (r, s, . . . , z), is adequate for representing the entire collection of data. If the number of absorbing species is greater than m, it will not be possible to obtain a satisfactory numerical fit of absorbance data at each wavelength in the form of eq 5; on the other hand, if the number of species is less than m, the absorbance at any wavelength can be fitted as a linear function of absorbances at m other wavelengths.
It should be emphasized that other types of physical data which depend linearly on species concentrations may be treated simultaneously with or independently of spectral data in tests of linear dependence. For example, the total concentration of a self-associating solute, B, may be expressed as
[B] = Ci + 2C2 - 3C3 + . . . (6)
where Ci, C2, C3,. . . represent the concentrations of monomeric, dimeric, trimeric, etc., species. Similarly, the osmotic coefficient, <t>, in such a system is related to the species concentrations and [B] by
0[B] = Ci + C2 + C3 + . .. (7)
Equations 6 and 7 may therefore be treated as typical Ay relations (see eq 1 ) in formulating the linear dependency problem. Weighting of the individual data points can be conveniently handled in least-squares fitting of data of mixed type via eq 5; in fact, variable weighting becomes quite important when data of varying precision are employed.12
In fitting data obtained at p wavelengths for q sets of species concentrations, we have used the following strategy. Data are first fitted in all of the one-parameter (two-wave- length) forms of eq 5: Ai = rA2; A] = r'An\ . .. ; A2 = r"A3;. . . ; Ap_i = r” ' A p . Next, sets of data are fitted in the two- parameter linear forms: Ai = sA2 + íA3; Ai = s'A2 + t'A4;. . . Continuing in this way, the linear regression expressions are developed and tested for data in all of the three- parameter, four-parameter, . . . , and p — 1 parameter forms of eq 5.
Table I displays results of this type of analysis for a collection of hypothetical absorbance data at four wavelengths for 15 different sets of concentrations of the absorbing species. Only one of the x 2 values for the one-parameter fits, the 3-4 combination, is near the expectation value; this
691
TABLE I: Results of Linear Dependence Tests on Hypothetical Absorbance Data0
Combination of Degrees of Meanwavelengths* x2 Obsd x2 probr freedom* x2
1-2 451.5 <0.0011-3 4078.9 <0.0011-4 9308.6 <0.001 14 3547.02-3 2475.0 <0.0012 -4 4353.9 <0.0013-4 14.3 0.43
1-2-3 11.6 0.561-2-4 9.8 0.71 13 11.51-3-4 12.3 0.502-3-4 12.4 0.49
1-2-3-4 8.7 0.73 12 8.7
Absorbance data were produced for 15 different sets of concen-trations of two species; one species absorbed at only wavelengths one and two while the other absorbed at all four wavelengths. Random, normally distributed errors13 were introduced into all absorbance values in order to simulate a set of measured absorbances with errors. 6 Integers designate selected wavelengths; e.g., 3-4 indicates that absorbance data at wavelengths three and four are fitted in the form A3 = rA4. c The probability that a random variable, distributed according to the x2 distribution, would be greater than the observed x2 value. * x2 has an expectation value (0.5 probability level) slightly lower than the number of degrees of freedom (the number of concentration sets less the number of fitting parameters).
indicates that, while only one species may absorb at wavelengths three and four, one species is not sufficient to explain all of the data. The group of two-parameter (three- wavelength) fits is satisfactory, as is the 1-2-3-4 fit; thus, two chemical species are sufficient to explain the entire collection of spectral data (A group of fits is judged to be acceptable if the distribution of x2 values about the expectation value is not badly skewed toward the high x 2. low probability side and if the mean x2 value is not significantly greater than the number of degrees of freedom.) The type of data display snown in Table I is convenient, because it indicates quite clearly if any subsets of the data, in selected wavelength regions, can be fitted by a lesser number of presumed species than that required to fit all of the data.
ExamplesData for the following systems were fitted according to
the scheme explained in the preceding section.14 In these cases the interpretation of the least-squares results was straightforward and produced reasonable answers. Unfortunately, no method for determining numbers of species is able to yield clear results in all instances. In each case below, the results are given in a table in which the distribution among the x2 probability levels is shown for each group of fits.
A. / 2-Br2 in CCI4. The absorbances of 15 solutions of iodine and bromine in CC14 were measured at five wavelengths in a region in which I2, Br2, and IBr absorb (580, 550, 518, 460, and 430 nm).15 The data were taken on a Beckman DU-2 spectrophotometer. Errors of 0.3% transmittance were assumed in both the 100% setting and in the actual transmittance reading; absorbance errors were calculated using propagation of error formulas. Uncertainties of 1% were assumed in all of the concentrations. I2 and Br2 concentrations were combined with the absorbances to give
The Journal of Physical Chemistry. Vol. 80. No. 7. 1976
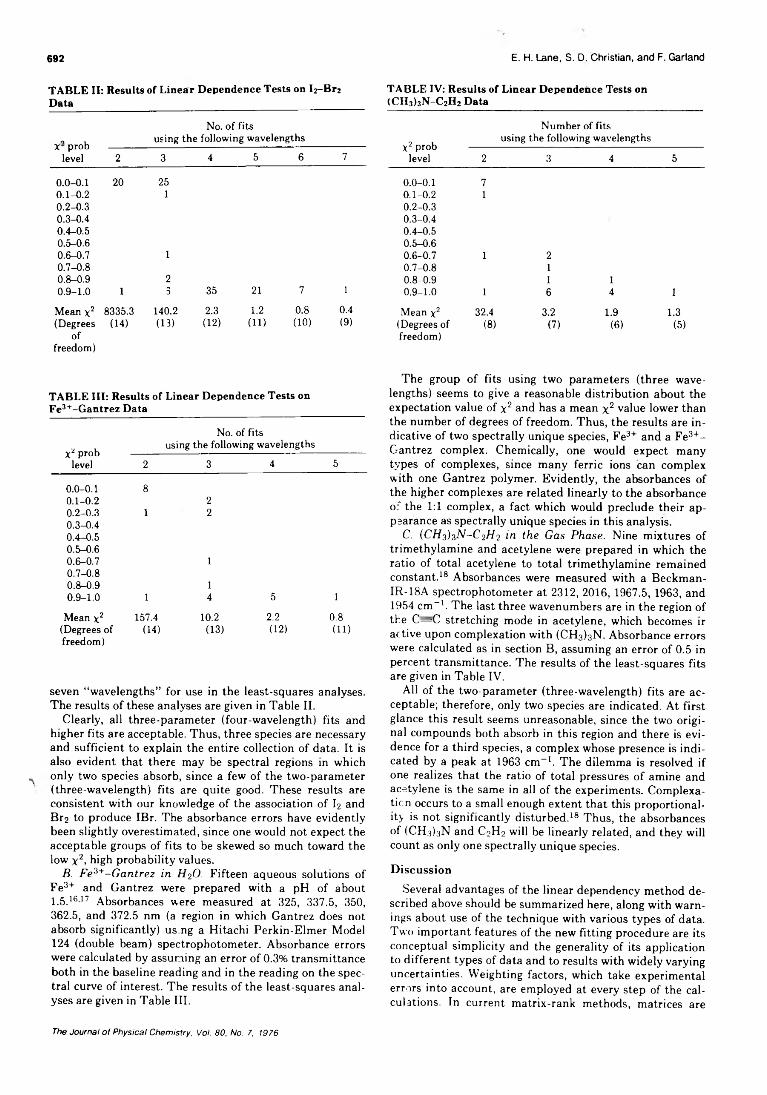
692 E. H. Lane, S. D, Christian, and F. Garland
TABLE II: Results of Linear Dependence Tests on IrBrz Data
No. of fits„ , using the following wavelengthsX prob ----------------- ----------------------------------------------level 2 3 4 5 6 7
0.0-0.1 20 250.1- 0.2 10.2-0.30.3-0.40.4-0.50.5-0.60.6-0.7 10.7-0.80.8-0.9 20.9-1.0 1 3 35 21 7 1
Mean x2 (Degrees
8335.3(14)
140.2(13)
2.3(12)
1.2(ID
0.8GO)
0.4(9)
offreedom)
TABLE III: Results of Linear Dependence Tests on Fe3+-Gantrez Data
No. of fitsusing the following wavelengths
X 2 prob ------------------------------------------ ---- --------level 2 3 4 5
0.0- 0.10.1-0.2
82
0.2-0.3 1 20.3-0.40.4-0.50.5-0.60.6-0.70.7-0.8
1
0.8-0.9 10.9-1.0 1 4 5 1
Mean x2 157.4 10.2 2.2 0.8(Degrees of freedom)
(14) (13) (12) (11)
seven “wavelengths” for use in the least-squares analyses. The results of these analyses are given in Table II.
Clearly, all three-parameter (four-wavelength) fits and higher fits are acceptable. Thus, three species are necessary and sufficient to explain the entire collection of data. It is also evident that there may be spectral regions in which only two species absorb, since a few of the two-parameter (three-wavelength) fits are quite good. These results are consistent with our knowledge of the association of I2 and Br2 to produce IBr. The absorbance errors have evidently been slightly overestimated, since one would not expect the acceptable groups of fits to be skewed so much toward the low x2, high probability values.
B. Fe3+-Gantrez in H%0. Fifteen aqueous solutions of Fe3+ and Gantrez were prepared with a pH of about1.5.16’17 Absorbances were measured at 325, 337.5, 350,362.5, and 372.5 nm (a region in which Gantrez does not absorb significantly) using a Hitachi Perkin-Elmer Model 124 (double beam) spectrophotometer. Absorbance errors were calculated by assuming an error of 0.3% transmittance both in the baseline reading and in the reading on the spectral curve of interest. The results of the least-squares analyses are given in Table III.
TABLE IV: Results of Linear Dependence Tests on(CHshN-CaHî Data
Number of fits
X2 prob level
using the following wavelengths2 3 4 5
0.0- 0.1 70.1- 0.2 0.2-0.3 0.3-0.4 0.4-0.5 0.5-0.6
1
0.6-0.7 1 20.7-0.8 10.8-0.9 1 10.9-1.0 1 6 4 1
Mean x2 32.4 3.2 1.9 1.3(Degrees of freedom)
(8) (7) (6) (5)
The group of fits using two parameters (three wavelengths) seems to give a reasonable distribution about the expectation value of x2 and has a mean x2 value lower than the number of degrees of freedom. Thus, the results are indicative of two spectrally unique species, Fe3+ and a Fe3+- Gantrez complex. Chemically, one would expect many types of complexes, since many ferric ions can complex with one Gantrez polymer. Evidently, the absorbances of the higher complexes are related linearly to the absorbance of the 1:1 complex, a fact which would preclude their appearance as spectrally unique species in this analysis.
C. (CHs)sN-C2H2 in the Gas Phase. Nine mixtures of trimethylamine and acetylene were prepared in which the ratio of total acetylene to total trimethylamine remained constant.18 Absorbances were measured with a Beckman- IR-18A spectrophotometer at 2312, 2016, 1967.5, 1963, and 1954 cm-1. The last three wavenumbers are in the region of the C =C stretching mode in acetylene, which becomes ir active upon complexation with (CH3)3N. Absorbance errors were calculated as in section B, assuming an error of 0.5 in percent transmittance. The results of the least-squares fits are given in Table IV.
All of the two-parameter (three-wavelength) fits are acceptable; therefore, only two species are indicated. At first glance this result seems unreasonable, since the two original compounds both absorb in this region and there is evidence for a third species, a complex whose presence is indicated by a peak at 1963 cm-1. The dilemma is resolved if one realizes that the ratio of total pressures of amine and acetylene is the same in all of the experiments. Complexa- ticn occurs to a small enough extent that this proportionality is not significantly disturbed.18 Thus, the absorbances of (CH3)3N and C2H2 will be linearly related, and they will count as only one spectrally unique species.
DiscussionSeveral advantages of the linear dependency method de
scribed above should be summarized here, along with warnings about use of the technique with various types of data. Two important features of the new fitting procedure are its conceptual simplicity and the generality of its application to different types of data and to results with widely varying uncertainties. Weighting factors, which take experimental errors into account, are employed at every step of the calculations. In current matrix-rank methods, matrices are
The Journal of Physical Chemistry, Vol. 80, No. 7, 1976
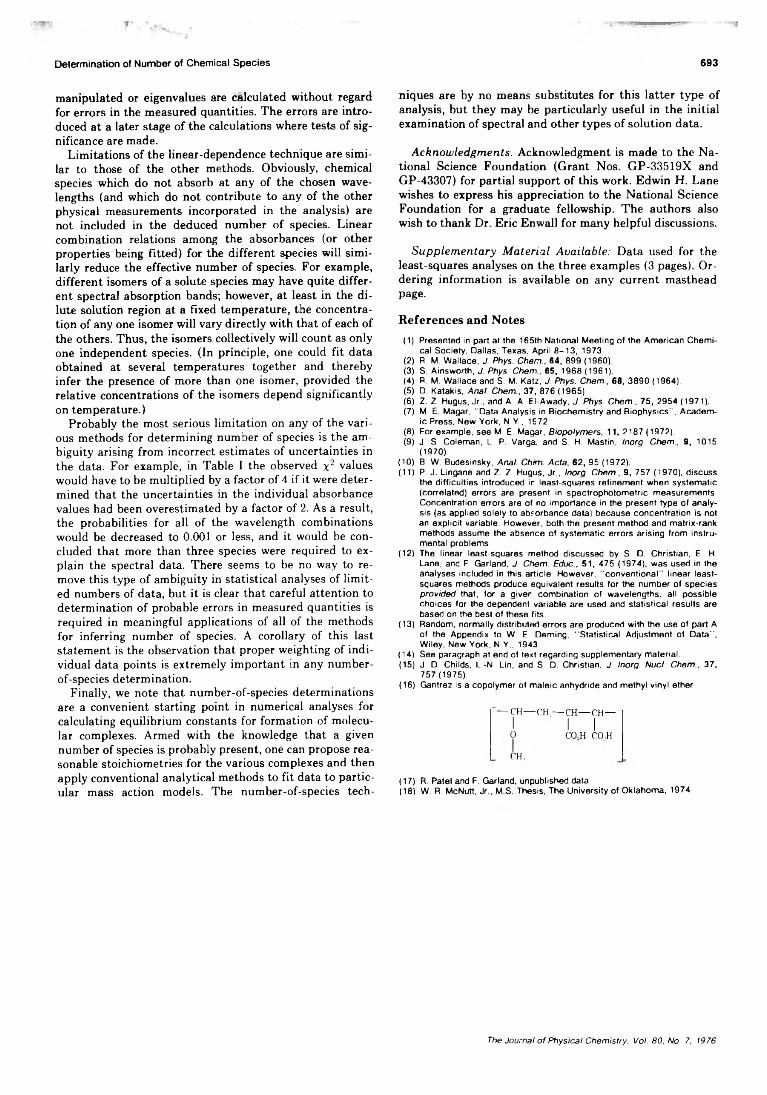
Determination of Number of Chemical Species 693
manipulated or eigenvalues are calculated without regard for errors in the measured quantities. The errors are introduced at a later stage of the calculations where tests of significance are made.
Limitations of the linear-dependence technique are similar to those of the other methods. Obviously, chemical species which do not absorb at any of the chosen wavelengths (and which do not contribute to any of the other physical measurements incorporated in the analysis) are not included in the deduced number of species. Linear combination relations among the absorbances (or other properties being fitted) for the different species will similarly reduce the effective number of species. For example, different isomers of a solute species may have quite different spectral absorption bands; however, at least in the dilute solution region at a fixed temperature, the concentration of any one isomer will vary directly with that of each of the others. Thus, the isomers collectively will count as only one independent species. (In principle, one could fit data obtained at several temperatures together and thereby infer the presence of more than one isomer, provided the relative concentrations of the isomers depend significantly on temperature.)
Probably the most serious limitation on any of the various methods for determining number of species is the ambiguity arising from incorrect estimates of uncertainties in the data. For example, in Table I the observed x2 values would have to be multiplied by a factor of 4 if it were determined that the uncertainties in the individual absorbance values had been overestimated by a factor of 2. As a result, the probabilities for all of the wavelength combinations would be decreased to 0.001 or less, and it would be concluded that more than three species were required to explain the spectral data. There seems to be no way to remove this type of ambiguity in statistical analyses of limited numbers of data, but it is clear that careful attention to determination of probable errors in measured quantities is required in meaningful applications of all of the methods for inferring number of species. A corollary of this last statement is the observation that proper weighting of individual data points is extremely important in any number- of-species determination.
Finally, we note that number-of-species determinations are a convenient starting point in numerical analyses for calculating equilibrium constants for formation of molecular complexes. Armed with the knowledge that a given number of species is probably present, one can propose reasonable stoichiometries for the various complexes and then apply conventional analytical methods to fit data to particular mass action models. The number-of-species tech
Acknowledgments. Acknowledgment is made to the National Science Foundation (Grant Nos. GP-33519X and GP-43307) for partial support of this work. Edwin H. Lane wishes to express his appreciation to the National Science Foundation for a graduate fellowship. The authors also wish to thank Dr. Eric Enwall for many helpful discussions.
Supplementary Material Available: Data used for the least-squares analyses on the three examples (3 pages). Ordering information is available on any current masthead page.
References and Notes(1) Presented in part at the 165th National Meeting of the American Chemi
cal Society, Dallas, Texas, April 8-13, 1973.(2) R. M. Wallace, J. Phys. Chen., 64, 899 (1960).(3) S. Ainsworth, J. Phys. Chem, 65, 1968 (1961).(4) R. M. Wallace and S. M. Katz, J. Phys. Chem., 6 8 , 3890 (1964).(5) D. Katakis, Anal. Chem., 37, 876 (1965).(6 ) Z. Z. Hugus, Jr., and A. A. El-Awady, J. Phys. Chem., 75, 2954 (1971).(7) M. E. Magar, “ Data Analysis in Biochemistry and Biophysics", Academ
ic Press, New York, N.Y., 1S72.(8 ) For example, see M. E. Magar, Biopolymers, 11, 2187 (1972).(9) J. S. Coleman, L. P. Varga, and S. H. Mastin, Inorg. Chem., 9, 1015
(1970).(10) B. W. Budesinsky, Anal. Chrm. Acta, 62, 95 (1972).(11) P. J. Lingane and Z. Z. Hugus, Jr., Inorg. Chem., 9, 757 (1970), discuss
the difficulties introduced ir least-squares refinement when systematic (correlated) errors are present in spectrophotometric measurements. Concentration errors are of no importance in the present type of analysis (as applied solely to absorbance data) because concentration is not an explicit variable. However, both the present method and matrix-rank methods assume the absence of systematic errors arising from instrumental problems.
(12) The linear least-squares method discussed by S. D. Christian, E. H. Lane, and F. Garland, J. Chem. Educ., 51, 475 (1974), was used in the analyses included in this article. However, “ conventional" linear least- squares methods produce equivalent results for the number of species provided that, for a giver combination of wavelengths, all possible choices for the dependent variable are used and statistical results are based on the best of these fits.
(13) Random, normally distributed errors are produced with the use of part A of the Appendix to W. E. Deming, “ Statistical Adjustment of Data” , Wiley, New York, N.Y., 1943.
(14) See paragraph at end of text regarding supplementary material.(15) J. D. Childs, L.-N. Lin, and S. D. Christian, J. Inorg. Nucl. Chem., 37,
757(1975).(16) Gantrez is a copolymer of maleic anhydride and methyl vinyl ether
- — CH— C H ,~ CH— CH— 1
I ' l l0 C0,H CO.H
CH,
(17) R. Patel and F. Garland, unpublished data.(18) W. R. McNutt, Jr., M S. Thesis, The University of Oklahoma, 1974.
niques are by no means substitutes for this latter type ofanalysis, but they may be particularly useful in the initialexamination of spectral and other types of solution data.
The Journal of Physical Chemistry, Vol. 80, No. 7, 1976
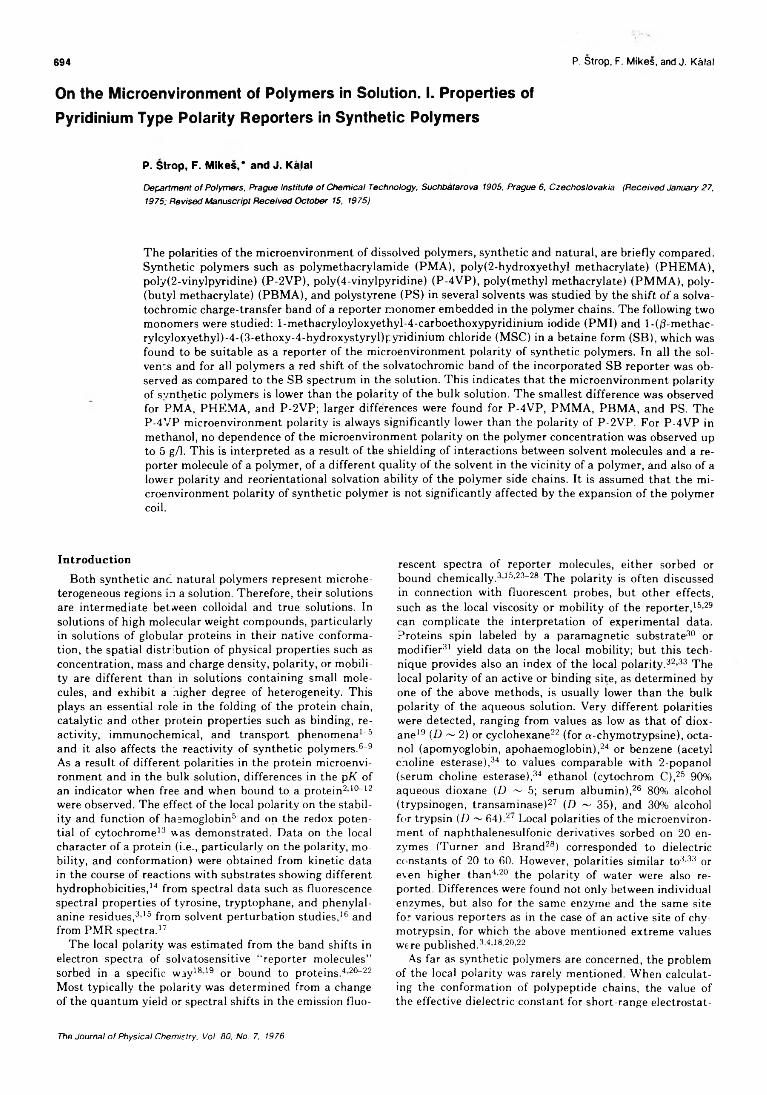
694 P. Strop, F. Mikes, and J. Kálal
O n t h e M ic r o e n v ir o n m e n t o f P o ly m e r s in S o lu t io n . I. P r o p e r t ie s o f
P y r id in iu m T y p e P o la r ity R e p o r t e r s in S y n t h e t i c P o ly m e r s
P. Strop, F. Mikes,* and J. Kalal
Department of Polymers, Prague Institute of Chemical Technology, Suchbatarova 1905, Prague 6, Czechoslovakia (Received January 27, 1975; Revised Manuscript Received October 15, 1975)
The polarities of the microenvironment of dissolved polymers, synthetic and natural, are briefly compared. Synthetic polymers such as polymethacrylamide (PMA), poly(2-hydroxyethyl methacrylate) (PHEMA), poly(2-vinylpyridine) (P-2VP), poly(4-vinylpyridine) (P-4VP), poly(methyl methacrylate) (PMMA), poly- (butyl methacrylate) (PBMA), and polystyrene (PS) in several solvents was studied by the shift o f a solva- tochromic charge-transfer band of a reporter monomer embedded in the polymer chains. The following two monomers were studied: l-methacryloyloxyethyl-4-carboethoxypyridinium iodide (PMI) and l-(0-methac- rylcyloxyethyl)-4-(3-ethoxy-4-hydroxystyryl)pyridinium chloride (MSC) in a betaine form (SB), which was found to be suitable as a reporter of the microenvironment polarity of synthetic polymers. In all the solvents and for all polymers a red shift of the solvatochromic band of the incorporated SB reporter was observed as compared to the SB spectrum in the solution. This indicates that the microenvironment polarity of synthetic polymers is lower than the polarity of the bulk solution. The smallest difference was observed for PMA, PHEMA, and P-2VP; larger differences were found for P-4VP, PMMA, PBMA, and PS. The P-4VP microenvironment polarity is always significantly lower than the polarity of P-2VP. For P-4VP in methanol, no dependence of the microenvironment polarity on the polymer concentration was observed up to 5 g/1. This is interpreted as a result of the shielding of interactions between solvent molecules and a reporter molecule of a polymer, of a different quality of the solvent in the vicinity of a polymer, and also of a lower polarity and reorientational solvation ability of the polymer side chains. It is assumed that the microenvironment polarity of synthetic polymer is not significantly affected by the expansion of the polymer coil.
IntroductionBoth synthetic anc natural polymers represent microhe-
terogeneous regions in a solution. Therefore, their solutions are intermediate between colloidal and true solutions. In solutions of high molecular weight compounds, particularly in solutions of globular proteins in their native conformation, the spatial distribution of physical properties such as concentration, mass and charge density, polarity, or mobility are different than in solutions containing small molecules, and exhibit a nigher degree of heterogeneity. This plays an essential role in the folding of the protein chain, catalytic and other protein properties such as binding, reactivity, immunochemical, and transport phenomena1“5 and it also affects the reactivity of synthetic polymers.6-9 As a result of different polarities in the protein microenvironment and in the bulk solution, differences in the pK of an indicator when free and when bound to a protein210-12 were observed. The effect of the local polarity on the stability and function of haemoglobin5 and on the redox potential of cytochrome13 was demonstrated. Data on the local character of a protein (i.e., particularly on the polarity, mobility, and conformation) were obtained from kinetic data in the course of reactions with substrates showing different hydrophobicities,14 from spectral data such as fluorescence spectral properties of tyrosine, tryptophane, and phenylalanine residues,315 from solvent perturbation studies,16 and from PMR spectra.17
The local polarity was estimated from the band shifts in electron spectra of solvatosensitive “ reporter molecules” sorbed in a specific way1819 or bound to proteins.4 20-22 Most typically the polarity was determined from a change of the quantum yield or spectral shifts in the emission fluo
rescent spectra of reporter molecules, either sorbed or bound chemically.3 15-23-28 The polarity is often discussed in connection with fluorescent probes, but other effects, such as the local viscosity or mobility of the reporter,15'29 can complicate the interpretation of experimental data. Proteins spin labeled by a paramagnetic substrate30 or modifier31 yield data on the local mobility; but this technique provides also an index of the local polarity.32,33 The local polarity of an active or binding site, as determined by one of the above methods, is usually lower than the bulk polarity of the aqueous solution. Very different polarities were detected, ranging from values as low as that of diox- ane19 (D ~ 2) or cyclohexane22 (for o-chymotrypsine), octanol (apomyoglobin, apohaemoglobin),24 or benzene (acetyl choline esterase),34 to values comparable with 2-popanol (serum choline esterase),34 ethanol (cytochrom C),25 90% aqueous dioxane (D ~ 5; serum albumin),26 80% alcohol (trypsinogen, transaminase)27 (D ~ 35), and 30% alcohol for trypsin (D ~ 64).2‘ Local polarities of the microenvironment of naphthalenesulfonic derivatives sorbed on 20 enzymes (Turner and Brand28) corresponded to dielectric constants of 20 to 60. However, polarities similar to3-33 or even higher than4-20 the polarity of water were also reported. Differences were found not only between individual enzymes, but also for the same enzyme and the same site for various reporters as in the case of an active site of chy- motrypsin, for which the above mentioned extreme values were published.3,4,18'20'22
As far as synthetic polymers are concerned, the problem of the local polarity was rarely mentioned. When calculating the conformation of polypeptide chains, the value of the effective dielectric constant for short-range electrostat
The Journal of Physical Chemistry, Vol. 80, No. 7, 1976
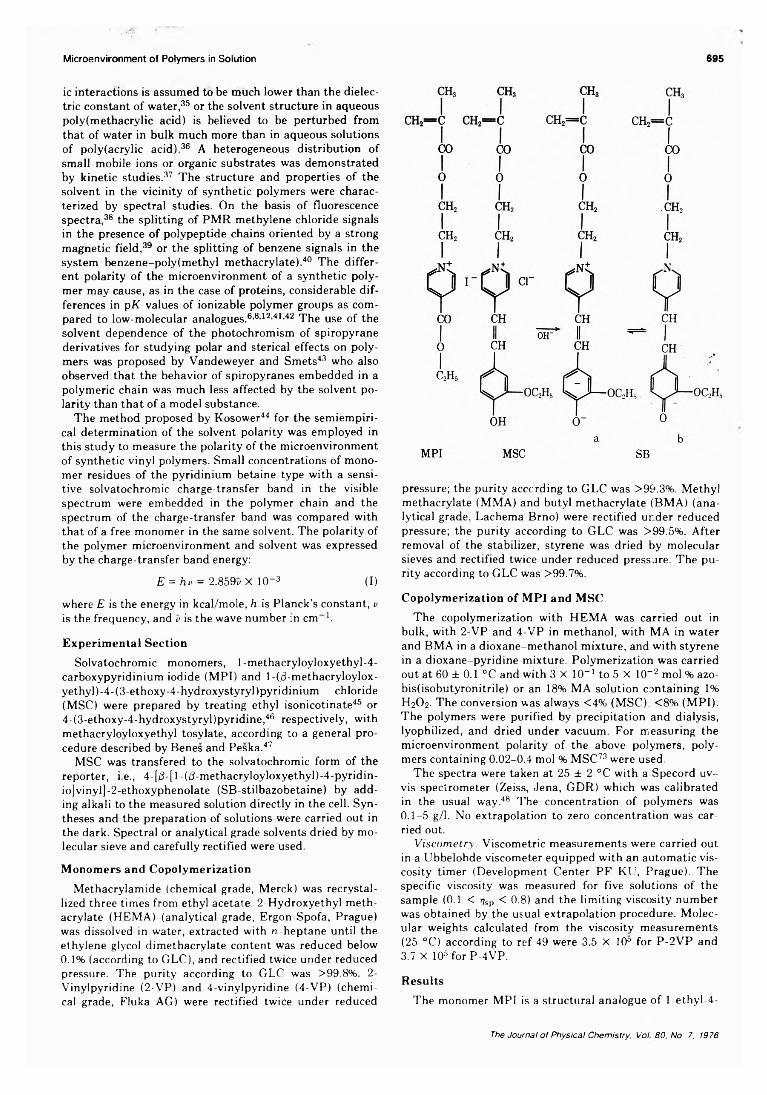
Microenvironment of Polymers in Solution 695
ic interactions is assumed to be much lower than the dielectric constant of water,35 or the solvent structure in aqueous poly(methacrylic acid) is believed to be perturbed from that of water in bulk much more than in aqueous solutions of poly(acrylic acid).36 A heterogeneous distribution of small mobile ions or organic substrates was demonstrated by kinetic studies.37 The structure and properties of the solvent in the vicinity of synthetic polymers were characterized by spectral studies. On the basis of fluorescence spectra,38 the splitting of PMR methylene chloride signals in the presence of polypeptide chains oriented by a strong magnetic field,39 or the splitting of benzene signals in the system benzene-poly(methyl methacrylate).40 The different polarity of the microenvironment of a synthetic polymer may cause, as in the case of proteins, considerable differences in pK values of ionizable polymer groups as compared to low-molecular analogues.6’8’12,41’42 The use of the solvent dependence of the photochromism of spiropyrane derivatives for studying polar and sterical effects on polymers was proposed by Vandeweyer and Smets43 who also observed that the behavior of spiropyranes embedded in a polymeric chain was much less affected by the solvent polarity than that of a model substance.
The method proposed by Kosower44 for the semiempiri- cal determination of the solvent polarity was employed in this study to measure the polarity of the microenvironment of synthetic vinyl polymers. Small concentrations of monomer residues of the pyridinium betaine type with a sensitive solvatochromie charge-transfer band in the visible spectrum were embedded in the polymer chain and the spectrum of the charge-transfer band was compared with that of a free monomer in the same solvent. The polarity of the polymer microenvironment and solvent was expressed by the charge-transfer band energy:
E = hv = 2.859k X K ) - 3 ( I )
where E is the energy in kcal/mole, h is Planck’s constant, v is the frequency, and v is the wave number in cm-1.
Experimental SectionSolvatochromie monomers, l-methacryloyloxyethyl-4-
carboxypyridinium iodide (MPI) and l-(/3-methacryloylox- yethyl)-4-(3-ethoxy-4-hydroxystyryl (pyridinium chloride (MSC) were prepared by treating ethyl isonicotinate45 or 4-(3-ethoxy-4-hydroxystyryl)pyridine,46 respectively, with methacryloyloxyethyl tosylate, according to a general procedure described by Benes and Peska.47
MSC was transfered to the solvatochromie form of the reporter, i.e., 4-[/3-[l-(d-methacryloyloxyethyl)-4-pyridin- io]vinyl]-2-ethoxyphenolate (SB-stilbazobetaine) by adding alkali to the measured solution directly in the cell. Syntheses and the preparation of solutions were carried out in the dark. Spectral or analytical grade solvents dried by molecular sieve and carefully rectified were used.
Monomers and CopolymerizationMethacrylamide (chemical grade, Merck) was recrystal
lized three times from ethyl acetate. 2-Hydroxyethyl methacrylate (HEMA) (analytical grade, Ergon-Spofa, Prague) was dissolved in water, extracted with n-heptane until the ethylene glycol dimethacrylate content was reduced below0.1% (according to GLC), and rectified twice under reduced pressure. The purity according to GLC was >99.8%. 2- Vinylpyridine (2-VP) and 4-vinylpyridine (4-VP) (chemical grade, Fluka AG) were rectified twice under reduced
pressure; the purity according to GLC was >99.3%. Methyl methacrylate (MMA) and butyl methacrylate (BMA) (analytical grade, Lachema Brno) were rectified under reduced pressure; the purity according to GLC was >99.5%. After removal of the stabilizer, styrene was dried by molecular sieves and rectified twice under reduced pressure. The purity according to GLC was >99.7%.
Copolymerization of MPI and MSCThe copolymerization with HEMA was carried out in
bulk, with 2-VP and 4-VP in methanol, with MA in water and BMA in a dioxane-methanol mixture, and with styrene in a dioxane-pyridine mixture. Polymerization was carried out at 60 ± 0.1 °C and with 3 X 10~' to 5 X 10⁻² mol % azo- bis(isobutyronitrile) or an 18% MA solution containing 1% H2O2. The conversion was always <4% (MSC). < 8% (MPI). The polymers were purified by precipitation and dialysis, lyophilized, and dried under vacuum. For measuring the microenvironment polarity of the above polymers, polymers containing 0.02-0.4 mol % MSC73 were used.
The spectra were taken at 25 ± 2 °C with a Specord uv- vis spectrometer (Zeiss, Jena, GDR) which was calibrated in the usual way.48 The concentration of polymers was 0.1-5 g/1. No extrapolation to zero concentration was carried out.
Viscometry. Viscometric measurements were carried out in a Ubbelohde viscometer equipped with an automatic viscosity timer (Development Center PF KU, Prague). The specific viscosity was measured for five solutions of the sample (0.1 < rjsp < 0.8) and the limiting viscosity number was obtained by the usual extrapolation procedure. Molecular weights calculated from the viscosity measurements (25 °C) according to ref 49 were 3.5 X 10° for P-2VP and3.7 X 10s for P-4VP.
ResultsThe monomer MPI is a structural analogue of l-ethyl-4-
The Journal of Physical Chemistry, Vol 80, No. 7. 1976
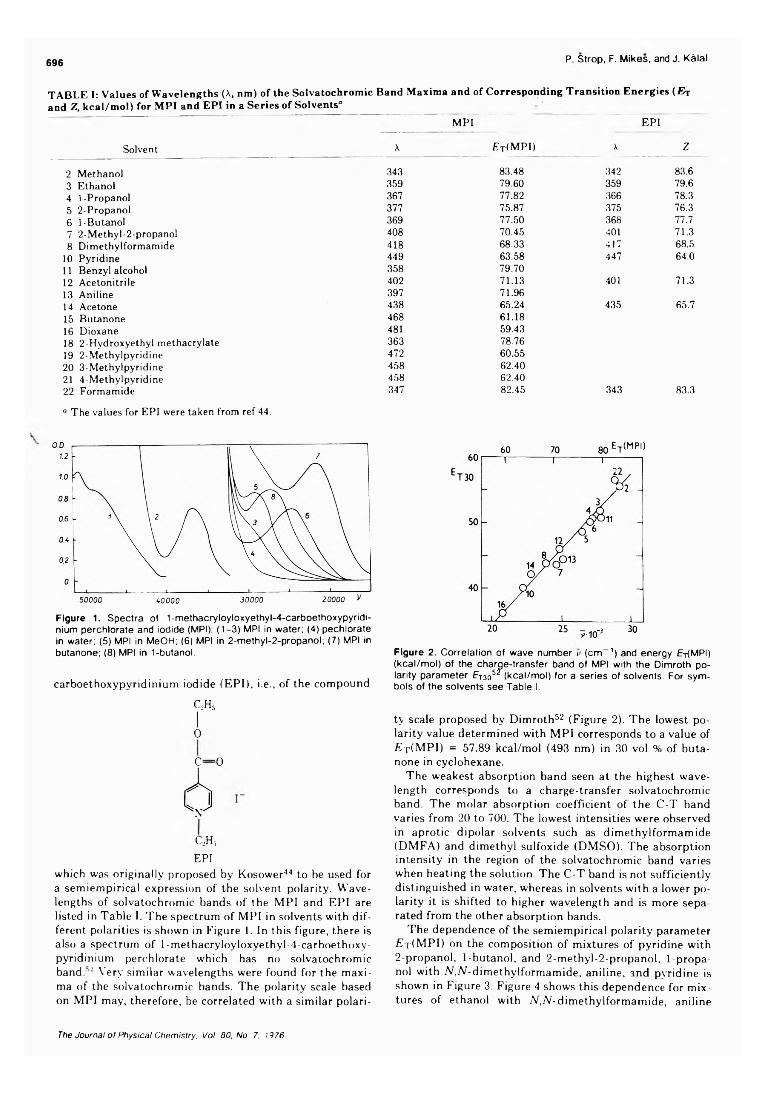
696 P Strop, F. Mikes, and J. Kâlal
TABLE I: Values of Wavelengths (X, nm) of the Solvatochromic Band Maxima and of Corresponding Transition Energies (Er and Z, kcal/mol) for MPI and EPI in a Series of Solvents'1
MPI EPI
Solvent
2 Methanol3 Ethanol4 1 -Propanol5 2-Propanol6 1-Butanol7 2-Methyl-2-propanol8 Dimethylformamide
10 Pyridine11 Benzyl alcohol12 Acetonitrile13 Aniline14 Acetone15 Butanone16 Dioxane18 2-Hydroxyethyl methacrylate19 2-Methylpyridine20 3-Methylpyridine21 4-Methylpyridine22 Formamide
° The values for EPI were taken from ref 44.
Figure 1. Spectra of 1-methacryloyloxyethyl-4-carboethoxypyridi- nium perchlorate and iodide (MPI): (1-3) MPI in water; (4) pechlorate in water; (5) MPI in MeOH; (6 ) MPI in 2-methyl-2-propanol; (7) MPI in butanone; (8 ) MPI in 1-butanol.
carboethoxypyridinium iodide (EPI), i.e., of the compound
X £ t(MPI) x Z
343 83.48 342 83.6359 79.60 359 79.6367 77.82 366 78.3377 75.87 375 76.3369 77.50 368 77.7408 70.45 401 71.3418 68.33 417 68.5449 63.58 447 64.0358 79.70402 71.13 401 71.3397 71.96438 65.24 435 65.7468 61.18481 59.43363 78.76472 60.55458 62.40458 62.40347 82.45 343 83.3
60 70 80 ET<MPI>
Figure 2. Correlation of wave number v (cm-1 ) and energy EjfMPI) (kcal/mol) of the charge-transfer band of MPI with the Dimroth polarity parameter £T305^(kcal/mol) for a series of solvents. For symbols of the solvents see Table I.
c2h5I
0
c — o
C-H5EPI
which was originally proposed by Kosower44 to be used for a semiempirical expression of the solvent polarity. Wavelengths of solvatochromic bands of the MPI and EPI are listed in Table I. The spectrum of MPI in solvents with different polarities is shown in Figure 1. In this figure, there is also a spectrum of 1-methacryloyloxyethyl-4-carboethoxy- pyridinium perchlorate which has no solvatochromic band.nl Very similar wavelengths were found for the maxima of the solvatochromic bands. The polarity scale based on MPI may, therefore, be correlated with a similar polari
ty scale proposed by Dimroth52 (Figure 2). The lowest polarity value determined with MPI corresponds to a value of E t (MPI) = 57.89 kcal/mol (493 nm) in 30 vol % of butanone in cyclohexane.
The weakest absorption band seen at the highest wavelength corresponds to a charge-transfer solvatochromic band. The molar absorption coefficient of the C-T band varies from 20 to 700. The lowest intensities were observed in aprotic dipolar solvents such as dimethylformamide (DMFA) and dimethyl sulfoxide (DMSO). The absorption intensity in the region of the solvatochromic band varies when heating the solution. The C-T band is not sufficiently distinguished in water, whereas in solvents with a lower polarity it is shifted to higher wavelength and is more separated from the other absorption bands.
The dependence of the semiempirical polarity parameter ■Et (MPI) on the composition of mixtures of pyridine with2-propanol, 1 -butanol, and 2-methyl-2-propanol, 1 -propanol with A(,A/-dimethylformamide, aniline, and pvridine is shown in Figure 3. Figure 4 shows this dependence for mixtures of ethanol with N,N- dimethylformamide, aniline
The Journal of Physical Chemistry, Vol. 80, No. 7, IJ76
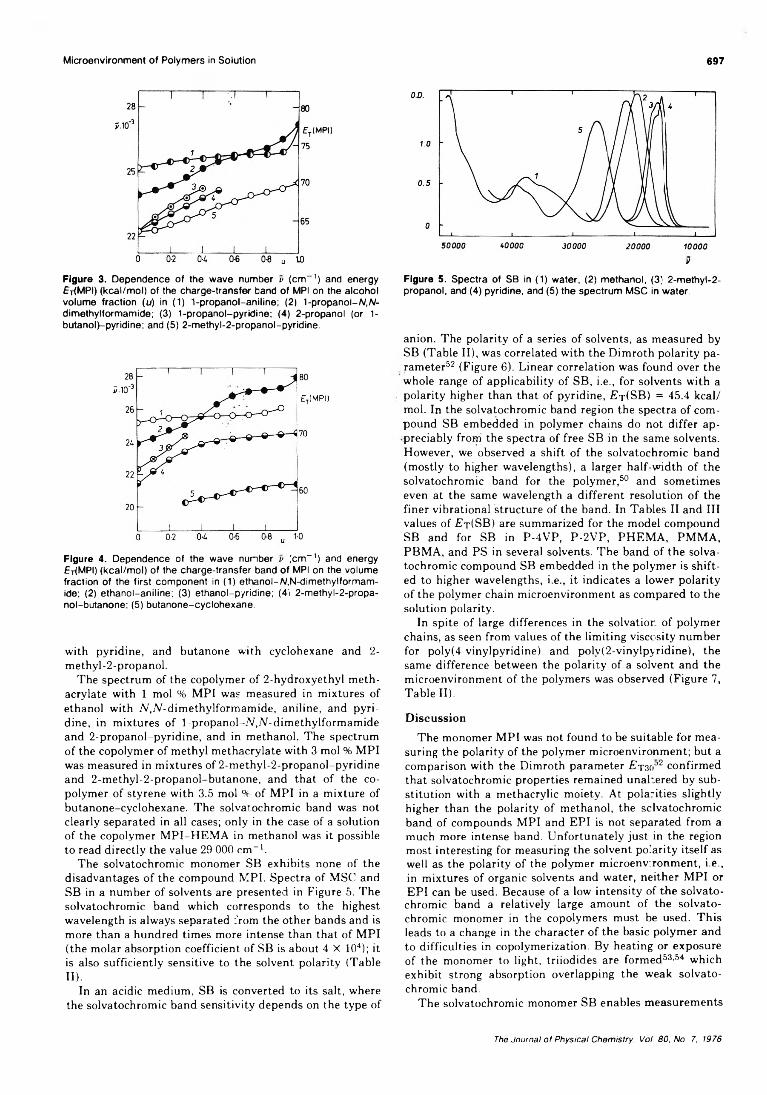
Microenvironment of Polymers in Solution 697
Figure 3. Dependence of the wave number v (cm-1 ) and energy £t(MPI) (kcal/mol) of the charge-transfer band of MPI on the alcohol volume fraction (u) in ( 1 ) 1 -propanol-aniline; (2 | 1 -propanol-W,/V- dimethylformamide; (3) 1-propanol-pyridine; (4) 2-propanol (or 1 - butanol)-pyridine; and (5) 2-methyl-2-propanol-pyridine.
Figure 4. Dependence of the wave number v ¡cm-1 ) and energy £r<MPI) (kcal/mol) of the charge-transfer band of MPI on the volume fraction of the first component in (1) ethanol-A/,N-dimethylformam- ide; (2) ethanol-aniline; (3) ethanol-pyridine; (4i 2-methyl-2-propa- nol-butanone; (5) butanone-cyclohexane.
with pyridine, and butanone with cyclohexane and 2- methyl-2-propanol.
The spectrum of the copolymer of 2-hydroxyethyl methacrylate with 1 mol % MPI was measured in mixtures of ethanol with N.N-dimethylformamide, aniline, and pyridine, in mixtures of l-propanol-N,N-dimethylformamide and 2-propanol-pyridine, and in methanol. The spectrum of the copolymer of methyl methacrylate with 3 mol % MPI was measured in mixtures of 2-methyl-2-propanol-pyridine and 2-methyl-2-propanol-butanone, and that of the copolymer of styrene with 3.5 mol % of MPI in a mixture of butanone-cyclohexane. The solvatochromic band was not clearly separated in all cases; only in the case of a solution of the copolymer MPI-HEMA in methanol was it possible to read directly the value 29 000 cm-1.
The solvatochromic monomer SB exhibits none of the disadvantages of the compound MPI. Spectra of MSC and SB in a number of solvents are presented in Figure 5. The solvatochromic band which corresponds to the highest wavelength is always separated from the other bands and is more than a hundred times more intense than that of MPI (the molar absorption coefficient of SB is about 4 X 10⁴); it is also sufficiently sensitive to the solvent polarity (TableII).
In an acidic medium, SB is converted to its salt, where the solvatochromic band sensitivity depends on the type of
Figure 5. Spectra of SB in (1) water, (2) methanol, (3) 2-methyl-2- propanol, and (4) pyridine, and (5) the spectrum MSC in water.
anion. The polarity of a series of solvents, as measured by SB (Table II), was correlated with the Dimroth polarity parameter52 (Figure 6). Linear correlation was found over the whole range of applicability of SB, i.e., for solvents with a polarity higher than that of pyridine, Et(SB) = 45.4 kcal/ mol. In the solvatochromic band region the spectra of compound SB embedded in polymer chains do not differ appreciably from the spectra of free SB in the same solvents. However, we observed a shift of the solvatochromic band (mostly to higher wavelengths), a larger half-width of the solvatochromic band for the polymer,50 and sometimes even at the same wavelength a different resolution of the finer vibrational structure of the band. In Tables II and III values of £ t(SB) are summarized for the model compound SB and for SB in P-4VP, P-2VP, PHEMA, PMMA, PBMA, and PS in several solvents. The band of the solvatochromic compound SB embedded in the polymer is shifted to higher wavelengths, i.e., it indicates a lower polarity of the polymer chain microenvironment as compared to the solution polarity.
In spite of large differences in the solvation of polymer chains, as seen from values of the limiting viscosity number for poly(4-vinylpyridine) and polv(2-vinylpyridine), the same difference between the polarity of a solvent and the microenvironment of the polymers was observed (Figure 7, Table II).
DiscussionThe monomer MPI was not found to be suitable for mea
suring the polarity of the polymer microenvironment; but a comparison with the Dimroth parameter Et 3o°2 confirmed that solvatochromic properties remained unaltered by substitution with a methacrylic moiety. At polarities slightly higher than the polarity of methanol, the sclvatochromic band of compounds MPI and EPI is not separated from a much more intense band. Unfortunately just in the region most interesting for measuring the solvent polarity itself as well as the polarity of the polymer microenvironment, i.e., in mixtures of organic solvents and water, neither MPI or EPI can be used. Because of a low intensity of the solvatochromic band a relatively large amount of the solvatochromic monomer in the copolymers must be used. This leads to a change in the character of the basic polymer and to difficulties in copolymerization. By heating or exposure of the monomer to light, triiodides are formed53-54 which exhibit strong absorption overlapping the weak solvatochromic band.
The solvatochromic monomer SB enables measurements
The Journal of Physical Chemistry, Vol. 80, No. 7, 1976
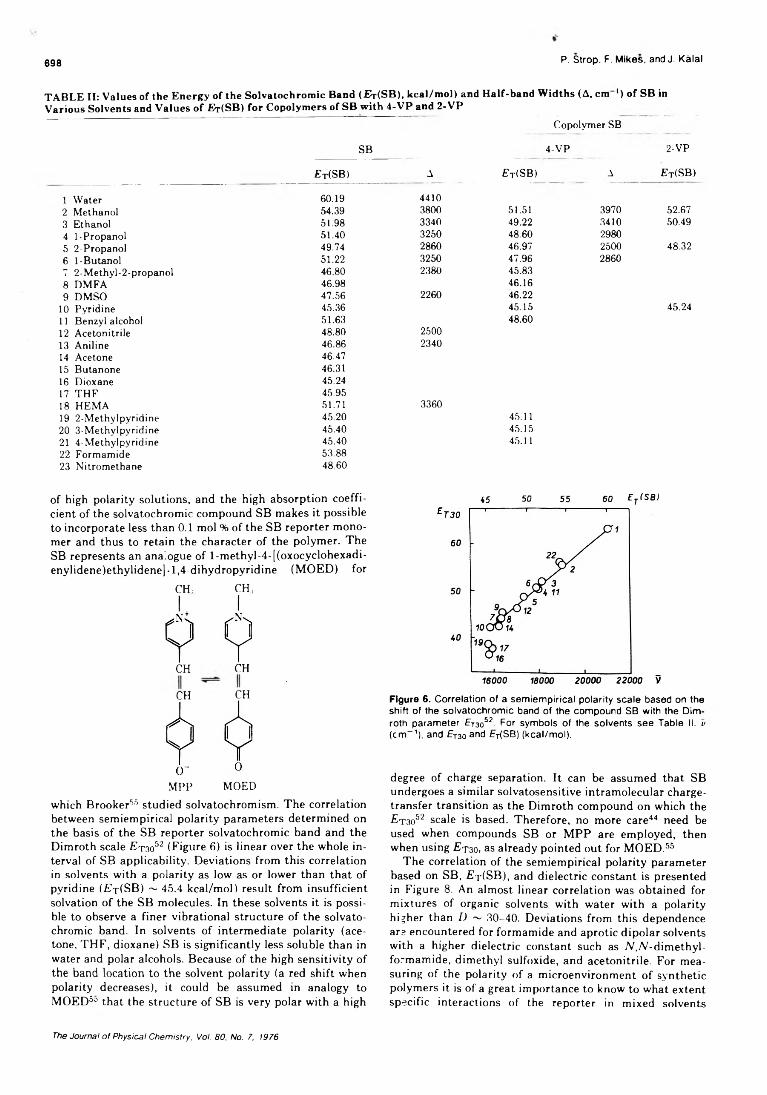
698 P. Strop. F. Mikes, and J. Kâlal
TABLE II: Values of the Energy of the Solvatochromie Band (Br(SB), kcal/mol) and Half-band Widths (A, cm ‘) of SB in Various Solvents and Values of £>r(SB) for Copolymers of SB with 4-VP and 2-VP
Copolymer SB
SB 4-VP 2-VP
Et(SB)
1 Water 60.192 Methanol 54.393 Ethanol 51.984 1-Propanol 51.405 2-Propanol 49.746 1 -Butanol 51.227 2-Methyl-2-propanol 46.808 DMFA' 46.989 DMSO 47.56
10 Pyridine 45.3611 Benzyl alcohol 51.6312 Acetonitrile 48.8013 Aniline 46.8614 Acetone 46.4715 Butanone 46.3116 Dioxane 45.2417 THF 45.9518 HEMA 51.7119 2-Methylpyridine 45.2020 3-Methylpyridine 45.4021 4-Methylpyridine 45.4022 Formamide 53.8823 Nitromethane 48.60
of high polarity solutions, and the high absorption coefficient of the solvatochromie compound SB makes it possible to incorporate less than 0.1 mol % of the SB reporter monomer and thus to retain the character of the polymer. The SB represents an analogue of l-methyl-4-[(oxocyclohexadi- enylidene)ethylidene)-l,4-dihydropyridine (MOED) for
CH: CH(
CH CH
CH CH
MPP MOEDwhich Brooker55 studied solvatochromism. The correlation between semiempirical polarity parameters determined on the basis of the SB reporter solvatochromic band and the Dimroth scale Et3o52 (Figure 6) is linear over the whole interval of SB applicability. Deviations from this correlation in solvents with a polarity as low as or lower than that of pyridine (¿?t (SB) ~ 45.4 kcal/mol) result from insufficient solvation of the SB molecules. In these solvents it is possible to observe a finer vibrational structure of the solvatochromic band. In solvents of intermediate polarity (acetone, THF, dioxane) SB is significantly less soluble than in water and polar alcohols. Because of the high sensitivity of the band location to the solvent polarity (a red shift when polarity decreases), it could be assumed in analogy to MOED53 that the structure of SB is very polar with a high
A £ t(SB) A £ t(SB)
44103800 51.51 3970 52.673340 49.22 3410 50.493250 48.60 29802860 46.97 2500 48.323250 47.96 28602380 45.83
46.162260 46.22
45.15 45.2448.60
25002340
336045.11 45.1545.11
45 50 55 60 Ej(SB)
Figure 6. Correlation o f a semiempirical polarity scale based on the shift of the solvatochrom ic band o f the compound SB with the Dimroth parameter ET3052. For sym bols o f the solvents se e Table II. v (cm - 1 ), and £T3o and fr-HSB) (kcal/m ol).
degree of charge separation. It can be assumed that SB undergoes a similar solvatosensitive intramolecular charge- transfer transition as the Dimroth compound on which the £ t 3o52 scale is based. Therefore, no more care44 need be used when compounds SB or MPP are employed, then when using Et3o, as already pointed out for MOED.55
The correlation of the semiempirical polarity parameter based on SB, Et (SB), and dielectric constant is presented in Figure 8. An almost linear correlation was obtained for mixtures of organic solvents with water with a polarity higher than D ~ 30-40. Deviations from this dependence are encountered for formamide and aprotic dipolar solvents with a higher dielectric constant such as /V,./V-dimethyl- formamide, dimethyl sulfoxide, and acetonitrile. For measuring of the polarity of a microenvironment of synthetic polymers it is of a great importance to know to what extent specific interactions of the reporter in mixed solvents
The Journal of Physical Chemistry. Vol. 80. No. 7. 1976
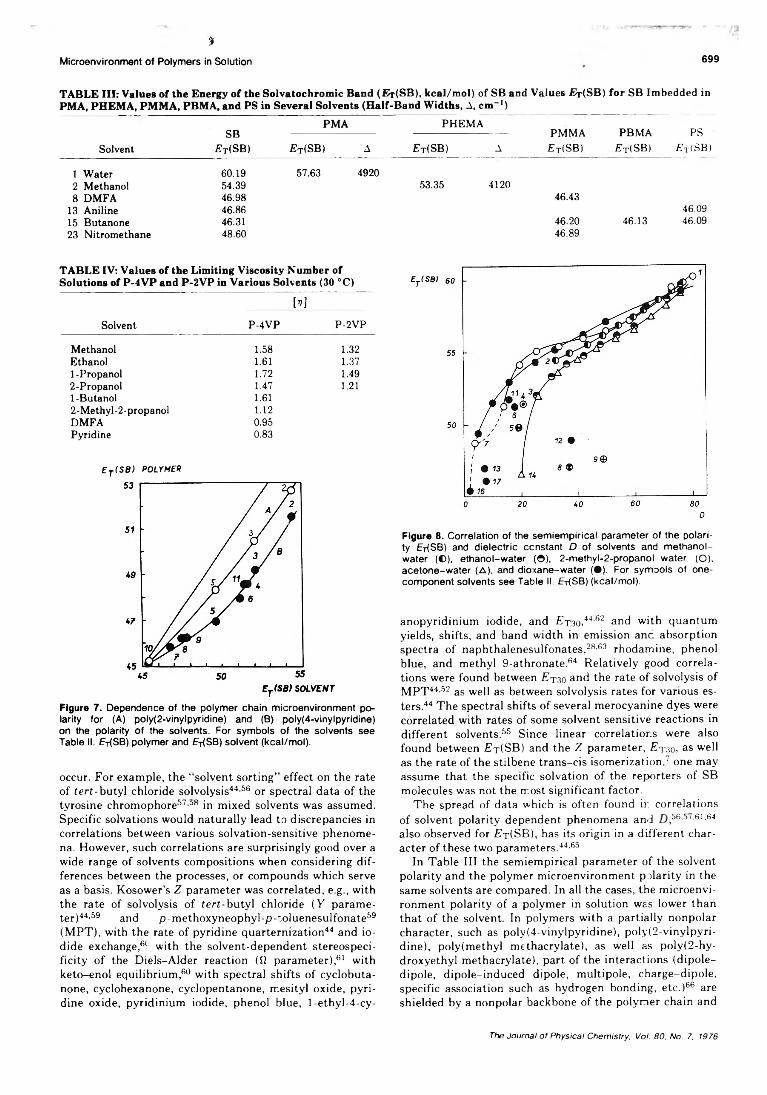
%Microenvironment of Polymers in Solution 699
TABLE III: Values of the Energy of the Solvatochromie Band (£r(SB), kcal/mol) of SB and Values Er(SB) for SB Imbedded in PMA, PHEMA, PMMA, PBMA, and PS in Several Solvents (Half-Band Widths, A, cm'1)
SolventSB
Et(SB)
PMA PHEMAPMMA
£ t(SB)PBMA
Et (SB)PS
Æ’tîSB)Et(SB) A £ t(SB) A
1 Water 60.19 57.63 49202 Methanol 54.39 53.35 41208 DMFA 46.98 46.43
13 Aniline 46.86 46.0915 Butanone 46.31 46.20 46.13 46.0923 Nitromethane 48.60 46.89
TABLE IV: Values of the Limiting Viscosity Number of Solutions of P-4 VP and P-2VP in Various Solvents (30 °C)
[1 ]Solvent P-4VP P-2VP
Methanol 1.58 1.32Ethanol 1.61 1.371-Propanol 1.72 1.492-Propanol 1.47 1.211-Butanol 1.612-Methyl-2-propanol 1.12DMFA 0.95Pyridine 0.83
E t ( S B ) POLYMER
Figure 7. Dependence of the polymer chain microenvironment polarity for (A) poly(2-vinylpyridine) and (B) poly(4-vinylpyridine) on the polarity of the solvents. For symbols of the solvents see Table II. EH SB) polymer and EH SB) solvent (kcal/mol).
occur. For example, the “ solvent sorting” effect on the rate of tert-butyl chloride solvolysis44-56 or spectral data of the tyrosine chromophore57-08 in mixed solvents was assumed. Specific solvations would naturally lead to discrepancies in correlations between various solvation-sensitive phenomena. However, such correlations are surprisingly good over a wide range of solvents compositions when considering differences between the processes, or compounds which serve as a basis. Kosower’s Z parameter was correlated, e.g., with the rate of solvolysis of tert-butyl chloride (Y parameter)44-59 and p-methoxyneophyl-p-toluenesulfonate59 (MPT), with the rate of pyridine quarternization44 and iodide exchange,60 with the solvent-dependent stereospecificity of the Diels-Alder reaction (ii parameter),61 with keto-enol equilibrium,60 with spectral shifts of cyclobuta- none, cyclohexanone, cyclopentanone, mesityl oxide, pyridine oxide, pyridinium iodide, phenol blue, l-ethyl-4-cy-
Flgure 8. Correlation of the semiempirical parameter of the polarity EHSB) and dielectric ccnstant D of solvents and methanol- water (©), ethanol-water (©), 2-methyl-2-propanol-water (O), acetone-water (A), and dioxane-water (•) . For symools of one- component solvents see Table II. EHSB) (kcal/mol).
anopyridinium iodide, and £ t30,44,62 and with quantum yields, shifts, and band width in emission anc absorption spectra of naphthalenesulfonates,28-63 rhodamine, phenol blue, and methyl 9-athronate.64 Relatively good correlations were found between £ t30 and the rate of solvolysis of MPT44-52 as well as between solvolysis rates for various esters.44 The spectral shifts of several merocyanine dyes were correlated with rates of some solvent sensitive reactions in different solvents.55 Since linear correlations were also found between £ t (SB) and the Z parameter, Etso, as well as the rate of the stilbene trans-cis isomerization,' one may assume that the specific solvation of the reporters of SB molecules was not the most significant factor.
The spread of data which is often found ir. correlations of solvent polarity dependent phenomena and 56,s < ,6i ,6-t also observed for Et (SB), has its origin in a different character of these two parameters.44-60
In Table III the semiempirical parameter of the solvent polarity and the polymer microenvironment polarity in the same solvents are compared. In all the cases, the microenvironment polarity of a polymer in solution was lower than that of the solvent. In polymers with a partially nonpolar character, such as poly(4-vinylpyridine), poly(2-vinylpyri- dine), poly(methyl methacrylate), as well as poly(2-hy- droxyethyl methacrylate), part of the interactions (dipole- dipole, dipole-induced dipole, multipole, charge-dipole, specific association such as hydrogen bonding, etc.)66 are shielded by a nonpolar backbone of the polymer chain and
The Journal of Physical Chemistry, Vol. 80, No. 7, 1976
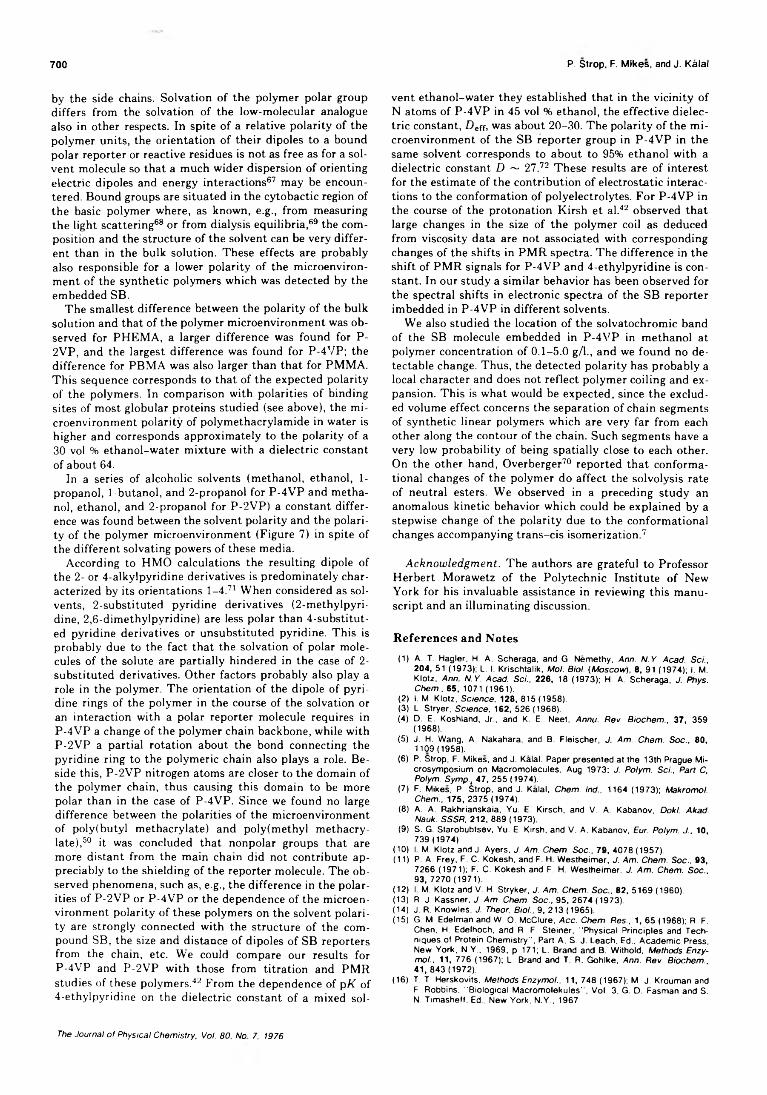
700 P. Strop, F. Mikes, and J. Kalal
by the side chains. Solvation of the polymer polar group differs from the solvation of the low-molecular analogue also in other respects. In spite of a relative polarity of the polymer units, the orientation of their dipoles to a bound polar reporter or reactive residues is not as free as for a solvent molecule so that a much wider dispersion of orienting electric dipoles and energy interactions67 may be encountered. Bound groups are situated in the cytobactic region of the basic polymer where, as known, e.g., from measuring the light scattering68 or from dialysis equilibria,69 the composition and the structure of the solvent can be very different than in the bulk solution. These effects are probably also responsible for a lower polarity of the microenvironment of the synthetic polymers which was detected by the embedded SB.
The smallest difference between the polarity of the bulk solution and that of the polymer microenvironment was observed for PHEMA, a larger difference was found for P- 2VP, and the largest difference was found for P-4VP; the difference for PBMA was also larger than that for PMMA. This sequence corresponds to that of the expected polarity of the polymers. In comparison with polarities of binding sites of most globular proteins studied (see above), the microenvironment polarity of polymethacrylamide in water is higher and corresponds approximately to the polarity of a 30 vol % ethanol-water mixture with a dielectric constant of about 64.
In a series of alcoholic solvents (methanol, ethanol, 1- propanol, 1 -butanol, and 2-propanol for P-4 VP and methanol, ethanol, and 2-propanol for P-2VP) a constant difference was found between the solvent polarity and the polarity of the polymer microenvironment (Figure 7) in spite of the different solvating powers of these media.
According to HMO calculations the resulting dipole of the 2- or 4-alkylpyridine derivatives is predominately characterized by its orientations 1-4.71 When considered as solvents, 2-substituted pyridine derivatives (2-methylpyri- dine, 2,6-dimethylpyridine) are less polar than 4-substitut- ed pyridine derivatives or unsubstituted pyridine. This is probably due to the fact that the solvation of polar molecules of the solute are partially hindered in the case of 2- substituted derivatives. Other factors probably also play a role in the polymer. The orientation of the dipole of pyridine rings of the polymer in the course of the solvation or an interaction with a polar reporter molecule requires in P-4VP a change of the polymer chain backbone, while with P-2VP a partial rotation about the bond connecting the pyridine ring to the polymeric chain also plays a role. Beside this, P-2VP nitrogen atoms are closer to the domain of the polymer chain, thus causing this domain to be more polar than in the case of P-4VP. Since we found no large difference between the polarities of the microenvironment of poly(butyl methacrylate) and polyfmethyl methacrylate),50 it was concluded that nonpolar groups that are more distant from the main chain did not contribute appreciably to the shielding of the reporter molecule. The observed phenomena, such as, e.g., the difference in the polarities of P-2VP or P-4VP or the dependence of the microenvironment polarity of these polymers on the solvent polarity are strongly connected with the structure of the compound SB, the size and distance of dipoles of SB reporters from the chain, etc. We could compare our results for P-4VP and P-2VP with those from titration and PMR studies of these polymers.42 From the dependence of pK of 4-ethylpyridine on the dielectric constant of a mixed sol
vent ethanol-water they established that in the vicinity of N atoms of P-4VP in 45 vol % ethanol, the effective dielectric constant, Deff, was about 20-30. The polarity of the microenvironment of the SB reporter group in P-4VP in the same solvent corresponds to about to 95% ethanol with a dielectric constant D ~ 27.72 These results are of interest for the estimate of the contribution of electrostatic interactions to the conformation of polyelectrolytes. For P-4 VP in the course of the protonation Kirsh et al.42 observed that large changes in the size of the polymer coil as deduced from viscosity data are not associated with corresponding changes of the shifts in PMR spectra. The difference in the shift of PMR signals for P-4VP and 4-ethylpyridine is constant. In our study a similar behavior has been observed for the spectral shifts in electronic spectra of the SB reporter imbedded in P-4VP in different solvents.
We also studied the location of the solvatochromic band of the SB molecule embedded in P-4VP in methanol at polymer concentration of 0.1-5.0 g/1., and we found no detectable change. Thus, the detected polarity has probably a local character and does not reflect polymer coiling and expansion. This is what would be expected, since the excluded volume effect concerns the separation of chain segments of synthetic linear polymers which are very far from each other along the contour of the chain. Such segments have a very low probability of being spatially close to each other. On the other hand, Overberger70 reported that conformational changes of the polymer do affect the solvolysis rate of neutral esters. We observed in a preceding study an anomalous kinetic behavior which could be explained by a stepwise change of the polarity due to the conformational changes accompanying trans-cis isomerization.7
Acknowledgment. The authors are grateful to Professor Herbert Morawetz of the Polytechnic Institute of New York for his invaluable assistance in reviewing this manuscript and an illuminating discussion.
References and Notes(1) A. T. Hagler, H. A. Scheraga, and G. Nemethy, Ann. N.Y. Acad. Sei.,
204, 51 (1973); L. I. Krischtalik, Mol. Biol. (Moscow), 8 , 91 (1974); I. M. Klotz, Ann N.Y. Acad. Sei., 226, 18 (1973); H. A. Scheraga, J. Phys. Chem., 65, 1071 (1961).
(2) I. M. Klotz, Science, 128, 815 (1958).(3) L. Stryer, Science, 162, 526 (1968).(4) D. E. Koshland, Jr., and K. E. Neet, Annu. Rev. Biochem., 37, 359
(1968).(5) J. H. Wang, A. Nakahara, and B. Fleischer, J. Am. Chem. Soc., 80,
1109(1958).(6 ) P. Strop, F. Mikes, and J. Kalal. Paper presented at the 13th Prague Mi
crosymposium on Macromolecules, Aug 1973; J. Polym. Sei., Part C, Polym. Symp., 47, 255 (1974).
(7) F. Mikes, P. Strop, and J. Kalal, Chem. Ind., 1164 (1973); Makromol. Chem., 175, 2375 (1974).
(8 ) A. A. Rakhrianskaia, Yu. E. Kirsch, and V. A. Kabanov, Dokl. Akad. Nauk. SSSR, 212, 889 (1973).
(9) S. G. Starobubtsev, Yu. E. Kirsh, and V. A. Kabanov, Eur. Polym. J., 10, 739 (1974).
(10) I M. Klotz and J. Ayers, J. Am. Chem. Soc., 79, 4078 (1957).(11) P. A. Frey, F. C. Kokesh, and F. H. Westheimer, J. Am. Chem. Soc., 93,
7266 (1971); F. C. Kokesh and F. H. Westheimer. J. Am. Chem. Soc., 93, 7270 (1971).
(12) I M. Klotz and V H. Stryker, J. Am. Chem. Soc , 82, 5169 (1960).(13) R. J. Kassner. J. Am. Chem. Soc., 95, 2674 (1973).(14) J. R. Knowles, J Theor. Biol., 9, 213 (1965)(15) G. M. Edelman and W. O. McClure, Acc. Chem. Res., 1, 65 (1968); R. F.
Chen. H. Edelhoch, and R. F. Steiner, "Physical Principles and Techniques of Protein Chemistry” , Part A, S. J. Leach, Ed., Academic Press, New York, N.Y., 1969, p 171; L. Brand and B. Withold, Methods Enzy- mol., 11, 776 (1967); L. Brand and T. R. Gohlke, Ann. Rev. Biochem., 41, 843 (1972).
(16) T. T. Herskovits, Methods Enzymol., 11, 748 (1967); M. J. Krouman andF. Robbins, "Biological Macromolekules", Vol. 3, G. D. Fasman and S. N. Timasheff, Ed., New York, N.Y., 1967.
The Journal of Physical Chemistry, Vol. 80, No 7, 1976
Microenvironment of Polymers in Solution 701
(17) W. J. O ’Sullivan and M. Cohn, J. Biol. Chem., 241, 3104, 3116 (1966).(18) S. A. Brenhard, B. F. Lee, and Z. H. Tashjian, J. Mol. Biol.. 18, 405
(1966).(19) R. J. Foester and D. R. Coahran, Fed. Proc., 22, 245 (1963).(20) M. B. Hille and D. E. Koshland, Jr., J. Am. Chem. Soc., 89, 5945 (1967).(21) H. R. Horton and D. E. Koshland, Jr., Methods Enzymol., 11, 856 (1967);
M. E. Kirtley and D. E. Koshland, Jr., Biochem. Biophys. Res. Commun.,23, 810 (1966); D. E. Koshland, Jr., V. D. Karkhanis. and H. G. Latham, J. Am. Chem. Soc., 86, 1448 (1964).
(22) J. Kallos and K. Avatis, Biochemistry, 5, 1979 (1966).(23) A. Kotaki, M. Naoi, and K. Yagi, Biochem. Biophys. Acta, 229, 547
(1971).(24) L. Stryer, J. Mol. Biol., 13, 482 (1965).(25) A. Azzi, S. Fleischer, and B. Chance, Biochem. Biophys. Res. Com
mun., 36, 322 (1969).(26) D. J. R. Laurence, Biochem. J., 51, 168 (1952).(27) R. A. Kenner and H. Neurath, Biochemistry, 10, 551 (1971); C. G. Dimi-
tropoulos, N. G. O konomakos, I. A. Karni-Katsadima, T. G. Kalog- erakos, and A. E. Evangelopoulos, Eur. J. Biochem., 38, 537 (1973).
(28) D. C. Turner and L. Brand, Biochemistry, 7, 3381 (1968).(29) J. B. Le Pecq and C. Paoletti, J. Mol. Biol., 27, 87 (1967).(30) L. J. Berlimer and H. M. McConnell, Proc. Natl. Acad. Sei. U.S.A., 55,
708 (1966).(31) 0 . H. Griffith and H. M. McConnell, Proc. Natl. Acad. Sei. U.S.A., 55, 8
(1966).(32) O. H. Griffith and A. S. Waggoner, Acc. Chem. Res.. 2, 17 (1969).(33) G. K. Radda and R. A. Dwek, “Protein-Protein Interaction” , R. Jaenicke
and E. Helmerich, Ed., Springer-Verlag, Berlin, 1972, p 213.(34) C. M. Himel, R. T. Mayer, and L. L. Cook, J. Polym. Sei., Part A-1, 8,
2219 (1970).(35) H. A. Scheraga, Adv. Phys. Org. Chem., 6, 103 (1968).(36) J. Eliassaf, J. Polym. Sei., Part B, 3, 767 (1965).(37) H. Mora wetz and G. Gordlmer, J. Am. Chem. Soc., 92, 7532 (1970); I.
A. Taha and H. Morawetz, ibid., 93, 829 (1971); C. 3. Overberger and J.G. Salamone, Acc. Chem. Res., 2, 217 (1969); G. P. Royer and I. M. Klotz, J. Am. Chem. Soc., 91, 5885 (1969).
(38) G. Witz and B. L. Van Duuren, J. Phys. Chem., 77, 648 (1973).(39) R. D. Orwoll and R. L. Void, J. Am. Chem. Soc., 93. 5335 (1971).(40) K. J. Liu, Trans. N Y. Acad. Sei., 33, 333 (1971).(41) G. Oster, J. Polym. Sei., 9, 553 (1952).(42) Yu. E. Klrsh, O. P. Komarova, and G. M. Lukovln, Europ. Polym. J., 9,
1405 (1973).(43) P. H. Vjndewyer and G. Smets, J. Polym. Sei., Part A-1, 8, 2361
(1970).(44) E. M. Kosower, “An Introduction to Physical Organ c Chemistry” , Wiley,
New York, N.Y., 1968.
(45) F. Sorm and K. Protiva, “Laboratorni chemické predpisy", Vol. 1, SNTL Praha, 1954.
(46) M. C. Chiang and W. H. Harturg, J. Org. Chem., 10, 21 (1945).(47) M. J. Benes and J. Peska, Czech. Patent Appl. No. 7688-71 (Oct 1971).(48) G. Kortüm, “Kolorimetrié, Photometrie und Spektrometrle” , 3rd ed,
Springer-Verlag, Berlin, 1955.(49) M. Kurata, M. Iwama, and K. Kamada, “Polymer Handbook IV ” , B.
Brandrup and E. H. Immergut, Ed., Wiley-lnterscience, New York. N.Y., 1967.
(50) F. Strop, F. Mikes, and J. Kàlal, J. Phys. Chem., following paper in this issue.
(51) A. Ray, J. Am. Chem. Soc., 93, 7146 (1971).(52) D. Dimroth, C. Reichard, T. Slepman, and F. Bohlman, Annales, 661, 1
(1963).(53) E. M. Kosower, J. Am. Chem. Soc., 77, 3883 (1955).(54) E. M. Kosower and P. E. Klinedinst, Jr., J. Am. Chem. Soc., 78, 3493
(1956).(55) L. G. S. Brooker, A. C. Craig, D. W. Heseltime, P. W. Jenkins,.and L. L.
Lincoln, J. Am. Chem. Soc., 87, 2443 (1965).(56) A. H. Fainberg and S. Winstein, J. Am. Chem. Soc., 78, 2770 (1956).(57) W. O. McClure and G. M. Edelman, Biochemistry, 5, 1908 (1966).(58) J. F. Brandts and L. J. Kaplan, Biochemistry, 12, 2011 (1973).(59) S. G. Smith, A. H. Fainberg, and S. Winstein, J. Am. Chem. Soc., 83,
618(1961).(60) E. M. Kosower, J. Am. Chem. Soc., 80, 3267 (1958).(61) J. A. Berson, Z. Hamlet, and W. A. Mueller, J. Am. Chem. Soc., 84, 297
(1962).(62) E. M. Kosower, J. Am. Chem. Soc., 80, 3261 (1958).(63) S. Ainsworth and M. T. Flanagan, Biochem. Biophys. Acta, 194, 213
(1969).(64) T. C. Werner and R. M. Hoffman, J. Phys. Chem., 77, 1611 (1973).(65) A. J. Parker, Chem. Rev., 69, 1 (1969).(66) P. Suppan, J. Chem. Soc. A. 3125 (1968).(67) H. Morawetz, Adv. Protein Chem., 26, 243 (1974).(68) R. H. Eward, C. D. Roe, P. Debye, and J. R. McCartney, J. Chem. Phys.,
14 ,687 (1946 ).(69) T. Ool, J. Polym. Sci., 28, 459 (1958); A. Vrlj and J. T. G. Overbeek, J.
Colloid. Sci., 17, 570 (1962).(70) C. G. Overberger and M. Morimoto, J. Am. Chem. Soc., 93, 3222
(1971).(71) J. Kuthan, J. Palecek, J. Prochàzkovà, and V. Skàla, Collect. Czech.
Chem. Commun., 33, 3138 (1968), and authors' unpublished results.(72) G. Akerlbf, J. Am. Chem. Soc., 54, 4125 (1932).(73) The absorption coefficient in the microenvironment of the synthetic
polymer of a given polarity (broadening of the band) is not exactly determined.50
The Journal o f Physical Chemistry, Vol. 80. No. 7. 1976
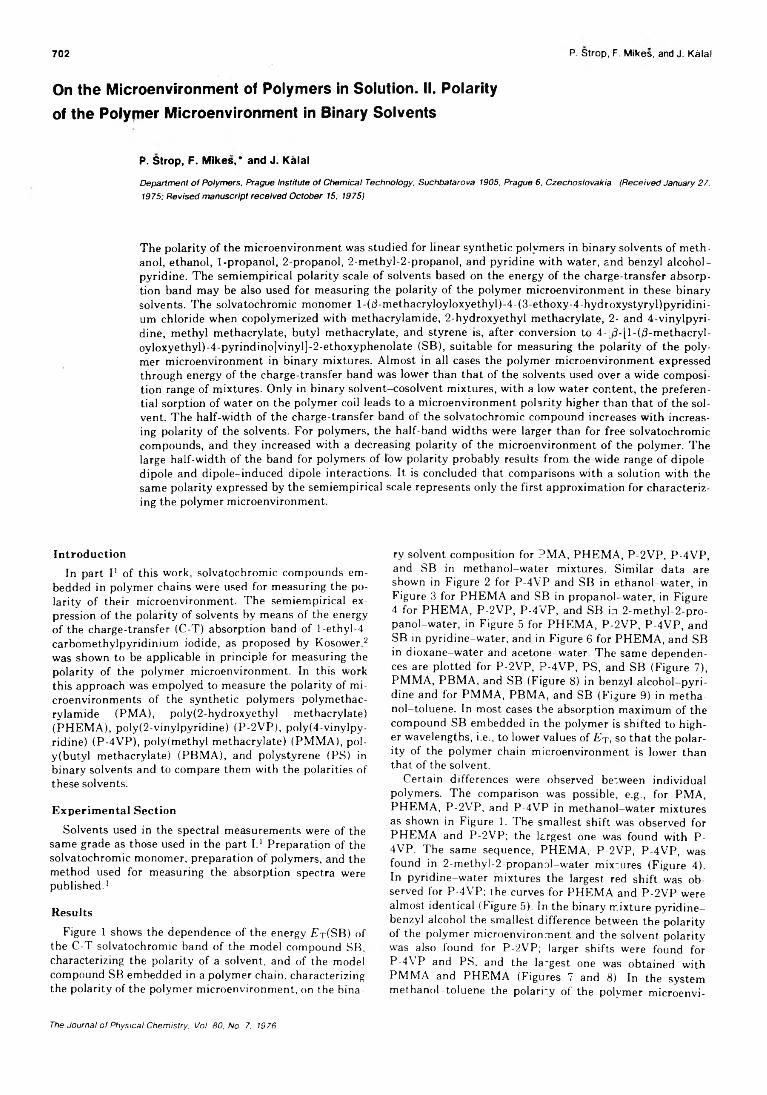
702 P. S trop, F. M ikes, and J. Kà la l
On the Microenvironment of Polymers in Solution. II. Polarity of the Polymer Microenvironment in Binary Solvents
P. Strop, F. Mikes,* and J. Kalal
Department o f Polymers, Prague Institute of Chemical Technology, Suchbatarova 1905, Prague 6, Czechoslovakia (Received January 27. 1975; Revised manuscript received October 15, 1975)
The polarity of the microenvironment was studied for linear synthetic polymers in binary solvents of methanol, ethanol, 1-propanol, 2-propanol, 2-methyl-2-propanol, and pyridine with water, and benzyl alcohol- pyridine. The semiempirical polarity scale of solvents based on the energy of the charge-transfer absorption band may be also used for measuring the polarity of the polymer microenvironment in these binary solvents. The solvatochromie monomer l-(d-methacryloyloxyethyl)-4-(3-ethoxy-4-hydroxystyryl)pyridini- um chloride when copolymerized with methacrylamide, 2-hydroxyethyl methacrylate, 2- and 4-vinylpyri- dine, methyl methacrylate, butyl methacrylate, and styrene is, after conversion to 4- /3-ll-(/3-methacryl- oyloxyethyl)-4-pyrindino]vinyl]-2-ethoxyphenolate (SB), suitable for measuring the polarity of the polymer microenvironment in binary mixtures. Almost in all cases the polymer microenvironment expressed through energy of the charge-transfer band was lower than that of the solvents used over a wide composition range of mixtures. Only in binary solvent-cosolvent mixtures, with a low water content, the preferential sorption of water on the polymer coil leads to a microenvironment polarity higher than that of the solvent. The half-width of the charge-transfer band of the solvatochromie compound increases with increasing polarity of the solvents. For polymers, the half-band widths were larger than for free solvatochromie compounds, and they increased with a decreasing polarity of the microenvironment of the polymer. The large half-width of the band for polymers of low polarity probably results from the wide range of dipole- dipole and dipole-induced dipole interactions. It is concluded that comparisons with a solution with the same polarity expressed by the semiempirical scale represents only the first approximation for characterizing the polymer microenvironment.
IntroductionIn part I1 of this work, solvatochromic compounds em
bedded in polymer chains were used for measuring the polarity of their microenvironment. The semiempirical expression of the polarity of solvents by means of the energy of the charge-transfer (C-T) absorption band of l-ethyl-4- carbomethylpyridinium iodide, as proposed by Kosower,2 was shown to be applicable in principle for measuring the polarity of the polymer microenvironment. In this work this approach was empolyed to measure the polarity of microenvironments of the synthetic polymers polymethacrylamide (PMA), poly(2-hydroxyethyl methacrylate) (PHEMA), poly(2-vinylpyridine) (P-2VP), poly(4-vinylpy- ridine) (P-4VP), poly(methyl methacrylate) (PMMA), pol- y(butyl methacrylate) (PBMA), and polystyrene (PS) in binary solvents and to compare them with the polarities of these solvents.
Experimental Section
Solvents used in the spectral measurements were of the same grade as those used in the part I.1 Preparation of the solvatochromic monomer, preparation of polymers, and the method used for measuring the absorption spectra were published.1
Results
Figure 1 shows the dependence of the energy ET(SB) of the C-T solvatochromic band of the model compound SB. characterizing the polarity of a solvent, and of the model compound SB embedded in a polymer chain, characterizing the polarity of the polymer microenvironment, on the bina
ry solvent composition for PMA, PHEMA, P-2VP, P-4VP, and SB in methanol-water mixtures. Similar data are shown in Figure 2 for P-4VP and SB in ethanol-water, in Figure 3 for PHEMA and SB in propanol-water, in Figure 4 for PHEMA, P-2VP, P-4VP, and SB in 2-methyl-2-pro- panol-water, in Figure 5 for PHEMA, P-2VP, P-4VP, and SB in pyridine-water, and in Figure 6 for PHEMA, and SB in dioxane-water and acetone-water. The same dependences are plotted for P-2VP, P-4VP, PS, and SB (Figure 7), PMMA, PBMA, and SB (Figure 8) in benzyl alcohol-pyridine and for PMMA, PBMA, and SB (Figure 9) in methanol-toluene. In most cases the absorption maximum of the compound SB embedded in the polymer is shifted to higher wavelengths, i.e., to lower values of E T , so that the polarity of the polymer chain microenvironment is lower than that of the solvent.
Certain differences were observed between individual polymers. The comparison was possible, e.g., for PMA, PHEMA, P-2VP, and P-4VP in methanol-water mixtures as shown in Figure 1. The smallest shift was observed for PHEMA and P-2VP; the largest one was found with P- 4VP. The same sequence, PHEMA, P-2VP, P-4VP, was found in 2-methyl-2-propanol-w'ater mixtures (Figure 4). In pyridine-water mixtures the largest red shift was observed for P-4VP; the curves for PHEMA and P-2VP were almost identical (Figure 5). In the binary mixture pyridine- benzyl alcohol the smallest difference between the polarity of the polymer microenvironment and the solvent polarity was also found for P-2VP; larger shifts were found for P-4VP and PS, and the largest one was obtained with PMMA and PHEMA (Figures 7 and 8). In the system methanol-toluene the polarity of the polymer microenvi-
The Journal o f Physical Chemistry, Vol. 80, No. 7, 1976
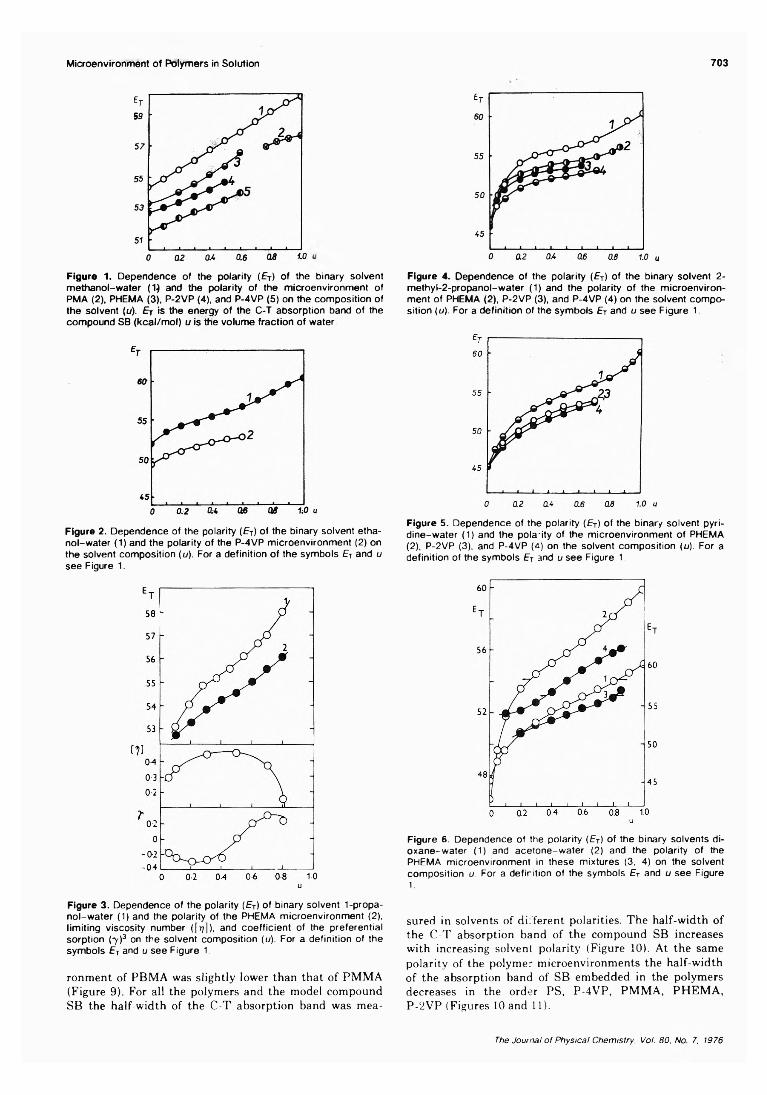
Microenvironment of Polymers in Solution 703
Figure 1. D ep en den ce of the po larity (£ T) of the binary solvent m eth a n o l-w a te r ( 1} and the polarity of the m icroenvironm ent of P M A (2), PHEM A (3), P -2V P (4), and P -4 VP (5 ) on the com position of the solvent (u). ET is the energy of the C -T absorption band of the com pound SB (k c a l/m o l) u is the volum e fraction of water.
Figure 2. D ependence of the polarity (£ T) of the binary solvent e than o l-w a te r (1 ) and the po larity of the P -4V P m icroenvironm ent (2) on the solvent com position (u). For a definition of the sym bols ET and u see Figure 1.
Figure 3. D ependence of the polarity (S r) of binary solvent 1-propan o l-w a te r (1) and the polarity of the PHEMA m icroenvironm ent (2), lim iting viscosity num ber ( [ 77]), and coe ffic ien t of the preferentia l sorption (7 ) 3 on the solvent com position (u). For a definition of the sym bols ET and u see Figure 1.
ronment of PBMA was slightly lower than that of PMMA (Figure 9). For all the polymers and the model compound SB the half-width of the C-T absorption band was mea-
Figure 4. D ep en dence of the polarity (£ T) of the binary solvent 2 - m eth yl-2 -p ro p a n o l-w a te r ( 1) and the polarity o f the m icroenvironm ent of PHEM A (2), P -2V P (3), and P -4V P (4) on the solvent com position (u). For a definition of the sym bols £ T and u see Figure 1.
Figure 5. D ependence of the polarity (£ T) o f the binary solvent pyrid in e -w a te r (1 ) and the po la 'ity of the m icroenvironm ent of PHEMA (2), P -2V P (3), and P -4V P (£) on the solvent com position (u). For a definition of the sym bols £ T and u see Figure 1.
F igure 6 . D ependence of the polarity (ET) of the binary solvents di- o x a n e -w a te r ( 1 ) and a c e to n e -w a te r (2 ) and the polarity of the PHEMA m icroenvironm ent in these m ixtures (3, 4) on the solvent com position u. For a defirition of the sym bols £ T and u see Figure 1 .
sured in solvents of different polarities. The half-width o f
the C-T absorption band of the compound SB increases with increasing solvent polarity (Figure 10). At the same polarity of the polymer microenvironments the half-width of the absorption band of SB embedded in the polymers decreases in the order PS, P-4VP, PMMA, PHEMA, P-2VP (Figures 10 and 11).
The Journal o f Physical Chemistry, Vol. 80, No 7, 1976
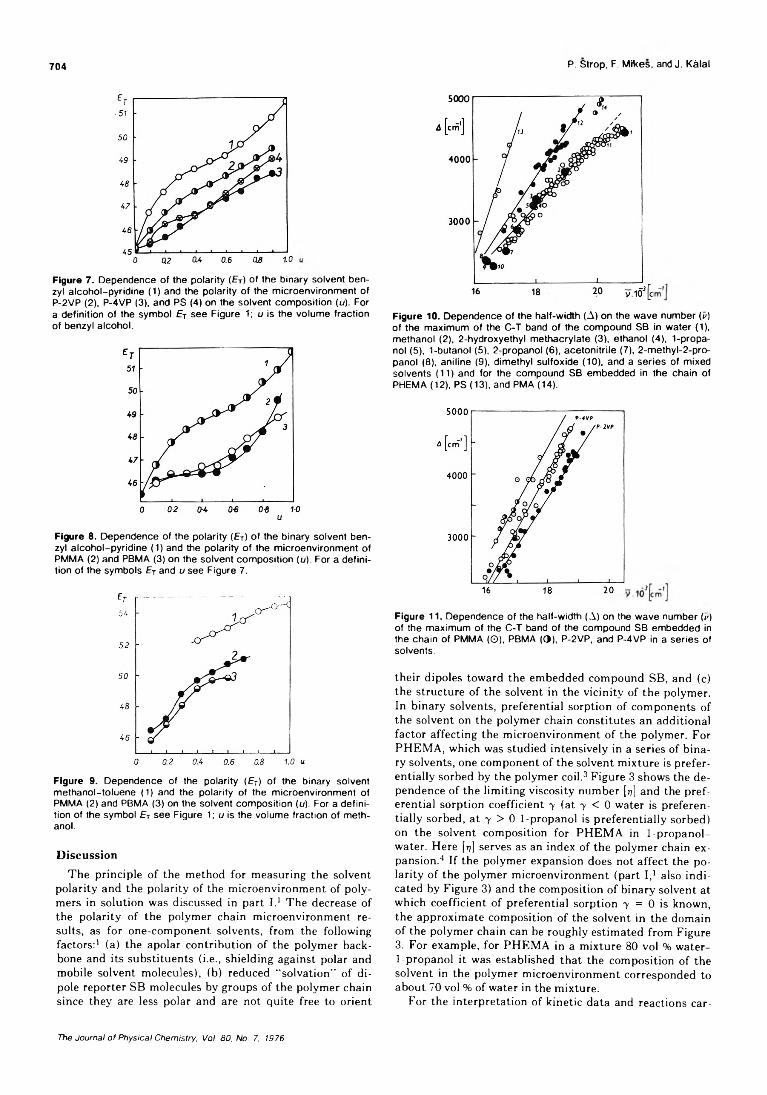
704 P. Strop, F. Mikes, and J. Kàlal
Figure 7. D ependence of the polarity (ET) of the binary solvent benzyl a lcoho l-p yrid ine (1) and the polarity of the m icroenvironm ent of P -2V P (2), P -4V P (3), and PS (4) on the solvent com position (u). For a definition of the sym bol ET see Figure 1; u Is the volum e fraction of benzyl alcohol.
Figure 8. D ependence of the polarity (£7) o f the binary solvent benzyl a lcoho l-pyrid ine (1) and the po larity o f the m icroenvironm ent of PM M A (2) and PBMA (3) on the solvent com position (u). For a defin ition of the symbols EY and u see Figure 7.
Figure 9. D ep en dence of the polarity (ET) of the binary solvent m eth an o l-to luene (1) and the polarity of the m icroenvironm ent of PM M A (2) and PBMA (3) on the solvent com position (u). For a defin ition of the symbol ET see Figure 1; u is the volum e fraction of m ethanol.
Discussion
The principle of the method for measuring the solvent polarity and the polarity of the microenvironment of polymers in solution was discussed in part I.1 The decrease of the polarity of the polymer chain microenvironment results, as for one-component solvents, from the following factors:' (a) the apolar contribution of the polymer backbone and its substituents (i.e., shielding against polar and mobile solvent molecules), (b) reduced “solvation” of dipole reporter SB molecules by groups of the polymer chain since they are less polar and are not quite free to orient
Figure 10. D ependence of the half-w idth (A ) on the w ave num ber (P) of the m axim um of the C -T band o f the com pound SB In w a te r (1), m ethanol (2), 2-hydroxyethyl m ethacry la te (3), ethanol (4), 1-propanol (5), 1-butanol (5), 2-propanol (6), aceton itrile (7), 2 -m eth y l-2 -p ro - panol (8), aniline (9), dim ethyl sulfoxide (10), and a series of m ixed solvents (11 ) and for the com pound SB em bedded in the chain of PHEM A (12), PS (13), and PM A (14).
Figure 11. D ependence of the half-w idth (A) on the w a v e num ber (v) of the m axim um of the C -T band of the com pound SB em bedded in the chain of PM M A (O ), PBMA (O ), P -2V P , and P-4 VP in a series of solvents.
their dipoles toward the embedded compound SB, and (c) the structure of the solvent in the vicinity of the polymer. In binary solvents, preferential sorption of components of the solvent on the polymer chain constitutes an additional factor affecting the microenvironment of the polymer. For PHEMA, which was studied intensively in a series of binary solvents, one component of the solvent mixture is preferentially sorbed by the polymer coil.3 Figure 3 shows the dependence of the limiting viscosity number [77] and the preferential sorption coefficient 7 (at 7 < 0 water is preferentially sorbed, at 7 > 0 1-propanol is preferentially sorbed) on the solvent composition for PHEMA in 1-propanol- water. Here [77] serves as an index of the polymer chain expansion.4 If the polymer expansion does not affect the polarity of the polymer microenvironment (part I,1 also indicated by Figure 3) and the composition of binary solvent at which coefficient of preferential sorption 7 = 0 is known, the approximate composition of the solvent in the domain of the polymer chain can be roughly estimated from Figure3. For example, for PHEMA in a mixture 80 vol % water- 1-propanol it was established that the composition of the solvent in the polymer microenvironment corresponded to about 70 vol % of water in the mixture.
For the interpretation of kinetic data and reactions car-
The Journal o f Physical Chemistry, Vol. 80, No. 7, 1976
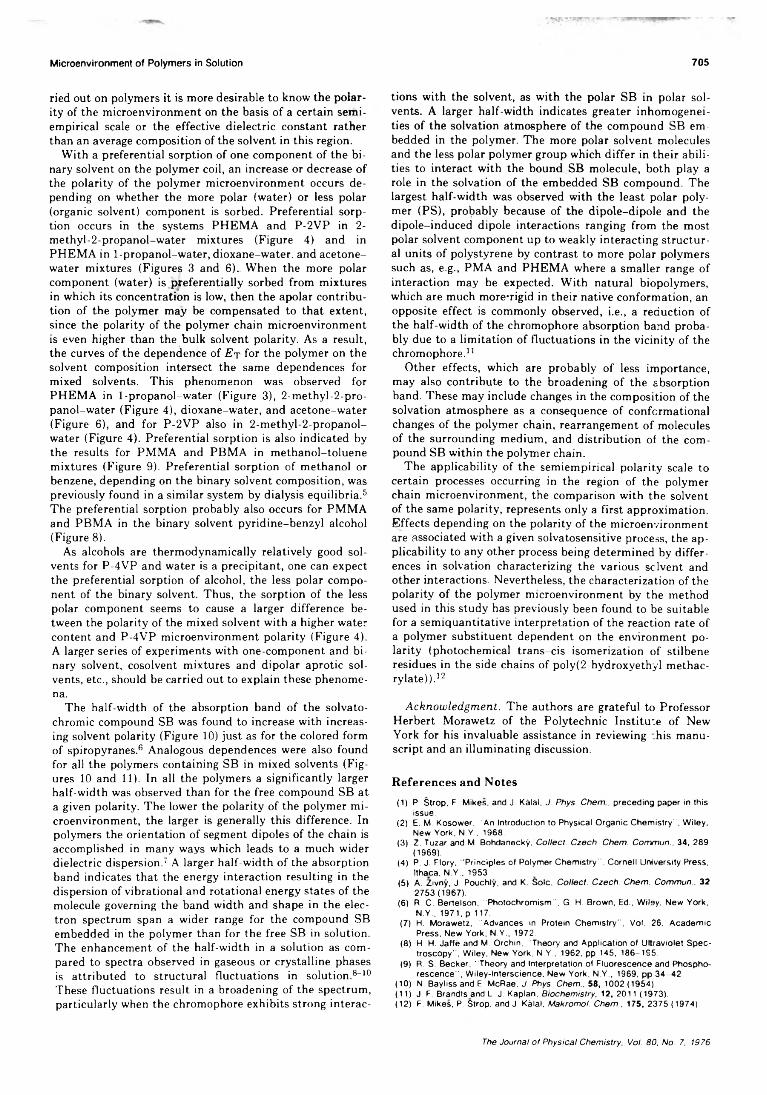
M icroenvironm ent o f Po lym ers in Solution 705
ried out on polymers it is more desirable to know the polarity of the microenvironment on the basis of a certain semi- empirical scale or the effective dielectric constant rather than an average composition of the solvent in this region.
With a preferential sorption of one component of the binary solvent on the polymer coil, an increase or decrease of the polarity of the polymer microenvironment occurs depending on whether the more polar (water) or less polar (organic solvent) component is sorbed. Preferential sorption occurs in the systems PHEMA and P-2VP in 2- methyl-2-propanol-water mixtures (Figure 4) and in PHEMA in 1-propanol-water, dioxane-water. and acetone- water mixtures (Figures 3 and 6 ). When the more polar component (water) is preferentially sorbed from mixtures in which its concentration is low, then the apolar contribution of the polymer may be compensated to that extent, since the polarity of the polymer chain microenvironment is even higher than the bulk solvent polarity. As a result, the curves of the dependence of E t for the polymer on the solvent composition intersect the same dependences for mixed solvents. This phenomenon was observed for PHEMA in 1 -propanol-water (Figure 3), 2-methyl-2-pro- panol-water (Figure 4), dioxane-water, and acetone-water (Figure 6 ), and for P-2VP also in 2-methyl-2-propanol- water (Figure 4). Preferential sorption is also indicated by the results for PMMA and PBMA in methanol-toluene mixtures (Figure 9). Preferential sorption of methanol or benzene, depending on the binary solvent composition, was previously found in a similar system by dialysis equilibria.5
The preferential sorption probably also occurs for PMMA and PBM A in the binary solvent pyridine-benzyl alcohol (Figure 8 ).
As alcohols are thermodynamically relatively good solvents for P-4VP and water is a precipitant, one can expect the preferential sorption of alcohol, the less polar component of the binary solvent. Thus, the sorption of the less polar component seems to cause a larger difference between the polarity of the mixed solvent with a higher water content and P-4VP microenvironment polarity (Figure 4). A larger series of experiments with one-component and binary solvent, cosolvent mixtures and dipolar aprotic solvents, etc., should be carried out to explain these phenomena.
The half-width of the absorption band of the solvato- chromic compound SB was found to increase with increasing solvent polarity (Figure 10) just as for the colored form of spiropyranes.6 Analogous dependences were also found for all the polymers containing SB in mixed solvents (Figures 10 and 11). In all the polymers a significantly larger half-width was observed than for the free compound SB at a given polarity. The lower the polarity of the polymer microenvironment, the larger is generally this difference. In polymers the orientation of segment dipoles of the chain is accomplished in many ways which leads to a much wider dielectric dispersion.7 A larger half-width of the absorption band indicates that the energy interaction resulting in the dispersion of vibrational and rotational energy states of the molecule governing the band width and shape in the electron spectrum span a wider range for the compound SB embedded in the polymer than for the free SB in solution. The enhancement of the half-width in a solution as compared to spectra observed in gaseous or crystalline phases is attributed to structural fluctuations in solution.8-10
These fluctuations result in a broadening of the spectrum, particularly when the chromophore exhibits strong interac
tions with the solvent, as with the polar SB in polar solvents. A larger half-width indicates greater inhomogeneities of the solvation atmosphere of the compound SB embedded in the polymer. The more polar solvent molecules and the less polar polymer group which differ in their abilities to interact with the bound SB molecule, both play a role in the solvation of the embedded SB compound. The largest half-width was observed with the least polar polymer (PS), probably because of the dipole-dipole and the dipole-induced dipole interactions ranging from the most polar solvent component up to weakly interacting structural units of polystyrene by contrast to more polar polymers such as, e.g., PMA and PHEMA where a smaller range of interaction may be expected. With natural biopolymers, which are much more-rigid in their native conformation, an opposite effect is commonly observed, i.e., a reduction of the half-width of the chromophore absorption band probably due to a limitation of fluctuations in the vicinity of the chromophore.11
Other effects, which are probably of less importance, may also contribute to the broadening of the absorption band. These may include changes in the composition of the solvation atmosphere as a consequence of confcrmational changes of the polymer chain, rearrangement of molecules of the surrounding medium, and distribution of the compound SB within the polymer chain.
The applicability of the semiempirical polarity scale to certain processes occurring in the region of the polymer chain microenvironment, the comparison with the solvent of the same polarity, represents only a first approximation. Effects depending on the polarity of the microenvironment are associated with a given solvatosensitive process, the applicability to any other process being determined by differences in solvation characterizing the various solvent and other interactions. Nevertheless, the characterization of the polarity of the polymer microenvironment by the method used in this study has previously been found to be suitable for a semiquantitative interpretation of the reaction rate of a polymer substituent dependent on the environment polarity (photochemical trans-cis isomerization of stilbene residues in the side chains of poly(2 -hydroxyethyl methacrylate) ) . 12
A c k n o w l e d g m e n t . The authors are grateful to Professor Herbert Morawetz of the Polytechnic Institute of New York for his invaluable assistance in reviewing this manuscript and an illuminating discussion.
References and Notes(1) P. Strop, F. Mikes, and J. Kàlal, J. Phys. Chem , preceding paper in this
issue.(2) E. M. Kosower, "An Introduction to Physical Organic Chemistry". Wiley,
New York, N.Y.. 1968.(3) Z. Tuzar and M. Bohdanecky, Collect. Czech. Chem. Commun., 34, 289
(1969).(4) P. J. Flory, “Principles of Polymer Chemistry", Cornell University Press.
Ithaca, N.Y., 1953.(5) A. Zivny, J. Pouchly, and K. Sole, Colled. Czech. Chem. Commun.. 32
2753(1967).(6) R. C. Bertelson, "Photochromism", G. FI. Brown, Ed., Wiley, New York,
N.Y., 1971, p 117.(7) FI. Morawetz, "Advances in Protein Chemistry". Vol. 26, Academic
Press, New York, N.Y., 1972.(8) H. Fl. Jaffé and M. Orchin, "Theory and Application of Ultraviolet Spec
troscopy” , Wiley, New York, N.Y., 1962, pp 145, 186-195.(9) R. S. Becker, “Theory and Interpretation of Fluorescence and Phospho
rescence", Wiley-lnterscience, New York, N.Y., 1969, pp 3 4-42 .(10) N. Bayliss and E. McRae, J. Phys. Chem.. 58, 1002 (1954).(11) J. F. Brandts and L. J. Kaplan, Biochemistry. 12, 2011 (1973).(12) F. Mikes, P. Strop, and J. Kàlal, Makromol. Chem., 175, 2375 (1974).
The Journal o f Physical Chemistry, Vol. 80, No. 7, 1976
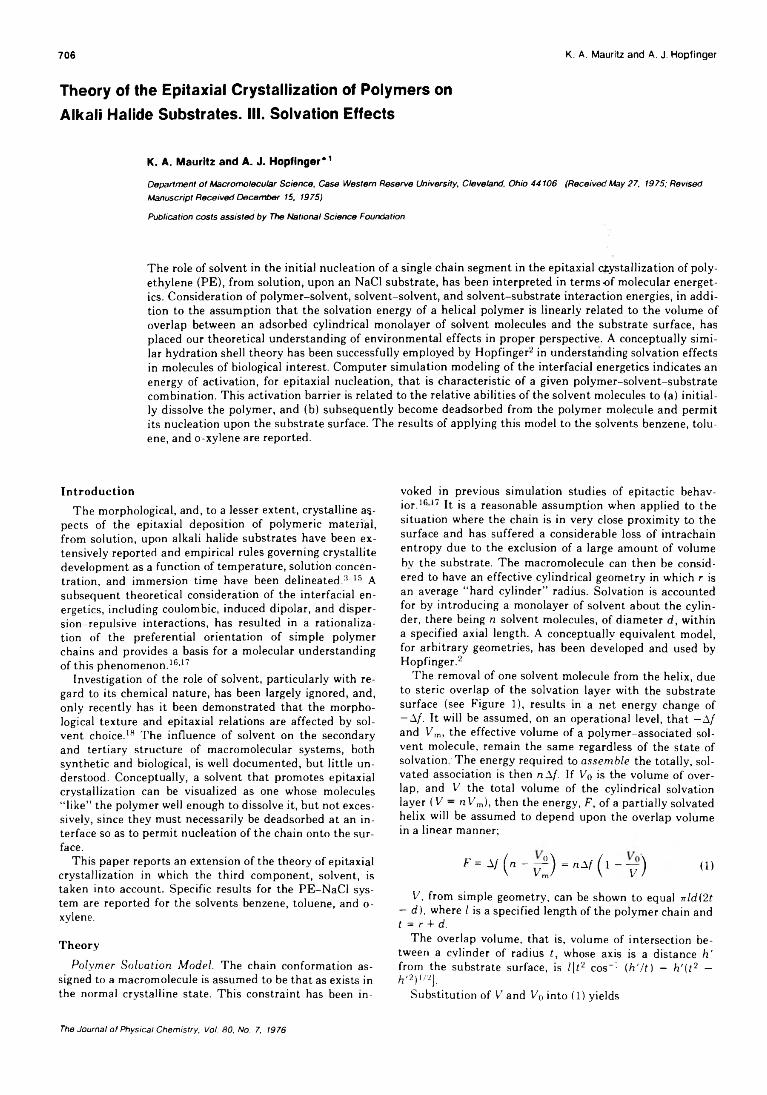
706 K. A. Mauritz and A. J. H opfinger
Theory of the Epitaxial Crystallization of Polymers on Alkali Halide Substrates. III. Solvation Effects
K. A. Mauritz and A. J. Hopfinger*1
Department o f Macromolecular Science, Case Western Reserve University, Cleveland, Ohio 44106 (Received May 27, 1975; Revised Manuscript Received December 15, 1975)
Publication costs assisted by The National Science Foundation
The role of solvent in the initial nucleation of a single chain segment in the epitaxial c&ystallization of polyethylene (PE), from solution, upon an NaCl substrate, has been interpreted in terms-of molecular energetics. Consideration of polymer-solvent, solvent-solvent, and solvent-substrate interaction energies, in addition to the assumption that the solvation energy of a helical polymer is linearly related to the volume of overlap between an adsorbed cylindrical monolayer of solvent molecules and the substrate surface, has placed our theoretical understanding of environmental effects in proper perspective. A conceptually similar hydration shell theory has been successfully employed by Hopfinger2 in understanding solvation effects in molecules of biological interest. Computer simulation modeling of the interfacial energetics indicates an energy of activation, for epitaxial nucleation, that is characteristic of a given polymer-solvent-substrate combination. This activation barrier is related to the relative abilities of the solvent molecules to (a) initially dissolve the polymer, and (b) subsequently become deadsorbed from the polymer molecule and permit its nucleation upon the substrate surface. The results of applying this model to the solvents benzene, toluene, and o-xylene are reported.
IntroductionThe morphological, and, to a lesser extent, crystalline as
pects of the epitaxial deposition of polymeric material, from solution, upon alkali halide substrates have been extensively reported and empirical rules governing crystallite development as a function of temperature, solution concentration, and immersion time have been delineated.3' 15 A subsequent theoretical consideration of the interfacial energetics, including coulombic, induced dipolar, and dispersion-repulsive interactions, has resulted in a rationalization of the preferential orientation of simple polymer chains and provides a basis for a molecular understanding of this phenomenon. 16'17
Investigation of the role of solvent, particularly with regard to its chemical nature, has been largely ignored, and, only recently has it been demonstrated that the morphological texture and epitaxial relations are affected by solvent choice. 18 The influence of solvent on the secondary and tertiary structure of macromolecular systems, both synthetic and biological, is well documented, but little understood. Conceptually, a solvent that promotes epitaxial crystallization can be visualized as one whose molecules “ like” the polymer well enough to dissolve it, but not excessively, since they must necessarily be deadsorbed at an interface so as to permit nucleation of the chain onto the surface.
This paper reports an extension of the theory of epitaxial crystallization in which the third component, solvent, is taken into account. Specific results for the PE-NaCl system are reported for the solvents benzene, toluene, and o- xylene.
Theory
P o l y m e r S o lu a t io n M o d e l . The chain conformation assigned to a macromolecule is assumed to be that as exists in the normal crystalline state. This constraint has been in
voked in previous simulation studies of epitactic behavior. 1 6 1 7 It is a reasonable assumption when applied to the situation where the chain is in very close proximity to the surface and has suffered a considerable loss of intrachain entropy due to the exclusion of a large amount of volume bv the substrate. The macromolecule can then be considered to have an effective cylindrical geometry in which r is an average “ hard cylinder” radius. Solvation is accounted for by introducing a monolayer of solvent about the cylinder, there being n solvent molecules, of diameter d , within a specified axial length. A conceptually equivalent model, for arbitrary geometries, has been developed and used by Hopfinger.2
The removal of one solvent molecule from the helix, due to steric overlap of the solvation layer with the substrate surface (see Figure 1 ), results in a net energy change of —A/. It will be assumed, on an operational level, that -A / and V m, the effective volume of a polymer-associated solvent molecule, remain the same regardless of the state of solvation. The energy required to a s s e m b le the totally, solvated association is then n l f . If V 0 is the volume of overlap, and V the total volume of the cylindrical solvation layer ( V - n V m), then the energy, F , of a partially solvated helix will be assumed to depend upon the overlap volume in a linear manner;
F ‘ v ( " - v t ) - aAI ( l - v ) 111V , from simple geometry, can be shown to equal r r ld (2 t
- d ) , where l is a specified length of the polymer chain and t = r + d.
The overlap volume, that is, volume of intersection between a cylinder of radius t , whose axis is a distance h ' from the substrate surface, is l [ t 2 cos'- ( h ' / t ) - h ' ( t 2 — h ’ 2)i/2j.
Substitution of V and To into (1 ) yields
The Journal o f Physical Chemistry, Vol. 80, No. 7, 1976
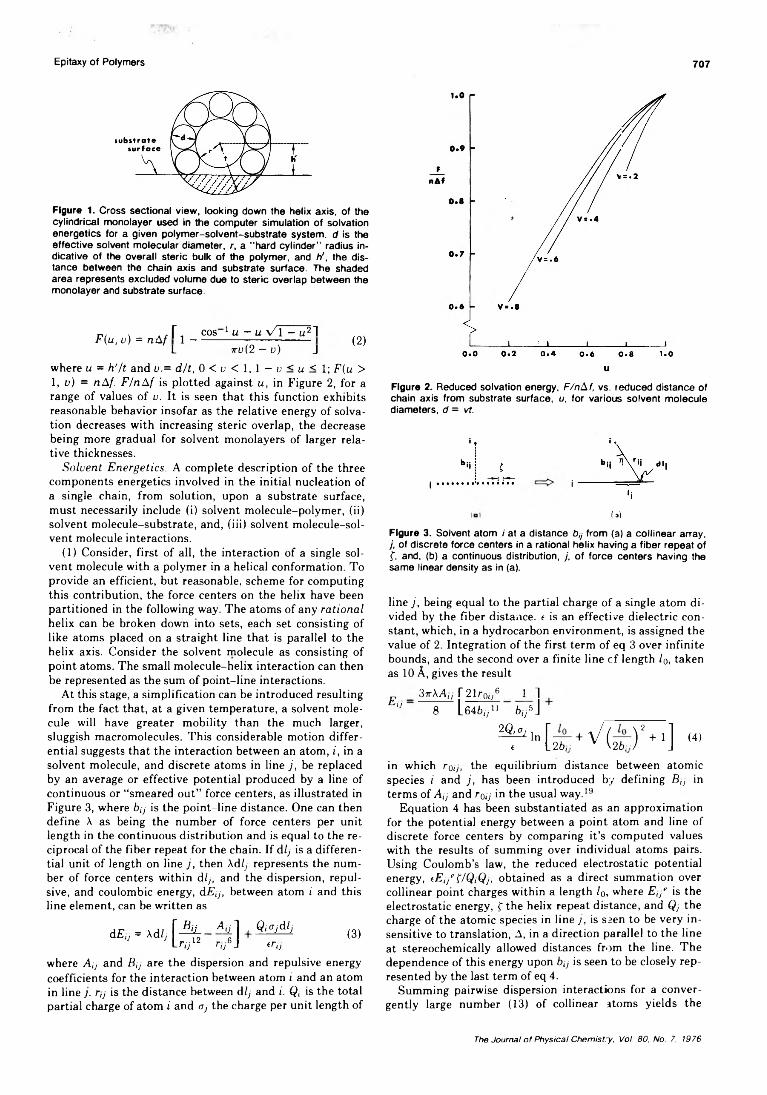
Epitaxy o f Polymers 707
Figure 1. Cross sectional view, looking down the helix axis, of the cylindrical monolayer used in the computer simulation of solvation energetics for a given polymer-solvent-substrate system, d is the effective solvent molecular diameter, r, a “hard cylinder” radius indicative of the overall steric bulk of the polymer, and h', the distance between the chain axis and substrate surface. The shaded area represents excluded volume due to steric overlap between the monolayer and substrate surface.
tv \ a/ T i cos ' “ ■ u v 'l - u 2 1F ( u , v ) = n A f 1 -------------------- -------- (2)L 7t u ( 2 — v ) J
where u = h ' / t and v . = d / t , 0 < u < 1, 1 — v < u < 1; F ( u > 1, v ) = n A f . F / n A f is plotted against u , in Figure 2, for a range of values of v . It is seen that this function exhibits reasonable behavior insofar as the relative energy of solvation decreases with increasing steric overlap, the decrease being more gradual for solvent monolayers of larger relative thicknesses.
S o lv e n t E n e r g e t ic s . A complete description of the three components energetics involved in the initial nucleation of a single chain, from solution, upon a substrate surface, must necessarily include (i) solvent molecule-polymer, (ii) solvent molecule-substrate, and, (iii) solvent molecule-sol- vent molecule interactions.
(1) Consider, first of all, the interaction of a single solvent molecule with a polymer in a helical conformation. To provide an efficient, but reasonable, scheme for computing this contribution, the force centers on the helix have been partitioned in the following way. The atoms of any r a t i o n a l helix can be broken down into sets, each set consisting of like atoms placed on a straight line that is parallel to the helix axis. Consider the solvent molecule as consisting of point atoms. The small molecule-helix interaction can then be represented as the sum of point-line interactions.
At this stage, a simplification can be introduced resulting from the fact that, at a given temperature, a solvent molecule will have greater mobility than the much larger, sluggish macromolecules. This considerable motion differential suggests that the interaction between an atom, i , in a solvent molecule, and discrete atoms in line j , be replaced by an average or effective potential produced by a line of continuous or “smeared out” force centers, as illustrated in Figure 3, where 6 ,y is the point-line distance. One can then define X as being the number of force centers per unit length in the continuous distribution and is equal to the reciprocal of the fiber repeat for the chain. If d l j is a differential unit of length on line j , then Xd/; represents the number of force centers within d l j , and the dispersion, repulsive, and coulombic energy, dE,y, between atom i and this line element, can be written as
d E , j = Xd/y A j i 1 . Q i O jd l j r,j6\ trij
(3)
where A,y and B tJ are the dispersion and repulsive energy coefficients for the interaction between atom i and an atom in line j . r tJ is the distance between d l j and i. Q i is the total partial charge of atom i and ay the charge per unit length of
u
Figure 2. Reduced solvation energy, F/nAf, vs. reduced distance of chain axis from substrate surface, u, for various solvent molecule diameters, d = vt.
i'i
(»)
di,
Figure 3. Solvent atom i at a distance £>,; from (a) a collinear array, j, of discrete force centers in a rational helix having a fiber repeat of f, and, (b) a continuous distribution, j, of force centers having the same linear density as in (a).
line j , being equal to the partial charge of a single atom divided by the fiber distance, t is an effective dielectric constant, which, in a hydrocarbon environment, is assigned the value of 2. Integration of the first term of eq 3 over infinite bounds, and the second over a finite line c f length /o, taken as 10 A, gives the result
E i j3rrAA,, I-21ro,y6 1 1
8 1.646,711 by5-I
^ l n i — + V / (— ) 2 + l l« L 26,, V '26,,/ J (4)
in which r 0ij, the equilibrium distance between atomic species i and j , has been introduced by defining fi,y in terms of A,y and ro,y in the usual way. 19
Equation 4 has been substantiated as an approximation for the potential energy between a point atom and line of discrete force centers by comparing it’s computed values with the results of summing over individual atoms pairs. Using Coulomb’s law, the reduced electrostatic potential energy, <E,y<T/Q,Qy, obtained as a direct summation over collinear point charges within a length l 0 , where E , j e is the electrostatic energy, f the helix repeat distance, and Q j the charge of the atomic species in line j , is seen to be very insensitive to translation, A , in a direction parallel to the line at stereochemically allowed distances from the line. The dependence of this energy upon 6 ,y is seen to be closely represented by the last term of eq 4.
Summing pairwise dispersion interactions for a conver- gently large number (13) of collinear atoms yields the
The Journal o f Physical Chemistry, Vol. 80, No. 7, 1976
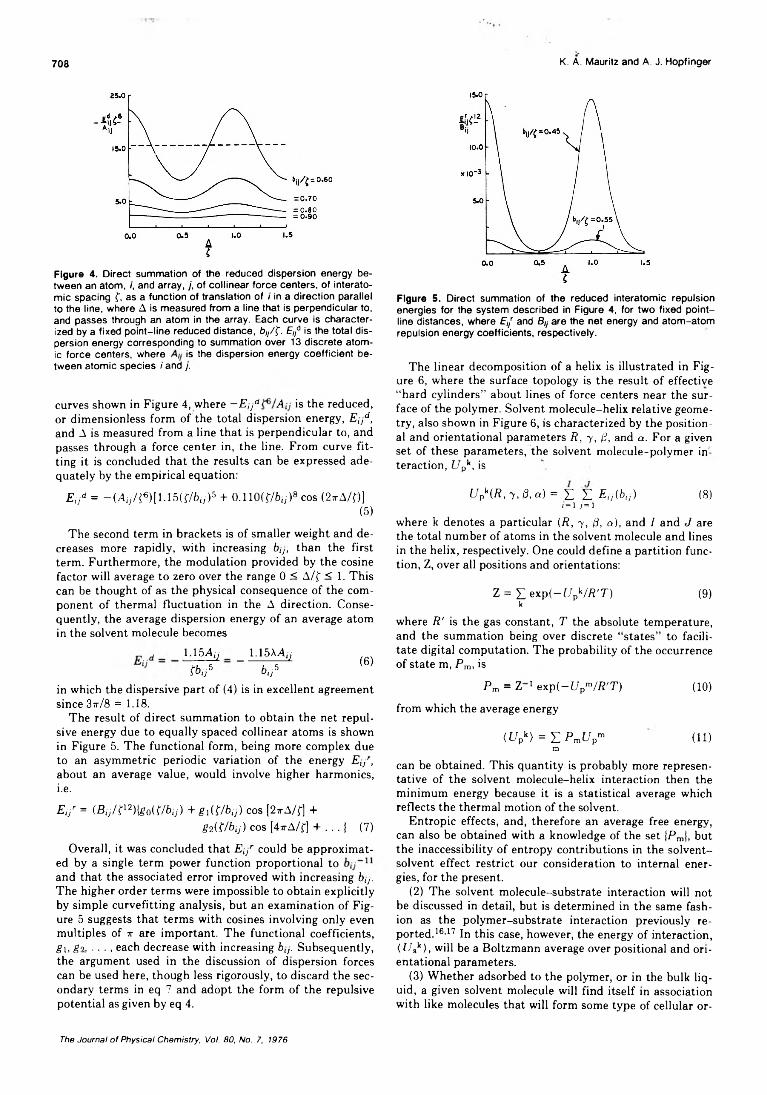
708 K. A. Mauritz and A. J. Hopfinger
Figure 4. Direct summation of the reduced dispersion energy between an atom, /, and array, /, of collinear force centers, of interatomic spacing f, as a function of translation of / in a direction parallel to the line, where A is measured from a line that is perpendicular to, and passes through an atom in the array. Each curve is characterized by a fixed point-line reduced distance, b/y/f. E)yd is the total dispersion energy corresponding to summation over 13 discrete atomic force centers, where is the dispersion energy coefficient between atomic species i and y.
curves shown in Figure 4, where - E t, d A is the reduced, or dimensionless form of the total dispersion energy, E lJd, and A is measured from a line that is perpendicular to, and passes through a force center in, the line. From curve fitting it is concluded that the results can be expressed adequately by the empirical equation:
E i j d = -(iV i« )[1.15(r/6 i7-)6 + 0.110i t / b i j ) 8 cos (2*A/J)](5)
Figure 5. Direct summation of the reduced interatomic repulsion energies for the system described in Figure 4, for two fixed pointline distances, where E,[ and By are the net energy and atom-atom repulsion energy coefficients, respectively.
The linear decomposition of a helix is illustrated in Figure 6 , where the surface topology is the result of effective “ hard cylinders” about lines of force centers near the surface of the polymer. Solvent molecule-helix relative geometry, also shown in Figure 6 , is characterized by the positional and orientational parameters R , y , fi, and a . For a given set of these parameters, the solvent molecule-polymer interaction, Upk, is
Upk(R,y,(3,a) = H Ejj(bij) ( 8 )*=i l=i
The second term in brackets is of smaller weight and decreases more rapidly, with increasing btJ, than the first term. Furthermore, the modulation provided by the cosine factor will average to zero over the range 0 < A/f < 1 . This can be thought of as the physical consequence of the component of thermal fluctuation in the A direction. Consequently, the average dispersion energy of an average atom in the solvent molecule becomes
1.15A,; _ _ L15XA^
foy5 b i j5(6 )
where k denotes a particular (/?, y , /3, a), and / and J are the total number of atoms in the solvent molecule and lines in the helix, respectively. One could define a partition function, Z, over all positions and orientations:
Z = X>xp ( ~ u vW T ) (9)k
where R ' is the gas constant, T the absolute temperature, and the summation being over discrete “ states” to facilitate digital computation. The probability of the occurrence of state m, P m, is
in which the dispersive part of (4) is in excellent agreement since 37t/8 = 1.18.
The result of direct summation to obtain the net repulsive energy due to equally spaced collinear atoms is shown in Figure 5. The functional form, being more complex due to an asymmetric periodic variation of the energy E , j r, about an average value, would involve higher harmonics,i.e.
£ ,/ = (By/f12)teo(f/fcy) A g M / b i j ) cos [2»A/fl +g i i t / b i j ) cos [4xA/f] + . . . | (7)
Overall, it was concluded that E , j r could be approximated by a single term power function proportional to and that the associated error improved with increasing 6 ,y. The higher order terms were impossible to obtain explicitly by simple curvefitting analysis, but an examination of Figure 5 suggests that terms with cosines involving only even multiples of tt are important. The functional coefficients, g i, go, ■ ■ ■ , each decrease with increasing bt]. Subsequently, the argument used in the discussion of dispersion forces can be used here, though less rigorously, to discard the secondary terms in eq 7 and adopt the form of the repulsive potential as given by eq 4.
P m = Z 1 e x p ( - U pm/ R ' T ) (10)
from which the average energy
( U pk ) = Z P m U p™ (1 1 )m
can be obtained. This quantity is probably more representative of the solvent molecule-helix interaction then the minimum energy because it is a statistical average which reflects the thermal motion of the solvent.
Entropic effects, and, therefore an average free energy, can also be obtained with a knowledge of the set ¡Pml, but the inaccessibility of entropy contributions in the solvent- solvent effect restrict our consideration to internal energies, for the present.
(2 ) The solvent molecule-substrate interaction will not be discussed in detail, but is determined in the same fashion as the polymer-substrate interaction previously reported. 16,17 In this case, however, the energy of interaction, (i/9k), will be a Boltzmann average over positional and orientational parameters.
(3) Whether adsorbed to the polymer, or in the bulk liquid, a given solvent molecule will find itself in association with like molecules that will form some type of cellular or-
The Journal o f Physical Chemistry, Voi. 80, No. 7, 1976
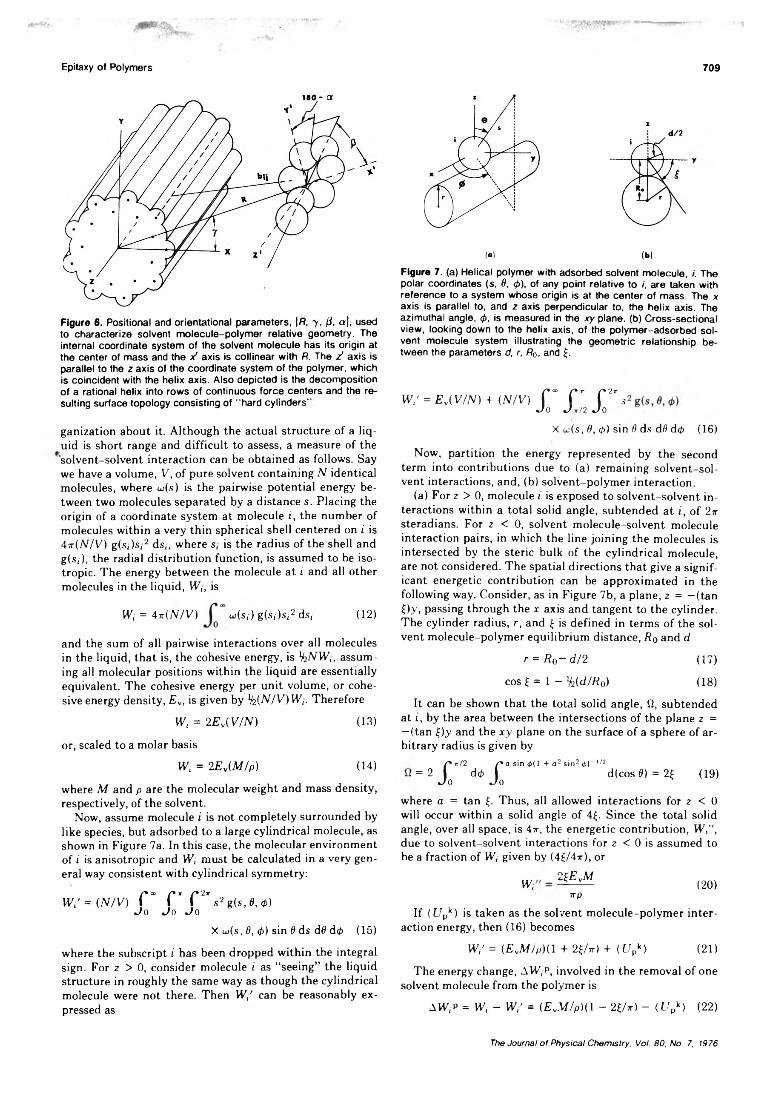
Epitaxy o f Polym ers 709
iso - a
Figure 6. Positional and orientational parameters, jfl, y , /3, a), used to characterize solvent molecule-polymer relative geometry. The internal coordinate system of the solvent molecule has its origin at the center of mass and the V axis is collinear with R. The z' axis is parallel to the z axis of the coordinate system of the polymer, which is coincident with the helix axis. Also depicted is the decomposition of a rational helix into rows of continuous force centers and the resulting surface topology consisting of "hard cylinders".
(“I (b)Figure 7. (a) Helical polymer with adsorbed solvent molecule, /'. The polar coordinates (s, 8, <p), of any point relative to /, are taken with reference to a system whose origin is at the center of mass. The x axis is parallel to, and z axis perpendicular to, the helix axis. The azimuthal angle, <p, is measured in the xy plane, (b) Cross-sectional view, looking down to the helix axis, of the polymer-adsorbed solvent molecule system illustrating the geometric relationship between the parameters d, r, fl0, and £.
W l ’ = E v( V / N ) + ( N / V ) f ” C W r , J o J r n J o
ganization about it. Although the actual structure of a liquid is short range and difficult to assess, a measure of the 'solvent-solvent interaction can be obtained as follows. Say we have a volume, V , of pure solvent containing N identical molecules, where a>(s) is the pairwise potential energy between two molecules separated by a distance s. Placing the origin of a coordinate system at molecule i, the number of molecules within a very thin spherical shell centered on i is 4 i r ( N / V ) g(s,)s, 2 ds,, where s, is the radius of the shell and g(s,), the radial distribution function, is assumed to be isotropic. The energy between the molecule at i and all other molecules in the liquid, IV,, is
W , = 4A N / V ) «(«,-) g(s,)s,-2 ds, (12)
and the sum of all pairwise interactions over all molecules in the liquid, that is, the cohesive energy, is H i N W , , assuming all molecular positions within the liquid are essentially equivalent. The cohesive energy per unit volume, or cohesive energy density, E w, is given by l/2{ N / V ) W l . Therefore
IV, = 2 E v( V / N ) (13)
or, scaled to a molar basis
X u ( s , 8, tp) sin 8 ds dö dtp (16)
Now, partition the energy represented by the second term into contributions due to (a) remaining solvent-solvent interactions, and, (b) solvent-polymer interaction.
(a) For z >0, molecule i is exposed to solvent-solvent interactions within a total solid angle, subtended at i, of 2 ir steradians. For z < 0 , solvent molecule-solvent molecule interaction pairs, in which the line joining the molecules is intersected by the steric bulk of the cylindrical molecule, are not considered. The spatial directions that give a significant energetic contribution can be approximated in the following way. Consider, as in Figure 7b, a plane, z = —(tan £)y, passing through the x axis and tangent to the cylinder. The cylinder radius, r, and £ is defined in terms of the solvent molecule-polymer equilibrium distance, fl0 and d
r = R 0 ~ d / 2 (17)
cos £ = 1 - %(d/Ä0) (18)
It can be shown that the total solid angle, fi, subtended at i , by the area between the intersections of the plane z = —(tan £)y and the x y plane on the surface of a sphere of arbitrary radius is given by
W i = 2 E v( M / p ) (14)
where M and p are the molecular weight and mass density, respectively, of the solvent.
Now, assume molecule i is not completely surrounded by like species, but adsorbed to a large cylindrical molecule, as shown in Figure 7a. In this case, the molecular environment of i is anisotropic and IV, must be calculated in a very general way consistent with cylindrical symmetry:
lV /= (N/V) r C C * s 2 g (s , 8, <p)J o J o J o
X <j(s, 8, <p) sin 6 ds d0 dtp (15)
= 2 p /2 dtp rJ o J o
•a sin 0(1 + a2 sin2 0)_1/'2d(cos0) = 2£ (19)
where a = tan £. Thus, all allowed interactions for z < 0
will occur within a solid angle of 4£. Since the total solid angle, over all space, is 4x, the energetic contribution, IV¡", due to solvent-solvent interactions for z < 0 is assumed to be a fraction of IV, given by (4 £/47t), or
W,2 ££vAf
irp(2 0 )
If ( U pk) is taken as the solvent molecule-polymer interaction energy, then (16) becomes
where the subscript i has been dropped within the integral sign. For z > 0, consider molecule i as “ seeing” the liquid structure in roughly the same way as though the cylindrical molecule were not there. Then W t' can be reasonably expressed as
IV,' = (gvM/p)(l + 2£Ar) + (t /pk) (21)
The energy change, AIV,p, involved in the removal of one solvent molecule from the polymer is
AIV,p = W, - W,' = ( E vM / p ) ( l - 2£Ar) - (Upk) (22)
The Journal o f Physical Chemistry, Vol. 80, No. 7, 1976
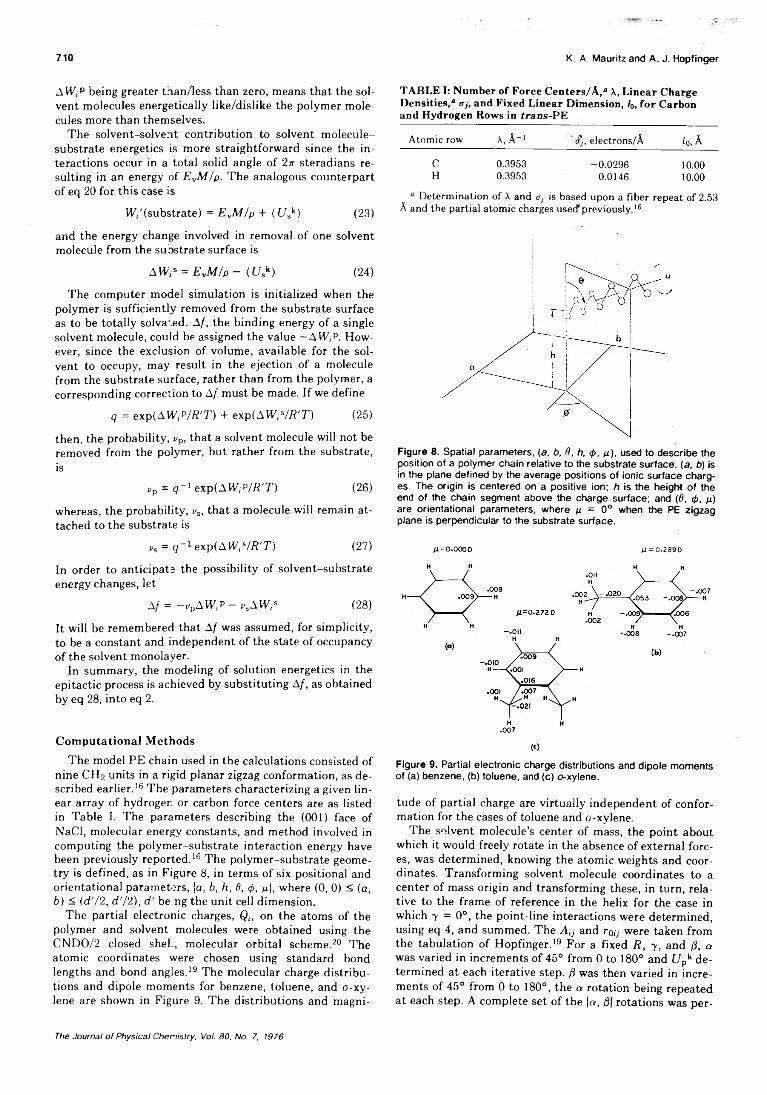
710 K. A. Mauritz and A. J. Hopfinger
AVF,P being greater tnan/less than zero, means that the solvent molecules energetically like/dislike the polymer molecules more than themselves.
The solvent-solvent contribution to solvent molecule- substrate energetics is more straightforward since the interactions occur in a total solid angle of 2 tt steradians resulting in an energy of E vM / p . The analogous counterpart of eq 2 0 for this case is
W/(substrate) = E vM / p + ( U sk ) (23)
and the energy change involved in removal of one solvent molecule from the substrate surface is
A W,s = E vM / p - ( U sk) (24)
The computer model simulation is initialized when the polymer is sufficiently removed from the substrate surface as to be totally solvated. A f , the binding energy of a single solvent molecule, could be assigned the value -A1V,P. However, since the exclusion of volume, available for the solvent to occupy, may result in the ejection of a molecule from the substrate surface, rather than from the polymer, a corresponding correction to A/ must be made. If we define
q = exp(A W i P / R ' T ) + exp(A W f / R ' T ) (25)
then, the probability, vp, that a solvent molecule will not be removed from the polymer, but rather from the substrate, is
„p = q“ 1 exp(A W S / R ' T ) (26)
whereas, the probability, vs, that a molecule will remain attached to the substrate is
vs = q ~ l e x p ( A W i s/ R ' T ) (27)
In order to anticipate the possibility of solvent-substrate energy changes, let
A/ = -VpAlVy - vsA VF,S (28)
It will be remembered that A f was assumed, for simplicity, to be a constant and independent of the state of occupancy of the solvent monolayer.
In summary, the modeling of solution energetics in the epitactic process is achieved by substituting A f , as obtained by eq 28, into eq 2 .
Computational Methods
The model PE chain used in the calculations consisted of nine CH2 units in a rigid planar zigzag conformation, as described earlier. 16 The parameters characterizing a given linear array of hydrogen or carbon force centers are as listed in Table I. The parameters describing the (001) face of NaCl, molecular energy constants, and method involved in computing the polymer-substrate interaction energy have been previously reported. 16 The polymer-substrate geometry is defined, as in Figure 8 , in terms of six positional and orientational parameters, ja, b, h , 8, <f>, p], where (0 , 0 ) < (a, b ) < ( d ' / 2 , d ' / 2 ) , d ' being the unit cell dimension.
The partial electronic charges, Qi, on the atoms of the polymer and solvent molecules were obtained using the CNDO/2 closed sheL, molecular orbital scheme.20 The atomic coordinates were chosen using standard bond lengths and bond angles. 19 The molecular charge distributions and dipole moments for benzene, toluene, and o-xylene are shown in Figure 9. The distributions and magni-
TABLEI: Number of Force Centers/A,® X, Linear Charge Densities,® oy, and Fixed Linear Dimension, /o, for Carbon and Hydrogen Rows in trans-PE
Atomic row x,A-> ¿j, electrons/A lo, A
c 0.3953 -0.0296 10.00H 0.3953 0.0146 10.00
° Determination of X and <7 is based upon a fiber repeat.of 2.53 A and the partial atomic charges used1 previously.16
Figure 8. Spatial parameters, (a, b, 6, h, <f>, p), used to describe the position of a polymer chain relative to the substrate surface, (a, b) is in the plane defined by the average positions of ionic surface charges. The origin is centered on a positive ion; h is the height of the end of the chain segment above the charge surface; and (8, <f>, p) are orientational parameters, where p = 0° when the PE zigzag plane is perpendicular to the substrate surface.
P = O.OOOD p = 0.289D
.007
M
Figure 9. Partial electronic charge distributions and dipole moments of (a) benzene, (b) toluene, and (c) o-xylene.
tude of partial charge are virtually independent of conformation for the cases of toluene and o-xylene.
The solvent molecule’s center of mass, the point about which it would freely rotate in the absence of external forces, was determined, knowing the atomic weights and coordinates. Transforming solvent molecule coordinates to a center of mass origin and transforming these, in turn, relative to the frame of reference in the helix for the case in which 7 = 0 °, the point-line interactions were determined, using eq 4, and summed. The A t] and ro,y were taken from the tabulation of Hopfinger. 19 For a fixed R , 7 , and 0 , a was varied in increments of 45° from 0 to 180° and U pk determined at each iterative step, 0 was then varied in increments of 45° from 0 to 180°, the a rotation being repeated at each step. A complete set of the \ a , 0} rotations was per
The Journal o f Physical Chemistry, Vol. 80, No. 7, 1976
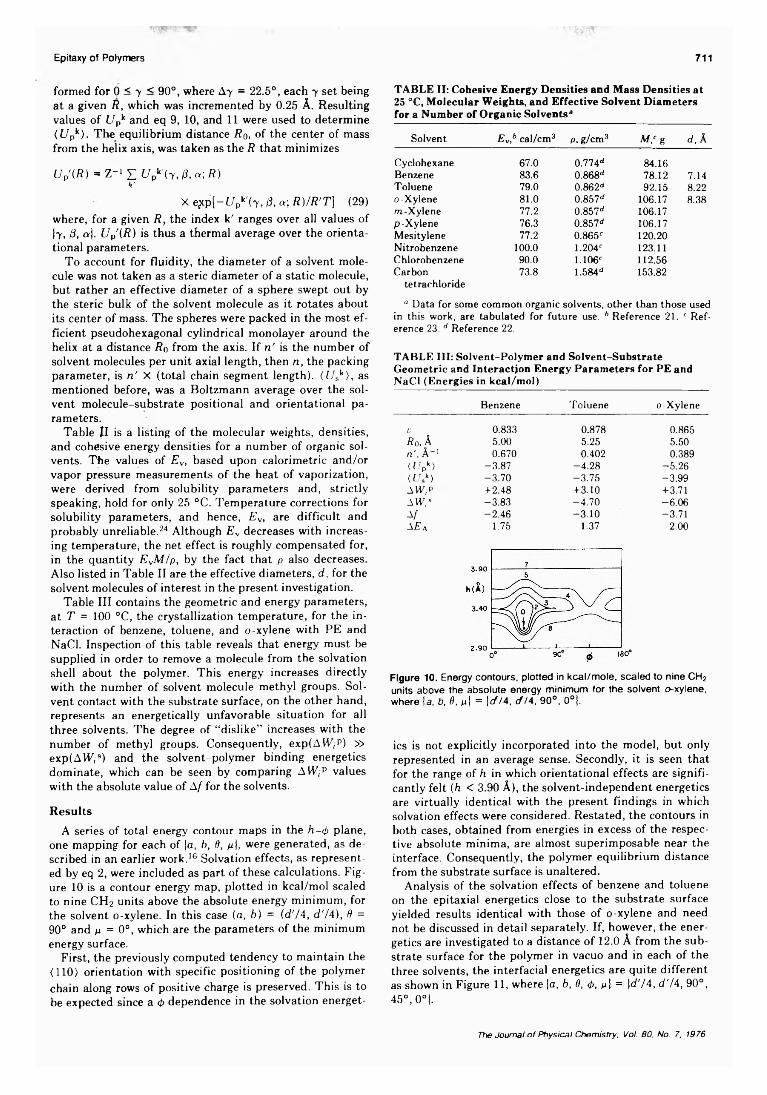
formed for 0 < 7 < 90°, where A7 = 22.5°, each 7 set being at a given R, which was incremented by 0.25 A. Resulting values of t/pk and eq 9, 10, and 11 were used to determine ( U pk). The equilibrium distance R 0, of the center of mass from the helix axis, was taken as the R that minimizes
U P' ( R ) = Z- 1 £ t/pk'(7 , ft a ; R )k'
X e£p[-f/pk'(7 , /3, «; R ) / R ' T ] (29)where, for a given R , the index k' ranges over all values of ¡7 , ¡5, oj. U P' ( R ) is thus a thermal average over the orientational parameters.
To account for fluidity, the diameter of a solvent molecule was not taken as a steric diameter of a static molecule, but rather an effective diameter of a sphere swept out by the steric bulk of the solvent molecule as it rotates about its center of mass. The spheres were packed in the most efficient pseudohexagonal cylindrical monolayer around the helix at a distance R o from the axis. If n ' is the number of solvent molecules per unit axial length, then n , the packing parameter, is n ' X (total chain segment length). ( U sk ) , as mentioned before, was a Boltzmann average over the solvent molecule-substrate positional and orientational parameters.
Table II is a listing of the molecular weights, densities, and cohesive energy densities for a number of organic solvents. The values of E v, based upon calorimetric and/or vapor pressure measurements of the heat of vaporization, were derived from solubility parameters and, strictly speaking, hold for only 25 °C. Temperature corrections for solubility parameters, and hence, E v, are difficult and probably unreliable.24 Although E v decreases with increasing temperature, the net effect is roughly compensated for, in the quantity E vM / p , by the fact that p also decreases. Also listed in Table II are the effective diameters, d , for the solvent molecules of interest in the present investigation.
Table III contains the geometric and energy parameters, at T = 100 °C, the crystallization temperature, for the interaction of benzene, toluene, and o-xylene with PE and NaCl. Inspection of this table reveals that energy must be supplied in order to remove a molecule from the solvation shell about the polymer. This energy increases directly with the number of solvent molecule methyl groups. Solvent contact with the substrate surface, on the other hand, represents an energetically unfavorable situation for all three solvents. The degree of “ dislike” increases with the number of methyl groups. Consequently, exp(AH/P) » exp(AW/s) and the solvent-polymer binding energetics dominate, which can be seen by comparing AW/p values with the absolute value of A/ for the solvents.
ResultsA series of total energy contour maps in the h-<t> plane,
one mapping for each of \a , b, 0, p \ , were generated, as described in an earlier work.1® Solvation effects, as represented by eq 2, were included as part of these calculations. Figure 1 0 is a contour energy map, plotted in kcal/mol scaled to nine CH2 units above the absolute energy minimum, for the solvent o-xylene. In this case (a, b ) = (<¿74, d ' / 4 ) , 8 = 90° and p. = 0 °, which are the parameters of the minimum energy surface.
First, the previously computed tendency to maintain the <1 1 0 ) orientation with specific positioning of the polymer chain along rows of positive charge is preserved. This is to be expected since a <j> dependence in the solvation energet-
Epitaxy of Polymers 711
TABLE II: Cohesive Energy Densities and Mass Densities at 25 °C, Molecular Weights, and Effective Solvent Diameters for a Number of Organic Solvents*
Solvent E v,b cal/cm3 p, g/cm3 M ,c g d, Â
Cyclohexane 67.0 0.714d 84.16Benzene 83.6 0.868d 78.12 7.14Toluene 79.0 0.862d 92.15 8.22o-Xylene 81.0 0.857d 106.17 8.38m -Xylene 77.2 0.857d 106.17p-Xylene 76.3 0.857d 106.17Mesitylene 77.2 0.865c 120.20Nitrobenzene 100.0 1.204c 123.11Chlorobenzene 90.0 1.106c 112.56Carbon 73.8 1.58411 153.82
tetrachloride“ Data for some common organic solvents, other than those used
in this work, are tabulated for future use. b Reference 21. c Ref-erence 23. d Reference 22.
TABLE III: Solvent-Polymer and Solvent-Substrate Geometric and Interaction Energy Parameters for PE andNaCl (Energies in kcal/mol)
Benzene Toluene o-Xylene
V 0.833 0.878 0.865R o . 5.00 5.25 5.50n\ A"1 0.670 0.402 0.389<iV> -3.87 -4.28 -5.26( U k) -3.70 -3.75 -3.99A W , p +2.48 +3.10 +3.71AW,S -3.83 -4.70 -6.06A / -2.46 -3.10 -3.71A E a 1.75 1.37 2.00
Figure 10. Energy contours, plotted in kcal/mole, scaled to nine CH2 units above the absolute energy minimum for the solvent oxylene, where \a, b, 8 , p\ = \d 14, d 14, 90°, 0°|.
ics is not explicitly incorporated into the model, but only represented in an average sense. Secondly, it is seen that for the range of h in which orientational effects are significantly felt (h < 3.90 A), the solvent-independent energetics are virtually identical with the present findings in which solvation effects were considered. Restated, the contours in both cases, obtained from energies in excess of the respective absolute minima, are almost superimposable near the interface. Consequently, the polymer equilibrium distance from the substrate surface is unaltered.
Analysis of the solvation effects of benzene and toluene on the epitaxial energetics close to the substrate surface yielded results identical with those of o-xylene and need not be discussed in detail separately. If, however, the energetics are investigated to a distance of 12.0 A from the substrate surface for the polymer in vacuo and in each of the three solvents, the interfacial energetics are quite different as shown in Figure 11, where |a, b, 8, <f>, p \ = \ d ' / 4 , d ' / 4 , 90°, 45°, 0°).
The Journal o f Physical Chemistry, Vol. 80, No. 7, 1976
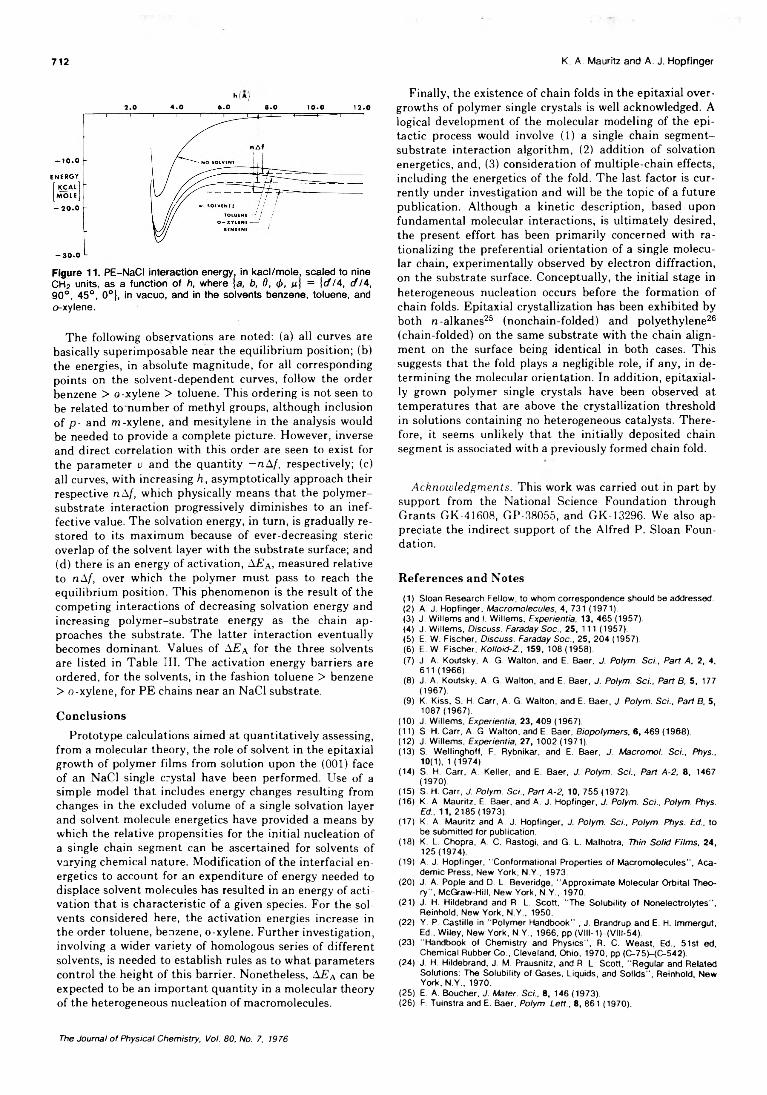
712 K. A. Mauritz and A. J. Hopfinger
h (*)2 .0 4 .0 6 .0 8 .0 1 0 .0 1 2 .0
oxylene.
The following observations are noted: (a) all curves are basically superimposable near the equilibrium position; (b) the energies, in absolute magnitude, for all corresponding points on the solvent-dependent curves, follow the order benzene > o-xylene > toluene. This ordering is not seen to be related to number of methyl groups, although inclusion of p- and m-xylene, and mesitylene in the analysis would be needed to provide a complete picture. However, inverse and direct correlation with this order are seen to exist for the parameter v and the quantity —n A f , respectively; (c) all curves, with increasing h , asymptotically approach their respective n \ f , which physically means that the polymer- substrate interaction progressively diminishes to an ineffective value. The solvation energy, in turn, is gradually restored to its maximum because of ever-decreasing steric overlap of the solvent layer with the substrate surface; and(d) there is an energy of activation, A E a, measured relative to n A f , over which the polymer must pass to reach the equilibrium position. This phenomenon is the result of the competing interactions of decreasing solvation energy and increasing polymer-substrate energy as the chain approaches the substrate. The latter interaction eventually becomes dominant. Values of A E a for the three solvents are listed in Table III. The activation energy barriers are ordered, for the solvents, in the fashion toluene > benzene > o-xylene, for PE chains near an NaCl substrate.
Conclusions
Prototype calculations aimed at quantitatively assessing, from a molecular theory, the role of solvent in the epitaxial growth of polymer films from solution upon the (0 0 1 ) face of an NaCl single crystal have been performed. Use of a simple model that includes energy changes resulting from changes in the excluded volume of a single solvation layer and solvent molecule energetics have provided a means by which the relative propensities for the initial nucleation of a single chain segment can be ascertained for solvents of varying chemical nature. Modification of the interfacial energetics to account for an expenditure of energy needed to displace solvent molecules has resulted in an energy of activation that is characteristic of a given species. For the solvents considered here, the activation energies increase in the order toluene, benzene, o-xylene. Further investigation, involving a wider variety of homologous series of different solvents, is needed to establish rules as to what parameters control the height of this barrier. Nonetheless, A E r\ can be expected to be an important quantity in a molecular theory of the heterogeneous nucleation of macromolecules.
Finally, the existence of chain folds in the epitaxial overgrowths of polymer single crystals is well acknowledged. A logical development of the molecular modeling of the epi- tactic process would involve (1 ) a single chain segment- substrate interaction algorithm, (2 ) addition of solvation energetics, and, (3) consideration of multiple-chain effects, including the energetics of the fold. The last factor is currently under investigation and will be the topic of a future publication. Although a kinetic description, based upon fundamental molecular interactions, is ultimately desired, the present effort has been primarily concerned with rationalizing the preferential orientation of a single molecular chain, experimentally observed by electron diffraction, on the substrate surface. Conceptually, the initial stage in heterogeneous nucleation occurs before the formation of chain folds. Epitaxial crystallization has been exhibited by both n -alkanes25 (nonchain-folded) and polyethylene26
(chain-folded) on the same substrate with the chain alignment on the surface being identical in both cases. This suggests that the fold plays a negligible role, if any, in determining the molecular orientation. In addition, epitaxially grown polymer single crystals have been observed at temperatures that are above the crystallization threshold in solutions containing no heterogeneous catalysts. Therefore, it seems unlikely that the initially deposited chain segment is associated with a previously formed chain fold.
A c k n o w l e d g m e n t s . This work was carried out in part by support from the National Science Foundation through Grants GK-41608, GP-38055, and GK-13296. We also appreciate the indirect support of the Alfred P. Sloan Foundation.
References and Notes(1) Sloan Research Fellow, to whom correspondence should be addressed.(2) A. J. Flopflnger, Macromolecules, 4, 731 (1971).(3) J. Willems and I. Willems, Experientia, 13, 465 (1957).(4) J. Willems, Discuss. Faraday Soc., 25, 111 (1957).(5) E. W. Fischer, Discuss. Faraday Soc., 25, 204 (1957).(6) E. W. Fischer, Kollold-Z., 159, 108 (1958).(7) J. A. Koutsky, A. G. Walton, and E. Baer, J. Polym. Sci., Part A, 2, 4,
611 (1966).(8) J. A. Koutsky, A. G. Walton, and E. Baer, J. Polym. Sci., Part B, 5, 177
(1967).(9) K. Kiss, S. H. Carr, A. G. Walton, and E. Baer, J. Polym. Sci., Part B, 5,
1087 (1967).(10) J. Willems, Experientia, 23, 409 (1967).(11) S. H. Carr, A. G. Walton, and E. Baer, Biopolymers, 6, 469 (1968).(12) J. Willems, Experientia, 27, 1002 (1971).(13) S. Wellinghoff, F. Rybnikar, and E. Baer, J. Macromol. Sci., Phys.,
10(1), 1 (1974).(14) S. FI. Carr, A. Keller, and E. Baer, J. Polym. Sci., Part A-2, 8, 1467
(1970).(15) S. H. Carr, J. Polym. Sci., Part A-2, 10, 755 (1972).(16) K. A. Mauritz. E. Baer, and A. J. Flopfinger, J. Polym. Sci., Polym. Phys.
Ed., 11, 2185(1973).(17) K. A. Mauritz and A. J. Flopfinger, J. Polym. Sci., Polym. Phys. Ed., to
be submitted for publication.(18) K. L. Chopra, A. C. Rastogi, and G. L. Malhotra, Thin Solid Films, 24,
125(1974).(19) A. J. Flopfinger, "Conformational Properties of Macromolecules” , Aca
demic Press, New York, N.Y., 1973.(20) J. A. Pople and D. L. Beveridge, "Approximate Molecular Orbital Theo
ry", McGraw-Hill, New York, N.Y., 1970.(21) J. H. Hildebrand and R. L. Scott, “The Solubility of Nonelectrolytes",
Reinhold, New York, N.Y., 1950.(22) Y. P. Castiile in "Polymer Handbook" , J. Brandrup and E. H. Immergut,
Ed., Wiley, New York, N.Y., 1966, pp (VIII-1 )-(VIII-54).(23) "Handbook of Chemistry and Physics", R. C. Weast, Ed., 51st ed,
Chemical Rubber Co., Cleveland, Ohio, 1970, pp (C -75H C -542).(24) J. H. Hildebrand, J. M. Prausnltz, and R. L. Scott, “Regular and Related
Solutions: The Solubility of Gases, Liquids, and Solids", Reinhold, New York, N.Y., 1970.
(25) E. A. Boucher, J. Mater. Sci., 8, 146 (1973).(26) F. Tuinstra and E. Baer. Polym. Lett., 8, 861 (1970).
The Journal o f Physical Chemistry, Vol. 80, No. 7, 1976
Mechanism of Pyrene Photoionization in Polar Solvents 713
The Mechanism of Pyrene Photoionization in Polar Solvents
A. R. Watkins1
Max-Planck-Institut für Biophysikalische Chemie, 3400 Göttingen-Nikolausberg, West Germany (Received June 16, 1975; Revised Manuscript Received October 28, 1975)
Publication costs assisted by Max-Planck-lnstitut für Biophysikalische Chemie
In this paper an investigation of the photoionization of the aromatic hydrocarbon pyrene in acetonitrile solvent is reported. The transient spectrum obtained on flashing pyrene solutions is shown to be composed of the pyrene triplet state, the pyrene radical cation, and the pyrene radical anion. By using the optical absorption of the radical cation as a measure of the degree of photoionization, it was possible to measure the dependence of the photoionization yields on the spectral distribution of the exciting light, the exciting light intensity, and the concentration of pyrene ground state molecules. It could be shown that two processes are responsible for the photoionization: a bimolecular interaction between a pyrene molecule in its first excited singlet state and a ground state pyrene molecule, and, with light of sufficiently short wavelengths, electron ejection from some higher excited singlet state of pyrene. It was also concluded, from kinetic and energetic considerations, that the pyrene excimer is probably not an intermediate in the photoionization process.
Introduction
Within the last 10 years, considerable interest has developed concerning the mechanism of photoionization of organic molecules in fluid solution.2 One of the molecules which has received attention is pyrene, which is known to photoionize by two processes (a biphotonic process with a triplet intermediate and a monophotonic process involving a higher singlet state) in boric acid glasses.2 The first report of the occurrence of pyrene photoionization in liquid solutions appeared in 1968, when Gary, de Groot, and Jarnag- in3 found that flashing pyrene dissolved in tetrahydrofuran produced charge carriers; from an analysis of the kinetics it was concluded that ions were produced by a bimolecular interaction of two pyrene triplets.3 Later workers came to the same conclusion;4 they also investigated the temperature dependence and kinetic behavior of the delayed fluorescence and photoconductivity, and obtained results which indicated that these two processes, while both proceeding from the interaction of two pyrene triplets, have different intermediate states.4
The photoionization of pyrene has also been investigated in other solvents with much higher photon fluxes than those used in the experiments mentioned above. Thus, excitation with a focussed, frequency-doubled ruby laser of pyrene dissolved in ethanol or methanol produces the pyrene radical cation and solvated electrons.5 The yield of this process depends on the square of the exciting light intensity, and appears to take place via a two-photon absorption process.5 A similar investigation,6 this time with an undoubled ruby laser, showed that it is possible to produce pyrene charge carriers in THP by a two-photon absorption to produce the lowest excited singlet state of pyrene, which then ionizes on absorbing the third photon of exciting light.
A recent publication,7 dealing with a photoconductime- tric study of pyrene photoionization in tetrahydrofuran, has found that a transition from the triplet-triplet annihilation mechanism to a biphotonic mechanism occurs on increasing the intensity of the laser pulse used for excitation.
Recently it was found the pyrene photoionization in acetonitrile takes place on flash excitation.8 Some significant differences to the photoionization in TH F were found.9
The quantum yield of ion production in acetonitrile was very much higher, and sensitization experiments showed that the pyrene triplet was not involved in the photoionization process in acetonitrile.9 It seemed that the triplet- triplet annihilation mechanism found in TH F3 did not play any important part in the photoionization mechanism in acetonitrile, and that some other process, presumably proceeding via a singlet state, was responsible for the photoionization in this solvent. It has also been postulated that pyrene photoionizes in acetonitrile via a semiionized state. 10 This paper reports a more detailed investigation of pyrene photoionization in acetonitrile, the main aim of which was to resolve the uncertainties surrounding the mechanism by which photoionization takes place.
Experimental Section
Commercial pyrene was purified by column chromatography over AI2O3 followed by treatment with maleic anhydride and a second purification by chromatography; the product was then sublimed and zone refined. No impurities could be detected in the fluorescence spectra or the triplet- triplet absorption spectra of the purified sample. Traces of water and acetamide were removed from commercial acetonitrile (Merck UVASOL) by refluxing over P 2O5 and fractionally distilling. A 1 cm thick layer of the purified solvent was virtually transparent to 2 0 0 nm.
The flash apparatus used in this work has been described in a previous publication.8 Narrow quartz cells (1 mm X 10 mm) were used for the flash experiments; all samples were degassed prior to the experiments by repeated freeze- pump-thaw cycles. The intensity of the flash light reaching the cell was varied by inserting calibrated wire mesh filters between the flash lamps and the sample cell. The concentration dependence of the photoionization was studied in a flash cell equipped with three attached reservoirs, 11 ensuring that the same degassing conditions prevailed during the entire experiment. The measured transient absorptions at 412 nm (the absorption maximum of the pyrene triplet) and at 445 nm (the maximum of the pyrene radical cation) were corrected for the presence of delayed fluorescence. It was also found necessary to allow for a small contribution
The Journal o f Physical Chemistry, Vol. 80, No 7. 1976
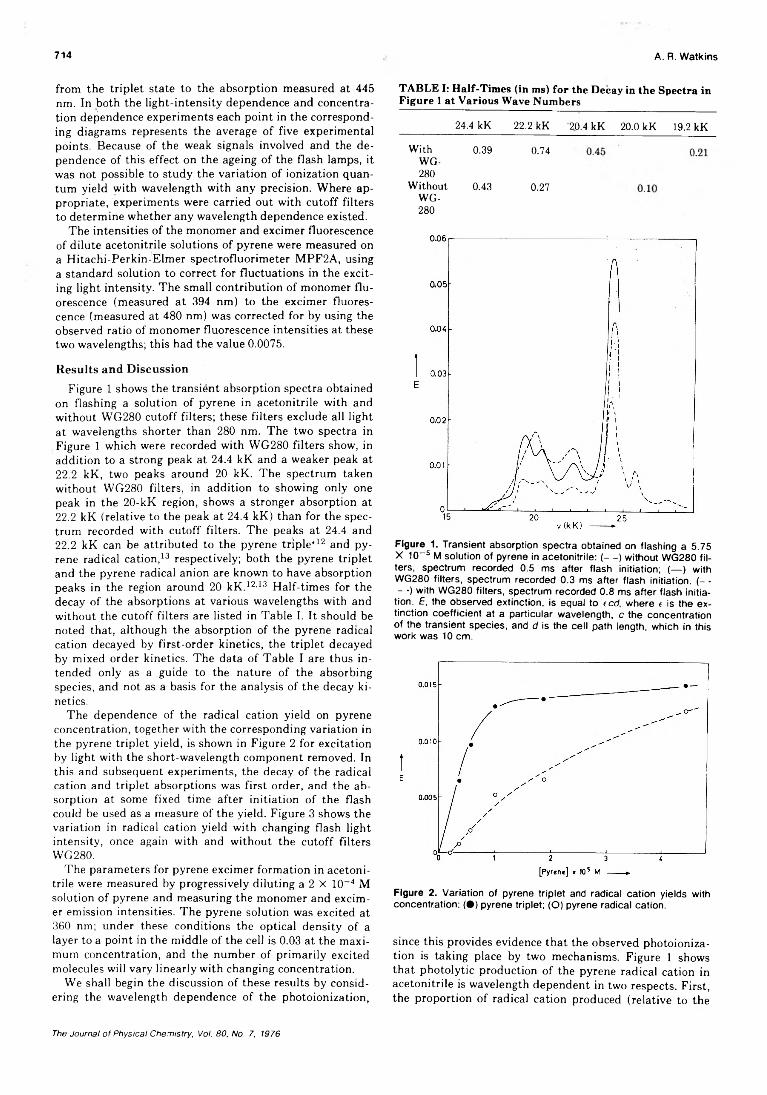
from the triplet state to the absorption measured at 445 nm. In both the light-intensity dependence and concentration dependence experiments each point in the corresponding diagrams represents the average of five experimental points. Because of the weak signals involved and the dependence of this effect on the ageing of the flash lamps, it was not possible to study the variation of ionization quantum yield with wavelength with any precision. Where appropriate, experiments were carried out with cutoff filters to determine whether any wavelength dependence existed.
The intensities of the monomer and excimer fluorescence of dilute acetonitrile solutions of pyrene were measured on a Hitachi-Perkin-Elmer spectrofluorimeter MPF2A, using a standard solution to correct for fluctuations in the exciting light intensity. The small contribution of monomer fluorescence (measured at 394 nm) to the excimer fluorescence (measured at 480 nm) was corrected for by using the observed ratio of monomer fluorescence intensities at these two wavelengths; this had the value 0.0075.
Results and Discussion
Figure 1 shows the transient absorption spectra obtained on flashing a solution of pyrene in acetonitrile with and without WG280 cutoff filters; these filters exclude all light at wavelengths shorter than 280 nm. The two spectra in Figure 1 which were recorded with WG280 filters show, in addition to a strong peak at 24.4 kK and a weaker peak at22.2 kK, two peaks around 20 kK. The spectrum taken without WG280 filters, in addition to showing only one peak in the 20-kK region, shows a stronger absorption at2 2 .2 kK (relative to the peak at 24.4 kK) than for the spectrum recorded with cutoff filters. The peaks at 24.4 and2 2 .2 kK can be attributed to the pyrene triple* 12 and pyrene radical cation, 13 respectively; both the pyrene triplet and the pyrene radical anion are known to have absorption peaks in the region around 20 kK . 12-13 Half-times for the decay of the absorptions at various wavelengths with and without the cutoff filters are listed in Table I. It should be noted that, although the absorption of the pyrene radical cation decayed by first-order kinetics, the triplet decayed by mixed order kinetics. The data of Table I are thus intended only as a guide to the nature of the absorbing species, and not as a basis for the analysis of the decay kinetics.
The dependence of the radical cation yield on pyrene concentration, together with the corresponding variation in the pyrene triplet yield, is shown in Figure 2 for excitation by light with the short-wavelength component removed. In this and subsequent experiments, the decay of the radical cation and triplet absorptions was first order, and the absorption at some fixed time after initiation of the flash could be used as a measure of the yield. Figure 3 shows the variation in radical cation yield with changing flash light intensity, once again with and without the cutoff filters WG280.
The parameters for pyrene excimer formation in acetonitrile were measured by progressively diluting a 2 X 10~ 4 M solution of pyrene and measuring the monomer and excimer emission intensities. The pyrene solution was excited at 360 nm; under these conditions the optical density of a layer to a point in the middle of the cell is 0.03 at the maximum concentration, and the number of primarily excited molecules will vary linearly with changing concentration.
We shall begin the discussion of these results by considering the wavelength dependence of the photoionization,
714 A. R. Watkins
TABLE I: Half-Times (in ms) for the Decay in the Spectra in Figure 1 at Various Wave Numbers
24.4 kK 22.2 kK 20.4 kK 20.0 kK 19.2 kK
With 0.39 0.74WG-280
Without 0.43 0.27WG-280
Figure 1. Transient absorption spectra obtained on flashing a 5.75 X 10~5 M solution of pyrene in acetonitrile: (- -) without WG280 filters, spectrum recorded 0.5 ms after flash initiation; (— ) with WG280 filters, spectrum recorded 0.3 ms after flash initiation. (- • - •) with WG280 filters, spectrum recorded 0.8 ms after flash initia
tion. E, the observed extinction, is equal to ted, where t is the extinction coefficient at a particular wavelength, c the concentration of the transient species, and d is the cell path length, which in this work was 10 cm.
Figure 2. Variation of pyrene triplet and radical cation yields with concentration: ( • ) pyrene triplet; (O) pyrene radical cation.
since this provides evidence that the observed photoionization is taking place by two mechanisms. Figure 1 shows that photolytic production of the pyrene radical cation in acetonitrile is wavelength dependent in two respects. First, the proportion of radical cation produced (relative to the
The Journal o f Physical Chemistry, Vol. 80, No. 7, 1976
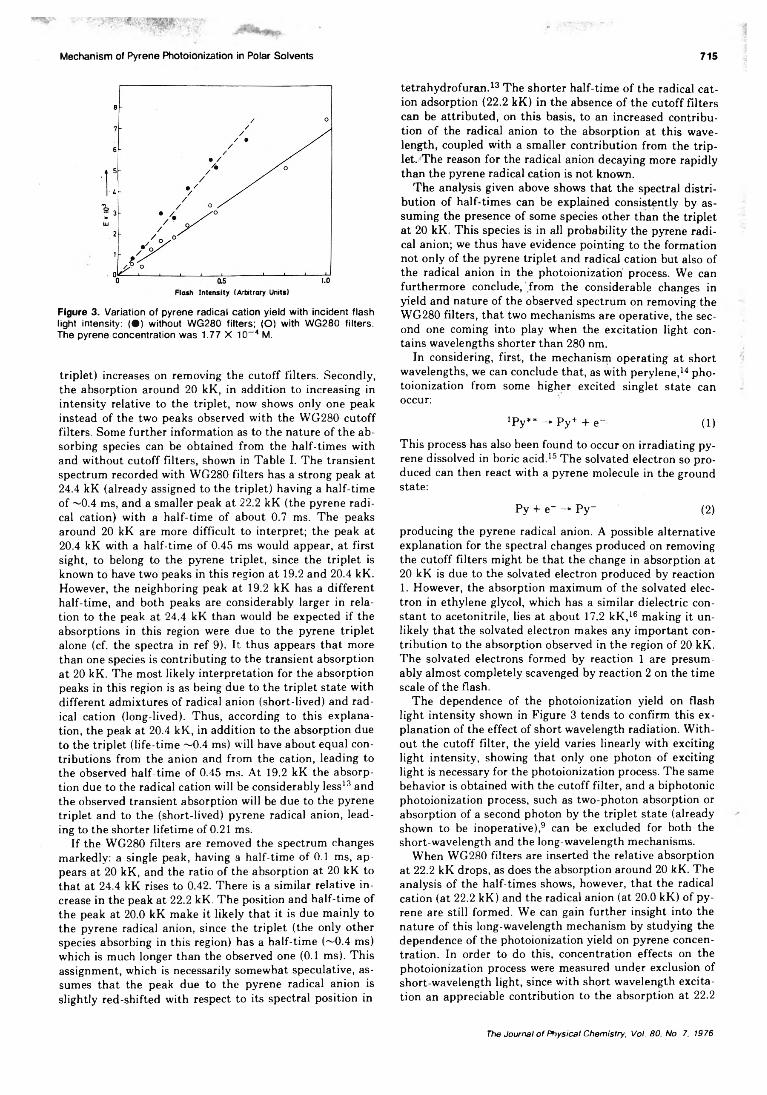
Mechanism of Pyrene Photoionization in Polar Solvents 715
Figure 3. Variation of pyrene radical cation yield with incident flash light intensity: ( • ) without WG280 filters; (O) with WG280 filters. The pyrene concentration was 1.77 X 10⁻⁴ M.
triplet) increases on removing the cutoff filters. Secondly, the absorption around 20 kK, in addition to increasing in intensity relative to the triplet, now shows only one peak instead of the two peaks observed with the WG280 cutoff filters. Some further information as to the nature of the absorbing species can be obtained from the half-times with and without cutoff filters, shown in Table I. The transient spectrum recorded with WG280 filters has a strong peak at24.4 kK (already assigned to the triplet) having a half-time of ~0.4 ms, and a smaller peak at 22.2 kK (the pyrene radical cation) with a half-time of about 0.7 ms. The peaks around 20 kK are more difficult to interpret; the peak at20.4 kK with a half-time of 0.45 ms would appear, at first sight, to belong to the pyrene triplet, since the triplet is known to have two peaks in this region at 19.2 and 20.4 kK. However, the neighboring peak at 19.2 kK has a different half-time, and both peaks are considerably larger in relation to the peak at 24.4 kK than would be expected if the absorptions in this region were due to the pyrene triplet alone (cf. the spectra in ref 9). It thus appears that more than one species is contributing to the transient absorption at 20 kK. The most likely interpretation for the absorption peaks in this region is as being due to the triplet state with different admixtures of radical anion (short-lived) and radical cation (long-lived). Thus, according to this explanation, the peak at 20.4 kK, in addition to the absorption due to the triplet (life-time ~0.4 ms) will have about equal contributions from the anion and from the cation, leading to the observed half-time of 0.45 ms. At 19.2 kK the absorption due to the radical cation will be considerably less13 and the observed transient absorption will be due to the pyrene triplet and to the (short-lived) pyrene radical anion, leading to the shorter lifetime of 0 .2 1 ms.
If the WG280 filters are removed the spectrum changes markedly: a single peak, having a half-time of 0 .1 ms, appears at 20 kK, and the ratio of the absorption at 20 kK to that at 24.4 kK rises to 0.42. There is a similar relative increase in the peak at 22.2 kK. The position and half-time of the peak at 20.0 kK make it likely that it is due mainly to the pyrene radical anion, since the triplet (the only other species absorbing in this region) has a half-time (~0.4 ms) which is much longer than the observed one (0.1 ms). This assignment, which is necessarily somewhat speculative, assumes that the peak due to the pyrene radical anion is slightly red-shifted with respect to its spectral position in
tetrahydrofuran. 13 The shorter half-time of the radical cation adsorption (22.2 kK) in the absence of the cutoff filters can be attributed, on this basis, to an increased contribution of the radical anion to the absorption at this wavelength, coupled with a smaller contribution from the triplet. The reason for the radical anion decaying more rapidly than the pyrene radical cation is not known.
The analysis given above shows that the spectral distribution of half-times can be explained consistently by assuming the presence of some species other than the triplet at 20 kK. This species is in all probability the pyrene radical anion; we thus have evidence pointing to the formation not only of the pyrene triplet and radical cation but also of the radical anion in the photoionization process. We can furthermore conclude, from the considerable changes in yield and nature of the observed spectrum on removing the WG280 filters, that two mechanisms are operative, the second one coming into play when the excitation light contains wavelengths shorter than 280 nm.
In considering, first, the mechanism operating at short wavelengths, we can conclude that, as with perylene,14 photoionization from some higher excited singlet state can occur:
'Py** _* p y + + e- (1)
This process has also been found to occur on irradiating pyrene dissolved in boric acid. 15 The solvated electron so produced can then react with a pyrene molecule in the groundstate:
Py + e~ -* P y- (2 )
producing the pyrene radical anion. A possible alternative explanation for the spectral changes produced on removing the cutoff filters might be that the change in absorption at 20 kK is due to the solvated electron produced by reaction1. However, the absorption maximum of the solvated electron in ethylene glycol, which has a similar dielectric constant to acetonitrile, lies at about 17.2 kK , 16 making it unlikely that the solvated electron makes any important contribution to the absorption observed in the region of 20 kK. The solvated electrons formed by reaction 1 are presumably almost completely scavenged by reaction 2 on the time scale of the flash.
The dependence of the photoionization yield on flash light intensity shown in Figure 3 tends to confirm this explanation of the effect of short wavelength radiation. Without the cutoff filter, the yield varies linearly with exciting light intensity, showing that only one photon of exciting light is necessary for the photoionization process. The same behavior is obtained with the cutoff filter, and a biphotonic photoionization process, such as two-photon absorption or absorption of a second photon by the triplet state (already shown to be inoperative) ,9 can be excluded for both the short-wavelength and the long-wavelength mechanisms.
When WG280 filters are inserted the relative absorption at 22.2 kK drops, as does the absorption around 20 kK. The analysis of the half-times shows, however, that the radical cation (at 22.2 kK) and the radical anion (at 20.0 kK) of pyrene are still formed. We can gain further insight into the nature of this long-wavelength mechanism by studying the dependence of the photoionization yield on pyrene concentration. In order to do this, concentration effects on the photoionization process were measured under exclusion of short-wavelength light, since with short wavelength excitation an appreciable contribution to the absorption at 2 2 .2
The Journal o f Physical Chemistry, Vol. 80, No. 7, 1976
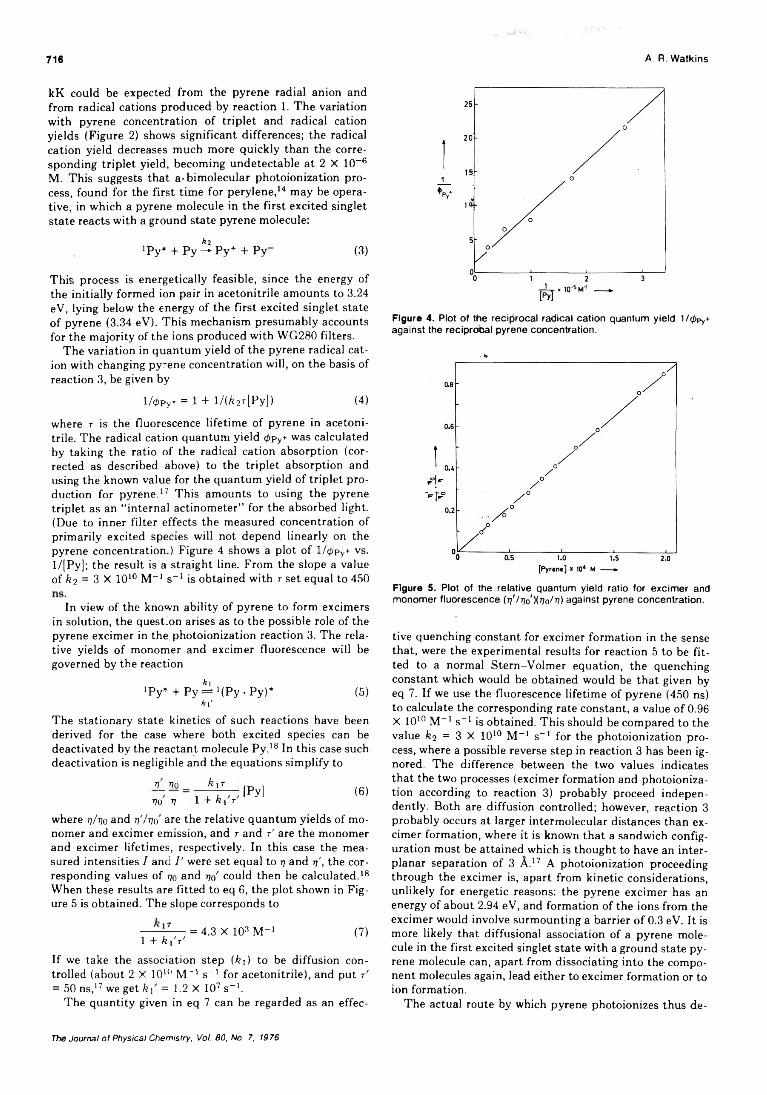
716 A. R. Watkins
kK could be expected from the pyrene radial anion and from radical cations produced by reaction 1 . The variation with pyrene concentration of triplet and radical cation yields (Figure 2) shows significant differences; the radical cation yield decreases much more quickly than the corresponding triplet yield, becoming undetectable at 2 X 10- 6
M. This suggests that a-bimolecular photoionization process, found for the first time for perylene, 14 may be operative, in which a pyrene molecule in the first excited singlet state reacts with a ground state pyrene molecule:
*2IPy* + Py —► P y+ + Py (3)
This process is energetically feasible, since the energy of the initially formed ion pair in acetonitrile amounts to 3.24 eV, lying below the energy of the first excited singlet state of pyrene (3.34 eV). This mechanism presumably accounts for the majority of the ions produced with WG280 filters.
The variation in quantum yield of the pyrene radical cation with changing pyrene concentration will, on the basis of reaction 3, be given by
l/0 py+ = 1 + l/(/?2r[Py]) (4)
where r is the fluorescence lifetime of pyrene in acetonitrile. The radical cation quantum yield 0 py+ was calculated by taking the ratio of the radical cation absorption (corrected as described above) to the triplet absorption and using the known value for the quantum yield of triplet production for pyrene.17 This amounts to using the pyrene triplet as an “ internal actinometer” for the absorbed light. (Due to inner filter effects the measured concentration of primarily excited species will not depend linearly on the pyrene concentration.) Figure 4 shows a plot of l/0 py+ vs. l/[Pyj; the result is a straight line. From the slope a value of k 2 = 3 X 10¹⁰ M - 1 s_ 1 is obtained with r set equal to 450
In view of the known ability of pyrene to form excimers in solution, the question arises as to the possible role of the pyrene excimer in the photoionization reaction 3. The relative yields of monomer and excimer fluorescence will be governed by the reaction
>Py* + P y ^ 1 ( P y P y ) * (5)k\'
The stationary state kinetics of such reactions have been derived for the case where both excited species can be deactivated by the reactant molecule P y . 18 In this case such deactivation is negligible and the equations simplify to
v _ v o vo v
k \ T1 + k \ t '
[Py] (6 )
where 77/770 and tj' / tjo are the relative quantum yields of monomer and excimer emission, and r and r' are the monomer and excimer lifetimes, respectively. In this case the measured intensities / and /' were set equal to rj and jj', the corresponding values of 770 and -rjo' could then be calculated. 18
When these results are fitted to eq 6 , the plot shown in Figure 5 is obtained. The slope corresponds to
... - T = 4.3 X 10³ M- 1 (7)1 + k i ' r '
If we take the association step (k \ ) to be diffusion controlled (about 2 X 10¹⁰ M _ 1 s_1 for acetonitrile), and put r' = 50 ns, 17 we get k \ = 1.2 X 10⁷ s_1.
The quantity given in eq 7 can be regarded as an effec-
Figure 4. Plot o f the reciprocal radical cation quantum yield 1/$py+ against the reciprocal pyrene concentration.
.9 ,
Figure 5. Plot of the relative quantum yield ratio for excim er and m onom er flu orescen ce ( tj' / t/o'K W * ? ) against pyrene concentration.
tive quenching constant for excimer formation in the sense that, were the experimental results for reaction 5 to be fitted to a normal Stern-Volmer equation, the quenching constant which would be obtained would be that given by eq 7. If we use the fluorescence lifetime of pyrene (450 ns) to calculate the corresponding rate constant, a value of 0.96 X 10¹⁰ M - 1 s“ 1 is obtained. This should be compared to the value ¿ 2 = 3 X 10¹⁰ M - 1 s_ 1 for the photoionization process, where a possible reverse step in reaction 3 has been ignored. The difference between the two values indicates that the two processes (excimer formation and photoionization according to reaction 3) probably proceed independently. Both are diffusion controlled; however, reaction 3 probably occurs at larger intermolecular distances than excimer formation, where it is known that a sandwich configuration must be attained which is thought to have an inter- planar separation of 3 À .17 A photoionization proceeding through the excimer is, apart from kinetic considerations, unlikely for energetic reasons: the pyrene excimer has an energy of about 2.94 eV, and formation of the ions from the excimer would involve surmounting a barrier of 0.3 eV. It is more likely that diffusional association of a pyrene molecule in the first excited singlet state with a ground state pyrene molecule can, apart from dissociating into the component molecules again, lead either to excimer formation or to ion formation.
The actual route by which pyrene photoionizes thus de-
The Journal o f Physical Chemistry, Vol. 80, No. 7, 1976
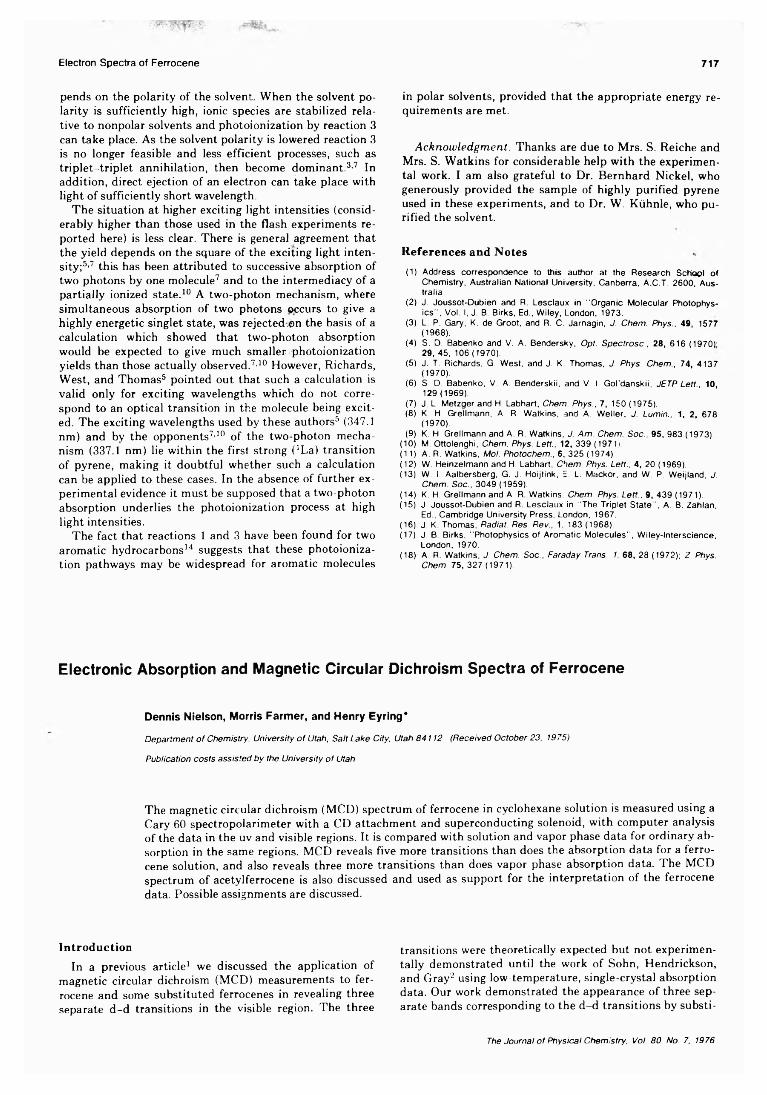
Electron Spectra o f Ferrocene 717
pends on the polarity of the solvent. When the solvent polarity is sufficiently high, ionic species are stabilized relative to nonpolar solvents and photoionization by reaction 3 can take place. As the solvent polarity is lowered reaction 3 is no longer feasible and less efficient processes, such as triplet-triplet annihilation, then become dominant.3’7 In addition, direct ejection of an electron can take place with light of sufficiently short wavelength.
The situation at higher exciting light intensities (considerably higher than those used in the flash experiments reported here) is less clear. There is general agreement that the yield depends on the square of the exciting light intensity ;5,7 this has been attributed to successive absorption of two photons by one molecule7 and to the intermediacy of a partially ionized state. 10 A two-photon mechanism, where simultaneous absorption of two photons occurs to give a highly energetic singlet state, was rejected.on the basis of a calculation which showed that two-photon absorption would be expected to give much smaller photoionization yields than those actually observed.7,10 However, Richards, West, and Thomas5 pointed out that such a calculation is valid only for exciting wavelengths which do not correspond to an optical transition in the molecule being excited. The exciting wavelengths used by these authors5 (347.1 nm) and by the opponents7,10 of the two-photon mechanism (337.1 nm) lie within the first strong ('La) transition of pyrene, making it doubtful whether such a calculation can be applied to these cases. In the absence of further experimental evidence it must be supposed that a two-photon absorption underlies the photoionization process at high light intensities.
The fact that reactions 1 and 3 have been found for two aromatic hydrocarbons14 suggests that these photoionization pathways may be widespread for aromatic molecules
A c k n o w l e d g m e n t . Thanks are due to Mrs. S. Reiche and Mrs. S. Watkins for considerable help with the experimental work. I am also grateful to Dr. Bernhard Nickel, who generously provided the sample of highly purified pyrene used in these experiments, and to Dr. W. Kiihnle, who purified the solvent.
References and Notes
(1) Address correspondence to this author at the Research School of Chemistry, Australian National University, Canberra, A.C.T. 2600, Australia.
(2) J. Joussot-Oubien and R. Lesclaux in “Organic Molecular Photophys- ics” , Vol. I, J. B. Birks, Ed., Wiley, London, 1973.
(3) L. P. Gary, K. de Groot, and R. C. Jarnagin, J. Chem. Phys., 49, 1577(1968).
(4) S. D. Babenko and V. A. Bendersky, Opt. Spectrosc., 28, 616 (1970)' 29, 45, 106 (1970).
(5) J. T. Richards, G. West, and J. K. Thomas, J. Phys. Chem., 74, 4137 (1970).
(6) S. D. Babenko, V. A. Benderskii, and V. I. Gol'danskii, JETP Lett., 10, 129 (1969).
(7) J. L. Metzger and H. Labhart, Chem. Phys., 7, 150 (1975).(8) K. H. Grellmann, A. R. Watkins, and A. Weller, J. Lumin., 1, 2, 678
(1970).(9) K. H. Grellmann and A. R. Watkins, J. Am. Chem. Soc., 95, 983 (1973).
(10) M. Ottolenghi, Chem. Phys. Lett., 12, 339 (19711.(11) A. R. Watkins, Mol. Photochem., 6, 325 (1974).(12) W. Heinzelmann and H. Labhart, Chem. Phys. Lett., 4, 20 (1969).(13) W. I. Aalbersberg, G. J. Hoijtink, E. L. Mackor, and W. P. Weijland, J.
Chem. Soc., 3049 (1959).(14) K. H. Grellmann and A. R. Watkins. Chem. Phys. Lett., 9, 439 (1971).(15) J. Joussot-Dubien and R. Lesclaux in “The Triplet State", A. B. Zahlan,
Ed., Cambridge University Press, London, 1967.(16) J. K. Thomas, Radlat. Res. Rev., 1, 183 (1968).(17) J. B. Birks, “Photophysics of Aromatic Molecules” , Wiley-lnterscience,
London, 1970.(18) A. R. Watkins, J. Chem. Soc., Faraday Trans. 1. 68, 28 (1972); Z. Phys.
Chem. 75, 327 (1971).
in polar solvents, provided that the appropriate energy requirements are met.
Electronic Absorption and Magnetic Circular Dichroism Spectra of Ferrocene
Dennis Nielson, Morris Farmer, and Henry Eyring*
Department o f Chemistry, University o f Utah, Salt Lake City, Utah 84112 (Received October 23, 1975)
Publication costs assisted by the University o f Utah
The magnetic circular dichroism (MCD) spectrum of ferrocene in cyclohexane solution is measured using a Cary 60 spectropolarimeter with a CD attachment and superconducting solenoid, with computer analysis of the data in the uv and visible regions. It is compared with solution and vapor phase data for ordinary absorption in the same regions. MCD reveals five more transitions than does the absorption data for a ferrocene solution, and also reveals three more transitions than does vapor phase absorption data. The MCD spectrum of acetylferrocene is also discussed and used as support for the interpretation of the ferrocene data. Possible assignments are discussed.
IntroductionIn a previous article1 we discussed the application of
magnetic circular dichroism (MCD) measurements to ferrocene and some substituted ferrocenes in revealing three separate d-d transitions in the visible region. The three
transitions were theoretically expected but not experimentally demonstrated until the work of Sohn, Hendrickson, and Gray2 using low-temperature, single-crystal absorption data. Our work demonstrated the appearance of three separate bands corresponding to the d-d transitions by substi-
The Journal of Physical Chemistry, Vol. 80, No. 7, 1976
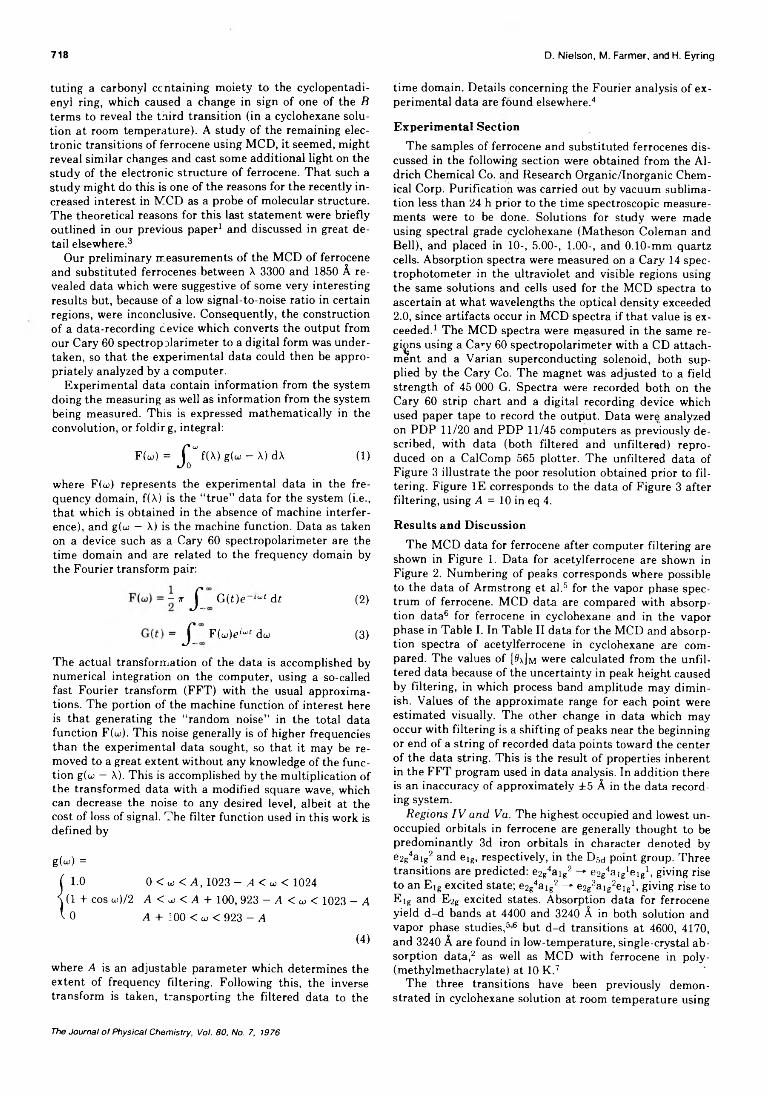
718 D. Nielson, M. Farmer, and H. Eyring
tuting a carbonyl containing moiety to the cyclopentadi- enyl ring, which caused a change in sign of one of the B terms to reveal the third transition (in a cyclohexane solution at room temperature). A study of the remaining electronic transitions of ferrocene using MCD, it seemed, might reveal similar changes and cast some additional light on the study of the electronic structure of ferrocene. That such a study might do this is one of the reasons for the recently increased interest in MCD as a probe of molecular structure. The theoretical reasons for this last statement were briefly outlined in our previous paper1 and discussed in great detail elsewhere.3
Our preliminary measurements of the MCD of ferrocene and substituted ferrocenes between X 3300 and 1850 A revealed data which were suggestive of some very interesting results but, because of a low signal-to-noise ratio in certain regions, were inconclusive. Consequently, the construction of a data-recording device which converts the output from our Cary 60 spectropolarimeter to a digital form was undertaken, so that the experimental data could then be appropriately analyzed by a computer.
Experimental data contain information from the system doing the measuring as well as information from the system being measured. This is expressed mathematically in the convolution, or folding, integral:
FM=X"f(x) g(“- x) dx (1)where F(gj) represents the experimental data in the frequency domain, f(A) is the “ true” data for the system (i.e., that which is obtained in the absence of machine interference), and g(oj — X) is the machine function. Data as taken on a device such as a Cary 60 spectropolarimeter are the time domain and are related to the frequency domain by the Fourier transform pair:
- 7T ^ G ( t ) e lut d£ (2 )
— ^ F(co)eíu,í dcü (3)
The actual transformation of the data is accomplished by numerical integration on the computer, using a so-called fast Fourier transform (FFT) with the usual approximations. The portion of the machine function of interest here is that generating the “ random noise” in the total data function F(u>). This noise generally is of higher frequencies than the experimental data sought, so that it may be removed to a great extent without any knowledge of the function g(o; — X). This is accomplished by the multiplication of the transformed data with a modified square wave, which can decrease the noise to any desired level, albeit at the cost of loss of signal. The filter function used in this work is defined by
g(w) =
! 1.0 0 <co < A , 1023 - A < oj < 1024(1 + cos oj)/2 A < uj < A + 100, 923 - A < co < 1023 - A
0 A + 100 < u < 923 - A
(4)
where A is an adjustable parameter which determines the extent of frequency filtering. Following this, the inverse transform is taken, transporting the filtered data to the
time domain. Details concerning the Fourier analysis of experimental data are found elsewhere.4
Experimental Section
The samples of ferrocene and substituted ferrocenes discussed in the following section were obtained from the Aldrich Chemical Co. and Research Organic/Inorganic Chemical Corp. Purification was carried out by vacuum sublimation less than 24 h prior to the time spectroscopic measurements were to be done. Solutions for study were made using spectral grade cyclohexane (Matheson Coleman and Bell), and placed in 10-, 5.00-, 1.00-, and 0.10-mm quartz cells. Absorption spectra were measured on a Cary 14 spectrophotometer in the ultraviolet and visible regions using the same solutions and cells used for the MCD spectra to ascertain at what wavelengths the optical density exceeded2.0, since artifacts occur in MCD spectra if that value is exceeded. 1 The MCD spectra were measured in the same regions using a Cary 60 spectropolarimeter with a CD attachment and a Varían superconducting solenoid, both supplied by the Cary Co. The magnet was adjusted to a field strength of 45 0 0 0 G. Spectra were recorded both on the Cary 60 strip chart and a digital recording device which used paper tape to record the output. Data were analyzed on PDP 11/20 and PDP 11/45 computers as previously described, with data (both filtered and unfiltered) reproduced on a CalComp 565 plotter. The unfiltered data of Figure 3 illustrate the poor resolution obtained prior to filtering. Figure IE corresponds to the data of Figure 3 after filtering, using A = 10 in eq 4.
Results and Discussion
The MCD data for ferrocene after computer filtering are shown in Figure 1. Data for acetylferrocene are shown in Figure 2. Numbering of peaks corresponds where possible to the data of Armstrong et al.5 for the vapor phase spectrum of ferrocene. MCD data are compared with absorption data6 for ferrocene in cyclohexane and in the vapor phase in Table I. In Table II data for the MCD and absorption spectra of acetylferrocene in cyclohexane are compared. The values of [0\]m were calculated from the unfiltered data because of the uncertainty in peak height caused by filtering, in which process band amplitude may diminish. Values of the approximate range for each point were estimated visually. The other change in data which may occur with filtering is a shifting of peaks near the beginning or end of a string of recorded data points toward the center of the data string. This is the result of properties inherent in the FFT program used in data analysis. In addition there is an inaccuracy of approximately ±5 A in the data recording system.
R e g io n s I V a n d V a . The highest occupied and lowest unoccupied orbitals in ferrocene are generally thought to be predominantly 3d iron orbitals in character denoted by e2g4aig2 and eig, respectively, in the D5(j point group. Three transitions are predicted: e2g4aig2 — e2g4aig1eig1, giving rise to an Ejg excited state; e2g4aig2 —► e2g3aig2eig1, giving rise to E tg and E2g excited states. Absorption data for ferrocene yield d-d bands at 4400 and 3240 A in both solution and vapor phase studies,5 6 but d-d transitions at 4600, 4170, and 3240 A are found in low-temperature, single-crystal absorption data ,2 as well as MCD with ferrocene in poly- (methylmethacrylate) at 10 K .7
The three transitions have been previously demonstrated in cyclohexane solution at room temperature using
The Journal o f Physical Chemistry, Voi. 80, No. 7, 1976
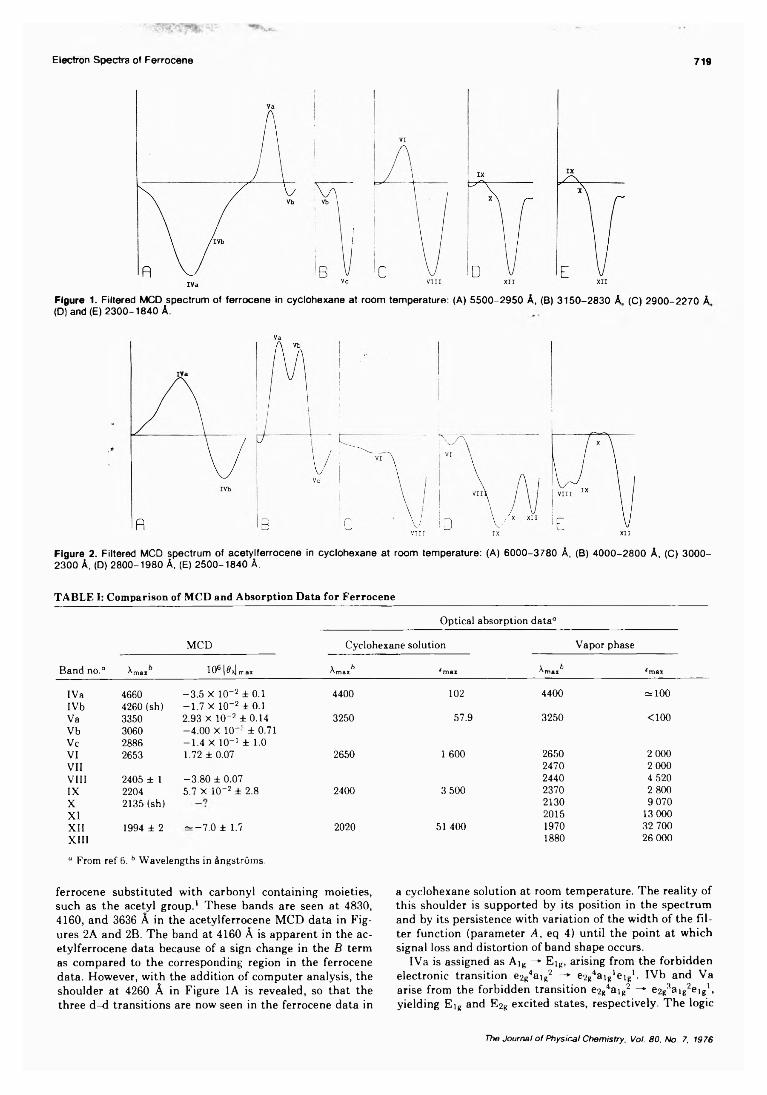
Electron Spectra of Ferrocene 719
Figure 1. Filtered MCD spectrum of ferrocene in cyclohexane at room temperature: (A) 5500-2950 A, (B) 3150-2830 A (C) 2900-2270 A (D) and (E) 2300-1840 A.
Figure 2. Filtered MCD spectrum of acetylferrocene in cyclohexane at room temperature: (A) 6000-3780 A, (B) 4000-2800 A, (C) 3000- 2300 A, (D) 2800-1980 A, (E) 2500-1840 A.
TABLE I: Comparison of MCD and Absorption Data for Ferrocene
Band no."
MCD
Optical absorption data“
Cyclohexane solution Vapor phase
i x bAmax 106| ibjrra* A b Amax (max A b Amax Émax
IVa 4660 -3 .5 X IO-2 ± 0.1 4400 102 4400 ür 100IVb 4260 (sh) -1 .7 X IO“ 2 ± 0.1Va 3350 2.93 X IO" 2 ± 0.14 3250 57.9 3250 <100Vb 3060 -4.00 X IO“ -' ± 0.71Vc 2886 -1 .4 X 10- 1 ± 1.0VI 2653 1.72 ± 0.07 2650 1 600 2650 2 000VII 2470 2 000Vili 2405 ± 1 -3.80 ± 0.07 2440 4 520IX 2204 5.7 X IO' 2 ± 2.8 2400 3 500 2370 2 800X 2135 (sh) 2130 9 070XI 2015 13 000XII 1994 ± 2 ~ —7.0 ± 1.7 2020 51 400 1970 32 700XIII 1880 26 000
“ From ref 6. 6 Wavelengths in ângstrüms.
ferrocene substituted with carbonyl containing moieties, such as the acetyl group. 1 These bands are seen at 4830, 4160, and 3636 A in the acetylferrocene MCD data in Figures 2 A and 2 B. The band at 4160 A is apparent in the acetylferrocene data because of a sign change in the B term as compared to the corresponding region in the ferrocene data. However, with the addition of computer analysis, the shoulder at 4260 A in Figure 1 A is revealed, so that the three d-d transitions are now seen in the ferrocene data in
a cyclohexane solution at room temperature. The reality of this shoulder is supported by its position in the spectrum and by its persistence with variation of the width of the filter function (parameter A , eq 4) until the point at which signal loss and distortion of band shape occurs.
IVa is assigned as A ig -* E lg, arising from the forbidden electronic transition e2g4aig2 —► e2g4a)g1eig1. IVb and Va arise from the forbidden transition e2g4aig2 -* e2g3aig2eig*, yielding E ig and E2g excited states, respectively. The logic
The Journal o f Physical Chemistry, Vol. 80, No. 7, 1976
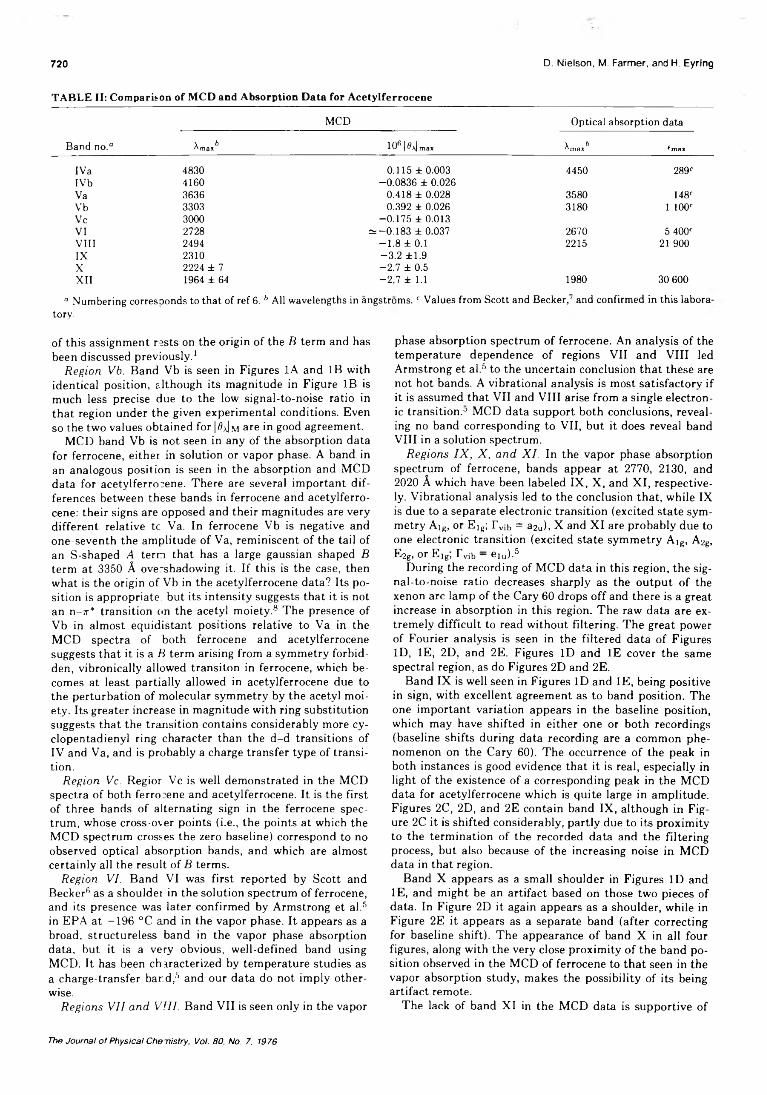
720 D. N ie lson, M. Farm er, and H. Eyring
TABLE II: Comparison of MCD and Absorption Data for Acetylferrocene
Band no.“
MCD Optical absorption data
A &Amax 106| ^ max A òAmax ¿max
IVa 4830 0.115 ± 0.003 4450 289"IVb 4160 -0.0836 ± 0.026Va 3636 0.418 ± 0.028 3580 148cVb 3303 0.392 ± 0.026 3180 1 100cVc 3000 -0.175 ± 0.013VI 2728 = -0.183 ±0.037 2670 5 400"VIII 2494 - 1.8 ± 0.1 2215 21 900IX 2310 -3 .2 ±1.9X 2224 ± 7 -2 .7 ± 0.5XII 1964 ± 64 -2 .7 ± 1.1 1980 30 600
“ Numbering corresponds to that of ref 6. h All wavelengths in angstroms. c Values from Scott and Becker,' and confirmed in this laboratory.
of this assignment rests on the origin of the B term and has been discussed previously. 1
R e g io n V b . Band Vb is seen in Figures 1A and IB with identical position, although its magnitude in Figure IB is much less precise due to the low signal-to-noise ratio in that region under the given experimental conditions. Even so the two values obtained for |0x|m are in good agreement.
MCD band Vb is not seen in any of the absorption data for ferrocene, either in solution or vapor phase. A band in an analogous position is seen in the absorption and MCD data for acetylferrocene. There are several important differences between these bands in ferrocene and acetylferro- cene: their signs are opposed and their magnitudes are very different relative tc Va. In ferrocene Vb is negative and one-seventh the amplitude of Va, reminiscent of the tail of an S-shaped A term that has a large gaussian shaped B term at 3350 A overshadowing it. If this is the case, then what is the origin of Vb in the acetylferrocene data? Its position is appropriate, but its intensity suggests that it is not an n-rr* transition on the acetyl moiety.8 The presence of Vb in almost equidistant positions relative to Va in the MCD spectra of both ferrocene and acetylferrocene suggests that it is a B term arising from a symmetry forbidden, vibronically allowed transiton in ferrocene, which becomes at least partially allowed in acetylferrocene due to the perturbation of molecular symmetry by the acetyl moiety. Its greater increase in magnitude with ring substitution suggests that the transition contains considerably more cy- clopentadienyl ring character than the d-d transitions of IV and Va, and is probably a charge transfer type of transition.
R e g io n Vc. Region Vc is well demonstrated in the MCD spectra of both ferrocene and acetylferrocene. It is the first of three bands of alternating sign in the ferrocene spectrum, whose cross-over points (i.e., the points at which the MCD spectrum crosses the zero baseline) correspond to no observed optical absorption bands, and which are almost certainly all the result of B terms.
R e g io n V I . Band VI was first reported by Scott and Becker6 as a shoulder in the solution spectrum of ferrocene, and its presence was later confirmed by Armstrong et al.5
in EPA at —196 °C and in the vapor phase. It appears as a broad, structureless band in the vapor phase absorption data, but it is a very obvious, well-defined band using MCD. It has been characterized by temperature studies as a charge-transfer bard ,5 and our data do not imply otherwise.
R e g io n s V I I a n d V I I I . Band VII is seen only in the vapor
phase absorption spectrum of ferrocene. An analysis of the temperature dependence of regions VII and VIII led Armstrong et al.5 to the uncertain conclusion that these are not hot bands. A vibrational analysis is most satisfactory if it is assumed that VII and VIII arise from a single electronic transition.3 MCD data support both conclusions, revealing no band corresponding to VII, but it does reveal band VIII in a solution spectrum.
R e g io n s I X , X , a n d X I . In the vapor phase absorption spectrum of ferrocene, bands appear at 2770, 2130, and 2020 A which have been labeled IX, X, and XI, respectively. Vibrational analysis led to the conclusion that, while IX is due to a separate electronic transition (excited state symmetry A ig, or E Jg; r vit, = a2U), X and XI are probably due to one electronic transition (excited state symmetry A ig, A2g, E2g, or E ig, r vib — e lu ) .5
During the recording of MCD data in this region, the signal-to-noise ratio decreases sharply as the output of the xenon arc lamp of the Cary 60 drops off and there is a great increase in absorption in this region. The raw data are extremely difficult to read without filtering. The great power of Fourier analysis is seen in the filtered data of FiguresID, IE, 2D, and 2E. Figures ID and IE cover the same spectral region, as do Figures 2D and 2E.
Band IX is well seen in Figures ID and IE, being positive in sign, with excellent agreement as to band position. The one important variation appears in the baseline position, which may have shifted in either one or both recordings (baseline shifts during data recording are a common phenomenon on the Cary 60). The occurrence of the peak in both instances is good evidence that it is real, especially in light of the existence of a corresponding peak in the MCD data for acetylferrocene which is quite large in amplitude. Figures 2C, 2D, and 2E contain band IX, although in Figure 2C it is shifted considerably, partly due to its proximity to the termination of the recorded data and the filtering process, but also because of the increasing noise in MCD data in that region.
Band X appears as a small shoulder in Figures ID andIE, and might be an artifact based on those two pieces of data. In Figure 2D it again appears as a shoulder, while in Figure 2E it appears as a separate band (after correcting for baseline shift). The appearance of band X in all four figures, along with the very close proximity of the band position observed in the MCD of ferrocene to that seen in the vapor absorption study, makes the possibility of its being artifact remote.
The lack of band XI in the MCD data is supportive of
The Journal o f Physical Chemistry, Vol. 80. No. 7. 1976
Electron Spectra of Ferrocene 721
Figure 3. Unfiltered data as recorded directly from the Cary 60 spectropolarimeter. The corresponding filtered data are shown in Figure 1E.
the supposition5 that X and XI comprise one electronic transition.
The great increase in amplitude of band IX with substitution, as compared with the nominal changes in X, suggests that IX represents a transition containing greater cyclopentadienyl ring character.
R e g io n X I I . Band XII in the MCD data correspond well with vapor phase absorption data .5 It has been assigned as a symmetry allowed transition, and must have either an A 2u or an E iu excited state.
R e g io n X I I I . Region XIII is out of the range of the Cary '60 at the present time.
P o s s ib le A s s ig n m e n t s o f F e r r o c e n e . There have been many theoretical calculations of the electronic structure of ferrocene, no two of which are in any great agreement. The work prior to 1961 is summarized by Scott and Becker.6
The more recent calculations2’9 are no less confusing than the older ones. One main point of contention is the ordering of the highest filled iron orbitals. Some calculations show the e2g orbital to be lower than the aig, and vice versa. Intensity arguments from the photoelectron spectrum have been used to infer the order aig < e2g. 10 However, interpretation of the absorption spectrum yields the reverse order.2’ 11 In a previous article1 it was shown that the MCD spectrum of ferrocene in the region of IVa, IVb, and Va is best explained if e2g < aig. Briefly, two states which are coupled in the B term and which have components of the magnetic moment at right angles will have B terms which are opposed in sign. It is difficult to imagine two states arising from the same origin, i.e., e2g4aig2 -*• e2g3aig2eig1, not being strongly coupled in the B term. IVb and Va have opposing signs, while IVa and IVb have the same sign in ferrocene. It follows that IVb and Va arise from the e2g4a lg 2
— e2g3aig2eig 1 transition, and, since IVa represents the e2g4aig2 —*■ e2g4aig1eig1 transition, the orbital order is e2g < a ig.
The possible assignments of bands Vb to X are numer
ous, there being any number of predicted transitions in these regions,2’6’9 both symmetry forbidden and allowed. The absence of apparent A terms in the MCD spectrum is frustrating, since their presence would have supplied some important clues as to the absence or presence of degenerate excited states and subsequent band assignments.
Band XII is the one band which can be said with certainty to arise from a symmetry allowed transition (emM ^50 0 0 0 ) which limits the possible excited states to A2u and E iu. Again the apparent absence of an A term hinders the differentiation.
Conclusions
MCD measurements of ferrocene in cyclohexane have revealed three transitions not previously seen in the vapor phase optical absorption spectrum ,5 five transitions more than absorption studies using a cyclohexane solution,6 and two more than seen by all other measurements combined (bands Vb and Vc) in the same spectral regions. The likelihood of the existence of other transitions in the uv-visible spectral regions as yet undiscovered is not small, especially in view of the numerous theoretically predicted possibilities.2’6 9 The power of MCD spectroscopy, especially when used in combination with computerized data analysis, to reveal detail not seen by other means has been well demonstrated. It is true that the smoothing process may have caused the loss of significant information in the experimental data, but it is just as true that it will not introduce any extraneous “ bands” . The possibilities of future discoveries with modification of equipment and experimental techniques are indeed enticing.
A c k n o w l e d g m e n t . The authors wish to thank the National Institutes of Health Grant No. GM 12862 and the National Science Foundation Grant No. GP 28631 for support of this research.
References and Notes(1) D. Nielson, D. Boone, and H. Eyring, J. Phys. Chem., 76, 511 (1972).(2) Y. S. Sohn, D. N. Hendrickson, and H. B. Gray, J. Am. Chem. Soc., 93,
3603 (1971).(3) A. D. Buckingham and P. J. Stephens, Annu. Rev. Phys. Chem., 17, 399
(1966); P. N. Schatz and A. D. McCaffery, Quart. Rev., Chem. Soc., 23, 552 (1969); D. J. Caldwell and H. Eyring, “The Theory of Optical Activity", Wiley-lnterscience, New York, N.Y., 1971; D. J. Caldwell, J. Thorne, and H. Eyring, Annu. Rev. Phys. Chem., 22, 2259 (1971).
(4) J. D. Black, Ed., “ Spectral Analysis: Methods and Techniques” , Marcel Dekker, New York, N.Y., 1970.
(5) A. T. Armstrong, F. Smith, E. Elder, and S. P. McGlynn, J. Chem. Phys., 46, 4321 (1967).
(6) D. R. Scott and R. S. Becker, J. Chem. Phys., 35, 516 (1961).(7) M. D. Rowe and A. J. McCaffery, J. Chem. Phys., 56, 3786 (1973).(8) H. L. McMurry, J. Chem. Phys., 9, 241 (1941).(9) A. T. Armstrong, D. G. Carroll, and S. P. McGlynn, J. Chem. Phys., 47,
1104 (1967); D. R. Scott and R. S. Becker, J. Organometal. Chem., 4, 409 (1965); J. H. Schachtschneider, R. Prins, and P. Ros, Inorg. Chim. Acta, 1, 462 (1967); M. Coutiere, J. Demuynck, and A. Veillard, Theor. Chim. Acta (Berl.), 27, 281 (1972); E. J. Baerends and P. Ros, Chem. Phys. Lett., 23, 391 (1973); N. Rosch and K. H. Johnson, ibid., 29, 179(1974); M. Rohmer, A. Veillard, and M. H. Wood, ibid., 29, 466 (1974).
(10) J. W. Rabalais, L. O. Werme, T. Bergmark, L. Karlsson, M. Hussain, andK. Seigbahn, J. Chem. Phys., 57, 1188 (1972); S. Evans, M. L. H. Green, B. Jewitt, A. F. Orchard, and C. Pygall, J. Chem. Soc., Faraday Trans. 2. 68, 1847(1972).
(11) Y. S. Sohn, D. N. Hendrickson, and H. B. Gray, Chem. Phys. Lett., 6, 499 (1970).
The Journal o f Physical Chemistry, Voi. 80, No. 7, 1976
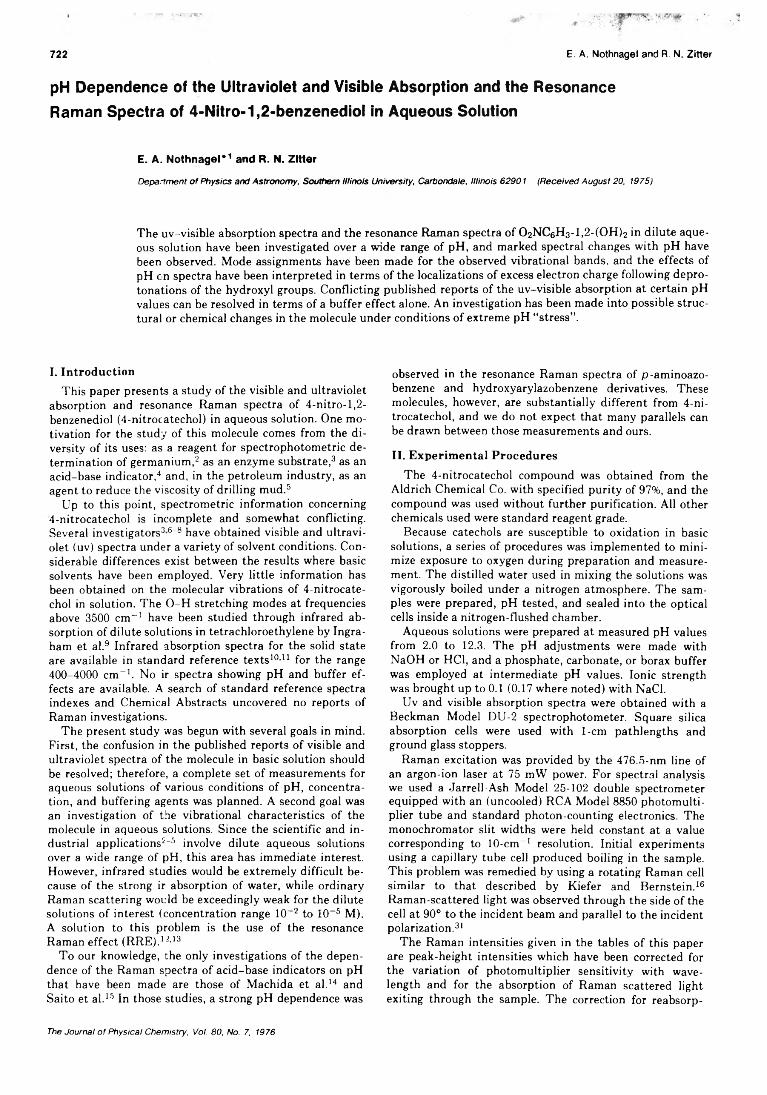
722 E. A. Nothnagel and R. N. Zitter
pH Dependence of the Ultraviolet and Visible Absorption and the Resonance Raman Spectra of 4-Nitro-1,2-benzenediol in Aqueous Solution
E. A. Nothnagel* 1 and R. N. Zitter
Department o f Physics and Astronomy, Southern Illinois University, Carbondaie, Illinois 62901 (Received August 20, 1975)
The uv-visible absorption spectra and the resonance Raman spectra of 0 2 NCeH3- l,2 -(0 H )2 in dilute aqueous solution have been investigated over a wide range of pH, and marked spectral changes with pH have been observed. Mode assignments have been made for the observed vibrational bands, and the effects of pH on spectra have been interpreted in terms of the localizations of excess electron charge following deprotonations of the hydroxyl groups. Conflicting published reports of the uv-visible absorption at certain pH values can be resolved in terms of a buffer effect alone. An investigation has been made into possible structural or chemical changes in the molecule under conditions of extreme pH “ stress” .
I. IntroductionThis paper presents a study of the visible and ultraviolet
absorption and resonance Raman spectra of 4-nitro-l,2- benzenediol (4-nitrocatechol) in aqueous solution. One motivation for the study of this molecule comes from the diversity of its uses: as a reagent for spectrophotometric determination of germanium,2 as an enzyme substrate,3 as an acid-base indicator,4 and, in the petroleum industry, as an agent to reduce the viscosity of drilling mud.5
Up to this point, spectrometric information concerning 4-nitrocatechol is incomplete and somewhat conflicting. Several investigators3 6-8 have obtained visible and ultraviolet (uv) spectra under a variety of solvent conditions. Considerable differences exist between the results where basic solvents have been employed. Very little information has been obtained on the molecular vibrations of 4-nitrocatechol in solution. The O-H stretching modes at frequencies above 3500 cm- 1 have been studied through infrared absorption of dilute solutions in tetrachloroethylene by Ingraham et al.9 Infrared absorption spectra for the solid state are available in standard reference texts10,11 for the range 400-4000 cm-1 . No ir spectra showing pH and buffer effects are available. A search of standard reference spectra indexes and Chemical Abstracts uncovered no reports of Raman investigations.
The present study was begun with several goals in mind. First, the confusion in the published reports of visible and ultraviolet spectra of the molecule in basic solution should be resolved; therefore, a complete set of measurements for aqueous solutions of various conditions of pH, concentration, and buffering agents was planned. A second goal was an investigation of the vibrational characteristics of the molecule in aqueous solutions. Since the scientific and industrial applications2-5 involve dilute aqueous solutions over a wide range of pH, this area has immediate interest. However, infrared studies would be extremely difficult because of the strong ir absorption of water, while ordinary Raman scattering would be exceedingly weak for the dilute solutions of interest (concentration range 10~ 2 to I0_s M). A solution to this problem is the use of the resonance Raman effect (RRE ) . 12,13
To our knowledge, the only investigations of the dependence of the Raman spectra of acid-base indicators on pH that have been made are those of Machida et al. 14 and Saito et al. 15 In those studies, a strong pH dependence was
observed in the resonance Raman spectra of p-aminoazo- benzene and hydroxyarylazobenzene derivatives. These molecules, however, are substantially different from 4-ni- trocatechol, and we do not expect that many parallels can be drawn between those measurements and ours.
II. Experimental Procedures
The 4-nitrocatechol compound was obtained from the Aldrich Chemical Co. with specified purity of 97%, and the compound was used without further purification. All other chemicals used were standard reagent grade.
Because catechols are susceptible to oxidation in basic solutions, a series of procedures was implemented to minimize exposure to oxygen during preparation and measurement. The distilled water used in mixing the solutions was vigorously boiled under a nitrogen atmosphere. The samples were prepared, pH tested, and sealed into the optical cells inside a nitrogen-flushed chamber.
Aqueous solutions were prepared at measured pH values from 2.0 to 12.3. The pH adjustments were made with NaOH or HC1, and a phosphate, carbonate, or borax buffer was employed at intermediate pH values. Ionic strength was brought up to 0 .1 (0.17 where noted) with NaCl.
Uv and visible absorption spectra were obtained with a Beckman Model DU-2 spectrophotometer. Square silica absorption cells were used with 1 -cm pathlengths and ground glass stoppers.
Raman excitation was provided by the 476.5-nm line of an argon-ion laser at 75 mW power. For spectral analysis we used a Jarrell-Ash Model 25-102 double spectrometer equipped with an (uncooled) RCA Model 8850 photomultiplier tube and standard photon-counting electronics. The monochromator slit widths were held constant at a value corresponding to 10-cm_ 1 resolution. Initial experiments using a capillary tube cell produced boiling in the sample. This problem was remedied by using a rotating Raman cell similar to that described by Kiefer and Bernstein. 16
Raman-scattered light was observed through the side of the cell at 90° to the incident beam and parallel to the incident polarization.31
The Raman intensities given in the tables of this paper are peak-height intensities which have been corrected for the variation of photomultiplier sensitivity with wavelength and for the absorption of Raman scattered light exiting through the sample. The correction for reabsorp-
The Journal o f Physical Chemistry, Vol. 80, No. 7, 1976
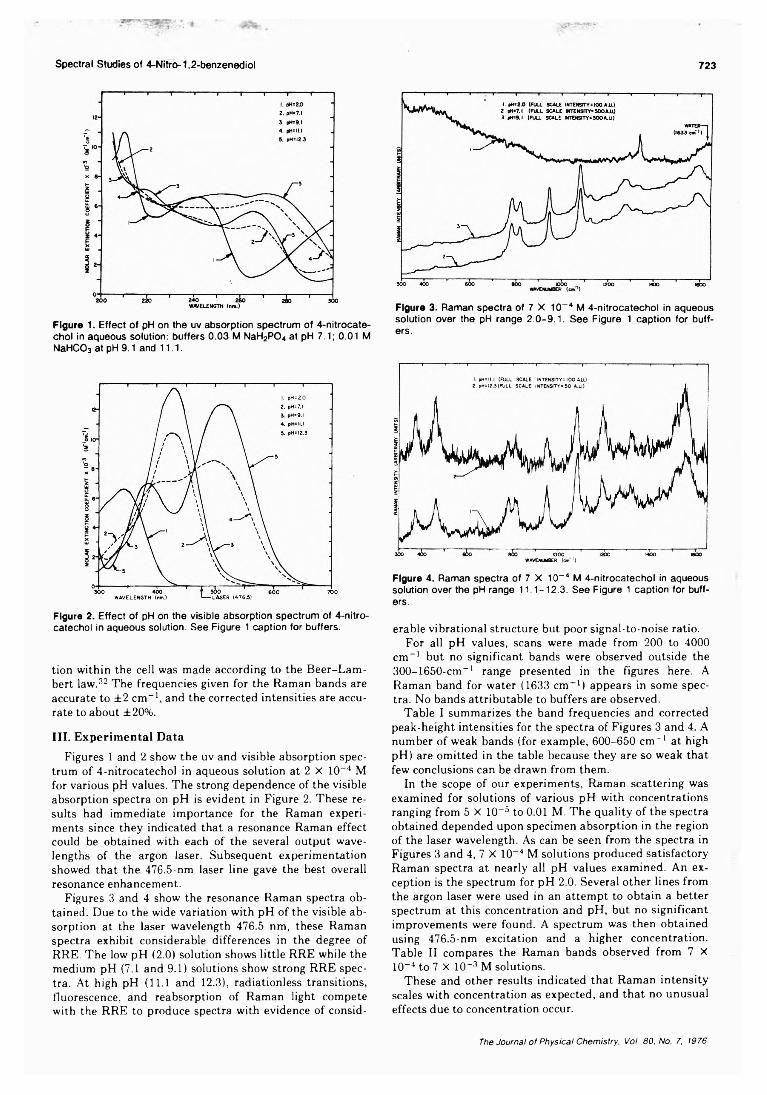
Spectral Studies of 4-Nitro-1,2-benzenediol 723
Figure 1. Effect of pH on the uv absorption spectrum of 4-nitrocate- chol in aqueous solution: buffers 0.03 M NaH2P04 at pH 7.1; 0.01 M NaHC03 at pH 9.1 and 11.1.
Figure 2. Effect of pH on the visible absorption spectrum of 4-nitro- catechol in aqueous solution. See Figure 1 caption for buffers.
tion within the cell was made according to the Beer-Lam- bert law.32 The frequencies given for the Raman bands are accurate to ± 2 cm-1 , and the corrected intensities are accurate to about ± 2 0 %.
III. Experim ental Data
Figures 1 and 2 show the uv and visible absorption spectrum of 4-nitrocatechol in aqueous solution at 2 X 10⁻⁴ M for various pH values. The strong dependence of the visible absorption spectra on pH is evident in Figure 2. These results had immediate importance for the Raman experiments since they indicated that a resonance Raman effect could be obtained with each of the several output wavelengths of the argon laser. Subsequent experimentation showed that the 476.5-nm laser line gave the best overall resonance enhancement.
Figures 3 and 4 show the resonance Raman spectra obtained. Due to the wide variation with pH of the visible absorption at the laser wavelength 476.5 nm, these Raman spectra exhibit considerable differences in the degree of RRE. The low pH (2.0) solution shows little RRE while the medium pH (7.1 and 9.1) solutions show strong RRE spectra. At high pH (11.1 and 12.3), radiationless transitions, fluorescence, and reabsorption of Raman light compete with the RRE to produce spectra with evidence of consid
Figure 3. Raman spectra of 7 X 10⁻⁴ M 4-nitrocatechol in aqueous solution over the pH range 2.0-9.1. See Figure 1 caption for buffers.
Figure 4. Raman spectra of 7 X 10⁻⁴ M 4-nitrocatechol in aqueous solution over the pH range 11.1-12.3. See Figure 1 caption for buffers.
erable vibrational structure but poor signal-to-noise ratio.For all pH values, scans were made from 200 to 4000
cm- 1 but no significant bands were observed outside the 300-1650-cm-1 range presented in the figures here. A Raman band for water (1633 cm- 1 ) appears in some spectra. No bands attributable to buffers are observed.
Table I summarizes the band frequencies and corrected peak-height intensities for the spectra of Figures 3 and 4. A number of weak bands (for example, 600-650 cm- 1 at high pH) are omitted in the table because they are so weak that few conclusions can be drawn from them.
In the scope of our experiments, Raman scattering was examined for solutions of various pH with concentrations ranging from 5 X 10- 5 to 0.01 M. The quality of the spectra obtained depended upon specimen absorption in the region of the laser wavelength. As can be seen from the spectra in Figures 3 and 4, 7 X 10~ 4 M solutions produced satisfactory Raman spectra at nearly all pH values examined. An exception is the spectrum for pH 2.0. Several other lines from the argon laser were used in an attempt to obtain a better spectrum at this concentration and pH, but no significant improvements were found. A spectrum was then obtained using 476.5-nm excitation and a higher concentration. Table II compares the Raman bands observed from 7 X 10~ 4 to 7 X 10- 3 M solutions.
These and other results indicated that Raman intensity scales with concentration as expected, and that no unusual effects due to concentration occur.
The Journal o f Physical Chemistry, Vol. 80, No. 7, 1976
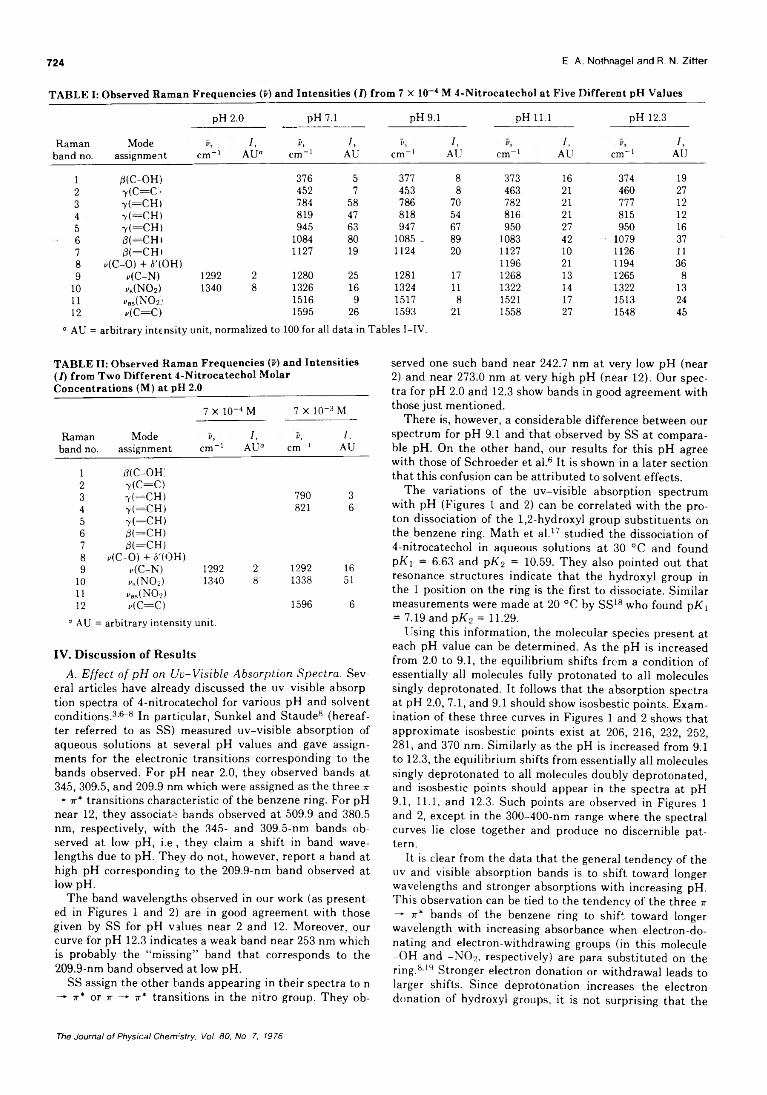
724 E. A. Nothnagel and R. N. Z itte r
TABLE I: Observed Raman Frequencies (v) and Intensities (I) from 7 X 10 4 M 4-Nitrocatechol at Five Different pH Values
pH 2.0 pH 7.1 pH 9.1 pH 11.1 pH 12.3
Raman band no.
Modeassignment cm- 1
/,AU“
î>,cm- 1
/,AU
V,cm- 1
I ,AU cm- 1
/,AU cm- 1
/,AU
1 d(C-OH) 376 5 377 8 373 16 374 192 y(C =C 1 452 7 453 8 463 21 460 273 y(=CHl 784 58 786 70 782 21 777 12
4 7 (=CH> 819 47 818 54 816 21 815 12
5 7 (=CH) 945 63 947 67 950 27 950 166 d(=CHl _ . 1084 80 1085 _ 89 1083 42 1079 377 (3(=CHi 1127 19 1124 20 1127 10 1126 1 1
8 HC-O) + S'(OH) 1196 21 1194 369 i>(C-N) 1292 2 1280 25 1281 17 1268 13 1265 8
10 ^(N02) 1340 8 1326 16 1324 1 1 1322 14 1322 131 1 Kas(N0 2 .' 1516 9 1517 8 1521 17 1513 2412 v ( C = C ) 1595 26 1593 21 1558 27 1548 45
0 AU = arbitrary intensity unit, normalized to 100 for all data in Tables I-IV.
TABLE II: Observed Raman Frequencies (v) and Intensities (I) from Two Different 4-Nitrocatechol Molar Concentrations (M) at pH 2.0
Raman band no.
Modeassignment
7 X 10-"4 M 7 X 10--3M
V,cm- 1
I ,AU“
V,cm- 1
/ ,AU
1 d(C-OH',2 y(C=C)3 t(=CH) 790 34 t(=CH) 821 6
5 y(=CH)6 d(=CH)7 d(=CH)8 j/(C -0) + ô'(OH)9 k(C-N) 1292 2 1292 16
1 0 *s(N02) 1340 8 1338 511 1 ^ ( N 0 2)1 2 »(C=C) 1596 6
IID<o arbitrary intensity unit.
IV. Discussion of ResultsA . E f f e c t o f p H o n U u - V i s i b l e A b s o r p t i o n S p e c t r a . Sev
eral articles have already discussed the uv-visible absorption spectra of 4-nitrocatechol for various pH and solvent conditions.3'6-8 In particular, Sunkel and Staude8 (hereafter referred to as SS) measured uv-visible absorption of aqueous solutions at several pH values and gave assignments for the electronic transitions corresponding to the bands observed. For pH near 2.0, they observed bands at 345, 309.5, and 209.9 nm which were assigned as the three tt —* ir* transitions characteristic of the benzene ring. For pH near 12, they associate bands observed at 509.9 and 380.5 nm, respectively, with the 345- and 309.5-nm bands observed at low pH, i.e , they claim a shift in band wavelengths due to pH. They do not, however, report a band at high pH corresponding to the 209.9-nm band observed at low pH.
The band wavelengths observed in our work (as presented in Figures 1 and 2 ) are in good agreement with those given by SS for pH values near 2 and 1 2 . Moreover, our curve for pH 12.3 indicates a weak band near 253 nm which is probably the “ missing” band that corresponds to the 209.9-nm band observed at low pH.
SS assign the other hands appearing in their spectra to n -* tt* or tt —► tt* transitions in the nitro group. They ob
served one such band near 242.7 nm at very low pH (near 2) and near 273.0 nm at very high pH (near 12). Our spectra for pH 2.0 and 12.3 show bands in good agreement with those just mentioned.
There is, however, a considerable difference between our spectrum for pH 9.1 and that observed by SS at comparable pH. On the other hand, our results for this pH agree with those of Schroeder et al.6 It is shown in a later section that this confusion can be attributed to solvent effects.
The variations of the uv-visible absorption spectrum with pH (Figures 1 and 2 ) can be correlated with the proton dissociation of the 1 ,2 -hydroxyl group substituents on the benzene ring. Math et al. 17 studied the dissociation of 4-nitrocatechol in aqueous solutions at 30 °C and found p K i = 6.63 and p K 2 = 10.59. They also pointed out that resonance structures indicate that the hydroxyl group in the 1 position on the ring is the first to dissociate. Similar measurements were made at 20 °C by SS 18 who found p K { = 7.19 and p K 2 = 11.29.
Using this information, the molecular species present at each pH value can be determined. As the pH is increased from 2.0 to 9.1, the equilibrium shifts from a condition of essentially all molecules fully protonated to all molecules singly deprotonated. It follows that the absorption spectra at pH 2.0, 7.1, and 9.1 should show isosbestic points. Examination of these three curves in Figures 1 and 2 shows that approximate isosbestic points exist at 206, 216, 232, 252, 281, and 370 nm. Similarly as the pH is increased from 9 .1
to 12.3, the equilibrium shifts from essentially all molecules singly deprotonated to all molecules doubly deprotonated, and isosbestic points should appear in the spectra at pH9.1, 1 1 .1 , and 12.3. Such points are observed in Figures 1
and 2, except in the 300-400-nm range where the spectral curves lie close together and produce no discernible pattern.
It is clear from the data that the general tendency of the uv and visible absorption bands is to shift toward longer wavelengths and stronger absorptions with increasing pH. This observation can be tied to the tendency of the three it — tt* bands of the benzene ring to shift toward longer wavelength with increasing absorbance when electron-donating and electron-withdrawing groups (in this molecule -OH and -N 0 2, respectively) are para substituted on the ring.8 19 Stronger electron donation or withdrawal leads to larger shifts. Since deprotonation increases the electron donation of hydroxyl groups, it is not surprising that the
The Journal o f Physical Chemistry, Vol. 80, No. 7, 1976
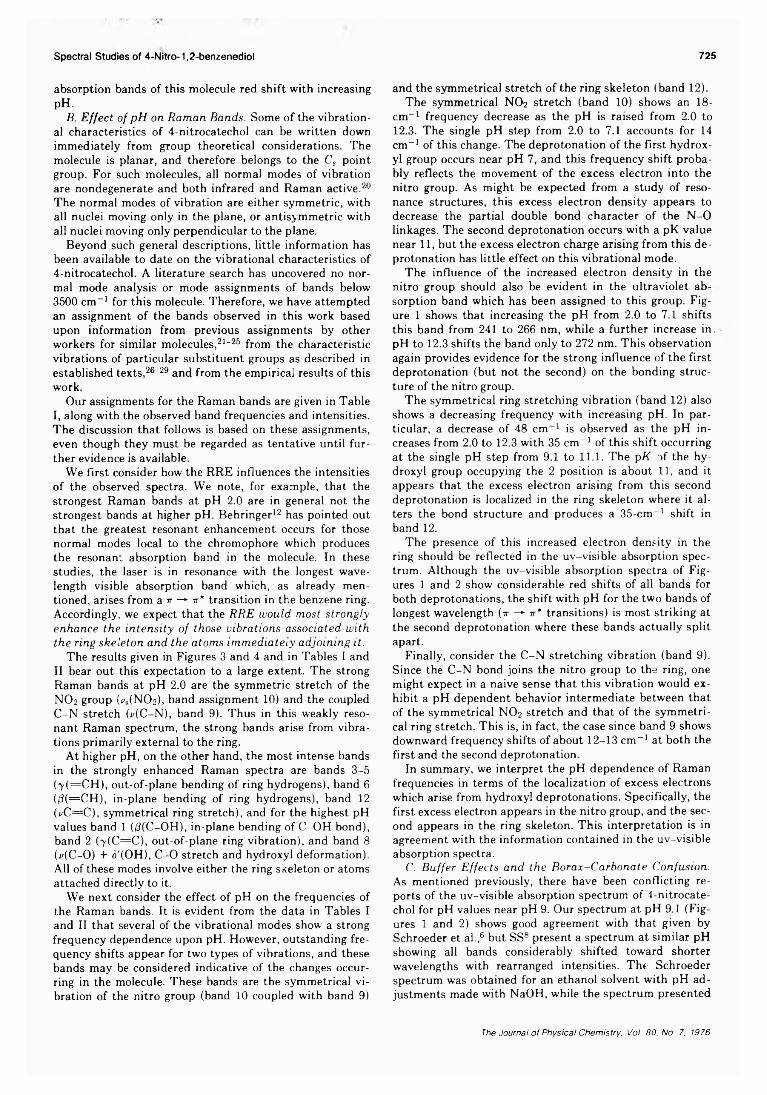
Spectral Studies o f 4 -N itro-1 ,2-benzenedio l 725
absorption bands of this molecule red shift with increasingpH.
B. E f f e c t o f p H o n R a m a n B a n d s . Some of the vibrational characteristics of 4-nitrocatechol can be written down immediately from group theoretical considerations. The molecule is planar, and therefore belongs to the C s point group. For such molecules, all normal modes of vibration are nondegenerate and both infrared and Raman active.20
The normal modes of vibration are either symmetric, with all nuclei moving only in the plane, or antisymmetric with all nuclei moving only perpendicular to the plane.
Beyond such general descriptions, little information has been available to date on the vibrational characteristics of 4-nitrocatechol. A literature search has uncovered no normal mode analysis or mode assignments of bands below 3500 cm- 1 for this molecule. Therefore, we have attempted an assignment of the bands observed in this work based upon information from previous assignments by other workers for similar molecules,21“ 25 from the characteristic vibrations of particular substituent groups as described in established texts,26-29 and from the empirical results of this work.
Our assignments for the Raman bands are given in Table I, along with the observed band frequencies and intensities. The discussion that follows is based on these assignments, even though they must be regarded as tentative until further evidence is available.
We first consider how the RRE influences the intensities of the observed spectra. We note, for example, that the strongest Raman bands at pH 2.0 are in general not the strongest bands at higher pH. Behringer12 has pointed out that the greatest resonant enhancement occurs for those normal modes local to the chromophore which produces the resonant absorption band in the molecule. In these studies, the laser is in resonance with the longest wavelength visible absorption band which, as already mentioned, arises from a ir —*■ it* transition in the benzene ring. Accordingly, we expect that the R R E w o u l d m o s t s t r o n g l y e n h a n c e t h e i n t e n s i t y o f th o s e v ib r a t i o n s a s s o c ia te d w i t h t h e r i n g s k e le t o n a n d t h e a t o m s i m m e d i a t e l y a d j o i n i n g i t .
The results given in Figures 3 and 4 and in Tables I and II bear out this expectation to a large extent. The strong Raman bands at pH 2.0 are the symmetric stretch of the NO2 group {«S(N 02), band assignment 1 0 ) and the coupled C -N stretch (HC-N), band 9). Thus in this weakly resonant Raman spectrum, the strong bands arise from vibrations primarily external to the ring.
At higher pH, on the other hand, the most intense bands in the strongly enhanced Raman spectra are bands 3-5 (y(= C H ), out-of-plane bending of ring hydrogens), band 6
(d(=CH), in-plane bending of ring hydrogens), band 12 (i/C=C), symmetrical ring stretch), and for the highest pH values band 1 (/3(C~OH), in-plane bending of C-OH bond), band 2 (7 (C=C), out-of-plane ring vibration), and band 8
(c(C-O) + ¿'(OH), C -0 stretch and hydroxyl deformation). All of these modes involve either the ring skeleton or atoms attached directly to it.
We next consider the effect of pH on the frequencies of the Raman bands. It is evident from the data in Tables I and II that several of the vibrational modes show a strong frequency dependence upon pH. However, outstanding frequency shifts appear for two types of vibrations, and these bands may be considered indicative of the changes occurring in the molecule. These bands are the symmetrical vibration of the nitro group (band 10 coupled with band 9)
and the symmetrical stretch of the ring skeleton (band 1 2 ).The symmetrical NO2 stretch (band 10) shows an 18-
cm- 1 frequency decrease as the pH is raised from 2.0 to12.3. The single pH step from 2.0 to 7.1 accounts for 14 cm- 1 of this change. The deprotonation of the first hydroxyl group occurs near pH 7, and this frequency shift probably reflects the movement of the excess electron into the nitro group. As might be expected from a study of resonance structures, this excess electron density appears to decrease the partial double bond character of the N -0 linkages. The second deprotonation occurs with a pK value near 1 1 , but the excess electron charge arising from this deprotonation has little effect on this vibrational mode.
The influence of the increased electron density in the nitro group should also be evident in the ultraviolet absorption band which has been assigned to this group. Figure 1 shows that increasing the pH from 2.0 to 7.1 shifts this band from 241 to 266 nm, while a further increase in . pH to 12.3 shifts the band only to 272 nm. This observation again provides evidence for the strong influence of the first deprotonation (but not the second) on the bonding structure of the nitro group.
The symmetrical ring stretching vibration (band 12) also shows a decreasing frequency with increasing pH. In particular, a decrease of 48 cm- 1 is observed as the pH increases from 2.0 to 12.3 with 35 cm - 1 of this shift occurring at the single pH step from 9.1 to 11.1. The pK of the hydroxyl group occupying the 2 position is about 1 1 , and it appears that the excess electron arising from this second deprotonation is localized in the ring skeleton where it alters the bond structure and produces a 35-cm- 1 shift in band 1 2 .
The presence of this increased electron density in the ring should be reflected in the uv-visible absorption spectrum. Although the uv-visible absorption spectra of Figures 1 and 2 show considerable red shifts of all bands for both deprotonations, the shift with pH for the two bands of longest wavelength (it —*■ 7r* transitions) is most striking at the second deprotonation where these bands actually split apart.
Finally, consider the C -N stretching vibration (band 9). Since the C -N bond joins the nitro group to the ring, one might expect in a naive sense that this vibration would exhibit a pH dependent behavior intermediate between that of the symmetrical NO2 stretch and that of the symmetrical ring stretch. This is, in fact, the case since band 9 shows downward frequency shifts of about 12-13 cm - 1 at both the first and the second deprotonation.
In summary, we interpret the pH dependence of Raman frequencies in terms of the localization of excess electrons which arise from hydroxyl deprotonations. Specifically, the first excess electron appears in the nitro group, and the second appears in the ring skeleton. This interpretation is in agreement with the information contained in the uv-visible absorption spectra.
C. B u f f e r E f f e c t s a n d t h e B o r a x - C a r b o n a t e C o n f u s io n . As mentioned previously, there have been conflicting reports of the uv-visible absorption spectrum of 4-nitrocatechol for pH values near pH 9. Our spectrum at pH 9.1 (Figures 1 and 2 ) shows good agreement with that given by Schroeder et al. ,6 but SS8 present a spectrum at similar pH showing all bands considerably shifted toward shorter wavelengths with rearranged intensities. The Schroeder spectrum was obtained for an ethanol solvent with pH adjustments made with NaOH, while the spectrum presented
The Journal o f Physical Chemistry, Vol. 80, No. 7, 1976
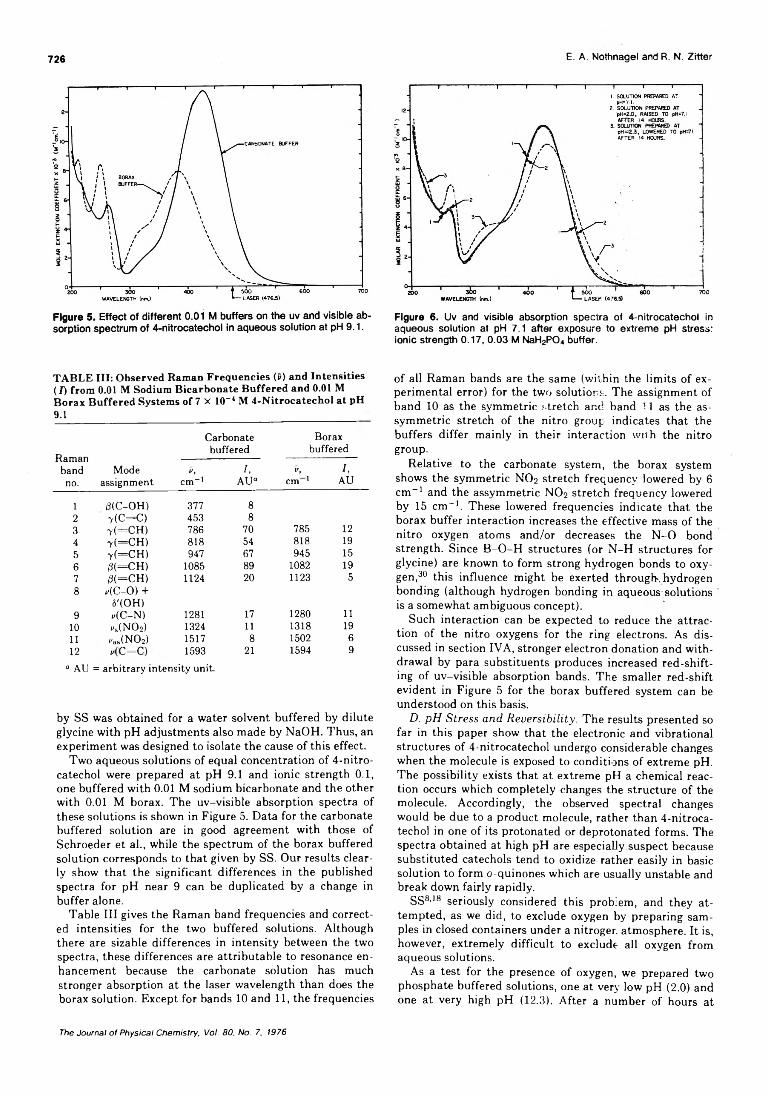
726 E. A. Nothnagel and R. N. Z itte r
Figure 6. Uv and visible absorption spectra of 4-nltrocatechol in aqueous solution at pH 7.1 after exposure to extreme pH stress: ionic strength 0.17, 0.03 M NaH2P04 buffer.
TABLE I I I : Observed Raman Frequencies (f) and Intensities( I) from 0.01 M Sodium Bicarbonate Buffered and 0.01 M Borax Buffered Systems of 7 X 10⁻⁴ M 4-Nitrocatechol at pH 9.1
Carbonatebuffered
Raman ------------------------band Mode i, I,no. assignment cm-1 AU“
Boraxbuffered
9, /,cm 1 AU
1 0(C-OH) 377 82 t (C=C) 453 83 t (=CH ) 786 70 785 124 7(=C H ) 818 54 818 195 7 (=C H ) 947 67 945 156 0(=C H ) 1085 89 1082 197 0(=C H ) 1124 20 1123 58 v( C-O) 4-
ô'(OH)9 *(C-N) 1281 17 1280 11
10 •s(N 02) 1324 11 1318 1911 ^as(N02) 1517 8 1502 612 'S o II o 1593 21 1594 9
O > e = arbitrary intensity unit.
by SS was obtained for a water solvent buffered by dilute glycine with pH adjustments also made by NaOH. Thus, an experiment was designed to isolate the cause of this effect.
Two aqueous solutions of equal concentration of 4-nitro- catechol were prepared at pH 9.1 and ionic strength 0.1, one buffered with 0.01 M sodium bicarbonate and the other with 0.01 M borax. The uv-visible absorption spectra of these solutions is shown in Figure 5. Data for the carbonate buffered solution are in good agreement with those of Schroeder et al., while the spectrum of the borax buffered solution corresponds to that given by SS. Our results clearly show that the significant differences in the published spectra for pH near 9 can be duplicated by a change in buffer alone.
Table III gives the Raman band frequencies and corrected intensities for the two buffered solutions. Although there are sizable differences in intensity between the two spectra, these differences are attributable to resonance enhancement because the carbonate solution has much stronger absorption at the laser wavelength than does the borax solution. Except for bands 10 and 11, the frequencies
of all Raman bands are the same (within the limits of experimental error) for the two solutions. The assignment of band 1 0 as the symmetric stretch and band ! 1 as the as- symmetric stretch of the nitro group indicates that the buffers differ mainly in their interaction with the nitro group.
Relative to the carbonate system, the borax system shows the symmetric N 0 2 stretch frequency lowered by 6
cm - 1 and the assymmetric NO2 stretch frequency lowered by 15 cm-1 . These lowered frequencies indicate that the borax buffer interaction increases the effective mass of the nitro oxygen atoms and/or decreases the N -0 bond, strength. Since B-O -H structures (or N-H structures for glycine) are known to form strong hydrogen bonds to oxygen,30 this influence might be exerted through-, hydrogen bonding (although hydrogen bonding in aqueous-solutions is a somewhat ambiguous concept).
Such interaction can be expected to reduce the attraction of the nitro oxygens for the ring electrons. As discussed in section IVA, stronger electron donation and withdrawal by para substituents produces increased red-shifting of uv-visible absorption bands. The smaller red-shift evident in Figure 5 for the borax buffered system can be understood on this basis.
D . p H S t r e s s a n d R e v e r s ib i l i t y . The results presented so far in this paper show that the electronic and vibrational structures of 4-nitrocatechol undergo considerable changes when the molecule is exposed to conditions of extreme pH. The possibility exists that at extreme pH a chemical reaction occurs which completely changes the structure of the molecule. Accordingly, the observed spectral changes would be due to a product molecule, rather than 4-nitrocatechol in one of its protonated or deprotonated forms. The spectra obtained at high pH are especially suspect because substituted catechols tend to oxidize rather easily in basic solution to form o-quinones which are usually unstable and break down fairly rapidly.
SS8-18 seriously considered this problem, and they attempted, as we did, to exclude oxygen by preparing samples in closed containers under a nitrogen atmosphere. It is, however, extremely difficult to exclude all oxygen from aqueous solutions.
As a test for the presence of oxygen, we prepared two phosphate buffered solutions, one at very low pH (2.0) and one at very high pH (12.3). After a number of hours at
The Journal o f Physical Chemistry, Vol. 80, No. 7, 1976

727'V * . V
Spectral Studies of 4-Nitro-1,2-ben2enediol
Figure 7. Raman spectrum of 7 X 10⁻⁴ M 4-nitrocatechol in aqueous solution at pH 7.1 after exposure to high pH stress: ionic strength 0.17, 0.03 M NaH2P0 4 buffer.
TABLE IV: Observed Raman Frequencies (5) and Intensities(7) from Unstressed and High pH Stressed Solutions of 7 X 10⁻⁴ M 4-Nitrocatechol at pH 7.1 (Ionic Strength 0.17)
High pHUnstressed stressed
Raman ---------------------bandno.
Modeassignment
V,cm-1
/,AU°
V,cm-1
I,AU
i d(C-OH) 373 8 374 82 Y(C=C) 450 9 452 103 t(=CH) 784 70 786 694 t(^CH) 820 56 820 625 r(=CH) 945 71 948 836 d(—CH) 1084 86 1083 1007 , d(=CH) 1125 18 1126 238 - i'(C-O) +
o'(OH)9 k(C-N) 1282 24 1281 31
10 *s(N02) 1327 11 1322 1611 yas(N02) 1516 8 1515 1112 k(C=C) 1595 31 1593 21
0 AU = arbitrary intensity unit.
room temperature, both were readjusted to pH 7.1, and the uv-visible absorption spectra were then compared to that of a phosphate buffered solution originally prepared at pH7.1.
The results are shown in Figure 6 . We note that the pH2.0 solution is reversible to pH 7.1, while the pH 12.3 solution is not. (These measurements were recorded within 1 h following pH readjustment to 7.1, but spectra taken up to 1 2 h later showed little further change.)
A similar comparison was made for Raman spectra. The results are given in Figure 7 and also in Table IV for the solution originally prepared at high pH. We note that the Raman spectrum after high pH stress is essentially identical with that of 4-nitrocatechol, although there is some alteration in intensity noticeable.
The combined implication of the two sets of experiments is that a partial chemical conversion does occur under high pH stress, to the extent that the product is detectable in uv-visible absorption but not by Raman scattering.
Using chromatographic techniques, we have made further attempts at demonstrating the presence of a product molecule in the high pH stressed solutions, but to date these have been unsuccessful.
A c k n o w l e d g m e n t . The authors wish to thank Dr. David Koster for many helpful discussions and Mr. Michael Murphy for his assistance in the chromatography experiments. Both are with the Chemistry Department of this Universit y -
References and Notes
(1) Submitted in partial fulfillment of the Master’s requirements. Present address: Field of Applied Physics, Cornell University, Ithaca, N.Y. 14853.
(2) N. Konopik and G. Wimmer, Monatsh. Chem., 93, 1404 (1962).(3) H. W. Duckworth and J. E. Coleman, J. Biol. Chem., 245, 1613 (1970).(4) S. R. Cooper and V. J. Tulane, Ind. Eng. Chem., Anal. Ed., 8, 210
(1936).(5) J. H. Kolaian (Texaco Inc.), U.S. Pat. 3 640 825 (8 Feb 1972).(6) W. A. Schroeder, P. E. Wilcox, K. N. Trueblood, and A. O. Dekker, Anal.
Chem., 23, 1740 (1951).(7) D. Robinson, J. N. Smith, B. Spencer, and R. T. Williams, Biochem. J.,
51, 202 (1952).(8) J, Sunkel and H. Staude, Ber. Bunsenges. Phys. Chem., 73, 203 (1969).(9) L. L. Ingraham, J. Corse, G. F. Bailey, and F. Stitt, J. Am. Chem. Soc.,
74, 2297 (1952).(10) The Coblentz Society, Ed., “Evaluated Infrared Reference Spectra” ,
Sadtler Research Laboratories, Philadelphia, Pa., 1970, spectrum 6656.(11) C. J. Pouchert, “The Aldrich Library of Infrared Spectra” , Aldrich
Chemical Co., Milwaukee, Wise., 1970, spectrum N1555-3.(12) J. Behringer in “Raman Spectroscopy” , H. A. Szymanski, Ed., Plenum
Press, New York, N.Y., 1967, pp 168-223.(13) M. M. Sushchinskii, “Raman Spectra of Molecules and Crystals”, Israel
Program for Scientific Translations, Ltd., New York, N.Y., 1972.(14) K. Machida, B-K. Kim, Y. Saito, K. Igarashi, and T. Uno, Bull. Chem.
Soc. Jpn., 47, 78 (1974).(15) Y. Saito, B-K. Kim, K. Machida, and T. Uno, Bull. Chem. Soc. Jpn., 47,
2111 (1974).(16) W. Kiefer and H. J. Bernstein, Appl. Spectrosc., 25, 500 (1971).(17) K. S. Math, K. A. Venkatachalam, and M. B. Kabadi, J. Ind. Chem. Soc.,
36, 65 (1959).(18) J. Sunkel and H. Staude, Ber. Bunsenges. Phys. Chem., 72, 567 (1968).(19) C. J. Creswell and O. Runquist, “Spectral Analysis of Organic Com
pounds” , Burgess Publishing Co., Minneapolis, Minn., 1970, pp 51, 30.(20) G. Herzberg, "Molecular Spectra and Molecular Structure; Vol. II, In
frared and Raman Spectra of Polyatomic Molecules” , Van Nostrand, Princeton, N.J., 1945, pp 134, 247, 252-254.
(21) M. Margoshes and V. A. Fassel, Spectrochim. Acta, 7, 14 (1955).(22) J. H. S. Green, W. Kynaston, and S. A. Lindsey, Spectrochim. Acta, 17,
486(1961).(23) R. D. Kross and V. A. Fassel, J. Am. Chem. Soc., 78, 4225 (1956).(24) R. J. Jakobsen and E. J. Brewer, Appl. Spectrosc., 16, 32 (1962).(25) G. Karagounis and R. M. Issa, Z. Elektrochem., 66, 874 (1960).(26) F. F. Bentley, L. D. Smithson, and A. L. Rozek, "Infrared Spectra and
Characteristic Frequencies 700-300 cm-1 ” Wiley-lnterscience, New York, N.Y., 1968, pp 66-69 .
(27) L. J. Bellamy, “The Infrared Spectra of Complex Molecules” , Wiley, New York, N.Y., 1958.
(28) H. A. Szymanski, "Interpreted Infrared Spectra, Vol. Ill” , Plenum Press, New York, N.Y., 1967.
(29) M. C. Tobin, “Laser Raman Spectroscopy", Wiley-lnterscience, New York, N.Y., 1971, pp 88-96 .
(30) L. Pauling, "The Nature of the Chemical Bond", Cornell University Press, Ithaca, New York, N.Y., 1960, pp 481, 498.
(31) Measurement of the Raman polarization ratios would have provided further useful information, but unfortunately the necessary equipment (e.g., polarization rotator) was unavailable to us during the period of this study.
(32) Sunkel and Staude8 have verified the Beer-Lambert law for this compound in the 10-3 to 10-4 M range, and our measurements showed no significant deviations down to 5 X 10⁻⁵ M.
The Journal o f Physical Chemistry, Vol. 80, No. 7, 1976
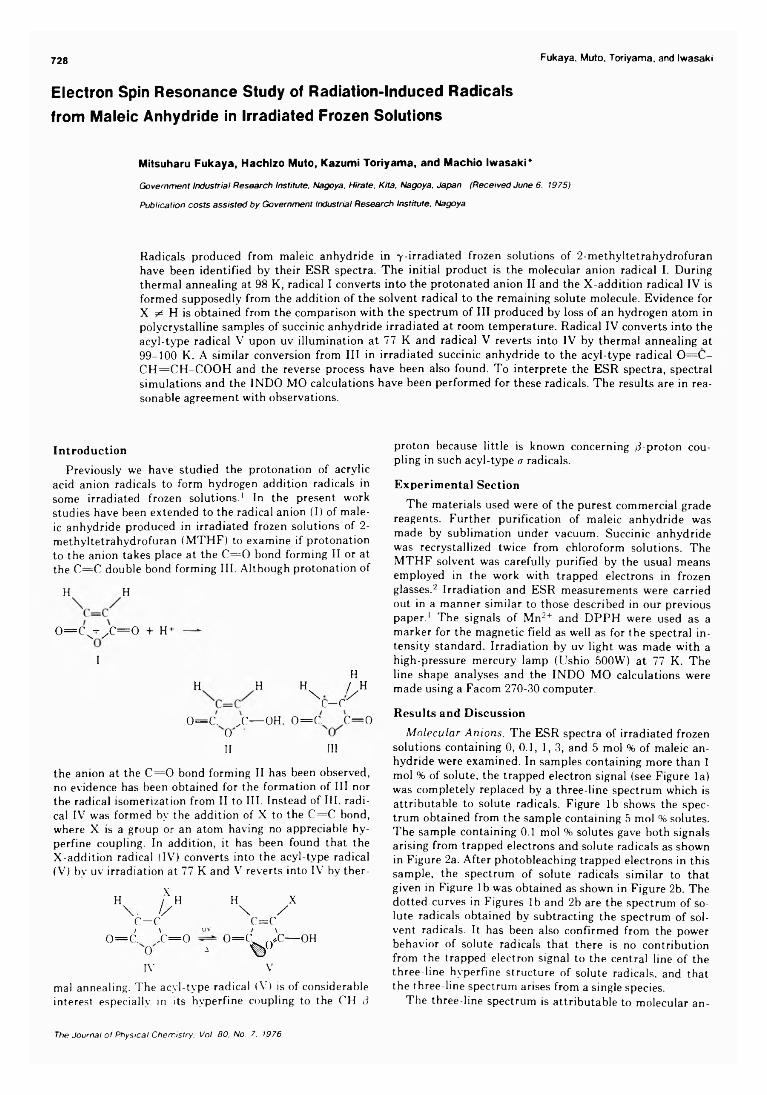
728 Fukaya, Muto. Toriyama, and Iwasaki
Electron Spin Resonance Study of Radiation-Induced Radicals from Maleic Anhydride in Irradiated Frozen Solutions
Mitsuharu Fukaya, Hachizo Muto, Kazumi Toriyama, and Machio Iwasaki*
Government Industrial Research Institute, Nagoya, Hirate, Kita, Nagoya. Japan (Received June 6. 1975)
Publication costs assisted by Government Industrial Research Institute, Nagoya
Radicals produced from maleic anhydride in 7 -irradiated frozen solutions of 2-methyltetrahydrofuran have been identified by their ESR spectra. The initial product is the molecular anion radical I. During thermal annealing at 98 K, radical I converts into the protonated anion II and the X-addition radical IV is formed supposedly from the addition of the solvent radical to the remaining solute molecule. Evidence for X ^ H is obtained from the comparison with the spectrum of III produced by loss of an hydrogen atom in polycrystalline samples of succinic anhydride irradiated at room temperature. Radical IV converts into the acyl-type radical V upon uv illumination at 77 K and radical V reverts into IV by thermal annealing at 99-100 K. A similar conversion from III in irradiated succinic anhydride to the acyl-type radical 0 = C - CH =CH -CO O H and the reverse process have been also found. To interprete the ESR spectra, spectral simulations and the INDO MO calculations have been performed for these radicals. The results are in reasonable agreement with observations.
IntroductionPreviously we have studied the protonation of acrylic
acid anion radicals to form hydrogen addition radicals in some irradiated frozen solutions. 1 In the present work studies have been extended to the radical anion (I) of maleic anhydride produced in irradiated frozen solutions of 2 - methyltetrahydrofuran (MTHF) to examine if protonation to the anion takes place at the C = 0 bond forming II or at the C = C double bond forming III. Although protonation of
H H
0 = C x- / C = 0 + H-1
1
H H HH
/ H^ C - C ^
o = c . j : — o h , o = c . c = o0II III
the anion at the C = 0 bond forming II has been observed, no evidence has been obtained for the formation of III nor the radical isomerization from II to III. Instead of III. radical IV was formed by the addition of X to the C = C bond, where X is a group or an atom having no appreciable hy- perfine coupling. In addition, it has been found that the X-addition radical (IV) converts into the acyl-tvpe radical (V) by uv irradiation at 77 K and V reverts into IV by ther-
XH / H
1 / /c - cI \ UV
o = c . ,c = 0 0o ^IV
H X\ /
c = c ' \
V
OH
mal annealing. The acyl-type radical (V) is of considerable interest especially in its hyperfine coupling to the CH 3
proton because little is known concerning d-proton coupling in such acyl-type o radicals.
Experimental Section
The materials used were of the purest commercial grade reagents. Further purification of maleic anhydride was made by sublimation under vacuum. Succinic anhydride was recrystallized twice from chloroform solutions. The MTHF solvent was carefully purified by the usual means employed in the work with trapped electrons in frozen glasses.2 Irradiation and ESR measurements were carried out in a manner similar to those described in our previous paper. 1 The signals of Mn2+ and DPPH were used as a marker for the magnetic field as well as for the spectral intensity standard. Irradiation by uv light was made with a high-pressure mercury lamp (Ushio 500W) at 77 K. The line shape analyses and the INDO MO calculations were made using a Facom 270-30 computer.
Results and Discussion
M o l e c u l a r A n io n s . The ESR spectra of irradiated frozen solutions containing 0, 0.1, 1, 3, and 5 mol % of maleic anhydride were examined. In samples containing more than 1
mol % of solute, the trapped electron signal (see Figure la) was completely replaced by a three-line spectrum which is attributable to solute radicals. Figure lb shows the spectrum obtained from the sample containing 5 mol % solutes. The sample containing 0 .1 mol % solutes gave both signals arising from trapped electrons and solute radicals as shown in Figure 2a. After photobleaching trapped electrons in this sample, the spectrum of solute radicals similar to that given in Figure lb was obtained as shown in Figure 2b. The dotted curves in Figures lb and 2 b are the spectrum of solute radicals obtained by subtracting the spectrum of solvent radicals. It has been also confirmed from the power behavior of solute radicals that there is no contribution from the trapped electron signal to the central line of the three-line hyperfine structure of solute radicals, and that the three-line spectrum arises from a single species.
The three-line spectrum is attributable to molecular an-
The Journal o f Physical Chemistry, Vol. 80, No. 7, 1976
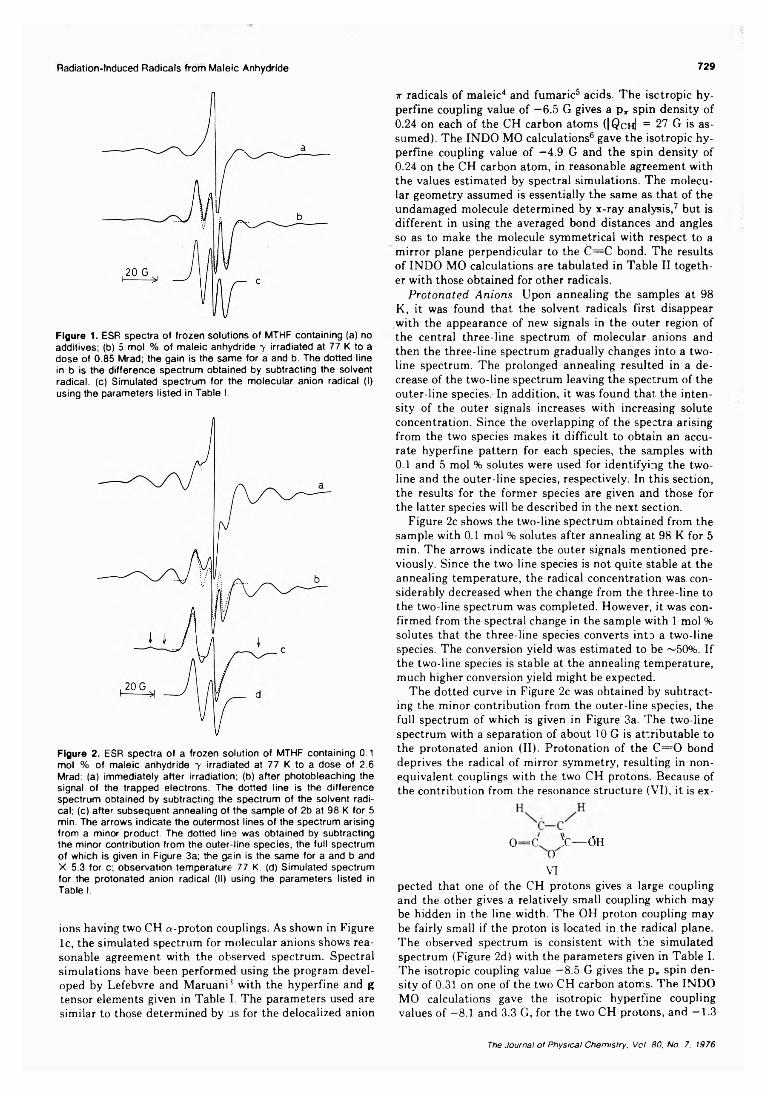
Radiation-Induced Radicals from Maleic Anhydride 729
Figure 1. ESR spectra of frozen solutions of MTHF containing (a) no additives; (b) 5 mol % of maleic anhydride y irradiated at 77 K to a dose of 0.85 Mrad; the gain is the same for a and b. The dotted line in b is the difference spectrum obtained by subtracting the solvent radical, (c) Simulated spectrum for the molecular anion radical (I) using the parameters listed in Table I.
Figure 2. ESR spectra of a frozen solution of MTHF containing 0.1 mol % of maleic anhydride 7 irradiated at 77 K to a dose of 2.6 Mrad: (a) immediately after irradiation; (b) after photobleaching the signal of the trapped electrons. The dotted line is the difference spectrum obtained by subtracting the spectrum of the solvent radical; (c) after subsequent annealing of the sample of 2b at 98 K for 5 min. The arrows indicate the outermost lines of the spectrum arising from a minor product. The dotted line was obtained by subtracting the minor contribution from the outer-line species, the full spectrum of which is given in Figure 3a; the gain is the same for a and b and X 5.3 for c; observation temperature 77 K. (d) Simulated spectrum for the protonated anion radical (II) using the parameters listed in Table I.
ions having two CH a-proton couplings. As shown in Figure lc, the simulated spectrum for molecular anions shows reasonable agreement with the observed spectrum. Spectral simulations have been performed using the program developed by Lefebvre and Maruani’ with the hyperfine and g tensor elements given in Table I. The parameters used are similar to those determined by us for the delocalized anion
rr radicals of maleic4 and fumaric5 acids. The isctropic hyperfine coupling value of -6 .5 G gives a pT spin density of0.24 on each of the CH carbon atoms (| Qch| = 27 G is assumed). The INDO MO calculations6 gave the isotropic hyperfine coupling value of —4.9 G and the spin density of0.24 on the CH carbon atom, in reasonable agreement with the values estimated by spectral simulations. The molecular geometry assumed is essentially the same as that of the undamaged molecule determined by x-ray analysis,7 but is different in using the averaged bond distances and angles so as to make the molecule symmetrical with respect to a mirror plane perpendicular to the C = C bond. The results of INDO MO calculations are tabulated in Table II together with those obtained for other radicals.
P r o t o n a t e d A n io n s . Upon annealing the samples at 98 K, it was found that the solvent radicals first disappear with the appearance of new signals in the outer region of the central three-line spectrum of molecular anions and then the three-line spectrum gradually changes into a two- line spectrum. The prolonged annealing resulted in a decrease of the two-line spectrum leaving the spectrum of the outer-line species. In addition, it was found that the intensity of the outer signals increases with increasing solute concentration. Since the overlapping of the spectra arising from the two species makes it difficult to obtain an accurate hyperfine pattern for each species, the samples with0.1 and 5 mol % solutes were used for identifying the two- line and the outer-line species, respectively. In this section, the results for the former species are given and those for the latter species will be described in the next section.
Figure 2c shows the two-line spectrum obtained from the sample with 0.1 mol % solutes after annealing at 98 K for 5 min. The arrows indicate the outer signals mentioned previously. Since the two-line species is not quite stable at the annealing temperature, the radical concentration was considerably decreased when the change from the three-line to the two-line spectrum was completed. However, it was confirmed from the spectral change in the sample with 1 mol % solutes that the three-line species converts into a two-line species. The conversion yield was estimated to be ~50%. If the two-line species is stable at the annealing temperature, much higher conversion yield might be expected.
The dotted curve in Figure 2c was obtained by subtracting the minor contribution from the outer-line species, the full spectrum of which is given in Figure 3a. The two-line spectrum with a separation of about 1 0 G is attributable to the protonated anion (II). Protonation of the C = 0 bond deprives the radical of mirror symmetry, resulting in nonequivalent couplings with the two CH protons. Because of the contribution from the resonance structure (VI), it is ex-
0 = C ! c — (5HOVI
pected that one of the CH protons gives a large coupling and the other gives a relatively small coupling which may be hidden in the line width. The OH proton coupling may be fairly small if the proton is located in the radical plane. The observed spectrum is consistent with the simulated spectrum (Figure 2 d) with the parameters given in Table I. The isotropic coupling value —8.5 G gives the p„ spin density of 0.31 on one of the two CH carbon atoms. The INDO MO calculations gave the isotropic hyperfine coupling values of -8 .1 and 3.3 G, for the two CH protons, and -1 .3
The Journal o f Physical Chemistry, Vol. 80, No. 7, 1976
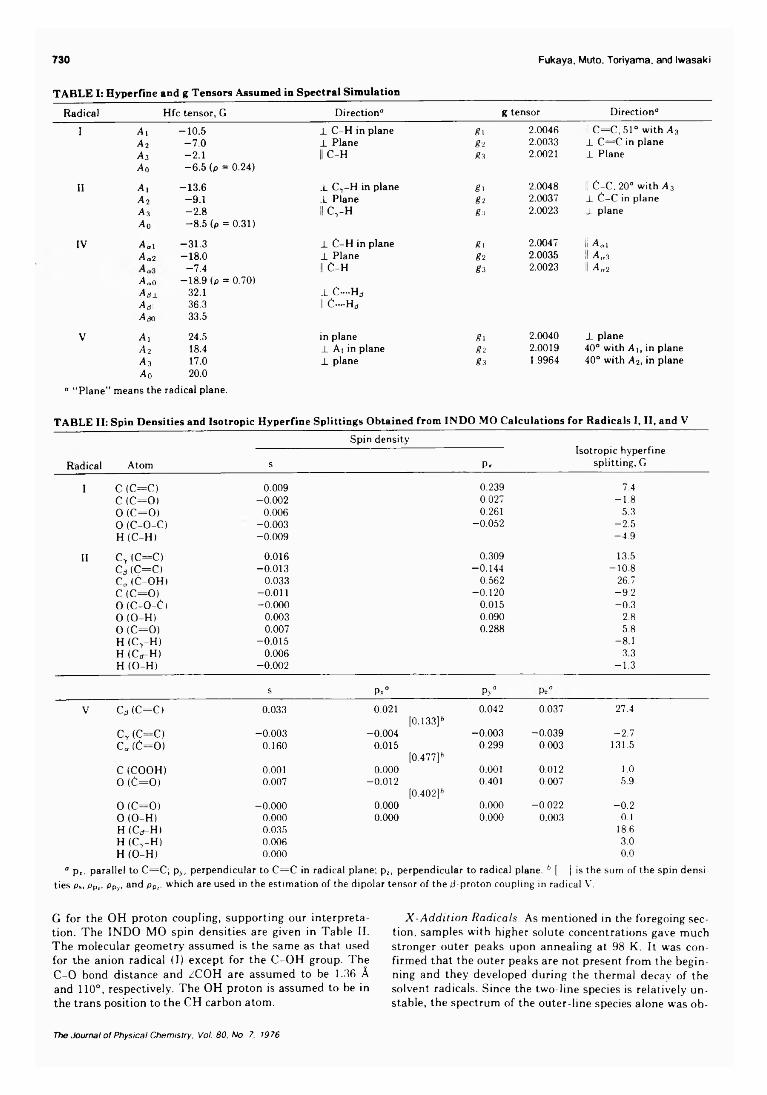
730 Fukaya, M uto, Toriyam a, and Iw asaki
TABLE I: Hyperfine and g Tensors Assumed in Spectral Simulation
Radical Hfc tensor, G Direction“ g tensor Direction“
I Ai -10.5 _L C-H in plane Si 2.0046 II C=C, 51° with A3A 2 -7 .0 _L Plane g 2 2.0033 X C =C in planeA3 - 2.1 II C-H «3 2.0021 X PlaneA0 -6 .5 (p = 0.24)
II Ai -13.6 _L C .-H in plane g 1 2.0048 II C-C. 20° with A3A 2 -9.1 _L Plane g 2 2.0037 X C-C in planeA j - 2.8 II CT-H g : i 2.0023 X planeA0 -8 .5 (p = 0.31)
IV A„i -31.3 X C-H in plane g 1 2.0047 li A„iA „2 -18.0 _L Plane g 2 2.0035 II A „ 3
-7.4 II C-H g 3 2.0023 II A „2A„ 0 -18.9 (p = 0.70)Apj. 32.1 -L C—HaAtfii 36.3 A ¿o 33.5
¡1 C-—H(j
V A, 24.5 in plane g 1 2.0040 X planeA 2 18.4 _L A i in plane g2 2.0019 40° with A], in planeA 3 17.0 A0 20.0
X plane g 3 1.9964 40° with A 2, in plane
“ “ Plane” means the radical plane.
TABLE II: Spin Densities and Isotropic Hyperfine Splittings Obtained from INDO MO Calculations for Radicals I, II, and VSpin density
Isotropic hyperfineRadical Atom s Pr splitting, G
I C (C=C) 0.009 0.239 7.4C (C = 0 ) - 0.002 0.027 - 1.8O (C = 0 ) 0.006 0.261 5.3O (C-O-C) -0.003 -0.052 -2.5H (C-H) -0.009 -4.9
II Cy (C=C) 0.016 0.309 13.5Cd (C=C) -0.013 -0.144 - 10.8C„ (C-OH) 0.033 0.562 26.7C (C = 0 ) - 0.011 - 0.120 -9.2O (C-O -C) - 0.000 0.015 -0.3O (O-H) 0.003 0.090 2.8O (C = 0 ) 0.007 0.288 5.8H (C,-H ) -0.015 - 8.1H (Cp-H) 0.006 3.3H (O-H) - 0.002 -1.3
S P*° P / P.Q
V Cá (C=C) 0.033 0.021 0.042 0.037 27.4[0.133]b
C7 (C=C) -0.003 -0.004 -0.003 -0.039 -2.7C„ (C = 0 ) 0.160 0.015 0.299 0.003 131.5
[0.477]bC (COOH) 0.001 0.000 0.001 0.012 1.0O (0 = 0 ) 0.007 - 0.012 0.401 0.007 5.9
[0.402]bO (C = 0 ) - 0.000 0.000 0.000 - 0.022 - 0.2O (O-H) 0.000 0.000 0.000 0.003 0.1H (Cp-H) 0.035 18.6H (C,-H) 0.006 3.0H (O-H) 0.000 0.0
“ p,. parallel to C=C ; py, perpendicular to C =C in radical plane; p¿, perpendicular to radical plane. 6 [ ) is the sum of the spin densi-ties ps, pPr, pPy, and pp,, which are used in the estimation of the dipolar tensor of the d-proton couipling in radical V.
G for the OH proton coupling, supporting our interpretation. The INDO MO spin densities are given in Table II. The molecular geometry assumed is the same as that used for the anion radical (I) except for the C-OH group. The C -0 bond distance and zCOH are assumed to be 1.36 A and 110°, respectively. The OH proton is assumed to be in the trans position to the CH carbon atom.
X - A d d i t i o n R a d ic a ls . As mentioned in the foregoing section. samples with higher solute concentrations gave much stronger outer peaks upon annealing at 98 K. It was confirmed that the outer peaks are not present from the beginning and they developed during the thermal decay of the solvent radicals. Since the two-line species is relatively unstable, the spectrum of the outer-line species alone was ob-
The Journal o f Physical Chemistry, Vol. 80, No. 7, 1976
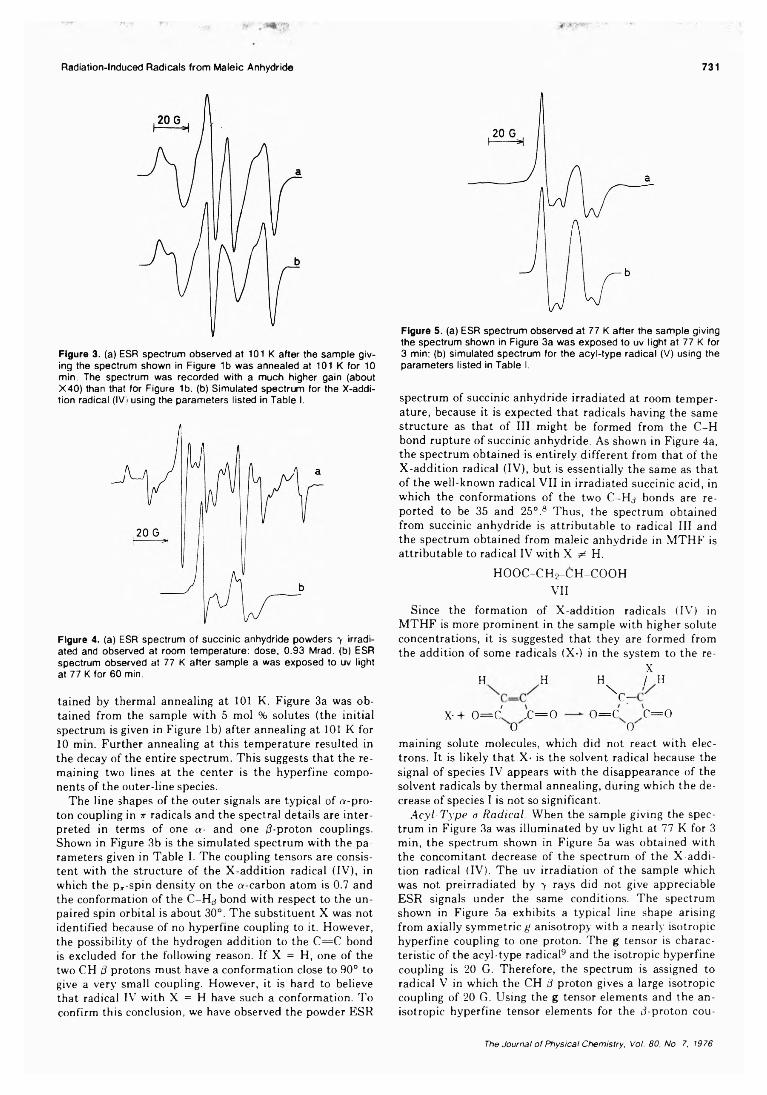
Radiation-Induced Radicals from M ale ic Anhydride 731
Figure 3. (a) ESR spectrum observed at 101 K after the sample giving the spectrum shown in Figure 1b was annealed at 101 K for 10 min. The spectrum was recorded with a much higher gain (about X40) than that for Figure 1b. (b) Simulated spectrum for the X-addi- tion radical (IV) using the parameters listed in Table I.
Figure 4. (a) ESR spectrum of succinic anhydride powders 7 irradiated and observed at room temperature: dose, 0.93 Mrad. (b) ESR spectrum observed at 77 K after sample a was exposed to uv light at 77 K for 60 min.
tained by thermal annealing at 101 K. Figure 3a was obtained from the sample with 5 mol % solutes (the initial spectrum is given in Figure lb) after annealing at 101 K for 10 min. Further annealing at this temperature resulted in the decay of the entire spectrum. This suggests that the remaining two lines at the center is the hyperfine components of the outer-line species.
The line shapes of the outer signals are typical of n-pro- ton coupling in v radicals and the spectral details are interpreted in terms of one a - and one d-proton couplings. Shown in Figure 3b is the simulated spectrum with the parameters given in Table I. The coupling tensors are consistent with the structure of the X-addition radical (IV), in which the p„-spin density on the a-carbon atom is 0.7 and the conformation of the C-Hjj bond with respect to the unpaired spin orbital is about 30°. The substituent X was not identified because of no hyperfine coupling to it. However, the possibility of the hydrogen addition to the C = C bond is excluded for the following reason. If X = H, one of the two CH d protons must have a conformation close to 90° to give a very small coupling. However, it is hard to believe that radical IV with X = H have such a conformation. To confirm this conclusion, we have observed the powder ESR
Figure 5. (a) ESR spectrum observed at 77 K after the sample giving the spectrum shown in Figure 3a was exposed to uv light at 77 K for 3 min; (b) simulated spectrum for the acyl-type radical (V) using the parameters listed in Table I.
spectrum of succinic anhydride irradiated at room temperature, because it is expected that radicals having the same structure as that of III might be formed from the C-H bond rupture of succinic anhydride. As shown in Figure 4a, the spectrum obtained is entirely different from that of the X-addition radical (IV), but is essentially the same as that of the well-known radical VII in irradiated succinic acid, in which the conformations of the two C -H j bonds are reported to be 35 and 25°.8 Thus, the spectrum obtained from succinic anhydride is attributable to radical III and the spectrum obtained from maleic anhydride in MTHF is attributable to radical IV with X ^ H .
HOOC-CH 2-CH -CO OHVII
Since the formation of X-addition radicals (IV) in MTHF is more prominent in the sample with higher solute concentrations, it is suggested that they are formed from the addition of some radicals (X-) in the system to the re-
H H
X - + o = c ' x = o 0
HX/ H
^ C —o = c c = o
0
maining solute molecules, which did not react with electrons. It is likely that X- is the solvent radical because the signal of species IV appears with the disappearance of the solvent radicals by thermal annealing, during which the decrease of species I is not so significant.
A c y l - T y p e a R a d ic a l . When the sample giving the spectrum in Figure 3a was illuminated by uv light at 77 K for 3 min, the spectrum shown in Figure 5a was obtained with the concomitant decrease of the spectrum of the X-addition radical (IV). The uv irradiation of the sample which was not preirradiated by 7 rays did not give appreciable ESR signals under the same conditions. The spectrum shown in Figure 5a exhibits a typical line shape arising from axially symmetric g anisotropy with a nearly isotropic hyperfine coupling to one proton. The g tensor is characteristic of the acyl-type radical9 and the isotropic hyperfine coupling is 20 G. Therefore, the spectrum is assigned to radical V in which the CH 3 proton gives a large isotropic coupling of 20 G. Using the g tensor elements and the anisotropic hyperfine tensor elements for the d-proton cou-
The Journal o f Physical Chemistry, Voi. 80. No. 7, 1976
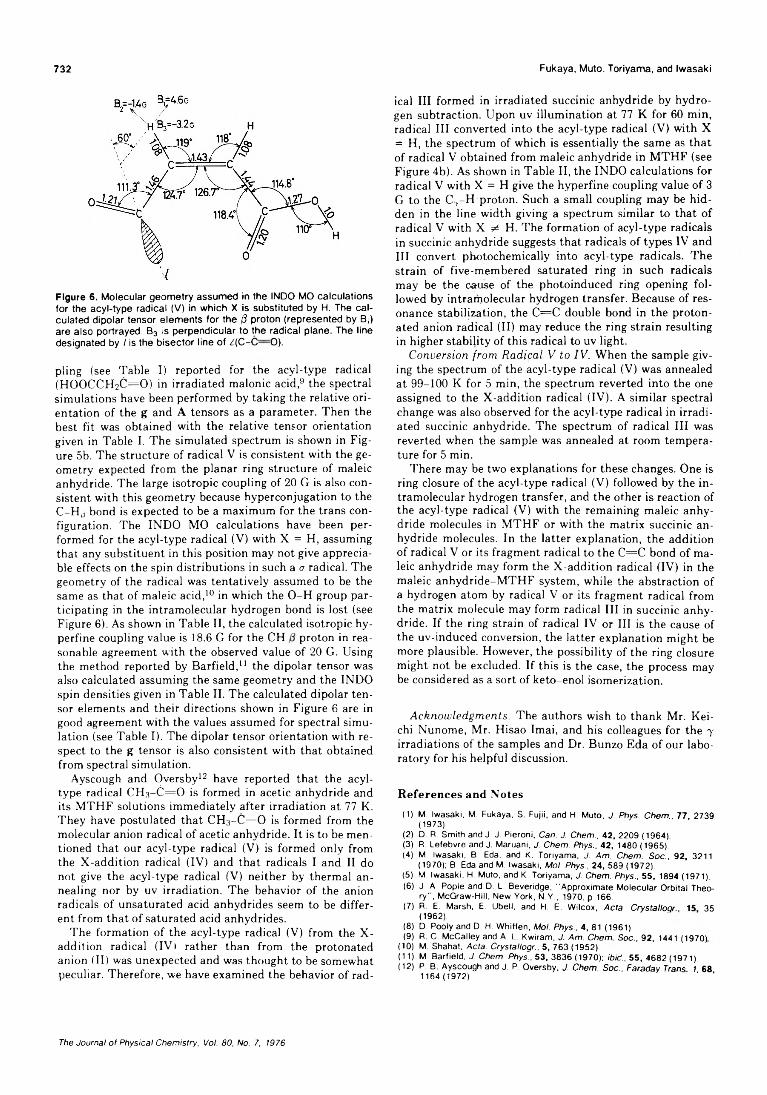
732 Fukaya, Muto. Toriyama, and Iwasaki
Figure 6. Molecular geometry assumed in the INDO MO calculations for the acyl-type radical (V) in which X is substituted by H. The calculated dipolar tensor elements for the /? proton (represented by B,) are also portrayed. B3 is perpendicular to the radical plane. The line designated by / is the bisector line of ¿(C -C — O).
pling (see Table I) reported for the acyl-type radical (H0 0 CCH 2C = 0 ) in irradiated malonic acid,9 the spectral simulations have been performed by taking the relative orientation of the g and A tensors as a parameter. Then the best fit was obtained with the relative tensor orientation given in Table I. The simulated spectrum is shown in Figure 5b. The structure of radical V is consistent with the geometry expected from the planar ring structure of maleic anhydride. The large isotropic coupling of 20 G is also consistent with this geometry because hyperconjugation to the C-Hjj bond is expected to be a maximum for the trans configuration. The INDO MO calculations have been performed for the acyl-type radical (V) with X = H, assuming that any substituent in this position may not give appreciable effects on the spin distributions in such a a radical. The geometry of the radical was tentatively assumed to be the same as that of maleic acid,10 in which the O-H group participating in the intramolecular hydrogen bond is lost (see Figure 6 ). As shown in Table II, the calculated isotropic hy- perfine coupling value is 18.6 G for the CH proton in reasonable agreement with the observed value of 20 G. Using the method reported by Barfield, 11 the dipolar tensor was also calculated assuming the same geometry and the INDO spin densities given in Table II. The calculated dipolar tensor elements and their directions shown in Figure 6 are in good agreement with the values assumed for spectral simulation (see Table I). The dipolar tensor orientation with respect to the g tensor is also consistent with that obtained from spectral simulation.
Ayscough and Oversby12 have reported that the acyl- type radical C H s-C = 0 is formed in acetic anhydride and its MTHF solutions immediately after irradiation at 77 K. They have postulated that CH3- C = 0 is formed from the molecular anion radical of acetic anhydride. It is to be mentioned that our acyl-type radical (V) is formed only from the X-addition radical (IV) and that radicals I and II do not give the acyl-type radical (V) neither by thermal annealing nor by uv irradiation. The behavior of the anion radicals of unsaturated acid anhydrides seem to be different from that of saturated acid anhydrides.
The formation of the acyl-type radical (V) from the X- addition radical (IV) rather than from the protonated anion (II) was unexpected and was thought to be somewhat peculiar. Therefore, we have examined the behavior of rad
ical III formed in irradiated succinic anhydride by hydrogen subtraction. Upon uv illumination at 77 K for 60 min, radical III converted into the acyl-type radical (V) with X = H, the spectrum of which is essentially the same as that of radical V obtained from maleic anhydride in MTHF (see Figure 4b). As shown in Table II, the INDO calculations for radical V with X = H give the hyperfine coupling value of 3 G to the C-y-H proton. Such a small coupling may be hidden in the line width giving a spectrum similar to that of radical V with X ^ H. The formation of acyl-type radicals in succinic anhydride suggests that radicals of types IV and III convert photochemically into acyl-type radicals. The strain of five-membered saturated ring in such radicals may be the cause of the photoinduced ring opening followed by intramolecular hydrogen transfer. Because of resonance stabilization, the C = C double bond in the protonated anion radical (II) may reduce the ring strain resulting in higher stability of this radical to uv light.
C o n v e r s io n f r o m R a d i c a l V to I V . When the sample giving the spectrum of the acyl-type radical (V) was annealed at 99-100 K for 5 min,.the spectrum reverted into the one assigned to the X-addition radical (IV). A similar spectral change was also observed for the acyl-type radical in irradiated succinic anhydride. The spectrum of radical III was reverted when the sample was annealed at room temperature for 5 min.
There may be two explanations for these changes. One is ring closure of the acyl-type radical (V) followed by the intramolecular hydrogen transfer, and the other is reaction of the acyl-type radical (V) with the remaining maleic anhydride molecules in MTHF or with the matrix succinic anhydride molecules. In the latter explanation, the addition of radical V or its fragment radical to the C = C bond of maleic anhydride may form the X-addition radical (IV) in the maleic anhydride-MTHF system, while the abstraction of a hydrogen atom by radical V or its fragment radical from the matrix molecule may form radical III in succinic anhydride. If the ring strain of radical IV or III is the cause of the uv-induced conversion, the latter explanation might be more plausible. However, the possibility of the ring closure might not be excluded. If this is the case, the process may be considered as a sort of keto-enol isomerization.
A c k n o w l e d g m e n t s . The authors wish to thank Mr. Kei- chi Nunome, Mr. Hisao Imai, and his colleagues for the y irradiations of the samples and Dr. Bunzo Eda of our laboratory for his helpful discussion.
R eferences and Notes
(1) M. Iwasaki. M. Fukaya, S. Fuji!, and FI. Muto, J. Phys. Chem., 77, 2739 (1973).
(2) D. R. Smith and J. J. Pieronl, Can. J. Chem., 42, 2209 (1964).(3) R. Lefebvre and J. Maruani, J. Chem. Phys., 42, 1480 (1965).(4) M. Iwasaki, B. Eda, and K. Toriyama. J. Am. Chem. Soc., 92, 3211
(1970); B. Eda and M. Iwasaki, Mol. Phys., 24, 589 (1972).(5) M. Iwasaki, FI. Muto, and K. Toriyama, J. Chem. Phys., 55, 1894 (1971).(6) J. A. Pople and D. L. Beveridge, “Approximate Molecular Orbital Theo
ry“ , McGraw-FIIII, New York, N.Y., 1970, p 166.(7) R. E. Marsh, E. Ubell, and FI. E. Wilcox, Acta. Crystallogr 15 35
(1962).(8) D. Pooly and D. H. Whltfen, Mol. Phys., 4, 81 (1961).(9) R. C. McCalley and A. L. Kwiram, J. Am. Chem Soc., 92, 1441 (1970)
(10) M. Shahat, Acta. Crystallogr., 5, 763 (1952).(11) M. Barfield, J. Chem. Phys., S3, 3836 (1970); ibid., 55, 4682 (1971).(12) P. B. Ayscough and J. P. Oversby, J. Chem. Soc.. Faraday Trans 1 68
1164(1972). ' '
The Journal of Physical Chemistry, Vol. 80, No. 7, 1976
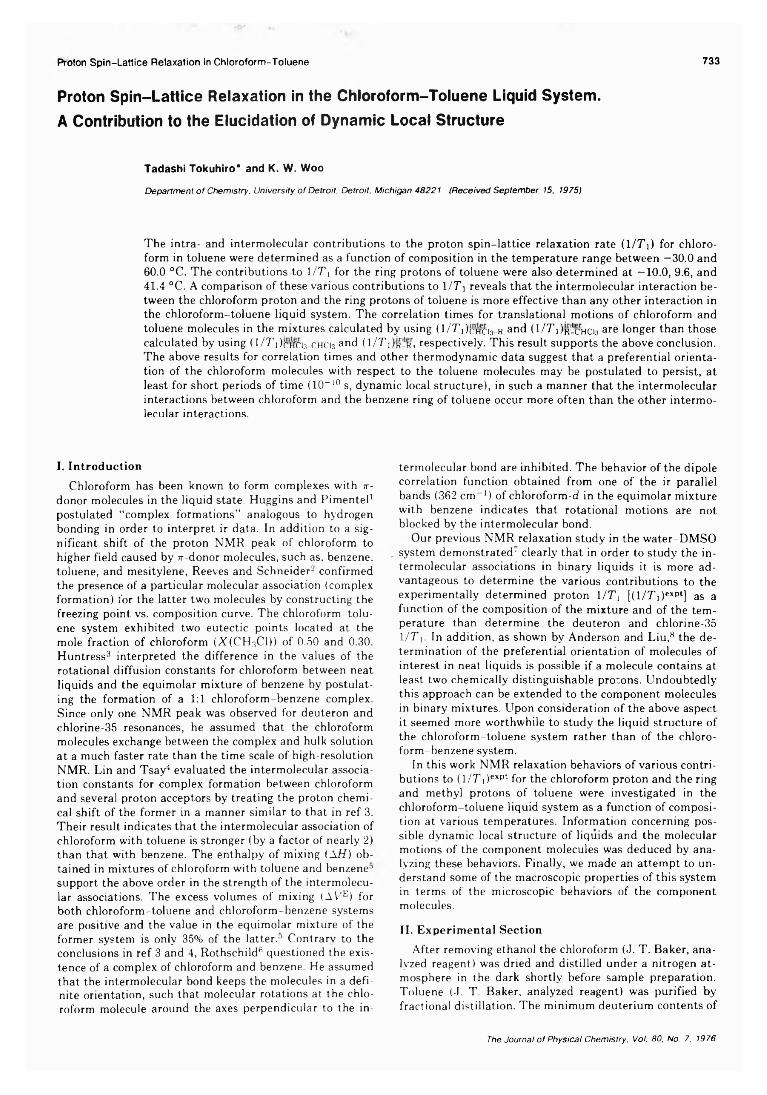
Proton Spin-Lattice Relaxation in Chloroform-Toluene 733
Proton Spin-Lattice Relaxation in the Chloroform-Toluene Liquid System. A Contribution to the Elucidation of Dynamic Local Structure
Tadashi Tokuhiro* and K. W. Woo
Department o f Chemistry. University o f Detroit. Detroit, Michigan 48221 (Received September 15, 1975)
The intra- and intermolecular contributions to the proton spin-lattice relaxation rate (1/Ti) for chloroform in toluene were determined as a function of composition in the temperature range between —30.0 and60.0 °C. The contributions to 1/T i for the ring protons of toluene were also determined at —10.0, 9.6, and41.4 °C. A comparison of these various contributions to 1 IT\ reveals that the intermolecular interaction between the chloroform proton and the ring protons of toluene is more effective than any other interaction in the chloroform-toluene liquid system. The correlation times for translational motions of chloroform and toluene molecules in the mixtures calculated by using (I/TOohc r and (1/T i)r/chci3 are longer than those calculated by using (1/Ti)cHCi3-CHCi3 and (1/T i)r/r, respectively. This result supports the above conclusion. The above results for correlation times and other thermodynamic data suggest that a preferential orientation of the chloroform molecules with respect to the toluene molecules may be postulated to persist, at least for short periods of time (10~10 s, dynamic local structure), in such a manner that the intermolecular interactions between chloroform and the benzene ring of toluene occur more often than the other intermolecular interactions.
I. Introduction
Chloroform has been known to form complexes with w- donor molecules in the liquid state. Huggins and Pimentel1 postulated “complex formations” analogous to hydrogen bonding in order to interpret ir data. In addition to a significant shift of the proton NMR peak of chloroform to higher field caused by 7r-donor molecules, such as. benzene, toluene, and mesitylene, Reeves and Schneider- confirmed the presence of a particular molecular association (complex formation) for the latter two molecules by constructing the freezing point vs. composition curve. The chloroform-toluene system exhibited two eutectic points located at the mole fraction of chloroform (X(CHsCl)) of 0.50 and 0.30. Huntress3 interpreted the difference in the values of the rotational diffusion constants for chloroform between neat liquids and the equimolar mixture of benzene by postulating the formation of a 1:1 chloroform-benzene complex. Since only one NMR peak was observed for deuteron and chlorine-35 resonances, he assumed that the chloroform molecules exchange between the complex and hulk solution at a much faster rate than the time scale of high-resolution NMR. Lin and Tsay4 evaluated the intermolecular association constants for complex formation between chloroform and several proton acceptors by treating the proton chemical shift of the former in a manner similar to that in ref 3. Their result indicates that the intermolecular association of chloroform with toluene is stronger (by a factor of nearly 2) than that with benzene. The enthalpy of mixing (AH ) obtained in mixtures of chloroform with toluene and benzene0 support the above order in the strength of the intermolecular associations. The excess volumes of mixing (Al/E) for both chloroform-toluene and chloroform-benzene systems are positive and the value in the equimolar mixture of the former system is only 35% of the latter.0 Contrary to the conclusions in ref 3 and 4, Rothschild6 questioned the existence of a complex of chloroform and benzene. He assumed that the intermolecular bond keeps the molecules in a definite orientation, such that molecular rotations at the chloroform molecule around the axes perpendicular to the in
termolecular bond are inhibited. The behavior of the dipole correlation function obtained from one of the ir parallel bands (362 cm-1) of chloroform-d in the equimolar mixture with benzene indicates that rotational motions are not blocked by the intermolecular bond.
Our previous NMR relaxation study in the water-DMSO system demonstrated' clearly that in order to study the intermolecular associations in binary liquids it is more advantageous to determine the various contributions to the experimentally determined proton 1/T; [(I/T^^p1] as a function of the composition of the mixture and of the temperature than determine the deuteron and chlorine-35 1/T]. In addition, as shown by Anderson and Liu,8 the determination of the preferential orientation of molecules of interest in neat liquids is possible if a molecule contains at least two chemically distinguishable protons. Undoubtedly this approach can be extended to the component molecules in binary mixtures. Upon consideration of the above aspect it seemed more worthwhile to study the liquid structure of the chloroform-toluene system rather than of the chloroform-benzene system.
In this work NMR relaxation behaviors of various contributions to (1/T 1)exPt for the chloroform proton and the ring and methyl protons of toluene were investigated in the chloroform-toluene liquid system as a function of composition at various temperatures. Information concerning possible dynamic local structure of liquids and the molecular motions of the component molecules was deduced by analyzing these behaviors. Finally, we made an attempt to understand some of the macroscopic properties of this system in terms of the microscopic behaviors of the component molecules.
II. Experimental Section
After removing ethanol the chloroform (J. T. Baker, analyzed reagent) was dried and distilled under a nitrogen atmosphere in the dark shortly before sample preparation. Toluene (J. T. Baker, analyzed reagent) was purified by fractional distillation. The minimum deuterium contents of
The Journal o f Physical Chemistry, Voi. 80, No. 7, 1976
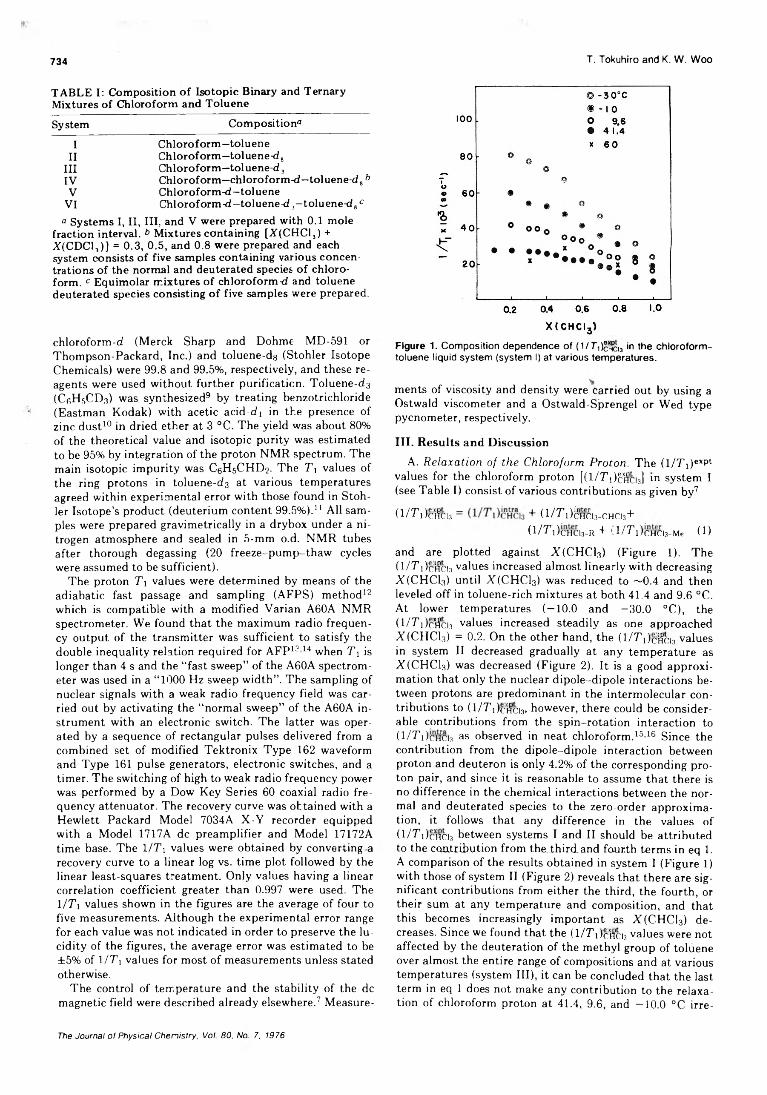
734 T. Tokuhiro and K. W. Woo
TABLE I: Composition o f Isotopic Binary and Ternary Mixtures of Chloroform and TolueneSystem Composition"
I Chloroform—tolueneII Chloroform—toluene-d s
III Chloroform—toluene-d 3IV Chloroform—chloroform-d—toluene-d8ftV Chloroform-d—toluene
VI Chloroform-d—toluene-d 3—toluene-d, ca Systems I, II, III, and V were prepared with 0.1 mole
fraction interval. 6 Mixtures containing [Y(CHC13) + X(CDC13)] = 0.3, 0.5, and 0.8 were prepared and each system consists of five samples containing various concentrations of the normal and deuterated species of chloroform. c Equimolar mixtures of chloroform-d and toluene deuterated species consisting o f five samples were prepared.
chloroform-d (Merck Sharp and Dohme MD-591 or Thompson-Packard, Inc.) and toluene-dg (Stohler Isotope Chemicals) were 99.8 and 99.5%, respectively, and these reagents were used without further purification. Toluene-d3 (C6H5CD3) was synthesized9 by treating benzotrichloride (Eastman Kodak) with acetic acid-di in the presence of zinc dust10 in dried ether at 3 °C. The yield was about 80% of the theoretical value and isotopic purity was estimated to be 95% by integration of the proton NMR spectrum. The main isotopic impurity was C6H5CHD2. The T1 values of the ring protons in toluene-d3 at various temperatures agreed within experimental error with those found in Stohler Isotope’s product (deuterium content 99.5%).11 All samples were prepared gravimetrically in a drybox under a nitrogen atmosphere and sealed in 5-mm o.d. NMR tubes after thorough degassing (20 freeze-pump-thaw cycles were assumed to be sufficient).
The proton T1 values were determined by means of the adiabatic fast passage and sampling (AFPS) method12 which is compatible with a modified Varian A60A NMR spectrometer. We found that the maximum radio frequency output of the transmitter was sufficient to satisfy the double inequality relation required for AFP13>14 when T1 is longer than 4 s and the “fast sweep” of the A60A spectrometer was used in a “1000 Hz sweep width”. The sampling of nuclear signals with a weak radio frequency field was carried out by activating the “normal sweep” of the A60A instrument with an electronic switch. The latter was operated by a sequence of rectangular pulses delivered from a combined set of modified Tektronix Type 162 waveform and Type 161 pulse generators, electronic switches, and a timer. The switching of high to weak radio frequency power was performed by a Dow Key Series 60 coaxial radio frequency attenuator. The recovery curve was obtained with a Hewlett Packard Model 7034A X-Y recorder equipped with a Model 1717A dc preamplifier and Model 17172A time base. The 1/Ti values were obtained by converting a recovery curve to a linear log vs. time plot followed by the linear least-squares treatment. Only values having a linear correlation coefficient greater than 0.997 were used. The 1/Xi values shown in the figures are the average of four to five measurements. Although the experimental error range for each value was not indicated in order to preserve the lucidity of the figures, the average error was estimated to be ±5% of 1 I T 1 values for most of measurements unless stated otherwise.
The control of temperature and the stability of the dc magnetic field were described already elsewhere.7 Measure-
Figure 1. Composition dependence of (1/7"i)Sici3 in the chloroform- toluene liquid system (system I) at various temperatures.
ments of viscosity and density were carried out by using a Ostwald viscometer and a Ostwald-Sjprengel or Wed type pycnometer, respectively.
III. Results and Discussion
A. R ela xa t ion o f th e Chloroform P ro ton . The (I/T xJ^p*- values for the chloroform proton [(l/TOgScij *n system I (see Table I) consist of various contributions as given by7
(l/TOclfch = + (l/7 1t)i?HCI3 -CHC13+( 1 / T i ) c h c i 3_ R + ( l / T l)cHCl3-Me ( 1 )
and are plotted against ATCHCls) (Figure 1). The (l/TDcifcu values increased almost linearly with decreasing X(CHC13) until X(CHC13) was reduced to ~0.4 and then leveled off in toluene-rich mixtures at both 41.4 and 9.6 °C. At lower temperatures (-10.0 and -30.0 °C), the (1/7”i)c1?ci3 values increased steadily as one approached X(CHC13) = 0.2. On the other hand, the (l/Ti)cSci3 values in system II decreased gradually at any temperature as X(CHC13) was decreased (Figure 2). It is a good approximation that only the nuclear dipole-dipole interactions between protons are predominant in the intermolecular contributions to (l/Ti)ci¥ci.v however, there could be considerable contributions from the spin-rotation interaction to (l/Ti)cHci3 as observed in neat chloroform.15-16 Since the contribution from the dipole-dipole interaction between proton and deuteron is only 4.2% of the corresponding proton pair, and since it is reasonable to assume that there is no difference in the chemical interactions between the normal and deuterated species to the zero-order approximation, it follows that any difference in the values of (l/Ti)cr¥ci3 between systems I and II should be attributed to the contribution from the third and fourth terms in eq 1. A comparison of the results obtained in system I (Figure 1) with those of system II (Figure 2) reveals that there are significant contributions from either the third, the fourth, or their sum at any temperature and composition, and that this becomes increasingly important as X(CHC13) decreases. Since we found that the (l/TOcffcb values were not affected by the deuteration of the methyl group of toluene over almost the entire range of compositions and at various temperatures (system III), it can be concluded that the last term in eq 1 does not make any contribution to the relaxation of chloroform proton at 41.4, 9.6, and -10.0 °C irre-
The Journal o f Physical Chemistry, Vol. 80, No. 7, 1976
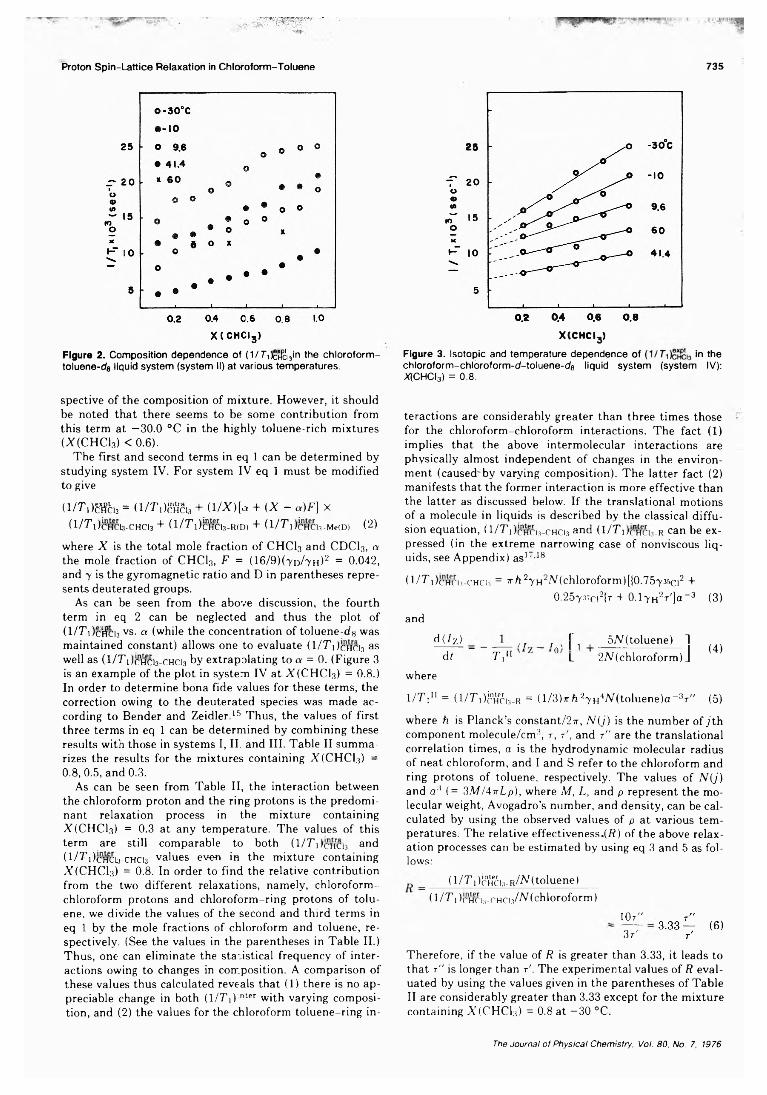
Proton Spin-Lattice Relaxation in Chloroform-Toluene 735
Figure 2. Composition dependence of (1/ Ti)cïféi3in the chloroform- toluene-ds liquid system (system II) at various temperatures.
X(CHCI3)
Figure 3. Isotopic and temperature dependence of in thechloroform-chloroform-d-toluene-da liquid system (system IV): X(CHCI3) = 0 .8 .
spective of the composition of mixture. However, it should be noted that there seems to be some contribution from this term at —30.0 °C in the highly toluene-rich mixtures (X(CHC13) < 0.6).
The first and second terms in eq 1 can be determined by studying system IV. For system IV eq 1 must be modified to give
(l/7\)8&>3 = (1 /TOiSSSb + (1/X)[a + (X - a)F] X (1 I T l)cHCLi-CHC1.3 + (1 I T l)cHCl3-R(D) + (1 I T l)cHCU-M e(D) (2)
where X is the total mole fraction of CHCI3 and CDCI3, a the mole fraction of CHC13, F = (16/9)(7d/ 7 h)2 = 0.042, and 7 is the gyromagnetic ratio and D in parentheses represents deuterated groups.
As can be seen from the above discussion, the fourth term in eq 2 can be neglected and thus the plot of (1/Ti)cffc,3 vs. a (while the concentration of toluene-dg was maintained constant) allows one to evaluate (1/T i Jchcis as well as (1/T i)chci3-chci3 by extrapolating to a = 0. (Figure 3 is an example of the plot in system IV at X(CHC13) = 0.8.) In order to determine bona fide values for these terms, the correction owing to the deuterated species was made according to Bender and Zeidler.15 Thus, the values of first three terms in eq 1 can be determined by combining these results with those in systems I, II. and III. Table II summarizes the results for the mixtures containing X(CHC13) =0.8, 0.5, and 0.3.
As can be seen from Table II, the interaction between the chloroform proton and the ring protons is the predominant relaxation process in the mixture containing X(CHCl3) = 0.3 at any temperature. The values of this term are still comparable to both (1/T i)chci3 and ( l /í ’i)cHCi3-CHCi3 values even in the mixture containing X(CHCls) = 0.8. In order to find the relative contribution from the two different relaxations, namely, chloroform- chloroform protons and chloroform-ring protons of toluene, we divide the values of the second and third terms in eq 1 by the mole fractions of chloroform and toluene, respectively. (See the values in the parentheses in Table II.) Thus, one can eliminate the statistical frequency of interactions owing to changes in composition. A comparison of these values thus calculated reveals that (1) there is no appreciable change in both (1/Ti) nter with varying composition, and (2) the values for the chloroform toluene-ring in
teractions are considerably greater than three times those for the chloroform-chloroform interactions. The fact (1) implies that the above intermolecular interactions are physically almost independent of changes in the environment (caused' by varying composition). The latter fact (2) manifests that the former interaction is more effective than the latter as discussed below. If the translational motions of a molecule in liquids is described by the classical diffusion equation, (1/T i)chci3-chci3 and (l/T 1)cnHci3_R can be expressed (in the extreme narrowing case of nonviscous liquids, see Appendix) as1,18
(1/T i)chci3-chci3 = Trh27H2Ar(chloroform)[(0.7573.3Q2 +0.25737ci2|t + 0.l7H2r']a-3 (3)
and
d ( /7 ) _____ — /i T \ |~i i 5/V(toluene) 1df T in ° L 2N(chloroform)J
where
(4)
1/T !* 11 = ( I /T O & V r = (l/3)7rh27H4X(toluene)a-3r" (5)
where h is Planck’s constant/2ir, N ( j ) is the number of j t h component molecule/cm3, r, r', and r" are the translational correlation times, a is the hydrodynamic molecular radius of neat chloroform, and I and S refer to the chloroform and ring protons of toluene, respectively. The values of N ( j ) and a3 (= S M / irL p ) , where M, L, and p represent the molecular weight, Avogadro’s number, and density, can be calculated by using the observed values of p at various temperatures. The relative effectiveness. (R) of the above relaxation processes can be estimated by using eq 3 and 5 as follows:
(l/Ti)hnffi-i3_R/N(toluene)(1/T llcHCh-CHCis/Nlehloroform)
__ 10r^3t'
(6)
Therefore, if the value of R is greater than 3.33, it leads to that t" is longer than r'. The experimental values of R evaluated by using the values given in the parentheses of TableII are considerably greater than 3.33 except for the mixture containing X (CHCI3) = 0.8 at —30 °C.
The Journal o f Physical Chemistry, Vol. 80, No. 7, 1976
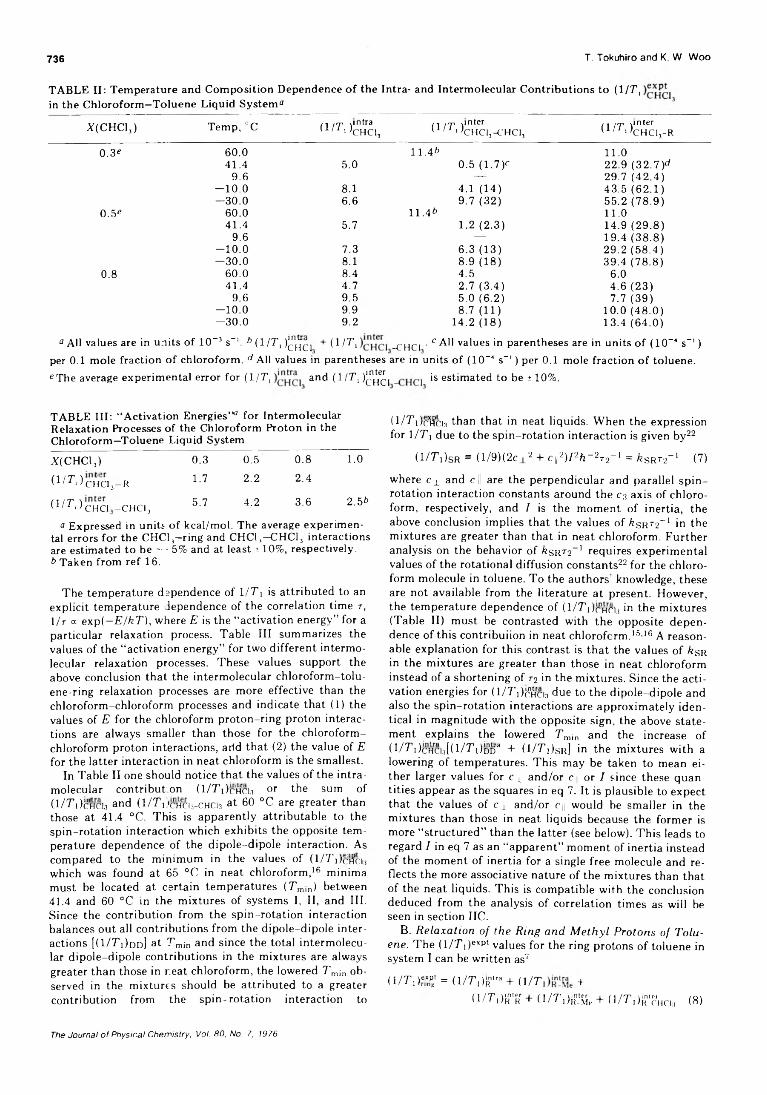
736 T. Tokuhiro and K. W. W oo
TABLE II: Temperature and Composition Dependence of the Intra- and Intermolecular Contributions to (1/T, in the Chloroform-Toluene Liquid System0
X(CHC13) Temp, °C (1/T )intra1 1 1 jCHC13 ( 1 /T )inter 1 ' 1 «CHC13-CHC13 (1 IT ),nter1 1 '«CHCI3-R
0 .3 ° 6 0 .0 11 .4« ’ 1 1 . 04 1 .4 5 .0 0 .5 (1 .7 ) ° 22 .9 ( 3 2 .7 ) d
9 .6 — 29 .7 ( 4 2 .4 )- 1 0 .0 8.1 4.1 (1 4 ) 4 3 .5 ( 6 2 .1 )— 3 0 .0 6.6 9 .7 (3 2 ) 5 5 .2 ( 7 8 .9 )
0.5e 6 0 .0 1 1 .4 * 1 1 . 04 1 .4 5.7 1 .2 (2 .3 ) 14 .9 ( 2 9 .8 )
9 .6 — 1 9 .4 ( 3 8 .8 )- 10 .0 7.3 6 .3 (1 3 ) 2 9 .2 ( 5 8 .4 )- 3 0 . 0 8.1 8 .9 (1 8 ) 3 9 .4 ( 7 8 .8 )
0.8 6 0 .0 8 .4 4 .5 6.04 1 .4 4 .7 2 .7 (3 .4 ) 4 .6 (2 3 )
9 .6 9 .5 5 .0 (6 .2 ) 7 .7 (3 9 )-1 0 .0 9.9 8 .7 (11) 1 0 .0 ( 4 8 .0 )- 3 0 . 0 9 .2 1 4 .2 (1 8 ) 1 3 .4 ( 6 4 .0 )
0 All values are in units of 10-3 s- '. * (1/T , )[^C] + (1/T , _£HC1 • c All values in parentheses are in units of (10-4 s~ ')per 0.1 mole fraction of chloroform. d All values in parentheses are in units of (10-< s_ l ) per 0.1 mole fraction of toluene. °The average experimental error for (1/T , and (1/T , ) ^ e| is estimated to be ± 10%.
TABLE III: “ Activation Energies”0 for Intermolecular Relaxation Processes of the Chloroform Proton in the Chloroform-Toluene Liquid System
A(CHC13) 0.3 0.5 0.8 1.0
( I / ^ cAcL-R 1.7 2.2 2.4
(1/T, ) CHa —CHC13 5.7 4.2 3.6 2.5*
0 Expressed in units of kcal/mol. The average experimental errors for the CHCl3-ring and CHC1,-CHC13 interactions are estimated to be ~±5% and at least ±10%, respectively.* Taken from ref 16.
The temperature dependence of 1/Ti is attributed to an explicit temperature dependence of the correlation time r, l /r cc exp(-E/kT), where E is the “ activation energy” for a particular relaxation process. Table III summarizes the values of the “ activation energy” for two different intermolecular relaxation processes. These values support the above conclusion that the intermolecular chloroform-toluene-ring relaxation processes are more effective than the chloroform-chloroform processes and indicate that (1 ) the values of E for the chloroform proton-ring proton interactions are always smaller than those for the chloroform- chloroform proton interactions, arid that (2) the value of E for the latter interaction in neat chloroform is the smallest.
In Table II one should notice that the values of the intramolecular contribution (l/TOciicb or the sum of ( l /7”i)tnHCi3 and (1/T, 'cHCb-CHCb at 60 °C are greater than those at 41.4 °C. This is apparently attributable to the spin-rotation interaction which exhibits the opposite temperature dependence of the dipole-dipole interaction. As compared to the minimum in the values of (1/Ti)cifci:i which was found at 65 °C in neat chloroform,16 minima must be located at certain temperatures (Tmjn) between41.4 and 60 °C in the mixtures of systems I, II, and III. Since the contribution from the spin-rotation interaction balances out all contributions from the dipole-dipole interactions [(1/TO dd] at Tm¡n and since the total intermolecular dipole-dipole contributions in the mixtures are always greater than those in r.eat chloroform, the lowered Tmin observed in the mixtures should be attributed to a greater contribution from the spin-rotation interaction to
(l/TOcWcis than that in neat liquids. When the expression for 1/T i due to the spin-rotation interaction is given by22
( 1 / T , ) s r = (1 /9) (2c 2 + c\\2)Ph~2T2~' = &sRr2-1 (7)
where c± and c|| are the perpendicular and parallel spin- rotation interaction constants around the cs axis of chloroform, respectively, and I is the moment of inertia, the above conclusion implies that the values of &SRr2_1 in the mixtures are greater than that in neat chloroform. Further analysis on the behavior of &srt2-1 requires experimental values of the rotational diffusion constants22 for the chloroform molecule in toluene. To the authors knowledge, these are not available from the literature at present. However, the temperature dependence of (1/T i)chci:i in the mixtures (Table II) must be contrasted with the opposite dependence of this contribuiion in neat chloroform.15-16 A reasonable explanation for this contrast is that the values of /?sr in the mixtures are greater than those in neat chloroform instead of a shortening of r2 in the mixtures. Since the activation energies for (l/TOgifcb due to the dipole-dipole and also the spin-rotation interactions are approximately identical in magnitude with the opposite sign, the above statement explains the lowered Tmin and the increase of (1/T i)chci3[(1/Ti)oi)ra + (1 /T j)sr] in the mixtures with a lowering of temperatures. This may be taken to mean either larger values for c x and/or C|j or / since these quantities appear as the squares in eq 7. It is plausible to expect that the values of c± and/or cj would be smaller in the mixtures than those in neat liquids because the former is more “ structured” than the latter (see below). This leads to regard I in eq 7 as an “ apparent” moment of inertia instead of the moment of inertia for a single free molecule and reflects the more associative nature of the mixtures than that of the neat liquids. This is compatible with the conclusion deduced from the analysis of correlation times as will be seen in section IIC.
B. Relaxation of the Ring and Methyl Protons of Toluene. The (l/T i)exPt values for the ring protons of toluene in system I can be written as7
(1 /T ,)”n‘ = ( 1 /T , ) r a + (1 /T +
(1 /T ,)n r + (l/T,)j£Se + U/r,)i?'FHcia (8)
The Journal o f Physical Chemistry, Vol. 80, No. 7, 1976
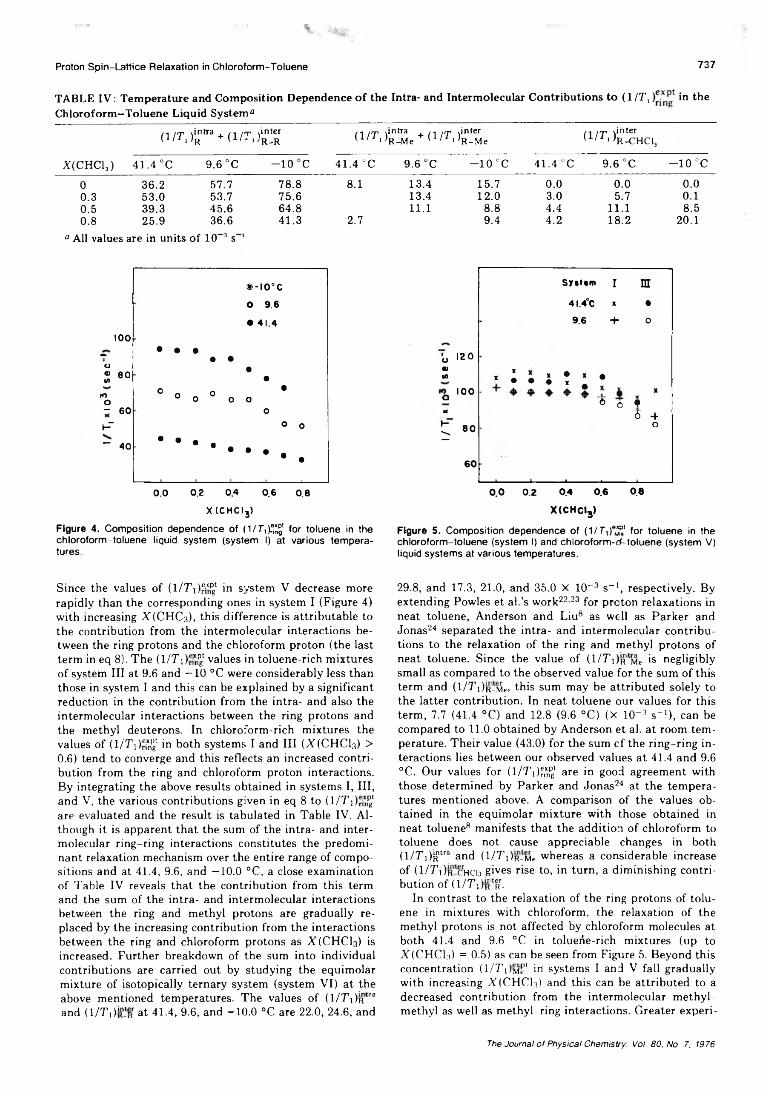
Proton S p in -L a ttice R elaxation in C h lo ro fo rm -T o luene 737
TABLE IV : Temperature and Composition Dependence of the Intra- and Intermolecular Contributions to (1 /T, in theChloroform-Toluene Liquid System0
X(CHC13)
(1 IT, )'Rntra + (l /T , .inter'r- r (1 /T )intra + ( 1 /T ) inter ‘ 'R-Me ' ' ‘ *R-Me (1 /T linter ' ' ‘ ^R-CHClj
41.4 °C 9.6 °C
UOT—1 1 41.4 "C 9.6 °C - 1 0 CC 41.4 °C 9.6 °C - 1 0 °C
0 36.2 57.7 78.8 8.1 13.4 15.7 0.0 0.0 0.00.3 53.0 53.7 75.6 13.4 12.0 3.0 5.7 0.10.5 39.3 45.6 64.8 11.1 8.8 4.4 11.1 8.50.8 25.9 36.6 41.3 2.7 9.4 4.2 18.2 20.1
a All values are in units of 10 3 s 1
®-IO°CO 9.6• 41.4
too• • •T • •O
• 80CD•
•fOO
O O O O O O
•
- 60 0H- O 0
• 40
------
---1 • • • • • • • • •
0.0 0.2 0.4 0.6 0.8X(CHCI3)
Figure 4. Composition dependence of ( l /T i ) ^ for toluene in the chloroform-toluene liquid system (system I) at various temperatures.
Sy*t«m I m
4I.4°C » •9.6 + O
■o 12 0o>(A « i • ; : ; •
100O * 0 ?X 5 +
1/T 00 0 0
60__L . 1_____ 1_____ 1_____ »
0.0 0.2 0.4 0.6 0.6X(CHCI3)
Figure 5. Composition dependence of (1/Ti)0 ' for toluene in the chloroform-toluene (system I) and chloroform-cMoluene (system V) liquid systems at various temperatures.
Since the values of ( l /T i )®- 1 in system V decrease more rapidly than the corresponding ones in system I (Figure 4) with increasing X (CHC3), this difference is attributable to the contribution from the intermolecular interactions between the ring protons and the chloroform proton (the last term in eq 8). The (l/T i),*^ values in toluene-rich mixtures of system III at 9.6 and —10 °C were considerably less than those in system I and this can be explained by a significant reduction in the contribution from the intra- and also the intermolecular interactions between the ring protons and the methyl deuterons. In chloroform-rich mixtures the values of (l/TO'S^ in both systems I and III (XfCHCla) > 0.6) tend to converge and this reflects an increased contribution from the ring and chloroform proton interactions. By integrating the above results obtained in systems I, III, and V, the various contributions given in eq 8 to (l/T i),*^ are evaluated and the result is tabulated in Table IV. Although it is apparent that the sum of the intra- and intermolecular ring-ring interactions constitutes the predominant relaxation mechanism over the entire range of compositions and at 41.4, 9.6, and —10.0 °C, a close examination of Table IV reveals that the contribution from this term and the sum of the intra- and intermolecular interactions between the ring and methyl protons are gradually replaced by the increasing contribution from the interactions between the ring and chloroform protons as X (CHCI3) is increased. Further breakdown of the sum into individual contributions are carried out by studying the equimolar mixture of isotopically ternary system (system VI) at the above mentioned temperatures. The values of ( l /T 1)Rtra and (1/T l)j"_tpir at 41.4, 9.6, and -10.0 °C are 22.0, 24.6, and
29.8, and 17.3, 21.0, and 35.0 X 10⁻³ s_1, respectively. By extending Powles et al.’s work22-23 for proton relaxations in neat toluene, Anderson and Liu8 as well as Parker and Jonas24 separated the intra- and intermolecular contributions to the relaxation of the ring and methyl protons of neat toluene. Since the value of (1/T i)r!mc is negligibly small as compared to the observed value for the sum of this term and (1/7 iIrIm«», this sum may be attributed solely to the latter contribution. In neat toluene our values for this term, 7.7 (41.4 °C) and 12.8 (9.6 °C) (X 10-3 s_1), can be compared to 11.0 obtained by Anderson et al. at room temperature. Their value (43.0) for the sum cf the ring-ring interactions lies between our observed values at 41.4 and 9.6 °C. Our values for ( l /T i ) ^ 1 are in good agreement with those determined by Parker and Jonas24 at the temperatures mentioned above. A comparison of the values obtained in the equimolar mixture with those obtained in neat toluene8 manifests that the addition of chloroform to toluene does not cause appreciable changes in both (l/T,)Kntra and (l/TOp^Me whereas a considerable increase of (1/T i)r ‘chc13 gives rise to, in turn, a diminishing contribution of (I/TO r^ -
In contrast to the relaxation of the ring protons of toluene in mixtures with chloroform, the relaxation of the methyl protons is not affected by chloroform molecules at both 41.4 and 9.6 °C in toluene-rich mixtures (up to X(CHCl:i) = 0.5) as can be seen from Figure 5. Beyond this concentration (I/TO mI” in systems I and V fall gradually with increasing X (CHCD and this can be attributed to a decreased contribution from the intermolecular methyl- methyl as well as methyl-ring interactions. Greater experi-
The Journal o f Physical Chemistry, Voi 80, No. 7, 1976
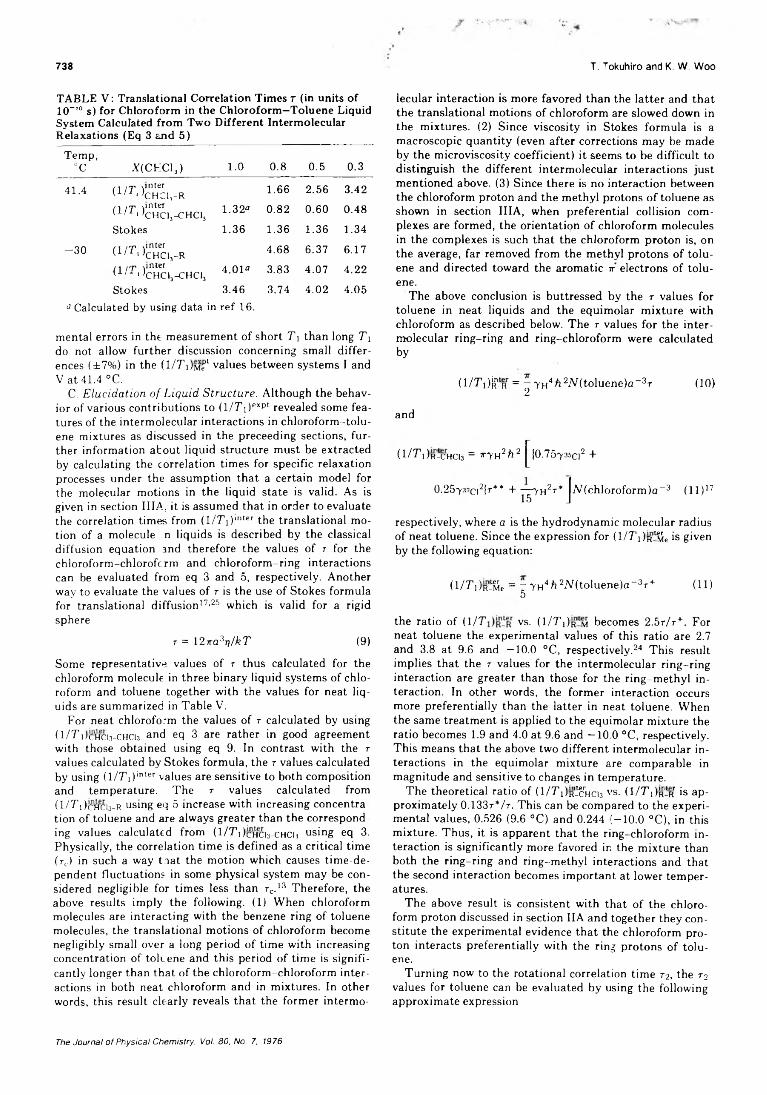
738
TABLE V : Translational Correlation Times r (in units of 10“ 10 s) for Chloroform in the Chloroform—Toluene Liquid System Calculated from Two Different Intermolecular Relaxations (Eq 3 and 5)
Temp,°C X(CKC13) 1.0 0 . 8 0.5 0.3
41.4 (1 ¡T Vnter 1 ' 1 'CHC1,-R 1 . 6 6 2.56 3.42
(1 i t iinterU/J , jChci3 -chci31.32a 0.82 0.60 0.48
Stokes 1.36 1.36 1.36 1.34
-3 0 11 IT Vntery ' 1 'CHCI3 -R 4.68 6.37 6.17
Cl I T Vnter(±l 1 ^CHC -CHCb 4.01a 3.83 4.07 4.22
Stokes 3.46 3.74 4.02 4.05a Calculated by using data in ref 16.
mental errors in the measurement of short Ti than long Ti do not allow further discussion concerning small differences (±7%) in the (1/TOm?1 values between systems I and Vat 41.4 °C.
C. Elucidation of Liquid Structure. Although the behavior of various contributions to ( l/7 '1)exPt revealed some features of the intermolecular interactions in chloroform-toluene mixtures as discussed in the preceeding sections, further information about liquid structure must be extracted by calculating the correlation times for specific relaxation processes under the assumption that a certain model for the molecular motions in the liquid state is valid. As is given in section 111A, it is assumed that in order to evaluate the correlation times from (1/T i)lnter the translational motion of a molecule :n liquids is described by the classical diffusion equation and therefore the values of r for the chloroform-chlorofcrm and chloroform-ring interactions can be evaluated from eq 3 and 5, respectively. Another way to evaluate the values of r is the use of Stokes formula for translational diffusion17’25 which is valid for a rigid sphere
r = l2ira3ri/kT (9)
Some representative values of r thus calculated for the chloroform molecule in three binary liquid systems of chloroform and toluene together with the values for neat liquids are summarized in Table V.
For neat chloroform the values of r calculated by using (l/Ti)cHCi3-CHCi3 and eQ 3 are rather in good agreement with those obtained using eq 9. In contrast with the r values calculated by Stokes formula, the r values calculated by using (1/T i)inter values are sensitive to both composition and temperature. The r values calculated from ( 1 / T i )c h c i3-r using eq 5 increase with increasing concentration of toluene and are always greater than the corresponding values calculated from (I/TO chc^ chci, using eq 3. Physically, the correlation time is defined as a critical time (tc) in such a way tnat the motion which causes time-dependent fluctuations in some physical system may be considered negligible for times less than rc.13 Therefore, the above results imply the following. (1) When chloroform molecules are interacting with the benzene ring of toluene molecules, the translational motions of chloroform become negligibly small over a long period of time with increasing concentration of toluene and this period of time is significantly longer than that of the chloroform-chloroform interactions in both neat chloroform and in mixtures. In other words, this result clearly reveals that the former intermo
lecular interaction is more favored than the latter and that the translational motions of chloroform are slowed down in the mixtures. (2) Since viscosity in Stokes formula is a macroscopic quantity (even after corrections may be made by the microviscosity coefficient) it seems to be difficult to distinguish the different intermolecular interactions just mentioned above. (3) Since there is no interaction between the chloroform proton and the methyl protons of toluene as shown in section IIIA, when preferential collision complexes are formed, the orientation of chloroform molecules in the complexes is such that the chloroform proton is, on the average, far removed from the methyl protons of toluene and directed toward the aromatic r electrons of toluene.
The above conclusion is buttressed by the r values for toluene in neat liquids and the equimolar mixture with chloroform as described below. The r values for the intermolecular ring-ring and ring-chloroform were calculatedby
(1/T i)¡?_tR = ^ 7 H4fc2/V(toluene)a-3T (10)
and
(1/T i)r/chci3 = Tr~m2h2 |jo.75735ci2 +
0.2573-C|2|t** H----- yh2t* |iV(chloroform)a-3 (11)1715 J
respectively, where a is the hydrodynamic molecular radius of neat toluene. Since the expression for (I /T iIr1 ,, is given by the following equation:
(l/T ’OR-tie = 7 7 H4ft2N(toluene)a“ 3r+ (11)5
the ratio of (1/ T v s . (1/T i)r‘m becomes 2.5r/r+. For neat toluene the experimental values of this ratio are 2.7 and 3.8 at 9.6 and —10.0 °C, respectively.24 This result implies that the r values for the intermolecular ring-ring interaction are greater than those for the ring-methyl interaction. In other words, the former interaction occurs more preferentially than the latter in neat toluene. When the same treatment is applied to the equimolar mixture the ratio becomes 1.9 and 4.0 at 9.6 and —10.0 °C, respectively. This means that the above two different intermolecular interactions in the equimolar mixture are comparable in magnitude and sensitive to changes in temperature.
The theoretical ratio of ( I / T O r ^ h c ^ v s . (I /T ^ r r is approximately 0.133t*/t. This can be compared to the experimental values, 0.526 (9.6 °C) and 0.244 {-10.0 °C), in this mixture. Thus, it is apparent that the ring-chloroform interaction is significantly more favored in the mixture than both the ring-ring and ring-methyl interactions and that the second interaction becomes important at lower temperatures.
The above result is consistent with that of the chloroform proton discussed in section IIA and together they constitute the experimental evidence that the chloroform proton interacts preferentially with the ring protons of toluene.
Turning now to the rotational correlation time ra, the r2 values for toluene can be evaluated by using the following approximate expression
T. Tokuhiro and K. W. Woo
The Journal of Physical Chemistry, Vol. 80, No. 7, 1976
6th4h 2b -« T 2 (12)
The T2 values in the equimolar mixture (1.5 and 1.7 X 10“ 12 s at 41.4 and 9.6 °C, respectively) can be compared to 2.2 at 25 °C in neat toluene,26 2.64 at 30 °C determined from deu- teron 1 IT i in neat toluene-4-di,25 and 2.34 (12 °C) and 1.69 (40 °C) determined from deuteron 1/T \ in neat toluene- d s-27 The activation energy for this relaxation process in the equimolar mixture was 1.08 kcal/mol as compared to1.18 in neat toluene.26 As discussed on other occasions concerning rotational motions of molecules in liquids25 we found also a large discrepancy in the T2 values obtained above and those calculated by Stokes equation (r2 = 4,-trqa3/ 3&T).17 This discrepancy is reflected in the values of correction factor k introduced by Kivelson et al.28’29 For the toluene molecule in the equimolar mixture k was found to be 0.07, 0.05, and 0.05 at 41.4, 9.6, and —10 °C, respectively. This can be compared to 0.18 at 30 °C for neat toluene;4- d \ . This result for k indicates that the rotational motions of toluene are affected considerably by the interaction of chloroform.
The inseparability of the contributions from the dipole- dipole and the spin-rotation interactions to (1 /T i)chci3 makes a comparison of the T2 values in the mixtures with those in neat chloroform15’16’30-31 impossible. It seems to be important to determine (1/T i)cdci3 for deuteron and chlorine-35 in toluene to study the rotational motions of this molecule in binary mixtures.
Since it was found that the chloroform proton interacts preferentially with the ring protons of toluene in their mixtures, it seems worthwhile to interpret the relaxation behaviors of the chloroform and ring protons under the assumption that associated forms (1:1 complex) of these molecules have a certain lifetime. In order to interpret concentration dependence of chloroform proton chemical shifts due to donor molecules such as benzene and toluene Lin and Tsay4 assumed that there is a chemical equilibrium between the unassociated and associated forms (1:1 complex) of the proton donor and acceptor. They pointed out that their treatment to evaluate the intermolecular association constant (0.69 mole fraction-1) for the chloroform-toluene system is applicable to the concentration range X(CHCla)= ~0 to 0.35. If this treatment (fast exchange limit)32 may be extended to 1/T i evaluation for the complex (as used by Huntress3 for the chloroform-benzene system), the composition dependence of (l/Ti)ÍCffci3-R must be predicted from the mole fraction of the complex in the mixtures since this contribution should be attributed exclusively to the complex in this treatment and since it is entirely possible to estimate the mole fraction of the complex from the association constant. Simple manipulations demonstrate clearly that this is actually not the case, i.e., the observed values of (1 /T i)chci3-r decrease with increasing X(CHCl3), and, on the other hand, the predicted values in the mixtures containing XICHCL) = 0.2 and 0.3 increase significantly (by a factor of 2-3) from that in the mixture with XiCH CD =0.1. Therefore, it seems difficult to describe the physical nature of this liquid system in terms of the chemical equilibrium between two component molecules and the 1:1 complex. This conclusion favors the previous conclusion by ir in the chloroform-benzene liquid system6 (see section I).
Finally, we will attempt to explain some of the macroscopic behaviors of this system on the basis of the results obtained in this study. It is known, in general, that a negative AH is associated with a volume contraction.33 As men
Proton Spin-Lattice Reiaxation in Chloroform-Toluene
tioned in section I, however, this liquid system exhibits a negative AH and a positive AVE. The former implies that the heteromolecular interactions are stronger than the homomolecular ones and the present study by proton T i clearly supports this argument. Composition and temperature dependence of excess viscosity (Atj)34 of this liquid system is also compatible with the above behavior, i.e., A77 exhibits the positive maxima at X (CHCI3 ) ~ 0.5. The average radii of molecules estimated from the density of neat liquids, by using the relation a 3 = 3M/4-xTp, are 3.2, 3.5, and 3.3 Á for chloroform, toluene, and benzene, respectively (41.4 °C). The molecular radius of the chloroform molecule, including electron clouds may be calculated from the bond distances, bond angles, and van der Waals radii of atoms, is found to be ~1.67 Á which is about 52% of the value obtained above. The toluene molecule has a planar benzene ring with a rather bulky methyl group and one- half of the longest molecular axis (r) is ~4.3 Á which is about 23% larger than the value obtained above. The corresponding value for benzene molecule is ~3.8 Á. The thickness of these two molecules (r') is ~ 2.0 Á.
In order to explain how large toluene molecules occupy a volume which is almost comparable to that of chloroform in the liquid state according to the above estimates, one must consider local liquid structure. This seems possible by postulating that toluene molecules line up in a layered structure in such a way that the intermolecular ring proton interactions are occurring more often than the intermolecular ring-methyl proton interactions. Thus, the reduction of volume along the direction perpendicular to the benzene ring would bring the “ average” value for the radius of a sphere to a smaller value than is expected from the size of a single molecule. The experimental results for various contributions to (1/T i)riríg shown above seem compatible with this postulated local liquid structure in neat toluene. The x-ray scattering experiment35 and the local liquid structure calculated by intermolecular pair correlations36 in neat benzene suggest that the nearest neighbor molecules tend to be perpendicular to one another. The values of a, r, and r' for neat benzene calculated above seem to reflect the suggested local liquid structure and to explain the difference from neat toluene. When chloroform was added to toluene, according to our results for proton (1/T i)lnter and the postulated local liquid structure in neat toluene, the chloroform molecules will squeeze into intermolecular layers of the benzene rings of the toluene molecules resulting in an increase of volume of mixing (positive AV/E). This situation seems to occur in the chloroform-benzene liquid system,i.e., (1 ) AVE is positive3 and (2) the proton (l/Ti)gSci3 value (0.056 s_1) at 9.6 °C in the equimolar mixture is significantly greater than that in neat chloroform. This should be due to the intermolecular interaction between the ring and chloroform protons. It should be mentioned that the above postulated local liquid structure in the chloroform- toluene liquid system emphasizes too strongly the static aspect of the liquid structure because there are appreciable amounts of other intermolecular interactions. However, it is plausible to postulate that a preferential orientation of the component molecules persists during a short period of time (~ 10-10 s, dynamic local structure) as represented by the correlation times in the chloroform-toluene liquid system. More “ structuring” (longer correlation times, see Table V) at lower temperatures seems favorable for the above postulated dynamic local structure which explains greater positive and negative values of AVE and AH at
739
The Journal o f Physical Chemistry, Vol.SO. No 7, 1976
740 T. Tokuhiro and K. W. Woo
lower temperatures, respectively;6 for example, we found that the AVE values in the equimolar mixture were 0.1 (41.4 °C), 0.25 (9.6 °C), and 0.36 (-30.0 °C) cm3/mol.
Acknowledgment. The authors are grateful to ProfessorsH. H. Szmant and J. C. Philips of this Department for their valuable comment on the synthesis of toluene-da. The authors are also indebted to Professor Szmant for his careful reading of the manuscript with valuable comments.
Appendix
When unlike spins, I and S, are coupled by magnetic dipole-dipole interaction, time dependence of the longitudinal magnetization (proportional to the ensemble average for the z component of spin /, </z>) can be written as the coupled equations13
d(h)/dt = - « /* > - Iq)/T i11 - (<SZ> - So)/7Vs (Al)
where / o is the magnetization in thermal equilibrium and the explicit forms for 7V 1 and T iIS are given in ref 13a. An equation for d(Sz)/df can be written similarly to eq Al. When AFP is applied to one of the nuclei in a heteronu- clear system such as the proton-deuteron coupling, only </z > becomes — 7o and, therefore, there is no contribution from the second term of eq A l to d(Iz)/dt, i.e., there is no effect of the magnetization of the other nucleus (S) on d ( /z)/dt under this experimental condition. This is the case for chloroform protons in systems II and IV. Consider a homonuclear coupling system in which I and S represent the nuclear spins occupying two chemically different sites. In our case, for example, I and S designate the nuclear spins of the chloroform proton and the ring protons of toluene, respectively. Immediately after AFP, ( /z ) becomes —7o, at the same time, (Sz> also becomes —So under the present experimental condition. Therefore, d(Iz)/dt is influenced by the magnetization of S through the second term of eq Al. This is the case for the intermolecular interaction between the chloroform proton and ring protons of toluene, i.e., the third term in eq 1 and the fifth term in eq8. The relative contribution from the first and second terms in eq A l can be estimated as follows. Under conditions of extreme narrowing the ratio R = (1/T \n)/(l/T iIS) is 2.13 Since (Sz — So) is approximately given by
(Sz — So) »5A(toluene)
N (chloroform) (h ~ Io)
eq Al becomes
d (/2 )/d i “ _ 7V 1 {‘ z ~ +5N(toluene) I
2iV(chloroform) J (A2)
Equation A2 is nothing but eq 4. For chloroform-toluene liquid mixtures with X(CHClo) = 0.2, 0.5, and 0.8, the
values for the entity in square bracket are 1 + 10, 1 + 2.5, and 1 + 0.625, respectively. This demonstrates how the magnetization of the ring protons (<SZ) — So) contribute to the time dependence of chloroform proton (d (/z)/dt) with varying X (CHCI3).
References and Notes
(1) C. H. Huggins and G. C. Pimentel, J. Chem. Phys., 23, 896 (1955).(2) L. W. Reeves and W. G. Schneider, Can. J. Chem., 35, 251 (1957).(3) W. T. Huntress, Jr., J. Phys. Chem., 73, 103 (1969).(4) W-C. Lin and S-j Tsay, J. Phys. Chem., 74, 1037 (1970).(5) R. P. Rastogi, J. Nath, and R. R. Misra, J. Chem. Thermodyn., 3, 307
(1971).(6 ) W. G. Rothschild, Chem. Phys. Lett., 9, 149 (1971).(7) T. Tokuhiro, L. Menafra, and H. H. Szmant, J. Chem. Phys., 61, 2275
(1974).(8 ) J. E. Anderson and K. J. Liu, J. Chem. Phys., 45, 4744 (1966).(9) R. Renald and L. C. Leitch, Can. J. Chem., 34, 98 (1956).
(10) L. F. Fieser, “Reagents for Organic Synthesis", Vol. 1, Wiley New York, N.Y., 1967, p 1276.
(11) The gift of toluene-d3 (0.5 g) from Stohler Isotope Chemicals is gratefully acknowledged.
(12) J. E. Anderson, J. Steele, and A. Warnick, Rev. Sci. Instrum., 38, 1139(1967).
(13) (a) A. Abragam, “ Principles of Nuclear Magnetism” Oxford University Press, London 1961, Chapter III; (b) C. P. Slichter, "Principles of Magnetic Resonance", Harper and Row, New York, N.Y., 1963, Chapter V.
(14) J. G. Powles, Proc. Phys. Soc. London, 71, 497 (1958).(15) H. J. Bender and M. D. Zeidler, Ber. Bunsenges. Phys. Chem., 75, 236
(1971) .(16) Dinesh and M. T. Rogers, J. Chem. Phys., 56, 542 (1972). There are in
correct numerical factors in eq 4 of ref 16 Hence, the calculated values of 1 0 0 0 /T,d inter in Table III in this reference must be multiplied by a factor of 1/ 2 .
(17) Reference 13a, Chapter VIII, Section E, pp 289-302.(18) Since the values of self-diffusion constants for chloroform and toluene
in their mixtures are not known to the authors’ knowledge, Torry's formulation19 and its modification20-21 for 1/T , due to translational motions were not used.
(19) H. C. Torry, Phys. Rev., 92, 962 (1953).(20) J. F. Harmon and B. H. Muller, Phys. Rev., 182, 400 (1969)(21) B. H. Muller, Phys. Lett., 22, 123 (1966).(22) D. K. Green and J. G. Powles, Proc. Phys. Soc. London, 85, 87 (1965).(23) J. G. Powles and D. J. Neale, Proc. Phys. Soc. London, 77, 737 (1961).(24) R. G. Parker and J. Jonas, J. Magn. Reson., 6 , 106 (1972).(25) R. A. Assink, J. DeZwaan, and J. Jonas, J. Chem. Phys., 56, 4975
(1972) .(26) D. E. O’Reilly and E. M. Peterson, J. Chem. Phys., 56, 2262 (1972).(27) D. E. Woessner and B. S. Snowden, Jr., Adv. Mol. Relaxation Pro
cesses, 3, 181 (1972).(28) R. E. D. McClung and D. Kivelson, J. Chem. Phys., 49, 3380 (1968).(29) D. Kivelson, M. G. Kivelson, and I. Oppenheim, J. Chem Phys 52
1810(1970).(30) D. L. Vander Hart, J. Chem. Phys., 70, 1858 (1974).(31) D. L. Hogenboom, D. E. O’Reilly, and E. M. Peterson, J. Chem. Phys
52, 2793 (1970).(32) J. A. Pople, W. G. Schneider, and H. J. Bernstein, “High Resolution Nu
clear Magnetic Resonance", McGraw-Hill, New York, N.Y., 1959.(33) For example, D. P. Shoemaker, C. W. Garland, and J. I. Steinfeld, “Ex
periments in Physical Chemistry", 3rd ed, McGraw-Hill, New York N Y 1974, p 230.
(34) Ari = rtMsd - where T^icd = X(CHCI3)p(neat CHCI3) + [1 .0 — J4 CHCI3)] r/jneat toluene).
(35) A. H. Narten, J. Chem. Phys., 48, 1630 (1968); J. A. O ’Malley and A. H. Narten, Oak Ridge National Laboratory Report No. ORNL-4166 Julv 1967.
(36) L. J. Lowden and D. Chandler, J. Chem. Phys., 61, 5228 (1974).
The Journal o f Physical Chemistry, Vol. 80, No. 7, 1976
Carboxyl Carbon-13-Proton Three Bond Coupling Constants 741
Carboxyl Carbon-13-Proton Three Bond Coupling Constants as an Indicator of Conformation
William G. Espersen and R. Bruce Martin*
Chemistry Department, University o f Virginia, Charlottesville, Virginia 22901 (Received October 31, 1975)
Publication costs assisted by the National Science Foundation
Three bond carboxyl carbon to d-hydrogen coupling constants are analyzed in terms of rotamer mole fractions estimated from proton vicinal coupling constants for histidine and cysteine derivatives and aspartic acid. Recommended three bond carboxyl carbon to proton coupling constants are 1.3 ± 0.3 Hz for the gauche positions and 9.8 ± 0.3 Hz for the anti position. It is shown that the predominant rotamer in aqueous solutions of aspartate, neutral and anionic histidine, acylated histidines, and cysteine derivatives possesses an anti disposition of the carboxylate group and the substituent at the d position. Low values of the three bond ester carbonyl carbon and d-hydrogens coupling constants in acetylcholine and acetyl-d-meth- ylcholine indicate in aqueous solution a predominance of rotamers about the ether oxygen-d-carbon bond with a gauche disposition of the carbonyl carbon and d hydrogens.
Introduction
Carbon-13-proton three bond coupling constants have the potential for eliciting the same kind of conformational information that has been obtained many times from vicinal proton spin coupling constants. For example, the vicinal relationship between the proton He and the pair of geminal protons Ha and Hb in Figure 1 has been analyzed to estimate relative populations of the three staggered rotamers in a-amino acids and derivatives possessing the ABC three spin system.1 When the time-averaged 'H NMR spectrum exhibits a sufficient number of lines, both vicinal coupling constants J ac and J b c may be determined and related to the vicinal coupling constants Jc and Jr for the gauche and anti positions.
J a c = tJ G + gJr + hJc,J b c = tJ t + gJc + hJc
The symbols t, g, and h are used to designate the rotamers in Figure 1 and their mole fractions (f + g + h = 1 ). The bulkiest groups are usually anti in rotamer f, gauche in rotamer g, and also gauche in the most sterically hindered rotamer h. The difference
J b c ~ J a c — (t ~ ~ J g) (2)
and, since Jr > Jq, J bc > J a c implies that the mole fraction of rotamer t exceeds that of rotamer g. Other relationships among these quantities have been derived.2 The labeling of Ha and Hb in Figure 1 involves a commitment to the designation of the Hb proton as anti to He in rotamer i, and the question arises as to which proton Ha or Hb is at higher field. This ambiguity has been resolved by steric and other arguments,1-3 but in some cases the assignments remain open to question. Reversal of the assignments results in reversal of the mole fraction of rotamers t and g.2
Carboxylate carbon-13-proton spin coupling constants provide an additional set of equations that frequently enable resolution of the ambiguity in assigning the Ha and Hb protons of Figure 1. Analogous to eq 1 for protons, the carboxylate carbon-13-proton vicinal coupling constants, K xa and K\b, may be determined and related to the vici
nal coupling constants K g and Kr for the gauche and anti positions
K\a = tKc, + gKo + hKT K XB = tKG + gKT + hKG
In this case the difference
Kx b — Kx a - (g — h)(Kr - K q)yields information on the difference in mole fractions of rotamers g and h rather than rotamers t and g as in eq 2. It may also be shown that the ratio of mole fractions g/h = (Kxb — Kg)/(K\a ~ Kq)- In most examples studied in this research only an average value Kav was observed.
2Kav = K\a + Kxb = Kg( 1 + t) + # t (1 ~ t) (4)
(The corresponding equation for average coupling constants of vicinal protons involves only rotamer h.) Even an average value of the carbon-13-proton coupling constants permits determination of the mole fraction of rotamer t which may be compared with the pair of possible results from 'H NMR to resolve the designation ambiguity of the Ha or Hb proton as the one at high field. Examples have been reported on a variety of amino acid systems.4
In order to utilize eq 4 to calculate the mole fraction of rotamer i, or eq 3 to evaluate all three rotamer mole fractions when K x a and K x b are resolved, it is necessary to estimate values of the vicinal 13C -4H coupling constants Kq and Kr for the gauche and anti positions. These values may be estimated even from only average experimental coupling constants A av if the mole fraction of rotamer t is known from 'H NMR studies on the same compounds under identical conditions. Equation 4 may be rearranged to give
2 Kav = (Kq — Kr)t + Kr + Kg (5)
Thus for a series of compounds a plot of 2Kav vs. t yields a slope of Kg — Kr and y intercept of Kr + Kc from which K g and Kr may be determined. It is the purpose of this paper to furnish an estimate of Kq and Kr that should be useful in eliciting conformational information by use of eq
The Journal o f Physical Chemistry, Vol. 80, No. 7, 1976
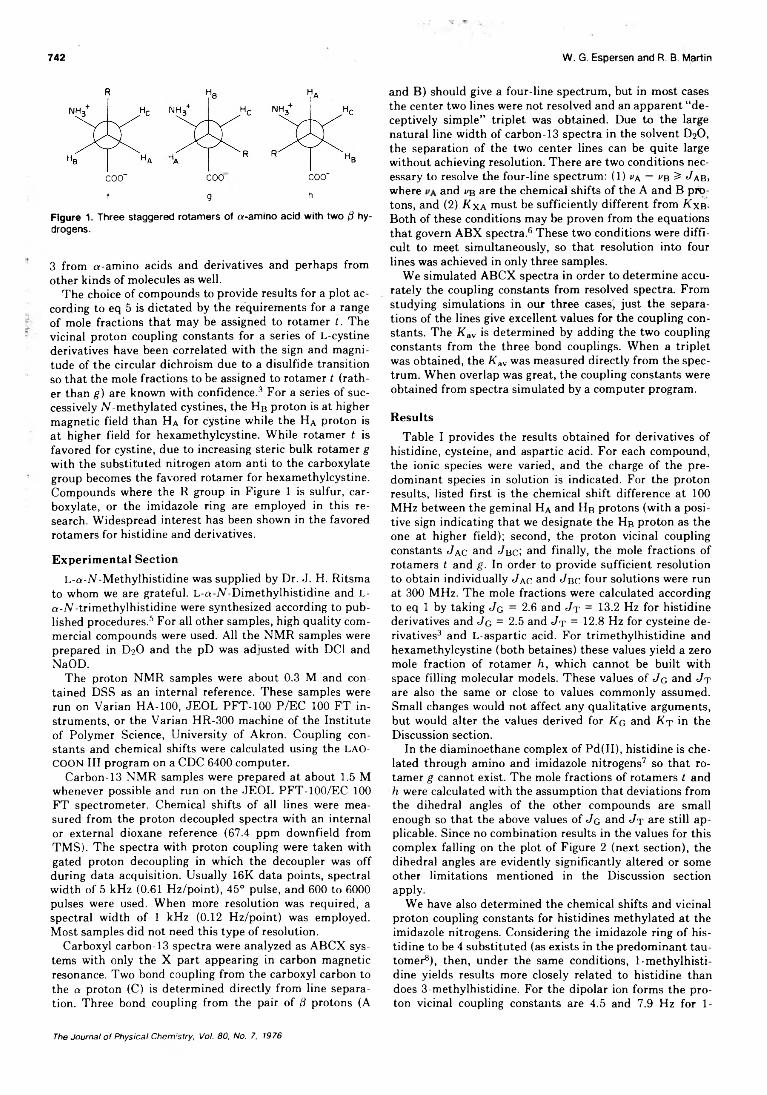
742 W. G. Espersen and R. B. Martin
cocrt
coog
coo-h
Figure 1. Three staggered rotamers of a-amino acid with two /3 hydrogens.
3 from a-amino acids and derivatives and perhaps from other kinds of molecules as well.
The choice of compounds to provide results for a plot according to eq 5 is dictated by the requirements for a range of mole fractions that may be assigned to rotamer t. The vicinal proton coupling constants for a series of L-cystine derivatives have been correlated with the sign and magnitude of the circular dichroism due to a disulfide transition so that the mole fractions to be assigned to rotamer t (rather than g) are known with confidence.3 For a series of successively TV-methylated cystines, the Hb proton is at higher magnetic field than Ha for cystine while the Ha proton is at higher field for hexamethylcystine. While rotamer t is favored for cystine, due to increasing steric bulk rotamer g with the substituted nitrogen atom anti to the carboxylate group becomes the favored rotamer for hexamethylcystine. Compounds where the R group in Figure 1 is sulfur, carboxylate, or the imidazole ring are employed in this research. Widespread interest has been shown in the favored rotamers for histidine and derivatives.
Experimental Section
L-a-TV-Methylhistidine was supplied by Dr. J. H. Ritsma to whom we are grateful. L-a-TV-Dimethylhistidine and L- a-TV-trimethylhistidine were synthesized according to published procedures.5 For all other samples, high quality commercial compounds were used. All the NMR samples were prepared in D2O and the pD was adjusted with DC1 and NaOD.
The proton NMR samples were about 0.3 M and contained DSS as an internal reference. These samples were run on Varian HA-100, JEOL PFT-100 P/EC 100 FT instruments, or the Varian HR-300 machine of the Institute of Polymer Science, University of Akron. Coupling constants and chemical shifts were calculated using the LAO- COON III program on a CDC 6400 computer.
Carbon-13 NMR samples were prepared at about 1.5 M whenever possible and run on the JEOL PFT-100/EC 100 FT spectrometer. Chemical shifts of all lines were measured from the proton decoupled spectra with an internal or external dioxane reference (67.4 ppm downfield from TMS). The spectra with proton coupling were taken with gated proton decoupling in which the decoupler was off during data acquisition. Usually 16K data points, spectral width of 5 kHz (0.61 Hz/point), 45° pulse, and 600 to 6000 pulses were used. When more resolution was required, a spectral width of 1 kHz (0.12 Hz/point) was employed. Most samples did not need this type of resolution.
Carboxyl carbon-13 spectra were analyzed as ABCX systems with only the X part appearing in carbon magnetic resonance. Two bond coupling from the carboxyl carbon to the a proton (C) is determined directly from line separation. Three bond coupling from the pair of /3 protons (A
and B) should give a four-line spectrum, but in most cases the center two lines were not resolved and an apparent “ deceptively simple” triplet was obtained. Due to the large natural line width of carbon-13 spectra in the solvent D2O, the separation of the two center lines can be quite large without achieving resolution. There are two conditions necessary to resolve the four-line spectrum: (1 ) i»a — »b > Jab, where and v% are the chemical shifts of the A and B protons, and (2).Kxa must be sufficiently different from Kxb- Both of these conditions may be proven from the equations that govern ABX spectra.6 These two conditions were difficult to meet simultaneously, so that resolution into four lines was achieved in only three samples.
We simulated ABCX spectra in order to determine accurately the coupling constants from resolved spectra. From studying simulations in our three cases, just the separations of the lines give excellent values for the coupling constants. The Kav is determined by adding the two coupling constants from the three bond couplings. When a triplet was obtained, the Kav was measured directly from the spectrum. When overlap was great, the coupling constants were obtained from spectra simulated by a computer program.
Results
Table I provides the results obtained for derivatives of histidine, cysteine, and aspartic acid. For each compound, the ionic species were varied, and the charge of the predominant species in solution is indicated. For the proton results, listed first is the chemical shift difference at 100 MHz between the geminal Ha and Hb protons (with a positive sign indicating that we designate the Hb proton as the one at higher field); second, the proton vicinal coupling constants Jac and Jbc; and finally, the mole fractions of rotamers t and g. In order to provide sufficient resolution to obtain individually J ac and J bc four solutions were run at 300 MHz. The mole fractions were calculated according to eq 1 by taking Jg = 2.6 and Jt = 13.2 Hz for histidine derivatives and Jg = 2.5 and Jt = 12.8 Hz for cysteine derivatives3 and L-aspartic acid. For trimethylhistidine and hexamethylcystine (both betaines) these values yield a zero mole fraction of rotamer h, which cannot be built with space filling molecular models. These values of Jg and Jt are also the same or close to values commonly assumed. Small changes would not affect any qualitative arguments, but would alter the values derived for Kq and Kt in the Discussion section.
In the diaminoethane complex of Pd(II), histidine is chelated through amino and imidazole nitrogens7 so that rotamer g cannot exist. The mole fractions of rotamers t and h were calculated with the assumption that deviations from the dihedral angles of the other compounds are small enough so that the above values of Jq and Jy are still applicable. Since no combination results in the values for this complex falling on the plot of Figure 2 (next section), the dihedral angles are evidently significantly altered or some other limitations mentioned in the Discussion section apply.
We have also determined the chemical shifts and vicinal proton coupling constants for histidines methylated at the imidazole nitrogens. Considering the imidazole ring of histidine to be 4 substituted (as exists in the predominant tautomer8), then, under the same conditions, 1 -methylhisti- dine yields results more closely related to histidine than does 3-methylhistidine. For the dipolar ion forms the proton vicinal coupling constants are 4.5 and 7.9 Hz for 1-
The Journal o f Physical Chem!stry, Vol. 80, No. 7, 1976
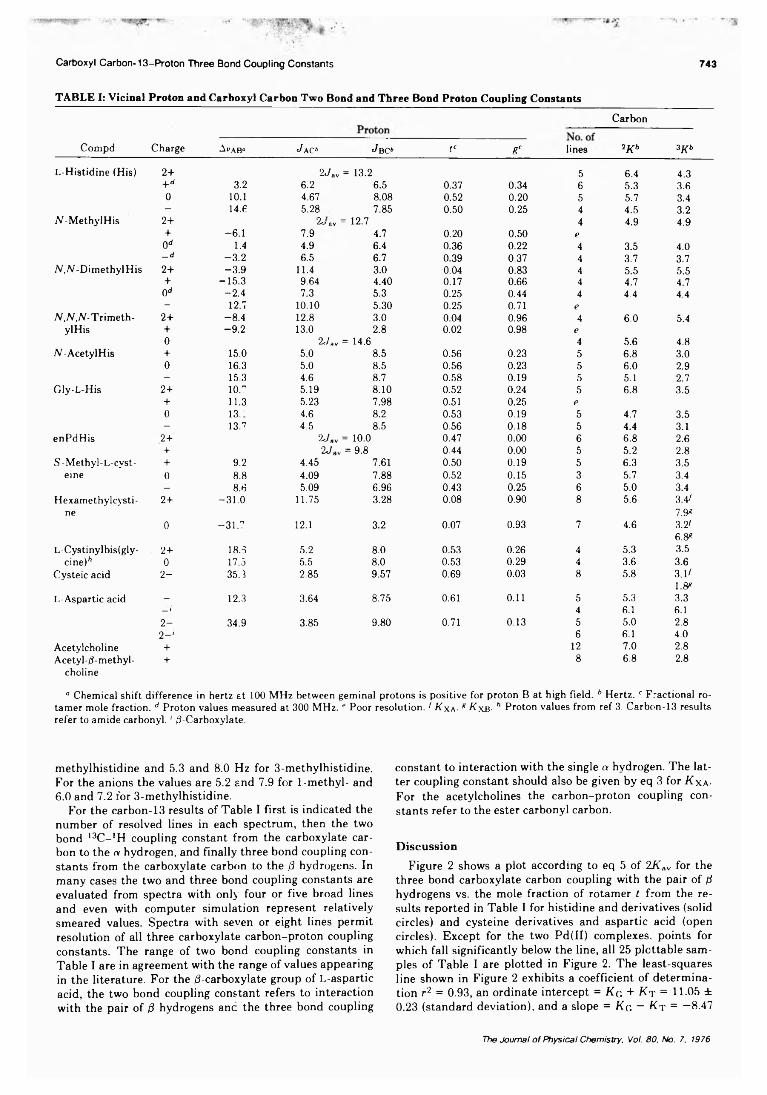
Carboxyl Carbon-13-Proton Three Bond Coupling Constants 743
TABLE I: Vicinal Proton and Carboxyl Carbon Two Bond and Three Bond Proton Coupling Constants
Carbon
Compd Charge Akab» Jao> Jbc> tc gc lines 2K b 3K b
L-Histidine (His) 2+ 2c/ av = 13.2 5 6.4 4.3+ d 3.2 6.2 6.5 0.37 0.34 6 5.3 3.60 10.1 4.67 8.08 0.52 0.20 5 5.7 3.4- 14.6 5.28 7.85 0.50 0.25 4 4.5 3.2
iV-MethylHis 2+ IIo? 12.7 4 4.9 4.9+ -6.1 7.9 4.7 0.20 0.50 e0d 1.4 4.9 6.4 0.36 0.22 4 3.5 4.0_ d -3 .2 6.5 6.7 0.39 0.37 4 3.7 3.7
N, TV-Dimethyl His 2+ -3.9 11.4 3.0 0.04 0.83 4 5.5 5.5+ -15.3 9.64 4.40 0.17 0.66 4 4.7 4.70d -2 .4 7.3 5.3 0.25 0.44 4 4.4 4.4- 12.7 10.10 5.30 0.25 0.71 e
A/,A/,N-Trimeth- 2+ -8.4 12.8 3.0 0.04 0.96 4 6.0 5.4ylHis + -9.2 13.0 2.8 0.02 0.98 e
0 2c/flv = 14.6 4 5.6 4.8N -AcetylHis + 15.0 5.0 8.5 0.56 0.23 5 6.8 3.0
0 16.3 5.0 8.5 0.56 0.23 5 6.0 2.9- 15.3 4.6 8.7 0.58 0.19 5 5.1 2.7
Gly-L-His 2+ lO.” 5.19 8.10 0.52 0.24 5 6.8 3.5+ 11.3 5.23 7.98 0.51 0.25 e0 13.1 4.6 8.2 0.53 0.19 5 4.7 3.5- 13.7 4.5 8.5 0.56 0.18 5 4.4 3.1
enPdHis 2+ 2c/av = 10.0 0.47 0.00 6 6.8 2.6+ 2Jav =■ 9.8 0.44 0.00 5 5.2 2.8
S - Methyl-L-cyst- + 9.2 4.45 7.61 0.50 0.19 5 6.3 3.5eine 0 8.8 4.09 7.88 0.52 0.15 3 5.7 3.4
- 8.6 5.09 6.96 0.43 0.25 6 5.0 3.4Hexamethylcysti - 2+ -31.0 11.75 3.28 0.08 0.90 8 5.6 3.4/
ne 7.9*0 -31.7 12.1 3.2 0.07 0.93 7 4.6 3.2 /
6.8*L-Cystinylbis(gly- 2+ 18.3 5.2 8.0 0.53 0.26 4 5.3 3.5
cine)'1 0 17.5 5.5 8.0 0.53 0.29 4 3.6 3.6Cysteic acid 2 - 35.3 2.85 9.57 0.69 0.03 8 5.8 3.1/
1.8*L-Aspartic acid - 12.3 3.64 8.75 0.61 0.11 5 5.3 3.3
_1 4 6.1 6.12 - 34.9 3.85 9.80 0.71 0.13 5 5.0 2.82—1 6 6.1 4.0
Acetylcholine + 12 7.0 2.8Acetyl-/3-methyl- + 8 6.8 2.8
choline
a Chemical shift difference in hertz at 100 MHz between geminal protons is positive for proton B at high field. 6 Hertz. c Fractional ro- tamer mole fraction. d Proton values measured at 300 MHz. * Poor resolution. / K xa - * Kxb- h Proton values from ref 3. Carbon-13 results refer to amide carbonyl. 1 /3-Carboxylate.
methylhistidine and 5.3 and 8.0 Hz for 3-methylhistidine. For the anions the values are 5.2 and 7.9 for 1-methyl- and6.0 and 7.2 for 3-methylhistidine.
For the carbon-13 results of Table I first is indicated the number of resolved lines in each spectrum, then the two bond 13C -'H coupling constant from the carboxylate carbon to the a hydrogen, and finally three bond coupling constants from the carboxylate carbon to the /J hydrogens. In many cases the two and three bond coupling constants are evaluated from spectra with only four or five broad lines and even with computer simulation represent relatively smeared values. Spectra with seven or eight lines permit resolution of all three carboxylate carbon-proton coupling constants. The range of two bond coupling constants in Table I are in agreement with the range of values appearing in the literature. For the /3-carboxylate group of L-aspartic acid, the two bond coupling constant refers to interaction with the pair of d hydrogens anc the three bond coupling
constant to interaction with the single a hydrogen. The latter coupling constant should also be given by eq 3 for K xa- For the acetylcholines the carbon-proton coupling constants refer to the ester carbonyl carbon.
Discussion
Figure 2 shows a plot according to eq 5 of 2K av for the three bond carboxylate carbon coupling with the pair of fl hydrogens vs. the mole fraction of rotamer t from the results reported in Table I for histidine and derivatives (solid circles) and cysteine derivatives and aspartic acid (open circles). Except for the two Pd(II) complexes, points for which fall significantly below the line, all 25 plottable samples of Table I are plotted in Figure 2. The least-squares line shown in Figure 2 exhibits a coefficient of determination r2 = 0.93, an ordinate intercept = KG + K T = ll-0 5 d t 0.23 (standard deviation), and a slope = K g — Kt = —8.47
The Journal o f Physical Chemistry, Vol. 80, No. 7, 1976
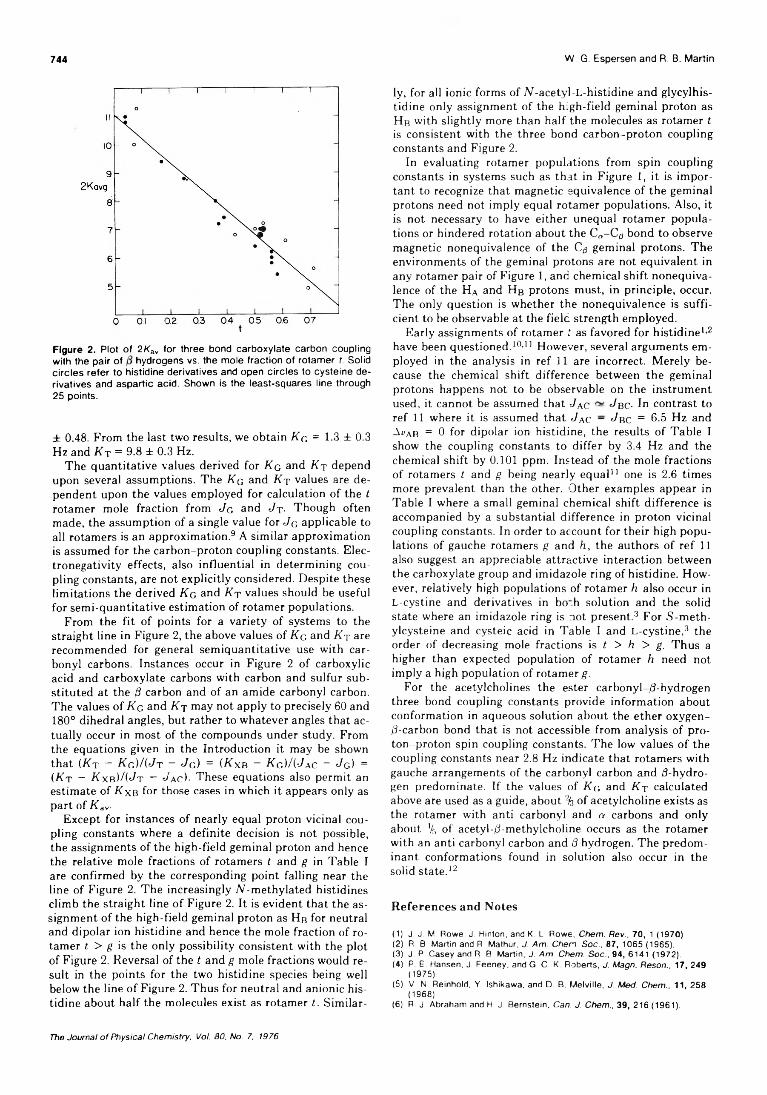
744 W. G. Espersen and R. B. Martin
Figure 2. Plot of 2 K aw for three bond carboxylate carbon coupling with the pa ir o f hydrogens vs. the m ole fraction of ro tam er t. Solid c irc les re fe r to histidine derivatives and open c ircles to cysteine derivatives and aspartic ac id . Shown is the least-squares line through 25 points.
± 0.48. From the last two results, we obtain K g = 1.3 ± 0.3 Hz and K t = 9.8 ± 0.3 Hz.
The quantitative values derived for K g and Kt depend upon several assumptions. The Kg and K t values are dependent upon the values employed for calculation of the t rotamer mole fraction from Jg and Jt- Though often made, the assumption of a single value for Jg applicable to all rotamers is an approximation.9 A similar approximation is assumed for the carbon-proton coupling constants. Electronegativity effects, also influential in determining coupling constants, are not explicitly considered. Despite these limitations the derived K g and Kt values should be useful for semi-quantitative estimation of rotamer populations.
From the fit of points for a variety of systems to the straight line in Figure 2, the above values of K g and K t are recommended for general semiquantitative use with carbonyl carbons. Instances occur in Figure 2 of carboxylic acid and carboxylate carbons with carbon and sulfur substituted at the /3 carbon and of an amide carbonyl carbon. The values of Kg and Kt may not apply to precisely 60 and 180° dihedral angles, but rather to whatever angles that actually occur in most of the compounds under study. From the equations given in the Introduction it may be shown that (Kt — Kq)/(Jt — Jc) = (Kxb — Kq)/(Jac ~ Jg) = (Kt — K xb)/(Jt ~ Jac)- These equations also permit an estimate of K \b for those cases in which it appears only as part of K av.
Except for instances of nearly equal proton vicinal coupling constants where a definite decision is not possible, the assignments of the high-field geminal proton and hence the relative mole fractions of rotamers t and g in Table I are confirmed by the corresponding point falling near the line of Figure 2. The increasingly N-methylated histidines climb the straight line of Figure 2. It is evident that the assignment of the high-field geminal proton as Hb for neutral and dipolar ion histidine and hence the mole fraction of rotamer t > g is the only possibility consistent with the plot of Figure 2. Reversal of the t and g mole fractions would result in the points for the two histidine species being well below the line of Figure 2. Thus for neutral and anionic histidine about half the molecules exist as rotamer t. Similar
ly, for all ionic forms of N-acetyl-L-histidine and glycylhis- tidine only assignment of the high-field geminal proton as Hb with slightly more than half the molecules as rotamer t is consistent with the three bond carbon-proton coupling constants and Figure 2.
In evaluating rotamer populations from spin coupling constants in systems such as that in Figure 1, it is important to recognize that magnetic equivalence of the geminal protons need not imply equal rotamer populations. Also, it is not necessary to have either unequal rotamer populations or hindered rotation about the Ca-C^ bond to observe magnetic nonequivalence of the Cfl geminal protons. The environments of the geminal protons are not equivalent in any rotamer pair of Figure 1, and chemical shift nonequivalence of the Ha and Hb protons must, in principle, occur. The only question is whether the nonequivalence is sufficient to be observable at the field strength employed.
Early assignments of rotamer t as favored for histidine1’2 have been questioned.10’11 However, several arguments employed in the analysis in ref 1 1 are incorrect. Merely because the chemical shift difference between the geminal protons happens not to be observable on the instrument used, it cannot be assumed that Jac — Jbc- In contrast to ref 11 where it is assumed that J ac — J bc = 6.5 Hz and Avar = 0 for dipolar ion histidine, the results of Table I show the coupling constants to differ by 3.4 Hz and the chemical shift by 0.101 ppm. Instead of the mole fractions of rotamers t and g being nearly equal11 one is 2.6 times more prevalent than the other. Other examples appear in Table I where a small geminal chemical shift difference is accompanied by a substantial difference in proton vicinal coupling constants. In order to account for their high populations of gauche rotamers g and h, the authors of ref 11 also suggest an appreciable attractive interaction between the carboxylate group and imidazole ring of histidine. However, relatively high populations of rotamer h also occur in L-cystine and derivatives in bo-h solution and the solid state where an imidazole ring is not present.3 For S-meth- ylcysteine and cysteic acid in Table I and L-cystine,3 the order of decreasing mole fractions is t > h > g. Thus a higher than expected population of rotamer h need not imply a high population of rotamer g.
For the acetylcholines the ester carbonyl-/!-hydrogen three bond coupling constants provide information about conformation in aqueous solution about the ether oxygen- /!-carbon bond that is not accessible from analysis of proton-proton spin coupling constants. The low values of the coupling constants near 2.8 Hz indicate that rotamers with gauche arrangements of the carbonyl carbon and /3-hydrogen predominate. If the values of Kg and Kt calculated above are used as a guide, about % of acetylcholine exists as the rotamer with anti carbonyl and « carbons and only about % of acetyl-/3-methylcholine occurs as the rotamer with an anti carbonyl carbon and 8 hydrogen. The predominant conformations found in solution also occur in the solid state.12
R eferences and Notes
(1) J. J. M. Rowe, J. Hinton, and K. L. Rowe, Chem. Rev., 70, 1 (1970).(2) R. B. Martin and R. Mathur, J. Am. Chem. Soc., 87, 1065 (1965).(3) J. P. Casey and R. B. Martin, J. Am. Chem. Soc., 94, 6141 (1972).(4) P. E. Hansen, J. Feeney, and G. C. K. Roberts, J. Magn. Resort., 17, 249
(1975).(5) V. N. Reinhold, Y. Ishikawa, and D. B. M elville, J. Med. Chem., 11, 258
(1968).(6) R. J. Abraham and H. J. Bernstein, Can. J. Chem., 39, 216 (1961).
The Journal o f Physical Chemistry, Vol. 80, No. 7, 1976
On ttie Structure of Water Absorbed in Collagen 745
(7) T. P. Pitner, E. W. Wilson, Jr., and R. B. Martin, Inorg. Chem., 11, 738(1972).
(8) W. F. Reynolds, I. R. Peat, M. H. Freedman, and J. R. Lyerla, Jr., J. Am. Chem. Soc.. 95, 328 (1973).
(9) R. J. Abraham and G. Gatti, J. Chem. Soc. B. 961 (1969).
(10) K. D. Kopple and M. Ohnishi, J. Am. Chem. Soc., 91, 962 ("969).(11) R. J. Weinkam and E. C. Jorgensen, J. Am. Chem. Soc., 95, 6084
(1973).(12) R. W. Baker, C. H. Chothia, P. Pauling, and T. J. Petcher, Nature (Lon
don), 230, 439 (1971).
On the Structure of Water Absorbed in Collagen
C. A. J. Hoeve* and S. R. Kakivaya
Department o f Chemistry, Texas A&M University, College Station, Texas 77843 (Received May 28, 1975; Revised Manuscript Received November 7, 1975)
Publication costs assisted by the National Science Foundation
It is shown that the contribution of water to the heat capacity is approximately 9 cal deg-1 mol-1 in those compounds in which water is bound. The configurational contribution in excess of 9 cal deg-1 mol-1 for liquid water in bulk and for water surrounding nonpolar compounds in solution is the result of serious distortion, or breakage, of hydrogen bonds. We may, therefore, conclude that, in general, these contributions are representative of the liquid state. Within experimental error the heat capacity contribution of water in collagen is found to be 23 cal deg-1 mol-1 at 30 °C over the entire range from 1 to 100% of water. Thus, large configurational contributions exist, indicating that water is in the liquid state, even at low concentrations. These results do not support suggestions based on x-ray data that water is bound and that it stabilizes the collagen triple-stranded helix; they also are at variance with the two-state models, recently proposed on the basis of wide-line NMR data. Instead, the results are consistent with the one-state, liquidlike, chain model previously proposed for water in the interstices between the collagen molecules.
Introduction
The structure of water in contact with solute molecules,1-2 or with surfaces, is known to be different from that of water in bulk. These water structures, sometimes referred to as icelike, give rise to unexpected energy and entropy effects on aggregation of solutes and are at the basis of the concept of hydrophobic bonding.2 Also, within the pores of membranes similar water structures might exist. Despite their importance, insight in these structures is still rather limited. With this in mind we have chosen a model system of collagen fibers in which the water structure is sufficiently simple to allow a thorough study.
In collagen fibers rigid, triple-stranded tropocollagen molecules are almost perfectly aligned along the fiber axis.3 Their packing is regular, approximately hexagonal. Therefore, the channels between the triple-stranded helices, which can be occupied by water, are also aligned and homogeneous throughout the fiber. Furthermore, these channels have cross sections of only approximately 10 Â2, disallowing sizeable three-dimensional water structures. On the basis of x-ray evidence,4 3 NMR results,6-13 and dielectric measurements,14 various structures have been proposed for water absorbed in collagen. It is our object to examine these proposals in light of the heat capacity measurements. In order to discuss the relevance of these measurements, let us first examine the value of the heat capacity in those cases where the water structure is reasonably well known.
The heat capacity of ice can be explained15 relatively easily on the basis of three vibrations and three librations of water molecules in a fixed lattice. Considered classically,
the contribution of each mode is R cal deg-1 mol-1; we arrive then at a calculated heat capacity of 12 cal deg-1 mol-1. The measured value of 9 cal deg-1 mol-1 at 0 °C is fairly close to this value. That the classical value has not yet been reached, is mainly the result of the relatively high Debye temperature (approximately 1000 K) of the librations.
For liquid water the heat capacity of 18 cal deg-1 mol-1 is far greater than can be accounted for by the classical contributions of vibrations around equilibrium positions. We conclude that the vibrations and/or librations must deviate considerably from harmonic oscillators. Several models have been proposed for these contributions beyond the classical values, called configurational contributions.16 In one model hydrogen bonds can be in two states: broken and unbroken.1718 The configurational heat capacity is then attributable to the breaking of hydrogen bonds with increase in temperature. Recently, Walrafen19 supported "-his model on the basis of infrared and Raman spectra. On the other hand, it is clear from x-ray work on different crystal structures of ice,15 and also from neutron diffraction data of salt hydrates,20 that hydrogen bonds can occur with a wide range of lengths and 0 -H ---0 angles. The question arises then whether it is realistic to consider only two states, hydrogen bonded and non-hydrogen bonded. Indeed, Pople21 proposed a continuum model in which a network of distorted hydrogen bonds, but no broken ones, exist in liquid water. According to his model the configurational contributions result from an increase in average distortion of hydrogen bonds with temperature. Of course, this contribution is in addition to the ones arising from small vibrations around
The Journal o f Physical Chemistry, Vol. 80, No. 7, 1976
746 C. A. J. Hoeve and S. R. Kakivaya
equilibrium positions of the distorted network. Whatever interpretation is adopted, however, the large, configurational heat capacity of water reflects large, structural, changes in water and not just a small increase in amplitude of nearly harmonic vibrations.
When water is in contact with nonpolar molecules, no hydrogen bonds can be formed with these molecules and restrictions are placed on the hydrogen-bonded structures. Contrary to expectation, no hydrogen bonds are broken. Instead, structures,2 sometimes described as icelike,1 are formed, which are low in energy and entropy content. These structures are probably similar to the low-energy, crystalline, clathrate hydrates.22 It is to be noted, however, that, unlike in crystals, the water molecules of the structures in solution interchange rapidly. Thus, although at any instant a close analogy might exist between the crystalline structures and those in solution, this is not true for the dynamic behavior. On raising the temperature the structures in solution gradually dissipate, resulting in even larger configurational contributions to the heat capacity than those of bulk water. In this manner the large value of the partial molal heat capacity of nonpolar solutes in water can be explained,2 at least qualitatively. In contrast, let us now consider a case, where the water molecules are bound.
In crystalline salt hydrates water molecules occupy fixed positions in a lattice. We expect, therefore, these contributions to the heat capacity to be comparable to those in ice. Taking data reported23 for the heat capacity of salt hydrates and for the corresponding dry salts and assuming additivity of the contributions of salt and water, we can calculate the contribution of water. The hydrates considered are CaS04-2H20 . MgCl2-H20 , MgCl2-2H20, MgCl2- 4H >0. MgCl2-6H20, KA1(S04)2-12H20 , A12(S04)3-6H20, NH4A1(S04)2-12H20 , BaCl2-2H20, and Na2SO4-10H2O. The average contribution of water to the heat capacity at 300 K is found to be 9.9 cal deg-1 mol-1 with a standard deviation of 0.8 cal deg-1 mol-1. It is to be remarked that the heat capacities of these salts have not yet reached their classical values. Since relatively large differences in lattice energies and Debye temperatures exist, it is hardly surprising that a standard deviation as high as 8% is observed. Nevertheless, these values are close to the extrapolated value for ice at 300 K of 9.5 cal deg-1 mol-1. As expected, configurational contributions are absent.
Although the foregoing analysis is qualitative, the results leave little doubt that on the basis of heat capacity data we can distinguish between water molecules that are strongly bound and those in liquidlike structures. We shall discuss the various models proposed for water absorbed in collagen on the basis of our heat capacity data.
Experimental SectionKangaroo-tail tendon was used without purification. It
was chopped in small pieces and stored over P2Os for more than 1 year. As was checked with a small sample, drying at 100 °C did not remove any further water. Subsequent drving under vacuum at 105 °C for 1 week caused a weight loss of only 0.7%. According to Yannas24 this residual water may correspond to tightly bound water. Because of the danger of denaturing collagen at high temperature, we did not remove this relatively small amount of water from our samples. Throughout this article the samples obtained by drying over P2Os at room temperature are referred to as dry collagen. The sample (5-10 mg) in aluminum pans was weighed on a microbalance and a suitable amount of water
was added with a microsyringe. An aluminum cover was placed on the pan and by exerting pressure the cover was crimped shut. Subsequent weighing yielded the amount of added water. Before heat capacity measurements, the samples were left overnight to allow them to reach equilibrium. After each heat capacity determination the sample weight was checked. Only those determinations were retained for which the sample weight remained unchanged.
The heat capacity of the samples was determined with a Perkin-Elmer DSC-1B differential scanning calorimeter. In this instrument two samples were heated at the constant rate of 5 deg/min, while the temperature difference between the samples was kept at zero by a servomechanism. The difference in heating rate of the left- and right-hand sample was recorded. First, the amplitude was recorded when a run was performed from 20 to 40 °C with empty aluminum pans. Various amounts of water were placed in the left-hand pan and runs over the same temperature range were carried out. The amplitudes obtained were linear in the amount of water with an average deviation of 1%. Using the value of 1.00 cal deg-1 g-1 for the specific heat of water, we obtained the calibration constant. The runs with the collagen samples were carried out over the same temperature range. From the calibration constant, the values of the amplitudes, and the weight of the samples, the heat capacity of the collagen samples was obtained. Duplicate runs were carried out for all samples. Within experimental error, the same values were obtained after storing the samples for several days. Apparently, equilibrium values are obtained after standing overnight.
Temperature calibration was performed by placing small amounts of water, or benzene, in the pan and scanning through the melting points.
Results and DiscussionOur heat capacity data valid at 30 °C are given in Table
I. They are represented in Figure 1, which is a graph of the heat capacity, Cp, of samples containing 1 g of collagen and y g of water vs. the water content, y, expressed in gram of water per gram of dry collagen. If the contribution per gram of water to the heat capacity is constant, a straight line is obtained. This is indeed the case. According to the principle of least squares, the best straight line is given by
Cp = 0.30 + 1.24y cal deg-1 (1 )
The average deviation between the experimental values and those given by eq 1 is 2.7%.
Our data are to be compared with those of Haly and Snaith25 for rat-tail collagen. Their data obtained at 20 °C span a range of y values from 0.38 to 1.44. If we apply the least-square procedure to their heat capacity data in the range of overlap (from y = 0.38 to 1.0) we find for their data
Cp = 0.30 + l . l ly cal deg-1 (2)
Despite the long extrapolation to y = 0, the value Cp = 0.30 cal deg-1 g-1 obtained for dry collagen is identical with our value (eq 1). At water contents corresponding to y = 1 their values are 8% lower than ours. This difference can largely be explained by the temperature difference of 10° between the sets of data. We found that the heat capacity of water in collagen increases approximately 5% for a temperature rise of 10°. Hence, the agreement between the sets of data in the region of overlap is excellent.
We note that the heat capacity of wet collagen is not ad-
The Journal of Physical Chemistry, Vol. 80, No. 7, 1976
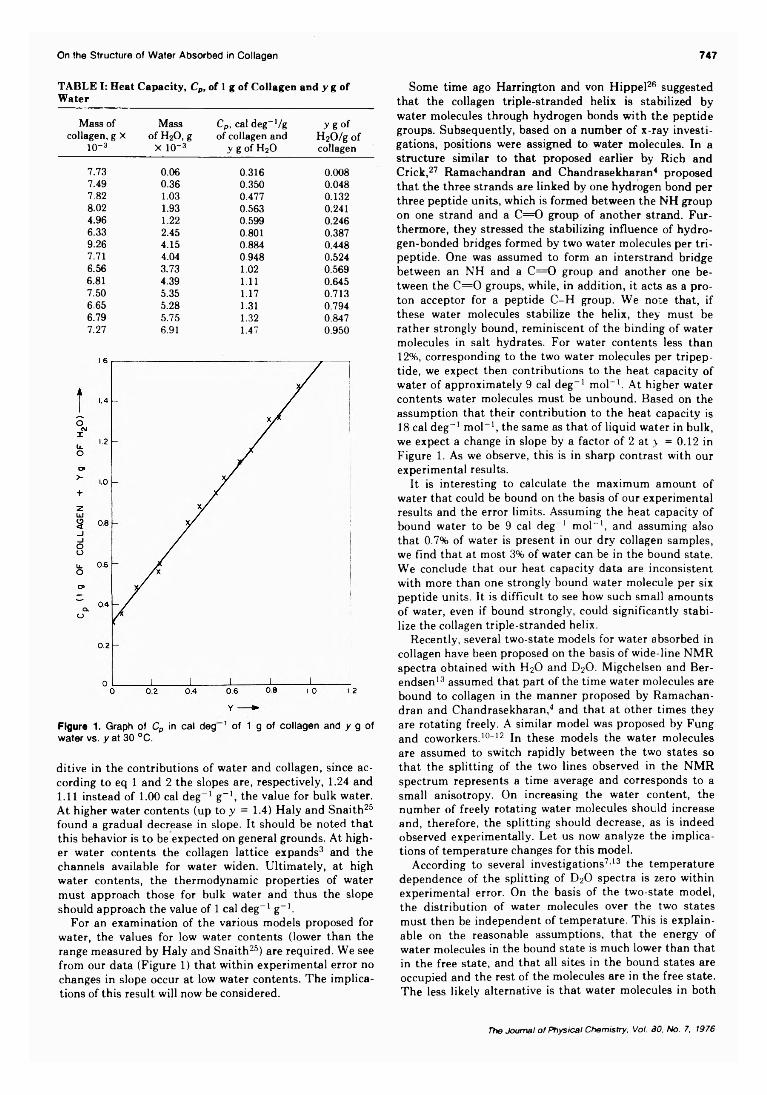
On the S tructure o f W ater Absorbed in Collagen 747
TABLE I: Heat Capacity, Cp, of 1 g of Collagen and y g of Water
Mass of collagen, g X
10-3
Mass of H2O, g
X 10-3
Cp, cal deg-1/g of collagen and
y g of H20
y g of H20/g of collagen
7.73 0.06 0.316 0.0087.49 0.36 0.350 0.0487.82 1.03 0.477 0.1328.02 1.93 0.563 0.2414.96 1.22 0.599 0.2466.33 2.45 0.801 0.3879.26 4.15 0.884 0.4487.71 4.04 0.948 0.5246.56 3.73 1.02 0.5696.81 4.39 1.11 0.6457.50 5.35 1.17 0.7136.65 5.28 1.31 0.7946.79 5.75 1.32 0.8477.27 6.91 1.47 0.950
Figure 1. Graph of Cp in cal deg 1 of 1 g of collagen and y g of water vs. y at 30 °C.
ditive in the contributions of water and collagen, since according to eq 1 and 2 the slopes are, respectively, 1.24 and 1.11 instead of 1.00 cal deg-1 g-1, the value for bulk water. At higher water contents (up to y = 1.4) Haly and Snaith25 found a gradual decrease in slope. It should be noted that this behavior is to be expected on general grounds. At higher water contents the collagen lattice expands3 and the channels available for water widen. Ultimately, at high water contents, the thermodynamic properties of water must approach those for bulk water and thus the slope should approach the value of 1 cal deg-1 g-1.
For an examination of the various models proposed for water, the values for low water contents (lower than the range measured by Haly and Snaith25) are required. We see from our data (Figure 1) that within experimental error no changes in slope occur at low water contents. The implications of this result will now be considered.
Some time ago Harrington and von Hippel28 suggested that the collagen triple-stranded helix is stabilized by water molecules through hydrogen bonds with the peptide groups. Subsequently, based on a number of x-ray investigations, positions were assigned to water molecules. In a structure similar to that proposed earlier by Rich and Crick,27 Ramachandran and Chandrasekharan4 proposed that the three strands are linked by one hydrogen bond per three peptide units, which is formed between the NH group on one strand and a C = 0 group of another strand. Furthermore, they stressed the stabilizing influence of hydrogen-bonded bridges formed by two water molecules per tripeptide. One was assumed to form an interstrand bridge between an NH and a C = 0 group and another one between the C = 0 groups, while, in addition, it acts as a proton acceptor for a peptide C-H group. We note that, if these water molecules stabilize the helix, they must be rather strongly bound, reminiscent of the binding of water molecules in salt hydrates. For water contents less than 12%, corresponding to the two water molecules per tripeptide, we expect then contributions to the heat capacity of water of approximately 9 cal deg-1 mol-1. At higher water contents water molecules must be unbound. Based on the assumption that their contribution to the heat capacity is 18 cal deg-1 mol-1, the same as that of liquid water in bulk, we expect a change in slope by a factor of 2 at > = 0.12 in Figure 1. As we observe, this is in sharp contrast with our experimental results.
It is interesting to calculate the maximum amount of water that could be bound on the basis of our experimental results and the error limits. Assuming the heat capacity of bound water to be 9 cal deg-1 mol-1, and assuming also that 0.7% of water is present in our dry collagen samples, we find that at most 3% of water can be in the bound state. We conclude that our heat capacity data are inconsistent with more than one strongly bound water molecule per six peptide units. It is difficult to see how such small amounts of water, even if bound strongly, could significantly stabilize the collagen triple-stranded helix.
Recently, several two-state models for water absorbed in collagen have been proposed on the basis of wide-line NMR spectra obtained with H2O and D2O. Migchelsen and Ber- endsen13 assumed that part of the time water molecules are bound to collagen in the manner proposed by Ramachandran and Chandrasekharan,4 and that at other times they are rotating freely. A similar model was proposed by Fung and coworkers.10-12 In these models the water molecules are assumed to switch rapidly between the two states so that the splitting of the two lines observed in the NMR spectrum represents a time average and corresponds to a small anisotropy. On increasing the water content, the number of freely rotating water molecules should increase and, therefore, the splitting should decrease, as is indeed observed experimentally. Let us now analyze the implications of temperature changes for this model.
According to several investigations7’13 the temperature dependence of the splitting of D20 spectra is zero within experimental error. On the basis of the two-state model, the distribution of water molecules over the two states must then be independent of temperature. This is explainable on the reasonable assumptions, that the energy of water molecules in the bound state is much lower than that in the free state, and that all sites in the bound states are occupied and the rest of the molecules are in the free state. The less likely alternative is that water molecules in both
The Journal o f Physical Chemistry, Vol. 30, No. 7, 1976
states have the same energy. In both cases, the heat capacity of water is the sum of the contributions of the two states. For low water contents, when all molecules are expected to be in the bound state, configurational contributions should be absent. Migchelsen and Berendsen13 found that their NMR data can be reconciled with 12% of bound water. We notice, however, that the slope in Figure 1 is constant, at least down to water contents of 3%. Thus, the contribution to the heat capacity per mole of water is constant; its value, 23 cal deg-1 mol-1, indicates large configurational contributions. This large value of the heat capacity for water contents below 12% and the deviation from 18 cal deg-1 mol-1 above 12% are inconsistent with bound and free water, respectively.
Also, basing themselves on wide-line NMR results, Chapman et al.9 have proposed a different two-state model. One state consists of an ordered chainlike structure of hydrogen-bonded water molecules, originally proposed by Berendsen.6 In this state the water molecules are hydrogen bonded to each other and to peptide groups which are assumed to be in register with the water molecules. According to Chapman et al.9 a limited fraction of the water molecules can be absorbed on these sites. When these sites are filled, additional water molecules enter into a second state, in which they are isotropically rotating. By considering the equilibrium between the states as a Langmuir adsorption, they deduced from the splitting in their proton NMR spectra that 24% of water is in the ordered state and that the free energy of adsorption is —2.2 kcal/mol. This large value would correspond to rather strong adsorption. We observe that in this case, just as for the other two-state models proposed, the configurational contribution to the heat capacity should be small for water in the adsorbed state. Again, this is contrary to our experimental results (Figure 1).
Another argument against the two-state models is provided by infrared measurements by Susi, Ard, and Carroll28 on collagen containing various amounts of water. On addition of water, frequency shifts occur in NH and C = 0 peptide bands as a result of hydrogen bonding with water molecules. In addition, bands due to water molecules appear. Gradual changes in frequencies of C = 0 and NH bands and broad bands were observed, similar to those of liquid water. Since exchange of water molecules between any two states postulated cannot be so rapid that time-averaged infrared spectra result, spectra corresponding to the two states are to be expected. Unless the absorption spectra of both states are assumed to be the same as that of liquid water, the data are difficult to explain.
We conclude that the proposed two-state models, although they can be made to comply with the splitting observed in NMR spectra, are difficult to reconcile with the results of dielectric,14 infrared,28 and heat capacity measurement. All of these results suggest that except for, at most, 3%, all water molecules are basically in the same liquidlike state.
Recently,14 we have proposed a one-state model in which the water molecules are hydrogen bonded in long zig-zag chains. Contrary to the fixed positions of the peptide groups in the rigid triple-stranded helix, the water molecules move in concert during chain diffusion along the channel.
To be sure, the channels between the triple-stranded helices are not straight, but are grooved, reflecting the grooves in the helix. Furthermore, different peptides of variable sizes, directed away from the helical axis, must
748
partially block the channels. As a result of these obstacles the chain cannot be a straight zig-zag. Rather than moving as a planar zig-zag, it is forced to snake through the chan- pel. Its exact path is difficult to assess, since that depends on the space available to the chain and its tendency to form as many hydrogen bonds with peptide groups as possible. Whatever its detailed structure, we observe that the chain is best described as a one-dimensional liquid, rather than a chain rendered immobile by adsorption on collagen.
Chapman et al.9 stated that a water content of 24% requires at least three water chains per interstitial channel, corresponding to 50% lateral swelling. Since such a lateral swelling is not observed, they dismissed the interstitial model. Contrary to their conclusions, however, our model14 requires only one chain of water molecules up to water contents of 15% in case the channels are straight. More water can be accommodated in a single chain, when the zig-zag is not straight; this is probably the case, as we have seen. According to x-ray data,3 the collagen matrix expands somewhat on addition of water and double- or triple-stranded chains of water might form, where space permits. Undoubtedly, these strands are hydrogen bonded to each other. In this manner local, three-dimensional, clusters can gradually be formed, just as in liquid water. It is to be noted, however, that since the single strand is also liquidlike, no new state in the thermodynamic sense is created. Despite the different topology of chains and clusters, their physical properties are expected to be similar. From the considerations in the Introduction, it is evident that we expect large configurational contributions of water in contact with collagen, even at low water contents. As we see from eq 1 and 2, the heat capacity of water is constant and equal to 23 cal deg-1 mol-1 over a wide range of water contents, in agreement with this expectation.
That the heat capacity is even larger than that of bulk water is not surprising, considering that, in its hydrogen bonding capability, collagen acts, at least partly, as a nonpolar surface toward water chains. As we have seen in the Introduction, the large partial molal heat capacity of nonpolar solutes in water is a reflection of the gradual breakdown of water structure with temperature. The configurational contributions to the heat capacity of these water structures are larger than those of bulk water. We suggest that the water structures around nonpolar solutes and those in collagen are similar in their thermodynamic behavior, although, of course, their topology is different. It is interesting to note that the precipitation of collagen from aqueous solution into the fibrous form is associated with entropy, enthalpy, and volume increases,29’30 instead of the decreases expected for the formation of an ordered, cystal- line state from a disordered solution. Just as for aggregation of nonpolar solutes from aqueous solution,22 we assume that the low-entropy, low-energy, and low-volume water structures existing around collagen in solution are, at least partly, dissipated on aggregation. According to this reasoning, the water remaining in collagen after aggregation should also have this structure. If, indeed, the structures of water in collagen and around nonpolar solutes are similar, collagen provides an excellent matrix for the study of water structures around nonpolar solutes in general.
Acknowledgments. For support of this work we thank the National Science Foundation for Grant No. GB-28019, and the Robert A. Welch Foundation for Grant No. A-445.
C. A. J. Hoeve and S. R. Kakivaya
The Journal o f Physical Chemistry, Vol. 80, No. 7, 1976
Electro lyte V iscos ities in Sulfolane
References and Notes(1) H. S. Frank and M. W. Evans. J. Chem. Phys., 13, 507 (1945).(2) W Kauzmann, Adv. Protein Chem., 14, 1 (1959).(3) M. A. Rougvie and R. S. Bear, J. Am. Leather Chem. Assoc., 48, 735
(1953).(4) G. N. Ramachandran and R. S. Chandrasekharan, Biopolymers, 6, 1649
(1968).(5) A. Yonath and W. Traub, J. Mol. Biol., 43, 461 (1969).(6) H. J. C. Berendsen. J. Chem. Phys., 36, 3297 (1962).(7) R. E. Dehl and C. A. J. Hoeve, J. Chem. Phys., 50, 3245 (1969).(8) G. E. Chapman and K. A. McLauchlan, Froc R. Soc. London, Ser. B,
173, 223(1969)(9) G. E. Chapman, S. S. Danyluk, and K. A. McLauchlan, Proc. R. Soc.
London. Ser. B, 178, 465 (1971).(10) B. M. Fung and P. Trautmann, Biopolymers, 10, 391 (1971).(11) B. M. Fung and M. M. Siegel, Biochem. Biophys. Acta, 278, 185 (1972).(12) B. M. Fung and S. C. Wei, Biopolymers, 12, 1053 (1973).(13) C. Migchelsen and H. J. C. Berendsen, J. Chem. Phys , 59, 296 (1973).(14) C. A. J. Hoeve and P. C. Lue, Biopolymers, 13, 1661 (1974).(15) D. Eisenberg and W. Kauzmann, "The Structure and Properties of
749
Water”, Oxford University Press. New York, N.Y., 1969, Chapter 3.(16) D. Eisenberg and W Kauzmann, ref 15, Chapter 4.(17) H. S. Frank and W. Y. Wen, Discuss. Faraday Soc., 24, 133 (1957).(18) G. Nemethy and H. A Scheraga, J. Chem. Phys., 36, 3382 (1962).(19) G. E. Walrafen, "Water, A Comprehensive Treatise” , Vol. 1, F. Franks,
Ed., Plenum Press. New York, N.Y., 1972, Chapter 5.(20) M. Falk and O Knop, "Water, A Comprehensive Treatise ', Vol. 2, F.
Franks, Ed., Plenum Press, New York, N.Y., 1973, Chapter 2.(21) J. A. Pople, Proc. R. Soc. London, Ser. A, 205, 163 (1951).(22) D. W. Davison, ref 20, Chapter 3.(23) Y. S Touloukian and E. H. Buyco, “ Specific Heat, Nonmetallic Solids,
Thermophysical Properties of Matter” , Vol. 5, IFI/Plenum, New York, N.Y., 1970.
(24) I. Yannas, J. Macromoi. Sei. Rev. Macromol. Chem., C 7, 49 (1972).(25) A. R. Haly and J. W. Snaith, Biopolymers, 10, 1681 (1971).(26) W. F. Harrington and P. H. von Hippel, Adv. Protein Chem., 16, 1
(1961).(27) A. Rich and F. H. C. Crick, J. Mol. Biol., 3, 483 (1961).(28) H. Susi, J. S. Ard, and R. J. Carroll, Biopolymers, 10, 1597 (1971).(29) J. M. Cassel. Biopolymers, 4, 989 (1966).(30) J. M. Cassel and R G. Christensen, Biopolymers, 5, 431 (1967).
Electrolyte Viscosities in Sulfolane at 30, 40, and 50 °C
Antonio Sacco,* Giuseppe Petrella, and Maurizio Castagnolo
Institute o f Physical Chemistry, University o f Bari, 70126 Bari, Italy (Received May 28, 1975; Revised Manuscript Received December 1, 1975)
Publication costs assisted by the University o f Bari
Viscosities of ¿Am3BuNBPh4, ¡AmsBuNI, NaBPh4, B114NCIO4, Bu4NI, BiLjNBr, Bu4NCl, LiC104, NaC104, KCIO4, RbC104, and CsC104 in sulfolane were determined at 30, 40, and 50 °C. Data were analyzed by the Jones-Dole equation. The B coefficients obtained were separated in the ionic contributions B±, assuming that B,Am3BuN+ = B BPh4- = B,Am3BuNBPh4/2. The By values were discussed in terms of Einstein’s equation. This analysis shows that cations are solvated, as opposed to all anions and ¿Am3BuN+ and Bu4N+. Some comments are made on the temperature dependence of the B± coefficients.
Introduction
Study of the transport properties of electrolytic solutions gives very useful information about ion-solvent interactions. One method employed for these investigations is to study the solution viscosity. Most viscometric measurements have been carried out on aqueous systems, whereas not much data on ions in nonaqueous solvents are available in the literature.
In the present paper the viscosities of solutions of several electrolytes in sulfolane at 30, 40, and 50 °C are reported. Sulfolane is a dipolar aprotic solvent of high dipole moment and intermediate dielectric constant (p = 4.8 D and t = 43.3 at 30 °C). In recent years much interest has been shown in this solvent, which possesses many useful properties for electrochemical studies. Particularly conductometric data1 have shown the existence of specific ion-solvent interactions. Viscosimetric measurements were performed in order to obtain more information about these effects.
Experimental Section
Materials. Commercial sulfolane (Shell Co.) was purified as described by Desbarres, Pichet, and Benoit2 and
then distilled three times over sodium hydroxide pellets under reduced pressure (10-4 mmHg). Water content in the final product, detected by the Karl Fisher method, was less then 0.007 wt %. Sulfolane densities and viscosities at 30, 40, and 50 °C are 1.26227, 1.25346, 1.24464 g/cm3 and 0.1029, 0.07946, 0.06304 P, respectively. The same values at 30 °C are reported by Fernandez-Prini and Prue.la
Triisoamylbutylammonium tetraphenylboride (TABBPh4) was prepared and purified following the method suggested by Coplan and Fuoss3 (mp 275 °C).
Sodium tetraphenylboride (NaBPh4) (Fluka puriss. p.a.) was recrystallized three times from acetone and then dried in vacuo at 80 °C for 3 days.
Triisoamylbutylammonium iodide (TABI) was obtained and purified by the method described by Coplan and Fuoss3 (mp 119 °C).
Tetrabutylammonium perchlorate (C. Erba R.S.) was purified by recrystallization from ether-acetone mixtures, followed by drying in vacuo for 48 h at room temperature (mp 213 °C).
Tetrabutylammonium iodide (C. Erba R.S.) was dissolved in a minimum amount of acetone and then ether was added. The resulting crystals were removed by filtration.
The Journal o f Physical Chemistry, Vol. 80, No. 7, 1976
750 A. Sacco, G. Petrella, and M. C astagnolo
This procedure was repeated three times and the salt was dried at 90 °C under reduced pressure.
Tetrabutylammonium bromide (C. Erba R.S.) was recrystallized three times from ethyl acetate and dried in vacuo at 56 °C (mp 118 °C).
Tetrabutylammonium chloride (K&K Laboratory) was recrystallized from acetone by the addition of ether. All manipulations of this salt owing to its extreme hygroscopic nature were carried out in a drybox through which dry nitrogen was passing.
Lithium perchlorate (Fluka purum), sodium and potassium perchlorates (Fisher Laboratory Chemicals), and rubidium and caesium perchlorates ( K & K Laboratory) were recrystallized several times from water-methanol mixtures (1 :1 ) and dried at 150 °C in a vacuum oven for 4 days.
A stock solution for each salt was prepared by weight and working solutions in the concentration range 0.01 < M < 0.08 were obtained by weight dilution. All weights were corrected to vacuum.
Apparatus. An Ubbelohde suspended bulb level viscometer (Jena Glaswerk Schott Gen-Mainz) was used for all measurements. Two photocells (Hewlett-Packard Co.) were attached to the viscometer approximately at the etched lines. The viscometer and lamp photocell assemblies were coupled by a Hewlett-Packard Auto-Viscometer, Model 5901B, which provided automatic influxing in preparation for the efflux measurements and digital display of efflux time in milliseconds.
The measurements were made in a viscometric water thermostat (Herzog-Berlin); the control was within ±0.01 °C and the temperature monitored by a NBS certified platinum resistance thermometer in conjunction with a G2 Mueller Bridge (L & N Co.).
Viscometer calibration was made with aqueous solutions of sucrose (Fisher certified ACS) at 15, 20, and 25 °C using viscosity and density values reported in literature.4
Kinematic viscosities (cSt) were converted to absolute viscosities (cP) using density values obtained by a DMA 02C densimeter manufactured by Anton Paar K.G.;6 reproducibility was found to be ±1 X 10~5 g/ml.
The densities p of working solutions were obtained from
P = p o + d m
where m is the concentration in moles per kilogram of solution, po >s the solvent density, and is an empirical constant determined by density measurements on the most concentrated solution studied for each salt.
ResultsThe viscosities were calculated from
ri/p = K t - j (1 )
where p is the absolute viscosity, p is the density, t the flow time, and K and L are characteristic viscometer constants. The values of K and L, obtained by calibration, were 0.03004 cSt/s and 0.64 cSt s, respectively.
Molar concentrations c and the values of (p/p0 ~ l)/\/c, where p/po is the relative viscosity of solution, are listed in Tables I, II, and III6 for each salt at 30, 40, and 50 °C, respectively. For TABBPh4 and NaBPh4, at all temperatures are included data for two runs performed using different samples of solvent and salt.
Experimental data were analyzed by Jones-Dole equation7
(p/po — l ) / y / c = A + B V c (2)where A and B are characteristic parameters for the solvent and the electrolyte. The viscosity A coefficient depends on ion-ion interactions and can be calculated if limiting ionic equivalent conductances and solvent physical properties are known.8 Theoretical A coefficients calculated at 30 °C by conductometric datalb>e are reported in Table IV for all salts studied. Viscosity B coefficient is an experimental constant related to ion-solvent interactions.
Experimental values of (p/po — l)A /c were plotted against v /c, as shown in Figures 1 and 2 at 30 °C. As may be seen, the points show linear trends for all salts, except for TABBPh4, NaBPh4, NaC104, Bu4NBr, and Bu4NI at c ~ 0.07 M. These points, which show positive deviations from linearity, were excluded in all calculations. By the least-squares method negative A values were calculated as intercept of the (p/po — l)A /c vs. V c plots, and this result is without physical significance. The same behavior was observed by Kay and co-workers in water9 and by Yao and Bennion in DMSO.10 According to the Yao and Bennion treatment, B coefficients were calculated as slopes of the straight lines, obtained by the least-squares method, with intercept forced close to theoretical A values. Theoretical A values at 40 and 50 °C cannot be calculated because conductometric data at those temperatures are lacking. So, supposing that A coefficients have a weak temperature dependence as observed for many solvents,10' 12 the values calculated at 30 °C were used at 40 and 50 °C. Viscosity B coefficients are summarized in Table IV together with their standard deviations.
Ionic B± coefficients were obtained as suggested by Krumgal’z13 assuming BTab+ = Bbpiu- = £(TABBPh4)/2.
The hydrodynamic equivalence in sulfolane at 30 °C of TAB+ and BPh4~ is also shown by the same mobilities found by Zipple on the basis of the transference numbers of Della Monica and co-workers.lb
The ionic B± coefficients at 30, 40, and 50 °C are reported in Table V.
Discussion
As may be seen in Figures 1 and 2 the Jones-Dole equation holds good in sulfolane in the range of concentrations investigated, with the exceptions of TABBPh4, NaBPh4, NaC104, Bu4NBr, and Bu4NI at c ~ 0.07 M. The internal consistency of our data can be shown by the good agreement between the B value obtained experimentally for TABI at 30, 40, and 50 °C (0.99, 0.89, and 0.80, respectively) and that obtained on adding ionic B± coefficients of TAB+ and I- derived from the sequence TABBPh4, NaBPlLi, NaC104, Bu4NC104, and Bu4NI (0.99, 0.89, and 0.79 at 30, 40, and 50 °C, respectively).
Viscosity coefficients for cations and for BPh4~ are all positive and very high. On the contrary the other anions show very low B- values; particularly Cl- at 30 °C, and C104~ at all temperatures, show small negative B_ values.
Ionic B± viscosity coefficients can be analyzed on the basis of Einstein’s equation14
B± = 2.5 4irR±3N 3 1000 (3)
where R± is the radius of the ion assumed as a rigid sphere, N is Avogadro’s number, and 2.5 is the shape factor for a
The Journal o f Physical Chemistry, Vol. 80, No. 7, 1976
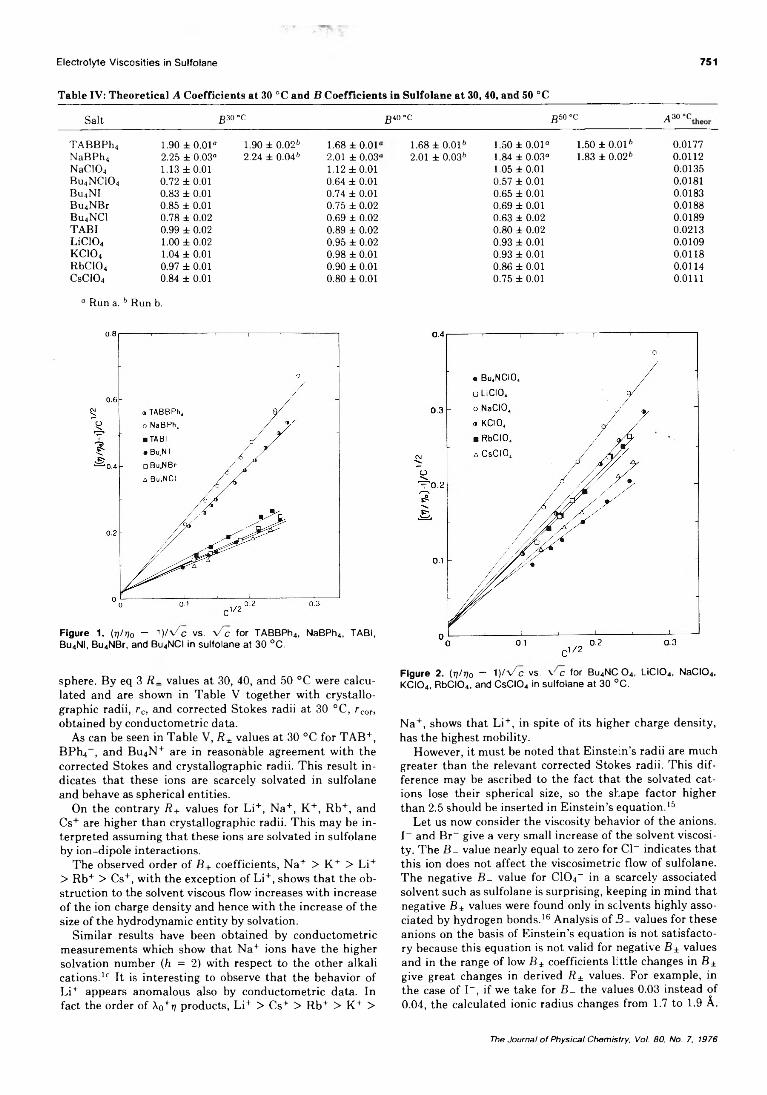
E lectro ly te V iscos ities in Sulfolane 751
Table IV: Theoretical A Coefficients at 30 °C and B Coefficients in Sulfolane at 30, 40, and 50 °C
Salt B30°c B40°c B50°c A36 °c
TABBPh4 1.90 ± 0.01“ 1.90 ± 0.026 1.68 ± 0.01'NaBPh4 2.25 ± 0.03“ 2.24 ± 0.04 b 2.01 ± 0.03'NaC104 1.13 ±0.01 1.12 ±0.01Bu4NC104 0.72 ± 0.01 0.64 ± 0.01Bu4NI 0.83 ± 0.01 0.74 ± 0.01Bu4NBr 0.85 ± 0.01 0.75 ± 0.02Bu4NC1 0.78 ± 0.02 0.69 ± 0.02TABI 0.99 ± 0.02 0.89 ± 0.02LiC104 1.00 ± 0.02 0.95 ± 0.02KC10„ 1.04 ± 0.01 0.98 ± 0.01RbC104 0.97 ± 0.01 0.90 ± 0.01CsCl04 0.84 ± 0.01 0.80 ± 0.01
“ Run a. b Run b.
Figure 1. (77/7/0 — 1 )/v^c vs. x / c for TABBPh4, NaBPh4, TABI, Bu4NI, Bu4NBr, and Bu4NCI in sulfolane at 30 °C.
sphere. By eq 3 R~ values at 30, 40, and 50 °C were calculated and are shown in Table V together with crystallographic radii, rc, and corrected Stokes radii at 30 °C, rcor, obtained by conductometric data.
As can be seen in Table V, R± values at 30 °C for TAB+, BPh4_ , and Bu4N+ are in reasonable agreement with the corrected Stokes and crystallographic radii. This result indicates that these ions are scarcely solvated in sulfolane and behave as spherical entities.
On the contrary R+ values for Li+, Na+, K+, Rb+, and Cs+ are higher than crystallographic radii. This may be interpreted assuming that these ions are solvated in sulfolane by ion-dipole interactions.
The observed order of B+ coefficients, Na+ > K+ > Li+ > Rb+ > Cs+, with the exception of Li+, shows that the obstruction to the solvent viscous flow increases with increase of the ion charge density and hence with the increase of the size of the hydrodynamic entity by solvation.
Similar results have been obtained by conductometric measurements which show that Na+ ions have the higher solvation number (h = 2) with respect to the other alkali cations.lc It is interesting to observe that the behavior of Li+ appears anomalous also by conductometric data. In fact the order of \o+i] products, Li+ > Cs+ > Rb+ > K+ >
1.68 ± 0.016 1.50 ±0.01“ 1.50 ± 0.016 0.01772.01 ± 0.03* 1.84 ± 0.03° 1.83 ± 0.02b 0.0112
1.05 ± 0.01 0:01350.57 ± 0.01 0.01810.65 ± 0.01 0.01830.69 ± 0.01 0.01880.63 ± 0.02 0.01890.80 ± 0.02 0.02130.93 ± 0.01 0.01090.93 ± 0.01 0.01180.86 ± 0.01 0.01140.75 ± 0.01 0.0111
Figure 2. (77/770 — 1)/V^c vs. v c for Bu4NC 0 4, LiCI04, NaCI04, KCI04, RbCI04, and CsCI04 in sulfolane at 30 °C.
Na+, shows that Li+, in spite of its higher charge density, has the highest mobility.
However, it must be noted that Einstein’s radii are much greater than the relevant corrected Stokes radii. This difference may be ascribed to the fact that the solvated cations lose their spherical size, so the shape factor higher than 2.5 should be inserted in Einstein’s equation.15
Let us now consider the viscosity behavior of the anions. I- and Br~ give a very small increase of the solvent viscosity. The B - value nearly equal to zero for Cl- indicates that this ion does not affect the viscosimetric flow of sulfolane. The negative B - value for C104- in a scarcely associated solvent such as sulfolane is surprising, keeping in mind that negative B± values were found only in solvents highly associated by hydrogen bonds.16 Analysis of B - values for these anions on the basis of Einstein’s equation is not satisfactory because this equation is not valid for negative B± values and in the range of low B± coefficients little changes in B± give great changes in derived R± values. For example, in the case of 1“ , if we take for B_ the values 0.03 instead of 0.04, the calculated ionic radius changes from 1.7 to 1.9 A.
The Journal o f Physical Chemistry, Vol. 80, No. 7, 1976
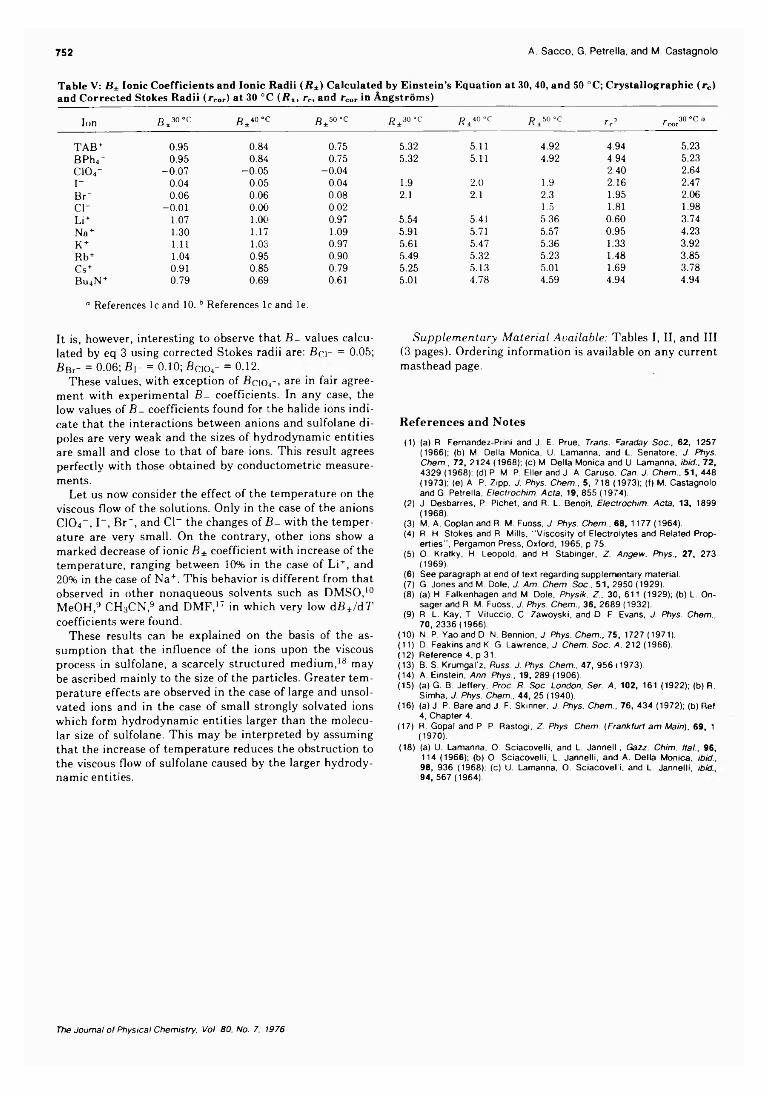
752 A. Sacco, G. Petrella, and M. Castagnolo
Table V: B± Ionic Coefficients and Ionic Radii (R±) Calculated by Einstein’s Equation at 30, 40, and 50 °C; Crystallographic (rc) and Corrected Stokes Radii (rcor) at 30 °C (R±, rc, and rCOT in Angstroms)
Ion B ± 3 °» C f i ± 4 0 "C S ± 5 0 "C R ± 3 0 ° C R ± 4 0 "C R± 50 ° c r <■’ r 30 °C 1 ' cor
TAB+ 0.95 0.84 0.75 5.32 5.11 4.92 4.94 5.23BPh4- 0.95 0.84 0.75 5.32 5.11 4.92 4.94 5.23cio4- -0.07 -0.05 -0.04 2.40 2.64I- 0.04 0.05 0.04 1.9 2 .0 1.9 2.16 2.47Br~ 0.06 0.06 0.08 2.1 2.1 2.3 1.95 2.06Cl" -0.01 0.00 0 .0 2 1.5 1.81 1.98Li + 1.07 1.00 0.97 5.54 5.41 5.36 0.60 3.74Na+ 1.30 1.17 1.09 5.91 5.71 5.57 0.95 4.23K + 1.11 1.03 0.97 5.61 5.47 5.36 1.33 3.92Rb+ 1.04 0.95 0.90 5.49 5.32 5.23 1.48 3.85Cs+ 0.91 0.85 0.79 5.25 5.13 5.01 1.69 3.78Bu4N+ 0.79 0.69 0.61 5.01 4.78 4.59 4.94 4.94
° References lc and 10. 6 References lc and le.
It is, however, interesting to observe that B - values calculated by eq 3 using corrected Stokes radii are: Bei- = 0.05; Bbt- = 0.06; Bi- = 0.10; Bcio4- = 0.12.
These values, with exception of Bcio4-, are ln a'r agreement with experimental S_ coefficients. In any case, the low values of B - coefficients found for the halide ions indicate that the interactions between anions and sulfolane dipoles are very weak and the sizes of hydrodynamic entities are small and close to that of bare ions. This result agrees perfectly with those obtained by conductometric measurements.
Let us now consider the effect of the temperature on the viscous flow of the solutions. Only in the case of the anions C104-, I- , Br~, and Cl- the changes of £ _ with the temperature are very small. On the contrary, other ions show a marked decrease of ionic B± coefficient with increase of the temperature, ranging between 10% in the case of Li+, and 20% in the case of Na+. This behavior is different from that observed in other nonaqueous solvents such as DMSO,10 MeOH,9 CH3CN ,9 and DMF,17 in which very low dB±/dT coefficients were found.
These results can be explained on the basis of the assumption that the influence of the ions upon the viscous process in sulfolane, a scarcely structured medium,18 may be ascribed mainly to the size of the particles. Greater temperature effects are observed in the case of large and unsolvated ions and in the case of small strongly solvated ions which form hydrodynamic entities larger than the molecular size of sulfolane. This may be interpreted by assuming that the increase of temperature reduces the obstruction to the viscous flow of sulfolane caused by the larger hydrodynamic entities.
Supplementary Material Available: Tables I, II, and III (3 pages). Ordering information is available on any current masthead page.
References and Notes(1) (a) R. Fernandez-Prim and J. E. Prue, Trans. caraday Soc., 62, 1257
(1966); (b) M. Della Monica, U. Lamanna, and L. Senatore, J. Phys. Chem., 72, 2124 (1968); (c) M. Della Monica and U. Lamanna. ibid., 72, 4329 (1968); (d) P. M. P. Eller and J. A. Caruso. Can. J. Chem., 51, 448(1973); (e) A. P. Zipp, J. Phys. Chem., 5, 718 (1973); (f) M. Castagnolo and G. Petrella, Electrochim. Acta, 19, 855 (1974).
(2) J. Desbarres, P. Pichet, and R. L. Benoit, Electrochim. Acta, 13, 1899(1968) .
(3) M. A. Coplan and R. M. Fuoss, J. Phys. Chem., 68, 1177 (1964).(4) R. FI. Stokes and R. Mills, “Viscosity of Electrolytes and Related Prop
erties", Pergamon Press, Oxford, 1965, p 75.(5) O. Kratky, H. Leopold, and H. Stabinger, Z. Angew. Phys., 27, 273
(1969) .(6) See paragraph at end of text regarding supplementary material.(7) G. Jones and M. Dole, J. Am. Chem. Soc.. 51, 2950 (1929).(8) (a) H. Falkenhagen and M. Dole, Physik. Z „ 30, 611 (1929); (b) L. On-
sager and R. M. Fuoss, J. Phys. Chem., 36, 2689 (1932).(9) R. L. Kay, T. Vituccio, C. Zawoyski, and D. F. Evans, J. Phys. Chem.,
70, 2336(1966)(10) N. P. Yao and D. N. Bennion, J. Phys. Chem., 75, 1727 (1971).(11) D. Feakins and K. G. Lawrence, J. Chem. Soc. A. 212 (1966).(12) Reference 4, p 31.(13) B. S. Krumgal'z, Russ. J. Phys. Chem.. 47, 956 11973).(14) A. Einstein, Ann. Phys., 19, 289 (1906).(15) (a) G. B. Jeffery, Proc. R. Soc. London, Ser. A, 102, 161 (1922); (b) R.
Simha, J. Phys. Chem., 44, 25 (1940).(16) (a) J. P. Bare and J. F. Skinner, J. Phys. Chem., 76, 434 (1972); (b) Ref
4, Chapter 4.(17) R. Gopal and P. P. Rastogi, Z. Phys. Chem. (Frankfurt am Main), 69, 1
(1970) .(18) (a) U. Lamanna, O. Sciacovelli, and L. Jannell, Gazz. Chim. Ital., 96,
114 (1966); (b) O. Sciacovelli, L. Jannelli, and A. Della Monica, ibid., 98, 936 (1968); (c) U. Lamanna, O. Sciacovel i, and L. Jannelli. ib id , 94, 567 (1964).
The Journal o f Physical Chemistry, Voi. 80, No. 7, 1976
Conductance of Binary Asymmetric Electrolytes 753
Conductance of Binary Asymmetric Electrolytes in Methanol
T. L. Broadwater,
Department o f Chemistry, Howard University, Washington, D.C. 20059
T. J. Murphy,
Department o f Chemistry, University o f Maryland, College Park, Maryland 20742
and D. F. Evans*
Department o f Chemical Engineering, Carnegie-Meiion University, Pittsburgh, Pennsylvania 15213 (Received May 22, 1975; Revised Manuscript Received December 18, 1975)
Publication costs assisted by the Petroleum Research Fund
The corrected Fuoss-Onsager conductance theory is applied to solutions of alkaline earth chlorides in methanol at 10 and 25 °C. The results are similar to those found for aqueous solutions and show that the “ primitive” model can adequately account for the effects of ion association at low concentration. Ionic conductances derived for the divalent cations are used to test the applicability of Zwanzig’s theory to the mobility of multivalent ions in a nonaqueous solvent. Similar data for multivalent ions in aqueous solutions are also examined.
Introduction
Conductance data for the alkaline earth chlorides in methanol at 10 and 25 °C are analyzed by a theory derived by Murphy and Cohen.1-3 The conductance behavior of un- symmetrical electrolytes, particularly in nonaqueous solvents, has received relatively little attention. This is due in large part to the difficulty encountered in analyzing such data since the usual methods require an arbitrary choice for some of the parameters needed in the analysis. The theory employed here uses the “ primitive” model of the Fuoss-Onsager equations,4-6 but starts with a corrected solution to the differential equation for the nonequilibrium pair distribution function. When combined with a higher order expression for the equilibrium distribution function, the equation can be applied to binary asymmetric electrolytes. The experimental data cover a sufficiently dilute concentration range. Comparison is made with NaCl and KC1 in methanol using data taker, from the literature.7
Experimental Section
The electrical equipment used for the conductance measurements has been described in previous publications.7*8 Conductance runs were carried out by adding small increments of concentrated salt solutions to a thermostated, partially filled Kraus-type conductance cell from a weight buret.10
Throughout each run great care was needed in order to ensure that the solvent was not exposed to the atmosphere. This was accomplished in the following way. The cell, usually stored filled with water, was drained, rinsed several times with solvent, then flushed for approximately 15 min with nitrogen which bubbled through methanol just before entering the cell. Solvent was then forced into the cell from closed storage containers using a slightly positive nitrogen pressure. The solvent flowed directly into the cell through a glass delivery device fitted with teflon stopcocks. The solvent level in the cell was adjusted slightly above the tubes which connect the electrode compartment to the Erlen- meyer flask. After filling, the cell was capped, weighed, and
placed in a constant temperature bath for approximately 20 min. For the runs carried out at 10 °C, solvent-saturated nitrogen was used to flush the area above the solvent in the cell until temperature equilibrium was attained. The nitrogen entered a side arm on the cell above the solvent level and exited through the cap opening. The ground glass cap was fitted loosely on the cell during this period and floated on the exiting stream of nitrogen. The solvent resistance was significantly lowered when this procedure was not followed. After thermal equilibrium had been a-tained and the solvent resistance determined, the cap was removed from the cell and small increments of concentrated electrolyte solution were added from the weight buret. Solvent- saturated nitrogen continually flushed the space above the solvent during each addition. The cell was then capped and the nitrogen flow stopped. After about 5 min the resistance remained constant and final readings were taken at 2 and 5 kHz. The contents of each cell were constantly stirred by teflon coated magnets.
The concentrated salt solutions were made up by weight, usually after the cell had been placed in the constant temperature bath, and were used immediately. A run was generally completed within 1.5 h. The effect of atmospheric contaminants on the solvent introduced through the salt solutions was found to be negligible when blank runs were made in which solvent, rather than salt solution, was added to the cell with the weight buret using our regular procedure.
Solvent resistances and those for solutions with salt concentrations below about 2 X IO-4 M exceeded the maximum value measurable directly with the decade resistance box used in this study. These measurements were made by placing a 50 000 ohm standard resistor either :n parallel or in series with the resistance box and carrying out the appropriate calculation. The frequency dependence of the measured resistances was generally found to be small, i.e., less than 0.01%; when it exceeded this, a correction was made by plotting resistances vs. 1/frequency and extrapolating to infinite frequency.
Methanol was purified by passing reagent grade solvent
The Journal o f Physical Chemistry, Voi. 80, No. 7, 1976
754 T. L. Broadwater, T. J. Murphy, and D. F. Evans
through a mixed bed ion-exchange column and then distilling under nitrogen from a 1 -m Stedman column. The middle fraction was collected and stored under nitrogen. Water had been removed from the ion-exchange resin by repeatedly soaking it in small amounts of reagent grade methanol. The distilled solvent had specific conductances of 0.6-3.0 X 10⁻⁸ ohm-1 cm-1 as measured in the cells shortly before beginning a conductance run.
The preparation cf the salt samples has previously been described.8,9
ResultsThe molar concentrations and corresponding equivalent
conductances for salts in methanol at 25 and 10 °C are available as supplementary material (see paragraph at end of text regarding supplementary material). The concentrations were initially calculated by weight (moles of salt/kilo- gram of solution) and converted to a molar basis by multiplying times the density of each solution. Densities were assumed to vary linearly with concentration of electrolyte, that is, d = do + Am, where d and do are the densities of the solution and solvent, respectively, m is moles/kilogram of solution, and A is a constant determined for each electrolyte by measuring the density of the most concentrated salt solution following a conductance run. The values of A determined at 25 °C were 0.137, 0.103, 0.114, and 0.164 for MgCb. CaCl2, SrCb and BaCl2, respectively. These same A values were used for converting to molarities at 10 °C.
The dielectric constant, viscosity (poise), and density (g/ml) used for methanol at 25 °C were 32.62, 0.005445, and 0.78653 while at 10 °C the values were 35.70, 0.00672, and 0.80073, respectively.8 The limiting ionic conductance for Cl- in methanol at 25 °C was taken from the literature7 while the value at 10 °C is based on data obtained from Kay.11
DiscussionThe Primitive-Model as Applied to Unsymmetrical
Electrolytes in Methanol. The data presented here extend to sufficiently low concentrations to enable us to compare it with the predictions of the primitive model of electrolytes. According to this theory, the equivalent conductivity, A, is given in terms of an expression in terms of the small parameter fix:
A = A0 + A-i(fix) + Xi'(fix)2 In (fix) + A2(d*)2 + . . . (1)
The “ Landau length’', fi, is given by fi = —e\eilDkT and the “ Debye length” , 1/x, is given by 1 /x = (^1\n\e^l DkT)~l/2, where n\ and e, represent the number density and charge of an ion of species i, D is the dielectric constant of the solvent, k Boltzmann’s constant, and T the absolute temperature. The limiting equivalent conductivity, Ao, represents the equivalent conductivity of a solution so dilute that each ion moves independently of the others, while the higher-order terms represent corrections due to the interionic interactions. Ai is given by the well-known Onsager limiting law while expressions for A2' and A2 are given in ref 3. The primitive model theory employed here uses a single adjustable parameter; the distance of closest approach, a, between two ions. A2 is dependent on a and A2' is not. Ao is obtained by extrapolation from the experimental data, so that in practice values of d and Ao are chosen to give the best fit with the experimental data.
The parameters obtained by fitting the experimental
data to eq 1 are given in Table I for the alkaline earth chlorides at the two temperatures studied. Table I also contains results calculated for these salts in H2O at 25 °C and for NaCl and KC1 in MeOH and H20. The NaCl and KC1 data in MeOH were taken from the literature and analyzed at rounded concentrations. The aqueous solution data are taken from an earlier publication.3
The adjustable parameters â and Ao in MeOH were determined using only the data points from Table I in the range 0.15 < fix < 0.30. The data points below fix = 0.15 deviated significantly from the best curve obtained in fitting the experimental data. These data points usually corresponded to the first addition of concentrated electrolyte to a conductance cell and the deviation is probably due to experimental difficulty. An improper solvent correction for the first data point or adsorption of electrolyte on the walls of the cell are possible explanations.
Data points greater than fix = 0.30 were not used in the analysis in order to minimize the effect of terms of order (fix)3/2 In (fix) and higher in eq 1. Whether the higher order terms are important over the concentration range being considered can be assessed for the SrCL data at 25 °C. There are enough data points to allow analysis in the range where fix < 0.2. The best fit of the data up to this concentration limit gave d = 5.4 Â. This compares well with d =5.2 Â for all of the data points up to fix = 0.3. It appears then, that inclusion of the yet unevaluated higher order terms in eq 1 would not lead to significantly different conclusions.
In Figure 1 values of AA are plotted vs. fix for SrCl2 in MeOH at 25 and 10 °C. AA is given by the expression
AA = AAfix)2 In (fix) + A2(fix)2 (2)
and shows the deviation of A from the Onsager limiting law. The plot in Figure 1 shows all of the data points for SrCl2 with fix < 0.30. Error bars are shown for the points with 0.15 < fix < 0.30 in the figure. In Figure 2 AA is plotted vs. fix for all of the alkaline earth salts in MeOH at 25 °C. Error bars are not shown for the points in the figure but are of the same order of magnitude as those shown for SrCl2 in Figure 1 .
In Figure 3 AA vs. fix is shown for NaCl and KC1 in MeOH. The remarkable feature of the results for 1:1 salts is that the (fix)2 term in eq 1 is dominated by the (fix)2 In (fix) term, which is independent of short-range phenomena such as association.12 For the alkaline earth salts the slopes of AA vs. fix plots are negative in MeOH since both terms in eq 2 are negative.
The values of the distances of closest approach are larger for divalent salts in water and methanol (a = 5.5 ± 0.2) than for the univalent salts in the same solvents (o = 3.5 ± 0.2). This is consistent with greater électrostriction of the polar solvent molecules as the charge of an ion increases.
It suggests that the effect of ion association appears to be treated adequately by the primitive model in the concentration range studied even though an ion pair is viewed simply as two oppositely charged hard spheres held together by their mutual electrostatic attraction.
The Mobilities of Divalent Ions in Methanol. The Ao values in Table I for the alkaline chlorides represent some of the best values available in a nonaqueous solvent for multivalent electrolytes. For this reason, it is of interest to compare the conductance-viscosity product (Aov) of the divalent ions in MeOH with the values predicted on the basis of theory. We will also include similar data for aqueous so-
The Journal o f Physical Cherristry, Vol. 80, No. 7, 1976
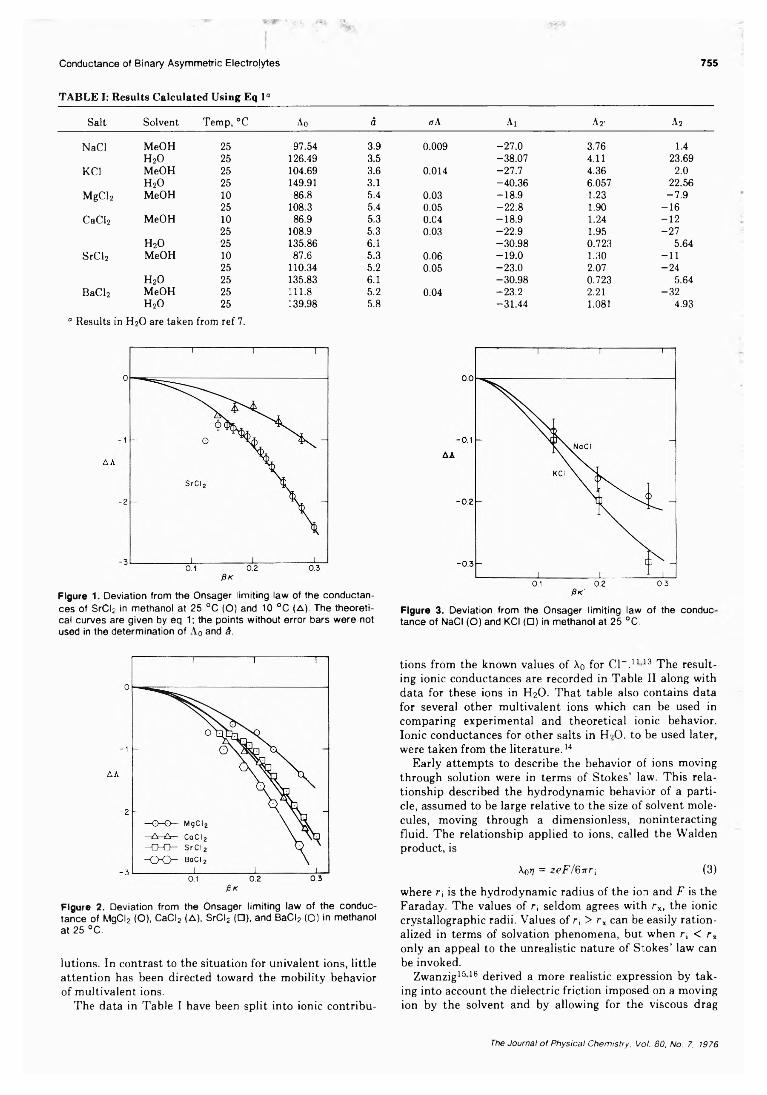
Conductance of Binary Asymmetric Electrolytes 755
TABLE I: Results Calculated Using Eq 1°
Salt Solvent Temp, °C Ao d (tA Ai A2' A2
NaCI MeOH 25 97.54 3.9 0.009 -27.0 3.76 1.4H20 25 126.49 3.5 -38.07 4.11 23.69
KCI MeOH 25 104.69 3.6 0.014 -27.7 4.36 2.0H20 25 149.91 3.1 -40.36 6.057 22.56
MgCl2 MeOH 10 86.8 5.4 0.03 -18.9 1.23 -7.925 108.3 5.4 0.05 -22.8 1.90 -16
CaCl2 MeOH 10 86.9 5.3 0.C4 -18.9 1.24 -1225 108.9 5.3 0.03 -22.9 1.95 -27
H20 25 135.86 6.1 -30.98 0.723 5.64SrCl2 MeOH 10 87.6 5.3 0.06 -19.0 1.30 -11
25 110.34 5.2 0.05 -23.0 2.07 -24H20 25 135.83 6.1 -30.98 0.723 5.64
BaCl2 MeOH 25 111.8 5.2 0.04 -23.2 2.21 -32H20 25 139.98 5.8 -31.44 1.081 4.93
“ Results in H2O are taken from ref 7.
Figure 1. Deviation from the Onsager limiting law of the conductances of SrCL in methanol at 25 °C (O) and 10 °C (A). The theoretical curves are given by eq 1 ; the points without error bars were not used in the determination of A0 and &.
Figure 3. Deviation from the Onsager limiting law of the conductance of NaCI (O) and KCI (□) in methanol at 25 °C.
Figure 2. Deviation from the Onsager limiting law of the conductance of MgCI2 (O), CaCI2 (A), SrCI2 (□), and BaCI2 (O) in methanolat 25 °C.
lutions. In contrast to the situation for univalent ions, little attention has been directed toward the mobility behavior of multivalent ions.
The data in Table I have been split into ionic contribu-
tions from the known values of \o for Cl- .1113 The resulting ionic conductances are recorded in Table II along with data for these ions in H20. That table also contains data for several other multivalent ions which can be used in comparing experimental and theoretical ionic behavior. Ionic conductances for other salts in H9O, to be used later, were taken from the literature. 14
Early attempts to describe the behavior of ions moving through solution were in terms of Stokes’ law. This relationship described the hydrodynamic behavior of a particle, assumed to be large relative to the size of solvent molecules, moving through a dimensionless, noninteracting fluid. The relationship applied to ions, called the Walden product, is
Xo r] = zeF/6irr\ (3)
where r; is the hydrodynamic radius of the ion and F is the Faraday. The values of ri seldom agrees with rx, the ionic crystallographic radii. Values of r\ > rx can be easily rationalized in terms of solvation phenomena, but when r; < rx only an appeal to the unrealistic nature of Stokes’ law can be invoked.
Zwanzig1516 derived a more realistic expression by taking into account the dielectric friction imposed on a moving ion by the solvent and by allowing for the viscous drag
The Journal of Physical Chemistry, Vo/. 80, No. 7, 1976
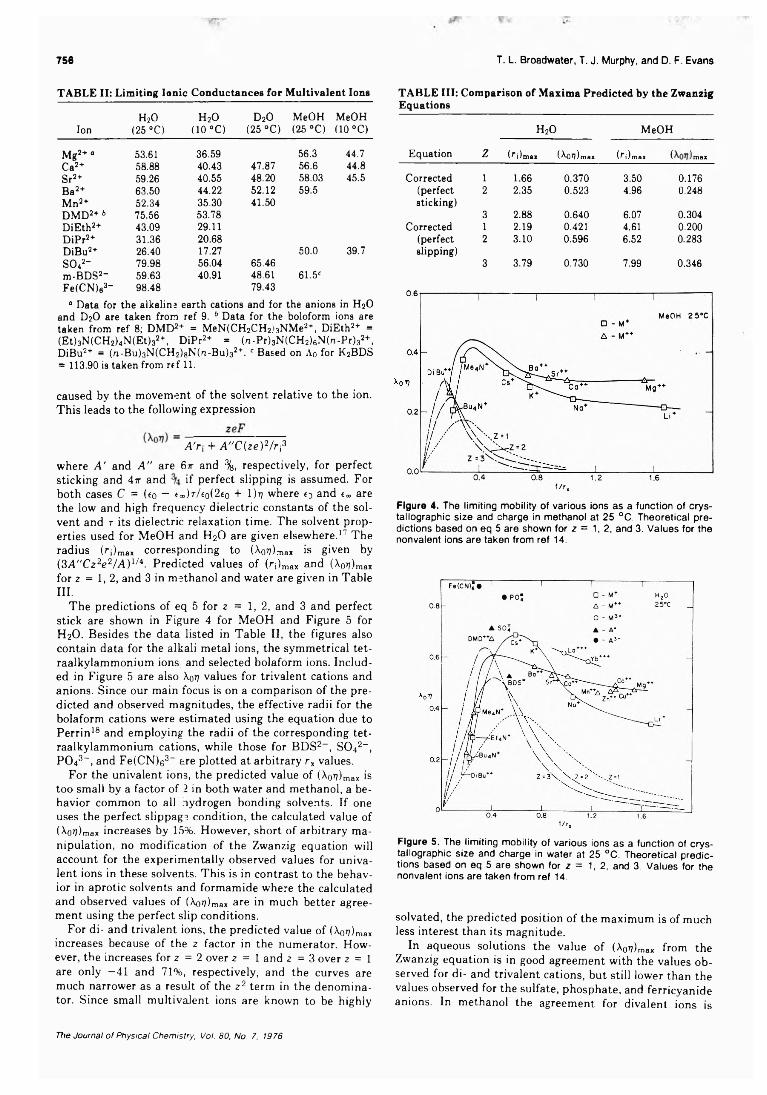
756 T. L. Broadwater, T. J. Murphy, and D. F. Evans
TABLE II: Limiting Ionic Conductances for Multivalent Ions
IonH20
(25 °C)h 2o
(10 °C)D20
(25 °C)MeOH(25 °C)
MeOH(10 °C)
Mg2* “ 53.61 36.59 56.3 44.7Ca2+ 58.88 40.43 47.87 56.6 44.8Sr2+ 59.26 40.55 48.20 58.03 45.5Ba2+ 63.50 44.22 52.12 59.5Mn2+ 52.34 35.30 41.50DMD2+ 6 75.56 53.78DiEth2+ 43.09 29.11DiPr2+ 31.36 20.68DiBu2+ 26.40 17.27 50.0 39.7SO42- 79.98 56.04 65.46m-BDS2- 59.63 40.91 48.61 61.5CFe(CN)e3- 98.48 79.43“ Data for the alkaline earth cations and for the anions in H20
and D20 are taken from ref 9. 6 Data for the boloform ions aretaken from ref 8; DMD2+ = MeN(CH2CH2)3NMe2+, DiEth2+ = (Et)3N(CH2)4N(Et)32+, DiPr2+ = (n-Pr)3N(CH2)6N(n-Pr)32+, DiBu2+ = (n-Bu)3N(CH2)8N(n-Bu)32+. c Based on Ao for K2BDS = 113.90 is taken from ref 11.
caused by the movement of the solvent relative to the ion. This leads to the following expression
A'r\ + A " C { z e ) 2/r ¡3where A ' and A ” are 6ir and %, respectively, for perfect sticking and 4rr and if perfect slipping is assumed. For both cases C = (c0 — t»)r/eo(2eo + 1)77 where (3 and e„o are the low and high frequency dielectric constants of the solvent and t its dielectric relaxation time. The solvent properties used for MeOH and H2O are given elsewhere.17 The radius (r max corresponding to (Xov)max is given by (3A " C z 2e 2/ A ) l/4. Predicted values of (r;)max and (X07;)max for 2 = 1,2, and 3 in methanol and water are given in TableIII.
The predictions of eq 5 for 2 = 1, 2, and 3 and perfect stick are shown in Figure 4 for MeOH and Figure 5 for H20. Besides the data listed in Table II, the figures also contain data for the alkali metal ions, the symmetrical tet- raalkylammonium ions and selected bolaform ions. Included in Figure 5 are also \oy values for trivalent cations and anions. Since our main focus is on a comparison of the predicted and observed magnitudes, the effective radii for the bolaform cations were estimated using the equation due to Perrin18 and employing the radii of the corresponding tet- raalkylammonium cations, while those for BDS2-, S042-, P043-, and Fe(CN)63- are plotted at arbitrary rx values.
For the univalent ions, the predicted value of (Ao?;)max is too small by a factor of 2 in both water and methanol, a behavior common to all nydrogen bonding solvents. If one uses the perfect slippage condition, the calculated value of (Xov)max increases by 15%. However, short of arbitrary manipulation, no modification of the Zwanzig equation will account for the experimentally observed values for univalent ions in these solvents. This is in contrast to the behavior in aprotic solvents and formamide where the calculated and observed values of (Xo7?)max are in much better agreement using the perfect slip conditions.
For di- and trivalent ions, the predicted value of (Xo7!)max increases because of the 2 factor in the numerator. However, the increases for 2 = 2 over 2 = 1 and 2 =3 over 2 = 1 are only —41 and 71%, respectively, and the curves are much narrower as a result of the z2 term in the denominator. Since small multivalent ions are known to be highly
TABLE III: Comparison of Maxima Predicted by the Zwanzig Equations
H20 MeOH
Equation Z ( i)max ( OV)max (n)max ( ) max
Corrected 1 1.66 0.370 3.50 0.176(perfect 2 2.35 0.523 4.96 0.248sticking)
3 2.88 0.640 6.07 0.304Corrected 1 2.19 0.421 4.61 0.200
(perfect 2 3.10 0.596 6.52 0.283slipping)
3 3.79 0.730 7.99 0.346
Figure 4. The limiting mobility of various ions as a function of crystallographic size and charge in methanol at 25 °C. Theoretical predictions based on eq 5 are shown for 2 = 1,2, and 3. Values for the non valent ions are taken from ref 14.
Figure 5. The limiting mobility of various ions as a function of crystallographic size and charge in water at 25 °C. Theoretical predictions based on eq 5 are shown for 2 = 1,2, and 3. Values for the nonvalent ions are taken from ref 14.
solvated, the predicted position of the maximum is of much less interest than its magnitude.
In aqueous solutions the value of (X0?7)max from the Zwanzig equation is in good agreement with the values observed for di- and trivalent cations, but still lower than the values observed for the sulfate, phosphate, and ferricyanide anions. In methanol the agreement for divalent ions is
The Journal of Physical Chemistry, Voi. 80, No. 7, 1976
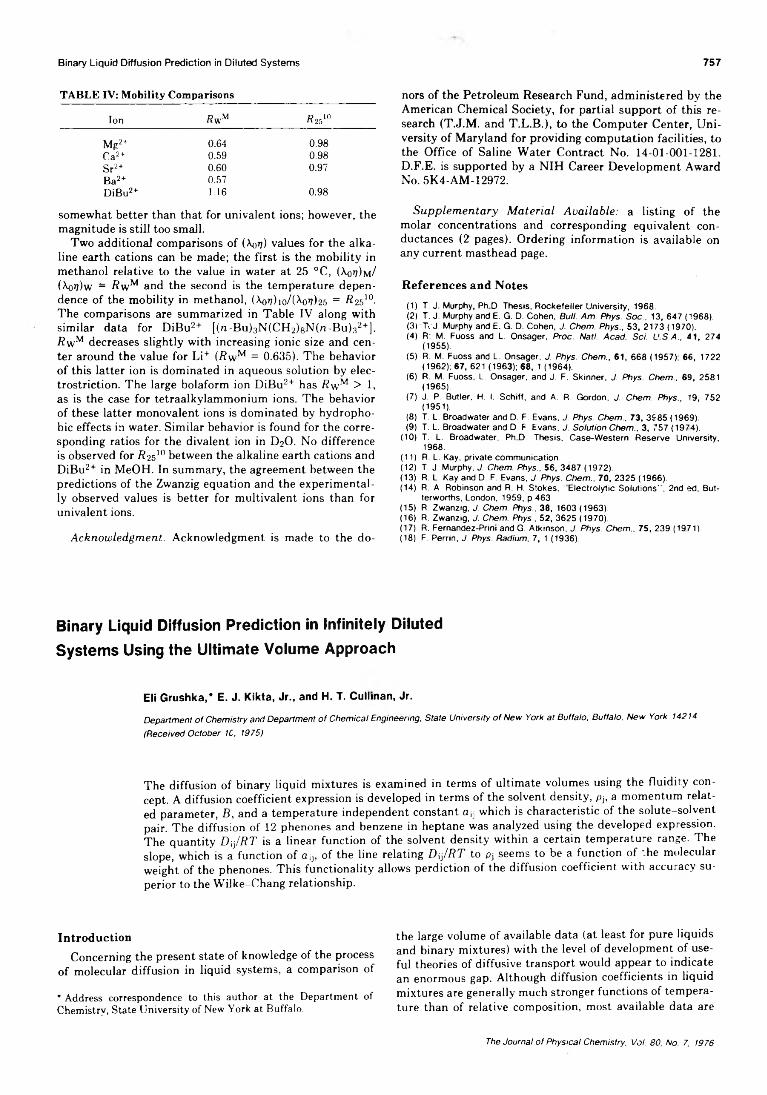
Binary Liquid Diffusion Prediction in Diluted Systems 757
TABLE IV: Mobility Comparisons
Ion fiwM Ä2510
Mg2+ 0.64 0.98Ca2+ 0.59 0.98Sr2+ 0.60 0.97Ba2+ 0.57DiBu2+ 1.16 0.98
somewhat better than that for univalent ions; however, the magnitude is still too small.
Two additional comparisons of (\ov) values for the alkaline earth cations can be made; the first is the mobility in methanol relative to the value in water at 25 °C, (\qv)m/ (^ov)w = RwM and the second is the temperature dependence of the mobility in methanol, (Aor/)io/Uo»?)25 = ^ 2S10- The comparisons are summarized in Table IV along with similar data for DiBu2+ [(n-Bu)3N(CH2)8N(n-Bu)32+]. RwM decreases slightly with increasing ionic size and center around the value for Li+ (RwM = 0.635). The behavior of this latter ion is dominated in aqueous solution by électrostriction. The large bolaform ion DiBu2+ has RwM > 1, as is the case for tetraalkylammonium ions. The behavior of these latter monovalent ions is dominated by hydrophobic effects in water. Similar behavior is found for the corresponding ratios for the divalent ion in D20. No difference is observed for R2 5 1 0 between the alkaline earth cations and DiBu2+ in MeOH. In summary, the agreement between the predictions of the Zwanzig equation and the experimentally observed values is better for multivalent ions than for univalent ions.
Acknowledgment. Acknowledgment is made to the do
nors of the Petroleum Research Fund, administered by the American Chemical Society, for partial support of this research (T.J.M. and T.L.B.), to the Computer Center, University of Maryland for providing computation facilities, to the Office of Saline Water Contract No. 14-01-001-1281.D.F.E. is supported by a NIH Career Development Award No. 5K4-AM-12972.
Supplementary Material Available: a listing of the molar concentrations and corresponding equivalent conductances (2 pages). Ordering information is available on any current masthead page.
References and Notes
(1) T. J. Murphy, Ph D. Thesis, Rockefeller University, 1968.(2) T. J. Murphy and E. G. D. Cohen, Bull. Am. Phys. Soc., 13, 647 (1968).(3) Tv J. Murphy and E. G. D. Cohen, J. Chem. Phys., 53, 2173 (1970).(4) R: M. Fuoss and L. Onsager, Proc. Natl. Acad. Sci. U.S.A., 41, 274
(1955).(5) R. M. Fuoss and L. Onsager, J. Phys. Chem., 61, 668 (1957): 66 , 1722
(1962): 67, 621 (1963); 68 , 1 (1964).(6) R. M. Fuoss, L. Onsager, and J. F. Skinner, J. Phys. Chem., 69, 2581
(1965).(7) J. P. Butler, H. I. Schlff, and A. R. Gordon, J. Chem. Phys., 19, 752
(1951).(8) T. L. Broadwater and D. F. Evans, J. Phys. Chem., 73, 3985 (1969).(9) T. L. Broadwater and D. F. Evans, J. Solution Chem., 3, 757 (1974).
(10) T. L. Broadwater, Ph D. Thesis, Case-Western Reserve University, 1968.
(11) R. L. Kay, private communication.(12) T. J. Murphy, J. Chem. Phys., 56, 3487 (1972).(13) R. L. Kay and D. F. Evans, J. Phys. Chem., 70, 2325 (1966).(14) R. A. Robinson and R. H. Stokes, 'Electrolytic Solutions ", 2nd ed, But
terworths, London, 1959, p 463.(15) R. Zwanzig, J. Chem. Phys.. 38, 1603 (1963).(16) R. Zwanzig, J. Chem. Phys., 52, 3625 (1970).(17) R. Fernandez-Prim and G. Atkinson, J. Phys. Chem., 75, 239 (1971).(18) F. Perrin, J. Phys. Radium, 7, 1 (1936).
Binary Liquid Diffusion Prediction in Infinitely Diluted Systems Using the Ultimate Volume Approach
Eli Grushka,* E. J. Kikta, Jr., and H. T. Cullman, Jr.
Department of Chemistry and Department of Chemical Engineering, State University of New York at Buffalo, Buffalo, New York 14214 (Received October 1C, 1975)
The diffusion of binary liquid mixtures is examined in terms of ultimate volumes using the fluidity concept. A diffusion coefficient expression is developed in terms of the solvent density, pj, a momentum related parameter, B, and a temperature independent constant a ¡j which is characteristic of the solute-solvent pair. The diffusion of 12 phenones and benzene in heptane was analyzed using the developed expression. The quantity Dy/RT is a linear function of the solvent density within a certain temperature range. The slope, which is a function of ay, of the line relating D^/RT to pj seems to be a function of the molecular weight of the phenones. This functionality allows perdiction of the diffusion coefficient with accuracy superior to the Wilke-Chang relationship.
Introduction
Concerning the present state of knowledge of the process of molecular diffusion in liquid systems, a comparison of
* Address correspondence to this author at the Department of Chemistry, State University of New York at Buffalo.
the large volume of available data (at least for pure liquids and binary mixtures) with the level of development of useful theories of diffusive transport would appear to indicate an enormous gap. Although diffusion coefficients in liquid mixtures are generally much stronger functions of temperature than of relative composition, most available data are
The Journal o f Physical Chemistry. Voi. 80. No. 7, 1976
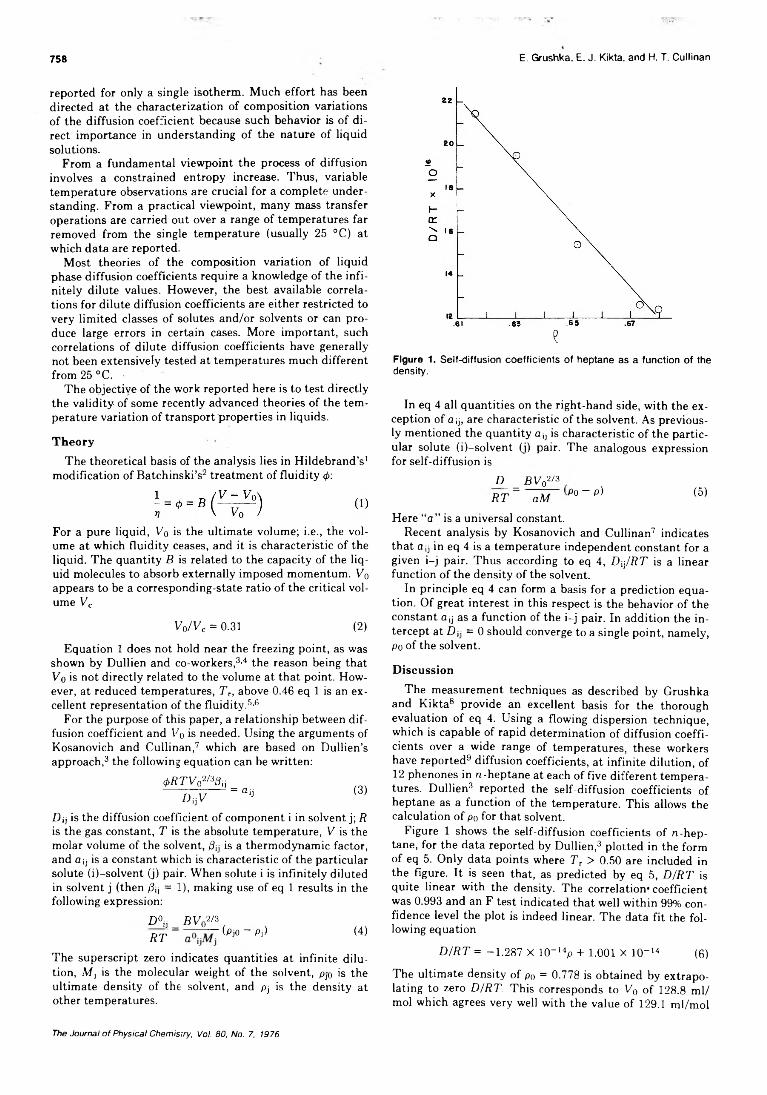
758 E. Grushka, E. J. Kikta, and H. T. Cullinan
reported for only a single isotherm. Much effort has been directed at the characterization of composition variations of the diffusion coefficient because such behavior is of direct importance in understanding of the nature of liquid solutions.
From a fundamental viewpoint the process of diffusion involves a constrained entropy increase. Thus, variable temperature observations are crucial for a complete understanding. From a practical viewpoint, many mass transfer operations are carried out over a range of temperatures far removed from the single temperature (usually 25 °C) at which data are reported.
Most theories of the composition variation of liquid phase diffusion coefficients require a knowledge of the infinitely dilute values. However, the best available correlations for dilute diffusion coefficients are either restricted to very limited classes of solutes and/or solvents or can produce large errors in certain cases. More important, such correlations of dilute diffusion coefficients have generally not been extensively tested at temperatures much different from 25 °C. -
The objective of the work reported here is to test directly the validity of some recently advanced theories of the temperature variation of transport properties in liquids.
Theory
The theoretical basis of the analysis lies in Hildebrand’s1 modification of Batchinski’s2 treatment of fluidity 4>:
For a pure liquid, Vo is the ultimate volume; i.e., the volume at which fluidity ceases, and it is characteristic of the liquid. The quantity B is related to the capacity of the liquid molecules to absorb externally imposed momentum. Vo appears to be a corresponding-state ratio of the critical volume Vc
Vo/Vc = 0.31 (2)
Equation 1 does not hold near the freezing point, as was shown by Dullien and co-workers,3,4 the reason being that Vo is not directly related to the volume at that point. However, at reduced temperatures, Tr, above 0.46 eq 1 is an excellent representation of the fluidity.5,6
For the purpose of this paper, a relationship between diffusion coefficient and Vo is needed. Using the arguments of Kosanovich and Cullinan,7 which are based on Dullien’s approach,3 the following equation can be written:
<t>RTV 0273ft;UÿV = aij (3)
Dij is the diffusion coefficient of component i in solvent j; R is the gas constant, T is the absolute temperature, V is the molar volume of the solvent, ftj is a thermodynamic factor, and ay is a constant which is characteristic of the particular solute (i)-solvent (j) pair. When solute i is infinitely diluted in solvent j (then ftj = 1 ), making use of eq 1 results in the following expression:
D° ¡j BV02/3RT (Pjo - Pj) (4)
The superscript zero indicates quantities at infinite dilution, M j is the molecular weight of the solvent, p]0 is the ultimate density of the solvent, and pj is the density at other temperatures.
e
Figure 1. Self-diffusion coefficients of heptane as a function of the density.
In eq 4 all quantities on the right-hand side, with the exception of a-,j, are characteristic of the solvent. As previously mentioned the quantity ay is characteristic of the particular solute (i)-solvent (j) pair. The analogous expression for self-diffusion is
D _ _ B V o 3
RT ~ aM Po ~ p) (5)Here “a” is a universal constant.
Recent analysis by Kosanovich and Cullinan7 indicates that ay in eq 4 is a temperature independent constant for a given i-j pair. Thus according to eq 4, Dy/RT is a linear function of the density of the solvent.
In principle eq 4 can form a basis for a prediction equation. Of great interest in this respect is the behavior of the constant ay as a function of the i-j pair. In addition the intercept at D y = 0 should converge to a single point, namely, Po of the solvent.
Discussion
The measurement techniques as described by Grushka and Kikta8 provide an excellent basis for the thorough evaluation of eq 4. Using a flowing dispersion technique, which is capable of rapid determination of diffusion coefficients over a wide range of temperatures, these workers have reported9 diffusion coefficients, at infinite dilution, of 12 phenones in rc-heptane at each of five different temperatures. Dullien3 reported the self-diffusion coefficients of heptane as a function of the temperature. This allows the calculation of po for that solvent.
Figure 1 shows the self-diffusion coefficients of n-hep- tane, for the data reported by Dullien,3 plotted in the form of eq 5. Only data points where Tr > 0.50 are included in the figure. It is seen that, as predicted by eq 5, D/RT is quite linear with the density. The correlation* coefficient was 0.993 and an F test indicated that well within 99% confidence level the plot is indeed linear. The data fit the following equation
D/RT = -1 .287 X 10~14p + 1.001 X 10“ 14 (6)
The ultimate density of p0 = 0.778 is obtained by extrapolating to zero D/RT. This corresponds to V0 of 128.8 ml/ mol which agrees very well with the value of 129.1 ml/mol
The Journal o f Physical Chemisiry, Vol. 80, No. 7, 1976
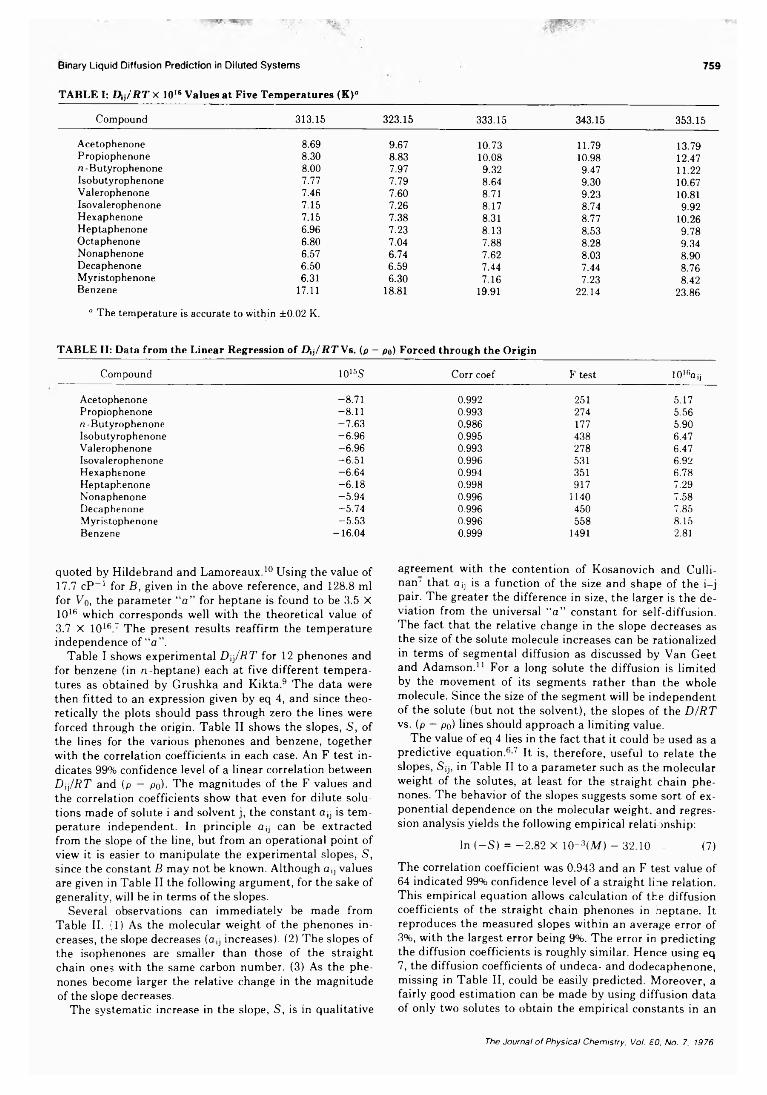
Binary Liquid Diffusion Prediction in Diluted Systems 759
TABLE I: D-,j/RT X 1016 Values at Five Temperatures (K)°
Compound 313.15 323.15 333.15 343.15 353.15
Acetophenone 8.69 9.67 10.73 11.79 13.79Propiophenone 8.30 8.83 10.08 10.98 12.47n -Butyrophenone 8.00 7.97 9.32 9.47 11.22Isobutyrophenone 7.77 7.79 8.64 9.30 10.67Valerophenone 7.46 7.60 8.71 9.23 10.81Isovalerophenone 7.15 7.26 8.17 8.74 9.92Hexaphenone 7.15 7.38 8.31 8.77 10.26Heptaphenone 6.96 7.23 8.13 8.53 9.78Octaphenone 6.80 7.04 7.88 8.28 9.34Nonaphenone 6.57 6.74 7.62 8.03 8.90Decaphenone 6.50 6.59 7.44 7.44 8.76Myristophenone 6.31 6.30 7.16 7.23 8.42Benzene 17.11 18.81 19.91 22.14 23.86
° The temperature is accurate to within ±0.02 K.
TABLE II: Data from the Linear Regression of D¡j/R T Vs. (p — po) Forced through the Origin
Compound 1015S Corr coef F test 1016aij
Acetophenone -8.71 0.992 251 5.17Propiophenone -8.11 0.993 274 5.56n -Butyrophenone -7.63 0.986 177 5.90Isobutyrophenone -6.96 0.995 438 6.47Valerophenone -6.96 0.993 278 6.47Isovalerophenone -6.51 0.996 531 6.92Hexaphenone -6.64 0.994 351 6.78Heptaphenone -6.18 0.998 917 7.29Nonaphenone -5.94 0.996 1140 7.58Decaphenone -5.74 0.996 450 7.85Myristophenone -5.53 0.996 558 8.15Benzene -16.04 0.999 1491 2.81
quoted by Hildebrand and Lamoreaux.10 Using the value of17.7 cP_1 for B , given in the above reference, and 128.8 ml for Vo, the parameter “a” for heptane is found to be 3.5 X
1016 which corresponds well with the theoretical value of3.7 X 1016.7 The present results reaffirm the temperature independence of “ a” .
Table I shows experimental D-JRT for 12 phenones and for benzene (in n-heptane) each at five different temperatures as obtained by Grushka and Kikta.9 The data were then fitted to an expression given by eq 4, and since theoretically the plots should pass through zero the lines were forced through the origin. Table II shows the slopes, S, of the lines for the various phenones and benzene, together with the correlation coefficients in each case. An F test indicates 99% confidence level of a linear correlation between Dij/RT and (p — po). The magnitudes of the F values and the correlation coefficients show that even for dilute solutions made of solute i and solvent j, the constant ajj is temperature independent. In principle a ¡j can be extracted from the slope of the line, but from an operational point of view it is easier to manipulate the experimental slopes, S, since the constant B may not be known. Although a;j values are given in Table II the following argument, for the sake of generality, will be in terms of the slopes.
Several observations can immediately be made from Table II. (1) As the molecular weight of the phenones increases, the slope decreases (ajj increases). (2) The slopes of the isophenones are smaller than those of the straight chain ones with the same carbon number. (3) As the phenones become larger the relative change in the magnitude of the slope decreases.
The systematic increase in the slope, S, is in qualitative
agreement with the contention of Kosanovich and Culli- nan' that a ¡j is a function of the size and shape of the i-j pair. The greater the difference in size, the larger is the deviation from the universal “ a” constant for self-diffusion. The fact that the relative change in the slope decreases as the size of the solute molecule increases can be rationalized in terms of segmental diffusion as discussed by Van Geet and Adamson.11 For a long solute the diffusion is limited by the movement of its segments rather than the whole molecule. Since the size of the segment will be independent of the solute (but not the solvent), the slopes of the DIRT vs. (p — po) lines should approach a limiting value.
The value of eq 4 lies in the fact that it could be used as a predictive equation.6-7 It is, therefore, useful to relate the slopes, Sij, in Table II to a parameter such as the molecular weight of the solutes, at least for the straight chain phenones. The behavior of the slopes suggests some sort of exponential dependence on the molecular weight, and regression analysis yields the following empirical relationship:
In ( -S ) = -2.82 X 10- 3(M) - 32.10 . (7)
The correlation coefficient was 0.943 and an F test value of 64 indicated 99% confidence level of a straight line relation. This empirical equation allows calculation of the diffusion coefficients of the straight chain phenones in heptane. It reproduces the measured slopes within an average error of 3%, with the largest error being 9%. The error in predicting the diffusion coefficients is roughly similar. Hence using eq 7, the diffusion coefficients of undeca- and dodecaphenone, missing in Table II, could be easily predicted. Moreover, a fairly good estimation can be made by using diffusion data of only two solutes to obtain the empirical constants in an
The Journal o f Physical Chemistry, Vol. SO, No. 7, 1976
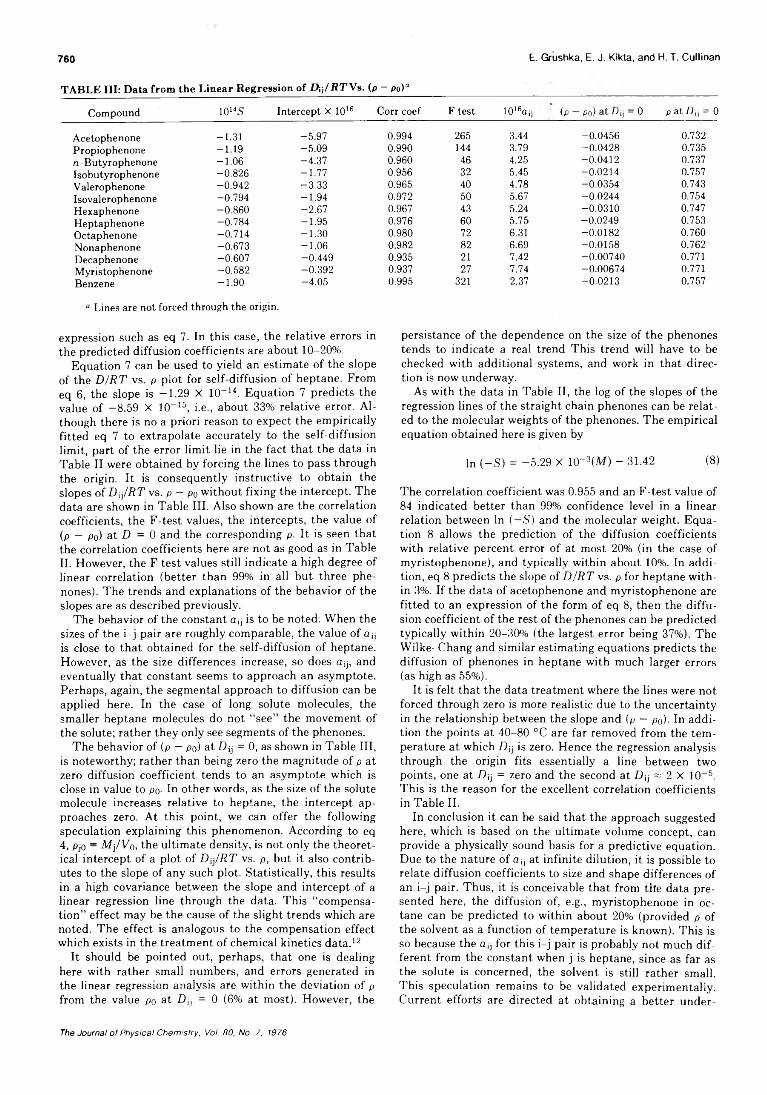
760 E. Grushka, E. J. Kikta, and H. T. Cullinan
TABLE III: Data from the Linear Regression of Dÿ/RTVa. (p - p0)a
Compound 1014S Intercept X 1016 Corr coef F test 1016ay (p Po) D\j — 0 p at D y = 0
Acetophenone -1.31 -5.97 0.994 265 3.44 -0.0456 0.732Propiophenone -1.19 -5.09 0.990 144 3.79 -0.0428 0.735n -Butyrophenone -1.06 -4.37 0.960 46 4.25 -0.0412 0.737Isobutyrophenone -0.826 -1.77 0.956 32 5.45 -0.0214 0.757Valerophenone -0.942 -3.33 0.965 40 4.78 -0.0354 0.743Isovalerophenone -0.794 -1.94 0.972 50 5.67 -0.0244 0.754Hexaphenone -0.860 -2.67 0.967 43 5.24 -0.0310 0.747Heptaphenone -0.784 -1.95 0.976 60 5.75 -0.0249 0.753Octaphenone -0.714 -1.30 0.980 72 6.31 -0.0182 0.760Nonaphenone -0.673 -1.06 0.982 82 6.69 -0.0158 0.762Decaphenone -0.607 -0.449 0.935 21 7.42 -0.00740 0.771Myristophenone -0.582 -0.392 0.937 27 7.74 -0.00674 0.771Benzene -1.90 -4.05 0.995 321 2.37 -0.0213 0.757
° Lines are not forced through the origin.
expression such as eq 7. In this case, the relative errors in the predicted diffusion coefficients are about 10- 20%.
Equation 7 can be used to yield an estimate of the slope of the D/RT vs. p plot for self-diffusion of heptane. From eq 6, the slope is -1.29 X 1CT14. Equation 7 predicts the value of -8.59 X 10⁻¹⁶, i.e., about 33% relative error. Although there is no a priori reason to expect the empirically fitted eq 7 to extrapolate accurately to the self-diffusion limit, part of the error limit lié in the fact that the data in Table II were obtained by forcing the lines to pass through the origin. It is consequently instructive to obtain the slopes of Dij/RT vs. p - po without fixing the intercept. The data are shown in Table III. Also shown are the correlation coefficients, the F-test values, the intercepts, the value of (p — po) at D = 0 and the corresponding p. It is seen that the correlation coefficients here are not as good as in TableII. However, the F test values still indicate a high degree of linear correlation (better than 99% in all but three phe- nones). The trends and explanations of the behavior of the slopes are as described previously.
The behavior of the constant ay is to be noted. When the sizes of the i-j pair are roughly comparable, the value of ay is close to that obtained for the self-diffusion of heptane. However, as the size differences increase, so does a y, and eventually that constant seems to approach an asymptote. Perhaps, again, the segmental approach to diffusion can be applied here. In the case of long solute molecules, the smaller heptane molecules do not “ see” the movement of the solute; rather they only see segments of the phenones.
The behavior of (p — po) at Dy = 0, as shown in Table III, is noteworthy; rather than being zero the magnitude of p at zero diffusion coefficient tends to an asymptote which is close in value to po- In other words, as the size of the solute molecule increases relative to heptane, the intercept approaches zero. At this point, we can offer the following speculation explaining this phenomenon. According to eq 4, pjo - Mj/Vo, the ultimate density, is not only the theoretical intercept of a plot of Dij/RT vs. p, but it also contributes to the slope of any such plot. Statistically, this results in a high covariance between the slope and intercept of a linear regression line through the data. This “ compensation” effect may be the cause of the slight trends which are noted. The effect is analogous to the compensation effect which exists in the treatment of chemical kinetics data.12
It should be pointed out, perhaps, that one is dealing here with rather small numbers, and errors generated in the linear regression analysis are within the deviation of p from the value po at D y = 0 (6% at most). However, the
persistance of the dependence on the size of the phenones tends to indicate a real trend This trend will have to be checked with additional systems, and work in that direction is now underway.
As with the data in Table II, the log of the slopes of the regression lines of the straight chain phenones can be related to the molecular weights of the phenones. The empirical equation obtained here is given by
In (—S) = -5 .2 9 X 1CT S(M) - 31.42 (8)
The correlation coefficient was 0.955 and an F-test value of 84 indicated better than 99% confidence level in a linear relation between In (—S) and the molecular weight. Equation 8 allows the prediction of the diffusion coefficients with relative percent error of at most 20% (in the case of myristophenone), and typically within about 10%. In addition, eq 8 predicts the slope of D/RT vs. p for heptane within 3%. If the data of acetophenone and myristophenone are fitted to an expression of the form of eq 8, then the diffusion coefficient of the rest of the phenones can be predicted typically within 20-30% (the largest error being 37%). The Wilke-Chang and similar estimating equations predicts the diffusion of phenones in heptane with much larger errors (as high as 55%).
It is felt that the data treatment where the lines were not forced through zero is more realistic due to the uncertainty in the relationship between the slope and (p — po)- In addition the points at 40-80 °C are far removed from the temperature at which Dy is zero. Hence the regression analysis through the origin fits essentially a line between two points, one at Dy = zero and the second at Dy « 2 X 10~5. This is the reason for the excellent correlation coefficients in Table II.
In conclusion it can be said that the approach suggested here, which is based on the ultimate volume concept, can provide a physically sound basis for a predictive equation. Due to the nature of ay at infinite dilution, it is possible to relate diffusion coefficients to size and shape differences of an i-j pair. Thus, it is conceivable that from the data presented here, the diffusion of, e.g., myristophenone in octane can be predicted to within about 20% (provided p of the solvent as a function of temperature is known). This is so because the ay for this i-j pair is probably not much different from the constant when j is heptane, since as far as the solute is concerned, the solvent is still rather small. This speculation remains to be validated experimentally. Current efforts are directed at obtaining a better under-
The Journal o f Physical Chemistry, Vol. 80, No. 7, 1976
761Solute-Membrane Interactions under Osmotic Pumping
standing of the constant ay for various solute (i)-solvent (j) systems with the hope that the size and shape effect can be better quantitized.
References and Notes(1) J. L. Hildebrand, Science, 174, 490 (1971).(2) A. J. Batschlnski, Z. Phys. Chem., 84, 643 (1913).(3) F. A. L. Dulllen, AlChE. J., 18, 62 (1972).(4) H. Ertl and F. A. L. Dulllen, AlChE. J., 19, 1215 (1973).(5) H. T. Culllnan and G. M. Kosanovlch, 77th National AlChE Meeting,
Pittsburgh, Pa., 1974.(6) H. T. Culllnan and G. M. Kosanovlch, AlChE. J., 21, 195 (1975).(7) G. M. Kosanovich and H. T. Cullinan, Ind. Eng. Chem., Fundam., 15, 41
(1976).(8 ) E. Grushka and E. J. Kikta, Jr., J. Phys. Chem., 78, 2297 (1974).(9) E. Grushka and E. J. Kikta, Jr., J. Am. Chem. Soc., accepted for publi
cation.(10) J. H. Hildebrand and R. H, Lamoreaux, Proc. Natl. Acad. Sel. U.S.A., 69,
3428 (1972).(11) A. L. Van Geet and A. W. Adamson, J. Phys. Chem., 8 8 , 238 (1964).(12) M. Boudart "Kinetics of Chemical Phenomena", Prentice-Hall, New
York, N.Y., 1968.
Adsorption, Desorption, and Permeation of Methoxychlor on Semipermeable Membranes under Osmotic Pumping
R. Seevers
Department of Chemistry, Southern Oregon State College, Ashland, Oregon 97520
and M. Deinzer"
Environmental Health Sciences Center, Department o f Agricultural Chemistry, Oregon State University, Corvallis. Oregon 97331 (Received July 16, 1975)
Publication costs assisted by the Environmental Health Sciences Center
The characteristics of cross-linked polyethyleneimine-toluene-2,4-diisocyanate membranes were investigated with regard to adsorption, desorption, and permeation of the pesticide methoxychlor during osmotic pumping using water and ethanol as cosolvents. The rejection for ethanol was determined to be 0.35 and for methoxychlor to be 0.995. An investigation of the adsorption-desorption kinetics for methoxychlor in ethanol-water system was conducted and shows that the presence of ethanol plays a significant role in these processes. A mechanism consistent with the rate studies is proposed which indicates that when a molecule of methoxychlor adsorbs to the membrane two ethanol molecules are released, one from the membrane and one from the solvation sheath surrounding each methoxychlor molecule. The rate constants for methoxychlor adsorption and desorption were found to be 725 mol-1 min-1 and 5.35 X 10⁻⁵ 1. mol-2 min-1, respectively. The equilibrium constant was calculated to be 1.36 X 10⁷ M which was then used to obtain an expression for the adsorption isotherm relating the quantity of adsorbed methoxychlor to its concentration in solution and to the concentration of ethanol involution. The membrane adsorption density at saturation was found to be 3.56 X 10⁻⁸ mol of methoxychlor per cm2.
Introduction
Within the past few years, considerably increased emphasis has been directed toward the use of semipermeable membrane technology for concentrating or removing trace amounts of organic contaminants in aqueous systems. The separation of these organic compounds from water by reverse osmosis is potentially useful for purification of drinking water supplies and for removal of chemicals and other wastes in effluents from industry and other sources prior to their discharge.
Hindin and co-workers1 first showed the potential of reverse osmosis for purifying water contaminated with such diverse organic compounds as pesticides, detergents, petroleum products, and humic acids. Recently, because of important desirable characteristics for environmental studies, reverse osmosis was investigated as a technique for concentrating and removing organic contaminants from drinking water supplies for toxicity studies2 and identification.3
Investigations to elucidate solute transport mechanisms have produced relationships between membrane solute transport and hydrogen bonding of alcohols and phenols,4 molar cohesive energy or aqueous solubility of hydrocarbons,5 pKa of carboxylic acids,6 and general solubility parameters for organic solutes.7 Systematic efforts to elaborate on factors which influence solute transport have shown an inverse relationship between diffusivity of the solute and its partition coefficient in cellulose acetate membranes.8 In view of the fact that solute permeability is the product of its solubility and diffusivity within the membrane9 these findings provide considerable encouragement for the use of membranes as a means of concentrating trace organic contaminants in water supplies for water quality analyses.
One serious drawback, however, is the tendency for many organic compounds to strongly sorb to the membrane. This is a disadvantage when membrane techniques are used in environmental studies for concentrating trace
The Journal of Physical Chemistry, Vol. 80, No. 7. 1976
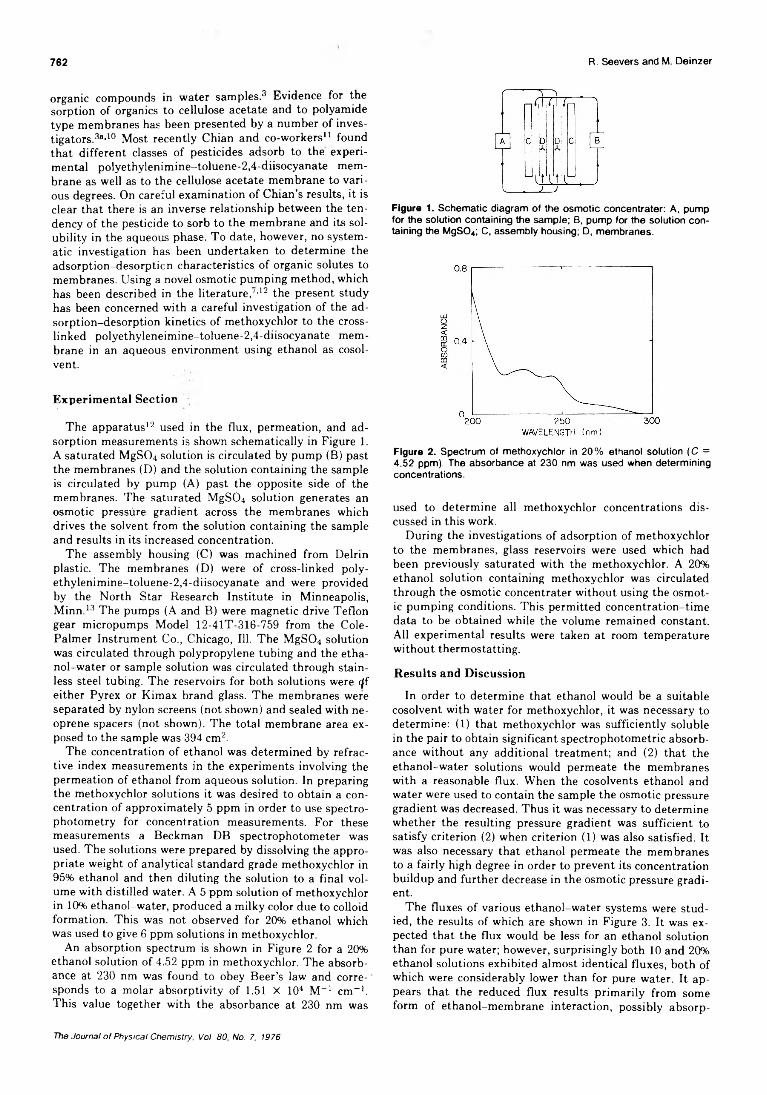
762 R. Seevers and M. Deinzer
organic compounds in water samples.3 Evidence for the sorption of organics to cellulose acetate and to polyamide type membranes has been presented by a number of inves- tigators.3“*10 Most recently Chian and co-workers11 found that different classes of pesticides adsorb to the experimental polyethylenimine-toluene-2,4-diisocyanate membrane as well as to the cellulose acetate membrane to various degrees. On careful examination of Chian’s results, it is clear that there is an inverse relationship between the tendency of the pesticide to sorb to the membrane and its solubility in the aqueous phase. To date, however, no systematic investigation has been undertaken to determine the adsorption-desorpticn characteristics of organic solutes to membranes. Using a novel osmotic pumping method, which has been described in the literature/ '12 the present study has been concerned with a careful investigation of the adsorption-desorption kinetics of methoxychlor to the cross- linked polyethyleneimine-toluene-2,4-diisocyanate membrane in an aqueous environment using ethanol as cosolvent.
Experimental Section ■
The apparatus12 used in the flux, permeation, and adsorption measurements is shown schematically in Figure 1 . A saturated MgS04 solution is circulated by pump (B) past the membranes (D) and the solution containing the sample is circulated by pump (A) past the opposite side of the membranes. The saturated MgS04 solution generates an osmotic pressure gradient across the membranes which drives the solvent from the solution containing the sample and results in its increased concentration.
The assembly housing (C) was machined from Delrin plastic. The membranes (D) were of cross-linked polyethylenimine-toluene-2,4-diisocyanate and were provided by the North Star Research Institute in Minneapolis, Minn.13 The pumps (A and B) were magnetic drive Teflon gear micropumps Model 12-41T-316-759 from the Cole- Palmer Instrument Co., Chicago, 111. The MgS04 solution was circulated through polypropylene tubing and the ethanol-water or sample solution was circulated through stainless steel tubing. The reservoirs for both solutions were cff either Pyrex or Kimax brand glass. The membranes were separated by nylon screens (not shown) and sealed with neoprene spacers (not shown). The total membrane area exposed to the sample was 394 cm2.
The concentration of ethanol was determined by refractive index measurements in the experiments involving the permeation of ethanol from aqueous solution. In preparing the methoxychlor solutions it was desired to obtain a concentration of approximately 5 ppm in order to use spectrophotometry for concentration measurements. For these measurements a Beckman DB spectrophotometer was used. The solutions were prepared by dissolving the appropriate weight of analytical standard grade methoxychlor in 95% ethanol and then diluting the solution to a final volume with distilled water. A 5 ppm solution of methoxychlor in 10% ethanol-water, produced a milky color due to colloid formation. This was not observed for 20% ethanol which was used to give 6 ppm solutions in methoxychlor.
An absorption spectrum is shown in Figure 2 for a 20% ethanol solution of 4.52 ppm in methoxychlor. The absorbance at 230 nm was found to obey Beer’s law and corresponds to a molar absorptivity of 1.51 X 10⁴ M_1 cm-1. This value together with the absorbance at 230 nm was
Figure 1. Schematic diagram of the osmotic concentrater: A, pump for the solution containing the sample; B, pump for the solution containing the MgSO«; C, assembly housing; D, membranes.
Figure 2. Spectrum of methoxychlor in 20% ethanol solution (C = 4.52 ppm). The absorbance at 230 nm was used when determining concentrations.
used to determine all methoxychlor concentrations discussed in this work.
During the investigations of adsorption of methoxychlor to the membranes, glass reservoirs were used which had been previously saturated with the methoxychlor. A 20% ethanol solution containing methoxychlor was circulated through the osmotic concentrater without using the osmotic pumping conditions. This permitted concentration-time data to be obtained while the volume remained constant. All experimental results were taken at room temperature without thermostatting.
Results and Discussion
In order to determine that ethanol would be a suitable cosolvent with water for methoxychlor, it was necessary to determine: (1 ) that methoxychlor was sufficiently soluble in the pair to obtain significant spectrophotometric absorbance without any additional treatment; and (2) that the ethanol-water solutions would permeate the membranes with a reasonable flux. When the cosolvents ethanol and water were used to contain the sample the osmotic pressure gradient was decreased. Thus it was necessary to determine whether the resulting pressure gradient was sufficient to satisfy criterion (2) when criterion (1 ) was also satisfied. It was also necessary that ethanol permeate the membranes to a fairly high degree in order to prevent its concentration buildup and further decrease in the osmotic pressure gradient.
The fluxes of various ethanol-water systems were studied, the results of which are shown in Figure 3. It was expected that the flux would be less for an ethanol solution than for pure water; however, surprisingly both 10 and 20% ethanol solutions exhibited almost identical fluxes, both of which were considerably lower than for pure water. It appears that the reduced flux results primarily from some form of ethanol-membrane interaction, possibly absorp-
The Journal o f Physical Chemistry, Vol. 80, No. 7, 1976
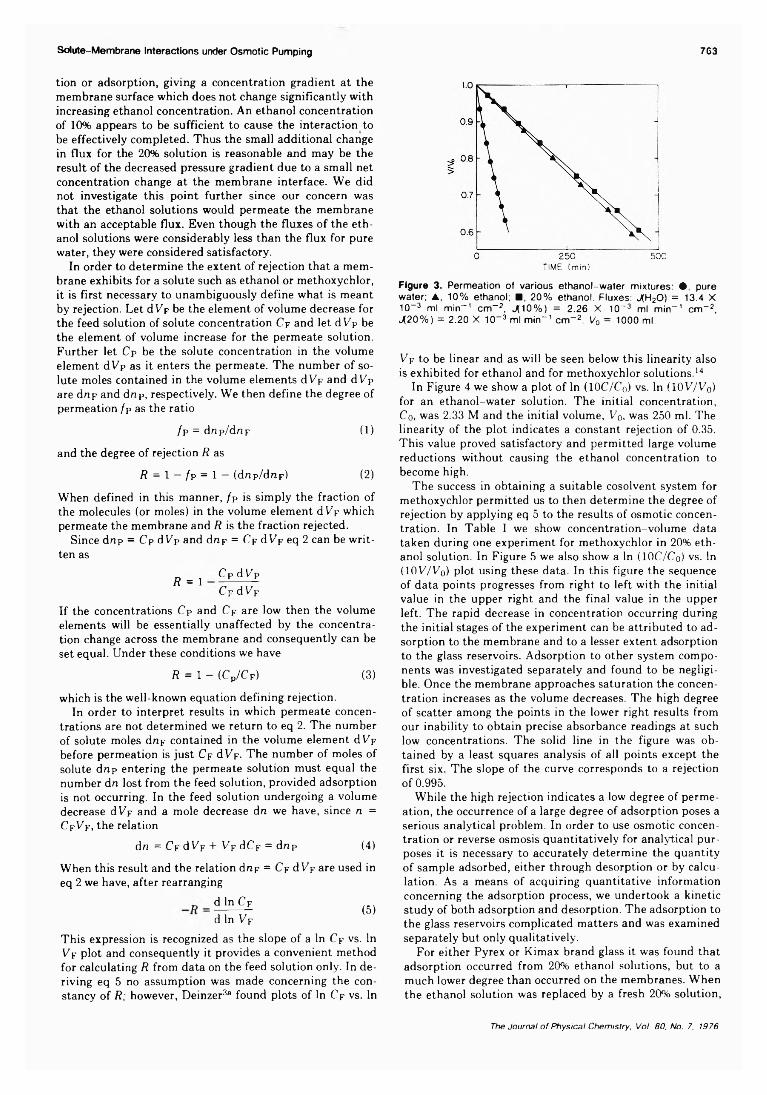
Solute-Membrane Interactions under Osmotic Pumping 763
tion or adsorption, giving a concentration gradient at the membrane surface which does not change significantly with increasing ethanol concentration. An ethanol concentration of 10% appears to be sufficient to cause the interaction to be effectively completed. Thus the small additional change in flux for the 20% solution is reasonable and may be the result of the decreased pressure gradient due to a small net concentration change at the membrane interface. We did not investigate this point further since our concern was that the ethanol solutions would permeate the membrane with an acceptable flux. Even though the fluxes of the ethanol solutions were considerably less than the flux for pure water, they were considered satisfactory.
In order to determine the extent of rejection that a membrane exhibits for a solute such as ethanol or methoxychlor, it is first necessary to unambiguously define what is meant by rejection. Let dV F be the element of volume decrease for the feed solution of solute concentration Cf and let d Up be the element of volume increase for the permeate solution. Further let Cp be the solute concentration in the volume element dVp as it enters the permeate. The number of solute moles contained in the volume elements dVF and dVp are driF and dnp, respectively. We then define the degree of permeation / p as the ratio
/ p = dnP/dnF (1 )
and the degree of rejection R as
R = 1 — / p = 1 — (dnp/dnF) ( 2 )
When defined in this manner, / p is simply the fraction of the molecules (or moles) in the volume element dl^F which permeate the membrane and R is the fraction rejected.
Since dnp = Cp dVp and dnF = Cf d V? eq 2 can be written as
R = 1CpdVpCFd l/F
If the concentrations Cp and Cf are low then the volume elements will be essentially unaffected by the concentration change across the membrane and consequently can be set equal. Under these conditions we have
R = 1 - (CP/C F) (3)
which is the well-known equation defining rejection.In order to interpret results in which permeate concen
trations are not determined we return to eq 2. The number of solute moles d«F contained in the volume element d^F before permeation is just CF dVF- The number of moles of solute dnp entering the permeate solution must equal the number dn lost from the feed solution, provided adsorption is not occurring. In the feed solution undergoing a volume decrease dVp and a mole decrease dn we have, since n = CfVf, the relation
dn = Cf dl^F + VF dCp = dnp (4)
When this result and the relation dnF = Cf dV F are used in eq 2 we have, after rearranging
d In Cp din VF
(5)
This expression is recognized as the slope of a In Cf vs. In Vf plot and consequently it provides a convenient method for calculating R from data on the feed solution only. In deriving eq 5 no assumption was made concerning the constancy of R; however, Deinzer3® found plots of In Cf vs. In
Figure 3. Permeation of various ethanol-water mixtures: • , pure water; A, 10% ethanol; ■, 20% ethanol. Fluxes: J(H20) = 13.4 X 10- 3 ml min- 1 cm“ 2, J(10%) = 2.26 X 10“ 3 ml min“ 1 cm“ 2, J(20%) = 2.20 X 10- 3 ml min- 1 cm-2 . V0 = 1000 ml.
Vf to be linear and as will be seen below this linearity also is exhibited for ethanol and for methoxychlor solutions.14
In Figure 4 we show a plot of In (10C/Co) vs. In (10V/V0) for an ethanol-water solution. The initial concentration, Co, was 2.33 M and the initial volume, Vo. was 250 ml. The linearity of the plot indicates a constant rejection of 0.35. This value proved satisfactory and permitted large volume reductions without causing the ethanol concentration to become high.
The success in obtaining a suitable cosolvent system for methoxychlor permitted us to then determine the degree of rejection by applying eq 5 to the results of osmotic concentration. In Table I we show concentration-volume data taken during one experiment for methoxychlor in 20% ethanol solution. In Figure 5 we also show a In (10C/Co) vs. In (lOV/Vo) plot using these data. In this figure the sequence of data points progresses from right to left with the initial value in the upper right and the final value in the upper left. The rapid decrease in concentration occurring during the initial stages of the experiment can be attributed to adsorption to the membrane and to a lesser extent adsorption to the glass reservoirs. Adsorption to other system components was investigated separately and found to be negligible. Once the membrane approaches saturation the concentration increases as the volume decreases. The high degree of scatter among the points in the lower right results from our inability to obtain precise absorbance readings at such low concentrations. The solid line in the figure was obtained by a least squares analysis of all points except the first six. The slope of the curve corresponds to a rejection of 0.995.
While the high rejection indicates a low degree of permeation, the occurrence of a large degree of adsorption poses a serious analytical problem. In order to use osmotic concentration or reverse osmosis quantitatively for analytical purposes it is necessary to accurately determine the quantity of sample adsorbed, either through desorption or by calculation. As a means of acquiring quantitative information concerning the adsorption process, we undertook a kinetic study of both adsorption and desorption. The adsorption to the glass reservoirs complicated matters and was examined separately but only qualitatively.
For either Pyrex or Kimax brand glass it was found that adsorption occurred from 20% ethanol solutions, but to a much lower degree than occurred on the membranes. When the ethanol solution was replaced by a fresh 20% solution,
The Journal o f Physical Chemistry, Vol. 80, No. 7, 1976
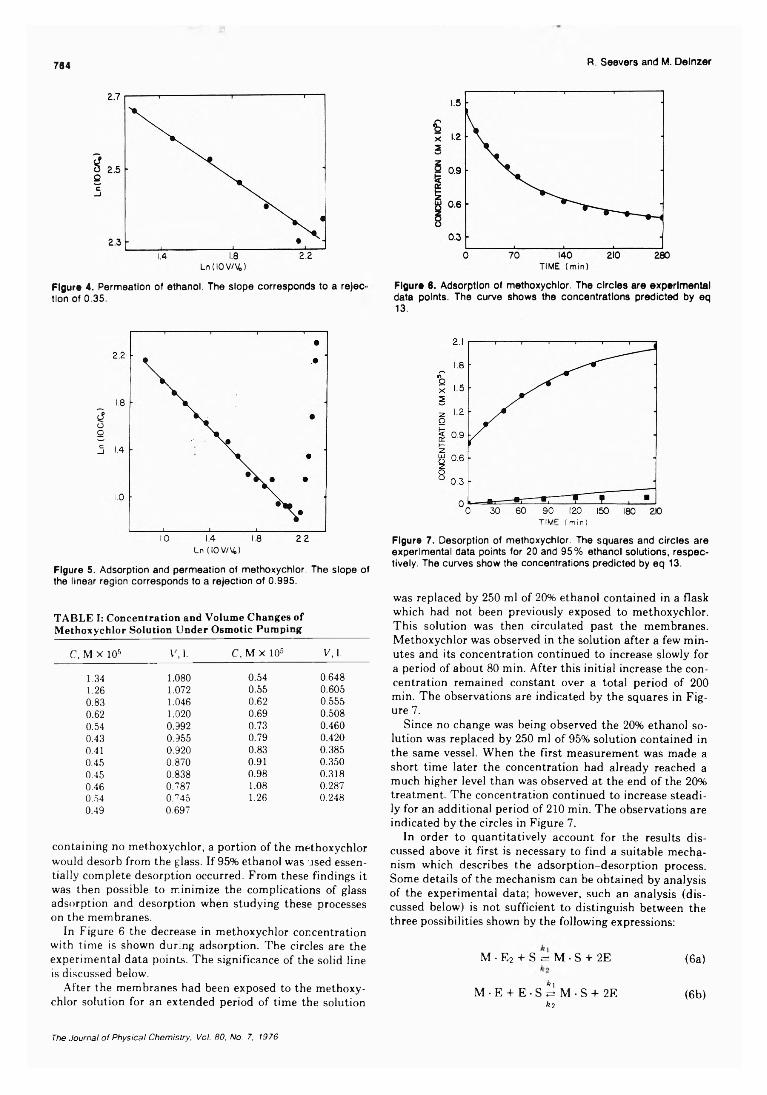
764 R. Seevers and M. Delnzer
Figure 4. Permeation of ethanol. The slope corresponds to a rejection of 0.35.
Figure 6. Adsorption of methoxychlor. The circles are experimental data points. The curve shows the concentrations predicted by eq13.
Ln (IOV/Vt)
Figure 5. Adsorption and permeation of methoxychlor. The slope of the linear region corresponds to a rejection of 0.995.
TABLE I: Concentration and Volume Changes of Methoxychlor Solution Under Osmotic Pumping
C, M X 105 V', 1. C, M X 105 V, 1.
1.34 1.080 0.54 0.6481.26 1.072 0.55 0.6050.83 1.046 0.62 0.5550.62 1.020 0.69 0.5080.54 0.992 0.73 0.4600.43 0.955 0.79 0.4200.41 0.920 0.83 0.3850.45 0.870 0.91 0.3500.45 0.838 0.98 0.3180.46 0.787 1.08 0.2870.54 0.745 1.26 0.2480.49 0.697
containing no methoxychlor, a portion of the methoxychlor would desorb from the glass. If 95% ethanol was used essentially complete desorption occurred. From these findings it was then possible to minimize the complications of glass adsorption and desorption when studying these processes on the membranes.
In Figure 6 the decrease in methoxychlor concentration with time is shown during adsorption. The circles are the experimental data points. The significance of the solid line is discussed below.
After the membranes had been exposed to the methoxychlor solution for an extended period of time the solution
TIME (min)Figure 7. Desorption of methoxychlor. The squares and circles are experimental data points for 20 and 95% ethanol solutions, respectively. The curves show the concentrations predicted by eq 13.
was replaced by 250 ml of 20% ethanol contained in a flask which had not been previously exposed to methoxychlor. This solution was then circulated past the membranes. Methoxychlor was observed in the solution after a few minutes and its concentration continued to increase slowly for a period of about 80 min. After this initial increase the concentration remained constant over a total period of 200 min. The observations are indicated by the squares in Figure 7.
Since no change was being observed the 20% ethanol solution was replaced by 250 ml of 95% solution contained in the same vessel. When the first measurement was made a short time later the concentration had already reached a much higher level than was observed at the end of the 20% treatment. The concentration continued to increase steadily for an additional period of 210 min. The observations are indicated by the circles in Figure 7.
In order to quantitatively account for the results discussed above it first is necessary to find a suitable mechanism which describes the adsorption-desorption process. Some details of the mechanism can be obtained by analysis of the experimental data; however, such an analysis (discussed below) is not sufficient to distinguish between the three possibilities shown by the following expressions:
M • K2 + S ;=? M • S + 2E (6a)
M -E + E- S ^ M - S + 2E (6b)*2
The Journal o f Physical Chemistry, Vol. 80, No. 7, 1976
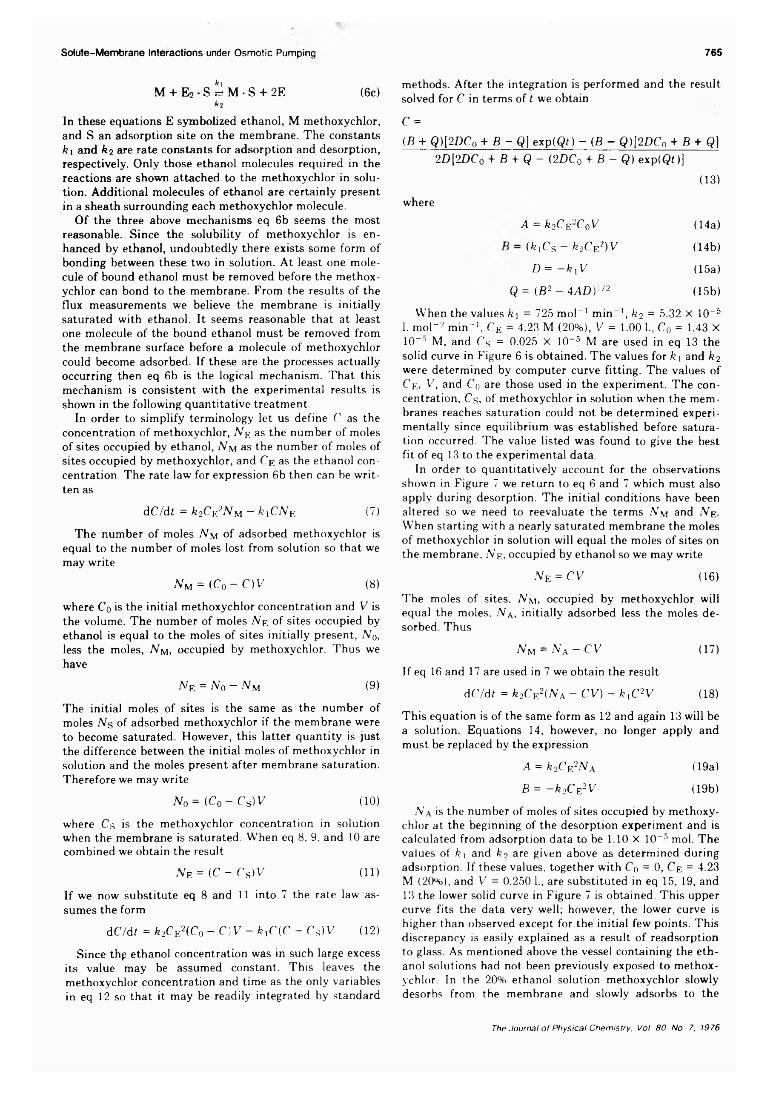
Solute-Membrane Interactions under Osmotic Pumping 765
M + E2 - S ^ M -S + 2E (6 c )*2
In these equations E symbolized ethanol, M methoxychlor, and S an adsorption site on the membrane. The constants k\ and k 2 are rate constants for adsorption and desorption, respectively. Only those ethanol molecules required in the reactions are shown attached to the methoxychlor in solution. Additional molecules of ethanol are certainly present in a sheath surrounding each methoxychlor molecule.
Of the three above mechanisms eq 6 b seems the most reasonable. Since the solubility of methoxychlor is enhanced by ethanol, undoubtedly there exists some form of bonding between these two in solution. At least one molecule of bound ethanol must be removed before the methoxychlor can bond to the membrane. From the results of the flux measurements we believe the membrane is initially saturated with ethanol. It seems reasonable that at least one molecule of the bound ethanol must be removed from the membrane surface before a molecule of methoxychlor could become adsorbed. If these are the processes actually occurring then eq 6 b is the logical mechanism. That this mechanism is consistent with the experimental results is shown in the following quantitative treatment.
In order to simplify terminology let us define C as the concentration of methoxychlor, N E as the number of moles of sites occupied by ethanol, N m as the number of moles of sites occupied by methoxychlor, and C E as the ethanol concentration. The rate law for expression 6 b then can be written as
dC/dt = k 2C E2N M - k t C N e (7)
The number of moles N u of adsorbed methoxychlor is equal to the number of moles lost from solution so that we may write
Nm = (C0 -C )V (8 )
where Co is the initial methoxychlor concentration and V is the volume. The number of moles N e of sites occupied by ethanol is equal to the moles of sites initially present, N 0, less the moles, N m, occupied by methoxychlor. Thus we have
A/e = N o — N m (9)
The initial moles of sites is the same as the number of moles N s of adsorbed methoxychlor if the membrane were to become saturated. However, this latter quantity is just the difference between the initial moles of methoxychlor in solution and the moles present after membrane saturation. Therefore we may write
N 0 = ( C 0 - C s ) V (10)
where Cs is the methoxychlor concentration in solution when the membrane is saturated. When eq 8 , 9, and 10 are combined we obtain the result
N e = ( C - C s ) V (11)
If we now substitute eq 8 and 1 1 into 7 the rate law assumes the form
dC/df = k 2C E2( C 0 - C ) V - k ^ i C - C s ) V (12)
Since thp ethanol concentration was in such large excess its value may be assumed constant. This leaves the methoxychlor concentration and time as the only variables in eq 1 2 so that it may be readily integrated by standard
methods. After the integration is performed and the result solved for C in terms of t we obtain
C =(B + Q)[2DC0 + B - Q ] exp(Q t ) - (B - Q ) [2 D C 0 + B + Q]
2D[2DC0 + B + Q - (2 D C o + B - Q ) exp(Qi)](13)
where
A = k 2C E2C 0 V (14a)
(k,Cs - k 2CE2)V (14b)
D = —k i V (15a)
Q = ( B 2 - 4 A D ) 1/2 (15b)
When the values k\ = 725 mol- 1 min-1, k 2 = 5.32 X 10-51. mol- 2 min-1, CE = 4.23 M (20% ), V = 1.00 I., C0 = 1.43 X10-:i M, and Cs = 0.025 X 10~5 M are used in eq 13 the solid curve in Figure 6 is obtained. The values for k \ and k 2 were determined by computer curve fitting. The values of CE, V, and C 0 are those used in the experiment. The concentration, Cs, of methoxychlor in solution when the membranes reaches saturation could not be determined experimentally since equilibrium was established before saturation occurred. The value listed was found to give the best fit of eq 13 to the experimental data.
In order to quantitatively account for the observations shown in Figure 7 we return to eq 6 and 7 which must also apply during desorption. The initial conditions have been altered so we need to reevaluate the terms N m and N e . When starting with a nearly saturated membrane the moles of methoxychlor in solution will equal the moles of sites on the membrane, N E, occupied by ethanol so we may write
N e = C V (16)
The moles of sites, N m, occupied by methoxychlor will equal the moles, N A, initially adsorbed less the moles desorbed. Thus
N m = N a - C V (17)
If eq 16 and 17 are used in 7 we obtain the result
d C / d t = k 2C E2( N A - C V ) - k 1C 2V (18)
This equation is of the same form as 12 and again 13 will be a solution. Equations 14, however, no longer apply and must be replaced by the expression
A = k 2C E2N A (19a)
B = - k 2C E2V (19b)
N a is the number of moles of sites occupied by methoxychlor at the beginning of the desorption experiment and is calculated from adsorption data to be 1.10 X 10- ° mol. The values of k-\ and k 2 are given above as determined during adsorption. If these values, together with Co = 0 , CE = 4.23 M (20% ), and V = 0.250 1., are substituted in eq 15, 19, and 13 the lower solid curve in Figure 7 is obtained. This upper curve fits the data very well; however, the lower curve is higher than observed except for the initial few points. This discrepancy is easily explained as a result of readsorption to glass. As mentioned above the vessel containing the ethanol solutions had not been previously exposed to methoxychlor. In the 20% ethanol solution methoxychlor slowly desorbs from the membrane and slowly adsorbs to the
The Journal of Physical Chemistry, Vol. 80, No. 7, 1976
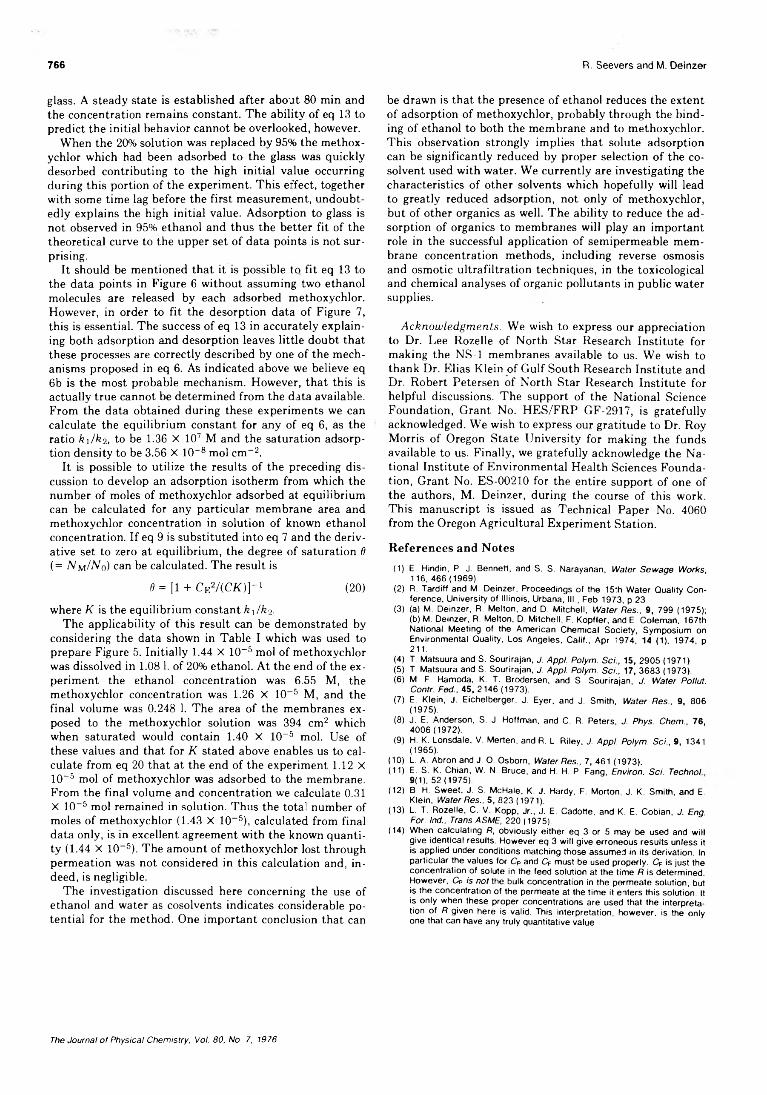
766 R. Seevers and M. Deinzer
glass. A steady state is established after about 80 min and the concentration remains constant. The ability of eq 13 to predict the initial behavior cannot be overlooked, however.
When the 20% solution was replaced by 95% the methox- ychlor which had been adsorbed to the glass was quickly desorbed contributing to the high initial value occurring during this portion of the experiment. This effect, together with some time lag before the first measurement, undoubtedly explains the high initial value. Adsorption to glass is not observed in 95% ethanol and thus the better fit of the theoretical curve to the upper set of data points is not surprising.
It should be mentioned that it is possible to fit eq 13 to the data points in Figure 6 without assuming two ethanol molecules are released by each adsorbed methoxychlor. However, in order to fit the desorption data of Figure 7, this is essential. The success of eq 13 in accurately explaining both adsorption and desorption leaves little doubt that these processes are correctly described by one of the mechanisms proposed in eq 6 . As indicated above we believe eq 6 b is the most probable mechanism. However, that this is actually true cannot be determined from the data available. From the data obtained during these experiments we can calculate the equilibrium constant for any of eq 6 , as the ratio k i/ k 2, to be 1.36 X 10⁷ M and the saturation adsorption density to be 3.56 X 10- 8 mol cm-2.
It is possible to utilize the results of the preceding discussion to develop an adsorption isotherm from which the number of moles of methoxychlor adsorbed at equilibrium can be calculated for any particular membrane area and methoxychlor concentration in solution of known ethanol concentration. If eq 9 is substituted into eq 7 and the derivative set to zero at equilibrium, the degree of saturation 8 (= N m / N q) can be calculated. The result is
e = [i + c e 2/(c k )]-i (2 0 )
where K is the equilibrium constant k \ lk 2.The applicability of this result can be demonstrated by
considering the data shown in Table I which was used to prepare Figure 5. Initially 1.44 X 10~ 5 mol of methoxychlor was dissolved in 1.08 1. of 20% ethanol. At the end of the experiment the ethanol concentration was 6.55 M, the methoxychlor concentration was 1.26 X 10~ 5 M, and the final volume was 0.248 1. The area of the membranes exposed to the methoxychlor solution was 394 cm2 which when saturated would contain 1.40 X 10- 5 mol. Use of these values and that for K stated above enables us to calculate from eq 20 that at the end of the experiment 1.12 X 1 0 ~ 5 mol of methoxychlor was adsorbed to the membrane. From the final volume and concentration we calculate 0.31 X 10- 5 mol remained in solution. Thus the total number of moles of methoxychlor (1.43 X 10⁻⁵), calculated from final data only, is in excellent agreement with the known quantity (1.44 X 10~5). The amount of methoxychlor lost through permeation was not considered in this calculation and, indeed, is negligible.
The investigation discussed here concerning the use of ethanol and water as cosolvents indicates considerable potential for the method. One important conclusion that can
be drawn is that the presence of ethanol reduces the extent of adsorption of methoxychlor, probably through the binding of ethanol to both the membrane and to methoxychlor. This observation strongly implies that solute adsorption can be significantly reduced by proper selection of the cosolvent used with water. We currently are investigating the characteristics of other solvents which hopefully will lead to greatly reduced adsorption, not only of methoxychlor, but of other organics as well. The ability to reduce the adsorption of organics to membranes will play an important role in the successful application of semipermeable membrane concentration methods, including reverse osmosis and osmotic ultrafiltration techniques, in the toxicological and chemical analyses of organic pollutants in public water supplies.
A c k n o w le d g m e n ts . We wish to express our appreciation to Dr. Lee Rozelle of North Star Research Institute for making the NS-1 membranes available to us. We wish to thank Dr. Elias Klein of Gulf South Research Institute and Dr. Robert Petersen of North Star Research Institute for helpful discussions. The support of the National Science Foundation, Grant No. HES/FRP GF-2917, is gratefully acknowledged. We wish to express our gratitude to Dr. Roy Morris of Oregon State University for making the funds available to us. Finally, we gratefully acknowledge the National Institute of Environmental Health Sciences Foundation, Grant No. ES-00210 for the entire support of one of the authors, M. Deinzer, during the course of this work. This manuscript is issued as Technical Paper No. 4060 from the Oregon Agricultural Experiment Station.
References and Notes
(1) E. Hindin, P. J. Bennett, and S. S. Narayanan, Water Sewage Works, 116, 466(1969).
(2) R. Tardiff and M. Deinzer, Proceedings of the 15th Water Quality Conference, University of Illinois, Urbana, III., Feb 1973, p 23.
(3) (a) M. Deinzer, R. Melton, and D. Mitchell, Water Res., 9, 799 (1975); (b) M. Deinzer, R. Melton, D. Mitchell, F. Kopfler, and E. Coleman, 167th National Meeting of the American Chemical Society, Symposium on Environmental Quality, Los Angeles, Calif., Apr 1974, 14 (1), 1974, p 2 1 1 .
(4) T. Matsuura and S. Sourirajan, J. Appl. Polym. Sci., 15, 2905 (1971).(5) T. Matsuura and S. Sourirajan, J. Appl. Polym. Sci., 17, 3683 (1973).(6 ) M. F. Hamoda, K. T. Brodersen, and S. Sourirajan, J. Water Pollut.
Contr. Fed., 45, 2146 (1973).(7) E. Klein, J. Eichelberger, J. Eyer, and J. Smith, Water Res., 9, 806
(1975).(8) J. E. Anderson, S. J. Hoffman, and C. R. Peters, J. Phys. Chem., 76,
4006 (1972).(9) H. K. Lonsdale, V. Merten, and R. L. Riley, J. Appl. Polym. Sci., 9, 1341
(1965).(10) L. A. Abron and J. O. Osborn, Water Res., 7, 461 (1973).(11) E. S. K. Chian, W. N. Bruce, and H. H. P. Fang, Environ. Sci. Technol
9(1), 52(1975).(12) B. H. Sweet, J. S. McHale, K. J. Hardy, F. Morton, J. K. Smith, and E.
Klein, Water Res., 5, 823 (1971).(13) L. T. Rozelle, C. V. Kopp, Jr., J. E. Cadotte, and K. E. Cobian, J. Eng.
For. Ind., Trans ASME, 220 (1975).(14) When calculating R, obviously either eq 3 or 5 may be used and will
give identical results. However eq 3 will give erroneous results unless it is applied under conditions matching those assumed in its derivation. In particular the values for Cp and Cp must be used properly. Cp is just the concentration of solute in the feed solution at the time R is determined. However, Cp is not the bulk concentration in the permeate solution, but is the concentration of the permeate at the time it enters this solution. It is only when these proper concentrations are used that the interpretation of R given here is valid. This interpretation, however, is the only one that can have any truly quantitative value.
The Journal of Physical Chemistry, Vol. 80, No. 7, 1976
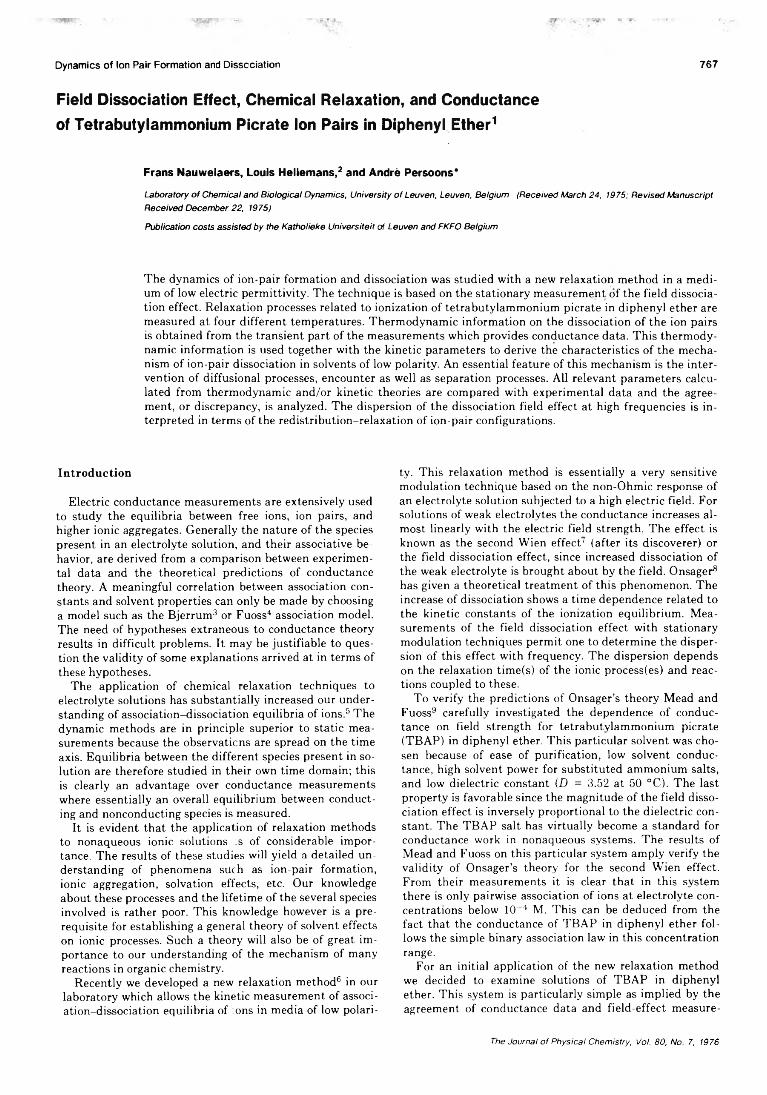
Dynamics of Ion Pair Formation and Dissociation 767
Field Dissociation Effect, Chemical Relaxation, and Conductance of Tetrabutylammonium Picrate Ion Pairs in Diphenyi Ether1
Frans Nauwelaers, Louis Hellemans,2 and André Persoons*
Laboratory of Chemical and Biological Dynamics, University of Leuven, Leuven, Belgium (Received March 24, 1975; Revised Manuscript Received December 22, 1975)
Publication costs assisted by the Katholieke Universiteit of Leuven and FKFO Belgium
The dynamics of ion-pair formation and dissociation was studied with a new relaxation method in a medium of low electric permittivity. The technique is based on the stationary measurement of the field dissociation effect. Relaxation processes related to ionization of tetrabutylammonium picrate in diphenyl ether are measured at four different temperatures. Thermodynamic information on the dissociation of the ion pairs is obtained from the transient part of the measurements which provides conductance data. This thermodynamic information is used together with the kinetic parameters to derive the characteristics of the mechanism of ion-pair dissociation in solvents of low polarity. An essential feature of this mechanism is the intervention of diffusional processes, encounter as well as separation processes. All relevant parameters calculated from thermodynamic and/or kinetic theories are compared with experimental data and the agreement, or discrepancy, is analyzed. The dispersion of the dissociation field effect at high frequencies is interpreted in terms of the redistribution-relaxation of ion-pair configurations.
Introduction
Electric conductance measurements are extensively used to study the equilibria between free ions, ion pairs, and higher ionic aggregates. Generally the nature of the species present in an electrolyte solution, and their associative behavior, are derived from a comparison between experimental data and the theoretical predictions of conductance theory. A meaningful correlation between association constants and solvent properties can only be made by choosing a model such as the Bjerrum3 or Fuoss4 association model. The need of hypotheses extraneous to conductance theory results in difficult problems. It may be justifiable to question the validity of some explanations arrived at in terms of these hypotheses.
The application of chemical relaxation techniques to electrolyte solutions has substantially increased our understanding of association-dissociation equilibria of ions.5 The dynamic methods are in principle superior to static measurements because the observations are spread on the time axis. Equilibria between the different species present in solution are therefore studied in their own time domain; this is clearly an advantage over conductance measurements where essentially an overall equilibrium between conducting and nonconducting species is measured.
It is evident that the application of relaxation methods to nonaqueous ionic solutions :s of considerable importance. The results of these studies will yield a detailed understanding of phenomena such as ion-pair formation, ionic aggregation, solvation effects, etc. Our knowledge about these processes and the lifetime of the several species involved is rather poor. This knowledge however is a prerequisite for establishing a general theory of solvent effects on ionic processes. Such a theory will also be of great importance to our understanding of the mechanism of many reactions in organic chemistry.
Recently we developed a new relaxation method6 in our laboratory which allows the kinetic measurement of association-dissociation equilibria of ions in media of low polari
ty. This relaxation method is essentially a very sensitive modulation technique based on the non-Ohmic response of an electrolyte solution subjected to a high electric field. For solutions of weak electrolytes the conductance increases almost linearly with the electric field strength. The effect is known as the second Wien effect' (after its discoverer) or the field dissociation effect, since increased dissociation of the weak electrolyte is brought about by the field. Onsager8
has given a theoretical treatment of this phenomenon. The increase of dissociation shows a time dependence related to the kinetic constants of the ionization equilibrium. Measurements of the field dissociation effect with stationary modulation techniques permit one to determine the dispersion of this effect with frequency. The dispersion depends on the relaxation time(s) of the ionic process(es) and reactions coupled to these.
To verify the predictions of Onsager’s theory Mead and Fuoss9 carefully investigated the dependence of conductance on field strength for tetrabutylammonium picrate (TBAP) in diphenyl ether. This particular solvent was chosen because of ease of purification, low solvent conductance, high solvent power for substituted ammonium salts, and low dielectric constant (D = 3.52 at 50 °C). The last property is favorable since the magnitude of the field dissociation effect is inversely proportional to the dielectric constant. The TBAP salt has virtually become a standard for conductance work in nonaqueous systems. The results of Mead and Fuoss on this particular system amply verify the validity of Onsager’s theory for the second Wien effect. From their measurements it is clear that in this system there is only pairwise association of ions at electrolyte concentrations below 10~ 4 M. This can be deduced from the fact that the conductance of TBAP in diphenyl ether follows the simple binary association law in this concentration range.
For an initial application of the new relaxation method we decided to examine solutions of TBAP in diphenyl ether. This system is particularly simple as implied by the agreement of conductance data and field-effect measure-
The Journal o f Physical Chemistry, Voi. 80, No. 7, 1976
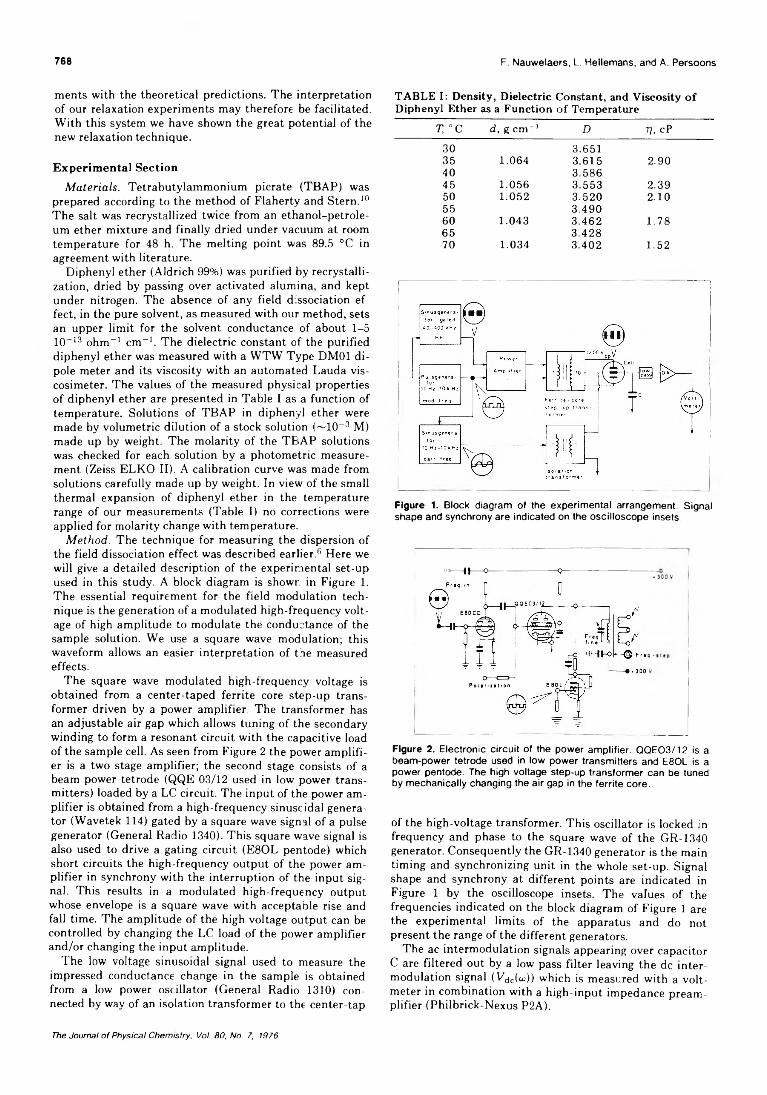
768 F. Nauwelaers, L. Hellemans, and A. Persoons
merits with the theoretical predictions. The interpretation of our relaxation experiments may therefore be facilitated. With this system we have shown the great potential of the new relaxation technique.
Experimental SectionM a te r ia ls . Tetrabutylammonium picrate (TBAP) was
prepared according to the method of Flaherty and Stern. 10
The salt was recrystallized twice from an ethanol-petroleum ether mixture and finally dried under vacuum at room temperature for 48 h. The melting point was 89.5 °C in agreement with literature.
Diphenyl ether (Aldrich 99%) was purified by recrystallization, dried by passing over activated alumina, and kept under nitrogen. The absence of any field dissociation effect, in the pure solvent, as measured with our method, sets an upper limit for the solvent conductance of about 1-5 10- 1 3 ohm- 1 cm-1. The dielectric constant of the purified diphenyl ether was measured with a WTW Type DM01 dipole meter and its viscosity with an automated Lauda viscosimeter. The values of the measured physical properties of diphenyl ether are presented in Table I as a function of temperature. Solutions of TBAP in diphenyl ether were made by volumetric dilution of a stock solution (—10—3 M) made up by weight. The molarity of the TBAP solutions was checked for each solution by a photometric measurement (Zeiss ELKO II). A calibration curve was made from solutions carefully made up by weight. In view of the small thermal expansion of diphenyl ether in the temperature range of our measurements (Table I) no corrections were applied for molarity change with temperature.
M e th o d . The technique for measuring the dispersion of the field dissociation effect was described earlier.fi Here we will give a detailed description of the experimental set-up used in this study. A block diagram is showr. in Figure 1 . The essential requirement for the field modulation technique is the generation of a modulated high-frequency voltage of high amplitude to modulate the conductance of the sample solution. We use a square wave modulation; this waveform allows an easier interpretation of the measured effects.
The square wave modulated high-frequency voltage is obtained from a center-taped ferrite core step-up transformer driven by a power amplifier. The transformer has an adjustable air gap which allows tuning of the secondary winding to form a resonant circuit with the capacitive load of the sample cell. As seen from Figure 2 the power amplifier is a two stage amplifier; the second stage consists of a beam power tetrode (QQE 03/12 used in low power transmitters) loaded by a LC circuit. The input of the power amplifier is obtained from a high-frequency sinusoidal generator (Wavetek 114) gated by a square wave signal of a pulse generator (General Radio 1340). This square wave signal is also used to drive a gating circuit (E80L pentode) which short circuits the high-frequency output of the power amplifier in synchrony with the interruption of the input signal. This results in a modulated high-frequency output whose envelope is a square wave with acceptable rise and fall time. The amplitude of the high voltage output can be controlled by changing the LC load of the power amplifier and/or changing the input amplitude.
The low voltage sinusoidal signal used to measure the impressed conductance change in the sample is obtained from a low power oscillator (General Radio 1310) connected by way of an isolation transformer to the center-tap
TABLE I: Density, Dielectric Constant, and Viscosity of Diphenyl Ether as a Function of Temperature
T, ° C d , gem 3 D T], cP30 3.65135 1.064 3.615 2.9040 3.58645 1.056 3.553 2.3950 1.052 3.520 2 . 1 055 3.49060 1.043 3.462 1.7865 3.42870 1.034 3.402 1.52
Figure 1. Block diagram of the experimental arrangement. Signal shape and synchrony are indicated on the oscilloscope insets.
"II------I I ------0------------------------------- 9-
Flgure 2. Electronic circuit of the power amplifier. QQE03/12 is a beam-power tetrode used in low power transmitters and E80L is a power pentode. The high voltage step-up transformer can be tuned by mechanically changing the air gap in the ferrite core.
of the high-voltage transformer. This oscillator is locked in frequency and phase to the square wave of the GR-1340 generator. Consequently the GR-1340 generator is the main timing and synchronizing unit in the whole set-up. Signal shape and synchrony at different points are indicated in Figure 1 by the oscilloscope insets. The values of the frequencies indicated on the block diagram of Figure 1 are the experimental limits of the apparatus and do not present the range of the different generators.
The ac intermodulation signals appearing over capacitor C are filtered out by a low pass filter leaving the de intermodulation signal (Vdeioj)) which is measured with a voltmeter in combination with a high-input impedance preamplifier (Philbrick-Nexus P2A).
The Journal o f Physical Chemistry, Vol. 80, No. 7, 1976
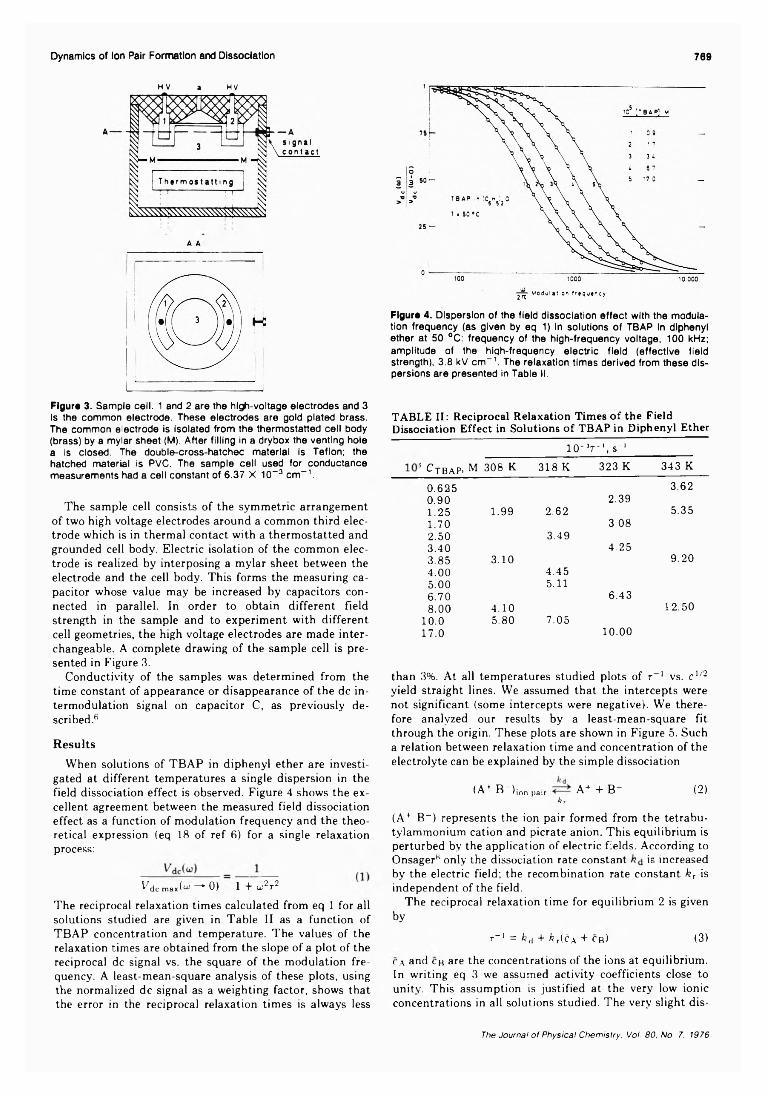
Dynamics of Ion Pair Formation and Dissociation 769
HV a HV
A A
Figure 3. Sample cell. 1 and 2 are the high-voltage electrodes and 3 is the common electrode. These electrodes are gold plated brass. The common electrode is isolated from the thermostatted cell body (brass) by a mylar sheet (M). After filling in a drybox the venting hole a is closed. The double-cross-hatchec material is Teflon; the hatched material is PVC. The sample cell used for conductance measurements had a cell constant of 6.37 X 10- 3 cm-1 .
The sample cell consists of the symmetric arrangement of two high voltage electrodes around a common third electrode which is in thermal contact with a thermostatted and grounded cell body. Electric isolation of the common electrode is realized by interposing a mylar sheet between the electrode and the cell body. This forms the measuring capacitor whose value may be increased by capacitors connected in parallel. In order to obtain different field strength in the sample and to experiment with different cell geometries, the high voltage electrodes are made interchangeable. A complete drawing of the sample cell is presented in Figure 3.
Conductivity of the samples was determined from the time constant of appearance or disappearance of the de intermodulation signal on capacitor C, as previously described.6
ResultsWhen solutions of TBAP in diphenyl ether are investi
gated at different temperatures a single dispersion in the field dissociation effect is observed. Figure 4 shows the excellent agreement between the measured field dissociation effect as a function of modulation frequency and the theoretical expression (eq 18 of ref 6 ) for a single relaxation process:
^dcmait“ —' 0 ) 1 + u 2T2
The reciprocal relaxation times calculated from eq 1 for all solutions studied are given in Table II as a function of TBAP concentration and temperature. The values of the relaxation times are obtained from the slope of a plot of the reciprocal dc signal vs. the square of the modulation frequency. A least-mean-square analysis of these plots, using the normalized dc signal as a weighting factor, shows that the error in the reciprocal relaxation times is always less
Figure 4. Dispersion of the field dissociation effect with the modulation frequency (as given by eq 1) in solutions of TBAP In diphenyl ether at 50 °C: frequency of the high-frequency voltage, 100 kHz; amplitude of the high-frequency electric field (effective field strength), 3.8 kV cm- '. The relaxation times derived from these dispersions are presented In Table II.
TABLE II: Reciprocal Relaxation Times of the Field Dissociation Effect in Solutions of TBAP in Diphenyl Ether
! c t b a P’ m
io- 3T " 1, s ' 1
308 K 318 K 323 K 343 K
0.625 3.620.90 2.391.25 1.99 2.62 5.351.70 3.082.50 3.493.40 4.253.85 3.10 9.204.00 4.455.00 5.116.70 6.438 .0 0 4.10 12.50
1 0 . 0 5.80 7.0517.0 1 0 . 0 0
than 3%. At all temperatures studied plots of r_1 vs. c l/2 yield straight lines. We assumed that the intercepts were not significant (some intercepts were negative). We therefore analyzed our results by a least-mean-square fit through the origin. These plots are shown in Figure 5. Such a relation between relaxation time and concentration of the electrolyte can be explained by the simple dissociation
(A+ B -)ionpair A+ + B- (2)kr
(A+ B~) represents the ion pair formed from the tetrabu- tylammonium cation and picrate anion. This equilibrium is perturbed by the application of electric fields. According to Onsager8 only the dissociation rate constant is increased by the electric field; the recombination rate constant k T is independent of the field.
The reciprocal relaxation time for equilibrium 2 is givenby
t~ 1 = k ti + k r{c,\ + cb) (3)
c a and cb are the concentrations of the ions at equilibrium. In writing eq 3 we assumed activity coefficients close to unity. This assumption is justified at the very low ionic concentrations in all solutions studied. The very slight dis-
The Journal o f Physical Chemistry, Vol. 80. No. 7. 1976
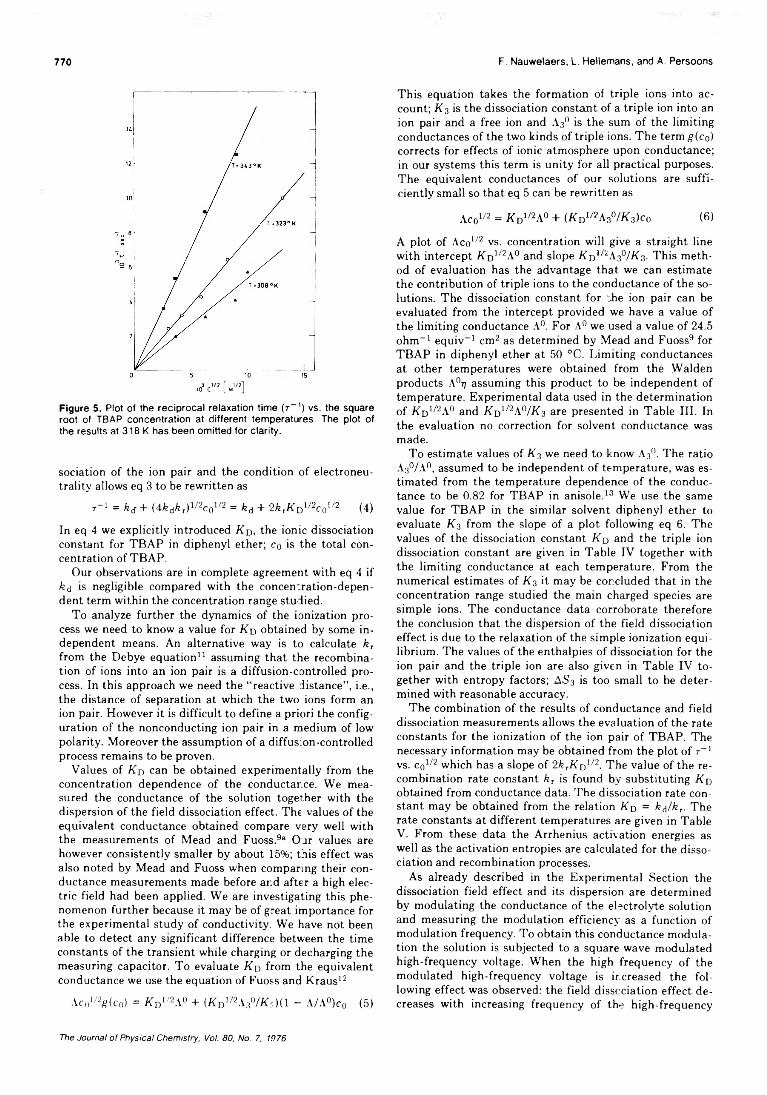
770 F. Nauwetaers, L. Hellemans, and A. Persoons
„3 1/2 f 1/2~1 10 C L M JFigure 5 . Plot o f the reciprocal relaxation time (r_1) vs. the square root of TBAP concentration at different temperatures. The plot of the results at 318 K has been omitted for clarity.
sociation of the ion pair and the condition of electroneutrality allows eq 3 to be rewritten as
r -1 = k d + (4 k dk r) ^ W /2 = fed + 2 k TK D ^ c 0l/2 (4)
In eq 4 we explicitly introduced Kd, the ionic dissociation constant for TBAP in diphenyl ether; co is the total concentration of TBAP.
Our observations are in complete agreement with eq 4 if k d is negligible compared with the concentration-depen- dent term within the concentration range studied.
To analyze further the dynamics of the ionization process we need to know a value for Kd obtained by some independent means. An alternative way is to calculate k T from the Debye equation11 assuming that the recombination of ions into an ion pair is a diffusion-controlled process. In this approach we need the “reactive distance”, i.e., the distance of separation at which the two ions form an ion pair. However it is difficult to define a priori the configuration of the nonconducting ion pair in a medium of low polarity. Moreover the assumption of a diffusion-controlled process remains to be proven.
Values of KD can be obtained experimentally from the concentration dependence of the conductance. We measured the conductance of the solution together with the dispersion of the field dissociation effect. The values of the equivalent conductance obtained compare very well with the measurements of Mead and Fuoss.9a Oar values are however consistently smaller by about 15%; this effect was also noted by Mead and Fuoss when comparing their conductance measurements made before and after a high electric field had been applied. We are investigating this phenomenon further because it may be of great importance for the experimental study of conductivity. We have not been able to detect any significant difference between the time constants of the transient while charging or decharging the measuring capacitor. To evaluate K d from the equivalent conductance we use the equation of Fuoss and Kraus12
Ac01/2g (c0) = K d 1/2A° + (K D1/2A3° /K f ) ( l - A /A °)c0 (5)
This equation takes the formation of triple ions into account; K3 is the dissociation constant of a triple ion into an ion pair and a free ion and A30 is the sum of the limiting conductances of the two kinds of triple ions. The term g(c0) corrects for effects of ionic atmosphere upon conductance; in our systems this term is unity for all practical purposes. The equivalent conductances of our solutions are sufficiently small so that eq 5 can be rewritten as
Ac01/2 = Kn1/2A° + (Kd1/2A30/K.3)co (6)
A plot of Aco1/2 vs. concentration will give a straight line with intercept K d1/2A° and slope Kd1/2A30/K 3. This method of evaluation has the advantage that we can estimate the contribution of triple ions to the conductance of the solutions. The dissociation constant for *he ion pair can be evaluated from the intercept provided we have a value of the limiting conductance A°. For A° we used a value of 24.5 ohm- 1 equiv- 1 cm2 as determined by Mead and Fuoss9 for TBAP in diphenyl ether at 50 °C. Limiting conductances at other temperatures were obtained from the Walden products A0?; assuming this product to be independent of temperature. Experimental data used in the determination of Kd1/2A° and Kd1/2A°/K3 are presented in Table III. In the evaluation no correction for solvent conductance was made.
To estimate values of K3 we need to know A3°. The ratio A3°/A°, assumed to be independent of temperature, was estimated from the temperature dependence of the conductance to be 0.82 for TBAP in anisole. 13 We use the same value for TBAP in the similar solvent diphenyl ether to evaluate K3 from the slope of a plot following eq 6 . The values of the dissociation constant K□ and the triple ion dissociation constant are given in Table IV together with the limiting conductance at each temperature. From the numerical estimates of K3 it may be concluded that in the concentration range studied the main charged species are simple ions. The conductance data corroborate therefore the conclusion that the dispersion of the field dissociation effect is due to the relaxation of the simple ionization equilibrium. The values of the enthalpies of dissociation for the ion pair and the triple ion are also given in Table IV together with entropy factors; AS3 is too small to be determined with reasonable accuracy.
The combination of the results of conductance and field dissociation measurements allows the evaluation of the rate constants for the ionization of the ion pair of TBAP. The necessary information may be obtained from the plot of 7 - 1
vs. c01/2 which has a slope of 2 k IK n 1/2. The value of the recombination rate constant k r is found by substituting Kd obtained from conductance data. The dissociation rate constant may be obtained from the relation Kd = k d/kT. The rate constants at different temperatures are given in TableV. From these data the Arrhenius activation energies as well as the activation entropies are calculated for the dissociation and recombination processes.
As already described in the Experimental Section the dissociation field effect and its dispersion are determined by modulating the conductance of the electrolyte solution and measuring the modulation efficiency as a function of modulation frequency. To obtain this conductance modulation the solution is subjected to a square-wave modulated high-frequency voltage. When the high frequency of the modulated high-frequency voltage is ir.creased the following effect was observed: the field dissociation effect decreases with increasing frequency of the high-frequency
The Journal of Physical Chemistry, Vol. 80, No. 7, 1976
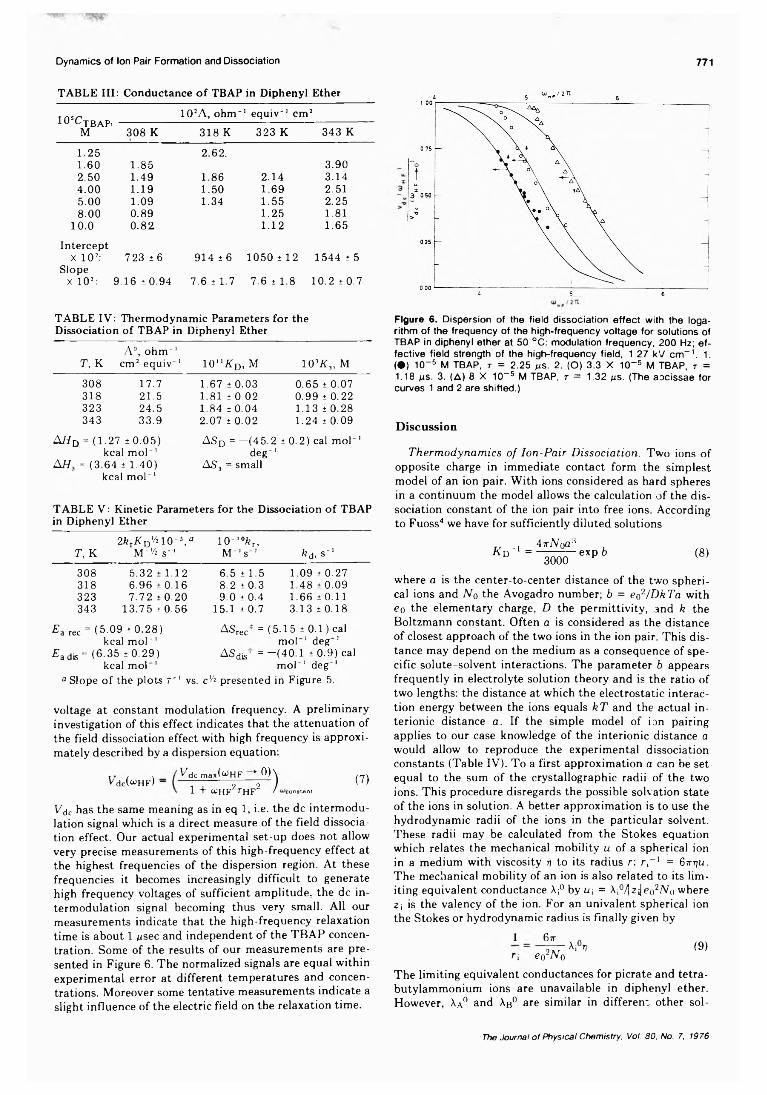
Dynamics of Ion Pair Formation and Dissociation 771
TABLE III: Conductance of TBAP in Diphenyl Ether
i0 sCyBAP’M
102A, ohm~1 equiv“1 cm2
308 K 318 K 323 K 343 K
1.25 2.62.1.60 1.85 3.902.50 1.49 1.86 2.14 3.144.00 1.19 1.50 1.69 2.515.00 1.09 1.34 1.55 2.258.00 0.89 1.25 1.81
10.0 0.82 1.12 1.65Intercept
X 10’: 723 ±6 914 ±6 1050 ±12 1544 ± 5Slope
X 102: 9.16 ± 0.94 7.6 ± 1.7 7.6 ± 1.8 10.2 ±0.7
TABLE IV: Thermodynamic Parameters for the Dissociation of TBAP in Diphenyl Ether
T, KA0, ohm“1
cm2 equiv“ ' 10"K d, m 103K3, m
308 17.7 1.67 ±0.03 0.65 ± 0.07318 21.5 1.81 ± 0.02 0.99 ± 0.22323 24.5 1.84 ±0.04 1.13 ± 0.28343 33.9 2.07 ± 0.02 1.24 ± 0.09
AH d = (1.27 ±0.05) ASD = -(45.2 ± 0.2) cal mol“ 'kcal mol 1 deg“'
A H , = (3.64 ± 1.40) AS3 = smallkcal mol"1
TABLE V : Kinetic Parameters for the Dissociation of TBAPin Diphenyl 1Ether
2LK n'AlO-s/ 10“'°fer,T, K M-K s"1 M -'s“' k d, s“1308 5.32 ± 1.12 6.5 ±1.5 1.09 ± 0.27318 6.96 ± 0.16 8.2 ±0.3 1.48 ±0.09323 7.72 ±0.20 9.0 ±0.4 1.66 ±0.11343 13.75 ±0.56 15.1 ±0.7 3.13 ± 0.18
£ a ree = (5.09 ±0.28) A Srec* = (5.15 ± 0.1 ) calkcal mol“' mol 1 deg 1
£ adis = (6.35 ±0.29) ASdif = - (40.1 ± 0.9) calkcal mol ' mol 1 deg
a Slope of the plots 7"1 vs. c'/2 presented in Figure 5.
voltage at constant modulation frequency. A preliminary investigation of this effect indicates that the attenuation of the field dissociation effect with high frequency is approximately described by a dispersion equation:
Vdc(wHF) -Vdcmax(wHF * 0 )
1 + o!HF27HF2 )constant(7)
Vdc has the same meaning as in eq 1, i.e. the de intermodulation signal which is a direct measure of the field dissociation effect. Our actual experimental set-up does not allow very precise measurements of this high-frequency effect at the highest frequencies of the dispersion region. At these frequencies it becomes increasingly difficult to generate high frequency voltages of sufficient amplitude, the de intermodulation signal becoming thus very small. All our measurements indicate that the high-frequency relaxation time is about 1 ^sec and independent of the TBAP concentration. Some of the results of our measurements are presented in Figure 6. The normalized signals are equal within experimental error at different temperatures and concentrations. Moreover some tentative measurements indicate a slight influence of the electric field on the relaxation time.
Figure 6. Dispersion of the field dissociation e ffect with the logarithm of the frequency o f the high-frequency voltage for solutions of TBAP in diphenyl ether at 50 °C: modulation frequency, 200 Hz; e ffective field strength o f the high-frequency field, 1.27 kV cm - 1 . 1 . (•) 10_s M TBAP, r = 2.25 ns. 2. (O) 3.3 X 10~6 M TBAP, r = 1.18 jus. 3. (A ) 8 X 10⁻⁵ M TBAP, r = 1.32 ¿rs. (The aoc issa e for curves 1 and 2 are shifted.)
Discussion
T h e r m o d y n a m ic s o f I o n -P a ir D is s o c ia t io n . Two ions of opposite charge in immediate contact form the simplest model of an ion pair. With ions considered as hard spheres in a continuum the model allows the calculation of the dissociation constant of the ion pair into free ions. According to Fuoss4 we have for sufficiently diluted solutions
k d - ' =i ir N o a 3
3000exp b (8 )
where a is the center-to-center distance of the two spherical ions and N o the Avogadro number; b = e ^ / D k T a with eo the elementary charge, D the permittivity, and k the Boltzmann constant. Often a is considered as the distance of closest approach of the two ions in the ion pair. This distance may depend on the medium as a consequence of specific solute-solvent interactions. The parameter b appears frequently in electrolyte solution theory and is the ratio of two lengths: the distance at which the electrostatic interaction energy between the ions equals k T and the actual interionic distance a . If the simple model of ion pairing applies to our case knowledge of the interionic distance a would allow to reproduce the experimental dissociation constants (Table IV). To a first approximation a can be set equal to the sum of the crystallographic radii of the two ions. This procedure disregards the possible solvation state of the ions in solution. A better approximation is to use the hydrodynamic radii of the ions in the particular solvent. These radii may be calculated from the Stokes equation which relates the mechanical mobility u of a spherical ion in a medium with viscosity r\ to its radius r: r;_1 = Girqu. The mechanical mobility of an ion is also related to its limiting equivalent conductance A;0 by ut = Ai0/]zi|eo2A/o where Zj is the valency of the ion. For an univalent spherical ion the Stokes or hydrodynamic radius is finally given by
1
n
6ir
e 02N 0Xi°i) (9)
The limiting equivalent conductances for picrate and tetra- butylammonium ions are unavailable in diphenyl ether. However, Xa° and Ab° are similar in different other sol-
The Journal o f Physical Chemistry, Vol. 30, No. 7, 1976
772 F. Nauwelaers, L. Hellemans, and A. Persoons
vents.14 Therefore we use rA = r s = r which allows us to write
1
r
3ire 02N 0
(XA° + -3ir
e 02N 0A0?; (1 0 )
\ °i) is recognized as the Walden product for the salt AB and is 0.51 for TBAP in diphenyl ether at 50 °C.9 With this value, assumed to be temperature independent, we find for the hydrodynamic radii of both cation and anion a value of 3.2 A. This yields an interionic distance of 6.4 A, which should be considered as an upper bound. With this value we calculate a dissociation constant of 1.60 X 10"10 M at 50 °C which is to be compared with the experimental value of 1.84 X 10“ 11 M. Either the simple model is not adequate or the value of the interionic distance used is too high. The latter is probably true since a = 6.4 A means simple juxtaposition of the two ions. Any desolvation process is disregarded and the possibility of the picrate anion penetrating into the relatively open structure of the tetrabutylammo- nium cation is not taken into account.
A more realistic value of the interionic distance is obtained from a value of the dipole moment of the ion pair. For this calculation we use the Bottcher’s model15 and assume that the dipole is formed by two ions considered as isotropically polarizable point charges a distance a apart and with polarizabilities a . Because the picrate ion has no centric charge distribution it is to be treated as a polarizable point charge superimposed on a permanent point dipole. The relation between interionic distance a and experimental dipole moment is given by16
M = e 0a - mb _( « a + a B le p a 4 + 2a3aAo‘B + 4 e o f l a A a B + 4o?A a B M B
a 6 — 4 a ^ a s
In the derivation of eq 11 all dipoles and induced moments are assumed to be parallel. We estimate mb to be 1.5 D on the basis of the dipole moment of the isoelectronic picryl fluoride as calculated from group moments and corrected for the higher electronegativity of fluorine. The polarizabilities are taken as16 aA = 16 X 10-24 cm3 and « b = 32.5 X 10⁻²⁴ cm3. With these values and the experimental dipole moment m = 16.3 D17 (in dioxane) eq 11 yields an interionic distance of 5.75 A. If we calculate dissociation constants on the basis of this new value, assumed to be independent of temperature, we find K q = 1-64 X 10” 11 M at 323 K and 0.96 X 10⁻¹¹ M at 308 K. These values are to be compared with the experimental values 1.84 X 10~n and 1.67 X 10⁻¹¹ M, respectively. In view of the assumptions made this agreement is good. It supports the hypothesis that the TBAP ion-pair formation in diphenyl ether is a simple diffusion process.
The thermodynamics of ion-pair dissociation have been discussed by Denison and Ramsey.18 In their treatment the ions are considered to be hard spheres immersed in a continuous medium of electric permittivity D . The ion pair is also defined as the configuration of two ions in immediate contact, with a center-to-center distance a . On the basis of a Born cycle the change in electrostatic free energy for the dissociation of the ion pair into free ions is
ACDR = ^ £ 2 ? _ T A S t (1 2 )a D
The term ASt is mainly determined by the greater translational freedom of the two ions compared with that of the rigid ion pair. The electrostatic contributions to the enthal-
TABLE VI: Interionic Distance and CalculatedThermodynamic Parameters
a, AaA H D ,b ASd,6 cal
T, K kcal mol"1 mol-1 deg-1308 5.89 1.84 —44.6318 5.82 1.44 -46 .0323 5.78 1.22 -46 .7343 5.64 0.31 -49 .3
“ As calculated from eq 8. * Calculated from eq 13 and 14, respectively. To be compared with the experimental values of 1.27 kcal mol'1 and—45.2 cal mol'1 deg'1.
py ( A / / d r ) and entropy (ASd r ) are easily derived from the Denison and Ramsey treatment. Usually it is assumed that the interionic distance a is independent of temperature so that the temperature dependence of AGdr is essentially due to the change of permittivity with temperature.
From the measurement of dielectric constant at different temperatures (Table I) we obtain (6 In D / b T )p = —(1.77 ± 0.02)10-3 deg-1 in the temperature range studied. With the interionic distance a = 5.75 A, as obtained from the experimental dipole moment of TBAP in dioxane, we calculate for A H d r = 7.03 kcal mol-1 and for ASdr = —27.5 cal mol-1 deg-1. If only electrostatic interactions contribute to the enthalpy and entropy of ionization these values should be compared directly with the experimental values, AHd = 1.27 kcal mol-1 and ASd = —45.2 cal mol-1 deg-1. From the large discrepancy between experimental values and those calculated by the Denison-Ramsey treatment it is usually concluded that specific solute-solvent interactions contribute to the energetics of the process.
The Denison-Ramsey model of an ion pair as hard spheres in close contact does not take into account a temperature dependence of the interionic distance a . If we calculate a with eq 8 from the experimental dissociation constants at different temperatures we find a continuous d e c r e a s e of a with temperature. It would therefore be of interest to consider the effect of a temperature dependence of a on the enthalpy and entropy of dissociation. Accepting the validity of the sphere-in-continuum model for the ion- pair formation at each temperature we calculate for the thermodynamic parameters, in the absence of specific interactions, but assuming a temperature d e p e n d e n t :
N 0e 02
a D(14)
The values of a at different temperatures, as derived from the dissociation constants using eq 8, are fitted to the following empirical equation as a function of temperature: a (A) = 8.55 — 9.94 X 10⁻³T + 4.26 X 10⁻⁶T2. From the empirical equation we obtain (5 In a / 6 T )p = —(1.24 ± 0.02) 10-3 deg-1. With this value and the values of a at different temperatures A //d and ASd are calculated. The results are given in Table VI. There is now good agreement between calculated and experimental values for AH d and ASd- The values for A H u are obtained as differences of two relatively
The Journal o f Physical Chemistry, Voi. 80, No. 7, 1976
Dynamics of Ion Pair Formation and Dissociation 773
TABLE VII: Comparison between Experimental and Calculated Kinetic Parameters for the Formation and Dissociation ofthe TBAP Ion Pair in Diphenyl Ether
T, K1010fer, M“1 s’ 1 s ’ 1
£arec> kcal mol 1 (eq 19)
Eadisi kcal mol" 1 (eq 21 )Exptl Eq 17 Eq 18 Exptl Eq 20
308 6.5 5.5 6.0 1.09 0.99 4.47 6.31318 8.2 6.8 7.5 1.48 1.37 4.50 5.94323 9.0 7.8 8.7 1.66 1.60 4.52 5.75343 15.1 11 12.7 3.13 2.61 4.60 4.91
exptl = 5.09 exptl = 6.35
large numbers, which may explain the range of calculated values. The continuous decrease in \ H q , or the small increase in ASd, could be explained by a small temperature dependence of (5 In a / b T )p which remains however within the experimental accuracy.
From the good agreement between experimental and calculated values we conclude that the ion pair of TBAP in diphenyl ether is a contact ion pair where the interionic distance is temperature dependent. There is no experimental evidence for specific solute-solvent interactions except for the temperature dependence of a . The change of a with temperature may be visualized as the picrate ion intruding deeper in between the alkyl chains of the tetrabutylammo- nium cation with temperature. A smaller interionic distance results in a lower dipole moment, which is what we expect when the permittivity of the medium decreases, as is the case with increasing temperature.
D y n a m ic s o f I o n -P a ir F o r m a t io n a n d D is s o c ia t io n . The upper rate limit for ion-pair formation is given by the number of encounters between two ions of opposite sign. Smo- luchowski19 calculated this encounter frequency for colloidal particles from the phenomenological theory of diffusion. Onsager8 accounted for the electrostatic interaction between the reacting particles and evaluated the recombination rate constant of point charges. Taking into account the finite radius of the reacting particles and assuming an interaction potential U between the two ions, Debye11 derived a rate constant k B (in M-1 s-1) for diffusional encounter of two spherical ions A and B:
kv. =2 X 10~ 3N 0k T (l/rA + l/rB)
3 vf exp (
J r A+ra \U_\ dr
k T Ì r2
(15)
r a and rB are the Stokes, or hydrodynamic, radii of the ions A and B, respectively. The integral in the denominator accounts for the interaction between the ions. At very low ionic concentrations we can use for U a simple Coulombic interaction potential. In this case eq 15 can be specified for univalent, oppositely charged ions diffusing toward each other in a medium of dielectric constant D :
2 X IQ"8 N 0e 02 +3 Dr] \ r A rB/
(17)
As shown in eq 10 the sum of the reciprocal hydrodynamic radii is directly related to the Walden product of the electrolyte. From the Walden product given as 0.51 at 50 °C we calculate a value of 6.22 X 107 cm-1 for the sum. This value allows the calculation of the rate constant for a diffusion- controlled recombination of the two ions to form a TBAP ion pair. The results of these calculations at different temperatures are presented in Table VII. As an approximation we assumed the sum of the reciprocal Stokes radii to be temperature independent. This is equivalent to the assumption that the activation energy7 for the recombination process is determined only by the temperature dependence of viscosity and permittivity.
The agreement between experimental and calculated recombination rate constants indicates that the recombination of ions in a low polar solvent is a process mainly determined by diffusion. An alternative way to evaluate the rate constant for diffusional encounter is to assume that the hydrodynamic radii of the two spherical ions are practically identical (which applies in our case) and to consider their sum as the reaction distance or the center-to-center distance a . Equation 17 can then be written
8 X 1 0 -3 ,, , 1
k E = — r ~ N o e o ^(18)
The values of the rate constants calculated according to this equation are given in Table VII. The values used for the interionic distance a are those calculated from the dissociation constants (Table VI). Again we note a better agreement between calculated and experimental values when a temperature dependence for a is taken into account. This is also seen in the calculation of the Arrhenius activation energy. From eq 18 this activation energy can be written as
£ arec = A //Vis - R T 2 (19)
3 D , r j
[ ‘ - “ p ( - o m ' f + „ - ) ) ] " ,16)In low polar media, where the range of electrostatic forces is large, the distance rc at which two oppositely charged univalent ions have an interaction energy equal to the thermal energy k T (r c = eo2/ D k T ) is many times larger than their contact distance (rA + rB). Since this condition applies to the system studied we can neglect the exponential term in eq 16 and the rate constant for diffusional encounter becomes
AHvis gives the temperature dependence of the viscosity and is equal to (3.90 ± 0.12) kcal mol-1, as calculated from the results of Table I. The values for the Arrhenius activation energy of the recombination process calculated according to eq 19 are given in Table VII. In view of the approximations made, in particular the assumption of the solvent being a continuum with a constant viscosity equal to the bulk viscosity, the accordance between experimental and calculated values is satisfactory.
If the ion pair present in solution is formed simply from two oppositely charged ions diffusing together without any internal subsequent change, the dissociation of the ion pair should be described as a diffusion-controlled separation
The Journal o f Physical Chemistry. Voi. B0. No. 7, 1976
774 F. Nauwelaers, L. Hellemans, and A. Persoons
process. According to Eigen20 the rate constant for such a dissociation is given by
= exp( —b ) (2 0 )7r D r j a 4
This expression is also obtained from a combination of the rate constant for diffusional encounter (eq 18) and the equilibrium constant for dissociation (eq 8 ). feo is a sensi-' tive function of the value of a, changing orders of magnitude with a relatively small change in a . Values of k D calculated according to eq 2 0 with the interionic distance a as obtained from the Fuoss equation (eq 8 ) are compared with the experimental rate constants fed in Table VII. The excellent agreement between the calculated and measured rate constants is a strong indication that the ion-pair dissociation is a diffusion-controlled process. This agreement is also proof of the temperature dependence of a since no agreement is unattainable with a constant reaction distance, independent of temperature. The agreement between experimental values and calculations is also borne out by the calculation of the Arrhenius activation energy for the dissociation process, as given in Table VII. These values are calculated using an expression derived from eq 2 0 :
Rr-u, - 4| ( ^ ¡ r ) p (211
M e c h a n is m o f I o n -P a ir F o r m a t io n a n d D is s o c ia t io n . The agreement between experimental values and the values calculated for the thermodynamic and kinetic parameters indicates a simple mechanism for the dissociation and formation of the TBAP ion pair in diphenyl ether. The formation can be explained as a consequence of a diffusional encounter between two oppositely charged ions. The dissociation of the ion pair into free ions can kinetically be described by a diffusion-controlled separation process. This indicates the absence of any process resulting in a structural change subsequent to the diffusional encounter.
The change of the interionic distance with temperature, representing an important correction to the hard-sphere model, is probably due to the insertion of the picrate anion between the butyl chains of the cation. Another possibility to explain the temperature dependence of a would be the existence of a temperature-dependent equilibrium between two different configurations of the ion pair with different interionic distances. One could think of two configurations where the plane of the picrate anion is either tangential or radial to the spherical cation. We have however no experimental evidence for such an equilibrium in the solutions investigated. We observe no spectral changes with temperature. The contrary would be expected if the two configurations were present in solution and had a reasonable difference in spectral properties as is often the case with ion pairs of different configurations, e.g.. the typical spectra of tight and loose ion pairs.21 Moreover, it would be difficult to reconcile the kinetic data with the presence of such a configurational change in the ion pair.
A possible reaction sequence with two different ion-pair configurations could be written
(A+ B-), (A+B - ) 2 ^ A+ + B- (22)*21 *22
This reaction mechanism is to be described by two coupled
differential equations yielding, for small perturbations, two relaxation times.5 If we assume that the configurational change is fast (the inverse assumption would yield no concentration dependence of r) then the slow relaxation measures the ionization, i.e., the process responsible for the dispersion of the field dissociation effect
= k1
231 + fe2l/fel
- + R32* (23)
where fe,32* = fe;i2(cA + cb) with ca and eg the ion concentrations at equilibrium.
Comparing this equation with eq 3 we concludek
fer = fe32 and fed = — - ~ 23 — (24)1 + k 2l/kl2
According to this mechanism the experimental recombination rate constant is the rate constant for the diffusion controlled formation of the ion pair in configuration 2. In order that fed would describe the diffusion-controlled separation into two ions from the same configuration, fed should approach fe23- This is the case if the ratio fe2i/fei2 « 1, which means that the configurational equilibrium in eq 2 2 is shifted (almost) completely to the right.
From kinetic and other evidence we therefore conclude that there is only one ion-pair configuration in which the plane of the picrate anion is radial to the spherical cation and the negative oxygen has more or less deeply penetrated in the open structure of the tetrabutylammonium cation. This ion pair dissociates into free ions by a diffusion-controlled separation process.
This simple mechanism cannot explain as yet the relaxation of the field dissociation effect with the frequency of the modulated high-frequency voltage. This may be considered as some evidence for a mechanism more complex than a combination of simple diffusion processes. As shown earlier there exists no equilibrium between different configurations of the ion pair in the system studied. The fast relaxation process can therefore not be assigned to a fast interconversion of different ion-pair species.
A tentative explanation22 for the high-frequency relaxation process could be given in terms of the redistribution of the configurations of two interacting ions. Analogous to the Bjerrum ion-pair concept3 we can assume a critical configuration where the separation between two oppositely charged ions becomes so large that their electrostatic interaction is balanced by their thermal energy. The main property of this configuration is that the probability of collapse into a stable ion pair is comparable to the probability for separation into free ions. This critical configuration represents also a state of low probability and hence may be considered as a stationary state. If we apply an electric field this stationary state will become depleted if not replenished from the “inside” i.e., fijom configurations of two ions at such a distance that the electrostatic interaction prevails. This means also that as long as we use electric fields of relatively low frequencies we measure the relaxation for the attainment of equilibrium between the ion pair and the free ions. When we however increase the frequency of the alternating electric field the redistribution between ionic configurations at intermediate distances is not fast enough to keep the critical configuration populated. At these high frequencies a dispersion of the dissociation field effect will arise, even at low modulation frequencies.
A c k n o w le d g m e n ts . It is a pleasure to thank Professors L.
The Journal o f Physical Chemistry, Vol. 80, No. 7, 1976
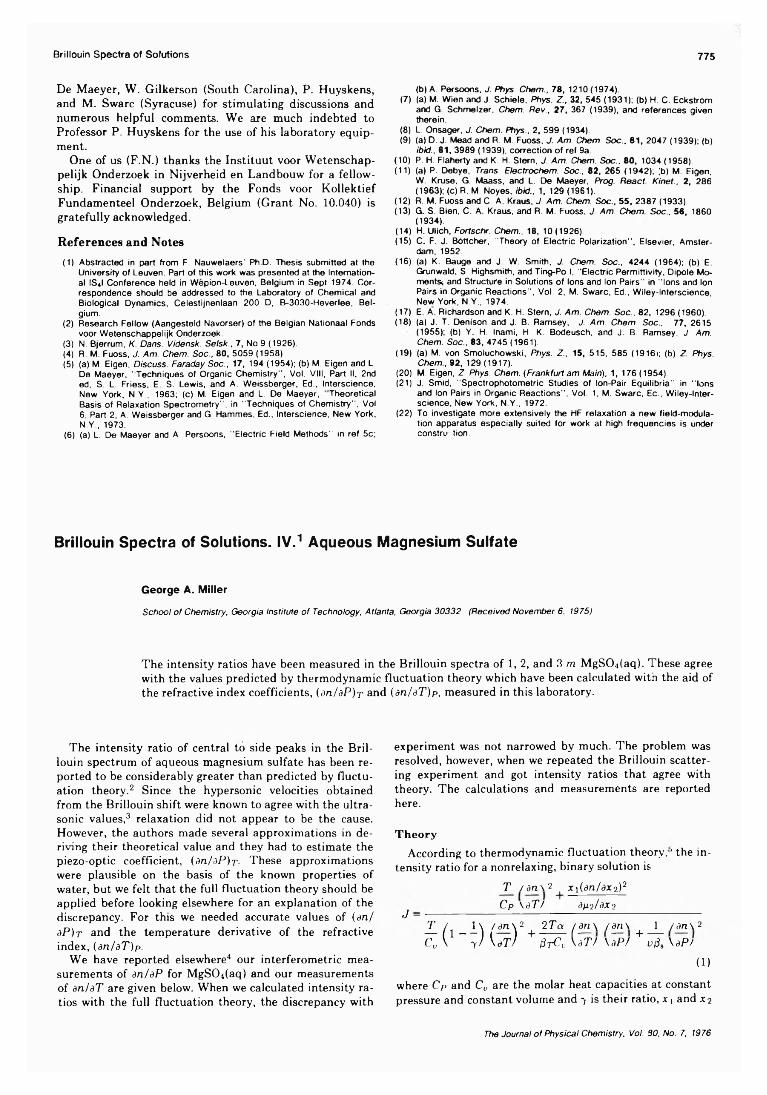
Brillouin Spectra of Solutions 775
De Maeyer, W. Gilkerson (South Carolina), P. Huyskens, and M. Swarc (Syracuse) for stimulating discussions and numerous helpful comments. We are much indebted to Professor P. Huyskens for the use of his laboratory equipment.
One of us (F.N.) thanks the Instituut voor Wetenschap- pelijk Onderzoek in Nijverheid en Landbouw for a fellowship. Financial support by the Fonds voor Kollektief Fundamenteel Onderzoek, Belgium (Grant No. 10.040) is gratefully acknowledged.
References and Notes(1) Abstracted in part from F. Nauwelaers’ Ph.D. Thesis submitted at the
University of Leuven. Part of this work was presented at the International IS<l Conference held in Wepion-Leuven, Belgium In Sept 1974. Correspondence should be addressed to the Laboratory of Chemical and Biological Dynamics, Celestljnenlaan 200 D, B-3030-Heverlee, Belgium.
(2) Research Fellow (Aangesteld Navorser) of the Belgian Nationaal Fonds voor Wetenschappelljk Onderzoek.
(3) N. Bjerrum, K. Dans. Vidensk. Selsk., 7, No 9 (1926).(4) R. M. Fuoss, J. Am. Chem. Soc., 80, 5059 (1958).(5) (a) M. Eigen, Discuss. Faraday Soc., 17, 194 (1954); (b) M. Eigen and L.
De Maeyer, "Techniques of Organic Chemistry” , Vol. VIII, Part II, 2nd ed, S. L. Frless, E. S. Lewis, and A. Welssberger, Ed., Interscience, New York, N.Y., 1963; (c) M. Eigen and L. De Maeyer, ' Theoretical Basis of Relaxation Spectrometry", in “ Techniques of Chemistry", Vol 6 , Part 2, A. Welssberger and G. Hammes, Ed., Interscience, New York, N.Y., 1973.
(6 ) (a) L. De Maeyer and A. Persoons, "Electric Field Methods" in ref 5c;
(b) A. Persoons, J. Phys. Chem., 78, 1210 (1974).(7) (a) M. Wien and J. Schiele, Phys. Z., 32, 545 (1931); (b) H. C. Eckstrom
and G. Schmelzer, Chem. Rev., 27, 367 (1939), and references given therein.
(8 ) L. Onsager, J. Chem. Phys., 2, 599 (1934).(9) (a) D. J. Mead and R. M. Fuoss, J. Am. Chem. Soc., 61, 2047 (1939); (b)
ibid., 61, 3989 (1939), correction of ref 9a.(10) P. H. Flaherty and K. FI. Stern, J. Am. Chem. Soc., 80, 1034 (1958).(11) (a) P. Debye, Trans. Electrochem. Soc., 82, 265 (1942); (b) M. Eigen,
W. Kruse, G. Maass, and L. De Maeyer, Prog. React Kinet., 2, 286 (1963); (c) R. M. Noyes, ibid., 1, 129 (1961).
(12) R. M. Fuoss and C. A. Kraus, J. Am. Chem. Soc., 55, 2387 (1933).(13) G. S. Bien, C. A Kraus, and R. M. Fuoss, J. Am. Chem Soc., 56, 1860
(1934).(14) H. Ulich, Fortschr. Chem., 18, 10 (1926).(15) C. F. J. Böttcher, "Theory of Electric Polarization", Elsevier, Amster
dam, 1952.(16) (a) K. Bauge and J. W. Smith, J. Chem. Soc., 4244 (1964); (b) E.
Grunwald, S. Flighsmith, and Ting-Po I, “Electric Permittivity, Dipole Moments« and Structure in Solutions of Ions and Ion Pairs" In "Ions and Ion Pairs In Organic Reactions", Vol. 2, M. Swarc, Ed., Wlley-lnterscience, New York, N.Y., 1974.
(17) E. A. Richardson and K. FI. Stern, J. Am. Chem. Soc., 82, 1296 (1960).(18) (a) J. T. Denison and J. B. Ramsey, J. Am. Chem. Soc., 77, 2615
(1955); (b) Y. Fl. Inami, FI. K. Bodeusch, and J. B. Ramsey, J. Am. Chem. Soc., 83, 4745 (1961).
(19) (a) M. von Smoluchowski, Phys. Z„ 15, 515, 585 (1916i; (b) Z Phys. Chem., 92, 129(1917).
(20) M. Eigen, Z. Phys. Chem. (Frankfurt am Main), 1, 176 (1954).(21) J. Smid, “ Spectrophotometric Studies of Ion-Pair Equilibria” In "Ions
and Ion Pairs in Organic Reactions", Vol. 1, M. Swarc, Ec., Wiley-lnter- sclence. New York, N.Y., 1972.
(22) To Investigate more extensively the FfF relaxation a new field-modulation apparatus especially suited for work at high frequencies is under constru tion.
Brillouin Spectra of Solutions. IV.1 Aqueous Magnesium Sulfate
George A. Miller
School of Chemistry, Georgia Institute of Technology, Atlanta, Georgia 30332 (Received November 6. 1975)
The intensity ratios have been measured in the Brillouin spectra of 1, 2, and 3 m MgSCMaq). These agree with the values predicted by thermodynamic fluctuation theory which have been calculated with the aid of the refractive index coefficients, (a n / a P )r and (a n / a T )p , measured in this laboratory.
The intensity ratio of central to side peaks in the Brillouin spectrum of aqueous magnesium sulfate has been reported to be considerably greater than predicted by fluctuation theory.2 Since the hypersonic velocities obtained from the Brillouin shift were known to agree with the ultrasonic values,3 relaxation did not appear to be the cause. However, the authors made several approximations in deriving their theoretical value and they had to estimate the piezo-optic coefficient, (an/aP )T• These approximations were plausible on the basis of the known properties of water, but we felt that the full fluctuation theory should be applied before looking elsewhere for an explanation of the discrepancy. For this we needed accurate values of (an/ a P ) r and the temperature derivative of the refractive index, (a n / a T )p .
We have reported elsewhere4 our interferometric measurements of an/aP for MgSCMaq) and our measurements of an/aT are given below. When we calculated intensity ratios with the full fluctuation theory, the discrepancy with
experiment was not narrowed by much. The problem was resolved, however, when we repeated the Brillouin scattering experiment and got intensity ratios that agree with theory. The calculations and measurements are reported here.
Theory
According to thermodynamic fluctuation theory,'’ the intensity ratio for a nonrelaxing, binary solution is
T /an\ 2 x1(dn/dx2) 2
r C p \ a T / ag.2/ax2J —
T / 1\ / an\2 + 2Tct / an\ /£n\ + J_ /8rc\2F A ' - y ) K t f ) + 0 t C u L tV \ a P / + ^ \aP/
G)
where C p and C v are the molar heat capacities at constant pressure and constant volume and y is their ratio, x \ and x2
The Journal o f Physical Chemistry, Vol. 30, No. 7, 1976
776 George A. Miller
TABLE I: Parameters for Eq 2 (MgS04(aq) at 25 °C)
MolalityPi
kg m“3 0104a,
deg-16us, Cp,
m s-1 c J kg-1 deg-1 d 7 - 110uan/aP, m2 N-1 e
104 an/aT, deg- 1 ! X
10 2an/ ame
a ln y d am*
1.0 Ilio 3.193 1609 3661 0.0203 12.28 - 1.22 -0.114 2.035 -0.3802.0 1211 3.220 1751 3347 0.0283 9.75 -1.26 - 0.112 1.632 +0.0413.0 1300 2.990 1892 3172 0.0301 8.15 - 1.21 -0.099 1.409 +0.307
“ K. H. Duecker, Ber. Bunsenges. Phys. Chem ., 74, 416 (1970). b “International Critical Tables,” Vol. III, McGraw-Hill, New York, N.Y., 1926, p. 72. c A. Weissler and V. A. Del Grosso, J. Acoust. Soc. Am ., 23, 219 (1951), and C. Bachem, Z. P h ys., 101, 541 (1936). d Landolt- Börnstein, “Physikalisch-Chemische Tabellen”, 5th ed, Supplement 3, Vol. 3, Springer Verlag, Berlin, 1936, p 2286, Table 257d, and J. D’Ans and H. Tollert, Z. Elektrochem ., 43, 81 (1937). e Reference 4. f This work. * Reference 10.
tial of component 2 , a is the thermal expansion coefficient, j3T and ds are the isothermal and adiabatic compressibilities, and v is the molar volume. The equivalent of eq 1 has been derived by others6 7 and to some extent anticipated by Jordan and Jordan.8
As the Lorentz-Lorenz relation suggests, an/aP is approximately (—f ir / a ) {an/aT ). Therefore, it is convenient to introduce a correction term, X = 1 + [/Spian/aT )/ a (an / aP )\ , which after some manipulation allows us to write eq 1 as
j _ 7 ~ 1 r + Cp /dn/ax2\ 2 *i ~|/ y X \2 L T \ a n / a T ) a\i2/ax 2J
+
For MgS04(aq), using molality for concentration, this is
J =7 - 1
7 * \ 2
i - x )
[ (1000 + 120.39m)CP ! an /am \2 1 1[ ! + T 1\ an /aT / ÒTTI J(2 )
where C p is the value per gram. We could have eliminated an/aT, upon introducing X , rather than an/aP. The expression for converting eq 2 to this form, which is more closely related to the approximate relation used in the work referred to above,2 is
(1 +y X \ 2 ( an\ 2
1 - x i \ 7 t )= { l + ( y - l ) X ) 2
The experimental quantities needed to calculate the relation of J to a\i2/am are a , C p , an/aT, an/aP, and an/am along with the velocity of sound (i>s) and the density (p) . These are used in eq 2 with the help of the standard relations, 7 — 1 = T u a2a 2/Cp and f i r = y / p v 2.
Experimental SectionBrillouin spectra were recorded at 25 °C, 632.8 nm, and a
scattering angle of 90° with the previous set-up. 1 Solutions were made up by weight from reagent grade MgS04-7H20 and checked by analysis. They were clarified by a single filtration through a submicron membrane filter. Several batches of each solution were filtered into the scattering cell and discarded to remove dust from the cell. The uncertainty in the intensity ratio due to remaining dust was about 0.1; the reproducibility was about ±5%. The hypersonic velocity was measured in the most concentrated solution (3 m) from the Brillouin shift and found to agree within 1% with the ultrasonic value. The latter had to be estimated from data at 30 °C on the basis of the temperature dependence at lower concentrations.
Values of an/aT were measured relative to water with the
TABLE II: Theoretical and Experimental Intensity Ratios
m J (eq 2) J (exptl)
1 3.31 3.12 3.10 3.03 2.30 2.8
TABLE III: Experimental Activity Coefficients
m 7± (eq 2) 7± dit.)“
1 (0.0488) 0.04882 0.043 0.04193 0.049 0.0495
“ Reference 10; these values are uncertain in the second significant figure.
Jamin interferometer described earlier.4 Water was placed in one channel and the solution in the other. The temperature was slowly increased from about 24.5 to 25.5 °C and the number of fringes (Am) passing the reference mark was counted to the nearest Vio of the fringe separation. The temperature change was monitored with a Beckman thermometer to ±0.001 °C. Water was assumed to have a value an/aT = —1.00 X 10- 4 deg-1. Thus, for the solution in question
an
XT-1.00 X 10- 4 ±
A m \
~ATd
where d is the path length of the channel, A is the wavelength of the source, and the sign of the second term is determined by the direction in which the fringes move.
ResultsFor MgS04(aq) we have p 2 = M2° + R T In ( y ± m ) 2, where
7 ± is the mean molal activity coefficient, which gives
¿M2
am
2 R T
m [1 + m
a In 7± ~|am J
Using the experimental quantities in Table I, we obtain via eq 2 the theoretical intensity ratios given in Table II. The agreement with experiment is good considering the uncertainty in the measured values of J and in the activity coefficient data upon which a p 2/am is based. 10 In particular, the slope of y ± vs. m at m = 3 can be only estimated.
It is instructive to turn our calculation around to obtain activity coefficients. Using our experimental intensity ratios along with y ± = 0.0488 for 1 m MgS0410 and the relation
J' m a In 7 4 -- ---- — d m
l am
The Journal o f Physical Chemistry, Voi. 80, No. 7, 1976
On the Apparent Symmetry of Cyclohexane 777
we obtain the results shown in Table III. In spite of the excellent agreement with literature values, there is a drawback to using light scattering to determine activity coefficients of electrolytes. The method is not sufficiently sensitive to handle the low concentrations needed to extrapolate to infinite dilation and must be used in conjunction with another method.
It has been reported that membrane filters contain 2-3% detergent to promote wetting.11 Much of the detergent is removed during initial filtration, but continued slow leaching shows up in later filtrates. Continuous recirculatory filtration may introduce detergent into the filtrate. This may have been the cause of the previous high intensity ratios for
MgS04(aq).
References and Notes(1) Part III: G. A. Miller and C. S. Lee, J. Phys. Chem., 77, 2441 (1973).(2) A. R. Maret and E. Yeager, J. Chem. Phys, 59, 206 (1973).(3) A. R. Maret and E. Yeager, J. Acoust. Soc. Am., 54, 668 ("973).(4) G. A. Miller, J. Chem Eng. Data, In press.(5) G. A. Miller, J. Phys. Chem., 71, 2305 (1967).(6 ) R. D. Mountain and J. M. Deutsch, J. Chem. Phys., 50, 1103 (1969).(7) S.-Y. Hsich, R. W. Gammon, P. B. Macedo, and C. J. Montrose J
Chem. Phys., 56, 1663 (1972).(8) P. C. Jordan and J. R. Jordan, J. Chem. Phys., 45, 2492 (1966).(9) J. D. Olson and F. H. Home, J. Chem. Phys., 58, 2321 (1973).
(10) H. S. Harned and B B. Owen, “The Physical Chemistry of Electrolyte Solutions", Reinhold, New York, N.Y., 1958.
(11) R. D. Cahn, Science, 155, 195 (1967).
On the Apparent Symmetry of Cyclohexane
R. L. Flurry, Jr.
Department of Chemistry, University of New Orleans, New Orleans, Louisiana 70122 (Received November 19, 1975)
Publication costs assisted by the National Science Foundation
It is shown that the product structure of the nonrigid molecular symmetry group of cyclohexane demonstrates the isomorphism to Deh- This approach is both simpler and more obvious than the cycle index method suggested by Leonard, Hammond, and Simmons.
In a recent article, Leonard, Hammond, and Simmons discussed the apparent symmetry of cyclohexane. 1 In this article they applied Polya’s cycle index2 to the cyclohexane system and showed that by the addition of a new operator which interchanged the axial and equatorial positions a group could be obtained which had the same cycle indices as the D eh point group. This, they concluded, provided the justification for the use of planar projection formulas (which would have D eh point symmetry for the framework) for counting the isomers of substituted cyclohexanes. In effect, what they have done is to determine the nonrigid molecular symmetry group3’4 for cyclohexane and to show that this is isomorphic to the D eh point group.
The same conclusions can be arrived at more simply by using Altmann’s derivation of nonrigid molecular symmetry group (or “supergroups”, to use his terminology4) and his concepts concerning the product structure of groups.5
Altman defines an isodynamic operator4 as an operator which changes the conformation of a molecule into another conformation which has the same energy as the original conformation. A rigorous treatment would require that this be done in such a way as to leave the angular momentum invarient;6 however, for our purposes it is sufficient that it preserve the center of mass and the moments of inertia. Examples of such operations are the threefold rotation of a methyl group, the inversion of ammonia, and the ring flip of either the chair or boat conformation of cyclohexane. The set of all isodynamic operations, along with the identity, form a group, the isodynamic group. The supergroup <? is the semidirect product5 of the isodynamic group 3 and the point group G of the molecule
S = 3 a G (1 )Isomorphisms between groups are determined by comparing the product structures of the groups. Groups which have the same product structure are isomorphic.5
In determining the product structure, two types of products are important: the d ir e c t p r o d u c t (denoted by X ) in which all elements of each group commute with all elements of the other group, and the s e m id ir e c t product (denoted by A) in which the full set of elements of one group (the invariant subgroup) commutes with all of the elements of the other group. In the latter case, the invariant subgroup is, by convention, written first.
In the case of chair cyclohexane, the isodynamic operator is the ring flip F
This is a generator of a group F of order 2, since two successive applications of F return the system to the original conformation (F2 = E ) . The point group is D 3<j. In this case F commutes with all elements of Ded\ consequently, the supergroup can be written as a direct product
f = F X D 3d (3)
For direct products, the order of writing the product is immaterial. Thus decomposing D^d into its product structure, the product structure of the supergroup is
# = C3 A C2 X C; X F (4)
The Journal o f Physical Chemistry, Voi. 80, No. 7, 1976
778 Additions and Corrections
The product structure of D$h is (the decompositions of most common point groups are given in ref 5)
Dsh = Cg a C -2 X Ch = C 2 X C 3 a Co' x Ch= C 3 a C2 x Ch x C 2 (5 )
The groups of eq 4 and 5 are isomorphic since they have the same product structure of primative groups having the same orders.
The question naturally arises as to when the supergroup is the appropriate group to use in describing a system. The answer to this depends either upon the energy barrier for the isodynamic operation in relation to the energy of the experiment being performed7 or upon the mean lifetime of a conformation in relation to the time scale of the experiment. In the case of cyclohexane, for example, no enantiomers of cis-l,2 -dibromocyclohexane can be isolated; however, at low temperatures the axial and equatorial protons of cyclohexane itself can be observed as distinct NMR sig
nals.8 The supergroup is appropriate for the attempt to separate isomers (at least at reasonable temperatures) while the point group is appropriate for the low temperature NMR.
A c k n o w le d g m e n ts . Financial support from the National Science Foundation (Grant No. GP-38740X) is gratefully acknowledged.
References and Notes
(1) J. E. Leonard, G. S. Hammond, and H. E. Simmons, J. Am. Chem. Soc., 97, 5052(1975).
(2) G. Pólya, Helv. Chim. Acta, 19, 22 (1936).(3) H. C. Longuet-Higgins, Mol. Phys., 6 , 445 (1963).(4) S. L. Altmann, Proc. R. Soc. London. Ser. A., 298, 184 (1967).(5) S. L. Altmann, Phil. Trans. R. Soc., Ser. A, 255, 216 (1963).(6 ) J. F. Gilles and J. Phlllpott, Int. J. Quantum Chem., 6 , 225 (1972).(7) R. L. Flurry, Jr., J. Mol. Spectrosc., 56, 88 (1975).(8 ) F. R. Jensen, D. S. Noyce, C. H. Sederholm, and A. J. Berlin, J. Am.
Chem. Soc., 84, 386(1962).
ADDITIONS AND CORRECTIONS
1972, Volume 76
N. Dennis Chasteen and Melvin W . Hanna: Electron Paramagnetic Resonance Line Widths of Vanadyl(IV) a - Hydroxycarboxylates.
Page 3952. Parallel and perpendicular subscripts were omitted. In the second column, the bottom line should read “Values for g and A ± were . . . ”. Equation 4 should read
uro = g doH / h + A \\M + ~ ~ - • •
The fourth line from the bottom should read “We derivedg\\ and A |! . . .”
Page 3956. Equation 1 1 should read " a " = . . .”—N. Dennis Chasteen
1975, Volume 79
Wayne M. Marley and Peter M. Jeffers: Shock Tube Cis-Trans Isomerization Studies. IV
Page 2085. The correct value for &“ (l,3-pentadiene) in line 3 of the Abstract is 1013 6 exp (—53,000/4.58T ) . The activation energy is correctly reported as 53 kcal/mol in the body of the paper.—Peter M. Jeffers
The Journal o f Physical Chemistry, Voi. 80, No. 7, 1976
CHEMICALCARCINOGENSA tape recorded in-depth look at the problem ot hazardous substances in the environment.
5 Speakers Length: 164 Minutes 14 Figures
The Speakers:
H.H. Fawcett—Purpose of Symposium B. Carroll (N.I.O.S.H.)—Toxic Substances
List—What. Why, How. For Whom W.F. Malone (N a tl Cancer Inst.)—Occupa
tional Cancer Control and Prevention N. Meade (EPA)—Actual vs Acceptable
Risks from AsbestosW.S. Wood (Wood Assoc.)—Engineering
Approach to Control of Chemical Carcinogen Exposure
PRICE: $18.00 (Cassettes Only)(Postpaid, includes printed copies of slides used)
Order From: American Chemical Society1155 Sixteenth Street. N.W. Washington, D.C. 20036 ATTN: Dept. AP
Name
C ity
Z ip
(a llow 4 to 6 w eeks fo r de live ry )
I N T E R F E R O NInterferon may play an important role in protecting against virus infections, cancer, and other diseases The potential for interferon is examined in this tape recorded symposium.
4 Speakers Length: 143 Minutes 44 Figures
The Speakers:
S . B a r o n (Nat l. Inst. Allergy, Infect.Dis.)— Biological Aspects of the Interferon System
H .B . L e v y (N.I.A.I.D.)— Mechanism of Antiviral Action of Interferon
J. V ilc e k (New York U.)— InterferonInduction with Polynucleotides and Viruses
J.F. Niblack (Pfizer)—Synthetic Inducers of Interferon
PRICE: $18.00 (Cassettes Only)(Postpaid, includes printed copies of slides used)
Order From: American Chemical Society1155 Sixteenth Street. N.W. Washington. D C. 20036 ATTN: Dept AP
N a m e __ __________________ ____________________ _
A d d r e s s ______ __ — — ------------------------
C i t y _______________ - — -------------- —
State________________ _____ Z ip ---------------(a llow 4 to 6 w eeks fo r de livery)
P R O G R E S S
I N C A N C E R
C H E M O T H E R A P Y
Tape recorded discussions about new drugs that look promising in the battle against cancer.5 Speakers/167 Minutes/85 FiguresThe SpeakersA.C. Sartorelli (Yale U.)—Optimization
of the Antineoplastic Potential of a-(N)-Heterocyclic Carboxaldehyde Thiosemicarbazones (HCT)
D.W. Henry (Stanford Res. Inst.)— Adriamycin
N.R. Bachur (Nat l Cancer Inst.)—Biochemical Pharmacology of the Anthracycline Antibiotics
A.J. Lin (Yale U.)—Potential Biore- ductive Alkylating Agents
G.P. Wheeler (Southern Res. Inst.) Review of Studies on the Mechanism of Action of Nitrosoureas
PRICE: $18.00 (Cassettes Only)(Postpaid, includes printed copies of slides used)
Order From: American Chemical Society1155 Sixteenth Street. N.W.Washington. D.C. 20036ATTN: Dept. AP
N a m e _____________________________
A dd re ss _____________________________
C ity_____ ___ ___ __________________
S ta te ______________________________Z ip _
(a llow 4 to 6 w eeks fo r de livery)
Selective Insect Control
Tape recorded sym posium exam ines the potential o f growth regulating ch em icals as selective insect control agents.
3 Speakers Length: 135 Minutes 95 Figures
The Speakers:
L.I. Gilbert (Northwestern U.) Biochemical and Physiological Aspects of Insect Growth and Development
J.H. Law (L. Chicago)- Juvenile Hormone Synthesis and Action in Insects
J.W. Barnett (Ciba-Geigy)- Recent Developments in Insect Growth Regulators
PRICE: $18.00 (Cassettes Only)(Postpaid, includes printed copies of slides used)
Order From: American Chemical Society1155 Sixteenth Street. N.W.Washington, D.C. 20036ATTN: Dept. AP
N am e------------------------------------------------------------------ --------
A d d r e s s -------------------------------------- --------------------
C ity____ ________________________________ —
S ta te _____________________________ Z ip --------------
(a llow 4 to 6 w eeks fo r de livery)
CONTROL OF ATHEROSCLEROSISA tape recorded symposium detailing the latest advances toward controlling atherosclerosis and reducing coronary heart disease which kills 600.000 Americans each year.
6 Speakers/210 Minutes/125 FiguresThe Speakers:R.l. Levy (Nat'l Heart & Lung Inst.)—
Lipids in Atheroscierosis G.F. Holland (Pfizer)—Recent Advances
in the Discovery & Development of Antihyperlipidemic Agents
R.M. Tornarelll (Wyeth)—Antihypercholester- olemic Activity of WY 14,643. a 2-Py-imi- dinylthioacetic Acid Derivative
R.A. Parker (Merrell-National)— 5-(Tetrade- cyloxy)-2-Furancarboxylic Acid (RMI 14,514) & Related Hypolidemic Fatty Acid- like Alkyloxyarylcarboxylic Acids
L.R. Mandel (Merck)—Studies of the Mode of Action of Halofenate
L.A. Kelly (Sandoz)—Studies of a Series of Compounds which Reduce Serum Cholesterol With and Without Accumulation of Sterol Precursors of CholesterolPRICE: $18.00 (Cassettes Only)(Postpaid, includes printed copies of slides used)
Order From: ACS; 1155 16th Street. N.W.Wash.. D C. 20036/Attn Dept. AP
N a m e ___________________________________ ____
A d d r e s s ________________________________________
City____________________________________
State_____________________ Z ip________(a llo w 4 to 6 w eeks fo r de livery)
P r o g r e s s T o w a r d S y n t h e t i c O i l s
Shale, coal, oil-bearing sands a'l offer an opportunity to add to our energy reserves. The potential for each Is examined in this tape recorded symposium.
4 Speakers Length: 125 Minutes 47 Figures
The Speakers:H.W. Sternberg (Lawrence Livermore Lab.)—
The Nature of Coal Liquefaction Products S.K. Kunchal (Paraho Oil Shale Demo.)—
Energy and Dollar Requirements in an Oil Shale Industry—Based on the Paraho Process
G.A. Myers (Atlantic-Richfield)—Predefining of Shale Oil
R.H. Fischer (Mobil)—Non-Hydrogenative Demetalation of Rcoidua Using Manganese Nodules
PRICE: $18.00 (Cassettes Only)(Postpaid, includes printed copies of slides used)
Order From: American Chemical Society1155 Sixteenth Street, N.W. Washington. D.C. 20036 ATTN: Dept. AP
N a m e _____________________________________________
A d d r e s s -------------------------------------------------------------------
C ity ______________________________________________
S ta te -------------------------------------------------- Z ip ------------------
(a llow 4 to 6 w eeks fo r d e liv e r /)
InternationalMonographsPhysical ChemistryG. Ertl/J. KijppersLow Energy Electrons and Surface Chemistry(Monographs in Modern Chemistry Vol. 4)1974. X, 251 pages with 152 figures and 3 tables. Linen DM 9 8 -
Dieter O. Hummel (Editor)Polymer Spectroscopy(Monographs in Modern Chemistry Vol. 6)1974. XII, 401 pages with 262 figures and 76 tables. Linen DM 125.-
Werner A. P. Luck (Editor)Structure of Water and Aqueous Solutions1974. XXVIII, 648 pages. DM 9 4 -
Hans MeierOrganic Semiconductors(Monographs in Modern Chemistry Vol. 2)1974. XV, 661 pages with 150 figures and 70 tables. Linen DM 138.-
« 4 ^chemieD-6940 Weinheim, P. O. Box 1260/1280
B. Schrader/W. Meier (Editors)Raman/IR-Atlas of Organic Compounds1974/75/76. 3 issues; may not be purchased separately. DM 795 -
M .TaubePlutonium - A General Survey |1974. XII, 242 pages with 96 figures and 36 tables.Linen DM 88.-
SorantinDetermination of Uranium and Plutonium in Nuclear Fuels1975. VIII, 285 pages with 110 figures and 54 tables. Linen DM 138.-
Please order these books from your bookseller or directly from the publisher.
ACS Centennial MugThe perfect accessory for office, den, or bar— 4 3/4 inch high pewter-colored noggin with ACS Centennial seal made of Armetale' to keep beer or ale ice cold
$8.50
ACS Centennial EmblemBlue, white, and gold diamond-shaped emblem commemorating the Centennial is available with pin back for women members, or as a lapel or tie tack for men
$2.00
ACS Centennial Seals1 1 /2 incn blue and gold ACS Centennial seal. Ideal for business correspondence or greeting cards.
Roll of 2.000 for $10.00 200 for 1.00
ACS Centennial Plate10 3/4 inch blue and white plate with gold rim featuring ACS Centennial seal. Made of top-quality Pickard china.
$20 .0 0
-h -Books Dept./American Chemical Society 1155 16th St.. N.W., Wash.. D C. 20036
ACS Mug($8.50 each)
ACS Plate($20.00 each)
□ ACS Emblem($2.00 each)
__ women's pin__ men’s lapel__ men’s tie tack
□ ACS Seals__ roll of 2.000 (S10.00)__ 200 fer S1.00
□ Check enclosed for $ ____________ _All orders postpaid in U S. and Canada.
Name _
A d d re s s ^
C i t y _____ S ta te . Zip-