The Internet as a Celestial TiVo
32
Electronic copy available at: http://ssrn.com/abstract=1922391 The Internet as a Celestial TiVo Stan J Liebowitz Alejandro Zentner University of Texas at Dallas August, 2011 It appears that the Internet is soon going to fulfill its potential to become a giant on- demand repository of television shows (and movies) available asynchronously. As companies such as Netflix and Hulu increase their activities in this sphere, there are many unanswered questions about the impacts of this transition. In this paper we attempt to foretell the impact of this shift on one key aspect of television viewing: the amount of time viewers devote to it. We use cable and satellite television’s impact on viewing as a proxy for the likely impact that future Internet transmission of programs will have. Using country-based panel data going back to the mid 1990s we find that the increased variety brought about by cable and satellite has had virtually no impact on time devoted to television viewing. We discuss the import of this finding for Internet business models of television transmission.
Transcript of The Internet as a Celestial TiVo

Electronic copy available at: http://ssrn.com/abstract=1922391
The Internet as a Celestial TiVo
Stan J Liebowitz
Alejandro Zentner
University of Texas at Dallas
August, 2011
It appears that the Internet is soon going to fulfill its potential to become a giant on-demand repository of television shows (and movies) available asynchronously. As companies such as Netflix and Hulu increase their activities in this sphere, there are many unanswered questions about the impacts of this transition. In this paper we attempt to foretell the impact of this shift on one key aspect of television viewing: the amount of time viewers devote to it. We use cable and satellite television’s impact on viewing as a proxy for the likely impact that future Internet transmission of programs will have. Using country-based panel data going back to the mid 1990s we find that the increased variety brought about by cable and satellite has had virtually no impact on time devoted to television viewing. We discuss the import of this finding for Internet business models of television transmission.

Electronic copy available at: http://ssrn.com/abstract=1922391
Recreational activities are often greatly changed by new technologies—the current
leading recreational activities—watching movies and television, listening to radio—were
all brought about by technological advances in the last century. These then-novel forms
of entertainment diffused throughout countries and populations at varying rates
depending on wealth, technological sophistication, government policy and other country
characteristics.
The Internet is currently the new technology on the block. The Internet may not
have changed everything, as was commonly suggested during the heyday of the tech
bubble, but it is changing many aspects of daily life (Brynjolfsson and Smith 2000;
Goolsbee 2000), including communications, advertising, distribution, and the focus of
this paper, television viewing. The Internet has already shown that it can greatly alter
entertainment activities by allowing users experiences that were not previously available,
such as social networking and altering other traditional activities, such as music listening
with sites such as Pandora or Spotify.
Our interest in this paper is to examine how the Internet is likely to influence one
aspect of the most popular entertainment activity of all: television viewing. The Internet
is proving to be a disruptive technology as television transitions from traditional forms of
delivery (over-the-air and cable or satellite) to Internet delivered content. Online sites
such as Netflix and Hulu have shown how the Internet can outdo what cable and satellite
have done in terms of providing greater variety and choice to viewers. It is not yet clear
which business models and firms are going to succeed in this new mode of transmission.
The previous technology to disrupt television markets was the introduction of cable
and satellite transmission. These technologies provided a much larger number of channels
than had been available with over-the-air transmission but the viewing of a program was
still synchronized with the transmission of the program. Many cable channels repeated
their programming on different days or times in the hopes of reducing the limitations of
this synchronization. Recording devices, such as the TiVo also attempted to break this
synchronization limitation by “time shifting” the program, recording it at one time and
playing it back at another. In recent years, many cable systems also have provided a form
1

of asynchronous “on demand” service which allows viewers to view a small subset of
cable programs when they want, as opposed to having to watch them when broadcast.
Internet based services, because they can entirely sever the synchronization
limitation, can considerably improve the set of viewing options relative to any of these
older technologies. This change fits hand-in-glove with a vision that was first applied to
music, of every digital form of entertainment being made available to everyone, in what
Paul Goldstein (1995) referred to as the “celestial jukebox.” The concept applies equally
to video programming. Similarly, the Internet has already made a great deal of printed
matter, such as newspapers, available on demand, and it will not be long before almost all
books become available on demand, as Google envisioned in its original book project.
Thus, all forms of entertainment capable of being digitized are likely, soon, to be part of a
celestial repository.
The general question is how this increased availability of programming may change
consumption of these products. In this paper we take a stab at an answer by looking at
how a change in the variety of television programs has changed the consumption of
television programming. We take the past impact of the additional viewing choice made
available by cable and satellite as a harbinger of the future impact of Internet-based
networks on viewing behavior.
Our approach in this paper is to use panel data on the television viewing habits in
various countries over a thirteen year period running from 1996 to 2008. Using viewing
data in conjunction with data on cable and satellite penetration, Internet usage, income,
and several other variables, we are able to measure the extent to which the additional
viewing choices made available by cable and satellite affected television viewing.
We acknowledge that the Internet’s alteration in viewing choice will be somewhat
different than the change in viewing choices made possible by cable and satellite
transmission. The change made possible by cable and satellite was from a few over-the-
air broadcasters to a much larger number of networks (sometimes as high as a few
hundred) available at a moment in time. The Internet, by contrast, will make tens of
thousands programs available at any time, but the universe of programs available, and
2

particularly the universe of new programming, is not likely to be much different in total
than what is available on cable and satellite channels.
The most important increase in viewing choice engendered by the Internet is due to
the breaking of the synchronicity bind that has previously limited the broadcast library
available to viewers at a moment of time. It is difficult to know and impossible to
precisely measure whether this type of increase in viewing choice can be considered
more or less consequential to viewers than was the increase caused by cable or satellite.
There is little reason to believe, however, that the alterations in viewing choice due to the
two technologies are qualitatively different. If so, the increase in viewing choice brought
about by cable and satellite is certainly large enough that it should provide useful
information about what we might expect from the increased choice to be brought about
by the Internet.
Our results, in short, are that that a greater number and variety of stations appear to
have virtually no impact on time spent viewing television. Thus, business models aiming
to take advantage of this new technology need to focus on appropriating some of the
extra value consumers receive from the additional choices and not expect to make
additional revenues or profits through greater volume, since competing on quantity will
be a zero sum game. In other words, focusing on subscription revenue should be more
important than focusing on advertising revenue.
The outline of the remainder of the paper is as follows. The next section studies the
possible impacts of product variety on television viewing. The relatively small amount of
research studying television viewing with respect to viewing choice is summarized in
section II. Section III provides some details about the data that we use. In section IV we
summarize univariate statistics from the data. Section V lays out the model and the
empirical strategy. Section VI presents the multivariate estimation results, and Section
VII discusses the implications of those results for business models. The last section offers
some conclusions.
3

I. Possible Impacts of Program Variety on Television Viewing
Although it is commonly held that greater choice should lead to greater
consumption of the product, this need not be the case.1 Even assuming that consumers
can easily navigate a plethora of choices to find the specific variants of the product
(programming) that they most value, the fact that consumers derive greater value from
their chosen consumption choices (television programs) when they are better able to find
variants that match their tastes does not necessarily imply that they will consume a
greater amount of the category (more hours of television).2
In the simplest case, the binding constraint on television viewing might be one of
time. Because consumers (viewers) get more value for each unit consumed (e.g., an hour
long television program) the demand for viewing hours might increase but a binding time
constraint would not change and the number of viewing hours would remain constant
even as the value of the programming increased for both the marginal and inframarginal
consumption units (television programs). Willingness to pay would increase, but viewing
time would not.
On the other hand, if we think of television programs as providing various
“characteristics,” a la Lancaster (1966) or “services” a la Hirshleifer (1971), then an
increase in the variety of programs available to consumers will allow viewers to consume
a greater amount of services for a given viewing hour. This does not, however, lead to an
unambiguous increase in the demand for viewing hours on the part of consumers. The
demand for viewing hours will tend to rotate clockwise as each viewing hour provides a
greater amount of services but satiation of these services occurs at a smaller number of
1 This presumed positive relationship between greater choice and greater consumption is evident in the discussions of “sampling” in the context of file-sharing. Sampling would occur when music listeners test out songs on file-sharing networks with the intention of purchasing music that they discover through this trial and error process. The claim is usually that sampling will increase demand for purchased music because consumers acquire more information about the choices available to them. But sampling, even if it occurred, would not necessarily increase the quantity of music consumed, since it merely increases the quality of each song purchased but does not necessarily increase the amount of music listening for the reasons explained in the main text. 2 There is even currently a question of whether viewers actually derive greater benefit from greater choice. See Benesch, Frey and Stutzer (2010) and also Bruni and Stanca (2008) who suggest that greater choice has increased viewing and lowered overall utility because viewers have less interaction with other people as a result of watching more television. Our analysis suggests that greater choice might not lead to greater viewing and thus it might not reduce the “relational” interactions at the heart of their analysis.
4

viewing hours.3 In other words, the first hours of program viewing have greater value
because those programs contain more units of the still high value “viewing services.” But
later hours of viewing, although they contain more services, have lower values than they
did with less program choice because those units of service are of lower value because
they are much further down the demand curve for services.
By way of analogy, programs with more ‘viewing services’ per program can be
analogized to consumers being provided with bigger candy bars at a constant price per
bar (which lowers the implicit price of candy). Although each bigger bar provides more
candy (the underlying service), consumers are satiated with a smaller number of bars.
Whether more bars (television programs) are consumed depends on the elasticity of
demand for candy (viewing services). A lower price of candy (due to making the bars
larger while holding the price of bars constant, for example) will increase revenues (and
thus increase the number of bars being sold at a fixed price) only in the case where the
demand for candy is elastic. The advent of greater television choice essentially lowers the
price of viewing services (price of candy), and only if the demand for television services
is elastic will this lowering of the implicit price lead to an increase in the number of hours
of television (candy bars).4
Finally, if each television program has unique characteristics that do not substitute
for characteristics (services) found in other television programs, then these models that
assume that all programs have different combinations of identical characteristics are no
longer appropriate. In this case an increase in the ability to view higher quality programs
that contain unique characteristics will increase the demand for television programs,
raising both the consumer willingness to pay and the quantities consumed at a fixed price,
if there is no binding time constraint.5
This admittedly brief examination should make it clear that it whether additional
variety of programming would increase or decrease television viewing is an open
3 This rotation does not hold in every possible instance. For example, in the case of a constant unit elasticity of demand for services, the quantity demanded of units (programs) would be fixed with regard to the amount of services in a program and would not rotate clockwise. 4 These types of models are discussed at length in Liebowitz (1982a). 5 If the nature of the programs is considered ‘unique’ to each program, then watching an additional program does not bring the consumer closer to satiation with regard to other programs.
5

question from a theoretical perspective. Nevertheless, the basic expectation has generally
been that greater choice will increase consumption. This basic intuition has been at least
somewhat supported by the small empirical literature that has examined the relationship
between viewing choice and viewing hours.
II. The Literature
There is a small literature on the impact of program variety on television viewing.
Some studies report the common finding that cable viewers watch more television than
over-the-air viewers and inappropriately assume causation, ignoring the possibility that
heavy viewers are more likely to be drawn to cable. At the introduction of cable in North
America, Park (1979) attempted to estimate the causal impact of cable on viewing hours,
but although the results supported an interpretation that cable increased viewing, he
remained skeptical of that result. Liebowitz (1982b) compared the link between viewing
hours and cable penetration across different Canadian metropolitan areas and found an
insignificant and sometimes negative relationship. In those days, however, the number of
channels on cable was rather small and tended to consist of distant over-the-air stations
and a handful of pay networks.
Similarly, the introduction of cable in Europe led to some assessments of its impact
on viewing. For example, a German government experiment in the mid 1980s, reported in
Noelle-Neumann and Schultz (1989), found that in the few small geographic areas
examined, the introduction of cable appeared to have increased viewing by 7.5% (from
133 minutes per day to 143 minutes per day). Recent work by Benesch, Frey and Stutzer
(2010), trying to determine whether there is overconsumption of television, has relied on
these claims that increased choice led to increased viewing.
Perhaps the most extreme instance of increased variety is the study by Weimann
(1996) who examined viewing in Israel (based on his own surveys and samples) after the
introduction of a relatively modern multi-channel cable system where previously there
had been but a single (public) channel. This is a more extreme increase in choice than can
be found almost anywhere and should provide something of an upper limit of increased
viewing due to greater variety, since variety (as measured by the choices that exist at a
moment of time) starts from the lowest possible level and increases to a more modern
6

number of channels. A year after cable was introduced, viewing time for cable
subscribers increased by 32 minutes from a base of 94 minutes per day, an increase of
33%.
Our study is, to our knowledge, the first to examine the impact of variety on
viewing time by using a panel of countries over a multiyear period. Using countries as the
unit of analysis allows great cross sectional variation and, hopefully, more precise
estimation. It also measures the impact of choice on viewing for a considerably wider
group of viewers than has previously been the case. Additionally, the number and variety
of cable and satellite channels is much greater than in the early days of cable television
when most previous analyses were undertaken. Finally, unlike many previous studies that
took snapshots before and after the introduction of cable, our results will be largely
immune to potential transient responses to a new technology (cable) that might have
influenced some of the previous studies.6
III. The data
Our data cover the period 1996-2008. In all we have data for 52 countries (and data
for 3 more observations for the double language Belgium and triple language
Switzerland).7 We acquired data on cable and satellite penetration from IHS Screen
Digest.
Our dependent variable, country level television viewing was acquired from
Mediametrie - Eurodata TV Worldwide. Viewing is based to a large extent on meters
attached to televisions.
The metric we have chosen to proxy the key variable of available program variety
is the share of the population with subscriptions to cable or satellite. These newer,
sources provide a much greater choice of programs to viewers than does over-the-air
programming. Before the advent of Internet transmission, viewers without cable and
satellite were restricted to a small number of traditional over-the-air television broadcast
signals. Over-the-air signals can travel only limited distances, often covering little more
6 Weimann (1996) reports a larger initial impact on viewing after 3-4 months after the introduction of cable than was the case at the end of 12 months. 7 The list of countries can be found in the Data Appendix.
7

than a single large-sized metropolitan area and the fixed costs associated with over-the-
air broadcasts tends to limit the number of signals available.8 Rural residents often had no
access to over-the-air signals. By contrast, cable and satellite signals tend to have
hundreds of channels, an order of magnitude more channels than would be available
over-the-air. Although cable and satellite signals are often sold in packages, even the
packages with the smallest number of signals usually contain several dozen, which is still
far more than are likely to be available over the air. Because the difference in the number
of choices is so great between over-the-air and cable/satellite reception we treat the latter
as providing far greater variety than the former.9 Because cable and satellite subscriptions
tend to carry the same or similar number of networks to one another, we have merged the
two together into a variable called “CabSat” that measures the sum of the penetration
rates of cable and satellite.10 Although we merge them together, we note that the increase
in variety due to satellite should be somewhat greater than the increase due to cable
because rural viewers, who have access to satellite but not cable, are unlikely to have as
many over-the-air alternatives as are city-based viewers.
Another important independent variable is the Internet penetration rate taken from
the International Telecommunication Union (ITU), a United Nations agency for
information and communication technology issues. The Internet variable is included
because the Internet is an increasingly important hub for new entertainment activities,
such as social networking or online game playing. To the extent that the Internet provides
substitutes for traditional entertainment, as opposed to merely replacing the hardware
locus of an already existing entertainment (such as switching radio listening from over-
the-air to the computer) it can be expected to alter the time spent on more traditional
entertainment. Ideally we would like to have a measure of the time spent using the
Internet for entertainment purposes, since this would most directly impact the time spent
8 In the U.S., for example, the Nielsen company creates what are known as “designated market areas” based on the contours of the distance from the transmitter where the share of the population capable of receiving the signal dropped below a standard threshold. 9 A metric for variety is difficult to construct or defend since it would involve not just the number of choices but also the “sameness” of those choices. Additionally, because the value of greater variety almost certainly increases at a decreasing rate with the number of channels, setting up a simple dichotomy between over-the-air viewing and cable/satellite seems likely to capture the main essence of increased variety. 10 Although there could in theory be some double counting, we are doubtful that there are many households with both satellite and cable because the two distribution systems carry much duplicative programming.
8

viewing television. Such a measure does not exist, however. Given the wide variation in
Internet penetration rates, the assumption that countries with higher rates also have higher
per capita amounts of time being entertained through the Internet seems quite reasonable.
Internet penetration was essentially zero at the beginning of our time period and grew
greatly over the period.
Income is likely to influence the time spent viewing television programs since it is
related to the ability to purchase a television, the quality and size of a purchased
television, and the number of available channels through an outdoor antenna, cable, or
satellite. Income also influences the opportunity cost of time spent watching television
and the ability to participate in other costly forms of substitute entertainment activities.
Thus, the direction of the relationship between Income and television viewing is unclear.
The measure of income that we use is constructed by combining the purchasing power
adjusted GDP per capita (normalized to the US dollar) for a base year (we use 2000) and
growth rates of GDP in local currency in constant values, and is based on data from the
International Monetary Fund World Economic Outlook Database. A potential
confounding influence when examining the relationship between national average income
and average television viewing might have been due to income altering the portion of
population being measured as more families acquired televisions. Fortunately, television
penetration was at already high levels, above 85% of the population, for almost all of the
countries in the sample except for a few less developed countries in the early years of the
period under investigation.11 This means that the viewing data represent very similar and
almost complete swaths of the population in most of the countries during the period of
this investigation.
Another variable that seems likely to be related to the extent of television viewing
in a country is the employed share of the population (from the World Bank). One
constraint to television watching, and perhaps the only binding constraint, is the amount
of time available for television watching. Adults who are not at work have more free time
and thus more time to watch television. In support of this proposition, Liebowitz and
Zentner (forthcoming) document that Americans over 65, a group with a high percentage 11 By 1999, all the countries but Latvia (at 80%), India (at 28%), Moldova (81%), and South Africa (56%) were in the range of 85% or above for the share of households owning a television.
9

of retired individuals, watch far more television than do younger Americans. Of course,
the share of the population employed may have very little variation across countries and
thus may not influence television viewing in an important way. Additionally, the share of
population employed may also be a barometer for current macroeconomic conditions and
as such might have a different impact on television viewing than just envisioned.
Nevertheless, because most countries have positive temporal correlations in their macro
economies, we think that the year fixed effects in the regression analysis will pick up
much in the way of macroeconomic fluctuations.
We also include population in the regression since economies of scale in producing
and transmitting television programs might mean that large countries are more likely to
have television programs created to fit the particular tastes and culture of the population
whereas small countries might need to import most of their programming. Nevertheless,
it is not clear how this might translate into viewing time since programs better tailored to
the audience might actually decrease television viewing, as discussed above.
Finally, we also examine cell phone penetration (from the ITU). We include this
variable because cell phones are often thought to be an important source of entertainment,
particularly for young individuals, implying that greater cell phone penetration might
reduce television viewing. Our own opinion is that cell phones are more likely to
substitute for land lines when used in the home and that the use of cell phones away from
home is not much of a substitute for television viewing since television viewing requires
attention and the ability to concentrate which does not usually occur to any significant
extent when travelling.12 While we do not deny that cell phones are sometimes used to
watch television, we believe such usage is likely to be small, particularly over the 1996-
2008 period (e.g., the iPhone was not introduced until 2007 in the US and 2008 in
Europe) and that to the extent that cell phones were used for entertainment purposes, they
were likely to substitute for computer usage (messaging, games) more than they
substituted for television viewing.
12 Although we acknowledge that the existence of cell phones does allow individuals at home to speak to people who are outdoors, possibly increasing home-based talk time somewhat.
10

IV. Summary Statistics
We were unable to obtain complete country data for every variable and year. This
complicates the analysis somewhat although we attempted to ensure that our results were
not dependent on particular cohorts of countries, or years, or variables, for which the data
were incomplete.
Table 1 presents means and standard deviations for those variables with complete
data for every year and every country and country-language permutation (54 “countries”
as indicated in the rightmost column).13 These variables include Internet penetration,
income, population, the share of the adult population that is employed, and cell phone
penetration.
CountriesYear Avg Std Dev Avg Std Dev Avg Std Dev Avg Std Dev Avg Std Dev N1996 3.32 4.26 15.67 9.55 71.34 210.43 52.65 7.41 7.53 8.31 541997 6.16 6.66 16.19 9.83 72.08 213.23 52.77 7.45 11.45 10.96 541998 9.96 10.13 16.54 9.97 72.80 215.92 52.85 7.36 17.06 14.29 541999 14.58 13.92 16.96 10.30 73.53 218.49 52.64 7.34 26.58 19.36 542000 19.90 16.85 17.63 10.65 74.28 220.99 52.63 7.48 39.30 25.94 542001 23.53 18.64 17.86 10.67 75.05 223.44 52.70 7.63 48.49 28.59 542002 30.73 22.49 18.15 10.73 75.73 225.82 52.52 7.47 55.07 29.49 542003 35.10 23.68 18.48 10.71 76.43 228.14 52.42 7.29 61.69 30.23 542004 38.74 24.16 19.12 10.92 77.11 230.44 52.46 7.06 69.94 29.94 542005 42.08 24.41 19.69 11.06 77.78 232.73 52.71 6.95 80.03 29.69 542006 45.63 24.33 20.40 11.23 78.41 234.93 53.26 6.97 89.85 29.46 542007 50.18 24.55 21.14 11.38 79.09 237.14 53.46 6.86 100.13 29.69 542008 53.82 24.30 21.25 11.21 79.78 239.33 53.44 6.82 107.37 29.45 54
Table 1: Summary StatisticsInternet
Penetration %GDP per cap Thousand $
Population (millions)
Share Employed %
Cell Phone Penetration %
The first pair of columns indicates that the average Internet penetration variable
grew dramatically, from 3% to 54%, with a fairly constant increase that showed little
indication of a slackening as of 2008. The relatively large standard deviations,
particularly in the early years, revealed that Internet penetration rates varied widely by
country. Although the details are not shown, highly industrialized countries generally
have the highest Internet penetrations and less developed countries tend to have the
lowest Internet penetration. In the later years the Internet penetration rates are
approaching saturation in some countries but the substantial idiosyncratic variation across
countries should provide sufficient contrast to help identify the relationships of interest.
13 There are 55 countries in the data set but Serbia is removed from Table 1 because it alone had missing data for these variables.
11

GDP, measured in constant US dollars, rose quite consistently over this period
although there is considerable variation in the size of these economies as indicated by the
relatively large standard deviations. Population shows a small increase over this time
interval, although, again, there is considerable cross sectional variation reflecting
substantial size differences across countries. The share of the population employed
reveals only a tiny increase over this time period and fairly little variation across
countries. As would be expected, cell phone penetration rates are seen to increase
markedly during this period.14
Table 2 provides summary statistics for the two variables which are incomplete in
some way: the television viewing variable and the CabSat variable. The CabSat variable
is almost complete, however, missing data only for two countries for two years.
Obviously, we would prefer to have had complete data on this important variable but this
is only a minimal deviation from complete data. The TV viewing data are not as complete
as the CabSat data but they do cover most countries most years, particularly after 2001.
Year Avg Std Dev Countries Avg Std Dev Countries Avg Std Dev Countries1996 188.1 52.4 28 177.0 33.9 24 34.8 31.4 521997 180.8 35.0 33 175.4 33.4 24 36.6 31.3 521998 186.9 34.9 37 180.6 34.9 24 39.9 30.6 551999 186.9 34.7 41 186.3 33.3 24 42.2 30.4 552000 193.0 34.6 44 190.8 32.6 24 44.3 29.9 552001 192.3 33.5 47 191.1 33.5 24 46.2 30.3 552002 198.9 34.3 49 194.2 34.8 24 47.0 30.0 552003 200.9 35.3 51 199.6 38.8 24 48.5 29.5 552004 203.1 37.2 51 204.7 40.3 24 51.0 29.1 552005 201.4 39.0 50 205.7 42.1 24 52.6 28.3 552006 205.3 38.7 55 203.3 38.7 24 54.6 28.1 552007 205.1 39.0 54 200.9 39.2 24 56.5 27.2 552008 208.4 38.5 54 203.2 36.7 24 58.2 26.4 55
TV Viewing (Unbalanced) TV Viewing (Balanced) CabSat % (Unbalanced)Table 2: Summary Statistics for Incomplete Variables
The CabSat penetration rates grew quite strongly in spite of the fact that a few
countries had CabSat penetration rates near 90% in 1996 that would limit the amount of
any growth possible in those countries. The growth of CabSat penetration over the period
was about 23 percentage points, or about 70% above its initial value. The variation across
countries is also quite high.
14 The Data Appendix explains why the cell phone penetration rate measured by the ITU has been over 100% in recent years for several countries.
12

Television viewing increased over this period, whether we look at the full data set
or a (balanced) data set based on a considerably smaller number of countries with
complete data. Viewing increased slightly during this time interval, from just over three
hours per day per person to a level of about three hours and twenty five minutes. The
variation across countries is small, perhaps surprisingly so given the seemingly large
differences in the levels of development in these countries as indicated in their income
differentials.
As implied by the standard deviations, audiences in the countries with the least
time spent viewing television watch about 2.5 hours per day whereas audiences in the
highest viewing countries are in the vicinity of 4 hours per day.
-80-60-40-20
020406080
100
-20.0 0.0 20.0 40.0 60.0 80.0
Cha
nge
in V
iew
ing
Min
utes
Change in CabSat Penetration Rate
Figure 1: CabSat Vs Viewing 1999-2008
Although we will explore more precisely the relationship between time spent
viewing television and the diversity of viewing choice in the regression analysis below, it
is instructive to examine the simple relationship between changes in viewing and changes
in CabSat penetration. Figure 1 would appear to indicate that there is no clear
relationship, certainly not a positive relationship, between changes in the number of
channels available (as proxied by changes in cable and satellite penetration) and changes
in average time spent viewing television and this is consistent with a linear trendline
which, although not shown, is almost flat.15
15 This is for the 39 countries that had viewing and CabSat data from 1999 to 2008 (the two negative viewing change outliers are Mexico and Cyprus). Cable penetration decreases 11% in Denmark, and the
13

Next we examine cross sectional correlation coefficients for the year 2002, a year
in the middle of the period and for which the sample is well populated with 48 out of 55
countries represented. Although not shown, the year by year correlations are basically
similar to those shown here for 2002.
TV Viewing Internet CabSat GDP Employment PopulationInternet Penetration -0.258 1CabSat Penetration -0.285 0.611 1GDP per Capita -0.247 0.841 0.559 1Employment % -0.334 0.578 0.283 0.500 1Population -0.217 -0.231 -0.029 -0.254 0.132 1Cell Phone Penetration -0.211 0.620 0.356 0.757 0.175 -0.417
Table 3: Correlation Coefficients 2002 (N=48)
There are moderate negative correlations between TV viewing and all the other
listed variables: Internet penetration, CabSat penetration, GDP per capita, the
employment rate, population, and cell phone penetration. The penetration of many of
these technologies (CabSat, Internet, and cell phone) is quite strongly related to average
income. TV viewing, by way of contrast, is negatively related to income. Therefore, these
newer technologies appear to be a form of ‘luxury’ good in many places, whereas
televisions appear to have become a necessity and since television viewing is negatively
related to income, it might not seem surprising that television viewing is negatively
related to these newer technologies. These univariate cross sectional relationships may
well give misleading results, however, so we now turn to multiple regression analysis.
V. The Econometric Model
Our main focus is to measure the extent to which an increase in variety of
television programming affects television viewing, but we also seek to measure how
Internet usage affects television viewing. A simple approach to studying these questions
would be to use cross sectional country-level variation in television viewing (T), variety
of viewing choices (V), and Internet use (I), to estimate whether the daily average
number of minutes of television per capita watched in country j in any given year
jjjjj uIVXT ++++= ψφβα)1(
pattern of the data suggest that this change is likely to have been caused by a change in the data source in year 2000
14

is correlated with the variety of viewing choices or with the daily average number of
minutes of Internet use per capita in that year. In Model (1), Xj represents other
covariates for country j and represents the error, which accounts for the effect of
unobservable variables on television viewing.
ju
An important shortcoming of this approach is that variation in television viewing
across countries may be related to factors that the limited control variables included in the
model are unable to capture. Cross section regressions estimate the effects of variety of
viewing choices and Internet use on television viewing by comparing countries with low
and high levels of variety and Internet use. But the levels of variety and Internet use are
unlikely to be randomly assigned across countries conditional on our limited observables
characteristics.
One solution is to use panel data variation. Panel data variation provides a far
superior approach because it allows us to control for time-invariant country unobservable
characteristics that may be correlated with the levels of both variety of viewing choices
and Internet use, such as the availability of alternative entertainment options or social
mores about television viewing. Panel data analysis also allows us to control for country-
invariant time characteristics, such as whether the Olympics or World Cup are being
televised or not.
The daily average number of minutes of television viewing per capita in country j
and year t, Tjt, is represented by
jtjjttjtjtjtjt udummydummyIVXT ++++++= ββψφβα)2(
whereα is a constant, is a set of variables with time variation within countries, jtX
tβ is a time t fixed effect (a year fixed effect which is common for all countries), dummyt
is an indicator variable equal to 1 in time t, jβ represents a country-specific and time-
invariant effect, dummyj is an indicator variable equal to 1 for country j, φ represents the
effect of increases in variety on the average number of minutes of television viewing in
that country, ψ measures the effect of changing the average number of minutes of
15
Internet use in a country on television viewing, and is the error. Country fixed effects
absorb the effect of unobserved time invariant factors specific to each country; using a
longitudinal model we can “difference out” the time invariant unobserved characteristics
at the country level. Because Model (2) includes time fixed effects, identification arises
from idiosyncratic variation in variety, Internet penetration, and television viewing from
year to year rather than aggregate global trends in programming variety, Internet
penetration, and television viewing over time.
jtu
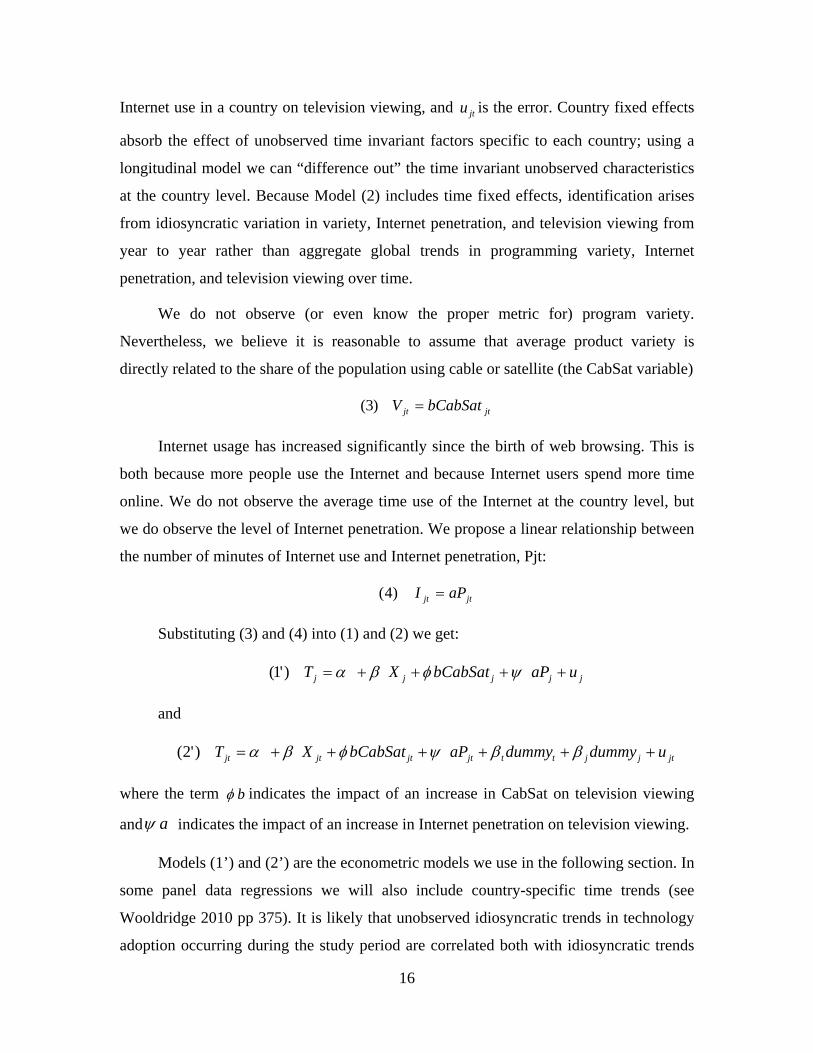
bCabSat
We do not observe (or even know the proper metric for) program variety.
Nevertheless, we believe it is reasonable to assume that average product variety is
directly related to the share of the population using cable or satellite (the CabSat variable)
jtjtV =)3(
Internet usage has increased significantly since the birth of web browsing. This is
both because more people use the Internet and because Internet users spend more time
online. We do not observe the average time use of the Internet at the country level, but
we do observe the level of Internet penetration. We propose a linear relationship between
the number of minutes of Internet use and Internet penetration, Pjt:
jtaPjtI =)4(
Substituting (3) and (4) into (1) and (2) we get:
jjjjj uaPXT ++++= ψφβα)'1( bCabSat
jtaP
and
jtjjttjtjtjt udummydummybCabSatXT ++++++= ββψφβα)'2(
where the term bφ indicates the impact of an increase in CabSat on television viewing
and aψ indicates the impact of an increase in Internet penetration on television viewing.
Models (1’) and (2’) are the econometric models we use in the following section. In
some panel data regressions we will also include country-specific time trends (see
Wooldridge 2010 pp 375). It is likely that unobserved idiosyncratic trends in technology
adoption occurring during the study period are correlated both with idiosyncratic trends
16

in cable and satellite penetration and with Internet adoption. For example, we do not
observe the rate of video games console adoption at the country level, although these
trends might influence television viewing and be correlated with idiosyncratic trends in
the adoption of both cable and satellite and Internet. In a random trend fixed effect
model, country-specific time trends may account for unobservable idiosyncratic trends.
Including the term in (2’), where t is a time trend, allows the study of the impact of
increasing the penetration of both cable and satellite and Internet on television viewing
controlling for country-specific time trends.
tjδ
Idiosyncratic time trends can also help in the identification of population-averaged
coefficients in random-coefficient models (when the slopes in (2’) are heterogeneous
across countries which may be the case if a and b in (3) and (4) vary by country).
Wooldridge (2005) shows that, “the fixed effects estimator that sweeps away individual-
specific trends is satisfyingly robust to the presence of individual-specific slopes on the
individual-specific covariates.”
Besides the assumptions we have already made, there are other possible
complications with this analysis. The rapid evolution of the Internet since the birth of the
World Wide Web, in terms of the quality and quantity of both entertainment and
productivity offerings, means that the impact of the Internet on television viewing may
not be consistent over time. As connection speeds increase and the quality and variety of
Internet web sites increase, it is unclear whether individuals will increase or decrease
their time spent using the Internet since they can accomplish each activity in less time but
there are also more activities in which they are likely to be interested. This problem is
more likely to influence productivity uses of the Internet but it can also impact
entertainment uses. Further, if early adopters of the Internet have different
(entertainment) uses for it than later adopters, the impact of the Internet on television
viewing may change over time merely due to the nature of the new Internet adopters
relative to the old adopters.
Finally, every Internet user also must have access to a computer. Although not
every computer user has Internet access, Internet access will be closely associated with
computer use. If computers were altering the entertainment habits of individuals
17

separately from the impact of the Internet we would not be able to separate out the two
and would tend to attribute to the Internet the possibly independent impact of computer
usage. Because it appears that the Internet has tended to dominate the entertainment uses
of computers, however, we do not consider this to be an important problem.16
VI. Estimation Results
Although we use panel data with both year and country fixed effects, we begin our
regression analysis with an examination of the pooled data with and without year fixed
effects and then extend the analysis to both year and country fixed effects.
A. Pooled Regressions and Year Fixed Effects
The results of the pooled regressions and including year fixed effects are presented
in Table 4. The simple pooled results indicate a small negative impact of CabSat
(viewing choice) on television viewing time and a still small but slightly larger negative
impact when year fixed effects are included as covariates in the regression. The
coefficient, approximately -0.2, indicates that an increase in CabSat penetration of one
hundred percentage points would decrease viewing by 20 minutes, which is only about
ten percent of average viewing levels, so this is a small effect (more so considering that
no country in the sample experienced such an increase in CabSat penetration). Neither of
these regressions provides small enough standard errors to reach typical levels of
statistical significance given the size of the coefficients although the confidence levels are
not that far away. Internet usage (penetration), which could substitute for television
viewing, has a small positive effect without year fixed effects and the smaller negative
effect with year fixed effects. These coefficients are measured quite imprecisely.
The only other variable with consistent results and that is measured with sufficient
precision to be interesting is the percentage of the population that is employed. It is
negative in both cases, with a hundred point increase in employment leading to a
reduction in daily viewing of about 130 minutes.
16 Computer-based videogames are a well known form of computer entertainment but have always been dwarfed by videogame consoles (see yearly reports from the Entertainment Software Association).
18

Pooled Regressions
Year Fixed Effects Regressions
CabSat Penetration -0.1957 -0.211(0.1275) (0.1274)
Internet Penetration 0.2711 -0.1384(0.2324) (0.2621)
GDP per capita -1.0238* 0.0705(0.6116) (0.8697)
Percentage Employment -1.2798* -1.1342*(0.6419) (0.6343)
Population -0.0247 -0.044(0.0328) (0.0296)
Cell Phone Penetration 0.0642 -0.276(0.1491) (0.1957)
Constant 284.71*** 319.99***(33.48) (34.75)
Observations 581 581R-squared 0.1934 0.2473Robust and clustered by country standard errors in parentheses. * significant at 10%; ** significant at 5%; *** significant at 1%
Table 4: Pooled and Year Fixed Effects Regressions Results on TV Viewing
We turn now to the more reliable full fixed effects regressions using the panel data.
B. Year and Country Fixed Effects
Table 5 reports OLS for the full sample and also for the smaller balanced panel. We
also have run the results with and without idiosyncratic time trends. As noted in Table 2,
the sample of countries with viewing data is considerably lower in years prior to 2001.
Therefore we deemed it useful to compare the CabSat coefficients for the consistent but
considerably smaller sample of countries that had complete data for every year.
Our main variable of interest, CabSat, is essentially zero in the full OLS
regressions, being slightly negative without idiosyncratic time trends but slightly positive
with them. Given these small coefficients of opposing sign, and their large standard
errors relative to the coefficients, we conclude that increases in viewing choices as
measured by CabSat is not related to changes in television viewing. A similar result holds
for the balanced panel, so we conclude that this lack of change in viewing in the presence
of extra viewing choices is not a byproduct of having an unbalanced panel.17
17 We also checked for the possible impact of outliers. First, we ran Huber-robust regressions (using a Stata routine that first eliminates observations with levels of Cook’s D that are above a particular threshold and then iteratively lowers the weight for observations with large absolute residuals until a convergence threshold is reached). The Huber-robust regressions had values of approximately -0.16 and appear to be
19

CabSat Penetration -0.1016 0.0692 -0.0108 -0.1129(0.2318) (0.2792) (0.2701) (0.3521)
Internet Penetration -0.0981 0.1851 -0.4610*** -0.1181(0.2858) (0.1377) (0.1337) (0.1368)
GDP per capita -0.9737 -2.0979 -4.3992*** -4.7150***(1.5864) (2.2009) (1.0269) (1.4846)
Percentage Employment -0.6183 0.0925 0.3604 0.6416(0.8885) (1.1406) (0.7583) (0.5580)
Population -0.2925*** -11.3586 0.5699* 7.6653(0.0827) (8.8271) (0.2813) (6.9274)
Cell Phone Penetration 0.0961 -0.0004 -0.1228 0.0103(0.1365) (0.1169) (0.1168) (0.1683)
Constant 297.70*** 731.00* 192.12*** -16.60(40.99) (375.11) (43.64) (283.47)
Idiosyncratic Trends No Yes No YesObservations 581 581 312 312R-squared 0.8275 0.9248 0.9438 0.9637Robust and clustered by country standard errors in parentheses. * significant at 10%; ** significant at 5%; *** significant at 1%
OLS Regressions OLS Balanced PanelTable 5: Country and Year Fixed Effects Regressions Results on TV Viewing
Further, there is an important potential endogeneity problem can arise when
comparing viewing and CabSat penetration across individuals since those individuals
with the greatest proclivity for watching television are also more likely to subscribe to
CabSat services. So, for example, in numerous studies where viewing habits of CabSat
subscribers have been compared to viewing habits of non-subscribers it has been the case
that CabSat subscribers watch considerably more television but this might have been due
to their interest in television and not due to the impacts of CabSat. This is likely to be less
of a problem with our design, however, since we are comparing entire populations over
time and overall viewing within a country will not be altered by the introduction or
growth of CabSat if CabSat merely attracts viewers with the greatest proclivity for
viewing and doesn’t actually change viewing behavior. Only if there is some exogenous
change over the time period of our analysis in the average viewing proclivity across
countries will our estimates of the impact of CabSat be biased upward.
statistically significant but the inability to cluster observations in those calculations may bias the standard error. We also looked at the DfBetas of the OLS CabSat variable but did not find any support for the more negative results indicated by the Huber Robust regressions. Similarly, we found that quantile regressions provided results much closer to the OLS regression than the Huber Robust results and thus feel that the OLS results are likely to be more reliable for this important variable.
20

Our next variable of interest is the extent to which the Internet, as a substitute
entertainment activity, is related to television viewing.18 The full sample OLS results
provide coefficients that are small, with the sign of the coefficients differing depending
on whether idiosyncratic time trends are included or not. Liebowitz and Zentner
(forthcoming) found, using data on American television viewing, a negative impact of
Internet penetration on television viewing of about 10% for an Internet penetration rate of
70% (an increase in Internet penetration from 0% to 70%). The current zero results might
seem to indicate that the effect of the Internet as an entertainment substitute for television
is weaker in an international context.
The balanced panel, however, tells a different story of the relationship between
Internet usage and television viewing and one that is more consistent with Liebowitz and
Zentner (forthcoming). The coefficients are negative whether or not idiosyncratic time
trends are included in the analysis. We can only have reasonable confidence that the
coefficient is negative when time trends are not included, and in that case the coefficient
leads to a result slightly larger than that of Liebowitz and Zentner (forthcoming) since an
increase in Internet penetration of 70 percentage points would lead to a viewing decline
of 31.5 minutes, or approximately 15%. The coefficient with a time trend, although we
cannot have much statistical confidence in it, would imply that the Internet lowered
viewing by about 4%. These two coefficients, from the balanced panel, bracket the results
of Liebowitz and Zentner (forthcoming). It is possible, therefore, that the unbalanced
aspect of the full panel has skewed the results away from a finding that the Internet was a
substitute form of entertainment during the period of our analysis. There is some
evidence to support this supposition since income for countries in the balanced panel is
approximately 30% higher than that for countries that have incomplete data. This implies
that those countries in the balance panel are more like the US, at least in terms of income,
and higher income countries seem more likely to have the internet act as a form of
alternative entertainment, an intuitively plausible result.
18 A related but different question is the study of the extent to which watching television shows on the Internet (e.g. YouTube) displaces conventional television viewing. Waldfogel (2009) studies this question and finds evidence of modest substitution between the two outlets.
21

Finally, we have the results for the more incidental variables. The full panel
regressions indicate that income has a negative relationship to viewing but we cannot
have much confidence in this result because of the relatively large standard errors. The
balanced panel (with its higher average income) tells a much stronger story, however. For
the balanced panel, income has a negative relationship with viewing that is both
economically and statistically significant. An increase in income per capita of 50%
(~$13,000 using the 2008 average values for the balanced panel) would be expected to
decrease television viewing by about 58 minutes, or about 30%, everything else constant.
The imprecise full panel estimates are less than half of this.
The relationship between the percentage of the population employed and television
viewing is basically nonexistent according to the regression results. The coefficients in
the various samples are all imprecisely measured and have disparate signs. Even if we
picked a particular sample and specification and only focused on the coefficient, the
seemingly large absolute value of the coefficients will not lead to much of a change in
viewing. That is because the employment rate has a very small variation over time and
the variation across countries is also very small (see Table 1). Therefore, even taking
these coefficients at face value, the very small variations in employment rates that occur
can only lead to very small changes in television viewing. For example, the average
absolute value of changes in employment percentages over the 1996-2008 time period for
our sample of countries is 4.6 percentage points, with a standard deviation of 2.8
percentage points. Thus, a change of two standard deviations in the percentage employed
would only change viewing by less than 4 minutes (using a coefficient of 0.65 to match
the largest coefficient in Table 5) and even the largest change in the percentage of
workers employed in any country (Romania’s 12.2 percentage points change) would
change viewing by less than 8 minutes.
The full fixed effects regressions all imply that cell phone penetration is irrelevant
to television viewing. This result fits with our intuition that cell phone usage should not
be related to television viewing.
Finally, the coefficients on population require some discussion. Because the
country fixed effects soak up the cross-country population variation and the year fixed
22
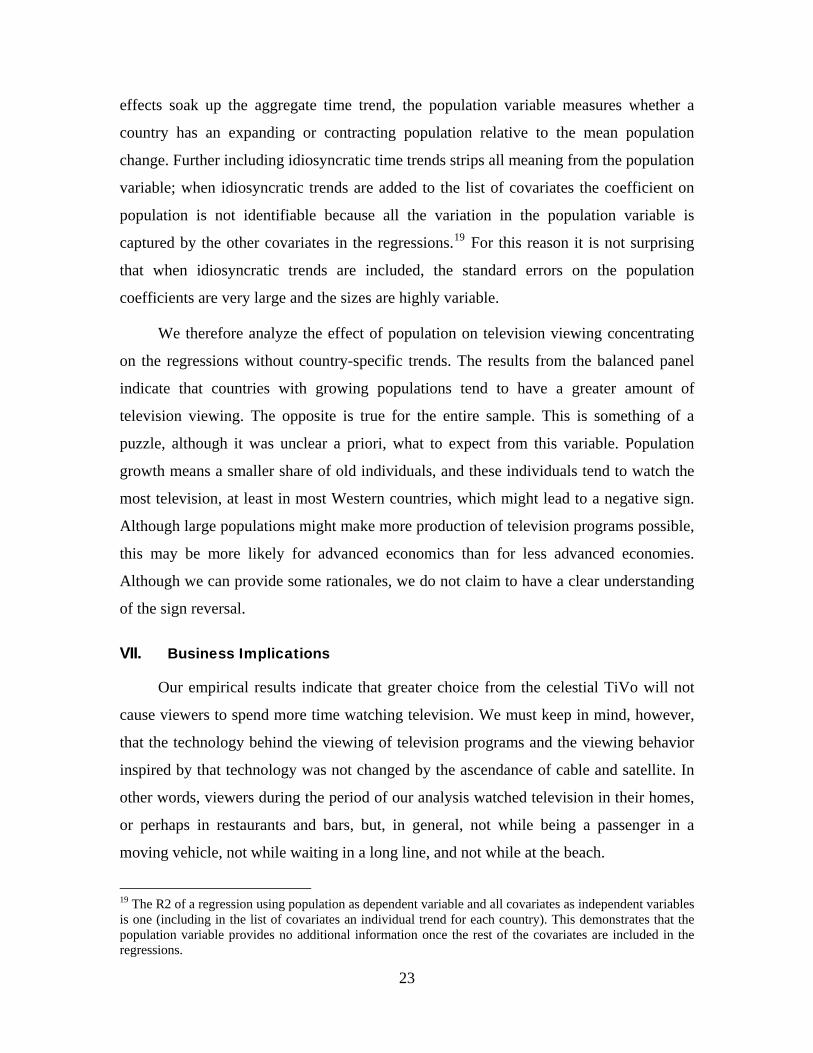
effects soak up the aggregate time trend, the population variable measures whether a
country has an expanding or contracting population relative to the mean population
change. Further including idiosyncratic time trends strips all meaning from the population
variable; when idiosyncratic trends are added to the list of covariates the coefficient on
population is not identifiable because all the variation in the population variable is
captured by the other covariates in the regressions.19 For this reason it is not surprising
that when idiosyncratic trends are included, the standard errors on the population
coefficients are very large and the sizes are highly variable.
We therefore analyze the effect of population on television viewing concentrating
on the regressions without country-specific trends. The results from the balanced panel
indicate that countries with growing populations tend to have a greater amount of
television viewing. The opposite is true for the entire sample. This is something of a
puzzle, although it was unclear a priori, what to expect from this variable. Population
growth means a smaller share of old individuals, and these individuals tend to watch the
most television, at least in most Western countries, which might lead to a negative sign.
Although large populations might make more production of television programs possible,
this may be more likely for advanced economics than for less advanced economies.
Although we can provide some rationales, we do not claim to have a clear understanding
of the sign reversal.
VII. Business Implications
Our empirical results indicate that greater choice from the celestial TiVo will not
cause viewers to spend more time watching television. We must keep in mind, however,
that the technology behind the viewing of television programs and the viewing behavior
inspired by that technology was not changed by the ascendance of cable and satellite. In
other words, viewers during the period of our analysis watched television in their homes,
or perhaps in restaurants and bars, but, in general, not while being a passenger in a
moving vehicle, not while waiting in a long line, and not while at the beach.
19 The R2 of a regression using population as dependent variable and all covariates as independent variables is one (including in the list of covariates an individual trend for each country). This demonstrates that the population variable provides no additional information once the rest of the covariates are included in the regressions.
23

It is possible that that the shift to Internet television will make viewing possibilities
more widespread than has been the case with regular broadcast television. For example,
while waiting on a long line it might not make sense to watch normal broadcast television
because the time spent on the line would not allow an entire 30 minute program to be
viewed, even if one had a portable television. But if the program can be started and
stopped at will, as would be the case with the celestial TiVo, the time spent on a line
would allow the portion of a program watched to be matched with the rest of the same
program viewed at the leisure of the viewer. This might enhance the viewing of television
in alternative locations (assuming that portable screens provide a sufficiently valuable
viewing experience). If the Internet broadened the instances where television programs
could be viewed (the way that the portable Sony Walkman allowed the listening of
prerecorded albums to occur in places never before available), television viewing might
increase. This would not be due to changes in the variety of programs, however, and our
regression analyses do not take such changes in behavior into account.20
With this caveat in mind, the business implication of our results, for purveyors of
television programs, are fairly clear. The current business model for television programs
is generally a mixture of advertising and subscription, with over-the-air broadcasters
using advertising and cable networks using both advertising and subscription fees (with a
few subscription-only premier networks). Even over-the-air broadcasters did not
voluntarily forgo subscriptions but instead did not have a technological option of directly
charging viewers.
Advertising generates revenues from audience size and composition, not from
audience enjoyment. This is not to say that extra viewing choices will have no effect on
advertising revenues. Additional choice allows viewers to self select according to tastes
and this segmentation might lead to more homogeneous viewers (in terms of their
purchase intentions) for any given program. If so, advertisers will find it easier to match
their ads to the interests of consumers, and advertising rates should rise. But this is likely
to be a second order effect since there is already a good deal of self selection in the 20 We are somewhat skeptical that viewing on small portable screens in public areas with possible distractions would be sufficiently worthwhile that this effect on viewing time would be large. But we might be misjudging the behavior of recent generations brought up enjoying portable game playing devices with the same small screens.
24

viewing of very narrow television programs, such as cooking or home remodeling
programs. Whether the more intense or satisfying viewing experience created by the
breaking of synchronization would translate into higher advertising revenues is unclear
since intense viewing of a program does not necessarily lead to intense viewing of an
advertisement.
Subscription-based demand, by way of contrast, is strongly related to the value that
viewers place on the programs they watch. Even if the celestial TiVo does not increase
viewing time, it almost certainly increases the value that viewers receive from watching
programs.21 This should allow Internet based program providers to increase subscription
fees relative to the fees charged by cable or satellite providers due to the much larger
choice of programming made available over the Internet at any moment in time.
In addition, the playback of prerecorded programs makes the avoidance of
commercials easier than is the case for live, synchronous viewing. This further erodes the
viability of the advertising model relative to subscription models as programming moves
to web-based transmissions.
Our results imply that the way for distributors of television programs to increase
industry revenues during and after this transition to Internet distribution is to focus on
subscription fees, instituting them if the distributors do not already use them and if they
already have subscription fees, to increase them as the availability of viewing choices
increases.
Our results also imply that Internet viewing will tend to come at the expense of
non-Internet viewing. Although it is sometimes claimed that Internet-distributed
programming can be complements to traditional cable/satellite/broadcast television,22 our
21 In the ‘candy bar’ model discussed above, for example, the total value of the programs viewed increases unless the viewer was always completely satiated, meaning there was no cost in money or time to viewing programs. But if satiation in viewing occurred, it would occur with a smaller number of hours of viewing when variety increased because each hour would have more ‘viewing services.’ Greater variety would then be associated with less viewing. This is inconsistent with the regression results which imply no impact on viewing as opposed to a negative impact. 22 For example, a recent news article in the Toronto Globe and Mail quotes an industry executive thusly: “But it’s important, I think, to remember that video consumption is not a zero-sum game. We believe that there is virtually an insatiable appetite for consumers to consume more media on a multitude of platforms…our belief is that new competitors will prove to be additive to the system as opposed to serving to carve up the pie.”
25

results indicate that this will not be the case since total viewing does not appear to
increase as more choice is made available.
To date, Netflix is subscription based and Hulu has advertising-only and mixed
advertising-subscription packages, with the latter having a higher definition picture. Our
results indicate that these companies should continue to emphasize the subscription
component relative to the advertising component. This prescription is made in spite of the
fact that the Internet tends to be associated with advertising models. For example, most
newspaper sites and social media sites are advertising based and the number of
subscription based sites, such as the Wall Street Journal, is quite small.
VIII. Conclusions
Because many entertainment industries are currently going through an upheaval
caused by the Internet, with one result of the upheaval likely to be a much large set of
products available to consumers, we have attempted to gauge the change in one
dimension of consumer behavior that is likely to affected by this market adjustment. We
have examined how an increase in viewing choice has affected the viewing of television
programs.
Our approach has been to look at how changes in the penetration of cable and
satellite television transmission during the last decade and a half were related to changes
in the amount of time spent viewing television programs for a large panel of countries.
Our main result indicates that increases in program variety, at least beyond that available
over-the-air, are not related to increases in viewing. This result was fairly robust relative
to various regression specifications or sample selection. An older literature that looked at
this issue and found that increases in viewing choice, starting from somewhat lower
levels of choice, had, if anything, only a small positive impact on viewing, so our results
are not surprising given those previous findings. Nor are our findings inconsistent with
economic theory, which has an ambiguous predicted relationship between viewing time
and viewing choice.
These results imply that broadcasters should view the transition to the celestial
TiVo as a zero sum game in terms of advertising (audience size). On the other hand we
26

expect an increase in willingness to pay on the part of viewers and this should allow
broadcasters benefit from the switch to the Internet if they adopt the correct business
models.
Our findings are subject to all the usual caveats found in empirical work. Given that
society is about to undergo a major transition in television viewing as the ‘transmission’
switches to the Internet, further research would provide useful information to help us
gauge the future of the most popular entertainment activity in the world.
27

References
Benesch, Christine, Bruno S. Frey, and Alois Stutzer (2010) “TV Channels, Self-Control and Happiness,” The B.E. Journal of Economic Analysis & Policy: Vol. 10: Iss. 1 (Contributions), Article 86. Available at: http://www.bepress.com/bejeap/vol10/iss1/art86
Bruni, Luigino and Luca Stanca (2008). Watching Alone: Relational Goods, Television and Happiness. Journal of Economic Behavior and Organization 65(3-4): 506-528.
Brynjolfsson, Eric and Michael D. Smith (2000), “Frictionless Commerce? A Comparison of Internet and Conventional Retailers,” Management Science, (4) Vol. 46, April, pp. 563-585.
Goldstein, Paul (1995). Copyright's Highway: From Gutenberg to the Celestial Jukebox, Hill and Wang,.
Goolsbee, Austan (2000) "In a World Without Borders: The Impact of Taxes on Internet Commerce," Quarterly Journal of Economics, May, Vol. 115(2), 561-576.
Hirshleifer, Jack (1971) "Suppression of Inventions," Journal of Political Economy, March/April, 79, 382—83.
Lancaster, Kelvin J., (1966) "A New Approach to Consumer Theory." Journal of Political Economy, 74, 132-157.
Liebowitz, Stan J. (1982a) “Durability, Market Structure And New-used Goods Models,” American Economic Review, September, 72-4, Pp. 816-824.
Liebowitz, Stan J. (1982b) “The Impacts of Cable Retransmission on Television Broadcasters,” Canadian Journal of Economics, 15-3, August, Pp. 503-524.
Liebowitz, Stan J., and Alejandro Zentner “Clash of the Titans: The Internet as a competitor to Television”, Review of Economics and Statistics forthcoming.
Noelle-Neumann, Elisabeth and Ruediger Schultz (1989) “Federal Republic of Germany: Social Experimentation with Cable and Commercial Television” in Audience Responses to Media Diversification edited by Lee Becker and Klaus Schoenbach, Lawrence Erlbaum Associates, , Hillsdale, New Jersey.
Park, R.E. (1979) “Audience diversion due to cable television: a statistical analysis of new data.” Rand Report R-2403-FCC (Santa Monica: Rand Corporation)
Toronto Globe and Mail, “Broadcasters call for CRTC to regulate Netflix service,” by Susan Krashinsky, April 15, 2011 available at
28

http://www.theglobeandmail.com/report-on-usiness/broadcasters-call-for-crtc-to-regulate-netflix-service/article1985547/
Waldfogel, Joel, “Lost on the Web,” Information Economics and Policy Volume 21, Issue 2, June 2009, Pages 158-168.
Weimann, Gabriel “Cable Comes to the Holy Land: The Impact of Cable TV on Israeli Viewers,” Journal of Broadcasting & Electronic Media, 40, 1996, pp. 243-257.
Wooldridge, Jeffrey, “Fixed Effects and Related Estimators for Correlated Random-Coefficient and Treatment Effect Panel Data Models,” Review of Economics and Statistics 87, 385-390.
Wooldridge, Jeffrey, “Econometrics Analysis of Cross Section and Panel Data,” Second Edition, 2010, MIT Press.
29

Data Appendix: Television Viewing, Cable and Satellite Penetration, Internet Penetration, Cell Phone Penetration, and Demographics
We acquired data on television viewing by country for the years 1996 to 2008 from
Mediametrie - Eurodata TV Worldwide, a company that collects information from
national-level companies measuring TV viewing using mainly electronic devices (various
types of meters). In all we have data for 52 countries although the panel is unbalanced
(many countries do not have complete data for all the years). The countries are:
Argentina, Armenia, Australia, Austria, Belgium, Brazil, Bulgaria, Canada, Chile, China,
Croatia, Cyprus, the Czech Republic, Denmark, Egypt, Estonia, Finland, France,
Georgia, Germany, Greece, Hong Kong, Hungary, India, Ireland, Israel, Italy, Japan,
Latvia, Lebanon, Lithuania, Mexico, Moldova, Netherlands, New Zealand, Norway,
Poland, Portugal, Romania, Russia, Serbia, Singapore, the Slovak Republic, Slovenia,
South Africa, Spain, Sweden, Switzerland, the United Kingdom, the United States,
Turkey, and Ukraine.23 Data for Belgium are separated for French and Flemish
communities, and data for Switzerland are separated for German, French, and Italian
communities. There are a total of 55 regional markets after adding countries and
communities.
Our data on cable and satellite penetration are from IHS Screen Digest. Screen
Digest collects separate data for cable and satellite; we combined the two variables and
created a variable called “CabSat” that measures the sum of the household penetration
rates of cable and satellite.
Data on Internet penetration by countries are from the International
Telecommunication Union (ITU), a United Nations agency for information and
communication technology issues. The Internet penetration variable that we use measures
the percentage of Internet users in the total population, and includes Internet access from
any device (e.g. mobile phones—although it should be noted that the iPhone was only
introduced in 2007 in the US and in 2008 in Europe).24
23 With the exception of Australia and Japan, the data measure television viewing at the national level. The data for Australia measure television viewing from the top five largest metropolitan Areas. The data from Japan measure the viewing from the Kanto region (this region includes the city of Tokyo). 24 These data are readily available at http://www.itu.int/ITU-D/ICTEYE/Indicators/Indicators.aspx#
30

31
We also obtained data on cell phone penetration by countries from the ITU. The
variable that we use measures the mobile cellular subscriptions penetration rate. The cell
phone penetration rate has been over 100% in recent years for several countries. The
explanation for a penetration rate over 100% is that this variable includes prepaid cell
phones subscriptions; and prepaid cell phone lines retain their status for three months
after the expiration of their card while these lines are still able to receive calls. Prepaid
cell phones are popular in many European countries and some individuals replace their
cell phone lines several times in any given year.25
The measure of income that we use is constructed using data from the International
Monetary Fund World Economic Outlook Database, and following the guidelines
proposed in the IMF discussion forum. The GDP per capita (normalized to the US
dollar), called GDP PPP, accounts for the prices of goods and services in each country,
and is an accepted measurement for comparing the level of development of different
countries at any given time. However, the GDP in PPP values does not measure income
in constant values and is therefore not appropriate for comparisons across time. A
measurement of the level of development that makes the comparison of development
levels across countries and across time feasible is constructed by combining the GDP in
PPP values for a base year (we use 2000) and growth rates of GDP in local currency in
constant values. A GDP measurement for each country and each year is constructed by
multiplying the GDP in PPP US dollar values in the base year by the yearly growth rates
of the GDP measured in local currency and constant values.
Finally, the measure of employment that we use is the percentage of the population
older than 14 years that are employed. These data are from the World Bank.
25 These data are readily available at http://www.itu.int/ITU-D/ICTEYE/Indicators/Indicators.aspx#