The intergroup rhabdomyosarcoma study-II
19
1904 The Intergroup Rhabdomyosarcoma Study - I I Harold M. Maurer, M.D.,* Edmund A. Gehan, Ph.D.,t Mohan Beltangady, Ph.D.,t William Crist, M.D.,* Paul S. Dickman, M.D.,$ Sarah S. Donaldson, M.D.,* Christopher Fryer, M.D.,$ Denman Hammond, M.D.,$ Daniel M . Hays, M.D.,S Janice Herrmann,t Ruth Heyn, M.D.,$ Pat Morris Jones, M.D.,§ Walter Lawrence, M.D.,S William Newton, M.D.,$ Jorge Ortega, M.D.,$ Abdelsalam H. Ragab, M.D.,* R. Beverly Raney, M.D.,* Frederick B. Ruymann, M.D.,* Edward Soule, M.D.,* Melvin Teft, M.D.,S Bruce Webber, M.D.,* Eugene Wiener, M.D.,S Moody Wharanz, M.D.,* and Teresa J. Vietti, M.D.* Background. Intergroup Rhabdomyosarcoma Study (1RS)-11, (1978-1984) had the general goals of improving the survival and treatment of children with rhabdomyo- sarcoma (RMS). Methods. Nine hundred ninety-nine previously un- treated eligible patients entered the study after surgery and were randomized or assigned to therapy by IRS Clin- ical Group (I-IV), tumor site, and histologic type. Out- comes were compared between treatments and with re- Results. Patients in Group I, excluding extremity al- veolar (EA) RMS, were randomized to standard vincris- tine (V), dactinomycin (A), and cyclophosphamide (C) or standard VA. At 5 years, disease-free survival (DFS) and survival (S) rates were similar between VAC and VA (DFS: 8O%, 70%, P = 0.47; S: 85%, 84%, P = 0.73). Patients in Group 11, excluding EA RMS, received radiation and were randomized to intensive VA or repetitive-pulse VAC. Outcomes were similar for rates of DFS (69%, 74%, P = 0.83) and S (88y0, 79%, P = 0.17). Patients in Group 111, excluding certain pelvic tumors, received radiation and sults of IRS-I (1972-1978). From the Medical College of Virginia/Virginia Commonwealth University, Richmond, Virginia; and the University of Texas, M.D. Anderson Cancer Center, Houston, Texas. Supported by Department of Health and Human Services, USPHS Grants CA-24507, CA-30138, CA-30969, CA-29139, and CA-13539. * Pediatric Oncology Group, St. Louis, Missouri. t Pediatric Intergroup Statistical Center, Houston, Texas. $ Children’s Cancer Study Group, Arcadia, California. 5 United Kingdom Children’s Cancer Study Group, Manches- ter, England. Address for reprints: Harold M. Maurer, M.D., Children’s Medi- cal Center, Medical College of Virginia, Virginia Commonwealth Uni- versity, Richmond, VA 23298. Accepted for publication August 19, 1992. were randomized to repetitive-pulse VAC or repetitive- pulse VAdrC-VAC (Adr, Adriamycin [doxorubicin]). Complete remission (CR) rates were close at 74%, 78%, respectively (P = 0.32), as were percentages in CR (73%) and S (66%) rates; the latter outcomes were significantly better than IRS-I (CR: 56%, P < 0.001; S: so%, P < 0.001). Central nervous system prophylaxis for Group 111 pa- tients with cranial parameningeal sarcoma increased S rate to 67% from 45% in IRS-I (P < 0.001). Patients in Group 1V received the same regimens as Group 111; the CR rate was 53%, 38% remained in CR and S rate was 27% with and 26% without Adr (P = 0.90). At 5 years, S rate for IRS-11, including EA and all pelvic tumors, was 63%: an 8% increase over IRS-I (P < 0.001). Outcomes by primary site were as good as, or better than, the IRS-I experience. Conclusions. Combining all Groups and treatments in IRS-11, the major improvement in S rate at 5 years be- tween studies was in nonmetastatic patients (71% for IRS-I1 versus 63% for IRS-I, P = 0.01). Cancer 1993; 71:1904-22. Key words: pediatric oncology, rhabdomyosarcoma, pa- thology, surgery, chemotherapy, radiation therapy, In- tergroup Rhabdomyosarcoma Study-11. The second Intergroup Rhabdomyosarcoma Study (IRS-11) was conducted between November 1978 and October 1984. Patients were enrolled in this multidisci- plinary cooperative cancer treatment study by members of Children’s Cancer Study Group, the Pediatric Oncol- ogy Group, and the United Kingdom Children’s Cancer Study Group. As in the preceding study (IRS-I, 1972- 1978),’ the general objectives of IRS-I1 were to improve
-
Upload
independent -
Category
Documents
-
view
0 -
download
0
Transcript of The intergroup rhabdomyosarcoma study-II

1904
The Intergroup Rhabdomyosarcoma Study - I I Harold M. Maurer, M.D.,* Edmund A. Gehan, Ph.D.,t Mohan Beltangady, Ph.D.,t William Crist, M.D.,* Paul S. Dickman, M.D.,$ Sarah S. Donaldson, M.D.,* Christopher Fryer, M.D.,$ Denman Hammond, M.D.,$ Daniel M . Hays, M.D.,S Janice Herrmann,t Ruth Heyn, M.D.,$ Pat Morris Jones, M.D.,§ Walter Lawrence, M.D.,S William Newton, M.D.,$ Jorge Ortega, M.D.,$ Abdelsalam H. Ragab, M.D.,* R. Beverly Raney, M.D.,* Frederick B. Ruymann, M.D.,* Edward Soule, M.D.,* Melvin Te f t , M.D.,S Bruce Webber, M.D.,* Eugene Wiener, M.D.,S Moody Wharanz, M.D.,* and Teresa J. Vietti, M.D.*
Background. Intergroup Rhabdomyosarcoma Study (1RS)-11, (1978-1984) had the general goals of improving the survival and treatment of children with rhabdomyo- sarcoma (RMS).
Methods. Nine hundred ninety-nine previously un- treated eligible patients entered the study after surgery and were randomized or assigned to therapy by IRS Clin- ical Group (I-IV), tumor site, and histologic type. Out- comes were compared between treatments and with re-
Results. Patients in Group I, excluding extremity al- veolar (EA) RMS, were randomized to standard vincris- tine (V), dactinomycin (A), and cyclophosphamide (C) or standard VA. At 5 years, disease-free survival (DFS) and survival (S) rates were similar between VAC and VA (DFS: 8O%, 70%, P = 0.47; S: 85%, 84%, P = 0.73). Patients in Group 11, excluding EA RMS, received radiation and were randomized to intensive VA or repetitive-pulse VAC. Outcomes were similar for rates of DFS (69%, 74%, P = 0.83) and S (88y0, 79%, P = 0.17). Patients in Group 111, excluding certain pelvic tumors, received radiation and
sults of IRS-I (1972-1978).
From the Medical College of Virginia/Virginia Commonwealth University, Richmond, Virginia; and the University of Texas, M.D. Anderson Cancer Center, Houston, Texas.
Supported by Department of Health and Human Services, USPHS Grants CA-24507, CA-30138, CA-30969, CA-29139, and CA-13539.
* Pediatric Oncology Group, St. Louis, Missouri. t Pediatric Intergroup Statistical Center, Houston, Texas. $ Children’s Cancer Study Group, Arcadia, California. 5 United Kingdom Children’s Cancer Study Group, Manches-
ter, England. Address for reprints: Harold M. Maurer, M.D., Children’s Medi-
cal Center, Medical College of Virginia, Virginia Commonwealth Uni- versity, Richmond, VA 23298.
Accepted for publication August 19, 1992.
were randomized to repetitive-pulse VAC or repetitive- pulse VAdrC-VAC (Adr, Adriamycin [doxorubicin]). Complete remission (CR) rates were close at 74%, 78%, respectively (P = 0.32), as were percentages in CR (73%) and S (66%) rates; the latter outcomes were significantly better than IRS-I (CR: 56%, P < 0.001; S: so%, P < 0.001). Central nervous system prophylaxis for Group 111 pa- tients with cranial parameningeal sarcoma increased S rate to 67% from 45% in IRS-I (P < 0.001). Patients in Group 1V received the same regimens as Group 111; the CR rate was 53%, 38% remained in CR and S rate was 27% with and 26% without Adr (P = 0.90). At 5 years, S rate for IRS-11, including EA and all pelvic tumors, was 63%: an 8% increase over IRS-I (P < 0.001). Outcomes by primary site were as good as, or better than, the IRS-I experience.
Conclusions. Combining all Groups and treatments in IRS-11, the major improvement in S rate at 5 years be- tween studies was in nonmetastatic patients (71% for IRS-I1 versus 63% for IRS-I, P = 0.01). Cancer 1993; 71:1904-22.
Key words: pediatric oncology, rhabdomyosarcoma, pa- thology, surgery, chemotherapy, radiation therapy, In- tergroup Rhabdomyosarcoma Study-11.
The second Intergroup Rhabdomyosarcoma Study (IRS-11) was conducted between November 1978 and October 1984. Patients were enrolled in this multidisci- plinary cooperative cancer treatment study by members of Children’s Cancer Study Group, the Pediatric Oncol- ogy Group, and the United Kingdom Children’s Cancer Study Group. As in the preceding study (IRS-I, 1972- 1978),’ the general objectives of IRS-I1 were to improve

IRS-II/Maurer et al . 1905
survival and define further the optimal treatment of rhabdomyosarcoma and similar sarcomas in patients younger than 21 years of age at the time of diagnosis. The cutoff point for this analysis was September 1991, and the median follow-up time for all patients remain- ing alive was 7.1 years, so this report gives the final results.
The rationale for the specific primary objectives of IRS-I1 was based upon the results of IRS-I.' The pri- mary objectives of IRS-I1 were to determine whether: (1) cyclophosphamide can be deleted from the standard regimen of vincristine, dactinomycin, and cyclophos- phamide (VAC) and local radiation omitted without de- creasing disease-free survival (DFS) and survival (S) rates in patients with Clinical Group I disease (extrem- ity alveolar lesions excluded); ( 2 ) repetitive courses of pulse VAC improve DFS and S rates beyond those at- tained with intensive cyclic-sequential vincristine and dactinomycin in patients with Clinical Group I1 disease (extremity alveolar lesions excluded); (3) Adriamycin (doxorubicin), if given repetitively in pulse combination with vincristine and cyclophosphamide (pulse VAdrC), improves the complete remission (CR) rate, prolongs the duration of remission and improves DFS and S rates beyond those attained with repetitive pulse VAC che- motherapy in patients with Clinical Groups I11 and IV diseases; (4)"prophylactic" local meningeal radiation, with or without intrathecal chemotherapy, prevents di- rect meningeal extension of cranial parameningeal sar- coma and improves the duration of remission and S rate; (5) a primary chemotherapeutic approach for pa- tients with sarcoma arising in the bladder, prostate, vagina, or uterus (special pelvic sites) reduces the frequency of total cystectomy without compromising patient survival; and (6) repetitive pulse VAC chemo- therapy improves DFS and S rates beyond those at- tained with either standard VAC or intensive cyclic-se- quential dactinomycin and vincristine therapy in pa- tients with alveolar rhabdomyosarcoma of the extremity in Clinical Groups I and 11.
Patients and Methods
Study Design
Patient eligibility requirements were identical to those in IRS--I. Previously untreated patients younger than 21 years of age with a confirmed diagnosis of rhabdomyo- sarcoma, extraosseous Ewings sarcoma, or undiff eren- tiated sarcoma were eligible for the study. Informed consent was obtained on all patients. Patients were re- quired to begin therapy within 42 days of the initial biopsy and within 21 days of any definitive surgical
procedure. Patients were staged according to the IRS Clinical Grouping Classification reported previously.* Briefly, Clinical Group I patients had complete removal of localized disease, and any regional nodes sampled gave negative results. Clinical Group I1 patients had grossly resected regional disease with microscopic resid- ual disease with or without regional node involvement, or had completely resected regional disease and re- sected positive nodes without microscopic residual dis- ease. Clinical Group 111 patients had gross residual dis- ease after surgery (biopsy); and Clinical Group IV pa- tients had metastases at the time of diagnosis.
Patients were classified by the submitting institu- tions into one of the four clinical groups at the time of registration. Except for patients in Clinical Group 111 with special pelvic tumors and those with extremity al- veolar lesions in Clinical Groups I and 11, patients were randomized within each clinical group to the relevant treatment regimens shown with drug dosages on Figure 1. An amendment early in the course of the study re- duced drug dosage by 50% for infants younger than 1 year of age to avoid unacceptable toxicity. Subsequent doses were to be increased to 75% and then to loo%, if tolerated.
Patients with Clinical Group I11 "special" pelvic le- sions were assigned to a primary chemotherapy regi- men consisting of repetitive monthly courses of pulse VAC for 2 years. After four monthly drug courses, radia- tion therapy, surgery, or both were used to eradicate any residual primary tumor. Sequential therapy de- pended on biopsy-proven disease. Limited surgery was desirable, if possible. Monthly courses of pulse VAC followed to complete 2 years of therapy. Since there was not a sufficient number of patients for a random- ized study with a primary surgery control arm, out- comes were compared with a similar group of patients treated on the IRS-I protocol. The results of regimen 27 and this portion of the IRS-I1 protocol have been in- cluded in a separate report.*
Patients with Clinical Groups I and I1 extremity al- veolar lesions all were assigned to regimen 25, shown in Figure 1, because the number of patients was not suff- cient to conduct a randomized trial. Therapy consisted of repetitive-pulse VAC chemotherapy beginning on day 0 and continuing for 2 years. The Clinical Group I1 patients began radiation therapy to the primary site and identified positive node sites at week 6, whereas the Clinical Group I patients received no postoperative radi- ation. The results of this treatment regimen compared with the less intensive therapy given to a comparable group of patients in IRS-I have been reported sepa- rat el^.^
Patients with primary tumor originating at any of the cranial parameningeal sites (nasopharynx-nasal

1906 CANCER March I , 2993, Volume 71, No. 5
INTERGROUP RHABDOMYOSARCOMA STUDY-II
GROUP REGIMEN W'EEK 0 2 4 6 8 10 12 14 16 18 20 Z? 24 26 28 30 3 2 34 36 38 40 42 44 46 48 50 5 2 54
VXXW Q V O D W VVVVVQ V V V V W 8 V W V V V 8 V V W O V
V V V V V Q V V V 0 8 8 8 8 8 8 8 8 8 8 cm an an an rm on rm on IID I113
v = VINCRISTINE,Z~.& I.V. ( i ~ p d o ~ e z r n g ) =VAC= VCR, d Q 4 I V 8 AMD,qdX5 I V CT= CYCLOPHOSPHAMIDE, 2.5 mg/Kg/d F! 0.
8 ; DACTINOMYCIN,0.015 rng/Kq/d I.V. (top dose 0 . 5 rng) X 5 an CYC. qdX3 I V .
A = ADRIAMYCIN. 30mg/mZ/d 1.V X 2
ADR: 30 mg/m2/d I .V.X2 CYC, qd X 3 I.V.
Lm= CYCLOPHOSPHAMIDE, 10 mq/Kg/d I.V. X 3 =VodrC=VCR d 0 I.V. $= CYCLOPHOSPWMIDE, ZOmglKg I V
= Omit in children who have lhe bladdar included in t lu radiation pmtal.
Figure 1. Treatment schedules for the Intergroup Rhahdomyosarcoma Study-11. VCR: vincristine; AMD: dactinomycin; CYC: cyclophosphamide; ADR: Adriamycin (doxorubicin). Treatment 21: standard VAC; 22: standard VA; 23: intensive VA plus radiation; 24 and 25: repetitive-pulse VAC plus radiation; 26: repetitive-pulse VAdrC-VAC plus radiation.
cavity, middle ear-mastoid region, paranasal sinuses (maxillary, ethmoid, sphenoid), pterygopalatine-infra- temporal fossa) were examined for evidence of menin- geal involvement by (1) plain radiographs and com- puted tomography (CT) scan, (2) cranial nerve function, and (3) cerebrospinal fluid (CSF) cytologic examination. Patients who had cranial parameningeal sarcoma and no evidence of meningeal involvement received radia- tion to the primary tumor plus a 2-cm margin of adja- cent meninges and no intrathecal ~hemotherapy.~ Pa- tients with tumor that extended intracranially, caused erosion at the base of the skull or cranial nerve palsy began radiation therapy on day 0 to the whole cranium and primary tumor in addition to a systemic chemother- apy regimen. Spinal radiation was withheld until week 6 to minimize early myelosuppression. The prescribed meningeal dose was 30 Gy in 3 to 4 weeks for children older than 5 years of age (24 Gy for children 5 years of age or younger) with a "boost" to the primary tumor of 20 to 25 Gy in 2 to 3 weeks. Additionally, methotrexate (12 mg/m2, maximum dose 15 mg), hydrocortisone (30 mg/m2), and cytosine arabinoside (60 mg/m2) were in- stilled sequentially and intrathecally by lumbar punc- ture beginning on day 0 and repeated at weeks 2, 4, 8, and 14, and then every 8 weeks thereafter for 18 months if CSF cytologic findings were negative, or for 24 months if the cytologic findings were positive or if
the spinal cord was involved. If spinal cord block was documented, immediate radiation with or without prior decompressive laminectomy was administered, and in- trathecal medications were given after the block was relieved.
Radiation therapy was not given to patients with Clinical Group I disease, but was begun with chemo- therapy as initial treatment for Clinical Group I1 pa- tients randomized to regimen 23. Patients in Clinical Group 11, who were randomized to regimen 24, and patients in Clinical Groups I11 and IV received 6 weeks of chemotherapy before beginning radiation therapy. The radiation therapy recommendations included de- livering 40 to 45 Gy in 4 to 5 weeks to the primary tumor, but not to clinically uninvolved regional nodes in Clinical Group I1 patients. For Clinical Group 111 pa- tients the radiation dose was dependent upon the pa- tient's age and tumor diameter before initiation of che- motherapy. Children younger than 6 years of age with tumor less than 5 cm in diameter received 40 to 45 Gy, whereas those with tumor equal to or greater than 5 cm in diameter received 45 to 50 Gy. Children 6 years of age and older were given 45 to 50 Gy if the tumor was less than 5 cm, and 50 to 55 Gy in 5 to 6 weeks if it was 5 cm or greater in size. Patients in Clinical Group IV were treated the same as those in Clinical Group 111, but, in addition, received radiation to sites of metastatic dis-

IRS-IIIMaurer e t al . 1907
ease. Lung metastases were treated with bilateral pul- monary radiation, not exceeding 18 Gy in nine equal fractions. Bone and soft tissue metastases were treated with 50 to 55 Gy in 5 to 6 weeks. Metastases were treated simultaneously with radiation of the primary site. Radiation was delivered at a rate of 9 to 10 Gy in five fractions per week with megavoltage equipment.
Patient Population
A total of 11 15 patients from 96 institutions were regis- tered on study. Of these, 116 (10%) were excluded from the analysis for the following reasons: 103 patients were ineligible for the study (100 patients did not have tumors with an eligible histologic type, 3 patients started treatment more than 42 days from the initial diagnosis), 1 patient had received prior treatment, and eligibility requirements could not be confirmed patho- logically for 12 patients. Hence, a total of 999 patients with confirmed eligibility constitutes the population of patients for the evaluation of therapies.
Consistent with the philosophy of analyzing pa- tients as randomized, the clinical group assigned by each institution was used in the analysis. There was 92% agreement in classification of clinical group by the institutions and the IRS Surgery Review Committee, which was consistent across Clinical Groups I to IV (95%, 90%, 92%, and 92%, respectively). If primary reexcision of the tumor was the definitive operation, patients were classified according to their clinical group after this operation, as long as this surgery was done within 42 days of the initial procedure and before the start of chemotherapy as per protocol.
The histopathologic type and subclassification of the tumor designated by the IRS Pathology Review Committee was used to determine eligibility and for the analysis of outcomes by subtypes. The overall agree- ment in classification to subtype between the institu- tions and Review Committee was 71%. Agreement dif- fered by histologic category: 82% for alveolar, 76% for embryonal and 60% for "other." The committee classi- fied more tumors as alveolar (22%) than did the sub- mitting institutions (15%). Of all the patients reviewed by the Review Committee, 91% were classified as one of the subtypes of rhabdomyosarcoma or a related clas- sification eligible for study.
Deviations from the protocol were detected for 8% of patients with respect to radiation therapy and for 3% of patients with respect to the administration of chemo- therapy. Overall, the percentage of patients classified as evaluable was 78% (776 of 999). The major reasons for nonevaluability were as follows: incorrect Clinical Group for treatment assignment (39), major protocol
violations for chemotherapy (34) or radiotherapy (76); inadequate trial because of early death (within 6 weeks from start of study) (lo), refusal of further treatment, toxicity, or progressive disease (1 7), insufficient data (32), lost to follow-up (2), or other (13). All eligible pa- tients have been included in the analysis, as recom- mended in the guidelines for reporting clinical trials by Simon and W i t t e ~ . ~ For treatment comparisons, the random treatment assignments were used.
Definitions of End Points
The primary end points of DFS and S rates were identi- cal to those used in IRS-I. Patients with Clinical Group I or I1 disease were classified as disease-free at the start of treatment based upon the surgery. DFS curves were calculated from the time of start of treatment to first failure, defined as relapse or death.
For patients in Clinical Groups 111 and IV, response to treatment was characterized as CR (complete remis- sion), defined as complete disappearance of all signs of disease based upon clinical and imaging evidence, par- tial remission (PR), defined as at least 50% reduction in the sum of the products of the maximum perpendicular diameters of all measured lesions, no response, or pro- gressive disease. CR duration was calculated from the time of achieving CR to the time of failure, defined as relapse or death (whichever occurred first). DFS time was defined as zero for all patients not achieving CR and as the time from start of treatment to relapse or death for patients who did achieve CR.
S curves were calculated from the time of start of treatment in all clinical groups and all deaths were counted as "failures."
Progression-free survival (PFS) characterizes the percentage of patients who are alive and have not expe- rienced a relapse, progressive disease, or died by a par- ticular time (t). For patients in Clinical Groups I or [I, DFS time is equivalent to PFS time, since patients in these Clinical Groups are considered to be in complete remission at the start of treatment. For patients in Clini- cal Groups 111 or IV, those who achieve CR are counted as failures at time of relapse or death whereas patients not achieving CR are counted as failures at time of pro- gressive disease or death. As the study is evolving, an important distinction between PFS and DFS time is that patients who cannot yet be classified as CR are counted as "successes" for PFS (since they have not progressed), and "failures" for DFS (since they have not yet achieved CR). Data will be given for PFS in Clinical Groups I11 and IV, since this end point is useful for characterizing outcomes for patients while the study is in progress and will be used in future IRS.

1908 CANCER March I, 2993, Volume 71, No. 5
Table 1. Number of Patients Required, Entered, and Eligible by Treatment
No. of Datients
Clinical group Treatment Required Entered Eligible
1 (excluding extremity alveolar) 21 VAC (2 yr) 25 48 37
11 (excluding extremity alveolar) 23 VA + XRT (1 yr) 38 49 45 22 VA (1 yr) 50 67 64
24 pulse VAC + XRT (1 yr) 75 90 85 111 (excluding certain pelvic sites) 25 pulse VAC + XRT 93 340 294
and IV 26 oulse VADRC + VAC + XRT 93 320 285
XRT: radiation theraov; V: vincristine; A: dactinomvcin; C: cvcloDhosDhamide; ADR: Adriamvcin (doxorubicin)
Statistical Methods arid Strategy
Patients in Clinical Groups I and I1 were randomized on a 1:2 basis between treatments (21 versus 22 in I; 23 versus 24 in 11). Regimen 21 was the same as Regimen A (VAC for 2 years) in IRS-I and Regimen 23 was the same as Regimen C (VA + radiation therapy for 1 year)
Table 2. Distribution of Characteristics for All Eligible Patients* by Clinical Group and Total Percentages of Patients in Each Column by Characteristic Value
Clinical group
Characteristic Total no. I I1 111 IV
No. of patients
Age (yr) < 1 1-4 5-9 10-14 2 15
Male Female
Primary site-group Orbit Head and neck Parameningeal GU-nonbladder/prosta te GU-bladder/prostate Extremity All others
Histologic type Alveolar Embryonal Botryoid-embryonal Pleomorphic Extraosseous Ewing Undifferentiated Other
Sex
999
10% 35% 25% 19% 1 2 Yo
58% 42%
8% 8%
18% 1 2 o/o
11% 17% 25%
2 1 70 5 1 Yo
6 Yo
1 Yo
5 yo 7 yo
11%
125 170 532 172
11% 8% 10% 9% 31% 36% 39% 26% 26% 25% 26% 19% 19% 18% 16% 27% 13% 14% 9% 19%
68% 56% 56% 58% 32% 44% 45% 42%
2% 6% 13% 2% 6% 16% 8% 3% - 8% 27% 12% 42% 12% 7% 8%
1% 2% 17% 8% 28% 35% 6% 29% 22% 21% 23% 38%
20% 38% 12% 33% 53% 37% 59% 4101~
6% 1% 8% 1% 4% 1% 1% - 6% 8% 4% 4% 5% 10% 6% 6% 6% 6% 11% 16%
CU: genitourinary. * Includes Datients with soecial uelvic and extremitv sites.
in IRS-I. Patients in Clinical Groups I11 and IV were randomized on a 1 : 1 basis between treatments.
The primary comparisons of treatments were made between the randomly assigned treatment regmens within IRS-11; also, treatment comparisons were made by combining comparable groups of patients in IRS-I1 and IRS-I that received the same treatments. Patients on IRS-I constituted a historical series for the patients in IRS-11. Patient groups were not combined, without dem- onstration in an analysis that the groups were compara- ble with respect to prognostic factors.
Disease-free survival, length of remission, PFS and S curves were calculated according to the method of Kaplan and Meier.6 Tests of the difference between curves were accomplished using log-rank (Mantel)7 tests and generalized Wilcoxon tests (Gehan),8 although significance levels usually were reported only for the generalized Wilcoxon tests. Chi-square tests were used for the comparison of frequency distributions of patient characteristics and to test differences in response rates between groups of patients (Fleiss).' For the compari- son of proportions over various strata, the Mantel- Haenszel chi-square statistic was used." The P values obtained from statistical tests were used as a measure of the strength of the evidence against the null hypothesis being tested, 0.01 < P < 0.05 indicating a statistically significant result with moderate evidence against the null hypothesis, and P < 0.01 indicating a highly signifi- cant result with strong evidence against the null hy- pothesis.
Results
Patient Population A total of 11 15 patients from 96 institutions were regis- tered on study. The numbers of patients entered, eligi- ble (and analyzed), and required for the detection of differences between randomized treatments are given in Table 1. Patients on nonrandomized treatments, those with extremity alveolar or special pelvic lesions, have been reported e l ~ e w h e r e . ~ , ~

IRS-IIIMaurer e t a l . 1909
The distribution of patient characteristics for eligi- ble patients by Clinical Group is shown in Table 2. The percentages of patients in Clinical Groups I to IV are, respectively, 13%, 17%, 53%, and 17%. Compared with the respective percentages in IRS-I of 15%, 25%, 41% and 19%, in IRS-I1 there were relatively more pa- tients in Clinical Group I11 and fewer patients in Clini- cal Group I1 ( P < 0,001). Patients with “special” pelvic tumors (sites in the bladder, prostate, vagina, uterus) were classified as Clinical Group I11 by the IRS-I1 proto- col because biopsies were done on these tumors rather than having them surgically removed at diagnosis. This policy in IRS-I1 was the major reason for the “move- ment” of patients from Group I1 in IRS-I to 111 in IRS-11.
Seventy percent of the patients were younger than 10 years of age at the time of diagnosis and 10% were younger than 1 year of age; some evidence existed that patients were younger on IRS-I1 than IRS-I (P < 0.001) since 63% of the latter patients were younger than 10 of
age and only 4% were younger than 1 year of age. The ma1e:female ratio was 1.4:1, similar to the IRS-I patient population.
The Pathology Review Committee classified tu- mors according to histologic type as embryonal, 51 70; alveolar, 21 %; botryoid, 6%; pleomorphic, 1%; ex- traosseous Ewings sarcoma, 5%; undifferentiated sar- coma (type indeterminate), 7%; and other, 11% (sar- coma, not otherwise specified because of inadequate tissue or poor tissue fixation). This case distribution was similar to that in IRS-I ( P = 0.16); details of the histo- pathologic type for both studies and clinical-pathologic correlations have been reported elsewhere.”,’*
Comparability of Patients b y Treatment
The distribution of patient characteristics according to the randomized treatments within each clinical group is shown in Table 3. No statistically significant differences
Table 3. Distribution of Characteristics by Randomized Treatments Within Clinical Group* and Percentages of Patients by Characteristics Within Treatments
Grouv ~~ ~
I I1 111 IV
Treatment Treatment Treatment Treatment Treatment Treatment Treatment Treatment Characteristic 21 22 23 24 25 26 25 26
No. o f patients 37 64 45 85 21 1 197 83 88 Age (yr) P = 0.98* P = 0.85 P = 0.52 P = 0.50
< 1 1 1 % 12% 9 % 9 % 5 yo 5 yo 8 % 9 % 1-4 32% 32% 3 1 % 32% 36% 32% 3 1 % 2 1 % 5-9 27% 23% 33% 25% 31% 32% 16% 23% 10-14 16% 20% 16% 19% 20% 19% 28% 27% 2 15 13% 12% 11% 15% 8 % 13% 17% 20%
Male 73% 75% 53% 58% 54% 54% 55% 60% Female 27% 25% 47% 42% 46% 46% 45% 40%
Orbit 3% 2 % 9 % 7 Yo 17% 16% 5 % - Head and neck 3 % 9% 24% 18% 10% 11% 1% 5 % Parameningeal - - 9 % 11% 36% 35% 14% 10% GU-nonbladder/prostate 54% 49% 16% 17% 4 % 2 % 7 yo 8 Yo
Sex P = 0.79 P = 0.64 P = 0.88 P = 0 5 2
Primary sitt.-group P = 0.54 P = 0.94 P = 0.90 P = 0.35
GU -bladder/prostate - 2% 4% 2 % 2 % 1 % 7% 8 % Extremity 8 Yo 15% 16% 18% 7% 8 % 28% 30% All others 32% 23% 22% 28% 26% 28% 37% 40%
Histologic tvpe P = 0.46 P = 0.10 P = 0.50 P = 0.70 Alveolar 3 % 6 % 3 1 % 17% 13% 17% 3 6 % 31% Embryonal 73% 59% 49% 46% 61% 57% 41% 40%
- Botryoid--embryonal - 11% 2 % 1 % 2 % 1 % 1 %
Extraosseuus Ewing 5% 8% 4 Yo 13% 4 Yo 6% 2 % 5 %
- - - 1 % 1 % - Pleomorphic 5 % 5 %
Undifferentiated 8 % 6 Yo 13% 12% 6 % 9 % 6 % 6% Other 5 % 6 % - 10% 13% 10% 13% 19%
GU: genitourinary * Excludes patients with special pelvic and extremity sites.

1910 CANCER March 1, 2993, Volume 71, No. 5
existed in the distributions of patient characteristics by treatment within any of the clinical groups.
Clinical Group I (Excluding Extremity Alveolar Tumors)
Regimen 21 (standard VAC) versus 22 (standard VA). Figure 2 gives the DFS curves and Figure 3 the S curves for comparing treatments, with the IRS-I results in comparable patients given for reference. In patients randomized to regimens 21 or 22, no statistical evidence favored either regimen for DFS (P = 0.47); at 5 years, 80% of patients were disease-free on regimen 21 com- pared with 70% on regimen 22. The overall S experi- ence was very similar (P = 0.73) on both regimens, with 85% and 84% of patients, respectively, alive at 5 years.
Patients in Clinical Group I receiving standard VAC in IRS-I (regimen A) and IRS-I1 (regimen 21) have been combined in the analysis because of similar DFS
1 oc
90
80-
70. .- P 'Z
60-
E 9
!2 40-
50- s! I 2
6 2 t!
30-
20-
10-
0-
NO. Percent DFS Treal.T~ta Fml 1 Yr. 3Yr. 5Yr. lOYr
21 37 7 86 60 60 80 22 &( 18 89 72 70 70
At21 76 13 91 85 82 62 lRSl 78 16 94 67 63 81
2 1 v l l z , P - . 4 7 A t 2 1 ~ 2 2 . P - 11
I I I I I I I I I I 0 1 2 3 4 5 6 7 8 9 10
Years Since Treatment Stan
Figure 2. DFS curves in Clinical Group 1, extremity alveolar cases excluded, by randomized treatments: treatment 21 (standard VAC) and treatment 22 (standard VA). IRS-I curve for same group of patients is shown for reference. Treatment A + 21 represents the combination of patients given standard VAC in IRS-I (treatment A) with those given standard VAC in IRS-I1 (treatment 21).
100
90-
80-
70-
60- D .- '5 2 50- C
2 n
40-
30-
20-
10-
0-
No PercenlS Treal Total Fail 1 Yr 3 V r 5 Y r 10Yr
21 37 5 97 85 85 85 2 2 M 9 9 6 9 0 M M
A+21 76 7 93 90 90 90 IRSI 78 11 100 91 90 6a
21 "5 22, P - 73 A r Z l v s 2 2 . P - 5 2
I I I I I I I I I I
0 1 2 3 4 5 6 7 8 9 10
Years Since Treatment Start
Figure 3. Overall S curves in Clinical Group I, extremity alveolar cases excluded, by randomized treatments: treatment 21 (standard VAC) and treatment 22 (standard VA). IRS-I curve for same group of patients is shown for reference. Treatment A + 21 represents the combination of patients given standard VAC in IRS-I (treatment A) with those given standard VAC in IRS-I1 (treatment 21).
and S experience in the two studies. When this larger group of patients receiving standard VAC is compared with patients receiving standard VA in IRS-I1 (Figs. 2 and 3), there was no statistical evidence that VAC had greater DFS at 5 years than VA (82% versus 70%, P = 0.11). Also, there was no evidence of a significant improvement in overall survival at 5 years for VAC- treated patients (90% versus 8470, P = 0.52). Thus, cy- clophosphamide did not contribute to the success of treatment of Clinical Group I patients.
In a comparison which is not shown explicitly, but which is evident from Figure 3, the percentage of pa- tients surviving 5 years was 80-90% for these Clinical Group I patients in the two studies (i.e., all IRS-I pa- tients versus those on regimen 21 and 22 combined of IRS-11). Twenty-five of the 101 patients relapsed (Table 4). Among the 37 patients who received regimen 21, the tumor recurred locally in 2 (5%) , regionally in 2 (5%), distantly in 2 (5%), and locally and distantly in 1 (3%).

IRS-IIIMaurer et al. 1911
60- P 2 u; 50-
I
0)
t E 40- 0 e a
30-
20-
10-
Table 4. Types of Failures (Relapse, Death, or Other) for Patients Who Achieve CR Clinical No. of No. of Local CNS Toxic group Treatment CR failures Local Regional Distant + distant ext. deaths Other*
- - - J 21 37 7 2 (5%) 2 (5%) 2 (5%) 1 (3%) - - 1(2%) - 22 64 18 9 (14%) 5 (8%) 3 (5%)
I1 23 45 13 3 (7%) 5 (11%) 3 (7%) - - 1 (2%) 1 (2%) 24 85 24 9 (11%) 4 (5%) 6 (7%) 3 (4%) - 1(1%) 1(1%)
I11 25 156 40 18 (12%) 9 (6%) 7 (4%) 2 (1%) 1 (1%) 1 (1%) 2 (1%)
IV 25 43 27 6 (14%) 2 (5%) 15 (35%) 3 (7%) 1(2%) 26 154 48 16 (8%) 4 (5%) 14 (9%) 3 (2%) 1(1%) 6 (6%) 4 (3%)
- -
26 47 28 5 (11%) 4 (9%) 13 (28%) 6 (13%) - - -
CNS: central nervous system; ext.: extension; CR: complete response. * Patients listed as "other" failed to respond to therapy for the following reasons: treatment 23, 1 suicide; treatment 24, 1 case entered as a Clinical Group 11, classified bv Surgery Committee as a Clinical Group IV, and patient did not achieve CR; Group 111 treatment 25, 2 deaths from second malignancies; Group III treatment 26, 1 second malignancy and 3 patients who died of reasons unrelated to treatment.
Among the 64 patients on regimen 22, there were 18 relapses: 9 local (14%), 5 regional (8%), 3 distant (5%), and 1 (2%) who died of toxicity while in CR.
No PercantDFS Treat TOW Fail 1 Yr 3Yr 5Yr 10Yr 23 45 13 91 74 69 69 24 85 24 84 74 14 70
C+23120 37 03 73 70 67 IRSI 158 52 80 71 69 67
23 v8 24, P - 63 C+23vs 24 P - 55
0
0 1 2 3 4 5 6 7 8 9 10
Years Since Treatment Start
Figure 4. DFS curves in Clinical Group 11, extremity alveolar cases excluded, by randomized treatments: treatment 23 (intensive VA + radiation) and treatment 24 (repetitive-pulse VAC + radiation). IRS-I curve for same group of patients is shown for reference. Treatment C t 23 represents the combination of patients given intensive VA t radiation in IRS-I (treatment C) with those given the same treatment in IRS-I1 (treatment 23).
Clinical Group I1 (Excluding Extremity Alveolar Tumors)
Regimen 23 (intensive cyclic-sequential VA + ra- diation) versus 24 (repetitive-pulse VAC + radia- tion). Figures 4 and 5 compare regimens 23 and 24 with respect to DFS and S curves, with the IRS-I data in comparable patients given for reference. There is no evidence of a difference in DFS experience between the two regimens ( P = 0.83); at 5 years, it was 69% for regimen 23 and 74% for regimen 24.
Also, there was no evidence of a difference in S experience between regimens (P = 0.17), with the per- centage of patients surviving 5 years being 88% on regi- men 23 and 79% on regimen 24.
Combining patients who received regimen 23 with those patients who received the same treatment in IRS-I (regimen C), at 5 years the percentage of patients DFS was 70% and S was 79%; combining these groups does not alter the conclusion that 24 is not superior to 23 either for DFS ( P = 0.55) or for S ( P = 0.78). Thus, cyclophosphamide did not contribute to the success of treatment in Clinical Group I1 patients.
A total of 37 of the 130 patients relapsed (Table 4). Of the 13 relapses on regimen 23, there were 3 (7%) local, 5 (11%) regional, 3 (7%) distant, and 2 (4%) pa- tients who died in CR (one fatal toxicity and one sui- cide); on regimen 24, the 24 relapses were 9 (1 1 YO) local, 4 (5%) regional, 6 (7%) distant, 3 (4%) local and distant, and 2 (2%) other (one who died of toxicity while in CR and one who did not achieve CR).
Clinical Group III (Excluding Special Pelvic Sites)
Regimen 25 (repetitive-pulse VAC + radiation) versus 26 (repetitive-pulse VAdrC-VAC + radia- tion). The CR rates were similar ( P = 0.32) for the two treatment regimens, being 74% (156/211) for regimen 25 and 78% (154/197) for regimen 26. Among the re-

1912 CANCER March 1, 2993, Volume 71, No. 5
....... *< ....................... .-__*_ . .- ...... .............
- -, .... ".-. c.rj -.
, \---. 2, lRSl
a
3 1 No Penants
Treat TOW Fad 1 Yr 3Yr 5 Y r i0Yr 23 45 5 95 91 (UI 88 24 85 20 w a2 79 73
C+23120 26 91 82 79 76 IRSI 159 46 89 76 72 71
23"s 24.P- 17 C + 2 3 v s 2 4 . P - 78
0 ) I I I I I I I I I 1
0 1 2 3 4 5 6 7 8 9 10
Years Since Treatment Start Figure 5. Overall S curves in Clinical Group 11, extremity alveolar cases excluded, by randomized treatments: treatment 24 (intensive VA + radiation) and treatment 24 (repetitive-pulse VAC t radiation). IRS-I curve for same group of patients is shown for reference. Treatment C + 23 represents the combination of patients given intensive VA t radiation in IRS-I (treatment C) with those given the same treatment in IRS-I1 (treatment 23).
sponders, the median time to response was 17 weeks for both treatments, with the longest time being 146 weeks. The overall CR rate of 76% (310/408) for pa- tients on IRS-I1 was higher than the rate of 69% (193/ 280) for a comparable group of patients on IRS-I ( P = 0.04). An additional 10% of patients on both regi- mens 25 and 26 achieved a PR.
Figures 6 and 7 compare the curves for CR duration and survival for regimens 25 and 26, with the experi- ence in IRS-I given for reference. There was no statisti- cal evidence of a difference in prognosis between regi- mens 25 and 26, either for CR duration ( P = 0.21) or S
duration and survival were significantly increased by the intensive regimens used in IRS-I1 ( P < 0.001 for CR duration, P < 0.001 for S). It should be pointed out, however, that more precise staging and radiation ther- apy planning with the CT scanner and improved sup- portive care, particularly care of the febrile neutropenic patient, occurred between the two studies and may have contributed to the improved outcome between studies. Over 73% of IRS-I1 patients who attained a CR were still in CR at 5 years, compared with 56% of pa- tients given the less intensive IRS-I treatments (consist- ing of pulse VAC + radiation [regimen El) alone and with Adriamycin added [regimen F] ( P < 0.001). Also, 66% of patients on IRS-I1 were surviving at 5 years compared with 50% of patients who received the IRS-I treatments ( P < 0.001). At 5 years, the percentage of patients progression-free and surviving (PFS) was 58% on treatment 25 and 60% on treatment 26 ( P = 0.73); for reference, in IRS-I, the percentage of patients PFS at 5 years was 44%.
TRT 25
TRT a
3 4 '-I 1
No PefcBnt in CR Treat TOY Fail 1 Vr 3Yr 5Yr I O Y r
25 156 40 90 70 75 73 26 154 48 B1 71 70 68
lASl 167 77 75 58 56 54
25va 28 P- 21
0 0 0 1 2 3 4 5 6 7 8 9 10
( P = 0.84). At 5 years, the percentages of patients re- maining in CR rates were 75%, 70%, respectively, for
percentages were 66%, 65%. c ~ d h l e d IRS-11 data with that from
IRS-I, there is strong statistical evidence that both CR
Years Since Achieving CR
regimens 25 and 26, whereas for S rates the respective Figure 6 . Duration of complete remission (CR) Curves among complete responders in Clinical Group Ill by randomized treatments: treatment 25 (repetitive-pulse VAC + radiation) and treatment 26 (repetitive-pulse VAdrC-VAC + radiation). IRS-I curve for same group of patients is shown for reference.

IRS-IIIMaurer et ul . 191 3
1 oc
90
80
7 0
6 0 .- P '$ KfY 50- t 9 n
c
40-
3cF
2 0
10
0 -.
TRT 26
TRT 25
No PercenlS Tr-I Told Fail 1 Yr 3 Y r 5 Y r l O Y r
25 211 77 86 69 66 57 26 197 69 86 70 65 63
IRSI 246 134 79 55 50 45
25"s m,P- 04
0 1 2 3 4 5 6 7 8 9 10
Years Since Treatment Start
Figure 7. Overall S curves in Clinical Group 111 by randomized treatments: treatment 25 (repetitive-pulse VAC + radiation) and treatment 26 (repetitive-pulse VAdrC-VAC + radiation). IRS-I curve for same group of patients is shown for reference.
A total of 35% (144/408) of patients treated with regimens 25 and 26 had tumors which arose at cranial- parameningeal sites. They received additional radiation and intrathecal chemotherapy, as previously described, according to the degree of meningeal involvement. As shown in Figures 8 and 9, the CR duration and S experi- ence for these patients were superior to those of a com- parable group of IRS-I patients who did not receive this central nervous system (CNS) "prophylaxis" ( P = 0.01 for CR duration, < 0.001 for S). At 5 years, 73% of patients who attained a CR were still in CR compared with 57% of IRS-I patients, and 67% of IRS-I1 patients were living compared with 45% of IRS-I patients. In addition, CNS relapse decreased from 5% in IRS-I to 0% in IRS-11 (P = 0.02).
There was a similar advantage in prognosis for pa- tients given IRS-I1 treatment when patients with tumors originating at nonparameningeal sites were considered. At 5 years, 72% of these patients remained in CR com- pared with 56% in IRS-I ( P = 0.01), and 65% were alive compared with 52% on IRS-I (P = 0.01).
Of the 31 1 patients who attained a CR on regimens 25 and 26,88 subsequently relapsed (Table 4). Relapses were approximately equally divided between the two regimens and comparable in types. The types of re- lapses on regimen 25 were local in 18 patients (12%), regional in 9 patients YO), distant in 7 patients (4%), local plus distant in 2 patients (1 YO), CNS extension in 1 patient (l?'~), and 3 (2%) patients died in CR (one fatal toxicity and 2 with second malignancies). On regimen 26, there were 16 (8%) local, 4 (5%) regional, 14 (9%) distant, 3 (2%) local plus distant, 1 (1%) CNS extension, and 6 (6%) who died of toxicity while in CR, 1 (106) second malignant neoplasm, and 3 (3%) who died of reasons unrelated to treatment.
Clinical Group N
Regimen 25 (repetitive-pulse VAC + radiation) versus 26 (repetitive-pulse VAdrC-VAC + radia- tion). There were nearly identical CR rates on both treatments: 52% (43/83) for regimen 25 and 53% (47/ 88) on regimen 26 (P = 0.83). The median time to CR was 13 weeks for regimen 25 and 15 weeks for 26, with
101
90
80
70
8 6 0 c .- cn .- $ so ; al ,$ 40
30
20
10
0
No P-mmCR GIOW Tom1 Ful 1 Yr 3Yr 5Yr l0Y1
IRSIPM 60 28 77 57 57 53 IRSIIPM 114 31 90 75 73 73 IRSINONPM 107 49 75 58 56 55 IRSIINONPM ig(l 57 85 75 72 69
PH IRS-I m I1 P - 01 NonPM 1%-In I1 P - 01
I I I I I I I I I I
0 1 2 3 4 5 6 7 8 9 10
Years Since Achieving CR
Figure 8. Duration of complete remission (CR) curves in Clinical Group I11 by study (IRS-I, -11) and primary site (PM, Non-PM). I'M: cranial parameningeal; Non-PM: nonparameningeal head and neck.

1914 CANCER March 1, 2993, Volume 71, No. 5
3 4
NO PsrcanlDFS Group Total Fa1 1 Yr 3 Y r 5Yr 1OYl
IRSIPM 80 M r4 51 45 42 IRSIIPM IU M 90 72 67 61 I R S I W N P M 1s 84 82 57 52 17 IRSllNON PM 264 96 85 611 65 80
PM IRS-I YI 11, P < 001 Nan PM IRS.1 vs It. P - 01
0 1 0 1 2 3 4 5 6 7 8 9 10
Years Since Treatment Start
Figure 9. Overall S curves in Clinical Group 111 by study (IRS-I, IRS-II) and primary site (PM, Non-I'M). I'M: cranial parameningeal; Non-PM: nonparameningeal head and neck.
the longest time being 129 weeks. By comparison, the CR rate was 50% (65/129) for IRS-I patients, who re- ceived regimens E (pulse VAC + radiation) and F (pulse VAC + Adriamycin + radiation), a difference between studies that was not near statistical significance (P = 0.78). The median times to CR in IRS-I were 15 weeks for regimen E (longest time = 77 weeks) and 9 weeks for F (longest time, 100 weeks). An additional 19% (16/83) of patients achieved a PR on regimen 25, and an addi- tional 27% (24/88) on 26.
Figures 10 and 11 give the curves for the duration of CR and S for the two treatments, with the IRS-I expe- rience shown for reference. The two treatments yielded similar results (P = 0.98 for CR duration, P = 0.90 for S), without much evidence of improvement in patient out- come for IRS-I1 when compared with the IRS-I experi- ence. At 5 years, about 38% of patients who attained CR on either regimen remained in CR and about 27% of patients were alive. However, there was statistical evi- dence favoring IRS-I1 with respect to CR duration ( P = 0.02) and S (P = 0.07) when treatments were com- bined and IRS-I and I1 patients compared. With respect to PFS in Clinical Group IV, the percentage of patients
being PFS at 5 years was 21% for regimen 25 and 25% for regimen 26 ( P = 0.63); for IRS-I, the percentage was 20%.
Fifty-five (61%) of the 90 patients who entered complete remission subsequently relapsed, the number being nearly equal for the two regimens (Table 4). Re- lapses in patients who received regimen 25 were local in 6 (14%), regional in 2 (5%), distant in 15 (35%), local plus distant in 3 (7%) and CNS extension in 1 (2%). The distribution for regimen 26 was very similar: 5 (11%) local, 4 (9%) regional, 13 (28%) distant, and 6 (13%) local plus distant.
Prognosis for Nonmetastatic (Clinical Groups I , ZZ, I l l ) and Metastatic (Clinical Group N) Patients (All Treatments Combined)
Patients were combined by Clinical Group and treat- ment so that the prognosis of nonmetastatic and meta- static patients could be compared between IRS-I and 11.
1 O(
90
80
70
a o 60 .- E 01 .- '5 5 0 v)
0)
"
2 0) 4 0 n
3 0
2 0
10
0
NO Percent CR Treat Tots1 Fail 1 YI 3 Y l 5 Y r l O Y r
25 43 27 74 39 36 30 26 47 28 68 40 40 40
IRSI 65 46 46 35 30 28
25 vs 26. P - 98
1 1 I I 1 I I I I I 0 1 2 3 4 5 6 7 8 9 10
Years Since Achieving CR
Figure 10. Duration of complete remission (CR) curves in Clinical Group IV by randomized treatments: treatment 25 (repetitive-pulse VAC + radiation) and treatment 26 (repetitive-pulse VAdrC-VAC + radiation). IRS-I curve for same group of patients is shown for reference.
IRS-IIIMaurer et al . 1915
25- 2 6 . P - 90
j j 7 : ,
I li.!
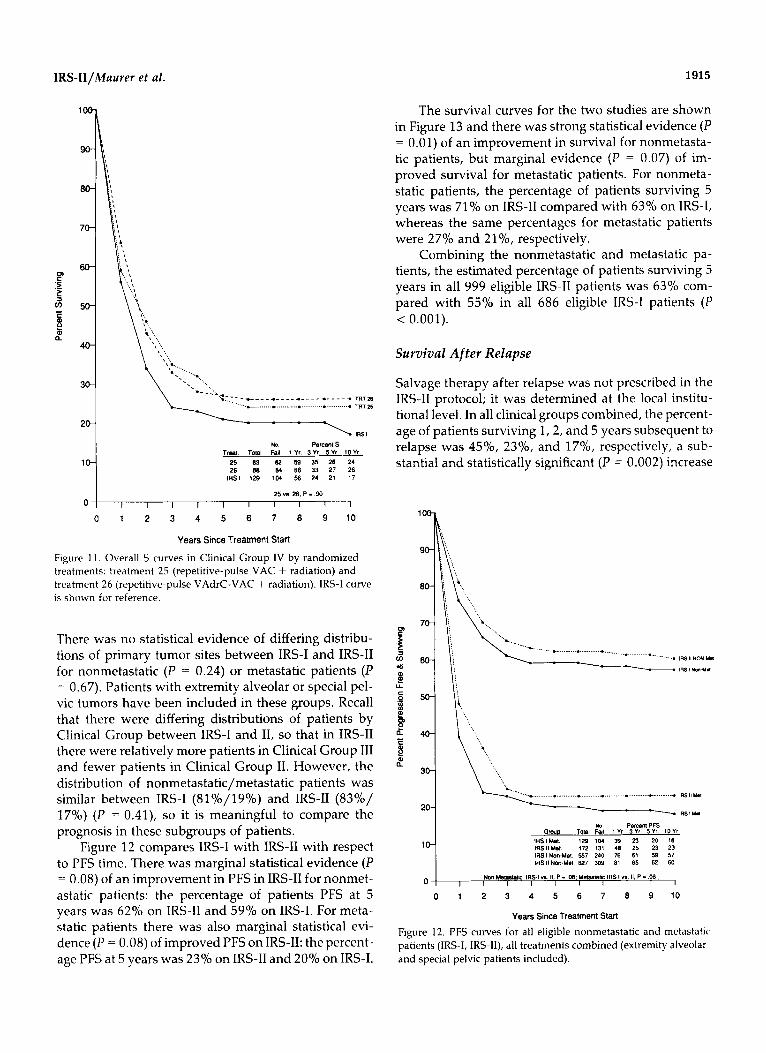
There was no statistical evidence of differing distribu- tions of primary tumor sites between IRS-I and IRS-I1 for nonmetastatic (P = 0.24) or metastatic patients (P = 0.67). Patients with extremity alveolar or special pel- vic tumors have been included in these groups. Recall that there were differing distributions of patients by Clinical Group between IRS-I and 11, so that in IRS-I1 there were relatively more patients in Clinical Group 111 and fewer patients in Clinical Group 11. However, the distribution of nonmetastatic/metastatic patients was similar between IRS-I (81%/19%) and IRS-I1 (83%/ 17%) ( P = 0.41), so it is meaningful to compare the prognosis in these subgroups of patients.
Figure 12 compares IRS-I with IRS-I1 with respect to PFS time. There was marginal statistical evidence (P = 0.08) of an improvement in PFS in IRS-I1 for nonmet- astatic patients: the percentage of patients PFS at 5 years was 62% on IRS-I1 and 59% on IRS-I. For meta- static patients there was also marginal statistical evi- dence (P = 0.08) of improved PFS on IRS-11: the percent- age PFS at 5 years was 23% on IRS-I1 and 20% on IRS-I.
The survival curves for the two studies are shown in Figure 13 and there was strong statistical evidence (P = 0.01) of an improvement in survival for nonmetasta- tic patients, but marginal evidence (P = 0.07) of im- proved survival for metastatic patients. For nonmeta- static patients, the percentage of patients surviving 5 years was 71% on IRS-I1 compared with 63% on IRS-I, whereas the same percentages for metastatic patients were 27% and 21%, respectively.
Combining the nonmetastatic and metastatic pa- tients, the estimated percentage of patients surviving 5 years in all 999 eligible IRS-I1 patients was 63% com- pared with 55% in all 686 eligible IRS-I patients (P < 0.001).
Survival After Relapse
Salvage therapy after relapse was not prescribed in the IRS-I1 protocol; it was determined at the local institu- tional level. In all clinical groups combined, the percent- age of patients surviving 1,2, and 5 years subsequent to relapse was 45%, 23%' and 17%, respectively, a sub- stantial and statistically significant (P = 0.002) increase
~ ........ ... .......... * ......______..._ ... ......... * ............ IRS I, Urn -- IRS I M I
m P a r m n t ~ ~ S Gmue Tml Fa11 1 V r 3 Yf 5 Yr 1 O Y l
IRSIMel 1 2 9 1 0 4 39 23 20 18 IRSIIMel 172 131 4U 25 23 23 IRSIMn.Me1 557 210 76 61 59 57 _ . . . . . IRSIINOII.MBI €27 309 81 65 62 60
No" MatUlm~ IRS-I n IN. P - OB. M W I I I C IRS I IS 11. P I .W 0 1 1 1 I I , l [ I I I
0 1 2 3 4 5 6 7 8 9 10
Years Since Treatment Start
Figure 12. PFS curves for all eligible nonmetastatic and metastatic patients (IRS-I, IRS-ll), all treatments combined (extremity alveolar and special pelvic patients included).

1916 CANCER March 1, 1993, Volume 71, No. 5
o . , - - , , I , I I I I I 1
4 \ .................... = _ ~ .................. ~
2
NO percans G ~ U D TOW FSII 1 rt 3 Y, 5 Y, IOYI
IRSIMOI 129 104 56 24 21 17 IRSIIMoI 172 127 62 34 27 24 IRSINon~Mll 557 218 07 68 63 61 IRSII NOWMOI a27 251 90 74 71 66
Non Msfastatlc IRS I M. 11, P - 01, M e M I C IRS I VI 11. P - 07 0 1 , I I I I I 1 1 , I
0 1 2 3 4 5 6 7 8 9 10
Years Since Treatment Start
Figure 13. Overall S curves for nonmetastatic and metastatic patients (IRS-I, 1RS-11) for all eligible patients, all treatments combined (extremity alveolar and special pelvic patients included).
over the respective percentages in IRS-I for the same time periods, which were 30%, l6%, and 8%. IRS-I1 patients had better a 5-year S rate after relapse than IRS-I patients in nonmetastatic patients (23% versus lo%, P < 0.01), but not for metastatic patients (4% ver-
As in IRS-I, there was a trend toward decreasing survival with increasing Clinical Group number, the percent of patients surviving 5 years subsequent to re- lapse being I, 43%; 11, 28%; 111, 15%; and IV, 4% ( P < 0.01).
Nonmetastatic patients having local or regional re- lapses survived significantly longer subsequent to re- lapse than patients developing distant metastases. The 5-year S rate subsequent to relapse was 28% for pa- tients having local or regional relapses compared with 13% for those having distant metastases ( P = 0.01). For metastatic patients, there was no evidence of differing survival subsequent to relapse whether the relapse was local or regional or distant metastases (P = 0.83); sur- vival was poor, with about 30% of patients surviving 1 year and about 8% surviving 2 years in all groups.
Of the patients relapsing (i.e., excluding patients
sus 2%, P = 0.10).
who died in remission without evidence of relapse), the percentages of patients having local or regional relapses were, by Clinical Group: I, 75% (18/24); 11, 64% (21/ 33); 111, 65% (49/75); and IV, 33% (18/55). This con- trasts with IRS-I where, among patients relapsing, the major type of relapse was evidence of distant metas- tases.
Prognosis by Primary Site
Figure 14 gives the survival curves for all eligible pa- tients with nonmetastatic disease in IRS-I1 according to seven primary site categories, Clinical Groups (I to 111) and all treatments combined. The survival experience was equal to or better than that in IRS-I in every pri- mary site group (curves not shown). There are striking differences in survival experience by primary site (P < 0.001), the primary sites seeming to separate into four groups. Tumors of the orbit had the best prognosis (92% survival at 5 years) and the next best prognosis was for head and neck and genitourinary (GU) non-
100
90
8 0
70
60 al .- .;
CJY 50 t 2 2
- 4 0
3 0
2 0
10
PM 157 51 91 74 69 63 GUNONWP110 21 94 83 80 80
GUWP 97 29 91 73 73 70 ExUerniIla 124 39 91 73 70 64
other ias 9p 80 Y) 53 a P < 001

IRS-lI/Maurer et al . 1917
Table 5. Comparison of Prognosis of Patients by Histologic Classification, All Treatments Combined ~ ~~ ~
Group 1-111 IV Group I-IV (nonrnetastatic) (metastatic)
Total no. No. of survival Total no. No. of survival Total no. No. of survivnl Histologic type of patients failures rate (YO) of patients failures rate ( o h ) of patients failures rate (YO) -
5-yr 5-yr 5-yr
Alveolar Embryonal Botryoid All others P value
Alveolar Embryonal Botryoid All others P value
208 106 511 168
55 7 225 97
< 0.001
208 123 511 215
55 20 225 122
0.002
52 68 89 55
41 58 64 46
Survival
15 1 54 440 120
54 6 182 68
< 0.001
Disease-free survival
151 72 440 163
54 19 182 89
0.03
66 74 89 61
53 64 65 51
57 49 71 48 1 1
43 29 < 0.001
57 51 71 52 1 1
43 33 0.59
18 32
30 -
10 27
23 -
bladder prostate patients (about SO% survival at 5 years). The ordering of these primary sites was the same as in IRS-I. The poorest prognosis was in patients with "other" sites (53% survival at 5 years) and the remain- ing patients (parameningeal, GU [bladder-prostate] and extremity) had about 70% of patients surviving 5 years.
Prognosis by Histologic Type
Table 5 gives the prognosis by tumor histologic type for nonmetastatic and metastatic patients, all treatments combined. The prognosis was best for patients with botryoid lesions. In nonmetastatic patients, the 5-year S rate was 89% for botryoid patients compared with 74% for those with embryonal lesions, 66% for those with alveolar lesions, and 61% for those with all other types
Table 6. Average Amount of Drug Administered by Treatment Regimen
Treatment patients (mg/m2) (mg/kg) (mg/kg) (mg/m2)
21 40 21.3 0.351 1330 - 22 68 19.7 0.328 - - 23 47 53.5 0.377 - - 24 89 17.6 0.739 345 - 25 344 17.2 0.700 322 - 26 285 17.1 0.398 361 374 27 126 64.5 1.32 521 -
No. of VCR AMD CYC ADR
VCR: vincristine; AMD: dactinomycin; CYC: cyclophosphamide; ADR: Adria- rnycin (doxorubicin).
(undifferentiated, extraosseous Ewings sarcoma, pleo- morphic and rhabdomyosarcoma, not otherwise speci- fied) ( P < 0.001). Histologic types were similarly or- dered by DFS, although the differences in percentages of patients DFS at 5 years were less significant ( P = 0.03).
For metastatic patients (i.e., those in Clinical Group IV), there was only one botryoid patient. There were significant differences in survival experience by histo- logic type (P < 0.001), with embryonal (alveolar) pa- tients having the most (least) favorable survival at 5
Table 7. Average Percent of Protocol Dose Administered by Treatment Regimen
~ ~~
No. of VCR A M D CY c ADR Treatment patients (range) (range) (range) (range)
21 40 88 9* 93 6 77 2 -
(100-50) (100-75) (100-25) - - 22 68 82 0 87 4
(100-1) (100-1)
23 47 74 3 83 7 - -
(100-1) (100-50)
24 89 73 5 82 1 82 2 -
25 344 71 8 77 8 76 7 -
(100-1) (111-1) (100-1)
(100-1) (111-25) (100-25) 26 285 71 1 66 4 73 6 77 9
27 126 67 2 67 6 66 8 -
(100-1) (111-25) (100-25) (lCl0-1)
(111-1) (100-25) (111-25)
Average percent. VCR: vincristine; AMD: dactinomycin; CYC: cyclophosphamide; ADR: Adria- rnvcin (doxorubicin).

1918 CANCER March 1, 2993, Volume 71, No. 5
years. There were no significant differences in DFS ex- perience by histologic type (P = 0.59).
Chemotherapy Doses Administered
Table 6 gives the average amount of each drug admin- istered by treatment regimen, which was estimated by using the total protocol doses for each drug multiplied by the average of protocol dose administered for each drug (Table 7). As expected from the protocol schemata the difference between randomized regimens 2 1 and 22 was the addition of cyclophosphamide taken orally on regimen 21. Comparing regimen 23 with 24, patients on regimen 23 received about three times the total dose of vincristine per square meter as patients on regimen 24, but only half of the dose of dactinomycin and no cyclo- phosphamide. Comparing regimens 25 and 26, patients received similar total doses of vincristine and cyclo- phosphamide, but those on regimen 26 received the additional drug, Adriamycin, but less dactinomycin.
Toxicity of Treatments
Table 8 gives the worst degree of toxicity by treatment regimen. There were 21 fatal toxicities: 1 (3%) on regi- men 23,l (1%) on 24,5 (2%) on 25,11 (4%) on 26, and three (3%) on 27, almost all due to infection secondary to myelosuppression. The types of fatal toxicities by treatment regimen were as follows: regimen 23, one infection secondary to myelosupression; regimen 24, one hepatic failure; regimen 25, four infections and one hepatic failure; regimen 26, nine infections and two CNS complications (one leukoencephalothapy and one demyelinization of the cord and brain stem); and regi- men 27, three infections and one toxic epidermal ne- crosis.
Life-threatening toxicities were seen most often with the more intensive regimens and were mainly neutropenia (neutrophil count less than 500/pl) or in- fection. Seventy-four percent of children younger than
1 year of age had severe or worse toxicity compared with 81% of children 1 year of age and older. Of course, those children younger than 1 year of age received a reduced drug dose as prescribed by protocol.
Of the 285 patients receiving regimen 26 which in- cluded Adriamycin, 4% (1 1) developed mild, 2% ( 5 ) moderate, and 2% (5) severe cardiac toxicity.
Discussion
With an overall 5-year S rate of 55% for the entire co- hort of 686 patients in IRS-I, the general goals of IRS-I1 were to improve survival for the groups of patients whose survival was unacceptably low, and to refine treatment for the remaining patients.
For randomized patients in Clinical Group I (ex- cluding extremity alveolar cases) withdrawing cyclo- phosphamide from the standard VAC regimen did not significantly alter DFS and S rates, although the percent- ages with the standard VAC regimen (control arm) in IRS-I1 were slightly lower than in IRS-I. The deletion of cyclophosphamide is beneficial to the overall therapy of these patients, since it eliminates its attendant poten- tial toxicities including hemorrhagic cystitis, bladder fi- brosis, and sterility. A more intensive VA regimen, such as the one used for Clinical Group I1 disease (regimen 23), may be more effective than regimen 22 and de- serves evaluation in this favorable group of patients. Such a trial is included in the third study, IRS-111. Pa- tients with Clinical Group I1 disease, excluding extrem- ity alveolar cases, were treated with either intensive VA (regimen 23) or repetitive-pulse VAC chemotherapy plus postoperative radiation (regimen 24). Regimen 24 included monthly 3-day courses of cyclophosphamide given intravenously at a dose of 10 mg/kg/d in addi- tion to three doses, each 20 mg/kg, given during weeks 3 to 9. The aim was to improve upon the 70% 5-year DFS and overall S rates achieved in IRS-I with intensive VA plus radiation. The cyclophosphamide was of no benefit, however. Both regimens (23 and 24) produced
Table 8. Worst Degree of Any Toxicity by Treatment for 999 Eligible Patients No. No. with
Regimen eligible toxicity Mild Moderate Severe LT F % LT + F % S + LT + F 21 40 33 2 22 8 1 0 3 23 22 68 51 7 25 17 2 0 3 28 23 47 38 2 11 23 1 1 4 53 24 89 81 2 8 56 11 1 13 76 25 344 320 8 36 196 71 5 22 79 26 285 271 5 18 170 67 11 27 87 27 126 111 1 18 59 28 3 25 71 Total 999 905 27 138 529 181 21 20 73
S: severe; LT: life-threatening; F: fatal.

IRS-II/Muurer et al . 1919
similar outcomes, comparable with the IRS-I DFS and overall S experiences, even with respect to the types of relapses. Thus, when radiation is included in treatment with intensive VA, cyclophosphamide used as de- scribed offers no additional advantage. However, the dose of cyclophosphamide was moderate in this regi- men compared with current dosing of up to 2.2 g/m'/ course in IRS-IV. Whether Adriamycin would be a bet- ter addition is being tested in IRS-111.
In Clinical Group I1 regimens 23 and 24, there were differences in total doses of vincristine and dactinomy- cin, in addition to the presence of cyclophosphamide in regimen 24. Yet the outcomes were similar. The total dose of vincristine was considerably higher in regimen 23 than 24, although the total dose of dactinomycin was lower in regimen 23 than 24. The same conclusions could be reached considering dose intensity of each drug. This suggests that vincristine dose intensity was relatively more important to the success of regimen 23 than dactinomycin. It further suggests that one might increase the dose intensity of dactinomycin in combina- tion with intensive vincristine as a strategy for a future trial.
Four major changes were made in the treatment of patients with Clinical Group 111 (excluding "special" pelvic cases) or IV disease to increase CR, duration of CR and overall S rates in IRS-11: intensive chemother- apy pulses were given monthly for 2 years in regimens 25 and 26; Adriamycin was given at the start of treat- ment in three courses followed by monthly alternating courses with dactinomycin during the first year of regi- men 26; CNS prophylaxis was prescribed for patients with primary cranial parameningeal lesions; and radia- tion therapy was delivered to essentially all sites of me- tastases rather than to lung only.
For patients in Clinical Group 111, the regimen with Adriamycin was no better than the regimen containing dactinomycin in inducing CR, but both regimens were superior in inducing CR to their less intensive counter- parts in IRS-I. CR rates were 74% on regimen 25, 78% on 26, and 69% on IRS-I regimens E and F combined. The strategies of continuing monthly pulses of chemo- therapy in both regimens in IRS-I1 plus the prescription of CNS prophylaxis for cranial parameningeal disease proved to be beneficial. The 5-year S rate was about 66% with either regimen 25 or 26, an increase of 16% over the result in IRS-I (P < 0.001). Similarly the CR rates were more durable: approximately 73% of pa- tients who achieved CR were still in CR at 5 years, a 17% increase over IRS-I (P < 0.001).
Although Adriamycin, used as a single agent, is ac- tive against rhabdomyosarcoma, it did not contribute to the efficacy of the VAC regimen, but did contribute to the toxicity of the regimen in that there were six toxic deaths in remission on regimen 26 versus one on regi-
men 25, and the overall toxic death rates on regimens 25 and 26 were 1.5% (5/344) and 3.9% (11/285), re- spectively (P = 0.06) (Tables 4 and 8). Thus far, Adria- mycin has not improved the efficacy of combination chemotherapy of rhabdomyosarcoma; its role in newly diagnosed patients is yet to be determined.
Patients with cranial parameningeal primaries in Clinical Group 111 were treated according to stricter crite- ria for coverage of adjacent base of meninges, with higher doses, and with earlier introduction of radiation than similar patients in IRS-I. The benefit of CNS pro- phylaxis which could be due, at least in part, to better compliance with these stricter criteria, is apparent when the patients with cranial parameningeal primaries in Clinical Group 111 are compared in the two studies. At 5 years, 67% of these patients were alive compared with 45% in IRS-I who did not have this additional treat- ment, a 22% increase in the S rate ( P < 0.001). CNS relapse was reduced from 5-0% (P = 0.02). There was also an improvement in CR duration from 57-73% of patients remaining in CR at 5 years ( P = 0.004).4 Radia- tion therapy given early in the course of treatment plays an important role in the local control of cranial para- meningeal tumors, although the benefit of intrathecal chemotherapy in the absence of positive CSF cytologic findings is questionable. Whether the results would be as good with a reduced volume of radiation in patients who have no intracranial lesions at diagnosis but have bone erosion at the base of the skull or cranial nerve palsy is an important question for IRS-111. Such an ap- proach would avoid any late effects of cranial radiation. Results of a series of 15 patients reported by Gasparini and associates suggest that encompassing the tumor vol- ume plus a 2-cm margin and the upper cervical homo- lateral regions is sufficient to achieve local tumor con-
If patients with only nonparameningeal primary sites in Clinical Group I11 are considered, the advantage in prognosis for IRS-I1 patients was also substantial and statistically significant. Seventy-two percent of these pa- tients remain in CR compared with 56% in IRS-I (P = 0.01) and 65% of them are living compared with 52% in IRS-I (P = 0.01), at 5 years, attesting to the effective- ness of the intensive systemic chemotherapy regimens.
With regard to Clinical Group IV disease, there was no substantial improvement in patient outcome over the IRS-I experience, nor did regimen 26 produce any survival advantage over regimen 25. The percentages of patients achieving CR were about 53% on both regi- mens and 50% in IRS-I. Five-year S rates were 26% on regimen 25, 27% on regimen 26, and 21% in IRS-I (P = 0.90 for 25 versus 26). About 38% of patients on either regimen who achieved CR were still in remission at 5 years compared with 30% in IRS-I ( P = 0.98 for 25 versus 26). Only when the two regimens combined are
tr01.I~

1920 CANCER March 1, 2993, Volume 71, No. 5
compared with the combined regimens in the first study is there some evidence ( P = 0.02) of improvement in CR duration. Overall, the strategies of this study were not successful in Clinical Group IV, nor did Adriamycin enhance the efficacy of the VAC regimen. More effec- tive agents are needed with or without bone marrow transplantation or hematopoietins such as G-CSF or GM-CSF, although other doses and schedules of exist- ing active agents certainly have not been exhausted.
The outcome of patients with extremity alveolar rhabdomyosarcoma registered on this study in Clinical Group I and I1 have been reported in detail e l~ewhere .~ In brief, repetitive-pulse VAC therapy increased the 3- year DFS rate to 69% compared with 43% with the less intensive two-drug and three-drug regimens in IRS-I (P = 0.06). Although overall S rate was increased to 77% by the IRS-I1 treatment from 57% in IRS-I, the 20% increase was not statistically significant ( P = 0.18), pos- sibly because of a relatively small number of patients in these groups (30 in IRS-I; 44 in IRS-11).
The outcome of patients with nonmetastatic "spe- cial" pelvic tumors, i.e., localized lesions of the bladder, prostate, vagina and uterus, treated with a primary che- motherapy approach (regimen 27) has been reported in detail elsewhere.* Our aim was to improve bladder sal- vage without jeopardizing patient survival. The results were disappointing and did not confirm the promising early reports of several small series of patients.14-16 In IRS-I1 only 52% of patients were disease-free at 3 years, compared with 70% disease-free patients among all nonmetastatic IRS-I patients with "special" pelvic tu- mors (P = 0.02). Almost all of the patients required radiation, surgery, or both to achieve CR. However, the overall S rate was comparable statistically in the two studies (78% for IRS-I versus 70% for IRS-11, P > 0.46), largely due to resection or irradiation of locally or re- gionally recurrent disease. Although by design the per- centage of patients with bladder or prostate lesions with bladders preserved was initially higher in IRS-11; there was only a 1% difference (23% in IRS-I versus 22% in IRS-11) in bladder salvage at 3 years in the two studies. These results underline the need for more effective agents, if this approach is to be successful. Meanwhile, rather than resorting to primary surgery, particularly for prostate and bladder neck lesions, giving radiation during induction chemotherapy might provide more du- rable local tumor control. Whether combined simulta- neous treatment will result in increased induction of second malignancies is yet to be evaluated. The alterna- tive would be surgical extirpation, placing the patient in Clinical Group I, and the resulting untoward effects of radical surgery and loss of functioning organs on the patient.
The relationship between survival prognosis and primary site was consistent between IRS-I and IRS-11.
Primary lesions of the orbit, GU tract (not bladder or prostate) and nonparameningeal head and neck had the most favorable prognosis, whereas lesions of the retroperitoneum ("other" category), had the least favor- able prognosis. Patients with extremity, parameningeal or GU tract (bladder-prostate) tumors had intermediate prognosis. A new IRS-SIOP pretreatment staging classi- fication, TNM based, takes these differences in progno- sis into account and includes primary site as an addi- tional staging f a ~ t o r . ' ~ , ' ~ This system is being used in
When patients in all clinical groups, regardless of treatment, are combined and comparisons made be- tween IRS-I and IRS-11, the S and duration of CR experi- ences were significantly superior for IRS-I1 patients (63% versus 55% for S, P < 0.001; 67% versus 61% for CR duration, P = 0.01). The major difference in S experi- ence at 5 years between studies was in nonmetastatic patients (71 O/O for IRS-I1 versus 63% for IRS-I, P = 0.01) and there was only a marginal improvement for meta- static patients (27% for IRS-I1 versus 21% for IRS-I, P = 0.07). Improved S rate after relapse was one of the factors leading to improved S rate of IRS-I1 over IRS-I. Further improvement in S experience is needed for both metastatic and nonmetastatic patients.
Although S rate after relapse improved in IRS-I1 compared with IRS-I, nevertheless it remains poor but not hopeless: 17% at 5 years. Local relapse accounted for 46% of relapses in Clinical Group I despite "com- plete" surgical removal of tumor, and 36%, 48%, and 20% of relapses in I1 to IV, respectively. The best ap- proach to the problem of relapse is prevention through more effective treatment of newly diagnosed patients, including adequate surgical excision and adequate dose and volume of radiation. Results are obviously better if we are confident these are microscopically clear mar- g i n ~ . ' ~ , ~ ~ To minimize the late morbidity of radiation, doses were lowered in IRS-I1 to 40 to 55 Gy. These doses may be inadequate for many patients with large tumor burdens. To avoid the late effects associated with higher doses while maintaining local control, hyper- fractionated radiation should be considered. This tech- nique permits the use of higher doses to the tumor. However, the late effects should be comparable with that observed with lower doses given by a conventional schedule. The efficacy of this approach is currently be- ing studied in IRS-IV.
How do the IRS-I1 results compare with other series in the literature? Flamant and Hillz1 reported a series of 193 patients treated according to TNM stage at the In- stitut Gustave-Roussy between 1972 and 1981. They used a primary chemotherapy approach for Stages I1 to IV and some Stage I patients, whereas other Stage I patients had initial surgery followed by radiation and concurrent chemotherapy. Chemotherapy varied by
IRS-IV.

IRS-II/Maurer et al. 1921
stage but essentially consisted of VAC-VAdr in an 18- month schedule. After maximum tumor regression, lim- ited surgery, radiation, or both were used. The 5-year S rate was 52%.
The study of Flamant and Hill formed the basis of the SIOP trial which included 317 patients (TNM Stages I-IV) entered from 1975-1983.'' The overall 3- year S rate for Stage I patients was 76% after tumor excision followed by radiation and VAC-VAdr chemo- therapy. Stage 11 and 111 patients were randomized be- tween primary VAC-VAdr chemotherapy followed by surgery and radiation for residual tumor and primary surgery or radiation followed by the same chemother- apy. The overall S rate at 3 years was 40%, with no significant difference between treatments. Stage IV pa- tients treated with all three modalities had a 3-year S rate of 33%. The SIOP study, which was conducted between 1984 and 1989, prescribed ifosfamide, vincris- tine, and dactinomycin (IVA) chemotherapy as its core therapy while exploring primary chemotherapy for Stages I1 and III.22 Preliminary results in 286 patients indicated an excellent CR rate of 83% including 54% after IVA alone. The early relapse rate was high (48%), however, with 52% living in first remission. Although the local relapse rate was 35%, about half of the pa- tients were living 2 years after the first relapse on pri- mary chemotherapy. The overall 4-year S rate was 69% for nonmetastatic patients and 28% for metastatic pa- tients.
The Italian group reported 118 patients treated in a manner very similar to the IRS patients, i.e., with sur- gery, radiation, VAC or modified VAC, and CNS pro- phylaxis for parameningeal tumors, between 1979 and 1985.23 Five-year S rates in Clinical Groups I to IV were 83%, 72%, 63%, and 33%, respectively.
The German study, CWS-81, accrued 352 patients with all types of soft tissue sarcoma, including 225 pa- tients with rhabdomyosarcoma, between 1981 and 1986.23 The design was similar to that of the IRS and the chemotherapy consisted of VAC plus Adriamycin (VACA). CNS prophylaxis was part of the protocol. Event-free S rates for patients with rhabdomyosarcoma in Clinical Groups I to IV were 8l%, 68%, 56%, and 11% at 5 years. They found that the CR rate at 7 weeks was a prognostic factor.24 Their successor study, CWS- 86, incorporated this into the design and used VAIA (I, ifosfamide) as the backbone of multimodality therapy.
Finally, the National Cancer Institute (NCI) re- ported the results of treatment of 76 patients with high- risk sarcomas including 25 with rhabdomyosarcoma registered on study between 1983 and 1986.25 High risk for rhabdomyosarcoma was defined as Clinical Group 111 patients with tumors arising in the chest wall, retro- peritoneum, perineum and extremity, and Clinical Group IV patients. Treatment consisted of short inten-
sive VAdrC induction courses in combination with radi- ation, followed by consolidation with total-body irra- diation and autologous bone marrow replacement for patients achieving CR and no maintenance chemother- apy. Ninety-one percent of patients achieved a CR and 87% maintained local tumor control. The actuarial overall S and DFS rates at 24 months were 68% and 48%, respectively, for the entire cohort of patients (rhabdomyosarcoma patients are not reported sepa- rately), indicating that treatment failure was primarily systemic. Comparing NCI results with IRS-I1 data sug- gest that although effective local treatment is essential, effective systemic therapy may be more important and should not be compromised by local treatment.
In summary, the results of IRS-I1 with 999 eligible patients are as good as or better than other reported series. Significant progress has been made in the treat- ment of the largest patient group, Clinical Group 111. However, treatment programs for all clinical groups and primary sites need to be improved if more children are to survive this disease.
We conclude that (1) cyclophosphamide did not contribute to the success of treatment in Clinical Groups I and I1 patients (extremity alveolar patients ex- cluded); (2) repetitive-pulse chemotherapy for 2 years increased S rates in children with Group I11 but not IV disease; Adriamycin offered no advantage over dactino- mycin and was associated with more fatal toxicities; (3) the overall approach to treating patients with paramen- ingeal sarcoma used in IRS-11, including compliance with radiation dose and volume and earlier timing, was successful in preventing CNS recurrence and increased S rates; (5) treatment of "special" pelvic tumors with primary repetitive-pulse VAC primary chemotherapy did not result in durable bladder salvage, although S rate was not compromised; and (6) there was some indi- cation that repetitive-pulse VAC chemotherapy im- proved the prognosis of patients with Clinical Groups I and I1 extremity alveolar rhabdomyosarcoma.
References
Maurer HM, Beltangady M, Gehan EA, Crist W, Hammond D, Hays DM, et al. The Intergroup Rhabdomyosarcoma Study-I: a final report. C a r m r 1988; 61:109-220. Raney RB, Gehan EA, Hays DM, Tefft M, Newton W, Maurer HM. Primary chemotherapy with or without radiation and/or surgery for children with localized sarcoma of the bladder, pros- tate, vagina, uterus and cervix: comparison of results in Inter- group Rhabdomyosarcoma Studies 1 and 11. Cancer 1990,
Heyn R, Beltangady M, Hays D, Lawrence W, Newton W, Crist W, et al. Results of intensive therapy in children with localized alveolar extremity rhabdomyosarcoma: a report from the 1RS Committee. Clin Oncol 1989; 7:200-7. Raney RB, Tefft M, Newton W, Ragab A, Lawrence W, Gehan EA, et al. Improved prognosis with intensive treatment of chil- dren with cranial soft tissue sarcomas arising in non-orbit para-
66:2072-81.

1922 CANCER March 1, 1993, Volume 71, No. 5
5.
6.
7.
8.
9.
10.
11.
12.
13.
14.
15.
16.
meningeal sites: a report from the lntergroup Rhabdomyosar- coma Study. Caiicer 1987; 59:147-55. Simon R, Wittes RS. Methodologic guidelines for reports of clin- ical trials. Cancer Treat Rep 1985; 69:l-3. Kaplan EL, Meier P. Nonparametric estimation from incomplete observations. ] A m Stat Assoc 1958; 53:457-581. Mantel N. Evaluation of survival data and two new rank order situations arising in its consideration. Cancer Cltemother Rep
Gehan EA. A generalized Wilcoxon test for comparing arbi- trarily singly-censored samples. Biomefrika 1965; 52:203-24. Fleiss JL. Statistical methods for rates and proportions. 1st ed. New York: Wiley and Sons, 1973:14-20. Mantel N, Haenszel W. Statistical aspects of the analysis of data from retrospective studies of disease. ] Natl Caiicer lnst 1959;
Newton WA, Soule EH, Harnoudi AB, Reiman HM, Shimada H, Beltangady M, et al. Histopathology of childhood sarcomas, In- tergroup Rhabdomyosarcoma Studies I and 11: clinicopathologic correlation. ] Cliii Oncol 1988; 6:67-75. Shimada H, Newton WA, Soule EH, Qualman SJ, Aoyama C, Maurer HM. Pathologic features of extraosseous Ewing’s sar- coma: a report from the Intergroup Rhabdomyosarcoma Study. Hum Pathol 1988; 19:442-3. Gasparini M, Lombardi F, Gianni MC, Massirnino M, Gandola L, Fossati-Bellani F. Questionable role of CNS radioprophylaxis in the therapeutic management of childhood rhabdornyosar- coma with meningeal extension. ] Cliti Oncol 1990; 8:1854-57. Hays DM, Ortega J. Primary chemotherapy in the management of pelvic rhabdomyosarcoma in infancy early childhood. In: Salmon S, Jones R, editors Adjuvant therapy of cancer. Amster- dam: Elseview-North Holland Biomedical Press, 1977:381-387. Ortega JA. A therapeutic approach to childhood pelvic rhabdo- myosarcoma without pelvic exenteration. ] Pediatr 1979;
Voute PA, Vos A. Combined chemotherapy as primary treat- ment in children with rhabdomyosarcoma to avoid mutilating surgery or radiotherapy [abstract]. Proc Am Soc CIin Oticol 1977; 18:327.
1966; 50:163-70.
22:719-48.
94:205-9.
17.
18.
19.
20.
21.
22.
23.
24.
25.
Lawrence W, Gehan EA, Hays DM, Beltangady M, Maurer HM. Prognostic significance of staging factors of the UlCC staging system in childhood rhabdomyosarcoma: a report from the In- tergroup Rhabdomyosarcoma Study (IRS-11). ] Clin Om01 1987;
Rodary C, Rey A, Olive D, Flamant F, Quintana E, Brunat-Men- tigny M, et al. Prognostic factors in 281 children with non-me- tastatic rhabdomyosarcorna at diagnosis. Med Pediatr Oiicd 1988; 16:71-7. Hays DM, Lawrence W, Wharam M, Newton W, Ruymann F, Beltangady M, et al. Primary reexcision for patients with “micro- scopic residual” tumor following initial excision of sarcomas of the trunk and extremity sites. ] Pediatr Surg 1989; 24:5-10. Lawrence W, Hays D, Heyn R, Beltangady M, Maurer HM. Sur- gical lessons from the Intergroup Rhabdomyosarcoma Study pertaining to extremity tumors. World ] Surg 1988; 12:676-84. Flamant F, Hill H. The improvement in survival associated with combined chemotherapy in childhood rhabdomyosarcoma: a historical comparison of 345 patients in the same center. Cancer
Flamant F, Rodary C, Rey A, Otten J, Voute PA, Sornmelet D, et al. Assessing the benefit of primary chemotherapy in the treat- ment of rhabdomyosarcoma in children: report from the Interna- tional Society of Pediatric Oncology: RMS 84 study [abstract]. Pror Am Sor Cfili Oiliol 1991; 10:309. Treuner J, Flamant F, Cadi M. Results of treatment of rhabdo- myosarcoma in the European studies. In: Maurer HM, Ruymann F, Pochedly C, editors Rhabdomyosarcoma and related tumors in children and adolescents. Boca Raton: CRC Press, 1991: 234-9. Treuner J, Suder J, Bode U, Kaatsch P, Riehm H, Jurgens H, et al. The degree of tumor response by initial chemotherapy as the main prognostic factor in childhood rhabdomyosarcoma [ab- stract]. Proc An7 Soc Cliii Oiicol 1986; 5:201. Kinsella TJ, Miser JS, Triche TJ, Horvath K, Glatstein E. Treat- ment of high-risk sarcomas in children and young adults: analy- sis of local control using intensive combined modality therapy. NCI Moliogr 1988; 6:291-6.
5~46-54.
1984; 5312417-21.