Different Methods and Formulations of Drugs and Vaccines for ...
Upload
khangminh22Category
view
0download
0
This paper should be cited as:
Costa, O. 2018. The influence of different smoking methods on the quality and stability of smoked redfish (Sebastes
norvegicus). United Nations University Fisheries Training Programme, Iceland [final project].
http://www.unuftp.is/static/fellows/document/osvaldo16prf.pdf
unuftp.is Final project 2016
THE INFLUENCE OF DIFFERENT SMOKING METHODS ON THE
QUALITY AND STABILITY OF SMOKED REDFISH (Sebastes
norvegicus)
Osvaldo da Costa
National Institute of Fisheries Research - Angola
Ilha de Luanda, Republica de Angola
Supervisors:
Sigurjon Arason
University of Iceland and Matis, Iceland
Magnea G. Karlsdóttir, Ph.D., Matis
Vínlandsleid 12, 113 Reyjavík, Iceland
Maria Gudjonsdottir, PhD.
University of Iceland, Reykjavik
Vínlandsleid 14, 113 Reyjavík, Iceland
ABSTRACT
Hot smoking is a traditional method for preserving fish in Angola, but the quality of the final
product is still unsatisfactory. The aim of this study was to examine new smoking technology,
which could benefit the rural areas of Angola, using redfish (Sebastes norvegicus) fillets and
testing two different smoking methods (Bradley and cabin kiln smoker). After smoking,
redfish was air packaged and during storage period the samples were divided in two
experimental groups, room cold storage (0-4) °C and room temperature (15-20) °C for both
smoked redfish fillets. Yield was 76.32% and 61.48% for Bradley smoker and cabin kiln
smoker respectively. The research results indicated significant difference in yield, and Total
Plate Count (TPC) for all study groups (p<0.05). Significant difference was observed
between storage days and color (lightness, yellowness and redness) (p<0.05). Total volatile
basic nitrogen (TVB-N) was stable for all samples except for Bradley smoked fillets. Storage
room temperature (104.7±6.08) and microbiological load was changed from 5 log(cfu/g) to
9 log(cfu/g). The level of PAHs in smoked fillets produced in cabin kiln was higher than
Bradley smoker.
Keywords: Smoked fish, cabin smoker, TBARS, smoking methods, PAH, water content, yield.
Costa
UNU Fisheries Training Programme 2
TABLE OF CONTENTS
LIST OF FIGURES .............................................................................................................. 4
LIST OF TABLES ................................................................................................................ 5
1 INTRODUCTION ......................................................................................................... 6
2 LITERATURE REVIEW ............................................................................................. 8
2.1 Fish smoking ............................................................................................................ 8
2.1.1 Hot smoke ......................................................................................................... 9
2.1.2 Open fire smoking .......................................................................................... 10
2.1.3 Cold smoking .................................................................................................. 11
3 MATERIAL AND METHODS .................................................................................. 11
3.1 Golden Redfish (Sebastes norvegicus) .................................................................. 11
3.2 Cabin Kiln .............................................................................................................. 11
3.4 Pre-trial .................................................................................................................. 12
3.5 Main trial ................................................................................................................ 13
3.6 Sampling ................................................................................................................ 14
3.7.1 The proximate composition ............................................................................ 14
3.7.2 Colour ............................................................................................................. 15
3.7.3 Free fatty acids................................................................................................ 15
3.7.4 Thiobarbituric Acid Reactive Substances (TBARS) ...................................... 15
3.7.5 Water activity ................................................................................................. 15
3.7.6 Water content (WC)........................................................................................ 15
3.7.7 Total Volatile Basic Nitrogen (TVBN) .......................................................... 16
3.7.8 Temperature .................................................................................................... 16
3.7.9 Salt content ..................................................................................................... 17
3.7.10 Acidity (pH) .................................................................................................... 17
3.7.11 Polycyclic Aromatic Hydrocarbons (PAH) Analysis ..................................... 17
3.7.12 Data analysis ................................................................................................... 17
4 RESULTS ..................................................................................................................... 17
4.1 Composition of Redfish fillets ........................................................................... 18
4.2 Yield changes ..................................................................................................... 18
4.3 Changes in temperature profile during smoke process and drying fillets .......... 18
4.4 Water activity ..................................................................................................... 20
4.5 Water content (WC) ............................................................................................... 21
4.6 Evolution in salt content over storage time............................................................ 21

Costa
UNU Fisheries Training Programme 3
4.7 Changes in TVB-N over storage time .................................................................... 22
4.8 Microbial Load ...................................................................................................... 23
4.9 Acidity (pH) ........................................................................................................... 23
4.10 Changes in colour .................................................................................................. 24
4.11 Changes in Free Fat Acids (FFA) .......................................................................... 26
4.12 Changes in TBARS ................................................................................................ 27
4.13 PAHs measurement ................................................................................................ 27
5 DISCUSSION .............................................................................................................. 28
5.1 Chemical composition of final product after smoking .......................................... 28
5.2 Quality of smoked fillets using Bradley and Cabin kiln smoker ........................... 30
6 CONCLUSION ............................................................................................................ 32
7 RECOMMENDATIONS ............................................................................................ 32
ACKNOWLEDGEMENTS ............................................................................................... 33
REFERENCES ................................................................................................................... 34
APPENDICES ..................................................................................................................... 41

Costa
UNU Fisheries Training Programme 4
LIST OF FIGURES
Figure 1: Estalagem informal market, Luanda. .................................................................... 10 Figure 2: Golden redfish (Sebastes norvegicus) and fillets. ................................................. 11 Figure 3: Matis cabin kiln smoker (source, Mgana 2014). ................................................... 12 Figure 4. Bradley smoker. .................................................................................................... 12
Figure 5: Flow chart of the smoking pre-trial....................................................................... 13 Figure 6: Flow charter of the main trial ................................................................................ 13 Figure 7: Yield changes in Golden redfish fillets smoking process. .................................... 18 Figure 8: Temperature changes in muscle fillets and inside cabin kiln smoker during smoke
redfish. .................................................................................................................................. 19
Figure 9: Changes in temperature in muscle fillet and distribution inside Bradley smoker
during smoking redfish. ........................................................................................................ 19
Figure 10: Temperature inside in redfish fillet during oven drying. .................................... 20 Figure 11: Changes in water activity (wa) after smoking and evolution during storage, RA-
Raw material; BR- Bradley; CA- cabin kiln; 0° and 20°- storage temperature. ................... 20
Figure 12: Changes in Water Content (WC) of smoked fillets for different smoking
methods and different storage conditions. ............................................................................ 21 Figure 13: Effect the smoke method in salt content (%) and storage conditions. ................ 22
Figure 14: Changes in TVB-N for smoke methods (Bradley and cabin kiln), effect in
storage temperature (0° C and 20°C) and shelf life. ............................................................. 22
Figure 15: The total plate count (Log cfu/g) of smoked redfish fillets (Bradley and Cabin
kiln) during chilled storage. .................................................................................................. 23 Figure 16: Acidity changes in storage time smoked redfish. ............................................... 24
Figure 17: Lightness (L* value) colour changes over storage time. .................................... 24 Figure 18: Effect over storage time and smoke methods in redness changes (a* value). .... 25
Figure 19: Yellowness Changes, b* value in smoke redfish fillets in storage time. ............ 26 Figure 20: Effect of smoke method in redfish fillets aver storage time. .............................. 27
Figure 21: Evolution salt content (a) and water content (b) in redfish muscle using different
brine concentrations and different time. ............................................................................... 41 Figure 22: Temperature changes in muscle fillets in different smoked fish methods, pre-
trial. ....................................................................................................................................... 41 Figure 23: Evolution of temperature in Bradley smoker in pre-trial. ................................... 42 Figure 24: Redfish fillets smoked in Kiln method. .............................................................. 43
Figure 25: Fillets in drying oven. ......................................................................................... 43

Costa
UNU Fisheries Training Programme 5
LIST OF TABLES
Table 1: Sampling plan ........................................................................................................ 14 Table 2: Changes in free fatty acid in different storage conditions in smoked redfish fillets
(g/100g Lipid). ...................................................................................................................... 26 Table 3: Levels of Polycyclic Aromatic Hydrocarbons in smoked redfish fillets. .............. 28
Table 4: Water activity and pH results at the pre-trial. ........................................................ 42 Table 5: Colour changes using different smoke methods and fuel....................................... 42

Costa
UNU Fisheries Training Programme 6
1 INTRODUCTION
The demand for fish and seafood products has consistently increased during the recent years
since fish protein is a major animal protein consumed in many parts of the world. Seafood is
a very perishable product and processing is therefore necessary to assure safety and
prolonged shelf life of seafood (Blackwell, 2014). Traditional processing methods of seafood
were originally developed to preserve fisheries products by either lowering the water activity
(Wa) and/or which points the growth of spoilage bacteria. In addition, preservation was also
carried out by applying salt and/or smoke components or other preservative compounds with
antibacterial activity to increase shelf life and improve safety of such products (Köse, 2010).
In the modern world, fish provides 16% of total animal protein consumed globally (FAO,
2016; Foline, 2011). Though perishable, fish is an important food stuff, especially in
developing countries, due to its high protein content and nutritional value of unsaturated fatty
acids and affordability by the masses when compared with beef (Adeyemi, 2013), poultry,
pork (FAO, 2016, Idah, 2013) and egg. Fish and fish products are of more importance in low-
income and food deficit countries, accounting for 24% of total animal protein consumed
(FAO, 2016). Its nutritional properties have been highlighted in several studies showing that
fish contains important micro-nutrients (riboflavin, iron and calcium) and fatty acids, such
as omega-3, all of which are important for human health, particularly during childhood (FAO,
2016).
Fish meat currently has a great market potential, because its product matches consumer
preferences for; nutrition (rich in proteins and polyunsaturated fatty acids), sensory (pleasant,
soft and characteristic taste), convenience (easy preparation or pre-ready), and
economic aspects (with affordable prices) (Ferreira et al., 2002).
One of the conservation processes of aquatic products is smoking (Bellagha, 2007). Fish
smoking is one of the oldest methods of preservation (Stlyhwo, 2005; Muratore, 2005; Yanar,
2006; Coban, 2013), giving a characteristic flavour and colour to the product and increasing
its shelf life (Frank, 2014). When, selecting a preservation method appropriate to developing
countries in relation to the raw material and the quality of the final product must be
determined/investigated (Cardinal et al., 2001; Ferreira et al., 2002; Souza et al., 2005).
Smoke is the product of incomplete combustion of wood and consists of numerous individual
components, namely, aldehydes, ketones, alcohols, acids, hydrocarbons, esters, phenols,
ethers, etc. These components are transferred to the smoked goods by deposition on their
surface and subsequent penetration into their flesh (Guillen, 2002; Goulas, 2005). For this
reason, the exportation of smoked fish is becoming increasingly stringent due to the
emergence of food safety and agricultural health standard, along with the fact that buyers
keep changing their requirements, offer new parameters for food safety (Gbolagunte, 2012).

Costa
UNU Fisheries Training Programme 7
Smoking fish in Angola
Angola has a coastline of about 1,650 km. Two diverging currents namely, the Angola current
with its warm water from the north and the cold Benguela current in the south creates a strong
upwelling with a highly productive ecosystem for marine resources. Angola also has several
high value freshwater fish species, currently estimated 255 species exploited. Tilapia sp. is
among the most important and abundant fresh water fish found in Angola. Other species
include the catfish (Clarias gariepinus), fresh water prawns, Giant river prawn
(Macrobrachuin rosenbergii) (FAO, 2007) and Rascasso-rosado (Scorpaena elongate),
Folger’s scorpionfish (Neomerinthe folgori) (Tweddle & Anderson, 2008).
Angola loses about 30 thousand tons of continental fish annually due to lack of processing
and capture centres, according to the representative of the United Nations Food and
Agriculture Organization (FAO) in Angola (Mamoudou, 2015).
The most common fish processing methods applied in Angola are salting drying and drying
hot drying smoked, identical to many other African countries. Various smoking kilns are
used all over the world. Older ovens have low purchasing cost but high operating costs due
to fuel consumption and the difficulty of controlling the system compared to more modern
smoking kilns (Arvanitoyannis, 2012).
The smoking of fish in Angola is performed in several rural areas, but the excess of smoke
in the product, the lack of control throughout processing and the amount of wood used for
smoking is high. This has led to the indiscriminate destruction of sensitive ecosystems
forested like mangroves has several other negative environmental impacts associated with
this practice.
Government institutions are responsible for regulating the introduction at new fish smoking
methods which one friendly to the environment protect health a safety of processors and
ensure safety of the fired products. Angola has not produced industrial smoked fish since
1975 and developing this activity is necessary to diversify Angola's economy.
1.1 Overall objectives
The main goal of this project is to examine a new smoking technology, which could benefit
the rural areas of Angola. The aim is to develop a final product with better commercial value,
and better food safety.
1.1.1 Specific objectives
• To compare the changes in smoked Redfish between two smoking methods; new
cabin kiln and modern Bradley smoker.
• To determine how quality and storage stability of smoked products are influenced by
different smoking techniques, smoking fuel and storage conditions, measuring and
comparing chemical (TVB-N, Free fat acid, TBARS, PAH), microbiological, and
physical parameters.

Costa
UNU Fisheries Training Programme 8
2 LITERATURE REVIEW
2.1 Fish smoking
Processing of seafood mainly inhibits and/or inactivates bacteria and enzymes which results
in shelf-life extension and also assures food safety. While the main role of processing is
preservation, processing not only extends shelf life but also creates a new range of products
(Blackwell, 2014).
It is imperative that only fresh, properly prepared fish be used for smoking. Smoking will not
mask or otherwise make a poor quality or spoiled fish acceptable (Martin, 1990). The
suitability of fish for yielding high-quality smoked products depends on the species
characteristics, but each species also depends on the impact of the nutrition, biological state,
and the effect of catching and handling after catch. The most important factors are the
composition of the meat (the content of fat and enzyme activity, as well as the vulnerability
to bacterial spoilage prior to smoking) (Doe, 1998).
In some species like herring, mackerel and freshwater trout, all of each have high lipid
contents, rancidity has been detected during spoilage (Connel, 1995). The lipid oxidation
process starts when molecular oxygen attacks unsaturated fats, through a series of reactions
where it takes part as reactants and intermediates and finish with formation of primary
oxidation products (hydroperoxide expressed as the peroxide value), the secondary oxidation
products are thiobarbituric acid-reactive substances (TBARS) and the tertiary products
(Rustad, 2010; Sohn & Ohshima, 2011) . The peroxide value (PV) is used as an indication of
the degree of oxidation that has taken place and is mainly used to determine the primary
oxidation of lipid in fish. The hydroperoxide break down and with further oxidation give a
variety of substances, some responsible for the rancid flavour and other effects (Rustad,
2010), this the reason because lipid degradation analysis combined with sensory analysis
gives information that can be used in evaluating the quality and storage life of smoked fish.
Heat processing remains one of the major methods for extending the shelf life of seafood and
provides a high level of safety and convenience. Smoking is the process of flavouring,
cooking, or preserving food by exposing it to smoke from burning or smouldering material,
most often wood or other fuels. However, agricultural biomass such as bagasse (plant
material derived from sugar cane), corn cobs, millet or rice stalks and coconut husks or shells
can also be used as fuel (Ndiaye, 2014).
Smoked foods generally cause health concerns, especially with respect to the possible
presence of Polycyclic Aromatic Hydrocarbons, (PAH), (Arantxa Rizo et al., 2016). PAHs
are a large class of organic material containing two or more fused aromatic rings formed by
incomplete combustion of wood and other organic materials. Generally, smoked foods
contain large amounts of these compounds (Chen, 1997; Moret, 1999; Phillips, 1999; Sinko,
2002). PAHs are a class of high lipophilic compounds that comprise a class of chemical
compounds known to be potent carcinogens. PAHs are present in the environment; in water,
air, soil and traces of these substances have been found in various food products. Food can
become contaminated during thermal treatments that occur in processes of food preparation
and manufacturing (drying and smoking) and cooking (roasting, baking, and frying)

Costa
UNU Fisheries Training Programme 9
(Ishizaki, 2010), incomplete burning of coal, oil, gas, wood, garbage, or other organic
substances (Agency for Toxic Substances and Disease Registry, 1995).
Due to their carcinogenic activity, PAHs have been included on the European Union (EU)
and the United States Environmental Protection Agency (USEPA) priority pollutant lists.
Human exposure to PAHs occurs in three ways: inhalation, dermal contact and consumption
of contaminated foods. Diet is the major source of human exposure to PAHs as it accounts
for 88 to 98% of such contamination (Farhadian, 2011).
The choice of smoking method and fuel are important aspects to consider to avoid potential
food contamination. For example, food contamination by PAHs differs depending on
whether wood, stalks or hay are used. Oilseed contamination with PAHs is higher when
coconut husks are used, instead of coconut shells, which are less rich in lignin (Ndiaye, 2014).
Through the years’ various ways of pyrolyzing wood to produce smoke-flavour compounds
have been developed. From a commercial standpoint this evolved from the first primitive
ways which probably just involved hanging meat on the ceiling of a dwelling and permitting
smoke resulting from a fire that was used solely as a source of warmth to pass through the
product (Maga, 2000).
In some countries advanced smoker – generation technology has been adapted in response to
the potential health concerns associated with certain rather primitive smoke – generation
systems (Maga, 2000).
As stated previously, smoking is a traditional preservation technology, used primarily for its
sensory advantages (taste and colour), in minimally processed products with lower salt
content to satisfy consumer taste (Gomes-Guillen et al., 2009). The smoking process leads
to weight loss due to both dehydration of the fish muscle and leaching of lipids from the fish
muscle. The weight loss depends on the raw material, the final product characteristics and
the smoking method (Blackwell, 2014).
2.1.1 Hot smoke
Hot smoking is a traditional smoking method using both heat and smoke. In Africa, hot-
smoking is a common way to preserve and market fish. The fish is smoked at temperatures
that are high enough and for a sufficient period of time to obtain heat coagulation of the
protein and elimination of bacteria. Generally, the temperature should reach at least 70–80
°C (Blackwell, 2014; Ahmed, 2011). During hot smoking, the fish is completely cooked and
can be consumed without further cooking (Blackwell, 2014). Due to the high temperature,
hot smoking takes only a short time, depending on the initial temperature of the product (Jr.
George, 2010). The smoking process can take the form of wet hot smoking or dry hot
smoking. Both processes are carried out at temperatures high enough to cook the fish (Alakali
et al., 2013).
Hot smoking involves the application of wood smoke to impart a smoky or smoked flavour
and to partially dry a fish product and to extend the shelf life of the product under some
conditions. Components in the fuel (wood/charcoal) via pyrolysis are broken down in the

Costa
UNU Fisheries Training Programme 10
process of burning to form smoke, which imparts on the fish a unique aroma and improves
taste and colour of the fish (Adeyemi, 2011).
Although the smoke-drying process may extend the shelf-life of fish by reducing the moisture
content which hinders microbial spoilage, the final product is often sold on open markets
where the fish are displayed uncovered on top of tables in the market place. This exposes the
products to contamination by unsanitary handling (by both sellers and buyers), dust and
insects such as flies and beetles (Ikutegbe, 2014). An image of a fish market common in
Angola is pictured in Figure 1.
Figure 1: Estalagem informal market, Luanda.
2.1.2 Open fire smoking
African populations have developed traditional fish processing techniques that make use of
available natural means, namely sun and wood (Ahmed, 2011). Smoking-drying is carried
out using various wood varieties. Fish are smoked for 2-3 hours at 70-80 °C, followed by
mild smoking (30-35°C) for 24-48 hours. (Ahmed, 2011). Dry hot smoking takes about 10–
18 hours, sometimes days yielding fish with 10–15% moisture content, or even below 10%.
Fish smoked by this process have an estimated shelf life of 6–9 months, packaged in air and
stored room temperature.
The hot smoking in fish includes diverse steps, the most important steps include drying the
surface and muscle, heating/cooking, smoking, drying, and cooling. Then, cooling down to
less than (3.3 °C) as quickly as possible and keeping products at that temperature to reduce
the growth of food poisoning bacteria until consumption (Kenneth & Hilderbrand, 1992).
Hot smoking has been applied to different fish species including Horse mackerel, sardine and
freshwater tilapia and Catfish.

Costa
UNU Fisheries Training Programme 11
2.1.3 Cold smoking
This involves smoking fish at temperatures where the products do not show any signs of heat
coagulation of the proteins. In cold smoking, the temperature should be maintained below 30
°C. Cold smoking is used to impart aroma and flavour in the fish muscle (Doe, 1998). The
Relative Humidity (RH) should be kept at 75–85%. During cold smoking, the fish will not
be cooked; therefore, it has to be cooked before consumption (Boziaris, 2014).
3 MATERIAL AND METHODS
3.1 Golden Redfish (Sebastes norvegicus)
Golden Redfish (Sebastes norvegicus) (Figure 2) also known as (Sebastes marinus) (ICES,
2012), is a species that as gain respect as a good food fish. Is one of the most common and
commercially important fish in Icelandic waters today (Ministry of Fisheries of Iceland,
2016).
Figure 2: Golden Redfish (Sebastes norvegicus) and fillets.
3.2 Cabin Kiln
The smoking cabin is a smoking kiln constructed by MATIS, used in some projects in Africa
(Figure 3). The smoking cabin is made of wood with a metal drum beneath the chamber
where burning wood is the source of heat and smoke. A metal cylinder connects the drum
and the smoking chamber to allow the heat flow into the compartment. A metal plate is placed
above the cylinder to diffuse the hot air and provide a more even circulation in the smoking
chamber. The fish is smoked on removable wooden frames with metal mesh. The
effectiveness of the cabin kiln may be impacted by weather conditions, permit efficient use
of the burned wood.

Costa
UNU Fisheries Training Programme 12
Figure 3: Matis cabin kiln smoker (Source: Mgana 2014).
3.3 Bradley smoker
Bradley smoker is an alternative electric smoker which is easier to control and more versatile
than traditional smokers, with the automatic smoke generator, electronic control and fully
insulated cabinet (Figure 4).
Figure 4. Bradley smoker.
3.4 Pre-trial
Two pre-trials were performed before the main experiment in order to determine appropriate
brining procedure (concentration and time). Pre-trials also compared two different smoking
facilities and two different smoking fuels, and defining appropriate processing procedures
during smoking, such as duration.
Fresh redfish fillets were thawed at 2-4°C overnight and were immersed in 8% and 12% salt
solution (ratio of 1:2 fish to brine) for up to 90 minutes at 0-2 °C. Samples were collected
after 30, 60 and 90 minutes for determination of salt content. After brining, the fillets were
placed on racks to drain overnight at 0-2 °C. The samples were smoked according to the

Costa
UNU Fisheries Training Programme 13
experiment design outlined in Figure 5, resulting in four experimental groups. Temperature
and time were monitored throughout the smoking period. The physical properties (colour,
water activity, pH, NIR and NMR) of the smoked samples were evaluated.
Figure 5: Flow chart of the smoking pre-trial.
3.5 Main trial
The experimental design of the main trial is shown on Figure 6. The results obtained in the
pre-trial however determined the final experimental design of the main trial. Frozen fillets
of redfish arrived at laboratory and were thawed at 2-4°C overnight and directly applied to
brining. After brining, the fillets were drained and dried at room temperature for
approximately 10 hours. The fish were subjected to two different smoking methods
facilitated in a smoking cabin kiln and Bradley. The smoking fuel used were based on the
results obtained in the pre-trial. Temperature loggers were placed both on the smoking
racks as well as inside the muscle to monitor the temperature profile during smoking. After
smoking, the final product was packed in open plastic bags (air packaging) and stored at 20
°C and 0-4 °C for up to 20 days.
Figure 6: Flow charter of the main trial
Smoking fuel
Smoking method
Raw materialFresh redfish fillets
with skin-on
Smoking cabin kiln -semi controlled
smoking
Manure and flakes
Wood and flakes
Drum - open fire smoking
Manure and flakes
Wood and flakes
Costa
UNU Fisheries Training Programme 14
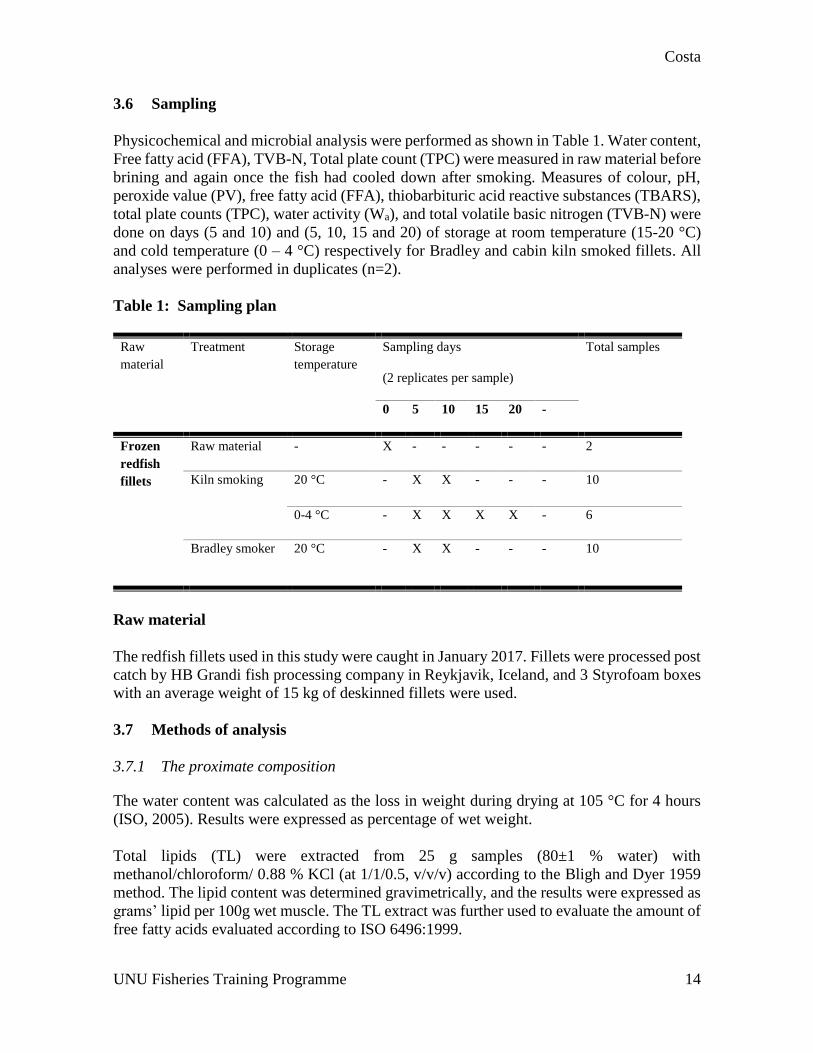
3.6 Sampling
Physicochemical and microbial analysis were performed as shown in Table 1. Water content,
Free fatty acid (FFA), TVB-N, Total plate count (TPC) were measured in raw material before
brining and again once the fish had cooled down after smoking. Measures of colour, pH,
peroxide value (PV), free fatty acid (FFA), thiobarbituric acid reactive substances (TBARS),
total plate counts (TPC), water activity (Wa), and total volatile basic nitrogen (TVB-N) were
done on days (5 and 10) and (5, 10, 15 and 20) of storage at room temperature (15-20 °C)
and cold temperature (0 – 4 °C) respectively for Bradley and cabin kiln smoked fillets. All
analyses were performed in duplicates (n=2).
Table 1: Sampling plan
Raw
material
Treatment Storage
temperature
Sampling days
(2 replicates per sample)
Total samples
0 5 10 15 20 -
Frozen
redfish
fillets
Raw material - X - - - - - 2
Kiln smoking 20 °C - X X - - - 10
0-4 °C - X X X X - 6
Bradley smoker 20 °C - X X - - - 10
Raw material
The redfish fillets used in this study were caught in January 2017. Fillets were processed post
catch by HB Grandi fish processing company in Reykjavik, Iceland, and 3 Styrofoam boxes
with an average weight of 15 kg of deskinned fillets were used.
3.7 Methods of analysis
3.7.1 The proximate composition
The water content was calculated as the loss in weight during drying at 105 °C for 4 hours
(ISO, 2005). Results were expressed as percentage of wet weight.
Total lipids (TL) were extracted from 25 g samples (80±1 % water) with
methanol/chloroform/ 0.88 % KCl (at 1/1/0.5, v/v/v) according to the Bligh and Dyer 1959
method. The lipid content was determined gravimetrically, and the results were expressed as
grams’ lipid per 100g wet muscle. The TL extract was further used to evaluate the amount of
free fatty acids evaluated according to ISO 6496:1999.

Costa
UNU Fisheries Training Programme 15
3.7.2 Colour
The intensity of the flesh colour was measured with a Minolta Chroma Meter CR-300
(Minolta, Osaka, Japan) using the CIE Lab system. The instrument records the L (lightness),
a (redness) and b (yellowness) values on CIELAB colour scale. The L value, lightness, was
recorded on the scale of 0 to 100 from black to white; a value was recorded as (+) red or (-)
green, and b value as (+) yellow or (-) blue. The colour was measured above the lateral line
at five positions, from the head to the tail of each fillet.
3.7.3 Free fatty acids
Free fatty acids (FFA) were determined according to method from (Lowry and Tinsley, 1976)
with a modification made by Bernardez et al., (2005). About 3 mL of the lower phase
resulting from lipid extraction (Bligh & Dyer, 1959) was added in a screw cap culture tube.
Any solvent present was removed at 55°C using nitrogen jet. After cooling down, 3 mL of
cyclohexane was added by 1 mL of Cupric Acetate – pyridine reagent and vortex for 40
seconds. After centrifugation at 2000 rpm for 10 min at 4 ºC, the upper layer was read at 710
nm in spectrophotometer. The FFA concentration in the sample was calculated as µmol Oleic
Acid based on a standard curve spanning a 2-14 µmol range.
3.7.4 Thiobarbituric Acid Reactive Substances (TBARS)
A modified method of Lemon (1975) was used for measuring thiobarbituric acid reactive
substance (TBARS). A sample (5.0 g) was homogenized with 10.0 mL of trichloroacetic acid
(TCA) extraction solution (7.5% TCA, 0.1% propyl gallate and 0.1% EDTA mixture
prepared in ultrapure water) using a homogenizer at maximum speed for 10 seconds (Ultra-
Turrax T-25 basic, IKA, Germany). The homogenized samples were then centrifuged at 5100
rpm for 20 min (TJ-25 Centrifuge, Beckmann Coulter, USA). Supernatant (0.1 mL) was
collected and mixed with the 0.9 mL thiobarbituric acid (0.02 M) and heated in a water bath
at 95°C for 40 min. The samples were cooled down on ice and immediately loaded into 96-
wells microplates (NUNC A/S Thermo Fisher Scientific, Roskilde, Denmark) for reading at
530 nm (Tecan Sunrise, Austria). A standard curve was prepared using tetraethoxypropane.
The results were expressed as µmol of malomaldehyde diethylacetal per kg of wet muscle.
3.7.5 Water activity
An Aqua Lab water activity meter was used to measure water activity (Wa) of the fresh and
smoked fish. About 2 g of samples were put into the instrument and Wa were measured
automatically after starting the program. Each sample were measured in duplicate.
3.7.6 Water content (WC)
Water content (WC) is the ability of a muscle to retain fluid under specific conditions. WC
was determined by a method that is built on a method by Børresen (Eide 1982). The sample
glasses were made from plexi-glass and their dimensions were: height 62 mm, inner diameter

Costa
UNU Fisheries Training Programme 16
19 mm and outer diameter 25 mm. The rotor used was SS-34 for Sorvall centrifuge, type RC-
5B (Dupoint, USA). The samples were centrifuged at 1500 rpm for five minutes in special
sample glasses. Samples were prepared by chopping them in a Braun Mixer (Type 4262,
Germany) for 10-15 seconds (until homogenous).
The sample glass was weighed empty and then 2 grams of the sample were weighted into the
glass. After centrifugation, the sample glass was weighed again with the sample in it minus
the loose bounded water.
The Water Holding Capacity (WHC) of the sample was then calculated using the following
formula:
𝑊𝐻𝐶 =W1 − ∆𝑟
𝑊1× 100(%)
Where:
W1 is the water content of the sample before centrifugation (%).
∆r is the weight lost by centrifugation (%).
3.7.7 Total Volatile Basic Nitrogen (TVBN)
The total volatile base nitrogen (TVB-N) was determined according to the method described
by Malle & Poumeyrol (1989). TVB-N was measured by steam distillation (Struer TVN
distillatory, STRUERS, Copenhagen) and titration, after extracting the fish muscle with 7.5
% aqueous trichloroacetic acid solution. The distilled TVB-N was then collected in boric acid
solution and titrated with sulphuric acid solution. TVB-N content was expressed as mgN/100
g of fish sample. TVB-N was then calculated as;
14
𝑚𝑔
𝑚𝑜𝑙𝑥𝑎𝑥𝑏𝑥300
25 𝑚𝐿[
𝑚𝑔𝑁
100]
Where;
a = volume of sulphuric acid (mL)
b = normality of sulphuric acid (%)
14 = is the molecular weight of nitrogen.
3.7.8 Temperature
The temperature during smoking and storage was recorded at five-minute intervals, by data
loggers placed inside in the fillet, on each rack of the smoker and oven, in the cooling room
and in room temperature storage. Additionally, the temperature in the centre of fish was
measured during smoking by a thermometer.

Costa
UNU Fisheries Training Programme 17
3.7.9 Salt content
Salt content of products was determined according to (AOAC 17th ed. 2000 no 976.18).
Soluble chloride was extracted from the samples with water. Upon addition of nitric acid, the
solution was titrated with silver nitrate and the end point was determined potentiometrically.
3.7.10 Acidity (pH)
The acidity of both muscle was determined with a combination glass electrode, pH meter at
room temperature. The pH of the muscle was measured by inserting the electrode directly
into the fillet mince, according to the method of Kramer and Peters (1981). The pH meter
was previously calibrated with buffer solutions of pH 7.00 ± 0.01 and 4.00 ± 0.01 at 20 °C,
after was measured using a calomel electrode (SE 104) pH meter (Knick-Portamess 913 (X)
pH meter, Germany, Berlin). The sample was done in duplicate.
3.7.11 Polycyclic Aromatic Hydrocarbons (PAH) Analysis
Polycyclic Aromatic Hydrocarbons was measured in the Eurofins WEJ contaminant
laboratory. After smoking, samples of Redfish fillets from the Bradley smoker and the cabin
kiln smoker were vacuum packaging keep in frozen storage (-80°C) and sent to the laboratory
for analysis.
3.7.12 Data analysis
The results from the experiment were analysed using Microsoft Excel 2016 to calculate
means and standard deviations for all multiple measurements in duplicate, and to generate
graphs. Single factor ANOVA and two sample t-test were also carried out. The significance
level was set at 95 % (p < 0.05).
4 RESULTS
During the smoke process, some changes in chemical content of the fish muscle occurred,
mainly in salt and water content, and consequently, in the weight of the fish. The results of
pre-trials on optimizing the best salting brine and steps in main trial are presented in
Appendix, Figures (21 to 23) and Tables (5 and 6).
This chapter presents the major changes in weight, salt percent, pH, water activity, water
content and the results of chemical and microbiological analysis of main trial of the final
product of the smoked redfish fillets during storage time.

Costa
UNU Fisheries Training Programme 18
4.1 Composition of Redfish fillets
The composition of the raw material fillets was measured after thawing. The total volatile
basic nitrogen (TVB-N) was determined to be 8.8±0.2 mg N/100g, the Water content (WC)
80.6±0.4 (%), total plate count 5.0±0.1 log (cfu/g), acidity 6.43±0.1, salt content 0.4, water
activity 1.00 and TBARS
4.2 Yield changes
Generally, the total yield changed in both study groups. It increased after brining and
decreased after smoking. The increase in yield at the brine salting step in cabin kiln method
was 5.51% and 5.91% for Bradley method. The dehydration after smoking yield had different
outcomes for two methods tested. Weight decreased to 5.93 kg for fillets produced in cabin
kiln and 7.28 kg for fillets produced using Bradley smoke method. The final product yield
was 76.32% and 61.48% for Bradley smoked and cabin kiln smoked fillets respectively.
Statistical analysis showed a difference between all phases in weight of the fillets (raw
material, after brine, after smoke and drying in oven) (p<0.03) (Figure 7).
Figure 7: Yield changes in Golden Redfish fillets smoking process.
4.3 Changes in temperature profile during smoke process and drying fillets
The temperature profiles are shown in Figures (8 and 9). The temperature was not as well
distributed in the cabin kiln smoke as inside Bradley smoker. The highest value recorded in
the fish muscle in the cabin kiln smoker were 120 °C and Bradley smoker 69.5 °C.
The temperature was higher on the top and decreased at the bottom in cabin kiln smoker. For
the Bradley smoker, the temperature was higher on the bottom and decreased at the top.
The temperature was 113.9±20.1 °C on rack and 69.3±17.1 inside muscle fillet at the top and
93.1±19.2 °C on rack, and 52.3±4.99 °C inside muscle on rack at the bottom for cabin kiln
smoker. For the Bradley smoker the temperature was 75.5±6.2 on rack, 50.5±7.2 inside
muscle fillet on the bottom, 69.5±6.7 on rack, and 49.5 inside muscle fillet on top.
05
101520253035404550556065707580859095
100105110
Bradley cabin kiln
Yiel
d (
%)
Smoke methods
After brined
After smoked

Costa
UNU Fisheries Training Programme 19
Figure 8: Temperature changes in muscle fillets and inside cabin kiln smoker during
smoking redfish.
Figure 9: Changes in temperature in muscle fillet and distribution inside Bradley
smoker during smoking redfish.
The result showed that the drying temperature increased with time, with a mean temperature
of 38.5±6.6 °C, and a maximum of 44°C during the 2 hours of oven drying (Figure 10).
0102030405060708090
100110120130140150
1 8
15
22
29
36
43
50
57
64
71
78
85
92
99
10
6
11
3
12
0
12
7
13
4
14
1
14
8
15
5
16
2
16
9
17
6
18
3
Tem
per
atu
re (°C
)
Time (Minuts)
fillet top on rack top fillet bottom on rack bottom
0102030405060708090
100110120
1
13
25
37
49
61
73
85
97
10
9
12
1
13
3
14
5
15
7
16
9
18
1
19
3
20
5
21
7
22
9
24
1
25
3
26
5
27
7
28
9
30
1
31
3
32
5
33
7
Tem
per
atu
re (°C
)
Time (Minuts)
Muscle rack bottom Muscle rack top Rack bottom Rack top

Costa
UNU Fisheries Training Programme 20
Figure 10: Temperature inside redfish fillet during oven drying.
4.4 Water activity
Water activity (Wa), measures how efficiently the water present in a food material can take
part in a chemical or physical reaction. The water activity of the raw material fillets was
1.000 (Figure 11).
For 0 °C storage samples, Wa was not stable in final product for both methods tested. For the
period between 5 and 10 days Bradley samples decreased and increased in day 20. For 20 °C
storage samples, Wa decreased in time and both smoke methods had similar evolution.
Figure 11: Changes in water activity (wa) after smoking and evolution during storage,
RA- Raw material; BR- Bradley; CA- cabin kiln; 0° and 20°- storage temperature.
05
101520253035404550
0 15 30 35 45 60 75 90 105 110 115 120
Tem
per
atu
re i
n °
C
Time (Minuts)Temperature
0,91
0,92
0,93
0,94
0,95
0,96
0,97
0,98
0,99
1,00
0 5 10 15 20
Wa
Time (days)RA BR 0° CA 0° BR 20° CA 20°

Costa
UNU Fisheries Training Programme 21
4.5 Water content (WC)
The water content of the hot smoke redfish fillets for both treatments decreased during the
storage period. In the beginning of the storage time the WC was similar between storage
samples at 0-4 °C temperature also but different for storage samples at 20 °C temperature.
Initial WC of the raw material was 80.6%. After smoking that decreased down to 66.5±4.2
% and storage time further reduced WC, resulting in similar values in both smoke methods
and storage temperature. For samples stored at 0-4° C the WC was 62.8±0.2 and 61.2 for
Bradley smoker and cabin kiln smoker respectively (Figure 12).
Figure 12: Changes in Water Content (WC) of smoked fillets for different smoking
methods and different storage conditions.
4.6 Evolution in salt content over storage time
The changes in salt content in the smoked redfish fillets increased over time in all groups
except for Bradley smoked storage samples at room temperature. In all groups, salt content
percent is two times higher between content measured in the pre-trial (Figure 13). For
samples stored at 20 °C, for both tested methods the results were above 3.5% with exception
for Bradley smoke method in day 10. The statistical results showed no difference between
all groups (p>0.05).
0,0
20,0
40,0
60,0
80,0
100,0
Day 0 Day 5 Day 10 Day 15 Day 20
Wat
er C
onte
nt
(%)
SAMPLES
RM BR 0°C CA 0°C BR 20°C Day 20

Costa
UNU Fisheries Training Programme 22
Figure 13: Effect the smoke method in salt content (%) and storage conditions.
4.7 Changes in TVB-N over storage time
The TVB-N of the samples after smoking and during storage were determined and presented
in Figure 14. In comparison with the raw material, the TVB-N of smoke fillets in all group
was increased significantly. It tripled during chilled storage samples and increased tenfold in
room temperature samples. There were very small variances between all groups (0.045±0.01
mg N/100g) and storage days, but measurements on day 10 for the Bradley smoker samples
storage at 20° C were highest (104.7 mg N/100g).
Figure 14: Changes in TVB-N for smoke methods (Bradley and cabin kiln), effect in
storage temperature (0° C and 20°C) and shelf life.
0,0
0,5
1,0
1,5
2,0
2,5
3,0
3,5
4,0
4,5
Day 0 Day 5 Day 10 Day 15 Day 20
Salt
(%
)
Time (days)
RM BR 0°C CA 0°C BR 20°C CA 20°C
0,05,0
10,015,020,025,030,035,040,045,050,055,060,065,070,075,080,085,090,095,0
100,0105,0110,0
Day 0 Day 5 Day 10 Day 15 Day 20
TVB
-N m
g N
/10
0g
Storage Time
Chart Title
RM BR 0 CA0 BR 20 CA 20

Costa
UNU Fisheries Training Programme 23
4.8 Microbial Load
For both fish smoking methods and storage temperatures tested, the Total Plate Count
bacteria (TPC) increased with time for Bradley smoked samples and decreased for cabin kiln
smoked samples (Figure 15). The TPC range for the microbial load of the smoked fish
products at 20 days was from 5.5x10⁴±0.1 cfu/g for raw material to 9.0x10⁹±0 cfu/g for
Bradley smoked samples at room temperature storage. Samples stored at room temperature
and smoked by the Bradley resulted in the most bacterial load. Statistical analysis showed
there was difference between TPC obtained on raw material and all groups of smoked
Redfish fillets mean over the storage period (p<0.05), but there was no difference between
TPC obtained in all groups.
Figure 15: The total plate count (Log cfu/g) of smoke Redfish fillets (Bradley and
Cabin kiln) during chilled storage.
4.9 Acidity (pH)
The pH of all smoke fillets changed over time. Day 5 to day 10 for samples stored at 20°C
for both smoke methods showed no statistical difference among the fillets (P>0.05) (Figure
16), which indicates that smoking method and the storage temperature used had no effect on
the pH levels of fillets during chilling storage. After smoking, pH increased over time storage
temperature, the increase is very notable in all samples with the exception of the Bradley
smoke fillets storage at room temperature.
0
1
2
3
4
5
6
7
8
9
10
Day 0 Day 5 Day 10 Day 15 Day 20
Lo
g c
fu/g
Storage time (Days)
RM BR 0° BR 20° CA 0° CA 20°

Costa
UNU Fisheries Training Programme 24
Figure 16: Acidity changes in storage time smoke Redfish.
4.10 Changes in colour
L* describing lightness (L* = 0 for black, L* = 100 for white), a* describing intensity in
red (a* > 0), b* describing intensity in yellow (b* > 0).
The initial mean L* value (lightness) of raw material (redfish) fillets was 51.5±2.7 and
decreased in time to 46.5±2.9 (Figure 17). No significant difference was observed between all
groups in time and storage temperature (p>0.05). Significant difference in lightness was
observed between the raw material and fillets produced in Bradley smoker (storage 0-4°C
and room temperature) and cabin kiln smoker samples storage 0-4°C, (p=0.01 and p=0.008)
respectively.
Figure 17: Lightness (L* value) colour changes over storage time.
5,90
6,00
6,10
6,20
6,30
6,40
6,50
6,60
D A Y 0 D A Y 5 D A Y 1 0 D A Y 1 5 D A Y 2 0
pH
-Val
ue
Storage time (days)
RM BR 0° BR 20° CA 0° CA 20°
0
5
10
15
20
25
30
35
40
45
50
0 5 10 15 20
Ligt
hn
ess
(L*
Val
ue)
Storage time (days)
RM BR 0 BR 20 CA 0 CA 20

Costa
UNU Fisheries Training Programme 25
Also, significant difference was observed in colour changes (lightness) between storage
samples 0°C for Bradley smoker and cabin kiln smoker and differences were observed
between temperature (p=0.0002).
The redness changes were alternating in storage temperature (Figure 18). The initial value for
a* value for raw material redfish fillets was 4.48±2.0 and increased to 5.72±2.32, 5.29±2.27
and 6.85±3.33 for Bradley 0° C, cabin kiln 0° C and cabin kiln 20° C samples respectively.
For Bradley 20° C samples the value decreased to 3.82±1.93. After smoking, no significant
difference in redness was observed between the groups and raw material. The statistical
analyses showed no difference in all smoked groups (p>0.05), and during prolonged storage.
Figure 18: Effect over storage time and smoke methods in redness changes (a* value).
The b value (yellowness) describes the changes in intensity of blue (negative) and yellow
(positive) colour of the redfish fillets before smoking and after smoking in storage time. The
yellowness of the smoked redfish was not significantly different compared with the smoked
method and all groups after storage time (p=0.194) but was significantly different in different
storage time (p=0.002) (Figure 19).
0
1
2
3
4
5
6
7
8
0 5 10 15 20
Red
nes
s in
ten
sity
Time (days)
RM BR 0 BR 20 CA 0 CA 20

Costa
UNU Fisheries Training Programme 26
Figure 19: Yellowness Changes, b* value in smoked redfish fillets in storage time.
4.11 Changes in Free Fat Acids (FFA)
The effect of smoke method, storage temperature and storage time on smoked redfish fillets
are presented in Table 2. The raw material samples of redfish had 3.98±0.9 g/100g lipid of
free fatty acids (FFA) before they were smoked for storage samples at room temperature (20
°C). For cabin kiln it decreased (4.89±0.0 to 3.93±0.09), while the cabin kiln storage samples
at cold room temperature (0 °C) and Bradley room temperature samples FFA value increased
over storage time. There was no significant difference in FFA content between the two
smoking methods and four groups during storage time p>0.05.
Table 2: Changes in free fatty acid in different storage conditions in smoked redfish
fillets (g/100g Lipid).
SAMPLES
R M BRADLEY CABIN KILN
STORAGE DAYS 0° C 20° C 0° C 20° C
0 3.98±0.9 - - - -
5 - 7.83±0.18 3.80±0.00 3.40±1.03 4.89±0.00
10 - 5.61±1.97 4.36±0.31 3.92±0.09 3.93±0.09
15 - 5.33±0.38 - 5.93±0.25 -
20 - 6.21±0.29 - 6.35±0.35 -
0
2
4
6
8
10
12
14
16
18
0 5 10 15 20
Yello
wn
ess
(b*
valu
e)
Time in days
RM BR 0 BR 20 CA 0 CA 20

Costa
UNU Fisheries Training Programme 27
4.12 Changes in TBARS
The oxidative stability of the smoked redfish fillet samples smoked with wood and flakes
was evaluated based on the concentration measurements of the substances reactive to
thiobarbituric acid – TBARS, and the results (mean ± SD) are shown in Figure 20. The
TBARS of raw material was 0.085 µmol/kg. After smoking TBARS decreased to 0.05
µmol/kg (for cabin kiln storage samples 0°C and day 10 for samples 20°C) and increased for
other samples to 0.9 µmol/kg (for Bradley samples storage 0°C). The results indicated that
the TBARS was not significantly different between smoking methods or storage temperature
samples (p>0.05).
Figure 20: Effect of smoke method in redfish fillets over storage time.
4.13 PAHs measurement
Levels of PAHs in smoked redfish from the project are shown in Table 3. Cyclopenta (c,d)
pyrene also known as CPP, Benzo (a) anthracene also known as BaA and Chrysene also
known as CHR with 26.25±0.07, 24.15±0.07 and 24.00±0.28 respectively, were the most
influent elements for samples smoked in cabin kiln. Moreover, the sum of the four main
PAHs, Benzo (a) anthranthene, Chrysene, Benzo (b) fluoranthene and Benzo (a) pyrene in
the smoked redfish fillets from Bradley was <2 µg/kg but inapplicable, for samples smoked
in cabin kiln the sum of all positive PAHs was 117.55±0.35.

Costa
UNU Fisheries Training Programme 28
Table 3: Levels of Polycyclic Aromatic Hydrocarbons in smoked redfish fillets.
PAH compound Abbreviation Level of PAHs in Bradley
smoker (µg/kg)
Level of PAHs in
cabin kiln smoker (µg/kg)
Benzo (a) anthracene BaA <0.5 24.15 ±0.07
Chrysene CHR <0.5 24.00±0.28
benzo (b) fluoranthene BbF <0.5 7.3
benzo (k) fluoranthene BkF <0.5 3.5±0.14
benzo (j) fluoranthene BjF <0.5 4.8
benzo (a) pyrene BaP <0.5 7.75 ± 0.07
Indeno (1,2,3-cd) pyrene IcP <1 3.3
Dibenzo (a, h) pyrene DhP <0.5 2.85±0.07
Benzo (ghi) pirylene BgP <1 ±0.9
Dibenzo (a, l) pyrene DlP <1 <1
Dibenzo (a, i) pyrene DiP <0.5 <1
Dibenzo (a, h) pyrene DhA <1 <0.5
Dibenzo (a, e) pyrene DeP <1 <1
Cyclopenta (c,d) pyrene CPP <1 26.25±0.07
5-Methylchrysene 5MC <1 13.6±0.28
Benzo- (c) - fluorene BcL <1 4.15±0.07
5 DISCUSSION
5.1 Chemical composition of final product after smoking
There are several factors which influence hot smoking. These include; fish factors, method
used and fuel. But fish factors like fat and water content in the muscles is very important.
The WC after smoking for samples stored at 0 °C for both smoke methods decreased to 63.0
and 60.4 for Bradley smoked and cabin kiln smoked samples respectively. For samples stored
at room temperature (20 °C) the results were 61.8 and 60.9°C respectively, showing small
changes during the storage time for the Bradley samples and cabin kiln smoker samples. The
results were not significantly different between groups and storage days, showing that the
smoking method used had no effect on the parameter. The storage conditions RH (Relativity
Humidity) affected the smoked redfish fillets and that effect is explained by (Boziaris, 2014)
as increasing temperature and increasing processing time resulting in a loss of WC. Also, the
changes in myofibrillar proteins which affect the quality of fish muscle have been related to
proteolytic activity in the muscle of fish (Benjakul, 1997). These changes were consistent
with (Yanar, 2006) in hot smoke tilapia and (Schubring, 2006) explain that changes can be
caused by gradual denaturation of muscle proteins with increasing refrigerated storage time
influenced by thermal treatment at low temperature during smoking and by additives,
particularly salt.
The water activity starting at 1.000 (100%) in raw material, after smoking decreased to 96.8%
for Bradley smoked fillets and 95.3% for cabin kiln smoked fillets. The values obtained for
Costa
UNU Fisheries Training Programme 29
this parameter were similar to those reported by other authors (Mgana, 2014; Karásková et
al., 2011), for this change in water activity value probably is the humidity in room storage
and this is agreement with surrounding environment relative humidity, pressure,
temperature/heat, and speed of air passing through the dried product are also important
factors to be considered (Hilderbrand Jr, 2001). The statistic results showed no significance
difference between methods smoked used and storage days (p>0.05).
The salt content in the raw fillets was 0.35±0.07 and after smoking for samples that value
increased for both methods, Bradley and cabin kiln smoker. The results showed significant
difference between storage samples at 0 °C for both methods and raw material (p<0.03) with
exception for storage samples at 20 °C (p>0.05). This variability has been also observed in
other studies carried out with smoked fish products (Karásková et al., 2011; Fuentes et al.,
2010). The increase in salt content in all redfish smoke fillets samples resulted from the salt
diffusion into the fish muscle and the removal of water (drying) during the smoking process,
and the less value of WHC over storage time. It could be because in pre-trial used fresh fillets
the skin was on and in the main trial used frozen fillets the skin was off.
The total volatile basic nitrogen (TVB-N) is one of the most widely used measurements of
seafood quality. TVB-N value is an important parameter for determining the freshness of fish
products. TVB-N value is affected by species, catching region and season, age and sex of
fish (Gökoğlu et al., 1998). According to Huss (1995), it is a general term which includes the
trimethylamine, dimethylamine, ammonia and other volatile basic nitrogenous compounds
associated with seafood spoilage.
The total volatile basic nitrogen or total volatile bases noted TVB-N or TVB or TVN consists
mainly of a mixture of ammonia, DMA and TMA plus amines from the decarboxylation of
amino acids (Garcia-Garrido, 1997) and other nitrogen compounds that become volatile
when made alkaline (Pedrosa-Menabrito and Regenstein, 1990). The results of analysis are
given in nitrogen equivalent, Ammonia-N, DMA-N, TMA-N and TVB-N.
The present study showed higher value for TVB-N value after smoking for all methods and
over storage time and showed that the raw material samples used in this experiment were of
good quality as the Total Volatile Nitrogen Bases (TVB-N) were below the recommended
maximum levels of 35 mg N/100 g for smoke fish., (Commission Regulation (EC) No
1022/2008, 2008). At the beginning, the TVB-N values of raw fillets redfish was 8.9 mg
N/100 g and after smoking, it increased for all sample groups and all study method groups
were higher than samples in cabin kiln smoker storage 20 °C (104 mg N/100 g flesh fish).
The results showed no significant difference between raw material and all groups (p>0.05)
with exception of Bradley smoked fillets stored at 20 °C (p=0.01) and that behaviour is
similar over storage time between all smoked groups (Bradley smoked fillets storage 0 °C,
cabin kiln smoked fillets storage 0 °C and cabin kiln smoked fillets storage 20 °C) and
Bradley smoked fillets storage 20 °C in day 10, (p<0.05). Progressive increase in TVB-N at
room temperature stored samples for Bradley smoked fillets signifies continuous
deterioration of the smoked fish. While at cold room temperature the values kept on
increasing but not at high rate.

Costa
UNU Fisheries Training Programme 30
The TVB-N of all the samples increased during the storage time but the values were not high
and were acceptable according to (Commission Regulation (EC) No 1022/2008, 2008) except
for 0°C storage samples after day 15 for Bradley smoked, cabin kiln smoked and all samples
storage room temperature, TVB-N value increased more than 25 mg N/100 g. The results of
this study are like the findings of other research (Ikutegbe, 2014; Alicicek & Atar, 2010;
Kumolu-Johnson, 2010; Plahar et al., 1999; Hood, 1983) where smoking processes
influenced the TVB-N level of smoked rainbow trout where the TVB-N increased after
smoking and through storage. This fact could be explained by the higher microbiological
load observed in smoked redfish 9 log(cfu/g), Debevere and Boskou (1996) explain that this
can be attributed to the fact that TMA values vary with species, season, storage conditions,
bacteria and intrinsic enzyme activity. (Huss, 1995) total volatile basic amines (TVB) is one
of the most widely used measurements of seafood quality. It is a general term which includes
the measurement of trimethylamine (produced by spoilage bacteria), dimethylamine
(produced by autolytic enzymes during frozen storage), ammonia (produced by the
deamination of amino-acids and nucleotide catabolites) and other volatile basic nitrogenous
compounds associated with seafood spoilage. Huss (1995) explain the little ammonia is also
formed in the first weeks of iced storage due to autolysis. In some fish that do not contain
TMAO or where spoilage is due to a non TMAO reducing flora, a slow rise in TVB is seen
during storage, probably resulting from the deamination of amino acids.
5.2 Quality of smoked fillets using Bradley and Cabin kiln smoker
The environment affects the growth of microorganisms, and they can alter the environment.
Also, microorganisms can inhibit or stimulate the growth of each other (Banwart, 1981). One
objective of the study was the investigation of shelf life of hot smoked redfish. The
microbiological results in this study showed mean total plate counts (TPC) samples of
smoked redfish during over storage time and are given in Figure 17. After smoking and over
storage time TPC increased significantly (p<0.05) between raw material and all study groups.
TPC rose sharply when the temperature storage increased to 20 °C (room temperature).
Furthermore, the TPC of redfish smoked samples was significantly (p<0.05) higher than that
compared to storage days throughout the processing and storage time. Also, spoilage of the
smoked fillets storage at 20 °C was not retarded by their exposure to storage conditions in
the temperature room. All experimental groups were affected by microbial growth,
enzymatic activity and lipid oxidation at different storage days although spoilage occurred
more rapidly in smoked samples stored at 23 °C. Microbial rates were also affected by
availability changes in both temperature and cold storage rooms
The results are associated with the higher results in WC, water activity and air packaging in
all smoked fillets. (Flick, 1990) explains packaging can play a key role in the inhibition of
bacteria controlling the environment to which the product is exposed. Vacuum packaging
removes most of the available oxygen needed by spoilage bacteria. The storage life of
smoked fish is affected by the initial microbial load of the fish, micro flora, packaging
material, production method, size and composition of initial numbers of freezing and thawing
cycles and quality of raw material, storage temperature and packing methods (Dondero,
2004).

Costa
UNU Fisheries Training Programme 31
Change in colour of hot smoked fish is a problem in the fishing industry concerning the
presentation of product to final consumer. Significant changes were observed in the colour
of the smoked redfish fillets during storage time (Figure 19, 20, 21, 22 and 23). There was
no significant difference in colour parameters between raw material and the four smoked
redfish groups (p>0.05) even as between smoked fillets groups.
Increase in lightness (L* value) of the muscle was observed in all groups with ageing. Also,
that change increased between Bradley fillets smoked and cabin kiln smoked storage at 0 °C.
The results showed the difference for raw material samples and all Bradley smoked fillets,
also cabin kiln smoked fillets (p<0.05). The results probably associated the temperature
inside the smoker used in this project (Sikorski and Kolakowski, 2000) this is mainly due to
the protein denaturation rate in the muscle of the cod, which is higher than for other
temperatures used, along with high enzyme activity in the muscle.
The changes in redness intensity (a* value), were quite unstable over storage time, and
showed no statistical difference between all groups in this study p>0.05 and similar results
were seen for smoked fillets samples storage in different and similar temperature. For
samples stored at room temperature there was little increase over storage time, while for
samples in cold storage, after smoked redness value was 2.25±2.39 for Bradley smoked fillets
and 5.29±1.94 for cabin kiln smoked fillets, decreasing on day 10 to 1.34±1.39 and 4.12±1.52
for Bradley and cabin kiln respectively. This trend repeats for day 15 and day 20.
Yellowness changes (b* value) in this project was decreasing for Bradley smoked fillets cold
storage samples and for cabin kiln smoked fillets at room temperature. (Doe, 1998) explains
that the carotenoids contribute to the striking yellow, orange, and red colour of several
important fish and shellfish products and changes in carotenoids during processing and
storage of fish. Yellowness were quite unstable and had the same behaviour as a* value for
fillets stored in cold room for cabin kiln and increased for Bradley room temperature samples.
The statistical results showed no significant difference between smoking methods used
(p>0.05) and significant difference in storage days (p<0.05). The increase in yellow colour
was presumed to be due to the oxidation of pigment in the fish muscle by oxygen and enzyme
oxidation (Khayat & Schwall, 1983; Hamre, 2003).
According to Karlsdottir et al., (2014) TBARS values measure secondary products of lipid
oxidation (normally from peroxidation process) and are always used in detecting rancidity of
tissues. The lipid oxidation product TBARS were generally more stable in smoked samples
stored in the cold storage room (0 °C) compared to when stored at room temperature (20 °C).
The TBARS decreased little over storage time. These finding were like previous results by
Siskos, 2007, and results were in contrast with (Huong, 2013). For Bradley smoked fillets
this was explained by the fact that low temperature (above 60) in muscle fillets during
smoking process does not deactivate the enzymatic activity.
PAHs are a group of fused ring aromatic compounds that are formed during the incomplete
combustion of organic material (Mcgrath, 2010). Levels of PAHs of smoked samples from
the smoking Bradley was inapplicable limits. For cabin kiln the total sum of the positive main
PAHs Benzo (a) anthranthene, Chrysene, Benzo (b) fluorene and Cyclopenta (c,d) pyrene

Costa
UNU Fisheries Training Programme 32
was 63.4 µg/kg and sum of all the positive PAHs was 117.8 µg/kg, and the EU legislation
limits are 12.0 from 2014 (Commission Regulation, 2011). The results showing differences
in PAHs concentration between samples (Yurchenko, 2005) explain, probablythe effect is
due to differences in smoking method.
6 CONCLUSION
Results obtained in present study indicated that smoked products using the cabin developed
by MATIS gives better smoked quality than Bradley smoker, is very cheap, but yields
inapplicable levels of PAHs.
Appropriate drying temperature for redfish smoked fillets must be higher than 50 °C, we
believe around 65 °C.
Microbial control can be ensured to minimize contamination before, during and after fish
smoking and combination air packaging and room temperature storage is not recommended
for longest shelf life products. The shelf life for smoked redfish in cold room temperature
storage (0 °C) is 15 days whereas room temperature storage is below 10 days.
Storage conditions are important parameters for the shelf life of smoked fish products. After
smoking fillets and over storage time the WC and salt concentration were inversely
proportional.
Fresh redfish fillets yielded very good smoked raw material product; however frozen fillets
are not so good for smoking because they are very difficult to manipulate and break easily.
7 RECOMMENDATIONS
This experiment could be repeated in rural areas in Angola using the cabin developed by
MATIS and better results can be produced by extending smoking time.
An experimental project can be designed and proposed to the competent authority to study
the introduction of these smoking methods in several areas in Angola and use the results to
adapt to the real situation.

Costa
UNU Fisheries Training Programme 33
ACKNOWLEDGEMENTS
This study was carried out at Matis –Icelandic Food and Biotech R&D. The work was
financed by United Nations University – Fisheries Training Programme.
I would like to express my sincere gratitude to my supervisors Sigurjon Arason, Magnea
Karlsdottir and Maria Gudjonsdottir for their technical and professional guidance, comments
and words of encouragement during this project.
I am thankful to the UNU-FTP for providing me with this opportunity to take part in this
training and all the people that contributed and helped me to succeed in this project. I also
acknowledge the help and hospitality accorded to me during my stay here by the staff of the
Matis Institute, for their kindly reception.
I am deeply grateful to the Director of the United Nations University – Dr. Tumi Tomasson,
along with Mr.Thor Asgeirsson and Mary Frances Davidson for their support and guidance
while developing the work and supporting me along this course and for their assistance,
comments and suggestions in relation to the completion of this project. My special thanks to
Sigríður Kr. Ingvarsdóttir for her especially lovely collaboration.
I would also like to thank the fellows of UNU-FTP 2016, specially (Carina Fernandes,
Angela Feliz, Martin Mutuga and Isatou Tamba) for their support and making our time here
in Iceland memorable.
I would like to address a word of gratitude for all staff of MATIS- Icelandic Food and Biotech
Research & Development for providing excellent facilities and friendly environment to carry
out my study, specially to PhD student Paulina Elzbieta Romotowska, PhD student Dang Thi
Thu Huong, PhD student Ildur Inga Sveinsdottir and M.Sc. student Benjamin Aidoo, for their
help on chemical analyses.
I thank Aldina Costa, my wife and my best friend, my sons (Divalda and Vadinho) for their
patience during my study. I also thank the National Institute of Fisheries Research and
Ministry of Fisheries of Angola for giving me the opportunity to participate in this training
programme.

Costa
UNU Fisheries Training Programme 34
LIST OF REFERENCES
Adeyemi, O. (2013). Stability study of smoked fish, horse mackerel (Trachurus trachurus)
by different methods and storage at room temperature. African Journal of
Biochemistry Research 7(6): 98-106.
Agency for Toxic Substances and Disease Registry. (1995). Toxicological profile for
polycyclic aromatic hydrocarbons. Atlanta - Georgia: U.S. Department Of Health
And Human Services - Public Health Service.
Ahmed, A. (2011). Influence of Traditional Drying and Smoke-Drying on the Quality of
Three Fish Species (Tilapia nilotocus, Silurus glanis and Arius parkii) from Lagdo
Lake, Cameroon. Journal of Animal and Veterinary Advances 10(3): 3001-306.
Alakali, J.S., Faasema, J. and Utongo, N. (2013). Design, fabrication and performance
evaluation of an improved fish smoke Kiln. Journal of Food Processing and
Preservation 37(5): 413-418.
Alicicek, Z., & Atar, H. and others (2010). The effects of salting on chemical quality of
vacuum packed liquid smoked and traditional smoked rainbow trout (Oncorhyncus
mykiss) fillets during chilled storage. Journal of Animal and Veterinary Advances
9(22): 2778–2783.
Andrzej, S., & Zdzislaw, E. S. (2005). Polycyclic aromatic hydrocarbons in smoked fish - a
critical review. Food Chemistry 91(2): 303-311.
Arantxa Rizo, A. F., Fernandez-Segovia, I., & Barat, J. (2016). Smoke-flavoured cod
obtained by a new method using water vapour permeable bags. Journal of Food
Engineering 179: 19-27.
Arvanitoyannis, I. S. and Kotsanopoulos, K. V. (2012). Smoking of Fish and Seafood:
History, Methods and Effects on Physical, Nutritional and Microbiological
Properties. Food Bioprocess Technology 5(3): 831–853.
Banwart, G.J. (1981). Basic Food Microbiology. Westport, Connecticut: The AVI publishing
company, Inc.
Bellagha, S. S. (2007). Studies on salting and drying of sardine (Sardinella aurita):
Experimental kinetics and modeling. Journal Food Engeniery 78: 947–952.
Benjakul, S. S. (1997). Physicochemical changes in Pacific whiting muscle proteins during
iced storage. Journal of Food Science 62(4): 729-733.
Bernardez, M., Pastoriza, L., Sampedro, G., Herrera, J. J. R. and Cabo, M. L. (2005).
Modified method for the analysis of free fatty acids in fish. J. Agric. Food Chem. 53:
1903-1906.

Costa
UNU Fisheries Training Programme 35
Blackwell, W. (2014). Seafood Processing Technology, Quality and Safety. Chichester, UK:
Institute of Food Science and Tecnology.
Bligh, E. G., & Dyer, W. S. (1959). A rapid method of total lipid extraction and purification.
Can. J. Biochem. and Physiol. 37(8): 911-917.
Boziaris, I. S. (2014). Seafood processing, Technology, Quality and Safety. Chichester, West
Sussex, UK: Wiley Blackwell.
Chen, B. (1997). Analysis, formation and inhibition of Plycyclic Aromatic Hydrocarbons in
food: An overview. Joutnal of Food and Drugs Analysis, 5(1): 25-42.
Coban, E. O. (2013). Antimicrobial and antioxidant effects of clove oil on sliced smoked
Oncorhynchus mykiss. Journal of Consumer Protection and Food Safety 8:195–199.
Codex Alimentarius. (2013). Standard for smoked fish, smoke flavoured fish and smoke-dried
fish. Rome: Food and Agricultural Organization of the United Nations.
Commission Regulation. (2011). (EU) No 835/2011 amending Regulation (EC) No
1881/2006 as regards maximum levels for polycyclic aromatic hydrocarbons in
foodstuffs. Official Journal of the European Union, 215.
Commission Regulation (EC) No 1022/2008. (2008). Amending Regulation (EC) N
2074/2005 as regards the total volatile basic nitrogen (TVB-N) limits. Official
Journal of the European Union, 18-30.
Connel, J. J. (1995). Control of fish quality. London, UK: Blakwell Science Ltd.
Danieldosttir, A. K. (1998). Genetic studies on redfish species and stock. Post-Ongoing-
Future. ICES 1998. SGRS.
Debevere, J., Boskou, G. (1996). Effect of modified atmosphere packaging on the
VB/TMA-producing microflora of cod fillets. International Journal of Food Microbiology
31:221 – 229.
Doe, P. E. (1998). Fish Drying & smoking production and quality. Lanncaster, Pennsylvania,
USA: Technomic publishing Company, Inc.
Doe, P. S. (1998). Basic principles, in Fish drying and smoking: Production and quality.
Lancaster, Pennsylvania, USA: Technomic Publishing Company Inc.
Dondero, M. C. (2004). Changes in quality of vacuum-packed cold-smoked salmon (Salmo
salar) as a function of storage temperature. Food Chemistry 87(4): 543−550.
Eide O, Børresen T, Strøm T. (1982). Minced fish production from capelin (Mallotus
villosus). A new method for gutting, skinning and removal of fat from small fatty fish
species. Journal of Food Science 47:347–9. 54

Costa
UNU Fisheries Training Programme 36
FAO (2004). Assessment and management of seafood safety and quality. FAO fisheries
technical paper No. 444. Rome: Food and Agricultual Organization of the United
Nations.
FAO (2007). Resumem Informativo De La Pesca Por Paises. Rome: Food and Agricultual
Organization of the United Nations.
FAO (2016). Handbook of the EAF-Nansen project training course on the ecosystem
approach to fisheries. Rome: FAO EAF-NANSEN Project Report No. 28.
Farhadian, A. J. (2011). Effects of meat preheating and wrapping on the levels of polycyclic
aromatic hydrocarbons in charcoal-grilled meat. Journal Food Chemistry 124(1):
141-141.
Flick, G. J. (1990). The seafood industry. New York, USA: Van Nostrand Reinhold.
Foline, O. F. (2011 ). Proximate composition of catfish (Clarias gariepinus) smoked in
Nigerian stored products research institute (NSPRI): Developed kiln. International
Journal of Fisheries and Aquaculture 3(5): 96-98.
Fuentes, A., Fernandez-Segovia, I., Barat, J. M., & Serra, J. A. (2010). Physicochemical
characterization of some smoked and marinated fish products. Journal Food Process
Preserv 34(1): 83-103.
Garcia-Garrido, J. A. (1997). Determination of trimethylamine in fish by pervaporation and
photometric detection. Analyst 122 (7): 663-666.
Gbolagunte, D.G., F.S. Abiola, & J.S. Ehoghase. (2012). Evaluation of the microbial load
on smoked fish from some markets in Ogun State, Nigeria. African Journal of
Microbiology research 6 (7): 1376-1379.
Gomes-Guillen. Maria del Carmem., G.-E. J. (2009). Alternative fish species for cold-
smoking process. International Journal of Food Science and Technology 44(8):
1525–1535.
Goulas, A.E. & Kontominas, M.G. (2005). Effect of salting and smoking-method on the
keeping quality of chub mackerel (Scomber japonicus): biochemical and sensory attributes.
Food Chemistry 93: 511–520.
Guillén, M.D. and Errecalde, C. (2002). Volatile components of raw and smoked black
bream (Brama rail) and rainbow trout (Oncorhynchus mykiss) studied by means of solid
phase microextraction and gas chromatography/mass spectrometry. J. Sci. Food Agric., 82,
945–952.

Costa
UNU Fisheries Training Programme 37
Hamre, K. L. (2003). Development of lipid oxidation and flesh colour in frozen stored fillets
of Norwegian spring-sapwning herring (Clupea Harrengus L.) Effects of treatment
with ascorbic acid. Food Chemistry 82(3): 445-453.
Hilderbrand Jr, K. S. (2001). Fish Smoking Procedures for Forced Convection Smokehouses.
Oregon, USA : Extension Sea Grant Program, Hatfield Marine Science Center.
Hood, M. A. (1983). Effects of storage on microbial loads of two commercially important
shellfish species, Crassostrea virginica and Mercenaria campechiensis. Applied
Environmental Microbiology 45(4): 1221-1228.
Huong, D. T. (2013). The effect of smoking methods on the quality of smoked Mackerel.
Final Project. Reykjavik: United Nations University - Fisheries Training
Programme.
Huss, H. H. (1995). Quality and quality changes in fresh fish (Vol. 348). Rome: Food And
Agriculture Organization Of The United Nations.
ICES (2012). Report of the Benchmark Workshop on Redfish (WKRED 2012).
Copepenhagen: International Council for the Exploration of the Sea.
Idah, P. H. (2013 ). Effects of smoke-drying temperatures and time on physical and
nutritional quality parameters of Tilapia (Oreochromis niloticus). International
Journal of Fisheries and Aquaculture 5(3): 29-34.
Ikutegbe, V. S. (2014). Microbiological and biochemical spoilage of smoke-dried fishes sold
in West African open markets. Food Chemistry 161: 332-336.
Ishizaki, A. S. (2010). Determination of polycyclic aromatic hydrocarbons in food samples
by automated on-line in-tube solid-phase microextraction coupled with high-
performance liquid chromatography-fluorescence detection. Journal of
Chromatography 1217: 5555-5563.
ISO (2005). ISO 9000:2005. International standard: quality management systems –
fundamentals and vocabulary. Geneva, Switzerland: International Organization
for Standardization.
Jr. George, J. F. (2010). Smoked Fish. Part III. Smoking, Storage, Microbiology. Rome:
Global Agriculture Alliance.
Karásková, P. F.-S., Karaskova, P., Fuentes, A., Fernandez-Segovia, I., & Alcaniz, M.
(2011). Development of a low-cost non-destructive system for measuring moisture
and salt content in smoked fish products. Procedia Food Science 1:1195-1201.
Karlsdottir M.G., P. H. (2014). "Oxidation in aquatic foods and analysis methods." In
Hristinsson H.G. eds. Antioxidants and functional components in Aquatic Food pp 1-
22. John Wiley & Sons Ltd.

Costa
UNU Fisheries Training Programme 38
Kenneth, S., & Hilderbrand, J. (1992). Fish Smoking Procedures for Forced Convection
Smokehouses. Oregon: Oregon State University Extension Service.
Khayat, A., & Schwall, D. (1983). Lipid oxidation in seafood. Food Technology 37(7): 130-
140.
Köse, S. (2010). Evaluation of seafood safety health hazards for traditional fish products:
Preventive measures and monitoring issues. Turkish Journal of Fisheries and Aquatic
Sciences 10(1): 139-160.
Kramer, D.E. and Peters, M.D. (1981). Effect of pH and prefeezing treatment on the texture
of yellowtail rockfish (Sebastes flavidus) as measured by Ottawa texture measuring system.
J. Food Technol., 16:493-504.
Kumolu-Johnson, C. A. (2010). The effects of smoking on the nutrional qualities and shelflife
of Clarias gariepinus (BURCHELL 1822). African Journal of biotechnology 9(1):
073-076.
Lemon. (1975). Protein measurement with the Folin phenol reagent. Journal of Biological
Chemistry 193(1): 265-275.
Lowry, R. and Tinsley, I. (1976). Rapid colorimetric determination od free fatty acids.
Journal of American Oil Chemists Society 53(7): 470-472.
Maga, J. A. (2000). Smoke in food processing. Boca Raton, Florida: CRC Press, Inc.
Mamoudou, D. (2015). Angola perde 30 mil toneladas de pescado por ano por falta de
conservacao. Expansao [October 2016] <www.expansao.co.ao.>
Martin, R. E. (1990). The seafood industry. New York, USA: Van Nostrand Reinhold.
Mcgrath, T. E., Woorten, J. B., Geoffrey, C. W., & Hajaligol, M. R. (2010). Formation of
polycyclic aromatic hydrocarbons from tabacco: the link between low twmperature
residual solid (char) and PAH formation. Food Chemistry Toxicology 45: 1039-1050.
Mgana, H. F. (2014). Quality assessment of hot smoked Copilen (Mollatus villosus) and
Redfish (Sebastes mentella). Final Project. Reykjavik: The United Nation University
- Fisheries Training Programme.
Ministry of Fisheries of Iceland (2016). Information Centre of the Icelandic Ministry of
Fisheries and Agriculture. [December 2016] <www.fisheries.is>
Moret, S. C. (1999). Assessment of Polycyclic aromatic hydrocarbon content of smoked fish
by means of a fast HPLC/HPLC method. Journal of Agricultural and Food Chemistry
47(4): 1367-1371.

Costa
UNU Fisheries Training Programme 39
Muratore, G., & Licciardella, F. (2005). Effect of vacuum and modified atmosphere
packaging on the shelf life liquid smoked swordfish (Xiphias gladius). Food
Cheminstry and Toxicology 70: 359–363.
Ndiaye, O.S.O. (2014). Guide for developing and using the FAO-Thiaroye processing
technique (FTT-Thiaroye). Rome: Food and Agricultutal Organization of the United
Nations.
Pedrosa-Menabrito, A. A. and Regenstein, J.M. (1990). Shelf-life extension of fresh fish - a
review. Part III - fish quality and methods of assessment. Journal of Food Quality
13(3): 209-223.
Phillips, D. H. (1999). Polycyclic aromatic hydrocarbons in the diet. . Mutation
Research/Genetic Toxicology and Environmental Mutagenesis 443(1-2): 139-147.
Plahar, W. A., Nerquaye-Tetteh, G. A., & Annan, N. T. (1999). Development of an integrated
quality assurance system for the traditional Sardinella sp. and anchovy fish smoking
industry in Ghana. Food Control 10(1): 15-25.
Rustad, T. (2010). Lipid Oxidation in Handbook of Seafood and Seafood Products Analysis.
USA: CRC Press.
Schubring, R. (2006). Thermal stability, texture, liquid holding capacity and colour of
smoked salmon on retail level. Thermochimica Acta 445: 168-178.
Sikorski Z. E. and Kolakowski, E. (2000). Endogenous Enzyme Activity and Seafood
Quality: Influence of Chilling, Freezing, and Other Environmental Factors. In: Haard
N. F. & Simpson B. K. eds Seafood Enzymes: Utilization and Influence on
Postharvest Seafood Quality pp 451-487. New York: Marcel Dekker, Inc.
Sinko, P. (2002). Determination of polycyclic aromatic hydrocarbons in smoked meat
products and smoke flavouring food aditives. Journal of Chromatography B 770(1):
3-8.
Siskos, I. Z. (2007). The eefect of liquid smoking of fillets of trout (Salmo gairdnerii)
onsensory, microbiological and chemical changes during chilled storage. Food
Chemistry 101(2): 458-464.
Sohn, J. H., & Ohshima, T. (2011). Lipid oxidation, odour, and colour of fish flesh in
Handbook of Seafood Quality, Safety and Health Applications. Blackwell Publishing
Ltd. UK.
Stlyhwo, A., and Sikorski, A. E. (2005). Polycyclic aromatic hydrocarbons in smoked fish –
a critical review. Food Chemistry 91(2): 303–311.
Tweddle, D., & Anderson, M. E. (2008). A collection of marine fishes from Angola, with
notes on new distribution records. Smithiana, Publications in Aquatic Biodiversity,
Bulletin, No. 8, 3-24.

Costa
UNU Fisheries Training Programme 40
Yanar, Y. Ç. (2006). Effects of brine concentration on shelf-life of hot smoked tilapia
(Oreochromis niloticus) stored at 4C. Food Chemistry 97: 244–247.
Yurchenko, S., & Molder, U. (2005). The determination of polycyclic aromatic hydrocarbons
in smoked fish by gas chromatography mass spectrometry with positive-ion chemical
ionization. Journal of Food Composition and Analysis 18(8): 857-869.

Costa
UNU Fisheries Training Programme 41
APPENDICES
Pre-trial results
Figure 21: Evolution salt content (a) and water content (b) in redfish muscle using
different brine concentrations and different time.
Figure 22: Temperature changes in muscle fillets in different smoke fish method, pre-
trial.
00,5
11,5
22,5
3
RAWMATERIAL
30 MIN. 60 MIN. 90 MIN.
Sal
t C
onte
nt
%
Time in Minuts
a
8% Brine 12% Brine
77
77,5
78
78,5
79
79,5
80
80,5
Wat
er c
on
ten
t %
Axis Title
b
water content % water content %
0
50
100
150
Tem
per
atu
re °
C
Time Minuts
Temperature fillet and Rack kiln wood
Rack Kiln wood Fillet Kiln wood Fillet Kiln Dung Rack Dung

Costa
UNU Fisheries Training Programme 42
Figure 23: Evolution of temperature in Bradley smoker in pre-trial.
Table 4: Water activity and pH results at the pre-trial.
Smoke Method Water activity value pH
Open Fire Wood 0.9646 ± 0.005 6.7 ± 0.20
Open Fire Dung 0.9676 ± 0 .006 6.56 ± 0.20
Kiln Wood 0.9552 ± 0.012 6.69 ± 0.60
Kiln Dung 0.981 ± 0.011 6.41 ± 0.21
Bradley 0.9943 ± 0.010 6.43 ± 0.03
Table 5: Colour changes using different smoke methods and fuel.
Smoke method L* a* b*
open wood 50.36±2.69 4.43 ± 1.81 14.99 ± 2.30
open dung 45.66±3.17 1.63 ± 1.25 13.01 ± 3.15
cabin kiln wood 34.68±2.45 0.65 ± 1.00 10.85 ± 3.76
cabin kiln dung 39.38±1.87 5.10 ± 1.70 24.83 ± 3.70
Bradley 40.30±1.67 0.26 ± 1.30 15.28 ± 0.94
0,0020,0040,0060,0080,00
100,00
00
:21
:01
00
:30
:01
00
:40
:01
00
:50
:01
01
:00
:01
01
:10
:01
01
:25
:01
01
:35
:01
01
:45
:01
01
:55
:01
02
:05
:01
02
:21
:01
02
:30
:01
02
:40
:01
02
:50
:01
03
:00
:01
03
:10
:01
03
:25
:01
03
:35
:01Te
mp
erat
ura
°C
Time in Minuts
Temperature Bradley Smoke
fillet 1 Rack

Costa
UNU Fisheries Training Programme 43
Pictures of smoke Redfish processing
Figure 24: Redfish fillets smoked in Kiln method.
Figure 25: Fillets in drying Oven.
Copyright © 2022 FDOKUMEN