The Plight of the Able-bodied Poor and the Unemployed in ...
Upload
independentCategory
view
2download
0
The Impact of Worker’s Experience Rating on Unemployed Workers
Prepared for:Strategic Evaluation and Monitoring
Evaluation and Data DevelopmentStrategic Policy
Human Resources Development Canada
Prepared by:Pierre Fortin
University of Quebec at Montreal andMarc Van Audenrode
Laval University
October 2000
SP-AH127-03-00E


Table of ContentsAbstract..................................................................................................................................i
1. Introduction ................................................................................................................1
2. Theoretical and empirical background ..................................................................3
3. Methodology ..............................................................................................................5
4. Data ..............................................................................................................................7
5. Results........................................................................................................................115.1 Corner effects ..................................................................................................115.2 Employment Insurance usage and replacement rate ......................................20
6. Predictions ................................................................................................................25
7. Conclusions ..............................................................................................................27
Bibliography ......................................................................................................................29


List of Tables
Table 1 Experience Rating in Perspective ......................................................................8
Table 2 Descriptive Statistics ..........................................................................................9
Table 3 Total Claims Filed During the Nineties by Respondents................................10
Table 4 Empirical Duration Hazards ............................................................................13
Table 5 Empirical Duration Hazards — Repeat Users Only ......................................15
Table 6 Cox Proportional Hazard Model of Weeks of Benefits Claimed ..................17
Table 7 Empirical Duration Hazards — Men and Women Separately........................18
Table 8 Determinants of the True Replacement Rate ..................................................21
Table 9 Employment Insurance Usage and Replacement Rate ..................................23
Table 10 Employment Insurance Usage and Replacement Rate ..................................24
Table 11 Experience Rating in Perspective — Savings Potential Reductions in Payments Associated with the Intensity Rule ............................................25
List of Figures
Figure 1 Employment Insurance Benefits Duration Hazard ........................................12
Figure 2 Employment Insurance Benefits Duration Hazard ........................................19


Abstract
The most original legal change introduced in the Employment Insurance Act is arguably theintroduction of a form of experience rating on unemployed workers. The new Act hasintroduced a reduction in replacement rates for repeat users of the insurance system. Forevery 20 weeks of benefits drawn from the system in the past 5 years, a claimant’s replacementrate will be reduced through the “intensity rule” by 1 percentage point of insured earnings,up to a maximum of 5 points.
The introduction of the rating system has significantly reduced the cost of operating the EIsystem, which in itself is positive for the economy. There are many ways of reducing theoperating cost of the system however. From a policy point of view, the decision to introduceexperience rating will be justified if it helps to solve a problem of moral hazard — abuseof the system by some claimants, or a problem of cost shifting — some workers takingmuch more out of the system than they put in. This paper examines this aspect of the reform.In doing so, we shall take into account the fact that the slate was wiped clean for claimantswhen the reform was introduced. Benefits collected before June 30, 1996 will not be countedin the calculation of a claimant’s replacement rate. This implies that this system will notbe fully in place until 2001. Meantime, a claimant’s actual history will differ from his orher “official” history.
We use data from the first seven waves of the Canadian Out of Employment Panel (COEP)Survey. Since our problem is essentially linked to Employment Insurance (EI) usage, specialemphasis will be put on administrative data (especially the Status Vector). This collectionof data is now well known, and no special description is required here.
For the purpose of this exercise, we extract from the Status Vector file all the claims filedby a COEP respondent between July 1995 and June 1997. Since July 1996 is the date inwhich weeks of benefits received started to be included in Human Resources DevelopmentCanada’s (HRDC) calculation of past usage, these data will provide us with two groups ofobservations to compare: one year of claims filed before and one year of claims filed afterthe implementation of experience rating.
We found some evidence of a behavioural response to the introduction of a rating systemin the EI program — the most obvious being an increase in the number of people leavingthe EI just before their future benefits might be affected if they stayed another week. Althoughthis change is statistically significant, its economic effect is minimal. We estimate thedifference in the implied average usage caused by the intensity rule to be less than a quarterof a week.
The estimation of the structural model does not provide us with many more clues. Althoughwomen appear to be behaving differently with respect to usage, they do not appear to havereacted differently to rating (these results are not shown here). The model also shows that,given our identifying strategy, those who are affected by the new rating system still use EImore than other comparable claimants.
The Impact of Worker’s Experience Rating on Unemployed Workers i

The Impact of Worker’s Experience Rating on Unemployed Workersii

1. Introduction
The most original legal change introduced in the Employment Insurance Act is arguably theintroduction of a form of experience rating on unemployed workers. The new Act introduceda reduction in replacement rates for repeat users of the insurance system. For every 20 weeksof benefits paid out over the past 5 years, a claimant’s replacement rate will be reduced by1 percentage point of insured earnings, up to a maximum of 5 points.1
This unique system is interesting because, as far as we know, it has no precedent. The UnitedStates Unemployment Insurance (UI) system has a form of experience rating for firms,but not for individuals. To our knowledge, no other industrialized country applies anysignificant form of experience rating to its unemployment insurance system. Probably theonly comparable rule is found in the new U.S. welfare system, which imposes a 100 percentreduction in welfare benefits for recipients after two years of lifetime benefits. This form of rating is obviously much more extreme than what was introduced in Canada throughthe EI reform. However, some of the lessons learned from Canada’s Employment Insurance(EI) reform could probably serve in an assessment of the U.S. welfare reform, and vice versa.
In the U.S. system, UI tax rates are increased for firms that use the system more than others,in order to cover the costs they deplete from the unemployment insurance fund. This ratingsystem was designed to increase the cost of layoffs for firms tempted to overuse UI as away to retain redundant workers — who would rotate through multiple spells of temporarylayoffs rather than being permanently let go. It was also intended to avoid the type of worker-employer collusion that is observed in Canada where no experience rating exists. Based onCanadian administrative data, Corak and Pyper (1995) show that firms use UI as a wagesubsidy through worker rotations tailored to extract the most out of the UI system.
In a model of implicit contracts where there is no unemployment insurance, risk-neutralfirms and risk-averse workers, there are no layoffs (Akerlof and Miyazaki, 1980). When anunemployment insurance system is introduced into the model without experience ratingof firms, some layoffs are shown to take place. Experience rating implicitly introduces atax on layoffs which is supposed to counterbalance the implicit subsidy on layoffs resultingfrom the UI system (Brechling, 1977).
From an economic point of view, the recent change in the Canadian EI law raises a question— will a system of experience rating of workers achieve the goals that are generally associatedwith the introduction of experience rating in any system — reducing moral hazard problemsand the corollary of cost shifting?
The Impact of Worker’s Experience Rating on Unemployed Workers 1
1 The new clawback provisions of the EI Act also have some experience-rating features. However, it is our viewthat these provisions should be studied more as a means-testing device than as a rating tool, since most of therating aspects included in them are conditional upon a stringent means test. Furthermore, the clawback will affectfar fewer people than the provisions considered here (7.5 percent of claimants, according to Human ResourcesDevelopment Canada (HRDC) (1998)).

The introduction of the rating system has significantly reduced the cost of operating the EI system, which in itself is positive for the economy. There are many ways of reducing theoperating cost of the system however. From a policy point of view, the decision to introduceexperience rating will be justified if it helps to solve a problem of moral hazard — abuseof the system by some claimants, or a problem of cost shifting — some workers takingmuch more out of the system than they put in. This paper proposes to examine this aspectof the reform. In doing so, we shall take into account the fact that the slate was wipedclean for claimants when the reform was introduced. Benefits collected before June 30,1996 will not count in the calculation of a claimant’s replacement rate. This implies thatthis system will not be fully in place until 2001, but also that in the meantime, a claimant’sactual history will differ from his or her “official” history.
The goal of the proposed research is to investigate this feature of the reform, and estimatehow Canadian workers changed their behaviour as a result of it.
We propose to use historical Status Vector data of Canadian Out of Employment Panel(COEP) respondents to:
• look at their past employment and unemployment patterns using duration analysis;
• predict what these patterns would have been in the absence of Bill C-12; and
• measure to what extent these have changed as a result of Bill C-12.
As time goes by and the unemployed’s “official” history moves closer to his or her actualhistory, behavioural changes should be observed. The advantage of this particular aspect ofthe reform is that it will take place only gradually, and will therefore be easier to isolate andidentify amongst all the other changes involved in the passage of Bill C-12.
Survey data will be useful as control variables in the duration analysis, but will also allowus to produce separate analysis by groups: seasonal workers vs. other repeat users; menvs. women; part-time vs. full-time workers; and, of course, younger vs. older workers.
The Impact of Worker’s Experience Rating on Unemployed Workers2

2. Theoretical and empirical background
It is important to remember here that the theoretical basis for the new system of experiencerating of workers is not the same as in the U.S. system. As we noted, the U.S. system forrating firms can be justified in a theoretical model of implicit contract as a way of compensatingfor the implicit subsidy to layoffs that Unemployment Insurance (UI) generates for firms.The logic for the rating of workers is based on a search model.
In the search model (Mortensen, 1977, for example), an unemployed worker’s return towork will be determined by the probability that he or she receives an acceptable job offer.The probability of receiving such an offer is determined by the intensity of their search, thegeneral economic environment they are placed in, and their personal characteristics. Theacceptability of such an offer will in turn be determined by the lowest acceptable wage forthat worker — the “reservation wage”. The model shows immediately that the more generousthe unemployment insurance system, the higher the reservation wage.
In such a model, Employment Insurance (EI) usage by an individual i can be described as:
Ui = f (Xi,Y,G) (1)
where: U is EI usage defined as the number of weeks of benefits a person will draw overa given period of time.X is a vector of characteristics representing the unemployedY is a vector of characteristics representing the economic environmentG is a vector of characteristics representing the generosity of the EI system
An individual’s characteristics and the characteristics of the economic environment clearlyaffect EI usage by taking into account the tightening of the labour market in which anindividual must find employment. Similarly, given our definition of usage, three aspectsof EI generosity can affect usage. The first one is obviously the rules of eligibility — theeasier it is to qualify for benefits, the more likely people are to actually draw benefits. Thesecond aspect is duration of benefits — the longer benefits can be drawn, the more likelypeople are to actually draw them. Finally, the third aspect is linked to replacement rates.The more generous the benefits, the more likely the unemployed are to claim, and delaytheir return to work.
The intent of the experience rating reform is to reduce the generosity of the EI system byreducing the benefits for repeat users of the system (those who have collected more than20 weeks of benefits in the previous 5 years). This targeting of repeat users can bejustified either because these workers have particular individual characteristics X that makethem prone to use EI, or out of the concern that repeat users should be supported on a broadertax base than EI.
The Impact of Worker’s Experience Rating on Unemployed Workers 3

Estimating a search model has always been difficult because of its very nature, which impliesthat search duration, re-employment wages and search intensity are all simultaneouslydetermined. Trying to isolate the impact of UI on search behaviour is even more difficult,especially in Canada. In the former Canadian UI system, the different measures of UIgenerosity were all strongly correlated with the other individual and economic characteristicsrelevant for EI usage.
Through the variable entry requirement provision, UI eligibility has been strongly correlatedwith regional unemployment rates. Similarly, the system used to compute the duration ofbenefits implied a strong correlation between benefit durations and regional unemploymentrates. These correlations, however, were not strong enough to make it hopeless to attemptto quantify the impacts of these aspects of the generosity of the Canadian UI system. Previousstudies sponsored by Human Resources Development Canada (HRDC) have provided goodevaluations of the impacts of these aspects of the generosity of the UI system on the behaviourof the unemployed.
There is, however, one aspect of the generosity of the Canadian UI system that has alwayseluded researchers — replacement rates. The former system provided little variation, hencelittle scope for testing. In addition, most replacement rate changes were perfectly correlatedto other determinants of UI usage. The replacement rate has been changed across the boarda number of times, making it very difficult to disentangle the impact of that change fromthe impact of other changes in the economic environment. On some occasions, it has beenchanged for a specific group of unemployed whose distinct characteristics had to be includedas an explanatory variable in any case. By providing real variations in the replacementrate for the first time in Canada, the EI reform provided the first opportunity to measureprecisely the impact of replacement rates, and thus the impact of experience rating, on theCanadian unemployed.
The Impact of Worker’s Experience Rating on Unemployed Workers4

3. Methodology
The purpose of the exercise is to try to estimate equation (1) so as to isolate the impact ofexperience rating, through its impact on replacement rates. While the reform provides somevariation in replacement rates, measuring its impact on unemployed workers is far fromstraightforward.
Unlike exogenously mandated variations — the differences in Unemployment Insurance(UI) systems between American states, for example — these differences will be endogenousto the unemployed’s behaviour. Experience rating will apply only to the extent that theunemployed uses the system; rational workers will take it into account in determining theirreservation wage, and deciding whether or not to claim.
Take the following very simple situation. A worker has the habit of claiming twentyweeks of Employment Insurance (EI) benefits yearly, for which he receives $275 weekly.Suppose that these $275 correspond to a 55 percent replacement rate for an insurablewage of $500.
When deciding whether to claim a 20th week, the claimant will know that this decision willreduce the replacement rate by 1 percentage point over the next five years. This would resultin a reduction in the weekly benefit of $5 over the next five years. Everything else beingequal, for a worker with a 5 percent discount rate, this amounts to a present value of $429.82,compared to a benefit of $275. This worker will choose to go back to work after 19 weeksof unemployment. Conversely, a comparable worker with a higher discount rate might electto take the reduction in replacement rate and stay unemployed for one more week. In thiscase, long unemployment durations would be associated with lower replacement rates,the two measures being inevitably simultaneous.
The solution to simultaneity problems in econometrics has always been to find instrumentalvariables, and fortunately the Canadian legislator has provided us with one. Since theunemployed will start the new EI regime with a clean slate, researchers will have moreinformation about them than Human Resources Development Canada (HRDC) will actuallytake into account in setting the replacement rate. For five years, it will be possible to distinguishbetween a repeat user with high replacement rates, and an unfortunate unemployed whohad one long unemployment spell and ended up with a lower replacement rate.
The second source of identification for the impact of experience rating on EI usage is linkedto the non-linearity in the relation between past usage and replacement rate. While claimingan additional week will not have any impact on future benefits up to 19 weeks, the marginalimpact of claiming a 20th week is considerable.
We will use this feature of the Act to measure the impact of experience rating of unemployedworkers on EI usage. We propose two tests and measures.
The Impact of Worker’s Experience Rating on Unemployed Workers 5

The Impact of Worker’s Experience Rating on Unemployed Workers6
The first and simplest empirical evidence would be to show if there exists a strong tendencyto claim during the 19th, 39th, 59th (and so on) weeks. As noted, the non-linearity in therelation between replacement rates and EI usage strongly increases the marginal cost ofclaiming a 20th, 40th (and so on) week of benefits, especially for repeat users. Ifclaimants are sensitive to the experience rating, such a tendency should be apparent.
The second test would be to perform a duration analysis explaining the number of weeksof benefits claimed before and after the introduction of the experience rating, controllingfor the socio-demographic variables generally included in such regressions, and controllingfor the number of weeks that could have been claimed by the unemployed in question. Giventhe specific features of the Act, it is worth noting that during the first year of the EI reform,replacement rate is only remotely linked to a worker’s actual unemployment history. Therefore,the replacement rate variable can be included as is in the regression, and control variablesindicating the number of weeks a worker actually claims during year t-2 to t-6 are alsoincluded. As time goes by, the number of weeks a worker claims during year t-2 to t-6 willbecome more and more closely correlated to the replacement rate, and this simple test willbecome impossible to perform.
Another approach is to estimate simultaneously EI usage and replacement rate. In that case,we will calculate:
Ui = f(Xi,Y,Gr) + g(RR) (2)
and RRi = h(Xi,Y,Gr) = i(Oi) (3)
where: Gr is the measure of EI generosity excluding the replacement rateRR is the replacement rateO is the official usage history of the worker.
Since the official and actual usage history diverge and will diverge for five years, the twoequations can be identified by including the actual history in the usage equation (becauseit is a relevant individual characteristic and is not correlated with the replacement rate), andincluding the official usage history in the replacement rate equation (because it is correlatedwith the replacement rate and is only weakly correlated with the actual history).

The Impact of Worker’s Experience Rating on Unemployed Workers 7
2 With the exception of 1998, but this result might be due to some long spells being censored, and will have to bevalidated when a more recent Status Vector file is available.
4. Data
We used data from the first seven waves of the Canadian Out of Employment Panel (COEP)Survey. Since our problem is essentially linked to EI usage, special emphasis was put onadministrative data (especially the Status Vector). This data set is now well known, and nospecial description is required here.
For the purpose of this exercise, we extracted from the Status Vector file all the claims filedby a COEP respondent between July 1995 and June 1997. Since July 1996 is the date inwhich weeks of benefits received started to be included in Human Resources DevelopmentCanada (HRDC)’s measure of past usage, these data will provide us with two groups ofobservations to compare — one year of claims filed before the implementation of experiencerating, and one year of claims filed after.
Table 1 gives an idea of the magnitude of the problem. In this table, we show the extent towhich the rating system would have affected COEP respondents between 1995 and 1998.The table presents the number of past usage weeks for all the claims filed during each ofthese years, past usage weeks being defined as in the Employment Insurance (EI) Act —weeks of benefits paid during the 260 weeks preceding the claim. The table also presentsthe impact that the rule would have had on the claimant’s replacement rates. The top panelshows that on average over these five years, claimants have received about 56 weeks ofbenefits in the 5 years preceding the claim. Fewer than 30 percent of claimants wouldhave received full benefits in any of these years. More than 20 percent of them wouldhave received the minimum 50 percent replacement rate.2 Remember, this is just an exercise.No experience rating was applied before 1997, and since people’s usage history has beenerased on July 1st, 1996, figures for 1996 onwards do not correspond to the officialHRDC figures.
The bottom part of the table presents the same figure for our two subsamples (i.e., July 1995to June 1996, July 1996 to June 1997). In addition, it allows us to distinguish between theactual usage history, as defined, and the official history that starts only in 1996. As expected,we do not see any significant difference in the actual history column. Too little time haselapsed for such a long-term variable to be affected. The similarities are even greaterwhen looking at a simplified version of the official usage history. Here we simply look atthe number of weeks of benefits claimed in the 52 weeks preceding for both subsamples.The distributions are exactly identical. This result confirms our expectation that if anybehavioural change is to be detected this early as a result of the introduction of experiencerating, it will be found in marginal effects rather than in average effects.

The Impact of Worker’s Experience Rating on Unemployed Workers8
All COEP respondents
Distribution of past usage weeks as defined in the EI Act
Mean Std. Dev
1995 56.793 47.374
1996 55.126 48.655
1997 57.835 46.341
1998 57.782 40.693
Distribution of Rate Reductions
Rate Reduced by 1995 1996 1997 1998
0% 28.6 30.5 25.7 19.7
1% 15.2 15.8 17.3 19.2
2% 13.9 13.8 14.4 18.2
3% 11.2 10.9 11.9 15.3
4% 9.6 8.7 10.0 11.0
5% 21.6 20.4 20.8 16.7
Two subsamples
Distribution of Rate Reductions
Before After
Rate Reduced by Actual History Official History Actual History Official History
0% 30.7 81.4 30.0 81.4
1% 15.0 18.5 16.8 18.5
2% 13.7 0.1 13.9 0.1
3% 10.8 0 11.0 0
4% 8.9 0 8.8 0
5% 20.9 0 19.6 0
TABLE 1Experience Rating in Perspective

The Impact of Worker’s Experience Rating on Unemployed Workers 9
Table 2 presents the descriptive statistics of the data used here. The data cover 37,224 claimsfiled by 25,241 claimants over the two-year period. These data show that those in the sampleare middle-aged and predominantly male; very few of them are disabled, minority or native.Almost 40 percent of the claims were filed in the Maritimes.
N=37,224 N=18,716 N=18,508Before After
Standard Standard Standard Demographic Variables Mean Deviation Mean Deviation Mean Deviation
Age 37.219 11.180 36.970 11.109 37.470 11.245
Minority 0.007 0.082 0.006 0.077 0.007 0.088
Native 0.015 0.123 0.015 0.120 0.016 0.126
Women 0.368 0.482 0.309 0.462 0.428 0.495
Disabled 0.003 0.059 0.003 0.055 0.004 0.063
Number of dependants 2.044 1.525 2.000 1.451 2.091 1.594
Geographic Variables
Newfoundland 0.107 0.309 0.108 0.310 0.106 0.308
Prince Edward Island 0.083 0.275 0.083 0.276 0.082 0.274
Nova Scotia 0.103 0.305 0.103 0.304 0.103 0.305
New Brunswick 0.105 0.306 0.105 0.306 0.105 0.306
Quebec 0.134 0.341 0.134 0.341 0.135 0.342
Ontario 0.107 0.309 0.104 0.305 0.110 0.312
Manitoba 0.091 0.287 0.092 0.289 0.089 0.285
Saskatchewan 0.077 0.267 0.079 0.270 0.075 0.263
Alberta 0.078 0.268 0.081 0.271 0.075 0.264
British Columbia and NWT 0.115 0.319 0.112 0.315 0.119 0.323
Claim Characteristics
Weeks of Benefits Paid 21.030 12.133 21.360 11.906 20.697 12.351
Benefits Rate 269.499 107.329 271.759 109.715 267.214 104.814
Weeks Entitlement 33.418 8.243 33.524 8.508 33.311 7.966
Benefits Exhausted 0.309 0.462 0.323 0.468 0.297 0.457
Claims Subject to Rating 0.497 0.500 0 1
TABLE 2Descriptive Statistics

On average, they qualify for 33 weeks of benefits, and draw benefits during 20 of these33 weeks; 30 percent of the claims are actually exhausted. Finally, these claims are almostevenly distributed before and after the introduction of the experience rating system. Thetable also shows the differences in sample characteristics for the before and after groups.The table shows that both groups are remarkably similar, with one major exception: manymore women claim in the second sample than in the first. We will come back to this.
Table 3 shows that the 25,241 people included here are quite different relative to past EI/UIusage: 14 percent of them filed for benefits for the first time in the nineties. At the otherextreme, 31 percent of them have filed six times or more during the same period. Repeatusage is clearly more prevalent among men: 27 percent of women have claimed six or moretimes, compared to 33 percent of men.
The Impact of Worker’s Experience Rating on Unemployed Workers10
Number of Claims Proportion Proportion Proportion of Claimants of Claimants of Claimants
All Female Male
1 0.143 0.175 0.125
2 0.168 0.196 0.151
3 0.142 0.149 0.138
4 0.123 0.116 0.127
5 0.113 0.092 0.126
6 0.108 0.090 0.119
7 0.139 0.129 0.145
8 0.058 0.049 0.063
9 or more 0.006 0.004 0.006
TABLE 3Total Claims Filed During the Nineties by Respondents

The Impact of Worker’s Experience Rating on Unemployed Workers 11
5. Results
5.1. Corner effectsOur first attempt was to show if there has been a significant increase in the number of peopleclaiming 19 weeks or less of benefits after the introduction of the experience ratingsystem to avoid having their future benefits reduced. Such an increase is clearly predictedby economic theory if the rating system is binding.
We compared the duration pattern for claims filed during the year preceding the introductionof experience rating (July 1995 to June 1996) with the pattern for those filed during the yearfollowing it (July 1996 to June 1997). Our data set includes all the Canadian Out ofEmployment Panel (COEP) respondents who filed a claim in either one of these two years.Our “dependent variable” was the number of weeks of benefits paid by Human ResourcesDevelopment Canada (HRDC) to an unemployed worker.
There is one preliminary technical question regarding the proper treatment of the “weekspaid” variable. First is the question of censoring. Under the Employment Insurance (EI)rules, the benefit weeks paid to a claimant will count in his or her usage history, whetheror not this number was reached because the claimant had exhausted their benefits. Thosewho exhaust their benefits should not be treated differently from those who do not. In aduration analysis, however, the “weeks of benefits paid” variable is censored when benefitsare exhausted. Taking exhaustion into account is essential when comparing subgroups, forexample. If two groups tend to have different lengths of benefits received, not accountingfor censoring could lead us to conclude that behavioural differences exist between thesegroups, while the observed differences in attitude with respect to claims result directly fromdifferences in benefit entitlements. In our analysis, we assumed that the “weeks paid” variablewas censored when benefits were exhausted. However, none of our results was criticallydependent on that assumption.
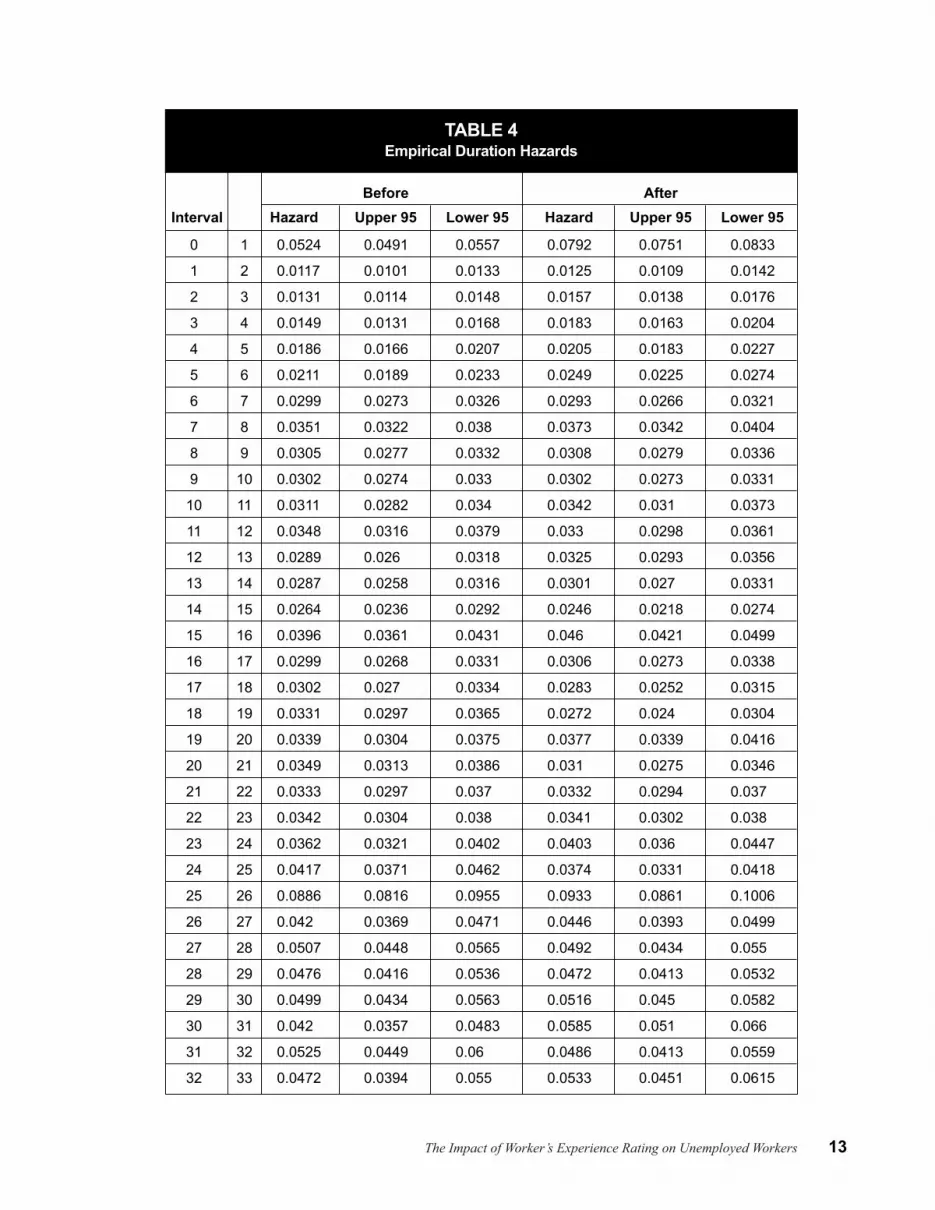
Figure 1 shows the Kaplan Meyer empirical hazard rates for the number of weeks paid,allowing for censoring. These hazards represent the probability that a spell will last exactlyn weeks, conditional upon the fact that it has lasted for n-1 weeks. These figures show thehazards separately for the claims filed before the introduction of experience rating (toppanel), and after (bottom panel). The upper and lower bounds of the estimation at the95 percent level are shown in dashed lines.
The figures show clearly that, as predicted by theory, a small but significant spike in theduration hazard at week 19. The figures presented in Table 4 confirm it. This table simplypresents the estimated empirical hazards. It shows that after the introduction of experiencerating, the probability of re-employment during week 19 goes up by one percentage pointcompared to the previous week. This implies that after the introduction of the rating system,

The Impact of Worker’s Experience Rating on Unemployed Workers12
FIGURE 1Employment Insurance Benefits Duration Hazard
Before Rating
Hazard Lower 95 Upper 95
Hazard Lower 95 Upper 95
After Rating
0.14
0.12
0.1
0.08
0.06
0.04
0.02
00
10 19
0.16
0.14
0.12
0.1
0.08
0.06
0.04
0.02
00
10 19
the probability of a return to work during the 19th week of benefits is significantly higherthan in week 18 or 20; this was not the case before the introduction of the system. Thisphenomenon is more marked when the sample is limited to repeat users (those who haveclaimed six or more times during the nineties). The spike for them is close to 1.3 points.
The Impact of Worker’s Experience Rating on Unemployed Workers 13
Before AfterInterval Hazard Upper 95 Lower 95 Hazard Upper 95 Lower 95
0 1 0.0524 0.0491 0.0557 0.0792 0.0751 0.0833
1 2 0.0117 0.0101 0.0133 0.0125 0.0109 0.0142
2 3 0.0131 0.0114 0.0148 0.0157 0.0138 0.0176
3 4 0.0149 0.0131 0.0168 0.0183 0.0163 0.0204
4 5 0.0186 0.0166 0.0207 0.0205 0.0183 0.0227
5 6 0.0211 0.0189 0.0233 0.0249 0.0225 0.0274
6 7 0.0299 0.0273 0.0326 0.0293 0.0266 0.0321
7 8 0.0351 0.0322 0.038 0.0373 0.0342 0.0404
8 9 0.0305 0.0277 0.0332 0.0308 0.0279 0.0336
9 10 0.0302 0.0274 0.033 0.0302 0.0273 0.0331
10 11 0.0311 0.0282 0.034 0.0342 0.031 0.0373
11 12 0.0348 0.0316 0.0379 0.033 0.0298 0.0361
12 13 0.0289 0.026 0.0318 0.0325 0.0293 0.0356
13 14 0.0287 0.0258 0.0316 0.0301 0.027 0.0331
14 15 0.0264 0.0236 0.0292 0.0246 0.0218 0.0274
15 16 0.0396 0.0361 0.0431 0.046 0.0421 0.0499
16 17 0.0299 0.0268 0.0331 0.0306 0.0273 0.0338
17 18 0.0302 0.027 0.0334 0.0283 0.0252 0.0315
18 19 0.0331 0.0297 0.0365 0.0272 0.024 0.0304
19 20 0.0339 0.0304 0.0375 0.0377 0.0339 0.0416
20 21 0.0349 0.0313 0.0386 0.031 0.0275 0.0346
21 22 0.0333 0.0297 0.037 0.0332 0.0294 0.037
22 23 0.0342 0.0304 0.038 0.0341 0.0302 0.038
23 24 0.0362 0.0321 0.0402 0.0403 0.036 0.0447
24 25 0.0417 0.0371 0.0462 0.0374 0.0331 0.0418
25 26 0.0886 0.0816 0.0955 0.0933 0.0861 0.1006
26 27 0.042 0.0369 0.0471 0.0446 0.0393 0.0499
27 28 0.0507 0.0448 0.0565 0.0492 0.0434 0.055
28 29 0.0476 0.0416 0.0536 0.0472 0.0413 0.0532
29 30 0.0499 0.0434 0.0563 0.0516 0.045 0.0582
30 31 0.042 0.0357 0.0483 0.0585 0.051 0.066
31 32 0.0525 0.0449 0.06 0.0486 0.0413 0.0559
32 33 0.0472 0.0394 0.055 0.0533 0.0451 0.0615
TABLE 4Empirical Duration Hazards

The Impact of Worker’s Experience Rating on Unemployed Workers14
Before AfterInterval Hazard Upper 95 Lower 95 Hazard Upper 95 Lower 95
33 34 0.0512 0.0422 0.0602 0.044 0.0359 0.0522
34 35 0.0479 0.0386 0.0572 0.048 0.0388 0.0572
35 36 0.0616 0.0502 0.0729 0.0509 0.0407 0.0611
36 37 0.043 0.0329 0.0532 0.0395 0.03 0.0491
37 38 0.0466 0.0354 0.0579 0.0485 0.0373 0.0597
38 39 0.049 0.0368 0.0612 0.0523 0.0399 0.0647
39 40 0.0378 0.0265 0.0491 0.0448 0.0325 0.0571
40 41 0.0357 0.024 0.0473 0.0405 0.0279 0.053
41 42 0.0442 0.0303 0.0581 0.0356 0.0231 0.0481
42 43 0.0302 0.0179 0.0425 0.0364 0.0229 0.0499
43 44 0.0226 0.0112 0.0341 0.0388 0.0239 0.0537
44 45 0.0306 0.0165 0.0448 0.0499 0.0317 0.068
45 46 0.0451 0.0267 0.0635 0 — —
46 47 0.0387 0.0203 0.0571 0 — —
47 48 0.0497 0.0273 0.072 0 — —
48 49 0.0352 0.0153 0.0552 0 — —
TABLE 4 (continued)Empirical Duration Hazards
In addition, the log-rank tests strongly reject the assumption of equality between the survivalcurves before and after the policy change.
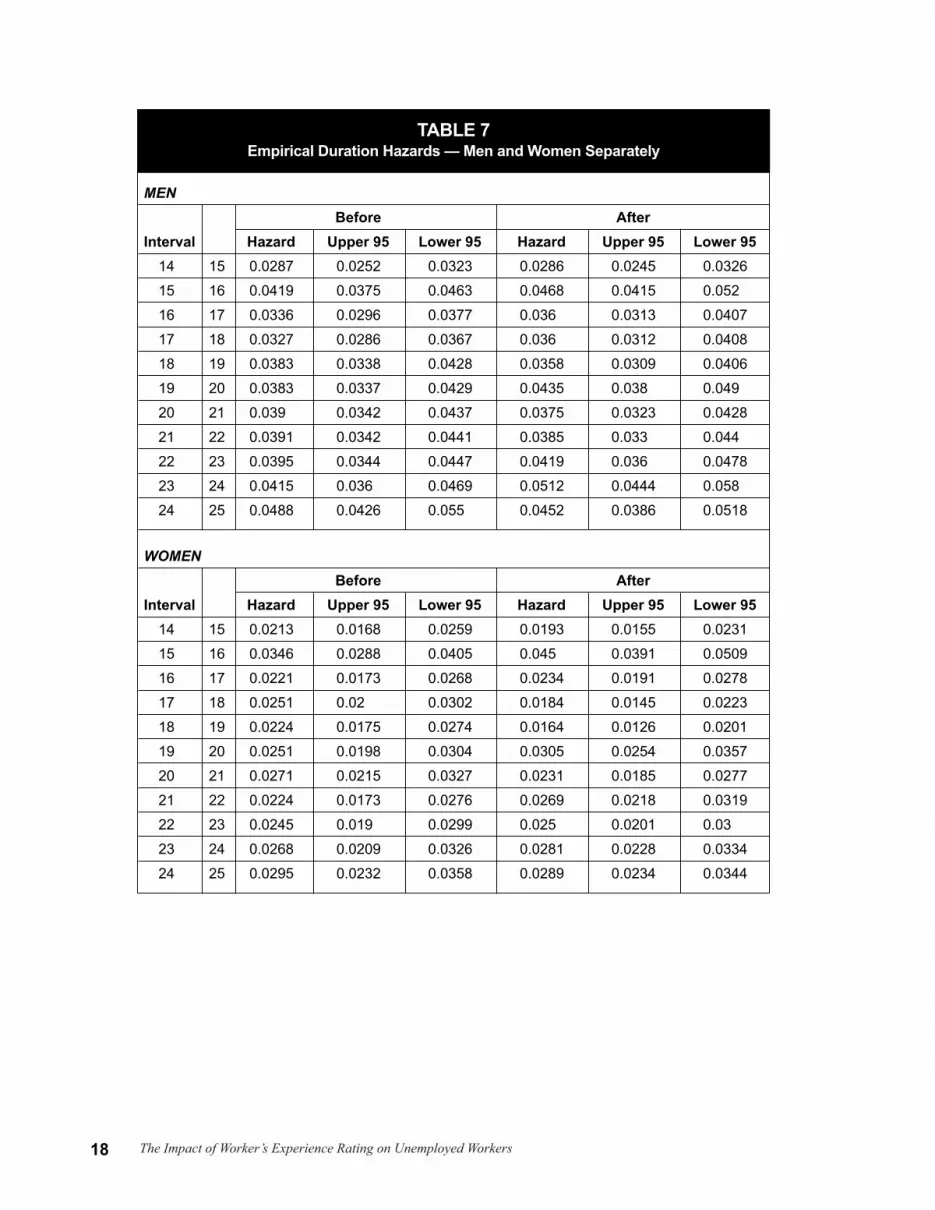
To account for other potential behavioural changes, we estimated a non-parametric durationmodel separately for the before and after groups. The results from these estimates are shownin Table 6. All coefficients show a remarkable stability, with the exception once again of thatapplied to women. While women were claiming on average longer than men before theapplication of the rating system, this difference disappears once the system is introduced.This behavioural change, however, could be (and likely is) related to the composition changewe noted in the preceding section. It runs counter to the expected impact of the rating reform:since men are more likely to make repeated claims, it was reasonable to expect that theywould respond more noticeably to the introduction of experience rating. However, it appearsthat women responded more than men. Table 7 summarizes the empirical hazards separatelyfor men and women around week 19 (see also Figure 2). In addition to the reduction in thedifference in the average number of weeks claimed between men and women, Table 7 showsthat the response at week 19 by women seems to be stronger: re-employment hazard forwomen at week 19 increases by 86 percent compared to its level at week 18. The increasefor men is only about 21 percent.

The Impact of Worker’s Experience Rating on Unemployed Workers 15
Before AfterInterval Hazard Upper 95 Lower 95 Hazard Upper 95 Lower 95
0 1 0.0168 0.0136 0.0199 0.0282 0.0241 0.0323
1 2 0.0066 0.0047 0.0086 0.009 0.0066 0.0113
2 3 0.0073 0.0052 0.0094 0.0094 0.007 0.0118
3 4 0.0072 0.0051 0.0093 0.0108 0.0082 0.0134
4 5 0.0093 0.0069 0.0117 0.0146 0.0115 0.0176
5 6 0.0166 0.0134 0.0198 0.0195 0.016 0.0231
6 7 0.0261 0.0221 0.0302 0.0252 0.0211 0.0292
7 8 0.035 0.0303 0.0398 0.0399 0.0346 0.0451
8 9 0.0294 0.0249 0.0338 0.0297 0.0251 0.0342
9 10 0.0325 0.0277 0.0372 0.0288 0.0243 0.0334
10 11 0.0356 0.0306 0.0407 0.0373 0.032 0.0426
11 12 0.0436 0.0379 0.0493 0.0356 0.0303 0.0409
12 13 0.0315 0.0265 0.0364 0.0371 0.0316 0.0426
13 14 0.0268 0.0222 0.0314 0.0303 0.0253 0.0354
14 15 0.0263 0.0216 0.0309 0.0278 0.0229 0.0327
15 16 0.0341 0.0287 0.0394 0.0357 0.0301 0.0413
16 17 0.033 0.0276 0.0383 0.036 0.0303 0.0418
17 18 0.0294 0.0242 0.0345 0.0351 0.0293 0.0409
18 19 0.0432 0.0369 0.0496 0.0374 0.0313 0.0435
19 20 0.0485 0.0417 0.0554 0.051 0.0437 0.0583
20 21 0.0513 0.0441 0.0585 0.0424 0.0356 0.0492
21 22 0.0529 0.0454 0.0605 0.0434 0.0364 0.0504
22 23 0.0595 0.0513 0.0678 0.0514 0.0436 0.0592
23 24 0.0695 0.0603 0.0787 0.0572 0.0487 0.0656
24 25 0.0899 0.0791 0.1008 0.0685 0.0589 0.0781
25 26 0.0988 0.0869 0.1107 0.0962 0.0844 0.108
26 27 0.1185 0.1047 0.1323 0.1118 0.0984 0.1252
27 28 0.1089 0.0949 0.1229 0.1094 0.0954 0.1235
28 29 0.1499 0.1324 0.1674 0.1523 0.1347 0.1699
29 30 0.1243 0.1073 0.1414 0.1803 0.1596 0.2011
30 31 0.2084 0.1845 0.2323 0.158 0.1368 0.1792
31 32 0.1742 0.1501 0.1983 0.1542 0.1316 0.1769
32 33 0.4369 0.3937 0.4801 0.275 0.2416 0.3083
TABLE 5Empirical Duration Hazards — Repeat Users Only

The Impact of Worker’s Experience Rating on Unemployed Workers16
Before AfterInterval Hazard Upper 95 Lower 95 Hazard Upper 95 Lower 95
33 34 0.2891 0.246 0.3323 0.36 0.3157 0.4044
34 35 0.2727 0.2244 0.3211 0.2869 0.2399 0.3339
35 36 0.2353 0.1841 0.2865 0.2116 0.1655 0.2578
36 37 0.1978 0.1453 0.2503 0.2092 0.1582 0.2601
37 38 0.2313 0.1682 0.2943 0.1833 0.1305 0.236
38 39 0.1488 0.0928 0.2047 0.2082 0.1463 0.2701
39 40 0.1333 0.0764 0.1902 0.1387 0.0834 0.1941
40 41 0.0559 0.0172 0.0947 0.1325 0.0745 0.1904
41 42 0.0981 0.0448 0.1514 0.1609 0.0923 0.2295
42 43 0.0488 0.0098 0.0878 0.087 0.0331 0.1408
43 44 0.0779 0.0271 0.1288 0.1154 0.0502 0.1806
44 45 0.0367 0.0007 0.0727 0.1075 0.041 0.1741
45 46 0.0478 0.0059 0.0898 0.271 0.1561 0.3858
46 47 0.04 0.0008 0.0792 0.0938 0.0188 0.1687
47 48 0.0417 0.0008 0.0825 0.0333 0 0.0795
48 49 0.0215 0 0.0513 0.0522 0 0.1112
TABLE 5 (continued)Empirical Duration Hazards — Repeat Users Only

The Impact of Worker’s Experience Rating on Unemployed Workers 17
Before AfterCoef. Stand. Dev. Coef. Stand. Dev.
Quarter
Winter 0.185 0.024 0.148 0.024
Spring 0.300 0.024 0.336 0.023
Summer -0.233 0.028 -0.220 0.026
Age -0.003 0.001 -0.005 0.001
Female -0.155 0.026 -0.040 0.028
Disabled -0.245 0.172 -0.235 0.144
Native -0.108 0.073 -0.283 0.073
Number of Dependants -0.022 0.007 -0.052 0.008
Minority -0.218 0.118 -0.262 0.103
Province
Newfoundland -0.499 0.039 -0.638 0.038
Prince Edward Island -0.437 0.043 -0.620 0.042
Nova Scotia -0.253 0.039 -0.265 0.037
New Brunswick -0.477 0.041 -0.467 0.039
Quebec -0.146 0.036 -0.111 0.034
Ontario 0.168 0.037 0.042 0.036
Manitoba 0.119 0.038 0.189 0.038
Saskatchewan 0.027 0.040 0.125 0.039
Alberta -0.025 0.040 0.149 0.040
TABLE 6Cox Proportional Hazard Model of Weeks of Benefits Claimed
The Impact of Worker’s Experience Rating on Unemployed Workers18
MENBefore After
Interval Hazard Upper 95 Lower 95 Hazard Upper 95 Lower 9514 15 0.0287 0.0252 0.0323 0.0286 0.0245 0.032615 16 0.0419 0.0375 0.0463 0.0468 0.0415 0.05216 17 0.0336 0.0296 0.0377 0.036 0.0313 0.040717 18 0.0327 0.0286 0.0367 0.036 0.0312 0.040818 19 0.0383 0.0338 0.0428 0.0358 0.0309 0.040619 20 0.0383 0.0337 0.0429 0.0435 0.038 0.04920 21 0.039 0.0342 0.0437 0.0375 0.0323 0.042821 22 0.0391 0.0342 0.0441 0.0385 0.033 0.04422 23 0.0395 0.0344 0.0447 0.0419 0.036 0.047823 24 0.0415 0.036 0.0469 0.0512 0.0444 0.05824 25 0.0488 0.0426 0.055 0.0452 0.0386 0.0518
WOMENBefore After
Interval Hazard Upper 95 Lower 95 Hazard Upper 95 Lower 9514 15 0.0213 0.0168 0.0259 0.0193 0.0155 0.023115 16 0.0346 0.0288 0.0405 0.045 0.0391 0.050916 17 0.0221 0.0173 0.0268 0.0234 0.0191 0.027817 18 0.0251 0.02 0.0302 0.0184 0.0145 0.022318 19 0.0224 0.0175 0.0274 0.0164 0.0126 0.020119 20 0.0251 0.0198 0.0304 0.0305 0.0254 0.035720 21 0.0271 0.0215 0.0327 0.0231 0.0185 0.027721 22 0.0224 0.0173 0.0276 0.0269 0.0218 0.031922 23 0.0245 0.019 0.0299 0.025 0.0201 0.0323 24 0.0268 0.0209 0.0326 0.0281 0.0228 0.033424 25 0.0295 0.0232 0.0358 0.0289 0.0234 0.0344
TABLE 7Empirical Duration Hazards — Men and Women Separately

The Impact of Worker’s Experience Rating on Unemployed Workers 19
FIGURE 2Employment Insurance Benefits Duration Hazard
Men Before Men After
Women Before Women After
0.16
0.14
0.12
0.1
0.08
0.06
0.04
0.02
090 19 29 39
0.1
0.08
0.06
0.04
0.02
090 19 29 39

The Impact of Worker’s Experience Rating on Unemployed Workers20
3 This limit in time for this sample is justified by the fact that we want to have accurate measures of the truereplacement rates, and therefore have to limit ourselves to claims filed around COEP time.
4 Although all these claims might not correspond to the COEP separations, this is probably the best estimation ofthe “true” replacement rate around that time, as perceived by the unemployed.
5.2 Employment Insurance usage and replacement rate
An alternative approach to the problem is to estimate directly the impact of variations inreplacement rates on EI usage. As noted, the EI reform provides us with a necessaryinstrumental variable to isolate this effect. Using all the claims made after July 1995,3 weestimated (2) and (3) to measure the extent to which the new system of experience ratingworked as a deterrent.
We first computed the true replacement rate, by dividing the amount of benefits payableto the unemployed, as reported in the Status Vector data, by the weekly lost wage reportedin the COEP Survey.4 In Table 8, we report the results of our estimations of the determinantsof the replacement rate. We included, as explanatory variables, all the socio-demographicvariables available — variables controlling for year and quarter (to account for seasonaland legal changes); and the lost wage (up to power three). The lost wage is introducedhere as a way to take into account the existence of a maximum insurable earnings. Wealso included weeks of benefits potentially available. Finally, we included both the “actual”measure of historical EI usage (the number of weeks of benefits received in the last 60 months), and the ‘official’ measure (EI usage since July 1996).
This estimation reveals that everything else being equal, women and people with dependantshave lower replacement rates. Once again, everything else being equal, there are largesignificant differences between provinces and quarters in average replacement rates. Theaverage replacement rate also rose in 1998.
We also isolated a highly significant relation between replacement rate and the past wage(not surprising given the existence of maximum insurable earnings). Finally, we were ableto isolate very precisely the impact of the first group of repeat users affected by thesystem. Those having between 20 and 40 weeks of usage since July 1996 would havetheir replacement rate reduced by 1 percentage point. This 1.8 percent reduction in benefitswas estimated to be 2.6 percent. Those between 40 and 60 weeks were supposed to suffera 3.6 percent reduction in benefits. That reduction was estimated to be 4.3 percent. Ourestimate of the reduction in replacement rates for those with more than 60 weeks usageclearly overshot at more than 13 percent. However, the very small sample could explainthis imprecision.
It is also interesting to note that those with long benefit entitlements tend to receive higherreplacement rates (denoting probably their stronger labour market attachment). Finally,everything else being equal, repeat users have higher replacement rates.

The Impact of Worker’s Experience Rating on Unemployed Workers 21
Regression of the replacement rateDependent Variable: (Weekly Benefits/Weekly COEP Wage)
(1) (2)Coef. Stand. Dev. Coef. Stand. Dev.
Age 0.001 (0.000) 0.001 (0.000)Female -0.035 (0.002) -0.034 (0.002)Disabled -0.022 (0.010) -0.024 (0.010)Native -0.006 (0.005) -0.009 (0.005)Number of Dependants 0.001 (0.001) -0.001 (0.001)Minority -0.007 (0.007) -0.005 (0.007)
ProvinceNewfoundland 0.008 (0.003) -0.021 (0.003)Prince Edward Island 0.000 (0.003) -0.020 (0.003)Nova Scotia -0.002 (0.003) -0.019 (0.003)New Brunswick 0.011 (0.003) -0.004 (0.003)Quebec -0.001 (0.003) -0.013 (0.003)Ontario 0.009 (0.003) 0.013 (0.003)Manitoba -0.006 (0.003) 0.000 (0.003)Saskatchewan 0.001 (0.003) 0.002 (0.003)Alberta 0.006 (0.003) 0.016 (0.003)
QuarterWinter -0.011 (0.002) -0.012 (0.002)Spring -0.015 (0.002) -0.015 (0.002)Summer -0.014 (0.002) -0.014 (0.002)
Year1985 -0.025 (0.003) -0.018 (0.003)1986 -0.024 (0.003) -0.020 (0.003)1987 -0.018 (0.003) -0.016 (0.003)Weeks Benefits Available 0.095 (0.003)Weeks Used in Past 60 Months 0.008 (0.000)Lost Wage -6.801 (0.231) -6.449 (0.227)Lost Wage Squared 1.201 (0.039) 1.137 (0.038)Lost Wage 3 -0.071 (0.002) -0.068 (0.002)
Actual History1% Reduction -0.026 (0.002) -0.024 (0.002)2% Reduction -0.043 (0.005) -0.038 (0.005)3% Reduction -0.132 (0.025) -0.129 (0.025)Adjusted R-Squared 0.290 0.315
TABLE 8Determinants of the True Replacement Rate

The Impact of Worker’s Experience Rating on Unemployed Workers22
The presence of this “official” EI usage history in the regression allows us to identify model(2)-(3), since these variables are clearly correlated with the replacement rate, though notto the usage decision, because they only remotely relate to actual past behaviour (which isknown and included). We estimated (2)-(3), first estimating (3) as a simple linear regressionusing two-stage least squares. Table 9 presents the results of these estimations. It shows thatwomen tend to use less, while older people and claimants with dependants tend to use more.There are also large seasonal differences and differences between provinces. The largedifferences with respect to 1998 can be justified by the fact that many of the later claimsare still active. Past usage is always strongly and positively correlated with current usage. In the Ordinary Least Squares (OLS) estimation, replacement rate is positively associatedwith usage. Surprisingly, weeks of entitlement are negatively correlated with usage. Theselast two signs are reversed when using two-stage methods. Long entitlement is now morenaturally associated with longer usage, but replacement rate is now negatively related to usage.
The same results persist when (3) is estimated using the Cox method rather than a linearregression. Predicted value for replacement rate from Table 9 is incorporated into a Coxmodel. Robust standard errors are computed. The results are presented in Table 10. The Cox estimation confirms that higher replacement rates are associated with higher exits fromEI — and therefore shorter usage. While this result seems paradoxical, remember that inthis case, the replacement rate is identified using basically the few people who have alreadybeen affected by the system. What this result says is that these people keep using more EIthan other comparable claimants.

The Impact of Worker’s Experience Rating on Unemployed Workers 23
Ordinary and Two-Stage Least Square Regression of EI UsageDependent Variable: Number of Weeks of Benefits Received During the Claim
OLS 2SLSCoef. Stand. Dev. Coef. Stand. Dev.
Age 0.002 (0.000) 0.006 (0.001)Female -0.106 (0.014) -0.322 (0.022)Disabled 0.187 (0.068) 0.038 (0.069)Native 0.164 (0.033) 0.101 (0.034)Number of Dependants 0.096 (0.004) 0.088 (0.004)Minority 0.128 (0.048) 0.097 (0.048)
ProvinceNewfoundland 0.364 (0.018) 0.196 (0.023)Prince Edward Island 0.305 (0.019) 0.147 (0.023)Nova Scotia 0.185 (0.018) 0.048 (0.021)New Brunswick 0.239 (0.018) 0.191 (0.018)Quebec 0.072 (0.017) -0.026 (0.018)Ontario -0.078 (0.018) 0.010 (0.019)Manitoba -0.112 (0.018) -0.109 (0.018)Saskatchewan -0.002 (0.019) 0.009 (0.019)Alberta -0.045 (0.019) 0.064 (0.021)
QuarterWinter 0.054 (0.012) 0.003 (0.013)Spring -0.135 (0.013) -0.218 (0.015)Summer 0.032 (0.012) -0.055 (0.014)
Year1985 1.008 (0.020) 0.998 (0.020)1986 0.943 (0.016) 0.909 (0.017)1987 0.783 (0.017) 0.731 (0.017)Weeks Benefits Available -0.091 (0.018) 0.555 (0.056)Weeks Used in Past 60 Months 0.078 (0.003) 0.126 (0.005)
Lost Wage 8.089 (1.509) -34.685 (3.830)Lost Wage Squared -1.356 (0.254) 6.183 (0.670)Lost Wage 3 0.075 (0.014) -0.373 (0.039)
Replacement Rate 0.189 (0.035) -6.432 (0.546)Adjusted R-Squared 0.183 0.186
TABLE 9Employment Insurance Usage and Replacement Rate

The Impact of Worker’s Experience Rating on Unemployed Workers24
Cox Proportional Hazard of EI UsageDependent Variable: Number of Weeks of Benefits Received during the Claim
Age -0.008 (0.001)
Female 0.204 (0.023)
Disabled 0.036 (0.103)
Native -0.200 (0.051)
Number of Dependants -0.057 (0.006)
Minority -0.156 (0.076)
Province
Newfoundland -0.428 (0.027)
Prince Edward Island -0.321 (0.030)
Nova Scotia -0.118 (0.027)
New Brunswick -0.362 (0.027)
Quebec -0.022 (0.025)
Ontario 0.004 (0.026)
Manitoba 0.203 (0.027)
Saskatchewan 0.045 (0.028)
Alberta -0.009 (0.029)
Quarter
Winter -0.208 (0.018)
Spring 0.154 (0.019)
Summer -0.238 (0.020)
Year
1985 -1.771 (0.030)
1986 -1.640 (0.025)
1987 -1.267 (0.024)
Weeks Used in Past 60 Months -0.071 (0.004)
Lost Wage 30.066 (2.939)
Lost Wage Squared -5.383 (0.503)
Lost Wage 3 0.328 (0.029)
Replacement Rate 6.525 (0.283)
Pseudo R-Squared 0.020
TABLE 10Employment Insurance Usage and Replacement Rate

The Impact of Worker’s Experience Rating on Unemployed Workers 25
6. Predictions
Experience rating, through the intensity rule, has the potential to affect the benefits of themajority of Employment Insurance (EI) recipients. Without behavioural change in responseto the introduction of this provision, and everything else being equal, 70 percent of claimsshould be rated below the maximum possible replacement rate. As Table 11 shows, thiscorresponds to a reduction of more than 2.5 percent in payments made to beneficiaries.
We have seen some evidence of a response to the introduction of a rating system in EI.The most obvious evidence is the increase in the number of people leaving EI just beforetheir future benefits could be affected if they stayed for one more week. Although we believethis effect to be statistically significant, its economic effect is minimal. Assuming that allthe increase in exits at the 19th week can be attributed to experience rating, we carried outthe following exercise. We started from the baseline hazard of the Cox regression on the“after” sample, as presented in Table 6, and compared the average usage implied by thisbaseline hazard with that implied by the same baseline, with the exception that the spikein the hazard at week 19 was replaced by an interpolation of the hazards for weeks 18 and20. The difference in the implied average usage caused by the spike corresponds to less thana quarter of a week.
Of course, the contrary would have been surprising. As we note, this is a marginal effect,but one that is quite easily identified.
The estimation of the structural model does not provide us with many more clues. Althoughwomen appear to be behaving differently with respect to usage, they do not appear to havereacted differently to experience rating (these results are not shown here). The model alsoshows that, given our identifying strategy, those who are affected by the new ratingsystem keep using EI more than the comparable unemployed.
This table shows the savings that would have been made in EI payments if the intensity rule had been in full force in 95, 96 and 97, using Status Vector information of Canadian Out ofEmployment Panel (COEP) respondents.
Claims filed in Payments Potential savings Savings as made on from intensity a proportion
these claims ($) rule ($) of payments (%)
1995 85,483,601 2,270,674 2.65%
1996 97,677,638 2,446,643 2.51%
1997 71,039,739 1,887,313 2.66%
TABLE 11Experience Rating in Perspective — Savings
Potential Reductions in Payments Associated with the Intensity Rule

The Impact of Worker’s Experience Rating on Unemployed Workers26

The Impact of Worker’s Experience Rating on Unemployed Workers 27
7. Conclusions
The system of experience rating instituted by the new Employment Insurance (EI) Actthrough the intensity rule has the potential to affect a very large majority of EI claimants.If the system had been implemented during the nineties, 70 percent of claimants would havebeen affected. One out of 5 claimants would have had their replacement rate reduced by5 points, or 9.1 percent. Such a large potential impact is bound to induce behavioural changes.
There is no doubt that this provision will have a major impact on EI disbursements. Theevidence that behavioural response to the introduction of the intensity rule is limited andeconomically small (although statistically large) confirms that potential. To the extent that Canadian Out of Employment Panel (COEP) is a representative sample of separations(and of potential new claims), the evidence shows that the intensity rule alone could generatea reduction in EI payments of approximately 2.5 percent.
Measuring the true impact of the change will be a slow process, however, as the “actual”employment history moves closer to the “official” history, and claimants start feeling thepain of reduced benefits. We believe we have seen the first signs of such a change, but thebehavioural changes observed so far are tiny: a slight increase in the number of benefitrecipients leaving after 19 weeks to avoid their future replacement rates being affected.
This evolution will have to be monitored. In addition to a marginal “corner” effect, we haveseen a reduction in the number of weeks claimed since the introduction of the experiencerating system. At this stage, a formal structural model cannot attribute this reduction directlyto the new system. If more conclusive results do not appear in the future, one will have toconclude that unemployed workers do not have as much control over their usage of EI asthe proponents of the reform thought they had. In this case, the experience rating systemwould merely result in a reduction of the welfare of the unemployed, with no improvementof welfare for the society as a whole.

The Impact of Worker’s Experience Rating on Unemployed Workers28

Bibliography
Akerlof, George A. and Hajime Miyazaki, “The Implicit Contract Theory of UnemploymentMeets the Wage Bill Argument,” Review of Economic Studies, 47, 1980, 312-338.
Corak, Miles and Wendy Pyper, “Firms, Industries and Cross-subsidies: Patterns in theDistribution of UI Benefits and Taxes” Human Resources Development Canada Report.1995.
HRDC, “A Guide to Employment Insurance.”
Mortensen, Dale T. “Unemployment Insurance and Job Search Decision,” Industrial andLabor Relations Review, Vol. 30, 1977, pp. 505-517.
The Impact of Worker’s Experience Rating on Unemployed Workers 29

The Impact of Worker’s Experience Rating on Unemployed Workers30
Copyright © 2022 FDOKUMEN