Support for the very long term unemployed trailblazer - GOV.UK
28
1 Support for the very long term unemployed trailblazer longer term analysis of benefit impacts December 2013
-
Upload
khangminh22 -
Category
Documents
-
view
1 -
download
0
Transcript of Support for the very long term unemployed trailblazer - GOV.UK

1
Support for the very long term unemployed trailblazer
longer term analysis of benefit impacts
December 2013

2
Support for the very long term unemployed trailblazer – longer term analysis of benefit impacts
1. INTRODUCTION .................................................................................................. 5
2. BACKGROUND.................................................................................................... 6
3. METHODOLOGY ................................................................................................. 7
Data definition ............................................................................................................................... 7
Cohort definition............................................................................................................................ 7
Outcome variables definition......................................................................................................... 9
Support option characteristics..................................................................................................... 10
Measuring outcomes and impacts .............................................................................................. 11
4. RESULTS ........................................................................................................... 11
Summary of outcomes and impact.............................................................................................. 12
Benefit outcomes and impact...................................................................................................... 13
Employment outcomes and impact ............................................................................................. 16
Cumulative impact over the tracking period ................................................................................ 17
Sub group analysis - age ............................................................................................................ 17
Sub group analysis - disability..................................................................................................... 20
5. CONCLUSIONS ................................................................................................. 22
6. ANNEX ............................................................................................................... 24
Annex A: Employment data cleaning and sensitivity................................................................... 24
List of figures
Figure 2.1: Trailblazer participant journey ........................................................................................ 6
Figure 4.1: Likelihood of claiming any out of work benefit before and after random assignment.... 13

3
Figure 4.2: Benefit impact of CAP and OCM before and after random assignment........................ 14
Figure 4.3: Likelihood of claiming any out of work benefit after random assignment...................... 15
Figure 4.4: Benefit impact of CAP and OCM after random assignment.......................................... 15
Figure 4.5: Likelihood of claiming JSA/TA after random assignment.............................................. 15
Figure 4.6: JSA/TA impact of CAP and OCM after random assignment......................................... 15
Figure 4.7: Likelihood of claiming ESA/IB/IS after random assignment.......................................... 16
Figure 4.8: ESA/IB/IS impact of CAP and OCM after random assignment..................................... 16
Figure 4.9: Likelihood of P45 recorded employment after random assignment .............................. 17
Figure 4.10: P45 employment impact of CAP and OCM after random assignment ........................ 17
Figure 4.11: Cumulative fewer days in receipt of any benefit ......................................................... 17
Figure 4.12: Cumulative additional days in P45 employment ......................................................... 17
Figure 4.13: Cumulative fewer days in receipt of any benefit – DP sub group ............................... 21
Figure 6.1: Employment outcomes - sensitivity to data cleaning .................................................... 27
Figure 6.2: Employment impact – sensitivity to data cleaning ........................................................ 27
List of tables
Table 3.1: Total random assignments .............................................................................................. 8
Table 3.2: Cohort under analysis and participants excluded ............................................................ 8
Table 3.3: Variables used to compare characteristics ...................................................................... 9
Table 3.4: Variables monitored following random assignment.......................................................... 9
Table 3.5: Characteristics of support option groups ....................................................................... 10
Table 4.1: Monitored outcome variables over 91 weeks................................................................. 12
Table 4.2: impact in measured variables over 91 weeks ................................................................ 12
Table 4.3: Impact – 18-24 year old participants.............................................................................. 18
Table 4.4: Impact – 25-49 year old participants.............................................................................. 18
Table 4.5: Impact – 50+ year old participants................................................................................. 19

4
Table 4.6: Impact – DP marker disabled participants ..................................................................... 20
Table 4.7: Impact – DP marker non-disabled participants .............................................................. 21
Table 6.1: Employment spells with a potential issue - pre cleaned HMRC data............................. 24
Table 6.2: Effect of employment data cleaning on recorded time in employment over the tracking period ...................................................................................................................................... 26

5
1. INTRODUCTION
The Work Programme (WP) was introduced in June 2011 as an integrated package of back to work support for long term unemployed people. In 2013 provision was put in place to help those Jobseeker’s Allowance (JSA) claimants reaching the end of their two years on the Work Programme who have not secured sustainable employment and require further support.
To inform the national programme of post-Work Programme support, the support for the very long term unemployed trailblazer (SVLTU) was introduced in order to explore what kinds of assistance would be effective for this group. The trailblazer had these key features:
A randomised controlled trial to give a high degree of confidence that any observed differences in outcomes are attributable to the support options,
A 13 week pre treatment period to test deterrence, informing and maintaining awareness of forthcoming support throughout the period, and
A 26 week period of treatment consisting of either intensive Jobcentre Plus support, contracted provider-led full time work experience or job search support, or a control option of standard Jobcentre Plus support.
This quantitative analysis is a follow up to a preliminary estimate of benefit impact published in 2012, available via this link1 on the gov.uk website.
The 2012 publication contains a full discussion of the trailblazer’s background and the methodology used to estimate the early benefit impacts, as well as the benefit impacts within this paper.
This report contains statistics describing a longer term estimate of the impact of the SVLTU trailblazer on the likelihood of participants being in receipt of an out of work benefit2 or training allowance3 over a much longer tracking period than the original analysis.
In addition, it also examines the likelihood of participants entering employment as recorded by Her Majesty’s Revenue and Customs (HMRC) P45 employment spells data, and looks at the impact of the trailblazer across a selection of sub-groups.
The figures presented are based on DWP working age benefit data to the end of July 2013 and HMRC P45 employment spells data to the end of October 2013.
The analysis focuses on a cohort of participants over 91 weeks (21 months) following random assignment to a trailblazer support option. Only participants that have completed 91 weeks before the end of July 2013 and were in receipt of an out of work benefit at the date of random
1 https://www.gov.uk/government/uploads/system/uploads/attachment_data/file/223103/20121203_svltu_ad_hoc_stats_publish.pdf 2 Jobseeker’s Allowance (JSA), Income Support (IS), Incapacity Benefit (IB) or Employment and Support Allowance (ESA) 3 A training allowance (TA) is a maintenance allowance paid instead of Jobseeker’s Allowance, out of public funds, to people taking part in a course of training or instruction provided by the Department or under arrangements made with a partner.

6
assignment are included within the cohort. This includes those who were randomly assigned to but did not start a support option4.
A long tracking period is desirable for this analysis, but the longer the tracking period the smaller the cohort size available, making statistical inference more difficult. For example, a tracking period of two years would reduce the size of the cohort to just 600 participants. A 91 week tracking period strikes the right balance between cohort size and length of tracking.
2. BACKGROUND
The trailblazer design identified Jobseeker’s Allowance claimants returning to Jobcentre Plus support following Flexible New Deal (FND) provision and randomly assigned them to one of three support options:
Standard Jobcentre Plus support – this is the control group within the trailblazer and consists of flexible and personalised adviser based support.
Community Action Programme (CAP) - delivered by contracted providers and comprising of 26 weeks of full time work experience or provider-led job search support.
Ongoing Case Management (OCM) – an intensive offer of flexible and personalised adviser based support, delivered by Jobcentre Plus (JCP) through increased interventions over 26 weeks.
Figure 2.1 sets out a participant’s journey through the trailblazer.
Figure 2.1: Trailblazer participant journey
4 Those who leave benefit in the pre treatment period or that reached the point of treatment after February 2012.
1. FND Completion
3. RA Notification Meeting
2 wks 13 wks 26 wks
4. Support Option Start
pre treatment period
5. Support Option End
treatment period
2. Random Assignment
WORK PROGRAMME
Assigned to JCP Control
Assigned to Ongoing Case Management (OCM)
Assigned to Community Action Programme (CAP)
1. FND Completion
3. RA Notification Meeting
2 wks 13 wks 26 wks
4. Support Option Start
pre treatment period
5. Support Option End
treatment period
2. Random Assignment
WORK PROGRAMME
Assigned to JCP Control
Assigned to Ongoing Case Management (OCM)
Assigned to Community Action Programme (CAP)

7
3. METHODOLOGY
Data definition
The 2012 paper discussed in detail the DWP datasets and methodology used, and the same process has been used again for the benefit tracking results within this paper. Here focus is on describing the data and methodology used for the additional employment and sub-group analysis within this paper.
The employment data used in this analysis comes from Her Majesty’s Revenue and Customs (HMRC) data systems. In most circumstances, employers are obliged to notify HMRC when an employee starts or ends a spell of employment. Employment history and outcomes of individuals were derived using the recorded start and end dates of these notified employment spells. However, there are a number of documented issues with the quality of this data5, briefly described below:
Employment spells are only recorded when a tax form is submitted. Some employment spells, such as those corresponding to self employment and individuals earning lower than the PAYE threshold, are therefore not recorded;
Where HMRC do not know the date on which an employment spell started, they assign a start date of the 6th April in the year that they become aware of the employment spell. This may not be the actual year in which the spell began. A similar process occurs when HMRC do not know the date on which an employment spell ended. In this case they assign an end date of the 5th April; and
A small number of records contain other known errors, such as missing start dates or missing end dates.
To mitigate the problem of erroneous dates, the employment spells data has been adjusted using DWP benefit records. Details of these adjustments and their impact on results can be found in Annex A.
A consequence of removing overlaps between benefit and employment spells is that an individual cannot be both in receipt of benefit and in P45 recorded employment at the same time. Where this is observed in the data individuals are assumed to be in receipt of benefit.
Although it is possible to claim benefits whilst employed, the PAYE earning and JSA benefit eligibility thresholds are such that it is unlikely to affect a significant amount of participants or employment spells.
Cohort definition
Table 3.1 shows the overall number of participants randomly assigned to a support option.
5 http://webarchive.nationalarchives.gov.uk/20130314010347/http://research.dwp.gov.uk/asd/asd5/rports2007-2008/rrep432.pdf

8
Table 3.1: Total random assignments
Journey stage JCP
Control CAP OCM Total
Random assignment 4,925 5,136 4,981 15,042
Random assignment % 32.7% 34.1% 33.1% 100%
The cohort for this analysis is shown in Table 3.2 and is drawn from the random assignment group above, minus the following exclusions (exclusion volumes shown in brackets).
Participants are excluded that:
Have not moved 91 weeks past random assignment before the end of July 2013 (296 participants excluded).
Could not be matched in administrative data to a benefit record (3 participants excluded).
Are not in receipt of an out of work benefit at the date of random assignment6 (448 participants excluded).
Transferred out of pilot districts less than 42 weeks7 following random assignment (461 participants excluded).
As individuals can appear in more than one exclusion category the sum of the exclusions above (1,208) is greater than the total number of individuals excluded (1,157).
Table 3.2 shows how the excluded participants are spread across support option groups. A significance test shows no differences in the proportion of participants excluded between JCP Control and CAP or OCM groups.
Table 3.2: Cohort under analysis and participants excluded
JCP
Control CAP OCM Total
Random assignment 4,925 5,136 4,981 15,042
Participants excluded from cohort 371 433 353 1,157
Proportion of participants excluded 7.5% 8.4% 7.1% 7.7%
Cohort under analysis 4,554 4,703 4,628 13,885
Proportion of cohort in each group 32.8% 33.9% 33.3% 100.0%
Support option start8 3,945 3,245 3,527 10,717
CAP referral (no start) n/a 388 n/a 388
6 This is possible in process terms as assignment takes place at the meeting booking stage when the participant is not in attendance at the Jobcentre Plus office. 7 42 weeks is the expected journey time in Fig 2.1 from random assignment to the end of support option treatment. 8 Recorded starts on CAP and OCM, and for comparative purposes only, a pseudo treatment start defined as those assigned to the control group that are in receipt of JSA or training allowance 15 weeks after random assignment.

9
Outcome variables definition
The variables used in this analysis to compare the characteristics of participants are presented in Table 3.3. If random assignment is successful we would expect the values to be similar across the three support option groups.
Table 3.3: Variables used to compare characteristics
Variable Type Values
Support option group Categorical The result of the random assignment process. Values are: JCP Control; CAP; OCM.
Gender Categorical Male; Female.
Age Numerical - continuous
18-65 years old.
Disability9 Categorical Not disabled; Disabled; Unknown.
Ethnicity Categorical White; Black; Asian; Mixed; Chinese; Other; Unknown
Lone Parent Categorical Lone Parent; Couple; No (not a Parent); Not Known; Missing
Low Qualified Categorical No; Yes; Unknown.
Benefit and Employment history
Categorical
728 binary variables (7 days x 104 weeks) – representing each of the days in the two years prior to random assignment. Values are: in P45 employment/receipt of benefit; not in P45 employment /receipt of benefit.
Benefit and Employment spell history
Numerical Number of open spells in 104 weeks prior to random assignment. Spells include JSA/ESA/IS/IB and P45 employment
The outcome variables used in this analysis observed over the tracking period are described in Table 3.4.
Table 3.4: Variables monitored following random assignment
Variable Type Values
Benefit and Employment outcomes (days)
Categorical
637 binary variables (7 days x 91 weeks) – representing each of the days in 91 weeks following random assignment. Values are: in P45 employment/receipt of benefit; not in P45 employment /receipt of benefit.
Benefit and Employment outcomes (weeks)
Categorical
91 binary variables – representing each of the 91 weeks following random assignment. Values are: in P45 employment/receipt of benefit; not in P45 employment /receipt of benefit.
Benefit and Employment spell outcomes
Numerical Number of benefit claims / employment spells in 91 weeks following random assignment.
9 Since disability is set by a Jobcentre Plus adviser based on claimant self -disclosure, this variable is not a systematic identification of disability as defined by the Disability Discrimination Act (DDA).

10
Support option characteristics
Table 3.5 compares the characteristics of the JCP control group to the CAP and OCM groups. There are no statistically significant differences in the proportions of missing or unknown values between support option groups. However the proportion of missing data within the ‘low qualified’ and ‘lone parent’ markers is high (86% and 10% respectively). All other demographic variables report less than 1% missing or unknown values.
Comparing support option groups within the trailblazer, there are no significant differences in the characteristics that we might expect to influence results, such as overall benefit and employment history, age and gender. Overall this table provides assurance that the random assignment process was successful, with no significant differences in these key characteristics.
There are minor differences in some characteristics. Low qualification is 2 percentage points lower in both CAP and OCM groups, a small but significant difference compared to the control. However this should be set in context of the high number of missing and unknown values in this outcome variable. There are also differences in the CAP group’s non-JSA benefit history and OCM JSA spell history, but overall these differences are small and not likely to influence results.
Table 3.5: Characteristics of support option groups
Group name JCP Control CAP OCM 13,885 4,554 4,703 4,628
Personal / Demographic Characteristics Age (mean years) 38 38 38 Male (%) 75% 75% 77% Ethnic Minority (%) 15% 16% 15% Disabled (%) 35% 34% 35% Low Qualified (%) 12% 10%* 10%* Lone Parent (%) 4% 4% 3% Benefit / Employment Characteristics Benefit history (mean days claiming any benefit in past two years)
690 690 689
JSA history (mean days claiming in past two years) 679 677 677
non JSA benefit history (mean days claiming in past two years) 11.0 12.9* 12.0
P45 employment history (mean days in past two years)
15.6 16.0 16.1
Benefit spell history (mean spells in past two years) 2.12 2.15 2.17*
JSA spell history (mean spells in past two years) 1.99 2.01 2.03
P45 employment spell history (mean spells in past two years) 0.31 0.32 0.32
non JSA spell history (mean spells in past two years) 0.129 0.147* 0.143

11
Ethnic Minority (%) - em marker value not equal to 'white'. Includes unknown and 'prefer not to say'
**Significant difference at 99% confidence interval between JCP control and CAP/OCM
*Significant difference at 95% confidence level
Measuring outcomes and impacts
Table 3.5 shows that the pre-treatment characteristics are well balanced, giving reassurance that the randomisation has eliminated any selection bias and enabling impacts to be inferred confidently. This means that we believe the difference in outcomes across the different support options captures the average causal effect of the support option treatment.
The variables in Table 3.4 have been measured for each participant for the 91 weeks following random assignment to a support option.
For benefit outcomes, each day / week from the date of random assignment we measure whether the individual was in receipt of out of work benefits (or training allowance) or in recorded P45 employment. A definitive outcome is assigned where the point in time is identified as being between a benefit/employment spell start and end date.
For each individual the outcome period covers an independently calculated period of time spanning from the participant’s random assignment date to the end of the maximum period of the data available for the cohort (91 weeks later).
To calculate the net impacts for a given week, we take the mean outcome value of the CAP/OCM treatment group (i.e. the proportion of the group who are receiving benefit) and subtract the mean value of the control group. Thus the net impact measure is the absolute difference between the CAP/OCM and control group for the corresponding outcome.
Spell outcome variables count any out of work benefit claim or employment spell opened between the participant’s random assignment date and the end of the tracking period.
As a consequence of employment data cleaning, some employment spells are broken into several smaller spells (see Annex A) increasing the overall number within the data. Additional spells created by the cleaning process are ignored within the employment spells outcome variable.
4. RESULTS
This section presents a summary of outcomes and impact for all variables monitored over the tracking period, specifically:
Summary of all outcomes and impact (Table 4.1 and Table 4.2)
All out of work benefits (Figure 4.1 to Figure 4.4)
JSA only (Figure 4.5 and Figure 4.6)
Displacement to other benefits (Figure 4.7 and Figure 4.8)
Employment outcomes (Figure 4.9 and Figure 4.10)

12
Days in employment and in receipt of benefit (Figure 4.11 and Figure 4.12)
Sub group analysis (Table 4.3 to Table 4.7)
Summary of outcomes and impact
Table 4.1 shows outcomes over the tracking period and indication of significant differences between control and CAP/OCM groups. Table 4.2 subtracts the JCP control outcomes from the CAP/OCM values to give the impact on each measured variable.
Table 4.1: Monitored outcome variables over 91 weeks
JCP Control CAP OCM
13,885 4,554 4,703 4,628 Benefit and Employment Impact Benefit outcomes (mean days in receipt of any benefit) 509 488** 483**
JSA Benefit outcomes (mean days in receipt of JSA/TA) 470 439** 434**
ESA/IB/IS Benefit outcomes (mean days in receipt of ESA/IB/IS) 39 49** 49**
P45 employment outcomes (mean days in P45 employment) 74 83* 84**
In receipt of any benefit at 91 weeks 68% 66%* 64%**
In P45 employment at 91 weeks 18% 18% 19%
Benefit spells outcome (mean benefit spells on any benefit) 1.66 1.75** 1.81**
JSA spells outcome (mean JSA spells) 1.48 1.54** 1.59**
non JSA spells outcome (mean ESA/IB/IS spells) 0.18 0.22** 0.22**
P45 employment spells outcome (mean P45 spells) 0.42 0.46 0.48**
2 3 4
**Significant difference at 99% confidence interval between JCP control and CAP/OCM
*Significant difference at 95% confidence level
On average those assigned to CAP/OCM spent significantly fewer days claiming JSA/TA, significantly more days claiming ESA/IB/IS and in P45 recorded employment, and had a greater number of benefit and employment spells.
Table 4.2: impact in measured variables over 91 weeks
JCP Control CAP OCM
13,885 4,554 4,703 4,628 Benefit and Employment Impact

13
Benefit outcomes (mean days in receipt of any benefit) -21** -26**
JSA Benefit outcomes (mean days in receipt of JSA/TA) -31** -36**
ESA/IB/IS Benefit outcomes (mean days in receipt of ESA/IB/IS) 10** 11**
P45 employment outcomes (mean days in P45 employment) 9* 11**
In receipt of any benefit at 91 weeks -2%* -3%**
In P45 employment at 91 weeks 0% 1%
Benefit spells outcome (mean benefit spells on any benefit) 0.10** 0.15**
JSA spells outcome (mean JSA spells) 0.06** 0.11**
non JSA spells outcome (mean ESA/IB/IS spells) 0.04** 0.04**
P45 employment spells outcome (mean P45 spells) 0.03 0.06**
Benefit outcomes and impact
Figure 4.1 shows the proportion of the cohort in receipt of an out of work benefit10 for the 104 weeks preceding and 91 weeks following random assignment. The lines are closely aligned over the previous 104 weeks indicating groups consist of participants with similar benefit history. This is consistent with a successful random assignment process, and combined with the characteristic comparison in Table 3.5 gives assurance that the differences in outcomes are attributable to the effect of support options.
Figure 4.1: Likelihood of claiming any out of work benefit before and after random assignment
10 JSA, ESA, IB, IS or a training allowance

14
68%66%
64%
50%
55%
60%
65%
70%
75%
80%
85%
90%
95%
100%
- 10
4-
96-
88-
80-
72-
64-
56-
48-
40-
32-
24-
16 - 8
TS
+ 8
+ 1
6+
24
+ 3
2+
40
+ 4
8+
56
+ 6
4+
72
+ 8
0+
88
+ 9
6+
104
weeks before and after tracking period start date
% c
oh
ort
in
rec
eip
t o
f b
enef
it
JCP Control
CAP
OCM
Tracking Period Start
Figure 4.2 shows the benefit impact of CAP and OCM with red and green t-bars representing a 95% confidence range. There is no significant difference between groups pre random assignment, supporting the view that randomisation was successful.
At the point of highest impact (+38 weeks) a 5 and 7 percentage point difference was observed, subsequently declining, although a statistically significant 2 (CAP) and 3 (OCM) percentage point difference is observed at the 91 week point. On current trends the point where no additional impact will occur is somewhere after two years post-assignment.
Figure 4.2: Benefit impact of CAP and OCM before and after random assignment
-2%
-3%
-10%-9%-8%-7%-6%-5%-4%-3%-2%-1%0%1%2%3%4%5%
- 10
4-
96-
88-
80-
72-
64-
56-
48-
40-
32-
24-
16 - 8
TS
+ 8
+ 1
6+
24
+ 3
2+
40
+ 4
8+
56
+ 6
4+
72
+ 8
0+
88
+ 9
6+
104
weeks before and after tracking period start date
dif
fere
nce
fro
m c
on
tro
l (p
p)
Impact_JCP Control
Impact_CAP
Impact_OCM
Tracking Period Start
Figure 4.3 and Figure 4.4 present the same data in the post random assignment phase only. A statistically significant impact at the 95% level is observed from 13 weeks following random

15
assignment, echoing the conclusion from the 2012 publication, finding no evidence of impact in the majority of the pre-treatment period11.
Figure 4.3: Likelihood of claiming any out of work benefit after random assignment
68%66%64%
50%
55%
60%
65%
70%
75%
80%
85%
90%
95%
100%
TS
+ 8
+ 1
6
+ 2
4
+ 3
2
+ 4
0
+ 4
8
+ 5
6
+ 6
4
+ 7
2
+ 8
0
+ 8
8
+ 9
6
+ 1
04weeks after tracking period start date
% c
oh
ort
in
rec
eip
t o
f b
enef
it
JCP Control
CAP
OCM
Figure 4.4: Benefit impact of CAP and OCM after random assignment
-2%
-3%
-15%-14%-13%-12%-11%-10%
-9%-8%-7%-6%-5%-4%-3%-2%-1%0%1%2%3%4%5%
TS
+ 8
+ 1
6
+ 2
4
+ 3
2
+ 4
0
+ 4
8
+ 5
6
+ 6
4
+ 7
2
+ 8
0
+ 8
8
+ 9
6
+ 1
04
weeks after tracking period start date
dif
fere
nce
fro
m c
on
tro
l (p
p)
Impact_JCP Control
Impact_CAP
Impact_OCM
Figure 4.5 and Figure 4.6 show the outcomes and impact on the likelihood of remaining on JSA/TA after random assignment. At the point of highest impact a 9 (CAP) and 10 (OCM) percentage point difference is observed, declining to a significant 3 (CAP) and 5 (OCM) percentage point difference at 91 weeks.
Figure 4.5: Likelihood of claiming JSA/TA after random assignment
57%54%53%
50%
55%
60%
65%
70%
75%
80%
85%
90%
95%
100%
TS
+ 8
+ 1
6
+ 2
4
+ 3
2
+ 4
0
+ 4
8
+ 5
6
+ 6
4
+ 7
2
+ 8
0
+ 8
8
+ 9
6
+ 1
04
weeks after tracking period start date
% c
oh
ort
in
rec
eip
t o
f b
enef
it
JCP Control
CAP
OCM
Figure 4.6: JSA/TA impact of CAP and OCM after random assignment
-3%
-5%
-15%-14%-13%-12%-11%-10%
-9%-8%-7%-6%-5%-4%-3%-2%-1%0%1%2%3%4%5%
TS
+ 8
+ 1
6
+ 2
4
+ 3
2
+ 4
0
+ 4
8
+ 5
6
+ 6
4
+ 7
2
+ 8
0
+ 8
8
+ 9
6
+ 1
04
weeks after tracking period start date
dif
fere
nce
fro
m c
on
tro
l (p
p)
Impact_JCP ControlImpact_CAPImpact_OCM
Figure 4.7 and Figure 4.8 show the probability of claiming non-JSA benefits (ESA, IB or IS) for 91 weeks following random assignment, and impact with a 95% confidence interval. A 3 percentage point difference between control and treatment occurs at the point of highest impact indicating assignment to CAP/OCM led to some displacement to non-JSA benefits. However the magnitude is much less than that observed in JSA/TA and has fallen to a (not significant) 1% by the end of the tracking period.
11 Potentially impact in the 13 to 20 week range may be due in part to deterrent, but limitations in the analysis prevent a definitive conclusion. See the 2012 report.

16
Figure 4.7: Likelihood of claiming ESA/IB/IS after random assignment
10%12%
0%
5%
10%
15%
20%
25%
30%
35%
40%
45%
50%
TS
+ 8
+ 1
6
+ 2
4
+ 3
2
+ 4
0
+ 4
8
+ 5
6
+ 6
4
+ 7
2
+ 8
0
+ 8
8
+ 9
6
+ 1
04
weeks after tracking period start date
% c
oh
ort
in
rec
eip
t o
f b
enef
it
JCP Control
CAP
OCM
Figure 4.8: ESA/IB/IS impact of CAP and OCM after random assignment
1%
-15%-14%-13%-12%-11%-10%
-9%-8%-7%-6%-5%-4%-3%-2%-1%0%1%2%3%4%5%
TS
+ 8
+ 1
6
+ 2
4
+ 3
2
+ 4
0
+ 4
8
+ 5
6
+ 6
4
+ 7
2
+ 8
0
+ 8
8
+ 9
6
+ 1
04
weeks after tracking period start date
dif
fere
nce
fro
m c
on
tro
l (p
p)
Impact_JCP Control
Impact_CAP
Impact_OCM
Employment outcomes and impact
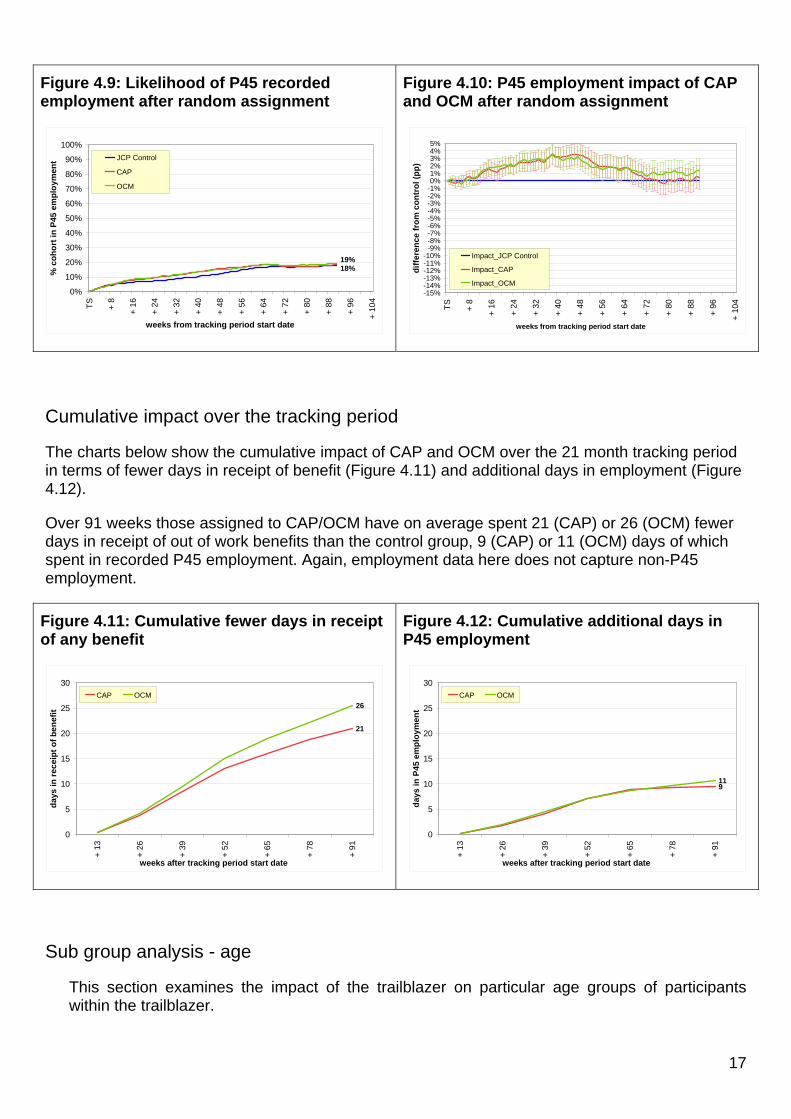
Figure 4.9 and Figure 4.10 show outcomes and impact from random assignment on the likelihood of being in P45 recorded employment. Assignments to CAP or OCM are more likely to be in employment than the control group over much of the tracking period, at the point of greatest impact 4 percentage points higher subsequently declining to a (not significant) 0% (CAP) and 1% (OCM) at the 91 week point.
As mentioned above, the employment data used is limited and does not capture all types of employment most notably self employment, employment where earnings are below the PAYE threshold, and potentially through cleaning some legitimate employment time where it overlaps a benefit spell (see Annex A).
If this data were captured then we could expect the outcomes to be more consistent with other evidence, for example the DWP benefit leaver destination survey12 that shows between 68% (immediately) and 55% (after 9 months) of JSA leavers have entered paid employment.
Inclusion of unrecorded employment data would increase outcomes above levels shown here, where just over 40% of participants not claiming JSA are in recorded employment13 at the end of the tracking period.
Across support options, around 15% of participants are as neither in recorded employment or in receipt of benefit at the end of the tracking period. This figure includes the unrecorded employment discussed above, but also other reasons for ending a JSA claim (other than moving into employment or a different benefit). The destinations survey records losing benefit eligibility (including the result of sanctions), full / part time education, and volunteering as reasons given by respondents.
12 https://www.gov.uk/government/uploads/system/uploads/attachment_data/file/214578/rrep791.pdf 13 40% calculated by dividing the employment outcome for each option at 91 weeks by the proportion of the cohort not in receipt of JSA/TA e.g. for OCM 19% / (1-53%) = 40%
17
Figure 4.9: Likelihood of P45 recorded employment after random assignment
18%19%
0%
10%
20%
30%
40%
50%
60%
70%
80%
90%
100%
TS
+ 8
+ 1
6
+ 2
4
+ 3
2
+ 4
0
+ 4
8
+ 5
6
+ 6
4
+ 7
2
+ 8
0
+ 8
8
+ 9
6
+ 1
04
weeks from tracking period start date
% c
oh
ort
in
P45
em
plo
ymen
t JCP Control
CAP
OCM
Figure 4.10: P45 employment impact of CAP and OCM after random assignment
-15%-14%-13%-12%-11%-10%
-9%-8%-7%-6%-5%-4%-3%-2%-1%0%1%2%3%4%5%
TS
+ 8
+ 1
6
+ 2
4
+ 3
2
+ 4
0
+ 4
8
+ 5
6
+ 6
4
+ 7
2
+ 8
0
+ 8
8
+ 9
6
+ 1
04
weeks from tracking period start date
dif
fere
nce
fro
m c
on
tro
l (p
p)
Impact_JCP Control
Impact_CAP
Impact_OCM
Cumulative impact over the tracking period
The charts below show the cumulative impact of CAP and OCM over the 21 month tracking period in terms of fewer days in receipt of benefit (Figure 4.11) and additional days in employment (Figure 4.12).
Over 91 weeks those assigned to CAP/OCM have on average spent 21 (CAP) or 26 (OCM) fewer days in receipt of out of work benefits than the control group, 9 (CAP) or 11 (OCM) days of which spent in recorded P45 employment. Again, employment data here does not capture non-P45 employment.
Figure 4.11: Cumulative fewer days in receipt of any benefit
21
26
0
5
10
15
20
25
30
+ 1
3
+ 2
6
+ 3
9
+ 5
2
+ 6
5
+ 7
8
+ 9
1
weeks after tracking period start date
day
s in
rec
eip
t o
f b
enef
it
CAP OCM
Figure 4.12: Cumulative additional days in P45 employment
911
0
5
10
15
20
25
30
+ 1
3
+ 2
6
+ 3
9
+ 5
2
+ 6
5
+ 7
8
+ 9
1
weeks after tracking period start date
day
s in
P45
em
plo
ymen
t
CAP OCM
Sub group analysis - age
This section examines the impact of the trailblazer on particular age groups of participants within the trailblazer.

18
Examining data for participants aged 18-24 we see just 2,500 participants (around 19% of the cohort), consequently results are less robust and statistical inference is more difficult compared to analysis of the entire cohort.
All characteristics are well balanced for this group with the exception of non-JSA benefit history where CAP participants spent 3 additional days claiming ESA/IB/IS than the control group over the two year history period.
The data shows a positive but not significant benefit impact for CAP, and for OCM a similar benefit impact to that observed for all age groups. In terms of employment, no significant impact is detected for either group throughout the tracking period.
Table 4.3: Impact – 18-24 year old participants
18-24 JCP Control CAP OCM
2,527 821 861 845 Benefit and Employment Impact Benefit outcomes (mean days in receipt of any benefit) -5 -26**
JSA Benefit outcomes (mean days in receipt of JSA/TA) -14 -35**
ESA/IB/IS Benefit outcomes (mean days in receipt of ESA/IB/IS) 10 9
P45 employment outcomes (mean days in P45 employment) -7 6
In receipt of any benefit at 91 weeks -2% -5%*
In P45 employment at 91 weeks -1% 1%
More than 8,500 participants are in the 25-49 category (around 61% of the cohort). Characteristics are balanced, with just non-JSA benefit history for the CAP group showing a significant difference from the control group (3 days higher).
CAP and OCM show a similar, significant impact of 21 fewer days on benefit however at the 91 week point there is no significant difference from control in the likelihood of being on benefit.
Impact on days in employment is also similar for CAP and OCM, although not significant for the CAP group. There is no significant difference in the likelihood of being in employment at the end of the tracking period.
Table 4.4: Impact – 25-49 year old participants
25-49 JCP Control CAP OCM
8,527 2,811 2,854 2,862 Benefit and Employment Impact Benefit outcomes (mean days in receipt of any benefit) -21** -21**

19
JSA Benefit outcomes (mean days in receipt of JSA/TA) -30** -32**
ESA/IB/IS Benefit outcomes (mean days in receipt of ESA/IB/IS) 8** 11**
P45 employment outcomes (mean days in P45 employment) 10 11**
In receipt of any benefit at 91 weeks -1% -2%
In P45 employment at 91 weeks 0% 1%
There are around 2,800 participants aged 50+ in the cohort (20%). Characteristics are balanced for the CAP group in comparison to control, but the OCM group shows a significant difference in JSA benefit history (6 fewer days over the two year history period) and low qualification. As benefit history is a key characteristic this may influence OCM results here.
JSA benefit impacts for 50+ participants are much higher than for the other two age categories, non-JSA impacts are similar, and at the end of the current tracking period impacts remain significantly different from the control group.
Additional days in employment are also much higher for this age group, CAP performance in particular stands out having a higher impact than OCM as well as maintaining a significant impact at the end of tracking.
Table 4.5: Impact – 50+ year old participants
JCP Control CAP OCM
2,819 918 984 917 Benefit and Employment Impact Benefit outcomes (mean days in receipt of any benefit) -34** -38**
JSA Benefit outcomes (mean days in receipt of JSA/TA) -49** -49**
ESA/IB/IS Benefit outcomes (mean days in receipt of ESA/IB/IS) 15* 12
P45 employment outcomes (mean days in P45 employment) 23** 15**
In receipt of any benefit at 91 weeks -5%* -6%**
In P45 employment at 91 weeks 3%* 2%
Overall OCM has a positive impact for all the age categories, the 50+ group in particular, although lower benefit history may be a consideration here.
For CAP the picture is less clear, with a small and not significant impact for those aged 18-24, a strong impact for the 25-49s and the highest impact in the 50+ category.

20
The qualitative evaluation of the trailblazer14 suggests that CAP was more effective for participants whose main barriers were a lack of recent work experience, motivation or work ethic, so a potential explanation of CAP performance is that older customers are more likely to have lack of recent work experience or longer gaps in employment history as a primary barrier in comparison to other groups.
The long term unemployed cohort contains participants with a diverse set of barriers, one effect of the random assignment process within the trailblazer was assigning participants to CAP whose primary barriers were not motivational or recent work experience, such that providers were unable to secure them work experience placements (40% of the group did not undertake placements).
Unfortunately it is not possible to accurately identify those that started a CAP placement within DWP administrative data, or investigate whether being placed is driving performance differences for CAP across sub groups, however this could be a factor underlying some of the results we see here.
The evaluation also found OCM is flexible and tailored provision, better at addressing a wide range of barriers, in contrast to CAP. Consequently random assignment is unlikely to result in participants entering OCM with barriers the provision is not equipped to address.
Sub group analysis - disability
Table 4.6 shows the impact of the trailblazer on participants that have a disability as recorded by the Jobcentre Plus ‘Disabled Person’ (DP) marker, set by Jobcentre Plus advisers based on claimant self-disclosure. This variable is not a systematic identification of disability as defined by the Disability Discrimination Act (DDA).
All characteristics are balanced for the DP group, and data shows that for both CAP and OCM the displacement impact to ESA/IS/IB is much higher than that observed in the overall cohort (18 additional days compared to 10 and 11). This is consistent with the view that this group are more likely to be closer to ESA eligibility and therefore move in greater numbers or for longer to ESA when assigned to support options.
CAP appears to be less effective for DP participants compared to OCM, with impact in overall benefit outcomes and employment much lower and not significant. The positive (significant) impact on JSA is offset by displacement to ESA/IS/IB. Random assignment within the pilot may again be playing a part, with disabled participants entering provision with complex barriers CAP is not focused on addressing.
Table 4.6: Impact – DP marker disabled participants
JCP Control CAP OCM
4,773 1,585 1,590 1,598 Benefit and Employment Impact Benefit outcomes (mean days in receipt of any benefit) -10 -27**
14 http://www.natcen.ac.uk/media/26249/evaluation-support-very-long-term.pdf

21
JSA Benefit outcomes (mean days in receipt of JSA/TA) -28** -45**
ESA/IB/IS Benefit outcomes (mean days in receipt of ESA/IB/IS) 18** 18**
P45 employment outcomes (mean days in P45 employment) 3 13**
In receipt of any benefit at 91 weeks 0% -3%*
In P45 employment at 91 weeks -1% 2%
Figure 4.13 shows the difference in benefit impact for CAP and OCM over the tracking period. The 10 and 27 day impact represent 1.6% and 4.2% of the tracking period.
Figure 4.13: Cumulative fewer days in receipt of any benefit – DP sub group
1
3
68
89
1
4
10
16
20
23
10
27
0
5
10
15
20
25
30
+ 1
3
+ 2
6
+ 3
9
+ 5
2
+ 6
5
+ 7
8
+ 9
1
weeks after tracking period start date
few
er d
ays
in r
ecei
pt
of
ben
efit
CAP OCM
Table 4.7 shows results for those without the DP marker. Both support options are effective, CAP having marginally better outcomes for days in employment in particular.
Table 4.7: Impact – DP marker non-disabled participants
JCP Control CAP OCM
9,112 2,969 3,113 3,030 Benefit and Employment Impact Benefit outcomes (mean days in receipt of any benefit) -26** -25**

22
JSA Benefit outcomes (mean days in receipt of JSA/TA) -32** -32**
ESA/IB/IS Benefit outcomes (mean days in receipt of ESA/IB/IS) 6* 7**
P45 employment outcomes (mean days in P45 employment) 12* 9**
In receipt of any benefit at 91 weeks -3%* -3%**
In P45 employment at 91 weeks 1% 1%
5. CONCLUSIONS
The support option volumes and analysis of characteristic differences across our measured variables indicate that the random assignment process was successful at apportioning participants to each group. This gives a high degree of confidence that the observed differences in the outcome variables are attributable to the support group options and not to underlying differences in the composition of the groups themselves.
The results from the trailblazer are very positive, showing people assigned to Community Action Programme (CAP) and Ongoing Case Management (OCM) spent significantly less time on benefits and more time in employment in comparison to the control group, and this impact was sustained over a long period.
Those assigned to CAP and OCM spent significantly fewer days in receipt of an out of work benefit (21 and 26 days respectively), but the fewer days observed on JSA/TA (31 and 36 days) were partially offset by a smaller displacement to ESA/IB/IS (10 and 11 days). At the end of the observable 91 week tracking period there is still a significant positive benefit impact (2 and 3 percentage points) meaning time off benefit impact will continue to increase over a longer tracking period.
The likelihood of those assigned to CAP and OCM being in P45 recorded employment was 4 percentage points higher than control at the point of highest impact (weeks 47 and 38) and overall they spent significantly more days in employment (9 and 11 days) over the 91 weeks.
Limitations in recording employment data mean estimates could potentially be higher if all types of employment were captured. In the absence of this unrecorded data, the ratio of people moving to employment as a proportion of off-benefit is lower than estimates in found in other evidence, such as the DWP destination survey.
Sub group analysis shows OCM is effective across age categories, in particular those aged 50+. It is also effective for participants that self-identify as having a long term illness or disability. This is consistent with the view that the flexible and tailored nature of OCM makes it effective in addressing a wide range of barriers.
CAP impacts were significant for those aged 25 and over, however positive benefit impacts found for the 18-24 group and those with the disability marker were not statistically significant, perhaps as the barriers these groups are likely to face are not what CAP focuses on.

23
CAP is effective in addressing specific barriers, but random assignment within the trailblazer has demonstrated it is better suited to a tailored referral mechanism that selects only participants whose main barriers are a lack of recent work experience, motivation or work ethic.
Ali McAuley ([email protected])
Department for Work and Pensions

24
6. ANNEX
Annex A: Employment data cleaning and sensitivity To mitigate the limitations of the employment data used in the analysis, a process of cleaning and adjusting of the data takes place before it is used. This section sets out the cleaning method as well as sensitivity analysis showing the impact of the adjustments on results. The first step in cleaning the data is removing inappropriate data, adjusting unreliable dates, and removing duplicate records. The following types of P45 spell are removed from the data: Records with no personal identifier, Records where the employment start date is later than the employment end date, Records with end dates before the beginning of the data series (June 1999), Occupational pension records, Known benefit spells that are duplicated in DWP administration data, and Records starting in the future.
Where HMRC do not know the date on which an employment spell started, they assign a start date of the 6th April in the year that they become aware of the employment spell. This may not be the actual year in which the spell began. A similar process occurs when HMRC do not know the date on which an employment spell ended. In this case they assign an end date of the 5th April.
Where these spells are identified, they are examined in conjunction with DWP benefit records (that are reliably recorded on administration systems), employment spell dates are then adjusted using the start or end date of the nearest benefit record under the assumption that people move directly from benefits to employment or vice versa.
An alternative approach used in other analysis15 is to mitigate the problem of erroneous dates by randomly assigning start and end dates within the assigned tax year for records in which they are unknown. The approach used here was chosen for its consistency with the final stage of cleaning that removes overlaps between employment and benefit spells, again under the assumption that people move directly from benefits to employment or vice versa.
The table below breaks down the employment spells data for the cohort and shows the proportion of records in each category above. Identified spells can be in more than one category. The table shows that the proportion of problematic records appears to be unbiased across the support option groups, which we would expect with the random allocation process.
Table 6.1: Employment spells with a potential issue - pre cleaned HMRC data
All Cohort (inc excluded participants)
Impact cohort
(All groups)
JCP Control
CAP OCM
15 https://www.gov.uk/government/uploads/system/uploads/attachment_data/file/222938/early_impacts_mwa.pdf

25
total employment spells 356,020 326,708 104,589 111,875 110,244 Records pre Jun99 5.8% 5.9% 6.0% 5.9% 5.7% Records where the start date is later than the end date
0.5% 0.5% 0.5% 0.4% 0.5%
Occupational pension records
0.5% 0.5% 0.4% 0.6% 0.5%
Known benefit spell 41.8% 41.7% 41.2% 42.2% 41.7% Records starting in the future.
7.4% 7.3% 7.0% 7.3% 7.6%
5th Apr end date 23.0% 23.0% 22.6% 23.1% 23.2% 6th Apr start date 12.2% 12.2% 12.4% 12.0% 12.2%
Where multiple employment records starting on the same day are encountered, only one record is kept using the following preference order: Earliest reliable end date, Earliest corrected end date, Open records (no end date), Earliest date of data extract. The second step in cleaning the data is to adjust employment spells that overlap with benefit spells, and employment spells that overlap with each other. For overlapping benefit spells, where a: benefit spell wholly surrounds employment spell – the employment spell is removed entirely
Benefit Data:
Employment Data:
Adjusted Employment Data:
BENEFIT SPELL
EMPLOYMENT SPELL
REMOVE EMPLOYMENT SPELL benefit spell overlaps the start of an employment spell – the employment spell start is
adjusted to the end of the benefit spell
Benefit Data:
Employment Data:
Adjusted Employment Data:
BENEFIT SPELL
EMPLOYMENT SPELL
EMPLOYMENT SPELL benefit spell overlaps the end of an employment spell – the employment spell end is
adjusted to the start of the benefit spell
Benefit Data:
Employment Data:
Adjusted Employment Data: EMPLOYMENT SPELL
EMPLOYMENT SPELL
BENEFIT SPELL
benefit spell(s) are wholly enclosed in an employment spell – the employment spell is
broken into multiple spells.

26
Benefit Data:
Employment Data:
Adjusted Employment Data: EMP 1
BENEFIT SPELL 1 BENEFIT SPELL 2
EMPLOYMENT SPELL
EMP SPELL 2 EMP SPELL 3 Adjusting employment spells to remove overlaps that occur within them is made on the assumption that employment start dates are more reliable than end dates, (for example as notifications of end dates are likely to be reported in a less timely way than starts, higher proportion of problematic end dates in the data). When an overlap occurs the end date of a spell is adjusted based on the start date of the subsequent overlapping spell.
Employment Data 1:
Employment Data 2:
Adjusted Employment Data 1:
EMPLOYMENT SPELL 1
EMPLOYMENT SPELL 2
EMPLOYMENT SPELL 1 Table 6.2 shows the P45 employment outcomes over the tracking period with and without the cleaning. The data adjustments described above remove around 85% of the recorded time in employment, 68% of which is attributable to exclusions, adjusting unreliable start/end dates and removing duplicate records. The remaining 17% of the time removed relates to overlaps in employment spells and overlaps in employment spells and benefit spells.
Table 6.2: Effect of employment data cleaning on recorded time in employment over the tracking period
recorded days removed through
cleaning
total P45 days recorded in 91wks Adjustment
step P45 sensitivity
CAP OCM CAP OCM
Raw HMRC data
No P45 Adjustment 0 0 550 546
Step 1 Exclusions, adjust start/end dates and remove duplicates
-374 -369 175 177
Step 1 & 2 Step 1 including removing overlaps
-92 -92 83 84
Total adjustment -467 -461
% of total recorded -85% -85% 15% 15%
Employment spells that overlap with benefit spells are adjusted using two assumptions. The first is that benefit data is more reliably recorded than employment data, as benefit data is system processed and quickly validated by DWP, for example if a JSA claimant leaves benefit and fails to notify DWP this will be identified quickly as at least fortnightly claimant contact is required. In contrast employment data could be manually keyed from dates on forms submitted by employers. The second assumption is that a participant cannot be in receipt of benefit and be in P45 recorded employment at the same time. Figure 6.1 shows how this removed data changes the likelihood of a participant being in recorded employment.

27
The pre-cleaned P45 data implies that at the tracking start date 80% of participants are in P45 recorded employment and also claim benefit. The first cleaning step reduces this to around 20% by removing duplicate and non-employment data, and refining end dates. Previous analyses15 have used this cleaning method (with a variant on the treatment of 5th/6th April dates). The second cleaning step reduces this to 0%, where no participant in receipt of benefit is in employment. This is slightly more problematic as it opens the possibility that some non-erroneous time in employment is being removed from the data, and employment is therefore under recorded. Where overlaps with benefits occur, administrative data cannot distinguish between erroneous and legitimate time in employment, but the balance of probabilities suggests that, given benefit eligibility rules and P45 recorded employment definitions (PAYE earnings threshold), that the amount of erroneous data removed far outweighs the legitimate data, and therefore this cleaning step is worth while. As part of the qualitative evaluation of the trailblazer a quantitative survey of around 1,500 participants examined a variety of issues, including questions on employment. The survey found that 13% to 16% of survey respondents had entered or were about to enter paid work (excluding self employment) at the time of the survey (around 45 weeks after random assignment). This gives some confidence that the second cleaning step produces results consistent with alternative sources of data. Figure 6.2 shows how cleaning the data changes the impact data. With no cleaning there is no detectable impact. As we move through the cleaning steps we see the employment data become more consistent with the benefit picture. In numerical terms, after the first cleaning step the observed employment impact is 9.2 (CAP) and 10.4 (OCM) additional days, following the second step this becomes 9.5 (CAP) and 10.7 (OCM), a difference of 0.3 days over 91 weeks or a 3.4% (CAP) and 2.5% (OCM) increase.
Figure 6.1: Employment outcomes - sensitivity to data cleaning
Pre cleaning
0%
10%
20%
30%
40%
50%
60%
70%
80%
90%
100%
- 10
4-
96-
88-
80-
72-
64-
56-
48-
40-
32-
24-
16 - 8
TS
+ 8
+ 1
6+
24
+ 3
2+
40
+ 4
8+
56
+ 6
4+
72
+ 8
0+
88
+ 9
6+
104
weeks from tracking period start date
% c
oh
ort
in
P45
em
plo
ymen
t
JCP Control
CAP
OCM
Tracking Period Start
Figure 6.2: Employment impact – sensitivity to data cleaning
Pre cleaning
-10%-9%-8%-7%-6%-5%-4%-3%-2%-1%0%1%2%3%4%5%
- 10
4-
96-
88-
80-
72-
64-
56-
48-
40-
32-
24-
16 - 8
TS
+ 8
+ 1
6+
24
+ 3
2+
40
+ 4
8+
56
+ 6
4+
72
+ 8
0+
88
+ 9
6+
104
weeks from tracking period start date
dif
fere
nce
fro
m c
on
tro
l (p
p)
Impact_JCP Control
Impact_CAP
Impact_OCM
Tracking Period Start

28
Step 1 cleaning
0%
10%
20%
30%
40%
50%
60%
70%
80%
90%
100%
- 10
4-
96-
88-
80-
72-
64-
56-
48-
40-
32-
24-
16 - 8
TS
+ 8
+ 1
6+
24
+ 3
2+
40
+ 4
8+
56
+ 6
4+
72
+ 8
0+
88
+ 9
6+
104
weeks from tracking period start date
% c
oh
ort
in
P45
em
plo
ymen
t
JCP Control
CAP
OCM
Tracking Period Start
Step 1 cleaning
-10%-9%-8%-7%-6%-5%-4%-3%-2%-1%0%1%2%3%4%5%
- 10
4-
96-
88-
80-
72-
64-
56-
48-
40-
32-
24-
16 - 8
TS
+ 8
+ 1
6+
24
+ 3
2+
40
+ 4
8+
56
+ 6
4+
72
+ 8
0+
88
+ 9
6+
104
weeks from tracking period start date
dif
fere
nce
fro
m c
on
tro
l (p
p)
Impact_JCP Control
Impact_CAP
Impact_OCM
Tracking Period Start
All cleaning
0%
10%
20%
30%
40%
50%
60%
70%
80%
90%
100%
- 10
4-
96-
88-
80-
72-
64-
56-
48-
40-
32-
24-
16 - 8
TS
+ 8
+ 1
6+
24
+ 3
2+
40
+ 4
8+
56
+ 6
4+
72
+ 8
0+
88
+ 9
6+
104
weeks from tracking period start date
% c
oh
ort
in
P45
em
plo
ymen
t JCP Control
CAP
OCM
Tracking Period Start
All cleaning
-10%-9%-8%-7%-6%-5%-4%-3%-2%-1%0%1%2%3%4%5%
- 10
4-
96-
88-
80-
72-
64-
56-
48-
40-
32-
24-
16 - 8
TS
+ 8
+ 1
6+
24
+ 3
2+
40
+ 4
8+
56
+ 6
4+
72
+ 8
0+
88
+ 9
6+
104
weeks from tracking period start date
dif
fere
nce
fro
m c
on
tro
l (p
p)
Impact_JCP Control
Impact_CAP
Impact_OCM
Tracking Period Start