“The Impact of Securities Regulation on the Information ...
60
«This paper is financed by National Funds of the FCT – Portuguese Foundation for Science and Technology within the project «UIDB/03182/2020» “The Impact of Securities Regulation on the Information Environment around Stock-Financed Acquisitions” https://www.eeg.uminho.pt/pt/investigar/nipe 2021 #7 WORKING PAPER Gilberto Loureiro Sónia Silva
-
Upload
khangminh22 -
Category
Documents
-
view
4 -
download
0
Transcript of “The Impact of Securities Regulation on the Information ...

«This paper is financed by National Funds of the FCT – Portuguese
Foundation for Science and Technology within the project «UIDB/03182/2020»
“The Impact of Securities Regulation on the
Information Environment around
Stock-Financed Acquisitions”
https://www.eeg.uminho.pt/pt/investigar/nipe
2021
#7
WORKING PAPER
Gilberto Loureiro Sónia Silva
The Impact of Securities Regulation on the Information Environment around
Stock-Financed Acquisitions
Gilberto Loureiro* University of Minho, School of Economics and Management & NIPE
Sónia Silva† NIPE - Centre for Research in Economics and Management, University of Minho
June, 2021
This study is financed by National Funds of the FCT – Portuguese Foundation for Science and Technology - project PTDC/EGE-OGE/27936/2017 * Associate Professor, University of Minho, School of Economics and Management & NIPE (Centre for Research in Economics and Management). Campus de Gualtar, 4710-057 Braga, Portugal. Email: [email protected]. (Corresponding author). † Researcher, NIPE (Centre for Research in Economics and Management), University of Minho. Campus de Gualtar, 4710-057 Braga, Portugal. Email: [email protected].

1
The Impact of Securities Regulation on the Information Environment around
Stock-Financed Acquisitions
ABSTRACT
We investigate the effects of securities regulation, enacted by the European Union (EU) (namely,
the Transparency Directive - TPD) to improve the quality of financial reporting and disclosure, on
the information environment around stock-financed acquisition announcements. EU directives
comprised in the Financial Services Action Plan aim to improve the information quality that flows
to investors, which may help reduce the adverse selection discount when stock is used as the
method of payment in Mergers and Acquisitions (M&As). We use a difference-in-differences
methodology and document a significant increase in announcement returns of stock-paid
acquisitions by European acquirers after the change in regulation. We also find that this result
accrues essentially to companies with better firm-specific information quality and companies
domiciled in EU countries with better institutional quality and shareholder protection. Our results
highlight how the impact of the same regulation may differ depending on country and firm-level
attributes associated with the information environment.
JEL Classifications: F30; G15; G30; G34; G38
Keywords: Securities Regulation; Mergers & Acquisitions; Earnings Management; Information
Asymmetry, Transparency Directive; European Union
2
1. Introduction
Prior research has debated whether securities regulation do actually improve the functioning
of capital markets. Some studies stand in favor of securities regulation that targets disclosure
requirements and transparency, by advocating the beneficial outcomes of those rules, such as
market-wide cost savings, discouraging undesirable behavior in capital markets, and a vast array
of positive externalities (e.g., Coffee, 1984, 2007; Zingales, 2009; Christensen, Hail, and Leuz,
2016; Leuz and Wysocki, 2016; Fauver, Loureiro, and Taboada, 2017; Watanabe, Imhof, and
Tartaroglu, 2019).
More interestingly, a strand of the literature examines how the ex ante quality of the
institutional environment impacts the enforcement and efficacy of new rules (Djankov et al.,
2003). The same or similar regulation applied in countries with weaker legal enforcement is not
expected to yield the same outcomes. The EU offers the appropriate setting to study the diverse
effects of the same securities regulation applied around the same time, albeit not simultaneously,
in a number of countries with different levels of shareholder protection and different institutional
quality. Although all countries in the EU belong to the same economic union, there are still
significant differences in legal enforcement and the overall quality of their institutions (see, e.g.,
Christensen et al., 2016; Fauver et al., 2017). The harmonization of EU directives, based on
minimal requirements, mutual recognition, and national supervision (Lannoo and Levin, 2004;
Enriques and Gatti, 2008), allows for different paces of integration. Nonetheless, the EU’s
Financial Services Action Plan (FSAP), launched in 1999, made significant progress towards the
harmonization of securities regulation among EU member states1. Such advances contribute to the
Europeanization process (see, e.g., Economides and Ker‐Lindsay, 2015) and set a standard for
accession countries, which may undertake significant regulatory reforms prior to entry the EU to
facilitate the integration process.
In this paper, we study the impact of EU directives, particularly the Transparency Directive
(TPD), enacted to improve the quality of financial reporting and disclosure, on the wealth
1 See our Internet Appendix for further details.
3
outcomes of Mergers and Acquisitions (M&A) involving stock as the main method of payment.
Several studies show that acquirers’ shareholders earn relatively lower announcement returns in
acquisitions of public targets when the payment is based in stocks (e.g., Asquith, Bruner, and
Mullins, 1987; Travlos, 1987; Servaes, 1991; Walker, 2000; Fuller, Netter, and Stegemoller, 2002;
Ang and Cheng, 2006; Faccio, McConnell, and Stolin, 2006; Moeller, Schlingemann, and Stulz,
2007; Savor and Lu, 2009; Fu, Lin, and Officer, 2013; Golubov, Yawson, and Zhang, 2015;
Golubov, Petmezas, and Travlos, 2016)2. Similar to the adverse selection effect of issuing equity
(Myers and Majluf, 1984), acquirers that use equity in a stock-for-stock acquisition obtain lower
announcement returns as stock markets react to correct for the potential overvaluation of the
acquirer’s stocks (e.g., Rhodes-Kropf, Robinson, and Viswanathan, 2005; Ang and Cheng, 2006;
Dong et al., 2006). One possible way of artificially boosting the stock prices prior to a stock-
financed acquisition is to engage in accruals-based earnings management by postponing
inconvenient news that may hurt the stock prices in the short run. The literature shows that prior
to acquisitions paid in stock, acquirers engage in more aggressive earnings management to inflate
earnings and current stock prices and, therefore, gain an advantage in the stock swap exchange
ratio (the number of acquirer’s shares per each target share). In their seminal paper, Erickson and
Wang (1999), using a sample of U.S. M&A deals, find that acquiring firms manipulate total
accruals, managing earnings upwards, particularly in the quarter immediately preceding the offer.
Other studies find similar evidence – e.g., Louis (2004), Botsari and Meeks (2008), Gong, Louis,
and Sun (2008a, 2008b), Pungaliya and Vijh (2009), Karim, Sarkar, and Zhang (2016).
Knowing that both the adverse market reaction to potentially overvalued equity and the
efficacy of manipulating earnings to boost stock prices is greater when the information
environment is weaker, we test whether the adoption of EU securities regulation targeted to
increase transparency mitigates these effects. Our empirical tests focus on the Transparency
Directive (TPD), comprised in the EU’s FSAP, which generically aims to improve the quality of
2 In studies involving acquisitions of private targets, there is no discount for acquirers that use stock as the method of payment (e.g., Chang, 1998; Fuller et al., 2002; Draper and Paudyal, 2006; Faccio et al., 2006; Martynova and Renneboog, 2008; Golubov et al., 2015; Alexandridis, Antypas, and Travlos, 2017).

4
financial reporting and disclosure. First, we investigate the impact of the TPD enactment on
bidders’ announcement returns of public stock-financed acquisitions for our treatment group of
acquirers from EU countries. Second, we analyze the moderating effect of a firm-specific attribute
– the bidders’ earnings quality – on their announcement returns post-regulation. Third, we examine
whether TPD enforcement is stronger in countries with ex ante better investor protection rules,
higher disclosure requirements, and better quality of their institutions (regarding the regulatory
quality and the law enforcement).
We test our predictions using a difference-in-differences (DiD) methodology with a treatment
sample of acquirers from 23 EU countries that adopted the regulation and a control sample of
acquirers from 31 non-EU countries, covering the period from January of 2000 until December of
2018. We find that post adoption of TPD, EU acquirers earn, on average, about 2.4 percentage
points (pp) higher returns over a three-day window around the announcement of a stock-financed
public acquisition. This result is robust after controlling for the parallel trend assumption
underlying our DiD methodology. We then test the moderating effect of the acquirers’ financial
information quality on the impact of the regulation in reducing the discount associated with stock-
paid acquisitions. We use two alternate proxies for the quality of the acquirers’ earnings: (i) an
accrual-based earnings management measure estimated from the modified Jones’ (1991) model,
adjusted for operating performance (see Kothari, Leone, and Wasley, 2005) and sales growth as
proposed by Collins, Pungaliya, and Vijh (2017), and (ii) a firm-year measure of accounting
conservatism, C-SCORE, as in Khan and Watts’s (2009). Based on prior evidence (e.g., Francis,
Hasan, and Wu, 2013; Lara, Osma, and Penalva, 2020), we expect that bidders with higher
accounting conservatism are less prone to withhold unfavorable news and manipulate earnings
upward before stock-financed acquisitions. Overall, we find that acquirers with weaker earnings
quality, i.e. more aggressive earnings management or less conservative accounting ex ante, earn
lower announcement returns post TPD than their peers. These results suggest that TPD helped
increase transparency in the financial markets, allowing investors to better identify firms with
higher or lower quality of their financial reports. Thus, bidders that exhibit lower earnings quality
5
are more penalized when they acquire public targets in stock-for-stock acquisitions. These results
seem to suggest that the new regulation creates the right incentives to achieve significant
improvements in firms’ information environment, by reducing the asymmetry between managers
and outside investors with positive consequences in mitigating adverse selection problems that
might affect stock-financed acquisitions of public targets. Finally, in line with Djankov et al.
(2003), we find that the same rule applied to different countries with different pre institutional
conditions yields different outcomes. Our results suggest that the impact of the regulation differs
across countries: the benefits of adopting TPD accrue essentially to acquirers domiciled in
countries with stronger ex ante shareholder protection and better institutional quality. This result
raises some interesting policy questions as to whether the efficacy of EU securities regulation can
be challenged by the existing differences in countries’ institutional quality and compromise the
ultimate goal of a deeper integration of EU financial markets.
Our study offers several contributions. First, we contribute to the literature on the effects of
securities regulation for capital markets. Leuz and Wysocki (2016) argue that the evidence on the
causal effects of disclosure and reporting regulation is still scarce (e.g., Christensen et al., (2016),
Fauver et al. (2017), and Watanabe et al. (2019) are some of the few studies about EU regulation).
Establishing a clear causal relation between regulation and improvements in capital markets offers
some challenges, as many times the adoption of regulation is part of a broader reform, which
effects are difficult to disentangle. An advantage of studying EU securities regulation is that
although the entry-into-force of the directives is predetermined, each member state has the
flexibility to adopt the regulation at different points in time3. This staggered implementation of
EU directives across countries is therefore more likely to create an exogenous shock, which helps
isolate their potential causal effects.
3 EU regulation is enacted in the form of EU directives, which will be further transposed to member states’ national regulation. Member states have a predetermined period of time to adopt the EU directives, which can vary between 2-3 years. Thus, member states hardly will all pass the EU legislation at the same time – for example, the TPD was adopted in January of 2007 in Germany and in January of 2009 in The Netherlands. The staggered implementation is considered to cause exogenous shocks – see Christensen et al. (2016).

6
This study also contributes to the M&A literature about the acquirer’s discount associated with
stock payment in acquisitions of public targets (e.g., Asquith et al., 1987; Fuller et al., 2002; Ang
and Cheng, 2006; Dong et al., 2006; Faccio et al., 2006; Moeller et al., 2007; Savor and Lu, 2009;
Fu et al., 2013; Golubov et al., 2016, among others), by showing that improvements in
transparency brought about by the passage of some specific securities regulation can mitigate that
discount. Moreover, we also contribute to some recent literature that documents no significant
discount for bidders that pay for public targets using stock in continental Europe (Alexandridis,
Petmezas, and Travlos., 2010; Mateev and Andonov, 2016), by showing that the passage of EU
regulation aimed at improving firm transparency may partially explain that result.
Finally, we add to the literature on the efficacy of securities regulation enforcement in the EU
(Christensen et al., 2016; Fauver et al., 2017; Watanabe et al, 2019), and the expected
harmonization and integration of EU financial markets, which is the main goal of the EU’s FSAP
of 1999. Achieving full integration is, however, an ambitious goal, which requires a harmonization
process that is comprehensive in scope, mandatory in nature, and maximal in integration, leaving
little room for countries’ discretion (Enriques and Gatti, 2008). By showing that the benefits of
the regulation depend on the ex ante levels of investor protection and institutional quality of each
member state, our study challenges the idea that these directives per se help bring countries
together towards a deeper integration of their financial markets and stresses the importance of
other reforms that enhance the overall quality of countries’ institutions. Some important policy
implications can be derived from our study: (i) securities regulation aimed at improving corporate
transparency and disclosure help reduce market frictions, (ii) improving the quality of the
underlying institutional environment through reforms that enhance regulatory quality, law
enforcement, and investor protection, are essential to achieve the full benefits of EU directives and
a deeper integration, and (iii) the evidence on the effects of EU securities regulation and its
moderating factors sets an example to be followed by other countries seeking a higher integration
with EU financial markets.

7
The remaining of this study is organized as follows. Section 2 provides a review of securities
regulation in the EU and their impact on firms’ information environment. Section 3 describes our
research methodology, the sample and data. Section 4 presents and discusses the empirical results.
Section 5 concludes.
2. EU Securities Regulation and Information Environment
As stated in paragraph 21 of the Prospectus Directive4 “Information is a key factor in investor
protection”. In the spirit of the EU’s Financial Services Action Plan (FSAP), information is the
main driver to boost investor confidence (Lamfalussy, 2000). Therefore, the efficiency,
transparency, and integration of securities markets contribute to “a genuine single market in the
Community (…) by better allocation of capital and by reducing costs”, as the “disclosure of
accurate, comprehensive and timely information about security issuers builds sustained investor
confidence and allows an informed assessment of their business performance and assets. This
enhances both investor protection and market efficiency” 5 as stated in the Transparency Directive
preamble. The FSAP based its strategy in boosting investor protection because it believes that a
high level of investor protection throughout the EU countries “would enable barriers to the
admission of securities to regulated markets situated or operating within a member state to be
removed”5. These are the pillars of FSAP, that launched various regulation initiatives intending to
reduce adverse selection in capital markets, as is the case of i) Transparency Directive (TPD) that
regards corporate reporting and disclosure, ii) Market Abuse Directive (MAD) that concerns
insider trading and market manipulation, and iii) Prospectus Directive (PD) that intends to
harmonize information and improve firm transparency around securities offerings. We focus our
empirical tests on the effects of the TPD due two main reasons: 1) the TPD specifically addresses
aspects related to firm transparency and improved financial disclosure, which are the main factors
that might moderate the acquirer’s discount in public acquisitions paid in stock; and 2) the scope
4 Quoted from the Prospectus Directive (PD) text preamble (directive 2003/71/EC). Available at: https://eur-lex.europa.eu/legal-content/EN/TXT/?uri=CELEX%3A32003L0071. 5 Quoted from the Transparency Directive (TPD) text preamble (directive 2004/109/EC). Available at: https://eur-lex.europa.eu/legal-content/EN/TXT/?uri=CELEX:32004L0109.
8
of TPD covers and expands the main objectives released in the case of MAD and PD, which
transposition dates to national laws are about two years prior to TPD – 2007-2009 for TPD and
2005-2007 for MAD and PD6.
The taxonomy of harmonization7 of many EU directives is based on minimal (harmonization)
requirements, mutual recognition and national supervision (Lannoo and Levin, 2004). As
established by the International Organization of Securities Commissions (IOSCO), the success of
regulation consists of enforcement, compliance, and supervision. These aspects can be critical
concerning the enactment of EU directives (Steunenberg and Toshkov, 2009) and amplified by
the disparity between EU financial regulation and national contract law (Cherednychenko, 2021;
Andenas and Della Negra, 2017). Although TPD requires mainly mandatory harmonization, it is
yet partial in scope and minimal in integration8 in national law (Enriques and Gatti, 2008).
Nevertheless, considerable advances towards harmonization in securities regulation have been
made by the EU’s FSAP of 1999. Despite the lack of EU political legitimacy, having a common
ground of rules and regulations9 (Toshkov, 2012) helps overcome obstacles to integration.
Moreover, the transposition and enforcement of that set of rules, known as the Europeanization
process (Economides and Ker‐Lindsay, 2015), may lead to fundamental changes in the behavior
of accession countries (i.e., states eligible for EU membership), which start implementing reforms
before they become members, as a way of assuring that EU legislation will be transposed and
enforced.
The underlying quality of countries’ domestic institutions, such as government and regulatory
quality, legal enforcement, and protection of investors’ rights are key factors to effectively
achieve the goals of EU directives, including securities regulation. TPD deals with transparency
6 Section A in the Internet Appendix provides a comprehensive review of the EU directives mentioned in this paper. 7 The taxonomy of harmonization7 is classified as i) comprehensive or partial in scope, ii) mandatory or optional in nature, and iii) minimal or maximal concerning the integration and relationship with national laws (Enriques and Gatti, 2008). 8 Partial means that do not set a uniform disclosure on information related party transactions and it requires minimal integration because it mandates each member state to ensure that their laws apply to persons/entities responsible within the issuer. Moreover, member states can impose stricter rules to issuers with a registered office within its national boundaries, but cannot impose additional requirements on issuers headquartered elsewhere and listed in a domestic market in that member state (see Enriques and Gatti (2008) for a further discussion). 9 The set of EU rules and regulations is known as acquis communautaire and includes all legal acts (directives, regulations, and decisions) based on EU Treaties (see, e.g., Radaelli, 2003).
9
and information transmission in the financial markets. Law enforcement and monitoring in these
domains require a number of procedures that can be more efficiently implemented by developed
institutions that offer greater protection of investors’ rights, ensure government effectiveness and
accountability, and regulatory quality.
Christensen et al. (2016) are one of the few studies to provide causal evidence about the EU
directives transposition and explore cross-country differential effects. As argued by the authors,
the staggered transposition of the EU directives across countries allows researchers to better
isolate the impact of the reforms and understand their causal effects. In addition, the adoption of
EU directives offers a unique setting to study cross-country differences and assess how
differences in ex ante institutional quality and enforcement affect the outcome of the regulation.
Most of the previous research focuses on the impact of U.S. regulatory changes (Leuz and
Wysocki, 2016), whereas Christensen et al. (2016), Fauver et al. (2017), and Watanabe et al.
(2019) provide evidence about the effects of EU regulation on information environment, which
contributes to a broader debate about the benefits of regulation and its differential effects across
countries.
Christensen et al. (2016) find that market liquidity increases post enactment of MAD and PD,
after controlling for the adoption of other EU Directives. The authors point out that such
improvement in liquidity results from a reduction in adverse selection, thus lowering the cost of
capital, increasing the market value of equity, and contributing to more efficient markets; these
potential effects meet the FSAP objectives. Their results suggest that the effects are stronger in
countries with higher quality of their institutions and better legal enforcement, meaning that
countries with weaker enforcement obtain a lower marginal benefit from the regulation (the
hysteresis hypothesis); the authors also conclude that those countries will benefit more from
institutional changes, rather than simply adopt stricter regulation.
Fauver et al. (2017) find that the enactment of MAD and PD in EU member states leads to a
significant decrease in earnings manipulation prior to equity issues; the authors show that the
improvement in information environment quality leads to a positive spillover effect on stock return

10
performance after an equity offering both in the short- and long-run. Moreover, their results show
higher abnormal returns around the equity offer announcement after the adoption of MAD and
PD, which indicates that the change in EU securities regulation has the potential benefit of
mitigating the typical adverse selection effect around equity issues. However, and consistent with
Christensen et al. (2016), Fauver et al. (2017) also document that the impact of the new regulations
depends significantly on the prior quality of institutions and regulatory regimes. This evidence is
corroborated by Watanabe et al. (2019), who show that stock price informativeness improved post-
TPD; however, such improvement was more pronounced in countries with prior strong regulatory
environments.
Taken together, one of the most salient features of this literature is that securities regulation
aiming to improve transparency in the financial markets has positive effects for firms and
investors, but the quality of their enforcement depends significantly on the quality of their
domestic environment, such as the strength of investor protection rules, the quality of institutions,
and transparency and disclosure standards.
2.1 Stock-Financed Acquisition Discount and the Quality of Firms’ Information Environment
An extensive number of previous studies support the hypothesis of a discount in acquirer’s
announcement returns associated with stock payment in acquisitions of public targets (e.g.,
Asquith et al., 1987; Travlos, 1987). Consistent with the liquidity discount hypothesis, Fuller et
al. (2002) find that bidders that make many acquisitions in a short period of time earn positive
announcement returns when buying private firms but achieve negative returns when the target is
public. This evidence led to a generalized idea pointed out in former studies that overvalued
acquirers use a swap stock as the method of payment (e.g., Fu et al., 2013). More recently,
Golubov et al. (2016) contribute to this debate showing that stock-financed acquisition is a double
event because it joins the takeover bid with an equity-issue event; the authors show that the equity
issuance event explains the markets’ perception about bidders’ stock overvaluation. These studies,
mainly based in the United States and United Kingdom, generally converge to the idea that the
11
market is skeptical of bidders that offer stock to pay for public targets. Similar to the adverse
selection effect of issuing overvalued equity of Myers and Majluf (1984). The incidence and
magnitude of such effect are related to the quality of the firms’ information environment. Firms
with greater transparency and better earnings quality should observe a smaller discount in stock-
for-stock acquisitions. The literature provides examples of firms engaging in more aggressive
earnings management to artificially boost stock prices prior to a stock-paid acquisition and being
the main reason for a cold market reaction when the deal is announced (e.g., Erickson and Wang,
1999; Louis, 2004; Botsari and Meeks, 2008; Gong et al., 2008a, 2008b; Pungaliya and Vijh,
2009; Karim et al., 2016).
In contrast, some recent evidence using European M&As (excluding the United Kingdom)
shows no significant discount for bidders that pay for public targets using stock (Alexandridis et
al., 2010; Mateev and Andonov, 2016). These authors argue that in continental Europe the market
for corporate control is less competitive, thus bidders end up paying lower bid premia, even in
stock-for-stock acquisitions. We offer an alternative explanation, by showing that the passage of
TPD and the consequent improvement in firm transparency around main corporate events, such as
stock paid M&As, partially explains the lower discount associated with those deals.
Not only the quality of the bidders’ earnings, but also the overall quality of the information
environment of the bidder’s domestic country, may play a role in moderating the discount
associated with stock-financed acquisitions. For instance, La Porta et al. (1998) and Rossi and
Volpin (2004) argue that bidders from Common Law countries benefit from higher investor
protection, which increases competition in the market for corporate control and enhances the levels
on information quality in the market. Thus, bidders from Common Law countries tend to earn, on
average, higher announcement returns. Martynova and Renneboog (2008) and Mateev and
Andonov (2016), who focused on European acquisitions, show that announcement returns are
higher for acquirers domiciled in countries with a legal system offering better protection of
shareholders’ rights relative to the targets’ countries. Starks and Wei (2013) analyzed the case of
foreign bidders acquiring U.S. targets and find that announcement returns to bidders are

12
significantly related to the quality of acquirers’ corporate governance for stock-financed
acquisitions; their results suggest that acquirers from countries with better corporate governance
are more likely to make stock offers. Moreover, Karim et al. (2016), using a worldwide sample
excluding the U.S., find that managers’ propensity to inflate earnings prior to stock swapping
acquisitions decreases in the level of investor protection.
Altogether, prior evidence suggests that differences in firms’ information environment quality,
either at the firm or the country levels, can moderate the M&As gains to acquirers and targets, and
consequently moderate the discount associated with public stock-paid acquisitions.
3. Research Design
3.1 Data
Our sample consists of all M&A deals announced between January of 2000 and December of
2018, collected from Security Data Corporation’s (SDC); our final dataset includes a treatment
group from 23 EU countries and a control group of 31 non-EU countries. Following prior literature
(e.g., Alexandridis, Mavrovitis, and Travlos, 2010, 2012), we exclude leveraged buyouts, spinoffs,
recapitalizations, self-tender offers, exchange offers, repurchases, partial equity stake purchases,
acquisitions of remaining interest, and privatizations, as well as deals in which the target or the
acquirer is owned by the government. The deal status is complete, its value is disclosed and above
$1US Million. The acquirer and target are publicly-traded companies. An acquisition is defined
as a target when the percentage owned prior to the announcement is lower than 50% and is higher
than 50% after the deal is complete. We also collected quarterly accounting and financial data
from Thomson Financial’s Datastream and Worldscope. As noted by some former studies (e.g.,
Christensen et al., 2016; Fauver et al., 2017; and Watanabe et al., 2019), the staggered
implementation of EU directives allow us to use quarterly data, which mitigates confounding
effects around the entry-into-force dates of those directives. Those confounding effects may arise
from, for example, external shocks that are unrelated to the adoption of EU Directives.

13
We exclude all observations without available information on the market and book value of
equity, and on total assets. As in previous research, we also exclude financial acquirers with SIC
codes between 6000 and 6999 and acquirers that are utility firms with SIC codes between 4900
and 4949 (Seshadri et al., 2007).
All firm- and country-level variables are lagged one quarter. All continuous variables are
winsorized at the 1% and the 99% level to reduce the influence of outliers.
Our final sample includes a treatment sample of 925 deals involving public targets from 23
EU countries, and a control sample of 4329 deals of public target firms from 31 countries outside
the EU. Table 1 describes our sample by acquirers’ country. Panel A shows our treatment sample
formed of EU countries and also the entry-into-force dates of Transparency Directive (TPD) in
each EU member state. We also include in our treatment sample non-EU member states as Iceland
and Norway because they voluntarily adopt the EU directives as a way to get access to the EU’s
single market. Panel B of Table 1 reports the number of acquirers and the number of M&A deals
for our control sample composed of non-EU countries. The number of observations presented in
Table 1 is further reduced in our empirical analysis due to limited data availability for variables’
construction and also because of our scheme of fixed effects framework.
[Insert Table 1 here]
In Panel A, Table 1, we observe that acquirers from the United Kingdom (UK), France,
Sweden, Germany, The Netherlands, Norway, Poland, and Italy are the most dynamic markets;
together, they aggregate more than 80% of the deals, noting that the UK alone counts for about
37% of the market for corporate control. On the other side, we find Malta, Hungary, Cyprus, and,
the most recent member state – Croatia, display the lowest takeover activity in the EU.
Regarding our control group of non-EU acquirers, the U.S., Canada, Japan, and Australia
aggregate almost 85% of public acquisitions, whereas the U.S. concentrates about 48% of M&A
deals.
3.2 Information Quality Measures
3.2.1 Earnings quality measures: Discretionary Accruals and Accounting Conservatism
14
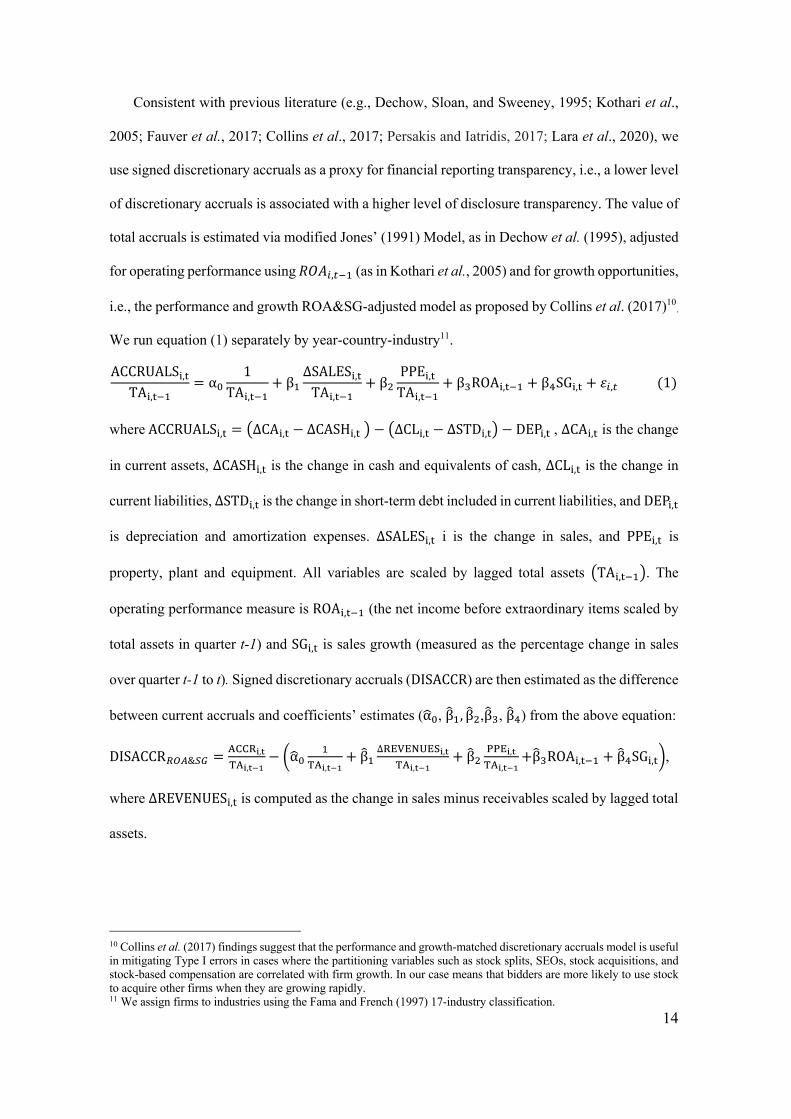
Consistent with previous literature (e.g., Dechow, Sloan, and Sweeney, 1995; Kothari et al.,
2005; Fauver et al., 2017; Collins et al., 2017; Persakis and Iatridis, 2017; Lara et al., 2020), we
use signed discretionary accruals as a proxy for financial reporting transparency, i.e., a lower level
of discretionary accruals is associated with a higher level of disclosure transparency. The value of
total accruals is estimated via modified Jones’ (1991) Model, as in Dechow et al. (1995), adjusted
for operating performance using 𝑅𝑂𝐴!,#$% (as in Kothari et al., 2005) and for growth opportunities,
i.e., the performance and growth ROA&SG-adjusted model as proposed by Collins et al. (2017)10.
We run equation (1) separately by year-country-industry11.
ACCRUALS&,'TA&,'$%
= α(1
TA&,'$%+ β%
∆SALES&,'TA&,'$%
+ β)PPE&,'TA&,'$%
+ β*ROA&,'$% + β+SG&,' + 𝜀!,#(1)
whereACCRUALS&,' = 9∆CA&,' − ∆CASH&,'< − 9∆CL&,' − ∆STD&,'< − DEP&,', ∆CA&,' is the change
in current assets, ∆CASH&,' is the change in cash and equivalents of cash, ∆CL&,' is the change in
current liabilities, ∆STD&,' is the change in short-term debt included in current liabilities, and DEP&,'
is depreciation and amortization expenses. ∆SALES&,' i is the change in sales, and PPE&,' is
property, plant and equipment. All variables are scaled by lagged total assets 9TA&,'$%<. The
operating performance measure is ROA&,'$% (the net income before extraordinary items scaled by
total assets in quarter t-1) and SG&,' is sales growth (measured as the percentage change in sales
over quarter t-1 to t). Signed discretionary accruals (DISACCR) are then estimated as the difference
between current accruals and coefficients’ estimates (α?(, β@%, β@),β@*, β@+) from the above equation:
DISACCR,-.&01 =2334!,#52!,#$%
− Bα?(%
52!,#$%+ β@%
∆47879:7;!,#52!,#$%
+ β@)<<7!,#52!,#$%
+β@*ROA&,'$% + β@+SG&,'C,
where ∆REVENUES&,' is computed as the change in sales minus receivables scaled by lagged total
assets.
10 Collins et al. (2017) findings suggest that the performance and growth-matched discretionary accruals model is useful in mitigating Type I errors in cases where the partitioning variables such as stock splits, SEOs, stock acquisitions, and stock-based compensation are correlated with firm growth. In our case means that bidders are more likely to use stock to acquire other firms when they are growing rapidly. 11 We assign firms to industries using the Fama and French (1997) 17-industry classification.

15
As an alternate proxy for earnings quality, we use Khan and Watts’s (2009) firm-year measure
of earnings conservatism, C-SCORE, which is based on the timely recognition of negative events
in the firms’ accounts. We adopt C-SCORE as a proxy for firms’ information environment to the
extent that numerous authors (e.g., LaFond and Watts, 2008; Francis et al., 2013; Khalilov and
Osma, 2020; Lara et al., 2020) have shown that earnings conservatism is negatively related to
information asymmetry. According to Francis et al. (2013), accounting conservatism is a
governance mechanism that reduces information asymmetry, thus mitigating agency costs (Zaher,
Mohamed, and Basuony, 2020).
Khan and Watts’s (2009) firm-year C-SCORE is an extension of Basu’s (1997) model12, as
demonstrated in equation (2):
𝑁𝐼!,#𝑀𝐶!,#$%
= 𝛼! + 𝛽%𝐷!,#+𝛽)𝑅𝑒𝑡𝑢𝑟𝑛!,#9𝜇% + 𝜇)𝑆𝐼𝑍𝐸!,#$% + 𝜇*𝑀𝐵!,#$% + 𝜇+𝐿𝐸𝑉𝐸𝑅𝐴𝐺𝐸!,#$%<
+ 𝛽*𝐷!,#𝑅𝑒𝑡𝑢𝑟𝑛!,#9𝜆% + 𝜆)𝑆𝐼𝑍𝐸!,#$% + 𝜆*𝑀𝐵!,#$% + 𝜆+𝐿𝐸𝑉𝐸𝑅𝐴𝐺𝐸!,#$%<
+ (𝛿%𝑆𝐼𝑍𝐸!,#$% + 𝛿)𝑀𝐵!,#$% + 𝛿*𝐿𝐸𝑉𝐸𝑅𝐴𝐺𝐸!,#$% + 𝛿+𝐷!,#𝑆𝐼𝑍𝐸!,#$%
+ 𝛿=𝐷!,#𝑀𝐵!,#$% + 𝛿>𝐷!,#𝐿𝐸𝑉!,#$%) +𝜀!,#(2)
where firm-year-specific timeliness of good news is expressed as 𝛽)𝑅𝑒𝑡𝑢𝑟𝑛!,#9𝜇% +
𝜇)𝑆𝐼𝑍𝐸!,#$% + 𝜇*𝑀𝐵!,#$% + 𝜇+𝐿𝐸𝑉𝐸𝑅𝐴𝐺𝐸!,#$%<,and timely recognition of bad news is:
𝛽*𝐷!,#𝑅𝑒𝑡𝑢𝑟𝑛!,#9𝜆% + 𝜆)𝑆𝐼𝑍𝐸!,#$% + 𝜆*𝑀𝐵!,#$% + 𝜆+𝐿𝐸𝑉𝐸𝑅𝐴𝐺𝐸!,#$%< = 𝐶 − 𝑆𝐶𝑂𝑅𝐸.
In equation (2), 𝑁𝐼# is the net income before extraordinary items scaled by the market value
of equity in quarter t-1. 𝑅𝑒𝑡𝑢𝑟𝑛!,# is the monthly compounded return over the current quarter. 𝐷!,#
is an indicator variable that equals one if 𝑅𝑒𝑡𝑢𝑟𝑛!,# is negative, and zero otherwise. 𝑆𝐼𝑍𝐸!,#$% is
the natural logarithm of the market value of equity in quarter t-1. 𝑀𝐵!,#$% is the market value of
equity divided by the book value of equity in quarter t-1. 𝐿𝐸𝑉𝐸𝑅𝐴𝐺𝐸!,#$% is the short-term plus
long-term (total) debt scaled by the market value of equity in quarter t-1.
12 Basu’s (1997) model: 𝑁𝐼&/𝑀𝐶𝐴𝑃&'( = 𝛼) + 𝛽(𝐷&+𝛽*𝑅𝑒𝑡𝑢𝑟𝑛& + 𝛽+𝐷& × 𝑅𝑒𝑡𝑢𝑟𝑛& + 𝜀&.
16
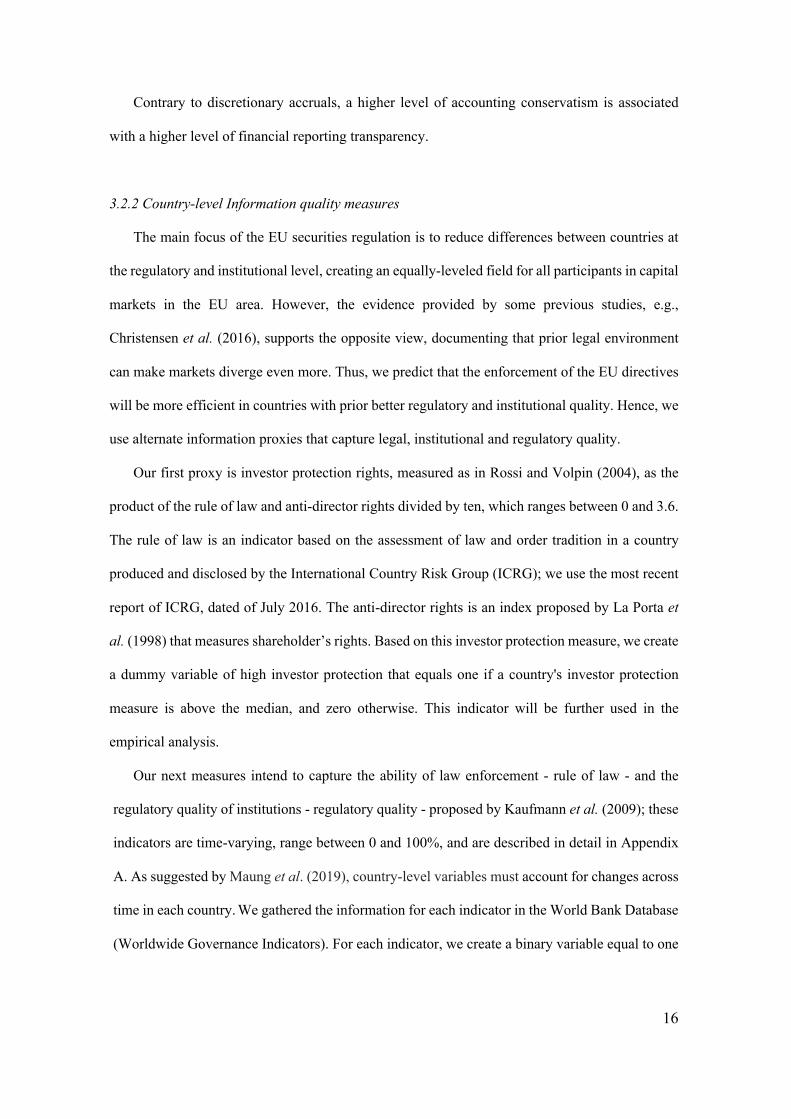
Contrary to discretionary accruals, a higher level of accounting conservatism is associated
with a higher level of financial reporting transparency.
3.2.2 Country-level Information quality measures
The main focus of the EU securities regulation is to reduce differences between countries at
the regulatory and institutional level, creating an equally-leveled field for all participants in capital
markets in the EU area. However, the evidence provided by some previous studies, e.g.,
Christensen et al. (2016), supports the opposite view, documenting that prior legal environment
can make markets diverge even more. Thus, we predict that the enforcement of the EU directives
will be more efficient in countries with prior better regulatory and institutional quality. Hence, we
use alternate information proxies that capture legal, institutional and regulatory quality.
Our first proxy is investor protection rights, measured as in Rossi and Volpin (2004), as the
product of the rule of law and anti-director rights divided by ten, which ranges between 0 and 3.6.
The rule of law is an indicator based on the assessment of law and order tradition in a country
produced and disclosed by the International Country Risk Group (ICRG); we use the most recent
report of ICRG, dated of July 2016. The anti-director rights is an index proposed by La Porta et
al. (1998) that measures shareholder’s rights. Based on this investor protection measure, we create
a dummy variable of high investor protection that equals one if a country's investor protection
measure is above the median, and zero otherwise. This indicator will be further used in the
empirical analysis.
Our next measures intend to capture the ability of law enforcement - rule of law - and the
regulatory quality of institutions - regulatory quality - proposed by Kaufmann et al. (2009); these
indicators are time-varying, range between 0 and 100%, and are described in detail in Appendix
A. As suggested by Maung et al. (2019), country-level variables must account for changes across
time in each country.We gathered the information for each indicator in the World Bank Database
(Worldwide Governance Indicators). For each indicator, we create a binary variable equal to one

17
if a country's measure is above the median in a specific year, and zero otherwise. Once, countries
above the median are included in the group of high legal and institutional quality.
The last measure is the Disclosure requirements index proposed by La Porta, Lopez-De-
Silanes, and Shleifer (2006) as an alternate proxy that captures the information environment
quality, which varies between 0 and 1. Once, we assign countries to high (low) levels of disclosure
if they are above (below) the median value13.
3.2.3 The Difference-in-Differences methodology
We hypothesize a positive effect post regulation on acquirers’ returns due to an improvement
in the information environment around the stock-financed M&A announcements. To test this
prediction, we estimate cumulative abnormal returns from the market model using a local market
index and also including a world market index (see, e.g., Fauver et al., 2017), as shown in equation
(3).
𝑅!,# = 𝛼!,? + 𝛽%𝑅?,# + 𝛽)𝑅@,# + 𝜀!,?,# (3)
where 𝑅!,# is firm i’s daily’s stock return; 𝑅?,# is daily’s domestic market index return for country
c; Rw,t is daily’s return on a world market index; domestic and world market indexes are
Datastream indexes, respectively. 𝜀!,?,# is firm i’s firm-specific daily’s return. Our estimation
window is (-255, -25) relative to the announcement day (event day 0) to assure that normal
performance is not affected by the event itself (see, e.g., MacKinlay, 1997). We estimate
cumulative abnormal returns (CAR) for acquirers over a three-day window (-1,+1), and an eleven-
day window (-5,+5). Table 2 shows the descriptive statistics of CARs and other variables for the
treatment and control samples.
[Insert Table 2 here]
13 Table I in the Internet Appendix describes our measures of information quality and the origin of the law per country. The judicial system of most countries included in our sample is Civil Law. Although our sample is majority formed from Civil Law countries (about 72%), comparing this information with Table 1 we conclude that most M&A deals are concentrated in Common Law countries (as is the case of Canada, the United Kingdom, and the United States).

18
Panel A of Table 2 shows that the mean of abnormal returns for acquirers that make public
acquisitions in treatment (control) group ranges between 0.52% (0.20%) and 0.12% (0.49%).
However, when we consider only the acquirers’ abnormal returns from 100% stock-financed deals,
returns are negative; e.g. over a 3-day window, the mean is -0.28% (-0.45%) for treatment (control)
sample. In Panel B, we observe that differences in means of CARs are not statistically significant
among treat and control groups. We also observe in Panel A that about one fourth of M&A deals
are paid in stock in our treatment sample of EU public firms, while in the control sample the
fraction of deals paid in stock is about one third.
To analyze the impact of regulation on abnormal returns around stock-financed acquisitions
announcements, first, we test the reaction on CARs to the method of payment by estimating
equation (4) as follows:
𝐶𝐴𝑅!,# = 𝛼!,? + 𝛽%𝑀&𝐴!,#(𝑆𝑡𝑜𝑐𝑘𝑃𝑎𝑦𝑚𝑒𝑛𝑡) + 𝛾%9𝐹𝑖𝑟𝑚𝑙𝑒𝑣𝑒𝑙!,#$%< +
𝛾)9𝐷𝑒𝑎𝑙𝑙𝑒𝑣𝑒𝑙!,#<+𝛾*9𝐶𝑜𝑢𝑛𝑡𝑟𝑦𝑙𝑒𝑣𝑒𝑙?,#$%< + 𝜆? + 𝜂A + 𝛾# + 𝜀!,?,# (4)
Second, we run different specifications of our generalized difference-in-differences (DiD)
model (see, e.g., Atanasov and Black, 2016), as shown in equation (5):
𝐶𝐴𝑅!,# = 𝛼!,? + 𝛽%𝑇𝑟𝑒𝑎𝑡? + 𝛽)𝑃𝑜𝑠𝑡𝑇𝑃𝐷?,# + 𝛽*𝑃𝑜𝑠𝑡𝑇𝑃𝐷?,# ×𝑀&𝐴!,#(𝑆𝑡𝑜𝑐𝑘𝑃𝑎𝑦𝑚𝑒𝑛𝑡) +
𝛽+𝑀&𝐴!,#(𝑆𝑡𝑜𝑐𝑘𝑃𝑎𝑦𝑚𝑒𝑛𝑡) + 𝛾%9𝐹𝑖𝑟𝑚𝑙𝑒𝑣𝑒𝑙!,#$%< +
𝛾)9𝐷𝑒𝑎𝑙𝑙𝑒𝑣𝑒𝑙!,#<+𝛾*9𝐶𝑜𝑢𝑛𝑡𝑟𝑦𝑙𝑒𝑣𝑒𝑙?,#$%< + 𝜆? + 𝜂A + 𝛾# + 𝜀!,?,# (5)
where 𝐶𝐴𝑅!,# is the cumulative abnormal returns estimated over a three-day window (-1,+1), and
an eleven-day window (-5,+5). 𝑇𝑟𝑒𝑎𝑡! is an indicator variable that equals one if firm i is included
in our treatment group, and zero otherwise. Our treatment group includes all M&A deals involving
EU listed acquirers, announced between 2000 and 2018. 𝑃𝑜𝑠𝑡𝑇𝑃𝐷?,# is an indicator variable that
equals one starting in the quarter after the adoption of TPD in EU countries, and zero otherwise;
M&A(Stock Payment) dummy assumes one if M&A deals are 100% stock-financed.Our vector of
firm-level variables includes: 𝑀𝑎𝑟𝑘𝑒𝑡 − 𝐵𝑜𝑜𝑘!,#$% is the market value of equity divided by the
19
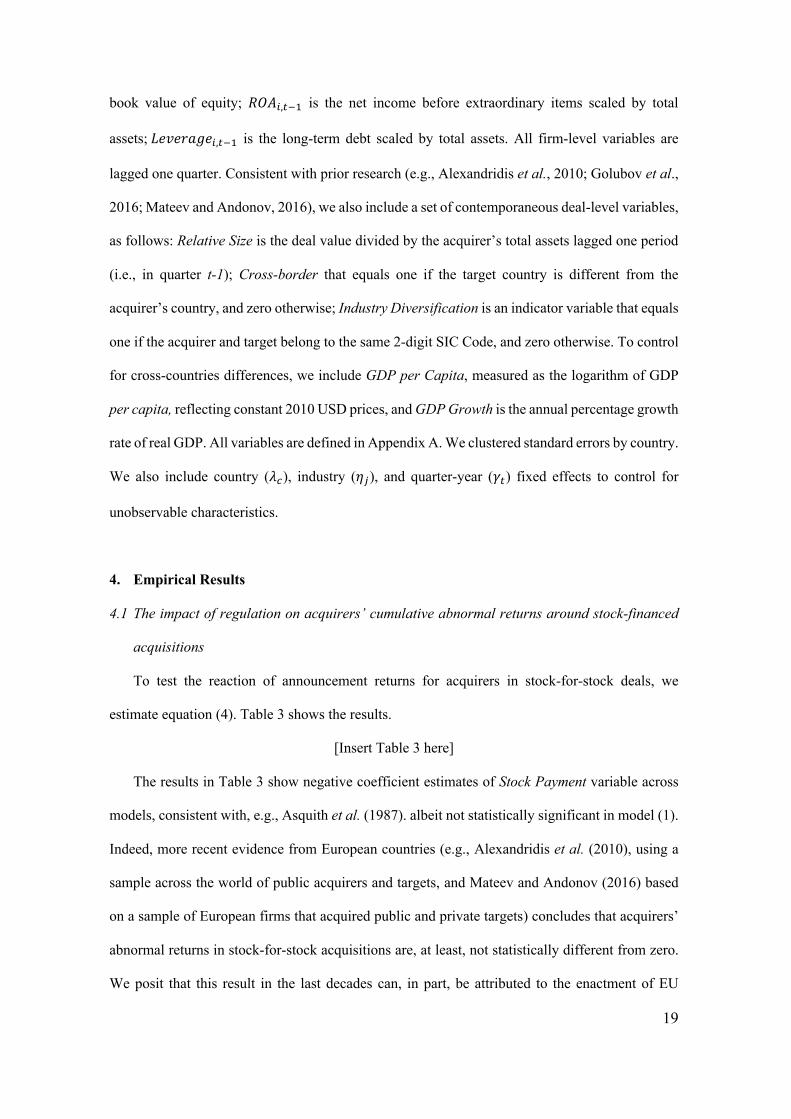
book value of equity; 𝑅𝑂𝐴!,#$% is the net income before extraordinary items scaled by total
assets;𝐿𝑒𝑣𝑒𝑟𝑎𝑔𝑒!,#$% is the long-term debt scaled by total assets. All firm-level variables are
lagged one quarter. Consistent with prior research (e.g., Alexandridis et al., 2010; Golubov et al.,
2016; Mateev and Andonov, 2016), we also include a set of contemporaneous deal-level variables,
as follows: Relative Size is the deal value divided by the acquirer’s total assets lagged one period
(i.e., in quarter t-1); Cross-border that equals one if the target country is different from the
acquirer’s country, and zero otherwise; Industry Diversification is an indicator variable that equals
one if the acquirer and target belong to the same 2-digit SIC Code, and zero otherwise. To control
for cross-countries differences, we include GDP per Capita, measured as the logarithm of GDP
per capita, reflecting constant 2010 USD prices, and GDP Growth is the annual percentage growth
rate of real GDP. All variables are defined in Appendix A. We clustered standard errors by country.
We also include country (𝜆?), industry (𝜂A), and quarter-year (𝛾#) fixed effects to control for
unobservable characteristics.
4. Empirical Results
4.1 The impact of regulation on acquirers’ cumulative abnormal returns around stock-financed
acquisitions
To test the reaction of announcement returns for acquirers in stock-for-stock deals, we
estimate equation (4). Table 3 shows the results.
[Insert Table 3 here]
The results in Table 3 show negative coefficient estimates of Stock Payment variable across
models, consistent with, e.g., Asquith et al. (1987). albeit not statistically significant in model (1).
Indeed, more recent evidence from European countries (e.g., Alexandridis et al. (2010), using a
sample across the world of public acquirers and targets, and Mateev and Andonov (2016) based
on a sample of European firms that acquired public and private targets) concludes that acquirers’
abnormal returns in stock-for-stock acquisitions are, at least, not statistically different from zero.
We posit that this result in the last decades can, in part, be attributed to the enactment of EU
20
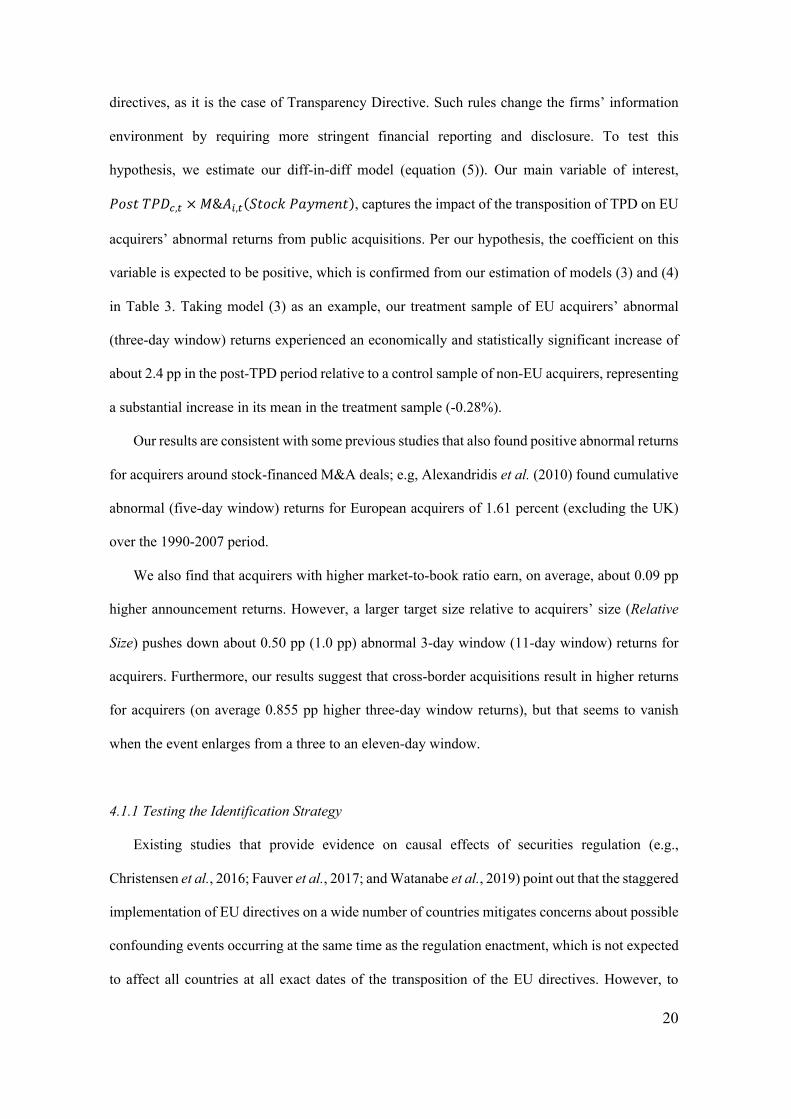
directives, as it is the case of Transparency Directive. Such rules change the firms’ information
environment by requiring more stringent financial reporting and disclosure. To test this
hypothesis, we estimate our diff-in-diff model (equation (5)). Our main variable of interest,
𝑃𝑜𝑠𝑡𝑇𝑃𝐷?,# ×𝑀&𝐴!,#(𝑆𝑡𝑜𝑐𝑘𝑃𝑎𝑦𝑚𝑒𝑛𝑡), captures the impact of the transposition of TPD on EU
acquirers’ abnormal returns from public acquisitions. Per our hypothesis, the coefficient on this
variable is expected to be positive, which is confirmed from our estimation of models (3) and (4)
in Table 3. Taking model (3) as an example, our treatment sample of EU acquirers’ abnormal
(three-day window) returns experienced an economically and statistically significant increase of
about 2.4 pp in the post-TPD period relative to a control sample of non-EU acquirers, representing
a substantial increase in its mean in the treatment sample (-0.28%).
Our results are consistent with some previous studies that also found positive abnormal returns
for acquirers around stock-financed M&A deals; e.g, Alexandridis et al. (2010) found cumulative
abnormal (five-day window) returns for European acquirers of 1.61 percent (excluding the UK)
over the 1990-2007 period.
We also find that acquirers with higher market-to-book ratio earn, on average, about 0.09 pp
higher announcement returns. However, a larger target size relative to acquirers’ size (Relative
Size) pushes down about 0.50 pp (1.0 pp) abnormal 3-day window (11-day window) returns for
acquirers. Furthermore, our results suggest that cross-border acquisitions result in higher returns
for acquirers (on average 0.855 pp higher three-day window returns), but that seems to vanish
when the event enlarges from a three to an eleven-day window.
4.1.1 Testing the Identification Strategy
Existing studies that provide evidence on causal effects of securities regulation (e.g.,
Christensen et al., 2016; Fauver et al., 2017; and Watanabe et al., 2019) point out that the staggered
implementation of EU directives on a wide number of countries mitigates concerns about possible
confounding events occurring at the same time as the regulation enactment, which is not expected
to affect all countries at all exact dates of the transposition of the EU directives. However, to
21
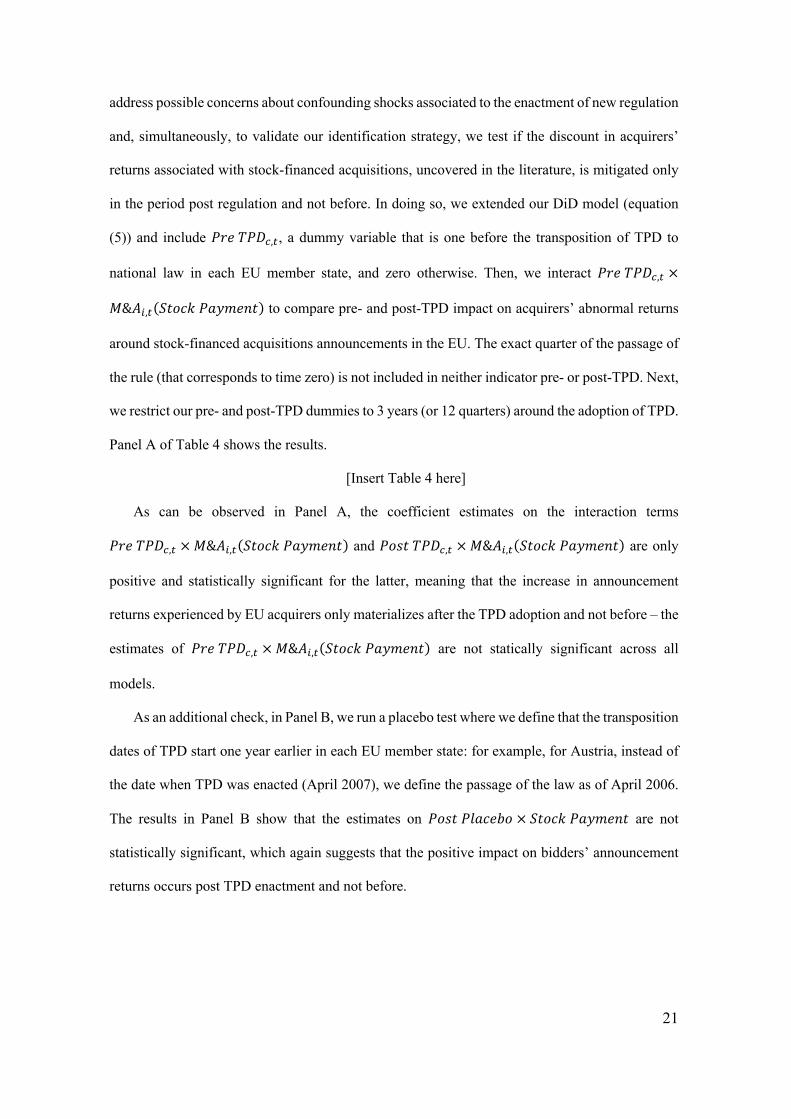
address possible concerns about confounding shocks associated to the enactment of new regulation
and, simultaneously, to validate our identification strategy, we test if the discount in acquirers’
returns associated with stock-financed acquisitions, uncovered in the literature, is mitigated only
in the period post regulation and not before. In doing so, we extended our DiD model (equation
(5)) and include 𝑃𝑟𝑒𝑇𝑃𝐷?,#, a dummy variable that is one before the transposition of TPD to
national law in each EU member state, and zero otherwise. Then, we interact 𝑃𝑟𝑒𝑇𝑃𝐷?,# ×
𝑀&𝐴!,#(𝑆𝑡𝑜𝑐𝑘𝑃𝑎𝑦𝑚𝑒𝑛𝑡) to compare pre- and post-TPD impact on acquirers’ abnormal returns
around stock-financed acquisitions announcements in the EU. The exact quarter of the passage of
the rule (that corresponds to time zero) is not included in neither indicator pre- or post-TPD. Next,
we restrict our pre- and post-TPD dummies to 3 years (or 12 quarters) around the adoption of TPD.
Panel A of Table 4 shows the results.
[Insert Table 4 here]
As can be observed in Panel A, the coefficient estimates on the interaction terms
𝑃𝑟𝑒𝑇𝑃𝐷?,# ×𝑀&𝐴!,#(𝑆𝑡𝑜𝑐𝑘𝑃𝑎𝑦𝑚𝑒𝑛𝑡) and 𝑃𝑜𝑠𝑡𝑇𝑃𝐷?,# ×𝑀&𝐴!,#(𝑆𝑡𝑜𝑐𝑘𝑃𝑎𝑦𝑚𝑒𝑛𝑡) are only
positive and statistically significant for the latter, meaning that the increase in announcement
returns experienced by EU acquirers only materializes after the TPD adoption and not before – the
estimates of 𝑃𝑟𝑒𝑇𝑃𝐷?,# ×𝑀&𝐴!,#(𝑆𝑡𝑜𝑐𝑘𝑃𝑎𝑦𝑚𝑒𝑛𝑡) are not statically significant across all
models.
As an additional check, in Panel B, we run a placebo test where we define that the transposition
dates of TPD start one year earlier in each EU member state: for example, for Austria, instead of
the date when TPD was enacted (April 2007), we define the passage of the law as of April 2006.
The results in Panel B show that the estimates on 𝑃𝑜𝑠𝑡𝑃𝑙𝑎𝑐𝑒𝑏𝑜 × 𝑆𝑡𝑜𝑐𝑘𝑃𝑎𝑦𝑚𝑒𝑛𝑡 are not
statistically significant, which again suggests that the positive impact on bidders’ announcement
returns occurs post TPD enactment and not before.
22
4.2 Does the quality of firms’ earnings moderate the impact of regulation on stock based
acquisition returns?
Besides the adverse selection effect that surrounds stock-financed acquisitions, which is
widely documented in previous literature, researchers find evidence of earnings manipulation
upward prior to stock-financed acquisition announcements (e.g., Erickson and Wang, 1999; Louis,
2004; Botsari and Meeks, 2008; Gong et al., 2008a, 2008b; Pungaliya and Vijh, 2009; Karim et
al., 2016). In our sample, we confirm the same facts. We estimate a probit model where the
dependent variable is one for stock-paid acquisitions and zero otherwise. We run the model on the
variable of interest – accrual-based earnings management prior to the deal – and a set of control
variables, including Market-Book, return-on-assets (ROA), Leverage, Relative Size, Cross-border
and Industry Diversification dummies, and GDP per capita and real GDP growth rate to control
for country-level characteristics. Table 5 provides the results.
[Insert Table 5 here]
In line with the literature, our results show that managers engage in more aggressive earnings
management prior to announce a public stock-financed acquisition.
Consistent with prior evidence, we expect that the ability of managers to manipulate earnings
prior to stock-financed acquisitions is inversely related to the level of investor protection (e.g.,
Leuz, Nanda, and Wysocki, 2003; Karim et al., 2016; Maung et al., 2019). In this section, we
examine the impact of adopting TPD on acquirers’ returns in stock-paid acquisitions conditional
of the quality of the acquirers’ financial reporting. The expected improved transparency around
M&As brought about by the enactment of TPD helps investors identify firms with better or worse
quality of their earnings. Acquirers with poor earnings quality are expected to be more penalized
in stock-for-stock acquisitions post TPD. For this analysis, we use two proxies for earnings
quality14: (i) signed discretionary accruals based on the performance and growth, ROA&SG-
adjusted model (as proposed by Collins et al., 2017), and (ii) Khan and Watts’s (2009) firm-year
14 Additionally, we will also use real earnings management as measures of financial reporting transparency, as explained in detail in Section B in the Internet Appendix. We estimate two proxies that capture real earnings management widely used in prior studies (e.g., Roychowdury, 2006; Cohen, Dey, and Lys, 2008; Cohen and Zarowin, 2010), such as i) abnormal cash flows from operations, and ii) abnormal production costs.
23
accounting conservatism measure, C-SCORE. Measures of discretionary accruals and accounting
conservatism have been using in the literature as proxies for financial reporting quality (e.g., Leuz
et al., 2003; Ball and Shivakumar, 2005; Hutton, Marcus, and Tehranian, 2009; Francis et al.,
2013; Khalilov and Osma, 2020; Lara et al., 2020; Zaher et al., 2020). Higher (lower) values of
discretionary accruals (accounting conservatism) are associated with poorer quality of the firms’
financial information. Using these two measures, we split the sample into high versus low earnings
quality, taking the country median as the cut-off point. Then, for each subsample, we re-estimate
our DiD model. Table 615 shows the results.
[Insert Table 6 here]
In models (1)-(4), we use signed discretionary accruals adjusted for performance and growth
to separate the groups of firms with high from low earnings quality, and, in models (5) to (8), we
use C-SCORE to separate the two groups. Our results indicate that, in the groups of acquirers with
better earnings quality the variable of interest, 𝑃𝑜𝑠𝑡𝑇𝑃𝐷?,# ×𝑀&𝐴!,#(𝑆𝑡𝑜𝑐𝑘𝑃𝑎𝑦𝑚𝑒𝑛𝑡), is
positive and statistically significant, indicating that post regulation this was the group of acquirers
that performed better in stock-paid acquisitions. Using the model (1) as an example, the results
show that acquirers from countries with below-median discretionary accruals (high earnings
quality group) earn, on average, more 3.1 pp post-TPD relative to our control sample (formed of
non-EU acquirers). Although the coefficient of interest is also statistically significant in model
(4) (low earnings quality group), the economic magnitude is considerably smaller than that of the
high group (0.064 for the high versus 0.05 for the low group).
Moreover, the coefficients are statistically different between groups among models (5)-(8),
i.e., the z-test for the equality of 𝛽*, our variable of interest, is statistically significant meaning
that acquirers from countries with above-median accounting conservatism captured by C-SCORE
(high earnings quality group) gain higher abnormal returns post-TPD relative to the low earnings
quality group.
15 We replicate results in Tables 5 and 6 using two proxies for real earnings management. Results are not tabulate for brevity, but they are available in the Internet Appendix, Tables II and III, respectively.
24
Taken together, the evidence provided in Table 6 suggests that after the TPD enactment, which
claims for improvements in firm transparency, the discount associated with stock-financed
acquisitions is lower for acquirers with better earnings quality when compared to the control
sample that was not subject to the passage of the rule.
4.3 The different impact of TPD across EU countries
In this section, we study whether the impact of TPD on mitigating the discount associated with
stock-paid acquisitions varies across EU countries. Specifically, we examine whether the ex ante
level of shareholder protection and the quality of the countries’ institutions moderates the impact
of the regulation. Previous studies conducted by, e.g., Djankov et al. (2003), Christensen et al.
(2016), Fauver et al. (2017), highlight some interesting facts: the same regulation applied to
different countries yields different outcomes, depending on some pre-existing conditions, such as
the level of shareholder protection, the quality of the legal enforcement, or the general quality of
the countries’ institutions. Based upon those studies, we posit that countries with ex ante stronger
regulatory conditions and better quality of their institutions benefit more from the adoption of
TPD. To investigate this hypothesis, we estimate our DiD equation (5) separately on different
samples of acquirers from countries with high versus low levels of investor protection and
institutional quality. We use four proxies to assign countries to the high and low groups, as follows:
(i) investor protection used by Rossi and Volpin (2004) that assesses the minority shareholders’
rights measured as the product of the rule of law (disclosed by ICRG) and anti-director rights (La
Porta et al., 1998) divided by ten, (ii) the rule of law, which captures the enforcement of the law
as proposed by Kaufmann et al. (2009), (iii) the regulatory quality of institutions also suggested
by Kaufmann et al. (2009), and (iv) disclosure requirements index of La Porta et al. (2006) as an
indicator of corporate information environment quality; all indicators are described in detail in
subsection 3.2.2. Hence, we create indicator variables that equal one if a country's information
quality measure is above the median, and zero otherwise. We report the results in Table 7.
[Insert Table 7 here]
25
In Panel A (Panel B) of Table 7, our main variable of interest is 𝑃𝑜𝑠𝑡𝑇𝑃𝐷?,# ×
𝑀&𝐴!,#(𝑆𝑡𝑜𝑐𝑘𝑃𝑎𝑦𝑚𝑒𝑛𝑡) that captures the impact of the TPD enactment on acquirers’
announcement returns for stock-financed M&A deals over a three-day window (an eleven-day
window), and for high versus low groups based on information environment proxies described
above. The evidence provided in Table 7 is consistent across estimations; there is a positive impact
on acquirers’ returns (our treatment group) in the post-regulation period for the high information
environment quality group. Therefore, our findings suggest that EU acquirers from countries with
better ex ante quality of their regulatory environment benefit more from the TPD enactment and
enforcement; the estimates of our variable of interest are significant across models for the high
group. Taking, in Panel A, the coefficients of models for the high information environment group
– models (1), (3), (5), and (7) – the change in acquirers’ CARs ranges between 3.17 pp in model
(3) and 4.25 pp in model (1). The economic magnitude of acquirers’ returns (over a three-day
window) increases, on average, about 4 pp for the high information environment quality group.
We also find similar results in Panel B, where acquirers from better information environment earn,
on average, more 4.6 pp estimated over an eleven-day window16.
Our results echo the findings of Christensen et al. (2016) and Fauver et al. (2017); the efficacy
of regulation may depend on the pre-existing quality of the countries’ institutions, which can
compromise what might (perhaps) be the major objective of the EU Financial Services Action
Plan: to create an equally-leveled field for all member states.
4.4 Robustness tests
In this section, we test whether the impact attributed to TPD that documented throughout this
study can be subsumed by the adoption of earlier EU Directives – Prospectus Directive (PD) and
Market Abuse Directive (MAD). Although these directives are not considered to be concurrent
16 We construct an alternative information quality measure - financial development - using country-level variables from Cihak et al. (2012) Global Financial Development Database, available in the World Bank’s World Development Indicators (WDI). This measure is described in detail in Appendix A. Then, we create an indicator variable equal to one if a country's measure is above the yearly median, and zero otherwise. Table IV in the Internet Appendix reports the results, which are consistent and qualitatively similar to the ones shown in Table 7.
26
but complementary to TPD, all intend to reduce capital markets inefficiencies and may have an
impact on reducing adverse selection problems. This raises the concern that our main results
presented in Tables 3-6 may not be attributed to the enactment of TPD, but to former directives.
To check the robustness of our results, we re-estimate our DiD specification (equation (5))
controlling for the transposition of both PD and MAD to analyze the impact of these directives on
acquirers’ returns around stock-paid acquisitions. Table 8 exhibits the results.
[Insert Table 8 here]
In models (1)-(2), Panel A, we add to our DiD model in equation (5) the control variables
Post-PD and Post-MAD that equal one starting the quarter after the transposition of each directive
- Prospectus Directive (PD) and Market Abuse Directive (MAD) - and zero otherwise. The high
correlation between the enactment dates of PD and MAD17 may anticipate some contamination in
our main results. Therefore, in Panel A, models (3)-(4) show results controlling for the passage of
PD, and in models (5)-(6) we control for the transposition of MAD.
The results in Table 8 show that our variable of interest (𝑃𝑜𝑠𝑡𝑇𝑃𝐷?,# ×
𝑀&𝐴!,#(𝑆𝑡𝑜𝑐𝑘𝑃𝑎𝑦𝑚𝑒𝑛𝑡)) exhibits coefficients of similar magnitude to the ones presented in
Table 3; EU acquirers’ abnormal returns over a three-day window (an eleven-day window)
experienced an economically and statistically significant increase of about 2.4 pp (3.0 pp) in the
post-TPD period relative to a control sample of non-EU acquirers.
The coefficients of control variables Post-PD and Post-MAD are, on average, insignificant
across estimations.
Taken together, our results suggest that the TPD effects on acquirers’ returns are not absorbed
by the PD or MAD. Nonetheless, evidence provided by Fauver et al. (2017) find that the enactment
of MAD and PD in EU member states leads to significant higher abnormal returns around
announcements of seasoned equity offerings after the adoption of those directives; hence, the most
plausible explanation is that the TPD enactment has absorbed the effects that emerged following
the passage of the PD and MAD.
17 See entry-into-force dates described in Table V in Section D of the Internet Appendix.

27
We replicate our prior analysis on the impact of earnings quality and information environment
quality (Tables 6 and 7, respectively) controlling for the passage of PD (MAD). Panels B-D of
Table 8 show the results. Again, this further evidence does not harm our previous findings and
gives support to our conclusion that the effects caused by the transposition of TPD overlapped the
effects of the passage of PD or MAD.
Additionally, we addressed the concern about the presence of accession countries18 in the
control sample due to the so-called Europeanization process that these countries undergo prior to
joining the EU, which involves the pre-adoption of a set of EU rules to increase their chances of
a successful integration (Steunenberg and Toshkov, 2009; Scholten and Ottow, 2014;
Economides and Ker‐Lindsay, 2015). The fact that such countries pre-commit to the EU
regulation may question their role as a control in our study. The only EU candidate included in
our control sample is Turkey, with only nine stock-for-stock acquisitions. We re-estimated all
models in our tables excluding Turkey and, as expected, found identical results. Finally, to
mitigate concerns that the duration of EU membership might distort our results, as it could in case
the pressure to comply with regulation is related to membership duration, we excluded all
countries that accessed EU after 2000 – Croatia (EU member since July/2013), Cyprus, Hungary,
Malta, Poland (since May/2004), and Romania (since Jan/2007). Again the number of
observations dropped was minimal (about 3.89% of treatment group observations); we then re-
estimate all models in all tables and found similar estimates on all coefficients of interest19.
5. Main Conclusions
In this study, we examine whether the passage of the EU Transparency Directive, aiming at
improving the information quality of public firms in the EU, helped mitigate the acquirer discount
in stock-financed public acquisitions, which is partially caused by information asymmetry
problems. The enactment of regulation that improves firm transparency is expected to reduce
18 Current EU candidate countries are Albania, the Republic of North Macedonia, Montenegro, Serbia, and Turkey. Potential candidates for pre-accession are Bosnia and Herzegovina and Kosovo. 19 For brevity, these results are not tabulated, but can be provided upon request.

28
adverse selection problems about the market value of firm equity, thus reducing the typical
negative acquirer’s stock price reaction surrounding the announcement of stock-for-stock
acquisitions of public targets.
We test our hypotheses using a difference-in-differences model with a treatment sample of
925 public acquisitions from 23 EU countries and a control sample of 4329 public acquisitions
from 31 non-EU countries, over the 2000-2018 period. Our findings suggest that, post TPD,
acquirers that engage in stock-for-stock acquisitions of public targets earn higher announcement
returns than their peers from the control group. We test our identification strategy and observe that
the increase in acquirers’ returns only materializes after the TPD adoption and not before.
Additionally, we find that the impact of TPD in mitigating acquirers’ discount of stock-
financed acquisitions is greater for acquirers with better earnings quality, suggesting that TPD
helped clear the water and allowed investors to better distinguish firms with better or worse
earnings quality. Finally, we also document that the impact of TPD in reducing the discount
associated with stock-paid acquisitions accrues essentially to acquirers located in EU countries
with better shareholder protection and institutional quality. This result echoes the findings of
Christensen et al. (2016) and Fauver et al. (2017), showing that the pre-existing quality of the
countries’ institutions are essential to the success of EU securities regulation, which ultimate goal
is to achieve a deeper integration of capital markets and create an equally-leveled field for all
member states.
Overall, our study offers some interesting policy implications. First, EU securities regulation
that promote a timely reporting of financial information and increase corporate transparency helps
reduce adverse selection problems, mitigating costs derived from market frictions and enhancing
the value of corporate activities that are more sensitive to be hurt by information asymmetry
problems. Second, our evidence suggests that improving the quality of the underlying national
institutions of EU member states in a broader sense is essential to achieve the full benefits of some
more specific securities regulation. For instance, advances in regulatory quality, law enforcement,
and investor protection will favor the harmonization process and contribute to a deeper integration

29
of EU financial markets. The Shareholder Rights Directive enacted by European Commission is
one step on that direction20. Third, the evidence on the effects of EU securities regulation, and
particularly the importance of the moderating factors, suggests areas of potential reforms in
domestic institutions to be followed by other accession countries seeking their integration in the
EU area to ensure a smoother harmonization process.
20 To dissipate differences in legislation on investor protection rights, the European Commission enacted the Shareholder Rights Directive (SRD), which requires companies to implement mandatory transparency procedures that ensure protection of shareholder rights and promote shareholding voting.

30
References
Alexandridis, G., Antypas, N. and Travlos, N. (2017). Value Creation from M&As: New Evidence. Journal of Corporate Finance, Vol. 45, pp. 632-650. doi:10.1016/j.jcorpfin.2017.05.010
Alexandridis , G., Mavrovitis, C. and Travlos, N. (2012). How have M&As changed? Evidence from the sixth merger wave. The European Journal of Finance, Vol. 18 No.8, pp. 663-688. doi:10.1080/1351847X.2011.628401
Alexandridis, G., Petmezas, D. and Travlos, N. (2010). Gains from Mergers and Acquisitions Around the World: New Evidence. Financial Management, Vol. 39 No.4, pp. 1671-1695. doi:10.1111/j.1755-053X.2010.01126.x
Andenas M. and Della Negra, F. (2017) Between contract law and financial regulation: towards the Europeanisation of general contract law. European Business Law Review, Vol. 28 No.4, pp. 499–521.
Ang, J. and Cheng, Y. (2006). Direct evidence on the market-driven acquisitions theory. Journal of Financial Research, Vol. 29 No.2, pp. 199–216. doi:10.1111/j.1475-6803.2006.00174.x
Asquith, P., Bruner, R. and Mullins, D. (1987). Merger returns and the form of financing. Proceedings of the Seminar on the Analysis of Security Prices, Vol. 34, pp. 115–146.
Atanasov, V. and Black, B. (2016). Shock-based causal inference in corporate finance and accounting research. Critical Finance Review, Vol. 5 No.2, pp. 207-304. doi:10.1561/104.00000036
Ball, R. and Shivakumar, L. (2005). Earnings quality in UK private firms: Comparative loss recognition timeliness. Journal of Accounting and Economics, Vol. 39 No.1, pp. 83–128. doi:10.1016/j.jacceco.2004.04.001
Basu, S. (1997). The conservatism principle and the asymmetric timeliness of earnings. Journal of Accounting and Economics, Vol. 24 No.1, pp. 3–37. doi:10.1016/S0165-4101(97)00014-1
Botsari, A. and Meeks, G. (2008). Do acquirers manage earnings prior to share for share bid? Journal of Business Finance and Accounting, Vol. 35, pp. 633-670. doi:10.1111/j.1468-5957.2008.02091.x
Chang, S. (1998). Takeovers of privately held targets, methods of payment, and bidder returns. The journal of Finance, Vol. 53, pp. 773-784. doi: 10.1111/0022-1082.315138
Cherednychenko, O. (2021). Two Sides of the Same Coin: EU Financial Regulation and Private Law. European Business Organization Law Review, Vol. 22 No. 1, pp. 147-172. doi:10.1007/s40804-020-00202-y
Christensen, H., Hail, L. and Leuz, C. (2016). Capital-Market Effects of Securities Regulation: Prior Conditions, Implementation, and Enforcement. Review of Financial Studies, Vol. 29 No.11, pp. 2885-2924. doi:10.1093/rfs/hhw055
Cihak, M., Demirgüç-Kunt, A., Feyen, E. and Levine, R. (2012). Benchmarking financial systems around the world. World Bank Policy Research, Washington, D.C.
Coffee, J. (1984). Market Failure and the Economic Case for a Mandatory Disclosure System. Virginia Law Review, Vol. 70 No.4, pp. 717–753. doi:10.2307/1073083
Coffee, J. (2007). Law and the market: The impact of enforcement. University of Pennsylvania Law Review, Vol. 156 No.2, pp. 229-311. Available at: https://scholarship.law.upenn.edu/penn_law_review/vol156/iss2/1
Cohen, D., Dey, A. and Lys, T. (2008). Real and accrual based earnings management in the Pre and Post Sarbanes Oxley periods. The Accounting Review, Vol. 83 No.3, pp. 757–787. doi:10.2308/accr.2008.83.3.757
31
Cohen, D. and Zarowin, P. (2010). Accrual-based and real earnings management activities around seasoned equity offerings. Journal of Accounting and Economics, Vol. 50 No.1, pp. 2–19. doi:10.1016/j.jacceco.2010.01.002
Collins, D., Pungaliya, R. and Vijh, A. (2017). The Effects of Firm Growth and Model Specification Choices on Tests of Earnings Management in Quarterly Settings. The Accounting Review, Vol. 92 No.2, pp. 69-100. doi: 10.2308/accr-51551
Dechow, P., Sloan, R. and Sweeney, A. (1995). Detecting earnings management. Accounting Review, Vol. 70 No.2, pp. 193–225.
Djankov, S., Glaeser, E., La Porta, R., Lopez-de-Silanes, F. and Shleifer, A. (2003). The New Comparative Economics. Journal of Comparative Economics, Vol. 31 No.4, pp. 595–619. doi:10.1016/j.jce.2003.08.005
Dong, M., Hirshleifer, D., Richardson, S. and Teoh, S. (2006). Does investor misvaluation drive the takeover market? The Journal of Finance, Vol. 61 No.2, pp. 725– 762. doi:10.1111/j.1540-6261.2006.00853.x
Draper, P. and Paudyal, K. (2006). Acquisitions: Private versus Public. European Financial Management, Vol. 12, pp. 57-80. doi:10.1111/j.1354-7798.2006.00310.x
Economides, S. and Ker‐Lindsay, J. (2015). Pre‐Accession Europeanization: The Case of Serbia and Kosovo. JCMS: Journal of Common Market Studies, Vol. 53 No. 5, pp. 1027-1044. doi:10.1111/jcms.12238
Enriques, L. and Gatti, M. (2008), Is There a Uniform EU Securities Law after the Financial Services Action Plan? Stanford Journal of Law, Business and Finance, Vol. 14, pp. 43–82.
Erickson, M. and Wang, S. (1999). Earnings Management By Acquiring Firms In Stock For Stock Mergers. Journal of Accounting and Economics, Vol. 27 No.2, pp. 149–176. doi:10.1016/S0165-4101(99)00008-7
Faccio, M., McConnell, J.and Stolin, D. (2006). Returns to acquirers of listed and unlisted targets. Journal of Financial and Quantitative Analysis, Vol. 41 No.1, pp. 197–220. doi:10.1017/S0022109000002477
Fama, E. and French, K. (1997). Industry costs of equity. Journal of Financial Economics, Vol. 43 No.2, pp. 153-193. doi:10.1016/S0304-405X(96)00896-3
Fauver, L., Loureiro, G. and Taboada, A. (2017). The Impact of Regulation on Information Quality and Performance around Seasoned Equity Offerings: International Evidence. Journal of Corporate Finance, Vol. 44, pp. 73-98. doi:10.1016/j.jcorpfin.2017.03.008
Francis, B., Hasan, I. and Wu, Q. (2013). The benefits of conservative accounting to shareholders: Evidence from the financial crisis. Accounting Horizons, Vol. 27 No.2, 319–346. doi:10.2308/acch-50431
Fu, F., Lin, L. and Officer, M. (2013). Acquisitions driven by stock overvaluation: are they good deals? Journal of Financial Economics, Vol. 109 No.1, pp. 24–39. doi:10.1016/j.jfineco.2013.02.013
Fuller, K. , Netter, J. and Stegemoller, M. (2002). What Do Returns To Acquiring Firms Tell Us? Evidence From Firms That Make Many Acquisitions. The Journal of Finance, Vol. 57, pp. 1763-1793. doi:10.1111/1540-6261.00477
Golubov, A., Petmezas, D. and Travlos, N. (2016). Do Stock-Financed Acquisitions Destroy Value? New Methods and Evidence. Review of Finance, Vol. 20 No.1, pp. 161–200. doi:10.1093/rof/rfv009
Golubov, A., Yawson, A. and Zhang, H. (2015). Extraordinary acquirers. Journal of Financial Economics, Vol. 116 No.2, pp. 314-330. doi:10.1016/j.jfineco.2015.02.005
32
Gong, G., Louis, H. and Sun, A. (2008a). Earnings management and firm performance following open-market repurchases. The Journal of Finance, Vol. 63, pp. 947-986. doi:10.1111/j.1540-6261.2008.01336.x
Gong, G., Louis, H. and Sun, A. (2008b) Earnings management, lawsuits, and stock-for-stock acquirer’s market performance. Journal of Accounting and Economics, Vol. 46 No.1, pp. 62-77. doi:10.1016/j.jacceco.2008.03.001
Hutton, A., Marcus, A. and Tehranian, H. (2009). Opaque financial reports, R2, and crash risk. Journal of Financial Economics, Vol. 94 No.1, pp. 67-86. doi:10.1016/j.jfineco.2008.10.003
Jones, J. (1991). Earnings management during import relief investigations. Journal of Accounting Research, Vol. 29 No.2, pp. 193–228. doi:10.2307/2491047
Karim, M., Sarkar, S. and Zhang, S. (2016). Earnings management surrounding M&A: Role of economic development and investor protection. Advances in accounting, Vol. 35, pp. 207-215. doi:10.1016/j.adiac.2016.10.002
Kaufmann, D., Kraay, A. and Mastruzzi, M. (2009). Governance Matters VIII: Governance Indicators for 1996–2008. World Bank Policy Research, Washington, D.C.
Khalilov, A. and Osma, B. (2020). Accounting Conservatism and the Profitability of Corporate Insiders Journal of Business Finance & Accounting, Vol. 47, pp. 333-364. doi:10.1111/jbfa.12438
Khan, M. and Watts, R. (2009). Estimation and empirical properties of a firm-year measure of accounting conservatism. Journal of Accounting and Economics, Vol. 48 No.2-3, pp. 132–150. doi:10.1016/j.jacceco.2009.08.002
Kothari, S., Leone, A. and Wasley, C. (2005). Performance matched discretionary accrual measures. Journal of Accounting and Economics. Vol. 39 No.1, pp. 163–197. doi:10.1016/j.jacceco.2004.11.002
La Porta, R., Lopez-De-Silanes, F. and Shleifer, A. (2006). What works in securities laws? The Journal of Finance, Vol. 61 No.1, pp. 1-32. doi:10.1111/j.1540-6261.2006.00828.x
La Porta, R., Lopez-De-Silanes, F., Shleifer, A. and Vishny, R. (1998). Law and finance. Journal of Political Economy, Vol. 106 No.6, pp. 1113–1155. doi:10.1086/250042
LaFond, R. and Watts, R. (2008). The Information Role of Conservatism. The Accounting Review, Vol. 83 No.2, pp. 447–478. doi:10.2308/accr.2008.83.2.447
Lamfalussy, A. (2000). Initial Report of the Committee of Wise Men on the Regulation of the European Securities Markets. The Committee of Wise Men, Brussels.
Lannoo, K. and Levin, M. (2004). Securities Market Regulation in the EU. The Centre for European Policy Studies, Research Report in Banking and Finance No. 33, Brussels.
Lara, J., Osma, B. and Penalva, F. (2020). Conditional Conservatism and the Limits to Earnings Management. Journal of Accounting and Public Policy, Vol. 39 No.4, pp. 1-26. doi:10.1016/j.jaccpubpol.2020.106738
Leuz, C. and Wysocki, P. (2016). The Economics Of Disclosure And Financial Reporting Regulation: Evidence and Suggestions for Future Research. Journal of Accounting Research, Vol. 54, pp. 525-622. doi:10.1111/1475-679X.12115
Leuz, C., Nanda, D. and Wysocki, P. (2003). Earnings management and investor protection: an international comparison. Journal of Financial Economics, Vol. 69 No.3, pp. 505-527. doi:10.1016/S0304-405X(03)00121-1
Louis, H. (2004). Earnings Management and the Market Performance of Acquiring Firms. Journal of Financial Economics, Vol. 74 No.1, pp. 121–48. doi:10.1016/j.jfineco.2003.08.004
33
MacKinlay, A. (1997). Event Studies in Economics and Finance. Journal of Economic Literature, Vol. 35 No.1, pp. 13–39.
Maung, M., Shedden, M., Wang, Y. and Wilson, C. (2019). The investment environment and cross-border merger and acquisition premiums. Journal of International Financial Markets, Institutions and Money, Vol. 59, pp. 19-35. doi:10.1016/j.intfin.2018.11.011
Martynova, M. and Renneboog, L. (2008). Spillover of corporate governance standards in cross-border mergers and acquisitions. Journal of Corporate Finance, Vol. 14, pp. 200–223. doi:10.1016/j.jcorpfin.2008.03.004
Mateev, M. and Andonov, K. (2016). Do cross-border and domestic bidding firms perform differently? New evidence from continental Europe and the UK. Research in International Business and Finance, Vol. 37, pp. 327–349. doi:10.1016/j.ribaf.2016.01.001
Moeller, S., Schlingemann, F. and Stulz, R. (2007). How Do Diversity of Opinion and Information Asymmetry Affect Acquirer Returns? The Review of Financial Studies, Vol. 20 No.6, pp. 2047–2078. doi:10.1093/rfs/hhm040
Myers, S. and Majluf, N. (1984). Corporate financing and investment decisions when firms have information that investors do not have. Journal of Financial Economics, Vol. 13 No.2, pp. 187–221. doi:10.1016/0304-405X(84)90023-0
Persakis, A. and Iatridis, G. (2017). The joint effect of investor protection, IFRS and earnings quality on cost of capital: An international study. Journal of International Financial Markets, Institutions and Money, Vol. 46, pp. 1-29. 10.1016/j.intfin.2016.10.001
Pungaliya, R. and Vijh, A. (2009). Do Acquiring Firms Manage Earnings? Available at SSRN: https://ssrn.com/abstract=1273464.
Radaelli, C. (2003). The Europeanization of Public Policy, in Featherstone, K. and Radaelli, C. (Eds), The Politics of Europeanization, Oxford: Oxford University Press.
Rhodes-Kropf, M., Robinson, D. and Viswanathan, S. (2005). Valuation waves and merger activity: the empirical evidence. Journal of Financial Economics, Vol. 77 No.3, pp. 561–603. doi:10.1016/j.jfineco.2004.06.015
Rossi, S. and Volpin, P. (2004). Cross-Country Determinants of Mergers and Acquisitions. Journal of Financial Economics, Vol. 74 No.2, pp. 277–304. doi:10.1016/j.jfineco.2003.10.001
Roychowdhury, S. (2006). Earnings management through real activities manipulation. Journal of Accounting and Economics, Vol. 42 No.3, pp. 335–370. doi:10.1016/j.jacceco.2006.01.002
Savor, P. and Lu, Q. (2009). Do Stock Mergers Create Value for Acquirers? The Journal of Finance, Vol.64 No.3, pp. 1061–97. doi:10.1111/j.1540-6261.2009.01459.x
Scholten, M. and Ottow, A. (2014). Institutional design of enforcement in the EU: the case of financial markets. Utrecht Law Review, Vol. 10, pp. 80-91.
Servaes, H. (1991). Tobin’s Q and the Gains from Takeovers. The Journal of Finance, Vol. 46 No.1, pp. 409-419. doi:10.2307/2328702
Seshadri, P., Peters, R., Gell, J., Morsches, G. and Finger, M. (2007). Utility M&A: Beating the odds. Boston Consulting Group Report.
Starks, L. and Wei, K. (2013). Cross-border mergers and differences in corporate governance. International Review of Finance, Vol. 13 No.3, pp. 265–297. doi:10.1111/irfi.12008
Steunenberg, B. and Toshkov, D. (2009). Comparing transposition in the 27 member states of the EU: the impact of discretion and legal fit. Journal of European Public Policy, Vol. 16 No. 7, pp. 951-970. doi:10.1080/13501760903226625

34
Toshkov, D. (2012). Compliance with EU law in Central and Eastern Europe. L'Europe en Formation, Vol. 364 No.2, pp. 91-109. doi:10.3917/eufor.364.0091
Travlos, N. (1987). Corporate takeover bids, methods of payment and bidding firms' stock returns. The Journal of Finance, Vol. 42 No.4, pp. 943–963. doi:10.2307/2328300
Walker, M. (2000). Corporate takeovers, strategic objectives and acquiring-firm shareholder wealth. Financial Management, Vol. 29 No.1, pp. 53–66. doi:10.2307/3666361
Watanabe, O., Imhof, M. and Tartaroglu, S. (2019). Transparency Regulation and Stock Price Informativeness: Evidence From the European Union’s Transparency Directive. Journal of International Accounting Research, Vol. 18 No.2, pp. 89–113. doi:10.2308/jiar-52383
Zaher, N., Mohamed, E. and Basuony, M. (2020). The effect of timely loss recognition and accrual quality on corporate bond spread: The influence of legal and financial institutions. Journal of International Financial Markets, Institutions and Money, Vol. 64, 101171. doi:10.1016/j.intfin.2019.101171
Zingales, L. (2009). The Future Of Securities Regulation. Journal of Accounting Research, Vol. 47, pp. 391-425. doi:10.1111/j.1475-679X.2009.00331.x
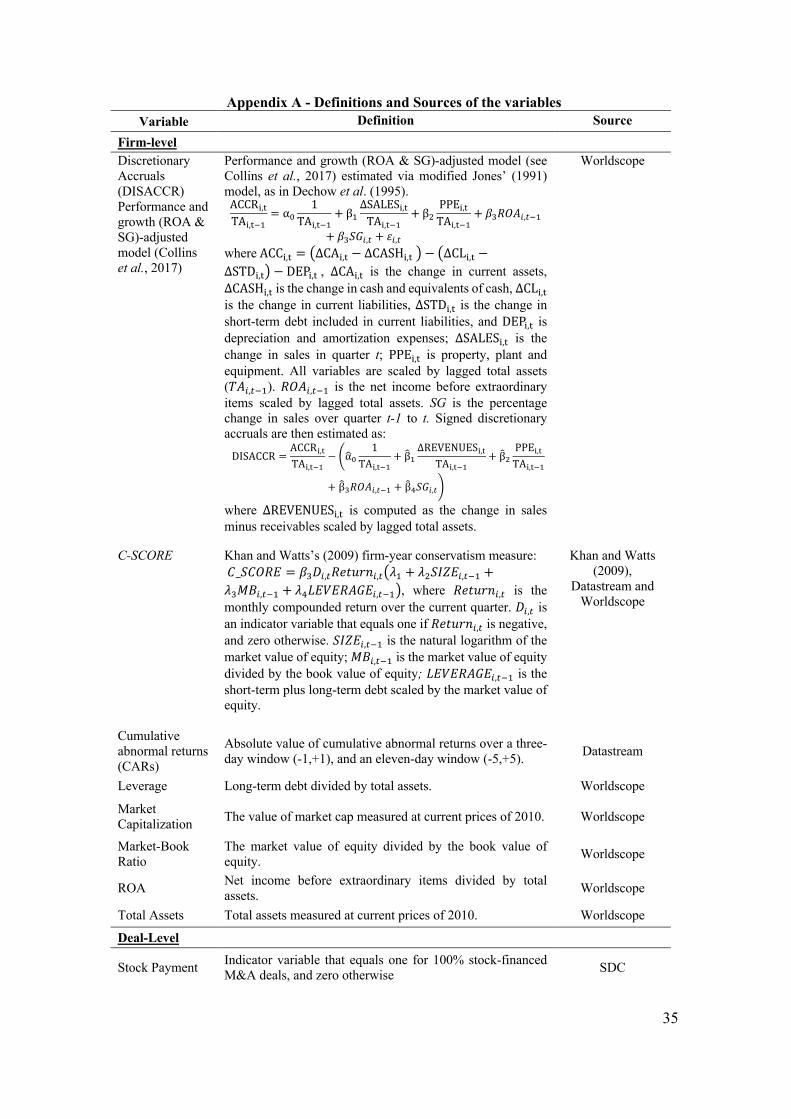
35
Appendix A - Definitions and Sources of the variables Variable Definition Source
Firm-level Discretionary Accruals (DISACCR) Performance and growth (ROA & SG)-adjusted model (Collins et al., 2017)
Performance and growth (ROA & SG)-adjusted model (see Collins et al., 2017) estimated via modified Jones’ (1991) model, as in Dechow et al. (1995). ACCR,,-TA,,-'(
= α.1
TA,,-'(+ β(
∆SALES,,-TA,,-'(
+ β*PPE,,-TA,,-'(
+ 𝛽+𝑅𝑂𝐴),&'(
+ 𝛽+𝑆𝐺),& + 𝜀),& whereACC!,# = %∆CA!,# − ∆CASH!,#* − %∆CL!,# −∆STD!,#* − DEP!,#, ∆CA!,# is the change in current assets, ∆CASH!,# is the change in cash and equivalents of cash, ∆CL!,# is the change in current liabilities, ∆STD!,# is the change in short-term debt included in current liabilities, and DEP!,# is depreciation and amortization expenses; ∆SALES!,# is the change in sales in quarter t; PPE!,# is property, plant and equipment. All variables are scaled by lagged total assets (𝑇𝐴$,%&'). 𝑅𝑂𝐴$,%&' is the net income before extraordinary items scaled by lagged total assets. SG is the percentage change in sales over quarter t-1 to t. Signed discretionary accruals are then estimated as: DISACCR =
ACCR!,#TA!,#$%
− *α,&1
TA!,#$%+ β0%
∆REVENUES!,#TA!,#$%
+ β0'PPE!,#TA!,#$%
+ β0(𝑅𝑂𝐴),*$% + β0+𝑆𝐺),*<
where ∆REVENUES!,# is computed as the change in sales minus receivables scaled by lagged total assets.
Worldscope
C-SCORE Khan and Watts’s (2009) firm-year conservatism measure: 𝐶_𝑆𝐶𝑂𝑅𝐸 = 𝛽(𝐷$,%𝑅𝑒𝑡𝑢𝑟𝑛$,%%𝜆' + 𝜆)𝑆𝐼𝑍𝐸$,%&' +𝜆(𝑀𝐵$,%&' + 𝜆*𝐿𝐸𝑉𝐸𝑅𝐴𝐺𝐸$,%&'*, where 𝑅𝑒𝑡𝑢𝑟𝑛$,% is the monthly compounded return over the current quarter. 𝐷$,% is an indicator variable that equals one if 𝑅𝑒𝑡𝑢𝑟𝑛$,% is negative, and zero otherwise. 𝑆𝐼𝑍𝐸$,%&' is the natural logarithm of the market value of equity; 𝑀𝐵$,%&' is the market value of equity divided by the book value of equity; 𝐿𝐸𝑉𝐸𝑅𝐴𝐺𝐸$,%&' is the short-term plus long-term debt scaled by the market value of equity.
Khan and Watts (2009),
Datastream and Worldscope
Cumulative abnormal returns (CARs)
Absolute value of cumulative abnormal returns over a three-day window (-1,+1), and an eleven-day window (-5,+5). Datastream
Leverage Long-term debt divided by total assets. Worldscope
Market Capitalization The value of market cap measured at current prices of 2010. Worldscope
Market-Book Ratio
The market value of equity divided by the book value of equity. Worldscope
ROA Net income before extraordinary items divided by total assets. Worldscope
Total Assets Total assets measured at current prices of 2010. Worldscope
Deal-Level
Stock Payment Indicator variable that equals one for 100% stock-financed M&A deals, and zero otherwise SDC

36
Variable Definition Source
Cash Payment Indicator variable that equals one for 100% cash-financed M&A deals, and zero otherwise. SDC
Cross-border Dummy variable that equals one if the target country differs from the acquirer’s country, and zero otherwise SDC
Industry Diversification
Dummy variable that equals one if the acquirer and target belong to the same 2-digit SIC Code, and zero otherwise. SDC
Relative Size The M&A deal value divided by the acquirer’s total assets measured in the quarter before the acquisition announcement.
SDC and Worldscope
Industry-Level
Industry Classification scheme proposed by Fama and French (1997), based on 17 Industry Portfolios.
Fama and French (1997)
2-SIC Code 2-digit Standard Industrial Classification (SIC) Code. Datastream Country-Level
Disclosure Disclosure requirements index proposed by La Porta, Lopez-De-Silanes and Shleifer (2006).
La Porta, Lopez-De-Silanes and Shleifer (2006)
Financial Development
Proxy that captures the size of financial institutions and markets; it includes the stock market capitalization, stock market total value traded, and private and public debt securities, all expressed in % of GDP, and stock market turnover ratio (in %). This index is a weighted average of these variables, where the weights are given by their principal components.
Cihak et al. (2012) Global Financial
Development Database
Worldbank (Development
Indicators)
GDP Growth Annual percentage growth rate of real gross domestic product 0(GDP).
Worldbank (Development
Indicators) GDP per Capita Logarithm of gross GDP per capita, measured at constant
2010 U.S. dollar prices.
Worldbank (Development
Indicators) Investor Protection
Proxy for minority shareholders’ rights, measured as the product of the rule of- law (ICRG) and anti-director rights (La Porta et al. (1998)) divided by ten. Rule of Law is a measure based on the assessment of law and order tradition in a country produced and disclosed by the International Country Risk Group (ICRG). Anti-director rights is an index proposed by La Porta et al. (1998) that assesses the effective rights of minority shareholders.
La Porta et al. (1998)
International Country Risk
Group
Regulatory Quality
Proxy for institutional quality based on the ability of governments to formulate and adopt policies and regulations that promote private sector development.
Kaufmann et al. (2009)
Worldbank (Worldwide Governance Indicators)
Rule of law Proxy that captures the enforcement of the law measured by
the quality of contract enforcement, property rights, confidence in law forces and courts.
Kaufmann et al. (2009)
Worldbank (Worldwide Governance Indicators)
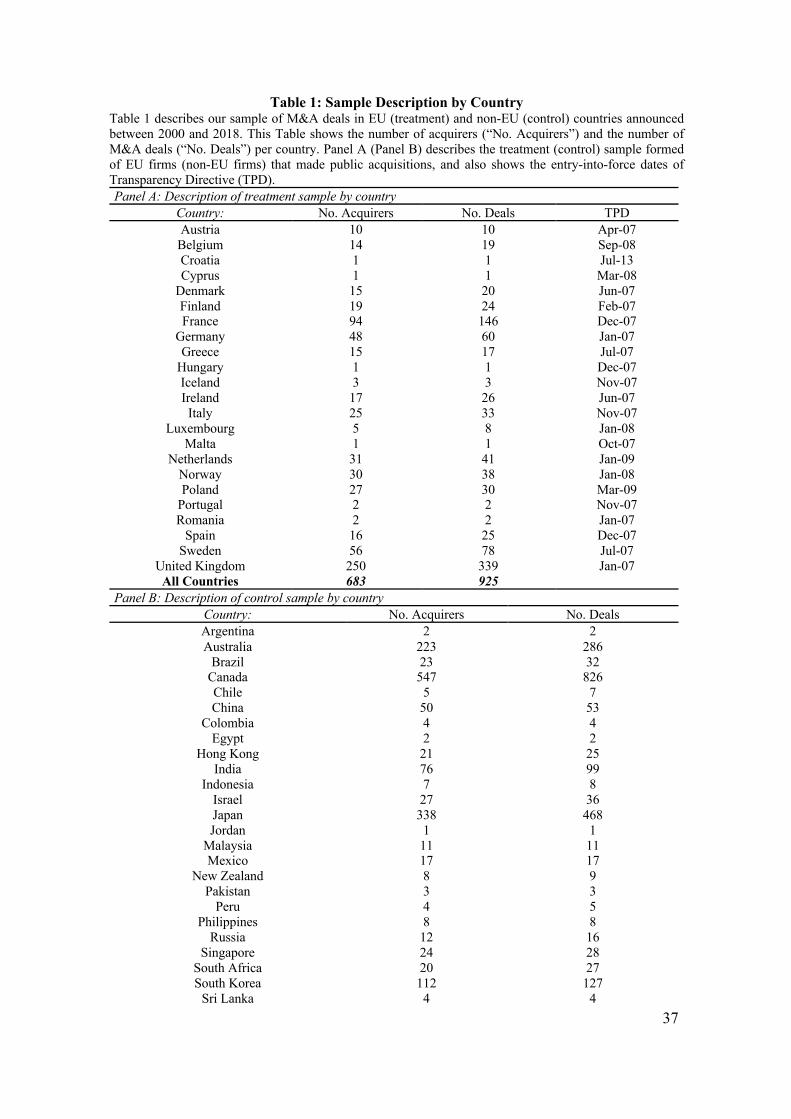
37
Table 1: Sample Description by Country Table 1 describes our sample of M&A deals in EU (treatment) and non-EU (control) countries announced between 2000 and 2018. This Table shows the number of acquirers (“No. Acquirers”) and the number of M&A deals (“No. Deals”) per country. Panel A (Panel B) describes the treatment (control) sample formed of EU firms (non-EU firms) that made public acquisitions, and also shows the entry-into-force dates of Transparency Directive (TPD). Panel A: Description of treatment sample by country
Country: No. Acquirers No. Deals TPD Austria 10 10 Apr-07 Belgium 14 19 Sep-08 Croatia 1 1 Jul-13 Cyprus 1 1 Mar-08
Denmark 15 20 Jun-07 Finland 19 24 Feb-07 France 94 146 Dec-07
Germany 48 60 Jan-07 Greece 15 17 Jul-07
Hungary 1 1 Dec-07 Iceland 3 3 Nov-07 Ireland 17 26 Jun-07 Italy 25 33 Nov-07
Luxembourg 5 8 Jan-08 Malta 1 1 Oct-07
Netherlands 31 41 Jan-09 Norway 30 38 Jan-08 Poland 27 30 Mar-09
Portugal 2 2 Nov-07 Romania 2 2 Jan-07
Spain 16 25 Dec-07 Sweden 56 78 Jul-07
United Kingdom 250 339 Jan-07 All Countries 683 925
Panel B: Description of control sample by country Country: No. Acquirers No. Deals Argentina 2 2 Australia 223 286
Brazil 23 32 Canada 547 826 Chile 5 7 China 50 53
Colombia 4 4 Egypt 2 2
Hong Kong 21 25 India 76 99
Indonesia 7 8 Israel 27 36 Japan 338 468 Jordan 1 1
Malaysia 11 11 Mexico 17 17
New Zealand 8 9 Pakistan 3 3
Peru 4 5 Philippines 8 8
Russia 12 16 Singapore 24 28
South Africa 20 27 South Korea 112 127
Sri Lanka 4 4

38
Switzerland 36 57 Taiwan 48 62
Thailand 19 21 Turkey 8 9
United States 1240 2074 Uruguay 1 2
All Countries 2901 4329

39
Table 2: Descriptive Statistics Table 2 describes our sample of M&A deals in EU (treatment group) and non-EU (control group) countries announced between 2000 and 2018 and collected from Thomson Financial's SDC. Panel A reports the descriptive statistics for the main variables. The full sample is divided into treatment (EU public acquirers) and control (non-EU public acquirers). For each variable, we report the number of observations (“N”), the mean, the median, and the standard deviation. Cumulative abnormal returns (CAR) are estimated over a three-day window (-1,+1), and an eleven-day window (-5,+5). Total Assets (Market Capitalization) are expressed in US$ thousand million (reflecting 2010 Consumer Price Index). Market-book is the market value of equity divided by the book value of equity. Leverage is the ratio of long-term debt to total assets. ROA is net income before extraordinary items divided by total assets. Dis. Accruals is the signed discretionary accruals adjusted for performance and growth ROA&SG (see Collins et al., 2017), in year t-1. C-SCORE is Khan and Watts’s (2009) firm-year earnings conservatism measure. Stock (Cash) Payment is an indicator variable that equals one for 100% stock-financed (cash-financed) acquisitions, and zero otherwise. Relative Size is the deal value divided by the acquirer’s total assets measured in the quarter prior to the acquisition announcement. Cross-border is a dummy variable that equals one if the target country is different from the acquirer’s country, and zero otherwise. Industry Diversification is an indicator variable that equals one if the acquirer and target belong to the same 2-digit SIC Code, and zero otherwise. GDP per Capita is measured as a logarithm at constant 2010 USD prices. GDP Growth is the annual percentage growth rate of real GDP. All variables are defined in Appendix A. Panel B reports the differences in means of CARs between treatment and control groups. Differences in means are tested using t-statistic test. P-value of t-statistic test reported. Panel A – Descriptive Statistics
Treatment Control N Mean Median SD N Mean Median SD
Ab. Returns CAR (-1,+1) 834 0.0052 0.0030 0.0703 3792 0.0020 -0.0010 0.0870 CAR (-5,+5) 834 0.0012 -0.0013 0.0996 3792 0.0049 -0.0009 0.1287
100% Stock- CAR (-1,+1) 177 -0.0028 -0.0047 0.0835 1211 -0.0045 -0.0099 0.1097 CAR (-5,+5) 177 -0.0127 -0.0124 0.1112 1211 0.0007 -0.0093 0.1642
Firm-level Total Assets 925 8.5 1.5 15.9 4329 6.7 1.2 13.7 Market Cap 925 8.7 1.4 18.3 4329 8.2 1.2 18.5 Market-Book 925 2.8423 2.1160 3.4798 4329 3.0001 2.0305 4.3332 Leverage 922 0.1646 0.1479 0.1400 4285 0.1680 0.1341 0.1689 ROA 925 0.0066 0.0394 0.2428 4329 -0.0284 0.0323 0.2926 Disc. Accruals 681 -0.0105 -0.0072 0.0624 3771 -0.0101 -0.0071 0.0581 C-SCORE 865 -0.0349 -0.0340 0.5375 4034 0.003 -0.0092 0.5785
Deal-level Stock Payment 795 0.2566 0.0000 0.4370 3956 0.3496 0.0000 0.4769 Cash Payment 795 0.5195 1.0000 0.4999 3956 0.3911 0.0000 0.4880 Relative Size 925 0.3752 0.1376 1.1390 4329 0.4440 0.1540 1.1239 Cross-border 925 0.5686 1.0000 0.4955 4329 0.2315 0.0000 0.4218 Industry Diversification 925 0.5146 1.0000 0.5001 4329 0.5320 1.0000 0.4990
Country-level GDP per capita 881 10.5890 10.5976 0.3125 4091 10.5697 10.7640 0.7236 GDP growth(%) 880 2.1855 2.4247 1.9644 4091 2.6478 2.5849 2.1969 Panel B - Univariate Comparisons between Treatment and Control Groups Treatment Control (Treat-
Control) p value N Mean N Mean
Ab. Returns CAR (-1,+1) 834 0.0052 3792 0.0020 0.0032 0.311 CAR (-5,+5) 834 0.0012 3792 0.0049 -0.0037 0.428
100% Stock CAR (-1,+1) 177 -0.0028 1211 -0.0045 0.0017 0.843 CAR (-5,+5) 177 -0.0127 1211 0.0007 -0.0134 0.292
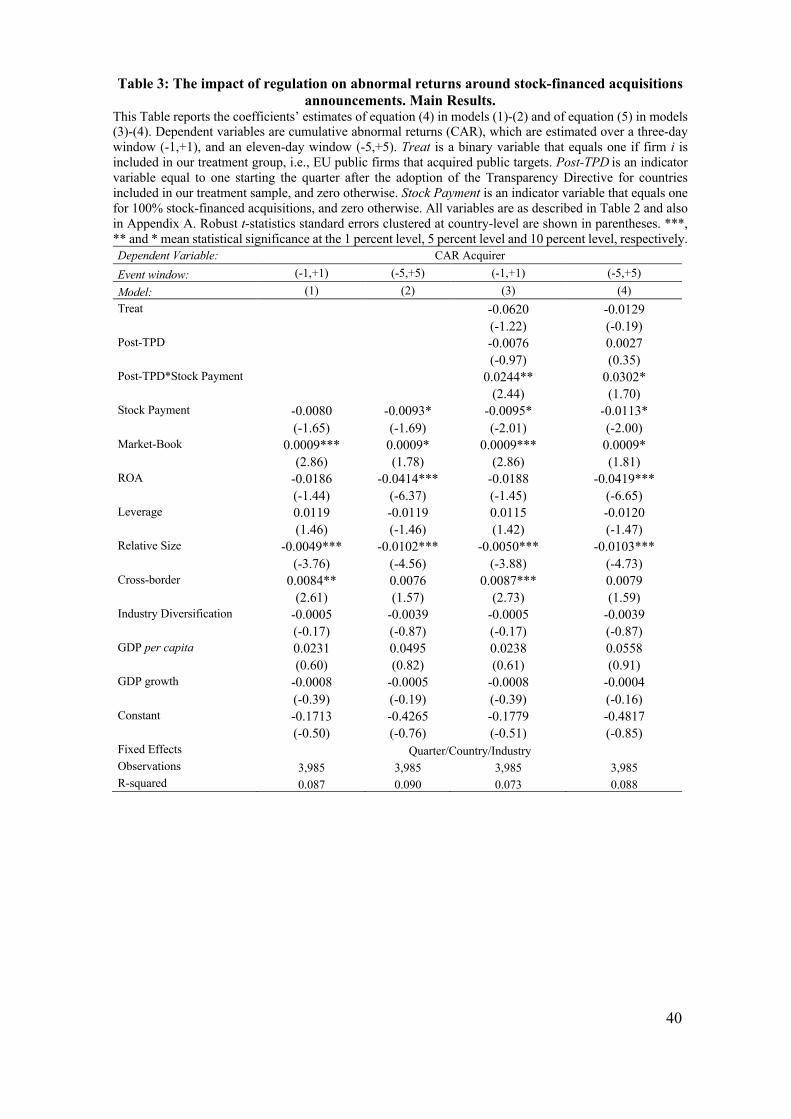
40
Table 3: The impact of regulation on abnormal returns around stock-financed acquisitions announcements. Main Results.
This Table reports the coefficients’ estimates of equation (4) in models (1)-(2) and of equation (5) in models (3)-(4). Dependent variables are cumulative abnormal returns (CAR), which are estimated over a three-day window (-1,+1), and an eleven-day window (-5,+5). Treat is a binary variable that equals one if firm i is included in our treatment group, i.e., EU public firms that acquired public targets. Post-TPD is an indicator variable equal to one starting the quarter after the adoption of the Transparency Directive for countries included in our treatment sample, and zero otherwise. Stock Payment is an indicator variable that equals one for 100% stock-financed acquisitions, and zero otherwise. All variables are as described in Table 2 and also in Appendix A. Robust t-statistics standard errors clustered at country-level are shown in parentheses. ***, ** and * mean statistical significance at the 1 percent level, 5 percent level and 10 percent level, respectively. Dependent Variable: CAR Acquirer Event window: (-1,+1) (-5,+5) (-1,+1) (-5,+5) Model: (1) (2) (3) (4) Treat -0.0620 -0.0129 (-1.22) (-0.19) Post-TPD -0.0076 0.0027 (-0.97) (0.35) Post-TPD*Stock Payment 0.0244** 0.0302* (2.44) (1.70) Stock Payment -0.0080 -0.0093* -0.0095* -0.0113* (-1.65) (-1.69) (-2.01) (-2.00) Market-Book 0.0009*** 0.0009* 0.0009*** 0.0009* (2.86) (1.78) (2.86) (1.81) ROA -0.0186 -0.0414*** -0.0188 -0.0419*** (-1.44) (-6.37) (-1.45) (-6.65) Leverage 0.0119 -0.0119 0.0115 -0.0120 (1.46) (-1.46) (1.42) (-1.47) Relative Size -0.0049*** -0.0102*** -0.0050*** -0.0103*** (-3.76) (-4.56) (-3.88) (-4.73) Cross-border 0.0084** 0.0076 0.0087*** 0.0079 (2.61) (1.57) (2.73) (1.59) Industry Diversification -0.0005 -0.0039 -0.0005 -0.0039 (-0.17) (-0.87) (-0.17) (-0.87) GDP per capita 0.0231 0.0495 0.0238 0.0558 (0.60) (0.82) (0.61) (0.91) GDP growth -0.0008 -0.0005 -0.0008 -0.0004 (-0.39) (-0.19) (-0.39) (-0.16) Constant -0.1713 -0.4265 -0.1779 -0.4817 (-0.50) (-0.76) (-0.51) (-0.85) Fixed Effects Quarter/Country/Industry Observations 3,985 3,985 3,985 3,985 R-squared 0.087 0.090 0.073 0.088
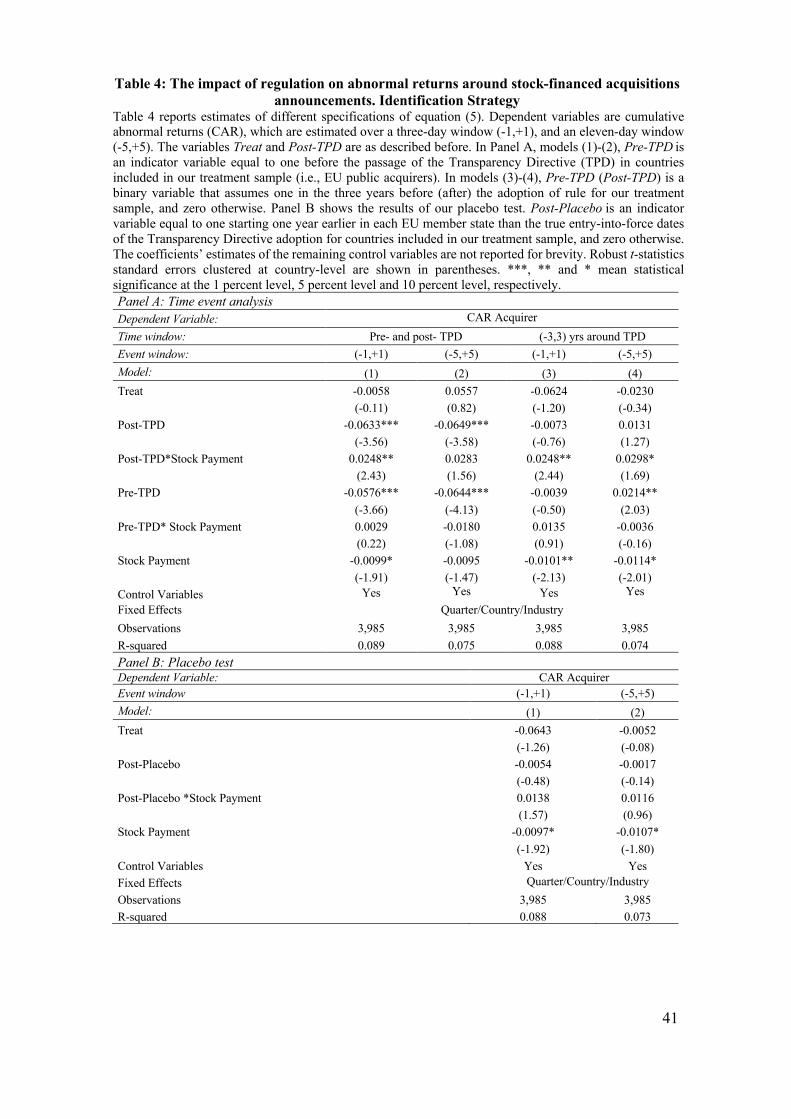
41
Table 4: The impact of regulation on abnormal returns around stock-financed acquisitions announcements. Identification Strategy
Table 4 reports estimates of different specifications of equation (5). Dependent variables are cumulative abnormal returns (CAR), which are estimated over a three-day window (-1,+1), and an eleven-day window (-5,+5). The variables Treat and Post-TPD are as described before. In Panel A, models (1)-(2), Pre-TPD is an indicator variable equal to one before the passage of the Transparency Directive (TPD) in countries included in our treatment sample (i.e., EU public acquirers). In models (3)-(4), Pre-TPD (Post-TPD) is a binary variable that assumes one in the three years before (after) the adoption of rule for our treatment sample, and zero otherwise. Panel B shows the results of our placebo test. Post-Placebo is an indicator variable equal to one starting one year earlier in each EU member state than the true entry-into-force dates of the Transparency Directive adoption for countries included in our treatment sample, and zero otherwise. The coefficients’ estimates of the remaining control variables are not reported for brevity. Robust t-statistics standard errors clustered at country-level are shown in parentheses. ***, ** and * mean statistical significance at the 1 percent level, 5 percent level and 10 percent level, respectively. Panel A: Time event analysis Dependent Variable: CAR Acquirer Time window: Pre- and post- TPD (-3,3) yrs around TPD Event window: (-1,+1) (-5,+5) (-1,+1) (-5,+5) Model: (1) (2) (3) (4) Treat -0.0058 0.0557 -0.0624 -0.0230
(-0.11) (0.82) (-1.20) (-0.34) Post-TPD -0.0633*** -0.0649*** -0.0073 0.0131
(-3.56) (-3.58) (-0.76) (1.27) Post-TPD*Stock Payment 0.0248** 0.0283 0.0248** 0.0298*
(2.43) (1.56) (2.44) (1.69) Pre-TPD -0.0576*** -0.0644*** -0.0039 0.0214**
(-3.66) (-4.13) (-0.50) (2.03) Pre-TPD* Stock Payment 0.0029 -0.0180 0.0135 -0.0036
(0.22) (-1.08) (0.91) (-0.16) Stock Payment -0.0099* -0.0095 -0.0101** -0.0114*
(-1.91) (-1.47) (-2.13) (-2.01) Control Variables Yes Yes Yes Yes Fixed Effects Quarter/Country/Industry Observations 3,985 3,985 3,985 3,985 R-squared 0.089 0.075 0.088 0.074 Panel B: Placebo test Dependent Variable: CAR Acquirer Event window (-1,+1) (-5,+5) Model: (1) (2) Treat -0.0643 -0.0052
(-1.26) (-0.08) Post-Placebo -0.0054 -0.0017 (-0.48) (-0.14) Post-Placebo *Stock Payment 0.0138 0.0116 (1.57) (0.96) Stock Payment -0.0097* -0.0107*
(-1.92) (-1.80) Control Variables Yes Yes Fixed Effects Quarter/Country/Industry Observations 3,985 3,985 R-squared 0.088 0.073
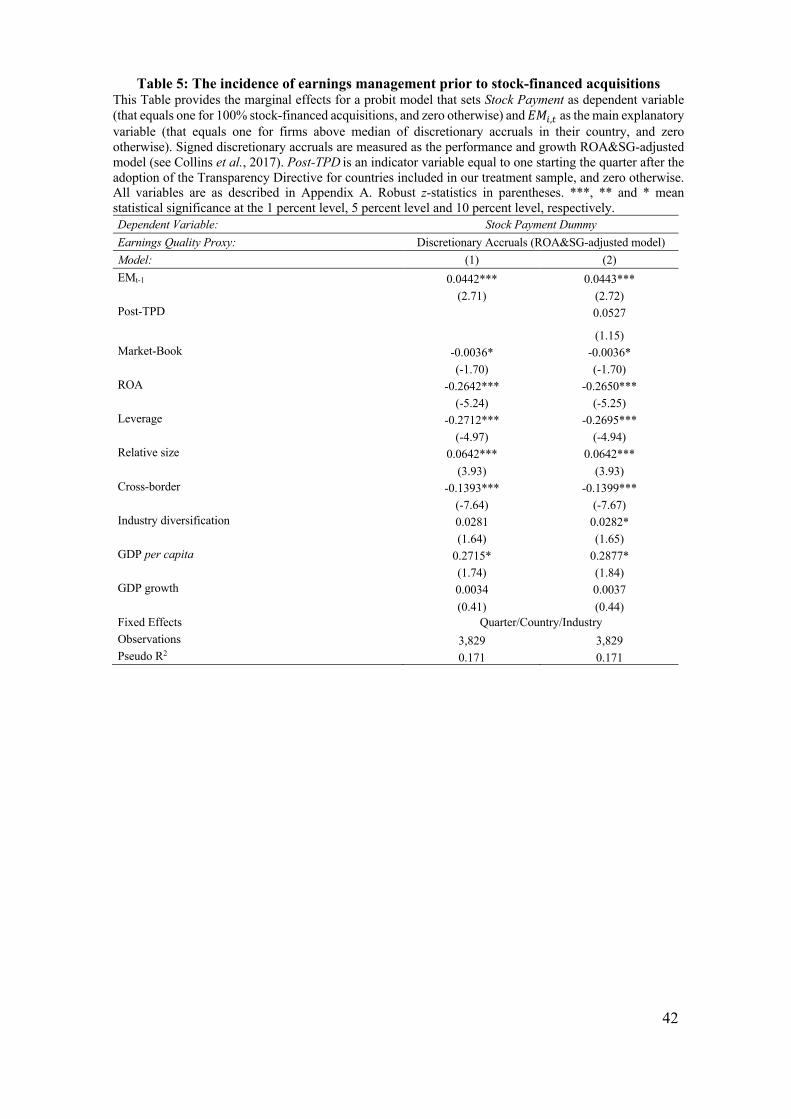
42
Table 5: The incidence of earnings management prior to stock-financed acquisitions This Table provides the marginal effects for a probit model that sets Stock Payment as dependent variable (that equals one for 100% stock-financed acquisitions, and zero otherwise) and 𝐸𝑀$,%as the main explanatory variable (that equals one for firms above median of discretionary accruals in their country, and zero otherwise). Signed discretionary accruals are measured as the performance and growth ROA&SG-adjusted model (see Collins et al., 2017). Post-TPD is an indicator variable equal to one starting the quarter after the adoption of the Transparency Directive for countries included in our treatment sample, and zero otherwise. All variables are as described in Appendix A. Robust z-statistics in parentheses. ***, ** and * mean statistical significance at the 1 percent level, 5 percent level and 10 percent level, respectively. Dependent Variable: Stock Payment Dummy Earnings Quality Proxy: Discretionary Accruals (ROA&SG-adjusted model) Model: (1) (2) EMt-1 0.0442*** 0.0443*** (2.71) (2.72) Post-TPD 0.0527
(1.15) Market-Book -0.0036* -0.0036* (-1.70) (-1.70) ROA -0.2642*** -0.2650*** (-5.24) (-5.25) Leverage -0.2712*** -0.2695*** (-4.97) (-4.94) Relative size 0.0642*** 0.0642*** (3.93) (3.93) Cross-border -0.1393*** -0.1399*** (-7.64) (-7.67) Industry diversification 0.0281 0.0282* (1.64) (1.65) GDP per capita 0.2715* 0.2877* (1.74) (1.84) GDP growth 0.0034 0.0037 (0.41) (0.44) Fixed Effects Quarter/Country/Industry Observations 3,829 3,829 Pseudo R2 0.171 0.171
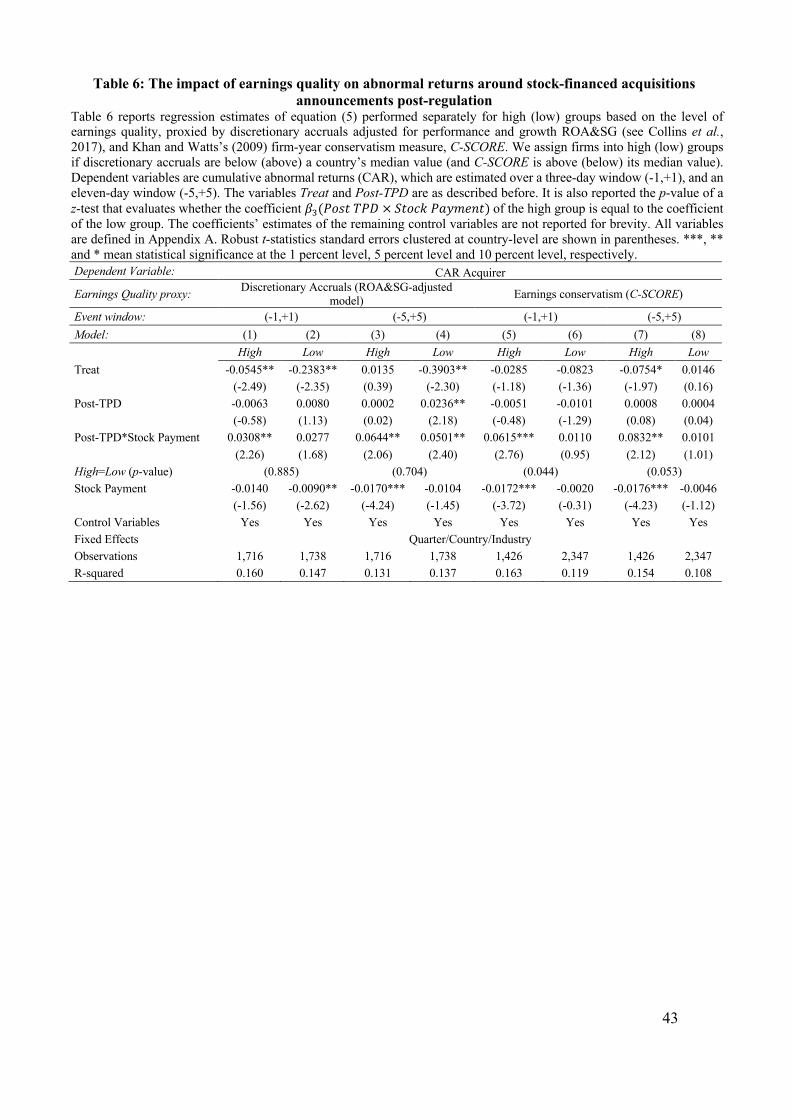
43
Table 6: The impact of earnings quality on abnormal returns around stock-financed acquisitions announcements post-regulation
Table 6 reports regression estimates of equation (5) performed separately for high (low) groups based on the level of earnings quality, proxied by discretionary accruals adjusted for performance and growth ROA&SG (see Collins et al., 2017), and Khan and Watts’s (2009) firm-year conservatism measure, C-SCORE. We assign firms into high (low) groups if discretionary accruals are below (above) a country’s median value (and C-SCORE is above (below) its median value). Dependent variables are cumulative abnormal returns (CAR), which are estimated over a three-day window (-1,+1), and an eleven-day window (-5,+5). The variables Treat and Post-TPD are as described before. It is also reported the p-value of a z-test that evaluates whether the coefficient 𝛽((𝑃𝑜𝑠𝑡𝑇𝑃𝐷 × 𝑆𝑡𝑜𝑐𝑘𝑃𝑎𝑦𝑚𝑒𝑛𝑡)of the high group is equal to the coefficient of the low group. The coefficients’ estimates of the remaining control variables are not reported for brevity. All variables are defined in Appendix A. Robust t-statistics standard errors clustered at country-level are shown in parentheses. ***, ** and * mean statistical significance at the 1 percent level, 5 percent level and 10 percent level, respectively. Dependent Variable: CAR Acquirer
Earnings Quality proxy: Discretionary Accruals (ROA&SG-adjusted model) Earnings conservatism (C-SCORE)
Event window: (-1,+1) (-5,+5) (-1,+1) (-5,+5) Model: (1) (2) (3) (4) (5) (6) (7) (8) High Low High Low High Low High Low Treat -0.0545** -0.2383** 0.0135 -0.3903** -0.0285 -0.0823 -0.0754* 0.0146 (-2.49) (-2.35) (0.39) (-2.30) (-1.18) (-1.36) (-1.97) (0.16) Post-TPD -0.0063 0.0080 0.0002 0.0236** -0.0051 -0.0101 0.0008 0.0004 (-0.58) (1.13) (0.02) (2.18) (-0.48) (-1.29) (0.08) (0.04) Post-TPD*Stock Payment 0.0308** 0.0277 0.0644** 0.0501** 0.0615*** 0.0110 0.0832** 0.0101 (2.26) (1.68) (2.06) (2.40) (2.76) (0.95) (2.12) (1.01) High=Low (p-value) (0.885) (0.704) (0.044) (0.053) Stock Payment -0.0140 -0.0090** -0.0170*** -0.0104 -0.0172*** -0.0020 -0.0176*** -0.0046 (-1.56) (-2.62) (-4.24) (-1.45) (-3.72) (-0.31) (-4.23) (-1.12) Control Variables Yes Yes Yes Yes Yes Yes Yes Yes Fixed Effects Quarter/Country/Industry Observations 1,716 1,738 1,716 1,738 1,426 2,347 1,426 2,347 R-squared 0.160 0.147 0.131 0.137 0.163 0.119 0.154 0.108

44
Table 7: The impact of information environment quality on abnormal returns around stock-financed acquisitions announcements post-regulation
Table 7 shows regression estimates of equation (5) run separately for high (low) groups based on the level of information quality measures: Investor protection, Rule of Law, Regulatory Quality, and Disclosure. High is a dummy variable that equals one if a country is above the median of each measure, and zero otherwise (the low group). Panel A show estimates including as dependent variable CARs estimated over a three-day window (-1,+1), and Panel B use CARs estimated over an eleven-day window (-5,+5). The variables Treat and Post-TPD are as described before. It is also reported the p-value of a z-test that evaluates whether the coefficient 𝛽((𝑃𝑜𝑠𝑡𝑇𝑃𝐷 × 𝑆𝑡𝑜𝑐𝑘𝑃𝑎𝑦𝑚𝑒𝑛𝑡)of the high group is equal to the coefficient of the low group. The coefficients’ estimates of the remaining control variables are not reported for brevity. All variables are defined in Appendix A. Robust t-statistics standard errors clustered at country-level are shown in parentheses.***, ** and * mean statistical significance at the 1 percent level, 5 percent level and 10 percent level, respectively. Panel A:. CAR estimated over a three-day window (-1,+1) Dependent Variable: CAR Acquirer Information environment proxy: Investor Protection Rule of Law Regulatory Quality Disclosure
Model: (1) (2) (3) (4) (5) (6) (7) (8)
High Low High Low High Low High Low Treat -0.0327 -0.1394** 0.1015 -0.1516*** -0.1265 -0.1312*** -0.1971 0.0230
(-2.77) (-2.65) (0.69) (-3.54) (-0.64) (-3.25) (-1.66) (0.72) Post-TPD -0.0057 0.0151** -0.0058 -0.0003 -0.0167** -0.0041 -0.0048 0.0173*** (-2.65) (2.19) (-0.93) (-0.03) (-2.59) (-0.53) (-1.19) (2.88) Post-TPD*Stock Pay. 0.0425*** 0.0038 0.0317*** 0.0090 0.0390*** -0.0002 0.0420*** 0.0035 (24.67) (0.21) (3.12) (0.48) (4.88) (-0.01) (15.35) (0.19) High=Low (p-value) (0.033) (0.287) (0.014) (0.039) Stock Payment -0.0178*** 0.0052 -0.0174*** -0.0016 -0.0178*** -0.0038 -0.0180*** 0.0047 (-22.40) (1.12) (-4.71) (-0.26) (-3.92) (-0.82) (-13.50) (1.36) Control Variables Yes Yes Yes Yes Yes Yes Yes Yes Fixed Effects Quarter/Country/Industry Observations 2,713 1,272 2,400 1,585 2,002 1,983 2,826 1,159 R-squared 0.103 0.200 0.115 0.189 0.133 0.136 0.106 0.205 Panel B: CAR estimated over an eleven-day window (-5,+5) Model (1) (2) (3) (4) (5) (6) (7) (8) High Low High Low High Low High Low Treat -0.0429 -0.0683 0.1169 -0.0795 -0.2556 -0.0874 -0.3124 0.1138**
(-2.06) (-0.87) (0.52) (-1.02) (-1.16) (-1.52) (-1.59) (2.28) Post-TPD 0.0073* 0.0141 0.0043 0.0066 -0.0072 -0.0001 0.0064** 0.0140 (2.96) (1.38) (0.62) (0.68) (-1.06) (-0.00) (2.21) (1.55) Post-TPD*Stock Pay. 0.0419* 0.0036 0.0413* 0.0047 0.0579*** -0.0128 0.0432*** 0.0041 (3.70) (0.11) (1.98) (0.20) (3.67) (-0.48) (5.01) (0.12) High=Low (p-value) (0.269) (0.244) (0.016) (0.270) Stock Payment -0.0172 -0.0010 -0.0142* -0.0129*** -0.0148 -0.0145*** -0.0176** 0.0001 (-2.46) (-0.11) (-1.89) (-3.18) (-1.42) (-5.71) (-3.07) (0.01) Control Variables Yes Yes Yes Yes Yes Yes Yes Yes Fixed Effects Quarter/Country/Industry Observations 2,713 1,272 2,400 1,585 2,002 1,983 2,826 1,159 R-squared 0.087 0.172 0.114 0.154 0.130 0.120 0.086 0.187
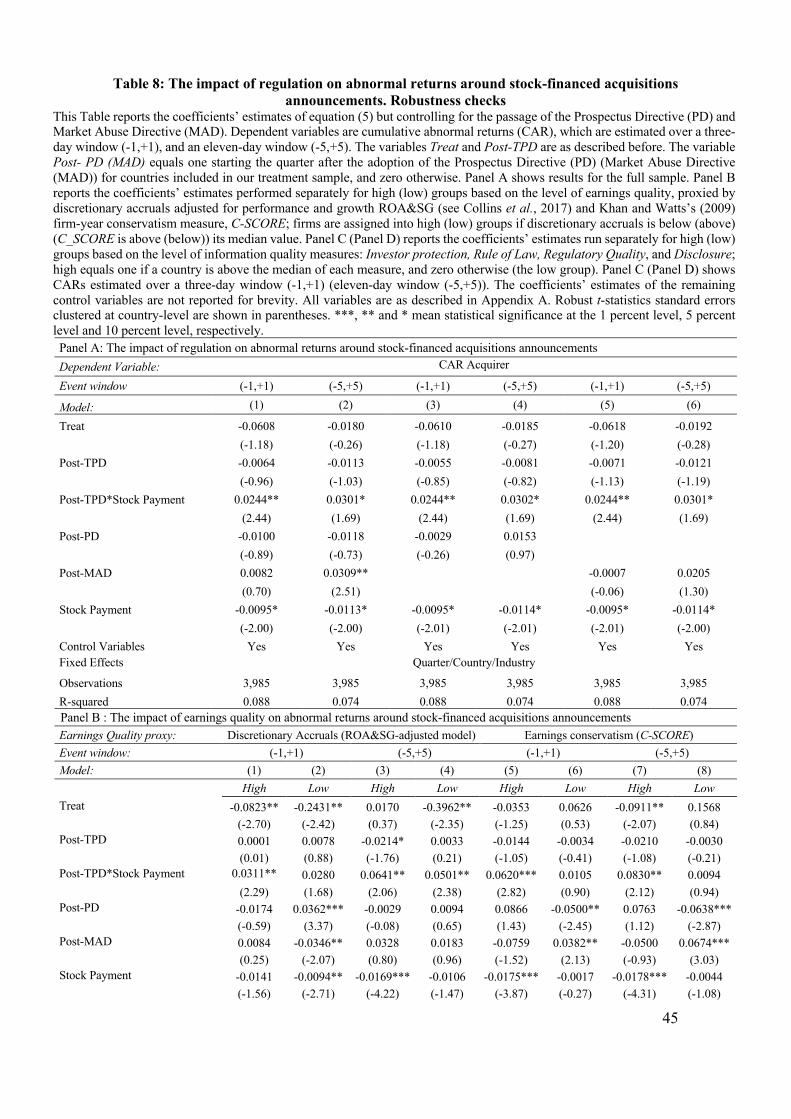
45
Table 8: The impact of regulation on abnormal returns around stock-financed acquisitions announcements. Robustness checks
This Table reports the coefficients’ estimates of equation (5) but controlling for the passage of the Prospectus Directive (PD) and Market Abuse Directive (MAD). Dependent variables are cumulative abnormal returns (CAR), which are estimated over a three-day window (-1,+1), and an eleven-day window (-5,+5). The variables Treat and Post-TPD are as described before. The variable Post- PD (MAD) equals one starting the quarter after the adoption of the Prospectus Directive (PD) (Market Abuse Directive (MAD)) for countries included in our treatment sample, and zero otherwise. Panel A shows results for the full sample. Panel B reports the coefficients’ estimates performed separately for high (low) groups based on the level of earnings quality, proxied by discretionary accruals adjusted for performance and growth ROA&SG (see Collins et al., 2017) and Khan and Watts’s (2009) firm-year conservatism measure, C-SCORE; firms are assigned into high (low) groups if discretionary accruals is below (above) (C_SCORE is above (below)) its median value. Panel C (Panel D) reports the coefficients’ estimates run separately for high (low) groups based on the level of information quality measures: Investor protection, Rule of Law, Regulatory Quality, and Disclosure; high equals one if a country is above the median of each measure, and zero otherwise (the low group). Panel C (Panel D) shows CARs estimated over a three-day window (-1,+1) (eleven-day window (-5,+5)). The coefficients’ estimates of the remaining control variables are not reported for brevity. All variables are as described in Appendix A. Robust t-statistics standard errors clustered at country-level are shown in parentheses. ***, ** and * mean statistical significance at the 1 percent level, 5 percent level and 10 percent level, respectively. Panel A: The impact of regulation on abnormal returns around stock-financed acquisitions announcements Dependent Variable: CAR Acquirer
Event window (-1,+1) (-5,+5) (-1,+1) (-5,+5) (-1,+1) (-5,+5)
Model: (1) (2) (3) (4) (5) (6)
Treat -0.0608 -0.0180 -0.0610 -0.0185 -0.0618 -0.0192
(-1.18) (-0.26) (-1.18) (-0.27) (-1.20) (-0.28) Post-TPD -0.0064 -0.0113 -0.0055 -0.0081 -0.0071 -0.0121
(-0.96) (-1.03) (-0.85) (-0.82) (-1.13) (-1.19) Post-TPD*Stock Payment 0.0244** 0.0301* 0.0244** 0.0302* 0.0244** 0.0301*
(2.44) (1.69) (2.44) (1.69) (2.44) (1.69) Post-PD -0.0100 -0.0118 -0.0029 0.0153
(-0.89) (-0.73) (-0.26) (0.97) Post-MAD 0.0082 0.0309** -0.0007 0.0205
(0.70) (2.51) (-0.06) (1.30) Stock Payment -0.0095* -0.0113* -0.0095* -0.0114* -0.0095* -0.0114*
(-2.00) (-2.00) (-2.01) (-2.01) (-2.01) (-2.00) Control Variables Yes Yes Yes Yes Yes Yes Fixed Effects Quarter/Country/Industry
Observations 3,985 3,985 3,985 3,985 3,985 3,985 R-squared 0.088 0.074 0.088 0.074 0.088 0.074 Panel B : The impact of earnings quality on abnormal returns around stock-financed acquisitions announcements Earnings Quality proxy: Discretionary Accruals (ROA&SG-adjusted model) Earnings conservatism (C-SCORE) Event window: (-1,+1) (-5,+5) (-1,+1) (-5,+5) Model: (1) (2) (3) (4) (5) (6) (7) (8) High Low High Low High Low High Low Treat -0.0823** -0.2431** 0.0170 -0.3962** -0.0353 0.0626 -0.0911** 0.1568 (-2.70) (-2.42) (0.37) (-2.35) (-1.25) (0.53) (-2.07) (0.84) Post-TPD 0.0001 0.0078 -0.0214* 0.0033 -0.0144 -0.0034 -0.0210 -0.0030 (0.01) (0.88) (-1.76) (0.21) (-1.05) (-0.41) (-1.08) (-0.21) Post-TPD*Stock Payment 0.0311** 0.0280 0.0641** 0.0501** 0.0620*** 0.0105 0.0830** 0.0094 (2.29) (1.68) (2.06) (2.38) (2.82) (0.90) (2.12) (0.94) Post-PD -0.0174 0.0362*** -0.0029 0.0094 0.0866 -0.0500** 0.0763 -0.0638*** (-0.59) (3.37) (-0.08) (0.65) (1.43) (-2.45) (1.12) (-2.87) Post-MAD 0.0084 -0.0346** 0.0328 0.0183 -0.0759 0.0382** -0.0500 0.0674*** (0.25) (-2.07) (0.80) (0.96) (-1.52) (2.13) (-0.93) (3.03) Stock Payment -0.0141 -0.0094** -0.0169*** -0.0106 -0.0175*** -0.0017 -0.0178*** -0.0044 (-1.56) (-2.71) (-4.22) (-1.47) (-3.87) (-0.27) (-4.31) (-1.08)

46
Control Variables Yes Yes Yes Yes Yes Yes Yes Yes Fixed Effects Quarter/Country/Industry Observations 1,716 1,738 1,716 1,738 1,426 2,347 1,426 2,347 R-squared 0.160 0.147 0.132 0.138 0.165 0.121 0.155 0.109 Panel C: The impact of information environment quality on abnormal returns around stock-financed acquisitions announcements. CAR estimated over a three-day window (-1,+1) Information environment proxy: Investor Protection Rule of Law Regulatory Disclosure Model: (1) (2) (3) (4) (5) (6) (7) (8)
High Low High Low High Low High Low Treat -0.0354 -0.1451*** 0.1055 -0.1526*** -0.1158 -0.1284*** -0.1961 0.0226
(-2.73) (-2.78) (0.71) (-3.84) (-0.58) (-3.31) (-1.64) (0.73) Post-TPD -0.0127 0.0091 -0.0126 -0.0017 -0.0127 0.0010 -0.0078*** 0.0127 (-2.16) (0.81) (-1.39) (-0.11) (-0.70) (0.09) (-4.51) (1.18) Post-TPD*Stock Payment 0.0425*** 0.0038 0.0316*** 0.0090 0.0389*** -0.0002 0.0420*** 0.0035 (24.54) (0.21) (3.11) (0.48) (4.79) (-0.01) (15.20) (0.19) Post-PD -0.0024 -0.0066 -0.0056 0.0031 -0.0279* -0.0051 -0.0010 -0.0096 (-1.22) (-0.28) (-0.60) (0.11) (-1.83) (-0.21) (-0.24) (-0.45) Post-MAD 0.0113 0.0163 0.0145 -0.0011 0.0200 -0.0020 0.0047 0.0174 (1.08) (0.81) (1.16) (-0.04) (1.32) (-0.08) (0.76) (0.89) Stock Payment -0.0178*** 0.0052 -0.0174*** -0.0016 -0.0177*** -0.0037 -0.0180*** 0.0046 (-21.93) (1.10) (-4.66) (-0.26) (-3.84) (-0.81) (-13.42) (1.32) Control Variables Yes Yes Yes Yes Yes Yes Yes Yes Fixed Effects Quarter/Country/Industry Observations 2,713 1,272 2,400 1,585 2,002 1,983 2,826 1,159 R-squared 0.103 0.200 0.116 0.189 0.133 0.137 0.106 0.205 Panel D: The impact of information environment quality on abnormal returns around stock-financed acquisitions announcements. CAR estimated over an eleven-day window (-5,+5) Model: (1) (2) (3) (4) (5) (6) (7) (8) High Low High Low High Low High Low Treat -0.0556 -0.0712 0.1227 -0.0841 -0.2461 -0.0892 -0.3046 0.1147**
(-2.77) (-0.90) (0.58) (-1.07) (-1.10) (-1.54) (-1.62) (2.32) Post-TPD -0.0253* 0.0115 -0.0259** -0.0009 -0.0086 -0.0024 -0.0252*** 0.0178 (-3.53) (0.72) (-2.27) (-0.03) (-0.43) (-0.12) (-7.67) (1.07) Post-TPD*Stock Payment 0.0418* 0.0037 0.0412* 0.0044 0.0578*** -0.0128 0.0433*** 0.0043 (3.68) (0.11) (1.96) (0.18) (3.60) (-0.48) (5.03) (0.12) Post-PD -0.0067 -0.0089 -0.0078 0.0262 -0.0225 -0.0077 -0.0009 -0.0153 (-0.42) (-0.31) (-0.53) (0.71) (-1.04) (-0.22) (-0.05) (-0.54) Post-MAD 0.0484** 0.0135 0.0486*** -0.0167 0.0217 0.0116 0.0420*** 0.0102 (6.91) (0.51) (3.82) (-0.58) (1.35) (0.35) (3.54) (0.36) Stock Payment -0.0173 -0.0011 -0.0142* -0.0129*** -0.0147 -0.0145*** -0.0177** 0.0001 (-2.45) (-0.11) (-1.87) (-3.18) (-1.42) (-5.58) (-3.07) (0.01) Control Variables Yes Yes Yes Yes Yes Yes Yes Yes Fixed Effects Quarter/Country/Industry Observations 2,713 1,272 2,400 1,585 2,002 1,983 2,826 1,159 R-squared 0.088 0.172 0.116 0.154 0.130 0.120 0.087 0.187

47
Internet Appendix
The Impact of Securities Regulation on the Information Environment around Stock-Financed Acquisitions
Section A – Review about the Legislative Process in European Union and EU Directives: Transparency, Prospectus, and Market Abuse Directives The Financial Services Action Plan (FSAP) of 1999, the same year that marks the establishment of the European Monetary Union, intends to enhance the competitiveness of capital markets, reduce market abuse, increase transparency, and improve liquidity (see, e.g., Lamfalussy, 2000). In brief, the FSAP focuses on the harmonization of securities regulation, hence creating an equally-leveled-plan for all Member States. The Legislative Process in the EU is a direct result of the decision-making process that must be approved by the elected European Parliament23 and by the European Council24 (until 2018, EU was formed of 28 EU member-states governments), known as “codesision”. The council of the European Union25 also participates in this process. The legislative process includes different acts, as is the case of directives. The EU defines directive as an act that sets an equal objective that all member states must achieve. However, each individual member state must incorporate and adjust it to their own laws and should designate an authority(es) to supervise the enforcement of directives in order to achieve EU legislative process goals. The EU directives26 start as a proposal draft based on new legislative initiatives triggered by the European Commission27 for different areas (e.g., economic, financial, etc.). To assess the potential benefits and disadvantages of new regulation, the Commission consults different interested parties (e.g., non-governmental organizations, citizens,…). Then, the Parliament and the Council review those legislative proposals and (usually) propose amendments. This process will be repeated if these two organs cannot agree upon amendments. Sometimes it is needed the intervention of a conciliation committee to try to find a solution. When this process is ended, the directive is enacted by the Commission. Each directive contains a deadline by which EU countries must transpose its provisions into their national legislation and inform the Commission. The Commission is responsible to assure that all EU member states properly apply EU directives. If member states fail to properly implement EU directives, the Commission has the power to launch a formal infringement procedure against those countries, and may eventually refer the case to the European Court of Justice. The European Securities and Markets Authority (ESMA) is the authority that supervises the implementation and enforcement of the FSAP.
23 The European Parliament is the EU’s legislative organ. Available at: https://europa.eu/european-union/about-eu/institutions-bodies/european-parliament_en. 24 The European Council comprises all EU government leaders. Available at: https://europa.eu/european-union/about-eu/institutions-bodies/european-council_en. 25 The Council of the European Union is composed of ministers from EU member states governments for different areas (e.g., economic, social, etc.). Available at: https://europa.eu/european-union/about-eu/institutions-bodies/council-eu_en. 26 Information available at: https://europa.eu/european-union/law/legal-acts_en. 27 The European Commission is the EU's executive organ. Available at: https://europa.eu/european-union/about-eu/institutions-bodies/european-commission_en.
48
A.1 Transparency Directive The Transparency Directive (TPD), regarding corporate reporting and disclosure, was enacted by EU Directive 2004/109/EC28, and according to paragraph 1 of art. 1, “establishes requirements in relation to the disclosure of periodic and ongoing information about issuers whose securities are already admitted to trading on a regulated market situated or operating within a Member State.” Hence, the TPD aims the efficiency, transparency and integration of securities markets, which according to this directive preamble contributes “to a genuine single market in the Community by better allocation of capital and by reducing costs”. Thus, this Directive regards the “disclosure of accurate, comprehensive, and timely information about security issuers builds sustained investor confidence and allows an informed assessment of their business performance and assets”. In the spirit of the FSAP, paragraph 5 of this directive preamble states “Greater harmonization of provisions of national law on periodic and ongoing information requirements for security issuers should lead to a high level of investor protection throughout the Community”, which enhances both investor protection and market efficiency that in accordance with this Directive purpose “upgrade the current transparency requirements for security issuers and investors” as stated in the preamble, paragraph 38. According to the main objective of the FSAP, i.e., the integration of securities markets, the TPD main purpose is investor protection, which in turn would enhance the admission of securities to regulated markets in the Member States, making markets more dynamics and appealing. Paragraph 7 sets that “Member States other than the home Member State should no longer be allowed to restrict the admission of securities to their regulated markets by imposing more stringent requirements on periodic and ongoing information about issuers whose securities are admitted to trading on a regulated market.” Regarding investor protection, the disclosure of financial information plays a master role, as highlighted in paragraph 27 of the Directive preamble, which states that “ So as to ensure the effective protection of investors and the proper operation of regulated markets, the rules relating to information to be published by issuers whose securities are admitted to trading on a regulated market should also apply to issuers which do not have a registered office in a Member State (…) It should also be ensured that any additional relevant information about Community issuers or third country issuers, disclosure of which is required in a third country but not in a Member State, is made available to the public in the Community”. And to reinforce this idea, Paragraph 2 (c), art. 4, states that “(…) statements made by the persons responsible within the issuer, whose names and functions shall be clearly indicated, to the effect that, to the best of their knowledge, the financial statements prepared in accordance with the applicable set of accounting standards give a true and fair view of the assets, liabilities, financial position and profit or loss of the issuer and the undertakings included in the consolidation taken as a whole and that the management report includes a fair review of the development and performance of the business and the position of the issuer and the undertakings included in the consolidation taken as a whole, together with a description of the principal risks and uncertainties that they face.”
28 Available at: https://eur-lex.europa.eu/legal-content/EN/TXT/?uri=CELEX:32004L0109. The Transparency Diretive is in force, however, this act has been changed. Latest consolidated version dated 26th November, 2013. Entry-into-force dates available at: https://eur-lex.europa.eu/legal-content/EN/NIM/?uri=CELEX:32004L0109.
49
A.2 Prospectus Directive The Prospectus Directive (PD) intends to “ensure investor protection and market efficiency, in accordance with high regulatory standards adopted in the relevant international” institutions, improving the procedures and firm transparency around securities offerings, as stated in paragraph 10 of the EU Directive 2003/71/EC29 preamble. Moreover, the information disclosure in securities prospectus must “take account of the different requirements for protection of the various categories of investors and their level of expertise” as highlighted in paragraph 16, that provides “protection of the interests of actual and potential investors are required in all Member States in order to enable them to make an informed assessment of such risks and thus to take investment decisions in full knowledge of the facts”, as quoted from paragraph 19. Hence, such information disclosure in securities prospectus boosts investor confidence in securities, contributing in this way to the proper functioning and development of securities markets across the EU. According to Lamfalussy (2000), it is of extreme importance the harmonization of securities offerings that enhances the raising on a Community-wide basis and therefore having real access to a large, liquid and integrated financial market. This can be achieved "by granting a single passport to the issuer”, as stated in the preamble of this Directive. This “grant to the issuer of a single passport, valid throughout the Community” is regulated by the member state where the issuer is placed its offer. Therefore, “information must be of easy access, the summary should be written in non-technical language and normally should not exceed 2500 words in the language in which the prospectus was originally drawn up. The prospectus should be filed with the relevant competent authority and be made available to the public by the issuer and relevant information must be updated. A clear time limit should be set for the validity of a prospectus in order to avoid outdated information.” This Directive also provides the disclosure requirements in the context of admission to trading of securities on a regulated market. The best practices have been adopted at the international level in order to allow cross-border offers of equities to be made using a single set of disclosure standards established by the International Organization of Securities Commissions (IOSCO); the IOSCO disclosure standards will upgrade information available for the markets and investors and at the same time will simplify the procedure for Community issuers wishing to raise capital in third countries. However, this Directive does not prevent a Member State or a competent authority or an exchange through its rule book to impose other particular requirements. Although, and according to paragraph 15 of the preamble: “Such requirements may not directly or indirectly restrict the drawing up, the content and the dissemination of a prospectus approved by a competent authority”. A.3 Market Abuse Directive30 The Commission Directive 2003/125/EC enacted the Market Abuse Directive (MAD) that concerns insider trading and market manipulation. The MAD preamble establishes in paragraph 1 that “Harmonized standards are necessary for the fair, clear and accurate presentation of information and disclosure of interests and conflicts of interest, to be complied with by persons
29 This content is available at: https://eur-lex.europa.eu/legal-content/EN/TXT/?uri=CELEX%3A32003L0071. It is no longer in force. Date of end of validity: July 20, 2019. Latest consolidated version: 21st July 2018. 30 Available at: https://eur-lex.europa.eu/legal-content/EN/TXT/?uri=CELEX:32003L0125 (no longer in force, repealed by https://eur-lex.europa.eu/legal-content/en/TXT/?uri=CELEX:32014R0596). Date of end of validity: July 2, 2016.

50
producing or disseminating information recommending or suggesting an investment strategy”, moreover, “market integrity requires high standards of fairness, probity and transparency when information recommending or suggesting an investment strategy is presented” by market participants. To ensure high standards in transparency and information disclosure, the MAD provides that “the identity of the producer of investment recommendations, his conduct of business rules and the identity of his competent authority should be disclosed”. Furthermore, is required the disclosure “of significant financial interests in any financial instrument which is the subject of the information recommending investment strategies, or of any conflicts of interest or control relationship with respect to the issuer to whom the information relates, directly or indirectly” Moreover, the preamble states that “those recommendations should be presented clearly and accurately” as “the meaning of any recommendation made, such as buy, sell or hold, which may include the time horizon of the investment to which the recommendation relates, is adequately explained and any appropriate risk warning, including a sensitivity analysis of the relevant assumptions”.
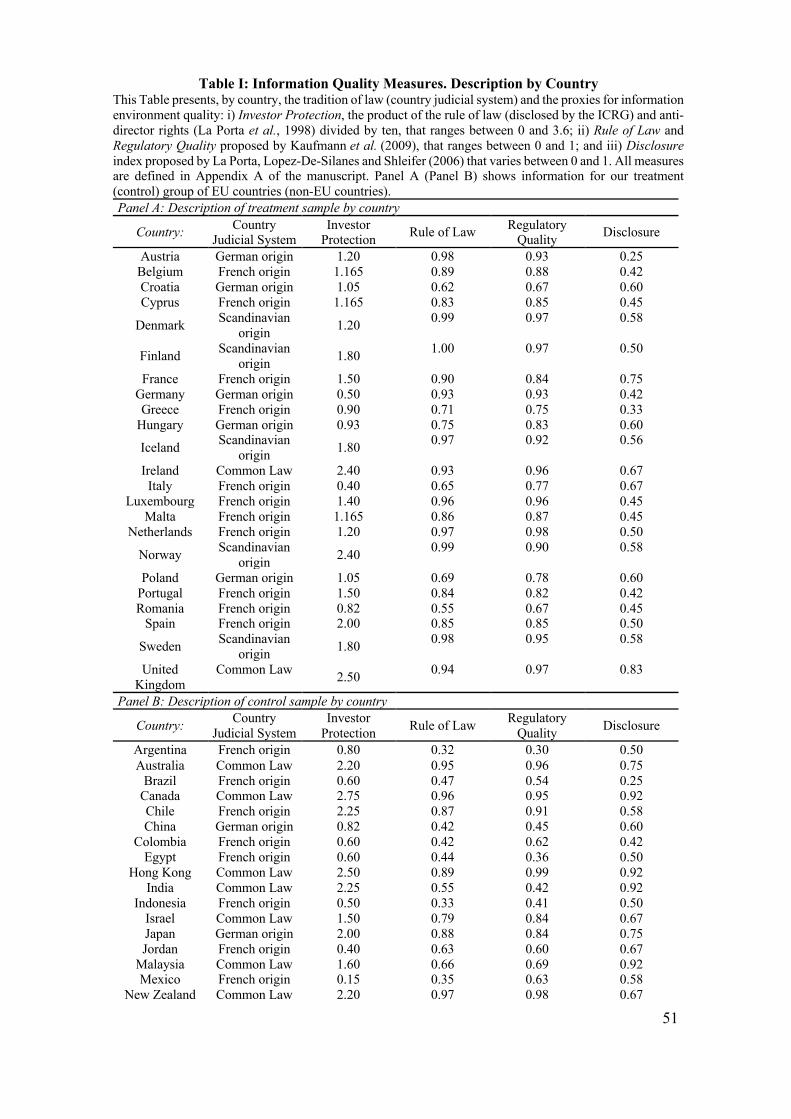
51
Table I: Information Quality Measures. Description by Country This Table presents, by country, the tradition of law (country judicial system) and the proxies for information environment quality: i) Investor Protection, the product of the rule of law (disclosed by the ICRG) and anti-director rights (La Porta et al., 1998) divided by ten, that ranges between 0 and 3.6; ii) Rule of Law and Regulatory Quality proposed by Kaufmann et al. (2009), that ranges between 0 and 1; and iii) Disclosure index proposed by La Porta, Lopez-De-Silanes and Shleifer (2006) that varies between 0 and 1. All measures are defined in Appendix A of the manuscript. Panel A (Panel B) shows information for our treatment (control) group of EU countries (non-EU countries). Panel A: Description of treatment sample by country
Country: Country Judicial System
Investor Protection Rule of Law Regulatory
Quality Disclosure
Austria German origin 1.20 0.98 0.93 0.25 Belgium French origin 1.165 0.89 0.88 0.42 Croatia German origin 1.05 0.62 0.67 0.60 Cyprus French origin 1.165 0.83 0.85 0.45
Denmark Scandinavian origin 1.20 0.99 0.97 0.58
Finland Scandinavian origin 1.80 1.00 0.97 0.50
France French origin 1.50 0.90 0.84 0.75 Germany German origin 0.50 0.93 0.93 0.42 Greece French origin 0.90 0.71 0.75 0.33
Hungary German origin 0.93 0.75 0.83 0.60
Iceland Scandinavian origin 1.80 0.97 0.92 0.56
Ireland Common Law 2.40 0.93 0.96 0.67 Italy French origin 0.40 0.65 0.77 0.67
Luxembourg French origin 1.40 0.96 0.96 0.45 Malta French origin 1.165 0.86 0.87 0.45
Netherlands French origin 1.20 0.97 0.98 0.50
Norway Scandinavian origin 2.40 0.99 0.90 0.58
Poland German origin 1.05 0.69 0.78 0.60 Portugal French origin 1.50 0.84 0.82 0.42 Romania French origin 0.82 0.55 0.67 0.45
Spain French origin 2.00 0.85 0.85 0.50
Sweden Scandinavian origin 1.80 0.98 0.95 0.58
United Kingdom
Common Law 2.50 0.94 0.97 0.83
Panel B: Description of control sample by country
Country: Country Judicial System
Investor Protection Rule of Law Regulatory
Quality Disclosure
Argentina French origin 0.80 0.32 0.30 0.50 Australia Common Law 2.20 0.95 0.96 0.75
Brazil French origin 0.60 0.47 0.54 0.25 Canada Common Law 2.75 0.96 0.95 0.92 Chile French origin 2.25 0.87 0.91 0.58 China German origin 0.82 0.42 0.45 0.60
Colombia French origin 0.60 0.42 0.62 0.42 Egypt French origin 0.60 0.44 0.36 0.50
Hong Kong Common Law 2.50 0.89 0.99 0.92 India Common Law 2.25 0.55 0.42 0.92
Indonesia French origin 0.50 0.33 0.41 0.50 Israel Common Law 1.50 0.79 0.84 0.67 Japan German origin 2.00 0.88 0.84 0.75 Jordan French origin 0.40 0.63 0.60 0.67
Malaysia Common Law 1.60 0.66 0.69 0.92 Mexico French origin 0.15 0.35 0.63 0.58
New Zealand Common Law 2.20 0.97 0.98 0.67

52
Pakistan Common Law 1.50 0.25 0.28 0.58 Peru French origin 0.90 0.31 0.66 0.33
Philippines French origin 0.75 0.38 0.52 0.83 Russia French origin 0.70 0.22 0.39 0.45
Singapore Common Law 2.00 0.93 0.99 1.00 South Africa Common Law 1.00 0.56 0.66 0.83 South Korea German origin 1.00 0.81 0.79 0.75
Sri Lanka Common Law 1.05 0.54 0.48 0.75 Switzerland German origin 1.00 0.98 0.96 0.67
Taiwan German origin 1.50 0.81 0.85 0.75 Thailand Common Law 0.50 0.54 0.60 0.92 Turkey French origin 0.60 0.54 0.61 0.50
United States Common Law 2.50 0.92 0.92 1.00 Uruguay French origin 0.50 0.71 0.65 0.00

53
Section B: Does the quality of firms’ financial reporting moderate the impact of regulation on stock based acquisition returns? Real Earnings Management Measures
We estimate two proxies that capture real earnings management widely used in prior studies
(e.g., Roychowdury, 2006; Cohen, Dey, and Lys, 2008; Cohen and Zarowin, 2010). The first
proxy is the abnormal level of cash flows from operations (CFO), measured as the difference
between actual CFO and the normal level of CFO (estimated via equation (B.1)): 𝐶𝐹𝑂!,#𝑇𝐴!,#$%
= 𝛼(1
𝑇𝐴!,#$%+ 𝛽%
𝑆𝐴𝐿𝐸𝑆!,#𝑇𝐴!,#$%
+ 𝛽)∆𝑆𝐴𝐿𝐸𝑆!,#𝑇𝐴!,#$%
+ 𝜀!,#(B. 1)
where 𝐶𝐹𝑂!,# is cash flows from operations of firm i in year t, and 𝑆𝐴𝐿𝐸𝑆!,# are the net sales. All
variables are scaled by lagged total assets (𝑇𝐴!,#$%).
It is expected that more negative values of abnormal levels of CFO are associated with higher
levels of real earnings management. Thus, to harmonize the interpretation of the signs of
coefficients across estimations of different earnings management proxies, we multiply abnormal
CFO by -1.
Our second measure is based on the level of production costs (𝑃𝑅𝑂𝐷!,#), measured as the
sum of the cost of goods sold plus changes in inventory. The estimated residuals of equation (B.2)
corresponds to the abnormal level of production costs. 𝑃𝑅𝑂𝐷!,#𝑇𝐴!,#$%
= 𝛼(1
𝑇𝐴!,#$%+ 𝛽%
𝑆𝐴𝐿𝐸𝑆!,#𝑇𝐴!,#$%
+ 𝛽)∆𝑆𝐴𝐿𝐸𝑆!,#𝑇𝐴!,#$%
+ 𝛽*∆𝑆𝐴𝐿𝐸𝑆!,#$%𝑇𝐴!,#$%
+ 𝜀!,#(B. 2)
where 𝑃𝑅𝑂𝐷!,# is the sum of costs of goods sold BB-0C/,0C./,0$%= 𝛼(
%C./,0$%
+ 𝛽%0.DE0/,0C./,0$%
Cand change
in inventory B∆FGH/,0C./,0$%= 𝛼(
%C./,0$%
+ 𝛽%∆0.DE0/,0C./,0$%
+ 𝛽)∆0.DE0/,0$%C./,0$%
C.
Larger values of abnormal production costs provide evidence of a higher level of real earnings
management.
Descriptive Statistics Treatment Group Control Group N Mean Median SD N Mean Median SD
Abnormal CFO 697 -0.0133 -0.0282 0.1913 4114 -0.0290 -0.0511 0.2086 Abnormal PROD. 682 -0.0495 -0.0560 0.2202 4012 -0.0438 -0.0469 0.2319

54
Table II: The incidence of real earnings management prior to stock-financed acquisitions This Table provides the marginal effects for a probit model as described in Table 5 of the manuscript. The dependent variable is Stock Payment that equals one for 100% stock-financed acquisitions, and zero otherwise. The 𝐸𝑀$,%, is an indicator variable that equals one for firms above median of the proxies for real earnings management in their country, and zero otherwise. Real EM proxies are: i) abnormal cash flow from operations (ACFO), and ii) abnormal production costs (APROD). Post-TPD is an indicator variable equal to one starting the quarter after the adoption of the Transparency Directive for countries included in our treatment sample, and zero otherwise. All variables are defined in Appendix A of the manuscript. Robust z-statistics in parentheses. ***, ** and * mean statistical significance at the 1 percent level, 5 percent level and 10 percent level, respectively. Dependent Variable: Stock Payment Dummy Earnings Quality Proxy: Abnormal Cash Flow from Operations Abnormal Production Cost Model: (1) (2) (3) (4) EMt-1 0.1749*** 0.1754*** 0.1342*** 0.1340*** (9.55) (9.57) (7.69) (7.68) Post-TPD 0.0511 0.0356
(1.08) (0.75) Market-Book -0.0017 -0.0017 -0.0021 -0.0021 (-0.79) (-0.79) (-0.97) (-0.97) ROA -0.2171*** -0.2175*** -0.2721*** -0.2728*** (-4.42) (-4.42) (-5.22) (-5.23) Leverage -0.3124*** -0.3113*** -0.3300*** -0.3292*** (-5.55) (-5.53) (-5.88) (-5.87) Relative Size 0.0575*** 0.0575*** 0.0599*** 0.0598*** (3.46) (3.46) (3.59) (3.59) Cross-border -0.1491*** -0.1495*** -0.1488*** -0.1490*** (-7.98) (-7.99) (-8.01) (-8.02) Industry Diversification 0.0309* 0.0309* 0.0334* 0.0334* (1.78) (1.78) (1.91) (1.91) GDP per capita 0.3127* 0.3289* 0.2431 0.2544 (1.84) (1.93) (1.47) (1.54) GDP growth -0.0000 0.0001 -0.0003 -0.0003 (-0.00) (0.01) (-0.04) (-0.03) Fixed Effects Quarter/Country/Industry Observations 4,132 4,132 4,018 4,018 Pseudo R2 0.212 0.212 0.203 0.203

55
Table III: The impact of earnings quality on abnormal returns around stock-financed acquisitions announcements post-regulation
This Table reports regression estimates of equation (5) of the manuscript, performed separately for high (low) groups based on the level of real earnings management, which is an indicator variable that equals one for firms below (above) the median in their country, and zero otherwise. Dependent variables are cumulative abnormal returns (CAR), which are estimated over a three-day window (-1,+1), and an eleven-day window (-5,+5). Treat is a binary variable that equals one if firm i is included in our treatment group, i.e., EU public firms that acquired public targets. Post-TPD is an indicator variable equal to one starting the quarter after the adoption of the Transparency Directive for countries included in our treatment sample, and zero otherwise. It is also reported the p-value of a z-test that evaluates whether the coefficient 𝛽((𝑃𝑜𝑠𝑡𝑇𝑃𝐷+,% ×𝑆𝑡𝑜𝑐𝑘𝑃𝑎𝑦𝑚𝑒𝑛𝑡)of the high group is equal to the coefficient of low group. The coefficients’ estimates of the remaining control variables are not reported for brevity. All variables are defined in Appendix A of the manuscript. Robust t-statistics standard errors clustered at country-level are shown in parentheses. ***, ** and * mean statistical significance at the 1 percent level, 5 percent level and 10 percent level, respectively. Dependent Variable: CAR Acquirer Earnings Quality proxy: Abnormal Cash Flow from Operations Abnormal Production Cost Event window: (-1,+1) (-5,+5) (-1,+1) (-5,+5) Model: (1) (2) (3) (4) (5) (6) (7) (8) High Low High Low High Low High Low Treat 0.0273 -0.0075 0.0894 0.0462 0.0380* -0.1497 0.0916* -0.2289 (0.75) (-0.20) (1.43) (0.59) (1.86) (-0.69) (1.90) (-0.53) Post-TPD 0.0060 -0.0074 0.0016 0.0174 -0.0093 0.0034 -0.0188** 0.0411** (0.65) (-0.46) (0.14) (0.96) (-1.45) (0.31) (-2.57) (2.63) Post-TPD*Stock Payment 0.0296** 0.0237 0.0403* 0.0398 0.0507** 0.0143 0.0678*** 0.0175 (2.12) (1.08) (1.90) (0.94) (2.30) (0.75) (3.08) (0.48) High=Low (p-value) (0.820) (0.991) (0.212) (0.238) Stock Payment -0.0038 -0.0085 0.0049 -0.0178*** -0.0070 -0.0087** 0.0040 -0.0144* (-1.49) (-1.54) (1.14) (-2.94) (-1.35) (-2.64) (1.02) (-2.01) Control Variables Yes Yes Yes Yes Yes Yes Yes Yes Fixed Effects Quarter/Country/Industry Observations 2,222 1,489 2,222 1,489 2,042 1,578 2,042 1,578 R-squared 0.145 0.144 0.120 0.131 0.139 0.148 0.109 0.148

56
Section C: The different impact of TPD across EU countries
Table IV: The impact of information environment quality on abnormal returns around stock-financed acquisitions announcements post-regulation
This Table reports the coefficients’ estimates of equation (5) run separately for high (low) groups based on the level of our measure of financial development, explained in detail in the manuscript, Appendix A. Dependent variables are cumulative abnormal returns (CAR), which are estimated over a three-day window (-1,+1), and an eleven-day window (-5,+5). Post-TPD is an indicator variable equal to one starting the quarter after the adoption of the Transparency Directive for countries included in our treatment sample, and zero otherwise. The coefficients’ estimates of the remaining control variables are not reported for brevity. All variables are as described in Appendix A of the manuscript. Robust t-statistics standard errors clustered at country-level are shown in parentheses. ***, ** and * mean statistical significance at the 1 percent level, 5 percent level and 10 percent level, respectively. Dependent Variable: CAR Acquirer Information environment proxy: Financial Development Event window: (-1,+1) (-5,+5) Model: (1) (2) (3) (4) High Low High Low Treat -0.0149 -0.0814 -0.0540** 0.0222
(-1.09) (-1.39) (-2.64) (0.26) Post-TPD -0.0120* 0.0210 0.0086 0.0385**
(-1.72) (1.52) (0.68) (2.48) Post-TPD*Stock Payment 0.0321*** 0.0182 0.0393*** 0.0430
(3.82) (0.71) (3.15) (0.94) Stock Payment -0.0138*** -0.0074 -0.0226*** -0.0051
(-3.68) (-1.40) (-7.41) (-0.70) Control Variables Yes Yes Yes Yes Fixed Effects Quarter/Country/Industry Observations 2,291 1,694 2,291 1,694 R-squared 0.142 0.139 0.115 0.129

57
Section D: Robustness checks. Concurrent Directives
Table V: Entry-into-force dates of the Prospectus Directive (PD) and Market Abuse Directive (MAD)
Country: PD MAD Austria Jul-05 Jan-05 Belgium Jun-06 Sep-05 Croatia Jul-13 Jul-13 Cyprus Sep-05 Sep-05
Denmark Jul-05 Apr-05 Finland Jul-05 Jul-05 France Jul-05 Jul-05
Germany Jul-05 Oct-04 Greece Oct-05 Jul-05
Hungary Jul-05 Jul-05 Iceland Nov-07 Nov-07 Ireland Jul-05 Jul-05 Italy Apr-07 April-05
Luxembourg Jul-05 May-06 Malta Nov-05 Apr-05
Netherlands Oct-05 Oct-05 Norway Jul-05 Sep-05 Poland Oct-05 Oct-05
Portugal Mar-06 Mar-06 Romania Jan-07 Jan-07
Spain Nov-05 Nov-05 Sweden Jul-05 Jul-05
United Kingdom Jul-05 Jul-05

Most Recent Working Paper
NIPE WP
7/2021
Loureiro, G., and Silva, S., The Impact of Securities Regulation on the Information Environment
around Stock-Financed Acquisitions, 2021
NIPE WP
6/2021
Aguiar-Conraria, L., Conceição, G., and Soares, M. J., How far is gas from becoming a global
commodity?, 2021
NIPE WP
5/2021
Rosa-Branca Esteves and Francisco Carballo Cruz, Access to Data for Personalized Pricing:
Can it raise entry barriers and abuse of dominance concerns?, 2021
NIPE WP
4/2021
Rosa-Branca Esteves, Liu, Q. and Shuai, J. Behavior-Based Price Discrimination with Non-
Uniform Distribution of Consumer Preferences, 2021
NIPE WP
3/2021
Ghandour, Z., Siciliani, L. and Odd Rune Straume, Investment and Quality Competition in
Healthcare Markets, 2021
NIPE WP
2/2021
Martins, João, Linda Veiga and Bruno Fernandes, Does electronic government deter
corruption? Evidence from across the world, 2021
NIPE WP
1/2021
Kurt R. Brekke, Dag Morten Dalen and Odd Rune Straume, Paying for pharmaceuticals:
uniform pricing versus two-part tariffs, 2021
NIPE WP
10/2020
Ghandour, Z. and Odd Rune Straume, Quality competition in mixed oligopoly, 2020
NIPE WP
09/2020
Gabrielsen, T. S., Johansen, B. O., and Odd Rune Straume, National pricing with local quality
competition, 2020
NIPE WP
08/2020
Engle, R. F., and Campos-Martins, S., Measuring and Hedging Geopolitical Risk, 2020
NIPE WP
07/2020
Boukari, M., and Veiga, F. J., Fiscal Forecast Manipulations and Electoral Results: Evidence
from Portuguese Municipalities, 2020
NIPE WP
06/2020
Alexandre, F., Cruz, S. and Portela, M., Financial distress and the role of management in micro
and small-sized firms, 2020
NIPE WP
05/2020
Cooke, D., Ana P. Fernandes and Priscila Ferreira, Entry Deregulation, Firm Organization and
Wage Inequality, 2020
NIPE WP
04/2020
Fernando Alexandre, Pedro Bação, João Cerejeira, Hélder Costa and Miguel Portela,
Minimum wage and financially distressed firms: another one bites the dust, 2020
NIPE WP
03/2020
Luís Sá and Odd Rune Straume, Quality provision in hospital markets with demand inertia:
The role of patient expectations, 2020
NIPE WP
02/2020
Rosa-Branca Esteves, Liu Qihong and Shuai, J., Behavior-Based Price Discrimination with Non-
Uniform Distribution of Consumer Preferences, 2020
NIPE WP
01/2020
Diogo Teixeira and J. Cadima Ribeiro, “Residents’ perceptions of the tourism impacts on a
mature destination: the case of Madeira Island”, 2020
NIPE WP
17/2019
Liao, R. C., Loureiro, G., and Taboada, A. G., “Women on Bank Boards: Evidence from Gender
Quotas around the World”, 2019
NIPE WP
16/2019
Luís Sá, “Hospital Competition Under Patient Inertia: Do Switching Costs Stimulate Quality
Provision?”, 2019
NIPE WP
15/2019
João Martins and Linda G. Veiga, “Undergraduate students’ economic literacy, knowledge of
the country’s economic performance and opinions regarding appropriate economic policies”, 2019
NIPE WP
14/2019
Natália P. Monteiro, Odd Rune Straume and Marieta Valente, “Does remote work improve or
impair firm labour productivity? Longitudinal evidence from Portugal”, 2019
NIPE WP
13/2019
Luís Aguiar-Conraria, Manuel M. F. Martins and Maria Joana Soares, “ Okun’s Law Across
Time and Frequencies”, 2019
NIPE WP
12/2019
Bohn, F., and Veiga, F. J., “Political Budget Forecast Cycles”, 2019
NIPE WP
11/2019
Ojo, M. O., Aguiar-Conraria, L. and Soares, M. J., “A Time-Frequency Analysis of Sovereign
Debt Contagion in Europe”, 2019
NIPE WP
10/2019
Lommerud, K. E., Meland, F. and Straume, O. R., “International outsourcing and trade union
(de-) centralization”, 2019
NIPE WP
09/2019
Carvalho, Margarita and João Cerejeira, “Level Leverage decisions and manager
characteristics”,2019