The impact of hard and soft skills on managers' innovativeness
67
The impact of hard and soft skills on managers’ innovativeness Chibuike Maduko & Pedro Vidal Puche Supervisor Eva Lövstål Karlskrona, Sweden June 2020 MBA Thesis DEPARTMENT OF INDUSTRIAL ECONOMICS www.bth.se/mba
-
Upload
khangminh22 -
Category
Documents
-
view
3 -
download
0
Transcript of The impact of hard and soft skills on managers' innovativeness

The impact of hard and soft skillson managers’ innovativeness
Chibuike Maduko & Pedro Vidal Puche
SupervisorEva Lövstål
Karlskrona, SwedenJune 2020
MBA Thesis
DEPARTMENT OF INDUSTRIAL ECONOMICSwww.bth.se/mba

This thesis is submitted to the Department of Industrial Economics at Blekinge Institute of Technologyin partial fulfilment of the requirements for the Degree of Master of Science in Industrial Economicsand Management. The thesis is awarded 15 ECTS credits.
The author(s) declare(s) that they have completed the thesis work independently. All external sourcesare cited and listed under the References section. The thesis work has not been submitted in the sameor similar form to any other institution(s) as part of another examination or degree.
Author information:
Chibuike [email protected]
Pedro Vidal [email protected]
Department of Industrial EconomicsBlekinge Institute of TechnologySE-371 79 Karlskrona, Sweden
Website: www.bth.seTelephone: +46 455 38 50 00Fax: +46 455 38 50 57

i
Abstract
Background: Competition in today’s markets has made organizations focus greatly on innovativeworkers and managers to meet up with dynamic market demands, which forms the bedrock of humancapital theory as discussed by Cr ciun (2015). As part of human capital theory, managers’ skills are thesubject of this thesis in relation to innovation.
Objectives: To analyze the impact of hard and soft skills on manager’s innovativeness, therebyaddressing a real problem facing organizations. This research therefore investigates how hard and softskills of low-level managers’ impact their innovativeness by drawing inspiration from previous studies.The population for this study is limited to managers in engineering consultancy firms.
Methodology: Quantitative analysis is used for this research. Based on the research purpose andquestion, this study is explanatory. This study approaches theory development in a deductive way, suchthat hypotheses are proposed first and then data are collected to test the hypotheses. The model contains3 constructs: Hard skills (HS), soft skills (SS) and managers’ innovativeness (MI). Each of theseconstructs contain variables that are operationalized in the questionnaire. Cronbach’s alpha andExploratory Factor Analysis is used to check the reliability of each factor and validity of the constructs.
Results: Six models are analyzed with IBM SPSS Statistics 26. Quantitative tools such as Multipleregression and Spearman Rank Order Correlation was used for the analysis. The results show that thereis significant and positive relationship between managers’ hard and soft skills and their innovativeness.
Conclusions: The empirical analysis shows that managers’ hard and soft skills are positively andsignificantly related to their innovativeness. This confirms the proposed hypothesis H1, H2 and H4 tobe true. The result also shows that soft skills are more positively related to managers’ innovativenessthan hard skills. The result of this thesis show that the more hard and soft skills managers have, the moreinnovative they will be. One of the implications of this study is that firms should ensure that theirmanagers possess both hard and soft skills competencies.
Recommendations for future research: Further research on this subject should ensure that largernumber of responses are collected. The inability to develop a model to test for hypothesis H3 was achallenge due to the existence of multicollinearity when forming the interaction variable between hardand soft skills. This will be an interesting area for further research. In addition, using other quantitativetools other than multiple linear regression may give more significant result.
Keywords: Innovativeness, Hard skills, Soft skills, Manager, Engineering consultancy.

ii
Acknowledgements
We want to sincerely thank our thesis supervisor Eva Lövstål for all her constructive and detailedguidance in writing this thesis, especially during the first critical stages. In addition, we thank all studentcolleagues that gave opposition reviews of this thesis, which helped in improving it. The surveyrespondents of this thesis are also part of it and have our gratitude for spending their time to answer thisquestionnaire during the Covid-19 pandemic. Your inputs are highly appreciated. Finally, we would liketo thank our families and friends whom have encouraged and supported us as we worked on this thesisand also the whole MBA program, which started in September of 2018.
Ludvika and Murcia, June 2020
Chibuike Maduko and Pedro Vidal Puche.

iii
Table of contents
1. Introduction ____________________________________________ 1
1.1. Problem discussion ______________________________________________________ 1
1.2. Problem formulation and purpose ___________________________________________ 2
1.3. Thesis structure ________________________________________________________ 3
2. Literature review ________________________________________ 4
2.1. Innovativeness _________________________________________________________ 4
2.1.1. Definition of innovativeness ______________________________________________ 4
2.1.2. Innovative aspects of leaders _____________________________________________ 4
2.1.3. Technical and non-technical innovativeness ___________________________________ 5
2.2. Hard skills ____________________________________________________________ 5
2.2.1. Definition of hard skills _________________________________________________ 5
2.2.2. Perspectives of hard skills _______________________________________________ 5
2.3. Soft skills _____________________________________________________________ 6
2.3.1. Definition of soft skills __________________________________________________ 6
2.3.2. Perspectives of soft skills ________________________________________________ 7
2.4. Theoretical framework and hypothesis _______________________________________ 8
3. Methodology __________________________________________ 10
3.1. Research design _______________________________________________________ 10
3.1.1. Quantitative research _________________________________________________ 10
3.1.2. Research methods and motivation ________________________________________ 10
3.2. Operationalization of variables and survey design _______________________________ 11
3.3. Data collection ________________________________________________________ 13
3.3.1. The population ______________________________________________________ 13
3.3.2. Implementation of questionnaire _________________________________________ 14
3.4. Data analysis __________________________________________________________ 14
3.5. Consequences of methods selected _________________________________________ 15
3.5.1. Type of research results _______________________________________________ 15
3.5.2. Validity and reliability __________________________________________________ 15
3.5.3. Ethical issues ________________________________________________________ 16
4. Results _______________________________________________ 17
4.1. Respondents’ demographics ______________________________________________ 17

iv
4.2. Construct reliability ____________________________________________________ 17
4.3. Construct validity ______________________________________________________ 17
4.4. Quality check _________________________________________________________ 19
4.4.1. Check for outliers ____________________________________________________ 19
4.4.2. Check for multicollinearity______________________________________________ 19
4.5. Evaluating the models ___________________________________________________ 20
4.6. Evaluating the regression coefficients ________________________________________ 20
5. Analysis and discussion ___________________________________ 22
5.1. Hard skills and managers’ innovativeness _____________________________________ 22
5.2. Soft skills and managers’ innovativeness ______________________________________ 22
5.3. Hard skills versus soft skills _______________________________________________ 22
5.4. Interaction of hard and soft skills ___________________________________________ 23
5.5. Technical versus non-technical innovativeness _________________________________ 23
5.6. Control variables ______________________________________________________ 23
6. Conclusions ___________________________________________ 25
6.1. Summary ____________________________________________________________ 25
6.2. Implications __________________________________________________________ 25
6.3. Further research _______________________________________________________ 26
7. Bibliography ___________________________________________ 27
8. Appendix _____________________________________________ 31
8.1. Questionnaire _________________________________________________________ 31
8.2. Respondents’ demographics ______________________________________________ 42
8.3. Survey result _________________________________________________________ 46
8.4. Scatter plots __________________________________________________________ 55
8.5. Correlation matrix _____________________________________________________ 58

v
List of Tables
Table 1: Operationalization of dependent and independent variables. ______________________ 12Table 2: Control variables. _____________________________________________________ 13Table 3: Description of the different regression models. _______________________________ 15Table 4: Cronbach’s alpha estimation. _____________________________________________ 17Table 5: Initial eigenvalues. _____________________________________________________ 18Table 6: Communalities. _______________________________________________________ 18Table 7: Component matrix. ____________________________________________________ 19Table 8: Variance inflation factor of the regression models. _____________________________ 20Table 9: Adjusted R Square of each model. _________________________________________ 20Table 10: Unstandardized coefficients of each model. __________________________________ 20Table 11: Respondents’ demographics _____________________________________________ 42Table 12: Summary statistics ____________________________________________________ 54Table 13: Correlation matrix of all variables. ________________________________________ 58

vi
List of Figures
Figure 1: Conceptual model. _____________________________________________________ 9Figure 2: The research onion. ___________________________________________________ 11Figure 3: Scree plot of initial eigenvalues. ___________________________________________ 18Figure 4: Age of respondents ___________________________________________________ 43Figure 5: Gender of respondents ________________________________________________ 43Figure 6: Country of residence of respondents. ______________________________________ 44Figure 7: Educational level of respondents. _________________________________________ 44Figure 8: Years in management position of respondents. _______________________________ 45Figure 9: Size of firm where respondents work. ______________________________________ 45Figure 10: I have years of experience in the tasks performed at the department that I am managing. 46Figure 11: I know how to use most of the tools and application used at the department that I ammanaging. __________________________________________________________________ 46Figure 12: I understand the technical language and terms used at the department that I am managing. _________________________________________________________________________ 47Figure 13: I communicate effectively with members of my team. __________________________ 47Figure 14: I communicate effectively with other stakeholders. ___________________________ 48Figure 15: I am able to build professional relationship with members of my team. _____________ 48Figure 16: I am able to build professional relationship with other stakeholders. _______________ 49Figure 17: I influence my team in a strategic way. _____________________________________ 49Figure 18: I am able to analyze and solve problems effectively. ___________________________ 50Figure 19: I have implemented product or service improvement within the department that I manageand in the workplace in general. _________________________________________________ 50Figure 20: I have initiated product or service improvement within the department that I manage andin the workplace in general. ____________________________________________________ 51Figure 21: I have implemented product or service development within the department that I manageand in the workplace in general. _________________________________________________ 51Figure 22: I have initiated product or service development within the department that I manage andin the workplace in general. ____________________________________________________ 52Figure 23: I have implemented organizational improvements within the department that I manage andin the workplace in general. ____________________________________________________ 52Figure 24: I have initiated organizational improvements within the department that I manage and inthe workplace in general. ______________________________________________________ 53Figure 25: I have implemented innovative strategies within the department that I manage and in theworkplace in general. _________________________________________________________ 53Figure 26: I have initiated innovative strategies within the department that I manage and in theworkplace in general. _________________________________________________________ 54Figure 27: Scatterplot of Model 1. ________________________________________________ 55Figure 28: Scatterplot of Model 2. ________________________________________________ 55Figure 29: Scatterplot of Model 3. ________________________________________________ 56Figure 30: Scatterplot of Model 4. ________________________________________________ 56Figure 31: Scatterplot of Model 5. ________________________________________________ 57Figure 32: Scatterplot of Model 6. ________________________________________________ 57

vii
List of abbreviations
CPD Critical path diagram
EVR Earned value reports
NPD New product development
WBS Work breakdown structure
HR Human resource
VIF Variance inflation factor

1
1. Introduction
Competition in today’s markets has made organizations focus greatly on innovative workers andmanagers to meet up with dynamic market demands (Teece, 2016). This increased focus on innovativeworkers and managers forms the bedrock of human capital theory as discussed by Cr ciun (2015, p. 45)- in which human capital is explained “as the totality of knowledge, skills, competencies and otherattributes embodied in an individual”. Skills which are one aspect of the human capital is the subject ofthis thesis in relation to innovation.
Skills are generally classified as hard or soft. While hard skills are technical skills required to carry outa particular task, soft skills on the other hand are non-technical skills that complement hard skills suchas communication and interpersonal skills (Rao, 2018). Although the studies by Hendarman et al. (2018)and Hendarman et al. (2012) found that both hard and soft skills have a direct relationship with anindividual’s innovativeness, the authors of this thesis could not find any study that have investigated therelationship hard and soft skills have with managers innovativeness. Hence, the need for this study.
This research therefore investigates how hard and soft skills impact managers’ innovativeness bydrawing insights from previous studies. The models used by Hendarman et al. (2012; 2018) are furtherdeveloped and used for this investigation.
1.1. Problem discussionThe sustenance of any enterprise in today’s markets is dependent on its level of innovativeness (Brettelet al., 2011). This is due to the stiff competition amongst firms in virtually every industry to increase itsmarket share. Therefore, organizations are in dire need to build innovative capabilities to keep theirbusinesses going (Lawson et al., 2001). One aspect of innovative capabilities is the skill level of theworkforce (Teece, 2016). The workforce includes both “ordinary workers” and managers, but the roleof managers is very important and different from that of “ordinary workers” in the organization (Augieret al., 2009). From low-level to top-level, managers are saddled with the responsibility to ensuresuccessful operation of the firm. Hence their level of innovativeness is very important and impacts theinnovativeness of the firm more than that of “ordinary workers”. Wronka-Po piech (2016, p. 41) statedthat “personality, charisma and leadership skills of a person managing a social enterprise are the driversof the development of such an organization”. While Bloom et al. (2013) concluded that managementpractices impact organizational performance, Agle et al. (2006) concluded that there is a positivecorrelation between CEO charisma and organizational performance.
The importance of low-level, front-line managers is often neglected in organizations (Lee et al., 2013).These managers are responsible the team they manage and are considered “team-leaders” or “unitmanagers” (Hales, 2005, p. 479). Front-line managers “stand in a unique position which shape theirfollowers’ behaviors” (Shum et al., 2018, p. 59). Therefore, their “followers understand organizationalpolicy and practices (Purcell and Hutchinson, 2007), service culture (Boshoff and Allen, 2000) throughtheir direct and distal leaders” (Shum et al., 2018, p. 59). Their innovative ideas and solutions are usuallyless explored compared to that of medium and top-level managers, even in firms where innovation is ofhigh priority (Hornsby et al., 2009). However, innovation function well in organizations when the pathis bottom-up (Burgelman, 1983). Low-level, front-line managers work directly with “ordinary workers”;hence the need to have innovative capabilities. Therefore, the authors of this thesis chose to narrowdown this investigation to low-level managers, since at their level, innovativeness is crucial to firms.
Rao (2013) explains that there are managers with high level of hard skills but lacking the necessaryleadership and interpersonal skills to guide and encourage their teams to innovate. Also, there aremanagers with high level of soft skills but having limited technical knowledge and hard skills. These

2
managers usually cannot solve technical issues nor follow all conversations with colleagues and clients.This is a challenge confronting many firms.
DuBrin (2013, p. 413) defines innovation as the “creation of new ideas and their implementation orcommercialization”. Teece (2016, p. 211) explains that “innovation refers to creative ideas related tothe generation and delivery of products and services”. So, the question is: does a manager’s hard andsoft skills impact his or her ability to initiate and implement new ideas? Is there any correlation betweenmanagers’ hard skills, soft skills and innovativeness?
Previous studies on this subject, as it relates to individuals or workers, have all come up with similarconclusions, even though their methods differ. While some of the studies collected data through surveysand performed quantitative analysis to verify their hypothesis, others did not follow this approach butrather formed conclusions through concepts and available theories. For instance, Balcar (2016)concluded that both hard and soft skills increase individual productivity, and productivity of hard skillsis enhanced when used in combination with soft skills. This study did not use any empirical method tocome to this conclusion. Rao (2018) was also not an empirical study but explained that “judicious blendof hard and soft skills is essential for achieving professional and leadership success” (p. 215) and that“soft skills are presentation of hard skills in the workplace” (p. 217). Since managers play a peculiarrole in organizations, there is a possibility that the established relationship between hard and soft skillswith individual innovativeness from Hendarman’s studies may not be valid in the context of managers.Hence, the need for this study.
In addition, Hendarman et al. (2018, p. 142) explained that the “borderline between the concepts relatingto hard skills and soft skills are not always clear-cut”. This is because researchers have varying opinionson what skills can be classified as soft or hard. For instance, while Poisson-de et al. (2012) classifiedconceptual thinking as hard skills since it is more cognitive in nature, Spencer et al. (1993) classified itas soft, stating that it is more of a behavioral skill. This study discusses several types of hard and softskills and how they relate to innovativeness. Innovativeness as a concept is also explored to understandits various aspects and why it is an important attribute for managers at all levels of the organization.
The population of this survey is limited to low-level managers in engineering consultancy firms.Innovation is the bedrock of engineering consultancy; therefore, this industry is chosen for this study.Innovativeness can take place in both technical and non-technical aspects (Van Oort et al. 2009).Therefore, technical and non-technical innovativeness are investigated and discussed in this study.
1.2. Problem formulation and purposeThis thesis builds upon the research works carried out by Hendarman et al. (2012; 2018). In thesestudies, individual’s hard skills, soft skills and innovativeness were operationalized and used to test theproposed hypotheses. The model used in this thesis is further developed by aligning it more to suit thetopic of this thesis as it relates to managers. The research question of this thesis is:
What are the relationships between hard and soft skills, and managers’ innovativeness?
The purpose of this thesis is to explain the effect hard and soft skills have on managers’ innovativeness.Hard skills, soft skills and innovativeness related to managers are operationalized. Though hard skillsare specific to the type of job been done, they are operationalized using generic items. Based on theoperationalized variables, low-level managers are surveyed to assess their hard skills, soft skills, andinnovativeness. This is used to test the proposed hypotheses and answer the research question.

3
1.3. Thesis structureThis thesis comprises of six chapters, bibliography and appendixes. Chapter 1 contains background andpurpose of the thesis. Chapter 2 establishes the theoretical framework for hard skills, soft skills andinnovativeness by doing a literature review on the subject. It consists of sub-chapters which treat theessential necessities to comprehend, study and answer the theoretical problem presented. Themethodology, which serves as a foundation for this research, is explained in Chapter 3, including thedifferent hypothesis and variables set upon the established theoretical framework. Description ofdifferent methods and techniques is made by explaining their benefits and shortcomings, and the finalchoices are motivated. The justifications for the transition from theoretical concepts to empiricalquestions and variables are explained. Results obtained through the theoretical framework and theapplied methodology are presented in Chapter 4. The empirical data is presented and motivated usingthe theoretical framework. Descriptive statistics are depicted by tables and graphs and statisticalanalyses are conducted according to the theoretical framework.
In Chapter 5, the data and results are analyzed to demonstrate the relationships between hard and softskills and managers’ innovativeness using the theoretical framework. The results are discussed inrelation to the theory and to what is available in previous studies. The hypotheses are also discussed.General analysis and discussions are made. Finally, conclusions of this thesis are presented in Chapter6, where a short summary of this thesis is made prior to drawing conclusions. Also, the research questionis accurately answered. Implications and contributions of this study are stated, ending with shortcomingsof this study and providing some suggestions for future research.

4
2. Literature review
In this chapter, the authors review the literature of the themes that are related to this study which aremainly: hard skills, soft skills and innovativeness. The theoretical framework for this study, includingthe proposed hypotheses are also discussed in this chapter.
2.1. Innovativeness
2.1.1. Definition of innovativenessInnovativeness makes a significant contribution to business performance and is regarded as one of theavenues to gain a competitive advantage (Tajeddini et al., 2014, p. 62). Tajeddini et al. (2006, p. 64)defined innovativeness as “the willingness and ability to adopt new technologies, processes and ideasand offer new, unique products and services before most competitors.”
Innovation is considered to be an important factor to the development of enterprises and their improvedcompetitive advantage (Wronka-Po piech, 2016). This research is focused on managers’innovativeness, which is the ‘‘engagement in innovative behaviors, which includes behaviors related tothe innovation process…’’ (Parzefall et al. 2008, p. 166). “Innovation is based on the feelings of desireand anger” (Hammershøj, 2017, p. 115). Therefore, an innovative person should have a strong desire toconvert his/her ideas into reality while combating the resistance against innovation. This study is aimedat detecting and clarifying the characteristic of an innovative person, what drives him/her and how hardand soft skills support innovation.
Rapid innovation can affect any type of industry and companies should be able to adapt quickly to thedemands from customers in order to continue being a player in the market. There are many types ofinnovation since it can be a process, service and/or a product, which are essential for the improvementof any organization at all levels. To innovate, there must be an established innovation strategy within anorganization, which allows putting into practice creative ideas, and selecting and implementing them aswhole new developments or innovative improvements of existing processes, services or products (Oke,2007). This strategy works in favor of innovative leaders.
2.1.2. Innovative aspects of leadersAn innovative leader “creates an environment of change and growth” when pursuing innovation(DuBrin, 2013, p. 436). To make this happen, it is essential to be willing to invest time and resources,take the necessary risks, and also being able to transmit the advantages and disadvantages of doing it,while encouraging the rest of the organization to innovate. As stated by Teece (2016, p. 209), “a keyrole of entrepreneurial managers is to permit experimentation and search, then support promising pathsand close down foolish ones” by having skills as creative vision, hypothesis creation and validation,wily pragmatism and sensitive people skills.
DuBrin (2013, p. 438) also remarks that “most innovations stem from networks”, thus it is clear thatpromoting collaboration between employees increases the innovativeness of any work group. Throughhard and soft skills, an innovative leader permanently looks for innovation, nevertheless it is not alwaysnecessary to innovate since every company has its own objectives and work procedures and thesecompanies could function well without innovation for long periods. For instance, in case of developingnew products or services, the market and customers are not always willing to accept and absorb them.Therefore, each innovation has its right time to be created, released and used.
To a certain degree, innovative leaders provide employees freedom to test ideas by investing time andresources, knowing that most of the new intended innovations for work procedures, products and

5
services are discarded before a successful one is approved. To obtain organizational innovation,“individual willingness is essential” (Shanker et al., 2017, p. 73).
For any innovation to be developed, it is essential that Research & Development processes can operateat the same time with production process within an organization, without affecting the regular demandfrom clients. It is the duty of innovative leaders to consider both processes, adjusting the time andresources of the enterprise, and allowing them to function together without negatively affecting eachother. The innovative leader should also be prepared to assume and acknowledge failed innovations,since they can be relevant to develop new concepts and ideas, based on what did not work and what wasexpected to be considered a success. It is important that this mindset is transmitted to all personnelinvolved with the process of innovation.
2.1.3. Technical and non-technical innovativenessInnovativeness can take place in technical and non-technical positions. Hendarman (2012) considerstechnical innovativeness to be related to product and services while non-technical innovativeness to berelated to organization and marketing. Individual innovativeness affects individual job performance andcan be a result related to innovation. A technical innovative worker can develop “processes, procedures,tools and techniques” (Azim et al. 2010, p. 392) by mainly using hard skills. A non-technical innovativeworker can develop management, organization, and services (Van Oort et al. 2009) by mainly using softskills. Nevertheless, hard and soft skills must function together and interrelated to obtain both technicalinnovativeness and non-technical innovativeness. Hendarman (2012, p. 42) concluded that “informationseeking soft skills positively influenced technical innovativeness and only hard skills positivelyinfluenced non-technical innovativeness”.
Hard skills for innovation can be classi ed into ‘‘subject-based skills’’ and ‘‘thinking and creativity’’(Scott et al., 2014, pp. 77–78) which can lead to technical innovativeness and the same time support thecreation of non-technical innovativeness. Soft skills for innovation are listed in Section 2.3 (Martino etal., 2011). Carmeli et al. (2010) discusses the leadership skill called innovation leadership. This skill isprevalent to workers with innovation talents who can encourage and manage the innovation processes,thereby leading the rest of the team.
2.2. Hard skills
2.2.1. Definition of hard skillsHard skills are technical skills needed to carry out a task (Rainsbury et al., 2002). These skills are usuallydeveloped through formal and informal education and are influenced by an individual’s cognitiveabilities and intelligence quotient (Page et al., 1993). Even though soft skills are becoming moreimportant in organizations, hard skills are still very essential. Hard skills raise the confidence ofmanagers and enhances their ability to influence their team. Ramsoomair et al. (2004, p. 232) explainthat “it is reasonable to expect supervisors and line managers to have a technical comprehension of thework that they manage”. While Poisson-de et al. (2012) believe that technical and conceptual skills areessential for managers, Rao (2018, p. 217) explains that “there are three skills essential for leaders at alllevels – technical skills, human skills and conceptual skills”. Rao (2013, p. 4) explains that the need forhard and soft skills varies depending on the level of management, stating that “Entry-level leaders needlots of hard skills. Middle-level leaders need equal amounts of hard and soft skills. For top-levelmanagers, soft skills are more important than hard ones”.
2.2.2. Perspectives of hard skillsSeveral theoretical views of hard skills have been developed by various researchers. Marando (2012)looked into hard skills from the perspective of project management. The study explains that hard skillsof project management include the ability to create deliverable tangibles such as: work breakdown

6
structures (WBS), project schedules, project budgets, critical path diagrams (CPD) and earned valuereport (EVR). Poisson-de et al. (2012) study on developing better managers opines that conceptual skillssuch as: “intellectual agility, vision, rationality, wisdom, insight, adaptability and a sense of mission”(p. 215), are hard skills of management.
Hard skills in relation to innovation was discussed by Scott et al. (2014). In this study, hard skills forinnovation are classified into “subject-based skills” and “thinking and creativity” (pp. 77 – 78). Whilesubject-based skills are technical skills related to a specific field, thinking and creativity falls underconceptual skills as discussed by Poisson-de et al. (2012). The model of hard skills used in Hendarman(2018) is developed based on this reasoning. Subject-based skills is operationalized using the ability touse tools, equipment and application related to one’s job. Conceptual skills on the other hand isoperationalized broadly into information seeking, conceptual thinking and quick study.
Operationalizing hard skills in this thesis for low-level, front-line managers working in engineeringconsultancy firms are mainly focused on subject-based skills. The idea is to determine if subject-basedskills influence the innovativeness of this set of managers. The intention of this thesis is to understandif managers with more subject-based skills are more innovative compared to managers with less subject-based skills. Using Hendarman (2018) as guide, this study uses task experience, ability to use tospecialized tools and application, and knowledge of technical language, to operationalize hard skills.The following sub-chapters discuss these indicators of hard skills.
2.2.2.1. Task experienceYears of experience in a task is one of the best indicators of the level of hard skills a person has acquiredwith respect to that job. The level of hard skills increases with years of task experience, as knowledgeis acquired while on the job (Page et al., 1993). In addition, technical comprehension of any field asdiscussed by Ramsoomair et al. (2004) happen through years of work experience. Using Marando (2012)study for illustration, a project manager’s ability to create work breakdown structures, project budgets,time schedules etc., is enhanced by the years of experience he has managing projects.
2.2.2.2. Ability to use specialized tools and applicationsThe ability to use specialized tools, equipment, applications and software related to any job gives anindication of the level of hard skills one has. Using project management as an example, a projectmanager needs to know how to use specialized project scheduling and budgeting applications such asPrimavera or Microsoft Project in order to create project deliverables such as WBS and CPD.
2.2.2.3. Knowledge of technical languageEvery field has a technical language associated with it. Knowledge of technical language is acquiredpartly through education and partly through work experience. The amount of technical language oneknows has a positive correlation with the level of hard skill they possess (Ramsoomair et al., 2004). Aperson who is not a project manager may not understand technical terms of project management suchas: WBS, CPD, EVR.
2.3. Soft skills
2.3.1. Definition of soft skillsSoft skills are interpersonal and behavioral skills which are not specific to any job function and areusually not acquired through formal education (Weber et al., 2011; Moss et al., 1996). Hendarman et al.(2018) further explained that “soft skills are largely intangible, not associated with a deliverable or areal output, and they are employed without the use of tools or templates”. Soft skills can also be

7
described as character traits that enhances individual performance (Robles, 2012). Sarkar et al. (2020,p. 348) defined soft skills as generic skills “transferable to a wide range of tasks”.
Soft skills are required in interpersonal relationships and in work environments and are essential forsuccess of organizations (AbuJbara et al., 2018). Although hard skills are required to carry out tasks,organizations nowadays are very much interested in workers having a good level of soft skills, as itsimportance in workplaces is increasingly becoming obvious (Gutman et al., 2013; Robles, 2012;Cimatti, 2016). The study by Klaus (2010) shows that only 25% of job success depends on hard skills,whereas 75% depends on soft skills. In addition, the survey carried out by Aasheim et al. (2009) foundthat IT managers ranked soft skills higher than hard skills, as a requisite for success in IT industry.AbuJbara et al. (2018, p. 247) explain that “cultural diversity, globalization and technology are factorsthat influence the need for enhanced soft skills in the workplace”. Due to the importance of soft skillsin organizations, Ramsoomair et al. (2004, p. 231) suggests that “proper execution of corporate strategyshould include provision for building strength in soft skills”.
2.3.2. Perspectives of soft skillsThere are several theoretical perspectives of soft skills that are investigated and discussed by differentresearchers. For instance, Marando (2012) discussed skills as it relates to project management andconcluded that interpersonal skills such as: leadership skills, communication skills, negotiation skills,influencing skills, problem-solving skills and decision-making skills, are the most essential soft skillsfor project managers. Rao (2018) looked into soft skills from the perspective of leadership and listedseveral soft skills that are essential for leaders such as: critical thinking skills, communication skills,conceptual skills, problem-solving skills, conflict management skills, team building skills etc. Martinoet al. (2011) investigated soft skills in relation to innovation and concluded that soft skills such as:passion and optimism, tolerance for uncertainty, entrepreneurial orientation, relationship building andmaintenance, strategic in uencing skills, communication skills and quick study, are essential forinnovation. The differences and similarities between these perspectives of soft skills is due to theirdifferent focuses and purposes.
The model of soft skill developed in the study by Hendarman (2018) were based on the studies byMartino et al. (2011) and Carmeli et al. (2010), due to their focus and argument on soft skills requiredfor innovation. Passion and optimism, tolerance for uncertainty, relationship building and maintenance,taken from Martino et al. (2011) were operationalized. Innovation leadership skills, a concept of softskill discussed in Carmeli et al. (2010), was also operationalized.
This thesis is focused on the innovativeness of low-level, front-line managers. These set of managersare also leaders in their own sphere (Teece, 2016). Management, leadership and innovation are theperspectives to be considered in building a model of soft skills for this thesis, taking into account thecontext of low-level managers. Based on Marando (2012), Rao (2018), Martino et al. (2011) andHendarman et al. (2018), communication skills, interpersonal skills, strategic influencing skills andproblem-solving skills are operationalized to develop the model of soft skill for this study. The limitationto four skills is to keep the model simple but suitable for this study. The following sub-chapters discussthe soft skills to be operationalized.
2.3.2.1. Communication skillsCommunication is important at all levels of the organization (Ramsoomair et al., 2004). The ability tocommunicate effectively, both verbally and non-verbally is crucial for effective leadership (DuBrin,2013). Poor communication skills can lead to misunderstanding and conflicts. This skill helpsindividuals know when, how and what to communicate. Through good communication skills, managerscan create an environment within his or her team that encourages creativity and innovation.

8
2.3.2.2. Interpersonal skillsInterpersonal skill can also be referred to as relationship building skill. This skill enhances the ability towork and build relationship with people. With increasing globalization and cultural diversity inworkplaces, interpersonal skills become even more important (DuBrin, 2013). Through interpersonalskills, workers in an organization build synergy that enhances organizational performance. Interpersonalskills include being patient, empathetic, personable and having self-control and a sense of humor(Robles, 2012). Managers with interpersonal skills build confidence and synergy with their team.
2.3.2.3. Strategic influencing skillsAlthough strategic influencing skills is somewhat similar to interpersonal skills, it goes further than justbeen personable, to been able to exert influence on people. Strategic influencing can also be said to beleadership skills, since the purpose of leadership is to influence people (DuBrin, 2013). Innovative andstrategic ideas need to be sold out within an organization through communication and influencing skills.Successful leaders are masterful in the art of influencing.
2.3.2.4. Problem solving skillsThe ability to solve problems quickly and appropriately is an important soft skill useful to organizations.Problems ranging from internal conflicts within an organization or a team, to external conflicts withcustomers and other stakeholders need to be solved appropriately. Marando (2012) listed problemsolving as one of the soft skills required by project managers. Problem solving also involves having agood sense of judgement as well as been decisive (DuBrin, 2013). Analytical and critical thinking skillsas noted by Rao (2018) are part of problem-solving skill.
2.4. Theoretical framework and hypothesisSeveral studies have found that there is a direct correlation between soft skills and individualperformance in workplace (Heckman et al., 2006; Balcar, 2016; Hendarman et al., 2018). People areusually educated in specific areas, for instance, science and literature, while the interpersonal andleadership skills are not included in regular education. It is essential that low-level managers acquiresoft skills, since they are as important as hard skills. The paper by Crosbie (2005) highlights theimportance of soft skills development for leaders - explaining that soft skills can be learnt, though itusually takes more time than hard skills. Low-level, front-line managers are leaders of the team theymanage. Hence, they should invest time in developing soft skills that are essential for leaders andmanagers.
To have hard and soft skills is highly important for professional life, but to blend both skills is essentialfor successful managers and leaders. As indicated by Rao (2013), the lack of a good combination ofhard and soft skills, is even more detrimental in management than at any other discipline. Rao also refersto real cases in history, as Steve Job’s career, where the lack of soft skills was the main reason for a badmanagement.
The article from Heckman et al. (2006) explained that cognitive and non-cognitive skills are required toobtain performance of an individual, stating that the lack of non-cognitive skills is not compensated bya “surplus of cognitive skills” (p. 4). Therefore, both cognitive and non-cognitive skills are strictlynecessary for managers to compete in today’s market. Cognitive and non-cognitive skills can beconsidered as hard and soft skills respectively, but according to Balcar (2016, p. 454) “some soft skillsare more closely connected with cognitive than non-cognitive abilities (e.g. problem solving, planningand organizing or exploring and orientation in information)”.
Since hard and soft skills contribute to individual performance, high levels of both and itscomplementarity increase productivity of an individual. This increase in managers’ performance leads

9
to more and better innovation for the organization. To evaluate the level of hard and soft skills from anindividual is difficult. While hard skills are more related to specific knowledge, soft skills are developedthrough our lives and thus they are long-term skills as it is related on how to act and think upon differentcircumstances. Therefore, it is more difficult to measure soft skills than hard skills. Rao (2013, p. 3)stated that “hard skills are mostly tangible while soft skills are mostly intangible”. The conceptual modelshown in Figure 1 is developed to answer the research question of this thesis.
Figure 1: Conceptual model.
Based on Hendarman et al., (2012; 2018) and the conceptual model in Figure 1, the following hypothesesshall be tested:
H1: Hard skills are positively associated with managers’ innovativeness.H2: Soft skills are positively associated with managers’ innovativeness.H3: The interaction between hard skills and soft skills is positively associated with managers’innovativeness.H4: Hard and soft skills are positively associated with managers’ technical innovativeness.H5: Hard and soft skills are positively associated with managers’ non-technical innovativeness.
H4
H5
H4
H5

10
3. Methodology
This chapter layouts the methodology employed in carrying out this thesis. It is organized in subchaptersexplaining the analytical tools that are employed in the thesis in order to answer the research question.
3.1. Research design
3.1.1. Quantitative researchQuantitative research will provide accurate numerical and detailed results to evaluate the relationshipbetween hard and soft skills and managers’ innovativeness. According to Saunders et al (2019, p. 568-569) qualitative analysis data “are likely to be more varied, elastic and complex than quantitative data”and related with “interpretivist philosophy” rather than the “meanings derived from numbers” as inquantitative analysis. In addition, this study tests the need of both hard and soft skills, findingquantitative results to explain how they have an impact in managers’ innovativeness. Therefore, theresearch approach is quantitative. Furthermore, Saunders et al. (2019, p. 186) states that “research canbe designed to fulfil either an exploratory, descriptive, explanatory or evaluative purpose, or somecombination of these”. Based on the research purpose and question, this study is explanatory.
3.1.2. Research methods and motivationThis study approaches theory development in a deductive way, such that hypotheses are proposed firstwith guidance from previous studies and then data are collected to test the hypotheses. Since this studyis mainly focused on determining relationships between variables, primary data shall be collected innumerical and standardized form and analyzed using statistical techniques. This implies thatquantitative research method is used in this study. Survey research strategy is deployed in this studysince this strategy is “usually associated with deductive research approach” (Saunders et al., 2019, p.193). Also, this strategy is most suitable for quantitative research method. Mono method quantitativestudy is used in this research, since single data collection technique (questionnaires) was used. AlthoughBryman et al. (2001) advocates the use of multiple methods for data collection, this study deployed onlyquestionnaires. This is due to limited time and resources available for this study, as well as difficulty ingetting access to deploy other quantitative data collection techniques such as structured observation orsemi-structured interviews.
Regarding time horizon, this study is cross-sectional. This is because the research questions andobjectives require data to be collected at a particular time in order to understand the relationship betweenvariables. Furthermore, this study is based on positivism research philosophy. This is because it aims ataddressing a common problem many organizations are facing. The study determines causalexplanations. Also, the researchers are objective, to avoid any personal bias, as data were collectedthrough structured questionnaires and analyzed using quantitative methods. The choices made indesigning this research are put together into a “research onion” as shown in Figure 2 (Saunders et al.,2019, p. 130). This research onion gives a pictorial understanding of the process of this research designby placing each stage into layers from the first step (outer layer) to the last step (inner layer).

11
Figure 2: The research onion.
3.2. Operationalization of variables and survey designThe conceptual model in Figure 1 indicates how the theoretical framework transits to empiricalvariables. The model contains 3 constructs: Hard skills (HS), soft skills (SS) and managers’innovativeness (MI). Each of these constructs contain variables that are operationalized in thequestionnaire.
The survey is designed following the design used in Hendarman et al. (2018) as a guide. The threeconstructs are measured at the individual respondent level using a five-point Likert scale (Allen et al.,2007; Krosnick et al., 2009). The scale ranges from ‘‘1: Strongly disagree’’, ‘‘2: Disagree’’, ‘‘3:Neutral’’, ‘‘4: Agree’’ and ‘‘5: Strongly agree’’ (Boone et al., 2012). The respondents are low-level,front-line managers working in engineering consultancy firms and the survey collect their level of hardskills, soft skills and innovativeness. The responses received are analyzed statistically - to test thehypotheses and answer the research questions.
As discussed in the theory chapter, hard skills are operationalized into three variables which are goodindicators for measuring the level of hard skills one has in a particular profession. These variables are:task experience (TE), ability to use tools and applications (TA) and knowledge of technical language(TL). The geometric mean of these variables gives the measure of hard skills.
The most essential soft skills for low-level, front-line managers are explained in the theory chapter. Thesoft skills are: communication skills (CS), interpersonal skills (IS), strategic influencing skills (SIS) andproblem-solving skills (PSS). These soft skills are operationalized, and the geometric mean is used tomeasure the level of soft skills a manager has.
Innovativeness is categorized into technical and non-technical, as discussed in the theory chapter. Thesetwo categories are deployed as factors of managers’ innovativeness in the survey: technicalinnovativeness (TI) and non-technical innovativeness (nTI). Each of these factors are calculated usingtwo variables each: TI1, TI2, nTI1 and nTI2. The geometric mean of these two variables is used to

12
measure each of the factor and the geometric mean of the factor gives a measure of the managers’innovativeness.
In this study, hard and soft skills are the independent variables, while managers’ innovativeness is thedependent variable. This is because the study aims at explaining the relationship hard and soft skillshave on managers’ innovativeness. Table 1 explains the operationalization of these variables in thequestionnaire.
Table 1: Operationalization of dependent and independent variables.Construct Variable Item OperationalizationHS HS TE Managers’ perception of the amount of experience they have of the
tasks carried out at the department they are managing.
TA Managers’ perception of their ability to use tools and applications thatare used at the department he or she is managing.
TL Managers’ perception of their ability to understand technical languageand terms used at the department they are managing.
SS SS CS Managers’ perception of how effective they communicate with theirteam and other stakeholders.
IS Managers’ perception of how effective they are in buildingprofessional relationship with members of their team and otherstakeholders.
SIS Managers’ perception of how effective they are in strategicallyinfluencing their team.
PSS Managers’ perception of their ability to analyze and solve problemseffectively.
MI TI TI1 Managers’ perception of how effective they have been in initiatingand implementing product or service development within thedepartment they manage and in the workplace in general.
TI2 Managers’ perception of how effective they have been in initiatingand implementing product or service improvement within thedepartment they manage and in the workplace in general.
nTI nTI1 Managers’ perception of how effective they have been in initiatingand implementing organizational improvements within thedepartment they manage and in the workplace in general.
nTI2 Managers’ perception of how effective they have been in initiatingand implementing innovative strategies within the department theymanage and in the workplace in general.
In addition to the independent and dependent variables, control variables are also introduced to improvethe robustness of the result. The control variables are respondent’s demographics and are used togetherwith multiple regression analysis (Shanker et al., 2017, p. 72). The control variables are applied so thatits effect on the relationship between hard and soft skills and managers’ innovativeness is controlled.The control variables are classified into individual and firm variable. The individual variables are: Age(A), years in management position (MP), Gender (G), level of education (E). Size of the firm (F) is theonly firm variable deployed in the questionnaire. Table 2 explains how these variables are deployed inthe questionnaire. The control variables are measured and analyzed as ordinal data.

13
Table 2: Control variables.Classification Variables QuestionnaireIndividual level A Age:
1 20-30 years2 31-40 years3 41-50 years4 51-60 years5 above 60 years
MP Years in management position:1 0-5 years2 6-10 years3 11-15 years4 16-20 years5 above 20 years
G Gender:1 Male2 Female
E Educational level:1 Senior high school2 Bachelor’s degree3 Master’s degree4 PhD
Firm level F Firm size:1 Small firm (1-50 employees)2 Medium firm (51-200 employees)3 Large firm (more than 200 employees)
3.3. Data collectionAs previously stated, questionnaires are used for data collection in the research design. A “descriptivesurvey” (Ghauri & Grønhaug, 2010, p. 119) is chosen to gather information on a specific subject suchas managers’ innovativeness. Literature review of previous studies is relevant to determine the type ofquestions to be included in the questionnaire. The objective of the questionnaire is to get data from low-level managers within engineering consultancy firms and understand how hard and soft skills impacttheir innovativeness.
3.3.1. The populationBased on the purpose of this study, the research question and the survey design, the population of thissurvey is limited to low-level managers (Teece, 2015) who are overseeing a team or department inengineering consultancy firms. Therefore, the questionnaires were sent to active low-level, front-linemanagers in consultancy engineering firms across Europe. 22 companies were selected to answer thequestionnaire mainly from Denmark and Sweden, but also from Spain. In addition, it was also sent toHR departments of theses engineering consultancy firms to reach out their low-level managers. Due tothe situation of confinement from Covid-19, no responses from the HR departments were received. Thecollection period was carried out in three weeks and during this time, the questionnaire was sent to 133managers but only 40 responses were received, giving a response rate of about 30 percent. The lowresponse rate could also be attributed to the sensitive nature of the questions.

14
3.3.2. Implementation of questionnaireThe survey was implemented using online questionnaires with the help of Google online Form, whichis shown in Appendix 8.1. The questionnaire consist of 17 closed-ended questions and the five-pointLikert scale is used to answer the questions. The questionnaires were distributed via a hyperlinkcontained in email to respondents. The authors sent the hyperlink to the network of low-level managersthey know working in different countries. Due to limited time in completing this research, three weekswere provided for the questionnaires to be answered and weekly reminders were sent out. Thequestionnaire contains three sections. The first section contains a short description of the purpose of thequestionnaire. It also includes statement of confidentiality and anonymity of the survey (Saunders et al.,2019). The second section contains information on the demography of the respondents such as age, sex,country of residence, education level, years in management position and firm size, while the third sectioncontains the closed-ended questions regarding hard skills, soft skills and managerial innovativeness.
3.4. Data analysisThe data collected was scanned for error before using it for statistical analysis. IBM SPSS Statistics wasused in this research for the quantitative analysis of data collected. Cronbach’s alpha reliability analysiswas performed to check the reliability that each factor measures the same construct (Peterson, 1994;Mitchell, 1996; Field, 2018). Exploratory factor analysis is also performed “to determine whattheoretical constructs underlie a given data set and the extent to which these constructs represent theoriginal variables” (Henson et al., 2006, p. 396). In order to understand the relationship between thevariables, bivariate analysis was performed. Spearman Rank Order Correlation is chosen for thisanalysis because the control variables are ordinal.
Data collected contains dependent variables (MI, TI and nTI), independent variables (SS and HS) andcontrol variables (A, MP, G, E and F). Although MI, TI, nTI, HS and SS are measured using Likert scalein the questionnaire, this study considers these variables to be continuous since they are obtained throughgeometric mean of their underlying items. This is in line with the approach followed by Hendarman etal. (2018). Multiple linear regression is performed to test the proposed hypotheses (H1, H2, H3, H4 andH5). There are two reasons for choosing multiple linear regression over other available methods. First,the authors aim at comparing the result of this thesis to Hendarman et al. (2018), where multiple linearregression is used. In addition, this thesis aims at understanding the relationship managers’ hard and softskills have with their innovativeness. Multiple linear regression is very suitable for testing therelationship between a continuous dependent variable and two or more continuous independent variables(Pallant, 2011). The data collected was also checked for outliers and multicollinearity, since these aresome of the assumptions behind multiple linear regression. The linear regression models showing allvariables for the analysis are shown in equations 1, 2 and 3.= 0+ 1 + 2 + 3 + + (1)= 0 + 1 + 2 + 3 + + (2)= 0+ 1 + 2 + 3 + + (3)
Where:MI, TI and nTI are the dependent variables.HS and SS are the main independent variables.HSxSS is interaction variable between hard and soft skills (for testing H3). represents the coefficient of independent variables to be determined.
i represents individual manager surveyed.X represent the vector of k control variables. represent the error term.

15
Different regression models as described in Table 3 were analyzed to get a robust result for testing thehypotheses stated in Chapter 2.
Table 3: Description of the different regression models.Regression model DescriptionModel 1 This model does not apply any control variable. Only the dependent and
independent variables are included. The dependent variable is managerialinnovativeness and the model is used for testing hypotheses H1 and H2.
Model 2 This model applies control variables at the individual level. Therefore,dependent, independent and individual control variables are included. Theinteraction variable and firm control variable are excluded. The dependentvariable is managerial innovativeness and the model used for testinghypotheses H1 and H2.
Model 3 This model applies all control variables. Therefore, dependent, independentand all control variables are included. The interaction variable is excluded. Thedependent variable is managerial innovativeness and the model is used fortesting hypotheses H1 and H2.
Model 4 This model applies all control, dependent and independent variables. Theinteraction variable is also included. The dependent variable is managerialinnovativeness and the model is used for testing hypothesis H3.
Model 5 This model applies all control, dependent and independent variables. Thedependent variable is technical innovativeness and the model is used for testinghypothesis H4.
Model 6 This model applies all control, dependent and independent variables. Thedependent variable is non-technical innovativeness and the model is used fortesting hypothesis H5.
3.5. Consequences of methods selected
3.5.1. Type of research resultsResults are obtained from statistical analysis of the models detailed in Table 3. Modifying the dependentvariable, the output results are numerical data gathered in Multiple Regression Model Summary andIndependent Variable Significance from IBM SPSS Statistics. The key output is composed by the p-value, the variance R2 which indicates how much variance is accounted for by the regression model andthe residual plots. The results also provide significance level to point out that the model has explanatoryvalue. The type of research results allows to determine if the relation among the response and thevariables in the model is statistically significant. Also, to validate if the elaborated concept model fitswell the data collected. Finally, to review if the model confirms the assumptions of the analysis.
3.5.2. Validity and reliabilityValidity and reliability have been considered with respect to the chosen research design and methods.Since a deductive approach to theory development is used, questions in the questionnaires are carefullychosen so that the questionnaire represents what is been measured. Also, the questions are written toavoid any ambiguity and misunderstanding to the respondents. Pilot testing with a small group wasperformed before the questionnaire was deployed. This is to ensure that the questions are correctlyunderstood by respondents, thereby increasing the quality of the data collected.
With the use of close-ended questions in the questionnaires with Likert scale, the researcher bias isexcluded, and the researcher should have no problems interpreting the survey result. The externalvalidity of the research is also improved by not limiting the survey to any geographical location or type

16
of industry. Also, ‘logic leaps and false assumption’ as explained by Saunders et al. (2019, p. 215) isavoided in the research design.
Furthermore, online questionnaire creates a challenge to the validity and reliability of result obtained.The online questionnaire is designed such that incomplete questionnaires cannot be submitted. Inaddition, as discussed earlier in the data analysis section, Cronbach’s alpha is used to test the reliabilityof each of construct. Exploratory factor analysis is also performed to determine construct validity.
3.5.3. Ethical issuesOne of the reasons for choosing online survey is to ensure that data collected is anonymous anduntraceable to respondents. This is achieved by excluding respondent and company name from thequestionnaire. In addition, the questionnaire is designed such that there is no traceability to therespondents’ email address.

17
4. Results
In this chapter, result of the survey conducted is presented, first by looking at the respondentdemographics. Results of other analyses made are presented in sub-chapters. 40 responses werereceived, and the survey result is presented in Appendix 8.3.
4.1. Respondents’ demographicsPictorial representations of respondents’ demographics are presented in Appendix 8.2. 60% of therespondents are within the age of 31 to 40. This could be because low-level managers are usuallyyounger compared to higher level managers. Managers between the age of 41 to 50 represent 22% ofthe respondents. A slightly below representation are the ones from 51 to 60 years with 18%. There wasno response from managers above 60 years or younger than 30 years. In addition, 80% of respondentswere male while 20% were female. Respondents from Denmark and Sweden have the vast majority with42% and 37% of the respondents respectively. Respondents in Spain are 13%, United Kingdom 5% andFrance 3%.
Regarding educational level, most respondents hold a master’s degree (78%), while bachelor’s degreefollows with 12% and PhD respondents were 10% of the respondents. Years in management positionsare quite fragmented, while majority of respondents (44%) have held a management position from 0 to5 years, 29% of respondents from 6 to 10 years and 17% from 11 to 15 years. Very small representationof managers with between 16 to 20 years of management experience is collected (3%), and 7% ofrespondents with more than 20 years in management position. In addition, managers were asked to statethe size of the firm where they work. The range include large firms with over 200 employees, whichcovered 67% of respondents. Small firms with 50 or less employees represent 30%, while only 3% ofthe respondents work in medium sized firms.
4.2. Construct reliabilityThe raw data collected was scanned for errors before proceeding with the analysis. The internalconsistency of each construct is checked, in order to assess the reliability that each item measures thesame factor. Cronbach’s alpha, which is one of the most common indicators of internal consistency, isused for this assessment (Pallant, 2011). The result of Cronbach’s alpha reliability estimation usingSPSS is shown in Table 4.
Table 4: Cronbach’s alpha estimation.Factor Cronbach’s alpha coefficientHard Skills (HS) 0.793Soft Skills (SS) 0.689Technical Innovativeness (TI) 0.875Non-technical Innovativeness (nTI) 0.814
Since the Cronbach’s alpha estimation of each factor exceeds 0.6, it is considered that all factors fulfillthe reliability threshold (Peterson, 1994).
4.3. Construct validityExploratory factor analysis is used “to determine what theoretical constructs underlie a given data setand the extent to which these constructs represent the original variables” (Henson & Roberts, 2006, p.396). The questionnaire included 17 questions on HS, SS, TI and nTI. These can measure a smallernumber of underlying factors. Each component has a quality score called Eigenvalue. Only componentswith high Eigenvalues can represent a real underlying factor.

18
Table 5: Initial eigenvalues.
Component Total % of Variance Cumulative %1 2,06 51,49 51,492 0,866 21,658 73,1483 0,732 18,312 91,464 0,342 8,54 100
A high Eigenvalue are those of at least 1. Applying this rule to the previous table it measures only 1underlying factor. The other components having low quality scores do not represent real traitsunderlying our 17 questions for the EFA. These components are considered scree as shown by thefollowing line chart.
Figure 3: Scree plot of initial eigenvalues.
The steep drop between components 1 and 2 strongly suggests that only 1 factor underlie the questions.Therefore, it is investigated to what extent do our 1 underlying factor account for the variance of our 4input variables. This is answered by the r square values which are called communalities in EFA.
Table 6: Communalities.
Initial ExtractionHard Skills 1 0,337Soft skills 1 0,451Technical Innovativeness 1 0,787Non-Technical Innovativeness 1 0,485
Thus, if TI is predicted from our 4 components by multiple regression, R2 = 0.787 is TI’s communality.Variables having communalities lower than 0.40, do not contribute much to measuring the underlyingfactors. Pearson correlations between the items and the component are shown in the component matrix.These correlations are defined as factor loadings.

19
Table 7: Component matrix.
Component 1Technical Innovativeness 0,887Non-Technical Innovativeness 0,696Soft skills 0,672Hard Skills 0,580
Ideally, each input variable should measure precisely one factor. Fortunately, that is the case. Allvariables correlate with component 1. It is possible to see that Technical Innovativeness is stronglycorrelated to Non-technical Innovativeness, but also with soft skills and hard skills.
4.4. Quality checkMultiple linear regression is very sensitive to outliers. It is also sensitive to the existence ofmulticollinearity between independent variables. The existence of outliers and multicollinearity willaffect the result of linear regression (Pallant, 2011; Heeringa et al., 2010). Hence, check for outliers andmulticollinearity is performed to validate the result of the analyses.
4.4.1. Check for outliersPallant (2011, p. 159) states that “the presence of outliers can be detected from the scatterplot”. Caseswith a standardized residual more than 3.3 or less than -3.3 (as shown in the scatterplot) is defined to bean outlier (Tabachnick et al., 2007). The scatterplots of all models are presented in Appendix 8.4. Eachscatter plot has standardized residuals within 3.3 and -3.3. Therefore, there are no outliers in the models.
4.4.2. Check for multicollinearityThe first check for multicollinearity is obtained from bivariate analysis. Since the control variables arecategorical, Spearman Rank Order Correlation is performed on all variables. The correlation matrix ispresented in Table 13 in Appendix 8.5. If the correlation between independent and control variables isvery high (above 0.7), it indicates the presence of multicollinearity between those variables (Pallant,2011).
From Table 13, it is seen that multicollinearity exist between the control variables: age (A) and years inmanagement position (MP) (correlation coefficient (rho) = 0.713). This is not strange as age is likely tohave a strong relationship with years in management position. Since regression analysis is very sensitiveto multicollinearity (Heeringa et al., 2010), age is removed as a control variable in the regression models.Also, multicollinearity exist between hard skills (HS) and the interaction variable (HSxSS). This isbecause the interaction variable is obtained by multiplying HS and SS variables as discussed in Heeringaet al. (2010). Pallant (2011) notes that combining independent variables to form another independentvariable will lead to multicollinearity and the regression model will give insignificant result.
Another check for multicollinearity is obtained from the variance inflation factor (VIF). If the VIF valueof any variable is greater than 10, it indicates the presence of multicollinearity (Pallant, 2011). Thevariance inflation factors of all models are presented in Table 8 and shows that for Model 4, the VIFvalues are greater than 10 for variables HS, SS and HSxSS. This confirms that multicollinearity existbecause of introduction of the interaction variable.

20
Table 8: Variance inflation factor of the regression models.Variables VIF
(model 1)VIF(model 2)
VIF(model 3)
VIF(model 4)
VIF(model 5)
VIF(model 6)
HS 1.034 1.043 1.044 150.31 1.044 1.044SS 1.034 1.038 1.279 29.7 1.279 1.279HSxSS - - - 203.239 - -G - 1.022 1.059 1.118 1.059 1.059E - 1.119 1.244 1.308 1.244 1.244MP - 1.119 1.208 1.208 1.208 1.208F - - 1.574 1.574 1.574 1.574
4.5. Evaluating the modelsThe R Square value explains how much of the variance in the dependent variable is accounted for bythe model. R square increases with the number of independent variables in the model (Pallant, 2011).Hence to compare models, Adjusted R Square data is used since it is adjusted for the number ofindependent variables. Table 9 shows the Adjusted R Square for each of the model and their confidenceinterval.
Table 9: Adjusted R Square of each model.Model Adjusted R Square Confidence interval1 0.216 99%2 0.182 99%3 0.159 95%4 0.132 95%5 0.285 99%6 0.059 76%
The Adjusted R square values of the models are quite low – meaning that not much of the variance inthe dependent variable is accounted for by the model. The probable reason for this is the small numberof cases in the model (40 respondents). Table 9 also shows that with the introduction of more variablesinto the model, the Adjusted R square and the confidence interval are reduced.
4.6. Evaluating the regression coefficientsThe regression coefficients of the independent and control variables explain the interrelationship thesevariables have with the dependent variables. Table 10 shows the unstandardized coefficients for each ofthe models and their standard errors.
Table 10: Unstandardized coefficients of each model.Model 1 2 3 4 5 6Hard Skills (HS) 0.213***
(0.112)0.209***(0.113)
0.209***(0.115)
0.230(1.397)
0.317*(0.127)
0.096(0.136)
Soft Skills (SS) 0.622**(0.237)
0.628**(0.239)
0.594**(0.269)
0.614(1.315)
0.668**(0.298)
0.514***(0.318)
HS and SS interaction (HSxSS) - - - -0.005(0.346)
- -
Years in management position(MP)
- 0.022(0.082)
0.029(0.087)
0.032(0.123)
0.028(0.128)
0.009(0.103)
Gender (G) - -0.326(0.233)
-0.313(0.241)
-0.314(0.251)
-0.302(0.269)
-0.312(0.285)

21
Educational level (E) - -0.154(0.206)
-0.174(0.220)
-0.173(0.229)
0.089(0.244)
-0.416(0.216)
Firm size (F) - - -0.038(0.128)
-0.038(0.130)
-0.141(0.149)
0.054***(0.152)
Constant 0.331(0.989)
0.807(1.175)
1.076(1.503)
0.995(5.509)
-0.238(1.673)
2.368(1.782)
Standard errors in parenthesis; * 99% confidence interval, ** 95% confidence interval, *** 90% confidence interval.
From Table 10, it is seen that only coefficients of hard and soft skills in Models 1, 2 and 3 are statisticallysignificant with hard skills having 90% confidence interval and soft skills having 95% confidenceinterval. Model 4 has no statistically significant coefficients, and this is because of the multicollinearityin the model due to the introduction of the interaction variable. Therefore, the result of Model 4 cannotbe used for testing hypothesis H3. Models 5 and 6 show the relationship hard and soft skills have withtechnical and non-technical innovativeness.

22
5. Analysis and discussion
In this chapter, the results are discussed and analyzed in sub-chapters. The proposed hypotheses inChapter two are also discussed.
5.1. Hard skills and managers’ innovativenessThe relationship between managers’ hard skills and innovativeness is shown in the correlation matrix(Table 13) with Spearman correlation coefficient = 0.389 at 95% confidence interval, implying that therelationship is positive, substantial and significant. This means that the more hard skills a manager has,the more innovative he/she will be.
The result of the regression analyses on models 1, 2 and 3 (Table 10) shows that the regressioncoefficient of hard skills are 0.213, 0.209 and 0.209 in the three models respectively, with 90%confidence interval. This also shows that hard skills are positively and significantly associated withmanagers’ innovativeness.
The first hypothesis, H1 is: Hard skills are positively associated with managers’ innovativeness. Theresult of models 1, 2 and 3 show that hypothesis H1 is true and therefore confirmed. This is consistentwith previous studies, mainly Hendarman et al. (2018) in which an individuals’ hard skills is confirmedto have a positive and significant association with their innovativeness.
5.2. Soft skills and managers’ innovativenessThe relationship between managers’ soft skills and innovativeness is shown in the correlation matrix(Table 13) with Spearman correlation coefficient = 0.421 at 99% confidence interval, implying that therelationship is positive, substantial and significant. This means that the more soft skills a manager has,the more innovative he/she will be.
The result of the regression analyses on models 1, 2 and 3 (Table 10) shows that the regressioncoefficient of soft skills are 0.622, 0.625 and 0.594 in the three models respectively, with 95%confidence interval. This also shows that soft skills are positively and significantly associated withmanagers’ innovativeness.
The second hypothesis H2 is: Soft skills are positively associated with managers’ innovativeness. Theresult of models 1, 2 and 3 show that hypothesis H2 is true and therefore confirmed. This is consistentwith previous studies, mainly Hendarman et al. (2018) in which an individual’s soft skills is confirmedto have a positive and significant association with their innovativeness.
5.3. Hard skills versus soft skillsThe correlation matrix shows that soft skills have a stronger relationship with managers’ innovativenessthan hard skills. Result of the regression models also show that soft skills have a stronger associationwith managers’ innovativeness than hard skills. These findings are also consistent with the results ofHendarman et al. (2018).
Furthermore, the correlation matrix shows that hard skills and soft skills do not have a strongrelationship, with correlation coefficient of 0.153. This is expected as there is no guarantee that a personwith a certain amount of hard skills will also have similar amount of soft skills. This implies that anindividual’s hard and soft skills are not related, and a person with high level of hard skills can have lowlevel soft skills and vice-versa.

23
5.4. Interaction of hard and soft skillsThe relationship between the interaction of managers’ hard and soft skills and innovativeness is shownin the correlation matrix (Table 13) with Spearman correlation coefficient = 0.505 at 99% confidenceinterval, implying that the relationship is positive, substantial and significant. This means that the morehard and soft skills interaction a manager has, the more innovative he/she will be.
However, model 4 which was designed for testing hypothesis H3, gave regression coefficients that areinsignificant. This arises because of the multicollinearity that exist in forming the interaction variable.Russel et al. (1992) found that the use of Likert scales in questionnaires are not suitable for findinginteraction effects. Hendarman et al. (2018) also confirms that Likert scale is not suitable for testinginteraction effects. Hence, hypothesis H3 cannot be tested with the method followed in this thesis.
5.5. Technical versus non-technical innovativenessIt can be seen from Table 10 that soft skills have a stronger relationship with managers’ technical andnon-technical innovativeness than hard skills. The relationship is positive, significant and substantialwith regression coefficient of 0.668 at 95% confidence interval for technical innovativeness andregression coefficient of 0.514 at 90% confidence interval for non-technical innovativeness. Hard skillson the other hard have a positive, significant and substantial relationship with technical innovativenesswith regression coefficient of 0.317 at 99% confidence interval. The relationship with non-technicalinnovativeness is neither significant nor substantial. This implies that the more hard skills a managerhas, the more technical innovative he/she will be. However, the more soft skills a manager has, the moretechnical and non-technical innovative he/she will be.
This result is consistent with Hendarman et al. (2012) with respect to the relationship between soft skillsand technical innovativeness. However, there is a contradiction with respect to the relationship betweenhard skills and non-technical innovativeness in which result from Hendarman et al. (2012) shows thathard skills have a strong and significant relationship with non-technical innovativeness.
Hypothesis H4 is: Hard and soft skills are positively associated with technical innovativeness. The resultof model 5 shows that this hypothesis is true and therefore confirmed. Hypothesis H5 is: Hard and softskills are positively associated with non-technical innovativeness. However, the result of model 6 showsthat this hypothesis is not completely true, since hard skills did not show a significant relationship withnon-technical innovativeness. This hypothesis is therefore confirmed to be partly true.
5.6. Control variablesIt can be seen from Table 10 that none of the control variables have a significant association withmanagers’ innovativeness in models 1 to 4. One reason for this could be because the sample size is smalland multiple linear regression is sensitive to sample size and better suited for large sample size (Pallant,2011). Another reason could be because linear regression was used for this analysis, whereas the controlvariables are ordinal. Also, the correlation matrix in Table 13 shows that the control variables do nothave a significant relationship with the dependent and independent variables. However, the correlationmatrix shows some interesting relationship between some control variables.
Years in management position and level of education have a correlation coefficient of -0.344 at 90%confidence interval. Though the relationship is substantial and significant, it is in the negative direction.This means that years in management position decreases with managers’ higher level of education.Another interesting relationship is between the age of managers and size of firm with a correlationcoefficient of 0.457 at 95% confidence interval. The relationship is positive, substantial and significantand implies that older managers are more likely to be in larger firms while younger managers are morelikely to be in small firms like start-ups.

24
In addition, another interesting relationship is between managers’ level of education and size of firm,having a correlation coefficient of -0.380 at 90% confidence interval. This relationship is negative,substantial and significant and implies that managers with lower education are more likely to be in largerfirms while managers with higher education are more likely to be in smaller firms like start-ups, whereinnovation is the driving force.

25
6. Conclusions
In this chapter, the thesis is summarized, including its implications and contributions in relation to otherstudies. Shortcomings of this thesis are also stated and recommendations for future research are given.
6.1. SummaryThis thesis investigates the impact of managers’ hard and soft skills on their innovativeness. Otherfactors that can influence managers’ innovativeness such as: size of the firm, years in managementposition, gender, level of education and age are also controlled in this study. The population for thisstudy is limited to low-level managers in engineering consultancy firm, since innovation is the bedrockof engineering consultancy.
After careful review of the literature on this subject, managers’ hard skills, soft skills and innovativenessare operationalized in the questionnaire. Hard skills were operationalized using factors such as:knowledge of technical language, task experience and ability to use tools and applications. Soft skillsare operationalized into four factors: communication skills, problem-solving skills, strategic influencingskills and interpersonal skills. Innovativeness is broken down into technical and non-technicalinnovativeness. Technical innovativeness is operationalized to initiating and implementing product andservice development and improvement. Non-technical innovativeness on the other hand isoperationalized to initiating and implementing organizational improvement and innovative strategies.Questionnaires are sent to respondents and quantitative tools such as Spearman rank correlation andmultiple linear regression are used in analyzing the data collected.
The empirical analysis shows that managers’ hard and soft skills are positively and significantly relatedto their innovativeness. This confirms the proposed hypothesis H1 and H2 to be true. The result alsoshows that soft skills have a stronger relationship with managers’ innovativeness than hard skills. Inaddition, the result also shows that managers’ hard and soft skills are positively and significantly relatedto their technical innovativeness, thereby confirming hypothesis H4 to be true. However, hypothesis H5is confirmed to be partly true since only managers’ soft skills show to be significantly related to theirnon-technical innovativeness. The research question for this thesis is:
What are the relationships between hard and soft skills and managers’ innovativeness?
From the result, the answers to the research question are:Managers’ hard skills have a positive and significant relationship with their innovativeness.Managers’ soft skills have a positive and significant relationship with their innovativeness.Managers’ hard and soft skills have a positive and significant relationship with their technicalinnovativeness.Managers’ soft skills have a positive and significant relationship with their non-technicalinnovativeness.Managers’ hard skills does not have a significant relationship with their non-technicalinnovativeness.
6.2. ImplicationsThe result of this thesis show that the more hard and soft skills managers have, the more innovative theywill be. This has an implication for firms. The need for innovative managers to drive organizationalgrowth and increase efficiency of the firm cannot be over emphasized in today’s markets. This is due tothe stiff competition available in many industries. Managers at all levels of the organization play a veryimportant role in initiating, supporting and implementing innovative products, processes, services and

26
strategies that would enhance market differentiation. Hence, the need to study managers’ innovativenessis a subject of interest to many firms.
One of the implications of this study is that firms should ensure that their managers possess both hardand soft skills competencies. Investment in developing managers’ hard and soft skills competenciesshould be prioritized in order to sustain organizational growth, increase market share and enhanceprofitability. In addition, this study shows that managers’ soft skills have a stronger relationship withboth their technical and non-technical innovativeness than hard skills. This is consistent with previousstudies on this subject and implies that firms should emphasize the need for managers to develop anddisplay high level of soft skills in the organization.
With focus on managers, the empirical result of this thesis has deepened research in the field of skillsand innovation - explaining that the established relationship between hard skills, soft skills andindividual innovativeness also applies to managers, with emphasis on low-level managers.
6.3. Further researchThis study has some shortcomings. First, the number of responses received is not much with a responserate of about 30% of which 79% are from Denmark and Sweden alone. The quantitative methodsemployed are sensitive to sample size and the accuracy of the result will increase with larger samplesize. Further research on this subject should ensure that larger responses are collected. Bryman et al.(2001) advocates the use of multiple methods for data collection. Getting responses from managers inother countries is recommended for further research. In addition, other levels of managers and industriescan be explored, to see if there will be any difference in the result.
The inability to develop a model to test for hypothesis H3 was a challenge due to multicollinearity thatexist in the formulation of the interaction variable between hard and soft skills. Hendarman et al. (2018)also faced similar problem and the result of the model was insignificant. This will be an interesting areafor further research to explore how to develop the interaction variable between hard and soft skills. Inaddition, using multiple linear regression may not be the most optimal quantitative method to use forthis analysis considering that dependent and independent variables are measured using Likert scale andthe control variables are ordinal. Further research should investigate other quantitative methods that canbe used for this analysis.
Empirical study on the impact of innovative managers on organizational performance is another area ofresearch that strengthen or weaken the argument made in this thesis - that having innovative managerswill improve organizational performance. Finally, the operationalization of hard skills, soft skills andmanagers’ innovativeness in the questionnaire can be expanded to include more items that can providedeeper explanation of the relationships.

27
7. Bibliography
Aasheim, C., Li, L., & Williams, S. (2009). Knowledge and skill requirements for entry-levelinformation technology workers: A comparison of industry and academia. Journal ofInformation Systems Education, 20(3), 349-356.
AbuJbara, N.K. & Worley, J.A. (2018), "Leading toward new horizons with soft skills", On theHorizon, vol. 26, no. 3, pp. 247-259.
Agle, B.R., Nagarajan, N.J., Sonnenfeld, J.A. & Srinivasan, D. (2006), "Does CEO Charisma Matter?An Empirical Analysis of the Relationships among Organizational Performance, EnvironmentalUncertainty, and Top Management Team Perceptions of CEO Charisma", The Academy ofManagement Journal, vol. 49, no. 1, pp. 161-174.
Allen, I. E. & Seaman, 2007. Likert Scales and Data Analyses. Quality Progress, 40(7), pp. 64-65.
Augier, M. & Teece, D.J. (2009), "Dynamic Capabilities and the Role of Managers in Business Strategyand Economic Performance", Organization Science, vol. 20, no. 2, pp. 410-421.
Azim, S., Gale, A. W., Lawlor-Wright T., Kirkham R., Khan A., Alam M., (2010), “The Importance ofSoft skills in Complex Projects”, International Journal of Managing Projects in Business, vol.3, no. 3, p. 392.
Balcar, J. (2016), "Is it better to invest in hard or soft skills?", The Economic and Labour RelationsReview, vol. 27, no. 4, pp. 453-470.
Bloom, N., Eifert, B., Mahajan, A., McKenzie, D. & Roberts, J. (2014), "DOES MANAGEMENTMATTER? EVIDENCE FROM INDIA", The Quarterly Journal of Economics, vol. 128, no. 1,pp. 1-51.
Boone, H. N., & Boone, D. A. 2012, “Analyzing Likert data”, Journal of extension, 50(2), pp. 1–5.
Boshoff, C., Allen, J., 2000. The influence of selected antecedents on frontline staff’s perceptions ofservice recovery performance. Int. J. Serv. Ind. Manag. 11, pp. 63–90.
Brettel, M., & Cleven, N. J. (2011). Innovation Culture, Collaboration with External Partners and NPDPerformance. Creativity & Innovation Management, 20(4), pp. 253-272.
Bryman, A. & Cramer, D., 2001, Quantitative Data Analysis with SPSS release 10 for Windows.Routledge.
Burgelman, R.A. (1983). A process model of internal corporate venturing in the diversified major firm.Adm. Sci. Q. 28 (2), pp. 223-244.
Carmeli, A., Gelbard, R., & Gefen, D. (2010). The importance of innovation leadership in cultivatingstrategic t and enhancing rm performance. The Leadership Quarterly, vol. 21, no. 3, pp. 339–349.
Cimatti, B. (2016). Definition, development, assessment of soft skills and their role for the quality oforganizations and enterprises", International Journal for Quality Research, vol. 10, no. 1, pp.97-130.

28
Cr ciun, E. (2015), "Human Capital - A Quality Factor For The Competitiveness Of IT Companies",Manager, vol. 21, no. 1, pp. 44-51.
Crosbie R., (2005), “Learning the soft skills of leadership”, Industrial and commercial training, vol. 37,no. 1, p. 45.
DuBrin, A. J. (2013). Principles of Leadership. 7th ed. Delhi: Cengage Learning. pp. 416, pp. 436-438.
Field, A. (2018). Discovering Statistics Using IBM SPSS Statistics. 5th Ed. London: Sage.
Ghauri, P. and Gronhaug, K. (2010), Research Method in Business Studies. 4th Edition, Pearson,London, p. 119.
Gutman, L.M. and Schoon, I. (2013), The Impact of Non-Cognitive Skills on Outcomes for YoungPeople, Education Empowerment Foundations, London.
Hales, C. (2005), “Rooted in supervision, branching into management: continuity and change in the roleof the first-line manager”, Journal of Management Studies, Vol. 42 No. 3, p. 479.
Hammershøj, L.G., (2018), “Conceptualizing creativity and innovation as affective processes: SteveJobs, Lars von Trier, and responsible innovation”, Philosophy of Management, vol. 17, no. 1,p. 115.
Heckman, J.J., Stixrud, J. and Urzua, S. (2006), “The effects of cognitive and noncognitive abilities onlabor market outcomes and social behavior”, Journal of Labor Economics, vol. 24 No.3, p. 4,pp. 411-482.
Heeringa, S.G., West, B.T. & Berglund, P.A. 2010, Applied Survey Data Analysis, Chapman & Hall,GB.
Hendarman, A.F. & Cantner, U. (2018), "Soft skills, hard skills, and individual innovativeness",Eurasian Business Review, vol. 8, no. 2, p. 42, pp. 139-169.
Hendarman, A.F. & Tjakraatmadja, J.H. (2012), "Relationship among Soft Skills, Hard Skills, andInnovativeness of Knowledge Workers in the Knowledge Economy Era", Procedia - Social andBehavioral Sciences, vol. 52, pp. 35-44.
Henson & Roberts (2006), “Use of Exploratory Factor Analysis in Published Research”, Educationaland Psychological Measurement, vol. 66, no. 3, p. 396.
Hornsby, J.S., Kuratko, D.F., Shepherd, D.A., Bott, J.P. (2009). Managers’ corporate entrepreneurialactions: examining perception and position. J. Bus. Ventur. 24 (3), 236-247.
Klaus, P. (2010). Communication breakdown. California Job Journal, 28, 1-9.
Krosnick, J. A. & Presser, S., 2009. Question and Questionnaire Design. 2nd red. San Diego: Elsevier.
Lawson, B., & Samson, D. (2001). Developing innovation capability in organizations: A dynamiccapabilities approach. International Journal of Innovation Management, 5(3), 377-400.
Lee, S., & Teece, D.J. (2013). The Functions of middle and top management in the dynamic capabilitiesframework. Kindai Manag. Rev. 1, 28-40.

29
Marando, A. (2012). Balancing Project Management Hard Skills and Soft Skills. Rabb School ofContinuing Studies: Division of Graduate Professional Studies, Brandeis University.
Martino, G., & Bartolone, J. (2011). Soft Skills for Open Innovation Success. In Paul Sloane (Ed), Aguide to open innovation and crowd sourcing. Advice from leading expert (pp. 98–105). UnitedKingdom. Kogan page.
Mitchell, V. (1996). Assessing the reliability and validity of questionnaires: An empirical example.Journal of Applied Management Studies, Vol. 5, No. 2, pp. 199-207.
Moss, P., & Tilly, C. (1996). ‘‘Soft’’ skills and race: an investigation of black men’s employmentproblems. Work and Occupations, 23(3), 252–276.
Oke, A., (2007), “Innovation types and innovation management practices in service companies”,International Journal of Operations & Production Management, vol. 27, no. 6, pp. 564-587.
Page, C., Wilson, M., & Kolb, D. (1993). Managerial competencies and New Zealand managers: On theinside, looking in. Auckland: University of Auckland.
Pallant, J. (2011). SPSS Survival Manual. 4th Ed. Crows Nest: Allen & Unwin.
Parzefall, M. R., Seeck, H., & Leppänen, A. (2008), Employee innovativeness in organizations: a reviewof the antecedents. Finnish Journal of Business Economics, 2(08), pp. 165–182.
Peterson, R. A. (1994). A meta-analysis of Cronbach’s coef cient alpha. Journal of consumer research,21(2), 381–391.
Poisson-de Haro, S., & Turgut, G. (2012). Expanded strategy simulations: developing better managers.Journal of Management Development, 31(3), 209–220.
Purcell, J., Hutchinson, S., 2007. Front-line managers as agents in the HRM-performance causal chain:theory, analysis and evidence. Hum. Resour. Manag. J. 17, pp. 3–20.
Rainsbury, E., Hodges, D. L., Burchell, N., & Lay, M. C. (2002). Ranking workplace competencies:Student and graduate perceptions.
Ramsoomair, F. & Howey, R. (2004), "The hard realities of soft skills", Problems and Perspectives inManagement, vol. 2, no. 4, pp. 231-239.
Rao, M.S. (2013), "Blend hard and soft skills to fast-track a management career", Human ResourceManagement International Digest, vol. 21, no. 7, pp. 3-4.
Rao, M.S. (2018), "Soft skills: toward a sanctimonious discipline", On the Horizon, vol. 26, no. 3, pp.215-224.
Robles, M.M. (2012), "Executive Perceptions of the Top 10 Soft Skills Needed in Today's Workplace",Business Communication Quarterly, vol. 75, no. 4, pp. 453-465.
Russell, C. J., & Bobko, P. (1992). “Moderated regression analysis and Likert scales: too coarse forcomfort”, Journal of Applied Psychology, 77, no. 3, p. 336.

30
Sarkar, M., Overton, T., Thompson, C.D. & Rayner, G. (2020), “Academics' perspectives of the teachingand development of generic employability skills in science curricula”, Higher EducationResearch & Development, vol. 39, no. 2, pp. 346-361.
Scott, R., & Vincent-Lancrin, D., (2014), “The human factor in innovation”, In S. Dutta, B. Lanvin, &S. Wunsch-Vincent (Eds). The Global Innovation Index 2014. Cornell University, INSEAD,WIPO Fontainebleau, Ithaca.
Shanker, R., Bhanugopan, R., van der Heijden, B., Farrell, M., (2017), “Organizational climate forinnovation and organizational performance: The mediating effect of innovative work behavior”,Journal of Vocational Behavior, vol. 100, no. 1, pp. 67-77.
Shum C., Gatling A., Shoemaker S., (2018), “A model of hospitality leadership competency for frontlineand director level managers: Which competencies matter more?”, International Journal ofHospitality Management, vol. 74, p. 59.
Spencer, L. M., & Spencer, S. M. (1993). Competency at work. New York: John Wiley & Sons.
Tabachnick, B.G. & Fidell, L.S. (2007). Using multivariate statistics (5th edn). Boston: PearsonEducation.
Tajeddini, K., Trueman M., (2014), Perceptions of innovativeness among Iranian hotel managers,Journal of Hospitality and Tourism Technology, vol. 5, no. 1, pp. 62-67.
Tajeddini, K., Trueman, M. and Larsen, G. (2006), “Examining the effect of market orientation oninnovativeness”, Journal of Marketing Management, Vol. 22, Nos. 5/6, pp. 529-551.
Teece, D.J. (2016). Dynamic capabilities and entrepreneurial management in large organizations:Toward a theory of the (entrepreneurial) firm. European Economic Review, 86 (2016), 202-216.
Van Oort, G. F., Oud, J. H., & Raspe, O., (2009). “The urban knowledge economy and employmentgrowth: a spatial structural equation modeling approach”, The Annals of Regional Science, vol.43, no. 4, 859–877.
Weber, M. R., Crawford, A., Rivera, D., Jr., & Finley, D. A. (2011). Using Delphi panels to assess softskill competencies in entry level managers. Journal of Tourism Insights, 1(1), 98–106.
Wronka-Po piech, M. (2016), "The identification of skills and competencies for effective managementin social enterprises. A managerial perspective", Management, vol. 20, no. 1, pp. 40-57.

31
8. AppendixThe questionnaire, respondents’ demographics, survey results, scatter plots and correlation matrix arepresented in subchapters.
8.1. Questionnaire

32

33

34

35

36

37

38

39

40

41

42
8.2. Respondents’ demographicsTable 11: Respondents’ demographicsCase No. Age Sex Country of Residence Education level Years in management Firm size
1 31-40 Female Denmark Master's degree 0-5 Large firm (more than 200 employees)2 31-40 Male Spain Master's degree 0-5 Large firm (more than 200 employees)3 31-40 Female Sweden Master's degree 0-5 Large firm (more than 200 employees)4 31-40 Male Denmark PhD 0-5 Small firm (1-50 employees)5 51-60 Male Sweden Bachelor's degree 11-15 Large firm (more than 200 employees)6 31-40 Male Sweden Master's degree 0-5 Large firm (more than 200 employees)7 41-50 Female Sweden Master's degree 6-10 Large firm (more than 200 employees)8 31-40 Male Denmark Master's degree 11-15 Large firm (more than 200 employees)9 51-60 Male Sweden Master's degree 6-10 Large firm (more than 200 employees)
10 31-40 Male Sweden Master's degree 0-5 Large firm (more than 200 employees)11 31-40 Female Sweden Master's degree 6-10 Large firm (more than 200 employees)12 51-60 Male Sweden Master's degree 11-15 Large firm (more than 200 employees)13 41-50 Male Sweden Bachelor's degree 6-10 Large firm (more than 200 employees)14 41-50 Female Sweden Master's degree 6-10 Large firm (more than 200 employees)15 31-40 Female Denmark Master's degree 6-10 Small firm (1-50 employees)16 51-60 Female Denmark Bachelor's degree above 20 Large firm (more than 200 employees)17 31-40 Male Sweden Master's degree 0-5 Large firm (more than 200 employees)18 41-50 Male Sweden Master's degree 6-10 Large firm (more than 200 employees)19 51-60 Male Sweden Master's degree 11-15 Large firm (more than 200 employees)20 31-40 Male Denmark Master's degree 0-5 Small firm (1-50 employees)21 31-40 Male France Bachelor's degree 6-10 Large firm (more than 200 employees)22 51-60 Male Denmark Master's degree above 20 Large firm (more than 200 employees)23 41-50 Male Sweden Master's degree 0-5 Large firm (more than 200 employees)24 31-40 Male Spain Master's degree 6-10 Medium firm (51-200 employees)25 31-40 Male Denmark Master's degree 0-5 Small firm (1-50 employees)26 31-40 Male Sweden Master's degree 0-5 Small firm (1-50 employees)27 41-50 Male Denmark Master's degree 6-10 Small firm (1-50 employees)28 31-40 Male Denmark PhD 0-5 Small firm (1-50 employees)29 31-40 Male Denmark Master's degree 0-5 Small firm (1-50 employees)30 31-40 Male Denmark Master's degree 6-10 Small firm (1-50 employees)31 31-40 Male Denmark Master's degree 0-5 Large firm (more than 200 employees)32 41-50 Female Spain Master's degree 11-15 Large firm (more than 200 employees)33 41-50 Male United Kingdom Master's degree above 20 Large firm (more than 200 employees)34 31-40 Male Denmark PhD 0-5 Large firm (more than 200 employees)35 31-40 Male Spain PhD 0-5 Small firm (1-50 employees)36 41-50 Male United Kingdom Master's degree 11-15 Large firm (more than 200 employees)37 31-40 Male Denmark Master's degree 11-15 Small firm (1-50 employees)38 31-40 Male Denmark Master's degree 0-5 Small firm (1-50 employees)39 31-40 Male Spain Bachelor's degree 0-5 Large firm (more than 200 employees)40 51-60 Male Denmark Master's degree 16-20 Large firm (more than 200 employees)

43
Figure 4: Age of respondents
Figure 5: Gender of respondents
60% (24)22% (9)
18% (7)
AGE
31-40 41-50 51-60
80% (32)
20% (8)
GENDER
Male Female

44
Figure 6: Country of residence of respondents.
Figure 7: Educational level of respondents.
42% (17)
37% (15)
13% (5)
3% (1) 5% (2)COUNTRY OF RESIDENCE
Denmark Sweden Spain France United Kingdom
12% (5)
78% (31)
10% (4)
EDUCATIONAL LEVEL
Bachelor's degree Master's degree PhD

45
Figure 8: Years in management position of respondents.
Figure 9: Size of firm where respondents work.
44% (18)
29% (12)
17% (7)
3% (1)7% (3)
YEARS IN MANAGEMENT POSITION
0-5 06-10 11-15 16-20 Above 20
67% (27)3% (1)
30% (12)
FIRM SIZE
Large firm (more than 200 employees) Medium firm (51-200 employees)
Small firm (1-50 employees)

46
8.3. Survey resultThe questionnaire contains 17 closed-ended questions with the Likert scale. The response to eachquestion is shown in the figures below.
Figure 10: I have years of experience in the tasks performed at the department that I am managing.
Figure 11: I know how to use most of the tools and application used at the department that I am managing.
2 (5%)
4 (10%)3 (7.5%)
15 (37.5%)16 (40%)
0
2
4
6
8
10
12
14
16
18
Strongly Disagree Disagree Neutral Agree Strongly Agree
0 (0%)
5 (12.5%)4 (10%)
21 (52.5%)
10 (25%)
0
5
10
15
20
25
Strongly Disagree Disagree Neutral Agree Strongly Agree

47
Figure 12: I understand the technical language and terms used at the department that I am managing.
Figure 13: I communicate effectively with members of my team.
1 (2.5%) 0 (0%)
6 (15%)
14 (35%)
19 (47.5%)
0
2
4
6
8
10
12
14
16
18
20
Strongly Disagree Disagree Neutral Agree Strongly Agree
0 (0%) 0 (0%) 2 (5%)
28 (70%)
10 (25%)
0
5
10
15
20
25
30
Strongly Disagree Disagree Neutral Agree Strongly Agree

48
Figure 14: I communicate effectively with other stakeholders.
Figure 15: I am able to build professional relationship with members of my team.
0 (0%) 0 (0%)
6 (15%)
25 (62.5%)
9 (22.5%)
0
5
10
15
20
25
30
Strongly Disagree Disagree Neutral Agree Strongly Agree
0 (0%) 0 (0%) 2 (5%)
26 (65%)
12 (30%)
0
5
10
15
20
25
30
Strongly Disagree Disagree Neutral Agree Strongly Agree

49
Figure 16: I am able to build professional relationship with other stakeholders.
Figure 17: I influence my team in a strategic way.
0 (0%) 0 (0%)
10 (25%)
22 (55%)
8 (20%)
0
5
10
15
20
25
Strongly Disagree Disagree Neutral Agree Strongly Agree
0 (0%) 1 (2.5%)
8 (20%)
26 (65%)
5 (12.5%)
0
5
10
15
20
25
30
Strongly Disagree Disagree Neutral Agree Strongly Agree

50
Figure 18: I am able to analyze and solve problems effectively.
Figure 19: I have implemented product or service improvement within the department that I manage and in theworkplace in general.
1 (2.5%) 0 (0%)
6 (15%)
24 (60%)
9 (22.5%)
0
5
10
15
20
25
30
Strongly Disagree Disagree Neutral Agree Strongly Agree
1 (2.5%) 2 (5%)
7 (17.5%)
21 (52.5%)
9 (22.5%)
0
5
10
15
20
25
Strongly Disagree Disagree Neutral Agree Strongly Agree

51
Figure 20: I have initiated product or service improvement within the department that I manage and in theworkplace in general.
Figure 21: I have implemented product or service development within the department that I manage and in theworkplace in general.
0 (0%)
4 (10%)
12 (30%)
15 (37.5%)
9 (22.5%)
0
2
4
6
8
10
12
14
16
Strongly Disagree Disagree Neutral Agree Strongly Agree
0 (0%)
4 (10%)5 (12.5%)
19 (47.5%)
12 (30%)
0
2
4
6
8
10
12
14
16
18
20
Strongly Disagree Disagree Neutral Agree Strongly Agree

52
Figure 22: I have initiated product or service development within the department that I manage and in theworkplace in general.
Figure 23: I have implemented organizational improvements within the department that I manage and in theworkplace in general.
0 (0%)
3 (7.5%)
16 (40%)
14 (35%)
7 (17.5%)
0
2
4
6
8
10
12
14
16
18
Strongly Disagree Disagree Neutral Agree Strongly Agree
0 (0%)
4 (10%)
14 (35%)15 (37.5%)
7 (17.5%)
0
2
4
6
8
10
12
14
16
Strongly Disagree Disagree Neutral Agree Strongly Agree

53
Figure 24: I have initiated organizational improvements within the department that I manage and in theworkplace in general.
Figure 25: I have implemented innovative strategies within the department that I manage and in the workplacein general.
0 (0%)
6 (15%)
12 (30%)
15 (37.5%)
7 (17.5%)
0
2
4
6
8
10
12
14
16
Strongly Disagree Disagree Neutral Agree Strongly Agree
0 (0%)
5 (12.5%)
9 (22.5%)
20 (50%)
6 (15%)
0
5
10
15
20
25
Strongly Disagree Disagree Neutral Agree Strongly Agree
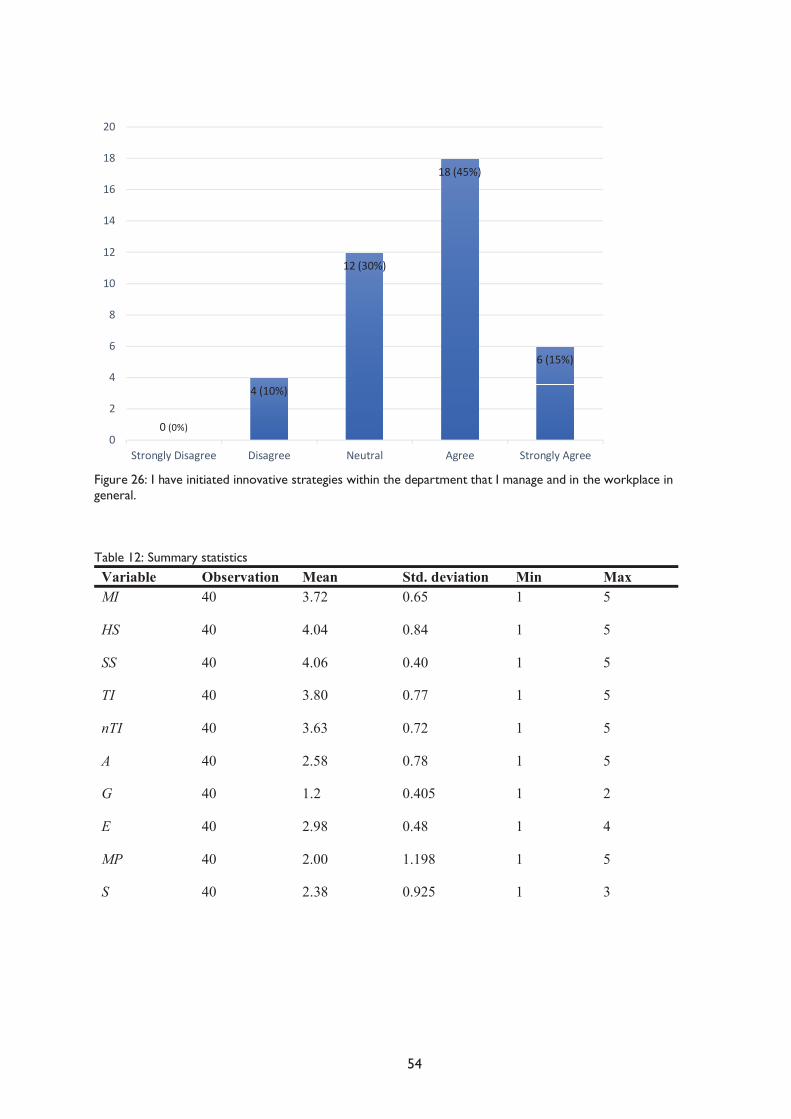
54
Figure 26: I have initiated innovative strategies within the department that I manage and in the workplace ingeneral.
Table 12: Summary statisticsVariable Observation Mean Std. deviation Min MaxMI 40 3.72 0.65 1 5
HS 40 4.04 0.84 1 5
SS 40 4.06 0.40 1 5
TI 40 3.80 0.77 1 5
nTI 40 3.63 0.72 1 5
A 40 2.58 0.78 1 5
G 40 1.2 0.405 1 2
E 40 2.98 0.48 1 4
MP 40 2.00 1.198 1 5
S 40 2.38 0.925 1 3
0 (0%)
4 (10%)
12 (30%)
18 (45%)
6 (15%)
0
2
4
6
8
10
12
14
16
18
20
Strongly Disagree Disagree Neutral Agree Strongly Agree

55
8.4. Scatter plots
Figure 27: Scatterplot of Model 1.
Figure 28: Scatterplot of Model 2.

56
Figure 29: Scatterplot of Model 3.
Figure 30: Scatterplot of Model 4.

57
Figure 31: Scatterplot of Model 5.
Figure 32: Scatterplot of Model 6.

58
8.5.
Cor
rela
tion
mat
rix
Tab
le 1
3: C
orre
latio
n m
atri
x of
all
vari
able
s.Correlations
Man
ager
ial
inno
vativ
enes
sH
ard
skills
Soft
skills
HS
and
SSin
tera
ctio
nAg
ese
xLe
vel o
fed
ucat
ion
Year
s in
man
agem
ent
Size
of
firm
Spea
rman
'srh
oM
anag
eria
lin
nova
tiven
ess
Cor
rela
tion
Coe
ffici
ent
1,00
0,3
89*
,421
**,5
05**
,018
-,215
-,070
-,004
-,219
Sig.
(2-ta
iled)
.,0
13,0
07,0
01,9
12,1
84,6
69,9
81,1
75N
4040
4040
4040
4040
40H
ard
Skills
Cor
rela
tion
Coe
ffici
ent
,389
*1,
000
,153
,882
**-,0
07-,1
32,0
66,0
03-,1
52
Sig.
(2-ta
iled)
,013
.,3
46,0
00,9
68,4
17,6
86,9
83,3
50N
4040
4040
4040
4040
40So
ft sk
illsC
orre
latio
nC
oeffi
cien
t,4
21**
,153
1,00
0,5
57**
-,119
-,030
,059
,007
-,454
**
Sig.
(2-ta
iled)
,007
,346
.,0
00,4
65,8
54,7
19,9
68,0
03N
4040
4040
4040
4040
40H
S an
d SS
inte
ract
ion
Cor
rela
tion
Coe
ffici
ent
,505
**,8
82**
,557
**1,
000
-,088
-,144
,129
-,027
-,309
Sig.
(2-ta
iled)
,001
,000
,000
.,5
88,3
77,4
29,8
70,0
52N
4040
4040
4040
4040
40Ag
eC
orre
latio
nC
oeffi
cien
t,0
18-,0
07-,1
19-,0
881,
000
,062
-,299
,716
**,4
57**
Sig.
(2-ta
iled)
,912
,968
,465
,588
.,7
05,0
61,0
00,0
03N
4040
4040
4040
4040
40se
xC
orre
latio
nC
oeffi
cien
t-,2
15-,1
32-,0
30-,1
44,0
621,
000
-,104
,133
,209
Sig.
(2-ta
iled)
,184
,417
,854
,377
,705
.,5
23,4
15,1
96N
4040
4040
4040
4040
40Le
vel o
f edu
catio
nC
orre
latio
nC
oeffi
cien
t-,0
70,0
66,0
59,1
29-,2
99-,1
041,
000
-,344
*-,3
80*
Sig.
(2-ta
iled)
,669
,686
,719
,429
,061
,523
.,0
30,0
15N
4040
4040
4040
4040
40Ye
ars
in m
anag
emen
tC
orre
latio
nC
oeffi
cien
t-,0
04,0
03,0
07-,0
27,7
16**
,133
-,344
*1,
000
,314
*
Sig.
(2-ta
iled)
,981
,983
,968
,870
,000
,415
,030
.,0
48N
4040
4040
4040
4040
40Si
ze o
f firm
Cor
rela
tion
Coe
ffici
ent
-,219
-,152
-,454
**-,3
09,4
57**
,209
-,380
*,3
14*
1,00
0
Sig.
(2-ta
iled)
,175
,350
,003
,052
,003
,196
,015
,048
.N
4040
4040
4040
4040
40*.
Cor
rela
tion
is s
igni
fican
t at t
he 0
.05
leve
l (2-
taile
d).
**. C
orre
latio
n is
sig
nific
ant a
t the
0.0
1 le
vel (
2-ta
iled)
.