DAU Program Managers Tool Kit - AcqNotes
157
-
Upload
khangminh22 -
Category
Documents
-
view
4 -
download
0
Transcript of DAU Program Managers Tool Kit - AcqNotes

Program ManagersTool Kit
Sixteenth Edition (Ver. 1.0)January 2011
Author: William Parker
DEFENSE ACQUISITION UNIVERSITY

DAU PROGRAM MANAGERS TOOL KIT
i
DAU PROGRAM MANAGERS TOOL KIT
Sixteenth Edition (Ver. 1.0)
January 2011

DAU PROGRAM MANAGERS TOOL KIT
ii
For sale by theU.S. Superintendent of Documents, Government Printing Office
Internet: http://bookstore.gpo.gov/ Phone: 202-512-1800 Fax: 202-512-2250 Mail Stop: SSOP, Washington, DC 20402-0001
ISBN 978-0-16-087469-7, Stock Number 008-020-01604-7

DAU PROGRAM MANAGERS TOOL KIT
iii
PREFACE
This Sixteenth Edition (version 1.0) of the DAU Program Managers Tool Kit contains a graphic summary of acquisition policies and manage-rial skills frequently required by DoD program managers. It is a current version of a “Tool Box” that was first developed by Charles F. Schied of the Defense Acquisition University (DAU) Program Management Course (PMC) 92-1. The information in the Tool Kit is extracted from DAU course material and is based on DoDD 5000.01 (May 12, 2003), DoDI 5000.02 (December 8, 2008), the Defense Acquisition Guide-book (DAG), (August 5, 2010), CJCSI 6212.01E (December 15, 2008), CJCSI 3170.01G (March 1, 2009), the Joint Capabilities Integration and Development System Manual (July 31, 2009), and the Weapon Systems Acquisition Reform Act of 2009. Material from the DAU Acker Library and Knowledge Repository was also used.
Since the DAU Program Managers Tool Kit is a compilation of class-room presentation and teaching materials used in a number of different courses at DAU, the charts and tables vary in look and feel.
Users of the Tool Kit are reminded that this summary is a guide only and should not be used as a substitute for official policy guidance. Peri-odic review of official policy guidance is recommended.
An e-Toolkit has been developed which contains current updated ac-quisition guidance and direction (https://pmtoolkit.dau.mil). This (“hard-copy”) Tool Kit is current as of January 1, 2011 and is extracted from the e-Tool Kit. The hard copy Tool Kit can be found at http://www.dau.mil/pubscats/pages/tool%20kit.aspx.

DAU PROGRAM MANAGERS TOOL KIT
iv

DAU PROGRAM MANAGERS TOOL KIT
v
ACKNOWLEDGMENTS
As sponsor of the Tool Kit, the Learning Capabilities Integration Center (LCIC) recognizes the following members of the DAU staff and faculty for their input to this Sixteenth Edition (Version 1.0):
• BillBahnmaier,formerlyofDAU’sProgramManagementandLeadership Department, Capital and Northeast Region, for coordinating the input and editing the material received.
• ChuckCochrane,formerlytheDAUProgramManagementCenterDirector and currently a DoD contractor supporting DAU, for his significant contributions regarding current DoD acquisition policy.
• MikeDorohovich,CSCCorporationcontractorsupportingDAU,forhis contribution regarding the DAU knowledge sharing systems.
• AndreaReese,CSCCorporationcontractorsupportingDAU,forherefforts in developing and updating the e-Tool Kit.
• TheDefenseSystemsManagementCollege–SchoolofProgramManagers (DSMC-SPM) for input, including Duane Tripp, international acquisition policy and guidance; Al Moseley, Diamond Card and Probability of Program Success Model; and Roberta Tomasini and John Krieger, budgeting and finance issues.
• TheLearningCapabilitiesIntegrationCenteranditsCenterDirectorsand Performance Learning Directors, including Sharon Jackson, Robert Pratt, Leslie Deneault, Bill Kobren, John Claxton, John Snoderly, George Prosnik, Bill Motley, and Larry Baker.
• MartySherman,DAUWestRegion,forhiscontributionregardingtheContinuous Process Improvement/Lean Six Sigma processes.
• TheVisualArtsandPressDepartment,includingMiracleRieseforlayout/graphics, Debbie Gonzalez for editing, and Frances Battle for serving as liaison with the printers.
Other significant contributors from the DAU faculty were John Kelley of the Program Management Department; Robert Carlson, Kim Hunter, Bob Gustavus, Gerry Land, and Miriam Cohe of the Business, Cost Estimating, and Financial Management Department; Tom Simcik of the Logistics Management Department; and Randy Zittel of the Engineer-ing and Technology Department. Dr. Paul Alfieri, professor for T&E also provided valuable information on test and evaluation processes.
Tim ShannonDirector, Learning CapabilitiesIntegration Center
William ParkerDirector, Center for Acquisition Management

DAU PROGRAM MANAGERS TOOL KIT
vi

DAU PROGRAM MANAGERS TOOL KIT
vii
TABLE OF CONTENTSPreface ................................................................................................................................... iiiAcknowledgments .................................................................................................................. v
CHAPTER 1—ACQUISITION PROCESS AND RESOURCES ............. 1The Program Manager’s Bill of Rights and Responsibilities ........................................... 2Defense Acquisition Management System ..................................................................... 3Acquisition Categories (ACAT) ........................................................................................ 4Acquisition Strategy Considerations................................................................................ 5Acquisition, Technology and Logistics (AT&L) Knowledge
Management System .........................................................................................6–8Defense Acquisition Portal (DAP) ...............................................................................6Ask A Professor (AAP) ........................................................................................... 6Acquisition Community Connection (ACC) ........................................................... 6Defense Acquisition Guidebook (DAG) ................................................................. 7ACQuipedia ............................................................................................................ 7Integrated Defense AT&L Life Cycle Management System Chart ....................7–8AT&L ACQuire ........................................................................................................ 8Best Practices Clearinghouse (BPCh) ................................................................... 8Performance Learning Tools .................................................................................. 8
Defense Acquisition Board Timeline Milestones B, C, and FRPDR ............................... 9Milestone Decision Information—A Possible Construct .................................................. 9Requirements for Milestone/Decision Reviews ........................................................10–11Interoperability Certification ........................................................................................... 12S&T Linkage to Defense Acquisition Process ............................................................... 13Joint Capabilities Technology Demonstration (JCTD) ................................................... 14Acquisition Program vs. ATD and JCTD ....................................................................... 15Program Structure ......................................................................................................... 16
INTERNATIONAL ACQUISITION ............................................ 17–18DoD International Armaments Cooperation Policy ....................................................... 17The Scope of Defense Cooperation .............................................................................. 17Defense Sales vs. Cooperative Acquisition ................................................................... 18International Activities Associated with Defense Acquisition Phases ........................................18
FUNDS MANAGEMENT .......................................................... 19–33Resource Allocation Process—Overlap ........................................................................ 19PPBE—Planning Phase ................................................................................................ 20PPBE—Program/Budget Review .................................................................................. 20Resource Allocation Process ......................................................................................... 21Congressional Enactment Timetable ............................................................................ 22Procurement Appropriations (Account Numbers and Budget Activities) ................ 23–24Research, Dev., Test, and Eval. (RDT&E) Appropriations (Account Numbers) ................. 25RDT&E Appropriations (Relationship Between MFP 6 R&D Categories and RDT&E Appropriations Budget Activities) ................................... 25

DAU PROGRAM MANAGERS TOOL KIT
viii
CHAPTER 1—ACQUISITION MANAGEMENT (CONTINUED)
Sample Navy Appropriations and Budget Activities ...................................................... 26Appropriation Life ........................................................................................................... 27Below Threshold Reprogramming Actions .................................................................... 27Life Cycle Cost Composition ......................................................................................... 28Product Improvements .................................................................................................. 28Cost Estimating .............................................................................................................. 29Cost Estimating Relationships (CER)—Parametric ...................................................... 29Cost Estimating Requirements ...................................................................................... 30Program Cost and Schedule Breach Parameters ......................................................... 31Earned Value Management “Gold Card” ................................................................. 32–33
CONTRACTING ....................................................................... 34–38Contracting—Components of Contract Price ................................................................ 34Types of Contracts ......................................................................................................... 34Contract Type Features ........................................................................................... 35–36Pre-Solicitation Process ................................................................................................ 37Post-Solicitation Process ............................................................................................... 37Other Ways to Buy ......................................................................................................... 38
DEFENSE INDUSTRY BUSINESS MANAGEMENT ............... 39–45Contractor Profitability Ratios ........................................................................................ 39Aerospace/Defense Industry Contractor Profitability Ratios ......................................... 40Lockheed Martin Corp.—Dupont Formula Analysis (An Example) ................................... 41Cash Cycle..................................................................................................................... 42Contractor Financing and Payments ............................................................................. 42Direct and Indirect Costs ............................................................................................... 43Assigning Indirect Costs ................................................................................................ 43Life Cycle of Indirect Cost Rates ................................................................................... 44Contractor’s Cost Proposal ........................................................................................... 44Contractor Business Planning Process Outputs ........................................................... 45
LOGISTICS .............................................................................. 46–54Life Cycle Logistics ........................................................................................................ 46Principal Life Cycle Logistics Goals/Objectives ............................................................ 46
Goal 1: Life Cycle Sustainment Metrics ..........................................................46–47Goal 2: Affordable System Operational Effectiveness (SOE) ................................ 48Goal 3: DoD Product Support Strategy Process Model ..................................48–49Goal 4: Integrated Product Support Elements ................................................ 49–50Goal 5: Product Support Business Model (PSBM) ............................................... 51
The Sustainment Chart .................................................................................................. 52Logistics Management Community of Practice (LOG CoP) ......................................... 52Life Cycle Logistics Linkage to Defense Acquisition Process ....................................... 53Defense Acquisition Guidebook—Life Cycle Logistics ...................................... 54Life Cycle Logistics References and Guidance ........................................................... 54

DAU PROGRAM MANAGERS TOOL KIT
ix
CHAPTER 1—ACQUISITION MANAGEMENT (CONTINUED)
ORGANIZATION ...................................................................... 55–56Program Office Organization Structures (Examples) ............................................. 55–56 “Traditional” or Functional Structure ....................................................................... 55
“Pure” Product Structure ......................................................................................... 55Matrix Structure ........................................................................................................ 56Integrated Product Teams ........................................................................................ 56
MANUFACTURING .................................................................. 57–61The Role of Manufacturing in the Acquisition Process ................................................. 57Common Production Risks That Greatly Impact Cost, Schedule, and Performance .................................................................................... 57Producibility ..............................................................................................................58–61 Producibility (Defense Acquisition Guidebook) ............................................................ 58 Quality Management Systems (Defense Acquisition Guidebook) ........................... 59 Key Characteristics and Variation Reduction ......................................................59–60 Production Readiness Review (PRR) ....................................................................... 61 Additional Manufacturing Information Sources ......................................................... 61
TEST AND EVALUATION ........................................................ 62–67Test and Evaluation (T&E)—Types and Tasks .............................................................. 62Test and Evaluation Nomograph .............................................................................63–64Modeling and Simulation (M&S) Planning .................................................................... 65Hierarchy of Models and Simulations ............................................................................ 66The Evolution of Modeling and Simulation .................................................................... 67
PLANNING AND CONTROL TOOLS ....................................... 68–75Gantt Chart (Example) ................................................................................................... 68Milestone Chart (Example) ............................................................................................ 68 Network Schedules .................................................................................................. 69 Network Schedules—General ................................................................................. 69 Arrow Diagramming Method (ADM) ........................................................................ 69 Precedence Diagramming Method (PDM) .............................................................. 69Network Schedules (Example) ...................................................................................... 70Examples of Network Scheduling Software .................................................................. 71Schedule Development ................................................................................................. 72Lead Time Chart ............................................................................................................ 73Line of Balance Technique ............................................................................................ 74Acquisition Program Baseline ....................................................................................... 75
RISK MANAGEMENT .............................................................. 76–79Program Manager’s Checklist for Review of Tradeoff Planning and Studies .............................................................................................................76Technical Performance Measurement ....................................................................................... 76DoD Risk Management Process Model ........................................................................ 77Root Cause Analysis...................................................................................................... 77Risk Management Process—Details ............................................................................. 78Program Success Metrics Model * Summary ............................................................... 79

DAU PROGRAM MANAGERS TOOL KIT
x
CHAPTER 1—ACQUISITION MANAGEMENT (CONTINUED)
SYSTEMS ENGINEERING ....................................................... 80–98What is Systems Engineering? ..................................................................................... 80Systems Engineering Processes .................................................................................. 80Systems Engineering Policy in DoD .............................................................................. 80Systems Engineering Process—Technical Management Processes ..................................81Defense Acquisition Management System—Technical “V” Activities ............................ 82Materiel Solution Analysis Phase Systems Engineering SE Activities.......................... 83Technology Development Phase SE Activities .............................................................. 83Engineering and Manufacturing Development Phase (SE) Activities .............................. 84Production and Deployment Phase—SE Activities ............................................................ 85Operations and Support Phase—SE Activities ............................................................. 85Requirements (User Needs) Analysis Questions .......................................................... 86Attributes of a Well-Defined Requirement ..................................................................... 86Systems Engineering Design Process Illustrated ......................................................... 87Specification Development and Technical Reviews ...................................................... 88Technical Management Processes Key Questions ....................................................... 89Technical Review Definitions ................................................................................... 90–91Technical Review Best Practices ................................................................................... 92Program-Unique Specifications ..................................................................................... 93Performance vs. Detail Specifications ........................................................................... 94Configuration Management ........................................................................................... 95Interface Management ................................................................................................... 96Interface Control Concept .............................................................................................. 96Work Breakdown Structure (WBS) ................................................................................ 97How to Create a Work Breakdown Structure ................................................................ 98Basic Purposes of WBS ................................................................................................ 98
SOFTWARE ............................................................................ 99–102Software Development—Technical Review Relationships ........................................... 99Software Development—Key Life Cycle Review Factors ........................................... 100Candidate Software Measures (Metrics) ..................................................................... 101Quality Events for Software ......................................................................................... 101Software Management Best Practices ........................................................................ 102Software Acquisition Worst Practices .......................................................................... 102
CHAPTER 2—LEADERSHIP AND MANAGERIAL SKILLS .............. 103Management and Leadership...................................................................................... 103Program Management “Diamond Card” .............................................................. 104–105 Management .......................................................................................................... 104 Leadership ............................................................................................................. 104 Technology Readiness Levels ............................................................................... 105Empowerment, Delegation, and Coaching ......................................................... 106–107Coaching Skills ........................................................................................................... 107Generic Integrated Product Team (IPT) Process ....................................................... 108Formula for Effective Team Performance .................................................................... 109Team Charter ............................................................................................................... 110

DAU PROGRAM MANAGERS TOOL KIT
xi
CHAPTER 2—LEADERSHIP AND MANAGERIAL SKILLS (CONTINUED)
Working Groups .................................................................................................... 111–112 Team Development Wheel .....................................................................................111 Typical Working Groups ......................................................................................... 112 Management Tradeoffs for Working Groups ......................................................... 112Team Performance Model ........................................................................................... 112Team Decision Making ................................................................................................ 113Effective Meetings ....................................................................................................... 114Decision Briefing .......................................................................................................... 115Communications ...................................................................................................116–118 Counseling ............................................................................................................. 118Time Management ....................................................................................................... 119Management Tools and Techniques .................................................................... 120–121Continuous Process Improvement/Lean Six Sigma (CPI/LSS) .................................. 122
CHAPTER 3—PROBLEM-SOLVING TOOLS .................................... 123Brainstorming ....................................................................................................... 123–124Cause-and-Effect Diagram ......................................................................................... 125Force Field Analysis .................................................................................................... 126Histogram .................................................................................................................... 127Scatter Diagram .......................................................................................................... 128Surveys ........................................................................................................................ 129Affinity Diagram ........................................................................................................... 130Pairwise Ranking ................................................................................................. 131–132Pareto Chart................................................................................................................. 133Benchmarking .............................................................................................................. 134Flowcharting ........................................................................................................ 135–136Deployment Flowcharts ............................................................................................... 137Nominal Group Technique (NGT) ........................................................................ 138–139Creative Problem Solving ............................................................................................ 140Responsibility Assignment Matrix (RAM) .................................................................... 141Knot Chart .................................................................................................................... 142Qualitative Problem Solving ........................................................................................ 143Gantt Chart .................................................................................................................. 144

DAU PROGRAM MANAGERS TOOL KIT
xii

DAU PROGRAM MANAGERS TOOL KIT
1
CHAPTER 1 ACQUISITION PROCESSES AND RESOURCES
• Things that make you go “Hmmm?...”
4 The only thing most auditors fix is the blame.
4 Experience is something you got just after you needed it.
4 People are smarter than they look; listen to them.
4 The last 10 percent of the performance sought generates one- third of the cost and two-thirds of the problems.
4 Never open a can of worms unless you want to go fishing.
4 Those who believe it cannot be done, will you please get out of the way of those who are busy doing it?
• Things we should always remember.
4 Be honest in everything you say, write, and do.
4 Be good to your people, and they will be good to you.
4 Forgiveness is easier to obtain than permission.
4 Keep everyone informed; when in doubt, coordinate.
4 Be the first to deliver bad news.
4 Bad news does not get any better with time.
4 If you are sitting at your desk, you are not managing your program.

DAU PROGRAM MANAGERS TOOL KIT
2
THE PROGRAM MANAGER’S BILL OF RIGHTSAND RESPONSIBILITIES
Rights:
Program Managers have the RIGHT to:
• asingle,clearlineofauthorityfromtheDefenseAcquisitionExecutive;
• authoritycommensuratewiththeirresponsibilities;• timelyseniorleadershipdecisions;• becandidandforthcomingwithoutfearofpersonalconsequences;• speakfortheirprogramandhavetheirjudgmentsrespected;• receivethebestavailabletrainingandexperienceforthejob;and• begivenadequatefinancialandpersonnelresources.
Responsibilities:
Program Managers have the RESPONSIBILITY to:
• acceptprogramdirectionfromacquisitionexecutivesandimplementit expeditiously and conscientiously;
• managetheirprogramstothebestoftheirabilitieswithinapprovedresources;
• becustomer-focusedandprovidetheuserwiththebest,mostcost-effective systems or capabilities;
• innovate,striveforoptimalsolutions,seekbetterwaystomanage,and provide lessons-learned to those who follow;
• becandidaboutprogramstatus,includingrisksandproblemsaswell as potential solutions and likely outcomes;
• preparethoroughestimatesoffinancialandpersonnelresourcesthat will be required to manage the program; and
• identifyweaknessesintheacquisitionprocessandproposesolutions.

DAU PROGRAM MANAGERS TOOL KIT
3
DE
FE
NS
E A
CQ
UIS
ITIO
N M
AN
AG
EM
EN
T S
YS
TE
M(D
oD
I 500
0.02
)
AB
C
Pre-
Syst
ems
Acqu
isiti
on
User
Nee
ds
Prod
uctio
n &
Depl
oym
ent
Ope
ratio
ns &
Su
ppor
tEn
gine
erin
g an
dM
anuf
actu
ring
Deve
lopm
ent
FRP
Deci
sion
Revi
ew
Syst
ems
Acqu
isiti
onSu
stai
nmen
t
• Th
e M
ilest
one
Deci
sion
Aut
horit
y w
ill d
eter
min
e th
e
initi
al p
hase
of e
ntry
at t
he M
ater
iel D
evel
opm
ent D
ecis
ion.
• En
tranc
e cr
iteria
mus
t be
met
bef
ore
ente
ring
phas
e.•
Evol
utio
nary
acq
uisi
tion
or s
ingl
e-st
ep s
trate
gy is
use
d to
obt
ain
full
capa
bilit
y.
Mat
erie
l Sol
utio
nAn
alys
isM
ater
ial
Deve
lopm
ent
Deci
sion
Prog
ram
Initi
atio
n
Tech
nolo
gy D
evel
opm
ent
Tech
nolo
gy O
ppor
tuni
ties
& Re
sour
ces
Post
-PDR
Asse
ssm
ent
Post
-CDR
Asse
ssm
ent
LRIP
& IO
T&E
SCM
PDIS
DLi
fe C
ycle
Sust
ainm
ent
Disp
osal
Deci
sion
Poi
ntM
ilest
one
De
cisi
on P
oint
if P
DR is
not
con
duct
ed b
efor
e M
ilest
one
B.
IOC
FOC
LEG
END:
CD
R—
Crit
ical
Des
ign
Rev
iew
FOC
—Fu
ll Ope
ratio
nal C
apab
ility
FRP—
Full-
Rat
e Pr
oduc
tion
IOC
—In
itial O
pera
tiona
l Cap
abilit
y
IOT&
E—In
itial O
pera
tiona
l Tes
t & E
valu
atio
nIS
D—
Inte
grat
ed S
yste
m D
esig
nLR
IP—
Low
-Rat
e In
itial P
rodu
ctio
nPD
R—
Prel
imin
ary
Des
ign
Rev
iew
SCM
PD—
Syst
em C
apab
ility
& M
anuf
actu
ring
P
roce
ss D
emon
stra
tion

DAU PROGRAM MANAGERS TOOL KIT
4
ACQUISITION CATEGORIES (ACAT)
l DAB Review l Designated by USD(AT&L) l Decision by USD(AT&L) l Component Review l Designated by USD(AT&L) l Decision by Component Head/CAE
l ITAB Reviewl Designated by USD(AT&L)*l Decision by USD(AT&L)* l Component Review l Designated by USD(AT&L)* l Decision by Component Head/CAE
l Does Not Meet ACAT I Criteria l Designated by Svc Sec/CAE l Decision by Svc Sec/CAE
l Does Not Meet ACAT I, IA, or II Criteria
l Designated IAW Component Policy
l Decision IAW Component Policy
l Not otherwise designated ACAT I, IA, II, or III
l Designated IAW Navy Policy l Navy/USMC ACAT IVT/IVM l Decision at lowest appropriate level
ACAT ID:
ACAT IC:
ACAT IAM:
ACAT IAC:
ACAT II:
ACAT III:
ACAT IV:
MajorDefenseAcquisition Programs
Major AISAcquisition Programs
MajorSystems
All Others(except Navy and USMC)
NavyUSMC
SECNAVINST 5000.2_
No Fiscal Criteria
$140M RDT&E or $660M Procurement (FY 00 Constant $)
$378M Life Cycle Cost or $126M Total Program Cost or $32M Program Cost in any single year (FY 00 Constant $)
$365M RDT&E or $2.190B Procurement (FY 00 Constant $)
* May be delegated
LEGEND:ACAT— Acquisition CategoryAIS— Automated Information SystemCAE— Component Acquisition ExecutiveDAB— Defense Acquisition Board
ITAB— Information Technology Acquisition BoardRDT&E— Research, Development, Test, and EvaluationUSD(AT&L)— Under Secretary of Defense
(Acquisition, Technology and Logistics)

DAU PROGRAM MANAGERS TOOL KIT
5
ACQUISITION STRATEGY CONSIDERATIONS(Defense Acquisition Guidebook, Chapter 2)
NOTES: 1) The content of the Technology Development Strategy (TDS) due at Milestone A is very similar to the Acquisition Strategy due at Milestone B. 2) In addition to the Acquisition Strategy, there are five plans required: Acquisition Plan (FAR/DFARS), Program Protection Plan (PPP), Test and Evaluation Master Plan (TEMP) (DoDI 5000.02), Information Support Plan (ISP) (CJCSI 6212.01E ), and Systems Engineering Plan (DoDI 5000.02).
• AcquisitionApproach
— Modular Open Systems Approach Summary
— Tailoring• Source&RelatedDocuments• CapabilityNeeds• Top-LevelIntegratedSchedule
— EMD Top-Level Schedule *— MS C & FRP Top-Level Schedule *
• ProgramInterdependency&InteroperabilitySummary
• InternationalCooperation— Test Requirements for Export of
Defense Systems • Risk&RiskManagement• TechnologyMaturation• IndustrialCapability&Manufacturing
Readiness — Industrial Capability — Elevating Industrial Capability Issues — Industrial & Manufacturing Readiness— Sustaining Industrial Capabilities
• BusinessStrategy— Small Business & Small Business
Innovation Research ◆ Subcontracting Plan/Small Business
Participation◆ Performance Measurement◆ Small Business Innovation Research
Considerations— Contract Approach
◆ Performance-Based Business Strategy – Modular Contracting
◆ Contracting Bundling or Consolidation ◆ Major Contract(s) Planned
– Contract Type Selection– Sustainment Procurement Strategy
◆ Multi-Year Contracting ◆ Contract Incentives ◆ Warranties
◆ Leasing◆ Developmental Testing Requirements◆ Incorporation of Systems Engineering
Requirements• MarketResearch• Competition• ResourceManagement
— PM Office Staffing & Support Contractors
— Cost & Funding — Cost Control & CAIV Plan — Earned Value Management — Advanced Procurement
• ProgramSecurityConsiderations— Information Assurance — Critical Program Information & Program
Protection Plan Summary — Anti-Tamper Measures— Supply Chain Risk Management Key
Practices• TestandEvaluation• DataManagement
— Data Management & Technical Data Rights
— Integrated Data Management• Life-CycleSustainmentPlanning
— LCSP Executive Summary for Acquisition Strategy
• Life-CycleSignatureSupportPlan• Chemical,Biological,Radiologicaland
Nuclear Survivability• HumanResourcesIntegration• Environment,SafetyandOccupational
Health (ESOH)• MilitaryEquipmentValuation&
Accountability — Proper Financial Accounting Treatment
for Military Equipment — Accounting Review
• CorrosionPrevention&ControlPlan/Strategy

DAU PROGRAM MANAGERS TOOL KIT
6
ACQUISITION, TECHNOLOGY AND LOGISTICS (AT&L) KNOWLEDGE MANAGEMENT SYSTEM
< https://acc.dau.mil/at&lkm >(Composed of the following subsystems)
Defense Acquisition Portal (DAP)
The Defense Acquisition Portal (DAP) <https://dap.dau.mil/> was launched to replace the AT&L (Acquisition, Technology, and Logistics) Knowledge Sharing System (AKSS). Like its predeces-
sor, DAP continues to provide acquisition information for all DoD service components and across all functional disciplines. DAP serves as the central point of access for all AT&L resources and information, and to communicate acquisition reform. As the primary reference tool for the Defense Acquisi-tion workforce, it provides a means to link together information and refer-ence assets from various disciplines into an integrated, but decentralized, information source. Information is organized under eight major tabs: Home, Acquisition Process, Workforce, Policy, Communities of Practice, Training and Education, Industry, and DAU. DAP is one part of the AT&L Knowledge Management System (AKMS).
A major feature in DAP is the Acquisition Career Gateways <https://dap.dau.mil/career/Pages/Default.aspx>, where each acquisition career field provides specific career, training, and job-specific information and resourc-es. To tie it all together, the Search feature has been reengineered to make it easier to find specific learning assets or job support tools in the Portal.
Ask A Professor (AAP)
Ask a Professor (AAP) <https://akss.dau.mil/aap> is a service offered as part of AKMS. Users submit acquisition-related ques-tions and receive formal responses. In addition, the AAP contains
a database of questions and answers that are categorized by subject area and can be browsed or searched.
Acquisition Community Connection (ACC)
The ACC <https://acc.dau.mil/> is the collaborative component of the AKMS that focuses on acquisition-related topics and disci-plines such as contracting, logistics, program management, and
risk management. It consists of Communities of Practice, Special Interest Areas, and collaborative workspaces that:
• connectpeoplewithknow-howacrossDoDorganizationsandindustry;

DAU PROGRAM MANAGERS TOOL KIT
7
• enablememberstointeractandshareresources,ideas,andexperiences to support job performance and avoid duplication of effort; and
• identifypartnershipdevelopmentopportunities.
Members may request workspaces in ACC, which provide a way for physi-cally dispersed individuals to centrally locate and share documents and references as well as manage team projects. To learn more, go to the ACC <https://acc.dau.mil/> and take the online virtual tour.
Defense Acquisition Guidebook (DAG)
The DAG <https://acc.dau.mil/dag> provides links to policy, law, and useful content housed in communities of practice. It allows users to navigate through the DAG via a document index, graphi-
cal interface (Life Cycle System), or a search by topic.
ACQuipedia
The ACQuipedia <https://acquipedia.dau.mil/> is your acquisi-tion encyclopedia for common defense acquisition topics. Each topic is identified as an article; each article contains a definition, a
brief narrative that provides context, and links to the most pertinent policy, guidance, tools, practices, and training. Articles aggregate the most relevant references and learning assets to narrowly focus users and quickly provide high-value content.
Integrated Defense AT&L Life Cycle Management System Chart
(See next page for details)

DAU PROGRAM MANAGERS TOOL KIT
8
This chart <https://acc.dau.mil/ifc> is a pictorial road map of key activities in the systems acquisition process. Users navigate through a graphical model of the three major acquisition process
areas: Joint Capabilities Integration and Development System (JCIDS); De-fense Acquisition; and Planning, Programming, Budgeting, and Execution (PPB&E). The short title for this chart is Integrated Life Cycle (ILC) Chart.
AT&L ACQuire
ACQuire <https://acquire.dau.mil/> is a search tool focused on the specific needs of the Defense Acquisition Workforce. It uses the DAU acquisition taxonomy, trusted acquisition sites, and selected
AT&L resources to enhance searches and derive better results. Searches can be conducted by individual or multiple sites; document titles; topic; con-tent, via an index of major categories; and subcategories.
Courseware is also searchable via ACQuire. Users can suggest additional AT&L sites that should be included in ACQuire crawls.
Best Practices Clearinghouse (BPCh)
The BPCh <https://bpch.dau.mil/Pages/default.aspx> is an inno-vative “clearinghouse” approach that will improve all DoD acquisi-tion processes by helping AT&L professionals select and imple-
ment proven practices appropriate to the individual program needs. Initially, the BPCh will focus on software acquisition and systems engineering.
The Clearinghouse provides: • anauthoritativesourceforpractices,lessonslearned,andrisksto
avoid;• validatedpracticeswithconsistent,verifiableinformation;• anactiveknowledgebasetohelpwithpracticequestions;• anintelligentfront-endtoquicklygettoanswers;• usefulinformationandtoolstohelpfind,select,andimplement
practices appropriate to specific programs; and• livingknowledgethroughaconstantlyupdated,expanded,andrefined
database.
Performance Learning Tools
Performance Learning Tools (PLTs) link learning and job support assets to complicated process flow to help users create plans and other AT&L prod-ucts accurately and efficiently. The following PLTs have been developed:
• PricingSupportTool<http://pricingtool.dau.mil/>• Performance-BasedLogisticsToolkit<https://acc.dau.mil/pbltoolkit>

DAU PROGRAM MANAGERS TOOL KIT
9
OIPTReviewOIPT
Review
Defense Acquisition Board Timeline
25 DAYS
2 WEEKS20 DAYS
15 DAYS
10 DAYS
5 DAYSMilestone
45 DAYS40 DAYS
DABDAB
21 DAYS
6 MONTHS
Final DocumentCheck for OIPT
Final Documentto OSD
AoAResults toDir, CAPE
Final CCPto CAPE
CAPEBriefs FinalICE to PMCAPE briefs
PreliminaryICE to PM
DraftCARD
to CAPE
10 DAYS
3 DAYS
DABRead-Ahead
LEGEND: CAPE—Cost Assessment & Program EvaluationCARD—Cost Analysis Requirements DescriptionCCE—Component Cost Estimate
DAB—Defense Acquisition BoardICE—Independent Cost Estimate JROC—Joint Requirements Oversight Council
DABReadinessMeeting
DABPlanningMeeting
JROCReview
OIPTReport
CAPEReport to
OIPT
DEFENSE ACQUISITION BOARD TIMELINE —MILESTONES B, C, AND FRPDR
MILESTONE DECISION INFORMATION — A POSSIBLE CONSTRUCT
1
• Have I presented all necessary information?• Does the information flow logically?
2 WHAT?• Requirement
• Analysis of Alternatives
3 HOW?• Acquisition Strategy
RISKS?• Risk Management Plan• Test & Evaluation Plan
• Test & Evaluation Results
4 COSTS?• CAIV Objectives
• Life Cycle Cost Estimate• Independent Cost Estimate
5 MANAGEMENT?• Program Management Office Structure
• Integrated Product Team• WIPT—OIPT Structure
6
AGREEMENT?• Acquisition Program Baseline
• Acquisition Decision Memorandum• Exit Criteria
7
WHY?• Threat
• Capability
• Is the information clear and accurate?• Is it concise, executive-level information?
LEGEND:CAIV—Cost as an Independent VariableOIPT—Overarching Integrated Product TeamWIPT—Working-Level Integrated Product Team

DAU PROGRAM MANAGERS TOOL KIT
10
REQUIREMENTS FOR MILESTONE/DECISION REVIEWSSee encl 4, DoDI 5000.02
Milestone/Decision Point
Requirement MDD A B P-CDRA C FRP
Acquisition Decision Memorandum 5 X X X X X X
Acquisition Program Baseline 5 X X X
Acquisition Strategy 5 (see Page 5) X X X
Acquisition Information Assurance Strategy (all IT incl NSS) X X X X
Affordability Assessment X X
Alternate LF T&E Plan (programs with waiver from full-up LFT&E) 2 X
Analysis of Alternatives (AoA) 3, 5 X X X X
AoA Study Guidance X
Benefit Analysis & Determination 1,8 (bundled acquisitions) X
Beyond LRIP Report 2 (incl MDAPs that are also MAIS) X
Capability Development Document (CDD) 5 X
Capability Production Document (CPD) X
Clinger-Cohen Act (CCA) Compliance 5,7 X X X X
Competition Analysis 1 ,8 (depot-level maintenance rule) X
CIO Confirmation of CCA Compliance (DoD CIO for MAIS and MDAP) X X X X
Component Cost Estimate 5,9 (MAIS; optional MDAP) X X X
Consideration of Technology Issues (MDAP & MAIS) X X X
Cooperative Opportunities 1 X X X
Core Logistics/Source of Repair Analysis 1,8 X X
Corrosion Prevention Control Plan1 X X
Cost Analysis Requirements Description 5,9 (MDAP & MAIS) X X X
Data Management Strategy 1 (MDAP, MAIS & ACAT II) X X X X
Economic Analysis (MAIS) 7 (may be combined w/AoA at MSA) X X X
Exit Criteria 5 X X X X
Industrial Base Capabilities 1 (MDAPs only) X X X
Independent Cost Estimate (ICE) 5,10,15 (MDAPs only) X X X X
Independent Technology Readiness Assessment 11 X X
Information Support Plan 1,5 X X X
Initial Capabilities Document (ICD) 4,5 X X X X
Initial Operational Test & Evaluation Completed (ACAT I & II) X
Item Unique Identification (IUID) Plan (Part of SEP) X X X
Joint Interoperability Test Certification (IT & NSS) X
Life-Cycle Signature Support Plan 5 X X X
Life-Cycle Sustainment Plan 1 X X X
LF T&E Waiver 2 (covered systems) (n/a MAIS) X
LF T&E Report 2 (covered systems) (n/a MAIS) X

DAU PROGRAM MANAGERS TOOL KIT
11
Milestone/Decision Point
Requirement MDD A B P-CDRA C FRP
LRIP Quantities MDAP & ACAT II (n/a AIS) X
Manpower Estimate (MDAPS only) 5 X X X
Market Research X X
Milestone Decision Authority (MDA) Certification (MDAPs only)4 X X X
MDA assessment of chem, bio, rad, and nuc survivability X X
Military Equipment Validation 1 X X
Net-Centric Data Strategy 5,12 X X X
Operational Test Agency Report of OT&E Results X X X
Preliminary Design Review (PDR) Report16 X
Post-Critical Design Review (CDR) Report X
Post Implementation Review X
Program Protection Plan (PPP) 1 X X X
Prog Environment, Safety & Occup Health Evaluation (PESHE)5 X X X
Replaced System Sustainment Plan 5 (MDAPs only) X
Selected Acquisition Report (SAR) 4,13
Spectrum Supportability Determination 8 X X
System Threat Assessment (STA) (ACAT II) 5,14 X X
System Threat Assessment Report (STAR) (ACAT I) 5,6 X X
Systems Engineering Plan (SEP) X X X
Technology Development Strategy (TDS) X X X
Technology Readiness Assessment (TRA) 5 X X
Test & Evaluation Master Plan (TEMP) X X X
Test & Evaluation Strategy (TES) X
1 Part of TDS or Acquisition Strategy2 OSD T&E Oversight Programs 3 MDAP: A,B,C; MAIS: A, B, FRP4 Milestone C if Program Initiation5 Program Initiation for Ships6 Validated by DIA for ACAT ID; AIS use DIA validated capstone info/ops Threat Assessment Decision7 Milestone C if equivalent to FRP8 Milestone C if no Milestone B9 MAIS whenever an economic analysis is required10 May be CAIG Assessment at Milestone A11 ACAT ID only if required by DDR&E12 Summarized in TDS; details in ISP13 SAR at program initiation; annually thereafter14 Validated by Component; AIS use DIA validated capstone info/ops Threat Assessment Decision15 MDA may request cost assessment at Milestone A16 If PDR is after Milestone B, MDA will conduct a post-PDR assessment review

DAU PROGRAM MANAGERS TOOL KIT
12
IT a
nd N
SS e
mpl
oyed
by
U.S
. For
ces
shal
l, w
here
requ
ired
(bas
ed o
n ca
pabi
lity c
onte
xt),
inte
rope
rate
with
exis
ting
and
plan
ned,
sys
tem
s an
d eq
uipm
ent,
of jo
int,
com
bine
d an
d co
alitio
n fo
rces
and
with
oth
er U
.S. G
over
nmen
t Dep
artm
ents
and
Age
ncie
s, a
s ap
prop
riate
.
D
oD D
irect
ive 4
630.
08
Serv
ice/
Agen
cy
USJ
FCO
M re
view
s N
R-K
PPs
& so
lutio
n ar
chite
ctur
es
J-6
Inte
rop
erab
ility
an
d S
up
po
rtab
ility
Cer
tifi
cati
on
Join
tSt
aff
Join
tSt
aff
Com
bata
ntC
omm
ands
JIT
C In
tero
per
abili
ty T
est
Cer
tifi
cati
on
•JI
TCw
itnes
ses/
cond
ucts
inte
rope
rabi
lityte
sts,
and
•Pr
ovid
esJ
oint
Inte
rope
rabi
lityT
estC
ertifi
catio
nva
lidfo
r4y
ears
oru
ntil
chan
ges
occu
r tha
t affe
ct in
tero
pera
bility
of t
he c
ertifi
ed c
apab
ility
Cer
tifica
tion
TEM
P/Te
st R
esul
tsJI
TC
CD
DC
PD ISP*
LEG
END:
CDD
— C
apab
ility
Deve
lopm
ent D
ocum
ent
CPD
— C
apab
ility
Prod
uctio
n Do
cum
ent
J-6
Cer
tifica
tion*
Serv
ice/
Agen
cy
ISP
— In
form
atio
n Su
ppor
t Pla
n JI
TC —
Joi
nt In
tero
pera
bility
Test
Com
man
d
INT
ER
OP
ER
AB
ILIT
Y C
ER
TIF
ICA
TIO
N
(CJC
SI 6
212.
01E
)
TEM
P —
Test
and
Eva
luat
ion
Man
agem
ent P
lan
*NR-
KPP
certi
ficat
ion

DAU PROGRAM MANAGERS TOOL KIT
13
(1)
(2)
(2)
(3)
(4)
(3)
War
fight
ing
Need
s&
R&D
Obj
ectiv
es
Syst
ems
S&T
Tech
Bas
e
Adv
Tech
Dev
• Bas
ic R
esea
rch
Appl
ied
Rese
arch
•
• Joi
nt C
apab
ilitie
s Tec
h De
mo
Adva
nced
Tech
nolo
gy D
emo
Lab/
field
Dem
oW
arfig
htin
gEx
perim
ents
• • •
STO
P
STO
P
Ove
rsig
htPa
nel
Ove
rsig
htPa
nel
Opt
ions
:(1
) De
velo
p co
ncep
ts fo
r new
sys
tem
s.(2
) In
sert
into
ong
oing
sys
tem
s de
velo
pmen
t.(3
) Up
grad
e sy
stem
in p
rodu
ctio
n/ou
tof
pro
duct
ion
or fi
elde
d sy
stem
s.(4
) Im
prov
e su
stai
nmen
t or d
emili
tariz
e/di
spos
e.
Prod
uctio
n &
Depl
oym
ent
Ope
ratio
ns &
Su
ppor
tEn
gine
erin
g &
Man
ufac
turin
g De
velo
pmen
tM
ater
iel S
olut
ion
Anal
ysis
Tech
nolo
gy D
evel
opm
ent
AB
C
FRP
Deci
sion
Revi
ew
Mat
eria
lDe
velo
pmen
tDe
cisi
on
Post
-PDR
Asse
ssm
ent
Post
-CDR
Asse
ssm
ent
IOC
FOC
LRIP
FRP&
DIS
DLi
fe C
ycle
Sust
ainm
ent
Disp
osal
SCM
PD MDA
DECI
SIO
N
LRIP
—Lo
w-R
ate
Initi
al P
rodu
ctio
nM
DA—
Mile
ston
e D
ecis
ion
Auth
ority
PDR
—Pr
elim
inar
y D
esig
n R
evie
wSC
MPD
—Sy
st C
apab
ility
& M
anuf
Pro
c D
emo
LEG
END:
CD
R—
Crit
ical
Des
ign
Rev
iew
FOC
—Fu
ll O
pera
tiona
l Cap
abilit
yFR
P—Fu
ll-R
ate
Prod
uctio
nIO
C—
Initi
al O
pera
ting
Cap
abilit
yIS
D—
Inte
grat
ed S
yste
ms
Des
ign
S&
T L
INK
AG
E T
O D
EF
EN
SE
AC
QU
ISIT
ION
PR
OC
ES
S

DAU PROGRAM MANAGERS TOOL KIT
14
JOINT CAPABILITIES TECHNOLOGY DEMONSTRATION (JCTD)
JCTD EXECUTION APPROACHAnnual call for proposals; proposals submitted at any time • CandidateprojectsidentifiedbyCombatantCommands,Servicesand
Agencies, Interagency or Coalition Partners, and industry• Joint/InteragencyGovernment-ledteamsbuildproposals• TechnicalmanagerfromServiceorAgency• OperationalmanagerfromCombatantCommandchain-of-command• TransitionmanagerfromAcquisitionCommunity• USD(AT&L)approvalofrecommendednewstarts• CongressionalNotification• DDR&E/RapidFieldingDirectorateoversightduringprojectexecution• Operationaldemonstrationandrigorousassessment• Continuoustransitionofcapabilitiesdemonstratingrequired
capabilitiesBeginning in FY10: • QuarterlyCandidateDecisionBoardstorecommendnewstarts,
chaired by DDR&E, co-chaired by Joint Staff Deputy J8• QuarterlyReviewBoardstoreviewongoingprojects• Moreshortprojects(1yearorless);fewerlong-termprojects(more
than 1 year)• Allprojectsstructuredfordeliverablesinfirstyear,withannualreview• JROCvalidationfollowingfirstyearofexecution
CDB &(DDR&E
Approval)USD (AT&L)
ApprovalNotify
Congress
CDB &(DDR&E
Approval)USD (AT&L)
ApprovalNotify
Congress
JCTD Project Review Boards
Annual Review and Approval for New Fiscal Year Starts
JCTD Identification, Selection, and Review
Jan Feb Mar Apr May Jun Jul Aug Sep Oct Now Dec
CNB
PRB
New JCTDProposals
PRB PRBPRB
Rack &Stack
CDB &DDR&E
Approval
CDB &(DDR&E
Approval)USD (AT&L)
ApprovalNotify
Congress
USD(AT&L)Approval
NotifyCongress
Legend:CDB — Candidate Decision BoardCNB — Candidate Nomination Board PRB — Project Review Board

DAU PROGRAM MANAGERS TOOL KIT
15
AC
QU
ISIT
ION
PR
OG
RA
M v
s. A
TD
AN
D J
CT
D
Imp
lem
enta
tio
n D
irec
tive
/ FA
R/O
TA
• G
ain
un
der
stan
din
g o
f an
d
eval
uat
e u
tility
pri
or
to
acq
uis
itio
n d
ecis
ion
• D
evel
op
co
nce
pts
of
op
erat
ion
an
d d
oct
rin
e
JRO
C A
pp
rova
l an
d
Pri
ori
tiza
tio
n
Ro
le o
f U
ser
Mo
tiva
tio
n
Do
cum
ente
dN
eed
Ove
rsig
ht
Fu
nd
ing
AC
AT
Co
nfi
gu
rati
on
an
d T
esti
ng
Ru
les
Fu
lly F
YD
P F
un
ded
Acq
uis
itio
n
Pro
gra
m
• D
evel
op
, pro
du
ce,
and
fiel
d s
yste
m•
Co
st, s
ched
ule
, p
erfo
rman
ce
ICD
/CD
D/C
PD
Mile
sto
ne
Dec
isio
n
Au
tho
rity
Do
D 5
000
Ser
ies/
FA
R
All
AC
AT
Sys
tem
/Su
bsy
stem
P
roto
typ
es D
T/O
T
Max
Invo
lvem
ent
Ad
van
ced
Tec
hn
olo
gy
Dem
on
stra
tio
n (
AT
D)
No
t A
CA
T E
ffo
rt
• D
emo
nst
rate
feas
ibili
ty
and
mat
uri
ty•
Red
uce
tech
nic
al r
isks
an
d u
nce
rtai
ntie
s at
re
lativ
ely
low
co
st
No
t Req
uir
ed
Ser
vice
-Lev
el L
abs/
R
&D
Cen
ters
RD
T&
E
Tech
no
log
y D
emo
nst
rati
on
s
Info
rmal
/FA
R/O
TA
So
me
Invo
lvem
ent
Join
t C
apab
ility
Tec
h
Dem
on
stra
tio
n (
JCT
D)
DD
R&
E O
vers
igh
t P
anel
wit
h
Join
t S
taff
RD
T&
E (
2 ye
ars
in fi
eld
)
No
t A
CA
T E
ffo
rt
Max
Invo
lvem
ent
Tech
Dem
on
stra
tio
ns
in F
ield
E
nvir
on
men
t/M
UA
LEG
END:
ACAT
—Ac
quisi
tion
Cat
egor
y C
DD
—C
apab
ility
Dev
elop
men
t Doc
umen
tC
PD—
Cap
abilit
y Pr
oduc
tion
Doc
umen
tD
DR
&E—
Dire
ctor
, Def
ense
Res
earc
h &
Engi
neer
ing
DT/
OT—
Dev
elop
men
tal/O
pera
tiona
l Tes
ting
FAR
—Fe
dera
l Acq
uisit
ion
Reg
ulat
ion
FYD
P—Fu
ture
Yea
rs D
efen
se P
rogr
am
ICD
—In
itial C
apab
ilitie
s D
ocum
ent
MU
A—M
ilitar
y U
tility
Ass
essm
ent

DAU PROGRAM MANAGERS TOOL KIT
16
PR
OG
RA
M S
TR
UC
TU
RE
(Exa
mpl
e—N
o S
trea
mlin
ing)
Mile
ston
eRe
view
s &
Phas
es
Cont
ract
Awar
d(In
crem
ent 1
)
Tech
nica
lRe
view
s(In
crem
ent 1
)
Test
ing
(Incr
emen
t 1)
LFT&
E
FY01
FY02
FY03
FY04
FY05
FY06
FY07
FY08
FY09
FY10
FY11
FY12
FY13
FY14
Deliv
erie
s(In
crem
ent 1
)ED
MLR
IPPr
oduc
tion
EOA
OA
BFR
P IO
CIn
crem
ent 2
BC
IOC
MSA
Tech
Dev
RDT&
EPr
ocur
emen
tO
&MM
ILCO
N
TD
Incr
emen
t 3
BC
Full-
Rate
Pro
d &
Depl
Full-
Rate
Pro
d &
Depl
A
Post
-CD
R A
Post
-CD
R A
LRIP
PRO
DM
SAEM
D
A
Prod
uctio
n &
Depl
oym
ent
FRP
C
Eng
& M
anuf
Dev
elop
men
t IS
DSC
MPD
Post
-CD
R A
(Eng
Dev
Mod
els)
Prot
otyp
eCo
mpe
titio
n
MDD
FOT&
EIO
T&E
A
FRP
IOC
LRIP
Full-
Rate
Pro
d &
Depl
Ope
ratio
ns &
Sup
port
Post
-PD
R A DT
&E

DAU PROGRAM MANAGERS TOOL KIT
17
DOD INTERNATIONAL ARMAMENTS COOPERATION POLICY
“PMs shall pursue international armaments cooperation to the maximum extent feasible, consistent with sound business practice and with the overall political, economic, technological, and national security goals of the United States. International agreements for international armaments cooperation programs shall complete the interagency consultation and Congressional notification requirements contained in 10 U.S.C. 2350a, Section 2751 of the Arms Export Control Act, and 10 U.S.C. 2531.”
— DoDD 5000.01 (Para E1.1.1)
Production and RDT&E Procurement Follow-on Support
Information Foreign Military Sales Cooperative LogisticsExchanges Supply Support
Engineer and Direct Commercial Sales Mutual SupportScientist Exchanges Exchanges
Cooperative R&D Cooperative Production Logistics Support (Joint Funds)
Comparative or Coproduction/Licensing Host Nation SupportJoint Testing (Foreign Funds) Defense Industrial BaseStandardization Reciprocal Procurement
The Program Manager’s Focus
THE SCOPE OF DEFENSE COOPERATION

DAU PROGRAM MANAGERS TOOL KIT
18
INTERNATIONAL ACTIVITIES ASSOCIATED WITH DEFENSE ACQUISITION PHASES
DEFENSE SALES vs. COOPERATIVE ACQUISITION
They are Different
• Defense Sales– AnyNation– U.S.Contracts(FMS)– U.S.Manages(FMS)– ProductionandSupport– Dept.ofStateorDept.
of Commerce + DoD (USD(Policy))
– ForeignInitiated– ForeignFunds(orU.S. Credit/Grants)
• Cooperative Acquisition– AlliedorFriendly– U.S.,AllyorNATO– JointlyManaged– AllAcquisition– DoD(USD(AT&L))+
Dept. of State and Dept. of Commerce
– U.S.and/orForeignInitiated– Foreign+U.S.Funds
LEGEND:DEA—Data Exchange AgreementEMD—Engineering & Manufacturing DevelopmentIEP—Information Exchange ProjectS&E—Science and Engineering
Cooperative ProductionCoproduction Licensed Production Production SharingForeign Military Sales
Technology Opportunitiesand User Capability Needs
NATO ForumsDEAs/IEPsStaff TalksS&E Exchanges
Cooperative DevelopmentInternational Testing
Materiel Solution Analysis andTechnology Development
System Capability and Manufacturing Process Demo of EMD Phase
Production andDeployment, Sustainment

DAU PROGRAM MANAGERS TOOL KIT
19
RE
SO
UR
CE
AL
LO
CA
TIO
N P
RO
CE
SS
—O
VE
RL
AP
FY11
FY12
FY13
FY14
FY15
CY11
CY12
CY13
Enac
tmen
tEx
ecut
ion
Plan
ning
Prog
ram
min
g &
Budg
etin
gEn
actm
ent
Plan
ning
Enac
tmen
tEx
ecut
ion
Exec
utio
n
Prog
ram
min
g &
Budg
etin
gPl
anni
ng
FY12
FY11
& p
rior
FY12
& p
rior FY
13
FY13
& p
rior
DPPG
FY1
4–18
POM
FY1
3–17
BES
FY13
FY14
FY14
&pr
ior
DPPG
FY1
5–19
DPPG
FY1
3–17
POM
FY1
4–18
BES
FY14
LEG
END:
D
PPG
—D
efen
se P
lann
ing
& Pr
ogra
mm
ing
Gui
danc
e
PB
—Pr
esid
ent’s
Bud
get
POM
—Pr
ogra
m O
bjec
tives
Mem
oran
dum
BE
S—Bu
dget
Est
imat
e Su
bmis
sion
JF
MA
MJ
AS
ON
DJ
Exec
utio
n
JF
MA
MJ
AS
ON
DJ
JF
MA
MJ
AS
ON
DJ
POM
FY1
5–19
BES
FY15
Prog
ram
min
g &
Budg
etin
g
PB
PB
PB

DAU PROGRAM MANAGERS TOOL KIT
20
PPBE—PLANNING PHASE
PPBE—PROGRAM/BUDGET REVIEW
LEGEND:CPR—Chairman’s Program Recommendation CJCS—Chairman, Joint Chiefs of Staff
DPPG—Defense Planning & Programming GuidanceQDR—Quadrennial Defense Review
FEBPresident
NationalSecurityStrategy
NationalDefenseStrategy
NationalMilitaryStrategy
Joint Strategy Review(Joint Staff, Combatant Commands, Military Departments)
National Security Council
National Strategy DocumentsProvide Input to PPBE
MAR APR MAY JUN
SECDEFJoint Staff/OSD
CJCSJoint Staff
ComponentsMilitary DepartmentsDefense AgenciesUnified Commands
every 4 years SECDEFQDR
CPR
DPPG
Front End Assessments
FEBDEC
SECDEF
CPA
POM
BES
Components
Components (PEO/PM)
Budget Review
Program Review
SECDEF Option
President’sBudget
Major BudgetIssues
UpdatesFYDP
UpdatesFYDP
Military DepartmentsDefense AgenciesUnified Commands
ResourceManagement
Decisions
OSD/OMB
OSD/3-Star Programmers/DAWG
Answer questions / Reclama decisions
OSD Budget Execution & Program Performance Review
Front End Assessments
CJCS
NOVOCTAUGJUL
LEGEND:BES—Budget Estimate SubmissionCPA—Chairman’s Program AssessmentDAWG—Deputy’s Advisory Working Group
FYDP—Future Years Defense ProgramPOM—Program Objectives Memorandum

DAU PROGRAM MANAGERS TOOL KIT
21
RE
SO
UR
CE
AL
LO
CA
TIO
N P
RO
CE
SS
Phas
e II:
Phas
e I:
Test
imon
yAp
peal
sAl
loca
tion/
Exec
utio
n
Phas
e III
:
Phas
e IV
:
Cong
ress
Enac
tmen
t
Budg
etCo
mm
ittee
s
Pres
iden
t’sBu
dget
PPBE
DoD
Pres
iden
t&
OM
B
Auth
oriz
atio
nCo
mm
ittee
sAu
thor
izat
ion/
Appr
opria
tion
Acts
Pas
sed
Appr
opria
tion
Com
mitt
ees
Appo
rtion
men
t

DAU PROGRAM MANAGERS TOOL KIT
22
CO
NG
RE
SS
ION
AL
EN
AC
TM
EN
T T
IME
TAB
LE
15
15
^
^
BU
DG
ETR
ESO
LUTI
ON
AU
THO
RIZ
ATI
ON
APP
RO
PRIA
TIO
N
JAN
FEB
AP
RM
AR
MA
YJU
NJU
LA
UG
SE
PO
CT
“TA
RG
ET”
FIS
CA
LY
EA
R
PRES
BU
DG
ET CO
MM
ITTE
EIN
PUTS
HO
USE
SEN
ATE
HO
USE
SEN
ATE
AC
T
CO
NF/
REP
T
CO
NF/
REP
T
FLO
OR
FLO
OR
FLO
OR
FLO
OR
FLO
OR
HR
NG
S M
AR
KS
FLO
OR
BIL
L/R
PT
BIL
L/R
PT
BIL
L/R
PT
BIL
L/R
PT
HO
USE
SEN
ATE
RES
OLU
TIO
NC
ON
F
HR
NG
S M
AR
KS
FLO
OR
HA
SC H
RN
GS
M
AR
K-U
P
FLO
OR
SASC
HR
NG
S
MA
RK
-UP
FL
OO
R
HA
C H
RN
GS
M
AR
K-U
P
FLO
OR
SAC
HR
NG
S
MA
RK
-UP
FL
OO
R
AC
T
^
FLO
OR
^

DAU PROGRAM MANAGERS TOOL KIT
23
PROCUREMENT APPROPRIATIONS(Account Numbers and Budget Activities)
Appropriation Budget ActivityArmy (21 -)
Aircraft - 2031 1 Aircraft 2 Modification of Aircraft 3 Spares and Repair Parts 4 Support Equipment and FacilitiesMissile - 2032 1 Not Used 2 Other Missiles 3 Modification of Missiles 4 Spares and Repair Parts 5 Support Equipment and Facilities
Weapons and Tracked - 2033 1 Tracked Combat Vehicles Combat Vehicles 2 Weapons and Other Combat Vehicles 3 Spares and Repair PartsAmmo - 2034 1 Ammo 2 Ammo Production Base SupportOther - 2035 1 Tactical and Support Vehicle 2 Communications and Electronics 3 Other Support Equipment 4 Initial Spares
Navy (17 -)
Aircraft - 1506 1 Combat Aircraft 2 Airlift Aircraft 3 Trainer Aircraft 4 Other Aircraft 5 Modification of Aircraft 6 Aircraft Spares and Repair Parts 7 Aircraft Support Equipment and FacilitiesWeapons - 1507 1 Ballistic Missiles 2 Other Missiles 3 Torpedoes and Related Equipment 4 Other Weapons 5 Not Used 6 Spares and Repair PartsAmmo, Navy and - 1508 1 Ammo, Navy Marine Corps 2 Ammo, Marine Corps
Shipbuilding - 1611 1 Not Used and Conversion 2 Other Warships 3 Amphibious Ships 4 Not Used 5 Auxiliaries, Craft, and Prior-Year Program CostsOther - 1810 1 Ships Support Costs 2 Communications and Electronics Equipment 3 Aviation Support Equipment 4 Ordnance Support Equipment 5 Civil Engineering Support Equipment 6 Supply Support Equipment

DAU PROGRAM MANAGERS TOOL KIT
24
PROCUREMENT APPROPRIATIONS(Account Numbers and Budget Activities) (Continued)
Other (continued) -1810 7 Personnel and Command Support Equipment 8 Spares and Repair Parts
Marine Corps (17 -)
Procurement - 1109 1 Not Used 2 Weapons and Combat Vehicles 3 Guided Missiles and Equipment 4 Communications and Electronics Equipment 5 Support Vehicles 6 Engineering and Other Equipment 7 Spares and Repair Parts
Air Force (57 -)
Aircraft - 3010 1 Combat Aircraft 2 Airlift Aircraft 3 Trainer Aircraft 4 Other Aircraft 5 Modification of In-Service Aircraft 6 Aircraft Spares and Repair Parts 7 Aircraft Support Equipment and Facilities
Missile - 3020 1 Ballistic Missiles 2 Other Missiles 3 Modification of In-Service Missiles 4 Spares and Repair Parts 5 Other Support
Ammo - 3011 1 Ammo 2 Weapons
Other - 3080 1 Not Used 2 Vehicular Equipment 3 Electronics and Telecommunications Equipment 4 Other Base Maintenance and Support Equipment 5 Spares and Repair Parts
Defense (97 -)
Defense-wide - 0300 1 Major Equipment 2 Special Operations Command 3 Chemical/Biological DefenseNational Guard - 0350 1 Reserve Equipment and Reserve 2 National Guard Equipment Equipment Defense Production - 0360 1 Defense Production Activity Purchases Activity PurchaseChemical Agents - 0390 1 Chemical Agents and Munitions Destruction—O&M and Munitions 2 Chemical Agents and Munitions Destruction—RDT&E Destruction 3 Chemical Agents and Munitions Destruction— ProcurementRapid Acquisition Fund -2095 1 Rapid Acquisition Fund
Appropriation Budget Activity

DAU PROGRAM MANAGERS TOOL KIT
25
RDT&E APPROPRIATIONS(Relationship Between MFP 6 R&D Categories and
RDT&E Appropriations Budget Activities)
RESEARCH, DEVELOPMENT, TEST, AND EVALUATION (RDT&E) APPROPRIATIONS
(Account Numbers)
MFP 6 RDT&E R&D Budget RDT&E Category Activity Budget Activity Title
6.1 BA 1 Basic Research 6.2 BA 2 Applied Research6.3 BA 3 Advanced Technology Development6.4 BA 4 Advanced Component Development and Prototypes6.5 BA 5 System Development and Demonstration6.6 BA 6 RDT&E Management Support --- BA 7 Operational System Development
*NOTE: Although similar, titles of the Major Force Program (MFP) 6 categories (which are not shown above) are not exactly the same as titles of the RDT&E Appropriation Budget Activities. In addition, the “Operational System Development” Budget Activity for RDT&E BA 7 is not considered MFP 6. While correctly funded with RDT&E dollars, these efforts do not fall under a MFP 6 Category; rather, for MFP purposes, the efforts are considered part of the MFP that the fielded operational system falls within. Congress calls BA 4, Demonstration and Validation, and calls BA 5, Engineering and Manufacturing Development.
Account Appropriation Number
RDT&E,Army 21–2040RDT&E,Navy 17–1319RDT&E,AirForce 57–3600RDT&E,Defense-wide 97–0400DevelopmentT&E,Defense 97–0450OperationalT&E,Defense 97–0460
LEGEND:BA—Budget ActivityMFP—Major Force Program
R&D—Research and DevelopmentT&E—Test and Evaluation

DAU PROGRAM MANAGERS TOOL KIT
26
SAMPLE NAVY APPROPRIATIONS AND BUDGET ACTIVITIES
*Below Threshold Reprogramming (BTR) amount limits are cumulative over entire period of time the specific fiscal year appropriation is available for obligation purposes (i.e., 1, 2, 3, or 5 years).**Reference Source: DoD FMR, Volume 3, Chapter 6, a/o September 2010.
PROCUREMENT (Proc.)
SCN-1 Not Used Lesser of Lesser of 5 FullSCN-2 Ship Conversion—Other Warships +$20M or -$20M orSCN-3 Ship Conversion—Amphibious Ships +20% of -20% ofSCN-4 Not Used amount amountSCN-5 Ship Conversion—Auxiliaries, Craft, and appropriated appropriated Prior-Year Program Costs
WPN-1 Weapons Proc—Ballistic Missiles 3 WPN-2 Weapons Proc—Other MissilesWPN-3 Weapons Proc—Torpedos and EquipmentWPN-4 Weapons Proc—Other WeaponsWPN-5 Not UsedWPN-6 Weapons Proc—Spares and Repair Parts
OPN-1 Other Proc—Ship Support Equipment (SE)OPN-2 Other Proc—Comm./Electronics Equip.OPN-3 Other Proc—Aviation SEOPN-4 Other Proc—Ordnance SEOPN-5 Other Proc—Civil Engineering SEOPN-6 Other Proc—Supply SEOPN-7 Other Proc—Pers. and Command SEOPN-8 Other Proc—Spares and Repair Parts
APN-1 Aircraft Proc—Combat AircraftAPN-2 Aircraft Proc—Airlift AircraftAPN-3 Aircraft Proc—Trainer AircraftAPN-4 Aircraft Proc—Other AircraftAPN-5 Aircraft Proc—Modifications of AircraftAPN-6 Aircraft Proc—Aircraft Spares and Repair PartsAPN-7 Aircraft Proc—Aircraft SE and Facilities
6.1 BA 1 Basic Research Lesser of Lesser of 2 Incremental6.2 BA 2 Applied Research +$10M or -$10M or 6.3 BA 3 Advanced Tech. Development +20% of -20% of6.4 BA 4 Adv. Comp. Dev. and Prototypes amount amount6.5 BA 5 System Devel. and Demo. appropriated appropriated6.6 BA 6 RDT&E Management Support (T&E Ranges) (Civilian Salaries) BA 7 Operational Systems Devel. (Post-Production)
Procurement Below Threshold Years Available Budget Budget Activity Reprogramming Rules for Obligation Funding Activity Description Max In Max Out Purposes Policy (At Line Item Level)
MFP 6 Below Threshold Years Available R&D RDT&E Budget Activity (BA) Reprogramming Rules for Obligation Funding Category Number and Title Max In* Max Out* Purposes Policy (At Prog. Element Level)
Below Threshold Years Available Reprogramming Rules for Obligation FundingOther Appropriations / Titles Max In Max Out Purposes Policy
O&M, N Operations and Maintenance $15M No Congressional 1 Annual Restriction MILPER, N Military Personnel $10M No Congressional 1 Annual Restriction MILCON, N Military Construction Lesser of No Congressional 5 Full +$2.0M or +25% Restriction Appropriated

DAU PROGRAM MANAGERS TOOL KIT
27
BELOW THRESHOLD REPROGRAMMING ACTIONSAmounts are Cumulative Over Entire Period of
Obligation Availability
APPROPRIATION LIFE
Reference Sources: (1) USD (C) Memo; SUBJECT: FY 2006 Below Threshold Reprogramming Authority Policy, 10 Feb 2006, (2) USD (C) Memo, SUBJECT: DD 1414, Base for Reprogramming Actions, 5 Jan 2010
APPN
RDT&E
PROC
O&M
MILPERS
MILCON
MAX OUT
Lesser of -$10M or
-20%
Lesser of -$20M or
-20%
None, Unless Otherwise Specified
No Specific Congressional
Restriction
No Specific Congressional
Restriction
OBLIGATIONAVAILABLE
2 Years
3 Years
(Shipbuilding and Conversion,
Navy: 5 Years)
1 Year
1 Year
5 Years
LEVEL OF CONTROL
Program Element
Line Item
Budget Activity (BA) Some BA 1 Sub-activity
Limitations on Decreases (Operating Forces)
Budget Activity
Project
MAX INTO
Lesser of +$10M or
+20%
Lesser of +$20M or
+20%
+$15M
+$10M
Lesser of +$2M +25%
Current Period: Available for new obligations, obligation adjustments, expenditures, and outlaysExpired Period: Available for obligation adjustments, expenditures, and outlays
Cancelled: Unavailable for obligations, obligation adjustments, expenditures, and outlays
O&M
RDT&E
PROCUREMENT
SHIPS
MILCON
MILPERS
YEARS1 2 3 4 5 6 7 8 9 10 11

DAU PROGRAM MANAGERS TOOL KIT
28
LIFE CYCLE COST COMPOSITION
PRODUCT IMPROVEMENTSFunding Decision Tree
IF . . .
THEN . . .
AND . . . Fund Purchase of the Mod Kits and Installation of those Mod Kits on the Fielded System with . . .
Does ProposedModification (Mod)Increase System
Performance?Is System
Currently InProduction?
NO
O&M $Procurement $
NO
YES YES
Fund Development and Testing with . . . (To Include the Mod Kits used for Testing)
Is DT or IOT&E Required?
Procurement $
YES
RDT&E $
NO
RDT&EDevelopment Costs of
PME and Support ItemsSystems EngineeringProgram ManagementTest and Evaluation
Flyaway Cost
PROCUREMENTPrime MissionEquipment (PME)
Weapon System Cost
Procurement Cost
PROCUREMENTInitial Spares
MILCONFacilities
Operations andSupport•O&M, MILPERS(or others as appropriate)
PROCUREMENTSupport Items
Program Acquisition Cost
Life Cycle Cost
DisposalO&M (or others
as appropriate)•
Development Cost

DAU PROGRAM MANAGERS TOOL KIT
29
Estimate Methods Comments
Analogy Comparison to one similar existing system; based on judgments. Little or no data available; relatively quick, easy, flexible. Used in early phases (e.g., Material Solution Analysis and Tech. Dev.)
Parametric Comparison to many similar existing systems; based on statistical analysis. Determine primary cost drivers and establish Cost Estimating Relationships (CERs). Used in early to mid-phases (e.g., Material Solution Analysis, Tech. Dev., and Engr. and Manufacturing Dev.)
Engineering or Summation of “all” individual items in the system.“Bottoms-Up” Uses Work Breakdown Structure (WBS) for estimating purposes. Used in mid-phases (e.g., Engineering and Manufacturing Development)
Extrapolation Comparison to historical cost of same system. Based on extrapolation from actuals. Uses Learning Curve Theory. Used in late phases (e.g., Production and Operations/Support)
COST ESTIMATING
Guidelines1. Make sure cost data are relevant and homogeneous. Caution: Watch out for
historical data in times of change. Prior actuals may include uncompensated overtime or were priced as a “buy-in.”
2. Focus on cost drivers.3. Test sensitivities and data relationships.
COST ESTIMATING RELATIONSHIPS (CER)—PARAMETRIC
Regression Line
Cost ($)
PredictedCost withParameter(size)
Parameter(e.g., size, wt., etc.)
= Similar Systems

DAU PROGRAM MANAGERS TOOL KIT
30
COST ESTIMATING REQUIREMENTS
POE
CARD
CCE
ICE
ACAT IC and ID (MDAP)
Program initiation & all subsequent milestones, including FRP DR
Program initiation & all subsequent milestones including FRP DR• Draft:180dayspriortoOIPT• Final:45dayspriortoOIPT
MS A and all subsequent milestonesincluding FRP DR
ACAT IAM and IAC (MAIS)
Program initiation & all subsequentmilestones
Program initiation & whenever Economic Analysis is required• Draft:180dayspriortoOIPT• Final:45dayspriortoOIPT
MS A and whenever an EconomicAnalysis including is required
LEGEND: AFCAA—Air Force Cost Analysis AgencyCAE—Component Acquisition ExecutiveCAPE—Cost Assessment & Program EvaluationCARD—Cost Analysis Requirements DescriptionCCE—Component Cost EstimateDASA-CE—DepAsst Sec of Army (Cost &
Economics)FRP DR—Full Rate Production Decision ReviewICE—Independent Cost Estimate
MAIS—Major Automated Information SystemMDA—Milestone Decision AuthorityMDAP—Major Defense Acquisition ProgramNCCA—Naval Center for Cost AnalysisOIPT—Overarching Integrated Product TeamPOE—Program Office EstimateUSD(AT&L)—Under Secretary of Defense
(Acquisition, Technology, & Logistics)
ACAT II & ACAT III: POE (and, at MDA discretion, an independent cost estimate prepared by the component cost agency) at program initiation and all subsequent milestones
Required by law for all MDAP programs *•PreparedbyOSDCAPEforACATID,andACATICatdiscretionofUSD(AT&L)•Preparedbycomponentcostagency(AFCAA,DASA-CE,NCCA)forACATIC(ifno
CAPE estimate)•InadvanceofanycertificationunderTitle10,U.S.C.,Section2366a(MSA)and
Section 2366b (MS B)•Inadvanceofanydecisiontoenterlow-rateinitialproduction(LRIP)(MSC)or
full-rate production (FRP DR)•InadvanceofanycertificationofMDAPsthatexperiencecriticalcostgrowth(Title
10, U.S.C., Sec 2433a)•InadvanceofanyreportofCriticalProgramChangesforMAIS(Title10,U.S.C.,
Sec 2445c(f))*ICE statutory requirement (Title 10, US Code, Sec 2434) and P.L. 111-23, May 22, 2009Source: DoDI5000.02, December 2008 and Weapon Systems Acquisition Reform Act of 2009

DAU PROGRAM MANAGERS TOOL KIT
31
PR
OG
RA
M C
OS
T A
ND
SC
HE
DU
LE
BR
EA
CH
PA
RA
ME
TE
RS
Sch
edu
le
Mile
sto
nes
Co
st
Rep
ort
s R
equ
ired
if
Bre
ach
Occ
urs
SA
R(T
itle 1
0, U
.S.C
., Se
c 24
32)
6 m
onth
slip
from
pr
evio
us S
AR
15/3
0% P
AU
C G
row
th(C
urre
nt/O
rigin
al)
15/3
0% A
PU
C G
row
th(C
urre
nt/O
rigin
al)
Qua
rter
ly S
AR
Un
it C
ost
Rep
ort
(UC
R)
(Title
10,
U.S
.C.,
Sec
2433
) (N
unn-
McC
urdy
)
N/A
15/3
0% P
AU
C G
row
th(C
urre
nt/O
rigin
al)
15/3
0% A
PU
C G
row
th(C
urre
nt/O
rigin
al)
Qua
rter
ly/E
xcep
tion
DA
ES
S
ervi
ce n
otifi
es C
ongr
ess
(≥15
/30%
) S
ecD
ef C
ertifi
catio
n (≥
25/5
0%)
AP
B(T
itle 1
0, U
.S.C
., Se
c 24
35)
Slip
bey
ond
thre
shol
d da
te*
Def
ault
thre
shol
d =
obje
ctiv
e pl
us6
mon
ths;
MD
A d
iscr
etio
n 15
/30%
PA
UC
Gro
wth
15
/30%
AP
UC
Gro
wth
(Cur
rent
/Orig
inal
)
* R
DT
&E
Gro
wth
* P
rocu
rem
ent G
row
th*
MIL
CO
N o
r O
&M
Gro
wth
* 10
% d
efau
lt; M
DA
dis
cret
ion
Pro
gram
Dev
iatio
n R
epor
t(P
M n
otifi
es M
DA
)
Ap
plic
able
to M
ajo
r D
efen
se A
cqu
isiti
on
Pro
gra
ms
(MD
AP
s)
AC
AT
II a
nd
III:
15/3
0% P
AU
C/A
PU
C A
PB
bre
ach
par
amet
ers
are
N/A
; act
ual
bre
ach
par
amet
ers
at M
DA
dis
cret
ion
Criti
cal C
ost G
row
th (A
PB/S
AR/U
CR)
PAU
C o
r APU
C in
crea
ses
of 2
5% o
f cur
rent
bas
elin
e or
50%
of o
rigin
al b
asel
ine
requ
ires
Sec
Def c
ertifi
catio
n to
Con
gres
s:—
Ess
entia
l to
Nat
iona
l Def
ense
— N
o ac
cept
able
alte
rnat
ive c
apab
ility
at le
ss c
ost
— N
ew e
stim
ates
are
reas
onab
le p
er D
ir, C
APE
— P
rogr
am c
ost g
row
th h
ighe
r prio
rity
than
pro
gram
s pr
ovid
ing
offs
ets
— M
anag
emen
t stru
ctur
e ad
equa
te to
con
trol c
osts
Sign
ifica
nt C
ost G
row
th (A
PB/S
AR/U
CR)
PAUC
or A
PUC
incr
ease
s of
15%
of c
urre
nt b
asel
ine
or 3
0% o
f orig
inal
bas
elin
e is
“repo
rtabl
e”
to C
ongr
ess.
LEG
END
:AP
B—Ac
quisi
tion
Prog
ram
Bas
elin
eAP
UC
—Av
erag
e Pr
ocur
emen
t Uni
t Cos
tD
AES—
Def
ense
Acq
uisit
ion
Exec
utive
Sum
mar
y
Dir,
CAP
E—D
irect
or, C
ost A
sses
smen
t &
Prog
ram
Eva
luat
ion
PAU
C—
Prog
ram
Acq
uisit
ion
Uni
t Cos
t SA
R—
Sele
cted
Acq
uisit
ion
Rep
ort

DAU PROGRAM MANAGERS TOOL KIT
32
Management Reserve
EAC
TABBAC
CostVariance{Schedule Variance
PMB
ACWP
BCWP
BCWS
Time TimeNow
CompletionDate
$ }
EARNED VALUE MANAGEMENT “GOLD CARD”
VARIANCES Favorable is Positive, Unfavorable is NegativeCost Variance CV = BCWP – ACWP CV % = (CV / BCWP) * 100Schedule Variance SV = BCWP – BCWS SV % = (SV / BCWS) * 100Variance at Completion VAC = BAC – EAC
OVERALL STATUS% Schedule = (BCWSCUM / BAC) * 100% Complete = (BCWPCUM / BAC) * 100% Spent = (ACWPCUM / BAC) * 100
DoD TRIPWIRE METRICS (TW) (TW) Cost Efficiency CPI = BCWP / ACWP Favorable is > 1.0, Unfavorable is < 1.0(TW) Schedule Efficiency SPI = BCWP / BCWS Favorable is > 1.0, Unfavorable is < 1.0(TW) BASELINE EXECUTION INDEX (BEI) (Schedule Metric) BEI = Tasks with Actual Finish Date / (# of Baseline Tasks Scheduled to Finish Prior to Status Date + Tasks Missing Baseline Start or Finish Date)(TW) CRITICAL PATH LENGTH INDEX (CPLI) (Schedule Metric) CPLI = (CP Length (Time Now to Contract End) + Total Float (To Contract End Baseline Finish)) / CP Length
HIT/MISS (Month’s Task Completed ON or AHEAD/ Month’s Tasks Scheduled to Complete)
TO COMPLETE PERFORMANCE INDEX (TCPI) # §
TCPIEAC = Work Remaining / Cost Remaining = (BAC – BCWPCUM) / (EAC – ACWPCUM )
ESTIMATE AT COMPLETION # (EAC) (Actuals to Date + [(Remaining Work)/(Performance Factor)]EACCPI = ACWPCUM + [(BAC – BCWPCUM) / CPICUM ] = BAC / CPICUM EACComposite = ACWPCUM + [(BAC – BCWPCUM) / (CPICUM * SPICUM)]
# To determine a contract level TCPI or EAC, you may replace BAC with TAB.§ To determine the TCPI BAC or LRE, substitute BAC or LRE for EAC.
For more information, go to the EVM Home Page at https://acc.dau.mil/evm, e-mail EVM at [email protected], or call 703-805-5259 (DSN 655).

DAU PROGRAM MANAGERS TOOL KIT
33
ControlAccounts
Summary LevelPlanning Packages
UndistributedBudget
Work Packages Planning Packages
OVERRUN AUW
ControlAccounts
NCC
OTB
TAB Profit / Fees
Summary LevelPlanning Packages
Contract Price
CBB
PMB Management Reserve
UndistributedBudget
EARNED VALUE MANAGEMENT “GOLD CARD” (Continued)
TERMINOLOGYACWP Actual Cost of Work Performed Cost actually incurred in accomplishing work performed = ACTUAL COSTAUW Authorized Unpriced Work Work contractually approved, but not yet negotiated /definitizedBAC Budget At Completion Total budget for total contract thru any given levelBCWP Budgeted Cost for Work Perf. Value of completed work in terms of the work’s assigned budget = EARNED VALUEBCWS Budgeted Cost for Work Sched. Time-phase Budget Plan for work currently scheduled = PLANNED VALUECA Control Account Lowest CWBS element assigned to a single focal point to plan and control scope / schedule / budgetCBB Contract Budget Base Sum of NCC and AUWEAC Estimate At Completion Estimate of total Cost for total contract thru any given level; may be generated by Ktr, PMO, DCMA, etc. = EACKTR / PMO / DCMALRE Latest Revised Estimate Ktr’s EAC or EACKTRMR Management Reserve Budget withheld by Ktr PM for unknowns / risk managementNCC Negotiated Contract Cost Contract Price minus profit / fee(s)OTB Over Target Baseline Sum of CBB and recognized overrun PAC Price At Completion NCC Plus Profit or Fee(s)PMB Perf. Measurement Baseline Contract time-phased budget planPP Planning Package Far-term CA activities not yet defined into WPsSLPP Summary Level Plan. Package Far-term activities not yet defined into CAs TAB Total Allocated Budget Sum of all budgets for work on contract = NCC, CBB, or OTB TCPI To Complete Performance Index Efficiency needed from ‘time now’ to achieve an BAC, EAC, or LREUB Undistributed Budget Broadly defined activities not yet distributed to CAs WP Work Package Near-term, detail-planned activities within a CA
EVM POLICY: DoDI 5000.02, Table E4.T5. EVMS in accordance with ANSI/EIA-748 is required for cost or incentive contracts, subcontracts, intra-government work agreements, and other agreements valued ≥ $20M (Then-Yr $). EVMS contracts ≥ $50M (TY $) require that the EVM system be formally validated by the cognizant contracting officer. Additional guidance is in the Defense Acquisition Guidebook and the Earned Value Management Implementation Guide (EVMIG). EVMS is discouraged on Firm-Fixed Price & Time & Material Contracts, & LOE activities regardless of cost.
EVM CONTRACTING REQUIREMENTS:FAR EVM Clauses Non-DoD — 52.234-2 for Solicitation (Pre-Award IBR) or 52.234-3 (Post Award IBR) — 52.234-4 Solicitation & ContractDoD Use DFAR Clauses ( ≥ $20M) — 252.234-7001 “Notice of EVMS” for solicitations — 252.234-7002 “EVMS” for solicitations & contractsContract Performance Report — DI-MGMT-81466A* 5 Formats (WBS, Organization, Baseline, Staffing & Explanation)
Integrated Master Schedule — DI-MGMT-81650* (Mandatory for DoD EVMS contracts)
Integrated Baseline Review (IBR) — Mandatory for all EVMS contracts * See the EVMIG for CPR and IMS tailoring guidance.

DAU PROGRAM MANAGERS TOOL KIT
34
CONTRACTING—COMPONENTS OF CONTRACT PRICE
TYPES OF CONTRACTS
Cost Family — Appropriate when product not well defined; high risk; contractor provides best efforts; government pays all allowable costs. Fee varies by type. Cost Plus Fixed Fee — Fee same regardless of actual cost outcome. Cost Plus Incentive Fee — Actual fee earned computed by applying share ratio to over/under run, subject to min/max fee limits. Fixed Price Family — Product well defined, low risk; contractor must deliver product. Firm Fixed Price — Price fixed regardless of actual cost incurred. Fixed Price Incentive (Firm Target) — Final price computed by applying share ratio to over/underrun, subject to ceiling price limitation. Award Fee — Either stand-alone Cost Plus Award Fee or combined with cost or fixed price types. Award Fee unilaterally determined by government based onsubjectiveevaluationofcontractor’sperformance.Fee Limits: Cost Plus Fixed Fee — Fee limited to 15% for R&D; 10% for production and services. No statutory or FAR/DFARS regulatory limitation on other contract types.
Contract Price = Cost + Profit / Fee
OtherDirect Cost
Subcontracts
TYPICAL CONTRACT TYPE BY PHASE
MSA TD EMD/ISD EMD/SCMPD PROD
CPFF, FFP CPFF, FFP FPI(F), CPFF, CPIF CPIF, CPAF FPI(F), FFP
FCCM
EngineeringLabor
ManufacturingLabor
RawMaterial
PurchasedParts
EngineeringSupport
ManufacturingSupport
MaterialHandling
StandardCommItems Interdivisional
Transfers
G&A
Direct Cost Indirect Cost
Direct Labor Direct Material Overhead
LEGEND:AF — Award Fee CPAF — Cost Plus Award Fee CPFF — Cost Plus Fixed Fee CPIF — Cost Plus Incentive Fee CR — Cost Reimbursement EMD — Engineering and Manufacturing
Demonstration FAR/DFARS — Federal Acquisition
Regulation/Defense FAR Supplement FCCM — Facilities Capital Cost of Monies FFP — Firm Fixed Price
FPI(F) — Fixed Price Incentive (Firm Target) G&A — General and Administrative (Expense) ISD — Integrated System Design MSA — Materiel Solution Analysis ODC — Other Direct Cost PROD — Production R&D — Research and Development SCMPD — System Capability and Manufacturing
Process DemonstrationTD — Technology Development

DAU PROGRAM MANAGERS TOOL KIT
35
CONTRACT TYPE FEATURES
PRICE = COST + FIXED FEE
Cost Plus Fixed Fee (CPFF)FEE
FIXEDFEE
(SHARE 100/0)
COST ESTIMATED COST
•RiskHighesttotheGovernment•ObtainsFeeRegardlessofCost
FEE
COST TARGET COST
MAX
TARGET
MIN
Cost Plus Incentive Fee (CPIF)
Share Ratio
(Target) PRICE = (Target) COST + (Target) FEE
•AllReasonableCostPaid•SharedRiskBetweenMin/MaxFee
PromiseContractor Risk
Cash FlowProgress Payments %
AdministrationFee Limit %
FIXED PRICE
COST REIMBURSEMENT
Best EffortsLowAs IncurredN/AHigh15/10/6 on CPFF
DeliveryHighDelivery75/90/95LowNone

DAU PROGRAM MANAGERS TOOL KIT
36
CONTRACT TYPE FEATURES(Continued)
Fixed Price Incentive (Firm Target) (FPI(F))
Firm Fixed Price (FFP)
PRICE = COST + PROFIT
COST
0/100 SHARE
PROFIT
COST TARGET COST
PTA
Share Ratio
CEILING PRICE
PROFIT
TARGET PROFIT
Point of Total Assumption = CEILING PRICE – TARGET PRICE + Target Cost (PTA) GOVERNMENT SHARE
(Target) PRICE = (Target) COST + (Target) PROFIT

DAU PROGRAM MANAGERS TOOL KIT
37
PRE-SOLICITATION PROCESS
POST-SOLICITATION PROCESS
MarketResearch
AcquisitionStrategy
Requirement
AcquisitionPlan
Post Draft RFPon ElectronicBulletin Board
FBO/CBD NoticeAdvisory Multi-Step
FinalizeRFP
CBD Notice ofRFP
Release
RFP Releaseto Industry
SourceSelection Plan/
Strategy
RFP ReleaseBriefing to
SSA
LEGEND:FBO/CBD—FedBizOps/Commerce Business Daily RFP—Request for Proposal
SSA—Source Selection AuthoritySSAC—Source Selection Advisory Council
SSADecision
Receipt of Oraland WrittenProposals
Initial Eval ClarificationsLimited Communications
CompetitiveRange
Determination
Face-to-FaceDiscussions/Negotiations
DebriefUnsuccessful
Offerors
Contract Award(Distribution)
BriefSSAC
Request FinalProposalRevision
Receive andAnalyze
Final Revision
BriefSSA
Receive and AnalyzeField Surveys (if requested)
Prepare for Discussionswith
Remaining Offerors

DAU PROGRAM MANAGERS TOOL KIT
38
OTHER WAYS TO BUY
• GSA Multiple Award Schedules (MAS)
–GeneralServicesAdministrationcontractsforbothproductsandservices—available to all agencies.
• Government-Wide Agency Contracts (GWACs)
–SimilartoMAS,butmorerestrictedinproductsandservicesavailable.
• Indefinite Delivery/Indefinite Quantity Contracts
–Taskorders(services)anddeliveryorders(products)issuedunderomnibus umbrella contract.
• Other Transactions (OT)
–Defined: Vehicles used for basic, applied, and advanced research projects and prototype development. OTs are not contracts, grants, or cooperative agreements.
–Objective: Attract commercial companies and consortia that historically have not done business with the Department of Defense because of statutory and/or regulatory requirements. OTs are not subject to the Federal Acquisition Regulation. Designed to increase DoD access to dual-use technologies.
–Research Projects:◆ Where practical, government cost share should not exceed cost
share of other parties.◆ Use OT when standard contract, grant, or cooperative agreement is
not appropriate.–Prototype Projects: ◆ Must be directly relevant to weapons or weapon systems
proposed to be acquired or developed by DoD.
–Constraints: ◆ At least one nontraditional contractor participating. ◆ If no nontraditional contractor participates, 1/3 of cost paid by
parties other than federal government or senior procurement executive justifies transaction.
– OT Guide for Prototype Projects, January 2001.

DAU PROGRAM MANAGERS TOOL KIT
39
CONTRACTOR PROFITABILITY RATIOS
The basic concept of profitability ratios is to measure net income against revenue or against the investment required to produce it. There are three principal profitability ratios with which you should be familiar. They are:
1. Return on Sales, which shows what percentage of dollars are left after the company has paid for all costs, interest, and taxes. It is expressed as:
Return on Sales = Net Income Sales
2. Return on Total Assets, which looks at the efficiency with which management has used its resources, the company’s assets, to generate income. It is computed as:
ROA = Net Income Total Assets
As noted, Return on Assets addresses how well management utilizes the assets of the firm in generating income. The ROA formula reflects the combined result of Return on Sales and the total asset turnover ratio (total sales/total assets), broken down as follows:
ROA = Net Income X Total Sales Total Sales Total Assets
3. Return on Stockholders’ Equity measures the rate of return on the owners’ investment—their equity in the company. This is also known as Return on Equity:
ROE = Net Income Stockholders’ Equity
ROE can also be broken into two components: return on assets and financial leverage (a ratio reflecting the relationship of creditor to owner financing—expressed as total assets/stockholders equity). This is shown by:
ROE = Net Income X Total Assets Total Assets Stockholders’ Equity
These profitability ratios give three different viewpoints concerning the “bottom line” on the income statement—how much net profit is being made on each sale, how much is being made for the assets that are employed, and how much is being made for the company owners. Contractor profitability ratios for the aerospace/defense industry for the period of 1980 to date are shown on page 38.
From an owner’s perspective, another profitability ratio you may be aware of is Earnings Per Share:
EPS =
LEGEND:EPS—Earnings Per Share ROA—Return on Assets ROE—Return on Equity
Net IncomeNumber of Shares of Common Stock Outstanding

DAU PROGRAM MANAGERS TOOL KIT
40
AEROSPACE/DEFENSE INDUSTRY CONTRACTOR PROFITABILITY RATIOS
Return Asset Return Financial Return On Sales Turnover On Assets Leverage On Equity (NI/S) (S/TA) (NI/TA) (TA/SE) (NI/SE)
1980 4.3 1.21 5.2 3.08 16.01981 4.4 1.18 5.2 3.06 16.01982 3.3 1.12 3.7 3.24 12.01983 3.5 1.17 4.1 2.98 12.11984 4.1 1.15 4.7 3.00 14.11985 3.1 1.13 3.6 3.17 11.11986 2.8 1.07 3.1 3.13 9.41987 4.1 1.07 4.4 3.32 14.61988 4.3 1.02 4.4 3.39 14.91989 3.3 1.00 3.3 3.24 10.71990 3.4 1.00 3.4 3.38 11.51991 1.8 1.06 1.9 3.21 6.11992 -1.4 0.86 -1.2 4.33 -5.21993 3.6 0.97 3.5 3.80 13.21994 4.7 0.92 4.3 3.44 14.81995 3.8 0.92 3.5 3.17 11.11996 5.6 0.91 5.1 3.35 17.11997 5.2 0.92 4.8 3.60 17.31998 5.0 0.96 4.8 3.73 18.01999 6.5 0.95 6.2 3.52 21.82000 4.7 0.91 4.3 3.30 14.22001 3.9 0.92 3.6 3.22 11.62002 4.1 0.90 3.7 3.16 11.72003 3.1 0.84 2.6 3.81 9.9
AVERAGE 3.8 1.0 3.8 3.4 12.7Source: Aerospace Industries Association.
LEGEND:NI/S—Net Income/SalesNI/SE—Net Income/Stockholders’ EquityNI/TA—Net Income/Total Assets
S/TA—Sales/Total AssetsTA/SE—Total Assets/Stockholders’ Equity
Aerospace/Defense Industry Contractor Profitability Ratios

DAU PROGRAM MANAGERS TOOL KIT
41
LO
CK
HE
ED
MA
RT
IN C
OR
P.—
DU
PO
NT
FO
RM
UL
A A
NA
LYS
IS (
AN
EX
AM
PL
E)
X X==
4.00
%
3.00
%
2.00
%
1.00
%
0.00
%
-1.0
0%
-2.0
0%
-3.0
0%
-4.0
0%
-5.0
0%
Retu
rn o
n Sa
les
(%)
(Net
Inco
me/
Sale
s)
1999
2002
2003
2000
2001
5.00
%4.
00%
3.00
%2.
00%
1.00
%0.
00%
-1.0
0%-2
.00%
-3.0
0%-4
.00%
-5.0
0%
Retu
rn o
n As
sets
(%)
(Net
Inco
me/
Tota
l Ass
ets)
1999
2002
2003
2000
2001
5.00
04.
500
4.00
03.
500
3.00
02.
500
2.00
01.
500
1.00
00.
500
0.00
0
Fina
ncia
l Lev
erag
e(T
otal
Ass
ets/
Shar
ehol
der E
quity
)
1999
2000
2001
2002
2003
5.00
%4.
00%
3.00
%2.
00%
1.00
%0.
00%
-1.0
0%-2
.00%
-3.0
0%-4
.00%
-5.0
0%
Retu
rn o
n As
sets
(%)
(Net
Inco
me/
Tota
l Ass
ets)
1999
2002
2003
2000
2001
Fisc
alYe
ar
Tota
l Ass
etTu
rnov
erR
etur
n on
Ass
ets
%
Fina
ncia
lLe
vera
geR
etur
non
Equ
ity %
R
etur
n on
Sale
s %
=
XX
4.75
7=
X=
X4.
249
=X
=X
4.30
1=
XX
4.60
0=
1999
2000
2001
2002
2003
1.53
%-2
.11%
-4.3
6%1.
88%
3.31
%X
0.82
60.
807
0.86
60.
985
1.21
6
1.26
%-1
.71%
-3.7
7%1.
85%
4.02
%
1.26
%-1
.71%
-3.7
7%1.
85%
4.02
%X
3.87
4=
6.01
%7.
25%
-16.
23%
8.53
%15
.59%
Ret
urn
on A
sset
s %
X
=
== =
X
20.0
0%
15.0
0%
11.0
0%
10.0
0%
5.00
%
0.00
%
-5.0
0%
-10.
00%
-15.
00%
-20.
00%
Retu
rn o
n Eq
uity
(%)
(Net
Inco
me/
Shar
ehol
der E
quity
)
1999
2002
2003
2001
2000
1.4
1.2
1.0
0.8
0.6
0.4
0.2 0
Tota
l Ass
et T
urno
ver
(Sal
es/T
otal
Ass
ets)
1999
2000
2001
2002
2003
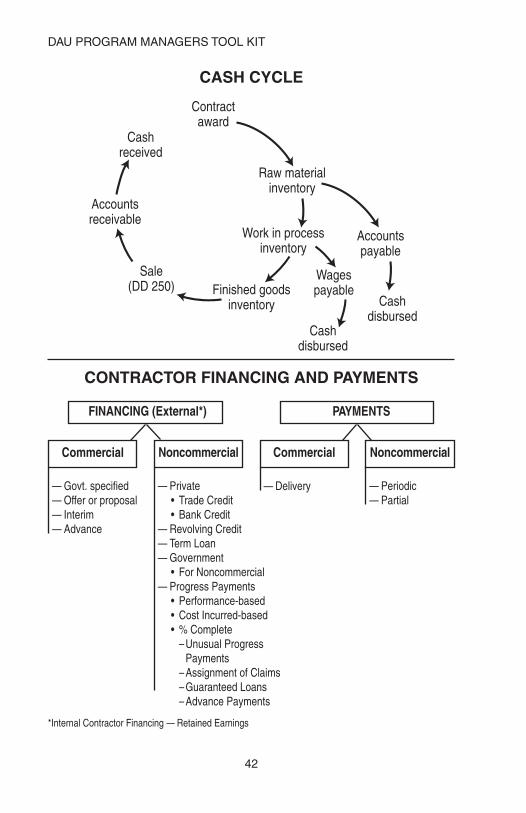
DAU PROGRAM MANAGERS TOOL KIT
42
CASH CYCLE
CONTRACTOR FINANCING AND PAYMENTS
— Delivery
*Internal Contractor Financing — Retained Earnings
— Govt. specified — Offer or proposal — Interim — Advance
— Private• TradeCredit• BankCredit
— Revolving Credit — Term Loan — Government
• ForNoncommercial— Progress Payments
• Performance-based• CostIncurred-based• %Complete
– Unusual Progress Payments
– Assignment of Claims – Guaranteed Loans – Advance Payments
— Periodic— Partial
PAYMENTS FINANCING (External*)
NoncommercialCommercial NoncommercialCommercial
Cashreceived
Accountsreceivable
Sale(DD 250) Finished goods
inventory
Raw materialinventory
Contractaward
Cashdisbursed
Cashdisbursed
Wagespayable
Work in processinventory
Accountspayable

DAU PROGRAM MANAGERS TOOL KIT
43
DIRECT AND INDIRECT COSTS
ASSIGNING INDIRECT COSTS
Indirect costs are assigned to
contracts usingindirect rate(s).
(Traced directly)
(Traced directly)Direct
material
Direct labor
Contract
Calculation of Indirect Rates
Note: See DAU Indirect-Cost Management Guide at<www.dau.mil/pubs/gdbks/icmguide.asp>.
INDIRECT RATE = Indirect Cost PoolAllocation Base
Indirect costs
• Costs that can’t be traced to a single contract because they are associated with multiple contracts
• Example: Electricity for the company’s facilities
Direct costs
• Costs that can be traced to a single contract
• Examples: material and labor to assemble an aircraft

DAU PROGRAM MANAGERS TOOL KIT
44
LIFE CYCLE OF INDIRECT COST RATES
BIDDING ONCONTRACTS
ADJUSTING PAYMENT AND
CLOSINGCONTRACTS
PAYINGCONTRACTS
FORWARD PRICING RATES
BILLING RATES
ACTUALRATES
Direct material $ 40,000Material handling 10% 4,000
Direct engineering labor 6,000Engineering overhead 100% 6,000
Direct manufacturing labor 12,000Manufacturing overhead 150% 18,000
Other direct costs 6,000Subtotal 92,000
General and administrative 25% 23,000Total cost 115,000
Profit 15% 17,250Cost of money for facilities capital 1,500
Price $133,750
CONTRACTOR’S COST PROPOSALEXAMPLE

DAU PROGRAM MANAGERS TOOL KIT
45
CONTRACTOR BUSINESS PLANNING PROCESS OUTPUTS
MANPOWER PLAN
Ratesfor
Estimating
SALES
ANNUAL OPERATING PLAN
CAPITAL INVESTMENT PLAN
PRODUCTION ANDENGINEERING PLAN
MASTER DELIVERY SCHEDULE
IR&D/B&P PLAN
TOP MANAGEMENT GOALS, OBJECTIVES,
STRATEGIES
OVERHEAD FORECAST
BUSINESS BASE SALES FORECAST
$ $
TREND
LEGEND:B&P—Bid of ProposalIR&D—Independent Research and Development

DAU PROGRAM MANAGERS TOOL KIT
46
LIFE CYCLE LOGISTICS
The planning, development, implementation, and management of a comprehensive, affordable, and effective product support strategy, within Total Life Cycle Systems Management. Life Cycle Logisticsencompassestheentiresystem’slifecycle,includingacquisition (design, develop, test, produce, and deploy), sustainment (operations and support), and disposal.
PRINCIPAL LIFE CYCLE LOGISTICS GOALS/OBJECTIVES
• Goal1:Definesupportabilityobjectivesandestablishlifecyclesustainment metrics.
• Goal2:Influencesystemdesignforaffordablesystemoperationaleffectiveness.
• Goal3:Designanddevelopthesupportsystemutilizingperformance-based life cycle product support.
• Goal4:Acquireanddeployefficientandeffectiveproductsupportto maintain the readiness and operational capability of the system.
• Goal5:Continuouslyimprovereadinessandaffordabilitythroughenhanced life cycle management.
GOAL 1: LIFE CYCLE SUSTAINMENT METRICS
Availability Key Performance Parameter (KPP) consists of two components:
Materiel Availability Operational Availability
Materiel Availability: • DevelopmentoftheMaterielAvailabilitymetricisaProgram
Manager responsibility • Addressesthetotalpopulationofend
items planned for operational use• Ameasureofthepercentageofthe
total inventory operationally capable of performing an assigned mission
• Formula:NumberofEndItemsOperational ÷ Total Population of End Items
MeanDownTime
Mat
erie
l Rel
iabi
lity
Materiel Availability
Ow
nership Cost

DAU PROGRAM MANAGERS TOOL KIT
47
Operational Availability (Aº):
• DevelopmentoftheOperationalAvailabilitymetricisaRequirementsManager responsibility
• Indicatesthepercentageoftimethatasystemorgroupofsystemswithin a unit are operationally capable
• Formula:Uptime÷(Uptime+Downtime)Reliability Key System Attribute (KSA)• DevelopmentoftheReliabilitymetricisaRequirementsManager
responsibility • Measureoftheprobabilitythatsystemwillperformwithoutfailure
over a specific interval• MustsupportbothAvailabilitymetricsOwnership Cost Key System Attribute (KSA) • DevelopmentoftheOwnershipCostmetricisaProgramManager
responsibility• O&Svalueshouldcovertheplannedlifecycletimeframe• BalancetothesustainmentsolutionbyensuringO&Scostsare
considered• UsetheCAIGCostEstimatingStructureMean Downtime Sustainment Outcome Metric• AveragetotalDowntimerequiredtorestoreanassettoitsfull
operational capabilities• “Umbrella”metricthatcapturesallcausesofsystemDowntime• Formula:TotalDowntimeforAllFailures÷TotalNumberofFailures
Logistics Downtime
(LDT)
Corrective Maintenance Time Maintenance Time
(CMT)
AdministrativeDelay Time
(ADT)
Preventive
(PMT)
• Parts availability “in the bin”• Needed items awaiting transportation
• Locating tools• Setting up test equipment• Finding personnel (trained)• Reviewing manuals• Complying with supply procedures
• Preparation time• Fault location time• Getting parts• Correcting fault• Test and checkout
• Servicing• Inspection
AO =
StandbyTime
OperatingTime
Uptime
DowntimeUptime +

DAU PROGRAM MANAGERS TOOL KIT
48
GOAL 2: AFFORDABLE SYSTEM OPERATIONAL EFFECTIVENESS (SOE)
To achieve Affordable System Operational Effectiveness (SOE), the PM should design for the optimal balance between technical performance (including Reliability, Availability, and Maintainability (RAM)), categories of ownership cost, schedule, and process efficiencies. A development program that targets only some categories of technical performance capability; or fails to optimize system RAM technical performance, risks financial burden during operations and support.
GOAL 3: DOD PRODUCT SUPPORT STRATEGY PROCESS MODEL
• Aproductsupportstrategyencompassesthemeansbywhichde-
fense system sustainment is to be accomplished. • TheLife-CycleProductSupportStrategyProcessModelrepresents
the major activities required to implement, manage, evaluate, and refine product support over the system life cycle. It is not a one-time process, but rather a continuing, iterative process in which the sustainment of a system (or systems) is adapted and evolved to optimally support the needs and requirements of the warfighter in an affordable and effective manner.
Capabilities
Production
Operations
Life Cycle Cost/Total Ownership Cost
ProductSupport
Public PrivateSupport
Infrastructure
AffordableSystem
OperationalEffectiveness
Package Logistics
Maintenance
Support Features
Maintainability
Reliability
Effectiveness
Supportability
ProcessEfficiency
Mission
Design
TechnicalPerformance
Functions

DAU PROGRAM MANAGERS TOOL KIT
49
12-Step Process Model<https://acc.dau.mil/pbl>
GOAL 4: INTEGRATED PRODUCT SUPPORT ELEMENTS
(See next page for details)

DAU PROGRAM MANAGERS TOOL KIT
50
Product Support Management: Plan, manage, and fund weapon sys-tem product support across all Integrated Product Support (IPS)Elements.
Design Interface: Design interface is the integration of the quantitative design characteristics of systems engineering (reliability, maintain-ability, etc.) with the functional logistics elements (i.e., integrated product support elements) described below.
Sustaining Engineering: Those technical tasks (engineering and logis-tics investigations and analyses) to ensure continued operation and maintenance of a system with managed (i.e., known) risk.
Supply Support: Management actions, procedures, and techniques necessary to determine requirements to acquire, catalog, receive, store, transfer, issue and dispose of spares, repair parts, and supplies.
Maintenance Planning and Management: Establishes maintenance concepts and requirements for the life of the system for both hard-ware and software.
Packaging, Handling, Storage, and Transportation (PHS&T): The combination of resources, processes, procedures, design, consid-erations, and methods to ensure that all system, equipment, and support items are preserved, packaged, handled, and transported properly.
Technical Data: Represents recorded information of scientific or techni-cal nature, regardless of form or character (such as equipment technical manuals and engineering drawings), engineering data, specifications, standards, and Data Item Descriptions (DID).
Support Equipment: Consists of all equipment (mobile or fixed) re-quired to support the operation and maintenance of a system.
Training and Training Support: The policy, processes, procedures, techniques, Training Aids Devices Simulators and Simulations (TADSS), planning and provisioning for the training base including equipment to acquire, operate, maintain, and support a system.
Manpower and Personnel: Involves the identification and acquisition of personnel (military and civilian) with the skills and grades required to operate, maintain, and support systems over their lifetime.
Facilities and Infrastructure: Consists of the permanent and semi-permanent real property assets required to support a system, including studies to define types of facilities or facility improvements, location, space needs, environmental and security requirements, and equipment.
Computer Resources: Encompass the facilities, hardware, software, documentation, manpower, and personnel needed to operate and support mission critical computer hardware/software systems.

DAU PROGRAM MANAGERS TOOL KIT
51
GOAL 5: PRODUCT SUPPORT BUSINESS MODEL (PSBM)
• ThePSBMencompassestheoverallstrategyforproductsupportplanning, implementation, management, and measurement over the life cycle of a weapon system component, subsystem, or platform.
• AProductSupportManager(PSM)willprovideproductsupport
subjectmatterexpertisetothePMforexecutionofthePM’sduties as the Total Life Cycle Systems Manager. This PSM will be designated as a key leadership position (KLP) for all Major Defense Acquisition Programs and designated a critical acquisition position (CAP) for all other major weapon systems. Product Support Integrators (PSIs) are charged with integrating all sources of product support, both public and private, defined within the scope of a product support arrangement.
Product Support Business Model (PSBM)
Recommendation:Adopt a “product support business model” that drives cost-effective performance and capability for the warfighter across the weapon system life cycle and enables the most advantageous use of an integrated defense industrial base.
Product Support Integrators
Warfighter
Program Manager (PM)
Product Support Manager (PSM)
Product Support Providers
Performance Based Agreement (PBA)
PBA / Partnering Agreement
Defined Performance Outcomes
Inherently Governmental
Integrated Industrial Base: Commercial and Government
Accountability
Responsibility / Authority
PSI PSI PSI
Depots DLA ICPs OEMs DPO Tier X

DAU PROGRAM MANAGERS TOOL KIT
52
THE SUSTAINMENT CHARTThe “Sustainment Chart” is one tool the PM may use for key decision-making becauseitreadilyidentifiesaweaponsystem’sproductsupportbusinessmodel and captures its operating and support costs and operational metrics data. PMs are required to use the sustainment chart to report status of sus-tainment planning at OIPT and DAB meetings.
LOGISTICS MANAGEMENT COMMUNITY OF PRACTICE (LOG COP)
Transforming the Way We WorkWhere YOU can ….
Find Helpful Tools and Templates• LatestPBLResources• SupportabilityBestPractices• ContractingLessonsLearned
Get Ahead In YOUR Career• LogisticsTrainingandEducation• LatestOSDPolicyandDirection• LogisticsConferences/Events• LinktoTopDoDWebsites
Connect With Professionals• ShareExperiencesandIdeas• StartandJoinDiscussions
<http://acc.dau.mil/log>• LocateDoDandIndustryExperts

DAU PROGRAM MANAGERS TOOL KIT
53
LIF
E C
YC
LE
LO
GIS
TIC
S L
INK
AG
E T
O D
EF
EN
SE
AC
QU
ISIT
ION
PR
OC
ES
S
Mod
ifica
tions
&Te
chno
logy
Inse
rtion
Acqu
isiti
onSt
rate
gy
Supp
ort
Stra
tegy
IOC
Sust
ainm
ent
Pre-
Syst
ems
Acqu
isiti
on
Prod
uce
Prod
uct
Prod
uce
Supp
ort S
yste
m
Read
ines
s &
Tota
lO
wne
rshi
p Co
stO
bjec
tives
Perfo
rman
ce-
Base
d Lo
gist
ics
(PBL
)Eval
uate
Alte
rnat
ive
Logi
stic
sCo
ncep
ts
Supp
ort
Conc
epts
IOC
Syst
ems
Acqu
isiti
on
SE P
roce
ssSE
Pro
cess
Eval
uate
Prod
uct S
uppo
rtCa
pabi
litie
s
Deve
lop
Initi
alPr
oduc
tSu
ppor
t Stra
tegy
Prod
uct
Supp
ort P
lan
Dem
o Pr
oduc
tSu
ppor
tCa
pabi
lity
PBL
& Pr
oduc
tSu
ppor
tIm
plem
enta
tion
PBL
& Pr
oduc
tSu
ppor
tM
anag
emen
t
Ope
ratio
ns/
Sust
ainm
ent
Sing
le S
tep
orEv
olut
ion
to F
ull
Capa
bilit
y
Dem
il&
Disp
osal
Dem
onst
rate
Supp
orta
bilit
y&
Life
Cyc
leAf
ford
abili
ty
Dem
onst
rate
Supp
orta
bilit
y&
Life
Cyc
leAf
ford
abili
ty
Inpu
ts to
:• C
DD
•
TEM
P• A
PB
•
Con
tract
FACT
ORY
CLO
SED
Influ
ence
De
sign
for
Affo
rdab
le S
OE
Desi
gn S
uppo
rt Sy
stem
Util
izin
g Pe
rform
ance
Bas
ed
Life
-Cyc
le P
rodu
ct
Supp
ort
Post
-Dep
loym
ent
Supp
ort
Cont
inuo
usly
Im
prov
e Re
adin
ess
& Af
ford
abili
ty
GOAL 5
GOAL 2
Defin
e Su
ppor
tabi
lity
Obj
ectiv
es/
Esta
blis
h m
etric
s
GOAL 1
GOAL 3
Post
-Dep
loym
ent
Eval
uatio
ns
Acqu
ire &
Dep
loy
Supp
orta
ble
Syst
em&
Prod
uct S
uppo
rt
GOAL 4
USER
NEE
DS
PRO
DUCT
ION
&DE
PLO
YMEN
TO
PERA
TIO
NS &
SU
PPO
RTEN
GIN
EERI
NG A
NDM
ANUF
ACTU
RING
DEV
ELO
PMEN
TFR
PDe
cisi
onRe
view
MAT
ERIE
L SO
LUTI
ON
ANAL
YSIS
Mat
eria
lDe
velo
pmen
tDe
cisi
on
Prog
ram
Initi
atio
n
TECH
NOLO
GY
DEV
ELO
PMEN
T
TECH
NOLO
GY
OPP
ORT
UNIT
IES
& RE
SOUR
CES
Post
-PDR
Asse
ssm
ent
Post
-CDR
Asse
ssm
ent
LRIP
& IO
T&E
SCM
PDIS
DLi
fe C
ycle
Sust
ainm
ent
Disp
osal
AB
CFO
C

DAU PROGRAM MANAGERS TOOL KIT
54
DEFENSE ACQUISITION GUIDEBOOKLIFE CYCLE LOGISTICS<https://acc.dau.mil/dag_5>
LIFE CYCLE LOGISTICS REFERENCES & GUIDANCE• DefenseAcquisitionGuidebook(DAG)Chapter5-https://acc.dau.mil/dag_5
• DAULogisticsCommunityofPractice(LOGCoP)-https://acc.dau.mil/log
• ProductSupportManager(PSM)Homepage-https://acc.dau.mil/psm
• PSMACQuipediaSite-https://acc.dau.mil/CommunityBrowser.aspx?id=375980
• PerformanceBasedLifeCycleProductSupport(PBL)Toolkit-https://acc.dau.mil/pbl
• LifeCycleSustainmentPlan(LCSP)-https://acc.dau.mil/lcsp
• DoDLogisticsHumanCapitalStrategy(HCS)-http://www.acq.osd.mil/log/sci/hcs.html
• LifeCycleLogisticsACQuipediaRepository-https://acquipedia.dau.mil/log_lcic.aspx
• LifeCycleLogisticsBlog-https://dap.dau.mil/career/log/blogs/default.aspx
• RecommendedReadingList-https://acc.dau.mil/CommunityBrowser.
aspx?id=383460
• LogisticsCareerFieldGateway-https://dap.dau.mil/career/log
• DAULifeCycleLogisticsMediaLibrary-http://www.dau.mil/mpi/default.html
• IntegratedDefenseAT&LLifeCycleFrameworkChart-https://ilc.dau.mil/
• ArmyLifeCycleLogisticsFrameworkChart-https://acc.dau.mil/logsa
• JointLifeCycleLogisticsFrameworkChart-WillbepostedontheLOGCoP
• Product Support Manager’s (PSM) Guidebook - Will be posted on the LOG CoP
• BusinessCaseAnalysis(BCA)Guidebook-WillbepostedontheLOGCoP
• Life Cycle Logistics Guidebook - Will be posted on the LOG CoP

DAU PROGRAM MANAGERS TOOL KIT
55
“Pure” Product Structure
PROGRAM OFFICE ORGANIZATION STRUCTURES (Examples)
“Traditional” or Functional Structure
Note: Functional divisions shown are notional.
PM
Staff
Engineering ProductionLogisticsBusiness/Finance
Staff
Note: Functional divisions shown are notional.
Staff
Engr
FunctionalDivisions
Log BusEngr
FunctionalDivisions
Log BusEngr
FunctionalDivisions
Log Bus
StaffStaff
Product/Project
ManagerSystem A
Product/Project
ManagerSystem B
Product/Project
ManagerSystem C
PM
LEGEND: Engr—Engineering Log—Logistics Bus—Business

DAU PROGRAM MANAGERS TOOL KIT
56
PROGRAM OFFICE ORGANIZATION STRUCTURES (Continued)
PM
Staff
PM Program A
Component Head
Engineering ProductionLogistics Bus/Fin
PM Program B
PM Program C
NOTE: Functional divisions shown are notional.
Staff
Staff
Functional Directors
DPM
Program ManagerAPMs Log Eng Test Prod Bus/Fin Contracts
Primary Vehicle
LogisticsSystems Engineering
Test & Evaluation
Frame Engine/Drive Train
Suspension & Steering
FireControl
Level 1IPT
Level 2IPTs
Level 3IPTs
Note 1
NOTE 1: Functional titles shown are notional.
Note 2
NOTE 2: IPTs often align with WBS elements.
Matrix Structure
Integrated Product Teams

DAU PROGRAM MANAGERS TOOL KIT
57
THE ROLE OF MANUFACTURING IN THE ACQUISITION PROCESS
• Unstablerequirements/engineeringchanges• Unstableproductionratesandquantities• Insufficientprocessproofing• Insufficientmaterialscharacterization• Changesinprovenmaterials,processes,subcontractors,
vendors, components• Producibility• Configurationmanagement• Subcontractormanagement• Specialtooling• Specialtestequipment
COMMON PRODUCTION RISKS THAT GREATLY IMPACT COST, SCHEDULE, AND PERFORMANCE
SUSTAINMENTFULLRATE
LRIPMSA TD DEMON-
STRATION INTEGRA-
TION
CBA
• ExecutetheManufacturingPlan –Reflect Design Intent –Repeatable Processes• ContinuousProcessImprovement
PRODUCTION• InfluencetheDesign
Process• PrepareforProduction
RDT&E
•Manufacturingprocesseshavebeen demonstrated in a pilot line environment
• Nosignificantmanufacturingrisks
EMD EXIT REQUIREMENTS
CURRENT DoD 5000 PROCESS
• Uniform,Defect-FreeProduct
• ConsistentPerformance• LowerCost
NET RESULT

DAU PROGRAM MANAGERS TOOL KIT
58
PRODUCIBILITY
DEFINITION:
The measure of relative ease of manufacturing a product. The product should be easily and economically fabricated, assembled, inspected, and tested with high quality on the first attempt that meets perfor-mance thresholds.
PRODUCIBILITY ISSUES:
• Designengineering,NOTmanufacturing,isthetechnicalgroupresponsible for producibility. Program offices and design engineers often dislike producibility because it usually requires performance functionality sacrifices (especially if cost is a set value, i.e., CAIV).
• Manydesignengineersdonothavepropertrainingorexperienceindesigning for producibility. Manufacturing facilities must be explicitly recognized as a major design constraint. This includes process capabilities and rate capabilities at each facility.
The PM is responsible for Producibility
Producibility (see Defense Acquisition Guidebook)
• Producibility:degreetowhichsystemdesignfacilitatestimely,afford-able, optimum-quality manufacture, assembly, and delivery of system.
• Produciblesystemdesignshouldbeadevelopmentpriority.• Designengineeringeffortsconcurrentlydevelop:
— Producible and testable design;— Capable manufacturing processes; and— Necessary process controls to:
◆ Meet requirements, and◆ Minimize manufacturing costs.
• PMshoulduseexistingmanufacturingprocesseswheneverpossible.• Whendesignrequiresnewmanufacturingcapabilities,PMneedsto
consider process flexibility (e.g., rate and configuration insensitivity).• Full-rateproductionnecessitates:
— Stable systems design;— Proven manufacturing processes; and— Available production facilities and equipment.
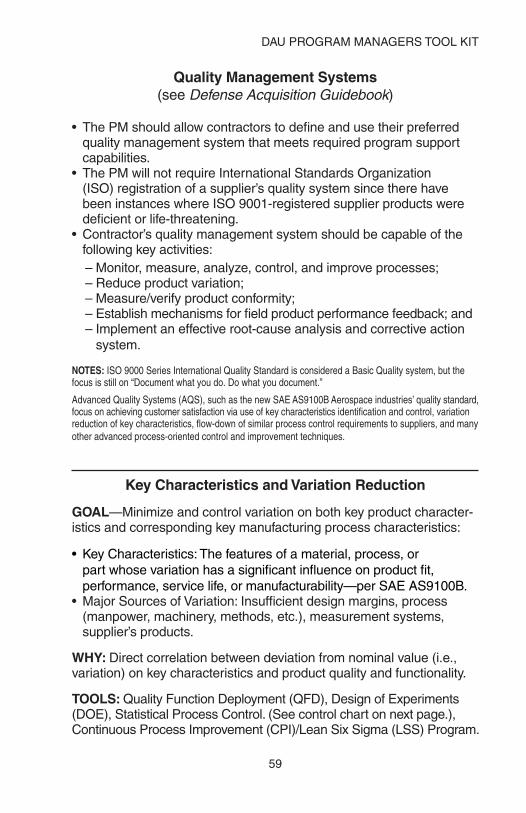
DAU PROGRAM MANAGERS TOOL KIT
59
Quality Management Systems (see Defense Acquisition Guidebook)
• The PM should allow contractors to define and use their preferred quality management system that meets required program support capabilities.
• ThePMwillnotrequireInternationalStandardsOrganization(ISO)registrationofasupplier’squalitysystemsincetherehavebeen instances where ISO 9001-registered supplier products were deficient or life-threatening.
• Contractor’squalitymanagementsystemshouldbecapableofthefollowing key activities: –Monitor,measure,analyze,control,andimproveprocesses;–Reduceproductvariation;–Measure/verifyproductconformity;–Establishmechanismsforfieldproductperformancefeedback;and–Implementaneffectiveroot-causeanalysisandcorrectiveaction
system.
NOTES: ISO 9000 Series International Quality Standard is considered a Basic Quality system, but the focus is still on “Document what you do. Do what you document.”
Advanced Quality Systems (AQS), such as the new SAE AS9100B Aerospace industries’ quality standard, focus on achieving customer satisfaction via use of key characteristics identification and control, variation reduction of key characteristics, flow-down of similar process control requirements to suppliers, and many other advanced process-oriented control and improvement techniques.
Key Characteristics and Variation Reduction
GOAL—Minimize and control variation on both key product character-istics and corresponding key manufacturing process characteristics:
• KeyCharacteristics:Thefeaturesofamaterial,process,orpart whose variation has a significant influence on product fit, performance, service life, or manufacturability—per SAE AS9100B.
• MajorSourcesofVariation:Insufficientdesignmargins,process(manpower, machinery, methods, etc.), measurement systems, supplier’sproducts.
WHY: Direct correlation between deviation from nominal value (i.e., variation) on key characteristics and product quality and functionality.
TOOLS: Quality Function Deployment (QFD), Design of Experiments (DOE), Statistical Process Control. (See control chart on next page.), Continuous Process Improvement (CPI)/Lean Six Sigma (LSS) Program.

DAU PROGRAM MANAGERS TOOL KIT
60
Key Characteristics and Variation Reduction (Continued)
The (X bar) and R Control Charts are used to monitor manufacturing processes. Upper or Lower Control Limits (UCL or LCL) are NOT design specification parameters. Instead, they are predicted boundaries for stable processes, calculated using (X double bar) (average of sampled process Means), (R Bar) (the average of the sample Ranges, which are the spreads between extreme values per sample), plus the selected data sample size and process-keyed statistical formulas. Values outside the UCL and/or LCL indicate possible process instability, likely due to uncommon “special” causes of variation.
Caution: A process in control is desirable because it is predictable, yet it could fail to meet design requirements due to inherent “common” variation and/or because the process average isn’t centered on the design nominal value.
Reference: The Memory JoggerTM II; ©1994 by GOAL/QPC.
UCL
R (Control Chart)*
UCL
LCL
.40
.30
.20
.10
.90
.85
.80
.75
.70
.65
.60
.55
1 2 3 4 5 6 7 8 9 10 11 12 13 14 15 16 17 18 19 20 21 22 23 24 25
X (Control Chart)
R =.178
–
1 2 3 4 5 6 7 8 9 10 11 12 13 14 15 16 17 18 19 20 21 22 23 24 25
X=
*Note: No lower control limit for R chart for sample size below 7.
–

DAU PROGRAM MANAGERS TOOL KIT
61
Production Readiness Review (PRR)
WHY WE DO THEM• RiskManagementTool:Identifyprogramrisksandissuesandopportunitiesearlyandoften
(small, incremental, proactive vice big, single, reactive). • Assesscapabilityofcontractor(andsubcontractor)todeliveraproductontimeandwithincost
that meets performance and quality requirements.• Assessactualcontractorperformance(metrics).• Assesseffectivenessofcontractor’scorrective/preventativeactions.• Measureimprovementofcontractor’sperformance.
HOW TO DO THEM
• Writeacharterthattheprogramofficeandcontractorbothunderstand.• CoordinatewiththeDefenseContractManagementAgency(DCMA)—usetheircapability.• Establishareasofassessmentwithmetrics:
— Producibility;— Engineering Change Orders (ECO)/design stability;— Manufacturing process control (key characteristics);— Cost, time of scrap, rework, and repair;— Tooling status; and— Subcontractor management (same metrics as listed above).
• Askquestions,touchthings,talktoshopfloorworkers:—See what is actually happening on the factory floor rather than the conference
room, i.e., go see and talk to the people doing the work.
WHEN TO DO THEM
• Earlyandoften(seeDefense Acquisition Guidebook, 4.3.3.9.3, Production Readiness Reviews).• Concurrentlywithothertechnicalreviews,suchastheSystemFunctionalReview(SFR),
Preliminary Design Review (PDR), and the Critical Design Review (CDR).• InSystemsIntegrationandSystemsDemonstration.• “Final”PRRoccursatendofSystemsDemonstration(beforeMilestoneC).• PRRsshouldbeheldinLRIPandbeyondIFmajorchanges(todesign,manufacturing
processes, rates/quantities, etc.) occur during LRIP.
Additional Manufacturing Information Sources
• DAU’sProduction,QualityandManufacturingInformationWebsite:— Go to <www.dau.mil>; select Knowledge Sharing; select Acquisition Community Connection;
then see Participate in a Community; and select Production, Quality and Manufacturing. — Contains references to subjects including DoD Manufacturing Requirements, and Best
Business Practices, such as Lean Enterprise, e-Commerce, Six Sigma, Basic and Advanced Quality Systems, Supply Chain Management, etc.
• BestManufacturingPracticesCenterofExcellence—<www.bmpcoe.org>.• LeanAerospaceInitiative(LAI)—<http://lean.mit.edu>.

DAU PROGRAM MANAGERS TOOL KIT
62
TEST AND EVALUATION (T&E)—TYPES AND TASKS
T&E Required Before Going Beyond Low Rate Initial Production•Production Qualification T&E—Verify design article meets spec/PM responsible; per -
form ed by contractor and/or Government/DPRO assistance valuable. Readiness for IOT&E.•Live Fire T&E (LFT&E)—Vulnerability and Lethality/Developmental Agency fund and
execute. DOT&E oversight, approval, and Congressional reporting (LFTE Report) for ACAT I, II, and selected programs.
•Initial Operational T&E (IOT&E)—Operational Effectiveness and Suitability/Indepen-dent Service OTA plan and manage. DOTE oversight, approval, and Congressional reporting (BLRIP Report) for ACAT I and selected systems.
Developmental T&E (DT&E)/Operational T&E (OT&E) Comparisons
OT&E•Operationaleffective/suitable•OperationalTestAgency(OTA)responsible•“Typical”userpersonnel•Manytestarticles/eachtest•“Combat”environment/threats•“ProductionRep”testarticles•Contractormaynotbeallowed(IOT&E)
DT&E•Technicalperformancemeasurement•Developmentalagencyresponsible(PM)•Technicalpersonnel•Limitedtestarticles/eachtest•Controlledenvironment•Alltypesoftestarticles•Contractorinvolved
T&E Tasks and Events
Use Integrated DT/OT—Single integrated contractor/government DT and OT team;shared test events and test data; independent data analysis and reporting.
ACAT I and II Programs—Require an independent, dedicated IOT&E to proceed beyond Low Rate Initial Production (LRIP).
Joint Interoperability Test Certification—All Information Technology and National Security Systems must be evaluated and certified by the Joint Interoperability Test Command (JITC) prior to (initial or updated) fielding, and periodically during their entire life - as a minimum, every four (4) years.
Models and Simulations Used Throughout the Acquisition Process
Test Requirements•TestInterfaces•Eval.Strategy•SystemsEngineering•DesignforTest•S/WHumanT&E•TES/TEMP•SubsystemT&E•SoftwareOnlyT&E
System DT&E•ComputerSoftware Configuration Item T&E•Reliability,Availability, and Maintainability•Supportability•Interoperability•ProductionQuality•LFT&E•Certificateof Readiness for IOT&E
To support T&E during: Requirements Definition T&E Planning Engineering Design Fabrication Integration Systems DT&E OT&E Training Operations
System OT&E•Effectiveness•Suitability
•AcceptanceTest •ManufacturingTest
•DataCollection•Reporting
PRODUCTION (PAT&E, PQT&E, FOT&E)
INTEGRATION AND TEST(H/W IN THE LOOP)
OT&E: EOA, OA, IOT&E/OPEVAL
DEPLOY AND OPERATIONAL SUPPORT
FABRICATION AND TEST (BENCH, LAB)
REQUIREMENTS DEVELOPMENT
ENGINEERING DESIGN
DEVELOPMENT T&E: QUALIFICATION T&E,
ACCEPTANCE T&E, LFT&E

DAU PROGRAM MANAGERS TOOL KIT
63
What is a nomograph? A two-dimensional graphical representation of the cumulative binomial distribution.
Why use nomograph? It enables a relatively simple solution to a complex mathematical calculation.
What does it do? It allows you to calculate the performance of an item with associated statistical confidence.
When do you use it?• Whenyourrequirementincludesa“ConfidenceLevel”withaspecific
level of performance. For example: THIS missile must hit THAT target 90 percent of the time with 80 percent statistical confidence?
•Whentheperformanceofanitemundertestcanbecharacterizedbya binomial distribution.
What are the characteristics of a binomial distribution?• Resultofeachevent(firing)isanindependentfromotherevents.• Probabilityofsuccessofeacheventisconstant.• Eacheventresultsina“success”ora“failure.”(Inotherwords,there
are no points for being close; each event must be scored as a hit or a miss.)
What are some examples of binomially distributed events?• Coinflip• Missilelaunch• Rocketfiring• Startingacar
BOTTOM LINE: Each of these test events must be graded as “pass” or “fail,” and you must determine the success criteria before the test begins.
The nomograph can be used (pre-test) as a test planning device to determine how many tests will be necessary to verify that specified performance has been met. The nomograph can also be used (post-test) to evaluate test data.
NOTE: There are two axes on the nomograph. One axis is the total number of trials. The other axis in the total number of failures. Additionally, the nomograph is non-linear.
TEST AND EVALUATION NOMOGRAPH

DAU PROGRAM MANAGERS TOOL KIT
64
0.99
0.98
0.97
0.96
0.95
0.94
0.93
0.92
0.91
0.90
0.85
0.80
0.75
0.70
0.65
0.60
0.55
0.50
0.999
0.995
0.99
0.98
0.95
0.90
0.80
0.70
0.60
0.50
0.40
0.30
0.20
0.10
0.05
0.02
0.01
0.005
0.001
1000
700
500
400
300
200
140
100
70
50
40
30
20
10
5
2
0
NU
MB
ER
OF TR
IALS
OR
SA
MP
LE S
IZE (n)
FAIL
UR
ES
(r)
1
2
3
4
5
7
9
RE
LIA
BIL
ITY
, R
CO
NF
IDE
NC
E L
EV
EL
How do you get a solution?• Fromthedata,determinethenumberoftrials(totalnumberofcoinflipsormissileshots,etc.)andlocatetheappropriate
line on the nomograph.• Determinethenumberoffailuresandlocatetheappropriatelineonthenomograph.• Drawapointattheintersectionofthesetwolinesonthenomograph.• Anystraightlinedrawnthroughthispointisavalidsolutionforthedatasetused.For example:• Requirement:Yourmissilemusthitthetargetatleast90%ofthetime,withatleast80%confidence.• Given:Youfired20missileswith19hitsand1failure.• Whatisthestatisticalconfidencethatyouwillhave90%successinthefieldwiththesemissilesfiredagainstTHATtarget?
Answer: 60% confidence.• Didyoumeettherequirement?NO,youachievedonly60%confidenceofhittingTHATtarget90%ofthetime,andthe
requirement was 80% confidence or better. One other way to look at the same data is to say that you did achieve 90% prob-ability of success, but you only had 60% confidence in this result; either way you look at it, you did not meet the requirement.
NOTE: If you had fired 30 missiles and missed only 1 time, you would have achieved the 80% confidence along with the required 90% performance level.

DAU PROGRAM MANAGERS TOOL KIT
65
MODELING AND SIMULATION (M&S) PLANNING
Integrated Digital Environment (IDE) Planning
• Establish a business process improvement team• Identify high payback process areas• Identify potential legacy systems and data repositories• Identify user base, including remote sites• Capacity of PC workstations• Bandwidth of communication lines• Where servers are/will be located• Identify legacy system host platforms
HOW DO WE PLAN?—A NOTIONAL APPROACH
Simulation Support Plan (SSP) (Required by Army, Marine Corps, and Air Force)
• Access your service centers for M&S expertise• Establish a simulation coordinating group; the EARLIER the better• Design long-term M&S applications and the Integrated Digital Environment through
the acquisition strategy, Test and Evaluation Management Plan (TEMP), Source Selection Plan (SSP)
• Create constructive, virtual, or live models and simulations• CONTINUOUS PLANNING PROGRAM PLANNING
TEST AND EVALUATION STRATEGY/TEMP
Modeling and Simulation (M&S)Planning
• Identify high payback process areas• Identify potential legacy systems, Service/Joint-standard simulations, architectures and data repositories• Identify where user and simulators are/will be located• Determine capabilities and architectures
of existing simulations• Network bandwidth requirements• IDE utilization opportunities• Interoperability/interface/immersion
requirements• Required capability cap• Design M&S architectures• Establish a Simulation and Verification, Validation, and Authentication (SVV&A) planning process• Establish long-term plan, budget, document and implement• Manage, update, and implement the
SSP

DAU PROGRAM MANAGERS TOOL KIT
66
HIE
RA
RC
HY
OF
MO
DE
LS
AN
D S
IMU
LA
TIO
NS
F
UN
CT
ION
SR
ES
OL
UT
ION
S
UP
PO
RT
ED
M
OD
EL
S A
ND
SIM
UL
AT
ION
S
FO
RC
E O
R S
YS
TE
M L
EV
EL
Incr
easi
ngR
esol
utio
n A
ctua
l P
erfo
rman
ce
Incr
easi
ng
Agg
rega
tion
Com
para
tive
Res
ults
Tes
t and
Eva
luat
ion
Ope
ratio
nal R
eqts
. Dev
elop
men
tE
ffect
iven
ess
Ana
lysi
sT
actic
s D
evel
opm
ent M
issi
on
Pla
nnin
g an
d R
ehea
rsal
Des
ign
Man
ufac
turin
gC
ost
Sup
port
Dev
elop
men
tTe
ch R
eqts
. Dev
.
Join
t/Com
bine
d F
orce
s
Air
Win
gsB
attle
Gro
ups
Air
Win
g
EW
A/C
Airc
raft
Sys
tem F
ire C
ontr
ol
Rad
ar
Cor
ps
Air
Veh
icle
(Sys
tem
/Sub
syst
em/C
ompo
nent
)
(One
-on-
One
)
(Man
y-on
-Man
y)
Thea
ter/
Cam
pai
gn
Mis
sio
n/B
attl
e
En
gag
emen
t
En
gin
eeri
ng
(Gro
ups
of S
yste
ms—
F
orce
Pac
kage
)
The
Hie
rarc
hica
l Agg
rega
tion
of M
odel
s re
duce
s fid
elity
si
gnifi
cant
ly a
nd m
ust b
e ev
alua
ted—
(PM
, DIS
, an
d D
MS
O)
LEG
END:
DIS
—D
istrib
uted
Inte
ract
ive S
imul
atio
n
D
MSO
—D
efen
se M
odel
ing
and
Sim
ulat
ion
Offi
ce

DAU PROGRAM MANAGERS TOOL KIT
67
TH
E E
VO
LU
TIO
N O
F M
OD
EL
ING
AN
D S
IMU
LA
TIO
N
Dis
trib
ute
d
Inte
ract
ive
Sim
ula
tio
n
(DIS
)
Fu
ll S
yste
m
Pro
toty
pes
CA
D
CA
M
CA
EC
AD
AM
Sim
ula
tio
n-
Bas
ed D
esig
n(V
irtu
al
Pro
toty
pin
gw
ith
mfg
. des
ign
,ri
sk/c
ost
an
alys
es,
mat
’l. d
esig
nat
ion
)CO
NC
EP
T
DE
VE
LOP
ME
NT
DE
PLO
YM
EN
T
AN
D S
UP
PO
RT
MA
NU
FAC
TU
RIN
G
EN
GIN
EE
RIN
G D
ES
IGN
A
ND
AN
ALY
SIS
INTEGRATED
SYSTEM DATA
TE
ST
AN
D
EVA
LU
AT
ION
VIR
TU
AL
PR
OTO
TY
PE
PH
YS
ICA
L M
OC
K-U
PF
INA
L P
RO
DU
CT
Sim
ula
tio
n-B
ased
A
cqu
isit
ion
The
Adv
anci
ng C
ompu
ter
and
Com
mun
icat
ions
Tec
hnol
ogy
Rev
olut
ions

DAU PROGRAM MANAGERS TOOL KIT
68
GANTT CHART(Example)
Planned activity scheduleStatus of activityForecast completion behind scheduleForecast completion ahead of schedule
Activity
Preliminary Design
Design Analysis
Define Interfaces
Interface Specs
Preliminary Drawings
NOTE: There is no standard set of Gantt chart symbols.
Symbol MeaningCurrent
Date
J F M A M J J A S O
•Showsplannedstartandfinishdates;mayalsoshowprogress.•Depictsactivitiesashorizontalbarsimposedoveratimeline.•Primarystrengthsaresimplicityanddepictingoverallprojectplanandstatus.•Canshowdependenciesbetweenactivities(canbedifficulttoreadasthe
number of activities and dependencies between activities increases).
4Q3Q2Q1Q4Q3Q2Q1Q4Q3Q2Q1Q
Contract AwardIBRSRRPDRCDR
Symbol Meaning
Activity
Planned event completion
Actual event completion
Actual completion behind schedule
Forecast completion behind schedule
•Showswhenkeyeventsarescheduledandwhentheyareactuallyaccomplished.
•Primarystrengthsaresimplicityanddepictinginformationatthe“bigpicture”level.•Doesnotshowprogressrelatedtoeventsordependenciesbetweenevents.
MILESTONE CHART(Example)
CurrentDate

DAU PROGRAM MANAGERS TOOL KIT
69
Network Schedules—General
•Graphicallyportraydependenciesandconstraintsamongprojectactivitiesand the sequence in which the activities occur.
•Allowsmanagerstoconductasystematic,disciplined,andthoroughreviewof the activities required to complete the project.
•Providesinformationaboutearlyandlatestartandfinishtimes.•Usedtodeterminetheproject’scriticalpath,andslackorfloatinschedule
activities.•Generally,therearetwotypesofnetworks:ArrowDiagrammingMethod
(ADM) and Precedence Diagramming Method (PDM).
Arrow Diagramming Method (ADM)
• Also known as Activity-on-Arrow (AOA); information about activities is shown above/below the arrows connecting events in the schedules. Events are usually shown as circles, squares, or rectangles (see following page).
•ADMgenerallytreatsallrelationships(seebelow)asfinish-to-start(i.e.,firstactivity must finish before the next activity can start).
•ADMcanshowotherrelationships(e.g.,start-to-start,finish-to-finish)through the use of “dummy” activities.
Precedence Diagramming Method (PDM)•AlsoknownasActivity-on-Node(AON);informationaboutactivitiesisshown
in/on the network nodes. Nodes are usually shown as squares or rectangles (see following page).
•Linesconnectingthenodesshowtherelationshipsbetweentheactivities.•PDMcanshowallformsofschedulerelationships,includingleadandlag
situations (see below).
Finish-to-Start.Activity “A” must finishbefore Activity “B” canstart.
Finish-to-Finish.Activity “A” must finishbefore Activity “B” canfinish.
A Start-to-Start.Activity “A” must startbefore Activity “B” canstart.
A Start-to-Finish.Activity “A” must startbefore Activity “B” canfinish. Rarely used.
B
B
A B
A
B
NETWORK SCHEDULES

DAU PROGRAM MANAGERS TOOL KIT
70
NE
TW
OR
K S
CH
ED
UL
ES
(E
XA
MP
LE
)
Sla
ck =
LS
–E
S o
r L
F –
EF
Cri
tica
l Pat
h
Du
mm
y A
ctiv
ity
Tas
k ID
(ES
, EF
)
Du
rati
on
(LS
, LF
)
Tas
k ID
Du
rati
on
F(1
8, 2
6)
9(1
8, 2
6)
H(2
7, 3
8)
12(2
7, 3
8)
E(1
7, 2
4)
8(1
9, 2
6)
G(2
2, 3
1)
10(2
9, 3
8)
B(6
, 16)
11(8
, 18)
D(6
, 21)
16(1
3, 2
8)
A(1
, 5)
5(1
, 5)
C(6
, 17)
12(6
, 17)
I (
39, 4
8)
10 (
39, 4
8)
J(4
9, 5
3)
5(4
9, 5
3)
Net
wo
rk S
ched
ule
s (E
xam
ples
)
Tas
k ID
Du
rati
on
Pre
dec
esso
rA
5--
B11
AC
12A
D16
AE
8B
F9
C, D
G10
DH
12E
, FI
10G
, HJ
5I
A 5
Pre
ced
ence
Dia
gra
mm
ing
Met
ho
d (
PD
M)
or
Act
ivit
y-o
n-N
od
e (A
ON
)
Leg
end
15
15
C 12
617
617
F 9
1826
1826
H 12I 10
J 5
2738
2738
B 11
616
818
D 16
621
1328
E 8
1724
1926
G 10
2231
2938
3948
3948
4953
4953
Arr
ow
Dia
gra
mm
ing
Met
ho
d (
AD
M) *
or
Act
ivit
y-o
n-A
rro
w (
AO
A)
ES
EF
LS
LF
ES
= E
arly
Sta
rtE
F =
Ear
ly F
inis
hL
S =
Lat
e S
tart
LF
= L
ate
Fin
ish
Leg
end
ES
= E
arly
Sta
rt
EF
= E
arly
Fin
ish
LS
= L
ate
Sta
rt
LF
= L
ate
Fin
ish
Eve
nt
Cri
tica
l Pat
h*
NO
TE
: Als
o so
met
imes
ref
erre
d to
as
Crit
ical
Pat
h M
etho
d (C
PM
) or
Pro
gram
Eva
luat
ion
Rev
iew
Tec
hniq
ue (
PE
RT
)
NO
TE
1:
Tas
k ID
, Dur
atio
n, a
nd P
rede
cess
or in
fo is
th
e sa
me
for
both
exa
mpl
esN
OT
E 2
:E
ight
-hou
r cl
ock
is u
sed
in b
oth
exam
ples
NO
TE
1
NO
TE
2
NO
TE
2
Tas
k ID
Du
rati
on
Pre
dec
esso
rA
5--
B11
AC
12A
D16
AE
8B
F9
C, D
G10
DH
12E
, FI
10G
, HJ
5
Pre
ced
ence
Dia
gra
mm
ing
Met
ho
d (
PD
M)
or
Act
ivit
y-o
n-N
od
e (A
ON
)
Arr
ow
Dia
gra
mm
ing
Met
ho
d (
AD
M) *
or
Act
ivit
y-o
n-A
rro
w (
AO
A)
*NO
TE: A
lso
som
etim
es re
ferre
d to
as
Crit
ical
Pat
h M
etho
d(C
PM) o
r Pro
gram
Eva
luat
ion
Rev
iew
Tech
niqu
e (P
ERT)
Sla
ck =
LS
–E
S o
r L
F –
EF
Cri
tica
l Pat
h
Du
mm
y A
ctiv
ity
Tas
k ID
(ES
, EF
)
Du
rati
on
(LS
, LF
)
Tas
k ID
Du
rati
on
F(1
8, 2
6)
9(1
8, 2
6)
H(2
7, 3
8)
12(2
7, 3
8)
E(1
7, 2
4)
8(1
9, 2
6)
G(2
2, 3
1)
10(2
9, 3
8)
B(6
, 16)
11(8
, 18)
D(6
, 21)
16(1
3, 2
8)
A(1
, 5)
5(1
, 5)
C(6
, 17)
12(6
, 17)
I (
39, 4
8)
10 (
39, 4
8)
J(4
9, 5
3)
5(4
9, 5
3)
I
A 5
Leg
end
15
15
C 12
617
617
F 9
1826
1826
H 12I 10
J 5
2738
2738
B 11
616
818
D 16
621
1328
E 8
1724
1926
G 10
2231
2938
3948
3948
4953
4953
ES
EF
LS
LF
ES
= E
arly
Sta
rtE
F =
Ear
ly F
inis
hL
S =
Lat
e S
tart
LF
= L
ate
Fin
ish
Leg
end
ES
= E
arly
Sta
rt
EF
= E
arly
Fin
ish
LS
= L
ate
Sta
rt
LF
= L
ate
Fin
ish
Eve
nt
Cri
tica
l Pat
h
NO
TE
1:T
ask
ID, D
urat
ion,
and
Pre
dece
ssor
info
is
the
sam
e fo
r bo
th e
xam
ples
NO
TE
2:
Eig
ht-h
our
cloc
k is
use
d in
bot
h ex
am
ples
NO
TE
1
NO
TE
2
NO
TE
2

DAU PROGRAM MANAGERS TOOL KIT
71
EX
AM
PL
ES
OF
NE
TW
OR
K S
CH
ED
UL
ING
SO
FT
WA
RE
A 5 d
ays
B 11 d
ays
C 12 d
ays
D 16 d
ays
E 8 d
ays
F 9 d
ays
G 10 d
ays
H 12 d
ays
I 10 d
ays
J 5 d
ays
Criti
cal P
ath
Gan
tt C
har
t Vie
w
Net
wo
rk V
iew
NOTE
: Tas
k na
me,
dur
atio
n, a
nd p
rede
cess
or in
form
atio
n is
the
sam
e as
in N
etw
ork
Sche
dule
on
the
prev
ious
pag
e.

DAU PROGRAM MANAGERS TOOL KIT
72
SC
HE
DU
LE
DE
VE
LO
PM
EN
T
IMP
PM
Pri S
ys
IPT
A
Sec
Sys
SE
IPT
DH
/W
IPT
BIP
T E
S/W
IPT
CIP
T F
Pro
gra
m O
rg S
tru
ctu
re
Inte
rmed
iate
Sch
edu
leM
aste
r S
ched
ule
Det
aile
d S
ched
ule
Det
aile
d S
ched
ule
Des
ign
Engi
neer
ing
Inte
grat
ion
Asse
mbl
yTe
st a
nd E
valu
atio
n
WB
S1.0
1.1.
1
1.1.
2
1.1.
3
1.1.
4
1.1
1.3.
1
1.3.
2
1.3.
3
1.3
1.4.
1
1.4.
2
1.4.
3
1.4.
4
1.4
1.5.
1
1.5.
2
1.5
1.2.
1
1.2.
2
1.2.
3
1.2
SO
W,
Sp
ecs,
SE
P, e
tc.
Wo
rkP
acka
ges
Pro
gra
mR
equ
irem
ents
Tec
hn
ical
Do
cum
ents
Pro
gra
mP
lan
s
Res
ou
rce
Pla
nn
ing
Sch
edu
les
Tas
kL
ists
ICD
,C
DD
,C
PD
,et
c.
S.E
.P
roce
ss
IPT
CIP
T C
IPT
CIP
T C
IPT
C
Trac
k 1
Trac
k 2
Trac
k 3
Trac
k 4
Trac
k 5Res
po
nsi
bili
ty M
atri
x
Du
rati
on
& R
eso
urc
eE
stim
ates
Net
wo
rk (
Tas
k S
eque
nce)
His
tori
cal D
ata
SM
Es

DAU PROGRAM MANAGERS TOOL KIT
73
26
25
2
4
23
2
2
21
2
0
19
1
8
17
1
6
15
1
4
13
1
2
11
1
0
9
8
7
6
5
4
3
2
1
0W
OR
KIN
G D
AY
S P
RIO
R T
O C
OM
PL
ET
ION
(L
EA
D T
IME
)
(SU
BC
ON
TR
AC
T
PAR
T)
(PU
RC
HA
SE
PA
RT
)
(PU
RC
HA
SE
PA
RT
)(P
UR
CH
AS
E P
AR
T)
(SU
BA
SS
EM
BLY
“B
”)
(SU
BA
SS
EM
BLY
“A
”)
FIN
AL
AS
SE
MB
LY
(FA
BR
ICA
TE
D P
AR
T
IN-H
OU
SE
)
TE
ST
S
HIP
6
87
4
1
2 35
1211
109
LE
AD
TIM
E C
HA
RT
(Use
with
“Li
ne o
f Bal
ance
Tec
hniq
ue” o
n ne
xt p
age.
)

DAU PROGRAM MANAGERS TOOL KIT
74
80 70 60 50 40 30 20 10 0
80 70 60 50 40 30 20 10 0
OD
NF
JA
MJ
MJ
21
43
56
79
810
1121
SH
TN
OM
OR
TN
OC
PL
ST
NIO
08 07 06 05 04 03 02 01 0
dennalP
lautcA
6225
4223
2221
0219
1817
1615
1413
1211
18
90
56
71
23
40
NOI
TC
UD
OR
PD
AEL
TIM
ER
AH
CT
22K
RO
WT
NO
M/S
YA
DH
012
tohspanS
nie
mit1:
aM
y
61
47
8
2 35
9 1011
LIN
E O
F B
AL
AN
CE
TE
CH
NIQ
UE

DAU PROGRAM MANAGERS TOOL KIT
75
• EveryprogrammusthaveanAPBstartingatprograminitiation(normallyMilestoneB).• TheAPBreflectsthethresholdandobjectivevaluesforaminimumnumberofcost,
schedule, and performance parameters that describe the program over its life cycle.• Costthresholdsandobjectivesreflectmajorelementsoflifecyclecost(RDT&E,
procurement, PAUC, APUC, etc.). • Schedulethresholdsandobjectivesreflectcriticalevents(milestonedecisions,
start of DT/OT, first flight, IOC, etc.). • Performancethresholdsandobjectivesarekeyperformanceparameters(KPPs)
extracted verbatim from the CDD/CPD.• TheJROCrequiresKPPsforforceprotection,survivability,sustainment
(availability), net-ready, and KPPs traceable to the Joint Pub 3-0, Joint Operations.
• TheMDAmayaddothersignificantperformanceparametersifnecessary.• TheAPBissignedbyPM,PEO,andCAE,asappropriate,andapprovedbyMDA.
ACQUISITION PROGRAM BASELINEKey Performance Parameter (KPP)—An Example
Objective
Threshold
X
.85
.80
.75
.70
.65
(Prob)
ExitCriteria
(.77)
Full-Rate Production
CurrentEstimate*
Growth (Maturity) Curve
SURVIVABILITY
ExitCriteria
(.73)
* In this example, the current estimate falls below the threshold—this represents a baseline breach of performance.
Integrated System Design
System Capability and Manufacturing Process
DemonstrationLow-Rate
Initial Production
PCDRAMS B MS C FRP DR
BaselineValues
Engineering and Manufacturing Development
Production andDeployment Phase
LEGEND:APB—Acquisition Program BaselineAPUC—Average Procurement Unit CostCAE—Component Acquisition ExecutiveCDD—Capabilities Design DocumentCPD—Capabilities Production DocumentDRR—Design Readiness ReviewDT/OT—Development Test/Operational TestFRP DR—Full-Rate Production Design ReviewIOC—Initial Operational Capability JROC—Joint Requirements Oversight Council
MDA—Milestone Decision AuthorityMS—MilestonePAUC—Program Acquisition Unit Cost PCDRA—
Post Critical Design Review Assessment
PEO—Program Executive OfficerPM—Program ManagerRDT&E—Research, Development, Test and Evaluation
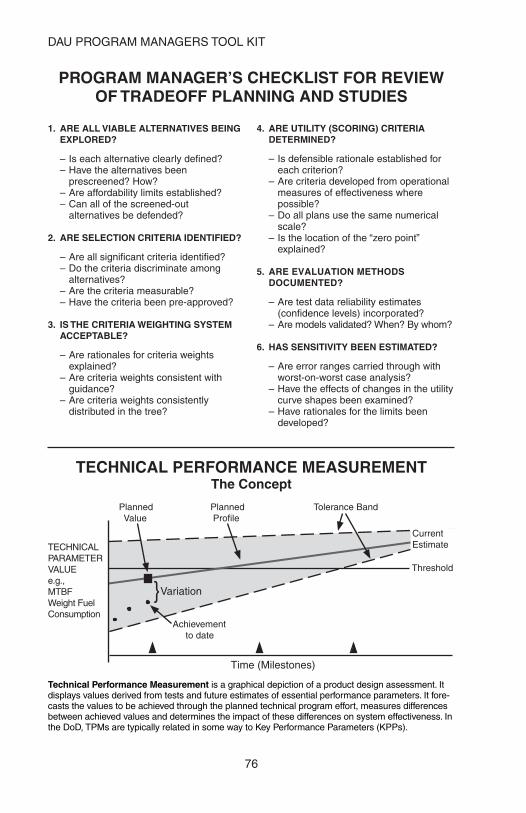
DAU PROGRAM MANAGERS TOOL KIT
76
TECHNICAL PERFORMANCE MEASUREMENTThe Concept
TECHNICAL PARAMETER VALUEe.g.,MTBF Weight Fuel Consumption
Tolerance Band
Threshold
Planned Value
Current Estimate
Variation
Planned Profile
Achievement to date
Time (Milestones)
}
1. ARE ALL VIABLE ALTERNATIVES BEING EXPLORED?
–Iseachalternativeclearlydefined?–Havethealternativesbeen
prescreened? How?–Areaffordabilitylimitsestablished?–Canallofthescreened-out
alternatives be defended?
2. ARE SELECTION CRITERIA IDENTIFIED?
–Areallsignificantcriteriaidentified?–Dothecriteriadiscriminateamong
alternatives? –Arethecriteriameasurable?–Havethecriteriabeenpre-approved?
3. IS THE CRITERIA WEIGHTING SYSTEM ACCEPTABLE?
–Arerationalesforcriteriaweightsexplained?
–Arecriteriaweightsconsistentwithguidance?
–Arecriteriaweightsconsistentlydistributed in the tree?
4. ARE UTILITY (SCORING) CRITERIA DETERMINED?
–Isdefensiblerationaleestablishedforeach criterion?
–Arecriteriadevelopedfromoperationalmeasures of effectiveness where possible?
–Doallplansusethesamenumericalscale?
–Isthelocationofthe“zeropoint”explained?
5. ARE EVALUATION METHODS DOCUMENTED?
–Aretestdatareliabilityestimates(confidence levels) incorporated?
–Aremodelsvalidated?When?Bywhom?
6. HAS SENSITIVITY BEEN ESTIMATED?
–Areerrorrangescarriedthroughwithworst-on-worst case analysis?
–Havetheeffectsofchangesintheutilitycurve shapes been examined?
–Haverationalesforthelimitsbeendeveloped?
PROGRAM MANAGER’S CHECKLIST FOR REVIEW OF TRADEOFF PLANNING AND STUDIES
Technical Performance Measurement is a graphical depiction of a product design assessment. It dis plays values derived from tests and future estimates of essential performance parameters. It fore-casts the values to be achieved through the planned technical program effort, measures differences between achieved values and determines the impact of these differences on system effectiveness. In the DoD, TPMs are typically related in some way to Key Performance Parameters (KPPs).

DAU PROGRAM MANAGERS TOOL KIT
77
A Process, Not an Event
Risk Identification
Risk Analysis
RiskTracking
Risk MitigationPlanning
Risk MitigationImplementation
Root cause analysisof the risks identified
ROOT CAUSE ANALYSIS
• Riskidentificationincludesanalysistoidentifytherootcausesoftherisks identified.
• RootcausesareidentifiedbyexaminingeachWBSproductandprocess element in terms of the sources or areas of risk.
• Anapproachforidentifyingandcompilingalistofrootcausesisto:–listWBSproductorprocesselements;–examineeachintermsofrisksourcesorareas;–determinewhatcouldgowrong;and–ask“why”multipletimesuntilthesource(s)isdiscovered.
• Acommonmisconceptionandprogramofficepracticeconcerningrisk management root cause analysis is to identify and track issues (vice risks) and then manage the consequences (vice the root causes). Risks should not be confused with issues (realized risks). If a root cause is described in the past tense, the root cause has already occurred and is, therefore, an issue that needs to be resolved but not a risk!
DoD Risk Management GuideAugust 2006
DOD RISK MANAGEMENT PROCESS MODEL

DAU PROGRAM MANAGERS TOOL KIT
78
Prio
ritiz
edLi
st
Avo
idT
rans
fer
Ass
ume
Qu
anti
fy S
ome
Qu
alif
y A
ll
Iden
tify
Ris
k M
itig
atio
n—
plan
and
impl
emen
t
An
alyz
epr
iorit
ize/
list
Tra
ckin
gst
atus
topl
an
Con
trol
Pla
n fo
r ea
chpr
ogra
m b
yph
ase/
eval
uatio
n
Miti
gatio
n Im
plem
enta
tion
thro
ugh
Inte
grat
ed P
rodu
ct a
nd P
roce
ss D
evel
opm
ent (
IPP
D)
Per
iod
icU
pd
ate
Raw
Lis
t
Upd
ate
asne
eded
Inte
grat
ein
to P
rogr
am
Pla
ns a
nd
Con
trol
Too
lsas
nec
essa
ry
RIS
K M
AN
AG
EM
EN
T P
RO
CE
SS
—D
ETA
ILS

DAU PROGRAM MANAGERS TOOL KIT
79
PR
OG
RA
M S
UC
CE
SS
ME
TR
ICS
MO
DE
L*
SU
MM
AR
Y
Colo
rs:
O
n Tr
ack,
No/
Min
or Is
sues
O
n Tr
ack,
Sig
nific
ant I
ssue
s
Off
Trac
k, M
ajor
Issu
es
Tren
ds:
Up
Arro
w—
Situ
atio
n Im
prov
ing
Dow
n Ar
row
—Si
tuat
ion
Det
erio
ratin
gSi
tuat
ion
Stab
ility—
Num
ber w
ithin
par
enth
esis
is th
e nu
mbe
r
of r
epor
ting
perio
ds th
at th
e ite
m h
as b
een
stab
le
PEO
XXX
COL,
PM
Date
of R
evie
w: d
d m
mm
yy
Prog
ram
Acro
nym
ACAT
XX
Prog
ram
Life
Cyc
le P
hase
: ___
____
_
Prog
ram
Suc
cess
(2)
Con
tract
Ear
ned
Valu
e M
etric
s (3
)
Prog
ram
“
Prog
ram
Par
amet
erSt
atus
(3)
DoD
Vis
ion
(2)
Tran
sfor
mat
ion
(2)
Test
ing
Stat
us (2
)
Prog
ram
Ris
k A
sses
smen
t (5)
Con
tract
orPe
rform
ance
(2)
Con
tract
or H
ealth
(2)
Fixe
d Pr
ice
Perfo
rman
ce (3
)
Sust
aina
bilit
y Ri
skAs
sess
men
t (3)
Join
t (3)
Tech
nica
l Mat
urity
(3)
INTE
RNAL
FAC
TORS
/MET
RICS
EXTE
RNAL
FAC
TORS
/MET
RICS
10 10
14 3 3
2 2 2 8 2 2 2
7.5
7.5
Indu
stry
(3)
Inte
rnat
iona
l (3)
*Als
o kn
own
as P
roba
bilit
y of
Pro
gram
Suc
cess
(PoP
S) M
odel
; ini
tially
dev
elop
ed b
y M
r. Jo
hn H
igbe
e at
the
DAU
. For
mor
e in
form
ation
on
PoPS
Mod
el, g
o to
ht
tps:
//acc
.dau
.mil/
Com
mun
ityBr
owse
r.asp
x?id
=244
15.
Man
ning
Prog
ram
R
esou
rces
Arm
y Se
cret
aria
t
Prog
ram
Requ
irem
ents
(3)
Bud
get
40406060
Prog
ram
Sco
peEv
olut
ion
Inte
rope
rabi
lity
(3)
Arm
y Vi
sion
(4)
OSD
(2)
Join
t Sta
ff (2
)
War
fight
er (4
)
Prog
ram
Exec
utio
n 20
2020
15Fi
t Cap
abili
tyVi
sion
(2)
2 5 9 2 1 15C
ongr
essi
onal
100
100
” 25
Prog
ram
Advo
cacy
Curr
ent F
orce
(4)
Futu
re F
orce
UH-6
0 M
ODE
L SU
MM
ARY
CHAR
T—AN
EXA
MPL
E

DAU PROGRAM MANAGERS TOOL KIT
80
WHAT IS SYSTEMS ENGINEERING?Systems Engineering (SE) is an interdisciplinary approach encompassing the entire technical effort to evolve and verify an integrated and total life cycle balanced set of system, people, and process solutions that satisfy customer needs. SE is the integrating mechanism across the technical efforts related to the development, manufacturing, verification, deployment, operations, support, disposal of, and user training for systems and their life cycle processes; and SE develops technical information to support the program management decision-making process. (DoD definition)
SYSTEMS ENGINEERING PROCESSESDoD SE Technical and Technical Management Processes:
Technical Processes: Stakeholder Requirements Definition, Requirements Analysis, Architecture Design, Implementation, Integration, Verification, Validation, Transition
Technical Management Processes: Decision Analysis, Technical Planning, Technical Assessment, Requirements Management, Risk Management, Configuration Management, Technical Data Management, Interface Management
SYSTEMS ENGINEERING POLICY IN DOD(DoD 5000.1 and Encl 12, DoDI 5000.02)
• ManageacquisitionprogramsthroughtheapplicationofaSEapproachthatoptimizes total system performance and minimizes total ownership costs.
• SEPlans(SEPs)arerequiredforeachmilestonereview.SEPsmust describe the overall technical approach; key risks, processes, resources, metrics and performance incentives; the timing and content of technical reviews (TRs); and item unique identification (IUID) and reliability, availability, and maintainability (RAM) summaries.
• Aleadorchiefsystemsengineerisrequiredattheprogramexecutiveofficer (PEO) level and is responsible to the PEO for effective application of SE processes across the PEO portfolio.
• Calledoutforspecialemphasisare:—TRs: Event driven and meeting SEP entrance criteria;—Configuration management: Required across the life cycle; PM takes
control of product baseline after critical design review;—Environment, safety and occupational health: Required to be
integrated into SE processes;—Corrosion prevention, and control: ACAT I programs require formal plan; —A modular, open-systems approach shall be employed, where feasible;—Data management strategy: Required for all ACAT I and II programs;—IUID: An implementation plan is required; and—RAM: A strategy is required to include reliability growth program.

DAU PROGRAM MANAGERS TOOL KIT
81
SY
ST
EM
S E
NG
INE
ER
ING
PR
OC
ES
S—
TE
CH
NIC
AL
MA
NA
GE
ME
NT
PR
OC
ES
SE
S
Tech
nica
lPl
anni
ng
Requ
irem
ents
Man
agem
ent
Conf
igur
atio
nM
anag
emen
t
Risk
Man
agem
ent
Inte
rface
Man
agem
ent
Data
Man
agem
ent
Tech
nica
lAs
sess
men
t
Deci
sion
Anal
ysis
Stak
ehol
der
Requ
irem
ents
Defin
ition
Requ
irem
ents
Anal
ysis
Arch
itect
ure
Desi
gn
Impl
emen
tatio
n
Tran
sitio
n
Valid
atio
n
Verif
icat
ion
Inte
grat
ion
Real
izat
ion
Proc
esse
s
Desi
gn P
roce
sses

DAU PROGRAM MANAGERS TOOL KIT
82
DE
FE
NS
E A
CQ
UIS
ITIO
N M
AN
AG
EM
EN
T S
YS
TE
M—
TE
CH
NIC
AL
“V
” A
CT
IVIT
IES
Tech
nic
al A
ctiv
ity
“V”
for
Eac
h P
has
e
Pre-
Syst
ems
Acqu
isiti
on
User
Nee
ds
Prod
uctio
n &
Depl
oym
ent
Ope
ratio
ns &
Su
ppor
tEn
gine
erin
g an
dM
anuf
actu
ring
Deve
lopm
ent
FRP
Deci
sion
Revi
ew
Syst
ems
Acqu
isiti
onSu
stai
nmen
t
Mat
erie
l Sol
utio
nAn
alys
isM
ater
iel
Deve
lopm
ent
Deci
sion
Prog
ram
Initi
atio
n
Tech
nolo
gy D
evel
opm
ent
Tech
nolo
gy O
ppor
tuni
ties
& Re
sour
ces
AB
C
Post
-PDR
Asse
ssm
ent
Post
-CDR
Asse
ssm
ent
LRIP
& IO
T&E
SCM
PDIS
DLi
fe C
ycle
Sust
ainm
ent
Disp
osal
IOC
FOC
LEG
END:
CD
R—
Crit
ical
Des
ign
Rev
iew
FOC
—Fu
ll Ope
ratio
nal C
apab
ility
FRP—
Full-
Rat
e Pr
oduc
tion
IOC
—In
itial O
pera
tiona
l Cap
abilit
yIO
T&E—
Initia
l Ope
ratio
nal T
est a
nd E
val
ISD
—In
tegr
ated
Sys
tem
Des
ign
LRIP
—Lo
w-R
ate
Initia
l Pro
duct
ion
PDR
—Pr
elim
inar
y D
esig
n R
evie
wSC
MPD
—Sy
stem
Cap
abilit
y an
d M
anuf
actu
ring
Proc
ess
Dem
o

DAU PROGRAM MANAGERS TOOL KIT
83
MATERIEL SOLUTION ANALYSIS PHASE SYSTEMS ENGINEERING (SE) ACTIVITIES
TECHNOLOGY DEVELOPMENT PHASE SE ACTIVITIES •System Allocated Baseline
•PDR Report•Test Reports•TEMP •SEP •PESHE •PPP •TRA•NEPA Compliance Schedule•Risk Assessment•Validated Sys Support & Maint Objectives & Requirements•Inputs to: -CDD -ISP -STA -IBR -Acq Strategy -Affordability Assessment -Cost/Manpower Est.
Interpret User Needs,Refine System
Performance Specs &Environmental Constraints
MTA
FMECA
FTA
LORA
RCM
Trades
Verification
Linkage
Linkage
Verification
Linkage
Verification
Linkage
Validation
Demo & Validate System& Tech Maturity Versus Defined User Needs &
Environmental Constraints
Design/Develop System Concepts,i.e., Enabling/Critical Technologies,
Update Constraints, & Cost/Risk Drivers
•ICD and Draft CDD•Approved Materiel Solution•Exit Criteria•Support and Maintenance•Concepts and Technologies•AoA •TDS•T&E Strategy•System Safety Analysis
Demo/ModelIntegrated System Versus
Performance Spec
Demo Enabling/Critical Technology
ComponentsVersus Plan
Decompose FunctionalDefinitions into CriticalComponent Definition &
Technologies Verification Plan
Demo System &Prototype
FunctionalityVersus Plan
Evolve FunctionalPerformance Specs into
System Allocated Baseline
Trades
Trades
SRR
SFR
PDR
Interpret User Needs.Analyze Operational
Capabilities &Environmental Constraints
Develop System Perf(& Constraints) Spec &Enabling/Critical Tech &
Prototypes Verification Plan
Develop FunctionalDefinitions for Enabling/
Critical Tech/Prototypes &Associated Verification Plan
Develop System Functional Specs & Verification Plan toEvolve System Functional
Baseline
ICDAoA PlanExit CriteriaAlternative Maintenance & Logistics Concepts
Prelim Sys SpecT&E StrategySEPSupport & Maintenance Concepts & TechInputs to: -Draft CDD -TDS -AoA -Cost/Manpower Est.
Decompose Concept Performance into Functional Definition & Verification Objectives
Analyze/AssessSystem Concept VersusFunctional Capabilities
Analyze/Assess Concepts Versus Defined User Needs &
Environmental Constraints
Assess/Analyze Concept &Verify System
Concept’s Performance
Develop Component Concepts, i.e., Enabling/Critical Technologies, Constraints & Cost/Risk Drivers
Analyze/AssessEnabling/Critical Components
Versus Capabilities
Decompose Concept Functional Definition into Component Concepts
& Assessment Objectives
Develop Concept Performance (& Constraints)
Definition & Verification Objectives
Interpret User Needs,Analyze Operational Capabilities &
Environmental Constraints
INPUTSOUTPUTS
Trades
ASRITR
Trades

DAU PROGRAM MANAGERS TOOL KIT
84
EN
GIN
EE
RIN
G A
ND
MA
NU
FAC
TU
RIN
G D
EV
EL
OP
ME
NT
PH
AS
E S
E A
CT
IVIT
IES
FCA
Dem
onst
rate
Sys
tem
toSp
ecifi
ed U
ser N
eeds
and
Envi
ronm
enta
l Con
stra
ints
CDR
Ligh
ter b
lock
s re
flect
tech
nica
l effo
rts
requ
ired
durin
g EM
D if
PDR
does
not
com
e pr
ior t
o M
ilest
one
B.
SV
RPR
R
TRR
INP
UT
S
Inte
rpre
t Use
r Nee
ds,
Refin
e Sy
stem
Perf
orm
ance
Spe
cs &
Envi
ronm
enta
l Con
stra
ints
Acqu
isiti
on S
trat
egy
Exit
Crite
riaSy
s Pe
rfor
man
ce S
pec
APB
•CDD
•ST
A •I
SPSE
P •T
EMP
•PES
HE •
PPP
NEPA
Com
plia
nce
Sche
dule
Risk
Ass
essm
ent
Valid
ated
Sys
Sup
port
& M
aint
Obj
ectiv
es &
Req
uire
men
tsPr
oduc
t Sup
port
Str
ateg
ySy
stem
Saf
ety
Anal
ysis
OU
TP
UT
S
Initi
al P
rodu
ct B
asel
ine
Test
Rep
orts
SEP
•TRA
•PE
SHE
•TEM
PNE
PA C
ompl
ianc
e Sc
hedu
leEl
emen
ts o
f Pro
duct
Sup
port
Risk
Ass
essm
ent
Life
Cyc
le S
usta
inm
ent
Syst
em S
afet
y An
alys
isIn
puts
to:
-CPD
-ST
A -I
SP -
IBR
-Cos
t/Man
pow
er E
st
Fabr
icat
e, A
ssem
ble,
Code
to “
Build
-to”
Docu
men
tatio
nInte
grat
ed D
T&E,
LFT
&E a
ndVe
rify
Perf
orm
ance
Com
plia
nce
to S
pecs
Indi
vidu
al C
IVe
rific
atio
n DT
&E
Syst
em D
T&E,
LFT
&E &
OAs
,Ve
rify
Syst
em F
unct
iona
lity
and
Cons
trai
nts
Com
plia
nce
to S
pecs
Evol
ve C
I Fun
ctio
nal
Spec
s in
to P
rodu
ct(B
uild
to) D
ocum
enta
tion
& In
spec
tion
Plan
Deve
lop
Syst
em F
unct
iona
lSp
ecs
& Ve
rific
atio
n Pl
an to
Evol
ve S
yste
m F
unct
iona
lBa
selin
e
Evol
ve F
unct
iona
lPe
rfor
man
ce S
pecs
into
Syst
em A
lloca
ted
Base
line
SFR
PDR
Verif
icat
ion
Link
age
Verif
icat
ion
Link
age
Trad
esTr
ades
Verif
icat
ion/
Valid
atio
nLi
nkag
e
Verif
icat
ion
Link
age
LEG
END:
APB—
Acq
Prog
ram
Bas
elin
eCD
D—Ca
pabi
lity
Dev
Doc
CDR—
Criti
cal D
esig
n Re
view
CI—
Conf
igur
atio
n Ite
mCP
D—Co
ntin
uing
Pro
f Dev
DT&E
—De
v Te
st &
Eva
lFC
A—Fu
nctio
nal C
onfig
Aud
itIB
R—In
tegr
ated
Bas
elin
e Re
view
ISP—
Info
rmat
ion
Supp
ort P
lan
LFT&
E—Li
ve F
ire T
est &
Eva
lNE
PA—
Nat’l
Env
ir Po
licy
Act
OA—
Ope
ratio
nal A
sses
smen
tPD
R—Pr
elim
inar
y De
sign
Rev
iew
PESH
E—Pr
og E
nvir,
Saf
ety
&
O
cc H
ealth
Eva
lPP
P—Pr
ogra
m P
rote
ctio
n Pl
anPR
R—Pr
oduc
tion
Read
ines
s Re
vSE
P—Sy
stem
s En
gine
erin
g Pl
anSF
R—Sy
stem
Fun
ctio
nal R
evie
wST
A—Sy
stem
Thr
eat A
sses
smen
tSV
R—Sy
stem
Ver
ifica
tion
Revi
ewTE
MP—
Test
& E
val M
aste
r Pla
nTR
R—Te
st R
eadi
ness
Rev
iew

DAU PROGRAM MANAGERS TOOL KIT
85
OPERATIONS AND SUPPORT PHASESE ACTIVITIES
PRODUCTION AND DEPLOYMENT PHASE SE ACTIVITIES
Analyze Deficiencies to Determine Corrective Actions
LFT&EReport toCongress
BLRIPReport toCongress
Verify and ValidateProduction Configuration
Independent IOT&E
OUTPUTS
•Production Baseline•Test Reports•TEMP •PESHE •SEP•System Safety Analysis•Input to: –Cost/Manpower Est
Full-Up System Level LFT&E
JITC Joint InteroperabilityTest Certification
Joint Interoperability Certification Testing
Production Qualification Testing
Verification/Validation Linkage
OTRRAOTR
INPUTS
•Test Results•Exit Criteria•APB •CPD •SEP •TEMP•Product Support Package•PESHE•System Safety Analysis
Modify Configuration(Hardware/Software/Specs)
to Correct Deficiencies
PCA
OUTPUTSINPUTS
• Process Change—Hardware/SupportMateriel Change•
Trades
• Service Use Data • User Feedback
• SEP
Monitor and CollectAll Service Use Data
Analyze Data toDetermine Root Cause
Determine System Risk/Hazard Severity
DevelopCorrective Action
Implement and Field
Assess Risk ofImproved System
Integrate and Test Corrective Action
In-ServiceReview
• Discrepancy Reports• Failure Reports
• Data for In-Service Review• Input to CDD for Next Increment• Modifications/Upgrades to Fielded Systems• SEP
Trades

DAU PROGRAM MANAGERS TOOL KIT
86
REQUIREMENTS (USER NEEDS) ANALYSIS QUESTIONS
• What are the reasons behind the system development?• What are the customer expectations? How will they measure the
performance of the system?• Who are the users and how do they intend to use the product?• What do the users expect of the product?• What are their levels of expertise?• With which environmental characteristics must the system comply?• What are existing and planned interfaces?• What functions will the system perform, expressed in customer
language?• What are the constraints—hardware, software, economic,
procedural—with which the system must comply?• What will be the final form of the product—model, prototype, mass
production?
• Specific, Clear, and Unambiguous: Contains no vague terms.• Understandable: Stated with sufficient detail in everyday
language.• Concise: Contains no unnecessary words.• Consistent: Top-to-bottom consistency with identical usage of
terms and conformance to standards.• Achievable: Reflects a need for which a solution is technically
feasible at affordable costs.• Traceable: Ultimately traceable back to a higher-level or stakeholder
requirement.• Verifiable: Expressed in such a manner so that the requirement can
be verified in an objective, preferably quantitative manner.• Feasible: Can achieve, produce, and maintain the requirement.
ATTRIBUTES OF A WELL-DEFINED REQUIREMENT

DAU PROGRAM MANAGERS TOOL KIT
87
X
F1
R1
F2
F3
FN
X
XX X
X X
R2
R3
RN
• Customer Needs• Tech Base• Prior Systems Engineering Output• Program Decision Requirements• Budget
StakeholderRequirements
Definition
Do what? FunctionsHow well? PerformanceEnvironment? Interfaces
ICD Req’ts Spec Req’tsImplied Req’tsQuestions for Requirers
TechnicalManagement
Inte
grat
ion,
Ver
ifica
tion/
Valid
atio
n, T
&E
Desi
gn L
oop
Requ
irem
ents
Loo
p
ArchitectureDesign
RequirementsAnalysis
ImplementationPhysical
Architecture
TIMELINE
HI / LO
Baselines
Functional(System) Allocated
(Perf)
Product(Detail)
Specifications
System
Item PerfItem Detail
Process
Material
TO
CRUISE
CLIMB
LAND DESCEND CLIMB
CRUISE
LOITER
ATTACK
(67 min., 50 km range)
FLY
TAKEOFF CRUISE LAND
(2 min.) (60 min.,50 km range)
(5 min.)
AIRCRAFT
ENGINE COMMUNICATIONSAIRFRAME
• Analyze Functions• Decompose Function• Allocate Requirements• Functional Acrhitecture
F1
F2
F3
FN
X X
X X
X
X X
HW1
HW2
SW1
SWN
• Technical Planning• Requirements Management• Configuration Management• Decision Analysis• Technical Assessment• Risk Management• Interface Management• Data Management
SYSTEMS ENGINEERING DESIGN PROCESSES ILLUSTRATED

DAU PROGRAM MANAGERS TOOL KIT
88
SP
EC
IFIC
AT
ION
DE
VE
LO
PM
EN
T A
ND
TE
CH
NIC
AL
RE
VIE
WS
IOC
FOC
AB
Prod
uctio
n an
dDe
ploy
men
t
BBC
PCDR
AFR
PDR
Mat
eria
lSo
lutio
nAn
alys
is
Engi
neer
ing
and
Man
ufac
turin
g De
velo
pmen
t
Inte
grat
edSy
stem
Desi
gn
Syst
emCa
pabi
lity
and
Man
ufac
turin
gPr
oces
sDe
velo
pmen
t
Pre-
Syst
ems
Acqu
isiti
onSy
stem
s Ac
quis
ition
Tech
nolo
gyDe
velo
pmen
t
Ope
ratio
ns a
ndSu
ppor
t
Sust
ainm
ent
Disp
osal
FRP
and
Depl
oym
ent
LRIP
Initi
al C
apab
ilitie
sDo
cum
ent (
ICD)
Capa
bilit
y Pr
oduc
tion
Docu
men
t (CP
D)Ca
pabi
lity
Deve
lopm
ent
Docu
men
t (CD
D)
� E
mph
asis
on
evol
utio
nary
acq
uisi
tion;
spi
ral d
evel
opm
ent (
softw
are
only
)� T
echn
olog
y de
velo
pmen
t stra
tegy
: App
rove
d by
Mile
ston
e De
cisi
on A
utho
rity
(MDA
) at M
ilest
one
A� S
yste
ms
Engi
neer
ing
Plan
: Int
egra
ted
with
acq
uisi
tion
stra
tegy
and
sub
mitt
ed fo
r MDA
app
rova
lat
eac
h m
ilest
one
revi
ew re
gard
less
of A
cqui
sitio
n Ca
tego
ry (A
CAT)
� In
tegr
ated
Bas
elin
e Re
view
(IBR
) est
ablis
hes
the
Perfo
rman
ce M
easu
rem
ent B
asel
ine
(PM
B) fo
r Ear
ned
Valu
e M
easu
rem
ent (
EVM
). Pr
ogra
m M
anag
ers
use
IBR
thro
ugho
ut p
rogr
am w
hen
EVM
requ
ired.
*Not
e: S
FR a
nd P
DR b
efor
e or
afte
r MS
B. I
f the
y oc
cur a
fter M
S B,
func
tiona
l and
allo
cate
d ba
selin
es
mov
e to
the
right
. A P
DR b
efor
e M
S B
is a
sta
tuto
ry re
quire
men
t for
Maj
or D
efen
se A
cqui
sitio
n
P
rogr
ams
(MDA
Ps).
[Initi
al]
[Ver
ified
][F
inal
]
Item
Per
form
ance
Spe
cific
atio
n (D
esig
n-to
)
Syst
em P
erfo
rman
ce S
peci
ficat
ion Ite
m D
etai
led
Spec
ifica
tion
(Bui
ld-to
)
Func
tiona
l Bas
elin
e
Allo
cate
d B
asel
ine Prod
uct B
asel
ine
Spec
ifica
tions
Conf
igur
atio
n Ba
selin
es
Tech
nica
l Rev
iew
san
d Au
dits
Conf
igur
atio
n Co
ntro
l
Prod
uct U
pgra
des
Plan
ning
for D
ispo
sal
SVR/
FCA/
PRR
S/W
Rev
iew
s
Sust
ainm
ent
LEG
END:
AOTR
–As
sess
men
t of O
pera
tiona
l Tes
t Rea
dine
ssAS
R–
Alte
rnat
ive S
yste
ms
Rev
iew
CD
R–
Crit
ical D
esig
n R
evie
wFO
C–
Full O
pera
tiona
l Cap
abilit
yFC
A–Fu
nctio
nal C
onfig
urat
ion
Audi
tFR
R–
Flig
ht R
eadi
ness
Rev
iew
FRPD
R–
Full-
Rate
Pro
duct
ion
Decis
ion
Revie
wIB
R–
Inte
grat
ed B
asel
ine
Rev
iew
IOC–
Initia
l Ope
ratio
nal C
apab
ility
ISR–
In-S
ervic
e R
evie
wIT
R–
Initia
l Tec
hnica
l Rev
iew
LRIP
–Lo
w-R
ate
Initia
l Pro
duct
ion
OTT
R–
Ope
ratio
nal T
est R
eadi
ness
Rev
iew
PC
A–Ph
ysica
l Con
figur
atio
n Au
dit
PDR–
Prel
imin
ary
Des
ign
Rev
iew
PCD
RA–
Post
-Crit
ical D
esig
n R
evie
w
A
sses
smen
tPR
R–
Prod
uctio
n R
eadi
ness
Rev
iew
SFR–
Syst
em F
unct
iona
l Rev
iew
SRR–
Syst
em R
equi
rem
ents
Rev
iew
SVR–
Syst
em V
erific
atio
n R
evie
wTR
A–Te
chno
logy
Rea
dine
ss A
sses
smen
tTR
R–
Test
Rea
dine
ss R
evie
w
ISR
SE P
roce
ss
(Rep
eate
d in
Eac
h Ph
ase)
Prot
otyp
eTe
ch. R
evie
ws
TRA
TRA
PCA
IBR
OTTR
AOTR
IBR
TRR
CDR
PDR*
PDR
SFR
SRR
ASR
ITR
IBR
IBR
SFR*
PRR

DAU PROGRAM MANAGERS TOOL KIT
89
SY
ST
EM
S E
NG
INE
ER
ING
TE
CH
NIC
AL
MA
NA
GE
ME
NT
PR
OC
ES
SE
S K
EY
QU
ES
TIO
NS
HO
W D
O W
E E
STA
BLI
SH
INT
EG
RAT
ED
PLA
NS
FO
R T
HE
EF
FO
RT
?
H
OW
DO
WE
KN
OW
WH
ER
E W
E A
RE
IN T
HE
EF
FO
RT
?
H
OW
DO
WE
EN
SU
RE
TH
E S
YS
TE
M W
ILL
ME
ET
STA
KE
HO
LDE
R N
EE
DS
? H
OW
DO
WE
AV
OID
ISS
UE
S IM
PAC
TIN
G D
EV
ELO
PM
EN
T?
HO
W D
O W
E ID
EN
TIF
Y, M
AN
AG
E, A
ND
CO
NT
RO
L T
EC
HN
ICA
L B
AS
ELI
NE
S?
HO
W W
ILL
DAT
A B
E A
VAIL
AB
LE W
HE
N N
EE
DE
D T
O S
UP
PO
RT
TH
E S
YS
TE
M?
HO
W W
ILL
TH
E S
YS
TE
M C
OM
E T
OG
ET
HE
R M
OS
T E
FF
EC
TIV
ELY
?
HO
W W
ILL
FO
RM
AL
AN
D IN
FO
RM
AL
TR
AD
EO
FF
S B
E B
ES
T M
AD
E?
TE
CH
NIC
AL
PLA
NN
ING
TE
CH
NIC
AL
AS
SE
SS
ME
NT*
RE
QU
IRE
ME
NT
S M
AN
AG
EM
EN
T
RIS
K M
AN
AG
EM
EN
T
CO
NF
IGU
RAT
ION
MA
NA
GE
ME
NT
T
EC
HN
ICA
L D
ATA
MA
NA
GE
ME
NT
INT
ER
FAC
E M
AN
AG
EM
EN
T
DE
CIS
ION
AN
ALY
SIS
*Via
Tec
hnic
al R
evie
ws,
Ear
ned
Val
ue M
anag
emen
t, Te
chni
cal P
erfo
rman
ce M
easu
rem
ent

DAU PROGRAM MANAGERS TOOL KIT
90
TECHNICAL REVIEW DEFINITIONS
Alternative Systems Review (ASR): The ASR assesses the preliminary materiel solutions that have been proposed and selects the one or more proposed materiel solution(s) that ultimately have the best potential to be developed into a cost-effective, affordable, and operationally effective and suitable system at an appropriate level of risk.
Critical Design Review (CDR): The CDR establishes the initial product baseline. A successful CDR is predicated on the determination that the subsystem requirements, subsystem detailed designs, results of peer reviews, and plans for test and evaluation form a satisfactory basis for proceeding into system implementation and integration.
Flight Readiness Review (FRR): The FRR is a subset of the Test Readiness Review and is applicable only to aviation programs. The FRR assesses the readiness to initiate and conduct flight tests or flight operations.
Initial Technical Review (ITR): The ITR is a multi-disciplined technicalreviewheldtoensurethataprogram’stechnicalbaselineis sufficiently rigorous to support a valid cost estimate as well as enable an independent assessment of that estimate.
In-Service Review (ISR): The ISR is held to ensure that the system under review is operationally employed with well-understood and managed risk. It provides an assessment of risk, readiness, technical status, and trends in a measurable form. These assessments help to substantiate in-service support budget priorities.
Preliminary Design Review (PDR): The PDR establishes the allocated baseline (hardware, software, human/support systems). A successful PDR is predicated on the determination that the subsystem requirements; subsystem preliminary design; results of peer reviews; and plans for development, testing, and evaluation form a satisfactory basis for proceeding into detailed design and test procedure development.

DAU PROGRAM MANAGERS TOOL KIT
91
Production Readiness Review (PRR): The PRR examines a program to determine if the design is ready for production and if the prime contractor and major subcontractors have accomplished adequate production planning. The PRR determines if production or production preparations have unacceptable risks that might breach thresholds of schedule, performance, cost, or other established criteria.
System Functional Review (SFR): The SFR is held to ensure that thesystem’sfunctionalbaselinehasareasonableexpectationofsatisfying stakeholder requirements within the currently allocated budgetandschedule.TheSFRassesseswhetherthesystem’sproposed functional definition is fully decomposed to its lower level, and that preliminary design can begin.
System Requirements Review (SRR): The SRR assesses the system requirements as captured in the system specification and ensures that the system requirements are consistent with the approved materiel solution (including its support concept) as well as available technologies resulting from any prototyping efforts.
System Verification Review (SVR): The SVR is held to ensure the system under review can proceed into initial and full-rate production within cost (program budget), schedule (program schedule), risk, and other system constraints. The SVR assesses system functionality and determines if it meets the functional requirements as documented in the functional baseline.
Test Readiness Review (TRR): The TRR is designed to ensure that the subsystem or system under review is ready to proceed into formal test. The TRR assesses test objectives, test methods and procedures, scope of tests, and safety; and it confirms that required test resources have been properly identified and coordinated to support planned tests.

DAU PROGRAM MANAGERS TOOL KIT
92
TECHNICAL REVIEW BEST PRACTICES
Technical reviews:
• AreafundamentalpartoftheSystemsEngineeringTechnicalAssessment Process for the program manager.
–Shouldbeevent-based;
–Objectiveentryandexitcriterianeedtobedefinedupfront.Seethe Defense Acquisition Guidebook (DAG) for general criteria and theprogram’sSystemsEngineeringPlan(SEP)forspecificcriteria;
–Areonlyasgoodasthosewhoconductthem;
–EngagementofTechnicalAuthority;
–Chairindependentofprogramteam;
–Independentsubject-matterexperts,determinedbyChair;and
–InvolveallaffectedSTAKEHOLDERS.
• Shouldreviewstatusofprogramdevelopmentfromatechnicalperspective.
–InvolveallaffectedSTAKEHOLDERS;and
–Involvesalltechnicalproducts(e.g.,specifications,baselines,riskassessments, etc.) relevant to the review.
• System-levelreviewsshouldoccurafterthecorrespondingsubsystem level review!
NOTE: Check out DAU Continuous Learning Module CLE003 (Technical Reviews), which includes detailed tailored checklists for all key Technical Reviews.
Easy in principle,difficult in practice.

DAU PROGRAM MANAGERS TOOL KIT
93
PROGRAM-UNIQUE SPECIFICATIONS
• Program-uniquespecificationsadvantages:–Helpsavoid duplication and inconsistencies.–Enablesgood estimates of necessary work and resources.–Providesconsistentcommunication among players as people
rotate.–Canbeusedtoprepare test plans.–Canbeusedalongtimeafter the system has been put into
operation.–Servesasaninterface between customers, developers, and
designers.–Canactasnegotiationandreferencedocumentforengineering
changes.
MIL-STD-961Standard Performance Specification
Standard Design Specification Program-Unique Specifications.
No waiver required to useSTD PRACTICE.
• Defines mission/technical performance requirements. Allocates requirements to functional areas. Defines interfaces.
• Defines performance characteristics of configuration items (form, fit, function). Details design requirements only to meet interfaces. “DESIGN-TO.”
• Includes “how to” and specific designrequirements. Usually includes specific processes and procedures. “BUILD-TO.”
• Defines process performed during fabrication.
• Defines production of raw materials or semi-fabricated material used in fabrication.
System
(Hardware or Software) ItemPerformance
(Hardware or Software) Item
Detail
Process
Material
Functional(“System”)
Allocated(“Design-to”)
Product(“Build-to”)
Product
Product
Specification Content Baseline
Specs

DAU PROGRAM MANAGERS TOOL KIT
94
Design/Fab. Require desired Specify exact parts and outcomes or functions; components specific design to contractor
Processes Few, if any Specify exact processes
Physical Give specifics only for Specify more physicalCharacteristics interfaces, environment, characteristics than or human factors for interfaces, environment, etc.
Interface Detailed interface data do Detailed interface dataRequirements NOT solely make a perf. spec. a detail spec.
Materials Leave specifics to Require specific materials contractor
Test and Evaluation State performance Prescribed testing need; contractor picks process test procedure
PERFORMANCE DETAIL / DESIGN
PERFORMANCE vs. DETAIL SPECIFICATIONS
Two generic categories of program-unique specifications are perfor-mance specifications and detail specifications.
• Performance Specifications: States requirements in terms of the required results without stating the method for achieving the required results, functional and performance (what and how well), the environment in which product(s) must operate; interface and interchangeability characteristics, and criteria for verifying compliance.
• Detail Specifications: Specifies requirements in terms of material to be used; how a requirement is to be achieved; and how a product is to be assembled, integrated, fabricated, or constructed. Applicable to development of contractor final design drawings as well as items being built, coded, purchased, or reused.
• MIL-STD 961: Defense and program-unique specifications format and content establishes the format and content requirements for defense specifications and program-unique specifications prepared either by DoD activities or by contractors for the DoD.

DAU PROGRAM MANAGERS TOOL KIT
95
CONFIGURATION MANAGEMENT(Defense Acquisition Guidebook, MIL-HDBK-61A and
ANSI/EIA Standard 649A)
“A management process for establishing and maintaining consistency of a product’s performance, functional, and physical attributes with its requirements, design, and operational information throughout its life.”
• Identify and document the functional and physical characteristics of configuration items.
•Change Management: control changes to configuration items and their related documentation.
•Record (Status Accounting) and report information needed to manage configuration items effectively, including the status of proposed changes and implementation status of approved changes.
•Verification and Audit of configuration items to verify conformance to specifications, drawings, interface control documents, and other contract requirements.
CONFIGURATION MANAGEMENT PLANNING
• The decisions on
– Which baselines the Government should eventually control– The data needed– When that control should be established
… are strategic management decisions that involve
– Acquisition strategies—sources, competition, etc.– Logistics support plans—repair levels, data needs, open
systems, etc.– Technology insertion—stable vs. rapidly moving technologies, etc.
• Government should control the Functional Baseline (document system level requirements)
• By DoD policy, at the completion of the system level Critical Design Review (CDR), the PM shall assume control of the initial product baseline for all Class 1 configuration changes.

DAU PROGRAM MANAGERS TOOL KIT
96
INTERFACE MANAGEMENTWill it all work together?
• ThegovernmentPMO:–Identifiesexternalinterfaces–Establishesinterfacestandards
(baselines)–Maintainsinterfacestability
• Thecontractor:–Managesinternalinterfaces–Establishesinterfacerequirements
to include internal and external interfaces
–Controlsinterfacestoensure◆ Accountability◆ Timely dissemination of changes
Since they are not under direct contractor control, the government plays a big role in managing external interfaces, leaving management and design details of
internal system interfaces to the contractor.
INTERFACE CONTROL CONCEPT
• Identifies,documents,andcontrolsallfunctionalandphysical characteristics
• Interfaces:
–What?◆ Common boundary◆ Types: mechanical, electrical, operational, software◆ Functional and physical characteristics
–Where?◆ Withinonecontractor’sdesign◆ Amongcontractor’sitemsandGFE◆ Amongmultiplecontractors’items◆ Among systems
–ControlledbyInterfaceControlWorkingGroup
–DocumentedinInterfaceControlDocuments
?

DAU PROGRAM MANAGERS TOOL KIT
97
WORK BREAKDOWN STRUCTURE (WBS)
A WBS:
• Is a product-oriented family tree composed of hardware, software, services, data, and facilities.
• Providesaconsistentandvisibleframeworkfordefensematerielitems and contracts within a program.
• Isanorganizedmethodtobreakdownthesystemstructureofaproduct into subproducts at lower levels of detail.
• Canbeexpresseddowntoanylevelofinterest.Generally,thetopthree levels are sufficient unless the items identified are high cost or high risk. If so, then it is important to take the WBS to a lower level of definition.
• KeytypesofaWBSareaProgramWBSandaContractWBS
– Program WBS: encompasses an entire program, including the Contract WBS and “other government” elements (e.g., Program Office Operations, Manpower, GFE, government Testing). It defines at a high level what is to be procured and consists of at least three program levels with associated definitions.
– Contract WBS: the complete WBS as extended to the agreed-to contract reporting level. It defines the lower level components of what is to be procured and includes all the product elements (hardware, software, data, or services), which are defined by the contractor and are their responsibility.
• MIL-HDBK-881A(WorkBreakdownStructuresforDefenseMaterielItems) should be consulted for developing Program and Contract WBS. It provides details on various types of defense systems as well as elements common to all defense systems.
– MIL-HDBK-881A Defense Systems: Aircraft Systems, Electronic/Automated Software Systems, Missile Systems, Ordnance Systems, Sea Systems, Space Systems, Surface Vehicle Systems, and Unmanned Air Vehicle Systems.
– MIL-HDBK-881A Common Elements: integration, assembly, test, and checkout, Systems Engineering, Program Management, training, data, System Test and Evaluation, peculiar and common support equipment, operational and site activation, industrial facilities, and initial spares and repair parts.

DAU PROGRAM MANAGERS TOOL KIT
98
HOW TO CREATE A WORK BREAKDOWN STRUCTURE (WBS)
BASIC PURPOSES OF WBS
Sys Eng
System
Training Test Mfg
Computer Sensor
CrewSimulator
HW
To BeDetermined
SystemSW
ApplicationSW
Displays
Grouping forSpecificationDevelopment
InterfaceManagementEarned Value
Evaluation
RiskAssessment
$$$Management
Product Tree
ECPImpact
IPTSetup
SupportCAT
NOTE: Oval shapes on periphery identify WBS purposes
Tech ReviewStructure
AppendixA
BC
MIL HDBK881 System
Define the Product
Tailor(Supporting Processes)
Create and Refine as Design Matures
SE Process

DAU PROGRAM MANAGERS TOOL KIT
99
Sys
tem
Req
uire
men
tsA
naly
sis
SR
R
SF
R
SS
R
PD
R CD
R
TR
R
SR
R
SF
R
SS
R
PD
R CD
R
TR
R
Sys
tem
Des
ign
Sof
twar
eR
equi
rem
ents
Ana
lysi
s
Sof
twar
eD
esig
n
Sof
twar
eU
nit C
odin
gS
oftw
are
Uni
t Tes
ting
SW
Uni
t Int
egra
tion
and
Tes
ting
Sys
tem
Sub
-Sys
tem
SW
Item
(SI)
SW
Item
(SI)
HW
Item
(HI)
SW
Item
(SI)
Sof
twar
eU
nits
Sof
twar
eU
nits
Sof
twar
eU
nits
Sof
twar
e Ite
m
Qua
lific
atio
n T
estin
g
HI a
nd S
I In
tegr
atio
nan
d T
estin
g
Sub
-sys
tem
In
tegr
atio
nan
d T
estin
g
Sys
tem
Q
ualif
icat
ion
Tes
ting
DT
and
OT
&E
Tes
ting
NO
TE: S
SR—
Softw
are
Spec
ifica
tion
Rev
iew.
The
SSR
is a
uni
que
sub-
syst
emre
view
hel
d to
ass
ess
SW re
quire
men
ts p
rior t
o st
art o
f des
ign.
SO
FT
WA
RE
DE
VE
LO
PM
EN
T—
TE
CH
NIC
AL
RE
VIE
W R
EL
AT
ION
SH
IPS

DAU PROGRAM MANAGERS TOOL KIT
100
SO
FT
WA
RE
DE
VE
LO
PM
EN
T—
KE
Y L
IFE
CY
CL
E R
EV
IEW
FA
CTO
RS
Rev
3.1
Softw
are
Deve
lopm
ent
Key
Fact
ors
• Are
requ
irem
ents
trac
eabl
e to
o
pera
tiona
l mis
sion
pro
files
?
• Is
top-
leve
l req
uire
men
ts a
lloca
tion
rea
sona
ble?
Are
sof
twar
e an
d h
ardw
are
allo
catio
ns re
alis
tic?
• Has
a s
oftw
are
arch
itect
ure
been
e
stab
lishe
d? Is
it re
ason
able
?
• Hav
e re
alis
tic c
ompu
ter r
esou
rce
util
izat
ion
limits
bee
n es
tabl
ishe
d? • H
ave
com
mun
icat
ion
and
inte
rface
r
equi
rem
ents
bee
n es
tabl
ishe
d?
• Hav
e cr
itica
l req
uire
men
ts (s
afet
y,
sec
urity
, priv
acy)
bee
n sp
ecifi
ed?
Softw
are
Deve
lopm
ent
Key
Fact
ors
• Hav
e so
ftwar
e re
quire
men
ts b
een
est
ablis
hed?
Are
they
prio
ritiz
ed?
Are
der
ived
requ
irem
ents
und
erst
ood?
• Hav
e co
nditi
ons
for s
oftw
are
acc
epta
nce
been
est
ablis
hed?
• Wha
t mod
ifica
tions
are
nee
ded
as a
r
esul
t of p
roto
type
test
ing?
• Wha
t are
reus
e &
COTS
leve
ls?
• Are
per
sonn
el, t
rain
ing,
and
sup
port
im
pact
s un
ders
tood
?
• Wha
t exc
eptio
n co
nditi
ons/
capa
city
l
imits
hav
e be
en ta
ken
into
acc
ount
?
• Is
the
prop
osed
low
er-le
vel b
reak
-out
of s
oftw
are
func
tiona
lity
reas
onab
le?
• Do
resu
lts o
f Det
aile
d De
sign
s
uppo
rt su
bseq
uent
cod
ing
and
im
plem
enta
tion
activ
ities
?
• Are
inte
rface
s sp
ecifi
ed in
s
uffic
ient
det
ail t
o su
ppor
t cod
ing
and
impl
emen
tatio
n?
• Wha
t sys
tem
s ar
e in
pla
ce fo
r s
oftw
are
conf
igur
atio
n m
anag
emen
t dur
ing
Softw
are
Sup
port?
• How
will
cha
nges
be
inco
rpor
ated
i
nto
the
field
ed s
oftw
are?
• Do
resu
lts o
f sof
twar
e te
sts
to
dat
e ve
rify
perfo
rman
ce, r
elia
bilit
y,
saf
ety,
sec
urity
, and
oth
er c
ritic
al
req
uire
men
ts?
Softw
are
Deve
lopm
ent
Key
Fact
ors
Prod
uct
Base
line(
s)
Allo
cate
dBa
selin
e(s)
Func
tiona
lBa
selin
e
Initi
al S
tage
Desi
gn &
Rev
iew
Activ
ities
ASR
SRR SF
RSS
R
PD
RCD
R T
RR P
RRSV
R P
CAFi
nal S
tage
Desi
gn &
Rev
iew
Activ
ities
Inte
rmed
iate
Sta
geDe
sign
& R
evie
wAc
tiviti
es

DAU PROGRAM MANAGERS TOOL KIT
101
CANDIDATE SOFTWARE MEASURES (METRICS)
• SoftwareSize• RequirementsVolatility• SoftwareEffort/Staffing• SoftwareProgress• Problem/ChangeReportStatus• Rework/Scrap• ComputerResourceUtilization• MilestonePerformance• Build/ReleaseContent• SoftwareComplexity• EffectofReuse• EarnedValue
Check out the handbooks at the “DoD’s Practical System and Software Measures” site at <www.psmsc.com>.
Software measures should be risk- or issue-driven and are phase-dependent.
QUALITY EVENTS FOR SOFTWARE
• Process-driven• Test and integration planning key• Includes qualification testing• Software item/configuration item oriented• White vs. black box testing
• Use specially trained teams• Formal process• Team attitude critical• Rigid entry/exit criteria• Basis for SW metrics• Genesis for process improvement• Around 70% defect removal
• Preparation critical• Entrance/exit criteria key• Frequently abridged• High-level review• May not be high-leverage, SW-quality event
Computer-Based
TestingActivities
Human-BasedQuality Activities
Spectrum ofQuality Events
for Software
DeskChecking
Walk-throughs
FormalInspections
JointReviews
• Ineffective• Better than nothing• Individually done
• May have defined procedures• Team-oriented review• Results may be recorded• Around 40% defect removal

DAU PROGRAM MANAGERS TOOL KIT
102
SOFTWARE MANAGEMENT BEST PRACTICES
•Adoptcontinuousriskmanagement•Estimatecostandscheduleempirically•Usesoftwaremetricstohelpmanage•Trackearnedvalue•Tracksoftwaredefectsagainstsoftwarequalitytargets•Treatpeopleasthemostimportantresource•Uselifecycleconfigurationmanagement•Manageandtracerequirements•Usesystem-basedsoftwaredesign•Ensuredataanddatabaseinteroperability•Defineandcontrolinterfaces•Designtwice,butcodeonce•Carefullyassessreuserisksandcosts•Inspectrequirementsanddesign•Managetestingasacontinuousprocess•Testfrequently•Usegoodsystemsengineeringprocesses
SOFTWARE ACQUISITION WORST PRACTICES
•Useschedulecompressiontojustifynewtechnologyonatime-critical project
•Havethegovernmentmandatetechnologicalsolutions•SpecifyimplementationtechnologyintheRFP•Useasmany“silverbullets”aspossible•Expecttorecovermorethan10%scheduleslipwithoutareductionin
delivered functionality•Putitemsoutofprojectcontrolonthecriticalpath•Planonachievingmorethan10%improvementfromobservedpast
performance•Buryasmuchoftheprojectcomplexityaspossibleinthesoftwareas
opposed to the hardware•Conductcriticalsystemengineeringtaskswithoutsoftwareexpertise•Believethatformalreviewsalonewillprovideanaccuratepictureof
the project•Expectthattheproductivityofaformalreviewisdirectlyproportional
to the number of attendees above five

DAU PROGRAM MANAGERS TOOL KIT
103
chapter 2LEADERSHIP AND MANAGERIAL SKILLS
• Morethingsthatmakeyougo“Hmmm?...”“An authority is a person who just happens to know the source.”“A conservative is a person who believes nothing should be done
the first time.”“Diplomacy is the art of hearing all parties arguing in a dispute and
nodding to all of them without ever agreeing with any of them.”“The meeting raised our confidence that the contractor can actually
accomplish the task and that it will occur in our lifetime.”“ThisistheearliestI’vebeenlate.”“Theworldwouldbeamuchbetterplaceifpeopleweren’tallowed
tohavechildrenuntilthey’veproventheycansuccessfullymanagea DoD program.”
“Everyone is bound to bear patiently the results of his/her own example.”
“The superior person is firm in the right way, and not merely firm.”
MANAGEMENT AND LEADERSHIP
ImplementChange
PlanStaff
Coordinate Monitor& Control
DriveChange
Set theDirection
Align thePeople
Energizethe People
BuildRelationships
Coach &Mentor
Make Things Happen
Create and Nurture an Environment for SuccessDemonstrate Integrity
MANAGEMENTDo Things
Right
LEADERSHIPDo the
Right Things
Organize
Program
Managers
Must
Balance
Both
Roles

DAU PROGRAM MANAGERS TOOL KIT
104
PROGRAM MANAGEMENT “DIAMOND CARD”
MANAGEMENT
• Logistics• Production• Contracting• Requirements
• Vision• Ethnics/Values• Teambuilding• Communication• LeadingChange• StrategicThinking• TimeManagement
LEADERSHIP
• CostEstimating• Processes/Tools• SystemsEngineering• SeniorSteering
Groups
• Test&EvaluationManagement
• Risk/Funds/SoftwareManagement
• OrganizationDesign• Expectation
Management• Goals• Strategy• Rewards• Partners
• Customers• Environment• Stakeholders• Teams/People• RelationshipBuilding
Designed by Al Moseley, DAU SPM

DAU PROGRAM MANAGERS TOOL KIT
105
TECHNOLOGY READINESS LEVELS
9 Actual system “flight proven” through successful mission operations
8 Actual system completed and “flight qualified” through test and demonstration
7 System prototype demonstration in an operational environment
6 System/subsystem model or prototype demonstration in a relevant environment
5 Component and/or breadboard validation in relevant environment
4 Component and/or breadboard validation in laboratory environment
3 Analytical and experimental critical function and/or characteristic proof-of-concept
2 Technology concept and/or application formulated
1 Basic principles observed and reported
System Test, Flight and Operations
System/Subsystem Development
Technology Demonstration
Technology Development
Research to ProveFeasibility
Basic TechnologyResearch
FRPDR
C
B
A
PROGRAM MANAGEMENT DIAMOND CARD (Continued)
NOTE: Technology Readiness Levels (TRL) enable consistent, uniform, discussions of technical maturity across different types of technologies. Decision authorities will consider the recommended TRLs when assessing program risk. TRLs are a measure of technical maturity. They do not discuss the probability of occurrence (i.e., the likelihood of attaining required maturity) or the impact of not achieving technology maturity. (Defense Acquisition Guidebook, Chapter 10)

DAU PROGRAM MANAGERS TOOL KIT
106
Reasons for Empowerment, Delegation, and Coaching
•Allowsmanagersmoretimeformanagerialandleadershiproles(e.g.,long-term planning, coordinating ongoing activities, monitoring and controlling activities, and providing feedback to employees)
•Increasesemployeecapabilityandmotivation•Enhancesemployeecareergrowth•Improvesteamwork•Maximizeslimitedresources•Pushesresponsibilityandaccountabilityfurtherdownintheorganization
Steps for Empowerment, Delegation, and Coaching
1. Select the task or tasks to be assigned2. Select the person or team; evaluate their current capabilities to complete
the task or tasks3. Provide training and/or coaching, if necessary, to improve their
capabilities4. Solicit input from the person or team regarding the task or tasks5. Agree on the tasks, objectives, responsibility, authority, and deadline6. Provide guidance, assistance, and support, as necessary7. Establish metrics to measure progress8. Monitor progress9. Provide feedback10. Identify lessons learned11. Evaluate performance
EMPOWERMENT, DELEGATION, AND COACHING
EMPOWERMENT
Assigning an employee or team responsibility and authority to take actions and make decisions in pursuit oftheorganization’sgoals.
DELEGATION
Assigning an employee (usually a subordinate) a specific task or tasks to complete.
COACHING
Providing employees with the tools, knowledge, and opportunities they need to develop their potential and increase their effectiveness.
NOTE: Some people use “empowerment” and “delegation” interchangeably, while others see a subtle distinction, e.g., delegation often refers to an individual, while empowerment is usually associated with groups or teams. Empowerment usually includes more authority and freedom related to making decisions, and taking actions while delegation is usually more bounded.

DAU PROGRAM MANAGERS TOOL KIT
107
EMPOWERMENT, DELEGATION, AND COACHING (Continued)
Leaders should ensure the components shown above are present.
CapabilitySknowledge, skills,
experience
Directionorganizational values, vision, purpose, goals
Authoritythe right to take actions
necessary to meet goals
FreedomSSable to take initiative within
prescribed boundaries
Trustorganizational values, vision, purpose, goals
Resourcesmaterials, facilities,
people, money, time, etc.
SSInformationaccess to and sharing of
essential information
Responsibilityor assignment to complete a specific activity or activities
Accountabilityassignment to complete a specific activity or activities
Supportright tools and
resources to do job
•Active Listening. Give your full attention. Focus on the message, not formulating your response to it. Establish and maintain eye contact, paraphrase key points, and avoid making judgments.
•Questioning. Ask questions to promote discovery of new knowledge and stimulate thinking. Use open questions that require some thought to complete.
•Giving Feedback. This is one of the most valuable yet least used tools in communication. People are often uncomfortable giving feedback to others, particularly when they believe it could be perceived as negative. Offer factual, specific, but non-judgmental (and unemotional) feedback.
•Sharing. Share your experiences. Make suggestions on overcoming difficulties or how to proceed.
COACHING SKILLS

DAU PROGRAM MANAGERS TOOL KIT
108
GENERIC INTEGRATED PRODUCT TEAM (IPT) PROCESS
Identify a Need for an IPT—Determine whether the creation of a team is the best method to accomplish the intended purpose.
Staff the Team—Determine what functional disciplines and organizations/activities need to be represented and who the team members will be.
Conduct Team Startup Activities—Conduct activities to get the team started, such as establishing operating agreements, assigning roles and responsibilities, and conducting team training sessions. Activities also include discussing and agreeing on the team’s intended purpose and developing shared goals, critical success factors, and metrics to measure team progress toward goals. A common output of these activities is the Team Charter. (See page 108.)
Develop a Plan of Action—Take specific action steps or processes for how the team will perform. This includes assigning action items, establishing target dates, determining what resources are needed, etc.
Execute the Plan—Perform the work necessary to accomplish the project goals and produce the team deliverables.
Assess and Realign—Conduct periodic assessments of team performance and use metrics to measure progress toward goals. Make adjustments as necessary.
Conduct Team Closeout Activities—Deliver the final product or service, update program documents, and compile lessons learned.
Identify the Need for an IPT
Staff theTeam
ConductTeam Startup Activities
Develop aPlan of Action
Conduct Team Closeout Activities
Execute the Plan
Assess and Realign

DAU PROGRAM MANAGERS TOOL KIT
109
FO
RM
UL
A F
OR
EF
FE
CT
IVE
TE
AM
PE
RF
OR
MA
NC
E
Dire
ctio
n+
Com
mitm
ent
+E
nerg
y+
Cap
abili
ty+
Em
pow
erm
ent
+E
ffect
ive
Tea
mE
nabl
ers
Per
form
ance
Lea
der
ship
Wha
t’s In
ItF
or T
he C
usto
mer
?F
or M
e?D
AU
PLM
OJT C
oach
ing/
Men
torin
g
*
Cu
sto
mer
Fac
tors
(Exa
mpl
es)
•Im
prov
ed C
apab
ility
•Im
prov
ed R
eadi
ness
•R
educ
ed O
&M
Cos
ts
Ind
ivid
ual
Fac
tors
(Exa
mpl
es)
•P
erso
nal S
tand
ards
•P
erso
nal I
nter
ests
•P
erso
nal V
alue
s•
Car
eer
Goa
ls
•W
ork
Eth
ic•
Sec
urity
•W
elfa
re•
Mor
ale
*Effe
ctiv
e T
eam
Ena
bler
s•
Com
mun
icat
ion
•C
olla
bora
tion
•C
ontr
ibut
ion
•T
rust
Wha
t’s In
It
LEG
END:
DAU
—D
efen
se A
cqui
sitio
n U
nive
rsity
O&M
—O
pera
tion
and
Mai
nten
ance
OJT
—O
n-th
e-Jo
b Tr
aini
ngPL
M—
Perfo
rman
ce L
earn
ing
Mod
el

DAU PROGRAM MANAGERS TOOL KIT
110
TEAM CHARTER
Team Charter. A document describing key aspects of why a team is established, what is expected of it, and what authority and responsibil-ity it has. The person or entity creating (i.e., “chartering” or authoriz-ing) the team normally provides some general guidance; however, the team may benefit considerably by developing the “meat and potatoes” of the charter, resulting in increased commitment of all team members. Examples of topics that may be included in a charter follow:
•Purpose. Describe why the team exists and what it is intended to accomplish.
•Goals/objectives. List specific, measurable items the team is focused on achieving to help it exceeditscustomer’sexpectations.
•Critical success factors. List the critical actions the team must perform to ensure it is successful in fulfilling its purpose.
•End products/deliverables. Describe the item(s) the team is responsible for delivering.
•Authority and accountability. Describe what team members are allowed/not allowed to do without authorization from a higher level. Describe what they are responsible for completing.
•Metrics. List measures of progress for critical success factors and goals/objectives.
•Program schedule. List key program/team milestones and events.•Team membership. List team members and contact information.•Roles and responsibilities. List specific assignments for improving
team performance (e.g., timekeeper, recorder or scribe, scheduler, etc.). Also, list specific tasks and/or action items the team is assigned to complete.
•Resources required. Describe the funding, materials, equipment, support, etc., the team needs to complete its mission.
•Program organizational structure. Define where the team fits within the overall program office structure.
•Program organizational structure. Describe or depict where the team fits in the overall program office structure.
•Operating agreements/ground rules. List agreed-upon guidelines describing how team members will interact, what processes they will use, and what they expect of one another.
•Customers, suppliers, and stakeholders. List key individuals, teams,andorganizationsinvolvedwiththeteam’soutput.

DAU PROGRAM MANAGERS TOOL KIT
111
RECOGNIZE WHICH PHASE OF TEAM DEVELOPMENT YOU ARE IN AND TAKE POSITIVE ACTION TO WORK THROUGH.
WORKING GROUPS
Team Development Wheel
PerformingCreativeTrustingEffectiveConfident
FormingMillingConfusionPolitePurposeless
NormingCohesionPurposeFeedbackRelevancy
StormingConflictFrustrationResistanceCliques
NOTE: There can be an additional phase—“Adjourning”—when the team disbands, says good bye, and reflects on lessons learned. This is a “celebration” phase.
This diagram is based on Dr. Bruce Tuckman’s 1965 study of small groups, which identified the traditional five phases experienced by project work teams.

DAU PROGRAM MANAGERS TOOL KIT
112
Disadvantages
•Takesmoretime•Hardtoterminate•Paralysisbyanalysis
Management Tradeoffs for Working Groups
Advantages
•Moreideasandsolutions•Consensuspositions•Strongcommitments
TEAM PERFORMANCE MODEL
• Decision Making• Resolving Issues• Communicating• Planning• Executing• Controlling
• Customer Focus• Leadership• Values• Vision• Purpose• Goals and Objectives• Critical Success Factors
• Awareness• Roles and Responsibilities• Operating Agreements• Team Accountability• Empowerment• Trust• Five Cs• Team Identity• Self-Assessment
CommunicationCommitmentCooperationContributionCaring
Team Processes
Team Principles
Team Dynamics
Team Foundation
ThinkingLearning
Charter
• Diversity• Conflict• Comfort Zones• Communications• Focus• Organizational Climate• Trends
Typical Working Groups
• LogisticsSupportManagementTeam(LSMT)• TestandEvaluationWorkingGroup(TEWG)• ComputerResourcesWorkingGroup(CRWG)• RequirementsInterfaceWorkingGroup• InterfaceControlWorkingGroup(ICWG)• TechnologyAssessmentWorkingGroup• “Tiger”Team• ProcessActionTeam(PAT)• IntegratedProductandProcessTeams(IPPTs)

DAU PROGRAM MANAGERS TOOL KIT
113
— Don’t try to force consensus. Listen to other positions and reactions before expressing your own point.
— No winners or losers. Don’t assume that someone must “win” and someone must “lose” if the discussion reaches a stalemate.
— Don’t avoid conflict. Don’t change your mind simply to reach agreement and maintain harmony.
— Avoid majority votes, compromises, or horse trading to reach an agreement.
— It’s OK to disagree. Differences of opinion are natural and expected.
NOTE: Groupthink. A phenomenon—to be avoided—where team members become so concerned about preventing disagreement or conflict that they abandon critical thinking to simply go along with whatever consensus seems to be emerging.
TEAM DECISION MAKING
Good team decision making is a critical element of team performance. It involves examining the decision context (e.g., current program environment, assumptions, con-straints, pressures, stakeholder inputs, etc.), determining who needs to be involved in the decision, verifying how much time is available to make the decision, and deciding on the decision-making process.
Generally Accepted Team Decision-Making Methods• Unilateral. One person makes the decision, usually the team leader. Variations:
— Directive or Authoritative. The person making the decision does so primarily using his/her knowledge, experience, and program guidelines/constraints, but is also influenced by his/her own reasons and motives.
— Consultative. The person making the decision may seek input from other team members, but ultimately, he/she still makes the decision on his/her own.
• Majority. Each team member votes, and the majority decides the course of action.• Consensus. Team members may not completely agree with the most preferred
approach, but they have the opportunity to express their point of view, understand the logic behind the decision, and support it. Consensus is generally the preferred decision-making method for most team issues, especially when the commitment of all team members is important.
Guidelines for Achieving Consensus:

DAU PROGRAM MANAGERS TOOL KIT
114
EFFECTIVE MEETINGS
Prior to the Meeting
•Determine and clarify the purpose for the meeting
•Determine expected meeting outcomes
•Identify meeting attendees— Subject-matter experts— Key decision makers— People directly affected by potential
decisions/outcomes
•Determine meeting format— Face-to-face, virtual teleconference,
teleconference, Web tool
•Determine date/time/location
•Develop and distribute meeting agenda (at least 24 hours prior)— Specific topics, presenter, estimated time, desired outcome
•Meeting logistics— Room setup, IT support needed
During the Meeting
•Opening— Start on time— Review agenda— Set or review ground rules— Clarify roles
•Conducting— Address one item at a time— Facilitate discussions— Encourage open communication and information sharing— Maintain focus and pace— Specify topics, presenter, amount of time devoted to item
•Closing— Summarize agreements and decisions— Review action items— Ask for agenda items for the next meeting— Set the date / time of the next meeting
After the Meeting
Review and publish minutes

DAU PROGRAM MANAGERS TOOL KIT
115
DECISION BRIEFING
Elements of a Decision Briefing
•Outline—Agenda
•PurposeofBriefing/Issue(s)
•Background
•Assumptions
•AlternativesIdentified
•EvaluationCriteria/Process
•AnalysisofIdentifiedAlternatives
•RecommendedAlternative
•RationaleforRecommendation
•RecommendedImplementationPlan
•KeyRisksforRecommendedImplementationPlan
What to Expect from the Person/People Receiving the Briefing
•Challengestoassumptions,definitions,methodology
•Questionsconcerningcompliancewithor
changes to policy
•Sensitivityoftheissueand/or
recommended alternative to change
•Questionsorchallengestoanalysis,
tradeoffs, rationale for recommendations, and implementation plan
•Questionsconcerningrisksfortherecommendedimplementation
plan
NOTE: Questions may be open-ended or closed (e.g., yes/no answers).

DAU PROGRAM MANAGERS TOOL KIT
116
Messages pass through filters; first through the filter of the person sending the message and then through the filter of the receiver. Filters sometimes act to enhance the message, and at other times, they can be barriers. Filters consist of factors such as personality, tone of voice, body language, facial expressions, accents, perceptions, attitudes, emotions, knowledge, functional background, the medium of com-munication used (verbal, written, e-mail, etc.). and much more. Each person’sfilterisdifferent,sometimesresultinginthereceiverinterpret-ing the message differently than the sender intended.
One of the most important communications skills (and often a barrier to effective communications) is listening. Learning to “actively listen” can increase communications effectiveness significantly
Active listening involves:
•Establishingandmaintainingeyecontact.•Focusingonwhatisbeingcommunicated.•Notmakingjudgmentsaboutthesender’s
information.•Notformulatingyourreplybeforethesenderhas
finished sending his/her message.•Paraphrasingkeypointsthesendermakes(whenthesender
pauses—don’tinterrupttoparaphrasewhat’sbeingcommunicated).
Effective program management requires that the right people get the right informa-tion at the right time. Program communica-tions must take place vertically (up and down), horizontally, and externally.
Program Office
COMMUNICATIONS
Message
Feedback
Sender Receiver
Filter
Filter

DAU PROGRAM MANAGERS TOOL KIT
117
Communications Plan
One way to ensure the right people get the right information at the right times is to develop a program (and/or team) communications plan. The plan may include:
•Key entities (program management leadership, IPTs, customer, contractor(s), and key stakeholders)
•What information they should provide
•What information they should receive
•How it is provided/received
•Format, frequency/interval, and other factors considered important for the particular program/situation
•Types of meetings, such as regular status meetings and program management reviews
•Reports (e.g., status reports, cost/schedule performance reports, action item lists)
•Issues and the policy for elevating them to higher levels
•Other forms of communication and how and by whom they are used
Interpersonal Negotiation Techniques
Purpose: Resolving conflicts
Objective: Seek to satisfy both parties’ interests
Methodology:— Acknowledge the conflict and its effect on performance.— Separate people and emotions from the issue.— Present issues in terms of the underlying interests or
requirements, i.e., the most important aspects of what you need to achieve.
— LISTEN to the other party’s interests/requirements; be able to restate their interests to their satisfaction (indicating you understand what interests they are trying to achieve).
— Agree on what the issue is.— Look for common goals and common interests.— Identify as many possible alternatives to resolve the issue and satisfy the interests of
both parties.— Resist the urge to compromise (“meet in the middle”). Instead, look at the issue from
different perspectives—challenge assumptions and constraints.— Agree on the alternative that best meets both parties’ interests.— Obtain the commitment of all members of both parties on what will be done to implement
the solution.

DAU PROGRAM MANAGERS TOOL KIT
118
DIRECTIVE• Giveadvice• Evaluate• Motivate• Explain• Reassure
NONDIRECTIVE• Don’tdisplayauthority• Listencarefully• Don’tadvise• Factsonly;noopinions• Employeefindsolution
Advantages• Effectivewithinexperi-
enced personnel• Quick• Takechargeattitude
Advantages• Developscommitment• Goodtraining• Employeeresponsible• Supportsdelegation
Disadvantages• Perceivedinsulting• Doesnotsupportdelegation• Managerkeepsresponsibility
Disadvantages• Takestime• Skill/patiencerequired• Ineffectivewithinexperi-
enced personnel
COUNSELING PROCESS
1. Set up interview—private, confidential, and unhurried2. Encourage discussion—open questions, active listening3. Help employee think it through—deal with facts, no opinions or own views4. Let employee find the solution—his/her solution to the problem
COUNSELING

DAU PROGRAM MANAGERS TOOL KIT
119
TIME MANAGEMENT
1. List all the tasks you have to complete.
2. Prioritize the tasks based on urgency and importance of completion using the format shown below.
3. Do Priority 1 tasks first. If possible delegate some of them.4. The key to effective time management is to schedule time to work on
small pieces of Priority 2 tasks. — If not completed early, they will eventually become Priority 1 tasks.
5. Reassign or delegate Priority 3 tasks if possible.— A common tendency is focusing on Priority 3 tasks (because of their
urgency) instead of Priority 2 tasks (because of their importance).
6. Priority 4 tasks are time wasters/busy work and should be avoided.
Priority 1 Important Priority 2 Important Urgent Not Urgent
Priority 3 Urgent Priority 4 Not Urgent Not Important Not Important
Common Time Robbers Avoidance Techniques
• Incomingtelephonecalls 4 Screen for importance 4 Allow voice mail to pick up the call 4 Limit length of calls (e.g., 2 min.)
• Outgoingtelephonecalls 4 Do as many at one time as possible 4 Itemize topics before calling 4 Stick to the topic; don’t socialize
• Unscheduledvisitors 4 Screen for importance 4 Do not invite visitor into your office 4 Remain standing 4 Schedule a time for visitor to return
• Improperdelegation 4 Re-delegate 4 Make a record of delegated tasks 4 Assign deadlines
• Poorlyconductedmeetings 4 Have a prepublished agenda 4 Stay focused on subject 4 Use a time keeper/gate keeper

DAU PROGRAM MANAGERS TOOL KIT
120
MANAGEMENT TOOLS AND TECHNIQUES
1. Activity-Based Management (ABM) uses detailed economic analyses of important business activities to improve strategic and operational decisions. ABM increases the accuracy of cost information by more precisely linking overhead and other indirect costs to products or customer segments. Traditional accounting systems distribute indirect costs using bases such as direct labor hours, machine hours, or materiel dollars. ABM tracks overhead and other indirect costs by activity, which can then be traced to products or customers.
2. Balanced Scorecard defines what management means by “performance” and measures whether management is achieving desired results. The Balanced Scorecard translates mission and vision statements into a comprehensive set of objectives and performance measures that can be quantified and appraised. These measures typically include: financial, customer value, internal business process, learning and growth, and employee performance.
3. Cycle Time Reduction decreases the time it takes a company or program to perform key activities throughout its value chain. Cycle Time Reduction uses analytic techniques to minimize waiting time, eliminate activities that do not add value, increase parallel processes, and speed up decision processes within an organization. Time-based strategies often emphasize flexible manufacturing, rapid response, and innovation in order to attract the most profitable customers.
4. Groupware refers to a broad range of technologies that allow people in organizations to work together through computer networks. These products range from sophisticated electronic mail packages to applications that link offices and employees. Organizations use such technology-aided communications to better inform strategic and financial decisions and to more effectively and economically bring together working groups. (DAU has a Groupware capability in its Management Decision Center, which is used for management decision making by offices and agencies throughout DoD.)

DAU PROGRAM MANAGERS TOOL KIT
121
5. Outsourcing occurs when a company or government agency uses third parties to perform non-core business activities. Contracting third parties enables a company or agency to focus its efforts on its core competencies. Many companies find that outsourcing reduces cost and improves performance of the activity. Third parties that specialize in an activity are likely to be lower cost and more effective, given their scale. Through outsourcing, a company or agency can access the state of the art in all of its business activities without having to master each one internally.
6. Business Process Reengineering involves the fundamental redesign of core business processes to achieve significant improvements in productivity, cycle times, and quality. In Business Process Reengineering, companies start with a blank sheet of paper and rethink existing processes to deliver more value to the customer. They typically adopt a new value system that places increased emphasis on customer needs. Companies and/or government agencies reduce organizational layers and eliminate unproductive activities in two key areas: First, they redesign functional organizations into cross-functional teams. Second, they use technology to improve data dissemination and decision making.
7. Strategic Planning is a comprehensive process for determining what a commercial business or government agency should become and how it can best achieve that goal. It appraises the full potential of a business and explicitly links the business objectives to the actions and resources required to achieve them. Strategic Planning offers a systematic process to ask and answer the most critical questions confronting a management team—especially large, irrevocable resource commitment questions.

DAU PROGRAM MANAGERS TOOL KIT
122
CONTINUOUS PROCESS IMPROVEMENT/ LEAN SIX SIGMA (CPI/LSS)
(DoD Directive 5010.42, 15 May 2008)
•“Lean”and“SixSigma”areactuallytwodistinctprocessimprovementideasoften merged together forming “Lean Six Sigma.”
•“Sigma”isthetermusedforstandarddeviation—astatisticalmeasureofvariation. Variation can be decreased via Standard Operating Procedures (SOPs) and training.
•“Lean”referencesaprocessthatcanbeshortenedbyeliminatingnon-value-added steps.
•Operatingata“SixSigma”levelofperformancemeanstheprocesstheoretically produces a 99.99966% defect-free yield or 3.4 Defects Per Million Opportunities (DPMO).
Lean
•Reduces waste•Eliminates“non-value
added” activities
Six Sigma
•Eliminatesvariability•Strivestoeliminatedefects•Uses5-StepProcess*
* Five-Step Process: Define, Measure, Analyze, Improve, Control (DMAIC)
Decide Which Opportunities Require Lean Six Sigma and Which Require Just Lean or Six Sigma
If …
•Slow,wastefulbusinessprocessesare the problem
•Littleornohistoricalprocessdata•GOAL: Process speed
•Streamlined,highlyefficientbusiness processes
•Processvariabilityidentifiedasa problem based on statistically significant historical data
•GOAL: Process consistency
•Slow,wastefulbusinessprocessescombined with low performance or quality variability
•GOAL: Speed and consistency
Then …
•Focus on Lean— Elimination of “non-value added”
activities— Workflow simplification
•Focus on Six Sigma — Elimination of variation factors
and lack of control— Data-driven management
•Focus on integrated Lean and Six Sigma— Methodology as a total perfor-
mance solution— Total process view with embed-
ded measurement and assess-ment capabilities leading to posi-tive performance management

DAU PROGRAM MANAGERS TOOL KIT
123
CHAPTER 3PROBLEM-SOLVING TOOLS
BRAINSTORMING
PURPOSE: To stimulate the free flow of ideas in a short amount of time without being analyzed or judged until the brainstorming is complete.
METHOD: There are three primary types of brainstorming: structured, unstructured, and silent.
• Structured: Participantstaketurnsofferingideas;ifsomeonedoesn’thave an idea when their turn comes, they can pass.— Advantage: Each person has an equal chance to participate.— Disadvantages: Lacks spontaneity; participants may get
distracted by other ideas and forget theirs when their turn comes, atmosphere is more rigid.
• Unstructured: Participants offer ideas as they think of them.—Advantage:Participantscanbuildoneachothers’ideas;
atmosphere is more relaxed.— Disadvantage: Less assertive and/or lower ranking participants
may feel intimidated and not contribute.
•Silent: Participants write ideas individually on paper or Post-itTM notes. This is particularly useful when you have participants who just can’tavoiddiscussingtheideasastheyareoffered.— Advantage: Prevents discussion of ideas during the idea
generation phase.—Disadvantages:Maylosetheopportunitytobuildonothers’
ideas unless a structured or unstructured session is held after the silent inputs are collected and displayed.
The brainstorming session ends when no more ideas are offered.

DAU PROGRAM MANAGERS TOOL KIT
124
GROUND RULES:
Don’t discuss ideas as they are offered. Inparticular,don’tanalyze, evaluate, criticize, or judge. Discussion can be held after the brainstorming session ends.
There are no outrageous ideas. There is plenty of time during the discussion after the brainstorming session to toss out ideas thatwon’twork.Evenifideaistotallyoutrageousandobviouslywon’twork,itmaysparkanotherideathatisusable.
Don’t quit when the ideas first stop flowing; try to get partici-pants to come up with at least 2-3 more ideas.
Strive for quantity, not quality. The more ideas you generate, the better the opportunity to find the best possible solution.
Combine and rearrange ideas; additions, revisions, and combi-nations may create even better ideas.
Record ideas exactly as offered,don’teditorparaphrase.
QUESTIONS TO STIMULATE YOUR THINKING:
1. Can we use this idea somewhere else? As is? With changes?2. If we change it, is there anything else like it? Any related
issues?3. Can we modify or rearrange: the meaning, quantity, color, size,
shape, form, layout, motion, sound, appearance, etc.?4. Can we maximize or magnify it to make it stronger, larger,
newer, more of it?5. Can we minimize or reduce it to make it smaller, lighter, less of
it?6. Can we substitute? Who? What? When? Where? How?7. Can we reverse it? Opposite? Backwards? Upside down?
Inside out?8. What assumptions or constraints are we considering? Are they
valid? What if we threw them out?9. What if you could do anything you can imagine?

DAU PROGRAM MANAGERS TOOL KIT
125
CAUSE-AND-EFFECT DIAGRAM (“FISHBONE” OR ISHIKAWA DIAGRAM)
PURPOSE: To help analyze a problem in increasing detail to identify all of its causes, leading to discovery of its root cause(s). The Cause-and-Effect Diagram graphically depicts the relationship between a problem and its causes.
METHOD: •Usebrainstormingtogeneratethepotentialorknowncausesforthe
problem (or effect) being studied.• Beginconstructingthe“fishbone”diagrambyplacingtheproblem
statement on the right side of the chart (head of the “fishbone”). • Drawanarrowfromlefttorightendingattheproblemstatement(the
backbone of the “fishbone”).• Placethemajorcausecategories(Ifknown)asthemajor“bones’
of the fishbone, as shown in the example below (in the example: people, product, process, equipment).
• Ifthemajorcausesarenotknown,afterbrainstormingallthecauses, sort them into similar groups using the Affinity Diagram. The titles of the groups become the major cause categories.
• Addthebrainstormedcausesasthesmallerbonesinthediagramas shown in the example below (e.g., inadequate training, poor teamwork, etc.). Causes can be added to the major categories after all the causes have been generated via brainstorming (recommended), or added as they are generated.
• Tosparkadditionalbrainstormingofcauses,askforeachofthe“small bone” causes: “What causes this to happen?”
EXAMPLE:
PROCESS EQUIPMENT
PoorComponentReliability
PEOPLE PRODUCT
InadequateTraining
High Operating Hours
HighTurnover
SpecsMiscalculated
PoorTeamwork
IncorrectTolerance
Miscalibrated
Miscalibrated
Curling Time
IncorrectSetting
Temperature
Humidity
MisalignedStorageFacility
High Operating Temp

DAU PROGRAM MANAGERS TOOL KIT
126
FORCE FIELD ANALYSIS
PURPOSE: To identify the factors or forces that either support or work against a desired outcome.
METHOD: • Drawa“T”shapeasshownbelow.• Brainstormtheforcesthatwillassistyouinachievingthedesired
outcome. List them on the left side of the vertical line.• Brainstormtheforcesthatmaypreventorrestrainyoufromreaching
your outcome. List them on the right side of the line.• (Optional)Prioritizethedrivingforces(leftside)and/ortherestraining
forces (right side).• Lookforopportunitiestotakeadvantageoforstrengthendriving
forces.• Identifyrestrainingforcesthatyoumightbeabletoeliminate(or
reduce the “force” or impact).• Itisoftenmorehelpfultoeliminaterestrainingforcesthanattempting
to strengthen driving forces. In most cases, the driving forces will remain present and continue to help you even if you do nothing to strengthen them; whereas eliminating restraining forces can have significant benefits in achieving your objective/outcome.
• Ina“pound-for-pound”or“bestbangforthebuck”fashion,theforcefield analysis is one of the most powerful tools in terms of the effort required to generate it and the potential benefits derived from it.
• Restrainingforcescanalsobeidentifiedaspotentialrisks,andentered into the risk management tracking system.
EXAMPLE:
OBJECTIVE: Successfully Complete Preliminary Design
+ Driving Forces
Experienced teamleader
Comprehensive Sys Eng Plan
Risk Management expertise
Computer-aided design tool
Event-driven tech reviews
Realistic schedule
Restraining Forces –
Poorly defined requirements
Insufficient personnel assigned
Poorly trained personnel
Lack of technology maturity
Unclear project objectives

DAU PROGRAM MANAGERS TOOL KIT
127
HISTOGRAM
PURPOSE: To graphically depict the frequency distribution of data items using a vertical bar chart (columns) format.
METHOD: • Collectdataonaparticularvariable.• Generateafrequencytablelistingallthedatapoints.• Countthenumberofdatapoints.• Determinetherangeofvaluesforthedata(maximumvalueminus
the minimum value).• Determinethenumberofbarstodepictinthechart.Onecommon
method is to use the square root of the number of data points; e.g., 100 data points = 10 bars; 225 data points = 15 bars, etc.
• Calculatetheintervalsrepresentedbyeachofthebars.Thesimplestmethod is to divide the range of values by the number of bars (from previous step).
• Determinethefrequencyofdatapointswithineachintervalofvalues.• Createaverticalbarchartwithaverticalbar(column)foreachofthe
variable values or range of values you measured on the horizontal axis. The height of the bar will equal the frequency (on the vertical axis) for each of the values/ranges.
EXAMPLE:• Intheexamplebelow,thesamplesizeis220datapoints(N=220).• Thesquarerootof220isbetween14and15,soeitherwillworkfor
the number of bars in the chart (14 bars are used in the example).• Therangeofvaluesis350hrs(1350hrsminus1000hrs).Dividing
the range (350) by the number of bars (14) results in intervals of 25 hrs.
Fre
qu
ency
Hours Between Failures
01000 1025 1050 1075 1100 1125 1150 1175 1200 1225 1250 1275 1300 1325 1350
5
10
15
20
25
30
35
40
N=220

DAU PROGRAM MANAGERS TOOL KIT
128
SCATTER DIAGRAM
PURPOSE: To graphically depict the changes in two variables to de-termine if there is a relationship between them.
METHOD: • Collectpaireddatasamplesforthetwovariables.• Placemeasuresfortheindependentvariable(thehypothesized
cause) on the horizontal axis, and measures for the dependent variable (the hypothesized effect) on the vertical axis.
• Plotthedataonthechart• Analyzethedatatodetermineifthereisastatisticalrelationship
between the two variables.
EXAMPLE:
Y
X
Y
X
Y
X
Positive CorrelationFor an in creasein “X”there is a correspondingincrease in “Y”
Negative CorrelationFor an in creasein “X”there is a correspondingdecrease in “Y”
No CorrelationFor an in creasein “X”there is no correspondingreaction in “Y”
5.0
4.5
4.0
3.5
3.0
2.5
2.0
1.5
1.0
100 105 110 115 120 125 130 135 140 145 150
NOTE: In the Example, it appears that for the increase in weight, there is a corresponding increase in cost
Cost
($K)
Weight (lbs.)

DAU PROGRAM MANAGERS TOOL KIT
129
SURVEYS
Surveys are used to collect data from a variable number of items or people for a comparative study. They are used when a new project is planned to prove the need and the demand of the customer.
Surveys can be used anywhere in the organization to find out specific information that is necessary to make improvements in a process.
Surveys:
• Areaninexpensivewaytotestasystemorproduct;• Canbeusedwithalargenumberofpeopleorasmallgroup;• Cangiveyouanoverallview,determinedbythequestionsyouask;• Showifanorganizationismeetingitsqualitygoals;and• Helpidentifysatisfiedanddissatisfiedcustomersoremployees.
Survey Process
1. Determine the group to be studied. 2. Determine what questions will be asked.
Note: Train your data collectors thoroughly. Everyone must know how to ask the questions, whom to approach, and how to approach them.
3. Compile your results in chart form using a Pareto Chart (see page 130), histogram, and other tools that will give you clarification.
4. Use the compounded data to form a base for improvement. 5. Continue to take data to monitor improvements and make sure the
improvements you have made are working.
Caution!
• Datamustbecollectedhonestlyandconsistently.
• Anuntrainedcollectorcanskewthedatatoreflectpersonalbiases.
• Apoor,inconsistentsurveywillgiveyouinvaliddata.
• Make sure there is enough time allowed for the collecting process.
BRAINSTORMING SURVEY

DAU PROGRAM MANAGERS TOOL KIT
130
AFFINITY DIAGRAM
PURPOSE: To help a team generate a large number of ideas or issues and organize them into categories for further analysis, evaluation, deci-sion, or action.
METHOD: • Agreeonwhattheproblem,issue,question,ordesiredoutcomeis.• Brainstormasmanyideasabouttheproblem,issue,question,or
desired outcome as you can.• Withoutdiscussion,sorttheideasintorelatedgroups.• Iftwopeoplecan’tagreeonwhichcategoryitbestfits,consider
duplicating it and including it under both.• Foreachgroup,identifyanamethatsummarizesthetopicslistedfor
them.Tip: Use Post-itTM type notes to record the ideas on, which allows you
to easily move the ideas from one category to another.
EXAMPLE:
Note: Attributes shown above are for illustration only, and not meant to portray actual answers to the question.
What are the Attributes of an Effective Leader?
HonestyTrustworthyDoes the right thingsLoyalCourageousSets the example
Integrity
InspiresFocused on peopleTrustingCaringSets high standardsEmpowersSupportive
Motivation
Good listenerEffective speakerEncourages open
communication
Communication
Provides career counseling
Supports trainingProvides professional
growth opportunities
Coaching/Mentoring
Has a big picture viewClearly stated goals
Visionary
Makes decisionsInvolves others in
decisions
Decisive
Drives changeInnovative
Change Agent
Strong technical expertise
Knowledgeable

DAU PROGRAM MANAGERS TOOL KIT
131
PAIRWISE RANKING
PURPOSE: To provide a structured method for ranking small lists of items in priority order.
METHOD: • Constructapairwisematrix.
— Each of the squares in the matrix at right represents the pairing of two items (where the numbers intersect).
— In this example, the list includes five items; the top square (shaded) represents the pairing of item 1 with item 2.
• Rankeachpairofitems.— For each pair of items, the team
should reach a consensus on which of the two items is preferred over the other.
— As the team completes each of the comparisons, the number of the preferred item is recorded in that square, until the matrix is completely filled in.
• Countthenumberoftimeseachitemappearsinthematrix.— Using the filled-in matrix (on the far right above), count how
many times each item is listed in the matrix, and record the totals in the ranking matrix (at right).
1
22
3
4
5
3
4
1
222
3
4
5
3
4
1 and 2 are compared;2 is preferred
1
1
222
3
4
5
3
4
1 and 3 are compared;1 is preferred
1
1
1
2
2
2
22
3
4
5 5 5 5 5
3
3 4
...and finally, 4 and 5 arecompared; 5 is preferred
Alternative 1 2 3 4 5
Count 2 3 1 0 4
Rank

DAU PROGRAM MANAGERS TOOL KIT
132
• Rankalloftheitems.— Rank the items based on how many times they appear in the
matrix.— To break a tie between two items appearing the same number
of times, look at the square in the matrix where the two were compared; the item appearing in that box receives the higher ranking.
EXAMPLE:
A program team was asked to recommend a site for testing a unique portion of a system. A feasibility study produced a list of six possible locations. The team then used Pairwise Ranking to determine that Nellis AFB was best suited for this particular test.
1. Fort Huachuca 4. Nellis AFB 2. Edwards AFB 5. Eglin AFB 3. Kirtland AFB 6. Hanscom AFB
Items 5 appear four times in the matrix, so it ranks 1st (see shaded squares in the matrix at right); Item 2 appears three times, which ranks 2nd, etc.
Alternative 1 2 3 4 5
Count 2 3 1 0 4
Rank 3rd 2nd 4th 5th 1st
1
2 2
1 3 3
4 4 4 4
5 5 5 4 5
1 6 6 4 5
2
3456
Site
Count
Rank
1
2
3rd
2
1
6th
3
1
5th
5
4
2nd
6
2
4th
4
5
1st

DAU PROGRAM MANAGERS TOOL KIT
133
PARETO CHART
PURPOSE: To help identify and prioritize issues or problems, identify root causes, or evaluate results of improvement areas. The Pareto Chart graphically displays the frequency of occurrence of data items.
METHOD: • Decideonthecategoriesofitems(e.g.,issuesorcauses)onwhich
to focus.• Choosethemeasurementunitswhichprovidethemostmeaningful
comparison between the categories of items.• Determinethetimeperiodtocollectdata.• Collectdataonthechosencategoriesofitems.• Createafrequencytablelistingallthecategories,thefrequencyof
their occurrence, and the percentage of their occurrence.• Createaverticalbarchartwithaverticalbar(column)foreachof
the categories you measured on the horizontal axis, starting with the category with the highest frequency of occurrence on the far left side and continuing in descending order to the right to the category with the lowest frequency of occurrence on the far right side. The height of the bar will equal the frequency (on the left vertical axis) for each of the categories.
• (Optional)Drawalineshowingthecumulativepercentageofthecategories from left to right (0-100%). Draw a vertical axis on the right side showing the percentage scale.
EXAMPLE:
10
20 20 %
Ope
rato
r Erro
r (31
)
Ove
rhea
ting
(17)
Vibr
atio
n (1
3)
Pow
er S
urge
(10)
Fact
ory
Setti
ng (9
)
Mis
calib
ratio
n (8
)
Impr
oper
Inst
all (
5)
Impr
oper
Sto
rage
(4)
Impr
oper
Han
dlin
g (4
)
Oth
er (3
)
40 %
60 %
80 %
100 %
30
40
50
60
70
80
90
100
Failure Causes
# o
f Fa
ilure
s

DAU PROGRAM MANAGERS TOOL KIT
134
BENCHMARKING
Benchmarking is the process of measuring products, services, and practices against the toughest competitors or those known as leaders in their field. Benchmarking can help you:• Understandhowyoucomparewithsimilarorganizations;and• Identifyareasforprocessimprovement.
HOW TO DO IT:Identify the process to be benchmarked. Select a process (as op-posed to a product) that is important to both your organization and your customers. Be sure the process in your organization is similar to and measured in the same manner astheonetowhichit’sbeingcompared.
Study other organizations. Develop a list of organizations with comparable products and services. Determine what specific pro-cesses the organization performs. Based on this information, rank the organizations from best to worst.
Compare and evaluate. Compare your process to the best and worst cases and list the important differences. These differences can suggest potential improvements to your process.
BENCHMARKING EXAMPLE:Using inputs their customers provided, the executive leaders at AF Product Division B decided that their source selection process needed improvement. As part of the initial analysis, they wanted to see how their process compared with others. They determined that the average number of days required for source selection was an important process measure.
As a result of this analysis, representatives visited AF Product Division A and Navy Division B and studied their source selection procedures.
Note: Benchmarking is not replicating a process from an organization that excels (unless your goal is to be 2nd best). It is studying the process, clearly understanding the theory behind the process, and then restudying your own process to determine improvements.
Cashreceived
Accountsreceivable
Sale(DD 250) Finished goods
inventory
Raw materialinventory
Contractaward
Cashdisbursed
Cashdisbursed
Wagespayable
Work in processinventory
Accountspayable

DAU PROGRAM MANAGERS TOOL KIT
135
FLOWCHARTING
PURPOSE: To identify the steps or tasks in a process. The current process can then be analyzed to discover duplicate or unnecessary actions, bottlenecks, or other problem areas. Ideas for improvement can then be identified.
METHOD: • Clearlydefinewheretheprocessbeginsandends.• Listallofthestepsintheprocess,includingdecisionpoints,and
inputs to and outputs from the process.• Arrangethestepsoftheprocessinthesequenceinwhichthey
currently occur. If it is a new process, begin with the sequence in which you believe they will occur.
• Drawtheappropriatesymbolsforeachoftheitemsintheprocess.• Labeltheitemsintheprocesswithtextdescribingthatitem.• Addarrowsshowingtheprocessflow.• Reviewforaccuracy.
— Correct symbols— Correct labels— Correct sequence— Correct direction of flow
EXAMPLE:Common Flowchart Symbols
Terminator - shows the begining and ending points ofthe process. Start points are usually some sort of triggeracrivity for the process.
Activity - an action step or process (within the process).
Decision Point - where a decision is required; usuallywith two options (e.g., yes/no).
Connector - shows a jump from one point in the processto another, or to another page. Usually labeled with letters(e.g., A<B<C< etc.).
Document - a step or action that produces a document.

DAU PROGRAM MANAGERS TOOL KIT
136
EXAMPLE:
Analyze RiskRoot Causes
DetermineProbability of RootCause Occurring
DetermineConsequence if
Root Cause Occurs
DetermineOverall Risk
Rating(Hi, Med, Low)
Prioritize Risk
DetermineConsequence
Category
Impact toPerformance?
Classify asPerformance
Risk
Classify asSchedule
Risk
Classify asCost Risk
Impact toSchedule?
Risk Analysis Process

DAU PROGRAM MANAGERS TOOL KIT
137
DEPLOYMENT FLOWCHARTS
PURPOSE: Depicts a process and the individuals or teams responsible for the steps/actions in the process. The Deployment Flowchart can be useful to clarify individual or team roles and responsibilities, and also to detect/prevent duplication of effort.
METHOD: • Listthestepsofthecurrentprocess.• Identifytheindividuals/teamsinvolved.• DrawtheDeploymentFlowchartshowingtheactivities,decisions,
inputs, outputs, documents, etc. (see example below).• Listtheindividuals/teamsacrossthetopofthechart,andthe
timeline (if applicable) down the side (see example below).• Evaluatethecurrentprocessforpossiblechanges,andupdateas
necessary.
EXAMPLE:
Person A
TIM
EL
INE
(O
pti
on
al)
Person B Person CTeam 1
Start
End
Action
Action
Action
Action
Action A
A
Dec
Dec
DecN
N
N
Y
Y
Y
Action
Action
Report

DAU PROGRAM MANAGERS TOOL KIT
138
NOMINAL GROUP TECHNIQUE (NGT)
PURPOSE: To rank or prioritize the importance of issues, alternatives, or processes. Helps a team reach consensus quicker by showing pre-liminary areas of agreement. Allows individual team members to assign a rank or priority to items without influence or pressure from others.
METHOD: • Brainstormalistoftheissues,alternatives,orprocessesthatyou
are analyzing.• Compileafinallistofbrainstorminginputsbyeliminatingduplicate
or similar inputs, and clarifying the meanings of any inputs that are unclear.
• Eachteammembervotesbyrankingtheinputsinorderofimportance (see first example on next page).
• Thehighestnumberisgenerallyusedtoindicatethemostimportantor highest priority item. For example, if team members are ranking 10 items, “10” would represent the most important item and “1” the least important item. Make sure you specify the values used in the ranking, i.e., which number represents the highest or most important rating, and which represents the lowest, to ensure there is no confusion.
• Teammembersmayrankalloftheitems,orsomepre-designatedportion of the items (particularly when there is a long list), such as a third or a half.
• Addalloftherankings,andanalyzetheresults.• Unlesstheteamispressedfortime,usetherankinginformationasa
starting point for discussion instead of accepting it as a “final score.”• Analternatemethodistoassigneachteammemberanumberof
points (e.g., 100), which they allocate across the options (some or all). This variation is known as weighted multivoting (see second example on next page).
• Whenusingweightedmultivoting,it’sagoodideatoassignamaximum number of points that can be assigned to any one item (e.g., 40 out of 100) to prevent one team member for over-representing the relative importance of an item (see Item H in the second example on the next page).

DAU PROGRAM MANAGERS TOOL KIT
139
Causes (7) Peter Paul Mary Total
Inadequate team training 6 3 5 14
Unclear objectives 4 7 3 14
Insufficient resource 3 5 2 10
High team member turnover 2 2 4 8
Inefficient team process 5 6 7 18
Team member hidden agendas 7 4 6 17
Poor functional representaion 1 1 1 3
Issues (12) John Paul Ringo George Total
Item A 40 30 10 20 100
Item B 5 5
Item C 10 10 20 40
Item D 10 20 30
Item E 20 10 30
Item F 5 5 10
Item G 15 20 20 20 75
Item H 50 50
Item I 10 5 5 20
Item J 5 10 15
Item K 10 10
Item L 5 5 5 15
Problems with Team Performance (Ranking for Example)
Weighted Multivoting Example

DAU PROGRAM MANAGERS TOOL KIT
140
CREATIVE PROBLEM SOLVING
DIVERGENT PHASE 1. Avoid judging or evaluating ideas as they are offered2. Generate as many ideas as possible3. Accept all the ideas generated4. Stretch your thinking5. Allow time for ideas to “grow”6. Combine or connect ideas or concepts
CONVERGENT PHASE 1. Use a logical, methodical approach to make choices or decisions2. Clearly and specifically state the basis for evaluating ideas3. Avoid a rush to closure4.Don’tignoreoravoiddifficultissues5. Look for strengths or positive aspects of ideas6. Remain focused on the objectives
Diverge
Converge
1. Identify the goal or challenge.
2. Gather releveant data.
3. Define the problem.
4. Generate potential solutions.
5. Select, and if possible, stengthen the solution.
6. Develop a plan to implement the chosen solution.
Each six steps above has a Divergent Phase ( ) followedby a Convergent Phase ( ). See below for a description ofthe steps in each phase

DAU PROGRAM MANAGERS TOOL KIT
141
RESPONSIBILITY ASSIGNMENT MATRIX (RAM)
PURPOSE: Display actions, tasks, or assignments; and what respon-sibilities each individual has for them.
METHOD: • Brainstormalistofactionsortaskstheteammustcomplete.• Listtheteammembersandotherstakeholderswhomayhave
responsibilities.• Constructamatrixwiththeactions/taskslisteddowntheleftsideof
the matrix, and the people listed across the top.• Choosethesymbolstoindicatethelevelofresponsibility
represented in the matrix (e.g., primary, secondary, keep informed, etc.).
• Agreeontheindividualresponsibilitiesandcompletethematrixbyplacing the symbols for each step/task under the appropriate people.
• Generally,onlyonepersonshouldhaveprimaryresponsibility,otherswith some responsibility would have secondary responsibility.
EXAMPLE:Goal:Establish and maintain an effective riskmanagement program
Legend:
= Primary Respond
= Second Respond
R = Review
C = Coord
Communicate Risk Mgmt Goals
PM
Ris
k C
oo
rd
RM
IPT
RM
IS M
gr
Pro
g IP
Ts
Ris
k S
ME
s
Identify Risk Coordinator
Establish Risk Mgmt IPT (RM IPT)
Draft Risk Mgmt Plan
Approve Risk Mgmt Plan
Identify Risk Events
Analyze Risks
Prioritize Risks
ID/Evaluate Mitigation Strategies
Select Risk Mitigation Strategies
Enter Risk in Risk M13 (RM13)
Tasks
I = Input
C
I
I
I
I
I I
I
I
I
C
C
R
CR
R

DAU PROGRAM MANAGERS TOOL KIT
142
As you work your way through the problem, everything should move into the left column—“Know.”
KNOT CHART
The KNOT Chart is useful for:
• Initiallysortingthewheatfromthechaff.• Organizing/coordinatingthenextstepsoftheproblem-solving
process.
Think Know Need to Know Opinion We Know

DAU PROGRAM MANAGERS TOOL KIT
143
QUALITATIVE PROBLEM SOLVING
Deviation Statement: Describe the actual performance vs. should performance
1. Define deviation.2. Describe what deviation IS and IS NOT.3. List distinctions between what deviation IS and IS NOT.4. Do distinctions indicate or suggest a change?5. Determine possible causes based on distinctions and changes.
Copyright Kepner Tregoe, Inc. (1981). All rights reserved. Reprinted with permission. (Kepner-Tregoe, Inc., Research Road, P.O. Box 704, Princeton, N.J. 08542)
SpecifyingQuestion
What?(Identify)
Where?(Location)
When?(Timing)
Extent?(Magnitude)
Does the distinctionsuggest a change?
What is distinctive about“Is” vs. “Is Not”?Is Is Not
Possible Causes:
Most Likely Cause:

DAU PROGRAM MANAGERS TOOL KIT
144
GANTT CHART
A Gantt Chart is used for planning schedules and managing projects. It is a method for basic planning and work instruction.
How to do it:
1. The Gantt Process begins by listing the activities of a project in order of execution.
2. Place the number of each activity across the top of your chart. Time duration such as days, weeks, years, etc., can replace activity numbers if appropriate.
3. Draw vertical lines across the chart for each item.
4. Starting with number 1, begin comparing the activities. Can number 1 be done at the same time as number 5 or 6?
5. Draw horizontal lines to indicate which activities can be done simultaneously.
6. You now have an overview of your project giving you a starting point and time-saving measures to help you complete the project on time.
ACTIVITIES 1 2 3 4 5 6
1. Requirements are written2. Finances are arranged3. Bidding takes place4. Contractor is selected5. Prototype is built6. Testing begins
ACTIVITIES
1. Requirements are written2. Finances are arranged3. Bidding takes place4. Contractor is selected5. Prototype is built6. Testing begins