
Emotionally Intelligent Leadership: An Integrative, Process ...

(This is a sample cover image for this issue. The actual cover is not yet available at this time.)
This article appeared in a journal published by Elsevier. The attachedcopy is furnished to the author for internal non-commercial researchand education use, including for instruction at the authors institution
and sharing with colleagues.
Other uses, including reproduction and distribution, or selling orlicensing copies, or posting to personal, institutional or third party
websites are prohibited.
In most cases authors are permitted to post their version of thearticle (e.g. in Word or Tex form) to their personal website orinstitutional repository. Authors requiring further information
regarding Elsevier’s archiving and manuscript policies areencouraged to visit:
http://www.elsevier.com/copyright

Author's personal copy
Testing an organizational innovativeness integrative modelacross cultures
Aviv Shoham a,*, Eran Vigoda-Gadot b,1, Ayalla Ruvio c,2, Nitza Schwabsky d
a Graduate School of Management, University of Haifa, Haifa 31905, Israelb Division of Public Administration and Policy, School of Political Sciences, University of Haifa, Haifa 31905, Israelc Fox School of Business, Temple University, 1801 Liacouras Walk, A511 Alter Hall (006-01), Philadelphia, PA 19122-6083,United Statesd Center for Public Management and Policy, School of Political Sciences, University of Haifa, Haifa 31905, Israel
Introduction
Global changes lead to increasingly complex environments and force organizations to innovate as away to stay competitive. In part, this increase is due to challenging cultural differences. Organizationsface pressure to innovate, change managerial processes, and re-structure to fit changing
J. Eng. Technol. Manage. 29 (2012) 226–240
A R T I C L E I N F O
JEL classification:
M10
M12
Keywords:
Organizational innovativeness
Performance
Public sector
A B S T R A C T
Most previous within-discipline research on innovativeness as an
organizational trait does not account for cross-disciplinary perspec-
tives, leading to incomplete findings. This paper develops an
integrative model of organizational innovativeness, based on
research in several disciplines to identify antecedents to, character-
istics of, and outcomes of organizational innovativeness. Cross-
sectional, questionnaire-based data from Israeli, Lithuanian, and
Slovakian public organizations were used to test the model. Market
and learning orientation enhanced organizational innovativeness,
whereas internal politics and centralization reduced it. Organiza-
tional innovativeness enhanced two individual-level outcomes
(satisfaction and commitment), as well as innovation performance,
which, in turn, improved overall organizational performance.
� 2012 Elsevier B.V. All rights reserved.
* Corresponding author. Tel.: +972 4 8249580; fax: +972 4 8248194.
E-mail addresses: [email protected] (A. Shoham), [email protected] (E. Vigoda-Gadot), [email protected]
(A. Ruvio), [email protected] (N. Schwabsky).1 Tel.: +972 4 8240709; fax: +972 4 8288576.2 Tel.: +1 215 204 4224.
Contents lists available at SciVerse ScienceDirect
Journal of Engineering andTechnology Management
journal homepage: www.elsevier.com/locate/jengtecman
0923-4748/$ – see front matter � 2012 Elsevier B.V. All rights reserved.
doi:10.1016/j.jengtecman.2012.01.002
Author's personal copy
environments. Externally, organizations feel pressure to develop new products/services for existing/new markets. Hence, organizational innovativeness (OI) is a central topic for inquiry in publicadministration, marketing, management, and political science.
Given its importance, scholars face a need to develop integrative OI models. While the literature onOI is large, several gaps still remain, which we seek to address. First, most previous researchconceptualizes OI uni-dimensionally and uses the number of new patents or products as a proxy. Wepresent a five-dimensional OI conceptualization, which captures its complexity more accurately thanexisting ones. This conceptualization serves as a basis for an integrative model of OI. Second, mostresearch has used within-disciplinary perspectives, leading to fragmented findings (Damanpour,1991). This study uses a multi-disciplinary approach with concepts from several disciplines, such asmanagement and marketing.
Third, most studies are restricted to one country. However, to advance research on OI, scholarsshould test its model’s validity in several countries (Steenkamp and Baumgartner, 1998). This studytests an OI integrative model in three countries. Fourth, most previous research deals with for-profitorganizations with new products as OI outcomes. Less is known about OI and its antecedents andperformance outcomes in the public sector, which the general public perceives as low oninnovativeness (Borins, 2002). This lacuna makes the under-researched public sector an interestingcontext in which to test this study’s model.
The paper begins with an OI conceptualization, the building blocks that constitute thisorganizational trait, delineates antecedents of OI, and suggests performance outcomes of OI. Thepaper concludes with theoretical and practical implications.
OI’s dimensions
Gopalakrishnan and Damanpour (1997) review the literature and argue that innovation means‘something new’ such as a new idea or product. Thus, previous research mostly conceptualizes OI asthe number of adoptions of innovations and treats organizations as innovative if they adopt manyinnovations (Subramanian and Nilakanta, 1996). Hurley and Hult (1998) conceptualize OI as a culturalorganizational trait, which refers to organizations’ innovation orientation, an approach of this studyfollows (see also Subramanian, 1996). Similarly, Lumpkin and Dess (1996) view OI as reflectingorganizations’ tendency to seek new ideas that can lead to development of new products. In otherwords, OI is an organizational characteristic, a part of its culture that reflects its willingness to pursuenew opportunities, which leads to a capacity to innovate and innovations, which, in turn, leads tosuccessfully adopted or implemented innovations (Hurley and Hult, 1998).
Research mostly conceptualizes OI uni-dimensionally. This approach hinders the study of OI andhas led to inconsistent findings about its outcomes. Following calls for a re-orientation of OI researchconceptualizing OI as a multi-dimensional trait (e.g., Salavou, 2004; Subramanian, 1996), this studyfollows such a conceptualization. The approach used to conceptualize OI was both inductive anddeductive. First, a survey of the literature was used as a top-down, deductive approach (Johnson et al.,2011). This survey suggested five dimensions of OI: creativity, risk-taking, future orientation,openness to change, and proactiveness. These are discussed and justified below. Notably, Lynch et al.(2010, p. 8) conducted a recent review, which was very helpful in triangulating OI’s dimensions.1
Specifically, they argued, provided theoretical justifications, and listed five OI dimensions, namely,‘‘creativity, openness to new ideas, intention to innovate, willingness for risk-taking, and technologicalcapacity to innovate’’. Importantly, three of the five they identified actually conceptualize OI, namelycreativity, openness, and risk-taking tendency. However, their approach and ours differ with regardsto the other two dimensions (intention to innovate and technological capacity to innovate versusfuture orientation and proactiveness, respectively). We believe that intention to innovate is areflection of behavioral intentions, which should be seen as an outcome of OI, rather than an elementof it. Likewise, capacity to innovate is more of a pre-condition for being OI than its dimension.
Further support to our view is based on an inductive approach to conceptualizing OI. As noted byJohnson et al. (2011), induction is based on a grounded approach to construct development. Thus, we
1 We thank a reviewer for informing us of this contribution.
A. Shoham et al. / Journal of Engineering and Technology Management 29 (2012) 226–240 227

Author's personal copy
presented our emerging conceptualization throughout its developmental process in several academicconferences and in several managerial seminars. The five-dimensional approach used here was an endresult of this deductive-inductive process.
Most innovations build on creativity (Rosenfeld and Servo, 1990). While some scholars use theseterms interchangeably, they only partially overlap at early stages of generating and implementingnew ideas (Martins and Terblanche, 2003). Importantly, removing barriers to creativity can help tomanage resources more efficiently/effectively (Mostafa and El-Masry, 2008). Hence, creativity, whichleads to the generation of new ideas or products internally or externally, is an OI dimension (Amabile,1988).
Risk-taking involves situations where managers’ decisions have uncertain outcomes (Morgan andStrong, 2003). Risk-taking reflects managers’ willingness to commit resources in making riskydecisions such as competitive strategy and choice of new products and markets (e.g., Venkatmaran,1989). The literature associates risk with novelty because developing/adopting new ideas involves riskin the absence of guaranteed positive outcomes (e.g., Caruana et al., 2002). In this respect, ourapproach differs from Nystrom et al. (2002), who viewed risk-taking as a moderator of theorganizational context–innovativeness relationship.
The strategy and entrepreneurial literatures document the importance of organizationspreparedness for future situations, which requires a future orientation (e.g., Venkatmaran, 1989).The need for a future orientation increases when environments change rapidly (Ganesan, 1994),requiring organizations to rely on their past and anticipate and react to the future as they innovate.Accordingly, research recognizes the importance of a temporal perspective in the context oforganizational forward- and backward-looking. Since Boyd (1991) established that long-termplanning enables firms to outperform less forward-looking competitors (Morgan and Strong, 2003),high-OI organizations should be future-oriented.
Openness to change refers to an organization’s flexibility/adaptability and includes a willingness tosupport changes (Wanberg and Banas, 2000). At the communication level, openness is antecedent toworkers’ and managers’ reactions to conflict events (Ayoko, 2007). Organizationally, such openness isa cultural aspect reflecting employees’ willingness to consider innovations’ adoption (Hult et al.,2004). Van de Ven (1986) refers to openness as the management of organizations’ culture to recognizethe need for new ideas and to act on this recognition. Similarly, Hurley and Hult (1998) see OI as beingopen to new ideas reflected in firms’ cultures.
Proactiveness refers to active pursuit of growth opportunities. Proactive organizations search forand exploit opportunities, experiment with change, and anticipate and act on future needs, though notnecessarily by being first (e.g., Lumpkin and Dess, 1996; Lynn et al., 1996). Since proactivenessemphasizes initiating activities, the strategic and entrepreneurial literatures view proactiveness ascentral to OI (Morgan and Strong, 2003).
In sum, based on our literature review, OI is a five-dimensional construct that includes creativity,risk-taking, future orientation, openness to change, and proactiveness. The next section of the paperdelineates antecedents to OI.
Antecedents of innovativeness
The four OI antecedents reflect this study’s multi-disciplinary nature. The marketing andmanagement disciplines discuss market orientation (MO), learning orientation (LO), centralization andorganizational politics as potential antecedents.
Organizational cultural characteristics: MO and LO
The marketing discipline views MO as an organizational driver of OI (Narver and Slater, 1990). MOincludes three dimensions (Jaworski and Kohli, 1993): information generation; information
dissemination; and responsiveness. Scholars study the MO – performance link across countries andwithin for-profit and not-for-profit organizations (e.g., Shoham et al., 2006).
Many studies argue that OI mediates MO’s impact on performance. Gatignon and Xuereb (1997)consider OI as an outcome of firms’ resources and organizational strategic orientations, including MO.
A. Shoham et al. / Journal of Engineering and Technology Management 29 (2012) 226–240228

Author's personal copy
Such arguments are aligned with the notion that a ‘‘market-oriented dialogue between the firm and itscustomers provides the identification of issues and source of ideas necessary to foster significantinnovation’’ (Noble et al., 2002, p. 30). MO–OI is a central link in Hurley and Hult’s model (1998), whichposits cultural aspects of an organization, including MO, as determining OI and, through OI, itsperformance. Later, Hult et al. (2004) argue that the innovative process flows out of an MO focus (e.g.,Atuahene-Gima, 1996). Such an argument parallels Jaworski and Kohli’s assertion (1993) that MOinvolves doing something new in response to market conditions, which is a form of innovativebehavior. In sum:
H1. High organizational MO leads to high OI in the public sector.
The second OI cultural organizational antecedent is LO. Following Hult et al. (2004), LO is anorganizational process of developing new knowledge that can influence behavior throughorganizations’ values and beliefs.
The literature includes several explanations for the LO–OI link. First, organizations characterized ashigh-learning ones are provided with new ideas, generated by individuals and groups, which are thebuilding blocks of innovations (Hurley, 1995). Second, organizational learning enhances organiza-tional members’ ability to understand new ideas (Dewar and Dutton, 1986). A continuous LOfacilitates creativity of employees and assists them in recognizing new opportunities, which can fosternew innovations (Martins and Terblanche, 2003). Finally, since LO can improve problem-solvingcapabilities, LO is useful in the implementation phase of turning OI into successful innovations(McGinnis and Ackelsberg, 1983). In sum:
H2. LO leads to higher OI in the public sector.
Organizational structure: centralization
Centralization refers to the degree of differentially distributed power within organizations (Slaterand Narver, 1995). Aiken and Hage (1966) define centralization in terms of employees’ involvementand participation in goal-setting and decision-making in organizations (e.g., for adopting new policies/programs). Centralization is a manifestation of organizational hierarchy, separation of power, anddissemination of information and knowledge. Many public agencies suffer from high centralizationand ensuing inflexibility due to low competitiveness, outdated bureaucratic structures, and aconservative managerial style (Golembiewski and Vigoda, 2000).
Centralization reduces OI for several reasons. First, centralization lowers organizational flexibility,which makes employees close-minded and hinders their innovative behavior (Dewar and Dutton,1986). Second, centralization leaves decision-making power in the hands of high-ranking managers,which transmits an implicit message to employees that being innovative could threaten the power ofthe higher ranks. Third, centralization reduces the amount of information needed for innovativenessavailable to employees (Dewar and Dutton, 1986). Hage and Dewar note (1973, p. 285): ‘‘Simplymoving towards a more democratic power structure [measured by decentralization] does have a small[but significant] influence on innovation, presumably by allowing circulation of new ideas fromvarious staff members, and perhaps by less blockage of innovative ideas’’. Fourth, centralizedorganizations do not create the psychological basis needed for collaboration, which diminishes thepower of self-thinking and collective effort as inputs to creative decision-making or innovations.Finally, centralization reduces employees’ willingness to share knowledge needed for increased OI. Insum:
H3. Centralization leads to lower OI in the public sector.
Organizational process: organizational politics (OP)
OP represents individuals’ willingness to participate in social processes, which determine powerdistribution. Such willingness requires individual and group resources, which are then unavailable for
A. Shoham et al. / Journal of Engineering and Technology Management 29 (2012) 226–240 229

Author's personal copy
innovativeness. Studies in political science confirm that the individuals most likely to play the politicalgame are those with energy, time, and material, social, or psychological resources (Brady et al., 1995).Additionally, OP leads to disagreements and conflicts among individuals and groups, which requiretime and energy to resolve. Hence, OP reduces employees’ time and energy available for innovation.
OP, viewed as employees’ aggregated influence tactics (e.g., Kipnis et al., 1980), focuses on the useof power to influence others, secure interests, or avoid negative organizational outcomes. High levelsof internal OP in public sector organizations reduce perceived justice and fairness in them, which thenimpact their outcomes such as OI (Vigoda, 2000a). Moreover, OP reduces employees’ motivation tocontribute to the organization, limits their attempts to suggest improvements to work processes, andlowers their creativity in promoting the collective interests of the organization (Du and Kacmar, 1992).Additionally, OP affects the efficiency of the human resource management system and decision-making processes. Finally, OP reduces employees’ willingness to pursue ideas that can promote theorganization (Folger et al., 1992). In sum:
H4. OP lead to lower OI in the public sector.
Consequences of innovativeness
The literature focuses mostly on the effect of OI and innovation adoption on organizationalperformance and views OI as an organizational strategy designed to enhance performance(Damanpour and Evan, 1984). Notably, the core problem of OI in public sector organizations is notlack of good ideas (Rogers, 1995). Rather, the sector delays or avoids the adoption of innovations due tothe bureaucratic nature of public administration agencies (e.g., Vigoda, 2002), which can lead to lowerbehavioral outcomes (e.g., commitment; Box et al., 2001). Thus, the first set of OI outcomes in thepublic sector is individual-level and includes commitment and job satisfaction.
Role perceptions lead to employees’ satisfaction and commitment (Mowday et al., 1982). Baroudiand Ginzberg (1986) argue that project innovativeness determines satisfaction and commitment ofprogramers/analysts because innovative/complex projects are more interesting than typical ones.Similarly, complex projects provide strong motivation and enhance satisfaction and commitment (Tuet al., 2001). Finally, innovative projects maintain/improve employees’ skills and make them moremarketable. This improvement enhances their motivation, commitment, and satisfaction (Rasch,1991). In this respect, out approach parallels implementation effectiveness’’, which Dong et al. (2008,p. 24) viewed as ‘‘the extent to which employees utilize a [new innovative] system with skillfulness,commitment and enthusiasm’’. Thus:
H5. High OI leads to higher satisfaction and commitment in the public sector.
The second set of outcomes includes innovations-specific and general organizational performance.Hurley and Hult (1998) recognize capacity to innovate as a mediator of the OI-performancerelationship. We follow their clarification of the distinction between OI and innovative capacity(Hurley et al., 2005, p. 281). OI ‘‘is a cultural readiness and appreciation for innovation whereas‘innovative capacity’ . . . is the degree of innovations actually produced or adopted by theorganization’’.
According to Atuahene-Gima (1996, p. 95), innovation performance includes project impactperformance. Defined as ‘‘. . .the intermediate consequences or advantages of the innovation projectfor the firm, such as providing cost efficiencies for the firm’’, project impact performance is similar tothis study’s innovations’ performance. Other terms for intermediate innovations’ performance includecapacity utilization (Sandvik and Sandvik, 2003) and innovations’ success (Gatignon and Xuereb,1997). Agarwal et al. (2003, p. 71) summarize: ‘‘Deshpande et al. (1993) and Slater and Narver (1995)suggest that perhaps the most important manifestation of market orientation is the success ofinnovation en route to superior performance’’. Thus OI flows through innovations’ performance tooverall performance.
H6. Higher OI leads to higher innovations’ performance in the public sector.
A. Shoham et al. / Journal of Engineering and Technology Management 29 (2012) 226–240230

Author's personal copy
H7. High innovations’ performance leads to higher overall organizational performance in the publicsector.
In sum, the study tests seven research hypotheses. These are presented graphically in Fig. 1. Thenext section describes the empirical test of the model.
Empirical study
Study population and samples
We tested the model using public sector managers and frontline employees from Slovakia,Lithuania, and Israel. Three convenience samples provided 562 questionnaires. In the Slovakian sectorof social care for the elderly, 204 (69.2%) provided complete questionnaires. In the Lithuanian socialservice sample, 221 (73.7%) provided complete questionnaires. In the Israeli social services sample,137 (85.6%) provided complete questionnaires. The combined response rate was 74.4%.
[(Fig._1)TD$FIG]
Fig. 1. Theoretical model.
A. Shoham et al. / Journal of Engineering and Technology Management 29 (2012) 226–240 231

Author's personal copy
The Slovakian sample includes 77.3% females, with an average age of 40.2 and 15.5 years ofeducation. Females comprise 76.6% of the Lithuanian sample, whose age averages 35.4 and educationaverages 17.2 years. The Israeli sample includes 66.9% females with 16.0 years of education andaveraging 40.3 on age. Given an emphasis on cross-national comparability of relationships and thenational samples’ homogeneity, non-probability sampling is acceptable (Reynolds et al., 2003).
Measures
We used mostly short versions of existing scales with minor changes. The use of shortened scalesreduced questionnaire length, study cost, and respondent fatigue while maintaining the integrity ofthe original scales (Steenkamp and Baumgartner, 1998).
We used back-translated versions of the original English scales. Three bilingual individuals translatedthe scales from English to the three local languages. The translations were back-translated into Englishby three other bilinguals, blind to the originals. The translators and a third bilingual individual assessedthe three versions for translation and cultural accuracy in each country with disagreements resolvedthrough discussions to arrive at the final versions (see Appendix for a list of items).
OI antecedents
The set of antecedents includes four scales. This study uses sub-sets of the market orientation (MO)items proposed by (Jaworski and Kohli, 1993) and includes the highest loading items previousresearch identified in Israel (Shoham and Rose, 2001). Information generation includes five items,information dissemination includes four items, and responsiveness includes five items. In all cases, thecombined scale satisfies the traditional a� .70 criterion (.79–.87).
Four items Hult et al. (2000) operationalized learning orientation (LO). Based on a pretest, we addedthree items patterned after the originals. After eliminating one of the new items, the scale hasacceptable reliability (.74�a� .86).
The centralization scale includes four of Jaworski and Kohli’s items (1993). After eliminating onelow-loading item, the scale has acceptable reliability (.71�a� .76).
Finally, three items Kacmar and Carlson (1997) developed operationalized internal politics. With avalues between .79 and .81, the scale is acceptable.
OI dimensions
The creativity scale includes five items (Siegel and Kaemmerer, 1978) and assesses top managers’creative thinking and behaviors. Reliability (a) ranges from .84 to .93.
Siegel and Kaemmerer (1978) used the organizational openness to change scale to operationalizeenacted support for innovation and open-mindedness to new ideas. We used their four highest-loading items. Chronbach’s a ranges from .83 to .90.
Javidan and Waldman’s (2003) vision dimension of the charismatic leadership profile measuresfuture orientation to represent the extent to which top management has a clear sense of direction andshares this direction with employees. The study used the four items with the highest loading in theoriginal and Chronbach’s a ranges from .80 to .85.
Jaworski and Kohli’s (1993) risk-aversion scale, referring to top managers’ disposition towardspursuing risky decisions, operationalized risk-taking. We used the four highest loading items in aprevious Israeli study (Shoham and Rose, 2001). After dropping one item, Chronbach’s a was .58–.61.We retained the scale due to its important role, an issue revisited later.
Covin and Slevin’s (1989) suggest a four-item proactiveness scale to measure the degree to whichmanagers possess a proactive orientation. We split one multifaceted item into two. Chronbach’s a inthis study ranged from .78 to .85.
The overall reliability of the OI scale was satisfactory. OI’s a values vary between .91 and .94 in thethree countries.
OI’s outcomes
Two performance scales assess consequences of OI. Previous research documents the difficultiesassociated with measuring public sector performance (Golembiewski and Vigoda, 2000). Hence, the
A. Shoham et al. / Journal of Engineering and Technology Management 29 (2012) 226–240232

Author's personal copy
scales for innovations’ and organizational performance in the public sector follow strategic referencepoint (SRP) theory (Fiegenbaum et al., 1996; Shoham and Fiegenbaum, 1999, 2002).
SRP theory addresses risk-taking behavior and argues that individuals use SRPs as guides. Risk-taking depends on managers’ perceptions of their firm’s being above/below a given SRP such that theyoperate in the domains of gains or losses, respectively. Individuals above (below) their SRP are risk-averse (risk-loving; Fiegenbaum, 1990; Fiegenbaum and Thomas, 1988, 1995).
SRP’s three dimensions (time, internal, and external) form a multi-dimensional construct, whichrepresents a menu of simultaneously determined reference points that managers use in differentcombinations (Fiegenbaum et al., 1996). The internal dimension highlights the importance of internalorganizational mechanisms with inputs (internal capabilities) and performance outputs of strategicchoices. The external dimension recognizes customers (citizens, in our case), stakeholders, andcompetitors. The temporal dimension recognizes that past strategies and future plans could impactpresent strategies.
Thus, performance should account for means/ends of the internal dimension – the efficiency andeffectiveness of an organization in attracting/holding the needed means and its use of them. Ourmeasures of means account for important inputs public sectors use to deliver services and its measures ofends include service benchmarks such as quality. The external dimension accounts for importantstakeholders – users and advocacy groups (the third sector). External SRP include scale end-points thatexternal stakeholders use to judge performance. For example, effective use of means varies betweenmore/less effective than service users’ expectations. Finally, time-wise performance benchmarks againstthe past – improvement over time, present – meeting targets, and future – targets to meet. Thus, forexample, performance on means varies between better/worse than present goals.
We adapted the four items proposed by Caruana et al. (1998) to measure innovations’ andorganizational performance. The questionnaire benchmarks their items against the organization’sthree-year plan, perceived political leadership expectations, and perceived users’ and advocacygroups’ expectations. This results in twelve innovations’ and twelve organizational performanceitems. Both the three-component innovations’ performance scale (a� .82) and the three-componentorganizational performance scale (a-values� .84) are reliable
Two scales assess behavioral outcomes of OI. Organizational commitment uses Vigoda’s scale (2000b)with reliability between .73 and .83. The work satisfaction scale uses five of Tsui et al. (1992). Its areliability exceeds .67 in all cases.
Analysis procedure
All analyses use structural equation modeling (AMOS). First the measurement model assessesitems’ correspondence to their respective latent variables (Anderson and Gerbing, 1982, 1988).Parceling randomly combines items into composites; thus reducing random errors and simplifies themeasurement model while simultaneously maintaining the concept of multiple indicator measure-ment. Parceling provides a solution for models with more than five items per construct (Bagozzi andHeatherton, 1994). Hence, we used parceling in our analyses.
The measurement model for the combined sample results in an acceptable fit. The x2/degrees offreedom ratio is 2.36 (x2 =188.78, df=80; p=.05), below the recommended level of 5.0 (Hair et al.,1998). NFI (.97), RFI (.95) and CFI (.98) are above the recommended .90 level whereas RMSEA is slightlyover the recommended .08 level (.09). Thus, the next section examines the substantive model.
The substantive model follows Janssens et al. (1995). The first step includes two models. Oneconstrains all structural relationships to equality across countries (x2 =3305.74; df=1384) and onefrees all such relationships (x2 =3231.98; df=1368). The x2 difference (73.76) is higher than thecritical value (x2
16 =26.30), which indicates differences across countries. Subsequent models free onestructural constraint at a time a procedure followed three times, freeing equality constraints on thecentralization–OI link, followed by the OI–innovation’s performance link and the OI–commitment link(x2 =3296.97, 3260.09, and 3241.54, respectively). In the first two phases, the x2 differences (65.01and 28.11, respectively) exceed the critical values (x2
14 =23.68 and x212 =21.03, respectively). The
final model with three links freed results in a x2 value of 3241.54 (df=1378). The difference betweenthis model and the fully unconstrained model (Dx2
10 =10.44) is below the cutoff value (x210 =18.31).
A. Shoham et al. / Journal of Engineering and Technology Management 29 (2012) 226–240 233

Author's personal copy
In sum, the three freed links differ across countries. The presentation below follows this final model(Table 1). All regression weights are statistically significant, except for centralization–OI, significantonly in Slovakia.
H1 expects MO to enhance OI. The analysis supports H1 in all three countries (g=.66). Similarly, LOenhances OI (H2; g=.42).
H3, according to which centralization reduces OI, received support for Slovakia (g=�.15; p� .01),but not for Israel (g=.06; p=.14) and Lithuania (g=�.07; p=.23). Organizational politics reduced OI(H4) in the three countries (g=�.22).
H5 posits that OI enhances satisfaction and organizational commitment. The data support H5 forsatisfaction (bthree counties= .67) and commitment (bIsrael=1.05; bSlovakia= .54; bLithuania= .97). Standar-dizedb’s show that OI’s impact on commitment is strongest in Lithuania, followed by Israel and Slovakia(bIsrael= .69; bSlovakia= .56; bLithuania= .81). OI enhances innovations’ performance in all countries (H6;bIsrael=1.02; bSlovakia= .59; bLithuania= .48), but the relationship is weaker in Slovakia than in the othercountries (standardized b’s: bIsrael= .92; bSlovakia= .69; bLithuania= .84). Finally, innovations’ performanceenhances overall organizational performance across countries (H7; b=1.11).
Discussion
While the studies had several limitations (discussed later), the findings are important. As noted, thestudy aimed to integrate existing fragmented OI research and develop an integrative model for it; usea multi-dimensional OI conceptualization; test the model in the under-researched, cross-culturalpublic sector context; and use a multi-dimensional, public sector-oriented performance construct. Wediscuss how the research achieved these goals below. We discuss the theoretical context first,followed by a presentation of the managerial/practical implications of the studies.
Multi-dimensional OI view
This study views organizations as high on OI to the extent that they are creative, ready to take risks,oriented towards the future, open to change, and proactive. For the most part, the scales for these fivedimensions have similar and acceptable reliability levels. Additionally, the measurement modelacross the samples shows adequate fit.
Table 1Final model’s results (cross-country constrained, except for centralization!OI and OI!innovations’ performance;
organizational commitment).
Regression weight Standardized regression
weight
P�
MO!OI .66 .56 .01
LO!OI .42 .47 .01
Centralization!OI Israel: .10; Slovakia: �.15;
Lithuania: �.07
Israel: .06; Slovakia: �.26;
Lithuania: �.07
Israel: .15; Slovakia: .01;
Lithuania: .24
Organizational politics!OI �.36 �.22 .01
OI!organizational commitment Israel: 1.05; Slovakia: .54;
Lithuania: .97
Israel: .69; Slovakia: .56;
Lithuania: .81
Israel: .01; Slovakia: .01;
Lithuania: .01
OI!satisfaction .67 .69 .01
OI!innovations’ performance Israel: 1.02; Slovakia: .59;
Lithuania: .48
Israel: .92; Slovakia: .69;
Lithuania: .84
Israel: .01; Slovakia: .01;
Lithuania: .01
Innovations’ performance!organizational performance
1.11 .87 .01
Fit statistics: x2 (df) 3241.54 (1378)
x2/df (normed-x2) 2.35
NFI .95
RFI .94
IFI .97
TLI .96
CFI .97
RMSEA .05
A. Shoham et al. / Journal of Engineering and Technology Management 29 (2012) 226–240234

Author's personal copy
The general public perceives the public sector as non-innovative although it implements manyinnovations (Borins, 2002). Hence, the failure of many such innovations or the public’s ignoranceabout their extent must drive the public’s perceptions. Assuming innovations’ failure, this study’sconceptualization aids future research about antecedents and consequences of OI in the public sector.An important challenge for future research is to identify the level beyond which OI does not pay off(assuming diminishing returns). A second issue requiring additional research is the extent to whichOI’s five dimensions are compensatory.
From a practical standpoint, as was noted earlier, many citizens view public sector organizations asnon-innovative. Taking into consideration that such organizations do implement many innovations,such views result from misperceptions. In the marketing discipline, situations in which anorganization’s offerings are misperceived by any target audience – be it customers, owners, financialmarkets, or governmental agencies – call for the use of advertising and promotion. These are designedto correct the misperceptions by providing evidence contradicting unfounded or inaccurate beliefs.Thus, we recommend that managers of public-sector organizations undertake corrective action usingadvertising tools with informational contents. These will be designed to reflect ongoing generationand implementation of innovations. A second benefit of such an approach is that it reflects a marketorientation on the part of initiating organizations, which lead to stronger commitment by employees.
Antecedents of OI
The four OI antecedents explain 71%, 68%, and 77% of the OI variance in Lithuania, Israel, andSlovakia, respectively. The strongest predictor of OI is MO (standardized b=.56), followed by LO (.47),internal politics (�.36), and centralization (only significant in Slovakia;�.26). These findings highlightthe positive impacts of MO and LO and the negative impact of internal politics on OI across countries.Additionally, centralization reduces OI in Slovakia, but not in Lithuania and Israel. This pattern offindings suggests that organizational culture, processes, and internal politics create a complex systemof contributing antecedents to OI.
MO and LO, which are manifestations of organizational culture, enhance OI. Thus, across countries,when public sector organizations follow MO and LO and maintain low levels of internal politics and (toa lesser extent) centralization, they are likely to have high levels of OI. This conclusion follows Hurleyand Hult’s logic (1998), according to which managers do not face a choice of organizational culture;rather, they need to manage, mold, and shape it.
Managerially, these findings should guide practitioners. Earlier, we alluded to the benefit ofeducating the public and correcting its misperceptions about public organizations being non-innovative vis-a-vis improved MO and, consequently, strengthening employees’ commitment.Coupled with the improvement in OI, building and improving an organization’s MO becomes a double-edge strategic tool. Externally, MO improves perceptions of innovation characteristics oforganizations. Internally, MO improves commitment and enhances innovativeness further.
Since Hofstede (2001) only provides Israeli data for cultural values, we identified estimates forLithuania (Mockaitis and Salciuviene, 2006) and Slovakia (Kolman et al., 2003). Slovakia showed ahigher power distance tendency than Israel (very low) and Lithuania (low-medium). These differencescould explain the findings. Israel and Lithuania should have decentralized organizations with flatterstructures and authority should be less concentrated compared to Slovakia. Such a pattern could havereduced centralization’s impact on OI in Israel and Lithuania.
Individualism and uncertainty avoidance might affect some components of our model. Forexample, the former could reduce centralization’s role in individualistic societies and the latter therole of OI (through its risk-taking dimension). Thus, while the results of this cross-cultural study areencouraging, replications in countries more extreme on individualism and uncertainty avoidanceshould follow.
OI outcomes
Notably, the SRP-based operationalization of performance has merit beyond the public sector, animportant task for future research. Moreover, this study included similar sets of measures for
A. Shoham et al. / Journal of Engineering and Technology Management 29 (2012) 226–240 235

Author's personal copy
innovations’ and performance, which can serve in assessing performance of public sectororganizations.
OI enhances innovations’ performance and behavioral outcomes (satisfaction and commitment).Then, innovations’ performance enhances overall organizational performance. In combination,these suggest that OI has beneficial organizational and individual outcomes. Thus, we echo Hurleyand Hult’s (1998) sentiments in suggesting that future research incorporate OI into performancemodels. The findings are also in line with their argument that ‘‘Framing the market and learningorientation paradigm in terms of innovation facilitates the inclusion of non-profit organizations inthis line of research’’ (p. 52). Such future research can use the performance operationalizationsdeveloped here.
Additional managerial/practical implications
For managers, the findings suggest that investing in OI should be worthwhile. Han et al (1998, p.41) that OI ‘‘facilitates the conversion of market-oriented business philosophy into superior corporateperformance’’ is supported here for public sector organizations. First, a heightened OI enhances thesuccess of new innovations and overall performance. Additionally, an improved OI enhancesemployees’ commitment and satisfaction. In short, investing in OI is a win/win investment.
Given OI’s positive outcomes, managers should strive to improve it. According to the data reportedhere, the road to managing OI should start with MO and LO. These organizational characteristics hadthe strongest impacts on OI’s consequences in all three countries. Then, internal politics, which alsoaffected the outcomes in all studies, but less so than MO/LO, should be managed and reduced. Finally,centralization was related significantly with OI only in Slovakia. Thus, managers in Slovakia shouldpay particular attention to reducing centralization in their public-sector organizations.
Above, we discussed the scales we used to measure OI’s dimensions. These provide managers witha simple way of measuring OI and temporal changes therein. Importantly, we advise managers tobenchmark OI measures over time (changes from past periods). Additionally, OI can be measured atmultiple public sector organizations. This would provide managers and policy-makers with thenecessary information to benchmark OI across units/departments.
Limitations
While we used convenience samples, the emphasis on cross-national comparability, high responserates, and homogeneous national samples, make non-probability sampling acceptable (Reynolds et al.,2003) and reduces potential non-response bias.
Second, the study establishes the model’s validity in three countries. Future research should testthe same model in additional nations. Finally, one scale had lower than desirable reliability. Futureresearch should develop more reliable measures for this scale.
Appendix A. Scales and items
Organizational innovativenessCreativity1. Creativity is encouraged here
2. Managers here expect us to be resourceful problem solvers
3. We are constantly looking to develop and offer new or improved services
4. Our ability to function creatively is respected by the leadership
5. We are encouraged to use original approaches when dealing with problems in the workplace
Openness to change (This organization. . .)1. Is always moving toward the development of new answers
2. Assistance in developing new ideas is readily available
3. Is open and responsive to changes
4. People here are always searching for fresh, new ways of looking at problems
A. Shoham et al. / Journal of Engineering and Technology Management 29 (2012) 226–240236

Author's personal copy
Future orientation (This organization. . .)1. Establishes a realistic set of future goals for itself
2. Effectively ensures that all managers and employees share the same vision of the future
3. Conveys a clear sense of future direction to employees
4. Has a realistic vision of the future for all departments and employees
Risk-taking (This organization. . .)1. Believes that higher risks are worth taking for high payoffs
2. Encourages innovative strategies, knowing well that some will fail
3. Likes to take big risks
4. Does not like to ‘‘play it safe’’
Proactiveness1. We are constantly seeking new opportunities for the organization
2. We take the initiative in an effort to shape the environment to our advantage
3. We are often the first to introduce new services
4. We usually take the initiative by introducing new administrative techniques
Organizational innovativeness antecedentsMarket orientation1. We systematically gather information of relevance to our work
2. We systematically poll users of our services at least once a year to assess the quality of our services
3. We do a lot of our own research about users of our services
4. We are slow to detect fundamental shifts in our service field
5. We are slow to detect changes in the preferences and needs of our users/citizens
6. We have interdepartmental meetings to discuss changes in the needs of users our services
7. We spend time discussing service users’ future needs
8. When something important happens to major users of our services, all of us know about it in a short period
9. Data on satisfaction of users of our services are disseminated at all levels of our organization on a regular basis
10. Complaints of users of our services fall on deaf ears here
11. Even if we came up with a great new plan, we probably would not be able to implement it in a timely fashion
12. For one reason or another we tend to ignore changes in the needs of our service users
13. We periodically review our service development efforts to ensure they are in line with what our service users need
14. If there is a major change in our service users’ needs, we would implement a response immediately
Learning orientation1. The sense here is that employees learning is an investment not an expense
2. The basic values here include learning as a key to improvements
3. Once we quit learning we endanger our organization
4. We agree that the ability to learn is the key to improvement
5. The staff is involved in making decisions about areas for improvement.
6. I have access to the data I need to perform my job in an efficient and effective manner
7. The organization does not have sufficient resources to implement systematic and adequate learning processes
CentralizationIn this organization
1. It is easy to talk with virtually anyone you need to, regardless of rank or position
2. Employees from different departments feel comfortable calling each other when the need arises
3. Communications from one department to another do not have to follow ‘‘proper channels’’
4. There can be little action taken here until a supervisor approves a decision
5. Even small matters have to be referred to someone higher up for a final answer
6. Managers encourage employees to discuss work-related matters with those who are not their immediate
superiors or subordinates
7. A person who wants to make his/her own decision would be quickly discouraged here
8. I have to ask my boss before I do almost anything
9. The inter departmental meetings and coordination is more time consuming than beneficial for the aims
of the organization
10. The inter departmental meetings and coordination fosters innovation
A. Shoham et al. / Journal of Engineering and Technology Management 29 (2012) 226–240 237
Author's personal copy
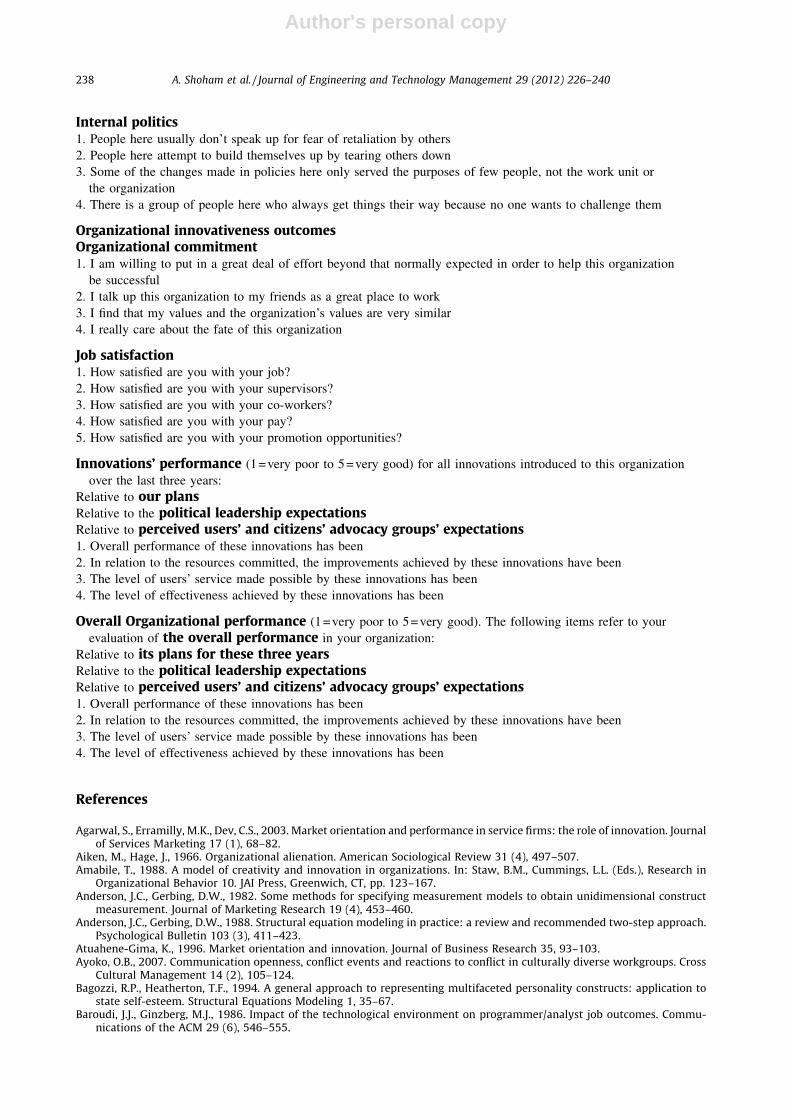
Internal politics1. People here usually don’t speak up for fear of retaliation by others
2. People here attempt to build themselves up by tearing others down
3. Some of the changes made in policies here only served the purposes of few people, not the work unit or
the organization
4. There is a group of people here who always get things their way because no one wants to challenge them
Organizational innovativeness outcomesOrganizational commitment1. I am willing to put in a great deal of effort beyond that normally expected in order to help this organization
be successful
2. I talk up this organization to my friends as a great place to work
3. I find that my values and the organization’s values are very similar
4. I really care about the fate of this organization
Job satisfaction1. How satisfied are you with your job?
2. How satisfied are you with your supervisors?
3. How satisfied are you with your co-workers?
4. How satisfied are you with your pay?
5. How satisfied are you with your promotion opportunities?
Innovations’ performance (1= very poor to 5 =very good) for all innovations introduced to this organization
over the last three years:
Relative to our plansRelative to the political leadership expectationsRelative to perceived users’ and citizens’ advocacy groups’ expectations1. Overall performance of these innovations has been
2. In relation to the resources committed, the improvements achieved by these innovations have been
3. The level of users’ service made possible by these innovations has been
4. The level of effectiveness achieved by these innovations has been
Overall Organizational performance (1 =very poor to 5= very good). The following items refer to your
evaluation of the overall performance in your organization:
Relative to its plans for these three yearsRelative to the political leadership expectationsRelative to perceived users’ and citizens’ advocacy groups’ expectations1. Overall performance of these innovations has been
2. In relation to the resources committed, the improvements achieved by these innovations have been
3. The level of users’ service made possible by these innovations has been
4. The level of effectiveness achieved by these innovations has been
References
Agarwal, S., Erramilly, M.K., Dev, C.S., 2003. Market orientation and performance in service firms: the role of innovation. Journalof Services Marketing 17 (1), 68–82.
Aiken, M., Hage, J., 1966. Organizational alienation. American Sociological Review 31 (4), 497–507.Amabile, T., 1988. A model of creativity and innovation in organizations. In: Staw, B.M., Cummings, L.L. (Eds.), Research in
Organizational Behavior 10. JAI Press, Greenwich, CT, pp. 123–167.Anderson, J.C., Gerbing, D.W., 1982. Some methods for specifying measurement models to obtain unidimensional construct
measurement. Journal of Marketing Research 19 (4), 453–460.Anderson, J.C., Gerbing, D.W., 1988. Structural equation modeling in practice: a review and recommended two-step approach.
Psychological Bulletin 103 (3), 411–423.Atuahene-Gima, K., 1996. Market orientation and innovation. Journal of Business Research 35, 93–103.Ayoko, O.B., 2007. Communication openness, conflict events and reactions to conflict in culturally diverse workgroups. Cross
Cultural Management 14 (2), 105–124.Bagozzi, R.P., Heatherton, T.F., 1994. A general approach to representing multifaceted personality constructs: application to
state self-esteem. Structural Equations Modeling 1, 35–67.Baroudi, J.J., Ginzberg, M.J., 1986. Impact of the technological environment on programmer/analyst job outcomes. Commu-
nications of the ACM 29 (6), 546–555.
A. Shoham et al. / Journal of Engineering and Technology Management 29 (2012) 226–240238

Author's personal copy
Borins, S., 2002. Leadership and innovation in the public sector. Leadership and Organization Development Journal 23 (8), 467–476.
Box, R., Marshall, G.S., Reed, B.J., Reed, C.M., 2001. New public management and substantive democracy. Public AdministrationReview 61 (5), 608–619.
Boyd, B.K., 1991. Strategic planning and financial performance: a meta-analytical review. Journal of Management Studies 27 (4),353–374.
Brady, H.E., Verba, S., Schlozman, K-L., 1995. Beyond SES: a resource model of political participation. American Political ScienceReview 89 (2), 271–294.
Caruana, A., Ewing, M.T., Ramaseshan, B., 2002. effects of some environmental challenges and centralization on the entre-preneurial orientation and performance of public sector entities. The Service Industries Journal 22 (2), 43–58.
Caruana, A., Rameseshan, B., Ewing, M.T., 1998. The market orientation–performance link: some evidence from the public sectorand universities. Journal of Nonprofit and Public Sector Marketing 6 (1), 63–82.
Covin, J.G., Slevin, D.P., 1989. strategic management of small firms in hostile and benign environments. Strategic ManagementJournal 10, 75–87.
Damanpour, F., 1991. Organizational innovation: a meta-analysis of effects of determinants and moderators. Academy ofManagement Journal 44 (3), 555–590.
Damanpour, F., Evan, W.M., 1984. Organizational innovation and performance: the problem of organizational lag. Adminis-trative Science Quarterly 129, 392–409.
Deshpande, R., Farley, J.U., Webster Jr., F.E., 1993. corporate culture, customer orientation, and innovativeness in Japanese firms:a quadrad analysis. Journal of Marketing 57 (1), 23–27.
Dewar, R.D., Dutton, J.E., 1986. The adoption of radical and incremental innovations: an empirical analysis. Management Science32 (11), 1422–1433.
Dong, L., Neufeld, D.J., Higgins, C., 2008. Testing Klein and Sorra’s innovation implementation model: an empirical examination.Journal of Engineering and Technology Management 25, 237–255.
Du, Y., Kacmar, K.M., 1992. Perceptions of organizational politics. Journal of Management 18 (1), 93–116.Fiegenbaum, A., 1990. Prospect theory and the risk-return association: an empirical examination in 85 industries. Journal of
Economic Behavior and Organization 14, 187–204.Fiegenbaum, A., Hart, S., Schendel, D., 1996. Strategic reference points theory. Strategic Management Journal 17, 219–235.Fiegenbaum, A., Thomas, H., 1988. Attitudes toward risk and the risk return paradox: prospect theory explanations. Academy of
Management Journal 31, 85–106.Fiegenbaum, A., Thomas, H., 1995. Strategic groups as reference groups: theory, modeling, and empirical examination of
industry and competitive strategy. Strategic Management Journal 16 (6), 461–476.Folger, R., Konovsky, M.A., Cropanzano, R., 1992. A due process metaphor for performance appraisal. In: Cummings, L.L., Staw,
B.M. (Eds.), Research in Organizational Behavior 14. JAI Press, Greenwich, CT, pp. 129–177.Ganesan, S., 1994. Determinants of long-term orientation in buyer–seller relationships. Journal of Marketing 58 (2), 1–19.Gatignon, H., Xuereb, J-M., 1997. Strategic orientation of the firm and new product performance. Journal of Marketing Research
34 (1), 77–90.Golembiewski, R.T., Vigoda, E., 2000. Organizational innovation and the science/craft of management. In: Mackenzie, A.M.,
Rahim, R.T., Golembiewski, K.D. (Eds.), Current Topics in Management 5. JAI Press, Greenwich, CT, pp. 263–280.Gopalakrishnan, S., Damanpour, F., 1997. A review of innovation research in economics, sociology and technology management.
Omega 25 (1), 15–29.Hage, J., Dewar, R., 1973. Elite values versus organizational structure in predicting innovation. Administrative Science Quarterly
18, 279–290.Hair Jr., J.F., Anderson, R.E., Tatham, R.L., Clark, W.C., 1998. Multivariate Data Analysis. Prentice Hall, Englewood Cliffs, NJ.Han, J.K., Kim, N., Srivastava, R.K., 1998. Market orientation and organizational performance: is innovation the missing link?
Journal of Marketing 62 (4), 30–45.Hofstede, G., 2001. Culture’s Consequences. Sage, Thousand Oaks, CA.Hult, T.M., Hurley, R.F., Knight, G.A., 2004. Innovativeness: its antecedents and impact on business performance. Industrial
Marketing Management 33, 429–438.Hult, T.M., Nichols, E.L., Giunipero, L.C., Hurley, R.F., 2000. Examining global organizational learning in multiple chains of users,
buyers, and suppliers: a low versus high learning study. Journal of International Marketing 8 (3), 61–83.Hurley, R.F., 1995. Group culture and its effect on innovative productivity. Journal of Engineering and Technology Management
12 (July), 57–75.Hurley, R.F., Hult, T.M., 1998. Innovation, market orientation, and organizational learning: an integration and empirical
examination. Journal of Marketing 62 (3), 42–54.Hurley, R.F., Hult, T.M., Knight, G.A., 2005. Innovativeness and capacity to innovate in a complexity of firm-level relationships: a
response to Woodside (2004). Industrial Marketing Management 34, 281–283.Janssens, M., Brett, J.M., Smith, F.J., 1995. Confirmatory cross-cultural research: testing the viability of a corporation-wide safety
policy. Academy of Management Journal 38 (2), 364–382.Javidan, M., Waldman, D.A., 2003. Exploring charismatic leadership in the public sector: measurement and consequences. Public
Administration Review 63 (2), 229–242.Jaworski, B.J., Kohli, A.K., 1993. Market orientation: antecedents and consequences. Journal of Marketing 57 (3), 53–70.Johnson, E.J., Rosen, C.C., Chang, C.-H., 2011. To aggregate or not to aggregate: steps for developing and validating higher-order
multidimensional constructs. Journal of Business Psychology 26, 241–248.Kacmar, K.M., Carlson, D.S., 1997. Further validation of the perceptions of politics scale (POPS): a multiple sample investigation.
Journal of Management 23, 627–658.Kipnis, D., Schmidt, S.M., Wilkinson, I., 1980. Intraorganizational influence tactics: exploration in getting one’s way. Journal of
Applied Psychology 65, 440–452.Kolman, L., Noorderhaven, N.G., Hofstede, G., Dienes, E., 2003. Cross-cultural differences in central Europe. Journal of Managerial
Psychology 18 (1), 76–88.
A. Shoham et al. / Journal of Engineering and Technology Management 29 (2012) 226–240 239

Author's personal copy
Lumpkin, T.G., Dess, G.G., 1996. Clarifying the entrepreneurial orientation construct and linking it to performance. Academy ofManagement Journal 21 (1), 135–172.
Lynch, P., Walsh, M., Harrington, D., 2010. Defining and dimensionalizing organizational innovativeness. In: 2010 ICHRIE AnnualSummer Conference & Marketplace, Caribe Hilton, San Juan, Puerto Rico, USA, 28–31 July.
Lynn, G.S., Monroe, J.G., Paulson, A.S., 1996. Marketing and discontinuous innovation: the probe and learn process. CaliforniaManagement Review 38, 8–37.
Martins, E.C., Terblanche, F., 2003. Building organisational culture that stimulates creativity and innovation. European Journal ofInnovation Management 6 (1), 64–74.
McGinnis, M.A., Ackelsberg, M.R., 1983. Effective innovation management: missing link in strategic planning? Journal ofBusiness Strategy 4 (Winter), 59–66.
Mockaitis, A.I., Salciuviene, L., 2006. An analysis of the influence of culture on need hierarchies in three Baltic countries. Aworking paper. http://www.leidykla.vu.lt/inetleid/ekonom/64/str10.html (accessed 30.06.06).
Morgan, R.E., Strong, C.A., 2003. Business performance and dimensions of strategic orientation. Journal of Business Research 56,163–176.
Mostafa, M.M., El-Masry, A., 2008. Perceived barriers to organizational creativity: a cross-cultural study of British And Egyptianfuture marketing managers. Cross Cultural Management 15 (1), 81–93.
Mowday, R.T., Porter, L.W., Steers, R.M., 1982. Employee-Organizational Linkages. Academic Press, NY.Narver, J.C., Slater, S.F., 1990. The effect of a market orientation on business profitability. Journal of Marketing 54 (4), 20–35.Noble, C.H., Sinha, R.K., Kumar, A., 2002. Market orientation and alternative strategic orientations: a longitudinal assessment of
performance implications. Journal of Marketing 66 (4), 25–39.Nystrom, P.C., Ramamurthya, K., Alla, L.W., 2002. Organizational context, climate and innovativeness: adoption of imaging
technology. Journal of Engineering and Technology Management 19, 221–247.Rasch, R.H., 1991. An Investigation of Factors that Impact Behavioral Outcomes of Software Engineers. ACP CPR, pp. 38–50.Reynolds, N.L., Simintiras, A.C., Diamantopoulos, A., 2003. Theoretical justification of sampling choices in international
marketing research: key issues and guidelines for researchers. Journal of International Business Studies 34 (1), 80–89.Rogers, E.M., 1995. Diffusion of Innovations. The Free Press, NY.Rosenfeld, R., Servo, J.C., 1990. Facilitating innovations in large organizations. In: West, M.A., Farr, J.L. (Eds.), Innovation and
Creativity at Work. Wiley publications, Chichester, England, pp. 151–164.Salavou, H., 2004. The concept of innovativeness: should we need to focus? European Journal of Innovation Management 7 (1),
33–44.Sandvik, I.L., Sandvik, K., 2003. The impact of market orientation on product innovativeness and business performance.
International Journal of Research in Marketing 20, 355–376.Shoham, A., Fiegenbaum, A., 1999. Extending the competitive marketing strategy paradigm: the role of strategic reference
points theory. Journal of the Academy of Marketing Science 27 (4), 442–454.Shoham, A., Fiegenbaum, A., 2002. Competitive determinants of organizational risk-taking attitude: the role of strategic
reference points. Management Decision 40 (2), 127–141.Shoham, A., Rose, G.M., 2001. Marketing orientation: a replication and extension. Journal of Global Marketing 14 (4), 2–25.Shoham, A., Ruvio, A., Vigoda-Gadot, E., Schwabsky, N., 2006. Market orientations in the nonprofit and voluntary sector: a meta-
analysis of their relationships with organizational performance. Nonprofit & Voluntary Sector Quarterly 35 (3), 453–476.Siegel, S.M., Kaemmerer, W.F., 1978. Measuring the perceived support for innovation in organizations. Journal of Applied
Psychology 63 (5), 553–562.Slater, S.F., Narver, J.C., 1995. Market orientation and the learning organization. Journal of Marketing 59 (3), 63–74.Steenkamp, J.-B.E.M., Baumgartner, H., 1998. Assessing measurement invariance in cross-national consumer research. Journal
of Consumer Research 25 (2), 78–91.Subramanian, A., 1996. Innovativeness: redefining the concept. Journal of Engineering and Technology Management 13, 223–
243.Subramanian, A., Nilakanta, S., 1996. Organizational innovativeness: exploring the relationship between organizational
determinant of innovation, types of innovations, and measures of organizational performance. Omega 24 (6), 631–647.Tsui, A.S., Egan, T.D., O’Reilly III, C.A., 1992. Being different: relational demography and organizational attachment. Admin-
istrative Science Quarterly 37, 549–579.Tu, Q., Ragunathan, B., Ragunathan, T.S., 2001. A path analytic study of the antecedents of organizational commitment of is
managers. Information Resources Management Journal 14 (3), 27–36.Van de Ven, A.H., 1986. Central problems in the management of innovation. Management Science 32 (5), 590–607.Venkatmaran, N., 1989. Strategic orientation of business enterprises: the construct, dimensionality, and measurement.
Management Science 35 (8), 942–962.Vigoda, E., 2000a. Political behavior in public administration systems: an empirical examination of its relationship with job
congruence, organizational citizenship behavior and in-role performances. Public Personnel Management 26, 185–210.Vigoda, E., 2000b. The relationship between organizational politics, job attitudes, and work outcomes: exploration and
implications for the public sector. Journal of Vocational Behavior 57, 326–347.Vigoda, E., 2002. From responsiveness to collaboration: governance, citizens, and the next generation of public administration.
Public Administration Review 62 (5), 527–540.Wanberg, C.R., Banas, J.T., 2000. Predictors and outcomes of openness to change in a reorganizing workplace. Journal of Applied
Psychology 85 (1), 132–142.
A. Shoham et al. / Journal of Engineering and Technology Management 29 (2012) 226–240240
Copyright © 2022 FDOKUMEN