
The Impact of Floods on House Prices: An Imperfect Information Approach with Myopia and Amnesia
41
1 THE IMPACT OF FLOODS ON HOUSE PRICES: An Imperfect Information Approach with Myopia and Amnesia Working Paper as at 18 September 2010 Gwilym Pryce a , Yu Chen b and George Galster c a Corresponding author; School of Social and Political Sciences, University of Glasgow, Glasgow, G12 8RS; email [email protected] . b School of Social and Political Sciences, University of Glasgow, Glasgow, G12 8RS; email [email protected] . c Department of Urban Studies and Planning, Wayne State University, Detroit MI 48202 USA; email [email protected] . Abstract How will housing markets respond to increased frequency and severity of flooding expected with global climate change? Existing models yield poor predictions because they assume perfect information and rational decision-making processes in the housing market. This paper sets out a plausible alternative framework for analysing housing price responses to flood frequency and severity based on findings of behavioural economics and the sociology of risk, which emphasize myopic and amnesiac perceptions of risk. It utilises this framework to analyze graphically a variety of flood scenarios and their implications for housing prices and government intervention.
Transcript of The Impact of Floods on House Prices: An Imperfect Information Approach with Myopia and Amnesia
1
THE IMPACT OF FLOODS ON HOUSE PRICES:
An Imperfect Information Approach with Myopia and Amnesia
Working Paper as at 18 September 2010
Gwilym Prycea , Yu Chenb and George Galsterc
a Corresponding author; School of Social and Political Sciences, University of Glasgow, Glasgow, G12 8RS;
email [email protected] . b School of Social and Political Sciences, University of Glasgow, Glasgow, G12 8RS; email
[email protected] . c Department of Urban Studies and Planning, Wayne State University, Detroit MI 48202 USA; email
Abstract
How will housing markets respond to increased frequency and severity of flooding expected with global climate change? Existing models yield poor predictions because they assume perfect information and rational decision-making processes in the housing market. This paper sets out a plausible alternative framework for analysing housing price responses to flood frequency and severity based on findings of behavioural economics and the sociology of risk, which emphasize myopic and amnesiac perceptions of risk. It utilises this framework to analyze graphically a variety of flood scenarios and their implications for housing prices and government intervention.
2
Introduction
Being able to predict the house price impacts of floods is important for at least three
reasons. Firstly, spatial variation in the price of a unit of housing services can, in principle,
reveal the money value of the welfare loss associated with vulnerability to flooding. Given
that the cost of insurance claims may understate the total impact of floods on human
wellbeing1, there is a potentially important role for housing economics in weighing up the
costs and benefits of potential interventions. Following a decade of major floods across the
world, assessing the case for such interventions has become a major policy concern (Pitt,
2008). These concerns will further rise given a growing scientific consensus that climate
change is expected to amplify the prevalence and severity of flood risk, due to changes in
winter precipitation, sea levels, storm surges, and extreme weather events (Foresight, 2004;
Stern, 2006, 2008; IPCC, 2007; Houghton, 2009).
Secondly, housing is a major source of collateral for the financial system. Being
able to simulate house price impacts may therefore help reveal the true exposure of
financial institutions to future flood risk. The US subprime crisis has illustrated the
vulnerability of the world financial system to the changes in the value of real estate in
specific locations, and so an important implication of growing flood dangers is the wider
destabilising effect that unanticipated house price declines could have.
Thirdly, fragility and poor performance of pension funds has encouraged many
households to make housing their major source of saving for retirement. The potential for
floods to wipe-out housing wealth accumulated over a person’s lifetime is of particular
concern in societies where there are high rates of homeownership and of households with
undiversified portfolios (Cauley et al., 2007).
1 Some households are uninsured and there are emotional and health effects not covered by insurance policies.
3
Despite the importance of predicting how floods will affect housing prices, the housing
economics literature has made an inadequate contribution because its models have been
built on assumptions about efficient markets and rational decision makers. Unfortunately,
these assumptions are at odds with the literatures on behavioural economics and the
sociology of risk, as we shall demonstrate.
This paper responds to this shortcoming by developing a new framework for
modelling the housing market response to flood dangers that is founded upon myopic,
amnesiac risk assessment by housing market actors. After a brief summary in the next
section of the theoretical and empirical studies on flooding and house prices, we endeavour
in the third section to distil the key insights from the literatures on behavioural economics
and the sociology of risk into four propositions that provide the foundation of our
framework. In the fourth section we analyze diagrammatically a variety of flood scenarios
to illustrate the usefulness and provocative implications of our framework. Finally, we
discuss our approach could provide a sounder housing economic analysis of flood risk
under a changing climatic regime and thus a more appropriate basis for future policy
interventions.
Existing Literature about the Effect of Floods on House Prices
The long-dominant neoclassical paradigm in housing economics for conceptualizing the
relationship between house prices and environmental disamenities has been hedonic theory
(Rosen, 1974; Harrison et al., 2001). Hedonic theory implicitly assumes that the household
will choose a dwelling that maximises expected utility, wherein the various attributes of the
dwelling and environs are assessed in evaluating utility. The rational decision maker
should be willing to pay a premium to avoid flood hazards, the amount depending on the
perceived expected value of utility lost from floods. This differential premium across
4
properties varying in their flood hazards should be fully capitalized into house prices
insofar as information about the frequency and severity of flooding associated with each
location is accurate and widely known (MacDonald et al., 1987).2 Thus, with the exception
of transitory post-flooding price reductions while homes are being repaired, the hedonic
approach would predict no temporal variation in home prices and flood occurrences in an
efficient market.
Tobin and colleagues (Tobin & Newton,1986; Tobin & Montz, 1994) contributed an
important advance by arguing that utility reduction from flooding (and thus home price)
depends on the spatial, temporal and hydrological aspects of the flood. They suggested that
there are different temporal profiles depicting flood impacts on home prices, depending on
how often floods occur compared to the time required to restore the property to pre-flood
utility. At one extreme with rare flooding, house prices fall immediately after a flood event
and then recover fully after repairs and remain at this higher level until the next rare flood.
In this case, over the long-term, neither past nor propsective flood damages are capitalized.
At the other extreme with flooding occurring so frequently that housing utility has
insufficient time to recover much if at all, house prices remain low. In this case, flood
damages have been almost completely capitalised into house prices ex post facto. Cases of
intermediate flood frequencies yield in their formulation an intertemporal housing price
pattern with incomplete and imperfect capitalization of flood damages.
Though the Tobin et al. approach offers a useful perspective, it is under-developed.
First, their model appears to assume no market foresight regarding floods, hence prices
capture only actual losses of utility, not future risks. Second, their model does not
distinguish between risk-adjusted house prices and observed (actual) house prices or their
interrelationship, yielding two additional ambiguities. Firstly, it is unclear whether the price 2 Even the presence of (unsubsidized) flood insurance should not upset this efficient market outcome, because the differentials in premiums required holding consumers harmless from flood risk should themselves be perfectly capitalized into housing values.
5
fall following a flood described in their model is due entirely to the physical damage to the
property or because of inadequate capitalisation. The former allows one to retain the
neoclassical assumption that risk-adjusted prices do not diverge from observed prices,
while the latter assumes that observed prices drifted away from their risk-adjusted levels
prior to the flood. Secondly, their model suggests that capitalisation occurs if frequency of
flooding is sufficiently high, yet it is not clear whether this means that the housing market is
perfectly informed (expected costs of rare floods are so infinitesimally small that the house
price effect is indistinguishable from zero) or imperfectly informed (frequent floods are
necessary to remind residents of the future risks).
Neither the hedonic nor the Tobin et al. approaches offer convincing explanations
for the findings of the statistical and survey literature. Some statistical studies have found
that home prices are discounted for substantial periods in locations with high flood risks
(Barnard, 1978; Donnelly, 1989; Speyrer & Ragas 1991; Bartosova et al., 1999; Harrison et
al., 2001; Bin et al., 2008). Other studies have observed negligible price effects
(Zimmerman, 1979; Bialaszewski & Newsome, 1990). Nevertheless, a consensus has been
reached that a price discount due to flood risks, if any, is greater after a flood than before
(Bartosova et al., 1999; Eves, 2002; Bin & Polasky 2004). Proponents of the efficient
market models may suggest that this finding only reflects transitory adjustments while
repairs are underway on damaged properties. Indeed, several studies have suggested
relatively rapid rebounds of housing prices in the wake of floods (Babock & Mitchell,
1980; Montz, 1992; Lamond & Proverbs 2006). We think it more plausible to posit that
these findings indicate imperfect capitalization due to imperfect risk assessment, as a flood
informs people about true flood risks.
Our interpretation is buttressed by survey findings showing that a large proportion
of households are ignorant of flood risk, particularly when floods have not occurred for
6
some time. Homeowner surveys in Boulder, Colorado, for example, revealed that the
majority of homeowners in the floodplain lacked information of flood risk when they bid
for a house, and 70% of respondents said they would have lowered their bid if they had
known the actual cost of flood insurance (Chivers & Flores, 2002). In the UK, the
Environment Agency/DEFRA 2004 survey of households in areas flooded in 1998 and
2000 found that, before the floods occurred, only 24 per cent of households were aware of
the risk of flooding (Burningham et al., 2008). Further, the 2005 British Market Research
Bureau survey estimated that, 41 per cent of the five million people in two million
properties in England and Wales that live in flood risk areas were unaware of the flood
threat (BMRB, 2005).
The Literature on Myopic, Amnesiac Decision Making
We need a new theoretical perspective to make sense of the existing evidence, a
perspective that takes a less naive view of how humans assess the risk of natural disasters.
Two literatures are of particular relevance to this enterprise. First, the behavioural
economics literature has shown how aspects of individual decision making deviate from
the conventional neoclassical economic model. Second, the sociology of risk literature has
demonstrated the role of institutions and social forces in exacerbating and concealing
perceived risk. We argue below how insights from these two bodies of work lead us to
expect that housing market actors will assess flood risk on the basis of:
(a) Myopia—discounting information from anticipated future events, with the
discount rising progressively as the event becomes less imminent; and
(b) Amnesia—discounting information from past events, with the discount rising
progressively as time elapses.
7
Myopia and amnesia mean that perceived risk can diverge considerably from actual
risk, particularly if a long period has elapsed since a local flood has occurred. This in turn
means that observed home prices may diverge from zero-risk prices and truly risk-adjusted
prices for an extended time, concepts that have not been previously distinguished in the
existing housing economics literature on flooding. Moreover, we will argue that in a
regime of climate change we are likely to witness two important tendencies:
(c) Contingency—the tendency for myopia and amnesia to diminish in housing
market importance as floods become more frequent and information and communication
technologies improve, thereby leading to a (non-linear) convergence of observed and risk-
adjusted home prices; and
(d) Path Dependency—the tendency for the convergence path of observed home
prices towards risk-adjusted prices to be idiosyncratic, contingent on the sequence of flood
experiences in each area.
Consider now the rationale behind each of these four propositions that constitute the
foundation of our framework and our contribution to advancing scholarship in this realm.
Proposition (a): Housing market response to flood risk will be characterised by myopia
There are four main reasons why we expect individuals to discount information regarding
the future. First, there may be a negative relationship between temporal distance and the
perceived salience of information. As empirical support, DellaVigna & Pollet (2007) found
little statistical relationship between stock returns and predictable demographic changes
arising from cohort effects, suggesting shortsighted market information and capitalization.
DellaVigna (2009, p.352) concludes that stock returns across a variety of industries are
“consistent with inattention to information further than approximately five years into the
future. … information that is further into the future … is less likely to be salient.”
8
Interviews conducted by Burningham et al. (2008) concluded that future flood risks were
“invisible” (to use Beck’s 1992b terminology) and thus dismissed. Hence, we might
expect predictions of rising flood risk five, ten or twenty years into the future to be met
with inattention and as a result, future flood risk may have little perceptible impact on
current home prices.
Numerous theoretical formulations of human decision-making have reached similar
conclusions regarding information salience declining with temporal distance. Tversky &
Kahneman (1973) highlight the importance of “availability heuristics” in shaping
perceptions of risk. "[A] person is said to employ the availability heuristic whenever he
estimates frequency or probability by the ease with which instances or associations could be
brought to mind" (Tversky & Kahneman, 1973). An individual may assess the likelihood of
an event as higher when examples come to mind more readily because such examples
provide an availability heuristic. Unusual events in the distant future may be more difficult
to imagine and identify with, and therefore will have little effect on current perceptions of
risk. Others have formulated this phenomenon as “self attribution bias,” defined as the
“tendency to discount information that is inconsistent with one’s priors” (DellaVigna, 2009,
p.343). One’s priors are fundamentally shaped by lived experience (Allen, 2009), which
may then cultivate “mental inertia,” the behavioural tendency to resist extrapolation
(Kousky et al., 2008). This over-reliance on experience helps explain why humans have a
tendency to underestimate risks that appear distant or global, or which others seem to
accept without concern (Zeckhauser, 1996; Kousky & Zeckhauser, 2006). Kousky &
Zeckhauser (2006) argue that such patterns of framing and herd behaviour characterise
economic responses to disasters, and lead humans to commit JARring actions—actions that
Jeopardize Assets that are Remote.
9
A second explanation for myopia—not unrelated to the first—is the nature of the
information itself. Because data on the future arise almost exclusively from statistical
forecasting models produced by institutional information providers indistinguishable from
the power structures that exert social control, the response of individuals may be to
associate climate predictions with attempts by vested interests to exert power. Indeed,
institutionalised scientific knowledge may be seen as much the cause of disasters (and of
inadequate preparation for and response to them) as the solution. In this view of the world,
scientific and institutional organisations “obscure the link between their generation and
control of risks, and can counter prevailing mandates, thereby exacerbating rather than
reducing risks” (Williams, 2008, p.1117). Hence, individuals have become “more cynical
about science, politics, business and the media” ( Williams, 2008, p.1117).
That individuals appear all too willing to accept conspiracy theory explanations of
the data rather than acknowledging the spectre of climate change is ostensibly confirmed
by a recent UK BBC opinion poll commissioned in February 2010, which asked
respondents whether they agreed with the statement, “Climate change is happening and is
now established as largely man-made” (BBC, 2010 p.1). Since the previous poll in
November 2009, a major scandal regarding leaked emails between climate scientists had
received extensive media coverage in the lead up to the Copenhagen Climate Conference
in December 2009.3 Only 26% of respondents in the February 2010 poll said they agreed,
down from 41% in November 2009. Those who believed either that “Climate change is
happening, but it is environmentalist propaganda that it is man-made” or that “Climate
change is not happening” had risen from 23% to 35% in three months.
3 The leaked emails were interpreted by climate change sceptics as evidence that data on global warming had been manipulated, and led to Professor Phil Jones of the Climatic Research Unit at the University of East Anglia stepping down pending an enquiry (see Jha 2009).
10
Alternatively, public myopia may occur as a result of the failure of institutions
themselves to acknowledge and communicate the true risks of climate change. “In
situations of high uncertainty, organizations deploy science and technology in combination
with a misplaced faith in their capabilities (including presumed infallibility) so as to
redefine risks as more manageable and acceptable” (Williams, 2008, p.1117, summarising
the work of Tierney 2006). Similarly, individuals may have misplaced confidence in the
role and ability of governments to provide technical solutions or maintain coastal and flood
defences (Wales Audit Office, 2009).
A third set of explanations for myopia relate to limitations of human cognition
and/or the costs of cognition. Climate models are highly technical and their outputs are
probabilistic. Human intuition has not evolved to facilitate absorption of such information
and so there may be innate human inabilities to respond appropriately to data couched in
terms of density functions and contingent scenarios. Psychological studies show that
“attention is a limited resource” (DellaVigna, 2009, p.349). As a result, humans respond to
complex problems by “processing only a subset of information” and by employing
“simplifying heuristics” (DellaVigna, 2009, p.349). Rather than devising a rational
response strategy which requires negotiating the complex decision sequences and
cost/benefit calculations implied by probabilistic climate change scenarios and associated
mitigation and adaptation strategies, individuals may tend towards caricatured extremes,
flipping between denial of the risks and the fatalistic polar view that rising temperatures
are unstoppable. Note that both viewpoints render behavioural change pointless. Such
responses may be a form of cognitive dissonance—an attempt to rationalize past or
planned decisions about house purchase and consumption choices.4 Rather than
4 The dissonance arises from the apparent conflict between the belief that a person has made the right decision to purchase a house on a flood plain and the scientific evidence to the contrary.
11
acknowledging the existence of growing flood risk, and the implication that it was a
mistake to purchase a dwelling on a flood plain and then taking corrective (if costly)
action, owners may deny the evidence that flood risks are increasing, resorting to
conspiracy theories and climate scepticism to disregard evidence to the contrary.
Finally, myopia may be caused by “framing effects.” House purchase decisions do
not occur in a vacuum, nor are they confined to the sterile conditions of pure financial
calculation. Acquiring a home is an emotional process fused with hopes, ambitions
regarding status, and imagined lifestyle aspirations. Houses become extensions of our
personality, symbols of achievement, and places where memories are made and preserved.
They are objects of affection, sentiment, and symbolism. These frames are reinforced by
the media portrayal of what the habitats of the successful look like (Lorenzo-Dus, 2006).
Estate agents attempt to exploit these frames in their marketing (Pryce & Oates, 2008).
Compared to this heady mix of emotion, aspiration and symbolism, the dangers of future
flooding wield little influence on the present task of home acquisition and pricing.
Proposition (b): Housing market response to flood risk will be characterised by amnesia
The counterpart of future temporal distance is the declining salience of information from
the past. Similar explanatory arguments therefore apply. For example, as recollection of a
flood experience decays over time, construction of an Availability Heuristic based on that
event becomes more difficult as memories fade.
One way to characterise this memory loss is in terms of non-Bayesian updating
where individuals overweight information from the present. As households weigh recent
flood information more heavily than aged floods, they will overestimate the risks of
flooding in the immediate aftermath of a flood, but their perceptions of risk decline rapidly
as the months pass with no repeated flood event. This could be viewed as a variant of the
12
“Law of Small Numbers” (Tversky & Kahneman, 1971; DellaVigna, 2009, p.344), where
individuals are essentially basing their risk estimates on an overly small sample of (current)
time periods.5
An important distinction in the context of the amnesia proposition is the difference
between market amnesia and individual amnesia. Market amnesia can occur even when
individuals have intact memories, due to the existence of private information asymmetries.
For example, owners of recently flooded houses may be perfectly aware of the flood risks
but potential buyers coming from outside the area may not be: “The ability to recognise and
read such clues takes time and is a skill that new residents in particular are likely to lack”
(Burningham et al., 2008, p.235). “For the community as a whole, turnover of property will
ensure that the average experience with flood will also decline with time. The rate of
forgetting will vary with the stability of the local area” (Lamond & Proverbs, 2006, p.366).
Information asymmetry may be exacerbated by owners and real estate professionals who
conceal flood risks in an attempt to allay stigmatisation of the neighbourhood and the
consequent reduction in home prices. In a study of floods in Lully, Geneva, November et
al. (2009, p. 192) observed that“[N]ew residents were easily convinced by the promoters,
the architects, and indeed the authorities, who described the basement flooding of the
partially built houses in 2001 as a one-off event.” Perversely, amnesia may be exacerbated
by the interventions of public institutions. Decisions by local authorities to award planning
permission on flood plains may act as signals of reduced flood risk, and protection
measures introduced to reduce risk may give a false sense of security. November et al.
(2009, p. 191) found“… the [Lully residents’] memory of the risk and all its various
5 Tversky & Kahneman (1971) originally formulated the “Law of Small Numbers” to describe the tendency of individuals to exaggerate how likely a small sample is to be representative of the parent population. For example, “people exaggerate the likelihood that a short sequence of flips of a fair coin will yield roughly the same number of heads as tails” (Rabin, 1998, p.25).
13
components seems to have been lost due to the adoption of successive protection
measures…”
Proposition (c): Myopia and amnesia will diminish in housing market importance as
floods become more frequent and information and communication technologies improve,
thereby leading to a (non-linear) convergence of observed and risk-adjusted home prices
The degree to which myopia and amnesia are important determinants of choices and risk
assessments is endogenous, contingent on the frequency and severity of flooding and
therefore on wider climatic determinants. As the planet warms, myopia and amnesia
influences will evolve over time in potentially non-linear ways, heightening the non-linear
adjustment of house prices to changes in flood risk. It is thus somewhat ironic that we
argue through propositions (a) and (b) that massive housing market inefficiencies arise
currently in how homes endangered by floods are priced, that the source of these
inefficiencies will wither as climate changes progress. We should not be misinterpreted as
implicitly advocating a laissez faire strategy of “wait for the long run when the market will
work well again,” because the long run probably constitutes an intolerably entended period
during which wrenching dislocations and major private and social costs will be incurred
during the adjustment, as we shall explain below.
We have argued that, markets tend to forget previous flood experiences as time
passes. When a flood occurs, people are reminded of the risk and awareness rises, not only
for the average individual but also for the market as a whole (Bin & Polasky, 2004). Even
those not affected directly will experience heightened awareness. We can think of the flood
as providing the missing Availability Heuristic, and leading to what November et al. (2009,
p. 189) term the “Lully Effect”—“how a critical event can refocus attention on known but
partially forgotten hazards, encouraging people to think about why such risks had been
14
forgotten in the first place, and helping to foster a more concerted effort to manage flood
risk in the future.”
Crucially, as the planet warms and floods become more frequent and severe,
households will be presented with a readily available heuristic through media accounts and
images, and through their own recurrent experiences of floods. Amnesia rarely has time to
take hold in such a world. Moreover, one might reasonably speculate that the future will be
characterised by improved information and knowledge transfer that will reduce myopia. We
know already that, “analysis of lay knowledge of flood risk … points to the importance of
visual clues (including the height of the water) in local assessments of risk.” (Burningham
et al., 2008, p.235). Society may be able to find ways to exploit the ergonomics of human
knowledge by creating flood risk mnemonics, “making flood risk locally visible, for
instance by marking the level of past flood waters on prominent buildings” (Burningham et
al., 2008, p.235). Both amnesia and myopia will then decline as the prevalence, severity,
and mediated visibility of floods increases in the future.
Major floods can also be a catalyst for institutional change and a coordinating effect
on disparate sources of knowledge that lead to improvements in the recording and
awareness of risk. November et al. (2009, p. 193) note how the Lully flood was the
“…driving force behind a restructuring of local government departments, including the
creation of a new post specifically to scrutinise planning applications in order to assess the
likelihood of associated flood risks.” They also demonstrate how those possessing scientific
and observational knowledge were brought into contact for the first time, yielding, a
collective experience that was “committed to memory, both in the minds of individuals and
in the relevant political, technical and administrative bodies” (November et al., 2009,
p.194). This evolution of knowledge is unlikely to occur as a smooth, linear transition, but
one punctuated by the catalysing effect of major catastrophes. As further developed in the
15
next section, we are therefore likely to observe a pattern of inertia in observed home prices
followed by tipping points to convergence with risk-adjusted prices as the symptoms of
climate change become sufficiently local to permeate knowledge, forcing individuals and
markets to embrace the risks long projected by meteorological models.
The non-linear nature of this home price adjustment process may be heightened by
“institutional time inconsistency”—as charity hazards associated with false assumptions
about government protection and the moral hazards of complete insurance markets are
revealed for what they are. If government is assumed to provide full compensation in the
event of a disaster and/or current home insurance premiums do not reflect the true risk of
floods, there is little incentive for home buyers and sellers to assess flood risk accurately.
Observed prices can drift widely from fully risk-adjusted prices under such circumstances.
Indeed, it is still the case in countries such as the UK that home insurance companies may
not fully price flood risk (Green & Penning-Rowsell, 2004; Crichton, 2005). In other
words, households in low-risk areas effectively cross-subsidise those located in high-risk
areas. This arrangement is not sustainable, however, in a future characterised by climate
change because the system is vulnerable to systematic risks; it only persists because floods
remain relatively infrequent and independent (Green & Penning-Rowsell, 2004). The
“social compact against industrially produced hazards and damages, stitched together out of
public and private insurance agreements” (Beck, 1992a, p.100) will eventually collapse as
ecological threats “exceed the usual mechanisms of assessment and regulation, and become
uninsurable” (Willams, 2008, p. 1123).
Already insurers in the UK have not guaranteed insurance cover for homes built on
flood plains since 2009 with the probability of being flooded in any single year higher than
1.3% (DEFRA, 2008). As flood risk increases in severity and ubiquity, insurance rationing
will become more prevalent. This has major implications, even for households willing to
16
accept the loss and inconvenience of flooding, because mortgage lenders may refuse to
offer mortgage finance for uninsurable homes in high flood risk areas. The risk of
insurance rationing is likely to increase the likelihood of credit rationing, and even if
neither are a problem at the point of purchase, the prospect that such a scenario may be
binding in future means that the buyer faces the risk that they will have problems upon
resale. As insurance rationing spills over into mortgage rationing, house prices will adjust
rapidly and decisively. And one might anticipate the changes to occur even in advance of
an area being red-lined. As soon as there is uncertainty about future insurance and mortgage
provision for an area, one would expect prices to be affected as buyers contemplate not
being able to sell their homes or not making the capital gains they hope for. Current
policies to encourage subsidised (as opposed to full-cost) insurance may therefore
unwittingly exacerbate or initiate a future tipping-point effect in home price adjustment to
flooding wrought by climate change.
In summary, that myopia and amnesia are endogenous leads to the possibility of
tipping points occurring in home price adjustment. This may occur either as a result of
increased knowledge due to greater frequency and severity of floods, or due to changes in
the availability and cost of insurance. These effects are neither mutually exclusive, nor
independent. For example, a shift in insurance premiums towards the true risk of flooding
will provide a very powerful market signal of flood risk. So, insurance trajectories and
market information trajectories will be closely intertwined, leading to a pronounced future
tipping point in home price adjustment.
Proposition (d): The convergence path of observed home prices towards risk-adjusted
prices will be idiosyncratic, contingent on the sequence of flood experiences in each area
17
“Recently experienced floods appear to set an upper bound to the size of the loss with
which managers believe they ought to be concerned” (Kates, 1962, p.140). Stated more
formally, Tversky & Kahneman (1973) argue that updating of risk in the aftermath of an
event is much greater when starting from zero perceived risk—what Kousky et al. (2008)
call “virgin risk”—than when starting from a perceived risk that is greater than zero—i.e.
“experienced risks”. The implication here is that, those who have recently experienced
relatively minor floods may, somewhat perversely, be inoculated against recognising the
significant increases in the severity and frequency of floods implied by climate change,
particularly when these increases are incremental. For such individuals, a growing gulf can
occur between perceived risk (and hence perceived market values of homes) and the actual
risk (and risk-adjusted prices). This implies that path dependency may be intrinsic to the
way that observed home prices adjust to the growing threat of floods.
Consider two identical geographic areas, i and j, both subject to an identical, rising
trajectory of flood risk. While the probability of flooding in these two areas is identical on
any given day, the pattern of actual flood events will be different because of random
variation. This means that, if area j experiences a minor flood event in time period 1
followed by a long period (T) without floods, home prices may not only recover but have
an increased resistance to official pronouncements of increased flood risk, compared to area
i where a major flood event occurs during the same period. Observed home prices in area j
may therefore drift higher above their risk-adjusted levels than they do in area i.
Nevertheless, observed prices in both areas will eventually converge to their risk-adjusted
levels as floods become sufficiently frequent to prevent amnesia and myopia from having a
material effect, though the convergence will be more cataclysmic in area j.
18
A New Framework for Understanding the Impacts of Floods on Housing Prices: A
Diagrammatic Exposition
In this section we advance the conceptualization of flood impacts on home prices beyond
hedonic theory and that of Tobin et al. by emphasizing the relationship between risk-
adjusted house prices and observed (actual) house prices and how market assessments of
the former are influenced by endogenous amounts of myopia and amnesia, following the
propositions developed in the prior section. We illustrate our framework in diagrammatic
expositions of alternative scenarios regarding the frequency and severity of flooding. We
do not develop here a rigorous theoretical or econometric model, but hope to do so in future
work.
The Effects of Myopia and Amnesia on Patterns of Home Prices and Perceived Flood Risks
in an Area of Rare, Frequent, and Increasingly Frequent Flood Regimes
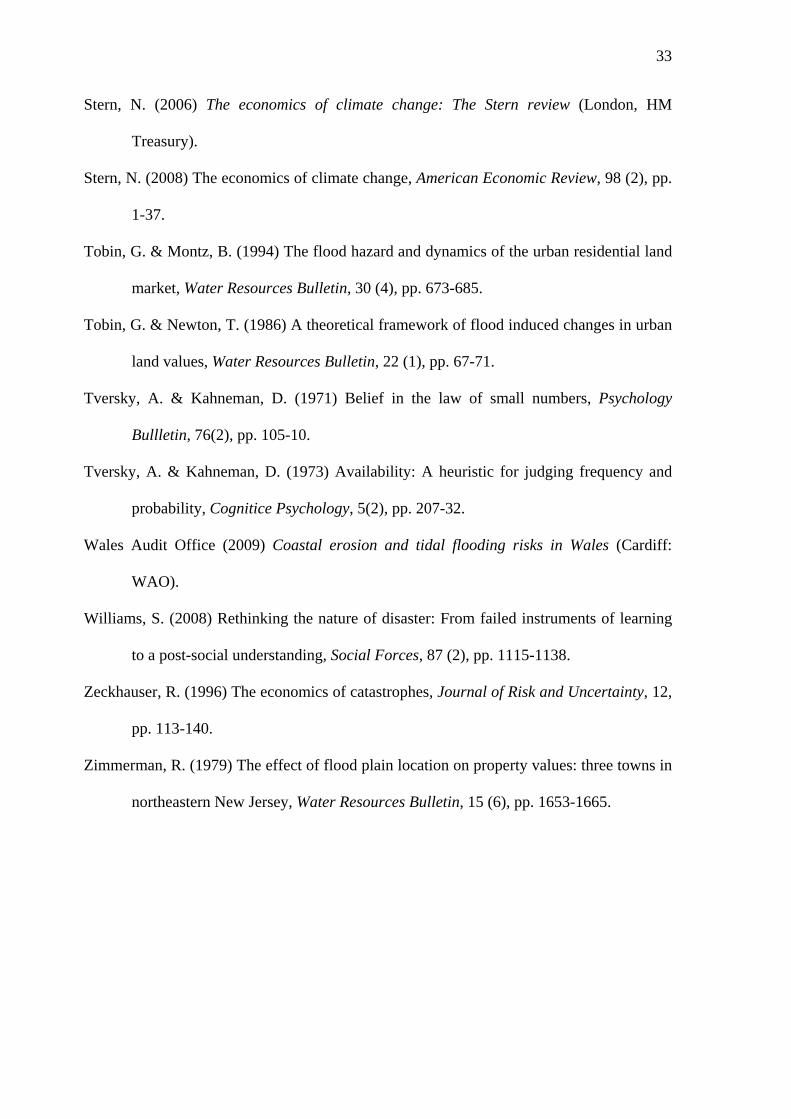
As a point of departure we portray the pattern expected in a geographic area with an
efficient housing market, distinguishing between risk-adjusted home prices (PRA), zero-risk
prices (PZR) and observed prices (PA).6 Figure 1 illustrates how flooding (at times tF1 and
tF2) would have only a temporary impact on observed home prices (PA) in a particular area
if market valuations were already fully risk-adjusted across locations with a non-zero flood
probability (PRA) and zero flood probability (PZR). The occurrence of a flood does not
affect the probability of future floods, so the value of a home is not diminished by a flood,
other than through a temporary reduction in quality while repairs are completed.
[Figure 1. Fully Risk-Adjusted Prices and Short-Run Responses to Flooding]
6 Throughout we assume that all prices are adjusted for any changes in quality of the dwelling and parcel.
19
In the world of imperfect information, however, different patterns emerge. We now
provide a diagrammatic application of our framework to consider the temporal pattern of
home prices in a particular area under three alternative regimes of flooding: rare, frequent,
and increasingly frequent, assuming that all floods are of equal severity.7
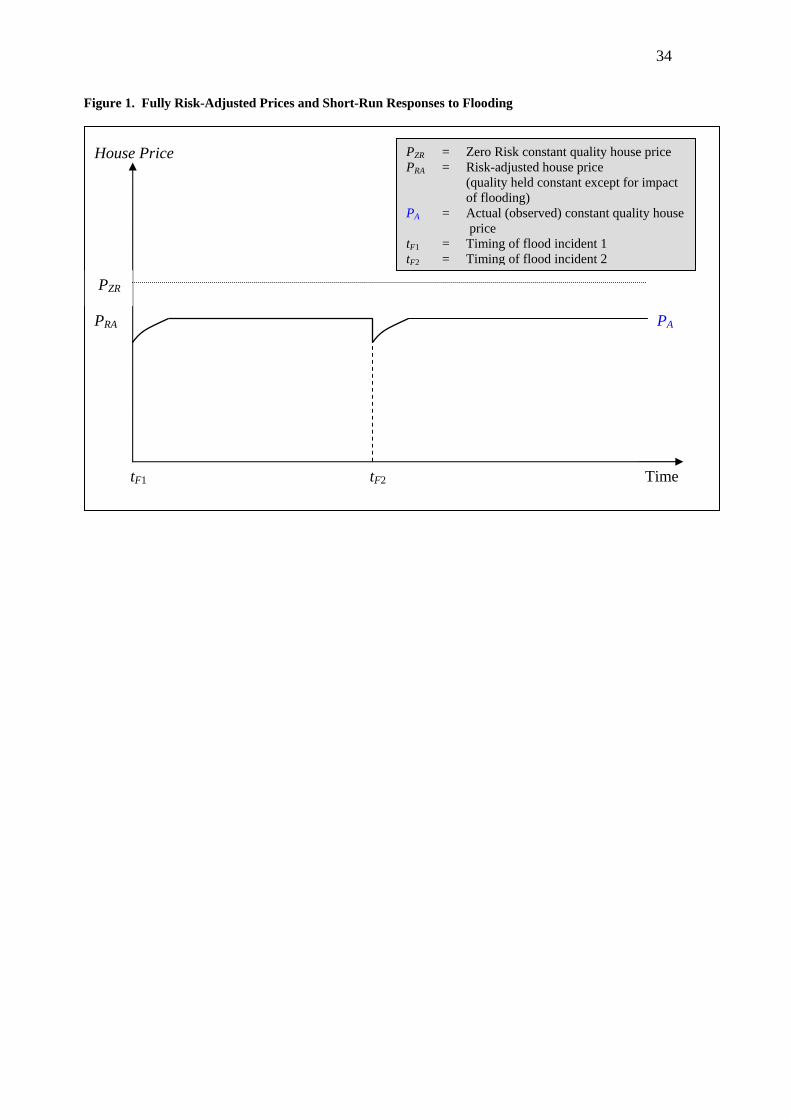
In the regime of rare floods, it will be likely that myopic, amnesiac market actors
will dominate at a given time. As shown in Figure 2, PA in this regime will drift away PRA
towards PZR as the years pass since the last flood at tF1. Then, when a flood occurs at tF2,
actors become aware of the true flood risk and PA quickly adjusts downwards towards PRA.
If myopia were particularly strong and the local media particularly sensationalist in their
exaggeration of future flood risk, actors may systematically overestimate risks in the
aftermath of a flood. If so, this could produce a fall in PA below PRA in excess of that
associated with short-term damage repairs.
[Figure 2. House Prices with Amnesia and Myopia: The Case of Infrequent Floods ]
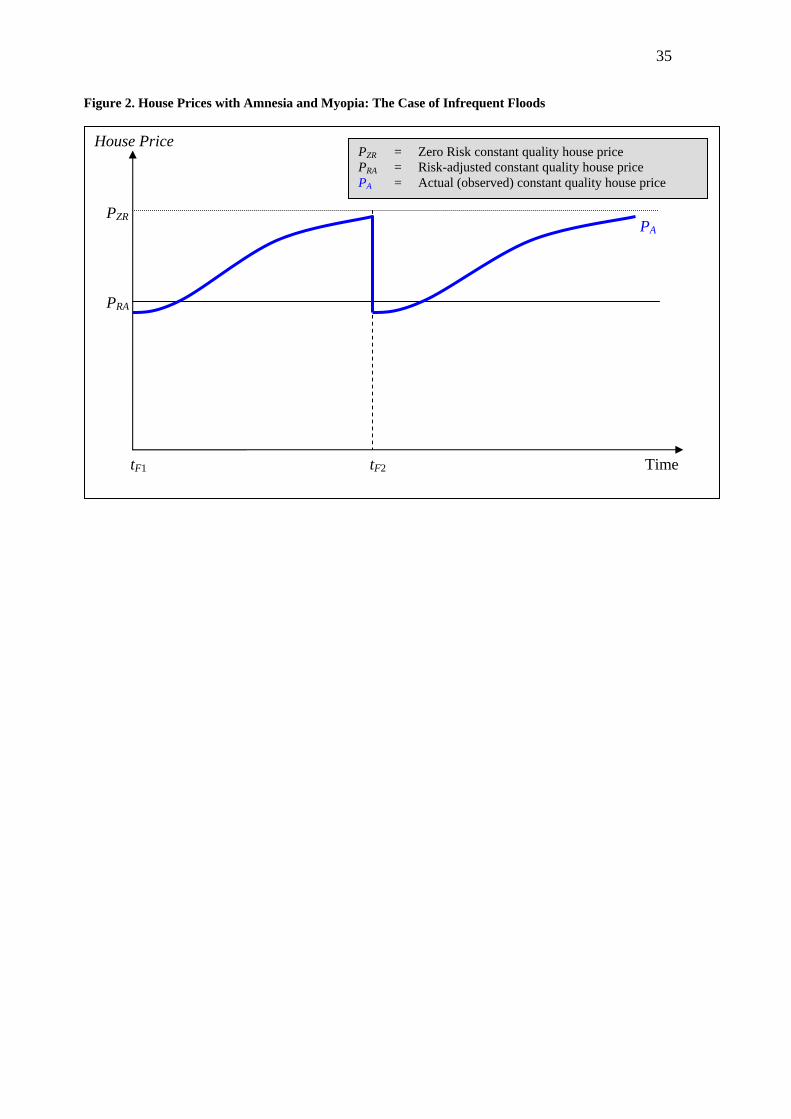
In the case of an area that floods frequently, the difference between PZR and PRA is
greater than for a low-risk area. Of more interest, PA may rarely deviate significantly from
PRA because floods occur often enough to remind actors of the true risks. Thus, on average,
the difference between PA and PRA is lower here than for a low-risk area and the bias of PA
> PRA is less (See Figure 3).
[Figure 3. House Prices with Amnesia and Myopia: The Case of Frequent Floods]
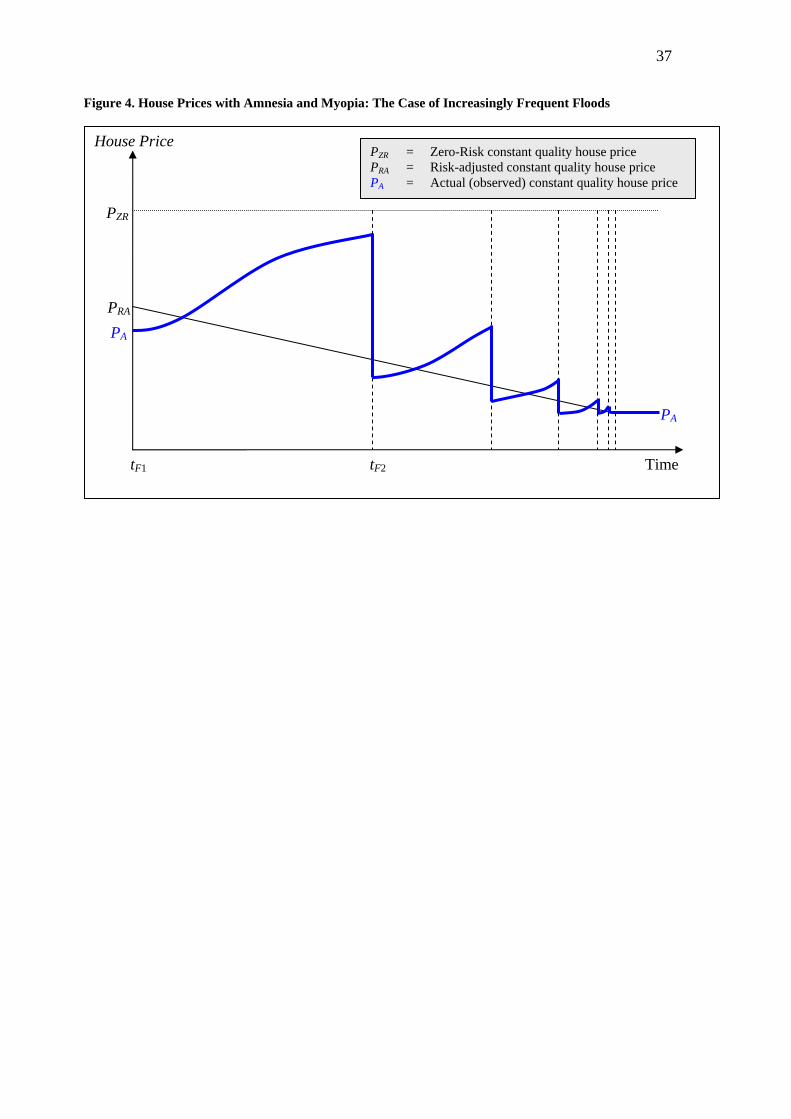
Finally, consider in Figure 4 the regime of increasingly frequent floods wherein .
PRA falls over time, instead of remaining constant as previously. In this case, PA drifts from
7 The impacts of flood severity will be discussed below.
20
PRA following a similar trajectory to that which occurs in a world with constant flood risks.
When a flood occurs, PA adjusts sharply not only to the risk that characterised the market
at the time of the previous flood tF1, but to the new, higher risk. The increased frequency of
floods constrains the drift of PA away from PRA, but myopia means that PA are always
drifting due to perpetually out-of-date flood risk estimates.
[Figure 4. House Prices with Amnesia and Myopia: The Case of Increasingly Frequent Flood]s
The Effects of Myopia and Amnesia on Patterns of Home Prices and Perceived Flood Risks
Across Areas
The prior section considered how housing prices would respond over time to floods in a
particular geographic area characterized by a particular flood risk regime. Here we
consider the aggregation of these price patterns at a given time across areas of differing
flood risks.
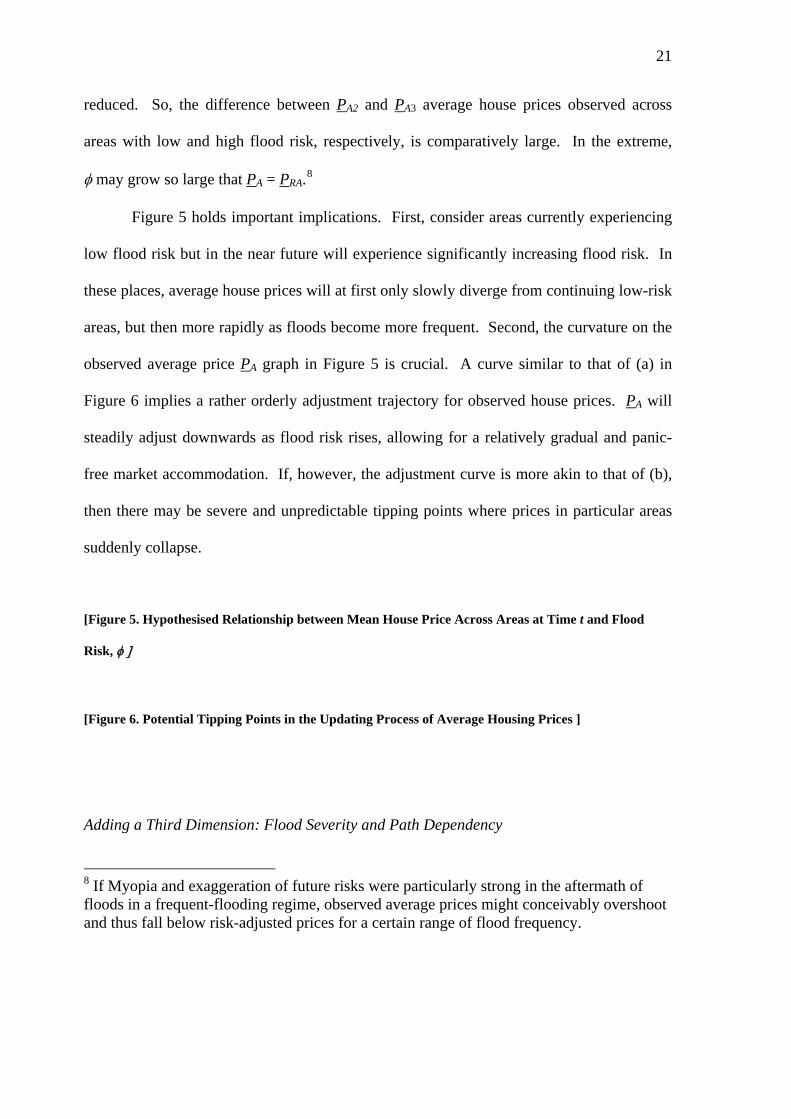
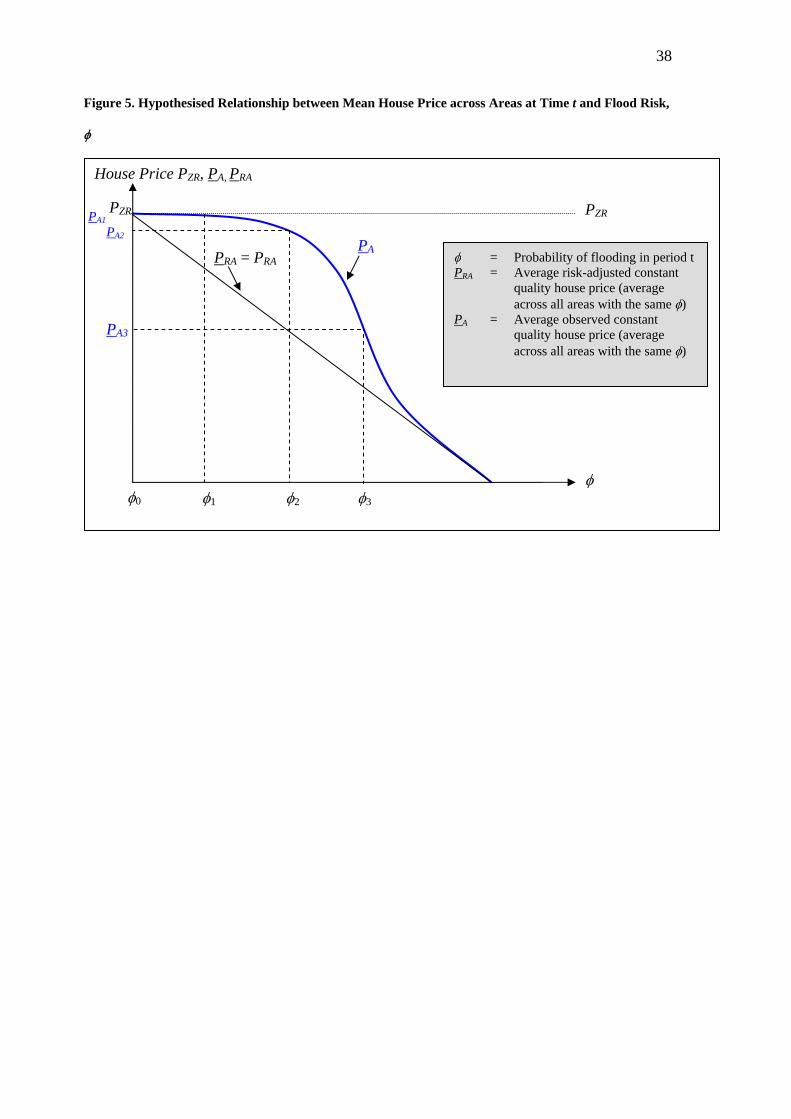
In general, we would expect to find a non-linear relationship between average home
prices (signified by P hereafter) and flood risk at a given time when measured across a
large cross section of areas (see Figure 5). For sake of simplicity, it is based on a linear
relationship between the average risk-adjusted price across areas, PRA, and probability of
flooding, . Other things being equal, when the risk of flooding is low at 1, the observed
average house price, PA1, is virtually indistinguishable from the observed price when flood
risk is zero (0), PZR,as explained in the context of Figure 2. In moderate-risk areas like at
2, the associated average prices observed PA2 will be somewhat less than PZR but
nevertheless diverge substantially from PRA, due to myopia and amnesia effects, as
explained above in the context of Figure 3. In areas of higher flood risks 3, PA3
converges towards PRA because, as the frequency of flooding rises, the amnesia effect is
21
reduced. So, the difference between PA2 and PA3 average house prices observed across
areas with low and high flood risk, respectively, is comparatively large. In the extreme,
may grow so large that PA = PRA.8
Figure 5 holds important implications. First, consider areas currently experiencing
low flood risk but in the near future will experience significantly increasing flood risk. In
these places, average house prices will at first only slowly diverge from continuing low-risk
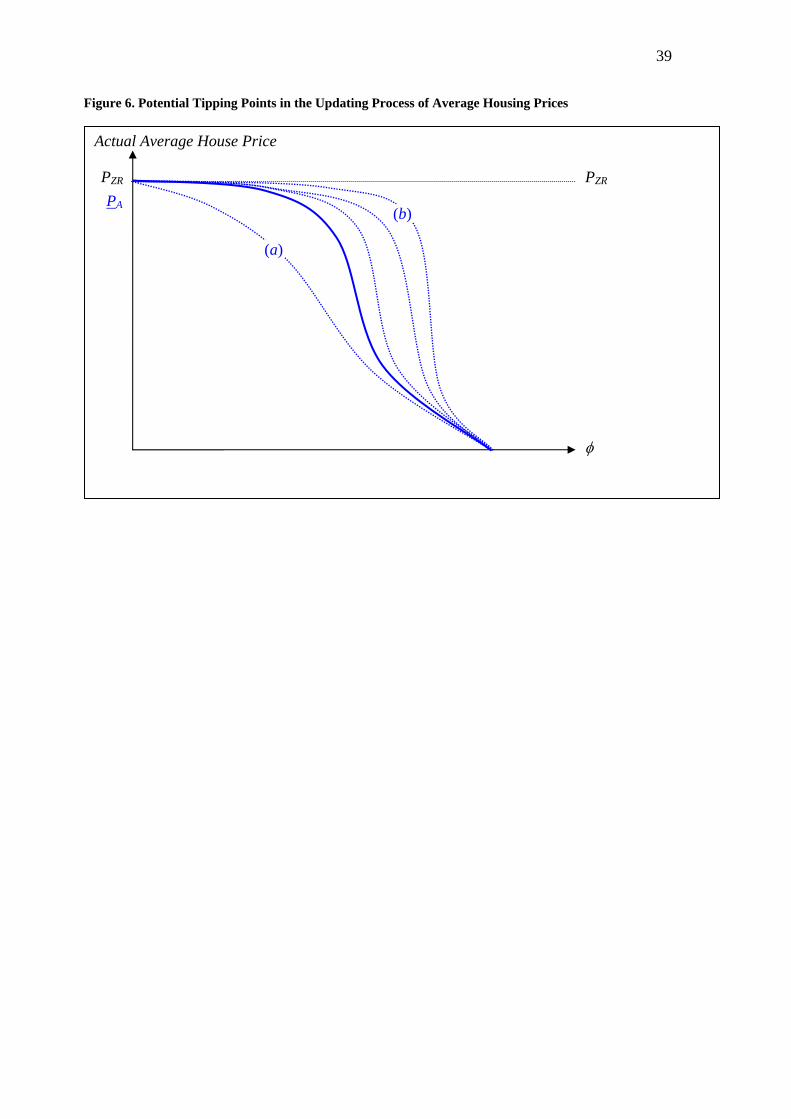
areas, but then more rapidly as floods become more frequent. Second, the curvature on the
observed average price PA graph in Figure 5 is crucial. A curve similar to that of (a) in
Figure 6 implies a rather orderly adjustment trajectory for observed house prices. PA will
steadily adjust downwards as flood risk rises, allowing for a relatively gradual and panic-
free market accommodation. If, however, the adjustment curve is more akin to that of (b),
then there may be severe and unpredictable tipping points where prices in particular areas
suddenly collapse.
[Figure 5. Hypothesised Relationship between Mean House Price Across Areas at Time t and Flood
Risk,
[Figure 6. Potential Tipping Points in the Updating Process of Average Housing Prices ]
Adding a Third Dimension: Flood Severity and Path Dependency
8 If Myopia and exaggeration of future risks were particularly strong in the aftermath of floods in a frequent-flooding regime, observed average prices might conceivably overshoot and thus fall below risk-adjusted prices for a certain range of flood frequency.
22
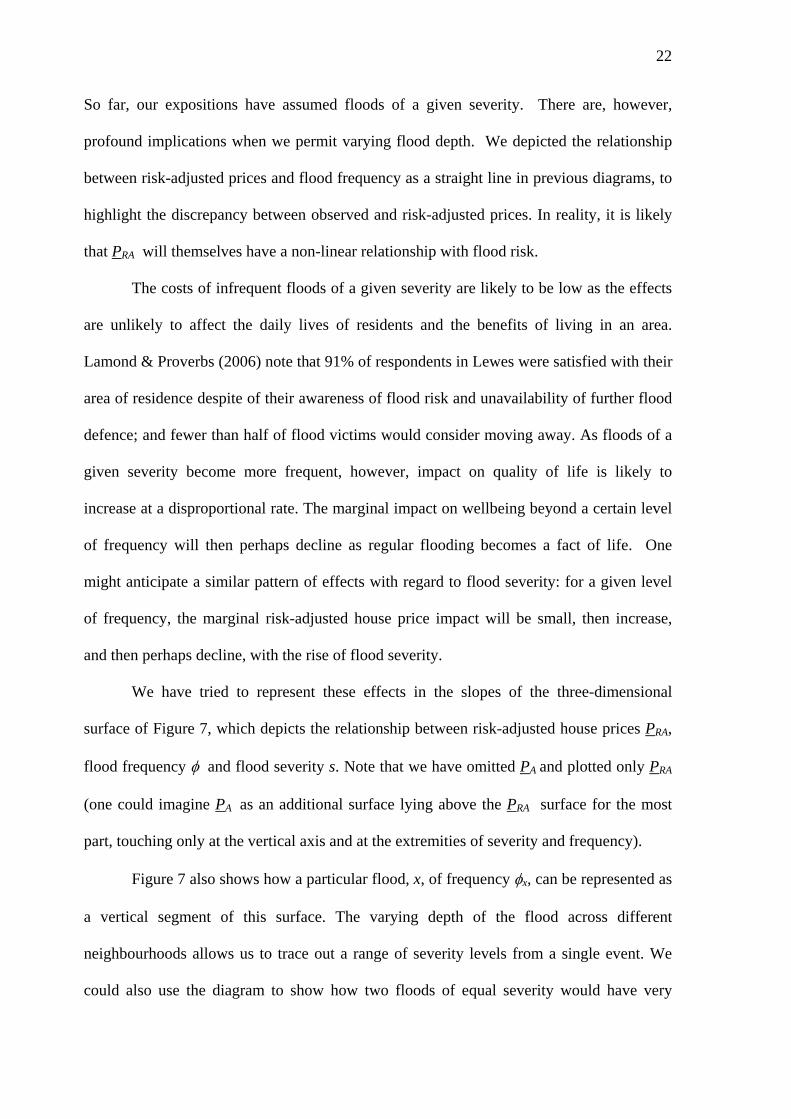
So far, our expositions have assumed floods of a given severity. There are, however,
profound implications when we permit varying flood depth. We depicted the relationship
between risk-adjusted prices and flood frequency as a straight line in previous diagrams, to
highlight the discrepancy between observed and risk-adjusted prices. In reality, it is likely
that PRA will themselves have a non-linear relationship with flood risk.
The costs of infrequent floods of a given severity are likely to be low as the effects
are unlikely to affect the daily lives of residents and the benefits of living in an area.
Lamond & Proverbs (2006) note that 91% of respondents in Lewes were satisfied with their
area of residence despite of their awareness of flood risk and unavailability of further flood
defence; and fewer than half of flood victims would consider moving away. As floods of a
given severity become more frequent, however, impact on quality of life is likely to
increase at a disproportional rate. The marginal impact on wellbeing beyond a certain level
of frequency will then perhaps decline as regular flooding becomes a fact of life. One
might anticipate a similar pattern of effects with regard to flood severity: for a given level
of frequency, the marginal risk-adjusted house price impact will be small, then increase,
and then perhaps decline, with the rise of flood severity.
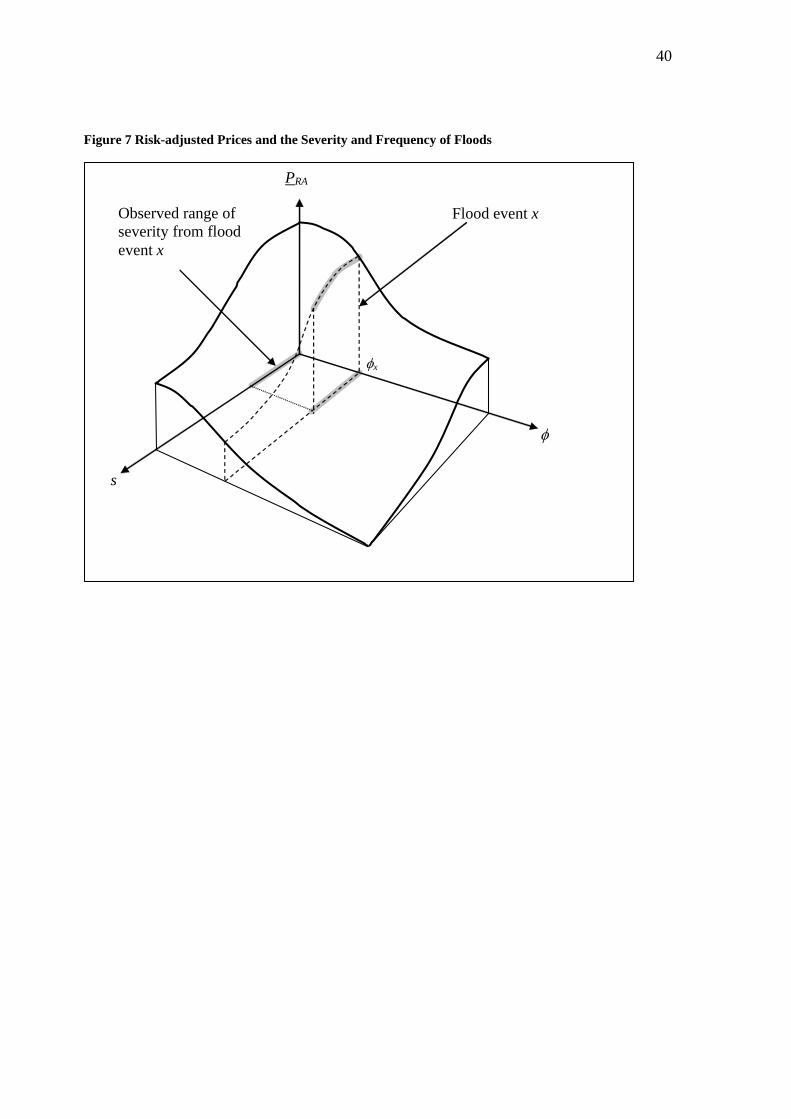
We have tried to represent these effects in the slopes of the three-dimensional
surface of Figure 7, which depicts the relationship between risk-adjusted house prices PRA,
flood frequency and flood severity s. Note that we have omitted PA and plotted only PRA
(one could imagine PA as an additional surface lying above the PRA surface for the most
part, touching only at the vertical axis and at the extremities of severity and frequency).
Figure 7 also shows how a particular flood, x, of frequency x, can be represented as
a vertical segment of this surface. The varying depth of the flood across different
neighbourhoods allows us to trace out a range of severity levels from a single event. We
could also use the diagram to show how two floods of equal severity would have very
23
different home price impacts depending on their estimated frequency (e.g. PRA will be much
lower if one expects to be flooded to a depth of two metres once every other year than if
one expects to be flooded to a depth of two metres once every thousand years).
Any one flood may not, however, reveal a full spectrum of severity across space
because the maximum severity may be limited, and so it may be that only a portion of the
line segment can be plotted for a particular flood. We have highlighted this as the
“observed range of severity from flood event x”. With projected climate change, we would
expect to observe more floods at the higher frequency portion of the surface and for an
increasing proportion of those floods to display a wide spectrum of severity.
[Figure 7 Risk-adjusted Prices and the Severity and Frequency of Floods]
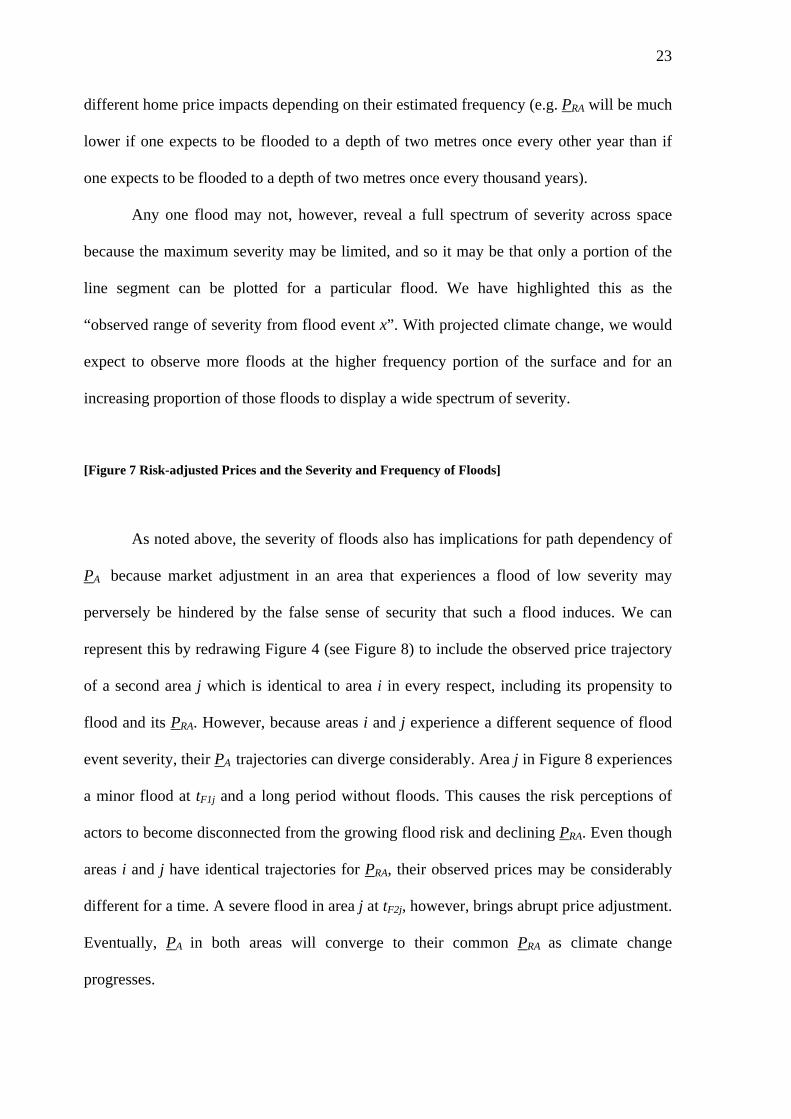
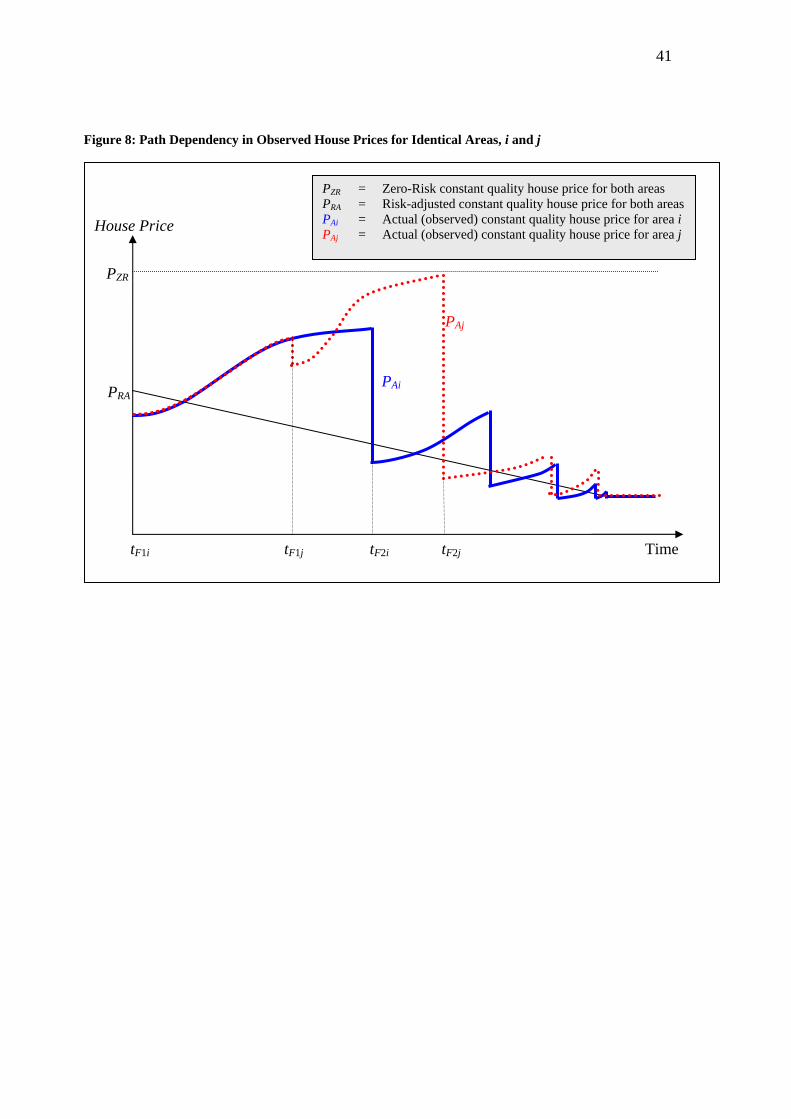
As noted above, the severity of floods also has implications for path dependency of
PA because market adjustment in an area that experiences a flood of low severity may
perversely be hindered by the false sense of security that such a flood induces. We can
represent this by redrawing Figure 4 (see Figure 8) to include the observed price trajectory
of a second area j which is identical to area i in every respect, including its propensity to
flood and its PRA. However, because areas i and j experience a different sequence of flood
event severity, their PA trajectories can diverge considerably. Area j in Figure 8 experiences
a minor flood at tF1j and a long period without floods. This causes the risk perceptions of
actors to become disconnected from the growing flood risk and declining PRA. Even though
areas i and j have identical trajectories for PRA, their observed prices may be considerably
different for a time. A severe flood in area j at tF2j, however, brings abrupt price adjustment.
Eventually, PA in both areas will converge to their common PRA as climate change
progresses.
24
[Figure 8: Path Dependency in Observed House Prices for Identical Areas, i and j ]
Implications
In this section we consider the implications of our framework for the interpretation and
construction of house price models, and for government policy.
Implication for the Interpretation and Construction of House Price Models
The first implication is that our framework provides an alternative interpretation of post-
flood recovery of homes. Rather than showing market robustness to flooding, the bounce-
back phenomena may be indicative of market myopia and amnesia with potentially
worrysome implications for the long-term adjustment process. Our framework also suggests
empirically testable hypotheses for assessing market efficiency in flood pricing. In an
efficient market, home prices in a locality should decline only slightly for a short period
following a flood, regardless of the time since the prior flood. In an myopic-amnesiac
market, home prices in a locality should decline substantially and for an extended period
following a flood.
Secondly, our analysis suggests that the price declines in the aftermath of a flood are
not informative in terms of helping us assess the impacts of climate change—they merely
reveal the extent of drift from risk-adjusted price. Such estimates of price declines are of
little use, however, in gauging the long-run impacts associated with global warming. This is
partly because the height to which prices rose prior to the flood event are partly dependent
on the severity of the previous flood (due to path dependency—see Figure 8) and the time
elapsed since that flood (amnesia). Moreover, in the event of climate change that leads to
increasingly frequent floods, convergence will make such divergence a thing of the past—
25
myopia and amnesia will desist and, therefore, current post-flood price declines tell us
nothing about future welfare impacts. Similarly, the relationship between observed house
prices and flood risk will be of little consequence because the meaning of those observed
prices will be ambiguous unless they are observed soon after a flood.
A third implication of our framework is more promising for housing economic research.
Because memories are fresh and publicity is pervasive in the aftermath of a flood, we have
argued that prices observed immediately after a flood9 are likely to reveal the variation in
risk-adjusted prices across space. Therefore, much greater focus should be given to the
spatial pattern of prices in the aftermath of floods, as this potentially allows one to see the
price level that markets will eventually converge towards for floods of a particular
frequency. This also gives housing economists an imperative to consider multiple floods of
varying frequency to trace out the entire surface depicting the relationship between risk-
adjusted prices, flood severity and flood frequency. This meta task should be the primary
objective of housing economists interested in the impacts of changing flood risks due to
climate change because it allows for translation of a given geography of flood risk
estimates associated with a particular climate scenario into risk-adjusted house price
estimates.
Implications for Government Policy
From a public policy perspective, our framework suggests the likelihood of irregular and
non-linear adjustment processes, characterised by inertia, cumulative internal tension
followed by abrupt adjustment. We have argued that a world of strongly myopic and
amnesiac flood risk assessment by market actors, exacerbated by subsidized flood
insurance, is a world ripe for illusory escalation in home prices, followed by catastrophic
9 Or perhaps a little after the flood, allowing for any overshoot to be rectified.
26
declines in the face of temporal increases in the frequency and severity of flooding. If the
hypothesized average home price—flood risk adjustment curve is indeed akin to (b) in
Figure 6, there may be severe and unpredictable tipping points where home prices in
particular areas suddenly collapse, causing acute negative home equity issues,
repossessions, panic selling, and out-migration. Such sudden adjustment could have
destabilising effects well beyond the local housing market, as the recent U.S. subprime
mortgage crisis has demonstrated.
Such non-linear market adjustments to intensifying risk is an important and
worrying prospect because it potentially compounds the impact of other tipping points
associated with the rapidity of climate change (and hence flood risk), which have already
been identified as plausible trajectories for global warming (Stern, 2006). The implication
for governments, then, is the importance of reducing the magnitude of tipping-points in
house price adjustment. A key goal of housing policy should be to facilitate a gradual
adjustment path through improved information dissemination and removal of obstacles to
price adjustment to prevent long-term price bubbles accumulating. Subsidised insurance
regimes are highlighted as particularly problematic in our schema because they delay such
adjustment and may store up sudden price collapse. Governments should also be clear and
realistic about the scope for publicly provided flood defence. Limited public resources
almost inevitably imply that a limited number of areas will be protected. The sooner those
areas are made known the better so that consumers and investors can then make informed
choices.
Another key implication for policy makers is the market sorting effect of price
adjustment. Other things equal, an expanding geography of significant flood risk will cause
prices to fall eventually in those areas, and prices in remaining low-risk areas to rise. Low-
income households will find it increasingly expensive to reside in neighbourhoods with low
27
flood risks and thus will be sorted by the market into higher-risk areas.10 This sorting can,
however, be ameliorated by boosting housing supply (especially of subsidized dwellings) in
low risk areas.11 Additional land for such residential construction can be released by
encouraging the relocation of agriculture and certain types of industry to zones with
medium flood risks.12 Regional structures of governance may encourage this process
through strategic infrastructure planning, informed by house price simulation models of
future geographies of land prices and optimal firm location. Housing economic models,
albeit ones based on appropriate behavioural assumptions, therefore have a potentially
important role to play in helping society adjust to climate change.
Conclusion In this paper we have demonstrated an imperative for fundamentally revising the
conventional full-information, efficient-market interpretation of house price responses to
floods, by drawing on the literature on behavioural economics and sociology of risk. We
posited that in estimating the risk of flood damage to a particular property, market actors
evince myopia and amnesia and that these effects, in the context of climate change, will
take on a derived and transformative dynamic. We used these insights to outline an
alternative framework where perceived flood risk (and observed home prices) likely
diverge considerably from actual risk (and risk-adjusted prices), particularly if a long period
has passed since the last flood. In our framework, home price adjustment to ever-increasing
levels of risk associated with global climate change is likely to evince an uneven pattern of
10 Note that this effect cannot be averted by temporarily buttressing subsidized insurance or making unrealistic promises about flood defence—the effect will be only to delay the inevitable and result in a more abrupt (and hence more harmful) adjustment. 11 We recognize that the class bias to sorting is imperfect inasmuch as some higher-income households may currently be residing in homes that are in risky locations but are nevertheless expensive due to their water views. For more discussion, see Pryce et al. (2009). 12 This process of land-use reallocation may occur in due course if markets operate efficiently because residential demand for low flood risk locations will drive up commercial rents and firms with lower rates of aversion to flood risk than homeowners will relocate to areas with medium flood risks.
28
inertia followed by rapid, tipping-point declines. We have shown how this new perspective
holds important implications for the estimation and interpretation of empirical models of
house prices and flood risks, as well as for public policy. Given the huge potential
dislocations associated with these catastrophic adjustments, it behooves housing economists
to map out the relationship between risk-adjusted prices and flood severity for floods of
varying frequency. To predict the dynamics of market behaviour accurately, behavioural
factors must be incorporated into models of the housing economy in a way that captures the
complex, inter-connected nature of the system. Only by understanding the nature of this
system will governments be able to identify appropriate policy responses. Finally, though
we have couched our analysis in terms of floods we hope that our framework is applicable
to housing market responses to a range of natural disasters.
29
References
Allen, C. (2009) The Fallacy of “housing studies”: Philosophical problems of knowledge
and understanding in housing research, Housing Theory and Society, 26(1), pp.53-
79.
Babcock, M. & Mitchell, B. (1980) Impact of flood hazard on residential property values in
Galt (Cambridge), Ontario, Water Resources Bulletin, 16(3), pp. 532-537.
Barnard, J. (1978) Externalities from urban growth: The case of increased storm runoff and
flooding, Land Economics, 54(3), pp. 298-315.
Bartosova, A., Clark, D., Novotny, V. & Taylor, K. (1999) Using GIS to evaluete the effects
of flood risk on residential property values. Institute for Urban Environmental Risk
Management. Technical Report 1. (Milwaukee, WI: Marquette University).
BBC (2010) BBC Climate Change Poll – February 2010, Conducted by Populus, Summary
available from
http://news.bbc.co.uk/nol/shared/bsp/hi/pdfs/05_02_10climatechange.pdf (accessed
9th March 2010).
Beck, U. (1992a) From industrial society to the risk society: Questions of survival, social
structure and ecological enlightenment, Theory, Culture & Society, 9, pp.97-123.
Beck, U. (1992b) Risk society: Towards a new modernity (London: Sage).
Bialaszewski, D. & Newsome, B. A. (1990) Adjusting comparable sales for floodplain
location: the case of Homewood, Alabama, The Appraisal Journal, 58(1), pp. 115 -
118.
Bin, O. & Polasky, S. (2004) Effects of flood hazards on property values: Evidence before
and after Hurricane Floyd, Land Economics, 80(4), pp. 490-500.
30
Bin, O., Kruse, J. & Landry, C. (2008) Flood hazards, insurance rates, and amenities:
Evidence from the coastal housing market, Journal of Risk and Insurance, 75 (1),
pp. 63-82.
Cauley, S.D., Pavlov, A.D. and Schwartz, E.S. (2007) Homeownership as a constraint on
asset allocation, The Journal of Real Estate Finance and Economics, 34(3), pp.283-
311.
BMRB (2005) Environment agency launches campaign to tackle flood apathy. Available
at: www.marketresearchworld.net (accessed September 2009).
Burningham, K., Fielding, J. & Thrush, D. (2008) ‘It’ll never happen to me’:
Understanding public awareness of local flood risk, Disasters, 32(2), pp. 216-238.
Chivers, J. & Flores, N.E. (2002) Market failure in information: The national flood
insurance program, Land Economics, 78(4), pp. 515-521.
Crichton, D. (2005) Flood risk and insurance in England and Wales: are there lessons to
be learned from Scotland? Technical Report (London: Benfield Hazard Research
Centre, University College London). Available at
http://www.abuhrc.org/rp/publications/pages/tech.apsx.
DEFRA (2008) ABI/Government statement on flooding and insurance for England
(London: Defra).
DellaVigna, S. (2009) Psychology and economics: Evidence from the field, Journal of
Economic Literature, 47(2) pp. 315-372.
DellaVigna, S. & Pollet, J.M. (2007) Demographics and industry returns, American
Economic Review, 97(5), pp. 1667–1702.
Donnelly, W.A. (1989) Hedonic price analysis of the effects of a floodplain on property
values, Water Resources Bulletin, 25 (3), pp.581-586.
31
Eves, C. (2002) The long-term impact of flooding on residential property values, Property
Management, 20 (4), pp. 214-227.
Foresight (2004) Foresight future flooding (London: DTI).
Green, C. & Penning-Rowsell, E. (2004) Flood insurance and government: ‘parasitic’ and
‘symbiotic’ relations, The Geneva Papers on Risk and Insurance, 29(3), pp. 518-
539.
Harrison, D.M., Smersh, G.T. & Schwartz Jr, A.L. (2001) Environmental determinants of
housing prices: The impact of flood zone status, Journal of Real Estate Research,
21 (½), pp.3-20.
Houghton, J. (2009) Global warming: The complete briefing, 4th Edition (Cambridge:
Cambridge University Press).
IPCC (2007) Climate change 2007: The physical science basis. Report of Working Group I
to the Fourth Assessment Report of the Intergovernmental Panel on Climate
Change. Summary for Policy Makers (Cambridge: Cambridge University Press).
Jha, A. (2009) Climate research chief Phil Jones stands down pending inquiry into leaked
emails, Guardian, 1st December 2009.
Kates, R. (1962) Hazard choice perception in flood plain management. Department of
Geography Research Paper No. 78. University of Chicago.
Kousky, C. & Zeckhauser, R. (2006) JARring actions that fuel the floods, in: R. Daniels, D.
Kettl & H. Kunreuther (Eds) On risk and disaster: Lessons from Hurricane Katrina.
(Philadelphia: University of Pennsylvania Press) pp.59-73.
Kousky, C., Pratt, J. & Zeckhauser, R. (2008) Virgin versus experienced risks, Mimeo,
forthcoming in: Erwann Michel-Kerjan and Paul Slovic (eds), The irrational
economist.Making decisions in a dangerous world, (New York: Public Affairs
Books).
32
Lamond, J. & Proverbs, D. (2006) Does the price impact of flooding fade away? Structural
Survey, 24 (5), pp. 363-377.
Lorenzo-Dus, N. (2006) “Buying and selling: mediating persuasion in British property
shows” Media Culture & Society, 28 (5), pp. 740-761.
MacDonald, D.N., Murdoch, J.C. & White, H.L. (1987) Uncertain hazards, insurance, and
consumer choice: Evidence from housing markets, Land Economics, 63 (4), pp.
361-371.
Montz, B. (1992) The effects of flooding on residential property values in three New
Zealand communities, Disasters, 16 (4), pp. 283-298.
November, V., Penelas, M. & Viot, P. (2009) When flood risk transforms a territory: The
Lully effect, Geography, 94(3), pp.189-197.
Pitt, M. (2008) The Pitt Review: Lessons learned from the 2007 floods (London: Cabinet
Office).
Pryce, G. & Oates, S. (2008) Rhetoric in the language of real estate marketing, Housing
Studies, 23 (2), pp. 319-348.
Pryce, G., Chen, Y. & Mackay, D. (2009) Flood risk, climate change, and housing
economics: Four fallacies of extrapolation. Paper presented at International
Sociological Association Housing Conference, Glasgow, September.
Rabin, M. (1998) Psychology and economics, Journal of Economic Literature, 36(1),
pp.11-46.
Rosen, S. (1974) Hedonic prices and implicit markets: product differentiation in pure
competition, Journal of Political Economy, l82, pp. 132-157.
Speyrer, J. & Ragas, W.R. (1991) Housing prices and flood risk: An examination using
spline regression, Journal of Real Estate Finance and Economics, 4, pp. 395-407.
33
Stern, N. (2006) The economics of climate change: The Stern review (London, HM
Treasury).
Stern, N. (2008) The economics of climate change, American Economic Review, 98 (2), pp.
1-37.
Tobin, G. & Montz, B. (1994) The flood hazard and dynamics of the urban residential land
market, Water Resources Bulletin, 30 (4), pp. 673-685.
Tobin, G. & Newton, T. (1986) A theoretical framework of flood induced changes in urban
land values, Water Resources Bulletin, 22 (1), pp. 67-71.
Tversky, A. & Kahneman, D. (1971) Belief in the law of small numbers, Psychology
Bullletin, 76(2), pp. 105-10.
Tversky, A. & Kahneman, D. (1973) Availability: A heuristic for judging frequency and
probability, Cognitice Psychology, 5(2), pp. 207-32.
Wales Audit Office (2009) Coastal erosion and tidal flooding risks in Wales (Cardiff:
WAO).
Williams, S. (2008) Rethinking the nature of disaster: From failed instruments of learning
to a post-social understanding, Social Forces, 87 (2), pp. 1115-1138.
Zeckhauser, R. (1996) The economics of catastrophes, Journal of Risk and Uncertainty, 12,
pp. 113-140.
Zimmerman, R. (1979) The effect of flood plain location on property values: three towns in
northeastern New Jersey, Water Resources Bulletin, 15 (6), pp. 1653-1665.
34
Figure 1. Fully Risk-Adjusted Prices and Short-Run Responses to Flooding
PA
tF1 tF2
PRA
PZR
House Price PZR = Zero Risk constant quality house price PRA = Risk-adjusted house price (quality held constant except for impact
of flooding) PA = Actual (observed) constant quality house
price tF1 = Timing of flood incident 1 tF2 = Timing of flood incident 2
Time
35
Figure 2. House Prices with Amnesia and Myopia: The Case of Infrequent Floods
Time tF2 tF1
PRA
PZR = Zero Risk constant quality house price
PZR PA
House Price
PRA = Risk-adjusted constant quality house price PA = Actual (observed) constant quality house price
36
Figure 3. House Prices with Amnesia and Myopia: The Case of Frequent Floods
Time tF4 tF1 tF3 tF2
PRA
House Price
PZR
PA
PZR = Zero Risk constant quality house price PRA = Risk-adjusted constant quality house price PA = Actual (observed) constant quality house price
37
Figure 4. House Prices with Amnesia and Myopia: The Case of Increasingly Frequent Floods
tF1 tF2
PRA
PZR = Zero-Risk constant quality house price PRA = Risk-adjusted constant quality house price
PZR
PA
PA
House Price
PA = Actual (observed) constant quality house price
Time
38
Figure 5. Hypothesised Relationship between Mean House Price across Areas at Time t and Flood Risk,
PZR
House Price PZR, PA, PRA
PZR
0
= Probability of flooding in period t PRA = Average risk-adjusted constant
quality house price (average across all areas with the same )
PA = Average observed constant quality house price (average across all areas with the same )
3 2 1
PRA = PRA PA
PA3
PA2 PA1
39
Figure 6. Potential Tipping Points in the Updating Process of Average Housing Prices
Actual Average House Price
PZR
PZR
PA (b)
(a)
40
Figure 7 Risk-adjusted Prices and the Severity and Frequency of Floods
s
PRA
Flood event x
x
Observed range of severity from flood event x
41
Figure 8: Path Dependency in Observed House Prices for Identical Areas, i and j
tF2j tF1j tF1i tF2i
PRA
PZR = Zero-Risk constant quality house price for both areas PRA = Risk-adjusted constant quality house price for both areas PAi = Actual (observed) constant quality house price for area i PAj = Actual (observed) constant quality house price for area j
House Price
PZR
PAi
PAj
Time