The impact of dry matter loss during herbaceous biomass storage on net greenhouse gas emissions from...
11
This article appeared in a journal published by Elsevier. The attached copy is furnished to the author for internal non-commercial research and education use, including for instruction at the authors institution and sharing with colleagues. Other uses, including reproduction and distribution, or selling or licensing copies, or posting to personal, institutional or third party websites are prohibited. In most cases authors are permitted to post their version of the article (e.g. in Word or Tex form) to their personal website or institutional repository. Authors requiring further information regarding Elsevier’s archiving and manuscript policies are encouraged to visit: http://www.elsevier.com/copyright
-
Upload
independent -
Category
Documents
-
view
4 -
download
0
Transcript of The impact of dry matter loss during herbaceous biomass storage on net greenhouse gas emissions from...
This article appeared in a journal published by Elsevier. The attachedcopy is furnished to the author for internal non-commercial researchand education use, including for instruction at the authors institution
and sharing with colleagues.
Other uses, including reproduction and distribution, or selling orlicensing copies, or posting to personal, institutional or third party
websites are prohibited.
In most cases authors are permitted to post their version of thearticle (e.g. in Word or Tex form) to their personal website orinstitutional repository. Authors requiring further information
regarding Elsevier’s archiving and manuscript policies areencouraged to visit:
http://www.elsevier.com/copyright
Author's personal copy
The impact of dry matter loss during herbaceous biomassstorage on net greenhouse gas emissions from biofuelsproduction
Isaac R. Emery a,b,c, Nathan S. Mosier a,b,*a Laboratory of Renewable Resources Engineering, Purdue University, West Lafayette IN, USAbDepartment of Agricultural and Biological Engineering, Purdue University, West Lafayette IN, USAcEcological Sciences and Engineering IGP, Purdue University, West Lafayette IN, USA
a r t i c l e i n f o
Article history:
Received 17 May 2010
Received in revised form
20 June 2011
Accepted 5 January 2012
Available online 27 January 2012
Keywords:
Corn stover
Silage
Biomass storage
Dry matter losses
Greenhouse gas emissions
a b s t r a c t
Life cycle inventory models of greenhouse gas emissions from biofuel production have
become tightly integrated into government mandates and other policies to encourage
biofuel production. Current models do not include life cycle impacts of biomass storage or
reflect current literature on emissions from soil and biomass decomposition. In this study,
the GREET model framework was used to determine net greenhouse gas emissions during
ethanol production from corn and switchgrass via three biomass storage systems: wet
ensiling of whole corn, and indoor and outdoor dry bale storage of corn stover and
switchgrass. Dry matter losses during storage were estimated from the literature and used
to modify GREET inventory analysis. Results showed that biomass stability is a key
parameter affecting fuel production per farmed hectare and life cycle greenhouse gas
emissions. Corn silage may generate 5358 L/ha of ethanol at 26.5 g CO2 eq/MJ, relative to
5654 L/ha at 52.3 g CO2 eq/MJ from combined corn stover and conventional grain corn
ethanol production, or 3919 L/ha at 21.3 g CO2 eq/MJ from switchgrass. Dry matter losses
can increase net emissions by 3e25% (ensiling), 5e53% (bales outdoors), or 1e12% (bales
indoors), decreasing the net GHG reduction of ethanol over gasoline by up to 10.9%. Greater
understanding of biomass storage losses and greenhouse gas fluxes during storage is
necessary to accurately assess biomass storage options to ensure that the design of
biomass supply logistics systems meet GHG reduction mandates for biofuel production.
ª 2012 Elsevier Ltd. All rights reserved.
1. Introduction
Biomass production for fuel and energy is a growing industry
around the globe. The rate of global energy production from
biomass grew at twice that of that of energy from crude oil
between 1973 and 2007 [1]. US biomass energy production has
grown from 3.2 to 3.8 EJ between 2000 and 2007, driven by an
increased production of feedstocks for liquid fuels from 0.33 to
1.08 EJ over the same time period [2]. Europeannations and the
U.S. have put in place policies to encourage the swift devel-
opment of second-generation biofuels from cellulosic feed-
stocks based on social, economic, and environmental
concerns over first-generation technologies [3,4]. Environ-
mental analyses of biofuel production practices are primarily
* Corresponding author. Department of Agricultural and Biological Engineering, 225 South University Street, West Lafayette, IN 47907-2093, USA. Tel.: þ1 765 496 2044; fax: þ1 765 494 7023.
E-mail address: [email protected] (N.S. Mosier).
Available online at www.sciencedirect.com
http: / /www.elsevier .com/locate/biombioe
b i om a s s a n d b i o e n e r g y 3 9 ( 2 0 1 2 ) 2 3 7e2 4 6
0961-9534/$ e see front matter ª 2012 Elsevier Ltd. All rights reserved.doi:10.1016/j.biombioe.2012.01.004
Author's personal copy
based on predicted reductions in net greenhouse gas emis-
sions, which are determined by life cycle analysis of the entire
production process, frequently including biomass production,
processing, and transportation, as well as fuel production,
transportation, and end use [4].
Many tools have been developed for the life cycle inventory
(LCI) or life cycle assessment (LCA) of biofuels. Most focus on
the economic, energy, or greenhouse gas flows in the
production system, and are used by public and private orga-
nizations in financial and policy decision making. Inventories
and assumptions concerning the biofuel production process
vary substantially between biofuel net energy and GHG
assessment models [5e8]. Resulting values for GHG emissions
from corn ethanol range from 32% lower to 20% higher than
emissions from conventional gasoline, although these
converge slightly when adjusted to more closely match
system boundaries between the models [9]. Though the data
used in biofuels assessments varies, most models support
that the energy use and greenhouse gas emissions from bio-
fuels are driven by land use change, N2O emissions from soil
and fertilizers, biomass yield, ethanol yield, and ethanol
production energy [10]. In 2009, the Greenhouse Gasses,
Regulated Emissions, and Energy Use in Transportation
(GREET) model was selected by the US EPA as the primary tool
for life cycle inventory analysis of greenhouse gas emissions
during biofuel production for implementing the renewable
fuel standard (RFS 2) [11].
Current life cycle inventories of biofuel production reflect
current grain storage and delivery infrastructure, utilizing on-
farm storage and on-demand transportation to the biorefinery
[12]. In these models, one transportation event transfers
biomass from on-farm storage to the biorefinery. Storage is
assumed to have no effect on the properties of the biomass
(mass, processing performance, etc.), cost no energy, and
generate no GHG emissions. These grain-based supply
systems assume that biomass is uniform, dense, and easily
stored without losses, while current and future cellulosic
biomass supply systems must be adaptable to site-specific
variability in collection strategies, crops, storage, and
pretreatment options [12]. Biomass storage in particular has
received little attention in studies of biomass processing and
logistics. While some economic models of biofuel production
and transport include storage factors [13], there have been few
studies on the effects of storage on the biofuel production
system, or on the associated greenhouse gas emissions.
Production and storage of biomass for animal fodder is in
many ways similar to systems of biofuel feedstock production
and storage. It has been long known that plant biomass
production for animal fodder suffers losses at harvest and
during storage [14]. From forage production research, it is
known that moisture content is a key factor determining the
extent of both harvest and storage losses. Dry crops (<40%
moisture) are subject to additional harvesting challenges and
fragmentation losses during baling and transport, while wet
crops (>60% moisture) are more susceptible to microbial
degradation and losses due to liquid effluent production
during storage [14e18]. Biomass between 40% and 60% mois-
ture is particularly difficult to manage during storage,
although some crops in this range can be successfully stored
as ‘haylage’ [19].
Storage losses may have large impacts on feedstock
production costs and greenhouse gas emissions associated
with biofuel production. All upstream inputs, including farm
activities, harvesting, and transportation to a storage facility
are increased to replace the lost biomass inorder to achieve the
desired supply of biomass at the processing plant gate. A
complete life cycle inventory of GHG emissions assigned to
those activities will have to take into account the difference
between a unit of biomass at harvest and a unit of biomass
supplied to the biofuel production facility. Recent studies have
demonstrated the importance of land use and feedstock
production on the greenhouse gas balance of biofuels relative
to conventional petroleum-based fuels [20e22]. Storage losses
magnify the GHG contributions of land, chemical, and energy
inputs to feedstock production, and could affect the interpre-
tation of biofuel LCA studies and subsequent policy decisions.
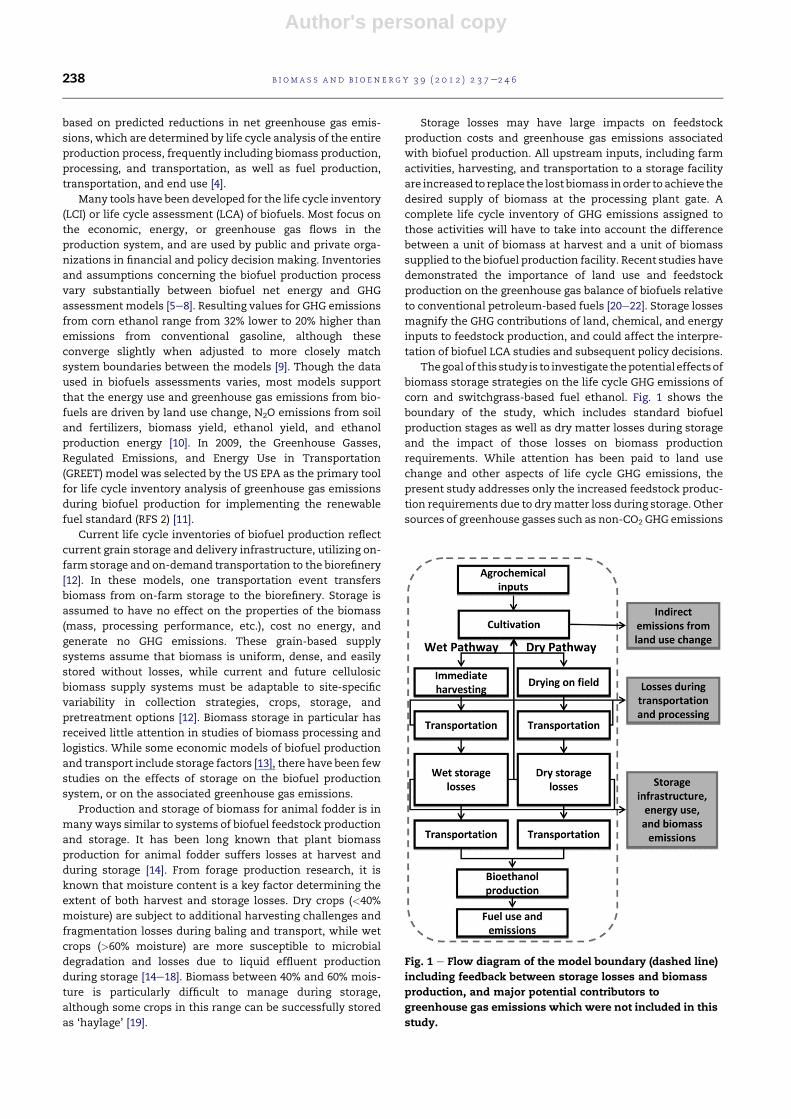
Thegoalof this study is to investigate thepotential effectsof
biomass storage strategies on the life cycle GHG emissions of
corn and switchgrass-based fuel ethanol. Fig. 1 shows the
boundary of the study, which includes standard biofuel
production stages as well as dry matter losses during storage
and the impact of those losses on biomass production
requirements. While attention has been paid to land use
change and other aspects of life cycle GHG emissions, the
present study addresses only the increased feedstock produc-
tion requirements due to drymatter loss during storage. Other
sources of greenhouse gasses such as non-CO2 GHG emissions
Fig. 1 e Flow diagram of the model boundary (dashed line)
including feedback between storage losses and biomass
production, and major potential contributors to
greenhouse gas emissions which were not included in this
study.
b i om a s s an d b i o e n e r g y 3 9 ( 2 0 1 2 ) 2 3 7e2 4 6238
Author's personal copy
fromstoredbiomass, forwhichdata arenot available,werenot
included. Prior literature on biomass production for animal
fodder demonstrates that dry matter (DM) loss during storage
can be significant. In the context of biofuels production, these
lossesmay contribute significantly to fuel life cycle emissions.
The results of this studymay be useful for comparing biomass
supply options and identifying areas where additional
research isnecessary toaccurately characterize theenergyand
GHG impacts of biomass supply to a biorefinery.
This study compares corn grain, corn stover, corn silage,
and switchgrass as feedstocks for bioethanol production,
examining the effects of additional production requirements
due to storage losseson greenhousegas emissions andethanol
yield from dry (stover, switchgrass) andwet (silage) pathways.
2. Methods
The results presented here utilized the GREET model frame-
work to assess the impacts of storage losses on life cycle GHG
emissions from cellulosic ethanol production. The GREET
model calculates estimated energy use and greenhouse gas
emissions (CO2, CH4, and N2O) during the fuel life cycle [23].
The model and user inputs are broken into several compo-
nents: feedstock production, transportation, fuel processing/
production, and vehicle use. Default GREET pathways include
bioethanol from corn grain, corn stover, herbaceous biomass,
and conventional gasoline, among others. The default model
values for corn farming and ethanol production are based on
US national average data or forecast based upon predicted
changes in technology and farming practices. GREET version
1.8 default values were used in this study unless otherwise
specified. The functional unit of this study is oneMJ of ethanol
produced at a biorefinery, or one MJ of conventional gasoline.
2.1. Silage model development
A corn silage feedstock production pathway was modeled by
modifying the default herbaceous biomass pathway in GREET.
Unlike the corn grain and corn stover pathways, the herba-
ceous biomass pathway allows inputs for both farming
material and energy use and electricity cogeneration during
fuel production, making it uniquely suited within the GREET
model to simulate emissions from nearly any biomass feed-
stock. On-farm input values for the corn silage pathway were
calculated from the default GREET values for corn grain,
modified for additional nitrogen fertilizer to compensate for
removal of nitrogen in corn stalks as per the default calcula-
tions for the corn stover pathway [24]. Biomass nitrogen, the
quantity of nitrogen in decaying crop biomass after harvest,
was calculated by adding residual aboveground nitrogen and
nitrogen from belowground biomass. Residual aboveground
biomass was calculated assuming 7% harvest losses [25].
Nitrogen from belowground biomasswas assumed to be equal
to the GREET default value for corn grain [24]. Emissions due to
land use change were beyond the scope of this study, and
GREET input values for land use change emissions were set to
zero.
The 2007 US national average silage yield of 39.4 wet Mg/ha
was used to convert corn grain farming inputs to the corn
silage model pathway [26]. Corn silage was assumed to have
a 32% dry matter content at harvest [27], and was assumed to
be converted to ethanol at a rate of 427 L/Mg [28]. While some
data suggests that silage may require lower energy use for
processing at the biorefinery than corn stover, the present
study assumes that there is no difference [29].
2.2. Dry matter losses
Due to the many potential complicating factors surrounding
drymatter losses during storage, a survey of the literaturewas
conducted to estimate likely storage losses for dry (baled) and
wet (ensiled) biomass and to estimate the probability distri-
bution of storage losses for each storage method. Due to the
high variability of reported values and the sensitivity of
storage losses tomany factors, a range of results was obtained
for both bales and silage instead of a single value. In analyzing
the data from the animal forage production literature, the
following heuristics were used to categorize the reported data
for further analysis. Harvestedmaterial between 10% and 40%
moisture were classified as ‘dry’, while material between 60%
and 80% moisture was categorized as ‘wet’. Biomass with
intermediate moisture contents between 40% and 60% mois-
ture were not included in this study. Herbaceous feedstocks
for bioenergy production are generally grasses or crop resi-
dues which are also grasses (e.g. maize and wheat). Studies of
corn silage and corn stover, ryegrass, switchgrass, sorghum,
and unspecified grasses were included in the survey. Storage
losses for alfalfa and other broadleaf crops were excluded.
Publications on wet biomass storage focus on the ensiling of
very fresh, wet biomass for forage, which was assumed to be
equivalent to biofuel feedstock storage due to the lack of data
on large-scale storage of wet biomass for bioenergy produc-
tion. In order to qualify for statistical analysis, studies were
required to contain ameasured drymatter content of biomass
at harvest and a measured average dry matter loss (%) for all
stored biomass over a period of no less than 4 months. A total
of 46, 22, and 47 data points were identified from the literature
for wet storage, dry indoor storage, and dry outdoor storage,
respectively, each representing the average of a study or
treatment [15,18,30e50]. Percentile loss values were identified
for each storage system by analyzing these data using the
Standard method. Data analysis was completed using
SigmaPlot� version 10 (Systat Software, Inc., San Jose, CA).
Corn grain storage losses are very low due to large invest-
ments in facilities for drying and storage to meet the high
standards of purity required for human and livestock
consumption. Grain losses of as little as 0.5% DM due to fungal
spoilage can be rejected [51]. The maximum salable propor-
tion of mold damaged kernels (20%) for food products corre-
sponds to only a 1.5% dry matter loss [52]. Such low losses
would not have a major impact on greenhouse gas emissions
during fuel production; therefore DM loss of grain was not
included in this study.
While GREET implicitly accounts for harvest losses for corn
stover and herbaceous biomass by counting as ‘harvested’
only biomass removed from the field, GREET does not account
for energy use or feedstock losses associated with biomass
storage. To estimate the effects of storage losses on life cycle
greenhouse gas emissions, a set of ‘upstream’ factors was
b i om a s s a n d b i o e n e r g y 3 9 ( 2 0 1 2 ) 2 3 7e2 4 6 239
Author's personal copy
identified within the GREET model. Pesticide and fertilizer
application rates, farming energy use, feedstock trans-
portation, and biomass N content (a GREET parameter used to
calculate N2O emissions from residual biomass), were all
considered to be upstream to biomass storage. These inputs
were increased by a factor equal to the additional feedstock
production required to compensate for dry matter lost in
storage, such that: Additional Production ¼ 1/(1�%DM
loss) � 1. Additional production was also assumed to increase
the effective land area needed to supply an ethanol plant.
Transportation distance, based on the radius of a hypothetical
circular supply area, was adjusted proportionally to the
increase in the supply area [53]. GREET input required
rounding distances to the nearest mile.
2.3. GREET model output
All GREET runs were conducted using default model data for
2010. Model inputs for each fuel production pathway are
shown in Table 1. Ethanol yield per acre was calculated both
with and without storage losses, using the GREET default
yields for corn grain, corn stover, and switchgrass (8.4, 4.2, and
11.21 dry Mg/ha, respectively) [9], and using the 2007 US
national average yield for corn silage (12.6 dry Mg/ha), which
was the most recent data available at the time the analyses
were performed. GREET defaults include a 90% harvested-to-
planted area parameter for corn grain. Ethanol yields from
biomass were taken from GREET defaults and the predicted
yield for corn silage ethanol. GREET well-to-pump greenhouse
gas emissions (g CO2 eq/Btu) for biofuels include emissions
credits for carbon sequestered by the feedstock, making
comparisons with conventional fuels difficult. In this study,
comparisons of GHG emissions in g CO2 eq/MJ ethanol were
calculated from GREET well-to-wheels output values (g CO2
eq/mile) using GREET factors for fuel economy and LHV
(10.4 km/L or 24.5 mpg and 32.3 MJ/L or 116,090 Btu/gal for
conventional gasoline; flexible fuel vehicles are assumed by
the GREET model to have identical fuel economy e MJ/km e
when using ethanol or gasoline). All GREET well-to-wheels
results for each feedstock were determined by modeling
a 100% ethanol fuel mix in the flex-fuel vehicle (FFV) pathway.
Emissions are also compared as reductions over average 2005
gasoline-fueled vehicle emissions using GREET default data.
3. Results
3.1. Dry matter losses
Using the GREET framework, we modeled life cycle (well-to-
wheels) GHG emissions during production of fuel ethanol
from corn silage using a probability distribution for expected
drymatter losses during storage estimated from the literature.
Comparing this novel biofuel pathway with established
pathways such as ethanol from corn grain, corn stover, and
switchgrass required introduction of storage losses into the
GREET model. Likely storage losses were estimated from the
literature based on the distribution of losses shown in Fig. 2.
Most studies reported losses less than or comparable to the
guidelines for storage losses described by Hoglund [14], except
for those of outdoor storage of dry biomass, for which losses
can be considerably greater. Among hay and corn stover baled
and stored indoors, reported DM losses were low, consistently
under 6%, even as DM content ranged from 88% to as low as
40% [18,30,33,42,45,54,55]. Bales of hay and corn stover stored
outdoors may frequently suffer losses of 10% to 20%, even
when baled under the 20% moisture threshold
[18,30,33,34,39,40,42,45]. Dry matter losses as high as 35% to
40% can also occur [18,42,49]. While many reviews of storage
losses may assume proper indoor storage of dry biomass, it is
clear that this is not always the case in practice.
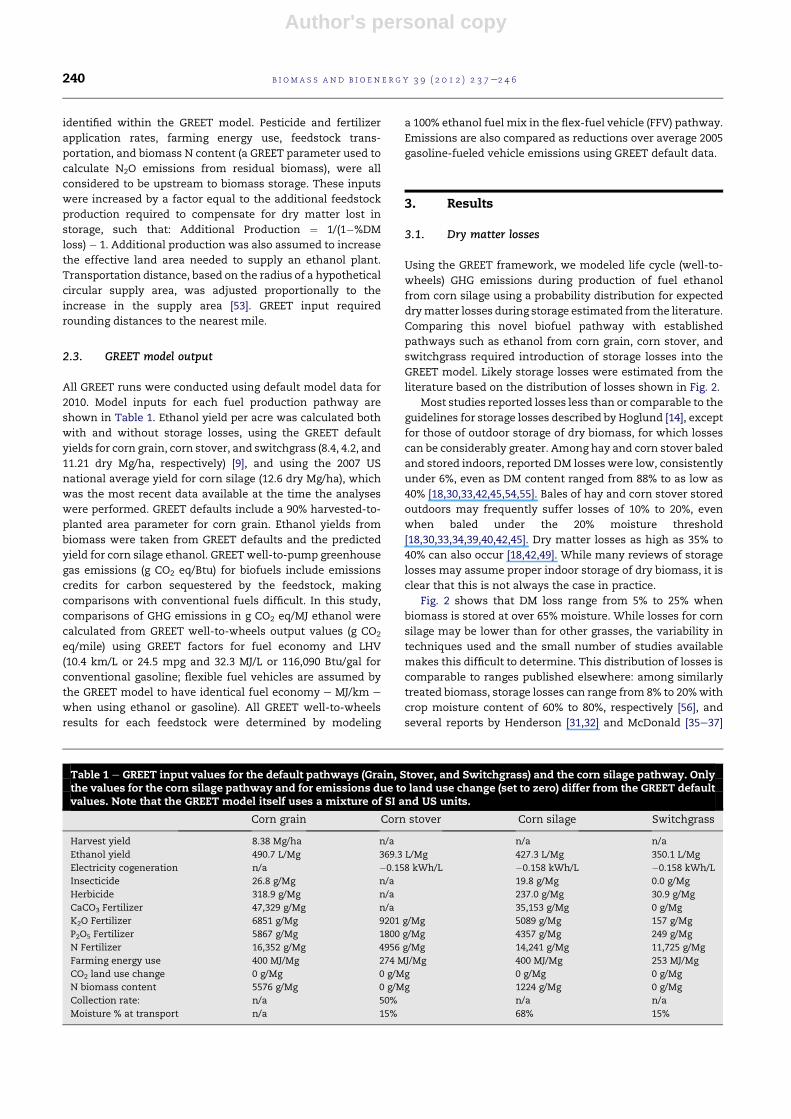
Fig. 2 shows that DM loss range from 5% to 25% when
biomass is stored at over 65% moisture. While losses for corn
silage may be lower than for other grasses, the variability in
techniques used and the small number of studies available
makes this difficult to determine. This distribution of losses is
comparable to ranges published elsewhere: among similarly
treated biomass, storage losses can range from 8% to 20%with
crop moisture content of 60% to 80%, respectively [56], and
several reports by Henderson [31,32] and McDonald [35e37]
Table 1 e GREET input values for the default pathways (Grain, Stover, and Switchgrass) and the corn silage pathway. Onlythe values for the corn silage pathway and for emissions due to land use change (set to zero) differ from the GREET defaultvalues. Note that the GREET model itself uses a mixture of SI and US units.
Corn grain Corn stover Corn silage Switchgrass
Harvest yield 8.38 Mg/ha n/a n/a n/a
Ethanol yield 490.7 L/Mg 369.3 L/Mg 427.3 L/Mg 350.1 L/Mg
Electricity cogeneration n/a �0.158 kWh/L �0.158 kWh/L �0.158 kWh/L
Insecticide 26.8 g/Mg n/a 19.8 g/Mg 0.0 g/Mg
Herbicide 318.9 g/Mg n/a 237.0 g/Mg 30.9 g/Mg
CaCO3 Fertilizer 47,329 g/Mg n/a 35,153 g/Mg 0 g/Mg
K2O Fertilizer 6851 g/Mg 9201 g/Mg 5089 g/Mg 157 g/Mg
P2O5 Fertilizer 5867 g/Mg 1800 g/Mg 4357 g/Mg 249 g/Mg
N Fertilizer 16,352 g/Mg 4956 g/Mg 14,241 g/Mg 11,725 g/Mg
Farming energy use 400 MJ/Mg 274 MJ/Mg 400 MJ/Mg 253 MJ/Mg
CO2 land use change 0 g/Mg 0 g/Mg 0 g/Mg 0 g/Mg
N biomass content 5576 g/Mg 0 g/Mg 1224 g/Mg 0 g/Mg
Collection rate: n/a 50% n/a n/a
Moisture % at transport n/a 15% 68% 15%
b i om a s s an d b i o e n e r g y 3 9 ( 2 0 1 2 ) 2 3 7e2 4 6240
Author's personal copy
show consistent 20% to 25% storage losses for ryegrass when
moisture content is above 80%. Reported losses vary from 1%
to 32% of total dry matter, but the majority of reports
emphasize losses between 5% and 21% [44,49,56e61].
The type and effectiveness of storage silos are closely
related to crop DM content and the type and percentage of
storage losses for silage. Covering and sealing the biomass is
critical, potentially reducing losses by 8-fold over as little as 2
months [58]. Bunker silos, best for minimizing effluent losses
from very wet silage (over 75% moisture) have expected DM
losses of 13%, somewhat greater than the 6 to 9% losses from
tower silos, which are optimal for silage between 60 and 75%
moisture. Wrapped bale silage has much smaller infrastruc-
ture and capital requirements, but suffers expected losses of
16% DM over 6 months for relatively dry biomass (60% to 70%
moisture) [61]. Studies of corn silage report 55% to 75% mois-
ture content and storage losses between 4% and 15%
[15,41,43,44,46e48].
Table 2 shows the probable (25th to 75th percentile) and
extreme (5th and 95th percentile) storage losses for dry and
wet storage identified from the chosen studies. Indoor dry
storage generates the smallest losses, with half of the pub-
lished values between 2.5% and 7.9% of initial dry matter.
Outdoor storage of dry bales commonly allows greater losses
of 7% to 16%, with the potential for extremely high losses of
over 36%. Ensiling biomass causes more degradation than
indoor storage but a narrower range of expected losses than
outdoor dry storage.
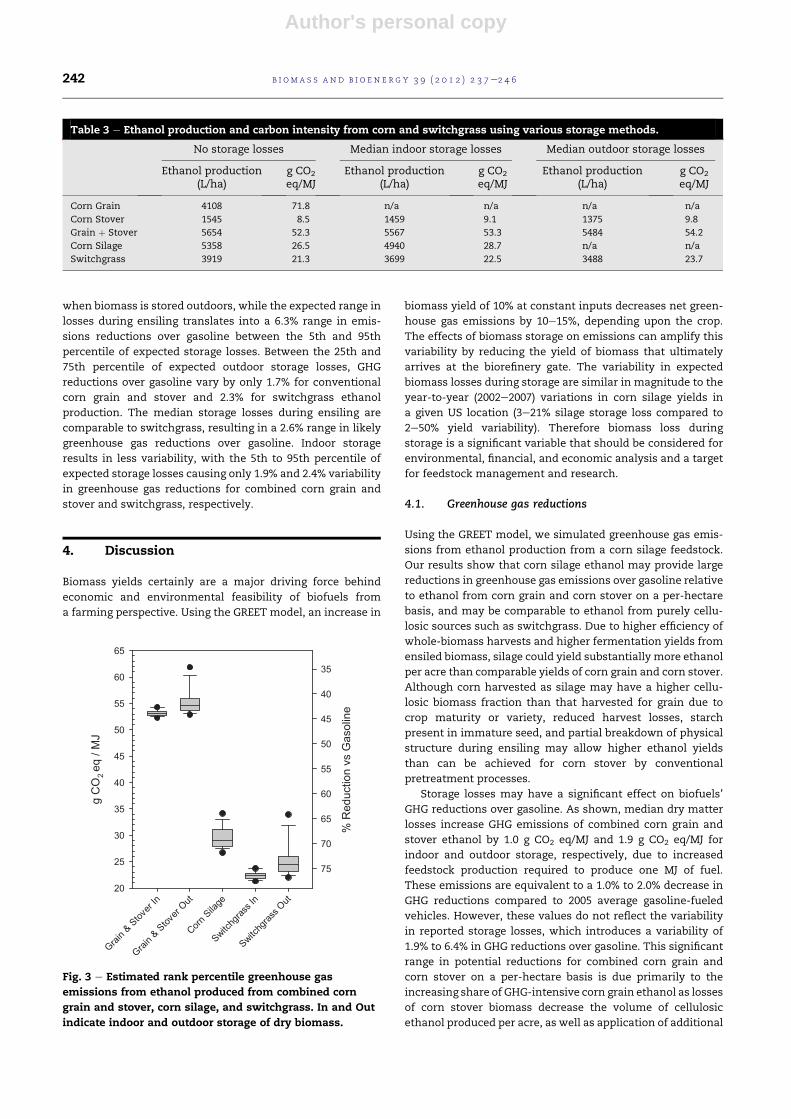
3.2. Ethanol yield
Silagemay produce comparable yields of biomass and ethanol
per acre to that achieved by harvesting and processing corn
grain and corn stover separately, and may generate greater
biomass and ethanol yields than switchgrass production
(Table 3). Without storage losses, corn silage may generate
5358 L/ha of ethanol, or 4940 L/ha with median storage losses.
Combined corn stover and conventional grain corn ethanol
production could generate 5654 L/ha without DM losses, or
5567 or 5484 L/ha atmedian indoor and outdoor storage losses,
respectively. 3919 L/ha could be produced from switchgrass
(3699 or 3488 L/ha at median indoor and outdoor storage los-
ses, respectively).
Storage losses have a greater effect on ethanol yield per
acre for silage than combined corn grain and stover. Ethanol
from corn grain comprises over 69% of the total fuel produced
per acre from the combination of conventional grain and
stover fuel production pathways. Since corn grain losses are
expected to be very low and are not considered in this study,
fuel yields per acre from combined grain and stover are less
affected by storage losses than the corn silage pathway.
However, median outdoor dry storage losses do have
a substantial impact on fuel yield from corn stover when
examined independently of corn grain ethanol yields.
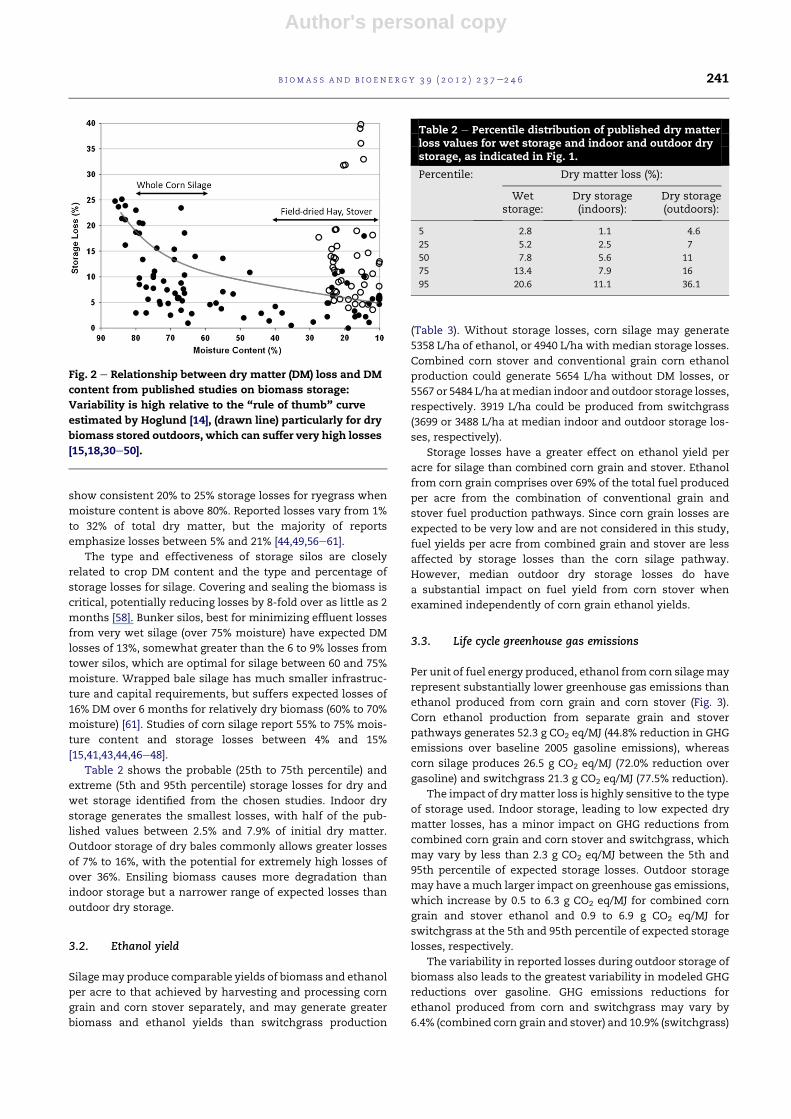
3.3. Life cycle greenhouse gas emissions
Per unit of fuel energy produced, ethanol from corn silagemay
represent substantially lower greenhouse gas emissions than
ethanol produced from corn grain and corn stover (Fig. 3).
Corn ethanol production from separate grain and stover
pathways generates 52.3 g CO2 eq/MJ (44.8% reduction in GHG
emissions over baseline 2005 gasoline emissions), whereas
corn silage produces 26.5 g CO2 eq/MJ (72.0% reduction over
gasoline) and switchgrass 21.3 g CO2 eq/MJ (77.5% reduction).
The impact of drymatter loss is highly sensitive to the type
of storage used. Indoor storage, leading to low expected dry
matter losses, has a minor impact on GHG reductions from
combined corn grain and corn stover and switchgrass, which
may vary by less than 2.3 g CO2 eq/MJ between the 5th and
95th percentile of expected storage losses. Outdoor storage
may have amuch larger impact on greenhouse gas emissions,
which increase by 0.5 to 6.3 g CO2 eq/MJ for combined corn
grain and stover ethanol and 0.9 to 6.9 g CO2 eq/MJ for
switchgrass at the 5th and 95th percentile of expected storage
losses, respectively.
The variability in reported losses during outdoor storage of
biomass also leads to the greatest variability in modeled GHG
reductions over gasoline. GHG emissions reductions for
ethanol produced from corn and switchgrass may vary by
6.4% (combined corn grain and stover) and 10.9% (switchgrass)
Fig. 2 e Relationship between dry matter (DM) loss and DM
content from published studies on biomass storage:
Variability is high relative to the “rule of thumb” curve
estimated by Hoglund [14], (drawn line) particularly for dry
biomass stored outdoors, which can suffer very high losses
[15,18,30e50].
Table 2 e Percentile distribution of published dry matterloss values for wet storage and indoor and outdoor drystorage, as indicated in Fig. 1.
Percentile: Dry matter loss (%):
Wetstorage:
Dry storage(indoors):
Dry storage(outdoors):
5 2.8 1.1 4.6
25 5.2 2.5 7
50 7.8 5.6 11
75 13.4 7.9 16
95 20.6 11.1 36.1
b i om a s s a n d b i o e n e r g y 3 9 ( 2 0 1 2 ) 2 3 7e2 4 6 241
Author's personal copy
when biomass is stored outdoors, while the expected range in
losses during ensiling translates into a 6.3% range in emis-
sions reductions over gasoline between the 5th and 95th
percentile of expected storage losses. Between the 25th and
75th percentile of expected outdoor storage losses, GHG
reductions over gasoline vary by only 1.7% for conventional
corn grain and stover and 2.3% for switchgrass ethanol
production. The median storage losses during ensiling are
comparable to switchgrass, resulting in a 2.6% range in likely
greenhouse gas reductions over gasoline. Indoor storage
results in less variability, with the 5th to 95th percentile of
expected storage losses causing only 1.9% and 2.4% variability
in greenhouse gas reductions for combined corn grain and
stover and switchgrass, respectively.
4. Discussion
Biomass yields certainly are a major driving force behind
economic and environmental feasibility of biofuels from
a farming perspective. Using the GREET model, an increase in
biomass yield of 10% at constant inputs decreases net green-
house gas emissions by 10e15%, depending upon the crop.
The effects of biomass storage on emissions can amplify this
variability by reducing the yield of biomass that ultimately
arrives at the biorefinery gate. The variability in expected
biomass losses during storage are similar in magnitude to the
year-to-year (2002e2007) variations in corn silage yields in
a given US location (3e21% silage storage loss compared to
2e50% yield variability). Therefore biomass loss during
storage is a significant variable that should be considered for
environmental, financial, and economic analysis and a target
for feedstock management and research.
4.1. Greenhouse gas reductions
Using the GREET model, we simulated greenhouse gas emis-
sions from ethanol production from a corn silage feedstock.
Our results show that corn silage ethanol may provide large
reductions in greenhouse gas emissions over gasoline relative
to ethanol from corn grain and corn stover on a per-hectare
basis, and may be comparable to ethanol from purely cellu-
losic sources such as switchgrass. Due to higher efficiency of
whole-biomass harvests and higher fermentation yields from
ensiled biomass, silage could yield substantially more ethanol
per acre than comparable yields of corn grain and corn stover.
Although corn harvested as silage may have a higher cellu-
losic biomass fraction than that harvested for grain due to
crop maturity or variety, reduced harvest losses, starch
present in immature seed, and partial breakdown of physical
structure during ensiling may allow higher ethanol yields
than can be achieved for corn stover by conventional
pretreatment processes.
Storage losses may have a significant effect on biofuels’
GHG reductions over gasoline. As shown, median dry matter
losses increase GHG emissions of combined corn grain and
stover ethanol by 1.0 g CO2 eq/MJ and 1.9 g CO2 eq/MJ for
indoor and outdoor storage, respectively, due to increased
feedstock production required to produce one MJ of fuel.
These emissions are equivalent to a 1.0% to 2.0% decrease in
GHG reductions compared to 2005 average gasoline-fueled
vehicles. However, these values do not reflect the variability
in reported storage losses, which introduces a variability of
1.9% to 6.4% in GHG reductions over gasoline. This significant
range in potential reductions for combined corn grain and
corn stover on a per-hectare basis is due primarily to the
increasing share of GHG-intensive corn grain ethanol as losses
of corn stover biomass decrease the volume of cellulosic
ethanol produced per acre, as well as application of additional
Grain &
Stov
er In
Grain &
Stov
er Out
Corn Sila
ge
Switchg
rass I
n
Switchg
rass O
ut
g C
O2 eq
/ M
J
20
25
30
35
40
45
50
55
60
65
% R
educ
tion
vs G
asol
ine
35
40
45
50
55
60
65
70
75
Fig. 3 e Estimated rank percentile greenhouse gas
emissions from ethanol produced from combined corn
grain and stover, corn silage, and switchgrass. In and Out
indicate indoor and outdoor storage of dry biomass.
Table 3 e Ethanol production and carbon intensity from corn and switchgrass using various storage methods.
No storage losses Median indoor storage losses Median outdoor storage losses
Ethanol production(L/ha)
g CO2
eq/MJEthanol production
(L/ha)g CO2
eq/MJEthanol production
(L/ha)g CO2
eq/MJ
Corn Grain 4108 71.8 n/a n/a n/a n/a
Corn Stover 1545 8.5 1459 9.1 1375 9.8
Grain þ Stover 5654 52.3 5567 53.3 5484 54.2
Corn Silage 5358 26.5 4940 28.7 n/a n/a
Switchgrass 3919 21.3 3699 22.5 3488 23.7
b i om a s s an d b i o e n e r g y 3 9 ( 2 0 1 2 ) 2 3 7e2 4 6242
Author's personal copy
fertilizers to compensate for removed stover. Changes in the
GHG intensity of ethanol from corn silage and switchgrass are
due directly to increased feedstock production requirements.
The US Renewable Fuel Standard categorizes fuels based
on feedstock and GHG reduction over the average 2005 life
cycle emissions from gasoline, with cutoffs of 20%, 50%, and
60% GHG reductions for renewable fuel, ‘advanced’, and
‘cellulosic’ biofuels [4]. For fuels calculated to be near the 50%
or 60% cutoffs, 6% to 10% variability is significant. While
national policy decisions require a more detailed modeling
approach than used in this preliminary study, it is clear that
variations in GHG reduction due to biofuel crop storage could
have a significant impact on the categorization of biofuels in
the United States and highlight the importance of careful
consideration of biomass storage in designing biomass supply
systems for biofuel production.
4.2. Biomass storage
It is widely accepted that dry storage losses are much smaller
than wet storage losses, though few detailed studies of the
sources of dry storage losses have been published. Dry matter
loss is frequently associated with moisture content, exposure
to precipitation, and bale contact with soil. Dry matter losses
are assumed to be a result of microbial degradation. Low
storage losses and smaller infrastructure and capital
requirements for bale storage of hay are expected to
compensate for the difficulties in harvesting field-dried
material [14]. Field drying is highly weather-dependent, and
rain events can cause delays in collection and loss of biomass
due to degradation [18,59,62]. Drying biomass to below 20%
moisture is accepted as necessary to avoid large losses during
storage. Literature concerning biomass loss and supply logis-
tics assumes on-farm, outdoor storage due to lower capital
investment than a centralized indoor storage system [63,64].
According to the results in this study, storage infrastructure
could be a much stronger determinant of biomass loss than
moisture content for hay collected below 40% moisture.
Most silage losses appear to occur in the initial loading and
fermentation period. Fermentation, which lowers the pH of
the silage, occurs during the first one week to one month of
storage, afterwhich silage is relatively stable for up to one year
with minimal losses if the silo is well sealed and good storage
practices are followed [65,66]. Therefore, losses are thought to
be resilient to variations in storage time. Significant drymatter
loss also occurs during removal from storage, as portions of
the silage are removed over the course of several months as
animal feed. Available data suggests renewed microbial
activity may cause losses of 1.5% total DM over 48 h between
unloading and use of ensiled material [61]. When supplying
a biorefinery, a silo may be unloaded in hours instead of days
or weeks as in the case for animal fodder, reducing the
potential for aerobic deterioration and dry matter loss.
Harvest losses also play an important role in determining
biomass availability at the fuel production plant. Degradation
and fracturing of biomass during drying, harvest, and trans-
portation are expected to result in drymatter losses of 20 to 25%
prior to bale storage, while wet biomass at over 60% moisture
can be harvested at nearly 95% efficiency [14,19]. The total
harvest and storage losses may vary by only 5 to 10% under
good management practices. While on-field losses during
harvest and baling (estimated at 26% for dry corn stover [64]) are
implicitly included in the GREET model by defining the harvest
yield as biomass successfully removed from the field, losses
during transportation or bale shredding have not been included
before the present study. Kumar and Sokhansanj [67] reported
dry matter losses of 2e3% during transportation, while
losses due specifically to bale size reduction are not known.
4.3. Best practices
‘Best practices’ in harvesting and storage may greatly reduce
dry matter losses. Many losses during ensiling are avoidable,
depending largely on the moisture content of the crop, silo
type, proper sealing and management of the silo, and the rate
and method loading and unloading [68]. The impact of these
‘avoidable’ losses may account for some of the discrepancies
between academic studies of ensiling and expected on-farm
losses. While McGechan [57] reports expected losses from
silage between 18% and 25% of dry matter depending on
moisture and harvest method, Shinners et al. [18] demon-
strate that dry matter losses can be kept under 10% by wrap-
ping dry bales that are too wet for conventional hay storage.
So-called wet stover or haylage may be an optimal storage
method for cellulosic ethanol feedstocks, though the
fermentation properties ofwet stover are not well understood.
Additives are frequently used to enhance the preservation
of corn silage, and may be an important management tool to
reduce storage losses, particularly in poor quality silage
[17,44,57]. However, some additives may significantly
contribute to the net greenhouse gas emissions of stored
biomass. Use of urea and ammonia to condition biomass
would directly increase GHGs through volatilization of N2O
from silos. Recommended lactic acid bacteria inoculation
rates of at least 0.1 to 1 kg per wetMg of forage could represent
a significant energy investment and financial cost to biomass
producers [69]. Similarly, adjusting the sugar content of low-
sugar biomass crops to ensure good fermentation could
require addition of 2% to 5% of biomass wet weight in sugars,
which could create additional logistical and economic barriers
for a biomass industry [70]. Enzymes used as silage additives
are similar in function to those used in biomass pretreatment,
used to degrade cellulose and hemicelluloses to accessible
sugars. These enzymes represent a significant cost barrier to
cellulosic ethanol commercialization, and would therefore
likely represent a significant cost in biomass storage treat-
ments as well. While such an investmentmay be preferable to
the alternative e loss of stored biomass e judicious and
appropriate use of additives is required to minimize the life
cycle GHG emissions from biofuel production.
In addition to risk of severe DM loss due to outdoor storage
of dry biomass, fire is also a concern. Improperly baled hay
and stover is subject to spontaneous combustion. Once begun,
extinguishing such fires is extremely difficult [50]. Such risks
pose additional challenges for developing a biomass supply
system, as consolidation of biomass in indoor storage facili-
ties may increase an operator’s vulnerability to such extreme
events. Biomass loss and financial investment are likely to be
greater concerns for farmers and fuel producers than emis-
sions standards in designing a biomass supply chain.
b i om a s s a n d b i o e n e r g y 3 9 ( 2 0 1 2 ) 2 3 7e2 4 6 243
Author's personal copy
4.4. Economic implications for the fuel-ethanolproduction cycle
A study of harvest yields and storage costs of corn stover and
silage by Perlack and Turhollow [71] demonstrated that feed-
stock supply costs to a biofuel plant can vary by 30 to 50%
depending on baling and harvest method, or up to 120% with
stover availability. The high packing density and moisture
content of silage also has a financial impact. Turhollow and
Sokhansanj [72] identified a 53%moisture threshold for trans-
portation of corn stover by truck. Highermoisture levels cause
loads to be limited by weight rather than volume, thereafter
having a direct impact on transportation costs and logistical
complexity as the quantity of dry matter per load decreases.
Aneconomically viable biomass supply systemmay require
storage and transportation to account for less than 30% of
biomass cost at the biorefinery gate [12]. Increased feedstock
production costs due to biomass loss may compete with the
investments necessary to build and maintain storage infra-
structure. Reducing the extreme variability in dry matter loss
associated with outdoor storage requires protecting bales of
dry biomass from rain and soil moisture, the costs of which
may be prohibitive to farmers (particularly those who rotate
crops). Centralized storage at the fuel processing plantmay be
more feasible, although centralization increases an owner’s
risk to spontaneous combustion or other disasters. Wet
storage of biomass by ensiling at the biorefinery could reduce
variability in storage losses and eliminate fire risks if a suffi-
cient quantity of whole corn is locally available, though
a greater density of feedstock cropping near the plant may be
required to keep the cost of transporting wet biomass afford-
able. The economic impacts of biomass storage losses include
increased costs of biomass production, transportation, and
storage infrastructure, which must all be considered when
determining the most cost-effective biomass supply system.
5. Conclusions
The potential impact of storage losses on life-cycle GHG
emissions of biofuel production emphasizes the role of
management and on-farm decision making in the environ-
mental impacts of biofuels. Increased biomass production to
compensate for storage losses may increase net biofuel GHG
emissions from combined corn grain and stover and corn
silage by 1.0 and 2.2 g CO2 eq/MJ respectively for indoor
storage, or 1.9 g CO2 eq/MJ if dry stover bales are kept
outdoors. DM losses from bales of stover or switchgrass stored
outdoors may vary 3-fold more than losses from bales stored
indoors. While silage DM losses have a similar median range
of expected losses to bales stored outdoors, the distribution
has a much shorter upper tail. These analyses do not support
conclusions comparing corn stover, corn silage, and switch-
grass as biofuel feedstocks, but rather emphasize that vari-
ability in storage losses is a key factor in accurately
determining life cycle emissions as required by regulatory
agencies. Uncertainty related to storage losses represents over
10% variability in the net emissions reductions over gasoline
for dry bale storage, or 6.2% variability for wet silage.
Storage losses are highly dependent on storage infrastruc-
ture and crop moisture at harvest. Decisions regarding the
moisture content at which to harvest cellulosic biomass and
the method of storage may have tremendous environmental
and economic implications over the followingyear.While little
information on storage practices for supplying biomass for
biofuel production is available, understanding the availability
of covered storage for bales and the distribution and economic
and environmental costs of constructing silos will be key in
accuratelymodeling the greenhouse gas emissions associated
with year-round storage of biomass for fuel production.
Acknowledgments
We are grateful to Peter Friedemann at Dow AgroSciences for
assisting with data collection, and to Dr. Fu Zhao for providing
a thorough critique of the manuscript. We would also like to
thank Jeryang Park and SajeevMohankumar formany thought-
provoking conversations regarding the work reported here.
Funding for this work was provided in part by Dow Agro-
Sciences. Isaac Emery’s efforts were partially supported by
a Lynn Fellowship through the Ecological Sciences and Engi-
neering Interdisciplinary Graduate Program at Purdue
University.
r e f e r e n c e s
[1] Renewable energy annual 2007. Energy informationadministration, US. Washington, DC: DOE; 2009.
[2] Renewable energy trends in consumption and electricity2007. Energy information administration, US. Washington,DC: DOE; 2009.
[3] Directive 2003/30/ec. European Parliament. Brussels,Belgium: Official Journal of the European Union; 2003.
[4] Regulation of fuels and fuel additives: changes to renewablefuel standard program. Proposed rule. Federal Register 2009;74:24903e5143.
[5] Liska AJ, Cassman KG. Towards standardization of life-cyclemetrics for biofuels: greenhouse gas emissions mitigationand net energy yield. J Biobased Mater Bioenergy 2008;2:187e203.
[6] Miller SA, Theis TL. Comparison of life-cycle inventorydatabases. J Ind Ecol 2006;10:133e47.
[7] Patzek TW. Thermodynamics of the corn-ethanol biofuelcycle. Crit Rev Plant Sci 2004;23:519e67.
[8] Wu M, Wu Y, Wang M. Mobility chains analysis oftechnologies for passenger cars and light-duty vehiclesfueled with biofuels: application of the greet model to therole of biomass in America’s future (RBAEF) project. ArgonneNational Laboratory; 2005.
[9] Farrell AE, Plevin RJ, Turner BT, Jones AD, O’Hare M,Kammen DM. Ethanol can contribute to energy andenvironmental goals. Science 2006;311:506e8.
[10] Mullins KA, Griffin WM, Matthews HS. Policy implications ofuncertainty in modeled life-cycle greenhouse gas emissionsof biofuels. Environ Sci Technol 2011;45:132e8.
[11] Renewable fuel standard program (RFS2) regulatory impactanalysis. In: Assessment and standards division UEPA; 2010.Washington, DC.
[12] Jacobson J, Searcy E, Muth D, Wilkerson E, Sokhansanj S,Jenkins B, et al. Sustainable biomass supply systems. IdahoNational Laboratory; 2009.
b i om a s s an d b i o e n e r g y 3 9 ( 2 0 1 2 ) 2 3 7e2 4 6244
Author's personal copy
[13] Sokhansanj S, Kumar A, Turhollow AF. Development andimplementation of integrated biomass supply analysis andlogistics model (IBSAL). Biomass Bioenergy 2006;30:838e47.
[14] Hoglund C. Some economic considerations in selectingstorage systems for haylage and silage for dairy farms.Agricultural Economics Report. East Lansing MI: MichiganState University; 1965.
[15] Jackson HA, Lessard JR. Effects of moisture content on cornsilage density and storage losses in a large tower silo. CanAgr Eng 1977;19:57e8.
[16] Khorvash M, Colombatto D, Beauchemin KA, Ghorbani GR,Samei A. Use of absorbants and inoculants to enhance thequality of corn silage. Can J Anim Sci 2006;86:97e107.
[17] Pitt R. Silage and hay preservation. Ithaca, New York:Northeast Regional Agricultural Engineering Service; 1990.
[18] Shinners KJ, Binversie BN, Muck RE, Weimer PJ. Comparisonof wet and dry corn stover harvest and storage. BiomassBioenergy 2007;31:211e21.
[19] Rotz CA, Borton LR, Black JR. Harvest and storage losses withalternative forage harvesting methods. In: Proceedings of theAmerican forage and grassland conference. Georgetown, TX:American Forage and Grassland Council; 1991. p. 210e3.
[20] Crutzen P, Mosier A, Smith K, Winiwarter W. N2O releasefrom agro-biofuel production negates global warmingreduction by replacing fossil fuels. Atmos Chem PhysDiscuss 2007;7:11191e205.
[21] Searchinger T, Heimlich R, Houghton RA, Dong F, Elobeid A,Fabiosa J, et al. Use of US croplands for biofuels increasesgreenhouse gases through emissions from land-use change.Science; 2008:319.
[22] Searchinger TD, Hamburg SP, Melillo J, Chameides W,Havlik P, Kammen DM, et al. Climate change. Fixing a criticalclimate accounting error. Science 2009;326:527e8.
[23] Wu M, Wang M, Huo H. Fuel-cycle assessment of selectedbioethanol production pathways in the United States.Argonne National Laboratory; 2006.
[24] Huo H, Wang M, Bloyd C, Putsche V. Life-cycle assessment ofenergy and greenhouse gas effects of soybean-derivedbiodiesel and renewable fuels. Argonne National Laboratory;2008.
[25] Mani S, Patterson J, Bi X, Sokhansanj S. Modeling of the wetstorage of biomass. ASABE Annual International Meeting.Portland, OR: ASABE; 2006.
[26] Census of agriculture. Corn for silage, yield, http://www.nass.usda.gov/index.asp; 2007.
[27] Friedemann P. Personal communication; 2009.[28] Kim Y, Ladisch MR, Friedemann P, Lickfeldt DW, Armstrong
K, Mosier NS. Rates and yields of cellulosic ethanol frommaize silage with effect of brown midrib mutations. 31stSymposium in Biotechnology for Fuels and Chemicals. SanFrancisco CA; 2009.
[29] Xu J, Thomsen MH, Thomsen AB. Feasibility of hydrothermalpretreatment on maize silage for bioethanol production.Appl Biochem Biotechnol 2009;162:33e42.
[30] Coble CG, Egg RP. Dry matter losses during hay productionand storage of sweet sorghum used for methane production.Biomass 1987;14:209e17.
[31] Henderson AR, McDonald P. The effect of delayed sealing onfermentation and losses during ensilage. J Sci Food Agric1974;26:653e67.
[32] Henderson AR, McDonald P, Woolford MK. Chemical changesand losses during the ensilage of wilted grass treated withformic acid. J Sci Food Agric 1972;23:1079e87.
[33] Huhnke RL. Round bale wheat hay storage losses. Appl EngAgric 1990;6:569e74.
[34] Mayne CS, Gordon FJ. Effect of harvesting system on nutrientlosses during silage making. 2. In-silo losses. Grass Forage Sci1986;41:341e51.
[35] McDonald P, Henderson AR, MacGregor AW. Chemicalchanges and losses during the ensilage of wilted grass. J SciFood Agric 1968;19:125e32.
[36] McDonald P, Henderson AR, Whittenbury R. The effectof temperature on ensilage. J Sci Food Agric 1966;17:476e80.
[37] McDonald P, Stirling AC, Henderson AR, Whittenbury R.Fermentation studies on wet herbage. J Sci Food Agric 1962;13:581e90.
[38] McDonald P, Stirling AC, Henderson AR, Whittenbury R.Fermentation studies on inoculated herbages. J Sci FoodAgric 1964;15:429e36.
[39] Richey CB, Liljedahl JB, Lechtenberg VL. Corn stover harvestfor energy production. Trans ASAE; 1982:25.
[40] Sanderson MA, Egg RP, Wiselogel AE. Biomass losses duringharvest and storage of switchgrass. Biomass Bioenergy 1997;12:107e14.
[41] Shinners KJ, Boettcher GC, Hoffman DS, Munk JT, Muck RE,Weimer PJ. Single-pass harvest of corn grain and stover:performance of three harvester configurations. Trans ASABE2009;52:51e60.
[42] Verma LR, Nelson BD. Changes in round bales during storage.Trans ASABE 1983;26:328e32.
[43] Weinberg ZG, Ashbell G. Changes in gas composition in cornsilages in bunker silos during storage and feedout. Can AgrEng 1994;36:155e8.
[44] Johnson LM, Harrison JH, Davidson D, Mahanna WC,Shinners KJ. Corn silage management: effects ofhybrid, maturity, innoculation, and mechanicalprocessing on fermentation characteristics. J Dairy Sci2003;86:287e308.
[45] Khanchi A, Jones CL, Sharma B. Characteristics andcompositional variation in round and square sorghum balesunder different storage conditions. ASABE AnnualInternational Meeting. Reno, NV: ASABE; 2009.
[46] Muck RE, Holmes B. Packing bunkers and piles to maximizeforage preservation. Sixth International Dairy HousingConference Proceeding. Minneapolis, Minnesota: ASABE;2007.
[47] Henk LL, Linden JC. Silage processing of forage biomass toalcohol fuel. In: Himmel M, editor. Enzymatic conversion ofbiomass for fuels production. Washington, DC: AmericanChemical Society; 1994.
[48] Singh K, Honig H, Wermke M, Zimmer E. Fermentationpattern and changes in cell wall constituents of straw-foragesilages, straws and partners during storage. Anim Feed SciTechnol; 1996:137e53.
[49] Shinners KJ, Boettcher GC, Muck RE, Weimer PJ, Casler MD.Harvest and storage of two perennial grasses as biomassfeedstocks. Trans ASABE 2010;53:359e70.
[50] Atchison JE, Hettenhaus JR. Innovative methods for cornstover collecting, handling, storing and transporting. Golden,Colorado: National Renewable Energy Laboratory; 2004.
[51] Magan N, Aldred D. Post-harvest control strategies:minimizing mycotoxins in the food chain. Int J FoodMicrobiol 2007;119:131e9.
[52] Yigezu YA, Alexander CE, Preckel PV, Maier DE,Woloshuck CP, Mason LJ, et al. Optimal management ofmolds in stored corn. Agric Sys 2008;98:220e7.
[53] Perlack RD, Turhollow A. Feedstock cost analysis of cornstover residues for futher processing. Energy 2003;28:1395e403.
[54] Collins A, Allinson DW. Growth-rate of herbage initiallydominated by reed canarygrass or tall fescue. J Prod Agric1995;8:227e32.
[55] McCormick ME, Cuomo GJ, Blouin DC. Annual ryegrassstored as balage, haylage, or hay for lactating dairy cows. JProd Agric 1998;11:293e300.
b i om a s s a n d b i o e n e r g y 3 9 ( 2 0 1 2 ) 2 3 7e2 4 6 245
Author's personal copy
[56] Honig H. Reducing losses during storage and unloading ofsilage. Conference on forage conservation towards 2000;1991. Braunschweig, Germany.
[57] McGechan MB. A review of losses arising duringconservation of grass forage: part 2, storage losses. Ag EngRes 1990;45:1e30.
[58] Oelberg TJ, Clark AK, McGuffey RJ, Schingoethe DJ.Evaluation of covering, dry-matter, and preservative atensiling of alfalfa in bunker silos. J Dairy Sci 1983;66:1057e68.
[59] Rotz CA, Muck RE. Changes in forage quality during harvestand storage. In: Fahey GC, editor. National conference onforage quality, evaluation, and utilization. University ofNebraska, Lincoln, NE: Forage Quality, Evaluation, andUtilization; 1994, p. 828e868.
[60] Savoie P, D’Amours L, Amyot A, Theriault R. Effect of density,cover, depth, and storage time on dry matter loss of cornsilage boom. ASAE. St. Joseph, Michigan: ASAE; 2006.
[61] Savoie P, Jofriet JC. Silage storage. Silage science andtechnology. Madison, WI: American Society of Agronomy,Crop Science Society of America, Soil Science Society ofAmerica; 2003.
[62] Monti A, Fazio S, Venturi G. The discrepancy between plotand field yields: harvest and storage losses of switchgrass.Biomass Bioenergy 2009;33:841e7.
[63] Brechbill S, Tyner WE. The economics of renewable energy:corn stover and switchgrass. Purdue extension bioenergy.
West Lafayette, IN: Purdue University Cooperative ExtensionService; 2009.
[64] Sokhansanj S, Turhollow A, Wilkerson E. Development of theintegrated biomass supply analysis and logistics model(IBSAL). Oak Ridge National Laboratory; 2008.
[65] McDonald P. The biochemistry of silage. John Wiley & Sons;1981.
[66] Williams AG, Hoxey RP, Lowe JF. Changes in temperatureand silo gas composition during ensiling, storage andfeeding-out grass silage. Grass Forage Sci 1997;52:176e89.
[67] Kumar A, Sokhansanj S. Switchgrass (Panicum virgatum, L.)delivery to a biorefinery using integrated biomass supplyanalysis and logistics (IBSAL) model. Bioresour Technol 2007;98:1033e44.
[68] McDonald P, Henderson AR, Heron SJE. The biochemistry ofsilage. 2nd ed. Marlow, Buckinghamshire, UK: ChalcombePublications; 1991.
[69] Pitt RE, Leibensperger RY. The effectiveness of silageinnoculants: a systems approach. Agric Sys 1987;25:27e49.
[70] Leibensperger RY, Pitt RE. Modeling the effects of formic acidand molasses on ensilage. J Dairy Sci 1988;71:1220e31.
[71] Perlack RD, Turhollow AF. Assessment of options for thecollection, handling, and transport of corn stover. Oak RidgeNational Laboratory; 2002.
[72] Turhollow AE, Sokhansanj S. Costs of harvesting, storing ina large pile, and transporting corn stover in a wet form. ApplEng Agric 2007;23:439e48.
b i om a s s an d b i o e n e r g y 3 9 ( 2 0 1 2 ) 2 3 7e2 4 6246