City and County of San Francisco Transportation Biofuels ...
62
PREPARED FOR THE SAN FRANCISCO DEPARTMENT OF THE ENVIRONMENT City and County of San Francisco Transportation Biofuels Planning Study JASON BARBOSE, GOLDMAN SCHOOL OF PUBLIC POLICY, M.P.P. 2012 YURI YAKUBOV, HAAS SCHOOL OF BUSINESS, M.B.A. 2013 WITH CONTRIBUTIONS FROM BILL ZELLER, SAN FRANCISCO DEPARTMENT OF THE ENVIRONMENT JUNE 2012
-
Upload
khangminh22 -
Category
Documents
-
view
0 -
download
0
Transcript of City and County of San Francisco Transportation Biofuels ...
PREPARED FOR THE SAN FRANCISCO DEPARTMENT OF THE ENVIRONMENT
City and County of San Francisco Transportation Biofuels Planning Study
JASON BARBOSE, GOLDMAN SCHOOL OF PUBLIC POLICY, M.P.P. 2012 YURI YAKUBOV, HAAS SCHOOL OF BUSINESS, M.B.A. 2013 WITH CONTRIBUTIONS FROM BILL ZELLER, SAN FRANCISCO DEPARTMENT OF THE ENVIRONMENT
JUNE 2012
- 1 -
Table of Contents
EXECUTIVE SUMMARY ....................................................................................................................................... - 2 -
SECTION 1: INTRODUCTION & BACKGROUND .................................................................................................... - 6 -
SECTION 2: EVALUATION OF FUELS .................................................................................................................. - 11 -
DIESEL ................................................................................................................................................................... - 11 -
BIODIESEL ............................................................................................................................................................... - 13 -
RENEWABLE DIESEL .................................................................................................................................................. - 20 -
GASOLINE ............................................................................................................................................................... - 23 -
ETHANOL ................................................................................................................................................................ - 24 -
RENEWABLE GASOLINE .............................................................................................................................................. - 27 -
NATURAL GAS ......................................................................................................................................................... - 29 -
BIOMETHANE .......................................................................................................................................................... - 33 -
HYDROGEN ............................................................................................................................................................. - 39 -
CONCLUSION ........................................................................................................................................................... - 42 -
SECTION 3: FUEL MIX SCENARIOS .................................................................................................................... - 45 -
BASELINE SCENARIO.................................................................................................................................................. - 45 -
B20 SCENARIO ........................................................................................................................................................ - 46 -
B50 SCENARIO ........................................................................................................................................................ - 47 -
BIOMETHANE SCENARIO ............................................................................................................................................ - 48 -
CNG SCENARIO (BIOMETHANE TRANSITION) ................................................................................................................. - 48 -
CONCLUSION ........................................................................................................................................................... - 49 -
SECTION 4: FINDINGS & NEXT STEPS ................................................................................................................ - 52 -
REFERENCES ..................................................................................................................................................... - 55 -
APPENDIX: FUEL MIX SCENARIOS METHODOLOGY .......................................................................................... - 60 -
- 2 -
Executive Summary
The City and County of San Francisco (CCSF) owns more than 7,000 vehicles and uses about 7.6 million
gallons of diesel and gasoline each year. Recognizing that opportunities exist to replace petroleum fuel
with biofuels, the Mayor’s Office asked the Department of the Environment to assess opportunities to
expand the use of biofuels. This paper is a response to that request as it aims to increase CCSF’s
understanding of the opportunities, challenges, benefits and drawbacks of increasing the use of biofuels
in the fleet.
Evaluation of Fuels
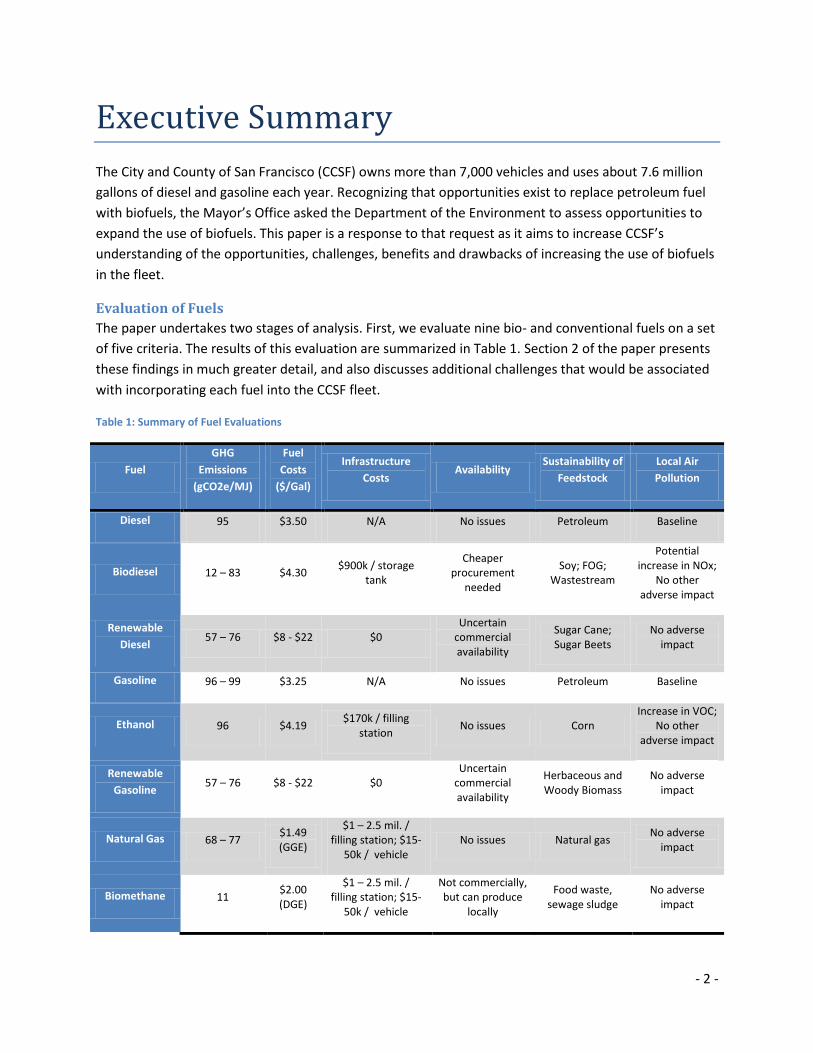
The paper undertakes two stages of analysis. First, we evaluate nine bio- and conventional fuels on a set
of five criteria. The results of this evaluation are summarized in Table 1. Section 2 of the paper presents
these findings in much greater detail, and also discusses additional challenges that would be associated
with incorporating each fuel into the CCSF fleet.
Table 1: Summary of Fuel Evaluations
Fuel
GHG
Emissions
(gCO2e/MJ)
Fuel
Costs
($/Gal)
Infrastructure
Costs Availability
Sustainability of
Feedstock
Local Air
Pollution
Diesel 95 $3.50 N/A No issues Petroleum Baseline
Biodiesel 12 – 83 $4.30 $900k / storage
tank
Cheaper procurement
needed
Soy; FOG; Wastestream
Potential increase in NOx;
No other adverse impact
Renewable
Diesel 57 – 76 $8 - $22 $0
Uncertain commercial availability
Sugar Cane; Sugar Beets
No adverse impact
Gasoline 96 – 99 $3.25 N/A No issues Petroleum Baseline
Ethanol 96 $4.19 $170k / filling
station No issues Corn
Increase in VOC; No other
adverse impact
Renewable
Gasoline 57 – 76 $8 - $22 $0
Uncertain commercial availability
Herbaceous and Woody Biomass
No adverse impact
Natural Gas 68 – 77 $1.49 (GGE)
$1 – 2.5 mil. / filling station; $15-
50k / vehicle No issues Natural gas
No adverse impact
Biomethane 11 $2.00 (DGE)
$1 – 2.5 mil. / filling station; $15-
50k / vehicle
Not commercially, but can produce
locally
Food waste, sewage sludge
No adverse impact
- 3 -
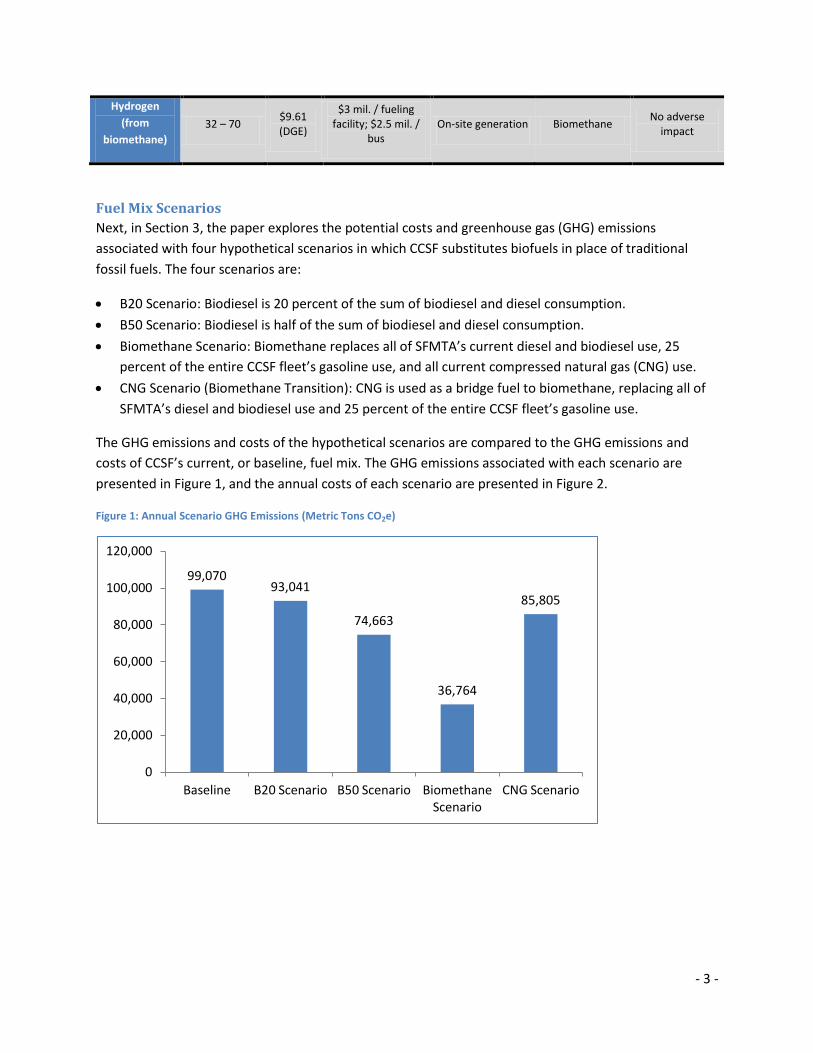
Hydrogen
(from
biomethane)
32 – 70 $9.61 (DGE)
$3 mil. / fueling facility; $2.5 mil. /
bus On-site generation Biomethane
No adverse impact
Fuel Mix Scenarios
Next, in Section 3, the paper explores the potential costs and greenhouse gas (GHG) emissions
associated with four hypothetical scenarios in which CCSF substitutes biofuels in place of traditional
fossil fuels. The four scenarios are:
B20 Scenario: Biodiesel is 20 percent of the sum of biodiesel and diesel consumption.
B50 Scenario: Biodiesel is half of the sum of biodiesel and diesel consumption.
Biomethane Scenario: Biomethane replaces all of SFMTA’s current diesel and biodiesel use, 25
percent of the entire CCSF fleet’s gasoline use, and all current compressed natural gas (CNG) use.
CNG Scenario (Biomethane Transition): CNG is used as a bridge fuel to biomethane, replacing all of
SFMTA’s diesel and biodiesel use and 25 percent of the entire CCSF fleet’s gasoline use.
The GHG emissions and costs of the hypothetical scenarios are compared to the GHG emissions and
costs of CCSF’s current, or baseline, fuel mix. The GHG emissions associated with each scenario are
presented in Figure 1, and the annual costs of each scenario are presented in Figure 2.
Figure 1: Annual Scenario GHG Emissions (Metric Tons CO2e)
99,070 93,041
74,663
36,764
85,805
0
20,000
40,000
60,000
80,000
100,000
120,000
Baseline B20 Scenario B50 Scenario Biomethane Scenario
CNG Scenario

- 4 -
Figure 2: Annual Scenario Costs (Millions of Dollars)
Findings & Next Steps
Our work on this project led us to four main conclusions:
Biomethane produced from local, waste-based feedstocks appears to be the most promising
long-term biofuel.
Biodiesel produced from local, waste-based feedstocks appears to be the most promising
near-term biofuel.
Measuring a fuel’s cost-effectiveness at reducing GHG emissions—as is done in this paper—is
a useful tool for comparing the relative merits of a fuel.
CCSF lacks rigorous tracking of fuel prices and consumption. As a result, estimates of fuel use
and costs vary and are often outdated.
In light of our findings, we recommend that CCSF consider the following near-term actions:
Enforce B20 purchasing requirement.
Recertify double-walled fuel storage systems.
Upgrade CCSF’s single-walled fuel storage systems.
Reduce biodiesel costs either through new contractual arrangements.
Test biodiesel blends above B20.
Institutionalize a system to collect fuel use data.
Conduct an in-depth study of biomethane and biodiesel.
$0
$5
$10
$15
$20
$25
$30
$35
Baseline B20 Scenario
B50 Scenario
Biomethane Scenario
CNG Scenario
Biomethane
CNG
Gasoline
B100
Diesel
$29.3 $30.1 $32.0
$26.8 $29.0

- 5 -
Develop and codify a new policy vision with respect to biofuels.
- 6 -
Section 1: Introduction & Background
Two years ago, on April 20, 2010, the world’s attention was drawn to an event that exemplified all-too-
well the hazards of using oil as the primary source for transporting the world’s people and goods. That
day there was an explosion on the Deepwater Horizon oil drilling platform in the Gulf of Mexico, killing
eleven workers on the platform and initiating the largest oil spill in U.S. history. Over the ensuing three
months, nearly five million barrels of crude oil would be released into Gulf waters, causing billions of
dollars in damage to the region’s wildlife, ecology, and economy. For San Franciscans, the Deepwater
Horizon spill was an outsized reminder of the damages posed by an oil-based economy. Two and a half
years before Deepwater Horizon, on November 7, 2007, San Franciscans experienced the consequence
of an oil spill first-hand when the Cosco Busan container ship crashed into the Bay Bridge, releasing
58,000 gallons of heavy-duty bunker fuel. The spill ultimately cost more than $70 million in
environmental cleanup, killed nearly 7,000 birds and damaged many fisheries.1
Deepwater Horizon and Cosco Busan are useful cautionary tales that highlight the risks of over-
dependence on oil. Yet they illustrate only one drawback of relying on petroleum fuels. In addition to
the risks of oil spills, and other risks associated with extracting petroleum, burning petroleum-based
fuels inflicts global warming and public health impacts. And with two percent of the world’s proven oil
reserves, and more than 20 percent of the world’s daily consumption, there are significant
macroeconomic and geopolitical consequences for the United States, which is destined to remain a net
importer of oil as long as it is primarily reliant on gasoline and diesel to power the nation’s cars and
trucks.
Fortunately, there are solutions to reduce America’s dependence on oil. Among those solutions is the
use of fuels from renewable biomass, most commonly referred to as “biofuels.” These fuels—such as
biodiesel, ethanol, renewable diesel, and biomethane—are not a panacea. They each have their own
benefits and drawbacks. However, by strategically injecting biofuels into the fuel mix, we can reduce
reliance on petroleum fuels and reduce the ecological impact of the transportation sector. By increasing
the use of biofuels in its fleet of vehicles, the City and County of San Francisco (CCSF) has the
opportunity more firmly establish itself as a leader of transportation sustainability, and to help it meet
its ambitious greenhouse gas (GHG) reduction goals. This paper explores the opportunities, challenges,
benefits, and drawbacks of using biofuels in the CCSF fleet in an effort to help shape the thinking and
planning of CCSF decision-makers.
1 State of California. Office of Spill Prevention and Response. Natural Resource Damage Assessment for the COSCO Busan Oil
Spill Bird Injury Summary. By Steve Hamptom et al., 2008. http://www.dfg.ca.gov/ospr/Science/cosco_busan_spill.aspx.; United States. National Transportation Safety Board. Marine Accident Report: Allision of Hong Kong‐Registered Containership M/V Cosco Busan with the Delta Tower of the San Francisco–Oakland Bay Bridge San Francisco, California November 7, 2007. By Mark Rosenker et al., 2009. http://www.ntsb.gov/investigations/summary/MAR0901.htm.
- 7 -
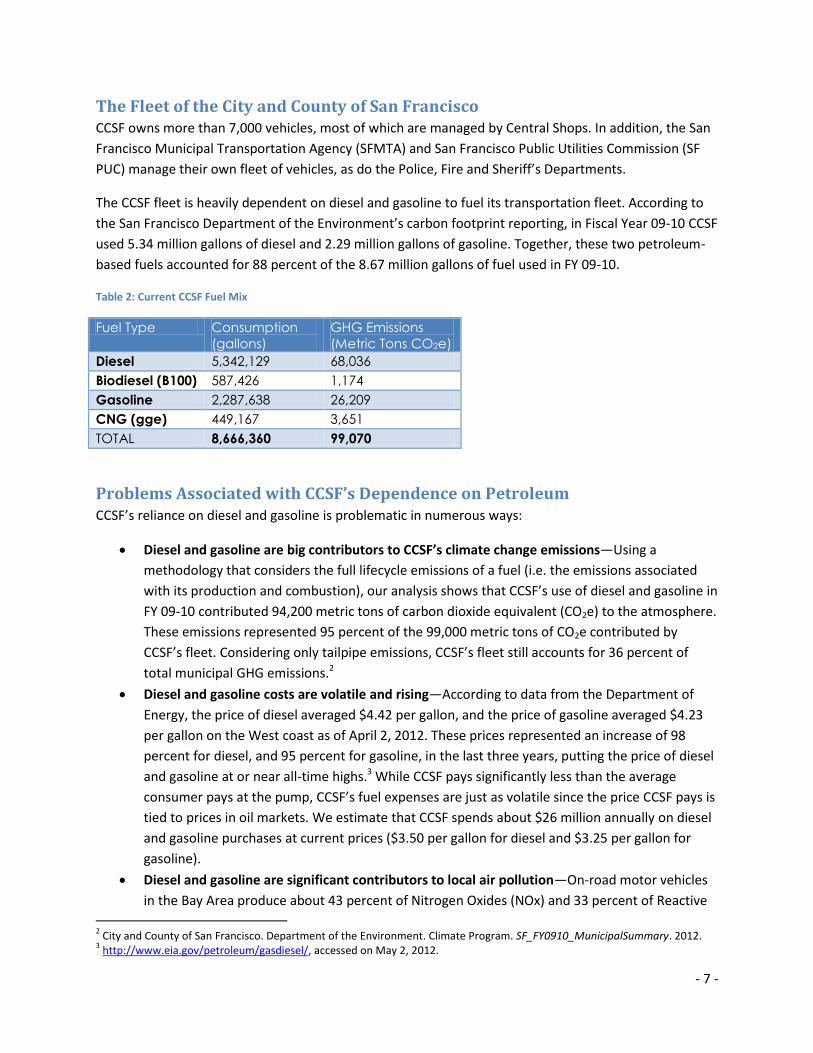
The Fleet of the City and County of San Francisco CCSF owns more than 7,000 vehicles, most of which are managed by Central Shops. In addition, the San
Francisco Municipal Transportation Agency (SFMTA) and San Francisco Public Utilities Commission (SF
PUC) manage their own fleet of vehicles, as do the Police, Fire and Sheriff’s Departments.
The CCSF fleet is heavily dependent on diesel and gasoline to fuel its transportation fleet. According to
the San Francisco Department of the Environment’s carbon footprint reporting, in Fiscal Year 09-10 CCSF
used 5.34 million gallons of diesel and 2.29 million gallons of gasoline. Together, these two petroleum-
based fuels accounted for 88 percent of the 8.67 million gallons of fuel used in FY 09-10.
Table 2: Current CCSF Fuel Mix
Fuel Type Consumption
(gallons)
GHG Emissions
(Metric Tons CO2e)
Diesel 5,342,129 68,036
Biodiesel (B100) 587,426 1,174
Gasoline 2,287,638 26,209
CNG (gge) 449,167 3,651
TOTAL 8,666,360 99,070
Problems Associated with CCSF’s Dependence on Petroleum CCSF’s reliance on diesel and gasoline is problematic in numerous ways:
Diesel and gasoline are big contributors to CCSF’s climate change emissions—Using a
methodology that considers the full lifecycle emissions of a fuel (i.e. the emissions associated
with its production and combustion), our analysis shows that CCSF’s use of diesel and gasoline in
FY 09-10 contributed 94,200 metric tons of carbon dioxide equivalent (CO2e) to the atmosphere.
These emissions represented 95 percent of the 99,000 metric tons of CO2e contributed by
CCSF’s fleet. Considering only tailpipe emissions, CCSF’s fleet still accounts for 36 percent of
total municipal GHG emissions.2
Diesel and gasoline costs are volatile and rising—According to data from the Department of
Energy, the price of diesel averaged $4.42 per gallon, and the price of gasoline averaged $4.23
per gallon on the West coast as of April 2, 2012. These prices represented an increase of 98
percent for diesel, and 95 percent for gasoline, in the last three years, putting the price of diesel
and gasoline at or near all-time highs.3 While CCSF pays significantly less than the average
consumer pays at the pump, CCSF’s fuel expenses are just as volatile since the price CCSF pays is
tied to prices in oil markets. We estimate that CCSF spends about $26 million annually on diesel
and gasoline purchases at current prices ($3.50 per gallon for diesel and $3.25 per gallon for
gasoline).
Diesel and gasoline are significant contributors to local air pollution—On-road motor vehicles
in the Bay Area produce about 43 percent of Nitrogen Oxides (NOx) and 33 percent of Reactive
2 City and County of San Francisco. Department of the Environment. Climate Program. SF_FY0910_MunicipalSummary. 2012.
3 http://www.eia.gov/petroleum/gasdiesel/, accessed on May 2, 2012.
- 8 -
Organic Gases, making vehicles the single largest source of ozone precursor emissions in the Bay
Area. On-road vehicles are directly responsible for 9 percent of the region’s PM2.5.4
Diesel and gasoline are largely sourced from outside the United States—In 2011, the U.S. was a
net importer of about 8.4 million barrels of crude oil and products each day, which accounted
for 45 percent of the country’s total petroleum consumption.5 With oil selling at around $100
per barrel, our reliance on foreign sources of oil contributed about $300 billion to the U.S. trade
deficit in 2011.
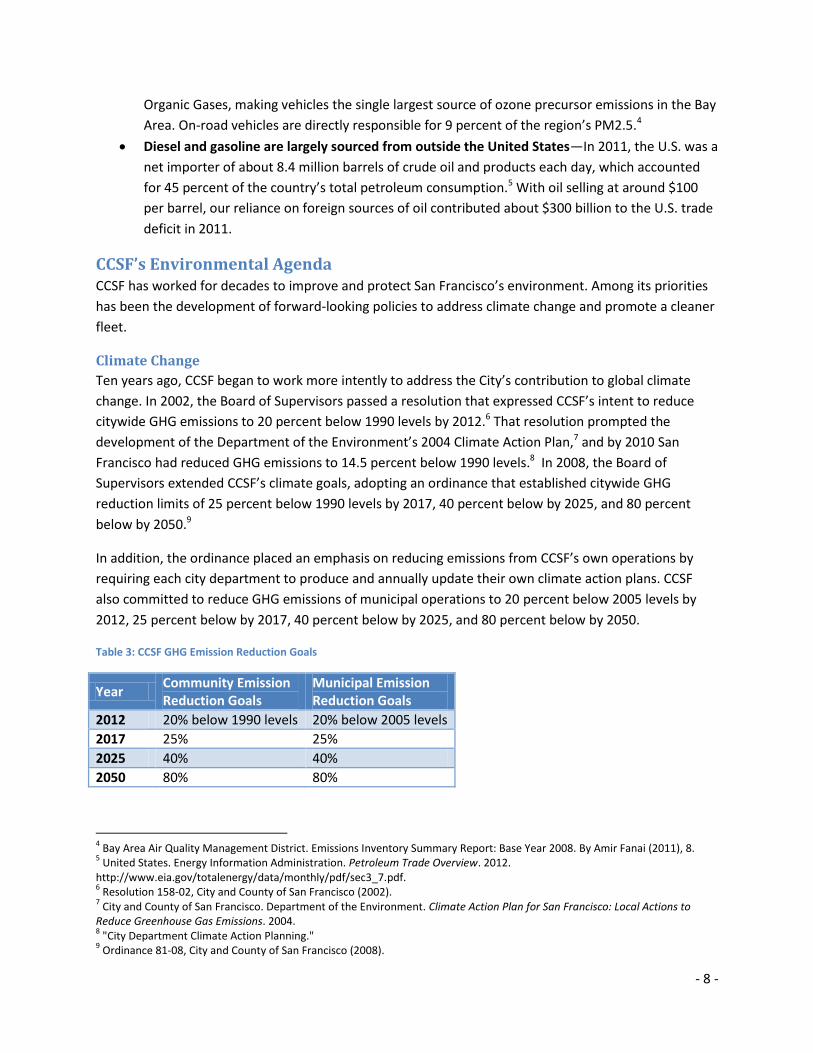
CCSF’s Environmental Agenda CCSF has worked for decades to improve and protect San Francisco’s environment. Among its priorities
has been the development of forward-looking policies to address climate change and promote a cleaner
fleet.
Climate Change
Ten years ago, CCSF began to work more intently to address the City’s contribution to global climate
change. In 2002, the Board of Supervisors passed a resolution that expressed CCSF’s intent to reduce
citywide GHG emissions to 20 percent below 1990 levels by 2012.6 That resolution prompted the
development of the Department of the Environment’s 2004 Climate Action Plan,7 and by 2010 San
Francisco had reduced GHG emissions to 14.5 percent below 1990 levels.8 In 2008, the Board of
Supervisors extended CCSF’s climate goals, adopting an ordinance that established citywide GHG
reduction limits of 25 percent below 1990 levels by 2017, 40 percent below by 2025, and 80 percent
below by 2050.9
In addition, the ordinance placed an emphasis on reducing emissions from CCSF’s own operations by
requiring each city department to produce and annually update their own climate action plans. CCSF
also committed to reduce GHG emissions of municipal operations to 20 percent below 2005 levels by
2012, 25 percent below by 2017, 40 percent below by 2025, and 80 percent below by 2050.
Table 3: CCSF GHG Emission Reduction Goals
Year Community Emission Reduction Goals
Municipal Emission Reduction Goals
2012 20% below 1990 levels 20% below 2005 levels
2017 25% 25%
2025 40% 40%
2050 80% 80%
4 Bay Area Air Quality Management District. Emissions Inventory Summary Report: Base Year 2008. By Amir Fanai (2011), 8.
5 United States. Energy Information Administration. Petroleum Trade Overview. 2012.
http://www.eia.gov/totalenergy/data/monthly/pdf/sec3_7.pdf.
6 Resolution 158-02, City and County of San Francisco (2002).
7 City and County of San Francisco. Department of the Environment. Climate Action Plan for San Francisco: Local Actions to
Reduce Greenhouse Gas Emissions. 2004.
8 "City Department Climate Action Planning."
9 Ordinance 81-08, City and County of San Francisco (2008).
- 9 -
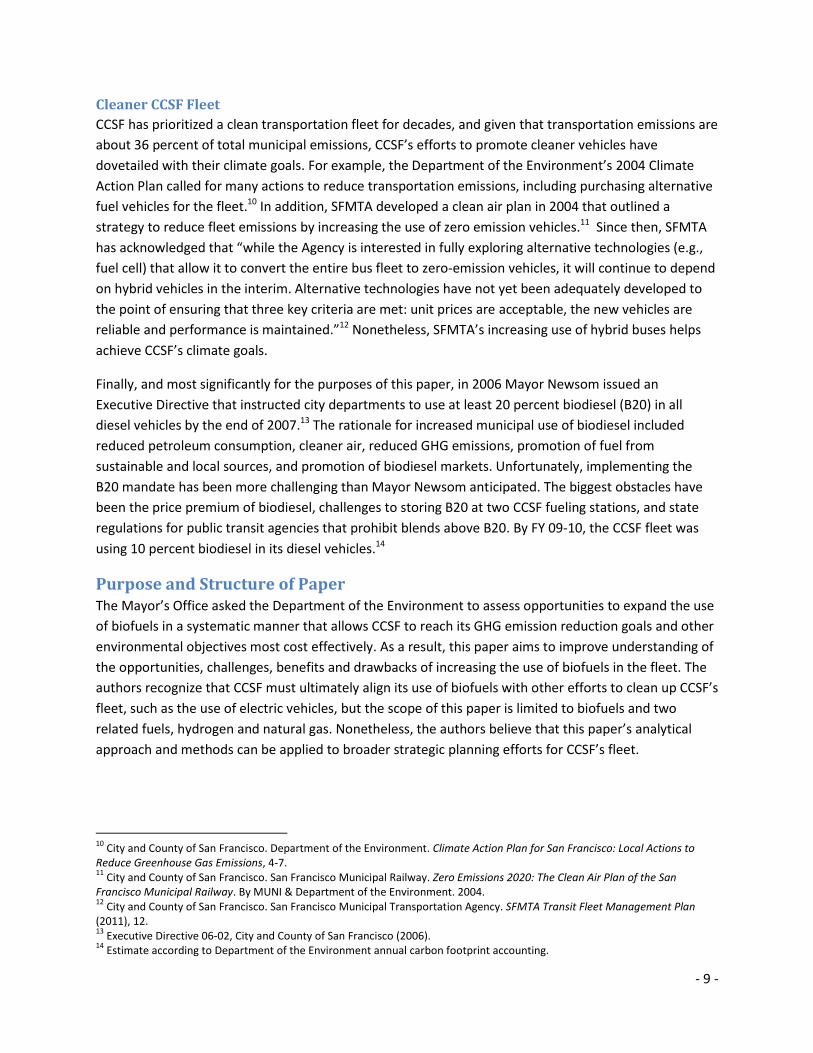
Cleaner CCSF Fleet
CCSF has prioritized a clean transportation fleet for decades, and given that transportation emissions are
about 36 percent of total municipal emissions, CCSF’s efforts to promote cleaner vehicles have
dovetailed with their climate goals. For example, the Department of the Environment’s 2004 Climate
Action Plan called for many actions to reduce transportation emissions, including purchasing alternative
fuel vehicles for the fleet.10 In addition, SFMTA developed a clean air plan in 2004 that outlined a
strategy to reduce fleet emissions by increasing the use of zero emission vehicles.11 Since then, SFMTA
has acknowledged that “while the Agency is interested in fully exploring alternative technologies (e.g.,
fuel cell) that allow it to convert the entire bus fleet to zero‐emission vehicles, it will continue to depend
on hybrid vehicles in the interim. Alternative technologies have not yet been adequately developed to
the point of ensuring that three key criteria are met: unit prices are acceptable, the new vehicles are
reliable and performance is maintained.”12 Nonetheless, SFMTA’s increasing use of hybrid buses helps
achieve CCSF’s climate goals.
Finally, and most significantly for the purposes of this paper, in 2006 Mayor Newsom issued an
Executive Directive that instructed city departments to use at least 20 percent biodiesel (B20) in all
diesel vehicles by the end of 2007.13 The rationale for increased municipal use of biodiesel included
reduced petroleum consumption, cleaner air, reduced GHG emissions, promotion of fuel from
sustainable and local sources, and promotion of biodiesel markets. Unfortunately, implementing the
B20 mandate has been more challenging than Mayor Newsom anticipated. The biggest obstacles have
been the price premium of biodiesel, challenges to storing B20 at two CCSF fueling stations, and state
regulations for public transit agencies that prohibit blends above B20. By FY 09-10, the CCSF fleet was
using 10 percent biodiesel in its diesel vehicles.14
Purpose and Structure of Paper The Mayor’s Office asked the Department of the Environment to assess opportunities to expand the use
of biofuels in a systematic manner that allows CCSF to reach its GHG emission reduction goals and other
environmental objectives most cost effectively. As a result, this paper aims to improve understanding of
the opportunities, challenges, benefits and drawbacks of increasing the use of biofuels in the fleet. The
authors recognize that CCSF must ultimately align its use of biofuels with other efforts to clean up CCSF’s
fleet, such as the use of electric vehicles, but the scope of this paper is limited to biofuels and two
related fuels, hydrogen and natural gas. Nonetheless, the authors believe that this paper’s analytical
approach and methods can be applied to broader strategic planning efforts for CCSF’s fleet.
10
City and County of San Francisco. Department of the Environment. Climate Action Plan for San Francisco: Local Actions to Reduce Greenhouse Gas Emissions, 4-7. 11
City and County of San Francisco. San Francisco Municipal Railway. Zero Emissions 2020: The Clean Air Plan of the San Francisco Municipal Railway. By MUNI & Department of the Environment. 2004. 12
City and County of San Francisco. San Francisco Municipal Transportation Agency. SFMTA Transit Fleet Management Plan (2011), 12. 13
Executive Directive 06-02, City and County of San Francisco (2006). 14
Estimate according to Department of the Environment annual carbon footprint accounting.
- 10 -
This paper attempts to achieve its objectives through two stages of analysis. First, in Section 2, we
evaluate nine bio- and conventional fuels based on a set of five criteria. This section of the paper also
explores procurement options for CCSF and challenges to incorporating each fuel into the fuel mix.
Next, Section 3 explores the potential cost and GHG emission impacts of four hypothetical fuel mix
scenarios in comparison to the costs and GHG emissions of CCSF’s current fuel mix. The scenarios were
chosen based on the findings of our analysis of the fuels, which found that biodiesel and biomethane are
the most promising biofuel options in the near future.
Finally, Section 4 concludes with three central conclusions, and a series of proposed next steps.

- 11 -
Section 2: Evaluation of Fuels
In this section, we evaluate the benefits and drawbacks of nine fuels, and the challenges and
opportunities CCSF faces in using each fuel. Of the fuels we evaluate, six are biofuels. They include two
liquid diesel substitutes, biodiesel and renewable diesel, two liquid gasoline substitutes, ethanol and
renewable gasoline, and two gaseous substitutes, biomethane and hydrogen (produced using
biomethane). We also evaluate three fossil fuels: diesel, gasoline and natural gas. The first two—diesel
and gasoline—are treated as “baseline” fuels, which means the performance of all other fuels is
measured relative to the performance of gasoline and diesel. Natural gas is included only as a bridging
fuel to biomethane.
Each fuel is evaluated based on five criteria that we believe to be important to CCSF decision-makers:
1) Minimize GHG emissions;
2) Minimize (fuel & infrastructure) costs;
3) Maximize sustainability of fuel feedstocks;
4) Prevent increases in local air pollution; and
5) Ensure availability of fuel.
Diesel
Background Diesel is a “baseline” fuel in this analysis, which means that the alternative fuels that would be replacing
diesel are evaluated in comparison to diesel.
Diesel fuel currently accounts for 62 percent of fuel consumed by the fleet. More than 83 percent of
diesel fuel is consumed by SFMTA.
GHG Emissions The California Air Resources Board (CARB) has certified the lifecycle GHG emissions of transportation
fuels for the state’s Low Carbon Fuel Standard (LCFS).15 CARB estimates that Ultra Low Sulfur Diesel
(ULSD) refined from the average crude in California produces life-cycle GHG emissions of 94.71
gCO2e/MJ.
15
“Lifecycle” GHG emissions refers to the emissions associated with the production, refining, transport and combustion of the fuel. This is can also be referred to as “well-to-wheel” GHG emissions. Significantly, “lifecycle” also includes indirect emissions from land use changes. The study of emissions from indirect land use change is a new and emerging field of study. As a result, there is considerable uncertainty about the exact emissions of many biofuels. Nonetheless, it is clear that indirect land use change is important, and therefore it should not be ignored.
- 12 -
Costs
Fuel Costs
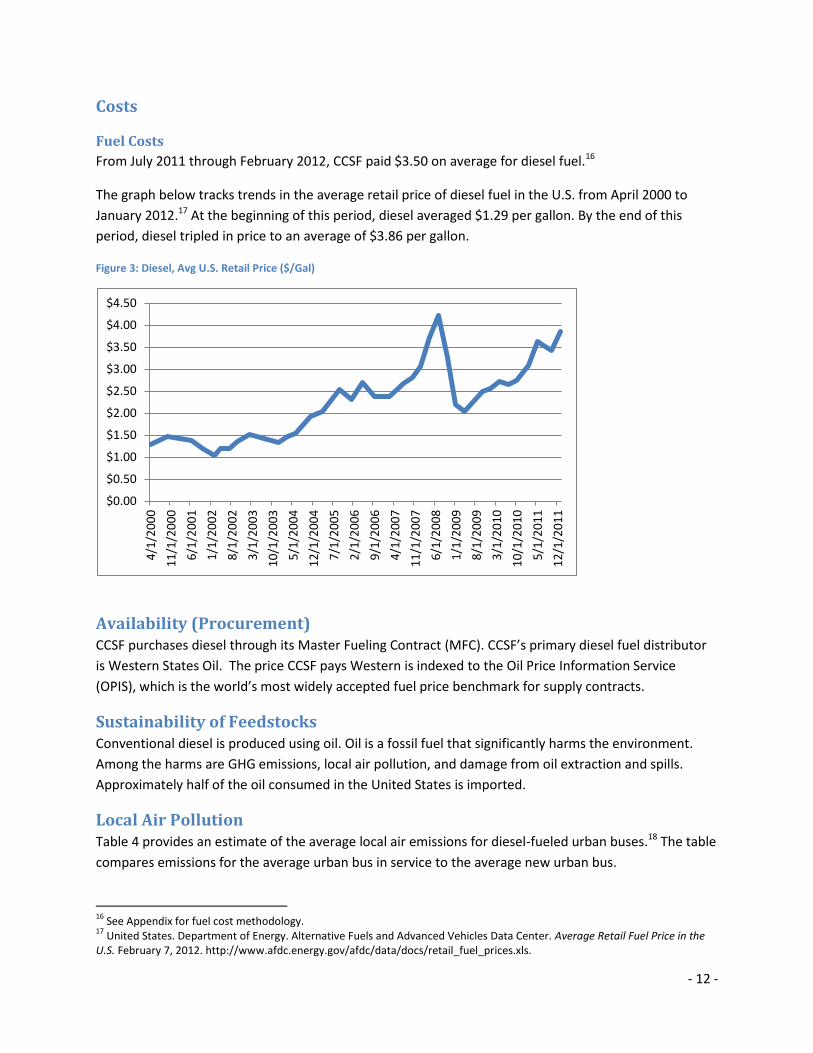
From July 2011 through February 2012, CCSF paid $3.50 on average for diesel fuel.16
The graph below tracks trends in the average retail price of diesel fuel in the U.S. from April 2000 to
January 2012.17 At the beginning of this period, diesel averaged $1.29 per gallon. By the end of this
period, diesel tripled in price to an average of $3.86 per gallon.
Figure 3: Diesel, Avg U.S. Retail Price ($/Gal)
Availability (Procurement) CCSF purchases diesel through its Master Fueling Contract (MFC). CCSF’s primary diesel fuel distributor
is Western States Oil. The price CCSF pays Western is indexed to the Oil Price Information Service
(OPIS), which is the world’s most widely accepted fuel price benchmark for supply contracts.
Sustainability of Feedstocks Conventional diesel is produced using oil. Oil is a fossil fuel that significantly harms the environment.
Among the harms are GHG emissions, local air pollution, and damage from oil extraction and spills.
Approximately half of the oil consumed in the United States is imported.
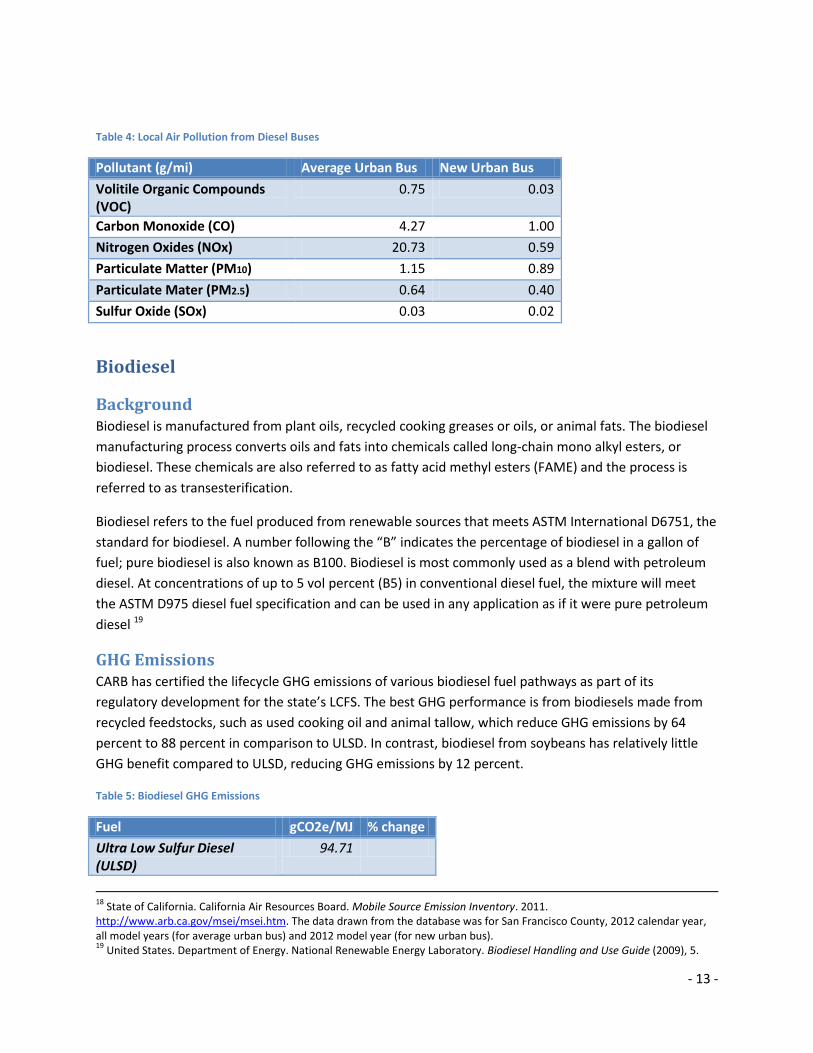
Local Air Pollution Table 4 provides an estimate of the average local air emissions for diesel-fueled urban buses.18 The table
compares emissions for the average urban bus in service to the average new urban bus.
16
See Appendix for fuel cost methodology. 17
United States. Department of Energy. Alternative Fuels and Advanced Vehicles Data Center. Average Retail Fuel Price in the U.S. February 7, 2012. http://www.afdc.energy.gov/afdc/data/docs/retail_fuel_prices.xls.
$0.00
$0.50
$1.00
$1.50
$2.00
$2.50
$3.00
$3.50
$4.00
$4.50
4/1
/20
00
11
/1/2
00
0
6/1
/20
01
1/1
/20
02
8/1
/20
02
3/1
/20
03
10
/1/2
00
3
5/1
/20
04
12
/1/2
00
4
7/1
/20
05
2/1
/20
06
9/1
/20
06
4/1
/20
07
11
/1/2
00
7
6/1
/20
08
1/1
/20
09
8/1
/20
09
3/1
/20
10
10
/1/2
01
0
5/1
/20
11
12
/1/2
01
1
- 13 -
Table 4: Local Air Pollution from Diesel Buses
Pollutant (g/mi) Average Urban Bus New Urban Bus
Volitile Organic Compounds (VOC)
0.75 0.03
Carbon Monoxide (CO) 4.27 1.00
Nitrogen Oxides (NOx) 20.73 0.59
Particulate Matter (PM10) 1.15 0.89
Particulate Mater (PM2.5) 0.64 0.40
Sulfur Oxide (SOx) 0.03 0.02
Biodiesel
Background Biodiesel is manufactured from plant oils, recycled cooking greases or oils, or animal fats. The biodiesel
manufacturing process converts oils and fats into chemicals called long-chain mono alkyl esters, or
biodiesel. These chemicals are also referred to as fatty acid methyl esters (FAME) and the process is
referred to as transesterification.
Biodiesel refers to the fuel produced from renewable sources that meets ASTM International D6751, the
standard for biodiesel. A number following the “B” indicates the percentage of biodiesel in a gallon of
fuel; pure biodiesel is also known as B100. Biodiesel is most commonly used as a blend with petroleum
diesel. At concentrations of up to 5 vol percent (B5) in conventional diesel fuel, the mixture will meet
the ASTM D975 diesel fuel specification and can be used in any application as if it were pure petroleum
diesel 19
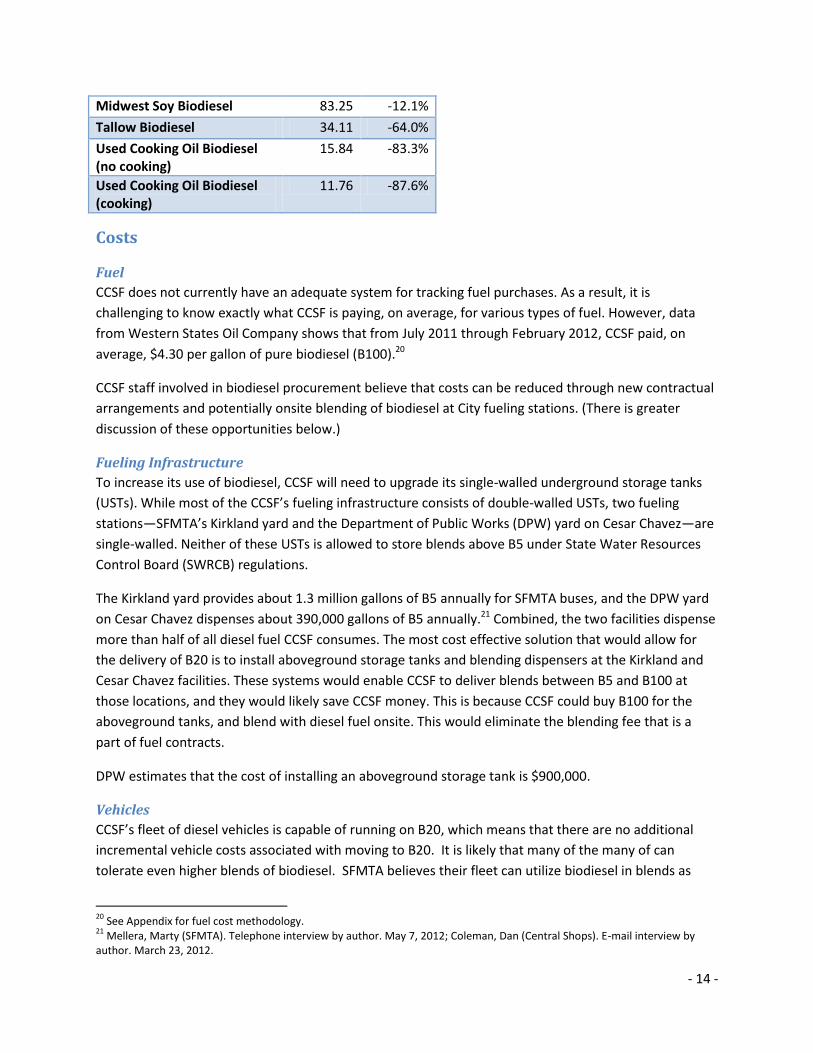
GHG Emissions CARB has certified the lifecycle GHG emissions of various biodiesel fuel pathways as part of its
regulatory development for the state’s LCFS. The best GHG performance is from biodiesels made from
recycled feedstocks, such as used cooking oil and animal tallow, which reduce GHG emissions by 64
percent to 88 percent in comparison to ULSD. In contrast, biodiesel from soybeans has relatively little
GHG benefit compared to ULSD, reducing GHG emissions by 12 percent.
Table 5: Biodiesel GHG Emissions
Fuel gCO2e/MJ % change
Ultra Low Sulfur Diesel (ULSD)
94.71
18
State of California. California Air Resources Board. Mobile Source Emission Inventory. 2011. http://www.arb.ca.gov/msei/msei.htm. The data drawn from the database was for San Francisco County, 2012 calendar year, all model years (for average urban bus) and 2012 model year (for new urban bus). 19
United States. Department of Energy. National Renewable Energy Laboratory. Biodiesel Handling and Use Guide (2009), 5.
- 14 -
Midwest Soy Biodiesel 83.25 -12.1%
Tallow Biodiesel 34.11 -64.0%
Used Cooking Oil Biodiesel (no cooking)
15.84 -83.3%
Used Cooking Oil Biodiesel (cooking)
11.76 -87.6%
Costs
Fuel
CCSF does not currently have an adequate system for tracking fuel purchases. As a result, it is
challenging to know exactly what CCSF is paying, on average, for various types of fuel. However, data
from Western States Oil Company shows that from July 2011 through February 2012, CCSF paid, on
average, $4.30 per gallon of pure biodiesel (B100).20
CCSF staff involved in biodiesel procurement believe that costs can be reduced through new contractual
arrangements and potentially onsite blending of biodiesel at City fueling stations. (There is greater
discussion of these opportunities below.)
Fueling Infrastructure
To increase its use of biodiesel, CCSF will need to upgrade its single-walled underground storage tanks
(USTs). While most of the CCSF’s fueling infrastructure consists of double-walled USTs, two fueling
stations—SFMTA’s Kirkland yard and the Department of Public Works (DPW) yard on Cesar Chavez—are
single-walled. Neither of these USTs is allowed to store blends above B5 under State Water Resources
Control Board (SWRCB) regulations.
The Kirkland yard provides about 1.3 million gallons of B5 annually for SFMTA buses, and the DPW yard
on Cesar Chavez dispenses about 390,000 gallons of B5 annually.21 Combined, the two facilities dispense
more than half of all diesel fuel CCSF consumes. The most cost effective solution that would allow for
the delivery of B20 is to install aboveground storage tanks and blending dispensers at the Kirkland and
Cesar Chavez facilities. These systems would enable CCSF to deliver blends between B5 and B100 at
those locations, and they would likely save CCSF money. This is because CCSF could buy B100 for the
aboveground tanks, and blend with diesel fuel onsite. This would eliminate the blending fee that is a
part of fuel contracts.
DPW estimates that the cost of installing an aboveground storage tank is $900,000.
Vehicles
CCSF’s fleet of diesel vehicles is capable of running on B20, which means that there are no additional
incremental vehicle costs associated with moving to B20. It is likely that many of the many of can
tolerate even higher blends of biodiesel. SFMTA believes their fleet can utilize biodiesel in blends as
20
See Appendix for fuel cost methodology. 21
Mellera, Marty (SFMTA). Telephone interview by author. May 7, 2012; Coleman, Dan (Central Shops). E-mail interview by author. March 23, 2012.
- 15 -
high as B100. Testing will be required to confirm the compatibility higher blends of biodiesel with
specific vehicles. The ability to deliver custom blends a fuel, as described in the infrastructure section
above, will allow the delivery of the highest biodiesel blend each vehicle can tolerate and maximize the
use of biodiesel.
Availability (Procurement) There are three main options for CCSF to procure biodiesel: (1) purchase through the MFC, (2) purchase
from a local producer, or (3) expand procurement from the SF PUC’s SF Greasecycle Program.
Purchase through Master Fueling Contract
CCSF procures biodiesel from Western States Oil as stipulated in MFC. The Department of the
Environment estimates that in FY 09-10 CCSF purchased biodiesel blends totaling 5.93 million gallons. Of
this amount, approximately 590,000 gallons, or 10 percent, was pure B100 biodiesel.
There are a few challenges with the MFC. First, the current MFC indexes the price CCSF pays for
biodiesel to the OPIS Price Index for biodiesel in the San Francisco Bay Area. Because there are relatively
few biodiesel sellers in the Bay Area, the sellers are potentially able to manipulate the index to secure a
higher price on biodiesel sold to CCSF. To correct this, CCSF is planning to expand to a regional OPIS
Price Index. In addition, CCSF is paying more for the biodiesel portion of low biodiesel blends. As CCSF
switches its remaining B5 consumption to B20, this problem will disappear.
Another factor that adds to the cost of fuel is CCSF’s emergency preparedness requirement that all City-
owned fuel tanks be kept three-quarter full. This results in frequent small deliveries of fuel to many of
the smaller fleets in order to “top off” their tanks. These smaller deliveries cost $0.24 to $0.33 more per
gallon than large deliveries.22
Finally, until November 2011, CCSF was purchasing soy-based biodiesel through the MFC. However, for
the last six months Western States Oil has purchased waste grease from commercial waste haulers that
service San Francisco’s largest sources of waste grease, and contracted with a biodiesel producer to turn
the grease into biodiesel.23 This has been a huge accomplishment in improving the sustainability of
CCSF’s biodiesel supply.
Purchase from a local biodiesel producer:
This option differs from the MFC option because CCSF would be bypassing distributors, such as Western
States Oil, to purchase biodiesel directly from producers. This option could provide CCSF with the cost
certainty and savings and would enable CCSF to prioritize locally-sourced, sustainable feedstocks. One
challenge with this option is that CCSF must develop its own blending infrastructure because the
producer would likely deliver pure (B100) biodiesel. One potential local procurement option is R-Power.
R-Power is currently building a 15-million gallon per year biodiesel production plant in Watsonville. R-
Power’s fuel, produced from animal tallow, has been certified by CARB with a carbon intensity of 33.11
22
Master Fueling Contract Workshop. January 19, 2012. Meeting Minutes, SFPUC, 3801 Third St, BERM Conference Room, San Francisco. 23
Mellera, Marty (SFMTA). Telephone interview by author. May 7, 2012.
- 16 -
gCO2/MJ, 64 percent lower than ULSD. R-Power president, Jim Levine, has indicated that the plant will
be operational in early Fall 2012.24
Expand SF Greasecycle Program:
The SF Public Utilities Commission (SF PUC) operates a program called SF Greasecycle.25 SF Greasecycle
collects 300,000 gallons of used cooking oil annually from small local restaurants and residences for
which it is not economical for commercial waste haulers to service. The SF PUC then removes water,
trash, and grit at CCSF’s southeast wastewater treatment plant—thereby turning the cooking oil into
high quality “yellow grease”—and sells the grease to a handful of regional biodiesel producers. One of
SF PUC’s main motivations for this program is to reduce grease-related blockages that cost the
Commission $3.5 annually.
The author lacks clarity as to whether CCSF is currently able to purchase the fuel that is produced from
SF Greasecycle grease. On the one hand, it is clear that CCSF does not have the necessary blending
infrastructure for wide-scale delivery of B100. In addition, SF PUC has indicated that there are issues
relating to “submitting taxes,” which prevent CCSF from using the fuel at all.26 On the other hand, SF
MTA reports that SF Greasecycle grease is currently going to Bently Biofuels in Nevada, and that in the
near future the fuel will be delivered to SF MTA’s Marin St. yard to serve as the fuel for an upcoming test
of buses on B100.27
Regardless of the current status of biodiesel produced from SF Greasecycle grease, it is clear that SF
Greasecycle could only serve as CCSF’s primary source of biodiesel if the program is greatly expanded.
However, SF Greasecycle can only be significantly expanded if it competes with the commercial waste
haulers that currently service the City’s largest producers of used cooking oil. There is some concern
whether this is an appropriate role for a public program like SF Greasecycle. Nonetheless, SF Greasecycle
staff believes that this procurement arrangement would increase the certainty of CCSF’s biodiesel costs,
and would likely reduce costs as well.28
Sustainability of Feedstocks
Soy
Soy is the least sustainable of the three feedstocks. First, there is an insignificant amount of soybeans
grown in California.29 Instead, most biodiesel used in California is produced from soybeans grown in the
Midwest. Soybeans are also a food crop, and therefore their use in biodiesel is competitive with our
food supply. In addition, increased demand for soybeans increases world soy prices, which has been
24
Information from a presentation Jim Levine made to CCSF’s Biofuels Working Group in March 2012. 25
http://sfwater.org/index.aspx?page=465 26
Ving, Karri. "RE: Biofuels Planning Study Questions We Need Your Help with." E-mail to Bill Zeller. March 4, 2012. 27
Mellera, Marty (SFMTA). 28
Ving, Karri (SF PUC). Telephone interview by author. March 7, 2012. 29
For example, soybeans are not even listed in the California Department of Food and Agriculture’s California Agriculture Production Statistics report for 2010. (http://www.cdfa.ca.gov/Statistics)

- 17 -
shown to amplifies economic incentives to destroy Amazonian forests and Brazilian tropical savannas for
soy production.30
Animal Fats
Rendered animal fat, or tallow, is another sustainable feedstock. Tallow is used primarily in animal feed
and soaps, but is also a useful feedstock for biodiesel. Because animals are not raised solely for their
tallow, animal fat represents another waste-based feedstock that is not competitive with the food
supply. Unlike local recycled cooking oils, however, tallow must come from farming operations outside
San Francisco.
Recycled Cooking Oils and Greases
Recycled cooking oils and greases—also known as yellow grease—is a highly sustainable feedstock. In
fact, oils and greases are often discharged into the sanitary sewer system, resulting in significant cost
and environmental impacts due to increased sewer cleaning and blockages leading to overflows. By
diverting grease from the sewer system, and using it instead as a feedstock for biodiesel, CCSF is
creating a win-win opportunity by improving the performance of the sewer system and using part of the
City’s waste stream as a feedstock for fuel.
Local Air Pollution While biodiesel is known to have lower emissions of local air pollutants, such as PM, there is
considerable debate as to whether, and how much, biodiesel increases NOx emissions. We examined
four sources, which when taken collectively indicate that biodiesel leads to a small and potentially
negligible increase in NOx emissions, but moderate decrease in PM emissions.
CARB’s assessment of biodiesel emissions is most relevant because CARB is regulates urban transit fleets
in California. CARB tested emissions from biodiesel in a 2011 study that analyzed the performance of
soy- and animal-based biodiesels in two different on-road diesel engines. 31 CARB performed the tests
using numerous test procedures, including the Urban Dynamometer Driving Schedule, which we
assumed would be a relevant test procedure for San Francisco’s fleet. These test results showed a
smaller increase in NOx for animal-based B20 blends (1.6 percent) than for soy-based B20 blends (4.1 to
4.4 percent).
In addition to CARB’s assessment, we examined three other sources:
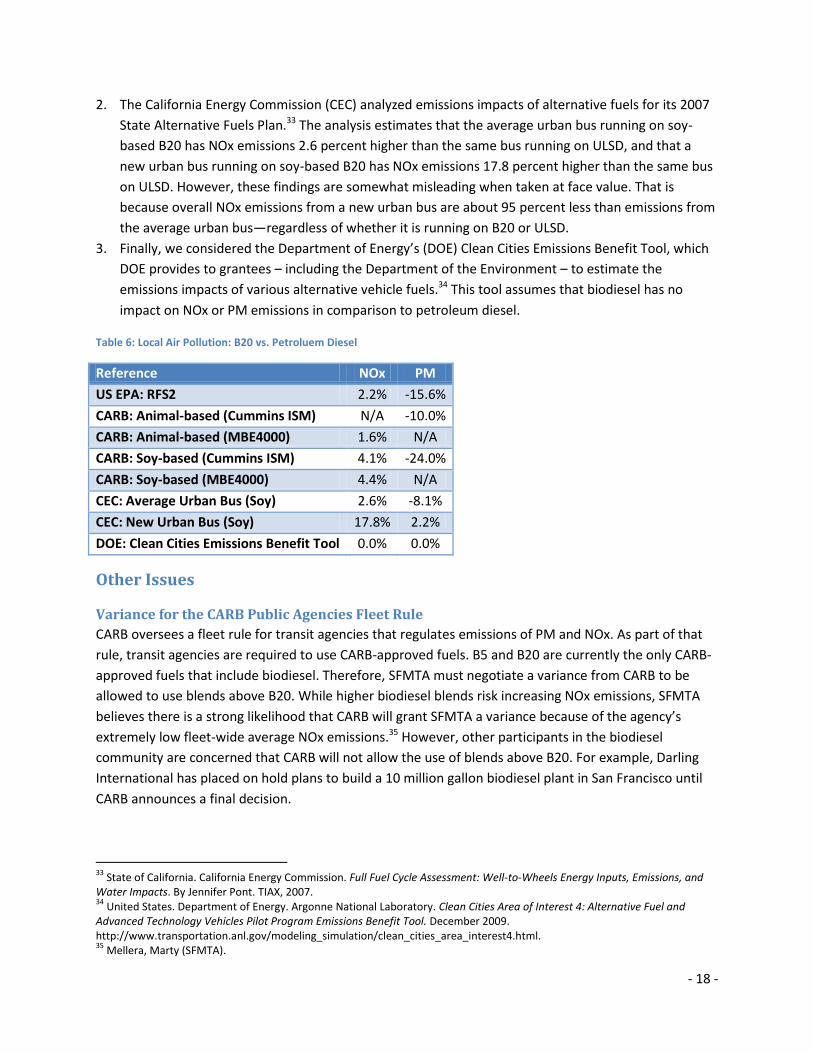
1. The US Environmental Protection Agency (U.S. EPA) investigated the emissions impacts of biodiesel
for the Renewable Fuel Standard Program Regulatory Impact Analysis.32 US EPA analyzed soy-based
B20 in comparison to conventional biodiesel, and found NOx emissions to increase by 2.2 percent
and PM emissions to drop by 15.6 percent.
30
Scharlemann, Jorn, and William Laurance. "How Green Are Biofuels?" Science 319, no. 5859 (January 4, 2008): 43-44. doi:10.1126/science.1153103. 31
State of California. California Air Resources Board. CARB Assessment of the Emissions from the Use of Biodiesel as a Motor Vehicle Fuel in California “Biodiesel Characterization and NOx Mitigation Study”. By Thomas Durbin et al., University of California CE-CERT, 2011. 32
United States. Environmental Protection Agency. Renewable Fuel Standard Program (RFS2) Regulatory Impact Analysis. 2010.
- 18 -
2. The California Energy Commission (CEC) analyzed emissions impacts of alternative fuels for its 2007
State Alternative Fuels Plan.33 The analysis estimates that the average urban bus running on soy-
based B20 has NOx emissions 2.6 percent higher than the same bus running on ULSD, and that a
new urban bus running on soy-based B20 has NOx emissions 17.8 percent higher than the same bus
on ULSD. However, these findings are somewhat misleading when taken at face value. That is
because overall NOx emissions from a new urban bus are about 95 percent less than emissions from
the average urban bus—regardless of whether it is running on B20 or ULSD.
3. Finally, we considered the Department of Energy’s (DOE) Clean Cities Emissions Benefit Tool, which
DOE provides to grantees – including the Department of the Environment – to estimate the
emissions impacts of various alternative vehicle fuels.34 This tool assumes that biodiesel has no
impact on NOx or PM emissions in comparison to petroleum diesel.
Table 6: Local Air Pollution: B20 vs. Petroluem Diesel
Reference NOx PM
US EPA: RFS2 2.2% -15.6%
CARB: Animal-based (Cummins ISM) N/A -10.0%
CARB: Animal-based (MBE4000) 1.6% N/A
CARB: Soy-based (Cummins ISM) 4.1% -24.0%
CARB: Soy-based (MBE4000) 4.4% N/A
CEC: Average Urban Bus (Soy) 2.6% -8.1%
CEC: New Urban Bus (Soy) 17.8% 2.2%
DOE: Clean Cities Emissions Benefit Tool 0.0% 0.0%
Other Issues
Variance for the CARB Public Agencies Fleet Rule
CARB oversees a fleet rule for transit agencies that regulates emissions of PM and NOx. As part of that
rule, transit agencies are required to use CARB-approved fuels. B5 and B20 are currently the only CARB-
approved fuels that include biodiesel. Therefore, SFMTA must negotiate a variance from CARB to be
allowed to use blends above B20. While higher biodiesel blends risk increasing NOx emissions, SFMTA
believes there is a strong likelihood that CARB will grant SFMTA a variance because of the agency’s
extremely low fleet-wide average NOx emissions.35 However, other participants in the biodiesel
community are concerned that CARB will not allow the use of blends above B20. For example, Darling
International has placed on hold plans to build a 10 million gallon biodiesel plant in San Francisco until
CARB announces a final decision.
33
State of California. California Energy Commission. Full Fuel Cycle Assessment: Well-to-Wheels Energy Inputs, Emissions, and Water Impacts. By Jennifer Pont. TIAX, 2007. 34
United States. Department of Energy. Argonne National Laboratory. Clean Cities Area of Interest 4: Alternative Fuel and Advanced Technology Vehicles Pilot Program Emissions Benefit Tool. December 2009. http://www.transportation.anl.gov/modeling_simulation/clean_cities_area_interest4.html. 35
Mellera, Marty (SFMTA).
- 19 -
Recertifying Double-Walled USTs
On February 21, 2012, the SWRCB approved an amendment to the current regulations pertaining to the
storage of biodiesel in underground storage tanks (USTs). The Department of Public Health is the
SWRCB’s local enforcement agency, which means they are responsible for ensuring compliance with this
amendment. DPH reports that they are already begun to address this. According to the California
Biodiesel Alliance:
“The new regulation will allow UST owner/operators to store all blends of biodiesel, including B100, [in double-walled tanks] provided they can show both the [Underwriters Laboratories] listing for petroleum diesel (until such time as a UL listing for biodiesel replaces it) and a written statement of materials compatibility for the blend of biodiesel from the equipment manufacturer for their UST equipment. The new regulation will take effect June 1, 2012 and will replace the variance that has been in place for the last 3 years… The new regulation applies to new UST systems as well as existing double-walled UST systems. Existing variance holders may be required to reapply to their [local enforcement agency] for permits to continue to store biodiesel. Those wishing to store higher blends must provide the documents required by the new regulations reflecting compatibility with the higher blend.”36
This ruling presents a short-term challenge and long-term benefit for CCSF. The short-term challenge is
that the existing variances are expiring on June 1, 2012, which means CCSF must submit “a written,
affirmative statement of compatibility from the manufacturer” of each double-walled UST in order to
continue storing B20 and remain in compliance with SWRCB regulations.37 The long-term opportunity is
that CCSF’s existing fuel infrastructure will be largely capable of storing blends above B20, provided that
the manufacturer of each UST vouches for the UST’s compatibility with higher blends, or until
Underwriters Laboratories determines that the UST is compatible with higher blends.
Unfamiliarity with Using Blends Above B20
It must be noted that high blends of biodiesel, usually above B20, void an engine’s warranty. Diesel
engine manufacturers have been hesitant to warranty blends above B20 because there is no assurance
that biodiesel fuel will be high quality. When fuel is of high quality there is little to no reason for concern
about engine compatibility. Multiple surveys of vehicle fleets across the country have shown little or no
compatibility issues or increased engine wear as a result of using biodiesel. The experience of fleets
across the country has underscored, however, that procuring biodiesel from certified producers is a
“critical step… to ensuring successful implementation of a biodiesel program at a fleet level.”38
Fortunately, CCSF already places a premium on quality as evidenced by the current Master Fueling
Contract, which requires “biodiesel and biodiesel blends [to] be handled, transported, stored and
delivered by brokers and distributors that have received or are applying for BQ-9000 Certification as
36
"California Biodiesel Alliance." California Biodiesel Alliance. Accessed May 04, 2012. http://www.californiabiodieselalliance.org/.
37 State of California. State Water Resources Control Board. Proposed Amendments to the California Code of Regulations: Title
23. Waters; Division 3. State Water Resources Control Board and Regional Water Quality Control Boards; Chapter 16. Underground Storage Tanks. Initial Statement of Reasons. 2011.
38 State of California. California Air Resources Board. Biodiesel Fleet Durability Study. By Thomas Durbin, J. Wayne Miller, and S.
Michelle Jiang. University of California CE-CERT, 2010.

- 20 -
Biodiesel Marketers, or through brokers and distributors demonstrating similar fuel quality control
protocols ensuring biodiesel consistently maintains the fuel quality of product received from the
biodiesel producer.”39
Renewable Diesel
Background Renewable diesel is a liquid fuel chemically identical to petroleum diesel created from biomass.
Methods of making renewable diesels can fall into two categories: 2nd and 3rd generation. There are a
number of methods for making 2nd generation renewable diesel, including hydrotreating, biomass-to-
liquid, and thermal conversion.40
Hydrotreating is a process in which a feedstock is reacted with hydrogen in a high temperature and
pressure environment. Animal fat is often used as the feedstock in this process. Hydrotreating is
common in petroleum refineries today and is frequently used by companies such as ConocoPhillips
and Petrobas. Since this process uses fossil fuel derived hydrogen, it is not a truly “renewable”
diesel.
Thermal Depolymerization is a process for converting large polymers of biomass into smaller
molecules through very high temperature and pressure conversion. Companies are using
slaughterhouse waste and other carbon containing solid waste to feed this process and produce
renewable diesel.
Biomass-to-Liquid is a process in which biomass (primarily cellulosic material) is converted into a
gaseous mixture rich in hydrogen and carbon monoxide and then catalytically converted into liquid
fuel. This process can use any source of biomass, whereas the other two processes mainly utilize
lipids obtained from recently living biomass.
Alternatively, 3rd generation renewable diesels rely on algae- and yeast-based production techniques.
There are two general methods for production of algae-based renewable fuels and one main one for
yeast. 41
Open pond systems use open air ponds that use large amounts of land to grow algae. This method
has high land and water usage, as well as, limited control over the algae getting into the surrounding
environment.
Closed Photobioreactors (PBRs) use closed tanks to cultivate the algae. This method is more capital
intensive, but allows the renewable diesel manufacturer to grow algae in a much smaller land
footprint, use 30 times less water, and be able to control the spread of algae.
39
City and County of San Francisco. Office of Contract Administration. Purchasing Division. 2009 Master Fueling Contract. 2009. 40
City and County of San Francisco. San Francisco Public Utilities Commission. Renewable Diesel Fact Sheet. Yoon, Jesse Jin. "What’s the Difference between Biodiesel and Renewable (Green) Diesel?" Advanced Biofuels USA, March 2011. http://advancedbiofuelsusa.info/wp-content/uploads/2011/03/11-0307-Biodiesel-vs-Renewable_Final-_3_-JJY-formatting-FINAL.pdf. 41
Frost & Sullivan. Next Generation Biofuels: Strategic Portfolio Management. 2010.
- 21 -
Emeryville, CA based Amyris uses genetically engineered yeast to convert sugars from the feedstock
into a hydrocarbon molecule. Once this molecule is hydrogenated, it can be turned into a drop-in
diesel fuel.
All of the renewable diesel production techniques above are still facing a number of issues and are not
quite ready for commercialization. The main technological issues facing 2nd generation renewable
diesels are process optimization, scalability of the gasification process, biochemical conversion process,
and feedstock supply. For 3rd generation fuels, the main issues are technology cost, conversion process
optimization, algae harvesting and dewatering, and algae cultivation.
GHG Emissions According to CARB’s analysis for the state’s LCFS, renewable diesel produced from tallow produces
lifecycle GHG emissions of between 20 and 40 gCO2e/MJ, which is 59 percent to 79 percent lower than
petroleum diesel. We did not find academic or governmental estimates of GHG emissions for third
generation renewable diesels produced from algae, but industry leaders have reported GHG emission
reductions in the range of 69-77 percent.42
Costs
Fuel Costs
At the end of 2010, estimates of costs to produce a gallon of 3rd generation renewable diesel ranged
between $8-22 for open pond systems and $12-42 for PBRs.43 In comparison, the California Energy
Commission estimates that cellulosic diesels cost about $6.00 per gallon.44 There is additional evidence
that the costs of producing renewable diesels is declining. For example, an NRDC paper on biodiesel
production costs estimates that Solazyme’s production cost for algae based renewable diesel is $3.44
per gallon.45 As the production scale continues to increase, the price of renewable diesel will continue to
converge with the price of petroleum based fuels.
Infrastructure Costs
Because renewable diesel is chemically identical to petroleum diesel, it can be used in any diesel
powered vehicles and stored in any storage tank suitable for petroleum diesel. Therefore, unlike
biodiesel, there is no additional infrastructure cost associated with using renewable diesel.
Availability (Procurement) There are numerous potential options for procuring 2nd and 3rd generation renewable diesels.
Interestingly, Darling International reports that it has plans to build the largest renewable diesel plant in
the United States in Louisiana. The Darling plant will use animal fat and used cooking oil as feedstocks
and produce 136 million gallons per year. Darling claims the plant will be online in the first quarter of
42
Barnitt, Robb, and Bob Ames (Solazyme). Telephone interview by Yuri Yakubov. 43
Frost & Sullivan. 44
State of California. California Energy Commission. Biofuel Values. November 14, 2011. http://www.energy.ca.gov/2011_energypolicy/documents/2011-11-14_workshop/2011-11-14_Biofuel_Values.xls. 45
Ruan, Yang. Biofuels Production Costs: A Review. Report. Natural Resources Defense Council, 2012.

- 22 -
2013 and will sell fuel at about the same price as biodiesel.46 In addition, companies such as Range Fuels,
BP, Choren, and Neste Oil are currently working on commercializing 2nd generation renewable diesels.
Many of them are still working on ramping up production and in some cases have reached as much as 2
million gallons of production per year. Companies that are working on thermal technologies are farther
along in their production capacity growth than companies that are pursuing the bio-chemical pathway.47
There are a few companies working on research and development of 3rd generation algae based
renewable diesels. In the Bay Area specifically, companies such as Solazyme, Amyris, Codexis, and LS9
are working to commercialize 3rd generation fuels. They are at different commercialization stages, but
none have yet reached full commercialization. However, many 3rd generation biofuel companies have
participated in demonstration projects. For example, Solazyme has supplied the U.S. Navy with 350,000
gallons of marine distillate fuels.48 Similarly, Amyris has been running test projects with two Brazilian
cities, fueling their commercial vehicles.
Once renewable diesels are commercially available, CCSF should be able to procure the fuels either
through fuel distributors or directly from fuel producers. In the meantime, Solazyme and Amyris
indicated they are potentially interested in partnering with CCSF on a test project.
Sustainability of Feedstocks The two main environmental issues with renewable diesel manufacturing are potential land use issues
and the genetic modification of algae and yeast. While renewable diesels use feedstocks that are not
nearly as land intensive as first generation biodiesels that are using corn, soy, and other sources that
compete for land and food sources, there is still potential that the sugar based feedstocks will crowd out
food growing land. Among these feedstocks are sweet sorghum, sugarcane, corn and stover,
miscanthus, and switchgrass. There are also many feedstocks used for 2nd and 3rd generation renewable
diesels that do not have these land use problems, including animal fats, forest residue, and other waste
streams. Additionally, there is a perception that the genetically modified algae and yeasts used in 3rd
generation renewable diesels could be harmful for the environment if released from the production
process. However, we have not found any evidence that this is the case.
Local Air Pollution Industry sources believe that local air pollution emissions for algae based renewable diesels are equal to
or less than traditional diesel emissions.49 In addition, a National Center for Agricultural Utilization
Research study estimates that renewable diesel reduces PM emissions by 45 to 50 percent compared to
petroleum diesel, and reduces NOx emissions by about 15 percent.50
46
DeSmet, Don (Darling International). Telephone interview. 14 May 2012. 47
Frost and Sullivan. 48
Solazyme’s VP of Fuel Operations hinted that the test project was successful. 49
United States. Department of Energy. National Renewable Energy Laboratory. Life Cycle Assessment of Gasoline and Diesel Produced via Fast Pyrolysis and Hydroprocessing. By David Hsu. 2011. 50
Knothe, Gerhard. "Biodiesel and Renewable Diesel: A Comparison." Progress in Energy and Combustion Science 38, no. 3 (December 2009): 364-73.
- 23 -
Gasoline
Background Gasoline is a “baseline” fuel in this analysis, which means that the alternative fuels are evaluated in
comparison to gasoline.
Gasoline currently accounts for 26 percent of fuel consumed by the CCSF fleet. The largest single user is
the Police Department, which accounts for about 29 percent of all gasoline consumed.
GHG Emissions CARB has certified the life-cycle GHG emissions of transportation fuels for the state’s Low Carbon Fuel
Standard. CARB estimates that California Reformulated Gasoline produces life-cycle GHG emissions of
95.85 gCO2e/MJ.
Costs
Fuel Costs
From July 2011 through February 2012, CCSF paid $3.25 on average for gasoline.
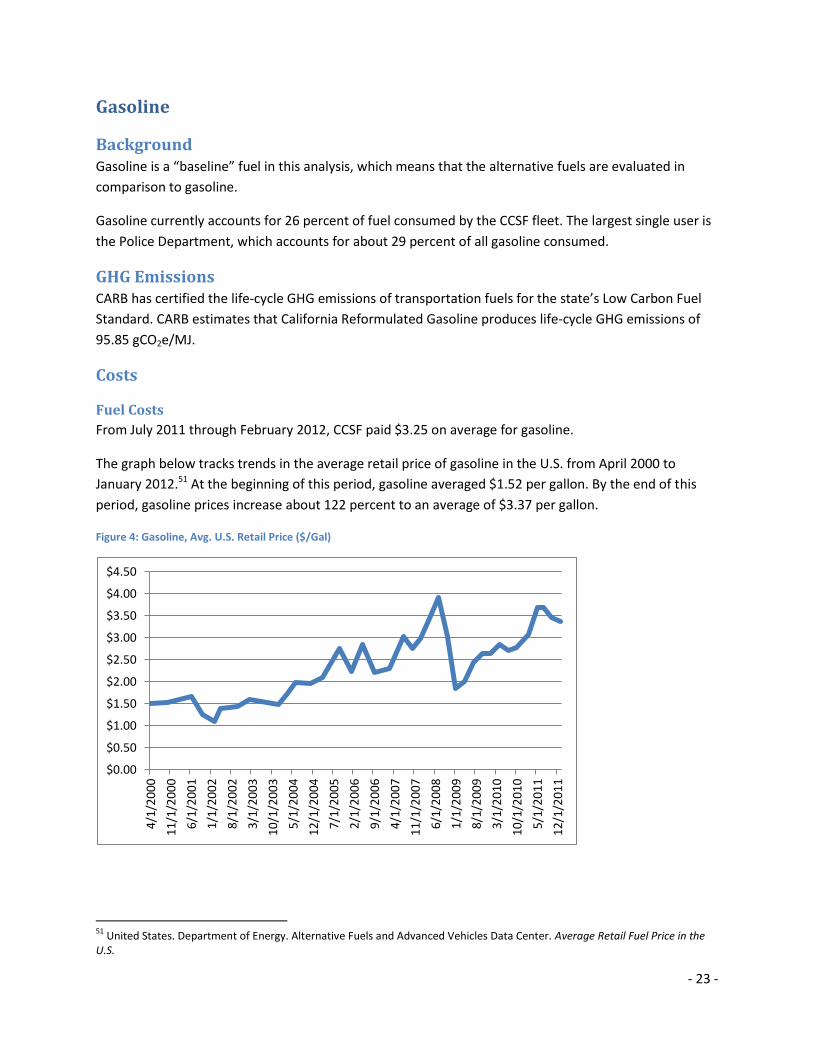
The graph below tracks trends in the average retail price of gasoline in the U.S. from April 2000 to
January 2012.51 At the beginning of this period, gasoline averaged $1.52 per gallon. By the end of this
period, gasoline prices increase about 122 percent to an average of $3.37 per gallon.
Figure 4: Gasoline, Avg. U.S. Retail Price ($/Gal)
51
United States. Department of Energy. Alternative Fuels and Advanced Vehicles Data Center. Average Retail Fuel Price in the U.S.
$0.00
$0.50
$1.00
$1.50
$2.00
$2.50
$3.00
$3.50
$4.00
$4.50
4/1
/20
00
11
/1/2
00
0
6/1
/20
01
1/1
/20
02
8/1
/20
02
3/1
/20
03
10
/1/2
00
3
5/1
/20
04
12
/1/2
00
4
7/1
/20
05
2/1
/20
06
9/1
/20
06
4/1
/20
07
11
/1/2
00
7
6/1
/20
08
1/1
/20
09
8/1
/20
09
3/1
/20
10
10
/1/2
01
0
5/1
/20
11
12
/1/2
01
1
- 24 -
Availability (Procurement) CCSF purchases gasoline through its Master Fueling Contract. CCSF’s primary gasoline distributor is
Western States Oil. The price CCSF pays Western is indexed to OPIS, a widely accepted fuel price
benchmark for supply contracts.
Sustainability of Feedstocks Gasoline is produced using oil. Oil is a fossil fuel that significantly harms the environment. Among the
harms are GHG emissions, local air pollution, and damage from oil extraction and spills. Approximately
half of the oil consumed in the United States is imported.
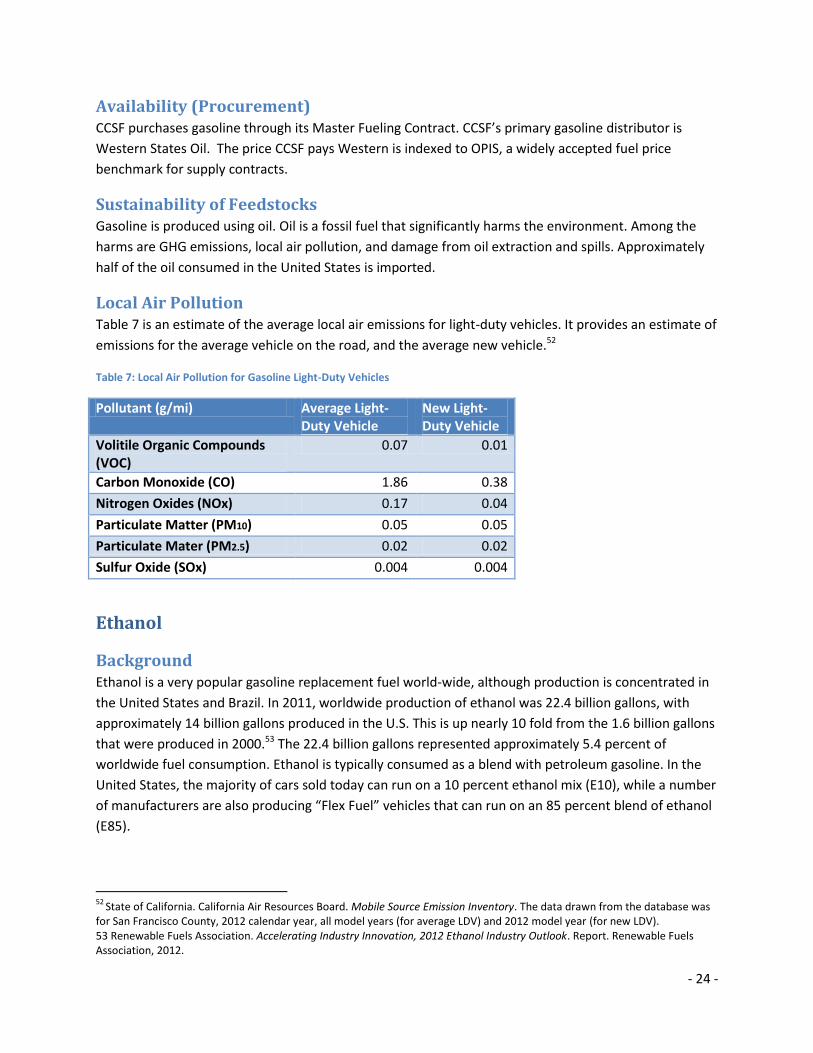
Local Air Pollution Table 7 is an estimate of the average local air emissions for light-duty vehicles. It provides an estimate of
emissions for the average vehicle on the road, and the average new vehicle.52
Table 7: Local Air Pollution for Gasoline Light-Duty Vehicles
Pollutant (g/mi) Average Light-Duty Vehicle
New Light-Duty Vehicle
Volitile Organic Compounds (VOC)
0.07 0.01
Carbon Monoxide (CO) 1.86 0.38
Nitrogen Oxides (NOx) 0.17 0.04
Particulate Matter (PM10) 0.05 0.05
Particulate Mater (PM2.5) 0.02 0.02
Sulfur Oxide (SOx) 0.004 0.004
Ethanol
Background Ethanol is a very popular gasoline replacement fuel world-wide, although production is concentrated in
the United States and Brazil. In 2011, worldwide production of ethanol was 22.4 billion gallons, with
approximately 14 billion gallons produced in the U.S. This is up nearly 10 fold from the 1.6 billion gallons
that were produced in 2000.53 The 22.4 billion gallons represented approximately 5.4 percent of
worldwide fuel consumption. Ethanol is typically consumed as a blend with petroleum gasoline. In the
United States, the majority of cars sold today can run on a 10 percent ethanol mix (E10), while a number
of manufacturers are also producing “Flex Fuel” vehicles that can run on an 85 percent blend of ethanol
(E85).
52
State of California. California Air Resources Board. Mobile Source Emission Inventory. The data drawn from the database was for San Francisco County, 2012 calendar year, all model years (for average LDV) and 2012 model year (for new LDV). 53 Renewable Fuels Association. Accelerating Industry Innovation, 2012 Ethanol Industry Outlook. Report. Renewable Fuels Association, 2012.
- 25 -
The typical steps for producing ethanol are: fermentation, distillation, and dehydration. The
fermentation process is largely the same as the production of drinking alcohol. The sugars in the
feedstock are converted by microbes (yeast) into an ethanol. During the distillation phase, the majority
of the water (95-96 percent) in the ethanol mixture produced in the fermentation phase is removed. The
last stage of the process uses one of a number of processes to remove the remainder of the water from
the solution.
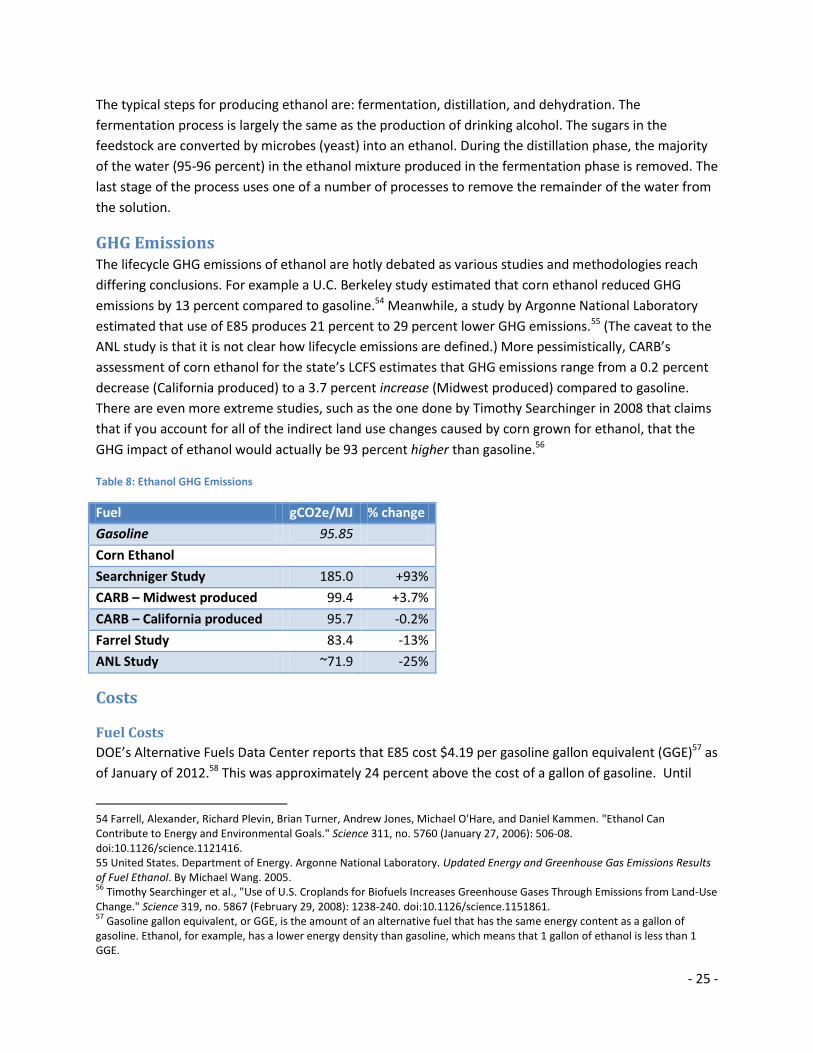
GHG Emissions The lifecycle GHG emissions of ethanol are hotly debated as various studies and methodologies reach
differing conclusions. For example a U.C. Berkeley study estimated that corn ethanol reduced GHG
emissions by 13 percent compared to gasoline.54 Meanwhile, a study by Argonne National Laboratory
estimated that use of E85 produces 21 percent to 29 percent lower GHG emissions.55 (The caveat to the
ANL study is that it is not clear how lifecycle emissions are defined.) More pessimistically, CARB’s
assessment of corn ethanol for the state’s LCFS estimates that GHG emissions range from a 0.2 percent
decrease (California produced) to a 3.7 percent increase (Midwest produced) compared to gasoline.
There are even more extreme studies, such as the one done by Timothy Searchinger in 2008 that claims
that if you account for all of the indirect land use changes caused by corn grown for ethanol, that the
GHG impact of ethanol would actually be 93 percent higher than gasoline.56
Table 8: Ethanol GHG Emissions
Fuel gCO2e/MJ % change
Gasoline 95.85
Corn Ethanol
Searchniger Study 185.0 +93%
CARB – Midwest produced 99.4 +3.7%
CARB – California produced 95.7 -0.2%
Farrel Study 83.4 -13%
ANL Study ~71.9 -25%
Costs
Fuel Costs
DOE’s Alternative Fuels Data Center reports that E85 cost $4.19 per gasoline gallon equivalent (GGE)57 as
of January of 2012.58 This was approximately 24 percent above the cost of a gallon of gasoline. Until
54 Farrell, Alexander, Richard Plevin, Brian Turner, Andrew Jones, Michael O'Hare, and Daniel Kammen. "Ethanol Can Contribute to Energy and Environmental Goals." Science 311, no. 5760 (January 27, 2006): 506-08. doi:10.1126/science.1121416. 55 United States. Department of Energy. Argonne National Laboratory. Updated Energy and Greenhouse Gas Emissions Results of Fuel Ethanol. By Michael Wang. 2005. 56
Timothy Searchinger et al., "Use of U.S. Croplands for Biofuels Increases Greenhouse Gases Through Emissions from Land-Use Change." Science 319, no. 5867 (February 29, 2008): 1238-240. doi:10.1126/science.1151861. 57
Gasoline gallon equivalent, or GGE, is the amount of an alternative fuel that has the same energy content as a gallon of gasoline. Ethanol, for example, has a lower energy density than gasoline, which means that 1 gallon of ethanol is less than 1 GGE.
- 26 -
2012, corn ethanol in the United States was subsidized at $0.46 per gallon of E100, meaning that prices
of E85 were being subsidized by approximately $0.39.
Since San Francisco has historically not purchased E85, we do not have any historical costs to look at for
this fuel.
Infrastructure Costs
According to various U.S. EPA, CARB, and DOE/Clean Cities publications, installing a new E85 fueling
station costs approximately $170,000. This cost includes a 10,000 gallon storage tank, one dispenser
with two nozzles, and lines connecting the fueling pump to the storage tanks.
Vehicle Costs
The additional incremental cost of a light-duty E85 vehicle is approximately $100.59
Availability (Procurement) While all retail gasoline that is sold in the United States is E10, E85 blends have not become widely
available in California. As of January 2011, out of the 2,644 nationwide stations selling E85, only 32 were
in California.60 To procure E85, CCSF would need to reach find a regional fuel distributor to deliver the
fuel.61
Sustainability of Feedstocks Corn used to produce ethanol faces many problems from a feedstock perspective. There are two main
arguments against using corn as a feedstock: (1) corn used for ethanol displaces other crops that could
be used for food production and therefore leads to food shortages and rising food prices and (2) there
are studies that show that it actually takes more energy to grow corn than is then released from it when
used as ethanol.
Today, approximately 25 percent of the corn grown in the United States is used for ethanol.62 There
have been arguments made that the displacement of food crops by ethanol feedstocks has caused food
prices to go up around the world. However, it is very difficult to calculate the actual impacts of the
feedstock land usage. Additionally, there are many conflating factors that are difficult to parse out
regarding the rising prices of food. Chief among them is the rising populations and living levels around
the globe, especially in India and China. This would cause the demand for food to increase, and
therefore the prices to increase as well. Despite this there is evidence that the rising consumption of
58
United States. Department of Energy. Alternative Fuels and Advanced Vehicles Data Center. Average Retail Fuel Price in the U.S. 59
Northeast States for Coordinated Air Use Management. Economic Analysis of a Program to Promote Clean Transportation Fuels in the Northeast/Mid-Atlantic Region. By Michelle Manion et al., NESCAUM (2011), 29. 60
United States. Department of Energy. Alternative Fuels and Advanced Vehicles Data Center. Alternative Fueling Stations. Accessed April 30, 2012. http://www.afdc.energy.gov/afdc/data/infrastructure.html. 61
It does not appear that Western States Oil can provide E85. 62
Kingsbury, Kathleen. "After the Oil Crisis, a Food Crisis?" Time, November 16, 2007.
- 27 -
ethanol has raised the price of corn by 21 percent by 2009, as compared to what the prices would have
been if the production of ethanol has remained steady at 2004 levels.63
It is fairly widely accepted that ethanol has an energy balance (energy output of ethanol over energy
input to produce the ethanol) of approximately 1.3.64 However, there are a number of other studies that
claim that ethanol actually has a negative energy balance. One of the most well-known is a study by
David Pimentel and Tadeusz Patzek that claims that production of ethanol using corn required 29
percent more energy to be expended than it produced when used as a fuel.65 This paper makes some
fairly aggressive assumptions to arrive at this number, such as that all gasoline used in the United States
would be replaced by ethanol.
Local Air Pollution A U.S. EPA study indicates that E85 shows an increase in volatile organic compounds as compared to
regular gasoline, however, it does not have any other negative impacts on criteria emissions. PM, NOx,
and CO all show declines versus gasoline.
Renewable Gasoline
Background Similar to renewable diesel, renewable gasoline is a drop-in fuel that can be utilized in any gasoline
powered vehicle without any modifications. Currently, renewable gasoline is being produced from
woody biomass or a grass called miscanthus. The process to produce renewable gasoline starts with
pelletized biomass that enters a gasifier, in which superheated steam and pressure is used to turn the
pellets into a gas mixture of hydrogen and carbon monoxide. The syngas is then “scrubbed” and through
a proprietary process is turned back into water and gasoline that are then separated.66 At the end of the
process you are left with a direct drop-in gasoline. The process is currently being tested by a number of
companies in pilot and demonstration plants. This fuel faces a number of challenges prior to reaching
commercialization.
GHG Emissions Renewable gasoline is likely to produce significantly lower lifecycle GHG emissions than petroleum
gasoline and ethanol. One estimate is that renewable gasoline reduces GHG emissions by 80 percent
compared to petroleum gasoline.67
63
Babcock, Bruce. The Impact of US Biofuel Policies on Agricultural Price Levels and Volatility. Issue brief. International Centre for Trade and International Development, 2011. 64
Alexander Farrell et al., "Ethanol Can Contribute to Energy and Environmental Goals." Science 311, no. 5760 (January 27, 2006): 506-08. doi:10.1126/science.1121416. 65
Pimentel, David, and Tad Patzek. "Ethanol Production Using Corn, Switchgrass, and Wood; Biodiesel Production Using Soybean and Sunflower." Natural Resources Research 14, no. 1 (March 2005): 65-76. doi:10.1007/s11053-005-4679-8. 66
"Biomass-based Fuels: Renewable Gasoline." GreenTechEurope.org 13 (April 2012). 67
Ibid.

- 28 -
Costs
Fuel Costs
The California Energy Commission estimates that cellulosic gasoline costs about $6.00 per gallon.68 As
the production scale continues to increase, the price of renewable gasoline will continue to converge
with the price of ethanol and petroleum based fuels.69 For example, Primus Green Energy estimates that
once they reach full scale production, they will be able to produce renewable gasoline at a cost of $1.69
per gallon.70
Infrastructure Costs
Because renewable gasoline is chemically identical to petroleum gasoline, it can be used in any gasoline
powered vehicle and stored in any storage tank suitable for petroleum gasoline. Therefore, unlike
ethanol, there is no additional infrastructure cost associated with using renewable gasoline.
Availability (Procurement) There are fewer companies working to develop renewable gasoline than renewable diesel. Primus
Green Energy, Blue Fuel Energy, Sapphire Energy, and Dynamotive are among the companies working on
renewable gasoline. We understand that the companies that are in the renewable diesel space, such as
Amyris and Solazyme, will be capable of producing renewable gasoline at some point in the future, but
are currently not focused on renewable gasoline.
Primus Green Energy recently raised $14 million to build a demonstration plant capable of producing 5
to 10 million gallons of renewable gasoline annually.71 The timeline for renewable gasoline to reach full
commercialization will depend on how well Primus’ and others’ demonstration plants perform. Once
renewable gasoline is commercially available, CCSF should be able to procure the fuels either through
fuel distributors or directly from fuel producers.
Sustainability of Feedstocks Renewable gasoline is currently produced from miscanthus and switchgrass, which are overall much
more sustainable than either the petroleum used to produce gasoline or the corn currently used to
produce ethanol. Miscanthus is a nonreproducing Asian grass that grows up to ten feet tall. Switchgrass
is a grass that is native to the United States and is already grown in many parts of the country.
Miscanthus produces roughly three times as much fuel per acre as corn used in ethanol production. 72 It
is also estimated that switching the 30 percent of lowest-productivity Midwest corn cropland to
68
State of California. California Energy Commission. Biofuel Values. 69
Ruan, Yang. 70
"Biomass-based Fuels: Renewable Gasoline." 71
Doom, Justin. "Primus Green Energy Raises $12 Million for Demo Plant." Bloomberg, March 14, 2012. Accessed April 30, 2012. http://www.bloomberg.com/news/2012-03-14/primus-green-energy-raises-12-million-for-demo-plant.html. 72
“Biomass-based Fuels: Renewable Gasoline.”
- 29 -
miscanthus would increase bioenergy feedstocks by 82 percent.73 Furthermore, miscanthus is suited for
a wide range of soil types, including land that is not suitable for food crops and is harvestable two years
after planting.
Local Air Pollution While we have not been able to find any in depth studies on the local air pollution produced by
renewable gasoline, we understand that they will offer similar reductions as renewable diesels. Industry
sources believe that local air pollution emissions for algae based renewable diesels are equal to or less
than traditional diesel emissions.74 In addition, a National Center for Agricultural Utilization Research
study estimates that renewable diesel reduces PM emissions by 45 to 50 percent compared to
petroleum diesel, and reduces NOx emissions by about 15 percent.75
Natural Gas
Background Natural gas is a fossil fuel. It is extracted by drilling from sub-surface porous rock reservoirs. Raw natural
gas must undergo processing to meet pipeline quality specifications for water content, heating value,
and other variables before it can be injected into a transmission pipeline. While natural gas is
predominantly methane (CH4), as delivered through the pipeline system, it also contains hydrocarbons
such as ethane and propane and other gases such as nitrogen, helium, carbon dioxide, hydrogen sulfide,
and water vapor.76 Because of the gaseous nature of this fuel, it can be very difficult to store. Storage
onboard a vehicle generally takes one of two forms: compressed natural gas (CNG), or liquefied natural
gas (LNG). To become CNG, natural gas is pressurized in a storage tank at, generally at 3,600 pounds per
square inch.
Natural gas has been in widespread use as a transportation fuel since the early 1990’s and the
technology is well developed. There were about 117,000 natural gas vehicles (NGVs) in use in 2007,
accounting for 0.2 percent of all fuel consumed by highway vehicles, and about 0.1 percent of natural
gas consumed in the country.77 The largest users of natural gas as a transportation fuel in California are
transit agencies such as Los Angeles Metropolitan Transportation Authority, Sacramento Regional
Transit, and Sonoma County Transit. These are approaching two decades of use, and report that natural
gas has been a safe, reliable, and very economical transportation fuel.
73
Mandel, Jenny. "Miscanthus, Switchgrass Show Promise as Corn Replacements -- Study." The New York Times (Greenwire), July 14, 2011. Accessed April 30, 2012. http://www.nytimes.com/gwire/2011/07/14/14greenwire-miscanthus-switchgrass-show-promise-as-corn-re-35815.html. 74
Solazyme’s VP of Fuel Operations hinted that the test project was successful. 75
Knothe, Gerhard. "Biodiesel and Renewable Diesel: A Comparison." Progress in Energy and Combustion Science 38, no. 3 (December 2009): 364-73. 76
"What Is Natural Gas?" Alternative Fuels and Advanced Vehicles Data Center:. Accessed May 04, 2012. http://www.afdc.energy.gov/afdc/fuels/natural_gas_what_is.html. 77
United States. Department of Energy. Argonne National Laboratory. Natural Gas Vehicles: Status, Barriers, and Opportunities. By M. Rood Werpy et al. (2010), 3.
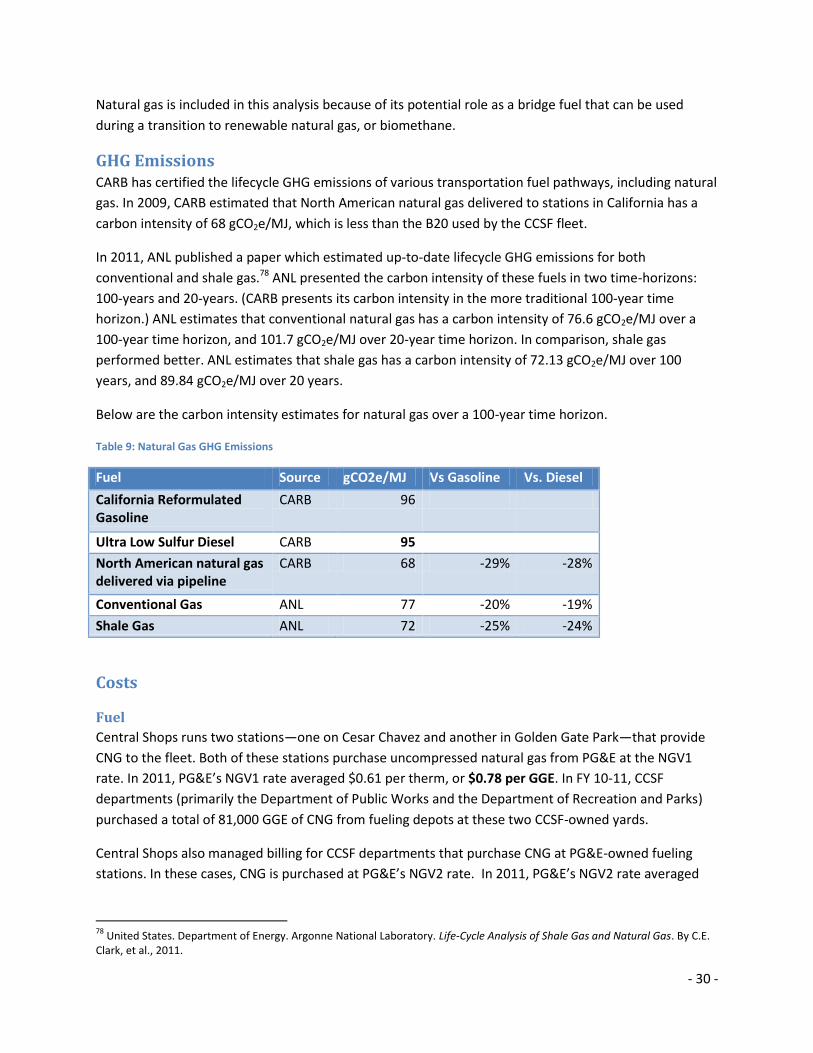
- 30 -
Natural gas is included in this analysis because of its potential role as a bridge fuel that can be used
during a transition to renewable natural gas, or biomethane.
GHG Emissions CARB has certified the lifecycle GHG emissions of various transportation fuel pathways, including natural
gas. In 2009, CARB estimated that North American natural gas delivered to stations in California has a
carbon intensity of 68 gCO2e/MJ, which is less than the B20 used by the CCSF fleet.
In 2011, ANL published a paper which estimated up-to-date lifecycle GHG emissions for both
conventional and shale gas.78 ANL presented the carbon intensity of these fuels in two time-horizons:
100-years and 20-years. (CARB presents its carbon intensity in the more traditional 100-year time
horizon.) ANL estimates that conventional natural gas has a carbon intensity of 76.6 gCO2e/MJ over a
100-year time horizon, and 101.7 gCO2e/MJ over 20-year time horizon. In comparison, shale gas
performed better. ANL estimates that shale gas has a carbon intensity of 72.13 gCO2e/MJ over 100
years, and 89.84 gCO2e/MJ over 20 years.
Below are the carbon intensity estimates for natural gas over a 100-year time horizon.
Table 9: Natural Gas GHG Emissions
Fuel Source gCO2e/MJ Vs Gasoline Vs. Diesel
California Reformulated Gasoline
CARB 96
Ultra Low Sulfur Diesel CARB 95
North American natural gas delivered via pipeline
CARB 68 -29% -28%
Conventional Gas ANL 77 -20% -19%
Shale Gas ANL 72 -25% -24%
Costs
Fuel
Central Shops runs two stations—one on Cesar Chavez and another in Golden Gate Park—that provide
CNG to the fleet. Both of these stations purchase uncompressed natural gas from PG&E at the NGV1
rate. In 2011, PG&E’s NGV1 rate averaged $0.61 per therm, or $0.78 per GGE. In FY 10-11, CCSF
departments (primarily the Department of Public Works and the Department of Recreation and Parks)
purchased a total of 81,000 GGE of CNG from fueling depots at these two CCSF-owned yards.
Central Shops also managed billing for CCSF departments that purchase CNG at PG&E-owned fueling
stations. In these cases, CNG is purchased at PG&E’s NGV2 rate. In 2011, PG&E’s NGV2 rate averaged
78
United States. Department of Energy. Argonne National Laboratory. Life-Cycle Analysis of Shale Gas and Natural Gas. By C.E. Clark, et al., 2011.
- 31 -
$1.85 per therm, or $2.36 per GGE. In FY 10-11, CCSF departments purchased a total of 70,000 GGE of
CNG from PG&E stations.
Fueling Infrastructure
Transit agencies and other industry experts indicate that a CNG fueling depot at a transit agency fueling
station serving around 200 buses costs approximately $4 million.79 In comparison, CARB estimates that
the cost of a smaller public access CNG station is about $1 million.80
ANL estimates the costs of natural gas fueling infrastructure by amortizing it on a GGE basis. ANL
estimates the combined amortized cost of fueling equipment to be $0.35 to $0.65 per GGE. 81
Maintenance and Repair
CNG buses are reported to experience higher maintenance and repair costs than diesel buses. Not long
ago, the Regional Public Transportation Authority (RPTA) in the Phoenix-Mesa metropolitan area
conducted a study to compare the operating costs of CNG and diesel buses.82 In the study, they
measured over a nine-month period the operating costs associated with 36 2008 CNG buses and 11
2007 diesel buses. During this period, the CNG buses traveled more than 20,000 miles and the diesel
buses traveled more than 17,000 miles. The RPTA found that CNG buses averaged $0.51 per mile in
maintenance costs while the diesel buses averaged $0.37 per mile.
Sacramento RT also shared information on the cost of operating their fleet of CNG buses from July 2011
through January 2012.83 Sacramento RT reports that the cost of parts and labor was $1.915 million, or
$0.48 per mile. It is unclear whether these labor costs include costs beyond those needed just for
maintenance and repair.
Electric Compression Costs
Sacramento RT reports that they spent $95,000 on compressing natural gas from July 2011 through
January 2012, or $0.02 per mile.
Meanwhile, ANL estimates that 1kWh per GGE is required to compress natural gas, and that this costs
on average $0.09 to $0.15 per GGE84
Vehicle Cost
According to a 2010 ANL report on NGVs, the incremental additional cost of a light-duty NGV is about
$7,000, and historically the medium- and heavy-duty NGVs has cost $20,000-$50,000 more than
79
Cameron, Doug (Clean Energy). Telephone interview by author. April 24, 2012. 80
State of California. California Air Resources Board. Final Program Review Report. By LCFS Program Review Advisory Panel. 2011.
81 United States. Department of Energy. Argonne National Laboratory. Natural Gas Vehicles: Status, Barriers, and Opportunities,
8.
82 RPTA - Mesa, AZ. Cost per Mile Comparison Between CNG and Diesel Buses. 2012. Raw data.
83 Hutch, Lyn, and David Harbour. Title Unknown. Rep. Sacramento RT, 2012. Print.
84 United States. Department of Energy. Argonne National Laboratory. Natural Gas Vehicles: Status, Barriers, and Opportunities,
8.
- 32 -
comparable diesel vehicles. However, the report notes that “the differential is narrowing as the price of
equivalent diesel vehicles rises in response to tough emissions standards.”85
Vehicle Maintenance Shops
Maintenance on NGVs requires alterations to maintenance shops. Industry experts estimate that
integrating these alterations into the design of a new maintenance facility costs about $500,000, while
retrofitting an existing facility costs about $1 million.86
Availability (Procurement) CCSF currently uses two procurement options that it can continue to use:
1. Purchasing uncompressed natural gas for compression on-site at CCSF-owned fueling stations. This
gas can be purchased from PG&E at the NGV1 rate, or it can be purchased under brokering
agreements CCSF uses for other large natural gas facilities. In that case, PG&E would only provide
transportation services under the NGV 4 rate schedule.
2. Purchasing CNG at PG&E stations. This gas is purchased from PG&E at the NGV2 rate.
The benefits of purchasing uncompressed natural gas are it costs less (between a third and a half as
much as the NGV2 rate) and there is probably not enough capacity at PG&E-owned stations to handle a
large CCSF fleet of NGVs. On the other hand, the benefit of fueling at PG&E stations is that CCSF does
not need to purchase and maintain its own fueling stations or pay the ongoing cost of compressing gas
on-site. Nonetheless, because of the tremendous fuel cost savings, we recommend that CCSF should
cease using PG&E stations except for emergencies or traveling outside the City in the long-term.
Sustainability of Feedstocks Natural gas shares many of the same negative attributes as petroleum fuel. Its use contributes to
climate change, produces local air pollution emissions, and damages the environment through its
extraction and transport. While natural gas has traditionally been considered a cleaner fuel than
petroleum fuels, there is currently an intense debate about the environmental impacts of extracting
shale gas through hydraulic fracturing, or fracking.87 Nonetheless, one irrefutable benefit of natural gas
in comparison to petroleum fuels is that the United States has much larger deposits of natural gas,
meaning that the fuel does not need to be imported.
Local Air Pollution The impact of NGVs on local air pollution can vary. Light-duty NGVs generally reduce smog-producing
pollutants by 60-90 percent.88 Historically, medium- and heavy-duty NGVs have also had lower
emissions. However, recent federal and state regulations require all heavy-duty duty vehicles to meet
85
Ibid., 9.
86 Cameron, Doug.
87 There is currently contentious debate about the environmental impacts of extracting shale gas through a process known as
hydraulic fracturing, or “fracking.” For more information, see the Department of Energy’s advisory board on the safety of shale gas development (at http://www.shalegas.energy.gov/) or a Duke University study on the impacts of fracking in Pennsylvania and New York (at http://www.nicholas.duke.edu/cgc/HydraulicFracturingWhitepaper2011.pdf) 88
United States. Department of Energy. Argonne National Laboratory. Natural Gas Vehicles: Status, Barriers, and Opportunities, 15.

- 33 -
more stringent emissions standards. As a result, as emissions from new diesel vehicles decrease, the
emission benefit of heavy-duty NGVs will likely diminish.
For example, DOE’s Clean Cities Emissions Benefit Tool estimates that medium- and heavy-duty NGVs
reduce NOx and PM emissions by more than 80 percent in comparison to the average medium- and
heavy-duty diesel vehicle on the road today. By contrast, DOE’s emissions tool estimates that NGVs
reduce NOx emissions by about 36 percent, and produce similar PM emissions, in comparison to new
medium- and heavy-duty vehicles. For light-duty vehicles, the DOE estimates that that CNG will
dramatically reduce NOx emissions – by nearly 99 percent – in comparison to the average light-duty
gasoline vehicle on the road, and will reduce PM emissions by about 8 percent. By contrast, the DOE
estimates that NGVs reduce NOx emissions by about 75 percent and produce similar PM emissions in
comparison to new light-duty vehicles.
Table 10: Local Air Pollution: Natural Gas vs. Diesel & Gasoline
Light Duty Vs. fleet avg gasoline
Vs. new gasoline
NOx -98.7% -75.0%
PM2.5 -8.3% 0.0%
Other Issues
CCSF Unfamiliarity with Gaseous Fuels
Natural gas currently accounts for only 5 percent of CCSF transportation fuel consumption, and half of
that is attributable to San Francisco International Airport. Therefore, if CCSF were to increase its use of
natural gas (as a bridge fuel to biomethane), it would have to overcome its lack of expertise in NGVs.
This is particularly true for SFMTA, since any plan to dramatically increase use of gaseous fuels would
necessarily involve a change in SFMTA’s bus fleet. Fortunately many transit agencies, such as
Sacramento RT and Sonoma Country Transit, have experience with NGVs. These agencies could surely be
a resource to CCSF should it pursue NGVs. Additionally, Recology has started the process of converting
their fleet from to NGVs to take advantage of the cost savings.
Biomethane
Background Biomethane is essentially a renewable form of natural gas. While conventional natural gas is a fossil fuel,
biomethane is produced from decaying organic materials, such as municipal solid waste, sewage sludge,
and livestock manure. The gas is formed through anaerobic digestion, which is a chemical process in
which several kinds of bacteria digest organic matter in the absence of oxygen.
Medium & Heavy Duty
Vs. fleet avg diesel
Vs. new diesel
NOx -84.5% -36.0%
PM2.5 -81.0% 0.0%
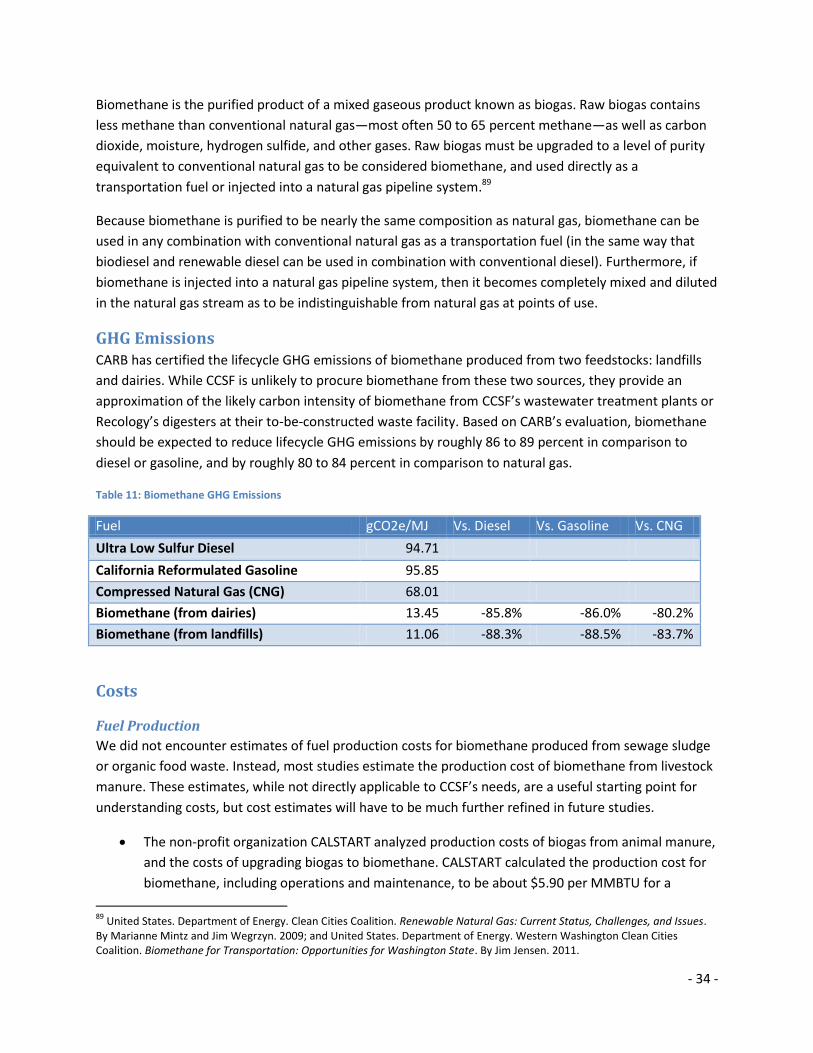
- 34 -
Biomethane is the purified product of a mixed gaseous product known as biogas. Raw biogas contains
less methane than conventional natural gas—most often 50 to 65 percent methane—as well as carbon
dioxide, moisture, hydrogen sulfide, and other gases. Raw biogas must be upgraded to a level of purity
equivalent to conventional natural gas to be considered biomethane, and used directly as a
transportation fuel or injected into a natural gas pipeline system.89
Because biomethane is purified to be nearly the same composition as natural gas, biomethane can be
used in any combination with conventional natural gas as a transportation fuel (in the same way that
biodiesel and renewable diesel can be used in combination with conventional diesel). Furthermore, if
biomethane is injected into a natural gas pipeline system, then it becomes completely mixed and diluted
in the natural gas stream as to be indistinguishable from natural gas at points of use.
GHG Emissions CARB has certified the lifecycle GHG emissions of biomethane produced from two feedstocks: landfills
and dairies. While CCSF is unlikely to procure biomethane from these two sources, they provide an
approximation of the likely carbon intensity of biomethane from CCSF’s wastewater treatment plants or
Recology’s digesters at their to-be-constructed waste facility. Based on CARB’s evaluation, biomethane
should be expected to reduce lifecycle GHG emissions by roughly 86 to 89 percent in comparison to
diesel or gasoline, and by roughly 80 to 84 percent in comparison to natural gas.
Table 11: Biomethane GHG Emissions
Fuel gCO2e/MJ Vs. Diesel Vs. Gasoline Vs. CNG
Ultra Low Sulfur Diesel 94.71
California Reformulated Gasoline 95.85
Compressed Natural Gas (CNG) 68.01
Biomethane (from dairies) 13.45 -85.8% -86.0% -80.2%
Biomethane (from landfills) 11.06 -88.3% -88.5% -83.7%
Costs
Fuel Production
We did not encounter estimates of fuel production costs for biomethane produced from sewage sludge
or organic food waste. Instead, most studies estimate the production cost of biomethane from livestock
manure. These estimates, while not directly applicable to CCSF’s needs, are a useful starting point for
understanding costs, but cost estimates will have to be much further refined in future studies.
The non-profit organization CALSTART analyzed production costs of biogas from animal manure,
and the costs of upgrading biogas to biomethane. CALSTART calculated the production cost for
biomethane, including operations and maintenance, to be about $5.90 per MMBTU for a
89
United States. Department of Energy. Clean Cities Coalition. Renewable Natural Gas: Current Status, Challenges, and Issues. By Marianne Mintz and Jim Wegrzyn. 2009; and United States. Department of Energy. Western Washington Clean Cities Coalition. Biomethane for Transportation: Opportunities for Washington State. By Jim Jensen. 2011.

- 35 -
medium facility and $9.00 per MMBTU for a small facility.90 This translates to a cost of $1.15 per
DGE for a small facility and $0.75 per DGE for a large facility. The report also noted that the
price is highly sensitive to scale of operation and type of technology used.
A 2005 report prepared for the Western United Dairymen estimated the capital costs of
hypothetical biogas production and biogas upgrading at dairies.91 For a small dairy, capable of
processing 45,000 cubic feet of methane per day, the report estimated that the anaerobic
digester and biogas upgrading equipment would cost approximately $500,000 each. For a large
diary, capable of processing 240,000 cubic feet of methane per day, the report estimate that the
anaerobic digester would cost approximately $2.1 million and the biogas upgrading equipment
would cost about $1.5 million. The study amortized the costs at 8 percent interest over 20 years
and added operations and maintenance costs to produce estimated total costs of $11.82 per
thousand cubic feet for a small dairy, and between $8.44 and $11.54 per thousand cubic feet for
a large dairy. This translates to $1.47 per DGE for a small facility and between $1.05 and $1.43
per DGE for a large facility.
A 2009 study by the European Biomass Association estimated the cost of a biogas production
plant at 2 million Euros, or $2.6 million, and the cost of equipment to upgrade biogas at 0.7
million Euros, or $920,000.92 These estimates were for a plant that produced one million cubic
meters of biomethane per year. Assuming a 20-year loan at 5% interest, this plant would require
combined annual payments of $285,000.93 This translates to a cost of about $1.00 per DGE.
However, this excludes the cost of operations and maintenance.
Fueling Infrastructure
Transit agencies and other industry experts indicate that a CNG fueling depot at a transit agency fueling
station serving around 100 buses costs approximately $2.5 million.94 In comparison, CARB estimates that
the cost of new public access CNG station is about $1 million.95
ANL estimates the costs of natural gas fueling infrastructure by amortizing it on a GGE basis. ANL
estimates the combined amortized cost of fueling equipment to be $0.35 to $0.65 per GGE. 96
Maintenance and Repair
CNG buses are reported to experience higher maintenance and repair costs than diesel buses. Not long
ago, the Regional Public Transportation Authority (RPTA) in the Phoenix-Mesa metropolitan area
conducted a study to compare the operating costs of CNG and diesel buses.97 In the study, they
measured over a nine-month period the operating costs associated with 36 2008 CNG buses and 11
90
Chen, Patrick, et al. Economic Assessment of Biogas and Biomethane Production from Manure. Report. CALSTART (2010), i. 91
Krich, Ken, et al. Biomethane from Dairy Waste. Report. Western United Dairymen, (2005), 147-164.
92European Biomass Association. A Biogas Road Map for Europe. Report. AEBIOM (2009), 10.
93 These are our own assumptions. In addition to assuming 5% interest on a 20-year loan, we assume 1,270 BTU per cubic foot
of biomethane. 94
Cameron, Doug (Clean Energy). Telephone interview by author. April 24, 2012. 95
State of California. California Air Resources Board. Final Program Review Report. By LCFS Program Review Advisory Panel. 2011.
96 United States. Department of Energy. Argonne National Laboratory. Natural Gas Vehicles: Status, Barriers, and Opportunities,
8.
97 RPTA - Mesa, AZ. Cost per Mile Comparison Between CNG and Diesel Buses. 2012. Raw data.
- 36 -
2007 diesel buses. During this period, the CNG buses traveled more than 20,000 miles and the diesel
buses traveled more than 17,000 miles. The RPTA found that CNG buses averaged $0.51 per mile in
maintenance costs while the diesel buses averaged $0.37 per mile.
Sacramento RT also shared information on the cost of operating their fleet of CNG buses from July 2011
through January 2012.98 Sacramento RT reports that the cost of parts and labor was $1.915 million, or
$0.48 per mile. It is unclear whether these labor costs include costs beyond those needed just for
maintenance and repair.
Electric Compression Costs
Sacramento RT reports that they spent $95,000 on compressing natural gas from July 2011 through
January 2012, or $0.02 per mile.
Meanwhile, ANL estimates that 1kWh per GGE is required to compress natural gas, and that this costs
on average $0.09 to $0.15 per GGE99
Vehicle Cost
According to a 2010 ANL report on NGVs, the incremental additional cost of a light-duty NGV is about
$7,000, and historically the medium- and heavy-duty NGVs has cost $20,00-$50,000 more than
comparable diesel vehicles. However, the report notes that “the differential is narrowing as the price of
equivalent diesel vehicles rises in response to tough emissions standards.”100
Vehicle Maintenance Shops
Maintenance on NGVs requires alterations to maintenance shops. Industry experts estimate that
integrating these alterations into the design of a new maintenance facility costs about $500,000, while
retrofitting an existing facility costs about $ 1million.101
Availability (Procurement) We considered three sources potentially available to CCSF to procure biomethane: (1) Recology’s
proposed Zero Waste Facility, between 2 and 8 million GGE annually, (2) expanded production at
SFPUC’s Southeast and Oceanside wastewater treatment plants, between 1.3 and 2.7 million GGE
Annually and (3) contracts with energy brokers to supply biomethane produced outside San Francisco
through the natural gas pipeline distribution system.
Recology Zero Waste Facility
One way to procure biomethane for use in the fleet is to use biomethane that is expected to be
produced from Recology’s new waste facility. Recology is planning to build a new Zero Waste Facility in
San Francisco that will include anaerobic digesters to produce biogas from the City’s food waste. San
Francisco currently produces about 100,000 tons of source-separated food waste annually, and there is
98
Hutch, Lyn, and David Harbour. Title Unknown. Rep. Sacramento RT, 2012. Print. 99
United States. Department of Energy. Argonne National Laboratory. Natural Gas Vehicles: Status, Barriers, and Opportunities, 8.
100 Ibid., 9.
101 Cameron, Doug.

- 37 -
probably another 100,000 tons that is currently going to landfills that could be separated.102 Estimates of
how much biomethane this will produce are very speculative, ranging from 2 million to nearly 8 million
DGE per year:
The consulting firm in charge of building the new Zero Waste Facility, estimates about 7.9
million DGE per year.103
Recology indicated that it is plausible to assume that he facility will process 500 tons of organic
waste per day (182,500 tons per year), and that every 100 tons per day produces 432,000 cubic
feet per day of biomethane. This would result in 6.4 million DGE per year.104
The San Francisco Department of the Environment speculated that the facility could produce 2
million to 5 million DGE per year.105
Recology currently uses about 2 million gallons of diesel (and biodiesel) per year, and is planning to
convert its fleet to NGVs to utilize its forthcoming supply of biomethane. However, it is likely that
Recology will produce more, and very possibly much more, biomethane than it can use in its fleet. If that
occurs, then CCSF is well positioned to tap into this local fuel source for its own vehicles.
San Francisco Public Utilities Commission Wastewater Treatment Plants
SF PUC operates the City’s wastewater treatment system, which includes two wastewater treatment
plants, the Oceanside Water Pollution Control Plant and the Southeast Water Pollution Control Plant.
Both plants create biogas as a byproduct of digesting and treating biosolids, which is used as fuel for the
plants’ boilers and also burned to create electricity. SFPUC has retained a consultant to estimate the
biomethane production at both of their water pollution control plants. At this time their best estimate
of biomethane production available for transportation uses is between 1.3 and 2.7 million GGE annually.
As a result, it is feasible that future biogas production could be purified to biomethane suitable for use
in CCSF’s fleet.
Contract with Energy Provider
A final procurement option is to contract with an energy provider that can supply biomethane produced
outside San Francisco via the natural gas pipeline distribution system. Pipeline biomethane is a very
nascent market and most biomethane projects available for procurement though a contract with an
energy provider are from landfills. One industry expert estimated that at high volumes – e.g., 1.5 million
to 3 million DGE per year –biomethane can be procured for about $1.00 to $1.30 per DGE, with added
transport costs of about $0.25 to $0.40 per DGE.106
However, industry experts stressed that it is not economical to procure small amounts of biomethane
through contracts with their companies.107 Furthermore, they noted that there is not a single project in
102
Drew, Kevin (Department of the Environment Zero Waste Program). Interview by author. March 9, 2012. 103
Mitchell, Alex. "RE: Message from 914155515184." E-mail to Bill Zeller. April 16, 2012. 104
Drda, Brad. "Site Generated Biogas Potential." E-mail to Bill Zeller. March 2, 2012. 105
Drew, Kevin. Kevin stressed that these numbers were highly speculative. 106
Lumpkin, Nick (Clean Energy Renewable Fuels). Telephone interview by author. March 13, 2012. 107
Lumpkin, Nick; and Theriault, David (BP Energy Company). Telephone interview by author. March 15, 2012.

- 38 -
the country that is currently supplying pipeline biomethane for transportation fuels. Instead, most
customers are utilities and electricity generators that need Renewable Energy Credits.
Sustainability of Feedstocks The use of local organic food waste (at Recology) or local sewage sludge (at SF PUC) to produce
biomethane would be highly-sustainable. Both feedstocks are locally produced and are typically
considered to be waste. Biomethane procured by an energy provider could be produced from a variety
of feedstocks, including livestock manure, which is also a waste. However, pipeline biomethane would
potentially travel far distances in the natural gas distribution system, which CCSF considers to be less
sustainable.
Local Air Pollution Local air pollution impacts of running vehicles on biomethane are identical to running vehicles on
conventional natural gas. Light-duty NGVs generally reduce smog-producing pollutants by 60-90
percent.108 Historically, medium- and heavy-duty NGVs have also had lower emissions. However, recent
federal and state regulations require all heavy-duty duty vehicles to meet more stringent emissions
standards. As a result, as emissions from new diesel vehicles decrease, the emission benefit of heavy-
duty NGVs will likely diminish. (For more information on local air pollution impacts, refer to Natural Gas
section above.)
Other Issues
CCSF Unfamiliarity with Gaseous Fuels
NGVs currently account for only 5 percent of CCSF transportation fuel consumption, and half of that is
attributable to San Francisco International Airport. Therefore, if CCSF were to begin to use biomethane,
it would have to overcome its lack of expertise in NGVs. This is particularly true for SFMTA, since any
plan to dramatically increase use of gaseous fuels would necessarily involve a change in SFMTA’s bus
fleet. Fortunately many transit agencies, such as Sacramento RT and Sonoma Country Transit, have
experience with NGVs. These agencies could surely be a resource to CCSF should it pursue NGVs.
Additionally, Recology has started the process of converting their fleet from to NGVs to take advantage
of the cost savings.
Securing Financing for Capital Expenditures
Developing biomethane as a transportation fuel would necessitate a significant upfront capital
investments for fueling infrastructure, vehicles, and retrofits to maintenance shops. The San Francisco
Controller’s Office has indicated that it is possible to finance the cost of clean transportation
infrastructure through CCSF-issued bonds. While the exact terms of terms of borrowing would need to
be determined, the Controller’s Office reports the following current interest rates:109
5-year: 0.875 percent
108
United States. Department of Energy. Argonne National Laboratory. Natural Gas Vehicles: Status, Barriers, and Opportunities, 15.
109 Whittaker, Angela. "Interest Rates for Bonds to Finance Clean Transportation Projects." E-mail to Bill Zeller. May 10, 2012.
- 39 -
7-year: 1.25 percent
10-year: 1.75 percent
30-year: 3.125 percent
Securing Access to PG&E Pipeline
If CCSF is to use biomethane produced at Recology or SFPUC wastewater treatment plants, it is likely
that CCSF need access to the PG&E natural gas distribution system to transport the gas from its
production site to CCSF fueling stations. PG&E currently only allows biomethane into its distribution
network if the biomethane was produced using “agricultural and/or animal waste.”110 In contrast, the
other two investor-owned gas utilities in California, San Diego Gas & Electric and Southern California
Gas, allow biomethane from any renewable source so long as the gas meets certain quality standards.111
Therefore, CCSF would need to work with PG&E and the California Public Utilities Commission to change
PG&E’s restrictions preventing biomethane produced by organic food waste or sewage sludge from
entering its distribution network.
Hydrogen
Background Hydrogen is like electricity in the sense that it is only an energy carrier and not an energy source. While
hydrogen can be produced from numerous energy sources, 95 percent of all hydrogen produced in the
U.S. is produced using natural gas through a process called steam methane reforming.112 Once
produced, hydrogen can be blended with natural gas and burned in natural gas internal combustion
engines, or it can be used in fuel cells. Fuel cells use hydrogen to produce electricity, which in turn
powers the vehicle. One of the benefits of using hydrogen in fuel cells is that it emits no exhaust
emissions.
There are no fully commercialized fuel cell vehicles in the world. However, there are many light-duty
and heavy-duty fuel cell vehicles that have been demonstrated and tested. One important example of
fuel cell vehicle testing is the Alameda-Contra Costa Transit District (AC Transit), which is currently using
twelve “third-generation” fuel cell buses, each powered by a 120 kW fuel cell power system coupled
with a battery storage system.
GHG Emissions CARB has certified the lifecycle GHG emissions of hydrogen fuel produced on-site with a feedstock of
one-third biomethane from landfills and two-thirds conventional natural gas. CARB’s estimate is that
such hydrogen produces 76.1 gCO2e/MJ. CARB’s estimate includes emissions associated with electricity
110
Pacific Gas and Electric. Gas Rule No. 21. PG&E, 2009. Accessed March 11, 2012. http://www.pge.com/tariffs/tm2/pdf/GAS_RULES_21.pdf. 111
Southern California Gas Company. Rule No. 30. SoCal Gas, 2011. Accessed May 11, 2011. http://www.socalgas.com/regulatory/tariffs/tm2/pdf/30.pdf.; San Diego Gas & Electric Company. Rule No. 30. SDG&E, 2012. Accessed May 11, 2012. http://regarchive.sdge.com/tm2/pdf/GAS_GAS-RULES_GRULE30.pdf. 112
"Hydrogen Production." Alternative Fuels and Advanced Vehicles Data Center. Accessed May 04, 2012. http://www.afdc.energy.gov/afdc/fuels/hydrogen_production.html.
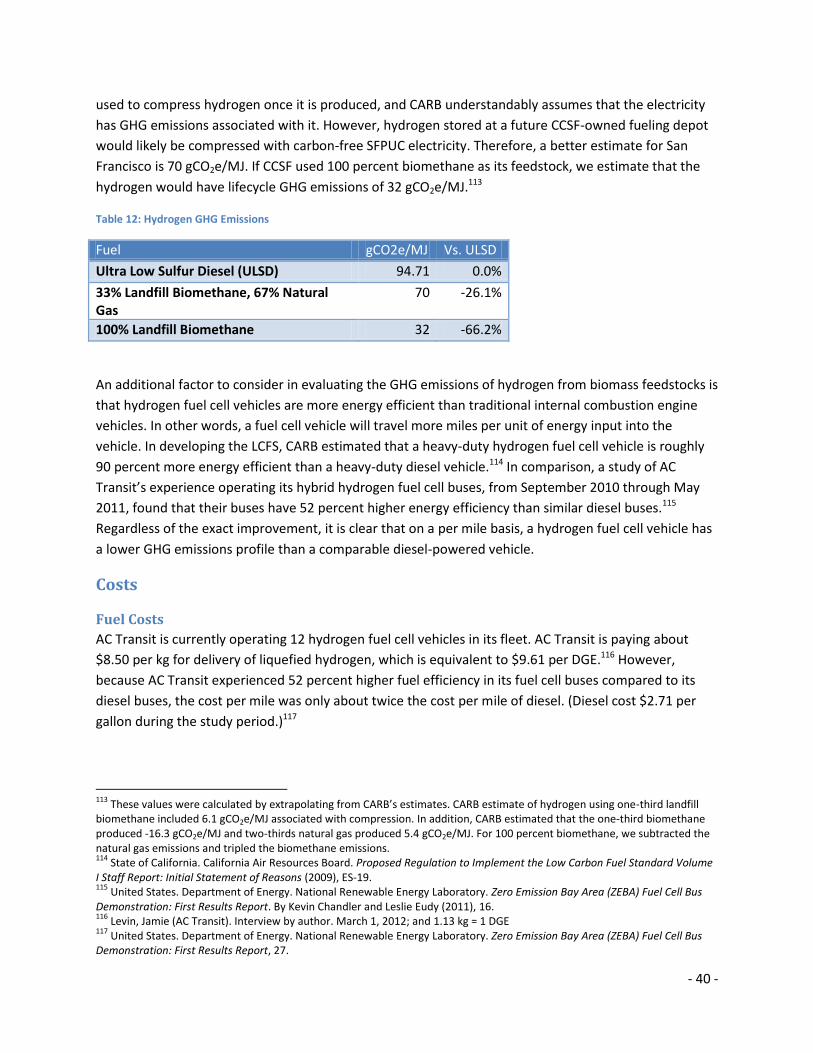
- 40 -
used to compress hydrogen once it is produced, and CARB understandably assumes that the electricity
has GHG emissions associated with it. However, hydrogen stored at a future CCSF-owned fueling depot
would likely be compressed with carbon-free SFPUC electricity. Therefore, a better estimate for San
Francisco is 70 gCO2e/MJ. If CCSF used 100 percent biomethane as its feedstock, we estimate that the
hydrogen would have lifecycle GHG emissions of 32 gCO2e/MJ.113
Table 12: Hydrogen GHG Emissions
Fuel gCO2e/MJ Vs. ULSD
Ultra Low Sulfur Diesel (ULSD) 94.71 0.0%
33% Landfill Biomethane, 67% Natural Gas
70 -26.1%
100% Landfill Biomethane 32 -66.2%
An additional factor to consider in evaluating the GHG emissions of hydrogen from biomass feedstocks is
that hydrogen fuel cell vehicles are more energy efficient than traditional internal combustion engine
vehicles. In other words, a fuel cell vehicle will travel more miles per unit of energy input into the
vehicle. In developing the LCFS, CARB estimated that a heavy-duty hydrogen fuel cell vehicle is roughly
90 percent more energy efficient than a heavy-duty diesel vehicle.114 In comparison, a study of AC
Transit’s experience operating its hybrid hydrogen fuel cell buses, from September 2010 through May
2011, found that their buses have 52 percent higher energy efficiency than similar diesel buses.115
Regardless of the exact improvement, it is clear that on a per mile basis, a hydrogen fuel cell vehicle has
a lower GHG emissions profile than a comparable diesel-powered vehicle.
Costs
Fuel Costs
AC Transit is currently operating 12 hydrogen fuel cell vehicles in its fleet. AC Transit is paying about
$8.50 per kg for delivery of liquefied hydrogen, which is equivalent to $9.61 per DGE.116 However,
because AC Transit experienced 52 percent higher fuel efficiency in its fuel cell buses compared to its
diesel buses, the cost per mile was only about twice the cost per mile of diesel. (Diesel cost $2.71 per
gallon during the study period.)117
113
These values were calculated by extrapolating from CARB’s estimates. CARB estimate of hydrogen using one-third landfill biomethane included 6.1 gCO2e/MJ associated with compression. In addition, CARB estimated that the one-third biomethane produced -16.3 gCO2e/MJ and two-thirds natural gas produced 5.4 gCO2e/MJ. For 100 percent biomethane, we subtracted the natural gas emissions and tripled the biomethane emissions. 114
State of California. California Air Resources Board. Proposed Regulation to Implement the Low Carbon Fuel Standard Volume I Staff Report: Initial Statement of Reasons (2009), ES-19. 115
United States. Department of Energy. National Renewable Energy Laboratory. Zero Emission Bay Area (ZEBA) Fuel Cell Bus Demonstration: First Results Report. By Kevin Chandler and Leslie Eudy (2011), 16. 116
Levin, Jamie (AC Transit). Interview by author. March 1, 2012; and 1.13 kg = 1 DGE 117
United States. Department of Energy. National Renewable Energy Laboratory. Zero Emission Bay Area (ZEBA) Fuel Cell Bus Demonstration: First Results Report, 27.
- 41 -
Maintenance Costs
The study of AC Transit’s experience operating hydrogen fuel cell buses found that maintenance costs
for the hydrogen buses averaged $1.51 per mile, while maintenance costs for diesel buses averaged
$0.66 per mile over the same period.118
Infrastructure Costs
A fueling station that serves 40 buses costs about $3 million to build.119
Vehicle Costs
Hydrogen fuel cell buses currently cost between $2.2 and $2.5 million.120 AC Transit speculated that a
procurement order of about 200 buses could reduce costs to about $1.2 million per bus.
Vehicle Maintenance Shops
According to AC Transit, the cost to retrofit their maintenance facilities to accommodate hydrogen fuel
cell vehicles was between $500,000 and $1 million per facility.
Availability (Procurement) SF MTA is currently arranging two separate hydrogen demonstration projects, although neither will be
utilizing hydrogen from biofuels. The first is directly with AC Transit. SFMTA will use one of AC Transit’s
12 hydrogen fuel cell buses and will fuel at the AC Transit fueling station. About 80 percent of AC
Transit’s hydrogen is produced in Southern California through methane reformation with conventional
natural gas feedstock, and then trucked to AC Transit’s fueling depot in Emeryville. The remaining 20
percent of their hydrogen is produced onsite using solar electrolysis.121 The second demonstration is
part of the Federal Transit Administration’s National Fuel Cell Bus Program Demonstration. This bus is a
compound hybrid fuel cell that combines a smaller fuel cell system with a diesel-hybrid propulsion
system. This bus will likely also be fueled at AC Transit, although a fueling agreement is not yet in place.
CCSF is apparently considering building a multi-use (public and city fleet) hydrogen fueling station. If
CCSF constructs a hydrogen station, it could potentially use biomethane as the feedstock. (See section
on biomethane for discussion of potential biomethane availability).
Sustainability of Feedstocks Hydrogen can be produced from numerous feedstocks. Locally-supplied, waste-based biomethane
would be a very sustainable feedstock. On the other hand, conventional natural gas is a much less
sustainable feedstock. (See sections on biomethane and natural gas for further discussion of feedstock
sustainability.)
118
Ibid., 18. 119
Building a Commercially Viable National Fuel Cell Electric Bus Program. Report. Fuel Cell and Hydrogen Energy Association, 2011. 120
Levin, Jamie; and Building a Commercially Viable National Fuel Cell Electric Bus Program. 121
Levin, Jamie.

- 42 -
Local Air Pollution One of the major benefits of hydrogen as a transportation fuel is that it emits no tailpipe emissions.
Therefore, hydrogen would reduce local air pollution.
Other Issues
CCSF Unfamiliarity with Hydrogen
Aside from the two pending demonstration projects, CCSF has no experience with hydrogen fuel.
Furthermore, because hydrogen fuel cell technology is new and has yet to reach commercialization,
there is not a wealth of expertise about hydrogen fuel cells on which CCSF can draw. One ameliorating
factor is AC Transit’s experience with hydrogen fuel cell technology and its close proximity to San
Francisco. Should CCSF pursue hydrogen as an alternative fuel, AC Transit would surely be an important
resource to CCSF.
Securing Financing for Capital Expenditures
Developing hydrogen as a transportation fuel would necessitate a significant upfront capital investments
for fuel production, fueling infrastructure, vehicles, and retrofits to maintenance shops. The San
Francisco Controller’s Office has indicated that it is possible to finance the cost of clean transportation
infrastructure through CCSF-issued bonds. While the exact terms of terms of borrowing would need to
be determined, the Controller’s Office reports the following current interest rates:122
5-year: 0.875 percent
7-year: 1.25 percent
10-year: 1.75 percent
30-year: 3.125 percent
Conclusion The table below summarizes our findings on each of the nine fuels.
Table 13: Fuel Evaluation Summary
Fuel
GHG
Emissions
(gCO2e/MJ)
Fuel
Costs
($/Gal)
Infrastructure
Costs Availability
Sustainability of
Feedstock
Local Air
Pollution
Diesel 95 $3.50 N/A No issues Petroleum Baseline
Biodiesel 12 – 83 $4.30 $900k / storage
tank
Cheaper procurement
needed
Soy; FOG; Wastestream
Potential increase in
NOx; No other adverse impact
Renewable 57 – 76 $8 - $22 $0 Uncertain commercial
Sugar Cane; Sugar Beets
No adverse impact
122
Whittaker, Angela. "Interest Rates for Bonds to Finance Clean Transportation Projects." E-mail to Bill Zeller. May 10, 2012.

- 43 -
Diesel availability
Gasoline 96 – 99 $3.25 N/A No issues Petroleum Baseline
Ethanol 96 $4.19 $170k / filling
station No issues Corn
Increase in VOC; No other adverse impact
Renewable
Gasoline 57 – 76 $8 - $22 $0
Uncertain commercial availability
Herbaceous and Woody Biomass
No adverse impact
Natural Gas 68 – 77 $1.49 (GGE)
$1 – 2.5 mil. / filling station; $15-
50k / vehicle No issues Natural gas
No adverse impact
Biomethane 11 $2.00 (DGE)
$1 – 2.5 mil. / filling station; $15-
50k / vehicle
Not commercially, but can produce
locally
Food waste, sewage sludge
No adverse impact
Hydrogen
(from
biomethane)
32 – 70 $9.61 (DGE)
$3 mil. / fueling facility; $2.5 mil. /
bus
On-site generation
Biomethane No adverse
impact
In conclusion, we fine evidence that:
Biomethane and biodiesel are the best biofuel options for CCSF based on their performance
against the five criteria.
o Biomethane excels due to its low GHG emissions and low fuel cost. The downside is that
it is not yet available, although there are local feedstocks and plans for its local
production.
o Biodiesel made from waste-based feedstocks excels due to its low GHG emissions and
its availability. The downsides are costs that are higher than diesel (although there are
opportunities to reduce costs) and a risk of slightly increasing NOx emissions.
Renewable diesel and renewable gasoline are promising options due to their potentially low
GHG emissions. Unfortunately, the fuels are not currently available to CCSF and current
estimates of their production costs are extremely high. These fuels need to be monitored for
future developments.
Hydrogen can produce very low GHG emissions if it is produced using biomethane and
compressed using zero-carbon electricity. However, hydrogen fuel cell vehicles, fueling
infrastructure, and fuel production are all currently very expensive.
Ethanol made from corn performs poorly due to GHG emissions that are roughly equal to
gasoline and diesel, and use of a feedstock that competes with the food supply. However, the

- 44 -
upside is that it is readily available and widely used.
Natural gas is a fossil fuel, and therefore is not a good long-term fuel option for CCSF. However,
it produces less GHG emissions and costs less than gasoline and diesel, which makes it an
improvement over those fossil fuels in the short-run. Most importantly, it could serve as a
“bridge” fuel if CCSF pursues biomethane.
- 45 -
Section 3: Fuel Mix Scenarios
In this section, we undertake a more quantitative approach to evaluating the merits of the two biofuels
that are most promising for use in CCSF’s fleet: biodiesel and biomethane. To do so, we designed four
hypothetical scenarios in which CCSF replaces much of its fossil fuel consumption with biodiesel,
biomethane, or CNG (as a “bridge” fuel to biomethane). We estimate the annual lifecycle GHG emissions
and the annual cost of fuel. We also include rough estimates of the cost of new fueling stations and
fueling infrastructure, the incremental additional cost of alternative fuel vehicles, and potential
additional costs associate with maintaining a fleet of alternative fuel vehicles. The results are compared
to our estimate of lifecycle GHG emissions and annual fuel costs for CCSF’s current fuel mix.
Below are a few key points about our methods. A complete description of the methodology is in the
Appendix.
We used the Department of the Environment’s estimate of fuel consumption in Fiscal Year 09-
10. This estimate is the result of the Department’s annual inventory of municipal GHG
emissions.
For diesel, biodiesel and gasoline fuel costs, we used data provided by CCSF’s main fuel provider,
Western States Oil, for September 2011 through February 2012. For CNG fuel costs, we used the
average cost paid by CCSF departments to Central Shops between July 2010 and February 2012.
For biomethane, we used a conservative estimate from the relevant literature.
Our estimates of GHG emissions use CARB’s estimate of lifecycle GHG emissions established for
the state’s LCFS.
Estimates for incremental additional maintenance costs, cost of fueling infrastructure and
stations, and incremental additional vehicle costs are all rough estimates based on
conversations with CCSF staff, input from industry experts, and research of the relevant
literature. We assume that fueling infrastructure and stations, and additional vehicle costs are
all financed.
Baseline Scenario The Baseline Scenario is an approximation of CCSF’s current fuel mix. The scenario relies on the
Department of the Environment’s estimate of fuel consumption in Fiscal Year 09-10 and fuel prices
provided by CCSF’s main fuel provider, Western States Oil, for September 2011 through February 2012.
CCSF consumes about 8.7 million gallons annually. We estimate Baseline fuel use costs about $29.3
million and is responsible for about 99,000 metric tons of CO2e.
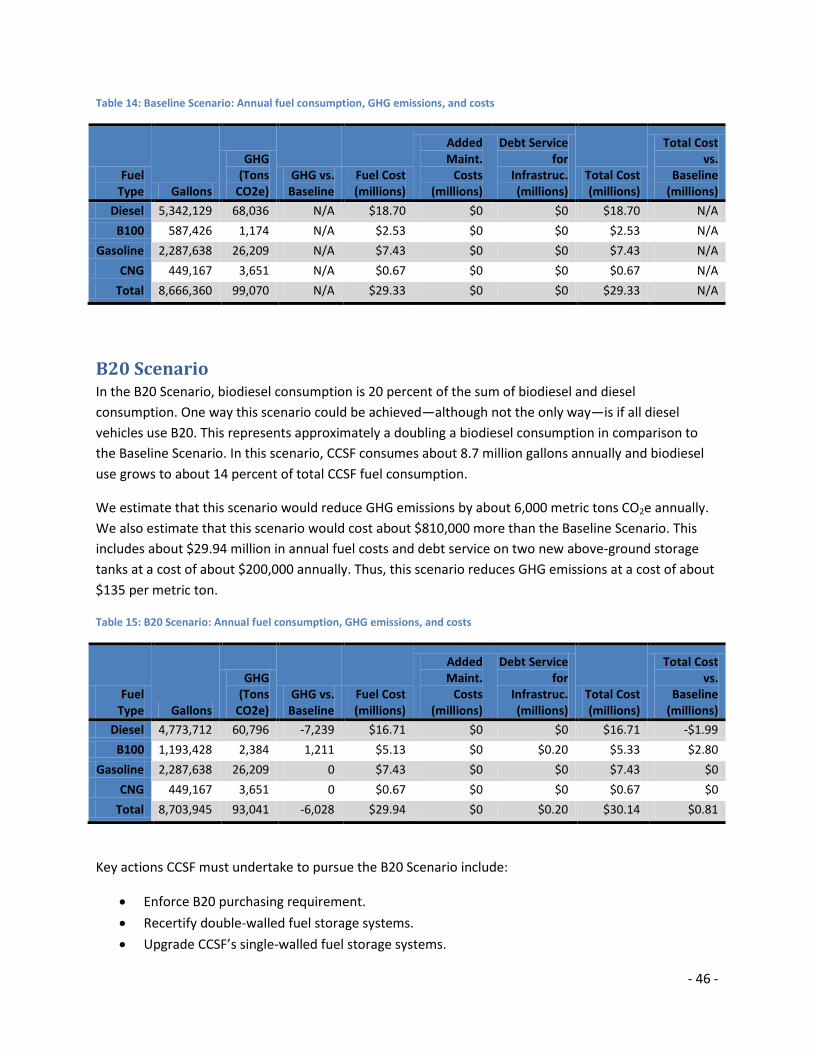
- 46 -
Table 14: Baseline Scenario: Annual fuel consumption, GHG emissions, and costs
Fuel Type Gallons
GHG (Tons
CO2e) GHG vs.
Baseline Fuel Cost (millions)
Added Maint.
Costs (millions)
Debt Service for
Infrastruc. (millions)
Total Cost (millions)
Total Cost vs.
Baseline (millions)
Diesel 5,342,129 68,036 N/A $18.70 $0 $0 $18.70 N/A
B100 587,426 1,174 N/A $2.53 $0 $0 $2.53 N/A
Gasoline 2,287,638 26,209 N/A $7.43 $0 $0 $7.43 N/A
CNG 449,167 3,651 N/A $0.67 $0 $0 $0.67 N/A
Total 8,666,360 99,070 N/A $29.33 $0 $0 $29.33 N/A
B20 Scenario In the B20 Scenario, biodiesel consumption is 20 percent of the sum of biodiesel and diesel
consumption. One way this scenario could be achieved—although not the only way—is if all diesel
vehicles use B20. This represents approximately a doubling a biodiesel consumption in comparison to
the Baseline Scenario. In this scenario, CCSF consumes about 8.7 million gallons annually and biodiesel
use grows to about 14 percent of total CCSF fuel consumption.
We estimate that this scenario would reduce GHG emissions by about 6,000 metric tons CO2e annually.
We also estimate that this scenario would cost about $810,000 more than the Baseline Scenario. This
includes about $29.94 million in annual fuel costs and debt service on two new above-ground storage
tanks at a cost of about $200,000 annually. Thus, this scenario reduces GHG emissions at a cost of about
$135 per metric ton.
Table 15: B20 Scenario: Annual fuel consumption, GHG emissions, and costs
Fuel Type Gallons
GHG (Tons
CO2e) GHG vs.
Baseline Fuel Cost (millions)
Added Maint.
Costs (millions)
Debt Service for
Infrastruc. (millions)
Total Cost (millions)
Total Cost vs.
Baseline (millions)
Diesel 4,773,712 60,796 -7,239 $16.71 $0 $0 $16.71 -$1.99
B100 1,193,428 2,384 1,211 $5.13 $0 $0.20 $5.33 $2.80
Gasoline 2,287,638 26,209 0 $7.43 $0 $0 $7.43 $0
CNG 449,167 3,651 0 $0.67 $0 $0 $0.67 $0
Total 8,703,945 93,041 -6,028 $29.94 $0 $0.20 $30.14 $0.81
Key actions CCSF must undertake to pursue the B20 Scenario include:
Enforce B20 purchasing requirement.
Recertify double-walled fuel storage systems.
Upgrade CCSF’s single-walled fuel storage systems.
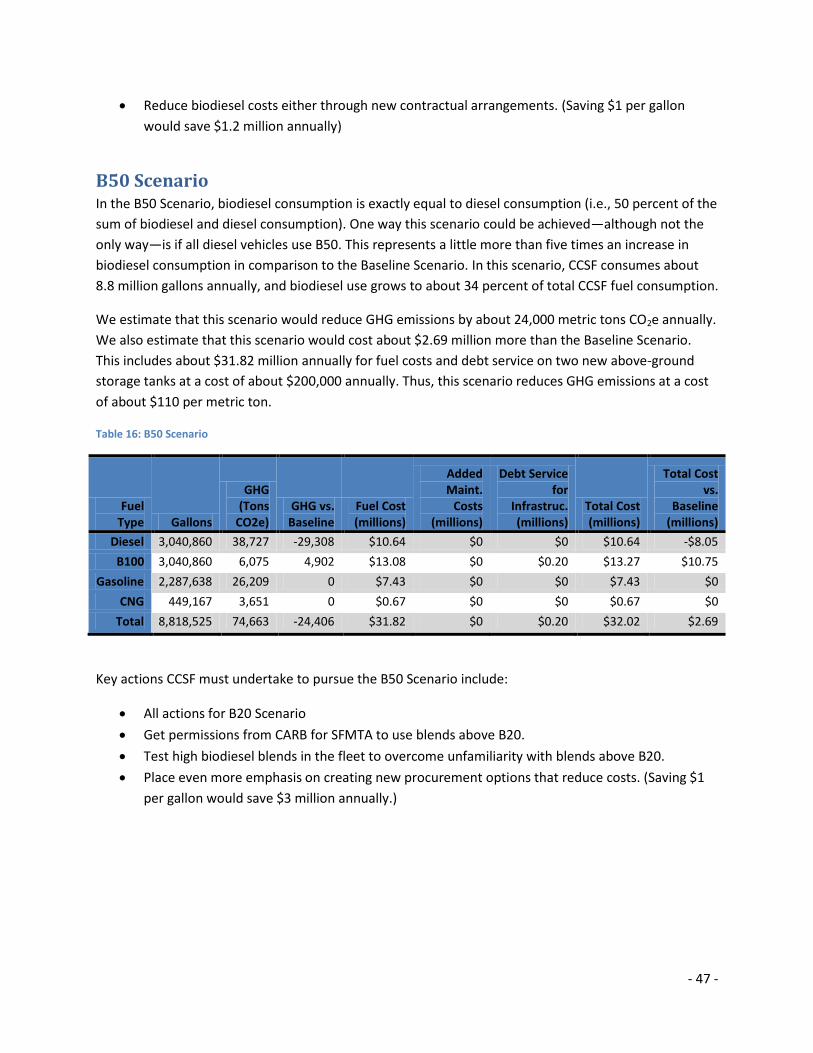
- 47 -
Reduce biodiesel costs either through new contractual arrangements. (Saving $1 per gallon
would save $1.2 million annually)
B50 Scenario In the B50 Scenario, biodiesel consumption is exactly equal to diesel consumption (i.e., 50 percent of the
sum of biodiesel and diesel consumption). One way this scenario could be achieved—although not the
only way—is if all diesel vehicles use B50. This represents a little more than five times an increase in
biodiesel consumption in comparison to the Baseline Scenario. In this scenario, CCSF consumes about
8.8 million gallons annually, and biodiesel use grows to about 34 percent of total CCSF fuel consumption.
We estimate that this scenario would reduce GHG emissions by about 24,000 metric tons CO2e annually.
We also estimate that this scenario would cost about $2.69 million more than the Baseline Scenario.
This includes about $31.82 million annually for fuel costs and debt service on two new above-ground
storage tanks at a cost of about $200,000 annually. Thus, this scenario reduces GHG emissions at a cost
of about $110 per metric ton.
Table 16: B50 Scenario
Fuel Type Gallons
GHG (Tons
CO2e) GHG vs.
Baseline Fuel Cost (millions)
Added Maint.
Costs (millions)
Debt Service for
Infrastruc. (millions)
Total Cost (millions)
Total Cost vs.
Baseline (millions)
Diesel 3,040,860 38,727 -29,308 $10.64 $0 $0 $10.64 -$8.05
B100 3,040,860 6,075 4,902 $13.08 $0 $0.20 $13.27 $10.75
Gasoline 2,287,638 26,209 0 $7.43 $0 $0 $7.43 $0
CNG 449,167 3,651 0 $0.67 $0 $0 $0.67 $0
Total 8,818,525 74,663 -24,406 $31.82 $0 $0.20 $32.02 $2.69
Key actions CCSF must undertake to pursue the B50 Scenario include:
All actions for B20 Scenario
Get permissions from CARB for SFMTA to use blends above B20.
Test high biodiesel blends in the fleet to overcome unfamiliarity with blends above B20.
Place even more emphasis on creating new procurement options that reduce costs. (Saving $1
per gallon would save $3 million annually.)
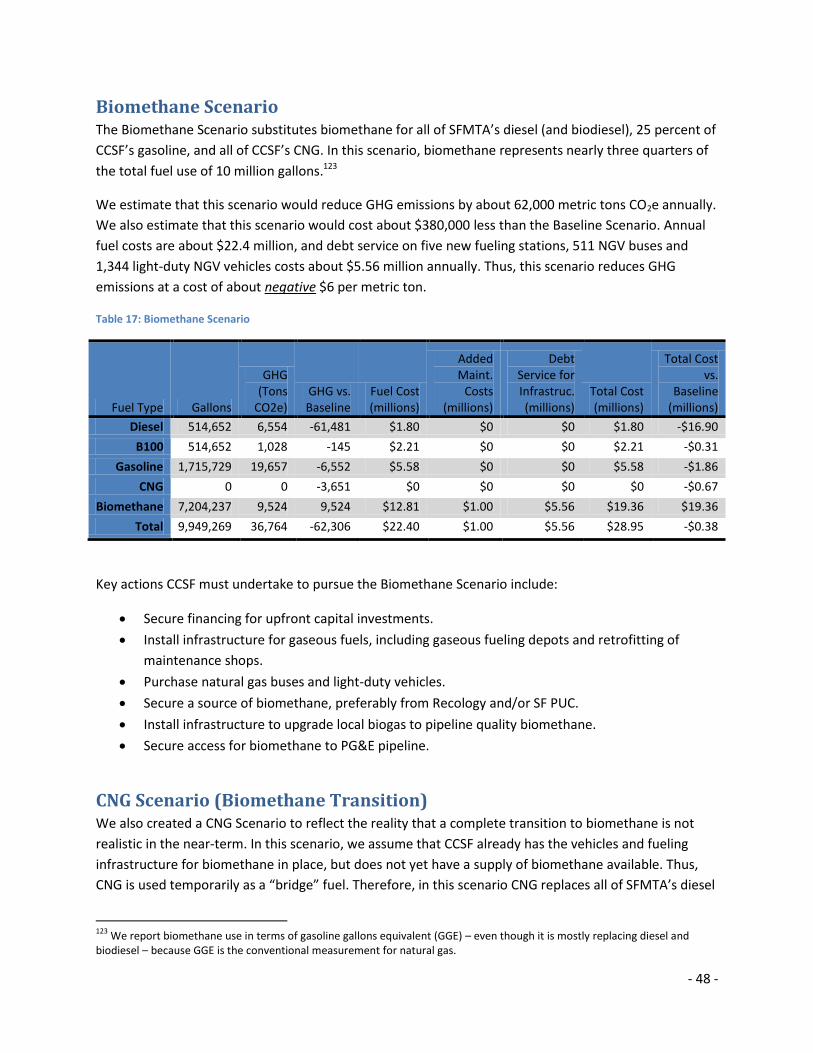
- 48 -
Biomethane Scenario The Biomethane Scenario substitutes biomethane for all of SFMTA’s diesel (and biodiesel), 25 percent of
CCSF’s gasoline, and all of CCSF’s CNG. In this scenario, biomethane represents nearly three quarters of
the total fuel use of 10 million gallons.123
We estimate that this scenario would reduce GHG emissions by about 62,000 metric tons CO2e annually.
We also estimate that this scenario would cost about $380,000 less than the Baseline Scenario. Annual
fuel costs are about $22.4 million, and debt service on five new fueling stations, 511 NGV buses and
1,344 light-duty NGV vehicles costs about $5.56 million annually. Thus, this scenario reduces GHG
emissions at a cost of about negative $6 per metric ton.
Table 17: Biomethane Scenario
Fuel Type Gallons
GHG (Tons
CO2e) GHG vs. Baseline
Fuel Cost (millions)
Added Maint.
Costs (millions)
Debt Service for Infrastruc. (millions)
Total Cost (millions)
Total Cost vs.
Baseline (millions)
Diesel 514,652 6,554 -61,481 $1.80 $0 $0 $1.80 -$16.90
B100 514,652 1,028 -145 $2.21 $0 $0 $2.21 -$0.31
Gasoline 1,715,729 19,657 -6,552 $5.58 $0 $0 $5.58 -$1.86
CNG 0 0 -3,651 $0 $0 $0 $0 -$0.67
Biomethane 7,204,237 9,524 9,524 $12.81 $1.00 $5.56 $19.36 $19.36
Total 9,949,269 36,764 -62,306 $22.40 $1.00 $5.56 $28.95 -$0.38
Key actions CCSF must undertake to pursue the Biomethane Scenario include:
Secure financing for upfront capital investments.
Install infrastructure for gaseous fuels, including gaseous fueling depots and retrofitting of
maintenance shops.
Purchase natural gas buses and light-duty vehicles.
Secure a source of biomethane, preferably from Recology and/or SF PUC.
Install infrastructure to upgrade local biogas to pipeline quality biomethane.
Secure access for biomethane to PG&E pipeline.
CNG Scenario (Biomethane Transition) We also created a CNG Scenario to reflect the reality that a complete transition to biomethane is not
realistic in the near-term. In this scenario, we assume that CCSF already has the vehicles and fueling
infrastructure for biomethane in place, but does not yet have a supply of biomethane available. Thus,
CNG is used temporarily as a “bridge” fuel. Therefore, in this scenario CNG replaces all of SFMTA’s diesel
123
We report biomethane use in terms of gasoline gallons equivalent (GGE) – even though it is mostly replacing diesel and biodiesel – because GGE is the conventional measurement for natural gas.

- 49 -
(and biodiesel) and 25 percent of CCSF’s gasoline. In this scenario, CNG represents nearly three quarters
of total fuel use of 10 million gallons.124
We estimate that this scenario would reduce GHG emissions by about 13,000 metric tons CO2e annually.
We also estimate that this scenario would cost about $2.45 million less than the Baseline Scenario. This
Annual fuel cost total about $20.32 million, and debt service on five new fueling stations, 511 NGV buses
and 1,344 light-duty NGV vehicles costs about $5.71 million annually. Thus, this scenario reduces GHG
emissions at a negative cost of about -$184 per metric ton.
Table 18: CNG Scenario
Fuel Type Gallons
GHG (Tons
CO2e) GHG vs.
Baseline Fuel Cost (millions)
Added Maint.
Costs (millions)
Debt Service for Infrastruc. (millions)
Total Cost (millions)
Total Cost vs.
Baseline (millions)
Diesel 514,652 6,554 -61,481 $1.80 $0 $0 $1.80 -$16.90
B100 514,652 1,028 -145 $2.21 $0 $0 $2.21 -$0.31
Gasoline 1,715,729 19,657 -6,552 $5.58 $0 $0 $5.58 -$1.86
CNG 7,204,237 58,565 54,914 $10.73 $1.00 $5.56 $17.29 $16.62
Biomethane 0 0 0 $0 $0 $0 $0 $0
Total 9,949,269 85,805 -13,265 $20.32 $1.00 $5.56 $26.88 -$2.45
Key actions CCSF must undertake to pursue the Biomethane Transition Scenario include:
Secure financing for upfront capital investments.
Install infrastructure for gaseous fuels, including gaseous fueling depots and retrofitting of
maintenance shops.
Purchase natural gas buses and light-duty vehicles.
Conclusion Figures 5 though 7 compare the annual GHG emissions, annual costs, and cost-effectiveness of each
scenario. The Biomethane Scenario produces the lowest annual GHG emissions, while the Biomethane
Transition Scenario produces the lowest costs.
124
We report CNG consumption in terms of gasoline gallons equivalent (GGE).
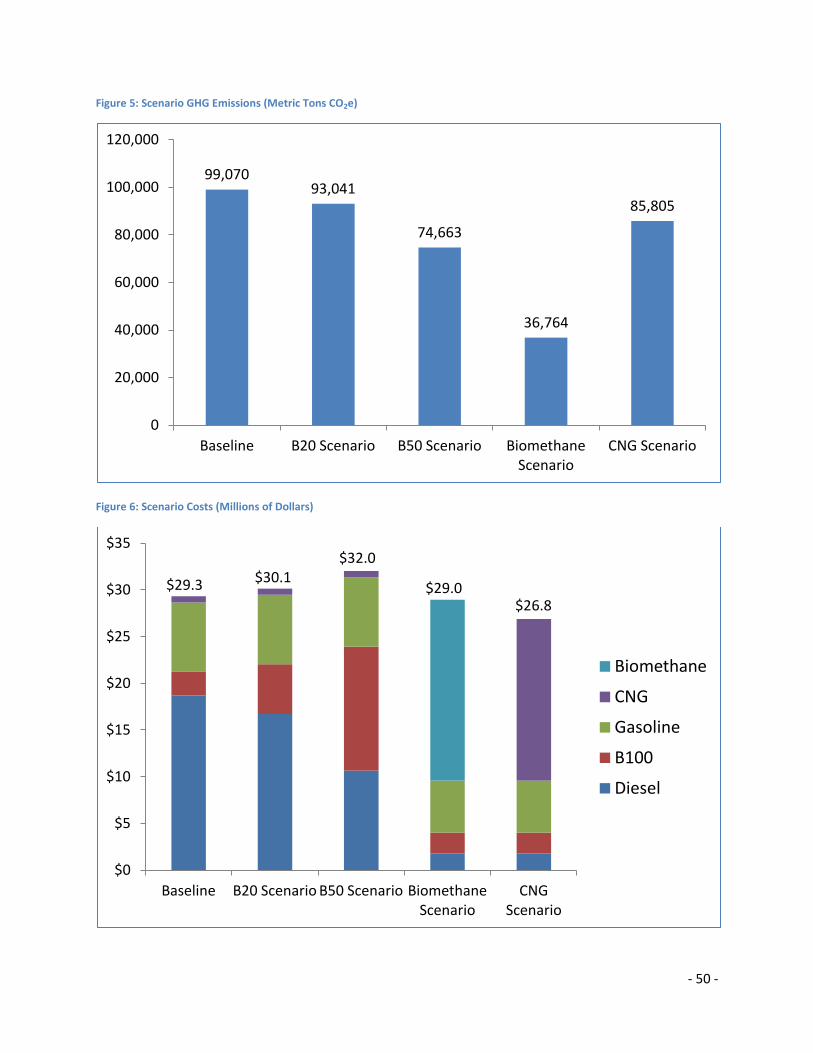
- 50 -
Figure 5: Scenario GHG Emissions (Metric Tons CO2e)
Figure 6: Scenario Costs (Millions of Dollars)
99,070 93,041
74,663
36,764
85,805
0
20,000
40,000
60,000
80,000
100,000
120,000
Baseline B20 Scenario B50 Scenario Biomethane Scenario
CNG Scenario
$0
$5
$10
$15
$20
$25
$30
$35
Baseline B20 Scenario B50 Scenario Biomethane Scenario
CNG Scenario
Biomethane
CNG
Gasoline
B100
Diesel
$29.3 $30.1 $32.0
$26.8 $29.0
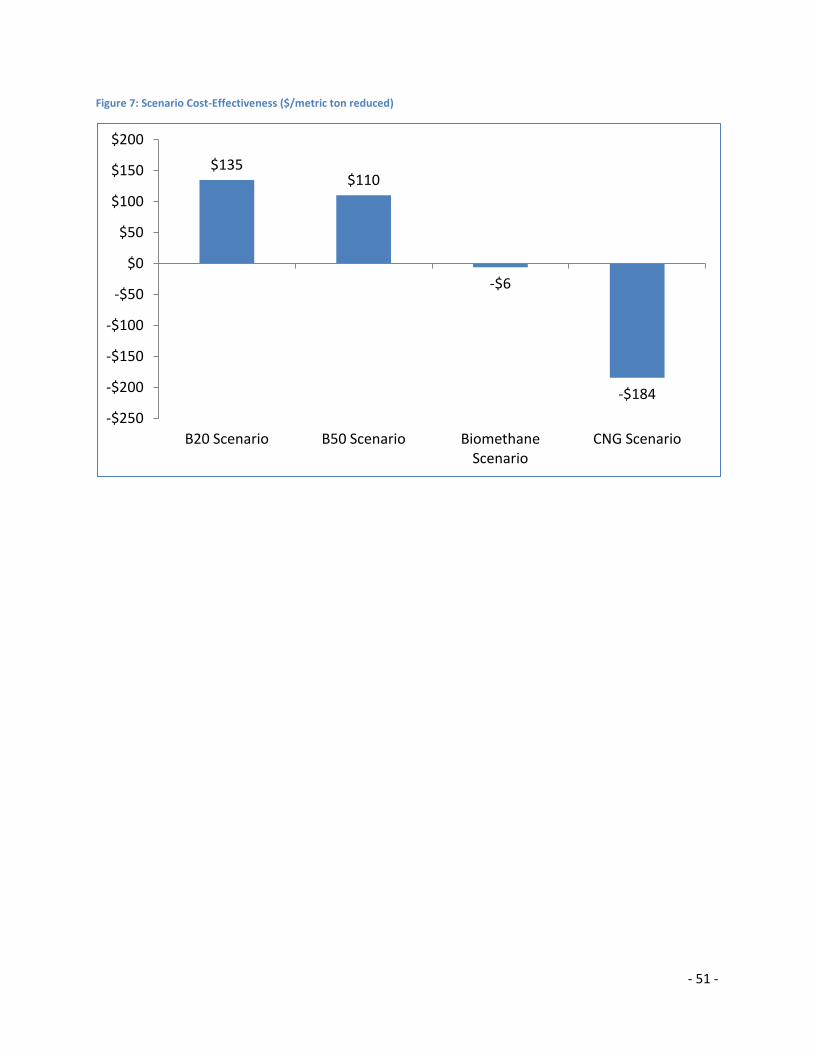
- 51 -
Figure 7: Scenario Cost-Effectiveness ($/metric ton reduced)
$135 $110
-$6
-$184
-$250
-$200
-$150
-$100
-$50
$0
$50
$100
$150
$200
B20 Scenario B50 Scenario Biomethane Scenario
CNG Scenario
- 52 -
Section 4: Findings & Next Steps
Our research, as well as our experience conducting the analysis, leads us to four central findings.
Biomethane performs well in our analysis. CCSF has an opportunity to use biomethane.
Biomethane reduces costs compared to diesel and gasoline, can be produced with a local,
waste-based feedstock, and results in significant reductions in GHG emissions. However,
biomethane is not currently available. Therefore, it appears to be the most promising long-term
biofuel.
Biodiesel performs well in our analysis. CCSF has an opportunity to expand its use of biodiesel.
Biodiesel is readily available today, can be produced with local, waste-based feedstocks, and
results in significant GHG reductions. On the other hand, long-term supplies of local feedstocks
are more limited than biomethane, and biodiesel also has the risk of slightly increasing local air
pollution. Therefore, it appears that biodiesel is the most promising near-term biofuel.
Measuring a fuel’s cost-effectiveness at reducing GHG emissions is a useful tool for comparing
the relative merits of a fuel. CCSF has ambitious GHG emission reduction targets that can only
be met with significant reductions in GHG emissions from the transportation sector. At the same
time, CCSF’s budget, like all governments’ budgets, is perennially squeezed. These broader
policy goals—reducing GHG emissions and limiting costs—could be incorporated into decisions
about CCSF’s future fuel mix by measuring a fuel’s cost-effectiveness at reducing GHG emissions.
This would allow CCSF decision-makers to make better informed decisions that help CCSF reach
multiple policy objectives. A cost-effectiveness framework could also be useful in evaluating
other alternative transportation fuels, such as electric vehicles.
CCSF lacks rigorous tracking of fuel prices and consumption. CCSF spends more than $25
million annually on fuel for the fleet. When burned, those fuels produce 36 percent of total
municipal GHG emissions. Despite this sizable cost and contribution to GHG emissions, CCSF
lacks a rigorous system for tracking fuel consumption and prices. Instead, City staff are forced to
cobble together estimates of fuel consumption and costs from various City Departments. As a
result, estimates of fuel use and costs often vary, and are often outdated. With timely, detailed
and accurate data on city fuel consumption, CCSF could better measure the GHG emissions, and
better evaluate whether there are opportunities to use more biofuels or procure fuels at lower
costs.
Next Steps
In light of our findings, we recommend that CCSF consider the following near-term actions:
Enforce B20 purchasing requirement. On March 21, 2012, the Office of the City Administrator
(OCA) issued a memorandum to City Departments that, effective July 1, 2012, all departments
- 53 -
are required to use B20 unless they apply for and receive a temporary, site-specific waiver from
OCA. Enforcing this requirement will help CCSF achieve its current goal of reaching B20.
Develop and codify a new policy vision with respect to biofuels. While it is important for CCSF
to reach the B20 goal, it is also important for CCSF to develop and codify a new policy vision that
builds on and expands Mayor Newsom’s 2006 Executive Directive with respect to biofuels and
other alternative fuels for the transportation fleet. This policy should recognize the value of
local, waste-based feedstocks, such as used cooking oil, organic food waste, and the City’s
wastewater treatment system. This policy should also recognize the importance of pursuing
fuels that cost-effectively reduce GHG emissions.
Institutionalize a system to collect fuel use data. CCSF should create a fuel tracking system to
collect detailed, timely and accurate data on fuel purchases and prices.
Conduct an in-depth study of biomethane and biodiesel. CCSF should commission an in-depth
study of biomethane and biodiesel to further quantify their benefits and costs, and identify the
challenges to their widespread use in the transportation fleet.
Recertify double-walled fuel storage systems. Pursuant to the State Water Resources Control
Board’s recent amendments to regulations on underground storage tanks, the Department of
Public Health—SWRCB’s local enforcement agency—must reapply for permits to continue to
legally store biodiesel in double-walled underground storage systems. DPH reports that they are
already begun to address this.
Reduce biodiesel costs either through new contractual arrangements. CCSF is currently paying
a steep premium for biodiesel blends. CCSF should continue to work to reduce biodiesel costs
either through a renegotiated Master Fueling Contract or through a new biodiesel-specific
contract. A renegotiated Master Fueling Contract that uses an improved biodiesel price index is
one simple way to reduce costs. A separate contract with a biodiesel producer could allow for
greater savings if CCSF develops the necessary infrastructure to accept B100 deliveries and
blend on-site.
Upgrade CCSF’s single-walled fuel storage systems. CCSF’s efforts to reach B20 are severely
hampered by its reliance on single-walled underground storage systems, which are not allowed
to store blends above B5. CCSF relies on single-walled storage systems at Kirkland (SFMTA) and
Cesar Chavez (DPW) fueling stations. These should be supplemented with above-ground storage
systems or double-walled underground storage systems.
Test biodiesel blends above B20. CCSF’s first priority with respect to biodiesel should be to
meet the existing B20 policy objective. However, CCSF would be wise to begin testing blends
above B20 in the fleet. SFMTA is planning to test B100 in a three diesel buses to monitor bus

- 54 -
performance, which is an excellent start.

- 55 -
References
Babcock, Bruce. The Impact of US Biofuel Policies on Agricultural Price Levels and Volatility. Issue brief.
International Centre for Trade and International Development, 2011.
Barnitt, Robb, and Bob Ames (Solazyme). Telephone interview by author.
Bay Area Air Quality Management District. Emissions Inventory Summary Report: Base Year 2008. By Amir Fanai.
2011.
"Biomass-based Fuels: Renewable Gasoline." GreenTechEurope.org 13 (April 2012).
Building a Commercially Viable National Fuel Cell Electric Bus Program. Report. Fuel Cell and Hydrogen Energy
Association, 2011.
"California Biodiesel Alliance." California Biodiesel Alliance. Accessed May 04, 2012.
http://www.californiabiodieselalliance.org/.
Cameron, Doug (Clean Energy). Telephone interview by author. April 24, 2012.
Chen, Patrick, Astrid Overholt, Brad Rutledge, and Jasna Tomic. Economic Assessment of Biogas and Biomethane
Production from Manure. Report. CALSTART, 2010.
City and County of San Francisco. Department of the Environment. Climate Action Plan for San Francisco: Local
Actions to Reduce Greenhouse Gas Emissions. 2004.
City and County of San Francisco. Department of the Environment. Climate
Program. SF_FY0910_MunicipalSummary. 2012.
City and County of San Francisco. Office of Contract Administration. Purchasing Division. 2009 Master Fueling
Contract. 2009.
City and County of San Francisco. San Francisco Municipal Railway. Zero Emissions 2020: The Clean Air Plan of the
San Francisco Municipal Railway. By MUNI & Department of the Environment. 2004.
City and County of San Francisco. San Francisco Municipal Transportation Agency. SFMTA Transit Fleet
Management Plan. 2011.
City and County of San Francisco. San Francisco Public Utilities Commission. Renewable Diesel Fact Sheet.
Coleman, Dan (Central Shops). E-mail interview by author. March 23, 2012.
DeSmet, Don (Darling International). Telephone interview. 14 May 2012.
Doom, Justin. "Primus Green Energy Raises $12 Million for Demo Plant." Bloomberg, March 14, 2012. Accessed
April 30, 2012. http://www.bloomberg.com/news/2012-03-14/primus-green-energy-raises-12-million-for-
demo-plant.html.
Drda, Brad. "Site Generated Biogas Potential." E-mail to Bill Zeller. March 2, 2012.

- 56 -
Drew, Kevin (Department of the Environment Zero Waste Program). Interview by author. March 9, 2012.
European Biomass Association. A Biogas Road Map for Europe. Report. AEBIOM, 2009.
Executive Directive 06-02, City and County of San Francisco (2006).
Farrell, Alexander, Richard Plevin, Brian Turner, Andrew Jones, Michael O'Hare, and Daniel Kammen. "Ethanol Can
Contribute to Energy and Environmental Goals." Science 311, no. 5760 (January 27, 2006): 506-08.
doi:10.1126/science.1121416.
Frost & Sullivan. Next Generation Biofuels: Strategic Portfolio Management. 2010.
Hutch, Lyn, and David Harbour. Title Unknown. Rep. Sacramento RT, 2012. Print.
"Hydrogen Production." Alternative Fuels and Advanced Vehicles Data Center. Accessed May 04, 2012.
http://www.afdc.energy.gov/afdc/fuels/hydrogen_production.html.
Kingsbury, Kathleen. "After the Oil Crisis, a Food Crisis?" Time, November 16, 2007.
Knothe, Gerhard. "Biodiesel and Renewable Diesel: A Comparison." Progress in Energy and Combustion Science 38,
no. 3 (December 2009): 364-73.
Krich, Ken, Don Augenstein, JP Batmale, John Benemann, Brad Rutledge, and Dara Salour. Biomethane from Dairy
Waste. Report. Western United Dairymen, 2005.
Levin, Jamie (AC Transit). Interview by author. March 1, 2012.
Lumpkin, Nick (Clean Energy Renewable Fuels). Telephone interview by author. March 13, 2012.
Mandel, Jenny. "Miscanthus, Switchgrass Show Promise as Corn Replacements -- Study." The New York Times
(Greenwire), July 14, 2011. Accessed April 30, 2012.
http://www.nytimes.com/gwire/2011/07/14/14greenwire-miscanthus-switchgrass-show-promise-as-
corn-re-35815.html.
Master Fueling Contract Workshop. January 19, 2012. Meeting Minutes, SFPUC, 3801 Third St, BERM Conference
Room, San Francisco.
Mellera, Marty (SFMTA). Telephone interview by author. May 7, 2012.
Mitchell, Alex. "RE: Message from 914155515184." E-mail to Bill Zeller. April 16, 2012.
Northeast States for Coordinated Air Use Management. Economic Analysis of a Program to Promote Clean
Transportation Fuels in the Northeast/Mid-Atlantic Region. By Michelle Manion, Arthur Marin, Andrew
Dick, Jason Rudokas, Matt Solomon, Allison Reilly-Guerette, and David Ganzi. NESCAUM, 2011.
Ordinance 81-08, City and County of San Francisco (2008).
Pacific Gas and Electric. Gas Rule No. 21. PG&E, 2009. Accessed March 11, 2012.
http://www.pge.com/tariffs/tm2/pdf/GAS_RULES_21.pdf.

- 57 -
Pimentel, David, and Tad Patzek. "Ethanol Production Using Corn, Switchgrass, and Wood; Biodiesel Production
Using Soybean and Sunflower." Natural Resources Research 14, no. 1 (March 2005): 65-76.
doi:10.1007/s11053-005-4679-8.
Renewable Fuels Association. Accelerating Industry Innovation, 2012 Ethanol Industry Outlook. Report. Renewable
Fuels Association, 2012.
Resolution 158-02, City and County of San Francisco (2002).
RPTA - Mesa, AZ. Cost per Mile Comparison Between CNG and Diesel Buses. 2012. Raw data.
Ruan, Yang. Biofuels Production Costs: A Review. Report. Natural Resources Defense Council, 2012.
San Diego Gas & Electric Company. Rule No. 30. SDG&E, 2012. Accessed May 11, 2012.
http://regarchive.sdge.com/tm2/pdf/GAS_GAS-RULES_GRULE30.pdf.
Scharlemann, Jorn, and William Laurance. "How Green Are Biofuels?" Science 319, no. 5859 (January 4, 2008): 43-
44. doi:10.1126/science.1153103.
Searchinger, Timothy, Ralph Heimlich, R. A. Houghton, Fenxgia Dong, Amani Elobeid, Jacinto Fabiosa, Simla Tokgoz,
Dermot Hayes, and Tun-Hsaing Yu. "Use of U.S. Croplands for Biofuels Increases Greenhouse Gases
Through Emissions from Land-Use Change." Science 319, no. 5867 (February 29, 2008): 1238-240.
doi:10.1126/science.1151861.
"SF Greasecycle." San Francisco Public Utilities Commission :. Accessed May 04, 2012.
http://sfwater.org/index.aspx?page=465.
Southern California Gas Company. Rule No. 30. SoCal Gas, 2011. Accessed May 11, 2011.
http://www.socalgas.com/regulatory/tariffs/tm2/pdf/30.pdf.
State of California. California Air Resources Board. Biodiesel Fleet Durability Study. By Thomas Durbin, J. Wayne
Miller, and S. Michelle Jiang. University of California CE-CERT, 2010.
State of California. California Air Resources Board. CARB Assessment of the Emissions from the Use of Biodiesel as
a Motor Vehicle Fuel in California “Biodiesel Characterization and NOx Mitigation Study”. By Thomas
Durbin, J. Wayne Miller, Kent Johnson, and Maryam Hajbabaei. University of California CE-CERT, 2011.
State of California. California Air Resources Board. Final Program Review Report. By LCFS Program Review Advisory
Panel. 2011.
State of California. California Air Resources Board. Mobile Source Emission Inventory. 2011.
http://www.arb.ca.gov/msei/msei.htm.
State of California. California Air Resources Board. Proposed Regulation to Implement the Low Carbon Fuel
Standard Volume I Staff Report: Initial Statement of Reasons. 2009.
State of California. California Energy Commission. Biofuel Values. November 14, 2011.
http://www.energy.ca.gov/2011_energypolicy/documents/2011-11-14_workshop/2011-11-
14_Biofuel_Values.xls.

- 58 -
State of California. California Energy Commission. Full Fuel Cycle Assessment: Well-to-Wheels Energy Inputs,
Emissions, and Water Impacts. By Jennifer Pont. TIAX, 2007.
State of California. Office of Spill Prevention and Response. Natural Resource Damage Assessment for the COSCO
Busan Oil Spill Bird Injury Summary. By Steve Hamptom, Greg Baker, and Al Donner. 2008.
http://www.dfg.ca.gov/ospr/Science/cosco_busan_spill.aspx.
State of California. State Water Resources Control Board. Proposed Amendments to the California Code of
Regulations: Title 23. Waters; Division 3. State Water Resources Control Board and Regional Water Quality
Control Boards; Chapter 16. Underground Storage Tanks. Initial Statement of Reasons. 2011.
Theriault, David (BP Energy Company). Telephone interview by author. March 15, 2012.
United States. Department of Energy. Alternative Fuels and Advanced Vehicles Data Center. Alternative Fueling
Stations. Accessed April 30, 2012. http://www.afdc.energy.gov/afdc/data/infrastructure.html.
United States. Department of Energy. Alternative Fuels and Advanced Vehicles Data Center. Average Retail Fuel
Price in the U.S. February 7, 2012. http://www.afdc.energy.gov/afdc/data/docs/retail_fuel_prices.xls.
United States. Department of Energy. Alternative Fuels and Advanced Vehicles Data Center. Clean Cities
Alternative Fuel Price Report. January 2012.
United States. Department of Energy. Argonne National Laboratory. Clean Cities Area of Interest 4: Alternative Fuel
and Advanced Technology Vehicles Pilot Program Emissions Benefit Tool.December 2009.
http://www.transportation.anl.gov/modeling_simulation/clean_cities_area_interest4.html.
United States. Department of Energy. Argonne National Laboratory. Life-Cycle Analysis of Shale Gas and Natural
Gas. By C.E. Clark, J. Han, A. Burham, J.B. Dunn, and M. Wang. 2011.
United States. Department of Energy. Argonne National Laboratory. Natural Gas Vehicles: Status, Barriers, and
Opportunities. By M. Rood Werpy, D. Santini, A. Burnham, and M. Mintz. 2010.
United States. Department of Energy. Argonne National Laboratory. Updated Energy and Greenhouse Gas
Emissions Results of Fuel Ethanol. By Michael Wang. 2005.
United States. Department of Energy. Clean Cities Coalition. Renewable Natural Gas: Current Status, Challenges,
and Issues. By Marianne Mintz and Jim Wegrzyn. 2009.
United States. Department of Energy. National Renewable Energy Laboratory. Biodiesel Handling and Use Guide.
2009.
United States. Department of Energy. National Renewable Energy Laboratory. Life Cycle Assessment of Gasoline
and Diesel Produced via Fast Pyrolysis and Hydroprocessing. By David Hsu. 2011.
United States. Department of Energy. National Renewable Energy Laboratory. Zero Emission Bay Area (ZEBA) Fuel
Cell Bus Demonstration: First Results Report. By Kevin Chandler and Leslie Eudy. 2011.
United States. Department of Energy. Western Washington Clean Cities Coalition. Biomethane for Transportation:
Opportunities for Washington State. By Jim Jensen. 2011.
- 59 -
United States. Energy Information Administration. Gasoline and Diesel Fuel Update. Accessed May 2, 2012.
http://www.eia.gov/petroleum/gasdiesel/.
United States. Energy Information Administration. Petroleum Trade Overview. 2012.
http://www.eia.gov/totalenergy/data/monthly/pdf/sec3_7.pdf.
United States. Environmental Protection Agency. Renewable Fuel Standard Program (RFS2) Regulatory Impact
Analysis. 2010.
United States. National Transportation Safety Board. Marine Accident Report: Allision of Hong Kong‐Registered
Containership M/V Cosco Busan with the Delta Tower of the San Francisco–Oakland Bay Bridge San
Francisco, California November 7, 2007. By Mark Rosenker, Robert Sumwalt, Kathryn O'Leary Higgins, and
Deborah Hersman. MAR-09/01. 2009. http://www.ntsb.gov/investigations/summary/MAR0901.htm.
Ving, Karri. "RE: Biofuels Planning Study Questions We Need Your Help with." E-mail to Bill Zeller. March 4, 2012.
Ving, Karri (SF PUC). Telephone interview by author. March 7, 2012.
"What Is Natural Gas?" Alternative Fuels and Advanced Vehicles Data Center:. Accessed May 04, 2012.
http://www.afdc.energy.gov/afdc/fuels/natural_gas_what_is.html.
Whittaker, Angela. "Interest Rates for Bonds to Finance Clean Transportation Projects." E-mail to Bill Zeller. May
10, 2012.
Yoon, Jesse Jin. "What’s the Difference between Biodiesel and Renewable (Green) Diesel?" Advanced Biofuels USA,
March 2011. http://advancedbiofuelsusa.info/wp-content/uploads/2011/03/11-0307-Biodiesel-vs-
Renewable_Final-_3_-JJY-formatting-FINAL.pdf.
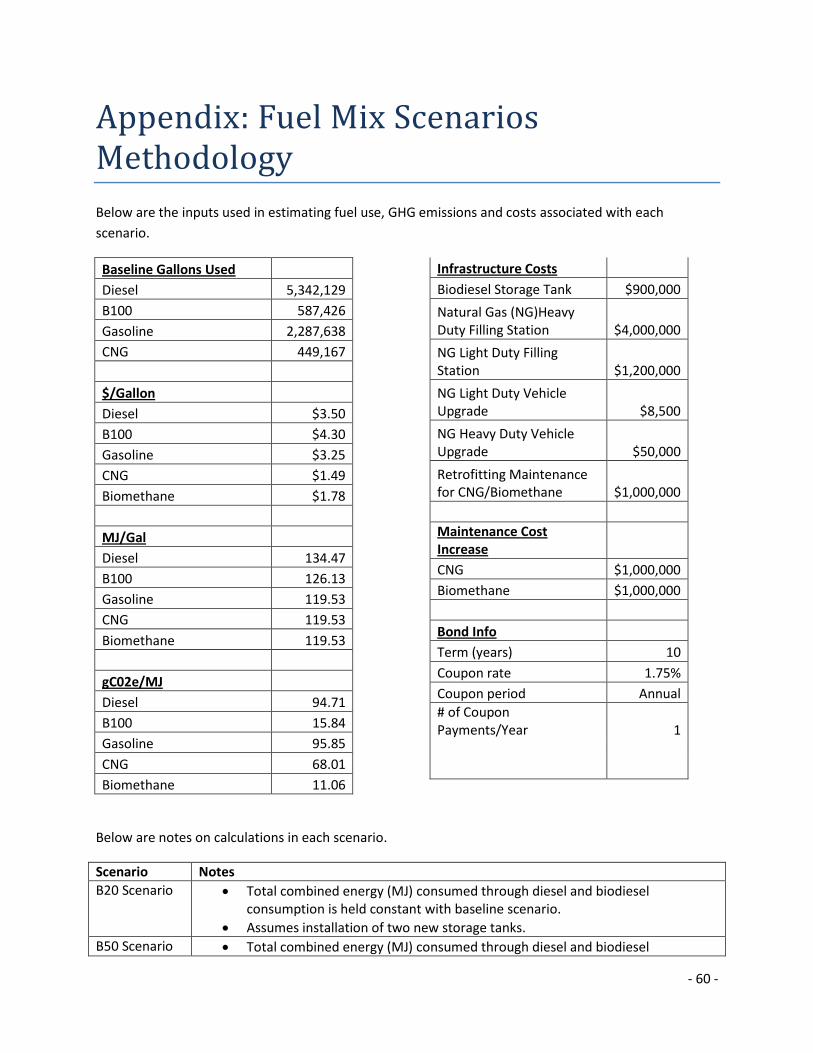
- 60 -
Appendix: Fuel Mix Scenarios Methodology
Below are the inputs used in estimating fuel use, GHG emissions and costs associated with each
scenario.
Baseline Gallons Used
Diesel 5,342,129
B100 587,426
Gasoline 2,287,638
CNG 449,167
$/Gallon
Diesel $3.50
B100 $4.30
Gasoline $3.25
CNG $1.49
Biomethane $1.78
MJ/Gal
Diesel 134.47
B100 126.13
Gasoline 119.53
CNG 119.53
Biomethane 119.53
gC02e/MJ
Diesel 94.71
B100 15.84
Gasoline 95.85
CNG 68.01
Biomethane 11.06
Infrastructure Costs
Biodiesel Storage Tank $900,000
Natural Gas (NG)Heavy Duty Filling Station $4,000,000
NG Light Duty Filling Station $1,200,000
NG Light Duty Vehicle Upgrade $8,500
NG Heavy Duty Vehicle Upgrade $50,000
Retrofitting Maintenance for CNG/Biomethane $1,000,000
Maintenance Cost Increase
CNG $1,000,000
Biomethane $1,000,000
Bond Info
Term (years) 10
Coupon rate 1.75%
Coupon period Annual
# of Coupon Payments/Year 1
Below are notes on calculations in each scenario.
Scenario Notes
B20 Scenario Total combined energy (MJ) consumed through diesel and biodiesel consumption is held constant with baseline scenario.
Assumes installation of two new storage tanks.
B50 Scenario Total combined energy (MJ) consumed through diesel and biodiesel

- 61 -
consumption is held constant with baseline scenario.
Assumes installation of two new storage tanks.
Biomethane Scenario
NGVs are assumed to run at 90% efficiency compared to gasoline and diesel vehicles. Therefore, total energy consumed increases.
Assumed construction of two heavy-duty fueling stations and three light-duty fueling stations.
Assumed purchase of 511 heavy-duty NGVs and 1,344 light-duty NGVs.
Assumes two maintenance facilities must be upgraded.
Assumes $1,000,000 increased annual maintenance costs.
CNG Scenario (Biomethane Transition)
NGVs are assumed to run at 90% efficiency compared to gasoline and diesel vehicles. Therefore, total energy consumed increases.
Assumed construction of two heavy-duty fueling stations and three light-duty fueling stations.
Assumed purchase of 511 heavy-duty NGVs and 1,344 light-duty NGVs.
Assumes two maintenance facilities must be upgraded.
Assumes $1,000,000 increased annual maintenance costs.