The impact of beneficial microbes on root architecture and ...
189
The impact of beneficial microbes on root architecture and metabolism of the model grass Brachypodium distachyon grown under non optimal temperatures and low phosphorus availability A thesis submitted in total fulfilment of the requirements for the degree of DOCTOR OF PHILOSOPHY By Martino Schillaci School of BioSciences The University of Melbourne Melbourne, Australia February 2021
-
Upload
khangminh22 -
Category
Documents
-
view
2 -
download
0
Transcript of The impact of beneficial microbes on root architecture and ...

The impact of beneficial microbes on root architecture
and metabolism of the model grass Brachypodium
distachyon grown under non optimal temperatures
and low phosphorus availability
A thesis submitted in total fulfilment of the requirements for the degree of
DOCTOR OF PHILOSOPHY
By
Martino Schillaci
School of BioSciences
The University of Melbourne
Melbourne, Australia
February 2021

i
Thesis abstract
Cereal crops are exposed to different abiotic stresses thus impacting agricultural productivity, but
soil beneficial microorganisms have the potential to improve the adaptation of crops to suboptimal
environments. This study resolves the time-specific dynamics between the plant growth promoting
bacteria Azospirillum brasilense and the model cereal species Brachypodium distachyon grown
under suboptimal temperatures and low P availability. Results contribute to our current
understanding of the phenotypic and biochemical adaptative rearrangements occurring in plants
during interaction with beneficial bacteria.

ii
Declaration
This is to certify that
(i) The thesis comprises only my original work, except where indicated in the Preface,
(ii) due acknowledgement has been made in the text to all other materials used,
(iii) the thesis is less than 100 000 words in length, exclusive of tables, maps, bibliographies and
appendices
Signature:
Martino Schillaci
School of BioSciences
The University of Melbourne
Parkville, Victoria 3010

iii
Preface
The candidate has contributed to more than 50% of the published parts of this thesis and is the
primary author of all thesis content.
The growth of plants and bacteria, plant phenotype analysis, harvesting, metabolite extraction and
metabolomic data analysis and interpretation were carried out by the candidate. Dr Volker
Nischwitz and Michelle Hupert performed the nutrient content analysis. Dr. Thusitha Rupasinghe
and Cheka Kehelpannala contributed the LC-MS analysis of lipid extracts, and Himasha Mendis
contributed to the GC-MS analysis of polar metabolites extracts. Federico Martinez Seidel created
the R script used for the k-means clustering analysis of lipid species.
Project supervisors Prof. Ute Roessner, Prof. Michelle Watt, Prof. Penelope Smith, Dr Borjana
Arsova and Dr. Robert Walker were involved in the design of experiments, and supervision of
the candidate.
All authors discussed the results and their implications and provided feedback on the
manuscripts at all stages.

iv
Acknowledgements
I would like to thank my supervisors Prof. Ute Roessner, Prof. Michelle Watt, Prof. Penelope
Smith, Dr. Borjana Arsova and Dr. Robert Walker for their guidance, support and the exchange of
ideas we had in the past years. Thanks to Ute in particular, for making the past 12 months less
tough than they could have been. A big “thank you” also to my past and present Committee
members Prof. Alex Andrianopoulos, Dr. Ulrike Mathesius and Prof. Antony Bacic for their
precious contribution to my project.
My gratitude goes also to the special people who I have met inside and outside the working
environment during my PhD, who made moving countries four times in four years more bearable.
Thanks to you all,
Martino

v
Publications
Schillaci M, Gupta S, Walker R, Roessner U (2019) The Role of Plant Growth-Promoting
Bacteria in the Growth of Cereals under Abiotic Stresses. In: Root Biology-Growth, Physiology,
and Functions. IntechOpen
Presented in Chapter 1
Schillaci M, Arsova B, Walker R, Smith PM, Nagel KA, Roessner U, Watt M (2020) Time-
resolution of the shoot and root growth of the model cereal Brachypodium in response to
inoculation with Azospirillum bacteria at low phosphorus and temperature. Plant Growth
Regul:1-14
Presented in Chapter 2

vi
Abbreviations
AA amino acid
ABA abscisic acid
ABC ATP binding cassette
ACC 1-aminocyclopropane-1-carboxylic acid
ACN acetonitrile
ADGGA acyl diacylglyceryl glucuronides
APCI atmospheric pressure chemical ionization
α-KG α-ketoglutaric acid
BHT butylated hydroxytoluene
BR branch root
BSTFA N,O-bis (trimethylsilyl) trifluoroacetamide
CDS calibrant delivery system
Cer-AP ceramide alpha-hydroxy fatty acid-phytospingosine
CL cardiolipin
CV coefficient of variation
DAG diacylglycerol
DAI days after the inoculation
DDA data-dependent acquisition
DGDG digalactosyldiacylglycerol
DGGA diacylglyceryl glucuronide
DHAP dihydroxyacetone phosphate
DW dry weight
ESI electro-spray ionization
FA fatty acid
FC fold change

vii
FT-ICR fourier-transform ion cyclotron resonance
FW forward
G6P glycerol-6-phosphate
G3P glycerol-3-phosphate
GA gibberellin
GABA γ-aminobutyric acid
GC gas chromatography
GDP gross domestic product
GL glycerolipid
GP glycerophospholipid
HCAA hydroxycinnamic acid amide
HexCer hexosylceramide
HexCer-AP hexosylceramide alpha-hydroxy fatty acid-
phytospingosine
IAA indole-3-acetic acid
ICP-OES inductively coupled plasma with optical emission
spectroscopy
IDA data-independent acquisition
IPP isopropanol
LB lysogeny broth
LC liquid chromatography
LGP lysoglycerophospholipid
LPC lysophophatidylcholine
LPE lysophophatidylethanolamine
LSC-MS live single-cell mass spectrometry
MAMP microbe associated molecular pattern
MGDG monogalactosyldiacylglycerol
MS mass spectrometry
MSI mass spectrometry imaging

viii
Mt metric tons
OA organic acid
PA phosphatidic acid
PBQC pooled biological quality control
PCR polymerase chain reaction
PBS phosphate buffered saline
PC phosphatidylcholine
PCA principal component analysis
PE phosphatidylethanolamine
PG phosphatidylglycerol
PGP plant growth promoting
PGPR plant growth promoting rhizobacteria
Pi inorganic phosphorus
Pi-Cer ceramide phosphoinositol
PI phosphatidylinositol
PPUE physiological P use efficiency
PR primary axile root
PVC polyvinyl chloride
QqToF quadrupole time of flight
QUAD single quadrupole
ROS reactive oxygen species
RP reverse phase
RV reverse
SAR systemic acquired resistance
SD standard deviation
SP sphingolipid
ST sterol lipid
SU sugar

ix
SWATH sequential window acquisition of all theoretical
fragment-ion spectra
TCA tricarboxylic acid
TG triacylglycerol
TMCS trimethylchlorosilane
TMS trimethyl silane
ToF time of flight
TRAP ion trap
UDPG uridine diphosphate glucose

x
Table of contents
Thesis abstract .................................................................................................................................. i
Declaration ...................................................................................................................................... ii
Preface............................................................................................................................................ iii
Acknowledgements ........................................................................................................................ iv
Publications ..................................................................................................................................... v
Abbreviations ................................................................................................................................. vi
List of tables ................................................................................................................................. xiv
List of figures ................................................................................................................................ xv
List of supplemental tables .......................................................................................................... xix
List of supplemental figures.......................................................................................................... xx
Chapter 1 ......................................................................................................................................... 1
1.1 The Role of Plant Growth-Promoting Bacteria in the Growth of Cereals under Abiotic
Stresses ............................................................................................................................................ 3
Abstract ........................................................................................................................................... 3
1.1.1 Introduction ............................................................................................................................ 3
1.1.2 Importance of cereals in global nutrition ............................................................................... 4
1.1.3 Abiotic stress effects on agriculture ....................................................................................... 5
1.1.3.1 Climate change…………………………………………………………………………….5
1.1.3.2 Agricultural soil degradation……………………………………………………………...6
1.1.4 Plant growth promoting bacteria ............................................................................................ 7
1.1.5 Plant-bacterial interactions enhance abiotic stress responses .............................................. 12
1.1.5.1 Thermic stress adaptation………………………………………………………………..12
1.1.5.2 Osmotic stress adaptation………………………………………………………………..13
1.1.5.3 Improvement of the plant nutritional status……………………………………………...15
1.1.6 Issues and perspectives ........................................................................................................ 18
1.2 Metabolic changes in cereal roots interacting with PGP bacteria ........................................... 21
1.2.1 Effects of bacterial interaction on plant root exudates......................................................... 22
1.2.2 PGP bacteria influence root internal metabolites ................................................................. 24
1.2.3 The role of lipids in PGP bacteria – plant interactions ........................................................ 26
1.2.4 Current technologies for untargeted metabolomics and lipidomics .................................... 27

xi
1.2.5 Conclusions .......................................................................................................................... 29
1.3 Aims of this thesis ................................................................................................................... 30
Chapter 2 ....................................................................................................................................... 32
2.1 Introduction ............................................................................................................................. 34
2.2 Materials and methods ............................................................................................................ 36
2.2.1 Seeds sterilization and germination ..................................................................................... 36
2.2.2 Bacterial inoculation ............................................................................................................ 36
2.2.3 Plant growth conditions ....................................................................................................... 36
2.2.3.1 First pilot experiment: Establishing growth and P conditions in GrowScreen-PaGe……38
2.2.3.2 Second pilot experiment to reproduce and validate the first pilot experiment…………..39
2.2.3.3 High throughput experiment…………………………………………………………….39
2.2.4 Shoot traits and nutrient analyses ........................................................................................ 40
2.2.4.1 First and second pilot experiment………………………………………………………..40
2.2.4.2 High throughput experiment……………………………………………………………..41
2.2.5 Root development analyses.................................................................................................. 41
2.2.5.1 First and second pilot experiment………………………………………………………..41
2.2.5.2 High throughput experiment……………………………………………………………..41
2.2.6 Validation of colonization by Azospirillum ........................................................................ 42
2.2.7 Statistical analyses and data display .................................................................................... 42
2.3 Results ..................................................................................................................................... 42
2.3.1 Shoot growth benefited from Azospirillum treatment ......................................................... 43
2.3.1.1 First pilot experiment………………………………………………………………. ……43
2.3.1.2 Second pilot experiment…………………………………………………………………43
2.3.1.3 High throughput experiment……………………………………………………………..43
2.3.2 The effect of inoculation with Azospirillum varied for different nutrients in Brachypodium
shoots ............................................................................................................................................ 44
2.3.3 Modulation of root development by Azospirillum at low P depended on time after
inoculation and type of root .......................................................................................................... 46
2.3.3.1 First pilot experiment………………………………………………………………. ……46
2.3.3.2 Second pilot experiment…………………………………………………………………46
2.3.3.3 High throughput experiment……………………………………………………………..46

xii
2.4 Discussion ............................................................................................................................... 48
2.4.1 Azospirillum inoculation benefited shoot growth at low P and temperature regardless of
root growth dynamics ................................................................................................................... 49
2.4.2 Azospirillum inoculation did not increase shoot nutrient concentrations ............................ 50
2.4.3 Axile and branch roots were differentially affected by bacterial inoculation ...................... 51
Chapter 3 ....................................................................................................................................... 54
3.1 Introduction ............................................................................................................................. 55
3.2 Materials and Methods ............................................................................................................ 58
3.2.1. Plant growth conditions ...................................................................................................... 58
3.2.2 Polar metabolites extraction from roots ............................................................................... 58
3.2.3 Polar metabolites extraction from bacteria .......................................................................... 59
3.2.4 GC-MS analysis of polar metabolites .................................................................................. 60
3.2.5. Data extraction, metabolite identification and quantification ............................................. 61
3.2.6 Statistical analyses and data visualisation............................................................................ 61
3.3 Results ..................................................................................................................................... 62
3.3.1 Root polar metabolites ......................................................................................................... 62
3.3.2 Bacterial polar metabolites .................................................................................................. 62
3.3.3 Polar metabolites of inoculated and non-inoculated plants ................................................. 62
3.3.4 P containing compounds ...................................................................................................... 74
3.4 Discussion ............................................................................................................................... 75
3.4.1 Significantly different compounds at 7 DAI ........................................................................ 77
3.4.2 Significantly different compounds at 14 DAI ...................................................................... 81
3.4.3 Significantly different compounds at 21 DAI ...................................................................... 86
Chapter 4 ....................................................................................................................................... 91
4.1 Introduction ............................................................................................................................. 92
4.2 Materials and methods ............................................................................................................ 93
4.2.1. Plant growth conditions ...................................................................................................... 93
4.2.2. Lipid extraction from roots ................................................................................................. 93
4.2.3. Lipid extraction from bacteria ............................................................................................ 94
4.2.4 LC-MS analysis ................................................................................................................... 94
4.2.5 MS data analysis .................................................................................................................. 96
4.2.6 Statistical and bioinformatic analyses .................................................................................. 96
4.3 Results ..................................................................................................................................... 97

xiii
4.3.1 The Brachypodium root lipidome ........................................................................................ 97
4.3.2 Bacterial lipids ..................................................................................................................... 98
4.3.3 Features comparison of inoculated and non-inoculated plants ............................................ 98
4.3.4 Glycerophospholipids and galactolipids ............................................................................ 111
4.4 Discussion ............................................................................................................................. 114
4.4.1 Phosphorus deficiency affected the root lipid profile of both inoculated and non-inoculated
Brachypodium ............................................................................................................................. 114
4.4.2 Azospirillum affected different root lipid classes in Brachypodium through time ........... 115
Chapter 5 ..................................................................................................................................... 120
5.1 Introduction and thesis outline .............................................................................................. 121
5.2 Relevance of the study .......................................................................................................... 122
5.3 Main insights ......................................................................................................................... 122
5.4 Conclusions ........................................................................................................................... 124
5.5 Remarks and outlook ............................................................................................................ 125
Appendices .................................................................................................................................. 129
References ................................................................................................................................... 146

xiv
List of tables
Table 3.1 List of polar metabolites detected in Brachypodium roots harvested at 7, 14 and 21
DAI. Columns display the class of each compound, its name, the relative response fold changes
(FC) (Azospirillum inoculated/non-inoculated plants) and the related p-value for each time point.
Compounds are divided into amino acids (AA), organic acids (OA) sugars (SU) or “Others” if they
did not belong to any of the previous classes. Compounds with a FC < -1.5 or FC > 1.5 and p<0.05
are presented in red font.
Table 3.2 List of polar metabolites detected in Azospirillum grown axenically on modified
N-free (NFb) medium.at 20°C. Compounds are divided into fatty acids (FA), organic acids (OA)
sugars (SU) or “Others” if they did not belong to any of the previous classes. Compounds detected
also in Brachypodium roots are presented in red font.

xv
List of figures
Figure 1.1 Cereal cultivation records and world population data since 1961. Cereals cultivated
land, soil productivity as yield, world grain production and world population are displayed (FAO).
Figure 1.2 A model of interactions between plants and PGPR. Exudates released by plant roots
attract soil bacteria that can colonize rhizosphere and/or plant tissues. Here, they provide various
beneficial compounds to the plant in exchange of nutrients, mainly photosynthates.
Figure 2.1 Conditions for growth and phenotyping of Brachypodium with or without
inoculation with Azospirillum in the GrowScreen-PaGe phenotyping platform. (a) Dehusked
Brachypodium seeds were first placed on moist filter paper to synchronize germination at 4°C for
7 d. Black arrows point to tips of primary axile roots (PR) emerging from the embryo at the base
of the seeds. (b) Brachypodium seedling with 1.5 cm long PR on moist gauze (G) on blue
germination paper (GP) after inoculation with Azospirillum. (c) Brachypodium plants with 2 to 3
leaves mounted on GrowScreen-PaGe PVC plates with metal clips (white arrows). (d)
Brachypodium root systems imaged 21 d after inoculation and after manual color-coding with
PaintRhizo image analysis software according to root type. Left root system is typical of plants
with the PR (green line) extending vertically through the experiment, becoming an axile root (AR)
with branch roots (BR, red). Right root system is typical of plants whereby the PR stopped growing
close to the seed (arrow), and new AR (red) extending vertically with BR (blue). PR, Primary axile
root; AR, axile root; BR, branch root; G, gauze; GP, germination paper.
Figure 2.2 Design and workflow of high throughput experiment to phenotype Brachypodium
responses to Azospirillum in the GrowScreen-PaGe platform, which combined non-invasive with
destructive measurements. The timeline arrow shows the days that root systems of plants were
imaged non-invasively (see Fig. 2.1d) after inoculation. These plants were harvested at 21 d for
analysis of root fresh and dry weight and bacterial colonization by PCR (see Suppl. Fig 7.1), and
shoot leaf area, shoot fresh and dry weight and nutrient analyses. Subgroups of plants were
destructively harvested at 7, 14 d for leaf area, shoot fresh and dry weight and nutrient analyses.
The nutrient solution in the GrowScreen-PaGe platform was replaced weekly.
Figure 2.3 Shoot growth of Brachypodium with or without Azospirillum inoculation and
harvested after 7, 14 and 21 d in the GrowScreen-PaGe platform. (a) Leaf area. (b) Shoot dry
weight (DW). Means ± standard error presented. At 7 d, n = 87 Azospirillum-inoculated and n =
87 non-inoculated plants; 14 d, n = 25 Azospirillum-inoculated and n = 37 non-inoculated plants;
21 d, n = 28 Azospirillum-inoculated and n = 32 non-inoculated plants. Asterisks indicate
probability of significant difference between mean of Azospirillum-inoculated and non-inoculated
plants based on Student’s t-test; *, p<0.05; **, p<0.01, ***, p<0.001. DW = dry weight.
Figure 2.4 Nutrients in Brachypodium shoots of plants with or without Azospirillum
inoculation and harvested after 7, 14 and 21 d in the GrowScreen-PaGe platform. Concentration
of phosphorus (a), nitrogen (b) and potassium (c); content of phosphorus (d), nitrogen (e) and
potassium (f). All points are the mean ± standard error of n = 3 samples of plants pooled within
each treatment. Asterisks indicate probability of significant difference between mean of A.
xvi
brasilense-inoculated and non-inoculated plants based on Student’s t-test; *, p<0.05; **, p<0.01,
***, p<0.001.
Figure 2.5 Root growth of Brachypodium plants with or without Azospirillum inoculation and
imaged non-destructively after 3, 5, 7, 9, 11, 14, 18 and 21 d in the GrowScreen-PaGe platform.
Images were analyzed with the PaintRhizo software. (a) Root system length. (b) Axile root length.
(c) Branch root length. (d) Root system growth rate. (e) Axile root growth rate. (f) Branch root
growth rate. Means ± standard error presented. n = 28 Azospirillum-inoculated and n = 32 non-
inoculated. Asterisks indicate probability of significant difference between mean of Azospirillum-
inoculated and non-inoculated plants based on Student’s t-test; *, p<0.05; **, p<0.01, ***,
p<0.001.
Figure 3.1 Hierarchical clustering coupled with heatmap of the polar metabolite profiles of
Azospirillum-inoculated (A) and non-inoculated roots (N) of Brachypodium harvested at 7, 14 and
21 DAI. The lettering at the bottom of the heatmap indicates the replicates: for each replicate, blue
and red colors indicate the lower or higher abundance of specific metabolites respectively
compared to the other replicates, with darker colors indicating more pronounced differences.
Figure 3.2 Principal component analysis of the polar metabolite profiles of Azospirillum-
inoculated (A) and non-inoculated roots (N) of Brachypodium harvested at 7, 14 and 21 DAI.
Ellipses around samples display 95% confidence areas.
Figure 3.3 Hierarchical clustering coupled with heatmap of the polar metabolite profiles of
Azospirillum-inoculated (A) and non-inoculated roots (N) of Brachypodium harvested at 7 DAI.
The lettering at the bottom of the heatmap indicates the replicates: for each replicate, blue and red
colours indicate the lower or higher abundance of specific metabolites compared to the other
replicates, with darker colours indicating more pronounced differences.
Figure 3.4 Hierarchical clustering coupled with heatmap of the polar metabolite profiles of
Azospirillum-inoculated (A) and non-inoculated (N) roots of Brachypodium harvested at 14 DAI
The lettering at the bottom of the heatmap indicates the replicates: for each replicate, blue and red
colours indicate the lower or higher abundance of specific metabolites compared to the other
replicates, with darker colours indicating more pronounced differences.
Figure 3.5 Hierarchical clustering coupled with heatmap of the polar metabolite profiles of
Azospirillum-inoculated (A) and non-inoculated (N) roots of Brachypodium harvested at 21 DAI
The lettering at the bottom of the heatmap indicates the replicates: for each replicate, blue and red
colours indicate the lower or higher abundance of specific metabolites compared to the other
replicates, with darker colours indicating more pronounced differences.
Figure 3.6 Principal component analysis of the polar metabolite profiles of Azospirillum-
inoculated (A) and non-inoculated (N) roots of Brachypodium harvested at 7, 14 and 21 DAI.
Ellipses around samples display 95% confidence areas.
Figure 3.7 Volcano plots of significantly affected polar metabolites in the comparison between
bacteria inoculated and non-inoculated samples at 7 DAI (a), 14 DAI (b) and 21 DAI (c). Red dots

xvii
represent compounds with FC<-1.5 or >1.5 and probability of significant difference between mean
of Azospirillum-inoculated and non-inoculated plants based on Student’s t-test p<0.05.
Figure 3.8 Relative response of P containing compounds in roots of plants with or without
Azospirillum inoculation and harvested after 7, 14 and 21 DAI. Means ± standard error are
presented. n = 6 for all pooled samples except for non-inoculated at 21 DAI (n = 8). Asterisks in
the graphs indicate a fold change (FC)<-1.5 or >1.5 and probability of significant difference
between relative response of Azospirillum-inoculated and non-inoculated plants based on
Student’s t-test p<0.05 (see also Table 3.1).
Figure 3.9 Mapping of the polar metabolites affected by inoculation with Azospirillum at 7,
14 or 21 DAI in relation to primary metabolism pathways. Measured compounds appear in bold
font. Compounds whose levels were increased appear in red font in the central diagram and have
a red background in the plots surrounding it. Compounds whose levels were decreased appear in
blue font in the central diagram and have a blue background in the plots surrounding it. A dotted
line connecting two compounds in the central diagram indicates that further intermediates are
present. Asterisks in the graphs indicate a FC<-1.5 or >1.5 and probability of significant difference
between mean of Azospirillum-inoculated and non-inoculated plants based on Student’s t-test
p<0.05.
Figure 3.10 2D structures and formulas of hexacosanol and campesterol.
Figure 4.1 Hierarchical clustering coupled with heatmap of the lipid profiles of Azospirillum-
inoculated (A) and non-inoculated roots (N) of Brachypodium harvested at 7, 14 and 21 DAI. The
lettering at the bottom of the heatmap indicates the replicates: for each replicate, blue and red
colors indicate the lower or higher abundance of specific lipids compared to the other replicates,
with darker colors indicating more pronounced differences. The main lipid clusters are indicated
with branches of different colors.
Figure 4.2 Principal component analysis of the lipid profiles of Azospirillum-inoculated (A)
and non-inoculated roots (N) of Brachypodium harvested at 7, 14 and 21 DAI. Ellipses around
samples display 95% confidence areas.
Figure 4.3 Hierarchical clustering coupled with heatmap of the unidentified features profiles
of Azospirillum-inoculated (A) and non-inoculated roots (N) of Brachypodium harvested at 7, 14
and 21 DAI. The lettering at the bottom of the heatmap indicates the replicates: for each replicate,
blue and red colors indicate the lower or higher abundance of specific lipids compared to the other
replicates, with darker colors indicating more pronounced differences.
Figure 4.4 Principal component analysis of the unidentified features profiles of Azospirillum-
inoculated (A) and non-inoculated roots (N) of Brachypodium harvested at 7, 14 and 21 DAI.
Ellipses around samples display 95% confidence areas.
Figure 4.5 Hierarchical clustering coupled with heatmap of the lipid profiles of Azospirillum-
inoculated (A) and non-inoculated roots (N) of Brachypodium harvested at 7 DAI. The lettering
at the bottom of the heatmap indicates the replicates: for each replicate, blue and red colours

xviii
indicate the lower or higher abundance of specific metabolites compared to the other replicates,
with darker colours indicating more pronounced differences.
Figure 4.6 Hierarchical clustering coupled with heatmap of the polar metabolite profiles of
Azospirillum-inoculated (A) and non-inoculated roots (N) of Brachypodium harvested at 14 DAI.
The lettering at the bottom of the heatmap indicates the replicates: for each replicate, blue and red
colours indicate the lower or higher abundance of specific metabolites compared to the other
replicates, with darker colours indicating more pronounced differences.
Figure 4.7 Hierarchical clustering coupled with heatmap of the polar metabolite profiles of
Azospirillum-inoculated (A) and non-inoculated roots (N) of Brachypodium harvested at 21 DAI.
The lettering at the bottom of the heatmap indicates the replicates: for each replicate, blue and red
colours indicate the lower or higher abundance of specific metabolites compared to the other
replicates, with darker colours indicating more pronounced differences.
Figure 4.8 Principal component analysis of the lipid profiles of Azospirillum-inoculated (A)
and non-inoculated (N) roots of Brachypodium harvested at 7, 14 and 21 DAI. Ellipses around
samples display 95% confidence areas.
Figure 4.9 Volcano plots of significantly affected lipids in the comparison between bacteria
inoculated and non-inoculated samples at 7 DAI (a), 14 DAI (b) and 21 DAI (c). Red dots represent
compounds with FC<-1.5 or >1.5 and probability of significant difference between mean of
Azospirillum-inoculated and non-inoculated plants based on Student’s t-test p<0.05.
Figure 4.10 Volcano plots of significantly affected unidentified features in the comparison
between bacteria inoculated and non-inoculated samples at 7 DAI (a), 14 DAI (b) and 21 DAI (c).
Red dots represent compounds with FC<-1.5 or >1.5 and probability of significant difference
between mean of Azospirillum-inoculated and non-inoculated plants based on Student’s t-test
p<0.05.
Figure 4.11 Time course profile k-means clustering of lipid species identified in bacteria
inoculated and non-inoculated samples harvested at 7, 14, and 21 DAI. Clusters formed in the two
treatments were matched based on their lipid species composition. ADGGA: acyl diacylglyceryl
glucuronide, Cer-AP: ceramide alpha-hydroxy fatty acid-phytospingosine, DG: diacylglycerol,
DGDG: digalactosyldiacylglycerol, DGGA: diacylglyceryl glucuronide, GP:
glycerophospholipids, HexCer: hexosylceramide, HexCer-AP: hexosylceramide alpha-hydroxy
fatty acid-phytospingosine, TG: triacylglycerol.
Figure 4.12 Relative response of GPs in roots of plants with or without Azospirillum
inoculation and harvested at 7, 14 and 21 DAI. Means are presented. n = 6 for all pooled samples
except for non-inoculated at 21 DAI (n = 8).
Figure 4.13 Relative response of galactolipids in roots of plants with or without Azospirillum
inoculation and harvested at 7, 14 and 21 DAI. Means are presented. n = 6 for all pooled samples
except for non-inoculated at 21 DAI (n = 8).

xix
List of supplemental tables
Supplemental Table 7.1 First pilot experiment. Root growth of Brachypodium inoculated or
not with Azospirillum and grown at different P availabilities. Plants were imaged nondestructively
after 3, 5, 7, 9, 11, 14, 18 and 21 d in the GrowScreen-PaGe platform and images were analyzed
with the PaintRhizo software. (a) Root system length (cm). (b) Root system growth rate (cm d-1).
Means ± standard error presented. n = 20 Azospirillum-inoculated 7 µM P, Azospirillum-
inoculated 25 µM P and non-inoculated 7 µM P; n = 19 non-inoculated 25 µM P. Different letters
next to values indicate probability of significant difference between mean of different treatment
(p<0.05) based on Student’s t-test.
Supplemental table 7.2 Composition and similarity of the k-means clusters of lipid species
extracted from Azospirillum-inoculated and non-inoculated Brachypodium roots harvested at 7,
14 and 21 DAI. ADGGA: acyl diacylglyceryl glucuronide, Cer-AP: ceramide alpha-hydroxy fatty
acid-phytospingosine, DG: diacylglycerol, DGDG: digalactosyldiacylglycerol, DGGA:
diacylglyceryl glucuronide, HexCer: hexosylceramide, HexCer-AP: hexosylceramide alpha-
hydroxy fatty acid-phytospingosine, LPC: lysophophatidylcholine, MGDG:
monogalactosyldiacylglycerol, PC: phophatidylcholine, PE: phosphatidylethanolamine, PG:
phosphatidylglycerol, PI: phosphatidylinositol, Pi-Cer: ceramide phosphoinositol, TG:
triacylglycerol.

xx
List of supplemental figures
Supplemental figure 7.1 1% agarose gel showing the A. brasilense Sp245 specific PCR
products amplified from genomic DNA extracted from randomly chosen samples. Non inoculated
samples harvested at 7 d (C1-5), 14 d (C6-10) and 21 d (C11-15). Inoculated samples at 7 d (B1-
5), 14 d (B6-10) and 21 d (B11-15). M: 100 bp DNA ladder (New England Biolabs, Ipswich,
USA). NEG: no template control. POS: positive control obtained amplifying DNA extracted from
axenic A. brasilense Sp245 culture. All DNA samples extracted from inoculated plants display an
amplicon slightly shorter than the 500 bp marker, consistent with the size of the amplicon (458 bp)
expected to be amplified by the used primers.
Supplemental figure 7.2 Leaf area of Brachypodium inoculated or not with Azospirillum and
harvested after 21 d in the GrowScreen-PaGe platform. (a) First pilot experiment: plants grown at
different P availabilities. n = 15 for Azospirillum-inoculated 7 µM P, Azospirillum-inoculated 25
µM P and non-inoculated 7 µM P; n = 14 for non-inoculated 25 µM P. (b) Second pilot experiment:
both Azospirillum-inoculated and non-inoculated treatments provided with 7 µM P. n = 15 for
both treatments. Means ± standard error presented. Different letters above bars indicate probability
of significant difference between mean of Azospirillum-inoculated and non-inoculated plants
(p<0.05) based on Student’s t-test.
Supplemental figure 7.3 Shoot DW of Brachypodium inoculated or not with Azospirillum
and harvested after 21 d in the GrowScreen-PaGe platform. (a) First pilot experiment: plants
grown at different P availabilities. n = 15 for Azospirillum-inoculated 7 µM P, Azospirillum-
inoculated 25 µM P and non-inoculated 7 µM P; n = 14 for non-inoculated 25 µM P. (b) Second
pilot experiment: both Azospirillum-inoculated and non-inoculated treatments provided with 7 µM
P. n = 15 for both treatments. Means ± standard error presented. Different letters above bars
indicate probability of significant difference between mean of Azospirillum-inoculated and non-
inoculated plants (p<0.05) based on Student’s t-test.
Supplemental figure 7.4 High throughput experiment. Changes in shoot nutrient content
between different time points of Brachypodium inoculated or not with Azospirillum and harvested
after 7, 14 and 21 d in the GrowScreen-PaGe platform. (a) P. (b) N. (c) K. All points are the mean
± standard error of n = 3 samples of plants pooled within each treatment. Asterisks indicate
probability of significant difference between mean of Azospirillum-inoculated and non-inoculated
plants based on Student’s t-test; *, p<0.05; **, p<0.01, ***, p<0.001.
Supplemental figure 7.5 Physiological phosphorus use efficiency (PPUE) of Brachypodium
with or without Azospirillum inoculation after 7, 14 and 21 d growth in the GrowScreen-PaGe
platform. PPUE was calculated as the shoot dry weight (DW) divided by the shoot concentration
of phosphorus [P], to indicate physiology associated with dry weight accumulation for shoots. All
points are the mean ± standard error of n = 3 samples of plants pooled within each treatment.
Asterisks indicate probability of significant difference between mean of Azospirillum-inoculated
and non-inoculated plants based on Student’s t-test; *, p<0.05; **, p<0.01, ***, p<0.001. DW =
dry weight; [P] = phosphorus concentration.

xxi
Supplemental figure 7.6 First pilot experiment. Root growth of Brachypodium inoculated or
not with Azospirillum and grown at different P availabilities. Plants were imaged nondestructively
after 3, 5, 7, 9, 11, 14, 18 and 21 d in the GrowScreen-PaGe platform and images were analyzed
with the PaintRhizo software. (a) Root system length. (b) Root system growth rate. Means ±
standard error presented. n = 20 Azospirillum-inoculated 7 µM P, Azospirillum-inoculated 25 µM
P and non-inoculated 7 µM P; n = 19 non-inoculated 25 µM P. Error bars show the standard error
of the mean. Significant difference between mean of treatments are displayed in Suppl. Table 7.1.
Supplemental figure 7.7 Second pilot experiment. Root growth of Brachypodium inoculated
or not with Azospirillum and imaged nondestructively after 3, 5, 7, 11, 14, 18 and 21 d in the
GrowScreen-PaGe platform. Images were analyzed with the PaintRhizo software. (a) Root system
length. (b) Root system growth rate. Means ± standard error presented. n = 20 for both treatments.
Asterisks indicate probability of significant difference between mean of Azospirillum inoculated
and non-inoculated plants based on Student’s t-test; *, p<0.05; **, p<0.01, ***, p<0.001.
Supplemental figure 7.8 High throughput experiment. Root system growth rate of individual
Brachypodium plants inoculated or not with Azospirillum and imaged nondestructively after 3, 5,
7, 9, 11, 14, 18 and 21 d in the GrowScreen-PaGe platform. Images were analyzed with the
PaintRhizo software. n = 28 Azospirillum-inoculated and n = 32 non-inoculated.
Supplemental figure 7.9 Correlation between leaf area and total root length of Brachypodium
plants with or without Azospirillum inoculation at 21 d after the inoculation. n = 28 Azospirillum-
inoculated and n = 32 non-inoculated plants.
Supplemental Figure 7.10 Graphical representation of unidentified features of Azospirillum-
inoculated (A) and non-inoculated (N) Brachypodium roots harvested at 7 DAI. a) Hierarchical
clustering coupled with heatmap. The lettering at the bottom of the heatmap indicates the
replicates: for each replicate, blue and red colours indicate the lower or higher abundance of
specific metabolites compared to the other replicates, with darker colours indicating more
pronounced differences. b) Principal component analysis. Ellipses around samples display 95%
confidence areas.
Supplemental Figure 7.11 Graphical representation of unidentified features of Azospirillum-
inoculated (A) and non-inoculated (N) Brachypodium roots harvested at 14 DAI. a) Hierarchical
clustering coupled with heatmap. The lettering at the bottom of the heatmap indicates the
replicates: for each replicate, blue and red colours indicate the lower or higher abundance of
specific metabolites compared to the other replicates, with darker colours indicating more
pronounced differences. b) Principal component analysis. Ellipses around samples display 95%
confidence areas.
Supplemental Figure 7.12 Graphical representation of unidentified features of Azospirillum-
inoculated (A) and non-inoculated (N) Brachypodium roots harvested at 21 DAI. a) Hierarchical
clustering coupled with heatmap. The lettering at the bottom of the heatmap indicates the
replicates: for each replicate, blue and red colours indicate the lower or higher abundance of
specific metabolites compared to the other replicates, with darker colours indicating more

xxii
pronounced differences. b) Principal component analysis. Ellipses around samples display 95%
confidence areas.

1
Chapter 1
Interactions between cereals
and PGP bacteria

2
Preface
The first chapter of my thesis covers the current knowledge on the interactions between cereals
and plant growth promoting (PGP) bacteria, first focusing on the plant phenotype and then
followed by a discussion on the effects that these interactions have on root polar metabolites such
as sugars, amino acids and organic acids and non-polar metabolites (lipids).
In Section 1.1 of this chapter, I will discuss how plant - PGP bacteria interactions can help cereals
to grow better in environments characterised by abiotic stresses, i.e. stresses caused by non-living
factors, as opposed to biotic stresses, caused by pathogens and herbivores. I discuss the various
mechanisms of these interactions and how they can improve plant resistance to abiotic stresses.
This part of the Literature Review has been published in form of a review paper (Schillaci et al.
2019), in a chapter of the book “Root Biology - Growth, Physiology, and Functions” by
IntechOpen. In the second part of the introduction, I will discuss the current knowledge on the
effects of the interactions between cereals and PGP bacteria on plant root metabolism.
Note: in the review paper (Section 1.1 of this Chapter) I use the expression “plant growth
promoting rhizobacteria (PGPR)” to indicate beneficial soil bacteria. After publishing the review,
I realised that the term “rhizobacteria” can be interpreted as “symbiotic bacteria”, while my intent
was to describe all beneficial bacteria, not only the symbiotic ones. For this reason, in the following
parts of my thesis I preferred to use the more comprehensive expression “plant growth promoting
(PGP) bacteria” instead.

3
1.1 The Role of Plant Growth-Promoting Bacteria in the
Growth of Cereals under Abiotic Stresses
Abstract
Plant growth promoting rhizobacteria (PGPR) are known to improve plant performance by
multiple mechanisms, such as the production of beneficial hormones, the enhancement of plant
nutritional status and the reduction of the stress-related damage. The interaction between plants
and PGPR becomes of particular interest in environments that are characterized by sub-optimal
growing conditions, e.g. high or low temperatures, drought, soil salinity and nutrient scarcity. The
positive role of PGPR will become even more appealing in the future, as world agriculture is facing
issues arising from climate change and soil degradation. This chapter aims to discuss the main
mechanisms of the interaction between PGPR and plants and will focus of how PGPR can decrease
abiotic stress damage in cereals, which are critical crops for human diet.
1.1.1 Introduction
Global agriculture is facing the difficult challenge of increasing the productivity and output
required to feed a growing population. Additionally, fertile land areas available for agriculture are
gradually decreasing due to climate change, soil degradation and pressure from urban
developments. These concerns are particularly relevant as they negatively affect yields of cereal
crops, which are a fundamental diet component in global society (Sarwar et al. 2013).
To help overcome this problem, researchers have turned their attention to understanding
interactions between plants and soil microorganisms. Plant roots interact with the soil microbiota,
which have various effects on plant growth and development, ranging from beneficial to
pathogenic (Hardoim et al. 2015). Plant Growth Promoting Rhizobacteria (PGPR) play important,
but still poorly understood, roles in plant growth promotion, especially under environmental stress
such as drought, temperature and salinity (Hardoim et al. 2015; Hurek et al. 1994; Lynch and de
Leij 2001).
There are various mechanisms through which PGPR improve plant performance, often in a
synergic manner some examples include, the production of plant growth promoting hormones,
improvement of plant nutritional status and decreased stress damage (Hardoim et al. 2015).
Interactions between plants and PGPR can result in improvement of plant performance and

4
enhanced resistance to biotic and abiotic stresses which are important traits for cultivated crops
(Germida and Siciliano 2001).
1.1.2 Importance of cereals in global nutrition
Cereals are annual plants belonging to the monocotyledonous Poaceae family and are a vital food
source for humans as they provide almost one half of the calories that are consumed daily in the
world (FAO 2018). Furthermore, cereals are also extensively used as animal feed, mainly for
livestock and poultry, and as raw materials for many industrial processes, primarily the production
of alcoholic beverages (Sarwar et al. 2013).
Figure 1.1 Cereal cultivation records and world population data since 1961. Cereals cultivated land, soil
productivity as yield, world grain production and world population are displayed (FAO).
In the last fifty years, the increase of cereals production (+240% in the time window 1961-2017
shown in Fig. 1.1) is the result of increased yields per hectare (+201%) rather than the expansion
of land allocated to cereals production (+12%) (Fig. 1.1). However, this trend has recently
decreased. The average production rate of cereals was 3.6% per year between 1961 and 2007, and
it decreased to an average of 2.7% between 2007 and 2017 (FAO). This is likely to be linked to
multiple factors, including climate change, soil degradation, use of soil for non-alimentary

5
purposes, restrictions on water, nutrients and land for agriculture, and limitations of traditional
breeding.
1.1.3 Abiotic stress effects on agriculture
Most cultivated soils in the world are characterized as being sub-optimal. Any deviation from
optimal growth conditions causes several interconnected reactions in plants that can be described
as an attempt to adapt to new environmental conditions in an effort to maintain homeostasis. If the
stress endures too long or is too severe, it can permanently damage plant physiology or result in
death. Whilst many plants are able to adapt to stress, the process requires energy that is diverted
from active growth, resulting in smaller acclimated plants (Kosová et al. 2011). Abiotic stresses,
that is, stresses caused by non-living factors, are thought to be the main cause of global crop loss
with decreased productivity of more than 50% annually (Atkinson and Urwin 2012). Drought and
salinity stress are potent environmental hazards for agriculture, particularly in arid and semi-arid
regions which are already approaching the limits of crop productivity, and due to global warming
and degradation of agricultural soils these regions may no longer support crop plants in the future
(Kompas et al. 2018; Tuteja 2007).
1.1.3.1 Climate change
Food security is positively correlated with social and economic stability, given climate change is
threatening food production there are extended and complex implications. Since the mid-19th
century, average temperatures have increased by 0.8°C, and by the end of this century temperatures
are predicted to increase between 1.8°C to 4°C compared to the end of the last century (Solomon
et al. 2007). This change is causally related with human activities by the production of greenhouse
gases such as carbon dioxide, the concentration of which rose from ~284 ppm in 1832 to 397 ppm
in 2013 (Tans and Keeling 2013).
While CO2 is generally accepted as a greenhouse gas, there is now increased interest in the role of
nitrous oxide (N2O). This compound can originate from the denitrification of N fertilizers, which
are commonly used in modern agriculture. In 2014-2015, more than half of all N fertilizer was
applied to cereal crops alone (Heffer P 2017). The reintroduction of N in N-depleted soil is an
essential agricultural practice that has led to increased yields over the last few decades. However,
the application of N fertilizer is inefficient and it is estimated that only one third of the applied N
is absorbed by plants, with the excess being lost in surface runoff, leaching in groundwater or

6
volatilization into the atmosphere (Garnett et al. 2009). Atmospheric N2O, while less abundant
than CO2, is 300 times more potent as a greenhouse gas (Ward et al. 2018).
Climate change caused by greenhouse gas emissions is predicted to directly impact the
productivity of agricultural systems in almost every part of the planet. While many agricultural
sites in cold-continental areas will benefit from the increased temperatures, regions characterized
by temperate, tropical arid or sub-arid climates are likely to face decreasing yields (Wheeler and
Von Braun 2013). By modelling the effects of climate change on the yields of various cereals in
different areas of the world, it was predicted that by the end of the century, heat stress events will
increase in areas of Central and Eastern Asia, Southern Australia, Central North America, and
South East Brazil (rice), Northern India, the Sahel region, South East Africa and Central South
America (maize), and Central Asia (wheat) (Teixeira et al. 2013). Kompas et al. (Kompas et al.
2018) estimated that if no measures are taken to reduce greenhouse gas emissions, the average
world temperature increase of 4°C by 2100 will severely decrease food production in almost all
countries in the world. This will result in economic loss of approximately 23 thousand billion US$
on average, with South East Asia and developing countries of Africa predicted to face the largest
losses (21% and 26% of GDP respectively).
1.1.3.2 Agricultural soil degradation
Soil degradation is one of the main concerns impacting agricultural productivity, especially in
tropical and sub-tropical areas (Lamb et al. 2005). Globally, one third of land is affected by some
form of deterioration (Bini 2009). Unsuitable agricultural techniques, together with excessive crop
residue removal and unbalanced use of chemical fertilizers can decrease soil quality, deplete
organic matter stocks and increase erosion. Crop removal from the production site causes the loss
of elements that are essential for plant growth and these elements must be constantly reintroduced
to avoid productivity decreases (Amundson et al. 2015).
Using soils for agricultural purposes can cause degradation of water sources, due to leaching of
degraded fertilizers into groundwater. Many rivers in developing countries have severe water
pollution and eutrophication issues. Irrigation is an essential management strategy to obtain
sufficient productivity to meet food demands in many arid and semi-arid areas, but it can lead to
undesirable effects. Improper irrigation techniques have increased saline-sodic soils, that now
occur in more than 20% of irrigated lands (Qadir and Oster 2004).

7
1.1.4 Plant growth promoting bacteria
A common misconception during the 19th century was that healthy plants should be sterile, not
interacting with any microorganisms. This assumption was initially questioned by Victor Galippe
(Galippe 1887), who proved that healthy plants could host various microbes in their tissues. Today,
we know that almost all terrestrial plants from various environments interact with the surrounding
microbiota during all stages of plant development. The relationship between host plant and
microbe can range from parasitism, commensalism or mutualism or neutral or beneficial for plant
growth, and can vary greatly due to a multitude of factors, both biotic and abiotic. PGPR are
attracted to plants by organic exudates released through roots and colonize the root surface and the
soil directly in contact with the root. The soil matrix directly in contact with plant roots is called
the rhizosphere (Smalla et al. 2006), and the extracellular surface of roots is termed the rhizoplane
(Foster 1986). Here, colonizing microorganisms can establish the exchange of nutrients and
various compounds with the plant, summarized in Fig. 1.2.
Nutrients and organic compounds released into the rhizosphere from roots are derived from
photosynthesis and plants release up to 30% of their photosynthates through the roots (Lynch and
Whipps 1990). These include a variety of compound classes such as carbohydrates, amino acids,
organic acids, flavonoids and lipids, that can be used as energy sources for microbes (Walker et
al. 2003). The sensing and active migration of bulk soil bacteria towards these compounds is called
chemotaxis, leading bacteria to colonize the rhizosphere and rhizoplane (Lugtenberg and Dekkers
1999). By producing exudates, plants can select bacterial species that are attracted to specific
compounds, thereby directing the abundance and diversity of microbes in the rhizosphere
(Philippot et al. 2013; Huang et al. 2019). Wild oat has been reported to modify the bacterial
population of its rhizosphere enriching mainly the Firmicutes, Actinobacteria and Proteobacteria
(DeAngelis et al. 2009). The latter group in particular is commonly believed to be the main
microbial component in PGPR interactions, due to their capacity for fast growth and diverse
metabolic pathways capable of utilizing a great variety of exudate compounds as an energy source
(Philippot et al. 2013). In the model cereal plant Brachypodium, the rhizosphere microbiome
changes not only within the loosely-bound rhizosphere soil and tightly-bound rhizosphere soil, but
also within seminal and nodal roots (Kawasaki et al. 2016). It is noteworthy that plants can
indirectly influence the colonization of the rhizosphere, by changing the environment conditions.

8
Some examples are changes in pH levels by ion uptake, the reduction of O2 and H2O levels caused
by root respiration, and water absorption (Philippot et al. 2013).
Different types of root exudates can attract different PGPR. For example, various strains of
Azospirillum brasilense, a gram-negative Alphaproteobacteria, showed different degree of
attractions to various compounds released by different host plants (Reinhold et al. 1985). The
composition of roots exudates can vary greatly among different plant species. Two different
studies (Bouffaud et al. 2012; Peiffer et al. 2013) reported how even different genotypes of the
Figure 1.2 A model of interactions between plants and PGPR. Exudates released by plant roots attract soil
bacteria that can colonize rhizosphere and/or plant tissues. Here, they provide various beneficial compounds
to the plant in exchange of nutrients, mainly photosynthates.
9
same plant species can host different bacterial populations in their rhizosphere. Exudates vary
between different parts of the roots, different developmental stages of the plant or as a response to
different growth conditions (el Zahar Haichar et al. 2008). This means that the same plant can
interact with a multitude of different soil bacterial strains over time and space (Compant et al.
2010).
Nehl et al. (1997) use the term ‘rhizobacteria’ to describe rhizoplane/rhizosphere bacteria but there
are also endophytic bacteria that can reside inside plant tissues. To date, numerous interactions
between plants and rhizosphere/rhizoplane colonizing bacteria have been described, but some
microbes are even more specialized. Once they have colonized the rhizoplane, they are able to
penetrate root tissues and directly access apoplastic organic compounds, thereby avoiding
competition with other microbes in the rhizosphere (Hallmann et al. 1997). Root penetration can
be both active, by the production of cell wall degrading enzymes such as cellulase, or passive, for
example entering via the cracks that form on the root surface during lateral root development
(Hardoim et al. 2008). Colonization beyond the rhizosphere into the apoplast requires specialized
microbial morphology. Czaban et al. (2007) described how the occurrence of flagellar motility in
bacterial strains isolated from the internal root tissue of wheat was five times higher than what was
observed in bacteria isolated from the rhizosphere.
Bacillus, Pseudomonas, Enterobacter, Klebsiella, Serratia and Streptomyces are some of the most
commonly found genera of endophytic bacteria in plant tissues (Dimkpa et al. 2009). By passing
the endodermis, many bacterial species are able to spread from the roots, reaching and colonizing
other organs of the stems (Compant et al. 2005). Endophytic bacteria can also spread from plant
tissue to seeds becoming the starting inoculum for the colonization of subsequent generations of
plants. The transmission of bacteria through generations of plants is a process known as vertical
transmission. Johnston-Monje and Raizada (Johnston-Monje and Raizada 2011) described how
modern varieties of maize and their wild ancestors share common endophytic bacteria
communities hosted in their seeds, and a following study conducted on wheat demonstrated how
these communities play a positive role in plant growth (Herrera et al. 2016).

10
Plant growth promotion driven by rhizobacteria
Galippe’s intuition that plants interact with microbes throughout their life led to a significant
increase in the comprehension of the beneficial role that bacteria can have on plant growth. PGPR
interactions can result in higher plant biomass, higher nutritional value, better survival rates, and
generally require lower agricultural inputs. Focusing on cereals, PGPR can significantly improve
plant performance in several environments, particularly those characterized by suboptimal growth
conditions. Some of the main benefits that plants obtain are increased root development which
imparts improved resistance to temperature and osmotic stress, soil pollutants, pests and pathogens
(Lugtenberg and Kamilova 2009).
It is well established that plant responses to biotic and abiotic stresses require complex adaptations
to structure and metabolism. When biotic and abiotic stresses are applied simultaneously, plants
respond much differently compared to stresses applied separately (Atkinson and Urwin 2012). It
is therefore reasonable to assume if a plant is exposed to both biotic and abiotic stresses that PGPR
may directly mitigate the effect of biotic stresses by improving plant resistance to abiotic stresses.
Hormone-related mechanisms
The most well described mechanism by which PGPR can improve cereal productivity is the
productions of various plant growth promoting hormones that usually co-affect the performance
of the plant in a highly integrated manner (Trewavas 2000). Auxins are a class of hormones
typically synthesized by apical buds, and from there they are transported to other parts of the plant.
In this class of hormones, the most characterized is indole-3-acetic acid (IAA), which enhances
cell elongation and differentiation and, in roots, stimulates lateral root development (Dimkpa et al.
2009; Glick 1995). Various reports have shown how the production of auxins from PGPR is one
of the most important mechanisms for plant growth promotion. Barbieri and Galli (Barbieri and
Galli 1993) inoculated wheat with two strains of Azospirillum brasilense, of which one was a
mutant with impaired IAA production. They observed how only the wild type strain promoted
lateral root development, a result that suggests a primary role of IAA in improving plant root
development. IAA can indirectly improve the nutritional status of the plant by increasing root
development (specifically lateral roots), hence allowing the plant to explore a higher portion of
soil substrate, an important trait particular for the acquisition of low mobility nutrients such as
phosphorus (Wittenmayer and Merbach 2005).

11
Gibberellins (GAs) can be produced by PGPR (Bastian et al. 1998) and are believed to play an
important role in promoting plant growth. These diterpene hormones are naturally present in
plants, regulating key processes such as seed germination, stem elongation, leaf expansion, root
growth and root hair abundance (Bottini et al. 2004; Yamaguchi 2008). One of the best-known
GAs is GA3, commonly known as gibberellic acid, which plays a key role in determining plant
source-sink relations. The role of gibberellins in the response of cereals to stresses varies
depending on the stress type (Iqbal et al. 2011), but in general, plants tend to reduce GAs levels
when growing in sub-optimal conditions. The exogenous application of gibberellins has been
reported to improve wheat and rice performance undergoing saline stress (Kumar and Singh 1996;
Prakash and Prathapasenan 1990) and to reduce heavy-metal stress symptoms in rice (Moya et al.
1995).
Many PGPR are able to degrade 1-aminocyclopropane-1-carboxylic acid (ACC) through the
enzyme ACC deaminase, and use the degradation products as a nitrogen source (Dimkpa et al.
2009). ACC is the biosynthetic precursor of ethylene, a hormone naturally present in plants and its
abundance is often increased in response to stresses. While at optimal levels, ethylene is involved
in essential processes such as tissue differentiation, root development, flowering, grain
development and natural tissue senescence and abscission, when overproduced it can decrease
plant performance (Saleem et al. 2007). In abiotically stressed plants, the increase of ethylene can
trigger chlorosis and early maturation and senescence of organs, seeds in particular (Glick 2007;
Hays et al. 2007) and have an inhibitory effect on root growth (Dimkpa et al. 2009). By impairing
the ethylene signaling pathway, the interaction with PGPR can decrease the stress-related damage
in the plant (Hardoim et al. 2015).
Similar to ethylene, abscisic acid (ABA) is a hormone commonly produced by plants in response
to various types of stress, particularly osmotic stress (Fahad et al. 2015). Naturally involved in
seeds and buds dormancy, ABA shares the first biosynthetic steps with cytokinins, a phytohormone
class that often plays an antagonistic role to ABA. In dry or saline soils, reactive oxygen species
(ROS) increase the biosynthesis of ABA, which is then transported to leaves, where it causes
stomatal closure to reduce transpiration and water loss (Xing et al. 2004). As a consequence, the
diffusion of CO2 into leaves is decreased, lowering photosynthetic rates (Flexas et al. 2004; Yang
et al. 2009). PGPR have been reported to increase the resistance of plants to salinity, hence

12
decreasing the stress-related ABA accumulation in plants and preserving photosynthetic efficiency
(Barnawal et al. 2017; Shahzad et al. 2017).
1.1.5 Plant-bacterial interactions enhance abiotic stress responses
Bacteria can have various effects on their host plant. PGPR can affect plant growth both directly,
such as by fixing atmospheric N2 into biologically available N compounds, or by producing growth
promoting hormones (Bottini et al. 2004), and indirectly, by preventing the growth of plant
pathogens or increasing plant resistance to them (Compant et al. 2005). A necessary condition for
bacteria to be beneficial to a plant is rhizosphere competence as the competition and conditions in
the rhizosphere are vastly different to that of bulk soil. The rhizosphere contains a higher
abundance of bacteria than bulk soil, but the diversity is much lower. The colonization of the root
system of plants is not homogenous, the density of specific bacteria varies in different parts of the
root system and is likely to be related to different root exudates released by different parts of the
roots (Compant et al. 2010). Another mechanism likely to regulate the colonization of the
rhizosphere is bacterial quorum sensing, which is the regulation of gene expression driven by
bacterial population density and can occur both within bacteria of the same species and amongst
different species (Miller and Bassler 2001). Quorum sensing can influence the bacterial
competitiveness, therefore affecting the roots colonization patterns (Compant et al. 2010).
1.1.5.1 Thermic stress adaptation
Temperature stress causes a shift in hormone production, particularly ethylene, which can often
impair plant growth (Saleem et al. 2007). High temperature stress causes denaturation and
aggregation of cellular proteins that, if left unchecked, leads to cell necrosis. Imbalance between
ABA and cytokinins derived from prolonged heat stress during the reproductive stage can lead to
grain abortion (Cheikh and Jones 1994). Heat responses include inhibition of normal transcription
and translation, and increased expression of genes coding for heat shock proteins and
thermotolerance induction (Krishna 2003). Low temperature stress, conversely, damages
metabolic processes, changes membrane properties, causes structural changes in proteins and
inhibits enzymatic reactions (Heino and Palva 2003). If it occurs during spore formation, cold can
cause sterility of flowers by interfering with meiosis (Dolferus et al. 2011).
The literature on PGPR interactions with cereals at sub-optimal temperatures is relatively scarce,
and the mechanisms by which cereals adapt are not well defined. It is suggested that the

13
geographical origin of the bacteria determines the optimal growth range at which they interact
beneficially with plants. In a study on wheat, bacteria isolated from cold climates have been
reported to efficiently colonize the plant rhizosphere and improve their resistance to low
temperature stress and the same trend was observed when wheat plants were inoculated with
bacteria isolated from warm environments and subjected to high temperature stress
(Egamberdiyeva and Höflich 2003). It is possible that the bacteria isolated from different
temperatures can outcompete the indigenous microbial population by tolerating either cold or
warm conditions giving rise to a higher abundance and colonization of the rhizosphere.
Inoculation with a Pseudomonas aeruginosa strain isolated from a hot semi-arid environment
improved survival rate, development and biochemical parameters of sorghum seedlings when the
plants were exposed to heat treatment, while the biomass production was not affected at optimal
temperatures (Ali et al. 2009). In another study, various cold-tolerating Pseudomonas spp. were
inoculated onto wheat grown at low temperatures, giving analogous results. The authors suggest
the beneficial effect was linked to a better root development in inoculated strains that improved
nutrient uptake and, in general, caused a better adaptation to cold (Mishra et al. 2011).
As global warming threatens to change significantly the temperature of most cultivated lands
(Wheeler and Von Braun 2013), the development of cereals with enhanced adaptation capacity to
heat or cold stress is an essential task in order to sustain profitability and production at suboptimal
temperature conditions. While further research is necessary to better understand the mechanisms
that regulate PGPR-plant interactions in such conditions, the studies done so far suggest how
PGPR can be a valuable source of temperature-stress resistance, especially when they evolved in
areas characterized by warm or cold climates, depending on the case.
1.1.5.2 Osmotic stress adaptation
Both dry and saline soils can cause osmotic stress in plants, which results in cell dehydration due
to lack of water (drought) or unavailability of water (salinity). These two stresses are often
agronomically significant, as high salinity in soil is mainly caused by irrigation, a necessary
practice for increasing yields in many areas of the world characterized by insufficient rainfalls.
When water supply is insufficient to remove ions from superficial soil layer, they accumulate
causing an increase of salinity (Blaylock 1994).

14
Salinity is also the result of land clearing, as deep subsurface roots no longer are able to keep the
water table below ground level. As the water table rises, it brings with it saline water that can
render hundreds of square kilometers of agricultural land uncultivable(Lambers 2003). Plants
growing on such soils often suffer from osmotic stress that reduces water absorption and increases
ionic concentration in tissues to toxic levels (Munns et al. 2006). PGPR can decrease these stress
symptoms through various mechanisms, such as production of Na+-binding exopolysaccharides
(Ashraf et al. 2004), improvement of ion homeostasis (Hamdia et al. 2004), decrease of ethylene
levels in plants through ACC deaminase (Nadeem et al. 2009) and synthesis of IAA (Chang et al.
2014). Wheat seeds inoculated with a species from the genus Pseudomonas showed increased
germination rates in a saline environment, Egamberdiyeva (2009) ascribed this to the production
of plant growth regulators by the bacteria.
Drought is considered as the major cause of yield loss (Lambers et al. 2008), negatively affecting
most physiological processes in plants. Plant cells respond to water loss by increasing the
production of abscisic acid (ABA) in roots, that increases water uptake and causes leaf stomatal
closure and reduces leaf expansion to reduce dehydration (Barnabas et al. 2008). Smaller leaves
cause impaired photosynthesis, consequently decreasing dry matter accumulation and grain yield
(Farooq et al. 2012). Under water deficiency, both cell division and enlargement are lowered due
to damaged enzyme activities, leading to overall smaller plant organs. Grain production is also
reduced in cereals due to flower abortion (Schussler and Westgate 1995; Yadav et al. 2004).
Plants often react to drought by increasing the amount of osmolytes in their tissues, and
consequently increase their osmotic potential (Ashraf 2010). Drought can also cause an increase
of ROS in plant tissues. Proline, an amino acid whose abundance is increased under water
deficiency, can both work as an osmolyte and scavenger for ROS under stress (Hayat et al. 2012).
In general, PGPR can improve the performance of plants in dry environments by exudating
osmolytes that increase the osmotic potential of plants (Casanovas et al. 2002; Dimkpa et al. 2009;
Vurukonda et al. 2016).
Another mechanism for improving resistance to drought is the synthesis of beneficial hormones
(IAA) and enzymes (ACC deaminases) and the decrease of stress related hormones such as
ethylene and ABA in the plant. Naveed et al. (2014) reported that two maize cultivars exposed to
drought showed reduced damage when inoculated with two different PGPR, probably due to

15
hormones produced by the bacteria and stress reducing enzymes synthesized by both the plants
and the bacteria during the interaction. Wheat plants inoculated with various PGPR showed an
improved resistance to salt and drought treatments, linked to decreased ABA and ACC levels in
plant tissues (Barnawal et al. 2017). In a similar study (Shahzad et al. 2017), rice plants showed
decreased endogenous ABA levels and increased biomass when inoculated with Bacillus
amyloliquefaciens, the authors hypothesize that inoculation increased salt tolerance in plants
through an ABA-independent pathway, and this prevented the stress-dependent ABA
accumulation and the resulting growth impairment (Flexas et al. 2004).
Sarig et al. (1992) report that sorghum plants subjected to osmotic stress after their emergence
showed decreased damage when colonized by Azospirillum brasilense. It is unclear, however, if
the observations were a drought specific response or an indirect effect of inoculated plants showing
a better root development and higher hydraulic conductivity at the time of the stress. In two
successive studies (Creus et al. 2004; El-Komy et al. 2003) conducted on various Azospirillum
spp., inoculated wheat plants subjected to drought had decreased grain loss, better water status and
higher K and Ca content, with the latter in particular suggested to be involved in the adaptation of
the plants to environmental stress. Bacterial nitrate reductase was also suggested to play an
important role in nitrate assimilation of plants under drought (El-Komy et al. 2003).
As previously mentioned, drought and saline stress are related, since salinity is often the result of
irrigation practices to avoid plant desiccation from drought stress. This concern may become more
relevant in future years, as higher temperatures caused by global warming will result in higher
evapotranspiration, hence requiring increased irrigation. By the year 2050, 50% of all arable lands
might be affected by serious salinization (Wang et al. 2003). Improving the resistance of plants to
dry environments would decrease the necessity of irrigation, indirectly decreasing the ongoing
salinization process in agricultural land.
1.1.5.3 Improvement of the plant nutritional status
In natural environments, plants die and decompose where they grew, and the subsequent detritus
reintroduces soils with most of the nutrients they absorbed during their growth. In cultivated lands,
those nutrients are removed at harvest and must be constantly replaced to avoid productivity
decrease. Among the macronutrients, nitrogen, phosphorus and potassium are the most important
for plant growth, and they are typically reintroduced using synthetic fertilizers. Unbalanced use of

16
fertilizers can decrease soil quality, consume organic matter stocks and increase the erosion risk.
Soil bacteria can improve the nutritional status of plants directly by increasing nutrient
bioavailability and/or indirectly by improving plant root development, hence allowing them to
explore higher areas of soil (Shaharoona et al. 2008).
N2 fixation and absorption
Several bacterial species are classified as diazotrophs, which are microorganisms that are able to
utilize the nitrogenase enzyme to fix atmospheric N2. Diazotrophic bacteria can fix N2 in either a
free-living form or in association with a host as an endosymbiont. The most well described
interaction between plants and diazotrophic bacteria is the rhizobia-legume symbiosis. Rhizobia
are a group of various Proteobacteria that can colonize plant roots and fix atmospheric nitrogen,
which is then partly provided to the plant in exchange of photosynthates (Long 1989). While this
association has been observed mainly in legumes, some species of rhizobia can also colonize
cereals. Gutierrez-Zamora and Martinez-Romero (2001) showed how maize and bean plants
cultivated in association shared the same Rhizobium etli strains, with the bean plants probably
constituting the source of inoculum for maize. The interaction with the rhizobia increased the
biomass of both crops, but in maize this outcome might have been linked to mechanisms other
than N2 fixation, such as hormone production. Rice inoculated with an Azoarcus sp. showed
improved growth regardless of colonization by the wild type strain or with a mutant strain deficient
in the nitrogenase genes (Hurek et al. 1994). When spring wheat and maize were inoculated with
two different rhizobia and grown at various soil N levels, the two strains were effective in
enhancing plant growth only at low and intermediate levels of soil N. The authors suggest that
plant growth promoting hormones released by the bacteria caused a better root development in
inoculated plants, that were able to absorb more nutrients from the soil (Dobbelaere et al. 2002).
In general, diazotrophic bacteria associated with cereal roots often carry the nitrogenase genes
necessary for the fixation of atmospheric nitrogen, but the relative enzymes are not always
synthesized inside plant tissues. Furthermore, the amount of fixed N provided to the plant is often
negligible, due to low presence of diazotroph bacteria or because bacteria use fixed nitrogen for
their own growth (Rosenblueth et al. 2018). The nitrogenase enzyme cannot function in the
presence of O2 so it may be desirable to engineer free-living diazotrophic bacteria that are able to
colonize plant tissues. Other possible ways might be to increase the fixing bacteria population by

17
engineering plants capable of exudating diazotroph favorable compounds or engineering bacteria
capable of providing the plant with higher levels of nitrogen (Van Dommelen et al. 2009).
Fox et al. (2016) modified a Pseudomonas sp. genome by adding a gene cluster with nitrogenase
activity that improved the performance of wheat and maize by fixing N2. This is an example of
some of the approaches towards nitrogen-fixing cereals, that is, plants capable of sourcing the N
necessary for their growth from the atmosphere via endosymbionts (Beatty and Good 2011).
Farmers have benefited from the rhizobia-legume symbiosis for centuries, and extending this
characteristic to cereals would be a decisive benefit for modern agriculture, providing a
continuous, ecologically and economically sustainable source of N to the most important crops.
Improvement of soil nutrient uptake
Despite the benefits PGPR impart on plant nutrient content, it is often unclear if this improvement
is related to an enhanced mineral uptake, or if it is the result of improved root system development
in inoculated plants due to bacterial hormones and/or enzymes (Glick 1995).
Various bacterial strains are known to increase bioavailability of phosphorus in soil, due to the
mineralization of organic phosphate and solubilization of inorganic phosphate. Some of the
bacterial compounds linked to these two processes are acid phosphatases and organic acids,
respectively (Rodrıguez and Fraga 1999). Phosphate-solubilizing bacteria have been reported to
improve the growth of maize (Chabot et al. 1996), rice (Murty and Ladha 1988) and wheat (Singh
and Kapoor 1999).
PGPR can also synthesize siderophores, that are low molecular weights compounds with high iron
binding affinity (Castignetti and Smarrelli 1986) that can complex with Fe (predominantly Fe3+)
in soil. The iron-siderophore complex is then assimilated by the bacterium using a complex
specific receptor (O'sullivan and O'Gara 1992). This has various effects, it depletes the soil iron
supply, thereby preventing the growth of other potentially pathogenic microbes and, if the iron is
then provided to the plant, it can directly improve plant growth (Glick 1995). Furthermore, the
bacterial nitrogenase activity and nif gene expression are iron dependent (Rees and Howard 2000;
Rosconi et al. 2013), hence the absorption of iron from the soil enables diazotroph bacteria to
convert atmospheric N2 to a form that is bioavailable for the plant.

18
PGPR can indirectly improve plant performance neutralizing the stress-related hormones produced
by the plant in poor soils. Wheat plants grown at various levels of N, P and K, showed increased
grain yield and biomass production when colonized by Pseudomonas spp., with the bacterial
growth promotion being negatively correlated with the amount of provided nutrients (Shaharoona
et al. 2008). The authors ascribe this outcome to bacterial production of ACC deaminase, that
decreased ethylene levels produced by plants as a response to low nutrients levels, which impaired
root development in uninoculated plants.
Overall, plant growth promotion is ascribed to a combination of multiple mechanisms.
Egamberdiyeva (Egamberdiyeva 2007) inoculated maize seeds with PGPR with nitrogenase
and/or IAA activity and grew them on two soil types with different nutrient availabilities.
Inoculated plants generally developed a higher root and shoot biomass and had higher N, P and K
contents, the improvement being more pronounced in plants grown on nutrient-poor soils.
However, this study did not consider the possible interactions of inoculated strains with the native
microbial populations that may have affected the results.
In 2014-2015, out of 182 million metric tons (Mt) of consumed fertilizer, one half was applied to
cereals (Heffer P 2017). Cereals consumed more than one half of N fertilizers, and more than one
third of P and K fertilizers. As previously mentioned, these amendments have both a high
economic and environmental cost, as they can cause soil degradation, pollution of water and
eutrophication. While developing N-fixing PGPR is a task yet to be achieved in cereal agriculture,
it is well documented how PGPR can improve the efficiency of nutrient uptake in crops. This can
occur by either increasing the bioavailability of nutrients in the soil or as a consequence of better
root development, resulting in better soil exploration.
1.1.6 Issues and perspectives
Cereal-PGPR interactions have been widely studied over the last few decades, and the positive
influence that they can have on plant growth is still being established. However, the lack of
consistency among different studies is still a concern, highlighting that when multiple biological
actors are involved, no generalizations can be made. The same bacterial strain can be beneficial to
a plant species and damage another (Coombs and Franco 2003), or have no effects or even be
detrimental for plant performance when the growing conditions are optimal but become beneficial
when growing conditions worsen (Hardoim et al. 2015; Hurek et al. 1994; Lynch and de Leij

19
2001). In two studies on maize and rice subjected to water deficiency (Casanovas et al. 2002;
Yuwono et al. 2005), the beneficial effects of various bacterial isolates on plant growth increased
with the severity of the stress. Studying the interaction between PGPR and gum rockrose (Cistus
ladanifer), Solano et al. (2007) hypothesized that a possible explanation for this is that poor
environments may impair the growth of indigenous microbial communities, this way decreasing
the competition for those microbes that establish advantageous relationships with plants. Another
possible explanation is that when the main bacterial mechanism of plant growth promotion is
providing them with nutrients, the benefit might be limited in nutrient-rich soil, while it can be
significant in the case of limiting nutrients (Kim et al. 2012).
The observed outcomes change particularly from laboratory and climate chamber trials to more
open setups such as greenhouses and field, in which bacteria often fail to improve plant growth
(Compant et al. 2010). Most of the studies conducted so far on the interaction between cereals and
PGPR were performed in controlled environments, usually applying only one single stress at a
time. While this is a necessary compromise when starting to study this interplay, it often entails a
significant bias from realistic field environment (Hardoim et al. 2015), in which plants frequently
face more variable growing conditions and face multiple stresses at the same time, triggering
unique responses in plants that are different from the sum of plant response to stress applied
individually (Suzuki et al. 2014). So far, very few experiments have studied the interaction
between bacteria and crops under multiple stresses, but replicating as accurately as possible real
field conditions is an essential step for understanding and exploiting the role of PGPR in
agriculture. In addition to the more unstable growing environment, another important variable
added in field experiments is the interaction with the native microbiota. Often inoculated bacteria
in the field show lower rhizosphere or root colonization compared to laboratory, climate chamber
and greenhouse trials (Lugtenberg et al. 2001), in which the growth medium is usually sterilized
at the beginning of the experiment.
One of the hypotheses that can be drawn from the current literature is that the origin of the
inoculated bacteria is often a decisive factor for the interaction to improve plant growth. Bacteria
isolated from the same plant species used in trials are more likely to play a beneficial role, probably
due to the plant-specific exudates that have a key role in the early phases of the interaction
(Dobbelaere et al. 2002). Similarly, bacteria isolated from environments characterized as sub-

20
optimal (temperature in particular) that are similar to the conditions and stress applied in plant
trials may be more beneficial than bacteria isolated from optimal conditions, delivering more
benefits to the plant, due to adaptations that allow the bacteria to be more competitive than the
native microbiota (Egamberdiyeva and Höflich 2003). Unfortunately, inoculum used in trials may
become less effective due to continual cultivation in laboratory environments and when planning
a plant trial, this should be taken into consideration.
One of the problems facing commercialization of PGPR on markets is the inoculation delivery
method on plants. In the laboratory, a common method is dip inoculation where seedling roots are
immersed in bacterial culture, and then transplanted into the growth substrate, but this approach is
not feasible for annual cereals on the field scale. The on-field application of bacterial solutions
after seedling germination, while less laborious, still requires considerable equipment and
technical knowledge. The most feasible way to apply PGPR on field is probably the use of pre-
inoculated seeds (this is already used for rhizobia-legume inoculation) allowing farmers to bulk
sow, relieving them from the inoculation step. When the seed bacterial treatment is done
immediately before germination, the required strength of bacterial inoculum is typically smaller
than in seedling treatments, but ideally inoculants should survive long enough on seed coats to be
present during germination, however, prolonged survival of microbial treatment on seeds is still a
challenge (O’Callaghan 2016). Moreover, inconsistencies between performance of seed inoculants
are often observed in different trials, and further research is required to address this issue (Nelson
2004). Utilizing vertical transfer of microbial endosymbionts in seeds may also present a possible
inoculation technology that has not been explored extensively and may provide economic benefits
to farmers (O’Callaghan 2016), and could potentially mitigate the problem of inoculum viability
in seed coats. Recently, studies on bacterial strains vertically transmitted in cereal seeds have
shown promising plant growth promoting effects, likely linked to their ability to solubilize
phosphorus, produce hormones, siderophores and ACC deaminase (Truyens et al. 2015). By
exploiting the existing interactions between plants and known seed endophytic bacteria or isolating
new bacterial strains capable of inhabiting seeds for vertical transmission by crops, new
technologies may emerge that have large scale economical applications.
During the last decades, selection of crops has been driven by increased productivity in nutrient
rich environments, with scarce focus on the positive effects of PGPR, and this trend might have

21
led to the loss of plant traits associated with the microbial interaction (Germida and Siciliano
2001). The identification and reintroduction of the genes associated with those traits might enhance
the positive effects of PGPR, especially in poor environments and selecting plants that have
superior interaction with rhizosphere microbiota should be considered in plant breeding programs.
Additionally, a more immediate way to alleviate temperature stress could be to inoculate plants
with bacteria originated from hot-climate regions, that as a consequence are more likely to help
their host to perform better in a warming environment (Egamberdiyeva and Höflich 2003;
Philippot et al. 2013).
The interaction with microbes will gain more attention in the future, considering the effects of
climate change, due to the microbial genetic plasticity compared to plants. PGPR may evolve
rapidly, developing efficient adaptation strategies to the benefit of the plant host as well.
1.2 Metabolic changes in cereal roots interacting with PGP
bacteria
The interaction of PGP bacteria can substantially affect many stages of plant metabolism, from
gene expression to protein and metabolite synthesis, all contributing to shaping the plant
phenotype.
Metabolomics and its recently developed tools are extremely promising approaches to discover
and characterize the metabolic pathways affected during the interaction between plant roots and
PGP bacteria (Kiely et al. 2006). Metabolomic techniques can furthermore be used to integrate
and elaborate findings from other “omics” (genomics, transcriptomics, proteomics). Compared to
transcript and protein changes, changes in the abundance of metabolites are far more dynamic, and
thus metabolites are more closely related to the phenotype of an organism. In other words, while
both the expression of a specific gene and the presence of a certain protein tell us about the
possibility that a biological pathway or function may occur, only the metabolite profile of a
particular cell or organ can provide us with certainty about those processes (Agtuca et al. 2020).
For this reason, metabolomics can provide useful biomarkers for characterizing and selecting plant
species and varieties with valuable agronomic characteristics (Hill and Roessner 2013) such as, in
my study, the ability to form beneficial interactions with PGP bacteria.

22
While root tissue is more challenging to harvest and process than shoot tissue for metabolomics,
the root metabolome is often more strongly affected by the interaction with PGP bacteria than the
shoot metabolome (Valette et al. 2019), possibly due to the fact that the degree and diversity of
bacterial colonization of root tissues is usually higher than in aerial parts (Vorholt 2012;
Egamberdiyeva and Höflich 2003). Some recent studies have aimed to further increase the
resolution of metabolomic studies on plant-bacteria interactions by harvesting only root tissues
where bacteria were present, hence focusing only on those parts of the plants which were more
highly affected by bacterial colonization (Agtuca et al. 2020). This approach has both advantages
and disadvantages: while increasing the resolution of tissue sampling can improve the
understanding of spatial distribution of compounds and better evaluate metabolomic differences
between treatments (Shelden and Roessner 2013), it prevents observation of holistic changes in
the whole plant. Further questions arise in the case of metabolites whose levels are increased upon
microbial colonization. For “increased” compounds, if their higher abundance depends on
increased biosynthesis rather than decreased plant consumption, follow-up studies are necessary
to verify if those compounds originated from the plant or from the microorganisms. For
“decreased” compounds instead, if their higher levels are caused by their higher consumption
rather than decreased plant biosynthesis, determining if their levels were decreased by increased
consumption from the plant or from the microorganisms is required.
The dicotyledonous model plant Arabidopsis is the most studied species to investigate the plant
metabolic response to external stimuli (Oburger and Jones 2018), but its root apparatus diverges
greatly from that of monocotyledonous species such as wheat, rice, maize and barley (Badri and
Vivanco 2009). Cereal crops retain a much greater importance as food source for humans, and
the temperate grass Brachypodium distachyon has been in recent years proposed as a model
species for cereals, due to its limited size, fast life cycle and small genome compared to other
grass species (Sasse et al. 2019), but studies on its metabolism in relation to soil bacteria are still
scarce (William Allwood et al. 2006; Kawasaki et al. 2016).
The following part of the chapter describes the current knowledge and literature on the effects of
the interactions with PGP bacteria on cereal root metabolism, discussing both metabolites
retrieved from roots and the rhizosphere.
1.2.1 Effects of bacterial interaction on plant root exudates

23
Virtually all plant species interact with soil microorganisms at all stages of their life, and actively
shape the rhizosphere microbiota by continuously releasing chemical compounds into the soil
(Kawasaki et al. 2016; Olanrewaju et al. 2019). Although studies report varying proportions
(Whipps 1990; Kawasaki et al. 2016), it is generally accepted that plants release a substantial
portion of their photosynthates through their roots and that soil microbiota constitute a strong
carbon sink (Badri and Vivanco 2009).
The composition and abundance of root exudate components changes among different plant
species, with perennial plants releasing, on average, more fixed carbon through their roots
compared to annual plants (Grayston et al. 1997). Annual species produce different root exudates
in response to external stimuli, as result of different adaptation strategies (Pearse et al. 2007).
Furthermore, through the life of a plant, root exudates are highly affected by developmental stage
and interactions with the biotic and abiotic components of the soil (Bais et al. 2006). Studies on
crested wheat grass (Biondini 1988), maize (Groleau‐Renaud et al. 2000), ryegrass (Meharg and
Killham 1995) and wheat (Phillips et al. 2004) grown in axenic or non-sterile conditions showed
that plants released higher amount of exudates when they interacted with the soil microbiota. Biotic
stresses can radically change the composition of root exudates by modifying the biochemical
pathways controlling the synthesis of compounds with antimicrobial and/or signalling functions
(Rolfe et al. 2019). For example, the defense compound salicylic acid, whose synthesis is induced
by pathogens in many plants including cereals, can be incorporated by, and promote the
development of, siderophore-producing bacteria, that often play a role in disease suppression
(Bakker et al. 2014). Plants have also been reported to adjust their root exudates depending on the
environmental conditions they are facing, in order to favor specific beneficial bacteria: a metadata
study conducted on the results from seven independent studies (for a total of 2211 bacterial strains)
reported that PGP hormone-producing microorganisms are typically recruited in nutrient-rich
environments, while others that can improve nutrient uptake are usually recruited from poor soils
(da Costa et al. 2014). However, it is important to note that this is a general approximation, and
the Additive Hypothesis - PGP bacteria usually promote plant performance through multiple
mechanisms (Bashan and Levanony 1990) - is probably the most used to describe the interaction
between plants and beneficial bacteria.

24
The composition of low molecular weight compounds (i.e. amino acids, organic acids, sugars) in
root exudates can vary greatly, while larger compounds such as polysaccharides and proteins are
less variable but account for the higher proportion of exudates (Bais et al. 2006). While some
secondary compounds can be released actively from the roots, most primary metabolites are
passively exuded to the environment at the meristematic root apex, where the lack of differentiated
cells facilitates the leakage of compounds (Canarini et al. 2019). Root exudates can directly
promote plant nutrient acquisition but also act as an energy source, biocides or semiochemicals
towards soil microorganisms, affecting different species differently (Pétriacq et al. 2017). Of great
importance during the early stages of plant-PGP bacteria interactions is the role of root exudates
as signalling molecules, which initiate cross-talk with microorganisms, stimulate bacterial
chemotaxis and can lead to root colonisation (Bais et al. 2006).
1.2.2 PGP bacteria influence root internal metabolites
Compared to bacterial effects on root exudates, those on root “internal” metabolites, i.e. those
sampled from plant tissues rather than from the rhizosphere, have been less investigated, and
current studies suggest a great variability of root metabolic profiles when interacting with PGP
bacteria.
Plant metabolic responses were reported to vary between different cultivars inoculated with the
same bacterial strain. Two maize cultivars inoculated with Azospirillum lipoferum CRT1 showed
a common core of primary metabolites whose abundance decreased in both genotypes, but a
number of metabolites were affected only in the cultivar with increased root growth and
photosynthetic efficiency due to inoculation. The authors hypothesize that the decreased
metabolites were released by both cultivars as root exudates, regardless of the growth promotion
caused by the inoculant (Rozier et al. 2016). In an analogous experiment, two maize cultivars were
inoculated with either Azospirillum brasilense or Herbaspirillum seropedicae or their mutants with
impaired nitrogen fixation, and plants were supplied with low N levels. The root metabolic profiles
differed between the same cultivar inoculated with different bacteria and between different
cultivars inoculated with the same bacteria. Furthermore, the metabolic responses were more
pronounced in plants inoculated with wild type strains compared to mutants. This suggested to the
authors that bacterial diazotrophy and N fixation affected plant metabolism (Brusamarello-Santos
et al. 2017), although bacterially-fixed N in plants was not measured,. This hypothesis fits the
25
earlier findings from Curzi et al. (2008), who reported that the concentration of amino acids
involved in N assimilation was increased in rice inoculated with H. seropedicae. In this study,
ethylene levels in plants were increased in the early stages of the interaction despite no abiotic
stress treatment during growth. Many PGP bacteria including H. seropedicae (Pedrosa et al. 2011)
synthesize enzymes that can improve plant adaptation to stresses by decreasing the ethylene levels
in the plant. The result observed by Curzi et al. suggests that bacteria can differently modulate the
ethylene levels of plants depending on environment and time from onset of interactions.
The metabolic rearrangements caused by PGP bacteria can vary greatly when inoculated plants are
grown under environmental stress compared to optimal growth conditions. Timothy grass
inoculated with Bacillus subtilis, grown under different water regimes and harvested after four and
eight weeks, showed improved growth in all conditions in the later harvest. Nevertheless, the main
shifts in the metabolic profiles of roots were observed in the tissues from the earliest harvest, when
the root metabolome was affected differently by the inoculation based on water availability. Root
sugars in particular were increased by inoculation under drought stress, which was likely to
improve root development and osmotic activity, an adaptation to water deficiency. The abundance
of many amino acids from the aromatic, glutamate and aspartate family was also affected
differentially in inoculated roots supplied with different water availabilities, showing the plasticity
of the plant-bacteria interaction in different conditions (Gagné-Bourque et al. 2016). In another
study, inoculation with A. brasilense increased free proline levels in maize roots subjected to water
deficiency and this, according to the authors, helped plants to maintain primary root elongation
under stress (Casanovas et al. 2002). The amino acid proline can play a major role in plant
adaptation to multiple stresses, and it can act both as an osmoprotectant and an energy source for
tissue development (Kaur and Asthir 2015).
Inoculation with PGP bacteria can elicit a metabolic response in cereals, without phenotype
changes in plant root architecture. This contrasting response in metabolome versus developmental
phenotype depends on the inoculating strain (Chamam et al. 2013; Rozier et al. 2016; Walker et
al. 2011). Furthermore, results of studies on metabolic rearrangements in cereals interacting with
PGP bacteria can be ambiguous. For example, Chamam et al. (2013) inoculated two rice genotypes
with two species from the genus Azospirillum sourced from the rhizosphere or from the surface
sterilized shoot tissues of those same rice genotypes. Rice roots and shoots had a higher amount

26
of significantly affected secondary metabolites rearrangements when inoculated with the species
capable that penetrated the plant tissues, regardless of the magnitude of plant growth promotion.
In the same experiment, the rhizoplane bacteria changed only the secondary metabolite profiles of
their original host, despite stimulating the growth of both cultivars. Conversely, the endophytic
bacteria promoted only the growth of the cultivar they were originally sourced from, but caused
metabolic rearrangements in both cultivars. The authors hypothesize that the endophytic species
elicited more stress and defence responses in the plant to limit and control the bacterial population
in its tissues, and this caused a greater change in the secondary metabolite profiles. The results
observed with the rhizoplane colonizing bacteria seem to suggest a correlation between the original
host of the bacteria and the metabolic rearrangements that they cause in the inoculated plants. On
the other hand, when Valette et al. (2019) inoculated a single rice cultivar with various strains of
A. brasilense obtained from other rice cultivars and other cereals, the magnitude of early metabolic
rearrangement was not related to the phylogenetic distance between rice and the original host plant.
Furthermore, they identified specific plant metabolites that were affected in all the plant-bacteria
interactions, particularly hydroxycinnamic acid amides (HCAAs) and alkylresorcinols. HCAAs
are phenolic compounds involved in plant responses to biotic and non-biotic stresses, and the
authors ascribe their increased accumulation to the early events in plant-microbe interactions. In
those early stages, plants often do not differentiate between detrimental and beneficial bacteria,
activating defense mechanisms for both (Spencer et al. 2003).
1.2.3 The role of lipids in PGP bacteria – plant interactions
Lipids are an extremely rich and diverse class of biomolecules of primary importance in most
metabolic pathways, cellular components and biological processes. Among the main roles, lipids
are intra- and intercellular signalling molecules, energy sources and components of cell
membranes, which are essential to all interactions of cells with the surrounding environment
(Natera et al. 2016).
Given that lipidomics is a relatively new branch of metabolomics, studies of lipid rearrangements
in roots of cereals interacting with PGP bacteria are still extremely scarce and further investigations
are necessary to expand our knowledge for this essential class of biomolecules.
The inoculation of wheat with A. brasilense decreased the damage related to osmotic stress and
changed the plant root lipidome, preventing increases of phosphatidylcholine (PC) species and

27
decreases of phosphatidylethanolamine (PE) species in water stressed plants (Pereyra et al. 2006).
In addition, the fatty acid (FA) composition of PC and PE species was affected by the inoculation.
In this study, these two classes of lipids represented more than 80% of detected phospholipids, as
essential components of cell membranes whose rearrangements play an important role in a plant’s
response to osmotic stress. Therefore, the authors suggest that the bacterial inoculation also
decreased the osmotic stress damage in wheat roots by stabilizing root cell membranes (Pereyra et
al. 2006). In a later experiment by Creus et al. (2010), linoleic acid (18:2) was the most increased
FA in inoculated wheat roots subjected to water stress, and the authors suggest that this was
probably caused by bacterial auxins which increased the synthesis of this FA in the plant.
Diacylglycerol (DG) is another class of lipids with a reported role as signalling molecules in the
early interactions between cereals and PGP bacteria. Alen’kina et al. (2014) found that lectin
isolated from A. brasilense cell culture increased wheat root levels of DG which, together with
inositol triphosphate, activated protein kinase C, an enzyme involved in numerous signal
transduction pathways in the cell.
1.2.4 Current technologies for untargeted metabolomics and lipidomics
Chromatography coupled to mass spectrometry has been used for decades to identify, qualify and
quantify increasing numbers of molecules in biological samples (Hill and Roessner 2013). Gas
chromatography (GC) and liquid chromatography (LC), when coupled to mass spectrometry (MS),
differ mainly for the kind of compounds that they target. GC-MS can analyse low molecular weight
compounds that are volatile or can be made volatile through chemical derivatization. In contrast,
LC-MS is suitable for the analysis of higher mass compounds which do not need to be volatile
(Roessner et al. 2011). GC-MS and LC-MS techniques can be used in the same study to increase
the spectrum of analysed metabolites. One possible way to integrate those techniques is to use GC-
MS for the analysis of small polar compounds (such as sugars, amino acids and organic acids) and
LC-MS to analyse larger lipophilic and larger polar compounds (mainly lipids and
oligosaccharides, but also secondary metabolites as alkaloids, flavonoids and terpenes). Analysis
of these compounds can be done using targeted and untargeted approaches. Targeted analyses
provide absolute quantitation for a subset of metabolites of interest, and usually the metabolite
extraction techniques are optimised for those compounds. For example, they allow the study of
less abundant or smaller classes of compounds, such as hormones, that are often not being detected

28
in untargeted studies (Cao et al. 2017). While the targeted approach allows higher accuracy and
sensitivity, and can quantify the abundance of specific metabolites, unknown metabolites and
global metabolic changes cannot be determined (Hill and Roessner 2014; Cajka and Fiehn 2016).
On the other hand, untargeted approaches enable monitoring of changes that happen in the whole
metabolome, including compounds that are yet unknown. Untargeted approaches however usually
provide comparative information only regarding the “fold change” of the detected compounds
among samples (Gika et al. 2018). While in recent years large databases of spectral information
have been built for the identification of compounds detected in GC-MS analyses (Schauer et al.
2005), reliable and extended databases for LC-MS approaches are still under development (Gika
et al. 2018). For their explorative nature, untargeted metabolomics analyses are of great value for
various purposes, from hypothesis generation to the discovery of new biomarkers (Monteiro et al.
2013), while targeted metabolomics are more commonly used for hypothesis validation (Cajka
2019).
GC-MS
As previously mentioned, GC-MS is typically used for the detection of small polar metabolites.
Compared to LC-MS, it offers higher chromatographic resolution and a more comprehensive
database to identify compounds using the very reproducible fragmentation patterns of molecules
caused by the electron ionization mode (Papadimitropoulos et al. 2018). For the analysis of polar
metabolites, the GC can be coupled to different types of MS: single quadrupole (QUAD), time of
flight (ToF) or ion trap (TRAP). QUADs are relatively simple and more versatile, analysing a great
range of masses but with lower mass resolution compared to the other instruments (Hill and
Roessner 2013). ToF provides better mass accuracy, which is useful for the identification of
unknown compounds, while mass resolution is analogous to QUAD. Compared to QUAD, TRAP
can perform a second fragmentation of the analysed compounds, which increases the mass
resolution, thus facilitating compound identification (Hill and Roessner 2013). It is important to
stress that no approach is clearly better than the others, and many variables, including the research
question that needs to be answered and budget availability, must be considered when determining
which is the most suitable approach to follow.

29
LC-MS
Untargeted LC-MS studies employing reverse-phase (RP) chromatography can analyse medium
polar to nonpolar compounds, and the most commonly used mass spectrometers for this purpose
are ToF, quadrupole time of flight (QqToF), fourier-transform ion cyclotron resonance (FT-ICR)
and Orbitrap instruments (Want 2018; Cajka and Fiehn 2016). QqToF allows reliable identification
of the analysed compounds - a highly valuable feature in untargeted approaches - due to its high
mass accuracy and high resolution, and its increased scan and data acquisition rate make it
particularly suitable for large scale experiments (Yu et al. 2018). Data-dependent acquisition
(DDA) is currently the most common approach for tandem mass spectrometry; in this mode only
compounds that respond to predetermined criteria (mass to charge ratio, intensity, charge state) are
automatically selected for MS/MS analysis. In recent years, however, data independent acquisition
(DIA) approaches such as Sequential Window Acquisition of All Theoretical Fragment-ion
Spectra (SWATH) are gaining increasing popularity. By acquiring MS/MS data for all detectable
ions, those methods allow increased coverage of detectable compounds (Cajka and Fiehn 2016).
The weakness of these approaches can be a decreased quality of acquired MS/MS spectra (Zhu et
al. 2014), therefore the most suitable approach should be carefully evaluated in each study.
1.2.5 Conclusions
Studying and improving the interactions with PGP bacteria can be an effective way to decrease
the damage caused by abiotic stresses to cereals, thanks to the capacity of various bacterial species
to enhance plant growth, mainly by improving plant nutritional status and synthetizing PGP
compounds. While numerous studies have investigated these interactions, both in controlled
environments and in field trials, the application of beneficial bacteria in agriculture is still limited
(see Section 1.1.6).
The effects of the interaction with PGP bacteria on plant phenotype have been studied more in
detail compared to the changes that this interaction causes in plant metabolome. Also, the link
between plant metabolome and phenotype needs to be further resolved. As previously mentioned,
studies on polar metabolites extracted from cereal roots interacting with PGP bacteria are relatively
scarce compared to studies on root exudates, and lipidomic studies are even more limited. The
studies on root metabolism of plants interacting with beneficial bacteria in suboptimal
environments did so by subjecting plants to a single biotic stress (Brusamarello-Santos et al. 2017;

30
Casanovas et al. 2002; Creus et al. 2010; Gagné-Bourque et al. 2016; Pereyra et al. 2006).
Typically crops face multiple stresses, whose effects on plant growth is often different from the
sum of the single stresses applied separately, and studying the role of PGP bacteria in more realistic
scenarios can increase the efficiency of their application in agriculture.
1.3 Aims of this thesis
The primary objective of this thesis is to characterize the effects of the inoculation with the bacteria
Azospirillum brasilense (Azospirillum) on the development of the model plant Brachypodium
distachyon (Brachypodium) grown at suboptimal temperature and low phosphorus availability.
The aim was to identify the plant metabolic pathways involved at different time points of the plant-
bacteria interaction and to clarify the role of PGP bacteria in plant adaptation to suboptimal
environments. Particularly, the following hypotheses were tested:
1. Azospirillum brasilense can improve Brachypodium distachyon adaptation to low P and
cold temperature, positively affecting both above and below ground portions of the plant
2. The interaction between Brachypodium distachyon and Azospirillum brasilense will
differentially affect the plant root classes
3. Brachypodium distachyon nutritional status will play a role in modulating the interaction
with Azospirillum brasilense
4. Rather than improving the plant nutritional status, Azospirillum brasilense will decrease
the stress related to P deprivation in inoculated Brachypodium distachyon roots
5. Bacterial inoculation will particularly affect the composition of cell membranes,
particularly their glycerophospholipids component
To test these hypotheses, I investigated the interaction between Azospirillum and Brachypodium
at three time points, using three approaches: phenotyping, metabolomics and lipidomics. While
plant phenotyping will be conducted on Brachypodium shoots and roots, the “omics” analyses will
focus on the changes occurring in plant roots.

31
In the 2nd Chapter of my thesis, I describe the experiments that I carried out at the
Forschungszentrum Juelich (DE) during the second year of my PhD, which provided both the data
for the phenotyping part of my thesis discussed in the same chapter, but also the tissues that were
used for the metabolomic and lipidomic analyses that are described and discussed in the 3rd and
4th Chapters of my thesis. This chapter aimed to verify if the inoculation with Azospirillum
improved Brachypodium adaptation to low P and cold temperature, focusing on the effects of the
inoculation on plant phenotype and nutrients content at different stages of the experiment,
resolving particularly into the root architecture through nondestructive analysis of their
development. The results observed in this Chapter provided a background to facilitate the
interpretation of the results observed in the 3rd and 4th Chapter of my thesis.
The 3rd Chapter and 4th Chapter of my thesis analyze the polar and non polar (lipids) metabolites
extracted from inoculated and non-inoculated Brachypodium roots at 7, 14 and 21 d of the
experiment described in the 2nd Chapter. The chapter use untargeted GC-MS (3rd Chapter) and
HPLC-MS (4th Chapter) techniques to obtain comparative information on the abundance of
metabolites between the two treatments, to investigate the root metabolic pathways that were
affected by the interaction with Azospirillum through the experiment. I aim to test if the bacterial
inoculation affected the levels of different compounds at various time points, and see if those
compounds can shed light on the different stages of the interaction between Brachypodium and
Azospirillum. In the 3rd Chapter I am interested in verifying the hypothesis that Azospirillum
would initially trigger defense mechanisms in inoculated plants, while decrease their stress-related
compounds and improve plant adaptation to cold temperatures and low P availability at later stages
of the experiment. In the 4th Chapter, I aim to investigate the role played by the bacterial
inoculation in the reorganization of glycerophospholipids in P deficient plant. Being at the same
time the main component of cell membrane and an essential P pool, glycerophospholipids are
likely to be affected by both the increasing P deficiency and the interaction with Azospirillum.
The 5th Chapter summarizes and integrates the results from the experimental chapters of my
thesis, to outline the main metabolic pathways that were changed in Brachypodium at various
stages of its interaction with Azospirillum, in relation to growth phenotype in response low to
temperature and P. Possible uses of those findings and future directions are further discussed.

32
Chapter 2
Time-resolution of the shoot and root
growth of the model cereal
Brachypodium in response to inoculation
with Azospirillum bacteria at low
phosphorus and temperature

33
Preface
This chapter has been published in form of a research paper (Schillaci et al. 2020) on the journal
“Plant Growth Regulation”.

34
2.1 Introduction
Cereals are consumed in all societies and retain a leading position in diets by providing almost one
half of the calories consumed by humans (FAO 2018). Increasing agricultural production while
availability of arable land decreases is one of the largest challenges facing modern agriculture,
particularly for cereal crops. Good soil fertility depends on availability of phosphorus (P) for crop
growth. P is essential for a multitude of plant processes and is a significant limitation to production
in many areas of the world due to decreasing availability of rock mineral phosphates, leading to
increasing market price (Cordell et al. 2011). Phosphorus use efficiency by cereals is typically low,
with a large proportion of P applied to a crop as fertilizer creating bonds with other elements such
as Ca, Fe and Al, hence becoming unavailable for plant uptake (Dhillon et al. 2017). Many cereals
germinate in winter, and the early stages of their growth often are subjected to suboptimal
temperatures, which can negatively affect the plant nutrient uptake capacity (Grant et al. 2001;
Hanway and Olson 1980) and inhibit root system elongation (McMichael and Quisenberry 1993).
Low P conditions are typical of many cereal agricultural systems subject to cool temperature,
causing poor early growth and seedling vigor after sowing in spring or autumn. Early plant vigor
is a critical trait for capturing fertilizer and water soon after planting (Palta and Watt 2009) and is
positively correlated with yield of cereals in many environments (Richards et al. 2007).
Numerous studies have shown that soil beneficial bacteria, so-called plant growth promoting
(PGP) bacteria, can improve early plant vigor (Biswas et al. 2000; Gholami et al. 2009). We are
not aware, however, of published results on the effects of PGP bacteria on plant seedling vigor
when subjected to low P and temperature together. Indeed, studies on the combined effects of these
stresses on cereals are scarce and quite dated (Baon et al. 1994; Batten et al. 1986). We have
therefore investigated the interaction between the well-studied PGP bacteria strain Azospirillum
brasilense Sp245 (Rothballer et al. 2005) and the model grass Brachypodium distachyon Bd21-3
(Catalan et al. 2014) in these conditions. A. brasilense Sp245 can promote plant growth, notably
root length, through the production of PGP hormones (Dobbelaere et al. 1999), and this has been
observed mainly when plants grow in suboptimal conditions (da Fonseca Breda et al. 2019; Pereyra
et al. 2009). The response of B. distachyon root systems to low P depends on genotype, substrate,
degree and duration of P deficiency (Ingram et al. 2012; Poiré et al. 2014; Sasse et al. 2019).
Responses to root-associated microorganisms also vary (Do Amaral et al. 2016; Fitzgerald et al.

35
2015; Gagne-Bourque et al. 2015; Schneebeli et al. 2016). In previous studies on the interaction
between B. distachyon and A. brasilense, Delaplace et al. (2015) exposed plant roots to bacterial
volatiles and grew them on nutrient rich agar, and Do Amaral et al. (2016) studied the effects of
the inoculation with both A. brasilense FP2-7 and Herbaspirillum seropedicae RAM4 on B.
distachyon genotypes grown under no or low N conditions in soil. To our knowledge no genotype
of B. distachyon has been tested for its response to any strain of A. brasilense under low P and
temperature conditions. In the present study, we tested the hypothesis that Brachypodium
distachyon Bd21-3 inoculated with A. brasilense Sp245 would have greater vigor than non-
inoculated plants in low P and low temperature conditions, and that this would result from
differences in the timing of shoot and root responses to inoculation. We used a phenotyping
platform to non-invasively measure the same plants over successive time points to test our
hypothesis.
Investigations of early interactions between plant roots and microorganisms have used destructive
methods in the past. For instance, Casanovas et al. (2002) measured the effect of bacterial
inoculation on water stressed maize seedlings 15 days after planting. Egamberdiyeva (2009)
recorded germination and growth of seeds in saline conditions with or without inoculation at five
days. Non-invasive imaging has been used to quantify the effects of beneficial bacteria in high
throughput systems at one time point (Wintermans et al. 2016). Here we used the GrowScreen-
PaGe (Gioia et al. 2016) phenotyping platform to quantify the dynamics of plant-root
microorganism interactions at multiple time points. This platform is a 2D image-based method
specifically designed for high throughput and non-destructive measurements of plant roots at
various stages of their growth. Non-destructive root phenotyping in soil is performed with X ray
CT and magnetic resonance imaging (reviewed in Wasson et al. (2020)). However the throughput
and optical resolutions of these approaches so far have been limited to smaller experiments with
crops like barley (Flavel et al. 2012) and maize (Pflugfelder et al. 2017) that have thick branch
roots relative to those of Brachypodium.
This study aims to quantify how the root-colonizing bacteria A. brasilense Sp245 modulated the
growth of Brachypodium distachyon Bd21-3 under unfavorable growth conditions of low P and
low temperatures with non-destructive phenotyping and destructive shoot growth and nutrient
analyses. By providing insights into the tissue- and time-specific effects of the inoculation, we

36
hope to advance knowledge of how PGP bacteria can improve growth of cereal crops in soils with
low fertility and cool temperature.
2.2 Materials and methods
2.2.1 Seeds sterilization and germination
Brachypodium distachyon Bd21-3 (hereafter referred to as Brachypodium in this study) seeds were
dehusked, sterilized as described by Sasse et al. (2019) and stored in Milli-Q water at 4°C for 7 d
to synchronize germination. Operating in a biosafety cabinet, seeds were then put between two
layers of moist Grade 1 Qualitative Filter Paper (Whatman, Maidstone, UK) with embryos facing
downwards in Petri dishes (Fig. 2.2.1a) that were then sealed and covered with foil to prevent light
reaching the emerging roots. The plates were placed vertically to ensure roots emerged with gravity
during germination and left to germinate for 48 h at room temperature (21°C) in the dark. After
this step, seedlings with a primary root of approximately 1.5 cm were selected for bacterial
inoculation (inoculated plants) or mock-inoculation (non-inoculated) before transferring to the
phenotyping system.
2.2.2 Bacterial inoculation
Azospirillum brasilense Sp245 (hereafter referred to a Azospirillum in this study) (Rothballer et
al. 2005) were maintained on lysogeny broth (LB) (Bertani 1951) with 1.2% w/v agar at room
temperature prior to inoculation. The bacterial suspension for seedling inoculation was prepared
by aliquoting a single bacterial colony from an agar plate into liquid LB, and incubated overnight
in a shaking incubator set at 210 rpm and 28°C. When the culture reached an OD600 of 0.8
(equivalent to 107 CFUs mL-1), it was diluted with sterile phosphate buffered saline (PBS) to give
a concentration of 105 CFUs mL-1. Entire 48 h old Brachypodium seedlings germinated as
described above were transferred to the bacterial culture for 90 min prior to transplanting to the
plant phenotyping system. Non-inoculated plants were mock-inoculated in sterile PBS.
2.2.3 Plant growth conditions
Plants were phenotyped in the GrowScreen-PaGe system, a plant phenotyping platform
originally designed to image root growth and architecture non-invasively over time at low or
high throughput and under abiotic conditions such as nutrient deficiency (Gioia et al. 2016).
Since this was the first study to use GrowScreen-PaGe with a biotic treatment, we conducted

37
two low throughput pilot experiments to establish plant growth and measurement conditions.
These were followed by one high throughput experiment to allow quantification of the dynamics
of growth. In these three experiments, plants are grown in the GrowScreen-PaGe system as
described by Gioia et al. (2016) with the exception that 37.5 x 23 cm polyvinyl chloride (PVC)
plates (Max Wirth GmbH, Braunschweig, DE) were used and steps were taken to minimize
contamination and maintain experimental conditions for the inoculated seedlings (details below
and see Fig. 2.2.1).
Figure 2.1 Conditions for growth and phenotyping of Brachypodium with or without inoculation with Azospirillum
in the GrowScreen-PaGe phenotyping platform. (a) Dehusked Brachypodium seeds were first placed on moist filter
paper to synchronize germination at 4°C for 7 d. Black arrows point to tips of primary axile roots (PR) emerging from
the embryo at the base of the seeds. (b) Brachypodium seedling with 1.5 cm long PR on moist gauze (G) on blue
germination paper (GP) after inoculation with Azospirillum. (c) Brachypodium plants with 2 to 3 leaves mounted on
GrowScreen-PaGe PVC plates with metal clips (white arrows). (d) Brachypodium root systems imaged 21 d after
inoculation and after manual color-coding with PaintRhizo image analysis software according to root type. Left root
system is typical of plants with the PR (green line) extending vertically through the experiment, becoming an axile
root (AR) with branch roots (BR, red). Right root system is typical of plants whereby the PR stopped growing close
to the seed (arrow), and new AR (red) extending vertically with BR (blue). PR, Primary axile root; AR, axile root;
BR, branch root; G, gauze; GP, germination paper.

38
2.2.3.1 First pilot experiment: Establishing growth and P conditions in GrowScreen-PaGe
A first pilot experiment was designed to test the GrowScreen-PaGe for biotic phenotyping and to
establish the P conditions where Azospirillum influenced Brachypodium growth at low
temperature when compared with control (non-inoculated) plants grown at the same conditions.
Non-inoculated and inoculated plants were provided with moderately low (25 µM KH2PO4) or
extremely low (7 µM KH2PO4) P levels. Twenty plants were grown for 21 d in each of the four
conditions.
Working on a surface-sterilized bench, inoculated seedlings were transplanted to the GrowScreen-
PaGe germination paper using sterile forceps. Seedlings were placed at the top of the paper and
wrapped between two layers of moist, sterile cotton gauze (Fig. 2.1b, c) to protect the roots from
light and dehydration. Following the results obtained by Gioia et al. (2016), dark blue 194 grade
paper, 430 g m-2 (Ahlstrom Germany GmbH, Bärenstein, DE) was used as germination paper. The
paper had been autoclaved and moistened with the nutrient solution described below, and attached
to the PVC plates, such that each plate had a germination paper with a plant on both sides when
placed vertically into the growth box. PVC plates and growth boxes had also been disinfected as
described by Gioia et al. (2016) to minimize background microorganisms. Once in the growth
boxes, the base of each germination paper was in nutrient solution that reached plant root systems
by capillarity.
A total of 4 boxes were used, and each box contained plants subjected to a different condition.
Each box had 12 plates, with two seedlings per plate (except the outer two plates - which were left
empty to counter edge effects). The top of each box was covered with aluminum foil, leaving only
a small opening for the shoot to grow, to prevent light from reaching the roots, reduce the
evaporation rate of the nutrient solution and minimize contamination of the plates within the
inoculated and control boxes. The GrowScreen-PaGe growth boxes were moved to a custom made
climate chamber set at the day/night temperature of 20/10°C and 70% relative air humidity with a
16/8 h light/dark cycle and light intensity of 250 µmol ∙ m -2 ∙ s-1, provided by alternating 400W
HPI and SON-T lamps (Philips, Amsterdam, NL) every 60 min. 20/10°C is a cool temperature
range for Brachypodium, which has an optimal growth temperature of 24/18°C day/night (Harsant
et al. 2013). The position of plants inside the boxes and boxes inside the chamber were rotated
during the experiment every time roots were imaged.

39
Previous studies report that the optimal P substrate concentration for Brachypodium’s growth is
approximately 1.5 mM in soil (Zhang et al. 2018) and 0.6 mM in hydroponic systems (Poiré et al.
2014), respectively. Through the experiment, each box was supplied with 12 L of 1/3 strength
Hoagland solution (Hoagland and Arnon 1950), where KH2PO4 was supplied at a concentration of
7 µM for the extremely low P treatment and 25 µM for the moderately low P treatment. The
solution was replaced weekly to prevent the depletion of nutrients (other than P), excessive pH
fluctuations and to decrease the risk of contamination (Gioia et al. 2016). All stock solutions were
autoclaved before use and the working 1/3 Hoagland was diluted using deionized water.
2.2.3.2 Second pilot experiment to reproduce and validate the first pilot experiment
A second pilot experiment was done to verify the reproducibility and validity of the results
observed in inoculated plants when compared with control (non-inoculated) plants at extreme low
P availability (7 µM P) during the first pilot experiment. Seeds were sterilized, germinated, and
seedlings were inoculated and grown as described above, with the exception that plants were
inoculated with bacteria or non-inoculated and grown with 7 µM KH2PO4. Twenty plants per
treatment were grown for 21 d in the GrowScreen-PaGe.
2.2.3.3 High throughput experiment
Once the conditions were refined and the plant response to inoculation at extremely low P levels
was confirmed in the pilot experiments, a third experiment was conducted in the GrowScreen-
PaGe at much higher throughput and with higher sampling resolution to determine the impact of
Azospirillum on shoot and root growth and nutrient concentrations in Brachypodium throughout
development. A total of 368 plants were divided into eight boxes, four containing inoculated plants
and four containing control (non-inoculated) plants. Each box had 25 PVC plates with two
seedlings per plate, except for the outer two plates which were left empty. Inoculated and non-
inoculated plants were provided weekly with 12 L of modified Hoagland solution containing the
lower P levels (7 µM KH2PO4) as described previously. The full scheduling of nutrient supply and
measurements is provided in Fig. 2.2.

40
Figure 2.2 Design and workflow of high throughput experiment to phenotype Brachypodium responses to
Azospirillum in the GrowScreen-PaGe platform, which combined non-invasive with destructive measurements. The
timeline arrow shows the days that root systems of plants were imaged non-invasively (see Fig. 2.1d) after inoculation.
These plants were harvested at 21 d for analysis of root fresh and dry weight and bacterial colonization by PCR (see
Suppl. Fig. 7.1), and shoot leaf area, shoot fresh and dry weight and nutrient analyses. Subgroups of plants were
destructively harvested at 7, 14 d for leaf area, shoot fresh and dry weight and nutrient analyses. The nutrient solution
in the GrowScreen-PaGe platform was replaced weekly.
2.2.4 Shoot traits and nutrient analyses
2.2.4.1 First and second pilot experiment
Inoculated and non-inoculated plants were harvested destructively at 21 d after inoculation (DAI).
Roots were separated from the shoots with a scalpel and the leaf area was recorded with a leaf area
meter (LI-COR Li3100, LI-COR Biosciences GmbH, Bad Homburg, DE). Shoots were then dried
at 80°C for 72 h and the shoot dry weight (DW) was measured using a digital scale with a 0.1 mg
resolution (Mettler Toledo, Columbus, USA).

41
2.2.4.2 High throughput experiment
Inoculated and non-inoculated plants were harvested destructively at 7, 14 and 21 DAI (Fig. 2.2)
and leaf area and shoot DW were recorded as described above for each individual plant. After DW
was determined, shoots of individual plants were pooled into three groups for each of the two
treatments, each with approximately the same number of individuals. Pooled dry tissues were
ground into a fine powder using a Retsch Mixer Mill MM400 (Retsch GmbH, Haan, DE) and
analyzed for P, N and K elements. N was detected in an elemental analyzer (vario EL cube,
Elementar, Langenselbold, DE) by combustion of 2 mg dry shoot tissue and detection of their
thermal conductivity, while P and K contents were recorded using microwave digestion and
analysis by Inductively Coupled Plasma with Optical Emission Spectroscopy (ICP-OES) using 40
mg dry shoot tissue. All nutrient analyses were performed at the Central Institute for Engineering,
Electronics and Analytics (ZEA-3) of Forschungszentrum Juelich (DE). The physiological P use
efficiency (PPUE, expressed as 𝑆ℎ𝑜𝑜𝑡 𝐷𝑊
𝑆ℎ𝑜𝑜𝑡 [𝑃]) (Hammond et al. 2009) at each harvest point was
recorded for both treatments.
2.2.5 Root development analyses
2.2.5.1 First and second pilot experiment
To non-destructively quantify root growth over time, roots were photographed at 3, 5, 7, 9, 11, 14,
18 and 21 DAI using the image capturing box described in Gioia et al. (2016) equipped with 16
MP cameras that allow high resolution imaging (74 µm per pixel) (Fig. 2.1d). Root images were
analyzed from each plant using the PaintRhizo software package (Belachew et al. 2018; Nagel et
al. 2012). At each time point, the total root length and root growth rate (root growth rate =
(𝑟𝑜𝑜𝑡 𝑙𝑒𝑛𝑔𝑡ℎ 𝑡1−𝑟𝑜𝑜𝑡 𝑙𝑒𝑛𝑔𝑡ℎ 𝑡0)
𝑡1−𝑡0) were compared across plants, time and treatment.
2.2.5.2 High throughput experiment
As in the pilot experiments, roots were photographed at 3, 5, 7, 9, 11, 14, 18 and 21 DAI (Fig. 2.2)
and the length and growth rate of the whole root system were analyzed. To further understand
when and how Azospirillum could alter the root systems, the PaintRhizo software was used to
manually select and color the root types: axile roots (AR) and branch roots (BR) (Fig.1d). Two
criteria were used to separate AR and BR: the angle of growth and site of emergence. Axile roots
developed vertically following gravity and came from either the seed (as in primary roots) or from

42
the primary root if the primary root had stopped elongating close to the seed. Branch roots grew
laterally (more horizontal to gravity) and developed from an AR (Roychoudhry and Kepinski
2015). In this experiment, no branch roots of an order higher than the first were observed.
2.2.6 Validation of colonization by Azospirillum
At 21 DAI in the pilot experiments and at 7, 14 and 21 DAI in the high throughput experiment,
the roots of five plants per treatment were randomly chosen and PCR was used to validate that
inoculated samples were colonized by A. brasilense, and that no cross-contamination occurred in
non-inoculated samples. The PCR used strain specific primers to amplify genomic DNA extracted
from roots using an adapted version of the CTAB protocol from Doyle and Doyle (1987).
The PCR primers (FW 5’ GGTGTTTCGCAACTCTCTGC 3’, RV 5’
GCACGACCTACACCTACTGG 3’) were designed to amplify a 458 bp strain specific portion of
the A. brasilense Sp245 nitrite reductase sequence (Pothier et al. 2008) using the NCBI primer
designing tool (Ye et al. 2012). Primers were synthesized by Eurofins Genomics GmbH
(Ebersberg, DE). The PCR products were run on a 1% agarose gel to confirm amplification of
target sequence.
Each PCR amplicon was sequenced by Sanger sequencing at LGC Genomics GmbH (Berlin, DE)
and was compared against the NCBI database using the BLAST program (Altschul et al. 1990) to
confirm sequence similarity to A. brasilense Sp245.
2.2.7 Statistical analyses and data display
The statistical significance of a difference between measured parameters in two treatments was
analyzed using the Student’s t-test (two tailed distribution, variance between treatments compared
using Levene’s test). Only those results with a significance level (P-value) < 0.05 were considered
reliable enough to reject the null hypothesis that the two treatments did not differ for a particular
parameter. The difference between the two treatments, when significant, is displayed as a
percentage (% change = 𝑝𝑎𝑟𝑎𝑚𝑒𝑡𝑒𝑟𝑖𝑛𝑜𝑐𝑢𝑙𝑎𝑡𝑒𝑑−𝑝𝑎𝑟𝑎𝑚𝑒𝑡𝑒𝑟𝑛𝑜𝑛−𝑖𝑛𝑜𝑐𝑢𝑙𝑎𝑡𝑒𝑑
𝑝𝑎𝑟𝑎𝑚𝑒𝑡𝑒𝑟𝑛𝑜𝑛−𝑖𝑛𝑜𝑐𝑢𝑙𝑎𝑡𝑒𝑑 ∙ 100).
2.3 Results
In the pilot and high throughput experiments in the GrowScreen-PaGe phenotyping system,
Azospirillum influenced the above and below ground portions of plants. The DNA extraction,

43
amplification with strain specific A. brasilense Sp245 specific primers and sequencing of the
obtained amplicons confirmed that in the pilot experiments (data not shown) and at 7, 14 and 21
DAI in the high throughput experiment (Suppl. Fig. 7.1) bacteria-inoculated samples contained A.
brasilense Sp245 DNA, while no products were amplified from DNA extracted from the non-
inoculated samples.
2.3.1 Shoot growth benefited from Azospirillum treatment
2.3.1.1 First pilot experiment
Inoculated plants supplied with lower P (7 µM KH2PO4) had 17% greater leaf area at 21 DAI than
inoculated plants provided with 25 µM KH2PO4. All other treatments did not differ (Suppl. Fig.
7.2a). The shoot DW did not differ among the treatments (Suppl. Fig. 7.3a).
2.3.1.2 Second pilot experiment
The repetition of the experiment with plants grown only with lower P provided different results
from the first pilot experiment, as at 21 DAI inoculated plants had 36% greater leaf area compared
to non-inoculated plants (Suppl. Fig. 7.2b) and the shoot DW of inoculated plants was higher
(+21%) than non-inoculated plants (Suppl. Fig. 7.3b).
2.3.1.3 High throughput experiment
The results from the high throughput experiment confirm those from the second pilot experiment.
Leaf area was consistently higher in inoculated plants than non-inoculated plants, at levels of 16,
13 and 14% at 7, 14 and 21 DAI, respectively (Fig. 2.3a). This result was also reflected in the
shoot DW, which was 12, 25 and 12% greater in Azospirillum inoculated plants at those harvest
points, respectively (Fig. 2.3b).

44
Figure 2.3 Shoot growth of Brachypodium with or without Azospirillum inoculation and harvested after 7, 14 and 21
d in the GrowScreen-PaGe platform. (a) Leaf area. (b) Shoot dry weight (DW). Means ± standard error presented. At
7 d, n = 87 Azospirillum-inoculated and n = 87 non-inoculated plants; 14 d, n = 25 Azospirillum-inoculated and n =
37 non-inoculated plants; 21 d, n = 28 Azospirillum-inoculated and n = 32 non-inoculated plants. Asterisks indicate
probability of significant difference between mean of Azospirillum-inoculated and non-inoculated plants based on
Student’s t-test; *, p<0.05; **, p<0.01, ***, p<0.001. DW = dry weight.
2.3.2 The effect of inoculation with Azospirillum varied for different nutrients in
Brachypodium shoots
High throughput experiment
The concentration of P, N and K in the shoots of inoculated and non-inoculated samples were
similar at all harvest points (Fig. 2.4a, b, c), except that N at 14 DAI was 13.24% lower in
inoculated plants than non-inoculated plants (Fig. 2.4b). The shoot concentration of P decreased
approximately 4 fold throughout the experiment in both treatments: at 7, 14 and 21 DAI the P

45
concentration was 3.61, 1.88 and 0.77 mg g-1 DW in inoculated plants and 3.90, 2.16 and 0.78 mg
g-1 DW in non-inoculated plants, respectively (Fig. 2.4a).
Figure 2.4 Nutrients in Brachypodium shoots of plants with or without Azospirillum inoculation and harvested after
7, 14 and 21 d in the GrowScreen-PaGe platform. Concentration of phosphorus (a), nitrogen (b) and potassium (c);
content of phosphorus (d), nitrogen (e) and potassium (f). All points are the mean ± standard error of n = 3 samples
of plants pooled within each treatment. Asterisks indicate probability of significant difference between mean of A.
brasilense-inoculated and non-inoculated plants based on Student’s t-test; *, p<0.05; **, p<0.01, ***, p<0.001.
P content was also similar with or without bacterial treatment (Fig. 2.4d), while N (Fig. 2.4e) and
K (Fig. 2.4f) contents were 15 and 17% greater, respectively, in plants treated with Azospirillum
by 21 DAI. While N and K content increased steadily in both treatments throughout the

46
experiment, the shoot content of P remained around 6 µg per shoot. The patterns of change of P,
N and K through the experiment are shown in Suppl. Fig. 7.4.
Plants inoculated with Azospirillum had significantly higher physiological phosphorus use
efficiency (PPUE; the shoot dry weight per P concentration in the shoot) than non-inoculated at
14 DAI (40%) and 21 DAI (16%) (Suppl. Fig. 7.5).
2.3.3 Modulation of root development by Azospirillum at low P depended on time after
inoculation and type of root
2.3.3.1 First pilot experiment
By 21 DAI, the root systems of plants inoculated with Azospirillum were 49% longer than those
of non-inoculated plants in the lower P (7 µM KH2PO4) condition. In contrast, inoculated and non-
inoculated plants with higher P (25 µM KH2PO4) had similar root lengths (Suppl. Fig. 7.6a).
Inoculated plants supplied with lower P had consistently longer roots and a higher root growth rate
than non-inoculated plants grown at the same P concentration throughout the experiment (Suppl.
Fig. 7.6), and developed longer roots than plants grown at higher P levels after 14 DAI (Suppl.
Table. 7.1). The difference in root length between inoculated plants grown in low P and those
grown at higher P was detected between 11 and 14 DAI (Suppl. Fig. 7.6, Suppl. Table 7.1).
2.3.3.2 Second pilot experiment
The second pilot experiment confirmed the low P treatment results from the first pilot experiment.
At 21 DAI, inoculated plants had roots 21% longer than non-inoculated plants. The difference in
the length of the root system in inoculated plants compared to non-inoculated plants became
significant at 11 DAI (Suppl. Fig. 7.7a). The length differences reflected growth rates, which were
faster in inoculated plants between 7 and 11, and 11 and 14 DAI (69 and 72%, respectively), but
similar during the last week of the experiment (Suppl. Fig. 7.7b).
2.3.3.3 High throughput experiment
As in the pilot experiments, inoculated plants in the high throughput experiment had significantly
longer root systems than non-inoculated plants at 14 DAI (18%), 18 DAI (33%) and 21 DAI (32%)
(Fig. 2.5a). The differences in growth rate indicate greatest stimulation from inoculation took place
between 14 and 18 DAI. Roots of inoculated plants elongated, on average, 27% faster than non-
inoculated plants between 11 and 14 DAI; 47% faster between 14 and 18 DAI and 31% faster

47
between 18 and 21 DAI (Fig. 2.5d). Growth rates of roots of individual plants plotted in Suppl.
Fig. 7.8 highlight the distinct shift to faster root growth around 11 DAI in plants inoculated with
Azospirillum.
Figure 2.5 Root growth of Brachypodium plants with or without Azospirillum inoculation and imaged non-
destructively after 3, 5, 7, 9, 11, 14, 18 and 21 d in the GrowScreen-PaGe platform. Images were analyzed with the
PaintRhizo software. (a) Root system length. (b) Axile root length. (c) Branch root length. (d) Root system growth
rate. (e) Axile root growth rate. (f) Branch root growth rate. Means ± standard error presented. n = 28 Azospirillum-
inoculated and n = 32 non-inoculated. Asterisks indicate probability of significant difference between mean of
Azospirillum-inoculated and non-inoculated plants based on Student’s t-test; *, p<0.05; **, p<0.01, ***, p<0.001.

48
Discriminating axile and branch roots revealed how inoculation specifically altered different root
types (Fig. 2.5). Notably, the inoculated axile roots were shorter from 14 DAI (-25, -32 and -36%
at 14, 18 and 21 DAI, Fig. 2.5b) because they were growing slower from 7-9 DAI (-28% between
7 and 9 DAI, -29% between 9 and 11 DAI, -46% between 11 and 14 DAI, -44% between 14 and
18 DAI and -48% between 18 and 21 DAI, Fig. 2.5e). In contrast, the branch roots of inoculated
plants developed earlier and were consistently longer compared to non-inoculated plants. The first
branch roots were observed in inoculated plants at 9 DAI, while non-inoculated plants started
developing branch roots at 14 DAI, by which time branch roots of inoculated plants were more
than 5 fold longer (1.2 cm versus 8.4 cm in non-inoculated and inoculated plants). Inoculated
plants had 199% longer branch roots at 18 DAI and 133% longer branch roots at 21 DAI (Fig.
2.5c). Branch root growth rates were consistently higher in inoculated plants from 7-9 DAI (Fig.
2.5f), the time window when the growth rate of axile root in these plants started to slow.
Inoculated plants generally had longer roots than non-inoculated plants irrespective of leaf area.
The slope of the linear regression was steeper for inoculated plants, which were growing 72 cm
root length per cm2 of leaf area while non-inoculated plants were growing 52 cm root length per
cm2 leaf area (Suppl. Fig. 7.9).
2.4 Discussion
These studies demonstrated that the PGP bacteria A. brasilense Sp245 stimulated the shoot and
root growth of seedlings of the model grass B. distachyon Bd21-3 at suboptimal P and temperature
conditions. Non-invasive phenotyping combined with destructive harvests resolved the following
dynamics. First, inoculation altered shoot growth relative to root growth. Although plants had
larger leaf area, the most noticeable difference was an increase in total root length which was 31%
greater in inoculated compared to non-inoculated plants at 21 DAI. This result was mainly
achieved by a higher root growth rate between 11 and 21 DAI (Fig. 2.5a, d, Suppl. Fig. 7.8).
Second, root types were differentially influenced by inoculation; inoculated plants had shorter
axile roots, but their branch roots appeared earlier and were more developed than in non-inoculated
plants (Fig. 2.5). We discuss these results in the context of shoot nutrients and propose a role for
plant P in the timing and spatial effects on roots versus shoots.

49
2.4.1 Azospirillum inoculation benefited shoot growth at low P and temperature regardless
of root growth dynamics
Shoots were more developed in inoculated than non-inoculated plants at all harvest time points
(Fig. 2.3a, b), although roots were similar during the first half of the experiment. We propose that
P levels in the plant modulated the positive effect of bacteria on roots in the second half of the
experiment, while shoots responded to Azospirillum by improving plant tolerance to the cool
temperature from the beginning of the experiment. Certain cold tolerant PGP bacteria, sourced
from cold areas, have been reported to alleviate low temperature stress in cereals whereby
inoculated plants showed increased shoot biomass, root growth, nutrient uptake, and water content
(Mishra et al. 2011; Selvakumar et al. 2010; Yarzábal et al. 2018). These previous studies ascribe
improved acclimation to low temperatures to mechanisms such as the bacterial production of PGP
hormones (mainly auxins), osmoprotectants that allowed osmotic adjustments for continued water
uptake and enzymes capable of interrupting the biosynthesis of stress hormones in the plant. A
further possible mechanism through which the bacterial treatment may have improved shoot
development is the change in the concentration of cold-response proteins caused by tissue
expansion in inoculated plants. Plant response to low temperature is regulated by a complex
network of genes and related transcription factors, whose tissue concentration can be affected by
changes in plant growth rate (Zhao et al. 2020). Overall, additional biochemical and molecular
studies are required with similar time resolved tissues to uncover hormone, signaling and omics
changes underlying how Azospirillum stimulated Brachypodium shoot growth before root growth
under low P and temperature conditions.
Interestingly, shoot growth was maintained in inoculated plants even though root growth
increased. When leaf P concentration decreases, shoot carbohydrates can be reallocated, mainly in
the form of sucrose, to the roots, where they function both as signaling molecules involved in
rearrangement of root architecture and as a source of energy for those rearrangements (Hammond
and White 2011). Low shoot P levels can also decrease plant biomass by impairing photosynthesis.
When the P reserves are depleted, this has direct effects on the energy transduction in thylakoids,
inhibiting various Calvin cycle enzymes (Hammond and White 2008). In our study, inoculated
plants showed not only a better developed root system, but also a higher shoot dry biomass and
higher leaf area compared to non-inoculated plants, suggesting that the larger root system did not
require redirection of resources needed for shoot development.

50
2.4.2 Azospirillum inoculation did not increase shoot nutrient concentrations
Shoot P concentration declined steadily through the experiment in inoculated and non-inoculated
plants, due to shoot biomass increasing without an increase in P uptake. P is an essential element
for early plant growth, and insufficient P availability can significantly alter plant physiology and
development (Richardson et al. 2009b; White and Hammond 2008). As a general approximation,
the critical leaf phosphorus concentration (the concentration in a diagnostic tissue that allows a
crop to achieve 90% of its maximum yield) is 2-5 mg g-1 DW (White and Brown 2010). The ICP
analyses performed on Brachypodium shoots at 7, 14 and 21 DAI show that both inoculated and
non-inoculated plants became P deficient in the second week of their growth and were suffering
severe P deficiency at the end of the experiment (Fig. 2.4a). This result shows that the more
developed root system of inoculated plants was unable to provide P to relieve tissue P deficiency.
Inoculation stimulated more shoot biomass per P and thus increased the PPUE (Suppl. Fig. 7.5).
This supports the hypothesis that A. brasilense Sp245 can increase the adaptation of grass plants
to low P through their PPUE. A similar result was observed on wheat and corn inoculated with
various PGP strains and grown on substrates with different P levels (Pereira et al. 2020; Talboys
et al. 2014). Ours and these studies suggest that PGP bacteria can improve the performance of
cereals in limiting P conditions also by improving plant PPUE. While the molecular mechanisms
underlying this result need to be fully understood, the improved PPUE is of importance for
agricultural environments where P is deficient.
The only difference in N shoot concentration was observed at 14 DAI, when it was higher in non-
inoculated plants (Fig. 2.4b). There was a small and significant increase in N content at 21 DAI
(Fig. 2.4e), possibly due to stimulation of root elongation by Azospirillum. N fixation is probably
the best known benefit that bacteria provide to legumes, but there is still a lack of experimental
evidence that this is an important mechanism in interactions between cereals and bacteria
(Dobbelaere et al. 1999; Rosenblueth et al. 2018). While there is one report of A. brasilense cd
improving the growth of foxtail millet by fixing and providing N to inoculated plants supplied with
suboptimal N levels (Kapulnik et al. 1981), most studies agree that the amount of N directly
provided to cereals by A. brasilense strains is less significant than was previously hypothesized
(Hungria et al. 2010; Rosenblueth et al. 2018). Our results seem to support the hypothesis that the

51
beneficial role of Azospirillum on Brachypodium was not limited to diazotrophy, and was more
related to promoting root length through branching.
Bacteria can enhance plant nutritional status by increasing the uptake of minerals from the soil,
which can be done directly by converting those nutrients into more bioavailable forms, or
indirectly by improving the development of plant roots, which then explore higher portions of soil
(Shaharoona et al. 2008). In this experiment, shoots of inoculated plants had a higher N and K
content per plant than non-inoculated plants (Fig. 2.4e, f), but this is probably a consequence of a
more developed root system, that allowed exploration of a larger area, rather than the consequence
of an active role of Azospirillum in nutrient uptake.
2.4.3 Axile and branch roots were differentially affected by bacterial inoculation
Thanks to their capacity to explore more portions of soil compared to axile roots, branch roots are
particularly important in supporting plant growth in poor environments. Studies performed on
barley (Nadira et al. 2016) and maize (Zhu and Lynch 2004) cultivars with varying performances
at low P showed that the tolerant ones tend to conserve root branching, which improved P
accumulation and relative growth rate compared to genotypes with less branch roots. We found
here that Azospirillum inoculation enhanced root length specifically by enhancing branch root
elongation. The root system of Brachypodium is highly responsive to P supply. In the first pilot
experiment of this study, non-inoculated Brachypodium plants supplied with 7 µM P had a
significantly shorter root system than non-inoculated plants supplied with 25 µM P (Suppl. Table
7.1). A previous study of Brachypodium grown at varying P levels found that the growth of seminal
roots was enhanced at moderately low P levels (Poiré et al. 2014). Interestingly, Ingram et al.
(2012) found that different Brachypodium genotypes supplied with low P levels varied in root
system length and branch root numbers. These studies did not distinguish between branch and
axile roots. While we could not find previous studies on the effects of the interaction with any
Azospirillum spp. on different root classes of Brachypodium, different A. brasilense strains have
been observed to modify the root development of cereals, particularly that of branch roots.
Malhotra and Srivastava (2009) inoculated sorghum, maize, wheat pearl millet and barley with A.
brasilense SM and recorded a higher number of branch roots in sorghum and maize but not in
barley and millet. In another study, pearl millet inoculated with A. brasilense Sp13t developed
significantly longer branch roots than non-inoculated plants (Tien et al. 1979).

52
We propose that the bacterial treatment sustained branch root development particularly when
plants started becoming P deficient, by stimulating earlier production of branch roots and
increasing their growth rate during the second half of the experiment (Fig. 2.2.5). Development of
branch roots can be a successful adaptation strategy in P poor environments, as it may require
lower P investment per unit root length (Zhu and Lynch 2004). Root branching is typically
increased by auxin accumulation, and the production of this hormone by bacteria is an important
mechanism for their promotion of branch root growth (Goh et al. 2013). Phytohormones also play
a decisive role in the rearrangements that occur in the root system of plants suffering P deficiency
(Nadira et al. 2016; Talboys et al. 2014), and it is likely that bacterial PGP hormones can modify
root responses in low P environments (Richardson et al. 2009a). Wheat plants inoculated with
Bacillus amyloliquefaciens developed more biomass and longer roots, branch roots particularly,
when grown at low P levels. The authors hypothesize that this result was linked to bacterial auxins,
which increased root branching (Talboys et al. 2014).
As well as promoting branch root elongation, Azospirillum inoculation caused concomitant
slowing of the parent axile roots. High auxin levels can also reduce root elongation, and it is
possible that axile and branch root tips have different sensitivities to auxin from Azospirillum.
Abiotic stresses such as soil strength (Watt et al. 2003) and salinity (Rahnama et al. 2011) cause
axile root growth to slow, while branch root growth is stimulated. It was shown with modelling
that a dynamic shift from axile to branch roots can reduce the energy costs of ATP-related transport
substantially because membrane surface area is much less (Arsova et al. 2020). Our phenotyping
study suggests that the interaction between Brachypodium and Azospirillum led to a
rearrangement of the shoot and root system to allow the plant to respond efficiently to the low P
and temperature conditions.
The GrowScreen-PaGe phenotyping platform is a promising tool to analyze the root growth of a
large number of plants in response to PGP bacteria during various stages of their growth. However,
the throughput and resolution of GrowScreen-PaGe did not allow us to extend to Brachypodium
root hairs. Root hairs are important particularly in nutrient-poor environments (Nestler et al. 2016)
and can play a significant role in the interaction with PGP bacteria (Mercado-Blanco and Prieto
2012). Brachypodium root hairs are sensitive to P concentrations and to compounds in soil
solutions (Sasse et al. 2019). It would be very interesting to study if Azospirillum can alter the root

53
hairs of cereals under low P and temperature conditions. While we hypothesize that in our study
the bacteria improved plant adaptation to the combined abiotic stresses of low temperature and P,
further studies are needed to identify the mechanisms by which Azospirillum mediated growth
changes, such as through a role in photosynthesis stimulation and reactive oxygen species (ROS)
scavenging. Another limitation of the GrowScreen-PaGe is that this environment differs greatly
from the one that plants and bacteria would be exposed to in the field. Although previous studies
validating lab screens in agricultural fields have shown that germination-paper root screens
robustly represent the root architecture of wheat grown in the field at the seedling stage (Rich et
al. 2020; Watt et al. 2013), we are aware that the findings of our study need to be further validated
in more realistic conditions. A great challenge for applying the results of bacteria-plant interaction
studies to the agricultural sector is the transition from lab experiments (relatively small scale,
controlled conditions, one or few stresses applied at the time) to “real” agricultural conditions,
characterized by the presence of diverse microbiota in soils, constantly fluctuating growing
conditions and multiple biotic interactions in both plants and PGP bacteria.
Our experiments show that Azospirillum can improve the shoot growth of the model plant
Brachypodium in environments characterized by low temperature and this beneficial role extends
to branch roots when plants are P deprived. The main phenotypic results observed in this study
were larger inoculated shoots, which nevertheless had similar nutrient concentrations as non-
inoculated plants, and longer branch roots at later stages of the experiments. The interactions
between cereals and PGP bacteria in suboptimal environments are likely to become increasingly
relevant in the coming decades. Our study allows resolution of beneficial developmental stages
and time points to inform new management and genetic solutions for the use of PGP bacteria, thus
contributing to a more economically and environmentally sustainable agriculture.

54
Chapter 3
Metabolome rearrangements in
Brachypodium distachyon roots at various
stages of the interaction with the PGP
Azospirillum brasilense
55
3.1 Introduction
Low temperature and P deficiency are two of the most common abiotic stresses for crops, and are
particularly detrimental during the early stages of cereal development across critical agricultural
regions of the world (see Section 1 of Chapter 1).
Low temperature affects virtually all metabolic processes of plants by changing the enzymatic
kinetics of biochemical reactions, inhibiting photosynthesis, damaging intra- and intercellular
structures, decreasing water and nutrient uptake capacity, and causing oxidative stress
(Chinnusamy et al. 2007; Strand et al. 1999). Plants typically respond most to low temperature by
modifying gene expression, along with post transcriptional and translational modifications (Miura
and Furumoto 2013).
Low temperature causes membrane rigidification by increasing the viscosity of their fluid parts,
and this change is believed to activate plant cold stress response. The primary signal for this
response is caused by an influx of Ca2+ from the vacuole to the cytosol. Molecules such as sugars,
abscisic acid (ABA) and reactive oxygen species (ROS) act as secondary signals to the Ca2+
(Chinnusamy et al. 2007; Tarkowski and Van den Ende 2015). A rigid membrane hinders the
exchange of compounds in cells. It is expected that plants react to temperature signals with
rearrangements of the membrane structures to increase membrane fluidity (Levitt 1980).
Phospholipids are the main component of the cell membrane, and they are highly affected by low
temperature. Together with other lipids, phospholipids will be discussed in Chapter 4 of this thesis.
Soluble sugars are some of the known metabolites that can play significant roles in stabilizing the
cell membrane structure by interacting with membrane phospholipids. Sugars are also believed to
act as scavengers of ROS, which increase during low temperature stress and cause damaging to
the plant.
Other polar metabolites in addition to sugars involved in cold stress responses include amino acids
and amines. These are often increased by cold stress, as a result of an increase of amino acid
production or because of increased protein breakdown caused by the stress. The increase of
specific amino acids such as proline and γ-aminobutyric acid can improve plant resistance to low
temperatures, since they can act as osmoprotectants, ROS scavengers, improve the C-N balance
and in general protect plants subjected to low temperatures (Krasensky and Jonak 2012).

56
Phosphorus, particularly as its orthophosphate form, is an essential element for most major
metabolic processes in plants, such as photosynthesis and respiration. Phosphate deficiency
activates various metabolic rearrangements in plants, which increase external inorganic P (Pi)
uptake and optimise internal Pi use efficiency (Plaxton and Tran 2011). Changes in gene
expression are important for these rearrangements, but recent studies displayed how post-
transcriptional modifications play an essential role in the plant response to P deficiency, suggesting
that studies that only investigate the transcriptome of P deficient plants may not be sufficient to
clearly illustrate the effects of this stress on plants (Plaxton and Tran 2011).
The main internal location of Pi is the vacuole, which can store up to 95% of the cell Pi. When the
cytoplasm Pi concentration starts to decrease, a P homeostasis mechanism controls Pi release from
the vacuole (Fang et al. 2009). Senescing tissues can also be a significant source of P: phosphatases
released by P deficient plants in those tissues can remobilise and redirect it to newly growing
tissues (Plaxton and Carswell 1999). In the case of extended P deprivation, plants often start
recycling P from P-containing biomolecules such as RNA, phospholipids and small
phosphorylated metabolites. Compounds such as ATP, ADP, inositol-1-phosphate, glycerol-3-
phosphate, glucose-6-phosphate and fructose-6-phosphate are important intermediates for
glycolysis, oxidative phosphorylation, biosynthesis of polysaccharides, phospholipids, amino
acids and nucleotides, and these essential metabolic pathways are severely impacted by prolonged
P deficiency (Huang et al. 2008).
Various amino acids can be used as a carbon source in P deficient plants to compensate for
hindered carbohydrate metabolism. Ammonium is a product of amino acid degradation. High
ammonium levels can be toxic for plants, and plants assimilate it into the amino acids asparagine
and glutamine to reduce the concentration. The biosynthesis of these amino acids uses oxaloacetic
acid and α-ketoglutaric acid which are sourced from the TCA cycle (Huang et al. 2008).
One of the most important plant strategies to increase P uptake from soil is the release of organic
acids such as citrate and malate by the roots, which increase phosphate availability by acidifying
the substrate and breaking the Al-, Fe- and Ca-P compounds (Fang et al. 2009). An additional
indirect effect of such organic acid release is the promotion of the growth of soil microorganisms
able to use organic acids as energy sources. Such microorganisms can make Pi available for the
plant through cleaving from organic forms or solubilisation (Schillaci et al. 2019). This Pi is then

57
moved into plant roots by P transporters, whose synthesis is highly modified during P deficiency
(Vance et al. 2003). While low affinity transporters are constitutively released by the plant when
P is available in the soil, the production of high-affinity transporters is triggered when plants are
facing P scarcity (Plaxton 2004).
Cold temperatures can affect plant metabolic responses to low P availability and vice versa. By
decreasing plant growth rate, low temperature might indirectly affect plant P requirements;
furthermore, these stresses have an opposite effect on root development – which is generally
stimulated by P deficiency and hindered by low temperatures (Grant et al. 2001). Low temperature
hampers photosynthesis by inhibiting sucrose synthesis, and this causes an accumulation of
phosphorylated intermediates and an imbalance in the ATP/ADP ratio (Sharkey et al. 1986). As
mentioned before, these compounds are also affected by low P availability, as they decrease in P
deficient plants. Arabidopsis thaliana mutants with reduced shoot Pi were able to adapt to low
temperature better than mutants with increased shoot Pi, but the authors suggest that this result
might be reversed in highly P deficient plants, as they might not be able to readjust their
metabolism to face low temperature (Hurry et al. 2000). When comparing the metabolic response
of maize leaves to low temperature and P limitation, Schlüter et al. (2013) reported that plants
subjected to low temperatures increased their carbohydrate and phosphorylated metabolite levels,
while the opposite was observed in P deficient plants.
Various studies suggest that plant growth promoting (PGP) bacteria can improve plant adaptation
to abiotic stresses by affecting their metabolism, particularly by producing PGP compounds,
improving nutrient uptake and interfering with plant stress signalling pathways (Glick 2007; Aeron
et al. 2011; Goswami et al. 2016). The metabolic response of cereal roots to inoculation with PGP
bacteria has been increasingly investigated in recent years (Agtuca et al. 2020; Brusamarello-
Santos et al. 2017; Chamam et al. 2013; Curzi et al. 2008; Valette et al. 2019; Planchamp et al.
2015; Gagné-Bourque et al. 2016), as discussed in Section 1.2 of Chapter 1. Few of those studies
have analyzed the role of PGP bacteria in shaping the root metabolome of cereals facing stress
(Gagné-Bourque et al. 2016; Planchamp et al. 2015). There is instead a lack of studies on the
effects of the interaction with PGP bacteria on the metabolome of roots subjected to low P and
cold temperatures, both applied in isolation or simultaneously.

58
This chapter focuses on the polar metabolite profiles of Brachypodium distachyon roots with and
without inoculation with Azospirillum brasilense and grown at low temperature and low P
availability. Metabolites were extracted and analysed at three different time points, to resolve the
changes occurring in plant roots at various stages of their interaction with the PGP bacteria and
possibly link them to the changes in phenotype observed in Chapter 2 of this thesis.
3.2 Materials and Methods
3.2.1. Plant growth conditions
The experimental setup and experimental conditions for Brachypodium inoculation and growth
are described in Section 2 of Chapter 2. Also the plant material for the root metabolome analysis
was obtained from the plants whose phenotype was described in Chapter 2.
Harvesting of plants was at three time points: at 7 days after the inoculation (DAI) (84 inoculated
and 87 non-inoculated); at 14 DAI (24 inoculated and 36 non-inoculated) and at 21 DAI (25
inoculated and 34 non-inoculated). To minimize variations caused by changes in the plant
metabolism during the day (Hill and Roessner 2013), all tissue harvesting was done in the morning.
Roots were separated from shoots using a scalpel and immediately snap-frozen in liquid nitrogen.
Frozen root tissues were ground to a fine powder using a Retsch Mixer Mill MM400 (Retsch
GmbH, Haan, DE) and plants from the same treatment and time point were pooled into samples
with approximately the same number of individuals (sample pool of 14 individuals at 7 DAI; 5 at
14 DAI and 4 at 21 DAI) and fresh weight, measured using a digital scale with a 0.1 mg resolution
(Mettler Toledo, Columbus, USA). Six pools were formed for each treatment x time point, except
for non-inoculated plants at 21 DAI which had eight groups. Samples were kept frozen during the
grinding and pooling steps, to maintain quenched metabolism and thus prevent degradation of
metabolites.
3.2.2 Polar metabolites extraction from roots
For polar metabolites analysis, a modified method described in Cheong et al. (2020) was used. 250
µL 100% LC-MS grade MeOH (Roth, Karlsruhe, DE), containing 4% 13C6 sorbitol/valine (Sigma-
Aldrich, Castle Hill, AU) was added to approximately 25 mg of frozen root tissue from each pooled
group. Tubes were shaken at 800 rpm for 15 min at 30oC, centrifuged at 13000 rpm for 15 min at
room temperature and the supernatant collected. The pellet was reextracted with 250 µL of Milli-

59
Q H2O as above and the supernatants combined. In case of cloudy supernatant or precipitate
observed during supernatant transfer, the pooled supernatant was centrifuged at 13000 rpm for 10
min at room temperature before transferring as much supernatant as possible to a new tube. 50 µl
aliquots of the supernatant were transferred into glass insert (Agilent, Santa Clara, USA) and dried
under vacuum at 30°C for 90 min.
GC-MS analysis was used to obtain comparative metabolite profiles between inoculated and
control plants at various time points. The metabolite samples were further derivatised for GC-MS
analysis as described below (Section 2.4).
3.2.3 Polar metabolites extraction from bacteria
Polar metabolites from axenically grown Azospirillum were also extracted to help deduce the
origin of the metabolites that were extracted from inoculated Brachypodium roots. Azospirillum
was grown in modified N-free (NFb) medium (Baldani and Döbereiner 1980) with the following
composition: K2HPO4 (2.87 mM), FeSO4 (130 µM), sodium lactate (44.62 mM), NH4Cl (18.69
mM), MgSO4∙7H2O (810 µM), NaCl (1.71 mM), CaCl2 (180 µM), 0.1 mg biotin (0.4 µM),
Na2MoO4∙2 H2O (830 µM), MnS04∙H2O (1.39 mM), H3BO3 (4.53 mM), CuS04∙5H2O (32 µM),
ZnS04∙7H2O (83.46 µM).
Bacteria were grown in the NFb medium at 20°C, the same diurnal temperature Brachypodium
plants were grown at during the experiment. Once Azospirillum reached the late exponential
growth phase, approximately 1.5x10⁸ cells per sample were harvested. Bacterial cells were washed
twice by first diluting bacterial culture 1:9 with sterile PBS and centrifuging the samples at 10000
rpm for 5 min at 4°C. The supernatant was then discarded, and the pellet was resuspended in 1 mL
of sterile PBS. Samples were centrifuged again at 10000 rpm for 5 min at 4°C, and the supernatant
was discarded.
All reagents used for this metabolite extraction were purchased from Sigma-Aldrich (Castle Hill,
AU). The polar metabolites were extracted by adding to each sample 250 µL 100% MeOH,
containing 4% 13C6 sorbitol/valine. The tubes were dipped into liquid nitrogen until frozen, then
shaken at room temperature until they thawed. This freeze-thaw step was repeated ten times, to
break all bacterial cells in the samples. The following steps are the same as those described in
Section 3.2.2 of this Chapter after the initial adding of MeOH.

60
3.2.4 GC-MS analysis of polar metabolites
Polar metabolite extracts were prepared as described by Dias et al. (2015). 20 µL of methoxyamine
hydrochloride (30 mg/ml in pyridine) were added to each sample, to convert the carbonyl groups
in the corresponding oximes. Samples were then shaken for 2 h at 37°C, and 20 µL of N,O-bis
(trimethylsilyl) trifluoroacetamide with trimethylchlorosilane (BSTFA with 1% TMCS, Thermo
Scientific) were added to each sample to replace the active hydrogen in polar functional groups
with a trimethyl silane (TMS). For this step, samples were further shaken for 30 min at 37°C and
then left at room temperature for 60 min. Prior to the injection, samples were placed randomly on
the sample tray, together with blank samples containing only the extraction reagents. 1 µL of
sample was injected onto the GC column using a hot needle technique. Each sample was injected
pure (splitless) and 1:30 diluted (split), in order to detect both lowly and highly abundant
metabolites within the dynamic range of the instrument.
The GC-MS system used for the analysis was composed of Gerstel 2.5.2 autosampler, a 7890A
Agilent gas chromatograph and a 5975C Agilent quadrupole mass spectrometer (Agilent, Santa
Clara, USA). The mass spectrometer was tuned according to the manufacturer’s
recommendations using tris-(perfluorobutyl)-amine (CF43).
Gas chromatography was performed modifying the method described by Hillyer et al. (2017).
Samples were run through a 30 m Agilent J & W VF-5MS column with 0.25 µm film thickness
and 0.25 mm internal diameter with a 10 m Integra guard column. Temperature was set at 250°C
for the injection, 280°C in the MS transfer line, 230°C in the ion source and 150°C in the
quadrupole. Helium was used as the carrier gas at a flow rate of 1 mL min-1. The GC oven was set
on the following temperature program: 70°C for the injection and hold for 60 s, followed by a 7°C
min-1 temperature increase up to 325°C and a final 6 min hold at 325°C. The oven temperature was
then lowered to 70°C prior to the injection of the following sample. Mass spectra were recorded
at 2.66 scans s-1 with an m/z 50-600 scanning range.

61
3.2.5. Data extraction, metabolite identification and quantification
The chromatograms and mass spectra obtained from the split and splitless injections were analysed
using the Agilent MassHunter Qualitative Analysis software (v B.07.00) and the AMDIS software
(v 2.73) for identification of the compounds, and the Agilent MassHunter Quantitative Analysis
software (v B.08.00) for their quantification. The commercial mass spectra library NIST
(http://www.nist.gov) and the in-house Metabolomics Australia mass spectral library were used as
references for the compound identification. During the compound identification step,
chromatograms with high peak intensity analysis for each treatment/time point set of samples were
selected to build the list of detected compounds in the samples.
The resulting data were normalised to the 13C6 sorbitol/valine internal standard value, and to the
exact weight of tissue used for metabolite extraction. When integrating the data from compounds
detected in both the splitless and the split samples run, data from the splitless run were preferred,
unless the chromatogram showed poor quality due to the overloading of the column or the overlap
of different compounds.
3.2.6 Statistical analyses and data visualisation
The abundance of polar metabolites detected in pooled roots samples of inoculated and non-
inoculated plants harvested at 7, 14 and 21 DAI were compared using the web-based tool
Metaboanalyst 4.0 (https://www.metaboanalyst.ca/), to determine if and when the inoculation with
Azospirillum affected the root metabolome of Brachypodium grown at low P availabilities and
low temperature. The number of replicates was 6 for each treatment x time point combination,
except for non-inoculated plants at 21 DAI, which had 8 replicates.
The metabolite profiles of the two treatments at each time point were displayed using 2D principal
component analysis (PCA) and hierarchical cluster analysis of the root metabolome paired with a
heatmap of metabolite abundances, with samples and features clustered using Euclidean distance
function and Ward clustering algorithm.
The abundance of the compounds detected in the two treatments was compared at each time point,
and the statistical significances between the measured abundances were analyzed using the
Student’s t-test (group variance assessed using the Levene’s test). Polar metabolites with a fold

62
change (FC) < -1.5 or > 1.5 and with raw P-value < 0.05 were considered differently abundant
between inoculated and non-inoculated treatments.
3.3 Results
3.3.1 Root polar metabolites
A total of 92 polar metabolites were detected in the roots of Brachypodium at low temperature and
P at 7, 14 and 21 DAI (Table 3.1), mainly belonging to the classes of sugars (25), amino
acids/amines (30) and organic acids (32). Inoculated and non-inoculated roots had a small number
of significantly different polar metabolites (Table 3.1). β-gentibiose, cystine, maltotriose,
melibiose and myo-inositol-2-phosphate were present only at 7 DAI.
3.3.2 Bacterial polar metabolites
A total of 22 compounds were identified in the GC-MS analysis of metabolites extracted from the
bacterial culture (Table 3.2). Six metabolites were present in samples from both bacterial and roots
inoculated with bacteria: galactosylglycerol, glycerol-3-phosphate, pyroglutamic acid, succinic
acid, sucrose and trehalose.
3.3.3 Polar metabolites of inoculated and non-inoculated plants
Polar metabolite patterns clustered based on time point (Fig. 3.1-3.2) but did not cluster based on
bacterial inoculation (Fig. 3.1-3.5); based on the levels of detected metabolites, samples from
different treatments were often more similar than samples belonging to the same treatment. The
only partial separation was observed at 14 DAI, when most samples from the two treatments
clustered separately (Fig. 3.4), except for control sample C14.5 and inoculated sample B14.1.

63
Figure 3.1 Hierarchical clustering coupled with heatmap of the polar metabolite profiles of Azospirillum-inoculated
(A) and non-inoculated roots (N) of Brachypodium harvested at 7, 14 and 21 DAI. The lettering at the bottom of the
heatmap indicates the replicates: for each replicate, blue and red colors indicate the lower or higher abundance of
specific metabolites respectively compared to the other replicates, with darker colors indicating more pronounced
differences.

64
Figure 3.2 Principal component analysis of the polar metabolite profiles of Azospirillum-inoculated (A) and
non-inoculated roots (N) of Brachypodium harvested at 7, 14 and 21 DAI. Ellipses around samples display
95% confidence areas.

65
Figure 3.3 Hierarchical clustering coupled with heatmap of the polar metabolite profiles of Azospirillum-inoculated
(A) and non-inoculated roots (N) of Brachypodium harvested at 7 DAI. The lettering at the bottom of the heatmap
indicates the replicates: for each replicate, blue and red colours indicate the lower or higher abundance of specific
metabolites compared to the other replicates, with darker colours indicating more pronounced differences.

66
Figure 3.4 Hierarchical clustering coupled with heatmap of the polar metabolite profiles of Azospirillum-inoculated
(A) and non-inoculated (N) roots of Brachypodium harvested at 14 DAI The lettering at the bottom of the heatmap
indicates the replicates: for each replicate, blue and red colours indicate the lower or higher abundance of specific
metabolites compared to the other replicates, with darker colours indicating more pronounced differences.

67
Figure 3.5 Hierarchical clustering coupled with heatmap of the polar metabolite profiles of Azospirillum-inoculated
(A) and non-inoculated (N) roots of Brachypodium harvested at 21 DAI The lettering at the bottom of the heatmap
indicates the replicates: for each replicate, blue and red colours indicate the lower or higher abundance of specific
metabolites compared to the other replicates, with darker colours indicating more pronounced differences.

68
The top three principal components explained 69.9, 68.7 and 60.2% of variance at 7, 14 and 21
DAI, respectively (Fig. 3.6). As with the hierarchical cluster analysis, PCA did not show separation
of samples from Azospirillum-inoculated and non-inoculated plants at 7 and 21 DAI, while a
partial separation of treatments was observed at 14 DAI when plotting PC1 vs PC2 and PC1 vs
PC3.
Figure 3.6 Principal component analysis of the polar metabolite profiles of Azospirillum-inoculated (A) and non-
inoculated (N) roots of Brachypodium harvested at 7, 14 and 21 DAI. Ellipses around samples display 95% confidence
areas.

69
While most metabolites did not show significant fold changes between the two treatments at any
time point, the response of a small group of metabolites varied (FC < -1.5 or FC > 1.5, p<0.05)
dynamically throughout the time series (Fig. 3.7, Table 3.1). A total of 18 compounds were
significantly increased or decreased when the two treatments were compared at each timepoint.
These included aminocaproic acid, campesterol, 3-cyano alanine, diethylene glycol, glycerol-3-
phosphate, hexacosanol, malic acid, α-ketoglutaric acid, pantothenic acid, pentonic acid, 1,4-
lactone, putrescine, pyroglutamic acid, quinic acid, ribonic acid, serotonin, sinapic acid, trehalose
and xylose.

70
Table 3.1 List of polar metabolites detected in Brachypodium roots harvested at 7, 14 and 21 DAI. Columns display
the class of each compound, its name, the relative response fold changes (FC) (Azospirillum inoculated/non-inoculated
plants) and the related p-value for each time point. Compounds are divided into amino acids (AA), organic acids (OA)
sugars (SU) or “Others” if they did not belong to any of the previous classes. Compounds with a FC < -1.5 or FC >
1.5 and p<0.05 are presented in red font.

71
At 7 DAI, the compounds that increased most in inoculated plants compared to non-inoculated
were hexacosanol (fold change = 2.36), campesterol (FC = 1.94), trehalose (FC = 1.58) and
glycerol-3-phosphate (FC = 1.53). The only compound that decreased was aminocaproic acid (FC
= -1.92) (Fig. 3.7a, Table 3.1).

72
Table 3.2 List of polar metabolites detected in Azospirillum grown axenically on modified N-free (NFb) medium.at
20°C. Compounds are divided into fatty acids (FA), organic acids (OA) sugars (SU) or “Others” if they did not belong
to any of the previous classes. Compounds detected also in Brachypodium roots are presented in red font.
The highest number of changed polar metabolites was observed in root samples harvested 14 DAI,
with a general trend of metabolites decreasing in inoculated samples compared to controls. At this
time point, the metabolites that increased most were trehalose (FC = 2.16), quinic acid (FC = 2.12),
α-ketoglutaric acid (FC = 1.99) and malic acid (FC = 1.76). Those that were reduced most were
pentonic acid, 1,4-lactone (FC = -2.98), aminocaproic acid (FC = -2.63), sinapic acid (FC = -2.54),
β-cyano-alanine (FC = -1.95), pantothenic acid (FC = -1.87), putrescine (FC= - 1.55) and
diethylene glycol (FC = -1.50) (Fig. 3.7b, Table 3.1).
At 21 DAI, the polar metabolites with higher abundance due to inoculation were ribonic acid
(FC = 5.43), xylose (FC = 1.8), pyroglutamic acid and serotonin (FC = 1.50). Pentonic acid, 1,4-
lactone (FC = -1.73) was the only compound with reduced abundance (Fig. 3.7c, Table 3.1).
Apart from pentonic acid, 1,4-lactone, trehalose and aminocaproic acid, no compounds were
significantly affected at more than one time point. Of the significantly increased compounds,
glycerol-3-phosphate, pyroglutamic acid and trehalose were also detected in the extracts of the
axenic Azospirillum culture.

73
Figure 3.7 Volcano plots of significantly affected polar metabolites in the comparison between bacteria inoculated
and non-inoculated samples at 7 DAI (a), 14 DAI (b) and 21 DAI (c). Red dots represent compounds with FC<-1.5 or
>1.5 and probability of significant difference between mean of Azospirillum-inoculated and non-inoculated plants
based on Student’s t-test p<0.05.

74
3.3.4 P-containing compounds
A total of five P-containing compounds were detected in the root samples: inositol-1-phosphate,
glycerol-3-phosphate, myo-inositol-2-phosphate, mannose-6-phosphate and phosphoric acid. The
levels of all these compounds decreased between 7 and 21 DAI, with a similar magnitude in both
treatments (Fig. 3.8). As mentioned in Section 3.3, the only compound which was significantly
affected by the inoculation was glycerol-3-phosphate, significantly more abundant (FC = 1.53) in
Azospirillum-inoculated plants at 7 DAI.
Figure 3.8 Relative response of P containing compounds in roots of plants with or without Azospirillum inoculation
and harvested after 7, 14 and 21 DAI. Means ± standard error are presented. n = 6 for all pooled samples except for
non-inoculated at 21 DAI (n = 8). Asterisks in the graphs indicate a fold change (FC)<-1.5 or >1.5 and probability of
significant difference between relative response of Azospirillum-inoculated and non-inoculated plants based on
Student’s t-test p<0.05 (see also Table 3.1).

75
3.4 Discussion
The profile of polar metabolites extracted from Brachypodium roots with and without
Azospirillum inoculation changed through time, suggesting bacterial interactions dynamically and
specifically altered plant metabolism at low temperature and P conditions. The time point at which
inoculation induced the largest number of metabolites changes was 14 DAI. Eleven metabolites
had significant fold changes, of which 4 were increased and 7 were decreased by inoculation.
Response in polar metabolites were more limited at 7 and 21 DAI, with four increased and one
decreased compound in inoculated plants at both time points (Fig. 3.7).
The metabolic pathways associated with significant changes in the study are shown in Fig. 3.9.
Significantly affected compounds are scattered across primary metabolism rather than belonging
to particular pathways, with the partial exception of sugar metabolism (trehalose, xylose) and the
citric acid cycle (malic acid, α-ketoglutaric acid). It was not possible to map hexacosanol,
diethylene glycol, pentonic acid, 1,4-lactone and ribonic acid onto Figure 6, because a pathway for
those compounds has not been characterized in plants yet.
Dynamic metabolite fluctuations in association with bacterial inoculation are evident by mapping
affected compounds at different time points (Fig. 3.9). This mapping of the data reveals
metabolites which were most significant in response to growing conditions (time, inoculation).
All detected P containing compounds decreased in both treatments through the experiment
(Fig. 3.8). This result aligns with the progressive decrease of shoot P concentration described in
Section 3.2 of Chapter 2 of this thesis. A reduction in phosphorylated compounds is typically
observed in P deficient plants which, once the vacuole inorganic P (detected as phosphoric acid)
reserves start declining (Fig. 3.8e), increase the internal P recycling from senescing tissues
(Plaxton and Carswell 1999) and implement alternative metabolic pathways which do not require
phosphorylated compounds in order to use those compounds as P source for essential metabolism
(Huang et al. 2008). The large reduction in all detected P containing compounds suggests that not
only were the shoots of both treatments increasingly P deficient but the same happened in the roots.

76
1 Figure 3.9 Mapping
of the polar
metabolites affected
by inoculation with
Azospirillum at 7, 14
or 21 DAI in relation
to primary
metabolism
pathways. Measured
compounds appear in
bold font.
Compounds whose
levels were increased
appear in red font in
the central diagram
and have a red
background in the
plots surrounding it.
Compounds whose
levels were decreased
appear in blue font in
the central diagram
and have a blue
background in the
plots surrounding it.
A dotted line
connecting two
compounds in the
central diagram
indicates that further
intermediates are
present. Asterisks in
the graphs indicate a
FC<-1.5 or >1.5 and
probability of
significant difference
between mean of
Azospirillum-
inoculated and non-
inoculated plants
based on Student’s t-
test p<0.05.

77
3.4.1 Significantly different compounds at 7 DAI
Hexacosanol is a fatty alcohol found in both the leaves (Zabka et al. 2008) and roots of various
cereals (Roumet et al. 2006). In A. thaliana roots, hexacosanol plays a role in the stimulation of
the ATP binding cassette (ABC) subfamily ABCG, which in turn is involved in the formation of
diffusion wax barriers such as suberin, whose synthesis is increased by environmental stress
factors, including pathogen attack (Shanmugarajah et al. 2019). Hexacosanol itself can also be one
component of suberin, as root suberin is a wax layer formed by esters of long chain fatty acids
with long-chain fatty alcohols (Zimmermann and Eeemüller 1984). Interestingly, hexacosanol has
also been found as a component of essential oils extracted from various plants belonging to the
Asterids clade, in which they play an antimicrobial role (Castilho et al. 2012; Mbosso et al. 2010).
While the plant biosynthetic pathway of hexacosanol has not been characterised yet, its levels
followed closely those of campesterol at all time points and in all samples (Fig. 3.3-3.5, Table
3.1), which suggests that those two compounds might be related in the metabolism of
Brachypodium. In this present experiment, hexacosanol content was significantly higher in
inoculated plants at 7 DAI, while the difference between the two treatments progressively
decreased through the experiment. As the literature shows that this compound can have a role in
plant response to biotic stresses, I hypothesize that its increased levels were part of a strategy of
inoculated plants to limit Azospirillum colonization during the early stages of the interaction.
Figure 3.10 2D structures and formulas of hexacosanol and campesterol.
Campesterol is one of the main membrane sterols of higher plants, and its balance with β-sitosterol,
determined by the enzyme activities of sterol methyltransferases, is believed to be a key element
of various cellular processes (Valitova et al. 2016). These two sterols are also important for

78
membrane fatty acid rearrangements, affecting membrane fluidity and permeability and the
activity of membrane bound proteins (Valitova et al. 2016). Furthermore, campesterol is a
precursor of the brassinosteroid phytohormones, a class of hormones normally involved in cell
elongation (Yokota 1997), which also play an important role in plant responses to environmental
stress (Bajguz and Hayat 2009). Brassinosteroids enhance low temperature adaptation in various
plants, including maize (He et al. 1991) and rice (Fujii and Saka 2001; Hotta et al. 1998). The
brassinosteroid brassinolide has also been reported to improve plant resistance to biotic stresses,
decreasing the symptoms from various pathogens attacks in rice (Nakashita et al. 2003) and barley
(Ali et al. 2013). The higher campesterol content in inoculated plants at 7 DAI could be a result of
the biotic stress caused by the bacterial colonization. Finally, brassinosteroids can regulate root
development in a dose dependent manner: while at high concentrations they inhibit both primary
root extension and branch root development, low concentrations can stimulate branch roots
formation (Yang et al. 2011). The higher campesterol levels in inoculated Brachypodium at 7 DAI,
could hence have caused the earlier branch roots observed in those plants (see Section 3.3.3 of
Chapter 2). As branch roots are of great importance for plants growing in a P poor environment
(see Section 4 of Chapter 2), this could have caused a significant advantage for Azospirillum-
treated plants.
Trehalose is a non-reducing disaccharide formed by two glucose molecules, and it plays an
important role in plant adaptation to environmental stresses by acting as an osmoprotectant, ROS
scavenger and increasing the levels of soluble carbohydrates and photosynthesis (Kour et al. 2019;
Lunn et al. 2014). Various studies successfully tested the positive effect of increased trehalose
levels on the growth of cereals subjected to environmental stress, by externally applying trehalose
to their tissues (Cha-um et al. 2019), creating transgenic lines containing bacterial genes for
trehalose biosynthesis (Garg et al. 2002) or inoculating plants with PGP bacteria with enhanced
trehalose production (Rodríguez-Salazar et al. 2009). In my experiment, roots of inoculated plants
contained higher amounts of trehalose than controls at 7 DAI (FC = 1.58) and 14 DAI (FC = 2.3)
(Fig. 3.9, Table 3.1). There was less difference at 21 DAI (FC = 1.2) due to an increase of trehalose
content in non-inoculated plants during the last week of the experiment (FC = 1.54). Trehalose
was also found in the metabolites extracted from Azospirillum axenic culture. It is unclear whether
the trehalose detected in inoculated plants was synthetised by the bacteria or Brachypodium, as it
plays a similar role in both organisms (Garg et al. 2002). It is not unlikely that the trehalose

79
extracted from inoculated roots was produced by both the organisms, but the disproportion
between host plant and bacterial biomass suggests that most trehalose was synthetised by
Brachypodium. An increased abundance of root trehalose after 14 d was also reported in maize
inoculated with Azospirillum brasilense or Herbaspirillum seropedicae, and the authors
hypothesize a role of this compound in the regulation of the plant - bacteria interaction, possibly
in defence related mechanisms (Brusamarello-Santos et al. 2017). The increase in trehalose content
observed in the roots of non-inoculated plants during the last week of the experiment might be part
of the plant response to P deficiency during the second half of the experiment (Fig. 3.9, see Section
3.2 in Chapter 2). An increase in the expression of genes related to trehalose biosynthesis was
observed in the roots of P deprived rice which, according to the authors, triggered increased root
growth (Tyagi and Rai 2017). Trehalose and sucrose are sugars separated by two enzymatic
reactions only (Fig. 3.9), and can accumulate in plants subjected to cold stress. Compared to
sucrose, trehalose biosynthesis requires much smaller amounts of carbon, and allows the uridine
diphosphate glucose (UDPG) and glycerol-6-phosphate (G6P) pools to be conserved (Griffiths et
al. 2016). In stressed plants, the metabolism of sucrose and trehalose is typically related (Lunn et
al. 2014), but the two compounds had analogous trends only in non-inoculated plants, with a
decrease during the second week of the experiment and an increase during the third. In contrast,
the trehalose content was relatively stable during the experiment in inoculated plants, while the
sucrose content followed the same trend as in non-inoculated plants. This can suggest two things;
(1) that the higher content of trehalose observed in inoculated plants at 7 and 14 DAI was caused
mainly by an increase in trehalose during the first week of the experiment, – probably as response
to the microbial colonization, and (2) that the bacteria caused a shift in sugar metabolism of
inoculated plants. Finally, genes involved in trehalose biosynthesis differed in the roots of two rice
cultivars subjected to various stresses, including P deficiency (Singh et al. 2016). Plants with
higher expression of such genes had shorter primary root and better developed shoots when
subjected to P deprivation, which is consistent with the phenotype of inoculated plants in my study
(see Sections 3.1.3 and 3.3.3 of Chapter 2). It is tempting to speculate on a role of trehalose in
shaping the development in cereals facing P deficiency, in particular preventing the redirection of
resources from the shoot to the root growth, which is a common response of plants to this stress
(Hammond and White 2011).

80
Glycerol-3-phosphate (G3P) is a phosphoric ester which can be synthetised in plants by glycerol
phosphorylation or dihydroxyacetone phosphate (DHAP) reduction. G3P is a precursor of all plant
glycerolipids, and it is also involved in fatty acid biosynthesis (Chanda et al. 2011). Furthermore,
it plays an essential role as a signalling molecule in plant systemic acquired resistance (SAR), a
defensive mechanism against a broad variety of pathogens which is activated during early infection
stages, preventing pathogen propagation in distal tissues (Chanda et al. 2011; Shah and Zeier
2013). In wheat leaves, increased levels of G3P after inoculation with the fungal pathogen
Puccinia striiformis induced SAR, which decreased the degree of the infection (Yang et al. 2013).
In this study, the content of G3P in inoculated and non-inoculated plants differed significantly only
at 7 DAI (FC = 1.53), and it decreased in both inoculated and non-inoculated plants between 7 and
14 DAI (FC = - 4.11 and FC = -2.67, respectively) (Fig. 3.9, Table 3.1). G3P content decreased
in both treatments through the experiment, as all P-containing compounds did, and as previously
discussed it can be explained with the recycling of P by increasingly P deficient plants, which used
such compounds as P source for essential processes. The strong reduction observed in inoculated
plants in the second half of the experiment, might also suggest a change in the interaction with
Azospirillum. G3P was also detected in the extracts of the axenic bacterial culture, and while the
possibility that the increased content of G3P observed in inoculated samples at 7 DAI was derived
from Azospirillum cannot be completely excluded, it is rather unlikely, due to the higher
proportion of host biomass compared to that of the bacteria when metabolites were extracted from
the inoculated root tissue.
Aminocaproic acid is a lysine derivative (Karlsson et al. 2018), commonly used in pharmacology
and in various laboratory procedures. To my knowledge, the only published study that reports the
presence of this compound in plant tissue is a recent study on two barley cultivars that differ in
their resistance to salt stress (Wang et al. 2019), where the leaf levels of this compound were
increased by salinity but did not differ between the two cultivars. Aminocaproic acid was one of
the few compounds significantly affected by the inoculation at more than one time point, as its
levels were lower in inoculated plants at both 7 and 14 DAI. The scarcity of studies on this
compound in cereals response to stresses prevents me from formulating hypotheses on the role of
Aminocaproic acid in this present experiment, which might be clarified by future targeted analyses.

81
It is noteworthy that all compounds whose levels were increased in inoculated plants may play a
role in the resistance against pathogens. It is not uncommon for PGP bacteria to be sensed as
pathogens during early stages of the interaction, as both beneficial and detrimental microorganisms
can trigger the plant immune system (Valette et al. 2019), and this can then cause an increased
resistance of plants to further biotic stresses (Spencer et al. 2003). Once different recognition
mechanisms of plant and microorganisms are established, the plant response to the PGP bacteria
changes, but it is reasonable to assume that at 7 DAI plants were producing antimicrobial
compounds to limit the bacterial colonisation of their roots.
3.4.2 Significantly different compounds at 14 DAI
Quinic acid is a phosphoenolpyruvate derivative, found in roots of various cereals (Ullah et al.
2017; Zuther et al. 2007) and legumes (Šibul et al. 2016). Quinic acid is a precursor of
phenylpropanoids such as flavonols, which can protect plants against abiotic stresses (Rasmussen
et al. 2012). Moreover, together with shikimic acid, this compound is a precursor of aromatic
amino acids (Sheflin et al. 2019), and different studies displayed how the balance between organic
and amino acids can be affected differently by different abiotic stresses. The quinic acid levels
were increased in the shoots and decreased in root exudates of rice plants subjected to P deprivation
(Tawaraya et al. 2013), which would suggest that the release of this organic acid is not part of rice
adaptation to P deficiency. Low P increased also the quinic acid shoot levels in a P use efficient
wheat cultivar, while the root levels were not affected (Nguyen et al. 2019). In this present study
instead, the root quinic acid levels increased in both treatments, though with different timing (Fig.
3.9, Table 3.1). In inoculated plants, the increase in quinic acid levels occurred between 7 and 14
DAI (FC = 2.20), while non-inoculated plants had a similar increase between 14 and 21 DAI (FC
= 1.98). This caused the quinic acid content to differ between the two treatments at 14 DAI (FC =
2.12). These results are not consistent with what is reported in literature, as they seem to suggest
a role of quinic acid in Brachypodium response to P deprivation. In this perspective, the earlier
increase in quinic acid detected in inoculated roots could potentially be a sign of an earlier
adaptation of inoculated plants to this stress, but further targeted analyses are necessary to verify
this hypothesis.
α-ketoglutaric acid (α-KG) is an organic acid involved in a multitude of reactions in the cell such
as amino acid synthesis, the tricarboxylic acid (TCA) cycle and in nitrogen assimilation (Weber

82
and Flügge 2002; Foyer et al. 2003). As for other low molecular weight organic acids, α-KG can
also be released by various organisms to increase the availability of P in the soil (Harrold and
Tabatabai 2006). α-KG was not detected in roots of rice grown with varying P availability nine
days after planting. While it was not found in plants supplied with normal P levels 14 days after
planting, it was present in plants supplied with low or no P, suggesting that the production of this
organic acid is involved in the adaptation of plants to P scarcity when they start depleting the seed
P reserve (Tawaraya et al. 2013). As many P deficient plants exudate organic acids, they need to
use amino acids as alternative carbon sources for various metabolic processes, and one of the by-
products of amino acids degradation is ammonium, which can reach toxic concentrations in the
plant. To reduce NH4+ levels, plants can increase the synthesis of certain amino acids and amines
(asparagine, glutamine, putrescine), whose synthesis incorporates two ammonium molecules into
one organic acid. α-KG can be withdrawn from the TCA cycle to be converted to such amino acids,
hence its abundance can be decreased in plants facing severe P starvation (Huang et al. 2008). α-
KG levels strongly decreased also in oat roots supplied for 10 days with low P levels, and P
deficient plants also had shorter roots compared to P sufficient plants (Wang et al. 2018). In this
present study, control plants showed decreased levels of α-KG between 7 and 14 DAI, while the
opposite was observed in inoculated plants (Fig. 3.9, Table 3.1). As a result, at 14 DAI inoculated
plants had 1.99 times higher levels of α-KG compared to controls. As the production of this organic
acid does not seem to be part of the A. brasilense strategy to increase P availability (Selvi et al.
2017), and this compound was not found in the metabolites extracted from the axenic bacterial
culture, this result may suggest that the bacterial interaction with Brachypodium preserved the
plant TCA cycle, preventing the use of α-KG for the decrease of ammonium levels. This theory is
also supported by the fact that, at 14 DAI, inoculated plants had lower (FC = -1.55) levels of
putrescine (Fig. 3.9, Table 3.1), one of the compounds used by plants to incorporate NH4+.
Interestingly, an increased concentration of putrescine was observed in suspension-cultured rice
cells facing P deficiency, and the authors of that study hypothesize that this contributed to their
growth inhibition (Shih and Kao 1996). This suggests a further protective role of Azospirillum in
the present experiment. α-KG is also a close precursor of γ-aminobutyric acid (GABA), whose
synthesis is usually increased by plants under adverse environmental conditions (Sarabia et al.
2018). In my study, GABA had a diametrically opposed fluctuation in inoculated plants during the
experiment, decreasing between 7 and 14 DAI and increasing again between 14 and 21 DAI (data

83
not shown), which suggests that inoculation decreased the conversion of α-KG to GABA during
the second week of the experiment. GABA levels were generally steady in non-inoculated plants,
suggesting that this compound does not play a major role in Brachypodium under low P and low
temperature conditions. Finally, the increased production and release of α-KG could also be a
strategy to release P from the environment or to provide a source of carbon for the bacteria
themselves. The α-KG levels were strongly decreased in inoculated plants at 21 DAI compared to
14 DAI (FC=-3.7), which could be due to a change of the plant strategy to face P unavailability.
Malic acid is an organic acid which plays an important role in plant roots as an intermediate in the
TCA cycle. As for other organic acids, its abundance in both root tissues and root exudates is often
increased as a response of plants to P deficiency (Hocking et al. 2000). Neumann and Roemheld
(1999) report that the malic acid concentration in roots of wheat was increased 13 days following
P withdrawal from the substrate, and a similar results was observed by Huang et al. (2008) in
barley roots subjected to P deprivation. In a different study, two maize cultivars with different
tolerance to low P were grown at various P levels for 18 d and their phenotype and the organic
acid content in their roots was analysed. While lower P supply decreased plant biomass in both
cultivars, the resistant cultivar showed increased malic acid contents in the root tips and higher
root development compared to the susceptible one. It is noteworthy however, that both cultivars
showed an increase of exuded organic acids, and many other factors, such as root acid phosphatase
and a better utilisation of seed P, are likely to play a role in the observed results (Gaume et al.
2001). Conversely, malic acid content was not increased in roots and root exudates of oat plants
subjected to P deficiency after two weeks, while its content in root exudates was increased after
four weeks of treatment (Wang et al. 2018). The increase in malic acid levels in inoculated plants
at 14 DAI (Fig. 3.9, Table 3.1) is consistent with the reported literature, which suggests a role of
this organic acid in plant adaptation to low P environments. Similarly to α-KG, the other TCA
cycle compound detected in this present study, the difference in malic acid levels was not observed
at 21 DAI, when plant P deprivation increased. Further targeted studies are required to clarify the
role of TCA cycle intermediates at various levels of P deprivation in cereal roots.
Pentonic acid, 1,4-lactone is an organic acid whose biosynthesis and role in plant metabolism, to
my knowledge, have not been described, and only two studies have reported its presence in plants.
Leaves of Arabidopsis plants with a mutation in a gene involved in the chloroplastic
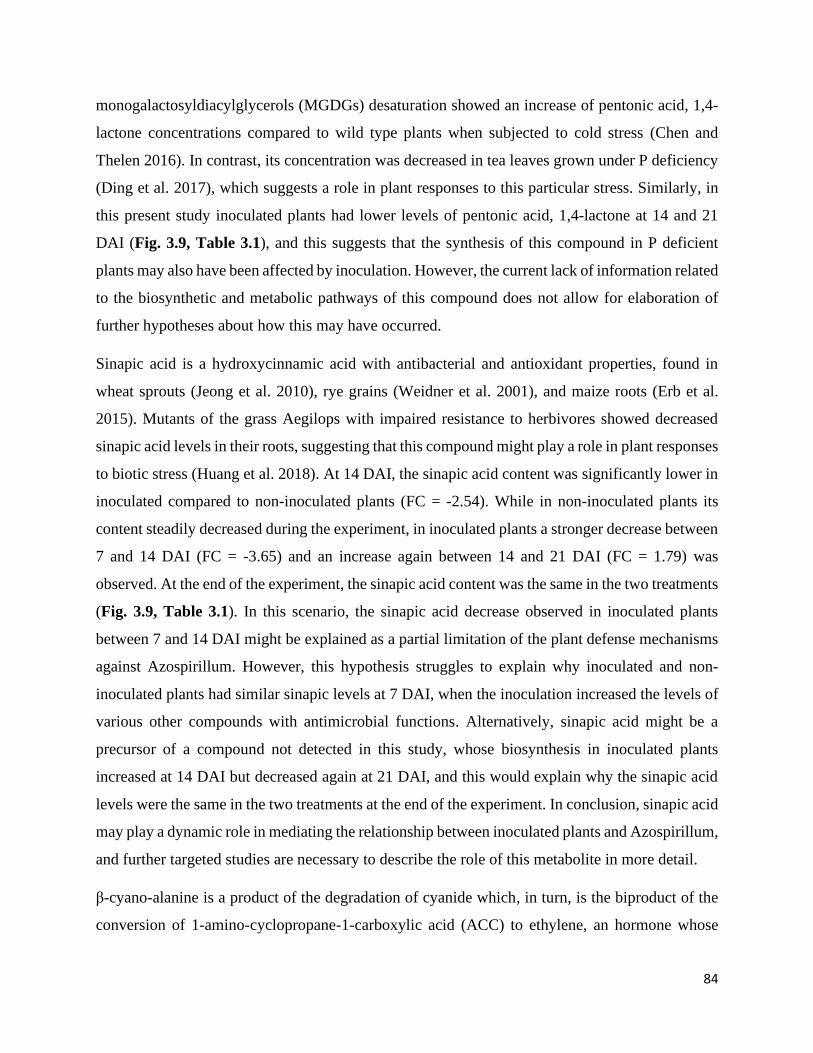
84
monogalactosyldiacylglycerols (MGDGs) desaturation showed an increase of pentonic acid, 1,4-
lactone concentrations compared to wild type plants when subjected to cold stress (Chen and
Thelen 2016). In contrast, its concentration was decreased in tea leaves grown under P deficiency
(Ding et al. 2017), which suggests a role in plant responses to this particular stress. Similarly, in
this present study inoculated plants had lower levels of pentonic acid, 1,4-lactone at 14 and 21
DAI (Fig. 3.9, Table 3.1), and this suggests that the synthesis of this compound in P deficient
plants may also have been affected by inoculation. However, the current lack of information related
to the biosynthetic and metabolic pathways of this compound does not allow for elaboration of
further hypotheses about how this may have occurred.
Sinapic acid is a hydroxycinnamic acid with antibacterial and antioxidant properties, found in
wheat sprouts (Jeong et al. 2010), rye grains (Weidner et al. 2001), and maize roots (Erb et al.
2015). Mutants of the grass Aegilops with impaired resistance to herbivores showed decreased
sinapic acid levels in their roots, suggesting that this compound might play a role in plant responses
to biotic stress (Huang et al. 2018). At 14 DAI, the sinapic acid content was significantly lower in
inoculated compared to non-inoculated plants (FC = -2.54). While in non-inoculated plants its
content steadily decreased during the experiment, in inoculated plants a stronger decrease between
7 and 14 DAI (FC = -3.65) and an increase again between 14 and 21 DAI (FC = 1.79) was
observed. At the end of the experiment, the sinapic acid content was the same in the two treatments
(Fig. 3.9, Table 3.1). In this scenario, the sinapic acid decrease observed in inoculated plants
between 7 and 14 DAI might be explained as a partial limitation of the plant defense mechanisms
against Azospirillum. However, this hypothesis struggles to explain why inoculated and non-
inoculated plants had similar sinapic levels at 7 DAI, when the inoculation increased the levels of
various other compounds with antimicrobial functions. Alternatively, sinapic acid might be a
precursor of a compound not detected in this study, whose biosynthesis in inoculated plants
increased at 14 DAI but decreased again at 21 DAI, and this would explain why the sinapic acid
levels were the same in the two treatments at the end of the experiment. In conclusion, sinapic acid
may play a dynamic role in mediating the relationship between inoculated plants and Azospirillum,
and further targeted studies are necessary to describe the role of this metabolite in more detail.
β-cyano-alanine is a product of the degradation of cyanide which, in turn, is the biproduct of the
conversion of 1-amino-cyclopropane-1-carboxylic acid (ACC) to ethylene, an hormone whose

85
synthesis is enhanced in plants facing stress (Morgan and Drew 1997). Thus stressed plants can
often produce higher levels of cyanide, which needs to be quickly metabolized as it inhibits
electron transport and metalloenzymes (Echevarría et al. 1984). The main pathway for this process
is the β-cyano-alanine synthase pathway, which incorporates the cyanide into a cysteine molecule
forming β-cyano-alanine, subsequently converted into asparagine, aspartate and ammonia, and
these compounds can be used for plant primary metabolism (Machingura et al. 2016). In this study,
inoculated Brachypodium plants had significantly lower β-cyano-alanine content at 14 DAI (Fig.
3.9, Table 3.1), which suggests a lower production of ethylene at this specific time point and hence
lower stress levels. Non-inoculated plants had higher levels of asparagine (FC = 2.63) compared
to the inoculated ones. Unfortunately, asparagine quantification is often problematic using GC-
MS, hence for this purpose LC-MS is preferred (Dias et al. 2015). The detected levels in our
samples varied substantially within each treatment resulting in asparagine FC being not
statistically significant (p-value = 0.68). However, this result at least partially supports the
hypothesis of cyanide detoxification occurring in non-inoculated plants, as asparagine is one of
the products of the β-cyano-alanine synthase pathway. A greater activity of the β-cyano-alanine
synthase pathway has been reported in cultivars with an increased cyanide detoxification capacity,
thus leading to better adaption to sub-optimal environments, as observed recently in wheat (Jacoby
et al. 2013). Nevertheless, the higher levels of β-cyano-alanine in non-inoculated Brachypodium
roots suggests that they were facing higher levels of stress compared to inoculated plants.
Pantothenic acid, known also as vitamin B5, is the precursor of important cofactors such as
coenzyme A and the prosthetic group of acyl carrier proteins (Hanson et al. 2016). The expression
of genes related to the pantothenic acid metabolism was progressively decreased in cucumber roots
subjected to waterlogging for 24 h (Qi et al. 2012). However, the actual concentration of
pantothenic acid in the roots was not measured, and the low number of biological replicates used
for each treatment (two) suggests caution should be used in interpreting these results. In a study
on sorghum, roots subjected to drought had lower levels of pantothenic acid compared to control
plants (Pavli et al. 2013). The cultivars used in both studies have high resistance to the abiotic
stresses they were subjected to, and the modulation of the pantothenic acid metabolic pathway
might contribute to their adaptation. In this present study, pantothenic acid levels were
significantly lower in inoculated plants at 14 DAI due to a decrease in those plants between 7 and
14 DAI, while the opposite was observed in non-inoculated plants. This trend was inverted during

86
the last week of the experiment, and at 21 DAI both treatments had the same levels of pantothenic
acid (Fig. 3.9, Table 3.1). The few available studies suggest that levels of pantothenic acid in plant
roots can be influenced by abiotic stresses, and the that a decrease of pantothenic acid might be
part of plant adaptation strategies to abiotic stresses.
Diethylene glycol is mainly known as an industrially produced contaminant, but recent studies
showed that this organic compound can also be synthetized by plants. While its biosynthetic
pathway and metabolic role are still unknown, diethylene glycol has been detected in root exudates
of a Pb tolerant plant species (Luo et al. 2017), and its abundance in water stressed Nicotiana
leaves was decreased upon inoculation with beneficial fungal endophytes. In the same study,
inoculated plants also had higher root biomass and relative water content than those that were not
inoculated (Dastogeer et al. 2017). The levels of the sugar alcohol diethylene glycol were lower in
inoculated plants at 14 DAI, and then increased in both treatments between 14 and 21 DAI (Fig.
3.9, Table 3.1). Based on the few available studies, I hypothesize that diethylene glycol might
have been involved in plant response to stresses; hopefully future studies will provide us with more
information regarding the role played by this compound in plant adaptation and microbial
inoculation.
Compared to samples harvested at 7 DAI, those from 14 DAI show a higher number of affected
metabolites. Only trehalose and aminocaproic acid were affected by the bacterial treatment at both
time points. The characteristics of most compounds whose levels were changed at 14 DAI suggest
a protective role played by Azospirillum in inoculated plants against both nutrient deficiency and
low temperature stress. This hypothesis seems to be validated by the decrease of compounds with
antimicrobial activity compared to the first time point in inoculated plants. Conversely, most
compounds significantly affected by the inoculation at 14 DAI can play a role in plant adaptation
to abiotic stresses, namely P deficiency. As our results on plant P concentration show (see Section
3.2 in Chapter 2), at 14 days plants started being P deficient, and the metabolic profile shift
observed in inoculated plants can be linked to an improved adaptation to this stress.
3.4.3 Significantly different compounds at 21 DAI
To the best of my knowledge, the biosynthetic pathway and role of ribonic acid in plant metabolism
have not been described. However, different studies suggest that this organic acid might be
involved in the plant interaction with microorganisms and involved in phosphorus deficiency

87
responses. The concentration of ribonic acid in sugarcane leaves was significantly increased upon
the inoculation with the PGP bacteria Herbaspirillum seropedicae and Gluconacetobacter
diazotrophicus (Aguiar et al. 2018). The concentration of ribonic acid in the leaves of tea plants
grown at different P levels was positively correlated with the amount of P provided to the plants
(Ding et al. 2017), and a similar result was observed in P deficient oat roots, which had
significantly lower ribonic acids compared to plants provided with sufficient P (Wang et al. 2018).
Oat plants had decreased primary roots but increased branch roots after four weeks of P deficiency,
and the ribonic acid content was also decreased compared to plants provided with sufficient P. In
my study, ribonic acid levels were overall steady through time in non-inoculated plants, while
there was a great increase in inoculated plants between 14 and 21 DAI (FC = 84.62), leading to
the highest fold change between the metabolites of inoculated and non-inoculated plants at 21 DAI.
The foliar application of GABA increased the leaf concentration of ribonic acid in the leaves of
the grass Agrostis stolonifera subjected to drought stress and improved their adaptation to the stress
(Li et al. 2017). Azospirillum has been reported to increase the GABA concentration in the tissues
of inoculated sorghum plants (Pacovsky 1988), and similar results were found in this present study
with the levels of GABA increased greatly in inoculated plants between 14 and 21 DAI (FC =
15.15, data not shown). This suggests a connection between ribonic acid and GABA in plant
responses to abiotic stresses. Overall, the results of this study partially confirm published data on
ribonic acid in plants: while inoculation with Azospirillum caused an increase in ribonic acid
content, the decrease in P levels in Brachypodium tissues did not decrease this compound’s levels
in any of the treatments. However, these results suggest the involvement of ribonic acid in
inoculated plants response to P deficiency and a higher content might be an indicator of better
adapted plants. Further studies are required to investigate the mechanisms through which
Azospirillum increased the ribonic acid contents in this experiment, which may possibly involve
GABA.
Xylose is a pentose monosaccharide, commonly found in the root exudates of many cereal species
(Bacilio-Jiménez et al. 2003; Vancura 1964), including Brachypodium (Kawasaki et al. 2016). In
rice, the xylose levels in root exudates seem to be affected by bacterial inoculation in a very
specific way, with different bacterial strains having different effects on the release of this sugar
(Naher et al. 2008). In another study, the application of wheat root exudates to Azospirillum
bacterial cultures strongly increased the xylose levels in the bacterial exopolysaccharide (Fischer

88
et al. 2003), which suggests that xylose detected in the current experiment could have been
synthetised by Azospirillum. Xylose levels were decreased in the roots of wheat plants grown in a
saline environment (Guo et al. 2015); as the cultivar used for this such study was described as salt-
resistant, lowering the xylose content might concur to adapt plants to this stress. In this experiment
(Fig. 3.9), xylose behaved quite similarly in the two treatments, although inoculated samples
contained comparatively higher levels of xylose over time. Xylose content strongly decreased in
both inoculated and control samples between 7 and 14 DAI (FC = -30.5 in control plants, FC = -
21 in inoculated plants). This trend was inverted between 14 and 21 DAI (FC = 1.3 in control
plants, FC = 2.2 in inoculated plants), causing inoculated plants to have higher xylose content than
controls at the end of the experiment (FC = 1.8) (Fig. 3.9, Table 3.1). While a decrease of xylose
levels as part of plant strategy to adapt to abiotic stresses would explain the strong decrease in
xylose content observed in both treatments between 7 and 14 DAI, this hypothesis fails to explain
why inoculated plants had higher xylose content at 21 DAI. It is however noteworthy that the
difference observed between the treatments at 21 DAI is negligible compared to the xylose levels
recorded in the early stages of the experiment (Fig. 3.7), and I suggest that the influence of this
compound on inoculated plants performance was not substantial.
Pyroglutamic acid is an amino acid derivative that can be involved in the interaction of various
plant species with bacteria. This amino acid was found in the root exudates of the grass species
Lolium multiflorum, and in the same study this compound could be used as the sole carbon source
by the bacteria Pseudomonas putida (Kuiper et al. 2002). Another study shows how pyroglutamic
acid detected in tomato root exudates activated chemotaxis in another Pseudomonas species,
Pseudomonas fluorescens (de Weert et al. 2002). Chemotaxis is an important mechanism for early
interactions between plants and bacteria, but as the increase in pyroglutamic acid was observed in
inoculated plants only at 21 DAI (Fig. 3.9, Table 3.1), this could suggest that the stimulation of
bacterial motility was not the main role played by this compound. In a recent study on lettuce, the
treatment with external pyroglutamic acid improved the growth of plants subjected to drought by
improving plant photosynthetic rate and scavenging of ROS (Jiménez-Arias et al. 2019). One
hypothesis is that in this present study the compound improved the adaptation of inoculated plants
to abiotic stress, particularly towards the end of the experiment, but further studies are required to
clarify the role of pyroglutamic acid in the interaction between cereals and PGP bacteria. It is also
noteworthy that the pyroglutamic acid levels were quite similar between the two treatments

89
through the experiment (Fig. 3.9). Finally, this compound was also found in the extracts of the
Azospirillum axenic culture, and it cannot be excluded that the pyroglutamic acid detected in the
inoculated root extracts was at least partially produced by the bacteria.
Serotonin, also known as 5-hydroxytryptamine, is an indoleamine mainly synthesized in plant
roots (Ramakrishna et al. 2011) and various studies suggest that serotonin can play a primary role
in plant resistance against biotic (Hayashi et al. 2016) and abiotic (Kang et al. 2009) stresses.
Serotonin is reported to accumulate in senescing tissues, and in a study on the effect of various
serotonin concentrations on tissue damage caused by nutrient deprivation, leaves of rice mutants
with enhanced serotonin biosynthesis showed delayed senescence compared to wild type plants,
while the opposite was observed in mutants with impaired serotonin biosynthesis (Kang et al.
2009). The authors suggest that this compound plays a protective role against ROS produced in
senescent tissues, and that it might improve nutrient recycling from those tissues towards sink
tissues, enhancing plant adaptation to low nutrient availability. In a study where serotonin
increased the early root development of barley seedlings, the authors hypothesized that it might
modify auxin metabolism (Csaba and Pál 1982). Most importantly, serotonin can shape root
architecture of plants, modulating the development of different root types. Arabidopsis primary
and lateral root growth is inhibited by high exogenous levels of serotonin, which affects cell
division and elongation, particularly of the stem cell niche. Conversely, lower serotonin levels,
while not affecting primary root, increased root branching by stimulating the maturation of lateral
root primordia (Wan et al. 2018; Pelagio-Flores et al. 2011). In my study, serotonin content was
similar in the two treatments at 7 and 14 DAI, but it increased in inoculated plants and decreased
in non-inoculated plants during the last week of the experiment, causing a significant difference at
21 DAI (Fig. 3.9, Table 3.1). This is consistent with the slower primary root and increased branch
roots development observed in inoculated plants at later stages of the experiment (see Section 3.3.2
of Chapter 2), and suggests a role of serotonin in shaping the root architecture of Brachypodium.
My study did not differentiate between primary and branch roots metabolome, and it would be
interesting to determine whether serotonin concentration differed between these root types,
possibly inhibiting primary root growth while at the same time stimulating branch roots. The
increased tissue concentration of serotonin is usually associated with an increased abundance of
its precursor and product, tryptophan and melatonin, respectively (Kaur et al. 2015; Hernández‐
Ruiz et al. 2005). While melatonin was not detected in this study, an increase of tryptophan levels

90
in inoculated plants between 14 and 21 DAI (FC = 2.26) was observed, which strengthens the
theory that inoculation did enhance the tryptophan pathway and this likely improved
Brachypodium’s adaptation to P deficiency. Tryptophan has an important role in the accumulation
of secondary metabolites, and the modulation of its levels in response to stress regulates the
biosynthesis of auxin and serotonin (Ramakrishna et al. 2011).
Compared to the results observed at 14 DAI, a smaller number of metabolites was significantly
different between the two treatments at 21 DAI, and the identity of those compounds changed
again compared to the previous time point, with the exception of pentonic acid, 1,4-lactone. This
may suggest a change in plant strategy to face the increasing P deficiency in their tissues. As
observed at 14 DAI, also at 21 DAI the significantly affected compounds may also play a role in
plant adaptation to nutrient deficiency and low temperatures, rather than limiting bacterial growth
as observed at 7 DAI.
In summary, the comparison between the metabolic profiles of inoculated and non-inoculated
plants at different time points of their growth in the Growscreen-PaGe system tells us that the
interaction between Brachypodium and Azospirillum changed greatly during the experiment.
During the early stages of the experiment, I hypothesize that bacteria were sensed as pathogens by
the host, and Brachypodium was producing compounds with antimicrobial properties in order to
limit the bacterial colonization of roots. This trend changed at later stages of the experiment, when
fewer and different compounds that can be linked to the plant immune response were produced,
and most compounds whose levels were affected suggest an improved response to P deficiency by
inoculated plants, a hypothesis supported by their enhanced root development compared to non-
inoculated plants during the second half of the experiment. The comparison between those
compounds that were increased in inoculated plants and the polar metabolites extracted from
Azospirillum axenic culture provided useful information on the origin of those compounds.
Nevertheless, I cannot exclude that some of those compounds might be synthetised by
Azospirillum only when interacting with Brachypodium, and further research is required to
determine with certainty which organism produced those compounds.

91
Chapter 4
Lipidome rearrangements in
Brachypodium distachyon roots at various
stages of the interaction with the PGP
Azospirillum brasilense

92
4.1 Introduction
Plant lipids play essential roles as energy storage compounds, and in cell compartmentalization,
interactions with other organisms and developmental processes. As the cell membrane’s main
components, they are particularly relevant in the interaction of cells with the surrounding
environment, and in recent years various studies focused on plant lipids to investigate plant
response to biotic and abiotic stresses (Sheikh et al. 2020; Hou et al. 2016; Siebers et al. 2016).
When focusing on lipid rearrangements in plants subjected to abiotic stresses, P deficiency is one
of the most studied issues. Cell membrane glycerophospholipids (GP) are a primary P deposit,
containing 15-20% of total organic P (Poirier et al. 1991), and P deficient plants can use them as
a source of P for essential metabolic pathways. Digalactosyldiacylglycerol (DGDG) is a
galactolipid found mainly in the chloroplasts of P sufficient plants but, thanks to its amphipathic
structure, it can replace GPs in the cell membrane. The levels of both DGDG and its precursor
monogalactosyldiacylglycerol (MGDG) increase in many species grown in low P (Andersson et
al. 2003; Dissanayaka et al. 2018; Pfaff et al. 2020; Tjellström et al. 2008). Recent studies also
report the increase of triacylglycerols (TG) in Arabidopsis (Pant et al. 2015) and tomato (Pfaff et
al. 2020) plants in low P conditions. TG is an energy storage compound in plants grown in optimal
conditions, and its function in P deficient plants still needs to be elucidated. Sphingolipids are
involved in plant responses to both biotic and abiotic stresses and are associated with cell
membrane and cell wall constitution, signal transduction, programmed cell death, cell division,
growth and differentiation. Interestingly, the signal transduction in response to pathogenic bacteria
can also be elicited by bacterial sphingolipids, but their role as signaling molecules has not been
clarified yet (Ali et al. 2018).
The majority of studies on the roles of lipids in plant-bacteria interactions have investigated
pathogenic bacteria (Ali et al. 2018; Farmer et al. 2003; Siebers et al. 2016) and those that studied
beneficial bacteria focused mainly on nitrogen fixing bacteria interacting with legumes (Zhang et
al. 2020; Santi et al. 2017). The few studies on plants colonized by PGP bacteria report that various
plant lipid classes can be affected by this beneficial interaction. Recently, Zhang et al. (2020)
suggested that increased membrane GP biosynthesis occurs in the nodules during the symbiosis
between soybean and nitrogen fixing rhizobia. While the concentration of various GPs was
increased in nodules compared to the rest of the roots, the opposite trend was displayed for

93
galactolipids (MGDGs and DGDGs). The effects of Azospirillum on plant GP levels are still
unclear: inoculation with Azospirillum increased the GP content of cowpea calli (Bashan et al.
1992), but no change in wheat root phospholipids levels was observed upon inoculation as
described by Pereyra et al. (2006), who rather reported that Azospirillum altered the GP
composition of inoculated plants, both under normal and water stressed condition.
In this chapter, I am studying the lipid compounds extracted from roots of Brachypodium
distachyon grown at suboptimal temperatures and P availability and inoculated or not with the
PGP bacteria Azospirillum brasilense sp245. Membrane GPs retain a particular importance in this
study as they are an essential component of the interface between cells and the surrounding
environment, but are also a source of P for the plant. I tested the effect of P deficiency on root lipid
composition at various stages of the experiment, and the possible interplay between bacterial
inoculation and increasing P deficiency. Furthermore, I investigated the possible role of the
affected lipid classes in the plant response to the growing conditions, comparing them with the
insights obtained from the polar metabolite analysis in Chapter 3.
4.2 Materials and methods
4.2.1. Plant growth conditions
See Section 2.1 of Chapter 3
4.2.2. Lipid extraction from roots
For lipid analysis, approximately 10 mg of frozen root tissue from each pooled group was
transferred to 2mL tubes and 400 µL of -20°C 100% LC-MS grade isopropyl alcohol (Roth,
Karlsruhe, DE) containing 25 µM deuterated cholesterol (internal standard, Sigma-Aldrich,
Munich, DE) and 0.01% butylated hydroxytoluene (BHT, Sigma-Aldrich, Munich, DE) were
added to each sample. The tubes were then shaken at 1400 rpm for 15 min at 75°C. Once cooled
to room temperature, 1.2 mL of a chloroform : MeOH : water (30 : 41.5 : 3.5, v : v : v) mixture
were added to each sample (all reagents were LC-MS grade and purchased from Roth, Karlsruhe,
DE). The tubes were then shaken at 300 rpm for 24 h at 25°C and centrifuged at 13000 rpm for 15
min at room temperature. The supernatant was then dried down with a N2 gas stream for
approximately 50 min.

94
The root lipid profiles of the two treatments at 7, 14 and 21 days after the inoculation (DAI) were
then compared through untargeted LC-MS analyses.
4.2.3. Lipid extraction from bacteria
Lipids were also extracted from Azospirillum grown axenically in NFb medium at 20°C (see
growing conditions in Section 2.3 of Chapter 3). This allowed comparison and the potential to
identify lipids derived from the bacteria in the inoculated Brachypodium root samples.
At late exponential growth phase, approximately 1.5 x 10⁸ Azospirillum cells per sample were
washed twice in sterile PBS and the cells harvested by centrifugation at 10000 rpm for 5 min at
4°C. Cells were resuspended in 500 µL of a MeOH : 0.1 N HCl (1:1) mixture (all reagents were
purchased from Sigma-Aldrich, Castle Hill, AU) at -40°C; snap frozen in liquid nitrogen and
shaken at room temperature until they thawed. This freeze-thaw step was repeated ten times, to
break all bacterial cells in the samples. 750 µL of a chloroform : MeOH (1:2) mixture containing
1 mM BHT & 50uM d-cholesterol were added to each sample and they were mixed using a vortex
and vigorously hand shaken for 5 min at room temperature. Samples were sonicated for 30 min at
room temperature and centrifuged at 13,000 rpm for 5 mins at 0°C. The upper phase was then
transferred to a new tube. The lower phase was mixed with 500 µL of a MeOH : chloroform:0.1
N HCl (1:2:0.8) mixture, and the sonication and centrifugation repeated as above. The upper phase
was combined with that previously obtained and dried down using a speed vacuum dryer (John
Morris Scientific Pty. Ltd, Australia).
4.2.4 LC-MS analysis
Dried lipid extracts were resuspended in 200 µL of a butanol : MeOH (1:1, v/v) mixture containing
10 mM ammonium formate. Eight pooled biological quality control (PBQCs) samples were
prepared by pooling 10 µL from each resuspended sample, and aliquoting this sample into eight
vials.
Untargeted analysis of samples extracted from Brachypodium roots was then performed using the
liquid chromatographic conditions derived from those described by Hu et al. (2008). An Agilent
1290 HPLC system was employed for the chromatographic separation of lipids on an InfinityLab
Poroshell 120 EC-C18 2.1 x 100 mm (2.7-Micron particle size) column (Agilent, USA) operated
at 55 °C. The samples were placed in the autosampler set at 12 °C and an injection volume of 10

95
µl and a flow rate of 0.26 mL/min were employed. Elution was performed over 30 min using a
binary gradient consisting of acetonitrile (ACN)-water (60:40, v/v) (eluent A) and isopropanol
(IPP)-ACN (90/10, v/v) (eluent B), both containing 10 mM ammonium formate. The gradient used
for the eluent B was the following: 1.5 min at 32%, increased to 45% in 2.5 min, to 52% in 1 min,
to 58% in 3 min, to 66% in 3 min, to 70% in 3 min, to 75% in 4 min, to 97% in 3 min and there
maintained for 4 min. Finally, solvent B was decreased to 32% in 0.1 min and maintained at 32%
for another 4.9 min for column re-equilibration. Lipids were analyzed using a Sciex Triple TOFTM
6600 QqTOF mass spectrometer equipped with a Turbo VTM dual-ion source [electro-spray
ionization (ESI) and atmospheric pressure chemical ionization (APCI)] and an automated calibrant
delivery system (CDS) using Information Dependent Acquisition method (IDA) in positive ion
mode. The parameters were set as follows: MS1 mass range, 80-1500 m/z; MS2 mass range, 80-
1000 m/z; time of flight (ToF) MS accumulation time, 250 ms; TOF MS/MS accumulation time,
40 ms; collision energy, +40 V; cycle time, 3579 ms. The following ESI parameters were used:
source temperature, 450 ºC; curtain gas, 45 psi; Gas 1, 45 psi; Gas 2, 45 psi; declustering potential,
+150 V; Ion spray voltage floating, 4500 V. The instrument was calibrated automatically with the
CDS delivering APCI calibration solution every five samples. A total of 46 samples (38 biological
samples + 8 PBQCs) were analysed.
Three root PBQC extract samples and three bacterial extract samples were further analysed using
a different IDA method and a Sequential Window Acquisition of All Theoretical Fragment-ion
Spectra (SWATH) method, both in positive ion mode. For the SWATH analysis, the HPLC
settings were the same as previously described, except that 15 µL of sample was injected in the
column. The same mass spectrometer employed previously was set as described in Hiroshi et al.
(2018): MS1 and MS2 mass range, 100-1250 m/z; TOF MS accumulation time, 50 ms; TOF
MS/MS accumulation time, 10 ms; collision energy, +45 V; period cycle time, 700 ms. ESI
parameters were: source temperature, 350 ºC; curtain gas, 35 psi; Gas 1, 60 psi; Gas 2, 60 psi;
declustering potential, +80 V; Ion spray voltage floating, 5500 V.
For the new IDA method, MS settings developed by Cheka Kehelpannala (personal
communication) were used: MS1 and MS2 mass range of 100-1700 Da, TOF MS accumulation
time of 200 ms, TOF MS/MS accumulation time of 25 ms, collision energy of +45 V and period

96
cycle time of 2750 ms. ESI parameters were: source temperature, 250 ºC; curtain gas, 30 psi; Gas
1, 25 psi; Gas 2, 25 psi; declustering potential, +80 V; Ion spray voltage floating, 5000 V.
4.2.5 MS data analysis
The features obtained from the IDA and SWATH analyses of the PBQC samples were annotated
using the internal lipid library of MS-DIAL v4.12 (Tsugawa et al. 2015) and the features were
processed using the following settings: MS1 tolerance, 0.01 Da; MS2 tolerance, 0.025 Da;
minimum peak height, 1000 amplitude; mass slice width, 0.1 Da; sigma window value, 0.5;
amplitude of MS/MS abundance cutoff, 0 and retention time tolerance, 24 min. The lipids were
annotated using the following parameters MS1 accurate mass tolerance, 0.01 Da; MS2 accurate
mass tolerance, 0.05 Da; identification score cut off, 80% and adduct ion settings, [M+H]+,
[M+NH4]+, [M+Na]+, [M+CH3OH+H]+, [M+K]+, [M+ACN+H]+, [M+H∙H2O]+,
[M+2H∙H2O]+, [M+2Na∙H]+, [M+IsoProp+H]+, [M+CAN+Na]+, [M+2K∙H]+, [M+DMSO]+.
The peaks were aligned using a retention time tolerance of 0.05 min and MS1 tolerance of 0.015
Da. Then, a list of annotated lipids with their respective retention times was compiled.
The compiled list of lipids was used to annotate the mass spectrometric features extracted from
the IDA of the root samples. The same settings described previously were used, except for the
alignment parameter settings, where a retention time tolerance of 1 min and MS1 tolerance of 0.02
Da were used.
4.2.6 Statistical and bioinformatic analyses
MS-DIAL output data consisting of peak areas of annotated lipids and unidentified features was
preprocessed prior to comparing them among the different treatments and time points. Peak area
of all detected features were normalized to the fresh weight of each sample, and features with
coefficient of variation (𝐶𝑉 =SD(PBQCs)
mean(PBQCs)) above 20% were discarded, to ensure the
reproducibility of the results (Yu et al. 2018).
The statistical analyses of lipidomic data were the same as described in Section 2.6 of Chapter 2.
Briefly, the lipid profiles were compared between treatments at the same time point and between
different time points of the same treatment using the web-based tool Metaboanalyst 4.0
(https://www.metaboanalyst.ca/). Six biological replicates were compared for each time point x
treatment combination, except for non-inoculated samples at 21 DAI, which had eight replicates.

97
Before undergoing statistical analyses, data were screened on Metaboanalyst by filtering-out non-
informative variables detected using interquantile range. The features abundance was then
normalized by median, log transformed and auto scaled.
Lipid profiles were displayed using 2D principal component analysis (PCA) and hierarchical
cluster analysis paired with a heatmap of metabolite abundances. The abundance of the lipids
detected in inoculated and non-inoculated treatments was compared at each time point, and the
statistical significance between the measured abundances were analyzed using the Student’s t-test.
When comparing abundance of the features between different treatments or time points, only those
with a fold change (FC) < -1.5 or > 1.5 and with raw P-value < 0.05 were considered significantly
different.
K-means clustering of the relative responses from identified lipid species through time was
performed in RStudio v. 1.2.5019 (Ihaka and Gentleman 1996). A function named “KmeansPlus”
was written and compiled in the publicly available R package RandoDiStats. The built function
uses and depends on the R package ComplexHeatmap (Gu et al. 2016) as is detailed in the GitHub
repository (https://github.com/MSeidelFed/RandodiStats_package). The function call defaults
were used. Briefly, Pearson correlation was taken as a similarity distance between lipid variables,
average was taken as the cluster construction method and a clustering consensus from 1000 runs
was compiled to prevent misrepresentation from an outlier run. Finally, seven partitions or clusters
were formed based on the encountered patterns between conditions. The R function returns in the
environment a data frame containing the lipid variables that belong to each of the produced
clusters, easing the interpretation of results. Additionally, in the working directory, plots dependent
on ggplot2 (Valero-Mora 2010) were generated. The plots feature the mean intensity of lipids that
belong to each cluster as solid-colored lines and the standard error as shade around the mean.
4.3 Results
4.3.1 The Brachypodium root lipidome
A total of 6297 features were detected in Brachypodium root extracts, and of those 257 were
annotated as lipids. Identified species belonged to glycerolipids (GL, 178), glycerophospholipids
(GP, 62) and sphingolipids (SP, 17). GLs were divided into acyl diacylglyceryl glucuronides
(ADGGA, 14), diacylglycerols (DG, 27), digalactosyldiacylglycerols (DGDG, 20), diacylglyceryl

98
glucuronides (DGGA, 11), monogalactosyldiacylglycerols (MGDG, 7) and triacylglycerols (TG,
99). GPs were divided into lysophophatidylcholines (LPC, 8), phophatidylcholines (PC, 27),
phosphatidylethanolamines (PE, 16), phosphatidylglycerols (PG, 6) and phosphatidylinositols (PI,
5). SPs were divided into ceramide alpha-hydroxy fatty acid-phytospingosines (Cer-AP, 9),
hexosylceramides (HexCer, 2), hexosylceramide alpha-hydroxy fatty acid-phytospingosines
(HexCer-AP, 4) and ceramide phosphoinositols (Pi-Cer, 2).
4.3.2 Bacterial lipids
105 lipid species were detected in Azospirillum lipid extracts. Identified species belonged to GLs
(71), GPs (29) and sterol lipids (ST, 5). GLs were divided into DGs (22) and TGs (49). GPs were
divided into cardiolipins (CL, 3), LPC (2), PCs (3), lysophophatidylethanolamines (LPE, 2), PEs
(12) and PGs (7). All 5 sterol lipids were cholesteryl esters (CE). Of the 105 lipid species present
Azospirillum axenic culture, 53 were also detected in Brachypodium lipid extracts.
4.3.3 Features comparison of inoculated and non-inoculated plants
The hierarchical clustering and PCA plot of lipid species and unidentified features detected in
Brachypodium inoculated and non-inoculated roots at different time points show that features
separated based on time of harvest. The relative abundance of two out of the three main lipid
clusters (Fig. 4.1) differed between 7 and 14 DAI, and the third one differed between 14 and 21
DAI. As a result, all the three cluster had opposite relative abundance between 7 and 21 DAI. Lipid
species did not separate based on the bacterial treatment (Fig. 4.1-4.2), while a more pronounced
clustering was observed in unidentified features, particularly at 7 and 21 DAI (Fig. 4.3). For both
identified lipid species (Fig. 4.5-4.7) and unidentified features (Suppl. Fig. 7.10a, 7.11a, 7.12a)
the hierarchical clustering of samples harvested at the same time points did not show separation
between the two treatments.

99
Figure 4.1 Hierarchical clustering coupled with heatmap of the lipid profiles of Azospirillum-inoculated (A) and
non-inoculated roots (N) of Brachypodium harvested at 7, 14 and 21 DAI. The lettering at the bottom of the heatmap
indicates the replicates: for each replicate, blue and red colors indicate the lower or higher abundance of specific
lipids compared to the other replicates, with darker colors indicating more pronounced differences. The main lipid
clusters are indicated with branches of different colors.

100
Figure 4.2 Principal component analysis of the lipid profiles of Azospirillum-inoculated (A) and non-inoculated roots (N) of
Brachypodium harvested at 7, 14 and 21 DAI. Ellipses around samples display 95% confidence areas.

101
Figure 4.3 Hierarchical clustering coupled with heatmap of the unidentified features profiles of Azospirillum-
inoculated (A) and non-inoculated roots (N) of Brachypodium harvested at 7, 14 and 21 DAI. The lettering at the
bottom of the heatmap indicates the replicates: for each replicate, blue and red colors indicate the lower or higher
abundance of specific lipids compared to the other replicates, with darker colors indicating more pronounced
differences.

102
Figure 4.4 Principal component analysis of the unidentified features profiles of Azospirillum-inoculated (A) and non-
inoculated roots (N) of Brachypodium harvested at 7, 14 and 21 DAI. Ellipses around samples display 95% confidence
areas.

103
Figure 4.5 Hierarchical clustering coupled with heatmap of the lipid profiles of Azospirillum-inoculated (A) and non-
inoculated roots (N) of Brachypodium harvested at 7 DAI. The lettering at the bottom of the heatmap indicates the
replicates: for each replicate, blue and red colours indicate the lower or higher abundance of specific metabolites
compared to the other replicates, with darker colours indicating more pronounced differences.

104
Figure 4.6 Hierarchical clustering coupled with heatmap of the polar metabolite profiles of Azospirillum-inoculated
(A) and non-inoculated roots (N) of Brachypodium harvested at 14 DAI. The lettering at the bottom of the heatmap
indicates the replicates: for each replicate, blue and red colours indicate the lower or higher abundance of specific
metabolites compared to the other replicates, with darker colours indicating more pronounced differences.

105
Figure 4.7 Hierarchical clustering coupled with heatmap of the polar metabolite profiles of Azospirillum-inoculated
(A) and non-inoculated roots (N) of Brachypodium harvested at 21 DAI. The lettering at the bottom of the heatmap
indicates the replicates: for each replicate, blue and red colours indicate the lower or higher abundance of specific
metabolites compared to the other replicates, with darker colours indicating more pronounced differences.

106
The first three principal components of identified lipid species explained 62.7, 58.4 and 52.3 % of
variance at 7, 14 and 21 DAI, respectively (Fig. 4.8). The visualization of PCA confirms the
hierarchical clustering results, i.e. no separation between samples was caused by the bacterial
inoculation, regardless of the time of harvest. For unidentified features, the first three principal
components explained 57, 52.7 and 50.6 % of variance at 7, 14 and 21 DAI. For these features,
clustering of the two treatments was more pronounced, particularly at 14 and 21 DAI (Suppl. Fig.
7.11b, 7.12b).
Figure 4.8 Principal component analysis of the lipid profiles of Azospirillum-inoculated (A) and non-inoculated (N)
roots of Brachypodium harvested at 7, 14 and 21 DAI. Ellipses around samples display 95% confidence areas.

107
Figure 4.9 Volcano plots of significantly affected lipids in the comparison between bacteria inoculated and non-
inoculated samples at 7 DAI (a), 14 DAI (b) and 21 DAI (c). Red dots represent compounds with FC<-1.5 or >1.5 and
probability of significant difference between mean of Azospirillum-inoculated and non-inoculated plants based on
Student’s t-test p<0.05.

108
Figure 4.10 Volcano plots of significantly affected unidentified features in the comparison between bacteria
inoculated and non-inoculated samples at 7 DAI (a), 14 DAI (b) and 21 DAI (c). Red dots represent compounds with
FC<-1.5 or >1.5 and probability of significant difference between mean of Azospirillum-inoculated and non-
inoculated plants based on Student’s t-test p<0.05.

109
The analysis of the individual lipid species in the two treatments at different time points shows
that the levels of very few lipids were affected by the inoculation. DGDG 36:1, LPC 14:0 and PE
33:2 were less abundant in inoculated plants at 7 DAI; PC 30:1 was more abundant in inoculated
plants at 14 DAI. No lipid species differed significantly at 21 DAI (Fig. 4.9). None of the affected
lipids was also detected in the extracts of bacteria grown in axenic culture (data not shown).
The levels of the unidentified features were more affected by inoculation, with 82 of the features
increased and 90 decreased at 7 DAI, 65 increased and 131 decreased at 14 DAI and 100 increased
and 72 decreased at 21 DAI (Fig. 4.10).

110
Figure 4.11 Time course profile k-means clustering of lipid species identified in bacteria inoculated and non-
inoculated samples harvested at 7, 14, and 21 DAI. Clusters formed in the two treatments were matched based on their
lipid species composition. ADGGA: acyl diacylglyceryl glucuronide, Cer-AP: ceramide alpha-hydroxy fatty acid-
phytospingosine, DG: diacylglycerol, DGDG: digalactosyldiacylglycerol, DGGA: diacylglyceryl glucuronide, GP:
glycerophospholipids, HexCer: hexosylceramide, HexCer-AP: hexosylceramide alpha-hydroxy fatty acid-
phytospingosine, TG: triacylglycerol.
The time series k-means clustering of identified lipid species in inoculated and non-inoculated
plants produced seven clusters, which were paired between the two treatments based on the lipids
they were comprised of (Fig. 4.11). The degree of similarity between the clusters in each pair was
generally good, varying between 48.7 and 75.5% for six out of the seven paired clusters (for the
complete cluster composition and the similarity scores of each cluster pair, see Suppl. Table 7.2).

111
The clusters of inoculated and non-inoculated samples differed particularly in the first and second
pairs. In the third pair (Fig. 4.11c), features identified in non-inoculated samples were generally
stable between 7 and 14 DAI, and decreased at 21 DAI, while those from inoculated samples
increased between 7 and 14 DAI and decreased again between 14 and 21 DAI. In the fourth pair
(Fig. 4.11d), features from non-inoculated samples decreased between 7 and 14 DAI and were
generally stable between 14 and 21 DAI, while features from inoculated samples were stable
between 7 and 14 DAI and increased between 14 and 21 DAI.
4.3.4 Glycerophospholipids and galactolipids
The comparison of specific lipid classes at different time points shows converse trends between
GPs (PCs and PEs) and galactolipids (MGDGs and DGDGs) in both treatments (Fig. 4.12-4.13).
Of the 27 detected PCs, 13 decreased and 5 increased in inoculated plants between 7 and 21 DAI.
A similar result was observed in non-inoculated plants, where 15 PCs decreased and 5 PCs
increased during the same time window (Fig. 4.12a). The 16 detected PEs show a similar behavior,
with 7 decreased and 2 increased lipid species in inoculated plants, and 7 decreased and 1 increased
lipid in non-inoculated plants (Fig. 4.12b). Between 7 and 21 DAI, all 20 detected DGDGs
increased in both treatments, while out of the 7 detected MGDGs, 5 and 4 increased in inoculated
and non-inoculated plants, respectively. None of the detected galactolipids decreased during the
experiment, in either of the treatments (Fig. 4.13a, b).

112
Figure 4.12 Relative response of GPs in roots of plants with or without Azospirillum inoculation and harvested at 7,
14 and 21 DAI. Means are presented. n = 6 for all pooled samples except for non-inoculated at 21 DAI (n = 8).

113
Figure 4.13 Relative response of galactolipids in roots of plants with or without Azospirillum inoculation and
harvested at 7, 14 and 21 DAI. Means are presented. n = 6 for all pooled samples except for non-inoculated at 21 DAI
(n = 8).

114
4.4 Discussion
Untargeted analysis of lipid compounds extracted from Azospirillum-inoculated and non-
inoculated Brachypodium roots at various time points of their growth provided three major
insights. Firstly, lipids changed in roots grown under both conditions similarly through time, thus
indicating a developmental effect on root lipid composition. Secondly, both treatments reacted in
a similar way to the increasing P deficiency, with a strong increase in galactolipids and a strong
decrease in GP levels. Finally, the bacterial treatment did not significantly affect the root lipid
profile, at any of the time points; however, specific lipid classes behaved differently through time
in the two treatments.
4.4.1 Phosphorus deficiency affected the root lipid profile of both inoculated and non-
inoculated Brachypodium
The levels of both GPs and galactolipids fluctuated similarly in both treatments, with most GPs
decreasing and most galactolipids increasing between 7 and 21 DAI (Fig. 4.12-4.13). The
magnitude of these changes was analogous in Azospirillum-inoculated and non-inoculated roots,
as the levels of very few lipid species differed significantly between the two treatments, and those
differences decreased with time (Fig. 4.9). Plants subjected to P deficiency can react by recycling
internal P for essential metabolic processes, and the capacity to remobilize P from senescing plant
tissues and redirect it to developing parts is a sought after trait for crops grown in P-poor
environments (Dissanayaka et al. 2018). GPs are second only to RNA as the most abundant
phosphorylated compounds in plants, and their replacement with non-phosphorous lipids in plasma
membranes, mitochondrial membranes and tonoplasts is an established strategy in roots of various
cereal crops to deal with P deficiency (Tjellström et al. 2008). The initial step of this rearrangement
is the hydrolysis of GPs to DGs and P, with the mobilized P then being utilized in important P
depending metabolic pathways. DGs are further converted to MGDGs and DGDGs by
consecutively adding two galactose moieties from UDP galactose (Kelly and Dörmann 2002).
DGDGs can then form a bilayer with similar characteristics to the GP bilayer in cell membranes
(Yu et al. 2002). When oat plants were supplied with varying P levels for 30 days, low P caused
an increase in the DGDG/PC ratio in plant roots through time, while this ratio remained stable in
plants supplied with optimal P levels (Tjellström et al. 2008). As my experiment did not include a
P-sufficient treatment, I cannot exclude that the strong decrease of GPs and concurrent increase of

115
galactolipids in both the treatments through time was caused by the aging of the plant. Nevertheless
these trends, together with the decreased shoot P concentration (see Section 3.2 of Chapter 2) and
the reduction in P-containing polar compounds (see Section 3.4 of Chapter 3) observed in both
treatments, are further indications of the increasing P deficiency that plants in both treatments were
facing through the experiment.
4.4.2 Azospirillum affected different root lipid classes in Brachypodium through time
The comparison in the abundances of single lipid species revealed that very few lipids were
significantly affected by the inoculation during the experiment: three lipid species were less
abundant in inoculated plants at 7 DAI and one was more abundant in inoculated plants at 14 DAI
(Fig. 4.9). This result made the extraction and analysis of lipids from the axenic bacterial culture
quite redundant, as the initial aim was to compare the lipids identified in the different extracts and
clarify the origin of those significantly increased by the inoculation, as previously done for the
polar metabolites (see Sections 2.3 and 4 of Chapter 3). Inoculation effects were more profound
on unidentified features, which displayed a clearer clustering at different time points (Fig. 4.3) and
a higher number of significantly affected features (Fig. 4.10).
Further insights were provided by the comparison of k-means clusters of identified features
through time, which revealed that the GP, DG and TG lipid classes behaved differently in the two
treatments through time (Fig. 4.11c, d).
Very few studies have so far focused on the effect of beneficial bacteria on the root lipid
composition of plants, either grown in optimal conditions or facing stresses. Due to the importance
of GPs in cell membranes, most studies focus on the effects of bacterial inoculation on this lipid
class, providing differing insights. A number of studies reviewed by Siebers et al. (2016) report
that during the interaction between plants and bacteria, microbe associated molecular patterns
(MAMPs) trigger plant immune response, and phosphate containing lipids play an important role
in this response. Phospholipases convert GPs to fatty acids (FAs) and lysoglycerophospholipids
(LGPs), DGs or phosphatidic acid (PA) which act as signaling molecules in the plant. Nonetheless,
not all studies report significant changes in plant GPs during the interaction with PGP bacteria.
When Pereyra et al. (2006) inoculated wheat plants with A. brasilense Sp245, GP levels in roots
were not affected in normal conditions or during osmotic stress. In my study, two GPs (LPC 14:0
and PE 33:2) were significantly less abundant in inoculated plants at 7 DAI, while PC 30:1 was

116
significantly more abundant in inoculated plants at 14 DAI (Fig. 4.7). The k-means clustering
suggests that through time, this lipid class, which clustered together with DGs, might have behaved
differently in the two treatments (Fig. 4.11c). As DGs can be a product of GPs hydrolysis, the fact
that their levels changed similarly through time is noteworthy, but further studies on the
importance of this lipid class in interactions between plants and PGP bacteria are required.
Galactolipids are normally found in plant chloroplasts, but their levels in cell membranes of both
shoots and roots can be significantly increased by both biotic and abiotic factors. The effect of
bacterial inoculation on plant galactolipids has been recently studied by Gao et al. (2017).
Expression of the genes encoding two lipases, the most important lipid metabolism enzymes, was
reduced in rice shoots as part of the defense response to the inoculation with the bacterial pathogen
Xanthomonas. In the same study, transgenic rice with increased lipase expression displayed
increased total MGDG levels and was more susceptible to the pathogen; transgenic plants with
reduced lipase expression had instead similar MGDG levels but were less susceptible than the wild
type. While the authors did not test whether the bacterial inoculation increased the actual
galactolipid levels in rice, they suggest that the two lipases and galactolipids negatively affected
rice defense against the pathogen. In my study, the polar metabolite analyses suggest that
Azospirillum was sensed as a pathogen during the first week of the interaction with Brachypodium
(see Section 4.1 of Chapter 3). Nevertheless, I did not observe significant changes in galactolipids,
except for DGDG 36:1, which was significantly decreased in inoculated plants at 7 DAI (Fig.
4.9a). In addition, in the k-means clustering analysis, the fluctuations of both MGDGs and DGDGs
did not clearly differentiate through time (Fig. 4.11, Suppl. Table 7.2). This may have different
explanations: Gao et al. (2017) only measured lipase gene expression levels in plant shoots until
48h after the inoculation, while I first compared the lipids in roots of inoculated and non-inoculated
plants only 7 d after the inoculation. It is still possible that the lipase (and consequently
galactolipid) levels changed in plant shoots during the earlier stages of the interactions between
Brachypodium and Azospirillum. Furthermore, galactolipids have been reported to differently
affect the immune response of different plants (Oh et al. 2005), and tissue- and time-specific
experiments are needed to clarify the role of this lipid class in Brachypodium when inoculated
with PGP bacteria.

117
Zhang et al. (2020) report that in the interaction between soybean and rhizobia, TG synthesis was
decreased in nodules compared to roots. Conversely, the halophyte Bassia indica grown under salt
stress showed improved growth and increased TG content in shoots when inoculated with the PGP
bacteria Bacillus subtilis (Abeer et al. 2015). Calderon-Vazquez et al. (2008) hypothesize that TG
degradation could be part of Zea mays response to P deficiency, to provide acyl groups for the
synthesis of glycolipids (e.g. galactolipids) as GPs substitutes. Overall, the available studies on the
link between plant TGs, PGP bacteria and P deficiency are still scarce and results are inconsistent,
but the different behavior of this class of lipids between inoculated and non-inoculated plants in
my study suggests that they may be involved in plant response to inoculation and could have been
involved in plant adaptation to low P.
Various studies suggest an important role of sphingolipids in plant acclimation to low temperatures
(Ali et al. 2018). Inoculated Brachypodium plants had better developed shoots than uninoculated
plants from the early stages of the experiment (see Section 3.1 of Chapter 2), when the shoot P
concentration suggests that they were not yet P deficient and the low temperature was arguably
the main abiotic stress the plants were subjected to. Despite this, no differences in the sphingolipids
levels between the two treatments were observed in my study at any time point. This could be
explained by different hypotheses; first, the improved cold acclimation seen in inoculated plants
could have been caused by mechanisms other than the change of sphingolipids levels, or those
changes could have happened earlier than 7 DAI, when I first analysed the roots lipidome. It is
also possible that the affected sphingolipids were not identified by my analyses, which annotated
a total of 17 sphingolipids. Finally, I hypothesize that the improved cold tolerance of inoculated
plants was mostly observed in their shoots, which developed larger leaves and more dry biomass
in the early stages of plant growth (see Section 3.1.3 of Chapter 2). It could also be that
sphingolipids levels were changed in Brachypodium shoots but not (or less) in their roots, which
were analysed in my study.
Although in the earlier stages of the experiment (7 DAI) a number of defense-related polar
metabolites were affected, the same was not observed for the identified lipid species, despite
membrane lipids being pivotal in plant interactions with microorganisms (Siebers et al. 2016). In
general, the effect of inoculation on Brachypodium root lipid profile was less significant than the
effect observed on the polar compounds observed in Chapter 3. Nevertheless, differences between

118
inoculated and non-inoculated plants were observed in the fluctuations of specific lipid classes
thanks to the k-means cluster analysis. Compared to other unsupervised methods for the graphical
representations of high-dimensional data such as PCA and hierarchical clustering, k-means
clustering can be more effective in identifying subtle changes in metabolites abundance (Dickinson
et al. 2018), and allowed to detect the effect of inoculation on DGs, GPs and TGs, which will need
to be further investigated in future studies.
Overall, the limited differences observed between the lipid profiles of the two treatments through
the experiment could have different explanations. Most of the cited studies on plant-microbes
interactions showed lipid rearrangements in the first stages of the interaction (12-48 h) (Gao et al.
2017; Pereyra et al. 2006). It is possible that, while the immune response involving polar
metabolites continued at least until 7 DAI (see Section 4.1 of Chapter 3), the lipid response
happened mainly in the first hours/days of the interaction. Since many of the membrane lipids
involved in plant response to biotic interactions are GPs, it is also possible that Brachypodium’s
response to Azospirillum was heavily affected by the increasing P deficiency they suffered through
the experiment, and this would also explain why the number of lipids significantly affected by the
inoculation gradually decreased during the experiment (3 at 7 DAI, 1 at 14 DAI and 0 at 21
DAI).The third possible explanation is that some affected lipids lie among the features that were
not identified as lipids using the currently available libraries. Those features separated more clearly
between the two treatments (Fig. 4.3, Suppl. Fig. 7.11b, Suppl. Fig. 7.12b) and a greater number
differed significantly between inoculated and non-inoculated plants (Fig. 4.10). While I am aware
that not all those features may be real lipids and some will just be noise, lipid fragments or
contaminants, a number of them could be novel lipid species still not present in the available
libraries, as reliable and comprehensive databases for the identification of detected lipid species
are still under construction (Gika et al. 2018). When improved libraries will become available,
using them to newly annotate the features detected in my study will hopefully allow us to
characterize further lipid species affected by the inoculation with Azospirillum. Finally, the fact
that the levels of identified lipid species did not vary between the two treatments does not
necessarily mean that plants were not synthetizing more or less of certain lipid species and those
changes were hidden by the bacterial production or consumption of those same compounds.
Transcriptomic analysis of inoculated and non-inoculated plant roots could help clarify this

119
hypothesis, by linking the abundance detected metabolites with the expression of the genes
involved in their synthesis.

120
Chapter 5
Conclusions

121
5.1 Introduction and thesis outline
In this study, I aimed to explore the interaction between the model cereal Brachypodium
distachyon and the bacteria Azospirillum brasilense grown at low temperatures and P availability,
with a particular focus on plant phenotype and root metabolism. Due to its small size, short life
cycle and an already sequenced and annotated genome, Brachypodium is a promising model
species for temperate cereals, and numerous studies have already investigated its interaction with
soil microbiota (Gagne-Bourque et al. 2015; Do Amaral et al. 2016; Fitzgerald et al. 2015).
Azospirillum brasilense sp245 was chosen as the inoculant as these free-living bacteria can
improve the growth of various cereals, particularly in challenging conditions (Creus et al. 2004;
Dobbelaere et al. 2002; Pereyra et al. 2006). Some studies have investigated the growth of
Brachypodium when interacting with Azospirillum strains (Do Amaral et al. 2016) or their
volatiles (Delaplace et al. 2015), but to my knowledge, this is first study on the role of Azospirillum
brasilense Sp245 in influencing the phenotype and metabolism of Brachypodium subjected to P
deficiency and/or low temperatures.
The first Section of Chapter 1 describes the effects of the interaction with plant growth promoting
(PGP) bacteria on plant phenotype, with a particular focus on the mechanisms of growth promotion
for plants subjected to different abiotic stresses. This section has been published in the form of a
review paper in the book Root Biology - Growth, Physiology, and Functions” by IntechOpen.
(Schillaci et al. 2019). The second section of Chapter 1 reports the current knowledge on the
metabolic changes that occur in plant roots during the interaction with PGP bacteria, and briefly
describes the technologies for untargeted metabolomic analysis.
Chapter 2 focused on the effects of the inoculation on the shoot and root development of
Brachypodium at various stages of its growth in an environment characterised by low P availability
and low temperature. Azospirillum inoculated and non-inoculated plants were grown in the
recently developed Growscreen-PaGe platform (Gioia et al. 2016), which allowed the non-
destructive and high-throughput phenotyping of plant roots to study their architecture in relation
to the bacterial treatment. In addition to the analysis of root phenotype, shoot traits such as leaf
area, dry weight and nutrient content were also investigated at 7, 14 and 21 days after the
inoculation (DAI) to further characterise the role of Azospirillum on Brachypodium growth. The
results of this chapter have been published in the form of a research paper titled “Time-resolution

122
of the shoot and root growth of the model cereal Brachypodium in response to inoculation with
Azospirillum bacteria at low phosphorus and temperature” in the journal “Plant Growth
Regulation” (Schillaci et al. 2020).
Chapters 3 and 4 focused on the polar metabolites and the lipids, respectively, extracted from
inoculated and non-inoculated Brachypodium roots at 7, 14 and 21 DAI. The tissue for these
analyses was obtained from those same plants whose phenotype was analysed in Chapter 2 of my
thesis, so that the insights obtained from the different approaches could be more reliably linked
with each other. For both the polar metabolite analysis (Chapter 3) and the lipid analysis (Chapter
4), untargeted mass spectrometry approaches were used to detect the relative responses of
metabolites and lipids. Statistical analyses to compare the root metabolite and lipid profiles were
performed between the two treatments at each time point and between different time points of the
same treatments, to evaluate both the role of time and inoculation on root metabolism.
5.2 Relevance of the study
Economically relevant cereals such as wheat and barley are often cultivated in areas with
insufficient P reserves, which require periodic fertilization to be profitable (Dhillon et al. 2017).
Furthermore, those crops are typically sown in autumn and germinate in winter, and therefore the
early stages of their growth are characterized by suboptimal temperature, which can negatively
affect their early vigor by decreasing their root development and nutrient uptake capacity
(McMichael and Quisenberry 1993; Grant et al. 2001). P is one of the main plant macronutrients,
and P deficient plants produce significantly lower yields. At the metabolic level, low temperatures
affect the speed of biochemical reactions, decrease membrane fluidity, cause oxidative stress and
damage plant tissues (Chinnusamy et al. 2007). P is a component of important biomolecules such
as ATP, RNA and the glycerophospholipids that compose the cell membrane. P deficiency strongly
impairs essential biological processes such as photosynthesis and respiration (Plaxton and Tran
2011), and plant metabolism is severely affected, which results in a modification of their
phenotype.
5.3 Main insights
The results from Chapter 2 showed that the inoculation with Azospirillum can improve shoot and
root development of Brachypodium subjected to low P availability and low temperatures. While

123
the beneficial effects of the bacterial treatment on shoot growth were visible from the early stages
of the experiment, the positive effects on root development appeared in the second half of the
experiment, when the shoot nutrient content analysis revealed that plants of both the treatments
were increasingly P deficient. Azospirillum shaped the root architecture of inoculated plants by
decreasing the axile root growth and increasing the development of branch roots, which are a more
P-efficient root type, allowing P deficient plants to explore higher portions of the substrate.
In the polar metabolite analysis in Chapter 3, Azospirillum did not radically change the metabolite
profile of Brachypodium roots, at any time point. Nevertheless, those compounds significantly
affected by the inoculation suggest that the interaction between the bacteria and the plant changed
with time. At 7 DAI, the compounds with increased abundance in inoculated plants have known
antimicrobial roles (Brusamarello-Santos et al. 2017; Castilho et al. 2012; Chanda et al. 2011;
Mbosso et al. 2010; Nakashita et al. 2003), and I hypothesize that in the earlier days of the
interaction, Azospirillum was sensed by Brachypodium as a pathogen and thus plants were
mounting a response to reduce root colonization by the bacteria. Confirming the results of P
concentration analysis in Chapter 2, the analysis of phosphorylated compounds showed that they
dramatically decreased in both treatments through the experiment, and the compounds that were
significantly increased or decreased in inoculated plants at 14 and 21 d after the inoculation show
how inoculated plants were less stressed by P deficiency. Specific compounds such as campesterol,
trehalose and serotonin that were more abundant in inoculated plants have been shown to improve
plant adaptation to low P (Tyagi and Rai 2017) and, most importantly, they can anticipate and
increase branch root development (Pelagio-Flores et al. 2011; Yang et al. 2011), which is
consistent with the observed root phenotype.
The root lipidome, analysed in Chapter 4, showed the lowest level of rearrangements caused by
the inoculation, with almost no detected lipid species significantly affected and no clear separation
in the lipid profiles of samples from the two treatments, at any time point. Despite this, the k-
means clustering analysis of the lipid species through time allowed differentiation of the
fluctuations of certain glycerophospholipids, diacylglycerols and triacylglycerols in the two
treatments. Furthermore, most glycerophospholipids decreased and most galactolipids increased
through time in both the treatments, suggesting the recycling of P contained in cell membrane
glycerophospholipids and their replacement with galactolipids as a plant mechanism to face P

124
deficiency. Finally, a better separation between the two treatments was observed in those
hydrophilic features that were not annotated with respect to their chemical structure using currently
available lipid libraries, suggesting that more significant changes might have occurred in lipid
species that have not been characterized yet.
5.4 Conclusions
In my study, the inoculation with Azospirillum improved the adaptation of Brachypodium to low
temperatures and low P availability. The bacterial treatment had a beneficial effect on early shoot
development, while the effects of the inoculation on root architecture were mostly observed in the
second half of the experiment.
At 7 DAI, the shoot biomass and leaf area parameters were already improved in inoculated plants,
while analysis of their nutrient concentration suggested that neither treatment was P deficient. All
root metabolites that were increased by the bacterial treatment can play a role in plant immune
responses (Brusamarello-Santos et al. 2017; Castilho et al. 2012; Chanda et al. 2011; Mbosso et
al. 2010; Nakashita et al. 2003), and this suggests that in the earlier stages of their interaction
Brachypodium was sensing Azospirillum as a pathogen and producing antimicrobial compounds
to limit its proliferation. Among those compounds, trehalose and campesterol can also enhance
plant resistance to cold stress, which could have been a secondary effect of their increased levels
in inoculated plants. This would explain the increased shoot development observed in inoculated
plants from 7 DAI. Trehalose can also stimulate root branching (Tyagi and Rai 2017), and I
hypothesize that this contributed to anticipating branch root formation, which were first observed
at 9 DAI in inoculated plants (14 DAI in non-inoculated).
At 14 DAI, shoots of inoculated plants had more biomass than non-inoculated plants, and plants
under both treatments began to be P deficient, as suggested by the decrease of P concentration in
the shoots and phosphorylated metabolites in the roots. The roots of inoculated plants were longer
than non-inoculated plants, particularly because of their longer branch roots. I believe that the
nutritional status of inoculated plants shaped the interaction with the bacteria, as most differences
in the levels of compounds with antimicrobial characteristics observed at 7 DAI disappeared at 14
DAI. Instead, those compounds which differed in the two treatments suggest that inoculation could
have improved the adaptation to the increasing P deficiency by conserving shoot development and
improving branch root growth at the partial expenses of axile root growth. As branch roots require

125
a lower P investment per unit root length compared to axile roots (Zhu and Lynch 2004), this shift
could have allowed inoculated plants to explore the substrate in a more P efficient way.
Phenotype analysis at 21 DAI confirmed the observations at 14 DAI, as inoculated plants produced
more shoot biomass and longer roots compared to non-inoculated plants. Both treatments were P
deficient, and this affected their cell membrane composition and generally their metabolism, which
was redirected towards less P demanding pathways. Azospirillum increased the serotonin levels in
inoculated plants, and this compound could have further contributed to the redirection of resources
from axile to branch roots development (Pelagio-Flores et al. 2011). Furthermore, some
triacylglycerols (TGs) increased in inoculated plants between 14 and 21 DAI. This was one of the
few differences in the lipidome observed between the two treatments in this study, and could have
improved plant adaptation to P deficiency, as this lipid class has been suggested to be involved in
cell membrane rearrangements caused by low P (Calderon-Vazquez et al. 2008).
The analysis of Brachypodium phenotype and metabolism at different time points of their
interaction with Azospirillum revealed that the inoculation improved the growth particularly when
they were P deficient. The low P absorption and efficiency of soil P by cereals has led to excessive
use of P fertilizers, which in turn caused eutrophication problems in many areas of the world. I
suggest that it is important to re-evaluate the use of P in modern agriculture, and move from high
P inputs from the farmers to high P-use efficiency from the plants. This means aiming towards
plants that are capable of optimizing suboptimal P levels – a common characteristic in many soils
all over the world - for their growth, still providing sufficient yields with lower environmental
costs. My study confirmed that the interaction with PGP bacteria can play a precious role when
plants are grown in P poor environments, as the most obvious benefit that was observed in the
phenotype of inoculated plants was a more developed root system when plants where P deficient.
Besides allowing improved substrate exploration, a larger root apparatus might cause a further
benefit in plants subjected to P deficiency, as it can be a pool of P which in extreme need can be
remobilized to the shoot, a strategy observed in plants adapted to P-poor soils (Dissanayaka et al.
2018).
5.5 Remarks and outlook
Biological experiments are always a compromise between the need of being realistic and
reproducible. In my study, where two interacting organisms were involved, we necessarily needed

126
a simplified setup that allowed us as much control as possible over the growth conditions.
Experiments in increasingly realistic conditions (pots in the greenhouse, then open field) should
be conducted to verify if Azospirillum can also improve Brachypodium growth in those conditions,
and if the plant metabolome is affected the same way. As Brachypodium is a model plant for
temperate cereals such as wheat and barley, the experiment should also be repeated on those
economically relevant crops. I also suggest performing an assay of colonization of the plant shoot
by the bacteria which, together with shoot metabolism analysis, could clarify the mechanisms
behind the improved shoot growth of inoculated plants. Some PGP bacteria are able to penetrate
the root endodermis and also colonize plant aerial parts (Batista et al. 2018; Compant et al. 2005),
and it is possible that the shoot phenotype observed in inoculated plants was caused by shoot
metabolism rearrangements caused locally by Azospirillum.
In this study, the bacterial inoculation was the sole treatment, and the low P and low temperature
should be considered as background conditions. It was however possible to make specific
comparisons within different time points of the same treatments, particularly between earlier time
points, when plants were still using the P supplies in the seed, and later stages of the experiments,
when plants were increasingly P deficient. Looking at the phenotype and metabolism of
Brachypodium at different time points, I have shown that the P deficiency caused a harsh stress
and resulted in metabolic rearrangements in plants from both the treatments. This hypothesis is
suggested by the observed root development and the fluctuations of P containing polar metabolites
and lipids, which decreased in both treatments through time. Nevertheless, this hypothesis should
be tested by growing plants separately at optimal temperature and P availability, to better evaluate
the effect of those stresses on plant development and bacterial colonization. Metabolomic analyses
of Azospirillum-inoculated and non-inoculated Brachypodium in P sufficient conditions might
also identify a greater number of compounds affected by the inoculation, particularly P containing
lipids. Plant glycerophospholipids are believed to play an important role in the interactions with
microorganisms (Siebers et al. 2016), and it is possible that in the second half of this experiment
the lipid response of plants to inoculation was decreased by their low P levels.
The analysis conducted in this study does not identify whether the metabolites detected in
inoculated plants were produced by Brachypodium or Azospirillum or both. While the extraction
performed on Azospirillum axenic culture gave us some indications on the origin of those

127
compounds, we cannot exclude that some compounds that were more abundant in inoculated plants
are produced by Azospirillum only when interacting with Brachypodium in the environmental
conditions of the present study. Another possibility is that inoculated Brachypodium plants
synthesized lower amounts of a certain metabolite, but this difference was not detected as it may
have been compensated by the same compound produced by the bacteria. On the other hand, the
great disproportion between the plant and bacteria biomass in inoculated plants suggests that it is
unlikely that bacterial metabolites had a significant impact on the results that we observed. Overall,
transcriptomic studies of the roots of Brachypodium (whose genome has already been sequenced
and annotated) at various stages of the interaction with Azospirillum could further clarify the origin
of the detected compounds by investigating the expression of plant genes involved in their
metabolism. Gene expression analysis could also be useful to determine whether the different
levels of certain compounds in the various treatments/time points were caused by their increased
or decreased biosynthesis/degradation, which was not possible to determine with the sole
metabolomic analysis conducted in this study.
I hypothesized that the increasing P deficiency changed the interplay between Brachypodium and
Azospirillum, as the beneficial effects of bacterial inoculation were most evident at 14 and 21 DAI,
and at those time points inoculated roots did not display higher content of antimicrobial
compounds. Numerous studies which subjected inoculated plants to varying degree of stresses
report that the beneficial effect of PGP bacteria can increase as the growing conditions worsen,
thanks to their capacity of decreasing the damage stress in plants (Casanovas et al. 2002; Hardoim
et al. 2015; Yuwono et al. 2005). It is possible that, as P levels decreased, some signalling
mechanism between Brachypodium and Azospirillum caused the change in the plant perception of
the bacteria from pathogenic to beneficial, and future studies should focus on the communication
between plants and bacteria in relation to plant nutritional status or, more in general, the degree of
abiotic stresses they are subjected to.
The metabolomic analysis that we performed did not allow us to link the single compounds that
were detected to the metabolic pathway(s) in which they acted with certainty. This issue was
worsened in the case of compounds which are involved in multiple pathways, e.g. α-ketoglutaric
acid. When allocating each metabolite to its metabolic pathway, I did my best to identify the most
important pathways for plant metabolism, to keep the schematization of plant metabolism as

128
simple as possible. I cannot exclude that the compound I attributed to a certain pathway belongs
to another pathway, or multiple ones. Spatially accurate metabolomic techniques such as mass
spectrometry imaging (MSI) and live single-cell mass spectrometry (LSC-MS) allow the spatial
analysis of the metabolites of a particular tissue type or a single cell (António 2018), and could be
a precious tool to assign the detected compounds to their specific cell compartments and metabolic
pathways. Overall, further targeted metabolic analyses are needed to increase our understanding
of the metabolic response of cereals to PGP inoculation in environments characterised by low
temperature and P availability, and I am most certain that my study will be a starting point for a
more detailed exploration of the biochemical nature of the interaction under abiotic stress
conditions.
In the phenotype part of my study (see Chapter 2) I differentiated between axile and branch roots
but, due to low tissue availability, I could not do the same in my metabolomic analyses. Some
metabolites that I believe played a role in shaping the root architecture of inoculated plants
(serotonin, campesterol-derived brassinosteroids, ribonic acid), could have different effects on
different root classes. Therefore, further analysis of the metabolome of specific root system
portions could clarify the molecular mechanisms of the Brachypodium-Azospirillum interaction.

129
Appendices

130
Supplemental figure 7.1 1% agarose gel showing the A. brasilense Sp245 specific PCR products amplified from
genomic DNA extracted from randomly chosen samples. Non inoculated samples harvested at 7 d (C1-5), 14 d (C6-
10) and 21 d (C11-15). Inoculated samples at 7 d (B1-5), 14 d (B6-10) and 21 d (B11-15). M: 100 bp DNA ladder
(New England Biolabs, Ipswich, USA). NEG: no template control. POS: positive control obtained amplifying DNA
extracted from axenic A. brasilense Sp245 culture. All DNA samples extracted from inoculated plants display an
amplicon slightly shorter than the 500 bp marker, consistent with the size of the amplicon (458 bp) expected to be
amplified by the used primers.

131
Supplemental figure 7.2 Leaf area of Brachypodium inoculated or not with Azospirillum and harvested after 21 d
in the GrowScreen-PaGe platform. (a) First pilot experiment: plants grown at different P availabilities. n = 15 for
Azospirillum-inoculated 7 µM P, Azospirillum-inoculated 25 µM P and non-inoculated 7 µM P; n = 14 for non-
inoculated 25 µM P. (b) Second pilot experiment: both Azospirillum-inoculated and non-inoculated treatments
provided with 7 µM P. n = 15 for both treatments. Means ± standard error presented. Different letters above bars
indicate probability of significant difference between mean of Azospirillum-inoculated and non-inoculated plants
(p<0.05) based on Student’s t-test.
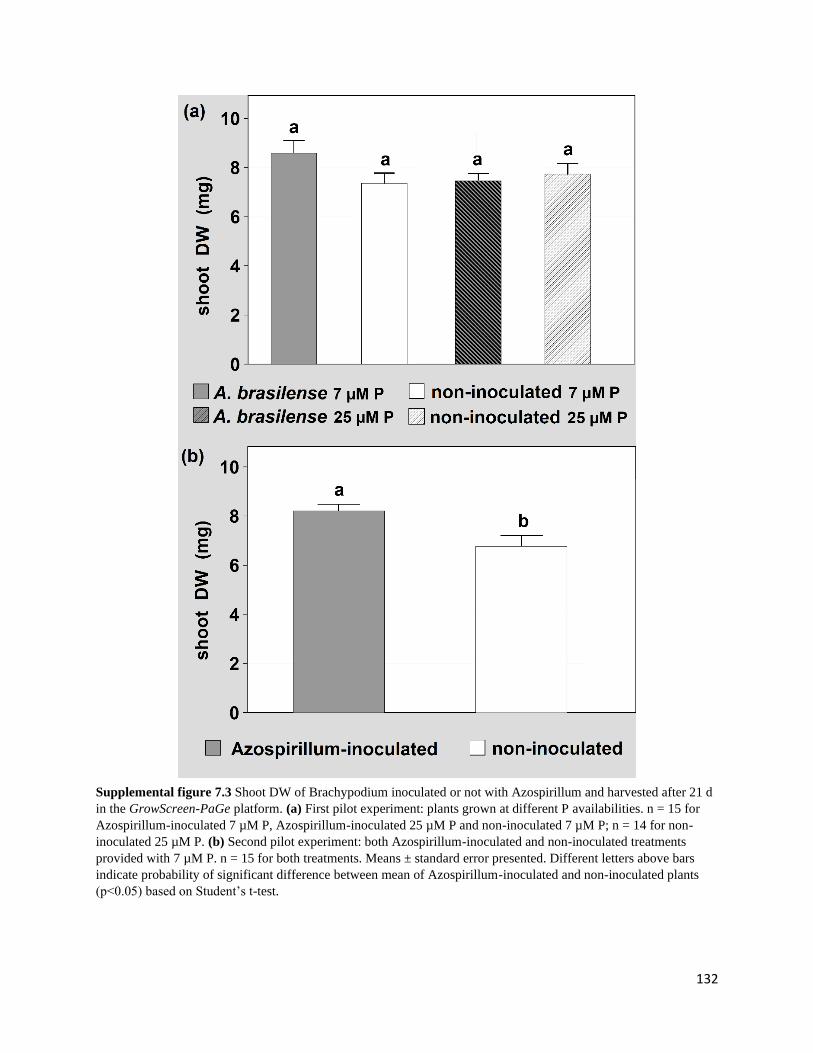
132
Supplemental figure 7.3 Shoot DW of Brachypodium inoculated or not with Azospirillum and harvested after 21 d
in the GrowScreen-PaGe platform. (a) First pilot experiment: plants grown at different P availabilities. n = 15 for
Azospirillum-inoculated 7 µM P, Azospirillum-inoculated 25 µM P and non-inoculated 7 µM P; n = 14 for non-
inoculated 25 µM P. (b) Second pilot experiment: both Azospirillum-inoculated and non-inoculated treatments
provided with 7 µM P. n = 15 for both treatments. Means ± standard error presented. Different letters above bars
indicate probability of significant difference between mean of Azospirillum-inoculated and non-inoculated plants
(p<0.05) based on Student’s t-test.

133
Su
pp
lem
enta
l fi
gu
re 7
.4 H
igh
th
rou
ghp
ut
exp
erim
ent.
Ch
ang
es i
n s
ho
ot
nu
trie
nt
con
ten
t b
etw
een
dif
fere
nt
tim
e po
ints
of
Bra
chyp
od
ium
in
ocu
late
d o
r n
ot
wit
h A
zosp
iril
lum
an
d h
arv
este
d a
fter
7,
14
an
d 2
1 d
in
th
e G
row
Scr
een
-Pa
Ge
pla
tfo
rm.
(a)
P.
(b)
N.
(c)
K.
All
po
ints
are
th
e m
ean
± s
tan
dar
d e
rror
of
n =
3
sam
ple
s o
f p
lan
ts p
oo
led
wit
hin
eac
h t
reat
men
t. A
ster
isk
s in
dic
ate
pro
bab
ilit
y o
f si
gn
ific
ant
dif
fere
nce
bet
wee
n m
ean
of
Azo
sp
iril
lum
-in
ocu
late
d a
nd
no
n-
ino
cula
ted
pla
nts
bas
ed o
n S
tud
ent’
s t-
test
; *,
p<
0.0
5;
**,
p<
0.0
1,
***,
p<
0.0
01
.

134
Supplemental figure 7.5 Physiological phosphorus use efficiency (PPUE) of Brachypodium with or without
Azospirillum inoculation after 7, 14 and 21 d growth in the GrowScreen-PaGe platform. PPUE was calculated as the
shoot dry weight (DW) divided by the shoot concentration of phosphorus [P], to indicate physiology associated with
dry weight accumulation for shoots. All points are the mean ± standard error of n = 3 samples of plants pooled within
each treatment. Asterisks indicate probability of significant difference between mean of Azospirillum-inoculated and
non-inoculated plants based on Student’s t-test; *, p<0.05; **, p<0.01, ***, p<0.001. DW = dry weight; [P] =
phosphorus concentration.

135
Supplemental figure 7.6 First pilot
experiment. Root growth of
Brachypodium inoculated or not
with Azospirillum and grown at
different P availabilities. Plants were
imaged nondestructively after 3, 5,
7, 9, 11, 14, 18 and 21 d in the
GrowScreen-PaGe platform and
images were analyzed with the
PaintRhizo software. (a) Root
system length. (b) Root system
growth rate. Means ± standard error
presented. n = 20 Azospirillum-
inoculated 7 µM P, Azospirillum-
inoculated 25 µM P and non-
inoculated 7 µM P; n = 19 non-
inoculated 25 µM P. Error bars show
the standard error of the mean.
Significant difference between mean
of treatments are displayed in Suppl.
Table 2.1.
Supplemental Table 7.1 First pilot experiment. Root growth of Brachypodium inoculated or not with
Azospirillum and grown at different P availabilities. Plants were imaged nondestructively after 3, 5, 7, 9, 11,
14, 18 and 21 d in the GrowScreen-PaGe platform and images were analyzed with the PaintRhizo software.
(a) Root system length (cm). (b) Root system growth rate (cm d-1). Means ± standard error presented. n = 20
Azospirillum-inoculated 7 µM P, Azospirillum-inoculated 25 µM P and non-inoculated 7 µM P; n = 19 non-
inoculated 25 µM P. Different letters next to values indicate probability of significant difference between
mean of different treatment (p<0.05) based on Student’s t-test.

136
Supplemental figure 7.7 Second pilot experiment. Root growth of Brachypodium inoculated or not with Azospirillum
and imaged nondestructively after 3, 5, 7, 11, 14, 18 and 21 d in the GrowScreen-PaGe platform. Images were
analyzed with the PaintRhizo software. (a) Root system length. (b) Root system growth rate. Means ± standard error
presented. n = 20 for both treatments. Asterisks indicate probability of significant difference between mean of
Azospirillum inoculated and non-inoculated plants based on Student’s t-test; *, p<0.05; **, p<0.01, ***, p<0.001.

137
Supplemental figure 7.8 High throughput experiment. Root system growth rate of individual Brachypodium plants
inoculated or not with Azospirillum and imaged nondestructively after 3, 5, 7, 9, 11, 14, 18 and 21 d in the
GrowScreen-PaGe platform. Images were analyzed with the PaintRhizo software. n = 28 Azospirillum-inoculated and
n = 32 non-inoculated.

138
Supplemental figure 7.9 Correlation between leaf area and total root length of Brachypodium plants with or without
Azospirillum inoculation at 21 d after the inoculation. n = 28 Azospirillum-inoculated and n = 32 non-inoculated
plants.

139
Supplemental Figure 7.10 Graphical representation of unidentified features of Azospirillum-inoculated (A) and non-
inoculated (N) Brachypodium roots harvested at 7 DAI. a) Hierarchical clustering coupled with heatmap. The lettering
at the bottom of the heatmap indicates the replicates: for each replicate, blue and red colours indicate the lower or
higher abundance of specific metabolites compared to the other replicates, with darker colours indicating more
pronounced differences. b) Principal component analysis. Ellipses around samples display 95% confidence areas.

140
Supplemental Figure 7.11 Graphical representation of unidentified features of Azospirillum-inoculated (A) and non-
inoculated (N) Brachypodium roots harvested at 14 DAI. a) Hierarchical clustering coupled with heatmap. The
lettering at the bottom of the heatmap indicates the replicates: for each replicate, blue and red colours indicate the
lower or higher abundance of specific metabolites compared to the other replicates, with darker colours indicating
more pronounced differences. b) Principal component analysis. Ellipses around samples display 95% confidence
areas.
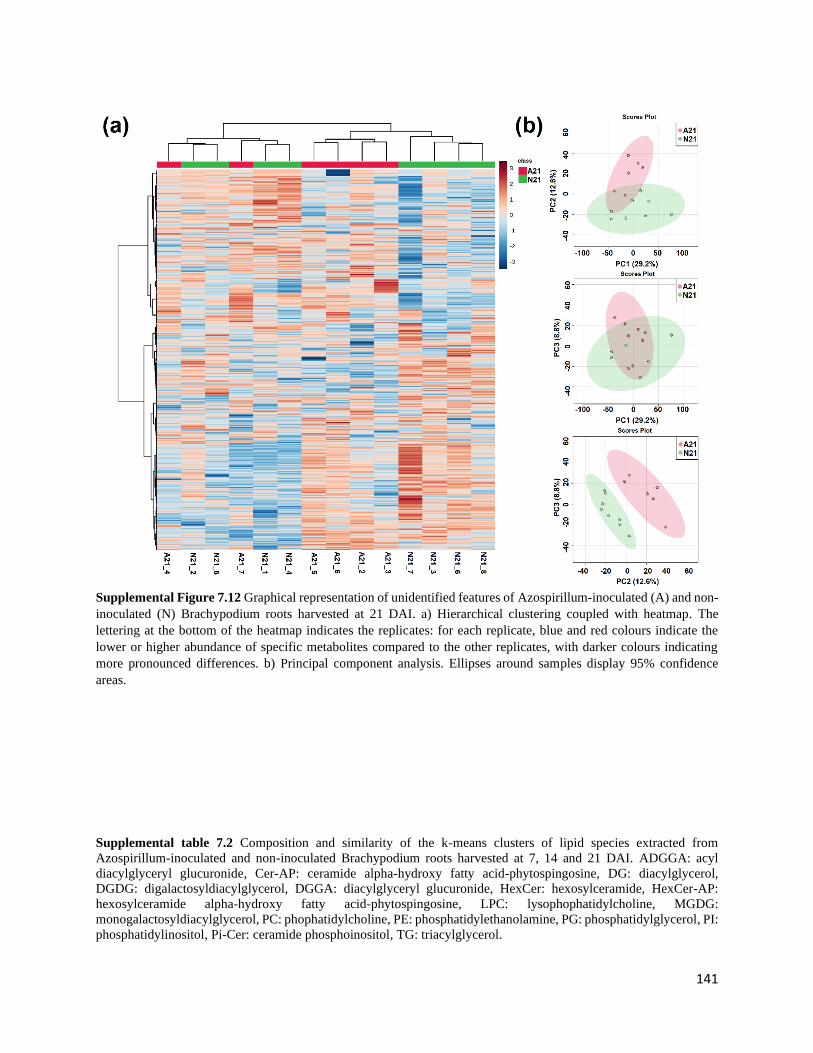
141
Supplemental Figure 7.12 Graphical representation of unidentified features of Azospirillum-inoculated (A) and non-
inoculated (N) Brachypodium roots harvested at 21 DAI. a) Hierarchical clustering coupled with heatmap. The
lettering at the bottom of the heatmap indicates the replicates: for each replicate, blue and red colours indicate the
lower or higher abundance of specific metabolites compared to the other replicates, with darker colours indicating
more pronounced differences. b) Principal component analysis. Ellipses around samples display 95% confidence
areas.
Supplemental table 7.2 Composition and similarity of the k-means clusters of lipid species extracted from
Azospirillum-inoculated and non-inoculated Brachypodium roots harvested at 7, 14 and 21 DAI. ADGGA: acyl
diacylglyceryl glucuronide, Cer-AP: ceramide alpha-hydroxy fatty acid-phytospingosine, DG: diacylglycerol,
DGDG: digalactosyldiacylglycerol, DGGA: diacylglyceryl glucuronide, HexCer: hexosylceramide, HexCer-AP:
hexosylceramide alpha-hydroxy fatty acid-phytospingosine, LPC: lysophophatidylcholine, MGDG:
monogalactosyldiacylglycerol, PC: phophatidylcholine, PE: phosphatidylethanolamine, PG: phosphatidylglycerol, PI:
phosphatidylinositol, Pi-Cer: ceramide phosphoinositol, TG: triacylglycerol.

142
Couple 1 Couple 2
non-inoculated Azospirillum-inoculated non-inoculated Azospirillum-inoculated
Matching: 21/42 = 50% Matching: 40/56 = 71.4%
ADGGA 50:2 ADGGA 50:3
ADGGA 50:3 ADGGA 50:6 ADGGA 50:6
ADGGA 56:2 ADGGA 52:3 ADGGA 52:3
ADGGA 56:3 ADGGA 56:3 ADGGA 52:4 ADGGA 52:4
Cer-AP t40:0+1O Cer-AP t40:0+1O ADGGA 52:5 ADGGA 52:5
Cer-AP t40:1+O Cer-AP t40:1+O ADGGA 54:6 ADGGA 54:6
Cer-AP t42:1+O Cer-AP t42:1+O ADGGA 54:7 ADGGA 54:7
DG 38:3 ADGGA 54:8 ADGGA 54:8
DG 41:0 ADGGA 54:9 ADGGA 54:9
DG 42:0|DG 20:0_22:0 DG 42:0|DG 20:0_22:0 ADGGA 56:2
DG 42:1 DGDG 32:0
DG 44:0|DG 20:0_24:0 DG 44:0|DG 20:0_24:0 DGDG 32:2 DGDG 32:2
DG 44:2 DGDG 34:2 DGDG 34:2
DGDG 32:0 DGDG 34:3 DGDG 34:3
DGDG 36:1 DGDG 35:2 DGDG 35:2
DGGA 33:2 DGDG 36:1
DGGA 44:3 DGGA 44:3 DGDG 36:3 DGDG 36:3
HexCer 42:2 HexCer 42:2 DGDG 36:5 DGDG 36:5
HexCer-AP t40:1+O HexCer-AP t40:1+O DGDG 38:2 DGDG 38:2
HexCer-AP t41:1+O HexCer-AP t41:1+O DGDG 38:5 DGDG 38:5
HexCer-AP t42:0+1O HexCer-AP t42:0+1O DGDG 40:2 DGDG 40:2
HexCer-AP t42:1+O HexCer-AP t42:1+O DGDG 41:2 DGDG 41:2
MGDG 36:2 MGDG 36:2 DGDG 41:3 DGDG 41:3
MGDG 42:2 MGDG 42:2 DGDG 42:2 DGDG 42:2
MGDG 44:2 DGDG 42:3 DGDG 42:3
PC 42:4 DGDG 42:4 DGDG 42:4
PC 43:3 DGDG 43:2 DGDG 43:2
PC 43:4 DGDG 43:3 DGDG 43:3
PC 44:4 PC 44:4 DGDG 44:2 DGDG 44:2
PE 43:4 PE 43:4 DGDG 44:3 DGDG 44:3
PE 44:3e PE 44:3e DGGA 33:2
PE 45:3e PE 45:3e DGGA 33:3|DGGA 15:0_18:3 DGGA 33:3|DGGA 15:0_18:3
TG 54:8|TG 18:2_18:3_18:3 DGGA 34:2 DGGA 34:2
TG 54:9|TG 18:3_18:3_18:3 TG 54:9|TG 18:3_18:3_18:3 DGGA 34:3 DGGA 34:3
TG 56:8|TG 18:2_18:3_20:3 TG 56:8|TG 18:2_18:3_20:3 DGGA 35:2 DGGA 35:2
TG 58:7 DGGA 36:2 DGGA 36:2
TG 58:8 TG 58:8 DGGA 36:6 DGGA 36:6
TG 58:9 DGGA 42:2 DGGA 42:2
TG 60:6 DGGA 43:2 DGGA 43:2
TG 60:7 DGGA 43:3 DGGA 43:3
TG 61:6 MGDG 34:1
TG 62:6 MGDG 34:2 MGDG 34:2 MGDG 44:2 PC 38:3 PC 38:3 PC 42:4 PC 43:3 PC 43:4 PI-Cer d39:4+1O PI-Cer d39:4+1O PI-Cer d39:5+1O PI-Cer d39:5+1O TG 51:6 TG 51:7 TG 53:6 TG 55:6 TG 57:7 TG 57:7 TG 58:9 TG 59:6

143
Couple 3 Couple 4
non-inoculated Azospirillum-inoculated non-inoculated Azospirillum-inoculated
Matching: 41/53 = 77.4% Matching: 17/27 = 63%
DG 34:2 DG 34:2 DG 34:0|DG 16:0_18:0 DG 34:3 DG 34:3 DG 41:0 DG 36:5 DG 36:5 TG 42:0 TG 42:0
DG 38:3 TG 43:0|TG 13:0_14:0_16:0 TG 43:0|TG 13:0_14:0_16:0
DG 38:4 TG 43:1|TG 14:0_15:0_14:1 DG 40:0|DG 20:0_20:0 DG 40:0|DG 20:0_20:0 TG 44:0 TG 44:0
DG 42:1 TG 45:0 TG 45:0
DG 42:2 DG 42:2 TG 45:1 TG 45:1
DG 44:2 TG 46:0|TG 14:0_16:0_16:0 TG 46:0|TG 14:0_16:0_16:0
DG 44:3 DG 44:3 TG 47:1 TG 47:1
HexCer 42:3 HexCer 42:3 TG 47:2
LPC 15:0/0:0 LPC 15:0/0:0 TG 48:0|TG 15:0_16:0_17:0 TG 48:0|TG 15:0_16:0_17:0
LPC 16:0/0:0 LPC 16:0/0:0 TG 49:0 TG 49:0
LPC 16:1 TG 49:1 TG 49:1
LPC 18:0/0:0 LPC 18:0/0:0 TG 50:0|TG 16:0_16:0_18:0 TG 50:0|TG 16:0_16:0_18:0
LPC 18:2/0:0 LPC 18:2/0:0 TG 50:1 LPC 18:3/0:0 LPC 18:3/0:0 TG 51:0 TG 51:0
MGDG 34:3 TG 51:1 TG 51:1
MGDG 36:5|MGDG 18:2_18:3 MGDG 36:5|MGDG 18:2_18:3 TG 52:0|TG 14:0_18:0_20:0 TG 52:0|TG 14:0_18:0_20:0
PC 32:2 PC 32:2 TG 52:1|TG 16:0_18:0_18:1 PC 33:2 PC 33:2 TG 54:0 TG 54:0
PC 34:3|PC 16:0_18:3 PC 34:3|PC 16:0_18:3 TG 55:1 PC 34:4|PC 16:1_18:3 TG 56:0 TG 56:0
PC 34:5 TG 57:0 TG 57:0
PC 34:6 PC 34:6 TG 58:0 PC 36:5|PC 18:2_18:3 PC 36:5|PC 18:2_18:3 TG 58:1
PC 36:6|PC 18:3_18:3 PC 36:6|PC 18:3_18:3 TG 60:1
PC 36:7 PC 36:7
PC 38:5 PC 38:5
PC 40:2 PC 40:2
PC 42:2 PC 42:2
PC 42:3 PC 42:3
PE 34:2 PE 34:2
PE 34:3
PE 36:4 PE 36:4
PE 36:5 PE 36:5
PE 36:6 PE 36:6
PE 40:2 PE 40:2
PE 40:3 PE 40:3
PE 41:2 PE 41:2
PE 43:3 PE 43:3
PE 44:4
PG 34:1
PG 34:3 PG 34:3
PG 34:5 PG 34:5
PG 36:5 PG 36:5
PG 36:6 PG 36:6
PI 34:2 PI 34:2
PI 36:5 PI 36:5
PI 36:6 PI 36:6
TG 41:0 TG 41:0
TG 52:9e
TG 62:1 TG 62:1

144
Couple 5 Couple 6
non-inoculated Azospirillum-inoculated non-inoculated Azospirillum-inoculated
Matching: 29/48 = 60.4% Matching: 44/57 = 77.2%
ADGGA 52:2 ADGGA 52:2 DG 36:0|DG 18:0_18:0 DG 36:2|DG 18:1_18:1
ADGGA 54:3 ADGGA 54:3 DG 36:3
Cer-AP t42:0+O PC 30:1 PC 30:1
Cer-AP t42:2+1O Cer-AP t42:2+1O PC 30:3 PC 30:3
Cer-AP t43:0+O Cer-AP t43:0+O PE 33:2 PE 33:2
Cer-AP t43:1+O Cer-AP t43:1+O TG 42:1 TG 42:1
Cer-AP t44:0+1O TG 46:1 TG 46:1
Cer-AP t44:0+1O Cer-AP t44:1+1O TG 46:2 TG 46:2
DG 32:0 DG 32:0 TG 46:3 TG 46:3
DG 32:1 DG 32:1 TG 47:2 DG 34:0|DG 16:0_18:0 TG 47:3 TG 47:3
DG 34:1 DG 34:1 TG 48:2|TG 14:0_16:1_18:1 TG 48:2|TG 14:0_16:1_18:1
DG 35:2 DG 35:2 TG 48:3 TG 48:3
DG 36:2|DG 18:1_18:1 TG 48:4 TG 48:4
DG 36:3 TG 49:2 DG 36:4 TG 50:2|TG 16:0_16:0_18:2 TG 50:2|TG 16:0_16:0_18:2
DG 36:0|DG 18:0_18:0 TG 50:4|TG 14:0_18:2_18:2 TG 50:4|TG 14:0_18:2_18:2
DG 36:4 TG 50:5|TG 14:0_18:2_18:3 TG 50:5|TG 14:0_18:2_18:3
DG 38:4 TG 50:6|TG 14:0_18:3_18:3 TG 50:6|TG 14:0_18:3_18:3
DG 40:3|DG 22:0_18:3 DG 40:3|DG 22:0_18:3 TG 51:2 DG 42:3 DG 42:3 TG 51:3 TG 51:3
DG 42:4 DG 42:4 TG 51:4 TG 51:4
DG 46:1e DG 46:1e TG 51:5 TG 51:5
DG 46:2e DG 46:2e TG 52:2|TG 16:0_18:1_18:1 TG 52:2|TG 16:0_18:1_18:1
LPC 14:0 LPC 14:0 TG 52:3 TG 52:3
LPC 16:1 TG 52:4 TG 52:4
LPC 18:1/0:0 LPC 18:1/0:0 TG 53:3 PC 30:0 PC 30:0 TG 53:4 TG 53:4
PC 32:0 PC 32:0 TG 54:1 PC 32:1 PC 32:1 TG 54:2|TG 16:0_20:0_18:2 TG 54:2|TG 16:0_20:0_18:2
PC 33:3 PC 33:3 TG 54:3|TG 18:0_18:1_18:2 TG 54:3|TG 18:0_18:1_18:2
PC 33:4 PC 33:4 TG 54:4|TG 18:1_18:1_18:2 TG 54:4|TG 18:1_18:1_18:2
PC 34:4|PC 16:1_18:3 TG 54:5|TG 18:1_18:2_18:2 TG 54:5|TG 18:1_18:2_18:2
PC 34:5 TG 54:6|TG 18:1_18:2_18:3
PC 36:2 PC 36:2 TG 55:3 TG 55:3
PC 38:6 PC 38:6 TG 55:4
PE 36:3 PE 36:3 TG 56:1 PE 44:2 PE 44:2 TG 56:2 TG 56:2
PG 34:1 TG 56:3 TG 56:3
PG 36:4 PG 36:4 TG 56:4|TG 20:0_18:2_18:2 TG 56:4|TG 20:0_18:2_18:2
PI 34:1 PI 34:1 TG 56:5|TG 20:0_18:2_18:3 TG 56:5|TG 20:0_18:2_18:3
PI 36:3 PI 36:3 TG 57:4 TG 57:4
TG 43:1|TG 14:0_15:0_14:1 TG 57:5 TG 57:5
TG 58:0 TG 58:2 TG 52:9e TG 58:4 TG 58:4
TG 54:6|TG 18:1_18:2_18:3 TG 58:5|TG 22:1_18:2_18:2 TG 58:5|TG 22:1_18:2_18:2
TG 60:4 TG 58:6 TG 62:4 TG 59:4 TG 59:4 TG 59:5 TG 59:5 TG 60:3 TG 60:3 TG 60:4 TG 60:5 TG 60:5 TG 61:5 TG 61:5 TG 62:4

145
non-inoculated Azospirillum-inoculated Matching: 7/38 = 18.4%
ADGGA 50:2 Cer-AP t42:0+O Cer-AP t44:1+1O MGDG 34:1 MGDG 34:3 PE 34:3 PE 44:4 TG 49:2 TG 49:3 TG 49:3 TG 50:1 TG 51:2 TG 51:6 TG 51:7 TG 52:1|TG 16:0_18:0_18:1 TG 52:5 TG 52:5 TG 52:7 TG 52:7 TG 53:2 TG 53:2 TG 53:3 TG 53:5 TG 53:5 TG 53:6 TG 54:1 TG 54:7|TG 18:2_18:2_18:3 TG 54:7|TG 18:2_18:2_18:3 TG 54:8|TG 18:2_18:3_18:3 TG 55:1 TG 55:4 TG 55:6 TG 56:1 TG 57:6 TG 57:6 TG 58:1 TG 58:2 TG 58:6 TG 58:7 TG 59:6 TG 60:1 TG 60:6 TG 60:7 TG 61:6 TG 62:6

146
References
Abeer H, Abdallah E, Alqarawi A, Al-Huqail AA, Alshalawi S, Wirth S, Dilfuza E (2015) Impact of plant growth promoting Bacillus subtilis on growth and physiological parameters of Bassia indica (Indian bassia) grown udder salt stress. Pakistan Journal of Botany 47 (5):1735-1741
Aeron A, Kumar S, Pandey P, Maheshwari D (2011) Emerging role of plant growth promoting rhizobacteria in agrobiology. In: Bacteria in Agrobiology: Crop Ecosystems. Springer, pp 1-36
Agtuca BJ, Stopka SA, Tuleski TR, do Amaral FP, Evans S, Liu Y, Xu D, Monteiro RA, Koppenaal DW, Paša-Tolić L (2020) In-Situ Metabolomic Analysis of Setaria viridis Roots Colonized by Beneficial Endophytic Bacteria. Molecular Plant-Microbe Interactions 33 (2):272-283
Aguiar NO, Olivares FL, Novotny EH, Canellas LP (2018) Changes in metabolic profiling of sugarcane leaves induced by endophytic diazotrophic bacteria and humic acids. PeerJ 6:e5445
Alen’kina SA, Bogatyrev VA, Matora LY, Sokolova MK, Chernyshova MP, Trutneva KA, Nikitina VE (2014) Signal effects of the lectin from the associative nitrogen-fixing bacterium Azospirillum brasilense Sp7 in bacterial–plant root interactions. Plant and Soil 381 (1-2):337-349
Ali SS, Kumar GS, Khan M, Doohan FM (2013) Brassinosteroid enhances resistance to fusarium diseases of barley. Phytopathology 103 (12):1260-1267
Ali SZ, Sandhya V, Grover M, Kishore N, Rao LV, Venkateswarlu B (2009) Pseudomonas sp strain AKM-P6 enhances tolerance of sorghum seedlings to elevated temperatures. Biology and Fertility of Soils 46 (1):45-55. doi:10.1007/s00374-009-0404-9
Ali U, Li H, Wang X, Guo L (2018) Emerging roles of sphingolipid signaling in plant response to biotic and abiotic stresses. Molecular Plant 11 (11):1328-1343
Altschul SF, Gish W, Miller W, Myers EW, Lipman DJ (1990) Basic local alignment search tool. Journal of Molecular Biology 215 (3):403-410
Amundson R, Berhe AA, Hopmans JW, Olson C, Sztein AE, Sparks DL (2015) Soil and human security in the 21st century. Science 348 (6235):1261071
Andersson MX, Stridh MH, Larsson KE, Liljenberg C, Sandelius AS (2003) Phosphate‐deficient oat replaces a major portion of the plasma membrane phospholipids with the galactolipid digalactosyldiacylglycerol. FEBS Letters 537 (1-3):128-132
António C (2018) Plant metabolomics: Methods and protocols. Springer, Arsova B, Foster KJ, Shelden MC, Bramley H, Watt M (2020) Dynamics in plant roots and shoots minimize
stress, save energy and maintain water and nutrient uptake. New Phytologist 225 (3):1111-1119 Ashraf M (2010) Inducing drought tolerance in plants: Recent advances. Biotechnology Advances 28
(1):169-183. doi:10.1016/j.biotechadv.2009.11.005 Ashraf M, Hasnain S, Berge O, Mahmood T (2004) Inoculating wheat seedlings with exopolysaccharide-
producing bacteria restricts sodium uptake and stimulates plant growth under salt stress. Biology and Fertility of soils 40 (3):157-162
Atkinson NJ, Urwin PE (2012) The interaction of plant biotic and abiotic stresses: from genes to the field. Journal of Experimental Botany 63 (10):3523-3543
Bacilio-Jiménez M, Aguilar-Flores S, Ventura-Zapata E, Pérez-Campos E, Bouquelet S, Zenteno E (2003) Chemical characterization of root exudates from rice (Oryza sativa) and their effects on the chemotactic response of endophytic bacteria. Plant and Soil 249 (2):271-277
Badri DV, Vivanco JM (2009) Regulation and function of root exudates. Plant, Cell & Environment 32 (6):666-681
Bais HP, Weir TL, Perry LG, Gilroy S, Vivanco JM (2006) The role of root exudates in rhizosphere interactions with plants and other organisms. Annual Review of Plant Biology 57:233-266
Bajguz A, Hayat S (2009) Effects of brassinosteroids on the plant responses to environmental stresses. Plant Physiology and Biochemistry 47 (1):1-8
147
Bakker PA, Ran L, Mercado-Blanco J (2014) Rhizobacterial salicylate production provokes headaches! Plant and Soil 382 (1-2):1-16
Baldani VLD, Döbereiner J (1980) Host-plant specificity in the infection of cereals with Azospirillum spp. Soil Biology and Biochemistry 12 (4):433-439
Baon JB, Smith SE, Alston AM (1994) Phosphorus uptake and growth of barley as affected by soil temperature and mycorrhizal infection. Journal of Plant Nutrition 17 (2-3):479-492
Barbieri P, Galli E (1993) Effect on Wheat Root Development of Inoculation with an Azospirillum-Brasilense Mutant with Altered Indole-3-Acetic-Acid Production. Research in Microbiology 144 (1):69-75. doi:Doi 10.1016/0923-2508(93)90216-O
Barnabas B, Jager K, Feher A (2008) The effect of drought and heat stress on reproductive processes in cereals. Plant Cell and Environment 31 (1):11-38. doi:10.1111/j.1365-3040.2007.01727.x
Barnawal D, Bharti N, Pandey SS, Pandey A, Chanotiya CS, Kalra A (2017) Plant growth‐promoting rhizobacteria enhance wheat salt and drought stress tolerance by altering endogenous phytohormone levels and TaCTR1/TaDREB2 expression. Physiologia Plantarum 161 (4):502-514
Bashan Y, Alcaraz-Melendez L, Toledo G (1992) Responses of soybean and cowpea root membranes to inoculation with Azospirillum brasilense. Symbiosis
Bashan Y, Levanony H (1990) Current status of Azospirillum inoculation technology: Azospirillum as a challenge for agriculture. Canadian Journal of Microbiology 36 (9):591-608
Bastian F, Cohen A, Piccoli P, Luna V, Baraldi R, Bottini R (1998) Production of indole-3-acetic acid and gibberellins A(1) and A(3) by Acetobacter diazotrophicus and Herbaspirillum seropedicae in chemically-defined culture media. Plant Growth Regulation 24 (1):7-11. doi:Doi 10.1023/A:1005964031159
Batista BD, Lacava PT, Ferrari A, Teixeira-Silva NS, Bonatelli ML, Tsui S, Mondin M, Kitajima EW, Pereira JO, Azevedo JL (2018) Screening of tropically derived, multi-trait plant growth-promoting rhizobacteria and evaluation of corn and soybean colonization ability. Microbiological Research 206:33-42
Batten G, Wardlaw I, Aston M (1986) Growth and the distribution of phosphorus in wheat developed under various phosphorus and temperature regimes. Australian Journal of Agricultural Research 37 (5):459-469
Beatty PH, Good AG (2011) Future prospects for cereals that fix nitrogen. Science 333 (6041):416-417 Belachew KY, Nagel KA, Fiorani F, Stoddard FL (2018) Diversity in root growth responses to moisture
deficit in young faba bean (Vicia faba L.) plants. PeerJ 6:e4401 Bertani G (1951) Studies on lysogenesis I.: the mode of phage liberation by lysogenic Escherichia coli1.
Journal of Bacteriology 62 (3):293 Bini C (2009) Soil: A Precious Natural Resource. In: Kudrow NJ (ed) Conservation of Natural Resources.
Nova Science Publishers, Hauppauge, NY, pp 1-48 Biondini M (1988) Carbon and nitrogen losses through root exudation by Agropyron cristatum, A smithii
and Bouteloua gracilis. Soil Biology and Biochemistry 20 (4):477-482 Biswas JC, Ladha JK, Dazzo FB, Yanni YG, Rolfe BG (2000) Rhizobial inoculation influences seedling vigor
and yield of rice. Agronomy Journal 92 (5):880-886 Blaylock AD (1994) Soil salinity, salt tolerance, and growth potential of horticultural and landscape
plants. University of Wyoming, Cooperative Extension Service, Department of Plant, Soil, and Insect Sciences, College of Agriculture,
Bottini R, Cassan F, Piccoli P (2004) Gibberellin production by bacteria and its involvement in plant growth promotion and yield increase. Applied Microbiology and Biotechnology 65 (5):497-503. doi:10.1007/s00253-004-1696-1

148
Bouffaud M-L, Kyselková M, Gouesnard B, Grundmann G, Muller D, Moënne-Loccoz Y (2012) Is Diversification History of Maize Influencing Selection of Soil Bacteria by Roots? Molecular Ecology 21 (1):195-206
Brusamarello-Santos LC, Gilard F, Brulé L, Quilleré I, Gourion B, Ratet P, de Souza EM, Lea PJ, Hirel B (2017) Metabolic profiling of two maize (Zea mays L.) inbred lines inoculated with the nitrogen fixing plant-interacting bacteria Herbaspirillum seropedicae and Azospirillum brasilense. PLoS One 12 (3)
Cajka T (2019) Towards Merging Targeted and Untargeted Analysis of the Lipidome, Metabolome, and Exposome.
Cajka T, Fiehn O (2016) Toward merging untargeted and targeted methods in mass spectrometry-based metabolomics and lipidomics. Analytical Chemistry 88 (1):524-545
Calderon-Vazquez C, Ibarra-Laclette E, Caballero-Perez J, Herrera-Estrella L (2008) Transcript profiling of Zea mays roots reveals gene responses to phosphate deficiency at the plant-and species-specific levels. Journal of Experimental Botany 59 (9):2479-2497
Canarini A, Wanek W, Merchant A, Richter A, Kaiser C (2019) Root exudation of primary metabolites: mechanisms and their roles in plant responses to environmental stimuli. Frontiers in Plant Science 10:157
Cao D, Lutz A, Hill CB, Callahan DL, Roessner U (2017) A quantitative profiling method of phytohormones and other metabolites applied to barley roots subjected to salinity stress. Frontiers in Plant Science 7:2070
Casanovas EM, Barassi CA, Sueldo RJ (2002) Azospirillum inoculation mitigates water stress effects in maize seedlings. Cereal Research Communications 30:343-350
Castignetti D, Smarrelli J (1986) Siderophores, the iron nutrition of plants, and nitrate reductase. FEBS Letters 209 (2):147-151
Castilho PC, Savluchinske-Feio S, Weinhold TS, Gouveia SC (2012) Evaluation of the antimicrobial and antioxidant activities of essential oils, extracts and their main components from oregano from Madeira Island, Portugal. Food Control 23 (2):552-558
Catalan P, Chalhoub B, Chochois V, Garvin DF, Hasterok R, Manzaneda AJ, Mur LA, Pecchioni N, Rasmussen SK, Vogel JP (2014) Update on the genomics and basic biology of Brachypodium: International Brachypodium Initiative (IBI). Trends in Plant Science 19 (7):414-418
Cha-um S, Rai V, Takabe T (2019) Proline, Glycinebetaine, and Trehalose Uptake and Inter-Organ Transport in Plants Under Stress. In: Osmoprotectant-Mediated Abiotic Stress Tolerance in Plants. Springer, pp 201-223
Chabot R, Antoun H, Cescas MP (1996) Growth promotion of maize and lettuce by phosphate-solubilizing Rhizobium leguminosarum biovar. phaseoli. Plant and Soil 184 (2):311-321
Chamam A, Sanguin H, Bellvert F, Meiffren G, Comte G, Wisniewski-Dyé F, Bertrand C, Prigent-Combaret C (2013) Plant secondary metabolite profiling evidences strain-dependent effect in the Azospirillum–Oryza sativa association. Phytochemistry 87:65-77
Chanda B, Xia Y, Mandal MK, Yu K, Sekine KT, Gao Q-m, Selote D, Hu Y, Stromberg A, Navarre D (2011) Glycerol-3-phosphate is a critical mobile inducer of systemic immunity in plants. Nature Genetics 43 (5):421-427
Chang P, Gerhardt KE, Huang X-D, Yu X-M, Glick BR, Gerwing PD, Greenberg BM (2014) Plant growth-promoting bacteria facilitate the growth of barley and oats in salt-impacted soil: implications for phytoremediation of saline soils. International Journal of Phytoremediation 16 (11):1133-1147
Cheikh N, Jones RJ (1994) Disruption of maize kernel growth and development by heat stress (role of cytokinin/abscisic acid balance). Plant Physiology 106 (1):45-51
Chen M, Thelen JJ (2016) Acyl‐lipid desaturase 1 primes cold acclimation response in Arabidopsis. Physiologia Plantarum 158 (1):11-22

149
Cheong BE, Onyemaobi O, Wing Ho Ho W, Biddulph TB, Rupasinghe TW, Roessner U, Dolferus R (2020) Phenotyping the Chilling and Freezing Responses of Young Microspore Stage Wheat Spikes Using Targeted Metabolome and Lipidome Profiling. Cells 9 (5):1309
Chinnusamy V, Zhu J, Zhu J-K (2007) Cold stress regulation of gene expression in plants. Trends in Plant Science 12 (10):444-451
Compant S, Clément C, Sessitsch A (2010) Plant growth-promoting bacteria in the rhizo-and endosphere of plants: their role, colonization, mechanisms involved and prospects for utilization. Soil Biology and Biochemistry 42 (5):669-678
Compant S, Duffy B, Nowak J, Clément C, Barka EA (2005) Use of plant growth-promoting bacteria for biocontrol of plant diseases: principles, mechanisms of action, and future prospects. Applied and Environmental Microbiology 71 (9):4951-4959
Coombs JT, Franco CM (2003) Isolation and identification of actinobacteria from surface-sterilized wheat roots. Applied and Environmental Microbiology 69 (9):5603-5608
Cordell D, Rosemarin A, Schröder JJ, Smit A (2011) Towards global phosphorus security: A systems framework for phosphorus recovery and reuse options. Chemosphere 84 (6):747-758
Creus CM, Pereyra MA, Casanovas EM, Sueldo RJ, Barassi CA (2010) Plant growth-promoting effects of rhizobacteria on abiotic stressed plants. Azospirillum-Grasses model. Plant science and biotechnology in South America: focus on Argentina 2:49-59
Creus CM, Sueldo RJ, Barassi CA (2004) Water relations and yield in Azospirillum-inoculated wheat exposed to drought in the field. Canadian Journal of Botany 82 (2):273-281
Csaba G, Pál K (1982) Effects of insulin, triiodothyronine, and serotonin on plant seed development. Protoplasma 110 (1):20-22
Curzi M, Ribaudo C, Trinchero G, Curá J, Pagano E (2008) Changes in the content of organic and amino acids and ethylene production of rice plants in response to the inoculation with Herbaspirillum seropedicae. Journal of Plant Interactions 3 (3):163-173
Czaban J, Gajda A, Wróblewska B (2007) The motility of bacteria from rhizosphere and different zones of winter wheat roots. Polish Journal of Environmental Studies 16 (2):301
da Costa PB, Granada CE, Ambrosini A, Moreira F, de Souza R, dos Passos JFM, Arruda L, Passaglia LM (2014) A model to explain plant growth promotion traits: a multivariate analysis of 2,211 bacterial isolates. PLoS One 9 (12)
da Fonseca Breda FA, da Silva TFR, dos Santos SG, Alves GC, Reis VM (2019) Modulation of nitrogen metabolism of maize plants inoculated with Azospirillum brasilense and Herbaspirillum seropedicae. Archives of Microbiology 201 (4):547-558
Dastogeer KM, Li H, Sivasithamparam K, Jones MG, Du X, Ren Y, Wylie SJ (2017) Metabolic responses of endophytic Nicotiana benthamiana plants experiencing water stress. Environmental and Experimental Botany 143:59-71
de Weert S, Vermeiren H, Mulders IH, Kuiper I, Hendrickx N, Bloemberg GV, Vanderleyden J, De Mot R, Lugtenberg BJ (2002) Flagella-driven chemotaxis towards exudate components is an important trait for tomato root colonization by Pseudomonas fluorescens. Molecular Plant-Microbe Interactions 15 (11):1173-1180
DeAngelis KM, Brodie EL, DeSantis TZ, Andersen GL, Lindow SE, Firestone MK (2009) Selective progressive response of soil microbial community to wild oat roots. The ISME Journal 3 (2):168
Delaplace P, Delory BM, Baudson C, de Cazenave MM-S, Spaepen S, Varin S, Brostaux Y, du Jardin P (2015) Influence of rhizobacterial volatiles on the root system architecture and the production and allocation of biomass in the model grass Brachypodium distachyon (L.) P. Beauv. BMC Plant Biology 15 (1):195
Dhillon J, Torres G, Driver E, Figueiredo B, Raun WR (2017) World phosphorus use efficiency in cereal crops. Agronomy Journal 109 (4):1670-1677

150
Dias DA, Hill CB, Jayasinghe NS, Atieno J, Sutton T, Roessner U (2015) Quantitative profiling of polar primary metabolites of two chickpea cultivars with contrasting responses to salinity. Journal of Chromatography B 1000:1-13
Dickinson E, Rusilowicz MJ, Dickinson M, Charlton AJ, Bechtold U, Mullineaux PM, Wilson J (2018) Integrating transcriptomic techniques and k-means clustering in metabolomics to identify markers of abiotic and biotic stress in Medicago truncatula. Metabolomics 14 (10):126
Dimkpa C, Weinand T, Asch F (2009) Plant–rhizobacteria interactions alleviate abiotic stress conditions. Plant, Cell & Environment 32 (12):1682-1694
Ding Z, Jia S, Wang Y, Xiao J, Zhang Y (2017) Phosphate stresses affect ionome and metabolome in tea plants. Plant Physiology and Biochemistry 120:30-39
Dissanayaka D, Plaxton WC, Lambers H, Siebers M, Marambe B, Wasaki J (2018) Molecular mechanisms underpinning phosphorus‐use efficiency in rice. Plant, Cell & Environment 41 (7):1483-1496
Do Amaral FP, Pankievicz VC, Arisi ACM, de Souza EM, Pedrosa F, Stacey G (2016) Differential growth responses of Brachypodium distachyon genotypes to inoculation with plant growth promoting rhizobacteria. Plant Molecular Biology 90 (6):689-697
Dobbelaere S, Croonenborghs A, Thys A, Broek AV, Vanderleyden J (1999) Phytostimulatory effect of Azospirillum brasilense wild type and mutant strains altered in IAA production on wheat. Plant and Soil 212 (2):153-162
Dobbelaere S, Croonenborghs A, Thys A, Ptacek D, Okon Y, Vanderleyden J (2002) Effect of inoculation with wild type Azospirillum brasilense and A. irakense strains on development and nitrogen uptake of spring wheat and grain maize. Biology and Fertility of Soils 36 (4):284-297
Dolferus R, Ji X, Richards RA (2011) Abiotic stress and control of grain number in cereals. Plant Science 181 (4):331-341
Doyle JJ, Doyle JL (1987) A rapid DNA isolation procedure for small quantities of fresh leaf tissue. Echevarría C, Maurĩno SG, Maldonado JM (1984) Reversible inactivation of maize leaf nitrate reductase.
Phytochemistry 23 (10):2155-2158 Egamberdieva D (2009) Alleviation of salt stress by plant growth regulators and IAA producing bacteria
in wheat. Acta Physiologiae Plantarum 31 (4):861-864 Egamberdiyeva D (2007) The effect of plant growth promoting bacteria on growth and nutrient uptake
of maize in two different soils. Applied Soil Ecology 36 (2-3):184-189 Egamberdiyeva D, Höflich G (2003) Influence of growth-promoting bacteria on the growth of wheat in
different soils and temperatures. Soil Biology and Biochemistry 35 (7):973-978 El-Komy H, Hamdia M, El-Baki GA (2003) Nitrate reductase in wheat plants grown under water stress
and inoculated with Azospirillum spp. Biologia Plantarum 46 (2):281-287 el Zahar Haichar F, Marol C, Berge O, Rangel-Castro JI, Prosser JI, Balesdent Jm, Heulin T, Achouak W
(2008) Plant host habitat and root exudates shape soil bacterial community structure. The ISME Journal 2 (12):1221
Erb M, Robert CA, Marti G, Lu J, Doyen GR, Villard N, Barrière Y, French BW, Wolfender J-L, Turlings TC (2015) A physiological and behavioral mechanism for leaf herbivore-induced systemic root resistance. Plant Physiology 169 (4):2884-2894
Fahad S, Hussain S, Bano A, Saud S, Hassan S, Shan D, Khan FA, Khan F, Chen Y, Wu C (2015) Potential role of phytohormones and plant growth-promoting rhizobacteria in abiotic stresses: consequences for changing environment. Environmental Science and Pollution Research 22 (7):4907-4921
Fang Z, Shao C, Meng Y, Wu P, Chen M (2009) Phosphate signaling in Arabidopsis and Oryza sativa. Plant Science 176 (2):170-180
FAO FAOSTAT Database [Internet]. Available from: http://www.fao.org/faostat/en/#data/QC [Accessed: 2019-02-25].

151
FAO (2018) WORLD FOOD AND AGRICULTURE – STATISTICAL POCKETBOOK 2018.254 Farmer EE, Alméras E, Krishnamurthy V (2003) Jasmonates and related oxylipins in plant responses to
pathogenesis and herbivory. Current Opinion in Plant Biology 6 (4):372-378 Farooq M, Hussain M, Wahid A, Siddique K (2012) Drought stress in plants: an overview. In: Plant
responses to drought stress. Springer, Berlin, pp 1-33 Fischer SE, Miguel MJ, Mori GB (2003) Effect of root exudates on the exopolysaccharide composition
and the lipopolysaccharide profile of Azospirillum brasilense Cd under saline stress. FEMS Microbiology Letters 219 (1):53-62
Fitzgerald TL, Powell JJ, Schneebeli K, Hsia MM, Gardiner DM, Bragg JN, McIntyre CL, Manners JM, Ayliffe M, Watt M (2015) Brachypodium as an emerging model for cereal–pathogen interactions. Annals of Botany 115 (5):717-731
Flavel RJ, Guppy CN, Tighe M, Watt M, McNeill A, Young IM (2012) Non-destructive quantification of cereal roots in soil using high-resolution X-ray tomography. Journal of Experimental Botany 63 (7):2503-2511
Flexas J, Bota J, Loreto F, Cornic G, Sharkey T (2004) Diffusive and metabolic limitations to photosynthesis under drought and salinity in C3 plants. Plant Biology 6 (03):269-279
Foster R (1986) The ultrastructure of the rhizoplane and rhizosphere. Annual Review of Phytopathology 24 (1):211-234
Fox AR, Soto G, Valverde C, Russo D, Lagares Jr A, Zorreguieta Á, Alleva K, Pascuan C, Frare R, Mercado‐Blanco J (2016) Major cereal crops benefit from biological nitrogen fixation when inoculated with the nitrogen‐fixing bacterium Pseudomonas protegens Pf‐5 X940. Environmental Microbiology 18 (10):3522-3534
Foyer CH, Parry M, Noctor G (2003) Markers and signals associated with nitrogen assimilation in higher plants. Journal of Experimental Botany 54 (382):585-593
Fujii S, Saka H (2001) The promotive effect of brassinolide on lamina joint-cell elongation, germination and seedling growth under low-temperature stress in rice (Oryza sativa L.). Plant Production Science 4 (3):210-214
Gagné-Bourque F, Bertrand A, Claessens A, Aliferis KA, Jabaji S (2016) Alleviation of drought stress and metabolic changes in timothy (Phleum pratense L.) colonized with Bacillus subtilis B26. Frontiers in Plant Science 7:584
Gagne-Bourque F, Mayer BF, Charron J-B, Vali H, Bertrand A, Jabaji S (2015) Accelerated growth rate and increased drought stress resilience of the model grass Brachypodium distachyon colonized by Bacillus subtilis B26. PLoS One 10 (6)
Galippe V (1887) Note sur la présence de micro-organismes dans les tissus végétaux. CR Seances Soc Biol Fil 39:410-416
Gao M, Yin X, Yang W, Lam SM, Tong X, Liu J, Wang X, Li Q, Shui G, He Z (2017) GDSL lipases modulate immunity through lipid homeostasis in rice. PLoS Pathogens 13 (11):e1006724
Garg AK, Kim J-K, Owens TG, Ranwala AP, Do Choi Y, Kochian LV, Wu RJ (2002) Trehalose accumulation in rice plants confers high tolerance levels to different abiotic stresses. Proceedings of the National Academy of Sciences 99 (25):15898-15903
Garnett T, Conn V, Kaiser BN (2009) Root based approaches to improving nitrogen use efficiency in plants. Plant, Cell & Environment 32 (9):1272-1283
Gaume A, Mächler F, De León C, Narro L, Frossard E (2001) Low-P tolerance by maize (Zea mays L.) genotypes: significance of root growth, and organic acids and acid phosphatase root exudation. Plant and Soil 228 (2):253-264
Germida J, Siciliano S (2001) Taxonomic diversity of bacteria associated with the roots of modern, recent and ancient wheat cultivars. Biology and Fertility of Soils 33 (5):410-415

152
Gholami A, Shahsavani S, Nezarat S (2009) The effect of plant growth promoting rhizobacteria (PGPR) on germination, seedling growth and yield of maize. International Journal of Agricultural and Biosystems Engineering 3 (1):35-40
Gika HG, Theodoridis GA, Wilson ID (2018) Metabolic Profiling: Status, Challenges, and Perspective. In: Metabolic Profiling. Springer, pp 3-13
Gioia T, Galinski A, Lenz H, Müller C, Lentz J, Heinz K, Briese C, Putz A, Fiorani F, Watt M (2016) GrowScreen-PaGe, a non-invasive, high-throughput phenotyping system based on germination paper to quantify crop phenotypic diversity and plasticity of root traits under varying nutrient supply. Functional Plant Biology 44 (1):76-93
Glick BR (1995) The enhancement of plant growth by free-living bacteria. Canadian Journal of Microbiology 41 (2):109-117
Glick BR Promotion of plant growth by soil bacteria that regulate plant ethylene levels. In: Proceedings 33rd PGRSA Annual Meeting, 2007.
Goh C-H, Vallejos DFV, Nicotra AB, Mathesius U (2013) The impact of beneficial plant-associated microbes on plant phenotypic plasticity. Journal of Chemical Ecology 39 (7):826-839
Goswami D, Thakker JN, Dhandhukia PC (2016) Portraying mechanics of plant growth promoting rhizobacteria (PGPR): A review. Cogent Food & Agriculture 2 (1):1127500
Grant C, Flaten D, Tomasiewicz D, Sheppard S (2001) The importance of early season phosphorus nutrition. Canadian Journal of Plant Science 81 (2):211-224
Grayston S, Vaughan D, Jones D (1997) Rhizosphere carbon flow in trees, in comparison with annual plants: the importance of root exudation and its impact on microbial activity and nutrient availability. Applied Soil Ecology 5 (1):29-56
Griffiths CA, Paul MJ, Foyer CH (2016) Metabolite transport and associated sugar signalling systems underpinning source/sink interactions. Biochimica et Biophysica Acta (BBA)-Bioenergetics 1857 (10):1715-1725
Groleau‐Renaud V, Plantureux S, Tubeileh A, Guckert A (2000) Influence of microflora and composition of root bathing solution on root exudation of maize plants. Journal of Plant Nutrition 23 (9):1283-1301
Gu Z, Eils R, Schlesner M (2016) Complex heatmaps reveal patterns and correlations in multidimensional genomic data. Bioinformatics 32 (18):2847-2849
Guo R, Yang Z, Li F, Yan C, Zhong X, Liu Q, Xia X, Li H, Zhao L (2015) Comparative metabolic responses and adaptive strategies of wheat (Triticum aestivum) to salt and alkali stress. BMC Plant Biology 15 (1):170
Gutiérrez-Zamora M, Martınez-Romero E (2001) Natural endophytic association between Rhizobium etli and maize (Zea mays L.). Journal of Biotechnology 91 (2-3):117-126
Hallmann J, Quadt-Hallmann A, Mahaffee W, Kloepper J (1997) Bacterial endophytes in agricultural crops. Canadian Journal of Microbiology 43 (10):895-914
Hamdia MAE-S, Shaddad M, Doaa MM (2004) Mechanisms of salt tolerance and interactive effects of Azospirillum brasilense inoculation on maize cultivars grown under salt stress conditions. Plant Growth Regulation 44 (2):165-174
Hammond JP, Broadley MR, White PJ, King GJ, Bowen HC, Hayden R, Meacham MC, Mead A, Overs T, Spracklen WP (2009) Shoot yield drives phosphorus use efficiency in Brassica oleracea and correlates with root architecture traits. Journal of Experimental Botany 60 (7):1953-1968
Hammond JP, White PJ (2008) Sucrose transport in the phloem: integrating root responses to phosphorus starvation. Journal of Experimental Botany 59 (1):93-109
Hammond JP, White PJ (2011) Sugar signaling in root responses to low phosphorus availability. Plant Physiology 156 (3):1033-1040

153
Hanson AD, Beaudoin GA, McCarty DR, Gregory JF (2016) Does abiotic stress cause functional B vitamin deficiency in plants? Plant Physiology 172 (4):2082-2097
Hanway J, Olson R (1980) Phosphate nutrition of corn, sorghum, soybeans, and small grains. The role of phosphorus in agriculture:681-692
Hardoim PR, Van Overbeek LS, Berg G, Pirttilä AM, Compant S, Campisano A, Döring M, Sessitsch A (2015) The hidden world within plants: ecological and evolutionary considerations for defining functioning of microbial endophytes. Microbiology and Molecular Biology Reviews 79 (3):293-320
Hardoim PR, van Overbeek LS, van Elsas JD (2008) Properties of bacterial endophytes and their proposed role in plant growth. Trends in Microbiology 16 (10):463-471
Harrold S, Tabatabai M (2006) Release of inorganic phosphorus from soils by low‐molecular‐weight organic acids. Communications in Soil Science and Plant Analysis 37 (9-10):1233-1245
Harsant J, Pavlovic L, Chiu G, Sultmanis S, Sage TL (2013) High temperature stress and its effect on pollen development and morphological components of harvest index in the C3 model grass Brachypodium distachyon. Journal of Experimental Botany 64 (10):2971-2983
Hayashi K, Fujita Y, Ashizawa T, Suzuki F, Nagamura Y, Hayano‐Saito Y (2016) Serotonin attenuates biotic stress and leads to lesion browning caused by a hypersensitive response to Magnaporthe oryzae penetration in rice. The Plant Journal 85 (1):46-56
Hayat S, Hayat Q, Alyemeni MN, Wani AS, Pichtel J, Ahmad A (2012) Role of proline under changing environments: a review. Plant Signaling & Behavior 7 (11):1456-1466
Hays DB, Do JH, Mason RE, Morgan G, Finlayson SA (2007) Heat stress induced ethylene production in developing wheat grains induces kernel abortion and increased maturation in a susceptible cultivar. Plant Science 172 (6):1113-1123
He R-y, Wang G-j, Wang X-s (1991) Effects of brassinolide on growth and chilling resistance of maize seedlings. In: Brassinosteroids. ACS Publications,
Heffer P GA, Roberts T (2017) Assessment of fertilizer use by crop at the global level. International Fertilizer Industry Association, Paris.
Heino P, Palva ET (2003) Signal transduction in plant cold acclimation. In: Plant responses to abiotic stress. Springer, Berlin, pp 151-186
Hernández‐Ruiz J, Cano A, Arnao MB (2005) Melatonin acts as a growth‐stimulating compound in some monocot species. Journal of Pineal Research 39 (2):137-142
Herrera SD, Grossi C, Zawoznik M, Groppa MD (2016) Wheat seeds harbour bacterial endophytes with potential as plant growth promoters and biocontrol agents of Fusarium graminearum. Microbiological Research 186:37-43
Hill CB, Roessner U (2013) Metabolic profiling of plants by GC-MS. The Handbook of Plant Metabolomics: Metabolite Profiling and Networking, Wiley-VCH:3-23
Hill CB, Roessner U (2014) Advances in high-throughput untargeted LC-MS analysis for plant metabolomics. Future Science eBook Series “Advanced LC-MS applicafions for metabolomics Future Science Group, UK
Hillyer KE, Dias DA, Lutz A, Wilkinson SP, Roessner U, Davy SK (2017) Metabolite profiling of symbiont and host during thermal stress and bleaching in the coral Acropora aspera. Coral Reefs 36 (1):105-118
Hiroshi T, Atsushi H, Kazuki I, Yosuke I, Yuya S, Makoto A (2018) High-Throughput Lipid Profiling with SWATH® Acquisition and MS-DIAL.
Hoagland DR, Arnon DI (1950) The water-culture method for growing plants without soil. Circular California agricultural experiment station 347 (2nd edit)

154
Hocking P, Randall P, Delhaize E, Keerthisinghe G (2000) The role of organic acids exuded from roots in phosphorus nutrition and aluminium tolerance in acidic soils. Management and conservation of tropical acid soils for sustainable crop production.
Hotta Y, Tanaka T, Luo B, Takeuchi Y, Konnai M (1998) Improvement of cold resistance in rice seedlings by 5-aminolevulinic acid. Journal of Pesticide Science (Japan)
Hou Q, Ufer G, Bartels D (2016) Lipid signalling in plant responses to abiotic stress. Plant, Cell & Environment 39 (5):1029-1048
Hu C, Van Dommelen J, Van Der Heijden R, Spijksma G, Reijmers TH, Wang M, Slee E, Lu X, Xu G, Van Der Greef J (2008) RPLC-ion-trap-FTMS method for lipid profiling of plasma: method validation and application to p53 mutant mouse model. Journal of Proteome Research 7 (11):4982-4991
Huang AC, Jiang T, Liu Y-X, Bai Y-C, Reed J, Qu B, Goossens A, Nützmann H-W, Bai Y, Osbourn A (2019) A specialized metabolic network selectively modulates Arabidopsis root microbiota. Science 364 (6440)
Huang CY, Roessner U, Eickmeier I, Genc Y, Callahan DL, Shirley N, Langridge P, Bacic A (2008) Metabolite profiling reveals distinct changes in carbon and nitrogen metabolism in phosphate-deficient barley plants (Hordeum vulgare L.). Plant and Cell Physiology 49 (5):691-703
Huang Q, Li L, Zheng M, Chen F, Long H, Deng G, Pan Z, Liang J, Li Q, Yu M (2018) The tryptophan decarboxylase 1 gene from Aegilops variabilis No. 1 regulate the resistance against cereal cyst nematode by altering the downstream secondary metabolite contents rather than auxin synthesis. Frontiers in Plant Science 9:1297
Hungria M, Campo RJ, Souza EM, Pedrosa FO (2010) Inoculation with selected strains of Azospirillum brasilense and A. lipoferum improves yields of maize and wheat in Brazil. Plant and Soil 331 (1-2):413-425
Hurek T, Reinhold-Hurek B, Van Montagu M, Kellenberger E (1994) Root colonization and systemic spreading of Azoarcus sp. strain BH72 in grasses. Journal of Bacteriology 176 (7):1913-1923
Hurry V, Strand Å, Furbank R, Stitt M (2000) The role of inorganic phosphate in the development of freezing tolerance and the acclimatization of photosynthesis to low temperature is revealed by the pho mutants of Arabidopsis thaliana. The Plant Journal 24 (3):383-396
Ihaka R, Gentleman R (1996) R: a language for data analysis and graphics. Journal of Computational and Graphical Statistics 5 (3):299-314
Ingram PA, Zhu J, Shariff A, Davis IW, Benfey PN, Elich T (2012) High-throughput imaging and analysis of root system architecture in Brachypodium distachyon under differential nutrient availability. Philosophical Transactions of the Royal Society B: Biological Sciences 367 (1595):1559-1569
Iqbal N, Nazar R, Khan MIR, Masood A, Khan NA (2011) Role of gibberellins in regulation of source-sink relations under optimal and limiting environmental conditions. Current Science(Bangalore) 100 (7):998-1007
Jacoby RP, Millar AH, Taylor NL (2013) Investigating the role of respiration in plant salinity tolerance by analyzing mitochondrial proteomes from wheat and a salinity-tolerant Amphiploid (wheat× Lophopyrum elongatum). Journal of Proteome Research 12 (11):4807-4829
Jeong E-Y, Sung B-K, Song H-Y, Yang J-Y, Kim D-K, Lee H-S (2010) Antioxidative and antimicrobial activities of active materials derived from Triticum aestivum sprouts. Journal of the Korean Society for Applied Biological Chemistry 53 (4):519-524
Jiménez-Arias D, García-Machado FJ, Morales-Sierra S, Luis JC, Suarez E, Hernández M, Valdés F, Borges AA (2019) Lettuce plants treated with L-pyroglutamic acid increase yield under water deficit stress. Environmental and Experimental Botany 158:215-222
Johnston-Monje D, Raizada MN (2011) Conservation and diversity of seed associated endophytes in Zea across boundaries of evolution, ethnography and ecology. PLoS One 6 (6):e20396

155
Kang K, Kim Y-S, Park S, Back K (2009) Senescence-induced serotonin biosynthesis and its role in delaying senescence in rice leaves. Plant Physiology 150 (3):1380-1393
Kapulnik Y, Okon Y, Kigel J, Nur I, Henis Y (1981) Effects of temperature, nitrogen fertilization, and plant age on nitrogen fixation by Setaria italica inoculated with Azospirillum brasilense (strain cd). Plant Physiology 68 (2):340-343
Karlsson E, Shin JH, Westman G, Eriksson LA, Olsson L, Mapelli V (2018) In silico and in vitro studies of the reduction of unsaturated α, β bonds of trans-2-hexenedioic acid and 6-amino-trans-2-hexenoic acid–Important steps towards biobased production of adipic acid. PLoS One 13 (2):e0193503
Kaur G, Asthir B (2015) Proline: a key player in plant abiotic stress tolerance. Biologia Plantarum 59 (4):609-619
Kaur H, Mukherjee S, Baluska F, Bhatla SC (2015) Regulatory roles of serotonin and melatonin in abiotic stress tolerance in plants. Plant Signaling & Behavior 10 (11):e1049788
Kawasaki A, Donn S, Ryan PR, Mathesius U, Devilla R, Jones A, Watt M (2016) Microbiome and exudates of the root and rhizosphere of Brachypodium distachyon, a model for wheat. PLoS One 11 (10):e0164533
Kelly AA, Dörmann P (2002) DGD2, an Arabidopsis gene encoding a UDP-galactose-dependent digalactosyldiacylglycerol synthase is expressed during growth under phosphate-limiting conditions. Journal of Biological Chemistry 277 (2):1166-1173
Kiely PD, Haynes J, Higgins C, Franks A, Mark GL, Morrissey JP, O'Gara F (2006) Exploiting new systems-based strategies to elucidate plant-bacterial interactions in the rhizosphere. Microbial Ecology 51 (3):257-266
Kim Y-C, Glick BR, Bashan Y, Ryu C-M (2012) Enhancement of plant drought tolerance by microbes. In: Plant responses to drought stress. Springer, Berlin, pp 383-413
Kompas T, Pham VH, Che TN (2018) The effects of climate change on GDP by country and the global economic gains from complying with the Paris Climate Accord. Earth's Future 6 (8):1153-1173
Kosová K, Vítámvás P, Prášil IT, Renaut J (2011) Plant proteome changes under abiotic stress—contribution of proteomics studies to understanding plant stress response. Journal of Proteomics 74 (8):1301-1322
Kour D, Rana KL, Yadav AN, Yadav N, Kumar V, Kumar A, Sayyed R, Hesham AE-L, Dhaliwal HS, Saxena AK (2019) Drought-tolerant phosphorus-solubilizing microbes: biodiversity and biotechnological applications for alleviation of drought stress in plants. In: Plant Growth Promoting Rhizobacteria for Sustainable Stress Management. Springer, pp 255-308
Krasensky J, Jonak C (2012) Drought, salt, and temperature stress-induced metabolic rearrangements and regulatory networks. Journal of Experimental Botany 63 (4):1593-1608
Krishna P (2003) Plant responses to heat stress. In: Plant responses to abiotic stress. Springer, Berlin, pp 73-101
Kuiper I, Kravchenko LV, Bloemberg GV, Lugtenberg BJ (2002) Pseudomonas putida strain PCL1444, selected for efficient root colonization and naphthalene degradation, effectively utilizes root exudate components. Molecular Plant-Microbe Interactions 15 (7):734-741
Kumar B, Singh B (1996) Effect of plant hormones on growth and yield of wheat irrigated with saline water. Annals of Agricultural Research 17:209-212
Lamb D, Erskine PD, Parrotta JA (2005) Restoration of degraded tropical forest landscapes. Science 310 (5754):1628-1632
Lambers H (2003) Introduction, dryland salinity: a key environmental issue in southern Australia. Plant and Soil 257 (2):5-7
Lambers H, Chapin III FS, Pons TL (2008) Plant physiological ecology. Springer Science & Business Media, New York

156
Levitt J (1980) Responses of plants to environmental stresses. Water, radiation, salt, and other stresses 2 Li Z, Yu J, Peng Y, Huang B (2017) Metabolic pathways regulated by abscisic acid, salicylic acid and γ‐
aminobutyric acid in association with improved drought tolerance in creeping bentgrass (Agrostis stolonifera). Physiologia Plantarum 159 (1):42-58
Long SR (1989) Rhizobium-legume nodulation: life together in the underground. Cell 56 (2):203-214 Lugtenberg B, Kamilova F (2009) Plant-growth-promoting rhizobacteria. Annual review of microbiology
63:541-556 Lugtenberg BJ, Dekkers L, Bloemberg GV (2001) Molecular determinants of rhizosphere colonization by
Pseudomonas. Annual Review of Phytopathology 39 (1):461-490 Lugtenberg BJ, Dekkers LC (1999) What makes Pseudomonas bacteria rhizosphere competent?
Environmental Microbiology 1 (1):9-13 Lunn JE, Delorge I, Figueroa CM, Van Dijck P, Stitt M (2014) Trehalose metabolism in plants. The Plant
Journal 79 (4):544-567 Luo Q, Wang S, Sun L-n, Wang H, Bao T, Adeel M (2017) Identification of root exudates from the Pb-
accumulator Sedum alfredii under Pb stresses and assessment of their roles. Journal of Plant Interactions 12 (1):272-278
Lynch J, Whipps J (1990) Substrate flow in the rhizosphere. Plant and Soil 129 (1):1-10 Lynch JM, de Leij F (2001) Rhizosphere. e LS Machingura M, Salomon E, Jez JM, Ebbs SD (2016) The β‐cyanoalanine synthase pathway: beyond
cyanide detoxification. Plant, Cell & Environment 39 (10):2329-2341 Malhotra M, Srivastava S (2009) Stress-responsive indole-3-acetic acid biosynthesis by Azospirillum
brasilense SM and its ability to modulate plant growth. European Journal of Soil Biology 45 (1):73-80
Mbosso EJT, Ngouela S, Nguedia JCA, Beng VP, Rohmer M, Tsamo E (2010) In vitro antimicrobial activity of extracts and compounds of some selected medicinal plants from Cameroon. Journal of Ethnopharmacology 128 (2):476-481
McMichael B, Quisenberry J (1993) The impact of the soil environment on the growth of root systems. Environmental and Experimental Botany 33 (1):53-61
Meharg A, Killham K (1995) Loss of exudates from the roots of perennial ryegrass inoculated with a range of micro-organisms. Plant and Soil 170 (2):345-349
Mercado-Blanco J, Prieto P (2012) Bacterial endophytes and root hairs. Plant and Soil 361 (1-2):301-306 Miller MB, Bassler BL (2001) Quorum sensing in bacteria. Annual Reviews in Microbiology 55 (1):165-199 Mishra PK, Bisht SC, Ruwari P, Selvakumar G, Joshi GK, Bisht JK, Bhatt JC, Gupta HS (2011) Alleviation of
cold stress in inoculated wheat (Triticum aestivum L.) seedlings with psychrotolerant Pseudomonads from NW Himalayas. Archives of Microbiology 193 (7):497-513
Miura K, Furumoto T (2013) Cold signaling and cold response in plants. International Journal of Molecular Sciences 14 (3):5312-5337
Monteiro M, Carvalho M, Bastos M, Guedes de Pinho P (2013) Metabolomics analysis for biomarker discovery: advances and challenges. Current Medicinal Chemistry 20 (2):257-271
Morgan PW, Drew MC (1997) Ethylene and plant responses to stress. Physiologia Plantarum 100 (3):620-630
Moya J, Ros R, Picazo I (1995) Heavy metal-hormone interactions in rice plants: Effects on growth, net photosynthesis, and carbohydrate distribution. Journal of Plant Growth Regulation 14 (2):61
Munns R, James RA, Läuchli A (2006) Approaches to increasing the salt tolerance of wheat and other cereals. Journal of Experimental Botany 57 (5):1025-1043
Murty M, Ladha J (1988) Influence of Azospirillum inoculation on the mineral uptake and growth of rice under hydroponic conditions. Plant and Soil 108 (2):281-285

157
Nadeem SM, Zahir ZA, Naveed M, Arshad M (2009) Rhizobacteria containing ACC-deaminase confer salt tolerance in maize grown on salt-affected fields. Canadian Journal of Microbiology 55 (11):1302-1309
Nadira UA, Ahmed IM, Wu F, Zhang G (2016) The regulation of root growth in response to phosphorus deficiency mediated by phytohormones in a Tibetan wild barley accession. Acta Physiologiae Plantarum 38 (4):105
Nagel KA, Putz A, Gilmer F, Heinz K, Fischbach A, Pfeifer J, Faget M, Blossfeld S, Ernst M, Dimaki C (2012) GROWSCREEN-Rhizo is a novel phenotyping robot enabling simultaneous measurements of root and shoot growth for plants grown in soil-filled rhizotrons. Functional Plant Biology 39 (11):891-904
Naher U, Radziah O, Halimi M, Shamsuddin Z, Razi IM (2008) Effect of inoculation on root exudates carbon sugar and amino acids production of different rice varieties. Research Journal of Microbiology 3 (9):580-587
Nakashita H, Yasuda M, Nitta T, Asami T, Fujioka S, Arai Y, Sekimata K, Takatsuto S, Yamaguchi I, Yoshida S (2003) Brassinosteroid functions in a broad range of disease resistance in tobacco and rice. The Plant Journal 33 (5):887-898
Natera SH, Hill CB, Rupasinghe TW, Roessner U (2016) Salt-stress induced alterations in the root lipidome of two barley genotypes with contrasting responses to salinity. Functional Plant Biology 43 (2):207-219
Naveed M, Mitter B, Reichenauer TG, Wieczorek K, Sessitsch A (2014) Increased drought stress resilience of maize through endophytic colonization by Burkholderia phytofirmans PsJN and Enterobacter sp. FD17. Environmental and Experimental Botany 97:30-39
Nehl D, Allen S, Brown J (1997) Deleterious rhizosphere bacteria: an integrating perspective. Applied Soil Ecology 5 (1):1-20
Nelson EB (2004) Microbial dynamics and interactions in the spermosphere. Annual Review of Phytopathology 42:271-309
Nestler J, Keyes SD, Wissuwa M (2016) Root hair formation in rice (Oryza sativa L.) differs between root types and is altered in artificial growth conditions. Journal of Experimental Botany 67 (12):3699-3708
Neumann G, Römheld V (1999) Root excretion of carboxylic acids and protons in phosphorus-deficient plants. Plant and Soil 211 (1):121-130
Nguyen VL, Palmer L, Roessner U, Stangoulis J (2019) Genotypic variation in the root and shoot metabolite profiles of wheat (Triticum aestivum L.) indicate sustained, preferential carbon allocation as a potential mechanism in phosphorus efficiency. Frontiers in Plant Science 10:995
O'sullivan DJ, O'Gara F (1992) Traits of fluorescent Pseudomonas spp. involved in suppression of plant root pathogens. Microbiology and Molecular Biology Reviews 56 (4):662-676
O’Callaghan M (2016) Microbial inoculation of seed for improved crop performance: issues and opportunities. Applied Microbiology and Biotechnology 100 (13):5729-5746
Oburger E, Jones DL (2018) Sampling root exudates–mission impossible? Rhizosphere 6:116-133 Oh IS, Park AR, Bae MS, Kwon SJ, Kim YS, Lee JE, Kang NY, Lee S, Cheong H, Park OK (2005) Secretome
analysis reveals an Arabidopsis lipase involved in defense against Alternaria brassicicola. The Plant Cell 17 (10):2832-2847
Olanrewaju OS, Ayangbenro AS, Glick BR, Babalola OO (2019) Plant health: feedback effect of root exudates-rhizobiome interactions. Applied Microbiology and Biotechnology 103 (3):1155-1166
Pacovsky R (1988) Influence of inoculation with Azospirillum brasilense and Glomus fasciculatum on sorghum nutrition. Plant and Soil 110 (2):283-287

158
Palta J, Watt M (2009) Vigorous crop root systems: form and function for improving the capture of water and nutrients. Applied crop physiology: boundaries between genetic improvement and agronomy Academic, San Diego:309-325
Pant BD, Burgos A, Pant P, Cuadros-Inostroza A, Willmitzer L, Scheible W-R (2015) The transcription factor PHR1 regulates lipid remodeling and triacylglycerol accumulation in Arabidopsis thaliana during phosphorus starvation. Journal of Experimental Botany 66 (7):1907-1918
Papadimitropoulos M-EP, Vasilopoulou CG, Maga-Nteve C, Klapa MI (2018) Untargeted GC-MS Metabolomics. In: Metabolic Profiling. Springer, pp 133-147
Pavli OI, Vlachos CE, Kalloniati C, Flemetakis E, Skaracis GN (2013) Metabolite profiling reveals the effect of drought on sorghum ('Sorghum bicolor'L. Moench) metabolism. Plant Omics 6 (6):371
Pearse SJ, Veneklaas EJ, Cawthray G, Bolland MD, Lambers H (2007) Carboxylate composition of root exudates does not relate consistently to a crop species’ ability to use phosphorus from aluminium, iron or calcium phosphate sources. New Phytologist 173 (1):181-190
Pedrosa FO, Monteiro RA, Wassem R, Cruz LM, Ayub RA, Colauto NB, Fernandez MA, Fungaro MHP, Grisard EC, Hungria M (2011) Genome of Herbaspirillum seropedicae strain SmR1, a specialized diazotrophic endophyte of tropical grasses. PLoS genetics 7 (5)
Peiffer JA, Spor A, Koren O, Jin Z, Tringe SG, Dangl JL, Buckler ES, Ley RE (2013) Diversity and heritability of the maize rhizosphere microbiome under field conditions. Proceedings of the National Academy of Sciences 110 (16):6548-6553
Pelagio-Flores R, Ortíz-Castro R, Méndez-Bravo A, Macías-Rodríguez L, López-Bucio J (2011) Serotonin, a tryptophan-derived signal conserved in plants and animals, regulates root system architecture probably acting as a natural auxin inhibitor in Arabidopsis thaliana. Plant and Cell Physiology 52 (3):490-508
Pereira NCM, Galindo FS, Gazola RPD, Dupas E, Rosa PAL, Mortinho ES (2020) Corn Yield and Phosphorus Use Efficiency Response to Phosphorus Rates Associated With Plant Growth Promoting Bacteria. Frontiers in Environmental Science
Pereyra M, Zalazar C, Barassi C (2006) Root phospholipids in Azospirillum-inoculated wheat seedlings exposed to water stress. Plant Physiology and Biochemistry 44 (11-12):873-879
Pereyra MA, Ballesteros FM, Creus CM, Sueldo RJ, Barassi CA (2009) Seedlings growth promotion by Azospirillum brasilense under normal and drought conditions remains unaltered in Tebuconazole-treated wheat seeds. European Journal of Soil Biology 45 (1):20-27
Pétriacq P, Williams A, Cotton A, McFarlane AE, Rolfe SA, Ton J (2017) Metabolite profiling of non‐sterile rhizosphere soil. The Plant Journal 92 (1):147-162
Pfaff J, Denton AK, Usadel B, Pfaff C (2020) Phosphate starvation causes different stress responses in the lipid metabolism of tomato leaves and roots. Biochimica et Biophysica Acta (BBA)-Molecular and Cell Biology of Lipids 1865 (9):158763
Pflugfelder D, Metzner R, van Dusschoten D, Reichel R, Jahnke S, Koller R (2017) Non-invasive imaging of plant roots in different soils using magnetic resonance imaging (MRI). Plant Methods 13 (1):102
Philippot L, Raaijmakers JM, Lemanceau P, Van Der Putten WH (2013) Going back to the roots: the microbial ecology of the rhizosphere. Nature Reviews Microbiology 11 (11):789
Phillips DA, Fox TC, King MD, Bhuvaneswari T, Teuber LR (2004) Microbial products trigger amino acid exudation from plant roots. Plant Physiology 136 (1):2887-2894
Planchamp C, Glauser G, Mauch-Mani B (2015) Root inoculation with Pseudomonas putida KT2440 induces transcriptional and metabolic changes and systemic resistance in maize plants. Frontiers in Plant Science 5:719
Plaxton WC (2004) Plant response to stress: biochemical adaptations to phosphate deficiency. Encyclopedia of plant and crop science Marcel Dekker, New York:976-980
Plaxton WC, Carswell MC (1999) Metabolic aspects of the phosphate starvation response in plants.

159
Plaxton WC, Tran HT (2011) Metabolic adaptations of phosphate-starved plants. Plant Physiology 156 (3):1006-1015
Poiré R, Chochois V, Sirault XR, Vogel JP, Watt M, Furbank RT (2014) Digital imaging approaches for phenotyping whole plant nitrogen and phosphorus response in Brachypodium distachyon. Journal of Integrative Plant Biology 56 (8):781-796
Poirier Y, Thoma S, Somerville C, Schiefelbein J (1991) Mutant of Arabidopsis deficient in xylem loading of phosphate. Plant Physiology 97 (3):1087-1093
Pothier JF, Prigent-Combaret C, Haurat J, Moënne-Loccoz Y, Wisniewski-Dyé F (2008) Duplication of plasmid-borne nitrite reductase gene nirK in the wheat-associated plant growth–promoting rhizobacterium Azospirillum brasilense Sp245. Molecular Plant-Microbe Interactions 21 (6):831-842
Prakash L, Prathapasenan G (1990) NaCl-and gibberellic acid-induced changes in the content of auxin and the activities of cellulase and pectin lyase during leaf growth in rice (Oryza sativa). Annals of Botany 65 (3):251-257
Qadir M, Oster J (2004) Crop and irrigation management strategies for saline-sodic soils and waters aimed at environmentally sustainable agriculture. Science of the Total Environment 323 (1-3):1-19
Qi X-H, Xu X-W, Lin X-J, Zhang W-J, Chen X-H (2012) Identification of differentially expressed genes in cucumber (Cucumis sativus L.) root under waterlogging stress by digital gene expression profile. Genomics 99 (3):160-168
Rahnama A, Munns R, Poustini K, Watt M (2011) A screening method to identify genetic variation in root growth response to a salinity gradient. Journal of Experimental Botany 62 (1):69-77
Ramakrishna A, Giridhar P, Ravishankar GA (2011) Phytoserotonin: a review. Plant Signaling & Behavior 6 (6):800
Rasmussen S, Parsons AJ, Jones CS (2012) Metabolomics of forage plants: a review. Annals of Botany 110 (6):1281-1290
Rees DC, Howard JB (2000) Nitrogenase: standing at the crossroads. Current opinion in chemical biology 4 (5):559-566
Reinhold B, Hurek T, Fendrik I (1985) Strain-specific chemotaxis of Azospirillum spp. Journal of Bacteriology 162 (1):190-195
Rich SM, Christopher J, Richards R, Watt M (2020) Root phenotypes of young wheat plants grown in controlled environments show inconsistent correlation with mature root traits in the field. Journal of Experimental Botany
Richards R, Watt M, Rebetzke G (2007) Physiological traits and cereal germplasm for sustainable agricultural systems. Euphytica 154 (3):409-425
Richardson AE, Barea J-M, McNeill AM, Prigent-Combaret C (2009a) Acquisition of phosphorus and nitrogen in the rhizosphere and plant growth promotion by microorganisms. Plant and Soil 321 (1-2):305-339
Richardson AE, Hocking PJ, Simpson RJ, George TS (2009b) Plant mechanisms to optimise access to soil phosphorus. Crop and Pasture Science 60 (2):124-143
Rodríguez-Salazar J, Suárez R, Caballero-Mellado J, Iturriaga G (2009) Trehalose accumulation in Azospirillum brasilense improves drought tolerance and biomass in maize plants. FEMS Microbiology Letters 296 (1):52-59
Rodrıguez H, Fraga R (1999) Phosphate solubilizing bacteria and their role in plant growth promotion. Biotechnology Advances 17 (4-5):319-339
Roessner U, Nahid A, Chapman B, Hunter A, Bellgard M (2011) Metabolomics–the combination of analytical biochemistry, biology, and informatics. In. Academic Press,

160
Rolfe SA, Griffiths J, Ton J (2019) Crying out for help with root exudates: adaptive mechanisms by which stressed plants assemble health-promoting soil microbiomes. Current opinion in Microbiology 49:73-82
Rosconi F, Davyt D, Martínez V, Martínez M, Abin‐Carriquiry JA, Zane H, Butler A, de Souza EM, Fabiano E (2013) Identification and structural characterization of serobactins, a suite of lipopeptide siderophores produced by the grass endophyte H erbaspirillum seropedicae. Environmental Microbiology 15 (3):916-927
Rosenblueth M, Ormeño-Orrillo E, López-López A, Rogel MA, Reyes-Hernández BJ, Martínez-Romero JC, Reddy PM, Martinez-Romero E (2018) Nitrogen fixation in cereals. Frontiers in Microbiology 9:1794-1800
Rothballer M, Schmid M, Fekete A, Hartmann A (2005) Comparative in situ analysis of ipdC–gfpmut3 promoter fusions of Azospirillum brasilense strains Sp7 and Sp245. Environmental Microbiology 7 (11):1839-1846. doi:10.1111/j.1462-2920.2005.00848.x
Roumet C, Picon‐Cochard C, Dawson LA, Joffre R, Mayes R, Blanchard A, Brewer MJ (2006) Quantifying species composition in root mixtures using two methods: near‐infrared reflectance spectroscopy and plant wax markers. New Phytologist 170 (3):631-638
Roychoudhry S, Kepinski S (2015) Shoot and root branch growth angle control—the wonderfulness of lateralness. Current Opinion in Plant Biology 23:124-131
Rozier C, Erban A, Hamzaoui J, Prigent-Combaret C, Comte G, Kopka J, Czarnes S, Legendre L (2016) Xylem sap metabolite profile changes during phytostimulation of maize by the Plant Growth-Promoting Rhizobacterium, Azospirillum lipoferum CRT1. Metabolomics 6:2153-0769
Saleem M, Arshad M, Hussain S, Bhatti AS (2007) Perspective of plant growth promoting rhizobacteria (PGPR) containing ACC deaminase in stress agriculture. Journal of industrial Microbiology & Biotechnology 34 (10):635-648
Santi C, Molesini B, Guzzo F, Pii Y, Vitulo N, Pandolfini T (2017) Genome-wide transcriptional changes and lipid profile modifications induced by Medicago truncatula N5 overexpression at an early stage of the symbiotic interaction with Sinorhizobium meliloti. Genes 8 (12):396
Sarabia LD, Hill CB, Boughton BA, Roessner U (2018) Advances of metabolite profiling of plants in challenging environments. Annual Plant Reviews online:629-674
Sarig S, Okon Y, Blum A (1992) Effect of Azospirillum brasilense inoculation on growth dynamics and hydraulic conductivity of Sorghum bicolor roots. Journal of Plant Nutrition 15 (6-7):805-819
Sarwar MH, Sarwar MF, Sarwar M, Qadri NA, Moghal S (2013) The importance of cereals (Poaceae: Gramineae) nutrition in human health: A review. Journal of Cereals and Oilseeds 4 (3):32-35
Sasse J, Kant J, Cole BJ, Klein AP, Arsova B, Schlaepfer P, Gao J, Lewald K, Zhalnina K, Kosina S (2019) Multilab EcoFAB study shows highly reproducible physiology and depletion of soil metabolites by a model grass. New Phytologist 222 (2):1149-1160
Schauer N, Steinhauser D, Strelkov S, Schomburg D, Allison G, Moritz T, Lundgren K, Roessner-Tunali U, Forbes MG, Willmitzer L (2005) GC–MS libraries for the rapid identification of metabolites in complex biological samples. FEBS Letters 579 (6):1332-1337
Schillaci M, Arsova B, Walker R, Smith PM, Nagel KA, Roessner U, Watt M (2020) Time-resolution of the shoot and root growth of the model cereal Brachypodium in response to inoculation with Azospirillum bacteria at low phosphorus and temperature. Plant Growth Regulation:1-14
Schillaci M, Gupta S, Walker R, Roessner U (2019) The Role of Plant Growth-Promoting Bacteria in the Growth of Cereals under Abiotic Stresses. In: Root Biology-Growth, Physiology, and Functions. IntechOpen,
Schlüter U, Colmsee C, Scholz U, Bräutigam A, Weber AP, Zellerhoff N, Bucher M, Fahnenstich H, Sonnewald U (2013) Adaptation of maize source leaf metabolism to stress related disturbances in carbon, nitrogen and phosphorus balance. BMC Genomics 14 (1):442

161
Schneebeli K, Mathesius U, Zwart AB, Bragg JN, Vogel JP, Watt M (2016) Brachypodium distachyon genotypes vary in resistance to Rhizoctonia solani AG8. Functional Plant Biology 43 (2):189-198
Schussler J, Westgate M (1995) Assimilate flux determines kernel set at low water potential in maize. Crop Science 35 (4):1074-1080
Selvakumar G, Kundu S, Joshi P, Nazim S, Gupta A, Gupta H (2010) Growth promotion of wheat seedlings by Exiguobacterium acetylicum 1P (MTCC 8707) a cold tolerant bacterial strain from the Uttarakhand Himalayas. Indian Journal of Microbiology 50 (1):50-56
Selvi K, Paul J, Vijaya V, Saraswathi K (2017) Analyzing the efficacy of phosphate solubilizing microorganisms by enrichment culture techniques. Biochemistry and Molecular Biology Journal 3 (1):1-7
Shah J, Zeier J (2013) Long-distance communication and signal amplification in systemic acquired resistance. Frontiers in Plant Science 4:30
Shaharoona B, Naveed M, Arshad M, Zahir ZA (2008) Fertilizer-dependent efficiency of Pseudomonads for improving growth, yield, and nutrient use efficiency of wheat (Triticum aestivum L.). Applied Microbiology and Biotechnology 79 (1):147-155
Shahzad R, Khan AL, Bilal S, Waqas M, Kang S-M, Lee I-J (2017) Inoculation of abscisic acid-producing endophytic bacteria enhances salinity stress tolerance in Oryza sativa. Environmental and Experimental Botany 136:68-77
Shanmugarajah K, Linka N, Gräfe K, Smits SH, Weber AP, Zeier J, Schmitt L (2019) ABCG1 contributes to suberin formation in Arabidopsis thaliana roots. Scientific Reports 9 (1):1-12
Sharkey TD, Stitt M, Heineke D, Gerhardt R, Raschke K, Heldt HW (1986) Limitation of photosynthesis by carbon metabolism: II. O2-insensitive CO2 uptake results from limitation of triose phosphate utilization. Plant Physiology 81 (4):1123-1129
Sheflin AM, Chiniquy D, Yuan C, Goren E, Kumar I, Braud M, Brutnell T, Eveland AL, Tringe S, Liu P (2019) Metabolomics of sorghum roots during nitrogen stress reveals compromised metabolic capacity for salicylic acid biosynthesis. Plant Direct 3 (3):e00122
Sheikh N, Barman D, Bhattacharjee K (2020) Abiotic and Biotic Stress Research in Plants: A Gizmatic Approach of Modern Omics Technologies. Sustainable Agriculture in the Era of Climate Change:413-439
Shelden MC, Roessner U (2013) Advances in functional genomics for investigating salinity stress tolerance mechanisms in cereals. Frontiers in Plant Science 4:123
Shih C-Y, Kao CH (1996) Growth inhibition in suspension-cultured rice cells under phosphate deprivation is mediated through putrescine accumulation. Plant Physiology 111 (3):721-724
Šibul F, Orčić D, Vasić M, Anačkov G, Nađpal J, Savić A, Mimica-Dukić N (2016) Phenolic profile, antioxidant and anti-inflammatory potential of herb and root extracts of seven selected legumes. Industrial Crops and Products 83:641-653
Siebers M, Brands M, Wewer V, Duan Y, Hölzl G, Dörmann P (2016) Lipids in plant–microbe interactions. Biochimica et Biophysica Acta (BBA)-Molecular and Cell Biology of Lipids 1861 (9):1379-1395
Singh A, Kumar P, Gautam V, Rengasamy B, Adhikari B, Udayakumar M, Sarkar AK (2016) Root transcriptome of two contrasting indica rice cultivars uncovers regulators of root development and physiological responses. Scientific Reports 6:39266
Singh S, Kapoor K (1999) Inoculation with phosphate-solubilizing microorganisms and a vesicular-arbuscular mycorrhizal fungus improves dry matter yield and nutrient uptake by wheat grown in a sandy soil. Biology and Fertility of Soils 28 (2):139-144
Smalla K, Sessitsch A, Hartmann A (2006) The Rhizosphere:‘soil compartment influenced by the root’. Blackwell Publishing Ltd Oxford, UK,

162
Solano BR, de la Iglesia MP, Probanza A, García JL, Megías M, Mañero FG Screening for PGPR to improve growth of Cistus ladanifer seedlings for reforestation of degraded mediterranean ecosystems. In: First International Meeting on Microbial Phosphate Solubilization, 2007. Springer, pp 59-68
Solomon S, Qin D, Manning M, Averyt K, Marquis M (2007) Climate change 2007-the physical science basis: Working group I contribution to the fourth assessment report of the IPCC, vol 4. Cambridge university press,
Spencer M, Ryu C-M, Yang K-Y, Kim YC, Kloepper JW, Anderson AJ (2003) Induced defence in tobacco by Pseudomonas chlororaphis strain O6 involves at least the ethylene pathway. Physiological and Molecular Plant Pathology 63 (1):27-34
Strand Å, Hurry V, Henkes S, Huner N, Gustafsson P, Gardeström P, Stitt M (1999) Acclimation of Arabidopsis leaves developing at low temperatures. Increasing cytoplasmic volume accompanies increased activities of enzymes in the Calvin cycle and in the sucrose-biosynthesis pathway. Plant Physiology 119 (4):1387-1398
Suzuki N, Rivero RM, Shulaev V, Blumwald E, Mittler R (2014) Abiotic and biotic stress combinations. New Phytologist 203 (1):32-43
Talboys PJ, Owen DW, Healey JR, Withers PJ, Jones DL (2014) Auxin secretion by Bacillus amyloliquefaciens FZB42 both stimulates root exudation and limits phosphorus uptake in Triticum aestivum. BMC Plant Biology 14 (1):51
Tans P, Keeling R (2013) Trends in Atmospheric Carbon Dioxide: daily mean concentration of carbon dioxide for Mauna Loa, Hawaii. National Oceanic and Atmospheric Administration, Earth System Research Laboratory (NOAA/ESRL)
Tarkowski ŁP, Van den Ende W (2015) Cold tolerance triggered by soluble sugars: a multifaceted countermeasure. Frontiers in Plant Science 6:203
Tawaraya K, Horie R, Saito A, Shinano T, Wagatsuma T, Saito K, Oikawa A (2013) Metabolite profiling of shoot extracts, root extracts, and root exudates of rice plant under phosphorus deficiency. Journal of Plant Nutrition 36 (7):1138-1159
Teixeira EI, Fischer G, Van Velthuizen H, Walter C, Ewert F (2013) Global hot-spots of heat stress on agricultural crops due to climate change. Agricultural and Forest Meteorology 170:206-215
Tien T, Gaskins M, Hubbell D (1979) Plant growth substances produced by Azospirillum brasilense and their effect on the growth of pearl millet (Pennisetum americanum L.). Applied and Environmental Microbiology 37 (5):1016-1024
Tjellström H, Andersson M, Larsson K, Sandelius A (2008) Membrane phospholipids as a phosphate reserve: the dynamic nature of phospholipid-to-digalactosyl diacylglycerol exchange in higher plants. Plant, Cell & Environment 31 (10):1388-1398
Trewavas A (2000) Signal perception and transduction. In: Buchannan B GW, Jones R (ed) Biochemistry and Molecular Biology of Plants. USA, pp 930-987
Truyens S, Weyens N, Cuypers A, Vangronsveld J (2015) Bacterial seed endophytes: genera, vertical transmission and interaction with plants. Environmental Microbiology Reports 7 (1):40-50
Tsugawa H, Cajka T, Kind T, Ma Y, Higgins B, Ikeda K, Kanazawa M, VanderGheynst J, Fiehn O, Arita M (2015) MS-DIAL: data-independent MS/MS deconvolution for comprehensive metabolome analysis. Nature Methods 12 (6):523-526
Tuteja N (2007) Abscisic acid and abiotic stress signaling. Plant Signaling & Behavior 2 (3):135-138 Tyagi W, Rai M (2017) Root transcriptomes of two acidic soil adapted Indica rice genotypes suggest
diverse and complex mechanism of low phosphorus tolerance. Protoplasma 254 (2):725-736 Ullah N, Yüce M, Gökçe ZNÖ, Budak H (2017) Comparative metabolite profiling of drought stress in roots
and leaves of seven Triticeae species. BMC Genomics 18 (1):969 Valero-Mora PM (2010) ggplot2: elegant graphics for data analysis. Journal of Statistical Software 35
(b01)

163
Valette M, Rey M, Gerin F, Comte G, Wisniewski‐Dyé F (2019) A common metabolomic signature is observed upon inoculation of rice roots with various rhizobacteria. Journal of Integrative Plant Biology
Valitova J, Sulkarnayeva A, Minibayeva F (2016) Plant sterols: diversity, biosynthesis, and physiological functions. Biochemistry (Moscow) 81 (8):819-834
Van Dommelen A, Croonenborghs A, Spaepen S, Vanderleyden J (2009) Wheat growth promotion through inoculation with an ammonium-excreting mutant of Azospirillum brasilense. Biology and Fertility of Soils 45 (5):549-553
Vance CP, Uhde‐Stone C, Allan DL (2003) Phosphorus acquisition and use: critical adaptations by plants for securing a nonrenewable resource. New Phytologist 157 (3):423-447
Vancura V (1964) Root exudates of plants. I. Analysis of root exudates of barley and wheat in their initial phases of growth. Plant Soil 21 (2):231-248
Vorholt JA (2012) Microbial life in the phyllosphere. Nature Reviews Microbiology 10 (12):828-840 Vurukonda SSKP, Vardharajula S, Shrivastava M, SkZ A (2016) Enhancement of drought stress tolerance
in crops by plant growth promoting rhizobacteria. Microbiological Research 184:13-24 Walker TS, Bais HP, Grotewold E, Vivanco JM (2003) Root exudation and rhizosphere biology. Plant
Physiology 132 (1):44-51 Walker V, Bertrand C, Bellvert F, Moënne‐Loccoz Y, Bally R, Comte G (2011) Host plant secondary
metabolite profiling shows a complex, strain‐dependent response of maize to plant growth‐promoting rhizobacteria of the genus Azospirillum. New Phytologist 189 (2):494-506
Wan J, Zhang P, Sun L, Li S, Wang R, Zhou H, Wang W, Xu J (2018) Involvement of reactive oxygen species and auxin in serotonin-induced inhibition of primary root elongation. Journal of Plant Physiology 229:89-99
Wang W, Vinocur B, Altman A (2003) Plant responses to drought, salinity and extreme temperatures: towards genetic engineering for stress tolerance. Planta 218 (1):1-14
Wang Y, Lysøe E, Armarego-Marriott T, Erban A, Paruch L, Van Eerde A, Bock R, Liu-Clarke J (2018) Transcriptome and metabolome analyses provide insights into root and root-released organic anion responses to phosphorus deficiency in oat. Journal of Experimental Botany 69 (15):3759-3771
Wang Y, Zeng X, Xu Q, Mei X, Yuan H, Jiabu D, Sang Z, Nyima T (2019) Metabolite profiling in two contrasting Tibetan hulless barley cultivars revealed the core salt-responsive metabolome and key salt-tolerance biomarkers. AoB Plants 11 (2):plz021
Want EJ (2018) LC-MS Untargeted Analysis. In: Metabolic Profiling. Springer, pp 99-116 Ward M, Jones R, Brender J, de Kok T, Weyer P, Nolan B, Villanueva C, van Breda S (2018) Drinking water
nitrate and human health: an updated review. International Journal of Environmental Research and Public Health 15 (7):1557
Wasson AP, Nagel KA, Tracy S, Watt M (2020) Beyond Digging: Noninvasive Root and Rhizosphere Phenotyping. Trends in Plant Science 25 (1):119-120
Watt M, McCully ME, Kirkegaard JA (2003) Soil strength and rate of root elongation alter the accumulation of Pseudomonas spp. and other bacteria in the rhizosphere of wheat. Functional Plant Biology 30 (5):483-491
Watt M, Moosavi S, Cunningham SC, Kirkegaard J, Rebetzke G, Richards R (2013) A rapid, controlled-environment seedling root screen for wheat correlates well with rooting depths at vegetative, but not reproductive, stages at two field sites. Annals of Botany 112 (2):447-455
Weber A, Flügge UI (2002) Interaction of cytosolic and plastidic nitrogen metabolism in plants. Journal of Experimental Botany 53 (370):865-874

164
Weidner S, Frączek E, Amarowicz R, Abe S (2001) Alternations in phenolic acids content in developing rye grains in normal environment and during enforced dehydration. Acta Physiologiae Plantarum 23 (4):475-482
Wheeler T, Von Braun J (2013) Climate change impacts on global food security. Science 341 (6145):508-513
Whipps J (1990) Carbon economy. The Rhizosphere:59-97 White P, Brown P (2010) Plant nutrition for sustainable development and global health. Annals of
Botany 105 (7):1073-1080 White PJ, Hammond JP (2008) Phosphorus nutrition of terrestrial plants. In: The ecophysiology of plant-
phosphorus interactions. Springer, pp 51-81 William Allwood J, Ellis DI, Heald JK, Goodacre R, Mur LA (2006) Metabolomic approaches reveal that
phosphatidic and phosphatidyl glycerol phospholipids are major discriminatory non‐polar metabolites in responses by Brachypodium distachyon to challenge by Magnaporthe grisea. The Plant Journal 46 (3):351-368
Wintermans PC, Bakker PA, Pieterse CM (2016) Natural genetic variation in Arabidopsis for responsiveness to plant growth-promoting rhizobacteria. Plant Molecular Biology 90 (6):623-634
Wittenmayer L, Merbach W (2005) Plant responses to drought and phosphorus deficiency: contribution of phytohormones in root‐related processes. Journal of Plant Nutrition and Soil Science 168 (4):531-540
Xing H, Tan L, An L, Zhao Z, Wang S, Zhang C (2004) Evidence for the involvement of nitric oxide and reactive oxygen species in osmotic stress tolerance of wheat seedlings: inverse correlation between leaf abscisic acid accumulation and leaf water loss. Plant Growth Regulation 42 (1):61-68
Yadav RS, Hash C, Bidinger F, Devos K, Howarth CJ (2004) Genomic regions associated with grain yield and aspects of post-flowering drought tolerance in pearl millet across stress environments and tester background. Euphytica 136 (3):265-277
Yamaguchi S (2008) Gibberellin metabolism and its regulation. Annual Review of Plant Biology 59:225-251
Yang C-J, Zhang C, Lu Y-N, Jin J-Q, Wang X-L (2011) The mechanisms of brassinosteroids' action: from signal transduction to plant development. Molecular Plant 4 (4):588-600
Yang J, Kloepper JW, Ryu C-M (2009) Rhizosphere bacteria help plants tolerate abiotic stress. Trends in Plant Science 14 (1):1-4
Yang Y, Zhao J, Liu P, Xing H, Li C, Wei G, Kang Z (2013) Glycerol-3-phosphate metabolism in wheat contributes to systemic acquired resistance against Puccinia striiformis f. sp. tritici. PLoS One 8 (11):e81756
Yarzábal LA, Monserrate L, Buela L, Chica E (2018) Antarctic Pseudomonas spp. promote wheat germination and growth at low temperatures. Polar Biology 41 (11):2343-2354
Ye J, Coulouris G, Zaretskaya I, Cutcutache I, Rozen S, Madden TL (2012) Primer-BLAST: a tool to design target-specific primers for polymerase chain reaction. BMC Bioinformatics 13 (1):134
Yokota T (1997) The structure, biosynthesis and function of brassinosteroids. Trends in Plant Science 2 (4):137-143
Yu B, Xu C, Benning C (2002) Arabidopsis disrupted in SQD2 encoding sulfolipid synthase is impaired in phosphate-limited growth. Proceedings of the National Academy of Sciences 99 (8):5732-5737
Yu D, Rupasinghe TW, Boughton BA, Natera SH, Hill CB, Tarazona P, Feussner I, Roessner U (2018) A high-resolution HPLC-QqTOF platform using parallel reaction monitoring for in-depth lipid discovery and rapid profiling. Analytica Chimica Acta 1026:87-100
Yuwono T, Handayani D, Soedarsono J (2005) The role of osmotolerant rhizobacteria in rice growth under different drought conditions. Australian Journal of Agricultural Research 56 (7):715-721

165
Zabka V, Stangl M, Bringmann G, Vogg G, Riederer M, Hildebrandt U (2008) Host surface properties affect prepenetration processes in the barley powdery mildew fungus. New Phytologist 177 (1):251-263
Zhang C, Simpson RJ, Kim CM, Warthmann N, Delhaize E, Dolan L, Byrne ME, Wu Y, Ryan PR (2018) Do longer root hairs improve phosphorus uptake? Testing the hypothesis with transgenic Brachypodium distachyon lines overexpressing endogenous RSL genes. New Phytologist 217 (4):1654-1666
Zhang G, Ahmad MZ, Chen B, Manan S, Zhang Y, Jin H, Wang X, Zhao J (2020) Lipidomic and transcriptomic profiling of developing nodules reveal the essential roles of active glycolysis and fatty acid and membrane lipid biosynthesis in soybean nodulation. The Plant Journal
Zhao Y, Antoniou-Kourounioti RL, Calder G, Dean C, Howard M (2020) Temperature-dependent growth contributes to long-term cold sensing. Nature
Zhu J, Lynch JP (2004) The contribution of lateral rooting to phosphorus acquisition efficiency in maize (Zea mays) seedlings. Functional Plant Biology 31 (10):949-958
Zhu X, Chen Y, Subramanian R (2014) Comparison of information-dependent acquisition, SWATH, and MSAll techniques in metabolite identification study employing ultrahigh-performance liquid chromatography–quadrupole time-of-flight mass spectrometry. Analytical Chemistry 86 (2):1202-1209
Zimmermann W, Eeemüller E (1984) Degradation of raspberry suberin by Fusarium solani f. sp. pisi and Armillaria mellea. Journal of Phytopathology 110 (3):192-199
Zuther E, Koehl K, Kopka J (2007) Comparative metabolome analysis of the salt response in breeding cultivars of rice. In: Advances in Molecular Breeding Toward Drought and Salt Tolerant Crops. Springer, pp 285-315

Minerva Access is the Institutional Repository of The University of Melbourne
Author/s:
Schillaci, Martino
Title:
The impact of beneficial microbes on root architecture and metabolism of the model grass
Brachypodium distachyon grown under non optimal temperatures and low phosphorus
availability
Date:
2021
Persistent Link:
http://hdl.handle.net/11343/273671
File Description:
Final thesis file
Terms and Conditions:
Terms and Conditions: Copyright in works deposited in Minerva Access is retained by the
copyright owner. The work may not be altered without permission from the copyright owner.
Readers may only download, print and save electronic copies of whole works for their own
personal non-commercial use. Any use that exceeds these limits requires permission from
the copyright owner. Attribution is essential when quoting or paraphrasing from these works.