
The History and Data Encoding of Pie and Donut Charts
8
1 The History and Data Encoding of Pie and Donut Charts Tracy Fabri PSYC 6135
-
Upload
khangminh22 -
Category
Documents
-
view
0 -
download
0
Transcript of The History and Data Encoding of Pie and Donut Charts
1
The History and Data Encoding of
Pie and Donut Charts
Tracy FabriPSYC 6135
History
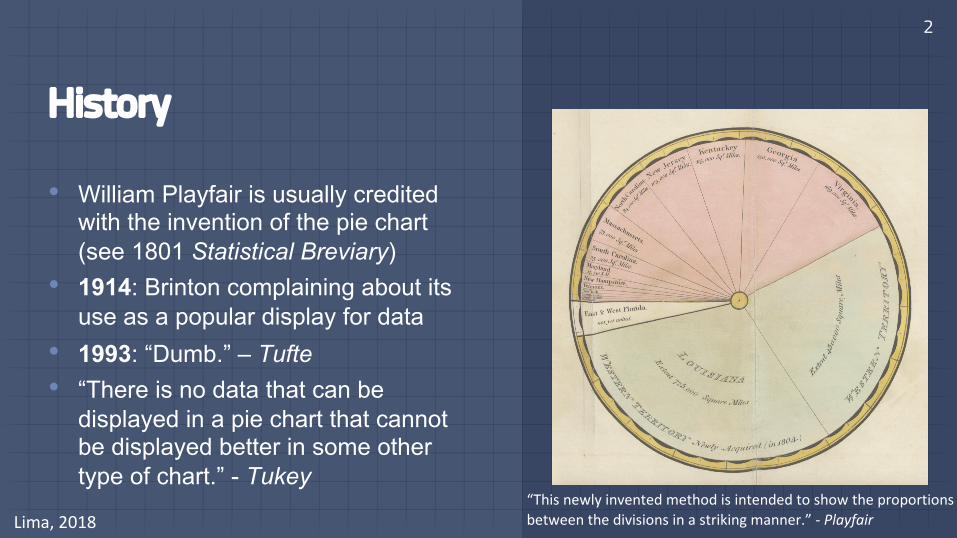
• William Playfair is usually credited with the invention of the pie chart (see 1801 Statistical Breviary)
• 1914: Brinton complaining about its use as a popular display for data
• 1993: “Dumb.” – Tufte• “There is no data that can be
displayed in a pie chart that cannot be displayed better in some other type of chart.” - Tukey
2
“This newly invented method is intended to show the proportions between the divisions in a striking manner.” - PlayfairLima, 2018
3
4
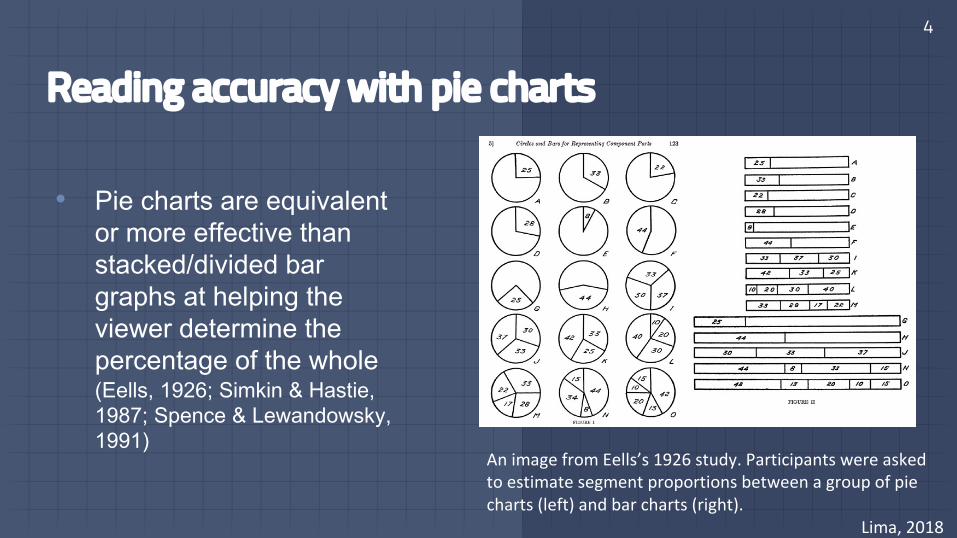
Reading accuracy with pie charts
• Pie charts are equivalent or more effective than stacked/divided bar graphs at helping the viewer determine the percentage of the whole (Eells, 1926; Simkin & Hastie, 1987; Spence & Lewandowsky, 1991)
An image from Eells’s 1926 study. Participants were asked to estimate segment proportions between a group of pie charts (left) and bar charts (right).
Lima, 2018
5
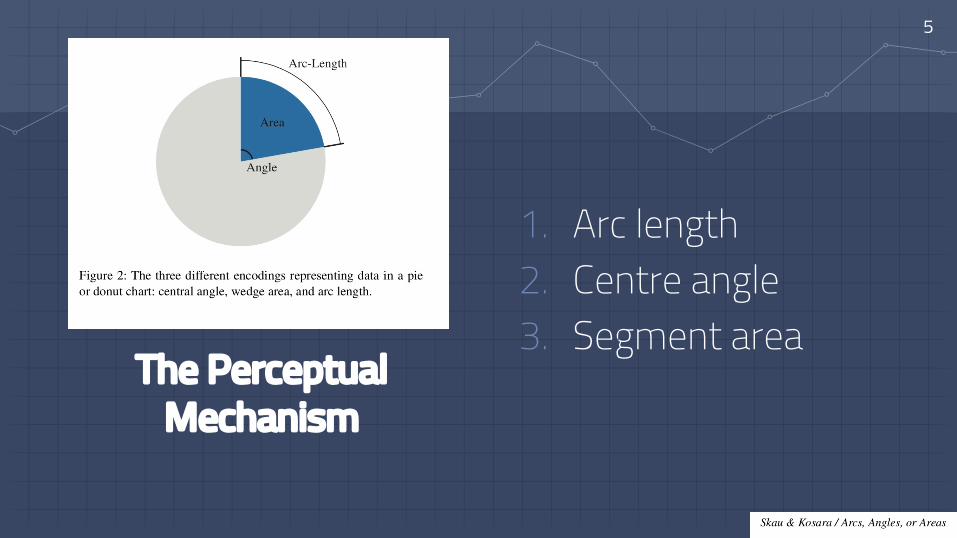
1. Arc length2. Centre angle3. Segment area
The Perceptual Mechanism
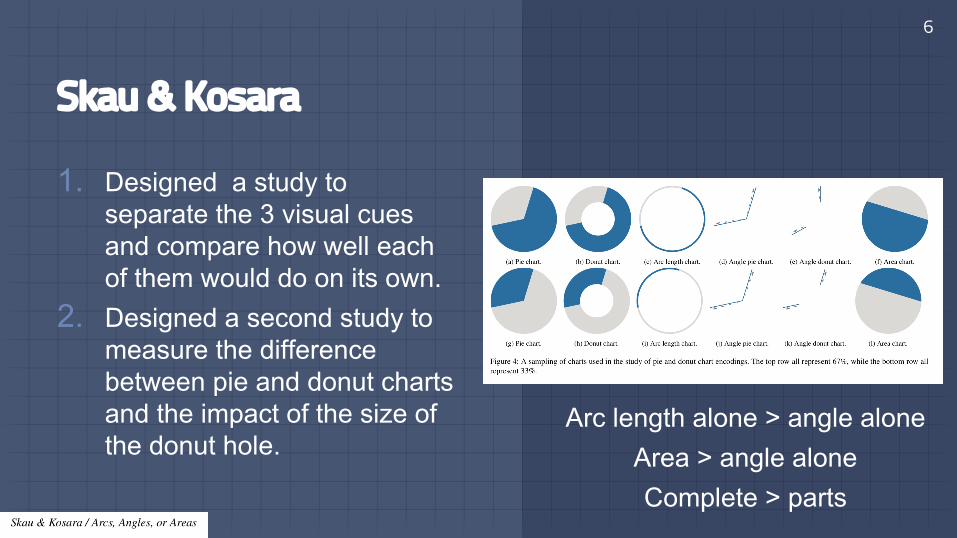
Skau & Kosara
1. Designed a study to separate the 3 visual cues and compare how well each of them would do on its own.
2. Designed a second study to measure the difference between pie and donut charts and the impact of the size of the donut hole.
6
Arc length alone > angle aloneArea > angle aloneComplete > parts
7
Summary
• The use of the pie chart has a controversial history despite their commonplace use today.
• The angle is not the primary factor when reading pie and donut charts. - The center of the pie can be removed without affecting how
precisely it can be read. The popular donut chart is thus no worse than the pie chart (though both are less accurate than bar charts).
8
Resources
Skau, D., & Kosara, R. (2016). Arcs, Angles, or Areas: Individual Data Encodings in Pie and Donut Charts. Computer Graphics Forum, 35(3), 121-130. doi:10.1111/cgf.12888
- https://github.com/dwskau/arcs-angles-area- https://github.com/dwskau/donut-radii
Lima, M. (2018, July 26). Why humans love pie charts. Retrieved from https://blog.usejournal.com/why-humans-love-pie-charts-9cd346000bdc


!['Pie Memorie' [An Unknown Motet by Noel Bauldeweyn]](https://static.fdokumen.com/doc/165x107/6334bb0b6c27eedec605dd06/pie-memorie-an-unknown-motet-by-noel-bauldeweyn.jpg)


