The Global Dimension of the Regional Integration Model (GDRI-Model)
24
Modern Economy, 2013, 4, 346-369 http://dx.doi.org/10.4236/me.2013.45037 Published Online May 2013 (http://www.scirp.org/journal/me) The Global Dimension of the Regional Integration Model (GDRI-Model) Mario Arturo Ruiz Estrada Faculty of Economics and Administration, University of Malaya, Kuala Lumpur, Malaysia Email: [email protected] Received February 8, 2011; revised March 8, 2013; accepted April 8, 2013 Copyright © 2013 Mario Arturo Ruiz Estrada. This is an open access article distributed under the Creative Commons Attribution License, which permits unrestricted use, distribution, and reproduction in any medium, provided the original work is properly cited. ABSTRACT This research paper presents a new model of analysis to study the trend of regional integration from a global perspective. This new model is called the Global Dimension of Regional Integration Model (GDRI-Model). The rationale for the creation of this model is the necessity to study regional integration from political, social, economic, and technological perspectives simultaneously. There are four basic phases in the implementation of the GDRI-Model. The first phase is the design of the multi-input database table. The second phase is the measurement of individual Regional Global De- velopment Indexes (X i ), which include the Regional Global Political Development Index (X 1 ), Regional Global Social Development Index (X 2 ), Regional Global Economic Development Index (X 3 ) and Regional Global Technological De- velopment Index (X 4 ). The third phase is the measurement of the Regional Global Development (RGD) index. The last phase is the measurement of Regional Integration Stage (RIS) index. The general objective of the GDRI-Model is to offer policy-makers and researchers a new analytical tool to study the evolution and stages of any regional integration process from a global perspective—based on a group of indexes and graphs. The GDRI-Model is not intended to be a forecasting model in any case. However, its application is not limited to the study of a special group of countries or re- gions. It is not constrained by issues about the region or the development stages of any member in a region that is inter- ested in integrating into a single regional trade bloc. The GDRI-Model, in effect, is a simple and flexible scheme, which can be applied to any case of regional integration. Keywords: Global Development Indexes; Regional Integration; Economics Modeling; Intraregional Global Development Index; Regional Integration Stage Index; Economic Development and Domestic System Development 1. Introduction Over the past 70 years, the field of research on regional integration has changed dramatically, with the discovery and implementation of new theories, models and tech- niques [1]. In this thesis, the study of regional integration is approached from a few different perspectives, namely, economic, political, social and technological analysis. In addition, the orientation of these perspectives in the con- text of regional integration is also accounted for. Evalu- ating regional integration and its benefits is not an easy task. The nature of the subject matter constitutes part of the problem in this regard [2]. Much of the study related to regional integration has so far been done from the economic perspective. According to Winters, the study of regional integration from the economic perspective is typically evaluated in light of the probable scenario in the absence of such an approach to the study [3]. Also, as pointed out by Winters, with complications in defining and measuring changes in economic welfare for a par- ticular sub-region, economists use proxy summary statis- tics that reflect the growth of trade [4]. On the basis of the above idea, this thesis introduces a new methodology of analysis that monitors regional in- tegration process from a new perspective. Called the Global Dimension of Regional Integration Model (GDRI- Model), this methodology will simultaneously study all areas of development (political, social, economic and technological analysis) that each country or domestic development system (DDS) in the same region (same geographical position) shows based on the results of the Copyright © 2013 SciRes. ME
Transcript of The Global Dimension of the Regional Integration Model (GDRI-Model)

Modern Economy, 2013, 4, 346-369 http://dx.doi.org/10.4236/me.2013.45037 Published Online May 2013 (http://www.scirp.org/journal/me)
The Global Dimension of the Regional Integration Model (GDRI-Model)
Mario Arturo Ruiz Estrada Faculty of Economics and Administration, University of Malaya, Kuala Lumpur, Malaysia
Email: [email protected]
Received February 8, 2011; revised March 8, 2013; accepted April 8, 2013
Copyright © 2013 Mario Arturo Ruiz Estrada. This is an open access article distributed under the Creative Commons Attribution License, which permits unrestricted use, distribution, and reproduction in any medium, provided the original work is properly cited.
ABSTRACT
This research paper presents a new model of analysis to study the trend of regional integration from a global perspective. This new model is called the Global Dimension of Regional Integration Model (GDRI-Model). The rationale for the creation of this model is the necessity to study regional integration from political, social, economic, and technological perspectives simultaneously. There are four basic phases in the implementation of the GDRI-Model. The first phase is the design of the multi-input database table. The second phase is the measurement of individual Regional Global De-velopment Indexes (Xi), which include the Regional Global Political Development Index (X1), Regional Global Social Development Index (X2), Regional Global Economic Development Index (X3) and Regional Global Technological De-velopment Index (X4). The third phase is the measurement of the Regional Global Development (RGD) index. The last phase is the measurement of Regional Integration Stage (RIS) index. The general objective of the GDRI-Model is to offer policy-makers and researchers a new analytical tool to study the evolution and stages of any regional integration process from a global perspective—based on a group of indexes and graphs. The GDRI-Model is not intended to be a forecasting model in any case. However, its application is not limited to the study of a special group of countries or re-gions. It is not constrained by issues about the region or the development stages of any member in a region that is inter-ested in integrating into a single regional trade bloc. The GDRI-Model, in effect, is a simple and flexible scheme, which can be applied to any case of regional integration. Keywords: Global Development Indexes; Regional Integration; Economics Modeling; Intraregional Global
Development Index; Regional Integration Stage Index; Economic Development and Domestic System Development
1. Introduction
Over the past 70 years, the field of research on regional integration has changed dramatically, with the discovery and implementation of new theories, models and tech-niques [1]. In this thesis, the study of regional integration is approached from a few different perspectives, namely, economic, political, social and technological analysis. In addition, the orientation of these perspectives in the con-text of regional integration is also accounted for. Evalu-ating regional integration and its benefits is not an easy task. The nature of the subject matter constitutes part of the problem in this regard [2]. Much of the study related to regional integration has so far been done from the economic perspective. According to Winters, the study of regional integration from the economic perspective is
typically evaluated in light of the probable scenario in the absence of such an approach to the study [3]. Also, as pointed out by Winters, with complications in defining and measuring changes in economic welfare for a par-ticular sub-region, economists use proxy summary statis-tics that reflect the growth of trade [4].
On the basis of the above idea, this thesis introduces a new methodology of analysis that monitors regional in-tegration process from a new perspective. Called the Global Dimension of Regional Integration Model (GDRI- Model), this methodology will simultaneously study all areas of development (political, social, economic and technological analysis) that each country or domestic development system (DDS) in the same region (same geographical position) shows based on the results of the
Copyright © 2013 SciRes. ME

M. A. R. ESTRADA 347
regional development indexes (Xi)1 The idea is to dem-
onstrate that regional development (RD)2 can affect the evolution of the regional integration process considerably. It is based on the application of a group of indexes and graphs. This group of indexes and graphs shows the evo-lution and stages of the regional integration process of any region from a multi-dimensional analysis.
It is assumed in the GDRI-Model that the basic pre- condition to start a stronger regional integration process in any type of trade bloc is a stronger domestic develop-ment experienced by each country or domestic develop- ment system (DDS) in the same region. Another pre- condition for a stronger regional integration process is a combination of historical timing and political and social willingness. For the latter, the countries involved must be interested in creating a formal or informal agreement with all its members so as to collectively consolidate themselves into a single region.
The difference between the GDRI-Model and the tra-ditional models of analysis is that the RIE-Methodology will analyze regional integration from a new analytical perspective, that is, under a multi-dimensional analysis based on the study of all areas that domestic development evolves such as political development, social develop-ment, economic development and technological devel-opment. It allows for the detection of the pros and cons in the evolution of regional integration blocs in any re-gion from a different perspective. The main idea is to show that successful regional integration blocs depend on the majority of the members being interested in building a trade bloc, and, therefore, there cannot be a large mar-
gin of difference in the domestic development (political development, social development, economic develop-ment and technological development) among its mem-bers. The objective of the GDRI-Model is to offer pol-icy-makers and researchers a new alternative analytical tool for studying the results achieved with regional inte-gration. This will benefit the parties concerned in their policy-making and program development.
2. Background Research and Analysis of Different Fields of Research in the Study of Regional Integration
Regional Integration can be studied and researched based on different focuses and approaches. This chapter applies four traditional fields of research in the study of Regional Integration: economic, political, social and technological fields of research. In the first part of the research per-taining to this study, an effort was made to identify the inclination of the fields of research in the study of re-gional integration. 500 chapters (100%) on regional inte-gration from 75 journals3 published between the 1950’s and the 1990’s were selected for this purpose [5,6]. Next, the percentage of participation by fields of research (eco- nomic, political, social and technological) in the study of regional integration was calculated.
The following trend in terms of fields of research in the study of regional integration was observed: 50% from the economic field of research, 40% from the political field of research, 7% from the social field of research and 3% from the technological field of research. It was also observed that, compared to the 1950’s, 1970’s and 1980’s, the topic of regional integration was more frequently researched and discussed in journals in the 1960’s (25%) and 1990’s (35%).
1The regional development index (Xi) is as follows: Regional Political Development Index (X1) will show the level of political environmental that this specific region shows. Regional Social Development Index (X2) will show trends in social agenda at regional level. Regional Eco-nomic Development Index (X3) will present the economic trends that the region shows. Regional Technological Development Index (X4)will present the level of technology development that this specific region shows. Each component of these regional development indices (Xi) by area will together present the different stages with which any country can chart its own evolution. 2Regional development (RD) originates from the different levels of political, social, economic and technological development that each member country in the same region shows. If the gap between all areas of development (political, social, economic and technological) among all members is considerably large, then the regional integration process can experience serious difficulties. 3American Economic Review, Canadian Journal of Economics, Eco-nometrica, Economic History Review, Economic Journal, International Economic Review, Journal of Economic History, Journal of Econo-mic Literature, Journal of Political Economy, Journal of Policy Mod-eling, Economic Development Journal, Oxford Economic Chapters,Quarterly Journal of Economics, Review of Economic Studies, Review of Economics and Statistics, Canadian Journal of Economics and Po-litical Science, Journal of Economic Abstracts, Contributions to Cana-dian Economics, Journal of Labor Economics, Journal of Applied Econometrics, Journal of Economic Perspectives, Publications of the American Economic Association, Brookings Chapters on Economic Activity, microeconomics and American Economic Association Quar-terly.
2.1. The Economic Field of Research in the Study of Regional Integration
In the economic field of research (i.e. the largest field of research) in the study of regional integration, attention was placed on three specific areas: economic theory, po-litical economy and applied economics. Economic theory is divided into two parts, namely microeconomics and macroeconomics, each of which has a different focus. Some of these focuses are: partial or general (type of equilibrium), ex-post or ex-antes (method analysis), static or dynamic (behavior), short term or long term (time frame). Method analysis is either quantitative (economet-rics, statistics and mathematics) or qualitative (in the form of comparative studies based on theories or histori-cal data). It is observed that the study of regional integra-tion from the economic perspective mainly centers on macroeconomics applications (80%), quantitative meth-ods (65%), partial equilibrium (60%), ex-antes approach
Copyright © 2013 SciRes. ME

M. A. R. ESTRADA 348
(65%), and static models (65%). Besides, these applica-tions are used in the short term in most research.
The common theories, models and theorems used by researchers in the economic field of research in the study of regional integration are: international trade policy4 framework, optimal current area theory5, fiscal federal-ism theory6, Heckscher-Ohlin model7, Kemp and Wan theorem8. Among all these theories, the most important theory applied is the customs union theory9 (including
the second best theory10). The customs union theory is still used today by many economists to choose between trade creation and trade diversion111 for evaluating re-gional integration. However, the static analysis used in the customs union theory poses a problem: it frequently uses a partial competitive equilibrium framework to ar-rive at a general conclusion about a process that is a gen-eral equilibrium phenomenon by Devlin and French- Davis.
According to Winters, many economists are of the stand that trade creation versus trade diversion is not the core of the problem. The problem lies with the deficiency of the models of dynamics and empirical foundations used for testing them. In effect, Mordechai and Plummer [16] point out that economists whose research into re-gional integration is based on ex-post models include a gravity model, an import-growth simulation and other regression approaches. This is because the computational general equilibrium (CGE)12 model (multi-country and multi-commodity dimension) has become very popular among economists.
4This includes the basic tariff analysis; cost and benefits of trade; tariff and non-tariff trade barriers analysis and the new protectionism [7]. 5The optimal currency areas were introduced by Mundell [8] and Mckinnon [9]. “This approach based its study on monetary policy issues (money, markets for goods, and markets for production factors.)First, we will present the concept of a currency area defined as an area in which a common currency exists. Optimal is defined in terms of the ability of an area to achieve both internal balance (maintenance of full employment and stable internal average price level) and external bal-ance (maintenance of balanced international payments equilibrium). The main idea of optimal currency area was developed because of a dilemma between introducing fixed versus flexible exchange rate.” 6“The fiscal federalism [10] is an offshoot of public finance theory that analyzes the special fiscal problems which arise in federal countries,drawing on the literature on public goods, taxation, income distribution and public debt incidence, and various parts of location theory.” We can observe that this approach focuses on fiscal policy issues based on fiscal coordination. The general objective of this theoretical approach is the improvement of market efficiency focused on the interaction of market and public goods. The method applied in fiscal federalism is of a positive dynamic (general equilibrium). 7The Heckscher-Ohlin (H-O) model [11], “which is the whole theo-retical construction concerning trade and production based upon a difference between countries in their factor endowments, and four hypotheses or propositions which arise from this model. The H-O model assume that each country will export products that are intensive in the use of that country’s abundant factor of production (labor or capital), and will import products that are intensive factor of produc-tion (labor and capital) in the use of the country’s scarce factor of production.” 8The Kemp and Wan theorem [12] presents this proposition related to the formation of custom unions: “It is considered any competitive world trading equilibrium, with any number of countries and com-modities, and with no restrictions whatever on the tariffs and other commodity taxes of individual countries, and with costs of transporta-tion fully recognized. Now let any subset of the countries form a cus-toms union. Ten there exists a common tariff vector and a system of lump-sum compensatory payments, involving only members of the union, such that there is an associated tariff-ridden competitive equilib-rium in which each individual, whether a member of the union or not,is not worse off than before the formation of the union.” 9“The custom union argument [13] is based on the free-trade point of view, whether a particular custom union is a move in the right or in the wrong direction depends, therefore, so far as the argument has as yet been carried, on which of two types of consequences ensue from that custom union. Where the free trade-creating force is predominant, one of the members at least must benefit, both may benefit, the two com-bined must have a net benefit, and the world at large benefits; but the outside world loses, in the short-run at least, and can gain in the long-run only as the result of the general diffusion of the increased prosperity of the custom union. Where the trade-diverting effect is predominant, one al least of the member countries is bound to be in-jured, both may be injured, the two combined will suffer a net injury,and there will be injury to the outside world and to the world at large.”
Furthermore, the economic field of research merely applies the positive theories of welfare gains and losses associated with regional integration; it provides no ex-planations of the political choices that allow for inte-grated fields of research. As such, the economic field of research negates the global context of the evolution and trend of regional integration process as a whole.
In a nutshell, this book maintains that the economic field of research poses many limitations in the study of the effects of regional integration, and that it is merely
10“The second best theory was presented by Lipsey and Lancaster [14]. These two authors present a deeper study about the custom union the-ory of Viner based on the application of a positive dynamic method (general equilibrium) to explain the custom union effect on the world trade. The contribution of Lipsey and Lancaster in the custom union theory follows the Paretian optimum which requires the simultaneous fulfillment of all the optimum conditions based on the general eco-nomic problem of maximization. A function is maximized subject to at least one constraint, in this case production function and utility func-tion.” 11“Trade-creation effect occurs when some domestic production in a nation that is a member of the custom union is replaced by lower-cost imports from another member nation. Assuming that all economic resources are fully employed before and after formation of the custom union, this production is based on comparative advantage. The Trade-diversion effect occurs when lower-cost imports from outside the custom union are replaced by higher cost import from a union member. This is a result of the preferential trade treatment given to member nations. Trade-diversion effect, by itself, reduces welfare because it shifts production from more efficient producers outside the custom union to less efficient inside in the union. Thus, trade diversion worsens the international allocation of resources and shifts production away from comparative advantage.” By Salvatore [15]. 12“The CGE models are standard tools for analyzing trade policy. The case of general equilibrium models are: first liking trade and produc-tivity growth; second foreign investment and productivity growth; thirdendogenous growth and CGE modeling.” By Mordechai and Plummer [16].
Copyright © 2013 SciRes. ME

M. A. R. ESTRADA 349
one part of the complicated puzzle of regional integration research. On this account, this study further maintains that the study of regional integration requires a multi- dimensional analysis (economic, social, political and technological dimensional simultaneously) to be opti-mally useful.
2.2. Political, Social and Technological Fields of Research
The study of regional integration from the political di-mension is also pervasive. It is observed that many stud-ies on regional integration involve extensive elaboration of the following politically-oriented topics: institutional framework (functionalism or neo-functionalism), policy dimensional agreements (negotiation) and international law issues.
As observed, more qualitative rather than quantitative methods of evaluation are used in the political dimension of research. Just as in the economic dimension of re-search, the political dimension of research in the study of regional integration has many limitations. However, as pointed out by Mattli, the political context in which inte-gration occurs has been specified in the political dimen-sion of research and this has provided insightful accounts of the process of integration. The third field of research, that is the social field of research, focuses on issues such as history, culture, education, social welfare programs and social policies applied by governments. Usually such research is in the form of comparative studies based on basic statistical comparison, feedback, interview results, history and social theoretical frameworks. Many of these studies are confined to highly important issues that are worthy of consideration in the study of the effects of re-gional integration. The fourth field of research, that is the technological field of research, has a relatively smaller presence. It focuses mainly on four specific topics: re-gional electrical inter-connection, telecommunications, technology transfer, and research and development (R & D). Some of these research documents involve advanced technical terminologies and the application of quantita-tive methods (statistics and mathematics).
3. The Global Dimension of the Regional Integration Model (GDRI-Model)
Economic, political, social and technological dimensions of research into regional integration clearly do not pro-vide a global perspective in the understanding of regional integration. For this reason, the global dimension of the regional integration model (GDRI-Model) is proposed in this thesis to address the issue.
The GDRI-Model is a measuring tool for studying re-gional integration from a global perspective. The pro-posed GDRI-Model is a simple and flexible model. It
applies dynamic and general equilibrium analysis to show the past and present situations in the regional inte-gration process of any region based on a set of indexes and graphs. Its field application is not constrained by region or the development stage of each member inter-ested in integrating into a single regional bloc.
The GDRI-Model can be applied to any form of re-gional integration process: between developed countries and developing countries, North-South Integration (e.g. within the Europe Union—EU—[17]), between devel-oped and developing countries (e.g. within the North American free trade area—NAFTA—[18]), and between developing countries or south-south integration (e.g. within MERCOSUR [19] and ASEAN [20]).
The application of the GDRI-Model is based on the characteristics, conditions and historical moments of a region’s regional integration development. The GDRI- Model is like a simulator that applies a series of simula-tions in different scenarios and in different phases of the regional integration process. This model does not attempt in any way to be a forecasting model. It focuses on the past and present situations in the regional integration process as a whole. It helps to provide a general idea about the situations and evolution of the regional integra-tion process in any region [21].
4. The Domestic Development System Concept
This part of the research presents a new concept entitled the “domestic development system (DDS).” The DDS incorporates all economic, political and social character-istics that any country may show in its different phases of development. The GDRI-Model assumes that each coun-try has its own domestic system development. At the same time, it defines regional integration as the joining of a certain number of different countries (or Domestic Development Systems) that are interested in creating a strong regional development system (RDS). The DDS concept is based on five assumptions: ● Change within the domestic development system
(DDS) in any country cannot be forced; it can only be induced by material incentives and motivation.
● The domestic development system (DDS) of any country is spurred onwards by the limited nature of resources.
● Each domestic development system (DDS) has its unique set of characteristics. Therefore it might be difficult to try to implement a successful domestic development system (DDS) in another, less success-ful, domestic development system (DDS).
● The RDS concept attempts to integrate different DDS into a regional integration agreement (RIA) depending on the different domestic development systems (DDS) that are available for integration into
Copyright © 2013 SciRes. ME

M. A. R. ESTRADA
Copyright © 2013 SciRes. ME
350
a single regional system. ● The creation of a regional development system (RDS)
depends on the flexibility of each domestic devel-opment system (DDS).
The domestic development system (DDS) concept of-fers a new perspective of analysis and research in the field of regional integration and development economics. The traditional research is based on economic, political, social and technological points of view; but the DDS concept makes it possible to visualize different countries’ developments from a global perspective.
5. Phases in the Global Dimension of the Regional Integration Model (GDRI-Model)
5.1. Phase I: Design of the Multi-input Database Table
The multi-input database table is an alternative style of database analysis framework that permits the storage of large amounts of data to measure a single variable. This single variable can show the evolution of any phenome-non from a general perspective. The multi-input database table is designed to evaluate either by country or region.
The multi-input database table is focused on measur-ing four main independent variables (e.g. X1, X2, X3, and
X4). Each main independent variable is formed by “n” number of sub-variables. The number of sub-variables in each main independent variable is non-limited; for this reason, the multi-input database table concept does not have any specific ranking. Instead, there exists a basic classification of sub-variables. Only two main independ-ent variables have a classification. First, political (X1) is divided into two large sections: external and internal factors are shown in the Table 1. Second, economic (X3) is divided into production, consumption, trade, labor, investment, infrastructure, government and international cooperation. However, each sub-variable has a code number respectively. The code number depends on the area of development (X1 = political; X2 = social; X3 = economic and X4 = technological). The reason that all sub-variables have the same importance (weight) is be-cause we are interested in measuring a single value; in this case, each main independent variable (X1, X2, X3 and X4). To give the same weight to all sub-variables, it is necessary to use a binary system. The binary system helps to maintain a balance among all variables in each multi-input database table. Another reason is that the binary system helps to create an alternative model of analysis when it comes to countries with limited infor-mation, especially in the case of developing countries and less developed countries (LDC’s).
Table 1. Multi-input database table of the regional global political development of trade bloc “XYZ”.
POLITICAL FACTORS LIST COUNTRY CODE
VARIABLES C1 C2 C3 …Cn AS TPR
P.1. External factors
P.1.1. Colonization (country) 1 or 0 1 or 0 1 or 0 1 or 0 ∑1 T1
P.1.2. Group negotiation power 1 or 0 1 or 0 1 or 0 1 or 0 ∑2 T2
P.1.3. Foreign policy influences
P.1.3.1. Regional 1 or 0 1 or 0 1 or 0 1 or 0 ∑3 T3
P.1.3.2. Global 1 or 0 1 or 0 1 or 0 1 or 0 ∑4 T4
P.1.4. Negotiation style 1 or 0 1 or 0 1 or 0 1 or 0 ∑5 T5
P.2. Internal factors
P.2.1. International organizations support 1 or 0 1 or 0 1 or 0 1 or 0 ∑6 T6
P.2.2. Regional institutions role 1 or 0 1 or 0 1 or 0 1 or 0 ∑7 T7
P.2.3. Political regime 1 or 0 1 or 0 1 or 0 1 or 0 ∑8 T8
P.2.4. Legislative background 1 or 0 1 or 0 1 or 0 1 or 0 ∑9 T9
P.2.5. Internal security 1 or 0 1 or 0 1 or 0 1 or 0 ∑10 T10
P.2.6. Human rights 1 or 0 1 or 0 1 or 0 1 or 0 ∑11 T11
P.2.7. Border problems 1 or 0 1 or 0 1 or 0 1 or 0 ∑12 T12
P.2.8. Political stability 1 or 0 1 or 0 1 or 0 1 or 0 ∑13 T13
P.2.9. Political structure and public administration 1 or 0 1 or 0 1 or 0 1 or 0 ∑14 T14
P.2.10. Army size 1 or 0 1 or 0 1 or 0 1 or 0 ∑16 T15
P.2.11. Bureaucracy level 1 or 0 1 or 0 1 or 0 1 or 0 ∑17 T16
TOTAL ∑AS ∑TPR
TOTAL (%) AP 100%
Ci = Country from the same Trade Bloc; AS = Actual Situation; TPR = Total of Possible Results; Xi= Total Global Development = ∑AS/∑TPR.

M. A. R. ESTRADA 351
The idea of applying a multi-input database is to find
the domestic development system—DS—(country) and finally the regional development—RD—(regional bloc). The idea of finding the DDS and the RD is to demon-strate that successful regional integration process de-pends on the major part of the DDS being strong enough; there can only be a small gap between its members. In this case, the RD is result of the sum of the component DDS. The four main independent variables will show the RD in different areas of development [political (X1), so-cial (X2), economic (X3) and technological (X4)].
The number of variables used in the GDRI-Model varies, depending on the objectives of the researchers or policy-makers and the orientation of the cases of research. In the case of this thesis, 98 variables with their respec-tive tables and parameters were selected: 19 variables for regional political development index (X1) is shown in the Table 1; 15 variables for regional social development index (X2) is shown in the Table 2; 54 variables for re-gional economic development index (X3) is shown in the Tables 3 and 10 variables for regional technological de-velopment index (X4) is shown in the Table 4.
Once the number of sub-variables is determined, the next step is to collect the statistical and historical data that constitute sub-variables (“n” number) in each main independent variable (X1, X2, X3 and X4). All sub-vari- ables within each main independent variable (X1, X2, X3 and X4) may not have a direct relationship between them—they may be independent variables or endogenous variables. However, all the sub-variables in each multi- input database table are meant to measure a single vari-able or main independent variable, that is, each of the Regional Development Indexes (Xi).
Each of the four Xi indexes (X1, X2, X3 and X4) to be measured is viewed as a main independent variable (i.e. endogenous variable). However, there is no connection or interdependency among these four Xi indexes when they are joined in the graph. These four Xi indexes are used to draw a graph that represents the evolution and
stages of the regional integration process of the region from a general perspective. The objective of this chapter is to apply the GDRI-Model in many trade blocs simul-taneously (e.g. European Union—EU—, North America free trade area—NAFTA—, association of south-east Asian nations—ASEAN—, and MERCOSUR).
5.1.1. The Rational Selection of Sub-Variables in Each Multi-Input Database Table
Regional Political Development Regional political development is divided into two
large sections: external factors and internal factors. External Factors Colonization: The model assumes that countries
which have been colonized for a long time in the past or continue under the domination of a hegemony can stop the process of regional integration anywhere.
Group negotiation power: This can be analyzed by the number of meetings that all members in the same region organize every year.
Foreign policy orientation of each member: The for-eign policy is divided into two large focuses: regional and global level (world).
Negotiation style: This sub-variable shows the style of negotiation, whether individual or group behavior.
Internal Factors International organization support: International or-
ganizations can facilitate financial and technical support. Intra-regional institution number: The number of
institutions can play an important role in the develop-ment of the regional integration process.
Political regime: This sub-variable encourages the political stability of the region.
Legislative background: This can help to facilitate the regional legal framework for environmental and other issues.
Internal security: Adequate security measures for lo- cal and regional citizens.
Table 2. Multi-input database table of the regional social development of trade bloc “XYZ”.
SOCIAL FACTORS LIST COUNTRY CODE
VARIABLES C1 C2 C3 …Cn AS TPR
S.1. Literacy 1 or 0 1 or 0 1 or 0 1 or 0 ∑1 T1
S.2. Social problems (crime & drugs) 1 or 0 1 or 0 1 or 0 1 or 0 ∑2 T2
S.3. Health and medical programs 1 or 0 1 or 0 1 or 0 1 or 0 ∑3 T3
S.4. External culture influence 1 or 0 1 or 0 1 or 0 1 or 0 ∑4 T4
S.5. Food security 1 or 0 1 or 0 1 or 0 1 or 0 ∑5 T5
S.6. Public education 1 or 0 1 or 0 1 or 0 1 or 0 ∑6 T6
S.7. Low cost housing projects 1 or 0 1 or 0 1 or 0 1 or 0 ∑7 T7
TOTAL ∑AS ∑TPR
TOTAL (%) AP 100%
Ci = Country from the same Trade Bloc; AS = Actual Situation; TPR = Total of Possible Results; Xi= Total Global Development = ∑AS/∑TPR.
Copyright © 2013 SciRes. ME

M. A. R. ESTRADA 352
Table 3. Multi-input database table of the regional economic development of trade bloc “XYZ”.
ECONOMICS FACTORS LIST COUNTRY CODE
VARIABLES C1 C2 C3 …Cn AS TPR
E.1. Production
E.1.1. GDP structure
E.1.1.1. Agriculture 1 or 0 1 or 0 1 or 0 1 or 0 ∑1 T1
E.1.1.2. Industry 1 or 0 1 or 0 1 or 0 1 or 0 ∑2 T2
E.1.1.3. Services 1 or 0 1 or 0 1 or 0 1 or 0 ∑3 T3
E.1.2. GDP (%) 1 or 0 1 or 0 1 or 0 1 or 0 ∑4 T4
E.1.3. Natural resources 1 or 0 1 or 0 1 or 0 1 or 0 ∑5 T5
E.1.4. Market location 1 or 0 1 or 0 1 or 0 1 or 0 ∑6 T6
E.1.5. Economic development stage 1 or 0 1 or 0 1 or 0 1 or 0 ∑7 T7
E.1.6. Subsidies level 1 or 0 1 or 0 1 or 0 1 or 0 ∑8 T8
E.1.7. Environmental protection 1 or 0 1 or 0 1 or 0 1 or 0 ∑9 T9
E.1.8. Industrial concentration in large cities 1 or 0 1 or 0 1 or 0 1 or 0 ∑10 T10
E.1.9. Production and export structure 1 or 0 1 or 0 1 or 0 1 or 0 ∑11 T11
E.1.10. Oil production and energy resources 1 or 0 1 or 0 1 or 0 1 or 0 ∑12 T12
E.1.11. Copy right regulations 1 or 0 1 or 0 1 or 0 1 or 0 ∑13 T13
E.2. Consumption
E.2.1. Income per-capita 1 or 0 1 or 0 1 or 0 1 or 0 ∑14 T14
E.2.2. Buyer purchase 1 or 0 1 or 0 1 or 0 1 or 0 ∑15 T15
E.2.3. Market size 1 or 0 1 or 0 1 or 0 1 or 0 ∑16 T16
E.2.4. Poverty level 1 or 0 1 or 0 1 or 0 1 or 0 ∑17 T17
E.2.5. Inflation rate 1 or 0 1 or 0 1 or 0 1 or 0 ∑18 T18
E.2.6. Wealth distribution 1 or 0 1 or 0 1 or 0 1 or 0 ∑19 T19
E.2.7. Saving rate 1 or 0 1 or 0 1 or 0 1 or 0 ∑20 T20
E.3. Trade
E.3.1. Intra-regional trade volume 1 or 0 1 or 0 1 or 0 1 or 0 ∑21 T21
E.3.2. Extra-regional trade volume 1 or 0 1 or 0 1 or 0 1 or 0 ∑22 T22
E.3.3. Intra-regional tariff structure application
E.3.3.1. Tariff barriers level 1 or 0 1 or 0 1 or 0 1 or 0 ∑23 T23
E.3.3.2. Non tariff barriers level 1 or 0 1 or 0 1 or 0 1 or 0 ∑24 T24
E.3.4. Opening economy to the world 1 or 0 1 or 0 1 or 0 1 or 0 ∑25 T25
E.3.5. Monopoly controls 1 or 0 1 or 0 1 or 0 1 or 0 ∑26 T26
Copyright © 2013 SciRes. ME

M. A. R. ESTRADA 353
Continued
E.4. Labor
E.4.1. International social division 1 or 0 1 or 0 1 or 0 1 or 0 ∑27 T27
E.4.2. labor concentration
E.4.2.1. Urban 1 or 0 1 or 0 1 or 0 1 or 0 ∑28 T28
E.4.2.2. Rural 1 or 0 1 or 0 1 or 0 1 or 0 ∑29 T29
E.4.3. Immigration level 1 or 0 1 or 0 1 or 0 1 or 0 ∑30 T30
E.4.4. Emigration level 1 or 0 1 or 0 1 or 0 1 or 0 ∑31 T31
E.4.5. Population growth 1 or 0 1 or 0 1 or 0 1 or 0 ∑32 T32
E.4.6. Labor productivity 1 or 0 1 or 0 1 or 0 1 or 0 ∑33 T33
E.5. Investment
E.5.1. Domestic Direct Investment (DDI) 1 or 0 1 or 0 1 or 0 1 or 0 ∑34 T34
E.5.2. Intra-regional Direct Investment (IDI) 1 or 0 1 or 0 1 or 0 1 or 0 ∑35 T35
E.5.3. Foreign Direct Investment (FDI) 1 or 0 1 or 0 1 or 0 1 or 0 ∑36 T36
E.5.4. Privatization process 1 or 0 1 or 0 1 or 0 1 or 0 ∑37 T37
E.5.5. Interest rate 1 or 0 1 or 0 1 or 0 1 or 0 ∑38 T38
E.5.6. Exchange rate stability 1 or 0 1 or 0 1 or 0 1 or 0 ∑39 T39
E.5.7. Stock market activity 1 or 0 1 or 0 1 or 0 1 or 0 ∑40 T40
E.6. Infrastructure
E.6.1. Domestic physical infrastructure 1 or 0 1 or 0 1 or 0 1 or 0 ∑41 T41
E.6.2. Transportation system 1 or 0 1 or 0 1 or 0 1 or 0 ∑42 T42
E.6.3. Intra-regional physical projects 1 or 0 1 or 0 1 or 0 1 or 0 ∑43 T43
E.6.4. Tourism facilities 1 or 0 1 or 0 1 or 0 1 or 0 ∑44 T44
E.6.5. Telecommunications 1 or 0 1 or 0 1 or 0 1 or 0 ∑45 T45
E.6.6. Electricity production 1 or 0 1 or 0 1 or 0 1 or 0 ∑46 T46
E.7. Government
E.7.1. Taxation
E.7.1.1. Indirect 1 or 0 1 or 0 1 or 0 1 or 0 ∑47 T47
E.7.1.2. Direct 1 or 0 1 or 0 1 or 0 1 or 0 ∑48 T48
E.7.2. Domestic debt 1 or 0 1 or 0 1 or 0 1 or 0 ∑49 T49
E.7.3. Foreign debt 1 or 0 1 or 0 1 or 0 1 or 0 ∑50 T50
E.7.4. Government expenditures
E.7.4.1. Operational and administrative 1 or 0 1 or 0 1 or 0 1 or 0 ∑51 T51
E.7.4.2. Investment 1 or 0 1 or 0 1 or 0 1 or 0 ∑52 T52
E.7.5. Trade promotion expenditures 1 or 0 1 or 0 1 or 0 1 or 0 ∑53 T53
E.7.6. Corruption 1 or 0 1 or 0 1 or 0 1 or 0 ∑54 T54
E.7.7. Planning economy (Medium run) 1 or 0 1 or 0 1 or 0 1 or 0 ∑55 T55
E.8. International cooperation
E.8.1. Financial 1 or 0 1 or 0 1 or 0 1 or 0 ∑56 T56
E.8.2. Technical 1 or 0 1 or 0 1 or 0 1 or 0 ∑57 T57
Total ∑AS ∑TPR
Total (%) AP 100%
Ci = Country from the same Trade Bloc; AS = Actual Situation; TPR = Total of Possible Results; Xi= Total Global Development = ∑AS/∑TPR.
Copyright © 2013 SciRes. ME

M. A. R. ESTRADA
Copyright © 2013 SciRes. ME
354
Table 4. Multi-input database table of the regional technological development of trade bloc “XYZ”.
TECHNOLOGY FACTORS LIST COUNTRY CODE
VARIABLES C1 C2 C3 …Cn AS TPR
T.1. Technology (R&D) level 1 or 0 1 or 0 1 or 0 1 or 0 ∑1 T1
T.2. Internet hosts 1 or 0 1 or 0 1 or 0 1 or 0 ∑2 T2
T.3. Software production 1 or 0 1 or 0 1 or 0 1 or 0 ∑3 T3
T.4. Internet access 1 or 0 1 or 0 1 or 0 1 or 0 ∑4 T4
T.5. Telecommunications (Mobil phones) 1 or 0 1 or 0 1 or 0 1 or 0 ∑5 T5
T.6. Research institutes 1 or 0 1 or 0 1 or 0 1 or 0 ∑6 T6
T.7. Biotechnology advances 1 or 0 1 or 0 1 or 0 1 or 0 ∑7 T7
T.8. Import of new technologies 1 or 0 1 or 0 1 or 0 1 or 0 ∑8 T8
T.9. R&D public investment 1 or 0 1 or 0 1 or 0 1 or 0 ∑9 T9
T.10. Technology information development 1 or 0 1 or 0 1 or 0 1 or 0 ∑10 T10
TOTAL ∑AS ∑TPR
TOTAL (%) AP 100%
Ci = Country from the same Trade Bloc; AS = Actual Situation; TPR = Total of Possible Results; Xi= Total Global Development = ∑AS/∑TPR.
Human rights: The level of protection of human
rights offered by each member in the same region. Border problems: Border problems can hinder or stop
the regional integration process. Political stability: This is a basic condition in order to
integrate all countries into the same region. Public administration: Good public administration
can facilitate management of the regional integration proc- ess.
Army size: Less expenditure on army services can help to redirect resources towards social and public services.
Bureaucracy level: A complicated bureaucracy sys-tem can generate difficulties in the regional integration process.
Regional Social Development Regional social development is generated by seven
sub-variables: Literacy: This sub-variable shows the human capital
stock under regional level. Social problems: These can generate instability in one
member country or at a regional level. Health and medical programs: The social welfare
orientation of the region is important. External culture influence: Societal behavior in or-
der to become an individual or a collective society. Food security: This prevents regional disasters and
quick handling of emergencies. Public education: Infrastructure for training and higher
education at the regional level. Low cost housing projects: Equitable distribution of
income at regional level. Regional Economic Development Regional economic development is formed by eight
large sections: production, consumption, trade, labor, investment, infrastructure, government and international
cooperation. Production: Eleven sub-variables are considered in
this section. Among these eleven sub-variables, we in-clude the study of the GDP to observe production struc-ture and growth. In the same section, we also consider natural resources, oil production and environmental pro-tection to evaluate the supply of resources for the re-gional production. Market location, industrial concentra-tion and subsidies level can generate distortions in re-gional prices. Export structure can help to visualize if there exist similarities in the export products that mem-bers in the same region offer to the international market. The copyright of patents and trademarks can play an im-portant role in the control of pirated mass production.
Consumption: In the consumption section, seven sub- variables are considered, including income per-capita, buyer purchase, poverty level, saving rate, inflation rate and wealth distribution. All these sub-variables need to be found among all members to determine consumption behavior at regional level. Market size can play an im-portant role in the regional integration process, which can help to join small markets into a single larger market.
Trade: The trade section has five sub-variables. All these variables show the behavior of the external sector at regional level and the possible obstacles that each member or the region may face. These variables are in-tra-regional trade volume, extra-regional trade volume, intra regional tariff application, openness and monopoly controls.
Labor: The labor section has six sub-variables. This section considers the fact that international social divi-sion can facilitate the regional integration process to-gether with labor distribution under urban and rural areas. The immigration and emigration levels can demonstrate the mobility of labor into the region and the rest of the
M. A. R. ESTRADA 355
world. Population growth is considered a vital variable in the study of labor to observe the population pyramid of the region and predict future human capital stock supply. Labor productivity also plays an important role in en-couraging the possibility of FDI attraction to expand re-gional production and exports.
Investment: This section is divided into seven sub- variables. Three categories of investment—domestic, intra-regional and foreign direct investment—are used in this section. We will study how these three types of in-vestment play an important role in the regional integra-tion process of any region. Additionally, the same section maintains that the privatization process (public goods) needs to be considered in the analysis of regional inte-gration process to facilitate the mobility of capital at re-gional and international level. The interest rate, exchange rate stability and stock market activity can show the level of banking and stock market development in the region, and the possibility of joining the financial regional sys-tem.
Infrastructure: The infrastructure is formed by six sub-variables; this section will show the level of coordi-nate infrastructure under the regional level, and how it can facilitate the mobility of labor and goods (transport system, intra-regional coordinate projects and tourism), communication services (telecommunications) and en-ergy (electricity production).
Government The government section has seven sub-variables. The
inclusion of this section into the analysis of regional economic development is in order to study the tax in-come distribution (taxation), domestic debt and foreign debt of each member in the same region. Centred on the same issue, it is possible to observe the level of govern-ment income and spending (e.g. government expendi-tures and planning economy sub-variables) of the differ-ent governments in the same region. We assume that the good performance of governments can help the stan-dardization and management of public finances (income and expenditure). Additionally, corruption levels are in-cluded in this study to help determine how corruption can affect the regional integration process originated by po-litical groups to protect its personal interests.
Regional Technological Development Regional technological development is formed by ten
sub-variables. This section aims to show the level of tech- nological development of each member in the same re-gion. We assume that if the majority of members in the same region have a small gap of technological develop-ment between members, this can facilitate the regional integration process. The variables are technology (R&D) level, internet hosts, software production, internet access, telecommunications, research institutes, biotechnology advances, import of new technologies, R&D public in-
vestment and IT development.
5.1.2. Types of Multi-Input Database Tables The first type of multi-input database table pertains to “country or domestic system development”. It uses “N” number of variables. The number “N” is decided by re-searchers or policy-makers. The number of cases in the study is represented by “M”. In the case of the GDRI- Model, “M” represents only one country (i.e. a domestic system development). The time factor “T” depends on the time parameters that the researchers or policy-makers are interested in using. Therefore, “T” can be in terms of years or decades. The second type of multi-input data-base table pertains to “region or regional system devel-opment”. All the conditions and functions of “N”, “M” and “T” factors are the same as that in the first type of multi-input database table, except that “M” here repre-sents a “region or regional system development” rather than a “country or domestic system development”. For this chapter, the second type of multi-input database (by region) is adopted.
5.2. Phase II: Measurement of Regional Development Indexes (Xi)
The second phase of the implementation of the GDRI-Model involves the measurement of regional de-velopment indexes (Xi) using the variables in four basic multi-input database tables. The regional development indexes are regional political development index (X1)
13, regional social development index (X2)
14, regional eco-nomic development index (X3)
15 and regional techno-logical development index (X4)
16. These variables are
13The measurement of the regional political development index (X1) originates from the calculus obtained from the politics multi-input database table is shown in the Tables 1 and 5. After we obtain the result of X1, we can proceed to classify the results into three different parameters. These parameters are: under-developed stage or level 1 (0 ≤ X1 ≤ 0.33), X1 index is developing stage or level 2 (0.34 ≤ X1 ≤ 0.66) and X1 index is developed stage or level 3 (0.67 ≤ X1 ≤ 1). 14The measurement of the regional social development index (X2) originates from the calculus applied in the social multi-input database table is shown in the Tables 2 and 7. After we obtain the result of X2,we can proceed to classify the results into three different parameters. These parameters are under-developed stage or level 1 (0 ≤ X2 ≤ 0.33),X2 index is developing stage or level 2 (0.34 ≤ X2 ≤ 0.66) and X2 index is developed stage or level 3 (0.67 ≤ X2 ≤ 1). 15The measurement of the regional economic development index (X3) originates from the calculus applied in the economic multi-input data-base table is shown in the Tables 3 and 9. After we obtain the result of X3, we can proceed to classify the results into three different parame-ters. These parameters are under-developed stage or level 1 (0 ≤ X3 ≤ 0.33), X3 index is developing stage or level 2 (0.34 ≤ X3 ≤ 0.66) and X3
index is developed stage or level 3 (0.67 ≤ X3 ≤ 1). 16The measurement of the regional technological development index (X4) originates from the calculus applied in the technological multi-input database table is shown in the Tables 4 and 11. After we obtain the result of X4, we can proceed to classify the results into three dif-ferent parameters. These parameters are under-developed stage or level 1 (0 ≤ X4 ≤ 0.33), X4 index is developing stage or level 2 (0.34 ≤ X4 ≤ 0.66) and X4 index is developed stage or level 3 (0.67 ≤ X4 ≤ 1).
Copyright © 2013 SciRes. ME

M. A. R. ESTRADA
Copyright © 2013 SciRes. ME
356
analyzed with their codes, descriptions, parameters and sources respectively are shown in the Tables 5-12.
The parameters are divided into two categories. The categories are:
1) Quantitative Variables a) The measurement of the regional variation rate
(RVR) consists of two phases. The first phase is to measure the variation rate by country (VRC). The VRC is calculated based on two periods: present period data minus last period data. The data of each period can be in percentage or absolute values. In the second phase, the sum of all VRC is divided by the total number of countries in the trade bloc. The end result is the number RVR.
RGR = Σ VRC/total number of countries
RGR = Σ (present period data – last period data)/total number of countries
The RVR can then be compared against each VRC. The final result obtained presents two possible scenarios: first, if RVR ≤ VRC then this specific country in the trade bloc obtains a value of 1; second, if RVR ≥ VRC then this specific country in the regional bloc obtains a value of 0.
b) The regional average rate (RAR) is obtained by di-viding the sum of the local input data of each country in the trade bloc by the total number of countries in the trade bloc.
RAR = Σ local input data/total number of countries
The RAR is a fixed parameter that can be compared against each local input data by country. The final result of the RAR presents two possible scenarios: first, if the RAR ≥ country value, then the final data has the average rate = 0; second, if the RAR ≤ country value, then the final data has the average rate = 1.
2) Qualitative Variables a) The historical data focalization (HDF) can be clas-
sified by existence (i.e. an attempt is made to prove if 1 = existing data or 0 = non-existing data). This type of qualitative variable provides an alternative way to meas-ure non-quantitative variables that affect ranking regional integration process.
b) The ranking list (RL) originates from the best re-sults of certain areas (social, economic, political and technological) in some countries. The RL can be found in international organizations such as United Nations, World Bank, International Monetary Fund and etc. The size of the RL is determined by the researcher or policy maker interested in applying the RL.
Once the RL is established, countries in the trade bloc can be compared. The RL can present two possible re-sults: first, if the country in the trade bloc is found in the RL, then this country receives a value of 1; second, if the country in the trade bloc cannot be found in the RL, then this country receives a value of 0.
Table 5. The global regional political development parameters.
POLITICAL FACTORS LIST CODE
VARIABLES Limit PARAMETERS
P.1. External factors
P.1.1. Colonization (country) 1 = Exist or 0 = Non-exist Short colonization
P.1.2. Group negotiation power 1 = High or 0 = Low Number of activities
P.1.3. Foreign policy influences
P.1.3.1. Regional 1 = High or 0 = Low Policy focus
P.1.3.2. Global 1 = High or 0 = Low Policy focus
P.1.4. Negotiation style 1= group or 0 = individual Number of agreements
P.2. Internal factors
P.2.1. International organizations support 1 = High or 0 = Low Number of institutions
P.2.2. Regional institutions role 1= Small or 0 = Large Number of activities
P.2.3. Political regime 1 = Exist or 0 = Non-exist Democracy
P.2.4. Legislative background 1 = Exist or 0 = Non-exist Exist strong law system
P.2.5. Internal security 1 = High or 0 = Low Spending levels
P.2.6. Human rights 1 = High or 0 = Low Exist human rights
P.2.7. Border problems 1 = Non-exist or 0 = Exist Any border problem
P.2.8. Political stability 1 = High or 0 = Low Exist democratic elections
P.2.9. Political structure and public administration 1= Large or 0 = small Taxation system
P.2.10. Army size 1 = Low or 0 = High Government spending
P.2.11. Bureaucracy level 1 = Low or 0 = High Bureaucracy size
OR = Old Regionalism; NR = New Regionalism; FTA = Free Trade Area; CU = Custom Union; D = Democratic; ND = Non Democratic; NE = Non Exist; E = Exist; R = Right; L = Left; U = Unitary; F = Federalism; P = Presidential; Par = Parliamentary. Note: */We are using in all QT measure, the average variation rate by decade (e.g. Variation rate between 1960’s and 1970’s to analyzing decade of 1970’s).

M. A. R. ESTRADA 357
Table 6. The global regional political development sources.
POLITICAL FACTORS LIST CODE
VARIABLES Source
P.1. External factors
P.1.1. Colonization (country) The Library of Congress U.S.:www.loc.gov
P.1.2. Group negotiation power Regional Integration Institutions by region in analysis
P.1.3. Foreign policy orientation in each member MOA by Country
P.1.3.1. Regional Ministry of Foreign Affairs by Country
P.1.3.2. Global Ministry of Foreign Affairs by Country
P.1.4. Negotiation style Regional Integration Institutions by region in analysis
P.2. Internal factors
P.2.1. International organizations support United Nations: www.un.org
P.2.2. Intra-Regional institutions number Ministry of Foreign Affairs by Country
P.2.3. Political regime Central Government Homepage by country
P.2.4. Legislative background Parliament by country
P.2.5. Internal security Ministry of Defense and Police Forces by country
P.2.6. Human rights Human Rights Watch: www.hrw.org
P.2.7. Border problems Haya Court: www.wpc-in.org
P.2.8. Political stability Transparency International: www.transparency.org
P.2.9. Public administration Transparency International: www.transparency.org
P.2.10. Army size NATO: http://www.nato.int
P.2.11. Bureaucracy level Transparency International: www.transparency.org
Table 7. The regional social development parameters.
SOCIAL FACTORS LIST CODE
VARIABLES Limit PARAMETERS
S.1. Literacy 1 = High or 0 = Low >70% of the total population has education
S.2. Social problems (crime & drugs) 1 = Low or 0 = High Crime growth rate
S.3. Health and medical programs 1 = High or 0 = Low >60% of the total population has health take care
S.4. External culture influence 1 = Exist or 0 = Non-exist Cable TV access
S.5. Food security 1 = Exist or 0 = Non-exist Food security programs
S.6. Public education 1 = High or 0 = Low Number of public schools and Universities
S.7. Low cost housing projects 1 = High or 0 = Low Number of projects on low cost housing
Table 8. Regional social development sources.
SOCIAL FACTORS LIST CODE
VARIABLES Source
S.1. Literacy United Nations: www.un.org
S.2. Social problems (crime & drugs) United Nations Office on Drugs and Crime: www.unodc.org/unodc/en/crime
S.3. Health and medical programs World Health Organization: www.who.int
S.4. External culture influence Cable TV. customers per capita
S.5. Food security United Nations World Food Program: www.wfp.org
S.6. Public education United Nations: www.un.org and World Bank: www.wb.org
S.7. Low cost housing projects World Bank: www.worldbank.org/poverty/
Copyright © 2013 SciRes. ME

M. A. R. ESTRADA 358
Table 9. The global regional economic development parameters.
ECONOMICS FACTORS LIST CODE
VARIABLES Limit PARAMETERS
E.1. Production
E.1.1. GDP structure
E.1.1.1. Agriculture 1 = High or 0 = Low Rate variation among two years
E.1.1.2. Industry 1 = High or 0 = Low Rate variation among two years
E.1.1.3. Services 1 = High or 0 = Low Rate variation among two years
E.1.2. GDP (%) 1 = High or 0 = Low Real GDP > 3% annual
E.1.3. Natural resources 1 = High or 0 = Low Agriculture line<50%
E.1.4. Market location Gravity model results
E.1.5. Economic development stage WB income classification
E.1.6. Subsidies level 1 = Low or 0 = High Free of subsidies
E.1.7. Environmental protection 1 = High or 0 = Low Exist environmental regulations
E.1.8. Industrial concentration in large cities 1 = Low or 0 = High <45% less concentration
E.1.9. Production and export structure Rate variations among two years
E.1.10. Oil production and energy resources Supply 40% of the domestic market
E.1.11. Copy right regulations Exist a legal framework
E.2. Consumption
E.2.1. Income per-capita 1 = High or 0 = Low Income large than US$ 1500/year
E.2.2. Buyer purchase 1 = High or 0 = Low Buyer purchase list
E.2.3. Market size 1 = large or 0 = small Population size/Income per capita
E.2.4. Poverty level 1 = Low or 0 = High <15% of whole population
E.2.5. Inflation rate 1 = Low or 0 = High <5% inflation rate
E.2.6. Wealth distribution 1 = Low or 0 = High Gini coefficient
E.2.7. Saving rate 1 = High or 0 = Low Amount of private deposits annually
E.3. Trade
E.3.1. Intra-regional trade volume 1 = High or 0 = Low Variation of trade volumes
E.3.2. Extra-regional trade volume 1 = High or 0 = Low Variation of trade volumes
E.3.3. Intra-regional tariff structure application
E.3.3.1. Tariff barriers level 1 = High or 0 = Low Tariff rates
E.3.3.2. Non tariff barriers level 1 = High or 0 = Low Number of restrictions
E.3.4. Opening economy to the world 1 = High or 0 = Low Openness index
E.3.5. Monopoly controls 1 = High or 0 = Low Index of anti-trust law report
Copyright © 2013 SciRes. ME

M. A. R. ESTRADA 359
Continued
E.4. Labor
E.4.1. International social division 1 = High or 0 = Low 60% of total population work in industry and services sector
E.4.2. labor concentration
E.4.2.1. Urban 1 = High or 0 = Low Urban labor concentration rate
E.4.2.2. Rural 1 = Low or 0 = High Rural labor concentration rate
E.4.3. Immigration level 1 = Low or 0 = High Immigration growth rate
E.4.4. Emigration level 1 = High or 0 = Low Emigration growth rate
E.4.5. Population growth 1 = Low or 0 = High <2% population growth rate
E.4.6. Labor productivity 1 = High or 0 = Low Multifactor productivity (MFP)
E.5. Investment
E.5.1. Domestic Direct Investment (DDI) 1 = High or 0 = Low DDI growth rates
E.5.2. Intra-regional Direct Investment (IDI) 1 = High or 0 = Low IDI growth rates
E.5.3. Foreign Direct Investment (FDI) 1 = High or 0 = Low FDI growth rates
E.5.4. Privatization process 1 = High or 0 = Low Number of privatization projects
E.5.5. Interest rate 1 = Low or 0 = High Interest rate growth rate
E.5.6. Exchange rate stability 1 = High or 0 = Low Exchange rate average
E.5.7. Stock market activity 1 = High or 0 = Low Market stock Growth rate
E.6. Infrastructure
E.6.1. Domestic physical infrastructure 1 = High or 0 = Low Number of ports, airports, Km. highways and railways
E.6.2. Transportation system 1 = Cheap or 0 = Expensive Prices growth rate
E.6.3. Intra-regional physical projects 1 = High or 0 = Low Number of projects
E.6.4. Tourism facilities 1 = High or 0 = Low Number of hotels
E.6.5. Telecommunications 1 = High or 0 = Low Number of suppliers
E.6.6. Electricity production 1 = High or 0 = Low Electricity supply
E.7. Government
E.7.1. Taxation
E.7.1.1. Indirect 1 = Low or 0 = High Growth rate expansion
E.7.1.2. Direct 1 = Low or 0 = High Growth rate expansion
E.7.2. Domestic debt 1 = Low or 0 = High Growth rate expansion
E.7.3. Foreign debt 1 = Low or 0 = High Growth rate expansion
E.7.4. Government expenditures
E.7.4.1. Operational and administrative 1 = Low or 0 = High Growth rate expansion
E.7.4.2. Investment 1 = High or 0 = Low Growth rate expansion
E.7.5. Trade promotion expenditures 1 = High or 0 = Low Growth rate expansion
E.7.6. Corruption 1 = Low or 0 = High Growth rate expansion
E.7.7. Planning economy (Medium run) 1 = High or 0 = Low Growth rate expansion
E.8. International cooperation
E.8.1. Financial 1 = High or 0 = Low Growth rate expansion
E.8.2. Technical 1 = High or 0 = Low Growth rate expansion
Copyright © 2013 SciRes. ME
M. A. R. ESTRADA 360
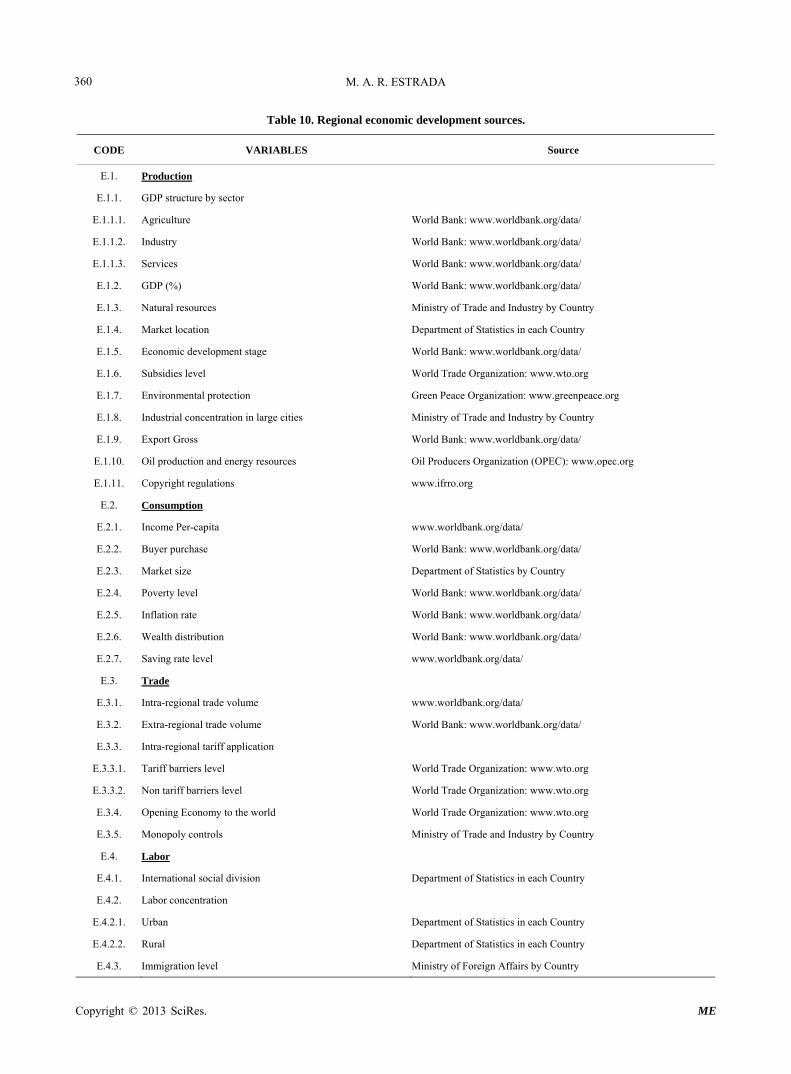
Table 10. Regional economic development sources.
CODE VARIABLES Source
E.1. Production
E.1.1. GDP structure by sector
E.1.1.1. Agriculture World Bank: www.worldbank.org/data/
E.1.1.2. Industry World Bank: www.worldbank.org/data/
E.1.1.3. Services World Bank: www.worldbank.org/data/
E.1.2. GDP (%) World Bank: www.worldbank.org/data/
E.1.3. Natural resources Ministry of Trade and Industry by Country
E.1.4. Market location Department of Statistics in each Country
E.1.5. Economic development stage World Bank: www.worldbank.org/data/
E.1.6. Subsidies level World Trade Organization: www.wto.org
E.1.7. Environmental protection Green Peace Organization: www.greenpeace.org
E.1.8. Industrial concentration in large cities Ministry of Trade and Industry by Country
E.1.9. Export Gross World Bank: www.worldbank.org/data/
E.1.10. Oil production and energy resources Oil Producers Organization (OPEC): www.opec.org
E.1.11. Copyright regulations www.ifrro.org
E.2. Consumption
E.2.1. Income Per-capita www.worldbank.org/data/
E.2.2. Buyer purchase World Bank: www.worldbank.org/data/
E.2.3. Market size Department of Statistics by Country
E.2.4. Poverty level World Bank: www.worldbank.org/data/
E.2.5. Inflation rate World Bank: www.worldbank.org/data/
E.2.6. Wealth distribution World Bank: www.worldbank.org/data/
E.2.7. Saving rate level www.worldbank.org/data/
E.3. Trade
E.3.1. Intra-regional trade volume www.worldbank.org/data/
E.3.2. Extra-regional trade volume World Bank: www.worldbank.org/data/
E.3.3. Intra-regional tariff application
E.3.3.1. Tariff barriers level World Trade Organization: www.wto.org
E.3.3.2. Non tariff barriers level World Trade Organization: www.wto.org
E.3.4. Opening Economy to the world World Trade Organization: www.wto.org
E.3.5. Monopoly controls Ministry of Trade and Industry by Country
E.4. Labor
E.4.1. International social division Department of Statistics in each Country
E.4.2. Labor concentration
E.4.2.1. Urban Department of Statistics in each Country
E.4.2.2. Rural Department of Statistics in each Country
E.4.3. Immigration level Ministry of Foreign Affairs by Country
Copyright © 2013 SciRes. ME

M. A. R. ESTRADA 361
Continued
E.4.4. Emigration level Ministry of Foreign Affairs by Country
E.4.5. Population growth Department of Statistics in each Country
E.4.6. Labor productivity Ministry of Industry and Trade by Country
E.5. Investment
E.5.1. Domestic Direct investment -DDI- Central Bank by Country
E.5.2. Intra-regional Direct Investment -IDI- Central Bank by Country
E.5.3. Foreign Direct Investment -FDI- Central Bank by Country
E.5.4. Privatization process Central Bank by Country
E.5.5. Interest rate Central Bank by Country
E.5.6. Exchange rate stability Central Bank by Country
E.5.7. Stock market activity Central Bank by Country
E.6. Infrastructure
E.6.1. Domestic physical infrastructure Ministry of Communication by country
E.6.2. Transportation system Ministry of Communication by country
E.6.3. Intra-regional physical projects World Trade Organization: www.wto.org
E.6.4. Tourism facilities Tourism Agency by country
E.6.5. Telecommunications Telecommunications companies by country
E.6.6. Electricity production Electricity Power Companies by country
E.7. Government
E.7.1. Taxation
E.7.1.1. Indirect International Monetary Fund (IMF): www.imf.org
E.7.1.2. Direct International Monetary Fund (IMF): www.imf.org
E.7.2. Domestic debt International Monetary Fund (IMF): www.imf.org
E.7.3. Foreign debt International Monetary Fund (IMF): www.imf.org
E.7.4. Government expenditures Ministry of Finance by country
E.7.4.1. Operational and administrative Ministry of Finance by country
E.7.4.2. Investment Ministry of Finance by country
E.7.5. Trade & Tourism promotion expenditures International Trade Promotion Agencies by Country
E.7.6. Corruption level Transparency International: www.transparency.org
E.7.7. Planning economy (medium run) Ministry of Planning and Development by Country
E.8. International cooperation
E.8.1. Financial Ministry of Foreign Affairs by Country
E.8.2. Technical Ministry of Foreign Affairs by Country
Copyright © 2013 SciRes. ME

M. A. R. ESTRADA
Copyright © 2013 SciRes. ME
362
Table 11. The technological development parameters.
TECHNOLOGY FACTORS LIST CODE
VARIABLES Limit PARAMETERS
T.1. Technology (R&D) level
1 = High or 0 = Low Number of technological parks
T.2. Internet hosts
1 = High or 0 = Low Number of WEB’s
T.3. Software production
1 = High or 0 = Low Number of software companies
T.4. Internet access
1 = High or 0 = Low Coverage among whole population
T.5. Telecommunications (Mobil phones)
1 = High or 0 = Low Number of Mobil phones
T.6. Research institutes
1 = High or 0 = Low Number of universities and research institutes
T.7. Biotechnology advances
1 = High or 0 = Low Number of universities and research institutes
T.8. Import of new technologies
1 = High or 0 = Low Volume of imports in capital goods
T.9. R&D public investment
1 = High or 0 = Low Number of public universities and research institutes
T.10. Technology information development
1 = High or 0 = Low Number of homepage designers companies
Table 12. The regional technological development sources.
CODE VARIABLES Sources
T.1. Technology (R&D) level Technological and Universities by Country
T.2. Internet hosts Internet Suppliers
T.3. Software production Companies Homepage
T.4. Internet access Telecommunications companies by Country
T.5. Telecommunications (Mobil phones) Telecommunications companies by Country
T.6. Research institutes Universities by Country
T.7. Biotechnology advances Biotechnology research centers by Country
T.8. Import of new technologies Customs Services Agencies by country
T.9. R&D public investment National Budget by Country
T.10. Technology information development Home-page Designers Companies
5.2.1. Steps to Obtain Regional Development Indexes
(Xi) There are four regional development indexes (Xi) to be obtained. These four Xi indexes are: regional political development index (X1), regional social development index (X2), regional economic development index (X3) and regional technological development index (X4). The first step is to define all variables and parameters. Once all the variables and parameters are defined, all the data based on the variables and parameters is listed in each multi-input database table. The next step is to add the values of all variables in the column of the actual situa-tion (AS) in each multi-input database table. The total possible results (TPR) obtained are then located in the TPR column next to AS column. With the TPR in place,
the next step is to compute each regional development index (Xi). The computation is done by applying the ex-pression (1) to the values in the multi-input database ta-bles.
4
1
100i i i
i i
X X ASTPR
(1)
Following the above four steps, the fifth step is the plotting of two graphs: a) the regional development in-dexes (Xi) are shown in the Figure 1, and b) the regional political, social, economic and technological diagnostic is shown in the Figure 2. The latter graph serves as a means to study the balance between achievements and difficulties that any region may experience in its regional integration process are shown in the Figure 2.

M. A. R. ESTRADA 363
Figure 1. The regional development (Xi) indexes diagram.
Figure 2. The Intra-regional political, social, economic, and technological diagnostic.
5.2.2. Introduction to Analysis of the RD Index and the RIS Index
Each of the regional global indexes (Xi’s) plays an im-portant role in the measurement of the regional develop-ment (RD) index and the regional integration stage (RIS) index. These two indexes can be affected by any change in the Xi indexes in the short and long term. The Xi in-dexes may reflect one of two different scenarios. First, if some or all regional development indexes which are po-litical (X1), social (X2), economic (X3) and technological (X4) increase, then the RD index and the RIS index may increase. The second scenario is that if some or all re-gional development indexes (Xi) by area of development (political, social, economic and technological) decrease, then the RD index and the RIS index may decrease.
5.3. Phase III: Measurement of the Regional Development (RD) Index
The third phase of the implementation of the GDRI- Model presents a general definition of the regional de-velopment indexes (Xi). The RD index is an indicator to compare different historical periods of the regional inte-gration process in any region. It is based on the regional development indexes (Xi) of a region. Therefore, the RD index is a means of analyzing the evolution of any re-
gional integration process from a global perspective.
5.3.1. Steps to Obtain the RD Index The first step is to plot each (Xi) index: regional politi-cal development index (X1), regional social develop-ment index (X2), regional economic development index (X3) and regional technological development index (X4) on the Cartesian plane is shown in the Figures 3 and 4. It should be noted that the RD index value (single per-centage) is an approximation of the past and present situations that any trade bloc may encounter in its evo-lution. The RD index is the summation of all the four regional development indexes (Xi). The second step is to plot the RD graph based on the total value of the four regional development indexes (Xi). This is followed by the calculation of the regional technological index (X4) based on expression (2). It should be noted that the val-ues of the Xi indexes are independent of one another. The RD graph consists of four different areas, where each area has a limit equivalent to 0.25. The total value of these four areas is equal to 1 as observed in the ex-pression (2.6.)
Figure 3. The regional development (RD) index.
Figure 4. Regional development (RD) index.
Copyright © 2013 SciRes. ME

M. A. R. ESTRADA 364
Each axis is shown in the Figure 5 is either the base or the height of the graph (represented by B and H respec-tively in the graph). The RD1 uses the result of the global development index in the axis X1 which is equal to B1, and the global development index in the axis X2 which is equal to H1, followed by the application of (2.1.) The same steps and expression are used for RD1, RD2, RD3 and RD4 is shown in the Figure 5. The total RD index for this period is the sum of all the RDs. This is depicted in expression (2.5). The total area is divided into four dissimilar triangles each with an area equal to {Base (=Bi) x Height (=Hi)}/2. Therefore, the triangle areas have to be summed up to derive the total surface area is shown in the expression (2.5).
4 4
1 1
Base
2ii i
RD
Heighti iX H (2)
B= Base H= Height
1 11 4 1:
X BB H RD
2 1
2
X H (2.1)
2 22 1 2:
X BB H RD
3 2
2
X H (2.2)
3 3
3 2 3:B H RD 4 3
2
X B X H (2.3)
4 4 1 4
2
X B X H
1 2 3 4RD RD RD RD RD
4 3 4:B H RD (2.4)
(2.5)
The main reason to apply this formula is based on the measurement of the area of the four sided figure on the horizontal plane. Therefore, the value of each area will be used to measure the final result on the origin (Y) or fifth axis. Y is based on the result of the four triangle areas under the horizontal plane.
Figure 5. Areas of rotation applied to RD index.
5.3.2. Analysis of the RD Index The analysis of the RD index is based on the comparison of two periods or regions. In the case of this thesis, two periods (i.e. first period and second period) are compared. The total RD index may present three possible scenarios, namely (a) expansion (RD’ first period < RD” second period), (b) stagnation (RD’ first period = RD’’ second period) and (c) contraction (RD’ first period > RD’’ sec-ond period). In terms of time-span, the RD index can be measured and compared on a yearly basis, five-yearly basis, and by decades. For this research, the time-span is divided into four specific decades (the 1960’s to the 1990’s), which can later be compared. In terms of space, the RD index can be measured and compared in relation to countries or regional blocs. At any historical moment, the regional integration process in any region is based on the comparison of the size of the regional development index (Xi).
5.4. Phase IV: Measurement of the Regional Integration Stage (RIS) Index
The last phase in the implementation of the GDRI-Model is the measurement of the regional integration stage (RIS) index. The RIS index measures the degree or stage of the regional integration development that any region achieves in its different stages of evolution. The RIS index is con-sidered a dependent variable in the GDRI-Model.
In the measurement of the RIS index, four regional development indexes (Xi) are used: regional political development index (X1), regional social development index (X2), regional economic development index (X3) and regional technological development index (X4). A constant coefficient—regional integration approach in-clines (RIAI)—is also used concurrently. The RIAI is represented by a, b, c, and d in expression (3) and is ap-plied to each global development index (Xi). Each RIAI (a, b, c, or d) has a limit that is equal to 1 is shown in the expression (3). The weighted sum of the RIAI’s cannot be more than 1.
The application of the RIAI is twofold. The first ap-plication is the RIAI Homogeneous Interest. In this ap-plication, each RIAI has the same level of importance in the analysis is shown in the expression (3.1). The second application is the RIAI Incline. There are four possibili-ties in this application: political approach incline is shown in expression (3.2), social approach incline is shown in expression (3.3), economic approach incline is shown in expression (3.4) and technological approach incline is shown in the expression (3.5).
5.5. Analysis of the RIS Index
After the type of RIAI to be applied is determined, the regional integration stage (RIS) index is measured ac-
Copyright © 2013 SciRes. ME

M. A. R. ESTRADA 365
cording to expression (3). The RIS index analysis may reveal one of three different scenarios, namely (a) un-der-developed stage (0 ≤ RIS ≤ 0.33); (b) developing stage (0.34 ≤ RIS ≤ 0.66); and (c) developed stage (0.67 ≤ RIS ≤ 1). The analysis of the RIS index can provide a general idea or approximation of the stage of regional integration achieved in any region through time and space. The following is a suggested combination of the application of the RIAI in the measurement of the RIS index:
Y = RIS = aX1 + bX2 + cX3 + dX4 ≤ 1 (3)
a = 0.25, b = 0.25, c = 0.25, d = 0.25 = 1
=> RIAI homogeneous interest (3.1)
a = 0.40, b = 0.20, c= 0.20, d = 0.20 = 1
=> RIAI political approach incline (3.2)
a = 0.20, b = 0.40, c = 0.20, d = 0.20 = 1
=> RIAI social approach incline (3.3)
a = 0.20, b = 0.20, c = 0.40, d = 0.20 = 1
=> RIAI economic approach incline (3.4)
a = 0.20, b = 0.20, c = 0.20, d = 0.40 = 1
=> RIAI technological approach incline (3.5)
It must be highlighted that the above combination represents only several of many possibilities or permuta-tions. This should draw attention to the flexibility of the RIS index in adapting to any situation or chosen policy mode. The RIS index presents an approximation of the global development from the political, social, economic and technological perspectives concurrently based on a new concept of graphic representation. This new concept of graphic representation consists of five axes, each of which has a positive value (in the case of this research, the value in each axis is represented by a percentage). Once the axes of the graph are in place, the next step is to plot the four Xi indexes (political, social, economic, and technological Xi indexes) in four of the axes respectively. These Xi indexes are independent variables. The total value of the four axes is equal to 1 is shown in the Fig-ure 6. The fifth axis, which is represented by Y and posi-tioned in the center of the graph (among the other four axes), represents the dependent variable RIS index. This fifth axis is the convergent point of all the other four axes or more precisely, the four areas—political, social, eco-nomic, and technological—of the regional development indexes (Xi). The RIS index (Y) is depicted as follows in expression 4:
Y = F (X1, X2, X3, X4) ≤ 1 (4)
6. Application of the GDRI-Model into a Single Trade Bloc
The GDRI-Model can be also applied to different trade
Figure 6. The graph of the regional integration stage (RIS) index. blocs in different regions around the world. The trade blocs under study in this thesis are the European Union (EU), the North American free trade area (NAFTA), the association of Southeast Asian nations (ASEAN-5) and the Market of the South cone (MERCOSUR). The two periods identified in the application of GDRI-Model are the 1980’s, 1990’s and the period from 2000-2010.
6.1. The European Union (EU): Advanced Regional Integration Development
The regional integration of the EU is based on the old regionalism. The custom union scheme in the EU gener-ated the highest level of regional development indexes (Xi) by area (political, social, economic and technologi-cal). The result of the regional political development in-dex (X1) was 0.80 and the regional social development index (X2) was 0.71 is shown in the Table 13. These two results locate EU in the top position of the regional inte-gration development stage in the world. Meanwhile, the regional economic development index (X3) and regional technological development index (X4) were 0.83 and 0.88 respectively is shown in the Table 13. The X3 and X4 were located at the developed stage, but not at the same level as the regional political development (X1) and regional social development (X2). While the RIS index of the EU in the 1980’s was 0.81, the RIS of the same trade bloc in the 1990’s was 0.83. The RIS index in the 1990s was located in the developed stage, as shown in the Fig-ure 8.
In the 1990’s, all regional development indexes (Xi) of EU (politics, social, economic, and technology) present a stronger growth. The regional political development in-dex (X1) and regional social development index (X2) present the highest value ever of 0.81 and 0.78 respec-tively. The RIS index in the 1990’s is located in the de-veloped stage of 0.83 is shown in the Figure 8. It is clear that the strong regional development indexes (Xi) in EU are the regional political development index (X1) and the regional social development index (X2). The regional economic development index (X3) and regional techno-logical development index (X4) present positive advances
Copyright © 2013 SciRes. ME

M. A. R. ESTRADA 366
of 0.85 and 0.89 respectively is shown in the Table 13. The EU scheme proves that if each member in the same region presents strong regional development indexes (Xi) in each area (political, social, economic, and technologi-cal), then regionalism can be successful. At the same time, successful regionalism can generate expansion of the regional development indexes (Xi) in each member.
In the period from 2000-2010, the idea came up to in-corporate new members into the EU with less regional development (social, political, economic and technologi-cal) such as the Republic of Cyprus (2004), the Republic of Estonia (2004), the Republic of Hungary (2004), the Republic of Latvia (2004), the Republic of Lithuania (2004), the Republic of Malta (2004), the Republic of Poland (2004), the Slovak Republic (2004), the Republic of Slovenia, and the Czech republic (2004). This gener-ated a negative impact on the EU Regional Development Stage (RIS) during this specific period. The regional po-litical development index (X1) was 0.75, the regional economic development index (X3) was 0.80, regional social development index (X3) was 0.73 and regional technological development index (X4) was 0.85. In this period, the new European Union members saw some amount of negative impact in all regional development indexes (Xi) of EU members. Meanwhile, the regional development stage (RIS) index decreased to 0.78 is shown in the Figure 9. However, the RIS index in the 2000-2010 periods was lower than those of the 1990’s due to the introduction of new members into the EU. Table 13. Regional political, social, economic and techno-logical development & regional integration stage (RIS).
RPD RSD RED RTD RIS
NAFTA
1980s 0.65 0.48 0.74 0.90 69
1990s 0.67 0.76 0.82 0.93 80
2000-2010 0.70 0.76 0.85 0.93 81
MERCOSUR
1980s 0.11 0.36 0.32 0.23 26
1990s 0.44 0.46 0.41 0.51 46
2000-2010 0.52 0.50 0.48 0.55 51
EU
1980s 0.80 0.71 0.83 0.88 81
1990s 0.81 0.78 0.85 0.89 83
2000-2010 0.75 0.73 0.80 0.85 78
ASEAN
1980s 0.23 0.37 0.36 0.22 30
1990s 0.33 0.46 0.41 0.51 43
2000-2010 0.32 0.40 0.41 0.52 41
6.2. NAFTA: Constant Regional Integration Development
Unlike the EU, the North America Free Trade Area (NAFTA) applies the Free Trade Areas scheme. The re-gional development in NAFTA in the 1980’s saw a high regional economic development index (X3). X3 is located in the developed stage with the value of 0.65 is shown in the Table 13. X3 of NAFTA is a higher value compared to the rest of the regional development indexes (Xi) of other areas: political, social and technological develop-ment indexes are shown in the Figure 7.
The regional technological development index (X4) was in the development stage of 0.90. The regional po-litical development index (X1) and regional social de-velopment index (X2) have lower results of 0.65 and 0.48 respectively. While the regional integration stage (RIS) index in NAFTA in the 1980’s is 0.69, in the 1990’s the RIS index experienced an expansion to the level of 0.80. Meanwhile the regional integration stage (RIS) index in the 1980s and the 1990s are both located in the devel-oped stage with the value of 0.69 and 0.80 respectively is shown in the Figure 8.
In the 1990’s, favorable conditions resulting from the improvement of the global development of Mexico made it possible for it to join NAFTA. The regional political development index (X1) of NAFTA was 0.67 and the
Figure 7. Regional integration stage (RIS) in different trade blocs in the 1980s.
Figure 8. Regional integration stage (RIS) in different trade blocs in the 1990s.
Copyright © 2013 SciRes. ME

M. A. R. ESTRADA 367
regional economic development index (X3) of NAFTA was 0.82. While X1 continued in the same stage level (developed stage), the regional social development index (X2) in the 1990’s saw a rise compared to 0.76, but con-tinued to be in the developed stage. The regional techno-logical development index (X4) also observed an expan-sion to 0.93 is shown in the Table 13. The improvement of Xi originated mainly from a strong regional economic development (X3).
The expansion of NAFTA in the period from 2000- 2010 is constant. The regional economic development index (X3) then was 0.70 is shown in the Figure 9. It is now being suggested that much of the growth during this period was actually due to export and, more specifi- cally, to exports that were destined abroad rather than among member countries. There are also favorable terms of trade, especially with respect to Mexico. The regional technological development index (X4) was recorded as 0.93. It is important to note that, in the period from 2000- 2006, Mexico presented a better political situation com-pared to the 1980’s and the 1990’s. This improvement was reflected in the regional political development index (X1) of 0.70. The regional social development index (X2) was 0.76, which moved within the developed stage or level 3. The regional integration stage (RIS) index being 0.81, the NAFTA was in the developing stage of regional integration is shown in the Figure 9. It can be concluded that in the period 2000-2010 NAFTA witnessed strong trade unification in this stage.
6.3. ASEAN: Stagnant Regional Integration Development
The following are the results of the regional development indexes (Xi) by area in the Association of Southeast Asian Nations (ASEAN) in the 1980’s is shown in the Figure 7: the regional political development index (X1) was in the under-developed stage of 0.23; the regional social development index (X2) was in the developing stage of 0.37; the regional economic development (X3)
Figure 9. Regional integration stage (RIS) in different trade blocs from 2000-2006.
was in the developing stage of 0.36 and the regional technological development (X4) was located in the un-der-developed stage of 0.22 is shown in the Table 13. The low regional development indexes (Xi) by area in ASEAN originated from the different levels of develop-ment in all member countries. There was a large gap in the regional development among most ASEAN members.
However, in the 1990’s, the regional political devel-opment index (X1) of ASEAN expanded to 0.33 is shown in the Table 13. X1 was located in the developing stage. The regional social development index (X2) maintained a high rate of 0.46. X2 is in the developing stage. It is im-portant to note that in the 1990s, the financial crisis of 1997 affected several ASEAN members, especially In-donesia, Thailand and Malaysia. In fact, the financial crisis in these three countries affected the regional eco-nomic development index (X3) of ASEAN in the 1990’s, as it was located in the developing stage of 0.41 is shown in the Table 13.
The regional technological development index (X4) also received a negative impact, with the value of 0.51. It was in the developing stage. The RIS index in the 1980’s was located in the under-developed stage with 0.30, but with the value of 0.43 in the 1990’s. It continues to be in the developing stage is shown in the Figure 7. From the above, it can be observed that the major factor that con-tributed to the small improvement of the regional devel-opment index (Xi) of ASEAN is the small improvement of the regional political development (X1).
The ASEAN regional integration process continued to decline in the period from 2000-2006. The average growth rates relative to those achieved in the previous decade declined. The regional economic development index (X3) of the ASEAN then fell to 0.32. The root of the problem was that ASEAN depended mainly on weak integration models. The regional technological develop-ment index (X4) was then 0.52. Consequently, ASEAN saw a drastic shift in the terms of trade among its mem-bers. It generated high levels of inflation and negative payoff trade with the rest of the world, especially from the Philippines, Indonesia and Thailand. Consequently, the interregional system of payments of the region is weak and a foreign exchange vulnerable in these three countries.
There was growing disillusionment among ASEAN members. The constant competition to attract foreign di- rect investment (FDI) among ASEAN members produced a large obstacle in the regional integration process of ASEAN. Several social problems also started to surface in some ASEAN members in the case of the South Part of Thailand (army forces and Islamic radical groups) during this period. This situation was reflected in the regional political development index (X2) of 0.32. It was also from 2000-2010 that several political problems in
Copyright © 2013 SciRes. ME

M. A. R. ESTRADA 368
Thailand arose against the former prime minister of Thailand Mr. Thaksin Shinawatra. As a result, the re-gional political development index (X1) decreased to 0.32 is shown in the Table 13. Natural disasters were another negative contributory factor to the regional inte-gration process of ASEAN members. Indonesia, Thai-land and Malaysia were hit by a massive tsunami in 2004. This tsunami generated a higher social and economic cost for these three countries from 2004-2005. During this period, all regional development indexes (Xi) for ASEAN members were located in the developing stage or levels 1 and 2. The regional integration stage (RIS) index was 0.41 compared to 0.44 in the 1990’s. Obvi-ously, there was a small contraction in the regional inte-gration process of ASEAN members from 2000-2010 is shown in the Figure 9.
6.4. MERCOSUR: Fast Regional Integration Development
The market of the South Cone (MERCOSUR) followed the NAFTA regional integration scheme (new regional-ism). The RIS of MERCOSUR in the 1980’s was 0.26, but in the 1990’s the RIS expanded to 0.46. The regional global development indexes (Xi) by area of MERCOSUR in the 1980’s exhibited these results: the regional politi-cal development index (X1) was in the under-developed stage of 0.11; the regional social development index (X2) was in the developing stage with a value of 0.36; the re-gional economic development index (X3) was located in the under-developed stage of 0.32 and the regional tech-nological development index (X4) was in the under-de- veloped stage with the value of 0.23 is shown in the Ta-ble 13. It can be observed that X1 in the 1980’s was weak and non-stable. The lower value of X1 in the 1980’s originated from military governments led by dictators and copula military groups.
In the 1990’s, the RIS reached 0.46. This is an expan-sion compared to the RIS of the 1980’s. The regional integration stage (RIS) attained the value of 0.46 is shown in the Figures 7 and 8. Thereafter, the RIS in the 1990’s was located in the developing stage. The better result of the RIS in the 1990’s originated from the im-proved regional political development index (X1) of 0.44, which is located in the developing stage. However, the regional social development index (X2) was in the de-veloping stage with a value of 0.46. The regional eco-nomic development index (X3) moved to the developing stage of 0.41. Meanwhile, the regional technological de-velopment index (X4) was in the developing stage with a value of 0.51 is shown in the Table 13.
Two basic factors that led to the formation of MER-COSUR are: 1) better conditions in external debt and a stable exchange rate in Argentina in the 1990’s; and 2) the strengthening of democracy in the 1990’s (democracy
is a decisive factor that consolidated the formation of MERCOSUR). Two main reasons for the improvement of the regional economic development index (X3) among MERCOSUR members in the 1990’s were the privatiza-tion of public enterprises coupled with the attraction and greater dynamism of foreign direct investment (FDI). Member countries of MERCOSUR encouraged the trans-fer of technology which then produced a greater dyna-mism in their market. Transfer of technology also per-mitted a higher competitiveness and greater productivity among MERCOSUR members. MERCOSUR can be considered the leader of the regional integration process of Latin America. It can be concluded that MERCOSUR has higher regional development indexes (Xi) value compared to the rest of the trade blocs in Latin America (e.g. CACM and AC), especially in the regional political development index (X1) and regional economic devel-opment index (X3).
The regional integration process of MERCOSUR from 2000-2010 has an RIS index result of 0.51 in shown in the Figure 9. The Xi indexes by area in the period 2000- 2010 are as follows: the regional political development index (X1) in the developing stage with the value of 0.52; the regional social development index (X2) in the devel-oping stage of 0.50; the regional economic development index (X3) in the developing stage of 0.48 and the re-gional technological development index (X4) in the de-veloping stage of 0.55 is shown in the Table 13. The origin of these better results, especially in the regional economic development (X3) was high inter-trade ex-change, stable exchange rates and improvement of ex-ternal debts in the major part of MERCOSUR members. The strong trade and investment relationship between Argentina and Brazil was based on a free trade regional agreement that was oriented to the intra-regional trade development adopted by MERCOSUR in the 1990’s. The MERCOSUR regional integration scheme is gener-ating positive results among MERCOSUR member coun- tries.
7. Concluding Remarks
Regional Integration can be given a new definition. It can be defined as a process that combines different domestic development systems (DDS) (countries) into a single regional development system (trade bloc). Strong region-alism, whether old regionalism or new regionalism, de-pends on the favorable conditions derived from regional development (RD), where RD is the combined result of all or most individual domestic development systems in the same trade bloc. Meanwhile, growth of RD in a trade bloc can be generated through strong domestic develop-ment systems (DDS) in the same region. If the domestic development systems (DDS) in some or most member countries in the trade bloc are weak, then the trade bloc
Copyright © 2013 SciRes. ME

M. A. R. ESTRADA
Copyright © 2013 SciRes. ME
369
cannot be successful. This chapter maintains that there is a strong inter-de-
pendency between regional global development (RGD) and domestic development systems (DDS). This can be observed from the application of the GDRI-Model to different trade blocs (i.e. European Union [EU], North America free trade area [NAFTA], association of South-east Asian nations [ASEAN] and MERCOSUR).
REFERENCES [1] A. V. Deardorff and R. M. Stern, “Multilateral Trade
Negotiations and Preferential Trading Arrangements,” In: A. V. Deardorff and R. M. Stern, Eds., Analytical and Negotiating Issues in the Global Trading System, Univer- sity of Michigan Press, Ann Arbor, 1994, pp. 27-85.
[2] R. Devlin and R. Ffrench-Davis, “Towards an Evaluation of Regional Integration in Latin America in the 1990’s,” Inter-American Development Bank (IDB), The Institute for the Integration of Latin American and the Caribbean (INTAL) Working Papers, Paper Vol. 2, 1998, pp. 19-22.
[3] A. Winters, “Regionalism vs. Multilateralism, Market Integration and the Global Economy,” The selected Es- says of E. Balwin, E. Richard, D. Cohen, A. Sapir and A. Venables, Centre for Economic Policy Research, 1999, pp. 7-49.
[4] A. Winters, “Assessing Regional Integration Arrangements,” International Trade Division, World Bank, Washington DC, 1997.
[5] JSTOR Journals Information. www.jstor.org
[6] Sciencesdirect Journals Information. www.elsevier.com
[7] P. Krugman and M. Obstfeld, “International Economics: Theory and Policy,” Addison-Wesley, Boston, 2000, pp. 187-197.
[8] R. Mundell, “A Theory of Optimum Currency Areas,” American Economic Review, Vol. 51, No. 4, 1961, pp. 657-
665.
[9] R. Mckinnon, “Optimum Currency Areas,” American Economic Review, Vol. 53, No. 4, 1963, pp. 717-725.
[10] W. Mattli, “The Logic of the Regional Integration,” Press Syndicate of the University of Cambridge, London, 1999, pp. 20-40. doi:10.1017/CBO9780511756238
[11] P. Breton, H. Scott and P. Sinclair, “International Trade,” Oxford University Press, Oxford, 1997, pp. 78-79.
[12] C. M. Kemp and Y. H. Wan, “An Elementary Proposition Concerning the Formation of Custom Unions,” Journal of International Economics, Vol. 6, No. 1, 1976, pp. 95-97. doi:10.1016/0022-1996(76)90025-8
[13] J. Viner, “The Economics of Custom Unions, in the Cus- toms Union Issues,” Carnegie Endowment for Interna-tional Peace, New York, 1950, pp. 41-81.
[14] R. G. Lipsey and K. Lancaster, “The General Theory of Second Best,” In: R. G. Lipsey, Ed., Microeconomics, Growth and Political Economy: The Selected Essays of Richard. G. Lipsey, Edward Elgar, Cheltenham, 1997, pp. 153-180.
[15] D. Salvatore, “International Economics,” John Wiley & Sons, Inc., Hoboken, 2001, pp. 328-329.
[16] K. Mordechai and M. G. Plummer, “Economic Integra- tion and Development: Has Regional Delivered for De- veloping Countries?” Edward Elgar Publishing Limited, Cheltenham Glos, 2002, pp. 33-52.
[17] Europe Union. www.europe.eu
[18] NAFTA Secretariat. www.nafta-sec-alena.org/
[19] MERCOSUR. http://www.mercosur.int/
[20] ASEAN Secretariat. http://www.asean.org/
[21] R. Fernandez, “The Central America Common Market (CACM),” Massachusetts Institute of Technology, 1986, Cambridge, pp. 1-65.