![Medial septal [beta]-amyloid 1-40 injections alter septo-hippocampal anatomy and function](https://static.fdokumen.com/doc/165x107/6329e172e9556f820801538c/medial-septal-beta-amyloid-1-40-injections-alter-septo-hippocampal-anatomy-and.jpg)
Medial septal [beta]-amyloid 1-40 injections alter septo-hippocampal anatomy and function
Upload
khangminh22Category
view
0download
0
The Genetics of Atrial Septal Defect
and Patent Foramen Ovale
EDWIN PHILIP ENFIELD KIRK
A thesis submitted in fulfilmentof the requirements for the degree of
Doctor of Philosophy
School of Women’s and Children’s Health University of New South Wales
December, 2007

ORIGINALITY STATEMENT I hereby declare that this submission is my own work and to the best of my knowledge it contains no materials previously published or written by another person, or substantial proportions of material which have been accepted for the award of any other degree or diploma at UNSW or any other educational institution, except where due acknowledgement is made in the thesis. Any contribution made to the research by others, with whom I have worked at UNSW or elsewhere, is explicitly acknowledged in the thesis. I also declare that the intellectual content of this thesis is the product of my own work, except to the extent that assistance from others in the project's design and conception or in style, presentation and linguistic expression is acknowledged.
Signed ……………………………………………..............
Date ……………………………………………..............

COPYRIGHT STATEMENT
‘I hereby grant the University of New South Wales or its agents the right to archive and to make available my thesis or dissertation in whole or part in the University libraries in all forms of media, now or here after known, subject to the provisions of the Coyright Act 1968. I retain all proprietary rights, such as patent rights. I also retain the right to use in future works (such as articles or books) all or part of this thesis or dissertation.I also authorise University Microfilms to use the 350 word abstract of my thesis in Dissertation Abstract International (this is applicable to doctoral theses only). I have either used no substantial portions of copyright material in my thesis or I have obtained permission to use copyright material; where permission has not been granted I have applied/will apply for a partial restriction of the digital copy of my thesis or dissertation’
Signed…………………………………………………….
Date……………………………………………………….
Authenticity Statement
‘I certify that the Library deposit digital copy is a direct equivalent of the final officially approved version of my thesis. No emendation of content has occurred and if there are any minor variations in formatting, they are the result of the conversion to digital format.’
Signed…………………………………………………….
Date……………………………………………………….

i
DEDICATION
To my dear wife, Sue.
With gratitude, and with all my love.
Abstract
Congenital heart disease is the most common form of birth defect, affecting
approximately 1% of liveborn babies. Secundum atrial septal defect (ASD) is
the second most common form of congenital heart disease (CHD). Most cases
have no known cause. Chromosomal, syndromal and teratogenic causes
account for a minority of cases. The hypothesis that mutations in the ASD
genes NKX2-5 and GATA4 may cause apparently sporadic ASD was tested by
sequencing them in unrelated probands with ASD. In this study, 1/102
individuals with ASD had an NKX2-5 mutation, and 1/129 had a deletion of the
GATA4 gene.
The cardiac transcription factor TBX20 interacts with other ASD genes but had
not previously been associated with human disease. Of 352 individuals with
CHD, including 175 with ASD, 2 individuals, each with a family history of CHD,
had pathogenic mutations in TBX20. Phenotypes included ASD, VSD, valvular
abnormalities and dilated cardiomyopathy.
These studies of NKX2-5, GATA4 and TBX20 indicate that dominant ASD
genes account for a small minority of cases of ASD, and emphasize the
considerable genetic heterogeneity in dominant ASD (also caused by mutations
in MYH6 and ACTC). A new syndrome of dominant ASD and the Marcus Gunn
jaw winking phenomenon is reported. Linkage to known loci was excluded,
extending this heterogeneity, but a whole genome scan did not identify a
candidate locus for this disorder.
Previous studies of inbred laboratory mice showed an association between
patent foramen ovale (PFO) and measures of atrial septal morphology,
particularly septum primum length (“flap valve length” or FVL). In humans, PFO
is associated with cryptogenic stroke and migraine, and is regarded as being in
a pathological contiuum with ASD. Twelve inbred strains, including
129T2/SvEms and QSi5, were studied, with generation of [129T2/SvEms x
ii

iii
QSi5] F1, F2 and F14 mice. Studies of atrial morphology in 3017 mice
confirmed the relationship between FVL and PFO but revealed considerable
complexity. An F2 mapping study identified 7 significant and 6 suggestive
quantitative trait loci (QTL), affecting FVL and two other traits, foramen ovale
width (FOW) and crescent width (CRW). Binary analysis of PFO supported four
of these.

iv
Acknowledgements During the course of an 8 year candidature, I have become indebted to a great number
of people for help of many kinds. Above all, I am grateful to my wife, Susan O’Regan,
for her love, support, encouragement and forbearance. My children, Seamus, Yasmin
and Finn are starting to understand what I’m up to and have been cheering me on in
recent months. I followed my father into medicine and he has been an inspiration to
me. My mother’s love and encouragement have been very important to me. In addition,
she has given me help with graphics (a talent I managed not to inherit from her).
Academically, my greatest debts are, of course, to my supervisor, Prof Richard Harvey
and co-supervisor, Dr Michael Buckley, for their patient guidance and friendship over
the years. I’ve learned a great deal from both of them, and in particular I think I’m
starting to get the hang of Richard’s lessons on structure (of manuscripts, as well as
hearts). Prof Richard Henry was initially my supervisor. Over time the research moved
in a different direction, but he continued to provide support and encouragement.
Many members of Richard Harvey’s lab have helped me and I am grateful to all of
them. I want especially to thank Dr Christine Biben for teaching me to dissect mouse
hearts, and for providing ongoing advice and occasional second opinions; Dr David
Elliott for advice and guidance with molecular methods; and Dr Changbaig Hyun for his
contributions to the QTL study and the studies of GATA4 and TBX20. Others at the
Victor Chang Cardiac Research Institute who have helped include Leticia Castro,
Louise Lynagh, Haley Crotty, Milena Furtado, and Drs Mauro Costa, Robyn Otway,
Thomas Yeoh, Guanglan Guo, Owen Prall, Orit Wolstein, Daniel Schaft, Mark
Solloway, Aaron Schindeler, Suchitra Chander, Fiona Stennard, and Donna Lai have
all helped me in various ways and have made the lab an enjoyable place to work.
A/Prof Diane Fatkin has been generous with her time and advice.
At Sydney University, Prof Chris Moran has been a major guiding force, generous with
his time and experience. A better collaborator could not be found. Dr Ian Martin taught
me everything I have learned about care and breeding of laboratory mice, including
how to dissect them. He also bred the F1 and F2 mice (Chapters 5 and 6), a large
undertaking. Dr Peter Thomson has been unstinting in giving of his time and expertise
in matters mathematical. All of the animal house staff, but especially Matt Jones and
Mamdouh Nessiem, have been unfailingly helpful, often going well beyond the scope of

v
their duties to make sure that things ran well. Noelia Lopez ordered and bred the
Hapmap mice, and did a number of dissections as well as co-measuring a subset of
these mice. Kim Dilati provided assistance in the last few weeks of the advanced
intercross line breeding and dissection, when things were very busy. At Sydney
Children’s Hospital, members of the Department of Medical Genetics have been
unfailingly supportive and helpful. Dr Fiona McKenzie worked as a part time research
assistant during the first year of the project, and I doubt it would have got off the ground
at all without her kickstarting things. Dr Owen Jones was invaluable in recruitment of
children with ASD. At the South Eastern Area Laboratory Service, Peter Taylor, George
Eliakis and Glenda Mullan have been especially helpful, but many other members of
staff have given advice or help over the years. At the Children’s Hospital at Westmead,
A/Prof David Winlaw and members of his lab have contributed greatly to the human
studies.
Prof Ian Glass first identified the ASD + Marcus Gunn family and contributed greatly to
recruitment of family members; he continues to advise and encourage on that project.
A/Prof Jenny Donald provided guidance on mapping, and Dr Kyall Zenger taught me to
drive LINKAGE, as well as doing a good deal of analysis towards the project himself.
Dr Carol Cheung did a similar QTL study and taught me to use Mapmaker/QTL, along
with a great deal of other advice and help. Many cardiologists have contributed their
time and expertise, especially Dr Rob Justo, Dr Michael Tsicalis (and his wonderful
secretary, Dianne Reddell) and Prof Michael Feneley. My thanks to them. Every co-
author on the papers arising from this project has helped me, and my thanks are due to
all. There have also been many others, such as the private laboratory services who
never failed to help with specimen collection and shipping, whom I’m unable to name
but would like to acknowledge. Likewise, I am immensely grateful to but unable to
name the many people who volunteered as research subjects, particularly those whose
families I studied and into whose homes and workplaces I was invited. If there are
others I should have named but have omitted, my apologies as well as thanks to them.
Lastly, I am deeply indebted to the bodies which funded this research. The National
Heart Foundation of Australia awarded me a scholarship as well as providing research
grant support. Goldman Sachs Australia, the Sydney Children’s Hospital Foundation,
the National Institutes of Health in the United States, the RT Hall Trust and the Royal
College of Pathologists of Australasia all provided research grant support; I am very
grateful to them all.
Publications arising from this work
1. Elliott DA, Kirk EP, Yeoh T, Chandar S, McKenzie F, Taylor P, Grossfeld P,
Fatkin D, Jones O, Hayes P, Feneley M, Harvey RP. Cardiac homeobox gene
NKX2-5 mutations and congenital heart disease - associations with atrial septal
defect and hypoplastic left heart syndrome. Journal of the American College of
Cardiology 2003;41(11):2072-2076
2. Kirk EP, Hyun C, Thomson PC, Lai D, Castro ML, Biben C, Buckley MF,
Martin ICA, Moran C, Harvey RP. Quantitative Trait Loci Modifying Cardiac
Atrial Septal Morphology and Risk of Patent Foramen Ovale in the Mouse.
Circulation Research 2006;98:651-658
3. Kirk EP*, Sunde M*, Costa MW, Rankin SA, Wolstein O, Castro ML, Butler
TL, Hyun C, Guo G, Otway R, Mackay JP, Waddell LB, Cole AD, Hayward C,
Keogh A, Macdonald P, Griffiths L, Fatkin D, Sholler GF, Zorn AM, Feneley MP,
Winlaw DS, Harvey RP. Mutations in cardiac T-box factor gene TBX20 are
associated with diverse cardiac pathologies, including defects of septation and
valvulogenesis and cardiomyopathy. American Journal of Human Genetics
2007;81:280-291
*shared first authorship
Published conference proceedings 1. Harvey RP, Lai D, Elliott D, Biben C, Solloway M, Prall O, Stennard F,
Schindeler A, Groves N, Lavulo L, Hyun C, Yeoh T, Costa M, Furtado M. and
Kirk E. Homeodomain Factor Nkx2-5 in Heart Development and Disease. Cold
Spring Harbor Symposium on Quantitative Biology. Volume 67, Cold Spring
Harbor Laboratory Press, Cold Spring Harbor 2002.
vi
Table of Contents
Dedication…………………………………………………………………………..iAbstract……………………………………………………………………………..iiAcknowledgements………………………………………………………………iv Publications arising from this work...…………………………………………vi Table of Contents…………………………………………………………………vii List of figures……………………………………………………………………...xvi List of tables……………………………………………………………………….xviii Abbreviations used……………………………………………………………….xxi
1. Literature review
1.1 Overview ...................................................................................................... 11.2 Genes and human disease ......................................................................... 21.3 Mapping Mendelian disorders ................................................................... 4
1.3.1 Principles of Mendelian inheritance ........................................................ 4
1.3.1.1 Dominance and recessiveness ........................................................ 5
1.3.2 Meiotic recombination ............................................................................. 8
1.3.3 Maps of genetic variation ........................................................................ 9
1.3.4 Mapping Mendelian disorders ................................................................ 9
1.4 Quantitative Genetics ............................................................................... 111.4.1 Quantitative trait loci ............................................................................. 11
1.4.1.1 The liability model for binary traits ................................................. 12
1.4.2 Mapping QTL ........................................................................................ 13
1.4.2.1 Experimental designs for QTL mapping ......................................... 15
1.4.2.2 Significance thresholds .................................................................. 15
1.4.2.3 Selective genotyping ...................................................................... 15
1.4.2.4 Software packages for QTL mapping ............................................ 16
1.4.2.5 The mouse as a model organism ................................................... 17
1.4.3 Identifying the underlying genetic basis of QTL .................................... 17
1.4.4 The mouse Hapmap project: application to QTL mapping .................... 19
vii
viii
1.5 The heart .................................................................................................... 201.5.1 Normal cardiac anatomy ....................................................................... 20
1.5.2 Heart development ............................................................................... 21
1.5.3 The interatrial septum ........................................................................... 23
1.5.4 Regulation of cardiac development by transcription factors ................. 26
1.6 Congenital heart disease .......................................................................... 281.6.1 Types of CHD ....................................................................................... 29
1.6.2 Causes of CHD .................................................................................... 29
1.6.3 Patent foramen ovale ........................................................................... 31
1.6.3.1 PFO and stroke .............................................................................. 32
1.6.3.2 PFO and migraine .......................................................................... 33
1.6.3.3 Other pathological consequences of PFO ..................................... 34
1.6.3.4 Genetics of PFO ............................................................................ 34
1.6.4 Atrial septal defect ................................................................................ 35
1.6.4.1 Secundum ASD ............................................................................. 36
1.6.4.2 Ostium primum ASD ...................................................................... 36
1.6.4.3 Sinus venosus ASD ....................................................................... 36
1.6.4.4 Coronary sinus ASD ...................................................................... 36
1.6.4.5 Pathology associated with ASD ..................................................... 36
1.6.5 Relationship between PFO and ASD ................................................... 37
1.7 Causes of ASD .......................................................................................... 391.7.1 Syndromes associated with CHD ......................................................... 39
1.7.1.1 Holt-Oram syndrome ...................................................................... 40
1.7.1.2 Chromosomal disorders, particularly 8p deletions ......................... 41
1.7.2 Non-syndromal Mendelian ASD ........................................................... 44
1.7.3 Multifactorial/polygenic causation of ASD ............................................. 49
1.7.3.1 Excess of females affected by ASD ............................................... 51
1.7.3.2 QTL for CHD .................................................................................. 51
1.7.4 Environmental factors ........................................................................... 51
1.7.4.1 Major teratogens ............................................................................ 52
1.7.4.2 Other environmental factors ........................................................... 52
1.8 Project outline ........................................................................................... 61
2. Materials and Methods
2.1 Mouse experiments .................................................................................. 622.1.1 Ethics committee approval ................................................................... 62
2.1.2 Animal resources .................................................................................. 62
2.1.3 Breeding protocols ............................................................................... 63
2.1.3.1 F2 mice .......................................................................................... 63
2.1.3.2 Advanced intercross line ................................................................ 63
2.1.4 Mouse phenotyping .............................................................................. 66
2.1.4.1 Initial dissection ............................................................................. 66
2.1.4.2 Fine dissection ............................................................................... 67
2.1.4.3 Identification of patent foramen ovale ............................................ 73
2.1.4.4 Measurements of atrial septal anatomy ......................................... 73
2.1.4.5 Blinding .......................................................................................... 73
2.1.5 Strain selection for F2 and AIL studies ................................................. 74
2.2 Human subjects ........................................................................................ 752.2.1 Ethics committee approval ................................................................... 75
2.2.2 Ascertainment of subjects .................................................................... 75
2.2.2.1 Children ......................................................................................... 75
2.2.2.2 Adults ............................................................................................. 75
2.2.2.3 Numbers of subjects studied for mutations in NKX2-5 & GATA4 ... 76
2.2.2.4 Follow-up of family members…………………………………………76
2.2.3 History .................................................................................................. 76
2.2.4 Examination .......................................................................................... 77
2.2.5 Investigations ....................................................................................... 78
2.3 Molecular genetics methods.................................................................... 782.3.1 Extraction of DNA from human blood and mouse spleens ................... 78
2.3.1.1 DNA extraction from mouse spleens .............................................. 78
2.3.1.2 DNA extraction from blood ............................................................. 80
2.3.4 Polymerase chain reaction (PCR) and sequencing of NKX2-5 and
GATA4........................................................................................................... 82
2.3.4.1 PCR of NKX2-5 .............................................................................. 82
2.3.4.2 PCR of Exon 5 of GATA4 .............................................................. 84
2.3.5 Sequence analysis ............................................................................... 86ix
2.4 Microsatellite analysis .............................................................................. 882.5 Marker selection ........................................................................................ 88
2.5.1 Human Markers .................................................................................... 88
2.5.2 Mouse Markers ..................................................................................... 88
2.6 Laboratory methods used at AGRF ......................................................... 882.7 Error checking ........................................................................................... 89
2.7.1 Error Checking of Human Data ............................................................ 89
2.7.2 Error Checking of Mouse Data ............................................................. 89
2.8 Statistical methods ................................................................................... 902.8.1 Basic statistical analyses ...................................................................... 90
2.9 Linkage analysis ....................................................................................... 912.9.1 Linkage analysis for autosomal dominant trait ...................................... 91
2.9.2 QTL analysis ........................................................................................ 91
2.9.2.1 Selective Genotyping ..................................................................... 91
2.9.2.2 Linkage analyses ........................................................................... 91
2.9.2.3 Binary trait analysis ........................................................................ 92
3. The role of mutations in the cardiac transcription factors NKX2-5, GATA4 and TBX20 in causing CHD and cardiomyopathy 3.1 Introduction ............................................................................................... 943.2 Mutations in NKX2-5 cause autosomal dominant CHD and AV conduction block ............................................................................................ 94
3.2.1 Subjects screened for NKX2-5 mutations ........................................... 104
3.2.2 Results ............................................................................................... 106
3.2.2.1 Family 1024: T178M .................................................................... 106
3.2.2.2 Family AF1: E21Q ....................................................................... 108
3.2.3 Role of NKX2-5 mutations in nonsyndromal ASD .............................. 109
3.2.4 Implications for asymptomatic mutation-positive individuals ............... 110
3.3 The role of mutations in GATA4 in ASD and PFO ................................ 1113.3.1 Subjects screened for GATA4 mutations ............................................ 115
x
3.3.2 Results of sequencing and cytogenetic analysis ................................ 115
3.3.2.1 Family 1012 – GATA4 variants A411V and S377G ..................... 115
3.3.2.2 Family z10 – GATA4 variant D425N ............................................ 118
3.3.2.3 Family 1006 – 8p23 deletion ........................................................ 118
3.3.3 The common variant S377G – possible role in PFO with stroke ........ 120
3.3.4 Role of GATA4 mutations in nonsyndromal ASD ............................... 124
3.4 Mutations in TBX20 are associated with diverse cardiac pathologies, including abnormal septation and valvulogenesis, andcardiomyopathy ............................................................................................ 125
3.4.1 Subjects screened for TBX20 mutations ........................................... 126
3.4.2 TBX20 mutations ................................................................................ 128
3.4.2.1 Family 9001: TBX20 mutation 152M ............................................ 129
3.4.2.2 Family z103: TBX20 mutation Q195X.......................................... 129
3.4.2.3 Family WM1: TBX20 polymorphism T209I ................................... 130
3.4.3 Functional and other studies of the TBX20 mutations ........................ 130
3.4.3.1 Transcriptional assays of Tbx20 function ..................................... 131
3.4.3.2 Xenopus embryo gastrulation assay ............................................ 131
3.4.3.3 Protein modelling ......................................................................... 131
3.4.4 Significance of mutations in TBX20 .................................................... 133
3.5 Conclusions: the role of mutations in NKX2-5, GATA4 and TBX20 inhuman disease .............................................................................................. 135
4. Atrial septal defect and Marcus Gunn phenomenon: further evidence for clinical and genetic heterogeneity in autosomal dominant atrial septal defect
4.1 Introduction ............................................................................................. 1374.2 Marcus Gunn phenomenon .................................................................... 1374.3 Phenotypes of affected family members .............................................. 1394.4 Cytogenetics ........................................................................................... 140
xi
4.5 Sequencing of cardiac genes ................................................................ 1404.6 Mapping results ...................................................................................... 142
4.6.1 Chromosome 1………………………………………………………….…142
4.6.2 Chromosome 5…………………………………………………………….143
4.6.3 Chromosome 6…………………………………………………………….144
4.6.4 Chromosome 7…………………………………………………………….144
4.6.5 Chromosome 8…………………………………………………………….144
4.6.6 Chromosome 12…………………………………………………………...144
4.6.7 Chromosome 14…………………………………………………………...144
4.6.8 Chromosome 15…………………………………………………………...145
4.7 Discussion ............................................................................................... 1454.7.1 Linkage results ................................................................................... 145
4.7.2 ASD and MGP .................................................................................... 146
4.7.3 Clefting ............................................................................................... 146
4.7.4 Future studies ..................................................................................... 147
5. Cardiac atrial septal morphology and risk of patent foramen ovale in inbred laboratory mice
5.1 Introduction ............................................................................................. 1485.2 The relationship between atrial septal morphology and PFO: previous work ............................................................................................................... 1495.3 Selection and breeding of mice for study ............................................. 1505.4 Analysis of data from QSi5, 129T2/SvEms, and the [QSi5 x 129T2/SvEms] F1, F2 and F14 mice ............................................................. 152
5.4.1 Descriptive statistics ........................................................................... 152
5.4.2 Relationships between the continuous traits ...................................... 155
5.4.3 Analysis of variance for factors affecting FVL, FOW and CRW in F2
mice ............................................................................................................. 157
5.4.4 Relationship between PFO and the continuous variables…………….159
5.4.4.1 Relationship between FVL and PFO ............................................ 160
xii
5.4.4.2 Relationship between FOW and PFO .......................................... 163
5.4.4.3 Relationship between CRW and PFO .......................................... 165
5.4.5 Biological significance of the relationships between FVL, FOW and
CRW ............................................................................................................ 168
6. Quantitative trait loci modifying cardiac atrial septal morphology and risk of patent foramen ovale in inbred laboratory mice
6.1 Introduction ............................................................................................. 1696.2 Study design ........................................................................................... 1716.3 Selection of mice for genotyping .......................................................... 1716.4 Markers used ........................................................................................... 1726.5 Linkage results ........................................................................................ 1726.6 Chromosomes with noteworthy findings .............................................. 184
6.6.1 MMU1 ................................................................................................. 187
6.6.2 MMU2 ................................................................................................. 187
6.6.3 MMU3 ................................................................................................. 187
6.6.4 MMU4 ................................................................................................. 187
6.6.5 MMU6 ................................................................................................. 188
6.6.6 MMU7 ................................................................................................. 188
6.6.7 MMU8 ................................................................................................. 188
6.6.8 MMU9 ................................................................................................. 188
6.6.9 MMU10 ............................................................................................... 188
6.6.10 MMU13 ............................................................................................. 188
6.6.11 MMU15 ............................................................................................. 188
6.6.12 MMU18 ............................................................................................. 188
6.6.13 MMU19 ............................................................................................. 189
6.7 Discussion ............................................................................................... 1896.7.1 Cryptic QTL ........................................................................................ 190
6.7.2 Binary trait analysis ............................................................................ 190
xiii 6.7.3 Genetic relationship between FVL, FOW and CRW ........................... 191
6.7.4 Contribution of the identified QTL to the phenotypes under study ...... 191
6.7.5 Candidate genes ................................................................................ 192
6.7.6 Future studies……………………………………………………………...193
7. Comparisons of atrial septal anatomy in 12 strains of inbred laboratory mice reveal unexpected complexity
7.1 Introduction ............................................................................................. 1947.2 History of the inbred laboratory mouse ................................................ 1957.3 Application of mouse haplotype data to mapping ............................... 1967.4 Number of mice to phenotype ............................................................... 1977.5 Analyses of Hapmap strains .................................................................. 1987.6 Training of a second observer ............................................................... 1987.7 Assessments of the reliability of measurement of atrial septalanatomy ......................................................................................................... 1987.8 Descriptive statistics for the Hapmap strains (including 129T2/SvEms and QSi5) ....................................................................................................... 2007.9 ASD in DBA/1J mice ............................................................................... 2037.10 Relationships between PFO and other traits in the 12 strains of inbred mice ................................................................................................................ 205 7.11 Comparison with the study by Biben and colleagues ....................... 210 7.12 Conclusions .......................................................................................... 211
8. Conclusions and Future Directions
8.1 Genetic heterogeneity and its clinical implications ............................. 2128.2 Cardiac phenotypes other than CHD..................................................... 213
8.2.1 AV conduction abnormalities and ASD ............................................... 213
8.2.2 Cardiomyopathy in association with mutations in TBX20
and NKX2-5 ................................................................................................. 214
xiv 8.3 The role of NKX2-5, GATA4 and TBX20 in multifactorial ASD ............ 214
8.4 Future studies of dominant ASD genes in unselected subjects ......... 2158.5 Mapping genes affecting prevalence of PFO in inbredlaboratory mice ............................................................................................. 2168.6 Significance of findings .......................................................................... 219
REFERENCES…………………………………………………………………..221
APPENDIX 1: ASD and Marcus Gunn Phenomenon - Linkage Results…245
APPENDIX 2: Microsatellite markers used for QTL mapping……………..262
APPENDIX 3: Candidate genes within QTL ................................................ 265
xv
List of figures
Page Figure 1.1: Dominance 8
Figure 1.2: The adult mammalian heart 22
Figure 1.3: Normal cardiac development 24
Figure 1.4: Relative arrangement of septum primum and
septum secundum 26
Figure 2.1: Cartoon illustrating the breeding scheme used 64
Figure 2.2: Dissection of mouse hearts
2.2A: Initial dissection 68
2.2B: Opening the auricle 69
2.2C: Laying open the atrium 70
2.2D: Final appearance of the heart 71
Figure 2.3: Detail of atrial septum 72
Figure 3.1: Families with ASD and NKX2-5 sequence changes 107
Figure 3.2: Families with GATA4 variants and 8p23 deletion 117
Figure 3.3: Families with TBX20 mutations 128
Figure 3.4: Transcription studies and Xenopus gastrulation
assay 132
Figure 4.1: Family with ASD and MGP 141
Figure 4.2: Multipoint mapping of chromosome 5 143
Figure 5.1: Scatterplot of FVL vs heart weight in F2 mice 157
Figure 5.2: Histogram of FVL in F2 mice with and without PFO 162
Figure 5.3: Histogram of FVL in F14 mice with and without PFO 162
Figure 5.4: Histogram of FOW in F2 mice with and without PFO 164
Figure 5.5: Histogram of FOW in F14 mice with and without PFO 164
Figure 5.6: Histogram of CRW in F2 mice with and without PFO 166
xvi Figure 5.7: Histogram of CRW in F14 mice with and without PFO 167
xvii
Page Figure 6.1: MMU1 173
Figure 6.2: MMU2 174
Figure 6.3: MMU3 174
Figure 6.4: MMU4 175
Figure 6.5: MMU5 175
Figure 6.6: MMU6 176
Figure 6.7: MMU7 176
Figure 6.8: MMU8 177
Figure 6.9: MMU9 177
Figure 6.10: MMU10 178
Figure 6.11: MMU1 1 178
Figure 6.12: MMU1 2 179
Figure 6.13: MMU1 3 179
Figure 6.14: MMU1 4 180
Figure 6.15: MMU1 5 180
Figure 6.16: MMU1 6 181
Figure 6.17: MMU1 7 181
Figure 6.18: MMU1 8 182
Figure 6.19: MMU1 9 182
Figure 6.20: MMUX (female mice) 183
Figure 6.21: MMUX (male mice) 183
Figure 7.1: ASD in a DBA/1J mouse 204
Figure 7.2: Scatterplot of %PFO vs FVL 207
Figure 7.3: Scatterplot of %PFO vs FOW 207
Figure 7.4: Scatterplot of %PFO vs CRW 208
Figure 7.5: Scatterplot of Weight vs Heart Weight 208
Figure 8.1: Mapping results for chromosome 1 218
List of tables
Page Table 1.1: Percentage of CHD accounted for by the most
common lesions 30
Table 1.2: Reports of dominant ASD prior to the first
identification of causative mutations 47
Table 1.3: Environmental exposures and other factors
significantly associated with risk of ASD 54
Table 1.4: Environmental exposures and other factors with
no significant association with risk of ASD 57
Table 2.1: Breeding scheme for AIL 65
Table 2.2: Primers used for PCR and sequencing 86
Table 3.1: Mutations in NKX2-5 97
Table 3.2: Patient characteristics (NKX2-5) 105
Table 3.3: Mutations in GATA4 112
Table 3.4: S377G allele distribution in indigenous human
populations 121
Table 3.5: S377G in Caucasian subjects 122
Table 3.6: Characteristics of subjects sequenced for TBX20
mutations 127
Table 5.1: Characteristics of parental strains, F1
and F2 mice 154
Table 5.2: Basic statistical data and correlations for F2 mice 155
Table 5.3: Basic statistical data and correlations for F14 mice 156
Table 5.4: Comparison between data for 129T2/SvEms mice
with and without PFO 159
Table 5.5: Analysis of variance for FVL in F2 mice 160
Table 5.6: Analysis of variance for FVL in F14 mice 161
xviii
xix
Page Table 5.7: Analysis of variance for FOW in F2 mice 163
Table 5.8: Analysis of variance for FOW in F14 mice 163
Table 5.9: Analysis of variance for CRW in F2 mice 165
Table 5.10: Analysis of variance for CRW in F14 mice 166
Table 6.1a: Loci with LOD score >2.8 for FVL 184
Table 6.1b: Loci with LOD score >2.8 for FOW 185
Table 6.1c: Loci with LOD score >2.8 for CRW 186
Table 6.2: LOD scores at loci of orthologues of reported
human ASD genes 189
Table 7.1: Measures of inter-rater reliability 199
Table 7.2: Descriptive statistics for 12 strains of inbred
laboratory mice 201
Table 7.3: Correlation between mean values for %PFO, FVL,
FOW, CRW, weight and heart weight 206
Table 7.4: Results of ANOVA for FVL, FOW and CRW – single
analyses with PFO as the model 209
Table 7.5: Combined mean values for 12 mouse strains with
and without PFO 209
Table A1.1a: Chromosome 1 245
Table A1.1b: Chromosome 1 – additional markers 246
Table A1.2: Chromosome 2 247
Table A1.3: Chromosome 3 248
Table A1.4: Chromosome 4 249
Table A1.5: Chromosome 5 250
Table A1.6: Chromosome 6 251
Table A1.7: Chromosome 7 251
Table A1.8: Chromosome 8 252
xx
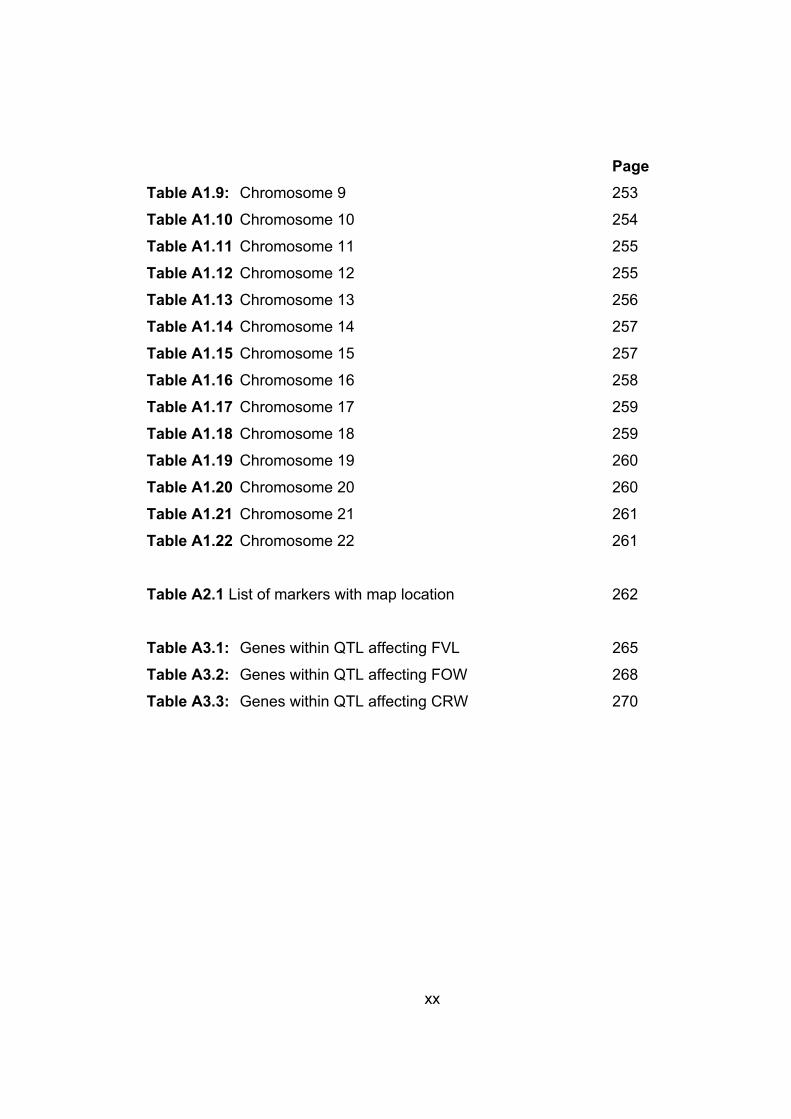
Page Table A1.9: Chromosome 9 253
Table A1.10 Chromosome 10 254
Table A1.11 Chromosome 11 255
Table A1.12 Chromosome 12 255
Table A1.13 Chromosome 13 256
Table A1.14 Chromosome 14 257
Table A1.15 Chromosome 15 257
Table A1.16 Chromosome 16 258
Table A1.17 Chromosome 17 259
Table A1.18 Chromosome 18 259
Table A1.19 Chromosome 19 260
Table A1.20 Chromosome 20 260
Table A1.21 Chromosome 21 261
Table A1.22 Chromosome 22 261
Table A2.1 List of markers with map location 262
Table A3.1: Genes within QTL affecting FVL 265
Table A3.2: Genes within QTL affecting FOW 268
Table A3.3: Genes within QTL affecting CRW 270
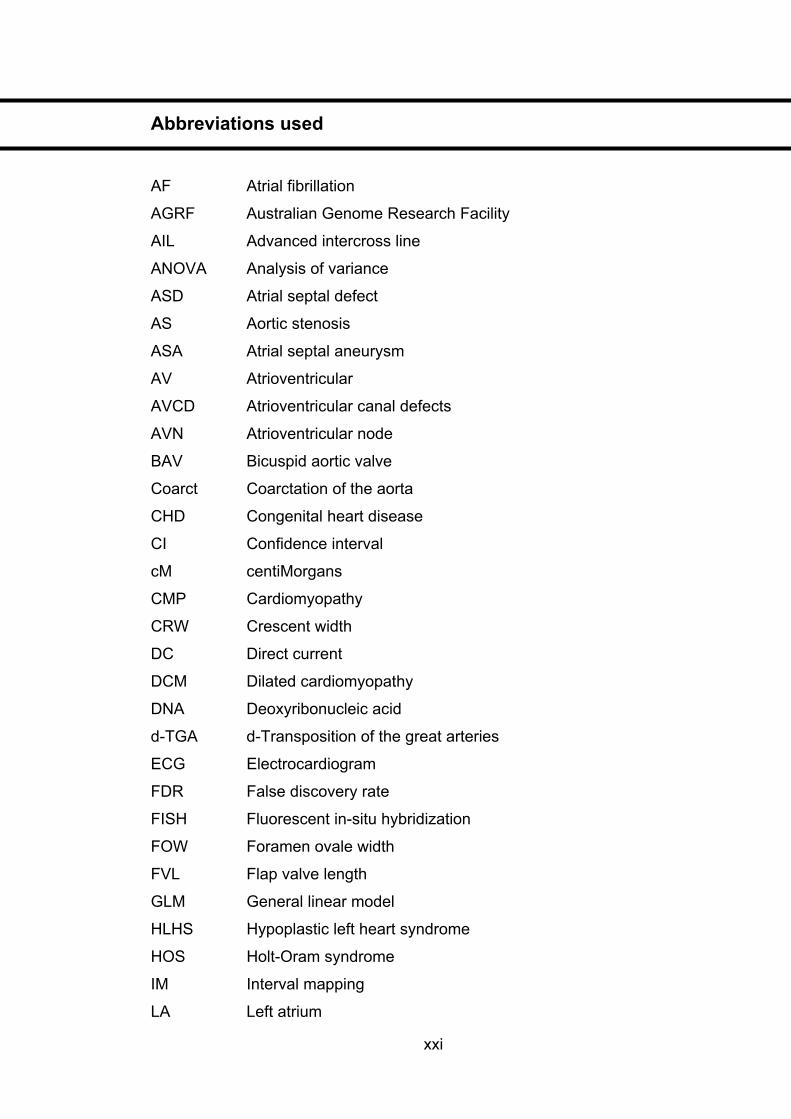
Abbreviations used
AF Atrial fibrillation
AGRF Australian Genome Research Facility
AIL Advanced intercross line
ANOVA Analysis of variance
ASD Atrial septal defect
AS Aortic stenosis
ASA Atrial septal aneurysm
AV Atrioventricular
AVCD Atrioventricular canal defects
AVN Atrioventricular node
BAV Bicuspid aortic valve
Coarct Coarctation of the aorta
CHD Congenital heart disease
CI Confidence interval
cM centiMorgans
CMP Cardiomyopathy
CRW Crescent width
DC Direct current
DCM Dilated cardiomyopathy
DNA Deoxyribonucleic acid
d-TGA d-Transposition of the great arteries
ECG Electrocardiogram
FDR False discovery rate
FISH Fluorescent in-situ hybridization
FOW Foramen ovale width
FVL Flap valve length
GLM General linear model
HLHS Hypoplastic left heart syndrome
HOS Holt-Oram syndrome
IM Interval mapping
LA Left atrium
xxi
xxii
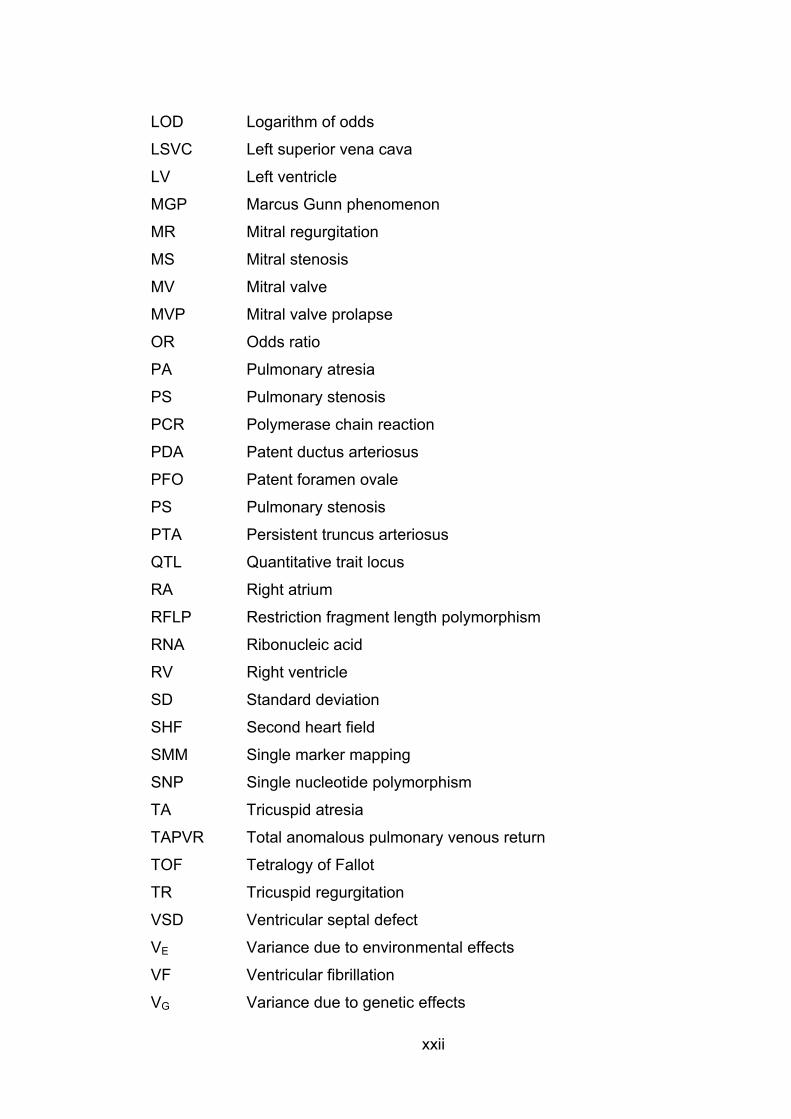
LOD Logarithm of odds
LSVC Left superior vena cava
LV Left ventricle
MGP Marcus Gunn phenomenon
MR Mitral regurgitation
MS Mitral stenosis
MV Mitral valve
MVP Mitral valve prolapse
OR Odds ratio
PA Pulmonary atresia
PS Pulmonary stenosis
PCR Polymerase chain reaction
PDA Patent ductus arteriosus
PFO Patent foramen ovale
PS Pulmonary stenosis
PTA Persistent truncus arteriosus
QTL Quantitative trait locus
RA Right atrium
RFLP Restriction fragment length polymorphism
RNA Ribonucleic acid
RV Right ventricle
SD Standard deviation
SHF Second heart field
SMM Single marker mapping
SNP Single nucleotide polymorphism
TA Tricuspid atresia
TAPVR Total anomalous pulmonary venous return
TOF Tetralogy of Fallot
TR Tricuspid regurgitation
VSD Ventricular septal defect
VE Variance due to environmental effects
VF Ventricular fibrillation
VG Variance due to genetic effects

xxiii
VT Total variance
WPW Wolff-Parkinson-White syndrome
� Recombination fraction
1. Literature review
1.1 Overview Congenital heart disease (CHD) is the most common form of birth defect, with
estimates of birth incidence in liveborn children ranging from 0.4-1.0% (Bower
and Ramsay, 1994; Grech and Gatt, 1999; Ferencz et al., 1985; Gillum, 1994).
A comprehensive review of epidemiological studies of CHD by Hoffman and
Kaplan (Hoffman and Kaplan, 2002) yielded a combined incidence of 6/1000
live births, rising to 75/1000 live births if trivial lesions, such as tiny muscular
ventricular septal defects (VSDs) present at birth but closing thereafter are
included. Although some cardiac malformations are relatively benign, the overall
morbidity and mortality associated with CHD are enormous. In the 10 year
period 1979-1988, there were 46,450 deaths attributed to CHD in the United
States of America, of which 26,319 occurred in the first year of life (Gillum,
1994). In Australia, 15% of neonatal deaths and 11% of post-neonatal childhood
deaths are attributable to CHD (Bower and Ramsay, 1994).
Given this, it is perhaps surprising how little is known of the causes of CHD.
There are many genetic syndromes associated with CHD, and there has been
considerable success in elucidating the causes of these. However, 75% of CHD
is non-syndromic, in the sense that there are no evident associated features
(Bower and Ramsay, 1994), and even among the “syndromic” category, not all
cases have a known cause. Genetic factors make an important contribution to
non-syndromic CHD, but specific mutations have so far been identified in only a
small minority of cases (Elliott et al., 2003; McElhinney et al., 2003). Teratogens
such as alcohol, although important because of the potential for prevention,
account for a small minority of cases (Tikkanen and Heinonen, 1992). This
applies even where the relative risk associated with an exposure is
comparatively high, such as the risk of CHD associated with maternal diabetes.
For this exposure, Pradat (Pradat, 1992) found a relative risk for all CHD of
2.67 (95% CI 1.43-4.99), and an even higher risk for septal defects (ASD and
VSD combined) for which the relative risk was 6.2 (95% CI 1.97-19.5).
1
2
Nonetheless, in this study only 1.2% of CHD was attributable to maternal
diabetes (specific figures not available for the subgroup of septal defects).
The parents of a child born with CHD naturally want to know why their child has
this problem. Based on current knowledge, as sketched above, the clinician
treating the child will usually be unable to answer this question in more than
general terms. This is the underlying motivation behind the work reported here:
the drive to understand the causes of CHD in more detail. The focus is
necessarily narrow – an attempt to delineate the genetic contribution to defects
of atrial septal morphogenesis, specifically secundum atrial septal defect (ASD)
and patent foramen ovale (PFO). However, it is anticipated that the lessons
learned from study of these disorders will have wider relevance to other forms
of CHD.
To place these genetic studies in context, this chapter starts with a discussion
of the contribution of genes to human disease, and ways of unravelling it,
including mapping techniques for Mendelian and quantitative traits. Next, there
is a description of cardiac development and particularly the role of the
transcription factors NKX2-5, GATA4 and TBX20 in early cardiac development.
Finally the nature, epidemiology and causation of CHD are reviewed, with a
focus on ASD and PFO.
1.2 Genes and human disease At the time of writing, the Entrez Genome Project web page listed 413
eukaryotic genome sequencing projects, of which 25 were complete, 162 at the
assembly stage and 226 in progress
(http://www.ncbi.nlm.nih.gov/genomes/leuks.cgi, accessed on 23rd August,
2007). In addition, there are nearly fourteen hundred prokaryote genome
projects at various stages. The human genome project published its draft
sequence of the human genome as long ago as 2001 (Lander et al., 2001).
From this vantage point, with vast and ever-increasing repositories of genomic
information readily accessible to us, it is easy to forget that it is only a little over
3
a century ago that the first paper correctly identifying a genetic mechanism for a
human disease was published. This was Garrod’s seminal paper on
alkaptonuria (Garrod, 1902), in which he recognised that alkaptonuria is
inherited in an autosomal recessive fashion. This in turn occurred only 37 years
after Mendel’s publication of the principles of what is now known as Mendelian
inheritance. Prior to these advances, while it was undoubtedly recognised that
some traits and diseases were hereditary, there was no accurate understanding
of the mechanisms underlying this.
It is now clear that there is a genetic contribution to many, and perhaps most,
forms of human disease. Over 1000 genes for rare disorders which conform to
Mendelian inheritance have now been identified. However, even taken together,
these account for only a small proportion of human disease (Altshuler et al.,
2005) – perhaps 1-2% in all (Rimoin et al., 2002). More importantly, most
common disease has an identifiable genetic contribution – from ischaemic heart
disease (Shiffman et al., 2005) to most forms of cancer (Knoepfler, 2007). In the
case of cancer the genetic contribution is not necessarily hereditary – in most
instances it consists of acquired, somatic mutation rather than inherited
germline mutation. Even conditions which have a readily identifiable external
cause, such as trauma and infectious diseases, can be shown to have a genetic
contribution. Impulsive behaviour and risk-taking, which increase the risk of
trauma, are contributed to by genetic factors (Kreek et al., 2005). Host factors
which are genetically determined affect the response to infectious disease,
influencing likelihood of clinically recognised infection and severity (Casanova
and Abel, 2007).
The reverse is also true. Disorders which have been thought of as purely
genetic in origin are influenced by environment. Children with cystic fibrosis, a
classic example of an autosomal recessive disorder, have lung disease the
severity of which is determined in part by which pathogens they happen to
encounter (Jones et al., 2004). The phenotype in phenylketonuria can be
greatly modified by provision of a modified diet low in phenylalanine (Scriver
and Waters, 1999). There are numerous other examples, but more importantly,
4
it is undoubtedly the case that less obvious, currently unrecognised,
environmental influences contribute to the phenotype of most (perhaps all)
genetic disease. Chance also represents an intrinsically unobservable, but
important, component of this environmental contribution. The regulation of gene
expression (and by extension, development) is an inherently stochastic process
(Fiering et al., 2000; Kaern et al., 2005).
Human disease, then, can be seen as the outcome of a complex interplay
between genes and environmental factors. Understanding the causation of
many forms of human disease – including CHD – thus requires investigation of
both genetic and environmental contributions. Environmental influences can be
studied by epidemiological means, or in some instances by the use of animal
models, although this can only ever provide indirect evidence for the role of a
particular environmental exposure in human disease. Epidemiological studies of
ASD and PFO are reviewed in section 1.7.4 of this chapter. In the remainder of
this section, methods of mapping traits inherited in a Mendelian fashion and
quantitative trait mapping will be reviewed.
1.3 Mapping Mendelian disorders Mapping of Mendelian disorders relies on Mendel’s principles of inheritance,
modified by the increased likelihood of co-segregation of alleles which are in
physical proximity, and on the effects of meiotic recombination. It is greatly
facilitated by the availability of maps of human genetic variation.
1.3.1 Principles of Mendelian inheritance Mendel derived four main principles from his work on the garden pea,
summarised by Cook et al (Cook J et al., 2002) as follows:
1. Genes come in pairs (Mendel termed them factors), one inherited from each
parent.
2. Individual genes can have different alleles, some of which (dominant traits)
exert their effects over others (recessive traits) – the principle of dominance.

5
In Mendel’s own words “those characters which are transmitted entire, or
almost unchanged in the hybridisation, and therefore in themselves constitute
the characters of the hybrid, are termed the dominant, and those which become
latent in the process recessive”
3. At meiosis alleles segregate from each other with each gamete receiving only
one allele – the principle of segregation, or Mendel’s first law.
4. The segregation of different pairs of alleles is independent – the principle of
assortment, or Mendel’s second law.
Some modification to these principles has been required. X-linked inheritance,
in which females have a pair of alleles but males only a single copy
(hemizygosity), was not discussed by Mendel. Nonetheless X-linked disorders
are considered Mendelian because the principles of X-linked inheritance are
essentially a special case of the principles described by Mendel.
Mendel’s second law is true except for alleles which are located close together
on the same chromosome, which do not segregate independently. Modification
of Mendel’s principles by the addition of this fact formed the basis on which the
mapping studies of Morgan, and indeed all subsequent genetic mapping
studies, including those reported here, are based.
1.3.1.1 Dominance and recessiveness The term “dominance” is used somewhat differently in Mendelian and
quantitative genetics, and somewhat differently again in reference to disease
states. For convenience, all three uses of the term will be discussed at this
point. Elsewhere in this thesis, the terms are used in the sense relevant to the
topic under discussion.
In both Mendelian and quantitative genetics, dominance is a term which
describes the relationship between two alleles. In Mendelian genetics, an allele
(A) is dominant to another (B) if the phenotype in heterozygous organisms is the
6
same as the phenotype in those homozygous for the A allele (Cook J et al.,
2002). The allele B is recessive to the allele A. Incomplete dominance, also
called semidominance, occurs if the phenotype in the heterozygote is
intermediate between that seen with the two homozygous states.
In speaking of diseases with Mendelian inheritance, however, dominant
inheritance refers to any disorder in which heterozygosity for a mutated allele is
sufficient to cause a pathological state.
There are some disorders in which it has been demonstrated that autosomal
dominant human diseases conform to the more rigorous definition of
dominance. For example, homozygosity for the triplet repeat expansion
responsible for Huntington disease produces a phenotype indistinguishable
from that seen in heterozygotes (Wexler et al., 1987). Similarly, a woman
homozygous for a BRCA1 mutation had breast cancer at the age of 32,
consistent with the phenotype seen in heterozygotes (Boyd et al., 1995). The
age of onset of her cancer would not have been unusually early for a woman
with a heterozygous mutation, and indeed a woman in the same family,
presumably heterozygous for the same mutation, had breast cancer aged 22
(Boyd et al., 1995).
However, there are numerous examples of autosomal dominant disorders which
in classical Mendelian terminology would be referred to as semidominant. For
example, heterozygosity for mutations in KCNQ1 causes long QT syndrome,
which is described as an autosomal dominant condition. Homozygosity causes
the Jervell and Lange-Nielsen syndrome with severe long QT syndrome and
sensorineural deafness (Splawski et al., 1997). Similarly, heterozygous
mutations in CDMP1 cause minor skeletal anomalies including brachydactyly
type C (Polinkovsky et al., 1997) and a phenotype resembling brachydactyly
type A1 (Thomas et al., 1997); however, homozygous mutations cause a severe
bone dysplasia, Grebe type chondrodysplasia (Thomas et al., 1997).
7
In practice, the effect of homozygosity for alleles associated with autosomal
dominant disorders is generally not known. It is likely that many, even most,
disorders described as having autosomal dominant inheritance are like these
examples, and in a strict sense should be termed semidominant. Homozygosity
for “dominant” mutations has been reported on numerous occasions, often as a
result of consanguinity or assortative mating (eg in achondrplasia). This often
results in a more severe phenotype than in the heterozyote (Zlotogora, 1997).
The mechanism by which the mutation produces a phenotype is likely to
influence this. It is highly likely, for example, that if haploinsuffiency is sufficient
to produce a phenotype, complete loss of gene function will produce a severe
phenotype. The effects of homozygosity for mutations which act in a different
fashion (gain of function, abnormal participation in homodimer function and so
on) are more difficult to predict but might reasonably be expected to be more
severe than heterozygosity in many cases.
In summary, there is overlap between the use of the term “dominant” and
“recessive” in classical Mendelian genetics and in the terminology of human
diseases with Mendelian inheritance. However, the terminology is more loosely
applied in relation to human diseases.
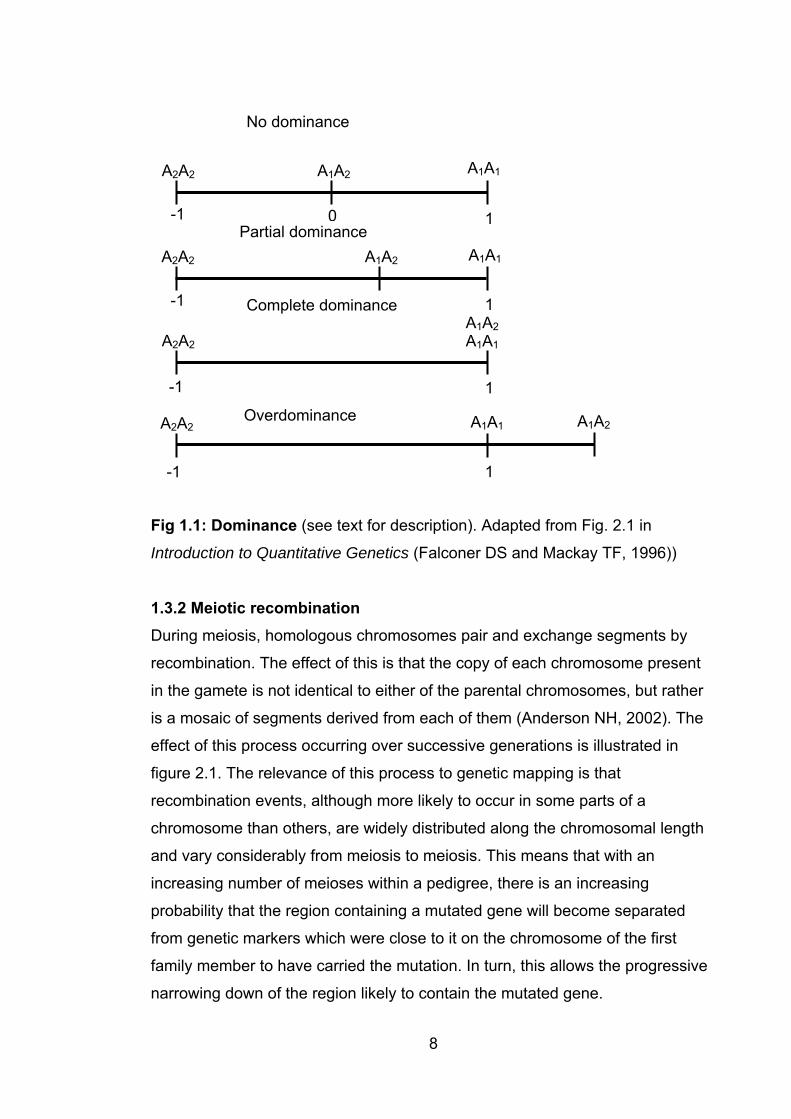
In quantitative genetics, the use of the term dominance is closely related to its
strict Mendelian meaning. Here, dominance refers to the heterozygote effect of
one allele relative to another (Fig 1.1, below). Suppose that homozygosity for
allele 1 results in a phenotypic value of +1 for a given trait, and homozygosity
for allele 2 results in a value of –1. If the heterozygote has a phenotypic value of
0, there is no dominance effect. Heterozygote values between 0 and 1 reflect
dominance of allele 1 over allele 2, values between –1 and 0 reflect partial
dominance of allele 2 over allele 1 and values of 1 or –1 represent complete
dominance of allele 1 or 2, respectively. Overdominance refers to the situation
in which the heterozygote has a more extreme phenotype than either
homozygous state (>1 or < -1). Note that this refers to a theoretical situation in
which the effects of a single pair of alleles on a quantitative trait can be
separated out from all other effects and measured.
No dominance
A1A1A2A2 A1A2
8
Partial dominance -1 0 1
A1A1A2A2 A1A2
-1 1Complete dominanceA1A2
A2A2 A1A1
-1 1
Overdominance A1A2A1A1A2A2
1-1
Fig 1.1: Dominance (see text for description). Adapted from Fig. 2.1 in
Introduction to Quantitative Genetics (Falconer DS and Mackay TF, 1996))
1.3.2 Meiotic recombination During meiosis, homologous chromosomes pair and exchange segments by
recombination. The effect of this is that the copy of each chromosome present
in the gamete is not identical to either of the parental chromosomes, but rather
is a mosaic of segments derived from each of them (Anderson NH, 2002). The
effect of this process occurring over successive generations is illustrated in
figure 2.1. The relevance of this process to genetic mapping is that
recombination events, although more likely to occur in some parts of a
chromosome than others, are widely distributed along the chromosomal length
and vary considerably from meiosis to meiosis. This means that with an
increasing number of meioses within a pedigree, there is an increasing
probability that the region containing a mutated gene will become separated
from genetic markers which were close to it on the chromosome of the first
family member to have carried the mutation. In turn, this allows the progressive
narrowing down of the region likely to contain the mutated gene.

9
1.3.3 Maps of genetic variation In order to track transmission of chromosomal segments through a pedigree, a
map of genetic variation is required. To be useful for genetic linkage studies, an
ideal map would contain markers which are densely spaced and highly
polymorphic – and thus likely to be informative within a family. Such maps have
been progressively developed, starting with restriction fragment length
polymorphisms (RFLPs) (Botstein et al., 1980), progressing to short tandem
repeats (also known as microsatellites) (Weber and May, 1989) and finally to
single nucleotide polymorphisms (SNPs) (The International Hapmap
Consortium, 2003; Altshuler et al., 2005). The availability of densely-spaced
marker maps is obviously also important to mapping for complex diseases.
1.3.4 Mapping Mendelian disorders Mapping of Mendelian disorders depends on identifying one or more alleles
which segregate with the phenotype in accordance with the principles of
Mendelian inheritance (Anderson NH, 2002; Ott and Hoh, 2000). Generally the
mode of inheritance will be known, but there will be no prior information
regarding the likely chromosomal localisation of the gene of interest. Exceptions
to this include X-linked disorders, and the rare circumstance of identification of
one or more affected individuals with apparently balanced chromosomal
translocations segregating with the phenotype (in which case the breakpoints
represent candidate loci). If no localising information is available, a screen of
the entire genome (less the sex chromosomes if X and Y-linkage can be
excluded on the basis of pedigree analysis) will be required. Polymorphic loci
spaced as closely as possible across the genome are genotyped in all available
family members. With the availability of extremely dense genetic maps, cost has
become the main limiting factor restricting marker density used in such a
screen.
While in principle it should be possible to identify regions of genetic linkage
simply by inspecting haplotypes to identify markers which segregate with
disease state, in practice this is not usually a straightforward undertaking (Ott
and Hoh, 2000). The large amount of data produced during a mapping exercise,
10
the problem of incomplete penetrance, and the fact that in the real world there
are often missing individuals or other barriers to such an approach, necessitate
the use of computer programs in data analysis in most instances. These
calculate the likelihood that the disease locus is present on a marker map. The
likelihood ratio is the ratio between the probability that the hypothesis that there
is linkage (�<0.5), LHA, and the null hypothesis of no linkage (�=0.5), LH0. �
(theta) is the recombination fraction, which is 0.5 when there is no linkage (i.e.
there is a 50% chance that two unlinked alleles will be transmitted together).
This is expressed as a logarithm of odds (LOD) score, which is the log10 of LHA/
LH0 (Ott and Hoh, 2000; Nyholt, 2002). Lander and Kruglyak calculated that in
a whole genome scan in humans, a LOD score of 1.9 would be expected to
occur by chance once per whole genome scan, and a LOD score of 3.3 would
be expected to occur by chance once per 20 whole genome scans (Lander and
Kruglyak, 1995). These were proposed as cutoffs for reporting suggestive and
significant linkage results, respectively. Thresholds were also calculated for
quantitative trait locus (QTL) mapping using various study designs.
Map distances are measured in centiMorgans (cM), named for the great fly
geneticist Thomas Hunt Morgan. The cM is equivalent to the recombination
fraction expressed as a percentage. A recombination fraction of 0.5 represents
a map distance of 50cM, a recombination fraction of 0.01represents a map
distance of 1cM and so on.
Examples of programs used in mapping of Mendelian traits (or potentially
Mendelian traits, in the case of nonparametric programs) include those used for
parametric analyses such as the LINKAGE package (Lathrop et al., 1984) and
VITESSE (O'Connell and Weeks, 1995) and nonparametric programs such as
GENEHUNTER (Kruglyak et al., 1996). Parametric programs specify a genetic
model (eg autosomal dominant inheritance) and other parameters such as
penetrance, whereas nonparametric methods are “model-free”. Parametric
methods are powerful when there is good information available about the mode
of inheritance and other relevant parameters. However, for more complex
11
situations or where there is limited information available about the disorder,
nonparametric approaches are superior (O'Connell and Weeks, 1995; Nyholt,
2002).
1.4 Quantitative GeneticsThe application of Mendelian genetics to human disease virtually always
involves discrete phenotypes –a patient either has or does not have cystic
fibrosis. Gradations of severity (variable expressivity) and the phenomenon of
incomplete penetrance, in which an individual has a genotype which is
associated with disease in others but is not affected by the disorder in question,
do not negate this observation. However, the great majority of variation within a
population involves traits which are continuously variable rather than discrete in
nature. These are quantitative traits. Examples include body weight, blood
pressure and levels of blood lipids and homocysteine. Of themselves, none of
these necessarily represents a pathological state, even at the extremes of their
distribution in the population (arguably malignant hypertension represents an
exception to this). However, these examples were chosen for discussion
because all of them represent risk factors for atherogenic cardiovascular
disease (Fruchart et al., 2004). Many, perhaps most, such traits are under
genetic control to some degree. Quantitative genetics deals with efforts to
identify the underlying genetic variants which are responsible for variation in
quantitative traits.
1.4.1 Quantitative trait loci A QTL is a chromosomal segment which contains one or more genetic
elements which affect a quantitative trait (Falconer DS and Mackay TF, 1996).
The use of the term “genetic elements” here is deliberate, as it is not certain that
all QTL have their effect due to variation in the coding region of a gene, or even
in the promotor region or other regulatory elements of a gene. Given the
emerging understanding of the regulatory function of RNAs not directly
associated with genes, or with regulatory effects beyond their immediate
chromosomal environment (Mattick, 2007), it is possible that variations in some
of these may affect quantitative traits and thus be responsible for the effects
12
observed due to a QTL. Any given QTL may, on closer dissection, resolve into
multiple loci (Flint et al., 2005), each of smaller effect than the original QTL. This
means that elucidating the underlying basis of a QTL can be a daunting task
(see section 1.4.3 below). Despite its difficulty, this is an important endeavour,
given the major contribution of polygenic inheritance to human disease. QTL
mapping is also important in agriculture, with the use of marker assisted
selection to improve conventional breeding schemes for the modification of
economically important species (Ribaut and Ragot, 2007).
The infinitesimal model, developed by RA Fisher in 1918 and still influential now
(Barton and Keightley, 2002), considered polygenic disorders as being
determined by a very large number of loci each of very small effect (Fisher RA,
1918). In practice, however, QTL of large effect are frequently detected,
sometimes accounting for up to 50% of observed variation in the trait under
study (Flint et al., 2005). Although most QTL effect sizes are substantially
smaller than this, QTL of moderate effect size (>10%) are fairly common.There
are a number of possible explanations for this, including overestimation of effect
size. This is particularly likely if the sample size is smaller than about 500
(Barton and Keightley, 2002). Having said that, the majority of detected QTL are
of relatively small size (~5%) and it is likely that for most traits there are indeed
many further QTL of very small effect.
1.4.1.1 The liability model for binary traits The focus of this thesis is CHD, and as CHD is a binary trait (either present or
absent in an individual) it is worth explicitly discussing the relationship between
binary traits and QTL. While it is undoubtedly true that as such, CHD is
intrinsically less informative and more difficult to analyze from a quantitative
genetic perspective than a continuously distributed trait, QTL mapping remains
a potentially important tool in understanding the genetic basis of CHD. Falconer
(Falconer, 1965) developed the liability model for binary traits with multifactorial
inheritance. This model assumes an underlying continuously distributed but
unobservable scale of liability, with a threshold above which the observable
binary trait is expressed. If it is possible to identify a quantitative phenotype
13
which confers a risk of an individual developing the binary trait, the quantitative
phenotype can act as a proxy for the binary trait in mapping experiments. QTL
mapping for traits such as blood pressure represents such an undertaking, with
the binary trait of interest being the occurrence or non-occurrence of a
cardiovascular event (myocardial infarction or stroke, for example).
1.4.2 Mapping QTL The principles on which methods for mapping QTLs are based are similar to
those for mapping of Mendelian traits (Falconer DS and Mackay TF, 1996).
Considering a single locus, there is evidence for a QTL at that locus if there is a
statistically significant difference between individuals with different genotypes at
that locus (Mackay TF, 2001). As for mapping of Mendelian traits, this implies
the need for an informative genetic map. It is necessary for the trait of interest to
be under significant genetic control. Although it is possible to study QTL directly
in humans, animal models have considerable advantages. It is possible to set
up crosses which allow phenotyping and genotyping of very large numbers of
individuals. Moreover, inbred laboratory animals are essentially homozygous at
every locus (Moore and Nagle, 2000). This means that in a breeding experiment
based on a cross between two strains, identification of a marker which is
polymorphic between the strains means that it will be informative in all offspring
derived from the cross. F1 animals will be heterozygous at every locus, and
subsequent generations will segregate the two parental alleles in predictable
ratios depending on the nature of the second (and subsequent, where relevant)
cross. Heterozygotes provide information regarding dominance effects but not
regarding the location of the QTL.
Formal description of the fundamentals of QTL mapping in an F2 population of
mice (as described in chapter 6) is relatively simple (Mackay TF, 2001).
Consider a hypothetical marker locus, M, and a QTL, Q, each with two alleles
(M1, M2, Q1, Q2), with the recombination fraction between M and Q being �. The
QTL has additive (a) and dominance (d) effects. In the F2 population, the
difference in the quantitative trait between homozygotes for each allele of the
QTL will be a(1-2�). The difference between the average mean phenotype of
14
the homozgotes and the mean phenotype of F1 (heterozygous) animals is d(1-
2�)2. If there is no linkage between Q and M, �=0.5 (see 1.3.4) and therefore
a(1-2x0.5) = 0; likewise d(1-2x0.5)=0. Since the total variance in the trait, VT, is
the sum of variance due to environmental effects (VE) and genetic effects (VG),
and VG in turn is the sum of the additive and dominance effects, it follows that
(assuming shared environment, which would be the expectation in experimental
conditions) at �=0.5 there will be no difference between the phenotypes of
M1M1 and M2M2 mice.
The closer the marker locus is to the QTL, the smaller the value of � and the
larger the difference in trait phenotype between the two homozygous classes.
Within a chromosomal region, the marker which is associated with the greatest
difference in mean values between homozygotes for the two alleles is closest to
the QTL. From this, it would intuitively follow that denser spacing of markers will
lead to more accurate localization of QTL. This is only true up to a certain point.
Exact figures will depend on the effect size, but for a QTL of moderate effect
(allele substitution effect 0.25) spacing of markers at 10cM has almost the same
power to detect a QTL as an infinitely dense map (Darvasi et al., 1993), and
spacing at 20cM and even 50cM does not substantially reduce power. For a
study size of 500 animals, power of detecting a QTL on a 100cM chromosome
is 0.64, 0.58 and 0.47 for a QTL located halfway between the interval midpoint
and the nearest marker, with map densities of 10cM, 20cM and 50cM
respectively. Increasing the size of the experiment does make a difference; the
equivalent figures for an experiment with 1000 animals are 0.91, 0.90 and 0.81
respectively (Darvasi et al., 1993). Increasing experiment size also has an
important effect on the capacity of the experiment to resolve the location of the
QTL. Resolving power (defined by Darvasi and Soller as “the 95% confidence
interval for the QTL map location, that would be obtained when scoring an
infinite number of markers”) is inversely proportional to the sample size and to
the proportion of variance explained by the QTL (Darvasi and Soller, 1997).
15
1.4.2.1 Experimental designs for QTL mapping The description above is of an intercross experiment. An alternate strategy is a
backcross, where the F1 (heterozygous) mice are crossed with one or both of
the parental strains. The choice of study design will depend on the phenotype
and mode of inheritance of the QTL. While an intercross design is more
powerful than a backcross design in many circumstances and is most
commonly used, backcross is superior in some situations - for example, if one
of the strains is zero for a fully recessive phenotype (Moore and Nagle, 2000).
This is a relatively uncommon scenario, however, and most commonly there is
no information available about the nature of the QTL prior to commencing the
experiment.
1.4.2.2 Significance thresholds Lander and Kruglyak calculated significance thresholds for backcross and
intercross studies in mouse or rat (Lander and Kruglyak, 1995), based on
results which would be expected to occur by chance once per genome scan
(“suggestive”) or once per 20 genome scans (“significant”). For the intercross
design used in this study (Chapter 6) the LOD score thresholds are 2.8 for
suggestive linkage and 4.3 for significant linkage. The reason such calculations
are required is to compensate for the effects of analysis of large numbers of
markers. The figures derived by Lander and Kruglyak are conservative
thresholds (Moore and Nagle, 2000), reducing the risk of type I statistical error
(i.e. false positive), although this is at the expense of increasing the risk of type
II error (i.e. false negative). An alternate approach is permutation testing, in
which the experimental data are repeatedly randomized and the randomized
figures analyzed to obtain experiment-specific levels of significance.
1.4.2.3 Selective genotyping As discussed above, larger numbers of animals lead to increased power to
detect QTL and increased ability to resolve the location of QTL. However,
increasing the number of animals in an experiment inevitably increases the
associated cost of genotyping, which is usually much more expensive than
measuring the phentoype under study. Lander and Botstein (Lander and
16
Botstein, 1989) introduced the principle of selective genotyping, in which only
individuals with extreme phenotypes are genotyped. The logic behind this is that
such individuals contain most of the genetic information.
Specifically, for a normally distributed trait, progeny with phenotypes more than
1 standard deviation (SD) from the mean comprise about 33% of the total
population but contribute about 81% of the total linkage information. Growing a
population only 25% larger and genotyping these extremes of the distribution
would provide the same amount of linkage information but require genotyping
only 40% as many individuals (Lander and Botstein, 1989). Progeny with
offspring 2 SD from the mean comprise about 5% of the population but
contribute about 28% of the total linkage information, and so on. However,
extension of selective genotyping beyond this level (and perhaps even to this
level) is not recommended, because of the risk that some of the more extreme
phenotypes may be artefactual (eg measurement error). Moreover, the relative
cost of phenotyping goes up as the percentage of animals to be genotyped
goes down (Lander and Botstein, 1989). The extent to which this is a problem
depends on the phenotype of interest and the cost of breeding and maintaining
the mice until they are old enough to be phenotyped.
1.4.2.4 Software packages for QTL mapping There are numerous software packages available for QTL mapping. A
comprehensive list is available at http://linkage.rockefeller.edu/soft/ . Among the
most commonly used are the MAPMAKER/EXP and MAPMAKER/QTL package
(Lander ES et al., 1987) and Mapmanager QT (Manly and Olson, 1999).
MAPMAKER/QTL performs interval mapping (IM) based on the maximum-
likelihood theorem. This uses data from multiple marker loci simultaneously to
estimate both the position and effects of QTL. A particular strength of this
package is its ability to handle missing genotype data – the program can “fill in”
a missing datum and still use the phenotype information from that individual.
This makes it particularly useful for data analysis in conjunction with selective
genotyping (Moore and Nagle, 2000).
17
Mapmanager QT uses multiple regression analysis, which is less
computationally demanding but almost as powerful as maximum-likelihood
analysis (Moore and Nagle, 2000); it is also more user-friendly than the
MAPMAKER/QTL. Unfortunately, however, it is much less tolerant of missing
data, and in the context of selective genotyping overestimates effect sizes
because it is unable to take the bulk of the phenotype data (that which is not in
the genotyped extremes) into account.
1.4.2.5 The mouse as a model organism Despite the obvious differences between humans and laboratory animals such
as mice, genetic studies in animals have contributed importantly to our
understanding of human genetics (Moore and Nagle, 2000), aided by the high
homology between the mouse and human genomes. Approximately 80% of
mouse genes have a single identifiable orthologue in the human genome; only
about 1% of mouse genes have no detectable orthologue in the human genome
(the reverse is also true) (Waterston et al., 2002). The mouse also has the
advantages of being easy to keep in a laboratory setting, having a short
generation time (approximately 9 weeks) and, for many strains, fecundity which
is high enough to make colony maintenance and breeding experiments
straightforward.
1.4.3 Identifying the underlying genetic basis of QTL By 2005, over 2000 QTL had been mapped in mice (Flint et al., 2005).
However, the genetic basis of at most 21 of these had been identified,
depending on the standard used. Two reviews at the time identified 21
quantitative trait genes in total, but agreed on only 4 genes in mice and 5 in rats
(Flint et al., 2005). Clearly, progressing from identifying a QTL to identifying its
underlying genetic basis is an extremely difficult task.
The confidence intervals for most QTL at the time of identification are very wide,
and contain large numbers of genes and even larger amounts of non-coding
DNA which may be of functional importance. It follows that the first step in
18
identifying the genetic basis of a QTL is to narrow down the region of interest. A
number of techniques have been developed or proposed to achieve this.
Congenic mouse strains have the QTL interval transferred from one of the
strains under study into the other, by repeated backcrossing (Moore and Nagle,
2000). This process can be accelerated by genotyping mice at each generation
to follow the region of interest (Markel et al., 1997), obviating the need for
phenotyping of mice at each generation to aid selection of mice to breed. Once
the region of interest has been bred from strain A into strain B, replacing the
original locus for that strain, further breeding between the congenic and strain B
can be done, looking for recombination events within the region of interest.
When these occur, mice homozygous for the alternate segregants can be
phenotyped to determine which side of the recombination contains the QTL.
An alternate approach is to watch for recombination events occurring during the
backcrossing process. Any mouse with a recombination event becomes the
founder of a new congenic line, so that a series of subinterval-specific congenic
strains are developed and can be phenotyped to determine the localization of
the QTL. In theory, analysis of ~1000 mice could reduce a QTL to ~1cM
(Darvasi, 1997).
Advanced intercross lines, a method proposed by Darvasi and Soller (Darvasi
and Soller, 1995) have the advantage of allowing fine mapping of multiple QTL
simultaneously. This is discussed in more detail in chapters 2 and 5. Briefly, the
pair of strains in which a QTL has been identified are crossed to produce an F1
population. These are then intercrossed and offspring of the F2 generation are
crossed in turn, continuing for a number of generations but avoiding inbreeding.
With each generation there are additional recombination events (Figure 2.1).
Phenotyping and genotyping are performed only at the last generation. Analysis
is then done along the same lines as the original QTL analysis.
Once a QTL has been narrowed down to as small an interval as possible, the
next, and possibly most difficult, step is to pinpoint the genetic basis of the QTL.
19
Identification and study of candidate genes is a common approach at this point
(Moore and Nagle, 2000). Problems with this include the likelihood that there
will be a large number of candidate genes even in the smallest region to which
a QTL is resolvable (Flint et al., 2005), and the existence of large numbers of
SNPs, meaning that any gene which is studied is likely to contain variants which
could potentially influence gene expression, and hence underlie the QTL.
Candidate variants can be used in association studies, but may prove to be
closely linked to the genetic variant which truly underlies the QTL. Resolving
this is likely to be very difficult. Expression studies, particularly using microarray,
may provide evidence supporting gene candidacy (Guo and Lange, 2000), but
such evidence is likely to fall short of proof. Targeted knock-in and knock-out
mice potentially can provide strong evidence for a gene’s role in a QTL – if the
phenotype under study is substantially altered in the knock-in or knock-out mice
(Flaherty et al., 2005). The resources involved in creating such mice are still
very considerable, however, forming a barrier to such studies.
At present, QTL mapping techniques are well-established. Experimental
designs are tried and tested, dense marker maps exist and software for data
analysis is readily available. However, the transition from identification of a QTL
to elucidation of its underlying genetic basis remains extremely difficult.
1.4.4 The mouse Hapmap project: application to QTL mapping The findings of the mouse Hapmap project (Frazer KA et al., 2007), including
the identification of over 8 million SNPs densely distributed across the mouse
genome, open up a new approach to QTL mapping (Flaherty et al., 2005;
Frazer et al., 2004). The mouse Hapmap project initially studied 11 classical
laboratory mouse strains and four wild-derived strains. The haplotype map
developed had over 40,000 segments each with an average of three ancestral
haplotypes, reflecting origin from one of the wild mouse substrains – M.m.
musculus, M.m.castaneus, M.m domesticus and the hybrid M.m. molossinus. In
the classical strains these subspecies contributed 68%, 6%, 3% and 10%
respectively, with the remainder being of unknown origin (Frazer KA et al.,
2007). Knowledge of the structure and distribution of these ancestral segments
20
allows the performance of association studies with considerable power to map
QTL (Frazer et al., 2004). In the next phase of this project, a total of 38
“classical” inbred strains and 11 wild-derived strains have been genotyped with
a SNP microarray covering 138,793 SNPs (data available at
http://www.broad.mit.edu/mouse/hapmap/ ). The existence of large amounts of
data regarding quantitative traits in the common laboratory strains means that
mapping for many such traits will be possible without the need to perform
additional experiments. For less well-studied phenotypes, like those described
here, however, additional phenotyping will be required to make use of this
resource.
1.5 The heart The heart’s role in mammalian physiology is a central one – without constant
distribution of oxygenated blood to the body’s tissues, oxidative metabolism
rapidly ceases, leading to death of the organism within minutes. This
fundamental role has meant that the heart’s structure and development have
been highly conserved during evolution, and in particular mammalian hearts,
from mouse to whale, share very similar anatomy. It is remarkable that, despite
the critical importance of the heart, severely disordered cardiac development,
leading to a markedly structurally and functionally abnormal heart, may still be
compatible with survival to and beyond birth. Lesser degrees of cardiac
maldevelopment may be asymptomatic, or may become symptomatic only well
into adult life.
1.5.1 Normal cardiac anatomy The adult mammalian heart is shown in Figure 1.2. Functionally, the heart can
be viewed as a pair of two-chambered muscular pumps, fused anatomically and
controlled by an electrical conducting system. The normal arrangement consists
of a right-sided circulation which receives deoxygenated blood from the
systemic veins, and distributes it to the lungs via the pulmonary arteries; and a
left sided circulation which receives oxygenated blood from the lungs and
distributes it to the body via the aorta. The atria are collecting chambers,
separated from the ventricles by valves (tricuspid on the right and mitral on the
21
left) which prevent regurgitation of blood during ventricular contraction. The
tricuspid and mitral valves are supported by fibrous chords, the chordae
tendinae. The ventricles are pumping chambers and are separated from the
great arteries by valves (pulmonary on the right and aortic on the left) which
prevent regurgitation of blood after ventricular contraction. Cardiac muscle
receives its own blood supply from the coronary arteries, which originate from
the proximal aorta. Cardiac contraction is regulated by an electrical conduction
system. Specialized cells are organized into nodes and tracts. The sinoatrial
node, located at the junction between the right atrium and the superior vena
cava, initiates the beat. The electrical impulse is then propagated throughout
the atria, and to the atrioventricular (AV) node and thence to the ventricles.
From the AV node, the impulse passes down the bundle of His and its branches
to the apex of the ventricles, and then along the Purkinje fibres to the remainder
of the ventricles.
1.5.2 Heart development The heart becomes the first functional organ in the developing embryo
(Buckingham et al., 2005). Cardiac development is illustrated in Fig 1.3. The
first identifiable cardiac tissue (expressing myocardial markers) forms as
bilateral groups of cells in the lateral mesoderm of the early embryo, having
originated as undifferentiated mesodermal cells which migrate from the anterior
region of the primitive streak (Buckingham et al., 2005). These cells are linked
across the anterior-ventral midline, to form the so-called cardiac crescent, which
in turn folds to form the linear heart tube. This is a transient structure composed
of an inner endothelial tube surrounded by a myocardial layer (Harvey, 2002).
At this point, cells from an addiional cardiac progenitor field called the second
heart field (SHF) migrate from dorsal mesocardium, pericardium and branchial-
arch mesoderm into the heart, and contribute to its structural development at
both poles(Moorman et al., 2003). These contribute to the outflow tract, right
ventricle and much of the atria (Buckingham et al., 2005).
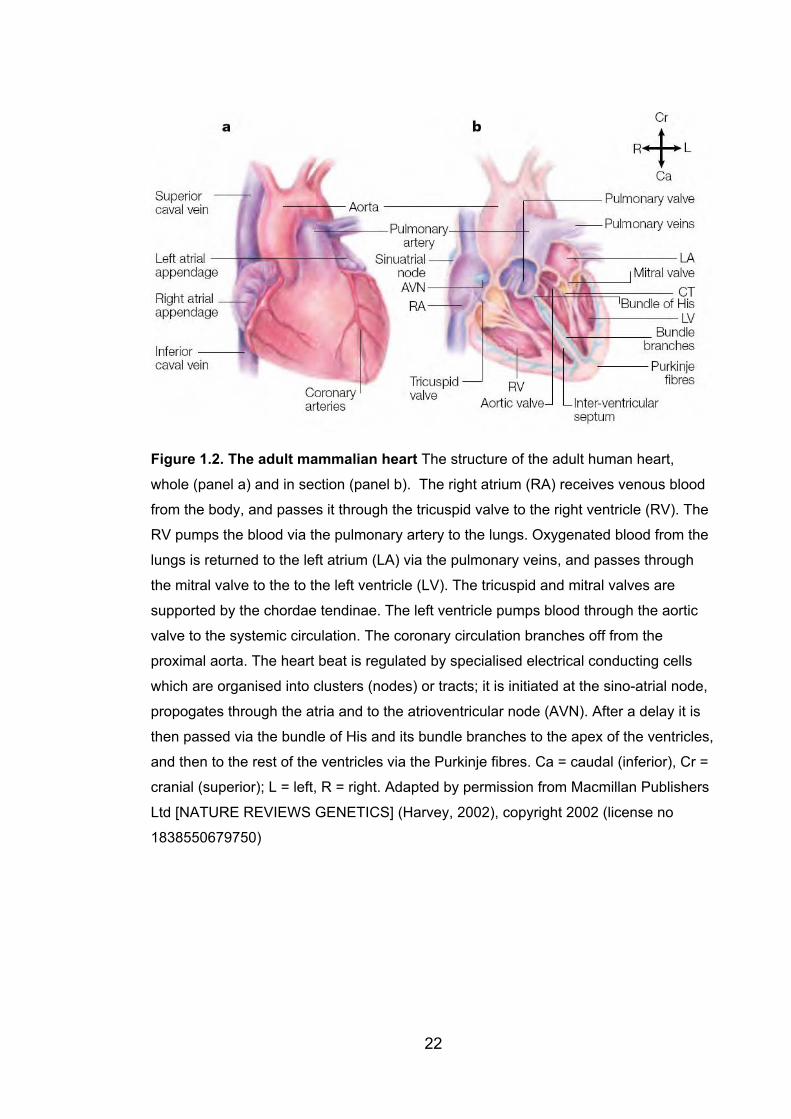
Figure 1.2. The adult mammalian heart The structure of the adult human heart,
whole (panel a) and in section (panel b). The right atrium (RA) receives venous blood
from the body, and passes it through the tricuspid valve to the right ventricle (RV). The
RV pumps the blood via the pulmonary artery to the lungs. Oxygenated blood from the
lungs is returned to the left atrium (LA) via the pulmonary veins, and passes through
the mitral valve to the to the left ventricle (LV). The tricuspid and mitral valves are
supported by the chordae tendinae. The left ventricle pumps blood through the aortic
valve to the systemic circulation. The coronary circulation branches off from the
proximal aorta. The heart beat is regulated by specialised electrical conducting cells
which are organised into clusters (nodes) or tracts; it is initiated at the sino-atrial node,
propogates through the atria and to the atrioventricular node (AVN). After a delay it is
then passed via the bundle of His and its bundle branches to the apex of the ventricles,
and then to the rest of the ventricles via the Purkinje fibres. Ca = caudal (inferior), Cr =
cranial (superior); L = left, R = right. Adapted by permission from Macmillan Publishers
Ltd [NATURE REVIEWS GENETICS] (Harvey, 2002), copyright 2002 (license no
1838550679750)
22
23
The heart tube during its progressive formation undergoes a process of looping,
with the development of a rightward spiral form, leading to the formation of
distinct anatomical features. The caudal part of the heart tube moves dorsally
and anteriorly to form the future atria (Prall et al., 2002). The ventricles become
distinct at this stage and balloon outwards. The spatial relationship between the
developing chambers at this point approximates their final alignment. The
precursors of the atrioventricular valves first appear as endocardial cushions at
this stage, forming at the level of the atrioventricular canal from cells from the
endocardial layer of the heart. Endocardial cushions giving rise to the aortic and
pulmonary valves also form in the outflow tract at this stage. Specification of
distinct myogenic tissue types is also a feature of the looping stage of heart
development. Of particular importance is the emergence of “working
myocardium” along the outer curvature of the looping heart tube (Christoffels et
al., 2000) – this becomes the contractile tissue of the heart chambers. Non-
chamber myocardium gives rise to elements of the conduction system and
fibrous tissue.
The looping phase of cardiac development is followed by a remodelling phase,
during which septation of the heart chambers becomes complete, with the
formation of distinct right and left atria and ventricles.The inflow and outflow
tracts assume their final positions at this stage.
1.5.3 The interatrial septum The interatrial septum is a wall of tissue which, in postnatal life, separates the
left and right atrium, preventing the flow of blood from left to right. During normal
heart development in mammals, the interatrial septum acts as a valved
communication between the atrial chambers, allowing a right-to-left atrial blood
shunt that helps to bypass circulation to the lungs, which are nonfunctional until
after birth. Two distinct septal walls, the septum primum and septum secundum,
contribute to its final structure (Webb et al., 1998). Each maintains a natural but
offset opening between the atrial chambers, creating a one-way flap valve
(Figure 1.4). Expansion of the lungs at birth is accompanied by an increase in
24
Figure 1.3 Normal cardiac development This figure illustrates the main stages in
early heart development in mammals and other amniotes, with staging in days of
embryonic development (E) based on mouse development. The whole embryo or
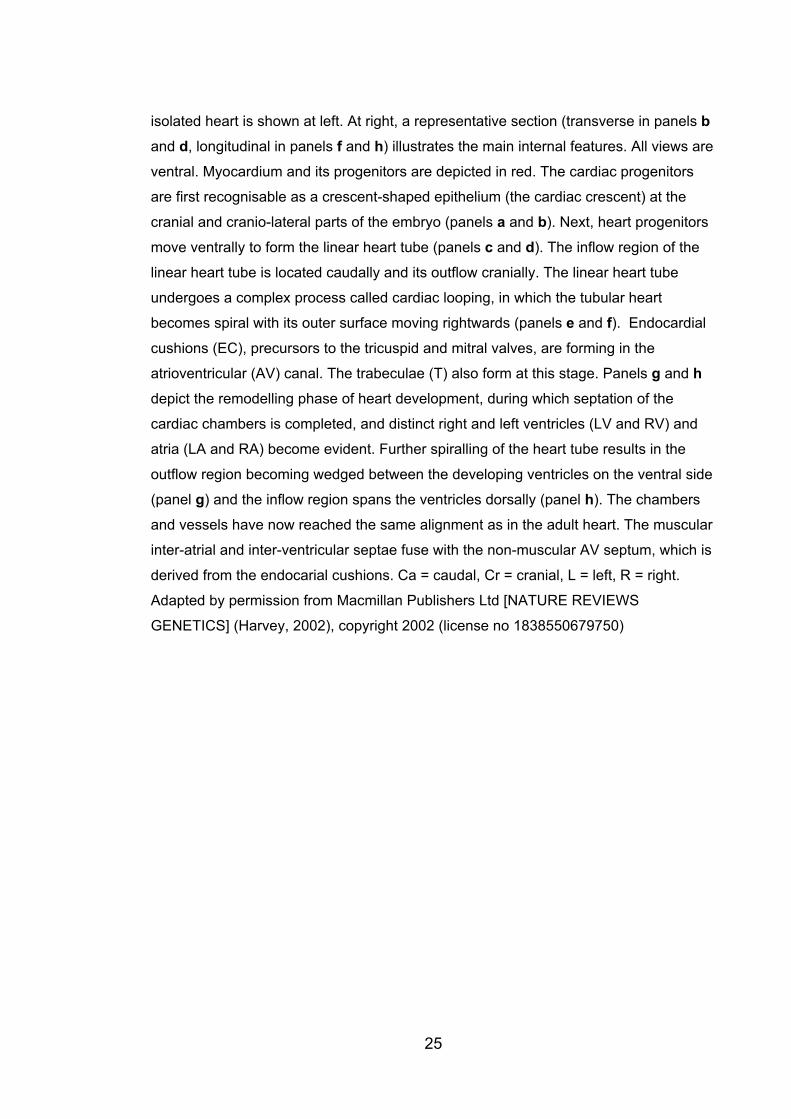
25
isolated heart is shown at left. At right, a representative section (transverse in panels band d, longitudinal in panels f and h) illustrates the main internal features. All views are
ventral. Myocardium and its progenitors are depicted in red. The cardiac progenitors
are first recognisable as a crescent-shaped epithelium (the cardiac crescent) at the
cranial and cranio-lateral parts of the embryo (panels a and b). Next, heart progenitors
move ventrally to form the linear heart tube (panels c and d). The inflow region of the
linear heart tube is located caudally and its outflow cranially. The linear heart tube
undergoes a complex process called cardiac looping, in which the tubular heart
becomes spiral with its outer surface moving rightwards (panels e and f). Endocardial
cushions (EC), precursors to the tricuspid and mitral valves, are forming in the
atrioventricular (AV) canal. The trabeculae (T) also form at this stage. Panels g and hdepict the remodelling phase of heart development, during which septation of the
cardiac chambers is completed, and distinct right and left ventricles (LV and RV) and
atria (LA and RA) become evident. Further spiralling of the heart tube results in the
outflow region becoming wedged between the developing ventricles on the ventral side
(panel g) and the inflow region spans the ventricles dorsally (panel h). The chambers
and vessels have now reached the same alignment as in the adult heart. The muscular
inter-atrial and inter-ventricular septae fuse with the non-muscular AV septum, which is
derived from the endocarial cushions. Ca = caudal, Cr = cranial, L = left, R = right.
Adapted by permission from Macmillan Publishers Ltd [NATURE REVIEWS
GENETICS] (Harvey, 2002), copyright 2002 (license no 1838550679750)
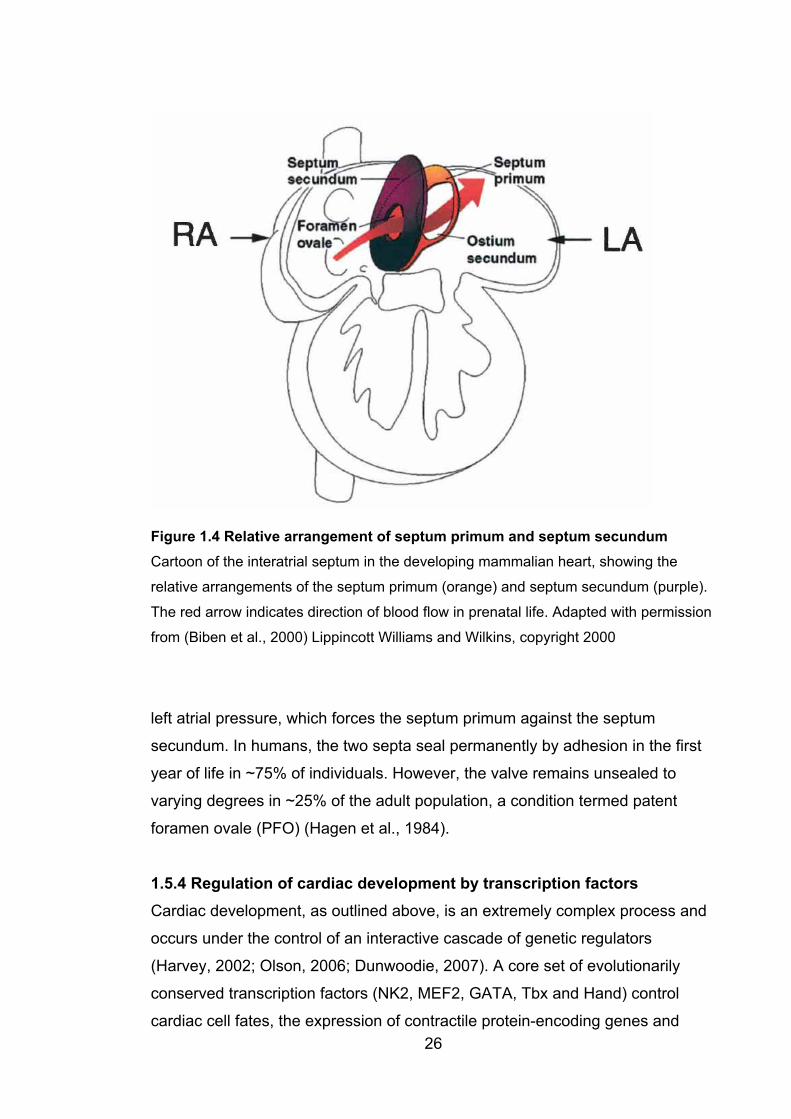
Figure 1.4 Relative arrangement of septum primum and septum secundum Cartoon of the interatrial septum in the developing mammalian heart, showing the
relative arrangements of the septum primum (orange) and septum secundum (purple).
The red arrow indicates direction of blood flow in prenatal life. Adapted with permission
from (Biben et al., 2000) Lippincott Williams and Wilkins, copyright 2000
left atrial pressure, which forces the septum primum against the septum
secundum. In humans, the two septa seal permanently by adhesion in the first
year of life in ~75% of individuals. However, the valve remains unsealed to
varying degrees in ~25% of the adult population, a condition termed patent
foramen ovale (PFO) (Hagen et al., 1984).
1.5.4 Regulation of cardiac development by transcription factors Cardiac development, as outlined above, is an extremely complex process and
occurs under the control of an interactive cascade of genetic regulators
(Harvey, 2002; Olson, 2006; Dunwoodie, 2007). A core set of evolutionarily
conserved transcription factors (NK2, MEF2, GATA, Tbx and Hand) control
cardiac cell fates, the expression of contractile protein-encoding genes and 26

27
cardiac morphogenesis (Olson, 2006). In turn these transcription factors
regulate one another, and many other transcription factors are involved. Of
these, MEF2 is the key myogenic transcription factor, involved in the
differentiation of all types of myocyte. In turn it is under regulation by NK2
homeobox genes, particularly tinman in Drosophila and its orthologues in
mammals. The homeodomain factor NKX2-5 is a key transcription factor in
cardiac development (Dunwoodie, 2007). It is expressed in cardiac progenitor
cells of both the first and second heart fields. Expression continues in the
primary heart tube and in the looping heart, in the outflow tract, ventricles,
common atrium and the proximal horns of the sinus venosus. Expression
continues in muscular layers of the heart throughout the remainder of
embryogenesis and into postnatal and adult life (Prall et al., 2002) The absence
of Nkx2-5 is catastrophic to heart development in the mouse embryo, resulting
in complete failure of cardiac morphogenesis, chamber formation and outflow
tract development.
NKX2-5 acts as part of a pathway in which it physically interacts with a set of
other transcription factors to activate target genes. For example, the zinc finger
transcription factor GATA4 (one of a group of genes named because their
protein products bind to the nucleotide sequence GATA) physically interacts
with NKX2-5. When co-expressed, their effect on the transcription of some
cardiac genes is synergistically augmented (Prall et al., 2002). GATA4 protein is
regulated by other co-transcription factors including the Friend of GATA (Fog)
proteins. Gata4 null mouse embryos have severely disrupted cardiac
development, with failure to form the primitive heart tube among other severe
developmental abnormalities (Molkentin et al., 1997).
The T-box genes are a group of transcription factors which share a highly
conserved 180-amino acid DNA binding domain called the T-box (Stennard and
Harvey, 2005). Of the seven or more T-box genes expressed in the developing
human heart, TBX1, TBX5 and TBX20 (chapter 3) have been implicated in
human congenital heart disease. TBX1 is important in the secondary heart field
and subsequently the outflow tract, consistent with its role as the major
28
determinant of the cardiac phenotype in velocardiofacial syndrome
(characterized by conotruncal malformations) (Yagi et al., 2003).
There is evidence that TBX5 functions as part of the NKX2-5 pathway (Prall et
al., 2002; Dunwoodie, 2007). Mouse Tbx5 associates directly with Nkx2-5 and
Gata4, synergistically stimulating chamber-specific genes in later stages of
cardiac development. Tbx5 is specifically expressed in the first heart field, at the
cardiac crescent stage and later in the primary heart tube. Tbx5 null mouse
embryos are severely dysmorphic and fail to undergo cardiac looping.
Interestingly, mice heterozygous for a Tbx5 null allele have similar cardiac
abnormalities to those seen in Holt-Oram syndrome, with septal defects and AV
conduction block (Stennard and Harvey, 2005; Prall et al., 2002).
Mouse Tbx20 is expressed in the cardiac crescent, and in some cells of the
secondary heart field. In the heart tube, it is expressed in myocardium and in
endothelial cells associated with the endocardial cushions; this latter expression
persists with further development, as myocardial expression weakens. Tbx20
interacts directly with Tbx5, Nkx2-5, and Gata4 (Stennard and Harvey, 2005).
Tbx20 null mouse embryos have hypoplastic, unlooped hearts. Expression of
Tbx20 is required for normal levels of Nkx2-5 expression (Dunwoodie, 2007).
1.6 Congenital heart disease The complexity of the developmental process briefly outlined above provides
many opportunities for maldevelopment of the heart, although it is still not
possible to ascribe a patho-developmental mechanism to all types of CHD with
confidence (Anderson et al., 1999). While some malformations are lethal in
utero, a wide variety of malformations are seen in liveborn infants, occurring
singly or in combination. The reported incidence of CHD varies from 0.4-1.0%
(Hoffman and Kaplan, 2002), with most studies at the higher end of that range.
A trend towards higher incidence in more recent studies appears to be due to
improved detection of minor lesions of no clinical importance, particularly small
VSDs with advances in cardiac imaging, especially 2-D echocardiography
(Wilson et al., 1993; Srephensen et al., 2004).
29
1.6.1 Types of CHD Various classification systems have been devised for CHD. Classification by
severity (Hoffman and Kaplan, 2002), by embryological origin (Marino and
Digilio, 2000), by presumed aetiology (Boughman et al., 1987), by associated
features (Bower and Ramsay, 1994; Stoll et al., 1989) and by anatomical
divisions such as sequential segmental analysis (Craatz et al., 2002) have been
proposed. While all may have merits, the proliferation of classification systems
can make comparisons between studies of the epidemiology of CHD
challenging. Depending on the classification system used, various
malformations may be grouped in different ways, making it hard to separate out
data relevant to particular lesions. Regardless of the classification system used,
however, the relative frequencies of the more common malformations are
generally consistent between studies, where data for individual lesions is
provided. The proportion of CHD accounted for by VSD has increased over
time, due to increased detection of small VSDs, as discussed above. Table 1.1
shows the percentages of common malformations reported in three studies from
different continents (Australia, Europe and North America) as an illustration of
this point, along with the data pooled from a large numbers of studies by
Hoffman and Kaplan (Hoffman and Kaplan, 2002).
1.6.2 Causes of CHD The majority of cases of CHD do not have a single identifiable cause. Among
identifiable causes, chromosomal abnormalities are the most common,
accounting for 8.5% of cases in an Australian series (Bower and Ramsay,
1994). Genetic syndromes, mainly inherited in a Mendelian fashion, account for
a further 1.2%. The Australian data are comparable to those obtained in other
populations. There have been recent epidemiological surveys from Malta
(Grech and Gatt, 1999), Iceland (Srephensen et al., 2004), Italy (Calzolari et al.,
2003) and a combination of California, France and Sweden (Harris et al., 2003).
In these studies, the percentage of cases attributable to chromosomal
abnormalities ranged from 4.9%-18%; 2%-4.5% of subjects had identifiable
syndromes and 6%-12% had associated extra-cardiac abnormalities.
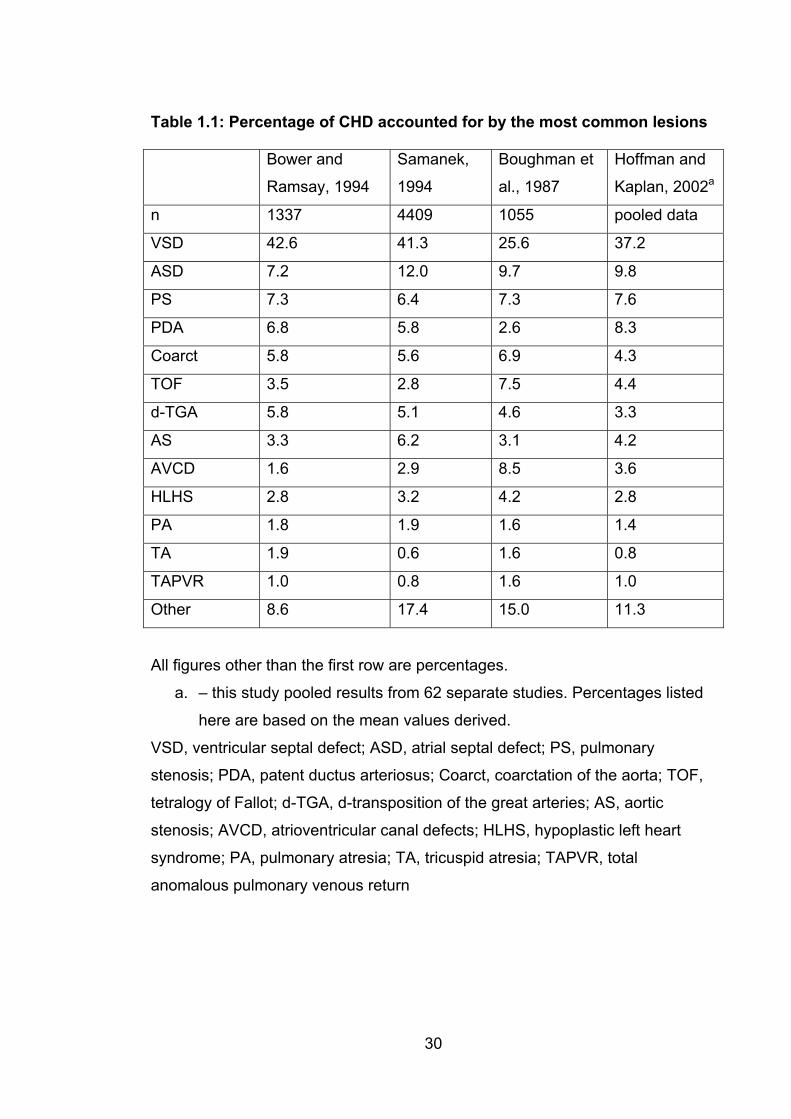
30
Table 1.1: Percentage of CHD accounted for by the most common lesions
Bower and
Ramsay, 1994
Samanek,
1994
Boughman et
al., 1987
Hoffman and
Kaplan, 2002a
n 1337 4409 1055 pooled data
VSD 42.6 41.3 25.6 37.2
ASD 7.2 12.0 9.7 9.8
PS 7.3 6.4 7.3 7.6
PDA 6.8 5.8 2.6 8.3
Coarct 5.8 5.6 6.9 4.3
TOF 3.5 2.8 7.5 4.4
d-TGA 5.8 5.1 4.6 3.3
AS 3.3 6.2 3.1 4.2
AVCD 1.6 2.9 8.5 3.6
HLHS 2.8 3.2 4.2 2.8
PA 1.8 1.9 1.6 1.4
TA 1.9 0.6 1.6 0.8
TAPVR 1.0 0.8 1.6 1.0
Other 8.6 17.4 15.0 11.3
All figures other than the first row are percentages.
a. – this study pooled results from 62 separate studies. Percentages listed
here are based on the mean values derived.
VSD, ventricular septal defect; ASD, atrial septal defect; PS, pulmonary
stenosis; PDA, patent ductus arteriosus; Coarct, coarctation of the aorta; TOF,
tetralogy of Fallot; d-TGA, d-transposition of the great arteries; AS, aortic
stenosis; AVCD, atrioventricular canal defects; HLHS, hypoplastic left heart
syndrome; PA, pulmonary atresia; TA, tricuspid atresia; TAPVR, total
anomalous pulmonary venous return
31
Non-syndromal familial forms of CHD account for an as yet undetermined
percentage. Multifactorial inheritance, with a strong genetic contribution,
probably accounts for most of the remainder – i.e. the great majority of all CHD.
The exact model which best describes the relative contribution of genes and
environment is uncertain. The classical multifactorial model, with numerous
genes each contributing a small amount to variation in the population, has been
challenged (Burn J and Goodship J, 2002) and it is possible that some forms of
CHD are better explained by oligogenic or other models.
Although there is clearly an important environmental contribution to the
causation of most CHD, it is usually not possible to identify a specific
environmental factor. Having said that, a small minority of cases are caused by
identifiable teratogens such as maternal exposure to alcohol and medications,
and the teratogenic effect of maternal diabetes. While it is possible to use
statistical analyses to determine the proportion of cases attributable to relatively
common in utero exposures such as maternal diabetes, in most instances it is
not possible to say for certain which infants have malformations which would
not have been present but for that teratogenic effect. Thus, for approximately
90% of children affected by CHD, no specific cause can be found.
1.6.3 Patent foramen ovale As described above (1.5.3), passage of blood from right to left atrium via the
foramen ovale is a normal feature of circulation before birth. Following birth,
persistent patency of the foramen ovale is very common, as noted above (found
in ~25% of adults) (Hagen et al., 1984) and has generally been considered
benign. Haemodynamically, PFO is usually of no consequence. Although there
is a structural passage between the atria, the pressure differential between the
left (higher pressure) and right sides produces a functional seal by pressing the
septum primum against the septum secundum, preventing shunting of important
volumes of blood in either direction. The small size of most PFOs (mean width
5mm (Hagen et al., 1984)) also reduces the likelihood of significant shunting of
blood.
32
1.6.3.1 PFO and stroke However, in recent years it has become apparent that PFO is not always
harmless. PFO has been shown to be a risk factor for ischaemic stroke without
an identifiable cause, known as “cryptogenic stroke”, and also for migraine.
Case-control studies show that, particularly among younger stroke patients,
there is a significantly higher incidence of PFO than among controls. In stroke
patients aged under 40 years, Webster and colleagues found PFO in 50% of
cases, but only 15% of controls (Webster et al., 1988). In patients younger than
55, Lechat and colleagues found PFO in 40% of cases and 10% of controls
(Lechat et al., 1988). The association is not seen in older patients (Jones et al.,
1994) but this may be due to the fact that other causes of ischaemic stroke
become very much more common with increasing age (particularly in individuals
>60), potentially masking the effect of PFO in older individuals.
The mechanism by which PFO confers an increased risk of stroke in younger
individuals is thought to be predominantly by producing a vulnerability to
“paradoxical embolism” in which an embolus (usually thrombus detached from a
deep vein thrombosis) crosses from the right side of the circulation to the left
(McGaw and Harper, 2001). This may be more likely to occur at times when the
systemic venous pressure is increased, for example if the patient is lifting a
heavy object or straining at stool.
The observation that PFOs in individuals with cryptogenic stroke are both larger
and are associated with a greater degree of right to left shunting of blood than
those seen in individuals with known causes of ischaemic stroke (Homma et al.,
1994) appears to support this proposition. However, although paradoxical
embolism has been directly observed during echocardiography in at least one
instance (Maier et al., 2007), there is little direct evidence to support this model
(Kizer and Devereux, 2005). There is seldom a history connecting the stroke
with an episode or condition which would be expected to raise right sided
pressure, and a source of emboli is seldom found.
33
It is thus possible that other factors are responsible for the observed association
between PFO and stroke. In situ thrombosis and atrial tachyarrhythmias have
been considered. Large PFO are often associated with other structural
anomalies such as aneurysm of the septum primum (McGaw and Harper, 2001)
and persistence of embryonic features of right atrial morphology (Hagen et al.,
1984), which could promote in situ formation of thrombus. However, mural
thrombi and atrial tachyarrhythmias are not commonly found in association with
cryptogenic stroke (Kizer and Devereux, 2005). There are likely to be cell
adhesion factors which are involved in physical closure of the foramen ovale
following birth. Hypothetically, these could be involved pathologically later in life,
in the development of small thrombi in the systemic circulation which then
embolize and cause stroke. Abnormalities of such factors could then predispose
to PFO and stroke without the requirement for paradoxical embolism to occur.
There is no direct evidence to support this concept either, however.
1.6.3.2 PFO and migraine Migraine is a common, recurrent form of headache with distinctive
characteristics. The headache is throbbing, unilateral, often severe, is
accompanied by nausea, vomiting or sensitivity to sound and light. The
headache typically lasts from 4-72 hours (Post et al., 2007). About one third of
patients with migraine experience aura, which is a period of focal neurological
symptoms usually occurring within the hour preceding the onset of headache
(Henry et al., 1992). The pathogenesis of migraine is not well understood but
changes in cerebral bloodflow have been implicated (Henry et al., 1992). The
observation that PFO was associated with stroke, combined with the previous
finding that migraine is also a risk factor for stroke, led to the hypothesis that
PFO may be associated with migraine.
A number of studies have been performed which appear to confirm that such a
relationship exists. Firstly, retrospective studies of the prevalence and severity
of migraine in people who have had PFO closure show a decreased prevalence
of migraine (particularly migraine with aura) after closure (Wilmshurst et al.,
2000; Reisman et al., 2005; Post et al., 2004). In a recent prospective study of
34
patients undergoing PFO closure (Anzola et al., 2006), 36% of patients with
migraine had resolution of their migraine symptoms 1 year after closure. Among
subjects with migraine with aura, only 7/33 still had aura symptoms 1 year after
closure of PFO, compared with 21/21 controls with migraine and PFO who did
not have closure.
Again, the mechanism for this relationship is not certain, although the passage
of microemboli from the systemic venous to arterial circulation across the atrial
septum has been suggested (Post et al., 2007) – a form in miniature of
paradoxical embolism.
1.6.3.3 Other pathological consequences of PFO In addition to stroke and migraine, PFO has been implicated in the
pathophysiology of decompression illness in divers (Wilmshurst et al., 2001)
and in hypoxaemia in individuals with obstructive sleep apnoea (Shanoudy et
al., 1998).
1.6.3.4 Genetics of PFO There has been relatively little study of the underlying causes of PFO. Research
to date has focused entirely on the genetics of PFO, at the level of establishing
that there is an increased risk of PFO in relatives of individuals with PFO and/or
ASD. Arquizan et al (Arquizan et al., 2001) studied sibs of patients with
ischaemic stroke, comparing sibs of those with PFO with sibs of those without
PFO. 61.5% of sibs of patients with PFO also had PFO, compared with 30.6%
of sibs of those without PFO. Interestingly, concordance for this trait was higher
among female than male sibs. Although ASD shows a female preponderance
(see 1.7.3.1), PFO seems to be evenly distributed between the sexes (Hagen et
al., 1984). The authors comment that the relatively small numbers in each group
once the figures are broken down by sex make a type I statistical error possible.
Wilmshurst and colleagues performed echocardiography on 71 relatives of 20
probands with either small ASD or large PFO with shunt (Wilmshurst et al.,
2004). Of the 71 individuals, 60.6% had ASD or PFO. There were no controls
35
but this is well above the population prevalence of PFO. However, the data may
have been skewed to some extent by the identification of several families in
which atrial shunting appeared to be segregating in an autosomal dominant
fashion, including one family with 21 affected members. This family was not
included in table 1.2 (below), because the authors do not differentiate between
ASD and PFO.
Rodriguez et al studied differences in PFO, ASA and right atrial anatomy in
patients with ischaemic stroke (Rodriguez et al., 2003) from white, black and
Hispanic backgrounds. They also assessed subjects for the presence of Chiari’s
network, a congenital remnant of the right valve of the sinus venosus, the
presence of which is associated with a high incidence of PFO and ASA
(Schneider et al., 1995). The presence of Chiari’s network is not a major
contributor to PFO, however, as it is present in only about 2% of adults
(Schneider et al., 1995). Rodriguez et al found a similar incidence of PFO, ASA
and Chiari’s network across the different racial groups. However, whites and
Hispanics were more likely to have a large PFO and the degree of shunt was
greater than in blacks. The significance of this finding is uncertain, particularly
as it may relate to ASD. In the Baltimore-Washington infant study, nonwhites
were found to be more likely to have ASD than whites, although the difference
was small (OR 1.5, 95% CI 1.1-2.0).
1.6.4 Atrial septal defect Notwithstanding the potential pathological consequences of PFO discussed
above, in most individuals PFO is associated with a functionally competent atrial
septum with minimal if any blood flow between the atria. An ASD is present
when there is a frank hole in the atrial septum. There are four anatomical types
of ASD; secundum ASD, ostium primum ASD, sinus venosus ASD and
coronary sinus defect, and these are described below. Confluent ASDs, large
holes caused by a combination of two types of lesion, can generally be
classified as secundum ASD; and common atrium is a form of primum ASD
(Kouchoukos NT et al., 2003). By far the most common type is secundumASD, which, with PFO, is the main focus of this thesis. Unless otherwise
36
specified (eg “primum ASD”), from this point onwards “ASD” refers to secundum
ASD.
1.6.4.1 Secundum ASD Secundum ASD forms in the region of the foramen ovale and is in essence a
failure of the flap valve (septum primum) to cover the opening of the foramen
ovale. This may be because the foramen ovale is too large, because the
septum primum is too short, because the septum primum forms abnormally and
is fenestrated, or from a combination of these abnormalities.
1.6.4.2 Ostium primum ASDOstium primum ASD is a form of endocardial cushion defect, in which the
septum primum does not fuse with the endocardial cushions, leaving a patent
foramen primum. There is usually an associated cleft in the anterior cusp of the
mitral valve.
1.6.4.3 Sinus venosus ASD Sinus venosus ASDs are located high in the septum, just below the orifice of the
superior vena cava, and are usually associated with anomalous pulmonary
venous return. This is a very rare type of ASD.
1.6.4.4 Coronary sinus ASD Coronary sinus ASDs are part of the “unroofed coronary sinus syndrome”
(Kouchoukos NT et al., 2003), in which the coronary sinus lacks a partition to
separate it from the left atrium. As a result, the ostium of the coronary sinus
forms a hole in the atrial septum.
1.6.4.5 Pathology associated with ASD Regardless of type, the main pathological consequence of ASD is the presence
of an intracardiac shunt (Krasuski, 2007). In postnatal life, the pressure in the
left atrium is greater than that in the right atrium, and an ASD permits left to
right shunting of blood. This results in volume overload of the right side of the
heart, as well as an increase in the pressure in the right atrium. Very large holes
37
may cause important symptoms in infancy or early childhood, with failure to
thrive, frequent respiratory infections and even heart failure, requiring early
surgical closure (Lammers et al., 2005). Smaller lesions, however, may take
many years to produce symptoms. If not detected on routine examination in
childhood, presentation well into adulthood is not uncommon. Presenting
symptoms of fatigue and breathlessness result from progressive pulmonary
hypertension, secondary to volume overload (Krasuski, 2007). Progressive right
atrial enlargement and thickening of the atrial wall is usually seen, in the
presence of a normal sized left atrium (Kouchoukos NT et al., 2003). This may
lead to atrial fibrillation. If untreated, pulmonary hypertension can result in
Eisenmenger syndrome, in which right sided pressure exceeds that on the left
and the shunt is reversed, causing systemic hypoxaemia (Krasuski, 2007).
Cryptogenic stroke has also been associated with ASD (Bartz et al., 2006),
although ASD is a much less common finding than PFO in patients with stroke.
This is not surprising given the very high prevalence of PFO in the population.
1.6.5 Relationship between PFO and ASD Clinically, the smallest ASDs can be viewed as large PFOs with an incompetent
flap valve, and indeed ASD and PFO are viewed as existing in a continuum by
cardiac surgeons and cardiologists (Kouchoukos NT et al., 2003) (personal
communication, Prof Michael Feneley, 2006). This clinical observation suggests
an aetiological relationship between ASD and PFO, which is supported by
studies in mice and humans. Wilmshurst and colleagues (Wilmshurst et al.,
2004) studied family members of patients with left to right shunting on
echocardiography. The probands had been investigated for a variety of reasons
including decompression illness, ischaemic stroke, haemodynamic features of
ASD and migraine with aura. Of the 71 family members who had contrast
echocardiography, 61% had either ASD or PFO. There were no controls but this
incidence is well above the population prevalence of PFO. Although most of
these lesions appear to have been PFOs, and the pedigrees presented do not
distinguish between ASD and PFO, the authors state that family members with
both lesions were identified. Evidence is presented that inter-atrial shunt
38
segregated as an autosomal dominant trait in at least 6/20 families. This study
supports the concept that there is a genetic link between ASD and PFO in
humans.
In mice, the main evidence that ASD and PFO have a shared aetiology comes
from the work of Biben and colleagues (Biben et al., 2000), which forms the
basis for most of the mouse work reported in this thesis. Biben and colleagues
studied the effects of heterozygous Nkx2-5 mutations on the murine atrial
septum. NKX2-5 mutations in humans had been shown to cause a variety of
forms of congenital heart disease, but particularly ASD. NKX2-5, and its murine
orthologue Nkx2-5, are homeodomain-containing transcription factors important
in early cardiac development in man and mouse, respectively (see above).
In Nkx2-5+/- mice, Biben et al found an increased incidence of patent formane
ovale, atrial septal aneurysm, and decreased length of the septum primum flap
valve compared with wild-type mice. These effects varied between strains and
were particularly striking in mice from the strain 129T2/SvEms, in which
heterozygosity for the Nkx2-5 null allele resulted in severe PFO bordering on
ASD in 6/35 mice (17%). In total, 5/425 Nkx2-5+/- had ASD – much lower than in
humans heterozygous for NKX2-5 mutations (see below) but considerably
higher than in wild-type mice, in which ASDs are generally very rare (see
chapter 5). Importantly, in every strain assessed, heterozygosity for the Nkx2-5
null allele was associated with a markedly increased incidence of PFO
compared with wild-type mice – 78% vs 26% in B6 mice, 94% vs 74% in
129T2/SvEms, 36% vs 6% in a Swiss x B6 cross, and 62% vs 2.6% in an FVB x
B6 cross. Thus, a mutation in Nkx2-5 led to measurable changes in atrial septal
morphology, and an increased incidence of both PFO and ASD.
In summary, ASD and PFO are common and closely related conditions. While
the role of PFO in human pathology makes it worthy of study in its own right, the
apparent aetiological link between the two lesions suggests that PFO in the
mouse may represent a valid model of ASD in the human. Insights gained from
39
the study of murine PFO may then be of importance in understanding ASD and,
in turn, other forms of CHD.
1.7 Causes of ASD In this section the known causes of ASD will be discussed.
1.7.1 Syndromes associated with CHD Numerous malformation syndromes have been described in which CHD occurs.
This can be one of the main defining features of a syndrome (as in Holt-Oram
syndrome (Basson et al., 1997), velocardiofacial syndrome (Fokstuen et al.,
1998) and Noonan syndrome (Tartaglia et al., 2002). Alternately, it may be an
association of variable importance in a syndrome defined primarily by non-
cardiac pathology – as in Smith-Magenis syndrome (Sweeney et al., 1999) and
Rubinstein-Taybi syndrome (Stevens and Bhakta, 1995), in both of which about
a third of affected individuals have CHD; or cerebrocostomandibular syndrome,
in which CHD is a rare but apparently real association (Plotz et al., 1996; Kirk
and Ades, 1998).
It is difficult to be accurate about how many syndromes are associated with
CHD. The London Dysmorphology database (London Medical Databases Ltd,
Bushey UK 2004) lists 873 syndromes in which CHD is a feature. The POSSUM
dysmorphology database (Murdoch Children’s Research Institute, Melbourne,
2005) lists 933 syndromes with abnormalities of structure or function of the
heart as a feature, although 151 of these are chromosomal anomalies, and
some refer to cardiomyopathy rather than structural lesions. A search using the
term “congenital heart disease” in the online database OMIM (Online Mendelian
Inheritance in Man, http://www.ncbi.nlm.nih.gov/sites/entrez?db=OMIM ;
accessed 7 June 2007) yields 387 results, although this is likely to be an
incomplete set because of the way OMIM is written – for example, an entry
which referred to “heart defects” but not to “congenital heart disease” would not
be captured by this search. In the appendix to their majestic review of the
genetics of CHD, Burn and Goodship (Burn J and Goodship J, 2002) list 317
syndromes associated with cardiac malformation, including many for which the
40
evidence that CHD is a feature of the disorder is limited to a single case report,
and also including a number of teratogenic syndromes such as fetal alcohol
syndrome. Of the Mendelian and chromosomal causes of CHD, although some
may be allelic disorders, the majority will be caused by distinct genetic
abnormalities, and in many instances mutations in more than one gene can lead
to a single syndrome. Thus, there are a very large number of separate routes
which lead to the common endpoint of CHD.
Almost every known mechanism of inheritance has been associated with CHD,
and ASD in particular, including all forms of Mendelian inheritance,
multifactorial/polygenic inheritance and chromosomal aneuploidies including
small deletions and duplications (Burn J and Goodship J, 2002). Even
mitochondrial inheritance has been suggested (Sherman et al., 1985), although
the evidence for this is limited, and it is difficult to see how abnormalities in the
function of the respiratory chain (the sole function of the mitochondrial genome
(DiMauro and Schon, 2003)) would lead to isolated CHD.
1.7.1.1 Holt-Oram syndrome Among syndromes with CHD as a feature, Holt-Oram syndrome (HOS)
deserves special mention here, for three reasons. Firstly, the great majority of
affected individuals have CHD, and particularly ASD, which affected most
individuals in the first reported family (Holt and Oram, 1960) and has been the
most commonly reported lesion in subsequent studies, affecting 60% of people
with HOS (Sletten and Pierpont, 1996). HOS is thus the syndrome most
strongly associated with ASD in the minds of clinical geneticists.
Secondly, HOS can be viewed as one form of autosomal dominant ASD with
conduction abnormalities, which is discussed in section 1.4.1.3 below. The non-
cardiac manifestations in HOS are skeletal abnormalities of the upper limbs,
which range from severe reduction anomalies in approximately 5% of affected
individuals through to very mild anomalies such as clinodactyly and sloping
shoulders (Newbury-Ecob et al., 1996). Although penetrance for limb anomalies
is very high in HOS, the high frequency of mild anomalies reported by Newbury-
41
Ecob and colleagues implies that HOS should always be considered in the
differential diagnosis of autosomal dominant CHD, particularly where ASD is the
main lesion observed in a family.
Thirdly, a proportion of patients with HOS can be shown to have mutations in
TBX5 (Basson et al., 1997; Li et al., 1997). As discussed in section 1.5.3, TBX5
interacts with NKX2-5 and GATA4, mutations in which cause autosomal
dominant ASD as well as other forms of CHD. It also interacts with TBX20,
mutations in which are shown here (see chapter 3) also to cause CHD,
particularly ASD. Although TBX5 is the main gene associated with HOS, in most
studies fewer than half of all patients with HOS have identifiable TBX5
mutations (Basson et al., 1997; Li et al., 1997; Borozdin W et al., 2006),
although when strict criteria for diagnosis (personal an/or family history of
abnormalities of cardiac septation and/or conduction with preaxial radial ray
deformity) are applied, the detection rate goes up to 74%(McDermott et al.,
2005). This is still low enough to suggest the possibility of genetic
heterogeneity; it is clear that such heterogeneity exists among the heart-hand
syndromes in general (Basson et al., 1995), but it may also be the case for HOS
in particular. Mutations in the gene SALL4 have been reported in a small
number of individuals with features of HOS (Brassington et al., 2003), although
no further cases have been reported, and there is clinical overlap between the
Duane-radial ray syndrome (caused by SALL4 mutations) and HOS.
1.7.1.2 Chromosomal disorders, particularly 8p deletions Numerous chromosomal abnormalities have been reported in association with
ASD, ranging from very common abnormalities such as trisomy 21 (Vida et al.,
2005) and 22q deletions associated with velocardiofacial syndrome (Fokstuen
et al., 1998) through to unique chromosomal rearrangements reported only in
single individuals. With the exception of balanced chromosomal
rearrangements, which cause phenotypic effects either by direct disruption of
genes at the breakpoint or by regional genomic effects of the translocation
(Lettice et al., 2002), the common theme in chromosomal disorders is
abnormalities of gene copy number. Trisomies, duplications, tetrasomies and so
42
on increase the copy number of genes within the affected chromosome or
chromosomal segment from two to three or more (in the case of autosomal
genes and X-linked genes in females) or from one to two or more (in the case of
X-linked genes in males). Deletions reduce the copy number of genes from two
to one (in the case of autosomal genes and X-linked genes in females) or from
one to none, in the case of X-linked genes in males.
There are undoubtedly many genes for which copy number is of no
consequence. For example, the great majority of autosomal recessive disorders
produce no discernable phenotype in heterozygotes, even if the mutation in
question is functionally a null mutation. Deletion of one copy of CFTR (for
example) would not of itself be expected to produce a phenotype. Similarly, for
many genes an increase in copy number would not be expected to produce a
phenotype. However, there are many autosomal dominant disorders for which
haploinsufficiency appears to be the main reason for the phenotypic effect of
mutations. Examples include TBX5 in HOS (Borozdin W et al., 2006), SHOX in
Leri-Weill syndrome (Rappold et al., 2002) and SOX9 in campomelic dysplasia
(Wunderle et al., 1998); numerous others are known. Similarly, it is clear that
increased gene copy number, as in trisomy 21, must be the reason for most, if
not all, of the pathological effects associated with chromosomal abnormalities
which result in a gain of chromosomal material.
Study of patients with chromosomal abnormalities and congenital heart disease
therefore holds out the prospect of identifying genes important in cardiac
development and relevant to CHD in general. In order for study of a
chromosomal abnormality to lead to identification of such a gene, the
chromosomal anomaly must either involve a very small region, containing few
genes, or must be sufficiently common that it is possible – by study of large
numbers of affected patients – to identify a relatively small critical region which
must be involved in order to produce a cardiac phenotype. Most chromosomal
abnormalities are detected because they are large enough to be visible
cytogenetically, and therefore are likely to contain large numbers of genes. This
43
means that in practice only relatively common chromosomal abnormalities are
likely to yield useful information in the study of CHD.
Examples of such lesions include deletions of 1p36, 22q11 and 8p23. Deletions
of 1p36 have been increasingly commonly recognised and are associated with
CHD, which however only infrequently includes ASD (2/30 cases in one series)
(Heilstedt et al., 2003). Deletions of 22q11 are very common and have been
intensively studied. Recently, evidence has been presented that
haploinsufficiency for TBX1 is responsible for most of the cardiac phenotype
associated with deletions of 22q11 (Yagi et al., 2003). Although ASD occurs in
patients with 22q11 deletions, conotruncal lesions such as tetralogy of Fallot are
more characteristic of this deletion, with only 4% of patients having ASD
(Fokstuen et al., 1998).
Deletions of 8p23 are of perhaps the greatest interest in the context of the
current study, because of the location of GATA4 within this region. CHD is a
common feature of patients with deletions of this cytogenetic band. Both
primum and secundum ASD have been reported in multiple patients with 8p23
deletions, although a variety of other cardiac lesions including pulmonary valve
stenosis, double outlet right ventricle, aortic valve stenosis and ventricular
septal defect have also been reported (Devriendt et al., 1999; Giglio et al.,
2000).
Devriendt et al defined a critical region for cardiac malformations in individuals
with 8p deletions and suggested GATA4 as a candidate gene which may be
responsible for the CHD in affected subjects (Devriendt et al., 1999). Pehlivan
and colleagues used fluorescent in-situ hybridization (FISH) to show that 4
patients with deletion of 8p23.1 and CHD were haploinsufficient for GATA4; a
fifth patient with a normal heart had two copies of GATA4 (Pehlivan et al.,
1999). Contradicting these findings, Giglio et al presented evidence that not all
subjects with 8p deletions and CHD were deleted for GATA4. Two subjects in
their study with CHD were FISH positive for a GATA4 probe, and they defined a
critical region between markers WI-8327 and D8S1825 which excluded GATA4
44
(Giglio et al., 2000). From this it appeared that GATA4 may not play a role in
causation of CHD in 8p23 deletions. However, in 2003, Garg et al reported
GATA4 mutations in two families with congenital heart disease, predominantly
ASD but also AVSD and various valvular abnormalities (Garg et al., 2003). It is
thus clear that GATA4 haploinsufficiency does contribute to CHD in at least
some indviduals with 8p23 deletions, although it is likely that at least one other
gene in the region also contributes to the cardiac phenotype, given the findings
of Giglio et al.
1.7.2 Non-syndromal Mendelian ASD Prior to the first identification of mutations associated with ASD, there were at
least 15 separate reports of nonsyndromal autosomal dominant ASD (Table
1.2), with 12 of the reported families having ASD and disorders of cardiac
conduction. There have been no reports of X-linked nonsyndromal ASD, and no
definite reports of autosomal recessive ASD, although it would be difficult to
confidently state that recurrence in a sibship was due to recessive inheritance
rather than multifactorial causation (see 1.4.1.4). It is possible that the family
reported by Libshitz and Barth (Libshitz and Barth, 1974), in which 4 sibs had
ASD and a fifth died at two years of suspected CHD, had an autosomal
recessive form of ASD. Dominant inheritance in this family could not be
excluded as assessment of the parents was described only as “routine cardiac
workup” and the study antedates 2-D routine echocardiography. Even if both
parents did have normal hearts, one of them may have been nonpenetrant for
cardiac disease. Thus, dominant inheritance cannot be excluded in this family.
Despite the large number of affected sibs, multifactorial causation is also
possible.
Autosomal recessive inheritance has been reported for at least one other form
of nonsyndromic CHD, persistent truncus arteriosus (PTA). In a large
consanguineous Kuwaiti family, a mutation in NKX2-6 segregated with PTA,
with affected individuals being homozygous (Heathcote et al., 2005). Indirect
evidence for autosomal recessive forms of ASD comes from studies of
consanguinity and CHD. In a case-control study of neonates with CHD, Khalid

45
et al found that parental consanguinity was a risk factor for CHD (Khalid et al.,
2006). Overall, first cousin marriages were associated with an adjusted odds
ratio (OR) for CHD of 1.8 (95% CI 1.1-3.1). In particular, consanguinity was
associated with an increased risk of ASD (first cousin marriages, p = 0.002,
more distant relatives, p=0.044). Similar studies comparing the rate of
consanguinity in cases to population data rather than directly to controls had
similar findings to those of Khalid et al, including an effect specifically on ASD
(Becker et al., 2001; Nabulsi et al., 2003). These data could be consistent with
recessively acting alleles contributing to multifactorial causation, but it is also
possible that there are indeed rare autosomal recessive forms of ASD.
In considering the reports of autosomal dominant ASD, some consistent themes
emerge. Firstly, there are substantially more reports of ASD with conduction
disorder than of ASD without conduction disorder. This is somewhat skewed by
the fact that four of the families were ascertained as part of a study of relatives
of probands with ASD + conduction disorder (Emanuel et al., 1975) and by the
inclusion of small families with ASD + conduction disorder but exclusion of small
families with ASD alone. It is also possible that families with conduction disorder
are more likely to be published, particularly as there is a striking tendency to
progression of the conduction disease with age, and there are numerous
instances of sudden unexpected death in family members. Nonetheless, it does
appear likely that dominant ASD with conduction abnormalities is more common
than dominant ASD without conduction abnormalities.
While atrial septal defect is the predominant cardiac lesion in all of the reported
families summarised in Table 1.2, the majority of the families include at least
one affected individual with other forms of CHD in addition to or instead of ASD.
There are a wide variety of lesions, but valvular abnormalities, particularly
affecting the mitral valve, are common, as are VSDs. On the whole, penetrance
for some form of cardiac abnormality is high, and in families with ASD with
conduction abnormalities, there are often individuals with structurally normal
hearts but with abnormal cardiac conduction. Conduction abnormalities range
from mild prolongation of the PR interval to complete heart block and in many
46
families there is progression with age. Older individuals often report syncopal
episodes and sudden death in adulthood is not uncommon.
The family reported by Mégarbané et al (Megarbane et al., 1999) is also worthy
of mention here. Although reported as a syndromal form of ASD, 8/15 affected
individuals had no noncardiac features. In many of the individuals who did have
noncardiac abnormalities these were realtively mild (pectus excavatum and
hypertelorism). Two subjects had cleft lip or cleft lip and palate; there were no
other malformations of note. Cardiac malformations other than ASD included
PS, MS, Ebstein anomaly and AS. One subject had Wolff-Parkinson-White
syndrome, which was also observed in two members of the family reported by
Zuckerman et al and Lynch et al (Zuckerman et al., 1962; Lynch et al., 1978).
Seven had right bundle branch block but there were no other conduction
abnormalities and this family is probably best classified in the group of ASD
without conduction abnormalities.
Subsequent to the reports summarised in Table 1.2, mutations in six genes
have been associated with autosomal dominant ASD. These are TBX5 (Basson
et al., 1997), NKX2-5 (Schott et al., 1998) (both associated with conduction
abnormalities), GATA4 (Garg et al., 2003), MYH6 (Ching et al., 2005), ACTC
(Matsson H et al., 2005) and TBX20 (Kirk et al., 2007) (this study; chapter 3).
Mutations in the latter four genes are not associated with conduction
abnormalities. In addition, there has been one report of a family linked to
chromosome 5p for which no causative mutation has yet been identified
(Benson et al., 1998). Mohl and Mayr reported linkage to the HLA complex on
chromosome 6p in three families, two quite small (Mohl and Mayr, 1977). The
paper is very brief (only a page in length) and contains no pedigrees. It is
difficult to be confident about the reliability of these findings, which have never
been replicated.
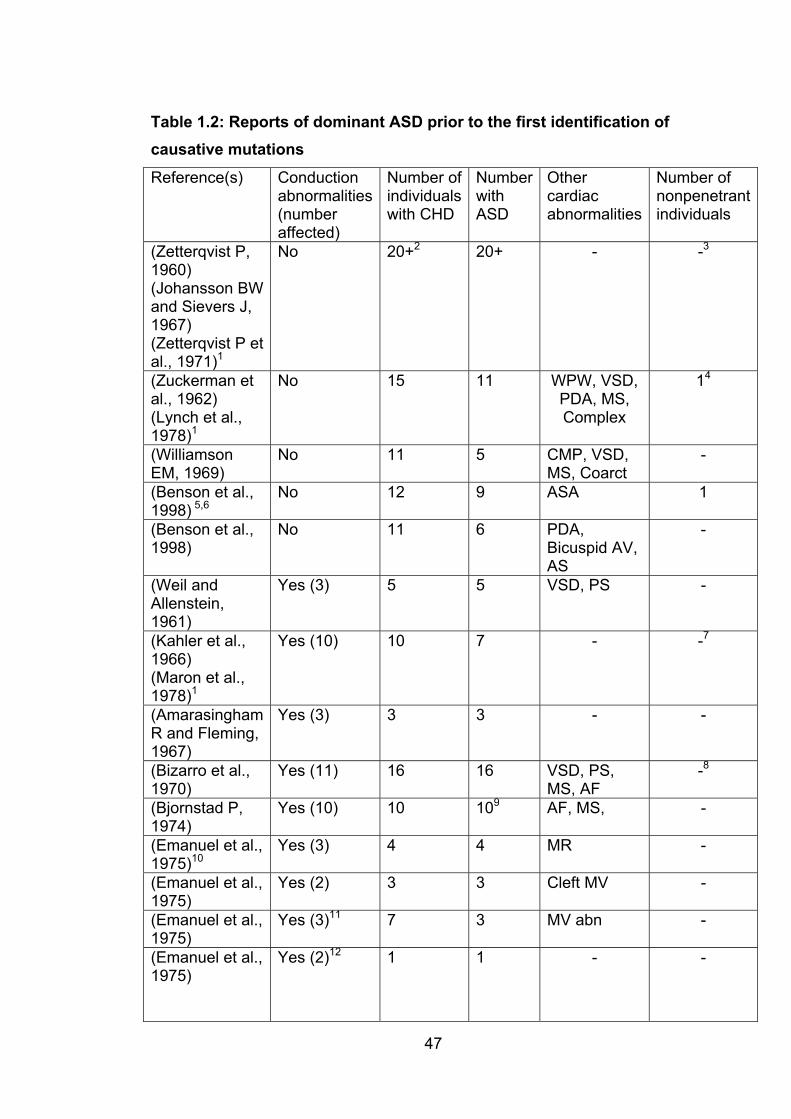
47
Table 1.2: Reports of dominant ASD prior to the first identification of causative mutations
Reference(s) Conductionabnormalities(numberaffected)
Number of individuals with CHD
NumberwithASD
Othercardiacabnormalities
Number of nonpenetrantindividuals
(Zetterqvist P, 1960) (Johansson BW and Sievers J, 1967) (Zetterqvist P et al., 1971)1
No 20+2 20+ - -3
(Zuckerman et al., 1962) (Lynch et al., 1978)1
No 15 11 WPW, VSD, PDA, MS, Complex
14
(Williamson EM, 1969)
No 11 5 CMP, VSD,MS, Coarct
-
(Benson et al., 1998) 5,6
No 12 9 ASA 1
(Benson et al., 1998)
No 11 6 PDA,Bicuspid AV, AS
-
(Weil and Allenstein, 1961)
Yes (3) 5 5 VSD, PS -
(Kahler et al., 1966) (Maron et al., 1978)1
Yes (10) 10 7 - -7
(AmarasinghamR and Fleming, 1967)
Yes (3) 3 3 - -
(Bizarro et al., 1970)
Yes (11) 16 16 VSD, PS, MS, AF
-8
(Bjornstad P, 1974)
Yes (10) 10 109 AF, MS, -
(Emanuel et al., 1975)10
Yes (3) 4 4 MR -
(Emanuel et al., 1975)
Yes (2) 3 3 Cleft MV -
(Emanuel et al., 1975)
Yes (3)11 7 3 MV abn -
(Emanuel et al., 1975)
Yes (2)12 1 1 - -
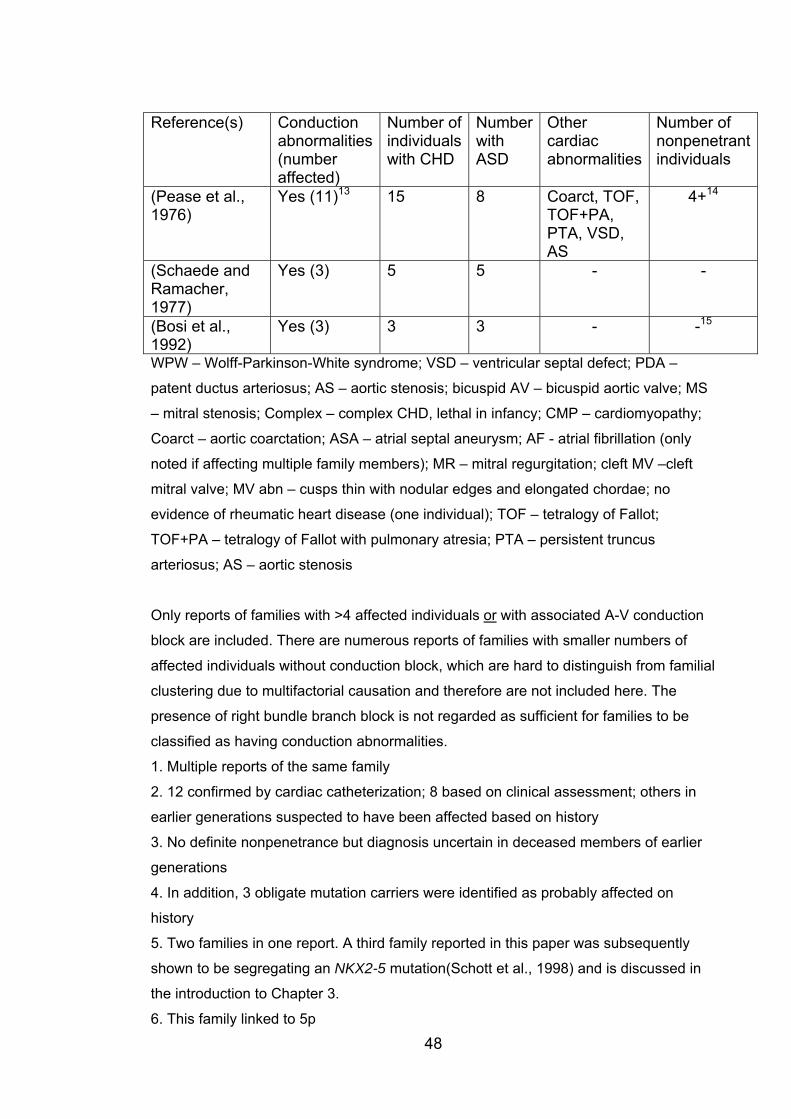
48
Reference(s) Conductionabnormalities(numberaffected)
Number of individuals with CHD
NumberwithASD
Othercardiacabnormalities
Number of nonpenetrantindividuals
(Pease et al., 1976)
Yes (11)13 15 8 Coarct, TOF, TOF+PA,PTA, VSD, AS
4+14
(Schaede and Ramacher,1977)
Yes (3) 5 5 - -
(Bosi et al., 1992)
Yes (3) 3 3 - -15
WPW – Wolff-Parkinson-White syndrome; VSD – ventricular septal defect; PDA –
patent ductus arteriosus; AS – aortic stenosis; bicuspid AV – bicuspid aortic valve; MS
– mitral stenosis; Complex – complex CHD, lethal in infancy; CMP – cardiomyopathy;
Coarct – aortic coarctation; ASA – atrial septal aneurysm; AF - atrial fibrillation (only
noted if affecting multiple family members); MR – mitral regurgitation; cleft MV –cleft
mitral valve; MV abn – cusps thin with nodular edges and elongated chordae; no
evidence of rheumatic heart disease (one individual); TOF – tetralogy of Fallot;
TOF+PA – tetralogy of Fallot with pulmonary atresia; PTA – persistent truncus
arteriosus; AS – aortic stenosis
Only reports of families with >4 affected individuals or with associated A-V conduction
block are included. There are numerous reports of families with smaller numbers of
affected individuals without conduction block, which are hard to distinguish from familial
clustering due to multifactorial causation and therefore are not included here. The
presence of right bundle branch block is not regarded as sufficient for families to be
classified as having conduction abnormalities.
1. Multiple reports of the same family
2. 12 confirmed by cardiac catheterization; 8 based on clinical assessment; others in
earlier generations suspected to have been affected based on history
3. No definite nonpenetrance but diagnosis uncertain in deceased members of earlier
generations
4. In addition, 3 obligate mutation carriers were identified as probably affected on
history
5. Two families in one report. A third family reported in this paper was subsequently
shown to be segregating an NKX2-5 mutation(Schott et al., 1998) and is discussed in
the introduction to Chapter 3.
6. This family linked to 5p
49
7. No unaffected individuals but 3/10 had conduction abnormalities with structurally
normal hearts
8. One individual with clinical diagnosis only. Two obligate heterozygotes not examined
and no history available (deceased).
9. 4/10 diagnosis on history only (deceased individuals)
10. Study of relatives of 10 probands with ASD + conduction delay; 4 families with >1
affected individual identified, listed separately here
11. 4/7 affected family members deceased, exact nature of CHD and presence of
conduction abnormalities uncertain
12. Father with ASD + conduction abnormality; son with conduction abnormality but
structurally normal heart
13. 2/11 had structurally normal heart
14. In one branch of the family, a grandmother (daughter of a deceased obligate
heterozygote) had a normal heart, as did three of her children each of whom had one
affected child. It seems very unlikely that three of 11 children in the last generation
would have had CHD by chance (i.e. phenocopy) implying nonpenetrance in 4
members of this branch of the family. In other branches of the family, there were
individuals who may have been nonpenetrant. One deceased obligate heterozgote had
no history of CHD. In another branch of the family, an affected individual had an
unaffected son and grandson but affected great-grandson. In another branch of the
family, an unaffected son of an obligate heterozygote had an unaffected son who had
an affected daughter. This case is more likely tohave been a phenocopy because there
were 24 individuals in that branch of the family of whom only one was affected.
15. One individual with structurally normal heart but with conduction delay
1.7.3 Multifactorial/polygenic causation of ASD Most common human diseases can be viewed as having multifactorial
causation, with contributions from both genes and environment. In general, the
genetic component involves contributions from multiple genes (usually modelled
as having additive effects), termed “polygenic inheritance”. Since polygenic
disorders (like all genetic disease) will inevitably be influenced by the
environment to some degree, and multifactorial causation implies a contribution
from multiple genes, the terms are effectively interchangeable. For continuous
traits, such as blood pressure or height, it is relatively straightforward to posit
the interaction of a number of genes with environmental factors, some of which
50
(eg salt intake for blood pressure and nutrition in childhood) can be readily
identified.
The proposition that most CHD is multifactorial in origin was put by Nora in
1968 (Nora, 1968) and was widely accepted for some time thereafter. In favour
of the concept were the recurrence risks for CHD – generally on the order of 2-
5%, similar to the square root of the incidence for individual lesions, as
predicted for multifactorial causation. Studies of heritability suggested
heritability of ~0.6 for CHD in general (Williamson EM, 1969; Burn J and
Goodship J, 2002). Other evidence such the work on PDA by Zetterqvist
(Zetterqvist P, 1972); discussed by Burn and Goodship (Burn J and Goodship J,
2002), supported multifactorial causation. PDA showed the characteristics
expected of a disorder with multifactorial causation; the recurrence risks were
as above, the risks to sibs and offspring were about equal, the risk to more
distant relatives declines rapidly, and the risk increases when there are multiple
affected family members.
More recent evidence, however, has called this model into question. In
particular, studies of the offspring of adults with CHD suggest a higher risk to
offspring of affected individuals than to sibs, with a higher risk to offspring if the
affected parent is the mother (Buskens et al., 1995; Burn et al., 1998; Romano-
Zelekha et al., 2001). Even taking into account the fact that a proportion of
families have CHD due to single gene disorders (as discussed in 1.4.2 above),
which makes interpretation of studies of the relatives of affected individuals
more difficult, it seems likely that at least some forms of CHD will prove to be
best explained by means other than the standard multifactorial model. In
particular, hypoplastic left heart syndrome (Boughman et al., 1987) and AVSD
(Burn et al., 1998) have been proposed to fit single gene models, and tetralogy
of Fallot an oligogenic model (Burn et al., 1998).
Notwithstanding these doubts about precise mechanisms, the debate is about
how genes and environment interact to produce CHD, rather than whether they
do.
51
1.7.3.1 Excess of females affected by ASD Since sex is genetically determined, it is relevant to comment at this point that
there is an apparent excess of females affected by ASD. Not all studies confirm
this finding, with the reported ratio of boys: girls ranging from 1.5:1 to 1:3
(Samanek, 1994), but larger studies generally do show an excess, with typically
about 55-60% of affected individuals being female (Rothman and Fyler, 1976;
Ferencz C et al., 1997).
1.7.3.2 QTL for CHD A Medline search combining the terms Quantitative Trait Loci/ and Heart/
(performed on 29th September, 2007) gave 22 results, none of which referred
to CHD; replacing Heart/ with Heart Defects, Congenital/ yielded only one
result, which did not in fact refer to a QTL study, and replacing Heart/ with
Cardiovascular Diseases/ yielded 48 results, none of which was relevant to
CHD. However, the published report of the findings described in chapter 6 (Kirk
et al., 2006) was not identified by either of these search strategies, suggesting
that it is possible that there have been other such studies which are not readily
identifiable using Medline. Although there have been numerous QTL studies
relevant to cardiovascular disease (Yagil and Yagil, 2006), the focus of such
research has been phenotypes relevant to atherogenic disease, not CHD. It
seems likely that the study reported here represents the first effort to identify
QTL potentially relevant to congenital heart disease.
1.7.4 Environmental factors There have been numerous studies of environmental contributors to CHD.
There are several clearly teratogenic influences which are capable of producing
CHD, probably with a relatively small influence from genetic effects. On the
other hand, there are numerous factors which have been identified as making
relatively small contributions in epidemiologic studies. The focus here will be on
environmental contributors to the causation of ASD rather than on CHD in
general.
52
1.7.4.1 Major teratogensThese can be divided into infections, the effects of maternal exposure to
medications and other substances, and the effects of maternal illness such as
diabetes. Fetal rubella infection, particularly in the first trimester, is strongly
associated with CHD (up to 48% affected (Overall, 1972)), with ASD being one
of the more common lesions. Maternal exposure to medications is not
particularly strongly associated with ASD, although ASD has been reported as
part of retinoic acid embryopathy (Lammer et al., 1985) and the fetal valproate
syndrome (Clayton-Smith and Donnai, 1995).
Maternal consumption of large amounts of ethanol during pregnancy may cause
the fetal alcohol syndrome (FAS). About a third of children with the full-blown
syndrome have CHD, typically ASD or VSD (Sandor et al., 1981). However, it is
possible that exposure to smaller amounts of ethanol in the first trimester may
produce ASD without other features of FAS (see section 1.7.4.2, below). It is
likely that genetic factors contribute to individual susceptibility to the effects of
ethanol on the fetal heart, as for other features of the syndrome (Gemma et al.,
2007).
Similarly, maternal diabetes can produce a multi-system embryopathy which
can include CHD. Although ASD is not commonly reported as part of this
syndrome (Ferencz et al., 1990), it is mentioned here because some of the
epidemiological surveys discussed in 1.7.4.2 support a contribution from
maternal diabetes to the causation of some cases of ASD.
1.7.4.2 Other environmental factors The distinction made here between “major teratogens” and “other environmental
factors” is arguably somewhat artificial, since an environmental influence which
causes a malformation is by definition a teratogen. The intention is to
distinguish between exposures which are clearly the major cause of ASD in at
least some individuals, and those for which there is statistical evidence of an
association but which are likely to be but one of multiple factors contributing to
ASD. Moreover, some of the factors discussed here, such as birth order, are not
53
likely to be teratogenic even under the strictest interpretation of the term. It is
possible that birth order is a marker for advancing maternal and paternal age,
with associated increase in risk of chromosomal abnormalities or new dominant
mutations. Alternately, large family size may reflect low socio-economic status
which could increase the risk of ASD on a purely environmental basis. Clearly, it
is hard in some cases to separate apparent environmental influences from
genetic effects.
Papers summarised in Tables 1.3 and 1.4 are restricted to those for which
separate data for ASD are given. Studies of paternal and maternal age effects
are included here, because such studies are done in conjunction with studies of
environmental influences. Two studies in particular, those of Tikkanen and
colleagues in Finland (Tikkanen and Heinonen, 1992; Tikkanen and Heinonen,
1991; Tikkanen J and Heinonen OP, 1990) and the Baltimore-Washington
Infant Study (Boughman et al., 1987; Ferencz et al., 1985; Ferencz C et al.,
1997) provide the bulk of the data discussed here.
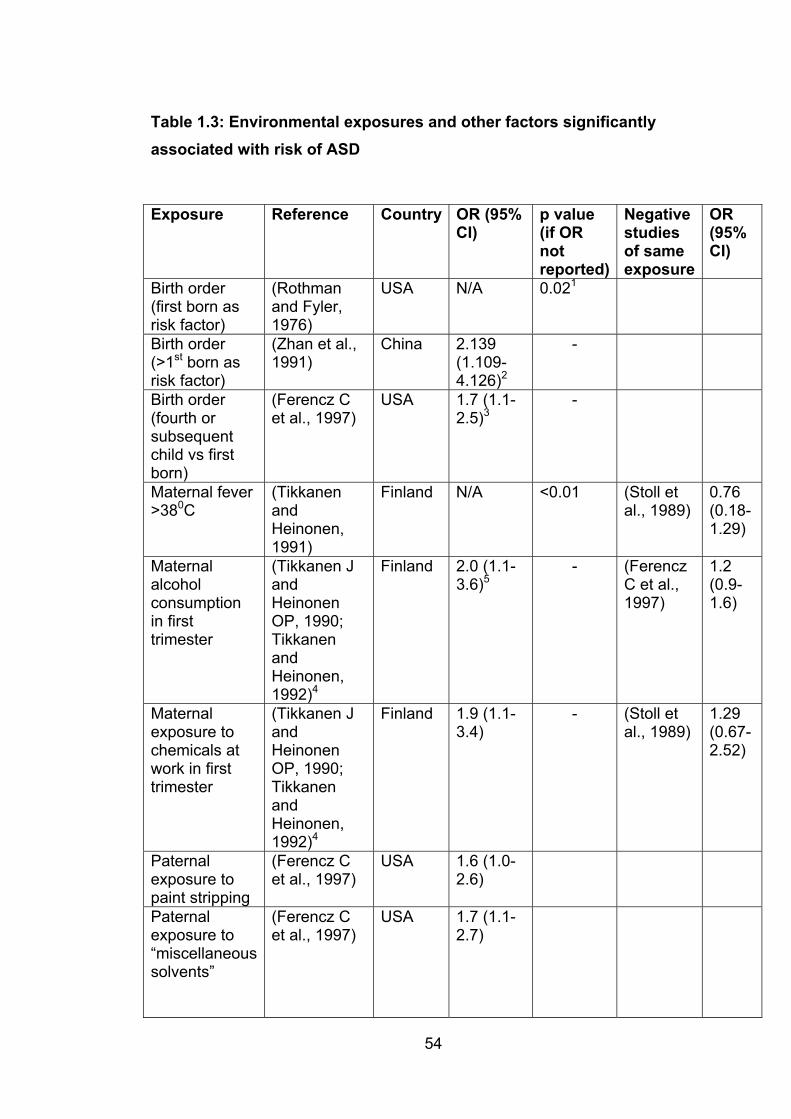
54
Table 1.3: Environmental exposures and other factors significantly associated with risk of ASD
Exposure Reference Country OR (95% CI)
p value (if OR notreported)
Negativestudiesof same exposure
OR(95% CI)
Birth order (first born as risk factor)
(Rothmanand Fyler, 1976)
USA N/A 0.021
Birth order (>1st born as risk factor)
(Zhan et al., 1991)
China 2.139(1.109-4.126)2
-
Birth order (fourth or subsequentchild vs first born)
(Ferencz C et al., 1997)
USA 1.7 (1.1-2.5)3
-
Maternal fever >380C
(TikkanenandHeinonen,1991)
Finland N/A <0.01 (Stoll et al., 1989)
0.76(0.18-1.29)
Maternalalcoholconsumptionin first trimester
(Tikkanen J andHeinonenOP, 1990; TikkanenandHeinonen,1992)4
Finland 2.0 (1.1-3.6)5
- (FerenczC et al., 1997)
1.2(0.9-1.6)
Maternalexposure to chemicals at work in first trimester
(Tikkanen J andHeinonenOP, 1990; TikkanenandHeinonen,1992)4
Finland 1.9 (1.1-3.4)
- (Stoll et al., 1989)
1.29(0.67-2.52)
Paternalexposure to paint stripping
(Ferencz C et al., 1997)
USA 1.6 (1.0-2.6)
Paternalexposure to “miscellaneoussolvents”
(Ferencz C et al., 1997)
USA 1.7 (1.1-2.7)
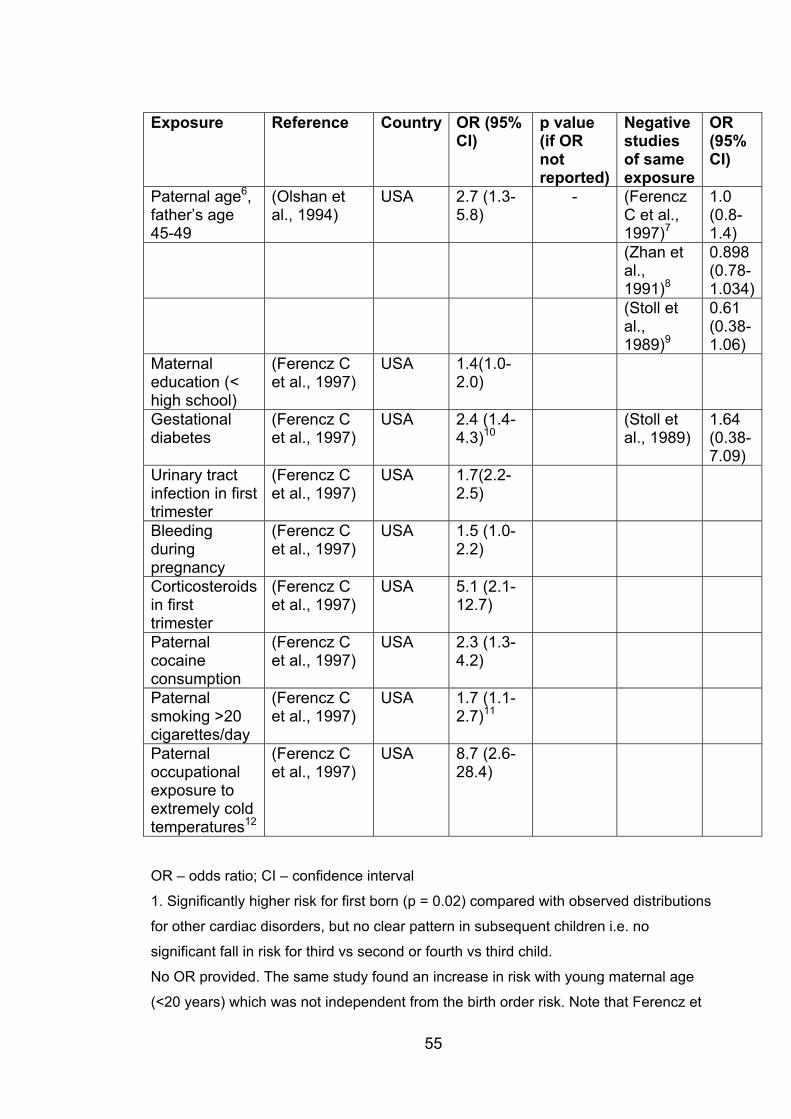
55
Exposure Reference Country OR (95% CI)
p value (if OR notreported)
Negativestudiesof same exposure
OR(95% CI)
Paternal age6,father’s age 45-49
(Olshan et al., 1994)
USA 2.7 (1.3-5.8)
- (FerenczC et al., 1997)7
1.0(0.8-1.4)
(Zhan etal.,1991)8
0.898(0.78-1.034)
(Stoll etal.,1989)9
0.61(0.38-1.06)
Maternaleducation (< high school)
(Ferencz C et al., 1997)
USA 1.4(1.0-2.0)
Gestationaldiabetes
(Ferencz C et al., 1997)
USA 2.4 (1.4-4.3)10
(Stoll etal., 1989)
1.64(0.38-7.09)
Urinary tract infection in first trimester
(Ferencz C et al., 1997)
USA 1.7(2.2-2.5)
Bleedingduringpregnancy
(Ferencz C et al., 1997)
USA 1.5 (1.0-2.2)
Corticosteroidsin first trimester
(Ferencz C et al., 1997)
USA 5.1 (2.1-12.7)
Paternalcocaineconsumption
(Ferencz C et al., 1997)
USA 2.3 (1.3-4.2)
Paternalsmoking >20 cigarettes/day
(Ferencz C et al., 1997)
USA 1.7 (1.1-2.7)11
Paternaloccupationalexposure to extremely cold temperatures12
(Ferencz C et al., 1997)
USA 8.7 (2.6-28.4)
OR – odds ratio; CI – confidence interval
1. Significantly higher risk for first born (p = 0.02) compared with observed distributions
for other cardiac disorders, but no clear pattern in subsequent children i.e. no
significant fall in risk for third vs second or fourth vs third child.
No OR provided. The same study found an increase in risk with young maternal age
(<20 years) which was not independent from the birth order risk. Note that Ferencz et
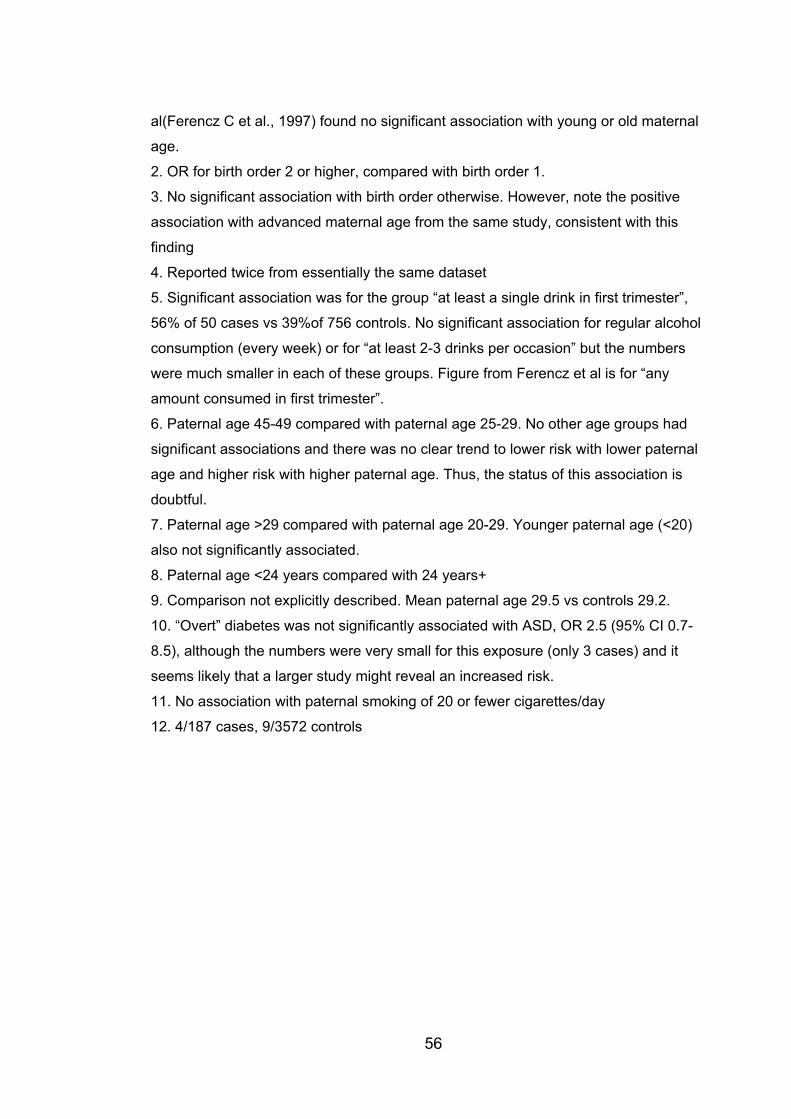
56
al(Ferencz C et al., 1997) found no significant association with young or old maternal
age.
2. OR for birth order 2 or higher, compared with birth order 1.
3. No significant association with birth order otherwise. However, note the positive
association with advanced maternal age from the same study, consistent with this
finding
4. Reported twice from essentially the same dataset
5. Significant association was for the group “at least a single drink in first trimester”,
56% of 50 cases vs 39%of 756 controls. No significant association for regular alcohol
consumption (every week) or for “at least 2-3 drinks per occasion” but the numbers
were much smaller in each of these groups. Figure from Ferencz et al is for “any
amount consumed in first trimester”.
6. Paternal age 45-49 compared with paternal age 25-29. No other age groups had
significant associations and there was no clear trend to lower risk with lower paternal
age and higher risk with higher paternal age. Thus, the status of this association is
doubtful.
7. Paternal age >29 compared with paternal age 20-29. Younger paternal age (<20)
also not significantly associated.
8. Paternal age <24 years compared with 24 years+
9. Comparison not explicitly described. Mean paternal age 29.5 vs controls 29.2.
10. “Overt” diabetes was not significantly associated with ASD, OR 2.5 (95% CI 0.7-
8.5), although the numbers were very small for this exposure (only 3 cases) and it
seems likely that a larger study might reveal an increased risk.
11. No association with paternal smoking of 20 or fewer cigarettes/day
12. 4/187 cases, 9/3572 controls
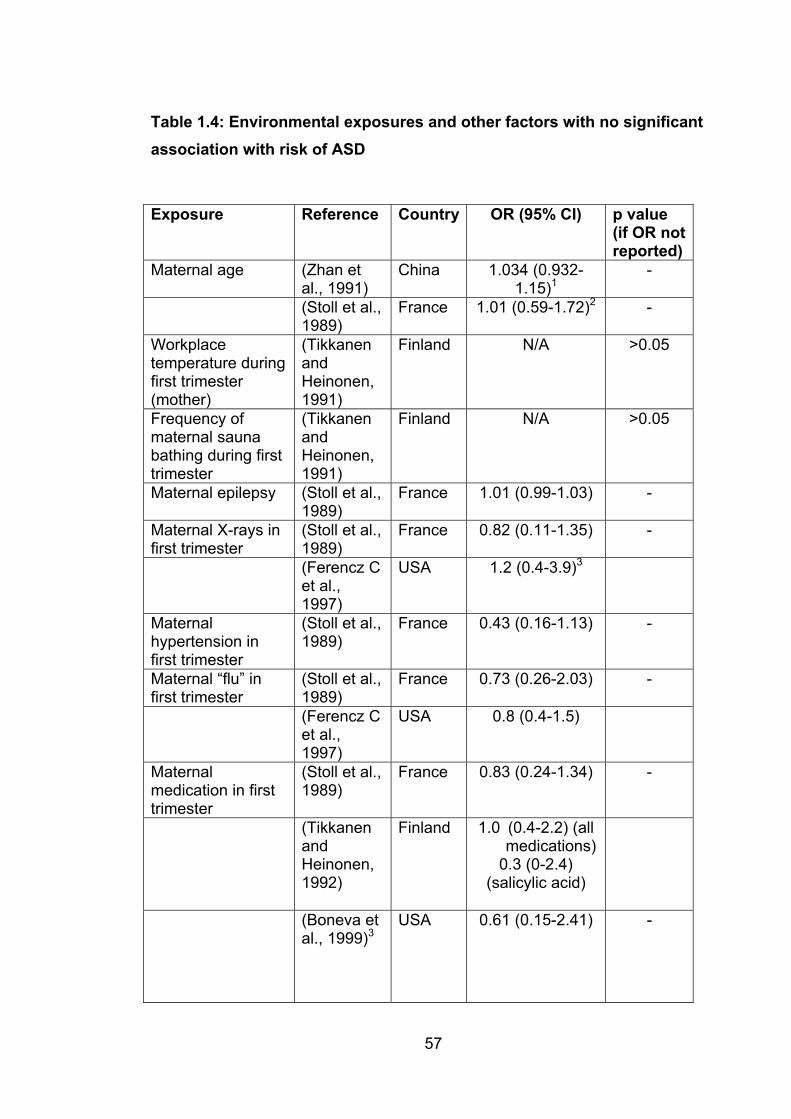
57
Table 1.4: Environmental exposures and other factors with no significant association with risk of ASD
Exposure Reference Country OR (95% CI) p value (if OR not reported)
Maternal age (Zhan et al., 1991)
China 1.034 (0.932-1.15)1
-
(Stoll et al., 1989)
France 1.01 (0.59-1.72)2 -
Workplacetemperature during first trimester (mother)
(TikkanenandHeinonen,1991)
Finland N/A >0.05
Frequency of maternal sauna bathing during first trimester
(TikkanenandHeinonen,1991)
Finland N/A >0.05
Maternal epilepsy (Stoll et al., 1989)
France 1.01 (0.99-1.03) -
Maternal X-rays in first trimester
(Stoll et al., 1989)
France 0.82 (0.11-1.35) -
(Ferencz Cet al., 1997)
USA 1.2 (0.4-3.9)3
Maternalhypertension in first trimester
(Stoll et al., 1989)
France 0.43 (0.16-1.13) -
Maternal “flu” in first trimester
(Stoll et al., 1989)
France 0.73 (0.26-2.03) -
(Ferencz Cet al., 1997)
USA 0.8 (0.4-1.5)
Maternalmedication in first trimester
(Stoll et al., 1989)
France 0.83 (0.24-1.34) -
(TikkanenandHeinonen,1992)
Finland 1.0 (0.4-2.2) (all medications)
0.3 (0-2.4) (salicylic acid)
(Boneva et al., 1999)3
USA 0.61 (0.15-2.41) -
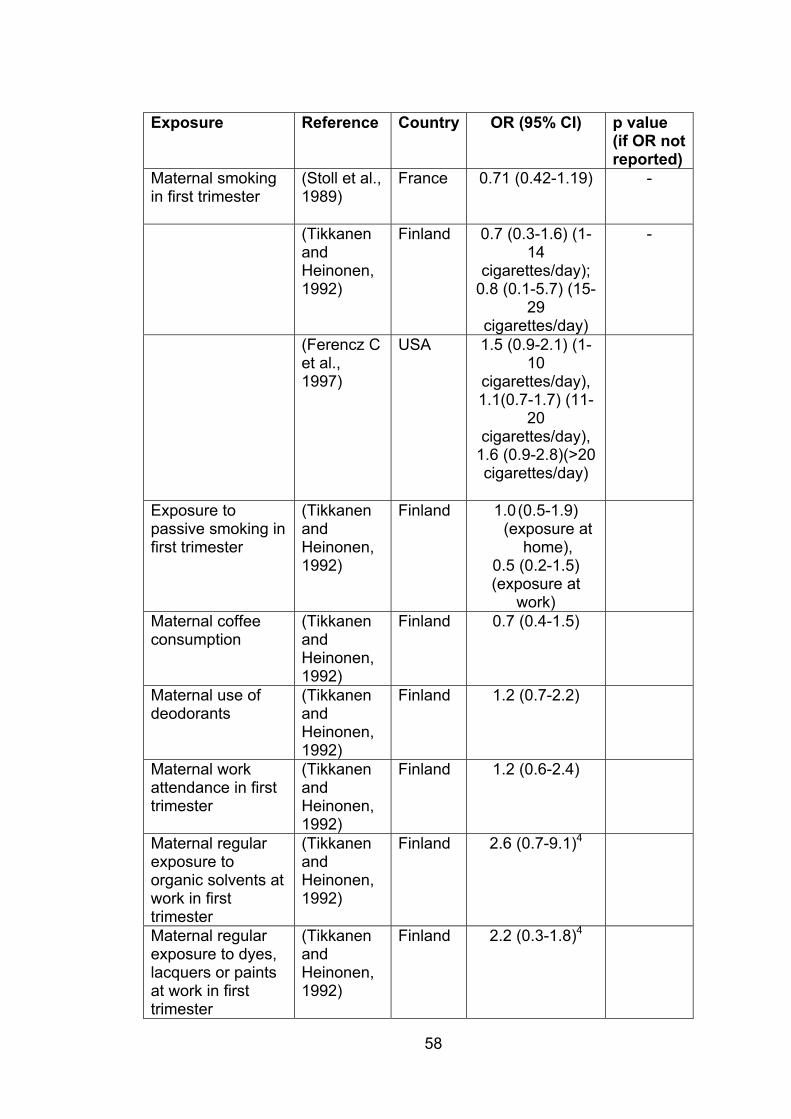
58
Exposure Reference Country OR (95% CI) p value (if OR not reported)
Maternal smoking in first trimester
(Stoll et al., 1989)
France 0.71 (0.42-1.19) -
(TikkanenandHeinonen,1992)
Finland 0.7 (0.3-1.6) (1-14
cigarettes/day);0.8 (0.1-5.7) (15-
29cigarettes/day)
-
(Ferencz Cet al., 1997)
USA 1.5 (0.9-2.1) (1-10
cigarettes/day),1.1(0.7-1.7) (11-
20cigarettes/day),
1.6 (0.9-2.8)(>20 cigarettes/day)
Exposure to passive smoking in first trimester
(TikkanenandHeinonen,1992)
Finland 1.0 (0.5-1.9) (exposure at
home),0.5 (0.2-1.5) (exposure at
work)Maternal coffee consumption
(TikkanenandHeinonen,1992)
Finland 0.7 (0.4-1.5)
Maternal use of deodorants
(TikkanenandHeinonen,1992)
Finland 1.2 (0.7-2.2)
Maternal work attendance in first trimester
(TikkanenandHeinonen,1992)
Finland 1.2 (0.6-2.4)
Maternal regular exposure to organic solvents at work in first trimester
(TikkanenandHeinonen,1992)
Finland 2.6 (0.7-9.1)4
Maternal regular exposure to dyes, lacquers or paints at work in first trimester
(TikkanenandHeinonen,1992)
Finland 2.2 (0.3-1.8)4
59
OR- odds ratio; CI – confidence interval; N/A – not available
1. Maternal age 29 years+ compared with <29 years
2. Anti-nausea medication only
3. Occupational exposure
4. Note significant effect from “exposure to chemicals at work” from same study
As can be seen from these tables, the literature is contradictory at times and
some of the reported significant associations are difficult to interpret or
biologically implausible. A brief discussion of each of these follows.
The data on birth order and parental age are contradictory, with two studies
suggesting later birth order as a risk factor for ASD (Zhan et al., 1991; Ferencz
C et al., 1997) and one suggesting that the first born is at higher risk (Rothman
and Fyler, 1976). Zhan et al find that advanced maternal age is associated with
increased risk, whereas Rothman et al find that lower maternal age is
associated with increaed risk. In a fourth study (Olshan et al., 1994), higher
paternal age is associated with increased risk, but the results are significant
only for a single age range and need to be treated with caution. Nonetheless,
overall it seems likely that late birth order and advancing parental age may be a
minor risk factor for ASD. The mechanism for this is uncertain, as discussed
above.
Tikkanen and Heinonen (Tikkanen and Heinonen, 1991) exhaustively
investigated the possibility that maternal hyperthermia in the first trimester
may contribute to causing CHD. CHD was divided into 5 categories, of which
ASD was one. They studied maternal fever >380C, workplace temperature,
suana bathing (which is very popular in Finland), month of birth (because of the
marked seasonal temperature variations in Finland) and a history of upper
respiratory tract infection and acetylsalicylic acid use as a marker of febrile
illness. The only significant association for ASD was with maternal fever. There
were relatively few positive associations among the other groups of
malformations. Even assuming this is a genuine association, it is not clear

60
whether the putative teratogenic effect relates to the fever per se or to
teratogenic effects of the pathogen responsible for the fever. Two other studies
did not find a relationship between viral upper respiratory tract infections in the
first trimester and ASD (Stoll et al., 1989; Ferencz C et al., 1997), and Stoll et al
also studied fever directly and found no association.
Given the teratogenic effect of ethanol in the fetal alcohol syndrome and of
diabetes in diabetic embryopathy (discussed in 1.4.4.1) it is not surprising that
positive associations with ASD have been reported (Tikkanen J and Heinonen
OP, 1990; Tikkanen and Heinonen, 1992; Ferencz C et al., 1997), although not
all studies confirm a role for ethanol (Ferencz C et al., 1997) or for diabetes
(Stoll et al., 1989). Urinary tract infection and maternal corticosteroid exposure were also identified as risk factors in one study (Ferencz C et al.,
1997). On the other hand, maternal smoking, including passive smoking, has
been extensively studied and no evidence has been found of any link with ASD
(Stoll et al., 1989; Tikkanen and Heinonen, 1992; Ferencz C et al., 1997)
The role of occupational exposures, if any, remains uncertain. Maternal
exposure to chemicals at work was implicated in one study (Tikkanen and
Heinonen, 1992) but not confirmed in another (Stoll et al., 1989). Given the
diversity of chemicals used in workplaces it seems unlikely that a broad
grouping of all chemical exposures would provide meaningful results. When
more specific exposures (organic solvents and dyes, lacquers and paints) were
studied, no association was found (Tikkanen and Heinonen, 1992), but the
numbers exposed were small and it is possible that a larger study would identify
a real causative role for such exposures.
Surprisingly, paternal exposures have also been identified as risk factors.
These include paternal exposure to paint stripping, “miscellaneous solvents”,
and extremely cold temperatures (Ferencz C et al., 1997). Paternal smokingand cocaine use are also significantly associated with ASD (presumably not
usually in an occupational setting) (Ferencz C et al., 1997). Again, it is difficult
to draw a biologically plausible link between such exposures and ASD.
61
Mutagenesis affecting sperm is implausible as a mechanism. It is possible that
these associations represent markers for other factors, such as socioeconomic
status, although there is little direct evidence for that as a significant contributor
(other than an association with low maternal education levels (Ferencz C et al.,
1997).
1.8 Project outline The aim of this project was to add to our understanding of the genetics of CHD,
with a focus on ASD and PFO. Complementary strategies, involving mouse and
man, were used.
In human subjects, two separate studies were undertaken, both focusing on
Mendelian forms of CHD. In the first, subjects with CHD including ASD,PFO
and a variety of other lesions were screened for mutations in the cardiac
transcription factors NKX2-5, GATA4 and TBX20. This work is described in
chapter 3. In the second study, a large family with a previously undescribed
autosomal dominant ASD syndrome was investigated, with clinical evaluation
and an attempt to map the disorder. This is described in chapter 4.
The major mouse study, reported in chapters 5 and 6 involved a QTL study,
using an F2 intercross design. The parental strains were 129T2/SvEms and
QSi5. In addition, an Advanced Intercross Line using the same parental strains
has been bred to completion and ~1000 mice from the final generation (F14)
phenotyped. Analysis of phenotype data from the parental strains and from F1,
F2 and F14 mice is presented in chapter 5. Chapter 6 describes the results of
the QTL study. After this study was completed, 10 additional mouse strains
were phenotyped as part of work towards an analysis based on the recently
published mouse Hapmap data. Phenotype data from these mice are reported
in Chapter 7. Overall conclusions and future directions are discussed in chapter
8.
2. Materials and Methods
2.1 Mouse experiments 2.1.1 Ethics committee approval Animal experiments were performed under Animal Care and Research Ethics
approvals N02/2-2001/1/3336, N02/2-2001/2/3336 and N02/2-2001/3/3336 (for
all studies other than the AIL) and N00/4-2003/1/3745, N00/4-2003/2/3745 and
N00/4-2003/3/3745 (for the AIL) from the University of Sydney.
2.1.2 Animal resources Parental inbred mice were obtained from the Centre for Advanced Technologies
in Animal Genetics and Reproduction, University of Sydney (QSi5), and from
the Garvan Institute (129T2/SvEms). Mice were kept in a rodent facility at the
University of Sydney in a purpose-built air-conditioned room with a 12 hour
light/dark cycle and ad libitum access to food and water until dissection at 6-8
weeks of age. The aim was to dissect at 6 weeks and efforts were made to
keep the age of dissection as close to that as possible. In practice, breeding
production varied from week to week. This resulted in a variable number of mice
reaching the age of 6 weeks in any given week. It was not always possible to
dissect all the available mice in a particular week, and if this happened the
excess mice were kept until they could be dissected.
For the F2 study, a total of 1437 mice (680 female, 757 male) were dissected
on 63 sampling days over a 9 month period. Mean age at dissection was 46.3
days (SD 3.46, range 39-60). Breeding of the AIL took three years and three
months, including the period during which the dissections were done. A total of
1003 AIL F14 mice were dissected on 34 sampling days over a 6 month period,
but data for 27 of these was lost as the result of a motor vehicle accident. Of the
remaining 976 F14 mice, 480 were male and 496 female. Mean age at
dissection was 44.0 days (SD 2.6, range 40-55).
In addition, 75 129T2/SvEms mice and 137 QSi5 mice were dissected, although
data are analyzed in chapter 5 for only 66 of the QSi5 mice. This is because
62
63
only minimal information was recorded about the first 71, which were dissected
as part of learning the dissection technique. Subsequently, 85 F1 mice were
also dissected. An additional 280 mice from the HapMap strains were
dissected. Of these, Ms Noelia Lopez did part or all of the dissections for 232.
Of these, in turn, 147 were co-measured by EK and Ms Lopez (results recorded
by each without knowledge of the other’s measurement), and 28 were
dissected and measured by Ms Lopez and not co-measured by EK. The total
number of mice dissected during the course of this project was 3017.
2.1.3 Breeding protocols 2.1.3.1 F2 mice The initial matings for the F2 mice were between 129T2/SvEms sires and QSi5
dams. The resulting F1 mice were then crossed to produce F2 mice. As the
parental strains were inbred mice, and hence essentially homozygous at every
locus, F1 mice were heterozygous at every locus. As discussed in Chapter 1,
meiotic recombination results in F2 mice inheriting variable contributions from
each of the parental strains. On average, at any given locus, the expected ratio
of alleles in F2 mice should be aa:2ab:bb where a represents the parental allele
from one strain and b the parental allele from the other. The cartoon (Fig 2.1)
illustrates breeding and transmission of alleles for F2 and onwards, as for the
AIL pedigree (see below).
2.1.3.2 Advanced intercross line Initial breeding for the AIL proceeded exactly as for the original F2 resource.
However, breeding then continued for a further 12 generations, and the F14
mice were dissected. Sufficient F2 mice were bred to stock 48 cages, each
containing one male and one female mouse. The offspring of these mice were
the F3 mice, and so on. For the F3 x F3 and subsequent matings, avoiding
inbreeding was essential, to reduce the risk of genetic drift causing loss of
genetic information within the AIL. To avoid brother/sister matings, a system of
cascading matings was used. Wherever possible, a female mouse born in one
cage would be mated with a male mouse from the next cage, and so on, as
illustrated in table 2.1.
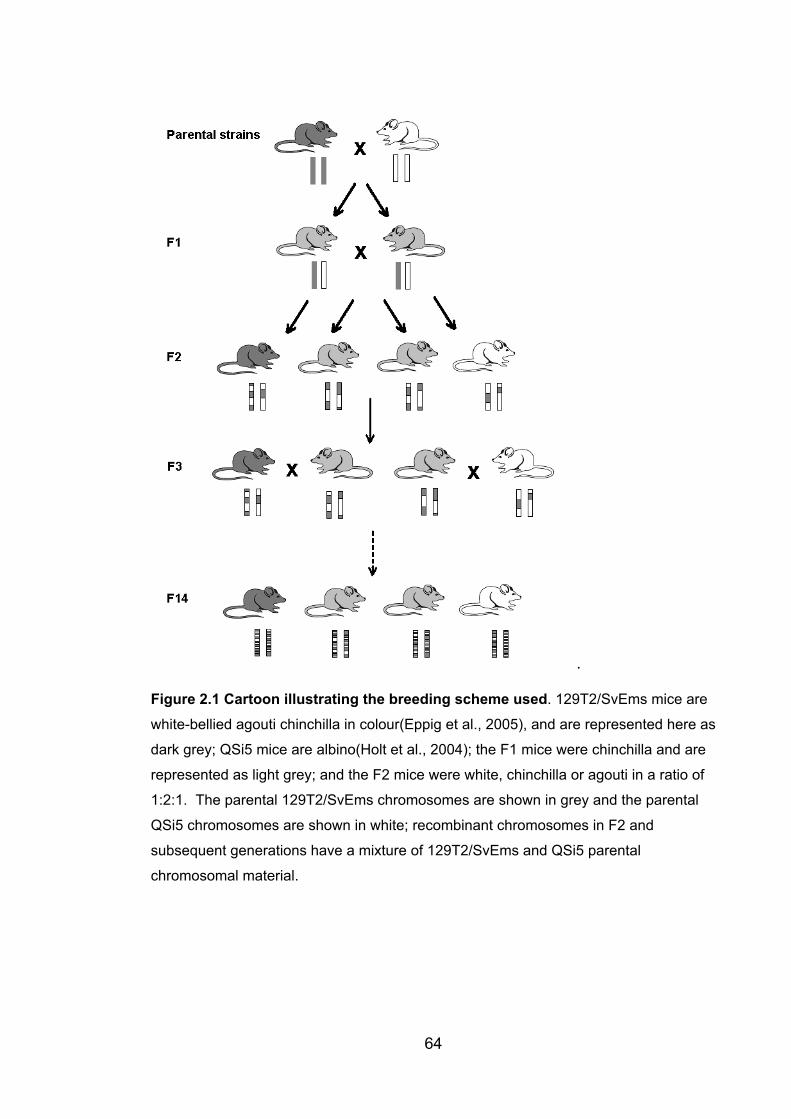
.
Figure 2.1 Cartoon illustrating the breeding scheme used. 129T2/SvEms mice are
white-bellied agouti chinchilla in colour(Eppig et al., 2005), and are represented here as
dark grey; QSi5 mice are albino(Holt et al., 2004); the F1 mice were chinchilla and are
represented as light grey; and the F2 mice were white, chinchilla or agouti in a ratio of
1:2:1. The parental 129T2/SvEms chromosomes are shown in grey and the parental
QSi5 chromosomes are shown in white; recombinant chromosomes in F2 and
subsequent generations have a mixture of 129T2/SvEms and QSi5 parental
chromosomal material.
64
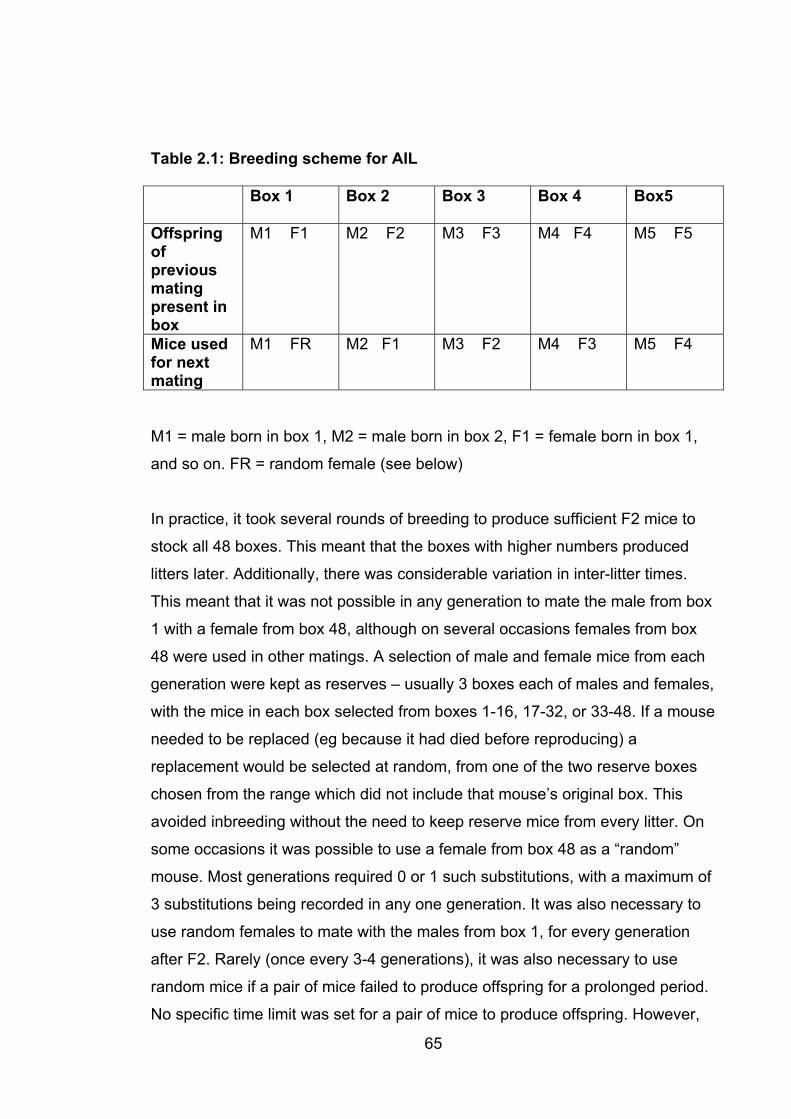
65
Table 2.1: Breeding scheme for AIL
Box 1 Box 2 Box 3 Box 4 Box5
Offspring ofpreviousmatingpresent in box
M1 F1 M2 F2 M3 F3 M4 F4 M5 F5
Mice used for next mating
M1 FR M2 F1 M3 F2 M4 F3 M5 F4
M1 = male born in box 1, M2 = male born in box 2, F1 = female born in box 1,
and so on. FR = random female (see below)
In practice, it took several rounds of breeding to produce sufficient F2 mice to
stock all 48 boxes. This meant that the boxes with higher numbers produced
litters later. Additionally, there was considerable variation in inter-litter times.
This meant that it was not possible in any generation to mate the male from box
1 with a female from box 48, although on several occasions females from box
48 were used in other matings. A selection of male and female mice from each
generation were kept as reserves – usually 3 boxes each of males and females,
with the mice in each box selected from boxes 1-16, 17-32, or 33-48. If a mouse
needed to be replaced (eg because it had died before reproducing) a
replacement would be selected at random, from one of the two reserve boxes
chosen from the range which did not include that mouse’s original box. This
avoided inbreeding without the need to keep reserve mice from every litter. On
some occasions it was possible to use a female from box 48 as a “random”
mouse. Most generations required 0 or 1 such substitutions, with a maximum of
3 substitutions being recorded in any one generation. It was also necessary to
use random females to mate with the males from box 1, for every generation
after F2. Rarely (once every 3-4 generations), it was also necessary to use
random mice if a pair of mice failed to produce offspring for a prolonged period.
No specific time limit was set for a pair of mice to produce offspring. However,
66
there was a policy of not setting up matings for one generation until all matings
for the previous generation had been set up (meaning that there were only ever
a maximum of two generations present in the colony at any one time) and this
influenced the timing of such decisions.
Despite the variability in inter-litter time for individual boxes, the intergeneration
time averaged 11 weeks over the course of the breeding programme, only two
weeks more than the expected minimum inter-litter time of 9 weeks. Fairly
frequently, there were delays of several weeks between one box being ready to
mate and the next box in the series being ready. As weaned litters were not
separated by sex, due to a lack of space, this created the risk that females
would already be pregnant by their littermates at the time of mating. This would
be undesirable as it would lead to inbreeding and loss of genetic information
from the colony. Careful attention was therefore paid to the time between
mating and birth of the first litter of pups in a box; any litters born before 21 days
post-mating were culled.
2.1.4 Mouse phenotyping 2.1.4.1 Initial dissection Mice were killed by asphyxiation in carbon dioxide. Within 15 minutes of death,
the thoracic organs were removed as follows. A nick was made in the
abdominal skin and the skin was firmly distracted rostrally and caudally,
exposing the thorax and abdomen. The xiphisternum was grasped with toothed
forceps and elevated. Using fine scissors, an incision was made below the
xiphisternum and this was extended laterally on each side in an arc through the
rib cage (convex laterally), leaving the sternum and the portions of the ribs
attached to it anchored proximally and by the diaphragm, but otherwise
unattached. The diaphragm was divided and the flap containing sternum and
attached rib ends reflected upwards and caudally. The heart and lungs were
gently lifted to expose the great vessels and oesophagus. These were then
firmly grasped with non-toothed forceps and cut distally to the forceps. Firm
upwards traction on the great vessels and oesophagus allowed rapid dissection
of the structures passing through the thoracic inlet, with removal en bloc of the
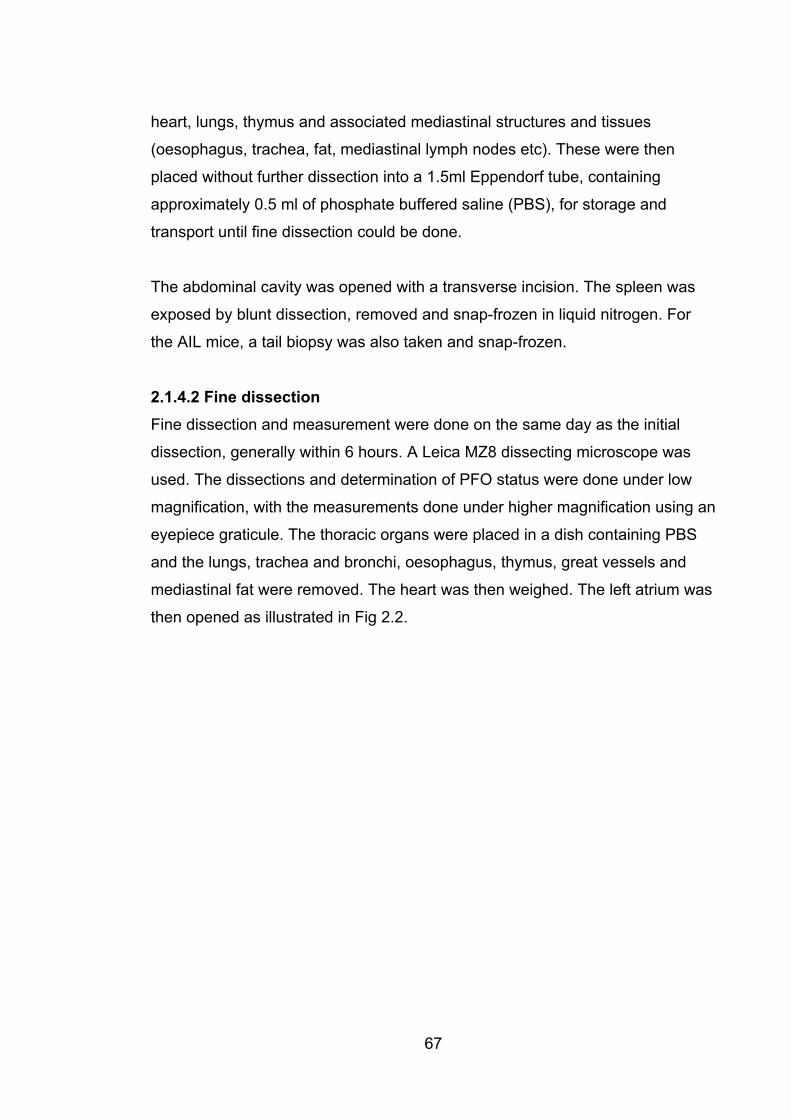
67
heart, lungs, thymus and associated mediastinal structures and tissues
(oesophagus, trachea, fat, mediastinal lymph nodes etc). These were then
placed without further dissection into a 1.5ml Eppendorf tube, containing
approximately 0.5 ml of phosphate buffered saline (PBS), for storage and
transport until fine dissection could be done.
The abdominal cavity was opened with a transverse incision. The spleen was
exposed by blunt dissection, removed and snap-frozen in liquid nitrogen. For
the AIL mice, a tail biopsy was also taken and snap-frozen.
2.1.4.2 Fine dissection Fine dissection and measurement were done on the same day as the initial
dissection, generally within 6 hours. A Leica MZ8 dissecting microscope was
used. The dissections and determination of PFO status were done under low
magnification, with the measurements done under higher magnification using an
eyepiece graticule. The thoracic organs were placed in a dish containing PBS
and the lungs, trachea and bronchi, oesophagus, thymus, great vessels and
mediastinal fat were removed. The heart was then weighed. The left atrium was
then opened as illustrated in Fig 2.2.
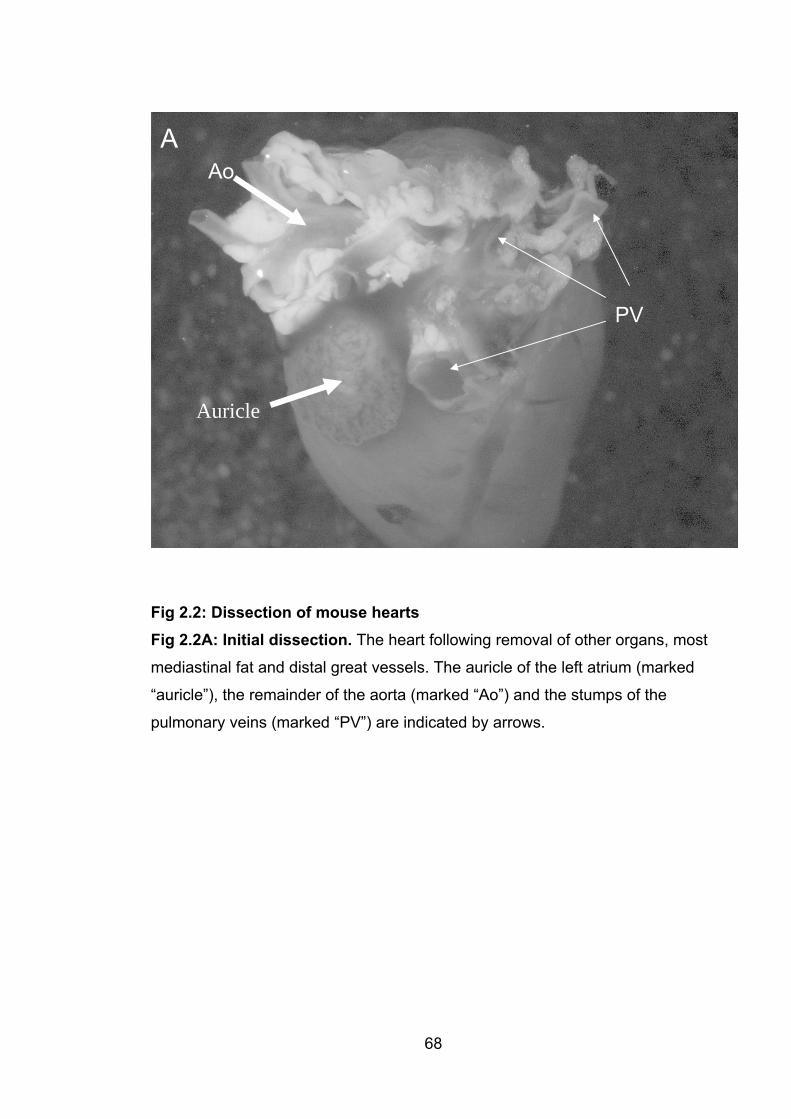
A
68
Fig 2.2: Dissection of mouse hearts Fig 2.2A: Initial dissection. The heart following removal of other organs, most
mediastinal fat and distal great vessels. The auricle of the left atrium (marked
“auricle”), the remainder of the aorta (marked “Ao”) and the stumps of the
pulmonary veins (marked “PV”) are indicated by arrows.
Auricle
Ao
PV
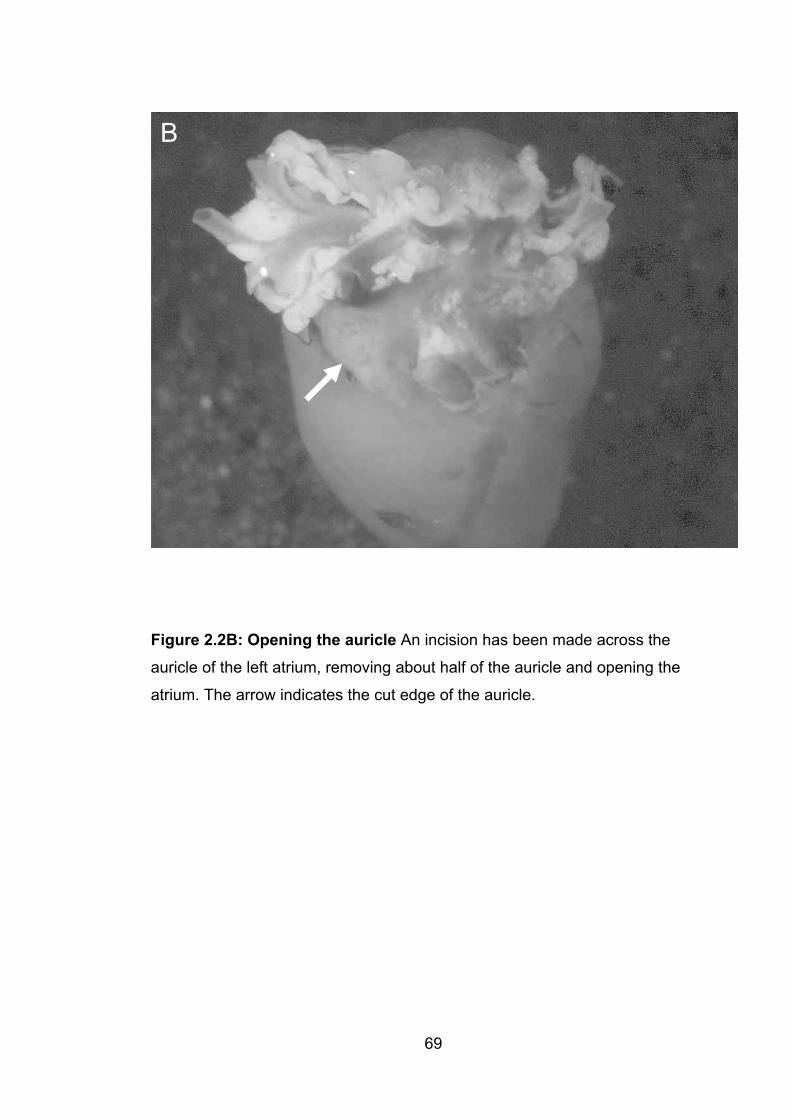
B
Figure 2.2B: Opening the auricle An incision has been made across the
auricle of the left atrium, removing about half of the auricle and opening the
atrium. The arrow indicates the cut edge of the auricle.
69
C
Figure 2.2C: Laying open the atrium. Fine dissecting scissors are inserted
through the opening created by the previous step. The lower blade is kept in as
superficial a position as possible to avoid damage to the atrial septum. A cut is
made to open the atrium. This is extended through the proximal pulmonary
veins for maximum exposure of the septum. Throughout the dissection the
heart is held in position by a needle (indicated by arrow) inserted through the
apex of the heart into the foam backing material.
70
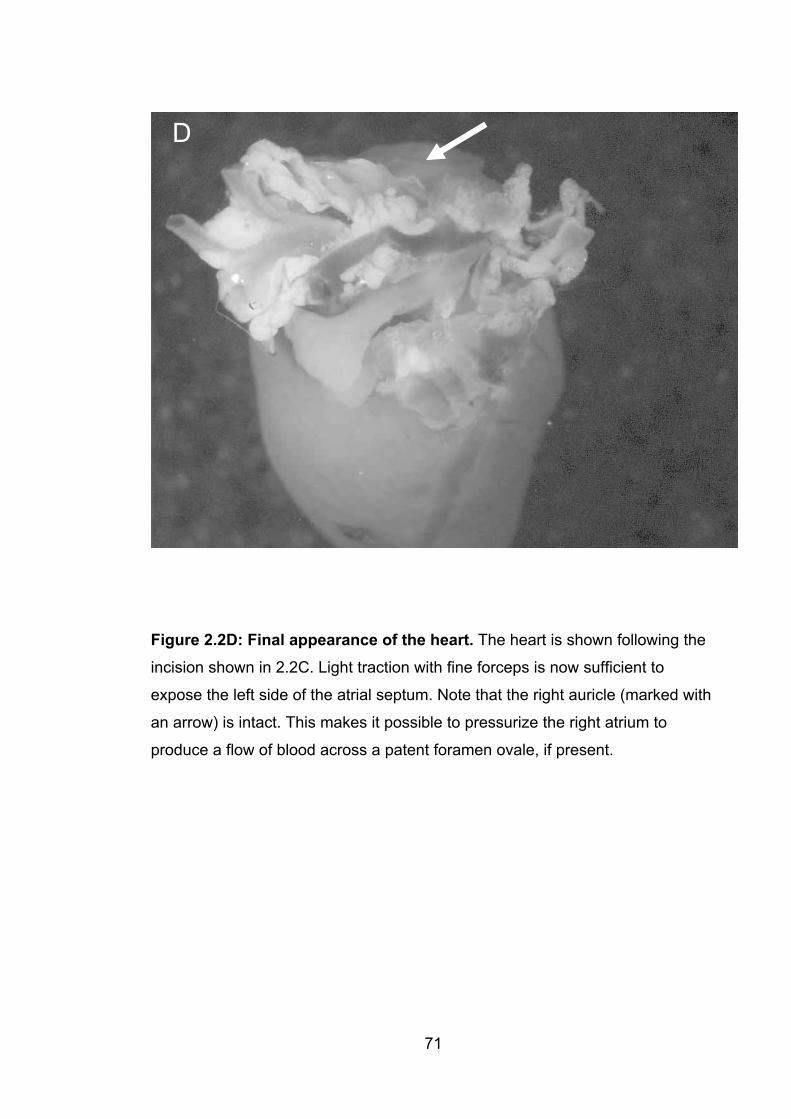
D
Figure 2.2D: Final appearance of the heart. The heart is shown following the
incision shown in 2.2C. Light traction with fine forceps is now sufficient to
expose the left side of the atrial septum. Note that the right auricle (marked with
an arrow) is intact. This makes it possible to pressurize the right atrium to
produce a flow of blood across a patent foramen ovale, if present.
71
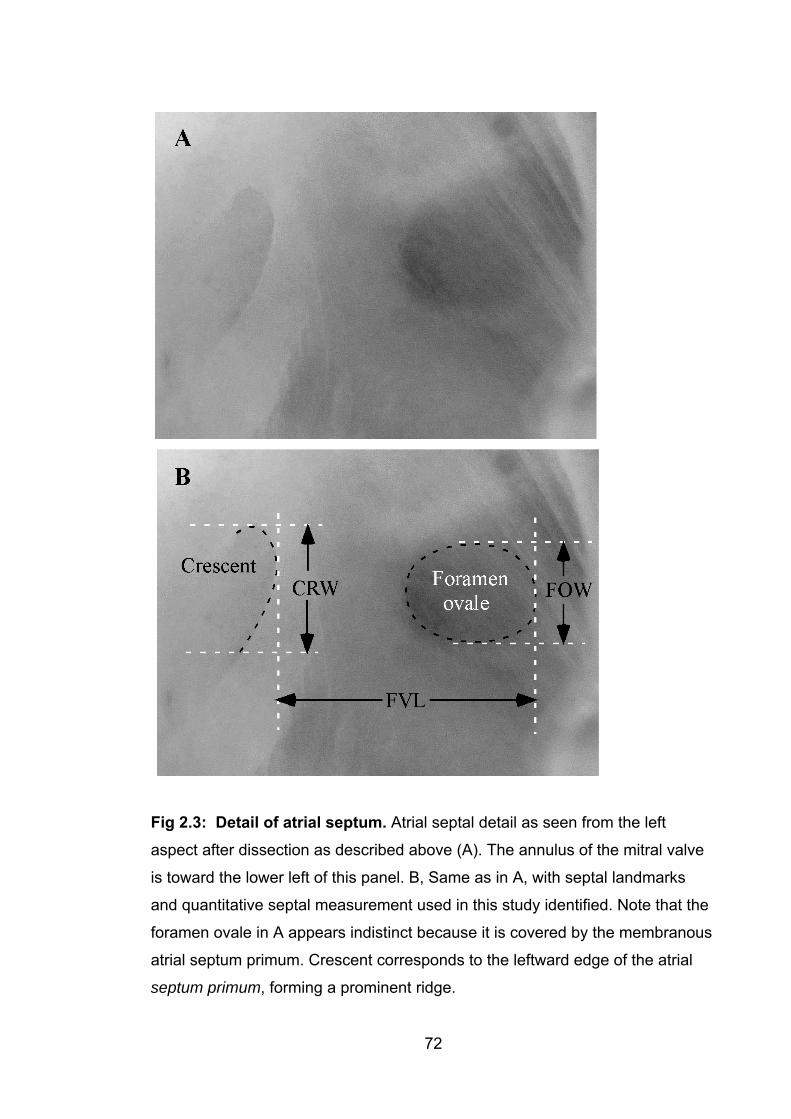
Fig 2.3: Detail of atrial septum. Atrial septal detail as seen from the left
aspect after dissection as described above (A). The annulus of the mitral valve
is toward the lower left of this panel. B, Same as in A, with septal landmarks
and quantitative septal measurement used in this study identified. Note that the
foramen ovale in A appears indistinct because it is covered by the membranous
atrial septum primum. Crescent corresponds to the leftward edge of the atrial
septum primum, forming a prominent ridge.
72
73
2.1.4.3 Identification of patent foramen ovale As described in Fig. 2.2, the integrity of the right atrium was protected during
dissection so that it was possible to pressurize the atrium and use the remaining
blood contained in it to determine whether a PFO was present. If present, blood
would pass across the septum, emerging to the left of the crescent with the
heart in the orientation illustrated above. The amount of blood passing across
the septum varied considerably, from free passage of large quantities of blood
without pressurization of the right atrium down to tiny quantities of blood, visible
only after careful and repeated pressurization of the right atrium. On rare
occasions, Orange G dye was injected into the left superior vena cava under
pressure, to supplement the use of the atrial blood as described above. This
was usually done when repeated pressurization of the atrium had exhausted the
available blood in the atrium and there was still a question as to whether a PFO
was present.
2.1.4.4 Measurements of atrial septal anatomy Measurements were done using an eyepiece graticule. Care was taken to
orientate the atrial septum perpendicularly to the observer’s line of sight, to
avoid parallax error. It was necessary to use dissecting forceps to hold the cut
edges of the atrium apart in order to expose the atrial septum. As the septum is
a highly elastic structure, measurements could be altered considerably by the
amount of force used to expose the septum. An excess of stretch would result
in falsely high measurements. Considerable attention was therefore directed
towards maintaining a consistent amount of stretch, with the aim being to use
the minimum amount of force necessary to fully expose the area of interest.
2.1.4.5 Blinding On the first day of dissections of the parental strains (129T2/SvEms and Qsi5)
an attempt was made to do dissections blinded to the strain of the mice. All
hearts for the day were placed in a plastic bag and each tube containing a heart
was removed with its number concealed. The heart was dissected and only
once all measurements were recorded was the number checked. However,
blinding to strain proved impossible. The two strains had such different atrial
74
septal wall morphology that the strain of the mouse being dissected was
instantly obvious once the atrium was opened. Attempts at blinding were
therefore discontinued for this pair of strains. For the Hapmap strains,
measurements by EK were generally done blinded to strain. Since there was no
prior information about the phenotypes for each strain, observer-introduced bias
is unlikely.
For dissections of the F2 and AIL mice, the genotypes of the mice were
unknown at the time of dissection, so blinding was not a consideration.
2.1.5 Strain selection for F2 and AIL studies As described in section 1.6.5, previous work by Christine Biben and colleagues
(Biben et al., 2000) had established that different strains of inbred laboratory
mice have varying cardiac septal anatomy, with a particularly close relationship
between mean flap valve length (FVL) and incidence of PFO (Biben et al.,
2000) (this study is discussed in detail in section 5.2). This measure formed the
basis for strain selection for this study. Strains evaluated by Biben et al included
FVB/N, 129T2/SvEms, C57Bl6, and Swiss QS (the latter is not an inbred strain),
as well as crosses of several of these strains and mice heterozygous for an
Nkx2-5 null mutation. Of the wild-type strains and crosses, the shortest flap
valve lengths were seen in 129T2/SvEms and the longest in FVB/N.
In addition to these strains, for this study a further inbred strain, QSi5, was
evaluated. This strain was developed at the University of Sydney with selection
for high fecundity and short inter-litter interval (Holt et al., 2004). The large
numbers of mice needed for this study made this superior reproductive
performance desirable. QSi5 proved to have the longest flap valve length of any
strain assessed, with FVL of 1.13mm (SD 0.11). Although FVB/N had a lower
incidence of PFO (FVB/N: 0 of 51, 0%, as opposed to QSi5: 3 of 66, 4.5%) the
combination of the long FVL and reproductive characteristics led to the choice
of QSi5 as one of the parental strains for the study. The other strain used,
129T2/SvEms, had the highest incidence of PFO (21 of 31, 75%) and shortest
FVL (0.6mm, SD 0.11). Although data on the characteristics of 129T2/SvEms

75
were already available, a further 75 129T2/SvEms mice were dissected at the
beginning of the study, to confirm the characteristics of the strain, and to
provide baseline measures for FOW and CRW, measurements which are
slightly different from those used in the study of Biben et al (Biben et al., 2000).
2.2 Human subjects2.2.1 Ethics committee approval Human experiments were conducted under Human Research Ethics Committee
approval from the South East Health Research Ethics Committee – Eastern
Division (approval no 99/261), the St Vincent’s Hospital Research Ethics
Committee (approval no H01/076) and the Children’s Hospital at Westmead
Research Ethics Committee (approval no 2003/049).
2.2.2 Ascertainment of subjects 2.2.2.1 Children Children were recruited from Sydney Children’s Hospital (SCH) and the
Children’s Hospital at Westmead (CHW). SCH subjects were recruited
retrospectively by searching the records of the cardiology department for
individuals with a diagnosis of ASD, and excluding those who had other
significant cardiac pathology. There was no selection on the basis of family
history, extracardiac pathology or the presence of abnormalities of cardiac
conduction. CHW patients were recruited prospectively by a cardiac surgeon
(Dr David Winlaw) by approaching patients with congenital heart disease (CHD)
during outpatient clinics. Again, there was no selection of subjects other than on
the basis of confirmed CHD.
2.2.2.2 Adults Adult subjects were recruited prospectively from St Vincent’s Hospital and St
Vincent’s Private Hospital. Most were recruited at the time that they were having
trans-oesophageal echocardiography (TOE). A number of different cardiologists
were involved, but Prof Michael Feneley was the main driving force behind this
recruitment effort.
76
2.2.2.3 Numbers of subjects studied for mutations in NKX2-5 and GATA4
In this study, a total of 146 individuals were screened for mutations in NKX2-5.
Subjects were unselected for familial disease and the proposal was to test the
significance of NKX2-5 mutations in common CHD and its prevalence among
familial cases, focusing on ASD and PFO. Recruitment at this stage of the study
came from St Vincent’s Hospital and Sydney Children’s Hospital. Additionally,
following the identification of one subject with HLHS and a mutation in NKX2-5,
a group of 18 children with HLHS recruited via the Children’s Hospital-San
Diego and US HLHS support group was included. Subjects with PFO were
recruited at the time of investigation for cryptogenic stroke, and thus represent a
group likely to have relatively severe forms of PFO.
A total of 129 subjects with ASD, 109 with other types of CHD, 59 with PFO
ascertained during investigation of cryptogenic stroke, and 29 with PFO
ascertained during investigation for reasons other than stroke had GATA4
sequencing performed, including the exons and intron/exon boundaries.
2.2.2.4 Follow-up of family members Whenever a possible or definite mutation was identified in a family, as many
first degree relatives as possible were recruited, and depending on the results
of testing of those individuals, more distant relatives were also sometimes
recruited.
2.2.3 History For all children recruited at Sydney Children’s Hospital, and for all subjects in
whom a possible or definite mutation was identified, plus the members of their
families, a detailed clinical history was taken. This included details of cardiac
malformations, other malformations, pregnancy history, growth, developmental
progress and any prior investigations. Permission was obtained to review
hospital medical records when possible. For adult subjects recruited at St
Vincent’s Hospital or St Vincent’s Private Hospital, a more limited history was
taken by cardiology staff which included cardiac history (malformations,
77
arrhythmias, surgical or other procedures), and family history. Ethnicity was not
recorded initially but part way through recruitment this began to be recorded
and previously-recruited subjects were re-contacted to obtain this information.
Age and sex were recorded for all subjects.
2.2.4 Examination All children recruited at Sydney Children’s Hospital had a full clinical
examination by EK and/or Dr Fiona McKenzie. This included attention to
presence of dysmorphic features, examination of limbs including palmar and
plantar creases, palate, genitalia, skin, nails, teeth and hair. Examination of the
hands included close inspection for radial ray anomalies, with the thenar
eminences, thumbs and nails being closely examined, and comparison being
made between the two sides for evidence of asymmetry. A record was kept of
all examination findings.
Adults generally had a more limited clinical examination. All probands were
examined by a cardiologist. Relatives of probands were examined by a clinical
geneticist (the author) but it was often not appropriate to do as thorough an
examination as was possible for children. This was in part because many of
these examinations were carried out during the course of home visits without a
chaperone present. In some cases examinations were conducted in unusual
circumstances; several members of one family were examined (and had blood
taken) in the food storage and preparation area of the family’s grilled chicken
shop. Another woman had history taken, limited clinical examination done and
blood taken, all in the lobby of a large hotel, where she was attending a
conference. The reason for this was that she was seen during a short trip to
Brisbane and there was a limited window of opportunity for meeting her. Two
other members of the same family were examined in a back room of the family
business, a carpet warehouse. Notwithstanding this, the minimum examination
for such patients included examination of upper limbs (with attention to the
radial ray as described above) and a dysmorphological assessment of the face,
head and neck, plus inspection of palate, exposed skin, teeth, nails and hair.
78
Trips were made to Wollongong, Nowra, Canberra, Newcastle, Grafton,
Lismore, the Gold Coast and Brisbane for the purpose of recruiting subjects.
Numerous home visits were also done within the Sydney metropolitan area.
Despite this a small number of subjects could not be examined because they
lived in remote areas. For these individuals, a history was taken by telephone
and medical records were obtained.
2.2.5 Investigations All subjects had at least electrocardiography (ECG) and transthoracic
echocardiography. Most of the adult probands had TOE as well. These
investigations were interpreted wherever possible by one of the collaborating
cardiologists – Drs Owen Jones and Robert Justo and the cardiologists at
Children’s Hospital at Westmead, especially A/Prof Gary Sholler (paediatric
patients) and Prof Michael Feneley (adult patients), however in some instances
access was gained to the records of assessments done by other cardiologists.
Dr Michael Tsicalas assessed several members of the family described in
Chapter 4. Other investigations were arranged from time to time, if clinically
indicated. Two subjects had a standard blood karyotype done using routine
methods in service laboratories, and one had FISH for 22q11 deletion.
2.3 Molecular genetics methods 2.3.1 Extraction of DNA from human blood and mouse spleens Genomic DNA was extracted from human blood and mouse spleens using
modified salt precipitation protocols derived from the method of Miller et al
(Miller et al., 1988).
2.3.1.1 DNA extraction from mouse spleens All tubes used at each stage of this procedure were pre-labelled with the unique
identification number assigned to the mouse from which the spleen had been
taken.
1. Preparation of spleen tissue
Following sampling (described above), the spleens were stored in liquid
nitrogen until the time of DNA extraction. On removal from the storage tube, the
79
spleen was placed on a dissection platform lined with clean foil. A segment of
partially-thawed spleen weighing approximately 30mg (corresponding to a piece
roughtly 3mm x 3mm x 3mm in size) was cut off using a new surgical blade.
The remainder of the spleen was re-frozen.
2. Differential red cell lysis.
The 30mg sample of spleen was transferred into a 1.5mL Eppendorf tube and
soaked in 600�L of NH4Cl lysis buffer (NH4Cl 160mM, KHCO310mM, di-sodium
EDTA 0.4mM) for 24 hours at room temperature.
3. Nucleated cell lysis
The supernatant (which contained the red cell lysate) was removed. The
remaining splenic tissue was then homogenized using a DNAase-free
micropestle (SST). 600�L of TNES (50mM Tris-HCl pH 7.5, 400mM NaCl,
20mM EDTA, 0.5% SDS) was added, with 30�L of proteinase K (20mg/mL).
The sample was then briefly vortexed and placed in a 500C water bath for
overnight incubation.
4. Protein precipitation
200�L of 5M NaCl solution was added to the Eppendorf tube and the sample
was mixed by vortexing, and then centrifuged at 13 000 rpm for 8 minutes.
5. DNA precipitation
The supernatant (which should at this point be clear) was transferred to a
second 1.5mL Eppendorf tube, with care being taken to avoid transferring any
precipitate. 600�L of 100% ethanol was added to the supernatant and inverted
gently several times. At this point condensed DNA strands would be visible
within the liquid in the tube.
6. Removal of excess salt
200�L of 70% ethanol was placed in a third Eppendorf tube. A clean yellow
disposable pipette tip was used to transfer the DNA from the previous tube into
the 70% ethanol. The tube which now contained the DNA was then centrifuged
at 13 000 rpm for 3 minutes in a benchtop centrifuge, leaving a DNA pellet
firmly attached to the bottom of the tube. The ethanol was gently tipped out of
the tube and the sample left to air-dry for 30-60 minutes.
80
7. Dissolving and storage of DNA
300�L of 1x TE buffer was then added to the DNA pellet, and the DNA was left
to stand at room temperature for 1-2 weeks.
The concentration of DNA in the sample was then determined by
spectrophotometry.
2.3.1.2 DNA extraction from blood 1. Sample collection, transport and storage
Peripheral blood samples were collected by venesection using standard
techniques, and placed in tubes containing EDTA as an anticoagulant. Sample
collection from children was facilitated by the use of Emla cream (lignocaine
25mg/g and prilocaine 25mg/g, Astrazeneca) as a local anaesthetic agent,
applied 60 minutes before venesection. In some instances local pathology
services collected blood from subjects resident in remote areas. However,
wherever possible, arrangements were made to visit areas where subjects lived
in order to examine subjects and collect blood, as described in section 2.2
above. Samples were transported at room temperature.
2. Sample labelling
The initial sample tube was labelled with at least two identifying pieces of
information – usually study identification number, name and date of birth.
Intermediate tubes used during the process of DNA extraction were labelled
with the identification number only. The final tube in which the extracted DNA
was stored was labelled with the identification number, date of birth of the
subject, date of extraction and concentration of DNA as determined by
spectrophotometry.
3. Red cell lysis
A biological safety cabinet class II was used for handling blood samples. The
blood was transferred from the EDTA-containing tube into a 50mL screw-cap
centrifuge tube. For every 10mL of whole blood, 40mL of NH4Cl lysis buffer was
added (NH4Cl 160mM, KHCO3 10mM, di-sodium EDTA 0.4mM). The sample
and lysis buffer were mixed well by inversion and allowed to stand for 30-120
minutes at room temperature, inverted once more during this time to ensure
81
thorough mixing. The sample was then centrifuged for 10min at 3500rpm. The
supernatant was discarded, leaving a white cell pellet in the bottom of the tube.
5mL of NH4Cl lysis buffer was then added and the pellet was resuspended by
vigorous shaking or vortexing. A further 30mL of NH4Cl lysis buffer was added
and the tube shaken hard to ensure resuspension of the pellet. The sample was
again centrifuged for 10min at 3500rpm, and the supernatant discarded.
Optional: at this stage, if required, the sample could be stored at –200C for
future completion of DNA extraction.
4. Nucleated cell lysis
The white cell pellet was resuspended in 1-2mL (1mL if the pellet was small) of
TE lysis buffer (Tris-HCl 200mM, di-sodium EDTA 5mM). 30�L of Proteinase K
(10mg/mL) was added and the sample mixed with gentle shaking. 100�L of
10% SDS solution was added and mixed by gentle shaking. The sample was
then incubated overnight in a water bath at 500C.
5. Protein precipitation
The next day, the sample was taken from the water bath and cooled to 40C in a
refrigerator. 700�L of ammonium acetate (5M) was added to the sample and
the sample was shaken vigorously for approximately 20 seconds. It was then
centrifuged for 10min at 5000rpm.
6. DNA precipitation
The supernatant was transferred to a clean 20mL screwcap container and two
volumes (4mL) of 95% ethanol added. Gentle mixing caused strands of DNA to
condense and become visible. The DNA was then removed using a 1�L
disposable microbiological loop and washed with 70% ethanol while still on the
loop to remove excess salt. The DNA was then transferred to a 1.5ml screwcap
tube and air dried for 1-5 minutes. Sterile TE (100�L per 5mL of blood in the
original sample) was then added and the sample allowed to stand overnight to
allow the DNA to dissolve.
82
The DNA concentration was then measured by spectrophotometry, and the
sample stored at –200C.
2.3.4 Polymerase chain reaction (PCR) and sequencing of NKX2-5 andGATA4
2.3.4.1 PCR of NKX2-5
Initially the two exons of NKX2-5 were amplified in separate PCR reactions.
Results for exon 1 were generally good but amplification and sequencing of
exon 2 were problematic, possibly due in part to the high GC content of this
exon. Subsequently the Expand PCR system (Roche) was used to amplify both
exons and the intron in a single amplicon. Genomic DNA was diluted to a
working concentration of 100ng/�L and this stock was used in PCR.
Reaction mixture (per sample):
Template DNA 1�L
Expand polymerase 0.75�L
10x Expand buffer 5�L
10mM dNTPs 2.5�L
Oligonucleotide PF1
(concentration 50ng/�L) 2.5 �L
Oligonucleotide PR1
(concentration 50ng/�L) 2.5 �L
dH2O 35.75 �L
83
The following cycling conditions were used:
950C for 1min: 30sec
940C for 30 sec
680C for 2 min
(10 cycles)
940C for 20 sec
680C for 2 min +5 sec/cycle
(24 cycles)
720C for 5 min
(1 cycle)
DNA purification
The PCR products were purified using the Qiaquick PCR purification kit
(Qiagen) according to the manufacturer’s instructions.
Sequencing of NKX2-5: second method
Sequencing was done using the BigDye sequencing mix (ABI). Oligonucleotide
concentration was 25ng/�L
Reaction mixture (per sample):
PCR product 6�L
Oligonucleotide
(S1R, S1F, S2R, or S2F) 1�L
CSA buffer 3�L
BigDye sequencing mix 4�L
dH2O 6�L
84
CSA buffer: 200mM Tris pH9, 5mM MgCL
Cycling conditions:
960C for 2 minutes
960C for 10 sec
500C for 10 seconds
600C for 4 min
(25 cycles)
2.3.4.2 PCR of Exon 5 of GATA4
The AmpliTaq Gold PCR system (ABI) was used to amplify exon 5 of GATA4.
Genomic DNA was diluted to a working concentration of 100ng/�L and this
stock was used in PCR.
Reaction mixture (per sample):
Template DNA 0.7�L
AmpliTaq polymerase 0.1�L
10x buffer (Buffer II) 1.5�L
5mM dNTPs 0.6�L
Oligonucleotide G1
(concentration 50ng/�L) 0.5�L
Oligonucleotide G2
(concentration 50ng/�L) 0.5�L
MgCl2 0.8�L
dH2O 10.5�L
85
The following cycling conditions were used:
940C for 11min
(1 cycle)
940C for 10 sec
600C for 45 sec
720C for 1 min
(35 cycles)
720C for 5 min
(1 cycle)
DNA purification
The PCR products were purified using the Qiaquick PCR purification kit
(Qiagen) according to the manufacturer’s instructions.
Sequencing of GATA4
Sequencing was done using the BigDye sequencing mix (ABI). Oligonucleotide
concentration was 25ng/�L
Reaction mixture (per sample):
PCR product 5�L
Oligonucleotide (G1) 1�L
CSA buffer 2�L
BigDye sequencing mix 2�L
CSA buffer: 200mM Tris pH9, 5mM MgCL
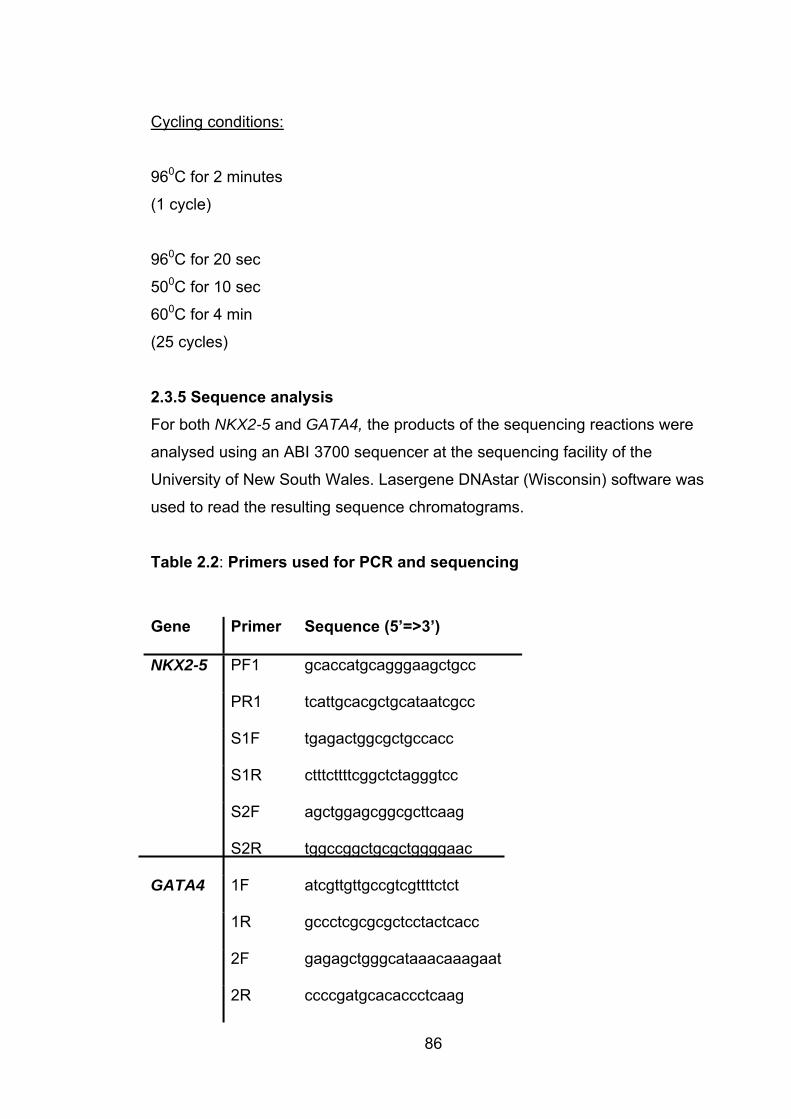
Cycling conditions:
960C for 2 minutes
(1 cycle)
960C for 20 sec
500C for 10 sec
600C for 4 min
(25 cycles)
2.3.5 Sequence analysis For both NKX2-5 and GATA4, the products of the sequencing reactions were
analysed using an ABI 3700 sequencer at the sequencing facility of the
University of New South Wales. Lasergene DNAstar (Wisconsin) software was
used to read the resulting sequence chromatograms.
Table 2.2: Primers used for PCR and sequencing
Gene Primer Sequence (5’=>3’)
NKX2-5 PF1 gcaccatgcagggaagctgcc
PR1 tcattgcacgctgcataatcgcc
S1F tgagactggcgctgccacc
S1R ctttcttttcggctctagggtcc
S2F agctggagcggcgcttcaag
S2R tggccggctgcgctggggaac
GATA4 1F atcgttgttgccgtcgttttctct
1R gccctcgcgcgctcctactcacc
2F gagagctgggcataaacaaagaat
2R ccccgatgcacaccctcaag
86
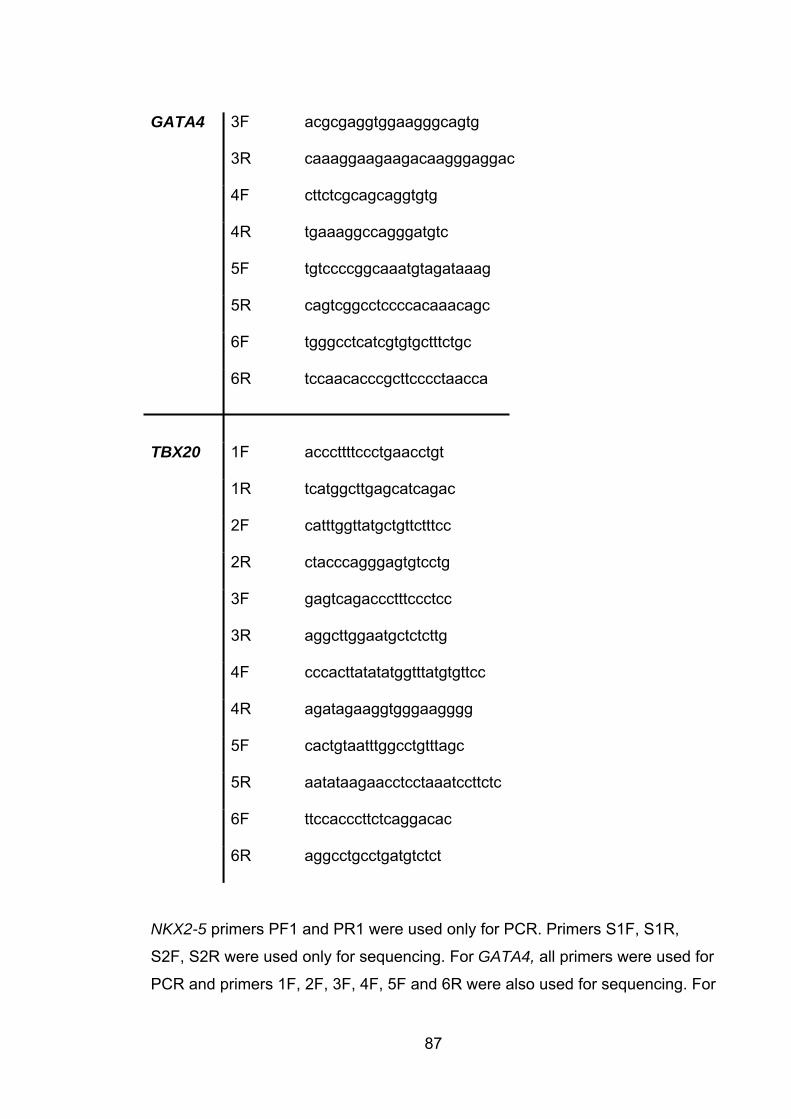
GATA4 3F acgcgaggtggaagggcagtg
3R caaaggaagaagacaagggaggac
4F cttctcgcagcaggtgtg
4R tgaaaggccagggatgtc
5F tgtccccggcaaatgtagataaag
5R cagtcggcctccccacaaacagc
6F tgggcctcatcgtgtgctttctgc
6R tccaacacccgcttcccctaacca
TBX20 1F acccttttccctgaacctgt
1R tcatggcttgagcatcagac
2F catttggttatgctgttctttcc
2R ctacccagggagtgtcctg
3F gagtcagaccctttccctcc
3R aggcttggaatgctctcttg
4F cccacttatatatggtttatgtgttcc
4R agatagaaggtgggaagggg
5F cactgtaatttggcctgtttagc
5R aatataagaacctcctaaatccttctc
6F ttccacccttctcaggacac
6R aggcctgcctgatgtctct
NKX2-5 primers PF1 and PR1 were used only for PCR. Primers S1F, S1R,
S2F, S2R were used only for sequencing. For GATA4, all primers were used for
PCR and primers 1F, 2F, 3F, 4F, 5F and 6R were also used for sequencing. For
87
88
TBX20, all primers were used for PCR and 1F, 2R, 3F, 4R, 5R and 6R were
used for sequencing
2.4 Microsatellite analysis All microsatellite analyses were performed by a commercial service, the
Australian Genome Research Facility (AGRF), in Melbourne, Australia.
2.5 Marker selection 2.5.1 Human Markers A standard set of 382 autosomal markers used by the AGRF (selected from the
Genethon linkage map) were used in human mapping studies. An additional 5
markers were used in a second round of (fine) mapping, to investigate an area
of interest on chromosome 1. The average intermarker distance in the initial
genome screen was 9.0cM. The markers used are shown in Chapter 4, tables
4.1a –4.22.
2.5.2 Mouse Markers Candidate microsatellites were selected from the Whitehead Institute database
and from local resources, and their informativeness confirmed by screening with
DNA from the parental mouse strains. This was done by gel electrophoresis at
the AGRF (as detailed below) and by polyacrylamide gel electrophoresis and
autoradiography at the Victor Chang Cardiac Research Institute, with this being
done largely by Dr Changbaig Hyun. Eighty-nine markers were selected to span
the mouse genome, yielding an average intermarker distance of ~17cM. The
markers used are shown in Chapter 6 (Table 6.1).
2.6 Laboratory methods used at AGRF Microsatellites were amplified under standard conditions. Each PCR reaction
was carried out in a total volume of 6ul. Reactions were amplified using a PTC-
225 DNA Engine Tetrad (MJ Research) and PCR products pooled to run more
than one marker per lane. Primers were fluorescently labelled with the
fluorescent dyes FAM, HEX and TET. Gel electrophoresis was done using
0.2mm denaturing polyacrylamide gels, 4.5%. PCR product (1uL) was
89
electrophoresed for 2.8 hours on an Applied Biosystems 377 DNA Sequencer,
with the size standard TAMRA 500 (Red) applied to each gel. Genescan
software Version 3.1.2 (AB) was used to assign tracking for each sample lane.
Files were then imported into Genotyper Version 2.1 (AB) software in order to
interpret the electropherogram and assign genotypes.
2.7 Error checking All genotypes were machine scored and then manually checked by AGRF staff.
The majority of the markers used performed well and it was possible to use the
genotype information directly as provided by the AGRF, following this process.
However, the data quality was checked, as described below.
2.7.1 Error Checking of Human Data In the analysis of the human data the main assurance of data quality was
confirmation of Mendelian segregation of markers within the family. There were
only 8 genotypes with apparent non-Mendelian segregation. These were re-
examined and four were found to be due to incorrect reading of the original
trace, two were probable new mutations and two were probable null alleles. The
data were adjusted appropriately before analysis.
2.7.2 Error Checking of Mouse Data It was possible to examine the data quality for each mouse marker by
comparing the observed ratios of the three possible genotypes (homozygous for
the QSi5 allele, heterozygous, homozygous for the 129T2/SvEms allele) with
the expected ratio of 1:2:1. A Chi-square test was performed to compare the
observed with expected ratios. On review of the data, 9 markers gave results
not consistent with Mendelian segregation of alleles. The expected ratio was
1:2:1 and the following markers had results which were highly significantly
different from this ratio: D1Mit26, D3Mit41, D16Mit38, D2Mit83, D2Mit265,
D5Mit125, D7Mit67, D11Mit62, and D14Mit125. On review of results for these
markers it emerged that 96 of the genotypes for D1Mit26 had been incorrectly
copied from proprietary software to Microsoft Excel; correction of these
genotypes resulted in a return to Mendelian ratios.
90
In addition to the manual checking of the machine calls described above, all
genotypes for D16Mit38 and a selection (~10% of genotypes) for each of the
remaining 8 markers were manually checked in Sydney (by the author). It was
found that D16Mit38 performed well and that calling by AGRF of the genotypes
had been accurate. The deviation from Mendelian patterns in this case was less
marked than in most of the other suspect markers and it appears that in this
instance the skewed distribution of alleles occurred by chance. It is unlikely to
have been caused by overrepresentation of a phenotype-associated allele, as
both extremes of the phenotype distributions were selected for genotyping –
thus any such effect should have been balanced out.
The remaining markers, D3Mit41, D2Mit83, D2Mit265, D5Mit125, D7Mit67,
D11Mit62, and D14Mit125 all proved to have performed poorly at the
genotyping stage despite having appeared suitable during marker evaluation. In
each case one or both alleles amplified inconsistently, leading to a high number
of miscalls which could not be corrected with repeated genotyping.
Replacement markers were therefore selected for D3Mit41, D2Mit83, D2Mit265,
D5Mit125, D7Mit67, D11Mit62, and D14Mit125. The replacement markers were
D3Mit147, D2Mit235, D2Mit517, D5Mit71, D7Mit74, D11Mit71, and D14Mit7,
respectively.
2.8 Statistical methods 2.8.1 Basic statistical analyses All basic statistical analyses including calculations of mean values, standard
deviations, correlation coefficients, chi square calculations, t-tests and analysis
of variance (ANOVA) using the general linear model (GLM) were performed
using Minitab V14.1 (Minitab, Inc).
91
2.9 Linkage analysis 2.9.1 Linkage analysis for autosomal dominant trait Linkage analysis in the family with dominant ASD and Marcus Gunn
Phenomenon was done using the MLINK and LINKMAP programs within the
LINKAGE software package (Lathrop and Lalouel, 1988). Allele frequency data
generated in Australian subjects were used. These were generously provided
by the CRC for Discovery of Genes for Common Diseases.
2.9.2 QTL analysis 2.9.2.1 Selective Genotyping As discussed in section 1.4.2.3, selective genotyping of animals at the
extremes of the phenotypic distribution has advantages in terms of cost and
study power (Lander and Botstein, 1989) In this study, therefore, the top and
bottom deciles for each of FVL and FOW (corrected for sex and week of
gestation) were genotyped, a total of 466 mice, selected from the 1328 F2 mice
with complete records.
The relationship between other traits for which data were recorded (age, sex,
week of dissection, coat colour, body weight and heart weight) and the cardiac
phenotypes of interest is discussed in detail in Chapter 5.
2.9.2.2 Linkage analyses Linkage analyses were performed using the Mapmaker/QTL package (Lander
and Botstein, 1989). This program performs interval mapping using a maximum
likelihood estimation algorithm, as discussed in section 1.4.2.4. It is particularly
advantageous for analysis of a selectively genotyped population, because
provided that the phenotypic data for all individuals are included (with the
genotypes for individuals not in the extremes entered as “missing”), the program
can accurately estimate the effect sizes of QTL. This is in contrast to most other
available QTL mapping programs. Important consequences would arise from
the use of a program not designed with selective genotyping in mind. The main
issue is that as all the phenotype data is from individuals with extreme
phenotypes, effect sizes will be overestimated. This was seen in practice when

the linkage analyses were performed in parallel with the Mapmanager QTXb13
software (Manly and Olson, 1999), which uses a regression-based algorithm but
cannot handle missing genotype data. Although this program confirmed the
location of the QTL detected using Mapmaker/QTL, the effect sizes were
overestimated as predicted.
2.9.2.3 Binary trait analysis As discussed in Chapter 1.4.1.1, PFO can be viewed as essentially a binary
trait (PFO is either present or absent). As such it is intrinsically less informative
and more difficult to analyze from a quantitative genetic perspective than a
continuously distributed trait. However, the large amount of data available in this
study made it practicable to conduct such an analysis. This was done by Dr
Peter Thomson, using an approach (detailed below) and software developed by
him.
For binary analysis of PFO, the model took the form
( ) ( ) ( )log sex1
QQ Qq qqiM i i i i
i
p ax dx axp
� �� � �� � � � �� �
or equivalently,
( ) ( ) ( )
11 exp[ ( sex )]i QQ Qq qq
M i i i i
pax dx ax
�� � � �� � � �
where pi is the probability that an animal has PFO, sexi is a 0 or 1 indicator
variable for sex (male = 1, female = 0), and ( )QQix , ( )Qq
ix and ( )qqix are u
0 or 1 indicator variables indexing the QTL genotype (QQ, Qq, or qq) with ( ) (QQ Qqi ix x� hat the Q allele refers to the 129T2/SvEms line,
while the q allele refers to the QSi5 line. The parameters a and d refer to
additive and dominance effects of the 129T2/SvEms allele, on the logit scale.
nobserved
Note t) ( ) 1qqix� � .
92
Because the QTL genotypes indicator variables are unobserved, the model is
fitted as a three-component mixture, with mixing probabilities
� �( ) ( ) 1|QQ QQi iP x� � � mi , � �( ) ( ) 1|Qq Qq
i iP x� � � mi , and � �( ) ( ) 1|qq qqi iP x� � � mi , with
, where these are the conditional probabilities of the QTL
genotype, given the flanking marker genotypes, mi. These are calculated in a
standard way for an inbred F2 design.
( ) ( ) ( ) 1QQ Qq qqi i i� � � � � �
As a protection against spurious results, QTL “peaks” with LOD > 2 were
checked by selecting the nearest marker and performing a standard (non-
mixture) logistic regression,
( ) ( ) (log sex1
)MM MmiM i i i i
i
p ax dx axp
� �� � �� � � � �� �
mm ,
where the ( )MMix , ( )Mm
ix and ( )mmix are the (observed) 0-1 indicator variables for
the marker genotypes.
93
3. The role of mutations in the cardiac transcription factors NKX2-5, GATA4 and TBX20 in causing CHD and cardiomyopathy
3.1 Introduction It is now 10 years since the genetic basis of rare Mendelian forms of CHD
began to be elucidated, with the identification of mutations in TBX5 in Holt-
Oram syndrome (Basson et al., 1997). Subsequently, mutations were found in
NKX2-5 (Schott et al., 1998), GATA4 (Garg et al., 2003), MYH6 (Ching et al.,
2005) and ACTC (Matsson H et al., 2005) in families with nonsyndromal
autosomal dominant ASD. The discovery of causes for rare forms of CHD
naturally raises the question: could mutations in the same genes cause
common CHD? Moreover, the fact that TBX5, NKX2-5 and GATA4 interact
during early development, and MYH6 and ACTC are downstream targets of the
other known ASD genes, raises the question: could other genes which interact
with them also be associated with dominant ASD? This chapter represents a
partial answer to these questions, with investigation of a large number of
individuals with ASD and other forms of CHD to determine whether they
harbour mutations in each of NKX2-5, GATA4 and TBX20. The latter was a
candidate gene based on its known interactions with NKX2-5 and TBX5 (see
section 1.5.3).
The chapter is divided into three sections, one for each of these three genes.
Because the work has been progressing over a period spanning the years
2000-2007, the number of subjects studied for each gene was different.
3.2 Mutations in NKX2-5 cause autosomal dominant CHD and AV conduction blockMutations in human NKX2-5 were first identified by Schott and colleagues in
1998 (Schott et al., 1998). They described four families, each with multiple
individuals affected by CHD and/or AV conduction block, in which NKX2-5
mutations segregated with the cardiac phenotype. In this and subsequent
94
95
reports, the AV block associated with NKX2-5 mutations has been noted to
become progressively more severe with age (Schott et al., 1998; Gutierrez-
Roelens I et al., 2002). Although ASD was the main form of CHD in all four
families, there were a number of other malformations including VSD, tetralogy
of Fallot, subvalvular aortic stenosis, pulmonary atresia and redundant mitral
valve leaflets with fenestrations. This and subsequent reports have led to
identification of a total of 35 germline mutations in NKX2-5. The mutations
identified to date are summarized in Table 3.1.
The results of the study described here (reported in (Elliott et al., 2003)) are not
included in the table. The intriguing findings of Dentice and colleagues (Dentice
et al., 2006), are not included because the study was not of CHD. They noted
expression of Nkx2-5 during thyroid development in the mouse. This led them to
screen 241 individuals with thyroid dysgenesis for mutations in NKX2-5. Three
missense mutations were found, two of which were not found in 561 healthy
controls, and one of which was found once among the 561 controls. One of the
affected individuals had mild mitral valve regurgitation, but otherwise they did
not have CHD or conduction abnormalities. In each family, there was at least
one heterozygote who was clinically normal. Thus, if these are pathogenic
changes, the penetrance for thyroid disease associated with them must be low.
Mutations in the related gene NKX2-1 have been identified in patients with
congenital hypothyroidism (Devriendt et al., 1998). A homozygous mutation in
NKX2-6 has also been found to cause common arterial trunk in a large
consanguineous family (Heathcote et al., 2005).
Also not included in the table are the reports by Reamon-Buettner and
colleagues of multiple somatic NKX2-5 mutations in complex CHD seen in
fomalin-fixed hearts, part of a museum collection (Reamon-Buettner and Borlak,
2004; Reamon-Buettner et al., 2004; Reamon-Buettner and Borlak, 2006). The
authors argue that the lack of mutations in healthy tissue and the lack of
mutations in other, non-cardiac specific genes in the same samples confirm that
these are genuine mutations and not artefact. Nonetheless, testing of formalin-
fixed tissues, stored for decades, is fraught with difficulty and these results must
96
be viewed with caution until they are replicated by another group, preferably in
fresh tissue obtained at surgery. The only attempt to do this to date has been
inconclusive, with no somatic mutations found in 19 subjects undergoing
surgery for bicuspid aortic valve (Majumdar et al., 2006).
This represents only weak evidence against a role for somatic NKX2-5
mutations in CHD, however, as bicuspid aortic valve is not one of the typical
lesions associated with NKX2-5 mutations, although it is more frequent in mice
heterozygous for an Nkx2-5 mutation (Biben et al., 2000). Of the 35 NKX2-5
mutations summarized above, 21 are missense mutations, 6 are nonsense
mutations, 6 are frameshift mutations, one a splice site mutation and one an in-
frame deletion of a single amino acid. However, of the missense mutations,
there is currently limited evidence for pathogenicity for R25C, E21Q, A219V,
K15I, Q22P, A63V, A127E, R126C, and P275T. The single amino acid deletion
�N291 is also of uncertain significance. For all of these mutations, there is
either demonstrated nonpenetrance in the setting of only a small number of
affected individuals (in most cases only one), or no information is available
about the mutation status of family members other than the proband, with no
family history of CHD. It is striking that all of the other 12 missense mutations,
including all missense mutations identified as the result of study of families with
multiple individuals affected by CHD, are located within the homeodomain.
It remains possible that the missense mutations located outside the
homeodomain are pathogenic. The identification of these sequence variants in
a relatively large number of individuals with CHD, but not in controls, makes it
likely that this is the case for at least some of them. The absence of family
history does not exclude the possibility that other family members have
unrecognised CHD. Some or all may be proven pathogenic on study of
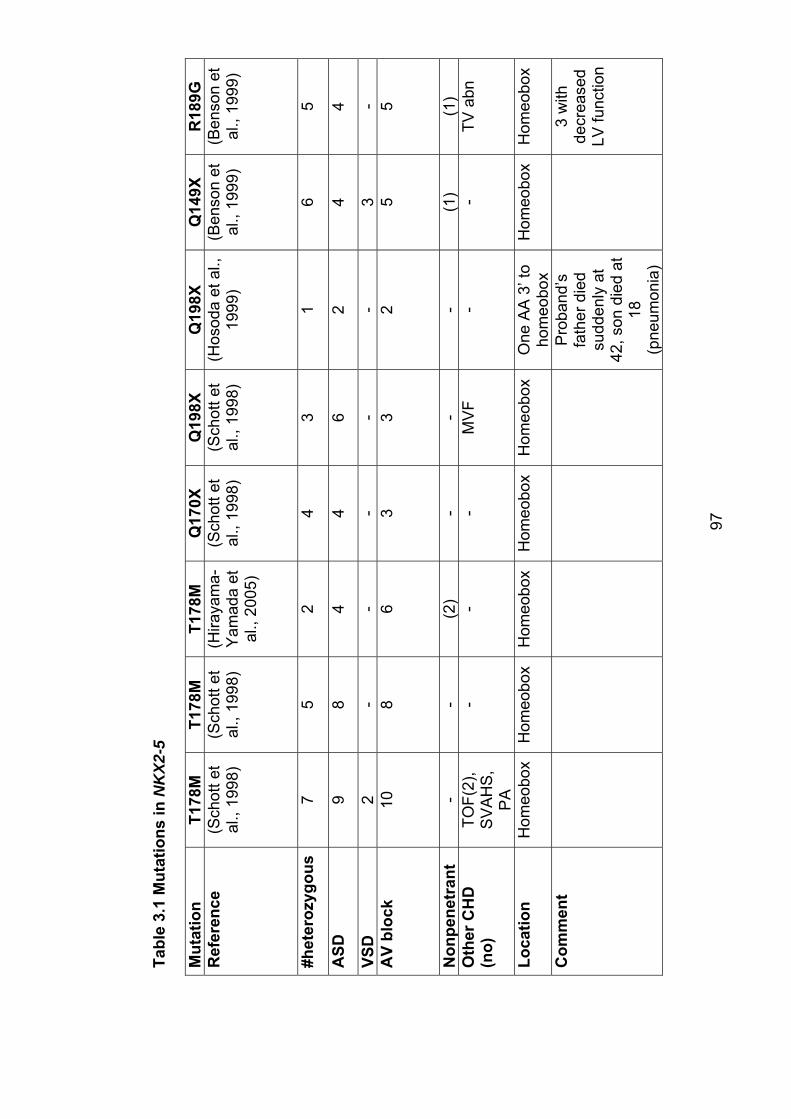
Tabl
e 3.
1 M
utat
ions
in N
KX2
-5
Mut
atio
nT1
78M
T178
MT1
78M
Q17
0XQ
198X
Q19
8XQ
149X
R18
9G
Ref
eren
ce
(Sch
ott e
t al
., 19
98)
(Sch
ott e
t al
., 19
98)
(Hira
yam
a-Y
amad
a et
al
., 20
05)
(Sch
ott e
t al
., 19
98)
(Sch
ott e
t al
., 19
98)
(Hos
oda
et a
l.,
1999
) (B
enso
n et
al
., 19
99)
(Ben
son
et
al.,
1999
)
#het
eroz
ygou
s
75
24
31
65
ASD
98
44
62
44
VSD
2-
--
--
3-
AV
bloc
k 10
86
33
25
5
Non
pene
tran
t-
-(2
)-
--
(1)
(1)
Oth
er C
HD
(n
o)TO
F(2)
,S
VA
HS
,P
A
--
-M
VF
--
TVab
n
Loca
tion
Hom
eobo
xH
omeo
box
Hom
eobo
xH
omeo
box
Hom
eobo
xO
ne A
A 3
’ to
hom
eobo
xH
omeo
box
Hom
eobo
x
Com
men
tP
roba
nd’s
fath
er d
ied
sudd
enly
at
42, s
on d
ied
at
18(p
neum
onia
)
3 w
ith
decr
ease
dLV
func
tion
97
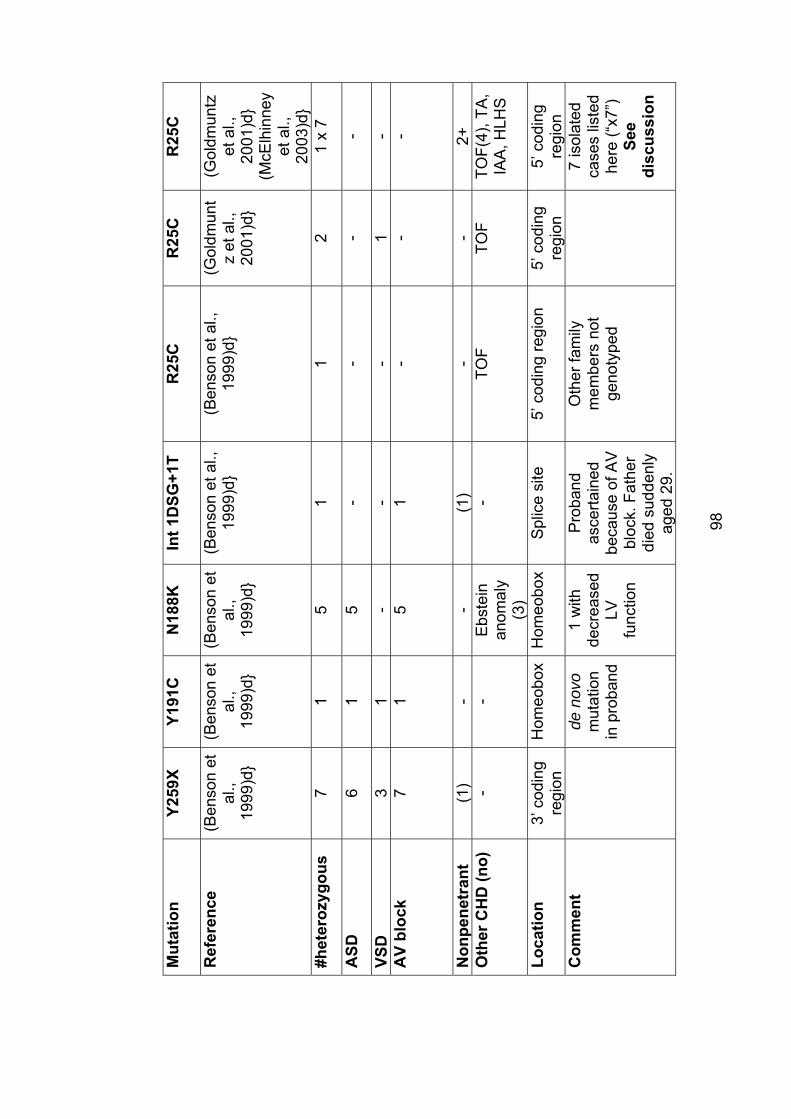
Mut
atio
nY2
59X
Y191
CN
188K
Int 1
DSG
+1T
R25
CR
25C
R25
C
Ref
eren
ce
(Ben
son
et
al.,
1999
)d}
(Ben
son
et
al.,
1999
)d}
(Ben
son
et
al.,
1999
)d}
(Ben
son
et a
l.,
1999
)d}
(Ben
son
et a
l.,
1999
)d}
(Gol
dmun
tz
et a
l.,
2001
)d}
(Gol
dmun
tzet
al.,
20
01)d
} (M
cElh
inne
yet
al.,
20
03)d
} #h
eter
ozyg
ous
7
15
11
21
x 7
ASD
61
5-
--
-
VSD
31
--
-1
-A
V bl
ock
71
51
--
-
Non
pene
tran
t(1
)-
-(1
)-
-2+
Oth
er C
HD
(no)
-
-E
bste
inan
omal
y(3
)
-TO
FTO
FTO
F(4)
,TA
,IA
A, H
LHS
Loca
tion
3’ c
odin
g re
gion
Hom
eobo
xH
omeo
box
Spl
ice
site
5’
cod
ing
regi
on
5’ c
odin
g re
gion
5’ c
odin
g re
gion
Com
men
tde
nov
om
utat
ion
in p
roba
nd
1 w
ith
decr
ease
dLV
func
tion
Pro
band
asce
rtain
edbe
caus
e of
AV
bl
ock.
Fat
her
died
sud
denl
y ag
ed 2
9.
Oth
er fa
mily
m
embe
rs n
ot
geno
type
d
7 is
olat
ed
case
s lis
ted
here
(“x7
”) Se
edi
scus
sion
98
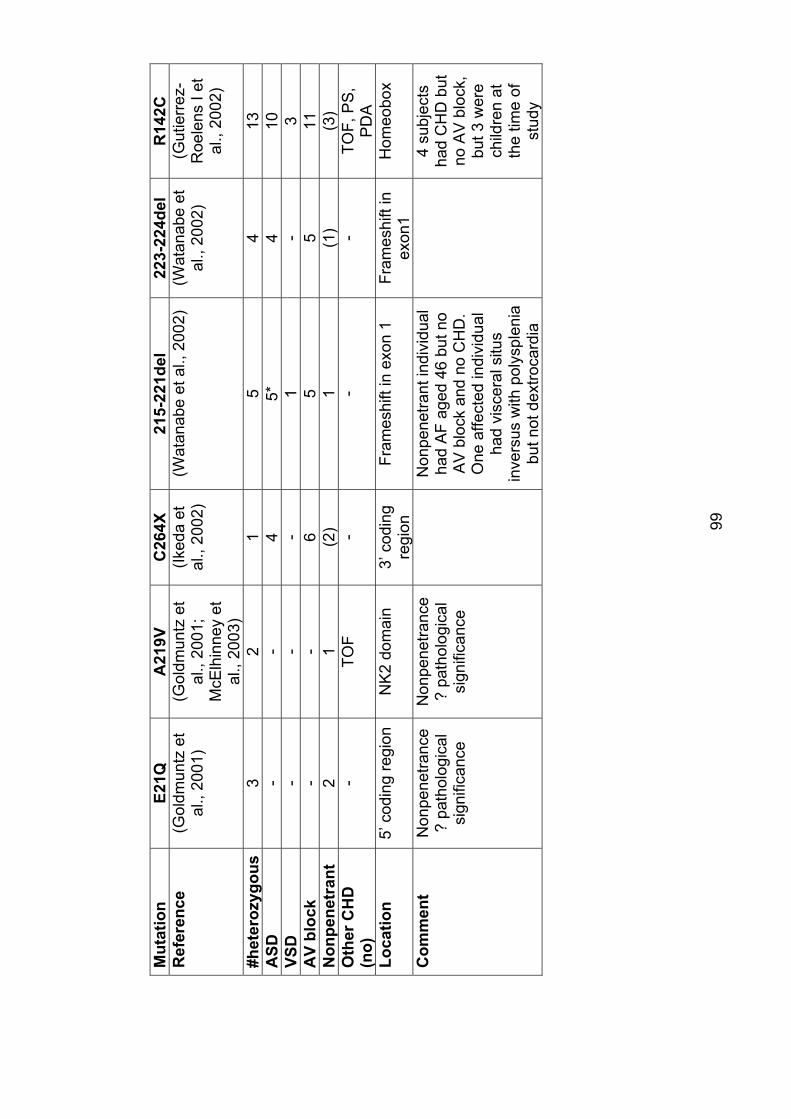
Mut
atio
nE2
1QA
219V
C26
4X21
5-22
1del
22
3-22
4del
R
142C
Ref
eren
ce
(Gol
dmun
tz e
t al
., 20
01)
(Gol
dmun
tz e
t al
., 20
01;
McE
lhin
ney
et
al.,
2003
)
(Iked
a et
al
., 20
02)
(Wat
anab
e et
al.,
200
2)
(Wat
anab
e et
al
., 20
02)
(Gut
ierr
ez-
Roe
lens
I et
al
., 20
02)
#het
eroz
ygou
s
32
15
413
ASD
--
45*
410
VSD
--
-1
-3
AV
bloc
k -
-6
55
11N
onpe
netr
ant
21
(2)
1(1
)(3
)O
ther
CH
D
(no)
-TO
F-
--
TOF,
PS
,P
DA
Loca
tion
5’ c
odin
g re
gion
NK
2 do
mai
n 3’
cod
ing
regi
onFr
ames
hift
in e
xon
1 Fr
ames
hift
in
exon
1H
omeo
box
Com
men
tN
onpe
netra
nce
? pa
thol
ogic
al
sign
ifica
nce
Non
pene
tranc
e?
path
olog
ical
si
gnifi
canc
e
Non
pene
trant
indi
vidu
al
had
AF
aged
46
but n
o A
V b
lock
and
no
CH
D.
One
affe
cted
indi
vidu
al
had
visc
eral
situ
s in
vers
us w
ith p
olys
plen
ia
but n
ot d
extro
card
ia
4 su
bjec
ts
had
CH
D b
ut
no A
V b
lock
, bu
t 3 w
ere
child
ren
at
the
time
of
stud
y
99
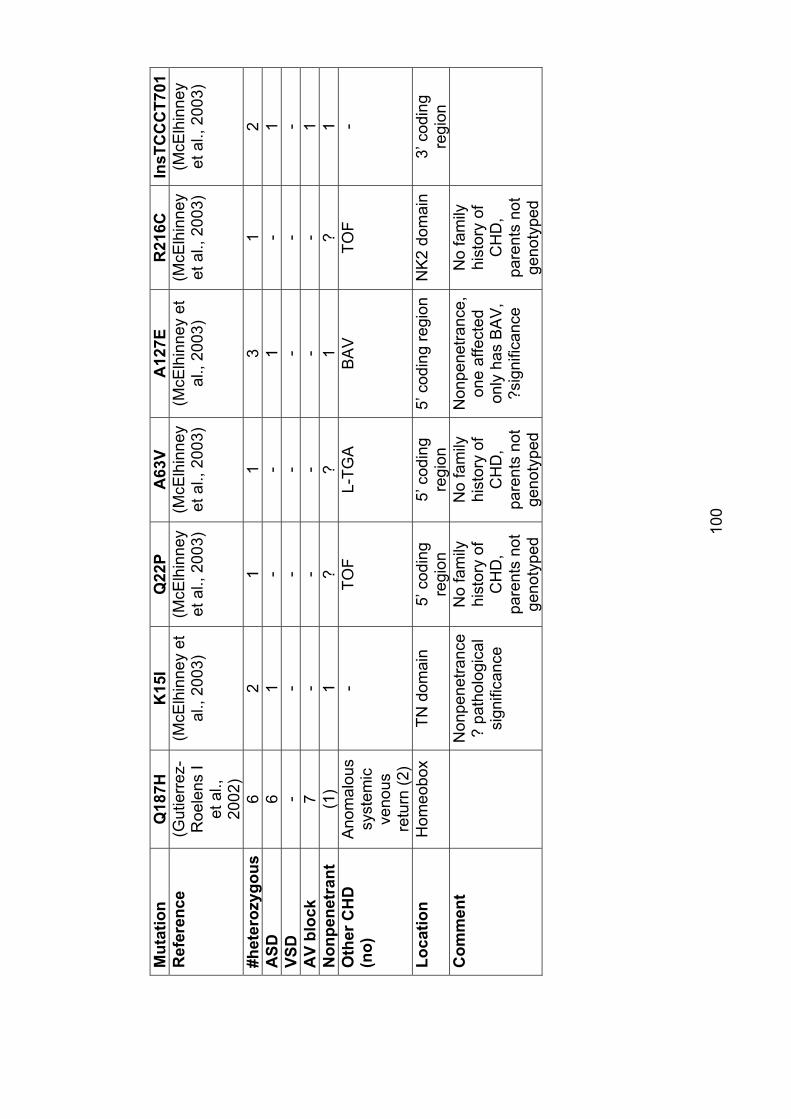
Mut
atio
nQ
187H
K15
IQ
22P
A63
VA
127E
R21
6C
InsT
CC
CT7
01
Ref
eren
ce
(Gut
ierr
ez-
Roe
lens
I et
al.,
20
02)
(McE
lhin
ney
et
al.,
2003
) (M
cElh
inne
yet
al.,
200
3)
(McE
lhin
ney
et a
l., 2
003)
(M
cElh
inne
y et
al
., 20
03)
(McE
lhin
ney
et a
l., 2
003)
(M
cElh
inne
yet
al.,
200
3)
#het
eroz
ygou
s
62
11
31
2A
SD6
1-
-1
-1
VSD
--
--
--
-A
V bl
ock
7-
--
--
1N
onpe
netr
ant
(1)
1?
?1
?1
Oth
er C
HD
(n
o)A
nom
alou
s sy
stem
icve
nous
retu
rn (2
)
-TO
FL-
TGA
BA
VTO
F-
Loca
tion
Hom
eobo
xTN
dom
ain
5’ c
odin
g re
gion
5’ c
odin
g re
gion
5’ c
odin
g re
gion
NK
2 do
mai
n3’
cod
ing
regi
onC
omm
ent
Non
pene
tranc
e ?
path
olog
ical
si
gnifi
canc
e
No
fam
ily
hist
ory
of
CH
D,
pare
nts
not
geno
type
d
No
fam
ily
hist
ory
of
CH
D,
pare
nts
not
geno
type
d
Non
pene
tranc
e,on
e af
fect
ed
only
has
BA
V,
?sig
nific
ance
No
fam
ily
hist
ory
of
CH
D,
pare
nts
not
geno
type
d
100
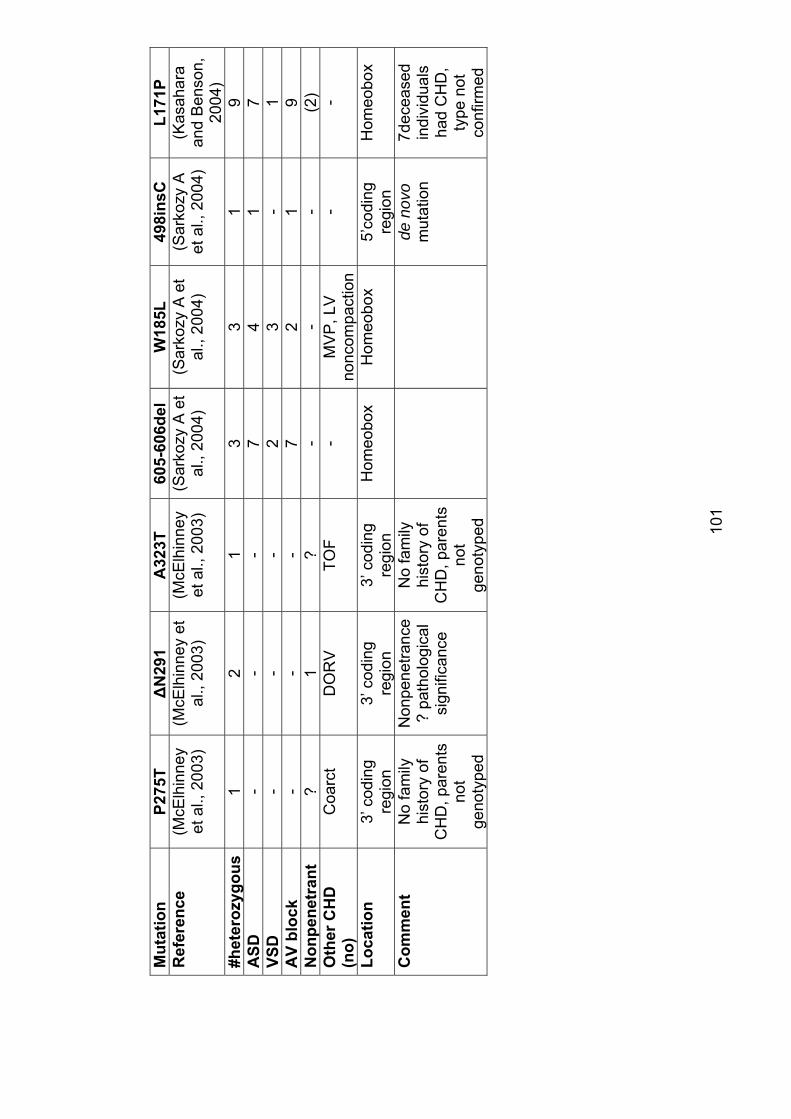
Mut
atio
nP2
75T
�N
291
A32
3T
605-
606d
el
W18
5L
498i
nsC
L171
PR
efer
ence
(M
cElh
inne
yet
al.,
200
3)
(McE
lhin
ney
et
al.,
2003
) (M
cElh
inne
yet
al.,
200
3)
(Sar
kozy
A e
t al
., 20
04)
(Sar
kozy
A e
t al
., 20
04)
(Sar
kozy
A
et a
l., 2
004)
(K
asah
ara
and
Ben
son,
20
04)
#het
eroz
ygou
s
12
13
31
9A
SD-
--
74
17
VSD
--
-2
3-
1A
V bl
ock
--
-7
21
9N
onpe
netr
ant
?1
?-
--
(2)
Oth
er C
HD
(n
o)C
oarc
tD
OR
V
TOF
-M
VP
, LV
no
ncom
pact
ion
--
Loca
tion
3’ c
odin
g re
gion
3’ c
odin
g re
gion
3’ c
odin
g re
gion
Hom
eobo
xH
omeo
box
5’co
ding
regi
onH
omeo
box
Com
men
tN
o fa
mily
hi
stor
y of
C
HD
, par
ents
no
tge
noty
ped
Non
pene
tranc
e?
path
olog
ical
si
gnifi
canc
e
No
fam
ily
hist
ory
of
CH
D, p
aren
ts
not
geno
type
d
de n
ovo
mut
atio
n7d
ecea
sed
indi
vidu
als
had
CH
D,
type
not
co
nfirm
ed
101
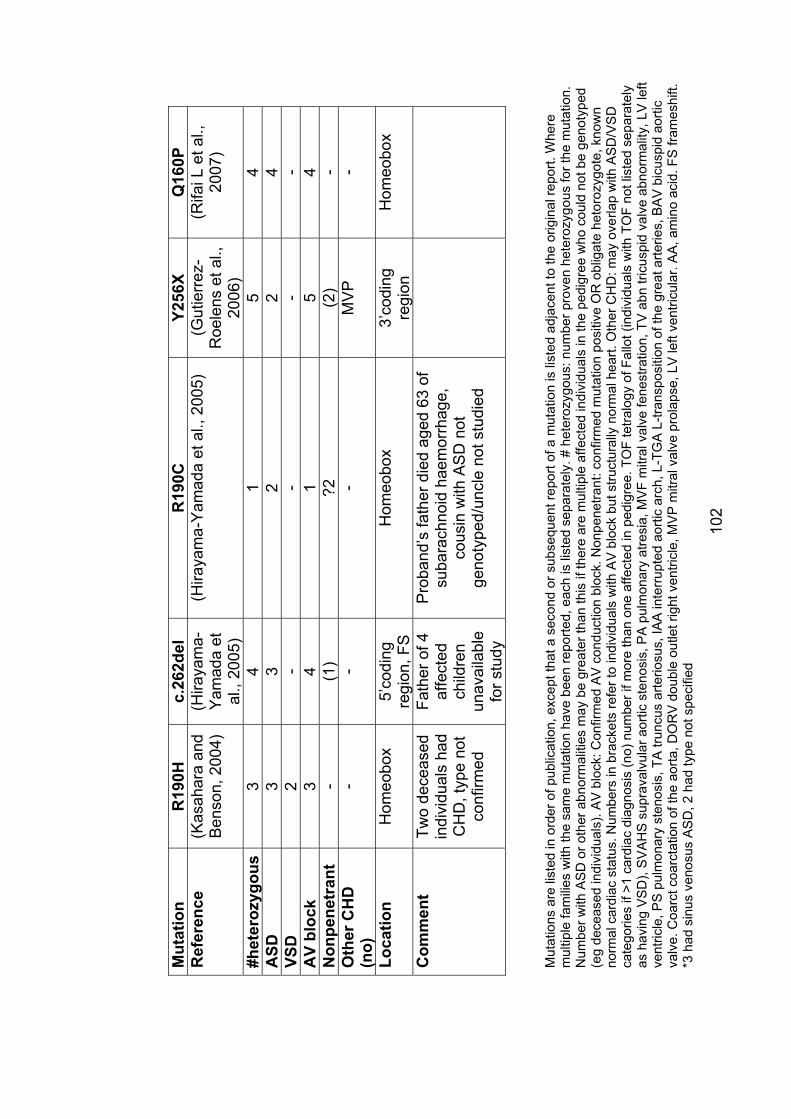
102
Mut
atio
nR
190H
c.26
2del
R19
0CY2
56X
Q16
0PR
efer
ence
(K
asah
ara
and
Ben
son,
200
4)
(Hira
yam
a-Y
amad
a et
al
., 20
05)
(Hira
yam
a-Y
amad
a et
al.,
200
5)
(Gut
ierr
ez-
Roe
lens
et a
l.,
2006
)
(Rifa
i L e
t al.,
20
07)
#het
eroz
ygou
s
34
15
4A
SD3
32
24
VSD
2-
--
-A
V bl
ock
34
15
4N
onpe
netr
ant
-(1
)?2
(2)
-O
ther
CH
D
(no)
--
-M
VP
-
Loca
tion
Hom
eobo
x5’
codi
ngre
gion
, FS
H
omeo
box
3’co
ding
regi
onH
omeo
box
Com
men
tTw
o de
ceas
ed
indi
vidu
als
had
CH
D, t
ype
not
conf
irmed
Fath
er o
f 4
affe
cted
child
ren
unav
aila
ble
for s
tudy
Pro
band
’s fa
ther
die
d ag
ed 6
3 of
su
bara
chno
id h
aem
orrh
age,
co
usin
with
AS
D n
ot
geno
type
d/un
cle
not s
tudi
ed
Mut
atio
ns a
re li
sted
in o
rder
of p
ublic
atio
n, e
xcep
t tha
t a s
econ
d or
sub
sequ
ent r
epor
t of a
mut
atio
n is
list
ed a
djac
ent t
o th
e or
igin
al re
port.
Whe
re
mul
tiple
fam
ilies
with
the
sam
e m
utat
ion
have
bee
n re
porte
d, e
ach
is li
sted
sep
arat
ely.
# h
eter
ozyg
ous:
num
ber p
rove
n he
tero
zygo
us fo
r the
mut
atio
n.
Num
ber w
ith A
SD
or o
ther
abn
orm
aliti
es m
ay b
e gr
eate
r tha
n th
is if
ther
e ar
e m
ultip
le a
ffect
ed in
divi
dual
s in
the
pedi
gree
who
cou
ld n
ot b
e ge
noty
ped
(eg
dece
ased
indi
vidu
als)
. AV
blo
ck: C
onfir
med
AV
con
duct
ion
bloc
k. N
onpe
netra
nt: c
onfir
med
mut
atio
n po
sitiv
e O
R o
blig
ate
heto
rozy
gote
, kno
wn
norm
al c
ardi
ac s
tatu
s. N
umbe
rs in
bra
cket
s re
fer t
o in
divi
dual
s w
ith A
V b
lock
but
stru
ctur
ally
nor
mal
hea
rt. O
ther
CH
D: m
ay o
verla
p w
ith A
SD
/VS
D
cate
gorie
s if
>1 c
ardi
ac d
iagn
osis
(no)
num
ber i
f mor
e th
an o
ne a
ffect
ed in
ped
igre
e. T
OF
tetra
logy
of F
allo
t (in
divi
dual
s w
ith T
OF
not l
iste
d se
para
tely
as
hav
ing
VS
D),
SV
AH
S s
upra
valv
ular
aor
tic s
teno
sis,
PA
pul
mon
ary
atre
sia,
MVF
mitr
al v
alve
fene
stra
tion,
TV
abn
tric
uspi
d va
lve
abno
rmal
ity, L
V le
ft ve
ntric
le, P
S p
ulm
onar
y st
enos
is, T
A tr
uncu
s ar
terio
sus,
IAA
inte
rrupt
ed a
ortic
arc
h, L
-TG
A L
-tran
spos
ition
of t
he g
reat
arte
ries,
BA
V b
icus
pid
aorti
c va
lve.
Coa
rct c
oarc
tatio
n of
the
aorta
, DO
RV
dou
ble
outle
t rig
ht v
entri
cle,
MV
P m
itral
val
ve p
rola
pse,
LV
left
vent
ricul
ar. A
A, a
min
o ac
id. F
S fr
ames
hift.
*3
had
sin
us v
enos
us A
SD
, 2 h
ad ty
pe n
ot s
peci
fied
103
additional families. Even if the family history is correct, some or all of these
mutations may be pathogenic but with reduced penetrance. Alternately, these
may be rare polymorphisms (they are not common as they were not identified in
100 control chromosomes) or may be participating in multifactorial causation of
CHD.
The recurrent mutation R25C is particularly noteworthy. The mutation is not in a
recognised functional domain of the gene. It has mainly been reported in
individuals with TOF. None of the affected individuals with this mutation have
had ASD or conduction abnormalities. In most of the families in which it has
been reported, studies of family members other than the proband have not been
possible. There are three families in which other family members have been
studied. In two, a healthy parent was heterozygous for the mutation. In the third,
the father of the proband was heterozygous for the mutation and had VSD
(Goldmuntz et al., 2001; McElhinney et al., 2003). Although the mutation was
not identified in 50 healthy individuals not selected for racial background, 2/43
healthy African-American controls were heterozygous for the mutation. Of the 7
probands identified with the mutation, 5 were of African-American ancestry, one
Hispanic and one Caucasian (McElhinney et al., 2003). In functional studies in
vitro, NKX2-5 protein with the R25C mutation localised normally to the nucleus,
bound to DNA normally at low concentrations but was subtly abnormal in
formation of dimers at higher concentrations, and had similar effects on
transcriptional activation to wild-type protein (Kasahara and Benson, 2004). The
clinical data, including identification of the mutation in two healthy controls,
suggest that this mutation is likely to have low penetrance. The in vitro data
show only subtle differences between wild-type and mutant protein. On the
other hand, the identification of a family with two affected individuals (one with
TOF and one with VSD) with CHD segregating with the mutation represents
evidence in favour of its pathogenicity. It is possible is that this is not a benign
polymorphism, but rather is a mutation which participates in multifactorial
causation of CHD.
104
The E21Q mutation was identified in a proband with TOF and was also present
in the proband’s mother and maternal grandmother, both of whom had normal
hearts (McElhinney et al., 2003). Its status is therefore uncertain.
Studies of DNA binding in homeodomain NKX2-5 missense mutations indicates
that DNA binding is impaired by these mutations (Kasahara and Benson, 2004).
This, together with the nonsense and frameshift mutations, and the observation
of CHD and AV conduction defects in children with deletions of the NKX2-5
locus (Baekvad-Hansen et al., 2006), suggest that the mechanism by which
NKX2-5 mutations cause disease is haploinsufficiency. However, dominant
negative inhibition of other transcription factors or transcription complexes may
also play a role.
The penetrance associated with mutations other than those listed above as
being of uncertain significance is very high. Penetrance for AV conduction
disease is almost complete, with the exceptions being children at the time of
assessment, implying a possibility that they will develop AV conduction defects
later in life. This has important clinical implications, implying a need for long
term cardiac follow-up for individuals found to be heterozygous for an NKX2-5
mutation. Penetrance for CHD, although lower than penetrance for AV
conduction defects, is likewise high.
3.2.1 Subjects screened for NKX2-5 mutationsSubjects screened for mutations in NKX-5 were as described in section 2.2.2.3.
Patient characteristics are shown in Table 3.2.
Contributions by EK to this part of the study include participation in study
design, patient recruitment (recruitment of all paediatric subjects, assisted by Dr
Fiona MacKenzie, but also including review of medical records and reading of
ECGs for many of the adult subjects), DNA extraction, sequencing of samples
from paediatric subjects and some of the adult subjects (the majority of
sequencing of adult subjects was performed by Dr David Elliott), clinical
evaluation of family members, and data analysis.
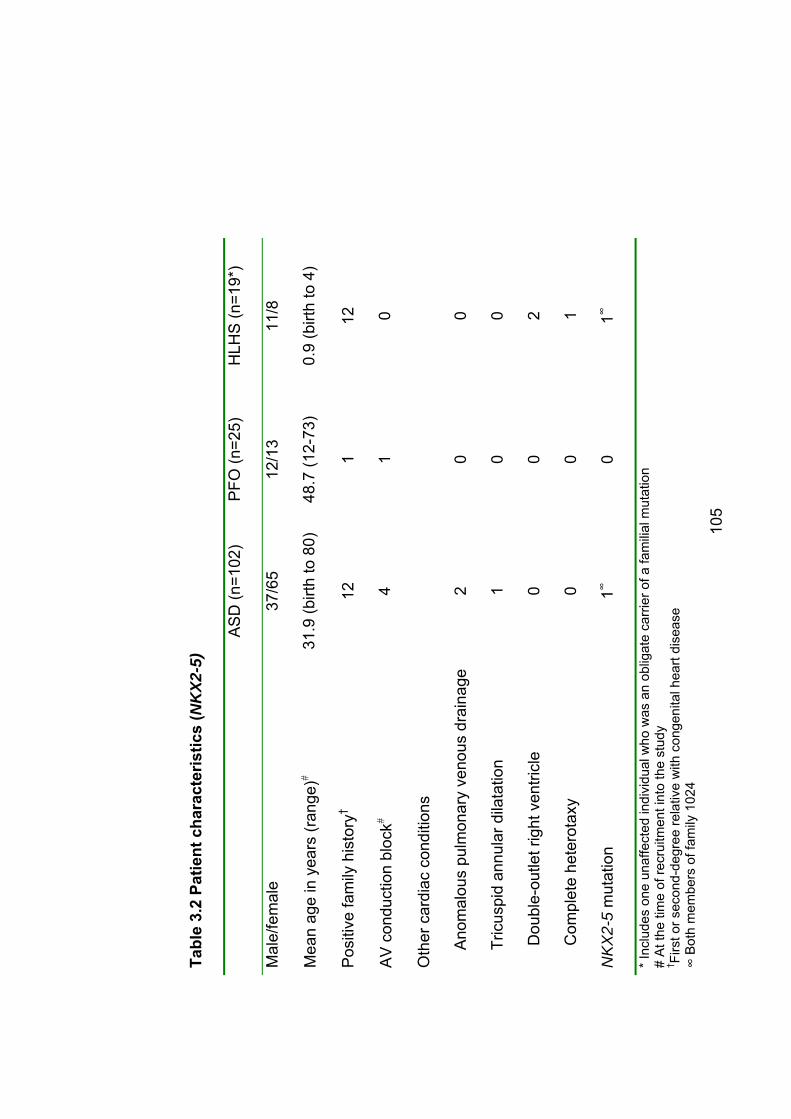
Tabl
e 3.
2 Pa
tient
cha
ract
eris
tics
(NK
X2-5
)
AS
D (n
=102
) P
FO (n
=25)
H
LHS
(n=1
9*)
Mal
e/fe
mal
e37
/65
12/1
311
/8
Mea
n ag
e in
yea
rs (r
ange
)�31
.9 (b
irth
to 8
0)48
.7 (1
2-73
)0.
9 (b
irth
to 4
)
Pos
itive
fam
ily h
isto
ry†
121
12
AV
con
duct
ion
bloc
k�4
10
Oth
er c
ardi
ac c
ondi
tions
A
nom
alou
s pu
lmon
ary
veno
us d
rain
age
20
0
T
ricus
pid
annu
lar d
ilata
tion
10
0
D
oubl
e-ou
tlet r
ight
ven
tricl
e 0
02
C
ompl
ete
hete
rota
xy
00
1
NK
X2-
5 m
utat
ion
1�0
1�
* Inc
lude
s on
e un
affe
cted
indi
vidu
al w
ho w
as a
n ob
ligat
e ca
rrier
of a
fam
ilial m
utat
ion
# A
t the
tim
e of
recr
uitm
ent i
nto
the
stud
y † Fi
rst o
r sec
ond-
degr
ee re
lativ
e w
ith c
onge
nita
l hea
rt di
seas
e �
Bot
h m
embe
rs o
f fam
ily 1
024
105
106
3.2.2 Results The coding regions and intron-exon boundaries of NKX2-5 were sequenced in
102 subjects ascertained only because of their need for ASD repair and 25 with
PFO diagnosed following cryptogenic stroke. Thirty-two were children (age
range birth to 14 years, mean 3.9 years) and the remainder were adults (age
range18-80 years, mean 44.7 years). Within the cohort, five individuals (3.9%)
also had first-degree heart block and 3 (2.9%) had some other form of CHD
(table 3.2). Thirteen patients (10%) had a family history of ASD in at least one
first or second-degree relative, although no family members had evidence of AV
conduction block. Clinical and laboratory methods were as described in sections
2.2 and 2.3.
Two individuals had sequence changes in NKX2-5 identified, both of which had
been reported previously (Figure 3.1). These were 61G>C, leading to the amino
acid change E21Q, and 532C>T, leading to the amino acid change T178M.
3.2.2.1 Family 1024: T178M This mutation has been reported previously, in two of the families in the original
report of NKX2-5 mutations in human disease (Schott et al., 1998) and in a
more recent report by Hirayama-Yamada and colleagues (Hirayama-Yamada et
al., 2005). The substitution of a threonine residue with methionine in the
homeobox between the second and third helix probably changes the angle of
the third helix, reducing contact to the major groove of DNA (Kasahara and
Benson, 2004).
It has been shown to markedly impair the ability of NKX2-5 protein to bind DNA
(Kasahara et al., 2000; Kasahara and Benson, 2004) .
In the family reported here, the proband was a girl aged 10 at the time of
recruitment into the study. A cardiac murmur was noted on clinical screening six
weeks after birth and the diagnosis of ASD was made. Surgical repair was
done at age 4 and was complicated by pulmonary oedema; however, she made
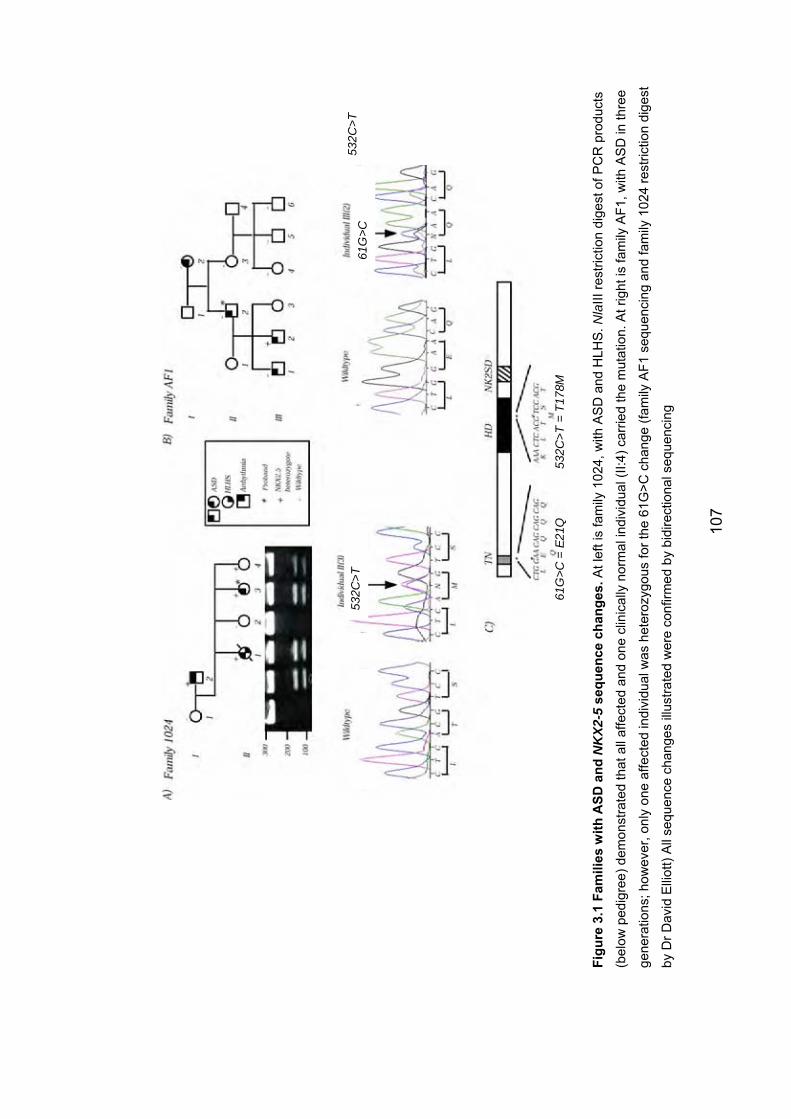
532C
>T61
G>C
61G
>C =
E21
Q
532C
>T =
T17
8M
532C
>T
Figu
re 3
.1 F
amili
es w
ith A
SD a
nd N
KX2
-5se
quen
ce c
hang
es. A
t lef
t is
fam
ily 1
024,
with
AS
D a
nd H
LHS
. Nla
III re
stric
tion
dige
st o
f PC
R p
rodu
cts
(bel
ow p
edig
ree)
dem
onst
rate
d th
at a
ll af
fect
ed a
nd o
ne c
linic
ally
nor
mal
indi
vidu
al (I
I:4) c
arrie
d th
e m
utat
ion.
At r
ight
is fa
mily
AF1
, with
AS
D in
thre
e
gene
ratio
ns; h
owev
er, o
nly
one
affe
cted
indi
vidu
al w
as h
eter
ozyg
ous
for t
he 6
1G>C
cha
nge
(fam
ily A
F1 s
eque
ncin
g an
d fa
mily
102
4 re
stric
tion
dige
st
by D
r Dav
id E
lliot
t) A
ll se
quen
ce c
hang
es il
lust
rate
d w
ere
conf
irmed
by
bidi
rect
iona
l seq
uenc
ing
107
108
a good recovery and at age 10 was in good health. Clinical examination was
normal other than the presence of the surgical scar. On review at age 13,
transthoracic echocardiogram and ECG were normal. Her father (I:2 on the
pedigree) had had an ASD diagnosed and surgically repaired at the age of 27;
he also had mitral valve replacement for mitral regurgitation at the same time.
Twelve months later he developed heart failure due to restrictive pericarditis,
which was managed surgically. At the age of 37, he had a cardiac arrest while
at a concert, and was successfully treated for ventricular fibrillation (VF) with DC
cardioversion. He had consumed approximately 5L of beer just before the
concert, which his cardiologist regarded as a possible contributing factor.
Electrophysiological studies did not induce any arrythmias and an implantable
defibrilllator was placed. He also developed atrial fibrillation, for which he was
successfully treated with flecainide. There was little extended family history
available.
The proband had three sibs. The first child in the family (II:1) had died aged 9
weeks of hypoplastic left heart syndrome with an associated ASD. With the
consent of the parents, this child’s newborn screening card was accessed and
DNA extracted from it. An NlaIII restriction enzyme digest performed by Dr
David Elliott confirmed that she was heterozygous for the T178M mutation.
Of the other two sibs, one was found not to carry the mutation. The other (II:4)
was heterozygous for the mutation. However, clinical examination,
echocardiography and ECG were normal when she was last seen, aged 10
years.
The finding of this mutation in a child with HLHS prompted sequencing of the
gene in an additional 18 individuals with HLHS, none of whom had identifiable
mutations in NKX2-5.
3.2.2.2 Family AF1: E21Q The sequence change 171G>C, leading to the amino acid change E21Q, was
identified in one member of a family in which four individuals had ASD without
109
AV conduction abnormalities. However, E21Q did not segregate with the
cardiac phenotype in the family – the other three affected individuals did not
carry the mutation. The mother of the individual who was heterozygous for
E21Q (II:1) was not available for testing, so it is not certain whether this was a
de novo change or inherited. Although II:1 was said not to have cardiac disease
it is possible that she did have unrecognised CHD. Nonetheless, this finding
adds weight to the suggestion that this may be a benign polymorphism (see 3.2
above).
3.2.3 Role of NKX2-5 mutations in nonsyndromal ASD The findings reported here are consistent with those of other investigators.
Considering ASD alone, among 102 individuals with ASD one definite mutation
was identified, in an individual with a strong family history of CHD and
conduction disease; this represented 1/12 subjects with a family history (or 1/13
if PFO is considered to represent CHD). Ikeda and colleagues found that 1/109
individuals with ASD had a mutation in NKX2-5; that proband had a family
history of ASD and conduction block (Ikeda et al., 2002). This paper does not
state how many of the individuals studied had a family history. Gutierrez-
Roelens and colleagues found mutations in 2/50 subjects, both of whom had
extensive family histories of CHD and conduction block (Gutierrez-Roelens I et
al., 2002). There were a total of 16 probands with a family history of CHD.
McElhinney and colleagues studied a total of 608 individuals, of whom 18 had a
mutation identified (although, as discussed above, a number of these are of
uncertain significance; 9/18 had tetralogy of Fallot including 7/9 with R25C)
(McElhinney et al., 2003). Considering ASD alone, 3/71 had mutations. One of
these individuals was heterozygous for the K15I mutation. This subject had no
conduction abnormality and one parent was heterozygous for the mutation but
had no CHD. A second individual had the A127E mutation. This individual had
ASD with no conduction defect, a parent with a normal heart and a grandparent
with bicuspid aortic valve (BAV). Given the high frequency of BAV, it is hard to
be certain that this confirms pathogenicity of the mutation. However, mice with
Nkx2-5 mutation have an increased frequency of bicuspid aortic valve (Biben et
110
al., 2000) so it is possible that the bicuspid valve in the grandparent was caused
by the A127E variant and that this is indeed a pathogenic mutation. The third
individual had an unequivocal mutation; this subject had ASD and AV
conduction disease and had a de novo frameshift mutation, InsTCCCT701
(McElhinney et al., 2003). Assuming that these latter two mutations are
pathogenic but R25C is not, 2/71 subjects with ASD had mutations. It is not
stated how many of the 71 subjects with ASD had a family history.
Combining these figures, 6/332 individuals ascertained purely on the basis of
ASD have been shown to have mutations in NKX2-5 (1.8%). However, 3/28
individuals with a family history of ASD had mutations (10.7%). It is possible
that publication bias is at work, with negative studies not having been published.
Nonetheless, these findings suggest that where there is a family history of ASD,
particularly with conduction defects, the yield from screening for NKX2-5
mutations is high enough to warrant testing, particularly as this a relatively small
gene (two exons). These figures do not support screening individuals without
family history for mutations in NKX2-5; of the 6 individuals with mutations, 5 had
a family history of CHD (if the bicuspid aortic valve is included) and the sixth
had AV conduction block in addition to ASD.
Supporting this conclusion, Benson and colleagues (Benson et al., 1999) found
mutations in all of five individuals with CHD and AV block, four of whom had an
extensive family history. In addition, 1/10 individuals with idiopathic 2nd or 3rd
degree heart block but no CHD had a mutation (Benson et al., 1999). The latter
part of the study has not been replicated and it remains to be seen whether this
of itself is sufficient indication for mutation testing, but based on these studies
the combination of CHD (particularly ASD) and AV conduction block does
represent sufficient indication for NKX2-5 mutation testing, even in the absence
of family history.
3.2.4 Implications for asymptomatic mutation-positive individuals The identification of an asymptomatic child with an NKX2-5 mutation (and, of
course, her sister whose ASD has been successfully treated) raises the
111
question of the implications for the future health of such individuals. As
discussed above, conduction disease in patients with NKX2-5 mutations is often
progressive, and sudden death has been reported. Penetrance for conduction
disease in adults is very high. Individual I:2 would probably not have survived
his episode of VF if it had not occurred at a concert, with paramedics equipped
with a defibrillator stationed close at hand. Normal ECGs in childhood are
therefore not reassuring. Currently, these children are being monitored with
annual ECG. This regimen is not evidence-based, as evidence for a specific
monitoring program does not yet exist. It may need modification as more
experience with the phenotype associated with NKX2-5 mutations accumulates.
3.3 The role of mutations in GATA4 in ASD and PFO As discussed in section 1.7.1.2, a role for GATA4 in human CHD was first
suggested by the observation that patients with deletions of 8p23, where
GATA4 is located, commonly have CHD. Mutations in GATA4 were first
reported in 2003 (Garg et al., 2003). The mutations G296S and c.1075delG
segregated with CHD, predominantly ASD, without conduction abnormalities or
extracardiac manifestations. Since then, an additional three germline mutations
have been reported (Table 3.3). Reamon-Buettner and colleagues have
reported multiple somatic GATA4 mutations in formalin-preserved cardiac
specimens. These mutations are not included in Table 3.3. This study used the
same set of hearts in which the same investigators identified numerous somatic
NKX2-5 mutations (Reamon-Buettner and Borlak, 2005). As for the NKX2-5
mutations, these somatic GATA4 mutations may be artefactual, and until the
findings are replicated by another group, preferably in fresh cardiac tissue, their
status will be uncertain.
The five previously reported mutations include two single basepair deletions
causing frameshifts, and three missense mutations. Apart from the missense
mutation E216D, which was found to occur de novo in two unrelated individuals
with TOF (Nemer G et al., 2006), all of them segregate with disease in the
families in which they have been reported, and none have been found in large
numbers of controls.
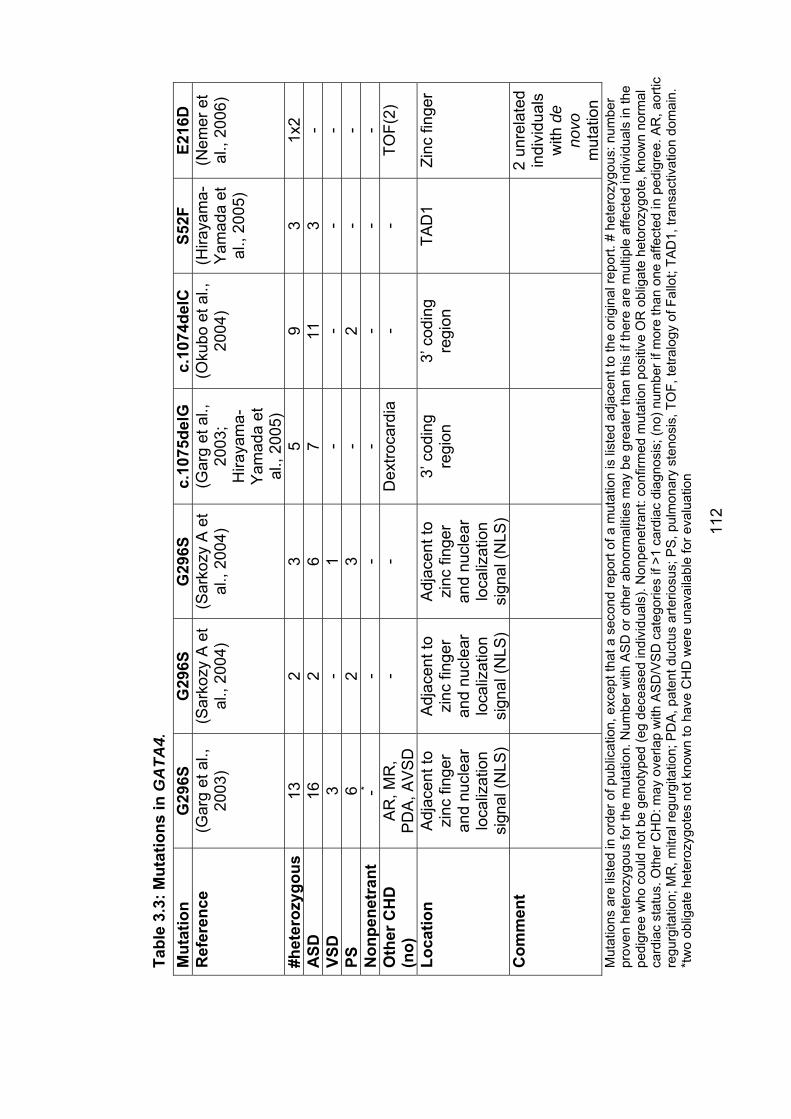
Tabl
e 3.
3: M
utat
ions
in G
ATA
4.M
utat
ion
G29
6SG
296S
G29
6Sc.
1075
delG
c.
1074
delC
S5
2F
E216
DR
efer
ence
(G
arg
et a
l.,
2003
) (S
arko
zy A
et
al.,
2004
) (S
arko
zy A
et
al.,
2004
) (G
arg
et a
l.,
2003
;H
iraya
ma-
Yam
ada
et
al.,
2005
)
(Oku
bo e
t al.,
20
04)
(Hira
yam
a-Y
amad
a et
al
., 20
05)
(Nem
er e
t al
., 20
06)
#het
eroz
ygou
s
132
35
93
1x2
ASD
162
67
113
-VS
D3
-1
--
--
PS6
23
-2
--
Non
pene
tran
t-*
--
--
--
Oth
er C
HD
(n
o)A
R, M
R,
PD
A, A
VS
D
--
Dex
troca
rdia
-
-TO
F(2)
Loca
tion
Adj
acen
t to
zinc
fing
er
and
nucl
ear
loca
lizat
ion
sign
al (N
LS)
Adj
acen
t to
zinc
fing
er
and
nucl
ear
loca
lizat
ion
sign
al (N
LS)
Adj
acen
t to
zinc
fing
er
and
nucl
ear
loca
lizat
ion
sign
al (N
LS)
3’ c
odin
g re
gion
3’ c
odin
g re
gion
TAD
1Zi
nc fi
nger
Com
men
t
Mut
atio
ns a
re li
sted
in o
rder
of p
ublic
atio
n, e
xcep
t tha
t a s
econ
d re
port
of a
mut
atio
n is
list
ed a
djac
ent t
o th
e or
igin
al re
port.
# h
eter
ozpr
oven
het
eroz
ygou
s fo
r the
mut
atio
n. N
umbe
r with
AS
D o
r oth
er a
bnor
mal
ities
may
be
grea
ter t
han
this
if th
ere
are
mul
tiple
affe
cted
indi
vidu
als
in th
e pe
digr
ee w
ho c
ould
not
be
geno
type
d (e
g de
ceas
ed in
divi
dual
s). N
onpe
netra
nt: c
onfir
med
mut
atio
n po
sitiv
e O
R o
blig
ate
heto
rozy
gote
, kno
wn
norm
al
card
iac
stat
us. O
ther
CH
D: m
ay o
verla
p w
ith A
SD
/VS
D c
ateg
orie
s if
>1 c
ardi
ac d
iagn
osis
; (no
) num
ber i
f mor
e th
an o
ne a
ffect
ed in
ped
igre
e. A
R, a
ortic
re
gurg
itatio
n; M
R, m
itral
regu
rgita
tion;
PD
A, p
aten
t duc
tus
arte
riosu
s; P
S, p
ulm
onar
y st
enos
is, T
OF,
tetra
logy
of F
allo
t; TA
D1,
tran
sact
ivat
ion
dom
ain.
*t
wo
oblig
ate
hete
rozy
gote
s no
t kno
wn
to h
ave
CH
D w
ere
unav
aila
ble
for e
valu
atio
n
ygou
s: n
umbe
r
2un
rela
ted
indi
vidu
als
with
deno
vom
utat
ion
112
114
In expression studies, both G296S and c.1075delG showed reduced activity,
with the effect being most pronounced with the frameshift mutation (Garg et al.,
2003). GATA4 protein with the hypomorphic G296S allele showed reduced
DNA binding compared with wild-type protein, and there was evidence that
interaction with TBX5 was disrupted. This mutation appears to be particularly
associated with pulmonary stenosis (PS), with 11/24 reported affected
individuals having PS (all of them also have ASD). Somewhat confusingly, the
family with c.1075delG from the first report of GATA4 mutations was reported a
second time, in a paper first-authored by one of the authors of the original paper
(Hirayama-Yamada et al., 2005). No additional clinical information or laboratory
information was provided in this subsequent paper, however.
No functional assays have been done on the single base-pair deletion
c.1074delC (Okubo et al., 2004). However, this mutation results in a frameshift,
with a premature stop codon resulting at amino acid 403. This, combined with
the location of the mutation very close to the well-studied and very similar
c.1075delG, plus the segregation of the mutation with CHD in the family in
which it is reported, leave little doubt as to its pathogenicity.
The missense mutation S52F is located in a known functional domain (the
transcriptional activation domain (TAD1)) and segregated with CHD in a small
family (3 affected individuals in two generations) (Hirayama-Yamada et al.,
2005). No functional assays have been reported on this sequence change but it
is likely to be pathogenic.
The missense mutation E216D, identified as a de novo change in two unrelated
individuals with TOF, showed normal cellular localization and binding to the
consensus GATA binding site in assays in rat cells. However, transcriptional
activity was modestly, but statistically significantly, reduced, by about 50%
(Nemer G et al., 2006). This is a highly conserved residue. although the amino
acid change is relatively conservative – both glutamate and aspartate are polar
amino acids, although glutamate is larger than aspartate. Overall, the status of
this mutation is uncertain based on currently available evidence.
115
3.3.1 Subjects screened for GATA4 mutationsSubjects screened for GATA4 mutations were as described in section 2.2.2.3.
There were two control groups. The first group had had trans-oesophageal
echocardiography (TOE) for a variety of indications and were known to have
structurally normal hearts, and in particular intact atrial septa (“TOE controls”).
The second group were ascertained by Dr Lyn Griffiths and were unselected
except for Caucasian ancestry (see below). Results of testing for the S377G
variant (see below) were confirmed by commercial SNP analysis (Genera
Biosystems). Contributions by EK to this work were participation in study
design, patient recruitment, management of clinical data including coordination
of a retrospective data collection exercise to obtain ethnicity information (with
the assistance of Ms Haley Crotty and Ms Janan Fornusek); follow-up and
clinical assessment of family members, and data analysis.
3.3.2 Results of sequencing and cytogenetic analysis Two missense changes, A411V and D425N, were identified, in subjects with
ASD and large PFO + mitral regurgitation respectively (Figure 3.2).
Additionally, when the proband in family 1006 was evaluated, the history and
examination findings (see below) raised the possibility of a chromosomal
abnormality. Cytogenetic analysis confirmed the presence of a deletion of 8p23.
A previously reported sequence variant, S377G, was identified in a number of
cases and controls and further studies were done to investigate the possibility
that this may be a contributor to CHD (see below; Tables 3.4 and 3.5).
3.3.2.1 Family 1012 – GATA4 variants A411V and S377G In this family (Figure 3.2a), the proband (II:1) had ASD diagnosed aged 9 weeks
following identification of a cardiac murmur at routine examination aged 6
weeks. The pregnancy and birth history were unremarkable. At 20 months a
10mm diameter lesion was repaired surgically. Subsequently he was in good
health apart from mild asthma. The only family history of note was that his
116
mother had unilateral breast cancer diagnosed at the age of 29. There was no
other family history suggestive of a familial cancer syndrome.
On examination at the age of 21, II:1 was not dysmorphic. He had mild bilateral
fifth finger clinodactyly. Individual II:1 was found to be heterozygous for both
A411V and S377G. The latter variant is discussed in more detail below.
Sequencing of GATA4 in all first-degree relatives showed that both of the
proband’s sisters (II:2 and II:3) were heterozygous for S377G but not for A411V.
The proband’s father, I:I, proved to be homozygous for both S377G and
heterozygous for A411V. He was a healthy 53 year old man, with no past
medical history of note. Transoesophageal echocardiography by Prof Michael
Feneley was normal, and in particular the atrial septum appeared intact. A
bubble study did not reveal any evidence of PFO.
The alanine at position 411 is not in a recognised functional domain. The
change to valine is relatively conservative, substituting a large nonpolar amino
acid for a small nonpolar amino acid. This residue is not evolutionarily
conserved – at the same position, mice share the alanine with humans, but in
rat a proline is sustituted, in chicken a glutamine and in Xenopus histidine. This
variant has been reported previously as a rare polymorphism (minor allele
frequency <0.01) (Poirier et al., 2003). In this family, one of two individuals
heterozygous for A411V has a structurally and functionally normal heart. Taking
all these factors into consideration, it is likely that A411V is a polymorphism with
no pathogenic impact. A role in multifactorial causation of ASD cannot be
excluded.
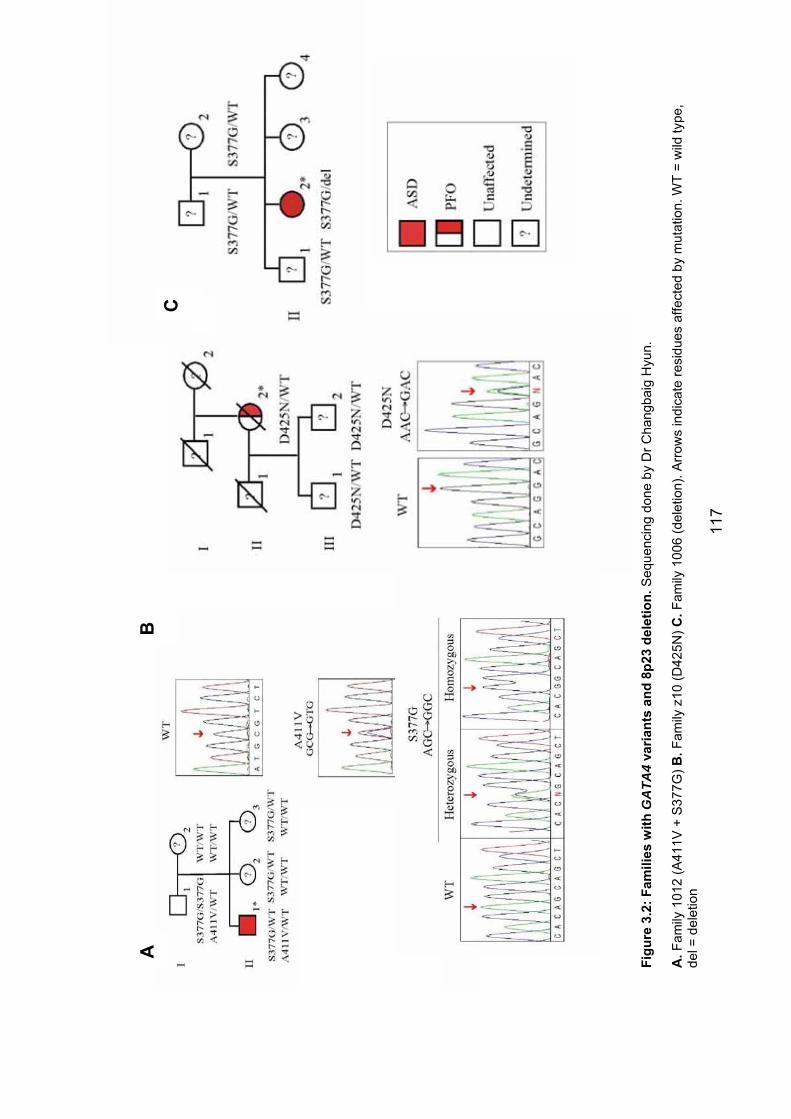
BC
A
Figu
re 3
.2: F
amili
es w
ith G
ATA
4 va
riant
s an
d 8p
23 d
elet
ion.
Seq
uenc
ing
done
by
Dr C
hang
baig
Hyu
n.
A.F
amily
101
2 (A
411V
+ S
377G
) B.F
amily
z10
(D42
5N) C
.Fam
ily 1
006
(del
etio
n). A
rrow
s in
dica
te re
sidu
es a
ffect
ed b
y m
utat
ion.
WT
= w
ild ty
pe,
de
l = d
elet
ion
117
118
3.3.2.2 Family z10 – GATA4 variant D425N In this family (Figure 3.2b) the proband, I:2, had mitral valve replacement aged
65 for mitral stenosis presumed to be due to rheumatic heart disease. A large
PFO with bidirectional shunting was identified during pre-operative evaluation
for this surgery. Other cardiac findings included atrial fibrillation, severe tricuspid
regurgitation and mild thickening of the aortic valve leaflets with normal function.
The only other known medical history was cholecystectomy. It was not clear
whether or not she had actually had rheumatic fever in childhood. Unfortunately,
II:1 died aged 76, between the time that she was recruited to the study and the
finding that she was heterozygous for D425N. Her sons (II:1 and II:2) were
uncertain of the cause of death. They agreed to venepuncture (collected during
a home visit) for the purpose of the study, but were unwilling to travel to a
hospital in order to have echocardiography (clinical assessment and
venepuncture were conducted at the home of one of them). This was
disappointing, particularly given that both proved to be heterozygous for D425N.
On clinical examination, neither was dysmorphic and neither had clinical
evidence of CHD. II:1 had a unilateral single transverse palmar crease. There
was no other family history of note.
D425N has not been reported previously. The aspartate residue at position 425
is not in a recognized functional domain. It is highly conserved, being invariate
in mouse, rat, chicken and frog. Nonetheless, the lack of definitive cardiac
assessment in individuals II:1 and II:2 means that the status of this sequence
variant is uncertain.
3.3.2.3 Family 1006 – 8p23 deletion At the time of recruitment to the study, the proband in this family (II:2) was 17
years old. She had been born at term following an uncomplicated pregnancy.
Birth weight and length were on the 10th centile, but head circumference was
on the 50th. ASD and PDA were identified in the newborn period, as was a left-
sided diaphragmatic hernia. The diaphragmatic hernia was repaired in the
newborn period and the ASD at the age of 4 years. Medical problems in
childhood included mild asthma and several episodes of pneumonia. Cognitive
119
development was delayed. Formal developmental assessment at ages 6 and 8
placed her in the mild range of intellectual disability (IQ 60-70), and she
required special schooling. Cerebral CT scan and karyotype at 6 years were
normal.
There was a steady increase in weight during her teenage years. She was not
hyperphagic. Aged 17, she had a mildly low serum calcium at 2.17 mmol/L (NR
2.25-2.58) and fasting insulin was high at 47.4mU/L (NR 0.8-16), suggesting
insulin resistance. Other endocrine investigations were normal and treatment
with modified diet and metformin were commenced.
On examination aged 17, weight was 71.1kg (90th centile) , height 141.8cm
(<3rd centile) and head circumference 52.5cm (2nd centile). She had deepset
eyes, short palpebral fissures and a smooth philtrum. She had truncal obesity.
Her 4th and 5th metacarpals were mildly short bilaterally. She had striae on her
shoulders but no cutaneous calcification. She was pubertal, at Tanner stage 5
for both breast and pubic hair development.
These features raised the possibility of a chromosomal disorder. It was more
than 10 years since the previous karyotype and given advances in cytogenetic
techniques, chromosomal analysis on blood was repeated. This showed a
deletion at chromosome 8p23, with the karyotype being
46,XX,del(8)(p23.1p23.3). This includes the locus of GATA4. Because of the
similarities of the phenotype to that seen in Albright Hereditary Osteodystrophy
(AHO), sequencing of GNAS1 was also requested and this was kindly done by
Dr Eileen Shore; no mutation was identified.
The S377G variant was also identified in members of this family and in
particular the proband was found to be hemizygous for S377G.
Deletions of 8p23, encompassing GATA4, were discussed in section 1.7.1.2. It
is likely that the high incidence of CHD in patients with these deletions is at
least in part due to haploinsufficiency for GATA4. Although a phenotype similar
to AHO has not previously been reported in patients with such deletions, other
120
features seen in II:2 have been previously reported. Apart from intellectual
handicap, which is common to most chromosomal deletions, it is noteworthy
that congenital diaphragmatic hernia (CDH) has been repeatedly reported in
association with deletions of 8p23 – there have been more than 10 such cases
reported (Holder et al., 2007). Since CDH has not been reported in families with
GATA4 mutations, it is likely that deletion of another gene or genes within the
region is responsible for CDH.
3.3.3 The common variant S377G – possible role in PFO with stroke The GATA4 variant S377G has previously been reported as a common SNP
with a minor allele frequency of 0.11. Given the role of GATA4 in dominant
CHD, this allele is a candidate for involvement in multifactorial causation of
CHD. Allele frequency can vary between ethnic groups due to selection or
founder effects. Therefore, before performing an association study, the allele
frequency was determined in a previously established set of globally distributed
indigenous populations (Martinson et al., 2000). This was done by Dr Jeremy
Martinson (Table 3.4).
High allele frequencies were observed in populations of European and
American Caucasian, Middle Eastern and – to a lesser extent – Indian and
Hispanic-American descent. African, East Asian and Pacific Islander
populations had very low frequencies. These data suggest a relatively recent
and Caucasian origin for S377G.
The association study was therefore restricted to Caucasian subjects (Table
3.5). There was some variation in both heterozygosity and allele frequency
between groups. The differences between the ASD and “other CHD” groups
and controls were not statistically significant. However, an excess of S377G
was observed in subjects with PFO with stroke, with an allele frequency of 0.18.
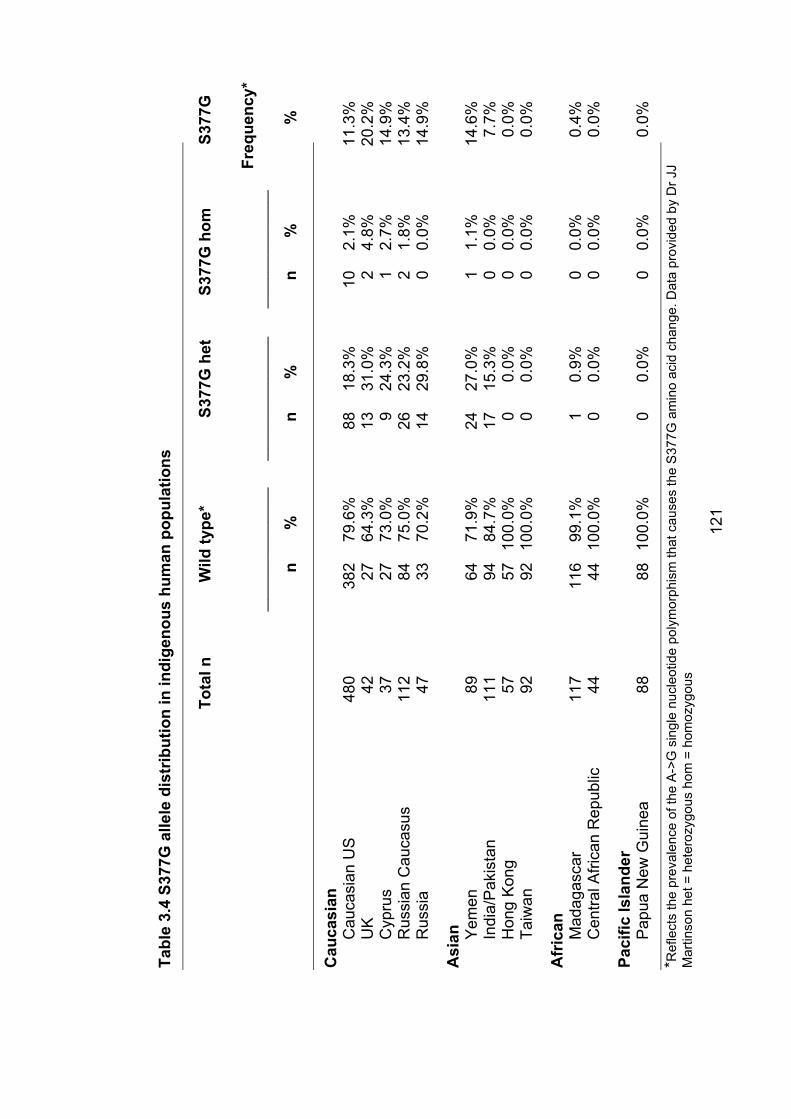
Tabl
e 3.
4S3
77G
alle
le d
istr
ibut
ion
in in
dige
nous
hum
an p
opul
atio
ns
Tota
l n
Wild
type
* S3
77G
het
S3
77G
hom
S3
77G
H
eter
ozyg
osity
* Hom
ozyg
osity
* A
llele
hehe
te
Freq
uenc
y*__
____
____
____
____
___
____
____
____
____
____
_ __
____
____
____
____
__
n %
n
%
n %
%
Cau
casi
an
Cau
casi
an U
S
480
382
79.6
%
88
18.3
%
10
2.1%
11
.3%
UK
42
27
64
.3%
13
31
.0%
2
4.8%
20
.2%
Cyp
rus
37
27
73.0
%
9 24
.3%
1
2.7%
14
.9%
Rus
sian
Cau
casu
s 11
2 84
75
.0%
26
23
.2%
2
1.8%
13
.4%
Rus
sia
47
33
70.2
%
14
29.8
%
0 0.
0%
14.9
%
Asi
an
Yem
en
89
64
71.9
%
24
27.0
%
1 1.
1%
14.6
%
In
dia/
Pak
ista
n 11
1 94
84
.7%
17
15
.3%
0
0.0%
7.
7%
H
ong
Kon
g 57
57
10
0.0%
0
0.0%
0
0.0%
0.
0%
Taiw
an
92
9210
0.0%
00.
0%0
0.0%
0.0%
Afr
ican
M
adag
asca
r 11
7 11
6 99
.1%
1
0.9%
0
0.0%
0.
4%
C
entra
l Afri
can
Rep
ublic
44
44
100.
0%
0 0.
0%
0 0.
0%
0.0%
Paci
fic Is
land
er
Pap
ua N
ew G
uine
a 88
88
100.
0%
0 0.
0%
0 0.
0%
0.0%
*Ref
lect
s th
e pr
eval
ence
of t
he A
->G
sin
gle
nucl
eotid
e po
lym
orph
ism
that
cau
ses
the
S37
7G a
min
o ac
id c
hang
e. D
ata
prov
ided
by
Dr J
J M
artin
son
het =
het
eroz
ygou
s ho
m =
hom
ozyg
ous
121
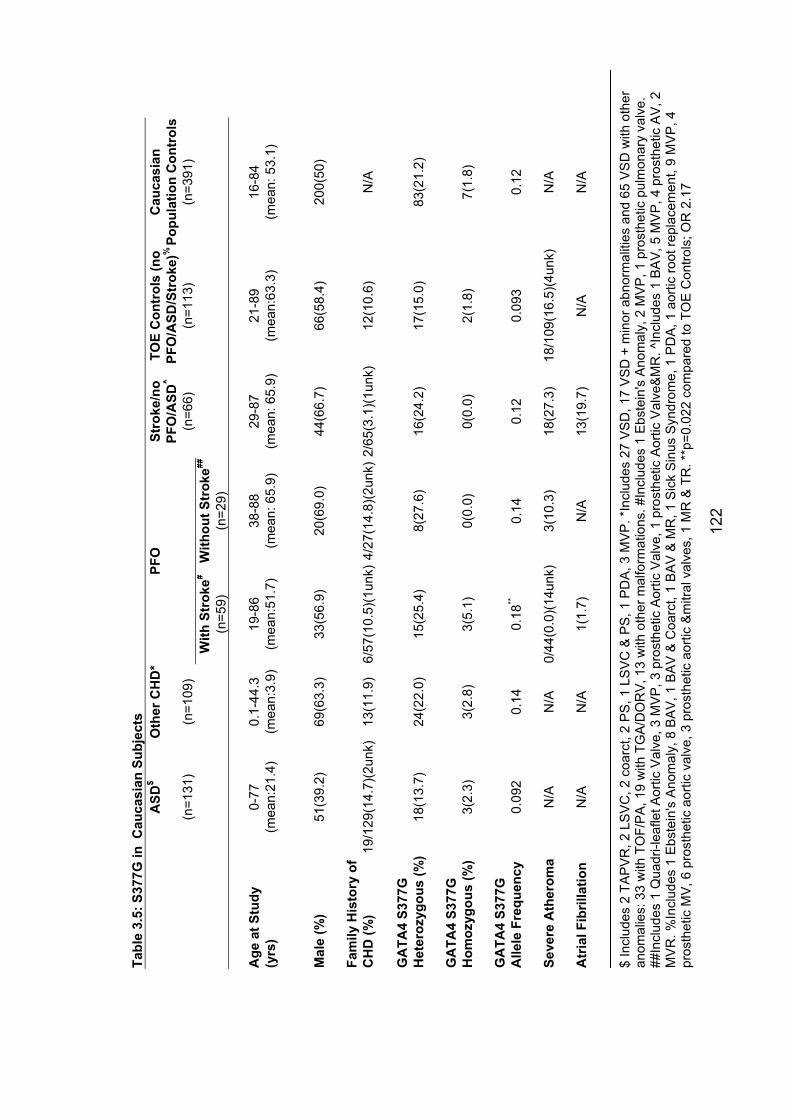
122
$ In
clud
es 2
TA
PV
R, 2
LS
VC
, 2 c
oarc
t, 2
PS
, 1 L
SV
C &
PS
, 1 P
DA
, 3 M
VP
. *In
clud
es 2
7 V
SD
, 17
VS
D +
min
or a
bnor
mal
ities
and
65
VS
D w
ith o
ther
an
omal
ies:
33
with
TO
F/PA
, 19
with
TG
A/D
OR
V, 1
3 w
ith o
ther
mal
form
atio
ns. #
Incl
udes
1 E
bste
in's
Ano
mal
y, 2
MV
P, 1
pro
sthe
tic p
ulm
onar
y va
lve.
##
Incl
udes
1 Q
uadr
i-lea
flet A
ortic
Val
ve, 3
MV
P, 3
pro
sthe
tic A
ortic
Val
ve, 1
pro
sthe
tic A
ortic
Val
ve&
MR
. ^In
clud
es 1
BA
V, 5
MV
P, 4
pro
sthe
tic A
V, 2
M
VR
. %In
clud
es 1
Ebs
tein
's A
nom
aly,
8 B
AV
, 1 B
AV
& C
oarc
t, 1
BA
V &
MR
, 1 S
ick
Sin
us S
yndr
ome,
1 P
DA
, 1 a
ortic
root
repl
acem
ent,
9 M
VP
, 4
pros
thet
ic M
V, 6
pro
sthe
tic a
ortic
val
ve, 3
pro
sthe
tic a
ortic
&m
itral
val
ves,
1 M
R &
TR
. **p
=0.0
22 c
ompa
red
to T
OE
Con
trols
; OR
2.1
7
Tabl
e 3.
5: S
377G
in C
auca
sian
Sub
ject
s A
SD$
Oth
er C
HD
*PF
OSt
roke
/no
TOE
Con
trol
s (n
oC
auca
sian
PF
O/A
SD^
PFO
/ASD
/Str
oke)
%Po
pula
tion
Con
trol
s (n
=131
) (n
=109
) (n
=66)
(n
=113
) (n
=391
) W
ith S
trok
e#W
ithou
t Str
oke##
(n=5
9)
(n=2
9)
Age
at S
tudy
0-
77
0.1-
44.3
19
-86
38-8
8 29
-87
21-8
9 16
-84
(yrs
) (m
ean:
21.4
) (m
ean:
3.9)
(mea
n:51
.7)
(mea
n: 6
5.9)
(m
ean:
65.
9)(m
ean:
63.3
) (m
ean:
53.
1)
Mal
e (%
) 51
(39.
2)
69(6
3.3)
33
(56.
9)
20(6
9.0)
44(6
6.7)
66
(58.
4)
200(
50)
Fam
ily H
isto
ry o
f C
HD
(%)
19/1
29(1
4.7)
(2un
k)13
(11.
9)
6/57
(10.
5)(1
unk)
4/27
(14.
8)(2
unk)
2/65
(3.1
)(1un
k)12
(10.
6)
N/A
GA
TA4
S377
G
Het
eroz
ygou
s (%
) 18
(13.
7)
24(2
2.0)
15
(25.
4)
8(27
.6)
16(2
4.2)
17
(15.
0)
83(2
1.2)
GA
TA4
S377
G
Hom
ozyg
ous
(%)
3(2.
3)
3(2.
8)
3(5.
1)
0(0.
0)
0(0.
0)
2(1.
8)
7(1.
8)
GA
TA4
S377
G
Alle
le F
requ
ency
0.
092
0.14
0.
18**
0.14
0.
12
0.09
3 0.
12
Seve
re A
ther
oma
N/A
N/A
0/44
(0.0
)(14u
nk)
3(10
.3)
18(2
7.3)
18
/109
(16.
5)(4
unk)
N/A
Atr
ial F
ibril
latio
n N
/AN
/A1(
1.7)
N
/A13
(19.
7)
N/A
N/A

124
When compared with the TOE control group, this was statistically significant
(p=0.022, chi square test) . This is arguably the most appropriate comparison
given the high prevalence of PFO in the general population – it is likely that
approximately 25% of the unselected Caucasian controls have PFO (Hagen et
al., 1984).
These findings suggest the possibility that S377G may be implicated in the
causation of PFO. This finding should be interpreted with caution. Multiple
comparisons were made. ASD did not show an increase in S377G as might be
expected given the presumed shared aetiology of ASD and PFO (see section
1.6.5). It is possible that if there is a relationship between S377G and PFO with
stroke, the effect is not an increase in the risk of PFO but rather a direct effect
on stroke risk. GATA4 is expressed in liver as well as heart, and has been
implicated as a transcriptional repressor of the gene for apolipoprotein(a), high
levels of which are an independent risk factor for atherosclerosis and stroke
(Negi et al., 2004). However, if there were such an independent effect, an
increased allele frequency would be expected in the “stroke/no PFO/ASD”
group and this was not seen.
At present, despite these data, S377G is most likely to represent a
polymorphism of no clinical significance. However, a replication study is under
way and if this finding can be reproduced it will have important implications for
the pathogenesis of cryptogenic stroke.
3.3.4 Role of GATA4 mutations in nonsyndromal ASD The findings reported here are consistent with previous studies. It appears that
GATA4 mutations are somewhat less common than mutations in NKX2-5. If
A411V and D425N are considered polymorphisms, 1/131 subjects with ASD
had a whole gene deletion, and 0/19 with a family history of CHD had a GATA4
mutation identified. Sarkozy and colleagues found mutations in 2/29 probands,
including 16 familial cases (Sarkozy A et al., 2004). In a subsequent study, the
same group studied 42 subjects with AVCD for mutations in GATA4 and
125
CRELD1 but found no mutations (Sarkozy et al., 2005) (not included in the
combined figures below). Zhang and colleagues found mutations in 0/99
subjects with CHD, of which however only 6 had ASD (no information available
regarding family history) (Zhang L et al., 2006). Schluterman and colleagues
found no mutations in 157 probands with CHD, of whom 14 had ASD (no family
history information available) (Schluterman M et al., 2007). Nemer and
colleagues found mutations in 0/94 subjects with a variety of forms of CHD,
including 0/12 with ASD (their findings in TOF are discussed above) (Nemer G
et al., 2006). Hirayama-Yamada and colleagues found mutations in 2/16 familial
cases (Hirayama-Yamada et al., 2005), but this was not part of a larger study of
unselected cases.
Combining all of these data, 3/192 unselected cases (the majority being from
this study) had a GATA4 mutation or deletion (1.5%), and 4/51 cases with a
family history had a GATA4 mutation (7.8%). Of the three unselected cases,
one had extracardiac malformations, intellectual disability, short stature and
dysmorphic features as clues to the chromosomal basis of her problems, and
the other two both had a family history of CHD. Thus, screening for mutations in
GATA4 appears indicated in affected individuals with a family history of CHD,
particularly in families in which the predominant phenotype is ASD +/- PS.
3.4 Mutations in TBX20 are associated with diverse cardiac pathologies, including abnormal septation and valvulogenesis, and cardiomyopathy As discussed in 1.5.3, the T-box transcription factors share a highly conserved
DNA-binding domain called the T-box. TBX20 is an ancient member of this
family of genes, related to TBX1. In mice, Tbx20 is expressed in cardiac
progenitor cells, in the developing myocardium and in endothelial cells
associated with the endocardial cushions, which are the precursors for the
cardiac valves and AV septum (Stennard et al., 2003). The Tbx20 protein
contains both transcriptional and repression domains, and it physically or
genetically interacts with Nkx2-5, Gata4, and Tbx5 (Brown et al., 2005). Tbx20
null mice have profoundly abnormal cardiac development (Stennard and
Harvey, 2005) , with a rudimentary heart lacking chamber myocardium. There is
126
evidence that Tbx20 directly represses Tbx2, which in turn functions as a
repressor in the development of both chamber and nonchamber myocardium
(Stennard and Harvey, 2005). Mice heterozygous for a Tbx20 null mutation
have an atrial septal phenotype similar to mice heterozygous for Nkx2-5
mutations. They have mild atrial septal abnormalities, including an increased
prevalence of PFO, atrial septal aneurysm (ASA) and ASD, as well as mild
dilated cardiomyopathy (Stennard and Harvey, 2005).
TBX20 mutations have not previously been associated with human disease, but
the information described above, plus the knowledge that mutations in TBX5,
NKX2-5 and GATA4 are associated with CHD above made TBX20 a logical
candidate gene for study in human subjects with CHD.
3.4.1 Subjects screened for TBX20 mutationsA total of 353 individuals with CHD were screened for mutations in TBX20 by
sequencing of the coding regions of the gene and intron-exon boundaries. This
sequencing was done by Leticia Castro, Changbaig Hyun and Andrew Cole. At
this stage of the study, subjects were recruited mainly from the Children’s
Hospital at Westmead and St Vincent’s Hospital, with only 10% being recruited
from Sydney Children’s Hospital. Contributions by EK to this part of the study
were limited to participation in study design, patient recruitment, particularly
recruitment and clinical evaluation of family members of probands with possible
mutations, and data analysis and figure preparation (but not laboratory
benchwork) for the transcriptional assays, and to a lesser extent the Xenopus
studies.
Patient characteristics are summarised in Table 3.6
127
Table 3.6 Characteristics of subjects sequenced for TBX20 mutations
Phenotypes ASDonlya
ASD+Other CHDb
VSDonly
VSD+other CHDc
OtherCHD
No of subjects: Total 151 24 41 22 115 Male 53 16 23 10 70 With positive family historye
20 5 4 2 8
With AV conduction blockf
5 3 0 1 0
With atrial fibrillation
8 0 0 0 0
With LV dysfunction
5g 1h 0 0 0
Mean (range) age at enrolment, in years
26 (0-79)
12(0.2-62) 6 (0-68)
6(0-59) 4 (0-16)
a. Three adults had mitral valve prolapse.
b. Including sinus venosus ASD (n = 13; all others are secundum ASD); partial
anomalous pulmonary venous connection (n = 6); left SVC (n=2); valvular lesions (n =
5), including one example of supravalvar mitral ring; coarctation of the aorta (n = 1).
c. Including ASD (n = 7), left SVC (n = 5), aortic valve abnormalities (n = 5), coarctation
of the aorta (n = 4), double-chambered right ventricle
(n = 2), pulmonary stenosis (n = 1), patent ductus arteriosus (n = 1), and partial
anomalous venous connection (n = 1). One subject had mitral valve prolapse, and one
had supravalvar mitral ring.
d. Including outflow tract lesions (n = 75), atrioventricular septal defect and variants (n
= 18), functional single ventricle (n = 17, including 2
with mitral valve atresia), heterotaxy (n = 2), cor triatriatum (n = 1), and Ebstein
anomaly (n = 1).
e. Positive family history was defined as at least one first-degree relative affected with
CHD. Thirty-seven subjects were found to have syndromes known to be associated
with CHD, including trisomy 21 (n = 20) and 22q microdeletions (n = 12). However, only
two subjects with a positive family history were from this group.
f. First-degree or complete heart block. Complete and partial right bundle-branch block
were not included in this group. Two subjects with ASD had left bundle branch block.
g. All subjects were aged 1-55 years. Subjects had normal LV size and contractility but
impaired diastolic relaxation (n = 2) or impaired systolic function with (n = 2) or without
(n = 1) LV dilation.
h. This patient (family 2, individual III:4) was positive for the TBX20 mutation Q195X.
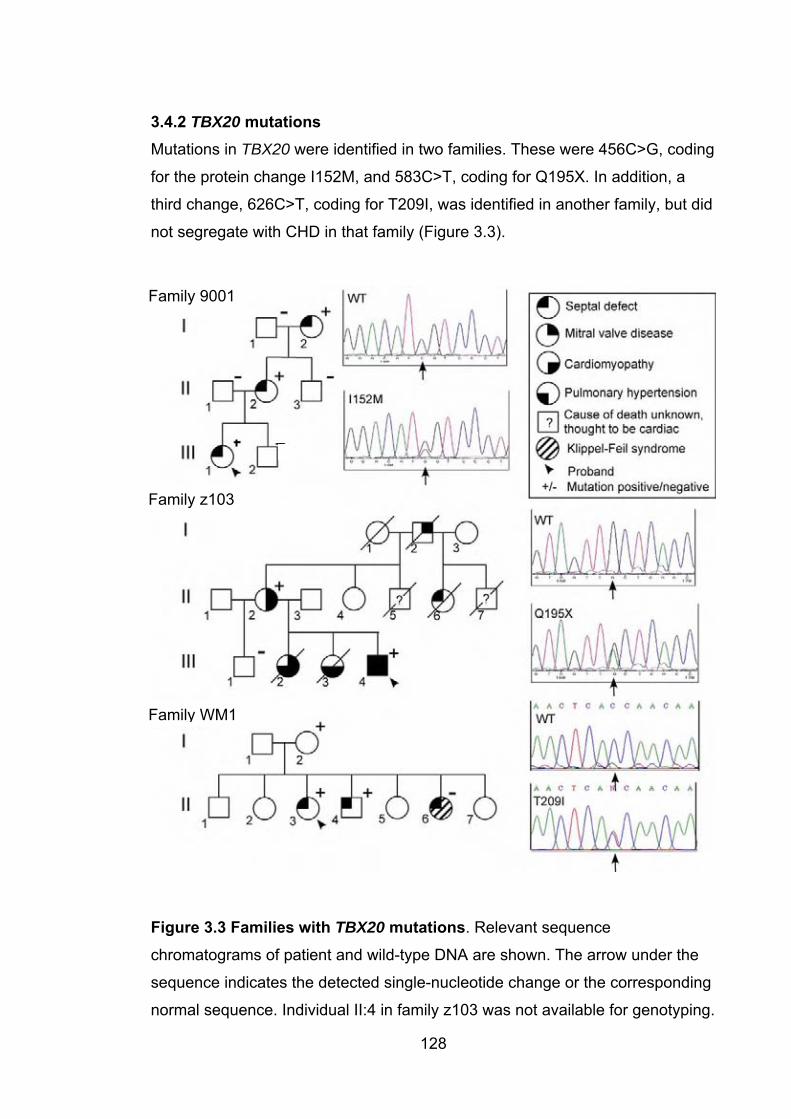
3.4.2 TBX20 mutations Mutations in TBX20 were identified in two families. These were 456C>G, coding
for the protein change I152M, and 583C>T, coding for Q195X. In addition, a
third change, 626C>T, coding for T209I, was identified in another family, but did
not segregate with CHD in that family (Figure 3.3).
Family 9001
Family z103
Family WM1
Figure 3.3 Families with TBX20 mutations. Relevant sequence
chromatograms of patient and wild-type DNA are shown. The arrow under the
sequence indicates the detected single-nucleotide change or the corresponding
normal sequence. Individual II:4 in family z103 was not available for genotyping.
128
129
3.4.2.1 Family 9001: TBX20 mutation 152M This mutation was identified in a family in which septal defects affected
members of three generations. The proband (III:1) had ASD, which was
corrected surgically in childhood. Her mother (II:2) had a large PFO with a
permanent left to right shunt. The proband’s grandmother (I:2) had a small VSD.
Cardiac valves and LV function were normal in all family members. There were
no limb anomalies or other malformations, and the affected individuals did not
have AV conduction abormalities or arrhythmias. The mutation was absent in
>450 controls.
3.4.2.2 Family z103: TBX20 mutation Q195XIn family 2, in which the Q195X mutation was identified, the phenotype was
more complex and varied considerably between affected family members.
Congenital heart disease included atrial septal defect and coarctation of the
aorta (in the proband, III:4), and a strongly suggestive history of congenital
heart disease in individual II:6. Although records for this woman are no longer
available, she was said to have been born with a “hole in the heart” and was
scheduled for corrective cardiac surgery at the time of her death in a motor
vehicle accident, aged in her early 20s. Valvular dysfunction, primarily affecting
the mitral valve, was present in several affected family members; individual II:2
has marked mitral valve prolapse (but only mild mitral regurgitation), and
individual I:2 had a mitral valve replacement in the 1960s for presumed
rheumatic heart disease. While it is possible that this was a correct diagnosis,
the presence of mitral valve disease in other family members suggests that this
may have been a manifestation of the family’s TBX20 mutation.
Individual III:2 died of cardiac failure in 1967, aged 11 months. At 10 months,
cardiac catheterization showed evidence of severe pulmonary hypertension,
right ventricular hypertrophy and and enlarged left atrium, presumably due to
mitral stenosis. At post mortem examination, she had a small mitral valve ring
and thickened valve leaflets. In addition, she was found to have endocardial
fibroelastosis, more pronounced in the left ventricle than the right, right
ventricular hypertrophy and hypoplasia of the left ventricle. The atrial septum
was intact. Her sister, III:3, died in 1977, aged 7, of heart failure following a
130
long history of pulmonary hypertension. She was first investigated with cardiac
catheterization aged 3, at which time she was asymptomatic but was shown to
have moderate pulmonary hypertension. This progressed over the next 4 years.
No post mortem examination was done. The proband, III:4, also had pulmonary
hypertension in childhood (in addition to his cardiac structural malformations),
but this resolved by early adulthood. However, at the age of 34 he was found to
have a mildly dilated left ventricle with mild global impairment of systolic
function. His mother, II:2, also has evidence of a mild left ventricular dilated
cardiomyopathy, with unusual apico-lateral hypertrophy recorded. Q195X was
not identified in >300 controls. There are no noncardiac malformations in
members of this family.
3.4.2.3 Family WM1: TBX20 polymorphism T209IIn family WM1, in which the TBX20 mutation T209I was identified, the proband
(II:3) had an ASD, one brother (II:4) had a VSD and one sister (II:6) had an
ASD. Several members of this family declined to take part in the study (clinical
studies of this family were done by A/Prof David Winlaw and members of his
lab). Both II:3 and II:4 were heterozygous for the T209I mutation, but II:6 was
homozygous for the wild-type allele. II:3 also had features of Klippel-Feil
syndrome, in which CHD is relatively common (Tracy et al., 2004). Thus, the
T209I mutation is not segregating with the cardiac phenotype in this family.
While it is possible that II:6 represents a phenocopy, the significance of the
mutation in this family is uncertain, based on pedigree analysis. It seems most
likely that this is a polymorphism of no pathological significance, although it is
possible that it does play some role in the pathogenesis of CHD in the family
members who carry it. If it is a polymorphism, it is a rare one – it was not found
in >300 controls.
3.4.3 Functional and other studies of the TBX20 mutationsWork done by a number of others, outlined below, supported the pathogenicity
of the I152M and Q195X mutations, and provided some evidence of abnormal
function associated with T209I (Kirk et al., 2007). Specifically, transcriptional
assays were done by members of Prof Richard Harvey’s lab, including Drs
131
Mauro Costa, Orit Wolstein and Guanglan Guo. Work in Xenopus embryos was
done by Drs Aaron Zorn and Scott Rankin. Biophysical studies were performed
by Drs Margaret Sunde and Joel Mackay.
3.4.3.1 Transcriptional assays of Tbx20 functionThe mouse Tbx20 protein exists in long (Tbx20a) and short (Tbx20c) isoforms .
The long isoform has weak transcriptional activity, when assayed alone,
compared with the short isoform, because of dominant effects of its C-terminal
trans-repression domain (absent in the short isoform) (Stennard et al., 2003).
However, when collaborating with Nkx2-5 and Gata4, the long isoform has
strong transcriptional activity. In a transcriptional assay in 293T cells (Figure
3.4), measuring activation of the Nppa promotor in the presence of Tbx20c,
activity of Tbx20 I152M was significantly reduced (p=0.05), and the activity of
Tbx20c with the Q195X was severely impaired. Interestingly, in this assay the
T209I change was also associated with reduced transcriptional activity
(p=0.008). When assayed together with Nkx2-5, Tbx20a I152M activity was
slightly elevated (p=0.05); Tbx20a T209I activity was unchanged, and not
surprisingly Tbx20a Q195X activity was again severely reduced (p=0.02).
3.4.3.2 Xenopus embryo gastrulation assay Microinjection of synthetic Tbx20a wildtype mRNA into Xenopus laevis embryos
severely disrupts gastrulation (figure 3.4) . This capacity was preserved with
Tbx20a I152M and Tbx20a T209I mRNA, but was abolished when Tbx20a
Q195X mRNA was used.
3.4.3.3 Protein modellingA model of the Tbx20 T-box was constructed by Drs Margaret Sunde and Joel
Mackay, using the known crystal structure of the human TBX3 T-box. This
model placed the side chain of the I152 residue in the core of the T-box, packed
against other hydrophobic residues. Replacement of isoleucine by methionine in
other proteins has been shown to have a destabilising effect (Gassner et al.,
1996; Ohmura et al., 2001). The T209 residue is also located in the T-box, at
the DNA-interaction face. Substitution of threonine with isoleucine at this point
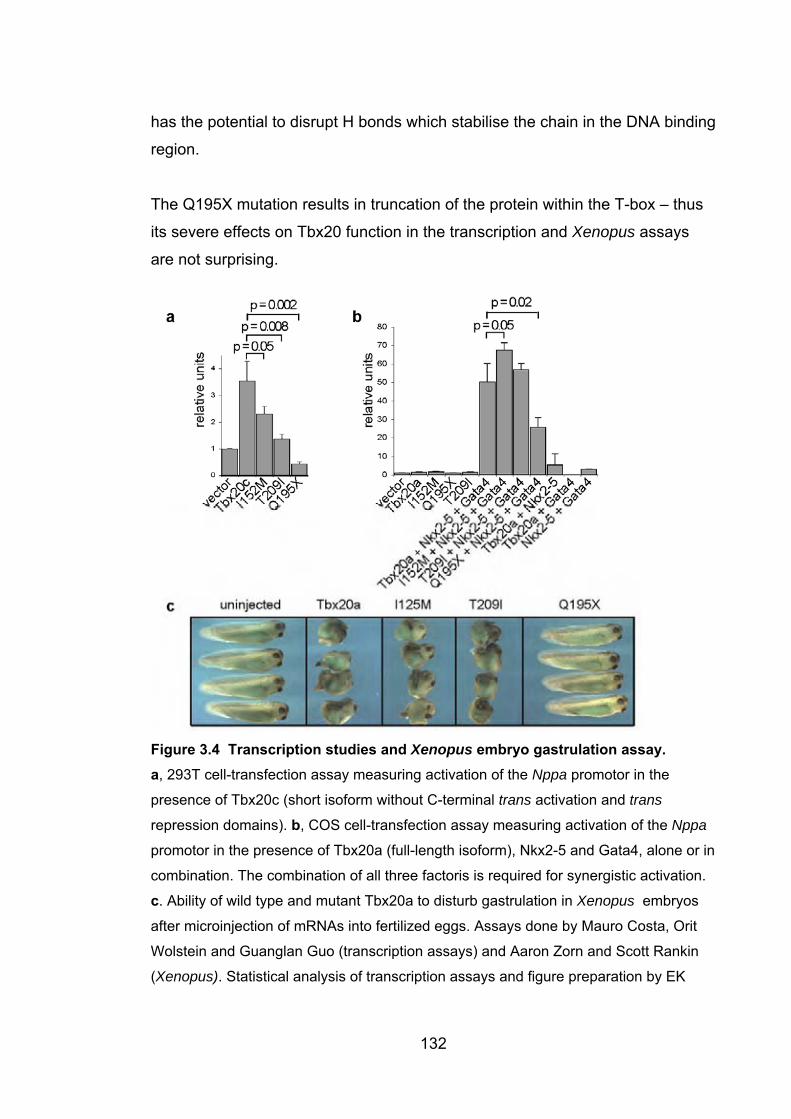
has the potential to disrupt H bonds which stabilise the chain in the DNA binding
region.
The Q195X mutation results in truncation of the protein within the T-box – thus
its severe effects on Tbx20 function in the transcription and Xenopus assays
are not surprising.
Figure 3.4 Transcription studies and Xenopus embryo gastrulation assay. a, 293T cell-transfection assay measuring activation of the Nppa promotor in the
presence of Tbx20c (short isoform without C-terminal trans activation and trans
repression domains). b, COS cell-transfection assay measuring activation of the Nppa
promotor in the presence of Tbx20a (full-length isoform), Nkx2-5 and Gata4, alone or in
combination. The combination of all three factoris is required for synergistic activation.
c. Ability of wild type and mutant Tbx20a to disturb gastrulation in Xenopus embryos
after microinjection of mRNAs into fertilized eggs. Assays done by Mauro Costa, Orit
Wolstein and Guanglan Guo (transcription assays) and Aaron Zorn and Scott Rankin
(Xenopus). Statistical analysis of transcription assays and figure preparation by EK
132

133
3.4.4 Significance of mutations in TBX20There is strong evidence that the cardiac pathology seen in members of families
1 and 2 is caused by the unique mutations in TBX20 found in each. Neither
mutation was found in >300 controls. The missense mutation, I152M, affected a
highly conserved amino acid in the T- box DNA binding domain. It segregated
with cardiac septal abnormalities over three generations in the affected family.
Biophysical studies by Drs Margaret Sunde and Joel Mackay showed
abnormalities including a fourfold reduction in the DNA-binding “on” rate (Kirk et
al., 2007)). Transcriptional activity of the short isoform of mouse Tbx20 was
significantly reduced, by ~40%, although the overexpression assays relying on
a synergistic interaction with other transcription factors did not confirm this.
These data point to I152M causing reduced TBX20 function, although it is
clearly not a null allele.
By contrast, the Q195X mutation results in a functionally inactive protein. It
introduces a stop mutation within one of the exons coding for the T-box DNA-
binding domain, a key functional domain of the protein. The resulting TBX20
protein is truncated within the T-box and completely lacks the trans activation
and trans repression domains located in the C terminus of the protein (Stennard
et al., 2003). In all functional assays the Q195X mutation had severely reduced
activity. Although only two affected individuals within the family were alive and
available for genotyping, both are heterozygous for the mutation. Moreover, the
pattern of congenital heart disease and cardiomyopathy within the family is
consistent with autosomal dominant inheritance.
The range of phenotypes seen in this family is remarkable for its range, and
particularly the occurrence of CHD and cardiomyopathy. Mitral valve structural
malformations were prominent, with both mitral valve stenosis and prolapse
occurring in different members of the family. Congenital mitral valve stenosis is
a rare but serious malformation, generally associated with poor prognosis,
whereas mitral valve prolapse is common, and is usually detected later in life.
The causes of both of these types of mitral valve pathology are unknown, but it
appears that both can arise from loss of TBX20 function. As discussed in
134
Chapter 1, mouse Tbx20 is expressed strongly in cells of the endocardial
cushions and, subsequently, the cardiac valves (Stennard and Harvey, 2005;
Stennard et al., 2003). Consistent with a functional role for TBX20 in this tissue,
mouse embryos with a partial RNAi-mediated knockdown of Tbx20 expression
show severely hypoplastic and/or immature atrioventricular valves (Takeuchi et
al., 2005).
Dilated cardiomyopathy (DCM) was present with structural CHD in two
individuals heterozygous for the Q195X mutation. While this could reflect
pathological decompensation after functional adaptation to structural defects,
the impression of the treating cardiologists was that the degree of DCM was
greater than could be explained on this basis in both affected individuals.
Consistent with the idea that the TBX20 mutation may cause DCM
independently of structural anomalies, mild DCM was observed in mice
heterozygous for Tbx20 mutation but without signficant structural anomalies
(Stennard and Harvey, 2005). A possible explanation is that the TBX20
mutation provides a sensitized developmental template for adult-onset DCM.
Heart failure is also seen in some patients carrying NKX2-5 mutations, years
after correction of structural CHD (Schott et al., 1998; Benson et al., 1999). In a
mouse model of Nkx2-5 deficiency, DCM is present even in fetal life (Elliott et
al., 2006). Familial DCM is highly genetically heterogeneous, with most
mutations occurring in genes encoding myofilament, cytoskeletal, energy, and
Ca2+ handling proteins (Fatkin and Graham, 2002), rather than transcription
factors. However, mutation of the transcriptional coactivator, EYA4 (MIM
603550), causes familial DCM and sensorineural hearing loss (Schonberger et
al., 2005).
The pathology seen in the family with the Q195X mutation is generally more
severe than in the family with the I152M mutation, and this may reflect the more
severe disruption to the protein. It seems likely that for this mutation at least, the
pathogenic effects of the mutation result from haploinsufficiency, although a
dominant-negative effect of the mutant protein cannot be excluded.
135
The third change detected in this study, T209I, did not segregate with pathology
in the proband’s family – similarly to the E21Q mutation in NKX2-5 described in
section 3.2.2.2. The affected residue is located within the T-box, subtle
transcriptional defects and instability in bacteria were observed for this allele
and it was not found in controls. However, the lack of segregation with
phenotype makes it difficult to ascribe it a role in causing pathology in this
family. Although every effort was made to prevent this, the possibility that the
non-segregation was due to one or more sample handling errors cannot be
excluded. Additional samples from the family members were not available to
check this.
Mutations in TBX20 have not previously been linked to human disease, but from
the data presented here there is little doubt that, in some families at least,
TBX20 mutation is responsible for CHD, particularly septal and mitral valve
abnormalities, and DCM. Although mutations were present in only 0.6% (2 of
352) of probands with CHD, among those with a family history 5.1% (2/39)
carried a TBX20 mutation.
3.5 Conclusions: the role of mutations in NKX2-5, GATA4 and TBX20 inhuman disease The hypothesis that mutations in genes responsible for dominant forms of ASD
might contribute to common forms of ASD is only partially borne out by the
studies reported here. Mutations in NKX2-5, GATA4 and TBX20 accounted for
1.8%, 1.5% and 0.6% respectively of unselected cases of ASD. The great
majority of individuals with mutations had a positive family history, and this is
reflected in the finding that 10.7%, 7.8% and 5.1% of familial cases respectively
(including all reported studies) had mutations in one of these three genes.
Combining these figures, nearly a quarter of familial ASD is accounted for by
mutations in one of these three genes. It seems likely that studies of the other
known nonsyndromal ASD genes, MYH6 and ACTC, will produce similar
results. This will leave a considerable percentage of familial ASD unaccounted
for. Some cases will represent recurrences in families due to multifactorial
inheritance, rather than autosomal dominant inheritance, but it is likely that
136
there is considerable genetic heterogeneity yet to be unravelled, accounting for
the bulk of familial cases. Chapter 4 describes an effort to identify an additional
gene contributing to this heterogeneity.
There are tantalizing hints here that variation in these genes may play a role in
the multifactorial causation of ASD. In each of these three genes, sequence
changes resulting in altered amino acid structure have been identified, which
although not found in large numbers of controls, do not segregate with disease
or meet other criteria for Mendelian mutations. Determining whether such
variants are truly relevant to common forms of ASD will require large scale
association studies of a type not yet conducted. The exception is the S377G
variant, which remains of uncertain significance despite the association study
reported here, but may contribute to PFO and cryptogenic stroke.
4. Atrial septal defect and Marcus Gunn phenomenon: further evidence for clinical and genetic heterogeneity in autosomal dominant atrial septal defect
4.1 Introduction As discussed in Chapters 1 and 3, to date mutations in six genes have been
associated with autosomal dominant ASD – TBX5 (as part of Holt-Oram
syndrome), NKX2-5, GATA4, MYH6, ACTC and now TBX20. In addition,
linkage to 5p has been reported in a single family, with the responsible gene yet
to be identified (Benson et al., 1998). Four of the genes identified to date have
been transcription factors and two (MYH6 and ACTC) structural proteins. There
is thus considerable genetic heterogeneity in dominant ASD. This chapter
describes a large autosomal dominant ASD family without conduction defects,
in which 5 of 10 affected family members also have the Marcus Gunn jaw
winking phenomenon. Although the effort to map the ASD gene in this family
was unsuccessful, there was no evidence of linkage to any of the known ASD
loci, indicating that this is an eighth form of dominant ASD. No association
between ASD and Marcus Gunn phenomenon (MGP) has previously been
reported – thus the phenotype in this family represents a new syndrome.
4.2 Marcus Gunn phenomenon MGP consists of synkinetic upper eyelid motion with stimulation of the ipsilateral
pterygoid muscles, in association with varying degrees of congenital ptosis. This
manifests as rapid movements of the affected eyelid with movement of the
mandible during jaw protusion or opening (eg during chewing). It is most
pronounced in the newborn period, when the eye movements are noted during
sucking, but usually persists into adult life. It is thought that the disorder results
from abnormal connection of axons which would normally travel within the
motor branch of the trigeminal nerve, innervating the pterygoid muscle
(Freedman H and Kushner B, 1997). The abnormal connection is to the levator
superioris muscle (normally innervated by a branch of the oculomotor nerve).
137
138
Although most cases of MGP are sporadic, there have been several reports of
familial occurrences of the condition, usually consistent with autosomal
dominant inheritance (Falls et al., 1949; Kuder GG and Laws HW, 1968;
Kirkham, 1969; Mrabet et al., 1991; Pratt et al., 1984). Incomplete penetrance
has been observed in dominant MGP (Mrabet et al., 1991), but no associated
malformations have been reported in these families. The only previous report of
an association between CHD and MGP was in a case report of a child with
MGP and complex CHD involving Tetrallogy of Fallot, with left heart hypoplasia
and total anomalous pulmonary return (Festa et al., 2005). The MGP is
mentioned only in the abstract of the paper and there is no mention of family
history.
There has been a single report of KIF21A mutations in four patients with
congenital fibrosis of the extra-ocular muscles (CFEOM) who also have MGP
(Yamada et al., 2005). CFEOM is an autosomal dominant disorder
characterised by nonprogressive ophthalmoplegia, bilateral ptosis and a
downward primary position of the eyes, with limited ability to elevate (supraduct)
the eyes, and is caused by mutations in KIF21AI, a kinesin motor protein
located at 12q12 (Yamada et al., 2003). CFEOM is associated with abnormal
development of the oculomotor axis, including the nucleus of the oculomotor
nerve, the superior division of the nerve itself and the levator and superior
rectus muscles (Yamada et al., 2005), and thus its pathogenesis overlaps with
that of MGP. In a total of four patients with CFEOM and MGP, two had de novo
mutations in KIF21A and two had familial mutations. In the latter two families
there were other family members who had CFEOM but did not have MGP
(Yamada et al., 2005). To date, there have been no reports of mutation
screening in KIF21A in subjects with isolated MGP, familial or otherwise.
Doco-Fenzy and colleagues (Doco-Fenzy et al., 2006) reported a child with a
chromosomal duplication involving 12q24.1-q24.2 who had MGP as well as
multiple congenital anomalies. The cardiac phenotype of this child was of
multiple small VSDs, which closed spontaneously, and pseudo-coarctation of
the aorta. TBX5 is one of the more than 75 genes within the duplicated region. It
139
is not clear what link, if any, this has to the association of ASD and MGP
reported here. Holt-Oram syndrome is caused by loss of function of TBX5
(Basson et al., 1999), rather than gain of function as would be expected in a
duplication; however, in animal models cardiac development is disrupted by
Tbx5 overexpression (Hatcher et al., 2004), and it is plausible that TBX5
duplication could cause CHD.
There has been a single report of MGP in a child with CHARGE syndrome
(Weaver et al., 1997). This antedated the identification of CHD7 mutations in
individuals with CHARGE syndrome (Vissers et al., 2004) so the molecular
basis of CHARGE syndrome in this patient is not confirmed although a CHD7
mutation is likely. Facial nerve palsy, usually unilateral, is a common feature of
CHARGE syndrome, and indeed abnormalities of all other cranial nerves have
been reported (Sanlaville and Verloes, 2007). It is plausible that the MGP in the
patient reported by Weaver et al (Weaver et al., 1997) is an unusual
manifestation of a common component of the syndrome, i.e. abnormal
development of cranial nerves and their nuclei. It seems unlikely that CHD7
mutations would account for MGP in patients without other features of CHARGE
syndrome.
4.3 Phenotypes of affected family members The pedigree is shown in Figure 4.1. Ten individuals in four generations were
affected by congenital heart disease. All of these had secundum ASD but
otherwise structurally normal hearts, except for individuals II:7 (primum and
secundum ASD), III:4 (VSD, no ASD), and III:5 (TOF and ASD). The severity of
ASD ranged from a defect only a few mm in size in an asymptomatic 88 year
old man (I:1) diagnosed as part of the study, to a lesion 4cm in diameter
requiring surgical closure (II:7). No affected family members had cardiac
conduction abnormalities, but II:7 had atrial fibrillation diagnosed at the age of
55. In addition, 5 of the 10 individuals with congenital cardiac malformations
had MGP. Individual III:6 had very pronounced bilateral MGP and required
surgery for ptosis and to eliminate the "wink". Other individuals were less
severely affected. No family members with MGP in the absence of congenital
140
heart disease were identified. Individual II:1 is an obligate gene carrier, since he
has an affected parent and child, but is apparently non-penetrant for the
disorder, having a normal heart on echocardiography and lacking MGP.
Individual III:7 had unilateral cleft lip and palate which were repaired in
childhood, in addition to ASD. All family members were assessed by a clinical
geneticist (EK). None had significant craniofacial dysmorphism or other features
suggestive of known syndromes. In particular, none had features of
velocardiofacial syndrome, or subtle limb abnormalities suggestive of Holt-Oram
syndrome. Individuals II:4 and III:4 declined to take part in the study, and
information about their cardiac lesions and the MGP in III:4 is based on history
provided by other family members. The family was originally ascertained by Prof
Ian Glass, and he played an important role in recruitment of subjects, including
doing many of the venepunctures. Dr Rob Justo and Dr Michael Tsicalis did the
cardiac assessments and Dr Tim Sullivan provided opthalmological advice.
4.4 Cytogenetics Although no family members were felt to have features consistent with
velocardiofacial syndrome, a karyotype and FISH for 22q11 microdeletion was
performed in individual IV:2. This was normal.
4.5 Sequencing of cardiac genes No abnormalities in the coding sequences of NKX2-5, GATA4 or TBX20 were
detected in individual II:7 (sequencing of NKX2-5 by EK, GATA4 by Dr
Changbaig Hyun and TBX20 by Ms Leticia Castro). DNA extraction was done
by EK, assisted by Dr Fiona McKenzie.
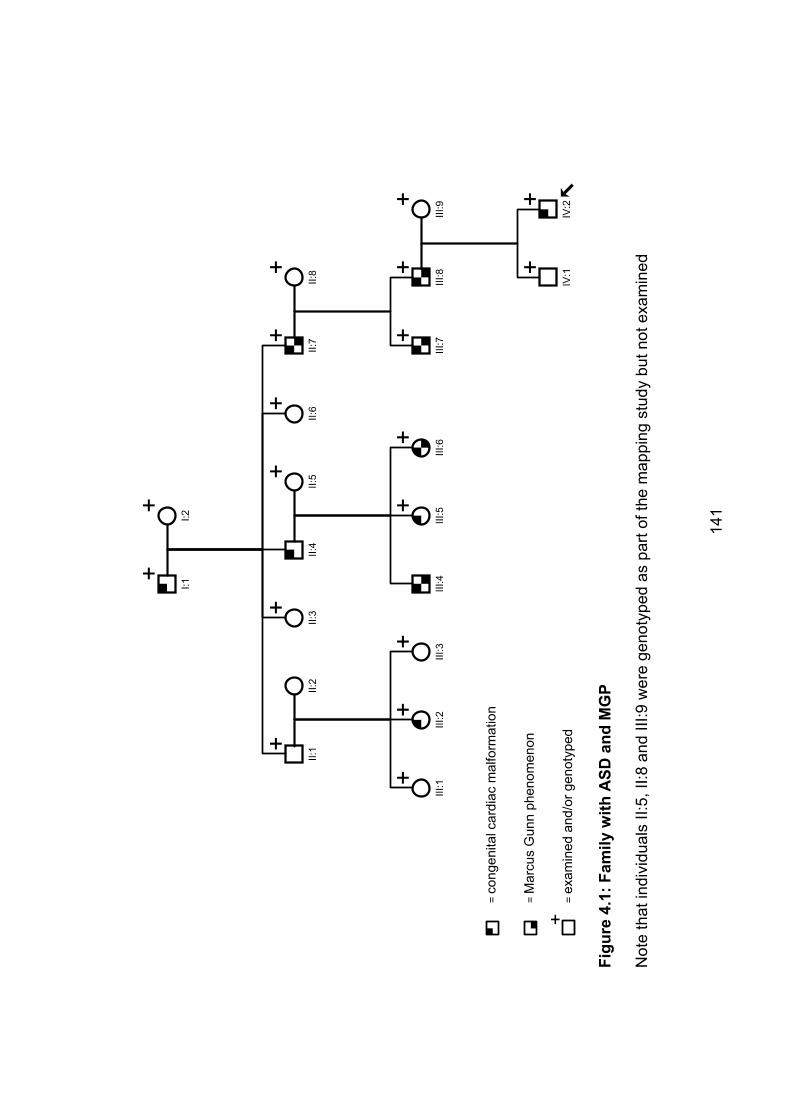
+I:1
+I:2
+II:
1II:
4
+II:
7
+II:
3
+II:
6II:
2
+III
:1
+III
:2
+III
:3
+II:
5
III:4
+III
:5
+III
:6
+II:
8
+III
:7
+III
:8
+III
:9
+IV
:1
+IV
:2
=co
ngen
ital c
ardi
ac m
alfo
rmat
ion
=M
arcu
s G
unn
phen
omen
on
+=
exam
ined
and
/or g
enot
yped
Figu
re 4
.1:F
amily
with
ASD
and
MG
P
Not
e th
at in
divi
dual
s II:
5, II
:8 a
nd II
I:9 w
ere
geno
type
d as
par
t of t
he m
appi
ng s
tudy
but
not
exa
min
ed
141
142
4.6 Mapping results The names and map locations of the markers used in this study, together with
the 2-point LOD scores obtained for each marker at � = 0, are shown in
Appendix 1. Analysis was also done at � = 0.025, 0.05, 0.075, 0.1, 0.15, 0.2,
0.3 and 0.4 (data not shown) but no loci had substantially higher LOD scores at
� > 0 than at � =0. Two LOD scores are shown for each marker. The first
(“LOD score all”) is the score obtained using all available phenotype data.
Because this was inconclusive, the genome scan was re-run with all unaffected
individuals coded as “unknown”, apart from the unaffected spouses II:5, II:8 and
III:9. The results are in the columns headed “LOD score affected”. The rationale
for this was that if one of the individuals who was phenotypically unaffected was
in fact heterozygous for the disease-causing mutation, this would manifest in
the mapping results as a recombinant, lowering the LOD score. Although the
maximum obtainable LOD score using only affected individuals would be lower,
this problem would be avoided. Genetic distances from the Généthon linkage
map (Gyapay et al., 1994) are given in cM from the p telomere. As there are 6
instances of male to male transmission in the pedigree, the X chromosome was
not analysed. Dr Kyall Zenger did the initial analysis of the data (LOD score all)
and the multipoint analysis of chromosome 5; EK did all other analyses.
4.6.1 Chromosome 1 Marker D1S2878 was the only marker studied to give a result suggestive of
linkage, with a LOD score of 2.03 – just above the threshold of 1.9 proposed by
Lander and Kruglyak as the threshold for suggestive linkage. Interestingly,
when non-affected individuals are removed from the analysis the LOD score at
this marker actually goes down to –1.23. Nonetheless, as the best candidate
locus further study was warranted and additional markers closely flanking
D1S2878 were genotyped. The results are in appendix 1, Table A1.1b. Note
that the map locations given in the key are from the Marshfield map, as two of
the additional markers selected (D1S382 and D1S1679) are not listed on the
Généthon map. This is important because D1S382 is at the same position on
the genetic map as D1S2878, but has a slightly different map position listed in
table 1b. Given the results for these closely flanking markers, and the fact that

I:1 was homozygous for D1S2878, linkage to this region can be regarded as
excluded.
4.6.2 Chromosome 5 No mutation was found in NKX2-5, which is located on 5q at 180cM, in an
affected family member. However, additional analysis was done on this
chromosome because of the previously reported linkage (with no gene yet
identifed) on the short arm of chromosome 5. The results of multipoint linkage
analysis are shown in Figure 4.2. Linkage to both loci is excluded.
Figure 4.2 Multipoint mapping of chromosome 5. The locations of NKX2-5
and D5S208, the marker at which maximum linkage was found by Benson et al
(Benson et al., 1998), are indicated.
143
144
4.6.3 Chromosome 6Mohl and Mayr (Mohl and Mayr, 1977) reported linkage of ASD to the HLA
complex, which is at about 44cM on the Généthon map. As discussed above, it
is difficult to assess their very brief report, and the finding has not been
replicated in the 30 years since its publication. Although the data shown do not
suggest linkage to 6p is likely in this family, the possibility has not been
completely excluded.
4.6.4 Chromosome 7 TBX20 is located at 55.6cM, between markers D7S516 and D7S484. Given the
low LOD scores at these markers, it is not surprising that no mutation was found
in the coding regions of TBX20 in an affected family member.
4.6.5 Chromosome 8 GATA4 is located at 21.2cM, between D8S550 and D8S549. Given the low
LOD scores in this region, it is not surprising that sequencing of the coding
regions of this gene in an affected family member did not reveal a mutation.
4.6.6 Chromosome 12 TBX5 is located at 125cM, between D12S78 and D12S79. Given their very low
LOD scores it is unlikely that this family is linked to TBX5. Clinically there is no
evidence of even subtle limb changes in any family member, which is additional
strong evidence against a role for TBX5 mutation in this family. Penetrance for
limb anomalies is very high in Holt-Oram syndrome (Newbury-Ecob et al.,
1996).
4.6.7 Chromosome 14 MYH6 is located at 10.97cM, close to D14S283. The low LOD score at this
locus indicates a mutation in MYH6 is unlikely in this family.
145
4.6.8 Chromosome 15The dominant ASD gene ACTC is located at 32cM, between markers
D15S1007 and D15S1012. Given the linkage results for these markers it is
unlikely that an ACTC mutation is responsible for the phenotype in this family.
4.7 Discussion 4.7.1 Linkage results The size of the family reported here is, unfortunately, marginal at best for a
successful mapping effort. In principle, mapping in an autosomal dominant
pedigree with 10 affected individuals could yield a LOD score of 3. However,
this relies on a fully informative marker, positioned at or very close to the gene
of interest, and in practice analysis of a rather larger number of affected
individuals is likely to be required (Anderson NH, 2002). Although there are
unaffected individuals in the pedigree, they contribute relatively little linkage
information, because their status is uncertain (Lander and Botstein, 1989). The
exception is II:1, who is an obligate heterozygote on the basis of having an
affected parent and an affected child. The decision by two affected family
members (II:4 and III:4) not to participate in the study also reduced the
likelihood of success.
Non-penetrance, as seen in II:1, may also have been a problem. If one of the
individuals classed as unaffected was in fact heterozygous for the mutation but
was non-penetrant for a cardiac phenotype or for MGP, he or she would have
represented an apparent recombination event, even with a perfect marker, and
would have lowered the LOD score obtained. Similarly, with a common class of
malformations like CHD, there is the possibility of a phenocopy occurring – i.e. a
member of the family having CHD for reasons unconnected with the familial
mutation. This would have serious consequences for success of the linkage
analysis. Re-analyzing the data with clinically unaffected individuals marked as
“unknown” was an attempt to control for the possibility of non-penetrance in one
or more of those people. Although this had a significant effect on many of the
LOD scores obtained, none rose substantially above zero.
146
Although no definite linkage was detected, and the only suggestive locus – on
chromosome 1 – was not supported by additional fine mapping – the results of
this linkage analysis do have something to tell us about the genetics of
dominant ASD. All 6 of the known ASD genes were excluded, as was the only
locus which has been convincingly mapped without the gene yet being identified
(on 5p). Linkage to the HLA locus on 6p was not excluded but appears unlikely,
and in any case the status of that linkage result is in doubt, as discussed above.
Thus, this family provides firm evidence for further genetic heterogeneity in
dominant ASD. Including TBX5 and the locus responsible for this family’s CHD,
there are at least 8 different dominant ASD loci. It seems likely that ultimately
there will prove to be even more than this.
4.7.2 ASD and MGP The association of ASD and MGP represents a new dominant ASD syndrome.
Non-penetrance for MGP is common, with 5/11 presumed mutation carriers
(counting II:1) manifesting MGP. Non-penetrance has been observed in
previous families with dominant MGP (Mrabet et al., 1991). Although CHD has
not previously been reported in association with dominant MGP, ASD can easily
be missed – as evidenced by the fact that several members of this family had
their ASDs identified as a result of participation in the study – and it is possible
that this disorder may sometimes present as a primarily ophthalmological
phenotype.
4.7.3 Clefting Individual III:7 had cleft lip and palate repaired as a child. All other family
members had normal lips and palates on examination, and it is possible that
this is a chance association rather than representing a part of the phenotype of
this disorder. There have been two previous reports of an association between
MGP and orofacial clefting. In one case, the father of a girl with MGP had cleft
lip and palate (Brooks, 1987). In another, a boy with MGP had cleft lip, as did
two of his six sibs (neither of whom was affected by MGP) (Awan, 1976). This
raises the possibility that the cleft lip and palate seen in individual III:7 in the
147
family reported here may not be a chance association, but could in fact be an
uncommon feature of the disorder.
4.7.4 Future studies The majority of the work reported here was completed in 2000 and 2001. Since
then, there have been considerable technological advances in mapping
techniques. Specifically, SNP microarray is now becoming cheap enough to be
an accessible alternative to microsatellite markers, offering the advantage of
very dense map coverage – ranging upwards from 10,000 markers, compared
with the 382 microsatellite markers used in this study. This increases the
chance of finding the “perfect marker” or combination of closely linked markers
which would allow the maximum possible LOD score to be obtained from the
pedigree. While the spacing of markers used here was dense enough to make
double recombinants in between markers unlikely (another possible cause for
the lack of success in establishing linkage) it still seems possible that repeating
the whole genome screen at the density allowed by microarray technology may
be the key to future success.
5. Cardiac atrial septal morphology and risk of patent foramen ovale in inbred laboratory mice
5.1 Introduction Chapters 3 and 4 described studies of the Mendelian variants of ASD, which
proved to be rare. In affected individuals without a family history of CHD, the
chance of finding a mutation in one of the genes known to be associated with
ASD is low. It is unlikely that similar studies of other such dominant genes will
substantially advance our understanding of the causes of the majority of ASD.
An alternate approach is therefore required. This chapter and the next describe
studies of an animal model of atrial septal dysmorphogenesis. Different strains
of inbred laboratory mice have different susceptibilities to PFO, a point first
demonstrated by Biben and colleagues (Biben et al., 2000). The Biben study
formed the basis on which this study stands and will be discussed in detail in
section 5.2, below. An important finding of that study was that there are features
of the mouse atrial septal wall which correlate with the presence of PFO, with
strain to strain variation in these quantitative traits being closely related to the
risk of PFO in each strain. Biben and colleagues studied the length of the
septum primum, or flap valve length (FVL). The traits foramen ovale width
(FOW) and crescent width (CRW) were found in the course of this study to also
be associated with the risk of PFO (descriptions of all of these traits are to be
found in section 2.1.4.2, especially Figure 2.3).
While PFO itself is a binary trait, which offers relatively little power for mapping
studies, the identification of quantitative traits which are associated with risk of
PFO made a QTL mapping study a viable option. The underlying hypothesis of
this study was that if QTL relevant to FVL, FOW and CRW could be mapped,
these would also influence risk of PFO. Identification of the underlying genetic
basis of any such QTL should provide insight into normal and abnormal
morphogenesis of the atrial septal wall, and may have wider significance in the
study of CHD.
148
149
Chapter 6 reports the identification of QTL relevant to PFO risk in two strains of
inbred laboratory mice, QSi5 and 129T2/SvEms. For the QTL mapping study,
85 [QSi5 x 129T2/SvEms] F1 mice and 1437 F2 mice were dissected.
Subsequently, an advanced intercross line (AIL) was established from the same
parental strains and bred for 14 generations; 1003 mice from the F14
generation were dissected. These experiments generated a large amount of
quantitative data relating to atrial septal wall morphology. This chapter presents
analyses of those data, with a focus on the relationship between septal
morphology and PFO. Independently from the QTL analysis, the morphological
data provide insight into the relationships between PFO and each of FVL, FOW
and CRW, as well as information about interaction between the traits and their
relationship to other variables such as sex, body weight and heart weight.
All dissections, measurements and statistical analyses including LOD score
analysis presented in chapters 5 and 6 were done by EK.
5.2 The relationship between atrial septal morphology and PFO: previous work The only previous investigation of the relationship between atrial septal
morphology and incidence of PFO in laboratory mice was that of Biben and
colleagues (Biben et al., 2000). As part of an exploration of the effects of
heterozygous mutations of Nkx2-5 on the murine heart, Biben and colleagues
noted that the incidence of PFO varies considerably between strains of inbred
laboratory mice. Moreover, they found a relationship between measures of
atrial septal morphology and strain-specific incidence of PFO. In particular, the
mean FVL was inversely proportional to the incidence of PFO in a given strain.
Mice heterozygous for Nkx2-5 mutations had shorter FVL and a higher
incidence of PFO than wild-type mice of the same genetic background. There
was a very strong correlation between these traits, with a correlation coefficient
of –0.97 (Biben et al., 2000). The authors made the point that it was not clear
whether there was a causal relationship between short FVL and high risk of
PFO, or even in which direction such a causal relationship might act. Either the
shortness of the septum primum might reduce the chance of the flap valve
forming an effective seal, or the presence of the PFO might lead to increased
150
bloodflow which could place additional stress on a fragile structure, resulting in
a shorter flap valve in postnatal life.
Mice heterozygous for the Nkx2-5 mutation were found to have other
abnormalities, including (in 129T2/SvEms mice) a high incidence of ASD and
some 17% having borderline ASD (only 6% had no PFO or ASD). In C57Bl/6
mice, 1.4% of wild-type mice had bicuspid aortic valve, compared with 11% of
Nkx2-5+/- mice; and female heterozygotes had a mild but significant prolongation
of the PR interval. There was also an increased incidence of atrial septal
aneurysm (ASA) in heterozygotes.
This paper was a vital precursor to all of the mouse work described in this
chapter and the next. It showed 1) a relationship between FVL and PFO; 2) that
the mouse heart responds to Nkx2-5 haploinsufficiency in a similar way to the
human heart, albeit with a milder phenotype in mouse than man; and 3) clear
evidence of a genetic link between ASD and PFO. In short, the findings of
Biben and colleagues validated a quantitative analysis of the mouse atrial
septum, and particularly of PFO as a model for human ASD.
In addition to FVL, Biben and colleagues studied the relationship between the
width of the patent corridor behind the flap valve in cases of PFO, showing that
this was wider in Nkx2-5+/- than in wild-type mice. As this can only be studied in
mice with PFO, alternative measures were sought during initial dissections for
this study, and FOW and CRW were identified as being worthy of investigation.
5.3 Selection and breeding of mice for study The process of strain selection for the QTL mapping study reported in chapter 6
is described in section 2.1.5. The strains chosen for study, QSi5 and
129T2/SvEms, had extreme values for FVL, with QSi5 having FVL of
1.13±0.11mm (mean±SD), compared with 0.60±0.11mm for 129T2/SvEms. The
difference between the strains, which is 4.8 times the standard deviation of the
strains, is large enough that a QTL mapping exercise would be expected to
have good prospects of success. By way of comparison, Kirkpatrick and
151
colleagues (Kirkpatrick et al., 1998) identified 3 QTL for fecundity using just 41
informative markers across all chromosomes in an F2 resource of only 200
mice, where phenotypic means were separated by 4-5 SD. The study reported
here was designed to use much larger numbers of mice and a denser marker
map, suggesting that the prospects of success were excellent.
The F1 and F2 mice were bred by Dr Ian Martin as part of a mapping protocol,
as described in sections 1.4.2 and 2.1.3.1. A total of 85 F1 mice were dissected
early in the study, in order to gain an impression of overall dominance effects.
At that stage, the decision to measure FOW and CRW had not yet been made
and only FVL was measured.
Following the success of the QTL mapping project (Chapter 6), approaches to
fine mapping were considered. One such approach is the use of an Advanced
Intercross Line (AIL). The principles behind and generation of an AIL are
described in section 2.1.3.2. The advantages of this approach include the ability
to do fine mapping on multiple regions of interest simultaneously, and the ability
to breed over a number of generations and only phenotype and genotype at the
final generation. The gain in resolution of mapping diminishes with increasing
generation number and after about 10 generations, the confidence interval (i.e.
the size of the area of interest) is reduced only modestly for each additional
generation (Darvasi and Soller, 1995). As it happened, it was not possible to
devote the necessary time for phenotyping a large number of mice when the
10th generation of AIL mice were being born, and breeding (which was much
less time-consuming than phenotyping) was thus continued until the 14th
generation, when 1003 mice were dissected. These mice have yet to be
genotyped (see chapter 8 for a discussion of future plans). However, the
phenotype data generated by their dissection is of interest and is presented
here. All mouse breeding, dissections and measurements for the AIL were
done by EK.
152
5.4 Analysis of data from QSi5, 129T2/SvEms, and the [QSi5 x 129T2/SvEms] F1, F2 and F14 mice In this section, data are presented from the parental strains used in the QTL
mapping experiment, and from strains derived from crossing them at various
generations. Wherever possible, all available data for each trait are analysed,
but for the more complex comparisons, analyses are restricted to the subset of
mice with complete data. Selection of mice for genotyping was based only on
mice with complete data available. Data were missing for some mice for a
variety of reasons, most commonly inadvertent damage to the atrial septum
during dissection. Uncommonly, atypical anatomy made it impossible to do the
full set of measurements. For example, occasionally a PFO would be observed
with two separate outlets in the left atrial septal wall, making it possible to
measure FOW, but not CRW or FVL as there would be two values for each of
these.
5.4.1 Descriptive statistics Table 5.1 shows the means and standard deviations for the continuous traits
which were measured – body weight, heart weight, FVL, FOW, CRW, body
weight and heart weight – and the percentage of PFO in each set of mice. QSi5
mice had a low prevalence of PFO, associated with a long FVL, small FOW and
large CRW when compared with 129T2/SvEms. They were also heavier and
had correspondingly greater heart weight compared with 129T2/SvEms.
Interestingly, the atrial septa of the F1 mice were strikingly similar to QSi5 mice,
with no PFOs identified in 85 F1 mice, and with very similar FVL to QSi5 mice,
although body weight and heart weight were intermediate between the two
parental strains. This similarity may represent the effect of alleles with
substantial dominance effects in the direction of the QSi5 phenotype. FOW and
CRW were not measured for the F1 mice as the decision to include these
measures had not been made at the time that these mice were dissected. The
F2 mice were intermediate between the parental strains for %PFO (albeit closer
to QSi5 than 129T2/SvEms), for FVL and bodyweight. They were similar to
QSi5 for FOW and heart weight, and similar to 129T2/SvEms for CRW. It is
153
hard to interpret this information with confidence, but again, it is possible that
this represents dominance effects.
In theory, the F14 mice should be very similar to F2 mice for all measures. In
practice, although all the continuous variables for the F14 mice were within one
standard deviation of the values for the F2 mice, there was a substantial
difference in prevalence of PFO.
Of the F14 mice, 34% had PFO, double the value for the F2 mice (p<0.0005,
chi square test). The most likely explanation for this is that during the breeding
of successive generations of mice a significant amount of genetic drift occurred
– i.e. the random loss of some alleles from the population. The experiment was
structured to minimize the risk of this occurring, with the use of 48 pairs of mice
and with great care taken to avoid inbreeding at each generation. Nonetheless,
it is possible that the continuation of the experiment past the 10th generation
contributed to this unwanted outcome - if this is indeed the explanation for the
changes from the F2 to F14 generations. The reason this is undesirable is that
there is a risk that at one or more of the QTL detected in the F2 mapping
experiment (see chapter 6), the F14 mice have become fixed for one of the
parental strain alleles, or at least there may be heavy skewing towards one of
the parental strain alleles. If this has happened the experiment will be unable to
confirm and refine any such QTL (if fixed) or will have reduced power to do so
(if not fixed but skewed). The large number of QTL which were detected mean
that it is unlikely that all of the QTL will have been affected by genetic drift. It is
also possible that none have been affected, and that the difference in PFO
prevalence between F2 and F14 results from genetic drift affecting QTL which
were not detected in the original experiment. Other possible explanations for
this difference, such as a change in environmental factors in the interval
between the breeding and dissection of the F2 and F14 mice (several years),
are less likely. Animal husbandry practices in the animal house did not change
over the period of these studies.
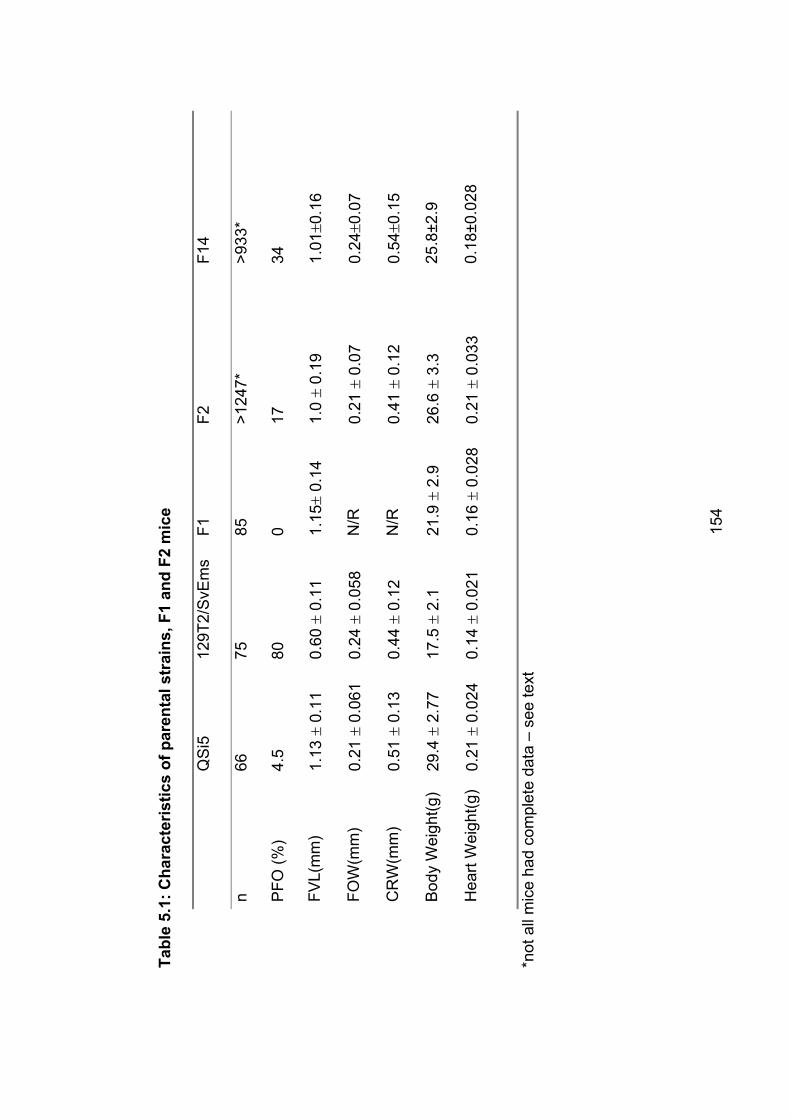
Tabl
e 5.
1: C
hara
cter
istic
s of
par
enta
l str
ains
, F1
and
F2 m
ice
QS
i5
129T
2/S
vEm
sF1
F2F1
4
n66
7585
>124
7*
>933
*
PFO
(%)
4.5
800
1734
FVL(
mm
)1.
13�
0.11
0.60
� 0.
11
1.15
� 0.
14
1.0
� 0.
191.
01�0
.16
FOW
(mm
) 0.
21�
0.06
1 0.
24�
0.05
8 N
/R0.
21�
0.07
0.
24�0
.07
CR
W(m
m)
0.51
� 0.
13
0.44
� 0.
12
N/R
0.41
� 0.
12
0.54
�0.1
5
Bod
y W
eigh
t(g)
29.4
� 2.
77
17.5
� 2.
1 21
.9�
2.9
26.6
� 3.
325
.8±2
.9
Hea
rt W
eigh
t(g)
0.18
±0.0
280.
21�
0.02
4 0.
14�
0.02
1 0.
16�
0.02
8 0.
21�
0.03
3
*not
all
mic
e ha
d co
mpl
ete
data
– s
ee te
xt
154
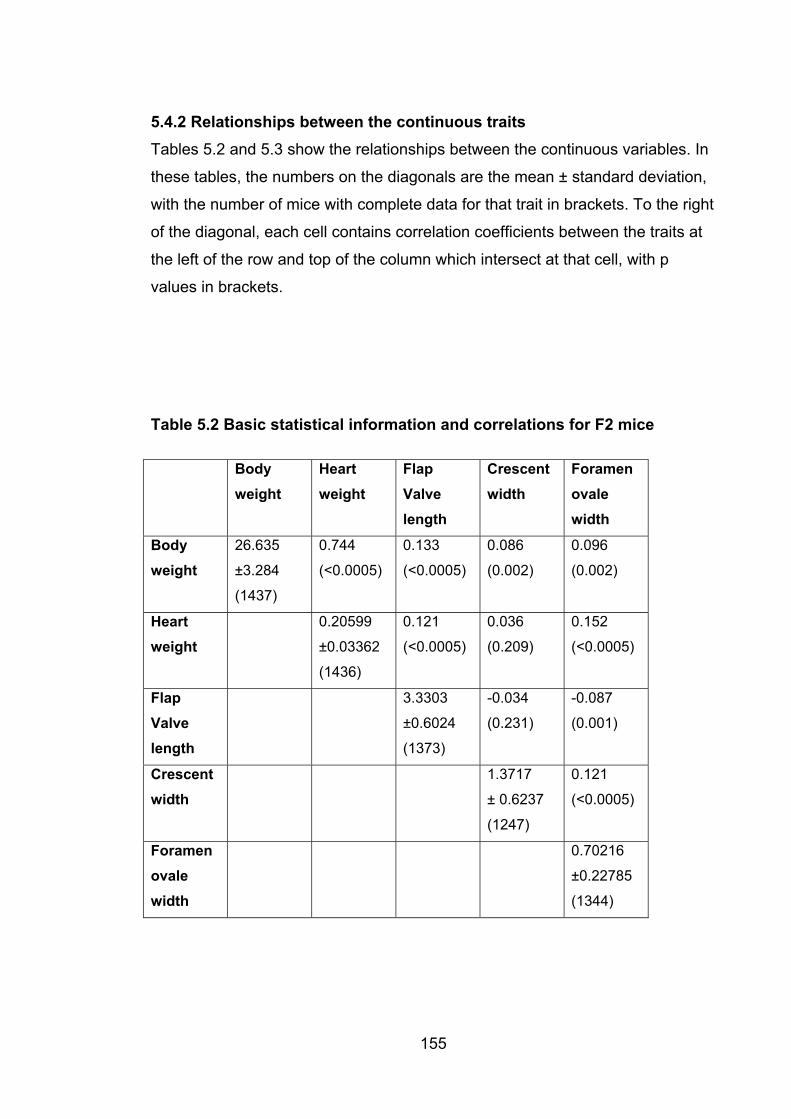
5.4.2 Relationships between the continuous traits Tables 5.2 and 5.3 show the relationships between the continuous variables. In
these tables, the numbers on the diagonals are the mean ± standard deviation,
with the number of mice with complete data for that trait in brackets. To the right
of the diagonal, each cell contains correlation coefficients between the traits at
the left of the row and top of the column which intersect at that cell, with p
values in brackets.
Table 5.2 Basic statistical information and correlations for F2 mice
Body weight
Heartweight
FlapValvelength
Crescentwidth
Foramenovalewidth
Body weight
26.635
±3.284
(1437)
0.744
(<0.0005)
0.133
(<0.0005)
0.086
(0.002)
0.096
(0.002)
Heartweight
0.20599
±0.03362
(1436)
0.121
(<0.0005)
0.036
(0.209)
0.152
(<0.0005)
FlapValvelength
3.3303
155
±0.6024
(1373)
-0.034
(0.231)
-0.087
(0.001)
Crescentwidth
1.3717
± 0.6237
(1247)
0.121
(<0.0005)
Foramenovalewidth
0.70216
±0.22785
(1344)
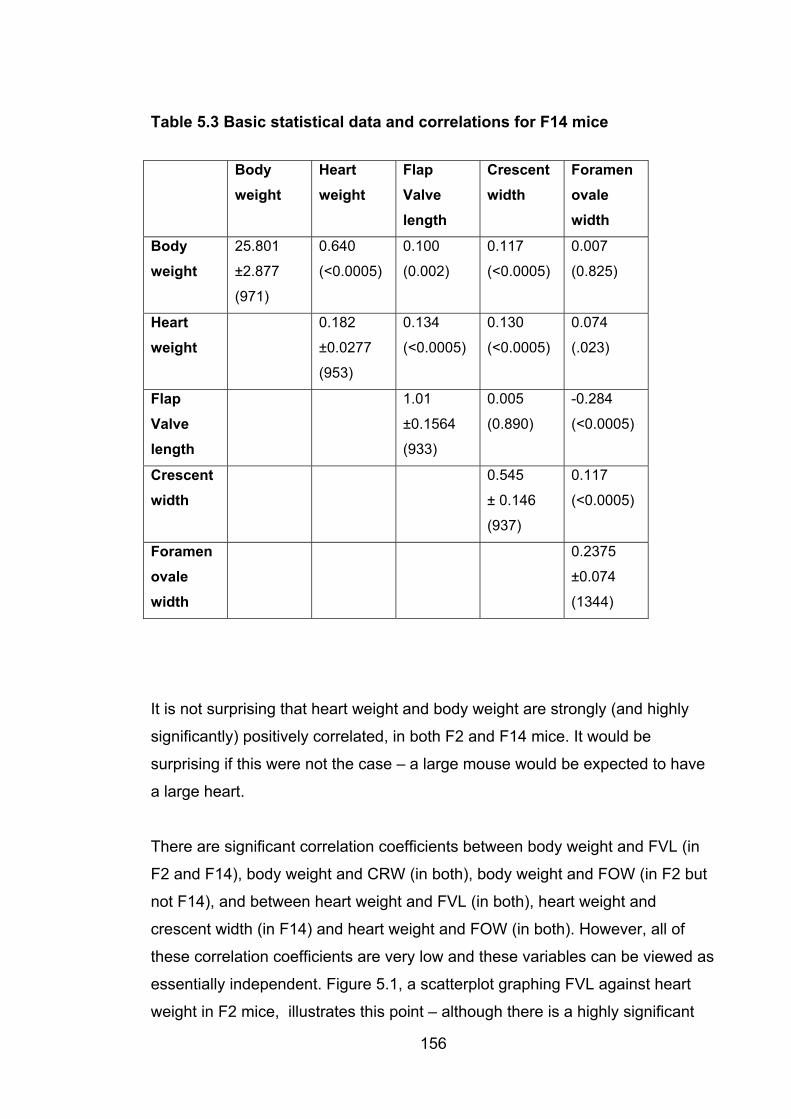
Table 5.3 Basic statistical data and correlations for F14 mice
Body weight
Heartweight
FlapValvelength
Crescentwidth
Foramenovalewidth
Body weight
25.801
±2.877
(971)
0.640
(<0.0005)
0.100
(0.002)
0.117
(<0.0005)
0.007
(0.825)
Heartweight
0.182
±0.0277
(953)
0.134
(<0.0005)
0.130
(<0.0005)
0.074
(.023)
FlapValvelength
1.01
±0.1564
(933)
0.005
(0.890)
-0.284
(<0.0005)
Crescentwidth
0.545
± 0.146
(937)
0.117
(<0.0005)
Foramenovalewidth
156
0.2375
±0.074
(1344)
It is not surprising that heart weight and body weight are strongly (and highly
significantly) positively correlated, in both F2 and F14 mice. It would be
surprising if this were not the case – a large mouse would be expected to have
a large heart.
There are significant correlation coefficients between body weight and FVL (in
F2 and F14), body weight and CRW (in both), body weight and FOW (in F2 but
not F14), and between heart weight and FVL (in both), heart weight and
crescent width (in F14) and heart weight and FOW (in both). However, all of
these correlation coefficients are very low and these variables can be viewed as
essentially independent. Figure 5.1, a scatterplot graphing FVL against heart
weight in F2 mice, illustrates this point – although there is a highly significant
correlation between these variables, the graph shows a lack of any clear
pattern. One of the weaknesses of the correlation coefficient is that if there are
very large numbers of observations, as in this study, there is a high chance of a
statistically significant correlation being observed, which is unlikely to be of any
biological significance.
Heart Weight
FVL
0.300.250.200.150.10
1.6
1.4
1.2
1.0
0.8
0.6
0.4
0.2
Figure 5.1: Scatterplot of FVL vs heart weight in F2 mice
Similarly, although several pairs of the measurements of greatest interest here,
FVL, FOW and CRW, have correlation coefficients which are statistically
significant, the size of the correlation coefficient is small in every instance. This
suggests that these variables are likely to be under largely independent genetic
control, a prediction supported by the results of the QTL mapping (see chapter
6).
5.4.3 Analysis of variance for factors affecting FVL, FOW and CRW in F2 miceAnalysis of variance (ANOVA) was used to study the relationships between the
various traits – cardiac and noncardiac – recorded for each mouse. The
General Linear Model (GLM) for ANOVA was used for all analyses of variance,
157
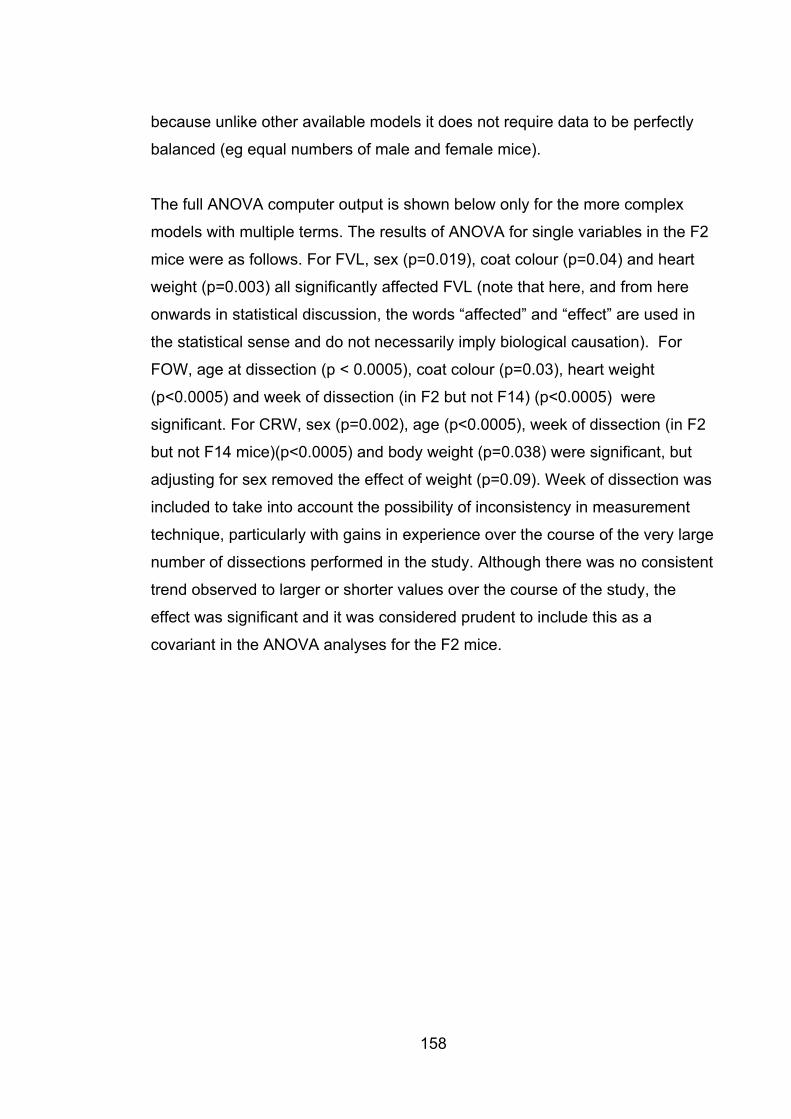
158
because unlike other available models it does not require data to be perfectly
balanced (eg equal numbers of male and female mice).
The full ANOVA computer output is shown below only for the more complex
models with multiple terms. The results of ANOVA for single variables in the F2
mice were as follows. For FVL, sex (p=0.019), coat colour (p=0.04) and heart
weight (p=0.003) all significantly affected FVL (note that here, and from here
onwards in statistical discussion, the words “affected” and “effect” are used in
the statistical sense and do not necessarily imply biological causation). For
FOW, age at dissection (p < 0.0005), coat colour (p=0.03), heart weight
(p<0.0005) and week of dissection (in F2 but not F14) (p<0.0005) were
significant. For CRW, sex (p=0.002), age (p<0.0005), week of dissection (in F2
but not F14 mice)(p<0.0005) and body weight (p=0.038) were significant, but
adjusting for sex removed the effect of weight (p=0.09). Week of dissection was
included to take into account the possibility of inconsistency in measurement
technique, particularly with gains in experience over the course of the very large
number of dissections performed in the study. Although there was no consistent
trend observed to larger or shorter values over the course of the study, the
effect was significant and it was considered prudent to include this as a
covariant in the ANOVA analyses for the F2 mice.
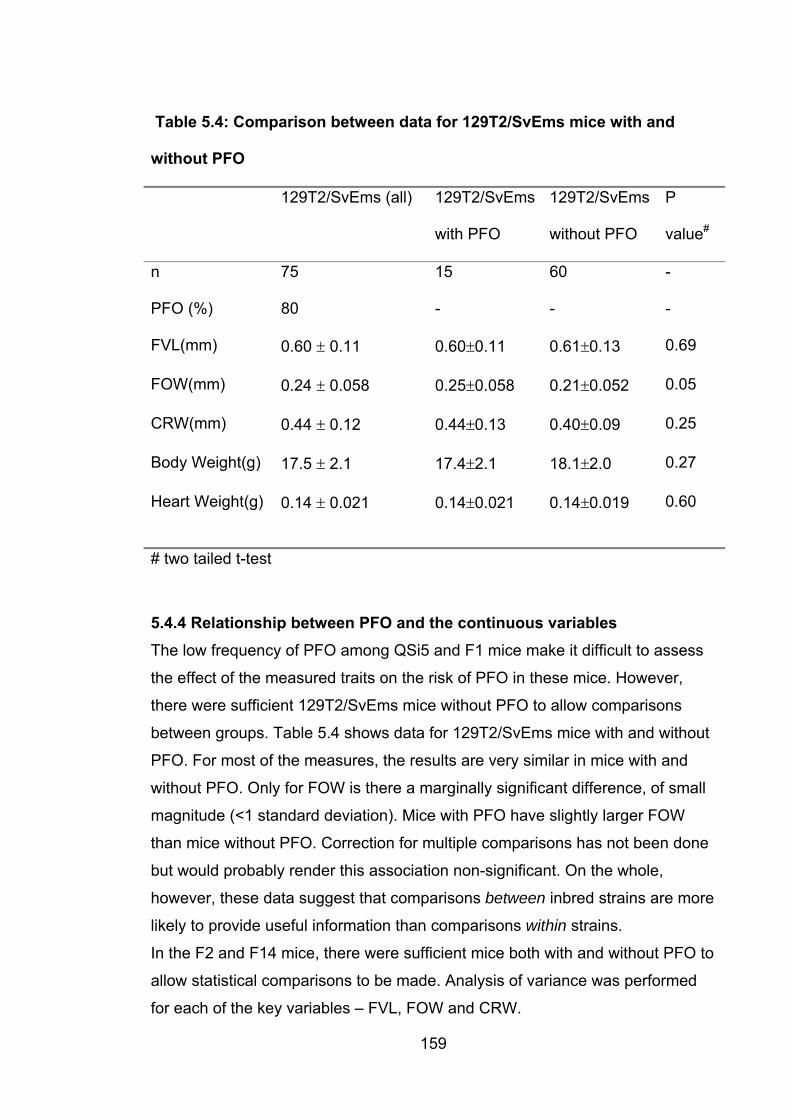
Table 5.4: Comparison between data for 129T2/SvEms mice with and
without PFO
129T2/SvEms (all) 129T2/SvEms
with PFO
129T2/SvEms
without PFO
P
value#
n 75 15 60 -
PFO (%) 80 - - -
FVL(mm) 0.60 � 0.11 0.60�0.11 0.61�0.13 0.69
FOW(mm) 0.24 � 0.058 0.25�0.058 0.21�0.052 0.05
CRW(mm) 0.44 � 0.12 0.44�0.13 0.40�0.09 0.25
Body Weight(g) 17.5 � 2.1 17.4�2.1 18.1�2.0 0.27
Heart Weight(g) 0.14 � 0.021 0.14�0.021 0.14�0.019
# two tailed t-test
0.60
5.4.4 Relationship between PFO and the continuous variables The low frequency of PFO among QSi5 and F1 mice make it difficult to assess
the effect of the measured traits on the risk of PFO in these mice. However,
there were sufficient 129T2/SvEms mice without PFO to allow comparisons
between groups. Table 5.4 shows data for 129T2/SvEms mice with and without
PFO. For most of the measures, the results are very similar in mice with and
without PFO. Only for FOW is there a marginally significant difference, of small
magnitude (<1 standard deviation). Mice with PFO have slightly larger FOW
than mice without PFO. Correction for multiple comparisons has not been done
but would probably render this association non-significant. On the whole,
however, these data suggest that comparisons between inbred strains are more
likely to provide useful information than comparisons within strains.
In the F2 and F14 mice, there were sufficient mice both with and without PFO to
allow statistical comparisons to be made. Analysis of variance was performed
for each of the key variables – FVL, FOW and CRW.
159
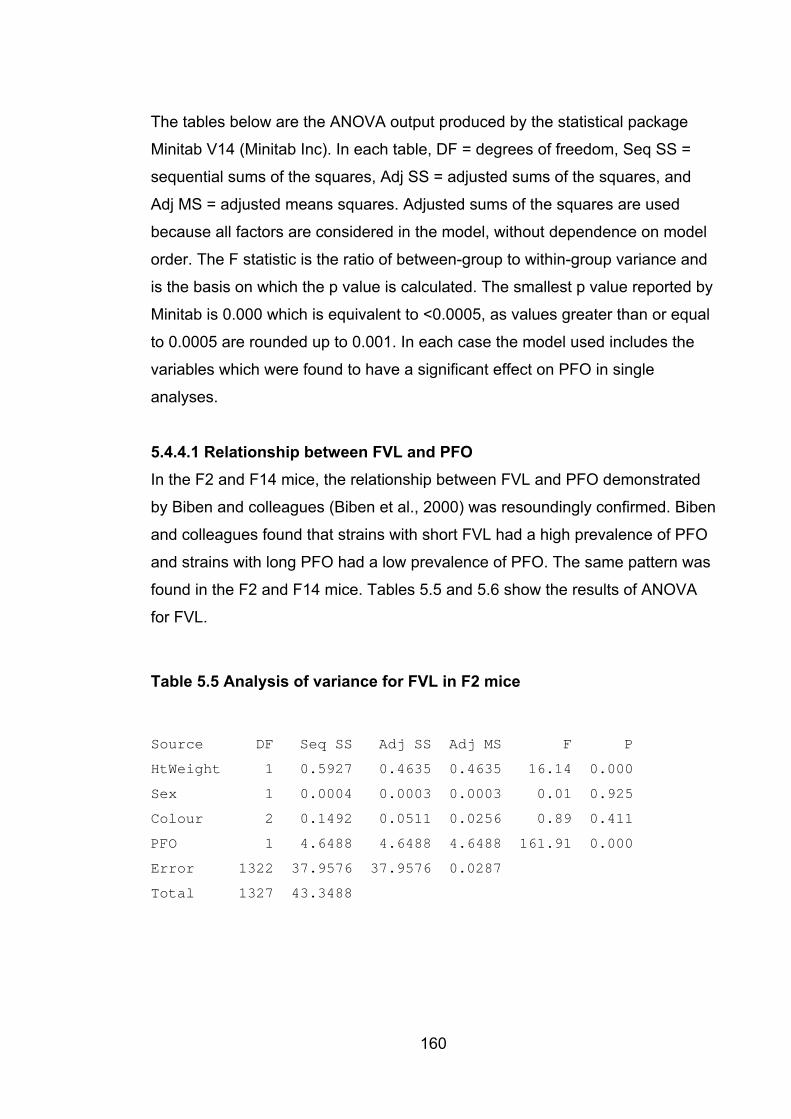
160
The tables below are the ANOVA output produced by the statistical package
Minitab V14 (Minitab Inc). In each table, DF = degrees of freedom, Seq SS =
sequential sums of the squares, Adj SS = adjusted sums of the squares, and
Adj MS = adjusted means squares. Adjusted sums of the squares are used
because all factors are considered in the model, without dependence on model
order. The F statistic is the ratio of between-group to within-group variance and
is the basis on which the p value is calculated. The smallest p value reported by
Minitab is 0.000 which is equivalent to <0.0005, as values greater than or equal
to 0.0005 are rounded up to 0.001. In each case the model used includes the
variables which were found to have a significant effect on PFO in single
analyses.
5.4.4.1 Relationship between FVL and PFO In the F2 and F14 mice, the relationship between FVL and PFO demonstrated
by Biben and colleagues (Biben et al., 2000) was resoundingly confirmed. Biben
and colleagues found that strains with short FVL had a high prevalence of PFO
and strains with long PFO had a low prevalence of PFO. The same pattern was
found in the F2 and F14 mice. Tables 5.5 and 5.6 show the results of ANOVA
for FVL.
Table 5.5 Analysis of variance for FVL in F2 mice
Source DF Seq SS Adj SS Adj MS F P
HtWeight 1 0.5927 0.4635 0.4635 16.14 0.000
Sex 1 0.0004 0.0003 0.0003 0.01 0.925
Colour 2 0.1492 0.0511 0.0256 0.89 0.411
PFO 1 4.6488 4.6488 4.6488 161.91 0.000
Error 1322 37.9576 37.9576 0.0287
Total 1327 43.3488
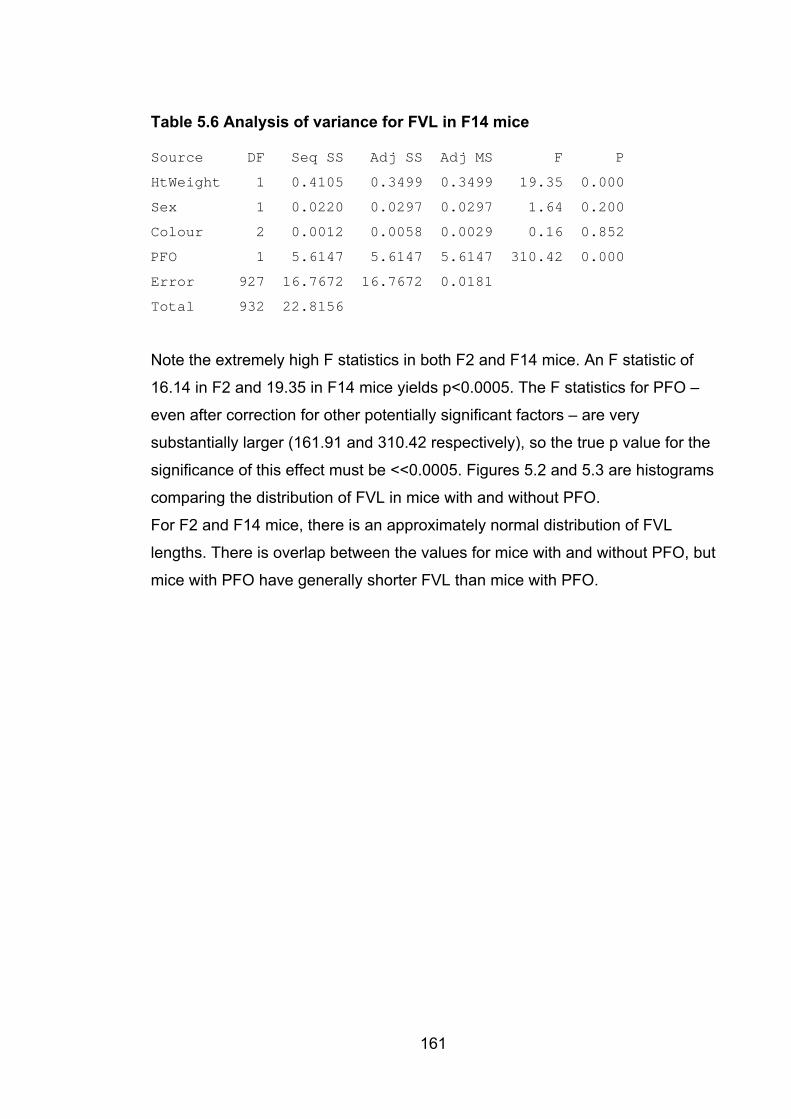
161
Table 5.6 Analysis of variance for FVL in F14 mice
Source DF Seq SS Adj SS Adj MS F P
HtWeight 1 0.4105 0.3499 0.3499 19.35 0.000
Sex 1 0.0220 0.0297 0.0297 1.64 0.200
Colour 2 0.0012 0.0058 0.0029 0.16 0.852
PFO 1 5.6147 5.6147 5.6147 310.42 0.000
Error 927 16.7672 16.7672 0.0181
Total 932 22.8156
Note the extremely high F statistics in both F2 and F14 mice. An F statistic of
16.14 in F2 and 19.35 in F14 mice yields p<0.0005. The F statistics for PFO –
even after correction for other potentially significant factors – are very
substantially larger (161.91 and 310.42 respectively), so the true p value for the
significance of this effect must be <<0.0005. Figures 5.2 and 5.3 are histograms
comparing the distribution of FVL in mice with and without PFO.
For F2 and F14 mice, there is an approximately normal distribution of FVL
lengths. There is overlap between the values for mice with and without PFO, but
mice with PFO have generally shorter FVL than mice with PFO.
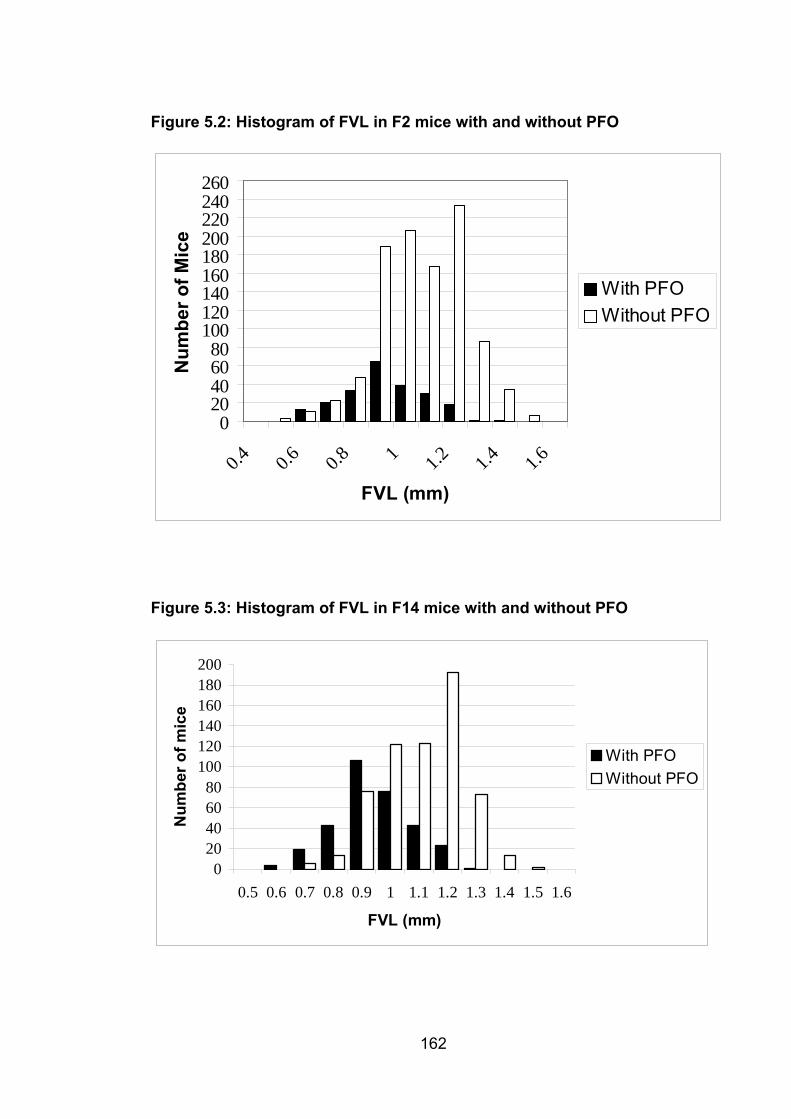
Figure 5.2: Histogram of FVL in F2 mice with and without PFO
020406080
100120140160180200220240260
0.4 0.6 0.8 1 1.2 1.4 1.6
FVL (mm)
Num
ber o
f Mic
e
With PFOWithout PFO
Figure 5.3: Histogram of FVL in F14 mice with and without PFO
020406080
100120140160180200
0.5 0.6 0.7 0.8 0.9 1 1.1 1.2 1.3 1.4 1.5 1.6
FVL (mm)
Num
ber o
f mic
e
With PFOWithout PFO
162
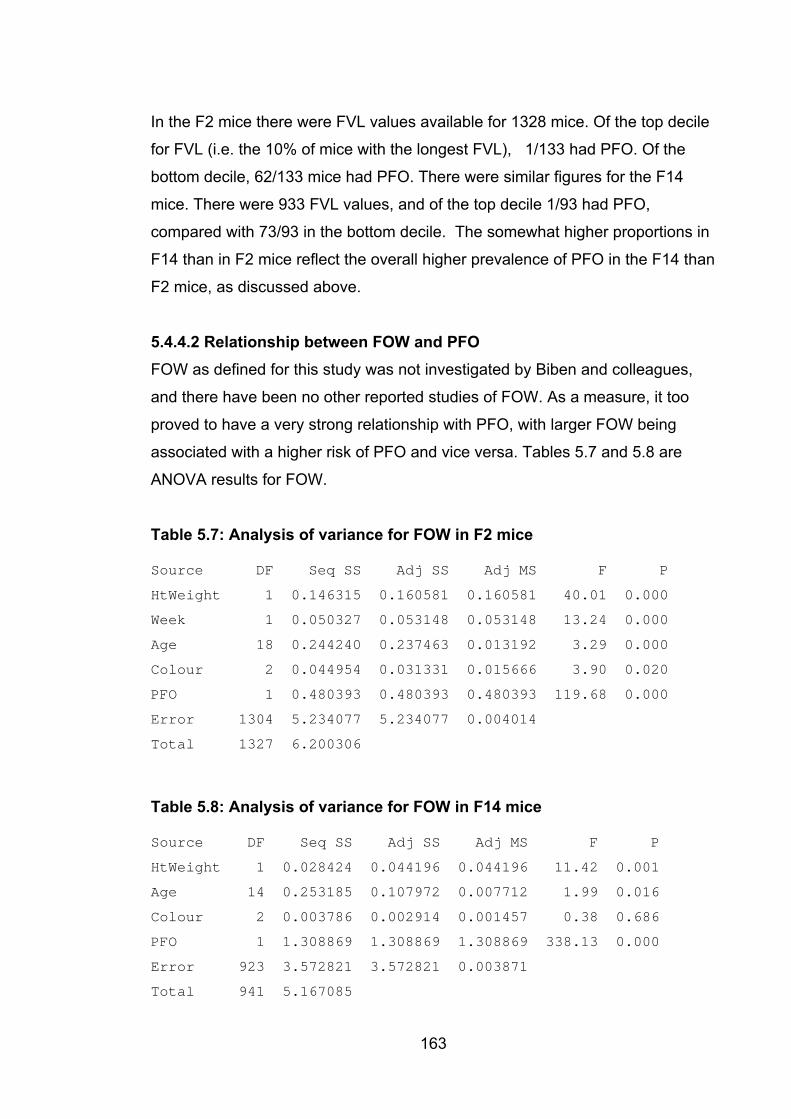
163
In the F2 mice there were FVL values available for 1328 mice. Of the top decile
for FVL (i.e. the 10% of mice with the longest FVL), 1/133 had PFO. Of the
bottom decile, 62/133 mice had PFO. There were similar figures for the F14
mice. There were 933 FVL values, and of the top decile 1/93 had PFO,
compared with 73/93 in the bottom decile. The somewhat higher proportions in
F14 than in F2 mice reflect the overall higher prevalence of PFO in the F14 than
F2 mice, as discussed above.
5.4.4.2 Relationship between FOW and PFO FOW as defined for this study was not investigated by Biben and colleagues,
and there have been no other reported studies of FOW. As a measure, it too
proved to have a very strong relationship with PFO, with larger FOW being
associated with a higher risk of PFO and vice versa. Tables 5.7 and 5.8 are
ANOVA results for FOW.
Table 5.7: Analysis of variance for FOW in F2 mice
Source DF Seq SS Adj SS Adj MS F P
HtWeight 1 0.146315 0.160581 0.160581 40.01 0.000
Week 1 0.050327 0.053148 0.053148 13.24 0.000
Age 18 0.244240 0.237463 0.013192 3.29 0.000
Colour 2 0.044954 0.031331 0.015666 3.90 0.020
PFO 1 0.480393 0.480393 0.480393 119.68 0.000
Error 1304 5.234077 5.234077 0.004014
Total 1327 6.200306
Table 5.8: Analysis of variance for FOW in F14 mice
Source DF Seq SS Adj SS Adj MS F P
HtWeight 1 0.028424 0.044196 0.044196 11.42 0.001
Age 14 0.253185 0.107972 0.007712 1.99 0.016
Colour 2 0.003786 0.002914 0.001457 0.38 0.686
PFO 1 1.308869 1.308869 1.308869 338.13 0.000
Error 923 3.572821 3.572821 0.003871
Total 941 5.167085
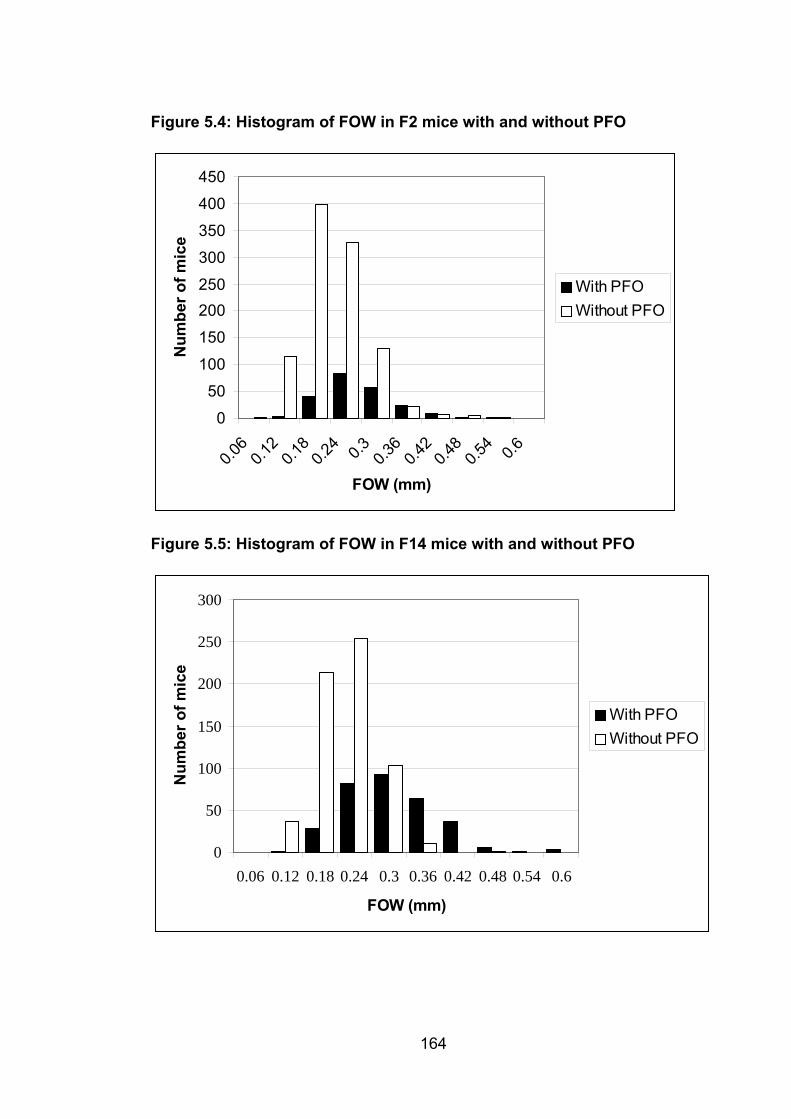
Figure 5.4: Histogram of FOW in F2 mice with and without PFO
0
50
100
150
200250
300
350
400
450
0.06
0.12
0.18
0.24 0.3 0.3
60.4
20.4
80.5
4 0.6
FOW (mm)
Num
ber o
f mic
e
With PFOWithout PFO
Figure 5.5: Histogram of FOW in F14 mice with and without PFO
0
50
100
150
200
250
300
0.06 0.12 0.18 0.24 0.3 0.36 0.42 0.48 0.54 0.6
FOW (mm)
Num
ber o
f mic
e
With PFOWithout PFO
164
165
As for FVL, there is a very highly significant relationship between FOW and
PFO. Figures 5.4 and 5.5 are histograms comparing the distribution of FOW in
mice with and without PFO. Week of dissection is not included as a variable for
ANOVA of F14 mice because of its lack of significant effect on FOW in the
single variable analysis of these mice (the same applies for CRW).
While the pattern of results is a little less striking than for FVL, it is similar in
essence. There is an approximately normal distribution of results for mice with
and without PFO, and the distributions overlap. The relationship is the opposite
to that seen for FVL in that larger values for FOW are associated with PFO.
Considering the upper and lower deciles, for the F2 mice there were values
available for 1328 mice. In the top decile, 55/133 mice had PFO; in the bottom
decile 4/133 mice had PFO. For the F14 mice, there were 942 values available.
87/94 mice in the top decile and 8/94 in the bottom decile had PFO.
In summary, FOW appears to be nearly as good a predictor of PFO as FVL.
These analyses led to the decision to select mice for genotyping in the QTL
study on the basis of both FVL and FOW.
5.4.4.3 Relationship between CRW and PFO CRW was not studied by Biben or colleagues and there have been no other
reported studies of this measurement. Tables 5.9 and 5.10 are ANOVA results
for CRW.
Table 5.9: Analysis of variance for CRW in F2 mice
Source DF Seq SS Adj SS Adj MS F P
Week 1 1.11120 1.06793 1.06793 81.93 0.000
Weight 1 0.50019 0.31863 0.31863 24.45 0.000
Sex 1 0.00033 0.00099 0.00099 0.08 0.783
Age 18 0.58072 0.48260 0.02681 2.06 0.006
PFO 1 0.47049 0.47049 0.47049 36.10 0.000
Error 1205 15.70660 15.70660 0.01303
Total 1227 18.36954

Table 5.10: Analysis of variance for CRW in F14 mice
Source DF Seq SS Adj SS Adj MS F P
Weight 1 0.27177 0.19664 0.19664 9.62 0.002
Sex 1 0.10741 0.08047 0.08047 3.94 0.048
Age 14 0.62692 0.61444 0.04389 2.15 0.008
PFO 1 0.06206 0.06206 0.06206 3.04 0.082
Error 919 18.78996 18.78996 0.02045
Total 936 19.85811
In the F2 mice, there was a strong association between CRW and PFO,
although this was much less pronounced than for FVL and FOW. Interestingly,
in the F14 generation the association appears to have been lost with p = 0.08 in
this analysis. This may be the result of the effects of genetic drift, as discussed
above in relation to the increased prevalence of PFO in the F14 mice. Figures
5.6 and 5.7 are histograms comparing the distribution of CRW in mice with and
without PFO.
Figure 5.6: Histogram of CRW in F2 mice with and without PFO
0
50
100
150
200
250
300
350
0.1 0.2 0.3 0.4 0.5 0.6 0.7 0.8 0.9 1 1.1 1.2 1.3 1.4
CRW (mm)
Num
ber o
f mic
e
With PFOWithout PFO
166
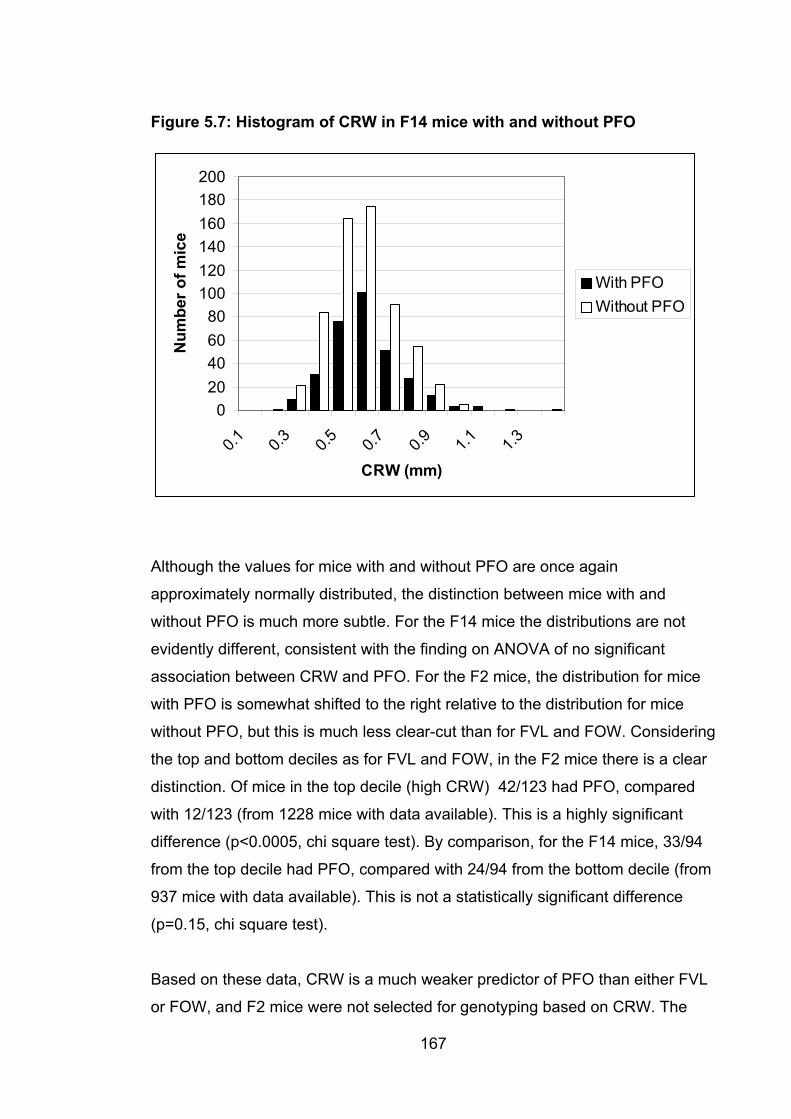
Figure 5.7: Histogram of CRW in F14 mice with and without PFO
020406080
100120140160180200
0.1 0.3 0.5 0.7 0.9 1.1 1.3
CRW (mm)
Num
ber o
f mic
e
With PFOWithout PFO
Although the values for mice with and without PFO are once again
approximately normally distributed, the distinction between mice with and
without PFO is much more subtle. For the F14 mice the distributions are not
evidently different, consistent with the finding on ANOVA of no significant
association between CRW and PFO. For the F2 mice, the distribution for mice
with PFO is somewhat shifted to the right relative to the distribution for mice
without PFO, but this is much less clear-cut than for FVL and FOW. Considering
the top and bottom deciles as for FVL and FOW, in the F2 mice there is a clear
distinction. Of mice in the top decile (high CRW) 42/123 had PFO, compared
with 12/123 (from 1228 mice with data available). This is a highly significant
difference (p<0.0005, chi square test). By comparison, for the F14 mice, 33/94
from the top decile had PFO, compared with 24/94 from the bottom decile (from
937 mice with data available). This is not a statistically significant difference
(p=0.15, chi square test).
Based on these data, CRW is a much weaker predictor of PFO than either FVL
or FOW, and F2 mice were not selected for genotyping based on CRW. The
167
168
strength of the association in the F2 mice did suggest that it may be possible to
map QTL for CRW, and analyses were done using the genotypes of mice
selected on the basis of FVL and/or CRW (discussed in Chapter 6).
5.4.5 Biological significance of the relationships between FVL, FOW and CRW These figures demonstrate a strong relationship between FVL and PFO
(confirming the findings of Biben and colleagues (Biben et al., 2000)), between
FOW and PFO, and to a lesser extent between CRW and PFO. The biological
bases for these associations are unknown. It is tempting to speculate that a
long flap valve presents greater opportunity for fusion, reducing the chance of
PFO, and that a short flap valve barely covers the foramen ovale, increasing the
likelihood of PFO. For FOW, it is possible that a wide foramen ovale results in
greater bloodflow across the septum in early postnatal life, inhibiting fusion of
the flap valve; or perhaps a wide foramen ovale results in a wider channel which
is less likely to close simply because there is more of it to close off. Likewise, it
is possible that a wide crescent reflects the width of the channel in prenatal life.
However, there is at present no direct evidence for any of these ideas.
Hopefully, identification of the genetic bases for the QTL identified in chapter 6
will provide evidence for one or more of these alternatives, or will suggest an
entirely different mechanism.
6. Quantitative trait loci modifying cardiac atrial septal morphology and risk of patent foramen ovale in inbred laboratory mice
6.1 Introduction Chapter 3 described an hypothesis-driven approach to understanding the
genetics of ASD. The hypothesis can be stated as follows: mutations in genes
associated with rare dominant forms of ASD or which are known to be important
during development of the heart may be responsible for a significant proportion
of ASD. In chapter 4, an effort was made to map an additional ASD gene. If this
had been successful, in turn it would have been logical to screen affected
individuals, as was done with NKX2-5, GATA4, and TBX20. However, the
results of this and similar studies suggest that this kind of candidate gene
approach identifies causative mutations in only a small proportion of cases, and
in most of them the mechanism appears to be autosomal dominant inheritance
rather than by playing a role in multifactorial causation. A possible exception to
this, as discussed in section 3.2.3, is the work of McElhinney and colleagues
(McElhinney et al., 2003) which does suggest a possible role for NKX-5 in the
multifactorial causation of ASD. The role of the GATA4 polymorphism S377G
(see section 3.3.3) may represent another exception to this rule. Nonetheless,
these genes are likely to be relatively minor contributors to the great bulk of
CHD, and ASD in particular.
It follows that a non-hypothesis driven approach is required if we are to
understand the genetic basis of common forms of CHD. One option might be to
conduct a whole-genome association study, studying very large numbers of
affected individuals and unaffected controls with markers densely spaced
through the genome (Carlson et al., 2004). While this is a powerful study design
and has the advantage of working directly with human disease, it remains
dauntingly expensive, and for this reason, in part, most studies to date have
been grossly under-powered. Even with continued reductions in the cost of
169
170
genotyping with improved technology, the sample sizes required for such
studies run to thousands of cases and controls (Wang et al., 2005).
QTL mapping in laboratory animals represents an approach which is non-
hypothesis-driven, allows ready generation of large sample sizes in a way which
is not possible in humans, and (compared with whole-genome association
studies) is relatively inexpensive. For this reason it has been widely used for
study of quantitative cardiovascular risk factors such as hypertension and
hyperlipidemia (as well as numerous other clinically relevant quantitative traits)
(Mashimo et al., 2007; Redina et al., 2006; Ueno et al., 2003).
These studies have shown the relevance of the animal models to human
disease. In QTL studies in humans of hypertension , a major cardiovascular
disease risk factor, 30 of 36 QTL regions identified were predicted by work in
rats or mice (Stoll et al., 2000; Cowley, 2006). This also points to the enormous
genetic complexity which can emerge in the course of QTL studies. In 2006,
Cowley identified 108 hypertension QTL in the human genome, and hundreds
more in rodents (Cowley, 2006).
Stroke and myocardial infarction, like CHD, can be treated as binary traits – a
patient either has one of these phenotypes or not. Although severity can be
clinically graded, the scoring scales are not continuous and thus cannot be used
to map QTL with nearly the same power afforded by QTL analysis. Decades of
intensive study into the causes of these problems has led to the identification of
quantitative risk factors which allow a QTL mapping approach to be applied –
not directly to the phenotype of ultimate interest but to a clinically important
proxy, in accordance with the liability model for binary traits (Falconer, 1965)
(see section 1.7.3). Until now, this has not been possible for CHD because of a
lack of quantitative endophenotypes which can be studied. The work of Biben
and colleagues (Biben et al., 2000) as discussed in sections 1.6.5 and 5.2, has
identified endophenotypes influencing the risk of PFO, which in turn made this
study possible.
171
6.2 Study design As described in 2.1.3.1, the study used an intercross design with parental
strains being represented by 129T2/SvEms males and QSi5 females, and the
F1 mice being crossed to produce the F2 generation. The strains were selected
on the basis of having extreme phenotypes for FVL and PFO. 129T2/SvEms
has short flap valve and high incidence of PFO, and QSi5 has FVL and low
incidence of PFO (see section 5.3). In addition, the strains have significantly
different mean FOW (QSi5 < 129T2/SvEms) and CRW (QSi5 >129T2/SvEms).
QSi5 has the additional advantage of very high fecundity (average litter size
13.4) (Holt et al., 2004), an advantage for a study in which large numbers of
animals are required.
6.3 Selection of mice for genotyping A total of 1437 F2 mice were dissected. Complete data were available from
1328 of these. After correction for sex and week of dissection, the top and
bottom deciles for FVL and FOW were selected for genotyping, amounting to
466 mice. Note that, as anticipated, there was a relatively small overlap
between the mice selected on the basis of FVL and those selected on the basis
of FOW – if there had been no overlap at all, 532 mice would have been
genotyped. This was an expected result because of the low correlation between
the two traits (see section 5.4.2). There was no selection on the basis of CRW
values, because this trait had the weakest association with PFO of any of the
three. However, taking advantage of the ability of MAPMAKER/QTL to deal with
missing data, it was possible to perform QTL mapping for QTL influencing
CRW, albeit with lower power than the mapping for FOW and FVL, because the
genotyped mice were not selected because of extreme values for CRW.
The decision to control for sex and week of dissection was based on the
significant statistical effects each of these had on the risk of PFO (see section
5.5.4). Heart weight (p=0.003) and coat colour (p=0.04) also affected FVL. Age
at dissection (p<0.001), coat colour (p=0.03), and heart weight (p<0.001)
affected FOW, and age (p<0.001) and weight (p=0.038) affected CRW.
However, it was decided not to control for these factors. Although statistically
significant, these effects (including the ones which were controlled for) were of
small size. For example, mean male FVL was 1.01 mm, whereas mean female
FVL was 0.98 mm, a difference of 0.03 mm, compared with an SD for FVL of
0.19. Adjustment for coat colour risked concealing the presence of a QTL that
may be linked to coat colour genes, and was not done for that reason.
Adjustment for heart weight could have masked QTL relevant to chamber
morphology which also affect heart weight. Importantly, although there were
substantial differences between heart weight and body weight in the parental
strains, in the F2 mice there was no apparent direct relationship between PFO
status and body weight or heart weight. Mice with PFO had a body weight of
26.85+/-3.32 g (mean+/-SD) and heart weight of 0.208+/-0.034 g, and mice
without PFO had a body weight of 26.61+/-3.28 g and heart weight of 0.205+/-
0.033 g. Moreover, in F2 mice, there were only weak correlations between each
of body weight and heart weight and FVL, FOW, and CRW (correlation
coefficients, all <0.16).
6.4 Markers usedEighty-nine markers were selected, spanning the mouse genome with an
average intermarker distance of ~17cM. As described in section 2.7.2, it was
necessary to replace 7 of the initial markers selected because although they
appeared to work well in the hands of the AGRF in evaluation, in practice they
were unreliable. The final set of markers used (after replacement of the poorly
performing markers) is listed in Appendix 2. Map positions, in cM, are from the
Whitehead institute database (Dietrich et al., 1996)
(http://www.broad.mit.edu/cgi-bin/mouse/sts_info?database=mouserelease).
6.5 Linkage results The figures and tables below show the results obtained using MAPMAKER/QTL
as described in 2.9.2.2. Each chromosome was treated as an independent
linkage group, and the phenotype data from all F2 animals with complete data
were used for the purposes of estimating QTL effect sizes. In addition to the
results from MAPMAKER/QTL, the figures include the results of a binary trait
172
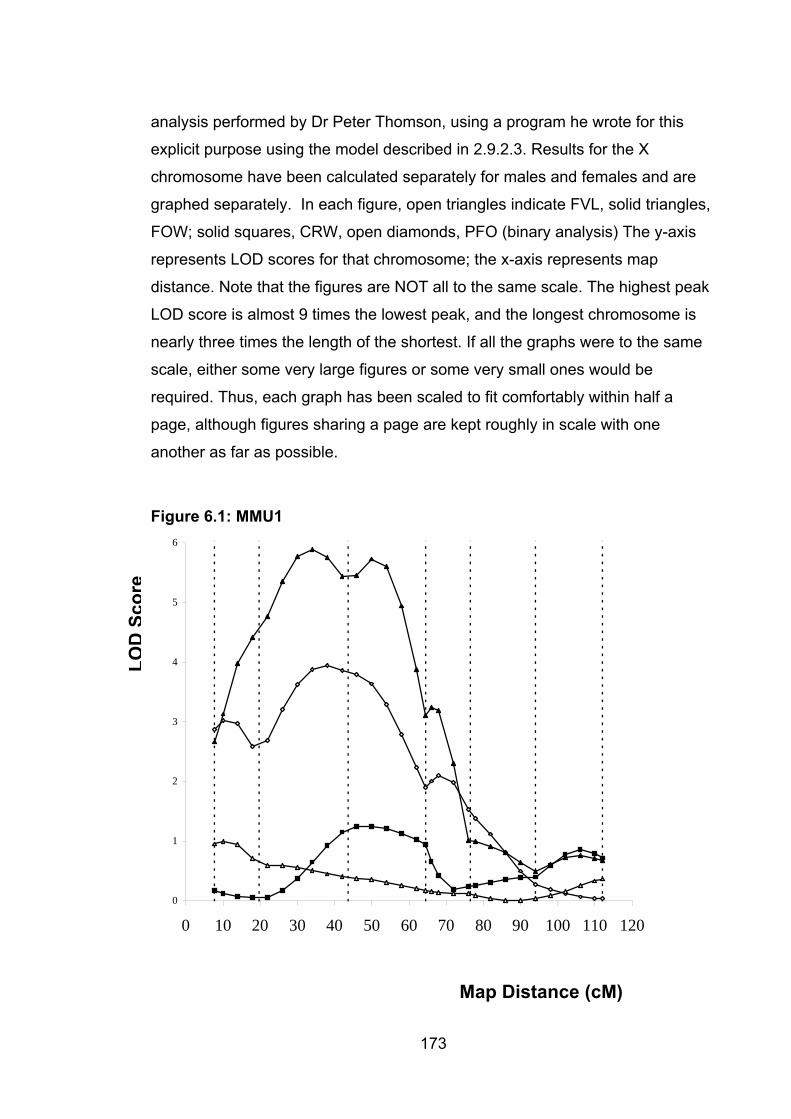
analysis performed by Dr Peter Thomson, using a program he wrote for this
explicit purpose using the model described in 2.9.2.3. Results for the X
0
1
2
3
4
5
6
0 10 20 30 40 50 60 70 80 90 100 110 120
chromosome have been calculated separately for males and females and are
graphed separately. In each figure, open triangles indicate FVL, solid triangles,
FOW; solid squares, CRW, open diamonds, PFO (binary analysis) The y-axis
represents LOD scores for that chromosome; the x-axis represents map
distance. Note that the figures are NOT all to the same scale. The highest peak
LOD score is almost 9 times the lowest peak, and the longest chromosome is
nearly three times the length of the shortest. If all the graphs were to the same
scale, either some very large figures or some very small ones would be
required. Thus, each graph has been scaled to fit comfortably within half a
page, although figures sharing a page are kept roughly in scale with one
another as far as possible.
Figure 6.1: MMU1
LOD
Scor
e
Map Distance (cM)
173
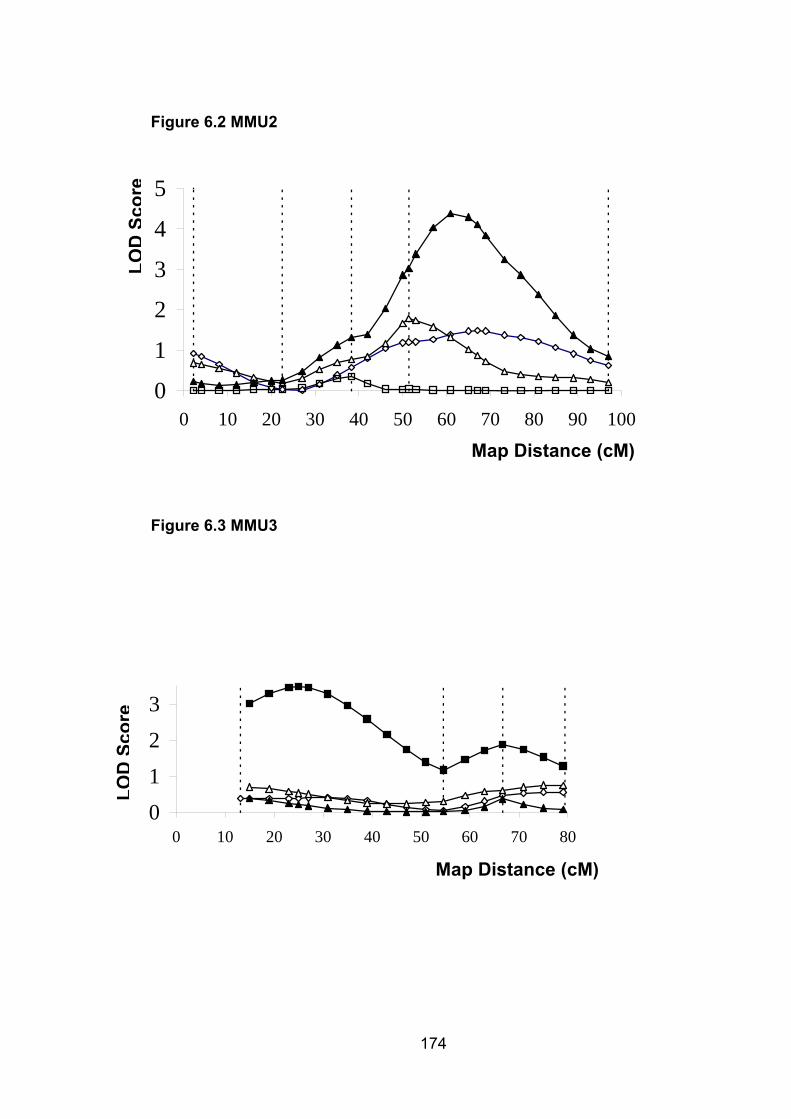
0
Figure 6.2 MMU2
174
1
2
3
4
5
0 10 20 30 40 50 60 70 80 90 100
LOD
Scor
e
Map Distance (cM)
Figure 6.3 MMU3
0123
0 10 20 30 40 50 60 70 800123
0 10 20 30 40 50 60 70 80
LOD
Scor
e
Map Distance (cM)
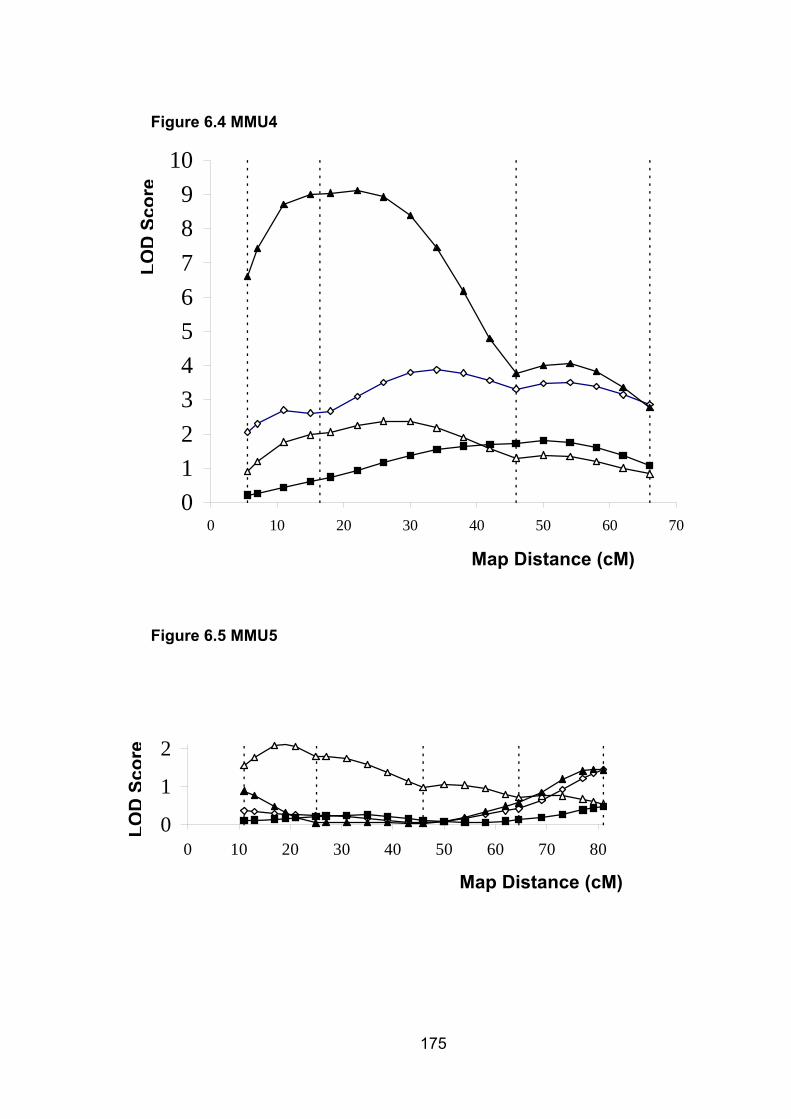
0123456789
10
0 10 20 30 40 50 60 7
Figure 6.4 MMU4 LO
DSc
ore
0
Map Distance (cM)
Figure 6.5 MMU5
0
1
2
0 10 20 30 40 50 60 70 80
LOD
Scor
e
Map Distance (cM)
175
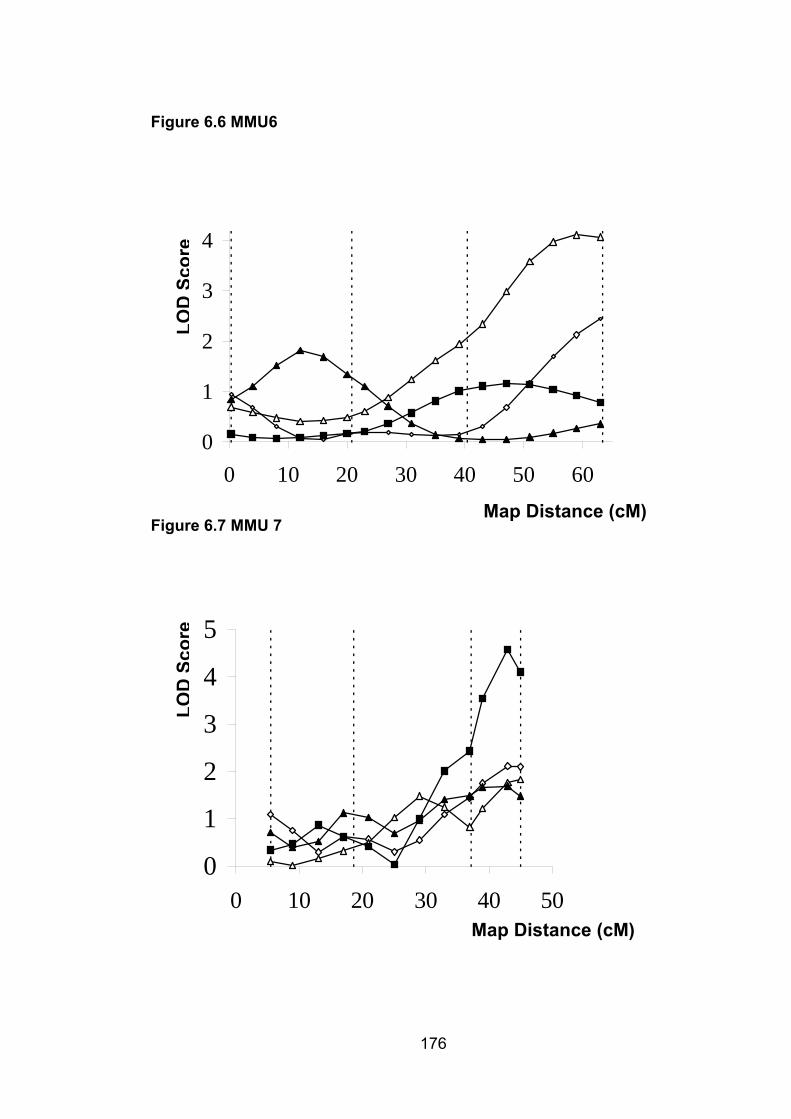
0
1
2
3
4
0 10 20 30 40 50 60
Figure 6.6 MMU6
LOD
Scor
e
Map Distance (cM) Figure 6.7 MMU 7
176
0
1
3
4
5
0 10 20 30 40 50
LOD
Scor
e
2
Map Distance (cM)
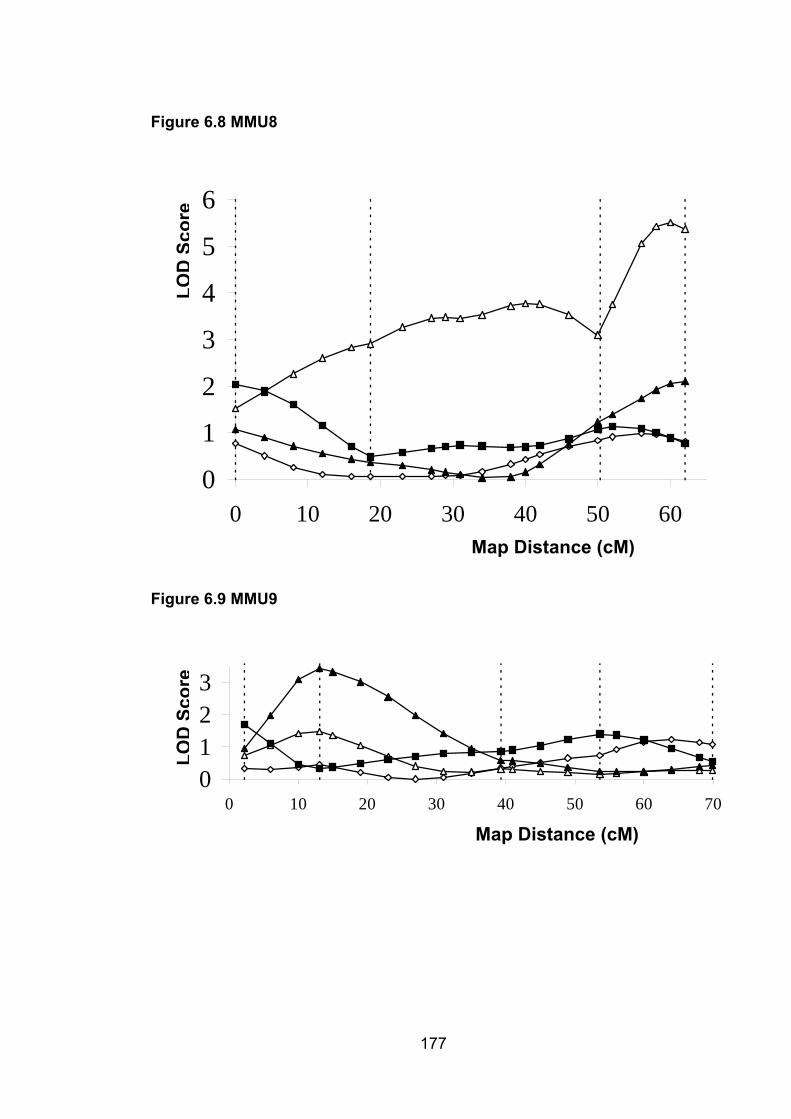
0
1
2
3
4
5
6
0 10 20 30 40 50 60
Figure 6.8 MMU8
LOD
Scor
e
Map Distance (cM)
Figure 6.9 MMU9
0123
0 10 20 30 40 50 60 70
LOD
Scor
e
Map Distance (cM)
177
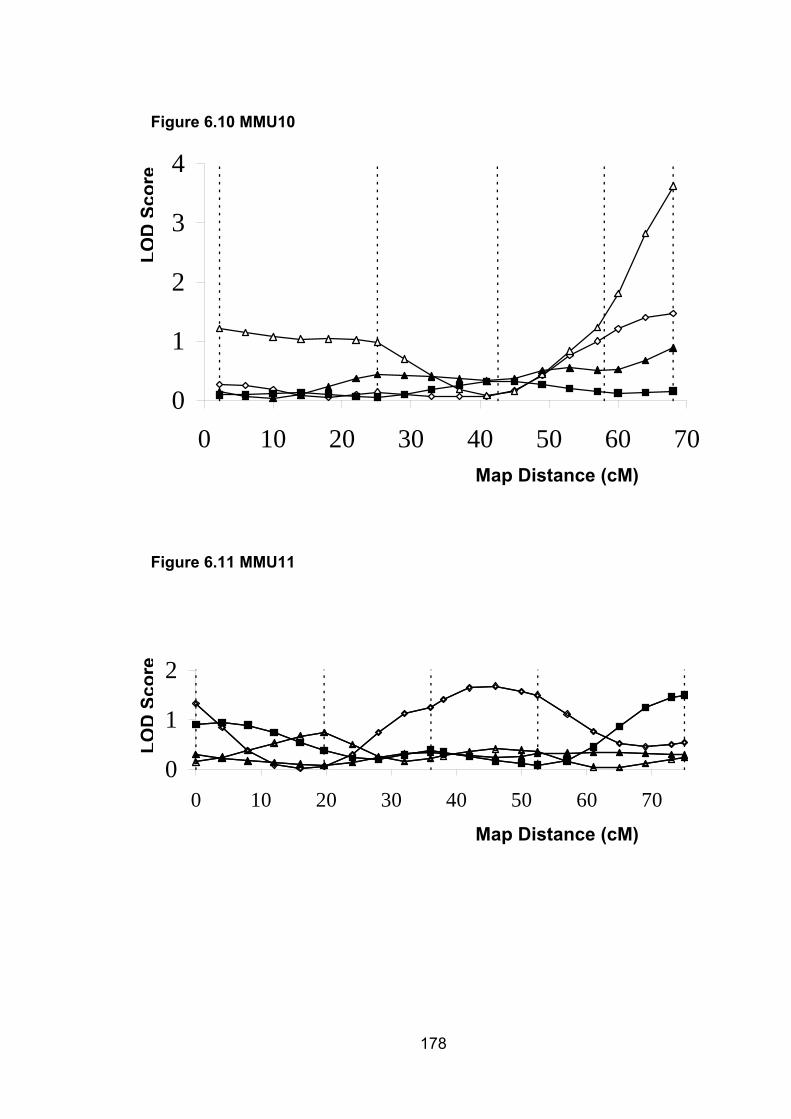
Figure 6.10 MMU10
0
1
2
3
4
0 10 20 30 40 50 60 70
LOD
Scor
e
Map Distance (cM)
Figure 6.11 MMU11
178
0
1
2
0 10 20 30 40 50 60 70
LOD
Scor
e
Map Distance (cM)
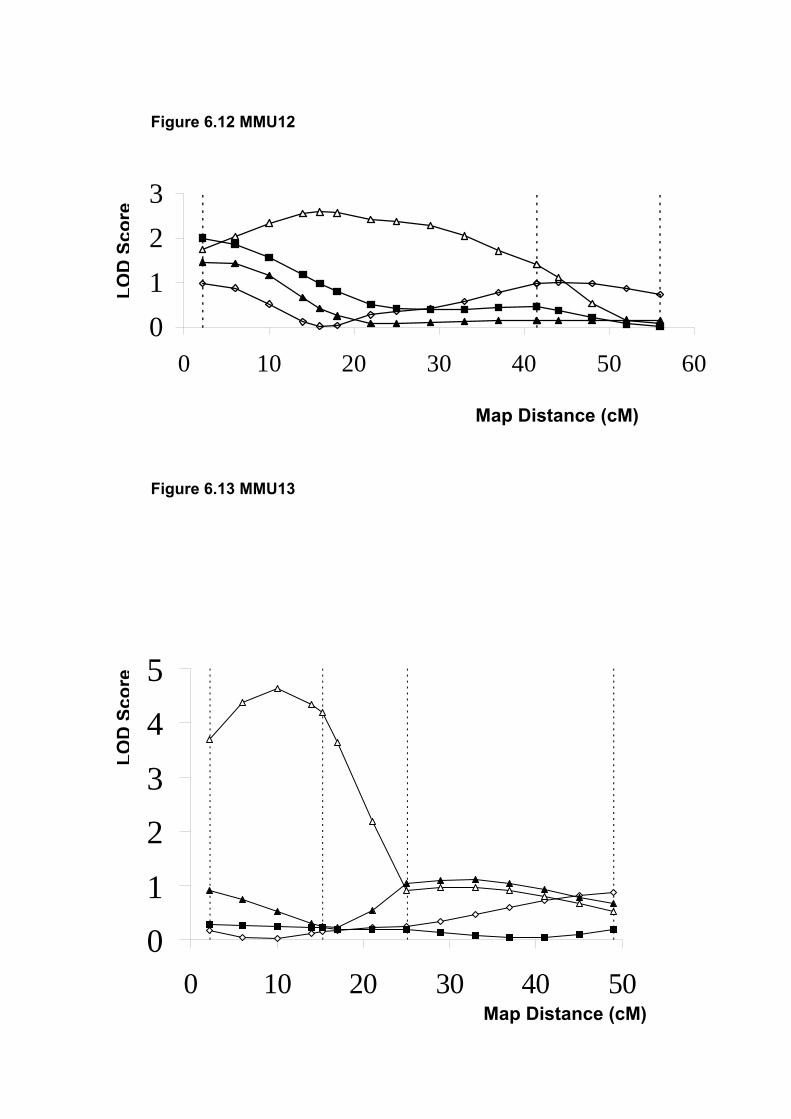
01
Figure 6.12 MMU12
3
LOD
Scor
e
2
0 10 20 30 40 50 60
Map Distance (cM)
Figure 6.13 MMU13
179
01
23
45
0 10 20 30 40 5
LOD
Scor
e
0Map Distance (cM)
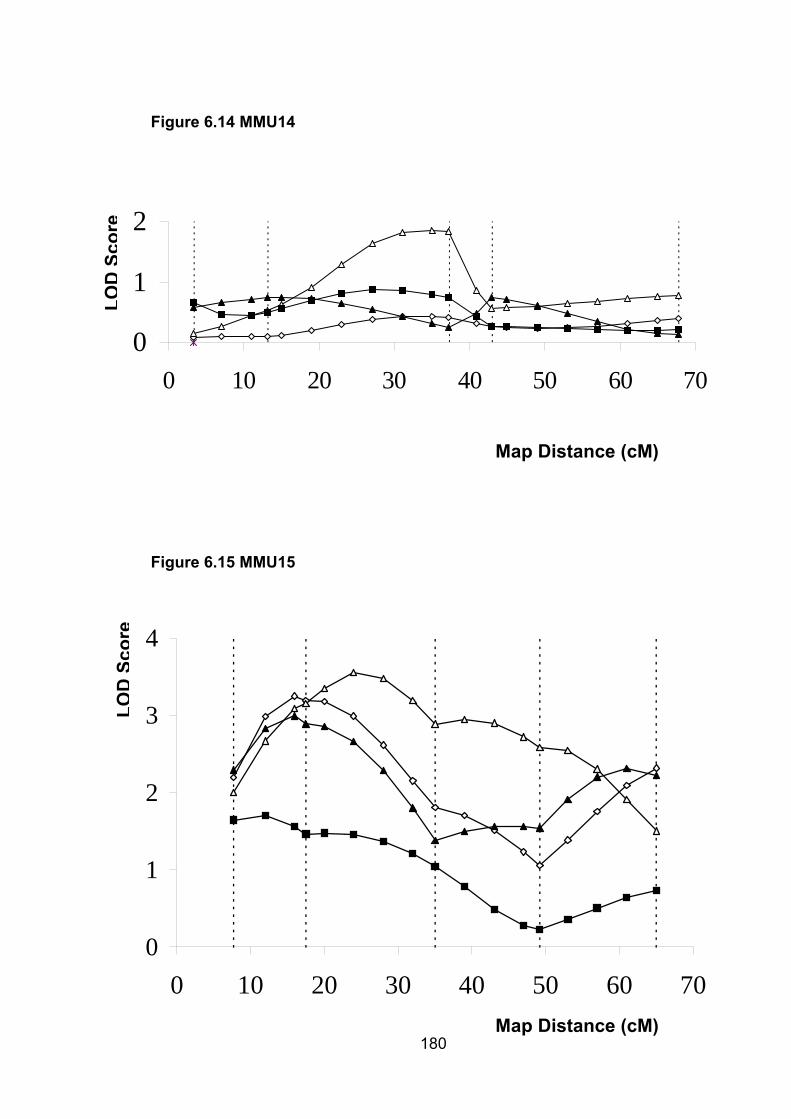
0
1
2
0 10 20 30 40 50 60 7
Figure 6.14 MMU14 LO
DSc
ore
0
Map Distance (cM)
Figure 6.15 MMU15
180
0
1
2
3
4
0 10 20 30 40 50 60 70
LOD
Scor
e
Map Distance (cM)
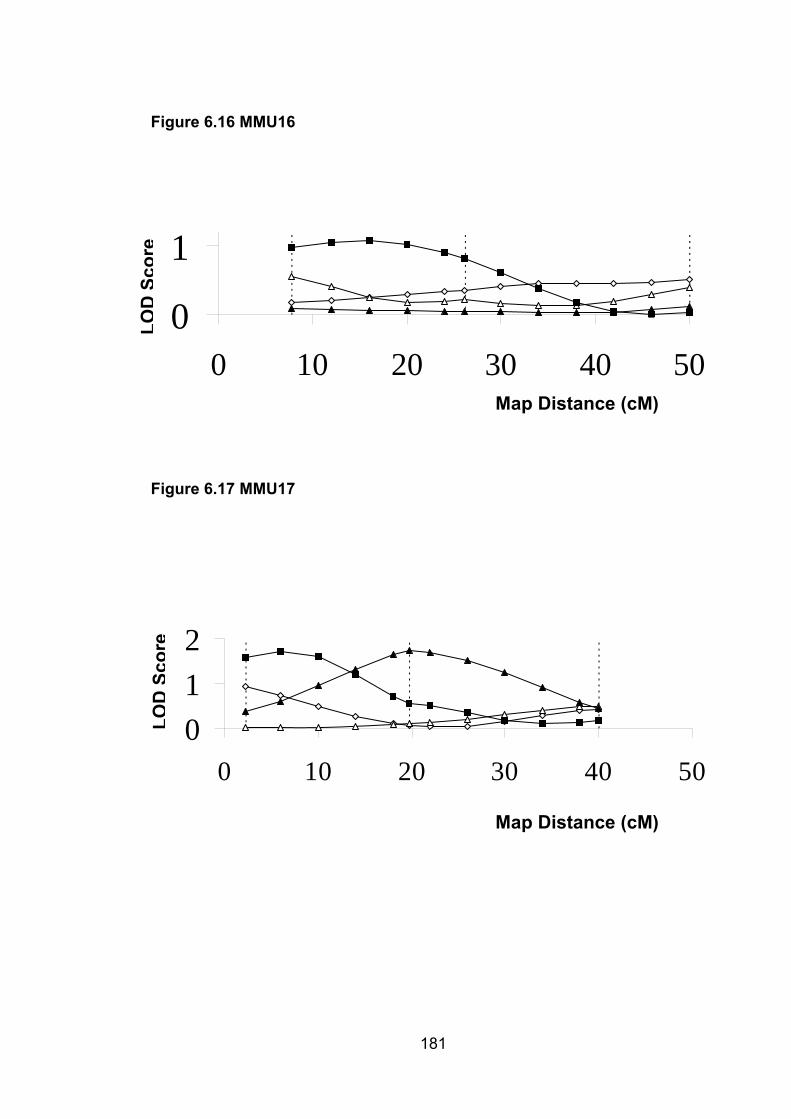
0
1
0 10 20 30 40 5
Figure 6.16 MMU16
181
0
012
0 10 20 30 40 50
Map Distance (cM)
Map Distance (cM)
LOD
Scor
e
Figure 6.17 MMU17
LOD
Scor
e
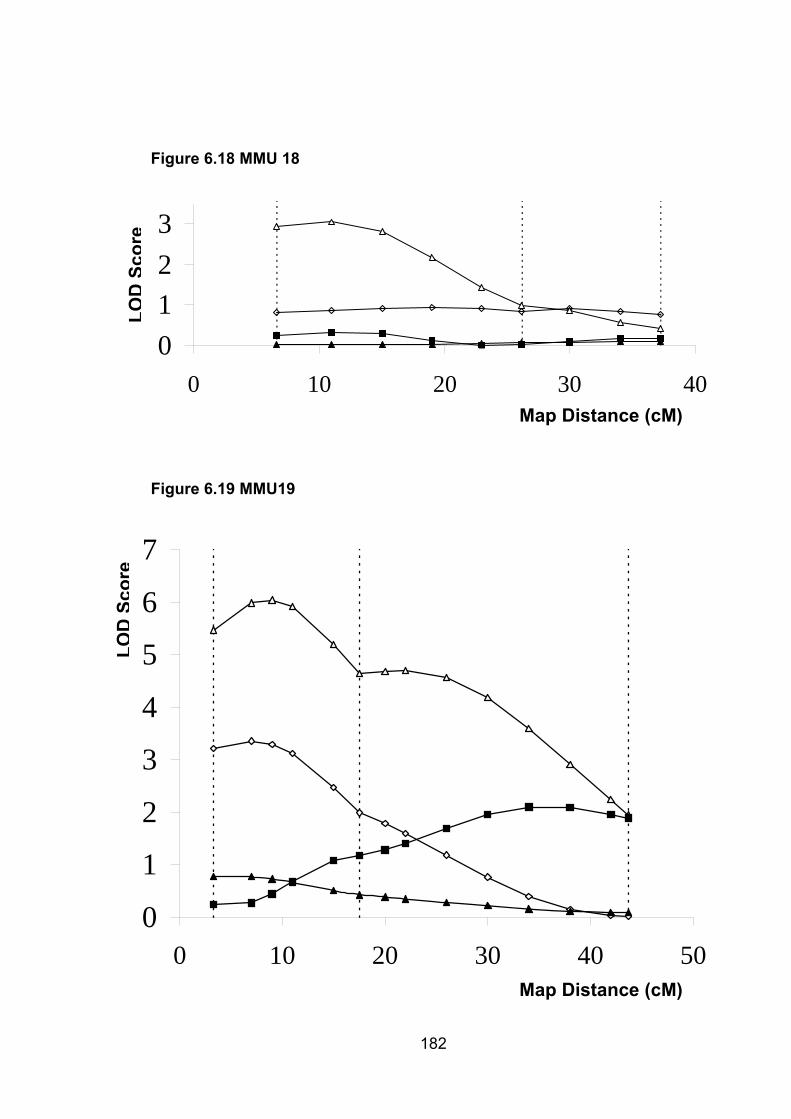
0123
0 10 20 30 4
Figure 6.18 MMU 18 LO
DSc
ore
0
182
0
1
2
3
0 10 20 30 40 50Map Distance (cM)
Map Distance (cM)
Figure 6.19 MMU19
4
5
6
7
LOD
Scor
e

Figure 6.20 MMUX (female mice)
183
Figure 6.21 MMX (male mice)
012
0 10 20 30 40 50 60
0
1
2
0 10 20 30 40 50 6
LOD
Scor
e
LOD
Scor
e
0Map Distance (cM)
Map Distance (cM)
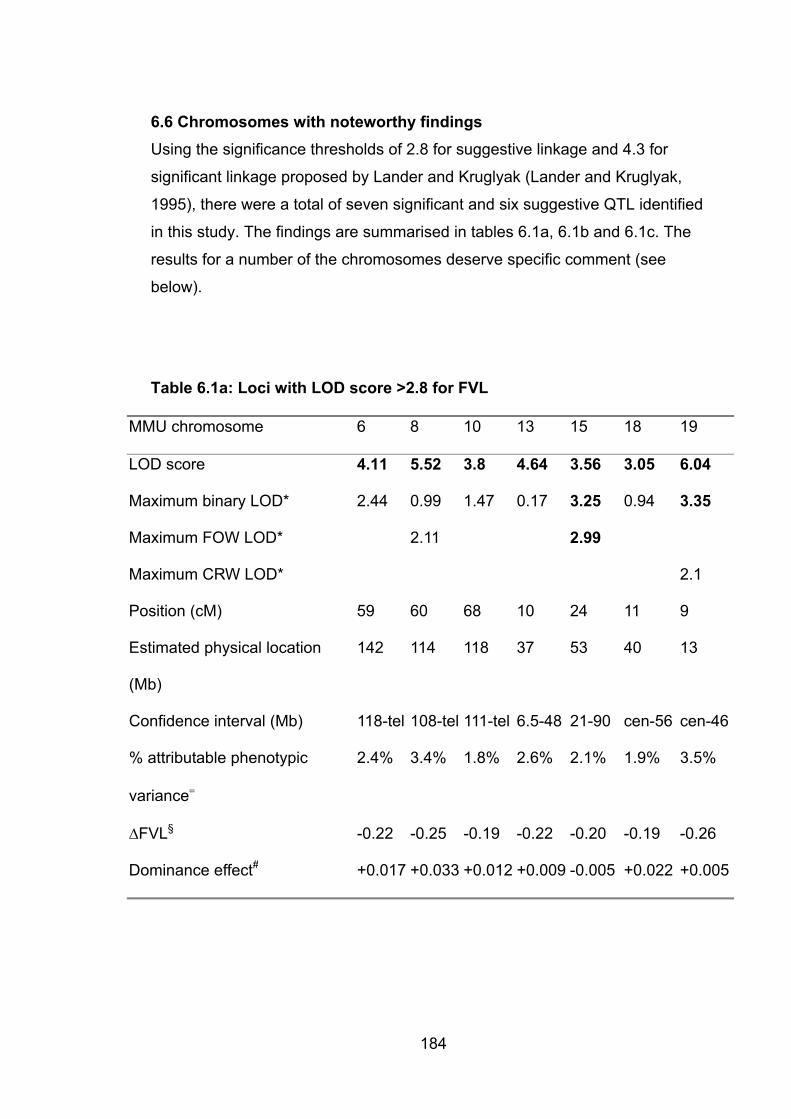
184
6.6 Chromosomes with noteworthy findings Using the significance thresholds of 2.8 for suggestive linkage and 4.3 for
significant linkage proposed by Lander and Kruglyak (Lander and Kruglyak,
1995), there were a total of seven significant and six suggestive QTL identified
in this study. The findings are summarised in tables 6.1a, 6.1b and 6.1c. The
results for a number of the chromosomes deserve specific comment (see
below).
Table 6.1a: Loci with LOD score >2.8 for FVL
MMU chromosome 6 8 10 13 15 18 19
LOD score 4.11 5.52 3.8 4.64 3.56 3.05 6.04
Maximum binary LOD* 2.44 0.99 1.47 0.17 3.25 0.94 3.35
Maximum FOW LOD* 2.11 2.99
Maximum CRW LOD* 2.1
Position (cM) 59 60 68 10 24 11 9
Estimated physical location
(Mb)
142 114 118 37 53 40 13
Confidence interval (Mb) 118-tel 108-tel 111-tel 6.5-48 21-90 cen-56 cen-46
% attributable phenotypic
variance�
2.4% 3.4% 1.8% 2.6% 2.1% 1.9% 3.5%
�FVL§ -0.22 -0.25 -0.19 -0.22 -0.20 -0.19 -0.26
Dominance effect# +0.017 +0.033 +0.012 +0.009 -0.005 +0.022 +0.005
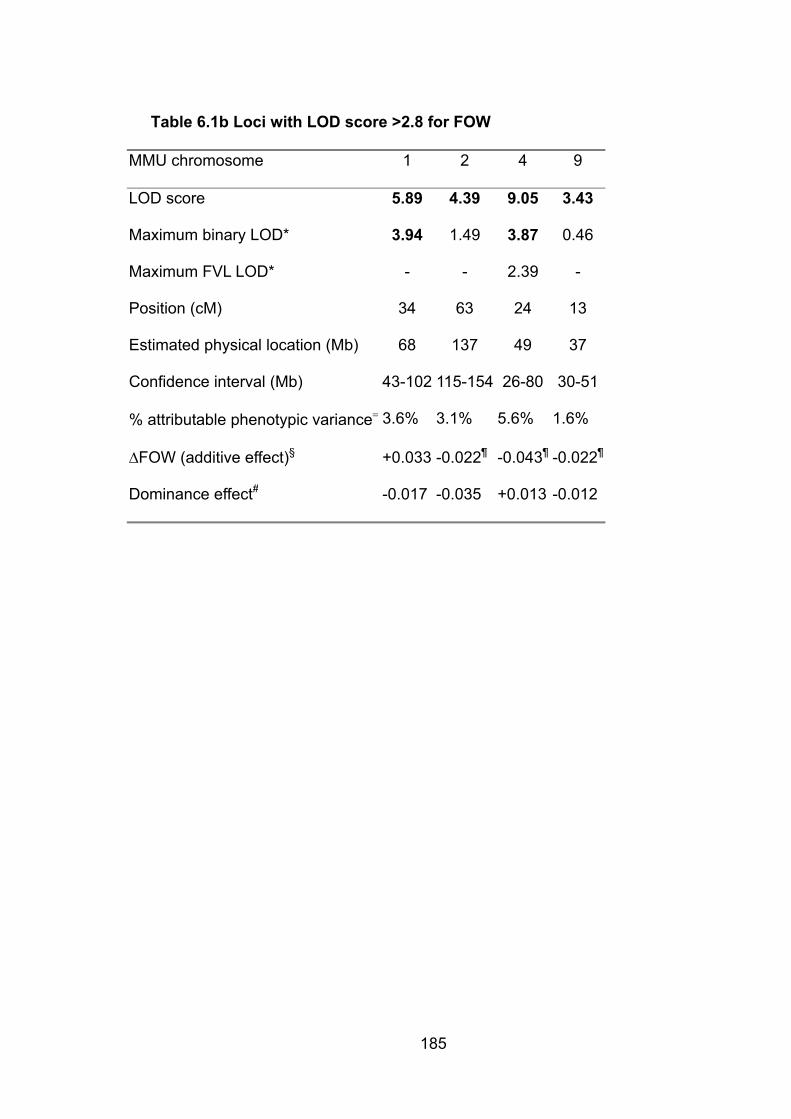
185
Table 6.1b Loci with LOD score >2.8 for FOW
MMU chromosome 1 2 4 9
LOD score 5.89 4.39 9.05 3.43
Maximum binary LOD* 3.94 1.49 3.87 0.46
Maximum FVL LOD* - - 2.39 -
Position (cM) 34 63 24 13
Estimated physical location (Mb) 68 137 49 37
Confidence interval (Mb) 43-102 115-154 26-80 30-51
% attributable phenotypic variance� 3.6% 3.1% 5.6% 1.6%
�FOW (additive effect)§ +0.033 -0.022¶ -0.043¶ -0.022¶
Dominance effect# -0.017 -0.035 +0.013 -0.012
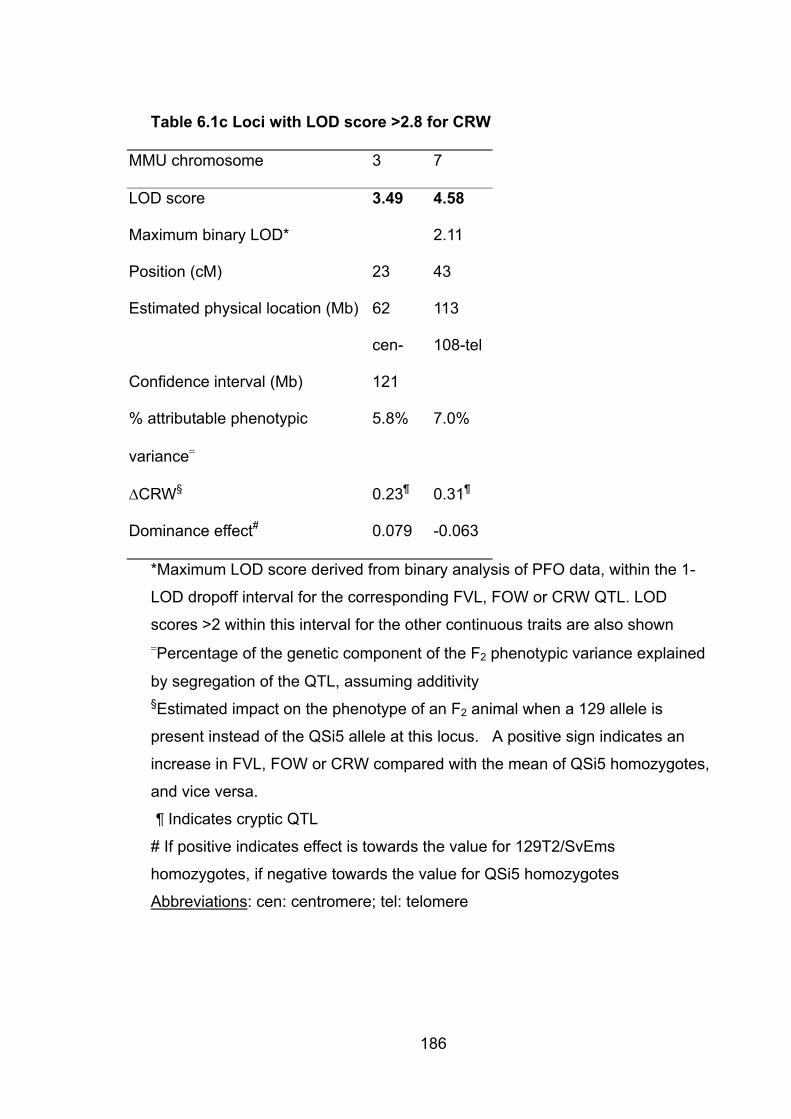
186
Table 6.1c Loci with LOD score >2.8 for CRW
MMU chromosome 3 7
LOD score 3.49 4.58
Maximum binary LOD* 2.11
Position (cM) 23 43
Estimated physical location (Mb) 62 113
Confidence interval (Mb)
cen-
121
108-tel
% attributable phenotypic
variance�
5.8% 7.0%
�CRW§ 0.23¶ 0.31¶
Dominance effect# 0.079 -0.063
*Maximum LOD score derived from binary analysis of PFO data, within the 1-
LOD dropoff interval for the corresponding FVL, FOW or CRW QTL. LOD
scores >2 within this interval for the other continuous traits are also shown �Percentage of the genetic component of the F2 phenotypic variance explained
by segregation of the QTL, assuming additivity §Estimated impact on the phenotype of an F2 animal when a 129 allele is
present instead of the QSi5 allele at this locus. A positive sign indicates an
increase in FVL, FOW or CRW compared with the mean of QSi5 homozygotes,
and vice versa.
¶ Indicates cryptic QTL
# If positive indicates effect is towards the value for 129T2/SvEms
homozygotes, if negative towards the value for QSi5 homozygotes
Abbreviations: cen: centromere; tel: telomere
187
6.6.1 MMU1 There was significant evidence for linkage for FOW. The results for the binary
analysis of the PFO data produced a strikingly similar pattern to that seen for
FOW, and with a maximum LOD score of 3.94, the binary analysis
independently exceeded the threshold for suggestive linkage. There was no
significant evidence for linkage with the other two traits on this chromosome.
Strikingly, this QTL accounts for 110% of the difference between the parental
means. This overrepresentation almost certainly reflects the presence of cryptic
QTL (see section 6.7.1 below)
6.6.2 MMU2 There was significant evidence for linkage for FOW, with a maximum LOD
score of 5.89. The mouse ortholog of ACTC, a human gene implicated in
autosomal dominant ASD (Matsson H et al., 2005) lies within the 1-LOD drop-
off interval for the position of this QTL. This is the only one of the six reported
human ASD genes (including TBX20, as reported in chapter 3) to have an
orthologue within one of the QTL identified by this study (see table 6.2). The
dominance effect for this QTL was greater than the additive effect, an example
of overdominance (see section 1.3.1.1 for a discussion of dominance and
overdominance).
6.6.3 MMU3 There was suggestive evidence for linkage for CRW. None of the other traits,
particularly PFO, demonstrated a similar pattern.
6.6.4 MMU4 There was highly significant evidence for linkage for FOW. There was evidence
for a QTL affecting PFO from the binary analysis, and although the shapes of
the curves for FOW and PFO are not as similar as for MMU1, some
correspondence between the two is apparent.
188
6.6.5 MMU6 There was suggestive evidence of a QTL for FVL, with a LOD score of 4.11
(only a little below the threshold for significant linkage). Again, the curve for
PFO paralleled that for FVL over the last 20 cM of the chromosome.
6.6.6 MMU7 There was significant evidence for linkage for CRW. Although Tbx20, the
mouse orthologue of human TBX20, is located on MMU7, it is well outside the
confidence interval for this QTL and can be excluded as a candidate gene.
6.6.7 MMU8 There was signficiant evidence for linkage for FVL.
6.6.8 MMU9 There was suggestive evidence of linkage for FOW.
6.6.9 MMU10 There was suggestive evidence of linkage for FVL.
6.6.10 MMU13 There was significant evidence of linkage for FVL.
6.6.11 MMU15 There was significant evidence for a QTL for FVL. There was also suggestive
evidence of a QTL for FOW, and the curves have similar shapes, as does the
curve for the binary analysis – which in turn is also above the threshold for
suggestive linkage, at 3.25. This is the only chromosome for which there was
evidence of a QTL which may affect two of the three continuous traits,
consistent with the observed low correlation between them (section 5.4.2)
6.6.12 MMU18 There was suggestive evidence for a QTL affecting FVL.

189
6.6.13 MMU19 There was significant evidence for a QTL for FVL. In addition, there was
suggestive evidence of a QTL from the binary analysis, with a similarly shaped
curve for PFO and FVL.
Table 6.2: LOD scores at loci of orthologues of reported human ASD
genes
Actc Tbx5 Tbx20 Myh6 Gata4 Nkx2-5
MMU chromosome 2 5 7 14 14 17
Position (cM) 53 54 5 28 34 5.5
Max LOD score*
(phenotype)#
3.38
(FOW)
1.0
(FVL)
1.1
(PFO)
1.75
(FVL)
1.86
(FVL)
1.7
(CRW)
* Highest LOD score of any of the traits at the location of this gene
# phenotype which had the highest LOD score at that location
6.7 Discussion This study has identified 7 QTL with significant and 6 with suggestive evidence
of linkage, affecting 3 distinct atrial septal anatomical phenotypes relevant to
septal dysmorphogenesis in the mouse. For 4 of these loci (on MMU1, MMU4,
MMU6, and MMU19), there is strong supportive evidence for the presence of a
QTL from a binary analysis of the data relating to presence or absence of PFO.
The stringent criteria for evidence of linkage proposed by Lander and Kruglyak
(Lander and Kruglyak, 1995) include a cutoff for “suggestive” linkage expected
to be seen by chance once per whole genome scan. It is therefore likely that
most or all of the “suggestive” loci identified here will be confirmed.
190
6.7.1 Cryptic QTL Several of the QTL identified in this study are “cryptic,” ie, the effect of the QTL
is in the opposite direction to that which would have been predicted from the
phenotypes of the parental strains. These include three of the four for FOW (two
with significant and one with suggestive evidence for linkage) and both for CRW
(one with significant and one with suggestiveevidence for linkage). For example,
mean FOW in QSi5 mice is 0.21 mm, compared with 0.24 mm in 129T2/SvEms
mice. For the FOW QTL with strongest statistical support (a LOD score of 9.05),
homozygosity for the 129T2/SvEms allele is associated with a decreasing effect
on FOW compared with the QSi5 allele. This phenomenon, known as
transgressive segregation, can result in more extreme phenotypes in F2
individuals than in either parental strain. Cryptic QTL are particularly commonly
reported in plant studies (Peng et al., 2003; Lauter and Doebley, 2002), but the
phenomenon is by no means restricted to plants. In a review of 171 studies
conducted in a variety of plant and animal species, 44% of 1229 traits studied
were transgressive (Rieseberg et al., 1999).
6.7.2 Binary trait analysis It is likely that the liability model for binary traits (Falconer, 1965), as applied
here using the software developed by Dr Peter Thompson for the purpose, is
applicable to most forms of CHD. The identification of continuous traits that act
as proxies for the phenotype of interest provides considerably more power than
would be available using a binary analysis alone. This is illustrated by our
results; even where the binary analysis closely conforms to the results for one
of the three continuous traits, the strength of evidence for linkage is always
substantially lower for the binary than for the continuous trait. However, these
results show that binary analysis can provide important independent information
in support of standard QTL analysis. In a sense, as discussed in section 6.1
above, this approach is already in use for the study of phenotypes related to
atherogenic vascular disease. Even if there were a useful rodent model of
stroke or myocardial infarction, direct study of these phenotypes would be much
less powerful than the current approach to dissecting quantitative risk factors
191
such as hypertension and hyperlipidaemia. The results reported here vindicate
this approach.
6.7.3 Genetic relationship between FVL, FOW and CRW In section 5.4 the relationships between FVL, FOW and CRW were discussed.
Each has an influence on the likelihood of PFO, FVL and FOW more strongly
than CRW. However, they appear to be largely independent traits, with very
low correlation coefficients between each pair of traits. This suggests they are
likely to be under largely separate genetic control. The results of the linkage
studies support this idea. Of all of the QTL identified, in only one instance (on
MMU15) was there suggestive evidence of linkage for a second trait (FOW) at a
locus where a QTL for another trait (FVL) had been identified. It remains
possible that other identified QTL do in fact contribute to more than one trait and
that the study has simply not detected this effect. Nonetheless, given the power
of this analysis, with a very large number of mice phenotyped and genotyped, it
is likely that these traits are indeed largely under separate genetic control.
6.7.4 Contribution of the identified QTL to the phenotypes under study Assuming that none of the “suggestive” loci are chance findings and taking the
conservative position that QTL are additive, the QTL identified account for 18%,
14%, and 13% of the phenotypic variance of FVL, FOW, and CRW,
respectively. However, phenotypic variance includes nongenetic variance
attributable to measurement error (which may be significant for this type of
study, although the replication of measurements described in section 7.7
suggests a fairly reliable technique), environmental effects, and biological noise.
Another way of considering the magnitude of the genetic effect on phenotype of
these QTL is to consider their contribution to observed differences in mean
phenotypic values between the parental strains. For example, for FVL, each of
the 7 QTL identified accounts for 13% to 18% of the difference between
parental means. Assuming additivity, this accounts for the complete difference
between those strains. Strikingly, a single QTL for FOW (on MMU1) accounts
for 111% of the difference between parental means. This overrepresentation
almost certainly reflects the presence of cryptic QTL for this and other traits
192
contributing to the parental means. Cryptic QTL detected for FOW and CRW
individually impact on these phenotypes by 73% to 143% relative to the
difference between parental means. The seemingly exaggerated effects testify
to the fact that QTL mapping can reveal genetic information that individually can
contribute to trait variation to an extent far beyond that seen as the difference
between parental strains. Thus, although it is difficult to precisely quantify the
effects of individual QTL on the genetic component of variation, it can be
concluded that QTL detected in this study are all of relatively strong effect. The
complexity of the effects of QTL is further emphasized by the figures for
dominance effects. While generally fairly modest, several (specifically those on
MMU1 MMU6, and MMU9) are of comparable magnitude to the additive effects
and one QTL (for FOW on MMU2) exhibits overdominance.
6.7.5 Candidate genes The very large confidence intervals of the QTL reported here mitigate against
immediately moving to a candidate gene approach in an effort to identify the
underlying genetic basis of the QTL. There are a total of 4964 genes listed
within the 1 LOD drop-off confidence interval of the 13 QTL, a not-
inconsiderable proportion of the entire mouse genome. Of these, 185 were
annotated as “heart” on the mouse genome informatics website of The
Jackson Laboratory (http://www.informatics.jax.org , accessed October 2005).
Undoubtedly many more genes than this are expressed in the developing heart,
but this selection gives a flavour of the problem of candidate gene selection in
the face of very large regions of interest. The 185 genes are listed in Appendix
3. Among them are many plausible candidate QTL genes, including members
of the bmp and fgf growth factor pathways involved in cardiac induction and
proliferation, as well as a host of others governing transcriponal regulation,
signaling, cell cycle, cell death, and extracellular matrix biology.
Notwithstanding this, given the relationship between ASD and PFO, and
particularly the known effect of heterozygosity for a mutation in NKX2-5 on
incidence of PFO and FVL (Biben et al., 2000), it is worth considering the
193
possibility that variants in murine orthologues to one or more of the 6 known
human ASD genes may be responsible for the QTL identified here.
Table 6.3 lists the locations of these genes. Of the QTL regions mapped in this
study, only the one for FOW on MMU2 contains a mouse ortholog (Actc) of 1 of
the 6 known human dominant ASD. Dr Donna Lai sequenced exons of the Actc
gene from the QSi5 and 129T2/SvEms strains and compared levels of Actc
mRNA in the atria and remaining portions of dissected E9.5 embryonic hearts
by quantitative RT-PCR (Kirk et al., 2006). There were no nonsynonymous
polymorphisms in coding regions of Actc or significant difference in mRNA
levels that would implicate Actc as the gene underlying the MMU2 QTL. The
mouse orthologues of the other 5 known ASD genes, Tbx5, Tbx20, Myh6,
Gata4, and Nkx2–5, all fall within regions where there is little evidence for
linkage.
6.7.6 Future studiesFrom the above it is clear that even a successful QTL mapping study like this
one can only represent a first step towards a deep understanding of the genetic
architecture of a complex trait. Work has already commenced on two different
approaches to refining the QTL reported here, using an Advanced Intercrossed
Line (AIL) and using an association technique based on the Mouse Hapmap
Project. These are discussed in Chapters 5 and 7.

7. Comparisons of atrial septal anatomy in 12 strains of inbred laboratory mice reveal unexpected complexity
7.1 Introduction The problem of moving from identification of a QTL to discovery of its underlying
genetic basis was raised in section 1.4.3. The results of the QTL mapping study
discussed in Chapter 6 highlight this issue: the QTL identified encompass a
sizeable fraction of the entire mouse genome. How, then, to find the genetic
needle in the genomic haystack? One approach, the AIL, has been discussed
already in sections 1.4.3, 2.1.3.2 and 5.3, with results from phenotypic analysis
of the F14 AIL mice forming a substantial part of Chapter 5. This approach was
chosen in preference to the generation of a congenic mouse line because
generation of an AIL allows simultaneous investigation of multiple QTL. This
was an attractive option because of the large number of QTL identified in the
mapping study (Chapter 6). Another advantage of the AIL is that phenotyping
and genotyping are not required until the final generation of mice.
During the course of this project, a new approach to fine mapping of QTL
emerged. This was the use of SNP data generated for a large number of inbred
strains of laboratory mice as a mapping tool, often without the need to
phenotype additional mice (for well studied phenotypes such as body weight
and haematological characteristics). Such SNP data have been generated and
made freely available by the Inbred Laboratory Mouse Haplotype Map project
(also referred to as the “mouse Hapmap project”) (Frazer KA et al., 2007)
(http://www.broad.mit.edu/mouse/hapmap). This approach was introduced in
section 1.4.4 and will be discussed in more detail below. It has the advantage
of not requiring genotyping (as this has already been done), requiring only
phenotyping of sufficient mice from each strain to accurately establish the mean
strain value for the trait of interest. It has the potential to play a complementary
role with the AIL, and this chapter reports the results of phenotyping of 10 of the
Hapmap strains, combined with data from QSi5 and 129T2/SvEms.
194
195
7.2 History of the inbred laboratory mouse The potential success of the haplotype-based approach to mapping in inbred
laboratory mice rests in large part on the unique history of the laboratory
mouse. Breeding of “fancy” mice in Asia from the 1700s, and subsequently in
Europe and the United States, provided a stock of relatively inbred strains. The
Asian strains originated from the subspecies Mus musculus musculus and Mus
musculus molossinus (the latter in turn being a hybrid of M.m.musculus and
M.m.castaneous). The European strains were bred from imported Asian strains
and from locally obtained wild mice of the subspecies Mus musculus
domesticus (Wade et al., 2002). In the early 20th century, the systematic use of
mice in laboratory research began with the work of pioneers such as Castle and
Little, who obtained mice from Abbie Lathrop – a breeder in Granby,
Massachusetts, who bred both Asian and European-derived strains (Wade and
Daly, 2005). Deliberate crossing and then inbreeding of these strains led to the
derivation of the classical inbred strains which are ancestors of many of today’s
laboratory mice. Recent work has shown an overall ancestral contribution to the
classical inbred laboratory strains of 68% from M.m.domesticus, 10% from
M.m.molossinus, 6% from M.m.musculus, 3% from M.m.castaneous and 13%
of unknown origin (Frazer KA et al., 2007).
One consequence of this history is that, to a greater or lesser extent, most
commonly used strains of laboratory mice share common ancestry. Analysis of
the fine structure of variation of the mouse genome has revealed long
interspersed regions of high and low sequence identity between pairs of strains
of laboratory mice (Wade and Daly, 2005). This reflects segments of recently
shared ancestral origins (high sequence identity) and differing ancestral origins
(low sequence identity). In a pairwise comparison, the frequency of SNPs can
range from 1 SNP per 20kb to 1 per 250-300bp (Wade et al., 2002).
Comparison of multiple strains reveals a mosaic of overlapping blocks of SNPs.
In a recent report, identification of 8.27 million SNPs in 15 mouse strains (4
wild-derived and 11 classical) led to generation of a haplotype map of 40,898
segments (Frazer KA et al., 2007).
196
7.3 Application of mouse haplotype data to mapping The properties of the genomic structure of common strains of laboratory mice,
as outlined above, have the potential to be a powerful resource for gene
mapping. Using the tyrosinase locus as an example, Wade and colleagues
showed that using then-available (in 2002) haplotype information in just 12
strains of mice, it was possible to map the tyrosinase locus to within 500kb,
assuming previous assignment of the gene to MMU7. This was done simply by
sorting the mice into albino and non-albino strians and identifying a region
shared by descent in all of the albino mice, which was not shared by any of the
non-albino mice (Wade et al., 2002).
While such a simple approach is unlikely to be effective in studying complex
traits, statistical methods have been developed which allow the use of
haplotype data to map QTL in laboratory mice, and this approach has already
been used to map QTL (Pletcher et al., 2004; McClurg et al., 2006). A simple
but effective approach is the single-marker mapping (SMM) approach. This
exploits the fact that each SNP is biallelic across inbred strains. A SNP by SNP
calculation of association is done, using a t-test to measure strength of
association between phenotype and genotype (McClurg et al., 2006). Because
this results in thousands of statistical tests being performed, correction for
multiple testing, for example using a false discovery rate (FDR) threshold, is
required (McClurg et al., 2006). This is also a requirement for the more complex
haplotype-based approaches, although the effective number of individual
comparisons is lower than if a SNP by SNP analysis is done.
The SMM approach is computationally simple, but it risks discarding a great
deal of useful information. In particular, while SNPs are biallelic, there are
multiple possible haplotypes in most regions and more information can be
obtained using analyses which consider multiple SNPs simultaneously. McClurg
and colleagues (McClurg et al., 2006) review several possible approaches to
mapping by inferred haplotype structure.
197
7.4 Number of mice to phenotype There is a considerable amount of publicly available information about
characteristics of commonly used strains of laboratory mice, opening the way to
in silico mapping without the requirement for the researcher to examine or
genotype a single animal. However, FVL, FOW and CRW have not been
studied by other investigators, and using the available mouse SNP data for
mapping requires phenotyping sufficient animals to provide an accurate
estimate of the mean values for each trait. An estimate of the required number
of animals can be made based on the equation
n = (Z�/d)2 (Kuzma JW and Bohnenblust SE, 2001)
where Z is the standardized normal score for the required confidence interval, �
is standard deviation of the trait and d is the number of units from the mean by
which a deviation from the true population mean is acceptable. Put another
way, if we wish to have 95% confidence that the mean of the animals scored is
within one standard deviation of the true population (or in this case, strain)
mean, the calculation resolves as follows:
n = (1.96 x 1 / 1 )2
(note that 1.96 is the standardized normal score for a 95% confidence interval)
i.e. n � 4. Estimation of the population to within half a standard deviation
requires � 15 mice, and within a quarter of a standard deviation requires � 61
mice. Each time the accuracy required is doubled, four times as many mice are
needed (the progression 4, 15, 61 represents the effects of rounding rather than
inaccuracy in this statement). Thus, the aim was to dissect a minimum of 15
mice from each of as many strains as possible, in order to achieve a mean
within half a standard deviation of the true mean for the strain. This represents a
balance between the time and resources required to phenotype large numbers
of mice and a reasonable level of accuracy. So far, 10 strains have been
assessed, and in addition Dr Claire Wade has generously arranged for SNP
data to be generated for both QSi5 and 129T2/SvEms, allowing the use of the
existing phenotype data for these strains in any analysis. For the remainder of
this chapter, reference to the Hapmap strains refers to these 12 strains
(including QSi5 and 129T2/SvEms), unless otherwise specified.
198
7.5 Analyses of Hapmap strains Data from 403 mice, representing 12 strains of inbred laboratory mice, are
presented in this section. This includes the QSi5 and 129T2/SvEms mice
described in section 5.4, and 262 mice from 10 strains selected from the 49
strains genotyped by the Inbred Laboratory Mouse Haplotype Map project
(http://www.broad.mit.edu/mouse/). These were 129X1/SvJ, A/J, AKR/J,
C3H/HeJ, C57Bl/6J, DBA/1J, DBA/2J, FVB/NJ, SJL/J and CBA/J.
7.6 Training of a second observer The original intention in this part of the project was to genotype most of the 49
strains studied by the Mouse Hapmap consortium. Phenotyping a minimum of
15 mice from each of 49 strains would mean dissecting at least 750 mice, an
effort comparable in scale to the work required for study of the F2 and F14
mice. This made training a second observer to do dissections and
measurements a worthwhile option, and Ms Noelia Lopez was recruited and
trained as part of a Master’s project. Unfortunately, delays in obtaining mouse
strains meant that there was insufficient time for her to complete the large scale
dissection exercise. However, there was time for her to co-measure 147 hearts,
with the two observers blinded to one another’s results. The availability of these
data is useful for assessing the reliability of the measurements.
7.7 Assessments of the reliability of measurement of atrial septal anatomy The atrial septum of a mouse is a tiny, delicate structure which is very easily
stretched or distorted during measurement. Small amounts of damage to the
surrounding structures would be expected to affect the quality of the
measurements. The structures under study ranged in size from 0.2-1.5mm. The
possibility of significant error was therefore a real concern.
Consideration was given to the option of fixing hearts in paraformaldehyde prior
to measurement, which would have had the added benefit of allowing later
checking of measurements. When this was attempted, hearts did not prove
suitable for study. The tissues became stiff and difficult to align for
measurement. Their pallor also made identification of landmarks more difficult.

Also, assessment for PFO in the absence of liquid blood to act as a marker (by
passing through the foramen ovale to the left side of the atrial septum) was
much more difficult, requiring the injection of dye prior to assessment for PFO.
Table 7.1 shows measures of inter-rater reliability for each atrial septal trait.
Table 7.1: Measures of inter-rater reliability
Coefficient FVL FOW CRW
Pearson’s r
(p value) 0.80 (<0.0005) 0.72 (<0.0005) 0.53 (p<0.0005)
ICC(individualvalues)
0.80 0.72 0.53
ICC (means)* 0.89 0.84
*ICC = Intra-class Correlation
0.69
Comparing observers, the correlation coefficients for FVL and FOW are high,
the correlation coefficient for CRW is moderately high and all three achieve very
high levels of statistical significance – in short, there is good agreement
between the observers for FVL and FOW, and fair agreement for CRW. One
limitation of Pearson’s correlation coefficient is that it does not take into account
any systematic difference between values (for example if one observer
consistently measures higher than the other). Intra-class correlation (ICC) is a
measure of homogeneity within groups relative to total variation, taking into
account random variation between groups (as for Pearson’s correlation
coefficient) and systematic variation. Like the Pearson correlation coefficient,
the ICC ranges from –1 to +1, with values close to zero indicating low
agreement between raters. The ICC is not calculated by Minitab, so a free
online calculator (at
http://department.obg.cuhk.edu.hk/researchsupport/IntraClass_correlation.asp)
was used. There are three classes of ICC, termed Case 1, Case 2 and Case 3
(Shrout and Fleiss, 1979) – referring to different relationships between raters
and data. Case 2 refers to a situation in which the same raters rate each case,
199
200
and the cases are a random sample. This is the best match with the mouse
data under analysis, so Case 2 was used for these analyses.
The Pearson’s correlation coefficient and ICC are identical for all measures
(there are in fact slight differences but only in the third decimal place, i.e. they
are of no consequence), indicating no systematic error. The ICC for means is of
particular interest here – this compares the means of the three measures. Since
the intention of the mapping exercise is to generate accurate approximations of
the true mean for the strains under study, the high values for the meaned ICC
are very encouraging, particularly for FVL and FOW. Given this encouraging
result – close agreement with high measures of correlation and no evidence for
systematic bias - for the 68 mice measured by Ms Lopez and not by EK, Ms
Lopez’s data are used in the subsequent analyses.
Overall, these analyses provide reassurance that the measures used
throughout this chapter, and which form the basis for the QTL mapping study,
are reliable and represent a reasonably accurate measure of the actual
anatomy of the mice which were studied.
7.8 Descriptive statistics for the Hapmap strains (including 129T2/SvEms and QSi5) Table 7.2 shows descriptive statistics for all 12 strains of inbred laboratory mice
which have been studied to date.
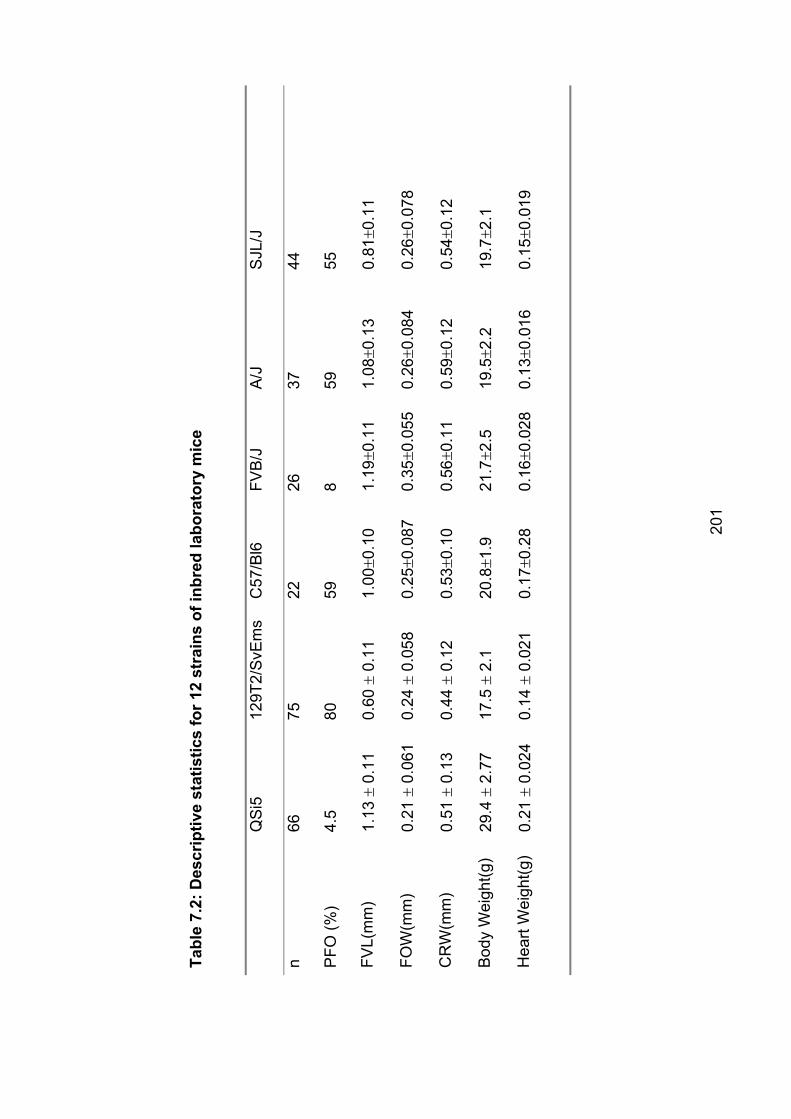
Tabl
e 7.
2: D
escr
iptiv
e st
atis
tics
for 1
2 st
rain
s of
inbr
ed la
bora
tory
mic
e
QS
i512
9T2/
SvE
ms
C57
/Bl6
FVB
/J
A/J
SJL
/J
n66
7522
2637
44
PFO
(%)
4.5
8059
859
55
FVL(
mm
)1.
13�
0.11
0.60
� 0.
11
1.00
�0.1
01.
19�0
.11
1.08
�0.1
30.
81�0
.11
FOW
(mm
)0.
21�
0.06
1 0.
24�
0.05
8 0.
25�0
.087
0.35
�0.0
550.
26�0
.084
0.26
�0.0
78
CR
W(m
m)
0.51
� 0.
13
0.44
� 0.
12
0.53
�0.1
00.
56�0
.11
0.59
�0.1
20.
54�0
.12
Bod
y W
eigh
t(g)
29.4
� 2.
77
17.5
� 2.
1 20
.8�1
.921
.7�2
.519
.5�2
.219
.7�2
.1
Hea
rt W
eigh
t(g)
0.21
� 0.
024
0.14
� 0.
021
0.17
�0.2
80.
16�0
.028
0.13
�0.0
160.
15�0
.019
201
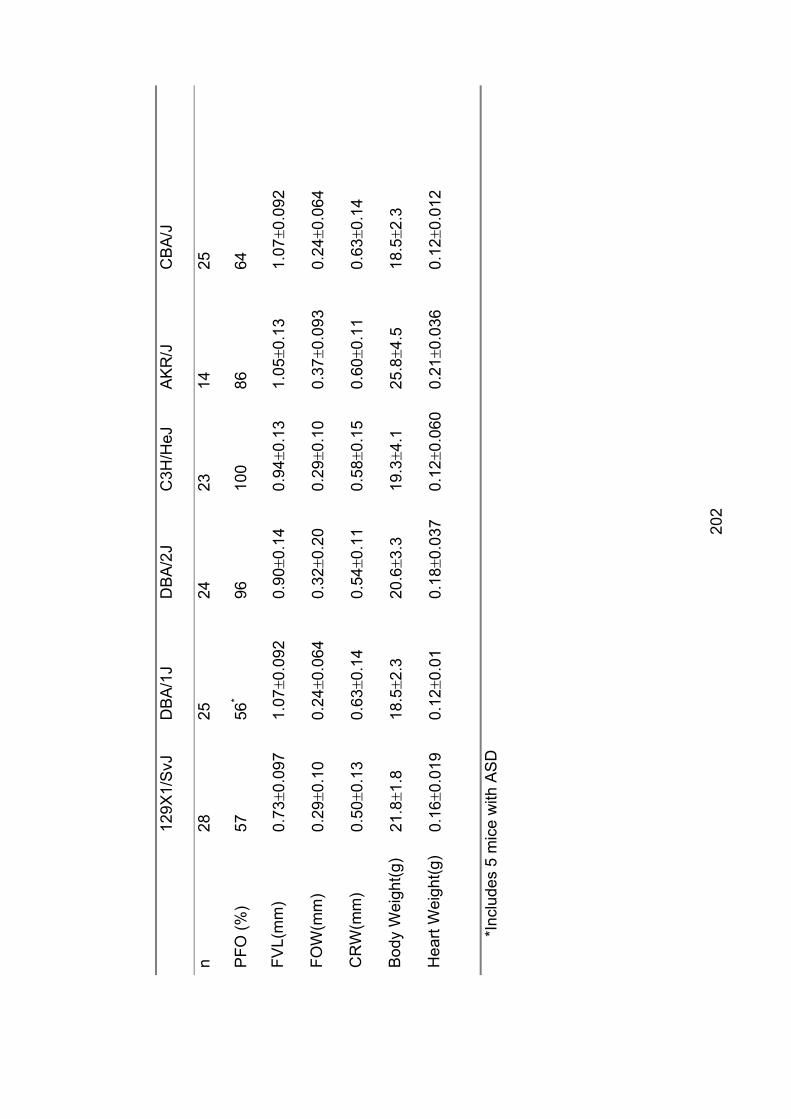
129X
1/S
vJ
DB
A/1
J D
BA
/2J
C3H
/HeJ
A
KR
/J
CB
A/J
n28
2524
2314
25
PFO
(%)
5756
*96
100
8664
FVL(
mm
)0.
73�0
.097
1.07
�0.0
920.
90�0
.14
0.94
�0.1
31.
05�0
.13
1.07
�0.0
92
FOW
(mm
)0.
29�0
.10
0.24
�0.0
640.
32�0
.20
0.29
�0.1
00.
37�0
.093
0.24
�0.0
64
CR
W(m
m)
0.50
�0.1
30.
63�0
.14
0.54
�0.1
10.
58�0
.15
0.60
�0.1
10.
63�0
.14
Bod
y W
eigh
t(g)
21.8
�1.8
18.5
�2.3
20.6
�3.3
19.3
�4.1
25.8
�4.5
18.5
�2.3
Hea
rt W
eigh
t(g)
0.16
�0.0
190.
12�0
.01
0.18
�0.0
370.
12�0
.060
0.21
�0.0
36
*In
clud
es 5
mic
e w
ith A
SD
0.12
�0.0
12
202
203
All of the traits under study varied widely between strains. Evaluation of these
additional strains did reveal some with more extreme phenotypes than those
chosen for the QTL mapping study, 129T2/SvEms and QSi5. However, these
strains were at or close to the extremes for FVL and frequency of PFO. QSi5
had the lowest frequency of PFO at 4.5%, and 129T2/SvEms had the fourth
highest at 80%. QSi5 had the second longest mean FVL (after FVB/J) and
129T2/SvEms had the shortest. As the strains were not selected on the basis of
FOW or CRW, it is not surprising that 129T2/SvEms had an unexceptional
FOW, but QSi5 had the smallest FOW of any strain studied to date, and
129T2/SvEms had the shortest CRW. The data for DBA/1J mice presented here
include mice with ASD (see below) and may be artefactually low – the ASDs
seen in this strain had a residual lip of flap valve, making it possible to record
measurements for each of FVL, FOW and CRW, but it is possible that these
traits have been modified to some degree by the presence of ASD.
7.9 ASD in DBA/1J mice Study of DBA/1J mice yielded a completely unexpected result, the presence of
frank ASD in 5/25 mice. Figure 7.1 illustrates ASD in a DBA/1J mouse. In
addition, atrial septal aneurysm (ASA) was very common, with 6/20 mice
without ASD having ASA. By way of comparison, among the 1438 F2 mice, one
had an ASA and one had TGA. Among the 1003 F14 mice, 4 had ASA and one
had an ASD. Among the other inbred strains, 2/23 C3H/HeJ had ASA, but none
of the other strains had any abnormalities recorded. Even mice heterozygous
for a mutation in Nkx2-5 have an incidence of ASD of only ~1% (Biben et al.,
2000).
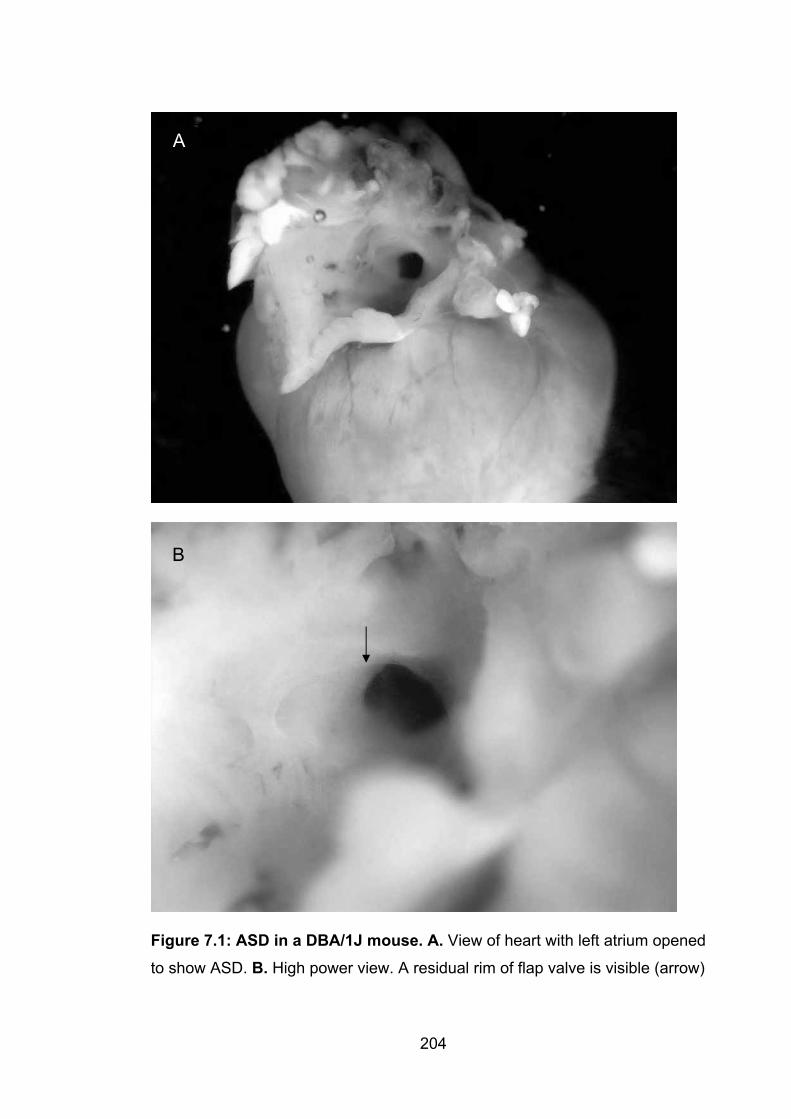
A
B
Figure 7.1: ASD in a DBA/1J mouse. A. View of heart with left atrium opened
to show ASD. B. High power view. A residual rim of flap valve is visible (arrow)
204
205
The dissections were targeted at atrial septal anatomy and it is possible that
some CHD was missed – for example, the ventricular septum was not routinely
examined and nor were the great vessels. The F2 mouse with TGA was
identified because of the observation during routine dissection that there was
massive right ventricular hypertrophy, which led to performance of a more
detailed fine dissection than usual. Nonetheless, it is clear that among inbred
laboratory mice, CHD is rare and the DBA/1J strain is exceptional in this regard.
This opens the possibility of further studies to determine whether other forms of
CHD occur more commonly in this strain, and if possible to identify the genetic
basis of this propensity to ASD.
7.10 Relationships between PFO and other traits in the 12 strains of inbred miceBased on the work of Biben and colleagues, and the results of the studies of
129T2/SvEms, QSi5 and the F1, F2 and F14 mice reported in chapter 5, it was
anticipated that study of the additional 10 strains would yield similar results.
Specifically, associations between PFO and each of FVL, FOW and CRW were
expected. Table 7.3 shows correlations between the traits in the 12 strains.
Remarkably, none of the relationships relevant to PFO established in studies of
129T2/SvEms, QSi5 and the strains derived by mating them are confirmed by
this analysis. The only significant correlations are between FVL and CRW
(r=0.684) (p=0.01), traits which had very low correlation in the earlier analyses.
For FVL and %PFO, the correlation coefficient is negative, as would be
expected, and moderately large at –0.485, but the correlation is not statistically
significant. The strongest correlation is between weight and heart weight – as
expected, heavier mice have heavier hearts. The correlation coefficient for
these traits is high and the correlation is highly statistically significant. Figures
7.2 – 7.4 are scatterplots with regression fit for percentage of PFO for each
strain, plotted against the strain means for each of FVL, FOW and CRW. These
figures illustrate the looseness of the relationship between these traits. By way
of comparison, figure 7.5 shows the strong relationship between weight and
heart weight.
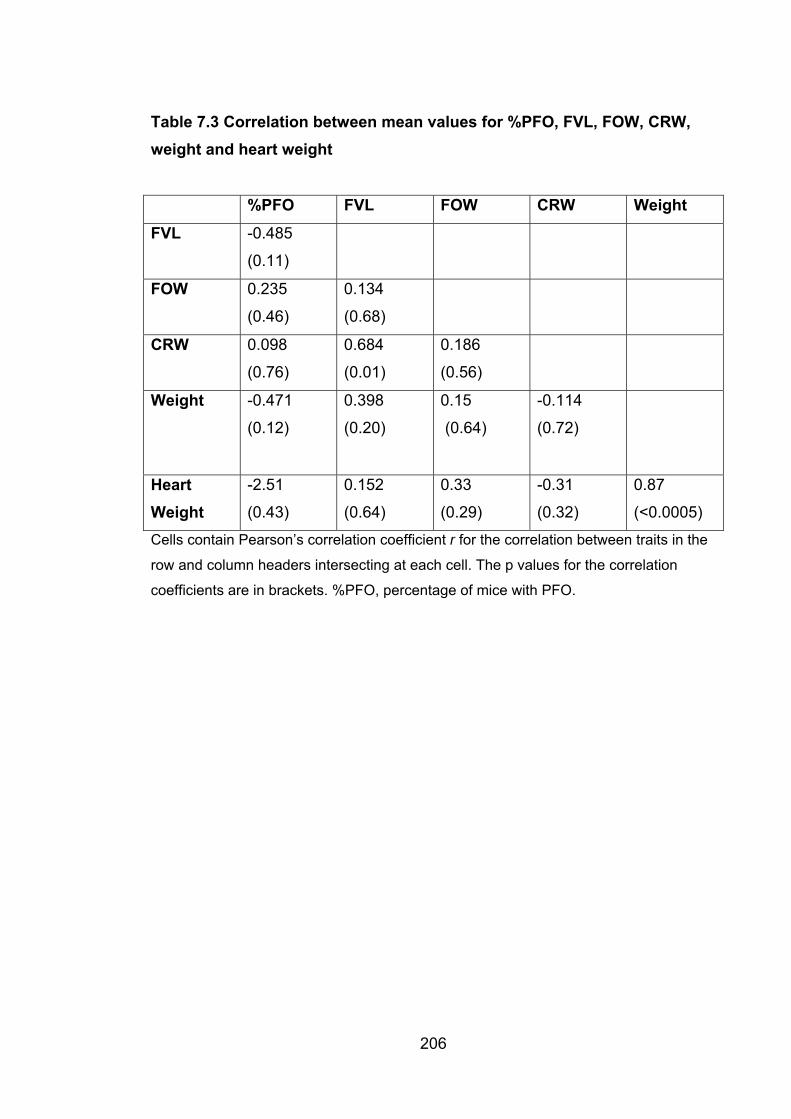
206
Table 7.3 Correlation between mean values for %PFO, FVL, FOW, CRW, weight and heart weight
%PFO FVL FOW CRW Weight
FVL -0.485
(0.11)
FOW 0.235
(0.46)
0.134
(0.68)
CRW 0.098
(0.76)
0.684
(0.01)
0.186
(0.56)
Weight -0.471
(0.12)
0.398
(0.20)
0.15
(0.64)
-0.114
(0.72)
HeartWeight
-2.51
(0.43)
0.152
(0.64)
0.33
(0.29)
-0.31
(0.32)
0.87
(<0.0005)
Cells contain Pearson’s correlation coefficient r for the correlation between traits in the
row and column headers intersecting at each cell. The p values for the correlation
coefficients are in brackets. %PFO, percentage of mice with PFO.
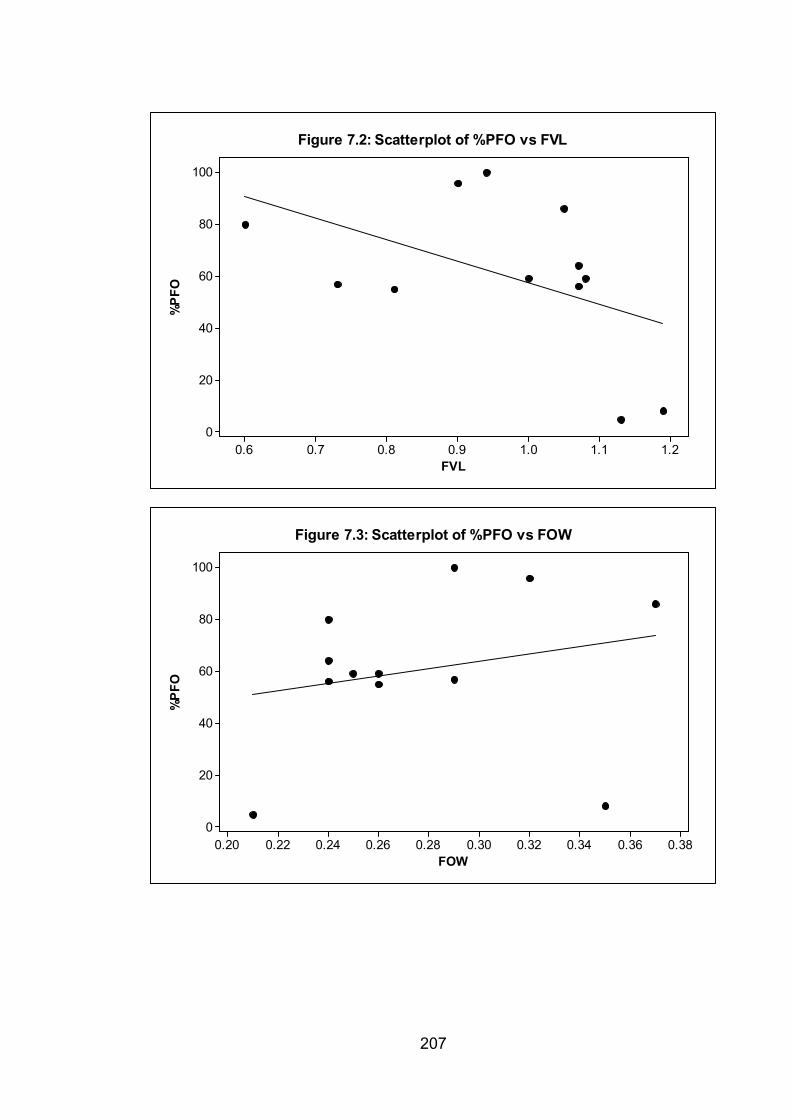
FVL
%P
FO
1.21.11.00.90.80.70.6
100
80
60
40
20
0
Figure 7.2: Scatterplot of %PFO vs FVL
FOW
%P
FO
0.380.360.340.320.300.280.260.240.220.20
100
80
60
40
20
0
Figure 7.3: Scatterplot of %PFO vs FOW
207
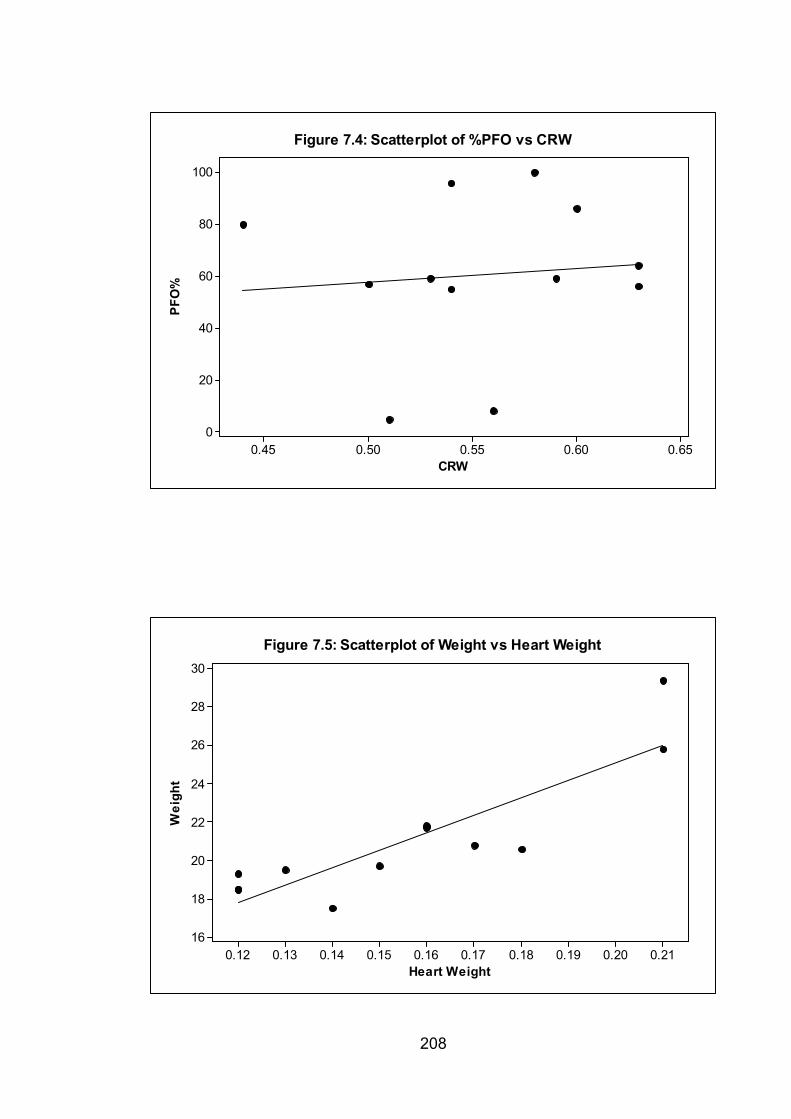
CRW
PFO
%
0.650.600.550.500.45
100
80
60
40
20
0
Figure 7.4: Scatterplot of %PFO vs CRW
Heart Weight
Wei
ght
0.210.200.190.180.170.160.150.140.130.12
30
28
26
24
22
20
18
16
Figure 7.5: Scatterplot of Weight vs Heart Weight
208
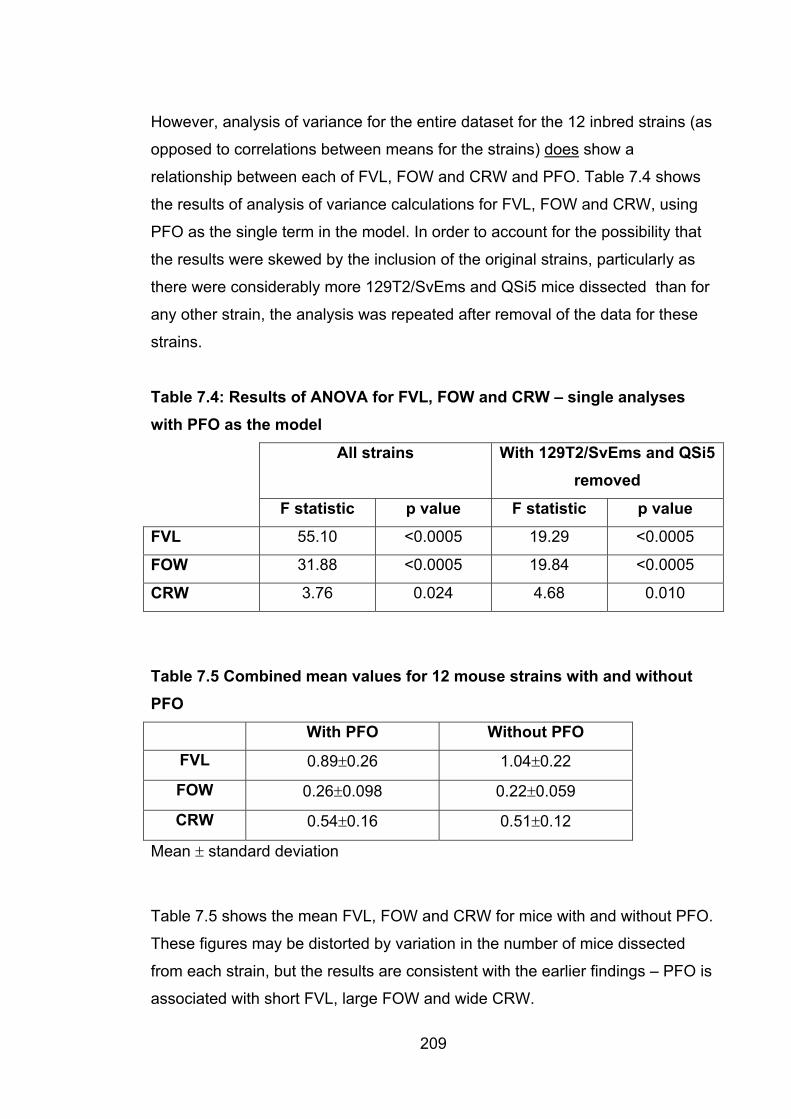
209
However, analysis of variance for the entire dataset for the 12 inbred strains (as
opposed to correlations between means for the strains) does show a
relationship between each of FVL, FOW and CRW and PFO. Table 7.4 shows
the results of analysis of variance calculations for FVL, FOW and CRW, using
PFO as the single term in the model. In order to account for the possibility that
the results were skewed by the inclusion of the original strains, particularly as
there were considerably more 129T2/SvEms and QSi5 mice dissected than for
any other strain, the analysis was repeated after removal of the data for these
strains.
Table 7.4: Results of ANOVA for FVL, FOW and CRW – single analyses with PFO as the model
All strains With 129T2/SvEms and QSi5 removed
F statistic p value F statistic p value
FVL 55.10 <0.0005 19.29 <0.0005
FOW 31.88 <0.0005 19.84 <0.0005
CRW 3.76 0.024 4.68 0.010
Table 7.5 Combined mean values for 12 mouse strains with and without PFO
With PFO Without PFO
FVL 0.89�0.26 1.04�0.22
FOW 0.26�0.098 0.22�0.059
CRW 0.54�0.16 0.51�0.12
Mean � standard deviation
Table 7.5 shows the mean FVL, FOW and CRW for mice with and without PFO.
These figures may be distorted by variation in the number of mice dissected
from each strain, but the results are consistent with the earlier findings – PFO is
associated with short FVL, large FOW and wide CRW.
210
There is an apparent conflict between these two analyses – comparison
between the strain means and grouped analysis of all data, with the former not
confirming the expected relationships between PFO and each of FVL, FOW and
CRW but the latter in agreement with the studies reported in Chapter 5. It
appears that the relationship between aspects of atrial septal morphology and
PFO is complex. It is likely that for some of the strains studied, the main
determinants of the presence of PFO are not causally connected with the
determinants of FVL, FOW and CRW. The wording used here is deliberately
cautious. It is not certain that having a short FVL (for example – the same
argument applies to the other measures) causes PFO. It may be, for example,
that short FVL is a consequence of the haemodynamic effects of an existing
PFO.
If it is true that for at least some strains, factors unconnected to FVL, FOW and
CRW are the main determinants of PFO, then it is to be expected that some
strains with high frequency of PFO will have septal morphology similar to others
with low frequency of PFO. This would be consistent with the lack of a clear
relationship between the strain means for PFO and the other measures. To take
one strain as an example, 100% of C3H/HeJ mice had PFO. But this strain has
only a moderately short FVL and moderately wide FOW. Perhaps C3H/HeJ
mice have PFO for other reasons, e.g. mildly abnormal function of cell adhesion
factors during early postnatal life.
7.11 Comparison with the study by Biben and colleagues It is puzzling that Biben and colleagues found such a close correlation between
PFO and FVL (Biben et al., 2000). A partial explanation for this may be that they
studied relatively few different types of wild-type mice – outbred Swiss QS,
FVB/J, C57Bl/6, and 129T2/SvEms. The other strains on which the correlation
coefficient of – 0.97 was based were crosses between these strains, and/or
were heterozygous for an Nkx2-5 mutation. FVB/J and Swiss QS mice are from
a similar background and might be expected to have similar determinants of
PFO, and Nkx2-5 haploinsufficiency has a substantial effect on FVL and PFO.
By contrast, the figures for strain means here are based on 12 separate strains
211
(although some, such as the two 129 strains, are from a similar background), all
of which are pure-bred and wildtype with respect to Nkx2-5.
7.12 Conclusions Comparisons between two independent observers show that the dissection and
measurement technique used is robust and does not suffer from systematic
bias. This is an important finding for this thesis given the dependence of
Chapters 5, 6 and 7 on the results of several thousand dissections.
The simple correlation between FVL and percentage of mice with PFO found by
Biben and colleagues (Biben et al., 2000) appears to break down with the
addition of further strains. However, on more detailed statistical analysis a
highly significant relationship remains, suggesting considerable and unexpected
complexity in the relationships between FVL, FOW and CRW. This finding was
rendered even more surprising by the strong confirmation of the findings of
Biben and colleagues in studies of QSi5 and 129T2/SvEms, including F2 and
F14 mice derived from crosses of these strains.
The contrast between the results in two closely studied strains (QSi5 and
129T2/SvEms) and the results in a larger group of strains is striking, and may
have implications for the use of the mouse Hapmap data for fine mapping. If the
genetic determinants of the atrial septal traits studied here vary importantly
between strains, the power of this mapping approach would be expected to be
reduced. It is possible that the genetic determinants of FVL, FOW and CRW are
common to all of the strains, even if these traits are not importantly related to
the risk of PFO in a substantial proportion of them. If this were the case, the
power of a mapping study directed at these quantitative traits would not be
affected, although an analysis designed to look only at the binary trait (presence
or absence of PFO) would still be weakened. However, preliminary mapping
based on the results to date indicates that in practice, this may not be an
important issue (see section 8.5).
8. Conclusions and Future Directions
8.1 Genetic heterogeneity and its clinical implications Previous work had established that dominant autosomal ASD is one of a
number of genetic disorders which is highly genetically heterogeneous. Other
examples include autosomal dominant dilated and hypertrophic
cardiomyopathy, long QT syndrome, autosomal dominant and recessive
sensorineural deafness, dominant and recessive retinitis pigmentosa and
nonspecific mental retardation (X-linked and other forms).
The studies reported in chapters 2 and 3 reinforce this point. Mutations in
NKX2-5 and GATA4 account for a relatively small proportion of cases, and even
when only individuals with a family history are considered, mutations in these
genes are found in 10.7% and 7.8% respectively. Mutations in TBX20, identified
in the course of this study as contributing to human CHD, possibly account for
another 5.1% of familial cases, leaving more than 75% of familial ASD
unaccounted for. Based on the figures for these three genes, it is unlikely that
studies of MYH6 and ACTC will account for more than another 10% of familial
cases each. Mutations in TBX5 are unlikely to account for more than a very
small percentage of cases, if cases of definite Holt-Oram syndrome are
excluded, given the high penetrance of limb anomalies in HOS (Newbury-Ecob
et al., 1996). Thus, the majority of the genetic basis of familial ASD is yet to be
elucidated, and it would not be at all surprising if there were 10 or more
dominant ASD genes yet to be discovered. The identification of syndromal
forms of ASD with relatively subtle extra-cardiac components, such as the
syndrome of ASD with Marcus Gunn phenomenon reported in Chapter 3, is
unlikely to be an aid to genetic diagnosis in more than a small percentage of
cases, even once the gene for this condition is mapped.
Conditions with this much genetic heterogeneity present a challenge in genetic
counselling, particularly if there is a strong indication for genetic testing in a
family. Even where known genes associated with a particular disorder account
for a relatively large proportion of cases, such as in long QT syndrome (Skinner 212
213
JR and Members of the CSANZ Cardiovascular Genetics Working Group,
2007), genetic testing is generally expensive (due to the large number of genes
which may need to be screened) and has a comparatively low chance of
identifying a causative mutation in any one affected individual.
There may not be strong demand for mutation testing in families where ASD is
the only manifestation. Prenatal diagnosis and termination of affected
pregnancies is unlikely to be sought for a condition which is perceived by many
families to be relatively mild, and curable even in more severe cases. However,
counselling needs to take into account the high incidence of other, more severe,
cardiac malformations in dominant ASD families, and even if no genetic testing
is undertaken in pregnancy, monitoring with fetal echocardiography in at-risk
pregnancies is desirable.
8.2 Cardiac phenotypes other than CHD 8.2.1 AV conduction abnormalities and ASD The observation that some families with dominant forms of ASD have
associated AV conduction block is of great importance for the clinical
management of affected individuals and for guiding genetic testing. It is thus
essential that descriptions of new forms of inherited CHD include information
about the presence or absence of ECG abnormalities. On currently available
evidence, both TBX20 – associated ASD and dominant ASD with MGP fall into
the group of dominant ASD without conduction abnormalities. Published reports
indicate that the combination of ASD and AV block is a strong pointer to the
possibility of an NKX2-5 mutation, even in the absence of a family history. This
association is also seen with TBX5 mutations, but as discussed above, most
such families can be clinically distinguished on the basis of radial ray anomalies
and other features such as the characteristic sloping shoulders seen in HOS
(Newbury-Ecob et al., 1996). The history of family 1024 with the NKX2-5
mutation T178M (Section 3.2.2.1) suggests that a history of sudden death or
otherwise unexplained ventricular fibrillation should also be a pointer to the
possibility of an NKX2-5 mutation.

214
The progressive nature of the AV block in many affected individuals mandates
long term surveillance. This is particularly important for mutation positive family
members with no structural heart disease, who may be less inclined to attend
for long term follow-up.
8.2.2 Cardiomyopathy in association with mutations in TBX20 and NKX2-5
Similarly, cardiomyopathy may be a long term complication of mutations in
either TBX20 (section 3.4.2.2) or NKX2-5 (Schott et al., 1998; Benson et al.,
1999) (discussed in section 3.4.4). The proportion of affected individuals who
will go on to develop cardiomyopathy at some time in their lives is unknown at
present. Therefore, it is probably premature to make a firm recommendation
that individuals with mutations in either gene should have long-term screening
for cardiomyopathy. However, it is important that clinicians managing patients
with mutations in either gene should be aware of this association. It will be
important for clinical future studies of affected individuals to include evaluation
of affected individuals for cardiomyopathy.
8.3 The role of NKX2-5, GATA4 and TBX20 in multifactorial ASD The studies reported here suggest that these three genes may contribute, in
some cases at least, to the causation of the common multifactorial form of ASD.
Sequence variants which affect amino acid structure, but do not fulfill all
requirements for confident identification as pathogenic mutations, have been
observed in each of NKX2-5, GATA4 and TBX20. It is possible that some or all
of these play a role in causing CHD in the individuals in whom they are found,
or at least in modulating the severity of CHD in families where the mutation
does not segregate with CHD (such as T209I in TBX20 and E21Q in NKX2-5).
Determining whether this is correct will be challenging. A first step might be to
conduct a case control study (as has already been done for the GATA4
polymorphism S377G) to assess the frequency of such alleles in individuals
with CHD in comparison to those without CHD. The problem is that such an
approach is expensive and labour-intensive even for a common allele such as
S377G; it is much more difficult for a rare allele or collection of rare alleles,
since larger numbers of subjects and controls must be tested to generate
215
meaningful data. Of the reported sequence variants of currently uncertain
significance, the NKX2-5 change R25C might be most amenable to this
approach (see section 3.2 for detailed discussion of this variant). It has been
reported mainly in association with TOF, particularly in African-American
patients, and was present in 2/43 healthy African-American controls
(McElhinney et al., 2003). A case-control study restricted to African-American
cases and controls would be challenging but possible and may provide
evidence for (or against) pathogenicity of R25C.
This kind of study has limitations, however. At most it can demonstrate an
association with CHD. It provides no information about interactions with other
genes. Before we can claim a true understanding of the polygenic inheritance of
any disorder, we will need to know the genes involved, the variants in those
genes which influence phenotype and the nature of their interactions.
8.4 Future studies of dominant ASD genes in unselected subjects Notwithstanding the limitations discussed above, there is still merit in
conducting studies like those reported in Chapter 3, as conducted by other
investigators (Goldmuntz et al., 2001; McElhinney et al., 2003; Nemer G et al.,
2006). As each new dominant ASD gene is identified, it makes sense to test a
cohort of subjects for mutations in that gene. Even negative studies such as that
of Schulterman and colleagues (Schluterman et al., 2007) are helpful in defining
the contribution of mutations in each gene. While it is unlikely, based on studies
so far, that this approach will contribute a great deal to our knowledge of the
causes of non-familial ASD, it is realistic to expect that eventually the molecular
basis of most Mendelian forms of CHD will be able to be determined.
With this in mind, a collaboration has been established with Professor David
Brook, whose group identified mutations in MYH6 (Ching et al., 2005), and was
instrumental in identifying mutations in ACTC (Matsson H et al., 2005) in
dominant ASD. DNA from Australian subjects has been sent to Prof Brook’s lab
to be screened for mutations in MYH6, and it is likely a similar exercise will be
conducted with ACTC in future.

216
8.5 Mapping genes affecting prevalence of PFO in inbred laboratory mice The studies reported in chapters 5 and 6 reveal considerable complexity in the
relationships between phenotypic features of the atrial septal wall and PFO. The
QTL mapping study identified 7 QTL with significant and 6 with suggestive
evidence of linkage. The challenge now is to identify the underlying genetic
bases for these QTL. This will not be a simple task. The object of the search
may prove to be an amino-acid altering sequence change in a gene, but could
also be a variation in the regulatory regions of a gene (including remote
elements such as enhancers) or even a change in an RNA with regulatory
functions. The first step is to narrow down the currently very large regions of
interest. Two complementary approaches to this are being undertaken.
The first technique involves the use of the AIL. The laborious first and second
stages of this project, breeding of the resource and dissection of >1000
[129T2/SvEms x QSi5] F14 mice, have been completed. While there is some
evidence of genetic drift, with the marked rise in prevalence of PFO in F14
compared with the F2 mice, it is likely that many of the QTL detected in the F2
mapping study will still be detectable in the F14 mice. It is possible that one or
more of the QTL will resolve into multiple QTL of smaller effect, as was seen in
the study by Iraqi and colleagues of trypanosomiasis resistance loci in mice
(Iraqi et al., 2000).
The intention at the start of the AIL project was to do targeted genotyping, with
the use of densely spaced markers selected to span the 1-lod dropoff regions
for a number of the QTL, with the number of loci studied and density of markers
determined largely by budget constraints. However, the rapid development of
microarray technology and the falling cost of microarray studies raises the
possibility of using a high density SNP microarray approach to genotyping the
AIL. This would make it possible to investigate all of the identified QTL again
simultaneously, and also to conduct a new genome-wide screen for additional
QTL not detected in the F2 study. The very large amount of data generated by
microarrays would be a challenge, but computational resources for mapping are
also developing rapidly.
217
The proposed second approach to fine mapping involves the use of the publicly
available mouse Hapmap data, as described in section 5.3. Dr Peter Thomson
wrote software for this purpose, based on the single marker mapping approach
(SMM) and conducted a preliminary analysis on data from 8 of the Hapmap
strains. The results were unexpected. As an example, Figure 7.1 shows the
results for FOW on chromosome 1, compared with the chromosome 1 QTL
data from chapter 6. The upper figure shows the result of Dr Thomson’s
analysis. The y axis is –log10 (p) i.e. if p = 0.001, -log10(p) = 3. The blue and
red lines represent 5% and 1% false discovery rates (FDR), respectively. In
other words, for each peak above the red line, there is a 1% chance that it
represents false discovery of an association, adjusted for the very large number
of individual tests.
This forest of peaks is typical of the analysis, with many chromosomes showing
such results. There are numerous peaks within the region defined by the F2
mapping study, but there are also many peaks outside this region. This is an
embarassment of riches – with so many highly significant associations, not
restricted to the regions of interest, it is impossible to know which peaks merit
further investigation, and which (if any) are responsible for the originally
observed QTL. While it may seem implausible that analysis based on only 8
strains could produce so many significant associations, it should be borne in
mind that not all of these significant associations are likely to be independent of
one another. Also, a comparison involving 8 strains involves 28 pairwise
comparisons, making this a powerful technique.
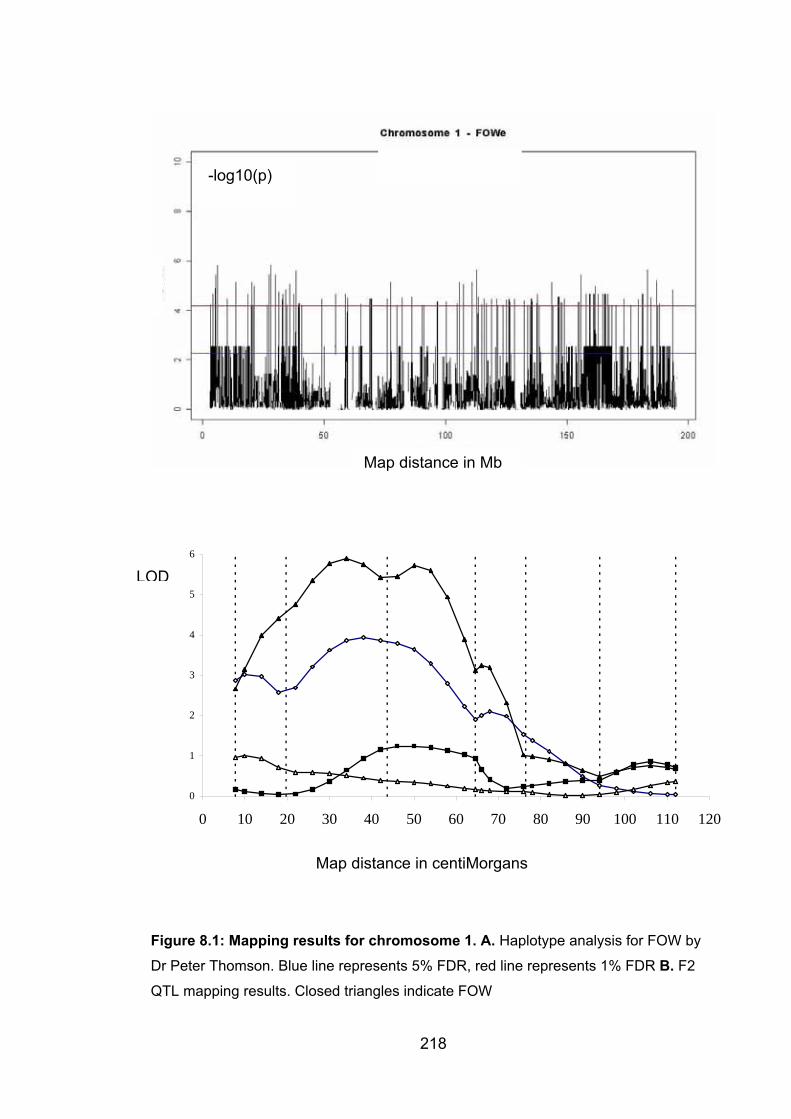
0
1
2
3
4
5
6
0 10 20 30 40 50 60 70 80 90 100 110 120
Map distance in Mb
-log10(p)
LOD
Map distance in centiMorgans
Figure 8.1: Mapping results for chromosome 1. A. Haplotype analysis for FOW by
Dr Peter Thomson. Blue line represents 5% FDR, red line represents 1% FDR B. F2
QTL mapping results. Closed triangles indicate FOW
218
219
Phenotyping additional strains is probably worth doing, and this is planned. It is
not certain whether this may add extra significant peaks, or will simplify matters
by increasing the significance of a subset of peaks, making them targets for
further study. There are obvious attractions to integration of the AIL and
haplotype-based approaches. If the original QTL can be substantially narrowed
by analysis of the AIL, relatively few peaks from the haplotype-based analysis
will lie within each revised region of interest. Each of them will be a candidate
for further investigation. The path from that point will depend on the number and
nature of SNPs of interest . If they lie in or near genes which appear likely
candidates for influencing heart development, a possible approach would be to
study the expression of those genes in the hearts of embryos from strains with
extreme atrial septal phenotypes. If there are no obvious candidates, an
alternate approach might be to examine any region of synteny in the human,
possibly by doing an association study in subjects with CHD and controls.
If we are ever to answer the question “why does my child have this problem” –
or the equally important question “what is the risk that my future child will have
this problem” with any clarity, it will be necessary to identify common alleles of
at least moderate effect. Rare alleles of small individual effect will present a
considerable challenge of interpretation, and their interaction is likely to be so
complex as to defy attempts to analyse their significance to an affected
individual or to a couple who are seeking genetic advice. For CHD, it remains to
be seen whether such alleles exist.
8.6 Significance of findings The findings of the studies described here support the idea that numerous
genes and regulatory elements can contribute to abnormal atrial septal
morphogenesis. Mendelian ASD is highly genetically heterogeneous. The
studies of NKX2-5 and GATA4 add to our knowledge of the phenotypes
associated with NKX2-5 mutation and GATA4 deletion, and help to define the
contribution of these genes to ASD in general. The finding that TBX20
mutations cause both CHD (including ASD, VSD and valvular abnormalities)
220
and cardiomyopathy adds to the roll of ASD genes and provides insights into
the function of TBX20.
The studies of atrial septal anatomy in inbred strains of laboratory mice reveal a
complex relationship between FVL, FOW, CRW and PFO, confirming and
building on the key findings of Biben and colleagues(Biben et al., 2000). The
QTL mapping study identified 13 QTL relevant to aspects of atrial septal
development and directly or indirectly to risk of PFO, a model of ASD. This
study appears to be the first QTL study of CHD, and was made possible by
exploiting the existence of endophenotypes associated with a binary trait.
Despite the large number of QTL identified, the majority of the genetic variation
in the strains studied has yet to be explained. There is a great deal more
complexity yet to be uncovered, and a long way to go before these early
insights are developed into anything approaching full understanding.
REFERENCES
Altshuler,D., Brooks,L.D., Chakravarti,A., Collins,F.S., Daly,M.J., and Donnelly,P. (2005). A haplotype map of the human genome. Nature 437, 1299-1320.
Amarasingham R and Fleming,H.A. (1967). Congenital Heart Disease with Arrhythmia in A Family. British Heart Journal 29, 78-&.
Anderson NH (2002). Analysis of genetic linkage. In Emery and Rimoin's Principles and Practice of Medical Genetics, Rimoin DL, Connor JM, Pyeritz RE, and Korf BR, eds. (London: Churchill Livingstone), pp. 133-148.
Anderson,R.H., Webb,S., and Brown,N.A. (1999). Clinical anatomy of the atrial septum with reference to its developmental components. Clinical Anatomy 12,362-374.
Anzola,G.P., Frisoni,G.B., Morandi,E., Casilli,F., and Onorato,E. (2006). Shunt-associated migraine responds favorably to atrial septal repair - A case-control study. Stroke 37, 430-434.
Arquizan,C., Coste,J., Touboul,P.J., and Mas,J.L. (2001). Is patent foramen ovale a family trait? A transcranial Doppler sonographic study. Stroke 32, 1563-1566.
Awan,K.J. (1976). Marcus Gunn (Jaw-Winking) Syndrome. American Journal of Ophthalmology 82, 503-504.
Baekvad-Hansen,M., Tumer,Z., Delicado,A., Erdogan,F., Tommerup,N., and Larsen,L.A. (2006). Delineation of a 2.2 Mb microdeletion at 5q35 associated with microcephaly and congenital heart disease. American Journal of Medical Genetics Part A 140A, 427-433.
Barton,N.H. and Keightley,P.D. (2002). Understanding quantitative genetic variation. Nature Reviews Genetics 3, 11-21.
Bartz,P.J., Cetta,F., Cabalka,A.K., Reeder,G.S., Squarcia,U., Agnetti,A., Aurier,E., Carano,N., Tachana,B., and Hagler,D.J. (2006). Paradoxical emboli in children and young adults: Role of atrial septal defect and patent foramen ovale device closure. Mayo Clinic Proceedings 81, 615-618.
Basson,C.T., Bachinsky,D.R., Lin,R.C., Levi,T., Elkins,J.A., Soults,J., Grayzel,D., Kroumpouzou,E., Traill,T.A., LeblancStraceski,J., Renault,B., Kucherlapati,R., Seidman,J.G., and Seidman,C.E. (1997). Mutations in human TBX5 cause limb and cardiac malformation in Holt-Oram syndrome. Nature Genetics 15, 30-35.
221
Basson,C.T., Huang,T.S., Lin,R.C., Bachinsky,D.R., Weremowicz,S., Vaglio,A., Bruzzone,R., Quadrelli,R., Lerone,M., Romeo,G., Silengo,M., Pereira,A.,
222
Krieger,J., Mesquita,S.F., Kamisago,M., Morton,C.C., Pierpont,M.E.M., Muller,C.W., Seidman,J.G., and Seidman,C.E. (1999). Different TBX5 interactions in heart and limb defined by Holt-Oram syndrome mutations. Proceedings of the National Academy of Sciences of the United States of America 96, 2919-2924.
Basson,C.T., Solomon,S.D., Weissman,B., Macrae,C.A., Poznanski,A.K., Prieto,F., Delafuente,S.R., Pease,W.E., Levin,S.E., Holmes,L.B., Seidman,J.G., and Seidman,C.E. (1995). Genetic-Heterogeneity of Heart-Hand Syndromes. Circulation 91, 1326-1329.
Becker,S.M., Al Halees,Z., Molina,C., and Paterson,R.M. (2001). Consanguinity and congenital heart disease in Saudi Arabia. American Journal of Medical Genetics 99, 8-13.
Benson,D.W., Sharkey,A., Fatkin,D., Lang,P., Basson,C.T., McDonough,B., Strauss,A.W., Seidman,J.G., and Seidman,C.E. (1998). Reduced penetrance, variable expressivity, and genetic heterogeneity of familial atrial septal defects. Circulation 97, 2043-2048.
Benson,D.W., Silberbach,G.M., Kavanaugh-McHugh,A., Cottrill,C., Zhang,Y.Z., Riggs,S., Smalls,O., Johnson,M.C., Watson,M.S., Seidman,J.G., Seidman,C.E., Plowden,J., and Kugler,J.D. (1999). Mutations in the cardiac transcription factor NKX2.5 affect diverse cardiac developmental pathways. Journal of Clinical Investigation 104, 1567-1573.
Biben,C., Weber,R., Kesteven,S., Stanley,E., McDonald,L., Elliott,D.A., Barnett,L., Koentgen,F., Robb,L., Feneley,M., and Harvey,R.P. (2000). Cardiac septal and valvular dysmorphogenesis in mice heterozygous for mutations in the homeobox gene Nkx2-5. Circulation Research 87, 888-895.
Bizarro,R.O., Callahan,J.A., Feldt,R.H., Kurland,L.T., Gordon,H., and BRANDENB.RO (1970). Familial Atrial Septal Defect with Prolonged Atrioventricular Conduction - A Syndrome Showing Autosomal Dominant Pattern of Inheritance. Circulation 41, 677-&.
Bjornstad P (1974). Secundum type atrial septal defect with prolonged PR interval and autosomal dominant mode of inheritance. British Heart Journal 36,1149-1154.
Boneva,R.S., Moore,C.A., Botto,L., Wong,L.Y., and Erickson,J.D. (1999). Nausea during pregnancy and congenital heart defects: A population-based case-control study. American Journal of Epidemiology 149, 717-725.
Borozdin W, Bravo Ferrer Acosta AM Bamshad MJ, Botzenhart EM, Froster UG, Lemke J, Schinzel A, Spranger S, McGaughran J, Wand D, Chrzanowska KH, and Kohlhase J (2006). Expanding the spectrum of TBX5 mutations in Holt-Oram syndrome: detection of two intragenic deletions by quantitative real time PCR, and report of eight novel point mutations. Human Mutation #920 (online).
223
Bosi,G., Sensi,A., Calzolari,E., and Scorrano,M. (1992). Familial Atrial Septal Defect with Prolonged Atrioventricular Conduction. American Journal of Medical Genetics 43, 641.
Botstein,D., White,R.L., Skolnick,M., and Davis,R.W. (1980). Construction of A Genetic Linkage Map in Man Using Restriction Fragment Length Polymorphisms. American Journal of Human Genetics 32, 314-331.
Boughman,J.A., Berg,K.A., Astemborski,J.A., Clark,E.B., Mccarter,R.J., Rubin,J.D., and Ferencz,C. (1987). Familial Risks of Congenital Heart Defect Assessed in A Population Based Epidemiologic Study. American Journal of Medical Genetics 26, 839-849.
Bower,C. and Ramsay,J.M. (1994). Congenital Heart-Disease - A 10-Year Cohort. Journal of Paediatrics and Child Health 30, 414-418.
Boyd,M., Harris,F., Mcfarlane,R., Davidson,H.R., and Black,D.M. (1995). A Human Brca1 Gene Knockout. Nature 375, 541-542.
Brassington,A.M.E., Sung,S.S., Toydemir,R.M., Le,T., Roeder,A.D., Rutherford,A.E., Whitby,F.G., Jorde,L.B., and Bamshad,M.J. (2003). Expressivity of Holt-Oram syndrome is not predicted by TBX5 genotype. American Journal of Human Genetics 73, 74-85.
Brooks,J.K. (1987). The Marcus Gunn Phenomenon - Discussion and Report of A Case. Oral Surgery Oral Medicine Oral Pathology Oral Radiology and Endodontics 64, 687-692.
Brown,D.D., Martz,S.N., Binder,O., Goetz,S.C., Price,B.M.J., Smith,J.C., and Conlon,F.L. (2005). Tbx5 and Tbx20 act synergistically to control vertebrate heart morphogenesis. Development 132, 553-563.
Buckingham,M., Meilhac,S., and Zaffran,S. (2005). Building the mammalian heart from two sources of myocardial cells. Nature Reviews Genetics 6, 826-835.
Burn J and Goodship J (2002). Congenital heart disease. In Emery and Rimoin's Principles and Practice of Medical Genetics, Rimoin DL, Connor JM, Pyeritz RE, and Korf BR, eds. (London: Churchill Livingstone), pp. 1239-1326.
Burn,J., Brennan,P., Little,J., Holloway,S., Coffey,R., Somerville,J., Dennis,N.R., Allan,L., Arnold,R., Deanfield,J.E., Godman,M., Houston,A., Keeton,B., Oakley,C., Scott,O., Silove,E., Wilkinson,J., Pembrey,M., and Hunter,A.S. (1998). Recurrence risks in offspring of adults with major heart defects: results from first cohort of British collaborative study. Lancet 351, 311-316.
Buskens,E., Grobbee,D.E., Frohnmulder,I.M.E., Wladimiroff,J.W., and Hess,J. (1995). Aspects of the Etiology of Congenital Heart Disease. European Heart Journal 16, 584-587.
224
Calzolari,E., Garani,G., Cocchi,G., Magnani,C., Rivieri,F., Neville,A., Astolfi,G., Baroncini,A., Garavelli,L., Gualandi,F., Scorrano,M., and Bosi,G. (2003). Congenital heart defects: 15 years of experience of the Emilia-Romagna Registry (Italy). European Journal of Epidemiology 18, 773-780.
Carlson,C.S., Eberle,M.A., Kruglyak,L., and Nickerson,D.A. (2004). Mapping complex disease loci in whole-genome association studies. Nature 429, 446-452.
Casanova,J.L. and Abel,L. (2007). Human genetics of infectious diseases: a unified theory. Embo Journal 26, 915-922.
Ching,Y.H., Ghosh,T.K., Cross,S.J., Packham,E.A., Honeyman,L., Loughna,S., Robinson,T.E., Dearlove,A.M., Ribas,G., Bonser,A.J., Thomas,N.R., Scotter,A.J., Caves,L.S.D., Tyrrell,G.P., Newbury-Ecob,R.A., Munnich,A., Bonnet,D., and Brook,J.D. (2005). Mutation in myosin heavy chain 6 causes atrial septal defect. Nature Genetics 37, 423-428.
Christoffels,V.M., Habets,P.E.M.H., Franco,D., Campione,M., de Jong,F., Lamers,W.H., Bao,Z.Z., Palmer,S., Biben,C., Harvey,R.P., and Moorman,A.F.M. (2000). Chamber formation and morphogenesis in the developing mammalian heart. Developmental Biology 223, 266-278.
Clayton-Smith,J. and Donnai,D. (1995). Fetal Valproate Syndrome. Journal of Medical Genetics 32, 724-727.
Cook J, Lam W, and Mueller RF (2002). Mendelian Inheritance. In Emery and Rimoin's Principles and Practice of Medical Genetics, Rimoin DL, Connor JM, Pyeritz RE, and Korf BR, eds. (London: Churchill Livingstone), pp. 104-124.
Cowley,A.W. (2006). The genetic dissection of essential hypertension. Nature Reviews Genetics 7, 829-840.
Craatz,S., Kunzel,E., and Spanel-Borowski,K. (2002). Classification of a collection of malformed human hearts: Practical experience in the use of Sequential Segmental Analysis. Pediatric Cardiology 23, 483-490.
Darvasi,A. (1997). Interval-specific congenic strains (ISCS): An experimental design for mapping a QTL into a 1-centimorgan interval. Mammalian Genome 8,163-167.
Darvasi,A. and Soller,M. (1995). Advanced Intercross Lines, An Experimental Population for Fine Genetic Mapping. Genetics 141, 1199-1207.
Darvasi,A. and Soller,M. (1997). A simple method to calculate resolving power and confidence interval of QTL map location. Behavior Genetics 27, 125-132.
Darvasi,A., Weinreb,A., Minke,V., Weller,J.I., and Soller,M. (1993). Detecting Marker-Qtl Linkage and Estimating Qtl Gene Effect and Map Location Using A Saturated Genetic-Map. Genetics 134, 943-951.
225
Dentice,M., Cordeddu,V., Rosica,A., Ferrara,A.M., Santarpia,L., Salvatore,D., Chiovato,L., Perri,A., Moschini,L., Fazzini,C., Olivieri,A., Costa,P., Stoppioni,V., Baserga,M., De Felice,M., Sorcini,M., Fenzi,G., Di Lauro,R., Tartaglia,M., and Macchia,P.E. (2006). Missense mutation in the transcription factor NKX2-5: A novel molecular event in the pathogenesis of thyroid dysgenesis. Journal of Clinical Endocrinology and Metabolism 91, 1428-1433.
Devriendt,K., Matthijs,G., Van Dael,R., Gewillig,M., Eyskens,B., Hjalgrim,H., Dolmer,B., McGaughran,J., Brondum-Nielsen,K., Marynen,P., Fryns,J.P., and Vermeesch,J.R. (1999). Delineation of the critical deletion region for congenital heart defects, on chromosome 8p23.1. American Journal of Human Genetics 64, 1119-1126.
Devriendt,K., Vanhole,C., Matthijs,G., and de Zegher,F. (1998). Deletion of thyroid transcription factor-1 gene in an infant with neonatal thyroid dysfunction and respiratory failure. New England Journal of Medicine 338, 1317-1318.
Dietrich,W.F., Miller,J., Steen,R., Merchant,M.A., DamronBoles,D., Husain,Z., Dredge,R., Daly,M.J., Ingalls,K.A., OConnor,T.J., Evans,C.A., DeAngelis,M.M., Levinson,D.M., Kruglyak,L., Goodman,N., Copeland,N.G., Jenkins,N.A., Hawkins,T.L., Stein,L., Page,D.C., and Lander,E.S. (1996). A comprehensive genetic map of the mouse genome. Nature 380, 149-152.
DiMauro,S. and Schon,E.A. (2003). Mechanisms of disease: Mitochondrial respiratory-chain diseases. New England Journal of Medicine 348, 2656-2668.
Doco-Fenzy,M., Mauran,P., Lebrun,J.M., Bock,S., Bednarek,N., Struski,S., Albuisson,J., Ardalan,A., Collot,N., Schneider,A., Dastot-Le Moal,F., Gaillard,D., and Goossens,M. (2006). Pure direct duplication (12)(q24.1 -> q24.2) in a child with Marcus Gunn phenomenon and multiple congenital anomalies. American Journal of Medical Genetics Part A 140A, 212-221.
Dunwoodie,S.L. (2007). Combinatorial signaling in the heart orchestrates cardiac induction, lineage specification and chamber formation. Seminars in Cell & Developmental Biology 18, 54-66.
Elliott,D.A., Kirk,E.P., Yeoh,T., Chandar,S., McKenzie,F., Taylor,P., Grossfeld,P., Fatkin,D., Jones,O., Hayes,P., Feneley,M., and Harvey,R.P. (2003). Cardiac homeobox gene NKX2-5 mutations and congenital heart disease - Associations with atrial septal defect and hypoplastic left heart syndrome. Journal of the American College of Cardiology 41, 2072-2076.
Elliott,D.A., Solloway,M.J., Wise,N., Biben,C., Costa,M.W., Furtado,M.B., Lange,M., Dunwoodie,S., and Harvey,R.P. (2006). A tyrosine-rich domain within homeodomain transcription factor Nkx2-5 is an essential element in the early cardiac transcriptional regulatory machinery. Development 133, 1311-1322.
Emanuel,R., Obrien,K., Somerville,J., Jefferson,K., and Hegde,M. (1975). Association of Secundum Atrial Septal-Defect with Abnormalities of Atrioventricular-Conduction Or Left Axis Deviation - Genetic Study of 10 Families. British Heart Journal 37, 1085-1092.
226
Eppig,J.T., Bult,C.J., Kadin,J.A., Richardson,J.E., and Blake,J.A. (2005). The Mouse Genome Database (MGD): from genes to mice - a community resource for mouse biology. Nucleic Acids Research 33, D471-D475.
Falconer DS and Mackay TF (1996). Introduction to Quantitative Genetics. (Harlow: Pearson Education Ltd).
Falconer,D.S. (1965). Inheritance of Liability to Certain Diseases Estimated from Incidence Among Relatives. Annals of Human Genetics 29, 51-&.
Falls,H.F., Kruse,W.T., and Cotterman,C.W. (1949). 3 Cases of Marcus Gunn Phenomenon in 2 Generations. American Journal of Ophthalmology 32, 53-59.
Fatkin,D. and Graham,R.M. (2002). Molecular mechanisms of inherited cardiomyopathies. Physiological Reviews 82, 945-980.
Ferencz C, Loffredo CA, Correa-Villasenor A, and Wilson PD (1997). Atrial Septal Defect. In Genetic and environmental risk factors of major cardiovascular malformations: the Baltimore-Washington infant study 1981-1989, Ferencz C, Loffredo CA, Correa-Villasenor A, and Wilson PD, eds. (Armonk, NY: Futura Publishing Co, Inc), pp. 267-283.
Ferencz,C., Rubin,J.D., Mccarter,R.J., Brenner,J.I., Neill,C.A., Perry,L.W., Hepner,S.I., and Downing,J.W. (1985). Congenital Heart-Disease - Prevalence at Livebirth - the Baltimore Washington Infant Study. American Journal of Epidemiology 121, 31-36.
Ferencz,C., Rubin,J.D., Mccarter,R.J., and Clark,E.B. (1990). Maternal Diabetes and Cardiovascular Malformations - Predominance of Double Outlet Right Ventricle and Truncus Arteriosus. Teratology 41, 319-326.
Festa,P., Lamia,A.A., Murzi,B., and Bini,M.R. (2005). Tetralogy of Fallot with left heart hypoplasia, total anomalous pulmonary venous return, and right lung hypoplasia: Role of magnetic resonance imaging. Pediatric Cardiology 26, 467-469.
Fiering,S., Whitelaw,E., and Martin,D.I.K. (2000). To be or not to be active: the stochastic nature of enhancer action. Bioessays 22, 381-387.
Fisher RA (1918). The correlation between relatives on the supposition of Mendelian inheritance. Transactions of the Royal Society of Edinburgh 52, 399-433.
Flaherty,L., Herron,B., and Symula,D. (2005). Genomics of the future: Identification of quantitative trait loci in the mouse. Genome Research 15, 1741-1745.
Flint,J., Valdar,W., Shifman,S., and Mott,R. (2005). Strategies for mapping and cloning quantitative trait genes in rodents. Nature Reviews Genetics 6, 271-286.
227
Fokstuen,S., Arbenz,U., Artan,S., Dutly,F., Bauersfeld,U., Brecevic,L., Fasnacht,M., Rothlisberger,B., and Schinzel,A. (1998). 22q11.2 deletions in a series of patients with non-selective congenital heart defects: incidence, type of defects and parental origin. Clinical Genetics 53, 63-69.
Frazer KA, Eskin E, Kang HM, Bogue MA, Hinds DA, Beilharz EJ, Gupta RV, Montgomery J, Morenzoni MM, Nilsen GB, Pethiyagoda CL, Stuve LL, Johnson FM, Daly MJ, Wade CM, and Cox DR (2007). A sequence-based variation map of 8.27 million SNPs in inbred mouse strains. Nature 448, 1050-1055.
Frazer,K.A., Wade,C.M., Hinds,D.A., Patil,N., Cox,D.R., and Daly,M.J. (2004). Segmental phylogenetic relationships of inbred mouse strains revealed by fine-scale analysis of sequence variation across 4.6 Mb of mouse genome. Genome Research 14, 1493-1500.
Freedman H and Kushner B (1997). Congenital ocular aberrant innervation: new concepts. Journal of Paediatric Ophthalmology and Strabismus 1997, 10-16.
Fruchart,J.C., Nierman,M.C., Stroes,E.S.G., Kastelein,J.J.P., and Duriez,P. (2004). New risk factors for atherosclerosis and patient risk assessment. Circulation 109, 15-19.
Garg,V., Kathiriyra,I.S., Barnes,R., Schluterman,M.K., King,I.N., Butler,C.A., Rothrock,C.R., Eapen,R.S., Hirayama-Yamada,K., Joo,K., Matsuoka,R., Cohen,J.C., and Srivastava,D. (2003). GATA4 mutations cause human congenital heart defects and reveal an interaction with TBX5. Nature 424, 443-447.
Garrod,A.E. (1902). The incidence of alkaptonuria a study in chemical individuality. Lancet 2, 1616-1620.
Gassner,N.C., Baase,W.A., and Matthews,B.W. (1996). A test of the ''jigsaw puzzle'' model for protein folding by multiple methionine substitutions within the core of T4 lysozyme. Proceedings of the National Academy of Sciences of the United States of America 93, 12155-12158.
Gemma,S., Vichi,S., and Testai,E. (2007). Metabolic and genetic factors contributing to alcohol induced effects and fetal alcohol syndrome. Neuroscience and Biobehavioral Reviews 31, 221-229.
Giglio,S., Graw,S.L., Gimelli,G., Pirola,B., Varone,P., Voullaire,L., Lerzo,F., Rossi,E., Dellavecchia,C., Bonaglia,M.C., Digilio,M.C., Giannotti,A., Marino,B., Carrozzo,R., Korenberg,J.R., Danesino,C., Sujansky,E., Dallapiccola,B., and Zuffardi,O. (2000). Deletion of a 5-cM region at chromosome 8p23 is associated with a spectrum of congenital heart defects. Circulation 102, 432-437.
Gillum,R.F. (1994). Epidemiology of Congenital Heart-Disease in the United-States. American Heart Journal 127, 919-927.
228
Goldmuntz,E., Geiger,E., and Benson,D.W. (2001). NKX2.5 mutations in patients with tetralogy of Fallot. Circulation 104, 2565-2568.
Grech,V. and Gatt,M. (1999). Syndromes and malformations associated with congenital heart disease in a population-based study. International Journal of Cardiology 68, 151-156.
Guo,S.W. and Lange,K. (2000). Genetic mapping of complex traits: Promises, problems, and prospects. Theoretical Population Biology 57, 1-11.
Gutierrez-Roelens I, Sluysmans T, Gewillig M, Devriendt K, and Vikkula M (2002). Progressive AV-block and anomalous venous return among cardiac anomalies associated with two novel missense mutations in the CSX/NKX2-5 gene. Human Mutation Mutation in brief #512 Online.
Gutierrez-Roelens,I., De Roy,L., Ovaert,C., Sluysmans,T., Devriendt,K., Brunner,H.G., and Vikkula,M. (2006). A novel CSX/NKX2-5 mutation causes autosomal-dominant AV block: are atrial fibrillation and syncopes part of the phenotype? European Journal of Human Genetics 14, 1313-1316.
Gyapay,G., Morissette,J., Vignal,A., Dib,C., Fizames,C., Millasseau,P., Marc,S., Bernardi,G., Lathrop,M., and Weissenbach,J. (1994). The 1993-94 Genethon Human Genetic-Linkage Map. Nature Genetics 7, 246-339.
Hagen,P.T., Scholz,D.G., and Edwards,W.D. (1984). Incidence and Size of Patent Foramen Ovale During the 1st 10 Decades of Life - An Autopsy Study of 965 Normal Hearts. Mayo Clinic Proceedings 59, 17-20.
Harris,J.A., Francannet,C., Pradat,P., and Robert,E. (2003). The epidemiology of cardiovascular defects, Part 2: A study based on data from three large registries of congenital malformations. Pediatric Cardiology 24, 222-235.
Harvey,R.P. (2002). Patterning the vertebrate heart. Nature Reviews Genetics 3, 544-556.
Hatcher,C.J., Diman,N.Y.S.G., Kim,M.S., Pennisi,D., Song,Y., Goldstein,M.M., Mikawa,T., and Basson,C.T. (2004). A role for Tbx5 in proepicardial cell migration during cardiogenesis. Physiological Genomics 18, 129-140.
Heathcote,K., Braybrook,C., Abushaban,L., Guy,M., Khetyar,M.E., Patton,M.A., Carter,N.D., Scambler,P.J., and Syrris,P. (2005). Common arterial trunk associated with a homeodomain mutation of NKX2.6. Human Molecular Genetics 14, 585-593.
Heilstedt,H.A., Ballif,B.C., Howard,L.A., Lewis,R.A., Stal,S., Kashork,C.D., Bacino,C.A., Shapira,S.K., and Shaffer,L.G. (2003). Physical map of 1p36, placement of breakpoints in monosomy 1p36, and clinical characterization of the syndrome. American Journal of Human Genetics 72, 1200-1212.
229
Henry,P., Michel,P., Brochet,B., Dartigues,J.F., Tison,S., and Salamon,R. (1992). A Nationwide Survey of Migraine in France - Prevalence and Clinical-Features in Adults. Cephalalgia 12, 229-237.
Hirayama-Yamada,K., Kamisago,M., Akimoto,K., Aotsuka,H., Nakamura,Y., Tomita,H., Furutani,M., Imamura,S., Takao,A., Nakazawa,M., and Matsuoka,R. (2005). Phenotypes with GATA4 or NKX2.5 mutations in familial atrial septal defect. American Journal of Medical Genetics Part A 135A, 47-52.
Hoffman,J.I.E. and Kaplan,S. (2002). The incidence of congenital heart disease. Journal of the American College of Cardiology 39, 1890-1900.
Holder,A.M., Klaassens,M., Tibboel,D., de Klein,A., Lee,B., and Scott,D.A. (2007). Genetic factors in congenital diaphragmatic hernia. American Journal of Human Genetics 80, 825-845.
Holt,M., Nicholas,F.W., James,J.W., Moran,C., and Martin,I.C.A. (2004). Development of a highly fecund inbred strain of mice. Mammalian Genome 15,951-959.
Holt,M. and Oram,S. (1960). Familial Heart Disease with Skeletal Malformations. British Heart Journal 22, 236-242.
Homma,S., Ditullio,M.R., Sacco,R.L., Mihalatos,D., Mandri,G.L., and Mohr,J.P. (1994). Characteristics of Patent Foramen Ovale Associated with Cryptogenic Stroke - A Biplane Transesophageal Echocardiographic Study. Stroke 25, 582-586.
Hosoda,T., Komuro,I., Shiojima,I., Hiroi,Y., Harada,M., Murakawa,Y., Hirata,Y., and Yazaki,Y. (1999). Familial atrial septal defect and atrioventricular conduction disturbance associated with a point mutation in the cardiac homeobox gene CSX/NKX2-5 in a Japanese patient. Japanese Circulation Journal-English Edition 63, 425-426.
Ikeda,Y., Hiroi,Y., Hosoda,T., Utsunomiya,T., Matsuo,S., Ito,T., Inoue,J., Sumiyoshi,T., Takano,H., Nagai,R., and Komuro,I. (2002). Novel point mutation in the cardiac transcription factor CSX/NKX2.5 associated with congenital heart disease. Circulation Journal 66, 561-563.
Iraqi,F., Clapcott,S.J., Kumari,P., Haley,C.S., Kemp,S.J., and Teale,A.J. (2000). Fine mapping of trypanosomiasis resistance loci in murine advanced intercross lines. Mammalian Genome 11, 645-648.
Johansson BW and Sievers J (1967). Inheritance of atrial septal defect. Lancet 1(7501), 1224-1225.
Jones,A.M., Dodd,M.E., Govan,J.R.W., Barcus,V., Doherty,C.J., Morris,J., and Webb,A.K. (2004). Burkholderia cenocepacia and Burkholderia multivorans: influence on survival in cystic fibrosis. Thorax 59, 948-951.
230
Jones,E.F., Calafiore,P., Donnan,G.A., and Tonkin,A.M. (1994). Evidence That Patent Foramen Ovale Is Not A Risk Factor for Cerebral-Ischemia in the Elderly. American Journal of Cardiology 74, 596-599.
Kaern,M., Elston,T.C., Blake,W.J., and Collins,J.J. (2005). Stochasticity in gene expression: From theories to phenotypes. Nature Reviews Genetics 6, 451-464.
Kahler,R.L., BRAUNWAL.E, Plauth,W.H., and Morrow,A.G. (1966). Familial Congenital Heart Disease - Familial Occurrence of Atrial Septal Defect with A-V Conduction Abnormalities Supravalvular Aortic and Pulmonic Stenosis and Ventricular Septal Defect. American Journal of Medicine 40, 384-&.
Kasahara,H. and Benson,D.W. (2004). Biochemical analyses of eight NKX2.5 homeodomain missense mutations causing atrioventricular block and cardiac anomalies. Cardiovascular Research 64, 40-51.
Kasahara,H., Lee,B., Schott,J.J., Benson,D.W., Seidman,J.G., Seidman,C.E., and Izumo,S. (2000). Loss of function and inhibitory effects of human CSX/NKX2.5 homeoprotein mutations associated with congenital heart disease. Journal of Clinical Investigation 106, 299-308.
Khalid,Y., Ghina,M., Fadi,B., Fadi,C., May,K., Joseph,R., Makhoul,G., and Hala,T. (2006). Consanguineous marriage and congenital heart defects: A case-control study in the neonatal period (vol 140, pg 1524, 2006). American Journal of Medical Genetics Part A 140A, 1990.
Kirk,E. and Ades,L. (1998). Hypoplastic left heart in cerebrocostomandibular syndrome. Journal of Medical Genetics 35, 879.
Kirk,E.P., Hyun,C., Thomson,P.C., Lai,D., Castro,M.L., Biben,C., Buckley,M.F., Martin,I.C.A., Moran,C., and Harvey,R.P. (2006). Quantitative trait loci modifying cardiac atrial septal morphology and risk of patent foramen ovale in the mouse. Circulation Research 98, 651-658.
Kirk,E.P., Sunde,M., Costa,M.W., Rankin,S.A., Wolstein,O., Castro,M.L., Butler,T.L., Hyun,C., Guo,G., Otway,R., Mackay,J.P., Waddell,L.B., Cole,A.D., Hayward,C., Keogh,A., Macdonald,P., Griffiths,L., Fatkin,D., Sholler,G.F., Zorn,A.M., Feneley,M.P., Winlaw,D.S., and Harvey,R.P. (2007). Mutations in cardiac T-box factor gene TBX20 are associated with diverse cardiac pathologies, including defects of septation and valvulogenesis and cardiornyopathy. American Journal of Human Genetics 81, 280-291.
Kirkham,T.H. (1969). Familial Marcus Gunn Phenomenon. British Journal of Ophthalmology 53, 282-&.
Kirkpatrick,B.W., Mengelt,A., Schulman,N., and Martin,I.C.A. (1998). Identification of quantitative trait loci for prolificacy and growth in mice. Mammalian Genome 9, 97-102.
231
Kizer,J.R. and Devereux,R.B. (2005). Clinical practice - Patent foramen ovale in young adults with unexplained stroke. New England Journal of Medicine 353,2361-2372.
Knoepfler,P.S. (2007). Myc goes global: New tricks for an old oncogene. Cancer Research 67, 5061-5063.
Kouchoukos NT, Blackstone EH, Doty DB, Hanley FL, and Karp RB (2003). Atrial Septal Defect and Partial Anomalous Pulmonary Venous Connection. In Cardiac Surgery: Morphology, Diagnostic Criteria, Natural History, Techniques, Results and Indications, Kouchoukos NT, Blackstone EH, Doty DB, Hanley FL, and Karp RB, eds. (Salt Lake City: Churchill Livingstone), pp. 715-752.
Krasuski,R.A. (2007). When and how to fix a 'hole in the heart': Approach to ASD and PFO. Cleveland Clinic Journal of Medicine 74, 137-147.
Kreek,M.J., Nielsen,D.A., Butelman,E.R., and LaForge,K.S. (2005). Genetic influences on impulsivity, risk taking, stress responsivity and vulnerability to drug abuse and addiction. Nature Neuroscience 8, 1450-1457.
Kruglyak,L., Daly,M.J., ReeveDaly,M.P., and Lander,E.S. (1996). Parametric and nonparametric linkage analysis: A unified multipoint approach. American Journal of Human Genetics 58, 1347-1363.
Kuder GG and Laws HW (1968). Hereditary Marcus Gunn Phenomenon. Canadian Journal of Ophthalmology 3, 97-98.
Kuzma JW and Bohnenblust SE (2001). Basic Statistics for the Health Sciences. (New York: McGraw-Hill).
Lammer,E.J., Chen,D.T., Hoar,R.M., Agnish,N.D., Benke,P.J., Braun,J.T., Curry,C.J., Fernhoff,P.M., Grix,A.W., Lott,I.T., Richard,J.M., and Sun,S.C. (1985). Retinoic Acid Embryopathy. New England Journal of Medicine 313, 837-841.
Lammers,A., Hager,A., Eicken,A., Lange,R., Hauser,M., and Hess,J. (2005). Need for closure of secundum atrial septal defect in infancy. Journal of Thoracic and Cardiovascular Surgery 129, 1353-1357.
Lander ES, Green P, Abrahamson A, Barlow A, Daly MJ, Lincoln SE, and Newburg L (1987). MAPMAKER: An interactive computer package for constructing primary genetic linkage maps of experimental and natural populations. Genomics 1, 174-181.
Lander,E. and Kruglyak,L. (1995). Genetic Dissection of Complex Traits - Guidelines for Interpreting and Reporting Linkage Results. Nature Genetics 11,241-247.
Lander,E.S. and Botstein,D. (1989). Mapping Mendelian Factors Underlying Quantitative Traits Using Rflp Linkage Maps. Genetics 121, 185-199.
232
Lander,E.S., Linton,L.M., Birren,B., Nusbaum,C., Zody,M.C., Baldwin,J., Devon,K., Dewar,K., Doyle,M., FitzHugh,W., Funke,R., Gage,D., Harris,K., Heaford,A., Howland,J., Kann,L., Lehoczky,J., LeVine,R., McEwan,P., McKernan,K., Meldrim,J., Mesirov,J.P., Miranda,C., Morris,W., Naylor,J., Raymond,C., Rosetti,M., Santos,R., Sheridan,A., Sougnez,C., Stange-Thomann,N., Stojanovic,N., Subramanian,A., Wyman,D., Rogers,J., Sulston,J., Ainscough,R., Beck,S., Bentley,D., Burton,J., Clee,C., Carter,N., Coulson,A., Deadman,R., Deloukas,P., Dunham,A., Dunham,I., Durbin,R., French,L., Grafham,D., Gregory,S., Hubbard,T., Humphray,S., Hunt,A., Jones,M., Lloyd,C., McMurray,A., Matthews,L., Mercer,S., Milne,S., Mullikin,J.C., Mungall,A., Plumb,R., Ross,M., Shownkeen,R., Sims,S., Waterston,R.H., Wilson,R.K., Hillier,L.W., McPherson,J.D., Marra,M.A., Mardis,E.R., Fulton,L.A., Chinwalla,A.T., Pepin,K.H., Gish,W.R., Chissoe,S.L., Wendl,M.C., Delehaunty,K.D., Miner,T.L., Delehaunty,A., Kramer,J.B., Cook,L.L., Fulton,R.S., Johnson,D.L., Minx,P.J., Clifton,S.W., Hawkins,T., Branscomb,E., Predki,P., Richardson,P., Wenning,S., Slezak,T., Doggett,N., Cheng,J.F., Olsen,A., Lucas,S., Elkin,C., Uberbacher,E., Frazier,M., Gibbs,R.A., Muzny,D.M., Scherer,S.E., Bouck,J.B., Sodergren,E.J., Worley,K.C., Rives,C.M., Gorrell,J.H., Metzker,M.L., Naylor,S.L., Kucherlapati,R.S., Nelson,D.L., Weinstock,G.M., Sakaki,Y., Fujiyama,A., Hattori,M., Yada,T., Toyoda,A., Itoh,T., Kawagoe,C., Watanabe,H., Totoki,Y., Taylor,T., Weissenbach,J., Heilig,R., Saurin,W., Artiguenave,F., Brottier,P., Bruls,T., Pelletier,E., Robert,C., Wincker,P., Rosenthal,A., Platzer,M., Nyakatura,G., Taudien,S., Rump,A., Yang,H.M., Yu,J., Wang,J., Huang,G.Y., Gu,J., Hood,L., Rowen,L., Madan,A., Qin,S.Z., Davis,R.W., Federspiel,N.A., Abola,A.P., Proctor,M.J., Myers,R.M., Schmutz,J., Dickson,M., Grimwood,J., Cox,D.R., Olson,M.V., Kaul,R., Raymond,C., Shimizu,N., Kawasaki,K., Minoshima,S., Evans,G.A., Athanasiou,M., Schultz,R., Roe,B.A., Chen,F., Pan,H.Q., Ramser,J., Lehrach,H., Reinhardt,R., McCombie,W.R., de la Bastide,M., Dedhia,N., Blocker,H., Hornischer,K., Nordsiek,G., Agarwala,R., Aravind,L., Bailey,J.A., Bateman,A., Batzoglou,S., Birney,E., Bork,P., Brown,D.G., Burge,C.B., Cerutti,L., Chen,H.C., Church,D., Clamp,M., Copley,R.R., Doerks,T., Eddy,S.R., Eichler,E.E., Furey,T.S., Galagan,J., Gilbert,J.G.R., Harmon,C., Hayashizaki,Y., Haussler,D., Hermjakob,H., Hokamp,K., Jang,W.H., Johnson,L.S., Jones,T.A., Kasif,S., Kaspryzk,A., Kennedy,S., Kent,W.J., Kitts,P., Koonin,E.V., Korf,I., Kulp,D., Lancet,D., Lowe,T.M., McLysaght,A., Mikkelsen,T., Moran,J.V., Mulder,N., Pollara,V.J., Ponting,C.P., Schuler,G., Schultz,J.R., Slater,G., Smit,A.F.A., Stupka,E., Szustakowki,J., Thierry-Mieg,D., Thierry-Mieg,J., Wagner,L., Wallis,J., Wheeler,R., Williams,A., Wolf,Y.I., Wolfe,K.H., Yang,S.P., Yeh,R.F., Collins,F., Guyer,M.S., Peterson,J., Felsenfeld,A., Wetterstrand,K.A., Patrinos,A., and Morgan,M.J. (2001). Initial sequencing and analysis of the human genome. Nature 409, 860-921.
Lathrop,G.M. and Lalouel,J.M. (1988). Efficient Computations in Multilocus Linkage Analysis. American Journal of Human Genetics 42, 498-505.
Lathrop,G.M., Lalouel,J.M., Julier,C., and Ott,J. (1984). Strategies for Multilocus Linkage Analysis in Humans. Proceedings of the National Academy of Sciences of the United States of America-Biological Sciences 81, 3443-3446.
233
Lauter,N. and Doebley,J. (2002). Genetic variation for phenotypically invariant traits detected in teosinte: Implications for the evolution of novel forms. Genetics 160, 333-342.
Lechat,P., Mas,J.L., Lascault,G., Loron,P., Theard,M., Klimczac,M., Drobinski,G., Thomas,D., and Grosgogeat,Y. (1988). Prevalence of Patent Foramen Ovale in Patients with Stroke. New England Journal of Medicine 318,1148-1152.
Lettice,L.A., Horikoshi,T., Heaney,S.J.H., van Baren,M.J., van der Linde,H.C., Breedveld,G.J., Joosse,M., Akarsu,N., Oostra,B.A., Endo,N., Shibata,M., Suzuki,M., Takahashi,E., Shinka,T., Nakahori,Y., Ayusawa,D., Nakabayashi,K., Scherer,S.W., Heutink,P., Hill,R.E., and Noji,S. (2002). Disruption of a long-range cis-acting regulator for Shh causes preaxial polydactyly. Proceedings of the National Academy of Sciences of the United States of America 99, 7548-7553.
Li,Q.Y., NewburyEcob,R.A., Terrett,J.A., Wilson,D.I., Curtis,A.R.J., Yi,C.H., Gebuhr,T., Bullen,P.J., Robson,S.C., Strachan,T., Bonnet,D., Lyonnet,S., Young,I.D., Raeburn,J.A., Buckler,A.J., Law,D.J., and Brook,J.D. (1997). Holt-Oram syndrome is caused by mutations in TBX5, a member of the Brachyury (T) gene family. Nature Genetics 15, 21-29.
Libshitz,H.I. and Barth,K.H. (1974). Familial Incidence of Atrial Septal-Defect - Report of 4 Siblings and and Review of Literature. Chest 65, 56-58.
Lynch,H.T., Bachenberg,K., Harris,R.E., and Becker,W. (1978). Hereditary Atrial Septal-Defect - Update of A Large Kindred. American Journal of Diseases of Children 132, 600-604.
Mackay TF (2001). The genetic architecture of quantitative traits. Annual Review of Genetics 35, 303-339.
Maier,L.S., Teucher,N., Dorge,H., and Konstantinides,S. (2007). Large emboli on their way through the heart - First live demonstration of large paradoxical embolisms through a patent foramen ovale. European Journal of Echocardiography 8, 158-160.
Majumdar,R., Yagubyan,M., Sarkar,G., Bolander,M.E., and Sundt,T.M. (2006). Bicuspid aortic valve and ascending aortic aneurysm are not associated with germline or somatic homeobox NKX2-5 gene polymorphism in 19 patients. Journal of Thoracic and Cardiovascular Surgery 131, 1301-1305.
Manly,K.F. and Olson,J.M. (1999). Overview of QTL mapping software and introduction to map manager QT. Mammalian Genome 10, 327-334.
Marino,B. and Digilio,M.C. (2000). Congenital heart disease and genetic syndromes: Specific correlation between cardiac phenotype and genotype. Cardiovascular Pathology 9, 303-315.
234
Markel,P., Shu,P., Ebeling,C., Carlson,G.A., Nagle,D.L., Smutko,J.S., and Moore,K.J. (1997). Theoretical and empirical issues for marker-assisted breeding of congenic mouse strains. Nature Genetics 17, 280-284.
Maron,B.J., Borer,J.S., Lau,S.H., Damato,A.N., Scott,L.P., and Epstein,S.E. (1978). Association of Secundum Atrial Septal-Defect and Atrioventricular Nodal Dysfunction - Genetically Transmitted Syndrome. British Heart Journal 40,1293-1299.
Martinson,J.J., Hong,L., Karanicolas,R., Moore,J.P., and Kostrikis,L.G. (2000). Global distribution of the CCR2-64I/CCR5-59653T HIV-1 disease-protective haplotype. Aids 14, 483-489.
Mashimo,T., Ogawa,H., Cui,Z.H., Harada,Y., Kawakami,K., Masuda,J., Yamori,Y., and Nabika,T. (2007). Comprehensive QTL analysis of serum cholesterol levels before and after a high-cholesterol diet in SHRSP. Physiological Genomics 30, 95-101.
Matsson H, Klar J, Sunnegardh J, Enell H, Jonzon A, Vikkula M, Guierrez I, Brook D, Newbury-Ecob RA, and Dahl N (2005). Alpha cardiac actin (ACTC) is mutated in autosomal dominant atrial septal defect. European Journal of Human Genetics 13(Suppl 1), P1172.
Mattick,J.S. (2007). A new paradigm for developmental biology. Journal of Experimental Biology 210, 1526-1547.
McClurg,P., Pletcher,M.T., Wiltshire,T., and Su,A.I. (2006). Comparative analysis of haplotype association mapping algorithms. Bmc Bioinformatics 7.
McDermott,D.A., Bressan,M.C., He,J., Lee,J.S., Aftimos,S., Brueckner,M., Gilbert,F., Graham,G.E., Hannibal,M.C., Innis,J.W., Pierpont,M.E., Raas-Rothschild,A., Shanske,A.L., Smith,W.E., Spencer,R.H., John-Sutton,M.G., Van Maldergem,L., Waggoner,D.J., Weber,M., and Basson,C.T. (2005). TBX5 genetic testing validates strict clinical criteria for Holt-Oram syndrome. Pediatric Research 58, 981-986.
McElhinney,D.B., Geiger,E., Blinder,J., Benson,D.W., and Goldmuntz,E. (2003). NKX2.5 mutations in patients with congenital heart disease. Journal of the American College of Cardiology 42, 1650-1655.
McGaw,D. and Harper,R. (2001). Patent foramen ovale and cryptogenic cerebral infarction. Internal Medicine Journal 31, 42-47.
Megarbane,A., Stephan,E., Kassab,R., Ashoush,R., Salem,N., Bouvagnet,P., and Loiselet,J. (1999). Autosomal dominant secundum atrial septal defect with various cardiac and noncardiac defects: A new midline disorder. American Journal of Medical Genetics 83, 193-200.
Miller,S.A., Dykes,D.D., and Polesky,H.F. (1988). A Simple Salting Out Procedure for Extracting Dna from Human Nucleated Cells. Nucleic Acids Research 16, 1215.
235
Mohl,W. and Mayr,W.R. (1977). Atrial Septal Defect of Secundum Type and Hla. Tissue Antigens 10, 121-122.
Molkentin,J.D., Lin,Q., Duncan,S.A., and Olson,E.N. (1997). Requirement of the transcription factor GATA4 for heart tube formation and ventral morphogenesis. Genes & Development 11, 1061-1072.
Moore,K.J. and Nagle,D.L. (2000). Complex trait analysis in the mouse: The strengths, the limitations and the promise yet to come. Annual Review of Genetics 34, 653-686.
Moorman,A., Webb,S., Brown,N.A., Lamers,W., and Anderson,R.H. (2003). Development of the heart: (1) - Formation of the cardiac chambers and arterial trunks. Heart 89, 806-814.
Mrabet,A., Oueslati,S., Gazzah,H., and Benhamida,M. (1991). Clinical and Electromyographic Studies of 2 Cases of Familial Marcus Gunn Phenomenon. Revue Neurologique 147, 215-219.
Nabulsi,M.M., Tamim,H., Sabbagh,M., Obeid,M.Y., Yunis,K.A., and Bitar,F.F. (2003). Parental consanguinity and congenital heart malformations in a developing country. American Journal of Medical Genetics Part A 116A, 342-347.
Negi,S., Singh,S.K., Pati,N., Handa,V., Chauhan,R., and Pati,U. (2004). A proximal tissue-specific module and a distal negative regulatory module control apolipoprotein(a) gene transcription. Biochemical Journal 379, 151-159.
Nemer G, Fadlalah F, Usta J, Nemer,M., Dbaibo G, Obeid M, and Bitar F (2006). A Novel Mutation in the GATA4 Gene in Patients with Tetralogy of Fallot. Human Mutation Mutation in brief #881.
Newbury-Ecob,R.A., Leanage,R., Raeburn,J.A., and Young,I.D. (1996). Holt-Oram syndrome: A clinical genetic study. Journal of Medical Genetics 33, 300-307.
Nora,J.J. (1968). Multifactorial Inheritance Hypothesis for Etiology of Congenital Heart Diseases - Genetic-Environmental Interaction. Circulation 38, 604-&.
Nyholt,D.R. (2002). GENEHUNTER: Your 'one-stop shop' for statistical genetic analysis? Human Heredity 53, 2-7.
O'Connell,J.R. and Weeks,D.E. (1995). The Vitesse Algorithm for Rapid Exact Multilocus Linkage Analysis Via Genotype Set-Recoding and Fuzzy Inheritance. Nature Genetics 11, 402-408.
Ohmura,T., Ueda,T., Hashimoto,Y., and Imoto,T. (2001). Tolerance of point substitution of methionine for isoleucine in hen egg white lysozyme. Protein Engineering 14, 421-425.
236
Okubo,A., Miyoshi,O., Baba,K., Takagi,M., Tsukamoto,K., Kinoshita,A., Yoshiura,K., Kishino,T., Ohta,T., Niikawa,N., and Matsumoto,N. (2004). A novel GATA4 mutation completely segregated with atrial septal defect in a large Japanese family. Journal of Medical Genetics 41.
Olshan,A.F., Schnitzer,P.G., and Baird,P.A. (1994). Paternal Age and the Risk of Congenital Heart Defects. Teratology 50, 80-84.
Olson,E.N. (2006). Gene regulatory networks in the evolution and development of the heart. Science 313, 1922-1927.
Ott,J. and Hoh,J. (2000). Statistical approaches to gene mapping. American Journal of Human Genetics 67, 289-294.
Overall,J.C. (1972). Intrauterine Virus Infections and Congenital Heart Disease. American Heart Journal 84, 823-&.
Pease,W.E., Nordenberg,A., and Ladda,R.L. (1976). Familial Atrial Septal-Defect with Prolonged Atrioventricular-Conduction. Circulation 53, 759-762.
Pehlivan,T., Pober,B.R., Brueckner,M., Garrett,S., Slaugh,R., Van Rheeden,R., Wilson,D.B., Watson,M.S., and Hing,A.V. (1999). GATA4 haploinsufficiency in patients with interstitial deletion of chromosome region 8p23.1 and congenital heart disease. American Journal of Medical Genetics 83, 201-206.
Peng,J.H., Ronin,Y., Fahima,T., Roder,M.S., Li,Y.C., Nevo,E., and Korol,A. (2003). Domestication quantitative trait loci in Triticum dicoccoides, the progenitor of wheat. Proceedings of the National Academy of Sciences of the United States of America 100, 2489-2494.
Pletcher,M.T., McClurg,P., Batalov S, Su AI, Barnes SW, Lagler E, Korstanje R, Wang X, Nusskern D, Bogue MA, Mural RJ, Paigen B, and Wiltshire,T. (2004). Use of a dense single nucleotide polymorphism map for in silico mapping in the mouse. PLoS Biol 2, e393.
Plotz,F.B., vanEssen,A.J., Bosschaart,A.N., and Bos,A.P. (1996). Cerebro-costo-mandibular syndrome. American Journal of Medical Genetics 62, 286-292.
Poirier,O., Nicaud,V., McDonagh,T., Dargie,H.J., Desnos,M., Dorent,R., Roizes,G., Schwartz,K., Tiret,L., Komajda,M., and Cambien,F. (2003). Polymorphisms of genes of the cardiac calcineurin pathway and cardiac hypertrophy. European Journal of Human Genetics 11, 659-664.
Polinkovsky,A., Robin,N.H., Thomas,J.T., Irons,M., Lynn,A., Goodman,F.R., Reardon,W., Kant,S.G., Brunner,H.G., vanderBurgt,I., Chitayat,D., McGaughran,J., Donnai,D., Luyten,F.P., and Warman,M.L. (1997). Mutations in CDMP1 cause autosomal dominant brachydactyly type C. Nature Genetics 17,18-19.
237
Post,M.C., Luermans,J.G.L.M., Plokker,H.W.M., and Budts,W. (2007). Patent foramen ovale and migraine. Catheterization and Cardiovascular Interventions 69, 9-14.
Post,M.C., Thijs,V., Herroelen,L., and Budts,W.I.H.L. (2004). Closure of a patent foramen ovale is associated with a decrease in prevalence of migraine. Neurology 62, 1439-1440.
Pradat,P. (1992). A Case-Control Study of Major Congenital Heart-Defects in Sweden - 1981-1986. European Journal of Epidemiology 8, 789-796.
Prall,O.W.J., Elliott,D.A., and Harvey,R.P. (2002). Developmental paradigms in heart disease: insights from tinman. Annals of Medicine 34, 148-156.
Pratt,S.G., Beyer,C.K., and Johnson,C.C. (1984). The Marcus Gunn Phenomenon - A Review of 71 Cases. Ophthalmology 91, 27-30.
Rappold,G.A., Fukami,M., Niesler,B., Schiller,S., Zumkeller,W., Bettendorf,M., Heinrich,U., Vlachopapadoupoulou,E., Reinehr,T., Onigata,K., and Ogata,T. (2002). Deletions of the homeobox gene SHOX (short stature homeobox) are an important cause of growth failure in children with short stature. Journal of Clinical Endocrinology and Metabolism 87, 1402-1406.
Reamon-Buettner,S.M. and Borlak,J. (2004). Somatic NKX2-5 mutations as a novel mechanism of disease in complex congenital heart disease. Journal of Medical Genetics 41, 684-690.
Reamon-Buettner,S.M. and Borlak,J. (2005). GATA4 zinc finger mutations as a molecular rationale for septation defects of the human heart. Journal of Medical Genetics 42.
Reamon-Buettner,S.M. and Borlak,J. (2006). Somatic mutations in cardiac malformations. Journal of Medical Genetics 43.
Reamon-Buettner,S.M., Hecker,H., Spanel-Borowski,K., Craatz,S., Kuenzel,E., and Borlak,J. (2004). Novel NKX2-5 mutations in diseased heart tissues of patients with cardiac malformations. American Journal of Pathology 164, 2117-2125.
Redina,O.E., Machanova,N.A., Efimov,V.M., and Markel,A.L. (2006). Rats with inherited stress-induced arterial hypertension (ISIAH strain) display specific quantitative trait loci for blood pressure and for body and kidney weight on chromosome 1. Clinical and Experimental Pharmacology and Physiology 33,456-464.
Reisman,M., Christofferson,R.D., Jesurum,J., Olsen,J.V., Spencer,M.P., Krabill,K.A., Diehl,L., Aurora,S., and Gray,W.A. (2005). Migraine headache relief after transcatheter closure of patent foramen ovale. Journal of the American College of Cardiology 45, 493-495.
238
Ribaut,J.M. and Ragot,M. (2007). Marker-assisted selection to improve drought adaptation in maize: the backcross approach, perspectives, limitations, and alternatives. Journal of Experimental Botany 58, 351-360.
Rieseberg,L.H., Archer,M.A., and Wayne,R.K. (1999). Transgressive segregation, adaptation and speciation. Heredity 83, 363-372.
Rifai L, Maazouzi W, and Sefiani A (2007). Novel point mutation in the NKX2-5 gene in a Moroccan family with atrioventricular conduction disturbance and an atrial septal defect in the oval fossa. Cardiology in the Young 17, 107-109.
Rimoin, Connor JM, Pyeritz RE, and Korf BR (2002). Nature and frequency of genetic disease. In Emery and Rimoin's Principles and Practice of Medical Genetics, Rimoin DL, Connor JM, Pyeritz RE, and Korf BR, eds. (London: Churchill Livingstone), pp. 55-59.
Rodriguez,C.J., Homma,S., Sacco,R.L., Di Tullio,M.R., Sciacca,R.R., and Mohr,J.P. (2003). Race-ethnic differences in patent foramen ovale, atrial septal aneurysm, and right atrial anatomy among ischemic stroke patients. Stroke 34,2097-2102.
Romano-Zelekha,O., Hirsh,R., Blieden,L., Green,M.S., and Shohat,T. (2001). The risk for congenital heart defects in offspring of individuals with congenital heart defects. Clinical Genetics 59, 325-329.
Rothman,K.J. and Fyler,D.C. (1976). Sex, Birth Order, and Maternal Age Characteristics of Infants with Congenital Heart Defects. American Journal of Epidemiology 104, 527-534.
Samanek,M. (1994). Boy-Girl Ratio in Children Born with Different Forms of Cardiac Malformation - A Population-Based Study. Pediatric Cardiology 15, 53-57.
Sandor,G.G.S., Smith,D.F., and Macleod,P.M. (1981). Cardiac Malformations in the Fetal Alcohol Syndrome. Journal of Pediatrics 98, 771-773.
Sanlaville,D. and Verloes,A. (2007). CHARGE syndrome: an update. European Journal of Human Genetics 15, 389-399.
Sarkozy A, Conti E, Neri C, D'Agostino R, Digilio MC, Esposito G, Toscano A, Marino B, Pizzuti A, and Dallapiccola B (2004). Spectrum of atrial septal defects associated with mutations of NKX2.5 and GATA4 transcription factors. Journal of Medical Genetics 42, e16.
Sarkozy,A., Esposito,G., Conti,E., Digilio,M.C., Marino,B., Calabro,R., Pizzuti,A., and Dallapiccola,B. (2005). CRELD1 and GATA4 gene analysis in patients with nonsyndromic atrioventricular canal defects. American Journal of Medical Genetics Part A 139A, 236-238.
239
Schaede,A. and Ramacher,J. (1977). Secundum Atrial Septal-Defect with Prolonged Atrioventricular-Conduction - Autosomal Dominant Hereditary Cardiac Defect. Deutsche Medizinische Wochenschrift 102, 1552-1554.
Schluterman,M.K., Krysiak,A.E., Kathiriya,I.S., Abate,N., Chandalia,M., Srivastava,D., and Garg,V. (2007). Screening and biochemical analysis of GATA4 sequence variations identified in patients with congenital heart disease. American Journal of Medical Genetics Part A 143A, 817-823.
Schneider,B., Hofmann,T., Justen,M.H., and Meinertz,T. (1995). Chiaris Network - Normal Anatomic Variant Or Risk Factor for Arterial Embolic Events. Journal of the American College of Cardiology 26, 203-210.
Schonberger,J., Wang,L., Shin,T.J., Kim,S.D., Depreux,F.F.S., Zhu,H., Zon,L., Pizard,A., Kim,J.B., Macrae,C.A., Mungall,A.J., Seidman,J.G., and Seidman,C.E. (2005). Mutation in the transcriptional coactivator EYA4 causes dilated cardiomyopathy and sensorineural hearing loss. Nature Genetics 37,418-422.
Schott,J.J., Benson,D.W., Basson,C.T., Pease,W., Silberbach,G.M., Moak,J.P., Maron,B.J., Seidman,C.E., and Seidman,J.G. (1998). Congenital heart disease caused by mutations in the transcription factor NKX2-5. Science 281, 108-111.
Scriver,C.R. and Waters,P.J. (1999). Monogenic traits are not simple - lessons from phenylketonuria. Trends in Genetics 15, 267-272.
Shanoudy,H., Soliman,A., Raggi,P., Liu,J.W., Russell,D.C., and Jarmukli,N.F. (1998). Prevalence of patent foramen ovale and its contribution to hypoxemia in patients with obstructive sleep apnea. Chest 113, 91-96.
Sherman,J., Angulo,M., Boxer,R.A., and Gluck,R. (1985). Possible Mitochondrial Inheritance of Congenital Cardiac Septal-Defects. New England Journal of Medicine 313, 186-187.
Shiffman,D., Ellis,S.G., Rowland,C.M., Malloy,M.J., Luke,M.M., Iakoubova,O.A., Pullinger,C.R., Cassano,J., Aouizerat,B.E., Fenwick,R.G., Reitz,R.E., Catanese,J.J., Leong,D.U., Zellner,C., Sninsky,J.J., Topol,E.J., Devlin,J.J., and Kane,J.P. (2005). Identification of four gene variants associated with myocardial infarction. American Journal of Human Genetics 77, 596-605.
Shrout,P.E. and Fleiss,J.L. (1979). Intraclass Correlations - Uses in Assessing Rater Reliability. Psychological Bulletin 86, 420-428.
Skinner JR and Members of the CSANZ Cardiovascular Genetics Working Group (2007). Guidelines for the Diagnosis and Management of Familial Long QT Syndrome. Heart, Lung and Circulation 16, 22-24.
Sletten,L.J. and Pierpont,M.E.M. (1996). Variation in severity of cardiac disease in Holt-Oram syndrome. American Journal of Medical Genetics 65, 128-132.
240
Splawski,I., Timothy,K.W., Vincent,G.M., Atkinson,D.L., and Keating,M.T. (1997). Molecular basis of the long-QT syndrome associated with deafness. Proceedings of the Association of American Physicians 109, 504-511.
Srephensen,S.S., Sigfusson,G., Eiriksson,H., Sverrisson,J.T., Torfason,B., Haraldsson,A., and Helgason,H. (2004). Congenital cardiac malformations in Iceland from 1990 through 1999. Cardiology in the Young 14, 396-401.
Stennard,F.A., Costa,M.W., Elliott,D.A., Rankin,S., Haast,S.J.P., Lai,D., McDonald,L.P.A., Niederreither,K., Dolle,P., Bruneau,B.G., Zorn,A.M., and Harvey,R.P. (2003). Cardiac T-box factor Tbx20 directly interacts with Nkx2-5, GATA4, and GATA5 in regulation of gene expression in the developing heart. Developmental Biology 262, 206-224.
Stennard,F.A. and Harvey,R.P. (2005). T-box transcription factors and their roles in regulatory hierarchies in the developing heart. Development 132, 4897-4910.
Stevens,C.A. and Bhakta,M.G. (1995). Cardiac Abnormalities in the Rubinstein-Taybi Syndrome. American Journal of Medical Genetics 59, 346-348.
Stoll,C., Alembik,Y., Roth,M.P., Dott,B., and Degeeter,B. (1989). Risk Factors in Congenital Heart Disease. European Journal of Epidemiology 5, 382-391.
Stoll,M., Kwitek-Black,A.E., Cowley,A.W., Harris,E.L., Harrap,S.B., Krieger,J.E., Printz,M.P., Provoost,A.P., Sassard,J., and Jacob,H.J. (2000). New target regions for human hypertension via comparative genomics. Genome Research 10, 473-482.
Sweeney,E., Peart,I., Tofeig,M., and Kerr,B. (1999). Smith-Magenis syndrome and tetralogy of Fallot. Journal of Medical Genetics 36, 501-502.
Takeuchi,J.K., Mileikovskaia,M., Koshiba-Takeuchi,K., Heldt,A.B., Mori,A.D., Arruda,E.P., Gertsenstein,M., Georges,R., Davidson,L., Mo,R., Hui,C.C., Henkelman,R.M., Nemer,M., Black,B.L., Nagy,A., and Bruneau,B.G. (2005). Tbx20 dose-dependently regulates transcription factor networks required for mouse heart and motoneuron development. Development 132, 2463-2474.
Tartaglia,M., Mehler,E.L., Goldberg,R., Zampino,G., Brunner,H.G., Kremer,H., van der Burgt,I., Crosby,A.H., Ion,A., Jeffery,S., Kalidas,K., Patton,M.A., Kucherlapati,R.S., and Gelb,B.D. (2002). Mutations in PTPN11, encoding the protein tyrosine phosphatase SHP-2, cause Noonan syndrome (vol 29, pg 465, 2001). Nature Genetics 30, 123.
The International Hapmap Consortium (2003). The International HapMap Project. Nature 426, 789-796.
Thomas,J.T., Kilpatrick,M.W., Lin,K., Erlacher,L., Lembessis,P., Costa,T., Tsipouras,P., and Luyten,F.P. (1997). Disruption of human limb morphogenesis by a dominant negative mutation in CDMP1. Nature Genetics 17, 58-64.
241
Tikkanen J and Heinonen OP (1990). Risk factors for cardiovascular malformations in Finland. European Journal of Epidemiology 6, 348-356.
Tikkanen,J. and Heinonen,O.P. (1991). Maternal Hyperthermia During Pregnancy and Cardiovascular Malformations in the Offspring. European Journal of Epidemiology 7, 628-635.
Tikkanen,J. and Heinonen,O.P. (1992). Risk Factors for Atrial Septal Defect. European Journal of Epidemiology 8, 509-515.
Tracy,M.R., Dormans,J.P., and Kusumi,K. (2004). Klippel-Feil syndrome - Clinical features and current understanding of etiology. Clinical Orthopaedics and Related Research 183-190.
Ueno,T., Tremblay,J., Kunes,J., Zicha,A., Dobesova,Z., Pausova,Z., Deng,A.Y., Sun,Y.L., Jacob,H.J., and Hamet,P. (2003). Resolving the composite trait of hypertension into its pharmacogenetic determinants by acute pharmacological modulation of blood pressure regulatory systems. Journal of Molecular Medicine-Jmm 81, 51-60.
Vida,V.L., Barnoya,J., Larrazabal,L.A., Gaitan,G., Garcia,F.D., and Castaneda,A.R. (2005). Congenital cardiac disease in children with Down's syndrome in Guatemala. Cardiology in the Young 15, 286-290.
Vissers,L.E.L.M., van Ravenswaaij,C.M.A., Admiraal,R., Hurst,J.A., de Vries,B.B.A., Janssen,I.M., van der Vliet,W.A., Huys,E.H.L.P., de Jong,P.J., Hamel,B.C.J., Schoenmakers,E.F.P.M., Brunner,H.G., Veltman,J.A., and van Kessel,A.G. (2004). Mutations in a new member of the chromodomain gene family cause CHARGE syndrome. Nature Genetics 36, 955-957.
Wade,C.M. and Daly,M.J. (2005). Genetic variation in laboratory mice. Nature Genetics 37, 1175-1180.
Wade,C.M., Kulbokas,E.J., Kirby,A.W., Zody,M.C., Mullikin,J.C., Lander,E.S., Lindblad-Toh,K., and Daly,M.J. (2002). The mosaic structure of variation in the laboratory mouse genome. Nature 420, 574-578.
Wang,W.Y.S., Barratt,B.J., Clayton,D.G., and Todd,J.A. (2005). Genome-wide association studies: Theoretical and practical concerns. Nature Reviews Genetics 6, 109-118.
Watanabe,Y., Benson,D.W., Yano,S., Akagi,T., Yoshino,M., and Murray,J.C. (2002). Two novel frameshift mutations in NKX2.5 result in novel features including visceral inversus and sinus venosus type ASD. Journal of Medical Genetics 39, 807-811.
Waterston,R.H., Lindblad-Toh,K., Birney,E., Rogers,J., Abril,J.F., Agarwal,P., Agarwala,R., Ainscough,R., Alexandersson,M., An,P., Antonarakis,S.E., Attwood,J., Baertsch,R., Bailey,J., Barlow,K., Beck,S., Berry,E., Birren,B., Bloom,T., Bork,P., Botcherby,M., Bray,N., Brent,M.R., Brown,D.G., Brown,S.D., Bult,C., Burton,J., Butler,J., Campbell,R.D., Carninci,P., Cawley,S.,
242
Chiaromonte,F., Chinwalla,A.T., Church,D.M., Clamp,M., Clee,C., Collins,F.S., Cook,L.L., Copley,R.R., Coulson,A., Couronne,O., Cuff,J., Curwen,V., Cutts,T., Daly,M., David,R., Davies,J., Delehaunty,K.D., Deri,J., Dermitzakis,E.T., Dewey,C., Dickens,N.J., Diekhans,M., Dodge,S., Dubchak,I., Dunn,D.M., Eddy,S.R., Elnitski,L., Emes,R.D., Eswara,P., Eyras,E., Felsenfeld,A., Fewell,G.A., Flicek,P., Foley,K., Frankel,W.N., Fulton,L.A., Fulton,R.S., Furey,T.S., Gage,D., Gibbs,R.A., Glusman,G., Gnerre,S., Goldman,N., Goodstadt,L., Grafham,D., Graves,T.A., Green,E.D., Gregory,S., Guigo,R., Guyer,M., Hardison,R.C., Haussler,D., Hayashizaki,Y., Hillier,L.W., Hinrichs,A., Hlavina,W., Holzer,T., Hsu,F., Hua,A., Hubbard,T., Hunt,A., Jackson,I., Jaffe,D.B., Johnson,L.S., Jones,M., Jones,T.A., Joy,A., Kamal,M., Karlsson,E.K., Karolchik,D., Kasprzyk,A., Kawai,J., Keibler,E., Kells,C., Kent,W.J., Kirby,A., Kolbe,D.L., Korf,I., Kucherlapati,R.S., Kulbokas,E.J., Kulp,D., Landers,T., Leger,J.P., Leonard,S., Letunic,I., LeVine,R., Li,J., Li,M., Lloyd,C., Lucas,S., Ma,B., Maglott,D.R., Mardis,E.R., Matthews,L., Mauceli,E., Mayer,J.H., McCarthy,M., McCombie,W.R., McLaren,S., Mclay,K., McPherson,J.D., Meldrim,J., Meredith,B., Mesirov,J.P., Miller,W., Miner,T.L., Mongin,E., Montgomery,K.T., Morgan,M., Mott,R., Mullikin,J.C., Muzny,D.M., Nash,W.E., Nelson,J.O., Nhan,M.N., Nicol,R., Ning,Z., Nusbaum,C., O'Connor,M.J., Okazaki,Y., Oliver,K., Larty,E.O., Pachter,L., Parra,G., Pepin,K.H., Peterson,J., Pevzner,P., Plumb,R., Pohl,C.S., Poliakov,A., Ponce,T.C., Ponting,C.P., Potter,S., Quail,M., Reymond,A., Roe,B.A., Roskin,K.M., Rubin,E.M., Rust,A.G., Santos,R., Sapojnikov,V., Schultz,B., Schultz,J., Schwartz,M.S., Schwartz,S., Scott,C., Seaman,S., Searle,S., Sharpe,T., Sheridan,A., Shownkeen,R., Sims,S., Singer,J.B., Slater,G., Smit,A., Smith,D.R., Spencer,B., Stabenau,A., Strange-Thomann,N.S., Sugnet,C., Suyama,M., Tesler,G., Thompson,J., Torrents,D., Trevaskis,E., Tromp,J., Ucla,C., Vidal,A.U., Vinson,J.P., von Niederhausern,A.C., Wade,C.M., Wall,M., Weber,R.J., Weiss,R.B., Wendl,M.C., West,A.P., Wetterstrand,K., Wheeler,R., Whelan,S., Wierzbowski,J., Willey,D., Williams,S., Wilson,R.K., Winter,E., Worley,K.C., Wyman,D., Yang,S., Yang,S.P., Zdobnov,E.M., Zody,M.C., and Lander,E.S. (2002). Initial sequencing and comparative analysis of the mouse genome. Nature 420, 520-562.
Weaver,R.G., Seaton,A.D., and Jewett,T. (1997). Bilateral Marcus Gunn (jaw-winking) phenomenon occurring with CHARGE association. Journal of Pediatric Ophthalmology & Strabismus 34, 308-309.
Webb,S., Brown,N.A., and Anderson,R.H. (1998). Formation of the atrioventricular septal structures in the normal mouse. Circulation Research 82,645-656.
Weber,J.L. and May,P.E. (1989). Abundant Class of Human Dna Polymorphisms Which Can be Typed Using the Polymerase Chain-Reaction. American Journal of Human Genetics 44, 388-396.
Webster,M.W.I., Smith,H.J., Sharpe,D.N., Chancellor,A.M., Swift,D.L., Bass,N.M., and Glasgow,G.L. (1988). Patent Foramen Ovale in Young Stroke Patients. Lancet 2, 11-12.
243
Weil,M.H. and Allenstein,B.J. (1961). A Report of Congenital Heart Disease in 5 Members of 1 Family. New England Journal of Medicine 265, 661-&.
Wexler,N.S., Young,A.B., Tanzi,R.E., Travers,H., Starostarubinstein,S., Penney,J.B., Snodgrass,S.R., Shoulson,I., Gomez,F., Arroyo,M.A.R., Penchaszadeh,G.K., Moreno,H., Gibbons,K., Faryniarz,A., Hobbs,W., Anderson,M.A., Bonilla,E., Conneally,P.M., and Gusella,J.F. (1987). Homozygotes for Huntingtons Disease. Nature 326, 194-197.
Williamson EM (1969). A family study of atrial septal defect. Journal of Medical Genetics 6, 255-265.
Wilmshurst,P.T., Nightingale,S., Walsh,K.P., and Morrison,W.L. (2000). Effect on migraine of closure of cardiac right-to-left shunts to prevent recurrence of decompression illness or stroke or for haemodynamic reasons. Lancet 356,1648-1651.
Wilmshurst,P.T., Pearson,M.J., Nightingale,S., Walsh,K.P., and Morrison,W.L. (2004). Inheritance of persistent foramen ovale and atrial septal defects and the relation to familial migraine with aura. Heart 90, 1315-1320.
Wilmshurst,P.T., Pearson,M.J., Walsh,K.P., Morrison,W.L., and Bryson,P. (2001). Relationship between right-to-left shunts and cutaneous decompression illness. Clinical Science 100, 539-542.
Wilson,P.D., Correavillasenor,A., Loffredo,C.A., and Ferencz,C. (1993). Temporal Trends in Prevalence of Cardiovascular Malformations in Maryland and the District Of Columbia, 1981-1988. Epidemiology 4, 259-265.
Wunderle,V.M., Critcher,R., Hastie,N., Goodfellow,P.N., and Schedl,A. (1998). Deletion of long-range regulatory elements upstream of SOX9 causes campomelic dysplasia. Proceedings of the National Academy of Sciences of the United States of America 95, 10649-10654.
Yagi,H., Furutani,Y., Hamada,H., Sasaki,T., Asakawa,S., Minoshima,S., Ichida,F., Joo,K., Kimura,M., Imamura,S., Kamatani,N., Momma,K., Takao,A., Nakazawa,M., Shimizu,N., and Matsuoka,R. (2003). Role of TBX1 in human del22q11.2 syndrome. Lancet 362, 1366-1373.
Yagil,Y. and Yagil,C. (2006). Integration - A key to success in the genetic dissection of complex diseases? Trends in Cardiovascular Medicine 16, 35-38.
Yamada,K., Andrews,C., Chan,W.M., McKeown,C.A., Magli,A., de Berardinis,T., Loewenstein,A., Lazar,M., O'Keefe,M., Letson,R., London,A., Ruttum,M., Matsumoto,N., Saito,N., Morris,L., Del Monte,M., Johnson,R.H., Uyama,E., Houtman,W.A., de Vries,B., Carlow,T.J., Hart,B.L., Krawiecki,N., Shoffner,J., Vogel,M.C., Katowitz,J., Goldstein,S.M., Levin,A.V., Sener,E.C., Ozturk,B.T., Akarsu,A.N., Brodsky,M.C., Hanisch,F., Cruse,R.P., Zubcov,A.A., Robb,R.M., Roggenkaemper,P., Gottlob,I., Kowal,L., Battu,R., Traboulsi,E.I., Franceschini,P., Newlin,A., Demer,J.L., and Engle,E.C. (2003). Heterozygous
244
mutations of the kinesin KIF21A in congenital fibrosis of the extraocular muscles type 1 (CFEOM1). Nature Genetics 35, 318-321.
Yamada,K., Hunter,D.G., Andrews,C., and Engle,E.C. (2005). A novel KIF21A mutation in a patient with congenital fibrosis of the extraocular muscles and Marcus Gunn jaw-winking phenomenon. Archives of Ophthalmology 123, 1254-1259.
Zetterqvist P (1960). Multiple occurrence of atrial septal defect in a family. Acta Paediatrica 49, 741-747.
Zetterqvist P. A clinical and genetic study of congenital heart defects. 1972.University of Uppsala, Sweden. Ref Type: Thesis/Dissertation
Zetterqvist P, Turesson I, Johansson BW, Laurell S, and Ohlsson N-M (1971). Dominant mode of inheritance in atrial septal defect. Clinical Genetics 2, 78-86.
Zhan,S.Y., Lian,Z.H., Zheng,D.Z., and Gao,L. (1991). Effect of Fathers Age and Birth Order on Occurrence of Congenital Heart Disease. Journal of Epidemiology and Community Health 45, 299-301.
Zhang L, Tumer Z, Jacobsen JR, Andersen PS, Tommerup N, and Larsen,L.A. (2006). Screening of 99 Danish patients with congenital heart disease for GATA4 mutations. Genetic Testing 10, 277-280.
Zlotogora,J. (1997). Dominance and homozygosity. American Journal of Medical Genetics 68, 412-416.
Zuckerman,H.S., Zuckerman,G.H., Wassermil,M., and Mammen,R.E. (1962). Atrial Septal Defect - Familial Occurrence in 4 Generations of 1 Family. American Journal of Cardiology 9, 515-520.
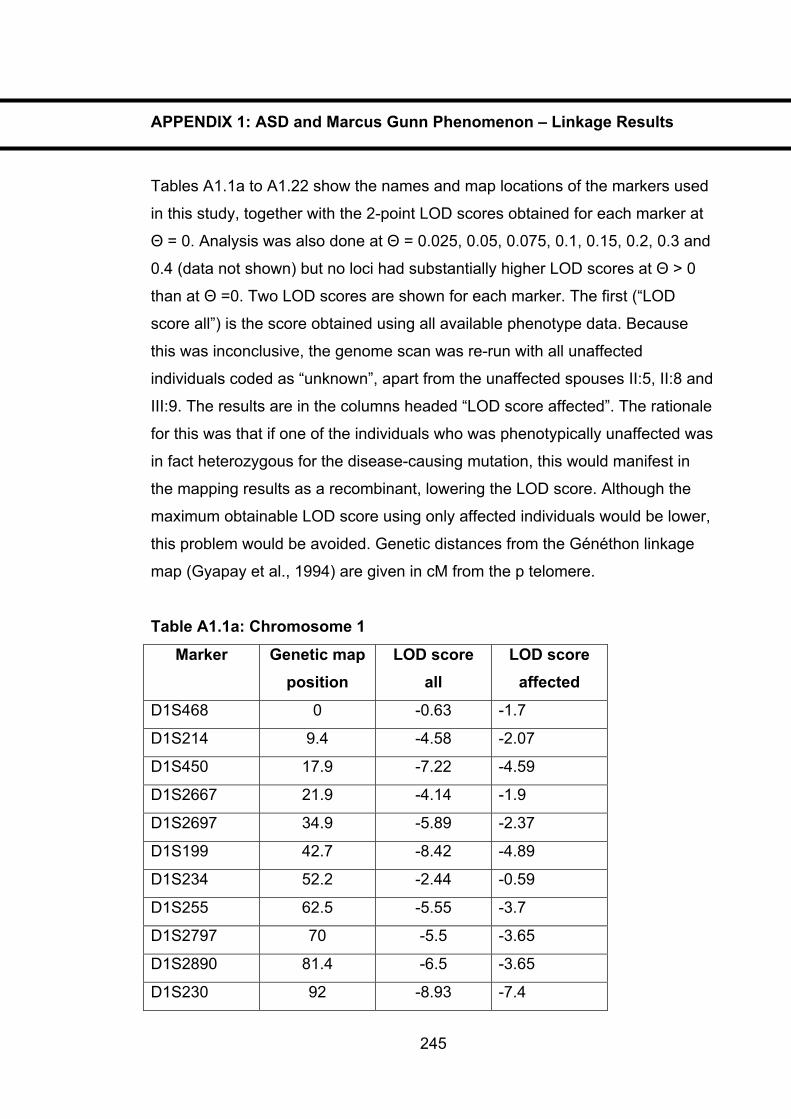
APPENDIX 1: ASD and Marcus Gunn Phenomenon – Linkage Results
Tables A1.1a to A1.22 show the names and map locations of the markers used
in this study, together with the 2-point LOD scores obtained for each marker at
� = 0. Analysis was also done at � = 0.025, 0.05, 0.075, 0.1, 0.15, 0.2, 0.3 and
0.4 (data not shown) but no loci had substantially higher LOD scores at � > 0
than at � =0. Two LOD scores are shown for each marker. The first (“LOD
score all”) is the score obtained using all available phenotype data. Because
this was inconclusive, the genome scan was re-run with all unaffected
individuals coded as “unknown”, apart from the unaffected spouses II:5, II:8 and
III:9. The results are in the columns headed “LOD score affected”. The rationale
for this was that if one of the individuals who was phenotypically unaffected was
in fact heterozygous for the disease-causing mutation, this would manifest in
the mapping results as a recombinant, lowering the LOD score. Although the
maximum obtainable LOD score using only affected individuals would be lower,
this problem would be avoided. Genetic distances from the Généthon linkage
map (Gyapay et al., 1994) are given in cM from the p telomere.
Table A1.1a: Chromosome 1
Marker Genetic map position
LOD score all
LOD score affected
D1S468 0 -0.63 -1.7
D1S214 9.4 -4.58 -2.07
D1S450 17.9 -7.22 -4.59
D1S2667 21.9 -4.14 -1.9
D1S2697 34.9 -5.89 -2.37
D1S199 42.7 -8.42 -4.89
D1S234 52.2 -2.44 -0.59
D1S255 62.5 -5.55 -3.7
D1S2797 70 -5.5 -3.65
D1S2890 81.4 -6.5 -3.65
D1S230 92 -8.93 -7.4
245
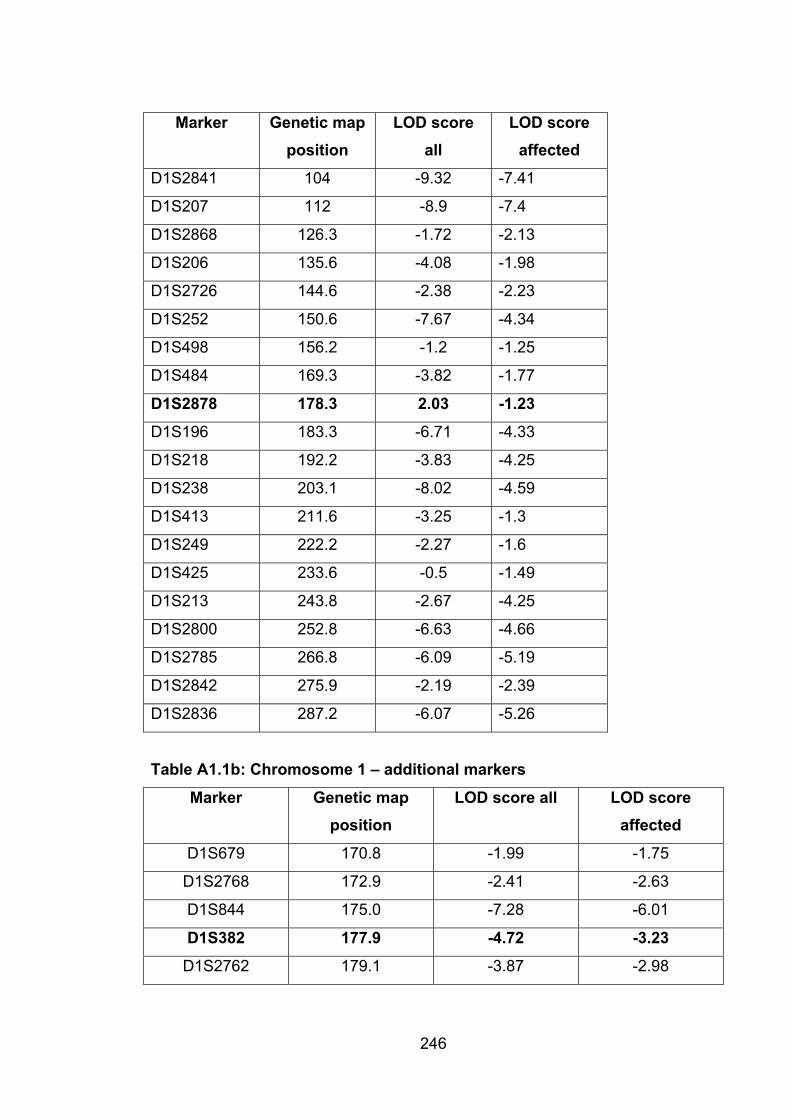
246
Marker Genetic map position
LOD score all
LOD score affected
D1S2841 104 -9.32 -7.41
D1S207 112 -8.9 -7.4
D1S2868 126.3 -1.72 -2.13
D1S206 135.6 -4.08 -1.98
D1S2726 144.6 -2.38 -2.23
D1S252 150.6 -7.67 -4.34
D1S498 156.2 -1.2 -1.25
D1S484 169.3 -3.82 -1.77
D1S2878 178.3 2.03 -1.23
D1S196 183.3 -6.71 -4.33
D1S218 192.2 -3.83 -4.25
D1S238 203.1 -8.02 -4.59
D1S413 211.6 -3.25 -1.3
D1S249 222.2 -2.27 -1.6
D1S425 233.6 -0.5 -1.49
D1S213 243.8 -2.67 -4.25
D1S2800 252.8 -6.63 -4.66
D1S2785 266.8 -6.09 -5.19
D1S2842 275.9 -2.19 -2.39
D1S2836 287.2 -6.07 -5.26
Table A1.1b: Chromosome 1 – additional markers
Marker Genetic map position
LOD score all LOD score affected
D1S679 170.8 -1.99 -1.75
D1S2768 172.9 -2.41 -2.63
D1S844 175.0 -7.28 -6.01
D1S382 177.9 -4.72 -3.23
D1S2762 179.1 -3.87 -2.98
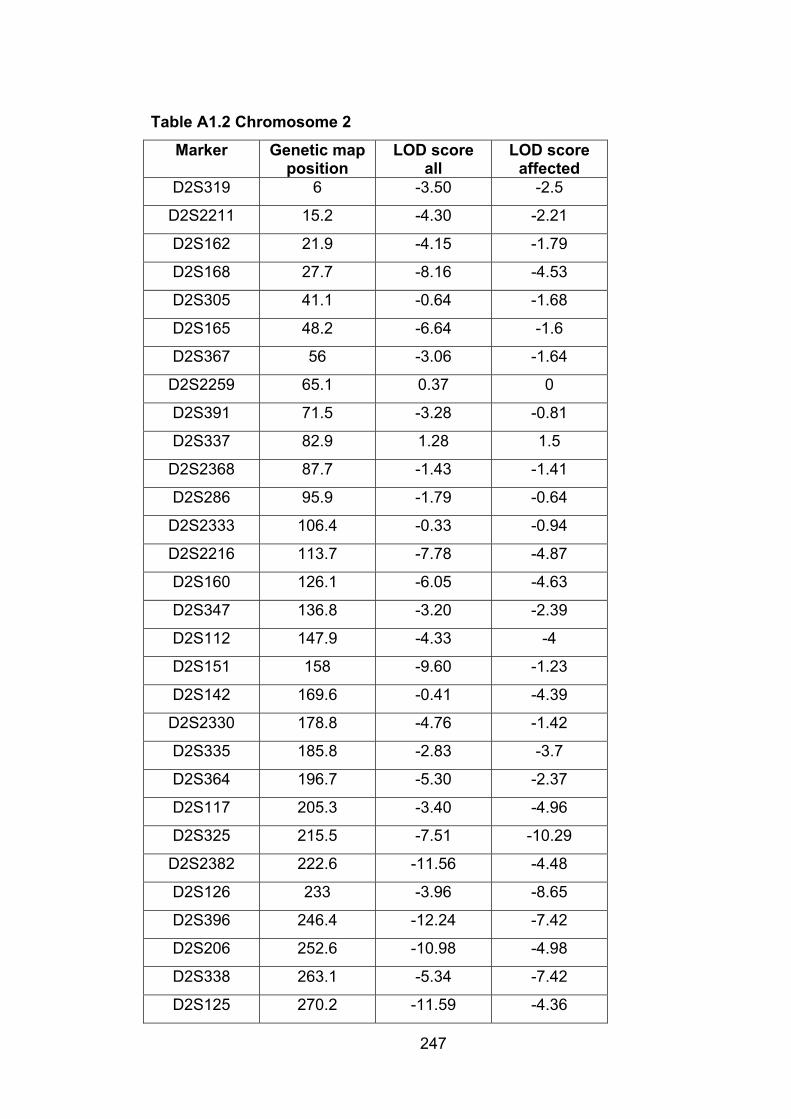
247
Table A1.2 Chromosome 2
Marker Genetic map position
LOD score all
LOD score affected
D2S319 6 -3.50 -2.5
D2S2211 15.2 -4.30 -2.21
D2S162 21.9 -4.15 -1.79
D2S168 27.7 -8.16 -4.53
D2S305 41.1 -0.64 -1.68
D2S165 48.2 -6.64 -1.6
D2S367 56 -3.06 -1.64
D2S2259 65.1 0.37 0
D2S391 71.5 -3.28 -0.81
D2S337 82.9 1.28 1.5
D2S2368 87.7 -1.43 -1.41
D2S286 95.9 -1.79 -0.64
D2S2333 106.4 -0.33 -0.94
D2S2216 113.7 -7.78 -4.87
D2S160 126.1 -6.05 -4.63
D2S347 136.8 -3.20 -2.39
D2S112 147.9 -4.33 -4
D2S151 158 -9.60 -1.23
D2S142 169.6 -0.41 -4.39
D2S2330 178.8 -4.76 -1.42
D2S335 185.8 -2.83 -3.7
D2S364 196.7 -5.30 -2.37
D2S117 205.3 -3.40 -4.96
D2S325 215.5 -7.51 -10.29
D2S2382 222.6 -11.56 -4.48
D2S126 233 -3.96 -8.65
D2S396 246.4 -12.24 -7.42
D2S206 252.6 -10.98 -4.98
D2S338 263.1 -5.34 -7.42
D2S125 270.2 -11.59 -4.36
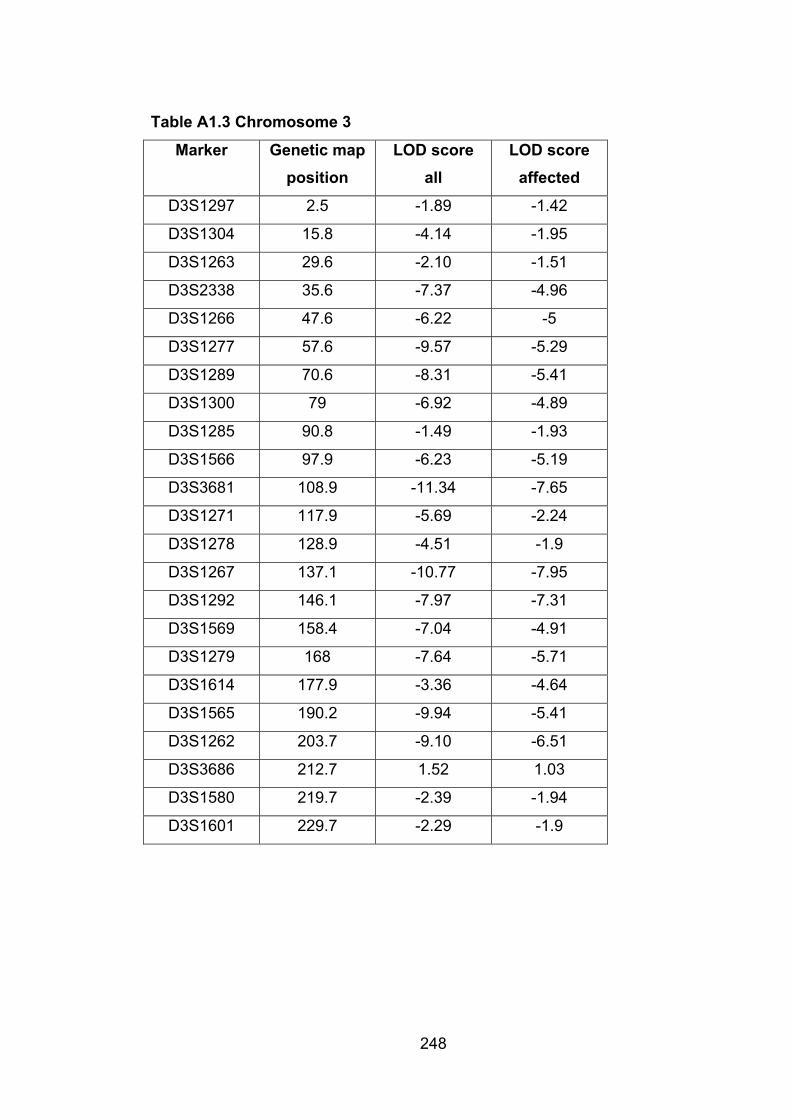
248
Table A1.3 Chromosome 3
Marker Genetic map position
LOD score all
LOD score affected
D3S1297 2.5 -1.89 -1.42
D3S1304 15.8 -4.14 -1.95
D3S1263 29.6 -2.10 -1.51
D3S2338 35.6 -7.37 -4.96
D3S1266 47.6 -6.22 -5
D3S1277 57.6 -9.57 -5.29
D3S1289 70.6 -8.31 -5.41
D3S1300 79 -6.92 -4.89
D3S1285 90.8 -1.49 -1.93
D3S1566 97.9 -6.23 -5.19
D3S3681 108.9 -11.34 -7.65
D3S1271 117.9 -5.69 -2.24
D3S1278 128.9 -4.51 -1.9
D3S1267 137.1 -10.77 -7.95
D3S1292 146.1 -7.97 -7.31
D3S1569 158.4 -7.04 -4.91
D3S1279 168 -7.64 -5.71
D3S1614 177.9 -3.36 -4.64
D3S1565 190.2 -9.94 -5.41
D3S1262 203.7 -9.10 -6.51
D3S3686 212.7 1.52 1.03
D3S1580 219.7 -2.39 -1.94
D3S1601 229.7 -2.29 -1.9
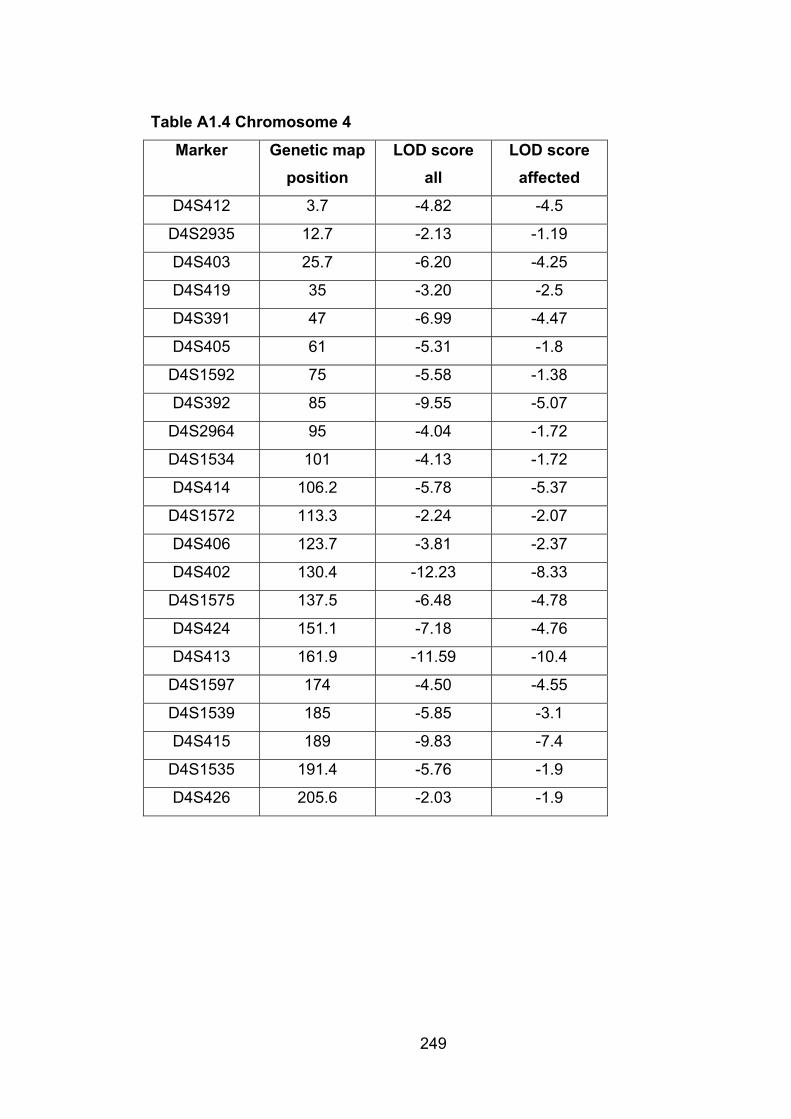
249
Table A1.4 Chromosome 4
Marker Genetic map position
LOD score all
LOD score affected
D4S412 3.7 -4.82 -4.5
D4S2935 12.7 -2.13 -1.19
D4S403 25.7 -6.20 -4.25
D4S419 35 -3.20 -2.5
D4S391 47 -6.99 -4.47
D4S405 61 -5.31 -1.8
D4S1592 75 -5.58 -1.38
D4S392 85 -9.55 -5.07
D4S2964 95 -4.04 -1.72
D4S1534 101 -4.13 -1.72
D4S414 106.2 -5.78 -5.37
D4S1572 113.3 -2.24 -2.07
D4S406 123.7 -3.81 -2.37
D4S402 130.4 -12.23 -8.33
D4S1575 137.5 -6.48 -4.78
D4S424 151.1 -7.18 -4.76
D4S413 161.9 -11.59 -10.4
D4S1597 174 -4.50 -4.55
D4S1539 185 -5.85 -3.1
D4S415 189 -9.83 -7.4
D4S1535 191.4 -5.76 -1.9
D4S426 205.6 -2.03 -1.9
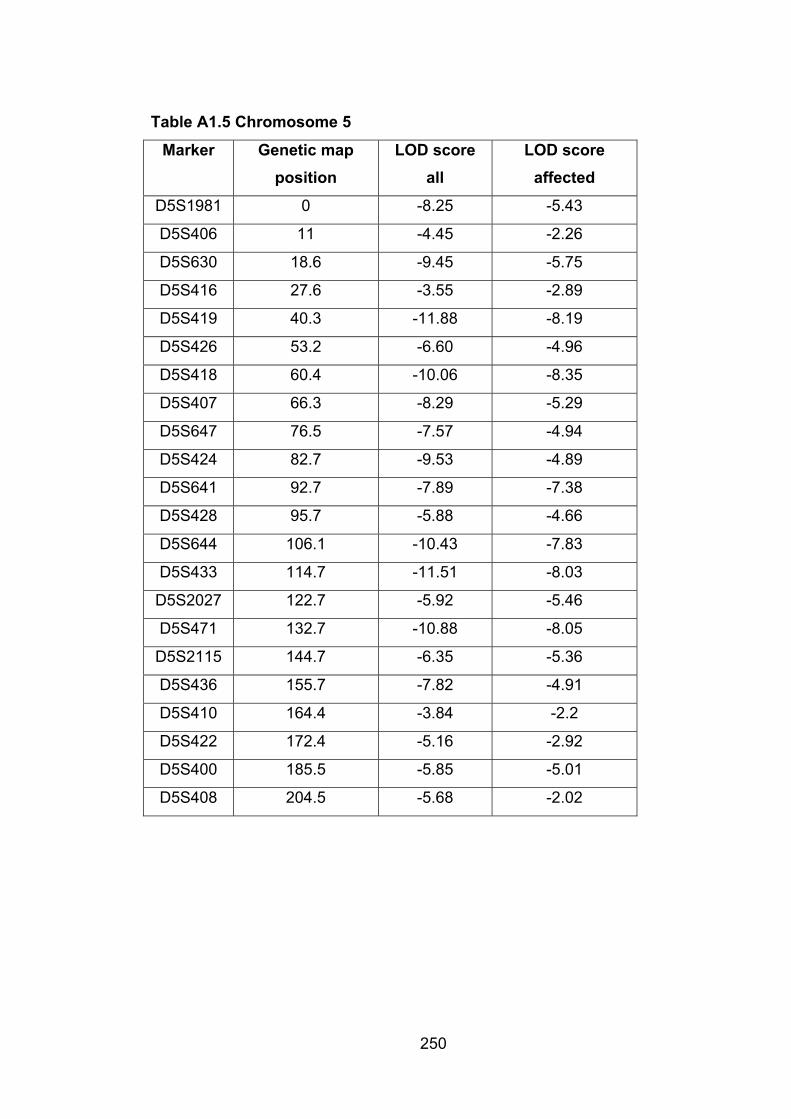
250
Table A1.5 Chromosome 5
Marker Genetic map position
LOD score all
LOD score affected
D5S1981 0 -8.25 -5.43
D5S406 11 -4.45 -2.26
D5S630 18.6 -9.45 -5.75
D5S416 27.6 -3.55 -2.89
D5S419 40.3 -11.88 -8.19
D5S426 53.2 -6.60 -4.96
D5S418 60.4 -10.06 -8.35
D5S407 66.3 -8.29 -5.29
D5S647 76.5 -7.57 -4.94
D5S424 82.7 -9.53 -4.89
D5S641 92.7 -7.89 -7.38
D5S428 95.7 -5.88 -4.66
D5S644 106.1 -10.43 -7.83
D5S433 114.7 -11.51 -8.03
D5S2027 122.7 -5.92 -5.46
D5S471 132.7 -10.88 -8.05
D5S2115 144.7 -6.35 -5.36
D5S436 155.7 -7.82 -4.91
D5S410 164.4 -3.84 -2.2
D5S422 172.4 -5.16 -2.92
D5S400 185.5 -5.85 -5.01
D5S408 204.5 -5.68 -2.02
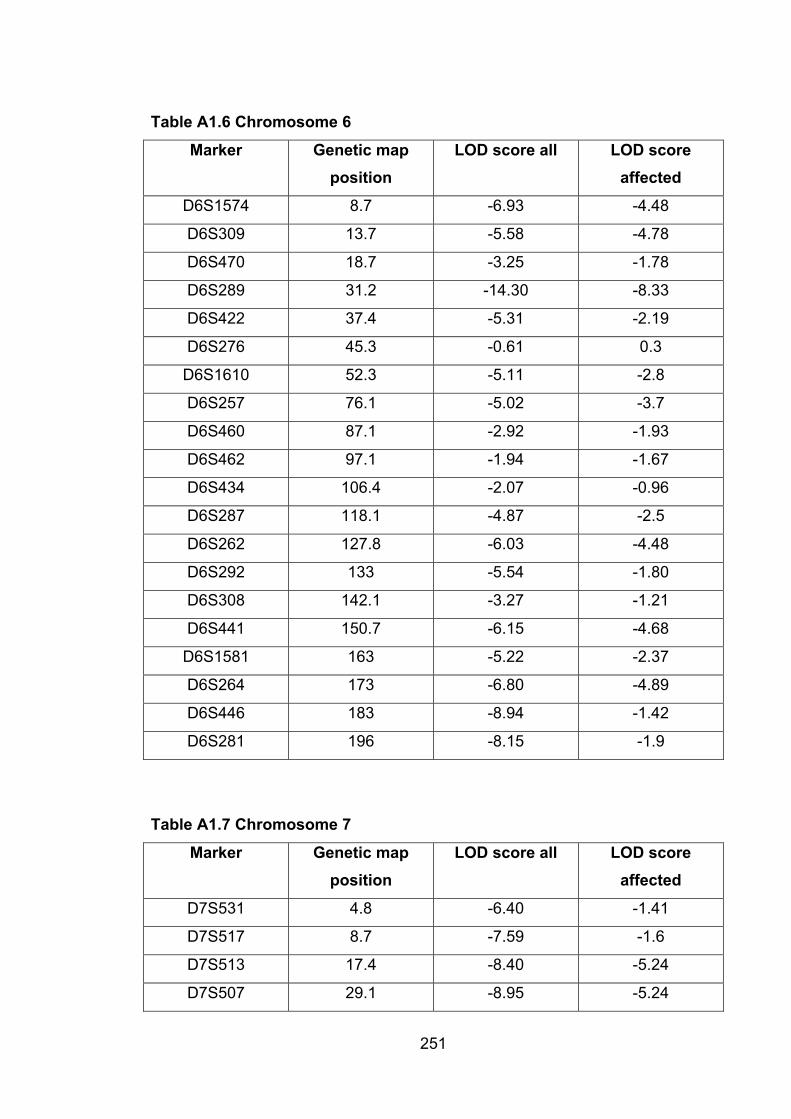
251
Table A1.6 Chromosome 6
Marker Genetic map position
LOD score all LOD score affected
D6S1574 8.7 -6.93 -4.48
D6S309 13.7 -5.58 -4.78
D6S470 18.7 -3.25 -1.78
D6S289 31.2 -14.30 -8.33
D6S422 37.4 -5.31 -2.19
D6S276 45.3 -0.61 0.3
D6S1610 52.3 -5.11 -2.8
D6S257 76.1 -5.02 -3.7
D6S460 87.1 -2.92 -1.93
D6S462 97.1 -1.94 -1.67
D6S434 106.4 -2.07 -0.96
D6S287 118.1 -4.87 -2.5
D6S262 127.8 -6.03 -4.48
D6S292 133 -5.54 -1.80
D6S308 142.1 -3.27 -1.21
D6S441 150.7 -6.15 -4.68
D6S1581 163 -5.22 -2.37
D6S264 173 -6.80 -4.89
D6S446 183 -8.94 -1.42
D6S281 196 -8.15 -1.9
Table A1.7 Chromosome 7
Marker Genetic map position
LOD score all LOD score affected
D7S531 4.8 -6.40 -1.41
D7S517 8.7 -7.59 -1.6
D7S513 17.4 -8.40 -5.24
D7S507 29.1 -8.95 -5.24

252
Marker Genetic map position
LOD score all LOD score affected
D7S493 37.4 -3.14 -2.75
D7S516 45.2 -5.17 -2.12
D7S484 58.4 -3.10 -2.75
D7S510 63.5 -6.84 -2.73
D7S519 75.9 -3.96 -1.6
D7S502 87.9 -5.58 -1.9
D7S669 91.9 -6.15 -1.6
D7S630 99.9 -7.06 -1.6
D7S657 106.9 -8.81 -4.89
D7S515 116.5 -2.76 0.8
D7S486 129.7 -4.86 -2.12
D7S530 139.9 -5.93 -2.02
D7S640 143.4 -5.22 -5.54
D7S684 154.6 -6.83 -5.27
D7S661 163.6 -6.36 -5.48
D7S636 171.6 -8.37 -7.32
D7S798 179.6 -9.07 -5.87
D7S2465 189.6 -9.75 -7.94
Table A1.8 Chromosome 8
Marker Genetic map position
LOD score all LOD score affected
D8S264 0.7 -3.94 -1.11
D8S277 8.7 -2.01 -2.09
D8S550 16.7 -4.04 -1.37
D8S549 27.7 -2.83 -1.90
D8S258 37.7 -1.58 0.80
D8S1771 47.7 -4.88 -2.31
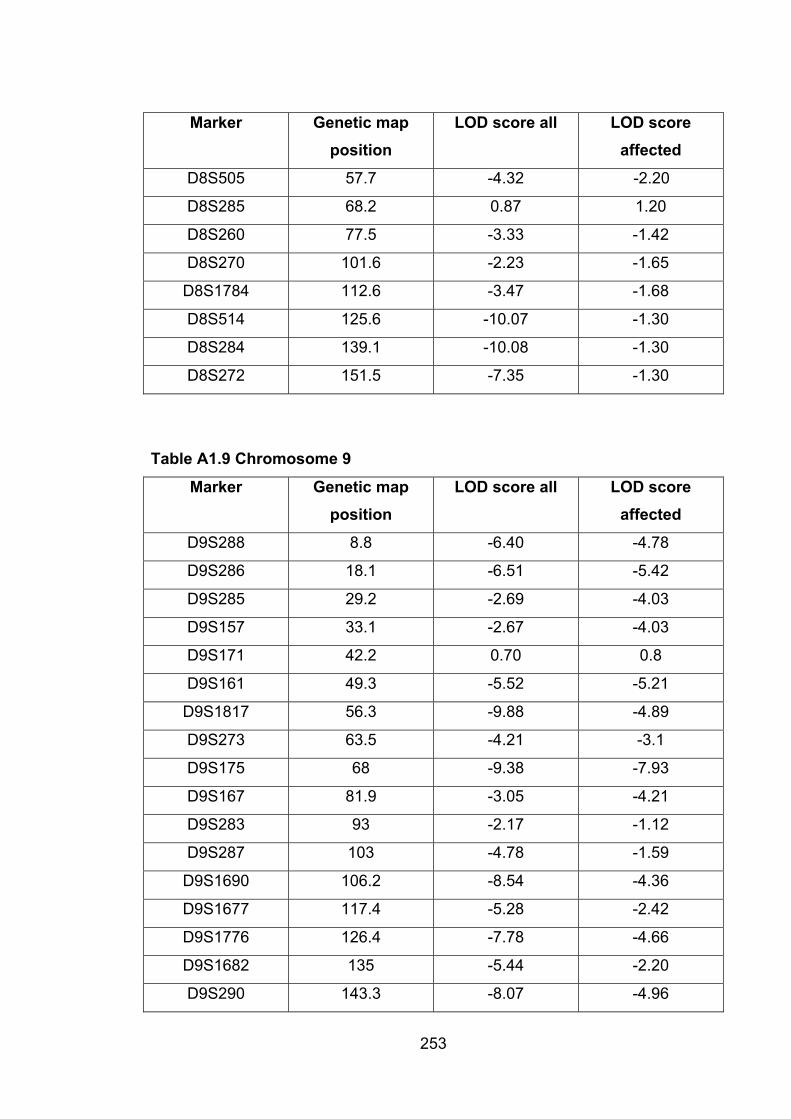
253
Marker Genetic map position
LOD score all LOD score affected
D8S505 57.7 -4.32 -2.20
D8S285 68.2 0.87 1.20
D8S260 77.5 -3.33 -1.42
D8S270 101.6 -2.23 -1.65
D8S1784 112.6 -3.47 -1.68
D8S514 125.6 -10.07 -1.30
D8S284 139.1 -10.08 -1.30
D8S272 151.5 -7.35 -1.30
Table A1.9 Chromosome 9
Marker Genetic map position
LOD score all LOD score affected
D9S288 8.8 -6.40 -4.78
D9S286 18.1 -6.51 -5.42
D9S285 29.2 -2.69 -4.03
D9S157 33.1 -2.67 -4.03
D9S171 42.2 0.70 0.8
D9S161 49.3 -5.52 -5.21
D9S1817 56.3 -9.88 -4.89
D9S273 63.5 -4.21 -3.1
D9S175 68 -9.38 -7.93
D9S167 81.9 -3.05 -4.21
D9S283 93 -2.17 -1.12
D9S287 103 -4.78 -1.59
D9S1690 106.2 -8.54 -4.36
D9S1677 117.4 -5.28 -2.42
D9S1776 126.4 -7.78 -4.66
D9S1682 135 -5.44 -2.20
D9S290 143.3 -8.07 -4.96
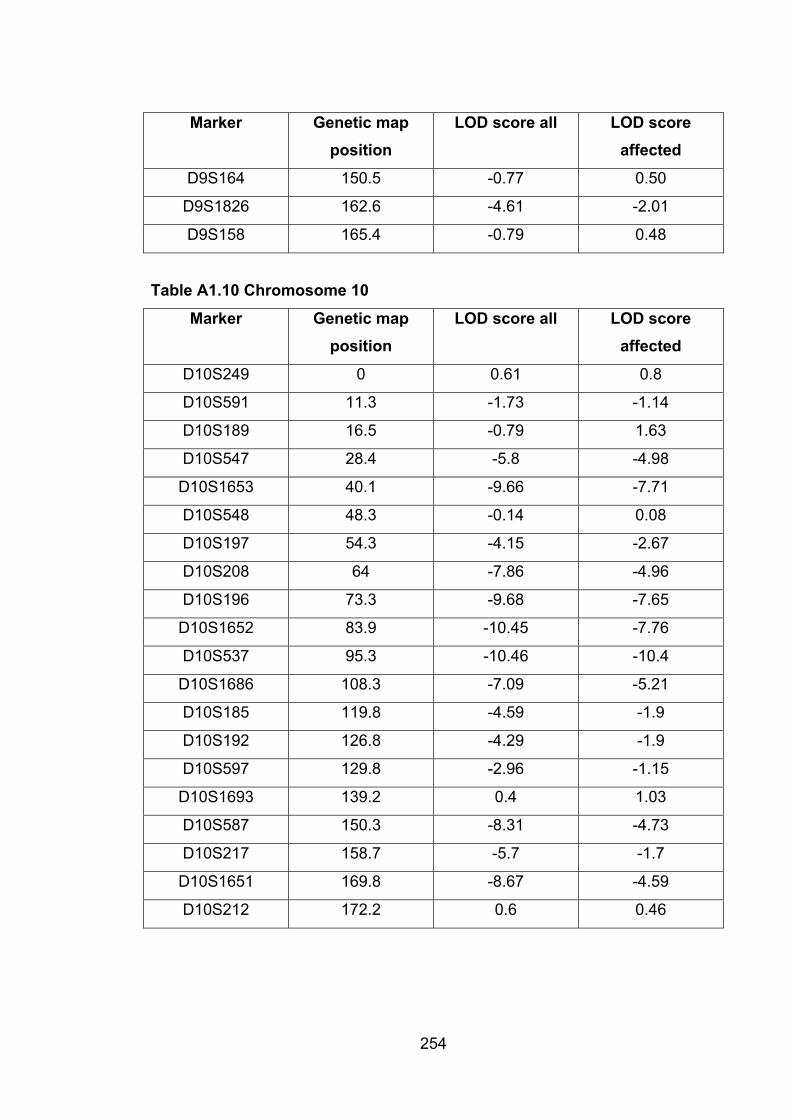
254
Marker Genetic map position
LOD score all LOD score affected
D9S164 150.5 -0.77 0.50
D9S1826 162.6 -4.61 -2.01
D9S158 165.4 -0.79 0.48
Table A1.10 Chromosome 10
Marker Genetic map position
LOD score all LOD score affected
D10S249 0 0.61 0.8
D10S591 11.3 -1.73 -1.14
D10S189 16.5 -0.79 1.63
D10S547 28.4 -5.8 -4.98
D10S1653 40.1 -9.66 -7.71
D10S548 48.3 -0.14 0.08
D10S197 54.3 -4.15 -2.67
D10S208 64 -7.86 -4.96
D10S196 73.3 -9.68 -7.65
D10S1652 83.9 -10.45 -7.76
D10S537 95.3 -10.46 -10.4
D10S1686 108.3 -7.09 -5.21
D10S185 119.8 -4.59 -1.9
D10S192 126.8 -4.29 -1.9
D10S597 129.8 -2.96 -1.15
D10S1693 139.2 0.4 1.03
D10S587 150.3 -8.31 -4.73
D10S217 158.7 -5.7 -1.7
D10S1651 169.8 -8.67 -4.59
D10S212 172.2 0.6 0.46
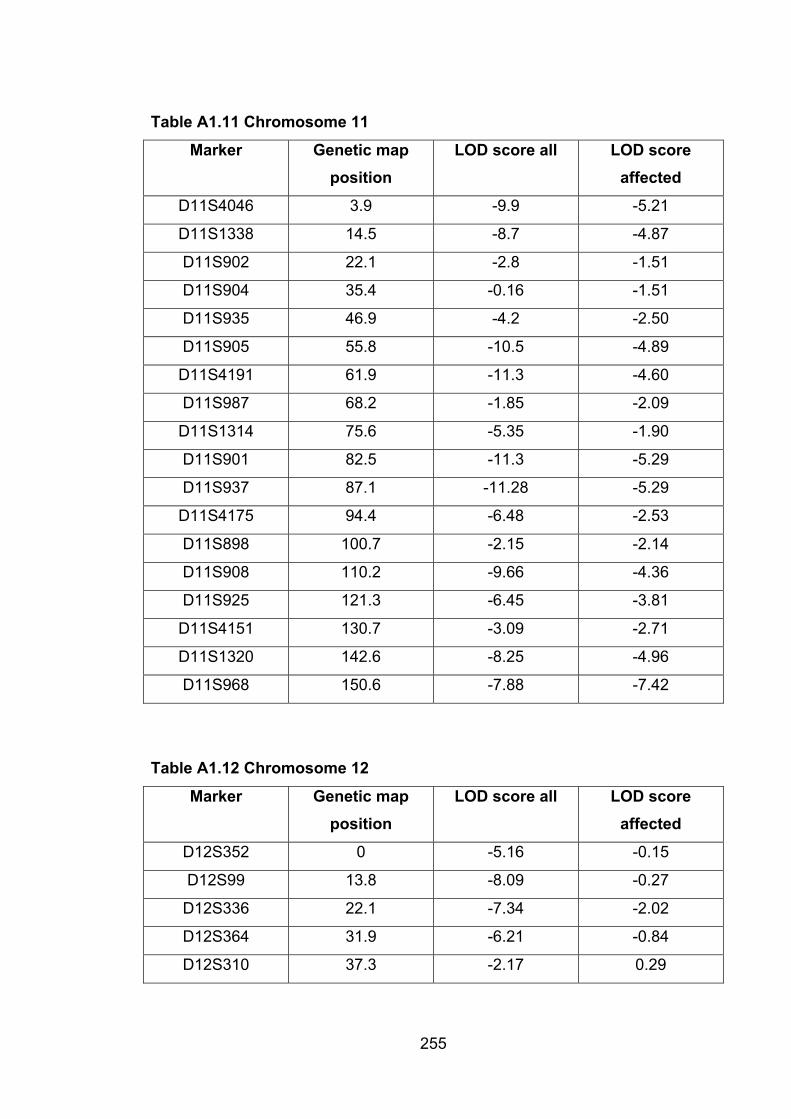
255
Table A1.11 Chromosome 11
Marker Genetic map position
LOD score all LOD score affected
D11S4046 3.9 -9.9 -5.21
D11S1338 14.5 -8.7 -4.87
D11S902 22.1 -2.8 -1.51
D11S904 35.4 -0.16 -1.51
D11S935 46.9 -4.2 -2.50
D11S905 55.8 -10.5 -4.89
D11S4191 61.9 -11.3 -4.60
D11S987 68.2 -1.85 -2.09
D11S1314 75.6 -5.35 -1.90
D11S901 82.5 -11.3 -5.29
D11S937 87.1 -11.28 -5.29
D11S4175 94.4 -6.48 -2.53
D11S898 100.7 -2.15 -2.14
D11S908 110.2 -9.66 -4.36
D11S925 121.3 -6.45 -3.81
D11S4151 130.7 -3.09 -2.71
D11S1320 142.6 -8.25 -4.96
D11S968 150.6 -7.88 -7.42
Table A1.12 Chromosome 12
Marker Genetic map position
LOD score all LOD score affected
D12S352 0 -5.16 -0.15
D12S99 13.8 -8.09 -0.27
D12S336 22.1 -7.34 -2.02
D12S364 31.9 -6.21 -0.84
D12S310 37.3 -2.17 0.29
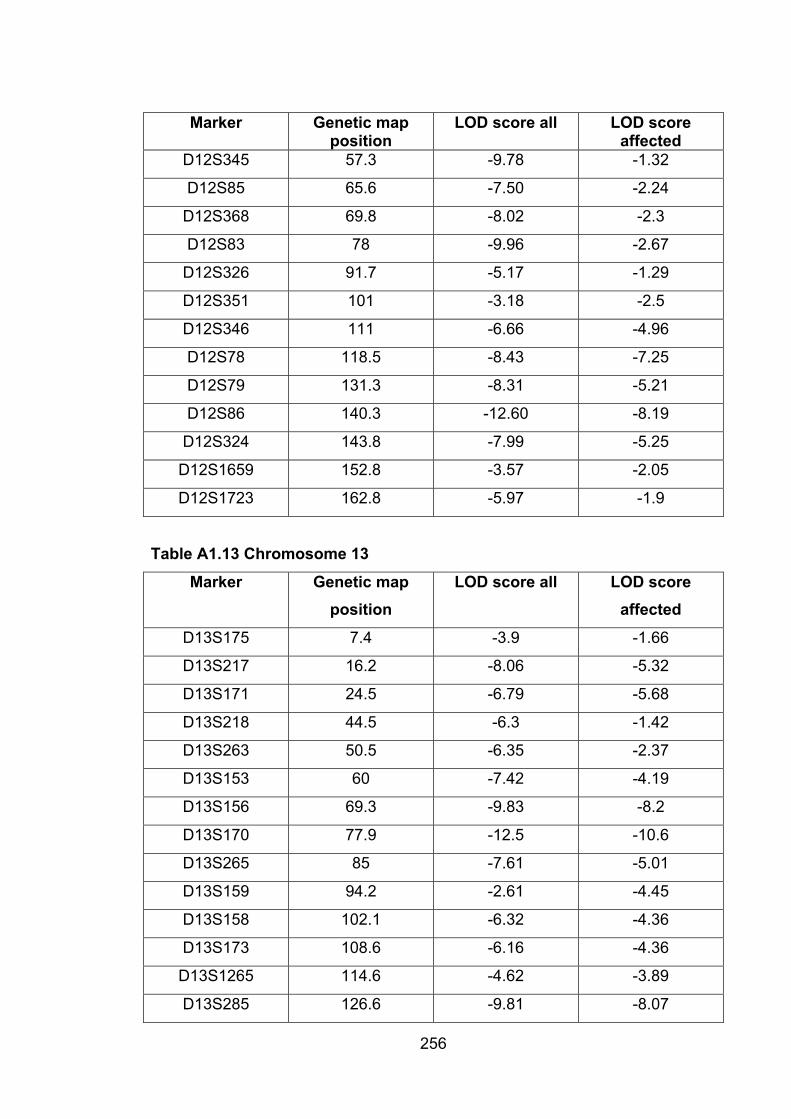
256
Marker Genetic map position
LOD score all LOD score affected
D12S345 57.3 -9.78 -1.32
D12S85 65.6 -7.50 -2.24
D12S368 69.8 -8.02 -2.3
D12S83 78 -9.96 -2.67
D12S326 91.7 -5.17 -1.29
D12S351 101 -3.18 -2.5
D12S346 111 -6.66 -4.96
D12S78 118.5 -8.43 -7.25
D12S79 131.3 -8.31 -5.21
D12S86 140.3 -12.60 -8.19
D12S324 143.8 -7.99 -5.25
D12S1659 152.8 -3.57 -2.05
D12S1723 162.8 -5.97 -1.9
Table A1.13 Chromosome 13
Marker Genetic map position
LOD score all LOD score affected
D13S175 7.4 -3.9 -1.66
D13S217 16.2 -8.06 -5.32
D13S171 24.5 -6.79 -5.68
D13S218 44.5 -6.3 -1.42
D13S263 50.5 -6.35 -2.37
D13S153 60 -7.42 -4.19
D13S156 69.3 -9.83 -8.2
D13S170 77.9 -12.5 -10.6
D13S265 85 -7.61 -5.01
D13S159 94.2 -2.61 -4.45
D13S158 102.1 -6.32 -4.36
D13S173 108.6 -6.16 -4.36
D13S1265 114.6 -4.62 -3.89
D13S285 126.6 -9.81 -8.07
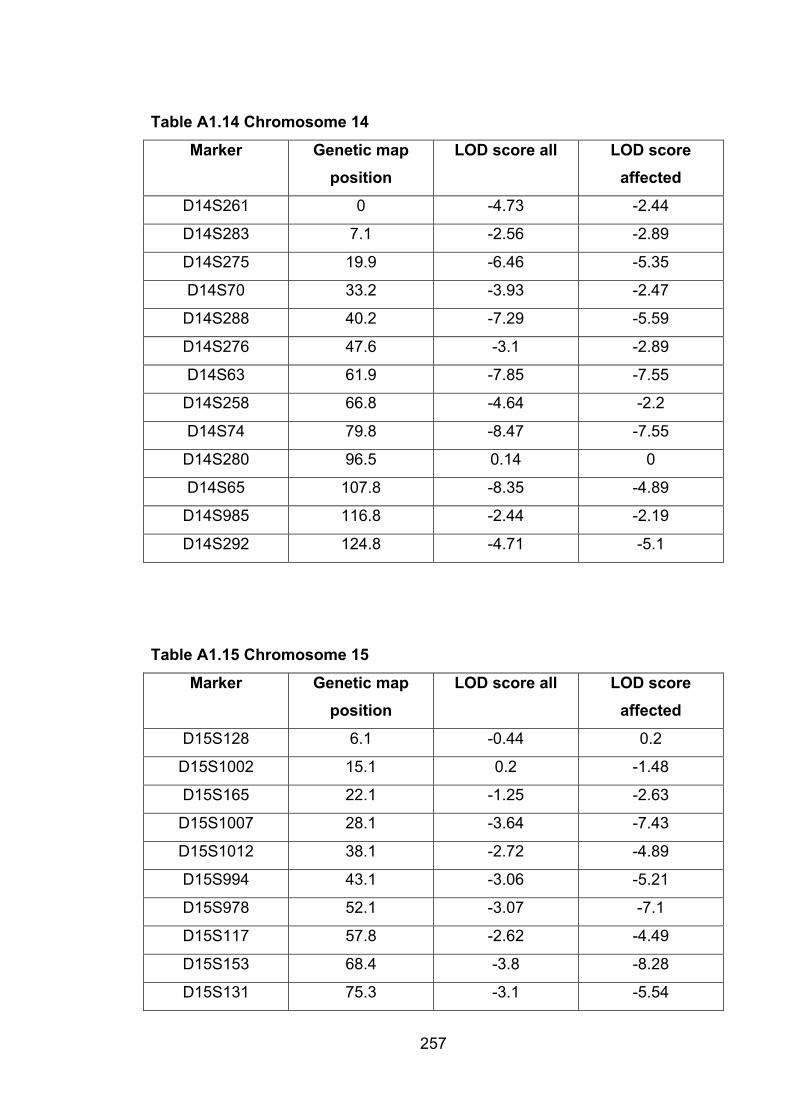
257
Table A1.14 Chromosome 14
Marker Genetic map position
LOD score all LOD score affected
D14S261 0 -4.73 -2.44
D14S283 7.1 -2.56 -2.89
D14S275 19.9 -6.46 -5.35
D14S70 33.2 -3.93 -2.47
D14S288 40.2 -7.29 -5.59
D14S276 47.6 -3.1 -2.89
D14S63 61.9 -7.85 -7.55
D14S258 66.8 -4.64 -2.2
D14S74 79.8 -8.47 -7.55
D14S280 96.5 0.14 0
D14S65 107.8 -8.35 -4.89
D14S985 116.8 -2.44 -2.19
D14S292 124.8 -4.71 -5.1
Table A1.15 Chromosome 15
Marker Genetic map position
LOD score all LOD score affected
D15S128 6.1 -0.44 0.2
D15S1002 15.1 0.2 -1.48
D15S165 22.1 -1.25 -2.63
D15S1007 28.1 -3.64 -7.43
D15S1012 38.1 -2.72 -4.89
D15S994 43.1 -3.06 -5.21
D15S978 52.1 -3.07 -7.1
D15S117 57.8 -2.62 -4.49
D15S153 68.4 -3.8 -8.28
D15S131 75.3 -3.1 -5.54
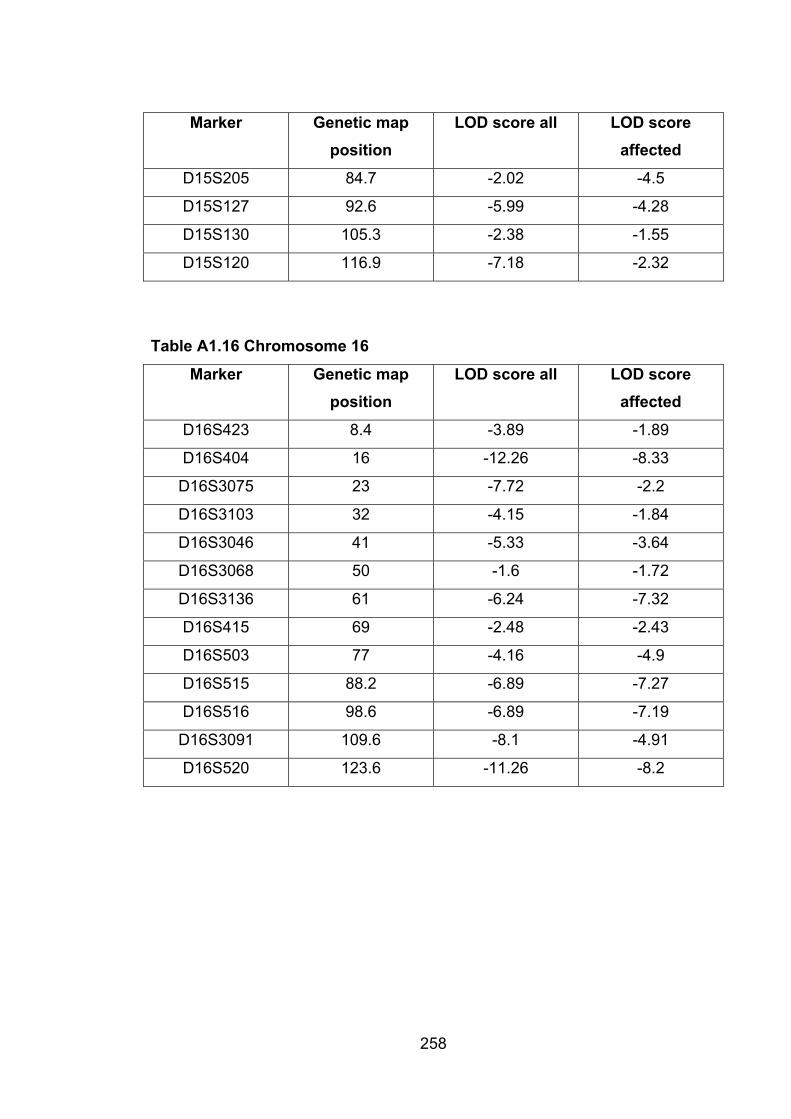
258
Marker Genetic map position
LOD score all LOD score affected
D15S205 84.7 -2.02 -4.5
D15S127 92.6 -5.99 -4.28
D15S130 105.3 -2.38 -1.55
D15S120 116.9 -7.18 -2.32
Table A1.16 Chromosome 16
Marker Genetic map position
LOD score all LOD score affected
D16S423 8.4 -3.89 -1.89
D16S404 16 -12.26 -8.33
D16S3075 23 -7.72 -2.2
D16S3103 32 -4.15 -1.84
D16S3046 41 -5.33 -3.64
D16S3068 50 -1.6 -1.72
D16S3136 61 -6.24 -7.32
D16S415 69 -2.48 -2.43
D16S503 77 -4.16 -4.9
D16S515 88.2 -6.89 -7.27
D16S516 98.6 -6.89 -7.19
D16S3091 109.6 -8.1 -4.91
D16S520 123.6 -11.26 -8.2
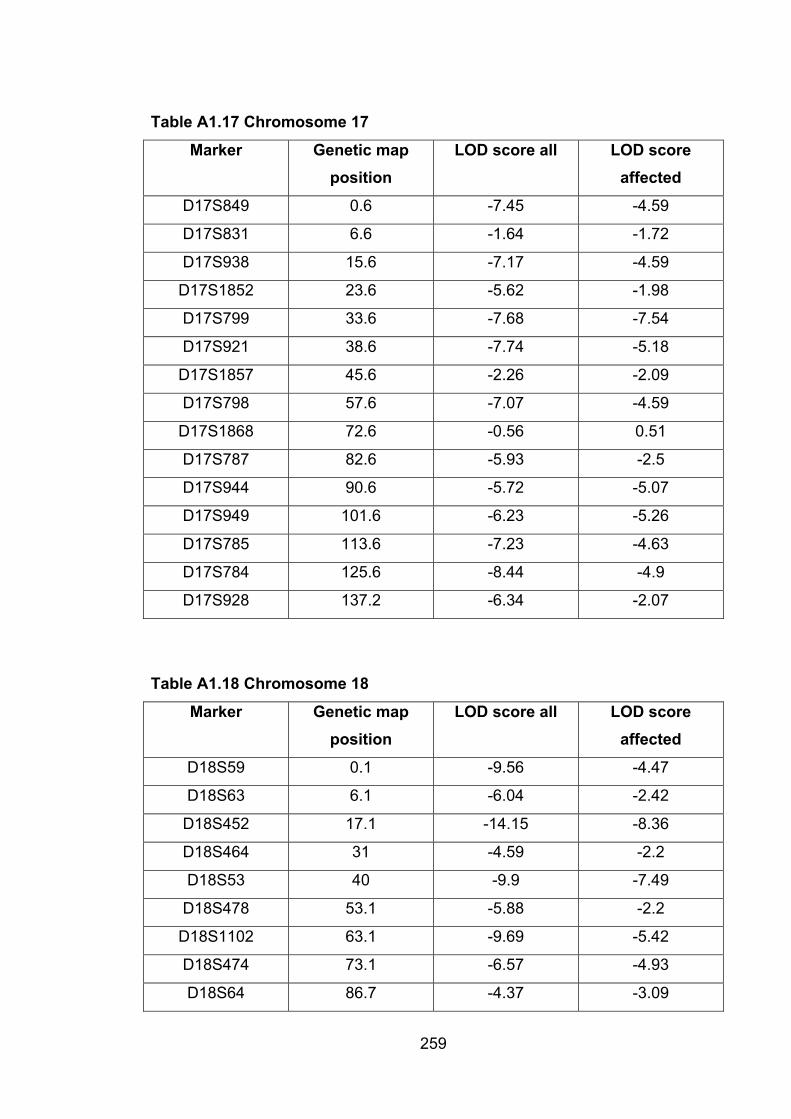
259
Table A1.17 Chromosome 17
Marker Genetic map position
LOD score all LOD score affected
D17S849 0.6 -7.45 -4.59
D17S831 6.6 -1.64 -1.72
D17S938 15.6 -7.17 -4.59
D17S1852 23.6 -5.62 -1.98
D17S799 33.6 -7.68 -7.54
D17S921 38.6 -7.74 -5.18
D17S1857 45.6 -2.26 -2.09
D17S798 57.6 -7.07 -4.59
D17S1868 72.6 -0.56 0.51
D17S787 82.6 -5.93 -2.5
D17S944 90.6 -5.72 -5.07
D17S949 101.6 -6.23 -5.26
D17S785 113.6 -7.23 -4.63
D17S784 125.6 -8.44 -4.9
D17S928 137.2 -6.34 -2.07
Table A1.18 Chromosome 18
Marker Genetic map position
LOD score all LOD score affected
D18S59 0.1 -9.56 -4.47
D18S63 6.1 -6.04 -2.42
D18S452 17.1 -14.15 -8.36
D18S464 31 -4.59 -2.2
D18S53 40 -9.9 -7.49
D18S478 53.1 -5.88 -2.2
D18S1102 63.1 -9.69 -5.42
D18S474 73.1 -6.57 -4.93
D18S64 86.7 -4.37 -3.09
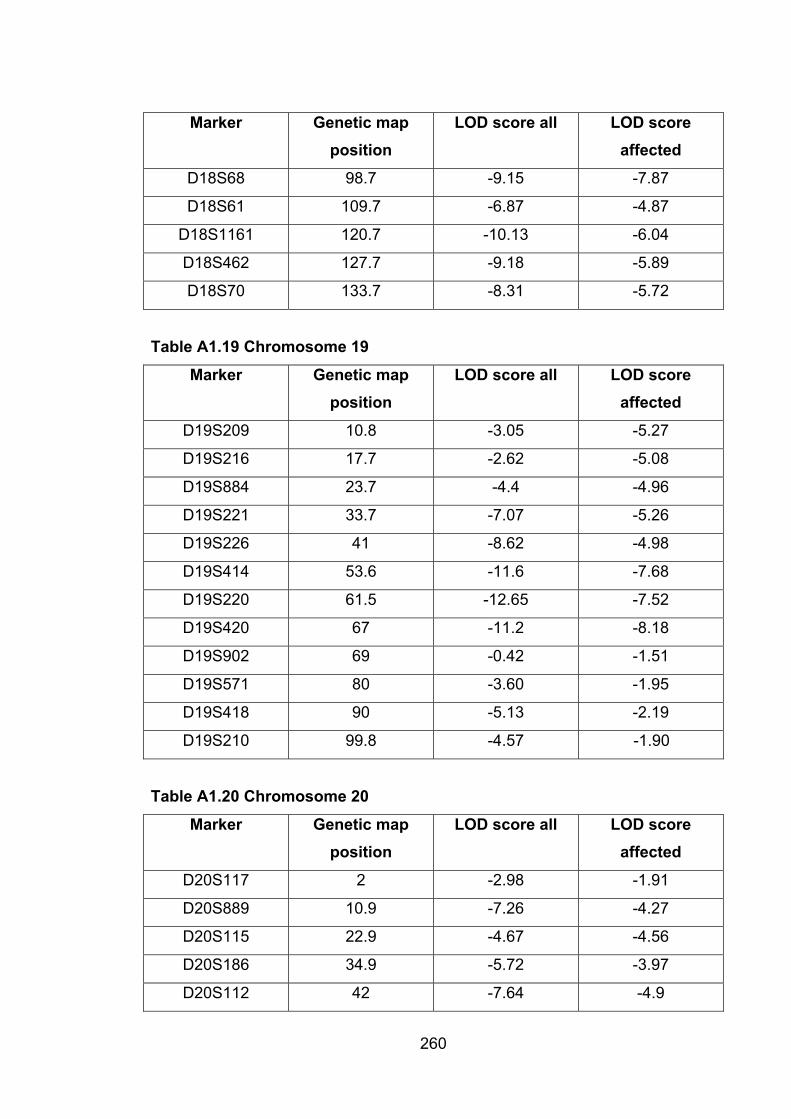
260
Marker Genetic map position
LOD score all LOD score affected
D18S68 98.7 -9.15 -7.87
D18S61 109.7 -6.87 -4.87
D18S1161 120.7 -10.13 -6.04
D18S462 127.7 -9.18 -5.89
D18S70 133.7 -8.31 -5.72
Table A1.19 Chromosome 19
Marker Genetic map position
LOD score all LOD score affected
D19S209 10.8 -3.05 -5.27
D19S216 17.7 -2.62 -5.08
D19S884 23.7 -4.4 -4.96
D19S221 33.7 -7.07 -5.26
D19S226 41 -8.62 -4.98
D19S414 53.6 -11.6 -7.68
D19S220 61.5 -12.65 -7.52
D19S420 67 -11.2 -8.18
D19S902 69 -0.42 -1.51
D19S571 80 -3.60 -1.95
D19S418 90 -5.13 -2.19
D19S210 99.8 -4.57 -1.90
Table A1.20 Chromosome 20
Marker Genetic map position
LOD score all LOD score affected
D20S117 2 -2.98 -1.91
D20S889 10.9 -7.26 -4.27
D20S115 22.9 -4.67 -4.56
D20S186 34.9 -5.72 -3.97
D20S112 42 -7.64 -4.9
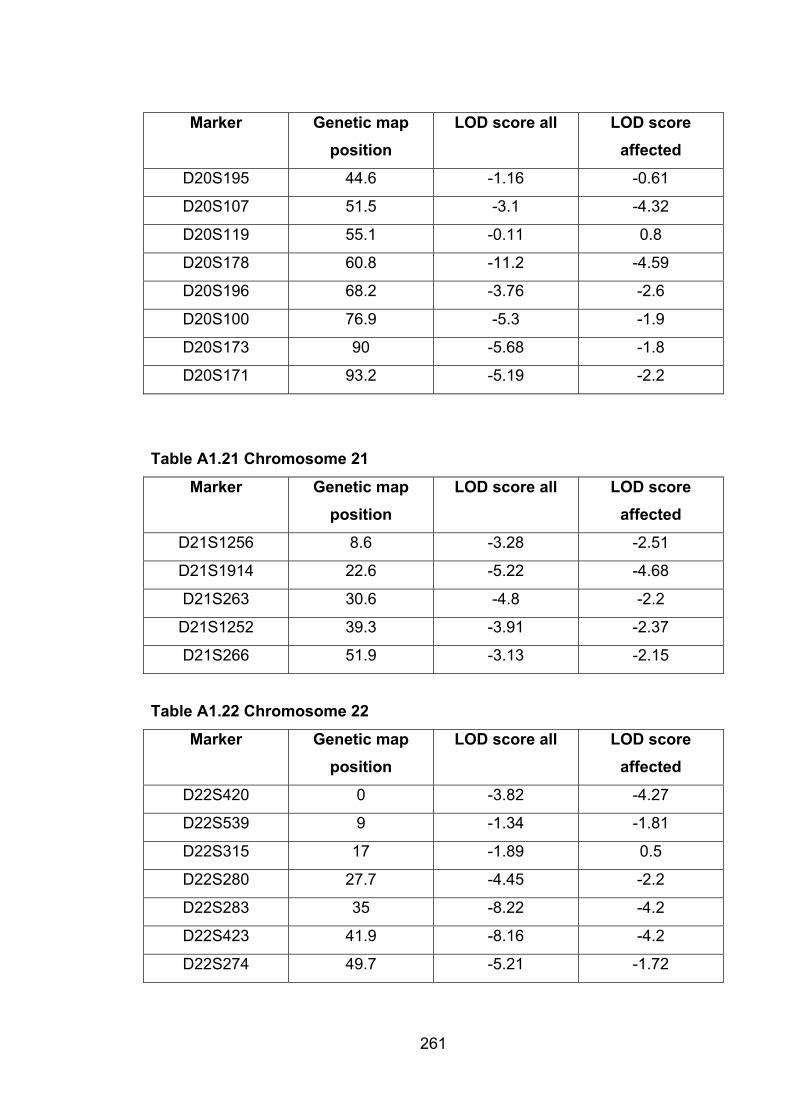
261
Marker Genetic map position
LOD score all LOD score affected
D20S195 44.6 -1.16 -0.61
D20S107 51.5 -3.1 -4.32
D20S119 55.1 -0.11 0.8
D20S178 60.8 -11.2 -4.59
D20S196 68.2 -3.76 -2.6
D20S100 76.9 -5.3 -1.9
D20S173 90 -5.68 -1.8
D20S171 93.2 -5.19 -2.2
Table A1.21 Chromosome 21
Marker Genetic map position
LOD score all LOD score affected
D21S1256 8.6 -3.28 -2.51
D21S1914 22.6 -5.22 -4.68
D21S263 30.6 -4.8 -2.2
D21S1252 39.3 -3.91 -2.37
D21S266 51.9 -3.13 -2.15
Table A1.22 Chromosome 22
Marker Genetic map position
LOD score all LOD score affected
D22S420 0 -3.82 -4.27
D22S539 9 -1.34 -1.81
D22S315 17 -1.89 0.5
D22S280 27.7 -4.45 -2.2
D22S283 35 -8.22 -4.2
D22S423 41.9 -8.16 -4.2
D22S274 49.7 -5.21 -1.72

APPENDIX 2: Microsatellite markers used for QTL mapping
Table A2.1 List of markers with map location
MMU Marker Maplocation
MMU Marker Maplocation
1 D1Mit230 7.7 4 D4Mit101 5.5
1 D1Mit212 19.7 4 D4Mit195 16.4
1 D1Mit46 43.7 4 D4Mit303 45.9
1 D1Mit26 64.5 4 D4Mit251 66.7
1 D1Mit265 76.5
1 D1Mit206 94 5 D5Mit73 11
1 D1Mit512 113.7 5 D5Mit255 25.1
5 D5Mit24 45.9
2 D2Mit1 2.2 5 D5Mit97 64.5
2 D2Mit235 22.5 5 D5Mit287 82
2 D2Mit91 38.3
2 D2Mit58 51.4 6 D6Mit232 0.3
2 D2Mit48 73.2 6 D6Mit186 20.8
2 D2Mit517 98.5 6 D6Mit149 40.4
6 D6Mit14 63.4
3 D3Mit167 13.1
3 D3Mit86 54.6 7 D7Mit22 5.5
3 D3Mit163 66.7 7 D7Mit158 18.6
3 D3Mit147 79.4 7 D7Mit126 37.2
7 D7Mit68 45.9
262
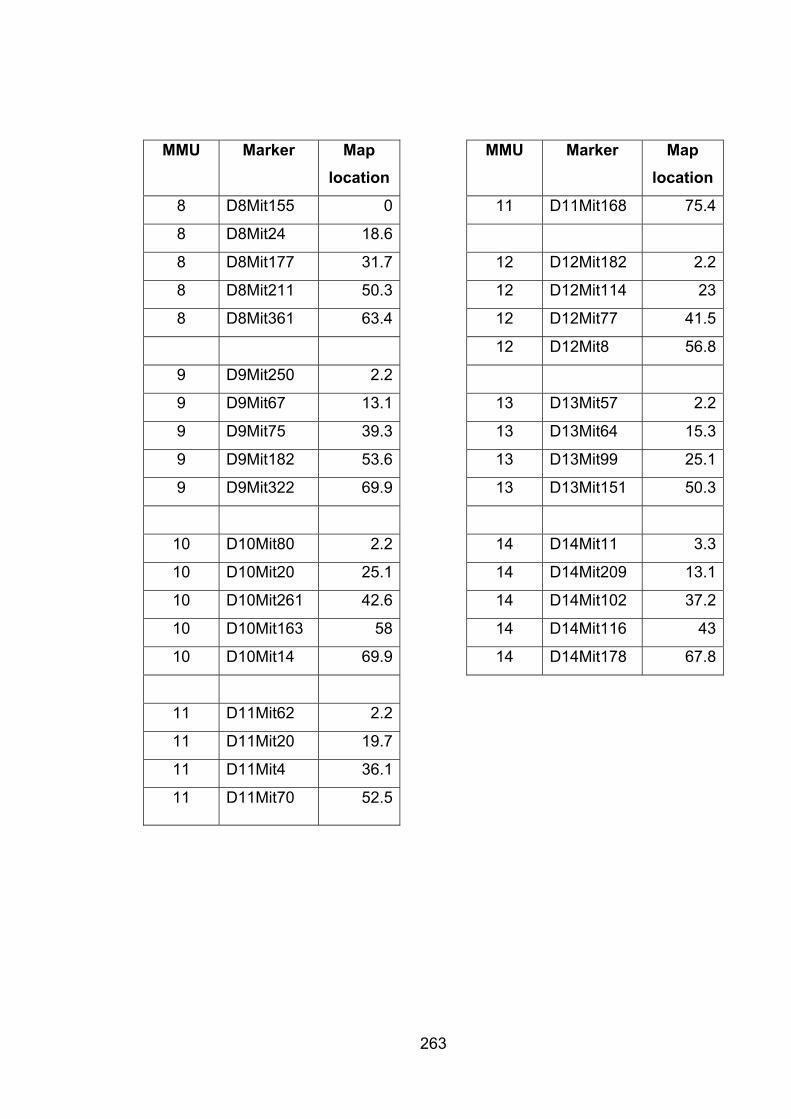
263
MMU Marker Maplocation
MMU Marker Maplocation
8 D8Mit155 0 11 D11Mit168 75.4
8 D8Mit24 18.6
8 D8Mit177 31.7 12 D12Mit182 2.2
8 D8Mit211 50.3 12 D12Mit114 23
8 D8Mit361 63.4 12 D12Mit77 41.5
12 D12Mit8 56.8
9 D9Mit250 2.2
9 D9Mit67 13.1 13 D13Mit57 2.2
9 D9Mit75 39.3 13 D13Mit64 15.3
9 D9Mit182 53.6 13 D13Mit99 25.1
9 D9Mit322 69.9 13 D13Mit151 50.3
10 D10Mit80 2.2 14 D14Mit11 3.3
10 D10Mit20 25.1 14 D14Mit209 13.1
10 D10Mit261 42.6 14 D14Mit102 37.2
10 D10Mit163 58 14 D14Mit116 43
10 D10Mit14 69.9 14 D14Mit178 67.8
11 D11Mit62 2.2
11 D11Mit20 19.7
11 D11Mit4 36.1
11 D11Mit70 52.5
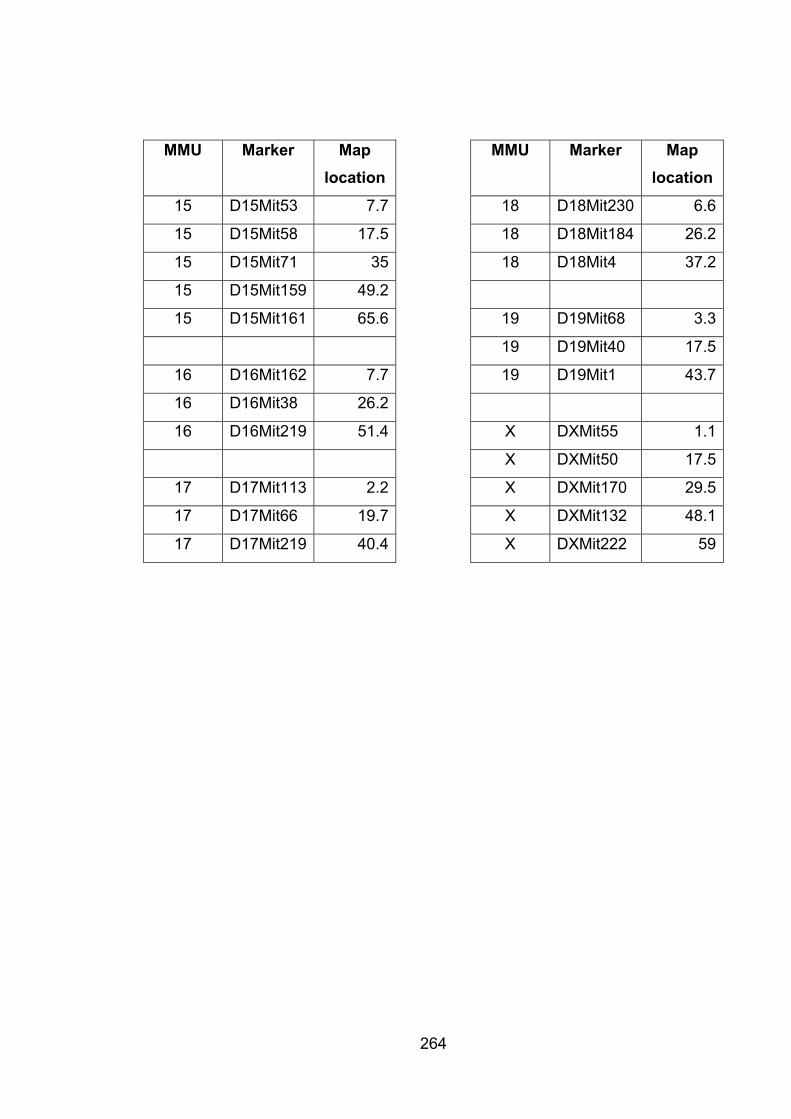
264
MMU Marker Maplocation
MMU Marker Maplocation
15 D15Mit53 7.7 18 D18Mit230 6.6
15 D15Mit58 17.5 18 D18Mit184 26.2
15 D15Mit71 35 18 D18Mit4 37.2
15 D15Mit159 49.2
15 D15Mit161 65.6 19 D19Mit68 3.3
19 D19Mit40 17.5
16 D16Mit162 7.7 19 D19Mit1 43.7
16 D16Mit38 26.2
16 D16Mit219 51.4 X DXMit55 1.1
X DXMit50 17.5
17 D17Mit113 2.2 X DXMit170 29.5
17 D17Mit66 19.7 X DXMit132 48.1
17 D17Mit219 40.4 X DXMit222 59
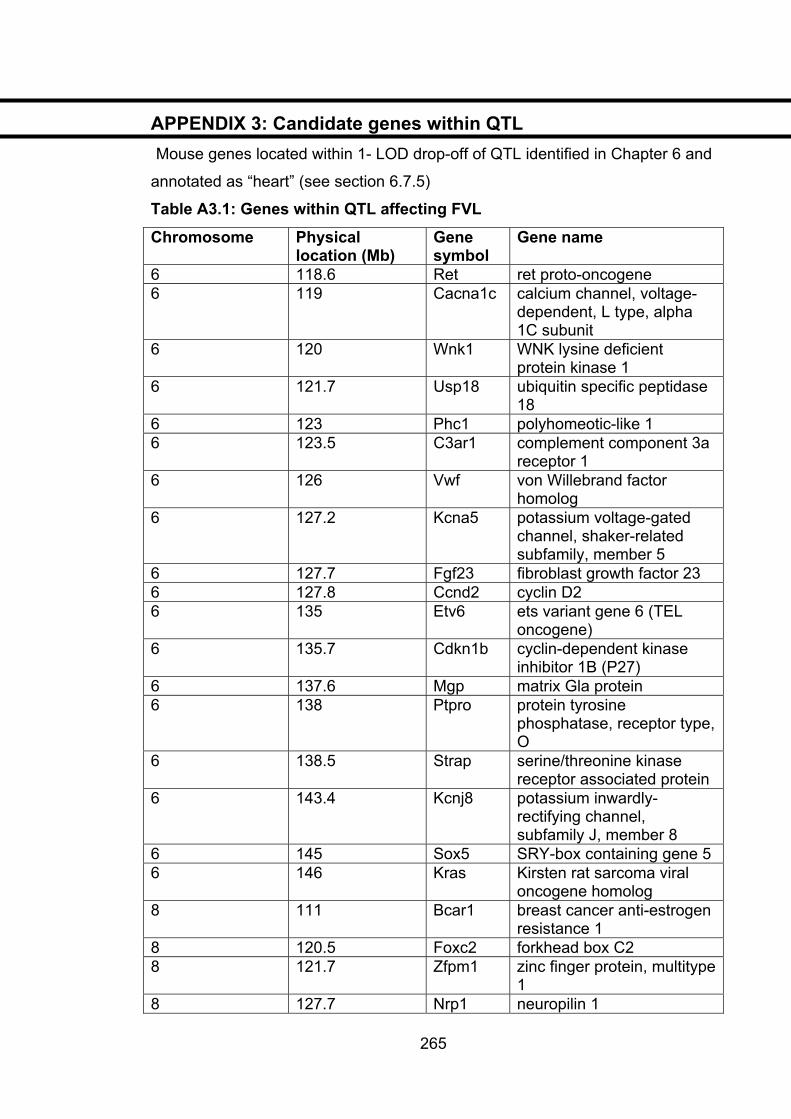
APPENDIX 3: Candidate genes within QTL Mouse genes located within 1- LOD drop-off of QTL identified in Chapter 6 and
annotated as “heart” (see section 6.7.5)
Table A3.1: Genes within QTL affecting FVL
Chromosome Physical location (Mb)
Genesymbol
Gene name
6 118.6 Ret ret proto-oncogene6 119 Cacna1c calcium channel, voltage-
dependent, L type, alpha 1C subunit
6 120 Wnk1 WNK lysine deficient protein kinase 1
6 121.7 Usp18 ubiquitin specific peptidase 18
6 123 Phc1 polyhomeotic-like 16 123.5 C3ar1 complement component 3a
receptor 1 6 126 Vwf von Willebrand factor
homolog6 127.2 Kcna5 potassium voltage-gated
channel, shaker-related subfamily, member 5
6 127.7 Fgf23 fibroblast growth factor 23 6 127.8 Ccnd2 cyclin D26 135 Etv6 ets variant gene 6 (TEL
oncogene)6 135.7 Cdkn1b cyclin-dependent kinase
inhibitor 1B (P27) 6 137.6 Mgp matrix Gla protein 6 138 Ptpro protein tyrosine
phosphatase, receptor type, O
6 138.5 Strap serine/threonine kinase receptor associated protein
6 143.4 Kcnj8 potassium inwardly-rectifying channel, subfamily J, member 8
6 145 Sox5 SRY-box containing gene 5 6 146 Kras Kirsten rat sarcoma viral
oncogene homolog 8 111 Bcar1 breast cancer anti-estrogen
resistance 1 8 120.5 Foxc2 forkhead box C2 8 121.7 Zfpm1 zinc finger protein, multitype
18 127.7 Nrp1
265
neuropilin 1
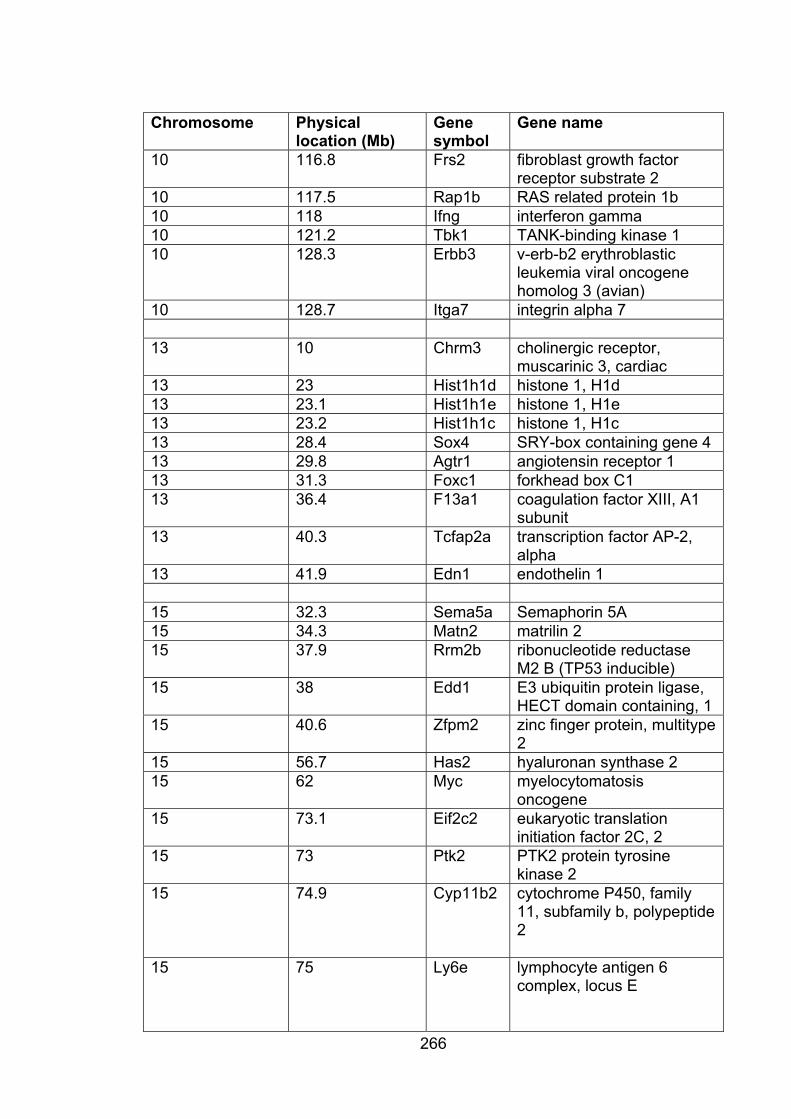
266
Chromosome Physical location (Mb)
Genesymbol
Gene name
10 116.8 Frs2 fibroblast growth factor receptor substrate 2
10 117.5 Rap1b RAS related protein 1b 10 118 Ifng interferon gamma10 121.2 Tbk1 TANK-binding kinase 1 10 128.3 Erbb3 v-erb-b2 erythroblastic
leukemia viral oncogene homolog 3 (avian)
10 128.7 Itga7 integrin alpha 7
13 10 Chrm3 cholinergic receptor,muscarinic 3, cardiac
13 23 Hist1h1d histone 1, H1d 13 23.1 Hist1h1e histone 1, H1e 13 23.2 Hist1h1c histone 1, H1c 13 28.4 Sox4 SRY-box containing gene 4 13 29.8 Agtr1 angiotensin receptor 1 13 31.3 Foxc1 forkhead box C1 13 36.4 F13a1 coagulation factor XIII, A1
subunit 13 40.3 Tcfap2a transcription factor AP-2,
alpha13 41.9 Edn1 endothelin 1
15 32.3 Sema5a Semaphorin 5A15 34.3 Matn2 matrilin 215 37.9 Rrm2b ribonucleotide reductase
M2 B (TP53 inducible) 15 38 Edd1 E3 ubiquitin protein ligase,
HECT domain containing, 1 15 40.6 Zfpm2 zinc finger protein, multitype
215 56.7 Has2 hyaluronan synthase 2 15 62 Myc myelocytomatosis
oncogene15 73.1 Eif2c2 eukaryotic translation
initiation factor 2C, 2 15 73 Ptk2 PTK2 protein tyrosine
kinase 2 15 74.9 Cyp11b2 cytochrome P450, family
11, subfamily b, polypeptide 2
15 75 Ly6e lymphocyte antigen 6 complex, locus E
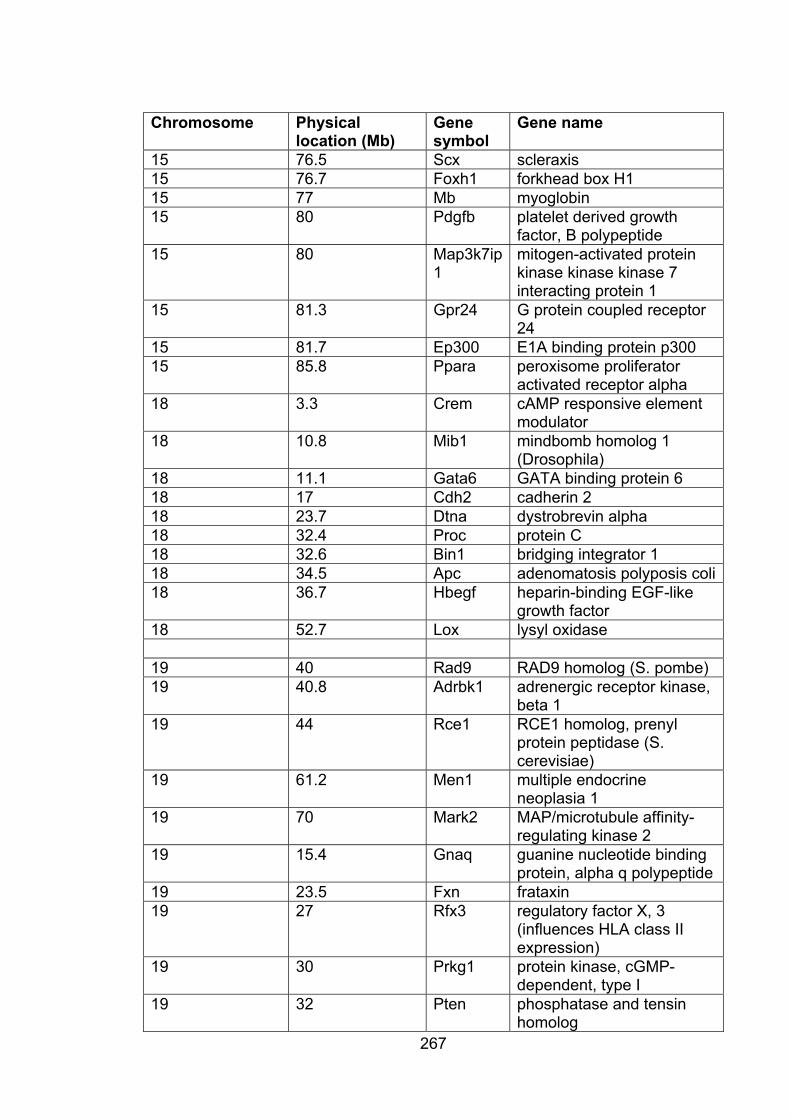
267
Chromosome Physical location (Mb)
Genesymbol
Gene name
15 76.5 Scx scleraxis 15 76.7 Foxh1 forkhead box H1 15 77 Mb myoglobin15 80 Pdgfb platelet derived growth
factor, B polypeptide 15 80 Map3k7ip
1mitogen-activated protein kinase kinase kinase 7 interacting protein 1
15 81.3 Gpr24 G protein coupled receptor 24
15 81.7 Ep300 E1A binding protein p300 15 85.8 Ppara peroxisome proliferator
activated receptor alpha 18 3.3 Crem cAMP responsive element
modulator18 10.8 Mib1 mindbomb homolog 1
(Drosophila)18 11.1 Gata6 GATA binding protein 6 18 17 Cdh2 cadherin 218 23.7 Dtna dystrobrevin alpha18 32.4 Proc protein C18 32.6 Bin1 bridging integrator 1 18 34.5 Apc adenomatosis polyposis coli18 36.7 Hbegf heparin-binding EGF-like
growth factor 18 52.7 Lox lysyl oxidase
19 40 Rad9 RAD9 homolog (S. pombe) 19 40.8 Adrbk1 adrenergic receptor kinase,
beta 1 19 44 Rce1 RCE1 homolog, prenyl
protein peptidase (S. cerevisiae)
19 61.2 Men1 multiple endocrineneoplasia 1
19 70 Mark2 MAP/microtubule affinity-regulating kinase 2
19 15.4 Gnaq guanine nucleotide binding protein, alpha q polypeptide
19 23.5 Fxn frataxin19 27 Rfx3 regulatory factor X, 3
(influences HLA class II expression)
19 30 Prkg1 protein kinase, cGMP-dependent, type I
19 32 Pten phosphatase and tensin homolog
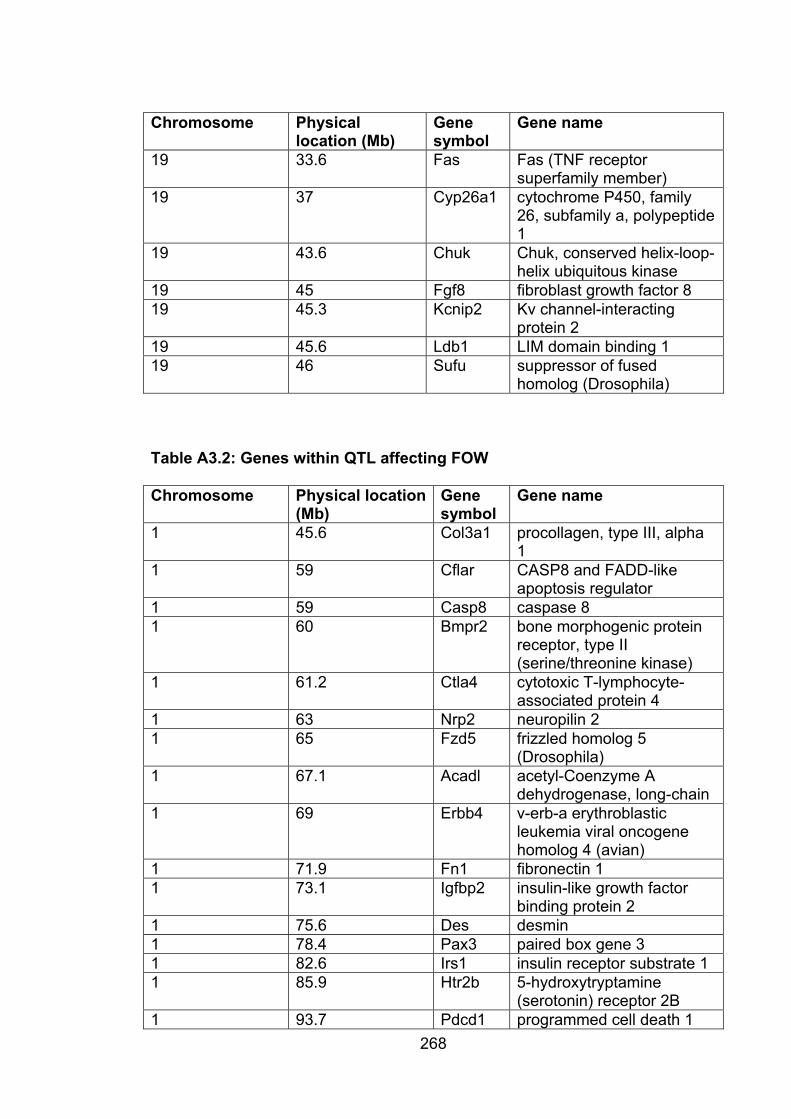
268
Chromosome Physical location (Mb)
Genesymbol
Gene name
19 33.6 Fas Fas (TNF receptor superfamily member)
19 37 Cyp26a1 cytochrome P450, family 26, subfamily a, polypeptide 1
19 43.6 Chuk Chuk, conserved helix-loop-helix ubiquitous kinase
19 45 Fgf8 fibroblast growth factor 8 19 45.3 Kcnip2 Kv channel-interacting
protein 2 19 45.6 Ldb1 LIM domain binding 1 19 46 Sufu suppressor of fused
homolog (Drosophila)
Table A3.2: Genes within QTL affecting FOW
Chromosome Physical location (Mb)
Genesymbol
Gene name
1 45.6 Col3a1 procollagen, type III, alpha 1
1 59 Cflar CASP8 and FADD-like apoptosis regulator
1 59 Casp8 caspase 81 60 Bmpr2 bone morphogenic protein
receptor, type II (serine/threonine kinase)
1 61.2 Ctla4 cytotoxic T-lymphocyte-associated protein 4
1 63 Nrp2 neuropilin 21 65 Fzd5 frizzled homolog 5
(Drosophila)1 67.1 Acadl acetyl-Coenzyme A
dehydrogenase, long-chain 1 69 Erbb4 v-erb-a erythroblastic
leukemia viral oncogene homolog 4 (avian)
1 71.9 Fn1 fibronectin 11 73.1 Igfbp2 insulin-like growth factor
binding protein 2 1 75.6 Des desmin1 78.4 Pax3 paired box gene 3 1 82.6 Irs1 insulin receptor substrate 1 1 85.9 Htr2b 5-hydroxytryptamine
(serotonin) receptor 2B 1 93.7 Pdcd1 programmed cell death 1
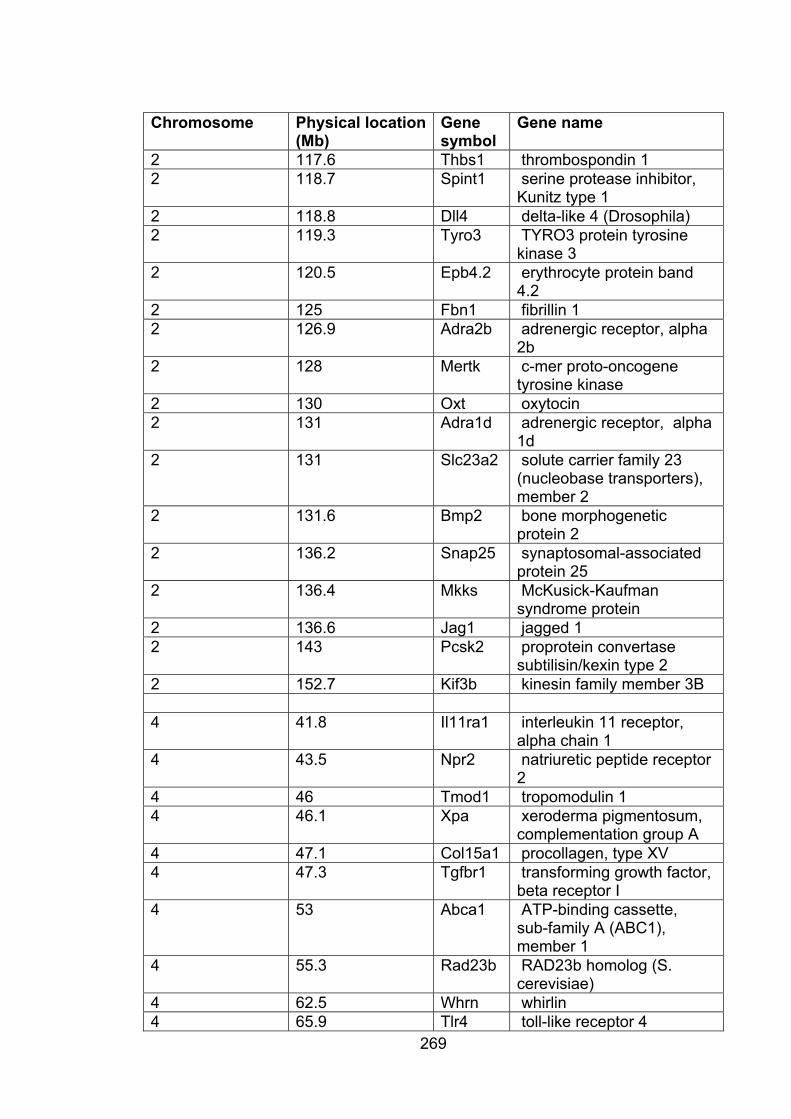
269
Chromosome Physical location (Mb)
Genesymbol
Gene name
2 117.6 Thbs1 thrombospondin 1 2 118.7 Spint1 serine protease inhibitor,
Kunitz type 1 2 118.8 Dll4 delta-like 4 (Drosophila) 2 119.3 Tyro3 TYRO3 protein tyrosine
kinase 3 2 120.5 Epb4.2 erythrocyte protein band
4.22 125 Fbn1 fibrillin 1 2 126.9 Adra2b adrenergic receptor, alpha
2b2 128 Mertk c-mer proto-oncogene
tyrosine kinase 2 130 Oxt oxytocin2 131 Adra1d adrenergic receptor, alpha
1d2 131 Slc23a2 solute carrier family 23
(nucleobase transporters), member 2
2 131.6 Bmp2 bone morphogenetic protein 2
2 136.2 Snap25 synaptosomal-associatedprotein 25
2 136.4 Mkks McKusick-Kaufmansyndrome protein
2 136.6 Jag1 jagged 1 2 143 Pcsk2 proprotein convertase
subtilisin/kexin type 2 2 152.7 Kif3b kinesin family member 3B
4 41.8 Il11ra1 interleukin 11 receptor,alpha chain 1
4 43.5 Npr2 natriuretic peptide receptor 2
4 46 Tmod1 tropomodulin 1 4 46.1 Xpa xeroderma pigmentosum,
complementation group A 4 47.1 Col15a1 procollagen, type XV 4 47.3 Tgfbr1 transforming growth factor,
beta receptor I 4 53 Abca1 ATP-binding cassette,
sub-family A (ABC1), member 1
4 55.3 Rad23b RAD23b homolog (S. cerevisiae)
4 62.5 Whrn whirlin4 65.9 Tlr4 toll-like receptor 4

270
Chromosome Physical location (Mb)
Genesymbol
Gene name
9 31.1 Aplp2 amyloid beta (A4) precursor-like protein 2
9 32.2 Kcnj5 potassium inwardly-rectifying channel, subfamily J, member 5
9 32.3 Kcnj1 potassium inwardly-rectifying channel, subfamily J, member 1
9 32.4 Fli1 Friend leukemia integration 1
9 37.5 Esam1 endothelial cell-specific adhesion molecule
9 44.1 Cbl Casitas B-lineage lymphoma
9 45.9 Tagln transgelin9 50.6 Pts 6-pyruvoyl-tetrahydropterin
synthase9 50.7 Sdhd succinate dehydrogenase
complex, subunit D, integral membrane protein
Table A3.3: Genes within QTL affecting CRW
Chromosome Physical location (Mb)
Genesymbol
Gene name
3 8.6 Hey1 hairy/enhancer-of-splitrelated with YRPW motif 1
3 10.2 Fabp4 fatty acid binding protein 4,adipocyte
3 14.6 E2f5 E2F transcription factor 5 3 19.3 Cp ceruloplasmin 3 19.3 Hps3 Hermansky-Pudlak
syndrome 3 homolog (human)
3 29.4 Evi1 ecotropic viral integration site 1
3 31.8 Pik3ca phosphatidylinositol 3-kinase, catalytic, alpha polypeptide
3 33.5 Fxr1h fragile X mental retardation gene 1, autosomal homolog
3 36.8 Fgf2 fibroblast growth factor 2 3 51.9 Foxo1 forkhead box O1 3 53.2 Frem2 Fras1 related extracellular
matrix protein 2
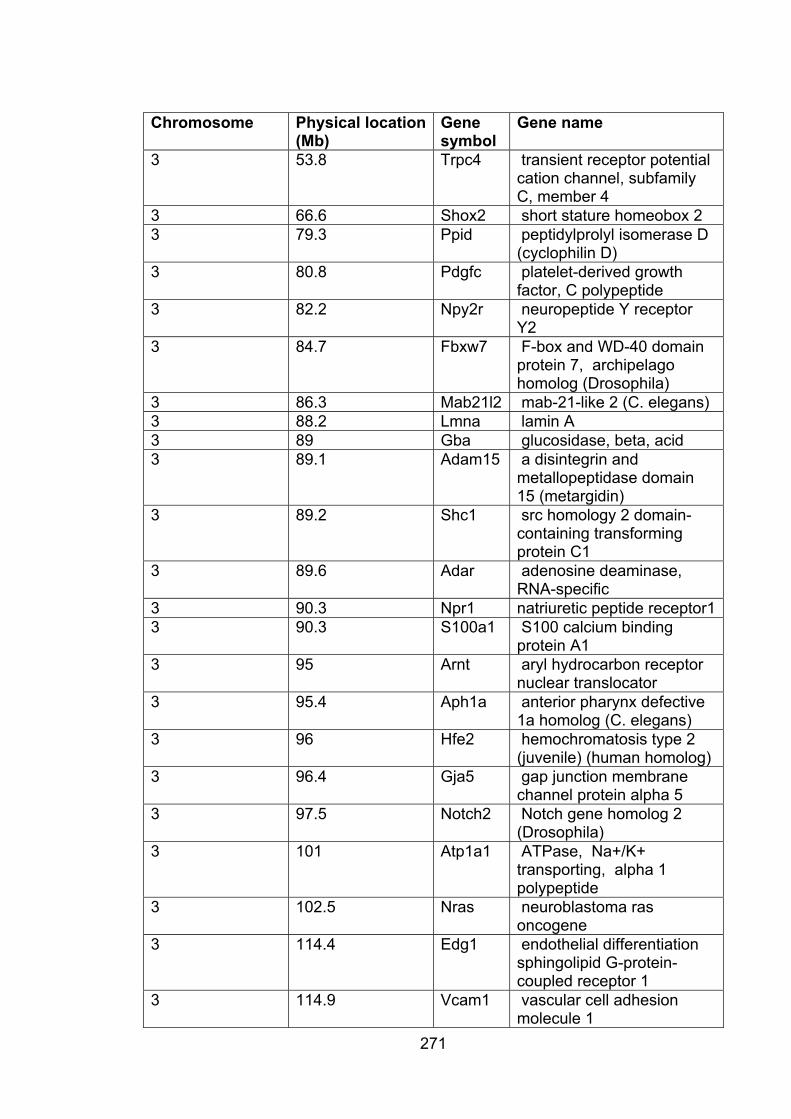
271
Chromosome Physical location (Mb)
Genesymbol
Gene name
3 53.8 Trpc4 transient receptor potential cation channel, subfamily C, member 4
3 66.6 Shox2 short stature homeobox 2 3 79.3 Ppid peptidylprolyl isomerase D
(cyclophilin D) 3 80.8 Pdgfc platelet-derived growth
factor, C polypeptide 3 82.2 Npy2r neuropeptide Y receptor
Y2 3 84.7 Fbxw7 F-box and WD-40 domain
protein 7, archipelago homolog (Drosophila)
3 86.3 Mab21l2 mab-21-like 2 (C. elegans) 3 88.2 Lmna lamin A 3 89 Gba glucosidase, beta, acid 3 89.1 Adam15 a disintegrin and
metallopeptidase domain 15 (metargidin)
3 89.2 Shc1 src homology 2 domain-containing transforming protein C1
3 89.6 Adar adenosine deaminase, RNA-specific
3 90.3 Npr1 natriuretic peptide receptor1 3 90.3 S100a1 S100 calcium binding
protein A1 3 95 Arnt aryl hydrocarbon receptor
nuclear translocator 3 95.4 Aph1a anterior pharynx defective
1a homolog (C. elegans) 3 96 Hfe2 hemochromatosis type 2
(juvenile) (human homolog) 3 96.4 Gja5 gap junction membrane
channel protein alpha 5 3 97.5 Notch2 Notch gene homolog 2
(Drosophila)3 101 Atp1a1 ATPase, Na+/K+
transporting, alpha 1 polypeptide
3 102.5 Nras neuroblastoma ras oncogene
3 114.4 Edg1 endothelial differentiation sphingolipid G-protein-coupled receptor 1
3 114.9 Vcam1 vascular cell adhesion molecule 1
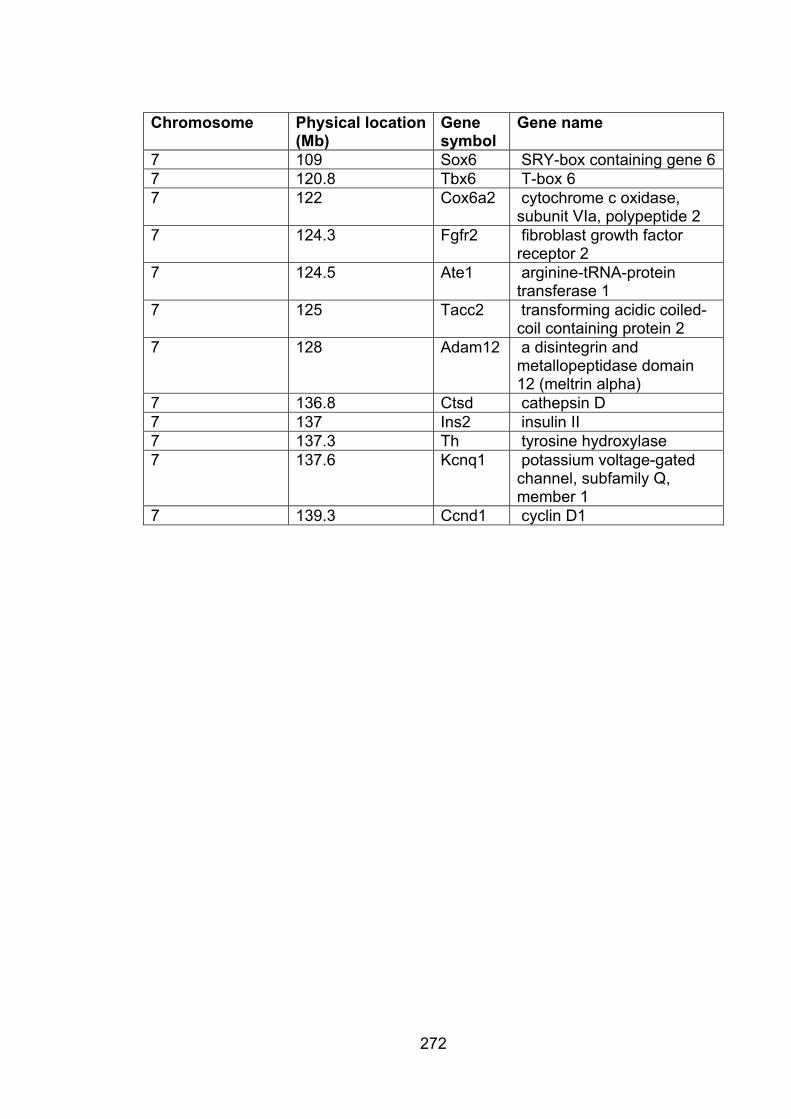
272
Chromosome Physical location (Mb)
Genesymbol
Gene name
7 109 Sox6 SRY-box containing gene 67 120.8 Tbx6 T-box 6 7 122 Cox6a2 cytochrome c oxidase,
subunit VIa, polypeptide 2 7 124.3 Fgfr2 fibroblast growth factor
receptor 2 7 124.5 Ate1 arginine-tRNA-protein
transferase 1 7 125 Tacc2 transforming acidic coiled-
coil containing protein 2 7 128 Adam12 a disintegrin and
metallopeptidase domain 12 (meltrin alpha)
7 136.8 Ctsd cathepsin D 7 137 Ins2 insulin II 7 137.3 Th tyrosine hydroxylase 7 137.6 Kcnq1 potassium voltage-gated
channel, subfamily Q,member 1
7 139.3 Ccnd1 cyclin D1
Copyright © 2022 FDOKUMEN


![Results of Ventricular Septal Myectomy and Hypertrophic Cardiomyopathy (from Nationwide Inpatient Sample [1998–2010])](https://static.fdokumen.com/doc/165x107/632e4970f835cf7c7c0a2906/results-of-ventricular-septal-myectomy-and-hypertrophic-cardiomyopathy-from-nationwide.jpg)

