The genetic study of three population microisolates in South Tyrol (MICROS): study design and...
15
BioMed Central Page 1 of 15 (page number not for citation purposes) BMC Medical Genetics Open Access Research article The genetic study of three population microisolates in South Tyrol (MICROS): study design and epidemiological perspectives Cristian Pattaro* 1 , Fabio Marroni 1 , Alice Riegler 1 , Deborah Mascalzoni 1 , Irene Pichler 1 , Claudia B Volpato 1 , Umberta Dal Cero 1 , Alessandro De Grandi 1 , Clemens Egger 1 , Agatha Eisendle 1 , Christian Fuchsberger 1 , Martin Gögele 1 , Sara Pedrotti 1 , Gerd K Pinggera 1 , Stefan A Stefanov 1 , Florian D Vogl 2 , Christian J Wiedermann 3,4 , Thomas Meitinger 5,6 and Peter P Pramstaller 1,7,8 Address: 1 Institute of Genetic Medicine, European Academy, Bolzano, Italy, 2 Department of Gynaecology, Hospital of Merano, Via Rossini 5, 39012 Merano-Meran, Italy, 3 Laboratory of Medical Intensive Care, Division of General Internal Medicine, Department of Medicine, Medical University of Innsbruck, Innsbruck, Austria, 4 Division of Internal Medicine II, Department of Medicine, Central Hospital of Bolzano, Bolzano/ Bozen, Italy, 5 Institute of Human Genetics, Technical University of Munich, Munich, Germany, 6 GSF – National Research Center for Environment and Health, Institute of Human Genetics, München-Neuherberg, Germany, 7 Department of Neurology, University of Lübeck, Lübeck, Germany and 8 Department of Neurology, General Regional Hospital, Bolzano, Italy Email: Cristian Pattaro* - [email protected]; Fabio Marroni - [email protected]; Alice Riegler - [email protected]; Deborah Mascalzoni - [email protected]; Irene Pichler - [email protected]; Claudia B Volpato - [email protected]; Umberta Dal Cero - [email protected]; Alessandro De Grandi - [email protected]; Clemens Egger - [email protected]; Agatha Eisendle - [email protected]; Christian Fuchsberger - [email protected]; Martin Gögele - [email protected]; Sara Pedrotti - [email protected]; Gerd K Pinggera - [email protected]; Stefan A Stefanov - [email protected]; Florian D Vogl - [email protected]; Christian J Wiedermann - [email protected]; Thomas Meitinger - [email protected]; Peter P Pramstaller - [email protected] * Corresponding author Abstract Background: There is increasing evidence of the important role that small, isolated populations could play in finding genes involved in the etiology of diseases. For historical and political reasons, South Tyrol, the northern most Italian region, includes several villages of small dimensions which remained isolated over the centuries. Methods: The MICROS study is a population-based survey on three small, isolated villages, characterized by: old settlement; small number of founders; high endogamy rates; slow/null population expansion. During the stage-1 (2002/03) genealogical data, screening questionnaires, clinical measurements, blood and urine samples, and DNA were collected for 1175 adult volunteers. Stage-2, concerning trait diagnoses, linkage analysis and association studies, is ongoing. The selection of the traits is being driven by expert clinicians. Preliminary, descriptive statistics were obtained. Power simulations for finding linkage on a quantitative trait locus (QTL) were undertaken. Results: Starting from participants, genealogies were reconstructed for 50,037 subjects, going back to the early 1600s. Within the last five generations, subjects were clustered in one pedigree Published: 5 June 2007 BMC Medical Genetics 2007, 8:29 doi:10.1186/1471-2350-8-29 Received: 30 November 2006 Accepted: 5 June 2007 This article is available from: http://www.biomedcentral.com/1471-2350/8/29 © 2007 Pattaro et al; licensee BioMed Central Ltd. This is an Open Access article distributed under the terms of the Creative Commons Attribution License (http://creativecommons.org/licenses/by/2.0 ), which permits unrestricted use, distribution, and reproduction in any medium, provided the original work is properly cited.
Transcript of The genetic study of three population microisolates in South Tyrol (MICROS): study design and...

BioMed CentralBMC Medical Genetics
ss
Open AcceResearch articleThe genetic study of three population microisolates in South Tyrol (MICROS): study design and epidemiological perspectivesCristian Pattaro*1, Fabio Marroni1, Alice Riegler1, Deborah Mascalzoni1, Irene Pichler1, Claudia B Volpato1, Umberta Dal Cero1, Alessandro De Grandi1, Clemens Egger1, Agatha Eisendle1, Christian Fuchsberger1, Martin Gögele1, Sara Pedrotti1, Gerd K Pinggera1, Stefan A Stefanov1, Florian D Vogl2, Christian J Wiedermann3,4, Thomas Meitinger5,6 and Peter P Pramstaller1,7,8Address: 1Institute of Genetic Medicine, European Academy, Bolzano, Italy, 2Department of Gynaecology, Hospital of Merano, Via Rossini 5, 39012 Merano-Meran, Italy, 3Laboratory of Medical Intensive Care, Division of General Internal Medicine, Department of Medicine, Medical University of Innsbruck, Innsbruck, Austria, 4Division of Internal Medicine II, Department of Medicine, Central Hospital of Bolzano, Bolzano/Bozen, Italy, 5Institute of Human Genetics, Technical University of Munich, Munich, Germany, 6GSF – National Research Center for Environment and Health, Institute of Human Genetics, München-Neuherberg, Germany, 7Department of Neurology, University of Lübeck, Lübeck, Germany and 8Department of Neurology, General Regional Hospital, Bolzano, Italy
Email: Cristian Pattaro* - [email protected]; Fabio Marroni - [email protected]; Alice Riegler - [email protected]; Deborah Mascalzoni - [email protected]; Irene Pichler - [email protected]; Claudia B Volpato - [email protected]; Umberta Dal Cero - [email protected]; Alessandro De Grandi - [email protected]; Clemens Egger - [email protected]; Agatha Eisendle - [email protected]; Christian Fuchsberger - [email protected]; Martin Gögele - [email protected]; Sara Pedrotti - [email protected]; Gerd K Pinggera - [email protected]; Stefan A Stefanov - [email protected]; Florian D Vogl - [email protected]; Christian J Wiedermann - [email protected]; Thomas Meitinger - [email protected]; Peter P Pramstaller - [email protected]
* Corresponding author
AbstractBackground: There is increasing evidence of the important role that small, isolated populationscould play in finding genes involved in the etiology of diseases. For historical and political reasons,South Tyrol, the northern most Italian region, includes several villages of small dimensions whichremained isolated over the centuries.
Methods: The MICROS study is a population-based survey on three small, isolated villages,characterized by: old settlement; small number of founders; high endogamy rates; slow/nullpopulation expansion. During the stage-1 (2002/03) genealogical data, screening questionnaires,clinical measurements, blood and urine samples, and DNA were collected for 1175 adultvolunteers. Stage-2, concerning trait diagnoses, linkage analysis and association studies, is ongoing.The selection of the traits is being driven by expert clinicians. Preliminary, descriptive statisticswere obtained. Power simulations for finding linkage on a quantitative trait locus (QTL) wereundertaken.
Results: Starting from participants, genealogies were reconstructed for 50,037 subjects, goingback to the early 1600s. Within the last five generations, subjects were clustered in one pedigree
Published: 5 June 2007
BMC Medical Genetics 2007, 8:29 doi:10.1186/1471-2350-8-29
Received: 30 November 2006Accepted: 5 June 2007
This article is available from: http://www.biomedcentral.com/1471-2350/8/29
© 2007 Pattaro et al; licensee BioMed Central Ltd. This is an Open Access article distributed under the terms of the Creative Commons Attribution License (http://creativecommons.org/licenses/by/2.0), which permits unrestricted use, distribution, and reproduction in any medium, provided the original work is properly cited.
Page 1 of 15(page number not for citation purposes)

BMC Medical Genetics 2007, 8:29 http://www.biomedcentral.com/1471-2350/8/29
of 7049 subjects plus 178 smaller pedigrees (3 to 85 subjects each). A significant probability offamilial clustering was assessed for many traits, especially among the cardiovascular, neurologicaland respiratory traits. Simulations showed that the MICROS pedigree has a substantial power todetect a LOD score ≥ 3 when the QTL specific heritability is ≥ 20%.
Conclusion: The MICROS study is an extensive, ongoing, two-stage survey aimed atcharacterizing the genetic epidemiology of Mendelian and complex diseases. Our approach,involving different scientific disciplines, is an advantageous strategy to define and to studypopulation isolates. The isolation of the Alpine populations, together with the extensive datacollected so far, make the MICROS study a powerful resource for the study of diseases in manyfields of medicine. Recent successes and simulation studies give us confidence that our pedigreescan be valuable both in finding new candidates loci and to confirm existing candidate genes.
BackgroundThe importance of isolated populations for revealing thegenetic etiology of common diseases has been frequentlyhighlighted in recent years: the homogeneity of the sharedenvironmental factors and the limited number of recom-bination events in the DNA make isolates a valuable toolfor linkage and association studies [1-5]. Caution was sug-gested when the isolated population is very large, as in thecase of Sardinia and Finland, because the distribution oflinkage disequilibrium (LD) across the chromosomes canbe similar to that of the general population [6,7]. Never-theless, when small isolates are concerned, there isincreasing evidence of their valuable contribution forfinding genes [3,8]. After the difficulties in identifying locifor complex diseases in outbred populations, research onsmall isolated populations could be a promising way fordiscovering genotype-phenotype association [9].
Perhaps surprisingly, population isolates are not as rare asit might be expected, and several isolates can be foundeven within nations of the "old Europe" [10-14], whereseveral population admixture events have taken place overthe centuries. Indeed, allele and haplotype distributionsacross Europe are very differentiated, especially where theItalian peninsula is concerned [15]. Despite their positionin the middle of Europe, the Alps seem to be an interestingarea for studying genetic isolates [16-18].
Bolzano is the northern-most province of Italy. This prov-ince is known as South Tyrol because it is the Southernpart of the Tyrol region, split between Italy and Austria.The geographical structure, historical, and political eventsof this region resulted in the isolation of the population,with scattered villages often located at the ends of remotevalleys. Two recent studies, one on the Y-chromosomeand mtDNA and autosomal Alu markers [19], the otheron the extent of LD on Xq13 [20], were designed to assessthe homogeneity of the genetic background of isolatedgroups in South Tyrol. Beyond the ethnic and linguisticdifferences, in some cases (the Ladin valleys), authorsfound genetic heterogeneity even between valleys of the
same ethnic group, as confirmed by phylogenetic analysis.The expression "microisolate" was used to distinguishsmall subpopulations in remote, high valleys that haveconserved an even higher degree of isolation than the cul-tural and linguistic South Tyrolean isolate, in which theyare included [21].
As a part of a larger, ongoing genetic healthcare researchprogram on the South Tyrolean population (the GenNovaproject), in 2002–2003, an extensive survey (the MICROSstudy) was carried out on the populations of Stelvio, Val-lelunga and Martello, three villages of the Val Venosta.Among them, Stelvio was already classified as a geneticmicroisolate [20]. The objective of the survey was toscreen the population for the presence of several traits bycollecting questionnaire-based information, pedigreestructure, clinical measurements and blood samples foranalyses. The study was intended as the first step of a com-prehensive approach for the assessment of the genetics ofdiseases affecting the South Tyrolean population.
The present article is intended to introduce the MICROSstudy to the scientific community. We report some pre-liminary results, and future perspectives are discussed.
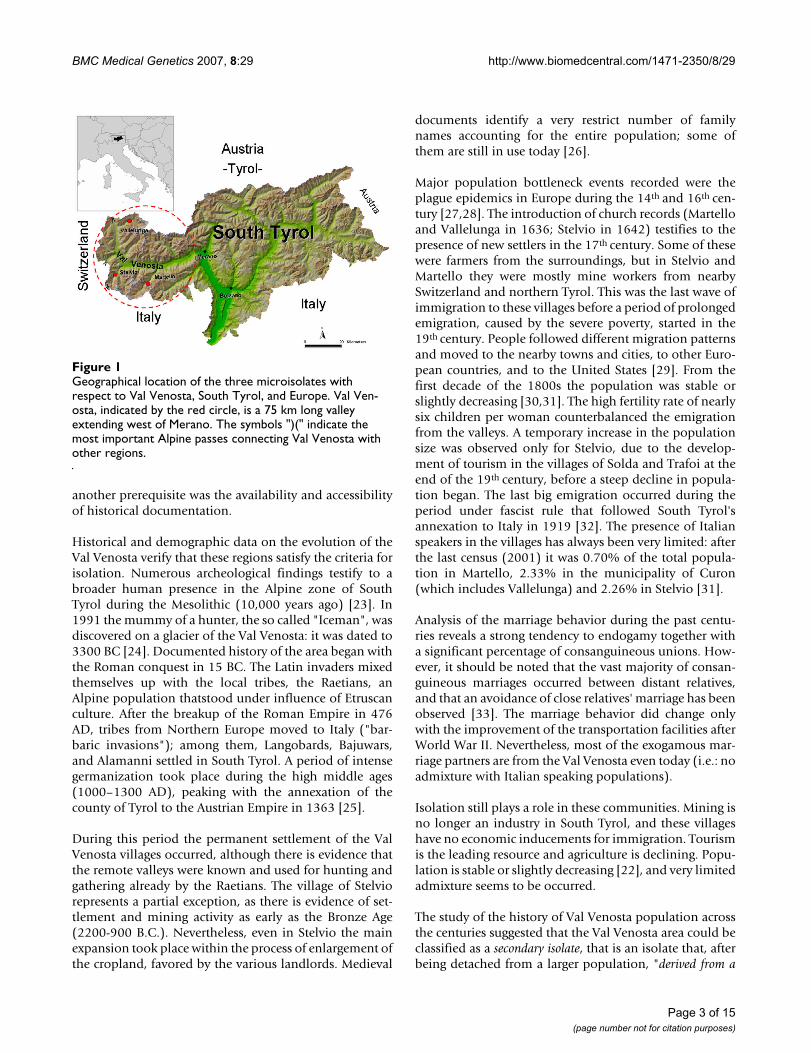
MethodsSelection of the microisolatesThe villages of Stelvio, Vallelunga and Martello wereselected for their geographical and historical isolation andfor the presence of highly collaborative local general prac-titioners (GPs). At the time of the survey, the adult popu-lation (aged 18+ year old) numbered 1043 people inStelvio, 693 in Martell, and 339 in Vallelunga [22]. Thegeographical location of the villages is presented in Figure1.
The three villages were selected for study on the basis offour criteria for isolation: i) evidence of an old settlement;ii) a small number of founders; iii) high endogamy rates;iv) slow or null population expansion and negligibleimmigration. Of course, for verifying these criteria,
Page 2 of 15(page number not for citation purposes)
BMC Medical Genetics 2007, 8:29 http://www.biomedcentral.com/1471-2350/8/29
another prerequisite was the availability and accessibilityof historical documentation.
Historical and demographic data on the evolution of theVal Venosta verify that these regions satisfy the criteria forisolation. Numerous archeological findings testify to abroader human presence in the Alpine zone of SouthTyrol during the Mesolithic (10,000 years ago) [23]. In1991 the mummy of a hunter, the so called "Iceman", wasdiscovered on a glacier of the Val Venosta: it was dated to3300 BC [24]. Documented history of the area began withthe Roman conquest in 15 BC. The Latin invaders mixedthemselves up with the local tribes, the Raetians, anAlpine population thatstood under influence of Etruscanculture. After the breakup of the Roman Empire in 476AD, tribes from Northern Europe moved to Italy ("bar-baric invasions"); among them, Langobards, Bajuwars,and Alamanni settled in South Tyrol. A period of intensegermanization took place during the high middle ages(1000–1300 AD), peaking with the annexation of thecounty of Tyrol to the Austrian Empire in 1363 [25].
During this period the permanent settlement of the ValVenosta villages occurred, although there is evidence thatthe remote valleys were known and used for hunting andgathering already by the Raetians. The village of Stelviorepresents a partial exception, as there is evidence of set-tlement and mining activity as early as the Bronze Age(2200-900 B.C.). Nevertheless, even in Stelvio the mainexpansion took place within the process of enlargement ofthe cropland, favored by the various landlords. Medieval
documents identify a very restrict number of familynames accounting for the entire population; some ofthem are still in use today [26].
Major population bottleneck events recorded were theplague epidemics in Europe during the 14th and 16th cen-tury [27,28]. The introduction of church records (Martelloand Vallelunga in 1636; Stelvio in 1642) testifies to thepresence of new settlers in the 17th century. Some of thesewere farmers from the surroundings, but in Stelvio andMartello they were mostly mine workers from nearbySwitzerland and northern Tyrol. This was the last wave ofimmigration to these villages before a period of prolongedemigration, caused by the severe poverty, started in the19th century. People followed different migration patternsand moved to the nearby towns and cities, to other Euro-pean countries, and to the United States [29]. From thefirst decade of the 1800s the population was stable orslightly decreasing [30,31]. The high fertility rate of nearlysix children per woman counterbalanced the emigrationfrom the valleys. A temporary increase in the populationsize was observed only for Stelvio, due to the develop-ment of tourism in the villages of Solda and Trafoi at theend of the 19th century, before a steep decline in popula-tion began. The last big emigration occurred during theperiod under fascist rule that followed South Tyrol'sannexation to Italy in 1919 [32]. The presence of Italianspeakers in the villages has always been very limited: afterthe last census (2001) it was 0.70% of the total popula-tion in Martello, 2.33% in the municipality of Curon(which includes Vallelunga) and 2.26% in Stelvio [31].
Analysis of the marriage behavior during the past centu-ries reveals a strong tendency to endogamy together witha significant percentage of consanguineous unions. How-ever, it should be noted that the vast majority of consan-guineous marriages occurred between distant relatives,and that an avoidance of close relatives' marriage has beenobserved [33]. The marriage behavior did change onlywith the improvement of the transportation facilities afterWorld War II. Nevertheless, most of the exogamous mar-riage partners are from the Val Venosta even today (i.e.: noadmixture with Italian speaking populations).
Isolation still plays a role in these communities. Mining isno longer an industry in South Tyrol, and these villageshave no economic inducements for immigration. Tourismis the leading resource and agriculture is declining. Popu-lation is stable or slightly decreasing [22], and very limitedadmixture seems to be occurred.
The study of the history of Val Venosta population acrossthe centuries suggested that the Val Venosta area could beclassified as a secondary isolate, that is an isolate that, afterbeing detached from a larger population, "derived from a
Geographical location of the three microisolates with respect to Val Venosta, South Tyrol, and EuropeFigure 1Geographical location of the three microisolates with respect to Val Venosta, South Tyrol, and Europe. Val Ven-osta, indicated by the red circle, is a 75 km long valley extending west of Merano. The symbols ")(" indicate the most important Alpine passes connecting Val Venosta with other regions.
Page 3 of 15(page number not for citation purposes)

BMC Medical Genetics 2007, 8:29 http://www.biomedcentral.com/1471-2350/8/29
relatively small population sample, which then slowly expands,with very little recruitment from outside the group" [34].Within this region, we are studying in detail three isolatedunits, named microisolates.
MICROS-stage 1. Subject enrollment, study setting and data collectionInhabitants of the target villages were invited, by publicadvertisement (posters, newspapers, flyers), to attend ameeting with the community mayor, the local GPs, andthe scientists leading MICROS. The meeting was designedto give the population a clear understanding of the moti-vations and importance of MICROS, and to outline howthe study would be performed, including the risks andpossible benefits to research participants and the commu-nity. It was stressed in the meeting that participation wasto be on a purely voluntary basis. During the event, thefield team (a trained group comprising an expert physi-cian, a nurse, and one to three graduating medical stu-dents) was introduced to the population. A call center wasestablished for scheduling appointments. During theappointment, the study was explained by a physician, anda detailed information sheet and a form for the writteninformed consent were provided to each prospective par-ticipant. The information sheet gave details regarding theaims and nature of the study, specimen handling and stor-age. In particular, the information clearly stated the rightsof the participants to rigorous privacy measures (non-dis-closure clause of personal identifiable data, access by theparticipant to his/her personal data, right to change orupdate the personal information provided) and thestudy's opt-out clause, guaranteeing that every participantmay withdraw at any time from the study, for any reasonand without consequences. To implement this right, theproject has in place several information strategies to keepthe communities updated about the development of theresearch. The study was approved by the Ethics Commit-tee of the Autonomous Province of Bolzano. Every sixmonths the Committee is informed of any changes ordevelopments.
A standardized, interviewer-administered questionnairewas submitted to the participants. The questionnaire wasstructured as follows: i) reconstruction of family history(pedigree); ii) questions about cardiology, angiology,neurology, psychiatry, ophthalmology, endocrinology,respirology, dermatology, allergy, internal medicine,hematology, oncology, gynecology (for women partici-pants), and injuries due to accidents; iii) life-style expo-sures (such as smoking habits, alcohol consumption). Thetypical question occurring in any field of part ii of thequestionnaire was a closed question, allowing a yes/no/don't know response. If the interviewing physician hadknowledge of whether the subject was affected, this couldbe indicated, regardless the subject's answer. Subjects were
asked the year or age of onset of their condition, they wereasked to add a free text description of symptoms (to allowfor identification of specific diseases or syndromes) andthey were questioned to determine if any relative had thesame trait.
Subjects underwent anthropometric measurements (suchas height, weight and waist measurements), respiratoryand ultrasound-based bone densitometry tests, dioptricmeasurement of eyeglasses, ECG, and blood pressuremeasurements. A urine sample was collected from eachparticipant, and blood samples were taken for DNA andserum extraction, and for routine, biochemical analyses,including blood count/differential blood count, Quick,aPTT, ferritine, TSH, T4, cholesterol, HDL, LDL, triglycer-ides, electrolytes (K, Na, Ca), GPT, GOT, GGT, glucose,and creatinine. A serum sample for each participant wasprepared and stored at -80°C for subsequent analysis.
Genomic DNA was isolated from 20 ml of EDTA-treatedblood, according to standard procedures [35]. DNA of all1175 study participants was included in a genome-widescan performed by deCODE genetics, Iceland, using 1000microsatellite markers (STRs) evenly spaced across thegenome at 4 cM intervals. deCODE's genome scan markersets are based on the Applied Biosystems HD-5 LinkageMapping Set and on in-house designed and validatedmarkers originally selected from the Marshfield geneticmap. Map order and position were determined from thedeCODE Icelandic genetic map [36].
Genealogical information was reconstructed by means ofchurch records (baptisms, marriages, death records, andfamily books) reaching back to the early 17th century andcompleted with municipality lists starting in 1924. Westarted by reconstructing single families, that in a secondstep were linked together to form genealogical trees of thewhole villages. Genealogical data were managed usingCyrillic© 2.1 (CyrillicSoftware 2000, Wallingford, UK).
MICROS-stage 2. Specialist examination and genetic analysisSubjects are selected on the basis of a reported trait ofinterest, then they are asked for further examination. Asfar as possible, the information is extended to the pedigreeof the targeted subjects, after all the ethical aspects aretaken into account. In case of agreement, targeted patientsand relatives are diagnosed by an expert specialist. Aftercollecting the diagnoses, the genetics of the disease isunder study, starting with linkage analysis and subse-quent association studies.
Database structure and privacy issuesData are entered in an enterprise-level database on a web-base front end providing a wide range of tools for entering
Page 4 of 15(page number not for citation purposes)

BMC Medical Genetics 2007, 8:29 http://www.biomedcentral.com/1471-2350/8/29
and querying subject information. The database designwas implemented in accordance with the Italian privacylaw. Personal identifying data are physically separatedfrom the other data and secured by anonymising meth-ods. A unique code is given to each questionnaire and tothe specimens, which are stored in a secure room. A role-based access policy guards access to the database. This sys-tem ensures that all information on individuals – genea-logical, medical and genetic – is anonymised, identifiableonly by authorized persons, who are assigned differentlevels of access rights to the database according to theirrole in the research. Transaction logs are maintained torecord access to sensitive data. Servers are backed upweekly on tapes and stored off-site in a fire-proof safe.
Furthermore, a java-api for the visual analysis of our com-plex data was implemented. It provides all the necessaryfunctionality for the interactive exploration and analysisof our extended genealogies [37].
Statistical analysisFor the purposes of this study, birthplace was defined asthe village in which the subject's mother was living at thetime of the subject's birth. Educational level was classifiedas "no school attended", "primary school" (from 6 to 10year old), "middle school" (11–14), "vocational school"(usually 15–17), "secondary school" (15–19), and uni-versity. Subjects were asked for their occupations in the life:a maximum of four jobs could be reported, together withthe respective working periods. For the smoking habitsmeasure, subjects were defined as "never smokers" (neversmoked or smoked for less than 1 year), "past smokers"(stopped smoking more than 1 year before the date of theinterview) and "current smokers". Alcohol consumption fre-quency was classified as rarely (never or seldom), often (1to 4 times per week), daily.
Prevalence and 95% exact confidence intervals (95%CIs)were estimated for the main binary traits. For each trait,the probability of familial clustering (PFC) was assessedthrough the estimation of a chi-square statistic, whichcompares the observed with the expected distribution ofaffected siblings [38,39]. To this aim, we used the GAPsoftware package under R 2.3.1 [40]: due to the highdimensionality of the tables, the enumeration of all pos-sible scenarios was not possible, thus simulated p-valueswere estimated via Monte Carlo permutations (10 millionruns).
Inter-village homogeneity of subject's characteristics andstudy traits was assessed through chi-square test or F-test,depending on the variable being qualitative or quantita-tive. Homogeneity of quantitative traits between sex andage classes (18–30, 30–50, 50–70, 70+) was determinedusing the Kruskal-Wallis test.
Thanks to the collection of extended genealogical trees forthe three villages from church and municipal records, andfrom information on a small number of marriagesbetween two of the three villages, we were able to build apedigree including participants from all three villages. Theaccuracy of the pedigree structures was verified by check-ing available genotype data for Mendelian inconsistenciesusing Pedstats 0.6.8 [41].
The power of variance component linkage analysis todetect a QTL was assessed via simulation using the SOLARsoftware package [42]. A biallelic locus was assumed, withminor allele frequency ranging from 0.01 to 0.50; narrowheritability (h2) was assumed taking values from 0.10 to0.60; QTL-specific heritability ranged from 0.05 to h2,with 0.05 increments. Since the average inter-marker dis-tance was 4 cM, we assumed the marker be located at 0, 1or 2 cM, respectively, from the QTL. Simulations were rep-licated on pedigrees from each single village separatelyand on the whole pedigree after splitting it with the Greffasoftware [43]. A LOD-score cutoff of 2 was taken as indi-cation of suggestive linkage, a LOD-score of 3 was taken asa cutoff threshold for significant linkage [44].
ResultsData were collected from September 2002 to December2003. A total of 1175 volunteers were enrolled in thestudy, 509 from Stelvio (percentage of the total popula-tion: 48%), 351 from Martello (51%) and 315 from Val-lelunga (93%). We obtained screening questionnaire,clinical measurements and genotypic data from each par-ticipant.
Complete genealogy was reconstructed for 50,037 indi-viduals, starting from the participants and going back tothe 1600s (15 generations). When, for analysis issues, welimited the extension of the pedigree to five generations,10,630 individuals were included, grouped into 178 ped-igrees. One thousand, seven hundred and thirty-two sin-gletons were discarded because it was impossible toinclude them in any pedigree. One of the 178 pedigreesaccounted for 7049 subjects; in the remaining 177 pedi-grees, the median number of subjects per pedigree was 8(range: 3–85). Overall, mean inbreeding coefficient was0.000565 (standard deviation, sd = 0.004441) and meankinship coefficient was 0.001777 (sd = 0.014439). Whenconsidering village-specific pedigrees, for Vallelunga, Mar-tello, and Stelvio, the mean inbreeding coefficient was0.000432 (sd = 0.002213), 0.000172 (sd = 0.001367) and0.000112 (sd = 0.003625), respectively, and the meankinship coefficient was 0.002228 (sd = 0.014822),0.002317 (sd = 0.015773), and 0.000806 (sd =0.012370), respectively.
Page 5 of 15(page number not for citation purposes)

BMC Medical Genetics 2007, 8:29 http://www.biomedcentral.com/1471-2350/8/29
Participant's characteristicsThe birthplace of participants, their parents and grandpar-ents was recorded: 85% of subjects from Martello, 77%from Vallelunga and 59% from Stelvio were born from amother who was living in the same village where theywere residing at the time of the interview. When extendingthe area to the Val Venosta, we observed that the percent-age of people born in the valley was 89% (Stelvio) to 99%(Vallelunga). A similar pattern was observed for the par-ent's and grandparent's generations (Figure 2).
Distribution of subject's characteristics is reported inTable 1. Subjects ranged in age 18–88 years (mean = 46.0,sd = 16.3), 56.5% were female. The sex/age distributionwas homogeneous between the three villages.
Overall, 52.1% of participants went to school until theywere 13 years old, 17.4% completed secondary schooland 3.9% had a higher degree. The educational level wasnon homogeneous between villages (p = 0.0003). Onaverage, males had a higher level of education thanfemales (p-value < 0.001) and education was related toage (p-value < 0.001): secondary school or university wereattended by 3% of the 70+ year old participants, and by49% of the 18–30 year old participants.
OccupationOverall, 19.4% were employed in tourism, with noticea-ble differences between villages (24.9% in Stelvio, 15.0%in Vallelunga). In Vallelunga, the leading sector was agri-culture (18.8%). Many people (in particular women)worked at home as housewives. The second most com-mon category of occupation (13.9%) was manual trades,typical of small villages: bricklayers, carpenters, electri-cians, etc. Ninety-five percent of participants held thesame occupation throughout life.
Smoking habitsWe observed a differential distribution of smoking habitsbetween the two sexes (p < 0.001). Percentage of neversmokers was lower for younger males than for oldermales, but higher for younger females than older females.Overall the smoking prevalence decreased with decreasingage. Smoking habits were homogeneous across villages (p= 0.1635).
Alcohol consumptionEighty-one percent of women and 41% of men reportedan alcohol consumption frequency of never to seldom;27% of males and 7% of females reported daily frequency;males consumed alcohol more often than females (p <0.001). Alcohol consumption varied by age (p-value <0.001) and village (p-value = 0.0001).
Distribution of participant's birthplaces by village (Stelvio = S, Vallelunga = V, Martello = M) and generationFigure 2Distribution of participant's birthplaces by village (Stelvio = S, Vallelunga = V, Martello = M) and generation.
Sibling generation
V
VV V
M
M
M M
S
S
SS
0.5
0.6
0.7
0.8
0.9
1.0
Village Val Venosta South Tyrol Tyrol
Parent generation(average)
V
V
V V
M
M
MM
S
S
S S
0.5
0.6
0.7
0.8
0.9
1.0
Village Val Venosta South Tyrol Tyrol
Grandparent generation(average)
V
V
VV
M
M
M M
S
S
S
S
0.5
0.6
0.7
0.8
0.9
1.0
Village Val Venosta South Tyrol Tyrol
Page 6 of 15(page number not for citation purposes)

BMC Medical Genetics 2007, 8:29 http://www.biomedcentral.com/1471-2350/8/29
Qualitative traitsDistribution of qualitative traits, by village, is reported inTable 2.
Symptoms for cardiovascular disease (CVD)Elevated blood pressure, cardiac arrhythmias, and anginapectoris were the most common disorders; all the threewith a non-homogeneous distribution across villages.Prevalence of these symptoms steeply increased with age.The percentage of women reporting symptoms was higherthan males, but this difference varied with age. Cardiacdisease was reported by 2.5% (95%CI: 1.7–3.6%) of sub-jects, with 1.2% (95%CI: 0.6–2.0%) having had a myocar-dial infarction. Interestingly, 36 subjects reported heartdefects, such as heart failure and coronary heart disease(3.2%, 95%CI: 2.3–4.4%). The last three symptoms werehomogeneously distributed across villages. For all theCVD symptoms, Martello had the highest prevalence. Forsex-age specific distribution of the main CVD symptoms[see additional file 1].
Neurological traitsThe most frequent neurological symptoms were vertigoand migraine. Migraine prevalence was higher in Martello
and Vallelunga than in Stelvio (p = 0.0244). Symptomscompatible with carpal tunnel syndrome were reported by14.8% (95%CI: 12.7–17.1%), with Vallelunga havingmuch higher prevalence than the other two villages (p =0.0017). Prevalence of restless leg's syndrome (RLS) was12.8% (95%CI: 10.9–14.8%). Three percent (95%CI:2.0–4.0%) had vascular problems in the carotid arteries,1.7% had a stroke (95%CI: 1.0–2.6%) and 2.0% (95%CI:1.3–3.0%) suffered from epilepsy.
Symptoms related to the respiratory system, allergy and dermatologyAny episode of asthma in life was reported by 4.2%(95%CI: 3.1–5.5%) of subjects; 5.2% (95%CI: 4.0–6.6%)reported to have had chronic bronchitis and 8.3%(95%CI: 6.8–10.0%) reported hay fever. At younger agesasthma prevalence was higher in women than in men,with the percentage increasing with age until more malesthan females were affected by asthma after the age of 70.A similar pattern of increasing prevalence with age wasobserved for chronic bronchitis, but with females alwayshaving a higher prevalence than males. An almost paralleldecreasing trend was observed for hay fever [see addi-tional file 1]. Hypersensitivity to any insect was quitecommon (12.7%, 95%CI: 10.9–14.7%). Four percent
Table 1: Distribution of demographic and social characteristics of study participants by village
Socio-demographic characteristics All villages Stelvio Martello Vallelunga p*n % n % n % n %
Total 1175 100 509 44.2 351 29.4 315 26.4Sex Males 511 43.5 216 42.5 147 41.9 147 46.8 0.3639
Females 664 56.5 293 57.5 204 58.1 168 53.2Age Mean, sd 45.9 16.2 46.0 15.7 46.4 15.8 45.1 17.5 0.5907Education Elementary school 334 28.4 144 28.2 122 34.7 68 21.7 0.0003
Middle school 279 23.7 123 24.1 81 23 75 23.9Vocational school 312 26.6 118 23.2 92 26.1 102 32.5Secondary school 205 17.4 96 18.8 47 13.4 62 19.7University 46 3.9 29 5.7 10 2.8 7 2.2
Occupation Agriculture 132 11.3 96 18.8 54 15.4 12 3.9 < 0.0001Working at home 196 16.7 92 18.2 59 16.9 49 15.6Manual workers 163 13.9 55 10.8 55 15.7 46 14.5Working in a shop 65 5.5 29 5.7 17 4.9 18 5.8Tourism 228 19.4 76 15.0 53 15.1 78 24.9Industry 40 3.4 10 1.9 11 3.1 14 4.4Public employee 72 6.1 26 5.1 21 6.0 21 6.8Teacher 72 6.1 28 5.4 12 3.4 26 8.3Health care personnel 35 3.0 23 4.5 7 2.0 9 2.7Other jobs 110 9.4 39 7.6 42 12.0 27 8.7Not working 64 5.4 36 7.0 19 5.4 14 4.4
Smoking habits Never smoker 634 54.0 280 55 188 53.6 166 52.7 0.1635Past smoker 265 22.5 107 21.1 92 26.2 66 20.8Current smoker 276 23.4 121 23.8 71 20.2 83 26.5
Alcohol consumption Never to seldom 745 63.4 301 59.1 218 62.1 226 71.7 0.00011 to 4 days a week 244 20.8 132 25.9 62 17.7 50 15.9Daily 186 15.9 76 15 71 20.2 39 12.4
*P-value for the Chi Square test for association between subject's characteristics and village; as long as age was continuous, it was tested with an F-test
Page 7 of 15(page number not for citation purposes)

BMC Medical Genetics 2007, 8:29 http://www.biomedcentral.com/1471-2350/8/29
Table 2: Total and village specific prevalence of selected traits, with 95% Confidence Intervals (95%CI) and Fisher's exact test p-value
Qualitative Traits
All Stelvio Martello Vallelunga
Prev 95%CI Prev 95%CI Prev 95%CI Prev 95%CI p-value
Symptoms for cardiovascular
disease
Elevated Blood Pressure
17.7 (15.5, 20.0) 17.5 (14.3, 21.0) 24.8 (20.2, 29.8) 10.5 (7.4, 14.4) < 0.0001
Cardiac Arrhythmias
19.5 (17.3, 21.9) 16.8 (13.7, 20.2) 25.2 (20.7, 30.1) 17.8 (13.8, 22.5) 0.0067
Angina pectoris
16.7 (14.6, 19.0) 11.9 (9.2, 14.9) 26.5 (22.0, 31.4) 13.9 (10.3, 18.2) < 0.0001
Cardiac Disease
2.5 (1.7, 3.6) 1.9 (0.9, 3.5) 3.7 (2.0, 6.3) 2.2 (0.9, 4.5) 0.2476
Myocardial Infarction
1.2 (0.6, 2.0) 1.3 (0.5, 2.7) 1.4 (0.5, 3.3) 0.6 (0.1, 2.3) 0.6176
Heart Defects 3.2 (2.3, 4.4) 2.8 (1.6, 4.6) 4.0 (2.2, 6.6) 2.9 (1.3, 5.4) 0.5882
Neurological traits
Vertigo 32.0 (29.3, 34.7) 34.4 (30.3, 38.6) 27.5 (22.8, 32.5) 33.0 (27.9, 38.5) 0.0900
Migraine 20.8 (18.6, 23.2) 20.5 (17.1, 24.2) 25.1 (20.7, 30.0) 16.6 (12.6, 21.1) 0.0244
Carpal Tunnel Syndrome symptoms
14.8 (12.7, 17.1) 20.2 (16.2, 24.6) 12.0 (8.8, 15.9) 11.5 (8.2, 15.5) 0.0017
Restless Leg's Syndrome (RLS)
12.8 (10.9, 14.8) 13.3 (10.5, 16.6) 12.6 (9.3, 16.6) 12.0 (8.7, 16.1) 0.8729
Vascular Problems in the Carotid Arteries
2.9 (2.0, 4.0) 2.3 (1.2, 4.0) 3.5 (1.8, 6.0) 3.2 (1.5, 5.8) 0.5677
Stroke 1.7 (1.0, 2.6) 1.2 (0.4, 2.5) 2.6 (1.2, 4.8) 1.6 (0.5, 3.7) 0.2714
Epilepsy 2.0 (1.3, 3.0) 2.7 (1.5, 4.4) 2.0 (0.8, 4.1) 1.0 (0.2, 2.8) 0.2337
Symptoms related to the
respiratory system, allergy
and dermatology
Asthma 4.2 (3.1, 5.5) 4.8 (3.1, 7.0) 4.3 (2.4, 7.0) 3.2 (1.5, 5.8) 0.5566
Chronic Bronchitis
5.2 (4.0, 6.6) 5.1 (3.4, 7.4) 6.9 (4.4, 10.0) 3.5 (1.8, 6.2) 0.1519
Hay Fever 8.3 (6.8, 10.0) 9.4 (7.0, 12.2) 6.3 (4.0, 9.4) 8.6 (5.7, 12.3) 0.2586
Insect Hypersensitivity
12.7 (10.9, 14.7) 12.6 (9.9, 15.7) 12.4 (9.1, 16.3) 13.3 (9.8, 17.6) 0.9252
Eczema 3.9 (2.9, 5.1) 5.3 (3.6, 7.6) 3.5 (1.8, 6.0) 1.9 (0.7, 4.1) 0.0403
Psoriasis 3.2 (2.3, 4.4) 3.6 (2.2, 5.6) 2.0 (0.8, 4.1) 3.8 (2.0, 6.5) 0.3134
Other traits Diabetes 3.6 (2.6, 4.9) 3.5 (2.1, 5.4) 4.9 (2.9, 7.7) 2.5 (1.1, 4.9) 0.2680
Goitre 6.4 (5.1, 7.9) 5.9 (4.0, 8.3) 7.7 (5.2, 11.0) 5.7 (3.4, 8.9) 0.4865
Gout or Hyperuricemia
3.5 (2.5, 4.7) 3.6 (2.2, 5.6) 4.6 (2.6, 7.3) 1.9 (0.7, 4.1) 0.1470
Gallbladder Disease
10.7 (9.0, 12.9) 12.2 (9.5, 15.3) 10.9 (7.8, 14.6) 7.9 (5.2, 11.5) 0.1454
Page 8 of 15(page number not for citation purposes)

BMC Medical Genetics 2007, 8:29 http://www.biomedcentral.com/1471-2350/8/29
Ulcer 9.3 (7.7, 11.1) 10.7 (8.2, 13.7) 8.0 (5.4, 11.4) 8.3 (5.5, 11.9) 0.3280
Liver Disease 6.3 (5.0, 7.9) 6.1 (4.2, 8.6) 9.2 (6.4, 12.8) 3.5 (1.8, 6.2) 0.0102
Kidney Disease 13.6 (11.7, 15.7) 13.1 (10.3, 16.3) 14.7 (11.1, 18.8) 13.3 (9.8, 17.6) 0.7877
Anemia 6.5 (5.1, 8.0) 5.8 (3.9, 8.2) 8.5 (5.8, 12.0) 5.4 (3.2, 8.5) 0.2038
Table 2: Total and village specific prevalence of selected traits, with 95% Confidence Intervals (95%CI) and Fisher's exact test p-value
(95%CI: 2.9–5.1%) reported eczema and 3.2% (95%CI: old women, maximum median = 28 in 70+ year old
2.3–4.4%) psoriasis. Eczema prevalence was lower inMartello than in other villages (p = 0.0403).Other symptomsDiabetes prevalence was 3.6% (95%CI: 2.6–4.9%). Goitrewas present in 6.4% (5.1–7.9%) and gout or hyperuri-cemia in 3.5% (95%CI: 2.5–4.7%) of the sample. Elevenpercent (95%CI: 9.0–12.6%) reported gallbladder dis-ease, 9.3% (95%CI: 7.7–11.1%) had ulcer and 6.3%(95%CI:5.0–7.9%) had liver disease. Between village het-erogeneity of liver disease was observed (p = 0.0102). Kid-ney disease was reported by 13.6% (95%CI: 11.7–15.7%)and anemia by 6.5% (95%CI: 5.1–8.0%).
Probability of familial clusteringThe hypothesis of random distribution of a trait across thepedigree was rejected for all the traits related to CVD: thep-values ranged from < 0.000001 for elevated blood pres-sure to 0.0295 for cardiac arrhythmias. When assessingthe likelihood of familial clustering within village, certainheterogeneity was observed. Elevated blood pressure clus-tered in families in each of the three villages, but cardiacarrhythmias was significantly clustered in families only inMartello, and myocardial infarction as well. Familial clus-ters of myocardial infarction and heart defects wereobserved in Stelvio and Vallelunga, but not in Martello.Clusters of angina pectoris were assessed in Stelvio.Among the neurological traits, vascular problems at thelevel of carotid arteries had the strongest evidence offamilial clustering (p < 0.000001). Other traits clusteringin families were stroke, apoplexy, migraine, Alzheimer'sdisease, CTS-like symptoms, and RLS. Similar to the caseof CVDs, some inter-village differences were observed.While some symptoms were clustering in families in all ofthe three villages (CTS, RLS, and migraine), in other casesthis evidence was related to one single village (e.g.:stroke). Asthma, chronic bronchitis, and diabetes showedevidence of familial clustering in Stelvio and Martello.Ulcer and liver disease were clustering in families in Mar-tello and Vallelunga. No evidence of familial clusteringwas observed for kidney and gallbladder diseases. Moreresults are reported in Table 3.
Quantitative traitsBody Mass Index (BMI) differed between sexes andincreased with age (minimum median = 21 in 18–30 year
women). Waist circumference was related to age, withyoung males having bigger waist circumference thanyoung females. Among the other determinants for CVD,diastolic and systolic blood pressure increased with age(younger males had higher blood pressure than youngfemales, p < 0.00001). Cholesterol increased with age; inthe elderly, females had slightly higher values than males.Mean High Density Lipoprotein (HDL) was 53 mg/dl (sd= 13) in males, 64 mg/dl (sd = 14) in females. Low Den-sity Lipoproteins (LDL) increased with age: mean = 104mg/dl (sd = 32) in 18–30 year old subjects, mean = 136(sd = 31) in 70+ year old subjects. Triglycerides were het-erogeneous between groups (sex and age, p-value <0.000001), with median within 75–120 mg/dl. For distri-bution of CVD traits by age and sex [see additional file 2].
Within the CVD/kidney related traits, median bloodsodium level was 138–139 mEq/l and median potassiumlevel was in 4.2–4.3 mEq/l. Higher calcium levels wereobserved in younger subjects and in males. Hemoglobinwas higher in males than in females. Mean creatinine was0.98 mg/dl (sd = 0.15) in males and 0.79 mg/dl (sd =0.15) in females. Regarding the intermediate phenotypesfor renal function, the distribution of albuminuria wassimilar across sex-age groups (median within 6–7 mg/l,quartile range: 5–15), with a peak in 70+ year old males,who had the highest values (median = 11 mg/l, quartilerange: 8–23). Creatinuria was lower for the elderly and forfemales: maximum median was 188 mg/dl in 18–30 yearold males; minimum median was 74 mg/dl in 70+ yearold females.
Fasting glucose was sex-age related, with median within77–87 mg/dl; among 50+ year old subjects the variabilityincreased as well as hyperglycemia cases. Liver transami-nases (glutamic-oxaloacetic transaminase, GOT; gluta-mate pyruvate transaminase, GPT) and gamma glutamyl-transpeptidase (GGT) had similar patterns: before the ageof 70, they were higher in males than in females, afterwhich levels converged to similar values [see additionalfile 3].
Among anemia related traits, ferritin was higher for malesthan females: in males the median ranged in 109–142 ng/ml, with no age trend; in females the values increasedfrom a median of 22 in 18–30 year old subjects to 76 in
Page 9 of 15(page number not for citation purposes)

BMC Medical Genetics 2007, 8:29 http://www.biomedcentral.com/1471-2350/8/29
the 70+ year old participants (the variability increasing aswell). Mean corpuscular hemoglobin concentration(MCHC) decreased slightly with age (mean = 35 g/dl, sd= 0.8). Red cell distribution width (RDW) was constantuntil 50 year of age (median 12.3–12.4%), then increased(median ≥ 12.90% after 70 years). Mean corpuscular vol-ume (MCV) was homogeneous between groups (mean =88 fl, sd = 5).
Immune system indicators exhibited little heterogeneity.Neutrophils were homogeneous between sexes, withsmall variations and no age trend (median = 48.0–54.2%,with a peak in the 50–70 age class). Lymphocytes weredecreasing with age (women: median from 39.5 to 34.1%;men: 38.1 to 31.7%), with females having higher valuesthan males. Heterogeneity (p = 0.00156) but no age trend
was observed for monocytes, with males having alwayshigher values than females (p < 0.00001). Median per-centage of eosinophils was within 2.3–3.1, with signifi-cant sex-age heterogeneity. Basophils had median of 0.7%(interquartile range: 0.5–1.0).
Statistically significant, between-village heterogeneity wasobserved for all the studied traits but waist circumference,GOT, and several hematological parameters (WBC, HGB,MCV, RDW, PLT, MPV, PCT, and PDW).
Power of the pedigree for detecting linkageWe ran power simulation for the pooled pedigree (thethree villages together), for each one of the three villagesseparately, and for the total pedigree after pedigree split-ting.
Table 3: Probability of Familial Clustering: Monte Carlo simulated p-values for some selected traits in the three microisolates separately and on the pooled data
Traits Stelvio Martello Vallelunga Pooled data
Symptoms for cardiovascular diseaseElevated Blood Pressure 0.0157 0.0035 0.0006 < 0.0001Cardiac Arrhythmias 0.0651 0.0213 0.5690 0.0295Angina pectoris 0.0005 0.6729 0.2500 0.0061Cardiac Disease 0.0026 0.2319 0.0138 0.0000Myocardial Infarction 0.6235 0.0003 0.2571 0.0000Heart Defects 0.0016 0.6294 0.0279 0.0048
Neurological traits
Vertigo 0.0258 0.1831 0.2167 0.1750Migraine < 0.0001 0.3916 0.0005 < 0.0001Carpal Tunnel Syndrome symptoms 0.0027 0.0303 0.0000 < 0.0001Restless Leg's Syndrome (RLS) 0.0109 0.0646 0.0008 < 0.0001Vascular Problems in the Carotid Arteries 0.0027 0.0006 0.0025 < 0.0001Stroke 0.3660 0.0180 0.2482 0.0059Epilepsy 0.0427 0.7504 0.8637 0.1561
Symptoms related to the respiratory system, allergy and dermatology
Asthma 0.0001 0.0005 0.6379 < 0.0001Chronic Bronchitis 0.0133 0.0396 0.4507 0.0007Hay Fever 0.1542 0.0207 0.1592 0.0916Insect Hypersensitivity 0.0863 0.0237 0.2724 0.0620Eczema 0.4639 0.0138 0.0012 0.0011Psoriasis 0.0118 1.0000 0.3600 0.0148
Other traits
Diabetes 0.0001 0.0003 0.5314 < 0.0001Goitre 0.0605 0.1413 0.0420 0.0639Gout or Hyperuricemia 0.7653 0.0053 1.0000 0.0184Gallbladder Disease 0.2856 0.4940 0.0535 0.3141Ulcer 0.0616 0.0010 0.0001 < 0.0001Liver Disease 0.6466 0.0050 0.0144 0.0163Kidney Disease 0.9723 0.3993 0.2123 0.4940Anemia 0.1978 0.0211 0.2789 0.0070
Page 10 of 15(page number not for citation purposes)

BMC Medical Genetics 2007, 8:29 http://www.biomedcentral.com/1471-2350/8/29
When considering the pooled data, the power for localiz-ing a QTL was substantial (Figure 3). When the narrowheritability was above 30%, for a QTL-specific heritabilityof around 18%, the probability to find a suggestive LOD-score (that is, LOD ≥ 2) was 80%. The pedigree had 80%of power to find a LOD-score ≥ 3, the threshold for detect-ing linkage, for QTLs with 22% of specific heritability.
By pooling all the samples together, we were making theassumption that people from the three microisolatesshare the same variants with the same frequencies and,consequently, the same effects. In the case that the threemicroisolates are genetically differentiated, this assump-tion could be unrealistic. In addition, running a linkageanalysis on pedigrees with size 7049 could be unfeasiblefor computational power limitations. For these reasonswe ran more simulations for each microisolate separately.
We obtained the best results when analyzing the Valle-lunga pedigree, probably because the collection of the93% of the total inhabitants allowed a better pedigreereconstruction. In Figure 4 we report the power curve forthe Vallelunga pedigree when h2 = 0.60. Red and bluelines indicate the probability to find a LOD-score ≥ 3 and≥ 2, respectively. Power curves for markers placed 0 (con-tinuous line) and 2 (shaped line) cM apart from the QTLare plotted. The grey area within the curves indicates thedifferential power at different marker-QTL distances. Aslong as the average microsatellite spacing is 4 cM, it isworth noting that placing the marker at 2 cM from theQTL corresponds to the worst scenario, while 0 cM corre-sponds to the best one. Depending on location, weobserved 80% probability to find a LOD-score ≥ 3 forQTLs with specific heritability from 0.31 (0 cM) to 0.35 (2cM). When the QTL specific heritability is 25 (0 cM) to 28(2 cM), the Vallelunga pedigree has 80% power to find asuggestive linkage signal (LOD-score ≥ 2).
When simulating power for QTLs with different minorallele frequencies (MAF), we did not observe any particu-lar relationship between MAF and power.
Finally, we considered the option to analyze the pooleddataset after splitting the big pedigrees into smaller ones.Under the constraints of pedigree size ≥ 3 and kinshipcoefficient ≥ 0.0000125, we obtained the entire sample besplit into 78 pedigrees, with 4 to 397 subjects each (mean= 29, median = 13). The average mean kinship coefficientwas 0.13 (min = 0.02, max = 0.25). This approach had theadvantage to consider all the three villages together whileenormously reducing the computational time. Unfortu-nately, despite these major advantages, the estimatedpower was lower than considering the Vallelunga microi-solate alone, for all the described scenarios.
DiscussionMICROS is an extensive, population-based survey onthree German-speaking microisolates of South Tyrol, withthe goal of genetic characterization of the most relevanttraits for this population. In this paper we described thefirst stage of the survey, the study design and the data col-lection. As described in the methods section, a secondstage is necessary to study the traits in a greater detail and,possibly, to recruit subjects that did not participate in thefirst phase, so that families could be completed. The sec-ond assessment phase requires contacting the GPs and thetargeted families, in order to narrowly define specific phe-notypes. To narrow the phenotype definition, subjects arethen re-examined by specialists for the medical fields ofinterest.
Among the strengths of the MICROS study, the interdisci-plinary scientific team is one of the most important. Theinterconnection between historians and biologists-geneti-cists was the first step toward the targeting of the microi-solates. Moreover, geneticists, ethicists andepidemiologists had a key role in the design of the survey.The correct data processing is being guaranteed by the bio-informatics core. At the same time, research is ongoing onall of these fields.
After demonstrating the historical isolation of South Tyrolacross the centuries, we concluded that this isolation still
Power of the pooled pedigree to detect a LOD score ≥ 2 (dashed line) and = 3 (solid line)Figure 3Power of the pooled pedigree to detect a LOD score ≥ 2 (dashed line) and ≥ 3 (solid line).
0.05 0.10 0.15 0.20 0.25 0.30
0.2
0.4
0.6
0.8
1.0
QTL−specific heritability
Pow
er
Page 11 of 15(page number not for citation purposes)

BMC Medical Genetics 2007, 8:29 http://www.biomedcentral.com/1471-2350/8/29
plays an important role in the microisolates; the analysisof demographical records highlighted that the populationis very stable and the absolute number of inhabitantsalmost the same across the years [22]. We demonstratedthat participants were used to live in the same place wherethey were born (Figure 2). Between 90 and 100% of thesubjects were born within the Val Venosta, making thisaggregate like a closed community. This custom was con-firmed also for the parental and grandparental genera-tions. The preference for the birthplace had, in ourpopulation, higher rates than in other very isolated popu-lations such as those living in Sardinia [45]. The high per-centage of endogamy and of consanguineous unionsobserved in these villages [33] could be a consequence ofthis temporal closeness. The temporal stability was alsoreflected in the occupational status of the participants:95% never changed jobs within their lifetime. Peoplemoved very rarely from home and then only for shortperiods. In fact, the number of people with an universitydegree was negligible, perhaps also because the closestuniversity was over 100 km far away.
All these features lead us to consider the possibility ofupper Val Venosta itself as a secondary isolate [34] with
several isolated units (which we termed microisolates)characterised by an even higher extent of linkage disequi-librium [20].
We have listed a number of traits, classifying qualitativesymptoms by those categories which will be the most rel-evant for the involved clinicians. Interestingly, many com-mon traits showed a significant probability of familialclustering. On the one hand, we observed some traits clus-tering in families within all three villages (e.g.: elevatedblood pressure and some neurological traits); on the otherhand, familial clusters were observed only in one or twovillages as, for example, the case of angina pectoris,migraine, asthma, and liver disease. Familial clusteringcan be driven by allelic homogeneity or common lifestyle. The combination of these two factors must be care-fully evaluated for each single trait under study and sim-plyfing assumption on the allelic distribution cannot bedone.
Until now, we have not performed further investigationson the qualitative traits obtained through the screeningquestionnaire, because these traits are intended to serve asindicators of the possible presence of specific phenotypes,which will be investigated in the second stage of the study.At that stage, clinical diagnoses will be performed, andpedigrees will be reconstructed starting from affected sub-jects. This was the case for RLS which was assessed in agreater detail with clinical diagnosis by a movement dis-order specialist and successive linkage analysis [21]. Agenome-wide linkage scan was carried out, which led tothe discovery of a novel locus on chromosome 2q [16],thus suggesting the potential in our pedigree for detectingqualitative trait loci.
Regarding the power to detect QTLs, the MICROS studyhas a potentially high power when pooling data from thethree villages. Unfortunately, this potentially big power isbounded by the limited computational power of linkageanalysis softwares. Nevertheless, the power resulting fromthe Vallelunga pedigree of finding LOD-scores ≥ 2 isencouraging and suggests that the villages of Martello andStelvio could be considered as replication samples forcommon variants. The results also suggest that someefforts should be spent in second phase studies for pheno-typing and genotyping new individuals, related to the cur-rent participants, especially from Martello and Stelvio.Currently, this strategy is being pursued.
The collected sample will also serve for association stud-ies, while controlling for disease specific determinant andeffect confounders. We expect that the assessment of phe-notype-genotype association could be favoured by thehigh extent of linkage disequilibriumobserved in the vil-lages [20]. Methods taking into account the non inde-
Power of the Vallelunga pedigree to detect a LOD score ≥ 2 (blue line) and ≥ 3 (red line) when the marker is placed 0 (solid line) or 2 (dashed line) cM apart from the QTLFigure 4Power of the Vallelunga pedigree to detect a LOD score ≥ 2 (blue line) and ≥ 3 (red line) when the marker is placed 0 (solid line) or 2 (dashed line) cM apart from the QTL. The grey area indicates the intermediate power for markers placed between 0 and 2 cM from the QTL. Narrow heritabil-ity = 0.60.
0.0 0.1 0.2 0.3 0.4 0.5 0.6
0.0
0.2
0.4
0.6
0.8
1.0
QTL−specific heritability
pow
er
Page 12 of 15(page number not for citation purposes)
BMC Medical Genetics 2007, 8:29 http://www.biomedcentral.com/1471-2350/8/29
pendence of observations are now available, such asfamily based association methods [46] and general linearand non linear mixed effect models. So, especially forquantitative traits, genowide association scans would be avalid tool to detect causal alleles.
In the case of Vallelunga, where the sample was 93% of allthe inhabitants, data will allow researchers to assess theglobal health of population living in the village, withinteresting issues for public health. The observed hetero-geneity in the distribution of several qualitative and quan-titative traits suggests that, for both linkage andassociation studies, covariates such as age, sex and envi-ronmental factors should be taken into account. Adjust-ment or stratification may be required, depending on thespecific situation.
Within the neurological diseases, further assessment onthe RLS is ongoing. In addition, as one out of five partici-pants was affected by migraine, a new research branch onthis disease is to be started. At the moment, a question-naire for the assessment of migraine is under validation.In case of positive response, it will be used to assessmigraine in the study subjects. Subjects reportingmigraine have been targeted together with relatives whichdid not participate in the first phase. Following this, acomprehensive study of the genetic epidemiology of thisdisease and genome-wide linkage analyses will be under-taken.
Genome-wide scans will allow detailed investigation ofnephrological diseases, and of gall bladder disease, in par-ticular gall stone formation. Chronic kidney disease(CKD) will be studied by means of a quantitative trait, theglomerular filtration rate (GFR), obtained from serumand urine creatinine measurements. Epidemiology ofCKD will be explored particularly in the isolated village ofVallelunga, where we have a sample which is representa-tive of the population. Moreover, linkage analysis will beperformed together with an association study with envi-ronmental and genetic factors.
ConclusionOur approach, involving different scientific disciplines,seems an advantageous strategy to define and study smallpopulation isolates. Priming of the population and sup-port by the local GPs is a prerequisite to ensure a high par-ticipation rate. The isolation of the Alpine populationsthat we included in our study together with the extensivedata collection make the MICROS study a powerfulresource for the study of diseases in many fields of medi-cine. It is a promising strategy to ascertain extended pedi-grees ensuring a homogeneous environment. Linkagedisequilibrium and historical data from the South Tyrolregion, and the small isolated villages suggest that individ-
uals may share a small number of disease alleles. Recentsuccesses and simulation studies give us confidence thatour pedigrees can be valuable both in finding new candi-dates loci and to confirm existing candidate genes.
Competing interestsThe author(s) declare that they have no competing inter-ests.
Authors' contributionsAll authors contributed to drafting the manuscript. Themain text was written by PC, MF, and RA with commentsand amendments made by all authors. PPP was the studycoordinator. PPP, MT, VFD, PGK, and PI conceived of thestudy and participated in its design. DGA and BVC partic-ipated in the study design. PC and MF did the statisticalanalyses and power simulations. RA, DCU, GM and PGKcollected the genealogical data and helped in the draft ofthe historical paragraphs. MD, EC and FC wrote all theparts related to ethics, privacy issues and database admin-istration. SSA designed the database and the data entrytool, and was involved in the study design. DGA, BVC, PIand PS carried out the DNA extraction, quality controls,sample storage management, and the molecular geneticstudies. EA was responsible for data collection and data-base quality control. Clinical data were commented byWCJ and PPP. All authors have read and approved thefinal manuscript.
Additional material
Additional file 1Distribution of cardiovascular and respiratory traits. Prevalence of the main cardiovascular disease symptoms (upper panel) and respiratory traits (lower panel), by age and sex (solid line = females, dashed line = males), with 95% confidence intervals.Click here for file[http://www.biomedcentral.com/content/supplementary/1471-2350-8-29-S1.pdf]
Additional file 2Distribution of cardiovascular disease's determinants. Differential distri-bution of six quantitative traits by age and sex (males: gray; females: white). Age is reported on the x-axis.Click here for file[http://www.biomedcentral.com/content/supplementary/1471-2350-8-29-S2.pdf]
Additional file 3Distribution of liver-related intermediate phenotypes. Distribution of glutamic-oxaloacetic transaminase (GOT), glutamate pyruvate transam-inase (GPT) and gamma glutamyl-transpeptidase (GGT), by age and sex (gray = males, white = females).Click here for file[http://www.biomedcentral.com/content/supplementary/1471-2350-8-29-S3.pdf]
Page 13 of 15(page number not for citation purposes)
BMC Medical Genetics 2007, 8:29 http://www.biomedcentral.com/1471-2350/8/29
AcknowledgementsSpecial thanks to Prof. Jeanette Papp and Prof. Eric Sobel (Department of Human Genetics, David Geffen School of Medicine at UCLA) for their use-ful suggestions and for revising the manuscript. We thank Sabine Geiser for her inestimable help in the administrative organization of the study, Harald Wieser for the database quality control, Stefanie Senoner and Christine Ausserer for helping in the DNA extraction. We owe a debt of gratitude to all study participants; to the primary care practitioners of the three vil-lages: Stocker Raffaela, Waldner Stefan, Pizzecco Toni, Plangger Josef, Mar-cadent Ugo; and to the personnel of the Hospital of Silandro (Department of Laboratory Medicine) for their participation and collaboration in this research project. This study was supported by the Ministry of Health of the Autonomous Province of Bolzano and the South Tyrolean Sparkasse Foun-dation.
References1. Peltonen L, Palotie A, Lange K: Use of population isolates for
mapping complex traits. Nature reviews 2000, 1(3):182-190.2. Shifman S, Darvasi A: The value of isolated populations. Nature
genetics 2001, 28(4):309-310.3. Escamilla MA: Population isolates: their special value for locat-
ing genes for bipolar disorder. Bipolar disorders 2001,3(6):299-317.
4. Jorde LB: Linkage disequilibrium and the search for complexdisease genes. Genome research 2000, 10(10):1435-1444.
5. Jorde LB, Watkins WS, Kere J, Nyman D, Eriksson AW: Gene map-ping in isolated populations: new roles for old friends? Humanheredity 2000, 50(1):57-65.
6. Eaves IA, Merriman TR, Barber RA, Nutland S, Tuomilehto-Wolf E,Tuomilehto J, Cucca F, Todd JA: The genetically isolated popula-tions of Finland and Sardinia may not be a panacea for link-age disequilibrium mapping of common disease genes.Nature genetics 2000, 25(3):320-323.
7. Zavattari P, Deidda E, Whalen M, Lampis R, Mulargia A, Loddo M,Eaves I, Mastio G, Todd JA, Cucca F: Major factors influencinglinkage disequilibrium by analysis of different chromosomeregions in distinct populations: demography, chromosomerecombination frequency and selection. Human molecular genet-ics 2000, 9(20):2947-2957.
8. Sheffield VC: Use of isolated populations in the study of ahuman obesity syndrome, the Bardet-Biedl syndrome. Pedi-atric research 2004, 55(6):908-911.
9. Heutink P, Oostra BA: Gene finding in genetically isolated pop-ulations. Human molecular genetics 2002, 11(20):2507-2515.
10. de la Chapelle A: Disease gene mapping in isolated human pop-ulations: the example of Finland. Journal of medical genetics 1993,30(10):857-865.
11. Angius A, Melis PM, Morelli L, Petretto E, Casu G, Maestrale GB,Fraumene C, Bebbere D, Forabosco P, Pirastu M: Archival, demo-graphic and genetic studies define a Sardinian sub-isolate asa suitable model for mapping complex traits. Human genetics2001, 109(2):198-209.
12. Aulchenko YS, Heutink P, Mackay I, Bertoli-Avella AM, Pullen J, Vaes-sen N, Rademaker TA, Sandkuijl LA, Cardon L, Oostra B, van DuijnCM: Linkage disequilibrium in young genetically isolatedDutch population. European Journal of Human Genetics 2004,12(7):527-534.
13. Vitart V, Biloglav Z, Hayward C, Janicijevic B, Smolej-Narancic N,Barac L, Pericic M, Klaric IM, Skaric-Juric T, Barbalic M, Polasek O,Kolcic I, Carothers A, Rudan P, Hastie N, Wright A, Campbell H,Rudan I: 3000 years of solitude: extreme differentiation in theisland isolates of Dalmatia, Croatia. European Journal of HumanGenetics 2006, 14(4):478-487.
14. Bulayeva KB, Glatt SJ, Bulayev OA, Pavlova TA, Tsuang MT:Genome-wide linkage scan of schizophrenia: a cross-isolatestudy. Genomics 2007, 89(2):167-177.
15. Mueller JC, Lohmussaar E, Magi R, Remm M, Bettecken T, Lichtner P,Biskup S, Illig T, Pfeufer A, Luedemann J, Schreiber S, Pramstaller P,Pichler I, Romeo G, Gaddi A, Testa A, Wichmann HE, Metspalu A,Meitinger T: Linkage disequilibrium patterns and tagSNPtransferability among European populations. American journalof human genetics 2005, 76(3):387-398.
16. Pichler I, Marroni F, Volpato CB, Gusella JF, Klein C, Casari G, DeGrandi A, Pramstaller PP: Linkage analysis identifies a novellocus for restless legs syndrome on chromosome 2q in aSouth Tyrolean population isolate. American journal of humangenetics 2006, 79(4):716-723.
17. Stenico M, Nigro L, Bertorelle G, Calafell F, Capitanio M, Corrain C,Barbujani G: High mitochondrial sequence diversity in linguis-tic isolates of the Alps. American journal of human genetics 1996,59(6):1363-1375.
18. Izzi C, Sanna-Cherchi S, Prati E, Belleri R, Remedio A, Tardanico R,Foramitti M, Guerini S, Viola BF, Movilli E, Beerman I, Lifton R, LeoneL, Gharavi A, Scolari F: Familial aggregation of primary glomer-ulonephritis in an Italian population isolate: Valtrompiastudy. Kidney international 2006, 69(6):1033-1040.
19. Pichler I, Mueller JC, Stefanov SA, De Grandi A, Beu Volpato C, Ping-gera GK, Mayr A, Ogriseg M, Ploner F, Meitinger T, Pramstaller PP:Genetic structure in contemporary South Tyrolean isolatedpopulations revealed by the analysis of Y chromosome,mtDNA and Alu polymorphisms. Human Biology 2006,78:441-464.
20. Marroni F, Pichler I, De Grandi A, Beu Volpato C, Vogl FD, PinggeraGK, Bailey-Wilson JE, Pramstaller PP: Population isolates in SouthTyrol and their value for genetic dissection of complex dis-eases. Annals of human genetics 2006, 70(6):812-821.
21. Vogl FD, Pichler I, Adel S, Pinggera GK, Bracco S, De Grandi A, Vol-pato CB, Aridon P, Mayer T, Meitinger T, Klein C, Casari G, Pram-staller PP: Restless legs syndrome: epidemiological andclinicogenetic study in a South Tyrolean population isolate.Movement Disorders 2006, 21(8):1189-1195.
22. ISTAT (National Institute of Statistics): accessed on September 19th,2006 [http://demo.istat.it/index_e.html].
23. Dondio W: Il Trentino-Alto Adige e le zone limitrofe dalleorigini all'età del rame. In La regione atesina nella preistoria Bolzano, Raetia; 1995.
24. Spindler K: The man in the ice. The preserved body of a Neo-lithic man reveals the secrets of the Stone Age. London , Wei-denfeld and Nicolson; 1994.
25. Finsterwalder K: Die hochmittelalterliche Siedlung in Südtirolim Spiegel der deutschen Umformung der Örtlichkeitsna-men. Tiroler Heimat 1962, 26:.
26. Stolz O: Das Verzeichnis der Tiroler Landesfürsten im Inntalund Vintschgau vom Jahre 1427. In Quellen zur Steuer-, Bev-ölkerungs- und Sippengeschichte des Landes Tirol im 13, 14 und 15 Jahr-hundert Volume 44. Innsbruck , Wagner; 1939:159-201.
27. Goswinus: Sammlung von Dokumenten und Urkunden desKlosters Marienberg von der Gründung bis 1390. Bolzano ,Athesia; 1996.
28. Demetz K: Die Pest in Tirol in den Jahren 1540-1580. Innsbruck, Universität Innsbruck; 1987.
29. Pinggera GK: Armutswanderungen in Tirol. In Pässe, Übergänge,Hospize Südtirol am Schnittpunkt der Alpentransversalen in Geschichte undGegenwart Lana , Tappeiner; 1999:93-132.
30. Fischer K: Die Bevölkerung im Vinschgau und in seinenNebentälern seit Ende des 18. Jahrhunderts. Der Schlern 1974,48:S555-67.
31. ASTAT (Bolzano Provincial Insitute of Statistics): accessed on Septem-ber 19th, 2006 [http://www.provincia.bz.it/astat/censimenti/cens_popolaz.htm].
32. Steininger R: South Tyrol- a minority conflict of the TwentiethCentury. New Brunswick , Transaction Publishers; 2003.
33. Riegler A Marroni, F, Pattaro, C, Gueresi, P, Pramstaller, PP: Isola-tion and marriage patterns in four South Tyrolean villages(Italy) from 1781 to 1920. submitted 2007.
34. Neel J: Minority Populations as Genetic Isolates: The Inter-pretation of Inbreeding Results. In Minority Populations Edited by:Bittles AH, Roberts DF. Houndmills, Basingstoke, Hampshire andLondon , The MacMillan Press; 1992.
35. Sambrook J, Fritsch EF, Maniatis T: Molecular cloning: A labora-tory manual. Cold Spring Harbor, NY , Cold Spring Harbor Labo-ratory Press; 1989.
36. Kong A, Gudbjartsson DF, Sainz J, Jonsdottir GM, Gudjonsson SA,Richardsson B, Sigurdardottir S, Barnard J, Hallbeck B, Masson G, Shl-ien A, Palsson ST, Frigge ML, Thorgeirsson TE, Gulcher JR, StefanssonK: A high-resolution recombination map of the humangenome. Nature genetics 2002, 31(3):241-247.
Page 14 of 15(page number not for citation purposes)
http://www.ncbi.nlm.nih.gov/entrez/query.fcgi?cmd=Retrieve&db=PubMed&dopt=Abstract&list_uids=8230163
http://www.ncbi.nlm.nih.gov/entrez/query.fcgi?cmd=Retrieve&db=PubMed&dopt=Abstract&list_uids=8230163
http://www.ncbi.nlm.nih.gov/entrez/query.fcgi?cmd=Retrieve&db=PubMed&dopt=Abstract&list_uids=8940282
BMC Medical Genetics 2007, 8:29 http://www.biomedcentral.com/1471-2350/8/29
Publish with BioMed Central and every scientist can read your work free of charge
"BioMed Central will be the most significant development for disseminating the results of biomedical research in our lifetime."
Sir Paul Nurse, Cancer Research UK
Your research papers will be:
available free of charge to the entire biomedical community
peer reviewed and published immediately upon acceptance
cited in PubMed and archived on PubMed Central
yours — you keep the copyright
Submit your manuscript here:http://www.biomedcentral.com/info/publishing_adv.asp
BioMedcentral
37. Fuchsberger C, Forer L: PedVizApi: A Java-Api for the 2D and2.5D Visual Analysis of Complex Pedigrees. In Technical reportVolume EURAC-TR-2006-12.. Bolzano , Institute of Genetic Medicine,EURAC-Research; 2006.
38. Yu C, Zelterman D: Exact inference for family disease clusters.Communications in Statistics - Theory and Methods 2001, 30:2293-2305.
39. Yu C, Zelterman D: Statistical inference for familial diseaseclusters. Biometrics 2002, 58:481-491.
40. The R Development Core Team: R: A Language and Environ-ment for Statistical Computing. Wien, Austria , R Foundationfor Statistical Computing; 2006.
41. Wigginton JE, Abecasis GR: PEDSTATS: descriptive statistics,graphics and quality assessment for gene mapping data. Bio-informatics (Oxford, England) 2005, 21(16):3445-3447.
42. Almasy L, Blangero J: Multipoint quantitative-trait linkage anal-ysis in general pedigrees. American journal of human genetics 1998,62(5):1198-1211.
43. Falchi M, Forabosco P, Mocci E, Borlino CC, Picciau A, Virdis E, Per-sico I, Parracciani D, Angius A, Pirastu M: A genomewide searchusing an original pairwise sampling approach for large gene-alogies identifies a new locus for total and low-density lipo-protein cholesterol in two genetically differentiated isolatesof Sardinia. American journal of human genetics 2004,75(6):1015-1031.
44. Lander E, Kruglyak L: Genetic dissection of complex traits:guidelines for interpreting and reporting linkage results.Nature genetics 1995, 11(3):241-247.
45. Pilia G, Chen WM, Scuteri A, Orru M, Albai G, Dei M, Lai S, Usala G,Lai M, Loi P, Mameli C, Vacca L, Deiana M, Olla N, Masala M, Cao A,Najjar SS, Terracciano A, Nedorezov T, Sharov A, Zonderman AB,Abecasis GR, Costa P, Lakatta E, Schlessinger D: Heritability of car-diovascular and personality traits in 6,148 Sardinians. PLoSgenetics 2006, 2(8):e132.
46. McQueen MB, Weiss S, Laird NM, Lange C: On the parsing of sta-tistical information in family-based association testing.Nature genetics 2007, 39(3):281-282.
Pre-publication historyThe pre-publication history for this paper can be accessedhere:
http://www.biomedcentral.com/1471-2350/8/29/prepub
Page 15 of 15(page number not for citation purposes)
http://www.ncbi.nlm.nih.gov/entrez/query.fcgi?cmd=Retrieve&db=PubMed&dopt=Abstract&list_uids=9545414
http://www.ncbi.nlm.nih.gov/entrez/query.fcgi?cmd=Retrieve&db=PubMed&dopt=Abstract&list_uids=9545414
http://www.ncbi.nlm.nih.gov/entrez/query.fcgi?cmd=Retrieve&db=PubMed&dopt=Abstract&list_uids=7581446