The fluvial geochemistry, contributions of silicate, carbonate and saline–alkaline components to...
26
This article appeared in a journal published by Elsevier. The attached copy is furnished to the author for internal non-commercial research and education use, including for instruction at the authors institution and sharing with colleagues. Other uses, including reproduction and distribution, or selling or licensing copies, or posting to personal, institutional or third party websites are prohibited. In most cases authors are permitted to post their version of the article (e.g. in Word or Tex form) to their personal website or institutional repository. Authors requiring further information regarding Elsevier’s archiving and manuscript policies are encouraged to visit: http://www.elsevier.com/copyright
Transcript of The fluvial geochemistry, contributions of silicate, carbonate and saline–alkaline components to...

This article appeared in a journal published by Elsevier. The attachedcopy is furnished to the author for internal non-commercial researchand education use, including for instruction at the authors institution
and sharing with colleagues.
Other uses, including reproduction and distribution, or selling orlicensing copies, or posting to personal, institutional or third party
websites are prohibited.
In most cases authors are permitted to post their version of thearticle (e.g. in Word or Tex form) to their personal website orinstitutional repository. Authors requiring further information
regarding Elsevier’s archiving and manuscript policies areencouraged to visit:
http://www.elsevier.com/copyright

Author's personal copy
The fluvial geochemistry, contributions of silicate, carbonate andsaline–alkaline components to chemical weathering flux and
controlling parameters: Narmada River (Deccan Traps), India
Harish Gupta a,b,⇑, Govind J. Chakrapani a, Kandasamy Selvaraj c, Shuh-Ji Kao b,c
a Department of Earth Sciences, Indian Institute of Technology, Roorkee 247667, Indiab State Key Laboratory of Marine Environmental Science, Xiamen University, Xiamen 361005, China
c Research Center for Environmental Changes, Academia Sinica, Nankang, Taipei 115, Taiwan
Received 29 April 2010; accepted in revised form 2 November 2010; available online 17 November 2010
Abstract
The Narmada River in India is the largest west-flowing river into the Arabian Sea, draining through the Deccan Traps, oneof the largest flood basalt provinces in the world. The fluvial geochemical characteristics and chemical weathering rates(CWR) for the mainstream and its major tributaries were determined using a composite dataset, which includes four phasesof seasonal field (spot) samples (during 2003 and 2004) and a decade-long (1990–2000) fortnight time series (multiannual)data. Here, we demonstrate the influence of minor lithologies (carbonates and saline–alkaline soils) on basaltic signature,as reflected in sudden increases of Ca2+–Mg2+ and Na+ contents at many locations along the mainstream and in tributaries.Both spot and multiannual data corrected for non-geological contributions were used to calculate the CWR. The CWR forspot samples (CWRspot) vary between 25 and 63 ton km�2 year�1, showing a reasonable correspondence with the CWRestimated for multiannual data (CWRmulti) at most study locations. The weathering rates of silicate (SilWR), carbonate(CarbWR) and evaporite (Sal–AlkWR) have contributed �38–58, 28–45 and 8–23%, respectively to the CWRspot at differentlocations. The estimated SilWR (11–36 ton km�2 year�1) for the Narmada basin indicates that the previous studies onthe North Deccan Rivers (Narmada–Tapti–Godavari) overestimated the silicate weathering rates and associated CO2
consumption rates. The average annual CO2 drawdown via silicate weathering calculated for the Narmada basin is�0.032 � 1012 moles year�1, suggesting that chemical weathering of the entire Deccan Trap basalts consumes approximately2% (�0.24 � 1012 moles) of the annual global CO2 drawdown. The present study also evaluates the influence of meteorolog-ical parameters (runoff and temperature) and physical weathering rates (PWR) in controlling the CWR at annual scale acrossthe basin. The CWR and the SilWR show significant correlation with runoff and PWR. On the basis of observed wide tem-poral variations in the CWR and their close association with runoff, temperature and physical erosion, we propose that theCWR in the Narmada basin strongly depend on meteorological variability. At most locations, the total denudation rates(TDR) are dominated by physical erosion, whereas chemical weathering constitutes only a small part (<10%). Thus, the CWRto PWR ratio for the Narmada basin can be compared with high relief small river watersheds of Taiwan and New Zealand(1–5%) and large Himalayan Rivers such as the Brahmaputra and the Ganges (8–9%).� 2010 Elsevier Ltd. All rights reserved.
1. INTRODUCTION
The first known effort to understand the links betweenatmospheric gases and earth surface processes was madeby Ebelmen in 1845 (Berner and Maasch, 1996). Later,Urey (1952) summarized the silicate–carbonate cycle in
0016-7037/$ - see front matter � 2010 Elsevier Ltd. All rights reserved.
doi:10.1016/j.gca.2010.11.010
⇑ Corresponding author at: State Key Laboratory of MarineEnvironmental Science, Xiamen University, Xiamen 361005,China. Tel.: +86 592 2182977; fax: +86 592 2184101.
E-mail address: [email protected] (H. Gupta).
www.elsevier.com/locate/gca
Available online at www.sciencedirect.com
Geochimica et Cosmochimica Acta 75 (2011) 800–824
Author's personal copy
the form of chemical reactions, popularly known asEbelmen–Urey reaction. However, most interesting partsof research on fluvial geochemistry have emerged after theseminal work by Garrels and Mackenzie (1967). Since then,the low temperature geochemical processes such as denuda-tion of continents and associated CO2 consumption havereceived wide attention due to their active role in regulatingthe global carbon cycle via silicate–carbonate sub-cycles.Walker et al. (1981) hypothesized a negative feedbackmechanism for long-term stabilization of the Earth’s sur-face temperature and argued for a direct dependency ofcontinental silicate weathering on climatic factors. Berneret al. (1983) further established that it is not the weatheringof carbonates that affect the carbon cycle, but the weather-ing of silicates in particular.
Chemical weathering of silicate rocks is thus consideredto be the principal process of removing CO2 from the atmo-sphere on geological timescale (Berner, 1992). A compara-tive study on a number of small watersheds dominated bysingle rock type has shown that basalts tend to weathermore easily than other crystalline silicate rocks (Meybeck,1987). For this reason, a number of field and laboratoryinvestigations have been conducted for understanding thedifferent aspects of basalt weathering (Dessert et al., 2009and reference therein). These studies both at the watershedand the global scales provided a quantitative picture of ba-salt weathering in different climates by determining the ma-jor controlling parameters and emphasized the importantrole of basalt weathering on the global climate (Gislasonet al., 1996, 2009; Louvat and Allegre, 1997, 1998; Dessertet al., 2001, 2003, 2009; Das et al., 2005; Pokrovsky et al.,2005; Vigier et al., 2005; Rad et al., 2006; Louvat et al.,2008). It is now well established that basalts are the silicaterocks with the highest weathering rates and therebyresponsible for disproportionate CO2 drawdown from theatmosphere (Dessert et al., 2003). Dessert et al. (2003)estimated that alteration of continental basalts accountfor �30% of total CO2 consumption. Further while therates of dissolution of silicate minerals in natural environ-ment are known to be very slow (Wollast and Chou,1988), a study in response to the recent climate change onthe Iceland Basalts (Gislason et al., 2009) shows that theweathering rates may change over much shorter timescales.Such information highlights the imperative need for a betterunderstanding the role of climatic factors on the chemicalweathering processes on shorter timescales.
The Narmada River in India flows largely through theDeccan Traps and the river basin is influenced by mon-soon-dominated tropical climate, serving as an ideal loca-tion to study the chemical weathering processes and theircontrolling factors. Deccan Traps are one of the largestbasaltic provinces on the Earth’s surface with an area of�0.5 � 105 km2. Based on the study of major elements,strontium and 87Sr/86Sr isotopic ratios of the large riversflowing through the North Deccan Traps, Dessert et al.(2001) suggested that the chemical weathering rate andassociated CO2 consumption are relatively high comparedto other basaltic regions. Their results indicate that runoffand temperature are the two main parameters that controlthe CO2 consumption during basalt weathering. Dessert
et al. (2001) also demonstrated the important control ex-erted by emplacement and weathering of large basalticprovinces on the geochemical and climatic changes onEarth. Das et al. (2005) reported a new dataset for theKrishna and the Western Ghat Rivers in India and showedthat CO2 consumption rate for the Deccan Traps in theirstudy area was two to three times lower than that reportedfor the North Deccan Rivers by Dessert et al. (2001).Although a considerable amount of published data onwater chemistry, chemical and silicate weathering ratesare available for the Deccan Rivers (Dessert et al., 2001,2003; Das et al., 2005; Sharma and Subramanian, 2008;Jha et al., 2009), the present contribution is a step forwardfor several reasons: First, the result and discussion pre-sented here are drawn from a composite dataset of surfacewater composition from field sampling done during 2003and 2004 (hereafter referred to as spot samples) as well asa decade-long (1990–2000) fortnight time-series data (here-after referred to as multiannual data). This approach pro-vides an opportunity for understanding the geochemicalprocesses at greater temporal scales. Second, availabilityof daily water discharge and annual runoff data facilitateto understand the influence of water discharge on solutetransportation, to calculate discharge weighted CWR andto access influence of runoff values on the CWR estima-tions. Given the large aerial extent of the Deccan Traps,the paucity of runoff data at spatial and temporal scalesproved to be a major gap in precise estimation of theCWR in most of the earlier studies (Dessert et al., 2001;Das et al., 2005; Jha et al., 2009). Third, among the esti-mated CWR, contributions from silicate, carbonate andsaline–alkaline components were separated. K-normalizedmolar ratios of Mg2+ derived from flood sediments wereused to obtain the Mg content of silicate component (Mgsil)from dissolved load and thus calculated Mgsil used to char-acterize Na+ and Ca2+ from river water. Fourth, CO2 con-sumption rates in silicate weathering for the Narmada basinwere estimated and used to revise annual CO2 drawdownby the entire Deccan Trap basalts. Finally, the presentstudy attempts to evaluate coupling of the CWR and itscomponents with climatic parameters and sediment erosionat annual scale. Thus, the present contribution provides abetter scope and bridges the knowledge gap in terms ofevaluating the influence of non-silicate lithologies over ba-salt signature, runoff in CWR estimation and to accessthe relationship of chemical/silicate weathering with meteo-rological parameters and sediment erosion in the DeccanTrap region.
2. STUDY AREA AND SAMPLING LOCATIONS
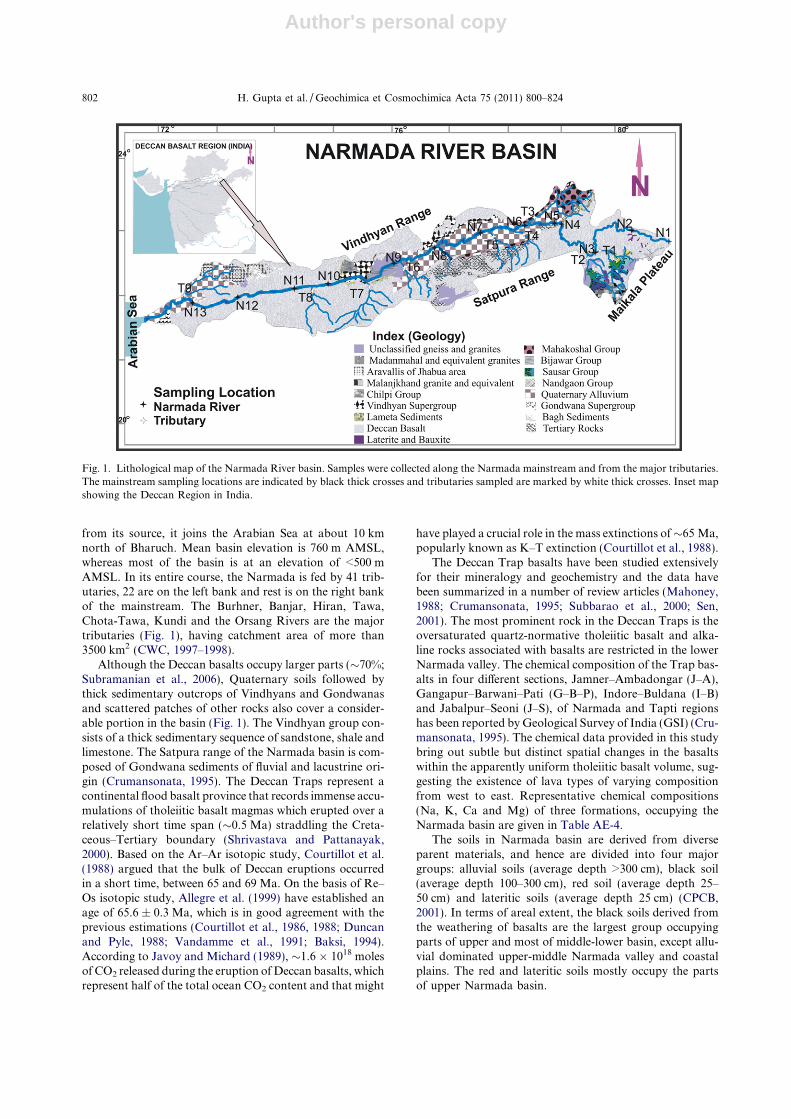
The Narmada is the largest west-flowing peninsularriver, ranks seventh in terms of water discharge(�38 km3 year�1) and drainage area (98,796 km2) in Indiansubcontinent. The river rises as groundwater seepage fromNarmada Kund (1057 m above mean sea level-AMSL) atAmarkantak on the eastern fringe of the Maikala Plateau(Fig. 1). Thereafter, the river flows mostly through theDeccan Traps, separating the Vindhyan and the Satpurarange of hills on both sides and after traversing 1312 km
Chemical weathering of basalts in the Narmada River basin, India 801
Author's personal copy
from its source, it joins the Arabian Sea at about 10 kmnorth of Bharuch. Mean basin elevation is 760 m AMSL,whereas most of the basin is at an elevation of <500 mAMSL. In its entire course, the Narmada is fed by 41 trib-utaries, 22 are on the left bank and rest is on the right bankof the mainstream. The Burhner, Banjar, Hiran, Tawa,Chota-Tawa, Kundi and the Orsang Rivers are the majortributaries (Fig. 1), having catchment area of more than3500 km2 (CWC, 1997–1998).
Although the Deccan basalts occupy larger parts (�70%;Subramanian et al., 2006), Quaternary soils followed bythick sedimentary outcrops of Vindhyans and Gondwanasand scattered patches of other rocks also cover a consider-able portion in the basin (Fig. 1). The Vindhyan group con-sists of a thick sedimentary sequence of sandstone, shale andlimestone. The Satpura range of the Narmada basin is com-posed of Gondwana sediments of fluvial and lacustrine ori-gin (Crumansonata, 1995). The Deccan Traps represent acontinental flood basalt province that records immense accu-mulations of tholeiitic basalt magmas which erupted over arelatively short time span (�0.5 Ma) straddling the Creta-ceous–Tertiary boundary (Shrivastava and Pattanayak,2000). Based on the Ar–Ar isotopic study, Courtillot et al.(1988) argued that the bulk of Deccan eruptions occurredin a short time, between 65 and 69 Ma. On the basis of Re–Os isotopic study, Allegre et al. (1999) have established anage of 65.6 ± 0.3 Ma, which is in good agreement with theprevious estimations (Courtillot et al., 1986, 1988; Duncanand Pyle, 1988; Vandamme et al., 1991; Baksi, 1994).According to Javoy and Michard (1989), �1.6 � 1018 molesof CO2 released during the eruption of Deccan basalts, whichrepresent half of the total ocean CO2 content and that might
have played a crucial role in the mass extinctions of�65 Ma,popularly known as K–T extinction (Courtillot et al., 1988).
The Deccan Trap basalts have been studied extensivelyfor their mineralogy and geochemistry and the data havebeen summarized in a number of review articles (Mahoney,1988; Crumansonata, 1995; Subbarao et al., 2000; Sen,2001). The most prominent rock in the Deccan Traps is theoversaturated quartz-normative tholeiitic basalt and alka-line rocks associated with basalts are restricted in the lowerNarmada valley. The chemical composition of the Trap bas-alts in four different sections, Jamner–Ambadongar (J–A),Gangapur–Barwani–Pati (G–B–P), Indore–Buldana (I–B)and Jabalpur–Seoni (J–S), of Narmada and Tapti regionshas been reported by Geological Survey of India (GSI) (Cru-mansonata, 1995). The chemical data provided in this studybring out subtle but distinct spatial changes in the basaltswithin the apparently uniform tholeiitic basalt volume, sug-gesting the existence of lava types of varying compositionfrom west to east. Representative chemical compositions(Na, K, Ca and Mg) of three formations, occupying theNarmada basin are given in Table AE-4.
The soils in Narmada basin are derived from diverseparent materials, and hence are divided into four majorgroups: alluvial soils (average depth >300 cm), black soil(average depth 100–300 cm), red soil (average depth 25–50 cm) and lateritic soils (average depth 25 cm) (CPCB,2001). In terms of areal extent, the black soils derived fromthe weathering of basalts are the largest group occupyingparts of upper and most of middle-lower basin, except allu-vial dominated upper-middle Narmada valley and coastalplains. The red and lateritic soils mostly occupy the partsof upper Narmada basin.
Fig. 1. Lithological map of the Narmada River basin. Samples were collected along the Narmada mainstream and from the major tributaries.The mainstream sampling locations are indicated by black thick crosses and tributaries sampled are marked by white thick crosses. Inset mapshowing the Deccan Region in India.
802 H. Gupta et al. / Geochimica et Cosmochimica Acta 75 (2011) 800–824
Author's personal copy
The Narmada basin is dominated by humid tropical cli-mate. Maximum (average) temperature is observed duringMay (40–42 �C) and minimum (average) is recorded inJanuary (8–13 �C). The majority of precipitation in the basintakes place during the southwest monsoon season frommiddle June to October, accounting for approximately85–95% of the annual precipitation. Approximately 60%of the annual rainfall is received during July and August.The mean annual rainfall in the basin is approximately1178 mm, though the rainfall distribution is not uniformand varies between 600 and 1800 mm.
Approximately 60%, 35% and 5% of the basin area areunder arable land, forest cover and scrub-grassland, respec-tively. The hill slopes with thin soil cover and dissected pla-teaus are main areas under forest cover. The upper, middleand lower plains are broad, fertile and mostly cultivated(CPCB, 2001). A number of dams have been constructedon the Narmada River and its tributaries, mainly for thepurpose of electric power generation, irrigation and forcontrolling floods. The Rani Avantibai Sagar (Bargi dam)at Jamtara, Indra Sagar (IS dam) at Punasa and the SardarSarovar (SS dam) few km upstream of Garudeshwar arethree major reservoirs in the mainstream, whereas UpperBurhner Barna Kolar, Bhagwant Sagar and Tawa damsare constructed on the tributaries.
3. SAMPLING AND METHODOLOGY
In order to demonstrate the spatial variations in waterchemistry, samples were collected from 13 locations alongthe Narmada River at approximately every 100 km dis-tance. In addition to mainstream, eight of major tributarieswere also sampled (Table 1). A total of 73 river water sam-ples, 45 from the mainstream and 28 from the tributaries,were collected in four phases covering pre-monsoon (May2004), monsoon (August 2003 and September 2004) andpost-monsoon (January 2004) seasons. In addition, 36 rain-water samples, 6 during August 2003 and the remainingsamples during June–September 2004, were collected fromdifferent sampling locations during the southwest monsoonperiod (Table AE-1). Rainwater samples were collected inopen buckets/rectangular trays, filled in laboratory pre-cleaned 100 ml polypropylene bottles and stored in refriger-ator until analysis.
The samples were mostly collected from the middle ofthe river either from the bridge or with the help of boatto avoid local heterogeneity and possible human influencenear the river banks. The samples were collected in1000 ml pre-cleaned, high density polypropylene bottlesthat had been copiously pre-rinsed with river water. ThepH, temperature and carbonate alkalinity (Stumm andMorgan, 1996) were measured in the field. The sampleswere filtered through 0.45 lm cellulose nitrate membranefilters within 24 h of sample collection. Each filtered samplewas divided into two aliquots. One aliquot of 250 ml waskept un-acidified to measure anions and dissolved silicaand another aliquot was acidified to pH �2 with HNO3
(suprapure) for cation (Na+, K+, Ca2+ and Mg2+) analysis.Water samples were kept in refrigerator (4 �C) before anal-ysis and equilibrated with ambient temperature prior to
analysis. The major cations in the samples collected duringfirst two phases (August 2003 and January 2004) were ana-lyzed using AAS (Atomic Absorption Spectrophotometer;Model: GBC Avanta) with a precision of ±5%. The accu-racy of the measurement was checked by measuring freshlyprepared standards of known concentrations made fromanalytical grade reagents. For first two phases of samplingand rainwater collected during August 2003, Cl� was mea-sured by argentometric method whereas SO4
2� and NO3�
were determined by spectrophotometric method (APHA,1998). The water samples collected during the last twophases and rainwater samples of September 2004 wereanalyzed for Na+, K+, Ca2+ and Mg2+, Cl�, SO4
2� andNO3
� by Ion Chromatograph (Metrohm792 Basic IC withsuppressor module) with a precision of ±2%. The systemwas calibrated using multi-element MDML standards(Metrohm). Dissolved silica in the river water was measuredwith UV Spectrophotometer (GENESYSe 10 UV) usingammonium molybdate reagent at 410 nm wavelength(APHA, 1998) with a precision of ±2%. Most of the watersamples from the mainstream and its tributaries show spe-cific charge balance, denoted as normalized inorganiccharge balance (NICB =
P+ �P�)/
P+) within ±7%(Table 2), suggesting that the ions measured in this studyby and large account for the charge balance.
The river bed sediments were collected from theNarmada basin in August 2003 from the same samplinglocations as given in Table 1. Freshly deposited floodsediments (within 15 days of a large flood) were collectedwith a plastic spade by scooping from the upper 1 cm ofthe river bed, representing contemporary deposits. Priorto chemical analysis, the samples were oven dried andhomogenized, and the bulk sediment of each sample was fi-nely ground (<200 mesh) in an agate mortar. The contentsof major oxides were determined using X-ray fluorescence(XRF) spectrometer (Siemens SRS-3000) at Wadia Insti-tute of Himalayan Geology, Dehradun. Details of theXRF methods and standardization are described in Sainiet al. (1998).
The multiannual data for a decade (collected fortnightlybetween June 1990 and May 2000) used in this study wereobtained from the Central Water Commission (CWC), anorganization of the Ministry of Water Resources, Govern-ment of India. CWC has a large number of monitoring sta-tions along the Narmada River and its major tributaries forvarious hydrological observations. The details of the rivermonitoring stations are presented in Table 1, whereas theprocedures dealing with the sampling and analysis are de-tailed in CWC working manuals (CWC, 1990–2000). Mostof the sampling locations selected for spot sampling over-lapped with the network of CWC monitoring stations, thusproviding multiannual hydrological data of water dis-charge, sediment load and water quality parameters. Chem-ical data of most of water samples analyzed by CWC showNICB within ±10% and thus comparable with the results ofspot sampling.
The SPSS software version 11.0 for Windows was usedfor the statistical analysis. The results of spot samples fordifferent seasons were processed by one-way analysis of var-iance (ANOVA) followed by Tukey’s multiple-comparison
Chemical weathering of basalts in the Narmada River basin, India 803

Author's personal copy
Tab
le1
Lo
cati
on
-wis
eh
ydro
logi
cal
char
acte
rist
ics
of
the
Nar
mad
am
ain
stre
aman
dit
sm
ajo
rtr
ibu
tari
es.
Sam
pli
ng
loca
tio
nL
oca
tio
nco
dea
Lat
.�N
Lo
ng.
�EE
leva
tio
n(m
)D
rain
age
area
up
tost
atio
n(k
m2)
Len
gth
of
rive
ru
pto
stat
ion
(km
)
An
nu
alra
infa
ll(m
m)
Mea
nan
nu
alte
mp
(�C
)W
ater
flu
x(1
09k
m3
year�
1)
Lea
nfl
ow
b(%
)R
un
off
(mm
year�
1)
f etc
Sed
imen
tfl
ux
(106
ton
year�
1)
Na
rma
da
ma
inst
ream
Am
ark
anta
kd
N1
22�4
2081
�420
1057
NA
8N
A18
.9N
AN
AN
AN
AN
AD
ind
ori
N2
22�5
7081
�050
666.
122
9295
1493
23.0
1.36
2.96
g59
40.
60N
AM
ano
tN
322
�440
80�3
1045
1.6
4467
218
1517
25.1
3.78
1.70
g84
60.
445.
9Ja
mta
rae
N4
23�0
5079
�570
371.
517
,157
389
1397
25.3
10.9
519
.163
80.
543.
6Ja
bal
pu
rd,f
N5
23�0
7079
�480
352.
018
,200
404
1397
25.3
NA
NA
NA
NA
NA
Bar
man
ghat
N6
23�0
1079
�000
319.
126
,453
504
1241
25.3
14.5
12.8
550
0.56
12.0
San
dia
N7
22�5
0078
�210
308.
633
,954
594
1150
25.3
19.1
12.5
563
0.51
12.8
Ho
shan
gab
adN
822
�460
77�4
3029
2.1
44,5
4867
613
0226
.125
.810
.557
90.
5623
.6H
and
iaN
922
�290
77�0
0027
0.2
54,0
2774
711
2427
.929
.08.
753
70.
5232
.5M
ort
akk
adN
1022
�210
76�0
2016
5.0
67,1
8489
496
527
.529
.7N
A44
20.
54N
AM
and
lesh
war
N11
22�1
0075
�390
153.
572
,809
940
820
27.2
36.2
6.3
497
0.39
38.1
Raj
ghat
N12
22�0
4074
�510
128.
077
,674
1015
636
26.9
37.6
5.8
448
0.24
42.6
Gar
ud
esh
war
N13
21�5
3073
�390
31.2
87,8
9211
6911
2327
.036
.25.
941
10.
6328
.3
Tri
bu
tari
es
Mo
hga
on
T1-
Bu
rhn
er22
�450
80�3
7044
7.0
4090
177
1517
25.7
2.54
0.97
g62
10.
593.
8H
ird
ayn
agar
T2-
Ban
jar
22�3
2080
�230
436.
031
3318
315
2824
.12.
090.
10g
648
0.56
0.9
Pat
anT
3-H
iren
23�1
8079
�390
500.
047
9518
812
8026
.42.
012.
30g
419
0.67
NA
Bel
kh
eri
T4-
Sh
er22
�540
79�2
0065
0.0
2903
129
1241
25.0
0.82
1.50
g54
50.
56N
AG
adar
war
aT
5-S
hak
kar
22�5
4078
�540
321.
022
7016
112
6827
.81.
551.
25g
682
0.46
1.7
Ch
hid
gao
nT
6-G
anja
l22
�250
77�2
0070
0.0
1931
8911
4829
.11.
130.
69g
586
0.49
NA
Gin
no
ree
T7-
Ch
ota
Taw
a22
�100
76�3
9021
8.0
4816
169
987
27.8
2.13
0.00
g44
20.
622.
6K
oga
on
T8-
Ku
nd
i22
�060
75�4
1090
0.0
3973
120
820
25.9
1.19
0.00
g29
80.
64N
AC
han
dw
ara
T9-
Ors
ang
22�0
1073
�250
18.0
3846
101
631
27.0
1.55
0.00
g40
40.
361.
6
NA
=D
ata
no
tav
aila
ble
.a
Nam
esfo
llo
win
gth
esa
mp
lin
gco
des
T1
thro
ugh
T10
rep
rese
nt
the
sam
ple
dtr
ibu
tari
es.
bC
alcu
late
dfr
om
wat
erd
isch
arge
du
rin
gM
arch
,A
pri
lan
dM
ay.
cE
vap
otr
ansp
irat
ion
fact
or.
dM
ult
ian
nu
ald
ata
of
wat
erch
emis
try
are
no
tav
aila
ble
thes
elo
cati
on
san
dth
eref
ore
,o
nly
dat
ao
fsp
ot
sam
ple
sw
ere
use
dfo
rca
lcu
lati
on
s.e
Riv
erw
ater
sam
ple
sw
ere
no
tco
llec
ted
fro
mth
ese
loca
tio
ns
and
for
Gin
no
re(T
7)m
ult
ian
nu
ald
ata
of
wat
erch
emis
try
wer
eu
sed
for
calc
ula
tio
ns.
fM
ult
ian
nu
ald
ata
of
afe
wk
mu
pst
ream
loca
ted
mo
nit
ori
ng
stat
ion
,Ja
mta
ra(N
4)w
ere
use
dfo
rca
lcu
lati
on
san
dco
mp
aris
on
.g
Val
ues
rep
rese
nt
the
po
ssib
legr
ou
nd
wat
erco
ntr
ibu
tio
n(%
)to
ann
ual
wat
erfl
ux
atco
rres
po
nd
ing
loca
tio
n.
804 H. Gupta et al. / Geochimica et Cosmochimica Acta 75 (2011) 800–824
Author's personal copy
Tab
le2
Dis
solv
edm
ajo
rel
emen
tal
com
po
siti
on
of
wat
ersa
mp
les
fro
mth
eN
arm
ada
Riv
eran
dit
str
ibu
tari
esat
diff
eren
tsa
mp
lin
glo
cati
on
s.
Sam
pli
ng
loca
tio
nS
amp
leC
od
ep
HN
a+
lM
K+
lM
Ca2
+
lM
Mg2
+
lM
HC
O3�
lM
Cl�
lM
NO
3�
lM
SO
42�
lM
SiO
2
lM
TZ
+
le
l�1
TZ�
le
l�1
NIC
B%
TD
Sm
gL�
1C
SI
Na+
*
lM
K+
*
lM
Ca2
+*
lM
Mg2
+*
lM
SO
42�
*
lM
TD
Sw
mg
L�
1
Mo
nso
on
20
03
Au
gu
st
Am
ark
anra
k–
NA
NA
NA
NA
NA
NA
NA
NA
NA
NA
NA
NA
NA
NA
NA
NA
NA
NA
NA
NA
NA
Din
do
riN
B1
8.2
588
1259
523
422
2411
212
2035
922
5923
88�
5.7
208
2.4
537
754
822
915
74M
oh
gao
nN
B2
7.4
174
920
213
180
851
1119
201
848
909
�7.
282
0.7
120
415
812
411
28M
ano
tN
B3
7.8
445
841
635
319
2012
422
1531
919
9120
96�
5.3
180
1.8
383
136
933
48
59B
amn
iN
B4
7.4
428
1835
125
716
4065
2024
188
1661
1774
�6.
814
91.
337
616
307
253
1548
Jab
alp
ur
–N
AN
AN
AN
AN
AN
AN
AN
AN
AN
AN
AN
AN
AN
AN
AN
AN
AN
AN
AN
AN
AP
atan
NB
57.
540
757
848
341
2760
157
2926
208
2842
2998
�5.
524
61.
936
656
791
324
1971
Bel
kh
eri
NB
68
554
951
928
021
6068
1120
348
2160
2279
�5.
519
92.
149
07
471
275
1669
Bar
man
NB
77.
334
012
461
249
1760
4516
1721
117
7418
55�
4.6
158
1.3
276
941
324
56
48G
adar
war
aN
B8
7.2
571
949
828
021
7622
1720
379
2135
2256
�5.
720
01.
349
83
437
270
1270
San
dia
NB
97.
640
814
517
268
2016
4710
1721
219
9321
08�
5.7
177
1.7
342
1046
325
97
53H
osa
nga
bad
NB
107.
146
513
596
333
2320
4512
1922
423
3824
14�
3.3
203
1.3
417
856
532
416
64C
hh
idga
on
NB
117.
541
813
692
513
2736
157
1731
563
2843
2972
�4.
626
11.
837
97
638
506
2390
Han
dia
NB
127.
553
814
554
334
2320
6711
2321
623
2724
44�
520
41.
744
510
502
328
1162
Mo
rtak
ka
NB
137.
254
615
517
317
2240
678
3021
322
3023
75�
6.5
197
1.3
464
1047
829
919
61M
and
lesh
war
NB
147.
252
014
489
308
2144
2219
2421
421
2822
33�
4.9
188
1.3
420
943
727
714
57K
oga
on
NB
157.
460
216
665
449
2672
203
2733
291
2848
2968
�4.
224
61.
754
813
623
441
2580
Raj
ghat
NB
167.
357
615
539
329
2336
4519
2921
323
2824
58�
5.6
205
1.5
468
�1
433
307
1259
Gar
ud
esh
war
NB
177.
445
217
558
341
2280
675
2422
222
6724
01�
5.9
199
1.6
393
1351
633
915
61C
han
dw
ara
NB
187.
253
218
465
260
1904
134
1123
149
1999
2094
�4.
817
11.
242
69
391
257
650
Po
st-M
on
soo
n2
00
4J
an
ua
ry
Am
ark
anra
kN
B19
723
826
160
130
752
8418
1716
684
588
80
770.
218
818
8212
18
26D
ind
ori
NB
207.
572
741
709
435
3024
141
1916
371
3056
3215
�5.
227
11.
967
636
662
429
1190
Mo
hga
on
NB
217.
463
838
609
441
2808
2410
2427
027
7628
90�
4.1
242
1.7
584
3356
543
416
77M
ano
tN
B22
7.5
889
4766
258
934
5610
315
1531
334
3936
04�
4.8
298
282
740
615
570
895
Bam
ni
NB
237.
265
085
364
263
1800
122
4552
174
1989
2071
�4.
117
11.
159
883
320
260
4362
Jab
alp
ur
–N
AN
AN
AN
AN
AN
AN
AN
AN
AN
AN
AN
AN
AN
AN
AN
AN
AN
AN
AN
AN
AP
atan
NB
247.
774
358
1426
685
4576
427
158
5819
750
2252
77�
5.1
412
2.6
702
5613
6966
951
119
Bel
kh
eri
NB
257.
959
748
972
889
4320
160
5929
461
4366
4597
�5.
337
82.
653
346
924
884
2611
3B
arm
anN
B26
7.6
679
5157
248
427
6812
234
2026
928
4129
63�
4.3
245
1.9
614
4852
347
99
77G
adar
war
a–
NA
NA
NA
NA
NA
NA
NA
NA
NA
NA
NA
NA
NA
NA
NA
NA
NA
NA
NA
NA
NA
San
dia
NB
277.
667
955
589
700
3264
141
4015
284
3312
3475
�4.
928
22
613
5153
469
15
83H
osa
nga
bad
NB
287.
710
3559
625
407
3056
141
6232
293
3156
3322
�5.
227
62.
198
754
593
397
2998
Ch
hid
gao
nN
B29
885
460
463
498
2544
255
3944
288
2835
2927
�3.
223
92.
181
554
408
491
3686
Han
dia
NB
307.
713
5455
575
438
3296
141
4330
305
3434
3541
�3.
129
62
1260
5152
443
119
107
Mo
rtak
ka
NB
318
1253
5664
050
734
5616
034
1441
736
0136
78�
2.1
313
2.4
1171
5060
048
93
113
Man
dle
shw
arN
B32
7.8
1051
5762
853
533
6013
639
1929
034
3435
73�
429
52.
295
052
576
505
996
Ko
gao
nN
B33
7.6
522
9156
882
328
9648
053
3229
133
9534
93�
2.9
272
1.9
468
8852
581
524
83R
ajgh
atN
B34
7.9
1202
7467
755
536
8814
139
2136
037
3939
09�
4.6
326
2.4
1094
5757
053
34
107
Gar
ud
esh
war
NB
358
1277
6256
464
735
3615
549
1629
237
6137
71�
0.3
312
2.3
1217
5752
364
56
109
Ch
and
war
a–
NA
NA
NA
NA
NA
NA
NA
NA
NA
NA
NA
NA
NA
NA
NA
NA
NA
NA
NA
NA
NA
(co
nti
nu
edo
nn
ext
pa
ge)
Chemical weathering of basalts in the Narmada River basin, India 805
Author's personal copy
Tab
le2
(co
nti
nu
ed)
Sam
pli
ng
loca
tio
nS
amp
leC
od
ep
HN
a+
lM
K+
lMC
a2+
lM
Mg2
+
lM
HC
O3�
lMC
l�
lM
NO
3�
lM
SO
42�
lM
SiO
2
lM
TZ
+
le
l�1
TZ�
le
l�1
NIC
B%
TD
Sm
gL�
1C
SI
Na+
*
lM
K+
*
lM
Ca2
+*
lM
Mg2
+*
lM
SO
42�
*
lM
TD
Sw
mg
L�
1
Pre
-Mo
nso
on
20
04
Ma
y
Am
ark
anra
kN
B36
6.9
176
2817
286
648
6232
1317
172
076
8�
6.8
690.
112
520
9477
522
Din
do
riN
B37
8.5
705
4769
747
030
5611
37
2842
730
8732
32�
4.7
277
2.9
654
4365
046
523
95M
oh
gao
nN
B38
8.3
382
3759
644
824
9686
430
577
2505
2646
�5.
623
82.
532
832
552
441
2184
Man
ot
NB
398.
280
353
752
684
3720
145
927
592
3726
3929
�5.
433
82.
774
146
705
664
2111
5B
amn
iN
B40
835
137
523
270
1968
6613
2340
219
7420
93�
618
62.
129
935
479
267
1465
Jab
alp
ur
BG
NB
417.
922
828
589
313
2048
476
2238
720
6021
45�
4.1
190
2.1
187
2653
229
615
62Ja
bal
pu
rS
GN
B42
7.9
259
2867
830
422
4069
627
426
2252
2368
�5.
220
92.
220
824
607
284
1968
Pat
anN
B43
8.3
1237
128
475
1078
4176
324
2429
408
4472
4582
�2.
537
42.
711
7312
742
710
7326
124
Bel
kh
eri
–N
AN
AN
AN
AN
AN
AN
AN
AN
AN
AN
AN
AN
AN
AN
AN
AN
AN
AN
AN
AN
AB
arm
anN
B44
838
841
746
428
2736
115
126
243
2777
2904
�4.
623
92.
431
535
685
419
1768
Gad
arw
ara
NB
458.
387
044
569
912
3720
194
527
412
3875
3973
�2.
532
82.
780
440
514
903
1710
5S
and
iaN
B46
8.2
506
4686
049
732
2494
1824
368
3266
3384
�3.
628
52.
745
841
828
487
2190
Ho
san
gab
adN
B47
7.8
749
4077
557
534
5611
215
3145
034
8936
45�
4.5
309
2.3
710
3472
056
823
103
Ch
hid
gao
nN
B48
8.4
2627
5146
110
4056
1666
1926
442
5680
5752
�1.
348
12.
925
3347
410
1033
1418
0H
and
iaN
B49
8.4
971
5271
969
639
8427
2012
484
3853
4055
�5.
234
52.
988
947
679
679
111
2M
ort
akk
aN
B50
8.3
574
4878
749
331
2010
323
2926
131
8233
04�
3.8
272
2.8
474
4373
546
219
80M
and
lesh
war
NB
518.
476
035
691
541
3152
168
2422
387
3260
3389
�4
285
2.8
706
3264
953
314
95K
oga
on
NB
528.
174
254
623
500
2880
221
1112
320
3041
3135
�3.
126
12.
463
338
516
478
�5
79R
ajgh
atN
B53
8.5
675
3662
054
930
2413
13
2245
030
4932
03�
527
42.
861
532
579
547
1392
Gar
ud
esh
war
NB
548.
533
825
594
291
2088
754
1840
421
3322
021
196
2.7
233
1752
128
71
63C
han
dw
ara
–N
AN
AN
AN
AN
AN
AN
AN
AN
AN
AN
AN
AN
AN
AN
AN
AN
AN
AN
AN
AN
A
Mo
nso
on
20
04
Sep
tem
ber
Am
ark
anra
k–
NA
NA
NA
NA
NA
NA
NA
NA
NA
NA
NA
NA
NA
NA
NA
214
2262
716
128
64D
ind
ori
NB
557.
526
427
673
167
1856
7446
3337
219
7120
41�
3.5
182
1.6
260
1651
230
139
70M
oh
gao
nN
B56
8.1
313
2155
630
819
6060
1147
442
2062
2126
�3.
119
12.
223
48
724
412
3383
Man
ot
NB
577.
929
615
771
431
2704
696
4051
127
1528
59�
5.3
251
2.3
250
2035
821
242
51B
amn
iN
B58
7.7
302
2240
121
614
4873
1650
274
1558
1638
�5.
214
21.
637
131
794
588
2286
Jab
alp
ur
NB
598.
242
235
865
608
3344
126
1329
353
3402
3541
�4.
129
42.
829
024
749
426
4588
Pat
anN
B60
7.8
331
2580
644
228
0857
553
512
2853
2976
�4.
326
12.
237
912
918
671
4710
4B
elk
her
iN
B61
8.2
444
1496
667
536
4095
3250
505
3740
3867
�3.
432
82.
835
040
627
332
2068
Bar
man
NB
627.
141
543
675
337
2416
7635
3127
524
8225
89�
4.3
218
1.4
361
1887
562
756
98G
adar
war
aN
B63
8.3
434
2493
663
734
5675
2365
432
3603
3684
�2.
231
12.
818
029
582
204
1952
San
dia
NB
648.
124
633
637
213
1880
7330
2923
119
7920
42�
3.1
173
2.2
440
4482
440
738
86H
osa
nga
bad
NB
657
488
4985
541
630
4087
1441
316
3080
3223
�4.
727
01.
553
717
962
668
7510
1C
hh
idga
on
NB
667.
857
623
1017
675
3920
114
983
250
3984
4209
�5.
633
82.
441
037
799
406
4087
Han
dia
NB
677.
750
441
851
412
3040
857
5137
830
7132
35�
5.3
274
2.2
236
4563
028
422
60M
ort
akk
aN
B68
7.7
318
5066
930
222
2480
1134
244
2310
2382
�3.
120
01.
925
952
640
288
3366
Man
dle
shw
arN
B69
735
957
693
319
2368
114
1243
299
2439
2579
�5.
821
71.
341
654
1023
460
5393
Ko
gao
nN
B70
8.1
470
5710
6646
834
7213
524
6127
135
9637
53�
4.3
307
2.7
307
2758
732
030
65R
ajgh
atN
B71
7.7
415
4469
334
223
8412
712
4628
925
3026
15�
3.4
220
224
131
552
265
1957
Gar
ud
esh
war
NB
727.
630
136
593
267
1960
874
2826
120
5721
07�
2.4
180
1.7
1154
5210
3862
241
136
Ch
and
war
aN
B73
8.1
1259
6111
1262
542
8064
041
5840
847
9350
77�
5.9
407
2.8
214
2262
716
128
64
NA
=n
ot
anal
yzed
;T
Z+
=to
tal
cati
on
char
ge;
TZ�
=to
tal
anio
nch
arge
;N
ICB
=n
orm
aliz
edin
org
anic
char
geb
alan
ce;
TD
S=
tota
ld
isso
lved
soli
ds;
CS
I=
carb
on
ate
satu
rati
on
ind
ex;
TD
Sw
=to
tal
dis
solv
edso
lid
sco
rrec
ted
for
no
n-g
eolo
gica
lin
pu
ts;
Jab
alp
ur
BG
and
SG
stan
dfo
rtw
osa
mp
lin
gst
atio
ns
(Bh
ergh
atan
dS
arsw
atig
hat
),a
few
100
md
ista
nce
wit
hd
iffer
ent
lith
olo
gy.
*C
orr
ecte
dfo
rra
inw
ater
con
trib
uti
on
.
806 H. Gupta et al. / Geochimica et Cosmochimica Acta 75 (2011) 800–824

Author's personal copy
post hoc test to identify statistical differences among indi-vidual seasonal groups.
4. RESULTS AND DISCUSSION
4.1. Major ion chemistry
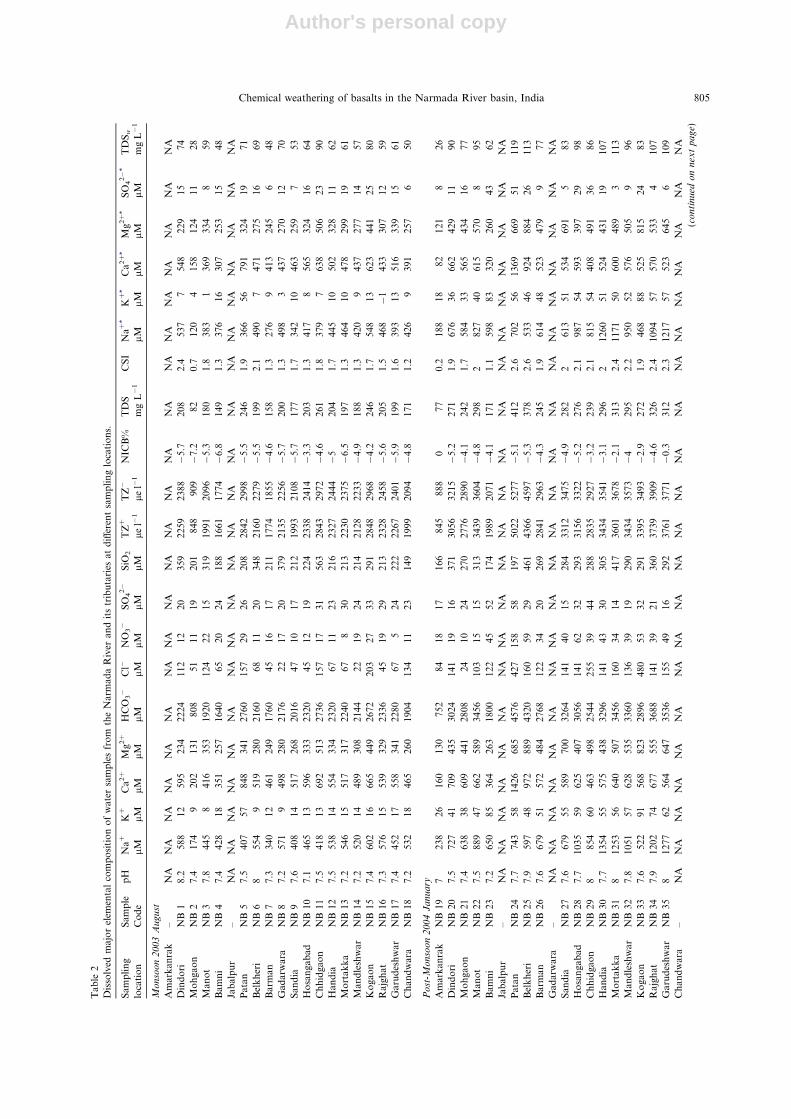
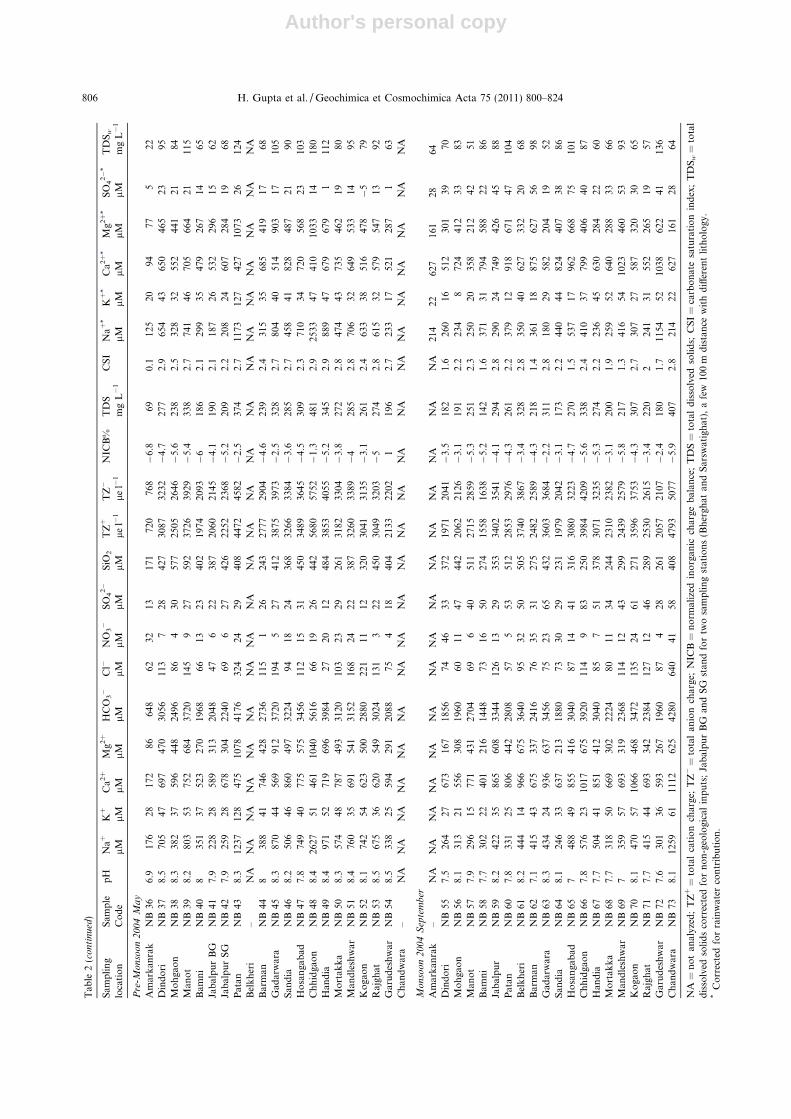
Table 2 presents the chemical composition of river watersamples analyzed in this study, i.e. spot sampling. Temper-ature measured only for samples collected during August2003 that ranges from 22 to 28 �C and therefore the dataare not included in Table 2. The pH varies from almost neu-tral to mild alkaline (6.9–8.5) with most samples fall withina range of 7.0–8.0. Samples collected during non-monsoonperiod (November–May) in low-flow conditions are morealkaline than those collected during monsoon (June–October) in high-flow conditions.
In the Narmada basin, total dissolved solids (TDS)range from 69 to 481 mg L�1 and is similar to the resultsof previous studies on the river flowing through the DeccanTraps (13–497 mg L�1; Dessert et al., 2001), Krishna (27–640 mg L�1; Das et al., 2005), Godavari (40–550 mg L�1;Jha et al., 2009) and Reunion Island (65–350 mg L�1; Louvatand Allegre, 1997). However, the TDS of the Narmada(average 270 mg L�1) is relatively higher than the Ganges(187 mg L�1; Dalai et al., 2002) and the Indus (164 mg L�1;Karim and Veizer, 2000) draining the Himalayas and otherrivers draining the basaltic terrains such as in Iceland (20–89 mg L�1; Louvat et al., 2008), Central Siberia (30–70 mg L�1; Pokrovsky et al., 2005), French Central Massif(40–134 mg L�1; Meybeck, 1987), Sao Miguel Island (50–140 mg L�1; Louvat and Allegre, 1998), Brazilian Paranabasin (63–166 mg L�1; Benedetti et al., 1994) and the is-lands of Martinique and Guadeloupe (27–255 mg L�1;Rad et al., 2006).
The major element composition of the Narmada and itstributaries is dominated by HCO3
�, Ca2+, Mg2+ and Na+
ions (Table 2), which together account for >80% of TDS.The HCO3
� concentration in the mainstream ranges from680 to 3984 lM, whereas the tributaries show slightly high-er HCO3
� contents (808–5616 lM). The Cl� concentrationrange between 22 and 640 lM, and constitute �1–14% oftotal anion charge (TZ�). Similar to bicarbonate, the sam-ples collected from some major tributaries (e.g., the Hiran,Kundi and the Orsang rivers) show higher Cl� values(>200 lM), suggesting a secondary source, either naturalor anthropogenic. The concentrations of NO3
� andSO4
2� are generally low, and make up a relatively smallproportion of TDS, although some tributaries show higherconcentrations of both NO3
� and SO42�.
Among the major cations, Ca2+ constitutes 16–75% of to-tal cationic charge (TZ+), followed by Mg2+ (5–48%), Na+
(11–46%) and K+ (<1–5%). Dissolved silica in the Narmadabasin ranges from 149 to 592 lM (Table 2), and the concen-trations are similar to the rivers draining volcanic rocks, suchas the Krishna (91–685 lM; Das et al., 2005), Godavari(223–761 lM; Jha et al., 2009), Reunion Island (200–800 lM; Louvat and Allegre, 1997), Sao Miguel Island(268–1250 lM; Louvat and Allegre, 1998), islands of Marti-nique and Guadeloupe (213–1000 lM; Rad et al., 2006),
Iceland (420–2700 lM; Gislason et al., 1996) and MountCameroon (276–1034 lM; Benedetti et al., 2003).
The major ion compositions of the Narmada and itstributaries measured in this study are comparable to thatreported by Dessert et al. (2001) and Das et al. (2005) inthe rivers draining the northern Deccan Traps and theKrishna River, including other west-flowing rivers in India.Compared to our values, these authors however reportedlower HCO3
�, NO3�, and SO4
2� but higher Cl� and similarrange of concentrations for all cations.
4.2. Spatial and interannual variability
The ANOVA analysis was performed for each chemicalparameter by taking values for pre-monsoon, post-monsoonand two monsoon (2003 and 2004) seasons as variables.The test of variance was determined by using F-distributionat 95% confidence level as a part of test of significance toanalyze the seasonal variability in data (Table 3). For mostparameters except Cl� and SO4
2�, variance is significant at0.05 levels, indicating significant temporal variations ofmajor ions and silica in the basin. Table 3 also presentsthe results of Tukey HSD test for inter-comparison of levelof significance between different seasons. Samples collectedin two successive monsoon seasons (2003 and 2004) alsoshow significant variations for K+, Ca2+, PO4
2�, SO42�
and SiO2 which may be attributed to the differences inwater discharge and hence dilution at the time of sampling(Table 3).
Seasonal and annual variations of water discharge, tem-perature and concentrations of major ions (Na+, K+, Ca2+,
Table 3Results of analysis of variance (ANOVA) of each parameter at 95%significant level to compare seasonal and Interannual variations.
Parameter ANOVA Tukey HSD
F Calculated Significance
pH 13.649 .000 ac, bc, cdNa+ 5.983 .001 ab, bdK+ 19.625 .000 ab, ac, ad, bdCa2+ 5.676 .002 adMg2+ 6.127 .001 ab, acHCO3
� 5.018 .003 ab, acCl� 2.537 .064 abNO3
� 11.539 .000 ab, bc, bdPO4
2� 5.342 .001 ab, ac, adSO4
2� 19.848 .064 ad, bd, cdSiO2 7.537 .003 ac, ad, bcTDS 5.393 .002 ab, ac
ab: refers to comparison of parameters between monsoon 2003 andpost monsoon 2004 samples.ac: refers to comparison of parameters between monsoon 2003 andpre monsoon 2004 samples.ad: refers to comparison of parameters between monsoon 2003 andmonsoon 2004 samples.bc: refers to comparison of parameters between post monsoon 2004and pre monsoon 2004 samples.bd: refers to comparison of parameters between post monsoon2004 and monsoon 2004.cd: refers to comparison of parameters between pre monsoon 2004and monsoon 2004.
Chemical weathering of basalts in the Narmada River basin, India 807
Author's personal copy
Mg2+, HCO3�, Cl�, SO4
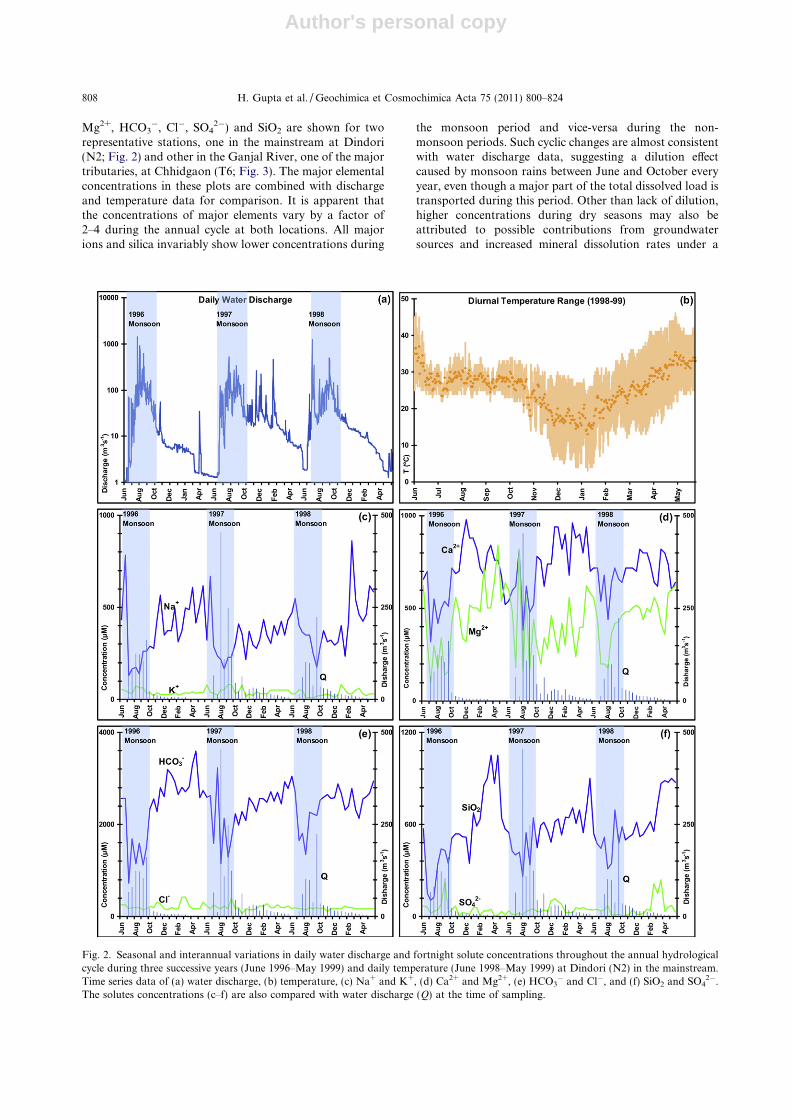
2�) and SiO2 are shown for tworepresentative stations, one in the mainstream at Dindori(N2; Fig. 2) and other in the Ganjal River, one of the majortributaries, at Chhidgaon (T6; Fig. 3). The major elementalconcentrations in these plots are combined with dischargeand temperature data for comparison. It is apparent thatthe concentrations of major elements vary by a factor of2–4 during the annual cycle at both locations. All majorions and silica invariably show lower concentrations during
the monsoon period and vice-versa during the non-monsoon periods. Such cyclic changes are almost consistentwith water discharge data, suggesting a dilution effectcaused by monsoon rains between June and October everyyear, even though a major part of the total dissolved load istransported during this period. Other than lack of dilution,higher concentrations during dry seasons may also beattributed to possible contributions from groundwatersources and increased mineral dissolution rates under a
Fig. 2. Seasonal and interannual variations in daily water discharge and fortnight solute concentrations throughout the annual hydrologicalcycle during three successive years (June 1996–May 1999) and daily temperature (June 1998–May 1999) at Dindori (N2) in the mainstream.Time series data of (a) water discharge, (b) temperature, (c) Na+ and K+, (d) Ca2+ and Mg2+, (e) HCO3
� and Cl�, and (f) SiO2 and SO42�.
The solutes concentrations (c–f) are also compared with water discharge (Q) at the time of sampling.
808 H. Gupta et al. / Geochimica et Cosmochimica Acta 75 (2011) 800–824

Author's personal copy
warm climate. Low river runoff and consequent increasedresidence time may enhance rock–water interactions, lead-ing to higher concentration of dissolved constituents inwaters during dry season. This inference is consistent withTipper et al. (2006) who suggested a higher proportion ofweathering of silicate minerals during the dry period whenthe residence time of water increases in the catchment.
It can also be inferred from the time series plots (Fig. 2)that Na-normalized molar ratios of Ca2+, Mg2+ andHCO3
� did not yield any clear seasonal pattern at Dindori
(N2). However, molar ratios at Chhidgaon (T6; Fig. 3)show distinct seasonal and identical annual patterns withgreater molar ratios for the monsoon season.
4.3. Downstream evolution and source of major ions
The distributions of anion-silica (Cl� + SO42� �
HCO3� � SiO2) and cation (Na+ + K+ � Ca2+ �Mg2+)
on ternary diagrams indicate the relative contributions ofmajor ions from diverse weathering regimes (Huh, 2003).
Fig. 3. Seasonal and interannual variations in daily water discharge and fortnight solute concentrations throughout the annual hydrologicalcycle during three successive years (June 1996–May 1999) and daily temperature (June 1998–May 1999) at Chhidgaon (T7) located in a majortributary, Ganjal. Time series data of (a) water discharge, (b) temperature, (c) Na+ and K+, (d) Ca2+ and Mg2+, (e) HCO3
� and Cl�, and (f)SiO2 and SO4
2�. The solutes concentrations (c–f) are also compared with water discharge (Q) at the time of sampling.
Chemical weathering of basalts in the Narmada River basin, India 809

Author's personal copy
The major ion data of spot samples are plotted individuallyfor the mainstream and the tributaries on anion-silica andcation plots (Fig. 4). The major ion composition of multi-annual data is also included in Fig. 4 for comparison. Onanion-silica plot, both spot and multiannual data fromthe mainstream as well as tributaries show the dominanceof HCO3
� over Cl�+SO42� and SiO2 (Fig. 4a and c). On
the cation plot, spot and multiannual samples from themainstream fall mostly at the line parallel to Ca2+ andMg2+ axis, suggesting the dominance of alkaline over alkaliions (Na+ + K+), whereas the data for tributaries showmore or less equal contribution of alkaline and alkali ions(Fig. 4b and d). To know the seasonal variations of majorions in terms of monsoon and non-monsoon, the multian-nual data are plotted on the combined anion–cation ternarydiagram for the mainstream at Dindori (N2; Fig. 4e) andthe Ganjal River at Chhidgaon (T6; Fig. 4f). It is apparentthat cations in the mainstream follow a similar pattern tocations in Fig. 4b and fall on mixing line parallel toCa2+–Mg2+ both for monsoon and non-monsoon samples,whereas anions lie on HCO3
�–SiO2 axis. Although anionsfrom the tributary mimic the mainstream trend, more scat-tered cations in waters at Chhidgaon (Fig. 4f) seem to beenriched in alkali ions compared to basaltic signature evi-dent at Dindori (Fig. 4e).
The molar ratios of Ca2+/Na+, Mg2+/Na+ and HCO3�/
Na+ in spot samples range from 0.03 to 3.55 (average:1.46); 0.03 to 2.52 (average: 0.96), and 2.22 to 11.57 (aver-age: 6.06), respectively. The Na-normalized molar ratiosfrom multiannual data also show a comparable range andvary from 0.1 to 5.99 (average: 1.55); 0.1 to 6.26 (average:0.98) and 1.15 to 21.9 (average: 5.40) for Ca2+, Mg2+ andHCO3
�, respectively. Dessert et al. (2003) calculated Na-normalized molar ratios for the basaltic watersheds and ob-served that most of the HCO3
�/Na+ ratios vary between 1and 10 (average: 5.3); Ca2+/Na+ ratios range from 0.2 to3.15 (average: 1.3) and Mg2+/Na+ ratios vary between0.15 and 3.15 (average: 1). Similar to the observation ofDessert et al. (2003) for the Hawaiian Rivers, a few samplesfrom multiannual data also show high HCO3
�/Na+ ratios(>10). A significant linear correlation between Na-normal-ized molar ratios of Ca2+ vs. HCO3
� and Ca2+ vs. Mg2+
were observed for both spot and multiannual datasets(Fig. 5a and b). Plots of Na-normalized molar ratios(Fig. 5a and b) show that approximately half of theNarmada basin samples occur outside the range determinedfor average continental silicate rock (Gaillardet et al.,1999) but fall parallel to trend line between silicate and car-bonate end members. Dessert et al. (2003) explained thispattern for the rivers draining basaltic terrains as a resultof possible mixing between silicate and carbonate end mem-bers. According to Dessert et al. (2003), this pattern mayalso be due to either preferential weathering of Ca- andMg-rich silicate minerals in volcanic rocks or due to agreater dissolution of disseminated calcite in basalt. Thus,Na+-normalized molar ratios in the Narmada basin in gen-eral point to a basalt source.
It is apparent from spatial profile of cations and silica(Fig. EA-2-1) that Na+, Ca2+, Mg2+ and SiO2 showmarked variations along the mainstream with the highest
Na+ concentration observed where the saline–alkaline soilsoccurs. The lowest values of major ions at Amarkantak(N1) reflect low chemical weathering rates under the influ-ence of lower temperature and thin layer of soil in thishighly elevated and well forested part of the basin. Subse-quently, the mainstream shows the influence of lithologicalheterogeneity, as reflected by the increased Ca2+ and Na+
concentrations at Jabalpur (N5) and Handia (N9), respec-tively. The observed decline in dissolved constituents atJabalpur (N5), Mortakka (N10) and Garudeshwar (N13)may be attributed to trapping efficiency of dams on themainstream, which discussed later (in Section 4.4). Despitebeing regulated by three large dams (thus possible trappingof dissolved load and lack of major contribution from trib-utaries at immediate downstream), total dissolved solidsshow a marked increase at many locations along the main-stream. Similar to the mainstream, tributaries also showheterogeneity in surface water composition (Fig. EA-2-2),particularly the Ganjal (T6) and the Orsang (T9) are enrichedin sodium ions. The concentration of K+ remains mostlyconstant throughout the basin, suggesting conservativebehavior of K+ in river systems (Garrels and Mackenzie,1971).
In contrast to major ions having multiple sources (litho-logical, atmospheric, anthropogenic and biological), silica ismainly derived from the dissolution of primary silicate min-erals. According to Treguer et al. (1995), riverine silica ismainly controlled by natural processes which contribute�80% of annual silica input into the ocean. Silica has neg-ligible contribution from anthropogenic (Nixon, 2003) andatmospheric sources (Berner and Berner, 1996). It does notget adsorbed onto the sediments and contribution from sus-pended sediments during riverine transport is also negligi-ble (Treguer et al., 1995). With the assumption that thebiological utilization of silica is in a steady state, we plottedSiO2 normalized molar ratios of Na+, Ca2+ + Mg2+, totalcations and HCO3
� (Fig. EA-3) to delineate the relativespatial contribution of silicate and non-silicate end mem-bers to dissolved load on the basin scale. Marked increasesin silica-normalized cation and HCO3
� ratios at Jabalpur(N5; Fig. EA-3-1) indicate additional contributions fromnon-silicate sources. Contrasting trends observed betweensilica-normalized molar ratios of Na+ and Ca2+ + Mg2+
in some mainstream locations advocate different sourcesfor these cations (i.e. carbonate and saline–alkaline). Thetributaries (e.g., T3-Hiran, T4-Sher, T5-Shakkar, T6-Ganjal)draining through carbonate- and saline–alkaline mineral-bearing soils have higher concentrations of cations (Na+
and Ca2+–Mg2+) and HCO3� (Fig. EA-3-2). These elevated
TDS values accentuate the importance of weathering ofcarbonate/saline–alkaline minerals in the elemental budgetof the mainstream and most of the tributaries.
The contributions from carbonate weathering is ex-pected because the carbonate rocks of Vindhayan andGondwana groups and pedogenic carbonates in soils(Tiwari and Bhai, 1997) are exposed across the basin.Additionally, minor carbonate phases in the form ofdisseminated calcite in basalts (Dessert et al., 2003) mayalso contribute to carbonate weathering. Gaillardet et al.(1999) grouped the Narmada along with rivers having
810 H. Gupta et al. / Geochimica et Cosmochimica Acta 75 (2011) 800–824

Author's personal copy
Fig. 4. Ternary plots of major anions-silica and cations for the Narmada River basin. The data are in charge equivalent units (lEq) and arenot corrected for atmospheric input. Plots (a–d) showing the distributions of anions-silica and cations in the mainstream and the tributaries.For comparison, both multiannual and spot samples were plotted together in each panel. The combined ternary plots (e and f) of anion-silicaand cations for two representative locations in the Narmada River basin. Plot (e) showing the seasonal variation at Dindori (N2) in themainstream and plot (f) showing the seasonal variation at Chhidgaon (T7) located in a major tributary, Ganjal River. For comparison, anion-silica/cations for monsoon and non-monsoon are plotted together in each panel. In these plots, only multiannual data are used.
Chemical weathering of basalts in the Narmada River basin, India 811

Author's personal copy
<10% of their dissolved loads derived from carbonatedissolution, such as Irrawady, Cauvery, Murray Darling,Parana and Tocantins. By contrast, Raymahashay (1986)suggested that up to 75% of HCO3
� in the Narmada Rivermay come from the weathering of carbonates alone. De-spite minor in occurrence, these carbonate minerals weatherin orders of magnitude faster than those of Ca-Mg silicateminerals (Gaillardet et al., 1999). In natural environment,the weathering of calcite disseminated in silicates wouldbe limited by the rate of their exposure; however, high sed-iment erosion coupled with monsoon rains (Gupta andChakrapani, 2005) in the Narmada basin may likely en-hance calcite dissolution.
The concentration of Na+ corrected for atmosphericcontribution Na* in the basin is in excess of Cl�, the Na:Clequivalent ratio varies between 2.83 and 14.9 (average:6.32), suggesting that most of the Na+ in these waters orig-inate from a source other than atmospheric precipitationand hence could be derived from weathering of silicate min-erals. The derivation of Na+ by weathering of silicate min-erals can be inferred from Si/(Na* + K) molar ratio(Stallard and Edmond, 1983) which show a variation of0.32–1.48 (average value for a given location) for the basin.Since Si/(Na* + K) molar ratio of >4 is expected for con-version of the Deccan basalts to kaolinite during weather-ing (Rengarajan et al., 2009), lower ratios as observed
Fig. 5. Mixing diagrams showing Na-normalized molar ratios in the Narmada River basin. Plots (a and c) showing the relationship of Ca2+/Na+ vs. HCO3
�/Na+ for the mainstream and the tributaries and plots (b and e) showing the relationship for Ca2+/Na+ vs. Mg2+/Na+. Thedata in these plots (a–d) illustrate significant positive correlations for both multiannual and spot samples in the mainstream and thetributaries. To avoid bias among the two different sets of data, spot samples were not corrected for atmospheric input.
812 H. Gupta et al. / Geochimica et Cosmochimica Acta 75 (2011) 800–824

Author's personal copy
here indicate either a depletion of dissolved silica duringtransportation and/or an addition of alkalis from non-sili-cate sources. The Deccan Traps are theoliitic basalts char-acterized by the dominance of Ca-rich plagioclase whichmainly occur as phenocrysts. Despite higher mobility ofNa+ relative to Ca2+ (Gaillardet et al., 1999), preferentialdissolution of Ca-minerals such as plagioclase may addconsiderable amounts of Ca2+ into the Narmada River.Being a biogenic nutrient, silica is also consumed/releasedby diatoms (Humborg et al., 2000), although there is nopublished information on this issue for the Narmada basin.For the samples collected during the monsoon (August2003 and September 2004), use of silica by diatoms is ex-pected to be minimal due to turbidity. The other possibilityis additions of Na+ from non-silicate and non-precipitationsources. Gaillardet et al. (1999) attributed the presence ofarid and semi arid zones to explain Cl� enrichment andNa+ depletion in some Indian Rivers. However, no relativeenrichment of Cl� or depletion of Na+ is noticed in case ofthe Narmada River. A large portion of the Narmada basin,particularly in middle and downstream, is overlain by salineand alkaline soils (Chhabra, 1996; CSSRI, 2007; Mondaland Sharma, 2008). These soils contain a variety of salts,such as NaCl, Na2SO4, MgCl2, MgSO4, CaCl2, Na2CO3,NaHCO3, MgCO3 and CaCO3 (Chhabra, 1996). Na-bear-ing minerals, such as NaHCO3 and NaCO3 could be asource for Na+ enrichment in some parts of the basin. Anassessment of multiannual data confirms an increased con-tribution of alkali ions (Na+ + K+) in six major tributaries(Hiran, Shakkar, Ganjal, Chota Tawa, Kundi and Orsang),suggesting for the presence of saline–alkaline soils in thecatchment of these tributaries. Mondal and Sharma(2008) reported that the poor drainage conditions coupledwith arid climate, poor groundwater quality and lack ofinfrastructure for irrigation in the black soil regions canlead to soil salinization in central India, including parts ofthe Narmada basin. According to them, the extent of alka-line soils (74%) is higher than saline soils (26%) in centralIndia. Our results suggest a large amount of dissolved loadsderived from both carbonates and saline sources in theNarmada basin. Mondal and Sharma (2008) found 37%of saline–alkaline soils in the zone of 700–800 mm year�1
rainfall and around 25% of soils in 800–900 mm year�1
rainfall zone, suggesting a greater extent of salinization inthe zone of low rainfall. Similarly, the rocks from Jurassic,Archaean and Pleistocene groups accounted for 43%, 23%and 12% of total salt-affected soils in the peninsular plainsof central India. Weathering of silicate minerals eitherre-precipitation of dissolved elements carried by the river orin-situ weathering may at least partly contribute to alkalineelements in these soils and thus can partly contribute toCO2 consumption. However, due to limited publishedinformation and experimental data, it has to be betterunderstood by further studies.
4.4. Estimation of chemical weathering rates (CWR)
To calculate CWR, it is essential to correct the riverineflux for inputs from non-weathering sources, such asanthropogenic, atmospheric, groundwater and thermal
springs. Because of the rough terrain with low populationdensity and slow industrial growth, the Narmada River re-mains in a relatively pristine state (CPCB, 2001). Time ser-ies plots (data not shown) for the major ions such as Cl�,NO3
�, PO42� and SO4
2� from multiannual data do notshow any remarkable change in their concentrations, imply-ing either negligible or constant anthropogenic inputs intothe river between 1990 and 2000.
The Narmada River flows through the Narmada-SonFault (NSF), a well-known seismotectonic feature (Biswas,1987), and is prone to inputs from groundwater and geo-thermal waters. Minissale et al. (2000) reported geochemi-cal data for a number of hydrothermal springs in theNSF zone, but none lies in the Narmada basin. Ravi Shan-ker (1995) reported the presence of three thermal springs,Anhoni, Anhoni-Samoni and Babeha, dominated by NaH-CO3 rich waters in the Narmada basin with recorded waterdischarges of 50–60 l m�1, 5–10 l m�1 and <5 l m�1, respec-tively. The Anhoni-Samoni and Anhoni both lie close toHoshangabad where the annual and non-monsoon waterdischarges (>500 and �300 m3 s�1, respectively) of theNarmada River are much higher than the contributionsfrom thermal springs. Therefore, the overall influence of thesethermal springs to the river water chemistry is consideredto be negligible in this study.
In contrast to many Himalayan Rivers fed by glacialmelt waters, the Narmada mainstream and many of itsperennial tributaries originate as groundwater seepage. Un-til now, no published data is available to estimate the con-tribution of groundwater (base-flow) to surface runoff.According to Gupta and Chakrapani (2007), the river flowis heavily dependent on monsoon rains as most of its an-nual flow is concentrated during monsoon (mainstream:70–92%; tributaries: 87–99%) between June and Novembereach year. This suggests that groundwater contribution tosurface runoff may not be large, at least in high-flow peri-ods. On the other hand, during low-flow periods, if largeamount of groundwater flows with higher solute concentra-tion, the riverine composition may be altered substantially.Water discharge during pre-monsoon season (March–May)for two upstream locations (Dindori and Manot) in themainstream and all tributaries, account for <3% of total an-nual discharge at these locations (Table 1), which is as-sumed to be the ground water contribution and thusrunoff data corrected for groundwater contributions wereused for the CWR calculation. Since the mainstream hasbeen regulated downstream of Manot (N3) where the dis-charge from Bargi Dam (at Jamtara; N4) maintains higherwater discharge (30% of annual discharge) even in non-monsoon season, the groundwater contributions forremaining locations along the mainstream (downstream ofManot) are also considered as negligible.
The atmospheric inputs for Na+, K+, Ca2+, Mg2+ andSO4
2� in the Narmada basin vary from 5% to 29% ofTDS at different sampling locations and constitute �10%of averaged TDS at basin scale (Table EA-1). Althoughlarge temporal and spatial variations are observed in therainwater composition, only average values for individuallocations have been used in this work for simplification.The data of nearby locations were used for some locations
Chemical weathering of basalts in the Narmada River basin, India 813

Author's personal copy
where rainwater composition was not measured (Table EA-1). The Cl�/Na+ molar ratio varies between 0.96 and 1.14and the values are slightly lower than the typical sea salt ra-tio of 1.16, suggesting dust-derived Na+ to rains. The ob-served alkalinity of rainwater is likely due to high loadingof particulate matter in the atmosphere which is in abun-dance in India (Khare et al., 2004).
Evapotranspiration factor (fet), the ratio of runoff toprecipitation, was determined using annual mean runoffand rainfall values at each sample location (Table 1). TheCl� concentration at a given sampling location in the basinwas multiplied by the fet to evaluate the concentrations ofmajor ions in river water and the factor varies between0.29 and 0.80 (Table 1). Large-scale evapotranspiration alsoenhances the overall contribution of major ions from rain-fall. Hence, rainwater contribution of major ions to riverwater is estimated as follows (Stallard and Edmond, 1981):
X rain ¼ ðX=ClÞrain � Clrain=feÞ ð1Þ
where Xrain (X = Na+, K+, Ca2+, Mg2+ and SO42�) is the
contribution of these ions (in lM) from rain to river water;(X/Cl) is the molar abundance ratios in rain; fet is the cor-rection factor for evapotranspiration. Following the ap-proach of Garrels and Mackenzie (1967), river water iscorrected for atmospheric inputs by subtracting the compo-sition of the rainwater (Xrain) from the stream water (Xriver)and can be written as:
X � ¼ X river � X rain ð2Þ
where X* represent to major ion concentrations (Na*, K*,Ca*, Mg* and SO�4) in rivers (corrected for atmosphericcontributions) resulting from chemical weathering and aregiven in Table 2. Total dissolved solids corrected for non-geological inputs, TDSw (=
PX* + SiO2), are the amount
of geochemically derived dissolved ions in river water, rang-ing from 22 to 180 mg L�1 (Table 2). TDSw were calculatedseparately for monsoon (average of August 2003 andSeptember 2004) and non-monsoon (average of January andMay 2004) seasons and subsequently used for the calcula-tion of CWR during monsoon and non-monsoon seasons.
Table 4 presents the location-wise mean TDSw and thepercentage of water discharge for monsoon and non-mon-soon periods. The runoff at different locations varies be-tween 298 and 846 mm year�1 with a mean of411 mm year�1 for the Narmada basin (Table 1). TheCWR in the basin were calculated using two different ap-proaches (Table 4). The first estimation named as CWRspot
used the spot sampling data given in Table 2 and usingaverage seasonal runoff values, whereas the second estima-tion, CWRmulti, was based on multiannual (10 years) dis-charge weighted data. In the second case, water flux atthe time of water sample collection was used to estimatedischarge weighted values. In both cases, corrections foratmospheric inputs were made by using the data given inTable EA-1. For the calculation of CWRmulti, such correc-tion was made by converting fet-corrected rainwater com-position in terms of percentages for major ions for eachlocation. The % rainwater contribution was calculatedusing the relative contribution of rain composition to spotsamples (Table 2). This approach allows us to compare
the accuracy of CWRspot estimates with CWRmulti whichhelps to assess the temporal variations in CWR and the roleof different controlling parameters. We observed that theCWR calculated using annual runoff values are 10–50%higher than those calculated separately from monsoonand non-monsoon runoff (CWRspot
* in Table 4).The location-wise CWRspot (except Amarkantak; N1) in
the mainstream and major tributaries vary between 25 and63 ton km�2 year�1 (Table 4). The basin average of33 ton km�2 year�1 is higher than the world average chem-ical denudation rate of 24 ton km�2 year�1 (Gaillardetet al., 1999). Along the mainstream, the highest weatheringrate of 63 ton km�2 year�1 is observed at Manot (N3), fol-lowed by Jabalpur (N5) with 51 ton km�2 year�1. A fewtributaries such as the Shakkar (T5; 58 ton km�2 year�1)and the Ganjal River (T6; 57.5 ton km�2 year�1) showcomparatively higher weathering rates. It is apparent thatthe CWR for the Narmada basin are higher than the largerrivers such as Congo/Zaire, Parana, Lena, Orinoco, Yenis-sei, Indus, Mackenzie, Mississippi, and the Amazon, butsimilar to the CWR of the Ganges, Brahmaputra and theChangjiang (Gaillardet et al., 1999). The CWR estimationby Dessert et al. (2001) for the Narmada–Tapti–Godavari(range: 21–63 ton km�2 year�1; mean: 37 ton km�2 year�1)and Das et al. (2005) for the Krishna and other WesternGhat Rivers (range: 3–60 ton km�2 year�1; mean:16 ton km�2 year�1) in India also indicates variable chemi-cal denudation rates for these Deccan Rivers. Higher CWRof the Narmada and the Tapti Rivers (approximately twiceof the Krishna River) may be due to additions from non-basalt sources (Das et al., 2005).
The average CWRmulti at different river monitoring sta-tions in the Narmada basin varies between 23 and50 ton km�2 year�1 (Table 4). Although the whole rangeof CWR calculated from the multiannual and spot samplesdata span the same order of magnitude, the CWRspot arerelatively higher at most locations. To understand the ex-tent of deviations between them, we normalized theCWRspot with CWRmulti. It is interesting to note thatCWRspot was found to be either 70% higher (at Chandwara;T9) or 35% lower (at Belkheri; T4) than CWRmulti. Thesampling frequency and stage of water discharge at the timeof sample collection may lead to the observed differences inboth estimations. Therefore, given the high sampling fre-quency while covering all possible ranges of water dischargeand compositions, multiannual data seem to be more suitedfor higher resolution studies.
Dams and associated reservoirs play an important role intrapping suspended sediments (Syvitski et al., 2005; Walling,2006) and dissolved loads, including nutrients (Humborget al., 2002, 1997; Friedl et al., 2004; Teodoru and Wehrli,2005; Li et al., 2007). Presence of three large dams on themainstream and several others on the tributaries may alsoinfluence solute transport in the Narmada basin. The solutesshow an abrupt decline in concentrations at Jabalpur (N5),Mortakka (N10) and Garudeshwar (N13) after passingthrough three large dams (Fig. EA-2-1), suggesting the pos-sible influence of dams on dissolved loads. For instance, dif-ferences in multiannual (1990–2000) dissolved flux betweenRajghat (N12) and downstream location Garudeshwar
814 H. Gupta et al. / Geochimica et Cosmochimica Acta 75 (2011) 800–824
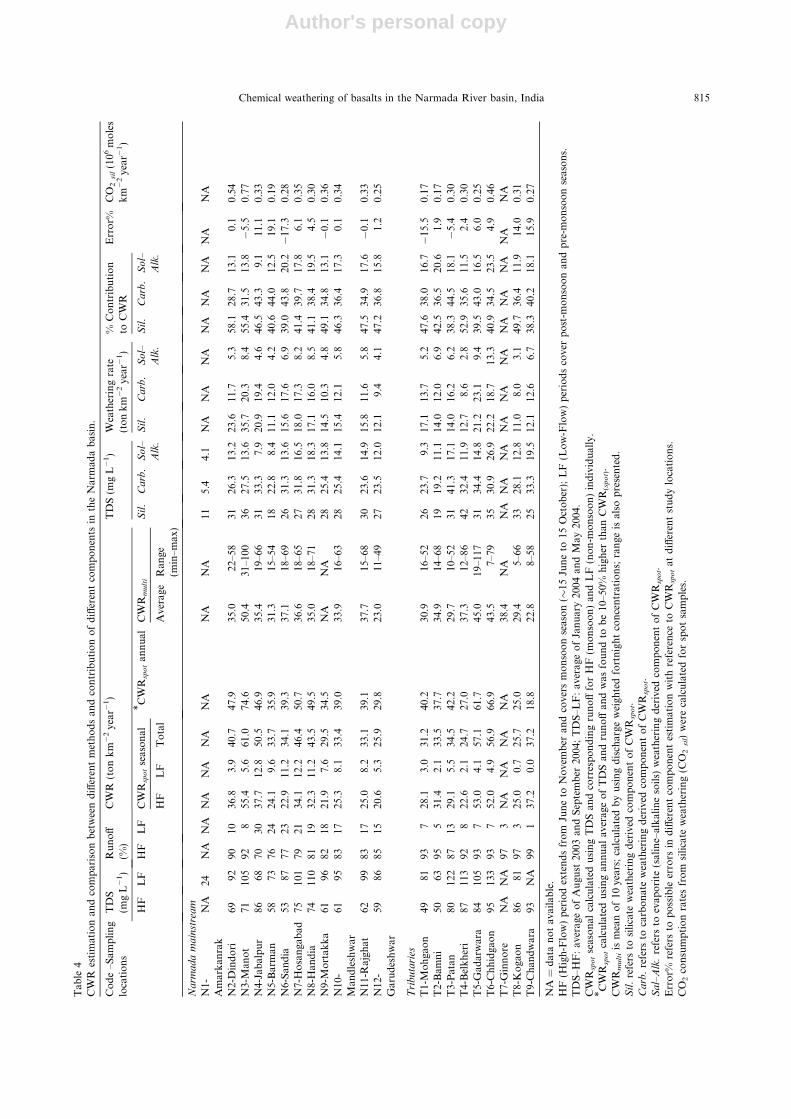
Author's personal copy
Tab
le4
CW
Res
tim
atio
nan
dco
mp
aris
on
bet
wee
nd
iffer
ent
met
ho
ds
and
con
trib
uti
on
of
diff
eren
tco
mp
on
ents
inth
eN
arm
ada
bas
in.
Co
de
–Sam
pli
ng
loca
tio
ns
TD
S(m
gL�
1)
Ru
no
ff(%
)C
WR
(to
nk
m�
2ye
ar�
1)
TD
S(m
gL�
1)
Wea
ther
ing
rate
(to
nk
m�
2ye
ar�
1)
%C
on
trib
uti
on
toC
WR
Err
or%
CO
2si
l(1
06m
ole
sk
m�
2ye
ar�
1)
CW
Rsp
ot
seas
on
al* C
WR
spo
tan
nu
alC
WR
mu
lti
Sil
.C
arb
.S
ol–
Alk
.
Sil
.C
arb
.S
ol–
Alk
.
Sil
.C
arb
.S
ol–
Alk
.
HF
LF
HF
LF
HF
LF
To
tal
Ave
rage
Ran
ge(m
in–m
ax)
Na
rma
da
ma
inst
rea
m
N1-
Am
ark
anra
kN
A24
NA
NA
NA
NA
NA
NA
NA
NA
115.
44.
1N
AN
AN
AN
AN
AN
AN
AN
A
N2-
Din
do
ri69
9290
1036
.83.
940
.747
.935
.022
–58
3126
.313
.223
.611
.75.
358
.128
.713
.10.
10.
54N
3-M
ano
t71
105
928
55.4
5.6
61.0
74.6
50.4
31–1
0036
27.5
13.6
35.7
20.3
8.4
55.4
31.5
13.8
�5.
50.
77N
4-Ja
bal
pu
r86
6870
3037
.712
.850
.546
.935
.419
–66
3133
.37.
920
.919
.44.
646
.543
.39.
111
.10.
33N
5-B
arm
an58
7376
2424
.19.
633
.735
.931
.315
–54
1822
.88.
411
.112
.04.
240
.644
.012
.519
.10.
19N
6-S
and
ia53
8777
2322
.911
.234
.139
.337
.118
–69
2631
.313
.615
.617
.66.
939
.043
.820
.2�
17.3
0.28
N7-
Ho
san
gab
ad75
101
7921
34.1
12.2
46.4
50.7
36.6
18–6
527
31.8
16.5
18.0
17.3
8.2
41.4
39.7
17.8
6.1
0.35
N8-
Han
dia
7411
081
1932
.311
.243
.549
.535
.018
–71
2831
.318
.317
.116
.08.
541
.138
.419
.54.
50.
30N
9-M
ort
akk
a61
9682
1821
.97.
629
.534
.5N
AN
A28
25.4
13.8
14.5
10.3
4.8
49.1
34.8
13.1
�0.
10.
36N
10-
Man
dle
shw
ar61
9583
1725
.38.
133
.439
.033
.916
–63
2825
.414
.115
.412
.15.
846
.336
.417
.30.
10.
34
N11
-Raj
ghat
6299
8317
25.0
8.2
33.1
39.1
37.7
15–6
830
23.6
14.9
15.8
11.6
5.8
47.5
34.9
17.6
�0.
10.
33N
12-
Gar
ud
esh
war
5986
8515
20.6
5.3
25.9
29.8
23.0
11–4
927
23.5
12.0
12.1
9.4
4.1
47.2
36.8
15.8
1.2
0.25
Tri
bu
tari
es
T1-
Mo
hga
on
4981
937
28.1
3.0
31.2
40.2
30.9
16–5
226
23.7
9.3
17.1
13.7
5.2
47.6
38.0
16.7�
15.5
0.17
T2-
Bam
ni
5063
955
31.4
2.1
33.5
37.7
34.9
14–6
819
19.2
11.1
14.0
12.0
6.9
42.5
36.5
20.6
1.9
0.17
T3-
Pat
an80
122
8713
29.1
5.5
34.5
42.2
29.7
10–5
231
41.3
17.1
14.0
16.2
6.2
38.3
44.5
18.1
�5.
40.
30T
4-B
elk
her
i87
113
928
22.6
2.1
24.7
27.0
37.3
12–8
642
32.4
11.9
12.7
8.6
2.8
52.9
35.6
11.5
2.4
0.30
T5-
Gad
arw
ara
8410
593
753
.04.
157
.161
.745
.019
–117
3134
.414
.821
.223
.19.
439
.543
.016
.56.
00.
25T
6-C
hh
idga
on
9513
393
752
.04.
956
.966
.943
.57–
7935
30.9
26.9
22.2
18.7
13.3
40.9
34.5
23.5
4.9
0.46
T7-
Gin
no
reN
AN
A97
3N
AN
AN
AN
A38
.4N
AN
AN
AN
AN
AN
AN
AN
AN
AN
AN
AN
AT
8-K
oga
on
8681
973
25.0
0.7
25.7
25.0
29.4
5–66
3328
.112
.811
.08.
03.
149
.736
.411
.914
.00.
31T
9-C
han
dw
ara
93N
A99
137
.20.
037
.218
.822
.88–
5825
33.3
19.5
12.1
12.6
6.7
38.3
40.2
18.1
15.9
0.27
NA
=d
ata
no
tav
aila
ble
.H
F(H
igh
-Flo
w)
per
iod
exte
nd
sfr
om
Jun
eto
No
vem
ber
and
cove
rsm
on
soo
nse
aso
n(�
15Ju
ne
to15
Oct
ob
er);
LF
(Lo
w-F
low
)p
erio
ds
cove
rp
ost
-mo
nso
on
and
pre
-mo
nso
on
seas
on
s.T
DS
–HF
:av
erag
eo
fA
ugu
st20
03an
dS
epte
mb
er20
04;
TD
S–L
F:
aver
age
of
Jan
uar
y20
04an
dM
ay20
04.
CW
Rsp
ot
seas
on
alca
lcu
late
du
sin
gT
DS
and
corr
esp
on
din
gru
no
fffo
rH
F(m
on
soo
n)
and
LF
(no
n-m
on
soo
n)
ind
ivid
ual
ly.
* CW
Rsp
ot
calc
ula
ted
usi
ng
ann
ual
aver
age
of
TD
San
dru
no
ffan
dw
asfo
un
dto
be
10–5
0%h
igh
erth
anC
WR
(sp
ot).
CW
Rm
ult
iis
mea
no
f10
year
s;ca
lcu
late
db
yu
sin
gd
isch
arge
wei
ghte
dfo
rtn
igh
tco
nce
ntr
atio
ns;
ran
geis
also
pre
sen
ted
.S
il.
refe
rsto
sili
cate
wea
ther
ing
der
ived
com
po
nen
to
fC
WR
spo
t.C
arb
.re
fers
toca
rbo
nat
ew
eath
erin
gd
eriv
edco
mp
on
ent
of
CW
Rsp
ot.
Sa
l–A
lk.
refe
rsto
evap
ori
te(s
alin
e–al
kal
ine
soil
s)w
eath
erin
gd
eriv
edco
mp
on
ent
of
CW
Rsp
ot.
Err
or%
refe
rsto
po
ssib
leer
rors
ind
iffer
ent
com
po
nen
tes
tim
atio
nw
ith
refe
ren
ceto
CW
Rsp
ot
atd
iffer
ent
stu
dy
loca
tio
ns.
CO
2co
nsu
mp
tio
nra
tes
fro
msi
lica
tew
eath
erin
g(C
O2
sil)
wer
eca
lcu
late
dfo
rsp
ot
sam
ple
s.
Chemical weathering of basalts in the Narmada River basin, India 815

Author's personal copy
(N13) indicate that SS dam alone can trap more than 30% ofdissolved flux and 45% of dissolved silica. One possible rea-son for this flux reduction could be the diversion of water forirrigation. However, in case of SS dam, it is not quite thecase, because compared to <5% reduction in annual waterdischarge, decrease in dissolved flux seems to be remarkablyhigher. Furthermore, to date there is no estimation availablefor the dissolved flux contributions from the tributariesdraining into the mainstream between these two monitoringlocations. Considering the presence of a series of large damson the Narmada mainstream and numerous other mediumand small dams on the tributaries, the overall quantity oftrapped dissolved load must be considerably higher,although any specific reason for such a behavior is to beascertained. One possible explanation may be the increasedwater residence time which will enhance biological processesleading to nutrient consumption. We speculate that physio-chemical processes involving formation of precipitated min-erals (Section 4.4.2) may also lead to reduction in dissolvedload. Therefore, the CWR values estimated here may belower than that of the current erosion rates.
As mentioned earlier, a major part of the dissolved constit-uents in the Narmada basin is derived from weathering of sil-icates and carbonates and contribution from saline–alkalinesoils. The values of CWR calculated in this study representa combined outcome of these three end members. Estimatingindividual contributions of different end members is impera-tive to characterize the weathering regime, CO2 consumptionrate via silicate weathering and their controlling factors.
4.4.1. Silicate weathering rates (SilWR)
Several approaches have been proposed to characterizesilicate end member (Tipper et al., 2006 and referencestherein). However, the presence of saline–alkaline soils, car-bonate rocks and minor outcrops of dolomite in the Nar-mada basin limits the scope of these approaches. Sincethe sediments in the river bed are believed to be the repre-sentative of source rocks (Blum et al., 1998), both bed andsuspended sediments have been successfully used for calcu-lating the component derived from silicate weathering(Blum et al., 1998; Wu et al., 2008; Wolff-Boenisch et al.,2009). In this study, first of all Kr is assumed to be derivedexclusively from the dissolution of silicate minerals and nocontribution from the dissolution of carbonates and saline–alkaline soil to K+ is assumed. Following the approach ofWolff-Boenisch et al. (2009), we also used K+ normalizedratios of Mg2+ to estimate the fraction of Mg from silicateweathering (Mgsil). The Mg/K ratios were obtained fromX-ray Fluorescence (XRF) analysis of flood sediments fromthe respective sampling locations (Table EA-4). The silicatecomponent of Ca2+ and Na+ in rivers are then calculated asfollows using Mgsil as a proxy:
Ksil � Kr ð3ÞMgsil ¼ Ksil � ðMg=KÞsed ð4ÞCasil ¼Mgsil � ðCa=MgÞr ð5ÞNasil ¼Mgsil � ðNa=MgÞr ð6Þwhere the subscripts sil, r and sed are silicates, river andsediment, respectively. The Kr has already been correctedfor atmospheric contribution (Table 2).
The SilWR at different sampling locations were calcu-lated using the relation:
SilWR ¼ TDSsil � runoff ð7Þ
where TDSsil = [P
(Nasil + Ksil + Casil + Mgsil)] + SiO2 (allin mg L�1)
The SilWR for the different sampling locations vary from11.0 to 35.7 ton km�2 year�1 and the SilWR at Garudeshwar(N13), an extreme downstream location on the NarmadaRiver) were relatively low (12.1 ton km�2 year�1). To avoidbias due to trapping effect in SS dam at Garusdehwar, theSilWR at Rajghat (N12; 15.8 ton km�2 year�1) were consid-ered to be representative of entire basin and are comparableto that of the Krishna at Alamatti (14 ton km�2 year�1).However, these rates are much lower than previous combinedestimates (37 ton km�2 year�1) for the Narmada–Tapti andthe Godavari Rivers by Dessert et al. (2001) and contribute38.3–58.1% of total chemical weathering inputs.
4.4.2. Carbonate weathering rates (CarbWR)
Weathering of carbonate minerals contribute a sizeableproportion of dissolved load in the Narmada basin. It isimportant therefore to constrain carbonate weatheringbudgets in the Narmada basin. In the present study, Ca*
and Mg* are substantially higher than the Casil and Mgsil.The excess Ca* and Mg* are considered to be derived fromweathering of carbonates and carbonate minerals of saline–alkaline origin, which were estimated as:
Cacarb ¼ Car � Casil ð8ÞMgcarb ¼Mgr �Mgsil ð9Þ
where the subscript carb refers to carbonate contribution.The Car and Mgr have already been corrected for atmo-spheric contributions.
The CarbWR at different sampling locations were calcu-lated using the relation:
CarbWR ¼ TDScarb � runoff ð10Þ
where TDScarb = [Cacarb + Mgcarb] (all in mg L�1)The calculated CarbWR in the basin vary between 8.0
and 23.1 ton km�2 year�1 (Table 4) and contribute 28.7–44.5% of annual chemical weathering flux. The CarbWRare of similar range to SilWR, suggesting an equivalentcontribution of carbonate minerals to total weathering flux.However, the CarbWR estimation seems complex due tothe observed oversaturation of calcite in river water.
Calcite saturation indices (CSI; Langmuir, 1971) calcu-lated at 25 �C suggest that the majority of the surfacewaters of the Narmada basin are oversaturated with respectto calcium carbonate (average for entire basin = 2.0; Ta-ble 2). Previous studies on the Deccan Trap region (Dessertet al., 2001; Das et al., 2005; Sharma and Subramanian,2008) have also observed calcium super-saturation in riverwaters. The mainstream and the tributaries across the basinare even found to be saturated with respect to calcite in themonsoon season, similar to the Himalayan Rivers (Galyand France-Lanord, 1999). Recently, based on X-ray dif-fraction analysis of suspended sediments from the Narmadaand the Tapti Rivers, Sharma and Subramanian (2008)
816 H. Gupta et al. / Geochimica et Cosmochimica Acta 75 (2011) 800–824

Author's personal copy
suggested that 8–9% of calcite gets precipitated in both ba-sins, thus undermining CarbWR.
4.4.3. Saline–alkaline weathering rates (Sal–AlkWR)
One of the important findings of this study is inputsfrom saline–alkaline soils to dissolved load. The contribu-tions from saline–alkaline soils were estimated using therelation:
Nasal�alk ¼ Nar �Nasil ð11ÞSO4sal�alk � SO4r ð12Þ
where the subscript sal–alk refers to saline–alkaline contri-bution. The Nar and SO4r have already been corrected foratmospheric contributions.
The Sal–AlkWR at different sampling locations werecalculated using the relation:
Sal–AlkWR ¼ TDSsal�alk � runoff ð13Þ
where TDSsal–alk = [Nasal–alk + SO4sal–alk] (all in mg L�1).The Sal–AlkWR vary between 2.8 and 13.3 ton
km�2 year�1 and contributes 9.1–23.4% of annual weather-ing flux (Table 4).
It is interesting to note that the calculated weatheringrates of silicate, carbonate and saline–alkaline componentsclosely follow the catchment lithology. In general, theSilWR in the basin decreases from upstream to down-stream, whereas CarbWR and Sal–AlkWR were higher inthe middle reaches of the basin. Highest SilWR were ob-served at Manot (N3) followed by Dinodri (N2), whereasthe lowest SilWR were observed at Barman (N5) which isexpected considering the additional contribution from thewidely distributed marble rock downstream of Jabalpur.Higher Sal–AlkWR were observed at Hoshangabad (N7),Handia (N8), Gadarwara (T5) and Chhidgaon (T6) whichare coincident with the widely exposed saline–alkaline soilsin these areas.
4.4.4. Uncertainties in CWR, SilWR, CarbWR and Sal–
AlkWR estimations
Errors associated with calculation of SilWR, CarbWRand Sal–AlkWR can be marked by comparing the CWRwith the combined SilWR, CarbWR and Sal–AlkWR,which vary between ±20% (Table 4). The errors for two-thirds of study locations (12 out of 18) were approximately±6% which validate the approach used in the present work.Uncertainties associated with chemical analysis, the calciteprecipitation, the violation of assumed conservative behav-ior of rest of solutes (trapping in dams and biological utili-zation) in certain cases and the silicate componentestimation (based on Mg2+/K+ ratio derived from the floodsediments) could be possible sources for the error in SilWR,CarbWR and Sal–AlkWR calculations.
Considering the importance of K in calculating normal-ized molar ratios of Mg2+ and subsequently silicate compo-nent estimations, the following paragraph details thecomplexities associated with distribution of K+ in sedi-ments. Some factors may substantially affect the chemicalcomposition (e.g., for K) of bed sediments such as grainsize/hydraulic sorting of minerals (Pettijohn, 1975) duringtransportation of eroded material, the extent of K mobility
during weathering and exchange/adsorption of dissolved Kon clay minerals (Nesbitt et al., 1980; Banfield et al., 1991)and hence need to be taken into account. The sedimentsamples were collected immediately after a large floodand thus can be considered as representative of total sedi-ments exported by the river. Because the sediments usedfor major oxides measurement in the present study werenot characterized for their grain size and were crushed inbulk, it is not possible to identify uncertainties associatedwith these factors. To understand the extent of K-normal-ized ratio measured in bed sediments as representative ofthe erosion-averaged composition of source rocks, we com-pared our results with average major elemental compositionof the Deccan basalts and sediments (Table EA-4) previ-ously reported by Das and Krishnaswami (2007).
The Mg/K molar ratios in sediments from the WesternGhat Rivers and the Krishna basin are relatively higherthan those of the Narmada basin (Table EA-4). However,a closer look of Mg/K ratios reveals large differences withinthe Western Ghat Rivers and Krishna basin. Even the aver-age Mg/K ratio of the tributaries of Krishna and the Bhimamainstream are similar to that of the Narmada basin. Itsuggests that one or more common factors influence Mg/K ratio in these sub-catchments. Large variations observedin Mg/K molar ratios (Table EA-4) of different sectionsof the Deccan basalts (Crumansonata, 1995; Das andKrishnaswami, 2007) seems to be due to the differences inchemical composition of different lava flows within the Deccanbasalts. Additionally, sediments derived from weatheringof non-basalt rocks (30%) also influence the overall sedi-ment composition. The K content (wt.%) in Narmada sed-iments are 2–3 orders higher than that of the Krishna basin.Wilkins et al. (1994) observed that the average mobilizationof K from the Deccan basalts is lower than that of Na, Ca,and Mg which is consistent with the K distribution inweathering profiles from the Deccan Traps. According toDas and Krishnaswami (2007), smectite clays formed dur-ing chemical weathering of basalts may also trap K, leadingto the limited K mobility. The Western Ghat Rivers travelshort distances before debouching into the coastal seas andare characterized by high gradient, thus reducing the chanceof high chemical alteration during transportation. The Mg/K molar ratio of the Western Ghat Rivers are relatively clo-ser to the average major elemental abundance of the Dec-can basalts and therefore to calculate uncertaintiesassociated with using Mg/K ratios in the Narmada basin,we used an average ratio (10.5) of the Western Ghat Rivers(Table EA-5). It is interesting to note that except two trib-utaries (Banjar and Hiren) most of the locations show errorwithin ±60% of that calculated from location specific Mg/K ratios from flood sediments (Table EA-5). Uncertaintiesestimated in the present study (for Mg/K ratios) are similarto those reported by Wolff-Boenisch et al. (2009), who re-ported errors up to 60% in estimations involving Ca/Naand Mg/K ratios.
4.4.5. CO2 consumption rates
The CO2 consumption rates (UCO2: moles km�2 year�1)during weathering of silicate minerals were calculated fol-lowing the model of Wu et al. (2008).
Chemical weathering of basalts in the Narmada River basin, India 817

Author's personal copy
½UCO2�sil ¼ UðTZþÞsil
¼ ð2Casil þ 2Mgsil þNasil þKsilÞ� discharge=drainage area ð14Þ
The CO2 consumption rates from silicate weathering(spot samples) in the Narmada basin vary between 0.17and 0.77 � 106 moles km�2 year�1 with an average valueof 0.33 � 106 moles km�2 year�1 at Rajghat (N12; Table 4).Though this average is slightly lower, it is of same order tothe values reported for the Krishna (0.36 � 106 moles -km�2 year�1; Das et al., 2005) and the Godavari basins(0.58 � 106 moles km�2 year�1; Jha et al., 2009). The aver-age annual CO2 drawdown via silicate weathering in theNarmada basin (area 98976 km2) based on average CO2
consumption rate is 0.032 � 1012 moles year�1.The present study on the Narmada River and previous
studies on the Krishna (Das et al., 2005) and the GodavariRivers (Jha et al., 2009) together suggest a large spatialvariation in CO2 consumption rates within the DeccanTraps. The Deccan basalts occupy �20%, 48% and 70%of catchment area of the Krishna, Godavari and theNarmada Rivers (Subramanian et al., 2006) respectivelyand all together constitute �60% of the Deccan Traps(5 � 105 km2). The combined annual CO2 drawdownduring basalt weathering by these three major DeccanRivers (Godavari–0.087 � 1012, Krishna–0.019 � 1012 andNarmada–0.023 � 1012 moles) is �0.129 � 1012 moles. Theaverage annual CO2 drawdown by the entire Deccan Trapbasalts estimated using average CO2 consumption valuesof these three rivers (�0.47 � 106 moles km�2 year�1) is�0.24 � 1012 moles, approximately 2% of the annual globalCO2 consumption (11.7 � 1012 moles year�1; Gaillardetet al., 1999) by silicate weathering. The proportion ofCO2 consumption by the Deccan basalts is �4 times higherthan its functional area of continental drainage, which ishaving an average CO2 consumption rate of0.1089 � 106 moles km�2 year�1 (Gaillardet et al., 1999).
As shown above, recently estimated values for thesethree Deccan rivers (Godavari, Krishna and Narmada)are significantly lower than the earlier reported values;0.63–2.54 � 106 moles km�2 year�1 (average: 1.26 � 106
moles km�2 year�1) by Dessert et al. (2001). In a later studyDessert et al. (2003) revised this value to 0.74 � 106 moles -km�2 year�1. In the following section we discuss some ofthe potential reasons that are responsible for this discrep-ancy. Dessert et al. (2001) used HCO3
� as a “surrogate”
for CO2 consumption with the assumption that the wholedissolved load is derived from basalt weathering, whereasthe silicate weathering and associated CO2 consumptionrates in other studies (Das et al., 2005; Jha et al., 2009and present) are calculated from cations derived from sili-cate components. We calculated the CO2 consumption ratesusing the model of Wu et al. (2008). In addition to differ-ences in abundance of catchment area occupied by basalts,variations in chemical composition of different lava flows,different proportion/type of minor rocks, different environ-mental parameters (rainfall-runoff, temperature, evapo-transpiration, soil cover, vegetation, etc.) show impactson variations in CO2 consumption across the three riversystems. Due to non-availability of water discharge data,
Dessert et al. (2001) used averaged runoff value(�463 mm year�1) for the entire Deccan, whereas Daset al. (2005) applied two different average values for theKrishna basin (�463 mm year�1) and the Western GhatRivers (�1690 mm year�1). Jha et al. (2009) showed thatrunoff values within the Godavari (�248–789 mm year�1)differ significantly. In the present study, for the first timewe used location specific runoff and evapo-transpirationvalues (Table 1) to calculate chemical/silicate weatheringrates and associated CO2 consumption. Further, in thisstudy chemical composition of 36 rainwater samples col-lected from the respective study locations were used to cor-rect atmospheric contribution. The observed variations indifferent studies from the Deccan Traps suggest diverserates of silicate weathering and associated CO2 consump-tion across the Deccan Traps as these estimations are influ-enced by a number of environmental parameters that arespecific to different river basins.
4.5. Controlling parameters
Based on the study of 60 large rivers in the world,Gaillardet et al. (1999) evaluated the role of lithology,climate (runoff and temperature), relief and physical erosionin controlling the spatial variations in chemical weatheringat global scale. Among these factors, lithology and reliefcontrol the spatial variation of CWR which remain moreor less similar on a geologic timescale. On the other hand,climate and physical erosion show considerable seasonaland annual discrepancies, resulting in temporal variationsin the CWR. Among the 60 large rivers in the world, theNarmada has been ranked 50th in terms of both catchmentarea and water discharge (Gaillardet et al., 1999). By usinga decade-long chemical data, we estimated the CWRmulti at20 locations across the basin for the first time to evaluatethe annual variations in CWR. Interestingly, these 10 years(1990–2000) cover some of the major floods in the Narmadabasin (1990, 1994 and 2000) and the globally known warmestyears (1990, 1991 1995, 1997 and 1998) on instrumentalrecords (WMO, 2002).
4.5.1. Role of climatic parameters
The climatic response of chemical weathering is consid-ered as a function of temperature and runoff (e.g., Berneret al., 1983; Velbel, 1993; White and Blum, 1995; Dessertet al., 2001). However, the relative importance of runoffand temperature remains controversial (Riebe et al., 2001)with many studies focusing on short-term climatic forcing.Here in the following sections, we examine the influence ofclimatic factors both spatial and temporal scales on theCWR and its components.
4.5.1.1. Runoff. Despite the observed higher TDS (�20%)during non-monsoon, the majority of elemental transporta-tion occurs during monsoon season. The major ion flux dur-ing monsoon accounts for 60–95% and 80–98% of the totalannual weathering flux in the mainstream and tributaries,respectively. Runoff and the CWRspot for the Narmada basinare well correlated (Fig. 6a). In contrast to the mainstreamwhich shows a good correlation (r2 = 0.86, p = 0.000,
818 H. Gupta et al. / Geochimica et Cosmochimica Acta 75 (2011) 800–824

Author's personal copy
n = 12), runoff and the CWRspot in the tributaries show noparticular correlation. The SilWR (r2 = 0.62, p = 0.000,n = 19) and CarbWR (r2 = 0.43, p = 0.002, n = 19) alsoshow significant correlations with runoff, whereas Sal–
AlkWR shows no correlation. The observed coupling be-tween runoff and CWR/SilWR/CarbWR in the Narmadabasin is consistent with a similar relationship found for theother large world rivers (Gaillardet et al., 1999), includingthe rivers from the basaltic watersheds (Dessert et al.,2003). On annual scale, the observed linear relationship be-tween SilWR and runoff reconfirms the previous findingsby Dessert et al. (2001) that atmospheric CO2 consumptionrates are a function of runoff. Das et al. (2005) also consid-ered runoff as an important parameter and observed thatthe CWR and SilWR of the Western Ghat Rivers of the Dec-can Traps are�4 times higher than that of the Krishna Riverowing to higher rainfall and runoff in the western region.
Rainfall shows large temporal and spatial variations inseasonal and annual distributions across the globe andhence in the river dissolved and suspended loads. Previousstudies mostly define the relationship between the CWRand runoff based on average runoff values at basin scale.Hence, it is imperative to examine the response of chemicalweathering rates at annual and/or seasonal scales. Being sit-uated in the monsoon climate regime, the Indian subconti-nent (including the Narmada basin) experiences a largevariation in annual rainfall and its seasonal distribution(Krishnamurthy and Shukla, 2000). This is also apparentin the seasonal flow regime of the most Indian Rivers asmany of them carry around 90% of their annul water dis-charge only during three monsoon months (July to Septem-ber). To understand the potential influence of runoff on theCWR, we plotted the data of annual CWRmulti and corre-sponding runoff in Fig. 6b. It is evident that CWRmulti issignificantly correlated with runoff both in the mainstreamand the tributaries even at annual scale, suggesting a stronginfluence of monsoon runoff.
The minimum and maximum values of the CWRmulti atany given location vary by a factor of 3–6 across the basin
(Table 4), indicating that “the monsoon strength, for in-stance abnormal, normal or deficient, seems to determinethe interannual variability of weathering rates”. Interest-ingly, despite having variations in lithology, relief andcatchment size, CWRmulti and annual runoff show similarlinear patterns across the basin.
4.5.1.2. Temperature (T). Across the Narmada basin, con-siderable diurnal T variations were observed (Figs. 2b and3b); the basin experiences hot summers with T reachingup to 50 �C (Fig. 3b). Despite having more than 5 �C vari-ations in annual mean T (Table 1), a poor correlation be-tween annual mean T and the CWRspot were observed atbasin scale. However, regression analysis of annual meanT and CWRspot for the eight tributaries illustrates a signif-icant correlation (Fig. 7). Dessert et al. (2001) showed thatat constant runoff, the observed increase of CO2 consump-tion rate reflects an increase of T. Our results also show thatthe T acts as an important controlling parameter even atsub-catchment scale. The Sal–AlkWR calculated for tribu-taries also show a significant correlation (r2 = 0.62,p = 0.021, n = 8), which may be related to the formationof saline–alkaline minerals under a warm climate. Nohet al. (2009) based on their recent study on the Three Riversregion of Eastern Tibet also showed similar correlationbetween weathering rates of halite minerals and T. In con-trast to the observed coupling between runoff and CWR atannual scale, T shows no significant correlation withCWRmulti. The possible explanation may be (1) the stronginfluence of runoff in mass transport; (2) the range of an-nual variation in runoff is significantly larger than T; and(3) the frequency and magnitude of large floods may sup-press the reflection of the role of temperature, as these ex-treme events transport huge amount of dissolved andsediment loads.
4.5.2. Physical weathering
Gupta and Chakrapani (2005, 2007) used long-termdaily sediment load data to study sediment transport and
Fig. 6. The relationship between runoff and CWR in the Narmada basin. (a) Runoff vs. CWRspot showing a significant correlation both atbasin scale (r2 = 0.49, p = 0.001, n = 19) and for the Narmada mainstream (r2 = 0.86; p = 0.000). (b) Runoff vs. CWRmulti showing asignificant correlation for both the mainstream (r2 = 0.81, p = 0.000, n = 90) and the tributaries (r2 = 0.76, p = 0.001, n = 86) at annual scale,suggesting a strong influence of monsoonal runoff in chemical weathering processes in the Deccan region.
Chemical weathering of basalts in the Narmada River basin, India 819

Author's personal copy
physical weathering rates in the Narmada basin. A moder-ately positive but significant correlation (Fig. 8a) was ob-served between PWR and CWRspot (except Jamtara vs.Jabalpur). As discussed earlier, downstream of Manot(N3) the Narmada River has been regulated by three largedams. Trend analysis of annual sediment load between 1979and 2002 indicate that downstream sediment flux at Jamt-ara (Bargi dam) and Garudeshwar (SS dam) have reducedby >90% due to construction of dams. In comparison toa sediment flux of 44.8 � 106 tons in 1979–1980, theNarmada River discharged only 4.75 � 106 tons of sedimentto the Arabian Sea during 2002–2003. It is obvious that thesediment transport regime of the river has been alteredsignificantly, thus resulting in poor correlation betweenPWR and CWR at many locations. The SilWR (exceptJamtara vs. Jabalpur) is also well correlated with PWR(r2 = 0.75, p = 0.000, n = 12).
A significant correlation between PWR and CWRmulti atannual scale for the mainstream locations was observed(Fig. 8b), but no such correlation exists for the tributaries.An assessment of annual CWRmulti and PWR relation atdifferent locations in the mainstream reveal that: (a) a closeexamination of individual location suggests, in spite of alarge interannual variability, a positive correlation(r2 > 0.69) exists between both weathering rates; (b) the up-stream location on the Narmada, Manot (N3) does not fol-low this correlation strictly due to a dominant control ofrelief factor; (c) extreme events characterized by huge sedi-ment loads tend to deviate the general trend; and (d) thecoupling between CWR and PWR both at temporal andspatial scales implies that one or more common factors con-trol these weathering rates across the mainstream.
The coupling between CWR and PWR may be a com-bined result of two different mechanisms. First, chemicalweathering may be strongly regulated by the rate of mineralsurfaces exposed for chemical reactions by physical break-down. On the contrary, the rate of rock breakdown may de-pend on weakening caused by chemical weathering. Giventhe torrential nature of monsoon rains and heavy erosion,
the former mechanism seems to be dominating in theNarmada basin. Regardless of a single climatic regime,the study locations across the Narmada basin show markedvariations in mean annual rainfall (Table 1), a key factorof sediment erosion in the Narmada basin (Gupta andChakrapani, 2007). It is interesting to note that in spite ofconsiderable variation in sediment erosion rates (more thanan order of magnitude) across the basin, PWR and CWRremain positively coupled. This suggests that either sedimenterosion process suppresses the influence of other physical(lithology, topography) and meteorological (rainfall andT) parameters or both PWR and CWR are influencedequally by these parameters.
4.6. Total denudation rate and dominance of physical
weathering
The average total denudation rate (TDR = PWR +CWR) estimated for the entire basin (at Rajghat) is
Fig. 7. Scatter plot showing a significant positive correlation(r2 = 0.70; p = 0.009, n = 8) between the mean annual temperatureand CWRspot for the major tributaries.
Fig. 8. The relationship between PWR and CWR across the Narmada basin. Plot (a) showing a significant positive correlation of PWR withCWRspot (r2 = 0.42, p = 0.022, n = 12). Due to high trapping of suspended sediment at Jamtara (N4), this location was not included incorrelation. Plot (b) showing a significant correlation between the PWR and CWRmulti (r2 = 0.40; p = 0.000) in the mainstream; however, nocorrelation exists for tributaries at annual scale.
820 H. Gupta et al. / Geochimica et Cosmochimica Acta 75 (2011) 800–824

Author's personal copy
559 ton km�2 year�1 (Table 5) with the highest TDR is ob-served at Manot (1283 ton km�2 year�1). The average TDRis �2 times higher than the average TDR of the continents(252 ton km�2 year�1; Berner and Berner, 1997). The ratioof dissolved to suspended sediment loads for the Narmadabasin varies from 0.034 to 0.122, except an odd value of0.368 at Jabalpur (Table 5) and are lower than the worldaverage of 0.232 (Milliman and Meade, 1983). The CWRconstitute 3–27% of TDR at different locations (Table 5)however CWR is only 5.9% of TDR at Rajghat. At theglobal scale the average continental CWR is 20% of TDR(Berner and Berner, 1997), thus suggesting a non steady stateweathering regime for the Narmada basin. This implies thatthe PWR in the basin are 10–30 times higher (except atJabalpur and Garudeshwar) than the CWR, indicatingthe dominance of physical weathering over chemicalweathering processes. The observed deviation in ratios atJabalpur (N5) and Garudeshwar (N13) could be attributedto huge reduction in suspended sediments load due togreater trapping of suspended solid over dissolved materialsin upstream dams. Additionally, increased carbonateweathering also play an important role at Jabalpur. It isinteresting to note that our results are comparable to thesmall mountain watersheds having high relief such asTaiwan and New Zealand (1–5%; Carey et al., 2006) andlarge rivers, the Brahmaputra (8%) and the Ganges (9%),draining the Himalayas.
5. CONCLUDING REMARKS
The data presented in this study contain a composite setof spot samples (four phases) and a decade-long fortnightmultiannual data at twenty-one study locations. This com-bination provides a glimpse into variations in chemical
composition at spatial and temporal scales and allows usto delineate the sources of major ions in a basaltic river thatwere rarely covered in previous investigations. Surfacewater samples analyzed for major elements show the influ-ence of carbonates and saline–alkaline soils-derived soluteson basaltic signature. Silica-normalized molar ratios ofHCO3
� and cations (Ca2+ + Mg2+ and Na+) indicate in-creased non-silicates contribution in the middle and lowerparts of the Narmada basin. All samples invariably showhigh calcite saturation indices and suggest calcite precipita-tion in the basin, accounting up to 10% of dissolved calciumcarbonate. The influence of saline–alkaline soils can easilybe distinguished by exceptionally high Na+ content at somesampling locations (Handia-N9 and Chhidgaon-T6) and itis therefore important to carefully evaluate the sources ofNa+ before using Na-normalized molar ratios to character-ize silicate/basaltic signature. The CWRspot show large spa-tial variations and are comparable with the results ofDessert et al. (2001) for the Deccan Trap region. Theweathering rates calculated from spot samples and multian-nual data show that CWRspot can be either similar or con-siderably different than that of CWRmulti. This suggests thathigh sampling frequency is crucial to capture a wide rangeof temporal variations in CWR and to evaluate the role ofmeteorological factors, given the uncertain nature of mon-soon rains. Our results also suggest that the seasonal vari-ability of meteorological parameters must be taken intoaccount for the estimation of mean annual weathering rate.Despite a large amount of dissolved and sediment loads arebeing trapped in the dams, the CWR are still higher com-pared to some of the large world rivers. Characterizationof solute sources suggested that weathering of silicate, car-bonate, and saline–alkaline soils contribute �38–58, 29–45and 9–24% to CWR at different locations. The average CO2
Table 5Total denudation rate (TDR) and CWR–PWR ratios at sampling locations on the Narmada mainstream and the tributaries.
Code-samplinglocations
PWRa,b
(ton km�2 year�1)CWRspot
(ton km�2 year�1)TDR(ton km�2 year�1)
CWR/PWRratio
CWR% ofTWR
Average Range(min–max)
Average Average
Narmada mainstream
N3-Manot 1222 221–2104 61.0 1283 0.050 5.0N4-Jabalpur 137 34–492 50.5 188 0.368 36.8N5-Barman 549 51–2233 33.7 583 0.061 6.1N6-Sandia 502 72–1270 34.1 536 0.068 6.8N7-Hosangabad 447 43–928 46.4 493 0.104 10.4N8-Handia 644 153–1889 43.5 687 0.068 6.8N10-Mandleshwar 564 149–1429 33.4 597 0.059 5.9N11-Rajghat 526 202–1394 33.1 559 0.063 6.3N12-Garudeshwar 206 26–586 25.9 232 0.125 12.5
Tributaries
T1-Mohgaon 923 134–2815 31.2 954 0.034 3.4T2-Hirdaynagar 274 57–761 33.5 308 0.122 12.2T5-Gadarwara 859 130–2676 57.1 916 0.066 6.6T9-Chandwara 398 204–723 37.2 436 0.093 9.3
TDR = (PWR + CWR).No sediment load data is available for rest of the sampling locations (N1, N2, N9, T3, T4, T6, T7 and T8).
a Estimations based on annual loads for more than 20 years (1979–1980 to 1999–2000).b Source of data: CWC, India.
Chemical weathering of basalts in the Narmada River basin, India 821

Author's personal copy
consumption rate via silicate weathering in the Narmadabasin is �0.33 � 106 moles km�2 year�1, accounting for an-nual CO2 drawdown of �0.032 � 1012 moles at basin scale.The average annual CO2 drawdown by the entire DeccanTrap basalts is �0.24 � 1012 moles, approximately 2% ofthe annual global CO2 consumption by silicate weathering.The composite dataset also permitted us to figure out therole of different parameters in controlling the spatial andtemporal variations in CWR. The examination of annualCWR reveals that runoff, sediment erosion and temperaturetogether control the temporal variation in chemical weath-ering. The observed relationship of CWR with runoff andPWR at annual scale will improve our understanding fora long-term evolution of climate and to justify its influenceon chemical weathering and vice versa. The present studysuggests a strong control of runoff and PWR on SilWRand a coupling of runoff with CarbWR. Furthermore, awide range of CWR and rapid response of the Narmada ba-sin to any annual variation in climatic parameters, suggest-ing an intimate coupling among the different controllingparameters and therefore seem to be an important featureof present day weathering conditions in the Narmada basin.Due to higher sediment erosion, basin scale ratio betweenthe CWR and PWR is estimated to be 5.9. The greaterdenudation rates and the dominance of physical erosionover chemical weathering indicate that the Narmada basinis currently not operating in a steady state condition.
ACKNOWLEDGEMENTS
This work was supported by the Council of Scientific andIndustrial Research (CSIR, India) in the form of a research fellow-ship to HG. We are thankful to officials of Central Water Commis-sion in Bhopal and Surat (India) for providing the multiannualdata and their help during the collection of river and rainwatersamples. We are thankful to M. Dai for giving valuable suggestionsto develop the manuscript. We are grateful to AE J. Gaillardet, C.Dessert and four other anonymous reviewers for their thoughtfulreviews and comments on the original manuscript.
APPENDIX A. SUPPLEMENTARY DATA
Supplementary data associated with this article can befound, in the online version, at doi:10.1016/j.gca.2010.11.010.
REFERENCES
Allegre C. J., Birck J. L., Capmas F. and Courtillot V. (1999) Ageof the Deccan Traps using 187Re–187Os systematics. Earth
Planet. Sci. Lett. 170, 197–204.
APHA (1998) Standard Method for the Examination of Water and
Wastewater, 20th ed.. Published by APHA, AWWA WEF andWPCE, Washington D.C.
Baksi A. K. (1994) Geochronological studies on whole-rockbasalts, Deccan Traps, India: evaluation of the timing ofvolcanism relative to the K–T boundary. Earth Planet. Sci.
Lett. 121, 43–56.
Banfield J. F., Jones B. F. and Veblen D. R. (1991) An AEM–TEMstudy of weathering and diagenesis, Abert Lake, Oregon: I.
Weathering reactions in the volcanics. Geochim. Cosmochim.
Acta. 55, 2781–2793.
Benedetti M. F., Dia A., Riotte J., Chabaux F., Gerard M.,Boulegue J., Fritz B., Chauvel C., Bulourde M., Deruelle B. andIldefonse P. (2003) Chemical weathering of basaltic lava flowsundergoing extreme climatic conditions: the water geochemistryrecord. Chem. Geol. 201, 1–17.
Benedetti M. F., Menard O., Noack Y., Carvalho A. and NahonD. (1994) Water–rock interactions in tropical catchments: fieldrates of weathering and biomass impact. Chem. Geol. 118, 203–
220.
Berner E. K. and Berner R. A. (1996) Global Environment: Water,
Air and Geochemical Cycles. Prentice-Hall, Upper Saddle River,NJ.
Berner E. K. and Berner R. A. (1997) Silicate weathering andclimate. In Tectonic Uplift and Climate Change (ed. W. F.Ruddiman). Plenum Press, New York.
Berner R. A. (1992) Weathering, plants, and the long-term carboncycle. Geochim. Cosmochim. Acta. 56, 3225–3231.
Berner R. A. and Maasch K. A. (1996) Chemical weathering,controls on atmospheric O2, CO2: Fundamental principles wereenunciated by J.J. Ebelmen in 1845. Geochim. Cosmochim. Acta
60, 1633–1637.
Berner R. A., Lasaga A. C. and Garrels R. M. (1983) Thecarbonate–silicate geochemical cycle and its effect on atmo-spheric carbon dioxide over the past 100 millions years. Am. J.
Sci. 284, 641–683.
Biswas S. K. (1987) Regional tectonic framework, structure andevolution of the western marginal basins of India. Tectonophy
135, 307–327.
Blum J. D., Gazis C. A., Jacobson A. D. and Chamberlain C. P.(1998) Carbonate versus silicate weathering in the Raikhotwatershed within the High Himalayan Crystalline series.Geology 164, 411–414.
Carey A. E., Kao S.-J., Hicks D. M., Nezat C. A. and Lyons W. B.(2006) The geochemistry of rivers in tectonically active areas ofTaiwan and New Zealand. GSA 398, 339–351, special paper.
Chhabra R. (1996) Soil salinity and Water Quality. Brookfield.Courtillot V., Besse J., Vandamme D., Montigny R., Jaeger J. J.
and Cappetta H. (1986) Deccan flood basalt at the Cretaceous/Tertiary boundary? Earth Planet. Sci. Lett. 80, 361–374.
Courtillot V., Feraud G., Maluski H., Vandamme D., Moreau M.G. and Besse J. (1988) Deccan flood basalts and the Creta-ceous/Tertiary boundary. Nature 333, 843–846.
CPCB (2001) Central Pollution Control Board, Environmental Atlas
of India. National Atlas & Thematic Mapping Organization,Kolkata.
Crumansonata (1995) Geoscientific Studies of the Son–Narmada–
Tapti Lineament Zone. Geological Survey of India, Calcutta.Special publication no. 10.
CSSRI (2007) Perspective Plan: Vision 2025. Central Soil SalinityResearch Institute, Karnal, India. Also available atwww.cssri.org..
CWC (1990–2000) Central Water Commission, Water Quality Data
Book(s). Narmada Basin Organization, Bhopal.CWC (1997–1998) Central Water Commission, Integrated Water
Year Book. Narmada Basin Organization, Bhopal.Dalai T. K., Krishnaswami S. and Sarin M. M. (2002) Major ion
chemistry in the headwaters of the Yamuna River system:chemical weathering its temperature dependence and CO2
consumption in the Himalaya. Geochim. Cosmochim. Acta 66,
3397–3416.
Das A., Krishnaswami S., Sarin M. M. and Pande K. (2005)Chemical weathering in the Krishna basin and the westernghats of the Deccan Traps: rates of weathering and theircontrol. Geochim. Cosmochim. Acta 69, 2067–2084.
822 H. Gupta et al. / Geochimica et Cosmochimica Acta 75 (2011) 800–824

Author's personal copy
Das A. and Krishnaswami S. (2007) Elemental geochemistry ofriver sediments from the Deccan Traps, India: implications tosources of elements and their mobility during basalt–waterinteraction. Chem. Geol. 242, 232–254.
Dessert C., Dupre B., Francois L. M., Schott J., Gaillardet J.,Chakrapani G. J. and Bajpai S. (2001) Erosion of Deccan Trapsdetermined by river geochemistry: impact on the global climateand the 87Sr/86Sr ratio of seawater. Earth Planet. Sci. Lett. 188,
459–474.
Dessert C., Dupre B., Gaillardet J., Francois L. M. and Allegre C.J. (2003) Basalt weathering laws and the impact ofbasalt weathering on the global carbon cycle. Chem. Geol. 20,
1–17.
Dessert C., Gaillardet J., Dupre B., Schott J. and Pokrovsky O. S.(2009) Fluxes of high- versus low-temperature water–rockinteractions in aerial volcanic areas: Example from the Kam-chatka Peninsula, Russia. Geochim. Cosmochim. Acta 73, 148–
169.
Duncan R. A. and Pyle D. G. (1988) Rapid eruption of the Deccanflood basalts at the Cretaceous/Tertiary boundary. Nature 333,
841–843.
Friedl G., Teodoru C. and Wehrli B. (2004) Is the iron gate Ireservoir on the Danube River a sink for dissolved silica?Biogeochemistry 68, 21–32.
Gaillardet J., Dupre B., Louvat P. and Allegre C. J. (1999) Globalsilicate weathering and CO2 consumption rates deduced fromthe chemistry of large rivers. Chem. Geol. 159, 3–30.
Galy A. and France-Lanord C. (1999) Weathering processes in theGanges–Brahmaputra basin and the riverine alkalinity budget.Chem. Geol. 159, 31–60.
Garrels R. M. and Mackenzie F. T. (1967). In Equilibrium Concepts
in Natural Water Systems, vol. 67 (ed. R. F. Gould). Am. Chem.Soc. Adv. Chem. Ser., pp. 222–242.
Garrels R. M. and Mackenzie F. T. (1971) Gregor’s denudation ofthe continents. Nature 231, 382–383.
Gislason S. R., Arnorsson S. and Armannsson H. (1996) Chemicalweathering of basalt in southwest Iceland: effects of runoff, ageof rocks and vegetative/glacial cover. Am. J. Sci. 296, 837–907.
Gislason S. R., Oelkers E. H., Eiriksdottir E. S., Kardjilov M. I.,Gisladottir G., Sigfusson B., Snorrason A., Elefsen S., Hardar-dottir J., Torssander P. and Oskarsson N. (2009) Directevidence of the feedback between climate and weathering.Earth Planet. Sci. Lett. 277, 213–222.
Gupta H. and Chakrapani G. J. (2005) Temporal and spatialvariations in water flow and sediment load in Narmada RiverBasin, India: natural and man-made factors. Environ. Geol. 48,
579–589.
Gupta H. and Chakrapani G. J. (2007) Temporal and spatialvariations in water flow and sediment load in the NarmadaRiver. Curr. Sci. 92, 679–684.
Huh Y. (2003) Chemical weathering and climate -a globalexperiment: a review. Geosci. J. 7, 277–288.
Humborg C., Blomqvist S., Avsan E., Bergensund Y., SmedbergE., Brink J. and Morth C.-M. (2002) Hydrological alterationswith river damming in northern Sweden: implications forweathering and river biogeochemistry. Global Biogeochem. Cyc.
16, 1039.
Humborg C., Conley D. J., Rahm L., Wulff F., Cociasu A. andIttekkot V. (2000) Silicon retention in river basins: far-reachingeffects on biogeochemistry and aquatic food webs in coastalmarine environments. Ambio 29, 45–50.
Humborg C., Ittekkot V., Cociasu A. and Bodungen B. V. (1997)Effect of Danube River dam on Black Sea biogeochemistry andecosystem structure. Nature 386, 385–388.
Javoy M. and Michard G. (1989). Am. Geophys. Union EOS Trans.
70, 1421.
Jha P. K., Tiwari J., Singh U. K., Kumar M. and Subramanian V.(2009) Chemical weathering and associated CO2 consumptionin the Godavari river basin, India. Chem. Geol. 264, 364–374.
Karim A. and Veizer J. (2000) Weathering processes in the Indusriver basin: implications from riverine carbon, sulfur, oxygenand strontium isotopes. Chem. Geol. 170, 153–177.
Khare P., Goel A., Patel D. and Behari J. (2004) Chemicalcharacterization of rainwater at a developing urban habitat ofNorthern India. Atmos. Res. 69, 135–145.
Krishnamurthy V. and Shukla J. (2000) Intraseasonal and Inter-annual Variability of Rainfall over India. J. Climate 13, 4366–
4377.
Langmuir D. (1971) The geochemistry of some carbonate ground-waters in central Pennsylvania. Geochim. Cosmochim. Acta 35,
1023–1045.
Li M., Xu K., Watanabe M. and Chen Z. (2007) Long-termvariations in dissolved silicate, nitrogen, and phosphorus fluxfrom the Yangtze River into the East China Sea and impacts onestuarine ecosystem. Estuar. Coast. Shelf Sci. 71, 3–12.
Louvat P. and Allegre C. J. (1997) Present denudation rates atReunion Island determined by river geochemistry: basaltweathering and mass budget between chemical and mechanicalerosions. Geochim. Cosmochim. Acta 61, 3645–3669.
Louvat P. and Allegre C. J. (1998) Present denudatation rates onthe island of Reunion determined by river geochemistry: basaltweathering and mass budget between chemical and mechanicalerosions. Geochim. Cosmochim. Acta 61, 3645–3669.
Louvat P., Gislason S. R. and Allegre C. J. (2008) Chemical andmechanical erosion rates in Iceland as deduced from riverdissolved and solid material. Am. J. Sci. 308, 679–726.
Mahoney J. (1988) Deccan Traps. In Continental Flood Basalts,
Petrology and Structural Geology (ed. J. D. Macdougall).Kluwer Academic, Dordrecht, pp. 151–194.
Meybeck M. (1987) Global chemical weathering of surficial rocksestimated from river dissolved loads. Am. J. Sci. 287, 401–428.
Milliman J. D. and Meade R. H. (1983) Worldwide delivery ofriver sediment to the oceans. J. Geol. 91, 1–21.
Minissale A., Vaselli O., Chandrasekharam D., Magro G., CasigliaF. and Tassi A. (2000) Origin and evolution of ‘intracratonic’thermal fluids from central-western peninsular India. Earth
Planet. Sci. Lett. 181, 377–394.
Mondal A. K. and Sharma R. C. (2008) Computerized database onsalt affected soils in western and central India using GIS.Geocarto. Int. 23, 373–391.
Nesbitt H. W., Markovics G. and Price R. C. (1980) Chemicalprocesses affecting alkalis and alkaline earths during continen-tal weathering. Geochim. Cosmochim. Acta 44, 1659–1666.
Nixon S. W. (2003) Replacing the Nile: are anthropogenic nutrientsproviding the fertility once brought to the Mediterranean byGreat River? Ambio 32, 30–39.
Noh H., Huh Y., Qin J. and Ellis A. (2009) Chemical weathering inthe Three Rivers region of Eastern Tibet. Geochim. Cosmochim.
Acta 73, 1857–1877.
Pettijohn F. J. (1975) Sedimentary Rocks. Harper and Row, NewYork, p. 628.
Pokrovsky O. S., Schott J., Kudryavtzev D. I. and Dupre B. (2005)Basalt weathering in Central Siberia under permafrost condi-tions. Geochim. Cosmochim. Acta 69, 5659–5680.
Rad S., Louvat P., Gorge C., Gaillardet J. and Allegre C. J. (2006)River dissolved and solid loads in the Lesser Antilles: newinsight into basalt weathering processes. J. Geochem. Exp. 88,
308–312.
Shanker Ravi. (1995) Fragmented Indian shield and recentearthquakes. J. Geol. Surv. Ind. 27, 41–48.
Raymahashay B. C. (1986) Geochemistry of bicarbonate in riverwater. J. Geol. Soc. Ind. 27, 114–118.
Chemical weathering of basalts in the Narmada River basin, India 823

Author's personal copy
Rengarajan R., Singh S. K., Sarin M. M. and Krishnaswami S.(2009) Strontium isotopes and major ion chemistry in theChambal River system, India: implications to silicate erosionrates of the Ganga. Chem. Geol. 260, 87–101.
Riebe C. S., Kirchner J. W., Granger D. E. and Finkel R. C. (2001)Strong tectonic and weak climatic control of long-term chem-ical weathering rates. Geology 29, 511–514.
Saini N. K., Mukherjee P. K., Rathi M. S., Khanna P. P. andPurohit K. K. (1998) A new geochemical reference sample ofgranite (DG-H) from Dalhousie, Himachal Himalaya. J. Geol.
Soc. Ind. 52, 603–606.
Sen G. (2001) Generation of Deccan Trap magmas. Proc. Ind.
Acad. Sci. (Earth Planet. Sci.) 110, 409–431.
Sharma S. K. and Subramanian V. (2008) Hydrochemistry of theNarmada and Tapti Rivers, India. Hydrol. Process. 22, 3444–
3455.
Shrivastava J. P. and Pattanayak S. K. (2000) Basalts of the EasternDeccan Volcanic Province, India. Gond. Res. 5, 649–665.
Stallard R. F. and Edmond J. M. (1981) Geochemistry of theAmazon. 1: precipitation chemistry and the marine contribu-tion to the dissolved load at the time of peak discharge. J.
Geophys. Res. 86, 9844–9858.
Stallard R. F. and Edmond J. M. (1983) Geochemistry of theAmazon. 2: the influence of geology and weathering environ-ment on the dissolved load. J. Geophys. Res. 88, 9671–9688.
Stumm W. and Morgan J. J. (1996) Aquatic Chemistry: Chemical
Equilibria and Rates in Natural Waters. Wiley, New York.Subbarao K. V., Bodas M. S., Khadri S. R. F., Bean J. E., Kale V.,
Widdowson M., Hooper P. R. and Walsh J. N. (2000) Field
Excursion Guide to the Western Deccan Basalt Province. PenroseDeccan, p. 249.
Subramanian V., Ittekkot V., Unger D. and Madhavan N. (2006)Silicate weathering in South Asian Tropical River Basins. In An
in Role of Silica in Land–Sea Interactions (eds. V. Ittekkot, D.Unger, C. Humborg and N. Tac). SCOPE, Washington D.C.,
pp. 3–13.
Syvitski J. P. M., Vorosmarty C. J., Kettner A. J. and Green P.(2005) Impact of humans on the flux of terrestrial sediment tothe global coastal ocean. Science 308, 376–380.
Teodoru C. and Wehrli B. (2005) Retention of Sediments andNutrients in the Iron Gate I Reservoir on the Danube River.Biogeochemistry 76, 539–565.
Tipper E. T., Bickle M. J., Galy A., West A. J., Pomie‘s C. andChapman H. J. (2006) The short term climatic sensitivity ofcarbonate and silicate weathering fluxes: insight from seasonalvariations in river chemistry. Geochim. Cosmochim. Acta 70,
2737–2754.
Tiwari M. P. and Bhai H. Y. (1997) Quaternary stratigraphy of theNarmada valley. Quaternary geology of the Narmada valley.Geol. Sur. Ind. 46, 33–63, special publication.
Treguer P., Nelson D. M., Van Bennekom A. J., DeMaster D. J.,Leynaert A. and Queguiner B. (1995) The silica balance in theworld ocean: a reestimate. Science 268, 375–379.
Urey H. C. (1952) The Planets: Their Origin and Development. YaleUniversity Press.
Vandamme D., Courtillot V., Besse J. and Montigney R. (1991)Palaeomagnetism and age determination of the Deccan Traps(India): results of a Nagpur–Bombay traverse, and review ofearlier work. Rev. of Geophys. 29, 159–190.
Velbel M. A. (1993) Temperature dependence of silicate weatheringin nature: how strong of a negative feedback on long termaccumulation of atmospheric CO2 and global greenhousewarming? Geology 21, 1059–1062.
Vigier N., Bourdon B., Lewin E., Dupre B., Turner S., ChakrapaniG. J., Calsteren P. and van, Allegre C. J. (2005) Mobility of U-series nuclides during basalt weathering: a example from theDeccan Traps (India). Chem. Geol. 219, 69–91.
Walker J. C. G., Hays P. B. and Kasting J. F. (1981) A negativefeedback mechanism for the long-term stabilization of Earth’ssurface temperature. J. Geophys. Res. 86, 9776–9782.
Walling D. E. (2006) Human impact on land–ocean sedimenttransfer by the world’s rivers. Geomorphology 79, 192–216.
White A. F. and Blum A. E. (1995) Effects of climate on chemicalweathering in watersheds. Geochim. Cosmochim. Acta 59, 1729–
1747.
Wilkins A., Subbarao K. V., Ingram G. and Walsh J. N. (1994)Weathering regimes within the Deccan Basalts. In Volcanism
(eds. K.V.Subbarao). Wiley Eastern, New Delhi, pp. 217–
231.
WMO (2002) WMO Statement on the Status of the Global Climate
in 2001. World Meteorological Organization, WMO-No. 940,Geneva, Switzerland.
Wolff-Boenisch D., Gabet E. J., Burbank D. W., Langner H. andPutkonen J. (2009) Spatial variations in chemical weatheringand CO2 consumption in Nepalese High Himalayan catchmentsduring the monsoon season. Geochim. Cosmochim. Acta 73,
3148–3170.
Wollast R. and Chou L. (1988) Rate control of weathering ofsilicate minerals at room temperature and pressure. In Physical
and Chemical Weathering in Geochemical Cycles, vol. 251 (eds.A. Lerman and M. Meybeck). NATO ASI series, Kluwer
Academic, pp. 11–32.
Wu W., Xu S., Yang J. and Yin H. (2008) Silicate weathering andCO2 consumption deduced from the seven Chinese riversoriginating in the Qinghai–Tibet Plateau. Chem. Geol. 249,
307–320.
Associate editor: Jerome Gaillardet
824 H. Gupta et al. / Geochimica et Cosmochimica Acta 75 (2011) 800–824