Quantification of drought tolerance in Ethiopian common bean ...
Upload
khangminh22Category
view
3download
0
�����������������
Citation: Chankaew, S.; Sriwichai, S.;
Rakvong, T.; Monkham, T.; Sanitchon,
J.; Tangphatsornruang, S.;
Kongkachana, W.; Sonthirod, C.;
Pootakham, W.; Amkul, K.; et al. The
First Genetic Linkage Map of Winged
Bean [Psophocarpus tetragonolobus (L.)
DC.] and QTL Mapping for Flower-,
Pod-, and Seed-Related Traits. Plants
2022, 11, 500. https://doi.org/
10.3390/plants11040500
Academic Editors: Fouad S. Maalouf
and Dil Thavarajah
Received: 15 January 2022
Accepted: 10 February 2022
Published: 12 February 2022
Publisher’s Note: MDPI stays neutral
with regard to jurisdictional claims in
published maps and institutional affil-
iations.
Copyright: © 2022 by the authors.
Licensee MDPI, Basel, Switzerland.
This article is an open access article
distributed under the terms and
conditions of the Creative Commons
Attribution (CC BY) license (https://
creativecommons.org/licenses/by/
4.0/).
plants
Article
The First Genetic Linkage Map of Winged Bean [Psophocarpustetragonolobus (L.) DC.] and QTL Mapping for Flower-, Pod-,and Seed-Related TraitsSompong Chankaew 1 , Sasiprapa Sriwichai 1, Teppratan Rakvong 1, Tidarat Monkham 1, Jirawat Sanitchon 1,Sithichoke Tangphatsornruang 2 , Wasitthee Kongkachana 2 , Chutima Sonthirod 2, Wirulda Pootakham 2 ,Kitiya Amkul 3, Anochar Kaewwongwal 3, Kularb Laosatit 3 and Prakit Somta 3,*
1 Department of Agronomy, Faculty of Agriculture, Khon Kaen University, Khon Kaen 40002, Thailand;[email protected] (S.C.); [email protected] (S.S.); [email protected] (T.R.);[email protected] (T.M.); [email protected] (J.S.)
2 National Omics Center (NOC), National Science and Technology Development Agency,111 Thailand Science Park, Khlong Nueng, Khlong Luang, Pathum Thani 12120, Thailand;[email protected] (S.T.); [email protected] (W.K.); [email protected] (C.S.);[email protected] (W.P.)
3 Department of Agronomy, Faculty of Agriculture at Kamphaeng Saen, Kasetsart University,Nakhon Pathom 73140, Thailand; [email protected] (K.A.); [email protected] (A.K.);[email protected] (K.L.)
* Correspondence: [email protected]
Abstract: Winged bean [Psophocarpus tetragonolobus (L.) DC.] (2n = 2× = 18) is a tropical legume cropwith multipurpose usages. Recently, the winged bean has regained attention from scientists as a foodprotein source. Currently, there is no breeding program for winged bean cultivars. All winged beancultivars are landraces or selections from landraces. Molecular markers and genetic linkage mapsare pre-requisites for molecular plant breeding. The aim of this study was to develop a high-densitylinkage map and identify quantitative trait loci (QTLs) for pod and seed-related traits of the wingedbean. An F2 population of 86 plants was developed from a cross between winged bean accessionsW054 and TPT9 showing contrasting pod length, and pod, flower and seed colors. A genetic linkagemap of 1384 single nucleotide polymorphism (SNP) markers generated from restriction site-associatedDNA sequencing was constructed. The map resolved nine haploid chromosomes of the winged beanand spanned the cumulative length of 4552.8 cM with the number of SNPs per linkage ranging from36 to 218 with an average of 153.78. QTL analysis in the F2 population revealed 31 QTLs controllingpod length, pod color, pod anthocyanin content, flower color, and seed color. The number of QTLsper trait varied between 1 (seed length) to 7 (banner color). Interestingly, the major QTLs for podcolor, anthocyanin content, and calyx color, and for seed color and flower wing color were locatedat the same position. The high-density linkage map QTLs reported in this study will be useful formolecular breeding of winged beans.
Keywords: RAD-seq; SNPs; pod length; seed color; winged bean; anthocyanin
1. Introduction
The winged bean [Psophocarpus tetragonolobus (L.) DC.] (2n = 2× = 18) is a tropicallegume crop belonging to the family Fabaceae and subfamily Papilionoideae [1]. Thecrop originated in South-East Asia or perhaps Papua New Guinea. It is widely grownin hot humid equatorial countries throughout Southeast Asia and East Africa [2], and isan important leguminous vegetable crop in Thailand, Burma, Laos, Malaysia, Vietnam,Indonesia, Bangladesh, Sri Lanka, Ghana, and Nigeria [2]. Although the young pod ofthe winged bean is the most popularly consumed part, the rest of the plant parts are alsoedible when appropriately prepared [3]. Winged bean seeds contain high protein (30–37%)
Plants 2022, 11, 500. https://doi.org/10.3390/plants11040500 https://www.mdpi.com/journal/plants

Plants 2022, 11, 500 2 of 16
and oil (15–18%) contents [4,5]. In addition, the winged bean tuber contains roughly 20%protein and 25–30% carbohydrates [6]. As a viable candidate for diversifying diets, roastedor boiled tuberous roots are capable of improving the nutritional security of the people intropical regions [6]. The crop has received scientific praise for its nutritional content, ascomprehensively described in ‘The winged bean: high-protein crop for the humid tropics’from the National Academy of Science in 1981 [7]. The winged bean is one of the mostimportant legume crops due to its high protein value and multipurpose usage. As avegetable legume crop, the winged bean holds a unique position in the world of food andagriculture [5]. It has been introduced to more than 80 countries worldwide [8].
The availability and assessment of genetic variability is a prerequisite for crop im-provement. The centers of origin and diversity of the winged bean are not yet known.In addition, the ancestors of the winged bean are still not known and may be extinct [9].However, winged beans from Papua New Guinea and Indonesia have been reported to bediverse, while increasing numbers of winged bean landraces have recently been discoveredin Thailand [2,10]. Studies of genetic diversity have demonstrated that the winged beanhas moderate genetic variation [5,8,10–12].
All winged bean cultivars planted today are indigenous or local cultivars. The demandfor winged bean production is increasing, due to its security as a staple food source andmultipurpose usage [13]. Therefore, cultivars possessing higher yields with improved traitsare desirable. However, knowledge on the genetics and breeding of the winged bean is verylimited. Most previous studies in this crop focused on production systems and variation inmorphological traits [6,14,15].
Very limited information on the genetics and genomics of the winged bean has beenreported. The genome size of winged beans is large (2n = 2× = 18; 1.22 Gbp/C) [11], anduntil now a genetic linkage map of the winged bean is not available. All previous studies ofmolecular genetics and genomics of the winged bean have been related to genetic diversityusing first and/or second-generation DNA markers (RAPD and ISSR markers [5], ISSR [8],and SSR [10]). As a result, there exists no study on the molecular breeding of the wingedbean, due to a lack of genomic tools.
A genetic linkage map is an indispensable tool for molecular breeding of crops asit is necessary identify the quantitative trait loci (QTLs) or genes controlling traits inbreeding programs which will be ultimately useful for marker-assisted selection. Toconstruct a genetic linkage map, DNA markers must be developed. Although some SSRand SNP markers have been developed for the winged been [11,12], not many of themhave been validated for use in molecular analysis. In addition, the analysis of SSR andSNP markers in winged bean is expensive, laborious, and difficult because of its largegenome size. Recently, next-generation sequencing (NGS) technologies have acceleratedwhole-genome sequencing and genotyping [16]. Whole genomes of numerous legumespecies, including mungbean (Vigna radiata) [17], cowpea (V. unguiculata [L.] Walp.) [18],beach pea (V. marina) [19], adzuki bean (V. angularis) [20], pea (Pisum sativum L.) [21],pigeonpea (Cajanus cajan) [22], chickpea (Cicer arietinum) [23], peanut (Arachis ipaensis) [24],and soybean (Glycine max) [25] have been sequenced. Genotyping using high-throughputNGS technologies reduces the complexity of genome analysis and allows the developmentof numerous SNP markers for any species of interest [26]. Restriction-site associated DNAsequencing (RAD-seq), including double digested RAD-seq (ddRAD-seq), is a preferableNGS-based technology for high-throughput genotyping [16,27]. The RAD-seq method,first described by Baird et al. [28], can be employed without a reference genome, and areference-guided RAD-seq approach can improve the accuracy of SNP detection.
In this study, we aimed to develop the first genetic linkage map and identify QTL con-trolling flower-, pod- and seed-related traits in the winged bean. The map was constructedusing SNP markers generated by the RAD-seq method. The genetic linkage map and theQTL information generated from this study will facilitate the molecular breeding of wingedbeans in future studies.

Plants 2022, 11, 500 3 of 16
2. Results2.1. Variation in Pod Anthocyanin Content, Pod Length, Seed Length, and Seed Width
The parents, TPT9 and W054, of the F2 mapping population used in this study wereclearly different in pod anthocyanin content (pod color) and pod length, but only slightlydifferent in seed size (length and width). Pod anthocyanin content of W054 was 17 timeshigher than that of TPT9. The value of the content was 40.93 and 2.40 mg/100 g for theformer and the latter, respectively (Figure 1A). The values of the pod anthocyanin contentsin the F2 population ranged from 1.91 to 34.28 mg/100 g, with an average of 9.08 mg/100 g.Pod length of the W054 and TPT9 was 24.29 and 15.06 cm, respectively. The pod length inthe F2 population varied from 14.25 to 26.50 cm with an average of 19.25 cm (Figure 1B).TPT9 and W054 produced seed length of 8.21 and 9.22 mm, respectively (Figure 1C). Seedlength in the F2 population varied between 7.67 and 10.70 mm, with an average of 9.43 mm.Seed width of TPT9 was 7.89 mm, while that of W054 was 7.13 mm. However, the seedwidth in the F2 population ranged from 5.82 to 9.10 mm, with an average of 7.76 mm(Figure 1D). Variation of pod anthocyanin content, pod length, seed length, and seed widthin the F2 population was continuous and normally distributed (Figure 1) (Durbin-Watsonstatistic test with p-values of 0.7053, 0.2435, 0.9836, and 0.1926, respectively—data notshown), suggesting that they are quantitative traits and possibly controlled by polygenes.
Plants 2022, 11, x FOR PEER REVIEW 3 of 16
2. Results 2.1. Variation in Pod Anthocyanin Content, Pod Length, Seed Length, and Seed Width
The parents, TPT9 and W054, of the F2 mapping population used in this study were clearly different in pod anthocyanin content (pod color) and pod length, but only slightly different in seed size (length and width). Pod anthocyanin content of W054 was 17 times higher than that of TPT9. The value of the content was 40.93 and 2.40 mg/100 g for the former and the latter, respectively (Figure 1A). The values of the pod anthocyanin contents in the F2 population ranged from 1.91 to 34.28 mg/100 g, with an average of 9.08 mg/100 g. Pod length of the W054 and TPT9 was 24.29 and 15.06 cm, respectively. The pod length in the F2 population varied from 14.25 to 26.50 cm with an average of 19.25 cm (Figure 1B). TPT9 and W054 produced seed length of 8.21 and 9.22 mm, respectively (Figure 1C). Seed length in the F2 population varied between 7.67 and 10.70 mm, with an average of 9.43 mm. Seed width of TPT9 was 7.89 mm, while that of W054 was 7.13 mm. However, the seed width in the F2 population ranged from 5.82 to 9.10 mm, with an average of 7.76 mm (Figure 1D). Variation of pod anthocyanin content, pod length, seed length, and seed width in the F2 population was continuous and normally distributed (Figure 1) (Durbin-Watson statistic test with p-values of 0.7053, 0.2435, 0.9836, and 0.1926, respectively—data not shown), suggesting that they are quantitative traits and possibly controlled by poly-genes.
Figure 1. Frequency distribution of pod anthocyanin content (A), pod length (B), seed length (C), and seed width (D) of the winged bean F2 population derived from the cross W054 × TPT9.
2.2. Variation in Organ Coloration TPT9 and W054 were contrastive in pod, seed, and flower (calyx, wing, and banner)
color (Figure 2). All of these traits except seed coat color showed high variation in the F2 population. For example, pod colors of TPT9 and W054 were blue and purple, respec-tively, while pod colors in the F2 population were green, green with purple spots, green with a purple spot at center, purple wing, purple center, light purple, purple, and dark purple (Figure 2A). Interestingly, wing and banner colors showed transgressive segrega-tion; some colors not existing in both parents. Classes and patterns of segregation of wing
Figure 1. Frequency distribution of pod anthocyanin content (A), pod length (B), seed length (C),and seed width (D) of the winged bean F2 population derived from the cross W054 × TPT9.
2.2. Variation in Organ Coloration
TPT9 and W054 were contrastive in pod, seed, and flower (calyx, wing, and banner)color (Figure 2). All of these traits except seed coat color showed high variation in the F2population. For example, pod colors of TPT9 and W054 were blue and purple, respectively,while pod colors in the F2 population were green, green with purple spots, green with apurple spot at center, purple wing, purple center, light purple, purple, and dark purple(Figure 2A). Interestingly, wing and banner colors showed transgressive segregation; somecolors not existing in both parents. Classes and patterns of segregation of wing color andbanner color in the F2 population were nearly the same (Figure 2D,E), suggesting thatcolorations of these two organs were controlled by the same genes or tightly linked genes.

Plants 2022, 11, 500 4 of 16
Nonetheless, these results suggest that coloration of pod, seed, and flower (calyx, wing,and banner) color is controlled by two or more genes in which some of the genes havepleotropic effect or are linked.
Plants 2022, 11, x FOR PEER REVIEW 4 of 16
color and banner color in the F2 population were nearly the same (Figure 2D,E), suggesting that colorations of these two organs were controlled by the same genes or tightly linked genes. Nonetheless, these results suggest that coloration of pod, seed, and flower (calyx, wing, and banner) color is controlled by two or more genes in which some of the genes have pleotropic effect or are linked.
Figure 2. Frequency distribution of coloration of pod (A), calyx (B), seed (C), wing (D), and banner (E) in the winged bean F2 population derived from the cross W054 × TPT9.
Results of Pearson’s correlation coefficient analysis of the nine flower-, pod-, and seed-related traits in the F2 population are presented in Table 1. The anthocyanin content was significantly correlated with pod color (0.748) and calyx color (0.706). Pod color and flower color were also significantly correlated, as were pod color and calyx color (0.812), calyx color and wing color (0.543), calyx color and banner color (0.523). The highest corre-lation was found between the wing color and banner color (0.978) (Table 1). Moreover, seed color was also significantly correlated with pod color (0.547) and calyx color (0.595) (Table 1). The significant correlation among flower, pod, and seed colors indicates, again, that colorations of these organs are controlled by the same or closely linked gene(s).
Table 1. Correlation between pod anthocyanin content, pod length, seed length, seed width; and pod, seed, calyx, wing, and banner colors of the winged bean F2 population derived from cross W054 × TPT9.
Traits AnthoCy PDL PDC CalyxC WingC BannerC SeedL SeedW PDL 0.248 *
PDC 0.748 ** 0.329 **
CalyxC 0.706 ** 0.262 * 0.812 **
WingC 0.431 ** 0.091 0.421 ** 0.543 **
BannerC 0.419 ** 0.081 0.405 ** 0.523 ** 0.978 **
Figure 2. Frequency distribution of coloration of pod (A), calyx (B), seed (C), wing (D), and banner (E)in the winged bean F2 population derived from the cross W054 × TPT9.
Results of Pearson’s correlation coefficient analysis of the nine flower-, pod-, and seed-related traits in the F2 population are presented in Table 1. The anthocyanin content wassignificantly correlated with pod color (0.748) and calyx color (0.706). Pod color and flowercolor were also significantly correlated, as were pod color and calyx color (0.812), calyxcolor and wing color (0.543), calyx color and banner color (0.523). The highest correlationwas found between the wing color and banner color (0.978) (Table 1). Moreover, seed colorwas also significantly correlated with pod color (0.547) and calyx color (0.595) (Table 1). Thesignificant correlation among flower, pod, and seed colors indicates, again, that colorationsof these organs are controlled by the same or closely linked gene(s).
Table 1. Correlation between pod anthocyanin content, pod length, seed length, seed width; andpod, seed, calyx, wing, and banner colors of the winged bean F2 population derived from crossW054 × TPT9.
Traits AnthoCy PDL PDC CalyxC WingC BannerC SeedL SeedW
PDL 0.248 *PDC 0.748 ** 0.329 **
CalyxC 0.706 ** 0.262 * 0.812 **WingC 0.431 ** 0.091 0.421 ** 0.543 **
BannerC 0.419 ** 0.081 0.405 ** 0.523 ** 0.978 **

Plants 2022, 11, 500 5 of 16
Table 1. Cont.
Traits AnthoCy PDL PDC CalyxC WingC BannerC SeedL SeedW
SeedL 0.158 0.151 0.110 0.095 0.082 0.114SeedW −0.034 −0.008 0.010 −0.027 −0.110 −0.096 0.500 **SeedC 0.381 ** 0.239 * 0.547 ** 0.595 ** 0.400 ** 0.378 ** −0.018 −0.197
AnthoCy = pod anthocyanin content, PDL = pod length, SDL = seed length, SDW = seed width, PDC = pod color,SDC = seed coat color, CalyxC = calyx color, WingC = wing color, and BannerC = banner color. * Significant at 0.05probability. ** Significant at 0.01 probability.
2.3. Construction of the Winged Bean Genetic Linkage Map2.3.1. RAD-Seq Library Construction, Sequencing, and SNP Calling
In this study, a RAD-seq library was constructed using the MGIEasy RAD librarykit on 86 F2 populations and their parents and sequenced on MGISEQ-2000RS using PE(150 bp) chemistry. A total of 261.9 Gbp reads were obtained (an average of 3.13 Gbp persample); each read contained 150 bp (×2). Among these data, 85.57% of bases were highquality (>Q30), and the average guanine-cytosine (GC) content was 38.76%. The sequencingdepth corresponded to 21.61-fold in TPT9, 14.71-fold in W054, and 25.62-fold in the 86 F2progenies (Table S1). A total of 23,576 polymorphic SNP markers were identified fromthe two parents. There were four types of polymorphic SNP markers: aa×bb, hk×hk,lm×ll, and nn×np. Since both of the parents were highly inbred, only the aa×bb genotypesshowing homozygous and polymorphic between the parents were used in further analysis.
2.3.2. Construction of the Winged Bean Genetic Linkage Map
While a total of 193,735 SNPs were identified, only the aa×bb marker could be used inthe linkage analysis. After SNPs with a minor allele frequency >0.1, depth coverage between10×–200×, fewer than 10% missing data, non−segregation distortion, and non−redundantgenotypes were filtered, 1384 SNP markers remained and were constructed into a geneticlinkage map. The map of the F2 population contained nine linkage groups (LGs) (Figure S1)and spanned a cumulative distance of 4552.8 cM (Table 2). The length of each LG rangedfrom 164.96 cM (LG6) to 755.74 cM (LG2), with an average of 505.87 cM. The number of SNPmarkers mapped in each linkage group varied from 36 markers on LG06 to 218 markerson LG02, with an average of 153.78 SNPs per LG (Table 2). The average distance betweenadjacent markers across the nine LGs was 3.38 cM (Table 2).
Table 2. Characteristics of an SNP-based linkage map constructed for winged bean F2 population of86 individuals derived from the cross W054 × TPT9.
Linkage Group Number of SNPMarkers Length (cM) Average Marker
Interval (cM)Maximum
Interval (cM)
1 208 707.12 3.40 11.092 218 755.74 3.47 11.983 186 604.61 3.25 13.374 170 507.73 2.98 11.535 96 293.99 3.06 9.556 36 164.96 4.58 16.447 176 560.28 3.18 10.678 180 587.78 3.27 16.909 114 370.59 3.25 15.28
Average 153.78 505.87 3.38 -
Total 1384 4552.8 - -
2.4. QTL Analysis for Flower-, Pod-, and Seed-Related Traits
Two methods, ICIM implemented in software QTL IciMapping 4.1 and MQM imple-mented in MapQTL 5.0, were used for QTL analysis. For ICIM for which a LOD score of 3.0
Plants 2022, 11, 500 6 of 16
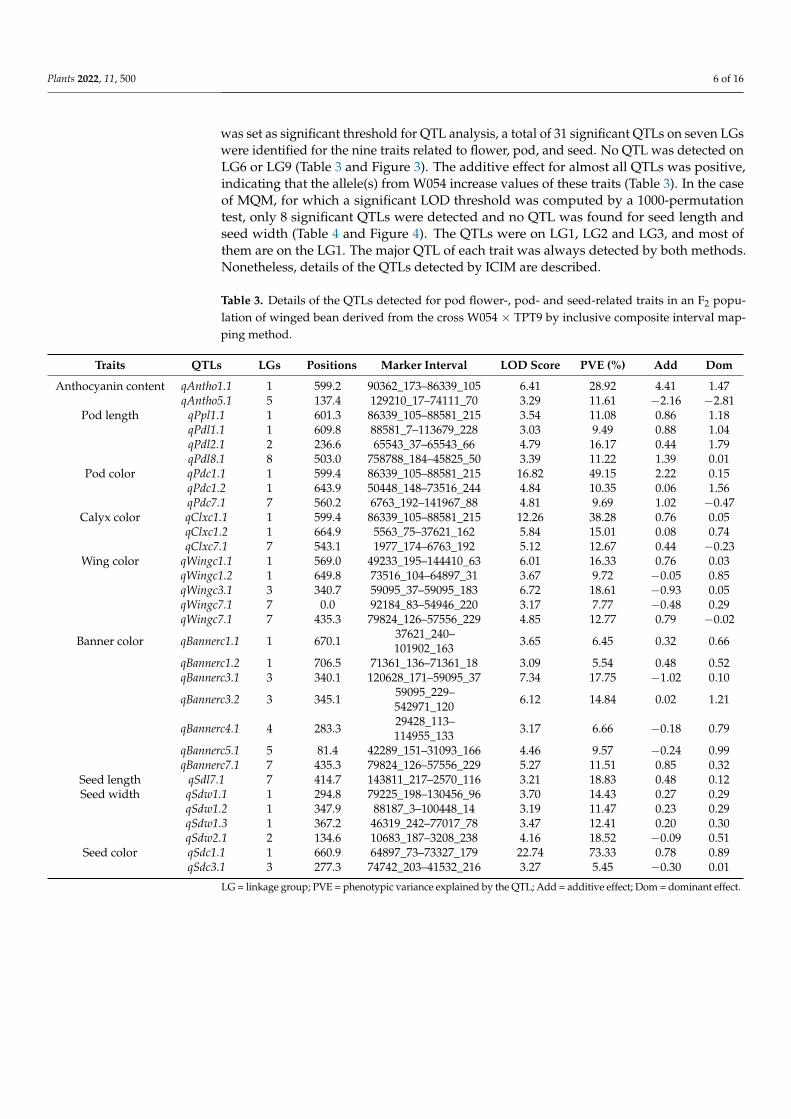
was set as significant threshold for QTL analysis, a total of 31 significant QTLs on seven LGswere identified for the nine traits related to flower, pod, and seed. No QTL was detected onLG6 or LG9 (Table 3 and Figure 3). The additive effect for almost all QTLs was positive,indicating that the allele(s) from W054 increase values of these traits (Table 3). In the caseof MQM, for which a significant LOD threshold was computed by a 1000-permutationtest, only 8 significant QTLs were detected and no QTL was found for seed length andseed width (Table 4 and Figure 4). The QTLs were on LG1, LG2 and LG3, and most ofthem are on the LG1. The major QTL of each trait was always detected by both methods.Nonetheless, details of the QTLs detected by ICIM are described.
Table 3. Details of the QTLs detected for pod flower-, pod- and seed-related traits in an F2 popu-lation of winged bean derived from the cross W054 × TPT9 by inclusive composite interval map-ping method.
Traits QTLs LGs Positions Marker Interval LOD Score PVE (%) Add Dom
Anthocyanin content qAntho1.1 1 599.2 90362_173–86339_105 6.41 28.92 4.41 1.47qAntho5.1 5 137.4 129210_17–74111_70 3.29 11.61 −2.16 −2.81
Pod length qPpl1.1 1 601.3 86339_105–88581_215 3.54 11.08 0.86 1.18qPdl1.1 1 609.8 88581_7–113679_228 3.03 9.49 0.88 1.04qPdl2.1 2 236.6 65543_37–65543_66 4.79 16.17 0.44 1.79qPdl8.1 8 503.0 758788_184–45825_50 3.39 11.22 1.39 0.01
Pod color qPdc1.1 1 599.4 86339_105–88581_215 16.82 49.15 2.22 0.15qPdc1.2 1 643.9 50448_148–73516_244 4.84 10.35 0.06 1.56qPdc7.1 7 560.2 6763_192–141967_88 4.81 9.69 1.02 −0.47
Calyx color qClxc1.1 1 599.4 86339_105–88581_215 12.26 38.28 0.76 0.05qClxc1.2 1 664.9 5563_75–37621_162 5.84 15.01 0.08 0.74qClxc7.1 7 543.1 1977_174–6763_192 5.12 12.67 0.44 −0.23
Wing color qWingc1.1 1 569.0 49233_195–144410_63 6.01 16.33 0.76 0.03qWingc1.2 1 649.8 73516_104–64897_31 3.67 9.72 −0.05 0.85qWingc3.1 3 340.7 59095_37–59095_183 6.72 18.61 −0.93 0.05qWingc7.1 7 0.0 92184_83–54946_220 3.17 7.77 −0.48 0.29qWingc7.1 7 435.3 79824_126–57556_229 4.85 12.77 0.79 −0.02
Banner color qBannerc1.1 1 670.1 37621_240–101902_163 3.65 6.45 0.32 0.66
qBannerc1.2 1 706.5 71361_136–71361_18 3.09 5.54 0.48 0.52qBannerc3.1 3 340.1 120628_171–59095_37 7.34 17.75 −1.02 0.10
qBannerc3.2 3 345.1 59095_229–542971_120 6.12 14.84 0.02 1.21
qBannerc4.1 4 283.3 29428_113–114955_133 3.17 6.66 −0.18 0.79
qBannerc5.1 5 81.4 42289_151–31093_166 4.46 9.57 −0.24 0.99qBannerc7.1 7 435.3 79824_126–57556_229 5.27 11.51 0.85 0.32
Seed length qSdl7.1 7 414.7 143811_217–2570_116 3.21 18.83 0.48 0.12Seed width qSdw1.1 1 294.8 79225_198–130456_96 3.70 14.43 0.27 0.29
qSdw1.2 1 347.9 88187_3–100448_14 3.19 11.47 0.23 0.29qSdw1.3 1 367.2 46319_242–77017_78 3.47 12.41 0.20 0.30qSdw2.1 2 134.6 10683_187–3208_238 4.16 18.52 −0.09 0.51
Seed color qSdc1.1 1 660.9 64897_73–73327_179 22.74 73.33 0.78 0.89qSdc3.1 3 277.3 74742_203–41532_216 3.27 5.45 −0.30 0.01
LG = linkage group; PVE = phenotypic variance explained by the QTL; Add = additive effect; Dom = dominant effect.

Plants 2022, 11, 500 7 of 16
Plants 2022, 11, x FOR PEER REVIEW 7 of 16
Pod length qPpl2.1 2 235.5 69533_212–65543_37 5.18 24.20 0.51 2.03 Pod color qPdc1.1 1 599.4 86339_105–88581_215 14.26 53.40 2.15 1.39
Calyx color qClxc1.1 1 673.03 37621_240–101902_163 12.78 49.60 0.82 0.83 Wing color qWingc1.1 1 664.83 73327_66–5563_75 3.94 19.00 0.72 0.68
qWingc3.1 3 372.46 52207_209–15865_163 5.44 25.30 −0.76 0.96 Banner color qBannerc3.1 3 338.69 120628_171–59095_37 6.69 30.10 −0.94 1.14 Seed length No QTL detected Seed width No QTL detected Seed color qSdc1.1 1 662.34 73327_179–73327_66 19.65 70.60 0.78 0.87
LG = linkage group; PVE = phenotypic variance explained by the QTL; Add = additive effect; Dom = dominant effect.
Figure 3. LOD (Logarithm of odds) graphs of quantitative trait loci for flower-, pod-, and seed-related traits detected by inclusive composite interval mapping (ICIM) method in the winged bean F2 population developed from the cross W054 × TPT9. The x-axis indicates the linkage groups, whereas the y-axis indicates the logarithm of odds (LOD) scores. The dash line horizontal to the y-axis indicates the LOD significance threshold.
Figure 3. LOD (Logarithm of odds) graphs of quantitative trait loci for flower-, pod-, and seed-related traits detected by inclusive composite interval mapping (ICIM) method in the winged beanF2 population developed from the cross W054 × TPT9. The x-axis indicates the linkage groups,whereas the y-axis indicates the logarithm of odds (LOD) scores. The dash line horizontal to they-axis indicates the LOD significance threshold.
Table 4. Details of the QTLs detected for pod flower-, pod- and seed-related traits in an F2 populationof winged bean derived from the cross W054 × TPT9 by multiple QTL mapping method.
Traits QTLs LGs Positions Marker Interval LOD Score PVE (%) Add Dom
Anthocyanin qAntho1.1 1 566.5 59413_160–49233_195 6.57 29.60 4.57 2.15Pod length qPpl2.1 2 235.5 69533_212–65543_37 5.18 24.20 0.51 2.03Pod color qPdc1.1 1 599.4 86339_105–88581_215 14.26 53.40 2.15 1.39
Calyx color qClxc1.1 1 673.03 37621_240–101902_163 12.78 49.60 0.82 0.83Wing color qWingc1.1 1 664.83 73327_66–5563_75 3.94 19.00 0.72 0.68
qWingc3.1 3 372.46 52207_209–15865_163 5.44 25.30 −0.76 0.96Banner color qBannerc3.1 3 338.69 120628_171–59095_37 6.69 30.10 −0.94 1.14Seed length No QTL detectedSeed width No QTL detectedSeed color qSdc1.1 1 662.34 73327_179–73327_66 19.65 70.60 0.78 0.87
LG = linkage group; PVE = phenotypic variance explained by the QTL; Add = additive effect; Dom = dominant effect.

Plants 2022, 11, 500 8 of 16
Plants 2022, 11, x FOR PEER REVIEW 8 of 16
Figure 4. LOD (Logarithm of odds) graphs of quantitative trait loci for flower-, pod-, and seed-related traits detected on LG1, LG2 and LG3 by multiple QTL mapping (MQM) method in the winged bean F2 population developed from the cross W054 × TPT9. The x-axis indicates the linkage groups, whereas the y-axis indicates the logarithm of odds (LOD) scores. The dash line horizontal to the y-axis indicates the LOD significance threshold.
2.4.1. QTLs Controlling Organ Coloration Two QTLs, qAntho1.1 and qAntho5.1, locating on LGs 1 and 5, were identified for pod
anthocyanin content. These QTLs accounted for 28.92% and 11.61% of the anthocyanin content variation in the F2 population, respectively. At the qAntho1.1 the allele(s) from W054 increased anthocyanin content, whereas at the qAntho5.1 the allele(s) from TPT9 decreased the anthocyanin content.
Three QTLs located on LGs 1 and 7 were detected for pod color. They explained 9.67% to 49.15% of pod color intensity variation in the F2 population. The QTL on LG1, qPdc1.1, showed the largest effect was on the LG1. At all QTLs, allele(s) from W054 in-creased coloration of the pod. The qPdc1.2 expressed an overdominant gene effect.
Similar to the pod color, three QTLs localizing on LGs1 and 7 were identified for calyx color. These QTLs explained 12.67% to 38.28% of calyx color variation in the F2 pop-ulation. The QTL qClxc1.1 located on LG1 showed the largest effect towards the calyx color. At these loci, allele(s) from W054 increased coloration of the pod. The qClxc1.2 showed a very strong overdominant gene effect.
Figure 4. LOD (Logarithm of odds) graphs of quantitative trait loci for flower-, pod-, and seed-relatedtraits detected on LG1, LG2 and LG3 by multiple QTL mapping (MQM) method in the winged beanF2 population developed from the cross W054 × TPT9. The x-axis indicates the linkage groups,whereas the y-axis indicates the logarithm of odds (LOD) scores. The dash line horizontal to they-axis indicates the LOD significance threshold.
2.4.1. QTLs Controlling Organ Coloration
Two QTLs, qAntho1.1 and qAntho5.1, locating on LGs 1 and 5, were identified for podanthocyanin content. These QTLs accounted for 28.92% and 11.61% of the anthocyanincontent variation in the F2 population, respectively. At the qAntho1.1 the allele(s) fromW054 increased anthocyanin content, whereas at the qAntho5.1 the allele(s) from TPT9decreased the anthocyanin content.
Three QTLs located on LGs 1 and 7 were detected for pod color. They explained 9.67%to 49.15% of pod color intensity variation in the F2 population. The QTL on LG1, qPdc1.1,showed the largest effect was on the LG1. At all QTLs, allele(s) from W054 increasedcoloration of the pod. The qPdc1.2 expressed an overdominant gene effect.
Similar to the pod color, three QTLs localizing on LGs1 and 7 were identified for calyxcolor. These QTLs explained 12.67% to 38.28% of calyx color variation in the F2 population.The QTL qClxc1.1 located on LG1 showed the largest effect towards the calyx color. Atthese loci, allele(s) from W054 increased coloration of the pod. The qClxc1.2 showed a verystrong overdominant gene effect.
Plants 2022, 11, 500 9 of 16
Five QTLs residing on LGs 1, 3, and 7 were detected for wing color. They accounted for7.76% to 18.61% of the wing color variation in the in the F2 population. Among these QTLs,qWingc3.1 residing on LG3 showed the largest effect. However, the qWingc7.1 mapped onLG7 showed comparable effect with the qWingc3.1. Allele(s) from W054 at the qWingc1.1and qWingc7.2 increased coloration of the wing. In contrast, allele(s) from W054 at theqWingc1.2, qWingc3.1 and qWingc7.1 reduced coloration of the wing. The qWingc1.2 showeda very strong overdominant gene effect.
Seven QTLs located on LGs 1, 3, 4, 5 and 7 were identified for banner color. Theyexplained 5.53% to 17.75% of the banner color variation in the in the F2 population. The QTLon LG3, qBannerc3.1, showed the greatest effect towards the banner color, followed by theqBannerc3.2 that was mapped only 5.0 cM away from the qBannerc3.1. Allele(s) from W054 atthe W054 at the qBannerc1.2, qBannerc1.2, qBannerc3.2 and qBannerc7.1 enhanced colorationof the banner. Allele(s) from W054 at the qBannerc3.1, qBannerc4.1, and qBannerc5.1 reducedcoloration of the banner. The qBannerc3.2, qBannerc4.1 and qBannerc5.1 expressed a strongoverdominant gene effect, especially the qBannerc3.2.
One major and one minor QTL were identified for seed coat color. The major QTL,qSdc1.1, was localized on LG1, while the minor QTL, qSdc3.1, was located on LG3. Theyexplained 73.34% and 5.45% of the seed coat variation in the F2 population, respectively.Allele(s) from W054 at the qSdc1.1 increased intensity of the seed coat color, whereasallele(s) from W054 at the qSdc3.1 decreased the color intensity. The qSdc1.1 expressed anoverdominant gene effect.
2.4.2. QTLs Controlling Organ Size
Four QTLs for pod length were detected on LGs 1, 2, and 8. These QTLs accounted for9.449% to 16.17% of the pod length variation in the F2 population. Among the four QTLs,qPdl2.1 showed the greatest effect. At all these QTLs, allele(s) from W054 enhanced thelength. However, all of the QTLs except qPdl8.1 expressed overdominant gene effect.
Only one QTL was detected for seed length, qSdl7.1. This QTL was located on LG7and explained 18.83% of the variation of seed length in the F2 population. Four QTLs onLGs 1 and 2 were detected for seed width, of which three QTLs were on the LG1. TheQTLs explained 11.47% to 18.52% of the variation of seed width in the F2 population. TheqSdw2.1 on LG02 showed the highest effect. In contrast to other QTLs, at the qSdw2.1allele(s) from W054 decreased width of the seed. In addition, the qSdw2.1 expressed a verystrong overdominant gene effect.
3. Discussion3.1. Genetics Controlling Traits in Winged Bean
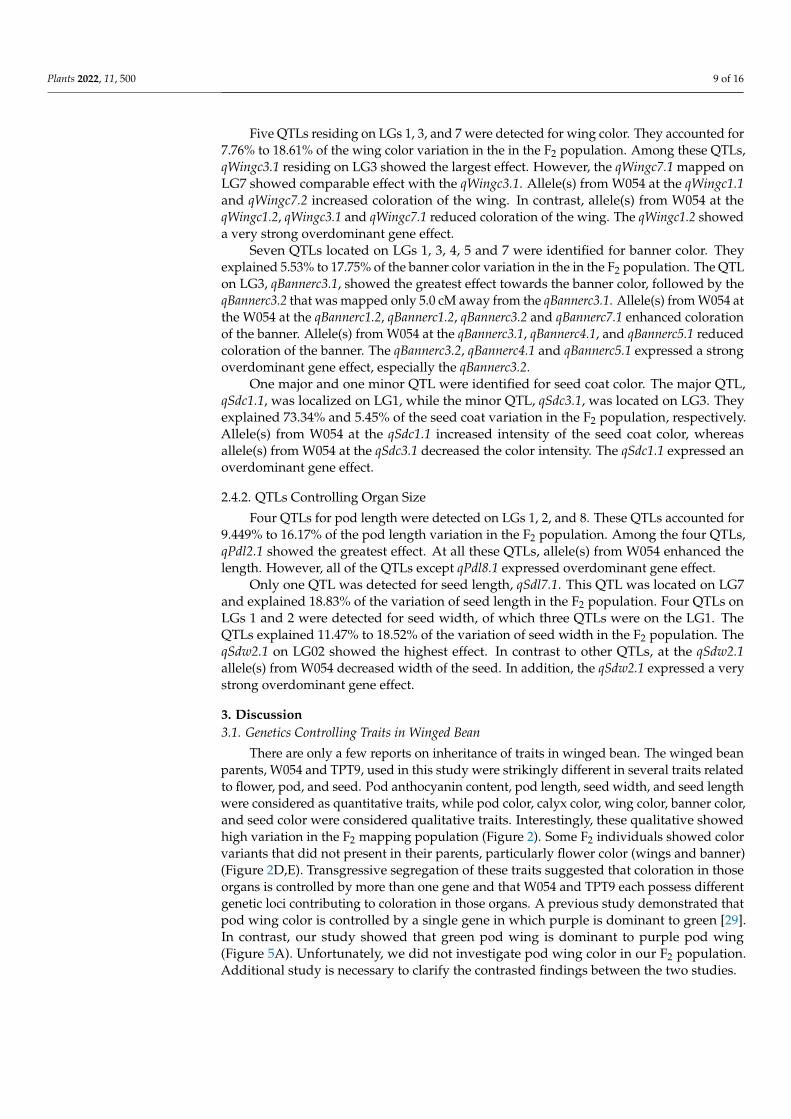
There are only a few reports on inheritance of traits in winged bean. The winged beanparents, W054 and TPT9, used in this study were strikingly different in several traits relatedto flower, pod, and seed. Pod anthocyanin content, pod length, seed width, and seed lengthwere considered as quantitative traits, while pod color, calyx color, wing color, banner color,and seed color were considered qualitative traits. Interestingly, these qualitative showedhigh variation in the F2 mapping population (Figure 2). Some F2 individuals showed colorvariants that did not present in their parents, particularly flower color (wings and banner)(Figure 2D,E). Transgressive segregation of these traits suggested that coloration in thoseorgans is controlled by more than one gene and that W054 and TPT9 each possess differentgenetic loci contributing to coloration in those organs. A previous study demonstrated thatpod wing color is controlled by a single gene in which purple is dominant to green [29].In contrast, our study showed that green pod wing is dominant to purple pod wing(Figure 5A). Unfortunately, we did not investigate pod wing color in our F2 population.Additional study is necessary to clarify the contrasted findings between the two studies.

Plants 2022, 11, 500 10 of 16Plants 2022, 11, x FOR PEER REVIEW 10 of 16
Figure 5. The phenotypes, parental and progenies, of the W054 × TPT9 cross. The pods and seeds of W054, TPT9, and F1 progeny are shown in (A), the pod colors of W054, TPT9, F1 progeny, and diver-sity of eight types are located in the surrounding F2 population (B), and the wing and banner colors of W054, TPT9, F1 progeny, and six types of F2 population are shown in (C).
In this study, correlation analysis of the flower-, pod-, and seed-related traits in the F2 population was determined (Table 1). Moderate to high and significant correlations were found between coloration of these traits (Table 1). These results suggest that these traits are controlled by pleiotropic locus/loci or linked loci. It has been reported that genes controlling stem color and calyx color, and pod wing color and pod speck color are linked [30].
3.2. The Winged Bean Genetic Linkage Map A genetic linkage map is indispensable for QTL analysis and gene discovery for
marker-assisted breeding. The SNP-based linkage map constructed for the F2 population in this study is the first genetic map of the winged bean. The map comprised 1384 SNP markers that were assigned to 9 linkage groups corresponding to haploid chromosomes of the winged bean. The total length of the map was 4552.8 cM with average distance between markers of 3.38 cM which is sufficient for genome-wide QTL analysis for eco-nomically important traits [31]. In this study, RAD-seq was used to discover SNP markers. RAD-seq has been used for large-scale SNP discovery and genetic mapping in many crop species, especially in species without a reference genome [32–34]. The high-density link-age map constructed for winged bean with the SNPs discovered from RAD-seq indicated that this genotyping method can be applied to develop large-scale SNP markers, and con-
Figure 5. The phenotypes, parental and progenies, of the W054 × TPT9 cross. The pods and seedsof W054, TPT9, and F1 progeny are shown in (A), the pod colors of W054, TPT9, F1 progeny, anddiversity of eight types are located in the surrounding F2 population (B), and the wing and bannercolors of W054, TPT9, F1 progeny, and six types of F2 population are shown in (C).
In this study, correlation analysis of the flower-, pod-, and seed-related traits in theF2 population was determined (Table 1). Moderate to high and significant correlationswere found between coloration of these traits (Table 1). These results suggest that thesetraits are controlled by pleiotropic locus/loci or linked loci. It has been reported thatgenes controlling stem color and calyx color, and pod wing color and pod speck color arelinked [30].
3.2. The Winged Bean Genetic Linkage Map
A genetic linkage map is indispensable for QTL analysis and gene discovery formarker-assisted breeding. The SNP-based linkage map constructed for the F2 populationin this study is the first genetic map of the winged bean. The map comprised 1384 SNPmarkers that were assigned to 9 linkage groups corresponding to haploid chromosomes ofthe winged bean. The total length of the map was 4552.8 cM with average distance betweenmarkers of 3.38 cM which is sufficient for genome-wide QTL analysis for economicallyimportant traits [31]. In this study, RAD-seq was used to discover SNP markers. RAD-seqhas been used for large-scale SNP discovery and genetic mapping in many crop species,especially in species without a reference genome [32–34]. The high-density linkage mapconstructed for winged bean with the SNPs discovered from RAD-seq indicated that thisgenotyping method can be applied to develop large-scale SNP markers, and constructhigh-density molecular genetic maps for winged beans without availability of reference

Plants 2022, 11, 500 11 of 16
genome. The method greatly shortens the sequencing cycle, and reduces the cost of markerdevelopment for non-model species [35].
3.3. QTL Analysis for Flower-, Pod-, and Seed-Related Traits of the Winged Bean
In this study, QTL analysis using two methods, ICIM and MQM, in the F2 populationrevealed 31 QTLs in total for nine flower-, pod-, and seed-related traits (Tables 3 and 4). Thenumber per QTL ranged from one (seed length) to seven (banner color). Most of the traitsinvestigated for the QTLs were associated with coloration of organs. The QTLs for organcolorations were clustered on LGs 1, 3 and 7 in which some QTLs were mapped to the sameor nearly the same position (Tables 3 and 4): for example, qAntho1.1 for pod anthocyanincontents, qPdc1.1 for pod color and qClxc1.1 for calyx color (Table 3) and qWingc1.1 forwing color and qSdc1.1 for seed color (Table 4). However, on each LG, different QTLs werealso found for the same trait (Table 3). These results suggested that organ coloration inthe winged bean is controlled by several QTLs in which some of the traits are likely to becontrolled by the same gene(s) (pleiotropic locus) and/or by the linked genes. This is inline with the significant and positive correlation among organ coloration traits in the F2population (Table 1). The results also suggested that anthocyanin is the major cause ofpurple pod color and purple calyx color in winged bean.
Among organ coloration traits in the winged bean, the color of young pods is as-sociated with consumer and farmer preferences [10]. In Thailand, most of winged beancultivars produce green pods, while cultivars with purple pods are rare, especially the oneswith dark purple pods [10]. Purple coloration in plants is principally caused by anthocyaninpigments which are associated with health benefits to humans [36,37]. Recently, wingedcultivars with purple coloration have become more popular among consumers becauseof health effects of anthocyanins. In this study, QTL analysis showed that anthocyanincontents in the young pods is controlled by only two major QTLs, qAntho1.1 and qAntho5.1(Table 3). This suggests that breeding new winged bean cultivars with purple young podsmay not be difficult. However, interestingly, additive effects towards pod color of theW054 (the parent with dark purple pods) at the qAntho1.1 and qAntho5.1 showed differentdirections; increasing anthocyanin content at qAntho1.1, while decreasing anthocyanincontent at qAntho5.1. This may complicate the selection for dark purple pods. The parents,W054 and TPT9, were different in flower color: purple vs. light blue. However, the F2populations showed wide variants in flower colors (Figure 5C). As many as 12 QTLs weredetected for flower color, 5 for wing color and 7 for banner color. Two co-localizations ofQTLs were found for wing and banner colors; one on LG1 (qWingc1.1 and qBannerc1.1) andone on LG7 (qWingc7.1 and qBannerc7.1) (Table 3). Both purple and blue colors in plantsare due to presence of anthocyanin pigments [36,37]. Cyanidin, delphinidin, pelargonidin,peonidin, malvidin, and petunidin are the most common anthocyanidins distributed inthe plants [36]. While most of these anthocyanidins give rise to purple or red colors inplants and foods, malvidin and delphinidin provide blue-colored flowers [38,39]. TheQTLs identified for flower color in the winged bean may be associated with production ofdifferent anthocyanidins.
Apart from pod color, pod length is also associated with consumer’s and farmer’spreferences [10]. Although long and extralong pods are possibly advantageous for podweight yield and some local consumers and farmers like winged bean cultivars withlong and extralong pods, cultivars with short pods are much more popular because ofconvenience in packaging. In fact, cultivars having extralong pods are scarce [10]. Inthis study, pod length of the mapping parents W054 and TPT9 were about 10 cm indifference and four QTLs were identified for this trait. Interestingly, the major QTL qPdl1.1controlling pod length was mapped to nearly the same position with the major QTLqAntho1.1 conferring pod anthocyanin content (Table 3). This suggests that increasing podlength would not hamper purple pod coloration. Nonetheless, fine mapping is necessaryto elucidate the co-localization of the qPdl1.1 and qAntho1.1. It is note-worthy that theqPdl2.1, the largest effect QTL for pod length, expressed a strong over-dominance gene
Plants 2022, 11, 500 12 of 16
effect (potence ratio is about 4.1; Table 3). Although this strong overdominance effect maybe useful for deployment of hybrid cultivars of winged bean, it can delay developmentof pure line cultivars in the winged bean as this crop is self-pollinating. Nonetheless,since overdominant effect can stem from allelic interaction or closely-linked genes [40],additional study is necessary to determine the cause of strong overdominance of the qPdl1.1.Moreover, a large population of recombinant inbred lines should be used for confirmationor fine mapping of the QTLs detected in this study.
4. Materials and Methods4.1. Plant Materials
An F2 mapping population was developed from a cross between TPT9 and W054.TPT9, an accession originally from Nigeria, has a short green pod, whereas W054 is acommercial winged bean cultivar from the Nakhon Pathom province, Thailand, containinga long purple pod (Figure 5). TPT9 is used as the male parent, crossed onto W054 to developF1 hybrids. An F1 hybrid was self-pollinated to produce F2 seeds. Eighty-six F2 individualswere grown under a field condition for DNA extraction and phenotypic evaluation.
4.2. Field Evaluation
The F2 mapping population and the parents were sown in a row with 1 m intra-holespacing and 1 m inter-row spacing. The row consisted of 50 plants (W054 and TPT9) whichwere subjected to a randomized complete block design (RCBD) with non-replication. Theexperimental field was located at the Agronomy Field Crops Station, Khon Kaen University,Khon Kaen, Thailand, and used from August 2020 to April 2021.
Measurement of pod length: pod length was determined in the F2 individuals. Threeto five fresh pods were harvested from individual F2 plant at 15 days after flowering (DAF)for pod length (cm) measurement.
Flower-related traits: three flowers of the F2 individuals were observed for banner,wing, and calyx colors using color scoring following IPGRI [41] with a slight modificationas white, white blue, white purple, blue, violet, and purple (Figure 5C).
Seed-related traits: ten seeds of the F2 individuals were observed for color using colorscoring following IPGRI [41]. Seed length and seed width (cm) were also recorded.
Measurement of pod pigmentation: pigmentation of the F2 pods was recorded usingcolor scoring following IPGRI [41] with a slight modification as green, green with purplespots, green with a purple spot at center, purple wing, purple center, light purple, purple,and dark purple (Figure 5B), and the pod anthocyanin contents were quantified. Thesample preparation and extraction of anthocyanin followed a slightly modified methodas previously reported [42]. The pH differential method was used to measure total antho-cyanin content (TAC) [43]. Briefly, three fresh pods of each individual F2 plant were sliced(0.2 g) and submerged in 10 mL of 0.1% trifluoroacetic acid (TFA) and 95% ethanol in a50 mL tube for anthocyanin extraction. The components were incubated at 4 ◦C for sixhours until the solution was colorless. The extract was filtrated through qualitative cellulosefilter paper (Whatman No.1, Sigma-Aldrich®, St. Louis, MO, USA). The anthocyanin of thefiltrate was evaluated by UV-Vis spectrophotometer at 530 nm [42]. The total anthocyanincontent was calculated by the following formula:
TAcy = OD × DV100 × TEV
SV × SW ×(
Ecf10
) (1)
where,
TAcy = total anthocyanin (mg/100 g)OD = Absorbance 530 nmDV = Volume of diluted solution (mL)SV = Volume of extracted solution for diluted (mL)TEV = Total extracted volume (mL)

Plants 2022, 11, 500 13 of 16
SW = Sample weight (g)Ecf = Extinction coefficient (Ecf of cyaniding-3-glucoside is 449.2)
4.3. RAD-Seq
Total genomic DNA of the parents and F2 population was extracted from fresh leaftissue using the CTAB method described by Lodhi et al. [44]. The DNA quantity andquality were determined by gel electrophoresis and spectrophotometric measurements.Total genomic DNA (300 ng) was used to construct a RAD-seq [28] library following theprotocol in the MGIEasy RAD library preparation kit (MGI Tech). Paired-end (150 bp)sequencing was performed on the MGISEQ-2000RS (MGI Tech) according to the manu-facturer’s instructions. SNPs were called using Stacks ver. 2.58 [45] and filtered with thefollowing criteria: (a) a minor allele frequency >0.1, (b) depth coverage between 10×–200×,and (c) fewer than 10% missing data. In addition, markers showing significant segregationdistortion (χ2 test p-value < 0.01) and having same genotypes as large haplotype blockswere excluded from further analysis. The filtered SNP markers were used to constructlinkage maps.
4.4. Linkage Map Construction
A linkage map was constructed utilizing QTL IciMapping 4.2 [46]. The segregationratio of each SNP marker was determined by chi-square test. Markers showing significant(p < 0.05) segregation distortion were excluded from linkage analysis. Then, markerswere grouped using log of odds (LOD) value of 7.0. Markers on the same linkage wereordered by recombination counting and ordering (RECORD) algorithm [47] with 2-optMAPfunction [48]. Map distances were calculated using the Kosambi mapping function [49].
4.5. QTL Analysis
QTLs for flower-, pod-, and seed-related traits were identified by inclusive compositeinterval mapping (ICIM) method [50] implemented in QTL IciMapping 4.1 software [46].ICIM is performed at every 0.1 cM with a probability in stepwise regression (PIN) of 0.001.LOD threshold of 3.0 was used to declare the presence of QTLs for each trait. In addition,the QTLs for all the traits were also identified by multi-QTL model (MQM) method usingMapQTL 5.0 software [51]. A 1000 permutation test was used to determine the LOD scoresignificance thresholds at a 95% confidence level.
5. Conclusions
In this study, we constructed the first genetic linkage map of the winged bean usingSNP markers generated from next generation sequencing technology. We performedQTL mapping for flower color, pod color and length, and seed color and seed size forthis crop. The mapping developed in this study is moderately saturated with distancebetween markers of about 3.0 cM and resolved haploid chromosome number of the wingedbean. Several QTLs related to the traits mentioned above were mapped on to the linkagemap of which some QTLs were co-localized. This linkage map is useful for molecularbreeding studies of the winged bean, while QTLs identified in this study provide betterunderstanding of the genetics of organ coloration in the winged bean.
Supplementary Materials: The following are available online at https://www.mdpi.com/article/10.3390/plants11040500/s1, Table S1: SNP information of TPT9, W054, and F2 mapping population.Figure S1: A genetic linkage map of the winged bean [Psophocarpus tetragonolobus (L.) DC.] constructedfrom an 86 F2 population, derived from the W054 x TPT9 cross, using SNP markers.

Plants 2022, 11, 500 14 of 16
Author Contributions: Conceptualization, S.C. and P.S.; methodology, S.C., S.S., T.R., S.T., W.K., C.S.,W.P., K.A. and A.K.; software, S.T., W.K., C.S., W.P., P.S. and K.L.; validation, T.M., S.C., A.K. andJ.S.; formal analysis, S.C., S.T., P.S. and A.K.; investigation, S.C.; resources, P.S., T.M. and J.S.; datacuration, S.C.; writing—original draft preparation, S.C.; writing—review and editing, S.C. and P.S.;visualization, A.K. and P.S.; supervision, P.S.; project administration, S.C.; funding acquisition, S.C.All authors have read and agreed to the published version of the manuscript.
Funding: This research was supported by the Thailand Research Fund (TRF) and Office of the HigherEducation Commission (OHEC) (Project code: MGR6280195) and Khon Kaen University.
Institutional Review Board Statement: Not applicable.
Informed Consent Statement: Not applicable.
Data Availability Statement: Data presented in this study are available on request from the corre-sponding author.
Acknowledgments: This research is financially supported by the Thailand Research Fund (TRF) andOffice of the Higher Education Commission (OHEC) (Project code: MGR6280195) and Khon KaenUniversity. Our gratitude is also extended to the Plant Breeding Research Center for SustainableAgriculture, Khon Kaen University, Khon Kaen, Thailand.
Conflicts of Interest: The authors declare no conflict of interest.
References1. Harder, D.K. Chromosome Counts in Psophocarpus. Kew Bull. 1992, 47, 529–534. [CrossRef]2. Peyachoknagul, S.; Matsui, T.; Shibata, H.; Hara, S.; Ikenaka, T.; Okada, Y.; Ohno, T. Sequence and expression of the mRNA
encoding the chymotrypsin inhibitor in winged bean (Psophocarpus tetragonolobus (L.) DC.). Plant Mol. Biol. 1989, 12, 51–58.[CrossRef] [PubMed]
3. Wilson, E. The Diversity of Life; The Belknap Press of Harvard University Press: Cambridge, UK, 1992.4. Khan, T.N. Papua New Guinea: A centre of genetic diversity in winged bean (Psophocarpus tetragonologus (L.) Dc.). Euphytica 1976,
25, 693–705. [CrossRef]5. Mohanty, C.S.; Verma, S.; Singh, V.; Khan, S.; Gaur, P.; Gupta, P.; Nizar, M.A.; Dikshit, N.; Pattanayak, R.; Shukla, A.; et al.
Characterization of winged bean (Psophocarpus tetragonolobus (L.) DC.) based on molecular, chemical and physiological parameters.Am. J. Mol. Biol. 2013, 3, 187–197. [CrossRef]
6. Adegboyega, T.T.; Abberton, M.T.; Abdelgadir, A.A.H.; Dianda, M.; Maziya-Dixon, B.; Oyatomi, O.A.; Ofodile, S.; Babalola, O.O.Nutrient and Antinutrient Composition of Winged Bean (Psophocarpus tetragonolobus (L.) DC.) Seeds and Tubers. J. Food Qual.2019, 2019, 3075208. [CrossRef]
7. NAS. The Winged Bean: High-Protein Crop for the Humid Tropics, 2nd ed.; National Academy Press: Washington, DC, USA, 1981;p. 41.
8. Chen, D.; Yi, X.; Yang, H.; Zhou, H.; Yu, Y.; Tian, Y.; Lu, X. Genetic diversity evaluation of winged bean (Psophocarpus tetragonolobus(L.) DC.) using inter-simple sequence repeat (ISSR). Genet. Resour. Crop Evol. 2015, 62, 823–828. [CrossRef]
9. Yang, S.; Grall, A.; Chapman, M.A. Origin and diversification of winged bean (Psophocarpus tetragonolobus (L.) DC.), a multipurposeunderutilized legume. Am. J. Bot. 2018, 105, 888–897. [CrossRef]
10. Laosatit, K.; Amkul, K.; Chankaew, S.; Somta, P. Molecular Genetic Diversity of Winged Bean Gene Pool in Thailand Assessed bySSR Markers. Hortic. Plant J. 2021, 8, 81–88. [CrossRef]
11. Vatanparast, M.; Shetty, P.; Chopra, R.; Doyle, J.J.; Sathyanarayana, N.; Egan, A.N. Transcriptome sequencing and markerdevelopment in winged bean (Psophocarpus tetragonolobus; Leguminosae). Sci. Rep. 2016, 6, 29070. [CrossRef]
12. Wong, Q.N.; Tanzi, A.S.; Ho, W.K.; Malla, S.; Blythe, M.; Karunaratne, A.; Massawe, F.; Mayes, S. Development of Gene-BasedSSR Markers in Winged Bean (Psophocarpus tetragonolobus (L.) DC.) for Diversity Assessment. Genes 2017, 8, 100. [CrossRef]
13. Sriwichai, S.; Monkham, T.; Sanitchon, J.; Jogloy, S.; Chankaew, S. Dual-Purpose of the Winged Bean (Psophocarpus tetragonolobus(L.) DC.), the Neglected Tropical Legume, Based on Pod and Tuber Yields. Plants 2021, 10, 1746. [CrossRef] [PubMed]
14. Eagleton, G. Review: Winged bean (Psophocarpus tetragonolobus) cropping systems. Biodiversitas J. Biol. Divers. 2020, 21, 5927–5946.[CrossRef]
15. Mahto, C.S.; Dua, R.P. Genetic Divergence for Yield Contributing Traits in Winged Bean. Indian J. Plant Genet. Resour. 2009, 22,239–242.
16. Peterson, B.K.; Weber, J.N.; Kay, E.H.; Fisher, H.S.; Hoekstra, H.E. Double Digest RADseq: An Inexpensive Method for De NovoSNP Discovery and Genotyping in Model and Non-Model Species. PLoS ONE 2012, 7, e37135. [CrossRef] [PubMed]
17. Kang, Y.J.; Kim, S.K.; Kim, M.Y.; Lestari, P.; Kim, K.H.; Ha, B.-K.; Jun, T.H.; Hwang, W.J.; Lee, T.; Lee, J.; et al. Genome sequence ofmungbean and insights into evolution within Vigna species. Nat. Commun. 2014, 5, 5443. [CrossRef] [PubMed]

Plants 2022, 11, 500 15 of 16
18. Lonardi, S.; Muñoz-Amatriaín, M.; Liang, Q.; Shu, S.; Wanamaker, S.I.; Lo, S.; Tanskanen, J.; Schulman, A.H.; Zhu, T.; Luo,M.-C.; et al. The genome of cowpea (Vigna unguiculata [L.] Walp.). Plant J. 2019, 98, 767–782. [CrossRef]
19. Singh, A.K.; Velmurugan, A.; Gupta, D.S.; Kumar, J.; Kesari, R.; Konda, A.; Singh, N.P.; Roy, S.D.; Biswas, U.; Kumar, R.R.; et al.Draft genome sequence of a less-known wild Vigna: Beach pea (V. marina cv. ANBp-14-03). Crop J. 2019, 7, 660–666. [CrossRef]
20. Sakai, H.; Naito, K.; Takahashi, Y.; Sato, T.; Yamamoto, T.; Muto, I.; Itoh, T.; Tomooka, N. The Vigna Genome Server, ‘VigGS’: Agenomic knowledge base of the genus Vigna based on high-quality, annotated genome sequence of the azuki bean, Vigna angularis(Willd) Ohwi and Ohashi. Plant Cell Physiol. 2016, 57, e2. [CrossRef]
21. Kreplak, J.; Madoui, M.-A.; Cápal, P.; Novák, P.; Labadie, K.; Aubert, G.; Bayer, P.E.; Gali, K.K.; Syme, R.A.; Main, D.; et al. Areference genome for pea provides insight into legume genome evolution. Nat. Genet. 2019, 51, 1411–1422. [CrossRef]
22. Varshney, R.K.; Chen, W.; Li, Y.; Bharti, A.K.; Saxena, R.K.; Schlueter, J.A.; Donoghue, M.T.; Azam, S.; Fan, G.; Whaley, A.M.; et al.Draft genome sequence of pigeonpea (Cajanus cajan), an orphan legume crop of resource-poor farmers. Nat. Biotechnol. 2012, 30,83–89. [CrossRef]
23. Varshney, R.K.; Song, C.; Saxena, R.K.; Azam, S.; Yu, S.; Sharpe, A.G.; Cannon, S.; Baek, J.; Rosen, B.D.; Tar’An, B.; et al. Draftgenome sequence of chickpea (Cicer arietinum) provides a resource for trait improvement. Nat. Biotechnol. 2013, 31, 240–246.[CrossRef] [PubMed]
24. Lu, Q.; Li, H.; Hong, Y.; Zhang, G.; Wen, S.; Li, X.; Zhou, G.; Li, S.; Liu, H.; Liu, H.; et al. Genome Sequencing and Analysis of thePeanut B-Genome Progenitor (Arachis ipaensis). Front. Plant Sci. 2018, 9, 604. [CrossRef] [PubMed]
25. Kajiya-Kanegae, H.; Nagasaki, H.; Kaga, A.; Hirano, K.; Ogiso-Tanaka, E.; Matsuoka, M.; Ishimori, M.; Ishimoto, M.; Hashiguchi,M.; Tanaka, H.; et al. Whole-genome sequence diversity and association analysis of 198 soybean accessions in mini-core collections.DNA Res. 2021, 28, dsaa032. [CrossRef] [PubMed]
26. Hyten, D.L.; Cannon, S.B.; Song, Q.; Weeks, N.; Fickus, E.W.; Shoemaker, R.C.; Specht, J.E.; Farmer, A.D.; May, G.D.; Cregan, P.B.High-throughput SNP discovery through deep resequencing of a reduced representation library to anchor and orient scaffolds inthe soybean whole genome sequence. BMC Genom. 2010, 11, 38. [CrossRef]
27. Parchman, T.L.; Gompert, Z.; Mudge, J.; Schilkey, F.D.; Benkman, C.W.; Buerkle, C.A. Genome-wide association genetics of anadaptive trait in lodgepole pine. Mol. Ecol. 2012, 21, 2991–3005. [CrossRef]
28. Baird, N.A.; Etter, P.D.; Atwood, T.S.; Currey, M.C.; Shiver, A.L.; Lewis, Z.A.; Selker, E.U.; Cresko, W.A.; Johnson, E.A. Rapid SNPDiscovery and Genetic Mapping Using Sequenced RAD Markers. PLoS ONE 2008, 3, e3376. [CrossRef]
29. Erskine, W.; Khan, T.N. Inheritance of pigmentation and pod shape in winged bean. Euphytica 1977, 26, 829–831. [CrossRef]30. Freyre, R.; Uzdevenes, C.; Gu, L.; Quesenberry, K.H. Genetics and Anthocyanin Analysis of Flower Color in Mexican Petunia.
J. Am. Soc. Hortic. Sci. 2015, 140, 45–49. [CrossRef]31. Dekkers, J.C.M.; Hospital, F. The use of molecular genetics in the improvement of agricultural populations. Nat. Rev. Genet. 2002,
3, 22–32. [CrossRef]32. Miller, M.R.; Dunham, J.P.; Amores, A.; Cresko, W.A.; Johnson, E.A. Rapid and cost-effective polymorphism identification and
genotyping using restriction site associated DNA (RAD) markers. Genome Res. 2006, 17, 240–248. [CrossRef]33. Hegarty, M.; Yadav, R.; Lee, M.; Armstead, I.; Sanderson, R.; Scollan, N.; Powell, W.; Skøt, L. Genotyping by RAD sequencing
enables mapping of fatty acid composition traits in perennial ryegrass (Lolium perenne (L.)). Plant Biotechnol. J. 2013, 11, 572–581.[CrossRef] [PubMed]
34. Pootakham, W.; Ruang-Areerate, P.; Jomchai, N.; Sonthirod, C.; Sangsrakru, D.; Yoocha, T.; Theerawattanasuk, K.; Nirapathpong-porn, K.; Romruensukharom, P.; Tragoonrung, S.; et al. Construction of a high-density integrated genetic linkage map of rubbertree (Hevea brasiliensis) using genotyping-by-sequencing (GBS). Front. Plant Sci. 2015, 6, 367. [CrossRef] [PubMed]
35. Zhao, Y.; Zhao, Y.; Guo, Y.; Su, K.; Shi, X.; Liu, D.; Zhang, J. High-density genetic linkage-map construction of hawthorn and QTLmapping for important fruit traits. PLoS ONE 2020, 15, e0229020. [CrossRef] [PubMed]
36. Khoo, H.E.; Azlan, A.; Tang, S.T.; Lim, S.M. Anthocyanidins and anthocyanins: Colored pigments as food, pharmaceuticalingredients, and the potential health benefits. Food Nutr. Res. 2017, 61, 1361779. [CrossRef] [PubMed]
37. Wallace, T.C.; Giusti, M.M. Anthocyanins—Nature’s Bold, Beautiful, and Health-Promoting Colors. Foods 2019, 8, 550. [CrossRef]38. Tanaka, Y.; Tsuda, S.; Kusumi, T. Metabolic Engineering to Modify Flower Color. Plant Cell Physiol. 1998, 39, 1119–1126. [CrossRef]39. Katsumoto, Y.; Fukuchi-Mizutani, M.; Fukui, Y.; Brugliera, F.; Holton, T.; Karan, M.; Nakamura, N.; Yonekura-Sakakibara, K.;
Togami, J.; Pigeaire, A.; et al. Engineering of the Rose Flavonoid Biosynthetic Pathway Successfully Generated Blue-Hued FlowersAccumulating Delphinidin. Plant Cell Physiol. 2007, 48, 1589–1600. [CrossRef]
40. Crow, J.F.; Crow, J.F. Dominance and Overdominance. In The Genetics and Exploitation of Heterosis in Crops; Coors, J.G., Pandey, S.,Eds.; The American Society of Agronomy, Inc.: Madison, WI, USA; Crop Science Society of America, Inc.: Madison, WI, USA,1999; pp. 49–58. [CrossRef]
41. IBPGR. International Board for Plant Genetic Resources. Revised Winged Bean Descriptors; IBPGR: Rome, Italy, 1982; 24p.42. Ryu, S.N.; Park, S.Z.; Kang, S.S.; Han, S.J. Determination of C3G content in black purple rice using HPLC and UV-Vis spec-
trophotometer. Korean J. Crop. Sci. 2003, 48, 369–371.43. Guisti, M.M.; Wrolstad, R.E. Characterization and Measurement of Anthocyanins by UV-Visible Spectroscopy. Current Protocols in Food
Analytical Chemistry; John Wiley and Sons: Hoboken, NJ, USA, 2001; pp. F1.2.1–F1.2.13.44. Lodhi, M.A.; Ye, G.-N.; Weeden, N.F.; Reisch, B.I. A simple and efficient method for DNA extraction from grapevine cultivars
andVitis species. Plant Mol. Biol. Rep. 1994, 12, 6–13. [CrossRef]

Plants 2022, 11, 500 16 of 16
45. Catchen, J.M.; Amores, A.; Hohenlohe, P.; Cresko, W.; Postlethwait, J.H. Stacks: Building and Genotyping Loci De Novo FromShort-Read Sequences. G3 Genes Genomes Genet. 2011, 1, 171–182. [CrossRef]
46. Meng, L.; Li, H.; Zhang, L.; Wang, J. QTL IciMapping: Integrated software for genetic linkage map construction and quantitativetrait locus mapping in biparental populations. Crop. J. 2015, 3, 269–283. [CrossRef]
47. Van Os, H.; Stam, P.; Visser, R.G.F.; Van Eck, H.J. RECORD: A novel method for ordering loci on a genetic linkage map. Theor.Appl. Genet. 2005, 112, 30–40. [CrossRef] [PubMed]
48. Zhang, L.; Li, H.; Meng, L.; Wang, J. Ordering of high-density markers by the k-Optimal algorithm for the traveling-salesmanproblem. Crop. J. 2020, 8, 701–712. [CrossRef]
49. Kosambi, D.D. The Estimation of Map Distances From Recombination Values. Ann. Eugen. 1943, 12, 172–175. [CrossRef]50. Li, H.; Ribaut, J.-M.; Li, Z.; Wang, J. Inclusive composite interval mapping (ICIM) for digenic epistasis of quantitative traits in
biparental populations. Theor. Appl. Genet. 2007, 116, 243–260. [CrossRef] [PubMed]51. Van Ooijen, J. MAPQTL5.0, Software for the Mapping of Quantitative Trait Loci in Experimental Population; Kyazma, B.V., Ed.; Plant
Research International: Wageningen, The Netherlands, 2004.
Copyright © 2022 FDOKUMEN