Symbiotic Nitrogen Fixation in Common Bean - University of ...
285
Symbiotic Nitrogen Fixation in Common Bean By Mehdi Farid A Thesis presented to The University of Guelph In partial fulfilment of requirements for the degree of Doctor of Philosophy in Plant Agriculture Guelph, Ontario, Canada © Mehdi Farid, October, 2015
-
Upload
khangminh22 -
Category
Documents
-
view
1 -
download
0
Transcript of Symbiotic Nitrogen Fixation in Common Bean - University of ...

Symbiotic Nitrogen Fixation in Common Bean
By
Mehdi Farid
A Thesis
presented to
The University of Guelph
In partial fulfilment of requirements
for the degree of
Doctor of Philosophy
in
Plant Agriculture
Guelph, Ontario, Canada
© Mehdi Farid, October, 2015
ABSTRACT
SYMBIOTIC NITROGEN FIXATION IN COMMON BEAN
Mehdi Farid Advisors:
University of Guelph, 2015 Dr. Ali Navabi
Dr. K. Peter Pauls
Despite its inherent symbiotic N2-fixing (SNF) ability, the common bean (Phaseolus
vulgaris L.), compared to other legumes, is generally known as a weak N2-fixer. The objectives
of this thesis were to examine the genetic variation, environmental and genotype by
environmental effects, and response to selection for SNF and related traits, as well as to identify
genomic regions and candidate genes underlying SNF in common bean. Significant variation
was found among bean genotypes for percentage of nitrogen derived from atmosphere (%Ndfa),
a measure of SNF, and related traits. In studies of a recombinant inbred line (RIL) population,
derived from a cross of high- and low-SNF genotypes, while SNF-dependent and fertilizer-
dependent N management strategies did not affect the overall yield, genotypes responded
differentially to N management across environments. Among the RILs, 6% maintained a stable
yield, independent of N management strategies. Estimates of heritability and genetic gain were
higher for %Ndfa and related traits in optimum moisture environments. Genotypes with longer
vegetative growth had higher SNF ability. Quantitative trait loci (QTL) analysis detected 42
QTL for %Ndfa and related traits. In spite of the significant Genotype by environment
interactions, a QTL was detected on Pv08 that was significantly associated with %Ndfa across
environments, accounting for up to 17% of variation in %Ndfa. Another QTL was identified on

Pv07, associated with %Ndfa only in the dry environments, which accounted for 14% of the
phenotypic variation. This QTL was in close linkage with a QTL for δ13
C, a measure of water
use efficiency. Close genetic association between %Ndfa and δ13
C QTL, either in the dry or
optimum rainfall conditions, conformed to the positive association between SNF and water use
efficiency, which emphasizes the importance of nodulation early in the growing season for
efficient SNF in common bean. Three potential candidate genes were detected in the %Ndfa
QTL region on Pv08, with potential roles in SNF.
iv
ACKNOWLEDGEMENTS
First and foremost, I would like to offer my sincerest gratitude to my supervisor, Dr. Ali
Navabi, for his support and supervision of this work. My thanks also extend to Dr. K. Peter
Pauls, my co-advisor, for his care and guidance. I acknowledge the extensive and critical review
of this work provided by members of the advisory committee, Dr. Hugh J. Earl, Dr. Istvan
Rajcan and Dr. John Lauzon. I also acknowledge Dr. Dave Hume for helpful guidance.
I wish to gratefully acknowledge the technical assistance of Tom Smith, Alberto Aguilera,
Terry Rupert, Peter Smith, Clarence Gilbertson, Benjamin Ellert, Jan Brazolot, Godfrey Chu,
Dietmar Scholz, Donna Hancock, BaiLing Zhang, Anastasia Chechulina, Katie Keenan,
Melanie Wolters, Allie Core, Katie Caldecott, Josh Good, Melanie Wolters-Inksetter, Melinda
Drummond, Sarah McClymont, Kristina Dydensborg, Emily Lynn, Arad Moghaddasi, Raja
Khanal, Weilong Xie, Andrew Burtt, Mohammad Erfatpour, and YanZhou Qi. I also appreciate
Jim Hoare and Mike H. Peppard for all their supports.
The financial support of the project provided by Agriculture and Agri-Food Canada, the
Ontario Bean Growers, the Ministry of Research and Innovation and the Agriculture Adaptation
Council of Canada are kindly acknowledged.
Last, but not the least, I thank my wife and daughter for supporting me through all my
studies and for providing a home, in which to complete my thesis write up.

v
TABLE OF CONTENTS
CHAPTER 1 General Introduction
1.1 General introduction………………………………………………………………………….2
1.2 Hypotheses ............................................................................................................................... 4
1.3 Research Objectives ................................................................................................................. 5
CHAPTER 2 Literature Review
2.1 Nitrogen (N) …………………………………………………………………………………7
2.2 Biological nitrogen fixation……………………………………………………..……………9
2.2.1 Free-living N2 fixing organisms…………………………………………………………..10
2.2.1.1 Aerobic, Azotobacter…………………………………………………..………………..11
2.2.1.2 Anaerobic, Clostridium and Klebsiella…………………………………………………12
2.2.2 Associative symbiosis relationship…………………………………………………….…13
2.2.2.1 Cyanobacteria…………………………………………………………………………...13
2.2.2.2 Azospirillum……………………………………………………………………...……..16
2.2.3 Symbiotic N2 fixation (SNF) ……………………………………………………………..17
2.2.3.1 Frankia………………………………………………………………………………..…17
2.2.3.2 Rhizobium………………………………………………………………………………19
2.3 BNF process………………………………………………………………………….……..20
2.4 SNF regulation……………………………………………………………….……………..22
2.4.1. Physiology regulation of BNF………………………………………………..…………..22
2.4.2 Host-plant regulation of SNF……………………………………………………………..24
2.4.3 Genetic Regulation of SNF………………………………………………………...……..28
2.4.3.1 Genes controlling SNF and nodule formation…………………………………...…...…28
2.4.3.2 Genes controlling infection and nodule development………………………...…...……32

vi
2.4.4 Environmental regulation of SNF……………………………………………...…………33
2.4.4.1 Soil moisture stress…………………………………………………………..………….33
2.4.4.2 Heat stress…………………………………………………………………………...…..34
2.4.4.3 Salinity stress……………………………………………………………………………35
2.4.4.4 Soil pH stress…………………………………………………………………..………..36
2.4.4.5 Macronutrients stress………………………………………………………..…………..38
2.4.4.5.1 Nitrogen………………………………………………………………………...……..38
2.4.4.5.2 Phosphorus………………………………………………………………...……...…..40
2.4.4.5.3 Potassium,Calcium and Sulfur………………………….……………………...……..41
2.4.4.6 Micronutrients…………………………………………………………………………..41
2.4.4.6.1 Boron………………………………………………………………………………….41
2.4.4.6 .2 Copper………………………………………………………………………………..42
2.4.4.6.3 Iron………………………………………………………………………………..…..42
2.4.4.6.4 Molybdenum…………………………………………………...……………………..43
2.4.4.6.5 Nickel………………………………………………………………………..………..43
2.4.4.6.6 Cobalt………………………………………………………………..………………..44
2.5 SNF estimation methods…………………………………………………………..………..44
2.5.1 N difference technique………………………………………………………………...….45
2.5.2 Acetylene reduction assay (ARA) …………………………………………..……………45
2.5.3 Relative ureide-abundance technique…………………………………………………..…46
2.5.4 Nitrogen-15 (15
N) isotope techniques…………………………………………………..…47
2.5.4.1 Total 15
N balance technique………………………………………………………….…48
2.5.4.2 15
N -enrichment isotope-dilution (ID) technique……………………………………….48
2.5.4.3 15
N natural abundance (NA) technique…………………………………...………..…...50
vii
2.6 SNF in common bean………………………………………………………………...……..52
2.6.1 Possibility of SNF improvement in common bean……………………………….………53
2.6.2 Relationships of SNF with agronomic traits……………………………………...………54
2.6.3 Molecular Tools in Common Bean……………………………………………….………56
2.6.4 SNP markers applications in common bean………………………………………………59
2.6.5 Quantitative trait loci (QTL) associated with SNF traits…………………………………60
CHAPTER 3 N2 Fixation Ability of Different Dry Bean Genotypes
3.1 ABSTRACT…………………………………………………………………………….…..66
3.2. INTRODUCTION…………………………………………………………………...……..67
3.3. MATERIALS AND METHODS…………………………………………………………..70
3.3.1 Plant materials…………………………………………………………………...………..70
3.3.2 Seedling nodulation assay………………………………………………………………...70
3.3.3 Greenhouse nodulation assay……………………………………………………………..72
3.3.4 Field N2 fixation assays…………………………………………………………………..73
3.3.5 Data collection …………………………………………………………………………...74
3.3.6 Statistical Analysis …………………………………………………………………….…76
3.4 RESULTS…………………………………………………………………………….……..78
3.4.1 Seedling Nodulation assays…………………………………………………………….....78
3.4.2 Greenhouse assays………………………………………………………………….……..78
3.4.3 Field assays………………………………………………………………………………..79
3.4.4 Seed yield…………………………………………………………………………..……..80
3.4.5 Nitrogen derived from atmospheric air (%Ndfa)……………………………………..…..80
3.4.6 Nitrogen Fixed per Unit Area……………………………………………………………..81
3.4.7 Seed nitrogen percentage………………………………………………………………….82

viii
3.4.8 Nodule weight and number…………………………………………………………...…..82
3.4.9 Carbon Discrimination (δ13
C)……………..…………………………………………..….82
3.4.10 Genotype by Trait Biplot and Trait Relationships……………………………………....83
3.5 DISCUSSION……………………………………………………………………………....84
CHAPTER 4 Yield Stability of Dry Bean Genotypes across Nitrogen Fixation
dependent and Fertilizer-dependent Management Systems
4.1 ABSTRACT………………………………………………………………………………..94
4.2 INTRODUCTION…………………………………………………………………………100
4.3 MATERIAL AND METHODS…………………………………………………………...102
4.3.1 Plant materials…………………………………………………………………………...102
4.3.2 Field trials………………………………………………………………………………..103
4.3.3 Nitrogen management treatments…………………………………………………….....104
4.3.4 Data collection……………………………………………………………………….….105
4.3.5 Statistical analysis…………………………………………………………………….....106
4.4 RESULTS………………………………………………………………………………….109
4.4.1 Mixed model analysis…………………………………………………………………....109
4.4.2 Multiplicative models of G by E interaction…………………………………………….109
4.4.3 Stability analysis………………………………………………………………………....111
4.5 DISCUSSION…………………………………………………………………………..…112
CHAPTER 5 Response to Selection for Improved Nitrogen Fixation in
Common Bean
5.1 ABSTRACT…………………………………………………………………………….…124
5.2 INTRODUCTION…………………………………………………………………………125
5.3 MATERIALS AND METHODS……………………………………………….…………127
ix
5.3.1 Plant Materials …………………………………………………………………………..127
5.3.2 Field trials…………………………………………………………………………….…128
5.3.3 Data Collection………………………………………………………………………….129
5.3.4 Statistical Analysis………………………………………………………………………131
5.4 RESULTS………………………………………………………………………………….135
5.5 DISCUSSION……………………………………………………………………………..137
CHAPTER 6 Quantitative Trait Loci for Symbiotic Nitrogen Fixation and Related
Traits in Common Bean
6.1 ABSTRACT……………………………………………………………………………….150
6.2 INTRODUCTION………………………………………………………………………....151
6.3 MATERIALS AND METHODS……………………………………………………...…..155
6.3.1 Plant materials…………………………………………………………………………...155
6.3.2 Growth-room assay…………………………………………………………………... ...155
6.3.3 Field assay…………………………………………………………………………….…156
6.3.4 Statistical Analysis……………………………………………………………………....159
6.3.5 Genotyping………………………………………………………………………………160
6.3.6 Linkage mapping and QTL analysis………………………………………………….…161
6.3.7 Candidate Gene Identification………………………………………………………..….162
6.4 RESULTS……………………………………………………………………………….…162
6.4.1 Phenotypic data analysis……………………………………………………………..….162
6.4.2 Linkage map……………………………………………………………………………..162
6.4.3 QTL mapping……………………………………………………………………………163
6.4.3.1 Chlorophyll concentration (SPAD)………………………………………………...….163
6.4.3.2 Nodule traits…………………………………………………………………………...163

x
6.4.3.3 Flowering date…………………………………………………………………………164
6.4.3.4 Maturity………………………………………………………………………………..164
6.4.3.5 Common bacterial blight….…………………………………………………………...164
6.4.3.6 Carbon isotope discrimination…………………………………………………………165
6.4.3.7 Seed protein content…………………………………………………………………...165
6.4.3.8 Seed yield…………………………………………………………………………..….165
6.4.3.9 Nitrogen derived from atmosphere…………………………………………………….166
6.4.4 Repeatable and overlapping %Ndfa QTL…………………………………………….…167
6.4.5 %Ndfa Candidate genes search…………………………………………….…………....168
6.5 Discussion…………………………………………………………………………………170
6.5.1 Phenotypic data analysis………………………………………………………………...170
6.5.2 QTL study………………………………………………………………………………..170
6.5.3 Potential candidate genes for %Ndfa………………………….…………………………175
CHAPTER 7 General Conclusions and Future Directions
7.1 General Conclusions……………………………………………………………………….188
7.2 Future Directions………………………………………………………………………......192
LITERATURE CITED………………………………………………………………………194

xi
LIST OF TABLES
Table 3.1 Gene-pool origin, commercial market class, growth habit,
and specific characteristics of dry bean genotypes.....................………..………………......…88
Table 3.2 Soil properties of trial environments………………………………………………...89
Table 3.3 Nodule number and SPAD reading of bean genotypes in a
growth pouch assay…………………………………………………………………………… 90
Table 3.4 Comparison of nitrogen fixation related traits per plant
.among 12 bean genotypes…………………………….…………………………………...…...91
Table 3.5 Maximum, minimum, and mean temperature, total monthly
precipitation data………………………………………..………………………..….……..….92
Table 3.6 Comparing dry bean genotypes for seed yield and maturity………….……………..93
Table 3.7 Comparison among 12 dry bean genotypes for nitrogen
fixation traits in different field trials ……………………..………………………………..…..94
Table 3.8 Comparison of 12 bean genotypes for nitrogen fixation
related traits across field trials environments ………………………………………….......…..96
Table 4.1 Soil properties of trial environments …………..………………………….……….116
Table 4.2 Maximum, minimum, and mean temperature, total monthly
precipitation data……………………………………………………………..…….…...…….117
Table 4.3 Maximum, minimum and mean and 95% confidence
interval of lsmeans of SNF related traits of 140 recombinant inbred
lines population and under different n management systems…………………...…………....118
Table 4.4 F-test of fixed effect of entry and variance component
estimates (S2) and their standard error (Se) of random effects in
the mixed-model analysis in multiple environments……………………………………………………………...…..119
Table 5.1 F-test of the fixed effect of genotype and variance
component estimates (S2) and their standard error (Se) of random
effects in the mixed-model analysis under N management systems……..........…...…………143
Table 5.2 F-test of fixed effect of entry and variance component
estimates (S2) and their standard error (Se) of random effects in the
mixed-model analysis under SNF-dependent environments………...……………...….……..144

xii
Table 5.3 Minimum (Min), maximum (Max), mean, phenotypic
variance (σ2
p), genetic variance (σ2
g), heritability (h2) and its standard
error (Se), observed genetic advance (GAo) and expected genetic
advance (GAe)…………..…………………………………………………………………….145
Table 5.4 Phenotypic (rp) and genetic (rg) correlations……………………………………….146
Table 6.1 F-test of fixed effect of entry and variance component
estimates (S2) and their standard error (Se) of random effects in the
mixed-model analysis in multiple locations field assays…..……………...…………...……..178
Table 6.2 F-test of fixed effect of entry and variance component
estimates (S2) and their standard error (Se) of random effects in the
mixed-model analysis in growth room assay……..…………………………...…………...…179
Table 6.3 Quantitative trait loci (QTL) analysis for RIL population
derived from Sanilac × Mist cross…………………………….………………………………180
Table 6.4 Candidate genes detected for %Ndfa in a 40 bp in the genomic
region of significant and repeatable %Ndfa QTL……………………………….…....……....182
xiii
LIST OF FIGURES
Figure 3.1 Genotype by Trait (GT) biplot …..……………………………………..………….97
Figure 4.1 Diagram of dendrogram generated from SHMM analysis for
grouping eight environments, under two different nitrogen (N) managements………………120
Figure 4.2 GGE biplot resulting from site regression analysis of average yield of
140 recombinant inbred lines (RIL) and two parental lines…………………………..……...121
Figure 4.3 Eberhart and Rusell yield stability model……………………………………..…..122
Figure 5.1 SNF relative efficiency index % (SNFRI) of 140 mapping population
and their parents tested across multiple location-years………………………….……………147
Figure 5.2 Genotype by Trait (GT) biplot…………………………………………..…….…..148
Figure 6.1 Maximum, minimum, mean (vertical solid line) and 95% confidence
interval (dashed lines) of least square means for SNF and related traits………………..…....183
Figure 6.2 Genetic linkage maps, QTL and corresponding marker(s)..………………………184

xiv
ABBREVIATIONS
BNF, Biological nitrogen fixation
δ13
C, Carbon discrimination
E, Environment effect
G, Genotype effect
G × E, Genotype by environment interaction effect
%Ndfa, Nitrogen derived from atmosphere
Nfix, Nitrogen fixed per unit area
N, Nitrogen
Ny, Nitrogen yield
PC, Principal component
QTL, Quantitative trait loci
SY, Seed yield
SNF, Symbiotic nitrogen fixation
WUE, Water use efficiency

1
CHAPTER 1
General Introduction

2
1.1 GENERAL INTRODUCTION
Among the five cultivated species of the genus Phaseolus, including P. acutifolius A. Gray
(tepary bean), P. coccineus L. (scarlet runner bean), P. lunatus L. (lima, butter or madagascar
bean), P. polyanthus Greenman (year-long bean), and P. vulgaris L. (common bean), the latter is
economically the most important one (Debouck, 1999). While common bean, in terms of its
global harvested area, is the third most economically-important grain legume after soybean
(Glycine max (L.) Merr.), and peanut (Arachis hypogaea L.), in terms of its role in direct human
consumption, is the most important grain legume (Broughton et al., 2003). Common beans are
generally harvested as dry beans, harvested as dried and matured seeds, shell beans, harvested at
physiological maturity before seeds are dry and green pods.
Dry bean balances the daily dietary needs of over 500 million people, mainly in Latin
America (Broughton et al., 2003). It supplies people with dietary protein (around 20% of seed
weight), fiber (Díaz-Batalla et al., 2006), folate (Hefni et al., 2010), minerals such as calcium,
zinc, copper, potassium, and iron (Sathe et al., 1984; Ribeiro et al., 2012), and thiamine and
riboflavin (Słupski, 2012).
The common bean belongs to Phaseoleae tribe, Fabaceae (formerly Leguminosae) family
and Papilionoideae subfamily. This herbaceous annual plant has determinate or indeterminate
growth habit. Archaeological and genetic evidence (Gepts, 1998) suggest that common bean
evolved and was domesticated in two distinct centers of origin in the Middle American and
Andean regions. More recently, molecular evidence identified the Oaxaca valley, in
3
Mesoamerica, and southern Bolivia and northern Argentina, in South America, as the centers of
domestication of common bean (Bitocchi et al., 2013).
Mendel (1870) explored the important principles of genetics in peas. Thereafter, beans
were used for illustration of nature of the inheritance of certain quantitative traits such as seed
weight by Johannsen (1911). All species of the genus Phaseolus are diploid and most have 22
chromosomes (2n=2x=22). P. vulgaris with a 625 Mbp of haploid genome size has one of the
smallest genomes among the legume family (Broughton et al., 2003).
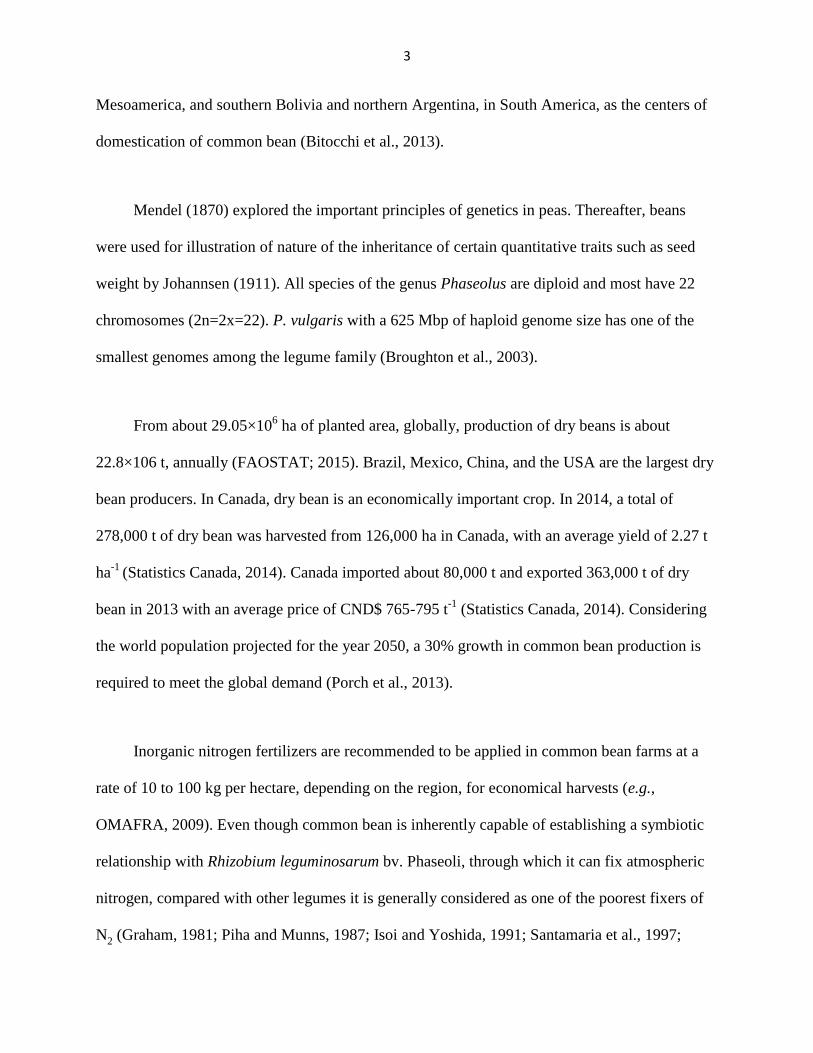
From about 29.05×10⁶ ha of planted area, globally, production of dry beans is about
22.8×10⁶ t, annually (FAOSTAT; 2015). Brazil, Mexico, China, and the USA are the largest dry
bean producers. In Canada, dry bean is an economically important crop. In 2014, a total of
278,000 t of dry bean was harvested from 126,000 ha in Canada, with an average yield of 2.27 t
ha-1
(Statistics Canada, 2014). Canada imported about 80,000 t and exported 363,000 t of dry
bean in 2013 with an average price of CND$ 765-795 t-1
(Statistics Canada, 2014). Considering
the world population projected for the year 2050, a 30% growth in common bean production is
required to meet the global demand (Porch et al., 2013).
Inorganic nitrogen fertilizers are recommended to be applied in common bean farms at a
rate of 10 to 100 kg per hectare, depending on the region, for economical harvests (e.g.,
OMAFRA, 2009). Even though common bean is inherently capable of establishing a symbiotic
relationship with Rhizobium leguminosarum bv. Phaseoli, through which it can fix atmospheric
nitrogen, compared with other legumes it is generally considered as one of the poorest fixers of
N2 (Graham, 1981; Piha and Munns, 1987; Isoi and Yoshida, 1991; Santamaria et al., 1997;

4
Martínez-Romero 2003). Both the total amount of nitrogen derived from the atmosphere per unit
area and the proportion of the plant N from the atmosphere in commonly-grown cultivars have
often been reported to be insufficient for production of economical yields (Bliss 1993). Bliss
(1993), however, argued that reports of poor N fixation of common beans have often been based
on the analysis of only a few genotypes and with unsuitable N2 measurement techniques. A
number of studies, on the other hand, have reported genetic diversity for symbiotic nitrogen
fixation (SNF) in common bean (Graham and Halliday 1976; Graham and Rosas 1977;
Kumarasinghe et al., 1992).
Identifying bean genotypes with high N2 fixation ability across a wide range of
environments could be a key finding, as an environmentally-friendly and low-cost strategy
towards the improvement of bean germplasm productivity with elevated N2 fixation ability and
to establish low-input cropping systems involving common bean. In addition, identification of
genomic regions, and ultimately gene(s), conditioning SNF in common bean can be useful for
breeding programs targeting improved nitrogen fixation.
1.2 HYPOTHESIS
The overarching hypothesis of the studies reported in this thesis was that if genetic
variation exists for SNF potential in the gene pools of common bean, then it should be feasible to
improve the SNF potential of dry beans in high yielding common bean genotypes. The following
predictions were made, examined, and reported in different research chapters:
1. Genetic variation exists for SNF ability.

5
2. Genotype by envioronemt effects influence the SNF ability of bean genotypes.
3. Ndfa and related traits have heritability greater than zero.
4. Phenotypic selection for N2 fixation traits will result in genetic improvement.
5. There are genomic regions in the vicinity of SNP markers with a consistently
significant effect on Ndfa and related traits in dry bean.
6. There are candidate gene(s) in the genomic regions of the QTL with significant
effect on Ndfa.
1.3 RESEARCH OBJECTIVES
1. To evaluate the potential differences in the common bean gene pools in terms of
SNF and its related traits and identify parental lines with contrasting %Ndfa for genetic
studies.
2. To establish selection criteria for SNF improvement.
3. To investigate genomic region(s) associated with SNF and related traits using single
nucleotide polymorphism (SNP).
4. To identify the potential candidate gene(s) conditioning SNF in common bean.

6
CHAPTER 2
Literature Review

7
2 LIRETATURE REVIEW
2.1 Nitrogen (N)
Although nitrogen gas (N2) constitutes near 80% of the Earth’s atmosphere, living
organisms can die of nitrogen deficiency (Döbereiner, 1997). Nitrogen is a vital element in all
organisms. It is needed in plant cells to manufacture amino acids, proteins, nucleic acids,
membrane lipids and other nitrogen-containing compounds. Therefore, meeting the N needs of a
crop is always an important consideration in agronomic practices. Generally, the nitrogen must
be supplied as NO3- and NH4
+ to the roots, since unlike most organisms except some prokaryotic
cells, plants cannot directly assimilate atmospheric N2 (Lam et al., 1996; Franche et al., 2009).
Fritz Haber (1868-1934) synthesized NH3 in 1905 from its elements in a laboratory with a
much more effective process. Four years later, Carl Bosch (1874-1940) in Germany’s largest
chemical company, BASF, scaled up Haber’s synthetic process of NH3 production to produce
inexpensive nitrogenous fertilizers. Hereafter, this process is referred to as the Haber-Bosch
process for the synthesis of ammonia (cited by Stoltzenberg, 2014).
By the 1960s, the introduction of semi-dwarf cereals, with increased harvest indices,
permitted increased N fertilizer application rates, which resulted in large gains in the productivity
of cereal crops. Increasing crop yields promoted the use of additional N fertilizer applications in
agricultural lands across the world. A FAO report in 2008 showed that the production of
inorganic nitrogen fertilizers for 2007 was around 130 Tg of N. The report also predicted further
increases in N fertilizer production and use. Today, China, as the world’s most populated

8
country, is the largest producer and consumer of synthetic N (FAO, 2012). Globally, total N
fertilizer nutrient demand has been projected to be 117 million tonnes in 2016 (Canfield et al.,
2010). It is estimated that approximately 140 Tg of N is annually incorporated into the soil
through inorganic N fertilization (Canfield et al., 2010).
The Haber-Bosch process is a costly N fertilizer production technique, because of the very
high energy demand at the chemical reduction step of N2 to NH3 (Bruinjin, 2015). Moreover,
plants generally only take up 30-40% of the N applied to the soil (Raun and Johnson, 1999).
Nitrification of N in the soil, leaching of nitrate into the ground water (London, 2005), and
emission of nitrous oxide through de-nitrification, which can contribute to depletion of ozone
(Moiser, 2002), are major environmental concerns associated with application of N fertilizers to
agricultural lands. Additionally, the process of N fertilizer manufacturing is an important source
of CO2 emission into the atmosphere, contributing to greenhouse and global warming effects
(Razon, 2014).
On the other hand, atmospheric N2 can be transformed into available forms for plants
(either NH4+ or NO3
-) through other processes. These could be through either abiotic fixation or
biological fixation, BNF, (Timothy, 1999). Mosier (2002) estimated that 20 million tons of
available forms of N for plants can originate from abiotic fixation i.e., atmospheric phenomena
such as lighting. Because of high economic and environmental costs of the Haber-Bosch process,
more attention has recently been directed towards BNF as an environmentally-friendly,
sustainable, and inexpensive approach towards supplying N demands of crop production
(Ferguson et al., 2010).

9
2.2 Biological nitrogen fixation
Even though the beneficial effect of legumes intercropped with cereals has been known
since ancient times, it was not until the late 19th
century that the involvement of soil bacteria
associated with the plant root surface (rhizosphere) in BNF was recognized by Hiltner,
1901(Rovira, 1991). BNF has tremendous environmental importance and is known to contribute
to the sustainability of agricultural systems, and is a critical part of the nitrogen cycle. BNF has
an essential role in the marine nitrogen cycle and the sequestration capacity of the marine living
organisms as well (Capone, 2001).
Galloway et al. (1995) indicated that the annual N contribution of BNF is globally
approximated 200 and 300 Tg of fixed N2 in terrestrial and marine systems, respectively. In other
estimations, Peter et al. (2002) projected that about 175 billion metric tons of atmospheric N2 per
year, around 70% of all N2 fixation on the earth, is fixed by some micro-organisms, including:
autotrophs, and heterotrophs. More recently Mosier (2002) and Herridge et al. (2008) estimated
that the annual fixation of N2 through BNF in the terrestrial and marine systems may exceed 100
Tg and120 Tg, respectively. Rubio and Ludden (2008) estimated that BNF accounts for about
65% of the total nitrogen fixed, globally.
N2 fixing organisms are able to improve soil fertility as well as plant nutrient and water
uptake through the production of chemicals such as hormones and siderophores (iron carriers),
(Badawi et al., 2011). For a long time, only a limited number of bacterial species were known to
be as N2-fixers (Postgate, 1981). However, more recently more micro-organisms have been
identified that have N2 fixing ability (Young, 1992); However, BNF can only be carried out by

10
prokaryotes, namely archaea (Lobo and Zinder, 1992; Leigh, 2000) and bacteria, with a majority
of the organisms being bacteria (Dean and Jacobson, 1992; Young, 1992; Fischer, 1994). These
prokaryotes are generally called diazotrophs (Figueiredo et al., 2013). Archaea were the first
diazotrophs that were discovered (Leigh, 2000) and are mainly restricted to the genus
Methanosarcina (Lobo and Zinder, 1992; Leigh, 2000), which includes two species i.e.,
Methanosarcina barkeri (Murray et al., 1984) and M. thermolithotrophicus (Belay et al., 1984).
Atmospheric N2 fixing bacteria can be divided into three major categories (Timothy 1999)
on the basis of their life forms, including:
(i) the free-living heterotrophic bacteria, characteristically associated with soil or detritus,
non-living particulate organic material, or autotrophic bacteria;
(ii) the bacteria that form associative relationships with fungi (lichens) or plants, and
(iii) those that establish symbiotic associations with vascular plants.
2.2.1 Free-living N2-fixing organisms
These bacteria are also called soil plant growth-promoting bacteria, rhizosphere, rhizoplane
or phylosphere bacteria. They are beneficial to plants under some conditions, since they are able
to fix atmospheric N2, solubilize phosphorus (P) and iron (Fe) and induce the production of plant
hormones. These bacteria live in soil, media or water and release N to the rhizosphere after
death. It is estimated that around 6 kg N2 ha-1
is annually fixed by these organisms (Van Kessel
11
and Hartley, 2000). Heterotrophic free-living N-fixing bacteria are divided into three subgroups,
including: aerobics, obligatory and facultative, and anaerobics.
2.2.1.1 Aerobic, Azotobacter
Azotobacter is an obligatory aerobic, N2-fixing, Gram-negative bacterium, though
Azotobacter, as a heterotrophic diazotroph can survive in low oxygen conditions. The high
sensitivity of its nitrogenase to O2 has resulted in the development of a dual mechanism to
decrease the O2 concentration at the active site of the nitrogenase (Yates, 1970). These two
mechanisms are:
(i) temporary inactivation of nitrogenase by a quick, symmetrical, change within the
nitrogenase complex structure so that the oxygen-sensitive sites are protected against
expose to O2, and
(ii) extreme increases in respiration to eliminate excess O2 at the N fixing site.
In Azotobacter species, molybdenum-iron nitrogenase or vanadium-iron nitrogenase can be
the N fixing enzyme (Robson et al., 1986; Narula et al., 2000). The energy requirement for N
fixation is obtained from carbon sources in the soil or water. Azotobacter can generally fix 10
mg N/g of carbohydrates under field conditions (Kanungo et al., 1997), which helps the survival
of the soil microbial community. It also brings back the N level into old fields through
production of plentiful amount of exopolysaccharides (Gauri et al., 2012), through protecting
nitrogenase against high oxygen concentration (Dalton and Postgate, 1968, cited by: Gauri et al.,

12
2012) and also participates in interaction between plants and N-fixing bacteria (Mandal et al.,
2008). The ecological distribution of Azotobacter is mainly a function of soil and environmental
conditions (González et al., 2005). Azotobacter is widely used as a bio-fertilizer and is
considered as a key player in developing sustainable agricultural systems (Bhardwaj et al., 2014),
especially in rice, Oryza sativa L., (Kannaiyan et al., 1980; Rüttimann et al., 2003). It is reported
that Azotobacter can also enhance the growth and yield in other cereals, e.g., in wheat, Triticum
aestivum L., in the presence of 50% inorganic N fertilizer (Kader et al., 2002; Milošević et al.,
2012; Salantur et al., 2006) and in maize, Zea mays L., especially in the absence of chemical
fertilizers (Baral and Adhikari, 2013).
2.2.1.2 Anaerobic, Clostridium and Klebsiella
Clostridium pasteurianum was the first free-living N-fixing organism to be isolated
(Winogradsky, 1895 cited by: Chen et al., 2001). A few species of the genus Clostridium have
been reported as N-fixing anaerobic microorganisms (McCoy et al., 1928; Sjolander and McCoy,
1937; Bodily, 1938; all cited by Rosenblum and Wilson, 1949). The ability of clostridia to fix N
was first reported by Rosenblum and Wilson (1949). It was later reported that clostridia could fix
atmospheric N in sugarcane fields under anaerobic conditions (Ruschel et al., 1975). Clostridium
is primarily a heterotrophic N-fixing bacterium (Brenzonik and Harper 1969; Brooks et al., 1971;
Keirn, 1971). Stewart (1966) correlated the rate of Clostridium N fixation with the presence of
photosynthetic bacteria in a marine ecosystem. Klebsiella is a wide-spread bacterium, often
present in surface water, but not in chlorinated water. Due to some illnesses it causes, Klebsiella
pneumoniae in water is a concern. Klebsiella pneumoniae has been shown to be a facultative
aerobic diazotroph (Young, 1992) as well.

13
Prior to 1970, the genetics of nitrogen fixation in diazotrophs was not well understood. In
the early 1970’s, Klebsiella pneumoniae became the model organism for genetic analysis of
nitrogen fixation in diazotrophs (Dixon, 1984) and helped scientists to discover the complex
inheritance of BNF.
2.2.2 Associative symbiosis relationship
Frequent isolation of bacteria from surface-sterilized plant roots explored a new class of N
fixing endophytes called associative symbionts, i.e. cyanobacteria and Azospirillum (Döbereiner,
1997; Reinhold-Hurek and Hurek, 1998). Associative symbionts are free living organisms that
assimilate atmospheric N using a particulate oxygen-sensitive nitrogenase in association with
some plants (Kelly, 1969). They include a wide range of N fixing species that colonize the root
surface of non-leguminous plants without formation of unique structures such as nodules
(Franche et al., 2009).
2.2.2.1 Cyanobacteria
Cyanobacteria are the largest and most diverse group of Gram-negative prokaryotes,
distributed in aquatic and terrestrial environments. They are found in relationships with large
number of vascular and non-vascular plants, fungi and algae (Meeks and Elhai, 2002). They are
classified into the domain of bacteria, into five sections based on morphology and reproductive
system. These five subgroups are: Chroococcales, Chamaesiphonales, Pleurocapsales,
Nostocales (including the families Oscillatonaceae, Nostocaceae, and Rivulanaceae), and
Stigonematales (Rippka et al. 1979). The first two subgroups are unicellular or colonial and the

14
latter three are non-differentiated filamentous, heterocystic filamentous, and branched
filamentous heterocystic, respectively. These prokaryotic cellular organisms are characterized by
the presence of extensive thylakoid membranes containing photosynthetic pigments (Fogg et al.,
1973). Under nitrogen limiting conditions, many filamentous and unicellular cyanobacteria are
able to fix atmospheric N through the formation of nitrogen-fixing cells called heterocysts, which
contain nitrogenase enzymes (Fogg et al., 1973), either in aquatic or in terrestrial ecosystems
(Fay, 1981; Bergman et al. 1996; Rai et al. 2000).
These microorganisms, as the first oxygenic photosynthetic creatures, appeared on the
earth more than 2.5 billion years ago (Rippka et al., 1979; Fay, 1992). They are commonly
termed thermophilic blue-green algae (Miyamoto et al., 1979) and acquire their vitality through
photosynthesis (Stewart, 1980), the same as vascular plants (Ho and Krogman, 1982). Water is
the final electron source for photosynthesis in these blue or green algae (Ho and Krogman,
1982), Electrons are transferred between two types of photosystems, photosystem I and
photosystem II, during light reactions of photosynthesis (Glazer, 1987). In some strains, slow
chemo-heterotrophy has been reported as a source of energy in weak light to dark conditions
(Smith, 1982). In phosynthetic cyanobacteria the phycobiliproteins (phycocyanin,
allophycocyanin, and phycoerythrin), are the source of their color and bind the major pigments
responsible for light interception (Glazer, 1987).
Heterocysts convert N2 to available forms of N and in filamentous cyanobacteria
heterocysts fix atmospheric N2 in return for carbohydrates from photosynthetic cells (Franche et
al., 2009). Cyanobacteria, utilizing a similar exchange, can form associative relationships with
vascular and non-vascular plants belonging to the bryophytes (such as liverworts and hornworts),

15
as well as with algae, fungi and many marine eukaryotes (Bergman et al. 1996; Rai et al. 2000).
The rate of N fixation in a plant-cyanobacteria association is approximately 4 to 35 times higher
than in free-living cyanobacteria (Adams 2002). N fixation occurs in unicellular and filamentous
species. However, only heterocystous Nostocales (Nostoc and Anabaena genera) can have
associations with plants, e.g., Azolla.
Azolla is a free floating water fern which is abundant in fresh water in tropical, subtropical,
and warm-temperate habitats (Yanni et al., 1992; Bindhu 2013). It is also known as mosquito
fern, duckweed fern or fairy moss (Yanni et al., 1992). The association between cyanobacteria
and Azolla is the only plant-prokaryote symbiosis that persists through all of the reproductive
growth phase of the host plant (Lumpkin and Plucknett, 1980; Nierzwicki-Bauer, 1990; Lechno-
Yossef and Nierzwicki-Bauer, 2002).
Cyanobacteria, through participation in an obligatory symbiotic relationship with Azolla,
create an endosymbiont called Anabaena azollae (Bergman et al. 1996; Rai et al. 2000; Bindhu
2013). This relationship starts with the establishment and growth of cyanobacteria inside a
distinct leaf cavity at the base of the dorsal lobe of Azolla leaves, during the vegetative growth
stage of the plant. Azolla leaves can also be a host for other bacteria with unknown functions
(Franche et al., 2009).
Decayed Anabaenazollae can release nutrients into water (Marwaha et al., 1992). N is
released from the cyanobiont mostly in the form of NH4+. Due to their high N content, Azolla
species, including Azolla pinnata R. Br., A. caroliniana Willd., and A. filiculoides Lam., have
been used as green manure in the wetland rice paddies in Northern Vietnam and China (Yanni et

16
al., 1992). Uma and Kannaiyan (1995) illustrated that the presence of cyanobacteria in paddies
can help remediate high saline paddies by reducing the need for urea application, and prevent
from soil erosion. Moreover, Mandal et al. (1999) suggested that N-fixing cyanobacteria can
improve plant growth and yield through the production of growth-promoting substances, e.g.,
gibberellins, cytokinins, auxins, abscisic acids, vitamins, antibiotics and amino acids. Azolla, as a
biofertilizer promotes plant growth in plants such as rice (Hove et al., 1996) and tomato (Ismail,
2015). Prasanna et al. (2015) reported positive impacts of cyanobaterial inoculants on soil
fertility, plant barrier catalyst activity, Zn content, and yields in maize. It can also suppress
different plant-parasitic nematodes such as Pratylenchus penetrans (Walker, 1969), Heterodera
glycines (Barker et al., 1971) Tylenchorhynchus vulgaris (Pate et al., 1989; Ismail, 2015) and
Meloidogyne incognita (Abadir and El-Hamawi, 1995) and weeds in paddies.
2.2.2.2 Azospirillum
Bacteria of the genus Azospirillum are associative nitrogen fixers, widespread in the soil of
tropical, subtropical and temperate areas. These microaerophilic organisms grow in close
associations with the roots of different wild and cultivated plants (Doroshenko et al., 2007;
Rawia et al., 2009) such as cereals. They penetrate into the root system of the plants and grow
intracellularly (Santi et al., 2013; Saikia et al., 2007). Beneficial effects of these bacteria have
been reported on yield and growth of different vascular plant species, including: Setaria italic
(Okon et al., 1983), rice (Nayak et al., 1986; Murty et al., 1988), wheat, soybean (Bashan et al.,
1990), foxtail millet (Rao and Charyulu, 2005), and maize (Saikia et al., 2007).

17
2.2.3 Symbiotic N2 fixation (SNF)
Peoples (2009) estimated that nearly 17% of annual BNF is derived from legume-rhizobia
symbiosis or symbiotic N2 fixation (SNF, Figueiredo et al., 2013). SNF is not only a source of N
for the plant but also helps it cope with different environmental stresses (Bashan and de-Bashan,
2005; Franche et al., 2009). The ability to symbiotically fix atmospheric N by microorganisms
nodules of vascular plants can be found in two unrelated bacteria, namely: rhizobia (Alpha-
proteobacterium), in association with legumes (Sy et al., 2001) and Frankia (an actinobacteria)
associated with a wide range of plants from eight families (Huss-Danell, 1997; Vessey et al.,
2004).
2.2.3.1 Frankia
Frankia, a Gram-positive filamentous actinobacterium, is a member of the family
Frankiaceae in the order of Actinomycetales (Normand et al., 1996). Frankia is able to fix
atmospheric N2 in small growths, called nodules, on the roots of some dicotyledonous plants
(Susamma et al., 2002). The colonized plants are called actinorhizal plants. Since 1928, the
symbiotic associations between N2-fixing Frankia and more than 200 tree species, from 24
genera of 8 families of angiosperms, have been studied (Schwencke and Carú, 2001) and to date
Frankia are the only actinobacteria that have been identified with the capability of nodulating on
actinorhizal plant roots (Clawson et al., 2004).
Definitive evidence of a symbiotic association between a Frankia strain and a plant came
from the successful culture of the bacteria from root nodules of Comptonia peregrina by

18
Callaham et al. (1978). This allowed the bacterium to be studied outside of its host and showed
that it forms slow growing hyphal colonies with the capacity to develop into two distinctive
structures, including vesicles and spores. The vesicles and spores have different roles in Frankia-
actinorhizal plant associations. The vesicles are sites of N fixation and spores are storage places
for the reproductive structures of sporangia (Lechevalier, 1994).
Under low levels of soil N, Frankia could improve soil fertility of agro-ecosystems
through fixing atmospheric N2 by symbiotic relationship with actinorhizal plants (Wheeler and
Miller, 1990; Myrold and Huss-Danell, 2003). Actinorhizal symbioses are spread all over the
world and their overall rates of N2 fixation are generally at the same level as Rhizobium-legume
symbiosis (Torrey, 1978). For instance, Frankia- actinorhizal plants in birch tree canopies can
annually fix at the range of 20 to 300 kg N ha-1
based on canopy age and density, and
environmental conditions (Wheeler and Miller, 1990). Hurd et al. (2001) indicated that 85-100%
of total foliar N in a spotted birch wood could be attributed to N fixation through the symbiotic
relationship between Frankia and birch.
In Frankia- actinorhizal plant symbiotic relationships, Frankia meets its energy needs by
acquiring carbohydrates from the host plant (Reddell et al., 1986; Smolander et al., 1988).
Advances in the molecular genetic of Frankia have been very small compared to the
understanding of rhizobia because of the slow growth rate of filamentous hyphae (Lavire and
Cournoyer 2003; Normand and Mullin 2008). Lois et al. (1999) and Joel et al. (2002) indicated
that the nif gene controlled N-fixation in Frankia.

19
2.2.3.2 Rhizobium
The first pure cultures of rhizobia were obtained at the end of the nineteenth century
(Callaham et al. 1978). Rhizobia have the ability to establish symbiotic relationships with a large
number of the 18,000 species of the Leguminosae (Fabaceae) family by inducing the
development of particular organs, called nodules. Rhozobia are Gram negative, free living
organisms in the soil able to convert atmospheric N2 to NH3 only in an endo-symbiotic life
association with the [lateral] roots of legumes (Cooper, 2004). These bacteria belong to five
major genera, including: Rhizobium, Bradyrhizobium, Azorhizobium, Mesorhizobium, and
Sinorhizobium (Rogel et al., 2011). While some rhizobium species, like the β-rhizobia have
narrow host ranges, some others, like γ-rhizobia, can establish symbiotic relationships with a
broad range of hosts (Dwivedi et al., 2015). For example, Burkholderia phymatum from the
genus Burkholderia effectively nodulate several important legumes, including common bean
(Gyaneshwar et al., 2011). Host-specific symbiovars, as a group of bacterial strains
distinguishable from other strains of the same species on the basis of physiological or
biochemical characters (Dwivedi et al., 2015), have been reported for all of the rhizobium genera
in different legumes, e.g. in soybean (Glycine max) Bradyrhizobium japanicum and Rhizobium
fredii; in alfalfa (Medicago sativa) R. meliloti; in sweet clovers (Melilotus sp.) R. trifolii; in peas
(Pisum sativum), R. leguminosarum; Sesbania sp. (Sesbania rostrata), Azarhizobium
caulinodans (stem nodulating rhizobia); in common bean (Phaseolus vulgaris), R. phaseoli
(Peoples et al. 1989 cited by Kumar and Rao, 2012), R. gallicum, R. giardinii, R.
leguminosarum, R. etli; in faba bean (Vicia faba), R. fabae; in common vetch (Vicia sativa), R.
leguminosarum and R. pisi (Rogel et al., 2011).

20
In a rhizobia-legume symbiotic relationship, atmospheric N fixation is carried out by the
bacteria within the nodules and the NH3 produced is absorbed by the plant. In return the bacteria
receive carbohydrate from the host plant. Legumes in association with rhizobia are often thought
to be the most important nitrogen-fixing living system, as they may absorb up to 90% of their N
from the atmosphere and play an important role in cropping systems as a renewable source of N
through fixation of 20-22 Tg atmospheric N per year (Herridge et al., 2008). Most legumes in a
symbiotic relationship with rhizobia can obtain around 200 to 300 kg N fixed ha-1
(Peoples et al.,
1995; Van Kessel and Hartley, 2000) though Unkovich and Pate (2000) reported a value of 165
to 450 kg N ha-1
y-1
for grain legumes with the maximum rate of 600 kg N fixed ha-1
y-1
for
temperate clover pastures. Large differences were, however, noted in the proportion of
atmospheric N2 fixed by the grain legume crops, e.g., 75% of the total nitrogen in plant was
derived from SNF by faba bean; 62–94% by soybean, groundnut, pea, and lentil; 54–58% by
cowpea, chickpea, and pigeon-pea; and up to 39% by common bean (Dwivedi et al., 2015). The
amount of atmospheric N fixed through rhizobium-legume symbiosis mostly depends on host
species and cultivars, micro-symbiont strain, and environmental conditions (Peoples et al., 1995;
Van Kessel and Hartley 2000; Unkovich and Pate, 2000). This relationship is not only beneficial
to the legume and bacteria, but also it is also able to enhance the growth and productivity of
other plants following them in the cropping system (Yanni and El-Fattah, 1999).
2.3 BNF process
During the BNF process, diazotrophs catalyse the conversion of atmospheric N2 to NH3
using a nitrogen fixing enzyme, called nitrogenase (Santi et al., 2013). This enzyme was
extracted from a wide range of diazotrophic species between the late 1960s and early 1970s

21
(Dixon, 1984). This complex enzyme is composed of two proteins, dinitrogenase and nitrogenase
reductase (Bottomley and Myrold, 2007). The most common form of nitrogenase consists of a
large heterotetrameric molybdenum and iron-containing iron-molybdenum cofactor, FeMo-co.
The smaller component of nitrogenase is the iron (Fe) protein. This dimeric protein is an ATP-
dependent electron donor to the larger heterotetrameric FeMo protein. Molybdenum depletion, in
some diazotrophic bacteria such as Azotobacter and several photosynthetic nitrogen fixers
including some cyanobacteria, induces alternative nitrogenases, containing vanadium-iron, V-
nitrogenase, or iron-only nitrogenases, Fe-Fe nitrogenase (Eady, 1996; Rubio and Ludden,
2005).
The N-fixation process can be summarized by the following equation:
N2 + 16 ATP + 8 e- + 8 H
+ → 2 NH3 + H2 + 16 ADP + 16 pi [1]
The process is a very high energy-consuming process. For reduction of one atmospheric
N2 molecule to two molecules of NH3, a total number of 16 molecules of adenosine triphosphate
(ATP) and eight electrons are needed [equation 1]. In the process 6 electrons and 16 ATPs are
used to reduce N2 into 2 molecules of NH3. The last 2 electrons are used to reduce 2 molecules of
H to H2 (Bottomley and Myrold, 2007). To activate of the nitrogenase for N2 fixation the Fe
component of the reductase enzyme must be reduced, which involves electron donors, e.g.
ferredoxin and flavodoxin. Then, ATP-dependent transfer of electrons occurs from the Fe protein
to the active site of the MoFe protein, containing a Pi cluster and is the site of N reduction
(Hageman and Burris, 1978, cited by: Dixon and Kahn, 2004).
22
2.4 SNF regulation
2.4.1. Physiological regulation of BNF
During the late 1960s to early 1970s, nitrogenase was extracted from a wide range of N-
fixing organisms. Afterwards, considerable physiological limits on diazotrophy due to the nature
of this enzyme were identified by scientists. In particular, it was found that nitrogenase is an
extremely O2-sensitive protein and is subject to be denatured by it (Yates, 1970). Indeed,
diazotrophs do respire to meet the high energy demand of BNF, but because free O2 has an
inhibitory effect on nitrogenase, diazotrophs have developed different anatomical and
physiological mechanisms to protect the nitrogenase enzyme from O2 damage (Denison et al.,
1992).
In some cyanobacteria specialised cells, heterocysts are developed that can use direct light
energy to drive the BNF process, without evolving O2 (Buikema and Haselkorn, 1993).
Combining respiration with thick cell walls is another mechanism to protect nitrogenase. N-
fixing azotobacters are able to grow and fix N2 at the highest dissolved O2 concentrations, about
230 μM O2 (Hill et al., 1972). In fact, azotobacters, through an extreme increase in their
respiration rate, eliminate the excess inner O2, subsequently protecting nitrogenase from
irreversible denaturation. This mechanism is called ‘respiratory protection’ (Yates, 1970). Oleze
(2000), however, believed that ‘respiratory protection’ of nitrogenase is less operational than
generally supposed. He suggested that “alternative factors such as ATP supply and reducing
equivalents” are more important than the respiratory protection mechanism in azotobacters. In
some N2-fixing, such as non-heterocystous cyanobacteria, N2 fixation can occur in darkness or

23
dim light in the absence of O2 (Fay, 1992). Another protection mechanism for nitrogenase
against O2 is a quick change in the symmetrical shape of the nitrogenase complex. This
temporary deformation can take the oxygen-sensitive sites of the enzyme out of O2 rich
environments (Einsle et al., 2002). In the legume-bacteria symbiosis, the nodule cortex is an
oxygen diffusion barrier (Appleby, 1984).
Not only is BNF a very high energy-demanding process, but also the catalysing enzyme,
nitrogenase, has a relatively slow turnover time. Therefore, large quantities of nitrogenase (10-
20% of the total protein in the cell) need to be synthesized by diazotrphs (Thornely and Lowe,
1985, cited by: Dixon and Kahn, 2004) to make the process efficient. In addition, many
functional nitrogenase proteins are denatured by O2 at a high rate. Turnover of these denatured
proteins demands an additional energy cost (Dixon, 2004). To prevent a negative influence of the
reduction in O2 on the ATP supply for BNF, a high affinity terminal oxidase protein, such as
NODULIN leghaemoglobin, facilitates oxygen diffusion at low free O2 concentrations (Appleby,
1984).
NH3 is the primary product of N2 fixation [equation 1], but at high concentrations it can be
toxic to living cells (Darwin, 1882, cited by: Schenk and Wehrmann, 1979). Glutamine
synthetase (GS) and glutamate synthase (GOGAT) are two highly efficient enzymes that prevent
NH3 from accumulating in N2-fixing bacteria and compromising more energy production.
Increases in nitrogenase, GS and GOGAT activities have been reported during nodule
development in legumes (Egli et al., 1989; Reynolds et al., 1982). In most diazotrophs, the
enzyme combination of GS and GOGAT carry out the reactions shown in equations 2 and 3:

24
In plant-rhizobium combinations the amount of photo-assimilate received by bacteria could
limit the rate of SNF carried out by bacteroids (Ben Salah et al., 2009). However, Kaschuk et al.
(2009) believed that SNF can stimulate photosynthesis and legumes are not suffering from
carbon assimilate limitation under symbiotic conditions. In a recent study on the role of nitrogen
and photo-assimilate on SNF in cowpea, Rodrigues et al. (2013) showed that SNF rate of
soybean plants co-inoculated with Bradyrhizobium species and plant growth-promoting bacteria
(either Paenibacillus durus or Paenibacillus graminis) was not significantly associated with
carbohydrate assimilation size, but was weakly associated with soluble acid invertase activity in
nodules at the beginning of senescence.
2.4.2 Host-plant regulation of SNF
Plant-rhizobia symbiosis is initiated by the invasion of plant roots or stem cortex by
rhizobia, followed by formation of specialized organs calls nodules. Nitrogen fixation only
happens after the establishment of the symbiotic state (Cooper, 2004). If this state is not
achieved, the bacteria will act as plant parasites (Franche, 2009).
A complex molecular dialogue between nitrogen-fixing rhizobium and the legume plant is
the first step in the invasion of plant by the bacteria (Dénarié et al., 1993, cited by: Franche,
2009; Perret et al., 2000). Legumes release some of their assimilated carbon through their roots
(Nguyen, 2003, cited by: Gage, 2009). These assimilates can promote rhizobial movement
towards the plant and act as inducer chemicals (Choudhury, et al., 2004). The most effective of
i [2] GS
Ketoglutarate + Glutamine + NADH 2 Glutamine + NADox [3] GOGAT
Glutamate + NH3 + ATP Glutamine + ADP + P
i

25
these inducers belong to the group of flavonoids (Schlaman et al., 1991). There are other
molecules, such as the betaines (e.g., stachydrine and trigonelline) and the aldonic acids (e.g.,
erythronic acid and tetronic acid) with inducing activity on some rhizobial species at higher
concentrations than flavonoids (Gagnon and Ibrahim, 1998). Rhizobial factors which contribute
to the specificity of the interaction include Nod factors and surface polysaccharides (Fauvart and
Michiels, 2008). Nod factors consist of an acylated chitin oligomeric backbone with various
substitutions at the non-reducing-terminal and/or nonterminal residues (D’Haeze and Holsters,
2002).
Flavonoids act as chemical signals and determine the compatibility of the plant host for
the bacterium through a type of LysR-type transcriptional factor (Peck et al., 2006) called NodD
protein, (Gage, 2009) or Lipo-chitooligosaccharidic nodulation (Nod) factors (D’Haeze and
Holsters, 2002). Nod factor is secreted by rhizobia in response to plant root exudates (Yang et
al., 1994). The induction of Nod factor production is specific for the structure of the flavonoid.
Taxonomically diverse bacteria produce different polyunsaturated acyl chain substituents
(Suominen et al. 2001; Yang et al. 1994). These features result in very specific symbiotic
relationships.
Flavanoids and Nod factor are important in host specificity too. While some plant species
can be infected by different symbionts from different bacterial genera, other species just accept a
very narrow range of bacteria. Host specificity is determined by several factors. From the
bacterial side, the main signalling molecules are Nod factors, surface polysaccharides and
secreted proteins. Either the composition of plant root secretion or the Nod factor construction
determines host specificity to the special symbionts (Perret et al., 2000).

26
As mentioned above, establishing the symbiotic state depends on the interaction between
the bacteria and plant host, created through a “molecular dialogue”. The first secreted rhizobial
protein with a role in symbiosis is NodO (a flavonoid) detected in Rhizobium leguminosarum bv.
viciae (De Maagd et al., 1989). Russo et al. (2006) also detected eight secreted rhizobial-
adhering proteins (Rap) in total, including: NodO, PlyA, PlyB, agglutinins (RapA1, RapA2, and
RapC), rhicadhesin and bacterial lectins. The last one is believed to be common to all rhizobia
(Smith et al., 1992; Ausmees et al., 2001). Later, Krehenbrink and Downie (2008) identified six
additional proteins in R. leguminosarum bv. viciae strain 3841 that function as a metalloprotease,
a glycosyl hydrolase, cadherins and a nucleoside diphosphate kinase. Calsymin is another
secretion observed in R. etli (Xi et al., 2000).
Bacteria, after recognizing the chemical signal released by the plant, will invade the plant
root hairs and infect them. Thereafter, the root hair begins to curl, which is a response to
penetration of rhizobium into the root hair, and the bacteria begins to multiply, form an infection
thread and initiate the formation of a nodule. The bacteria then convert to bacteroids, which can
convert atmospheric N2 into ammonia in return for receiving assimilates from the plant host. The
symbiotic relationship modifies and the metabolism and physiology of both plant host and
bacteria (Spaink, 2000).
As indicated before, plant-rhizobium combinations can result in nodule formation
containing parasitic rhizobia. Host and bacteria relationship can also be determined by the level
of N in the soil. High levels of soil N can induce bacteria to act as plant parasites. Also, different
bacterial variants can be ineffective (non-fixing) or effective (fixing nitrogen). It is also true for
different genotypes of a plant with specific bacterial strains. Plants cannot differentiate between

27
non-fixing and fixing strains of a bacterium and in a mixed inoculant treatment they accept both
strain types (Tas et al. 1996). Some bacterium species have a wide range of strains and genetic
variants (Johnston et al. 1978; Laguerre et al. 1993; Young et al. 2006). Rhizobium
leguminosarum can be exemplified as a bacterial species with a wide range of biovars due to
gene exchange. Among these, leguminosarum biovar viciae typically nodulates peas, Pisum sp.,
and vetches, Vicia sp., biovar phaseoli nodulates beans, Phaseolus sp., and biovar trifolii
nodulates clovers, Trifolium sp., (Mutch and Young, 2004).
In addition, there are bacterial strains with the ability to establish symbiotic relationships
with an enormous range of plant hosts. For instance, Sinorhizobium sp. strain NGR 234 can form
nodules on 112 plant genera. The flexibility of NodD protein induced by a variety of root
extracts and secretion of nodulation outer proteins (Nops), with a role in nodulation efficiency
and in some cases host specificity, gives this ability to this kind of bacteria (Freiberg et al., 1997;
Pueppke and Broughton, 1999; Marie et al., 2003; Ausmees et al., 2004; Cooper, 2007).
Rhizobia can produce four main types of surface polysaccharides. These can participate in
different stages of the symbiotic relationship establishment, including: root colonization, host
recognition, infection thread formation and nodule invasion (Mathis et al., 2005). They are
comprised of extracellular polysaccharides (EPS), K polysaccharides (K- antigens, capsular
polysaccharides or KPS) and cyclic glucans. EPS is essential for the development of fully
functioning nodules (Mathis et al., 2005). Rhizobia use the exact same secretion pathways and
some of the proteins utilized by pathogenic micro-organisms (Fauvart and Michiels, 2008).

28
2.4.3 Genetic Regulation of SNF
Besides the high ATP cost of reducing N2 to NH3, many genes and their products are
necessary for synthesis of a completely functional N2-fixing enzyme system. A large number of
bacterial genes that play roles in the formation of nodules on leguminous plants have been
identified, including more than 65 nodulation genes in the rhizobia. Each strain can carry one or
more of these genes. Several investigators have examined the possible functions of the common
genes involved in nodulation process.
2.4.3.1 Genes controlling SNF and nodule formation
The most important genes controlling SNF include three clusters of host plant genes and
bacterial genes. The host plant genes are called nod genes while the rhizobial genes that
condition SNF include nif and fix genes. The bacterial genes, that are collectively involved in the
synthesis of nitrogenase and the catalytic process of N2 fixation, are called nif genes. The fix
genes are accessory genes and play roles in the function and regulation of nitrogenase in micro-
aerobic and aerobic diazotrophic bacteria (Dixon and Khan, 2004).
The nif genes were discovered in the bacterium Klebsiella pneumoniae. The nif genes in
this bacterium are located on a very compact region of the genome, 24kb in size, containing
approximately 20 genes (Arnold et al., 1988). The nif genes, which have structural and functional
regulation roles in N2 fixation, are present in both free living and symbiotic bacteria
(Choudhurry, et al., 2004). The structural nif genes from taxonomically diverse microbes are
almost identical and act in similar ways to encode nitrogenase (Ruvkin and Ausubel, 1980;
29
Swain and Abhijita, 2013). In fact, two different groups of the nif genes are responsible for
coding the nitrogenase polypeptides. The first group includes nifD, nifK and nifH, of which the
first two control expression of structural Mo-nitrogenase polypeptides. Dinitrogenase is a
complex protein consisting of α and β subunits. The α subunit is the product of the nifD gene
while β is coded by the nifK gene (Beringer and Hirsch, 1984). The nifH gene codes for the
structural Fe protein component (Roberts et al., 1978). The second group of nif genes, (nifB,
nifQ, nifE, nifN, nifX, nifU, nifS, nifV, and nifY) have roles in the full assembly of nitrogenase.
From this group nifB, nifQ, nifE, nifN, nifX, nifU, nifS, nifV, nifY in addition to nifH from the first
group are involved in the synthesis of FeMoCo. Moreover, the nifS and nifU code for the
assembly of iron sulfur (Fe-S) clusters and nifW and nifZ code for maturation of the nitrogenase
components (Zheng et al., 1998; Rubio and Ludden, 2008). In addition to these genes, three more
genes were detected in Klebsiella, including nifF and nifJ, which are required for electron
transport to nitrogenase, and nifLA genes, which conditions expression of the nif cluster (Dixon
and Kahn 2004). It is now known that nifH, nifD, nifK, nifY, nifB, nifQ, nifE, nifN, nifX, nifU,
nifS, nifV, nifW, and nifZ are necessary for nitrogenase synthesis in all diazotrophs, although the
other genes are required for in vivo nitrogenase activity. For example, these genes code for
electron transport chain components (such as flavodoxin, ferredoxin), molybdenum uptake and
homeostasis, and oxygen protection and regulation (including respiratory chains adapted to low
oxygen conditions) which are all required for nitrogen fixation (Fischer 1994; Dixon and Kahn
2004; Pedrosa and Elmerich, 2007).
SNF is an energetically expensive process, so bacteria do not usually fix N2 in the presence
of mineral N sources. As a result, the synthesis of both Mo and the Mo-independent nitrogenases
are strictly regulated, at the transcriptional level, by the availability of inorganic N in the soil. A

30
number of mechanisms have been identified whereby nitrogenase activity is inhibited, and nif
gene expression is down-regulated, in response to any increase in levels of NO3- , NH4
+, and/or
amino acid N in the environment (Merrick, 1993). In the legume-Rhizobium symbiosis the root-
nodule cortex affects nif gene expression because transcriptional regulation of the nif gene in
diazotrophs is tightly controlled in response to the external oxygen concentration (Thornely and
Lowe, 1985, cited by: Dixon and Kahn, 2004).
The term "fix gene" is used for bacterial genes that are essential for nitrogen fixation but do
not have corresponding homologs in K. pneumoniae. The fix genes are, in fact, accessory genes
needed for development and metabolism of bacteroids. They are necessary for the function and
regulation of nitrogenase in micro-aerobic and aerobic diazotrophic bacteria. SNF requires the
coordinated function of the fix genes with nif genes (Fischer, 1994).
The nod genes responsible for the biosynthesis of chitin backbone are nodA, nodB and
nodC. The other nod gene, named nodD, activates the transcription of other genes, including the
nod genes (Martínez et al., 1990). The induction of Nod factor production is specific for the
structure of the flavonoid. The specificity of this process has been shown to be mediated by the
nodD genes in all rhizobial species (Spaink et al., 1987). Multiple isoforms of the nodD genes
have been found in several rhizobial strains. This multiplication of the nodD genes is probably
related to interactions of bacterial Nod factors with multiple hosts that secrete different
flavonoids (Demont et al., 1994, cited by: Spaink, 2000). The nod gene’s regulatory effect on
Nod factor production might also happen at the post-transcriptional level (Olsthoorn et al., 2000).
Olsthoorn et al. (2000) reported that the activity of the Nod factor was strongly temperature
dependent. The nod gene products are required for the early steps in nodule formation. Actually,
31
the nod genes are switched off at later stages of the symbiosis and at higher temperatures
(Schlaman et al., 1991).
There are additional genes involved in nodulation, other than those in the three main
categories (nod, nif and fix) (Shamseldin, 2013). For instance, the hsn gene is responsible for
host specific nodulation in Rhizobium leguminosarum sv. trifolii (Rolfe et al., 1985, cited by:
Shamseldin, 2013). Genotypic specific nodulation gene (nolA) was identified by Loh et al.
(1999), which controls nodulation of specific soybean genotypes by Bradyrhizobium japonicum.
The hydrogen gas that is evolved during the nitrogen fixation process [equation 1] can be
recycled through the activity of an H2-uptake (Hup) system synthesized by certain strains of
rhizobia (Brito et l., 1997), which is under control of hydrogenase structural (hup) gene (Soom et
al., 1993). Other genes reported with roles in nodulation including: gln, acds, dct, nfe, bacA, tfx
and moc. The gln (glutamine synthase) gene conditions antioxidant defenses involving NO
(nitric oxide) around the plant roots (Spaink, 2000). Genotype-specific infection and nodulation
can be also controlled by some other genes. Rj2 and Rfg1, encoding a class of plant resistance
(R) proteins called a Toll-interleukin receptor/nucleotide binding site/leucine-rich repeat (TIR-
NBS-LRR), was detected by Yang et al. (2010). Therefore, it is possible that there are similar
recognition mechanisms for legume-rhizobial and legume-pathogenic bacteria interactions Yang
et al. (2010).
The gene acds, detected by Ma et al. (2003), promotes nodule formation in pea (Finan et
al., 1983). The nfe gene controls nodule formation efficiency in Rhizobium meliloti (Sanjuan and
Olivares, 1989). The bacA has a critical role in bacteroid development during the symbiosis stage
in Rhizobium meliloti (Glazebrook et al., 1993). In different strains of R. etli, which nodulates

32
common bean roots, a gene was detected by Robleto et al. (1998) called tfx (Trifolitoxin), that
affects the competitiveness of the R. etli strains. A bacterial stress gene, moc, (Buts et al., 2005)
was identified with a role in nodule stabilization in the bacteroids of nodulated legumes. Sánchez
et al. (2013) detected two genes with important roles in nodule regulation, including the nap
gene encoding a periplasmic nitrate reductase and nos, encoding a N2O reductase.
2.4.3.2 Genes controlling infection and nodule development
The genes involved in the infection and nodule development process in several plants can
be categorized into two main groups, of early and late nodulin genes. The genes enod2, enod12
and enod40 are the early and leghemoglobin and uricase are examples of late nodulin genes.
While the early nodulin genes encode proteins responsible for the “molecular dialogue” during
the infection process, late nodulin genes encode proteins that play roles in the transformation of
bacterial into bacteroids and their settlement inside the nodules (Van De Sande et al., 1997).
In two different studies on R. meliloti, Ariel et al. (2012) and González-Rizzo et al. (2006)
detected knOx and Cre1 genes, involved in cytokinin function, as essential in nodule
development. In another study done by Suzaki et al. (2013), a gene named LHK1encoded the
lotus histidine kinase which had a role in nodule initiation and primordium development. A gene
called MtNIN was highlighted by Marsh et al. (2007) in the legume model of Medicago
truncatula with downstream effects on the early nod factor (NF) signaling in sequential and
spatial formation of root nodules. Another gene, CEP1, a peptide-encoding gene, noted by Imin
et al. (2013), controls lateral root and nodule numbers in Medicago truncatula. ACC gene affects
Rhizobium symbiosis and nodule senescence through coding for aminocyclopropane 1-

33
carboxylase (Nukui et al., 2006) and macronutrient degradation and remobilization (Xi et al.,
2013).
2.4.4 Environmental regulation of SNF
In addition to host genotype and rhizobia strain effects and their interaction, environmental
conditions, can affect SNF (Zahran, 1999; Hungria and Kaschuk, 2014). Most importantly,
factors that directly influence legume growth, such as soil moisture, nutrient availability,
pathogens and pests, crop husbandry practices (e.g., tillage, soil, nutrient and water management
and the use of crop protection practices) and natural resource management can limit SNF, either
through limiting the presence of effective rhizobia in the soil (Zahran, 1999; Giller, 2001), by
enhancing competition for soil minerals (Peoples et al., 2009; Weisany et al., 2013) or limiting
carbon supply to the SNF.
2.4.4.1 Soil moisture stress
SNF is an extremely drought-sensitive process. The evidence suggests that drought stress
could restrict SNF in legumes such as alfalfa, Medicago sativa (Abdel-Wahab and Zahran,
1983), pea and soybean (Gil-Quintana et al., 2013), broad bean, Vicia faba (Guerin et al., 1990),
common bean (Serraj and Sinclair, 1998) and the model legume Medicago truncatula (Gil-
Quintana et al., 2013). Water scarcity could affect N-fixing legume crops through oxygen
limitation, through an increase in nodular oxygen diffusion resistance (Durand et al., 1987), and
carbon shortage (Serraj and Sinclair, 1998). However, it does not have any impact on existence
and survival of rhizobia (Waldon et al., 1989). Moreover, Marino et al. (2007) in a partial

34
drought experiment where the roots were split, with half of the root system irrigated at field
capacity and the other half maintained with limited available water, observed that plant carbon
metabolism, protein synthesis, amino acid metabolism, and cell growth were the most affected
plant characteristics under drought stress in nodulted soybean plants (Gil-Quintana et al., 2013).
In spite of reports showing an inhibitory effect of drought stress on SNF, legume species showed
significant genetic variation in their ability to fix N2 under drought. For example, genotypes with
N2 fixation tolerance to water deficit were detected in soybean (Sinclair et al., 2000; Chen et al.,
2007; Devi and Sinclair, 2013), common bean (Serraj and Sinclair, 1998), and peanut (Dinh et
al., 2013).
2.4.4.2 Heat stress
Heat stress is a major limitation for SNF by legumes, not only in semiarid and arid regions,
but also in tropic of areas. Heat stress adversely affects rhizobium effectiveness and reduces host
legume and symbiont growth and development (Hungria and Kaschuk, 2014). High soil
temperatures strongly limit rhizobium populations and SNF in legumes, due to a delay in
nodulation or its restriction to the subsurface regions of the soil profile (Graham, 1992). The
critical temperature for SNF varies (from 30 to 42 oC) and is a function of the legume and
rhizobium strain. Graham (1992) indicated that for most rhizobium strains, 28 to 31°C is the
optimum temperature range of the soil with a threshold of 37°C, as many strains are not able to
grow after this temperature.
Inhibitory effects of high temperature were reported in some crops. For example, Piha and
Munns (1987) indicated a significant decline in nodule size of bean plants due to high

35
temperature. They reported that nodules were smaller at 35°C and subsequently low specific
nitrogenase activity was recorded. Moreover, Hernandez-Armenta et al. (1989) indicated that
transferring the nodulated plants from a daily temperature of 26 to 35°C significantly decreased
SNF.
However, there are some reports that legumes (Hungria and Franco, 1993) and rhizobium
strains (Graham, 1992) have a capacity to adapt to high temperature stress to maintain SNF at an
effective rate. Synthesis of heat-shock proteins has been reported as one of the most notable
mechanisms of heat tolerance in heat-tolerant bean genotypes and rhizobium strains (Graham,
1992; Michiels et al., 1994).
Heat stress and drought stress often occur together and synchronously making it difficult to
separate their effects (Sinclair and Serraj, 1995; Zahran, 1999). Many researchers have found
high performance rhizobia strains in symbiosis with legumes under both moisture deficiency and
heat stress (Hunt et al., 1981; Osa-Afiana and Alexander, 1982; Busse and Bottomley, 1989). So
far, many high-SNF legume landraces and cultivars have been identified under drought or high
temperature (Rai and Prasad, 1983; Venkateswarlu et al., 1983; Keck et al., 1984; Devi et al.,
2010).
2.4.4.3 Salinity stress
Soil salinization is also a major restriction for SNF and growth in legumes (Munns, 2005).
Salinity generally affects photosynthesis, and nitrogen and carbon metabolism in legumes
(Balibrea et al., 2003). High soil salinity can be lethal to legumes and rhizobia (Serraj and Adu-

36
Gyamfi, 2004). However, there are some reports showing genetic diversity of these organisms
for salt tolerance. Among different legumes some genotypes have been detected with high SNF
under salinity stress. For example, Tajini et al. (2012) reported SNF tolerance in two common
bean genotypes to moderate salinity stress. These genotypes could maintain adequate leaf area
and numerous active nodules under salt stress. There is some evidence of genetic diversity in
tolerance of SNF in other legumes to salinity, e.g., in alfalfa (Bernstein and Ogata, 1966), in
chickpea (Rao et al., 2002), and in broad bean (Cordovilla et al., 1995). However, Cordovilla et
al. (1995) believed that legume and rhizobial response to salinity depends on many factors such
as climatic conditions.
So far, many Rhizobium strains have been introduced to improve yielding ability of N-
fixing legumes under salinity stress (Sharma et al., 2013). However, there are some reports
indicating that the legume-Rhizobium symbioses and nodule formation in legumes are more
sensitive to salt stress than free-living rhizobia (El-Shinnawi, 1989; Zahran, 1991). Therefore,
inoculation of legumes with salt-tolerant bacteria could improve the SNF under salinity stress,
but it may not be enough to restore levels to non-stressed states (Craig et al., 1991). It seems that
tolerance of host plant is more important in this case for SNF improvement under saline
conditions.
2.4.4.4 Soil pH stress
A common problem caused by low pH in legumes, especially lower than 5, is a significant
decline in nodulation, even where a viable Rhizobium population is present in the field (Graham,
1992). Nodulation of legumes appears to be more sensitive to low pH than is plant growth

37
(Graham, 1992). Most leguminous plants require a neutral or slightly acidic soil for growth,
especially in SNF-dependent environments (Bordeleau and Prevost, 1994). Unsuitable soil
acidity could affect both rhizobia and the plant host. It could reduce SNF by limiting the
population of rhizobia in the soil and reducing nodulation (Graham et al., 1982; Ibekwe et al.,
1997). However, both legumes and rhizobia have varied responses to the soil pH. For example,
leguminous species exhibit a very wide range of acidity tolerance from extremely sensitive to
relatively high tolerance, e.g., alfalfa (M. sativa) and Lotus tenuis, respectively (Correa et al.,
1997). Highly tolerant rhizobium strains, usually, but not always, perform better in low pH soil
conditions in the field (Graham et al., 1994). Slow growing bacteria, Bradyrhizobium strains, are
generally more acid tolerant than fast growing ones though some strains of the fast-growing
rhizobia, e.g., R. loti and R. tropici (Graham et al.,1994) are acid tolerant. Acid tolerant bacteria
slow growing show less fluctuations of their cytoplasmic pH under different soil acidity (Chen et
al., 1993). R. leguminosarum bv. phaseoli is known as an acid-tolerant strain. This bacterium
increases its cytoplasmic potassium and glutamate levels in response to soil acidity, as reported
by Aarons and Graham (1991). Other acidity tolerance mechanisms reported in legumes include:
proton exclusion and extrusion (Chen et al., 1993), accumulation of cellular polyamines
(Fujihara and Yoneyama, 1993), synthesis of acid shock proteins (Hickey and Hirshfield, 1990),
and an acid tolerant composition and structure of the outer cell membrane (Graham et al., 1994).
Genetic studies of rhizobial tolerance to acidity revealed at least two loci conditioning this
trait (Chen et al., 1993). The host cultivar-rhizobial strain interaction is also important in SNF
response to soil acidity (Vergas and Graham, 1988). Vargas and Graham (1988) examined the
host plant-rhizobial interaction in common beans with Rhizobium strains under acidic conditions.

38
They reported that nodule occupancy of each strain was significantly influenced by the effect of
host cultivar, ratio of inoculation, and soil pH.
Caetano-Anolles et al. (1989) and Vergas and Graham (1988) indicated that an early stage
of nodulation process, when the rhizobia are attached to the root hairs, is the sensitive period of
nodualtion to low pH. Soil acidity impacts the survival and persistence of rhizobia and it could
be the main reason for nodulation failure (Graham et al., 1982). There are also some indirect
effects of acidity on SNF. In acidic soils, with pH of <5.0, metal sensitivities (to common metals
activity such as aluminum (Al) may be high. Decreasing the soil pH and increasing the
availability of Al inhibits legume nodulation (Bordeleau and Prevost, 1994). Both rhizobia and
legume species respond differently to high Al levels, with some plants being significantly and
more strongly affected by the metal than are the rhizobia (Graham, 1992). Taylor et al. (1991)
believed that improvement of Al tolerance is achieved by improving the plant, rather than the
rhizobia. Toxicity effects of manganese (Mn) under acidic soil on SNF are also well known. For
instance, this toxicity was reported as one of the main reason for low SNF in beans (Döbereiner,
1966).
2.4.4.5 Macronutrients stress
2.4.4.5.1 Nitrogen
SNF is energetically expensive for the host plants; therefore, bacteria do not usually fix N2
in the presence of available forms of inorganic N. The inhibitory effect of nitrate on SNF of
legume plants has been known for a long time (Minchin et al., 1987; Serrano and Chamber,

39
1990; Arrese-Igor et al., 1997; Chamber-Pérez et al., 1997). Generally, inorganic N in the soil
reduces both nodulation and N2 fixation levels of legumes (Streeter, 1988, cited by Arrese-lgor et
al., 1997; Fujikake et al., 2003). Although there are a few reports of positive effects of low
nitrate concentrations (less than 5 mM) on N2 fixation in legume species such as soybean
(Streeter, 1982; Gremaud and Harper, 1989; Gulden and Vessey, 1997), nitrogen fertilization
negatively affects nodulation in common bean and the usually-recommended rates of 40-60 kg N
ha-1
suppress SNF in this plant (Graham, 1981).
Mineral N usually accumulates in soils over the fallow period, before planting the annual
legume in a typical annual cropping system. At the beginning and during the lag phase of plant
growth, SNF level is expected to be low but it is anticipated to gradually increase when the plant
enters its exponential phase of growth if itis not limited by poorly effective bacteria or
inadequate nodulation (Pate and Layzell, 1990). Indeed, the quick growth rate of plants reduces
the seasonal mineral N (Unkovich et al., 1997) through increased demand for N (Pate and
Layzell, 1990). Therefore, the plant photosynthetic rate would determine the amount of N2 fixed,
only when the symbiotic machinery is operating effectively.
It is also known that there are various mechanisms by which nif gene expression is down-
regulated and nitrogenase activity is inhibited by increases in available N for the plant (Merrick,
1993). Mineral N can impact SNF during root infection by affecting nitrogenase activity and/or
the ratio of the nodule dry mass to the whole plant mass (Streeter, 1988, cited by Arrese-lgor et
al., 1997).

40
It is known that nitrogenase activity mainly relies on the concentration of free O2 inside the
nodules (Layzell and Hunt, 1990), which is controlled by the plant host (Minchin, 1997). The
host plant can regulate the available free O2 inside, due to the presence of leghemoglobin and the
diffusion resistance (Robertson et al., 1984). It is known that available nitrate in the soil may
directly or indirectly influence the proficiency of gas diffusion resistance (Arrese-Igor et al.,
1997).
2.4.4.5.2 Phosphorus
Phosphorus (P) is an essential element in various molecular and biochemical plant
processes, including construction of high energy compounds such as ATP and NADPH for
energy acquisition, storage and consumption (Epstein and Bloom, 2005). SNF is an expensive
process in terms of energy consumption and the availability of P determines the efficacy of any
energy-generating metabolic process (Plaxton, 2004). SNF is, therefore, a high P demanding
process and any P deficiency can supress legume SNF (Schulze et al., 1999). P deficiency also
causes a severe limitation on nodulation. The P content of nodules is usually greater than the
roots and shoots, particularly in environments with P shortages (Adu-Gyamfi et al., 1985). These
results indicate that nodules are stronger sinks for P than are the other parts of plant (Hart, 1989)
and suggest that a P shortage can have a bigger impact on nodulation than on plant growth
(Singleton et al., 1985; Leung and Bottomley, 1987; Saxena and Rewari, 1991).
Rhizobial and plant diversity for P requirements have been reported. For instance, Beck
and Munns (1985) indicated that slow-growing rhizobial strains were more tolerant to low levels
of P than the fast growing ones. Pereira and Bliss (1987) reported genetic diversity in common

41
bean for the response to P deficiency. Nodules usually compete for P with the vegetative sinks
such as shoots and roots in legumes (Jakobsen, 1985).
2.4.4.5.3 Potassium, Calcium and Sulfur
The availability of other macronutrients can also affect SNF. Potassium, K, is an essential
element for some rhizobia (Vincent, 1977). Incorporating calcium (Ca) into acidic soils can
eliminate the inhibitory effect of acidity on SNF, through increases in soil pH, as reported in
common bean (Buerkert, 1990) and alfalfa (Pijnenberg and Lie, 1990). SNF limitations have also
been reported in T. subterraneum (Banath et al., 1966), soybean (Blevins et al. 1977), and alfalfa
(Miller and Sirois, 1983) due to calcium deficiencies. Calcium deficiencies affect all stages of
the nodulation process, including root hair infection, attachment of rhizobia to the root hairs,
(Smith et al., 1992), nodulation and nodule development (Alva et al., 1991). In legumes,
limitation of sulfur (S) can also reduce N2 fixation by affecting nodule development and function
(Scherer, 2008).
2.4.4.6 Micronutrients
2.4.4.6.1 Boron
Boron (B) deficiency can cause significant declines in SNF (Yamagishi and Yamamoto,
1994). Bellaloui and Mengistu (2015) reported that foliar B resulted in a higher nitrogen fixation
in soybean plants. Bonilla et al. (1997) indicated that B deficiency impacts SNF through a
decrease in the number of nodules, when the existing nodules show structural aberrations.

42
2.4.4.6 .2 Copper
Copper (Cu) has been reported as an important micro-element in SNF in some legumes
(Sekliga, 1998). For instance, a need for Cu has been demonstrated for several rhizobial strains,
particularly R. leguminosarum bv. phaseoli (Johnston et al., 1978) and some legumes, such as
subterranean clover, white clover and Lupin (Cited by: Sekliga, 1998). Cu also plays a role in the
nitrogenase proteins encoded by nif genes in R. leguminosarum bv. phaseoli (Johnston et al.,
1978; Ruvkin and Ausubel, 1980). Different sensitivities of N-fixing grain legumes to Cu have
been reported (Sekliga, 1998).
2.4.4.6.3 Iron
Poor nodulation caused by Fe deficiency has been reported in chickpea (Rai et al., 1982),
lentil (Rai et al., 1984) and French bean (Hemantarajan and Garg, 1986). Indeed, Fe deficiency
affects both nodule initiation and formation, which results in a significant decline in the number
of nodules and plant biomass (Tang et al., 1990). Tang et al. (1990) indicated that Fe
requirements for nodule formation are greater than for host plant growth. It is also believed that
Fe deficiency directly restricts nodule function, because a reduction in nitrogenase activity has
been observed in Fe-limited nodules (O’Hara et al., 1988). This view is consistent with the fact
that Fe is also a key structural element of leghaemoglobin, nitrogenase, nitrogenase reductase,
FeMoCo cofactor, cytochromes and other electron donors (Delgado et al., 1998).
Although Fe deficiency did not significantly affect shoot growth, it severely depressed
nodule mass and particularly leghemoglobin content, number of bacteroids and nitrogenase

43
activity, compared with those plants five days after a foliar spray of Fe in peanut (O’Hara et al.,
1988). In contrast to peanut, in lupin (Lupinus angustifolius) Fe is not re-translocated into the
nodules after a foliar spray, and directs iron supply at the infection sites on the roots was required
for effective nodulation (Tang et al., 1990). In laboratory conditions, the lack of Fe has dramatic
effects on nodule development. In lupin and peanut, nodule development is much more
susceptible to a shortage of Fe than are other plant characteristics related to shoot and root
growth (O’Hara et al., 1988).
2.4.4.6.4 Molybdenum
It is well known that N2-fixation is much more sensitive to a Mo deficiency than is host
plant growth (Parker and Harris, 1977). This is attributed the role of Mo as a cofactor in the Mo–
Fe nitogenase protein. It contains two atoms of Mo and organizes the active site of the Mo-
containing nitrogenase protein in N2-fixing organisms (Allen et al., 1999). Mo provides the site
of N2 reduction to NH3 during N2 fixation (Smith, 1977, cited by: Brodrick and Giller, 1991).
Franco and Day (1980) reported that in the soil acidity range of 5.3-6.0, Mo application
significantly increased N2 fixation. At low Mo levels, in large seeded legumes, such as Andean
common bean, it is translocated to the nodules from the planted seed to support SNF (Brodrick
and Giller, 1991).
2.4.4.6.5 Nickel
Nickel (Ni) has both inhibitory and promoting effects on SNF at high and low
concentrations in soil, respectively. Singh and Rao (1997) reported that Ni at a low concentration

44
(1 μg mL-1
) promoted SNF through an increase in nodule number and nitrogenase activity.
However, Ni at high concentrations (>10 μg mL-1
) had inhibitory effects on SNF (Singh and
Rao, 1997). Buerkert (1990) and Dalton et al. (1985) reported that in many rhizobial bacteria Ni
is a key element in the hydrogenase activity during SNF as well.
2.4.4.6.6 Cobalt
Cobalt (Co) is an essential element for SNF because of its importance in rhizobial growth
(Cowles et al., 1969) and its role as a cofactor of cobalamin (Vitamin B6) involved in N2 fixation
and nodule growth (Licht et al., 1996; Jordan and Reichard, 1998). Cobalt is also required as a
part of a bacterial enzyme complex. A promoting effect of Co applications on N-fixing legumes
has been observed (Robson et al., 1979).
2.5 SNF estimation methods
An accurate method for measuring N2 fixing ability of legumes should be able to measure
the amount of N2 fixed by the crop. Bliss (1993) believed that distinguishing fixing from non-
fixing genotypes, while plants are growing in the field, is not possible so he recommended
measuring the SNF only on plants growing in an N-free medium under controlled environments.
Unkovich et al. (2008) mentioned that assessing the total amount of N accumulated during the
plant growing season simply gives the quantity of N2 derived from atmosphere through N
fixation in an N free medium. This opinion came from the fact that the early N2 fixation
assessment methods were based on plant N yield (La Rau and Peterson, 1981), which means that
soil N plant uptake was ignored in these methods (Herridge and damson, 1995). Thereafter, a
45
range of methods for field assessment of N2 fixation were developed. Most of the techniques to
estimate field N2 fixation in annual legume crops require computation of two assessments,
namely: the percentage of plant N derived from atmosphere (%Ndfa) and plant N yield, (Ny).
The most popular methods used to estimate N fixation are described below.
2.5.1 N difference technique
The N difference method is a simple and inexpensive technique which only relies on total
N analyses. It has a long history of utilization since its origin in the 1960s. In this technique, the
N2 fixation magnitude is estimated as the Ny difference value, between a reference plant (a non
N2 fixing crop) and a N2 fixing legume growing in a low N soil. The reference plant Ny is used as
an indicator of soil N absorbed by the N fixing legume. The accuracy of this method is a function
of the similarity of the root morphology between the reference plant and N fixing legume
(Herridge et al., 1995). Greater similarity makes it a reliable technique with the same accuracy as
other complicated methods if the reference and N fixing legume crop, growing in a low available
N soil, have large difference in their Ny (Boddey et al. 1984)
2.5.2 Acetylene reduction assay (ARA)
The reduction of acetylene (C2H2) to ethylene (C2H4) is also catalysed by nitrogenase
during SNF. This reaction creates a unique opportunity to estimate nitrogen reduction indirectly,
with the acetylene reduction assay (ARA). In this technique, the concentration of C2H2 and C2H4
is measured using the highly sensitive gas chromatographic procedures on tissues undergoing
SNF. The rate of C2H2 production gives an estimate of SNF (Vessey, 1994). ARA is known as a

46
simple, quick and inexpensive method (Hardy et al., 1973). However, since the 1980s it has been
broadly criticized for its low accuracy in field studies (Boddey et al., 1984). These criticisms at
first arose from the difficulties in root sampling. Nodules could not easily be recovered and
physical damage as well as their exposure to acetylene impacted their activity. Moreover, some
other disadvantages have been mentioned, including the complexity of applying this method in
the field. Calibration of the assay for each and every SNF evaluation must be accurately done. In
addition, significant extrapolation of the assay results in time need to be done because of the
short assay times that are typically used (Unkovich et al., 2008). This method is also very
environmentally sensitive, due to high sensitivity of ARA to soil moisture conditions (Huang et
al., 1975).
2.5.3 Relative ureide-abundance technique
In members of the Fabaceae family, N fixed through SNF in nodules can be transported
towards the shoots in two different forms (Schubert, 1986). Legumes, originating from temperate
regions, such as species of Phaseoleae and Desmodieae within the Papilionoideae subfamily,
mainly transport N in forms of ureides (allantoin and allantoic acid) from their nodules (Sprent
2001). These legumes are categorized in the ureide group. In the rest of the legume species N is
exported from the nodules to the shoots in the form of amides, either asparagine or glutamine so
they are labeled as belonging to the amide group (Atkins 1991, Pate 1989).
In the late 1970’s, nodules were discovered to be the central place of ureide synthesis
(Herridge et al., 1990). The ureides are exported to the upper parts of the plant through the xylem
along with NO3-. A relative ureide-abundance technique was developed, based on measuring of

47
the ratio of ‘ureide’ to ‘ureide + NO3-’ to estimate %Ndfa at the time of measurement (Peoples,
2009). It is recommended making a few (at least four) samplings (destructive harvests) of the
xylem sap to estimate the ratio of ‘ureide’ to ‘ureide + NO3-’ during plant development (Peoples,
2009). It is possible to measure the total %Ndfa through the plant development cycle. Many
studies were later conducted to estimate %Ndfa using this method (McClure and Israel, 1979)
and later Peoples and Herridge (1990) listed more than 25 tropical species in which the xylem
sap ‘ureide’ to ‘ureide + NO3-’ ratios were substantially correlated to estimated %Ndfa.
Advantage of this technique include that it does is not involve a technically demanding
procedure (Herridge et al., 1990), and does not require high-priced or complicated equipment to
perform (Unkovich, 2008). Moreover, it can provide a good estimate of %Ndfa without any
need to evaluate Ny (Peoples et al, 2009). However, because of two main drawbacks, the ureide
method is not known as a reliable way to estimate %Ndfa. First, “each field measurement reflects
N2 fixation by the crop at, or shortly before, the time of the assay” (Unkovich, 2000). As Aveline
et al. (1995) caution, it is very risky to estimate the whole growth period %Ndfa of the plant
based only on a single measurement. Moreover, Alamillo (2010) illustrated that during water
deficit conditions the accumulation of ureides in ureidic plant tissues comes not only from
synthesis of ureides in nodules, but it can also be from plant response to drought stress.
2.5.4 Nitrogen-15 (15
N) isotope techniques
Nitrogen has two naturally stable isotopic forms 14
N and 15
N, the first one of which, the
lighter isotope, is more abundant than the second one in nature. The concentration of 15
N in
atmospheric N2 is at the constant rate of 0.3663 atoms% (Högberg, 1979). Screening of the

48
difference between the 15
N concentration in the air and that of soil N, which is mostly 15
N, in the
N extracted from the plant, is the basis of three major 15
N isotope techniques described below.
2.5.4.1 Total 15
N balance technique
The total 15
N balance technique is based on exposing the whole soil/plant system to 15
N-
enriched air. The plant systems, including N-fixing legumes and non-fixing reference plants,
uptake soil N with the same isotopic composition. In this way, any difference between 15
N
utilization by the N-fixing legume and the reference plant can provide an estimation of %Ndfa
(Eskew et al., 1981). The total 15
N-balance technique requires very accurate analysis of 15
N in
both soil and plant at the planting date, and after harvest the quantification of total N in the
system is analysed again. During this quantification, N losses from the system must be
minimized and measured by completely controlling the isolated environment for light intensity,
temperature, CO2 and O2 pressures, etc. In spite of the fact that it is applicable to long term field
studies, the best results are obtained from indoor tests (Lima et al., 1987). This method is rather
expensive in terms of instruments and 15
N -labeled materials. This technique is, therefore,
practically impossible to apply in the field.
2.5.4.2 15
N -enrichment isotope-dilution (ID) technique
This method was the most commonly used approach for %Ndfa estimation in the 1970s
and 1980s (Peoples et al, 2009). For the ID method, the soil is artificially enriched with 15
N by
adding 15
N-labled fertiliser (e.g., ammonium sulphate, urea and/or calcium nitrate). To determine
the possible range of 15
N enrichment, it is recommended that several non-fixing reference plants

49
be sampled and slow-release labeled fertiliser is applied to prevent any leaching of the plant-
available 15
N during the enrichment process (Watanabe et al., 1990; McNeill et al., 1998). Many
protocols have been introduced for applying the ID technique, all based on the same principles
(Chalk, 1985). 15
N enriched fertilizer will be absorbed by both the N-fixing legume and
reference plant; the 15
N concentration of these two groups of plants will be different because the
N-fixing legume can dilute it by absorbing 14
N from atmospheric N2 (99.6337%), but it would be
constant in the reference plant. To determine the dilution value of the 15
N enriched fertiliser, both
N-fixing and reference plant materials are analysed for their 15
N content, following the harvest.
%Ndfa can be then estimated by the 15
N content of the N-fixing legume relative to that of the
non-N2-fixing plant, as the representative of 15
N enriched soil pool (Unkovich and Pate, 2000).
Danso et al. (1993) reported that a complication associated with the ID technique is the
difficulty of establishing the space and time of the 15
N labelling procedure. This is related to the
fact that the efficiency of N uptake by plants ranges from approximately 5%-90% (Peoples et al.
1995) and that N uptake pattern of plants are divergent Danso et al. (1993). Also, the
incorporation 15
N labeled fertilizer into the soil makes two soil inorganic N pools, including the
15N enriched pool and natural abundance pool (Peoples et al., 2009). A significant portion of
available N in the soil enrichment using 15
N labeled fertilizer comes from contributions of the
native inorganic N soil, unlabeled pool (Peoples et al., 2009). All these make it hard to get a
reliable estimate of the plant’s enriched mineral N (Watanabe et al., 1990; McNeill et al., 1998).
To alleviate this problem, the ID procedure was modified by Fried and Broeshart in 1975.They
suggested applying different rates of 15
N labeled fertilizer to the fixing and non-N2-fixing,
reference, plants according to differences in their corresponding orders for N. However, Chalk
(1996) indicated that Fried and Broesharts’ modification could not noticeably improve this

50
methodology. Labeling the soil N by 15
N labeled fertilizer is necessity in both, modified or
original technique. The other problem with this method is negative effect of the 15
N fertilizer
addition on legume nodulation. Even if it does not have any impact on nodulation, even under
conditions where 15
N fertiliser addition does not affect nodulation, nodule activity and
subsequently SNF may still be weakened. Therefore, some researchers believe that there are
numerous circumstances where assessments of N2 fixation, utilizing the ID technique, are
mistaken (Danso et al., 1993).
2.5.4.3 15
N natural abundance (NA) technique
The invention of gas chromatographs equipped with mass spectrometers, GC-MS (Gohlke
and McLafferty, 1993) encouraged scientists to develop an alternative technique to the ID
method. The method known as the 15
N natural abundance (Peoples et al., 2009) is a widely used
technique. The ratio of the two natural stable isotopic forms of N2, 15
N:14
N, can be measured by
mass spectrometry. The natural 15
N abundance is therefore conventionally estimated as
δ15
Nvalues, where
(𝛿15𝑁 =(15𝑁/𝛿14𝑁𝑠𝑎𝑚𝑝𝑙𝑒) − (15𝑁/𝛿14𝑁𝑎𝑡𝑚𝑜𝑠𝑝ℎ𝑒𝑟𝑒)
(15𝑁/𝛿14𝑁𝑎𝑡𝑚𝑜𝑠𝑝ℎ𝑒𝑟𝑒) × 100
15N values are expressed as parts per thousand or per mil (‰) with respect to the atmospheric N2
gas (Peterson and Fry, 1987).

51
Today, the 15
N natural abundance technique is one of the most easily applied methods in
field trials to evaluate the SNF activity of legume plants (Delwiche et al. 1979; Virginia and
Delwiche 1982; Shearer and Kohl 1986; Högberg 1997; Pauferro et al., 2010). The proportion of
15N atoms in the atmospheric N2 is always constant, and around 0.3663 atom %
15N (Högber,
1979) while the majority of N2 transformed in the soil is in the 15
N isotopic form of N.
This method relies on the different natural abundance of 15
N in soil N and atmospheric N.
The 15
N abundance in a non-N- fixing (reference) plant, which is all derived from the soil is
larger than that of a N fixing plant, which derives some of its N from atmospheric N through
SNF (Shearer and Kohl, 1986). Then the proportion of N in the legume plant derived from the
air (%Ndfa) can be quantified by interpreting this difference between the N-fixing and reference
plant. A critical assumption for this technique is that the N-fixing and non N-fixing plant have
the same ability to take up and accumulate N from the soil at the same 15
N abundance. Boddey et
al. (2000) suggested measuring 15
N abundance in several reference plants to define a possible
range of this value in woody plants. However in agricultural systems, minor variations in 15
N
natural abundance have been found among different non-N2-fixing reference plants (Unkovich et
al., 2000).
In the case of annual field crops, %Ndfa can be calculated with the equation presented by
Shearer and Kohl (1986):
%𝑁𝑑𝑓𝑎 =(𝛿15𝑁𝑟𝑒𝑓. 𝑝𝑙𝑎𝑛𝑡−𝛿15𝑁𝑁 𝑓𝑖𝑥𝑖𝑛𝑔 𝑝𝑙𝑎𝑛𝑡)
(𝛿15𝑁𝑟𝑒𝑓. 𝑝𝑙𝑎𝑛𝑡 − B)
[1]
52
where δ15
Nref. plant is the abundance of δ15
N in the non-fixing reference plant, δ15
Nfixing plant
is the 15
N abundance of the N-fixing legume and B is the δ 15
N of the legume obtaining its entire
N from N2 fixation in N-free medium. The B value has been shown to vary between legume
species, varieties of the same species, and different rhizobium strains (Boddey et al., 2000). It is
usually extremely difficult to recover all roots and nodules in field studies, but 15
N abundance of
the N derived from the air can be determined in the seed as described by Okito et al. (2004).
2.6 SNF in common bean
Common bean ranks low compared to the other grain legumes in terms of SNF. It was
claimed that SNF in common bean contributed less than 100 kg N ha-1
y-1
, which was 40 to 50%
of the total N found in bean plants at maturity (Westermann, 1981). However, substantial
genotypic variation for SNF has been reported in common bean germplasm. Hardarson et al.
(1983) compared 20 bean genotypes for SNF, using the 15
N isotope dilution method. They
reported significant SNF diversity among the genotypes with average and highest values of 35
and 70 %Ndfa, respectively. Rennie and Kemp (1983) reported that climbing beans were about
six times stronger than bush type beans in SNF. Afterwards, many other researchers recognized
genotypic variability for SNF in this species (Rennie and Kemp, 1983; Pereira et al., 1989; St.
Clair and Bliss 1991; Miranda and Bliss, 1991; Bliss, 1993; Hardarson et al., 1993; Kipe-Nolt,
1993, Peña-Cabriales and Castellanos, 1993; Tsai et al., 1993; Devi et al., 2013). In addition,
genetic diversity for nodulation-related traits was reported by some researchers, e.g., Graham and
Rosas (1977) and Park and Buttery (1989).

53
2.6.1 SNF improvement in common bean
Genetic variation in germplasm provides the raw material for crop improvement programs.
The findings mentioned in section 2.6 can, therefore, suggest that it is feasible to improve the
genetic potential of SNF in common bean. Bliss (1993) believed that common bean lines,
infected with effective rhizobia, could produce seed yields of 1-2 t ha-1
in field conditions
without any major yield limiting factors. In the 1980s and 1990s, plant breeders were
concentrating on combining high SNF efficiency into the elite common bean genotypes.
Selection for high SNF genotypes has produced breeding lines able to fix high levels of
atmospheric N2 (St. Clair et al., 1988; Miranda and Bliss, 1991; St. Clair and Bliss, 1991).
Bliss (1993) believed that an appropriate selection criterion to separate beans with superior
SNF ability from those that are inferior for SNF, combined with genetically diverse plant
materials segregating for SNF (or surrogate traits) and the use of a breeding method that provides
maximum breeding advance, are the main prerequisites for SNF breeding. Based on those
recommendations, field trials should be carried out without applications of large amounts of N
fertilizers.
In accordance with its genetic complexity, the genetic improvement of SNF is not an easy
task. A few reports (e.g., Pimratch et al., 2004; Sikinarum et al., 2007) suggest that the trait has
low to moderate heritability in legumes. It is, therefore, anticipated that there are strong
environmental and genotype × environmental effects on the SNF trait. Therefore, greater
selection efficiency can be achieved if selection is based on family mean rather than individual
values as the unit of selection (Barrona et al., 1999).

54
Moreover, direct selection of high SNF genotypes is difficult. SNF estimation in the field
is laborious and expensive, especially when the 15
N-isotope method (Shearer and Kohl, 1986) is
used. Most bean breeding programs do not routinely select for superior SNF per se. They select
on the basis of some easily measured agronomic and plant characteristics to determine
superiority for SNF and to develop an understanding of the inheritance of the trait (Pedalino et
al., 1992; Kipe-Nolt et al., 1993; Peña-Cabriales and Castellanos, 1993).
2.6.2 Relationships of SNF with agronomic traits
The presence of variation for SNF in the germplasm collection and the existence of
moderate to high associations between SNF and agronomic traits mean that nitrogen fixation per
se may be improved by introgressing positive alleles into locally adapted grain legume cultivars.
Even agronomic traits associated with SNF and grain yield could be used as surrogate traits to
improve high yielding varieties with improved SNF. However, the interaction of genotypes with
rhizobium (strain variability and effectiveness), and environment (location × year effect) could
complicate this breeding task. Therefore, this issue must be considered in any breeding effort for
high SNF.
So far, a few studies have been conducted to examine if there is any indicator or surrogate
trait for SNF improvement. In previous studies, a negative association between nitrogen fixation
and δ13
C, an indicator of water use efficiency in plants, has been reported (Knight et al., 1993;
Kumaarasinghe et al., 1992). However, there has been some discussion about the stability of this
association in different environmental conditions. Rennie and Kemp (1983) reported that

55
indeterminate and climbing beans were stronger N2 fixers than the bush type beans, due to longer
N fixation period, resulting from delayed flowering times and longer times to maturity.
The SNF process starts with the attraction of N-fixing bacteria by legumes. There is some
discussion in the literature whether the same infection mechanism is utilized by N-fixing bacteria
to establish nodules and bacterial pathogens to establish a disease state. In common bean,
breeders have over the years selected genotypes of beans that are resistant against to bacterial
diseases. Among the bacterial diseases of common bean, common bacterial blight (CBB), caused
by Xanthomonas axonopodis pv. phaseoli (Smith), has been a major disease of common bean, in
North America and elsewhere, for which bean breeders have introgressed resistance through
inter-specific crosses to close relatives (e.g., P. acutifolius) (Thomas and Waines, 1984; Scott
and Michaels, 1992). It is still unknown whether or not selection for resistance against the
bacterial pathogen causing CBB, over the years, has reduced the ability of the bean varieties to
establish symbiotic relationship with the beneficial bacteria.
A high and positive correlation of leaf color score (SPAD) with SNF suggests that this trait
as an indicator of SNF effectiveness in groundnut (Dinh et al., 2013) and soybean (Gwata et al.,
2004). Since SNF is adversely affected by low levels of P in the rhizosphere (Vance, 2001;
Schulze et al., 2006; Jemo et al., 2010) genetic differences for SNF under P deficiency may be
related to differences in P-uptake efficiency (Pereira and Bliss, 1987), which could be considered
as an indicator of SNF in low input environments. More studies are needed, involving diverse
germplasm and breeding populations to elucidate such relationships prior to exploiting them as
indices in breeding for high SNF in agriculturally important grain legume crops.

56
2.6.3 Molecular Tools in Common Bean
Narrow genetic diversity is the main restriction to achieving high rates of genetic gain in
breeding programs for many crops (Tanksley and McCouch 1997). It is likely that this is true for
common bean as well (Buso et al., 2006). Hence, detailed knowledge of the genetic diversity of
the available germplasm is the first prerequisite to improve the traits. Nowadays, DNA sequence
polymorphism marker technologies can provide enough knowledge of the genetic diversity in
breeding germplasm and also address the difficulty of direct selection for high SNF as well.
Some grain legumes have sufficient genomic data to identify genetic markers associated with
SNF. These valuable alleles could be transferred into the elite genotypes later. However,
compared with human and economic resources allocated to the research of other commercial
crops, efforts to develop molecular tools for the genetic analysis and breeding of common bean
are still limited.
In common bean, expressed sequence tags (ESTs), fragments of mRNA sequences derived
through single sequencing reactions performed on randomly selected clones from cDNA
libraries, are the source of gene-based markers, e.g., insertion-deletions (Indels) or single-
nucleotide polymorphisms (SNPs) (Cortés et al., 2011). For genetic studies the ideal molecular
marker should be generated in a high-throughput and cost-effective manner. However because of
the nature of these kinds of markers, the detection of polymorphisms is difficult. Instead,
development of intron-spanning EST-SNP markers has been developed as a valuable resource
for genetic studies (Cortés et al., 2011).
57
The search for molecular markers to increase the efficiency of selection is essential in plant
breeding programs. Among molecular markers, simple sequence repeats (SSRs) and single
nucleotide polymorphism (SNPs) are highly desirable, since they can be used for in-depth
genetic analysis (Cortés et al., 2011). SSR markers are highly polymorphic and evenly
distributed across the genome, co-dominant, and generate accurate and reproducible data (Yan et
al. 2010). However, these are not always low cost due to labor and time consumption (Brondani
et al., 1998; Ritschel et al., 2004). Single nucleotide polymorphism (SNP) markers exhibit high
levels of genetic diversity and low cost genotyping together with the potential for high
throughput (Cortés et al., 2011).
Single nucleotide polymorphisms (SNPs) are the most abundant class of polymorphic sites
in any genome, which are well distributed across the genome. They have become a powerful tool
in genetic mapping, association studies, diversity analysis and positional cloning (Rafalski, 2002;
Hyten et al., 2010a; Yan et al., 2010). SNPs are usually bi-allelic, therefore less polymorphic
than SSRs. However, this limitation is compensated for by the ability to use more markers and to
build SNP haplotypes (Rafalski, 2002). In common bean, SNP markers have mostly been used to
perform linkage map construction and synteny analysis (Galeano et al. 2009; McConnell et al.
2010). To date, gene-based markers have been used to develop transcript maps in chickpea
(Gujaria et al., 2011) and soybean (Choi et al., 2007). QTL analysis in cowpea, Vigna
unguiculata L. (Muchero et al., 2011), association mapping in Medicago truncatula (Friesen et
al, 2010) and synteny analysis in common bean (Galeano et al., 2009; McConnell et al., 2010)
have been reported as well.

58
In common bean, EST libraries of Negro Jamapa 8, a Middle American, and G19833, an
Andean, genotype were used to establish the first consolidated resource of SNP markers
(Ramirez et al., 2005). Ramírez et al. (2005) sequenced 21,026 ESTs from various cDNA
libraries (nitrogen-fixing root nodules, phosphorus-deficient roots, developing pods, and leaves)
derived from the Negro Jamapa 81 genotype and leaves from G19833 genotype. Approximately
10,000 of these identified ESTs were classified into 2,226 contigs and 7,969 singletons. It was a
wonderful resource of SNP markers for genetic studies in common bean. At the same time
Melotto et al. (2005) constructed three cDNA libraries from the Middle American breeding line
SEL1308 derived from 19-day old trifoliate leaves, 10-day old shoots, and 13-day old shoots
(inoculated with Colletotrichum lindemuthianum). Graham et al. (2006) integrated the complete
EST data set created by Ramírez et al. (2005) and Melotto et al. (2005) and provided 20,578
ESTs. Buso et al. (2006) constructed a genomic library enriched for AG/TC repeat sequences for
this species. They initially developed 20 microsatellite markers, 10 of which were characterized
using a panel of 85 representative accessions of the bean gene bank. Tian et al. (2007)
constructed a cDNA library of the Middle American genotype G19833 to identify genes
involved in response to phosphorous starvation derived from 6-day old seedlings from the
genotype. Later, Gaitan et al. (2008) identified a limited set of 25 SNPs from sequence fragments
obtained from DOR364, another Middle American genotype, and G19833. Galeano et al. (2009)
developed single-strand conformation polymorphism (SSCP) markers based on these ESTs and
named these BSNP (bean SNP) markers. Thibivilliers et al. (2009) detected 6,202 new common
bean ESTs by using a cDNA library assembled from the common bean rust resistant-cultivar
‘Early Gallatin’.

59
McConnell et al. (2010) generated gene-based SNP markers from the Andean genotype
JaloEEP558 and the Middle American genotype BAT93. Hyten et al. (2010b) discovered a total
of 3,487 SNPs of which 2,795 contained sufficient flanking genomic sequence for SNP assay
development. Furthermore, they designed a GoldenGate assay which contained 1,050 SNPs.
Kalavacharla et al (2011) obtained a substantial (31,664) transcriptome dataset for common
bean. Cortés et al. (2011) developed 94 SNP at 84 gene-based and 10 non-genic loci in a
diversity panel of 70 (41 Middle American and 29 Andean) genotypes. Galeno et al. (2012)
developed a total of 313 new gene-based markers. They placed a total of 53 new marker loci on
an integrated molecular map in the DOR364 × G19833 recombinant inbred line (RIL)
population. They also constructed the new map by merging the linkage maps of the BAT93 ×
JALO EEP558 and DOR364 × BAT477 populations. They succeeded to map a total of 1,060
markers, with a total map length of 2,041 cM across 11 linkage groups.
The first reference genome for common bean was introduced by Schmutz et al. (2014)
based on the assembly of 473 Mb of the 587-Mb genome and genetically anchoring 98% of this
sequence into 11 chromosome-scale pseudomolecules. The researchers compared this reference
genome with the soybean genome to identify changes in soybean resulting from polyploidy.
They also confirmed two independent origins of domestication for common bean, based on gene
pools of Andean high throughput
2.6.4 Applications SNP markers in common bean research
Genotyping technologies such as Single Nucleotide Polymorphism (SNP) can be used to
study the association of DNA markers with phenotypic data in germplasm collections or other

60
plant populations (Beebe et al., 2013).Using these technologies quantitative trait loci (QTL)
associated with desirable phenotypes (i.e., higher SNF ability, and seed yield) can be identified.
SNPs can be used in breeding and genetics programs for construction of linkage maps, genetic
diversity analyses, or marker-phenotype association studies, and ultimately for marker-assisted
selection (MAS) (Cortésetal.,2011). More than 30 approaches for SNP detection have been
proposed and applied in different plant species (Gupta et al., 2008). SNP detection in common
bean has been applied using Single Base Extension (SBE) (Gaitán-Solís et al.,2008), Expressed
Sequence Tags (EST) (Galeano et al., 2012), NGS (Hyten et al., 2010b) and competitive allele-
specific PCR (KASP) assays (Cortésetal.,2011; Gorettietal.,2014). SNP information from
common bean has previously been used to build linkage maps and to conduct synteny analysis
(Galeanoetal.,2009, 2012; Shi et al., 2011; Yuste-Lisbona et al., 2012). SNPs have been used for
the identification of QTL associated with SNF ability and related traits in a RIL population of an
inter-genepool cross (Ramaekers, et al., 2013) and in a genome-wide association analysis of SNF
in common bean (Kamfwa et al., 2015).
2.6.5 Quantitative trait loci (QTL) associated with SNF traits
Knowledge of the inheritance of SNF, not only in common bean, but also in other
economically important legumes, is very limited. Studies of SNF (Del Rosario et al., 1997),
nitrogenase activity (Nigam et al., 1985; Miller et al., 1986; Phillips et al., 1989) and nodulation
related traits (Isleib et al., 1980; Bhapkar and Deshmukh, 1982; Nigam et al., 1985; Miller et al.,
1986; Phillips et al., 1989; Del Rosario et al., 1997; Franco et al., 2001; Phudenpa et al., 2006)
suggest that these traits are controlled by additive or non-additive genes, with some evidence of

61
epistatic interactions. All studies suggest that SNF has a complex inheritance with involvement
of multiple genes.
Understanding the genetic basis of SNF by identifying quantitative trait loci (QTL) for
SNF-associated traits, therefore, advances the proficiency of breeding efforts to improve it.
However, few quantitative trait loci (QTL) and candidate genes underlying QTL associated with
SNF have been identified in model legumes and soybean. Most of these QTL are for nodulation-
related traits. For instance, eight and seven QTL in a RIL soybean population associated with
nodule number (NN) and nodule size, respectively, were detected by Hwang et al. (2014). Three
and one QTL for NN and ratio of nodule dry weight to nodule number (NDW/NN), respectively,
were reported by Santos et al. (2013) in soybean. In another study, Nicolás et al. (2006)
identified two QTL explaining up to 15 % of the diversity of NN and NDW in a soybean RIL
population. Bourion et al. (2010) reported nine QTL for NN and four genomic regions for NDW
were determined in a RIL population of pea.
To date, only six QTL studies on SNF traits in common bean have been published
(Nodari et al. 1993; Tsai et al. 1998; Souza et al. 2000; Franco et al., 2001; Ramaekers et al.;
Kamfwa et al., 2015). The majority of these studies identified quantitative trait loci (QTL) with
the focus on just SNF related traits, particularly nodulation traits. The first QTL study on NN
trait in common bean was done by Nodari et al. (1993), who reported four genomic regions for
NN in a RIL population derived from a cross between a Middle American genotype, BAT93
(low nodulating; moderately common bacterial blight, CBB, resistant), and the Andean
genotype, Jalo EEP558 (high nodulating; susceptible to CBB). One of these four genomic
regions influenced both NN and CBB resistance/susceptibility (Nodari et al., 1993). Later, Tasi

62
et al. (1998) screened the same RIL population, but at two different soil N levels. They
confirmed previous findings by Noradi et al. (1993) only in the low N level. Tsai et al. (1993)
reported three other QTL for NN in high levels of soil N. In 2000, Souza et al. constructed 12
linkage groups for common bean and identified 15 markers associated with NN on seven linkage
groups and seven QTL for NN in the same RIL population as screened by Noradi et al. (1993)
and Tsai et al. (1998). Souza et al. (2000) indicated that NN and CBB resistance in common bean
have four overlapping QTL. The stability of these QTL was claimed to be a function of the
adaptability of genotypes to diverse soil fertility (Souza et al., 2000). These three groups of
researchers did not construct similar numbers of linkage groups for QTL analysis of the traits.
There have been a few genetic studies of SNF traits in legumes, especially in soybean. For
instance, two QTL associated with plant acetylene reduction activity (ARA) were reported by
Tanya et al. (2005) in soybean. In addition, a QTL for ARA was reported by Tominaga et al.
(2012) with a pleiotropic effect on SNF and nodule weight in the model legume, Lotus
japonicas. ARA is very highly sensitive to soil moisture conditions (e.g., Huang et al., 1975).
Therefore, these findings should be examined in different environmental conditions. To address
the disadvantage of ARA method, it has been suggested that a more efficient method of SNF
measurement in the field, such as the natural 15
N abundance (Shearer and Kohl, 1986) be used.
Despite the availability of the more reliable natural 15
N abundance method for SNF
measurement, there have only been two studies of quantitative trait loci (QTL) associated with
SNF in common bean (Ramaekers et al., 2013; Kamfwa et al., 2015). Ramaekers et al. (2013)
conducted a QTL analysis of SNF and related traits in a bi-parental recombinant inbred line
(RIL) population derived from a cross between a climber, Middle American, genotype and a
bush, Andean, genotype. They constructed 11 linkage groups and identified two QTL accounting

63
for up to 21% of phenotypic variance in nitrogen content (N%) in a greenhouse. One of the QTL
overlapped with a QTL reported for total N content in a one year-location field trial. In another
greenhouse experiment, they detected two QTL, accounting for up to 18% of total variation of
total plant N fixed, on linkage groups 1 and 4, while in the field trial in only one site one QTL
for percentage of nitrogen derived from atmosphere (%Ndfa) at harvest was identified on linkage
group 4. Recently, Kamfwa et al. (2015) in an Andean diversity panel, including 237 common
bean genotypes, detected 11 SNPs, five on Pv03 and six on Pv09 for %Ndfa.
Ramaekers et al. (2013) detected two candidate genes, for an auxin-responsive
transcription factor and AP2/ERF-domain-containing transcription factor, underlying these QTL.
These candidate genes are associated with differences in growth between climbing and bush
beans and possibly yield and N accumulation and total amount of symbiotic nitrogen fixed,
respectively. Kamfwa et al. (2015) reported one gene, encoding leucine-rich repeat receptor-like
protein kinases (LRRRLK), as a potential candidate gene for %Ndfa. Both research groups had
only one location-year data for their field studies.
With the exception of a genome-wide mapping population of the Andean gene pool by
Kamfwa et al. (2015), all genetic studies of either SNF or its related traits in dry bean have been
conducted using bi-parental recombinant inbred line (RIL) populations originating from crosses
between two different common bean gene pools, Middle American and Andean. This was done
to take advantage of greater genetic diversity due to lack of SNF genetic diversity within each
gene pool. Recent findings reveal that there are molecular markers closely associated with SNF
which could potentially provide useful tools to increase the efficiency of selection for high SNF

64
in breeding programs. However, the stability of these QTL over different environments must be
considered before using them in applied crop breeding (Dwivedi et al., 2007).

65
CHAPTER 3
N2 Fixation Ability of Different Dry Bean Genotypes1
1 A version of this chapter has been published at Farid, M., and A. Navabi. 2015. N2 fixation
ability of different dry bean genotypes. Can. J. Plant Sci. In press. doi:10.4141/CJPS-2015-
084.

66
3.1 ABSTRACT
Common bean (Phaseolus vulgaris L.) is generally known as a weak N2 fixer compared
to other legumes. The availability of genetic variation for N2 fixation potential of common bean
supports the idea that symbiotic nitrogen fixation (SNF) in common bean can be improved
through breeding. To assess the potential N2 fixation of selected common bean genotypes, twelve
bean varieties including 3 Andean and 9 Middle American were screened for SNF ability and
related traits in controlled environments and field trials in Ontario, Canada. A non-nodulating
mutant, R99, was used as the reference plant to estimate percentage of nitrogen derived from the
atmosphere (%Ndfa) through the natural 15
N abundance method. Significant variation was found
among the bean genotypes for %Ndfa and its related traits. Environmental and genotype by
environmental effects significantly influenced %Ndfa and its related traits. The three Andean
bean genotypes were superior to Middle American genotypes for nodulation ability, while the
Middle American genotypes were generally stronger nitrogen fixers in optimum soil moisture
conditions. In general, nitrogen fixation was found to be significantly associated with seed yield
and carbon isotope discrimination, an indicator of water use efficiency.
67
3.2. INTRODUCTION
Common bean (Phaseolus vulgaris L.), with in excess of 23 million tonnes of global
production in 2012 (FAOSTAT, 2013), is an important pulse crop in the world. As a source of
protein, fiber, and minerals (Singh, 1999), common bean is a staple food for over 500 million
people in Latin America and Africa (Fageria et al., 2011). Genetic and archaeological studies
indicate that domestication of P. vulgaris occurred in two distinct centres of domestication in the
Middle America and Andes (Koenig and Gepts, 1989) resulting in two highly differentiated gene
pools (Gepts, 1998). More recent studies of domestication and the genetic diversity of P.
vulgaris within the two gene pools, using molecular evidence, identified the Oaxaca valley in the
Middle Americas and southern Bolivia and northern Argentina in South America as the centres
of domestication of common bean (Bitocchi et al., 2013).
Since the advent of nitrogen fertilizers in the 1800’s (Slack, 1973), chemical fertilizers
have become a major source of nitrogen supplements in agricultural lands across the world.
However, plants cannot uptake all the nitrogen applied to the soil in the form of nitrogen
fertilizers (Raun and Johnson, 1999). Therefore, the amount of nitrogen that is not absorbed by
the plants poses a serious management and often environmental concern in these cropping
systems (London, 2005). Symbiotic nitrogen fixation (SNF), the process of converting the
abundantly-available gaseous N2 to biologically-useful nitrogen through symbiotic relationships
between plant species and soil microbes, on the other hand, is known as an important
environmentally-sustainable source of nitrogen in the soil (Triboi and Triboi-Blondel, 2014).
Biological nitrogen fixation potentially contributes to reduced application of N fertilizer on
agricultural lands throughout the world. While free-living nitrogen-fixing organisms, such as
68
blue-green algae, may deposit less than 5.6 kg of nitrogen per ha per year (Van Kessel and
Hartley, 2000), nitrogen fixation through the symbiotic relationship between the members of the
leguminous family of plants and the soil rhizobial bacteria is known to supply in the range of 28
to 83 kg N ha-1
yr-1
in a natural ecosystem (Van Kessel and Hartley, 2000), and up to 400-500 kg
N ha-1
yr-1
in cropping systems involving nitrogen-fixing legumes (Van Kessel and Hartley,
2000).
Despite common bean’s inherent N2-fixing ability, the actual SNF of dry beans is often
reported to be lower than other legumes (Martínez and Roméro, 2003). Therefore, application of
N fertilizers in bean fields is recommended to achieve higher yields. However, it has been
reported that the climbing and indeterminate cultivars consistently have higher nodulation and
SNF abilities, compared with most bush type cultivars. These greater abilities are attributed to
the relatively longer period of fixation during the growth cycle in climbing type cultivars
(Graham, 1981; Piha and Munns, 1987). Miranda and Bliss (1991) reported that selection for
high levels of SNF, especially when performed in low fertility soils, might result in genetic gains
in common bean breeding populations. Bliss (1993) also discussed that the level of N2 fixation
can vary significantly among bean genotypes and argued that reports of insufficient levels of N2
fixation in common bean were often based on observations with only a few genotypes and
conducted with unsuitable N2 fixation measurement assays.
In addition to genetic background, environmental factors can greatly influence the SNF
ability of legumes. Carbon isotope discrimination (δ13
C), an indicator of water use efficiency
(Farquhar et al. 1989), was found to be negatively correlated with SNF (Kumarasinghe et al.,
1992), which indicated a positive correlation between drought tolerance and SNF in soybean.

69
Devi et al. (2013) also illustrated significant differences among twelve selected bean genotypes
(10 Middle American and 2 Andean genotypes) for SNF under different soil water conditions.
Other than water shortage, deficiencies of phosphorus (P), potassium (K), and sulfur (S) have
also been reported as environmental SNF-limiting factors, which may influence number and
weight of nodules (Divitoa and Sadras, 2014). Direct impacts of P, K and (or) S deficiencies on
nodules could be due to their influences on physiological and metabolic processes in nodules
(Divitoa and Sadras, 2014), though different responses of common bean genotypes to P
deficiency has been reported (Namayanja et al., 2014). The other important environmental factor
affecting SNF is salinity. In salt-sensitive species, like common bean (Faghire et al., 2011), salt
stress can suppress crop productivity due to reduction in plant growth and the capacity of SNF
(Delgado et al., 1993), because of weaker symbiotic association between plants and rhizobia
(Georgiev and Atkins, 1993).
Breeding for improved SNF can potentially improve legume crops that are normally
dependent on N fertilizers for high yields and promote the development of cropping systems that
are less dependent on N chemical fertilizers. The availability of superior genotypes with higher
N2-fixation ability supports the idea that SNF in common bean can be improved through
breeding efforts. The objective of this study was, therefore, to assess the potential genetic
diversity in selected North American common bean genotypes, from different market classes of
the two common bean gene pools, for their SNF ability and related traits across different
environmental conditions.

70
3.3. MATERIALS AND METHODS
3.3.1 Plant materials
Twelve common bean genotypes, selected based on their different morphological traits
from the two Phaseolus gene pools, Andean and Middle American, were included in this study
(Table 3.1). The non-nodulating mutant (R99; Park and Buttery, 1997) and its wild type
genotype, ‘OAC Rico’, were included as non nodulating and nodulating checks, respectively,
while R99 was also used as reference genotype for estimating N fixation via the 15
N natural
abundance approach (Shearer and Kohl, 1986). The determinate-bush navy bean genotype
‘Sanilac’ was included as a low-nodulating genotype based on previous studies (Bliss, 1993).
The upright indeterminate navy bean cultivars ‘Mist’ and OAC 09-3 were included as late
maturity navy beans, while the semi-determinate upright ‘AC Compass’ (Park and Rupert, 2000)
and indeterminate bush ‘OAC Thunder’ (Michaels and Smith, 1999) were included as early
maturity genotypes. SXB 415 is a carioca bean selected from our previous low-N studies (Smith
et al. 2012), because of its stable high yield across N treatments and environments. From the
Andean gene pool, the determinate upright bush light-red kidney bean ‘Chinook 2000’ was
selected for its strong root system (Román-Avilés et al. 2004), while ‘Majesty’ dark-red kidney
was selected for its upright indeterminate growth habit (unpublished).
3.3.2 Seedling nodulation assay
Seedling nodulation assays were conducted between June and September 2012 in a growth
room at the University of Guelph (Guelph, Ontario) set at 25/18 °C day/night temperature with

71
16 h photoperiod regime under overhead tubular florescent and incandescent lamps (1:1)
delivering approximately 300 μmol m-2
s-1
flux of photosynthetically active radiation (PAR).
Seeds were surface sterilized in a 7 % sodium hypochlorite solution for 20 min followed by
washing them twice with germ-free distilled water. The seeds were germinated in petri dishes,
thoroughly washed and sterilized in a hot air oven at 80oC for 36 h, on Whatman filter papers,
sterilized at 80oC for 24 h, in a laboratory at room temperature as described by Taffouo et al.
(2009). Next, 24 uniform seeds of each bean genotype were placed on two Petri dishes, 12 seeds
each, at a uniform distance. The Petri dishes were randomly arranged in a glass box to avoid the
loss of moisture through evaporation. When the radical emerged (> 5 mm), twelve seedlings
were inoculated by soaking in a solution of a commercially-available peat-based inoculum
(Rhizobium leguminosarum bv. phaseoli; Becker Underwood, Saskatoon, Saskatchewan,
Canada) at a 0.1% concentration, and two seedlings were placed in each growth pouch (Mega
International, St. Paul, MN, United States) following the method explained by Peters and Crist-
Estes (1989). Growth pouches were kept in a water container, containing distilled water. A
nutrient solution, containing a mixture of H3PO4 (18.7 g L-1
), KHCO3 (37.5 g L-1
), MgSO4-7H2
(3 g L-1
), and 3 g L-1
of chelated micronutrient (Plant Products Co. Ltd., 314 Orenda Road,
Brampton, ON, Canada), was added as a 1% solution when unifoliate leaves were fully
expanded. The position of the seedling root tip was marked on the growth pouch at the
beginning of the experiment. The trial was arranged in a randomized complete block design
(RCBD) with 6 replicates planted sequentially with a 1-week interval between replicates, to
spread the workload. Each experimental unit consisted of two seedlings of each genotype (tow
observations per experimental unit). Two weeks after transferring the seedlings to the growth
pouches, number of nodules above the root tip marks was counted and chlorophyll content of the

72
unifoliates leaves was measured using a SPAD 502 chlorophyll meter (Spectrum Technologies,
3600 Thayer Court, Aurora, IL 60504).
3.3.3 Greenhouse nodulation assay
This assay was conducted in 2.5 L plastic pots with drainage holes, filled with an N-free
medium MVP turface (Profile Products, LLC 750 Lake Cook Rd, Suite 440 Buffalo Grove, IL
60089) with a pH of 6.7, after fertigation. Four seeds of each genotype were planted in each pot,
following inoculation with 1 mL of a 1% slurry of the commercial peat-based inoculum of
Rhizobium leguminosarum bv. phaseoli (Becker Underwood, Saskatoon, Saskatchewan, Canada)
in a greenhouse at the University of Guelph. Approximately one week after planting, seedlings
were thinned to one per pot. Pots were arranged in a randomized complete block design with six
replicates, planted sequentially with a 5-d interval between replicates between February and
November 2011. Greenhouse conditions were day/night temperature settings of 25/18°C with
16-h photoperiod. Day length was extended with overhead high pressure sodium and metal
halide lamps delivering an additional flux of photosynthetically active radiation (PAR) of
approximately 300 μmol m-2
s-1
set at the top of the pots during the experiment. Plants were kept
water replete at all times by using daily subsurface drip irrigation system through two vinyl
tubes for each pot, equipped with one 12.5-cm slotted drip spike. Fertilizer was added to
irrigation water as an N-free solution containing H3PO4 (18.7 g L-1
), KHCO3 (37.5 g L-1
),
MgSO4-7H2 (3 g L-1
), 3 g L-1
chelated micronutrient mix (Plant Products Co. Ltd., Brampton,
Ontario, Canada), which was added in a 1% solution per pot, once a week after the first trifoliate
was fully expanded. The experiment was terminated 42 days after planting at the onset of
flowering. Roots were thoroughly washed and number of mature (red) and immature (pale)
73
nodules were determined using WinRHIZO (Regent Instruments Canada Inc., 2009) following
the manufacturer’s instructions. Root, shoot, and nodules were later dried in a forced air oven at
60 oC for about 48 h and weighed to measure their dry weight.
3.3.4 Field N2 fixation assays
Field trials were grown in four location-years (environments) during 2011 and 2012.
Locations in 2011 were farmers’ fields in the Grey-brown luvisols soil zone near Belwood
(43o40’16”N, -80
o11’34”W, elevation 430 AMSL) and near Rockwood (43
o39’56”N, -80
o9’54”W, elevation 353 AMSL) and in 2012 one field site at the University of Guelph Elora
Research Station near Elora (43°38'27.8"N 80°24'20.4"W, elevation 379 AMSL) and the other
field site at a farmer’s field near Belwood (43o40’16”N, -80
o11’34”W, elevation 430 AMSL),
all in Ontario, Canada. All trial locations were chosen based on their low N content, less than 5
ppm nitrate content for all locations according to soil analysis prior to planting (Table 3.2), as
well was having had no dry bean history for at least 10 years. Field sites were fertilized with 200
kg ha-1
of 0-20-20 of N-P-K fertilizers and sprayed, pre-planting with S-metolachlor (Syngenta
Crop Protection Canada, Inc, Guelph, Ontario), Imazethapyr (BASF Canada, Mississauga,
Ontario ) and Trifluralin (Dow AgroSciences Canada Inc., Calgary, Alberta) at the rates of 2.3 L
ha-1
, 200 mL ha-1
and 1.5 L ha-1
, respectively. The experimental design in each environment was
a randomized complete block design (RCBD) with 4 replicates. Each experimental unit
consisted of a 4-row, 6 m long plots with 36 cm row-spacing, planted the second week of June
of each year. Three hundred and fifty seeds of each genotype were inoculated, immediately prior
to planting, with a peat based culture of rhizobia, at the rate of 2.5 g of Rhizobium

74
leguminosarum bv. phaseoli in a commercial product (Becker Underwood, Saskatoon,
Saskatchewan, Canada) per kg of seed to give approximately 5×10⁵ bacteria/seed.
3.3.5 Data collection
Greenness of the plants (leaf chlorophyll concentration) was measured twice using SPAD
502 meter (Monje and Bugbee 1992) at the first trifoliate stage and at the first flower stage on
the youngest leaves, with three readings from each of the three leaflets on four plants per plot. At
the first flowering stage, three randomly chosen plants per plot were dug out carefully; the roots
were washed to remove adhering soil fractions and then transferred to the laboratory for nodule
count. Nodules were then dried in a forced air oven at 60oC for about 48 h and weighed to
estimate 100 nodule dry weight. Nodule weight and number were only measured in 2011
environments and were not measured in 2012 trials due to labor constraints. Days to
physiological maturity was recorded as the number of days from planting to the day when 50%
of pods turned yellow. At harvest maturity (18 -20 % moisture content), all plants in each plot
were harvested using a Wintersteiger plot combine (Wintersteiger AG, Ried im Innkreis, Upper
Austria, Austria) with a Classic Seed Gauge weighing system by HarvestMaster and plot seed
weight and moisture content were recorded. A sample of seeds was dried in a forced air oven at
60oC for about 48 h. From each experimental unit, five to six mg of ground seed sample was
weighed into a tin capsule (8×5 mm). The capsule was then closed, compressed and placed in
96-well micro plates. Samples were analyzed at the Agriculture and Agri-Food Canada,
Lethbridge Research Centre (Lethbridge, Alberta, Canada) to determine δ15
N, total N and δ13
C,
known to be negatively associated with water use efficiency (WUE; Farquhar et al., 1989),

75
using gas chromatography-mass spectrometry (GC-MS) following methods explained by
Shearer and Kohl (1993).
The non-nodulating mutant, R99 (Park and Buttery, 1997), was used as reference genotype
in N fixation estimates. Percent nitrogen derived from the atmosphere (%Ndfa) was calculated
for each experimental unit following the equation given by Shearer and Kohl (1986) as:
%𝑁𝑑𝑓𝑎 =(𝛿15𝑁𝑟𝑒𝑓. 𝑝𝑙𝑎𝑛𝑡−𝛿15𝑁𝑁 𝑓𝑖𝑥𝑖𝑛𝑔 𝑝𝑙𝑎𝑛𝑡)
(𝛿15𝑁𝑟𝑒𝑓. 𝑝𝑙𝑎𝑛𝑡 − B)
where δ15
Nref. plant is the rate of δ15
N in the reference genotype (R99), δ15
Nfixing plant is the 15
N
abundance of the dry bean genotype and B is the δ 15
N of the legume grown obtaining its entire
N from N2 fixation in an N-free medium. The B-value was obtained, as proposed by Peoples et
al. (2002), by taking the average of δ15
N measurements of a total of 20 randomly selected bean
genotypes including 11 genotypes studied here and 9 recombinant inbred lines from a cross
between Sanilac, low SNF genotype, and Mist, high SNF genotype, grown in a greenhouse
(Appendix I). Total nitroigen fixed per unitarea by each genotype in each experimental unit was
estimated following the equation
𝑁𝑓𝑖𝑥 = 𝑁𝑌 × 𝑁𝑑𝑓𝑎%
where NY represents the nitrogen yield, estimated with the following equation:
𝑁𝑌 = 𝑆𝑌 × 𝑁%

76
where SY is seed yield and N% is the percentage of seed nitrogen in the sample.
3.3.6 Statistical Analysis
Single environment and multi-environment data were subjected to an analysis of variance
in mixed model using the PROC MIXED procedure in SAS (version 9.3, SAS Institute, Cary,
NC, USA, 2012). For single environment analyses, the effects of replication and genotype were
considered random and fixed, respectively. In multi-environment analyses, the effects of year,
location within year, replication within year × location, and the interaction effects with year were
considered random, while the effect of genotype was considered fixed. The COVTEST statement
was used to perform a Z test for the significance of the variances of the random effects, while the
fixed effect test of significance was performed using an F-test with type III sums of squares.
Least squared means (LSmeans) were computed for fixed effects using the LSMEANS
statement. Standard errors of LSmeans were estimated and pair-wise tests of significant
differences were performed using the PDIFF statement. Genotype by environment interaction
effect was significant for the majority of N fixation and agronomic traits. Also for the majority of
SNF related traits the error variances of individual locations were not homogeneous (χ 2=491;
P<0.0001 in Bartlett’s test of homogeneity). Transformation of the raw data did not help to
achieve homogeneous error variances and therefore, we chose to present the results of test
environments separately, in addition to pooled data.
The PROC CORR procedure of SAS was used to compute Pearson’s and Spearman’s
correlation coefficients between pairs of traits. Furthermore, the Genotype × Trait (GT) biplot
analysis (Yan and Rajcan, 2002) was implemented for %Ndfa, seed yield and carbon isotope

77
discrimination (δ 13
C) to study trait associations in environments, based on the following
formula, which standardizes the data to remove the units of each measured trait:
𝛼𝑖𝑗 − 𝛽𝑗
𝜎𝑗= ∑ 𝛾𝑛𝛿𝑖𝑛
∗ 𝜌𝑗𝑛∗
2
𝑛=1
+ 휀𝑖𝑗 = ∑ 𝛿𝑖𝑛∗
2
𝑛=1
𝜌𝑗𝑛∗ + 휀𝑖𝑗
where 𝛼𝑖𝑗 is the value of the ith genotype for the jth trait, 𝛽𝑗 is the mean value of all
genotypes for the jth
trait, 𝜎𝑗 is the standard deviation of the jth
trait, 𝛾𝑛 is the singular value for
principle component n (PCn), 𝛿𝑖𝑛 is the PCn score for the ith
genotype, 𝜌𝑗𝑛 is the PCn score for
the jth
trait, and 휀𝑖𝑗 is the residual associated with genotype i in trait j. Genotype × Trait biplots
were constructed by plotting PC1 scores against PC2 scores for each genotype and each trait
(Yan and Rajcan, 2002). In GT biplots, if a line is drawn that passes through the origin of the
biplot and the marker of each trait, then perpendicular lines drawn from the markers of genotypes
to the first line, the order in which the genotype perpendiculars cross the first line indicates the
ranking of genotypes for that trait. Moreover, if the biplot explains a sufficient amount of the
total variation, then the cosine of the angle between the vectors of the two traits (or genotypes)
approximates the correlation coefficient between the two, while the distance of the markers of
traits or genotypes from the origin of the bilpot represents the amount of variation for that trait or
genotype.

78
3.4 RESULTS
3.4.1 Seedling Nodulation assays
Two-week old bean seedlings (growth stage V1) of different bean genotypes in growth
pouch assays were significantly different for nodule numbers (P < 0.0001). In accordance with
the nodulation assays, the Andean genotypes, on average, had 37% more (P = 0.05) nodules than
the Middle American genotypes two weeks after emergence (Table 3.3). The SPAD chlorophyll
readings in these assays were not significantly different among genotypes.
3.4.2 Greenhouse assays
In greenhouse, adult-plant nodulation, assays the effect of genotype was significant for all
nitrogen-fixation related traits. The Andean genotypes, on average, had 55% higher nodule dry
weight and 35 % higher nodule numbers than the Middle American genotypes (P < 0.0001).
However, the Middle American genotypes had significantly higher number of red nodules (P >
0.05) and the ratio of red nodules to total number of nodules (P > 0.01) than the Andean
genotypes. Among the Middle American genotypes, ‘Mist’ with 0.23 g/plant and 1094
nodules/plant had the highest nodule weight and number. The lowest nodule weight per plant
was observed for SXB 415 (0.04 g/plant), ‘OAC Rico’ (0.04 g/plant) and ‘Sanilac’ (0.03 g/plant)
(Table 3.4). The Andean genotype ‘Chinook 2000’ among all genotypes had the highest number
of nodules per plant (1497) followed by the Andean variety, ‘Majesty’, and the Middle American
variety ‘Mist’ with 1228 and 1094 nodules per plant, respectively.

79
While the Andean genotypes’ shoot dry weight, on average, was about twice that of the
Middle American genotypes (P < 0.05), their root dry weight was not significantly different
(Table 3.4). The Andean genotypes ‘Majesty’ and ‘Chinook 2000’ with 10.33 and 8.56 g/plant,
respectively, followed by the Middle American genotype ‘Mist’ with 6.65 g/plant, had the
highest shoot dry weight in greenhouse assays. ‘Mist’ with 1.44 g/plant of root dry weight had
significantly higher root dry weight than the other Andean or Middle American genotypes.
Among the Middle American genotypes, ‘OAC Rico’ had noticeably lower root dry weight (0.06
g/plant), even less than the non-nodulating genotype, ‘R99’. Even though ‘OAC Rico’ had the
lowest root dry weight, it had the highest ratio of red nodules to total number of nodules at
flowering stage. Total nodule weight was significantly correlated with root dry weight (r = 0.72,
P < 0.01), shoot dry weight (r = 0.82, P< 0.01) and total plant biomass (r = 0.78, P < 0.01).
Significant correlation was observed between total number of nodules and shoot dry weight (r =
0.89, P < 0.0001) However, no significant association was observed between nodule number and
root dry weight. Moreover, there was no significant correlation between number of red nodules
and total number of nodules, while the correlation between number of pale nodules and the total
number of nodules was highly significant (Spearman’s rank correlation r = 0.89; P < 0.0002).
3.4.3 Field assays
Based on the climatic data (Table 3.5) obtained from the weather stations closest to the
field sites, Rockwood in 2011, with 473 mm of rain from May to September, higher than the 30
year average, was considered an optimum soil moisture environment, while both locations in
2012 with less than the 30-year average (Belwood with 349 mm and Elora with 292 mm
precipitation during the same period) were considered drought-stressed environments. In the

80
field trials, the effect of genotype for all traits, with a few exceptions, was significant in all
environments (Tables 3.6 and 3.7) with no significant environmental effect for the traits (Table
3.8). Although the genotype × environment interaction was always significant for all traits, the
main effect of environment was not significant (Table 3.8).
3.4.4 Seed yield
Overall seed yield of bean genotypes showed 5% yield difference between optimum
moisture environments, Rockwood and Belwood in 2011, and dry environments, Belwood and
Elora in 2012. This difference was generally larger for Andean genotypes, 7% than that of
Middle American genotypes, 4% (Table 3.6). On average, the nodulating Andean and Middle
American genotypes yielded 15 % and 20 % higher than the non-nodulating genotype R99,
respectively. The Middle American genotype ‘Mist’, which was one of the highest nodulating
genotypes in the growth room nodulation assays produced up to 51 %, higher yield than the non-
nodulating R99, which was the lowest yielding genotype, in different location-years. Middle
American genotypes generally yielded about 8% more than the Andean genotypes (P = 0.03),
significant genotype × environment interaction was observed (Table 3.8).
3.4.5 Percentage of Nitrogen derived from atmospheric air (%Ndfa)
Although there was generally no significant difference between Andean and Middle
American genotypes across all environments (Table 3.8), significant diversity for nitrogen
derived from atmospheric air (%Ndfa) among genotypes (P < 0.0001) with a range of 9% to 78%
in an optimum environment (Belwood in 2011) was observed. ‘Belwood 2012’ and ‘Belwood

81
2011; with an average %Ndfa of 12% and 54 % had the lowest and highest %Ndfa, among all
environments. The difference between the Andean and Middle American genotypes, in general,
was significant only in Belwood 2011, with Middle American genotypes deriving about 5%
more of their N from atmosphere. A significant genotype × environment interaction for %Ndfa
(P < 0.0001) indicated that the genotypes responded differently to environments. Among the
Andean genotypes, ‘Red Rider’ cranberry bean was the lowest nitrogen fixing genotype in every
environment. ‘Mist’ was consistently one of the highest nitrogen fixing genotypes in all
environments (Table 3.6).
3.4.6 Nitrogen Fixed per Unit Area
There was a significant difference among genotypes for nitrogen fixed per unit area in all
location-years in the field (Table 3.7). In Belwood 2011, the environment with the highest
rainfall, the Middle American genotypes had more N fixed per unit area, about 34% higher than
the Andean genotypes (P = 0.0002). However there was no significant difference between these
two gene pools in the other environments or across all environments (Table 3.8). Among the
Middle American genotypes with extreme value for this parameter, ‘Mist’ fixed more nitrogen
per unit area than all other genotypes in all environments except Elora in 2012 (Table 3.7).
‘Sanilac’ in Belwood 2011 and ‘AC Compass’ in other environments were the weakest nitrogen
fixing genotypes (Table 3.7).
82
3.4.7 Seed nitrogen percentage
Seed nitrogen percentage (N%) was different among genotypes (P < 0.0001) in all
environments except Elora 2012, which was the driest environment. In the optimum soil
moisture environments, Belwood and Rockwood in 2011, the Andean genotypes had 7% and
15% lower N%, respectively than the non-nodulating mutant R99. However, in the dry
environments of Belwood and Elora 2012 they had about 5% and 7% higher N% than R99,
respectively (Table 3.7). Across all environments, the Middle American genotypes generally had
34% higher percentage of N than the non-nodulating genotype R99.
3.4.8 Nodule weight and number
Significant differences were only detected among genotypes in Belwood, but not in
Rockwood. ‘Chinook 2000’ and ‘Majesty’, both Andean genotypes, had noticeably higher
number of nodules than the other genotypes. SXB 415 and ‘OAC Rico’, Middle American
genotypes, produced the least number of nodules (48 and 56, respectively).
3.4.9 Carbon Discrimination (δ13
C)
Significant variation (P < 0.0001) was observed among genotypes for δ13
C. Moreover,
there was significant genotype × environment interaction for this trait (P < 0.0001) (Table 3.8).
Middle American genotypes in general had significantly lower δ13
C, i.e., higher WUE, values
than the Andean genotypes across all environments (Table 3.8). This was the case in every

83
environment except Belwood 2012, which received the highest rainfall among the test sites
(Table 3.7).
3.4.10 Genotype by Trait Biplot and Trait Relationships
The first two PCs of the genotype by trait biplot, constructed using the standardized values
of the selected traits for all genotypes in four environments explained a total of 62.44 % (49.39
% PC1 and 13.05% PC2) of the total variation (Figure 3.1).
The GT biplot indicated close association between measurements of % in Rockwood 2011
and Belwood 2012, (r = 0.85, P < 0.001). Similarly the %Ndfa measurements of Belwood 2011
and Elora 2012 were closely associated, (r = 0.74, P < 0.01). The %Ndfa and seed yield of each
environment, except Belwood 2011, were closely associated. %Ndfa was associated with yield in
Rockwood 2011 (r = 0.59, P < 0.05), Belwood 2012 (r = 0.71, P < 0.01), and Elora 2012 (r =
0.62, P < 0.05). In the same way, %Ndfa in Belwood 2012 was found closely associated with
yield in Belwood 2012 (r = 0.68, P < 0.05) and Elora 2012 (r = 0.65, P < 0.05). Overall, very
close association (r = 0.81, P = 0.03) was found between %Ndfa and seed yield across all
environments.
Carbon discrimination (δ13
C) in all environments, except for Elora 2012, was negatively
associated with %Ndfa (r = -0.62, P = 0.04; r = -0.42, P =0.2; r = -0.55, P = 0.05) in Belwood
2011, Rockwood 2001 and Belwood 2012, respectively) and seed yield (r = -0.42, P = 0.20, r = -
0.47, P = 0.05; r = -0.66, P = 0.03 in Belwood 2011, Rockwood 2001 and Belwood 2012,
respectively) as illustrated by their vectors in opposite directions in the biplot (Figure 3.1). The

84
association between %Ndfa and N% in the seed, even though observed for some specific
environment e.g., Belwood 2011, was not repeated across all environments.
In the GT biplot (Figure 3.1) genotype number 2 (Mist) can be identified as a genotype,
that ranked in the top two for yield and with a high %Ndfa, consistently in all four environments.
In Belwood 2012, genotype number 11 (Zorro) and in Belwood 2011, genotype number 9 (SXB
415) had high %Ndfa, but their high fixation was not repeated across all environments (Figure
3.1). In terms of %Ndfa, three Andean genotypes, number 3, 4 and 8 (Chinook 2000, Majesty
and Red Rider) and one of the Middle American genotypes, Sanilac (number 10) had the lowest
%Ndfa in all environments (Figure 3.1).
3.5 DISCUSSION
Results of this study, both in the greenhouse assays and in the field trials, highlighted the
relative advantage of the Andean genotypes over the Middle American genotypes in terms of
nodule number and weight. These findings are in agreement with the previous report by Franco
et al. (2002). Although genotypes of the two gene pools, examined in this study, were not found
to be different for root dry weight, the Andean genotypes had significantly higher shoot dry
weight than the Middle American genotypes. Namayanja et al. (2014) linked the relative
advantage of the Andean genotypes in terms of nodulation ability to their higher
photosynthetically-active plant tissue, which can support more and heavier nodules at the
flowering stage. Our results support this hypothesis considering the observed significant
correlation between shoot dry weight in the adult plant nodulation assay with nodule number in
the same assay as well as in the field trials. However, other contrasting findings reported

85
recently by Akter et al. (2014), in which the Middle American genotypes had higher nodulation
ability than the Andean genotypes, may suggest that the relative advantage of the two gene pools
in terms of nodulation ability may be genotype-specific and should not be generalized.
It is known that leghemoglobin, a protein complex with a high affinity to oxygen that
reduces the concentration of free oxygen at nitrogenase activity site (Appleby, 1984), causes the
red color of fully developed nodules (Downie, 2005). The results of this study showed that the
Middle American genotypes possessed significantly higher numbers of red nodules than the
Andean ones in a greenhouse assay. We also found a strong correlation between shoot dry
weight and numbers of pale nodules in Andean genotypes.
Generally, Middle American genotypes yielded more than the Andean genotypes in the
field, which is in accordance with previous reports (e.g., Sexton et al., 1994). The yield
advantage of the Middle American genotypes can, at least in part, be attributed to their
indeterminate growth habit, later maturity and higher %Ndfa. This is in accordance with a
significant correlation between seed yield and %Ndfa. Moreover, on average, the Middle
American genotypes had lower δ13
C than the Andean genotypes and therefore are considered
more water use efficient than the Andean genotypes studied here. This could also explain the
smaller average yield difference between dry and optimum environments for the Middle
American genotypes compared with the Andean genotypes. The observed positive correlation
between root dry weight and seed yield across field environments, when seed yield was
negatively associated with δ 13
C, may also explain the higher water use efficiency through a
stronger root system in high yielding genotypes under mild water stress. Other factors, such as

86
indeterminate growth habit and time to maturity are no doubt other contributors to greater yield
of the Middle American genotypes.
In accordance with previous reports, we report here that environmental and genotype by
environmental variation significantly influence N fixation in common beans. Substantial
differences for overall nitrogen fixation ability of dry beans were observed between
environments with optimum soil moisture and dry environments. Among all environments, the
highest (55.6%) and lowest (11.48%) %Ndfa were observed in Belwood 2011 with maximum
(602 mm) and Elora 2012 with the least (292 mm) amount of rainfall over the growing season.
The same trend was observed for N fixed per unit area. These results suggested that soil moisture
could be one of the major environmental factors influencing the SNF ability of beans in our
study. This is consistent with previous reports of the negative impact of water shortage on SNF
in common bean (Devi et al., 2013; Sangakkara et al., 1996), soybean (Sprent, 2006; Djekoun
and Planchon, 1991), faba bean, lupin, and peanut (Sinclair and Serraj 1995) . The reduction of
N fixation under dry environments has been attributed to induced nodule senescence and
declining in nitrogenase activity (Becana et a1. 1986), which cause decline in crop productivity.
Differential reduction in N fixation ability of bean genotypes under drought conditions has been
reported by Devi et al. (2013) and Serraj and Sinclair (1998) in common bean and Devi et al.
(2010) in peanut. In accordance with the findings of Farquhar et al. (1989), a negative
association between seed yield and δ13
C was observed. Moreover, the negative association
between %Ndfa and δ13
C, observed here, implies that the bean genotypes with higher water use
efficiency (or drought stress tolerance) were more efficient in terms of SNF and productivity.
This report confirmed the finding by Kumaarasinghe et al. (1992), who illustrated a negative
correlation between δ13
C and %Ndfa. Knight et al. (1993), on the other hand, suggested that the

87
negative association between these two traits is observed only under drought stress conditions.
The other environmental factors known to significantly affect nitrogen fixation are P deficiency
(Vadez et al., 1996), cation exchange capacity (CEC) and Na concentration (Faghire et al. 2013),
for which differential genotypic response is known to occur.
Strong genotype by environment interaction observed here for %Ndfa and seed yield were
associated with crossover interaction and significant genotypic rank change. In accordance with
significant genotype by environment interaction for %Ndfa, two environmental groups could be
identified. Each group included environments with closer association in terms of genotypic
ranking. The first group comprised of Belwood 2011, with optimum soil moisture condition, and
Elora 2012, with low soil moisture and high available P condition, formed the first group.
Rockwood 2011, optimum moisture, and Belwood 2012, dry with low available soil P were also
grouped together.
Although Chaverra and Graham (1992) reported positive correlation between early growth
stage nodulation and nitrogen fixation under phosphorous deficient conditions in a greenhouse
study, we could not find any correlation between nodule numbers in the seedling nodulation
assays in the growth room and SNF in field assays. This may require further investigation to
develop seedling assays that are more similar to field conditions.

88
Entry Gene pool Market class
Growth
habit Description
Sanilac Middle American White-Navy Type Iz Bush, poor nitrogen fixing Navy (Bliss, 1993)
Mist Middle American White-Navy Type IIy Upright, late maturity, high yielding, with P. acutifolius introgression
OAC 09-3 Middle American White-Navy Type II Upright, late maturity, high yielding, with P. acutifolius introgression
OAC Thunder Middle American White-Navy Type I Bush, strong root system (unpublished), early-mid maturity (Michaels and Smith, 1999)
Zorro Middle American Black Type II Upright, high-yielding, midseason-maturing (Kelly et al. 2009)
SXB 415 Middle American Carioca Type II Upright, stable yield under N limited environments (unpublished) (CIAT, 2009)
AC Compass Middle American White-Navy Type I Upright, high yielding (Park and Rupert, 2000)
OAC Rico Middle American White-Navy Type II Bush, wild type genotypes used in developing nodulating mutants (Beversdortf, 1984)
Chinook 2000 Andean Light Red Kidney Type I Upright, strong root system (Kelly et al., 1999)
Red Rider Andean Cranberry Type I Upright, high yielding (Park et al. 2009)
Majesty Andean Dark Red Kidney Type II Upright, dark red kidney (Park and Agriculture and Agri-Food Canada, 2006)
R99 (Reference) Middle American White-Navy Type I Bush, non-nodulating mutant (Park and Buttery, 1997)
Table 3.1 Gene-pool origin, commercial market class, growth habit, and specific characteristics of genotypes tested for N fixation-related traits in the
greenhouse and at four locations in south-west Ontario, Canada.
z Determinate
y Indeterminate

89
0-15 (cm) 15-45 (cm) 0-15 (cm) 15-45 (cm) 0-15 (cm) 15-45 (cm) 0-15 (cm) 15-45 (cm)
Organic matter (%) 3 1.5 3.5 1.4 4.9 3 4.4 2.3
P (bicarb, ppm) 7 19 5 4 5 4 82 23
P (Bray-P1, ppm) 16 25 12 5 6 5 219 39
K (ppm) 28 20 48 34 47 37 111 60
Mg (ppm) 190 145 235 190 315 265 365 335
Ca (ppm) 1330 970 2890 3040 2080 2040 2740 3520
Na (ppm) 8 3 60 50 2 1 13 14
Al (ppm) 850 1117 604 603 808 900 675 587
Nitrate (ppm) 4 3 3 2 3 2 5 4
pH 7.1 6.9 7.9 8.1 7.5 7.7 7.6 7.9
CECz (meq/100g) 9.2 7.3 16.8 17.1 13.2 12.5 17.1 20.6
Table 3.2 Soil properties of trial environments presented for samples taken from 0-15 and 15-45 cm soil depth, Ontario, Canada.
Soil Property
z Cation exchange capacity
Elora
2012Rockwood 2011
Belwood
2011
Belwood
2012

90
Nodule number
(Plant-1
)SPAD
Large-Seeded Andean
Chinook 2000 54 35.8
Majesty 59 35.1
Red Rider 32 35.0
Small-seeded Middle American
AC Compass 32 33.4
Mist 19 32.1
OAC 09-3 20 34.3
OAC Rico 24 35.6
OAC Thunder 27 37.7
SXB415 18 32.5
Sanilac 23 34.5
Non-nodulating reference
R99 0 19.3
Genotype < 0.0001 nsz
Andean vs. Middle American 0.05 ns
Test mean 36 35
LSD 95% 11.17 16.09z Non-significant
Table 3.3 Nodule number and SPAD reading of 11 dry bean genotypes in a growth pouch assay in a growth
room, Guelph, Ontario, Canada.
F-test

91
Nodule dwt.z
(g)
Pale/Total
nodule
number
(Plant-1)
Pale nodule
number
(Plant-1)
Red nodule
number
(Plant-1)
Red/total
nodule number
(Plant-1)
Root dwt.
(g)
Shoot dwt.
(g)
Total dwt.
(g)
Nodule
number
(Plant-1)
Chinook 2000 0.11 0.90 1344 153 0.10 0.78 8.56 9.68 1497
Majesty 0.26 0.91 1121 107 0.09 0.94 10.33 11.27 1228
Red Rider 0.27 0.93 759 60 0.07 0.86 6.48 7.36 819
AC Compass 0.06 0.71 513 211 0.29 0.72 4.4 6.22 724
Mist 0.23 0.83 912 182 0.17 1.44 6.65 8.27 1094
OAC 09-3 0.22 0.87 939 137 0.13 0.61 6.23 6.84 1076
OAC Rico 0.04 0.56 416 331 0.44 0.06 2.18 2.94 747
OAC Thunder 0.07 0.80 515 132 0.20 0.36 3.77 3.4 647
SXB 415 0.04 0.84 437 81 0.16 0.26 4.65 6 518
Sanilac 0.03 0.79 610 160 0.21 0.62 3.74 4.06 770
Zorro 0.07 0.93 501 38 0.07 0.55 3.52 4.09 539
R99 0 0 0 0 0 0.37 0.3 0.15 0
< 0.0001 < 0.0001 0.0006 0.0003 < 0.0001 0.0003 < 0.0001 < 0.0001 < 0.0001
< 0.0001 < 0.0001 0.004 0.03 0.004 ns 0.03 ns < 0.0001
0.13 0.80 734 145 0.20 0.65 5.50 6.26 878
0.059 0.243 70.5 13.7 0.137 0.316 1.982 2.803 229.3z Dry weight
Andean vs. Middle American
Test mean
LSD 95%
F-test
Table 3.4 Comparison of nitrogen fixation related traits per plant among 12 bean genotypes in a greenhouse in 2011, Guelph, Ontario, Canada.
Large-Seeded Andean
Small-seeded Middle American
Non-nodulating reference
Genotype

92
Table 3.5 Maximum, minimum, and mean temperature, total monthly precipitation at Rockwood, Belwood (two different fields), and Elora, Ontario, Canada for the 2011-2012 growing seasons.
Rockwood (2011)
May June July August September
Max Temperature (°C) 17.6 22.4 28 25.2 20.5
Min Temperature (°C) 8.8 12.5 16.5 14.6 11.3
Mean Temperature (°C) 13.2 17.4 22.2 19.9 15.9
Total Precipitation (mm) 119.8 112 37.6 125.1 78.6
Belwood (2011)
May June July August September
Max Temperature (°C) 17.5 22.3 28.2 25.2 20.2
Min Temperature (°C) 8.1 11.9 15.3 14 10.8
Mean Temperature (°C) 12.6 17.1 21.8 19.6 15.6
Total Precipitation (mm) 191.8 142.4 27.8 145.6 94.6
Belwood (2012)
May June July August September
Max Temperature (°C) 21.7 24.2 28.7 24.8 19.7
Min Temperature (°C) 8.3 12.6 15.5 13.1 8.4
Mean Temperature (°C) 15 18.4 22.1 19 14.1
Total Precipitation (mm) 25.9 97.2 44 52 130
Elora (2012)
May June July August September
Max Temperature (°C) 21.8 24.4 28.7 25.3 20.2
Min Temperature (°C) 7.5 12.2 14 11.8 7.3
Mean Temperature (°C) 14.7 18.3 21.3 18.6 13.8
Total Precipitation (mm) 28.2 64.6 30.4 62.6 106.2

93
Belwood Rockwood Belwood Elora Belwood Rockwood Belwood Elora
Large-Seeded Andean
Chinook 2000 1.11 1.64 1.25 0.69 121 120 115 114
Majesty 1.28 1.62 1.40 1.43 121 116 115 110
Red Rider 1.68 _ 1.67 1.95 122 123 116 116
Small-seeded Middle American
AC Compass 1.81 1.17 1.32 0.77 113 114 107 109
Mist 2.05 2.18 2.21 2.36 122 119 116 113
OAC 09-3 1.85 1.13 1.23 1.54 121 120 114 114
OAC Rico 1.50 1.30 0.97 1.35 116 115 110 109
OAC Thunder 1.07 1.53 1.56 1.42 113 108 107 102
SXB 415 1.52 1.58 1.34 1.03 123 120 117 114
Sanilac 1.45 1.55 1.16 1.25 119 115 113 109
Zorro 2.00 1.82 2.20 2.76 121 114 115 108
Non-nodulating check
R99 1.05 1.46 1.07 1.17 120 121 114 115
Genotype <.0001 ns <.0001 0.005 <.0001 <.0001 <.0000 <.0001
Andean vs. Middle American 0.02 ns 0.006 0.04 0.0006 ns 0.005 <.0001
Test mean 1.58 1.55 1.50 1.43 119 117 113 111
LSD 95% 0.766 0.417 0.208 0.684 2.3 2.5 2.9 2.3_ Missing observation
Table 3.6 Comparing dry bean genotypes for seed yield and maturity in the field trails in Ontario, Canada, 2011-2012.
F-test
20122011
Maturity
(days)
2012
Seed yield
(tha-1)
2011

94
Belwood Rockwood Belwood Elora Belwood Rockwood Belwood Elora Belwood Rockwood Belwood Elora
Large-Seeded Andean
Chinook 2000 40 64 45 30 57.4 30.9 10.5 14.7 21 18.1 4.7 10
Majesty 48 56 50 57 46.6 24.5 15 11.6 18.1 14.9 7.5 11.5
Red Rider 59 _ 59 79 50.3 _ 13.2 8.1 28.3 _ 8.2 7.9
Small-seeded Middle American
AC Compass 74 47 51 35 64.5 16.3 5.2 7.7 55.7 7.5 2.7 7
Mist 84 91 85 98 78.5 47.6 17.9 19.6 69.7 41.5 15.3 24.3
OAC 09-3 85 55 46 65 55.3 21.8 12 17.4 41.3 11.9 6.5 18.5
OAC Rico 58 59 38 58 61.5 21.5 8.6 19.2 34.8 13.7 3.2 18.5
OAC Thunder 49 57 62 59 69.3 13.6 9.9 8.4 34 7 6.3 7
SXB 415 64 65 62 43 53.9 15.1 11.7 20.2 34.5 11.1 7.2 17.5
Sanilac 82 76 43 54 9.3 24.4 13.6 12.9 8.9 19.3 5.9 12
Zorro 59 67 82 108 52.6 37.2 17.2 18.1 27.6 27.8 14.2 26
Non-nodulating reference
R99 42 63 36 45 0 0 0 0 0 0 0 0
Genotype 0.0002 ns <.0001 0.02 <.0001 0.05 <.0001 <.0001 <.0001 0.02 <.0001 <.0001
Andean vs. Middle American 0.0008 ns <.0001 0.03 0.002 ns ns ns 0.0002 ns ns ns
Test mean 64 64 57 59 54 25 12 14 34 17 7 14
LSD 95% 37.2 17.6 7.8 31.4 23.52 17.64 4.00 8.31 31.36 13.72 3.10 8.41z Nitrogen derived from atmosphere_ Missing observation
F-test
N fixed per unit area (kg ha-1)
201220112012 201220112011
Nitrogen yield (kg ha-1) Ndfa z (%)
Table 3.7 Comparison among 12 dry bean genotypes for nitrogen fixation traits in field trials in Ontario, Canada, 2011-2012.

95
Belwood Rockwood Belwood Elora Belwood Rockwood Belwood Elora
Large-Seeded Andean
Chinook 2000 3.8 3.9 3.6 4.3 -26.37 -26.20 -26.36 -24.42
Majesty 3.6 3.5 3.6 4.0 -26.21 -26.09 -26.19 -24.49
Red Rider 3.5 _ 3.6 4.1 -26.38 _ -26.74 -25.03
Small-seeded Middle American
AC Compass 4.2 4.1 3.9 4.5 -26.59 -26.26 -26.60 -25.29
Mist 4.1 4.2 3.9 4.1 -26.72 -26.30 -27.02 -25.08
OAC 09-3 4.5 5 3.8 4.2 -26.19 -25.93 -26.34 -24.64
OAC Rico 3.9 4.5 3.9 4.3 -26.54 -25.83 -26.33 -24.77
OAC Thunder 4.5 3.9 4 4.1 -25.74 -25.78 -26.23 -24.58
SXB 415 4.2 4.2 4.7 4.2 -26.49 -26.30 -26.46 -24.89
Sanilac 4 4.2 3.7 4.3 -25.65 -26.91 -26.88 -25.46
Zorro 4.1 4 3.7 3.9 -26.06 -26.70 -27.03 -25.49
Non-nodulating reference
R99 3.9 4.4 3.4 3.8 -26.82 -25.78 -26.30 -24.58
Genotype 0.03 0.02 <.0001 ns 0.05 <0.0001 0.003 0.002
Andean vs. Middle American 0.01 0.002 0.001 ns ns ns ns 0.01
Test mean 4.05 4.14 3.79 4.13 -26.31 -26.19 -26.55 -24.89
LSD 95% 0.43 0.45 0.29 0.45 0.650 0.196 0.314 0.431
Table 3.7 Continued...
Carbon discrimination (δ13C)
20122011
F-test
Seed nitrogen (%)
20122011
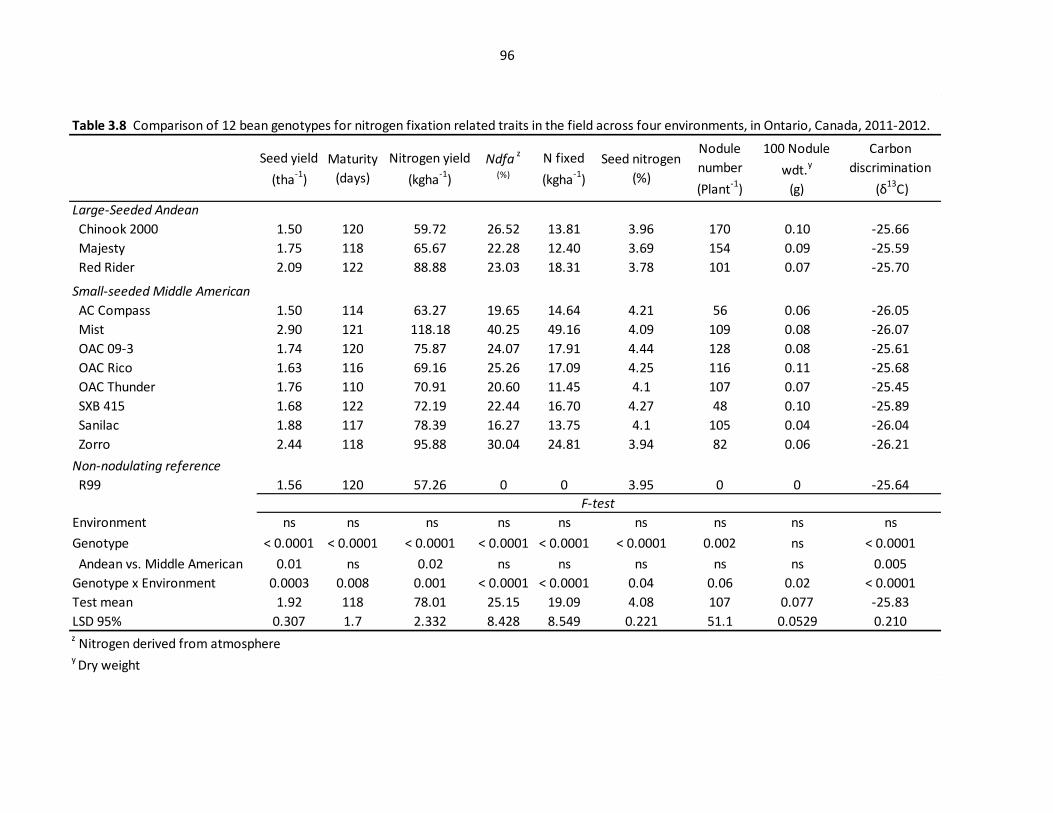
96
Seed yield
(tha-1
)
Maturity
(days)
Nitrogen yield
(kgha-1
)
Ndfa z
(%)
N fixed
(kgha-1
)
Seed nitrogen
(%)
Nodule
number
(Plant-1)
100 Nodule
wdt.y
(g)
Carbon
discrimination
(δ13C)
Large-Seeded Andean
Chinook 2000 1.50 120 59.72 26.52 13.81 3.96 170 0.10 -25.66
Majesty 1.75 118 65.67 22.28 12.40 3.69 154 0.09 -25.59
Red Rider 2.09 122 88.88 23.03 18.31 3.78 101 0.07 -25.70
Small-seeded Middle American
AC Compass 1.50 114 63.27 19.65 14.64 4.21 56 0.06 -26.05
Mist 2.90 121 118.18 40.25 49.16 4.09 109 0.08 -26.07
OAC 09-3 1.74 120 75.87 24.07 17.91 4.44 128 0.08 -25.61
OAC Rico 1.63 116 69.16 25.26 17.09 4.25 116 0.11 -25.68
OAC Thunder 1.76 110 70.91 20.60 11.45 4.1 107 0.07 -25.45
SXB 415 1.68 122 72.19 22.44 16.70 4.27 48 0.10 -25.89
Sanilac 1.88 117 78.39 16.27 13.75 4.1 105 0.04 -26.04
Zorro 2.44 118 95.88 30.04 24.81 3.94 82 0.06 -26.21
Non-nodulating reference
R99 1.56 120 57.26 0 0 3.95 0 0 -25.64
Environment ns ns ns ns ns ns ns ns ns
Genotype < 0.0001 < 0.0001 < 0.0001 < 0.0001 < 0.0001 < 0.0001 0.002 ns < 0.0001
Andean vs. Middle American 0.01 ns 0.02 ns ns ns ns ns 0.005
Genotype x Environment 0.0003 0.008 0.001 < 0.0001 < 0.0001 0.04 0.06 0.02 < 0.0001
Test mean 1.92 118 78.01 25.15 19.09 4.08 107 0.077 -25.83
LSD 95% 0.307 1.7 2.332 8.428 8.549 0.221 51.1 0.0529 0.210
Table 3.8 Comparison of 12 bean genotypes for nitrogen fixation related traits in the field across four environments, in Ontario, Canada, 2011-2012.
F-test
z Nitrogen derived from atmospherey Dry weight

97
Fig. 3.1 Genotype by Trait (GT) biplot of seed yield (GY), nitrogen derived from atmosphere (%Ndfa) and carbon discrimination (δ13C) of 11 bean genotypes tested in four environments Belwood 2011 (B11), Rockwood 2011 (R11), Belwood 2012 (B12), and Elora 2012 (E12) in Ontario, Canada. The non-nodulating genotype R99 was not included in the GT biplot analysis.

98
CHAPTER 4
Yield Stability of Dry Bean Genotypes across Nitrogen Fixation-dependent and Fertilizer-
dependent Management Systems2
2 A version of this chapter has been published at Farid, M., H. J. Earl, and A. Navabi. 2015.
Yield stability of dry bean genotypes across nitrogen fixation-dependent and fertilizer-dependent
management systems. Crop Sci. In press.

99
4.1 ABSTRACT
Despite the inherent N2-fixing ability of legumes, the actual symbiotic N2 fixation (SNF) of dry
bean (Phaseolus vulgaris L.) compared to other legumes is relatively low. Accordingly,
application of inorganic nitrogen (N) in bean fields has often been recommended to maximize
economical yield. The genetic diversity for SNF in common bean may provide the opportunity to
develop bean genotypes with stable yield across N fertilizer-dependent and SNF-dependent
production practices. A population of 140 recombinant inbred lines (RILs) of a cross between
high and low N fixing genotypes, Mist and Sanilac, respectively, was evaluated under two
different N management conditions, SNF- and N fertilizer-dependent, across multiple
environments. While N management did not significantly affect the overall yield, genotypes
responded differentially to SNF-dependent and N fertilizer-dependent environments. Among the
RILs with higher than average yield, the stability analysis identified 6% as generally adapted to
all environments, regardless of N management. The study highlights the opportunity to select
bean genotypes that maintain their yielding ability under SNF-dependent management systems.

100
4.2 INTRODUCTION
Common bean (Phaseolus vulgaris L.) accounts for around 50% of the grain legumes
consumed globally (Broughton et al., 2003). As a major source of protein in many parts of the
world, common bean provides an excellent source of low-fat carbohydrates (Díaz-Batalla et al.,
2006), fiber (Díaz-Batalla et al., 2006), folates (Hefni et al., 2010), minerals such as calcium,
zinc, copper, potassium, iron and phosphorous (Ribeiro et al., 2012), and thiamine and riboflavin
(Słupski, 2012).
Nitrogen management is an important aspect of any cropping system (Dalton and
Krammer, 2006) strongly affecting the overall productivity of the system. Application of
inorganic nitrogen (N) fertilizers in common bean fields is often recommended, due to the
generally poor symbiotic N fixation ability of common bean as compared with other members of
the Fabaceae family (Martínez and Roméro, 2003). However, variation for N fixation potential
has been reported among bean genotypes (Graham, 1981; Miranda and Bliss, 1991; Bliss, 1993;
Farid et al., 2015). It has been shown that SNF in beans and other legumes might be suppressed
in the presence of inorganic N, even at very low rates (Da Silva et al., 1993), as well in response
to other environmental factors such as extreme pH, low soil moisture, low phosphorus
availability, low soil temperature, and salinity. This causes SNF potential of bean genotypes to
be highly environment-dependent, and therefore inconsistent, representing an N-management
challenge. To achieve higher yields, application of N fertilizers may be recommended instead of
relying on SNF, which is generally more environment-dependent than relying on N fertilizer
application.

101
We hypothesize that bean genotypes respond differentially to SNF-dependent and N
fertilizer-dependent environments, and that they differ in the stability of their performance across
N management environments. Such genetic variation would permit selection for improved
performance in both N fertilizer-dependent and (or) SNF-dependent environments. We use
genotype by environment (G×E) interaction analysis models to test our hypotheses. Previous
G×E studies (Khalifa et al., 2013; Mekbib, 2003) in beans have not considered the stability of
genotypic performance in SNF-dependent vs. N-fertilizer application environments.
Dealing with G×E is often more complicated when it includes genotypic rank change,
generally known as cross-over interaction (COI; Gail and Simon, 1985). In the presence of COI-
type G×E, genotype correlation across different environments will not be significant (Yang and
Baker, 1991). Two linear-bilinear models, the shifted multiplicative model (SHMM) (Seyedsadr
and Cornelius, 1992) and the sites regression model (SREG) (Cornelius and Seyedsadr, 1997),
are suitable for dealing with G×E associated with COI. The SHMM has been used for studying
G×E and clustering environments (or genotypes) into groups with reduced rank change (Crossa
and Cornelius, 1997). The SREG model in G×E analysis of multi-location data has been applied
in association with a GGE (genotype and genotype-environment interaction) biplot for
interpretation of G×E associated with COI (Yan et al., 2000).
Among different stability analysis approaches, the linear regression method, first
proposed by Finlay and Wilkinson (1963) is the most commonly used method, in which the
coefficient of regression (bi) of genotypic yield over environmental yield is computed as a
stability parameter. Eberhart and Russell (1966) further proposed a linear regression stability
analysis model, in which deviation from linear regression, in addition to regression coefficient, is
102
used as the stability parameter. More recently, Piepho (1999) proposed the methods to estimate
Finlay and Wilkinson’s, and Eberhart and Russell's stability parameters in a “unifying mixed
model framework”, where regression-based stability parameters (denoted λi and σ2
fi) are
estimated as functions of variance components of a specific mixed model using the variance-
covariance structures (Piepho and Van Eeuwijk, 2002). Piepho (1999) provided SAS code for
computing the stability parameters using mixed model analysis, in which genotype and
environment are considered fixed and REPEATED factors, respectively.
This research was designed to examine the G×E interaction patterns of a recombinant
inbred line (RIL) population in a diverse set of environments, in which N management, either
through application of N fertilizers or through SNF, contributes to environmental variation. The
objectives of the study were to examine the magnitude of genotype by nitrogen within
environment interaction of bean genotypes in N management environments including those with
minimal inorganic N with rhizobial inoculation (SNF-dependent environments) and with
conventional inorganic nitrogen fertilizing systems (N fertilizer-dependent environments), and to
study the stability performance of the bean genotypes across theses environments.
4.3 MATERIAL AND METHODS
4.3.1 Plant materials
A total of 144 bean genotypes, including a population of 140 F4:5 RILs of a cross between
two navy bean varieties ‘Mist' and ‘Sanilac’, the two parental lines, the non-nodulating mutant,
R99 (Park and Buttery, 1988), and its wild type, OAC Rico (Beversdorf, 1984) were included in

103
this study. The parental lines of the RIL population were chosen because of their difference in
SNF ability. Mist is an indeterminate upright navy bean, which was found to be a high SNF
genotype in our previous work (Farid and navabi, 2015), while Sanilac (Anderson et al., 1960) is
a determinant bush type bean, reported to be a low SNF genotype (Bliss, 1993; Farid and
Navabi, 2015).
4.3.2 Field trials
Field trials were conducted in a total of five location-years during 2011 to 2013. These
included one location in 2011in a farmer’s field near Rockwood (43o39’56”N, 80
o9’54”W, 353
m elev.), two locations in 2012; one in a farmer’s field near Belwood (43o40’16”N, 80
o11’34”W, 430 m elev.) and one at the University of Guelph Elora Research Station near Elora
(43°38'27.8"N 80°24'20.4"W, 379 m elev.), and two locations in 2013; one in a farmer’s field
near Belwood (43o40’16”N, 80
o11’34”W, 430 m elev.) and one at the Elora Research Station,
all in the Grey-Brown luvisols soil zone in Ontario, Canada. The test at the Elora Research
station in 2013 was not harvested due to severe flooding, which caused severe non-uniformity
across the test.
All test-sites were chosen based on their low N availability, based on soil analysis
performed before planting (Table 4.1) and no dry bean history of cultivation for at least 10 years.
Rockwood 2011 and Belwood 2013 with total precipitation of 473 mm and 579 mm,
respectively, received more than average rainfall, while Belwood 2012 and Elora 2012 with
total precipitation of 349 mm and 299 mm, respectively, received less than average precipitation
during the growing season from May to September (Table 4.2). All test sites had very low
104
inorganic nitrogen levels in the soil root zone (0-45 cm) though they were very diverse for other
soil properties especially phosphorous content (Table 4.1). Field sites were sprayed, pre-
planting, with S-metolachlor (Syngenta Crop Protection Canada, Inc, Guelph, Ontario),
Imazethapyr (BASF Canada, Mississauga, Ontario ) and Trifluralin (Dow AgroSciences Canada
Inc., Calgary, Alberta) at the rates of 2.3 L ha-1
, 200 mL ha-1
and 1.5 L ha-1
, respectively. The
experimental design was a 12 ×12 unbalanced square lattice design (Cochran and Cox, 1950)
including 144 entries when each incomplete block of 12 included 12 genotypes. Each
experimental unit consisted of a plot with 4 rows, 2.7 m long with 36-cm row spacing. Planting
was done using an experimental plot drill (Fabro Enterprise Ltd., Swift Current, Saskatchewan,
Canada) with 350 seeds per plot.
4.3.3 Nitrogen management treatments
Two sets of the lattice design, each with two replications, were planted side by side in each
test site in each year. Each set was subjected to a different nitrogen management strategy. One
set did not receive any N amendment, but the seed was inoculated, immediately prior to
planting, with a peat based culture of rhizobia, at the rate of 2.5 g of Rhizobium leguminosarum
bv. phaseoli in a commercial product (Becker Underwood, Saskatoon, Saskatchewan, Canada)
per kg of seed to give approximately 5×10⁵ bacteria/seed. This set represented the SNF-
dependent management. The other set received 100 kg ha-1
N (N100), which represented
fertilizer-dependent management.
All experimental plots received 200 kg ha-1
of 0-20-20 of N-P-K fertilizers to supply plots
with 40 kg each of P2O5 and K2O ha-1
, while the N100 (100 kg N ha-1
) lattice was additionally

105
fertilized with 294 kg ha-1
of 34-0-0 of N-P-K fertilizer. Fertilizer application was performed at
the time of planting. Location-years are referred to as environments and combinations of
environments and N management treatments are referred to as N-environments. The N-
environments are henceforth identified with abbreviations, in which the first letter identifies the
location (R, E, and B for Rockwood, Elora, and Belwood, respectively), followed by a two-digit
number identifying the year, and the subscripts Rh and N for the rhizobia-inoculated (SNF-
dependent) and the N-amended (fertilizer-dependent) treatments, respectively. For example the
abbreviation R12Rh identifies the SNF-dependent N-environment in Rockwood 2012, while B11N
identifies the fertilizer-dependent N-environment in Belwood.
4.3.4 Data collection
As a measure of leaf chlorophyll concentration per unit area, leaf greenness was measured
using SPAD 502 Chlorophyll Meter (Minolta) at the first flowering stage on the second from
top-most fully-expanded leaf between 9:00 am and 5:00 pm. Four observations were recorded
for each leaflet on three plants in each experimental unit. Days to flowering and physiological
maturity were recorded as the number of days from planting until 50% of plants had at least one
open flower, and to the day when 50% of the pods turned yellow, respectively. At harvest
maturity (18 -20% seed moisture content), all plants in each plot were harvested using a
Wintersteiger plot combine (Wintersteiger AG, Ried im Innkreis, Upper Austria, Austria) with a
Classic Seed-Gauge weighing system by Harvest-Master (Juniper Systems Inc., Utah, USA) and
plot seed weight and moisture content were recorded. Seed weight was then adjusted to 18%
moisture.
106
4.3.5 Statistical analysis
The main and interaction effects of genotype (G), environment (location by year
combinations; E), and nitrogen management nested within environment [N(E)] were studied.
Data were subjected first to single environment and then multi-environment analysis of variance
in a mixed model analysis using the PROC MIXED procedure in SAS version 9.3; (SAS
Institute, Cary, NC, USA). In the single environment analyses, the effects of Nitrogen (N),
genotype (G) and genotype by N interaction (G×N) were considered fixed, while the effects of
Block within N [Blk(N)], incomplete block within block by N [iblk(N × Blk)] were considered
random. In the multi-environment analyses, the effect of G was considered fixed and the effects
of E, N(E), Blk(E × N), Iblk(Blk×E×N), and G × N(E) were considered random effects. The
COVTEST statement was used to compute the standard error values and to test the significance
of the components of variance for random effects. Tests of significance for the fixed effects were
performed using F-tests of type III sums of squares. Least squared means (lsmeans), their
standard errors and 5% confidence limits were computed for the fixed effects using the
LSMEANS statement in SAS.
A shifted multiplicative model (Seyedsadr and Cornelius, 1992) with a cluster analysis was
performed using SAS code provided and described by Crossa et al. (1993) using the lsmean
values of each genotype in each N management treatment in each environment. The SHMM
model with multiplicative terms is given by the model presented by Seyedsadr and Cornelius
(1992) as:

107
𝑦𝑖𝑗 = 𝛼 + ∑ 𝛽𝑘 . 𝛾𝑖𝑘 . 𝛿𝑗𝑘
𝑡
𝑘=1
+ ℰ𝑖𝑗
where 𝑦𝑖𝑗 is the seed yield of the 𝑖th genotype in the 𝑗th
N-environment (location×year×N
level); 𝛼 is the shift parameter; 𝛽𝑘 is the particular value (1-t) for the axis 𝑘; 𝛾𝑖1 and 𝛿𝑗1 are the
"primary effects" of the 𝑖th genotype and the 𝑗th
N-environment, respectively, 𝛾𝑖2 and 𝛿𝑗2 are
their "secondary effects", etc; ℰ𝑖𝑗 is a random error. This was done to identify sub-sets of
environments with reduced frequency of COI. The frequency of COI in each branch of the
dendrogram (subgroups of environments) was estimated using a modification of the Azzalini-
Cox’ test (Azzalini and Cox, 1984) using SAS code kindly provided by Dr. Rong-Cai Yang
(University of Alberta).
In addition, the genotypic lsmean values of the RILs in the N-environments were subjected
to the site regression model (SREG) analysis with two principle components (PC). The SREG
model presented by Cornelius and Seyedsadr (1997) is:
𝑋𝑖𝑗 = x̅𝑜𝑗 + 𝜆1 Ę1Ƞ1 + 𝜆2 Ę2Ƞ2 + ℰ𝑖𝑗
where, 𝑋𝑖𝑗 is the lsmean (seed yield) of the 𝑖th genotype in the 𝑗th
N-environment; x̅𝑜𝑗 is the
average of genotypes lsmeans in the 𝑗th N-environment; 𝜆1 is the singular value for the first
principal component (PC1); Ę1Ƞ1are the scores for Genotype i and Location j on PC1,
respectively; 𝜆2 is the singular value for the second principal component (PC2); Ę2Ƞ2are the
scores for 𝑖th genotype in the 𝑗th
N-environment on PC2, respectively.A biplot was then
108
constructed by plotting the first principal component (PC1) scores of the genotypes and N-
environments against the scores for the second principal component (PC2). The association
between any two N-environments in the biplot is approximated by the cosine of the angle
between their vectors, while the size of the vector represents the amount of relative genotypic
variation in the N-environment (Yan and Kang, 2003). The SAS codes used for the SREG
analysis were kindly provided by Dr. Jose Crossa of CIMMYT Biometrics Group.
Stability analysis was performed using the lsmeans of seed yield of the RILs and parental
lines in 4 environments, each with two N-management treatments, using linear regression of the
genotypic yield over environmental yield. A modification of the method proposed by Eberhart
and Russell (1966) was used, in which the regression coefficient (λi) in addition to the variance
of deviation from regression (σ2
fi) are used as stability parameters. The analysis was performed in
the mixed model framework following Piepho (1999). This mixed model analysis included two
factors, genotype and N-environment, which are considered fixed and the REPEATED factors,
respectively. Regression coefficient (λi), deviation variance (σ2
fi) and their standard error (Se)
values were computed using the variance-covariance structures by insertion of TYPE=FA(1) in
the REPEATED statement of the MIXED model procedure in SAS as proposed by Piepho
(1999). Genotypes with a λi close to the average, within two confidence limit (P = 0.05)
intervals, were grouped as genotypes with average stability while those with lower or higher λi
values were identified as genotypes with above and below average stability, respectively.
Genotypes with above-average seed yield across all environments which had λi close to the
population average and lower σ2
fi were classified as adapted to all environments.

109
4.4 RESULTS
4.4.1 Mixed model analysis
For the single-environment analyses (not shown), considerable genotype variation for yield
(P< 0.0001) and the other traits (P= 0.01 to < 0.0001) was observed in all the environments.
Although the G×N interaction was always significant (P < 0.0001), the main effect of N
management on yield was not significant in all environments. In the optimum precipitation
environments, R11 and B13, the effect of N management was not significant, whereas in the low
precipitation environments, B12 and E12, the fertilizer-dependent treatment yielded significantly
higher (11% and 8%, respectively) than the SNF-dependent treatment (Table 4.3). In the pooled
analysis over environments, the effect of genotype was highly significant (P < 0.0001) for all
traits, except days to maturity. However, neither E nor N(E) were significant for any trait, while
the effect of G×N(E) was significant for seed yield (P<0.0001), days to flowering (P< 0.001) and
maturity ( P < 0.001) (Table 4.4). The high SNF variety, Mist, had significantly higher yield,
SPAD reading and later flowering and maturity time than the low-SNF variety, Sanilac, in every
environment.
4.4.2 Multiplicative models of G by E interaction
Considering the presence of the highly significant G×N(E) effect on seed yield (Table 4.4),
SHMM cluster analysis (Crossa and Cornelius 1997) and SREG model with GGE biplot were
used to group environments into sub-groups with negligible COI. The dendrogram generated
using cluster analysis of the G×E data, following SHHM model, is presented in Figure 4.1. In the
110
first fusion level, R11N was identified as the N-environment with the highest frequency of COI
with the other environments. In the second fusion level, the remaining 7 environments were
grouped into two subgroups; one included all of the SNF-dependent environments (R11Rh, B13Rh,
B12Rh and E12Rh) and one of the fertilizer-dependent environments (B13N). The other two
fertilizer-dependent environments, B12N and E12N, formed another group in the dendrogram. As
expected, the frequency of COI, estimated following the Azzalini-Cox’ test (Azzalini and Cox,
1984), decreased by moving down the branches of the dendrogram (Figure 4.1).
In SREG analysis, both PC1 and PC2 were significant (P < 0.0001), accounting for 40 and
20 percent of the genotype and genotype by N within environment variation, respectively (Figure
4.2). The environment marker positioned farthest from the origin of the biplot, indicating greater
within-environment variation and hence greater discrimination ability for selecting genotypes for
their yielding ability, was R11N followed by R11Rh, B13Rh and B13N were. R11N with the largest
projection from the biplot origin was the highest yielding environment and even though it had
the greatest variation, it had strong COI with other environments and therefore was not
representative of overall genotypic performance across the test environments. The environments
with their markers closest to the biplot origin (E12Rh, B12Rh, E12N, and B12N) all received low
precipitation over the growing cycle and most likely were affected by some levels of drought
stress. Three groups of N environments can be identified in the bi-plot: a single environment
group formed by R11N; a second group, including B12N and E12N, clustered together, both with
high N and low precipitation; and a third group, including R11Rh, B12Rh and E12Rh, and B13Rh
(all low N environments) and B13N, which formed another cluster. The environments within each
of the two clusters are closely associated, in terms of genotypic rank. However, the two clusters
in the opposing directions of the bi-plot form two COI pattern groups with significant genotypic

111
rank change. Of the two clusters identified in the biplot, one included all the SNF-dependent
environments, and one of the fertilizer-dependent environments, B13N, and the other included
two fertilizer dependent environments, E12N and B12N (Figure 4.2). In accordance with the
SHMM cluster analysis, R11N with its vector positioned at close to a 90ᴼ angle with other
environments was identified as an N environment with its genotypic ranking unrelated with the
others’.
Yan et al. (2000) suggested that if the correlation between PC1 and genotypic main effects is
close to unity, then the GGE biplot can be used to identify which-won-where patterns. The
coefficient of correlation between PC1 and the genotypic main effects was 0.64 (P < 0.0001).
Due to relatively weak association between PC1 and the genotypic main effects the biplot was
not used to study wining genotypes within sub-groups of environments. However, it is clear from
the biplot that selections in one environment or groups within one cluster will not necessarily be
the best genotypes in the other cluster of environments, which may justify application of a
stability analysis for genotypic selection.
4.4.3 Stability analysis
The scatter plot of the regression coefficient λi against genotypic yield was partitioned into
different sectors by drawing horizontal and vertical lines representing population mean and the
95% confidence limits for λi and genotypic yield (Fig. 4.3). The average seed yield of the RILs
and parental lines across all environments ranged from 1.45 to 2.23 t ha-1
.The high-SNF parental
line, Mist, and 52% of the RILs yielded higher than the population mean. Six percent of the
RILs, 7 genotypes, fell in the middle right sector of the scatter plot with higher than average

112
yield and within one confidence limit of the average value of the stability parameter. These RILs
were identified as high yielding genotypes with average stability. These genotypes are those that
are well adapted to a range of environmental variation, regardless of source of N. Among these
lines, one RIL, designated AG 09-126-137 had the smallest deviation (σ2
fi = 0.02) from the
regression coefficient and can therefore be considered the most stable RIL. The top right sector
of the scatter plot included 6% of the RILs and the high SNF parental genotype, Mist. These
RILs yielded more than the population average with higher than average value of λi, and may be
grouped as genotypes adapted to favourable environments. Four percent of the RILs, in the
bottom right sector of the scatter plot with higher than average yield and with lower λi can be
identified as lines adapted to low yielding conditions. Among the seven genotypes, categorized
as high yielding genotypes with average stability, 4 genotypes including AG 09-126-137 were
also selected in the SREG biplot as the best performing lines with high genotypic main effect and
close to zero PC2 value.
4.5 DISCUSSION
The RIL population studied here, which was derived from a cross between high- and low-
SNF genotypes, showed considerable variation in seed yield across all SNF- and N fertilizer-
dependent environments. Across all environments, there was no indication of an advantage of N
fertilizer application over SNF in beans. However, the main effect of N management seemed to
be mostly dependent on other environmental variables, perhaps specifically the availability of
soil moisture. While under optimum rainfall SNF-dependent environments, in general, yielded
higher (Belwood 2013) or not differently (Rockwood 2011) than the fertilizer-dependent
environments, in low rainfall testing sites, the SNF-dependent treatments yielded lower than the

113
N fertilizer-dependent treatments. This is in agreement with the previous reports (e.g., Coleto,
2014; Devi et al., 2013; Arrese-Igor et al., 2011; Purcell et al., 2004) of inhibition of SNF by
moisture stress. It is known that insufficient soil moisture limits the productivity of the crop
(Abebe et al., 1998) through an adverse impact on plant source strength by reducing canopy
absorption of photosynthetically-active radiation (Earl and Davis, 2003) Carbon limitation
induced by water shortage reduces SNF (Gil-Quintana et al., 2013), which subsequently restricts
the availability of nitrogen compounds essential for seed production (e.g., Arrese-Igor et al.,
2011) and reduces the yield potential of the crop.
Significant genotype by N management within environment interaction effects, associated
with significant genotypic rank change, was evidenced by differential genotypic responses to N
management treatments across test environments. While some of the observed G×E can perhaps
be described by different responses of the RILs to N management, the data suggested that other
environmental variables, possibly the shortage of precipitation during the growing season in
some environments, may have been important contributors to overall G×E. Our attempt to
identify sub-sets of N environments with reduced COI, using SHMM and SREG model analyses,
resulted in identification of two reduced-COI subgroups of N environments, in which all SNF-
dependent environments grouped together. Even though genotypic variation was greater in the
optimum moisture than the dry N environments, the genotypic rank change within the sub-
groups was minimal. This suggested that even though drought was likely the major cause of
reduced yield due to its negative effect on SNF, the relative ranking of genotypes was not
drastically changed among SNF-dependent environments.

114
In terms of genotypic rank change, most of the SNF-dependent environments were in strong
COI with fertilizer-dependent environments. This may suggest that selecting genotypes that
perform well regardless of N management may not be an easy task. We believe that this is
mainly due to the environment-dependent nature of SNF, which is significantly influenced by
many external factors such as soil moisture (Gil-Quintana et al., 2013), soil pH (Bordeleau and
Prévost, 1994), phosphorous availability (Pereira and Bliss, 1987), and soil temperature (Piha
and Munns, 1987; Bordeleau and Prévost, 1994). Compared with SNF, the effect of N fertilizer
seems to be less environment-dependent, which might explain why growers, at least in the case
of dry beans, prefer N fertilizer application over SNF.
This lack of consistency of genotypic responses to SNF justified the application of stability
analysis to identify genotypes which maintain their performance regardless of N management
strategy. In stability analysis, 6% of the population yielded more than the population average
with their stability parameter close to the population average. Four genotypes out of these 8
entries were identified as winning genotypes across all environmental conditions in both stability
analysis and SREG model, suggesting that it is feasible to select genotypes that perform well
under both SNF-dependent and fertilizer-dependent management, which is consistent with a
previous report by Fageria et al. (2014).
In the SREG model 12, 6, 6 and 15 genotypes performed around the corresponding average
in Rockwood 2011, Elora 2012, Belwood 2012 and Belwood 2013, respectively, (data not
shown), while 13% of genotypes performed around average across all environments. Under
limited rainfall, in Elora and Belwood 2012, the genotype ranking was different from other sites
with optimum moisture conditions. Again, this supports the environmental dependency of SNF

115
and emphasizes water scarcity as a likely cause of lack of consistent genotypic responses to N
management strategies.

116
Table 4.1 Soil properties of trial environments presented for samples taken from 0-15 and 15-45 cm depth.
Soil Property
Rockwood Belwood Elora
Belwood
2011
2012
2012
2013
Soil depth (cm)
0-15 15-45
0-15 15-45
0-15 15-45
0-15 15-45
Organic matter (%) 3 1.5
4.9 3
4.4 2.3
3.5 3
P (bicarb, ppm) 7 19
5 4
82 23
11 4
P (Bray-P1, ppm) 16 25
6 5
219 39
14 7
K (ppm) 28 20
47 37
111 60
14 7
Mg (ppm) 190 145
315 265
365 335
175 170
Ca (ppm) 1330 970
2080 2040
2740 3520
1680 1590
Na (ppm) 8 3
2 1
13 14
6 8
Al (ppm) 850 1117
808 900
675 587
777 787
Nitrate (ppm) 4 3
3 2
5 4
7 9
pH 7.1 6.9
7.5 7.7
7.6 7.9
7.3 7.3
CEC† (meq/100g) 9.2 7.3
13.2 12.5
17.1 20.6
10.1 10.1
K/Mg 0.05 0.04 0.05 0.05 0.1 0.05 0.13 0.13 †CEC, Cation Exchange Capacity

117
Table 4.2 Maximum, minimum, and mean temperature, and total monthly precipitation data at trial environments during 2011 to 2013 (available at: weather.gc.ca/canada_e.html).
Rockwood (2011)
May June July August September Growing season
Max Temp† °C 17.6 22.4 28.0 25.2 20.5
Min Temp‡ °C 8.8 12.5 16.5 14.6 11.3
Mean Temp °C 13.2 17.4 22.2 19.9 15.9
Precipitation mm 120 112 38 125 79 473
Belwood (2012)
Max Temp °C 21.7 24.2 28.7 24.8 19.7
Min Temp °C 8.3 12.6 15.5 13.1 8.4
Mean Temp °C 15.0 18.4 22.1 19.0 14.1
Precipitation mm 26 97 44 52 130 349
Elora (2012)
Max Temp °C 21.8 24.4 28.7 25.3 20.2
Min Temp °C 7.5 12.2 14.0 11.8 7.3
Mean Temp °C 14.7 18.3 21.3 18.6 13.8
Precipitation mm 28 65 30 63 106 292
Belwood (2013)
Max Temp °C 20.0 22.0 25.1 24.1 20.3
Min Temp °C 7.1 12.5 15.3 12.5 8.8
Mean Temp °C 13.6 17.3 20.2 18.3 14.6
Precipitation mm 106 137 158 53 105 559 † Mean daily maximum temperature for the month ‡ Mean daily minimum temperature for the month

118
SNF N SNF N SNF N SNF N
Mist 1.8 2.1 1.8 1.8 1.6 2.3 2.1 2.1Sanilac 1.4 1.1 1.2 1.4 0.7 1.3 1.3 1.8RILs Max 3.1 4.1 2.4 3.3 2.2 3.1 3.1 4.1 Min 0.8 0.7 0.6 0.6 0.4 0.4 0.9 0.8 Mean 2.3 2.3 1.4 1.6 1.5 1.6 2.2 2.1
CI95% 2.2-2.3 2.2-2.4 1.3-1.2 1.5-1.6 1.0-1.1 1.6-1.7 2.2-2.2 2.0-2.1
Mist 49 42 43 35 44 35 52 45Sanilac 30 31 27 25 28 30 32 35RILs Max 65 64 50 41 49 45 66 49 Min 40 40 36 35 34 32 38 38 Mean 49 43 43 46 47 38 44 45
CI95% 48-47 41-44 41-45 44-48 45-49 36-40 41-46 43-47
Mist 113 114 112 111 113 114 113 114Sanilac 114 114 109 111 112 114 114 113RILs Max 131 135 120 119 126 120 142 142 Min 110 101 107 110 107 106 110 110 Mean 115 114 113.3 114.1 114 113 120 118
CI95% 114-115 113-115 113-114 113-114 113-115 112-114 119-121 117-119
Mist 40 43 40 39 41 41 41 37Sanilac 41 41 38 36 39 36 39 36RILs Max 48 54 46 53 48 55 46 54 Min 34 22 30 28 33 32 30 38 Mean 41 41.7 40 42 40 46 39 47
CI95% 40-41 41-42 41-42 41-42 41-42 45-47 38-39 43-48
SPAD(2nd fully expanded leaf) (mg Chlorophyll m-2)
Maturity (days)
Seed yield (t ha-1
)
Flowering (days)
Table 4.3 Maximum, minimum and mean and 95% confidence interval (P =0.05) of
Least-square means of grain yield, days to flowering, days to maturity and
chlorophyll concentration (SPAD) of the 2nd fully expanded leaf at 50% flowering
stage of 140 recombinant inbred lines and 2 parental lines , Sanilac and Mist in
2011, 2012, and 2013 in SNF-dependent (SNF) and N fertilizer-dependent (N)
management.
Rockwood-2011 Belwood-2012 Elora-2012 Belwood-2013
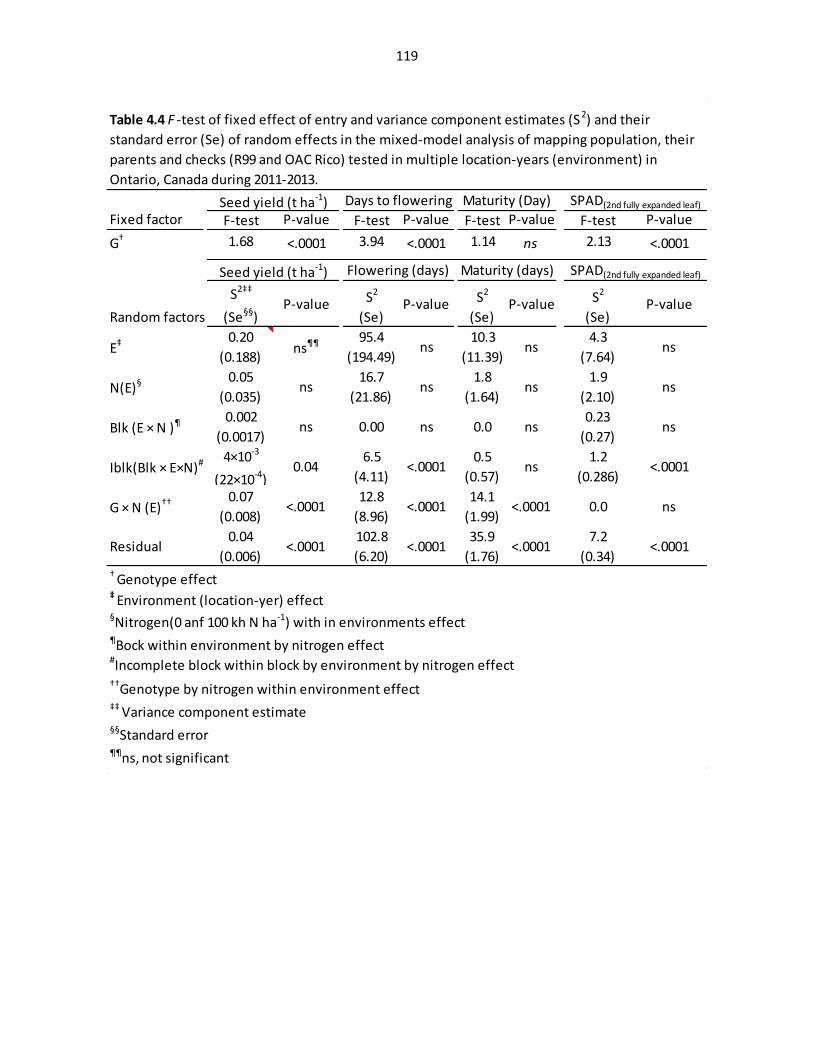
119
Fixed factor F-test P-value F-test P-value F-test P-value F-test P-value
G† 1.68 <.0001 3.94 <.0001 1.14 ns 2.13 <.0001
Random factors
S2‡‡
(Se§§)P-value S2
(Se)P-value S2
(Se)P-value S2
(Se)P-value
E‡ 0.20
(0.188)ns¶¶ 95.4
(194.49)ns
10.3
(11.39)ns
4.3
(7.64)ns
N(E)§ 0.05
(0.035)ns
16.7
(21.86)ns
1.8
(1.64)ns
1.9
(2.10)ns
Blk (E × N )¶ 0.002
(0.0017)ns 0.00 ns 0.0 ns
0.23
(0.27)ns
Iblk(Blk × E×N)# 4×10⁻³
(22×10-4)0.04
6.5
(4.11)<.0001
0.5
(0.57)ns
1.2
(0.286)<.0001
G × N (E)†† 0.07
(0.008)<.0001
12.8
(8.96)<.0001
14.1
(1.99)<.0001 0.0 ns
Residual0.04
(0.006)<.0001
102.8
(6.20)<.0001
35.9
(1.76)<.0001
7.2
(0.34)<.0001
¶¶ns, not significant
§§Standard error
‡‡ Variance component estimate
††Genotype by nitrogen within environment effect
#Incomplete block within block by environment by nitrogen effect
¶Bock within environment by nitrogen effect
§Nitrogen(0 anf 100 kh N ha-1) with in environments effect
Seed yield (t ha-1) Flowering (days) Maturity (days) SPAD(2nd fully expanded leaf)
Table 4.4 F -test of fixed effect of entry and variance component estimates (S2) and their
standard error (Se) of random effects in the mixed-model analysis of mapping population, their
parents and checks (R99 and OAC Rico) tested in multiple location-years (environment) in
Ontario, Canada during 2011-2013.
‡ Environment (location-yer) effect
† Genotype effect
SPAD(2nd fully expanded leaf)Seed yield (t ha-1) Days to flowering Maturity (Day)

120
Figure 4.1 Diagram of dendrogram which is generated from SHMM analysis for grouping eight environments, under two different
nitrogen (N) managements including symbiotic N2 fixation(SNF)-dependent and N fertilizer-dependent conditions (N), and cross over
interaction percentage (COI%) for each subgroup. Numbers on dendogram branches are the COI% in each branch based on Azzalini-
Cox’ test (Azzalini and Cox, 1984).

121

122

123
CHAPTER 5
Response to Selection for Improved Nitrogen Fixation in Common Bean3
3 A version of this chapter has been submitted for publication as Farid, M., H. J. Earl, and A.
Navabi. 2015. Response to selection for improved Nitrogen fixation in common bean
(Phaseolus vulgaris L.). Crop Sci. Submitted.

124
5.1 ABSTRACT
Breeding for high symbiotic nitrogen (N) fixation (SNF) in common bean (Phaseolus
vulgaris L.) is expected to contribute to reduced application of chemical fertilizers in cropping
systems involving common bean. The magnitude of variation and the genetic and phenotypic
correlation among SNF ability, seed yield and related traits were studied in a population of 140
F4-derived F5 recombinant inbred lines (RIL), developed from a cross between high- and low-
SNF bean genotypes ‘Mist’ and ‘Sanilac’, respectively. The experiment was conducted in a total
of 5 location-years in Ontario, Canada, from 2011 to 2013, which based on the total precipitation
during the growing season were grouped into stress- and non-stress test sites. Moreover, in each
test site, two nitrogen supply management strategies, SNF-dependent and N fertilizer-dependent,
were simulated separately in the field by inoculating the seed with a commercial Rhizobium
leguminosarum bv. phaseoli and by application of N fertilizers at 100 kg ha-1
, respectively. The
genetic variation was significant for SNF potential, measured as percentage of nitrogen derived
from atmosphere (%Ndfa), and related traits, while genotypes responded differently to
environments and the N management strategies. The heritability of the traits ranged from 14% to
71% and 4% to 25% in non-stress and in stress environments, respectively. There was no
significant correlation between %Ndfa and seed yield, indicating that selection for high SNF
genotypes does not necessarily lead to greater seed yield and that selection for both traits should
be performed simultaneously. A selection index was computed to select for lines with higher
yield in SNF-dependent management than N-fertilizer-dependent. Selection using the index
identified twenty percent of the RILs with better performance in SNF-dependent environments.

125
5.2 INTRODUCTION
Common bean (Phaseolus vulgaris L.), with a total production of 23 million tonnes of dry
seeds and 1.7 million tonnes of green beans in 2010 (Global Biodiversity Information Facilities,
2015) grown on more than 30 million ha of land, worldwide, is an important food legume. Dry
beans are rich sources of protein for over 500 million people, mainly in Latin America and
Africa (Fageria et al., 2011), and also provide low-fat carbohydrates (Díaz-Batalla et al., 2006),
fiber (Díaz-Batalla et al., 2006), folate (Hefni et al., 2010) and minerals such as calcium, zinc,
copper, potassium, iron and phosphorous (Ribeiro et al., 2012), all over the world.
Despite dry bean’s importance, it is usually planted in the marginal lands with its average
yield, on a global scale, estimated to be less than 20% of its potential yield (Fageria et al., 2011).
Availability of nitrogen is a major environmental and management factor, limiting bean
production. Nonetheless, dry beans are generally known as being relatively weak N2 fixers
compared to other legumes (Martínez-Roméro, 2003). Therefore, inorganic nitrogen fertilizers
(N) are often applied by farmers to maximize yield. Generally, plants can uptake only about 30
to 40% of the nitrogen applied to the soil in the form of N fertilizers (Raun and Johnson, 1999).
The increased application of the chemical fertilizers in agricultural lands, over the last 6 decades
(Sutton et al., 2013) on one hand, and the fate of the unused inorganic N in the soil, on the other
hand, are causing environmental concerns (Liang et al. 2013).
Previous studies (Graham, 1981, Miranda et al. 1991; Bliss et al., 1993; Farid and Navabi
2015) have provided evidence for the existence of variation in the symbiotic N2 fixation (SNF)
ability of bean genotypes. Identification of high yielding bean genotypes with superior SNF

126
ability across different environments can potentially contribute to reduced application of N
fertilizer in agricultural lands, which is both economically and environmentally beneficial.
An understanding of the association between SNF and agronomic traits could be very
helpful in exploring surrogate measure(s) for indirect selection of high-yielding and high-SNF
varieties in common bean breeding programs. In previous studies, negative association between
nitrogen fixation and δ13
C, an indicator of water use efficiency in plants, has been reported
(Kumaarasinghe et al., 1992; Knight et al., 1993; Farid et al., 2015). Rennie and Kemp (1983)
also showed that indeterminate and climbing beans were stronger N2 fixers than the bush type
beans, noting that these beans are usually late maturing, and with a longer vegetative growth
period and later flowering time, have a longer N fixation time.
On the other hand, dry bean breeders have over the years selected genotypes of beans that
are resistant against bacterial diseases. Among the bacterial diseases of common bean, common
bacterial blight (CBB), caused by Xanthomonas axonopodis pv. phaseoli (Smith), has been a
major disease of common bean, in North America and elsewhere, for which bean breeders have
introgressed resistance through inter-specific crosses to close relatives e.g., P. acutifolius
(Thomas and Waines, 1984; Scott and Michaels, 1992). While there are at least two reports of
genetic association between CBB resistance and nodulation traits (Nodari et al., 1993; Souza et
al., 2000), it is still not well understood whether or not selection for resistance against the
bacterial pathogen causing CBB, over the years, has reduced the ability of the bean plant to
establish symbiotic relationships with beneficial bacteria.
127
An understanding of the existing genetic diversity for yield, SNF and their related traits as
well as the magnitude of genetic correlation among these plant characteristics, which may
influence the efficiency of selection in plant breeding, is important for an efficient selection
strategy to improve SNF ability of dry beans while maintaining its yielding ability. The
objectives of the present study were, therefore, to (i) investigate the genetic variability,
heritability and the correlation among seed yield and SNF-related traits at the phenotypic and
genetic levels in a bi-parental population derived from crosses of high- and low-SNF genotypes,
(ii) estimate the realized and expected response to direct and indirect selection for seed yield,
SNF and related traits, and (iii) select genotypes with higher yielding ability in SNF-dependent
conditions compared with inorganic N-dependent production environments.
5.3 MATERIALS AND METHODS
5.3.1 Plant Materials
A population of 140 F4-derived F5 recombinant inbred lines (RILs), developed from a
cross between two navy bean genotypes, a high SNF white bean genotype, ‘Mist’, (Farid et al.,
2015) and a low SNF genotype, ‘Sanilac’, (Bliss, 1993), using a single seed descent approach,
was used for this study. The parental lines, a non-nodulating mutant, R99 (Park and Buttery,
1997), and it’s wild type, OAC Rico (Beversdorf, 1984) were included as checks to make a total
of 144 entries.
128
5.3.2 Field trials
Field trials were conducted in a range of different environments, chosen based on their low
N availability, following soil analysis of samples taken prior to planting, in addition to not being
seeded to dry beans for at least 10 years prior to the experiment. Field site-years included 5
locations over 3 years i.e., one location in 2011, two locations in 2012 and two locations in
2013. These included a farmer’s field near Rockwood (43o39’56”N, -80
o9’54”W, elevation 353
m elev.) in 2011, a farmer’s field near Belwood (43o40’16”N, -80
o11’34”W, elevation 430 m
elev.) and a field site at the University of Guelph Elora Research Station near Elora
(43°38'27.8"N 80°24'20.4"W, elevation 379 m elev.) in both 2012 and 2013, all in Ontario,
Canada in the Grey Brown luvisols soil zone. Data collected in Elora 2013 was not included in
the analysis due to severe flooding. Trial sites were sprayed, pre-planting, with S-metolachlor
(Syngenta Crop Protection Canada, IncInc., Guelph, Ontario), Imazethapyr Pursuit (BASF
Canada, Mississauga, Ontario ) and TrifluralinTreflan (Dow AgroSciences Canada Inc., Calgary,
Alberta) at the rate of 2.3 L ha-1
, 200 mL ha-1
and 1.5 L ha-1
, respectively. The experimental
design in each environment was a two-replication 12 ×12 unbalanced square lattice design
including 144 entries. At each site, two sets of the experiment were planted, side by side,
simulating two nitrogen management practices i.e., SNF-dependent and N fertilizer-dependent
management. Plots were seeded using a plot-planter (Fabro Enterprise Ltd., Swift Current,
Saskatchewan, Canada). Each experimental unit consisted of a 4-row, 2.7 m long plot with 36-
cm row-spacing, planted the second week of June of each year. Both sets of the trial at every
location, were fertilized with 200 kg ha-1
of 0-20-20 of N-P-K fertilizers to supply plants with 40
kg ha-1
of P2O5 (17.6 kg P ha-1
) and 40 kg ha-1
K2O (33.2 kg K ha-1
), pre-planting. The SNF-
dependent set was inoculated, immediately prior to planting, with a peat based culture of

129
rhizobia, at the rate of 2.5 g of Rhizobium leguminosarum bv. phaseoli in a commercial product
(Becker Underwood, Saskatoon, Saskatchewan, Canada) per kg of seed to give approximately
5×10⁵ bacteria/seed. The N fertilizer-dependent set received 294 lbs ha
-1 of 34-0-0 of N-P-K
fertilizer, in the form of ammonium nitrate, to supply 100 lbs N ha-1
at planting. The
combination of locations, years and N management provided a total of 8 environments, of which
four were SNF-dependent [Rockwood -2011-0 (R11Rh), Belwood-2012-0 (B12Rh), Elora-2012-0
(E12Rh), and Belwood-2013-0 (B13Rh)], and four were N-dependent environments [Rockwood -
2011-100 (R11100), Belwood-2012-100 (B12100), Elora-2012-100 (E12100), and Belwood-2013-
100 (B13100)].
5.3.3 Data Collection
Leaf chlorophyll concentration was measured using a SPAD 502 Plus Chlorophyll Meter
(Spectrum Technologies, Inc., Aurora, USA) at the 50% flower stage on the second top-most
fully expanded leaflets, SPAD, (four observations for each of the three leaflets on three plants in
each experimental unit). Days to flowering and physiological maturity, 95% of pods turned
yellow, were recorded as the number of days from planting to the day when 50% of plants in the
plot reached flowering, or until pods turned yellow, respectively. At harvest maturity (18 -20 %
seed moisture content), all plants in each plot were harvested using a Wintersteiger plot combine
(Wintersteiger AG, Ried im Innkreis, Upper Austria, Austria) with a Classic Seed-Gauge
weighing system by Harvest-Master (Juniper Systems Inc., Utah, USA) and plot seed weight and
moisture content were recorded. Two 200-g seed samples were collected, and dried in a forced
air oven at 60 oC for about 48 h. Seed protein content was then measured on one of the samples
using a Near Infrared (NIR) Portable Seed Analyzer (model Zx50, Zeltex, Hagerstown, MD,
130
USA) on a moisture-free basis. The second seed sample was ground finely and passed through a
100 mesh (0.149 mm) sieve. Five to 6 mg of ground seed sample was weighed into a tin capsule
(8×5 mm; Isomass Scientific Inc., Calgary, AB, Canada). The capsules were then closed,
compressed and placed in 96-well micro plates. Samples were shipped to the Agriculture and
Agri-Food Canada-Lethbridge Research Centre (Lethbridge, Alberta, Canada) to determine 15
N
abundance (δ15
N) and carbon isotope discrimination (δ13
C) using gas chromatography-mass
spectrometry (GC-MS), following methods explained by Shearer and Kohl (1993) for δ15
N
(15
N/14
N) using the light glutamic acid, NIST-8573, (NIST, National Institute of Standards and
Technology, Gaithersburg, MD, USA) into the same capsules.
Percent nitrogen derived from the atmosphere (%Ndfa) was calculated for each
experimental unit following the equation given by Shearer and Kohl (1986) as:
%𝑁𝑑𝑓𝑎 =(𝛿15𝑁𝑟𝑒𝑓. 𝑝𝑙𝑎𝑛𝑡−𝛿15𝑁𝑁 𝑓𝑖𝑥𝑖𝑛𝑔 𝑝𝑙𝑎𝑛𝑡)
(𝛿15𝑁𝑟𝑒𝑓. 𝑝𝑙𝑎𝑛𝑡 − B)
where δ15
Nref. plant is δ15
N for reference plant, the non-nodulating mutant R99 (Park and
Buttery, 1997), δ15
Nfixing plant is the δ15
N of the dry bean genotype tested and the correction factor,
B is by definition the δ 15
N value of the legume obtaining its entire N from N2 fixation in an N-
free medium. The B-value was obtained, as proposed by Peoples et al. (2009), by taking the
average of δ15
N measurements of a total of 20 randomly selected bean genotypes grown in an N
free medium in a greenhouse at the University of Guelph, Guelph, Ontario, Canada.
Carbon isotope discrimination δ C (‰), was calculated for each experimental unit using
the same samples taken for δ15
N as:

131
𝛿C(‰) =(𝛿𝑎 − 𝛿𝑝)
(1 +𝛿𝑝
1000)
where 𝛿𝑎 is the isotopic ratio of 13
C to 12
C (-8‰) in the atmospheric air and 𝛿𝑝 is isotopic
ratio of 13
C to 12
C in the seed sample.
A sample of the RIL population was planted separately in an artificially-inoculated
common bacterial blight nursery at the AAFC-Greenhouse and Processing Crops Research
Centre in Harrow, Ontario, Canada over 3 years from 2011 to 2013. Each year, two replications
of the population were planted in the nursery. Each experimental unit consisted of a hill plot
planted on rows at every 50 cm with 7 to 10 seeds each with 50-cm row-spacing. The nursery
was artificially inoculated at the fourth trifoliate leaf stage with spore suspensions of three
isolates of X. axonopodis pv. phaseoli (18, 118 and 98) by spraying the leaves with a suspension
of 107 CFU mL-1
inoculum. The CBB severity, defined as the average percentage of necrotic
leaf area, was rated 14 and 21 days after inoculation (as described by: Mutlu et al., 2005). The
disease severity was recorded based on the infected leaf area, across all leaves on the plant, on a
0 to 5 visual scale, where 0 = no symptoms, 1= < 5%, 2 = 5-10%, 3 =10-25%, 4 = 25-50%, and 5
= 50-100% (Yu et al. 2000).
5.3.4 Statistical Analysis
Statistical analyses were carried out using SAS 9.3 (SAS Institute Inc., Cary, NC, USA).
Data were subjected to a multi-environment analysis of variance in mixed model using the
PROC MIXED procedure in SAS (version 9.3, SAS Institute, Cary, NC, USA, 2007). The effect

132
of genotypes, G, was considered as a fixed effect and the effects of environment, E, nitrogen
within environment, N(E), block within environment by nitrogen interaction, Blk(E×N),
incomplete block within block by environment by nitrogen interaction, Iblk(Blk×E×N), and
genotype by nitrogen within environment interaction, G×N(E), were considered random. For
traits that were recorded only in one of the two N-management environments in each year
(%Ndfa and δ13
C), and CBB, which was recorded only in the CBB nursery, the mixed model
analysis was performed with G as the fixed effect and E, block within environment, Blk(E),
incomplete block within block by environment interaction, Iblk(Blk×E), and genotype by
environment interaction, G × E, as random effects. The COVTEST statement was used to
examine the significance of the variance of the random effects in the model. The significance of
the fixed effects was examined using an F-test of the type III sums of squares. Least squared
means (lsmeans) were computed for fixed effects using the LSMEANS statement in SAS. The
standard error of LSmean values were estimated and pair-wise tests of significant differences
were performed using the PDIFF statement.
Components of phenotypic variance were estimated using SAS macros developed by
Holland (2003), using the REML algorithm in the PROC VARCOMP procedure, in which all the
source of variation were considered random effects. The broad-sense heritability (ℎ2) was
estimated as
ℎ2 =σ𝑔
2
σ𝑝2
× 100

133
The expected genetic gain (Allard 1960; 𝐺𝐴𝑒) following 10 % selection intensity was
calculated as:
𝐺𝐴𝑒 = 𝑘 . σ𝑝 . ℎ2
where 𝑘 is constant (1.755 for 10% selection intensity), σ𝑝 is phenotypic standard
deviation. The realized (observed) genetic gain following the same 10 % selection intensity was
estimated as
𝐺𝐴𝑜 = �̅� 𝜇
where �̅� and 𝜇 are the average value of the selected subset and the unselected population,
respectively. 𝐺𝐴𝑒 and 𝐺𝐴𝑜 were also estimated as percentages of the genotypes mean for each
trait.
For each genotype, the best linear unbiased predictor (BLUP) value was estimated, in order
to estimate an un-shrunken genotypic value, using the PROC MIXED procedure by including
SOLUTIONR in the RANDOM statement in the random model. Coefficients of phenotypic
correlation were then estimated using the BLUP values in the PROC CORR procedure.
Coefficients of genetic correlation (rg) were estimated as:
𝑟𝑔 =𝐶𝑜𝑣𝑔𝑖𝑗
√(𝜎𝑔𝑖2 × 𝜎𝑔𝑗
2)

134
using SAS macros introduced by Holland (2006), where 𝐶𝑜𝑣𝑔𝑖𝑗 is the estimate of the
covariance of the ith
and jth
traits and 𝜎𝑔𝑖2 and 𝜎𝑔𝑗
2 are the estimates of variances of the ith
and jth
traits, respectively. A symbiotic nitrogen fixation relative efficiency index SNFI was also
computed for each genotype as
𝑆𝑁𝐹𝐼𝑖 =𝐺𝑌𝑆𝑁𝐹𝑖 − 𝐺𝑌𝑁𝐴𝑖
𝐺𝑌𝑁𝐴𝑖× 100
where 𝐺𝑌𝑆𝑁𝐹𝑖 and 𝐺𝑌𝑁𝐴𝑖 are yield LSMEANS of the i
th genotype in the SNF-dependent
management, and in the N fertilizer-dependent management, respectively.
The PROC CORR procedure of SAS was used to compute Pearson’s and Spearman’s
correlation coefficients between pairs of traits, and principle component analysis with the
Genotype × Trait (GT) biplot analysis (Yan and Rajcan, 2002) was implemented to examine the
multi-variable associations among traits and with symbiotic nitrogen fixation efficiency index
(SNFI) using the genotypic lsmeans values for, seed yield (SY), days to maturity (DM) , nitrogen
derived from atmosphere (%Ndfa), second fully expanded leaf chlorophyll concentration
(SPAD), response to CBB, and days to flowering (DF). The model for the principle component
analysis, using the standardized values of the selected traits including SNFI was:
𝛼𝑖𝑗 − 𝛽𝑗
𝜎𝑗= ∑ 𝛾𝑛𝛿𝑖𝑛
∗ 𝜌𝑗𝑛∗
2
𝑛=1
+ 휀𝑖𝑗 = ∑ 𝛿𝑖𝑛∗
2
𝑛=1
𝜌𝑗𝑛∗ + 휀𝑖𝑗
where 𝛼𝑖𝑗 is the value of the ith genotype for the jth trait, 𝛽𝑗 is the mean value of all
genotypes for the jth
trait, 𝜎𝑗 is the standard deviation of the jth
trait, 𝛾𝑛 is the singular value for

135
principle component n (PCn), 𝛿𝑖𝑛 is the PCn score for the ith
genotype, 𝜌𝑗𝑛 is the PCn score for
the jth
trait, and 휀𝑖𝑗 is the residual associated with genotype i in trait j. Genotype × Trait biplots
were constructed by plotting PC1 scores against PC2 scores for each genotype and each trait.
5.4 RESULTS
There were significant differences among the RILs and between parental lines (P <0.0001)
for all traits, except for number of days to maturity, across all environments. Even though the
effect of environment was not significant for all traits, G×N(E) and G×E effects in N-fertilizer-
dependent and SNF-dependent environments were significant for all the traits except SPAD. It
indicated that for the traits seed yield, days to flowering, days to maturity, seed protein content,
%Ndfa, CBB infection score, and δ13C genotypes responded differentially to the two N
management strategies (Table 5.1 and Table 5.2). For the variance component analysis and
heritability estimates, based on the amount of rainfall, the environments were categorized into
two groups. The first group was the optimum moisture group, which received more than the 30-
year precipitation average (418 mm), including R11Rh, B13Rh, R11100, and B13100. The second
group was limited moisture (dry) environments of Elora 2012 (E12Rh and E12100) and Belwood
2012 (B12Rh and B12100) with lower than the 30-year precipitation average
In general, traits had higher genetic variances in optimum environments than in the dry
environments. This indicated lower contribution of genetic variance to total phenotypic variation
under moisture stress conditions. The estimates of heritability were low to moderate, ranging
from 0.03 to 33, for traits across all environments. Estimates of heritability were higher in the
optimum environments (ranging from 0.32 to 71) than that of stress (dry) environments (ranging
136
from 0.04 to 13). In the optimum environments, days to flowering, seed yield and %Ndfa had
moderate heritability (ℎ2 = 71%, ℎ2 = 40%, and ℎ2 = 48%, respectively) while days to maturity
had relatively lower heritability estimates (ℎ2 = 14%). In the dry environments, estimates of
heritability were generally lower than in the optimum environments ranging from 4% to 25%
(Table 5.3).
The estimates of the expected genetic gain (𝐺𝐴𝑒) were less than the observed genetic gain
(𝐺𝐴𝑜) at 10% selection intensity for all traits across all environments, regardless of moisture
stress conditions (Table 5.3). Moreover, both 𝐺𝐴𝑒 and 𝐺𝐴𝑜 , for all the traits, were generally
higher in optimum environments than in dry environments. It indicated that selection will be
more effective under optimum environments.
The estimates of SNFI in the population ranged from -40% to 45% (Figure 5.1) with an
average of -0.04%. Using the 95% confidence limits of the mean SNFI values, the RILs were
grouped into 3 categories. The group with SNFI estimates within one confidence limit of the
mean included 14% of the RILs with statistically similar yield in SNF-dependent and N-
fertilizer-dependent environments. The group with SNFI estimates higher than one confidence
limit of the mean included the high SNF parent, Mist, and 27% of the RILs with better yielding
response in SNF-dependent environments. Finally, the group with SNFI estimates lower than one
confidence limit of the mean included the low SNF parent, Sanilac, and 59% of the RILs with
lower yielding ability in SNF-dependent environments than in N fertilizer-dependent
environments.

137
Around 30% of the estimated phenotypic (rp) and 36% of the estimated genetic (rg)
correlations were significant, P < 0.05, (Table 5.4). %Ndfa was significantly and positively
correlated with the number of days to flowering (rp = 0.30 and rg = 0.34, respectively). Seed
yield had a significant and negative genetic correlation with seed protein percentage (rg = -0.51).
Among all traits, SPAD2nd
leaf, taken at 50% flowering, was genetically associated with both seed
yield and %Ndfa (rg = 0.10, P = 0.05; rg = 0.13, P = 0.05). Additionally, there were significant
correlations between δ13
C and seed protein percentage (rp = -0.25, P < 0.01; rg = -0.37, P < 0.05),
and between SPAD2nd
leaf and days to flowering (rp = 0.17, P < 0.05; rg = 0.56, P < 0.05). The
first two PCs of the GT biplot explained a total of 81 % (74 % PC1 and 7% PC2) of the total
variation (Figure 5.2). The cosine of the angle between the vectors of two traits (or genotypes)
approximates the correlation coefficient between the two. The distance of the markers of traits or
genotypes from the origin of the bilpot represents the amount of variation for that trait or
genotype. SNFI among all traits showed the highest diversity. The GT biplot indicated close
association between measures of SNFI and days to maturity, DM, (r = 0.30, P < 0.001) and
clustered with %Ndfa, SPAD, and days to flowering (Figure 5.2).
5.5 DISCUSSION
The objectives of this study were to examine the genetic variation, heritability and the
genetic and phenotypic correlations among seed yield and %Ndfa and related traits in a bi-
parental population of dry bean, in order to investigate the response to direct and indirect
selection for high yield, high SNF potential, and related traits. The plant material was derived
from a cross between previously-identified high- and low-SNF genotypes of dry beans, which

138
together with multi-environment evaluations under SNF-dependent and N fertilizer-dependent
environments provided a range of genetic and environmental variation for the study.
The population was found to have high variation for %Ndfa and related traits in individual
test environments and across environments. Availability of genetic variation along with moderate
to high heritability for the majority of %Ndfa-related traits indicated the feasibility of breeding
for improved SNF potential in common bean. Heritability of a trait is known to predict the
probability of improvement of a phenotypic trait through selection (Robinson et al., 1949), while
the favourable selection environment has often been reported to be one that maximizes the
genetic variation of trait(s) (Ceccarelli et al., 1998). Under optimum moisture environments,
higher genotypic variance and ℎ2 values were observed for all traits than in the dry
environments. This was in agreement with previous reports of lower heritability of the traits
under stress conditions, which is believed to be the reason for higher efficiency of selection
under non stress environments (Eid, 2009; Bänziger et al., 1997; Ceccarelli, 1996; Whitehead
and Allen, 1990; Johnson and Geadelmann, 1989). Therefore, breeders have often argued that
genetic gain from selection for adaptation to both stress and optimum environments will be
higher if performed in favorable or near optimum conditions (Cited by: Ceccarelli et al., 1998).
However, Jinks and Connolly (1973) believed that selection for desirable traits should be
conducted based on average performance in two or more contrasting environments. There are
also other reports indicating higher heritability of the quantitative traits under stress
environments (Bolaños and Edmeades, 1993). Ceccarelli (1987) reported that selection for grain
yield was more efficient under stress conditions than selection under favourable conditions,
when dry areas were the target environment. Van Ginkel (1994), however, argued that lower
heritability of some traits under stress conditions is not a true estimation and it is just because of

139
significant G×E. In our study G×E and G×N(E) were significant for all the traits, with the
exception of SPAD, and ℎ2 was always smaller in the stress environments for all the traits.
Estimates of coefficients of genetic correlation among traits were generally greater than the
corresponding phenotypic correlation coefficients. From these, about 32% were significantly
different from zero. The positive genetic correlation between %Ndfa and days to flowering is of
importance from a physiological point of view. Luthra et al. (1983) reported that any reduction in
the availability of photo-assimilates for nodules may result in reduced nitrogen fixation.
Therefore, higher %Ndfa values could possibly be achieved by longer vegetative stage of growth
because of later flowering time. This is in agreement with findings in SNF studies in pigeon-pea
by Kumar Rao and Drat (1987). Moreover, %Ndfa was found to be positively correlated with
SPAD readings at the flowering stage, which is again in agreement with previous reports in
alfalfa lupin and soybean (Antipchuk et al., 1990), and in peanut (Dinh et al., 2013). The SPAD
was significantly correlated with seed yield, which conforms to previous findings in dry bean
(Güler and Özçelik 2007).
Korkovelos and Goulas (2011) demonstrated the heritable nature of SPAD in maize, which
was confirmed in our study by relatively high broad-sense heritability estimates for this trait.
Therefore, SPAD could be recommended as a possible surrogate measure for indirect selection
for genetic improvement of bean varieties with high SNF and yielding ability. Results are in
agreement with Ramaeker et al. (2013) who believed that SPAD is a desirable phenotyping tool
in breeding for SNF ability improvement, though they indicated that its efficacy for use as an
indirect trait for selecting for SNF ability would only be effective if plants are assessed in a low-
N environments.

140
Negative genetic correlation was observed between seed yield and protein, which was
consistent with previous findings in soybean (Eskandari et al., 2013) and maize (Mural et al.
2012), but did not conform to the report by Kibite and Evans (1984), who indicated that inverse
relationships between seed yield and seed protein content do not have a genetic basis and are
solely phenotypic.
Hafeez et al. (1998) and Appiah et al. (2015) reported a positive correlation between SNF
and seed yield in chickpeas and cowpea, respectively. Our study, however, does not point to any
significant correlation between yield and %Ndfa. Considering that Hafeez et al. (1998) and
Appiah et al. (2015) measured SNF as the amount of N2 fixed per unit area (Nfix) which is
mathematically a function of seed yield (Peoples et al., 2002), it can be expected that the two
characteristics would be highly correlated. In our study, on the other hand, SNF was measured as
the percentage of N derived from atmosphere (%Ndfa) in the seed, which is independent of seed
yield. Van Kessel and Hartley (2000) suggested that N2 fixation and seed yield are significantly
correlated in low-stress, high-yielding, environments. If N2 fixation supplies plant N demand
over the seed filling period, then seed yield will increase. When overall N supply through N2
fixation cannot meet plant requirements during seed filling, N will be remobilized from leaves to
the grain. Remobilization of N from the leaves will limit the photosynthetic capacity of the
canopy and in turn restrict the seed yield. Therefore, fluctuation of the ability of N2 fixation to
supply N needs of plants could explain lack of significant correlation between seed yield and
%Ndfa in our experiment.
Fageria et al. (2014), in a greenhouse study, identified bean genotypes with higher yielding
ability in a SNF-dependent culture system, compared with N-fertilized conditions. In this study,

141
we simulated SNF-dependent and N fertilizer-dependent management systems, in the field, by
either applying rhizobia or fertilizer at selected field sites with low soil nitrogen availability.
Using the overall yield data of genotypes in SNF-dependent and N fertilizer-dependent
environments, we computed a selection index (SNFI) which was used to identify lines with high
yield under SNF-dependent environments. Results not only identified relatively high performing
RILs in SNF-dependent compared to N-fertilizer-dependent conditions, but also confirmed the
relatively stable nature of SNFI, which can be used as a selection index in improving SNF
potential in dry bean maintaining the yielding ability of genotype. Even, more than 12% of the
RILs had high SNFI estimates and consistently performed better in SNF-dependent
environments.
The significant association between SNFI and days to maturity indicated that selection for
improved yield under SNF-dependent environments may result in later maturity. In the GT biplot
the vector of SNFI was in the same direction, and with close association, with the vectors of days
to maturity, %Ndfa, days to flowering, and SPAD, indicating that corelated response to selection
can be expected with selection for any of these traits. Luthra et al. (1983) believed that any
decline in availability of photo-assimilate to nodules could weaken nitrogen fixation. It is also
known that plant source size affects the SNF ability of the plant (Bethlenfalvay et al,. 1978).
Therefore, longer vegetative growth phase, because of later flowering, empowers the ability of
plant to carry out N2 fixation. If greater source size is accompanied by a larger sink size, longer
seed filling period due to later maturity is expected to result in higher SNF potential and higher
leaf N status and subsequently greater yielding ability.

142
In spite of the association of SNFI with maturity, %Ndfa, SPAD, and days to flowering,
and seed yield with SPAD, lack of association between %Ndfa and seed yield may suggest that
selection for high SNF genotypes does not necessarily lead to greater seed yield and that
selection for both traits should be performed simultaneously. Such multiple trait selection can be
done through application of selection indices such as the one used in this study, SNFI, which
imposes selection for high yield and independence from N fertilizers at the same time.
Despite the reports claiming association between resistance to the bacterial pathogen
causing CBB and nodulation traits (Souza et al., 2000; Nodari et al., 1993) our study does not
indicate any association between %Ndfa and CBB resistance, either at the phenotypic or genetic
level. The resistant parent of the population, Mist, is a derivative of inter-specific crosses to P.
acutifolius and P. coccineus, which were performed to introgress CBB resistance into common
bean. Results suggest that despite long-term breeding efforts to improve CBB resistance in
common bean, selection has not had any negative impact on the rate of rhizobial infection and
therefore SNF potential of common bean.

143
Fixed factor† F-test P-value F-test P-value F-test P-value F-test P-value F-test P-value
Genotype (G) 1.68 <.0001 3.94 <.0001 1.14 ns 2.13 <.0001 1.33 0.016
Random factors‡ S2 Se S2 Se S2 Se S2 Se S2 Se
E 0.20ns 0.188 59.41
ns 154.49 10.35ns 11.389 4.31
ns 7.64 0.01ns 0.008
N(E) 0.05ns 0.035 11.73ns 17.859 1.76ns 1.643 1.90ns 2.098 0.01ns 0.006
Blk(E × N ) 0.00ns 0.002 0.00ns 0.000 0.00ns 0.000 0.23ns 0.273 0.06ns 0.054
Iblk(Blk × E×N) 0.00* 0.002 4.46*** 4.111 0.45ns 0.570 1.20*** 0.286 0.00ns 0.000
G × N(E) 0.07*** 0.007 10.82*** 7.559 14.10*** 1.994 0.00* 0.000 0.10*** 0.02
Residual 0.14*** 0.006 92.62*** 4.232 35.91*** 1.764 7.20*** 0.337 0.21*** 0.014
† Genotype main effect ‡ E, N, Blk, iblk are environment, Nitrogen, block, and incomplete block, respectively.ns
Not significant; *, **, and *** are significant at 0.05, 0.01, and 0.001, respectively.
Table 5.1 F -test of the fixed effect of genotype and variance component estimates (S 2 ) and their standard error (Se ) of random effects in the mixed-
model analysis of 140 recombinant inbred lines of a bi-parental population and their parental lines, Mist and Sanilac, and checks tested in multiple location-
years under N-dependent and SNF-dependent environments in Ontario, Canada during 2011-2013.
Seed protein
(%)
Seed yield
(kg ha-1)
Flowering
(days)
Maturity
(days)SPAD

144
Fixed factor† F-test P-value F-test P-value P-value
G 1.3 0.03 1.56 0.001 2.43 <0.0001
Random factors‡ S
2 Se S2 Se S
2 Se
E 20.43ns 18.778 95.41ns 194.490 10.35ns 11.389
Blk (E ) 0.20ns 0.170 0.00ns 0.000 0.00ns 0
Iblk(Blk × E) 0.37ns 0.219 6.48*** 4.111 0.45ns 0.57
G × E 7.47*** 0.716 12.82*** 8.959 14.10*** 1.994
Residual 13.63*** 0.603 102.82*** 6.201 35.91*** 1.764
CBB¶ δ13C# (‰)Ndfa § (%)
Table 5.2 F -test of fixed effect of entry and variance component estimates (S 2 ) and their standard
error (Se ) of random effects in the mixed-model analysis of mapping population and their parents
tested in multiple location-years (environment) at 0-level of N in Ontario, Canada during 2011-2013.
† Genotype main effect
‡ E, N, Blk, iblk are environment, Nitrogen, block, and incomplete block, respectively.
§ Nitrogen derived from atmosphere ¶ Common bacterial blight severity# Carbon discriminationns Not significant; *, **, and *** are significant at 0.05, 0.01, and 0.001, respectively.
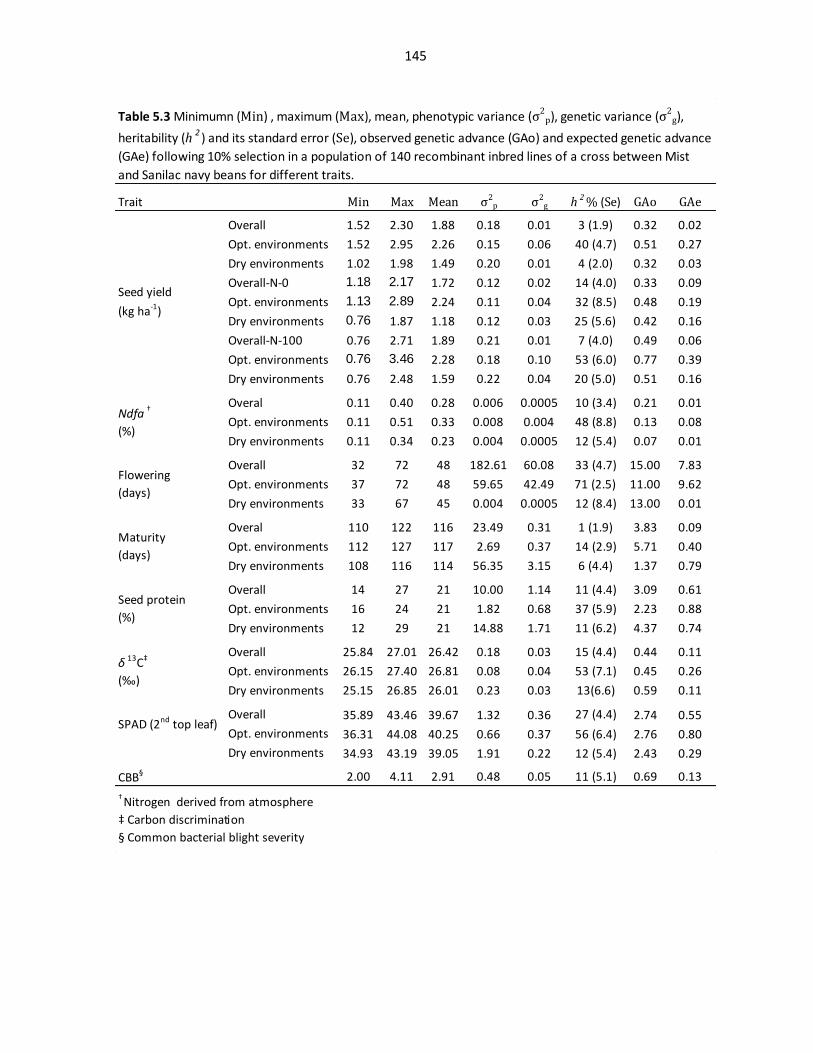
145
Trait Min Max Mean σ2p σ2g h 2% (Se) GAo GAe
Overall 1.52 2.30 1.88 0.18 0.01 3 (1.9) 0.32 0.02
Opt. environments 1.52 2.95 2.26 0.15 0.06 40 (4.7) 0.51 0.27
Dry environments 1.02 1.98 1.49 0.20 0.01 4 (2.0) 0.32 0.03
Overall-N-0 1.18 2.17 1.72 0.12 0.02 14 (4.0) 0.33 0.09
Opt. environments 1.13 2.89 2.24 0.11 0.04 32 (8.5) 0.48 0.19
Dry environments 0.76 1.87 1.18 0.12 0.03 25 (5.6) 0.42 0.16
Overall-N-100 0.76 2.71 1.89 0.21 0.01 7 (4.0) 0.49 0.06
Opt. environments 0.76 3.46 2.28 0.18 0.10 53 (6.0) 0.77 0.39
Dry environments 0.76 2.48 1.59 0.22 0.04 20 (5.0) 0.51 0.16
Overal 0.11 0.40 0.28 0.006 0.0005 10 (3.4) 0.21 0.01
Opt. environments 0.11 0.51 0.33 0.008 0.004 48 (8.8) 0.13 0.08
Dry environments 0.11 0.34 0.23 0.004 0.0005 12 (5.4) 0.07 0.01
Overall 32 72 48 182.61 60.08 33 (4.7) 15.00 7.83
Opt. environments 37 72 48 59.65 42.49 71 (2.5) 11.00 9.62
Dry environments 33 67 45 0.004 0.0005 12 (8.4) 13.00 0.01
Overal 110 122 116 23.49 0.31 1 (1.9) 3.83 0.09
Opt. environments 112 127 117 2.69 0.37 14 (2.9) 5.71 0.40
Dry environments 108 116 114 56.35 3.15 6 (4.4) 1.37 0.79
Overall 14 27 21 10.00 1.14 11 (4.4) 3.09 0.61
Opt. environments 16 24 21 1.82 0.68 37 (5.9) 2.23 0.88
Dry environments 12 29 21 14.88 1.71 11 (6.2) 4.37 0.74
Overall 25.84 27.01 26.42 0.18 0.03 15 (4.4) 0.44 0.11
Opt. environments 26.15 27.40 26.81 0.08 0.04 53 (7.1) 0.45 0.26
Dry environments 25.15 26.85 26.01 0.23 0.03 13(6.6) 0.59 0.11
Overall 35.89 43.46 39.67 1.32 0.36 27 (4.4) 2.74 0.55
Opt. environments 36.31 44.08 40.25 0.66 0.37 56 (6.4) 2.76 0.80
Dry environments 34.93 43.19 39.05 1.91 0.22 12 (5.4) 2.43 0.29
CBB§ 2.00 4.11 2.91 0.48 0.05 11 (5.1) 0.69 0.13
† Nitrogen derived from atmosphere
‡ Carbon discrimination
§ Common bacterial blight severity
Table 5.3 Minimumn (Min) , maximum (Max), mean, phenotypic variance (σ2p), genetic variance (σ
2g),
heritability (h 2 ) and its standard error (Se), observed genetic advance (GAo) and expected genetic advance
(GAe) following 10% selection in a population of 140 recombinant inbred lines of a cross between Mist
and Sanilac navy beans for different traits.
Seed yield
(kg ha-1)
SPAD (2nd top leaf)
Ndfa †
(%)
Flowering
(days)
Seed protein
(%)
Maturity
(days)
δ 13C‡
(‰)

146
0
Maturity
(days)Ndfa
(%)†
SPAD 2nd
top leaf
δ 13 C
(‰)
Protein
(%)CBB ††
Flowering
(days)
r p -0.10 0.09 0.04 0.13 0.14 0.19** -0.24
r g -0.03 0.14 0.10* 0.23 0.51* 0.19 0.44
r p 0.19* -0.01 0.04 0.12 -0.09 0.35*
r g 0.27 0.23* 0.03 0.14* 0.40 _
r p 0.11 0.009 0.01 -0.05 0.30*
r g 0.13* 0.10 0.21 0.26 0.34*
r p 0.06 0.14 -0.10 0.17*
r g0.31* 0.07 0.03 0.56*
r p 0.25** 0.11 0.16*
r g 0.37* 0.30 0.18
r p 0.05 0.07
r g 0.07 0.08
r p 0.18*
r g 0.30
† Correlations involving Ndfa , N2 fixationand δC were estimated using data from only the SNF-dependent
environments data.
†† Corrlations involving CBB was consisted of the data from 3 years of data taken in CBB nursery at Harrow,
Ontario and Processing Crops Research Centre, Agri-Food Canada Research Centre, Harrow, Ontario, Canada.
* and ** are significant at 0.05 and 0.01, respectively. Significant r P tested by the Student’s t test. Significance of
r g was tested by estimating 95% confidence limits of the rg estimates, rg intervals that did not include zero were
considered significantly different from zero.
δ 13C (‰)
CBB
Table 5.4 Phenotypic (r p ) and genetic (r g ) correlations among grain yield and other traits estimated in a
population of 140 recombinant inbred lines ofa a cross between Mist and Sanilac navy beans tested in multiple
environments in Ontario, Canada during 2011-2013.
Protein (%)
Seed yield
(kg ha-1)
Maturity
(days)
Ndfa (%)
SPAD 2nd
top leaf

147
Figure 5.1 SNF relative efficiency index % (SNFREI) of 140 mapping population and their parents tested across multiple location-years at two N-levels of 0 ,with inoculation, and 100 kg N ha-1, without inoculation, in Ontario, Canada during 2011-2013. Group i,SNFRI = 0, same yielding response of genotype(s) to N application and inoculation; group ii, SNFREI > 0 , bettr yielding response of genotype(s) to inoculation than that of N application; group iii, SNFREI < 0 , better yielding respose of genotype(s) to N application than that of inoculation.

148
Figure 5.2 Genotype by Trait (GT) biplot based on common bacterial blight (CBB), seed yield, symbiotic nitrogen fixaion
effeciency index (SNFI ), nitrogen derived from atmosphere (Ndfa ), second fullly expanded lef chlorophyl concentration
(SPAD), and days to flowering data on a population of 140 recombinant inbred lines derived from a cross between Mist
and Sanilac navy beans, their parental lines, and checks tested in eight environments under two nitrogen systems, N-
dependent and SNF-dependent conditions, in Ontario, Canada.

149
CHAPTER 6
Quantitative Trait Loci for Symbiotic Nitrogen Fixation and Related Traits in Common Bean
(Phaseolus vulgaris L.)

150
6.1 ABSTRACT
A study was conducted to better understand the inheritance of symbiotic nitrogen fixation
(SNF) and related traits in a bi-parental F4:5 recombinant inbred line (RIL) population (n = 140) of a
cross between low- and high-SNF Middle American common bean (Phaseolus vulgaris L.)
genotypes ’Sanilac’ and ’Mist’. The RILs were phenotyped for the percent nitrogen derived from
the atmospheric air (%Ndfa) and SNF-related traits in multi-environment field trials and for
nodulation potential in growth room assays. The population was also genotyped with genome-wide
single nucleotide polymorphic (SNP) markers. Composite interval mapping detected a total of 42
QTL significantly associated with %Ndfa and related traits. A QTL on Pv08 was repeatedly
detected in different tests, accounting for 19% of the phenotypic variation in %Ndfa. Moreover,
smaller effect QTL were detected for %Ndfa on PV01 and Pv07 accounting for up to 15% of the
variation in optimum and low rain fall environments. The Pv07 QTL for %Ndfa was in genetic
linkage with QTL for carbon isotope discrimination (δ13
C), an indicator of water use efficiency
(WUE), suggesting either a pleiotropic effect or linkage of genetic factors influencing both traits.
Three candidate genes associated with QTL for %Ndfa were identified in the genomic region of the
%Ndfa QTL on Pv08. These candidate genes encode SNARE-associated Golgi, 14-3-3, alcohol
dehydrogenase related protein family, auxin responsive protein, and Leucine-Rich Repeat
Receptor-Like Protein Kinase.

151
6.2 INTRODUCTION
The biological process of converting atmospheric nitrogen (N2) into ammonia through
symbiotic relationship between legumes and nitrogen fixing bacteria is referred to as symbiotic
nitrogen fixation (SNF). This beneficial role of legumes in rotation or in companion cropping with
other species has been known since the ancient times (Burris, 1974), even though the biology of
SNF was not well understood until the 1960s when the first successful experiments with cell-free
extracts of nitrogen-fixing bacteria were reported by Carnahan et al. (2005). Cropping systems
involving N2-fixing legumes offer opportunities to reduce inorganic nitrogen (N) fertilizer
application and improve the overall nitrogen use efficiency of the cropping systems.
Common bean (Phaseolus vulgaris L.), with a global production of 2.28×10⁶ tons of dry
beans and 21.36×10⁶ tons of green beans on 29.05×10
6 ha and 1.54×10
6 ha of land, respectively, in
2013, (FAOSTAT; 2015) is the third worth widely grown grain legume after soybean and peanuts.
Common bean supplies 20% of the protein consumed by people around the world, and is also a rich
source of low-fat carbohydrates, fiber (Díaz-Batalla et al., 2006), folate (Hefni et al., 2010) and
minerals such as calcium, zinc, copper, potassium, iron and phosphorous (Ribeiro et al., 2012).
Nevertheless, among members of the legume family, the common bean is known to have
relatively lower SNF ability (Martínez and Roméro, 2003; Isoi and Yoshida, 1991), often receiving
inorganic nitrogen fertilizer to supply its N demands. Reports of genetic diversity among dry bean
genotypes for SNF potential (Farid and Navabi 2015; Bliss et al., 1993; Kumarasinghe et al. 1992;
Miranda et al. 1991; Graham, 1981), however, support the idea that the SNF potential of common
bean can be improved through breeding. Such improvements, if achieved, are expected to

152
contribute to development of more sustainable and environment-friendly cropping systems,
especially in low-input cropping systems.
A number of studies have attempted to identify quantitative trait loci (QTL) in legumes,
mostly with a central focus on SNF-related traits, particularly nodule wt., number and size. Hwang
et al. (2014) reported eight QTL in a soybean (Glycine max (L.) Merr.) recombinant inbred line
(RIL) population associated with nodule number and seven QTL for nodule size. Santos et al.
(2013), also working with soybean, detected three QTL for nodule number and one QTL for the
ratio of nodule dry weight to nodule number. Nicolas et al. (2006) reported two QTL, explaining up
to 15 % of the phenotypic variation for nodule number and dry wt. in a soybean RIL population.
Bourion et al. (2010) reported nine QTL for nodule number and four QTL for nodule dry weight in
a pea (Pisum sativum L.) RIL population.
In common bean, Nodari et al. (1993) detected four QTL for nodule number on Pv01, Pv03
and Pv07 in a RIL population derived from an inter-gene pool cross between a low nodulating
Middle American small seeded bean (BAT93) and a high nodulating large seeded Andean bean
(Jalo EEP558). The study also reported that one of the Pv07 QTL was significantly associated with
resistance to common bacterial blight (CBB; caused by Xanthomonas campestris bv. phaseoli).
Later on, Tasi et al. (1998) screened the same RIL population in two different N levels and
confirmed the pervious findings by Nodari et al. (1993) under low N availability conditions. They
also reported another QTL for nodule number on Pv04 under high levels of N. Souza et al. (2000)
identified 15 markers associated with nodule number on seven linkage groups in the same BAT93 x
Jalo EEP558 population under low N.
Souza et al. (2000) identified four QTL associated with both nodule number and CBB
resistance and concluded that the QTL for nodule number and CBB resistance in common bean
153
may have the same genetic origin. They indicated that the stability of these QTL was a function of
the adaptability of genotypes to diverse soil fertility. Ramaeker et al. (2013) studied nodulation
traits of nodule number (NN) and nodule dry weight (NDW) in a RIL population generated from a
cross between a Middle American genotype and an Andean dry bean genotype, G2333 × G19839,
respectively. They reported two QTL for NDW on chromosomes 3 and 4 and two QTL associated
with NN located on chromosomes 3 and 5 from their studies in a greenhouse. In the most recent
Kamfwa et al. (2015) studied nodulation traits of NDW and NN on a diverse panel of Andean dry
bean genotypes. They reported two QTL; both were located on chromosome 9, with up to 12 %
explanation of the variability for NN in one year of a two years field trial.
Even though there have been several QTL mapping studies on nodulation traits in legume
crops, only a limited number of studies report QTL for SNF traits. Tanya et al. (2005) reported two
QTL associated with plant acetylene reduction activity (ARA), as a measure of SNF potential in
soybean. A QTL for ARA was also reported by Tominaga et al. (2012) on chromosome 4 of the
model legume, Lotus japonicas, with pleiotropic effect on SNF and nodule weight. Even though
application of ARA as a measure of SNF potential of legumes is known as a simple, quick and
inexpensive method (Hardey et al., 1973), it has been criticized for its accuracy in field studies
(Boddey, 1987). These criticisms arose from difficulties with root sampling, frequent calibration
requirements (Unkovich et al., 2008), and high sensitivity of ARA to environmental conditions
especially soil moisture (Huang et al., 1975).
A more efficient method of SNF measurement in the field is the natural 15
N abundance
(Shearer and Kohl, 1986). Ramaekers et al. (2013) studied the QTL associated with SNF, estimated
using the natural 15
N abundance method, and related traits in a RIL population derived from a cross
between a high SNF Middle American climbing bean genotype (Graham and Halliday 1976;
154
Graham and Rosas 1977; Kumarasinghe et al. 1992) and a low SNF bush type Andean genotype.
The study identified two QTL accounting for up to 21% of phenotypic variation in nitrogen (N %)
in whole plants, shoots and roots, in the greenhouse. One of the two QTL overlapped with a QTL
identified for total N content in a one location-year field trial in a different population. In another
greenhouse experiment, they detected two QTL on Pv01 and Pv04 accounting for up to 18% of
variation in total plant N fixed. Most recently, Kamfwa et al. (2015) detected significant QTL on
chromosomes 3 and 9 for nitrogen derived from atmosphere (%Ndfa) in the shoot at flowering, and
for %Ndfa in seed and chromosome 7 for %Ndfa in the shoot at flowering, in an Andean diversity
panel, in one field environment (location- year) out of two field environments.
The majority of genetic studies of either SNF or its related traits in dry bean have been
conducted using the progeny of inter-gene pool bi-parental crosses between Middle American and
Andean genotypes. This has mainly been done to take advantage of a greater genetic diversity
between the two genepools. However, phenotypic abnormalities and reduced productivity of
progenies are the main concerns with inter-genepool crosses (Johnson and Gepts, 1999), which may
have affected the ultimate results of these studies. Moreover, not only for common bean, but also
for all other legumes most genetic studies of SNF have been conducted in controlled conditions,
with only a few studies considering SNF measurement in the field in a limited number of
environments (Ramaekers et al. 2013; Kamfwa et al., 2015).
Unlike previous studies, we examined a RIL population derived from an intra-genepool cross
between two Middle American bean genotypes, which were previously identified as high- and low-
SNF genotypes, tested in multi-environment field and growth room trials. The objectives of this
study were to investigate the QTL for SNF and related traits and to identify candidate genes in the
identified QTL regions.

155
6.3 MATERIALS AND METHODS
6.3.1 Plant materials
A population of 140 F4:5 RILs of a cross between two Middle American navy bean varieties
‘Mist' and ‘Sanilac’, the two parental lines, the non-nodulating mutant, R99 (Park and Buttery,
1997) and its wild type ‘OAC Rico’ (a total of 144 entries) were included in this study. The
parental lines of the RIL population were chosen based on their significant difference in SNF
ability detected in previous studies. Mist is an indeterminate upright navy bean, which was found to
be a high SNF genotype in our previous work (Farid and Navabi 2015), while Sanilac (Anderson et
al., 1960) is a determinant bush type bean, reported to be a low SNF genotype (Bliss, 1993; Farid
and Navabi 2015).
6.3.2 Growth-room assay
Four seeds of each genotype were planted in 1-L plastic pots with drainage holes, filled with
an N-free medium, MVP Turface (Profile Products, LLC 750 Lake Cook Rd, Suite 440 Buffalo
Grove, IL 60089); with a pH of 6.7 in a growth-room at the University of Guelph. Seeds were
inoculated, immediately prior to planting, with a peat based culture of rhizobia, at the rate of 2.5 g
of Rhizobium leguminosarum bv. phaseoli in a commercial product (Becker Underwood,
Saskatoon, Saskatchewan, Canada) per kg of seed to give approximately 5×10⁵ bacteria/seed.
Growth-room day/night temperature was 25/18°C. Day length was set to 16 h using overhead light
with the flux of photosynthetically active radiation (PAR) of approximately 250 μmol m-2
s-1
.
Approximately two weeks after planting, seedlings were thinned to one per pot. The experimental
design was a randomized complete block design (RCBD) with six replicates planted sequentially
with a 5 to 10-d interval between replicates from January to December 2013, in order to spread the

156
workload. Plants were kept well-watered at all times by using daily subsurface drip irrigation
through two vinyl tubes for each pot, equipped with one 12.5-cm slotted drip spike. A nitrogen free
fertilizer containing H3PO4 (18.7 g L-1
), KHCO3 (37.5 g L-1
), MgSO4 7H2 (3 g L-1
), 3 g L-1
chelated
micronutrient mixed (Plant Products Co. Ltd., Brampton, Ontario, Canada) was added to irrigation
water, in 200-ml of a 1% solution, once a week after the first trifoliate was fully-expanded.
Twelve SPAD readings were recorded from the 3rd
trifoliate of each plant, with four readings
on each leaflet, using a SPAD 502 meter (Spectrum Technologie, Inc., Aurora, USA). The
experiment was terminated 42 days after planting at the onset of flowering. Plants were harvested
and roots were thoroughly washed. Next, nodule numbers were counted and nodules were dried in
a forced air oven at 80oC for about 48 h and 100-nodule dry weight and nodule unit weight as the
ratio of nodule weight to nodule number were determined.
6.3.3 Field assay
Field trials were conducted in a total of four environments during 2011 to 2013 in field sites
chosen based on their low N availability, following soil analysis performed prior to planting in
addition to having had no dry bean or soybean history for at least 10 years prior to the experiment.
Test environments were a farmer’s fields near Rockwood (43o39’56”N, -80
o9’54”W, elevation 353
m) in 2011, a farmer’s field near Belwood (43o40’16”N, -80
o11’34”W, elevation 430 m) and the
University of Guelph Elora Research Station (43°38'27.8"N 80°24'20.4"W, 379 m) in 2012, and a
farmer’s field near Belwood (43o40’16”N, -80
o11’34”W, elevation 430 m) in 2013, all in the Grey-
brown luvisols soil zone, in Ontario, Canada. Based on the climatic data obtained from the weather
stations closest to the field sites, Rockwood 2011 and Belwood 2013, with total precipitation of
473 mm and 579 mm, receptively, of rain during the growing season, had higher than the 30 year
average and were considered optimum soil moisture environments, while both locations in 2012

157
had less than the 30-year average (Belwood with 349 mm and Elora with 292 mm precipitation
during the growing season) and were considered dry environments.
All field sites were sprayed, pre-planting, with S-metolachlor (Syngenta Crop Protection
Canada, Inc., Guelph, Ontario), Imazethapyr Pursuit (BASF Canada, Mississauga, Ontario ) and
Trifluralin (Dow AgroSciences Canada Inc., Calgary, Alberta) at the rate of 2.3 L ha-1
, 200 mL
ha-1
and 1.5 L ha-1
, respectively. The experimental design in each site was a 12 ×12 partially
balanced lattice with two replications. The field was fertilized with 200 kg ha-1
of N free 0-20-20 of
N-P-K fertilizer to supply plants with 40 kg ha-1
of P2O5 and K2O at the time of planting. One
hundred and thirty five seeds of each genotype were inoculated, immediately prior to planting, with
a peat based culture of rhizobia, at the rate of 2.5 g of Rhizobium leguminosarum bv. phaseoli
commercial product (Becker Underwood, Saskatoon, Saskatchewan, Canada) per kg of seed to give
approximately 5×10⁵ bacteria/seed. Inoculated seeds were planted using a plot-planter (Fabro
Enterprise limited, Swift Current, Saskatchewan, Canada) in 4-row, 2.7 m long plots with 36 cm
row-spacing in the second week of June of each year.
As a measure of leaf chlorophyll concentration, leaf greenness was recorded using a SPAD
502 Chlorophyll Meter at 50% flowering from the second top-most fully-expanded leaf between
9:00 am and 5:00 pm. Four observations were recorded for each leaflet on three plants in each
experimental unit. Days to flowering and physiological maturity were recorded as the number of
days from planting to 50% flowering and the day when 50% of pods turned yellow, respectively.
At harvest maturity (18 -20 % seed moisture content), all plants in each plot were harvested using a
Wintersteiger plot combine (Wintersteiger AG, Upper Austria, Austria) with a Classic Seed-Gauge
weighing system by Harvest-Master (Juniper Systems Inc., Utah, USA) and plot seed weight and
moisture content were recorded. Two sub-samples (200 g each) of seeds harvested from each plot

158
were dried in a forced air oven at 60oC for about 48 h and seed protein percentage were measured
on one of the samples using a Near Infrared (NIR) Portable Seed Analyzer model Zx50 (Zeltex,
130 Western Maryland Parkway, Hagerstown, MD, USA) on a moisture-free basis. A seed sub-
sample of 94 randomly selected RIL, the two parental lines, and the non-nodulating mutant, R99
were ground finely and passed through a 100 mesh sieve. Afterwards, 5 to 6 mg of ground seed
sample was weighed into a tin capsule (8×5 mm; Isomass Scientific Inc. 140, 5700 - 1st Street
S.W., Calgary, AB. Canada) and closed, compressed and placed in 96-well micro plates. Samples
were shipped to the Agriculture and Agri-Food Canada, Lethbridge Research Centre (Lethbridge,
Alberta, Canada) to determine 15
N abundance (δ15
N) and carbon isotope discrimination value
(δ13
C) using gas chromatography-mass spectrometry (GC-MS) following the methods explained by
Shearer and Kohl (1993) using the light glutamic acid, NIST-8573, (NIST, National Institute of
Standards and Technology, Bureau Drive, Stop 1070, Gaithersburg, MD, USA) in the same kind
and size of capsules.
Percent nitrogen derived from the atmosphere (%Ndfa) was calculated for each experimental
unit following the equation given by Shearer and Kohl (1986) as:
%𝑁𝑑𝑓𝑎 =(𝛿15𝑁𝑟𝑒𝑓. 𝑝𝑙𝑎𝑛𝑡−𝛿15𝑁𝑁 𝑓𝑖𝑥𝑖𝑛𝑔 𝑝𝑙𝑎𝑛𝑡)
(𝛿15𝑁𝑟𝑒𝑓. 𝑝𝑙𝑎𝑛𝑡 − B)
where δ15
Nref. plant is δ15
N for reference plant, the non-nodulating mutant R99 (Park and Buttery,
1997), δ15
Nfixing plant is the δ15
N of the dry bean genotype and B is the δ 15
N value of the legume
grown obtaining its entire N from N2 fixation in an N-free medium. The B-value was obtained, as
proposed by Peoples et al. (2009), by taking the average of δ15
N measurements of a total of 20
randomly selected bean genotypes grown in an N free medium in a greenhouse at the University of
Guelph, Guelph, Ontario, Canada.
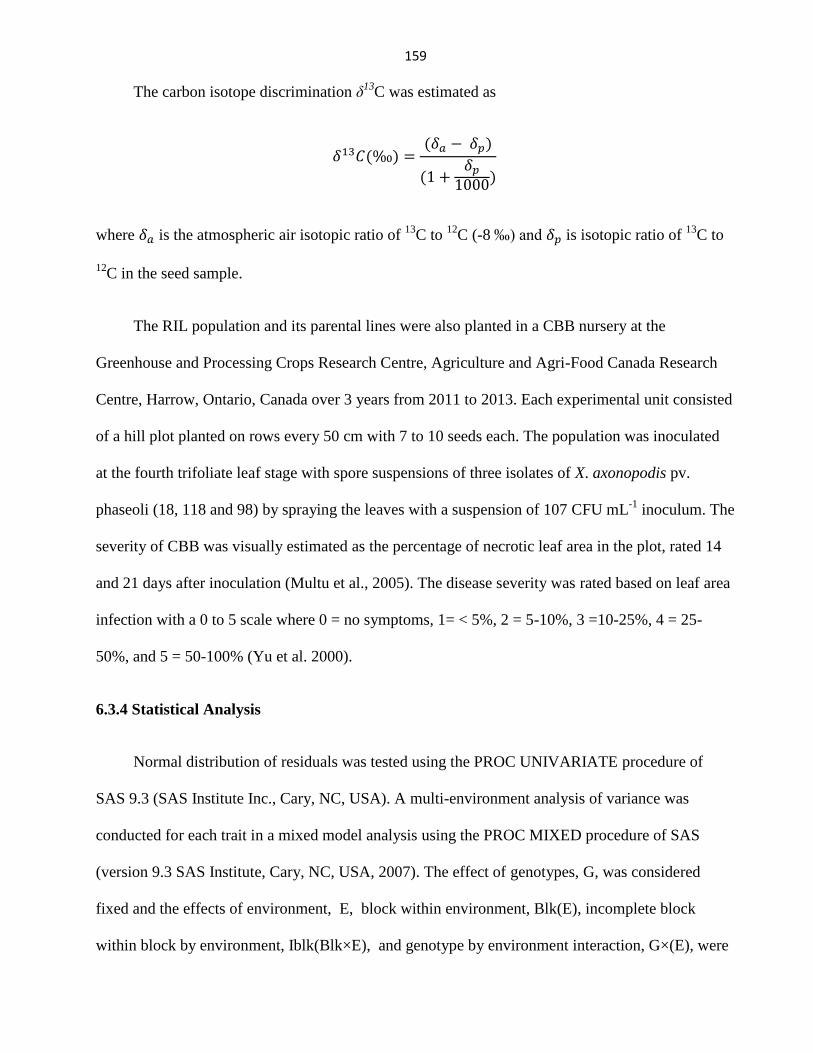
159
The carbon isotope discrimination δ13
C was estimated as
𝛿13𝐶(‰) =(𝛿𝑎 − 𝛿𝑝)
(1 +𝛿𝑝
1000)
where 𝛿𝑎 is the atmospheric air isotopic ratio of 13
C to 12
C (-8 ‰) and 𝛿𝑝 is isotopic ratio of 13
C to
12C in the seed sample.
The RIL population and its parental lines were also planted in a CBB nursery at the
Greenhouse and Processing Crops Research Centre, Agriculture and Agri-Food Canada Research
Centre, Harrow, Ontario, Canada over 3 years from 2011 to 2013. Each experimental unit consisted
of a hill plot planted on rows every 50 cm with 7 to 10 seeds each. The population was inoculated
at the fourth trifoliate leaf stage with spore suspensions of three isolates of X. axonopodis pv.
phaseoli (18, 118 and 98) by spraying the leaves with a suspension of 107 CFU mL-1
inoculum. The
severity of CBB was visually estimated as the percentage of necrotic leaf area in the plot, rated 14
and 21 days after inoculation (Multu et al., 2005). The disease severity was rated based on leaf area
infection with a 0 to 5 scale where 0 = no symptoms, 1= < 5%, 2 = 5-10%, 3 =10-25%, 4 = 25-
50%, and 5 = 50-100% (Yu et al. 2000).
6.3.4 Statistical Analysis
Normal distribution of residuals was tested using the PROC UNIVARIATE procedure of
SAS 9.3 (SAS Institute Inc., Cary, NC, USA). A multi-environment analysis of variance was
conducted for each trait in a mixed model analysis using the PROC MIXED procedure of SAS
(version 9.3 SAS Institute, Cary, NC, USA, 2007). The effect of genotypes, G, was considered
fixed and the effects of environment, E, block within environment, Blk(E), incomplete block
within block by environment, Iblk(Blk×E), and genotype by environment interaction, G×(E), were

160
considered random. The COVTEST statement was used to estimate the standard error (Se) for the
variance of the random effects and to examine their significance using a standardized normal Z
distribution. The fixed effect test of significance was done using the F-test of type III sums of
squares. Least squared means (LSmeans) were computed for the fixed effects using the LSMEANS
statement in SAS. The standard errors of LSmean values were estimated and pair-wise test of
significant differences were performed using the PDIFF option.
6.3.5 Genotyping
The population was grown in a growth room at the University of Guelph. At the second
trifoliate, the first few leaves of 94 RILs, which were randomly chosen for SNF assays, along with
the parents were collected for DNA isolation. Collected samples were transferred to liquid nitrogen
and stored at -80 °C in a freezer. About 0.5g of each sample was ground in liquid nitrogen.
Genomic DNA was extracted using the method explained by Yu et al. (1999). Genomic DNA of
each RIL was used for genotyping with a total of 6166 SNP markers. The Pv768 common bean
Illumina GoldenGate array (Illumina Inc., San Diego, CA) developed at the University of
Saskatchewan, Canada (Kirstin Bett, unpublished) and the Pv5398 common bean Illumina
GoldenGate array (Illumina Inc., San Diego, CA; Schmutz, et al. 2014) were used for genotyping.
Genotyping with Pv768 was performed at the University of Saskatchewan, while genotyping with
5398SNP markers was performed at the McGill University Genome Québec Innovation Center.
Genotyping was carried out according to the standard assay protocol
(http://www.illumina.com/technology/goldengate_ genotyping_ assay.ilmn). Products generated by
this assay were read with an Illumina HiScan (Illumina Inc., San Diego, CA) and the resulting data
were clustered for allele calling using GenomeStudio software version 2010.3 (Illumina Inc., San
Diego, CA). Allele calls were visually inspected for errors in automatic allele calling and corrected

161
where deemed necessary. Any calls that were not clearly one allele or the other were reported as
missing data to avoid errors.
6.3.6 Linkage mapping and QTL analysis
The software JoinMap 4.0 (Van Ooijen, 2006) was used to construct a linkage map of the
polymorphic SNP markers. The segregation rate of markers was first tested in Joinmap 4.0 and
distorted markers (chi-square threshold of 0.01) were omitted from further analysis. The LOD
(logarithm of odds) score of 5.0 was set as the minimum LOD score, Kosambi as the mapping
function, and regression mapping as the mapping algorithm to construct linkage groups. After
grouping, MapChart (Voorrips, 2002) was used to make linkage group figures. The genetic linkage
maps were aligned with the physical map of the SNPs based on their positions as identified in a
BLAST search in the Phaseolus Bean Genome sequence (Goodstein et al., 2011) in MapChart 2.3
using the chart option of Homol-1 as described by Voorrips (2002). QTL designations were
assigned following Pedrosa-Harand et al.(2008).To examine the associations between phenotypic
values and genotypes, composite interval mapping (CIM; Zeng, 1993; 1994) was performed in
WinQTL Cartographer Version 2.5 (Wang et al., 2011). For CIM, permutation tests (1000
permutations, α = 0.05) were used to determine the threshold values of the likelihood ratio (LR)
values, for each trait (Churchill and Doerge, 1994; Doerge and Churchill, 1996). Then LR values
were converted to LOD scores as explained by Lander and Botstein (1989). The CIM analysis was
performed using the standard model (Model 6) with a walk speed of 1 cM and forward-backward
stepwise regression to set the number of marker cofactors. The cofactors within 10 cM on either
side of the QTL were excluded from the model. All linkage groups and QTL were visualized using
MapChart 2.2 (Voorrips, 2002).

162
6.3.7 Candidate Gene Identification
The P. vulgaris reference genome sequence version 1.0, developed by Schmutz et al. (2014),
available at: http://www.phytozome.net [accessed 20 April 2015], was used to search for candidate
genes within the immediate genomic region (±20 kb) in the vicinity of the marker at the peak LOD
score value of the most repeatable QTL, within and across all field environments. The Jbrowse in
Phytozome v10.1 was conducted to browse the genome to search for the potential candidate genes
for %Ndfa.
6.4 RESULTS
6.4.1 Phenotypic data analysis
Significant genotypic variation (Table 6.1 and 6.2), highly significant genotype ×
environment interactions (Table 6.1), continuous frequency distributions, and transgressive
segregation were observed for %Ndfa and the other traits (Figure 6.1). The two parental lines were
significantly different for all traits. Sanilac had significantly higher nodule number in the growth
room assays, CBB severity, and carbon isotope discrimination (δ13
C), and significantly lower
%Ndfa, 100-nodule weight, SPAD reading and seed yield, as well as earlier flowering date than
Mist across all environments and in every single location-year.
6.4.2 Linkage map
From the total of 6166 SNP markers, 1203 SNPs were polymorphic between the two parental
lines. From these, 39 remained unlinked. The linkage map consisted of 11 linkage groups. These
linkage groups comprised 198 and 966 polymorphic SNP markers from Pv768 and Pv5398 panels,
respectively. The total map distance was 3200 cM with an average interval of 3.6 cM between
163
adjacent markers and a per-chromosome map distance ranging from 19 cM (Pv10) to 498 cM
(Pv02). Linkage and physical maps were reasonably aligned for most chromosomes except Pv02
and Pv07, in which a 20-cM and a 90-cM region, respectively, were found to be reversed.
6.4.3 QTL mapping
A total of 42 significant QTL was identified throughout the 3-year field and growth room
assays (Table 6.3). These QTL were distributed on 10 out of 11 linkage groups with the presence of
clusters of QTLs in different chromosomal regions (Figure 6.2).
6.4.3.1 Chlorophyll concentration (SPAD)
Four QTL were detected for SPAD on Pv02, Pv03, Pv06 and Pv08, designated SPAD2,
SPAD3, SPAD6, and SPAD8 with significant negative additive effects -1.7, -1.3, -2.1, and -2.0,
respectively. These QTL explained 13%, 11%, 13% and 19% of the variation, respectively, in
SPAD readings in the growth room. Although none of these QTL were associated with SPAD in
the field assays, two QTL on Pv07 and Pv11, SPAD7 and SPAD11, respectively, were detected
(LOD>3.0) for SPAD across field environments accounting for 14% and 13% of the variation. The
QTL associated with SPAD in the field had positive additive effects of 0.31 and 0.61 while QTL
for SPAD in the growth room had negative additive effects.
6.4.3.2 Nodule traits
Four QTL were detected (LOD > 3) for number of nodules in the growth room. Two of
these QTL, NN9.1 and NN9.2 were on Pv09, in repulsion phase, 84.9 cM apart. The markers
closest to the peak LOD value of the two QTL were “sc00016ln1258381_645222_T_G_
26331833” and “sc00030ln901868_598673_A_C _40799116”, with additive effects 33 and -31on

164
number of nodules, respectively, accounting for 11% and 9% of the phenotypic variance. The other
two QTL, NN1 and NN4, were on linkage groups Pv01 and Pv04 accounting for 11% and 15% of
the variation, respectively, and with additive effects 37 and -46 on nodule numbers.
Nodule weight and number in the field assays were only measured in Rockwood 2011. No
significant QTL were detected for nodule weight in the field. However, a QTL on Pv08, NN8, was
significant for nodule number, with additive effect of 14 nodules and accounting for 15% of the
variation.
6.4.3.3 Flowering date
Three QTL were detected on Pv01, Pv08 and Pv11 with significant effect on flowering date
including DTF1, DTF8 and DTF11, respectively. From these, the QTL on Pv08, DTF8, reduced the
flowering time by 4 days (LOD=3.2), accounting for 12 % of the variation. The other two QTL on
Pv01 (LOD=4.0) and Pv11 (LOD=5.0) delayed flowering date by 4 and 5 days, respectively.
6.4.3.4 Maturity
One QTL, MT9, was found significantly associated with number of days to physiological
maturity across all environments. This QTL on Pv09 (LOD = 3.2) accounted for 13% of the
phenotypic variation with an additive effect of 1.3 days. The marker sc00105ln590179_432554_
A_G_94086672 was closest to the peak LOD score for this QTL.
6.4.3.5 Common bacterial blight
Three QTL of CBB3, CBB5, and CBB8 on Pv03, Pv05 and Pv08, respectively, were
significantly associated with common bacterial blight resistance, accounting for 13%, 13% and
17% of variation, respectively. From these, CBB3 on Pv03 had a positive additive effect of 0.3 and

165
the other two QTL CBB5 and CBB8, located on Pv05 and Pv08, respectively, had negative additive
effect values of 0.2 and 0.13, respectively.
6.4.3.6 Carbon isotope discrimination
For Carbon isotope discrimination (δ13
C), as an indicator of water use efficiency (Farquhar et
al., 1989), two QTL were detected on Pv01, ∆1, and Pv07, ∆7, each accounting for 13% and 11% of
the phenotypic variation. The ∆1 had a positive additive effect of 0.11 % and the ∆7 had a negative
additive effect of -0.08 % on δ13
C.
6.4.3.7 Seed protein content
Seven QTL were detected on 4 different chromosomes for seed protein content including
PRO4, PRO6, PRO7.1, PRO7.2, PRO7.3, PRO7.4, and PRO9. Of these, four were on Pv07
spanning a 29 cM region, one of which, PRO7.1, with LOD=8.0 being a major QTL accounting for
23% of the phenotypic variation with an additive effect of 0.49 %. Among the other Pv07 QTL two,
PRO7.2 and PRO7.4, had negative additive effects accounting for 11% and 15% of the variation,
respectively, and PRO7.3 had an additive effect of 0.51%, accounting for 22% of variation. Other
QTL were detected on Pv04, PRO4, Pv06, PRO6, and Pv09, PRO9, accounting for 17%, 15% and
10% of the variation. They had significant additive effects of 0.56%, 0.58% and -0.46%,
respectively.
6.4.3.8 Seed yield
Six QTL were detected significantly associated with seed yield (LOD > 3.0) on 6
chromosomes, including Pv02, Pv03, Pv04, Pv06, Pv07, and Pv11. From these, 3 QTL SY2 on
Pv02, SY4 on Pv04, and SY6 on Pv06, were significantly affecting seed yield in low rain fall

166
conditions of Belwood and Elora 2012. SY2 on Pv02 accounted for 14% of variation, and could be
considered as a major QTL for seed yield in dry conditions. The other QTL SY2.2 on Pv02, SY4 on
Pv04, SY6 on Pv06, accounted for 11%, 14%, and 11%, respectively, of seed yield variations in dry
environments. All of these QTL except SY6 had negative additive effects ranging from -80 to -160
kg ha-1
. For seed yield under optimum soil moisture conditions in Rockwood 2011 and Belwood
2013, only one QTL, SY3, which accounted for 11% of the phenotypic variance, was identified on
Pv03 with a small but significant positive additive effect of 110 kg ha-1
. In addition, two genomic
regions SY7 and SY11 on Pv07 and Pv11, respectively, were significant, accounting for 9% and
21% of the variation in seed yield across all environments. These QTL had negative additive effects
of 60 and 130 kg ha-1
.
6.4.3.9 Percent Nitrogen derived from atmosphere
To avoid from anymathematicalassociation between SNF ability and seed yield percent
nitrogen derived from atmosphere (%Ndfa) was considerd as an indicator for SNF ability in this
study. Overall 8 QTL were significantly associated with %Ndfa at individual location-years and
(or) across all environmental conditions. For %Ndfa in optimum rainfall environments (Rackwood
2011, and Belwood 2013) two QTL, Ndfa 1 and Ndfa8.4, were detected on Pv01 and Pv08
accounting for 15% and14% of the variation with negative additive effect -2.83% and -2.94%,
respectively. The other QTL Ndfa 8.1and Ndfa8.3, associated with the marker “sc00089ln640327_
323100_T_C_84188591”, were detected in Belwood 2013 and Rockwood 2011 accounting for 12%
and 19% of the variation with negative additive effects -3.32%, -3.26% and -1.64, respectively.
Another QTL, Ndfa7, was significantly associated with %Ndfa in Rockwood 2011 on Pv07, which
accounted for 15% of total phenotypic variation and with significant positive additive effect of
2.50%.

167
In low rainfall environments, only in Elora 2012, one QTL was found significantly
associated with %Ndfa. Ndfa5, on Pv05 explained 17% of the variation in %Ndfa in Elora 2012
with a positive additive effect of 3.00 %. Grouping the environments into low and optimum rainfall
conditions revealed three other genomic regions including Ndfa7, Ndfa 1 and Ndfa 8.4 associated
with %Ndfa. Of these, the first one, Ndfa7, on Pv07 was associated with %Ndfa under dry
conditions accounting for 14 % of the variance and the other two QTL Ndfa1 on Pv01 and Ndfa8.4
onPv08 were associated with %Ndfa in optimum rainfall environments, accounting for 15 and 14 %
of total variance, respectively. Two QTL on linkage group Pv01 and Pv08 (LOD=3.0; LOD=4.0,
respectively) were detected for %Ndfa across optimum rainfall environments, both with negative
additive effects 2.94% and 2.82%, respectively. They accounted for 15% and 14% of phenotypic
variation, respectively. The only QTL on linkage group Pv07, Ndfa7, detected for %Ndfa in dry
condition (LOD=4.0) had a positive additive effect 2.31% accounted for 14% of the phenotypic
variance.
6.4.4 Repeatable and overlapping %Ndfa QTL
For %Ndfa across all environmental conditions just one genomic region in the vicinity of the
marker “sc00089ln640327_323100_T_C_84188591” on Pv08 was detected as carrying a QTL,
Ndfa8.1, which accounted to 17% of the variation in %Ndfa and with negative additive effect of
1.64%. This genomic region was detected as carrying QTL for %Ndfa in both optimum
environments, Rockwood 2011 and %Ndfa in Belwood 2013.
Three genomic regions on Pv01, Pv07 and Pv08 were repeatedly detected as carrying QTL
for %Ndfa across the environments, in optimum and dry conditions, and in single location years.
The %Ndfa QTL Ndfa7 on Pv07, associated with %Ndfa in dry environments, was in close genetic
linkage with the QTL detected for δ13
C, ∆7, (cM). These QTL had opposing additive effects on

168
%Ndfa and δ13
C, which is expected from the negative association between %Ndfa and δ13
C.
Moreover, the Pv01 genomic region associated with %Ndfa in optimum conditions, Ndfa1 was in
close genetic linkage (23 cM) with the QTL detected for flowering time, DTF1, with -3% additive
effect on %Ndfa in optimum environments and 4 days additive effect on days to flowering. A QTL
for %Ndfa in dry environments, Ndfa7, was in genetic linkage (2cM) with the QTL for δ13
C, ∆7,
which also had a positive additive effect (0.11%) on δ13
C. Similarly, the Pv07 genomic region,
which carried a QTL for %Ndfa in dry conditions and δ13
C, was found significantly associated with
protein content. The additive effects of this region for %Ndfa under dry conditions, δ13
C, and
protein content were 2.31%, -0.08‰ and 0.51%, respectively.
In addition, a genomic region on Pv02 was also significantly associated with both %Ndfa in
Belwood 2012 and seed yield in dry environments with opposing additive effects 4% for %Ndfa
and -70 kg ha-1
for seed yield in the dry environments. A QTL, NN8 on Pv08, accounting for 13%
of the variation for number of nodules in the field (Rockwood 2011) was associated with the
marker “PvSNP23p310253” at the peak LOD score, with a negative additive effect of 14 nodules. It
showed a close genetic linkage (9 cM) with a QTL detected for %Ndfa in optimum conditions.
6.4.5 %Ndfa Candidate genes search
Search in the genome sequence of the genomic regions with repeatedly detected significant
QTL for % Ndfa on Pv01, Pv07, and Pv08 in the reference Phaseolus Genome sequence (available
at http://www.phytozome.org; accessed 11 May 2015) in +20 kb region stretching each QTL
resulted in detection of 10 candidate genes with potential role in SNF in accordance with the
ontology of the genes (Table 6.4).

169
The genomic region identified for “%Ndfa across all environments” was linked to three
genes including Phvul.008G004000, Phvul.008G004300, and Phvul.008G004400.
Phvul.008G004000 encodes an “SNARE associated Golgi protein” (N-ethylmaleimide-sensitive
factor attachment protein receptor). Moreover, this gene was also associated with %Ndfa QTL in
both optimum rainfall location-years of Rockwood 2011 and Belwood 2013.
Phvul.008G004400 was another gene associated with the genomic region on Pv08. This gene
encodes alcohol dehydrogenase related proteins. Phvul.008G018100 gene was linked to the marker
associated with the significant genomic region on Pv08 associated with %Ndfa across all optimum
environments. This gene encodes “Chitinase Class I” proteins.
The other potential candidate gene in this genomic region was Phvul.008G017800, which
encodes an “aldo/keto reductase family”. Two other prospective candidate genes were located on
both sides of the genomic region associated with %Ndfa across optimum rainfall environments on
linkage group Pv01. One of these genes, Phvul.001G034300, encodes an abscisic acid receptor,
polyketide cyclase PYR/PYL family. The other gene, Phvul.001G033500, encodes a
hemoglobinase family protein member with a cysteine-type endopeptidase activity.
The gene Phvul.007G04350 was identified in the genomic region on Pv07 with the QTL
associated with %Ndfa in dry conditions. This gene encodes a receptor-like kinase gene from the
Leucine-Rich Repeat family, LRR-RLKs.
170
6.5 Discussion
6.5.1 Phenotypic data analysis
Significant variation, continuous frequency distributions, and transgressive segregation were
observed for %Ndfa and related traits. Unlike previous QTL mapping studies in common bean
(Nodari et al., 1993; Tasi et al., 1998; Souza et al., 2000; Ramaeker et al., 2013), in which QTL
were reported in inter-genepool populations, the population studied here was derived from crosses
of two Middle American small-seeded white beans, which is expected to result in the identified
QTL being potentially more applicable in plant breeding programs.
Presence of significant G×E for %Ndfa and related traits in this study conforms to the
previous reports of environmental dependency of SNF (Bliss, 1993; Peoples et al. 1995; Ramaeker
et al., 2013; Farid and Navabi, 2015). The environmental dependency was also apparent for most
SNF-related traits. This dependency could be due to variation in genotypic response to
environmental variables known to influence SNF in legumes i.e., soil moisture (Devi et al., 2013),
soil phosphorous (Namayanja et al., 2014; Divitoa and Sadras, 2014), potassium and sulfur (Divitoa
and Sadras, 2014), and soil salinity (Faghire et al., 2011) of soil. Based on the significant G×E,
which appeared to be associated with significant genotypic rank change (Farid et al, 2015) we
chose to conduct QTL analysis for %Ndfa and related traits using not only the overall multi-
environment data, but also on the single environment (location-year) of data.
6.5.2 QTL study
To prevent an overestimation of QTL effects, likely caused by Bayesian distribution due to
relatively small population size (Xu, 2003), a relatively dense genetic map was constructed using
two available common been SNP panels, Pv768 and Pv5398. Moreover, LOD scores for identifying
171
the significant QTL associated with the traits and optimizing the genotyping information a
composite interval mapping (CIM) analysis with 1000 permutations was carried out to determine
threshold LOD score for declaring significant QTL. Accordingly, a total of 45 QTL were detected
for various traits, distributed across 10 out of 11 linkage groups with the proportion of the variance
accounted for by the QTL ranging from 9 to 23%.
Although significant G×E interaction was observed for different traits over environmental
conditions, a number of consistent and repeatable QTL were detected for some traits. Two different
QTL were detected for %Ndfa in dry and optimum environments on Pv07 and Pv08, at 3.0 and 1.5
Mbp, accounting for 14 and 17% of the phenotypic variance of the traits, respectively. The genomic
region associated with %Ndfa across all environments on Pv08, Ndfa8.1, at 0.5 Mbp was also
detected as being significantly associated with %Ndfa in optimum soil moisture environments
(Rockwood 2011, and Belwood 2013). This genomic region on Pv08 appears to be a major QTL for
%Ndfa across all environmental conditions.
The association between SNF potential and water use efficiency has been previously reported
(Kumaarasinghe et al., 1992; Knight et al., 1993; Farid and Navabi, 2015). In our study, two QTL
were identified for %Ndfa in optimum and dry conditions on Pv01 and Pv07 at 3.0 and 3.4 Mbp,
respectively. Both of these QTL were in close proximity (47 cM on Pv01 and 2 cM on Pv07) with
the QTL associated with δ13
C at 42.5 Mbp and at 2.6 Mbp on the physical map. While the QTL on
Pv07, Ndfa7.1 at 3.4 Mbp, had a positive additive effect on %Ndfa, the other QTL , at 2.6 Mbp, was
associated with δ13
C in the dry environments with a negative effect. This genetic linkage of the
QTL for %Ndfa and δ13
C is in agreement with the previous reports of negative correlation between
nitrogen fixation and δ13
C, a measure of water use efficiency, which provides a genetic explanation
for positive association between SNF ability and WUE (Kumaarasinghe et al., 1992; Knight et al.,

172
1993; Farid and Navabi 2015). The other QTL for %Ndfa in optimum rainfall environments,
Ndfa1at 3 Mbp, was in genetic linkage with the δ13
C, at 42.5 Mbp, with opposing additive effects,
which agrees with previous reports of negative correlation between these two traits in drought stress
environments (Kumaarasinghe et al., 1992; Farid and Navabi, 2015).
The Pv01 QTL for %Ndfa at 3.0 Mbp was also in close proximity (23 cM) with a QTL for
days to flowering, DTF1 at 1.1 Mbp. This is in agreement with previous reports that genotypes with
longer vegetative growth phase, and climbing genotypes compared with bush types, often have
higher SNF ability (Graham and Halliday 1976; Graham and Rosas 1977; Kumarasinghe et al.
1992; Ramaeker et al. 2013). Results of this study indicate that any breeding efforts to improve
SNF (% Ndfa in our study) should consider selecting for high WUE level and an optimum
vegetative growth length that can photosynthetically support an optimum nodulation of the bean
genotypes.
Higher N status of the plant throughout the growing season, especially flowering stage,
results in higher seed protein content (McMullan et al., 1988; Zhao et al., 2005). As a result, a high
SNF bean genotype is expected to have higher N status throughout the growing season, which
should result in higher seed protein content. The genomic region on Pv07, which carries a major
QTL for seed protein content, PRO7.4 at 2.5 Mbp, accounting for up to 23% of the variation, was
consistent with the report by Casañas et al. (2013), who reported a significant QTL associated with
seed protein content on Pv07 in common bean. This QTL, PRO7.4 at 2.5 Mbp, in close proximity
with the QTL for %Ndfa in dry conditions, Ndfa7.1 at 4.0 Mbp, (10 cM) and δ13
C, at 2.0 Mbp (12
cM) in our study.
Previous studies of SNF in legumes have used greenness and chlorophyll content in the shoot
tissues as an indirect indicator of SNF potential, when legume species are grown under N deficient

173
conditions (Tint et al., 2011). In our growth room assays, QTL for SPAD were detected on Pv02,
Pv03, Pv06 and Pv08 at physical positions 2.8, 2.3, 24.5 and 57.5Mbp while one QTL, SPAD7, at
the physical position 4.8 Mbp was detected in association with SPAD in the field. Of these, the
QTL for SPAD on chromosomes 6 and 8 were also reported by Ramaeker (2013) in the same
physical regions and in close proximity with the genomic regions with significant QTL in the field
and growth room assays, respectively. The repeatability of SPAD QTL between our growth room
and field assays and with the study by Ramaeker et al. (2013) seem to be low and with opposing
additive effect between field and growth room assays. These unexpected results may be due to
significantly different light intensity and quality between the field and the growth room assays and
how they might influence gene expression.
Yield QTL were identified on Pv02, Pv03, Pv04, Pv06, Pv07, and Pv11 which accounted for
11%, 11%, 14%, 15%, 9%, and 21% of pheonotypic variations. SY2 (0.90 Mbp), SY3 (38.3 Mbp),
SY4 (44.5 Mbp), SY6 (21.5 Mbp), SY7 (42.5 Mbp), and SY11 (2.1 Mbp) were detected in different
environments or across environments. The more frequent QTL seed yield reported in common bean
were detected on chromosome 3 by Blair et al. (2006), Wright and Kelly (2011) Blair et al. (2012)
Checa and Blair (2012) Mukeshimana et al. (2014). While Mukeshimana et al. (2014) reported just
one QTL for seed yield on chromosome 9, three QTL on chromosomes 2, 4 and 4 and two QTL on
chromosomes 7 and 11 were detected in stress conditions and across all environments.
Nodule weight and number have been recommended as indirect selection criteria for SNF
potential in legumes (Wadisirisuk and Weaver, 1985). In our study 4 QTL were detected for
number of nodules in growth-room assays, one on each of Pv01 and Pv04, and two on Pv09, in
repulsion linkage within an 85 cM interval, at 4.6 Mbp, 4.0 Mbp, 2.7 Mbp, 4.6 Mbp, and 25.4 Mbp
on physical map. A total of 15 % of the variation was explained by the major QTL. Existence of a

174
QTL on Pv04, NN4 at 4.0 Mbp, for nodule number in controlled conditions was previously reported
in a diefferent RIL population, derived from an inter-genepool cross in two different greenhouse
studies (Tsai et al. 1998 and Noradi et al. 1993). For nodule number in the field, which was assayed
only in one location-year (Rockwood 2011), a QTL was identified on Pv08, 2.7Mbp, explaining
13% of total variance which was found at 9 cM and 41 cM distance from a QTL for %Ndfa across
all environments, Ndfa8.1 at physical position of 0.5 Mbp, and in optimum rainfall conditions.
Ramaeker et al. (2013) detected two different QTL for nodule number on Pv03 and Pv05 in the
field condition. Kamfwa et al. (2015) in a genome-wide association study of %Ndfa in the Andean
diversity panel detected such an association between QTL for nodule number and %Ndfa on a
different chromosome, Pv09. Lack of repeatability of detected QTL between controlled and field
environments suggests that selection for nodulation traits should be conducted in the field, but this
is a labor-intensive task, which is often not affordable in most breeding programs. Moreover, our
study does not provide any evidence for association between QTL for nodule number and SNF
potential, indicating that direct SNF assays such as 15
N natural abundance (Shearer and Kohl, 1986)
may be more suitable assays in breeding for high SNF potential in common beans than the other
SNF estimation methods.
In our study we also attempted to examine whether or not breeding for resistance to bacterial
diseases (CBB in this case), which has involved introgression from related species through inter-
specific crosses (Scott and Michaels, 1992), may have negatively influenced the symbiotic
relationship with beneficial bacteria. Previous report by Noradi et al. (1993) indicated the presence
of a common QTL for nodule number and CBB on Pv07. In our study, the high SNF parent of the
RIL population, Mist, is a derivative of crosses to CBB resistant varieties and lines, which had been
derived from inter-specific crosses to P. acutifolius. We did not identify any common genomic

175
region controlling both traits. However, the major CBB QTL for CBB resistance at the end of Pv08,
at physical location of 59.4 Mbp. At the population level, however, genetic association between
CBB and %Ndfa was found in our previous genetic correlation reports using the same population’s
data (Farid et al. submitted). This result indicated that long term breeding of common beans for
resistance to CBB, at least for the strains screened in our study, did not adversely influence their
SNF ability.
6.5.3 Potential candidate genes for %Ndfa
Ten genes were identified in the vicinity of the significant %Ndfa QTL as candidate genes for
SNF. The gene Phvul.008G004000 which encodes an SNARE-associated Golgi protein (N-
ethylmaleimide-sensitive factor attachment protein receptor is one of the candidate genes. SNARE
associated Golgi protein was previously reported in Medicago truncatula (Catalano et al., 2007;
Wang et al., 2010), common bean (Blanco et al., 2009), and Lotus japonicus (Hakoyama et al.,
2012), with a role in plant-Rhizobium interactions. This protein through the Golgi apparatus can
target numerous membrane proteins in the symbiosome membrane (Catalano et al., 2004). Several
SNARE proteins have been recognized with potential roles in resistance against pathogenic bacteria
(Kalde et al. 2007, respectively) and fungi (Feechan et al., 2013), but we did not detect any close
genetic linkage between CBB and %Ndfa QTL.
The other candidate gene is Phvul.008G004300, which encodes 14-3-3 protein family
member. This protein family is known to have critical roles in the nodulation process especially in
early developmental stages (Radwan et al., 2012; Gil-Quintana et al., 2013). Phvul.008G004400
was the other gene associated with %Ndfa, which encodes for alcohol dehydrogenase- related
proteins. Genes encoding this kind of protein have been reported as nodule-induced metabolic
factors in Lotus japonicus (Colebatch et al., 2004). Phvul.008G001500 and Phvul.008G001400

176
might be considered as two other candidate genes associated with %Ndfa. These genes encode for
an “auxin responsive protein” and Leucine-Rich Repeat Receptor-Like Protein Kinase, LRR-RLK
(Sánchez-Lopez et al., 2011), respectively. Ramaeker et al. (2013) also reported an auxin
responsive protein as a candidate gene for QTL associated with yield and N accumulation ability.
The LRR-RLK’s role in nodule development was reported by Sánchez-Lópes et al. (2011) in
common bean. Therefore, Phvul.008G001400 could be considered as another candidate gene
conditioning %Ndfa. In the study by Kamwfa et al. (2015), LRR-RLK was reported as another
candidate gene controlling the SNF ability in the Andean diversity panel, considering its role in
nodule development in common bean(Sánchez-Lópes et al., 2011).
The gene Phvul.008G018100 was also in the vicinity of the genomic region on Pv08 which
was significantly associated with %Ndfa across all optimum environments. Phvul.008G018100
encodes for “Chitinase Class I” protein. This group of proteins is known for their important role in
plant-rhizobia symbiotic interactions. They are known to enable the host plant to hydrolyze the
lipo-chitooligosaccharide (nod factor) produced by nitrogen-fixing bacteria (Perret et al. 2000;
Cullimore et al. 2001; Kasprzewska 2003; Colebatch et al., 2004) and to start the infection process.
The other potential candidate gene in this genomic region was Phvul.008G017800, associated
with the %Ndfa QTL in optimum rainfall conditions. This gene encodes an aldo/keto reductase
protein family. This group of proteins has a function in the nodule-inducing process in legumes
(Leborgne-Castle and Bouhidel, 2014).
Two other candidate genes were located either side of a significant SNP marker on Pv01,
associated with %Ndfa across optimum rainfall environments. One of these genes,
Phvul.001G034300 encodes an abscisic acid receptor, of the polyketide cyclase PYR/PYL family
with a known function through declining effect of abscisic acid on leghaemoglobin and

177
consequently may influence SNF (González et al., 2001). In accordance with the genetic linkage of
QTL for %Ndfa in optimum rainfall conditions and δ13
C in this genomic region, and the well-
known role of abscisic acid in plant water stress, Phvul.001G034300 could be suggested as a
candidate gene with pleotropic effect on %Ndfa and δ13
C. The other gene, Phvul.001G033500,
encodes a hemoglobinase family protein member with a cysteine-type endopeptidase activity.
These proteins have been reported as nodule development inhibitors in legumes (Vorster et al.,
2013). Assuming a similar role for this protein in common bean, it could be consider another
possible candidate gene controlling %Ndfa in non-stress conditions.
The gene Phvul.007G04350 linked to the QTL associated with %Ndfa in dry conditions, which
encodes a LRR-RLK. The same candidate gene for this QTL previously reported by Kamwfa et al.
(2015) at the same physical position on common bean genome in an Andean diversity panel.
The gene Phvul.007G04350 is also associated with a QTL associated with δ13
C, in accordance
with genetic linkage between %Ndfa in dry conditions and δ13
C on Pv07. This may suggest the
importance of quicker nodulation events in dry regions. Therefore, it suggests that the genetic
control of timing of nodulation in the field should perhaps be considered as a trait for future genetic
studies of SNF. Moreover, future functional genomic studies are needed to confirm the roles of the
candidate genes detected in our study either on %Ndfa or WUE.

178
Fixed factor† F-test P-value F-test P-value F-test P-value F-test P-value F-test P-value F-test P-value F-test P-value F-test P-value F-test P-value
G 1.3 0.03 1.56 0.001 2.43 <0.0001 1.69 <0.0001 5.45 <0.0001 1.26 0.05 1.96 <0.0001 1.16 0.04 1.4 0.01
Random factors‡S2 Se S2 Se S2 Se S2 Se S2 Se S2 Se S2 Se S2 Se S2 Se
E 20.43ns 18.778 95.41ns 194.49 0.08ns 0.09 0.18ns 0.159 11.8ns 10.108 15.98ns
16.2281.35ns
1.2960.00*
0.002
Blk (E) 0.20ns 0.17 0.00ns 0.000 0.10ns 0.015 0.02ns 0.02 57.09ns 88.632 0.00ns 0 0.19ns 0.235 0.00ns 0.000 0.00ns 0
Iblk(Blk × E) 0.37ns 0.219 6.48*** 4.111 0.00ns 0.000 0.0002* 0.00013 57.42** 23.113 0.00ns 0.004 0.01ns 0.004 1.06* 0.515 21.50ns 36.249
G×E 7.47*** 0.716 12.82*** 8.959 0.11*** 0.03 0.02*** 0.005 12.82*** 8.959 2.16* 1.285 3.54*** 0.422 2.52** 1.025
Residual 13.63*** 0.603 102.82*** 6.201 0.41*** 0.028 0.21*** 0.007 112.91*** 14.516 46.03*** 1.855 4.06*** 0.213 5.64*** 0.71 1133.20*** 99.333
Maturity
(days)Ndfa §
(%)CBB¶ δ 13C#
(‰)
Table 6.1 F -test of fixed effect of entry and variance component estimates (S 2 ) and their standard error (Se ) of random effects in the mixed-model analysis of 140 recombinant inbred lines of a cross
between the high SNF bean, Mist, and the low SNF bean, Sanilac, tested in multiple locations field assays in Ontario, Canada, 2011-2013.
_
Seed protein
(%)
Nodule numbers
(Rockwood 2011)SPAD
_
¶ Common bacterial blight severity# Carbon discriminationns Not significant; *, **, and *** are significant at 0.05, 0.01, and 0.001, respectively
Seed yield
(kg ha-1)
Flowering
(days)
† Genotype main effect ‡ E, N, Blk, iblk are environment, nitrogen, block, and incomplete block, § Nitrogen derived from atmosphere
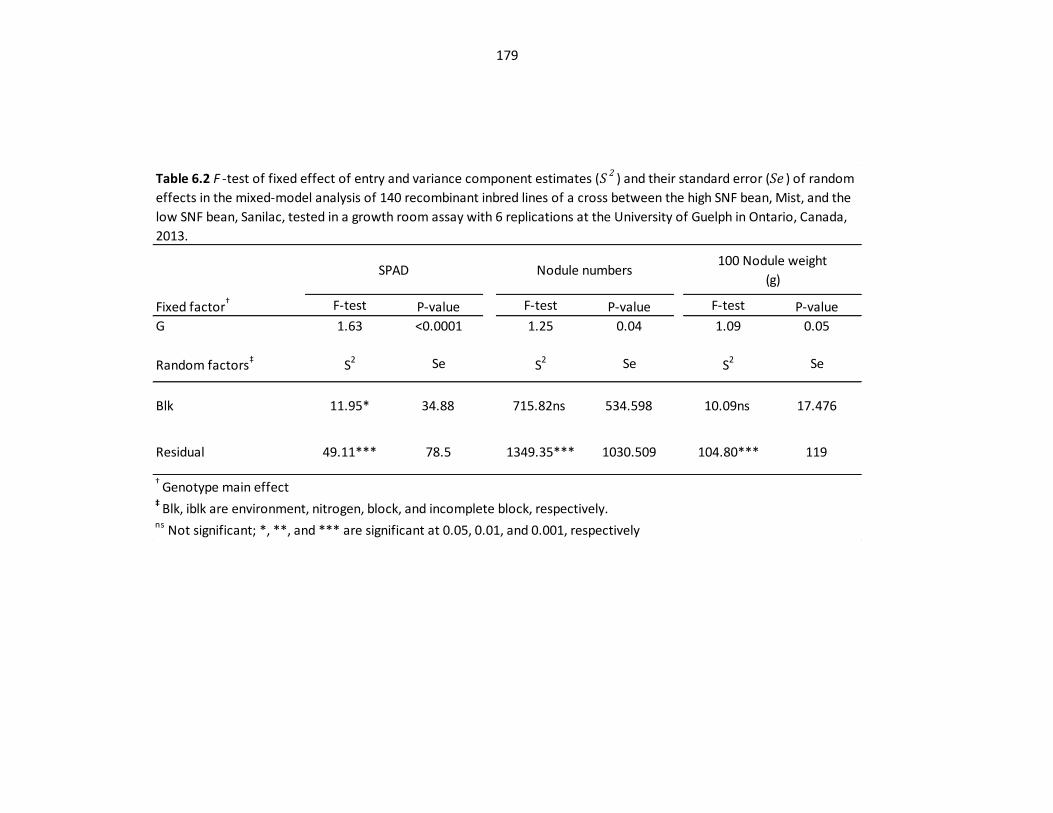
179
Fixed factor† F-test P-value F-test P-value F-test P-value
G 1.63 <0.0001 1.25 0.04 1.09 0.05
Random factors‡ S2 Se S2 Se S2 Se
Blk 11.95* 34.88 715.82ns 534.598 10.09ns 17.476
Residual 49.11*** 78.5 1349.35*** 1030.509 104.80*** 119
ns Not significant; *, **, and *** are significant at 0.05, 0.01, and 0.001, respectively
Table 6.2 F -test of fixed effect of entry and variance component estimates (S 2 ) and their standard error (Se ) of random
effects in the mixed-model analysis of 140 recombinant inbred lines of a cross between the high SNF bean, Mist, and the
low SNF bean, Sanilac, tested in a growth room assay with 6 replications at the University of Guelph in Ontario, Canada,
2013.
‡ Blk, iblk are environment, nitrogen, block, and incomplete block, respectively.
† Genotype main effect
SPAD Nodule numbers100 Nodule weight
(g)

180
LODR2
(%)
TR2
(%)
Additive
effect
growth room 2013 SPAD2 Pv 02 125.8 2.8 3.6 13 34 -1.7674
growth room 2013 SPAD3 Pv 03 87.4 2.3 3.2 11 36 -1.3074
growth room 2013 SPAD6 Pv 06 147.1 24.5 3.0 12 23 -2.1324
Field-across environments SPAD7 Pv 07 347.9 8.4 3.0 14 44 0.3132
growth room 2013 SPAD8 Pv 08 370.9 57.5 4.1 19 20 -2.0315
Field-across environments SPAD11 Pv11 118.3 10.0 4.0 13 36 0.6251
Field-across environments CBB3 Pv 03 279.8 40.8 4.6 13 51 0.3158
Field-across environments CBB5 Pv 05 236.4 40.3 3.0 13 19 -0.1505
Field-across environments CBB8 Pv 08 438.1 59.4 4.3 13 47 -0.1598
Field-across environments DTF1 Pv 01 4.2 1.1 3.0 11 21 -4.4001
Field-across environments DFT8 Pv 08 362.3 56.8 3.2 12 31 -3.6051
Field-across environments DTF11 Pv 11 367.8 1.1 4.6 13 51 4.9150
Field-across environments MD3 Pv 03 73.9 1.9 3.5 12 36 -0.9483
Field-across environments MD9 Pv 09 152.1 16.5 3.2 13 22 1.2645
Field- optimum Ndfa1 Pv 01 148.9 3.0 3.0 15 17 -2.9412
Rockwood 2011 Ndfa7.2 Pv 07 195.9 10.7 4.0 15 32 2.5015
Elora 2012 Ndfa5 Pv 05 152.3 37.6 3.3 17 22 3.0000
Field-dry Ndfa7.1 Pv 07 19.2 3.4 4.0 14 27 2.3062
Field-across environments Ndfa8.1 Pv 08 3.3 0.5 4.0 17 24 -1.6367
Belwood 2013 Ndfa8.2 Pv 08 3.3 0.5 4.0 19 34 -3.2642
Rockwood 2011 Ndfa8.3 Pv 08 3.6 0.5 3.0 12 25 -3.3210
Field- optimum Ndfa8.4 Pv 08 35.7 1.5 4.0 14 30 -2.8291
Chr, Chromosome
3rd leaf SPAD
Common Bacterial Blight
Floweing (days)
Maturity (days)
Table 6.3 Quantitative trait loci (QTL) analysis for RIL population drived from Sanilac × Mist cross in the
fied trial at 4 location-years (4 location over 3 years, 2011-2013) and 2 nitrogen fertilizer levels ( 0; 100
kg N ha-1
), and in the growth room (April-Nov., 2013).
ChrField/Growthroom assay Year QTLPosition
(cM)
Position
(Mbp)
Identified QTL (P < 0.01)
N derived from atmosphere (%)

181
LODR2
(%)
TR2
(%)
Additive
effect
growth room 2013 NN1 Pv 01 38.6 46.0 3.0 11 34 36.7610
growth room 2013 NN4 Pv 04 0.0 0.4 3.3 15 30 -45.7396
Rockwood 2011 NN8 Pv 08 44.4 2.7 3.0 13 14 -13.5552
growth room 2013 NN9.1 Pv 09 103.8 7.6 3.3 11 41 33.2815
growth room 2013 NN9.2 Pv 09 188.7 25.4 3.2 9 54 -31.4789
Field-across environments ∆1 Pv 01 196.1 42.5 3.0 13 16 0.1146
Field-across environments ∆7 Pv 07 20.7 2.6 3.3 11 41 -0.0835
Field-dry SY2 Pv 02 74.2 0.9 3.6 11 42 -0.1590
Field- optimum SY3 Pv 03 161.1 38.3 3.3 11 35 0.1092
Field-dry SY4 Pv 04 348.8 44.5 3.0 14 15 -0.0834
Field-dry SY6 Pv 06 92.0 21.5 3.6 15 21 0.1518
Field-across environments SY7 Pv 07 49.5 42.5 3.0 9 43 -0.0607
Field-across environments SY11 Pv 11 37.4 2.1 6.4 21 44 -0.1344
Field-across environments PRO4 Pv 04 34.6 1.3 3.9 17 28 0.5579
Field-across environments PRO6 Pv 06 57.7 13.1 3.3 15 16 -0.5162
Field-across environments PRO7.1 Pv 07 17.0 3.2 3.3 11 42 -0.3942
Field-across environments PRO7.2 Pv 07 162.4 48.8 4.6 15 44 -0.5579
Field-across environments PRO7.3 Pv 07 42.5 44.3 5.6 22 46 0.5087
Field-across environments PRO7.4 Pv 07 8.9 2.5 8.0 23 58 0.4868
Field-across environments PRO9 Pv 09 158.4 17.2 3.3 10 45 0.3183
Chr, Chromosome
Seed yield (t ha-1)
Seed protein (%)
QTL ChrPosition
(cM)
Position
(Mbp)
Identified QTL (P < 0.01)
Nodule Number
Carbon isotope discrimination(%)
Table 6.3 Continued…
Field/Growth room assay Year

182
QTL Chr Mbp Effecive in Locus name Gene
Phvul.008G004000 SNARE associated Golgi protein (Leborgnne and Bouhidel, 2014)
Phvul.008G004300 14-3-3 PROTEIN (Radwan et al. 2012 - in Soybean SNF)
Phvul.008G001400 Leucine-Rich Repeat Receptor-Like Protein Kinase (Sanchez-Lopez et al., 2011)
Phvul.008G004400 Alcohol dehydrogenase related protein (Colebatch et al., 2004)
Across optimum rainfall environments Phvul.008G018100 Chitinase class I (Perret et al., 2000; Colebatch et al., 2004)
Rockwood-2011 & Belwood-2013 Phvul.008G017800 Aldo/keto reductase family (Colebatch et al., 2004)
Phvul.001G034300 Abscisic acid receptorPolyketide cyclase PYR/PYL family / dehydrase
and lipid transport (González et al., 2001)
Phvul.001G033500Hemoglobinase family member/ Peptidase C13 family with a
cysteine-type endopeptidase activity (Vorster et al., 2013)
Ndfa7 Pv 07 32.3-35.9 Across low rainfall environments Phvul.007G043500 Leucine-Rich Repeat Receptor-Like Protein Kinase (Sanchez-Lopez et al., 2011)
Pv 08Ndfa8.1
Table 6.4 Candidate genes detected for Ndfa in a 40 bp in the genomic region of significant and repeatable Ndfa QTL .
Chr, Chromosome
Across optimum rainfall environments 30.2-34.5Pv01Ndfa1
15.2-15.6Pv 08Ndfa8.4
Position
Across all environments0.38-0.46

183
Figure 6.1 Maximum, minimum, mean (vertival solid line) and 95% confidence interval (dashed lines) of least square means for nodule number and 100 nodule weight (g), SPAD reading on the 3rd fully expanded leaf in growth room assay, seed yield (t ha-1), nitrogen derived from atmosphere (%) in optimum soil moisture (Ndfa-opimum), dry (Ndfa-dry) and across all environmrnts (Ndfa), nodule number in field (Rockwood 2011), common bacterial blight severity (0-5 scale), carbopn isotope discrimination (%), seed protein content (%), days to maturity and days to flowering in field assays, for 140 recombinant inbred lines of a cross between the high SNF bean, Mist, and the low SNF bean, Sanilac, tested in multiple locations in Ontario, Canada, 2011-2013.

184
Figure 6.2 Genetic linkage map of bean chromosomes in the Sanilac x Mist common bean RIL population, indicating the location of the quantitative trait loci (QTL). QTL and corresponding marker(s) are shown using different colours. Pv10 is not presented because no QTL was detected on it.

185
Figure 6.2 continued...

186
Figure 6.2 continued...

187
CHAPTER 7
General Conclusions and Future Directions

188
7.1 General Conclusions
Common bean (Phaseolus vulgaris L.) is generally known as a week N2-fixing legume
(Martínez-Roméro, 2003). The complex inheritance of symbiotic nitrogen fixation (SNF),
coupled with its environmental-dependency and high genotype by environment variation makes
it difficult to achieve significant progress in breeding for high SNF in common bean. Therefore,
the research projects reported in this thesis were conducted to investigate the variation in SNF
potential, the environmental and genotype by environmental effects on SNF and response to
selection for SNF and to better understand the genetic basis of SNF in common bean.
In the first step, I attempted to explore the genetic variation for SNF and related traits. A
small group of 12 dry bean genotypes, but diverse in terms of physiological and morphological
characteristics, selected from the two common bean gene pools, including 3 Andean and 9
Middle American beans, were examined for SNF and related traits in the field and in controlled
environments. Trials included inoculation treatments, which were performed immediately prior
to planting, with a peat-based culture of rhizobia, at the rate of 2.5 g of Rhizobium
leguminosarum bv. phaseoli commercial product (Becker Underwood, Saskatoon, Saskatchewan,
Canada) per kg of seed to give approximately 5×10⁵ bacteria/seed. A non-nodulating mutant,
R99, was used in the SNF trials as the reference plant to estimate SNF potential, measured as
nitrogen derived from atmosphere (%Ndfa), through the natural 15
N abundance method (Shearer
and Kohl, 1986) in the field. Significant inter- and intra-gene pool discrepancies were detected
for %Ndfa and related traits in the field assays. Moreover, environmental and genotype by
environmental effects significantly influenced %Ndfa and its related traits in the field. The
Andean bean genotypes showed greater nodulation ability compared to the Middle American
genotypes in the greenhouse, while the Middle American genotypes were generally superior in

189
terms of nitrogen fixation under optimum soil moisture conditions in the field in 2011. Nitrogen
fixation was generally associated with seed yield and carbon isotope discrimination (δ13
C), an
indicator of water use efficiency (WUE), in the field. Noticeably, two Middle American
genotypes, Mist and Sanilac, had contrasting extreme high and low values for proportion of
nitrogen derived from atmosphere (%Ndfa) and other SNF-related traits. These two Middle
American common bean genotypes were the parents of an F4-derived recombinant inbred lines
(RIL) population, developed using a single seed decent approach.
The second study was conducted to investigate if bean genotypes had stable yielding
ability across N fertilizer-dependent and SNF-dependent production practices using the F4:5
population of 140 RILs of the cross between Mist and Sanilac. The experiment in each location
was conducted under two different N management strategies, SNF- and N fertilizer-dependent,
across multiple environments and the study examined each genotype for stability of their
performance. The study highlighted the high level of environment dependency of SNF as
genotypes responded differentially to SNF-dependent and N fertilizer-dependent environments,
even though N management did not significantly affect the overall yield. It was revealed that
environmental variables, likely drought stress during the growing season in some environments,
affected the response of genotypes to N-management strategies. High environmental dependency
was observed for SNF in this study, which indicated that selecting genotypes that perform well
regardless of N management, while possible, may not be an easy task. However, among the RILs
with higher than average seed yield, the stability analysis identified 6% as generally-adapted to
all environments, regardless of N management.
Success of breeding for high SNF in common bean could therefore be explained as a
function of variation and heritability of SNF and related traits and genetic and phenotypic

190
correlation among traits that are being selected for. Therefore, the magnitude of these parameters
for SNF and related traits were studied in the third study on the same RIL population over multi-
environment field trials. The environments (location-years), based on the total precipitation
during the growing season, were grouped into stress- and non-stress test sites. The genetic
variation was significant for %Ndfa and related traits, while genotypes responded differently to
environments and N management strategies. There was no significant genetic correlation
between %Ndfa and seed yield, indicating that selection for high SNF genotypes does not
necessarily lead to greater seed yield and that selection for both traits should be performed
simultaneously. A selection index, identified as SNF relative efficiency index, was then
computed to identify lines with the same or higher yielding ability in SNF-dependent
management than in N-fertilizer-dependent conditions. Selection using the index identified
twenty percent of the RILs with better performance in SNF-dependent environments. This index
was significantly associated with days to maturity, indicating that selection for improved yield
under SNF-dependent environments may result in later maturity or vice-versa.
Moreover, upper leaf chlorophyll concentration, SPAD, was significantly associated with
both %Ndfa and yielding ability in this study, which indicated that greenness of dry bean plants
on the top of canopy, when grown under low N conditions, might be a good criterion to assess
the SNF and predict yielding ability of genotypes under SNF-dependent environments, and for
selection for high-SNF genotypes. The heritability of the traits ranged from 14% to 71% and 4%
to 25% in non-stress and in stress environments, respectively. Almost all the traits, including
%Ndfa and seed yield, had higher heritability under non-stress conditions. It can be concluded
that any selection attempts to improve SNF and yielding ability should be performed under
optimal soil water conditions.
191
There has been previous research (Nodari et al., 1993; Tasi et al., 1998; Souza et al., 2000;
Ramaeker et al., 2013) studying the genetic basis of SNF and/or nodulation traits in biparenal
RIL population derived from crosses between genotypes from the two Pheseolus gene pools. In
this thesis I report the results of a quantitative trait loci (QTL) analysis to better understand the
inheritance of SNF and related traits. However, my study differs from previous research in that I
studied a bi-parental F4:5 RIL (n = 94) population developed from a cross between two bean
genotypes from the same gene pool i.e., the Middle American genotypes ’Sanilac’ and ’Mist’.
Significant variation and transgressive segregation was observed for SNF and related traits in
field and growth room assays. Composite interval mapping, using genome-wide SNP markers,
detected a total of 43 QTL significantly associated with %Ndfa and related traits. A QTL on
Pv08 was consistently detected in different tests, accounting for 19% of the phenotypic variation
in %Ndfa. Moreover, smaller effect QTL were detected for %Ndfa on chromosomes PV01 and
Pv07 accounting for up to 15% of the variation in optimum and low rain fall environments. The
QTL for %Ndfa across dry environments on Pv07 was in genetic linkage with a QTL for carbon
discrimination (δ13
C), an indicator of WUE, suggesting either a pleiotropic effect or linkage of
genetic factors influencing both traits. This showed the importance of considering WUE and
early nodulation ability of common bean genotypes in the field for future breeding efforts for
efficient SNF in common bean. Although genetic linkages were detected between QTL for
%Ndfa in dry conditions and δ13
C (2 cM) and seed protein content (10 cM) on chromosome
Pv07, no genetic association was detected between %Ndfa and common bacterial blight (CBB)
infection severity.
To identify the potential candidate genes for %Ndfa, within the immediate genomic region
(±20 kb) in the vicinity of the marker at the peak LOD score value of the most repeatable QTL

192
was examined, within and across all field environments. The P. vulgaris reference genome
sequence version 1.0, developed by Schmutz et al., (2014), available at:
http://www.phytozome.net [accessed 20 April 2015] was browsed using Jbrowse in Phytozome
v10.1.
Three candidate genes associated with QTL for %Ndfa were identified in the genomic
region of the %Ndfa QTL on Pv08. These candidate genes encode SNARE associated Golgi,14-
3-3, and Alcohol dehydrogenase related protein family members which have role(s) in SNF
(Hakoyama et al., 2012; Gil-Quintana et al., 2013; Colebatch et al., 2004, respectively). Five
more potential candidate genes were detected for %Ndfa under different environmental
conditions as follows: one gene associated with a genomic region on Pv08 for %Ndfa across all
optimum environments coding for “Chitinase Class I” proteins. Two genes associated with the
genomic region associated with %Ndfa across optimum rainfall environments on linkage group
Pv01. One of these genes encodes an abscisic acid receptor, polyketide cyclase PYR/PYL
family. The other gene encodes a hemoglobinase family protein member with a cysteine-type
endopeptidase activity. One potential candidate gene was detected in probable association with
genomic region on Pv07 for %Ndfa in dry conditions. This gene encodes a receptor like kinase
gene from the Leucine-Rich Repeat family, LRR-RLKs. All of these genes were previously
reported with a role in SNF.
7.2 Future Directions
Six percent of the RIL population studied in my thesis were identified as generally
adapted to a wide range of environmental conditions, regardless of N management. Examination
of their performance in future yield trials under SNF- and N fertilizer-dependent multi-

193
environmental studies is suggested. Moreover, these genotypes could be used as suitable
germplasm for crossing in breeding programs to develop high-yielding bean genotypes for low
‘N’ input management systems, with potentially higher SNF.
Any future selection effort for SNF and yielding ability improvement in dry bean is
suggested to concurrently be performed in non-stress conditions when considering WUE and
early nodulation ability of bean genotypes. Significant differences were observed for SNF
between the two Middle American genotypes among selected bean genotypes in this study
Consequently, a genome-wide association analysis of SNF in a diverse panel of Middle
American bean genotypes to better understand the genetic architecture of SNF is suggested.
A number of candidate genes were identified in the genomic region of the significant
SNF-related QTL. Future functional genomic studies are needed to confirm the role of the
candidate genes detected in our study for %Ndfa, WUE, or both.

194
LITERATURE CITED
Aarons, S. R., and P. H. Graham. 1991. Response of Rhizobium leguminosarum bv. phaseoli to
acidity. Plant Soil 134:145-151.
Abadir S.K., M.H. El-Hamawi. 1995. Activity of azola plants against Meloidogyne incognita
infecting tomato. Egypt. J. Appl. Sci. 10:316-321.
Abdel-Wahab, H.H., and H.H. Zahran. 1983. The effects of water stress on N2 (C2H2)-fixation and
growth of Medicago sativa L. Acta Agron. Acad .Sci. Hung. 32:114-118.
Abebe, A., M.A. Bricka, and R.A. Kirkby. 1998. Comparison of selection indices to identify
productive dry bean lines under diverse environmental conditions. Field Crop. Res. 58:15-
23.
Adams, D.G. 2002. Symbioses with hornworts and liverworts. In: A.N. Rai, B. Bergman, and U.
Rasmussen (eds) Cyanobacteria in symbiosis. Dordrecht, Boston, Kluwer Academic Pub.,
Pp. 117-136.
Adu-Gyamfi, J.J., K. Fujika, and S. Ogata. 1989. Phosphorus absorption and utilization efficiency
of pigeonpea (Cajanus cajan (L.) Millsp.) in relation to dry matter production, and
dinitrogen fixation. Plant Soil 119:315-324.
Akter, Z., B.B. Pageni, N.Z. Lupwayi, and P.M. Balasubramanian. 2014. Biological nitrogen
fixation and nifH gene expression in dry beans (Phaseolus vulgaris L.). Can. J. Plant Sci.
94: 203-212.

195
Alamillo, J.M., J. Díaz-Leal, M.A.V. Sánchez-Moran, and M. Pineda. 2010. Molecular analysis of
ureide accumulation under drought stress in Phaseolus vulgaris. Plant, Cell and
Environment (2010) 33, 1828–1837 doi: 10.1111/j.1365-3040.2010.02187.x
Alexander, P.H., B. Rerkasem, S. Lordkaew, and P. Martin. 1993. Xylem-solute technique to
measure N2 fixation by Phaseolus vulgaris L.: Calibration and sources of error. Plant Soil
150:223-231. doi:10.1007/BF00013019
Allard, R.W. 1960. Principles of plant breeding. (2nd
ed) John Wiley and Sons, New York. Pp. 254.
Allen, R.M., J.T. Roll, P. Rangaraj, V.K. Shah, G.P. Roberts, and P.W. Ludden. 1999.
Incorporation of molybdenum into the iron-molybdenum cofactor of nitrogenase. J. Biol.
Chem. 274:15869-15874.
Alva, A.K., G.L. Kerven, D.G. Edwards, and C.J. Asher. 1991. Reduction in toxic aluminum to
plants by sulfate complexation. Soil Sci. 152: 351–359.
Anderson, A.L., E.E. Down, and G. Whitford. 1960. The Sanilac pea bean. Mich. State College,
Agric. Exp. Stn. Michigan quarterly bull. 43(2).
Antipchuk, A. F., R.M. Kantselyaruk, V.N. Rangelova, N.N. Skochinskaya, and E.V.
Tantsyurenko. 1990. Relation between the photoassimilation activity indices of leguminous
plants and their symbiotic nitrogen fixation. 6: 49-53. ProQuest. Web. 13 Nov. 2014.
(Abstract)
Appiah, F. K., J. K. Tufuor, and F. Amoako-Andoh. 2015. Nitrogen fixation and yield potential of
some early-maturing cowpea (Vigna Unguiculata (L) Walp) lines. J. Biol. Agr. Health Care
5:2224-3208.

196
Appleby, C.A. 1984. Leghemoglobin and Rhizobium respiration. Annu. Rev. Plant Physiol.,
35:443-478. doi:10.1146/annurev.pp.35.060184.002303
Ariel, F., M. Brault-Hernandez, C. Laffont, E. Huault, M. Brault, J. Plet, M. Moison, S. Blanchet,
J.L. Ichanate, J.L.M. Chabaud, S. Carrere, M. Crespi, R.L. Chan, and F. Frugier. 2012. Two
Direct Targets of Cytokinin Signaling Regulate Symbiotic Nodulation in Medicago
truncatula. The Plant Cell 24:3838-3852. Doi:10.1105/tpc.112.103267
Arnold, W., A. Rump, W. Klipp, U.B. Priefer, and A. Pűhler. 1988. Nucleotide sequence of a
24,206- basepair DNA fragment carrying the entire nitrogen fixation gene cluster of
Klebsiella pneumoniae. J. Mol. Bio1. 203:715-738.
Arrese-Igor, C., E.M. González, D. Marino, Ladrera R. Ladrera, E. Larrainzar, E. Gil-Quintana.
2011. Physiological responses of legume nodules to drought. Plant Stress 5: 24-31.
Arrese-lgor, C., F.R. Minchin, A.J. Gordon, and A.K. Nath. 1997. Possible causes of the
physiological decline in soybean nitrogen fixation in the presence of nitrate. J. Exp.
Bot.48:905-913.
Atkins, C.A. 1991. Ammonia assimilation and export of nitrogen from the legume nodule. In: M.
Dilworth, and A. Glenn (eds) Biology and biochemistry of nitrogen fixation. Pp. 293-319.
Elsevier, Amsterdam.
Ausmees, N., K. Jacobsson, and M. Lindberg. 2001. A unipolarly located, cell-surface-associated
agglutinin, RapA, belongs to a family of Rhizobium-adhering proteins (Rap) in Rhizobium
leguminosarum bv. trifolii. Microbiology 147: 549-559.

197
Ausmees, N., H. Kobayashi, W.J. Deakin, C. Marie, H.B. Krishnan, W.J. Broughton, and X. Perret.
2004. Characterization of NopP, a type III secreted effector of Rhizobium sp. strain
NGR234. J. Bacteriol.186:4774-4780. doi:10.1128/JB.186.14.4774-4780.2004
Aveline, A., Y. Crozat, X. Pinochet, A. Domenach, and J. Cleyetmarel. 1995. Early remobilization
- a possible source of error in the uride assay method for N2 fixation measurement by early
maturation soybean. Soil Sci. Plant Nutr. 41:737-751.
Azzalini, A., and D.R. Cox. 1984. Two new tests associated with analysis of variance. J. Roy. Stat.
Soc. Series B. 46:335-343, doi: 10.2307/2345519.
Badawi, F.S.H., A.M.M. Biomy, and A.H. Desoky. 2011. Peanut plant growth and yield as
influenced by co-inoculation with Brady-rhizobium and some rhizo-microorganisms under
sandy loam soil conditions. Ann. Agric. Sci. 56:17-25. doi: 10.1016/j.aoas.2011.05.005
Balibrea, M.E., J. Cuartero, M.C. Bolarín, and F. Pérez-Alfocea. 2003. Sucrolytic activities during
fruit development of Lycopersicon genotypes differing in tolerance to salinity. Physiol.
Plant, 118: 38-46.
Banath, C.L., E.A.N. Greenwood, and J.F. Loneragan. 1966. Effects of calcium deficiency on
symbiotic nitrogen fixation. Plant Physiol. 4l:760-763.
Bänziger, M., F.J. Betrán, and H.R. Lafitte, 1997. Efficiency of high nitrogen selection
environment for improving maize for low-nitrogen target environments. Crop Sci. 37: 1103-
1109.
Barker, K.R., P.S. Lehman, and D. Huisingh.1971. Influence of nitrogen and Rhizobium japonicum
on the activity of Heterodera glycines. Nematologica 17: 377-400.

198
Baral, B.R., and P. Adhikari. 2013. Effect of Azotobacter on growth and yield of maize. SAARC J
Agri. 11:141-147.
Barnett, M.J., J.A. Swanson, and S.R. Long. 1998. Multiple genetic controls on Rhizobium meliloti
syrA, a regulator of exopolysaccharide abundance. Genetics 148:19-32.
Barrona, J.E., R.J. Pasini, D.W. Davis, D.D. Stuthman, and P.H. Graham. 1999. Response to
selection for seed yield and nitrogen (N2) fixation in common bean (Phaseolus vulgaris L.).
Field Crops Res. 62:119-128.
Bashan, Y., and L.E. de-Bashan. 2005. Fresh-weight measurements of roots provide inaccurate
estimates of the effects of plant growth-promoting bacteria on root growth: a critical
examination. Soil Biol. Biochem. 37:1795-1804.
Bashan, Y., S. K. Harrison, and R.E. Whitmoyer. 1990. Enhanced growth of wheat and soybean
plants inoculated with Azospirillum brasilense is not necessarily due to general
enhancement of mineral uptake. Appl. Environ. Microbiol. 56:769-775.
Becana, M., P. Aparkio-Tejo, J. Pefia, J. Agulrreolea, and M. Sinchez-Diaz. 1986. N2 fixation
(C2H2-reducing activity) and leghaemoglobin content during nitrate- and water stress
induced senescence of Medicago sativa root nodules. J. Exp. Bot. 37:597-605.
Beck, D.P., and D.N. Munns. 1985. Effect of calcium on the phosphorus nutrition of Rhizobium
meliloti. Soil Sci. Soc. Am. J. 49:334-337.
Belay, N., R. Sparling, and L. Daniels. 1984. Dinitrogen fixation by a thermophilic methanogenic
bacterium. Nature 312:286-8.

199
Bellaloui, N., and A. Mengistu. 2015. Effects of boron nutrition and water stress on nitrogen
fixation, seed δ15
N and δ13
C dynamics, and seed composition in soybean cultivars differing
in maturities The Scientific World Journal 2015:1-11. doi:10.1155/2015/407872
Ben Salah, I., A. Albacete, C. Martinez Andujar, R. Haouala, N. Labidi, F. Zribi, V. Martinez, F.
Perez-Alfocea, and C. Abdelly. 2009. Response of nitrogen fixation in relation to nodule
carbohydrate metabolism in Medicago ciliaris lines subjected to salt stress. J. Plant Physiol.
166:477-488.
Bergman, B., A. Matveyev, and U. Rasmussen. 1996. Chemical signalling in cyanobacterial -plant
symbioses. Trends Plant Sci. 1:191–197. doi:10.1016/1360-1385(96)10021-2
Beringer, J.E., P.R. Hirsch. 1984. Genetic Engineering and nitrogen fixation. Biotechnol.
Gen.Engin. Rev. 1:65-88. doi:10.1080/02648725.1984.10647781
Bernstein, L., and G. Ogata. 1966. Effects of salinity on nodulation, nitrogen fixation, and growth
of soybeans and alfalfa. Agron. J. 58:201-203. Available at:
https://dl.sciencesocieties.org/publications/aj/pdfs/58/2/AJ0580020201
Bethlenfalvay, G.J., S.S. Abu Shakra, K. Fisbeck, and D.A. Phillips. 1978. The effect of source-
sink manipulations on nitrogen fixation in peas. Physiol. Plant. 43: 31-34.
Beversdortf, W.D. 1984. OAC Rico field bean. Can. J. Plant Sci. 64:753-755.
Bhapkar, D., and R. Deshmukh. 1982. Genetics of nodulation in Chickpea (Cicer arietinum L.).
Genetica 59:89-92.

200
Bhardwaj, D., M.W. Ansari, R.K. Sahoo, and N. Tuteja. 2014. Biofertilizers function as key player
in sustainable agriculture by improving soil fertility, plant tolerance and crop productivity.
Microb. Cell Fact. 13: 66-76. doi:10.1186/1475-2859-13-66
Bindhu, K.B. 2013. Effect of azolla extract on growth performance of Pisum sativum. Int. Res. J.
Biol. Sci. 2:88-90.
Bitocchi, E., E. Bellucci, A. Giardini, D. Rau, M. Rodriguez, E. Biagetti, R. Santilocchi, P.S. Zeuli,
T. Gioia, G. Logozzo, G. Attene, L. Nanni, and R. Papa. 2013. Molecular analysis of the
parallel domestication of the common bean (Phaseolus vulgaris L.) in Mesoamerica and the
Andes. New Phytol. 197: 300-313.
Blair, M.W., C.H. Galeano, E. Tovar, M.C.M. Torres, A.V. Castrillón, S.E. Beebe, and I.M. Rao.
2012. Development of a Mesoamerican intra-gene pool genetic map for quantitative trait
loci detection in a drought tolerant × susceptible common bean (Phaseolus vulgaris L.)
cross. Mol. Breed. 29:71-88. doi:10.1007/s11032-010-9527-9
Blair, M.W., G. Iriarte, and S. Beebe. 2006. QTL analysis of yield traits in an advanced backcross
population derived from a cultivated Andean × wild common bean (Phaseolus vulgaris L.)
cross. Theor. Appl. Genet. 112:1149-1163. doi:10.1007/s00122-006-0217-2
Blanco, F.A., E.P. Meschini, M.E. Zanetti, and O.M. Aguilar. 2007. A small GTPase of the Rab
family is required for root hair formation and pre-infection stages of the common bean-
Rhizobium symbiotic association. Plant Cell 21: 2797-2810. 10.1105/tpc.108.063420
Blevins, D.G., N.M. Barnett, and P.J. Bottino. 1977. The effects of calcium deficiency and the
ionophore A23187 on nodulation, nitrogen fixation and growth of soybeans. Physiol. Plant.
41:235-238.

201
Bliss, F.A. 1993. Breeding common bean for improved biological nitrogen fixation. Plant Soil
152:71-79.
Boddey, R. M., P.M. Chalk, R.L. Victoria, and E. Matsui. 1984. Nitrogen fixation by nodulated
soybean under tropical field conditions estimated by the 15
N isotope dilution techinque. Soil
Biol. Biochem. 16: 583-588.
Boddey, R.M., M.B. Peoples, B. Palmer, P.J. Dart. 2000. The use of 15
N natural abundance
technique to quantify biological nitrogen fixation by woody perennials. Nutr Cycl Agro-
ecosyst 57:235-270 doi:10.1023/A:100989051484
Bolaños, J., and G.O. Edmeades. 1993. Eight cycles of selection for water stress tolerance in
lowland tropical maize. I. Responses in grain yield, biomass and radiation utilization. Field
Crops Res. 31: 233-252; doi:10.1016/0378-4290(93)90064-T.
Bonilla, I., C. Mergold-Villasefisor, M.E. Campos, N. Sanches, H. Perez, L. Lopez, L. Castrejon,
F. Sánchez, and G.I. Cassab. 1997. The aberrant cell walls of boron-deficient bean root
nodules have no covalently bound hydroxyproline-proline-rich proteins. Plant Physiol. 115:
1329-1340.
Bordeleau, L. M., and D. Prévost. 1994. Nodulation and nitrogen fixation in extreme environments.
Plant Soil 161:115-124.Bottomley, P.J., and D.D. Myrold. 2007. Biological N inputs. In:
E.A. Paul (ed.) Soil microbiology, ecology, and biochemistry. Academic Press is an imprint
of Elsevier; Pp. 365-387.
Bottomley, P.J., and D.D. Myrold. 2007. Biological nitrogen fixation: The return of N to the soil.
In: E.A. Paul (ed.). Soil Microbiology, Ecology, and Biochemistry. Academic Press,
Burlington, MA p. 365-387.

202
Bourion, V., S.M. Rizvi, S. Fournier, H. De Larambergue, F. Galmiche, P. Marget, G. Duc, and J.
Burstin. 2010. Genetic dissection of nitrogen nutrition in pea through a QTL approach of
root, nodule, and shoot variability. Theor. Appl. Genet. 121:71-86. doi:10.1007/s00122-
010-1292-y
Brenzonik, P.L., and C.L. Harper. 1969. Nitrogen fixation in some anoxic lacustrine environments.
Sci. 164:1277-1279. Available online at: http://www.jstor.org/page/info
/about/policies/terms.jsp
Brito, B., M. Martinez, D. Fernández, L. Rey, and E. Cabrera. 1997. Hydrogenase genes from
Rhizobium leguminosarum bv. viciae are controlled by the nitrogen fixation regulatory
protein NifA. Proc. Natl. Acad. Sci. USA 94: 6019-6024.
Brodrick, S.J., and K. Giller. 1991. Genotypic Difference in molybdenum accumulation affects N2-
fixation in tropical Phaseolus vulgaris L. J. Exp. Bot. 42:1339-1343.
doi:10.1093/jxb/42.10.1339
Brondani, R.P.V., C. Brondani, R. Tarchini, and D. Grattapaglia. 1998. Development,
characterization and mapping of microsatellite markers in Eucalyptus grandis and E.
urophylla. Theor. Appl. Genet. 97:816-827.
Brooks, R., P.L. Brenzoik, H.D. Putnam, and M.A. Kerin. 1971. Nitrogen fixation in an estuarine
environment: the Waccasassa on the Florida Gulf Coast. Limnol. Oceanogr. 16: 701-710.
Available online at: http://www.jstor.org.subzero.lib.uoguelph.ca/stable/2834552v
Broughton, W.J., G. Hernández, M. Blair, S. Beebe, P. Gepts, and J. Vanderleyden. 2003. Beans
(Phaseolus spp.) - model food legumes. Plant Soil 252:55-128.
203
Broughton, W.J., S. Jabbouri, and X. Perret. 2000. Keys to symbiotic harmony. J. Bacteriol.
182:5641-5652.
Bruinjin. F.J. 2015. Biological nitrogen fixation. In: B. Lugtenberg (ed.) Principles of plant-
microbe interactions. Springer Int. Pub. Switzerland. Pp. 215-224. doi: 10.1007/978-3-319-
08575-3_23
Buerkert, A. 1990. Soil acidity and liming effects on stand, nodulation, and yield of common bean.
Agron. J. 82:749-754.
Buikema, W.J., and R. Haselkorn. 1993. Molecular genetics of cyanobacterial development. Annu.
Rev. Plant Physiol. Plant Mol. Biol. 44:33-52.
Burris, R.H. 1974. Biological nitrogen fixation, 1924-1974. Plant Physiol. 54: 443-449.
Buso, G.S.C., Z.P.S. Amaral, R.P.V. Brondani, and M.E. Ferreira. 2006. Microsatellite markers for
the common bean (Phaseolus vulgaris). Molecular Ecology Notes 6:252-254.
doi:10.1111/j.1471-8286.2006.01210.x
Busse, M.D., and P.J. Bottomley. 1989. Growth and nodulation responses of Rhizobium meliloti to
water stress induced by permeating and no permeating solutes. Appl. Env. Microbiol.
55:2431-2436.
Buts, L., J. Lah, M.H. Dao-Thi, L. Wyns, and R. Loris. 2005. Toxin-antitoxin modules as bacterial
metabolic stress managers. Trends Biochem. Sci. 30:672-679.
Caetano-Anolles, G., A. Lagares, and G. Favelukes. 1989. Adsorption of Rhizobium meliloti to
alfalfa roots: dependence on divalent cations and pH. Plant Soil 117:67-74.
204
Callaham, D., P. Del Tredici, and J.G. Torrey. 1978. Isolation and cultivation in vitro of the
actinomycete causing root nodulation in Comptonia. Sci. 199:899-902.
Canfield, D.E., A.N. Glazer, and P.G. Falkowski. 2010. The evolution and future of earth’s
nitrogen cycle. Rev. Sci. 330:192-196. doi: 10.1126/science.1186120
Capone, D. G. 2001. Marine nitrogen fixation: what’s the fuss? Curr. Opn. Microbiol. 4:341-348.
Carnahan, J.E., L.E. Mortenson, H.F. Mover, and J.E. Castle. 2005. Nitrogen fixation in cell-free
extracts of Clostridium pasteurianum. Biochim. Biophys. Acta 38:188-189.
Casañas, F., E. Pérez-Vega, A. Almirall, M. Plans, J. Sabaté, and J.J. Ferreira. 2013. Mapping of
QTL associated with seed chemical content in a RIL population of common bean
(Phaseolus vulgaris L.). Euphytica 192:279-288. doi:10.1007/s10681-013-0880-8
Catalano, C.M., K.J. Czymmek, J.G. Gann, and D.J. Sherrier. 2007. Medicago truncatula syntaxin
SYP132 defines the symbiosome membrane and infection droplet membrane in root
nodules. Planta 225:541-550. doi:10.1007/s00425-006-0369-y
Catalano, C.M., W.S. Lane, and D.J. Sherrier. 2004. Biochemical characterization of symbiosome
membrane proteins from Medicago truncatula root nodules. Electrophoresis 25:519-531.
doi:10.1002/elps.200305711
Ceccarelli, S. 1987.Yield potential and drought tolerance of segregating populations of barley in
contrasting environments. Euphytica 36:265-273. doi: 10.1007/BF00730673
Ceccarelli, S. 1996. Adaptation to low/high input cultivation. Euphytica 92:203-214.

205
Ceccarelli, S., S. Grando, and A. Impiglia. 1998. Choice of selection strategy in breeding barley for
stress environments. Euphytica 103:307-318. doi:10.1023/A:1018647001429
Chalk, P.M. 1985. Estimation of N2 fixation by isotope dilution: an appraisal of techniques
involving 15
N enrichment and their application. Soil Biol. Biochem. 17:389-410.
Chalk, P.M. 1996. Estimation of N2 fixation by 15
N isotope dilution - the A- value approach. Soil
Biol. Biochem. 28:1123-1130.
Chamber-Pérez, M.A., M. Camacho-Martínez, and J.J. Soriano-Niebla. 1997. Nitrate-reductase
activities of Bradyrhizobium spp. in tropical legumes: Effects of nitrate on O2 diffusion in
nodules and carbon costs of N2 fixation. J. Plant Physiol. 150:92-96. doi:10.1016/S0176-
1617(97)80186-1
Chaverra, M.H., and P.H. Graham. 1992. Cultivar variation in traits affecting early nodulation of
common bean. Crop Sci. 32:1432-1436.
Checa, O.E., and M.W. Blair. 2012. Inheritance of yield related traits in climbing beans (Phaseolus
vulgaris L). Crop Sci. 52:1998–2013. doi:10.2135/cropsci2011.07.0368
Chen, H., E. Gartner, and B. G. Rolfe. 1993. Involvement of genes on a mega-plasmid in the acid-
tolerant phenotype of Rhizobium leguminosarum biovar trifolii. Appl. Environ. Microbiol.
59:1058-1064.
Chen, J.S., J. Toth, and M. Kasap. 2001. Nitrogen-fixation genes and nitrogenase activity in
Clostridium acetobutylicum and Clostridium beijerinckii. J. Ind. Microbiol. Biot. 27:281-
286. Avaliable online at:www.nature.com/jim

206
Chen, M., Q.Y. Wanga, X.G. Chengb, Z.S. Xua, L.C. Lia, X.G. Yea, L.Q. Xiaa, and Y.Z. Ma.
2007. GmDREB2, a soybean DRE-binding transcription factor, conferred drought and high-
salt tolerance in transgenic plants. Biochem. Biophys. Res. Commun. 353:299-305.
doi:10.1016/j.bbrc.2006.12.027
Choi, I.Y., D.L. Hyten, L.K. Matukumalli, Q.J. Song, J.M. Chaky, C.V. Quigley, K. Chase,K.G.
Lark, R.S. Reiter, M.S. Yoon, Hwang E.Y., S.I. Yi, N.D. Young, R. C. Shoemaker, C.P.
Van Tassell, J.E. Specht, and P.B. Cregan. 2007. A soybean transcript map: Gene
distribution, haplotype and single-nucleotide polymorphism analysis. Genetics 176: 685-
696. doi:10.1534/genetics.107.070821
Choudhury, A.T.M.A., and I.R. Kennedy. 2004. Prospects and potentials for systems of biological
nitrogen fixation in sustainable rice production, Biol. Fertil. Soils. 39:219-227.
Churchill, G.A., and R.W. Doerge. 1994. Empirical threshold values for quantitative trait mapping.
Genetics 138:963-971.
Clawson, M.L., A. Bourret, D.R. Benson. 2004. Assessing the phylogeny of Frankia-related plant
nitrogen-fixing root nodule symbioses with Frankia 16SRNA and glutamine synthetase gene
sequences. Mol. Phylogenet. Evol. 31:131-138. doi:10.1016/j.ympev.2003.08.001
Cochran, W.G., and G.M. Cox. 1950. Experimental designs. John Wiley and Sons, Inc. Canada Pp.
274-314.
Colebatch, G., G. Desbrosses, T. Ott, L. Krusell, O. Montanari, S. Kloska, J. Kopka, and M.K.
Udvard. 2004. Global changes in transcription orchestrate metabolic differentiation during
symbiotic nitrogen fixation in Lotus japonicas. Plant J. 39:487-512.
207
Coleto, I., M. Pineda, A.P. Rodiño, A.M. De Ron, and J.M. Alamillo. 2014. Comparison of
inhibition of N2 fixation and Ureide accumulation under water deficit in four common bean
genotypes of contrasting drought tolerance. Ann. Bot. Pp. 1-12. doi:10.1093/aob/mcu029
Cooper, J. 2004. Multiple responses of rhizobia to flavonoids during legume root infection, in: J.A.
Callow (ed.) Advances in botanical research: Incorporating advances in plant pathology,
Academic Press, Pp. 1-62.
Cooper, J.E. 2007. Early interactions between legumes and rhizobia: disclosing complexity in a
molecular dialogue. J. Appl. Microbiol. 103:1355-1365. doi:10.1111/j.1365-2672. 2007.
03366.x
Cordovilla, M. P., A. Ocana, F. Ligero, and C. Lluch. 1995. Salinity effects on growth analysis and
nutrient composition in four grain legumes-Rhizobium symbiosis. J. Plant Nutr. 8:1595-
1609.
Cornelius, P. L., and M. S. Seyedsadr. 1997. Estimation of general linear-bilinear models for two
way tables. J. Sta. Comput. Sim. 58:287-322.
Correa, O. S., and A. J. Barneix. 1997. Cellular mechanisms of pH tolerance in Rhizobium loti.
World J. Microbiol. Biotechnol. 13:153–157.
Cortés, A.J., M.C. Chavarro, and M.W. Blair. 2011. SNP marker diversity in common bean
(Phaseolus vulgaris L.). Theor. Appl. Genet. 123:827-845. doi:10.1007/s00122-011-1630-8
Cowles, J.R., H.J. Evans, and S.A. Russell. 1969. B12 coenzyme-dependent ribonucleotide
reductase in Rhizobium species and the effects of cobalt deficiency on the activity of the
enzyme. J. Bacteriol. 97:1460-1465.

208
Craig, G.F., C.A. Atkins, and D.T. Bell. 1991. Effect of salinity on growth of Rhizobium and their
infectivity and effectiveness on two species of Acacia. Plant and Soil 133:253-262.
Crossa, J., and P. L. Cornelius. 1997. Sites regression and shifted multiplicative model clustering of
cultivar trials sites under heterogeneity of error variances. Crop Sci. 37:406-415.
Crossa, J., P. L. Cornelius, M. Seyedsadr, and P. Byrne. 1993. A shifted multiplicative model
cluster analysis for grouping environments without genotypic rank change. Theor. Appl.
Genet. 85: 577-586.
Cullimore, J.V., R. Ranjeva, and J.J. Bono. 2001. Perception of lipochitooligosaccharidic Nod
factors in legumes. Trends Plant Sci. 6:24-30.
Dalton, D.A., H.J. Evans, and F.J. Hanus. 1985. Stimulation by nickel of soil microbial urease
activity and urease and hydrogenase activities in soybeans grown in a low- nickel. Plant
Soil. 88: 245-258.
Dalton, D.A., and S. Kramer. 2006. Nitrogen-fixing bacteria in non-legumes. Springer Netherlands,
Dordrecht Pp. 105-130.
Danso, S.K.A., G. Hardarson, and Z. Zapata. 1993. Misconceptions and practical problems in the
use of 15
N soil enrichment techniques for estimating N2 fixation. Plant Soil 152:25-52.
Da Silva, P.M., S.M. Tsai, and R. Bonetti. 1993. Response to inoculation and N fertilization for
increased yield and biological nitrogen fixation of common bean (Phaseolus vulgaris L.).
Plant and Soil 152:123-130.

209
Dean, D.R., and M.R. Jacobson. 1992. Biochemical genetics of nitrogenase. In: G. Stacey, R.H.
Burris, and H.J. Evans (eds.) Biological nitrogen fixation. Chapman and Hall, New York
Pp.763-834.
Debouck, D. 1999. Diversity in Phaseolus species in relation to the common bean. p. 25-52. In:
S.P. Singh (ed.) Common Bean Improvement in the Twenty-First Century. Kluwer
Academic Publishers. Dordrecht, the Netherlands.
Delgado, M.J., E.J. Bedmar, and J.A. Downie. 1998. Genes involved in the formation and assembly
of rhizobial cytochromes and their role in symbiotic nitro-gen fixation. Adv. Microb.
Physiol. 40:191-231.
Delgado, M.J., J.M. Garrido, F. Ligero, and C. Lluch. 1993. Nitrogen fixation and carbon
metabolism by nodules and bacteroids of pea plants under sodium chloride stress. Physiol.
Plantarum 89: 824-829.
Delwiche, C. C., P. J. Zinke, C. M. Johnson, and R. A. Virginia. 1979. Nitrogen isotope distribution
as a presumptive indicator of nitrogen-fixation. Bot. Gaz. 140:65-69.
De Maagd, R.A., A.H. Wijfjes, H.P. Spaink, J.E. Ruiz-Sainz, C.A. Wijffelman, R.J. Okker, and B.J.
Lugtenberg. 1989. nodO, a new nod gene of the Rhizobium leguminosarum biovar viciae
sym plasmid pRL1JI, encodes a secreted protein. J Bacteriol 171: 6764-6770.
Denison, R.F., J.F. Witty, and F.R. Minchin. 1992. Reversible O2 inhibition of nitrogenase activity
in attached soybean nodules. Plant Physiol. 100:1863-1868.
210
Del Rosario, E.E., R.A. Hautea , and R.M. Lantican. 1997. Genetic effects of qunatitative traits in
nodulation and nitrogen fixation in mungbean (Vigna radiata (L) Wilczek). Philipp. J. Crop
Sci. 22:74-82.
Devi, M.J., and T.R. Sinclair. 2013. Nitrogen fixation drought tolerance of the slow-wilting
soybean PI471938. Crop Sci. 53:2129-2134.
Devi, M J., T.R. Sinclair, S.E. Beebe, and I.M. Rao. 2013. Comparison of common bean
(Phaseolus vulgaris L.) genotypes for nitrogen fixation tolerance to soil drying. Plant Soil
364:29-37.
Devi, M., T.R. Sinclair, and V. Vadez. 2010. Genotypic variability among peanut (Arachis hypogea
L.) in sensitivity of nitrogen fixation to soil drying. Plant Soil 330:139-148.
D’Haeze, W., and M. Holsters. 2002. Nod factor structures, responses, and perception during
initiation of nodule development. Glycobiol. 12: 79-105. doi:10.1093/glycob/12.6.79R
Díaz-Batalla, L., and J.M. Widholm, G.C. Fahey-J.R., E. Castaňo-Astano-Tostado, and O. Paredes-
Loäpez. 2006. Chemical components with health implications in wild and cultivated
Mexican common bean seeds (Phaseolus vulgaris L.). J. Agric. Food Chem. 54: 2045-2052.
Dinh, H.T., W. Kaewpradit, S. Jogloy, N. Vorasoot, and A. Patanothai. 2013. Biological nitrogen
fixation of peanut genotypes with different levels of drought tolerance under mid-season
drought. SABRAO J. Breed. Genet. 45:491-503.
Divitoa, G.A., and V.O. Sadras. 2014. How do phosphorus, potassium and sulphur affect plant
growth and biological nitrogen fixation in crop and pasture legumes? A meta-analysis Field
Crop Res. 156:161-171.

211
Dixon, R. 1984. The genetic complexity of nitrogen fixation - The ninth Fleming lecture. J. Gen.
Microbiol. 130:2745-2755.
Dixon, R. 2004. Historical Perspective – Development of nif genetics and regulation in Klebsiella
pneumonia. In: W. Klipp, B. Masepohl, J.R. Gallon, and W.E. Newton (eds.) Genetics and
regulation of nitrogen fixation in free-living bacteria. Kluwer Academic Publishers Pp. 1-
16.
Dixon, R., and D. Kahn. 2004. Genetic regulation of biological nitrogen fixation. Nat. Rev. 2:621-
631.
Djekoun, A., and C. Planchon. 1991. Water Status Effect on Dinitrogen Fixation and
photosynthesis in Soybean. Agron. J. 83:316-322.
Doerge, R.W., and G.A. Churchill. 1996. Permutation tests for multiple loci affecting a quantitative
character. Genet. Mol. Biol. 142:285-294.
Döbereiner, J. 1966. Manamgese toxicity effects on nodulation and nitrogen fixation of beans
(Phaseolus vulgaris L.), in acidic soils. Plant Soil 24:153-166.
Döbereiner, J.1997. Importância da fixação biológica de nitrogênio para a agricultura sustentável.
Biotecnol Ciênc Desenvolv 1:2-3. In: M.V.B. Figueiredo, A.C.E.S. Mergulhão, J.K. Sobral,
M.A.L. Junior, and A. S.F. Araújo. 2013. Biological nitrogen fixation: importance,
associated diversity, and estimates. In: N.K. Arora (ed.) Plant Microbe Symbiosis:
Fundamentals and Advances, Spring India, Pp. 267-289. doi: 10.1007/978-81-322-1287-
4_10

212
Doroshenko, E.V., E.S. Boulygina, E.M. Spiridonova, T.P. Tourova, and I.K. Kravchenko, 2007.
Isolation and characterization of nitrogen-fixing bacteria of the genus Azospirillum from the
Soil of a Sphagnum Peat Bog. Microbiol., 76: 93-101.
Downie, J.A. 2005. Legume haemoglobins: symbiotic nitrogen fixation needs bloody nodules.
Curr. Biol. 15:196-199.
Durand, J.L., J.E. Sheehy, and F.R. Minchin.1987. Nitrogenase activity, photosynthesis and nodule
water potential in soybean plants experiencing water-deprivation. J. Exp. Bot. 38:311-321.
Dwivedi, S.L., K.L. Sahrawat, H.D. Upadhyaya, A. Mengoni, M. Galardini, M. Bazzicalupo, E.G.
Biondi, M. Hungria, G. Kaschuk, M.W. Blair, and R. Ortiz. 2015. Advances in Host Plant
and Rhizobium Genomics to Enhance Symbiotic Nitrogen Fixation in Grain Legumes. Adv.
Agron. 129:1-116. doi:10.1016/bs.agron.2014.09.001
Dwivedi, S.L., J.H. Crouch, D.J. Mackill, Y. Xu, M.W. Blair, M. Ragot, H.D. Upadhyaya, and R.
Ortiz. 2007. The molecularization of public sector crop breeding: progress, problems, and
prospects. In: D.L Sparks (ed) Advances in Agronomy. 95: 163–318. Elsevier Academic
Press, San Diego, ISBN: 978-0-12-374165-3
Eady, R.R. 1996. Structure–function relationships of alternative nitrogenases. Chem. Rev. 96:3013-
3030.
Earl, H.J., and Davis R.F. 2003. Effect of drought stress on leaf and whole canopy radiation use
efficiency and yield of maize, Agron. J. 95:688.696.
Eberhart, S.A., and W.A. Russell. 1966. Stability parameters for comparing varieties. Crop Sci.
6:36-40. doi:10.2135/cropsci1966.0011183X000600010011x

213
Egli, M.A., S.M. Griffith, S.S. Miller, M.P. Anderson, and C.P. Vance. 1989. Nitrogen assimilating
enzyme activities and enzyme protein during development and senescence of effective and
plant gene-controlled ineffective alfalfa nodules. Plant Physiology, 91:898-904.
doi:10.1104/pp.91.3.898
Eid, M.H. 2009. Estimation of heritability and genetic advance of yield traits in wheat (Triticum
aestivum L.) under drought condition. Int. J. Genet. Mol. Biol.1:115-120; Available online
at http://www.academicjournals.org/IJGMB.
Einsle, O., F.A. Tezcan, S.L. Andrade, B Schmid, M. Yoshida, J.B. Howard, and D.C. Rees. 2002.
Nitrogenase MoFe-protein at 1.16 A resolution: a central ligand in the FeMo-cofactor. Sci.
297:1696-1700.
El-Shinnawi, M. M., N. A. El-Saify, and T. M. Waly. 1989. Influence of the ionic form of mineral
salts on growth of faba bean and Rhizobium leguminosarum. World J. Microbiol.
Biotechnol. 5:247-254.
Epstein, E. and A.J. Bloom. 2005. Mineral nutrition of plants: Principles and perspectives, 2nd
edition. Sunderland, Massachusetts: Sinauer Associates. P. 380.
Eskandari, M., E.R. Cober, and I. Rajcan. 2013. Genetic control of soybean seed oil: I. QTL and
genes associated with seed oil concentration in RIL populations derived from crossing
moderately high-oil parents. Theor. Appl. Genet. 126:483-495.
Eskew, D. L., A.R.J. Eaglesham, and A. A. App. 1981. Heterotrophic 15
N2 fixation and distribution
of newly fixed nitrogen in a rice-flooded soil system. Plant Physiol. 68: 48-52.
doi:10.1104/pp.68.1.48

214
Fageria, N.K., V.C. Baligar, and C.A. Jones. 2011. Growth and mineral nutrition of field crops.
Boca Raton, CRC Press p. 430.
Fageria, N.K., L.C. Melo, E.P.B. Ferreira, J.P. Oliveira, and A. M. Knupp. 2014. Dry matter, grain
yield, and yield components of dry bean as influenced by nitrogen fertilization and rhizobia.
Commun. Soil Sci. Plan. 45:111-125.
Faghire, M., A. Bargaz, M. Farissi, F. Palma, B. Mandri, C. Lluch, N.A. Tejera García, J.A.
Herrera-Cervera, K. Oufdou, and C. Ghoulam. 2011. Effect of salinity on nodulation,
nitrogen fixation and growth of common bean (Phaseolus vulgaris) inoculated with
rhizobial strains isolated from the Haouz region of Morocco. Symbiosis 55:69-75.
Faghire, M., M. Farissi, K. Taoufiq, R. Fghire, A. Bargaz, B. Mandri, K. Oufdou, A. Laury, J.
Drevon, and C. Ghoulam. 2013. Genotypic variation of nodules’ enzymatic activities in
symbiotic nitrogen fixation among common bean (Phaseolus vulgaris L.) genotypes grown
under salinity constraint. Symbiosis 60:115-122.
FAO. 2008. Current world fertilizer trends and outlook 2011/2012. Food and agricultural
organization of the United Nations, Rome. Available online at:
ftp://ftp.fao.org/agl/agll/docs/ cwfto11.pdf
FAO. 2012. Current world fertilizer trends and outlook to 2016.. Food and agricultural organization
of the United Nations, Rome, p. 43. Available online on at: ftp://ftp.fao.org/ag/agp/
docs/cwfto16.pdf
FAOSTAT. 2013. Available at: http:// faostat.fao.org
215
FAOSTAT. 2015. Food and agriculture organization of the United Nations, statistics division.
Accessed at: http://faostat3.fao.org/download/Q/QC/E
Farid, M., H.J. Earl, and A. Navabi. 2015. Yield stability of dry bean genotypes across nitrogen
fixation-dependent and fertilizer-dependent management systems. Crop Sci. In press
Farid, M., and A. Navabi. 2015. N2 fixation ability of different dry bean genotypes. Can. J. Plant
Sci. In press. doi; 10.4141/CJPS-2015-084
Farquhar, G.D., J. R. Ehleringer, and K.T. Hubick. 1989. Carbon isotope discrimination and
photosynthesis. Annu. Rev. Plant Physiol. Plant Mol. Biol. 40:503-537.
Fauvart, M. and J. Michiels. 2008. Rhizobial secreted proteins as determinants of host specificity in
the rhizobium-legume symbiosis. FEMS Microbiol. Lett. 285:1-9. doi:10.1111/j.1574-
6968.2008.01254.x
Fay, P. 1981. Photosynthetic microorganisms, p. 1-29. In W. J. Broughton (ed.), Nitrogen fixation,
vol. I. Ecology. Clarendon Press, Oxford. In: P. Fay. 1992. Oxygen relations of nitrogen
fixation in cyanobacteria. Microbiol. Rev. 340-373.
Fay, P. 1992. Oxygen relations of nitrogen fixation in cyanobacteria. Microbiol. Rev.1992, 56: 340-
373.doi:0146-0749/92/020340-34$02.00/0.
Feechan, A., A.M. Jermakow, A. Ivancevic, D. Godfrey, H. Pak, R. Panstruga, and I.B. Dry. 2013 .
Host cell entry of powdery mildew is correlated with endosomal transport of
antagonistically actingVvPEN1andVvMLO to the papilla. Mol. Plant Microbe Interact.
26:1138-1150. doi:10.1094/MPMI-04-13-0091-R

216
Ferguson, B.J., A. Indrasumunar, S. Hayashi, M.H. Lin, Y.H. Lin, D.E. Reid, and P.M. Gresshoff.
2010. Molecular analysis of legume nodule development and autoregulation. J. Integr. Plant
Biol. 52:61-76.
Figueiredo, M.V.B., A.C.E.S. Mergulhão, J.K. Sobral, M.A.L. Junior, and A. S.F. Araújo. 2013.
Biological nitrogen fixation: importance, associated diversity, and estimates. In: N.K. Arora
(ed.) Plant Microbe Symbiosis: Fundamentals and Advances, Spring India, Pp. 267-289.
doi: 10.1007/978-81-322-1287-4_10
Finan, T.M., J.M. Wood, and D.C. Jordon. 1983. Symbiotic properties of C4-dicarboxylic acid
transport mutants of Rhizobium leguminosarum. J. Bacteriol., 154: 1403-1413. Available at:
http://jb.asm.org/
Finlay, K.W., and G.N. Wilkinson. 1963. Analysis of adaptation in a plant-breeding programme.
Aust. J. Agric. Res. 14: 742-754.
Fischer, H.M. 1994.Genetic regulation of nitrogen fixation in rhizobia. Microbiol. Rev. 58:352-
386.
Fogg, G. E., W. D. P. Stewart, P. Fay, and A. E. Walsby. 1973. The blue-green algae. Academic
Press Ltd., London.
Franche, C., K. Lindström, and C. Elmerich. 2009. Nitrogen-fixing bacteria associated with
leguminous and non-leguminous plants. Plant Soil 321:35-59. doi: 10.1007/s11104-008-
9833-8
Franco, M.C., S.T.A. Cassini, V.R. Oliveira, C.D. Cruz, C. Vieira, and S.M. Tsai. 2002. Genetic
control of nodulation in common bean. J. Genet. Breeding 56:171-176.

217
Franco, A. A., and J. M. Day. 1980. Effects of lime and molybdenum on nodulation and nitrogen
fixation of Phaseolus vulgaris L. in acid soils of Brazil. Turrialba 30: 99-105. (Abstract)
Franco, M.C., St. Cassini, Vr. Oliveira, C. Vieira, S.M. Tsai, and C.D. Cruz. 2001. Combining
ability for nodulation in common bean (Phaseolus vulgaris L.) genotypes from Andean and
Middle American gene pools. Euphytica 118:265-270.
Freiberg, C., R. Fellay, A. Bairoch, W.J. Broughton, A. Rosenthal, and X. Perret. 1997. Molecular
basis of symbiosis between Rhizobium and legumes. Nature 387:394-401.
doi:10.1038/387394a0
Fried, M., and, H. Broeshart. 1975. An independent measurement of the amount of nitrogen fixed
by a legume crop. Plant Soil 43:707-711.
Friesen, M.L., M.A. Cordeiro, V. Penmetsa, M. Badri, T. Huguet, M.E. Aouani, D.R. Cook, and
S.V. Nuzhdin. 2010. Population genomic analysis of Tunisian Medicago truncatula reveals
candidates for local adaptation. Plant J.63:623-635.
Fujihara, S., and T. Yoneyama. 1993. Effects of pH and osmotic stress on cellular polyamine
contents in the soybean rhizobia Rhizobium fredii p220 and Bradyrhizobium japonicum
A1017. Appl. Environ. Microbiol. 59:1104-1109.
Fujikake, H., A. Yamazaki, N. Ohtake, K. Sueyoshi, S. Matsuhashi,T. Ito, C. Mizuniwa, T. Kume,
S. Hashimoto, N.S. Ishioka, S. Watanabe, A. Osa, T. Sekine, H. Uchida, A. Tsuji, and T.
Ohyama. 2003. Quick and reversible inhibition of soybean root nodule growth by nitrate
involves a decrease in sucrose supply to nodules. J. Exp. Bot. 54:1379-1388.
doi:10.1093/jxb/erg147

218
Gage, D.G. 2009. Nodule development in legumes. In: D.W. Emerich, and H.B. Krishnan (eds.)
Nitrogen fixation in crop production. ASA, CSSA, SSSA, Madison, USA Pp. 1-24.
Gagnon, H., and R.K. Ibrahim 1998. Aldonic acids: A novel family of nod gene inducers of
Mesorhizobium loti, Rhizobium lupini, and Sinorhizobium meliloti. Mol. Plant-Microbe
Interact. 11:988-998.
Gail, M., and R. Simon. 1985. Testing for qualitative interactions between treatment effects and
patient subsets. Biometrics 41: 361-372.
Gaitan, E., I.Y. Choi, C. Quigley, P. Cregan, and J. Tohme. 2008. Single nucleotide polymorphisms
in common bean: their discovery and genotyping using a multiplex detection system. Plant
Genome 1:125-134.
Galeano, C.H., A.J. Cortés, A.C. Fernández, Á. Soler, N. Franco-Herrera, G. Makunde, J.
Vanderleyden, and M.W. Blair. 2012. Gene-Based Single Nucleotide Polymorphism
Markers for Genetic and Association Mapping in Common Bean. BMC Genetics 13:48-59.
Available at: http://www.biomedcentral.com/1471-2156/13/48
Galeano, C.H., A.C. Fernandez, M. Gomez, and M.W. Blair. 2009. Single strand conformation
polymorphism based SNP and Indel markers for genetic mapping and synteny analysis of
common bean (Phaseolus vulgaris L.). BMC Genomics 10:629-643. doi:10.1186/1471-
2164-10-629
Galloway, J.N., W.H. Schlesinger, H.I. Levy, A.F. Michaels, and J.L. Schnoor, 1995. Nitrogen
fixation: anthropogenic enhancement environmental response. Global Biogeo-chemical
Cycles 9:235-252. doi: 10.1029/95GB00158

219
Gauri, S.S., S.M. Manda, and B.R. Pati. 2012. Impact of Azotobacter exopolysaccharides on
sustainable agriculture. Appl. Microbiol. Biotechnol. 95:331-338. doi: 10.1007/s00253-
012-4159-0
Georgiev, G.I., and C.A. Atkins. 1993. Effects of salinity on N2 fixation, nitrogen metabolism and
export and diffusive conductance of cowpea root nodules. Symbiosis 5:239-255.
Gepts, P. 1998. Origin and evolution of common bean: Past events and recent trends. Hort. Sci.
33:1124-1130.
Giller, K.E. 2001. Nitrogen fixation in tropical cropping systems, CAB International, Wallingford
Gil-Quintana, E., E. Larrainzar, A. Seminario, J.L. Díaz-Leal, J.M. Alamillo, M. Pineda, C. Arrese-
Igor, S. Wienkoop, and E.M. González. 2013. Local inhibition of nitrogen fixation and
nodule metabolism in drought-stressed soybean. J. Exp. Bot. 1-12. doi: 10.1093/jxb/ert074
Glazebrook, J., A. Ichige, and G.C. Walker. 1993. A Rhizobium meliloti homolog of the
Escherichia coli peptide-antibiotic transport protein SbmA is essential for bacteroid
development. Genes Dev. 7: 1485-1497. doi:10.1101/gad.7.8.1485
Glazer, A. N. 1987. Phycobilisomes: assembly and attachment, p. 69-94. In P. Fay, and C. Van
Baalen (ed.), The cyanobacteria. Elsevier/Science Publishers B.V., Amsterdam.
Global Biodiversity Information Facilities. 2015. Free and open access to biodiversity data.
Universitetsparken 15, DK-2100 Copenhagen, Denmark; availavle at: http://www.gbif.org.
Gohlke, R. S., F. W. McLafferty. 1993. Early gas chromatography/mass spectrometry. J. Am. Soc.
Mass Spectrom. 4:367-371.

220
González, E.M., L. Gálvez, and C. Arrese‐Igor. 2001. Abscisic acid induces a decline in nitrogen
fixation that involves leghaemoglobin, but is independent of sucrose synthase activity. J.
Exp. Bot. 52: 285-293. doi:10.1093/jexbot/52.355.285
González, L.J., B. Rodelas, C. Pozo, V. Salmeron, M.V. Martinez, and V. Salmeron, 2005.
Liberation of amino acids by heterotrophic nitrogen fixing bacteria. Amino Acids, 28: 363-
367. doi: 10.1007/s00726-005-0178-9
González -Rizzo, S., M. Martin Crespi, and F. Frugier. 2006. The Medicago truncatula CRE1
cytokinin receptor regulates lateral root development and early symbiotic interaction with
Sinorhizobium meliloti. Plant Cell 18:2680-2693.
Goodstein, D.M., S. Shu, R. Howson, R. Neupane, R.D. Hayes, J. Fazo, T. Mitros, W. Dirks, U.
Hellsten, N. Putnam, and D.S. Rokhsar. 2011. Phytozome: a comparative platform for green
plant genomics. Nucleic Acids Res. 40:1178-1186. doi:10.1093/nar/gkr944
Graham, P.H. 1981. Some problems of nodulation and symbiotic fixation in Phaseolus vulgaris L.:
A review. Field Crops Res. 4:93-112.
Graham, P.H. 1992. Stress tolerance in Rhizobium and Bradyrhizobium, and nodulation under
adverse soil conditions. Can. J. Microbiol. 38:475-484.
Graham, P. H., K. Draeger, M. L. Ferrey, M. J. Conroy, B. E. Hammer, E. Martinez, S. R. Naarons,
and C. Quinto. 1994. Acid pH tolerance in strains of Rhizobium and Bradyrhizobium, and
initial studies on the basis for acid tolerance of Rhizobium tropici UMR1899. Can. J.
Microbiol. 40:198-207.

221
Graham, P.H., and J. Halliday. 1976. Inoculation and nitrogen fixation in the genus Phaseolus. In:
J.M. Vincent, A.S. Whitney, and J. Bose (eds) Exploiting the legume-Rhizobium symbiosis
in tropical agriculture. Univ. Hawaii Misc. PublHawaii Pp. 313-334.
Graham, M.A., M. Ramírez, O. Valdés-López, M. Lara, M. Tesfaye, C.P. Vance, and G.
Hernández. 2006. Identification of candidate phosphorus stress induced genes in Phaseolus
vulgaris L. through clustering analysis across several plant species. Funct. Plant Biol.
33:789-797. http://dx.doi.org.subzero.lib.uoguelph.ca/10.1071/FP06101
#sthash.SF6OxgbS.dpuf
Graham, P.H., and J.H. Rosas. 1977 Growth and development of indeterminate bush and climbing
cultivars of Phaseolus vulgaris L. inoculated with Rhizobium. J. Agric. Sci. Camb. 88:503-
508.
Graham, P. H., S. E. Viteri, F. Mackie, A. T. Vargas, and A. Palacios. 1982. Variation in acid soil
tolerance among strains of Rhizobium phaseoli. Field Crops Res. 5:121-128.
Gremaud, M.F. and Harper, J.E. 1989. Selection and initial characterization of partially nitrate
tolerant nodulation mutants of soybean. Plant Physiol. 89:169-173.
Guerin, V., J.C. Trinchant, and J. Rigaud. 1990. Nitrogen fixation (C2H2 reduction) by broad bean
(Vicia faba L.) nodules and bacteroids under water-restricted conditions. J. Plant Physiol.
92:595-601.
Gujaria, N. , A. Kumar, P. Dauthal, A. Dubey, P. Hiremath, A. Bhanu Prakash, A. , Farmer, M.
Bhide, T. Shah, P. Gaur, H. Upadhyaya, S Bhatia, D. Cook, G. May, and R. Varshney.
2011. Development and use of genic molecular markers (GMMs) for construction of a
transcript map of chickpea (Cicer arietinum L.). Theor. Appl. Genet. 122:1577-1589.

222
Gulden, R.H., and J.K. Vessey.1997. The stimulating effect of ammonium on nodulation in Pisum
sativum L. is not long lived once ammonium supply is discontinued. Plant Soil 195:195-
205.
Güler, S., and H. Özçelik. 2007. Relationships between leaf chlorophyll and related yield characters
in dry bean (Phaseolus vulgaris L.). Asian J. Plant Sci. 6:700-703.
Gwata, E.T., D.S. Wofford, P.L. Pfahler, and K.J. Boote. 2004 .Genetics of promiscuous nodulation
in soybean: nodule dry weight and leaf color score. J. Hered. 95:154-157.
doi:10.1093/jhered/esh017
Gyaneshwar, P., A.M. Hirsch, L. Moulin, W.M. Chen, G.N Elliott, C. Bontemps, P. Estrada-de los
Santos,, E. Gross, , F.B. dos Reis, J.I. Sprent, J.P.W. Young,, and E. K. Jame, 2011.
Legume-nodulating Betaproteobacteri. Diversity, host range, and future prospects, Mol.
Plant. Microbe. In., 24, 1276–1288
Hafeez, F.Y., T. Ahmad, S. Hameed, S.K.A. Danso, and K.A. Malik. 1998. Comparison of direct
and indirect methods of measuring nitrogen fixation in field green chickpea genotypes. Pak.
J. Bot. 30:199-207.
Hakoyama, T., R. Oi, K. Hazuma, E. Suga, Y. Adachi, M. Kobayashi, R. Akai, S. Sato, E. Fukai, S.
Tabata, S. Shibata, G.J. Wu, Y. Hase, A. Tanaka, M. Kawaguchi, H. Kouchi, Y. Umehara,
and N. Suganuma. 2012. The SNARE Protein SYP71 Expressed in Vascular Tissues Is
Involved in Symbiotic Nitrogen Fixation in Lotus japonicus Nodules. Plant Physiol.
160:897-905.
Hardarson, G., F.A. Bliss, M.R. Cigales-Rivero, R.A. Henson, J.A. Kipe-Nolt, L. Longeri, A.
Manrique, J.J. Pena-Cabriales, P.A.A. Pereira, C.A. Sanabria, and S.M. Tsai. 1983.

223
Genotypic variation in biological nitrogen fixation by common bean. Dev. Plant Soil Sci.
52:59-70.
Hardy, R.W.F., R.C. Burns, and R.D. Holsten. 1973. Applications of the acetylene-ethylene assay
for measurement of nitrogen fixation. Soil Biol. Biochem. 5:47-81.
Hart, A. L. 1989. Nodule phosphorus and nodule activity in white clover. N. Z. J. Agric. Res. 32:
145-149. doi: 10.1080/00288233.1989.10423448
Hefni, M., O. Veronica, T. Mohamed, and W. Cornelia. 2010. Folate content in foods commonly
consumed in Egypt. J. Food Chem. 121:540-545.Htthn, M. 1996. Nonparametric analysis of
genotype×environment interactions by ranks. In: M.S. Kang, M.S., and H.G. Gauch (eds)
Genotype-by-Environment Interaction. CRC Press, New York. Pp. 235-271.
Hemantarajan, A., and O.K. Garg. 1986. Introduction of nitrogen-fixing nodules through iron and
zinc fertilization to the non-nodule-forming Frenich bean (Phaseolus vulgaris L.). J. Plant
Nutr. 9:281-288.
Hernandez-Armenta, R., H.C. Wien, and A.R.J. Eaglesham. 1989. Maximum temperature for
nitrogen fixation in common bean. Crop Sci. 29:1260-1265.
doi:10.2135/cropsci1989.0011183X002900050034x
Herridge, D.F., F. J. Bergersen, and M.B. Peoples. 1990. Measurement of nitrogen fixation by
soybean in the field using the ureide and natural 15
N abundance methods. Plant Physiol. 93:
708-716. doi:10.1104/pp.93.2.708
Herridge, D., and S. Danso. 1995. Enhancing crop legume N2 fixation through selection and
breeding. Plant Soil 174:51-82.

224
Herridge, D.F., M.B. Peoples, and R.M. Boddey. 2008. Global inputs of biological nitrogen fixation
in agricultural systems. Plant Soil 311: 1-18.
Hickey, E. W., and I. N. Hirshfield. 1990. Low-pH-induced effects on patterns of protein synthesis
and on internal pH in Escherichia coli and Salmonella typhimurium. Appl. Environ.
Microbiol. 56:1038-1045.
Hill, S., J.W. Drozd, and J.R. Postgate. 1972. Environmental effects on the growth of nitrogen-
fixing bacteria. J. Appl. Chem. Biotechnol. 22, 541-558; doi: 10.1002/jctb.2720220413.
Ho, K.K., and D.W. Krogman. 1982. Photosynthesis, p.191-214. In N. G. Carr and B. A. Whitton
(ed.), The biology of cyanobacteria. Blackwell Scientific Publications Ltd., Oxford.
Högberg, P. 1979. Tansley Review No. 95, 15
N natural abundance in soil‐plant systems. New
Phytol. 137:179-203. doi: 10.1046/j.1469-8137.1997.00808.x
Holland, J.B., W.E. Nyquist, and T. Cervants-Martínez. 2003. Estimating and interpreting
heritability for plant breeding: an update. Plant Breeding Rev. 22:9-112.
Houlton, B. Z., Y. P. Wang, P. M. Vitousek, and C. B. Field. 2008. A unifying framework for
dinitrogen fixation in the terrestrial biosphere. Nature 454:327-334.
Hove, C.V., and Lejeune, A. 1996. Biological nitrogen fixation associated with rice production.
Kluwer Aacademic Publishers, Dordrecht. Pp. 83 – 94. In: S.R.S. Kumar, and K.V.B. Rao.
2012. Biological nitrogen fixation: A review, Int. J. Life Sci. 1:1-9. Available online at:
www. ijals.com
225
Howarth, R.W., E.W. Boyer, W.J. Pabich, and J.N. Galloway. 2002. Nitrogen use in the United
States from 1961-2000 and potential future trends. Ambio 31:88-96. Available online on at:
http://www.ambio.kva.se
Huang, C.Y., J.S. Boyer, and L.N. Vanderhoef. 1975. Acetylene reduction (nitrogen fixation) and
metabolic activities of soybean having various leaf and nodule water potentials. Plant
Physiol. 56:222-227.
Hungria, M., and A. Franco. 1993. Effects of high temperature on nodulation and nitrogen fixation
by Phaseolus vulgaris L. Plant and Soil 149:95-102.
Hungria, M., and Kaschuk, G. 2014. Regulation of N2 fixation and NO3−/NH4
+ assimilation in
nodulated and N-fertilized Phaseolus. vulgaris L. exposed to high temperature stress.
Environ. Exp. Bot. 98:32-39.
Hunt, P.G., A.G. Wollum, and T.A. Matheny.1981. Effects of soil water on Rhizobium japonicum
infection, nitrogen accumulation, and yield in bragg soybeans. Agron.J. 73 :501-505.
doi:10.2134/agronj1981.00021962007300030024x
Hurd, T.M., D.J. Raynal, and C.R. Schwintzer. 2001. Symbiotic N2 fixation of Alnus incana spp
rugosa in shrub wetlands of the Adirondack Mountains, New York, USA. Oecologia
126:94-103. doi:10.1007/s004420000500
Huss-Danell, K. 1997. Actinorhizal symbioses and their N2 fixation. New Phytol. 136:375-405.
doi:10.1046/j.1469-8137.1997.00755.x

226
Hwang, S., J.D. Ray, P.B. Cregan, C.A. King, M.K. Davies, and L.C. Purcell. 2014. Genetics and
mapping of quantitative traits for nodule number, weight, and size in soybean (Glycine max
L.[Merr.]). Euphytica 195:419-434.
Hyten, D.L., S.B. Cannon, Q. Song, N. Weeks, E.W. Fickus, R.C. Shoemaker, J.E. Specht, A.D.
Farmer, G.D. May, and P.B. Cregan. 2010a. High-throughput SNP discovery through deep
resequencing of a reduced representation library to anchor and orient scaffolds in the
soybean whole genome sequence. BMC Genomics 11:1-8. Available online at:
http://www.biomedcentral.com/1471-2164/11/38.
Hyten, D.L., Q. Song, E.W. Fickus, C.V. Quigley, J.S. Lim, I.Y Choi, E.Y. Hwang, M. Pastor-
Corrales and P.B. Cregan. 2010b. High-throughput SNP discovery and assay development
in common bean. BMC Genomics 11:475. doi:10.1186/1471-2164-11-475
Ibekwe, A. M., J. S. Angle, R. L. Chaney, and P. Vonberkum. 1997. Enumeration and nitrogen
fixation potential of Rhizobium leguminosarum biovar trifolii grown in soil with varying pH
values and heavy metal concentrations. Agric. Ecosyst. Environ. 61:103-111.
Imin, N., Mohd-Radzman N.A., Ogilvie H.A., and Djordjevic M.A. 2013. The peptide-encoding
CEP1 gene modulates lateral root and nodule numbers in Medicago truncatula. J. Exp. Bot.
64:5395-409. doi: 10.1093/jxb/ert369.
Ismail, A.E. 2015. Evaluation of two species of water ferns, Azolla caroliniana and A. Pinnata as
soil amendments against Meloidogyne javanica infecting tomato in Egypt. Adv. Appl. Agr.
Sci. 3:18-22. ISSN: 2383-4234
Isoi, T., and S. Yoshida. 1991. Low nitrogen fixation of common bean (Phaseolus vulgaris L.). Soil
Sci. Plant Nutrit. 37:559-563. doi:10.1080/00380768.1991.10415069

227
Jakobsen, I. 1985. The role of phosphorus in nitrogen fixation by young pea plants (Pisum
sativum). Physiol. Plant. 64:90-196.
Jemo, M., C. Nolte, M. Tchienkoua, and R. C. Abaidoo. 2010. Biological nitrogen fixation
potential by soybeans in two low-P soils of southern Cameroon. Nutr. Cyc. Agroecosys.
88:49-58.
Jinks, J.L., and V. Connolly. 1973. Selection for specific and general response to environmental
differences. Heredity 30:33-40.
Joel, W., Richards., Glenn, D., Krumholz.,Matthew, S., Chval and Louis, and S. Tisa. 2002. Heavy
Metal Resistance Patterns of Frankia Strains. Appl. Environ. Microb. 68:923-927.
Johannsen, W. 1911. The Genotype Conception of Heredity. Am. Nat., 45: 129-159. Available
online on at: http://www.jstore.org
Johnson, S.S., and J.L. Geadelmann. 1989. Influence of water stress on grain yield response to
recurrent selection in maize. Crop Sci. 29:558-565.
Johnson, W.C., and P. Gepts. 1999. Segregation for performance in recombinant inbred populations
resulting from inter-gene pool crosses of common bean (Phaseolus vulgaris L.). Euphytica
106: 45-56.
Johnston, A.W.B., J.L. Beynon, A.V. Buchanan-Wollaston, S.M. Setcheli, P.R. Hirsch, and J.E.
Beringer. 1978. High frequency transfer of nodulating ability between strains and species of
Rhizobium. Nature 276:634-636. doi:10.1038/276634a0
Jordan, A. and P. Reichard. 1998. Ribonucleotide reductases. Annu. Rev. Biochem. 67: 71-98.

228
Kader, M.A., M.H. Miar, and M.S. Hoque. 2002. Effects of Azotobacter inoculants on the yield
and nitrogen uptake by Wheat. J. Biol.Sci. 2:259-261.
Kalavacharla, V., Z. Liu, B.C . Meyers, J. Thimmapuram, and K. Melmaiee. 2011. Identification
and analysis of common bean (Phaseolus vulgaris L.) transcriptomes by massively parallel
pyrosequencing. BMC Plant Biol. 2011; 11: 135. doi:10.1186/1471-2229-11-135
Kalde, M., T.S. Nühse, K. Findlay, and S.C. Peck. 2007. The syntaxin SYP132 contributes to plant
resistance against bacteria and secretion of pathogenesis-related protein. Proc. Natl. Acad.
Sci. 104:11850-11855. doi:10.1073/pnas.0701083104
Kamfwa, K., K.A. Cichy, and J.D. Kelly. 2015. Genome‐wide association analysis of symbiotic
nitrogen fixation in common bean. Theor. Appl. Genet. doi:10.1007/s00122-015-2562-5
Kannaiyan, S., Govindarajan, K., and Lewin, H.D.1980. Effect of foliar spray of Azotobacter
chroococcum on rice crop. Plant Soil 56:487-490.
Kanungo, P.K., D. Panda, T.K. Adhya, B. Ramakrishnan, and V.R. Rao. 1997 Nitrogenase Activity
and Nitrogen-Fixing Bacteria Associated with Rhizosphere of Rice Cultivars with Varying
N Absorption Efficiency. J. Sci. Food Agric. 73: 485-488. doi: 10.1002/(SICI)1097-
0010(199704)
Kaschuk, G., T.W. Kuyper, P.A. Leffelaar, M. Hungria, and K.E. Giller. 2009. Are the rates of
photosynthesis stimulated by the carbon sink strength of rhizobial and arbuscular
mycorrhizal symbioses? Soil Biol. Biochem. 41:1233-1244.
Kasprzewska, A. 2003. Plant chinatases - Regulation and function. Cell Mol. Biol. Lett 8:809-824.
Available online at: http://www.cmbl.org.pl.

229
Keck , T.J., R.J. Wagenet, W.F. Campbell, and R.E. Knighton. 1984. Effects of water and salt stress
on growth and acetylene reduction in alfalfa. Soil Sci. Soc. Am. J. 48:1310-1316.
Keirn, M.A., and P.L. Brezonik. 1971. Nitrogen fixation by bacteria in lake Mize, Florida, and in
some lacustrine sediments. Limnol. Oceanog. 16:720-731. available online at:
http://www.jstor.org/stable/2834554.
Kelly, M. 1969. Comparisons and cross reactions of nitrogenase from Klebsiella pneumoniae,
Azotobacter chroococcum and Bacillus polymyxa. Biochim. Biophys. Acta. 191:527-540.
In: C.W. Jones, J.M. Brice, V. Wright, and B.A.C. Ackrell. 1973. Respiratory protection of
nitrogenase in Azotobacter vinelandii. FEBS Letters 29: 77-81.
Kelly, J.D., G.L. Hosfield, G.V.Varner, M.A. Uebersax, and J. Taylor. 1999. Registration of
'Chinook 2000' light red kidney bean. Crop Sci. 39:293.
Kelly, J.D., G.V. Varner, P.O. Boyle, and B. Long. 2009. Registration of ‘Zorro’ Black Bean. J.
Plant Reg. 3:226-230.
Kibite, S., and L.E. Evans. 1984. Causes of negative correlations between grain yield and grain
protein concentration in common wheat. Euphytica 33:801-810.
Kipe-Nolt, J.A., H. Vargas, and K.E. Giller. 1993. Nitrogen fixation in breeding lines of Phaseolus
vulgaris L. Plant Soil 152:103-106.
Khalifa, G.E., A.E. Eljack, M.I. Mohammed, O.M. Elamin, and E.S. Mohamed. 2013. Yield
stability in common bean genotypes (Phaseolus vulgaris L.) in the Sudan. J. Plant Breeding
Crop Sci. 5:203-208.

230
Knight, J.D., F. Verhees, C. Van Kessel, and A.E. Slinkard. 1993. Does carbon isotope
discrimination correlate with biological nitrogen fixation? Plant Soil 153:151-153.
Koenig, R., and P. Gepts.1989. Allozyme diversity in wild Phaseolus vulgaris: further evidence for
two major centers of diversity. Theor. Appl. Genet. 78: 809-817. doi: 10.1007/bf00266663
Korkovelos, A. E. and C. K. Goulas. 2011. Divergent mass selection for leaf chlorophyll content
measured using chlorophyll meter readings in a maize composite population. Crop Sci.
51:1437–1443.
Krehenbrink, M., and J.A. Downie. 2008. Identification of protein secretion systems and novel
secreted proteins in Rhizobium leguminosarum bv. viciae. BMC Genomics 9: 55.
Kumar, S.R.S., and K.V.B. Rao. 2012. Biological nitrogen fixation: a review, Int. J. Adv. Life Sci.
1:1-9. available online at: http://www. ijals.com
Kumarasinghe, K.S., C. Kirda, A.R.A.G. Mohamed, F. Zapata, and S.K.A. Danso. 1992. Carbon 13
isotope discrimination correlates with biological nitrogen fixation in soybean (Glycine max
L. Merrill.). Plant Soil 139:145-147.
Kumar Rao, J.V.D.K., and P.J. Dart. 1987. Nodulation, nitrogen fixation and nitrogen uptake in
pigeonpea (Cajanus cajan (L.) Millsp) of different maturity groups. Plant Soil 99:255-266.
Kumarasinghe, K. S., C. Kirda, A. R. A. G. Mohamed, F. Zapata, and S. K. A. Danso. 1992.
Carbon 13 isotope discrimination correlates with biological nitrogen fixation in soybean
glycine max L. Merrill. Plant Soil 139:145-147.
Laguerre, G., E. Géniaux, S.I. Mazurier, R. Rodriguez Casartelli, and N. Amarger.1993.
Conformity and diversity among field isolates of Rhizobium leguminosarum bv. viciae, bv.

231
trifolii, and bv. phaseoli revealed by DNA hybridization using chromosome and plasmid
probes. Can. J. Microbiol. 39:412–419 doi: 10.1139/m93-060
Lander, E.S., and D. Botstein. 1989. Mapping Mendelian factors underlying quantitative traits
using RFLP linkage maps. Genetics 121:185-199.
Lam, H.M., K.T. Coschigano, I.C. Oliveira, R. Melo-Oliveira, G.M. Coruzzi. 1996. The molecular-
genetics of nitrogen assimilation into amino acids in higher plants. Annu. Rev. Plant Phys.
47: 569–593. doi:10.1146/ annurev.arplant.47. 1.569
Lavire, C., and B. Cournoyer. 2003. Progress on the genetics of the N2-fixing actinorhizal symbiont
Frankia. Plant Soil 254:125-137. doi:10.1023/A:1024915300030
Layzell, D.B., and S. Hunt. 1990. Oxygen and the regulation of nitrogen fixation in legume
nodules. Physiol. Plantarum 80: 399-3054. doi: 10.1111/j.1399-3054.1990.tb04414.x
Leborgne-Castel, N., and K. Bouhidel. 2014. Plasma membrane protein trafficking in plant–
microbe interactions: a plant cell point of view. Front. Plant Sci. 22: 1-13. http://dx.doi.org/
10.3389/fpls.2014.00735
Lechevalier, M.P. 1994. Taxonomy of the genus Frankia (Actinomycetales). Int. J. Syst. Bacteriol.
44:1-8.
Lechno-Yossef, S., and S.A. Nierzwicki-Bauer. 2002. Azolla-Anabaena azollae symbiosis. In: A.N.
Rai, B. Bergman, and U. Rasmussen (eds.) Cyanobacteria in symbiosis. Kluwer academic
publishers, Dordrecht, Pp. 153-178.
Leigh, J.A. 2000. Nitrogen fixation in methanogens: the archaeal perspective. Curr. Issues Mol.
Biol. 2:125-131.

232
Leung, K., and P.J. Bottomley. 1987. Influence of phosphate on the growth and nodulation
characteristics of Rhizobium trifolii. Appl. Environ. Microbiol. 53:2098-2105.
Licht, S., G.J. Gerfen, and J. Stubbe. 1996. The radicals in ribonucleotide reductases. Sci. 271:
477-481.
Lima, E., R.M. Boddey, and J. Dobereiner. 1987. Quantification of biological nitrogen fixation
associated with sugarcane using a 15
N aided nitrogen balance. Soil Biol Biochem 19 165-
170.
Liang, X .Q., L. Li, Y.X. Chen, H. Li, J. Liu, M.M. He, Y.S. Ye, G.M. Tian, M. Lundy. 2013.
Dissolved phosphorus losses by lateral seepage from swine manure amendments for organic
rice production. Soil Sci. Soc. Am. J. 77:765–773.
Lobo, A.L., and S.H. Zinder. 1992. Nitrogen fixation by methanogen bacteria. In: G. Stacey, R.H.
Burris, and H.J. Evans (eds.)Biological nitrogen fixation. Chapman and Hall, New York
Pp.736-762.
Lois, S.T., S.C. Matthew, D.K. Glenn, and R. Joel. 1999. Antibiotic resistance patterns of Frankia
Strains. Can. J. Botany 77:1257-1260.
Loh, J., M.G. Stacey, M.J. Sadowsky, and G. Stacey. 1999. The Bradyrhizobium japonicum nolA
gene encodes three functionally distinct proteins. J. Bacteriol. 181: 1544-1554.
London, J.G. 2005. Nitrogen study fertilizes fears of pollution. Nature 433:791.
Lumpkin, T.A., and D.L. Plucknett. 1980. Azolla: botany, physiology, and use as a green manure.
Econ. Bot. 34:111-153.
233
Luthra, Y.P., I. S. Seoran, and R. Singh. 1983. Ontogenetic interactions between photosynthesis
and symbiotic nitrogen fixation in pigeon pea. Ann. Appl. Biol. 103: 549-556.
Ma, W., F.C. Guinel, and B.R. Glick. 2003. Rhizobium leguminosarum bv. viciae 1-
aminocyclopropane-1-carboxylate deaminase promotes nodulation of pea plants. Appl.
Environ. Microbiol. 69:8 4396-4402. doi:10.1128/AEM.69.8.4396-4402.2003
Mandal, S.M., B.R. Pati, A.K. Das, and A.K. Ghosh. 2008. Characterization of a symbiotically
effective Rhizobium resistant to arsenic: Isolated from the root nodules of Vigna mungo (L.)
Hepper grown in an arsenic-contaminated field. J. Gen. Appl. Microbiol. 54:93-99.
Mandal, B.K., P.L.G. Velk, and L.N. Mandal. 1999. Beneficial effects of blue-green algae and
Azolla, excluding supplying nitrogen, on wetland rice fields: A review, Biol. Fertil. Soils 28:
329-342.
Marie, C., W.J. Deakin, V. Viprey, J. Kopciñska, W. Golinowski, H.B. Krishnan, X. Perret, and
W.J. Broughton. 2003. Characterization of Nops, nodulation outer proteins, secreted via the
type III secretion system of NGR234. Mol. Plant Microbe Interact. .16:743-751.
doi:10.1094/MPMI.2003.16.9.743
Marsh, J.F., A. Rakocevic, R.M. Mitra, L. Brocard, J. Sun, A. Eschstruth, S.R. Long, M. Schultze,
P. Ratet, and G.E.D. Oldroyd. 2007. Medicago truncatula NIN is essential for rhizobial-
independent nodule organogenesis induced by autoactive calcium/calmodulin-dependent
protein kinase. Plant Physiol. 144: 324-335. doi:10.1104/pp.106.093021
Martínez, E, and D. Roméro. 2003. Diversity of Rhizobium-Phaseolus vulgaris symbiosis:
overview and perspectives. Plant Soil 252: 11-23
234
Martínez, E., D. Roméro, and R. Palacios. 1990. Rhizobium genome. Plant Sci. 9:59-93.
Marino, D., P. Frendo, R. Ladrera, A. Zabalza, A. Puppo, C. Arrese-Igor, and E.M. González. 2007.
Nitrogen fixation control under drought stress. Localized or systemic? Plant Physiol.
143:1968-1974.doi:10.1104/pp.106.097139
Marwaha, T.S., B.V. Singh, and S.K. Goyal. 1992. Effect of incorporation of Azolla on wheat
(Triticum aestivum var. HD-2329), Acta Bot. Indica 20:218-220.
Mathis, R., F. Van Gijsegem, R. De Rycke, W. D’Haeze, E. Van Maelsaeke, E. Anthonio, M. Van
Montagu, M. Holsters, and D. Vereecke. 2005. Lipopolysaccharides as a communication
signal for progression of legume endosymbiosis. Proc. Natl. Acad. Sci. USA, 102: 2655-
2660.
McConnell, M., S. Mamidi, R. Lee, S. Chikara, M. Rossi, R. Papa, and P. McClean. 2010. Syntenic
relationships among legumes revealed using a gene-based genetic linkage map of common
bean (Phaseolus vulgaris L.). Theor. Appl. Genet. 121:1103-1116. doi:10.1007/s00122-
010-1375-9
McClean, P., J. Kamiand, and P. Gepts. 2004. Genomics and genetic diversity in common bean. In
Wilson, R.F., H.T. Stalker, and E.C. Brummer (eds.) Legume crop genomics. AOCS Press,
Champaign, IL. p. 60-82.
McClure, P.R., and D.W. Israel.1979.Transport of nitrogen in the xylem of soybean plants. Plant
Physiol. 64:411-416.
235
McMullan, P. M., McVetty, P. B. E., and A. A. Urquhart. 1988. Dry matter and nitrogen
accumulation and redistribution and their relationship to grain yield and grain protein in
wheat. Can. J. Plant Sci. 68:311-322.
McNeill, A.M., C.J. Pilbeam, H.C. Harris, and R.S. Swift. 1998. Use of residual fertiliser 15
N in soil
for isotope dilution estimates of N2 fixation by grain legumes. Aust. J. Agric. Res. 49:821-
828.
Meeks, J.C., and J. Elhai. 2002. Regulation of cellular differentiation in filamentous cyanobacteria
in free-living and plant-associated symbiotic growth states. Microbiol Mol Biol Rev 66:94-
121.
Mekbib, F. 2003. Yield stability in common bean (Phaseolus vulgaris L.) genotypes. Euphytica
130:147-153.
Melotto, M., C.B. Monteiro-Vitorello, A.G. Bruschi, and L.E. Camargo. 2005. Comparative
bioinformatic analysis of genes expressed in common bean (Phaseolus vulgaris L.)
seedlings. Genome. 48:562-570. doi: 10.1139/g05-010.
Mendel, G. 1870. Ueber eigie aus künstlichen Befruchtung gewonnenen Hieracium-
Bastarde.Verhandlungen des Naturforeschenden vereines, Alhandlungen, Brünn. In: T.M.
Cox 1999. Mendel and his legacy. Q. J. Med. 92:183-186.
Merrick., M. J. 1993. Organization and regulation of nitrogen fixation genes. Current Plant Sci.
Biot. 17:43-54.
Michiels, J., C. Verreth, and J. Vanderleyden. 1994. Effects of temperature stress on bean-
nodulating rhizobium strains. Appl. Environ. Microb. 60:1206-1212.

236
Miller, R.W. and J.C. Sirois. 1983. Calcium and magnesium effects on symbiotic nitrogen fixation
in the alfalfa (M. sativa) Rhizobium meliloti system. Physiol. Plant. 58:464-470.
Miller, J., K. Zary, and G. Fernandez. 1986. Inheritance of N2 fixation efficiency in cowpea.
Euphytica 35:551-560.
Milošević, N., B.Tintor, R. Porotić, G. Cvijanović, and T. Dimitrijević. 2012. Effect of inoculation
with Azotobacter chroococcum on wheat yield and seed quality. Rom. Biotec. Lett.17:
7352-7357.
Minchin, F.R. 1997. Regulation of oxygen diffusion in legume nodules. Soil Biol. Biochem.
29:881-888. doi:10.1016/S0038-0717(96)00204-0
Minchin, F. R., M.I. Minguezi, J. E. Sheehy, J. F. Witty, and L. Skǿt. 1987. Relationships between
nitrate and oxygen supply in symbiotic nitrogen fixation by white clover. J. Exp. Bot.
37:1103-111. doi: 10.1093/jxb/37.8.1103
Miranda, B.D., and F.A. Bliss. 1991 Selection for increased seed nitrogen accumulation in common
bean: Implications for improving dinitrogen fixation and seed yield. Plant Breeding
106:301-311.
Miyamoto, K., P.C. Hallenbeck, and J.R. Benemann. 1979. Nitrogen fixation by thermophilic blue-
green algae (Cyanobacteria): temperature characteristics and potential use in biophotolysis.
Appl. Environ. Microb. 37: 454-458.
Monje, O.A., and B. Bugbee. 1992. Inherent limitations of non-destructive chlorophyll meters: a
comparison of two types of meters. Hort. Sci. 27:69-71.

237
Mosier, A.R. 2002. Environmental challenges associated with needed increases in global nitrogen
fixation. Nutr. Cycl. Agroecosyst. 63:101-116. doi:10.1023/A:1021101423341
Muchero, W., J.D. Ehlers, T.J. Close, and PA. Roberts. 2011. Genic SNP markers and legume
synteny reveal candidate genes underlying QTL for Macrophomina phaseolina resistance
and maturity in cowpea [Vigna unguiculata (L) Walp.]. BMC Genomics, 12:8-22.
doi:10.1186/1471-2164-12-8
Mukeshimana, G., L. Butare, P.B. Cregan, M.W. Blair, and J.D. Kelly. 2014. Quantitative trait loci
associated with drought tolerance in common bean. Crop Sci. 54:923-938. doi:
10.2135/cropsci2013.06.0427
Munns, Rana. 2005. Genes and salt tolerance: bringing them together. New Phytol. 167:645-663.
Available at:http://www.jstor.org.subzero.lib.uoguelph.ca/stable/3694428
Mural, V., R. Chikkalingaiah, and S. Hittalmani. 2012. Correlation study for protein content, grain
yield and yield contributing traits in quality protein maize (QPM) (Zea mays L.). Electron. J.
Plant Breed. 3:649-651. Available at: http://sites.google.com/site/eiplantbreeding
Murray, P.A., and S.H. Zinder. 1984. Nitrogen fixation by a methanogenic archaebacterium. Nature
312:284-286.
Murty, M., G. and J.K. Ladha. 1988. Influence of Azospirillum inoculation on the mineral uptake
and growth of rice under hydroponic conditions. Plant Soil 108:281-285.
Mutch L.A., and J.P. Young. 2004. Diversity and specificity of Rhizobium leguminosarum bv.
viciae on wild and cultivated legumes. Mol. Ecol. 13:2435-2444. doi: 10.1111/j.1365-
294X.2004.02259.x

238
Mutlu, N., P. Miklas, J. Reiser, and D. Coyne. 2005. Backcross breeding for improved resistance to
common bacterial blight in pinto bean (Phaseolus vulgaris L.). Plant Breed. 124:282-287.
Myrold, D.D., and K. Huss-Danell. 2003. Alder and lupine enhance nitrogen cycling in a degraded
forest soil in Northern Sweden. Plant Soil 254:47-56. doi:10.1023/A:1024951115548
Namayanja, A., J. Semoka, R. Buruchara, S. Nchimbi, and M. Waswa. 2014. Genotypic variation
for tolerance to low soil phosphorous in common bean under controlled screen house
conditions. Agric. Sci. 5:270-285.
Narula, N., V. Kumar, R.K. Behl, A. Deubel, A. Granse, and W. Merbach. 2000. Effect of P-
solubilizing A. chroococcum on NPK uptake in P responsive wheat genotypes grown under
greenhouse conditions. J. Plant Nutr. Soil Sci. 163: 393-398. doi: 10.1002/1522-
2624(200008)
Nayak, D.N., J.K. Ladha, and I. Watanabe. 1986. The fate of marker Azospirillum lipoferum
inoculated into rice and its effect on growth,yield and N2 fixation of plants studied
byacetylene reduction, 15
N2 feeding and 15
N dilution techniques. Bio. Fertil. Soils 2:7-14.
Nicolás, M.F., M. Hungria, and C.A.A. Arias. 2006. Identification of quantitative trait loci
controlling nodulation and shoot mass in progenies from two Brazilian soybean cultivars.
Field Crops Res. 95:355-366. doi:10.1016/j.fcr.2005.04.012
Nierzwicki-Bauer, S.A. 1990. Azolla-Anabaena symbiosis. In: A.N. Rai (ed.) Handbook of
symbiotic cyanobacteria. CRC, Boca Raton, Pp. 119-136.

239
Nigam, S.N., S.L. Dwivedi, P.T.C. Nambiar, R.W. Gibbons, and P.J. Dart. 1985. Combining ability
analysis of N2-fixation and related traits in peanut. Peanut Sci. 12:55-57.
doi:http://dx.doi.org/10.3146/pnut.12.2.0001
Nodari, R.O., S.M. Tsai, P. Guzman, R.L. Gilbertson, and P. Gepts. 1993. Towards an integrated
linkage map of common bean. III. Mapping genetic factors controlling host-bacteria
interactions. Genetics 134:341-350.
Normand, P., and B.C. Mullin. 2008. Prospects for the study of a ubiquitous actinomycete, Frankia,
and its host plants. In: K. Pawlowski, and W.E. Newton (eds) Nitrogen-fixing actinorhizal
symbioses. Springer, Dordrecht, Pp 289-303. available online at: http://link.springer.com.
subzero.lib. uoguelph.ca/book/10.1007%2F978-1-4020-3547-0
Normand, P., S. Orso, B. Cournoyer, P. Jeannin, C. Chapelon, J. Dawson, L. Evtushenko, and K.
Misra. 1996. Molecular phylogeny of the genus Frankia and related genera and emendation
of the family Frankiaceae. Int J Syst Bacteriol. 46:1-9.
Nukui, N., K. Minamisawa, S. Ayabe and T. Aoki. 2006. Expression of the 1-aminocyclopropane-
1- carboxylic acid deaminase gene requires symbiotic nitrogen-fixing regulator gene nifA2
in Mesorhizobium loti MAFF303099. Appl. Environ. Microbiol. 72:4964-4969.
O’Hara, G.W., N. Boonkerd, and M.J. Dilworth. 1988. Mineral constraints to nitrogen fixation.
Plant Soil, 108:93-110.
Okito, A., B.J.R. Alves, S. Urquiaga, and Y.R.M. Boddey. 2004. Isotopic fractionation during N2
fixation by four tropical legumes. Soil Biol. Biochem. 36:1179-1190.

240
Okon, Y., P.G. Heytler, and R.W.F. Hardy. 1983. N2 Fixation by Azospirillum brasilense and its
Incorporation into host Setaria italica. Appl. Environ. Microb. 46:694-697. available online
at: http://aem.asm.org/
Oleze, J. 2000. Respiratory protection of nitrogenase in Azotobacter species: is a widely held
hypothesis unequivocally supported by experimental evidence? FEMS Microbiol. Rev.
24:321-333.
Olsthoorn, M.M.A., E. Stokvis, J. Haverkamp, H.P Spaink., and J.E. Thomas Oates. 2000. Growth
temperature regulation of host specific modifications of rhizobial lipo chitin
oligosaccharides: the function of nodX is temperature regulated. Mol. Plant-Microbe
Interact. 13:808-820.
OMAFRA. 2009. Agronomy guide for field crops - Ministry of Agriculture, Food and Rural
Affairs, publication 811. Available at: http://www.omafra.gov.on.ca/english/ crops/pub811
/p811toc.pdf
Osa-Afiana, L.O., and M. Alexander. 1982. Differences among cowpea rhizobia in tolerance to
high temperature and desiccation in soil. Appl. Environ. Microbiol. 43:435-439.
Park, S. J., and B. R. Buttery. 1988. Nodulation mutants of white bean (Phaseolus vulgaris L.)
induced by ethyl-methane sulphonate. Can. J. Plant Sci. 68: 199-202.
Park, S.J., and B.R. Buttery. 1989. Identification and characterization of common bean (Phaseolus
vulgaris L.) lines well nodulated in the presence of high nitrate. Plant Soil 119:237-244.
Park, S.J., and B.R. Buttery. 1997. Complementation of nodulation genes of various mutants in
common bean (Phaseolus vulgaris L.). J. Hered. 88:543-545.

241
Park, S.J., and T. Rupert. 2000. AC Compass navy bean. Can. J. Plant Sci. 80: 341–342.
Park, S.J., T. Rupert, K. Yu, and A. Navabi. 2009. Red Rider common bean. Can. J. Plant Sci. 89:
925-927.
Parker, M.B., and Harris, H.B., 1977. Yield and leaf nitrogen of nodulating and non-nodulating
soybean as affected by nitrogen and molybdenum. Agronomy Journal, 69:551-554.
Pate, J.S. 1989. Synthesis, transport, and utilization of products of symbiotic nitrogen fixation. In:
J.E. Poulton, J.T. Romeo, and E.E. Conn (eds.) Plant nitrogen metabolism. Pp. 65-115.
Plenum Press, New York, NY
Pate, J.S., and D.B. Layzell. 1990. Energetics and biological costs of nitrogen assimilation. In: P.
K. Stumpf, E. E. Conn, B. J. Miflin, and P. J. Lea (eds.) The biochemistry of plants, a
comprehensive treatise: intermediary nitrogen metabolism. 16:1-42. Academic Press, San
Diego, USA
Pauferro, N., A.P. Guimarães, C.P. Jantalia, S. Urquiaga, B.J.R. Alves, and R.M. Boddey. 2010.
15N natural abundance of biologically fixed N2 in soybean is controlled more by the
Bradyrhizobium strain than by the variety of the host plant. Soil Biol. Biochem. 42:1694-
1700. doi: 10.1016/j.soilbio.2010.05.032
Peck, M.C., R.F. Fisher, and S.R. Long. 2006. Diverse flavonoids stimulate NodD1 binding to nod
gene promoters in Sinorhizobium meliloti. J. Bacteriol. 188:5417-27.
Pedalino, M., K.E. Giller, and J. Kipe-Nolt. 1992. Genetic and Physiological Characterization of
the Non-nodulating Mutant of Phaseolus vulgaris L.-NOD125. J. Exp. Botany 43: 843-849.
242
Pedrosa, F.O., and C. Elmerich. 2007. Regulation of nitrogen fixation and ammonium assimilation
in associated and endophytic nitrogen fixing bacteria. In: C. Elmerich, W.E. Newton (eds)
Associative and endophytic nitrogen-fixing bacteria and cyanobacterial associations.
Springer, the Netherlands, Pp. 41-71.
Pedrosa-Harand, A., T. Porch, and P. Gepts. 2008. Standard nomenclature for common bean
chromosomes and linkage groups. Annu. Rep. Bean Improv. Coop. 51:106-107.
Peña-Cabriales, J.J., and J.Z. Castellanos. 1993. Effects of water stress on N2-fixation and grain
yield of Phaseolus vulgaris L. Plant Soil 152:151-155.
Peoples, M.B. 2009. The potential environmental benefits and risks derived from legumes in
rotations. In: D.W. Emerich, and H.B. Krishnah (ed) Nitrogen fixation in crop production.
ASA, CSSA, SSSA, Madison, USA Pp. 349-385.
Peoples, M. B., J. Brockwell, D. F. Herridge, I. J. Rochester, B. J. R. Alves, S. Urquiaga, R. M.
Boddey, F. D. Dakora, S. Bhattarai, and S. L. Maskey. 2009. The contributions of nitrogen-
fixing crop legumes to the productivity of agricultural systems. Symbiosis 48:1-17.
Peoples, M.B., and D.F. Herridge. 1990. Nitrogen fixation by legumes in tropical and subtropical
agriculture. Adv. Agron. 44:155-223.
Peoples, M. B., and D. F. Herridge, and J.k. Ladha. 1995. Biological nitrogen fixation: An efficient
source of nitrogen for sustainable agriculture production? Plant Soil 174:3-28.
Peoples, M.B., M.J. Unkovich, and D.F. Herridge.2002. Measuring symbiotic nitrogen fixation by
legumes. In: D.W. Emerich, and H.B. Krishnan (eds) Nitrogen Fixation in Crop Production.

243
American Society of Agronomy, Crop Science 52:125-170; doi:10.2134/ agronmonogr
52.c6.
Pereira, P.A.A., and F.A. Bliss. 1987. Nitrogen fixation and plant growth of common bean
(Phaseolus vulgaris L.) at different levels of phosphorus availability. Plant Soil 104:79-84.
Pereira, P. A. A., and F. A. Bliss.1989. Selection of common bean (Phaseolus vulgaris L.) for N2
fixation at different levels of available phosphorus under field and environmentally-
controlled conditions. Plant Soil 115:75-82.
Pereira, P.A.A., R.H. Burris, and F.A. Bliss. 1989. 15N-determined dinitrogen fixation potential of
genetically diverse bean lines (Phaseolus vulgaris L.). Plant Soil 120:171-179.
Perret, X., C. Staehelin, and W. J. Broughton. 2000. Molecular basis of symbiotic promiscuity.
Microbiol. Mol. Biol. Rev. 64180-64201. doi:10.1128/MMBR.64.1.180-201.2000
Peter, V.M., K. Cassman, C. Cleveland, T. Crews, B.F. Christopher, B.N. Grimm, W.R. Howarth,
R. Marinov, L. Martinelli, B. Rastetter, and I.J. Sprent, 2002. Towards an ecological
understanding of biological nitrogen fixation. Biogeochemistry, 57:1-45.
Peters, N.K., and D.K. Crist-Estes. 1989. Nodule formation is stimulated by the ethylene inhibitor
aminoethoxyvinylglycine. Plant Physiol. 91:690-693.
Peterson, B.J., and B. Fry. 1987 Stable isotopes in ecosystem studies.Annu. Rev. Ecol. Syst. 18,
293.
Phillips, T.D., J.C. Wynne, G.H. Elkan, and T J. Schneeweis. 1989. Inheritance of symbiotic
nitrogen fixation in two peanut crosses. Peanut Sci. 16:66-70.
doi:http://dx.doi.org/10.3146/i0095-3679-16-2-2

244
Phudenpa, A., S. Jogloy, B. Toomsan, S. Wongkaew, T. Kesmala, and A. Patanothai. 2006.
Combining ability analysis for traits related to N2-fixation and agronomic traits in peanut
(Arachis hypogaea L.). Songklanakarin J. Sci. Technol. 28:449-457.
Piepho, H.P. 1999. Stability analysis using the SAS. Agron. J. 91:154-160.
Piepho, H.P., and F.A., Van Eeuwijk. 2002. Stability analysis in crop performance valuation. In: M.
S. Kang (eds.) Crop Improvementimprovement: Challenges challenges in the Twentytwenty
First first Centurycentury. Food Products Press, New York. Pp. 315-331.
Piha, M.I., and D.N. Munnus. 1987. Sensitivity of the common bean (Phaseolus vulgaris L.)
symbiosis to high soil temperature. Plant Soil 98:183-194.
Pijnenberg, J.W., and M. Lie. 1990. Effect of lime-pelleting on the nodulation of lucerne
(Medicago sativa L.) in acid soil: A comparative study carried out in the field, in pots and in
rhizotrons. Plant Soil 121:225-234.
Pimratch, S., S. Jogloy, B. Toomsan, P. Jaisil, T. Kesmala, and A. Patanothai. 2004. Heritability
and correlation for nitrogen fixation and agronomic traits of peanut (Arachis hypogaea L.)
Songklanakarin J. Sci. Technol. 26:305-315.
Plaxton, W.C. 2004. Plant responses to stress: biochemical adaptations to phosphate deficiency. In:
R.M. Goodman (ed.), Encyclopedia of Plant and Crop Science. Marcel Dekker, New York
Porch, T.G., J.S. Beaver, D.G. Debouck, S.A. Jackson, and J.D. Kelly. 2013. Use of Wild Relatives
and Closely Related Species to Adapt Common Bean to Climate Change-Review, Agron.
3:433-461. doi:10.3390/ agronomy 3020433

245
Postgate, J. 1981. Microbiology of the free-living nitrogen fixing bacteria, excluding cyanobacteria.
In: A.H. Gibson, and W.E. Newton (eds) Current perspectives in nitrogen fixation.
Elsevier/North-Holland Biomedical, Amsterdam, Pp. 217-228.
Prasanna, R., N. Bidyarani, S. Babu, F. Hossain, Y.S. Shivay, and L. Nain. 2015. Cyanobacterial
inoculation elicits plant defense response and enhanced Zn mobilization in maize hybrids.
Soil Crop Sci., Cogent Food Agr. 1:1-13. doi:10.1080/23311932.2014.998507
Pueppke, S.G., and W.J. Broughton. 1999. Rhizobium sp strainNGR234 and R. fredii USDA257
share exceptionally broad, nested host ranges. Mol Plant Microbe Interact 12:293-318.
doi:10.1094/MPMI.1999.12.4.293
Purcell, L.C., R. Serraj, T.R. Sinclair, and A. De. 2004. Soybean N2 fixation estimates, ureide
concentration, and yield responses to drought. Crop Science 44:484-492.
Radwan, O., X. Wu, M. Govindarajulu, M. Libault, D.J. Neece, M.H. Oh, R.H. Berg, G. Stacey,
C.G. Taylor, S.C. Huber, and S.J. Clough. 2012. 14-3-3 proteins SGF14c and SGF14l play
critical roles during soybean nodulation. Plant Physiol. 60: 2125-2136.
doi:10.1104/pp.112.2070
Rafalski, A. 2002. Applications of single nucleotide polymorphism in crop genetics. Curr. Opin.
Plant Biol.5:94-100.
Rai, R., and V. Prasad. 1983. Salinity tolerance of Rhizobium mutants: Growth and relative
efficiency of symbiotic nitrogen fixation. Soil Biol. Biochem. 15:217-219.
doi:10.1016/0038-0717(83)90106-2

246
Rai, R., V. Prasad, S.K. Choudhury, and N.P. Sinha. 1984. Iron nutrition and symbiotic N2-fixation
of lentil (Lens eulinaris) genotypes in calcareous soil. J. Plant Nutr. 7:399-405.
Rai, R., S. Singh, and V. Prasad. 1982. Effect of pressmud amend pyrite on symbiotic N2-fixation,
active iron contents of nodules, grain yield and quality of chickpea (Cicer arietimim L.)
genotypes in calcareous soil. J. Ptant Nutr. 5:905-913.
Rai, A.N., E. Söderbäck, and B. Bergman .2000. Cyanobacteriumplant symbiosis. New Phytol.
147:449-481. doi:10.1046/j.1469-8137.2000.00720.x
Ramaekers, L, C. H. Galeano, N. Garzón, J. Vanderleyden, and M.W. Blair. 2013. Identifying
quantitative trait loci for symbiotic nitrogen fixation capacity and related traits in common
bean. Mol. Breeding 31:163-180. doi:10.1007/s11032-012-9780-1
Ramírez, M., M.A. Graham, L. Blanco-Lopez, S. Silvente, A. Medrano-Soto, M.W. Blair, G.
Hernandez, C.P. Vance, and M. Lara. 2005. Sequencing and analysis of common bean
ESTs. Building a foundation for functional genomics. Plant Physiol. 137:1211-1227.
Rao, K.V.B., and P.B.B.N. Charyulu. 2005. Evaluation of effect of inoculation of Azospirillum on
the yield of Setaria italic (L.). African J. Biotechnol. 4:989-995.
Rao, D. L. N., K. E. Giller, A. R. Yeo, and T. J. Flowers. 2002. The effects of salinity and sodicity
upon nodulation and nitrogen fixation in chickpea (Cicer arietinum). Ann. Bot. 89:563-570.
doi: 10.1093/aob/mcf097
Raun, W.R., and G.V. Johnson. 1999. Improving nitrogen use efficiency for cereals production.
Agron. J. 91:357-363.

247
Rawia, E.A., M.A. Nemat, and H.A. Hamouda, 2009. Evaluate effectiveness of bio and mineral
fertilization on the growth parameters and marketable cut flowers of Matthiola incana L.
American-Eurasian J. Agric. and Environ. Sci., 5: 509-518.
Razon, L.F. 2014. Life cycle analysis of an alternative to the haber-bosch process: Non-renewable
energy usage and global warming potential of liquid ammonia from cyanobacteria. Environ.
Prog. Sustain. Energy 33:618-624. doi: 10.1002/ep.11817
Reddell, P., G.C. Bowen, and A.D. Robson. 1986. Nodulation of Casuarinaceae in relation to host
Rennie, R.J., and G.A. Kemp. 1983. N2-fixation in field beans quantified by I5
N isotope dilution. II.
Effect of cultivars of beans. Agron. J. 75: 645-649.
doi:10.2134/agronj1983.00021962007500040016x
Reinhold-Hurek, B., and T. Hurek. 1998. Interactions of gramineous plants with Azoarcus spp. and
other diazotrophs: Identification, localization and perspectives to study their function. Crit.
Rev. Plant Sci. 17:9-54.
Reynold, P., M.J. Boland, D.G. Blevinks, K.R. Shubert, and D.D. Randall. 1982. Enzymes of amide
and ureide biogenesis in developing soybean nodules. Plant Physiology, 69:1334-1338.
doi:10.1104/pp.69.6.1334
Ribeiro, N.D., S. M. Maziero, M. Prigol, C.W. Nogueira, D.P. Rosa, and M.T.D.F. Possobom.
2012. Mineral concentrations in the embryo and seed coat of common bean cultivars. J.
Food Compos. Anal. 26:89-95.

248
Rippka, R., J. Deruelles, J. B. Waterbury, M. Herdman, and R. Y. Stanier. 1979. Generic
assignments, strain histories and properties of pure cultures of cyanobacteria. J. Gen.
Microbiol. 111:1-61.
Ritschel, PS., T.C.L. De Lins, R.L. Tristan, G.S.C. Buso, J.A. Buso, and M.E. Ferreira. 2004.
Development of microsatellite markers from an enriched genomic library for genetic
analysis of melon (Cucumis melo L.). BMC Plant Biol. 4:9-23.
Robinson, H.F., R.E. Comstocakn, and P.H. Harvey. 1949. Estimates of heritability and the degree
of dominance in corn. Agron. J. 41:353-359.
Robleto, E.A., K. Kmiecik, E.S. Oplinger, J. Nienhuis, and E.W. Triplett. 1998. Trifolitoxin
production increases nodulation competitiveness of Rhizobium etli CE3 under agricultural
conditions. Appl. Environ. Microbiol. 64: 2630-2633. Available at: http://aem.asm.org/
Robertson, J.G., B. Wells, T. Bisseling, K.J.F. Farnden, and A.W.B. Johnston. 1984. Immuno-gold
localization of leghaemoglobin in cytoplasm in nitrogen-fixing root nodules of pea. Nature
31:254-256. doi:10.1038/311254a0
Roberts, G.P., T. Macneil, D. Macneil, and W.J. Brill. 1978. Regulation and characterization of
protein products coded by the nif genes of Klebsiella pneumoniae. J. Bacteriol. 136: 267-
279. available at: http://jb.asm.org/
Robson, A.D., M.J. Dilworth, and D.L. Chatel. 1979. Cobalt and nitrogen fixation in Lupins
angustifolius L. I. Growth, nitrogen concentrations and cobalt distribution. New Phytol.
83:53-62. doi:10.1111/j.1469-8137.1979.tb00726.x

249
Robson, R.L., R.R. Eady, T.H. Richardson, R.W. Miller, M. Hawkins, and J.R. Postgate. 1986. The
alternative nitrogenase of Azotobacter chroococcum is a vanadium enzyme. Nature
322:388-390. doi:10.1038/322388a0
Rodrigues, A.C., A. Bonifacio, J.E.L. Antunes, J.A.G. Silveira, and M.V.B. Figueiredo. 2013.
Minimization of oxidative stress in cowpea nodules by the interrelationship between
Bradyrhizobium sp. and plant growth-promoting bacteria. Appl. Soil. Ecol. 64, 245–251.
doi:10.1016/j.apsoil.2012.12.018
Rogel, M.A., E. Ormeňo-Orillo, and E.M. Romero. 2011. Symbiovars in rhizobia reflect bacterial
adaptation to legumes. Syst. Appl. Microbiol. 34, 96-104. doi:10.1016/j.syapm.2010.11.015
Román-Avilés, B., S.S. Snapp, and J.D. Kelly. 2004. Assessing root traits associated with root rot
resistance in common bean. Field Crop Res. 86:147-156.
Rosenblum, E.D., and P.W. Wilson. 1949. Fixation of isotopic nitrogen by Clostridium. J.
Bacteriol. 57: 413-414. downloaded from http://jb.asm.org/ on February 1, 2015 by
University of Guelph
Rovira, A.D. 1991. Rhizosphere research, 85 years of progress and frustration. In: D.L. Keister, and
P.B. Cregan (eds) The rhizosphere and plant growth. Kluwer Academic, The Netherlands,
Pp. 3–13.
Rubio, L.M., and P.W. Ludden. 2008. Biosynthesis of the iron-molybdenum cofactor of
nitrogenase. Annual Review of Microbiology 62:93-111; doi:
10.1146/annurev.micro.62.081307.162737.

250
Ruschel, A.P., Y.Henis, and E. Salati. 1975. Nitrogen-15 tracing of N-fixation with soil-grown
sugarcane seedlings. Soil Biol. Biochem. , 7:181-182.
Russo, D.M., A. Williams, A. Edwards, D.M. Posadas, C. Finnie, M. Dankert, J.A. Downie, and A.
Zorreguieta. 2006 Proteins exported via the PrsD-PrsE type I secretion system and the
acidic exopolysaccharide are involved in biofilm formation by Rhizobium leguminosarum.
J. Bacteriol. 188: 4474-4486.
Rüttimann, J.C., L.M. Rubio, D.R. Dean, and P.W. Ludden. 2003. VnfY is required for full activity
of the vanadium-containing dinitrogenase in Azotobacter vinelandii. J. Bacteriol. 185:2383-
2386. doi:10.1128/JB.185.7.2383-2386.2003
Ruvkin, G.B. and F.M. Ausubel. 1980. Interspecies homology of nitrogenase genes, Proc. Natl.
Acad. Sci. USA, 77: 191-195.
Saikia, S.P., V. Jain, S. Khetarpal, and S. Aravind. 2007. Dinitrogen fixation activity of
Azospirillum brasilense in maize (Zea mays). J. Current science.93:1296 -1300. available
online at: http://www.currentscience.ac.in/Downloads/article_id_093_09_1296_1300_0.pdf
Salantur, A., A. Ozturk, and S. Akten. 2006. Growth and yield response of spring wheat (Triticum
aestivum L.) to inoculation with rhizobacteria. Plant soil Environ. 52:111-118.
Sánchez, C., M. Itakura, H. Mitsui, and K. Minamisawa. 2013. Linked expression of nap and nos
genes in a Bradyrhizobium japonicum mutant with incresed N2O reductase activity. Applied
Environ.Microbiol. 79:4178-4180. doi: 10.1128/AEM.00703-13
Sánchez-López, R., D. Jáuregui, N. Nava, X.L. Alvarado-Affantranger, J. Montiel, O. Santana, F.
Sánchez, and C. Quinto. 2011. Down-regulation of SymRK correlates with a deficiency in

251
vascular bundle development in Phaseolus vulgaris nodules. Plant, Cell and Environment
34:2109-2121. doi:10.1111/j.1365-3040.2011.02408.x
Sangakkara, U. R., U.A. Hartwig, and J. Nösberger. 1996. Soil moisture and potassium affect the
performance of symbiotic nitrogen fixation in faba bean and common bean. Plant and Soil
184:123-130.
Sanjuan, J., and J. Olivares. 1989. Implication of nifA in regulation of genes located a Rhizobium
meliloti cryptic plasmid that effect nodulation efficiency. J. Bacteriol., 171: 4154-4161.
Available at: http://jb.asm.org/
Santamaria, C., D.N. Rodriguez, M. Camacho, A. Daza, F.Temprano, and E.O. Leidi. 1997.
Selection de cepas de Rhizobium legominosarum bv. Phaseoli effectivas concultivars
comercial de judia verda. Consejeria Agriculture y Pesca, Junta de Andalucia, Seville,
pp.48-53. In: A.G Pirbalouti, I. Alahdadi, G.A. Akbari, and A.R. Golparvar. Nitrogen
fixation on common bean cultivars as affected by inoculation of different strains of
Rhizobium legominosarum bv. Phaseoli in Shahrekord Region. Proceedings of The Fourth
International Iran & Russia Conference
Santi, C., D. Bogusz, and C. Franche. 2013. Biological nitrogen fixation in non-legume plants. Ann.
Bot. London 111:743-767; doi:10.1093/aob/mct048.
Santos, M.A., I.O. Geralidi, A. A.F. Garcia, N. Bortolatto, A. Schiavon, and M. Hungria. 2013.
Mapping of QTLs associated with biological nitrogen fixation traits in soybean. Hereditas
150:17-25. doi:10.1111/j.1601-5223.2013.02275.x
SAS Institute Inc. 2012. SAS/STAT 9.3 user’s guide, 2nd ed. SAS Inst. Inc., Cary, NC

252
Sathe, S. K.; S. S. Deshpande, and D. K. Salunkhe. 1984. Dry beans of Phaseolus - A review, Part
2, Chemical composition: Carbohydrates, fiber, minerals, vitamins and lipids. Crit. Rev.
Food Sci. and Nutr. 21:41-93.
Saxena, A. K., and R. B. Rewari. 1991. The influence of phosphate and zinc on growth, nodulation
and mineral composition of chickpea (Cicer arietinum L.) under salt stress. World J.
Microbiol. Biotechnol. 7:202-205.
Schlaman, H.R.W., B. Horvath, E. Vijgenboom, R.J.H. Okker, and B.J.J. Lugtenberg 1991.
Evidence for a new negative regulation mechanism involved in the suppression of
nodulation gene expression of Rhizobium leguminosarum bv. viciae. J. Bacteriol. 173: 277-
4287.
Schenk, M., and J. Wehrmann. 1979. The influence of ammonium in nutrient solution on growth
and metabolism of cucumber plants. Plant Soil 52:403-414.
Scherer, H.W. 2008. Impact of Sulfur on N2 Fixation of Legumes. In: N.A. Khan, S. Singh, and S.
Umar (eds) Sulfur Assimilation and Abiotic Stress in Plants. Springer, Pp. 43-54. doi:
10.1007/978-3-540-76326-0
Schlaman, H.R.M., B. Horvath, E. Vijgenboom, R.J.H. Okker, and B.J.J. Lugtenberg. 1991.
Suppression of nodulation gene expression in bacteroids of Rhizobium leguminosarum
biovar viciae. J. Bacteriol. 173:4277-87.
Schlaman, H.R.M., B. Horvath, E. Vijgenboom, R.J.H. Okker, and B.J.J. Lugtenberg. 1991.
Suppression of nodulation gene expression in bacteroids of Rhizobium leguminosarum bv.
viciae. J. Bacteriol. 173:4277-4287.
253
Schmutz, J. P.E. McClean, S. Mamidi, G.Al. Wu, S.B. Cannon, J. Grimwood, J. Jenkins, S. Shu, Q.
Song, C. Chavarro, M. Torres-Torres, V. Geffroy, S. Mafi Moghaddam, D. Gao, B.
Abernathy, K. Barry, M. Blair, M.A. Brick, M. Chovatia, P. Gepts, D.M. Goodstein, M.
Gonzales, U. Hellsten, D.L. Hyten, G. Jia, J.D. Kelly, D. Kudrna, R. Lee, M.M.S. Richard,
P.N. Miklas, J.M. Osorno, J. Rodrigues, V. Thareau, C.A. Urrea, M. Wang, Y. Yu, M.
Zhang, R.A. Wing, P.B. Cregan, D.S. Rokhsar, and S.A. Jackson. 2014. A reference
genome for common bean and genome-wide analysis of dual domestications. Nat. Genet.
46:707-713. doi:10.1038/ng.3008
Schubert, K.R. 1986. Products of biological nitrogen fixation in higher plants: synthesis, transport,
and metabolism. Ann. Rev. Plant Physio. 37:539-574.
Schulze, J., E. Adgo, and W. Merbach.1999. Carbon costs associated with N2 fixation in Vicia faba
L. and Pisum sativum L. over a 14-day period. Plant Biology 1: 625-631.
Schulze, J., G. Temple, S.J. Temple, H. Beschow, and C.P. Vance 2006. Nitrogen fixation by white
lupin under phosphorus deficiency. Ann Bot. 98:731–740. doi:10.1093/aob/mcl154
Schwencke, J., and M. Caru. 2001. Advances in actinorhizal symbiosis: Host plant-Frankia
interactions, biology, and application in arid land reclamation. A review. Arid Land Res.
Manag. 15:285-327.
Scott, M.E., and T.E. Michaels. 1992. Xanthomonas resistance of Phaseolus interspecific cross
selections confirmed by field performance. HortScience, 27: 348-350.
Sekliga, H. 1998. Nitrogen fixation in several grain legume species with contrasting sensitivities to
copper nutrition. ACTA Physiol. Plant. 20:263-267.

254
Serraj, R., and J. Adu-Gyamfi. 2004. Role of symbiotic nitrogen fixation in the improvement of
legume productivity under stressed environments. West Africa Journal of Applied Ecology.
6:95-109. doi: 10.4314/wajae.v6i1.45615
Serraj, R., and T.R. Sinclair. 1998. N2 fixation response to drought in common bean (Phaseolus
vulgaris L.) Ann. Bot. London 82:229-234.
Serrano, A., and M. Chamber. 1990. Nitrate reduction in Bradyrhizobium sp. (Lupinus) strains and
its effects on their symbiosis with Lupinus luteus. J. Plant Physiol. 136:240-246.
doi:10.1016/S0176-1617(11)81673-1
Sexton, P.J., J.W. White, and K.J. Boote. 1994. Yield-determining processes in relation to cultivar
seed size of common bean. Crop Sci. 34:84-91.
Seyedsadr, M., and P.L. Cornelius. 1992. Shifted multiplicative models for nonadditive two-way
tables. Comm. Stat. B. Simul. Comp. 21:807-832.
Shamseldin, A. 2013. The role of different genes involved in symbiotic nitrogen fixation- Review.
Global J. Biotechnol. Biochem. 8:84-94. doi:10.5829/idosi.gjbb.2013.8.4.82103
Sharma, S.R., N.K. Rao, T.S. Gokhale, and S. Ismail. 2013. Isolation and characterization of salt-
tolerant rhizobia native to the desert soils of United Arab Emirates. Emir. J. Food Agric.
25:102-108. doi: 10.9755/ejfa.v25i2.7590
Shearer, G. and D.H. Kohl. 1986. N2-fixation in field settings: estimations based on natural δ15
N
abundance. Aust. J. Plant Physiol. 13:699-756.

255
Shearer, G., and D.H. Kohl. 1993. Natural abundance of 15
N: fractional contribution of two sources
to a common sink and use of isotope discrimination. In: R. Knowles, and T.H. Blackburn
(eds) Nitrogen isotope techniques. Academic Press, Inc. Pp. 89-125.
Sikinarum, J., P. Jaisil, S. Jogloy, B. Toomsan, T. Kesmala, and A. Patanothai. 2007. Heritability
and correlation for nitrogen (N2) fixation and related traits in peanut (Arachis hypogaea L.).
Pak. J. Biol. Sci. 15:1956-1962.
Sinclair, T.R., L.C. Purcell, V. Vadez, R. Serraj, C.A. King, and R. Nelson. 2000. Identification of
soybean genotypes with N2 fixation tolerance to water deficits. Crop Sci. 40:1803-1809.
doi:10.2135/cropsci2000.4061803x
Sinclair, T.R., and R. Serraj. 1995. Legume nitrogen fixation and drought. Nature 378:344.
doi:10.1038/378344a0
Singh, S.P. 1999. Common bean improvement in the twenty-first century. Kluwer: Dordrech. P.
403.
Singh, R.K., and P.J.M. Rao. 1997. Biological significance of nickel on the nitrogen fixing ability
of cowpea Bradyrhizobium. J. Plant Nutrition 20:1449-1455.
doi:10.1080/01904169709365346
Singleton, P.W., H.M. Abel Magid, and J. W. Tavares. 1985. Effect of phosphorus on the
effectiveness of strains of Rhizobium japonicum. Soil Sci. Soc. Am. J. 49:613-616.
Slack, A.V. 1973. History and status of ammonia production and use. In: A.V. Salck (ed)
Ammonia, part I. Fertilizer Sci. Technol. Series Vol. (2) Markel Dekker, Inc. New York.
p.1.

256
Słupski. J. 2012. Effect of freezing and canning on the thiamine and riboflavin content in immature
seeds of five cultivars of common bean (Phaseolus vulgaris L.). Int. J. Refrig. 35:890-896.
Smith, A. J. 1982. Modes of cyanobacterial carbon metabolism, p. 47-85. In N. G. Carr and B. A.
Whitton (ed.), The biology of cyanobacteria. Blackwell Scientific Publications Ltd., Oxford.
Smith, G., S. Swart, B.J. Lugtenberg, and J.W. Kijne. 1992. Molecular mechanisms of attachment
of Rhizobium bacteria to plant roots. Mol. Microbiol. 6:2897-6903.
Smith, T., T. Rupert, A. J. Burt, and A. Navabi. 2012. Nitrogen use efficiency of different dry bean
market classes in Ontario. Annu. Rep. Bean Imp. Coop. 55:63-64.
Smolander, A., C. Van Dijk, and V. Sundman, 1988. Survival of Frankia strains introducedinto
soil. Plant and soil 106:65-72.
Soom, C., V., N. Rumjanek, and J. Vanderleyden. 1993. .Hydrogenase in Bradyrhizobium
japonicum : genetics, regulation and effect on plant growth. World J. Microbiol. Biotechnol.
9:615-624.
Souza, A.A., R.L. Boscariol, D.H. Moon, L.E.A. Camargo, and S.M. Tsai. 2000. Effects of
Phaseolus vulgaris QTL in controlling host-bacteria interactions under two levels of
nitrogen fertilization. Gen. Mol. Biol. 23:155-161. http://dx.doi.org/10.1590/S1415-
47572000000100029
Spaink, H.P. 2000. Root nodulation and infection factors produced by rhizobial bacteria. Annu.
Rev. Microbiol. 54:257-288. doi:10.1146/annurev.micro.54.1.257

257
Spaink, H.P., C.A. Wijffelman, E. Pees, R.J.H. Okker, and B.J.J. Lugtenberg. 1987. Rhizobium
nodulation gene nodD as a determinant of host specificity. Nature 328:337-340.
doi:10.1038/328337a0
Sprent, J. I. 1972. Effects of water stress on nitrogen-fixing root nodules. IV Effects on whole
plants of Vicia faba and Glycine max. New Phytol. 71:603-611.
Sprent, J.I. 2001. Nodulation in legumes. Royal Botanic Gardens, Kew, UK
Sprent, J.I. 2006. The effects of water stress on nitrogen-fixing root nodules IV. Effects on whole
plants of Vicia faba and Glycin max. New Phytol. 71:603-611. doi: 10.1111/j.1469-
8137.1972.tb01270
St. Clair, D.A., and F.A. Bliss. 1991. Intrapopulation recombination for 15N-determined dinitrogen
fixation ability in common bean. Plant Breeding 106:215-225. doi:10.1111/j.1439-
0523.1991.tb00504.x
St. Clair, D.A., D.J. Wolyn, J. Dubois, R.H. Burris, and F.A. Bliss. 1988. Field comparison of
dinitrogen fixation determined with nitrogen-15-depleted and nitrogen-15-enriched
ammonium sulfate in selected inbred backcross lines of common bean. Crop sci. 28:773-
778. doi:10.2135/cropsci1988.0011183X002800050010x
Statistics Canada. 2014. Canada: Outlook for Principal Field Crops (2014-12-19), Canadian Dry
Bean Statistics, Agriculture and Agri-Food Canada. Available online on at:
http://www.agr.gc.ca/eng/ industry-markets-and-trade/statistics-and-market-information/by-
product-sector/crops/pulses-and-special-crops-canadian-industry/dry-
bean/?id=1174576605314
258
Stoltzenberg, D. 2014. Fritz Haber: Chemist, Nobel laureate, Jew. Philadelphia, Chemical Heritage
Press. ISBN 0-941901-24-6.
Stewart, W.D.P. 1966. Nitrogen fixation in plants. Athlone Press. p.155.
Stewart, W.D.P. 1980. Systems involving blue-green algae (cyanobacteria). In: F. J. Bergersen (ed.)
Methods for evaluating biological nitrogen fixation. Wiley. Chichester. p.583-635
Streeter, J.G. 1982. Enzymes of sucrose, maltose, and α,α-trehalose catabolism in soybean root
nodules. Planta 155:112-115.
Streeter, J.G. 1985. Nitrate inhibition of legume nodule growth and activity. II. Short-term studies
with high nitrate supply. Plant Physiol. 77:325-328. Doi: 0032-0889/85/77/0325/04/$0
1.00/0
Suominen, L., C. Roos, G. Lortet, L. Paulin, and K. Lindström. 2001. Identification and structure of
the Rhizobium galegae common nodulation genes: evidence for horizontal gene transfer.
Mol. Biol. Evol. 18:907-916.
Susamma, V., and A.K. Misra. 2002. Frankia- actinorhizal symbiosis with special reference to
host-microsymbiont relationship. Curr. Sci. India 83:405-408.
Sutton, M.A., S. Reis, S.N. Riddick, U. Dragosits, E. Nemitz, M.R. Theobald, Y.S. Tang, C.F.,
Braban, M. Vieno, A.J. Dore, R. F. Mitchell, S. Wanless, F. Daunt, D. Fowler, T.D.
Blackall, C. Milford, C. R. Flechard, B. Loubet, R. S. Massad, P. Cellier, E. Personne, P.F.
Coheur, L. Clarisse, M. Van Damme, Y. Ngadi, C. Clerbaux, C.A. Skjøth, C. Geels, O.
Hertel, R.J. Wichink Kruit, R.W. Pinder, J.O. Bash, J.T. Walker, D. Simpson, L. Horvath,
T.H. Misselbrook, A. Bleeker, F. Dentener, and W. De Vries. 2013. Towards a climate

259
dependent paradigm of ammonia emission and deposition. Phil. Trans. R. Soc. B. 368:
20130166. doi: 10.1098/rstb.2013.0166.
Suzaki, T., M. Ito, and M. Kawaguchi. 2013. Genetic basis of cytokinin and auxin functions during
root nodule development. Front Plant Sci. 4:42-46. doi:10.3389/fpls.2013.00042
Swain, H, and S Abhijita. 2013. Nitrogen fixation and its improvement through genetic
engineering. J. Global Biosciences. 2:98-112.
Sy, A., E Giraud, P. Jourdan, N. Garcia, A. Willems, P. de-Lajudie, Y. Prin, M. Neyra, M. Gillis,
C. Boivin-Masso, and B. Dreyfus. 2001. Methylotrophic Methylobacterium bacteria
nodulate and fix nitrogen in symbiosis with legumes. J. Bacteriol. 214-220. doi: 10.1128/
B.183 .1
Taffouo, V.D., J.K. Kouamou, M.T. Ngalangue, A.N. Ndjeudji, and A. Akoa. 2009. Effects of
salinity stress on growth, ions partitioning and yield of some cowpea (Vigna unguiculata L.
Walp.) cultivars. Int. J. Bot. 5: 135-143.
Tajini, F., J.J. Drevon, and M. Trabelsi. 2012. Flamingo is a new common bean (Phaseolus vulgaris
L.) genotype with tolerance of symbiotic nitrogen fixation to moderate salinity. Afr. J.
Agric. Res. 13:2016-2024. doi:10.5897/AJAR11.2172
Tang, C., A.D. Robson, and M.J. Dilworth. 1990. The role of iron in nodulation and nitrogen
fixation in Lupinus angustifolius L. New Phytol. 114:173-182.
Tang, C., and B. D. Thomson. 1996. Effects of solution pH and bicarbonate on the growth and
nodulation of a range of grain legumes. Plant Soil 186:321-330.

260
Tanksley, S.D., and S. McCouch.1997. Seed banks and molecular maps: unlocking genetic
potential from the wild. Sci.277:1063-1066.
Tanya, P., P. Srinives, T. Toojinda, A. Vanavichit, and S. Lee .2005. Identification of SSR markers
associated with N2-fixation components in soybean. Korean J. Genet. 27:351-359. available
at: http://eprints.icrisat.ac.in/10092 (Abstract)
Tas, É., PE. Leinonen, A. Saano, LE.A. Rȁsȁnen, S. Kaijlainen, S. Poppola, S. Hakola, and K.
Linfstöm. 1996. Assessment of competitiveness of rhizobia infecting Galega orientalis on
the basis of plant yield, nodulation, and strain identification by antibiotic resistance and
PCR. Appl. Environ. Microb. 62:529-535. doi: 0099-2240/96/$04.0010
Taylor, R. W., M. L. Williams, and K. R. Sistani. 1991. Nitrogen fixation by soybean-
Bradyrhizobium combinations under acidity, low P and high Al stresses. Plant Soil 131:293-
300.
Thibivilliers, S., T. Joshi, K.B. Campbell, B. Scheffler, D. Xu, B. Coopers, H.T. Nguyen, and G.
Stacey. 2009. Generation of Phaseolus vulgaris ESTs and investigation of their regulation
upon Uromyces appendiculatus infection. BMC Plant Biol. 9:46. doi: 10.1186/1471-2229-9-
46.
Thomas, C.V., and J.G. Waines. 1984. Fertile backcross and allotetraploid plants from crosses
between tepary beans and common beans. Heredity 75:93-98.
Tian, J., P. Venkatachalam, H. Liao, X. Yan, and K. Raghothama. 2007. Molecular cloning and
characterization of phosphorous starvation responsive genes in common bean (Phaseolus
vulgaris L.) Planta. 227:151-165. doi: 10.1007/s00425-007-0603-2.

261
Timothy, C.E., 1999. The presence of nitrogen fixing legumes in terrestrial communities:
Evolutionary vs. ecological considerations. Biogeochemistry 46: 233-246.
Tint, A.M.M., Ed. Sarobo, S. Nakasathein, and W. Chai-aree. 2011. Nodule growth and nitrogen
fixation of selected soybean cultivars under different soil water regimes. Kasetsart J. (Nat.
Sci.) 45:811-823.
Tominaga, A., T. Gondo, R. Akashi, S.H. Zheng, S. Arima, and A. Suzuki. 2012. Quantitative trait
locus analysis of symbiotic nitrogen fixation activity in the model legume Lotus japonicus.
J. Plant Res. 125:395-406. doi:10.1007/s10265-011-0459-1
Torrey, J. G. 1978. Nitrogen fixation by actinomycete-nodulated angiosperms. BioScience 28:586-
592. available online at: http://www.jstor.org/stable/1307515
Triboi, E., and A.M. Triboi-Blondel. 2014. Towards Sustainable, Self-Supporting Agriculture:
Biological nitrogen factories as a Key for Future Cropping Systems. In D. Denth (ed) Soil
as World Heritage. Springer, Dordrecht, the Netherlands. p. 329.
Tsai, S.M., P.M. Da Silva, W.L. Cabezas, and R. Bonetti. 1993. Variability in nitrogen fixation of
common bean (Phaseolus vulgaris L.) intercropped with maize. Plant Soil 152:93-101.
Tsai, S.M., R.O. Nodari, D.H. Moon, L.E.A. Camargo, R. Vencovsky, and P. Gepts. 1998. QTL
mapping for nodule number and common bacterial blight in Phaseolus vulgaris L. Plant
Soil 204:135-145.
Uma, D., and S. Kannaiyan. 1995. Monitoring the ammonia excretion by Anabaena azollae
immobilized in polyurethane foam and its effect on the growth of rice seedlings.

262
Paper presented at the National Seminar on Azollae and Algal Biofertilizers for rice,
Tamilnadu Agriculture University, Coimbatore: pp 56-62.
Unkovich, M.J., D.F. Herridge, M.B. Peoples, R.M. Boddey, G. Cadisch, K.E. Giller, B. Alves, and
P. Chalk. 2008. Measuring plant-associated nitrogen fixation in agricultural systems.
ACIAR Monogr. p. 136. Commonwealth of Australia, Canbera, Australia. available online
at: EBSCOhost Academic eBook Collection (North America)
Unkovich, M.J., and J.S. Pate. 2000. An appraisal of recent field measurements of symbiotic N2
fixation by annual legumes field Crops Res. 65:21-228. doi:10.1016/S0378-
4290(99)00088-X
Unkovich, M.J., J.S. Pate, and P. Sanford. 1997. Nitrogen fixation by annual legumes in Australian
Mediterranean agriculture. Aust. J. Agric. Res. 48:267-293. doi:10.1071/A96099
Vadez, V., F. Rodier, H. Payre, and J.J. Drevon. 1996. Nodule permeability to O2 and nitrogenase-
linked respiration in bean genotypes varying in the tolerance of N2 fixation to P deficiency.
Plant Physiol. Bioch. 34: 871-878.
Vance, C.P. 2003. Symbiotic nitrogen fixation and phosphorus acquisition. Plant nutrition in a
world of declining renewable resources. Plant Physiol. 127:390-397.
Van De Sande, K., K. Pawlowski, I. Czaja, U. Wieneke, J. Schell, J. Schmidt, R. Walden, M.
Matvienko, J. Wellink, A. van Kammen, H. Franssen, and T. Bisseling. 1997. Modification
of phytohormone response by a peptide encoded by enod40 of legumes and a non-legumes.
Sci. 273: 370-373. Available at:
http://www.jstor.org.subzero.lib.uoguelph.ca/stable/2889754

263
Van Ginkel, M. 1994. Bread wheat breeding for yield under drought conditions In: S. Rajaram, and
G.P. Hettel (eds.) Wheat breeding at CIMMYT: Commemorating 50 years of research in
Mexico for global wheat improvement. International Maize and Wheat Improvement Center
CIMMYT, Ciudad Obregon, Sonora, Mexico Pp. 22-29.
Van Kessel, C., and C. Hartley. 2000. Agricultural management of grain legumes: has it led to an
increase in nitrogen fixation? Field Crops Res. 65:165-181. doi:10.1016/S0378-
4290(99)00085-4
Van Ooijen, J.W. 2006. JoinMap ® 4, Software for the calculation of genetic linkage maps in
experimental populations. Kyazma B.V., Wageningen, Netherlands.
Vargas, A.A.T., and P. H. Graham. 1988. Phaseolus vulgaris cultivar and Rhizobium strain
variation in acid-pH tolerance and nodulation under acid conditions. Field Crops Res.
19:91-101.
Vauterin, L., B. Hoste, K. Kersters, and J. Swings.1995. Reclassification of Xanthomonas.
International Journal of Systematic Bacteriology 45:472-89 Cited by: A. F. Opio, D. J.
Allen, and J. M. TERI. 1996. Pathogenic variation in Xanthomonas campestris pv. Phaseoli,
the causal agent of common bacterial blight in Phaseolus beans. Plant Pathol. 45:1126-
1133.
Venkateswarlu, B., M. Maheswari, and N. Saharan. 1983. Effects of water deficit on N2 fixation in
cowpea and groundnut . Plant Soil 114:69-74.
Vessey, J.K. 1994. Measurement of nitrogenase activity in legume root nodules: In defense of the
acetylene reduction assay. Plant Soil 158:151-162.

264
Vessey, J.K., K. Pawlowski, and B. Bergman. 2004. Root-based N2-fixing symbioses: legumes,
actinorhizal plants, Parasponia and cycads. Plant Soil 266:205-230; doi:10.1007/ s11104-
005-0871-1.
Vincent, J.M. 1977. Rhizobium: General microbiology. In a treatise on dinitrogen fixation III. R
W.F. Hardy, and W.S. Silver (eds) New York, Wiley, Pp. 277-366.
Virginia, R. A., and C. C. Delwiche. 1982. Natural 15
N abundance of presumed N2-fixing and non-
N2 fixing plants from selected ecosystems. Oecologia 54:317-325.
Voorrips, R.E., 2002. MapChart: Software for the graphical presentation of linkage maps and QTL.
J. Hered. 93: 77-78.
Vorster, B.J., U. Schlüter, M. du Plessis, S. Van Wyk, M.E. Makgopa, I. Ncube, M.D. Quain, K.
Kunert, and C.H. Foyer. 2013. The cysteine protease-cysteine protease inhibitor system
explored in soybean nodule development. Agron. J. 3:550-570.
doi:10.3390/agronomy3030550
Wadisirisuk, P., and R.W. Weaver. 1985. Importance of bacteroid number in nodules and effective
nodule mass to dinitrogen fixation by cowpeas. Plant Soil 87:223-231. Wang S., C. J.
Basten, and Z.B. Zeng. 2012. Windows QTL Cartographer 2.5. Department of Statistics,
North Carolina State University, Raleigh, NC. Available online at:
http://statgen.ncsu.edu/qtlcart/ WQTLCart.htm
Wagner, G.M. 1997. Azolla, a review of its biological utilization, Bot. Rev. 63:1-26.

265
Waldon, H.B., M.B. Jenkins, R.A. Virginia, and E.E. Harding.1989.Characteristics of woodland
rhizobial populations from surface and deep-soil environment of the Sonoran Desert. Appl
Environ Microbiol. 55:3058-3064.
Walker, J.T. 1969. Depression of Pratylenchus penetrans populations by nitrogenous amendments.
Phytopathology 59: 403-404.
Wang, S., C.J. Basten, and Z.-B. Zeng. 2011. Windows QTL Cartographer V2.5_011. Program in
Statistical Genetics, North Carolina State University. Available at:
http://statgen.ncsu.edu/qtlcart/WQTLCart.htm
Wang, D., J. Griffitts, C. Starker, E. Fedorova, E. Limpens, S. Ivanov, T. Bisseling, and S. A. Long.
2010. Nnodule-specific protein secretory pathway required for nitrogen-fixing symbiosis.
Sci. 26:1126-9. doi:10.1126/science.1184096
Watanabe, I., C. Chiu, and T. Yoshida. 1990. Estimation of N2 fixation in soybean and cowpea by
using soil residual 15
N. Soil Sci. Plant Nutr. 36:375-381.
Weisany, W, Y. Raei, and K.H. Allahverdipoor. 2013. Role of Some of Mineral Nutrients in
Biological Nitrogen Fixation. Bulletin of Environment, Pharmacology and Life Science.
2:77-84.
Westermann, D.T., G.E. Kleinkopf, L.K. Porter, and G.E. Leggett. 1981. Nitrogen sources for bean
seed production. Agron. J. 73:660-664. doi:10.2134/agronj1981.00021962007300040022x
Wheeler, C.T., and I.M. Miller. 1990. Current potential uses of actinorhizal plants in Europe. In:
R.C. Schwintzer, and J.D. Tjepkema (eds). The biological of Frankia and actinorhizal
266
plants. Academic press Inc, San Diego, Pp. 365-389. Available online at:
http://www.sciencedirect.com/ science/book/9780126332100
Whitehead, W.F., and F.L. Allen. 1990. High- vs. low-stress yield test environments for selecting
superior soybean lines. Crop Sci. 30: 912-918.
Wright, E.M., and J.D. Kelly. 2011. Mapping QTL for seed yieldand canning quality following
processing of black bean (Phaseolus vulgaris L.). Euphytica 179:471–484.
doi:10.1007/s10681-011-0369-2
Xi, J., Y. Chen, J. Nakashima, S.M. Wang, and R. Chen. 2013. Medicago truncatula esn1 defines a
genetic locus involved in nodule senescence and symbiotic nitrogen fixation. Mol. Plant
Microbe Interact. 26:893-902. doi:10.1094/MPMI-02-13-0043-R
Xi, C., E. Schoeters, J. Vanderleyden, and J. Michiels. 2000. Symbiosis specific expression of
Rhizobium etli casA encoding a secreted calmodulin-related protein. Proc. Natl. Acad. Sci.
USA 97:11114-11119.
Xu, S. 2003. Theoretical basis of the Beavis effect. Genetics 165:2259-2268.
Yamagishi, M., and Y. Yamamoto. 1994. Effects of boron on nodule development and symbiotic
nitrogen fixation in soybean plants. Soil Sci. Plant Nutr. 40:265–274.
Yan, W., L.A. Hunt, Q. Sheng, and Z. Szlavnics. 2000. Cultivar evaluation and mega-environment
investigation based on the GGE biplot. Crop Sci. 40:597-605.
Yan, W., and M. S. Kang. 2003. GGE biplot analysis: A graphical tool for breeders, geneticists, and
agronomists. CRC Press, Boca Raton, FL, USA. 288 pp.

267
Yan, W., and I.R. Rajcan. 2002. Biplot analysis of test sites and trait relations of soybean in
Ontario. Can. J. Plant Sci. 42:11-20.
Yang, R.C., and R.J. Baker. 1991. Genotype-Environment interactions in two wheat crosses. Crop
Sci. 31:83-87.
Yang, W.C., C. De Blank, I. Meskiene, H. Hirt, J. Bakker, A. van Kammen, H. Franssen, and T.
Bisseling. 1994. Rhizobium Nod factors reactivate the cell cycle during infection and
nodule primordium formation, but the cycle is only completed in primordium formation.
Plant Cell 6:1415–1426.
Yang, S., F. Tang, M. Gao, H.B. Krishnan and H. Zhu, 2010. R gene-controlled host specificity in
the legume-rhizobia symbiosis. Proc. Natl. Acad. Sci. USA, 107: 18735-18740. (Abstract)
Yanni, Y.G. 1992. The effect of cyanobacteria and Azolla on the performance of rice under
different levels of fertiliser nitrogen. World J Microbiol Biotechnol 8 : 132-136.
Yanni, Y.G., and F.K.A. El-Fattah. 1999. Towards integrated bio-fertilization management with
free living and associative dinitrogen fixers for enhancing rice performance in the Nile
delta. Symbiosis 27:319-331.
Yates, M.G. 1970. Control of respiration and nitrogen fixation by oxygen and adenine nucleotides
in N2-grown Azotobacter chroococcum. J. Gen. Microb. 60:393-401. doi:
10.1099/00221287-60-3-393
Young, P. 1992. Phylogenetic classification of nitrogen-fixing organisms. In: G. Stacey, R.H.
Burris, and H.J. Evans (eds) Biological nitrogen fixation. Chapman and Hall Inc., New
York, Pp 43-86.
268
Young, J.P.W, L.C. Crossman, A.W.B. Johnston, N.R. Thomson, Z.F. Ghazoui, K.H. Hull, M.
Wexler, A.R.J. Curson, J.D. Todd, P.S. Poole, T.H. Mauchline, A.K. East, M.A. Quail, C.
Churcher, C. Arrowsmith, I. Cherevach, T., Kay Clarke2, A. Cronin, P. Davis, A. Fraser, Z.
Hance, H. Hauser, K. Jagels, S. Moule, K. Mungall, H. Norbertczak, E. Rabbinowitsch, M.
Sanders, M. Simmonds, S. Whitehead, and J. Parkhill. 2006. The genome of Rhizobium
leguminosarum has recognizable core and accessory components. Genome Biology 7:R34.
doi:10.1186/gb-2006-7-4-r34
Yu, K., S.J. Park, and V. Poysa. 2000. Marker-assisted selection of common beans for resistance to
common bacterial blight: efficacy and economics. Plant Breed. 119:411-415. doi:
10.1046/j.1439-0523.2000.00514.x
Zahran, H.H. 1991. Conditions for successful Rhizobium-legume symbiosis in saline environments.
Biol. Fertil. Soils. 12:73-80.
Zahran, H.H. 1999. Rhizobium-legume symbiosis and nitrogen fixation under severe conditions
and in an arid climate. Microb. Mol Biol. R. 63:968-989.
Zeng, Z. 1993. Theoretical basis for separation of multiple linked gene effects in mapping
quantitative trait loci. Proc. Natl. Acad. Sci. USA 90:10972-10976. Available
http://www.pnas.org
Zeng, Z. 1994. Precision mapping of quantitative trait loci. Genetics 136: 1457-1468.
Zhao, C., L. Liu, J. Wang, W. Huang, X. Song, and C. Li. 2005. Predicting grain protein content of
winter wheat using remote sensing data based on nitrogen status and water stress. Int. J.
Appl. Earth Obs. Geoinf. 7:1-9. doi:10.1016/j.jag.2004.10.002

269
Zheng, L., D.L. Cash, D.H. Flint, and D.R. Dean. 1998. Assembly of iron-sulfur clusters.
Identification of an iscSUA-hscBAfdx gene cluster from Azotobacter vinelandii. J. Biol.
Chem. 273:13264–13272 doi:10.1074/jbc.273.21.13264

270
Genotype δ15
NMist -2.126
Sanilac -1.844
OAC 09-3 -2.203
OAC Thunder -1.688Zorro -2.655
SXB 415 -2.642AC Compass -2.313
OAC Rico -2.177Chinook 2000 -1.755Red Rider -1.854
Majesty -1.886RIL 1 -1.984RIL 2 -1.744RIL 3 -2.642RIL 4 -1.788RIL 5 -1.666RIL 6 -1.848RIL 7 -1.668RIL 8 -1.621RIL 9 -1.655B value -1.988
Appendix I. Genotypes that were grown in N-free
media in growth room to estimate the B-values in 15N natural abundance method.
RIL, Recombinant inbred line of a cross between
low SNF genotype, Sanilac, and high SNF
genotype, Mist.

271