The Financial Crisis and Corruption in Europe. Can the Equilibrium Model Explain the Variance?
57
The Financial Crisis and Corruption in Europe Can the Equilibrium Model Explain the Variance? Masterarbeit im Fach Public Policy and Management Oktober 2014 Carolin Glandorf Gerichtstraße 23 VH, 1. OG 13347 Berlin [email protected] 0179/3696039 Matrikelnummer: 4642975 Gutachterinnen: Prof. Dr. Tanja A. Börzel Prof. Alina Mungiu-Pippidi, PhD
Transcript of The Financial Crisis and Corruption in Europe. Can the Equilibrium Model Explain the Variance?
The Financial Crisis and Corruption in Europe
Can the Equilibrium Model Explain the Variance?
Masterarbeit im Fach Public Policy and Management
Oktober 2014
Carolin Glandorf Gerichtstraße 23 VH, 1. OG 13347 Berlin [email protected] 0179/3696039 Matrikelnummer: 4642975
Gutachterinnen: Prof. Dr. Tanja A. Börzel
Prof. Alina Mungiu-Pippidi, PhD
2
1 INTRODUCTION 4
2 THEORY: MUNGIU-PIPPIDI’S EQUILIBRIUM MODEL OF CORRUPTION 7
2.1 Underlying Concepts To Mungiu-Pippidi’s Theory 7
2.1.1 Critique of Existing Definitions Of Corruption 7
2.1.2 Universalism v. Particularism 8
2.1.3 Governance Regimes 10
2.1.4 The Equilibrium Model 12
2.2 Embeddedness In Academic Debates 13
2.3 Contribution To Current Applied Research 14
2.4 The Model’s Explanatory Power For Time-Series Analysis 14
3 METHODOLOGY 16
3.1 Operationalizing The Crisis 16
3.2 Application Of Corruption Indicators 16
3.3 Operationalization Of The Equilibrium Components 17
4 THE DEVELOPMENT OF CORRUPTION LEVELS IN GIIPS COUNTRIES 20
4.1 Greece 22
4.2 Ireland 23
4.3 Italy 24
4.4 Portugal 25
4.5 Spain 26
5 THE DEVELOPMENT OF EQUILIBRIUM COMPONENTS DURING THE CRISIS 27
5.1 Greece 27
5.2 Ireland 28
5.3 Italy 30
5.4 Portugal 31
3
5.5 Spain 33
5.6 Tabular Overview: Development Of Equilibrium Components 34
6 DISCUSSION 35
6.1 Does The Equilibrium Model Fit The Data? 35
6.2 Other Explanations 38
6.3 The Effect Of The Crisis On Corruption In The GIIPS Countries 40
7 CONCLUSION 41
8 APPENDIX 43
8.1 Abbreviations 43
8.2 Development Of Corruption In The GIIPS Countries 43
8.3 Development Of Equilibrium Components In The GIIPS Countries 45
9 REFERENCES 50
EIDESSTATTLICHE ERKLÄRUNG ZUR MASTERARBEIT IM FACH PUBLIC POLICY UND
MANAGEMENT 57
4
1 Introduction
The international crisis worked like the flu in the cancerous body of corruption, which holds the scars of the black market, fraud, tax evasion, and mismanagement of public funds.
(Transparência e Integridade 2012: 5)
The European financial crisis of 2008 and the subsequent debt crises have deeply shaken political
systems, economies, and societies all over Europe. And while their devastating effects on many
sources of well-being (political stability, economic activity, social justice) are obvious, the
discourse about “the crisis” also features more optimistic tropes: an opportunity to make tabula
rasa, to “heal” dysfunctional financial systems, to deconstruct governance structures that are
prone to corruption. And indeed, in historical examples of governance norms transitioning from
particularism to universalism, there were always triggering factors, and one of those possible
triggering factors is a major financial crisis (Mungiu-Pippidi et al. 2011: 44). So, could the
financial, economic, political and social turmoil in Europe after 2008 – the “crisis” – be such a
triggering factor and have actually a positive effect on corruption levels?
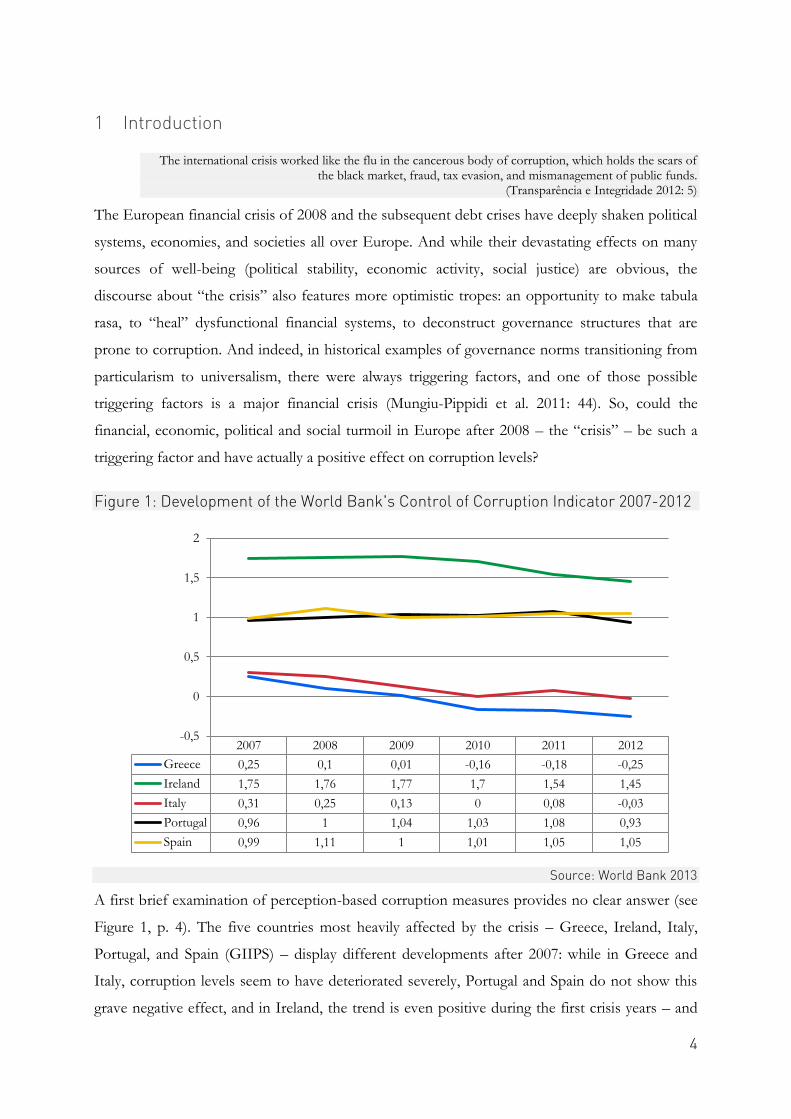
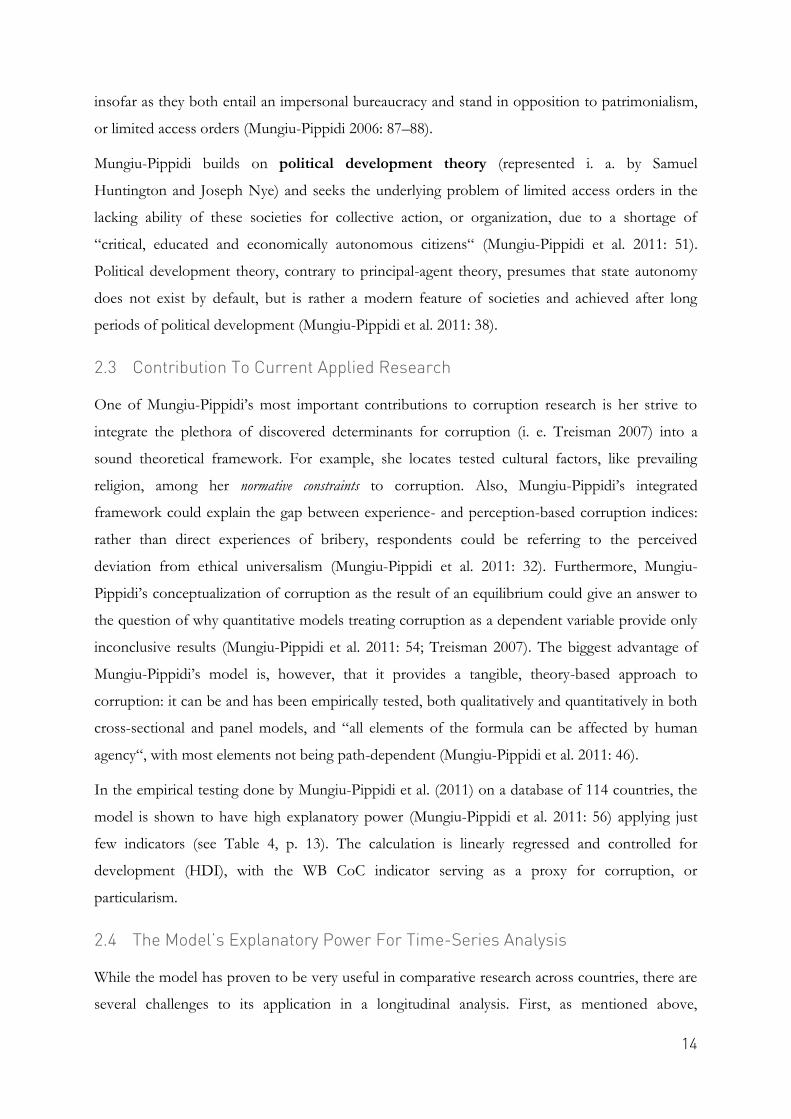
Figure 1: Development of the World Bank's Control of Corruption Indicator 2007-2012
Source: World Bank 2013
A first brief examination of perception-based corruption measures provides no clear answer (see
Figure 1, p. 4). The five countries most heavily affected by the crisis – Greece, Ireland, Italy,
Portugal, and Spain (GIIPS) – display different developments after 2007: while in Greece and
Italy, corruption levels seem to have deteriorated severely, Portugal and Spain do not show this
grave negative effect, and in Ireland, the trend is even positive during the first crisis years – and
2007 2008 2009 2010 2011 2012
Greece 0,25 0,1 0,01 -0,16 -0,18 -0,25
Ireland 1,75 1,76 1,77 1,7 1,54 1,45
Italy 0,31 0,25 0,13 0 0,08 -0,03
Portugal 0,96 1 1,04 1,03 1,08 0,93
Spain 0,99 1,11 1 1,01 1,05 1,05
-0,5
0
0,5
1
1,5
2
5
aggravates thereafter. It seems as if corruption levels in the individual countries were affected
differently by the complex crisis developments – but what could explain this variance?
According to the model by Alina Mungiu-Pippidi, corruption is the result of an equilibrium
between resources for corruption (material resources, power) and constraints to corruption (legal
and normative constraints). Now, as material resources for corruption have obviously decreased
with the crisis, should this not lead to less corruption? How are the other components of the
equilibrium affected? There is no intuitive answer to this last question: Should there be less
discretion because corrupt administrative structures are deconstructed, or more discretion
because competition has become very fierce? Did the European intervention bring more effective
legislation against corruption, or does the lack of funding lead to an ineffective judiciary system?
Does the crisis strengthen social ties because of shared negative experiences, or does it reduce
capacities for civil society, and curb media freedom by reducing funds? On the whole, can the
equilibrium model explain the development of corruption in the crisis-stricken countries?
This is the primary research question to this thesis. Along the way, I also want to investigate
whether the crisis has indeed “acted as a strong anti-corruption agent” (Mungiu-Pippidi et al.
2011: 45), or eventually worsened the situation. How could the causality be traced along changes
in the components of the equilibrium model? Obviously, real change from particularism to
ethical universalism takes much longer than the period of time under research in this project. But
while the scope of this research project is limited, it is hoped to establish if the crisis is indeed the
triggering factor that helps the affected countries overcome particularistic influences in their
governance regimes and, thus, fight corruption.
This research project’s relevance is two-fold: Firstly, Mungiu-Pippidi’s theoretical model has so
far not been applied in a similar research design – qualitative, longitudinal, cross-country – to the
crisis-affected countries. Secondly, while the role of corruption (or a country’s ability to control
corruption) in the emergence of the European debt crisis has been examined exhaustively (i. a.
Kaufmann 2010), the relationship has not been examined for any reverse effect. This is
astonishing, looking at the fact that the European financial crisis brings about many important
economical, social and political changes. While neoinstituionalist and rational-actor models
predict that with fewer resources and stronger legal or normative deterrents, corruption should
diminish (Mungiu-Pippidi 2013b: 28), the crisis has shown to have had adverse effects on, for
example, social capital, which is crucial for a country’s ability to control corruption (Mungiu-
Pippidi 2013a). So how is it now, does the European financial crisis worsen or lessen corruption
in Europe? With the crisis not entirely contained but first results on economic, social and political

6
changes over the four years since the beginning of the crisis available, this might be the exactly
right time to examine the effects of such fundamental changes in a society on its ability to control
corruption. Also, “[c]orruption that perhaps was concealed by strong or stable economic growth
is now, increasingly, being laid bare, with a commensurate loss of trust in the political system and
in politicians” (Koch 2012). This new awareness paves the road towards stronger anti-corruption
efforts on all levels of society.
The theoretical framework underlying this research project is, as noted above, the equilibrium
model by Alina Mungiu-Pippidi, which is the topic of chapter two (p. 7). Here, I explain the
concepts underlying the theory, such as universalism, particularism, and governance regimes.
Furthermore, I elaborate on how it is embedded in academic debates, how it contributes to
current applied research, and assess if and how it can be applied to a longitudinal analysis. Before
this theoretical framework can be applied to the research questions established above, I explain,
critically reflect and adapt my methodology (p. 16). Then, I embark on the analyses: In the first
step (p. 20), I would like to draw a holistic picture of the state of corruption in the GIIPS
countries. To that end, I intend to complement perception-based indicators, such as
Transparency International’s (TI’s) Corruption Perception Index (CPI) and the World Bank’s
(WB’s) Control of Corruption (CoC) index, with information from experience-based indicators as
well as surveys and reports on the topic. This allows me not only to track a (just seemingly)
quantifiable development of perceived corruption, but to add a qualitative depth to the analysis:
has the relation between petty corruption and grand corruption changed over the course of the
crisis? How was particularism as a norm affected? In the second step (p. 27), I track the
development of the equilibrium model’s components – discretionary and material resources, legal
and normative constraints – over the crisis years. Have they developed in a way that would foster
corruption – or in a way that would curb it? Then, in the following discussion (p. 35), I bring the
two analyses together: Can the development of the equilibrium components explain the
development of corruption in the GIIPS countries over the course of the crisis? Where is the
model challenged? Has the methodology applied contributed to the model’s explanatory value?
7
2 Theory: Mungiu-Pippidi’s Equilibrium Model Of Corruption
The theoretical basis for this research project is the equilibrium, or resources versus constraints, model by
Alina Mungiu-Pippidi, as presented in the report “Contextual Choices in Fighting Corruption”
(2011) that was commissioned by the Norwegian Agency for Development Cooperation
(NORAD). At the core of this theoretical framework is the conceptualization of corruption as
the result of an equilibrium:
Corruption = Resources (Power + Material resources) – Constraints (Legal + Normative) (Mungiu-Pippidi et al. 2011: 46)
In the following sections, I will explore the concepts underlying this framework (2.1), sketch out
its embeddedness in past and present scholarly debates (2.2) and critically assess its explanatory
power for this research project (2.3).
2.1 Underlying Concepts To Mungiu-Pippidi’s Theory
2.1.1 Critique of Existing Definitions Of Corruption
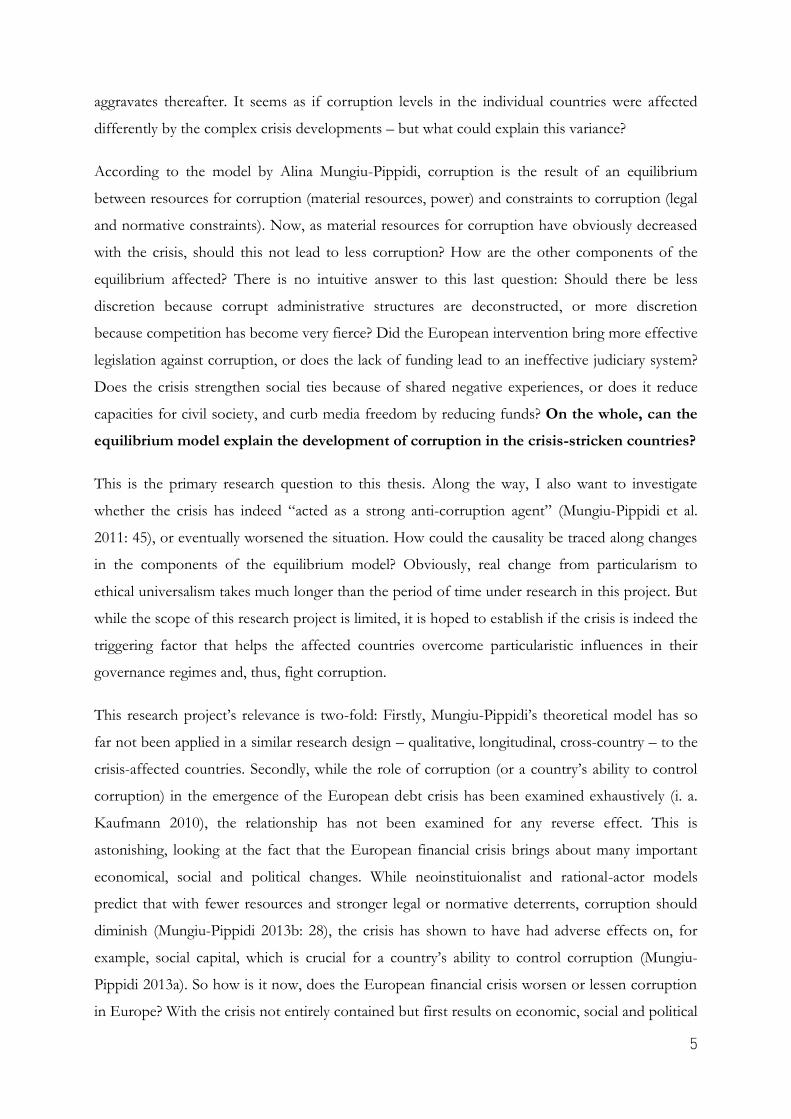
Mungiu-Pippidi’s starting point is a thorough critique of common definitions of corruption that
centre on the “private-public twist”: Often1, corruption is defined as an undue infringement of
the divide between the private and the public sphere (see Table 1, p. 7). As Treisman (2007: 211)
points out, the definition of “private” may extend to groups that the individual officer belongs to.
Table 1: Common structure of definitions of corruption
OF FOR
Betrayal Public Office / duty Private Gain Diversion Common Good / trust Personal Profit
Misuse / Abuse Communal Funds / resources Individual Benefit Manipulation Administrative Influence Unauthorized Advantage Exploitation Institutional Power Group Interests/goals
Bending Formal Rules Informal Network
Read like: “Betrayal of Public Office for Private Gain”. Source: Mungiu-Pippidi et al. 2011: 21
Mungiu-Pippidi points out three theoretical problems with understanding corruption in the way
that these definitions suggest. First, they presume that the prevailing norm in every state is a
sharp divide between the private and the public sphere (ethical universalism, which shall later be
discussed in depth), and that instances of corruption are merely deviations from this norm. This,
1 TI: Corruption is “the abuse of entrusted power for private gain” (TI 2014h) WB: “Corruption occurs when a function, whether official or private, requires the allocation of benefits or the
provision of a good or service. [...] In all cases, a position of trust is being exploited to realize private gains beyond what the position holder is entitled to.” (World Bank 2001)
Swiss State Secretariat for Economic Affairs SECO: “Corruption means any abuse of a position of trust in order to gain an undue advantage.” (State Secretariate for Economic Affairs SECO 2014)
8
however, is true only for the “modern”2 state (Mungiu-Pippidi et al. 2011: 20f.). For most states,
“modernity is not the rule, either historically or geographically” – even though they might have
written constitutions based on the norm of ethical universalism, or have signed international
agreements that reflect this norm. Instead, many societies are built around collectivist values, and
are not designed to distinguish between public and private spheres. Thus, “confusing the
appearances of modernity with the substance creates the first important problem in
understanding corruption” (Mungiu-Pippidi et al. 2011: 22).
The second theoretical problem is the underlying principal-agent perspective on the relationship
between public officers and the state (Mungiu-Pippidi et al. 2011: 23). These definitions presume
that the corrupt act is always performed by the public officer, who thereby abuses his or her role
as an agent to the state (the principal). In fact, though, it is not by default that the principal is the
state, and/or that it adheres to the norm of ethical universalism. Instead of conceptualizing
corruption as a principal-agent problem, Mungiu-Pippidi argues, in most cases it should be
understood as a “collective action problem, as societies reach a sub-optimal equilibrium of poor
governance and there is insufficient domestic agency to push for change” (Mungiu-Pippidi et al.
2011: 25).
The third theoretical problem of understanding corruption in this way is, according to Mungiu-
Pippidi, the focus on the individual level. This is only applicable in cultures where an individual’s
infringement of the public-private divide means corruption. But “how can the deviation based
definition be applied in a system where particularism (treating a person not as an indistinct
individual, but according to particular ties or group affiliations) is actually the norm?” (Mungiu-
Pippidi et al. 2011: 23, emphasis added).
Essentially, Mungiu-Pippidi’s criticism arises at the conceptual neglect of particularism as a norm.
In fact, the normative divide between ethical universalism and particularism is at the heart of
Mungiu-Pippidi’s theoretical framework.
2.1.2 Universalism v. Particularism
Mungiu-Pippidi distinguishes between ethical universalism and particularism as two ideal types (cf.
Weber) of different modes of social organization (Mungiu-Pippidi 2006: 87), or of different
relations between and among individuals and the state (Mungiu-Pippidi 2006: 27; Mungiu-Pippidi
et al. 2011: 27).
2 As Mungiu-Pippidi critically notes, this private-public divide is at the heart of the definition of modernity: “In a
developing context, the term [corruption] has been often used only as a catch word for non-universalistic
practices, in other words for the non‐modernity of a society.” (Mungiu-Pippidi et al. 2011: 22)
9
In ethical universalism, “equal treatment applies to everyone regardless of the group to which one
belongs” (Mungiu-Pippidi 2006: 88). Those societies display an even distribution of power among
different societal groups and functional bodies; the state is autonomous from private interests,
the allocation of public goods is universal, there is a sharp division between the public and the
private sphere, formal institutions are more powerful than informal institutions, and public
institutions can effectively be held accountable.
Particularism, on the other hand, represents the opposite of this organizational structure. Here,
treatment is dependent on status, and the distribution of public goods is subjected to the power
structures in the society (Mungiu-Pippidi 2006: 87). Those societies are usually organized
hierarchically and based on collectivistic norms. Here, different phenomena relating to corruption
(as understood in ethical universalism) can be identified:
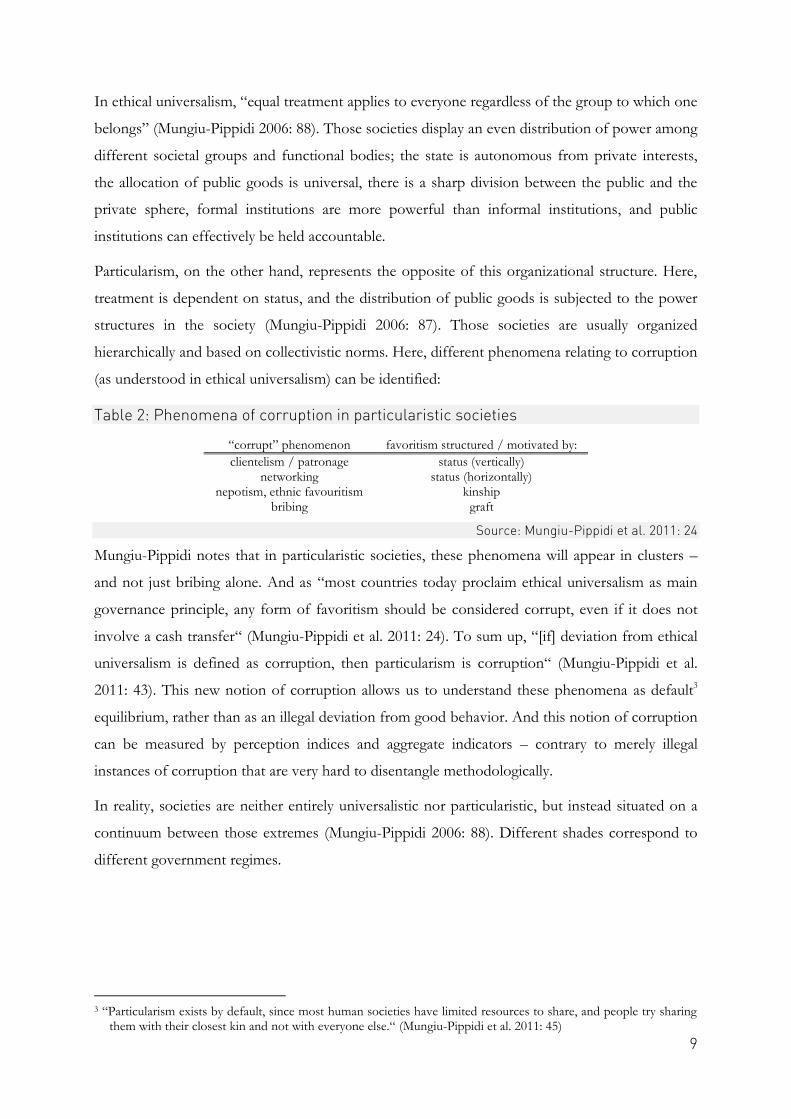
Table 2: Phenomena of corruption in particularistic societies
“corrupt” phenomenon favoritism structured / motivated by:
clientelism / patronage status (vertically) networking status (horizontally)
nepotism, ethnic favouritism kinship bribing graft
Source: Mungiu-Pippidi et al. 2011: 24
Mungiu-Pippidi notes that in particularistic societies, these phenomena will appear in clusters –
and not just bribing alone. And as “most countries today proclaim ethical universalism as main
governance principle, any form of favoritism should be considered corrupt, even if it does not
involve a cash transfer“ (Mungiu-Pippidi et al. 2011: 24). To sum up, “[if] deviation from ethical
universalism is defined as corruption, then particularism is corruption“ (Mungiu-Pippidi et al.
2011: 43). This new notion of corruption allows us to understand these phenomena as default3
equilibrium, rather than as an illegal deviation from good behavior. And this notion of corruption
can be measured by perception indices and aggregate indicators – contrary to merely illegal
instances of corruption that are very hard to disentangle methodologically.
In reality, societies are neither entirely universalistic nor particularistic, but instead situated on a
continuum between those extremes (Mungiu-Pippidi 2006: 88). Different shades correspond to
different government regimes.
3 “Particularism exists by default, since most human societies have limited resources to share, and people try sharing
them with their closest kin and not with everyone else.“ (Mungiu-Pippidi et al. 2011: 45)

10
2.1.3 Governance Regimes
This brings us to another important underlying concept of Mungiu-Pippidi’s framework:
governance and governance regimes. She defines4 governance as “the set of formal and informal rules
regulating who gets what in a given polity” (Mungiu-Pippidi et al. 2011: 26). Applying this
concept allows her to integrate the interaction of state and society into her holistic model of
corruption.
Building on this definition, Mungiu-Pippidi aims at developing a ‘taxonomy’ of different social
orders based on different approaches to governance. Drawing on existing literature (North et al.
2009), she identifies varying levels of access to common goods (Mungiu-Pippidi et al. 2011: 26–
27) as a starting point for such a taxonomy of what she calls governance regimes, where a “regime is
defined by the dominance of certain types of governance norms” (Mungiu-Pippidi et al. 2011:
28). Other variables defining the different units of her taxonomy are the distribution of power,
the autonomy of the state, the separation of the private and the public sphere, the relation of
formal and informal institutions, the mentality, the accountability of the government, and the
prevalence of rule of law.
The result of this taxonomy are four different governance regimes (see Table 3, p. 11), of which
one can be identified as an Open Access Order, signified by public impartiality and a thick rule of
law, inter alia. Here, corruption can indeed be understood as a deviation from the prevailing
norm of ethical universalism. Limited access orders display some degree of state capture, a lack of
separation between the private and the public realm and a collectivistic mentality, inter alia. In
their most extreme form, which Mungiu-Pippidi calls (Neo-)Patrimonialism, power is centralized in
a state-capturing ruler who cannot be held accountable. In Competitive Particularism, there is
competition among different groups that each, however, still end up capturing the state. Here,
the government can most likely be held accountable if and when it loses its power. But in this
environment, actions for transparency, accountability and against impunity often turn into
reciprocal attacks on political opponents. Mungiu-Pippidi has also identified a Borderline order, in
which determinants of both particularistic and universalistic regimes can be witnessed competing.
4 In the same instance, Mungiu-Pippidi notes that the concept of ‘good’ governance is normatively laden and can
refer to a variety of definitions: “‘Good’ governance is a normative concept with varying definition. Some of the definitions refer to its outcome, others describe the mechanisms of, and others still the process itself” (Mungiu-Pippidi et al. 2011: 26). Cf. Draude et al. (2012)
11
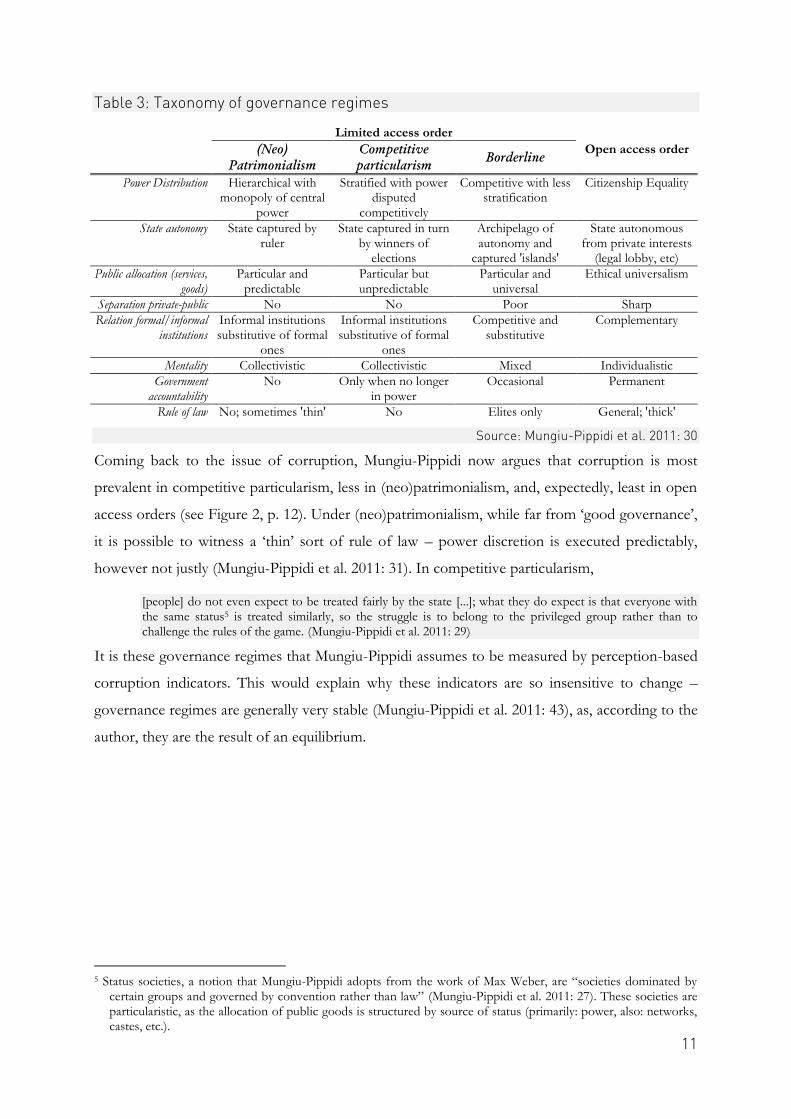
Table 3: Taxonomy of governance regimes
Limited access order
Open access order (Neo)
Patrimonialism
Competitive
particularism Borderline
Power Distribution Hierarchical with monopoly of central
power
Stratified with power disputed
competitively
Competitive with less stratification
Citizenship Equality
State autonomy State captured by ruler
State captured in turn by winners of
elections
Archipelago of autonomy and
captured 'islands'
State autonomous from private interests
(legal lobby, etc)
Public allocation (services, goods)
Particular and predictable
Particular but unpredictable
Particular and universal
Ethical universalism
Separation private-public No No Poor Sharp
Relation formal/informal institutions
Informal institutions substitutive of formal
ones
Informal institutions substitutive of formal
ones
Competitive and substitutive
Complementary
Mentality Collectivistic Collectivistic Mixed Individualistic
Government accountability
No Only when no longer in power
Occasional Permanent
Rule of law No; sometimes 'thin' No Elites only General; 'thick'
Source: Mungiu-Pippidi et al. 2011: 30
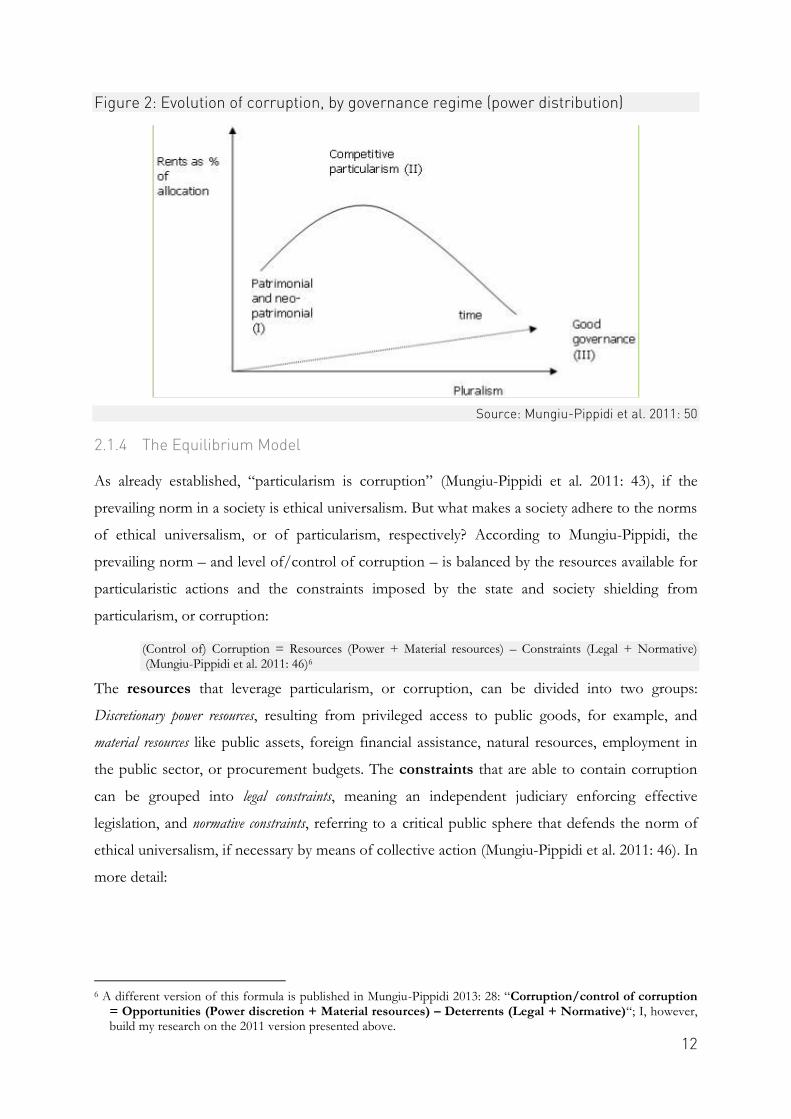
Coming back to the issue of corruption, Mungiu-Pippidi now argues that corruption is most
prevalent in competitive particularism, less in (neo)patrimonialism, and, expectedly, least in open
access orders (see Figure 2, p. 12). Under (neo)patrimonialism, while far from ‘good governance’,
it is possible to witness a ‘thin’ sort of rule of law – power discretion is executed predictably,
however not justly (Mungiu-Pippidi et al. 2011: 31). In competitive particularism,
[people] do not even expect to be treated fairly by the state [...]; what they do expect is that everyone with the same status5 is treated similarly, so the struggle is to belong to the privileged group rather than to challenge the rules of the game. (Mungiu-Pippidi et al. 2011: 29)
It is these governance regimes that Mungiu-Pippidi assumes to be measured by perception-based
corruption indicators. This would explain why these indicators are so insensitive to change –
governance regimes are generally very stable (Mungiu-Pippidi et al. 2011: 43), as, according to the
author, they are the result of an equilibrium.
5 Status societies, a notion that Mungiu-Pippidi adopts from the work of Max Weber, are “societies dominated by
certain groups and governed by convention rather than law” (Mungiu-Pippidi et al. 2011: 27). These societies are particularistic, as the allocation of public goods is structured by source of status (primarily: power, also: networks, castes, etc.).
12
Figure 2: Evolution of corruption, by governance regime (power distribution)
Source: Mungiu-Pippidi et al. 2011: 50
2.1.4 The Equilibrium Model
As already established, “particularism is corruption” (Mungiu-Pippidi et al. 2011: 43), if the
prevailing norm in a society is ethical universalism. But what makes a society adhere to the norms
of ethical universalism, or of particularism, respectively? According to Mungiu-Pippidi, the
prevailing norm – and level of/control of corruption – is balanced by the resources available for
particularistic actions and the constraints imposed by the state and society shielding from
particularism, or corruption:
(Control of) Corruption = Resources (Power + Material resources) – Constraints (Legal + Normative) (Mungiu-Pippidi et al. 2011: 46)6
The resources that leverage particularism, or corruption, can be divided into two groups:
Discretionary power resources, resulting from privileged access to public goods, for example, and
material resources like public assets, foreign financial assistance, natural resources, employment in
the public sector, or procurement budgets. The constraints that are able to contain corruption
can be grouped into legal constraints, meaning an independent judiciary enforcing effective
legislation, and normative constraints, referring to a critical public sphere that defends the norm of
ethical universalism, if necessary by means of collective action (Mungiu-Pippidi et al. 2011: 46). In
more detail:
6 A different version of this formula is published in Mungiu-Pippidi 2013: 28: “Corruption/control of corruption
= Opportunities (Power discretion + Material resources) – Deterrents (Legal + Normative)“; I, however, build my research on the 2011 version presented above.
13
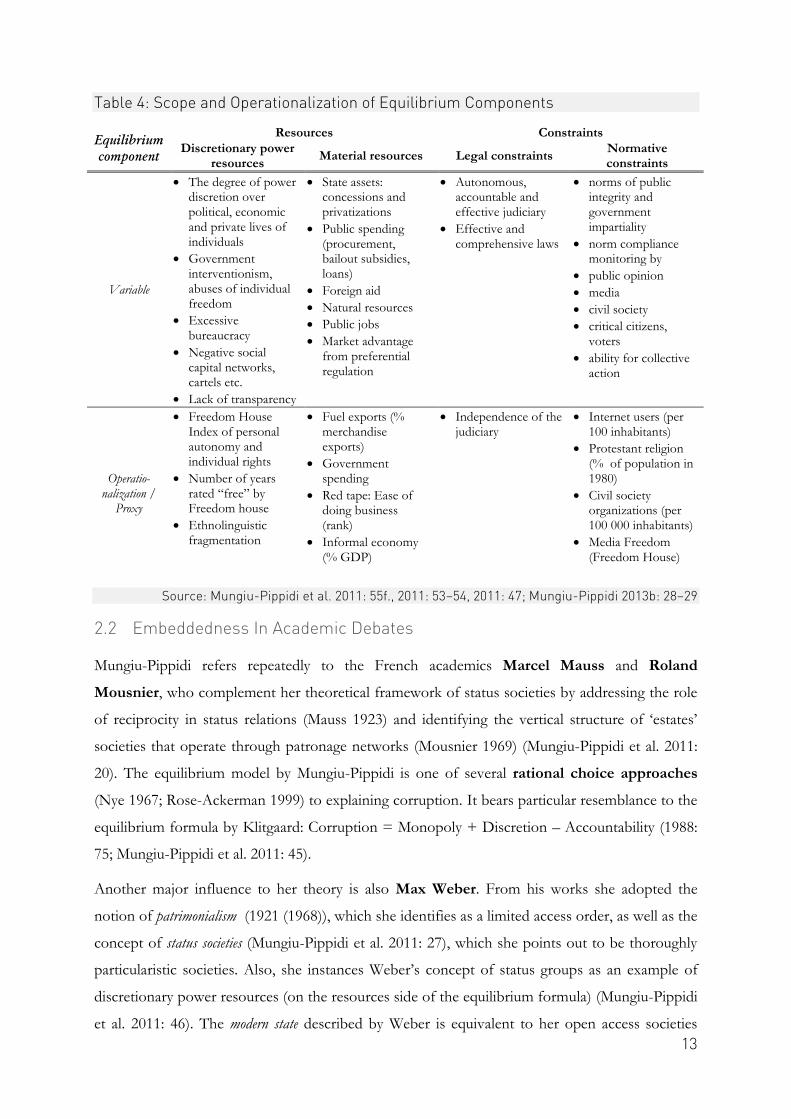
Table 4: Scope and Operationalization of Equilibrium Components
Equilibrium
component
Resources Constraints
Discretionary power resources
Material resources Legal constraints Normative constraints
Variable
The degree of power discretion over political, economic and private lives of individuals
Government interventionism, abuses of individual freedom
Excessive bureaucracy
Negative social capital networks, cartels etc.
Lack of transparency
State assets: concessions and privatizations
Public spending (procurement, bailout subsidies, loans)
Foreign aid
Natural resources
Public jobs
Market advantage from preferential regulation
Autonomous, accountable and effective judiciary
Effective and comprehensive laws
norms of public integrity and government impartiality
norm compliance monitoring by
public opinion
media
civil society
critical citizens, voters
ability for collective action
Operatio-nalization /
Proxy
Freedom House Index of personal autonomy and individual rights
Number of years rated “free” by Freedom house
Ethnolinguistic fragmentation
Fuel exports (% merchandise exports)
Government spending
Red tape: Ease of doing business (rank)
Informal economy (% GDP)
Independence of the judiciary
Internet users (per 100 inhabitants)
Protestant religion (% of population in 1980)
Civil society organizations (per 100 000 inhabitants)
Media Freedom (Freedom House)
Source: Mungiu-Pippidi et al. 2011: 55f., 2011: 53–54, 2011: 47; Mungiu-Pippidi 2013b: 28–29
2.2 Embeddedness In Academic Debates
Mungiu-Pippidi refers repeatedly to the French academics Marcel Mauss and Roland
Mousnier, who complement her theoretical framework of status societies by addressing the role
of reciprocity in status relations (Mauss 1923) and identifying the vertical structure of ‘estates’
societies that operate through patronage networks (Mousnier 1969) (Mungiu-Pippidi et al. 2011:
20). The equilibrium model by Mungiu-Pippidi is one of several rational choice approaches
(Nye 1967; Rose-Ackerman 1999) to explaining corruption. It bears particular resemblance to the
equilibrium formula by Klitgaard: Corruption = Monopoly + Discretion – Accountability (1988:
75; Mungiu-Pippidi et al. 2011: 45).
Another major influence to her theory is also Max Weber. From his works she adopted the
notion of patrimonialism (1921 (1968)), which she identifies as a limited access order, as well as the
concept of status societies (Mungiu-Pippidi et al. 2011: 27), which she points out to be thoroughly
particularistic societies. Also, she instances Weber’s concept of status groups as an example of
discretionary power resources (on the resources side of the equilibrium formula) (Mungiu-Pippidi
et al. 2011: 46). The modern state described by Weber is equivalent to her open access societies
14
insofar as they both entail an impersonal bureaucracy and stand in opposition to patrimonialism,
or limited access orders (Mungiu-Pippidi 2006: 87–88).
Mungiu-Pippidi builds on political development theory (represented i. a. by Samuel
Huntington and Joseph Nye) and seeks the underlying problem of limited access orders in the
lacking ability of these societies for collective action, or organization, due to a shortage of
“critical, educated and economically autonomous citizens“ (Mungiu-Pippidi et al. 2011: 51).
Political development theory, contrary to principal-agent theory, presumes that state autonomy
does not exist by default, but is rather a modern feature of societies and achieved after long
periods of political development (Mungiu-Pippidi et al. 2011: 38).
2.3 Contribution To Current Applied Research
One of Mungiu-Pippidi’s most important contributions to corruption research is her strive to
integrate the plethora of discovered determinants for corruption (i. e. Treisman 2007) into a
sound theoretical framework. For example, she locates tested cultural factors, like prevailing
religion, among her normative constraints to corruption. Also, Mungiu-Pippidi’s integrated
framework could explain the gap between experience- and perception-based corruption indices:
rather than direct experiences of bribery, respondents could be referring to the perceived
deviation from ethical universalism (Mungiu-Pippidi et al. 2011: 32). Furthermore, Mungiu-
Pippidi’s conceptualization of corruption as the result of an equilibrium could give an answer to
the question of why quantitative models treating corruption as a dependent variable provide only
inconclusive results (Mungiu-Pippidi et al. 2011: 54; Treisman 2007). The biggest advantage of
Mungiu-Pippidi’s model is, however, that it provides a tangible, theory-based approach to
corruption: it can be and has been empirically tested, both qualitatively and quantitatively in both
cross-sectional and panel models, and “all elements of the formula can be affected by human
agency“, with most elements not being path-dependent (Mungiu-Pippidi et al. 2011: 46).
In the empirical testing done by Mungiu-Pippidi et al. (2011) on a database of 114 countries, the
model is shown to have high explanatory power (Mungiu-Pippidi et al. 2011: 56) applying just
few indicators (see Table 4, p. 13). The calculation is linearly regressed and controlled for
development (HDI), with the WB CoC indicator serving as a proxy for corruption, or
particularism.
2.4 The Model’s Explanatory Power For Time-Series Analysis
While the model has proven to be very useful in comparative research across countries, there are
several challenges to its application in a longitudinal analysis. First, as mentioned above,
15
governance regimes and the prevailing norms that they exhibit are very stable, and significant
change in levels of corruption over a short period of time is theoretically not to be expected. As
outlined in the introduction, however, I expect the European financial and debt crisis to be an
event of such disruptive force that it triggers minor effects to the equilibrium already in the short
term. The second problem arises from the fact that with a research project designed to cover less
than a decade, any surveyed change in perceived levels of corruption might be a delayed effect of
changes to the equilibrium prior to the beginning of the time period under investigation, like a
shift of normative values due to a demographic change, etc. At the same time, a surveyed change
in the components of the equilibrium might not be mirrored by any effect in the levels of
corruption, because there could be a delay. This pitfall has to be kept in mind when discussing
the findings, but it should not inhibit the research undertaking from the start. Thirdly, some of
the tested determinants in the equilibrium model are static and therefore cannot contribute to
change (e. g. protestant share of population in 1980). For the purpose of this research project,
those proxies shall be substituted by non-static determinants, wherever possible. One of the most
significant problems, however, lies in the use of perception-based indicators as
operationalizations for the levels of corruption over time. These problems, as they do not relate
to the model itself, shall be addressed in the Methodology section of this paper.
On the other hand, Mungiu-Pippidi made a point in conceptualizing the model in a way that it
can be affected by human agency. Several of the used determinants, in fact, could be changed
within a matter of years – for better or worse. In a qualitative analysis, the development of the
individual components of the equilibrium can and should be monitored closely. Also, the model
helps establish not if illegal instances of corruption have increased or decreased during the crisis,
but if it was an event of enough disruptive power to change prevailing norms from particularism
to ethical universalism, or vice-versa. While change regarding these illegal instances might not be
detectable over the course of only a few years (many cases might not be reported or prosecuted
during such short time and have not yet affected relevant proxies), a changing norm might be
detected by these perceived corruption indicators.
16
3 Methodology
The research questions established in the first chapter can, in my opinion, not be answered in an
entirely quantitative way. In this regard, I join Mungiu-Pippidi in her critique of quantitative
models that include corruption as a dependent variable, “with little thought that control of
corruption in a society is actually an equilibrium and should be conceptualized in such terms”
(Mungiu-Pippidi et al. 2011: 45). Therefore, I have decided for an analysis that incorporates both
quantitative and qualitative data. The analysis covers the five countries most heavily affected by
the European financial and debt crisis, namely Greece, Ireland, Italy, Portugal, and Spain
(GIIPS).
3.1 Operationalizing The Crisis
The selection of these five countries will serve as the operationalization of the crisis itself.
Underlying this decision is the premise that the European financial and debt crisis has affected
these countries so gravely that any major political, economic and social development connects
more or less directly to it. If it was possible at all to quantify the impact specifically on the
equilibrium components, this would exceed by far the scope of this research project and would
direct attention away from its focal point: the explanatory power of the equilibrium model. While
the general effects of the crises on the GIIPS countries will be specified in the following chapter,
it is important to note that the selection of Greece, Ireland, Italy, Portugal and Spain is not
arbitrary, and that the assumed severity of their affectedness is not based on mere speculation.
Apart from being so widely mentioned as a crisis-affected group in the international media that
there was even a debate about an appropriate abbreviation (Chatelain 2010), the GIIPS countries’
economies were widely acknowledged by economic experts to have been affected most by the
crisis (for example, Sachverständigenrat zur Begutachtung der gesamtwirtschaftlichen
Entwicklung 2013: 44). But most importantly, these five countries exclusively were part of the
Securities Markets Programme, under which the Eurosystem acquired their nationally-issued
bonds – testifying to the severe financial distress these countries suffered (European Central
Bank 2013).
3.2 Application Of Corruption Indicators
To assess the development of corruption in these GIIPS countries, perception-based corruption
indicators (TI CPI, WB CoC) will be applied, among others – in full acknowledgement of their
methodological shortcomings widely discussed in the literature: “First, and most obviously, the
data do not measure corruption itself but only opinions about its prevalence” (Treisman 2007:

17
215). These indicators correlate highly with factors that represent “modernism”, and might be
biased to common expectations of which environment would foster corruption (Treisman 2007:
212–213). Cross-country differences could be explained by other factors than the prevalence of
corruption, such as “the socially encouraged level of cynicism, the degree of public identification
with the government, and the perceived injustice of social or economic relations.” They could be
influenced greatly by the topic’s salience, for example due to “politically motivated accusations by
opposition politicians” (Treisman 2007: 215). Also, especially in the case of the TI indicators,
they might be influenced by the ideological background of their producers. And, lastly, these
perception-based indicators are assumed to be relatively insensitive to environmental changes in
the short term: “It is hard to believe changes in political institutions would affect corruption
levels, and then the perceptions of raters, within a single year” (Treisman 2007: 221).
In spite of all these reservations, perception-based indicators still find application in this research
project, for several reasons, the most important of which is the lack of appropriate substitutes.
Alternative, more precise measures of corruption, such as the models undertaken by Di Tella and
Schargrodsky (2003) or Golden and Picci (2005), are not applicable to this research design, as
they cannot be extended cross-nationally and vastly exceed the scope of this research project.
Also, in an assessment by Kaufmann et al. (2004), no significant ideological biases on corruption
ratings were found (Treisman 2007: 217). Last, but not least, it should not be forgotten that
according to Mungiu-Pippidi’s theoretical model, perception-based indicators capture
particularism (Mungiu-Pippidi et al. 2011: 43, 2011: 32) (see Chapter 2).
As an experience-based indicator, TI’s Global Corruption Barometer (GCB) was used. In this
survey-based study, a representative share of the countries’ population is asked whether they or
anyone in their household had paid a bribe in any form during the previous twelve months.
Experience-based indicators have methodological problems, as well: the replies are assumed to be
tilted by desirability. Also, “[it] is possible that the experience-based measures are noisier and less
reliable or are measuring a different phenomenon (petty as opposed to grand corruption,
perhaps)” (Treisman 2007: 212–213). On a different note, experience-based indicators, like the
TI GCB, correlate quite highly with perception-based indicators such as TI CPI and WB CoC7.
3.3 Operationalization Of The Equilibrium Components
Overall, the methodology is largely modeled after the quantitative testing undertaken by Mungiu-
Pippidi (2011: 34). There is, however, one major difference: While Mungiu-Pippidi et al.
7 Correlation of TI GCB 2005 with WB CoC 2005: -0.727; TI GCB 2005 with TI CPI 2005: -0.699; (Treisman 2007:
218).

18
conducted a comparative cross-country analysis, the present research will instead trace the
development over time, for each of the GIIPS countries individually. This adaptation from a
cross-country to a time-series design requires certain adjustments to be made regarding the
operationalization of the equilibrium model components (cf. Table 4, p. 13).
In their original operationalization of the resources versus constraints model, Mungiu-Pippidi et
al. (2011) use the “number of years ranked free” by Freedom House as a proxy for discretionary power
resources. As all countries under observation here have a long history of being ranked “free” by
Freedom House, and as this indicator is not changing throughout the crisis years (except for a
linear increase due to the progress of time), it is not expected to contribute to answering my
research question here. Therefore, I will chose a more dynamic indicator for this segment of the
equilibrium formula, as provided by Mungiu-Pippidi et al. (2011: 32): The Freedom House index of
personal autonomy and individual rights (Freedom House 2014b).
To operationalize material resources, Mungiu-Pippidi et al. (2011) relied on the Ease of Doing
Business Ranking by the WB, the size of the informal economy as a percentage of the Gross
Domestic Product (GDP) and the share of fuel exports in total merchandise exports. As the
rankings and methodology for the Ease of Doing Business indicator are not consistent throughout the
time period 2008-2014 (World Bank 2014b), a closer look inside the data has to be taken in order
to establish if doing business has, in fact, become easier during and after the disruptive crisis
event or not. The indicator’s website provides detailed, comparable historical data (World Bank
2014a). Fuel exports, as a percentage of merchandise exports8, have increased in all GIIPS countries. For
the size of the informal economy as a percentage of the GDP, the data used in Mungiu-Pippidi’s study
(Schneider et al. 2010) is substituted by more recent estimates under the same methodology
(Schneider 2013). In all GIIPS states, the informal economy was on a decline before 2008, and
displayed temporary and small growth thereafter, before decreasing again. Schneider (2013)
explains this development with the “worldwide economic and financial crises”: “if the official
economy is recovering or booming, people have fewer incentives to undertake additional
activities in the shadow economy and to earn extra ‘black’ money“ (Schneider 2013: 1–2).
Therefore, the post-2008 development is attributed to the crisis and the successive economic
recovery.
8 But does this indicate increased material resources at hand? Instead, a higher ratio could merely be due to the fact
that merchandise exports have overall decreased, while fuel exports remained stable. The analysis shows that in most cases, a positive development in the fuel exports/total merchandise exports ratio is indeed due to an increase in fuel exports rather than a decrease in total merchandise exports (UN Comtrade 2014; World Bank 2014c). Therefore, in this analysis, the fuel exports ratio development is considered at face value.
19
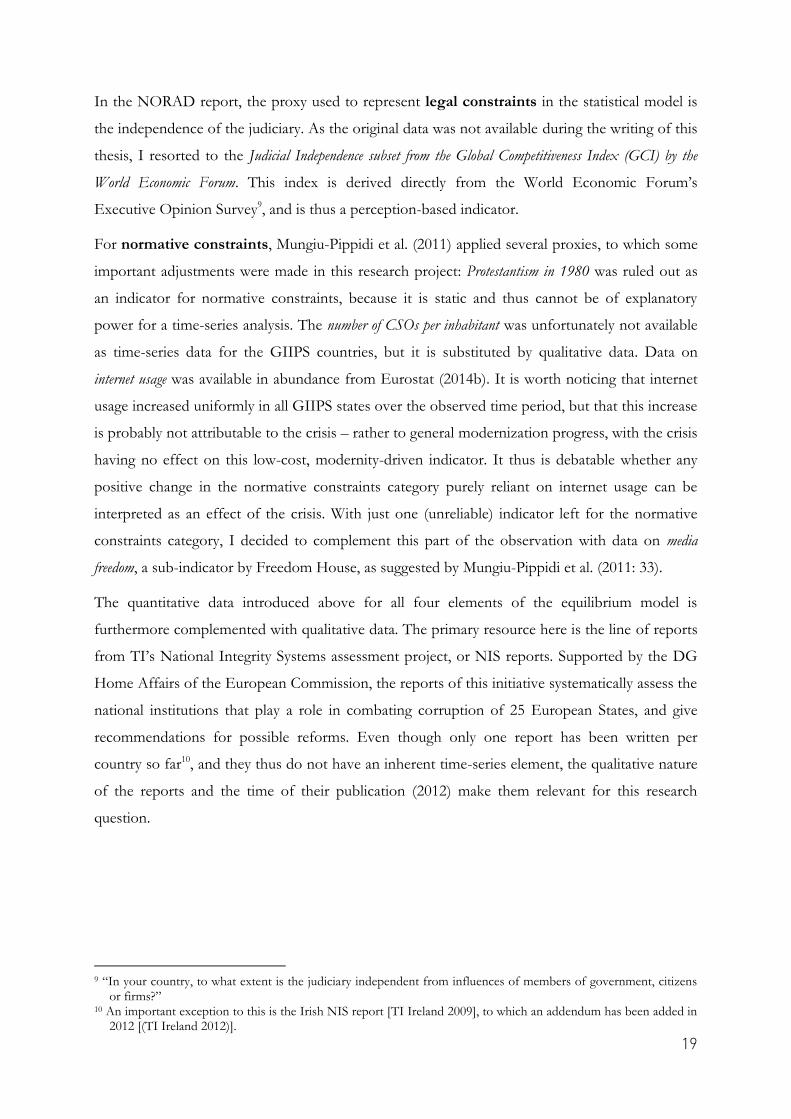
In the NORAD report, the proxy used to represent legal constraints in the statistical model is
the independence of the judiciary. As the original data was not available during the writing of this
thesis, I resorted to the Judicial Independence subset from the Global Competitiveness Index (GCI) by the
World Economic Forum. This index is derived directly from the World Economic Forum’s
Executive Opinion Survey9, and is thus a perception-based indicator.
For normative constraints, Mungiu-Pippidi et al. (2011) applied several proxies, to which some
important adjustments were made in this research project: Protestantism in 1980 was ruled out as
an indicator for normative constraints, because it is static and thus cannot be of explanatory
power for a time-series analysis. The number of CSOs per inhabitant was unfortunately not available
as time-series data for the GIIPS countries, but it is substituted by qualitative data. Data on
internet usage was available in abundance from Eurostat (2014b). It is worth noticing that internet
usage increased uniformly in all GIIPS states over the observed time period, but that this increase
is probably not attributable to the crisis – rather to general modernization progress, with the crisis
having no effect on this low-cost, modernity-driven indicator. It thus is debatable whether any
positive change in the normative constraints category purely reliant on internet usage can be
interpreted as an effect of the crisis. With just one (unreliable) indicator left for the normative
constraints category, I decided to complement this part of the observation with data on media
freedom, a sub-indicator by Freedom House, as suggested by Mungiu-Pippidi et al. (2011: 33).
The quantitative data introduced above for all four elements of the equilibrium model is
furthermore complemented with qualitative data. The primary resource here is the line of reports
from TI’s National Integrity Systems assessment project, or NIS reports. Supported by the DG
Home Affairs of the European Commission, the reports of this initiative systematically assess the
national institutions that play a role in combating corruption of 25 European States, and give
recommendations for possible reforms. Even though only one report has been written per
country so far10, and they thus do not have an inherent time-series element, the qualitative nature
of the reports and the time of their publication (2012) make them relevant for this research
question.
9 “In your country, to what extent is the judiciary independent from influences of members of government, citizens
or firms?” 10 An important exception to this is the Irish NIS report [TI Ireland 2009], to which an addendum has been added in
2012 [(TI Ireland 2012)].
20
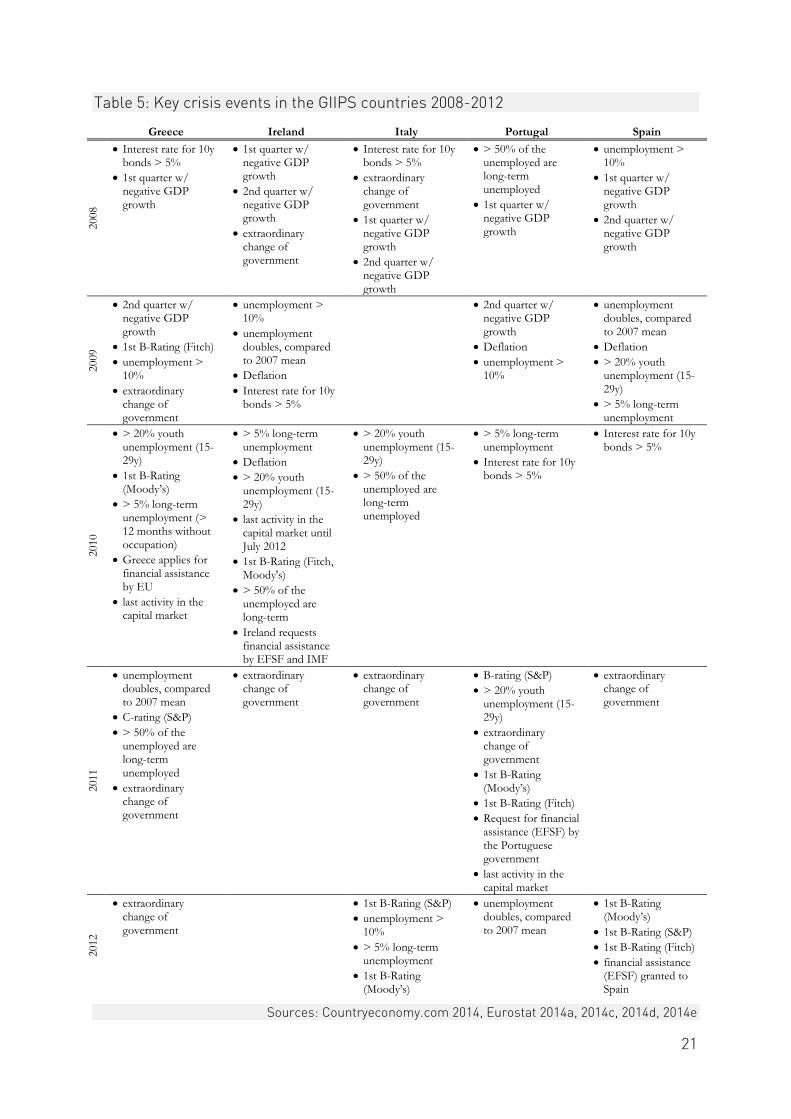
4 The Development Of Corruption Levels In GIIPS Countries
In the previous chapter, it was already established that the five cases under consideration –
Greece, Ireland, Italy, Portugal, and Spain – were selected as an operationalization for the
European Financial and Debt crisis as a disruptive event. Naturally, however, the crisis as defined
presented different challenges to each of the five individual countries in a financial, economic,
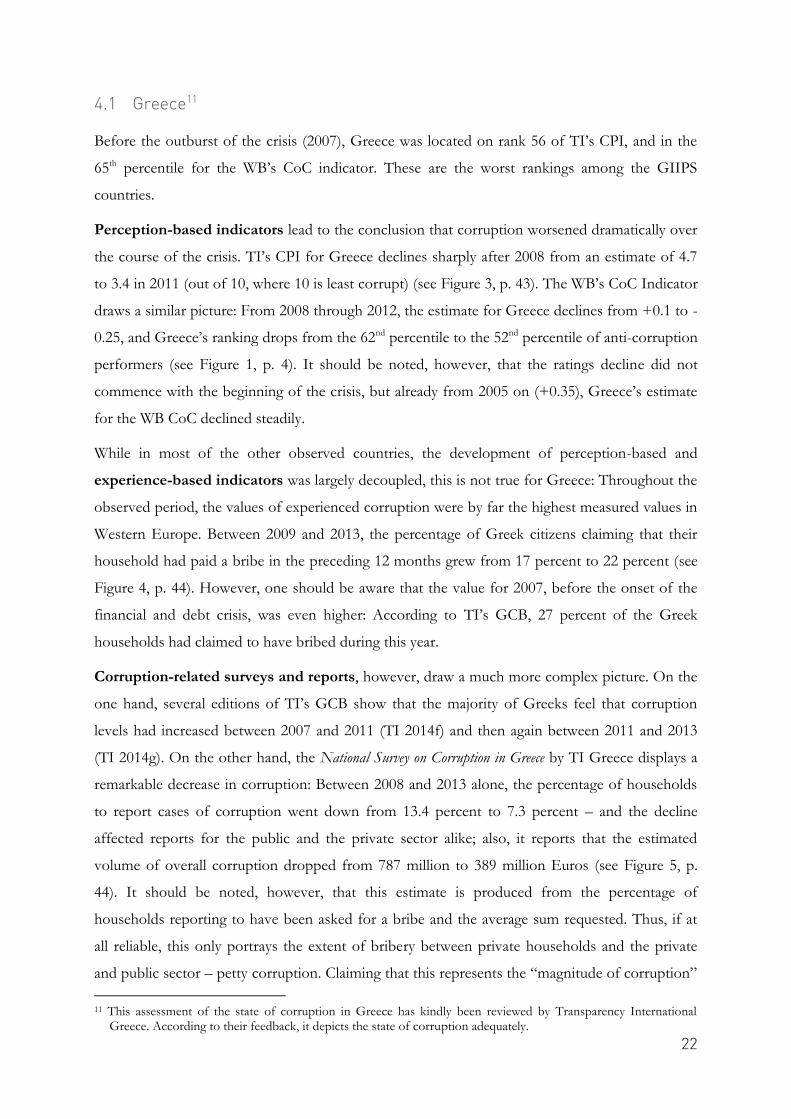
social, and political dimension. Table 5 (p. 21) illustrates how the individual countries underwent
key events in the years between 2008 and 2013. Financially, the countries had to cope with
problems on the capital markets, such as negative ratings by rating agencies, consequently high
interest rates for state bonds, which brought most of their activities on the capital markets to a
halt – after which they had to turn to European financial assistance. Economically, the crisis
surfaced in the form of a recession that hit all GIIPS countries in 2008, and was succeeded by
deflation in most of them. These economic developments were accompanied by social problems,
primarily by a strong growth of unemployment, youth unemployment and long-term
unemployment rates. In all GIIPS states, except Italy, unemployment rates doubled in 2008-2012,
compared to the 2007 average. This, together with other factors in the individual countries,
naturally brought along political tensions. All GIIPS countries underwent extraordinary changes
of government during the crisis years, i. e. the government was replaced prematurely.
21
Table 5: Key crisis events in the GIIPS countries 2008-2012
Greece Ireland Italy Portugal Spain
2008
Interest rate for 10y bonds > 5%
1st quarter w/ negative GDP growth
1st quarter w/ negative GDP growth
2nd quarter w/ negative GDP growth
extraordinary change of government
Interest rate for 10y bonds > 5%
extraordinary change of government
1st quarter w/ negative GDP growth
2nd quarter w/ negative GDP growth
> 50% of the unemployed are long-term unemployed
1st quarter w/ negative GDP growth
unemployment > 10%
1st quarter w/ negative GDP growth
2nd quarter w/ negative GDP growth
2009
2nd quarter w/ negative GDP growth
1st B-Rating (Fitch)
unemployment > 10%
extraordinary change of government
unemployment > 10%
unemployment doubles, compared to 2007 mean
Deflation
Interest rate for 10y bonds > 5%
2nd quarter w/
negative GDP growth
Deflation
unemployment > 10%
unemployment doubles, compared to 2007 mean
Deflation
> 20% youth unemployment (15-29y)
> 5% long-term unemployment
2010
> 20% youth unemployment (15-29y)
1st B-Rating (Moody’s)
> 5% long-term unemployment (> 12 months without occupation)
Greece applies for financial assistance by EU
last activity in the capital market
> 5% long-term unemployment
Deflation
> 20% youth unemployment (15-29y)
last activity in the capital market until July 2012
1st B-Rating (Fitch, Moody's)
> 50% of the unemployed are long-term
Ireland requests financial assistance by EFSF and IMF
> 20% youth unemployment (15-29y)
> 50% of the unemployed are long-term unemployed
> 5% long-term unemployment
Interest rate for 10y bonds > 5%
Interest rate for 10y bonds > 5%
2011
unemployment doubles, compared to 2007 mean
C-rating (S&P)
> 50% of the unemployed are long-term unemployed
extraordinary change of government
extraordinary change of government
extraordinary change of government
B-rating (S&P)
> 20% youth unemployment (15-29y)
extraordinary change of government
1st B-Rating (Moody’s)
1st B-Rating (Fitch)
Request for financial assistance (EFSF) by the Portuguese government
last activity in the capital market
extraordinary change of government
2012
extraordinary change of government
1st B-Rating (S&P)
unemployment > 10%
> 5% long-term unemployment
1st B-Rating (Moody’s)
unemployment doubles, compared to 2007 mean
1st B-Rating (Moody’s)
1st B-Rating (S&P)
1st B-Rating (Fitch)
financial assistance (EFSF) granted to Spain
Sources: Countryeconomy.com 2014, Eurostat 2014a, 2014c, 2014d, 2014e
22
4.1 Greece11
Before the outburst of the crisis (2007), Greece was located on rank 56 of TI’s CPI, and in the
65th percentile for the WB’s CoC indicator. These are the worst rankings among the GIIPS
countries.
Perception-based indicators lead to the conclusion that corruption worsened dramatically over
the course of the crisis. TI’s CPI for Greece declines sharply after 2008 from an estimate of 4.7
to 3.4 in 2011 (out of 10, where 10 is least corrupt) (see Figure 3, p. 43). The WB’s CoC Indicator
draws a similar picture: From 2008 through 2012, the estimate for Greece declines from +0.1 to -
0.25, and Greece’s ranking drops from the 62nd percentile to the 52nd percentile of anti-corruption
performers (see Figure 1, p. 4). It should be noted, however, that the ratings decline did not
commence with the beginning of the crisis, but already from 2005 on (+0.35), Greece’s estimate
for the WB CoC declined steadily.
While in most of the other observed countries, the development of perception-based and
experience-based indicators was largely decoupled, this is not true for Greece: Throughout the
observed period, the values of experienced corruption were by far the highest measured values in
Western Europe. Between 2009 and 2013, the percentage of Greek citizens claiming that their
household had paid a bribe in the preceding 12 months grew from 17 percent to 22 percent (see
Figure 4, p. 44). However, one should be aware that the value for 2007, before the onset of the
financial and debt crisis, was even higher: According to TI’s GCB, 27 percent of the Greek
households had claimed to have bribed during this year.
Corruption-related surveys and reports, however, draw a much more complex picture. On the
one hand, several editions of TI’s GCB show that the majority of Greeks feel that corruption
levels had increased between 2007 and 2011 (TI 2014f) and then again between 2011 and 2013
(TI 2014g). On the other hand, the National Survey on Corruption in Greece by TI Greece displays a
remarkable decrease in corruption: Between 2008 and 2013 alone, the percentage of households
to report cases of corruption went down from 13.4 percent to 7.3 percent – and the decline
affected reports for the public and the private sector alike; also, it reports that the estimated
volume of overall corruption dropped from 787 million to 389 million Euros (see Figure 5, p.
44). It should be noted, however, that this estimate is produced from the percentage of
households reporting to have been asked for a bribe and the average sum requested. Thus, if at
all reliable, this only portrays the extent of bribery between private households and the private
and public sector – petty corruption. Claiming that this represents the “magnitude of corruption”
11 This assessment of the state of corruption in Greece has kindly been reviewed by Transparency International
Greece. According to their feedback, it depicts the state of corruption adequately.
23
in Greece neglects grand corruption and public costs arising from nepotism, etc. The Greek NIS
report ascribes this somewhat dramatic reduction to the financial crisis (TI Greece 2012b: 22). It
furthermore claims that the state of corruption in Greece is changing as a consequence of the
crisis; it was yet to see, however, in which direction the change is going. The Special
Eurobarometers commissioned by the European Commission show that in 2011, the majority
(56 percent) of Greeks think that corruption has increased during the previous three years, and
59 percent held that view in 2013 (European Commission 2012, 2014).
Overall, the evidence provided sends mixed messages about the development of corruption in
Greece over the course of the crisis. On the one hand, both perception- and experience-based
indicators produced by international organizations (TI, WB) report that corruption has worsened
in Greece between 2008/09 and 2012/13. On the other hand, a series of surveys by the Greek
Think Tank Public Issue reveals that the percentage of households claiming to have been asked
to pay a bribe has decreased between 2009 and 2013, as well as the requested average sum,
leading to a decrease in petty corruption. This contradicts almost directly the findings from TI’s
GCB, where the percentage of people claiming that their households had paid a bribe has
increased throughout the years. One possible explanation for this is a different degree of
sophistication, methodology-wise.
4.2 Ireland
Ireland is the top performer, regarding anti-corruption, among the GIIPS countries. Before the
crisis began, it was ranked 17th in TI’s CPI, and in the 93rd percentile for the WB’s CoC index.
In Ireland, perception-based data indicates that the level of corruption has decreased slightly
until 2009/2010, and increased slightly afterwards. The TI CPI estimate decreases particularly
between 2010 and 2011 from an estimate of 8 to 7.5, although not as strikingly as Greece (see
Figure 3, p. 43). The WB’s CoC indicator does, however, show a stronger negative tendency
between 2009 and 2012 (from +1.77 to +1.45) – a decrease almost as big as Greece’s (see Figure
1, p. 4). Overall though, these indicators display more or less the same level of corruption for the
years in the beginning and at the end of the crisis – in hindsight, corruption levels have remained
more or less the same.
From the experience-based indicator TI GCB, only two relevant estimates are available for the
Irish case: 2007 and 2011 (see Figure 4, p. 44). While such few data points inhibit any analysis
anyhow, the low levels measured (in both cases, only two percent of the Irish report to have paid
a bribe in the preceding twelve months) indicate that analyzing experience-based data has only
very limited explanatory power to this research project’s guiding question for the Irish case.
24
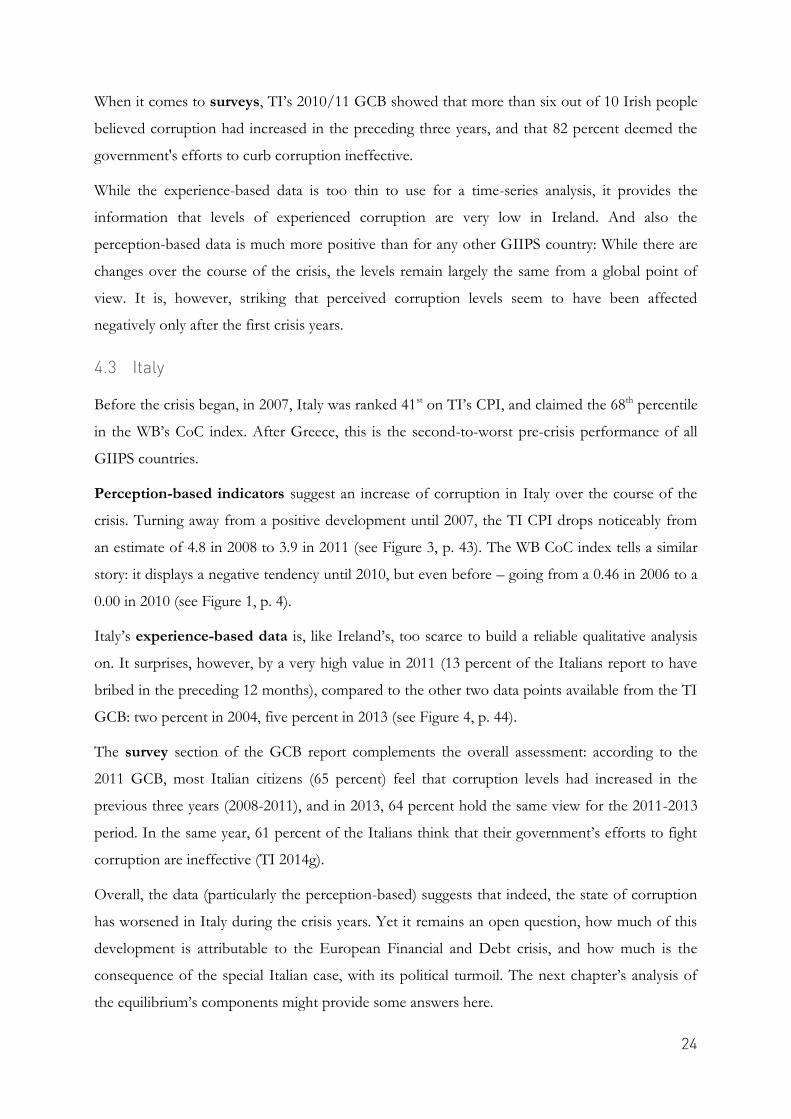
When it comes to surveys, TI’s 2010/11 GCB showed that more than six out of 10 Irish people
believed corruption had increased in the preceding three years, and that 82 percent deemed the
government's efforts to curb corruption ineffective.
While the experience-based data is too thin to use for a time-series analysis, it provides the
information that levels of experienced corruption are very low in Ireland. And also the
perception-based data is much more positive than for any other GIIPS country: While there are
changes over the course of the crisis, the levels remain largely the same from a global point of
view. It is, however, striking that perceived corruption levels seem to have been affected
negatively only after the first crisis years.
4.3 Italy
Before the crisis began, in 2007, Italy was ranked 41st on TI’s CPI, and claimed the 68th percentile
in the WB’s CoC index. After Greece, this is the second-to-worst pre-crisis performance of all
GIIPS countries.
Perception-based indicators suggest an increase of corruption in Italy over the course of the
crisis. Turning away from a positive development until 2007, the TI CPI drops noticeably from
an estimate of 4.8 in 2008 to 3.9 in 2011 (see Figure 3, p. 43). The WB CoC index tells a similar
story: it displays a negative tendency until 2010, but even before – going from a 0.46 in 2006 to a
0.00 in 2010 (see Figure 1, p. 4).
Italy’s experience-based data is, like Ireland’s, too scarce to build a reliable qualitative analysis
on. It surprises, however, by a very high value in 2011 (13 percent of the Italians report to have
bribed in the preceding 12 months), compared to the other two data points available from the TI
GCB: two percent in 2004, five percent in 2013 (see Figure 4, p. 44).
The survey section of the GCB report complements the overall assessment: according to the
2011 GCB, most Italian citizens (65 percent) feel that corruption levels had increased in the
previous three years (2008-2011), and in 2013, 64 percent hold the same view for the 2011-2013
period. In the same year, 61 percent of the Italians think that their government’s efforts to fight
corruption are ineffective (TI 2014g).
Overall, the data (particularly the perception-based) suggests that indeed, the state of corruption
has worsened in Italy during the crisis years. Yet it remains an open question, how much of this
development is attributable to the European Financial and Debt crisis, and how much is the
consequence of the special Italian case, with its political turmoil. The next chapter’s analysis of
the equilibrium’s components might provide some answers here.

25
4.4 Portugal
Portugal was located on rank 28 of TI’s CPI in 2007, before the crisis began. With the WB’s CoC
indicator, it performed similarly to Spain, and was ranked in the 80th percentile.
The perception-based indicators available for Portugal do not display any significant
development: The TI CPI estimate fluctuates around the value of 6 with a peak of 6.1 in 2008
and a low point in 2009 with 5.8 (see Figure 3, p. 43). The WB CoC indicator paints a similar
picture: Varying around an estimate of one (1.08 in 2011; 0.93 in 2012), the ranking for Portugal
also does not deviate greatly from the 80th percentile (see Figure 1, p. 4).
Portugal, like most other GIIPS countries, displays very low levels of experienced corruption:
The share of Portuguese claiming to have paid a bribe in the preceding 12 months lies between 2
percent (2004–2009) and 3 percent (2011; 2013) (see Figure 4, p. 44). As the data from TI’s GCB
is not more fine-grained, I will not deem this variation an increase and instead attribute it to
general statistical variance.
The Portuguese NIS report furthermore gives account of how, among the Portuguese
population, the tolerance for political corruption has decreased over the course of the crisis.
Conversely, the acceptance of the “efficient corrupt officer”, who requests bribes but “gets things
done”, grew. Also, the crisis and the resulting wage cuts in the public sector reportedly increase
the likelihood of bribe acceptance, and the problematic situation of private companies increase
the likelihood of bribe payments (Transparência e Integridade 2012). The report does not
characterize the crisis as a disruptive event that could potentially change the situation for the
better, but draws a very dark picture of the economic turmoil: “The international crisis worked
like the flu in the cancerous body of corruption, which holds the scars of the black market,
fraud, tax evasion, and mismanagement of public funds.” (2011, quoted in NIS Executive
Summary, p. 5). This sentiment seems to resonate with the Portuguese public, of which in 2010,
83 percent claim that corruption levels had increased since 2007, and in 2013, 78 percent felt an
increase in corruption since 2011. These are the highest values among all GIIPS countries. Both
times, around three quarters of the Portuguese citizenry think that their government is ineffective
to curb corruption (Transparência e Integridade 2012: 4).
Overall, while quantitative data shows no considerable impact of the crisis on corruption levels in
Portugal, the qualitative data reveals that the economic challenges seem to have increased the risk
for corruption and instilled a fatalist attitude towards corruption in the Portuguese population.
Together with the survey results indicating that the public assumes corruption to have increased,
this could direct at an actual increased adoption of a particularistic value system.
26
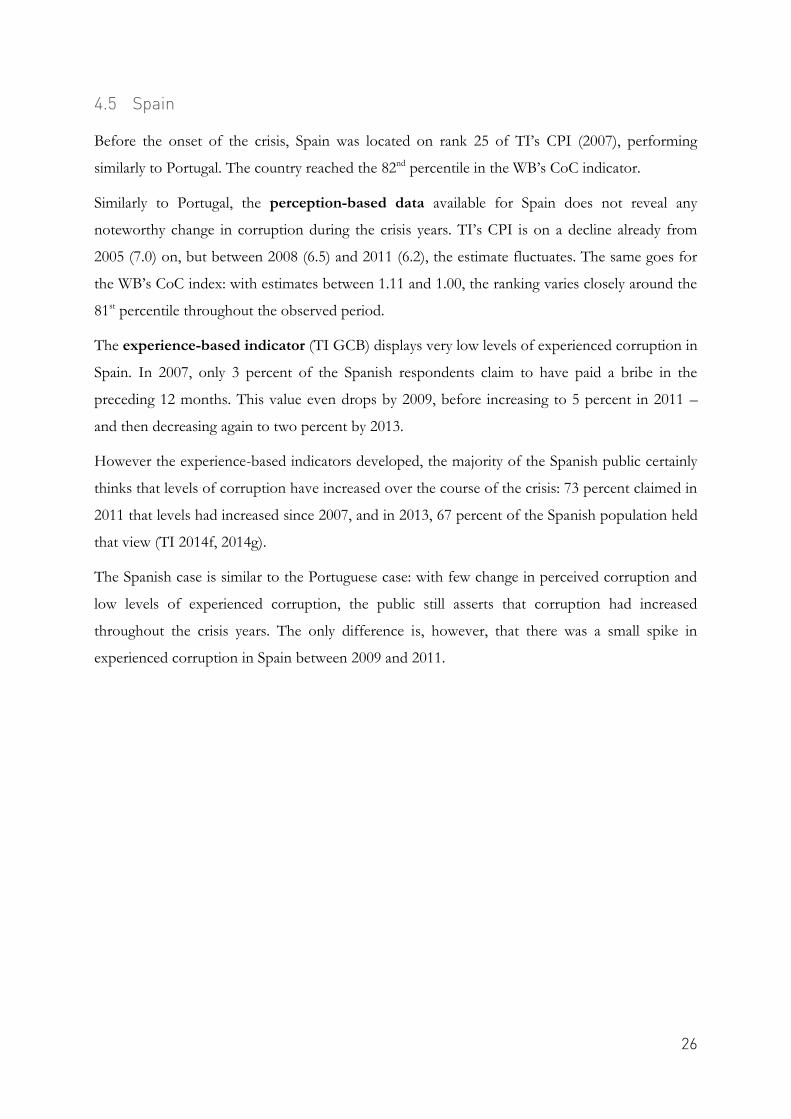
4.5 Spain
Before the onset of the crisis, Spain was located on rank 25 of TI’s CPI (2007), performing
similarly to Portugal. The country reached the 82nd percentile in the WB’s CoC indicator.
Similarly to Portugal, the perception-based data available for Spain does not reveal any
noteworthy change in corruption during the crisis years. TI’s CPI is on a decline already from
2005 (7.0) on, but between 2008 (6.5) and 2011 (6.2), the estimate fluctuates. The same goes for
the WB’s CoC index: with estimates between 1.11 and 1.00, the ranking varies closely around the
81st percentile throughout the observed period.
The experience-based indicator (TI GCB) displays very low levels of experienced corruption in
Spain. In 2007, only 3 percent of the Spanish respondents claim to have paid a bribe in the
preceding 12 months. This value even drops by 2009, before increasing to 5 percent in 2011 –
and then decreasing again to two percent by 2013.
However the experience-based indicators developed, the majority of the Spanish public certainly
thinks that levels of corruption have increased over the course of the crisis: 73 percent claimed in
2011 that levels had increased since 2007, and in 2013, 67 percent of the Spanish population held
that view (TI 2014f, 2014g).
The Spanish case is similar to the Portuguese case: with few change in perceived corruption and
low levels of experienced corruption, the public still asserts that corruption had increased
throughout the crisis years. The only difference is, however, that there was a small spike in
experienced corruption in Spain between 2009 and 2011.

27
5 The Development Of Equilibrium Components During The Crisis
The following section provides a compilation of qualitative and quantitative data to establish if
and how the individual segments of the equilibrium model were affected during the crisis years in
the observed countries Greece, Ireland, Italy, Portugal and Spain.
5.1 Greece12
Looking at the Freedom House Index of Personal Autonomy and Individual Rights,
discretionary power resources in Greece have not changed. In the years 2006 through 2014,
for which we have available data, Greece has not changed its comparatively low rating of 13
(maximum: 16) in Personal Autonomy and Individual Rights (see Table 6, p. 45).
Material resources have overall developed in a way that would, according to the model, worsen
corruption in Greece – but in detail, the results show a more complex picture: On the one hand,
red tape has decreased – it has become easier to do business in Greece in the late years of the crisis
(2012) than before (2007) (see Table 7, p. 46). On the other hand, the share of fuel exports in total
exports has increased significantly after 2009, while total exports have remained growing (see
Figure 6, p. 47). Also the development of the informal economy size in Greece compared to overall
GDP displayed a growth after 2008. The growth was longer than for most other GIIPS states,
enduring two years (see Figure 8, p. 48).
According to quantitative and qualitative data, the legal constraints in Greece have decreased.
The subset of indicators for judicial independence from the GCI displays a steady decline between
2008 and 2013 (see Figure 9, p. 48). Also, judges were affected by salary cuts due to the financial
crisis (TI Greece 2012b: 58). Although judges still have the highest salaries in the public sector,
this does not send a good signal and could – albeit not necessarily – impact judicial independence
negatively (TI Greece 2012b: 59).
Normative constraints have decreased as well. Admittedly, internet usage, like in all other GIIPS
countries, grew steadily throughout the entire crisis period (see Figure 10, p. 49). Much stronger
is the evidence, however, that Greece has been presented by Freedom House as the country with
the largest decline in media freedom between 2009 and 2013 worldwide (see Figure 11, p. 49).
According to the Greek NIS report, “there have been efforts by successive governments
regarding supervision of the media, with common phenomena of regression“ (TI Greece 2012b:
147). Also, declining advertising funds threaten the financial independence of media outlets,
12 This assessment of the developments in Greece has kindly been reviewed by Transparency International Greece.
According to their feedback, it depicts the state of the equilibrium components adequately.
28
which is attributed to the crisis (TI Greece 2012b: 151). The civil society, already a weak link in the
integrity system of Greece, has been taken aback by the crisis: although the amount of Greek
non-governmental organizations (NGOs) has reportedly increased over the years before 2012,
“the legal and institutional framework in which they function is still very immature, thus creating
serious doubts regarding their independence, transparency and integrity“ (TI Greece 2012b: 159).
Adversely, the participation in unions and professional associations
“has been negatively affected by the financial crisis, as citizens struggle to provide for their homes first. [...] Moreover, the client-patron relationships that are often created in the domain of NGOs lead to the fragmentation of the civil society“ (TI Greece 2012b: 161–162).
With discretionary power resources remaining the same, but all other elements of the equilibrium
model developing adversely over the course of the crisis, this should predict an increase of
corruption, or a decrease in the control of corruption, for Greece during the crisis years – unless
the reduction of red tape and increased internet usage have an unexpectedly high weight in the
equilibrium.
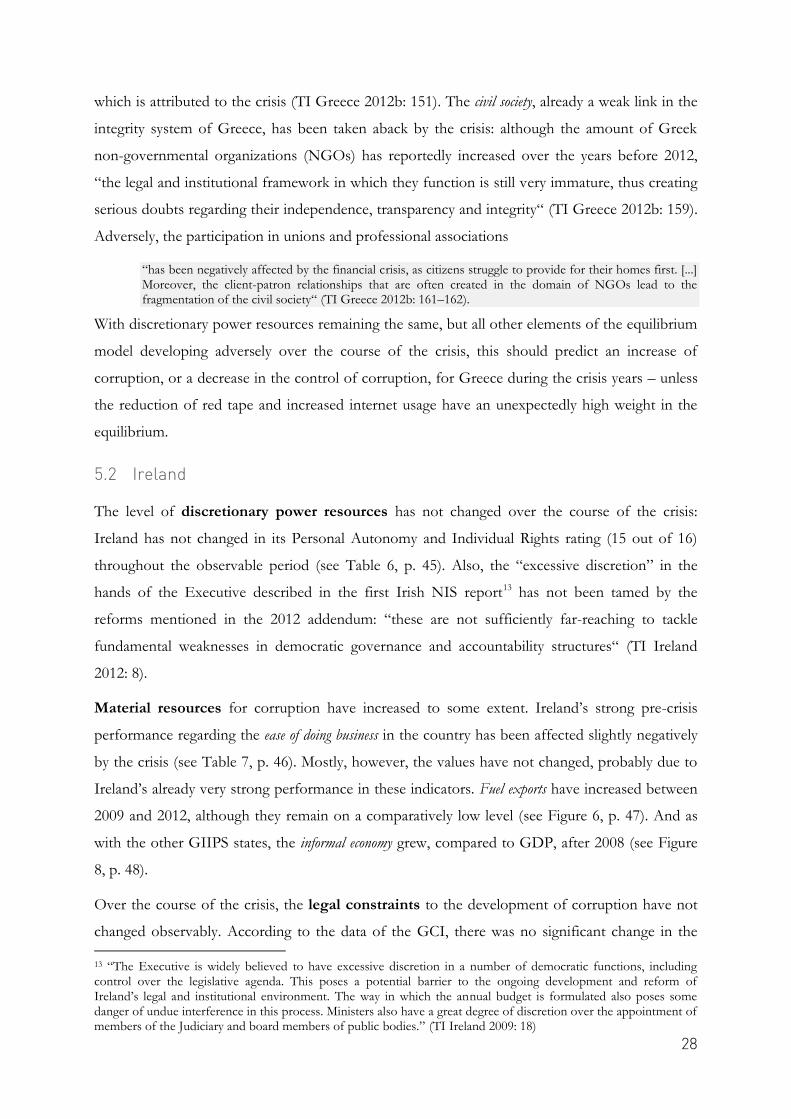
5.2 Ireland
The level of discretionary power resources has not changed over the course of the crisis:
Ireland has not changed in its Personal Autonomy and Individual Rights rating (15 out of 16)
throughout the observable period (see Table 6, p. 45). Also, the “excessive discretion” in the
hands of the Executive described in the first Irish NIS report13 has not been tamed by the
reforms mentioned in the 2012 addendum: “these are not sufficiently far-reaching to tackle
fundamental weaknesses in democratic governance and accountability structures“ (TI Ireland
2012: 8).
Material resources for corruption have increased to some extent. Ireland’s strong pre-crisis
performance regarding the ease of doing business in the country has been affected slightly negatively
by the crisis (see Table 7, p. 46). Mostly, however, the values have not changed, probably due to
Ireland’s already very strong performance in these indicators. Fuel exports have increased between
2009 and 2012, although they remain on a comparatively low level (see Figure 6, p. 47). And as
with the other GIIPS states, the informal economy grew, compared to GDP, after 2008 (see Figure
8, p. 48).
Over the course of the crisis, the legal constraints to the development of corruption have not
changed observably. According to the data of the GCI, there was no significant change in the
13 “The Executive is widely believed to have excessive discretion in a number of democratic functions, including control over the legislative agenda. This poses a potential barrier to the ongoing development and reform of Ireland’s legal and institutional environment. The way in which the annual budget is formulated also poses some danger of undue interference in this process. Ministers also have a great degree of discretion over the appointment of members of the Judiciary and board members of public bodies.” (TI Ireland 2009: 18)

29
level of judicial independence in Ireland throughout the years 2006-2014 (see Figure 9, p. 48). But
there are developments that have the potential to influence this element of the equilibrium
formula, both negatively and positively: On the other hand, due to poor public finances, judges’
salaries were subject to emergency cuts between 16 and 23 per cent in 2011 – a measure for
which a constitutional amendment was necessary, as judges previously were exempt from such
emergency steps.
Senior judges claimed the constitutional amendment would compromise judicial independence [...] because it did not provide for an independent body to decide on judges’ pay. However, the Government insisted that the changes would not affect judicial independence. (TI Ireland 2012: 27)
Additionally, other administrative institutions of the judiciary were subject to budgetary
reductions, such as the Courts Service. As a consequence, trial lead-in times have increased,
drawing criticism from various sides: “The Chief Justice in June 2012 said the current situation of
the Supreme Court, the country’s highest appellate court, was ‘unsustainable’, with even priority
cases waiting for nine months” (TI Ireland 2012: 28). On the other hand, several major reforms
were introduced in July 2012 by the government in spite of critical public finances, such as the
installation of new courts (TI Ireland 2012: 28). To conclude, while the above developments send
both negative and positive signals regarding the independence of the judiciary, neither the
(negative) budgetary cuts nor the (positive) reforms have shown to strengthen or weaken the
legal constraints to corruption in Ireland over the short term, where the independence of the
judiciary was very strong before the crisis (TI Ireland 2009: 17).
Similarly, the normative constraints to corruption in Ireland have displayed both positive and
negative developments during the crisis years, though overall, have weakened slightly. Also in
Ireland, the internet usage among the population grew (see Figure 10, p. 49). Since 2001, Ireland has
maintained a stable and high level of media freedom, ranging between 15 and 16 on the Freedom
House Media Freedom Index (see Figure 11, p. 49). The media was recognized from an early
point on to play a central role “in exposing and preventing corruption”. A series of libel law
reforms has additionally strengthened the rights of journalists who are conducting investigative
journalism (TI Ireland 2012: 9). But then again, deteriorating market conditions led several major
Irish newspapers to shut down, and “[signs] of concentration of ownership in the Irish media
market have been noted in recent years, with indications that they may be accelerated by the
economic downturn“ (TI Ireland 2012: 40–41). Similarly, the stumbling economy also had
considerable negative effects on the situation of civil society in Ireland (TI Ireland 2012: 43). As the
growth of internet usage is not being taken at face value in terms of an increase in normative
constraints (see above), the overall development for this element of the equilibrium is estimated
to be slightly negative.

30
In conclusion, the developments of the equilibrium components should predict a small increase
in the levels of corruption, if internet usage can indeed be neglected as an indicator for a short-
term time-series analysis in our time. It should be noted, however, that the Irish case does not
draw a picture as clear as Greece, as the qualitative and quantitative data is very complex, and
partially contradictory.
5.3 Italy
During the crisis years, discretionary power resources have changed in Italy, but it is debatable
inhowfar this can be attributed to the financial and debt crisis alone. Italy has displayed a ratings
change for the Freedom House Index of Personal Autonomy and Individual Rights for the observed
period: until 2008, it achieved a 15 out of 16 score, but from 2009 onwards, it was rated with 14
out of 16 (see Table 6, p. 45). While there is no detailed explanation provided for the change in
this particular subcategory, the organization explains the ratings change for the superordinate
category of civil liberties: “Italy’s civil liberties rating declined [...] due to the further
concentration of media outlets under Prime Minister Silvio Berlusconi and persistent interference
by organized crime networks in the functioning of private businesses” (Freedom House 2009b).
As neither of these developments is directly attributable to the European Financial and Debt
crisis, and as this does not necessarily affect the discretionary power resources to corruption
(rather: media freedom), this ratings change is deemed irrelevant to the research question and no
change to discretionary power resources is annoted in Italy.
The material resources to corruption have partly decreased, partly increased. On the one hand,
red tape is reduced significantly between 2007 and 2012 (see Table 7, p. 46). Also, the share of fuels
exported in total merchandise exports witnessed a drop in 2009, but recuperated to some extend
thereafter (see Figure 6, p. 47). On the other hand, with the advent of the crisis in 2008, the
Italian informal economy shortly increased in size, compared to the overall GDP. Then, it fluctuated,
before slightly decreasing again (see Figure 8, p. 48).
Legal constraints to corruption have developed inconclusively over the course of the crisis in
Italy. The data of the GCI displays significant variation in the level of judicial independence in Italy: it
hits its lowest point in 2009-2010, increases thereafter until 2011-2012 and then slightly decreases
again (see Figure 9, p. 48). This ambiguity is reflected in qualitative data: there is a “gap between
law and practice in independence [...], transparency [...], and accountability [of the judiciary]. [The]
judiciary has been particularly good in the Executive oversight, and the prosecution of
corruption“ (TI Italia 2012: 7).
31
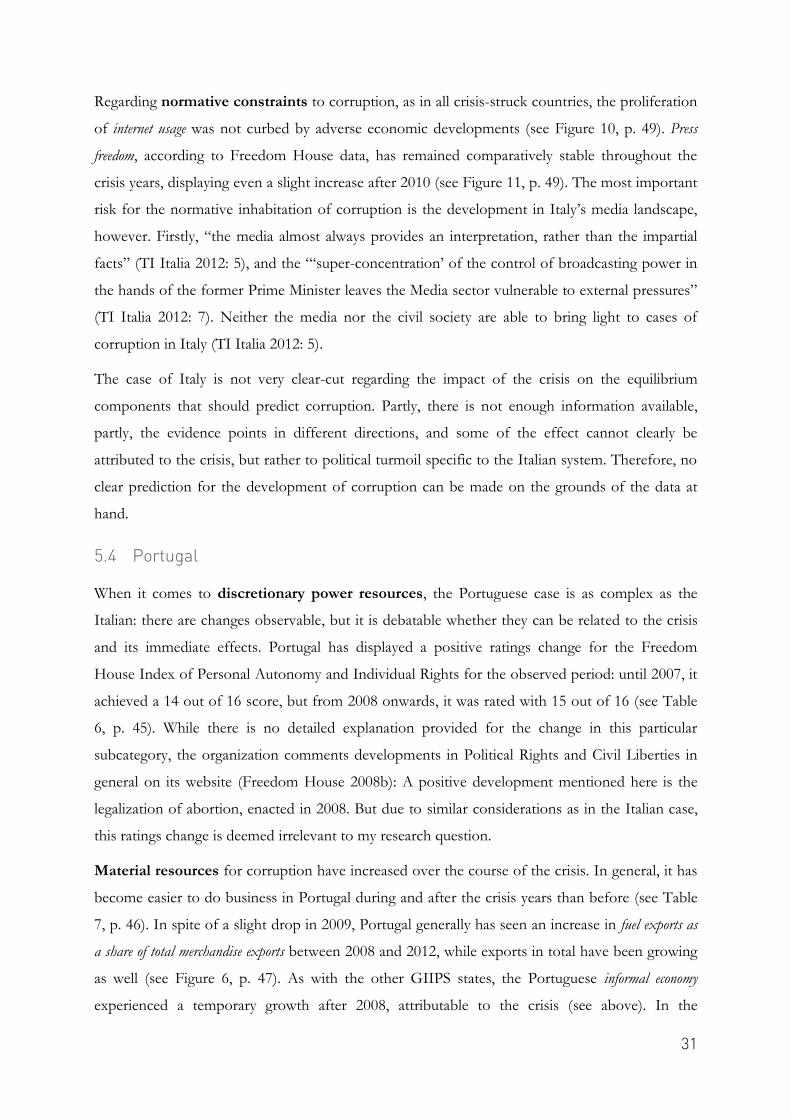
Regarding normative constraints to corruption, as in all crisis-struck countries, the proliferation
of internet usage was not curbed by adverse economic developments (see Figure 10, p. 49). Press
freedom, according to Freedom House data, has remained comparatively stable throughout the
crisis years, displaying even a slight increase after 2010 (see Figure 11, p. 49). The most important
risk for the normative inhabitation of corruption is the development in Italy’s media landscape,
however. Firstly, “the media almost always provides an interpretation, rather than the impartial
facts” (TI Italia 2012: 5), and the “‘super-concentration’ of the control of broadcasting power in
the hands of the former Prime Minister leaves the Media sector vulnerable to external pressures”
(TI Italia 2012: 7). Neither the media nor the civil society are able to bring light to cases of
corruption in Italy (TI Italia 2012: 5).
The case of Italy is not very clear-cut regarding the impact of the crisis on the equilibrium
components that should predict corruption. Partly, there is not enough information available,
partly, the evidence points in different directions, and some of the effect cannot clearly be
attributed to the crisis, but rather to political turmoil specific to the Italian system. Therefore, no
clear prediction for the development of corruption can be made on the grounds of the data at
hand.
5.4 Portugal
When it comes to discretionary power resources, the Portuguese case is as complex as the
Italian: there are changes observable, but it is debatable whether they can be related to the crisis
and its immediate effects. Portugal has displayed a positive ratings change for the Freedom
House Index of Personal Autonomy and Individual Rights for the observed period: until 2007, it
achieved a 14 out of 16 score, but from 2008 onwards, it was rated with 15 out of 16 (see Table
6, p. 45). While there is no detailed explanation provided for the change in this particular
subcategory, the organization comments developments in Political Rights and Civil Liberties in
general on its website (Freedom House 2008b): A positive development mentioned here is the
legalization of abortion, enacted in 2008. But due to similar considerations as in the Italian case,
this ratings change is deemed irrelevant to my research question.
Material resources for corruption have increased over the course of the crisis. In general, it has
become easier to do business in Portugal during and after the crisis years than before (see Table
7, p. 46). In spite of a slight drop in 2009, Portugal generally has seen an increase in fuel exports as
a share of total merchandise exports between 2008 and 2012, while exports in total have been growing
as well (see Figure 6, p. 47). As with the other GIIPS states, the Portuguese informal economy
experienced a temporary growth after 2008, attributable to the crisis (see above). In the
32
succeeding years, it maintained this size before now slightly decreasing again (see Figure 8, p. 48).
Additionally, from the NIS report, we learn that Portugal has witnessed a “rampant growth of
public spending and the inevitable increase in taxation“ (Transparência e Integridade 2012: 6),
another negative sign for the development of material resources to corruption.
Similarly, legal constraints developed during the crisis years in a way that would facilitate
corruption. The development of the judicial independence in Portugal during the crisis years is very
similar to the Greek case, in that it displays a strong decline between 2008 and 2012, but even
stronger so (see Figure 9, p. 48). Also the qualitative evidence draws a very negative picture of the
Portuguese judiciary: “The inefficiency of anti-corruption policies is accompanied by a
discredited judicial system“ (Transparência e Integridade 2012: 4–5). Particular heavy criticism is
directed towards the Supreme Audit court, which has oversight over public expenditure
management: its performance is sub-standard in that it relies solely on technical assistance while
not sanctioning the financial discretion over public spending (Transparência e Integridade 2012:
11). Overall, the Portuguese judiciary seems ill-equipped to control corruption: “the way in which
the judiciary has dealt with media-sensitive cases involving high-profile names, such as bankers or
political office-holders, has contributed to its own discredit.” A major problem is the lack of a
functioning whistleblowing system, which makes the detection of corruption cases so difficult.
Another obstacle is a lack of funding for adequate intelligence systems (Transparência e
Integridade 2012: 12), which can be expected to only aggravate as a consequence of crisis-
stricken public funds.
Regarding normative constraints, the Portuguese case is more complex. Also here, the internet
usage among the population grew (see Figure 10, p. 49). Conversely, since 2006, press freedom in
Portugal has diminished slightly, but regularly, reaching a new low in 2013 (see Figure 11, p. 49).
The qualitative evidence is also ambiguous on how the crisis has impacted normative constraints
to corruption in Portugal. On the one hand, even though there is extensive media coverage on
high-profile cases of corruption, the degree of impunity seems to instill a sense of fatalism in the
Portuguese public sphere: “The ever-growing apathy of citizens towards causes of common
interest is a clear symptom of an even bigger crisis of values“. This problem is furthered by a lack
of potential for collective action, due to poor levels of education and the “absence of a clear and
solid normative reference“ (Transparência e Integridade 2012: 6). On the other hand, the
Portuguese NIS report claims that, while corruption was more or less endured before, the crisis
has triggered a turn:
In times of plenty, citizens tend to disregard certain practices of politicians, considering them to be ‘small whims of power’ and perfectly tolerable. However, in the context of a financial crisis, decreasing well-being
33
results in hostile attitudes towards politicians, parties and representative bodies, and a general attitude of condemnation towards corrupt practices. (Transparência e Integridade 2012: 5)
While this change of attitude towards corruption instills hope for change, the lack of capacity for
collective action renders this force inactionable. This leads to the assumption that normative
constraints to corruption have been weakened by the crisis in Portugal.
With (questionably) no change to discretionary power resources, an increase of material resources
to corruption and insufficient constraints, corruption should have increased in Portugal as a
consequence of the crisis, if the equilibrium model can be applied in this context.
5.5 Spain
The scarce data available for the development of the equilibrium model’s first concept leads to
assume that discretionary power resources for corruption have not been impacted by the crisis:
In the years 2006 through 2013, Spain has not changed its high rating of 15 (maximum: 16) in
Personal Autonomy and Individual Rights (see Table 6, p. 45).
Material resources to corruption, however, have developed ambiguously: On the one hand, the
conditions in Spain have somewhat improved for entrepreneurs (see Table 7, p. 46). On the other
hand, Spain’s fuel exports have grown over the course of the crisis, even compared to growing total
exports (see Figure 6, p. 47). Also, the crisis induced a small growth of the Spanish informal
economy after 2008, which before had been declining. In spite of minimal decline thereafter, the
2008 level has not been achieved by 2013 – the new size of the informal sector remained quite
stable throughout the crisis years (see Figure 8, p. 48).
For legal constraints, the situation is similar. Spain, like Ireland and Italy, shows no clear
development trend for the independence of the judiciary during the crisis years: it reaches its peak
value during the 2008–2009 period and fluctuates, declines slightly thereafter (see Figure 9, p. 48).
But qualitative data suggests that the judiciary acts, in practice, independently, albeit burdened
with low resources and a high workload. “The judges act with integrity, responsibility and rigor.
Nevertheless, opposite behavior is not sufficiently sanctioned“ (TI España 2012: 7).
The proliferation of internet use was not curbed by adverse economic developments throughout
the crisis years (see Figure 10, p. 49). Conversely, since 2010, press freedom has been endangered
more and more in Spain (see Figure 11, p. 49). From qualitative evidence, we learn that while the
media has proven successful in revealing corruption cases, there is a lack of accountability
mechanisms, and the prevailing bipartisanship presents a danger to pluralism in news coverage
(TI España 2012: 5, 9). Additionally, Spain’s civil society “heavily relies on public funding, which
links the non-profit sector strongly to public administrations. This reduces the autonomy of
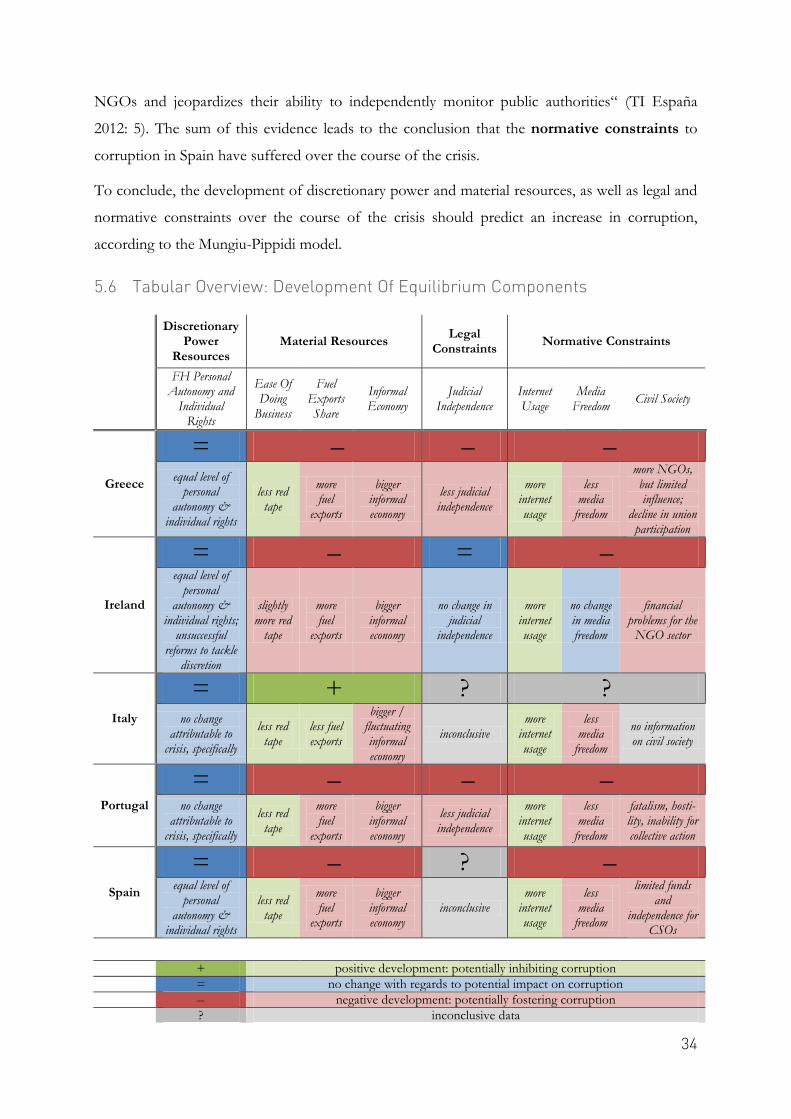
34
NGOs and jeopardizes their ability to independently monitor public authorities“ (TI España
2012: 5). The sum of this evidence leads to the conclusion that the normative constraints to
corruption in Spain have suffered over the course of the crisis.
To conclude, the development of discretionary power and material resources, as well as legal and
normative constraints over the course of the crisis should predict an increase in corruption,
according to the Mungiu-Pippidi model.
5.6 Tabular Overview: Development Of Equilibrium Components
Discretionary
Power Resources
Material Resources Legal
Constraints Normative Constraints
FH Personal Autonomy and
Individual Rights
Ease Of Doing
Business
Fuel Exports Share
Informal Economy
Judicial Independence
Internet Usage
Media Freedom
Civil Society
Greece
= – – – equal level of
personal autonomy &
individual rights
less red tape
more fuel
exports
bigger informal economy
less judicial independence
more internet usage
less media
freedom
more NGOs, but limited influence;
decline in union participation
Ireland
= – = – equal level of
personal autonomy &
individual rights; unsuccessful
reforms to tackle discretion
slightly more red
tape
more fuel
exports
bigger informal economy
no change in judicial
independence
more internet usage
no change in media freedom
financial problems for the
NGO sector
Italy
= + ? ? no change
attributable to crisis, specifically
less red tape
less fuel exports
bigger / fluctuating informal economy
inconclusive more
internet usage
less media
freedom
no information on civil society
Portugal
= – – – no change
attributable to crisis, specifically
less red tape
more fuel
exports
bigger informal economy
less judicial independence
more internet usage
less media
freedom
fatalism, hosti-lity, inability for collective action
Spain
= – ? – equal level of
personal autonomy &
individual rights
less red tape
more fuel
exports
bigger informal economy
inconclusive more
internet usage
less media
freedom
limited funds and
independence for CSOs
+ positive development: potentially inhibiting corruption
= no change with regards to potential impact on corruption
– negative development: potentially fostering corruption
? inconclusive data

35
6 Discussion
The goal of this chapter is to answer the research questions established in chapter one, based on
the evidence collected in the analyses above: Can the equilibrium model of corruption by
Mungiu-Pippidi explain the variance in the development of corruption levels among the GIIPS
countries over the course of the crisis? Could there be alternative explanations for the variance
that contradict the theoretical model? And, lastly, what was the effect of the crisis on corruption
in the most heavily affected countries? Could the crisis have functioned as a trigger for a
disruption of particularistic equilibria, introducing a new era of universalism? Or did the financial,
economic, political and social turmoil worsen the situation, corruption-wise?
6.1 Does The Equilibrium Model Fit The Data?
Greece Ireland Italy Portugal Spain
Development of
Corruption in Crisis
TI CPI /WB CoC only – = – = =
incl. additional
Evidence – – – – –
Prediction of Corruption
Development by
Equilibrium Model
Discretionary Power Resources = = = = =
Material Resources – – + – – Legal Constraints – = ? – ?
Normative Constraints – – ? – – Global
Prediction – – ? – –
+ development that should limit corruption/less corruption
= no change – development that should foster corruption/more corruption
The first important finding from this research project is that the variance found in analyzing the
perception-based corruption indicators is not necessarily reflected in other kinds of evidence.
Rather than differentiating between countries where corruption levels did not change significantly
over the course of the crisis (Ireland, Portugal, Spain) and countries that have (Greece, Italy), a
more holistic view of corruption levels (experience-based and survey data complement
perception-based data) allows for the assumption that corruption has worsened in all GIIPS
countries over the course of the crisis. As experience-based data was scarce, in most cases survey
data lead to this conclusion. This raises the question if surveys as those applied can reliably
reproduce levels of corruption. Two points challenge this: Firstly, the perception-based indicators
applied also rely on complex questionnaires and are essentially elaborately quantified survey data.
36
Why would their results differentiate from more “simple” surveys as the ones cited, if not for a
higher degree of sophistication14? Secondly, the survey design should be carefully reviewed, with
regards to the question if it is designed to bias the respondents15. These points should be
addressed in an improved research design, and in light of these considerations, I will differentiate
between the perception-based-only data and the global assessment produced in chapter four.
Now, can the equilibrium model explain the development of corruption levels in the GIIPS
countries over the course of the crisis? Looking at perception-based data only, it is hard to
sustain this hypothesis with the qualitative analysis undertaken: TI’s CPI and the WB’s CoC
Index display an increase of corruption only for Greece and Italy, while the equilibrium model
predicts a proliferation of particularism also in Ireland, Portugal and Spain. The evidence from
chapter five in hindsight also does not allow for a differentiation between two groups of
countries made up of Ireland, Portugal and Spain or Greece and Italy, respectively.
Taking, however, the additional evidence discussed above into consideration, the model is much
more fitting. All GIIPS states have witnessed corruption worsening, as the equilibrium
components would predict – except for Italy. In these four remaining cases, not one
development of equilibrium components would indicate a proliferation of universalism: during
the observed crisis years, all have been affected in a way that would have either no or a fostering
impact on corruption.
The Italian case, though, presents a major challenge to the methodology applied in this paper.
Firstly, there are few data – especially the lack of qualitative data is hindering an appropriate
assessment. Secondly, the political developments in Italy present somewhat of an extraordinary
case, with a sort of political turmoil characterizing the observed period that is not directly
attributable to Italy’s financial or economic performance, but rather to the person of Silvio
Berlusconi. This challenges the methodological decision underlying this paper to operationalize
the “crisis” as any major political, economic and social development taking place in the country
during the observed period. Thirdly, the evidence collected, especially in chapter five, is often
contradictory and largely inconclusive. While the evidence from chapter four displays an increase
in (perceived) corruption, material resources have rather decreased, and the role of legal
constraints remains unclear. Only the development of discretionary power resources and
normative constraints could explain the increase in corruption, and here as well, the evidence is
14 The report for the Eurobarometer notes, for example, that “Groups most likely to think corruption has increased
[in the past three years] are those who [...] struggle to pay their bills[,] are unemployed” (TNS opinion & social: 40), apart from having been a victim of corruption personally.
15 For example, does a survey dealing entirely with corruption topics bias the respondent towards the view that corruption is widespread or growing?
37
dominated by the person of Silvio Berlusconi and his then considerable power over the most
important media outlets in the country – as noted, not directly attributable to the position of Italy
in the European Financial and Debt crisis. Says the Italian NIS report:
[The] increase of conflict among powers of the state has been [...] linked to the figure of Silvio Berlusconi, tycoon and Prime Minister of Italy for many years. [...] A state of conflict seems to prevail over the rule of law, threatening the respect of rules, weakening the capacity to impose sanctions and damaging the image – and thus the authority – of civil servants. (TI Italia 2012: 6)
Therefore, in the current methodology, Italy cannot make the case for Mungiu-Pippidi’s
equilibrium model – not due to contrary evidence, but rather due to methodological unfitness.
Another methodological challenge was the operationalization of discretionary power resources.
Applying the Freedom House Index of Personal Autonomy and Individual Rights, there was hardly any
change in the measurement – the indicator was too static. If there was a change, as for example in
the Italian or Portuguese case, it was not clear which development was underlying the different
assessment by Freedom House regarding this complex indicator. It might be possible that the FH
indicator is an appropriate proxy for discretion in a comparative cross-country assessment. As an
indicator for a short-term time-series analysis, it is, however, not appropriate. Rather, the
development of this equilibrium component should have been operationalized by different, more
complex and more change-sensitive, means. For example, the “red tape” measurement applied
for material resources (the Ease of Doing Business indicator) should be a more fitting indicator
for discretion.
Material resources for corruption, unlike expected, have increased in all observed countries,
which should also be ascribed to the methodology: the proxies for this equilibrium component
were red tape, fuel exports as a share of GDP, and the development of the informal economy. As
noted, red tape is an indicator much more appropriate for discretion than for material resources.
The consideration of the informal economy has, however, contributed greatly to the assessment,
and its theoretical fit is also established: There is a causal link between economic distress and the
development of an informal economy (Schneider 2013) – but it is not as straightforward as one
might expect:
[The] most important reason for [a decreasing size of shadow economies] is, that, if the official economy is recovering or booming, people have fewer incentives to undertake additional activities in the shadow economy and to earn extra ‘black’ money. The only exceptions are Greece and Spain, where the recession of the official economy is so strong, that it even reduces the demand of the shadow economy activities due to the severe income losses of the Greek and Spanish people [...] (Schneider 2013: 1–2)
Thus, a growth of the informal economy should not only be interpreted as a sign of decreasing
economic resources, but also as a sign of considerable remaining personal resources in the
population.
38
Another observation gained from this research is the complex interaction of resources for and
constraints to corruption. In the Greek case, for example, there is evidence that less financial
resources reduced the scope and financial dimension of bribing and petty corruption – but with
low (and decreasing) legal and normative constraints, this did not hinder a (supposed)
proliferation of particularism among the population, as evident from perception-based and
qualitative data. The expected deterring function of the financial crisis is thus limited to instances
of petty corruption, and cannot be assumed to be sustainable. Rather, the crisis took a much
heavier toll on constraints to corruption, which could poignantly hinder an installation of
universalism as a governance norm. The effect of resources on a value system is not immediately
self-evident. If there is an effect, it should probably be expected with a certain delay.
Even among the constraints to corruption, there is an interesting dependency between legal and
normative constraints observable. In the Portuguese case, for example, the media is in a place to
report relatively freely on corruption cases. The reported level of impunity, however, combined
with a lack of potential for collective action, leads to the fatalist attitude towards corruption
resonating from the qualitative evidence in chapter four: The desire for a functioning, although
corrupt, bureaucracy conflicts with a diminishing tolerance for grand corruption in the political
sphere. In fact, normative constraints might be the first victim of the crisis: they are always
affected negatively, even before perception-based data display an increase in corruption. Also,
they could play an important role in the proliferation of particularism: If corruption is understood
as a collective action problem, a decrease of normative constraints – less potential for collective
action, less media freedom to report on corruption – might open up a downwards spiral of
assumed particularistic behavior by others and particularistic behavior by one self. At the same
time, and for the same reason, norms as a constraint to corruption are the hardest to rebuild
(Mungiu-Pippidi et al. 2011: 44).
6.2 Other Explanations
As noted in chapter two, one of the strengths of Mungiu-Pippidi’s model is that it integrates a
vast amount of empirically tested determinants for corruption into a sound theoretical
framework: Material resources, have an impact as well as culture-based explanations (normative
constraints). This, on the other hand, makes it hard to find explanations for the development of
corruption that differ enough from the model to be able to refute it. However, another self-
proclaimed strength of the model, the path-independency of its elements, could be challenged by
the findings in this research project. This is true for the analysis on the basis of the perception-
based indicators only: while they display a persistent increase of corruption levels only for Italy
39
and Greece, the development of the equilibrium components should predict the corruption to
worsen in the other countries, as well.
Looking at Figure 3 (p. 43), it is striking that corruption levels developed most positively in those
countries with the best ranking before the crisis (Ireland, Portugal, Spain), and the situation
actually deteriorated only in Greece and Italy, the two countries with the lowest pre-crisis CPI-
ratings. Was the impact of the crisis on corruption levels in the GIIPS countries not also
determined by their pre-crisis performance? If so, would this path-dependency contradict
Mungiu-Pippidi’s model?
Mungiu-Pippidi herself has previously identified the governance regimes dominating in the
GIIPS countries: Ireland as an “early achiever” of good governance (Mungiu-Pippidi et al. 2011:
17) – meaning that it has adopted universalism as its governance norm right after the second
world war – and Portugal and Spain as “contemporary achievers” of good governance,
acknowledging that they also adopted universalism as a governance norm, but only recently so
(Mungiu-Pippidi et al. 2011: 17). Greece and Italy, however, were characterized as competitive
particularistic countries (Mungiu-Pippidi et al. 2011: 40). Thus, not only the pre-crisis
performance of the GIIPS countries, but also their vulnerability to corruption risks induced by
the crisis can be interpreted as dependent on their prevailing governance norm: corruption levels
in universalistic countries (Ireland, Portugal, Spain) did not deteriorate, while those in competitive
particularistic countries did – according to perception-based indicators. Therefore, while there is
a certain amount of path-dependency visible (over the course of this short-term time-series
analysis), the impact of governance norms on the (control of) corruption is clearly indicated.
Also, a mere lack of evidence does not necessarily mean that Mungiu-Pippidi’s claim about the
actionability of the equilibrium components is wrong: The actions taken so far might have been
ineffective, they might have weakened the negative development without turning it around, or
they have only a delayed effect. Norm building programs, for example, “need to be sustained for
at least one generation in order to take hold“ (Mungiu-Pippidi et al. 2011: 44).
In fact, some of the measures taken by the European community to cope with the crisis might
even have fostered corruption in the GIIPS countries. From the Portuguese case:
[Some] of the reforms [recorded in the Memorandum of Understanding], such as the privatisation of state-owned assets, the renegotiation of public-private partnerships or the restructuring of the military, may open several opportunities for corruption, mainly due to the close relationship between private and public interests and the low legal and moral costs associated with illicit transactions.
(Transparência e Integridade 2012: 7)
40
6.3 The Effect Of The Crisis On Corruption In The GIIPS Countries
This research project started from the observation that in the historical examples of governance
norms transitioning from particularism to universalism, there were always triggering factors, and
one of those possible triggering factors were major financial crises (Mungiu-Pippidi et al. 2011:
44). This raised the question of whether the recent European Financial and Debt crisis could
have this positive effect on corruption levels in Europe. Concluding from the analyses
undertaken in this research project and the discussion above, there is little evidence that this is
true for the short term. Indeed, economic constraints might have limited the financial dimension
of petty corruption in Greece, for example, but it is questionable whether this is a sustainable
development or will be reversed by economic recovery. Much rather, the deteriorating effects on
the components of Mungiu-Pippidi’s equilibrium model for corruption suggest that the crisis
overall fostered corruption: the informal economy grew, the capacities of the judicial systems
were curbed by financial constraints, the media suffered from underfunding and, under economic
distress, the general public became much more inclined to provide for their own well-being than
to undertake collective action against particularism. Overall, the crisis seems to have increased
corruption risks particularly in those countries that were challenged with controlling corruption
even before the crisis: in Portugal, for example, the bad economic situation was reported to
increase the risk of bribe payment and acceptance in the population. Indeed, the crisis does not
seem to have disrupted a negative equilibrium for the better, but furthered (the expectation of) a
particularistic value system.
Whether the crisis had a positive effect on corruption in Europe in the long term, lies, however,
beyond the scope of this research project. After all, transitions from particularism to universalism
as governance norms are generally complex and tedious processes (Mungiu-Pippidi et al. 2011:
44) – and in some of the GIIPS countries, the restructuring of the political, social and economic
landscape is still in the making. The evidence presented, however, does not show signs of any
sustainable disruption of corruption-controlling structures in the observed countries.
41
7 Conclusion
In the first part of the analysis, the development of corruption levels in the GIIPS countries was
traced by examining corruption indices as well as surveys and more complex qualitative data.
While perception-based indicators displayed an aggravation of corruption only for Greece, Italy,
and possibly Ireland, the global assessment showed that all of the observed countries showed
signs of corruption and corruption risks increasing.
The second part of the analysis examined the development of the equilibrium components over
the course of the crisis years. While discretionary power resources were not shown to have
changed – probably due to a challenged methodology –, all other equilibrium components
globally developed over the crisis years in a way that would predict an increase in corruption:
material resources for corruption increased, i. a. due to a growing shadow economy; legal
constraints suffered over the crisis years, as budgetary cuts limited the capacity of the national
judiciary systems; normative constraints were heavily adversely affected, with lack of funding
threatening the survival of independent media outlets and limiting the resources for civil society
engagement.
This leads to the conclusion that the theoretical framework by Alina Mungiu-Pippidi can explain
the development of corruption in the GIIPS countries over the crisis years, as the equilibrium
model predicts the negative development that is reflected in the evidence. Also, the implications
regarding governance regimes could explain why Greece and Italy – the two competitive-
particularistic countries among the examined states – developed much more negatively under the
financial, economic, political and social distress (cf. Figure 1, p. 4; Figure 3, p. 43).
Overall, the findings support the model in general, but for a more rigorous longitudinal analysis,
more appropriate indicators should be theoretically deduced and applied. The adoption of a
methodological framework designed for a comparative cross-country analysis on a time-series
analysis has brought some challenges. Also, a longer-term analysis could be able to trace
development patterns, for example to find out which of the equilibrium components has to
change first in order to trigger a renunciation from particularistic structures.
The short-term analysis undertaken here, however, has not found any traces of the crisis being
this “trigger”. Indeed, the financial scope of petty corruption might have decreased in Greece, as
well as the tolerance for political corruption among the Portuguese society, but I do not expect
these developments to lead to a sustainable improvement concerning anticorruption efforts. But
maybe, the positive development hoped for takes much longer to unfold, and to even leave traces
42
detectable by this rather coarse methodology. Maybe, in several decades, academics will be able to
establish that the challenges of the past years have sparked off a broad development towards less
corruption, more transparency, and ethical universalism as a governance norm in more countries.
Political decision-makers, civil society, and anticorruption activists should certainly not refrain
from pursuing this goal.
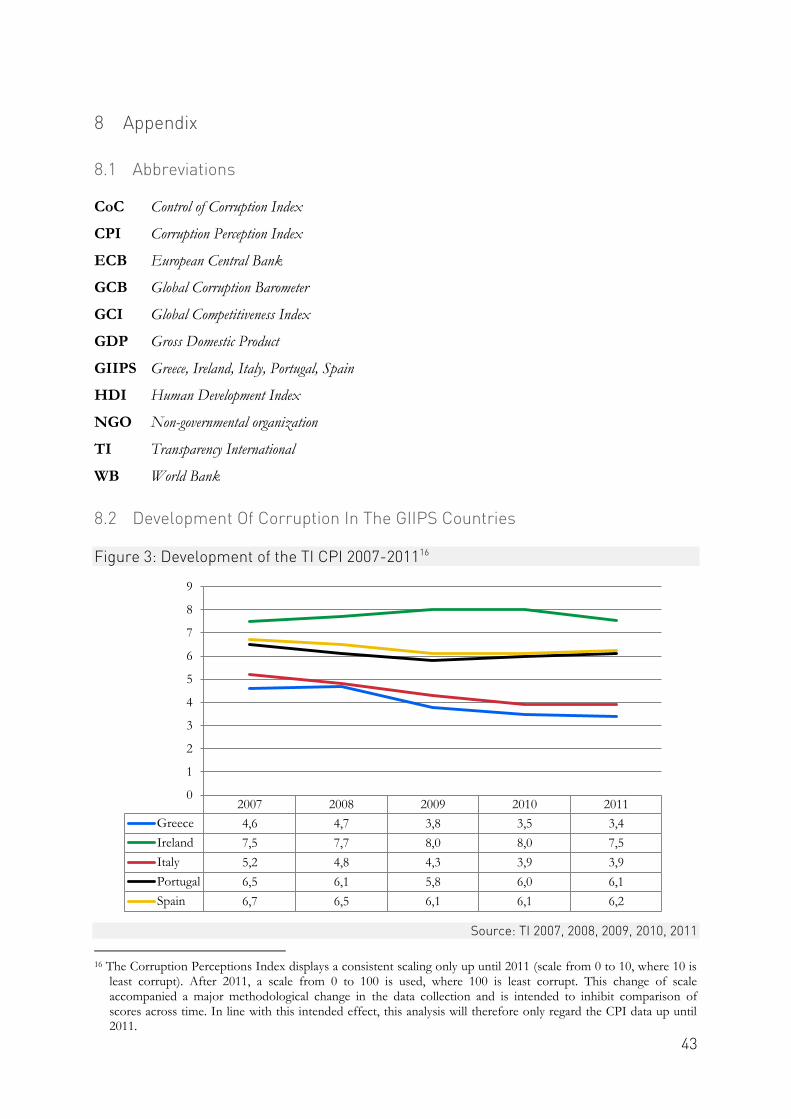
43
8 Appendix
8.1 Abbreviations
CoC Control of Corruption Index
CPI Corruption Perception Index
ECB European Central Bank
GCB Global Corruption Barometer
GCI Global Competitiveness Index
GDP Gross Domestic Product
GIIPS Greece, Ireland, Italy, Portugal, Spain
HDI Human Development Index
NGO Non-governmental organization
TI Transparency International
WB World Bank
8.2 Development Of Corruption In The GIIPS Countries
Figure 3: Development of the TI CPI 2007-201116
Source: TI 2007, 2008, 2009, 2010, 2011
16 The Corruption Perceptions Index displays a consistent scaling only up until 2011 (scale from 0 to 10, where 10 is
least corrupt). After 2011, a scale from 0 to 100 is used, where 100 is least corrupt. This change of scale accompanied a major methodological change in the data collection and is intended to inhibit comparison of scores across time. In line with this intended effect, this analysis will therefore only regard the CPI data up until 2011.
2007 2008 2009 2010 2011
Greece 4,6 4,7 3,8 3,5 3,4
Ireland 7,5 7,7 8,0 8,0 7,5
Italy 5,2 4,8 4,3 3,9 3,9
Portugal 6,5 6,1 5,8 6,0 6,1
Spain 6,7 6,5 6,1 6,1 6,2
0
1
2
3
4
5
6
7
8
9
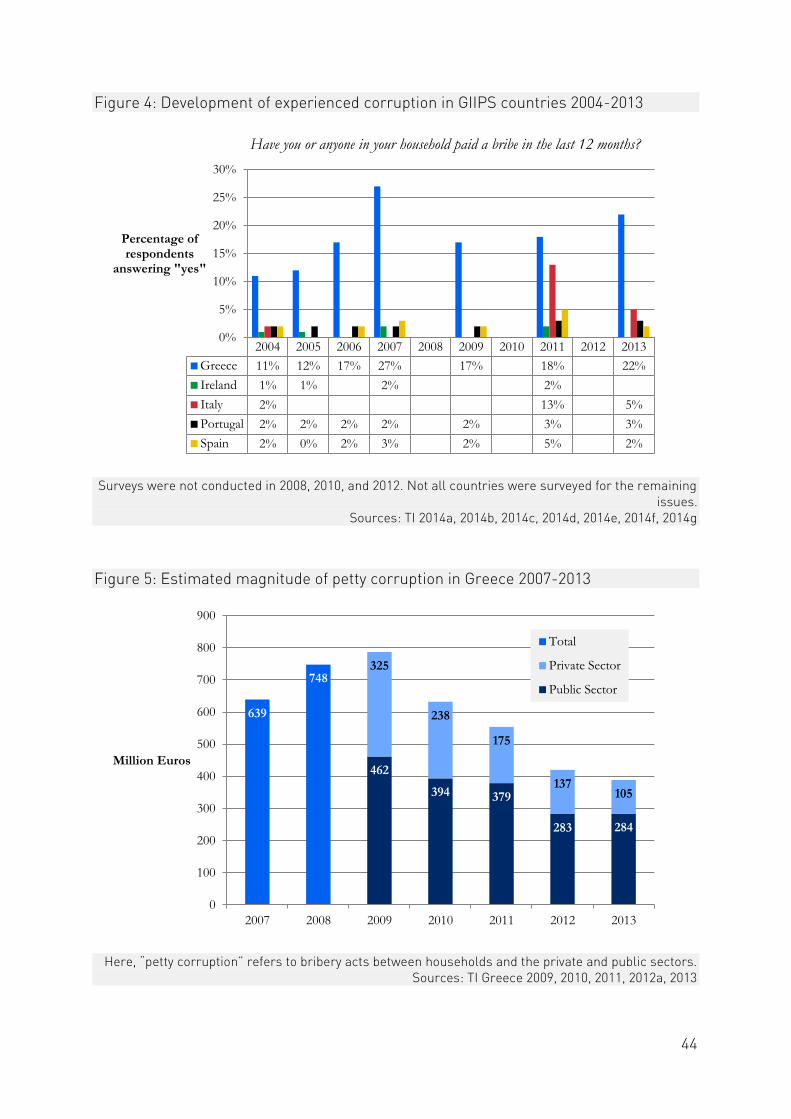
44
Figure 4: Development of experienced corruption in GIIPS countries 2004-2013
Surveys were not conducted in 2008, 2010, and 2012. Not all countries were surveyed for the remaining
issues.
Sources: TI 2014a, 2014b, 2014c, 2014d, 2014e, 2014f, 2014g
Figure 5: Estimated magnitude of petty corruption in Greece 2007-2013
Here, “petty corruption” refers to bribery acts between households and the private and public sectors.
Sources: TI Greece 2009, 2010, 2011, 2012a, 2013
2004 2005 2006 2007 2008 2009 2010 2011 2012 2013
Greece 11% 12% 17% 27% 17% 18% 22%
Ireland 1% 1% 2% 2%
Italy 2% 13% 5%
Portugal 2% 2% 2% 2% 2% 3% 3%
Spain 2% 0% 2% 3% 2% 5% 2%
0%
5%
10%
15%
20%
25%
30%
Percentage of respondents
answering "yes"
Have you or anyone in your household paid a bribe in the last 12 months?
462
394 379
283 284
325
238
175
137 105
639
748
0
100
200
300
400
500
600
700
800
900
2007 2008 2009 2010 2011 2012 2013
Million Euros
Total
Private Sector
Public Sector
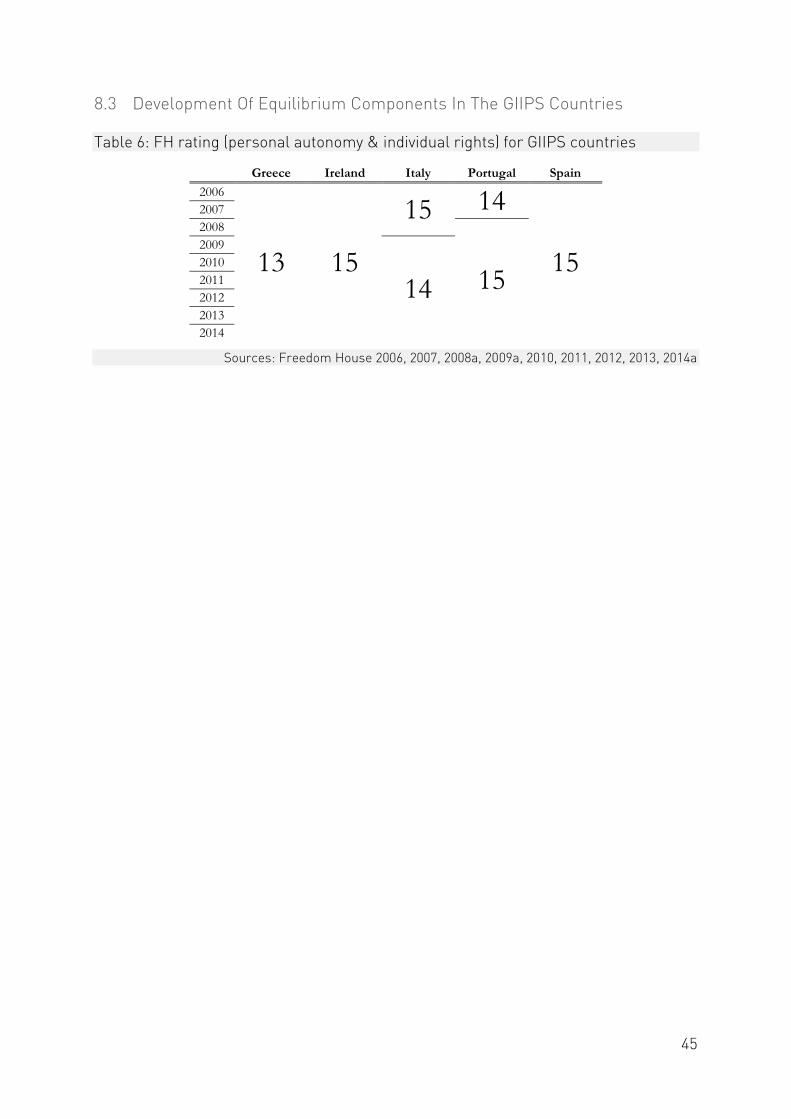
45
8.3 Development Of Equilibrium Components In The GIIPS Countries
Table 6: FH rating (personal autonomy & individual rights) for GIIPS countries
Greece Ireland Italy Portugal Spain
2006
13 15
15 14
15
2007
2008
15
2009
14 2010
2011
2012
2013
2014
Sources: Freedom House 2006, 2007, 2008a, 2009a, 2010, 2011, 2012, 2013, 2014a

46
Table 7: Development of red tape in GIIPS countries between 2007 and 2012
Gre
ece1
7
Irel
and
18
Ital
y19
Po
rtuga
l20
Sp
ain
21
Starting a Business
Procedures (number) + = + + =
Time (days) + = + + +
Cost (% of income per capita) + - + + +
Paid-in Min. Capital (% of income per capita) + = + + +
Dealing with Construction Permits
Procedures (number) = - = + -
Time (days) = - = + -
Cost (% of income per capita) + - - - -
Registering Property
Procedures (number) = = = + -
Time (days) + + = + =
Cost (% of property value) - + + + +
Getting Credit
Strength of legal rights index (0-10) = = = = =
Depth of credit information index (0-6) = = = = =
Public registry coverage (% of adults) = = + + +
Private bureau coverage (% of adults) + = + + +
Protecting Investors
Extent of disclosure index (0-10) = = = = =
Extent of director liability index (0-10) + = = = =
Ease of shareholder suits index (0-10) = = = = =
Strength of investor protection index (0-10) + = = = =
Paying Taxes
Payments (number per year) + = = = -
Time (hours per year) + = + + +
Total tax rate (% profit) + - + + +
Trading Across Borders
Documents to export (number) = = = = =
Time to export (days) = = = = =
Cost to export (US$ per container) - - - - -
Documents to import (number) = = = = +
Time to import (days) = = = + =
Cost to import (US$ per container) - + - - -
Enforcing Contracts
Time (days) - - = + =
Cost (% of claim) = = = + =
Procedures (number) = = + + +
Resolving Insolvency
Time (years) = = = = =
Cost (% of estate) = = = = +
Outcome (0 as piecemeal sale and 1 as going concern) = = = = =
Recovery rate (cents on the dollar) - - - - +
better 12 3 10 17 12
equal 17 23 20 13 15
worse 5 8 4 4 7
The values for 2007 and 2012 were compared. + indicates that the 2012 values were better for doing
business (less red tape), = indicates that the ease of doing business has not (or only insignificantly)
changed in this category, and – indicates that in 2012, it was harder to do business than in 2007.
Underlying Data Sources: World Bank 2008, 2013
17 Reforms undertaken in Greece: revising the bankruptcy system (2007/2008), implementing mandatory electronic filing for labour taxes and
contributions (2007/2008), lowering the threshold for derivative suits (2007/2008), reducing minimal capital requirements (2007/2008), the distribution of positive and negative credit data (2008/2009), the introduction of an electronic platform interconnecting governmental agencies, (2010/2011), and reducing the corporate income tax rate (2010/2011) (World Bank 2009, 2010, 2012).
18 The negative developments are not attributable to adverse reforms (there are no negative reforms listed in any of the Doing Business reports for that period; World Bank 2008, 2009, 2010, 2011, 2012), but rather, in the case of dealing with construction permits, to an increase in bureaucracy, probably due to cuts in public service.
19 Reforms undertaken by Italy: strengthening the rights of creditors, reforming the electronic registration system for businesses, and reducing the corporate income tax rate (World Bank 2009).
20 Reforms undertaken in Portugal: limiting statutory deadlines for bankruptcy proceedings, introducing simplified rules for small claims proceedings, adopting new building regulations, improving customs administration, reducing property tax rates, introducing a new fire safety approval process, reforming the social security code, lowering corporate tax rates, and eliminating the stamp tax on company’s share capital subscriptions (World Bank 2009, 2010, 2011, 2012).
21 Reforms undertaken in Spain: reducing the corporate income tax rate, streamlining the documentation for imports, reforming the insolvency process, and reducing the minimum capital requirement for starting a business (World Bank 2010, 2011, 2012).
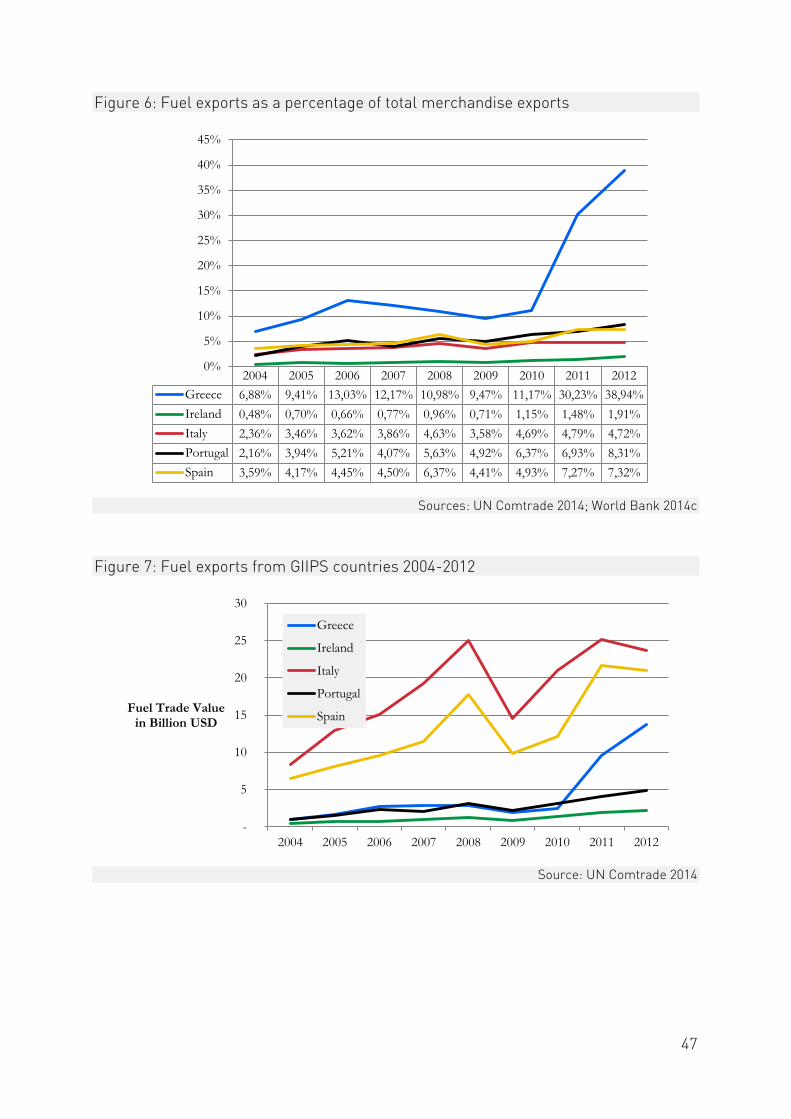
47
Figure 6: Fuel exports as a percentage of total merchandise exports
Sources: UN Comtrade 2014; World Bank 2014c
Figure 7: Fuel exports from GIIPS countries 2004-2012
Source: UN Comtrade 2014
2004 2005 2006 2007 2008 2009 2010 2011 2012
Greece 6,88% 9,41% 13,03% 12,17% 10,98% 9,47% 11,17% 30,23% 38,94%
Ireland 0,48% 0,70% 0,66% 0,77% 0,96% 0,71% 1,15% 1,48% 1,91%
Italy 2,36% 3,46% 3,62% 3,86% 4,63% 3,58% 4,69% 4,79% 4,72%
Portugal 2,16% 3,94% 5,21% 4,07% 5,63% 4,92% 6,37% 6,93% 8,31%
Spain 3,59% 4,17% 4,45% 4,50% 6,37% 4,41% 4,93% 7,27% 7,32%
0%
5%
10%
15%
20%
25%
30%
35%
40%
45%
-
5
10
15
20
25
30
2004 2005 2006 2007 2008 2009 2010 2011 2012
Fuel Trade Value in Billion USD
Greece
Ireland
Italy
Portugal
Spain

48
Figure 8: Size of the informal economy as a percentage of GDP
Source: Schneider 2013
Figure 9: Development of judicial independence in GIIPS countries 2006-2014
Source: World Economic Forum 2014
2007 2008 2009 2010 2011 2012 2013
Greece 25,1% 24,3% 25,0% 25,4% 24,3% 24,0% 23,6%
Ireland 12,7% 12,2% 13,1% 13,0% 12,8% 12,7% 12,2%
Italy 22,3% 21,4% 22,0% 21,8% 21,2% 21,6% 21,1%
Portugal 19,2% 18,7% 19,5% 19,2% 19,4% 19,4% 19,0%
Spain 19,3% 18,4% 19,5% 19,4% 19,2% 19,2% 18,6%
0%
5%
10%
15%
20%
25%
30%
2006-2007
2007-2008
2008-2009
2009-2010
2010-2011
2011-2012
2012-2013
2013-2014
Greece 4,27 4,41 4,08 3,68 3,54 3,33 3,06 3,41
Ireland 6,10 6,01 6,23 6,34 6,25 6,27 6,33 6,35
Italy 3,54 3,79 3,60 3,14 3,48 3,99 3,77 3,71
Portugal 5,63 5,68 5,21 4,70 4,29 3,93 3,87 4,18
Spain 3,74 3,76 4,26 4,07 3,82 3,92 4,01 3,68
0
1
2
3
4
5
6
7
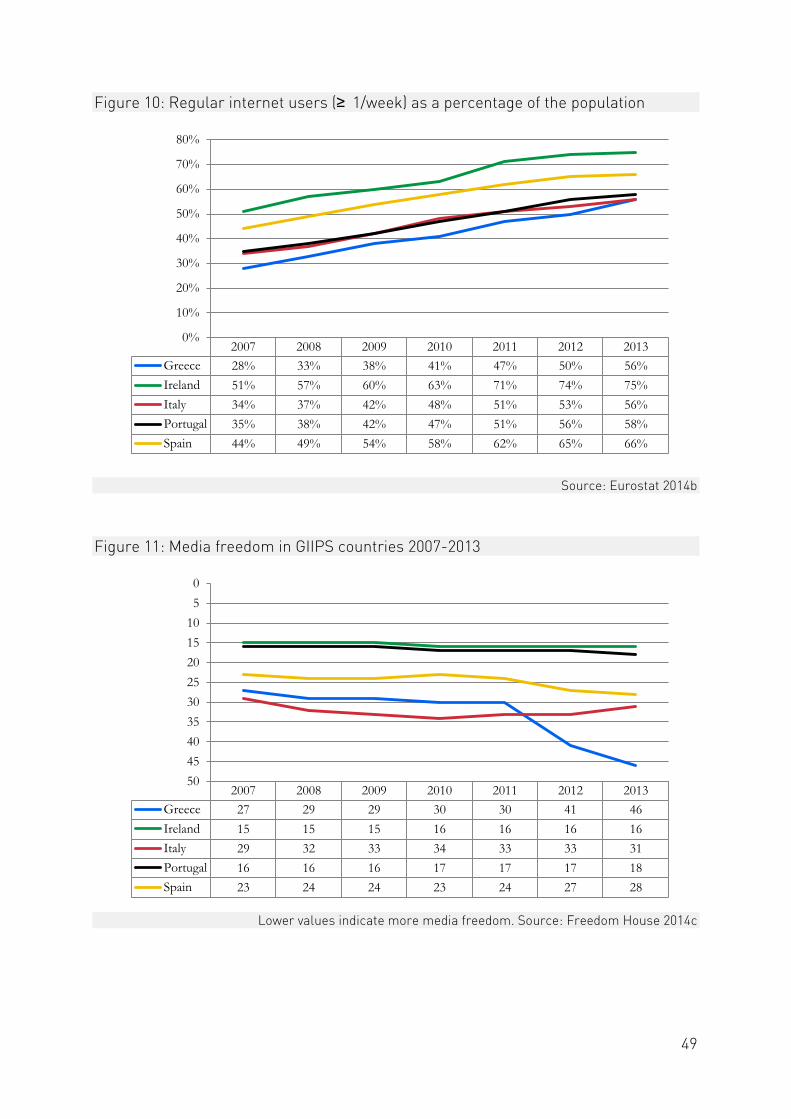
49
Figure 10: Regular internet users (≥ 1/week) as a percentage of the population
Source: Eurostat 2014b
Figure 11: Media freedom in GIIPS countries 2007-2013
Lower values indicate more media freedom. Source: Freedom House 2014c
2007 2008 2009 2010 2011 2012 2013
Greece 28% 33% 38% 41% 47% 50% 56%
Ireland 51% 57% 60% 63% 71% 74% 75%
Italy 34% 37% 42% 48% 51% 53% 56%
Portugal 35% 38% 42% 47% 51% 56% 58%
Spain 44% 49% 54% 58% 62% 65% 66%
0%
10%
20%
30%
40%
50%
60%
70%
80%
2007 2008 2009 2010 2011 2012 2013
Greece 27 29 29 30 30 41 46
Ireland 15 15 15 16 16 16 16
Italy 29 32 33 34 33 33 31
Portugal 16 16 16 17 17 17 18
Spain 23 24 24 23 24 27 28
0
5
10
15
20
25
30
35
40
45
50
50
9 References
Diário de Notícias. Cortes do FMI podem agravar corrupção.
http://www.dn.pt/especiais/interior.aspx?content_id=1832167&especial=Portugal%20pede
%20ajuda%20externa&seccao=ECONOMIA (11.07.2014).
Chatelain, Claude. 2010. Warum PIIGS eben PIIGS heissen.
http://www.bernerzeitung.ch/wirtschaft/dossier/vierte-saeule/Warum-PIIGS-eben-PIIGS-
heissen/story/22718620?track (23.06.2014).
Countryeconomy.com. 2014. Sovereigns Ratings List 2014. Online database.
http://countryeconomy.com/ratings (23.08.2014).
Di Tella, R. and E. Schargrodsky. 2003. The role of wages and auditing during a crackdown on
corruption in the city of Buenos Aires. In: Journal of Law & Economics 46 (1): 269–292.
Draude, Anke, Thomas Risse and Cord Schmelzle. 2012. Grundbegriffe der
Governanceforschung: Ein Beitrag aus dem Teilprojekt A1. Überarbeitete Auflage WP 8.
Working Paper 36.
European Central Bank. 2013. Details on securities holdings acquired under the Securities
Markets Programme. Press release.
http://www.ecb.europa.eu/press/pr/date/2013/html/pr130221_1.en.html (23.06.2014).
European Commission. 2012. Corruption. Special Eurobarometer 374 / Wave EB76.1.
European Commission. 2014. Corruption. Special Eurobarometer 397 / Wave EB79.1.
Eurostat. 2014a. Arbeitslosenquoten nach Geschlecht, Alter und Staatsangehörigkeit (%). Online
database.
http://epp.eurostat.ec.europa.eu/portal/page/portal/statistics/search_database (05.08.2014).
Eurostat. 2014b. Einzelpersonen, die das Internet regelmäßig nutzen. Online database.
http://epp.eurostat.ec.europa.eu/portal/page/portal/statistics/search_database (15.08.2014).
Eurostat. 2014c. Harmonisierte Verbraucherpreisindizes. Inflationsrate. Online database.
http://epp.eurostat.ec.europa.eu/portal/page/portal/statistics/search_database (05.08.2014).
Eurostat. 2014d. Jugendarbeitslosigkeit nach Geschlecht, Alter und Bildungsgrad. Online
database.
http://epp.eurostat.ec.europa.eu/portal/page/portal/statistics/search_database (05.08.2014).

51
Eurostat. 2014e. Langzeitarbeitslose (12 Monate und länger) als Prozentsatz der gesamten
Arbeitslosigkeit, nach Geschlecht und Alter (%). Online database.
http://epp.eurostat.ec.europa.eu/portal/page/portal/statistics/search_database (05.08.2014).
Freedom House. 2006. Freedom in the World. 2006 Subcategory Scores. Excel Document.
http://www.freedomhouse.org/report/freedom-world-aggregate-and-subcategory-scores
(14.08.2014).
Freedom House. 2007. Freedom in the World. 2007 Subcategory Scores. Excel Document.
http://www.freedomhouse.org/report/freedom-world-aggregate-and-subcategory-scores
(14.08.2014).
Freedom House. 2008a. Freedom in the World. 2008 Subcategory Scores. Excel Document.
http://www.freedomhouse.org/report/freedom-world-aggregate-and-subcategory-scores
(14.08.2014).
Freedom House. 2008b. Freedom in the World 2008. Portugal. Website.
http://www.freedomhouse.org/report/freedom-world/2008/portugal (14.08.2014).
Freedom House. 2009a. Freedom in the World. 2009 Subcategory Scores. Excel Document.
http://www.freedomhouse.org/report/freedom-world-aggregate-and-subcategory-scores
(14.08.2014).
Freedom House. 2009b. Freedom in the World 2009. Italy. Website.
http://www.freedomhouse.org/report/freedom-world/2009/italy (14.08.2014).
Freedom House. 2010. Freedom in the World. 2010 Subcategory Scores. Excel Document.
http://www.freedomhouse.org/report/freedom-world-aggregate-and-subcategory-scores
(14.08.2014).
Freedom House. 2011. Freedom in the World. 2011 Subcategory Scores. Excel Document.
http://www.freedomhouse.org/report/freedom-world-aggregate-and-subcategory-scores
(14.08.2014).
Freedom House. 2012. Freedom in the World. 2012 Subcategory Scores. Excel Document.
http://www.freedomhouse.org/report/freedom-world-aggregate-and-subcategory-scores
(14.08.2014).
Freedom House. 2013. Freedom in the World. 2013 Subcategory Scores. Excel Document.
http://www.freedomhouse.org/report/freedom-world-aggregate-and-subcategory-scores
(14.08.2014).

52
Freedom House. 2014a. Freedom in the World. 2014 Subcategory Scores. Excel Document.
http://www.freedomhouse.org/report/freedom-world-aggregate-and-subcategory-scores
(14.08.2014).
Freedom House. 2014b. Freedom in the World. Aggregate and Subcategory Scores. Website.
http://www.freedomhouse.org/report/freedom-world-aggregate-and-subcategory-scores
(14.08.2014).
Freedom House. 2014c. Press Freedom by Country, 1993–2013. Excel document.
http://freedomhouse.org/report/freedom-press-2014/press-freedom-numbers#by country
(16.08.2014).
Golden, M. A. and L. Picci. 2005. Proposal for a new measure of corruption, illustrated with
Italian data. In: Economics and Politics 17 (1): 37–75.
Kaufmann, Daniel. 2010. Can Corruption Adversely Affect Public Finances in Industrialized
Countries?
http://www.brookings.edu/research/opinions/2010/04/19-corruption-kaufmann
(30.09.2014).
Kaufmann, Daniel, Aart Kraay and Massimo Mastruzzi. 2004. Governance matters III:
Governance indicators for 1996, 1998, 2000, and 2002. In: The World Bank Economic Review 18
(2): 253–287.
Klitgaard, Robert. 1988. Controlling corruption: Univ of California Press.
Koch, Anne. 2012. Corruption Perceptions Index 2012 and the European Financial Crisis. Blog
entry (09.01.2014).
Mauss, Marcel. 1923. Essai sur le don. Forme et raison de l'échange dans les sociétés archaïques.
In: L'Année sociologique (1896/1897-1924/1925): 30–186.
Mousnier, Roland. 1969. Les hiérarchies sociales de 1450 à nos jours: Presses universitaires de France.
Mungiu-Pippidi, Alina. 2006. Corruption: Diagnosis and Treatment. In: Journal of Democracy 17 (3):
86–99.
Mungiu-Pippidi, Alina. 2013a. Controlling Corruption Through Collective Action. In: Journal of
Democracy 24 (1): 101–115.
Mungiu-Pippidi, Alina. 2013b. The Good, the Bad, and the Ugly. Controlling Corruption in the
European Union. ERCAS Working Papers 35: ERCAS – European Research Centre for
Anti-Corruption and State-Building.

53
Mungiu-Pippidi, Alina, Masa Loncaric, Bianca V. Mundo, Ana Carolina Sponza Braga, Michael
Weinhardt, Angelica P. Solares, Aiste Skardziute, Maira Martini, Fortune Agbele, Mette F.
Jensen, Christian v. Soest and Mariam Gabedava. 2011. Contextual Choices in Fighting
Corruption. Lessons Learned. ERCAS Working Papers 30. Oslo: NORAD Norwegian
Agency for Development Cooperation; ERCAS – European Research Centre for Anti-
Corruption and State-Building; Hertie School of Governance.
North, Douglass C., John J. Wallis and Barry R. Weingast. 2009. Violence and social orders. A
conceptual framework for interpreting recorded human history. Cambridge, New York: Cambridge
University Press.
Nye, Joseph S. 1967. Corruption and political development: A cost-benefit analysis. In: The
American Political Science Review: 417–427.
Rose-Ackerman, Susan. 1999. Corruption and Government: Causes, Consequences, and Reform, 1999. In: :
Cambridge University Press, Cambridge, UK.
Sachverständigenrat zur Begutachtung der gesamtwirtschaftlichen Entwicklung. 2013.
Jahresbericht 2013/14. Gegen eine rückwärtsgewandte Wirtschaftspolitik. Wiesbaden:
Statistisches Bundesamt.
Schneider, Friedrich. 2013. Size and Development of the Shadow Economy of 31 European and
5 other OECD Countries from 2003 to 2013: A Further Decline: Johannes Kepler University.
Schneider, Friedrich, Andreas Buehn and Claudio E. Montenegro. 2010. Shadow Economies All
over the World. New Estimates for 162 Countries from 1999 to 2007. Policy Research
Working Paper 5356: World Bank.
State Secretariate for Economic Affairs SECO. 2014. What is corruption?
http://www.seco.admin.ch/themen/00645/00657/00659/01387/index.html?lang=en
(26.09.2014).
Transparência e Integridade. 2012. National Integrity System Assessment Portugal. Executive
Summary.
Transparency International España (TI España). 2012. National Integrity System Assessment
Spain.
Transparency International Greece (TI Greece). 2009. National Survey on Corruption 2009.
Transparency International Greece (TI Greece). 2010. National Survey on Corruption 2010.
Transparency International Greece (TI Greece). 2011. National Survey on Corruption 2011.
54
Transparency International Greece (TI Greece). 2012a. National Survey on Corruption 2012.
Transparency International Greece (TI Greece). 2012b. National Integrity System Assessment
Greece. Athens.
Transparency International Greece (TI Greece). 2013. National Survey on Corruption 2013.
Transparency International Ireland (TI Ireland). 2009. National Integrity Systems. Transparency
International Country Study Ireland. Berlin.
Transparency International Ireland (TI Ireland). 2012. National Integrity Systems. Ireland 2012.
Country Study Addendum.
Transparency International Italia (TI Italia). 2012. National Integrity System Assessment Italy.
Executive Summary. Rome: Transparency International Italia (TI Italia); RiSSC - Centro
Ricerche e Studi su Sicurezza e Criminalità.
Transparency International (TI). 2007. Corruption Perceptions Index 2007. Online database.
http://www.transparency.org/research/cpi/cpi_2007.
Transparency International (TI). 2008. Corruption Perceptions Index 2008. Online database.
http://www.transparency.org/research/cpi/cpi_2008.
Transparency International (TI). 2009. Corruption Perceptions Index 2009. Online database.
http://www.transparency.org/research/cpi/cpi_2009.
Transparency International (TI). 2010. Corruption Perceptions Index 2010. Berlin.
Transparency International (TI). 2011. Corruption Perceptions Index 2011. Berlin.
Transparency International (TI). 2014a. Global Corruption Barometer 2004.
http://archive.transparency.org/policy_research/surveys_indices/gcb/2004 (26.09.2014).
Transparency International (TI). 2014b. Global Corruption Barometer 2005.
http://archive.transparency.org/policy_research/surveys_indices/gcb/2005 (26.09.2014).
Transparency International (TI). 2014c. Global Corruption Barometer 2006.
http://archive.transparency.org/policy_research/surveys_indices/gcb/2006 (26.09.2014).
Transparency International (TI). 2014d. Global Corruption Barometer 2007.
http://archive.transparency.org/policy_research/surveys_indices/gcb/2007 (26.09.2014).
Transparency International (TI). 2014e. Global Corruption Barometer 2009.
http://archive.transparency.org/policy_research/surveys_indices/gcb/2009 (26.09.2014).
55
Transparency International (TI). 2014f. Global Corruption Barometer 2010/11 - In Detail.
Online database.
http://www.transparency.org/gcb201011/in_detail (26.09.2014).
Transparency International (TI). 2014g. Global Corruption Barometer 2013 - In Detail. Online
database.
http://www.transparency.org/gcb2013/in_detail (26.09.2014).
Transparency International (TI). 2014h. Our organisation. FAQs on corruption.
http://www.transparency.org/whoweare/organisation/faqs_on_corruption/2/ (26.09.2014).
Treisman, Daniel. 2007. What Have We Learned About the Causes of Corruption from Ten
Years of Cross-National Empirical Research? In: Annual Review of Political Science 10 (1): 211–
244.
UN Comtrade. 2014. International Trade Statistics. Online database.
http://comtrade.un.org/data/ (26.09.2014).
Weber, Max. 1921 (1968). Economy and Society: An Outline of Interpretive Sociology. New York:
Bedmeister.
World Bank. 2001. Helping Countries Combat Corruption: The Role of the World Bank.
http://www1.worldbank.org/publicsector/anticorrupt/corruptn/cor02.htm#note1
(26.09.2014).
World Bank. 2008. Doing Business 2008. Comparing regulation in 178 economies. Washington,
D.C.
World Bank. 2009. Doing Business 2009. Comparing regulation in 181 economies. Washington,
D.C.
World Bank. 2010. Doing Business 2010. Reforming through difficult times. Washington, D.C.
World Bank. 2011. Doing Business 2011. Making a difference for entrepreneurs. Washington,
D.C.
World Bank. 2012. Doing Business 2012. Doing Business in a More Transparent World.
Washington, D.C.
World Bank. 2013. The Worldwide Governance Indicators. 2013 Update. Excel document.
http://info.worldbank.org/governance/wgi/index.aspx (06.08.2014).
World Bank. 2014a. Doing Business 2014 Data Notes. Measuring Business Regulation.
http://www.doingbusiness.org/methodology/methodology-note (06.08.2014).
56
World Bank. 2014b. Doing Business Historical Data Sets and Trends Data. Measuring Business
Regulation.
http://www.doingbusiness.org/Custom-Query/ (06.08.2014).
World Bank. 2014c. Fuel exports (% of merchandise exports). Online database.
http://data.worldbank.org/indicator/TX.VAL.FUEL.ZS.UN (26.09.2014).
World Economic Forum. 2014. The Global Competitiveness Report Data Platform. Online
database.
http://www.weforum.org/issues/competitiveness-0/gci2012-data-platform/ (14.08.2014).
57
Eidesstattliche Erklärung Zur Masterarbeit Im Fach Public Policy Und Management
Hiermit versichere ich, dass ich die Masterarbeit selbständig und lediglich unter Benutzung der
angegebenen Quellen und Hilfsmittel verfasst habe. Ich versichere außerdem, dass die
vorliegende Arbeit noch nicht einem anderen Prüfungsverfahren zugrunde gelegen hat.
Ich bin damit einverstanden, dass ein Exemplar meiner Masterarbeit in der Bibliothek
ausgeliehen werden kann.
Berlin, den 6. Oktober 2014 ______________________________