The Financial Crisis and Agricultural Productivity in Asia and ...
206
From: The Financial Crisis and Agricultural Productivity in Asia and the Pacific ©APO 2004, ISBN: 92-833-7025-2 Report of the APO Study Meeting on Effects of Financial Crisis on Productivity of Agriculture (STM-12-00) Japan, 6–13 December 2000 Edited by: Dr. Tongroj Onchan, President, the Mekong Environment and Resource Institute (MERI), Bangkok, Thailand. Published by the Asian Productivity Organization 1-2-10 Hirakawacho, Chiyoda-ku, Tokyo 102-0093, Japan Tel: (81-3) 5226 3920 • Fax: (81-3) 5226 3950 E-mail: [email protected] • URL: www.apo-tokyo.org Disclaimer and Permission to Use This document is a part of the above-titled publication, and is provided in PDF format for educational use. It may be copied and reproduced for personal use only. For all other purposes, the APO's permission must first be obtained. The responsibility for opinions and factual matter as expressed in this document rests solely with its author(s), and its publication does not constitute an endorsement by the APO of any such expressed opinion, nor is it affirmation of the accuracy of information herein provided. Note: This title is available over the Internet as an APO e-book, and has not been published as a bound edition.
-
Upload
khangminh22 -
Category
Documents
-
view
1 -
download
0
Transcript of The Financial Crisis and Agricultural Productivity in Asia and ...

From:
The Financial Crisis andAgricultural Productivity in Asia and the Pacific©APO 2004, ISBN: 92-833-7025-2
Report of the APO Study Meeting on Effects ofFinancial Crisis on Productivity of Agriculture (STM-12-00)Japan, 6–13 December 2000
Edited by:Dr. Tongroj Onchan, President, the MekongEnvironment and Resource Institute (MERI), Bangkok, Thailand.
Published by the Asian Productivity Organization1-2-10 Hirakawacho, Chiyoda-ku, Tokyo 102-0093, JapanTel: (81-3) 5226 3920 • Fax: (81-3) 5226 3950E-mail: [email protected] • URL: www.apo-tokyo.org
Disclaimer and Permission to Use
This document is a part of the above-titled publication, and is provided in PDFformat for educational use. It may be copied and reproduced for personal use only.For all other purposes, the APO's permission must first be obtained.
The responsibility for opinions and factual matter as expressed in this documentrests solely with its author(s), and its publication does not constitute anendorsement by the APO of any such expressed opinion, nor is it affirmation of theaccuracy of information herein provided.
Note: This title is available over the Internet as an APO e-book, and has not beenpublished as a bound edition.

THE FINANCIAL CRISIS AND
AGRICULTURAL PRODUCTIVITY
IN ASIA AND THE PACIFIC
2004Asian Productivity Organization
Tokyo

Report of the APO Study Meeting on Effects of Financial Crisis on Productivity ofAgriculture held in Japan, 6-13 December 2000(STM-12-00)
This report was edited by Dr. Tongroj Onchan, President, the Mekong Environment andResource Institute (MERI), Bangkok, Thailand.
The opinions expressed in this publication do not reflect the official view of the AsianProductivity Organization. For reproduction of the contents in part or in full, the APO’s priorpermission is required.
©Asian Productivity Organization, 2004
ISBN: 92-833-7025-2

TABLE OF CONTENTS
Foreword
Part I Summary of Findings . . . . . . . . . . . . . . . . . . . . . . . . . . . . . . . . . . . . . . . . . . . 3
Part II Selected Resource Papers1. Impact of the 1997 Financial Crisis on Southeast Asia’s Farm Sector
with a Special Reference to Thailand…………… Tongroj Onchan . . 192. Impact of Financial Crisis on Productivity of Agriculture:
Korean Case……………………………………… Young-Bong Yu . . 473. An Overview of the Impact of Financial Crisis on Productivity of
Agriculture in the Asia-Pacific Region………… Memed Gunawan . . 68
Part III Selected Country Reports1. Bangladesh…………………………………………… Ishrat Jahan . . 852. Republic of China…………………………… York Yaw-chung Liao . . 983. India………………………………………… Sanjib Chandra Hota . 1264. Indonesia…………………………………………… Djodi Hidayat . 1415. Islamic Republic of Iran………………… Jahangir Yadolahi Farsi . 1486. Republic of Korea………………………………… Seong-Jae Park . 1527. Malaysia…………………………… Lew Leong Poh and Ismail Mat . 1628. Pakistan………………………………… Muhammad Rafiq Saroya . 1719. Philippines……………………………… Sheila Marie M. Encabo . 175
10. Sri Lanka………………………………… Thuiappu A. Wimalasena . 18711. Thailand…………………………………………… Viroj NaRanong . 194
Part IV Appendices1. List of Participants, Resource Speakers, and Secretariat . . . . . . . . . . . . 2052. Program of Activities . . . . . . . . . . . . . . . . . . . . . . . . . . . . . . . . . . . . . . 209

FOREWORD
An unexpected financial crisis hit the East and Southeast Asian countries in 1997,putting their socio-economies in turmoil. Banking systems were disrupted, while manybusiness activities had to cease. Local currencies plummeted whereas domestic prices soared.The social impact of the crisis has been very severe as both unemployment and poverty haveincreased significantly. While clear signals of economic recovery have recently emerged inthese countries, the overall situation of Asian economies remains opaque.
The financial and economic crisis hit the agriculture sector as well: demand foragricultural commodities stagnated; public expenditures for agriculture declined due tolimited budgets; and many urban workers returned to their native villages for the sake ofsurvival. All of these have had an adverse effect on agricultural productivity, income, andemployment in the rural sector where the majority of the poor live. The impact may havebeen relatively minor and short-lived in some cases, but could be more profound and long-lasting where the disruptions were sufficiently large and long to cause capital investment todwindle, alter the nature of already weak labor markets, and delay the recovery of commoditydemand.
To assess these impacts and learn lessons from them, the APO organized the studymeeting on the Effects of the Financial Crisis on the Productivity of Agriculture in Japan.This publication is a compilation of the selected papers and proceedings of the meeting. Itis our hope that this publication will provide useful lessons and insights to our readers,especially planners, policymakers, and researchers who are keen to devise better policies andmeasures to cope with such sudden external shocks while avoiding negative impacts on long-term productivity growth in agriculture.
The APO is grateful to the Government of Japan, especially the Ministry ofAgriculture, Forestry and Fisheries, for hosting the meeting, and to the Association forInternational Cooperation of Agriculture and Forestry for implementing the program. Ourappreciation also goes to the resource persons for their valuable contributions and to Dr.Tongroj Onchan for editing the publication.
TAKASHI TAJIMASecretary-General
TokyoApril 2004

- 3 -
SUMMARY OF FINDINGS
INTRODUCTION
The Study Meeting on the Effects of Financial Crisis on Productivity of Agriculture,which was organized by the Asian Productivity Organization (APO), and hosted by theGovernment of Japan, was held in Tokyo from 6 to 13 December 2000. The Association forInternational Cooperation of Agriculture and Forestry (AICAF) implemented the programwith financial and technical assistance of the Ministry of Agriculture, Forestry and Fisheries(MAFF). Fifteen participants from 13 member countries and four resource speakers fromIndonesia, Japan, the Republic of Korea and Thailand attended the study meeting.
The objectives of the study meeting were to: 1) discuss the impact of financial crisison productivity of agriculture in the Asia-Pacific region; and (2) outline the main policymeasures and programs for alleviating the impacts of the crisis.
The study meeting consisted of the presentation and discussion of resource papers, aswell as country reports and field visits to JA Sawada, JA Maebashi-shi and JA Katashina-mura in the Gunma prefecture. The topics covered by the resource papers were: 1) Impact ofthe 1997 Financial Crisis on Southeast Asia’s Farm Sector with a Special Reference toThailand; 2) An Outline of the Credit Business of Agricultural Cooperatives in Japan;3) Impact of Financial Crisis on Productivity of Agriculture: Korean Case; and 4) AnOverview of the Impact of the Financial Crisis on Productivity of Agriculture in the Asia-Pacific Region. The country reports focused on the economic and social situation of therespective countries in relation to the Asian financial crisis, particularly the effects of theAsian financial crisis on the productivity of agriculture in the respective participating membercountries. In the workshop, participants identified major issues of the effects of the 1997financial crisis on the productivity of agriculture in the member countries, and suggestedspecific strategic actions to address such issues.
HIGHLIGHTS OF RESOURCE PAPERS
Impact of the 1997 Financial Crisis on Southeast Asia’s Farm Sectorwith a Special Reference to Thailand (Prof.Dr. Tongroj Onchan)
The paper reviews the subject under the following three sub-titles: 1) The Asianeconomy: From Boom to Crisis; 2) The Socio-economic Impact of the Financial Crisis in theAffected Southeast Asian Countries; and 3) The Impact of the Financial Crisis on Thailand’sFarm Sector. The paper also uses information relevant to the subject from other sources asindependent insets, e.g., the worsening agricultural performance of Asian countries during1998-99 (FAO 2000), crisis impact on Thailand’s rural sector (World Bank, pp. xii-xiii, April2000), and a postscript based on the reports of the Asian Development Bank (2000a and b)and the World Bank (1999 and 2000).
A summary of the paper is as follows:After experiencing a rapid and sustained economic growth, which had brought about
improved economic welfare for a great number of people in the Southeast Asian countries

- 4 -
during the 1970s to the mid-1990s, the unexpected financial crisis (which started in July 1997in Thailand) has had a great adverse impact on these economies, especially the five mostaffected countries of Thailand, Indonesia, Malaysia, the Rep. of Korea, and the Philippines.The pathways to the social impacts of the Asian crisis may be explained as follows: the crisisstarted with capital flight, which led to the depreciation of the local currency, unviablecorporate balance sheets, credit crunch, falling output (farm, non-farm) and loweredgovernment revenue (which caused reductions in government spending of social programs).Other related problems include higher costs of living, lower wages and rising unemployment.Regarding the farm sector, the following are expected to occur: migrations back to the ruralsector by unemployed workers, lower farm production and income, increase in rural povertyand income inequality. In sum, four major impacts consist of labor markets, changes inrelative prices, public spending, and assets and credit. These impacts may vary in severity bysocial groups, e.g., urban vs. rural or rich vs. poor.
The Asian financial crisis rapidly caused marked contractions in the GDP andemployment of the five affected countries. The shrinkages in GDP in 1998 ranged from 0.5percent in the Philippines to 14 percent in Indonesia. Unemployment rates increased in allcountries with the largest increase in the Rep. of Korea. The impact was usually more onprices; the currency devaluations had an almost immediate impact on the prices of goods andservices, which had high import content. Inflation was particularly serious in Indonesiabecause food prices rose markedly. Prices of farm inputs, e.g., fertilizer, fuel, and animalfeeds, also increased sharply. The crisis impact on the income of households, both urban andrural has been particularly significant. The reduction in remittances from urban sectors causedrural household incomes to markedly decline.
Overall, real per capita household income declined by 20 percent in the Rep. of Koreaand by 12 percent in the Philippines. Furthermore, rural poverty increased and incomeinequality worsened. In the Rep. of Korea, for example, the poverty rate increased from 3percent to 6.4 percent and the Gini coefficients (which show the degree of income inequality)increased from 0.28-0.29 in 1997 to 0.32-0.33 in 1998. Finally, as budget cuts wereexperienced in all of the affected countries, expenditures on education by both thegovernment and households decreased. In addition, enrollment rates have declined anddropout rates from schools have increased. Consequently, human resource development hasbeen adversely affected by the crisis.
The paper presents a case of Thailand in some detail, based on an impact study of thefinancial crisis on the farm sector. The data used were from two farm household surveysconducted before (1995/96) and after (1998/99) the crisis. The study showed substantialchanges in income and consumption, but these changes were not equitably distributed amongthe population. Major findings of the study could be summarized as follows:
1) There was little sign of a massive urban to rural migration, and out-migration seemedto have slowed considerably;
2) Net remittances declined for all but the richest households;3) The regional impacts of the crisis have been heterogeneous; the central region
performed much better in terms of consumption and income compared to the north andthe northeast;
4) The poor have been the most affected;5) There seems to be no credit crunch; and

- 5 -
6) The impact of the crisis on farm production and income was mixed. Rich householdsdid much better in terms of farm profits and productivity than poor households.
The findings of the Thai study also suggested two types of rural policy responses to thecrisis: changes in agricultural policy and changes in social policy targeted to rural areas.These findings and suggested policy responses may be of some interest and relevance to otheraffected countries.
An Outline of the Credit Business of Agricultural Cooperatives in Japan(Eikichi Koguchi)
The paper first gives an overview of the history and present status of the types ofcooperatives in Japan. The paper particularly emphasizes the cases of agricultural, fishery andforestry cooperatives.
Presently, there are 1,300 agricultural cooperatives and 1,700 fishery cooperatives inJapan, in addition to fishery production associations, marine products processingcooperatives, forestry cooperatives, credit associations, credit cooperatives, common facilitycooperatives, petty common facility cooperatives, mutual fire insurance cooperatives, jointenterprise cooperatives, consumers’ cooperatives and labor credit associations.
The author discusses the organizational structure of agriculture, forestry, fisherycooperatives and other organizations. Of the 1,300 agricultural cooperatives, some are singlepurpose, e.g., prefectural economic federations of agricultural cooperatives and prefecturalmutual insurance federations of agricultural cooperatives, while others are multipurposecooperatives.
Traditionally, agricultural cooperatives work in a three-tier system, i.e., at themunicipal, prefectural and national level. National level organizations include the NationalFederation of Agricultural Cooperatives Associations (Zen-Noh), the Norinchukin Bank andmany others. Presently, mega-mergers of Japanese agricultural cooperatives (JA) are takingplace, due to the changing financial environment. Such mergers will result in a fewer numberof JAs, but each JA will be much larger in size and not limited to one municipality. Forinstance, the Nara prefecture (near Osaka) now has only one JA. The number of JAs hasdeclined sharply from 4,072 in 1987 to 1,300 in 2000. Similarly, the number of employeesreduced sharply from the year 1987-99, while JA membership increased during the sameperiod. A large number of JA employees (70,000) are engaged in agricultural credit businessas well.
The savings of the multipurpose cooperatives have increased from ¥51 trillion (1989)to ¥70 trillion (1999). Out of the ¥70 trillion savings, ¥22 trillion are allocated for loans tofarmers. Thus, contrary to a steep decline in the number of JAs, their savings have increasedprogressively. Savings traditionally increase by ¥10 trillion every 2-3 years. However, lately,the same amount of savings took 10 years, due to the financial crisis in Japan, whichdecreased the price of land. Primary sources of the JA savings are deposits of farmers’savings and proceeds from the sale of farmland.
The author also introduced the role of the Norinchukin Bank in the agricultural,forestry and fishery cooperative systems in Japan, particularly in granting loans and otherservices. The Norinchukin Bank was established in 1923 and was officially renamed as theNorinchukin Bank in 1943. The bank has been rated as “AAA”. As of 31 March 2000, thebalance of loans and bills discounted in the consolidated settlement of the bank amounted to

- 6 -
¥21,553 million, which accounted for 41.8 percent of its total assets. Loans to corporations,which engage in business related to the primary sector, are the core of the bank’s lendingoperations. The bank is well positioned to offer a stable flow of financing by making use ofthe cooperative credit system’s abundant yen resources, and has thus built a strong reputationfor reliability.
The financial crisis in Japan during the last decade resulted in a sharp decline in theprice of land and the failure of many corporations, companies, banks, etc. Thus, the JapaneseGovernment has instructed financial institutions to undertake measures to avoid such a crisis.For this purpose, the Japanese Government has established a Financial Services Agency andthe supervisory role has been given to the Norinchukin Bank.
The paper discusses two types of government-programmed loans for agriculture,namely the interest subsidies type and the long-term, low/non-interest type. As of March2000, outstanding loans in agriculture, fishery and forestry sectors were ¥2.4, ¥1.0 and ¥0.2trillion, respectively. Outstanding savings and borrowings of farm households have alsodropped.
The Asian financial crisis of 1997 did not significantly affect agricultural productivityin Japan. Despite several financial turmoils, farmers were able to get loans/credits from thebanks. However, farmers are facing difficulties in paying back their 20-30-year-old loans, dueto low incomes. The latter is mainly due to the sharp decline in land prices and off-farmincomes. During the last decade, Japanese farmers had suffered because the GATTderegulated the livestock market, lowered rice prices and increased the import of vegetables.One positive aspect of the WTO (GATT) was that more people entered farming. For instance,the number of people who entered farming increased from 10,000 in 1990 to 60,000 in 1999.In conclusion, agricultural productivity in Japan was not affected much by the 1997 Asianfinancial crisis.
Impact of Financial Crisis on Productivity of Agriculture: Korean Case(Dr. Young-Bong Yu)
This study focuses on the impacts of the 1997 Asian financial crisis on agriculturalproductivity, especially in the Rep. of Korea. The analysis of this study is that the financialcrisis impact on the agricultural production sector varied by the economic level andagricultural characteristics of each country. To identify this, the author looked into theKorean agricultural characteristics and estimated the crisis impacts on agricultural economy.The Rep. of Korea realized that the financial crisis caused the input cost of agriculturalintermediate goods to rise, which led to a decrease in the consumption of agriculturalproducts, which in turn resulted in the price drop of agricultural products. Therefore, thecrisis affected value-added output and agricultural productivity. A summary of this analysisis as follows:
In the midst of the financial crisis in 1997, Korean agriculture was heavily dependenton the imports of agricultural intermediate goods, capital-intensive agricultural productionsystems and various agricultural products such as grains, fruits and meats. GDP per capitareached the level of US$10,000 and food consumption came to a limit. Therefore, thefinancial crisis caused the cost of agricultural intermediate goods, such as fertilizer, fuels,pesticide and feed grains, to rise. A fall in agricultural income caused a decrease in thedemand of agricultural products, which led to lower prices of agricultural products. Value-added output of the agricultural production sector fell sharply in 1998. Therefore, agriculturalproductivity also decreased rapidly. There was recovery in the agricultural production sectoralong with economic recovery in 1999, but both did not recover back to the pre-crisis level.

- 7 -
Financial crisis impacts varied by farm scale and the type of farming. In the Rep. ofKorea, large-scale farms and horticulture under the greenhouse farms suffered severely fromthe crisis. Also, small-scale farms could not survive due to low productivity. Farm debtscaused by a worsening farm economy skyrocketed. There is a great possibility that thefinancial crisis caused investment to decrease, which led to a downturn in the agriculturalproduction sector. If the stability of the Korean economy is not secured, agricultural input andoutput prices will be unstable. This will pose an obstacle for technology development andagricultural investment intended for boosting productivity. In short, the impact of thefinancial crisis on agricultural production is in sight and its long recovery will be under way.To neutralize the impacts, a stable agricultural interest rate must be secured.
An Overview of the Impact of the Financial Crisis on Productivity of Agriculturein the Asia-Pacific Region (Dr. Memed Gunawan)
The paper discusses the background and evolution of the 1997 Asian financial crisis,and also the economic recovery process in the Rep. of Korea, Malaysia and Thailand, alongwith the impact of the financial crisis on Indonesian agriculture.
It compares the rapid economic growth of Asian countries, particularly the Rep. ofChina, the Rep. of Korea, Singapore, Indonesia, Malaysia, Thailand and the Philippinesduring the 1980s and 1990s, with the slow economic growth of the free market economiessuch as the United States and Western Europe. Thereafter, the paper describes the weaknessesin the Asian economic systems that led to the 1997 financial crisis in these countries. Thepaper cites the specific example of Indonesia, where economic attention was shifted from theagriculture sector to the manufacturing industries. It then provides an overview of the Asianfinancial crisis and the factual conditions of the financial crisis, its evolution and impacts, aswell as the policy measures taken by the governments.
The last decade was marked with several important changes, such as: (1) the fastdevelopment of ICT and biotechnology; (2) the new role of government in publicmanagement; (3) the implementation of multilateral and regional agreements on trade, tariff,and economic cooperation such as the WTO, APEC, AFTA, etc.; and (4) the growingconcern about food security, environment, and human rights that to some extent, affecteconomic decisions but most certainly do affect resource allocation.
The crisis in Asia was triggered by the regional contagion effect of Thailand. Thecombination of over-investment, bad debts, a huge private sector foreign loan (around US$90billion), and an overvalued fixed exchange rate of the baht forced the Thai Government todevaluate the baht in July 1997. This crisis then spread to neighboring countries, such asIndonesia, Malaysia, the Philippines and the Rep. of Korea. The paper discusses in detail howthe financial crisis spread from Thailand to other countries, and reviews commoncharacteristics of economic development of Asian countries such as Thailand, the Philippinesand Indonesia. Japan experienced slow growth and an increase in unemployment, but it soonrecovered.
The financial crisis created substantial effects to the whole economy. A weakeningdomestic currency had cyclical effects to other economic sectors, which in turn worsened theexchange rate. The paper specifically discusses the inflation and interest rate, bankingsystems, investment and business activities, as well as social problems, in relation to the 1997Asian financial crisis.
The fluctuation in exchange rates has important effects on the prices of exports andimports. The direction of these effects depends on the currency one uses to measure prices.If import and export prices were affected equally by the movement of the dollar, an adverse

- 8 -
import shock would be matched by a favorable export shock. Experience suggests that thechanges in the exchange rate, in terms of the prices of exports and imports, are not equal indeveloping countries. When the dollar rises, import prices of developing countries seem tofall less than their export prices. The net effect is that a rising dollar worsens trade indeveloping countries.
Since the financial crisis is an impact of external shock, the ability of a country tohandle such a crisis depends on its macro economic foundation, external resources, theintensity of resources used in the economic sector and the initial condition of the economy.For example, an agriculture sector using mostly domestic resources would be less affectedby the financial crisis than enterprises that depend heavily on imported commodities.
Since 1999, economic recovery in the crisis-affected countries, namely Thailand, theRep. of Korea and Malaysia, has been witnessed. The process of economic recovery in theRep. of Korea, Malaysia, and Thailand initiated from the ability of these countries to takeadvantage of: 1) the increasing international demand for electronics and computer-relatedgoods; 2) low interest rates; and 3) expansive fiscal policies. This supports the recoveryprocess of investment, reduces unemployment and increases domestic demand. Despiteimpressive achievement at the macro-level, these countries have not been fully successful inrestructuring their financial system, which remains a challenge to be solved in the yearsahead.
Impact of the financial crisis on agriculture in Indonesia could be summarized asfollows:
As regards growth rates, all sectors of the economy fell 18-40 percent in 1998, exceptfor agriculture, which grew by 1.1 percent. This was well below the growth rates of 3-4percent that the agriculture sector experienced in 1995-96, but it represented a small recoveryfrom a growth rate of only 0.9 percent in 1997 during the El Niño drought. Estate cropproduction did not change much. However, the rupiah income to farmers increasedsignificantly, although world prices declined. The financial crisis caused a sharp fall inlivestock output in 1998 (7.1 percent), due to the higher prices of imported input.
Food prices were increasing more rapidly than non-food prices, giving rise to concernsabout food security.
Four major conclusions regarding the social impact of financial crisis are as follows:
1. Urban areas, in general, have been more severely affected than rural areas.2. Effects have varied widely across the country. For instance, both urban and rural areas
in Java were badly affected.3. Areas that were badly affected by the crisis were uncorrelated with the initial levels of
poverty.4. The more severely affected urban areas tended to be in those regions of the country
where the rural areas were also more severely affected, and vice versa.
In addition, the paper also discusses the effect of the financial crisis on employment,rice production, the credit market and farm prices in Indonesia.
HIGHLIGHTS OF COUNTRY REPORTS
The Asian financial crisis, which started in Thailand in July 1997, has had verydifferent impacts on the economies of various APO member countries. For instance, the crisis

- 9 -
had a deep impact on the economies of the five most affected Southeast Asian countries(Thailand, Indonesia, Malaysia, the Rep. of Korea and the Philippines) due to large and risingcurrent account deficits, very high levels of bad loans and extensive unproductiveinvestments, mostly in speculative real estate and stock markets. This was particularly thecase in Thailand, Indonesia and Malaysia. However, due to its sound economic foundation,the Rep. of China was less affected by the financial crisis. Also, South Asian countries(Bangladesh, India, Nepal, Pakistan, Sri Lanka and the Islamic Rep. of Iran) were able toescape direct effects of the 1997 financial crisis because of various favorable factors such aslower current account deficits, close monitoring of hot money and Foreign Direct Investment(FDI) money markets, no capital account convertibility, less investment in speculative realestate and stock markets, etc. Nevertheless, imports and exports, including the agriculturalproducts of these countries, experienced some shock of the crisis. In general, imports of theSouth Asian countries increased while exports declined, mainly due to very high levels ofcurrency devaluation in the Southeast Asian countries. Mongolia was also little affected bythe 1997 financial crisis because of her closed economy.
Not much data could be found on the effects of the financial crisis on agriculturalproductivity in many of the APO member countries. However, based upon the availableinformation, the pattern of the crisis impact on agricultural productivity was rather similarto that of the overall economy of these countries. For instance, the impact was more intensein the Thailand, Malaysia, the Rep. of Korea and the Philippines, but less in Indonesia andthe Rep. of China. The Rep. of China’s labor productivity was reduced by the crisis, but itrecovered quickly. In Indonesia, production in the crop sector was not affected by thefinancial crisis because of the use of domestic agricultural inputs and the dependence of thedomestic market on agricultural products. On the contrary, the poultry industry in Indonesiacollapsed due to its dependence on imported feeds. However, agricultural productivity inmost of the South Asian countries in general, was not affected by the financial crisis.
The South Asian countries however experienced a decline in agricultural productivity,particularly in crop productivity in the years 1998/99 due to the natural calamities such asfloods, long drought spells, insect pest and disease incidence, etc. These countries were ableto escape from the financial crisis because of various factors, such as no capital accountconvertibility, relatively closed markets and close monitoring of the flow of hot money andFDI money markets, less investment in speculative markets, the preponderance of subsistencefarming, etc. Nevertheless, agricultural productivity in a few of these countries was impactedto some extent by the financial crisis. For instance, the rubber industry in Sri Lanka collapseddue to its inability to export rubber to the crisis-hit countries like Malaysia and Indonesia,who were the traditional importers of rubber. Similarly, Nepal experienced an increase in theprices of agricultural inputs, due to the depreciation of its currency. However, theproductivity of Mongolia’s agriculture sector was not affected by the Southeast Asianfinancial crisis, due to her closed economy, which had little integration with the Asianeconomies.
In general, the financial crisis led to less financial resources for agricultural use, whichin turn adversely affected the supply of credit to farmers, depreciated local currencies,decreased off-farm incomes of the farm households, caused high inflation/cost of living,raised the cost of agricultural inputs and thus reduced their use, lowered wages, increasedunemployment and raised rural poverty in the affected countries.
Regardless of the extent of the effects of the Southeast Asian financial crisis on theproductivity of agriculture, all member countries were aware of the situation and wereadopting specific policy and institutional measures suited to their own needs in order to:

- 10 -
a) alleviate negative impacts of the crisis on their economy and agricultural productivity; andb) minimize the chances of recurrence of a similar financial crisis in the future.
Overall, the Asian financial crisis has underscored the importance of institutionalreform in preventing future crises. To pave the way for sustainable agricultural developmentand productivity enhancement, deregulation of financial activities accompanying soundfinancial supervision and an improved governance system would be beneficial to the farmsector, farming communities and farmers’ associations’ management.
Specific issues, concerning the effects of the financial crisis on agriculturalproductivity and strategic actions to be taken, were identified by the participants in theorganized workshop during the study meeting:
WORKSHOP OUTPUT
ObjectivesA workshop was conducted to: 1) identify major issues of the effects of the 1997
financial crisis on the productivity of agriculture; and 2) suggest strategic actions to addresssuch issues. To enhance the discussion and better share views and experiences, theparticipants were divided into two groups. The two groups were composed as follows:
Group I: Ms. I. Jahan (Bangladesh), Dr. G. S. Kaushal and Mr. S. C. Hota(India), Mr. J. Y. Farsi (Islamic Rep. of Iran), Mr. B. N. Maharjan(Nepal), Mr. M. R. Saroya (Pakistan), and Mr. T. A. Wimalasena (SriLanka)
Chairperson: Mr. Muhammad Rafiq SaroyaRapporteur: Ms. Ishrat JahanFacilitator: Dr. Memed GunawanGroup II: Dr. Y. C. Liao (Rep. of China), Mr. D. Hidayat (Indonesia), Mr. I.
Mat and Mr. F. L. L. Poh (Malaysia), Mr. D. Nyamrentsen(Mongolia), Ms. S. M. Encabo (Philippines), and Dr. V. NaRanong(Thailand)
Chairperson: Mr. Fred Lew Leong PohRapporteur: Ms. Sheila Marie EncaboFacilitator: Dr. Tongroj Onchan
The outputs of the two groups were presented in a plenary session, and are summarizedas follows:
Group I – Why were some South Asian countries able to escape the financial crisis?C No capital account convertibility.C Close monitoring of the flow of hot money and FDI money markets by the central
banks.C Short-term loans were not invested in long-term investments, such as real estates.C Due to low interest rates, the inflow of short-term loans was restricted, unlike
Southeast Asian countries where the interest rate was kept artificially high.C Agriculture is vulnerable to natural calamities.C Basic foundation for industrial development was not present because the main focus
was on agricultural development.

- 11 -
C Preponderance of subsistence farming except plantation crops – tea, coffee, rubber,cotton, jute – which were grown on a commercial basis.
C Food grain crops constitute almost 70 percent of total agriculture production, and aremainly grown for sustenance.
C Farmers do not have any control over the price of inputs, which are mainly imported.C Marketing of products is a major problem for all the countries because of the lack in
infrastructural development and competitiveness in the world market.
1. IssuesSouth Asian countries, including the Islamic Rep. of Iran, were not as significantly
affected as the Southeast Asian countries in terms of agricultural productivity.C Production of food crops, which is based on subsistence farming, was not affected
much. However, in the case of Nepal, price of inputs such as fertilizer, pesticides,seeds, etc., went up as a result of the devaluation of the Nepalese currency.
C Exports, including agricultural products to Southeast Asian countries suffered becausethe financial crisis resulted in the currency depreciation of these countries. This madeexports from South Asian countries to the Southeast Asian countries uncompetitivebecause of the increase in price. On the other hand, imports from Southeast Asiancountries to South Asian countries increased. As a result, terms of trade were affected.
C In the case of the Islamic Rep. of Iran, however, exports did not reduce and importsincreased.
C Although in terms of trade, South Asian countries were affected adversely, yet the totalshare of exports from these countries in the world market was very small. Thus, thesecountries were able to absorb the shock of the financial crisis, except for Sri Lanka,where the rubber industry collapsed because it could not export a major portion of itsrubber products, due to low prices of rubber products in the world market.
C Agricultural lands are highly fragmented.C Low prices of agricultural commodities especially rice.C The share of exports to the national economies (GDP) of these countries was very
small. Thus, they were little affected by the crisis.2. SuggestionsC South Asian countries, including the Islamic Rep. of Iran, should take a cautious
approach in opening up its capital account to the international economy.C Establishment of transparent accounting standards and practices, and the public
disclosure of information are important in improving financial infrastructures.C Strengthen banks’ profitability and capitalization by restricting connected lending.C All support and subsidies to the agriculture sector in the developed countries should
be transparent and open, so that South Asian countries will able to adopt appropriatemeasures for the export of their agricultural products in the context of the WTOregime.
C Tariff rate quotas set by the developed countries should be totally abolished.C Agriculture in these South Asian countries should adopt low-cost technologies by
resorting to micro-watershed development, bio-fertilizer, integrated pest management,etc.
C An increase in the allocation of resources for agricultural research and development.C Organic farming should be promoted in view of the increasing international demand
for organic products.C Support farmers in terms of alleviating their loan burdens.

- 12 -
Group IICountry Issues Strategies
Rep. of China C Agr icu l tu re sec to r g rea t lyaffected by the financial crisis
C Increase in non-performing loansdue to weak financial funda-mentals and poor supervision
C Increased infrastructure investmentsby the government
C Extended the grace period for debtpayments
C Promotion of exportable commoditiesC Establishment of nationwide farm
bank (Resolution and TrustCorporation [RTC])
C Encouraged agricultural cooperativesto merge
C Updated the capacity of farm organi-zations
Indonesia C Reduction in the budget allocatedfor agricultural projects, e.g., irri-gation and credit
C Agriculture generally unaffectedexcept those dependent on im-ported inputs for production, e.g.,livestock and poultry
C Increase in food pricesC Decline in the real wage rate
C Increased exportsC Expansion of existing subsidized
credit programC Efforts to fund substitutes for live-
stock intermediate inputsC Allocation of food safety and budgetC Promotion of crop diversity
Malaysia Small farmers:C Decrease in farm creditC Decrease public spendingC Increase in input prices more than
the increase in output pricesPlantation sector:C Gained due to the appreciation of
the US dollar
C More credit and incentives for smallfarmers
C Reduce the food import billPlantation:C Encourage diversification of fruit
cropsC Encourage private companies to en-
gage in food productionSmallholder:C Encourage group farming among
farmers
Phlippines C Reduction in government alloca-tion to the agriculture sector
C Increase in inflation and interestrate
C Reduction in government alloca-tion to the agriculture sector
C Increase in inflation and interestrate
C Agriculture/fisheries modernization3 Productivity and competitiveness3 Increase access to land and other
production resources3 Promote sustainable use of
resources3 Empower stakeholders and
rationalize the function of insti-tutions
Mongolia C Agriculture sector unaffected dueto little integration with otherAsian economies
C Increase access of farmers to com-mercial banks
C Privatization of farms... To be continued

- 13 -
ContinuationCountry Issues Strategies
Thailand C Temporary reduction in the laborproductivity of agriculture (highoutflow of laborers from theindustry)
C Perceived long-term decrease inlabor
C Temporary gain for tradable agri-cultural commodities due todepreciation
C Temporary reduction in budgetallocated for agriculture
C Decrease in non-farm incomeC Increase in farm debt
C Restructure the agricultural produc-tion system3 Encourage production of high-
value crops through field researchC Rely on market mechanism rather
than government interventionLong term: Improve R&DC Restructure the agricultural budget to
allocate more funds for researchinstead of construction or extension
C Focus on the provision of technicalassistance instead of monetarysupport
Rep. of Korea C Serious impact on agriculture dueto high dependence on importedintermediate inputs
C Decrease in agricultural producti-vity there was recovery in 1999but not equal to the pre-crisislevel
C Farm debts increasedC Large farms and horticulture
farms suffered severely
C Reform the agricultural financialsystem
C Provision of income subsidiesC Promotion of technology innovationC Structural adjustments for improving
the competitiveness of agriculture
General measures to alleviate the adverse effects of the financial crisis:C Reform/restructure the farm credit system to improve operational efficiency and to
relieve the debt burden of farmers (Rep. of Korea and Indonesia)C Restructure the agricultural production/marketing systems to emphasize more on high-
value products, raise farm productivity, and improve marketing efficiency (Thailandand Malaysia)
C Strengthen R&D activities and reallocate the budget for agriculture (Thailand)C Promotion of agricultural exportC Strengthen farmers’ associations/cooperatives to better serve farmer members (Rep.
of China)C Accelerate land reform activities (Philippines)C Promotion of group farming (Indonesia)C Introduction of a food bill scheme (Malaysia)C Increase subsidies on farm inputs and farm credit interest rates (Indonesia and Rep. of
Korea)
FIELD VISITS
The participants visited the following three Japanese Agricultural (JA) Cooperativesin the Gunma prefecture in order to observe the on site situation of agricultural productivityin the host country: 1) JA Sawada; 2) JA Maebashi-shi; and JA Katashina-mura.
- 14 -
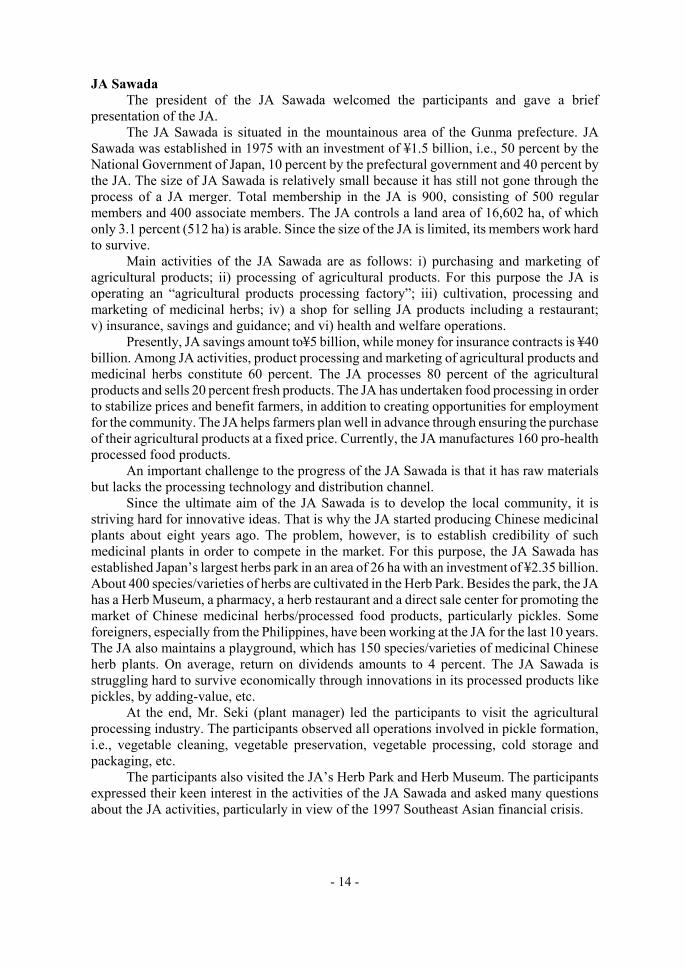
JA SawadaThe president of the JA Sawada welcomed the participants and gave a brief
presentation of the JA.The JA Sawada is situated in the mountainous area of the Gunma prefecture. JA
Sawada was established in 1975 with an investment of ¥1.5 billion, i.e., 50 percent by theNational Government of Japan, 10 percent by the prefectural government and 40 percent bythe JA. The size of JA Sawada is relatively small because it has still not gone through theprocess of a JA merger. Total membership in the JA is 900, consisting of 500 regularmembers and 400 associate members. The JA controls a land area of 16,602 ha, of whichonly 3.1 percent (512 ha) is arable. Since the size of the JA is limited, its members work hardto survive.
Main activities of the JA Sawada are as follows: i) purchasing and marketing ofagricultural products; ii) processing of agricultural products. For this purpose the JA isoperating an “agricultural products processing factory”; iii) cultivation, processing andmarketing of medicinal herbs; iv) a shop for selling JA products including a restaurant;v) insurance, savings and guidance; and vi) health and welfare operations.
Presently, JA savings amount to¥5 billion, while money for insurance contracts is ¥40billion. Among JA activities, product processing and marketing of agricultural products andmedicinal herbs constitute 60 percent. The JA processes 80 percent of the agriculturalproducts and sells 20 percent fresh products. The JA has undertaken food processing in orderto stabilize prices and benefit farmers, in addition to creating opportunities for employmentfor the community. The JA helps farmers plan well in advance through ensuring the purchaseof their agricultural products at a fixed price. Currently, the JA manufactures 160 pro-healthprocessed food products.
An important challenge to the progress of the JA Sawada is that it has raw materialsbut lacks the processing technology and distribution channel.
Since the ultimate aim of the JA Sawada is to develop the local community, it isstriving hard for innovative ideas. That is why the JA started producing Chinese medicinalplants about eight years ago. The problem, however, is to establish credibility of suchmedicinal plants in order to compete in the market. For this purpose, the JA Sawada hasestablished Japan’s largest herbs park in an area of 26 ha with an investment of ¥2.35 billion.About 400 species/varieties of herbs are cultivated in the Herb Park. Besides the park, the JAhas a Herb Museum, a pharmacy, a herb restaurant and a direct sale center for promoting themarket of Chinese medicinal herbs/processed food products, particularly pickles. Someforeigners, especially from the Philippines, have been working at the JA for the last 10 years.The JA also maintains a playground, which has 150 species/varieties of medicinal Chineseherb plants. On average, return on dividends amounts to 4 percent. The JA Sawada isstruggling hard to survive economically through innovations in its processed products likepickles, by adding-value, etc.
At the end, Mr. Seki (plant manager) led the participants to visit the agriculturalprocessing industry. The participants observed all operations involved in pickle formation,i.e., vegetable cleaning, vegetable preservation, vegetable processing, cold storage andpackaging, etc.
The participants also visited the JA’s Herb Park and Herb Museum. The participantsexpressed their keen interest in the activities of the JA Sawada and asked many questionsabout the JA activities, particularly in view of the 1997 Southeast Asian financial crisis.

- 15 -
JA Maebashi-shiThe vice president of the JA Maebashi-shi welcomed the participants, while his staff
gave a brief presentation on the JA.The JA Maebashi-shi is situated 18 km from Maebashi city. This JA was originally
established in October 1987, but the existing JA is much larger because it is the result of themerger of 12 JAs that took place in 1993. Three basic policies, which govern the activitiesof the JA Maebashi-shi, are as follows:
1. Promotion of highly productive agriculture using local resources2. Working in harmony with the environment and local communities3. Strengthening the JA and building people’s trust in the JA.
The JA has a total membership of 15,083 with 12,997 households. The number ofregular and associate members is 8,558 and 8,525, respectively with 7,841 and 5,156households. The JA has a board of executives consisting of 32 members and a board of sevenauditors.
The JA further consists of, among others, 12 branches for overall management, 176branches for agriculture, 110 women organizations, 12 branches for horticulture, etc. Thetotal number of JA staff in Maebashi city is 359.
The JA Maebashi-shi is blessed with a variety of agricultural products. Totalproduction in the area is worth ¥20 billion, of which production worth ¥12 billion is sold atthe JA. Sales of animal husbandry products and fruit comprise 34.7 and 22.3 percent,respectively. The JA maintains very elaborative and transparent accounts pertaining to itsproduction, income, expenditure, etc.
Farmers produce, harvest, and pack the agricultural products and bring them to the JA.The JA is responsible for the sale of these products. Prices of vegetables and meat are setthrough bids, while rice is marketed voluntarily; its price depends upon the brand and site ofproduction.
The Asian financial crisis had no direct impacts on the JA farmers because they weregranted credit without any hesitation. However, the crisis had its implications for the nationallevel JA administration. Similarly, the WTO has its own implications for the farmers as it hasresulted in a decline in the price of vegetables and thus has adversely affected farmers’incomes.
The participants also observed the various facilities at the JA’s main building. The JAhas provided a sale shop to the member farmers, where they could bring their agriculturalproducts, particularly the vegetables, fix prices themselves and sell the products. Similarly,the JA maintains an information center, where not only information on production andmarketing of agricultural products is provided to the members through the internet, butcomputer training is also provided. The farmers are organized into groups based on the typesof agricultural products they produce. Main vegetables grown in the JA include thecucumber, spinach, eggplant, tomato, etc. which are mainly sent to Tokyo. The participantsalso visited the JA nursery facility for vegetables. At this facility, seedlings of the improvedvegetable species/varieties are raised and given to the member farmers for production on 75ha of land. Organic farming is practiced on less than 10 percent of the total land areaallocated for vegetables.
The participants showed keen interest in the various activities of the JA Maebashi-shiand asked many questions to better acquaint themselves about the JA operations in Japan.

- 16 -
JA Katashina-muraMr. Yoshitsugu Miura, general manager, and Mr. Denroku Hoshino, manager of the
JA, welcomed the participants to the JA Katashina-mura.The JA is situated in a small village, namely Katashina, at an altitude of 810 m above
sea level. The JA was established in 1948. Total population of the village is 6,300 with 1,700households. The number of regular JA members is 1,060. Total area of the village is 39,150ha, of which 92.1 percent (36,038 ha) is under forests, etc., and is owned by the NationalGovernment. Sightseeing and agriculture are the two selling points of this village. It has eightskiing grounds, so heavy snow is always a blessing for the village.
The JA Katashina-mura is a unique agricultural cooperative. It promotes bothagriculture and tourism activities in the village. That is why it did not participate in theongoing mergers of JAs in Japan and has thus maintained its identity.
Regarding agricultural activities, the JA’s main concern is to promote agriculture inthe village, especially for its members. This is the second largest JA in the Gunma prefecture,based on cropped area. The relationship between the JA and the village government isexcellent. Main crops grown are the upland vegetables such as Japanese radishes andtomatoes. Due to high day temperatures and low night temperatures, these upland vegetablesare of very good quality and are thus sold in the Tokyo market. Besides vegetables, the JAhas some areas for rice and it also has a limited number of livestock. The annual turnover ofthe JA is ¥1.1 billion per year.
Tourism is an important activity for the Katashina-mura, which has 300 residencesavailable for rent to tourists. The JA operates 80 such residences and thus directly participatesin promotion of the local tourism. About 0.4 million tourists visit the village annually, whilemore than one million tourists pass through the village every year. The JA plays an importantrole in the promotion of tourism and earns much more income from tourism than agriculture.
The JA is private and does not receive any government subsidy for its managementoperations. The JA provides the following services to its members: i) guidance on agriculturalbusiness; ii) guidance on tourism, particularly, how to attract more tourists to the guesthouses; and iii) organize special events for the informal education and recreation of thevillage children.
The participants expressed their keen interest in the uniqueness of the JA Katashina-mura, but could not observe any ongoing JA activities due to heavy snowfall during the visit.
CONCLUSION
In view of the very different effects of the 1997 Southeast Asian financial crisis on theagricultural productivity of the APO member countries and diverse challenges they face inagricultural development, no specific common strategy could be formulated by theparticipants. However, all the participants emphasized the need for policy and institutionalreforms relevant to the situation of the individual countries to avoid such a crisis in the future.Also, improvement in agricultural productivity through the support of the farm sector willallow proper and sustainable use of resources, which would in turn produce value-addedagricultural products.
1 The Baht (B/ ) was floated on 2 July 1997, which caused the nominal rate to climb fromB/ 25-26 to B/ 40 to the dollar and then jumped to B/ 41 by April 1998. At the time of writing (28November 2000), the exchange rate is about B/ 44 to US$1.
2 Despite the fact that recovery has been occurring since 1999, most affected economies are stillexperiencing difficulties, especially in the financial sectors.
- 19 -
1. IMPACT OF THE 1997 FINANCIAL CRISIS ONSOUTHEAST ASIA’S FARM SECTOR WITHA SPECIAL REFERENCE TO THAILAND
Prof. Dr. Tongroj OnchanPresidentThe MekongEnvironment and Resource Institute (MERI)BangkokThailand
INTRODUCTION
Before the unexpected financial crisis, which started in Thailand in July 1997,1 therapid economic development of Asia was of much interest worldwide. The success achievedalso generated much debate on whether the Asian model was specifically for Asia or if itmight be applicable to other regions. Another point of interest was about the major factorsthat contributed to such a rapid growth. Though there are major differences between thevarious Asian countries, the high growth performance could be explained by sound economicfoundations encompassing competitive exchange rates, investment in the export sectors, lowinflation, high gross domestic savings, low deficits, the high priority of education, highforeign direct investment rates and relatively even distributions of income. These factors wereresponsible for Asia’s GDP growth of 7.8 percent in the 1980s and 9.9 percent over theperiod of 1990-97, compared to the world averages of 3.1 percent and 2.3 percent for thesame periods (World Bank, 1993; and ADB, 1997). Since 1970, Asia’s share of the world’stotal GDP has almost tripled. In 1997, three of the Asian economies, namely Japan, Singaporeand Hong Kong had higher per capita incomes than Sweden (Ministry of Foreign Affairs,Stockholm, 1999).
The Asian economic miracle during the 1980s to the mid-1990s had a great impact onthe Asian economies, especially in terms of poverty reduction, increase in income and ahigher standard of living. Expectation was also high, in regards to the sustainability of theincome growth and the higher level of development of several countries that would soon forma group known as the NICs (newly industrialized countries). In fact, there were very fewpeople who could foresee that many Asian countries would face an unprecedented economicand social crisis or that the crisis would be so serious as to continue to the present day.2

3 It must be noted that the majority of the poor people living in rural areas are farmers withsmall or no land.
- 20 -
However, this does not mean that there were no clear warning signs before the crisis.Large and rising current account deficits, extremely high levels of bad loans and extensiveunproductive investments, mostly in speculative real estate and stock markets, wereexperienced especially in Thailand, Indonesia and Malaysia. Furthermore, since the early1990s, the competitiveness of the ASEAN countries deteriorated. Also, foreign directinvestment declined, which led to high inflation and overvalued local currencies. This wasbecause they were usually pegged with the US dollar, which greatly appreciated as the localcurrencies become overvalued. However, these warning signs were mostly neglected becausemost people were led to believe that the recession was cyclical rather than structural incharacter. This thinking has proven to be a very costly assessment of the situation.
Needless to say, the crisis has had a deep impact on the economies of the most affectedcountries, namely Thailand, Indonesia, Malaysia, the Republic of Korea (hereafter referredto as Korea) and the Philippines. As the World Bank puts it, “What started as a financialcrisis has now developed into a comprehensive social crisis”. This is quite obvious, since thepoor has little or no savings to fall back on. They have little or no access to credit, especiallyfrom formal sources, and they have little or no assets to sell. Thus, the crisis has more serioussocial implications.3
The pathways to the social impacts of the Asian crisis can be illustrated with a diagramas shown in Figure 1. The crisis started with capital flight, which led to the depreciation ofthe local currency, followed by the unviable corporate balance sheets (financial problems).Then came the credit crunch that caused falling output (farm, non-farm), which thendecreased the demand for labor. This led to a shrinking government revenue that forced areduction in government spending, especially on social programs. Other problems includedhigher inflation/cost of living and lower wages or rising unemployment. As regards to thefarm sector, migration back to the rural sector by the unemployed workers, especially fromthe construction and manufacturing sectors, increased rural poverty. This might have causedlower farm production and income.
In sum, the major social impacts of the crisis are as follows:
1. Labor DemandThe short-run impact on households was a reduction in demand, due to layoffs, and a
reduced demand for products by urban and rural enterprises.2. Prices
Changes in the prices of commodities, public services, tax and subsidy compensatedfor the declining income caused by lower wages and/or unemployment.3. Public Spending Cuts
This was due to the reduction in government revenue.4. Changes in Assets
These may have had distributional effects, on both the rich and the poor. Prices of realestate properties and stocks declined sharply, while the poor might have had to sell theirassets, e.g., land, to compensate for their declining income.5. Long-term Impacts on Capabilities
For different socio-economic groups, the effects may be different, especially in regardsto nutrition, health, and education.

- 21 -
Initial Causes Second Round/Contagion Effects
Initial Impulse Local CurrencyDepreciation Capital Flight Other Currencies
Depreciation
Unviable CorporateBalance Sheets Increasing Export
Competition and FallingExport Demand
Rising Costs ofTradable Inputs
Credit Crunch
Falling Output
Falling Demandfor Labor
Falling GovernmentRevenue
Higher FoodPrices/Costs of
Living
Lower Budgetsfor a Number ofSocial Programs
Higher FoodPrices/Costs of
Living
Impacts onPeople/Families
Figure 1. Pathways of the Asian Financial and Economic Crisis to Social Impacts
Note: Thailand Development Research Institute (TDRI), 1999 adapted from Ammar and Orapin, 1998, p. 11.

- 22 -
This paper focuses on the impact of the financial crisis on the farm sectors of SoutheastAsian countries, with a special emphasis on Thailand. As the data on the impact of crisis onthe farm sector at the regional level is limited, I will briefly discuss the crisis impact mainlyon the general economies of the five affected countries. Then, a case of Thailand’s farmsector will be presented. This should be of particular interest as the crisis started in Thailand.Also, the impact on the Thai economy has been very serious, especially among the poor.During this uncertain period of economic recession, the farm sector has been of muchattention, as it could provide the necessary social safety net that has been absent in Thailand.The data used in the study are from farm household surveys conducted in 1995/ 96 (pre-crisisyear) and in 1998/99 (post-crisis year). The effects on consumption, income, production,credit, and assets will be discussed and conclusions will therefore be drawn.
THE SOCIO-ECONOMIC IMPACT OF THE FINANCIAL CRISISIN THE AFFECTED SOUTHEAST ASIAN COUNTRIES
The Asian financial crisis quickly caused marked contractions in both the GDP andemployment of the affected economies of Indonesia, Korea, Malaysia, the Philippines andThailand. The declines in GNP per capita were very sharp, especially in Indonesia (Table 1)in 1998. The shrinkages in GDP ranged from about 0.6 percent in the Philippines to 13percent in Indonesia, while those in the agriculture sector ranged from 1.4 percent in Thailandto 6.6 percent in Korea. However, Indonesia’s agriculture had a positive growth rate of 0.8percent (Table 2). Despite some signs of recovery at present, these economic recessions havesignificant social consequences which are likely to persist for some time, even after theeconomies return to a normal and stable state.
Table 1. Per Capita GNP in Five Southeast Asian Countries, 1996-98(Unit: US$)
1996 1997 1998
Indonesia 1,100 1,110 640Rep. of Korea 10,590 10,550 8,600Malaysia 4,330 4,530 3,670Philippines 1,160 1,200 1,050Thailand 2,930 2,740 2,160
Source: Asian Development Bank (ADB), 2000b.
As mentioned earlier, conceptually, the financial and economic crisis can exert adversesocial impacts in five ways: prices, labor markets, assets, credit and government budget.These impacts may vary in severity by social groups, e.g., urban vs. rural, or rich vs. poor.Our main attention here will be the impact on prices, employment, income, poverty, incomedistribution and human development.

- 23 -
Box 1: The Worsening Agricultural Performance of Asian Countries during 1998-99
A major factor behind the slow growth of output in developing countries is theworsening performance of the Far East and the Pacific developing region. Productiongrowth in this region slowed to only 1.8 percent in 1998. Bad weather conditions,particularly June to September torrential rains in some countries and El Niño-relateddroughts in others, were the main common factors behind the worsening performance. Theprovisional estimates for 1999 indicate that regional production growth may have slowedeven further, to only 1.2 percent. Such developments are, to a large extent, determined bythe situation in China where, after six consecutive years of output growth at more than 5percent of growth rate, in 1998, affected parts of the country fell to a more modest 3.3percent. The reduction in output growth was caused by floods in the central areas of thecountry that damaged the rice and wheat crops. Provisional estimates for 1999 point toalmost stagnant production, with an increase in output of less than 1 percent. A slightreduction, in paddy output is expected, partly owing to the lowering of the state purchasing
Table 2. Growth Rates of GDP and GDP of Agriculture(Unit: Percent)
GDP Agriculture
1996 1997 1998 1999 1996 1997 1998 1999
Indonesia 7.8 4.7 -13.2 0.2 3.1 1.0 0.8 0.7Rep. of Korea 6.7 5.0 -6.7 10.7 3.3 4.6 -6.6 4.7Malaysia 10.0 7.5 -7.5 5.4 4.5 0.4 -4.5 3.9Philippines 5.8 5.2 -0.6 3.3 3.8 3.1 -6.4 6.0Thailand 5.9 -1.7 -10.2 4.2 3.6 0.4 -1.4 -8.6
Source: ADB, 2000b.
Prices and Farm OutputCurrency devaluations had an almost immediate impact on the prices of goods and
services which had high import contents. Inflation was particularly serious in Indonesia,where food prices rose markedly. In the farm sector, prices of farm inputs, e.g., fertilizers,fuel and animal feeds, also increased sharply. These increases in input prices have had aneffect on farm output. In Indonesia, for example, the price of poultry feed increased fromRp.700/kg to Rp.3,000/kg, which caused a decline in output. In the Philippines, prices offarm inputs increased by 15-100 percent; animal feeds increased nearly 100 percent in priceand the price of fertilizer was raised by 30-60 percent (Knowles, et al., 1999).
As reported by the FAO, after the crisis at the global level, agricultural (crop andlivestock) production has been rather disappointing. In 1998, it expanded at the rate of only1.1 percent, which was the lowest since 1993. Agricultural production of developingcountries grew by only 2.6 percent, lower than the rate of 2.9 percent in 1997. A major factorfor the slow farm output growth in developing countries is the worsening performance of theAsia and Pacific developing region (FAO, 2000; and see Box 1). In the five crisis-affectedcountries, paddy production declined considerably in 1998, compared to that of 1996.However, some improvements were observed in 1999 (ADB, 2000a).

4 Data from the government labor force surveys (Sigit, 1998). This is quite different fromanother estimate which reports a very high rate of 10.3 percent (TDRI, March 1999).
- 24 -
prices for inferior quality grains and to crop damages caused by heavy rains in June andJuly. India recorded a slight reduction of less than 1 percent in agricultural output in 1998,while a modest recovery was expected to take place in 1999. Other larger countries in theregion suffered either declines in agricultural production (Indonesia, the Philippines, theRep. of Korea, Thailand, Malaysia) or slowdowns in output growth (Bangladesh,Cambodia) during 1998. Resumed output growth was expected in 1999 in most of thesecountries, with the exceptions of Indonesia and the Rep. of Korea. The productionestimates now point to Vietnam as the most consistently positive agricultural performer inthe region, with rates of production growth near or above 5 percent for the past eight years.
Source: FAO, 2000.
Percent
10 1997 1998
9876543210 Country
Indonesia Korea Malaysia Philippines Thailand*
EmploymentUnemployment rates increased in all countries, with the largest increase set by Korea
(Figure 2). Unemployment has also been a serious problem for Indonesia. Between Augustof 1997 and 1998, the unemployment rate in Indonesia rose from 4.7 percent to 5.4 percent,4and the crisis has had much more severe effects in urban areas. This is quite different fromThailand’s experience, where the rural economy experienced rising unemployment.Furthermore, the traditionally poor Northeastern region had been much adversely affected.In Malaysia, unemployment was estimated to rise from 4.5 percent to 5.5 percent, at the endof 1998. In the Philippines, the upper and middle class, especially those living in urban areas,were most affected by the crisis.
Figure 2. Unemployment Rates in Five Southeast Asian Countries, 1997-98
Sources: APO, Asia-Pacific Productivity Data and Analysis, 2003.Note: * Wet season (August).

- 25 -
Another interesting aspect of employment problems is the expansion of informalsectors in some countries, namely Indonesia and Korea. Information on this issue is notavailable in other countries, but it is likely that they have similar experiences. This seems tobe the case in Thailand, where the unemployed started several types of trading activities inurban areas.
IncomeAs unemployment increases, inflation rises, wage decreases, and thus household
incomes in the five affected countries have declined significantly. In Thailand, for example,over 50 percent of the households reported a decline in income, the highest proportion beingin the Northeast. Rural household incomes have also been affected by reduced remittancesfrom the urban sectors as well as by higher food prices (TDRI, 1999, p.9). In the Philippines,remittances declined by 14 percent between 1997 to 1998. In Indonesia, however, due to asharp increase in overseas migrant workers after the crisis, the level of remittances increaseddramatically from US$1.30 billion in 1997 to US$3.51 billion in 1998 (up until Octoberonly). In the Philippines, massive business closures are likely to impose the greatest incomelosses on middle to upper income groups. In addition, non-labor income (i.e., interest, rentand profits, including the income of the self-employed) has also been adversely affected.Income in the forms of rent and profits is expected to be especially hard hit by the crisis. InThailand, the largest declines in real income are experienced by entrepreneurs, in bothagriculture and non-agriculture sectors.
In the farm sector, shortage of credit was reported for farm and enterprise developmentamong poor families. They had to depend more on informal sources of credit, as bank loanswere not usually available to small farmers.
Overall, the available data showed that between 1997 and 1998 real per capitahousehold income declined by 20 percent in Korea and by 12 percent in the Philippines. InIndonesia, real per capita household expenditures declined by 34 percent in urban areas andby 14 percent in rural areas (Knowles, et al., 1999).
Inequality and PovertyAvailable information indicates that income inequality has increased during the crisis
in Thailand, Korea, and the Philippines, but has probably decreased in Indonesia (ADB,1999). In Thailand, during 1996-98, the expenditure of the richest urban quintile (only 5.5percent of population) increased from 20.5 percent to 22.5 percent (Table 3). As indicatedby percent change in the mean and the median of real per capita expenditure in Table 4,Indonesia decreased by 54 and 41 percent, respectively. In the Philippines, between 1997 and1998, the degree of income inequality increased sharply as the share of the richest decileincreased from 39.3 percent to 42.9 percent, while everyone else held less income (Table 5).The situation in Korea is similar as the Gini coefficients increased from 0.28-0.29 during thelast three quarters of 1997 to 0.32-0.33 during the first three quarters of 1998 and the shareof the richest decile increased from 22 percent to 24-25 percent during the same period.
With regards to poverty, available data also suggests that the problem worsened in allfive countries. In Indonesia, for example, a poverty rate of 39.1 percent was projected by theCentral Bureau of Statistics. However, other estimates are much lower, which range from 14percent to 20 percent (Table 6). In Korea, the poverty rate increased sharply from 3 percentin 1997, to 6.4 percent in 1998 and 7.5 percent in 1998. In Thailand, the increase was from11 percent in 1996 to 13 percent in 1998 with the poverty rate being the greatest in ruralareas.

- 26 -
Table 3. Changes in the Size Distribution of Real Per Capita Household Expenditurein Thailand, 1996-98 (1996 and 1998 SES data)
ExpenditureGroups
Percent of Total Real Per Capita Percent Change inShare, 1996-981996 1998
Urban: I (low) 2.6 2.5 -1.2II 4.6 4.6 -0.2III 6.8 6.7 -1.4IV 10.0 9.7 -2.7V 20.5 22.5 10.1
Sub-total 44.5 46.1 3.8
Rural: I (low) 3.9 3.8 -2.2II 6.1 5.9 -4.2III 8.3 8.0 -4.4IV 11.8 11.3 -4.0V 25.4 24.9 -1.8
Sub-total 55.5 53.9 -3.0
Total 100.0 100.0 -Source: Calculated from data provided in Brooker Group (1999).
Table 4. Changes in Real Per Capita Expenditure in Indonesia between 1997 and 1998,by 1997 Quartile (IFLS* data)
Quartile Percent Change in Mean Percent Change in MedianI (low) 120 49II 42 12III -2 -19IV -54 -41Total -34 -2
Source: Poppele, Sumarto, and Pritchett, 1999.Note: * IFLS = Indonesian Family Life Survey.
Table 5. Size Distribution of Nominal Household Income in the Philippines,1997 and 1998 (1997 FIES and 1998 APIS data)
(Unit: Percent)IncomeDecile
1(low) 2 3 4 5 6 7 8 9 10 Total
1997 1.7 2.7 3.5 4.3 5.4 6.8 8.7 11.5 16.3 39.3 100.001998 1.2 2.2 3.0 3.9 5.0 6.3 8.3 11.1 16.1 42.9 100.00
Source: Reyes, et al., 1999.

- 27 -
Table 6. Alternative Estimates of Changes in the Poverty Rate in Indonesia, 1997-98
SourceUrban Rural Total
1997 1998 1997 1998 1997 1998IFLS, using BPSa inflation rates 9.2 12.0 12.4 15.2 11.0 13.8IFLS, using IFLS inflation rates 9.2 15.8 12.4 23.0 11.0 19.9“100 Village” survey, using BPSinflation rates 11.0 14.4“100 Village” survey, using IFLSinflation rates 11.0 18.6Susenasb data, using BPS inflation 14.5 17.2 18.0 19.0 16.9 18.3World Bank projection 5.0 8.3 15.0 17.6 10.1 14.1BPS projection 11.3c 39.1
Source: Sigit, 1998.Note: a Central Bureau of Statistics; b National Social and Economic Survey; and c refers
to 1996.
Human Resource DevelopmentDue to a sharp decline in household incomes and the need to maintain certain levels
of food consumption, expenditures on education have decreased (see Table 7 for the case ofIndonesia). At an aggregate level, education budgets have been cut in most of the crisiscountries, with the exception of Malaysia. Enrollment rates are reported to have declined insome countries. Furthermore, dropout rates from schools were reported to increase.
Table 7. Changes in Indonesian Household Expenditure Shares, 1997-98(Unit: Percent)
ItemUrban Rural
1997 1998 Change 1997 1998 ChangeFood 59.0 64.0 8 76.2 80.8 6Selected foods: 13.0 20.6 59 30.6 39.4 29
StaplesMeat 12.7 10.4 -18 12.5 9.7 -22
Non-food: 4.1 5.7 41 4.4 4.0 -9Alcohol/tobaccoHealth 1.7 1.5 -14 1.2 0.7 -40Education 4.9 4.5 -8 2.4 1.8 -24Household goods 8.2 6.8 -17 3.6 3.2 -12Transport 3.2 3.2 1 1.8 1.5 -16Clothing 2.9 2.5 -16 2.2 1.5 -32Housing 10.8 9.1 -15 6.1 4.8 -21Recreation 2.6 2.1 -2 1.8 1.7 -7
Source: Frankenberg, Duncan and Beegle, 1999.
5 This section is drawn from a report by MERI and the World Bank (June 2000). The valuablecontribution of Gershon Feder, Charles Mehl and Hanan Jacoby of the World Bank osespecially acknowledged.
- 28 -
Box 2: Crisis Impact on Thailand’s Rural Sector
The crisis has further exacerbated the following unsustainable trends:
C The proportion of the poor has increased to 13.0 percent and 12.4 percent in thefirst and second quarter of 1998, or equivalent to around 7.6-7.9 million people.
C The income gap has widened: the top 20 percent income group enjoyed a 56-percent share of total income, a slight increase from 1996; while the 20 percentlowest income earners shared the same portion of total income (4.4 percent); andthe middle income group lost income.
C The total number of unemployed in rural areas increased from 3.1 percent to 8.1percent and a decline in real income of 25 percent.
C Remigration back to rural areas has led to increased pressure on natural resources,and greater competition for agricultural land and limited off-farm employment.
C Public expenditures for social and rural development have been slashed:appropriations for social services, education, and public health declined by 32percent, 11 percent and 15 percent over the originally approved FY1998 budget.
C The social fabric is stressed, as a variety of surveys document an increase inconflicts among families and groups, in the number of street children, and in therates of child labor, prostitution, crime, and suicides.
Source: World Bank, 2000, pp. xii-xiii.
IMPACT OF THE CRISIS ON THAILAND’S FARM SECTOR5
This section will present in some detail the results of a study on the impact of the 1997crisis on the farm sector of Thailand. As the macroeconomic context of the 1997 crisis hasalready been mentioned, and a summary of the magnitude of the impact is given in Box 2,no discussion of this aspect will be made here. I will first mention the agriculture sectorduring the crisis, then I will discuss the changes in the farm household consumption, incomeand production (including credit and assets), before and after the crisis.
In conducting the study, various hypotheses concerning the plausible effects of thecrisis on farmers have been advanced (e.g., World Bank, 1999). Therefore, one of theobjectives is to determine whether the data reported in the two surveys are consistent withany or all of these hypotheses. The following questions are considered in the report.
C It is thought that urban unemployment resulted in a large emigration bank to the ruralareas and in a sharp decrease in remittances, choking off an important source of cashfor small farmers. Did this large emigration materialize and are the poor indeed soreliant on remittances? What has happened to off-farm income as a result of thecrisis?
C In rural areas, unemployment increased from 2.4 percent to 5.3 percent betweenFebruary 1997 and February 1999, and underemployment rose as well. The Northeast

- 29 -
region, the poorest in the country, was hit the hardest. What has been the regionaldistribution of the crisis impacts in rural areas?
C It has been hypothesized that the crisis hurt mainly the poorest households, andtherefore contributed to the increasing inequality. The overall poverty rate increasedfrom 11.3 percent of the population in 1996 to 12.4 percent during the second quarterof 1998. While the upper-income group increased its income level since 1996, albeitin modest terms, the low- and middle-income groups experienced a decline. Have theimpacts of the crisis been harshest on the rural poor?
C The credit crunch that followed the baht devaluation and the initial increase in interestrates purportedly caused a drop in rural credit, which further reduced the demand forcash inputs. Has there been a rural credit crunch, and did it differentially harm poorfarmers?
C As a consequence of the devaluation and other factors, the price of the main cash crop(rice) rose, and the price of the main purchased input (fertilizer) fell. While thesechanges benefitted farmers, there was also the El Niño drought, as well as the potentiallosses of off-farm income and credit supplies. What has been the net impact of thesevarious shocks on agricultural production and income?
The report investigates these questions using the household survey data, and in doingso, examines the channels through which the crisis was likely to have been transmitted toagricultural households – mainly the markets for inputs, outputs, labor and credit. Also, inassessing the consequences of the crisis on the rural sector, a particular effort is made toanalyze how families at different welfare levels have weathered the crisis. Understandingwho was affected and how is the first step toward formulating a policy to ameliorate theimpact of the crisis.
The Agriculture Sector During the CrisisIn terms of volume, the main crops cultivated in Thailand are paddy rice, tapioca
(cassava) and sugarcane (Table 8), all of which are important both as cash and staple crops.The two main types of paddy rice are glutinous (long grain) and non-glutinous (5 percentbroken), which offer low substitutability in terms of consumption, but are highly substitutablein terms of production. Rice is predominantly cultivated in the North, Northeast and Centralregions, and other crops also have distinct geographical patterns. Overall, corn and oilseedsrepresent only a small share of the cultivated area.
Table 9 shows the evolution of the average yearly farm-gate price index for a numberof subgroups of agricultural products. Grain and food crops, oilseeds and tropical beveragesenjoyed a substantial increase in real prices between 1997 and 1998. In particular, the realprice of tropical beverages increased by 85 percent, while the real price of grains, food cropsand oilseeds increased by almost 25 percent. The livestock sector, by contrast, experienceda real price decline, probably due to the fact that this industry relied heavily, until the crisis,on imported corn for animal feed. The increase in the feed-to-output price ratio that resultedfrom the devaluation of the baht might have led producers to accelerate the liquidation oftheir stocks, with a consequent decline in the real price of livestock products.
Overall, the devaluation of the baht brought higher farm-gate prices for farmers. Amore precise estimate of the amount of pass-through that actually occurred would require acloser look at the functioning of marketing channels, which is beyond the scope of this study.

- 30 -
Table 8. Output of Major Crops(Unit: 000 mt)
Type of Crop 1990 1991 1992 1993 1994 1995 1996 1997pPaddya 17,026.0 19,809.0 20,184.0 19,098.0 20,125.5 20,678.6 22,081.9 22,389.2Rubberb 1,250.0 1,340.0 1,500.0 1,553.0 1,737.0 1,810.0 1,937.0 2,100.0Maize 3,800.0 3,600.0 3,400.0 3,300.0 3,900.0 4,060.0 3,970.0 3,842.0Tapioca roots 19,705.0 20,356.0 20,203.0 19,091.0 15,374.0 17,387.8 18,087.9 15,958.5Sugarcane 40,563.0 47,430.0 34,711.7 37,568.6 50,458.9 57,693.4 56,190.0 42,270.0Mung bean 303 304 261 231 255.5 234 237.9 212.1Groundnuts 161 157 137 136 150.3 147 151.6 147.5Soybeans 500 436 435 513 527.6 386 352.3 366.3Sesame 29.2 32 31.5 32.8 31.8 33.5 34.3 34.7Coconutc 1,426.0 1,379.0 1,411.0 1,462.0 1,476.0 1,412.6 1,410.0 1,419.0Castor beans 23 28 12 10 7 5.7 5.6 6Cotton 97 129 99 67 77.9 80.7 75.1 70.2Jute and kenaf 191 139.1 151 144 126.8 79 74.3 73Kapok and bombax fiber 37 37.1 37.2 39.7 40.9 43 46.4 46.8Tobacco leaves 66.8 85.4 93.6 50.8 48.8 59.8 72.4 79
Source: Office of Agricultural Economics, Ministry of Agriculture and Cooperatives.Notes: a Paddy production in year t includes the first crop in year t/t + 1 and the second crop in year t.
b Rubber Research Institute, Ministry of Agriculture and Cooperatives.c Production converted at 1.25 kg per nut. Updated 25 June 1999.

- 31 -
B/ /mt16,000
14,000
12,000Wholesale, 5%
10,000
8,000
6,000Farm-gate, 5%
4,000
2,000
0 Month
Apr
. 199
5
July
Oct
.
Jan.
199
6
Apr
.
July
Oct
.
Jan.
199
7
Apr
.
July
Oct
.
Jan.
199
8
Apr
.
July
Oct
.
Jan.
199
9
Figure 3. Wholesale and Farm-gate Prices of Non-glutinous Rice, 5 percent Broken
Table 9. Farm Price Index (1984 = 100)1994 1995 1996 1997 1998
Combined index: 143.70 166.36 178.50 185.01 230.57Crops 140.69 166.97 179.34 183.39 239.40Grains and food crops 143.14 168.10 183.72 191.71 255.31Oilseeds 100.48 98.52 119.12 113.18 149.92Agricultural raw materials 146.12 195.80 180.08 157.47 158.81Tropical beverages 67.84 139.80 93.06 77.49 149.37Livestock 122.94 138.07 146.15 146.65 156.70Fisheries 175.81 185.05 193.63 235.75 293.16Forestry 246.84 271.21 310.47 312.78 311.12
Source: Computed from Office of Agricultural Economics data.
1. RiceSince rice is both the most important staple crop and a considerable source of cash
income for the average Thai farmer, we must first look at how the baht crisis may haveimpacted its price. Figure 3 shows the behavior of the price of a representative rice quality,5 percent broken, in baht per mt, on the wholesale Bangkok market and at the farm-gate. Itshows that both (nominal) prices rose with the onset of the crisis, though the wholesale pricerose by more than the farm-gate. Figure 4 takes July 1997 as the base period, and while itconfirms the previous point, it clearly shows that by March 1999, the two price seriesreturned to their pre-crisis levels. Thus, the crisis had only a transitory impact on the domesticprice of rice. Moreover, both the wholesale and the farm-gate prices decreased in real termssince July 1997. Finally, Figure 5, taking April 1995 as the base period, indicates that the twoprice series followed the same trend, as one would expect in the absence of dramaticstructural changes in the marketing channels or government price policies. Both pricesincreased in real terms by almost 25 percent. In sum, the crisis had only a temporary impacton the price of rice; thus it appears that the factors contributing to the increase in the realprice of rice between April 1995 and March 1999 are to be found in the pre-crisis period.

- 32 -
B/ /mt180Wholesale, 5%
160
140
120
CPI100
80Farm-gate, 5%
60
40 Month
Apr
. 199
5
July
Oct
.
Jan.
199
6
Apr
.
July
Oct
.
Jan.
199
7
Apr
.
July
Oct
.
Jan.
199
8
Apr
.
July
Oct
.
Jan.
199
9
B/ /mt250
Wholesale, 5%
200
Farm-gate, 5%
150
CPI100
50 Month
Apr
. 199
5
July
Oct
.
Jan.
199
6
Apr
.
July
Oct
.
Jan.
199
7
Apr
.
July
Oct
.
Jan.
199
8
Apr
.
July
Oct
.
Jan.
199
9
Figure 4.Wholesaleand Farm-gate Prices of
5 percent Broken Rice and CPI (July 1997 = 100)
Figure 5. Wholesale and Farm-gate Prices of5 percent Broken Rice and CPI (April 1995 = 100)

- 33 -
B/ /mt2,5002,000
1,500
1,000
5000
-500
-1,000Month-1,500
Apr
. 199
5
July
Oct
.
Jan.
199
6
Apr
.
July
Oct
.
Jan.
199
7
Apr
.
July
Oct
.
Jan.
199
8
Apr
.
July
Oct
.
Jan.
199
9Figure 6. Premium of Glutinous (Long Grain) over Non-Glutinous
(5 percent Broken) Rice: Nominal Farm-gate Prices
A complicating factor is that there are geographical differences in the production ofrice qualities. Glutinous rice is produced and consumed mainly in the upper North andNortheast regions, while non-glutinous rice is consumed mainly in the lower North, Central,and Southern regions. Thus, when examining the geographic patterns in farm income growth,it is important to consider whether the prices of the two rice qualities have displayedsignificant differences across the time period under examination. Figure 6 shows the behaviorof the price premium of glutinous over non-glutinous rice. During most of 1997-98, non-glutinous rice is bought at a discount at the farm-gate. Thus, rice farmers in the regions whereglutinous rice is produced can be expected to have done well relative to farmers in non-glutinous regions, in terms of revenue growth.
Table
10 reports the farm-gate price of selected crops and livestock, and confirms that, in real terms,the price of rice increased by 43-86 percent between 1995 and 1998, depending on thequality. By contrast, the prices of sugarcane, cassava, corn, livestock and livestock productsdecreased in real terms. Price increases for rice are higher than those reported above becauseTable 10 uses average yearly data, and the 1998 data do not reflect the subsequent pricedecline that cancels the initial devaluation effect.2. Fertilizer
The most important variable input, second to labor, is fertilizer. Table 11 shows theevolution of fertilizer prices. As the government subsidizes the cost of commercialization andtransportation to rural areas, the relevant price, when considering those farmers that hadaccess to the program, is the wholesale price. The rest of the farmers pay the retail price. Inthe absence of a suitable fertilizer price index, consider the price of urea (46-0-0), thefertilizer commonly used by rice producers. First, note that the increase in the wholesale andretail price of fertilizers during 1997 and 1998 was less than the rate of the baht depreciation.This partly reflects the fact that the international price of urea declined during this period, by19 percent in US dollar terms (World Bank, 1999). Given a rough 35-percent devaluation ofthe baht during the same period, a one-to-one pass-through of the international price to thewholesale price would, therefore, have resulted in a 16-percent increase, as indicated in Table9. At the retail level, the nominal increase was even lower. Also note that between 1995 and

- 34 -
1999, the period of the household survey data, the nominal wholesale price of urea decreasedby more than 20 percent, while the international price decreased by almost 58 percent. At thesame time, the baht lost 48 percent of its value against the US dollar. Therefore, it seems thatover this longer period, the wholesale price of urea declined more than the sum of thedevaluation and the drop in the international price. This also holds for the retail price of urea.Thus, both in nominal and real terms, there was a strong decline in the price of fertilizers, atboth the wholesale and retail levels.
Table 10. Average Annual Prices of Selected Commodities, 1995-98(Unit: B/ /mt)
Year Non-glutinous/Glutinous Rice
SugarRice
LongGrain Rice Corn Cassava Livestock
1995 4,053 3,725 410 3.85 1.16 138.071996 5,189 4,664 394 4.06 0.91 146.151997 5,472 6,256 439 4.19 0.71 146.651998 6,629 7,694 485 3.93 1.31 156.70Percent change1995-98 63.6 106.6 18.3 2.1 12.9 13.51997-98 21.1 23.0 10.5 -6.2 84.5 6.9
Source: Ministry of Agriculture and Cooperatives.
Table 11. Average Yearly Fertilizer Prices, 1995-99Year 21-0-0 46-0-0 16-20-0 16-16-8 15-15-15
1995: CIF 2,680.46 5,756.03 4,723.05 4,949.19 5,600.54Wholesale 3,525.00 6,554.17 5,391.67 5,618.75 6,070.83Retail 4,440.00 7,200.00 6,200.00 6,660.00 7,000.00
1996: CIF 3,028.25 5,795.89 4,950.03 5,133.81 6,122.73Wholesale 3,770.83 6,354.17 5,570.83 5,725.00 6,362.50Retail 4,451.34 7,089.80 6,099.77 6,767.09 7,156.89
1997: CIF 3,436.01 5,326.94 5,075.56 5,399.39 8,178.80Wholesale 3,904.17 5,833.33 5,641.67 5,958.33 6,537.50Retail 4,626.42 6,954.00 6,222.25 6,552.25 7,543.92
1998: CIF 2,683.66 5,409.34 5,965.99 6,434.07 8,347.78Wholesale 4,208.33 6,788.00 7,404.17 7,754.55 8,637.50Retail 5,340.00 7,792.45 8,094.92 8,594.50 10,122.58
1999*: CIF 2,466.93 3,909.68 5,571.80 5,874.07 6,991.35Wholesale 4,000.00 5,114.29 6,342.86 6,828.57 7,850.00Retail 4,710.00 6,061.00 7,151.86 7,808.29 9,312.57
Percent change1995-98: CIF 0.12 -6.02 26.32 30.00 49.05
Wholesale 19.39 3.57 37.33 38.01 42.28Retail 20.27 8.23 30.56 29.05 44.61
1997-98: CIF -21.90 1.55 17.54 19.16 2.07Wholesale 7.79 16.37 31.24 30.15 32.12Retail 15.42 12.06 30.10 31.17 34.18
Source: Ministry of Agriculture and Cooperatives.Note: * Average price for January-July.

6 1 rai = 0.16 ha.7 The null hypothesis that the percentage change of the medians was equal across quintiles was
tested for each pair of quintiles. In order to do so, the standard deviation of th epercent changeof the medians by quintile was computed by bootstrapping the respective samples 600 times.The t-tests for equality across quintiles reject the null hypothesis in all cases at the 5-percentconfidence level.
- 35 -
To sum up, the aggregate price data indicates that rice farmers faced an improvedenvironment during the 1998/99 crop year as compared to 1995/96. While the real prices ofrice increased during the two crop years, this increase occurred mainly during the pre-crisisperiod. During the post-crisis period, the real farm-gate price of rice actually decreased.Moreover, fertilizer prices fell, despite the devaluation.
ConsumptionWere the rural poor especially hurt as a result of the crisis? This question is addressed
by first looking at changes in per capita household consumption, which is computed as thesum of cash and non-cash expenditures. A delicate issue in this kind of analysis is how tochoose an appropriate welfare ranking criterion. A common approach uses per capitaexpenditures in the baseline period. However, given the large transitory component ofexpenditures, and the relatively low precision with which expenditure is measured in the twosurveys, there is a high risk of ranking households improperly. In what follows, householdsare ranked using their per capita landholdings, which is adjusted for land fertility. Average(unadjusted) per-capita landholdings in rai6 ranging from the lowest to highest quintile areas follows: 1.3, 2.8, 4.8, 7.9 and 17.7.
Table 12 shows per-capita household expenditures by quintile and survey year.Medians are reported, here and throughout this report, in order to mitigate the influence ofoutliers. Two results appear striking when looking at these figures. First, all quintiles exceptthe highest one, display a real decline in per capita expenditures. Overall, the median percapita expenditure for the sample declined by 17.5 percent. Thus, the (unweighted) datasupport the hypothesis that the poorest households were hit the hardest by the crisis, but thedata also show that the richest households actually were better off.7 Similar findings areobtained when the expenditure data are weighted using information in the 1995 census toreflect the rural populations living in the corresponding regions. After weighing the data, thedeclines in consumption of the poorest households relative to the richest ones, are slightlymore pronounced.
Table 12. a) Per Capita Expenditure, by Quintile(Unit: B/ )
QuintileUnweighted Census-weighted
1995/96 1998/99 Percent RealChange 1995/96 1998/99 Percent Real
Change
1 7,496 7,705 -17.22 7,222 7,566 -15.242 7,956 7,411 -26.86 7,760 7,404 -24.593 8,396 9,012 -12.67 8,235 9,005 -10.654 9,668 10,717 -9.14 9,520 10,411 -10.645 11,676 16,096 17.85 11,360 15,995 20.80

- 36 -
b) Per Capita Expenditure, by Region(Unit: B/ )
1995/96 1998/99 Percent ChangeNortheast 7,631 8,595 -7.4North 9,776 9,119 -26.7Central 10,708 15,457 24.3
Second, there are important regional differences in consumption changes, as shown inTable 12b. Households in the Central region increased their consumption level substantiallyfrom the first to the second survey. On the other hand, households in the North regionsuffered a dramatic decline in real consumption, while the Northeast region suffered only amodest decline. The concern that rural households were hit hard by the crisis seems justifiedwhen looking at these results. The income data presented below also tell a very similar story,albeit with different magnitudes.
Farm and Off-farm IncomeHousehold income is composed of farm profits and other income from both agricultural
and nonagricultural sources. Farm profits are computed as the difference between farm outputvalue and costs. These include variable costs, which comprise of both crop-specific and jointcosts. Prices for goods produced but not sold are imputed using the same procedure as in thecase of consumption. Other (non-farm) income includes off-farm agricultural wage earnings,non-agricultural wage earnings, income from other businesses, government transfers andremittances.
Before turning to the findings, it is worth pointing out the dramatic differences acrossquintiles in the extent of income derived strictly from agricultural production. In the base year1995/96, the median share of farm profit in total income is a mere 30-percent for the lowestquintile and increases steadily by quintile as follows: 30 percent, 41 percent, 47 percent, 63percent and 75 percent. This fact has profound implications for the distributional impact ofthe crisis. Richer households are highly exposed to agricultural output and input price shocks;poorer households, by contrast, have comparatively greater exposure to labor market shocks.As has been shown, over the crisis period, rice and fertilizer prices moved in a directionfavorable to farmers, while the labor market performed badly. The poor, therefore, shouldhave suffered relative to the rich in terms of income growth.
Table 13 confirms this simple intuition, showing that in real terms the per capitaincome of the two poorest quintiles decreased between the two survey periods, while that ofthe three upper quintiles increased. In fact, both farm profits and non-farm income decreasedfor the two lowest quintiles and increased for the upper three quintiles. Especially strikingis the spectacular rise in farm income for the highest quintile. Non-farm income growth wasalso higher for the better-off households, but not nearly as skewed as farm income growth.Similar results are seen in the weighted data. One can speculate that households in the higherquintiles obtain more of their non-farm income from skilled labor, which was less affectedby the recession. In any event, the distance between the two extremes of the householdincome distribution almost doubled between the two survey periods. Thus, the hypothesis thatthe income distribution worsened as a consequence of the crisis may be well founded.
Regional differences are also marked, as Table 13b shows. The Central regionwitnessed an impressive increase in real income, while the other two regions basicallystagnated. The increase in income in the Central region was mainly due to soaring farmprofits, although non-farm income also increased considerably.

- 37 -
Table 13. Household Income
a) By quintile(Unit: B/ )
QuintileUnweighted Census-weighted
1995/96 1998/99 Percent RealChange 1995/96 1998/99 Percent Real
Change
Total income:1 12,506 13,126 -15.04 12,351 12,380 -19.772 12,121 12,464 -17.16 11,850 11,780 -20.593 12,716 17,144 14.82 12,356 17,073 18.184 14,571 18,995 10.36 14,463 19,006 11.415 15,962 30,472 70.90 16,041 30,111 67.71
Farm profits:1 2,475 1,987 -39.73 2,350 1,943 -37.322 3,870 3,897 -19.28 3,784 4,034 -13.393 4,333 6,337 26.25 4,362 6,363 25.874 6,638 9,564 24.08 6,098 8,566 20.475 6,705 18,406 154.53 6,540 17,265 143.99
Non-farm income:1 7,717 8,675 -7.58 7,700 8,250 -12.862 6,233 6,333 -18.40 6,200 6,167 -20.533 5,483 7,500 16.78 5,858 7,625 10.164 4,563 6,600 24.66 4,710 6,667 21.555 5,000 6,467 9.33 5,050 6,467 8.06
b) By region(Unit: B/ )
1995/96 1998/99 Percent Real ChangePer capita total income:
Northeast 11,854 15,370 9.7North 14,234 16,348 -5.1Central 16,902 29,297 53.3
Per capita farm profits:Northeast 3,219 4,529 20.7North 4,772 5,435 -6.1Central 3,962 12,791 202.8
Per capita non-farm income:Northeast 6,329 7,200 -6.2North 4,927 6,267 7.2Central 7,000 10,583 31.2
In sum, both income and consumption data tell similar stories; the poor were mostharmed by the crisis and attendant changes in the rural economy, and the North was the mostseverely affected region. The income and consumption data are not entirely in accord,

- 38 -
however, on the severity of the crisis. Consumption data exhibit more dramatic percentagedeclines than income data. Even though expenditure and income modules were compatibleacross the two surveys, it is typically the case that expenditures and income data collectedwith household surveys do not match up closely, for a variety of reasons. The discrepancyfound in the present analysis may be symptomatic of this more general problem; on the otherhand, economic factors could also play a part (see the discussion of asset changes below).
Remittances and MigrationThailand’s urban and rural sectors are closely linked by flows of remittances and
migration, so any discussion of crisis impacts in rural areas must consider these flows. AsTable 14 shows, only about a quarter of the rural households received remittances in 1998/99.Median remittances for the whole sample are thus zero for both crop years. Table 14 looksonly at those household with positive net remittances. The figures in this table are consistentwith the earlier findings on non-farm income and with the hypothesis that the downturn inthe urban labor market had negative consequences for rural households, especially the poor.That the richest households experienced an increase in net remittances might be due to theirurban relatives being more highly skilled and thereby less affected by urban unemployment.Their observed income gains may largely be of pre-crisis origin.
Table 14. Net Remittances
QuintileNet Remittances (households with
positive net remittances)Percentage of Households with
Positive Net Remittances
1995/9 1998/9 Percent Real Change 1995/96 1998/991 5,000 3,167 -56.7 16 222 4,500 3,850 -34.4 20 283 3,333 3,333 -20.0 24 264 3,000 3,333 -8.9 19 275 2,550 4,100 40.8 19 28
In sum, while there was a real decline in remittance income among recipienthouseholds (most sharply among the poor), the majority of rural households, particularly thepoorest ones, do not rely much on remittances. Once again, though, these findings must bequalified by noting that remittance income may easily be misclassified.
Turning to data on migratory flows, Table 15 covers the entire three-year periodbetween the two surveys. In order to capture migration decisions due to the crisis, the periodbetween the two survey years is divided into two: one period goes from approximately April1996 to March 1998, and the other period covers just the year prior the second survey. AsKakwani (1998) notes, the effect of the crisis should have begun to be felt in the urban labormarket by the beginning of 1998, so this breakdown should capture the labor force dynamicsthat the crisis put in motion.
The migration data show that, over the three-year period before the survey, morehouseholds had some of their members moving out (27 percent) than moving in (7 percent).A handful of households experienced both emigration and immigration of their members.Only 2 percent of the households had someone moving in before the crisis period. Thispercentage more than doubled during the year before the survey. Yet, the numbers involvedare so small that they can hardly be used to support the view of a major return migration to

- 39 -
rural areas. Out-migration has been quite steady and consistently greater than in-migration,except in the Central region, where during the year following the crisis more households hadsome members coming in than leaving. One caveat, however, is that sample from the Centralregion is less than half of the samples from the North and Northeast. Finally, there isevidence that the crisis deterred out-migration, most markedly in the North and Centralregions. The more dramatic fall in out-migration in the Central region might be explained byits proximity to Bangkok.
Table 15. Household Migration(Unit: Percent)
Percent by Region Northeast North Central Totala) During last three years
Move in 9.19 6.36 5.80 7.38Move out 39.72 17.09 25.00 27.37Move in and out 3.42 2.69 1.45 2.76
b) During last yearMove in 7.17 4.24 5.80 5.66Move out 20.09 5.37 4.71 11.07Move in and out 1.87 0.99 0.36 1.23
c) Between three years ago and last yearMove in 2.49 2.12 0.36 1.97Move out 25.70 12.01 21.01 18.94Move in and out 0.16 0.85 0.43 0.49
Overall, the picture that emerges from the data is that no massive migration back to therural areas has taken place since the crisis, and that out-migration seems to have slowedconsiderably.
Yields and Fertilizer UseDuring the 1998/99 (1995/96) crop year, rice was cultivated by 93.5 percent (91.2
percent) of the households in the Northeast, 77.4 percent (76.4 percent) in the North, and 71.3percent (69.3 percent) in the Central region. Overall, almost 83 percent of the 1,626 surveyedhouseholds cultivated rice during both crop years. No dramatic changes occurred in croppingpatterns between the two surveys.
Because of the importance of rice as a consumption and production good, the behaviorof rice yields is a key indicator of crisis impacts. Table 16 shows an overall increase in riceyields, but with farms in the Central region displaying the highest increase compared to farmsin the North and Northeast. Farmers in the Northeast, in fact, reported lower yields during thesecond survey. Interestingly, yields declined for farmers in the bottom two quintiles. Thisfinding is not merely due to the fact that the poor happen to live in regions that experiencedlower yields, since there are at least as many poor in the sample from the North where yieldsrose as there are from the Northeast where yields fell.
Some of the observed patterns in rice yields might be explained by the changes in theintensity of fertilizer used, as shown in Table 17. Fertilizer expenses are reported in nominalterms because the nominal price of urea was little changed between the two survey periods.Unfortunately, data on the quantities of chemical fertilizer are not available. Since the change

- 40 -
in the price of fertilizer is known, however, the change in fertilizer use can be inferred fromthe expenditure data. As Table 10 showed, farmers in all the quintiles increased their fertilizerexpenditures, which means that they must have increased their fertilizer use as well. To besure, the poorest farmers increased their expenditures the least, but this finding cannot govery far in explaining why their yields declined relative to richer farmers. On the other hand,the data certainly cast doubt on the hypothesis that the crisis led to a contraction in fertilizeruse.
Table 16. Rice Yields(Unit: kg/rai)
1995/96 1998/99 Percent Changea) By quintile
1 347 288 -16.92 369 350 -5.23 312 350 12.14 302 322 6.55 280 357 27.6
Total 320 333 4.1b) By region
Northeast 300.30 260.00 -13.42North 360.00 420.00 16.67Central 276.79 350.00 26.45
Table 17. Fertilizer Expenses(Unit: B/ /rai)
Quintile 1995/96 1998/99 Percent Nominal Change1 140 160 14.32 105 128 21.93 87 115 32.24 78 112 43.65 79 100 26.6
Given the dominance of rice, it is worth asking whether these yield changes translatedinto changes in farm profit. Certainly, the considerable yield increase in the Central regionis consistent with the large rise in farm profit reported in Table 13. In the Northeast, bycontrast, yields declined but profits rose. This finding might be explained by the fact thatglutinous rice is primarily grown in the Northeast and that the price of this variety rose moresubstantially than the price of ordinary rice. The experience in the North presents somewhatof a puzzle, since yields seem to have risen while profits fell in real terms, though not bymuch.
Finally, while rice yield and farm profit changes are encouragingly consistent acrossquintiles, the question remains why the poorest farmers have performed so badly. Neitherinformation on inputs or weather sheds much light on this issue. In the end, however, thequestion may be of limited significance, since these poorest households derive a relativelysmall proportion of their total income from farming their own land. Much more significant,from their perspective, is the decline in off-farm income.

- 41 -
CreditTo assess the hypothesis of a rural credit crunch, Tables 18 and 19 examine the
changes in the percentage of households receiving credit and in the average value of loansreceived by the households during the two crop years, from all sources and from the state-owned Bank of Agriculture and Agricultural Cooperatives (BAAC). Credit for buyingfertilizer and for consumption are treated separately, although the stated purpose forborrowing does not necessarily coincide with the final use of borrowed funds. An importantcaveat in interpreting the findings on credit is that supply and demand factors cannot bedistinguished with the data at hand; only the net change in use of credit is observed.However, if there was no significant fall in credit use, then it is reasonable to conclude thatthere could not have been much of a credit crunch (contraction in credit supply).
Table 18. Percentage of Farmers Obtaining Credit
a) Percentage of households obtaining a loan(Unit: Percent)
QuintileTotal Loans Consumption Fertilizers
1995/96 1998/99 1995/96 1998/99 1995/96 1998/991 32 29 3 5 6 42 34 41 5 7 6 133 39 43 4 4 5 144 42 49 3 6 9 155 52 61 5 5 11 23
b) Regions(Unit: Percent)
RegionTotal Loans Consumption Fertilizers
1995/96 1998/99 1995/96 1998/99 1995/96 1998/99Northeast 42 49 5 7 10 15North 37 38 3 5 7 9Central 43 51 3 5 2 25
c) Loans per household(Unit: B/ /household)
Quintile 1 2 3 4 5Total loans: 1995/96 24,500 25,000 20,000 25,000 30,000 1998/99 30,000 30,000 30,000 30,000 40,000 Percent real change 2.4 0.0 30.0 0.0 13.3Consumption loans: 1995/96 10,000 30,000 20,000 17,500 20,000 1998/99 12,000 30,000 10,500 20,000 20,000 Percent real change 0.0 -20.0 -67.5 -5.7 -20.0
... To be continued

- 42 -
Table 18. ContinuationQuintile 1 2 3 4 5
Fertilizer loans: 1995/96 10,000 19,190 10,900 20,000 20,000 1998/99 30,000 20,000 25,000 20,000 30,000 Percent real change 200.0 4.2 129.4 0.0 50.0
Table 19. Loans from the Agricultural and Cooperative Bank
QuintileHouseholds Obtaining Credit
from BAAC (percent)Medium-size Loan for Households
from BAAC (B/ /houseold)
1995/96 1998/99 1995/96 1998/99 Percent Real Change
1 23 24 15,500 20,000 9.02 20 23 10,000 15,000 30.03 25 24 12,000 20,000 46.74 29 28 15,000 20,000 13.35 35 34 20,000 30,000 30.0
Table 18a shows that only the poorest quintile reported a lower use of credit in thesecond survey compared to the first, and not much of a decline at that. Information on loansoutstanding is reported in Table 18b. No clear pattern emerges concerning the real changein outstanding loans. There appears to be a decline in consumption loans and a largeincrease in fertilizer loans, the latter finding consistent with the increase in fertilizerexpenditures reported earlier. Overall, though, there is no real sign of a credit crunch.Information on loans sizes and quantities disbursed by the BAAC in Table 19 reinforces thisconclusion. The percentage of farmers borrowing from the BAAC was stable between the twosurvey periods, and the median loan size increased for all quintiles.
AssetsTable 20 shows how these asset values changed by quintile and regions between the
two survey periods. The information is incomplete for quite a number of households, so theinformation reported below should be read with some caution. Nevertheless, one clear patternemerges. All households, except for those in the second quintile, experienced a sharp fall inthe value of their assets between the two periods. Regionally, asset values in the Northstagnated, while those of the other two regions showed a substantial decrease. Why shouldassets have depreciated so much? The overall increase in real farm profits is surely notconsistent with a fall in the value of assets, most of which are used in agricultural production.An initial tentative explanation is that the value of rural household assets was influenced bythe collapse in real estate values in urban areas. This has been a dramatic feature of the Thaicrisis, and it is likely that the fall in urban real estate values spilled over to rural areas. Onecan further speculate that the fall in asset values made households feel poorer and led themto limit their consumption plans; this may help explain why household expenditures fell morethan income, according to the survey data.

- 43 -
Table 20. Asset Values
a) Median Asset ValuesQuintile 1995/96 1998/99 Percent Real Change
1 90,879 88,333 -22.802 105,558 122,803 -3.663 159,810 159,736 -20.054 192,380 193,100 -19.635 302,158 300,483 -20.55
b) Regions1995/96 1998/99 Percent Real Change
Northeast 136,250 138,032 -18.69North 138,387 166,040 -0.02Central 268,861 274,150 -18.03
Conclusions and Policy ImplicationsBy combining two household surveys conducted before and after the 1997 economic
crisis, this report makes considerable progress in answering the questions posed earlier in PartIII. According to the data, the crisis indeed led to substantial changes in income andconsumption, but these changes were far from being equitably distributed among the ruralpopulation. While the analysis confirms some of the conventional wisdom about the ruralimpact of the crisis, other hypotheses put forth earlier are inconsistent with the data. Tosummarize:
C the analysis found little sign of a massive urban to rural migration, though thereappears to have been a slowdown in rural emigration. This finding is consistent withKakwani’s (1998) conclusion that the shock in the urban labor market was absorbedthrough lower wages and reduced work hours, rather than through unemployment.
C net remittances declined for all but the richest households – This again is consistentwith Kakwani’s (1998) findings that the poorest households experienced the largestdecline in this source of income. On the other hand, the poor are less reliant onremittances, and so, on balance, may not have been made so much worse off relativeto the rich. Overall, however, off-farm income (inclusive of remittances) declined forthe poor, but not for the rich.
C the regional impacts of the crisis have been heterogeneous, with the Central regionperforming much better in terms of consumption and income compared to both theNorth and Northeast. While unemployment figures suggest that the Northeast washardest hit, the household data indicate, rather, that the North fared the worst of thethree regions.
C the data strongly support the view that the poor have borne the brunt of the crisis.Between the 1995/96 and 1998/99 surveys, their expenditures and income (farm andoff-farm) fell both in real terms and those relative to the rich. These findings areconsistent with the fact that the poor derived most of their income from off-farmsources rather than from their own cultivation, whereas the situation is reversed for

- 44 -
richer farmers. The crisis and attendant events in the rural economy, conspired toimprove the profitability of rice production but worsened the labor market situation,thereby helping the rich and hurting the poor.
C evidence of a credit crunch is absent in the data. Although the information isinsufficient to distinguish changes in the supply of credit from changes in demand, arural credit crunch would have made itself apparent in a large decline of outstandingloans. Such a decline simply did not materialize.
C finally, the impact of the crisis on farm production and income was mixed. Richhouseholds did much better in terms of farm profits and yields than poor households,and households in the Central region did much better than those in the North andNortheast. It is possible that the beneficial macroeconomic events – higher rice pricesand lower fertilizer prices – were counterbalanced for smaller farmers by the reducedcash flow for input purchases (and to some extent by the regionally differentiatedimpact of the drought). However, differences in fertilizer expenditures across quintileswere not dramatic enough to explain differences in rice yields. In any case, since thepoorest farmers derive most of their income from non-farm sources, explaining theirrelative performance in their own cultivation is of secondary importance.
From the policy perspective, the findings of this report raise some important issues.One can envision two types of rural policy responses to the crisis: changes in agriculturalpolicy and changes in social policy (targeted to rural areas). As to the first type of policy,during the crisis period, the macroeconomic environment was generally favorable to Thaiagriculture, which has been made abundantly clear in this report. It could perhaps be arguedthat farmers would have benefitted more had increases in the international price of rice beenfully transmitted to the farm-gate. But even such a policy change would not have helped therural poor very much, as they are not the main beneficiaries of higher rice prices. Likewise,expansion of rural lending through the BAAC is unlikely to have been effectual, given theabsence of a credit crunch and no signs of reduced fertilizer use. Changes in social policy,by contrast, may be worth considering. Temporary social programs targeted to the rural poor,such as workfare, could be effective in providing support for households dislocated as a resultof the crisis. However, the situation in rural Thailand is fluid and must be closely monitoredas the economy recovers. Whether economic growth can fully repair the fabric of the socialsafety net is an important topic for future research.
POSTSCRIPT
A recent review of the ADB and the World Bank (World Bank, 1999 and 2000) revealsthat Asia’s recovery from the 1997 financial crisis has been faster than expected. Theeconomies of the five affected countries started to stabilize in the second half of 1998.
The ADB’s Asian Development Outlook 2000 states:
“The year 1999 saw the resolution of the financial crisis in developing Asia andacceleration of global growth, …, Asia posted a strong growth that meantalmost tripling the growth rate from the previous year.”
This has been due mainly to the increase in exports and the growth in themanufacturing sector, especially the electronics and electrical sectors in response toexpanding global demand. Korea’s recovery has been rapid, while the Philippines, Malaysia

- 45 -
and Thailand has shown positive, though slow, economic growth. Indonesia will probablycontinue to stagnate. One way to gauge the extent of recovery is to compare per capitaincome levels in local constant prices with their pre crisis levels. By the end of 1999, onlyKorea had exceeded its previous level of GDP per capita. This, however, has not yethappened in the other four affected countries, despite the fact that growth rates of GDP haveincreased from those of 1997. Thailand, for example, had a 4.2-percent growth in its 1999GDP and was projected to increase to 5 percent in 2000, compared to -1.7 percent in 1997and -10.2 percent in 1998 (Table 21). It appears that structural problems remain serious inthese countries, especially Thailand, where progress in bank restructuring has been slow(ADB, 2000a).
Due to the faster-than-anticipated recovery, the social impacts of the crisis have turnedout to be less serious than originally feared. The fast recovery may be attributed to threefactors: the ability of the agriculture to absorb unemployed labor; the effect of public-transferprograms in some countries; and to some extent the existence of an informal safety net.However, a full social recovery will still take a long time.
Table 21. Growth Rates of GDP in Five Southeast Asian Countries, 1998-2001(Unit: percent)
1998 1999 2000 2001Indonesia -13.0 0.3 4.0 5.0Korea -6.7 10.7 8.8 6.5Malaysia -7.4 5.6 6.0 6.0Philippines -0.6 3.3 4.0 4.5Thailand -10.2 4.2 5.0 5.0
Source: International Monetary Fund, 2000.
REFERENCE
Ammar Siamwalla, and Orapin Sobchokechai, 1998. Responding to the Thai EconomicCrisis.
Asian Development Bank, 1997. Emerging Asia, Manila.
----------, 2000a. Tracking Asia Recovery, A Regional Overview.
----------, 2000b. Key Indicators of Developing Asian and Pacific Countries.
Brooker Group, Ltd., 1998. “Impact of Thailand’s Economic Crisis on the Social Sector”,final report prepared for the National Economic and Social Development Board(NESDB).
Food and Agriculture Organization, 2000. The State of Food and Agriculture 2000, Rome.
Frankenberg, E., T. Duncan, and K. Beegle, 1999. The Real Costs of Indonesia’s EconomicCrisis: Preliminary Findings from the Indonesian Family Life Surveys, Labor andPopulation Program Working Paper Series 99-04, RAND, Santa Monica, CA.

- 46 -
International Monetary Fund, 2000. World Economic Outlook.
Kakwani, Nanak, 1998. “Impact of Economic Crisis on Employment, Unemployment andReal Income”, NESDB, undated mimeo, Bangkok.
Knowles, J. C., E. M. Pernia, and M. Racelis M., 1999. “Social Consequences of theFinancial Crisis in Asia”, Economic Staff Paper #60, Asian Development Bank,Manila, November 1999.
Mekong Environment and Resource Institute and the World Bank, 2000. The Impact of the1997 Crisis on Thailand’s Farm Sector, June 2000.
Ministry for Foreign Affairs, 1999. Our Future with Asia: Proposals for a Swedish AsiaStrategy, Stockholm, March 1999.
Poppele, J., S. Sumarto, and L. Pritchett, 1999. “Social Impacts of the Indonesian Crisis:New Data and Policy Implications”. SMERU, Jakarta, unpublished mimeo.
Reyes, C. M., R. G. Manasan, A. C. Orbeta, and G. G. de Guzman, 1999. “Social Impact ofthe Regional Financial Crisis in the Philippines”, paper prepared for the RETA 5799,Asian Development Bank, Manila, Philippines.
Sigit H., and S. Surbakti, 1999. “Social Impact of the Economic Crisis in Indonesia”, paperprepared for RETA 5799, Asian Development Bank, Manila, Philippines.
Thailand Development Research Institute (TDRI), 1999. Social Impacts of the AsianEconomic Crisis in Thailand, Indonesia, Malaysia and the Philippines, Bangkok,March 1999.
World Bank, 1993. The East Asian Miracle, Washington, D.C.
----------, 1999. Annual Report 1999, Washington, D.C.
----------, 2000. Beyond the Crisis: A Strategy for Renewing Rural Development in Thailand,The World Bank, Rural Development and Natural Resource Unit, East Asia andPacific Region, April 2000.

- 47 -
2. IMPACT OF FINANCIAL CRISIS ONPRODUCTIVITY OF AGRICULTURE:KOREAN CASE
Dr. Young-Bong YuProfessorDepartment of Agricultural EconomicsCheju National UniversityCheju-ShiRepublic of Korea
INTRODUCTION
The financial crisis of Asia began by the sudden fall of the Thai baht in July 1997.Since then, the Asian economies have been depressed. At the threshold of the new millenium,the Japanese economy stagnated for a long time, and the unrest of politics and economy ofTaiwan, as well as the unsatisfactory restructuring of economies in South-East Asiancountries and the Republic of Korea (henceforth referred to as Korea), reflect the gloomyeconomy of Asia. These economic depressions of the Asian countries are due to not onlyexternal factors, such as the liberalization of the world economy, but also internal factorssuch as the unstable economic and political situation in each country.
Although Korea received bailout money from the International Monetary Fund (IMF)in December 1997, it is still in the center of Asia’s financial crisis and has troubleovercoming it. In Korea, the financial crisis spilled over politics, society and other sectors aswell as the economy. For example, the value of won dropped sharply, unemployment rateincreased, the Chaebal (conglomerate) collapsed, many enterprises and banking agenciesbecame bankrupt, and political power changed. This crisis also had effects on the productionof agriculture sector and changed the consuming pattern of agricultural products. Agriculturalproduction declined in response to a decrease in the demand of agricultural products. Thus,some labor forces U-turned to the agriculture sector from non-agriculture sectors. Theinfluence of financial crisis on agricultural production was not smaller than on the non-agriculture sectors.
This study shows the impact of the financial crisis on Korean agriculture andagricultural productivity. The analysis here approaches from the following viewpoints.Firstly, the impacts of financial crisis on the agriculture sector varied according to theeconomic development level and agricultural characteristics. Since different economicdevelopment levels, demand of agricultural products and agricultural production technologyor trade dependency is different, far-reaching effects caused by financial crisis are dissimilar.Secondly, the influence of the financial crisis changes the price of agricultural output andinput directly.
This study is focused on Korea. Therefore, characteristics of the Korean economy,agriculture and condition of the financial crisis in Korea needs to be understood first. Next,the general influence of financial crisis on agricultural productivity is discussed. Thefinancial crisis in Korea doubtfully influenced the agricultural production system. Therefore,

- 48 -
it is necessary to understand how much influence the financial crisis had on agriculturalproductivity in Korea; this will be analyzed later.
WHAT HAPPENED IN THE KOREAN ECONOMY?
Structure of the Korean Economy and Its Agriculture SectorThrough the five-year economic development plan, which started in 1962, Korea
accomplished rapid economic development. In particular, during the third economicdevelopment plan period (1971-76), Korea experienced a variety of changes anddevelopments, which is known as the turning point of Korean economy.
As shown in Table 1, GNP per capita in the mid-1960s was less than US$1,500. Butafter 30 years (in the mid-1990s), it was up to US$10,000. This resulted from a rapid annualgrowth of 7 percent. For the last three decades, the Korean economy has had the highestgrowth that any country has ever experienced. As a result, some shares in the industrialstructure shifted from agriculture to manufacturing, and then to services.
Table 1. Trends of the GNP Per Capita and the Industrial Structure in Korea, 1965-97
Year GNP PerCapitaa
Share of GDP (percent)b Share of Labor Force (percent)A I S A I S
1965 1,374 37.2 24.2 38.6 58.5 10.4 31.21975 2,670 24.9 33.4 41.7 45.7 19.1 35.21985 4,709 12.5 41.0 46.5 24.9 24.4 50.61995 10,056 6.5 43.3 50.1 12.4 23.6 64.01997 11,028 5.7 42.9 51.4 11.3 21.4 67.3Annual growth rate1965-75 6.9 4.0 16.9 9.9 1.2 10.3 5.01975-85 5.4 1.1 13.5 7.3 -3.5 5.1 6.31985-97 7.3 1.3 9.7 8.6 -3.7 1.8 5.41965-97 6.7 2.3 12.5 8.6 -2.1 5.4 5.5
Sources: World Bank, 1999, World Development Indicators CD-ROM; and KoreaStatistical Information System, Korea National Statistical Office, Internet site.
Note: a At 1995 constant price (US$); and b A = agriculture, forestry and fishery, I =industry, and S = SOC and other services.
As regards its share of GDP, agriculture accounted for 37.2 percent in 1965 thathowever declined to less than 6 percent in 1997. Over the same period share of industry andservices in GDP increased from 24.2 and 38.6 percent, respectively to 42.9 and 51.4 percent.Until the mid-1970s, agriculture recorded 4 percent annual growth rate that slowed to about1 percent in mid-1990s. However, the industrial sector kept setting records with growth rateof more than 10 percent.
In the share of labor force among the sectors, agriculture accounted for 58.5 percentin the mid-1960s, but decreased to 11.3 percent in 1997. On the other hand, that of servicesstarted to increase remarkably. The agriculture sector saw increases in the number ofemployees until the mid-1970s and then experienced a decrease in labor of more than 3percent annually. Since the mid-1980s, the agricultural employment growth rate has beenslowed to less than 2 percent against the growth rate of 10 percent until the mid-1970s.

- 49 -
Since the mid-1990s, the industrial structure of the Korean economy has been similarto that of developed countries. The level of GNP per capita is close to that of an upper tomiddle income economy indicating that the Korean economy is close to becoming anadvanced economy.
The Agricultural Production StructureAgriculture production in Korea has experienced remarkable changes in the past 30
years (Table 2). First, total agricultural production achieved a high annual growth rate ofabout 5 percent, until the first half of the 1970s. Despite lower growth rates later on, thesector recorded annual growth rates of 4 percent from the early 1960s to the late 1990s. Forthe growth rates by sub-sector, the growth of the crop production sector has been stagnant,while the growth of the livestock production sector has been relatively greater (about thelevel of 5 percent). As the Korean livestock farming has been the intensive type, unlike thoseof Europe, the U.S.A. and Australia, and so forth, it should have imported much feed grainbecause of the soaring demand for livestock products and the given conditions of thedomestic agricultural production factors.
Table 2. Structural Changes in the Agricultural Production
Year
Agricultural Outputa
(US$ million) Agricultural input
Crops Livestock Total Land(000 ha)
Labor(000
person)
Fertilizerb
(000 mt)Tractors
(000)
1961/63 1,576 218 1,794 2,098 5,270 326 0.01971/73 2,316 537 2,853 2,280 5,701 668 0.21981/83 3,172 1,262 4,434 2,241 5,451 700 5.71991/93 3,438 2,676 6,114 2,138 3,302 955 651996/98 3,567 3,432 6,999 1,987 2,706 924 134Annual growth rates (percent)1961/63-1971/73 3.9 9.4 4.7 0.8 0.8 7.4 25.31971/73-1981/83 3.2 8.9 4.5 -0.2 -0.4 0.5 37.91981/83-1991/93 0.8 7.8 3.3 -0.5 -4.9 3.2 27.51991/93-1996/98 0.7 5.1 2.7 -1.5 -3.9 -0.7 15.71961/63-1996/98 2.4 8.2 4.0 -0.2 -1.9 3.0 28.0
Source: Young-Bong Yu, 2000.Notes: a 1979-81 constant US dollar; and b N+P+K total.
Let us see the trend of the main input factors of production, to grasp the technologicalprogress in agricultural production. The input of land and labor, among other factors, beganto decrease from the mid-1970s. This reflects the smooth transition into the structure of land-and labor-intensive technology in the Korean agriculture, which was caused by the overalleconomic growth. This trend in labor greatly intensified in the 1990s, and the decreasinginput of land has been striking. However, there have been increases in other factors. Forinstance, fertilizer consumption increased 3 percent annually and agricultural machinery suchas tractors showed an annual growth of 28 percent during the last 35 years.

- 50 -
As this increase or decrease in the input factors reflects the technological progress, theKorean agriculture shifted to capital-intensive agricultural production technology bysubstituting land and labor for fertilizer and machinery. This trend was greatly intensified in1990s. The input of the chemical fertilizer in the late 1990s showed the same trend as thoseof the developed countries. And the growth rate and input amount of chemical fertilizersbegan to fall. However, agricultural machinery input, such as tractors, increased steadily.
Demand for Agricultural ProductsOn the basis of the rapid growth in the Korean economy and the technological changes
of the agricultural production sector, the demand of agricultural products has alsoexperienced drastic changes in the past 30 years. In general, the demand of agriculturalproducts increases according to the economic growth, and becomes stagnant if it reaches acertain level in a high-income economy. The increase in demand for the products changesfrom inferior goods to superior goods. In other words, under the early stages of economicdevelopment, the consumption of cereals rises, and after that, consumption shifts graduallyto the demand of vegetables, fruits, meat and milk products. In the maturity stage of high-income economies, the trend leads to an increase in the demand of safe, healthy andenvironmental-friendly food.
Table 3 shows the trend of the annual food consumption per capita from the early1960s to the recent years. First, the demand in cereals decreased during the mid-1970s. Sincethe demand for rice fell after the early 1980s, the consumption level was less than 100 kg percapita in the late 1990s. This trend was caused by the changes in the consumption patterns,which was induced by the rising income. The demand for fruits, vegetables and livestockproducts is still increasing, and the rise in the consumption of livestock products isoutstanding compared to the increases in demand for other agricultural products. However,since the early 1990s, the increases in the consumption of fruits and livestock products havebeen sluggish, and the consumption of vegetables has already shown an annual growth rateof less than 1 percent since the early 1980s. This confirms that the demand in crop productsexcept livestock products entered the stagnant phase in Korea after the mid-1990s.
Table 3. Trends and Annual Growth Rates of Food Consumption in Korea, 1961/63-1996/98
YearFood Consumption Per Capita (kg/year)
Cerealsa Rice Fruitsb Vegetables Meat Milkc
1961/63 179 105 6 75 4 21971/73 227 118 13 106 6 41981/83 192 123 30 194 15 111991/93 167 99 59 204 31 211996/98 166 95 64 210 39 22Annual growth rates (percent)1961/63-1971/73 2.4 1.2 8.5 3.5 3.9 5.31971/73-1981/83 -1.6 0.4 8.4 6.3 10.1 11.81981/83-1991/93 -1.4 -2.1 7.2 0.5 8.0 6.91991/93-1996/98 -0.1 -0.8 1.4 0.6 4.4 1.11961/63-1996/98 -0.2 -0.3 7.0 3.0 6.9 6.9Source: FAOSTAT Agriculture Data, Food Balance Sheet.Notes: a Except beer; b except wine; and c except butter.

- 51 -
Index of food consumption by sub-sector (1961-65 = 100)1,200
Cereals1,000
800
Fruits
600
Meat400
Vegetables
200 Milk
0 Year1961 1965 1969 1973 1977 1981 1985 1989 1993 1997
Figure 1 depicts the above trend very well. The demand in cereals increased gentlyuntil the mid-1970s, thereafter it has been falling steadily. The consumption of vegetablesremained stagnant after the second half of the 1970s. The consumption of fruits rose until themid-1990s, but has recently been stagnant. Meanwhile, the demand for milk has beenstagnant after it increased until the late 1980s. The demand for meat is still rising, but itsannual growth rate has fallen during the 1990s. Therefore, it is probably safe to say that thedemand for agricultural products in Korea is characterized by the consumption saturation andthe diversification of consumption patterns that can be found in the developed countries.
Figure 1. Index of Food Consumption by Sub-sector, 1961-97(1961-65 = 100)
Source: FAOSTAT Agriculture Data, 1999, Food Balance Sheet (CD-ROM).
FINANCIAL CRISIS AND STRUCTURAL REFORMIN THE KOREAN ECONOMY
As Korea was struck by the currency devaluation in Asia, which started in Thailandin July 1997, the Korean Won value fell at least 59 percent in six months. On 3 December1997, the IMF agreed to offer US$57 billion with the purpose of reducing the financial crisisin Korea. Thereafter Korea has carried out the restructuring program based on the IMF’srecommendations. Figure 2 shows how the foreign exchange rate in Korea skyrocketed inDecember 1997, with the highest rate in January 1998. The year 1998 was the toughestrestructuring period in the Korean economy, and it was the turning point of rapid recoveryfrom the currency crisis. The Won value did return to the pre-crisis level. After the upwardtrend from September 1998, the Korean Composite Stock Price Index (KOSPI) has againshown a downward trend from December 1999. This trend may be attributed to the followingreasons: the restructuring of corporate and financial sectors, which was expected after 1997,

- 52 -
Exchange rate (W= /US$) KOSPI* (1980.1.4 = 100)2,000 1997.12
IMF agreement with Korea1,500
KOSPI 1,200
900
1,500
600Exchange rate
1,000
300
1995/01
‘95/06
‘95/11
‘96/04
‘96/09
‘97/02
‘97/07
1997/12
‘98/05
‘98/10
‘99/03
‘99/08
2000/01
‘00/06
0
500
0Year/month
did not materialize, even at the end of 1999, when the signs of the economic recoveryappeared. Economic recovery has yet to be achieved smoothly.
Figure 2. Trends of the Exchange Rate and the KOSPI, 1995-2000
Source: Korea National Statistical Office, Korea Statistical Information System, Inter-netHome Page, December 2000.
Note: * Stock average of period.
This financial crisis, which started in December 1997, has brought about variouschanges in the Korean economy (Table 4). The GDP growth rate decreased to -6.7 percentin 1998, which was right after the crisis, but showed an upward trend of 10.7 percent in 1999.This growth rate is the highest among the ones after 1998. Specifically by industry, therevival in the manufacturing industry was most remarkable (from -7.5 percent growth rate in1998 to 13 percent in 1999). The growth rate of the agriculture sector was -6.6 percent in1998, a slim gap compared to that of the industrial sector, but the upward trend remained verysluggish relative to the industrial sector, at a level of 4.7 percent. This indicates that theimpact of the financial crisis on the Korean agriculture was different from that on themanufacturing industry.
Due to the aftermath of company restructurings, and so forth after the currency crisis,the unemployment rate at the level of 3.1 percent in December 1997 continuously increasedto record the unprecedented highest level of 8.6 percent in February 1999. As the economyentered the recovery phase after that time, the rate decreased to 4.8 percent in December1999, 3.6 percent in September 2000, to gain stability, but it is premature to say that it isgoing into complete recovery just because it has recently shown a slightly increasing trend.

- 53 -
Table 4. Indicators of the Korean Economy, 1995-99Indicators Unit 1995 1996 1997 1998 1999
GDP growth Percent 8.9 6.8 5.0 -6.7 10.7GDP per capita Percent 7.8 5.7 4.0 -7.6 9.6Value-added, growth rate: Agriculture Percent 6.6 3.3 4.6 -6.6 4.7
Industry Percent 10.3 7.0 5.4 -7.5 13.0Services Percent 9.9 7.5 6.5 -4.7 9.8
Share of GDP: Gross domestic savings Percent/GDP 35.4 33.5 32.5 33.9 33.0Gross domestic investment Percent/GDP 37.2 37.9 34.2 21.2 26.8
Unemployment rate Percent 2.0 2.0 2.6 6.8 6.3Consumer prices Percent 4.5 4.9 4.5 7.5 0.8Merchandise exports growth Percent 31.2 4.3 6.7 -4.7 10.1Merchandise imports growth Percent 31.9 12.3 -2.2 -36.2 29.0Balance of trade US$ million -4,444 -14,965 -3,179 41,627 28,716Foreign direct investment US$ million 1,776 2,325 2,844 5,143 n.a.Exchange rates to the dollar (average of period) W= /US$ 771 805 951 1,401 1,190
Source: Asian Development Bank (ADB), 2000.

- 54 -
According to the rapid trend of economic recovery, consumer prices came back to thestability status. The inflation rate soared to the level of 7.5 percent in 1998, but fell to 0.8percent in 1999, which was the lowest in the history of the Korean economy. In addition, thebalance of trade turned from deficit to surplus, and the merchandise exports growth raterecovered from -4.7 percent in 1998 to 10.1 percent in 1999, whereas the merchandiseimports growth rate increased to 29 percent in 1999 in contrast to -36.2 percent in 1998.
The Korean economy has experienced rapid recovery thanks to the implementation ofIMF programs, expansionary macroeconomic policies and financial reform since the bankingcrisis. But, due to the decreased level of factory operation, the increased unemployment rate,the shrinking consumption, the delayed corporate and financial sector reform, signs ofanother stagnation begin to appear. Thus, recently concerns are raised about the transitioninto the long-term cyclic W-pattern, even when the Korean economy was expected to enterthe recovery trend of V-pattern in getting out of the shock of the currency crisis in the early2000.
IMPACT OF THE FINANCIAL CRISISON THE AGRICULTURAL PRODUCTIVITY
The effects of the financial crisis on the agriculture sector may be divided into directand indirect effects. First, the direct effect is on agricultural production. It influenced theindustries related to agricultural input goods, such as chemical fertilizers, pesticides,agricultural machineries, seeds, feed, as well as the factor market. It will also affect thesupply of the intermediate goods. Besides, it will further have an effect on the trade sector,the consumer market of agricultural products, agricultural finance and banking, etc., to affectthe agricultural production sector. The financial crisis consequentially influences theproduction cost and the price of the agricultural products.
The impact of the financial crisis on agricultural production and productivity can beillustrated with a simple diagram (Figure 3). First, its influence on the production sector willincrease the input costs of the intermediate goods, which lead to the increase in productioncosts. It will also affect the wage, rent and interest rate to increase production costs. Inaddition, the increase in banking costs in the financial sector will bring about the increasedcosts in both the facility investments of the agriculture sector and agricultural funding. Forthe trade sector, the higher import costs will serve as the elements of both the increased primecosts in the agricultural inputs sector and the increased prices in the imported agriculturalproducts. But, for the export sector, the decreased export unit price of agricultural productswill lead to increased export competitiveness. Besides, the stagnation of the overall nationaleconomy will bring about shrinking consumer demand and further lead to a decrease in thedemand for agricultural products.
Such an effect will generally lead to a rise in production cost, a fall in the price ofagricultural products, and it will further cause a decrease in the productivity of the agriculturesector. In particular, increased input costs of intermediate goods will lead to a decrease invalue-added production, to have an effect on the agricultural productivity.
The after-effects of the financial crisis on the agricultural production sector will varyaccording to the features of the agriculture that absorb its shocks. Among other things, itseffects will be greatly different according to the trade dependency of the agriculture sector.The degree of the financial crisis shock will vary in proportion to the import or exportdependency of the agricultural products and the trade dependency of the agriculturalintermediate goods (for instance, the intermediate goods including grain for feed, chemical

- 55 -
Intermediate goods:seed, fertilizer,
pesticide, fuel, etc.ProductionSector
Rent, wage costProduction
costFinancialSector
Agriculturalinvestment, interest of
agricultural finance AgriculturalProductivityFinancial
Crisis TradeSector
Agricultural inputs
Agricultural products Price ofagricultural
productsDemandSector
Demand ofagricultural products:domestic and foreign
fertilizer and seeds, etc.) The shock of the crisis will be different according to the demandpatterns of the agricultural products closely related to the income levels. In other words, theshock will be much greater when the consumption of the agricultural products is in saturationthan that when the food consumption is in shortage. This is due to the elasticity of fooddemand for price, and it means that the gaps of both the decreasing prices and the shrinkingconsumption vary according to the features of demand.
Figure 3. Effect of the Financial Crisis on Agricultural Production
Korean agriculture is import-dependent because while it imports feed grain, rawmaterials for pesticides, chemical fertilizer and seeds for flowers and vegetables, the exportvolume of the agricultural products is relatively negligible. Therefore, the impact of thefinancial crisis on agricultural productivity is relatively greater in Korea than that in theexport-dependent countries. As the demand for agricultural products enter the phase ofconsumption saturation, the shrinking consumption and decreasing prices of agriculturalproducts in the wake of reduced income will be the expected trend at least in the near future.These effects will vary by farm size as well as by commodity.
Impact on the Agriculture SectorAs shown in the previous Figure 3, the impact of the financial crisis has effects on the
cost of agricultural production and the price of agricultural products. Impact of the financialcrisis is relatively large for an import-dependent agriculture like one in Korea. In this part,let’s discuss what has happened to the Korean agriculture since December 1997.
1. Agricultural ProductionThe value-added output of the agriculture sector decreased to -6.6 percent in 1998 and
increased to 6.2 percent in 1999 (Table 5). The livestock production increased to 2.9 percent

- 56 -
in 1998, but value-added decreased to -3.0 percent. It was due to the 7.7-percent increase inthe cost of intermediate goods. The cost increase of intermediate goods was due to anincrease in production cost, which led to decreasing value-added agricultural products. Inparticular, Korea has an intensive livestock production system that depends heavily on feedgrain. An intensive livestock production system dependent on imported feed grain is one ofthe sectors that was influenced directly by the financial crisis.
Table 5. Value-added in Agriculture at 1995 Constant Prices(Unit: W= trillion)
YearValue-
added inAgriculture
Crop Production Livestock ProductionIntermediate
GoodsValue-added
TotalOutput
IntermediateGoods
Value-added
TotalOutput
1990 16.37 3.26 14.63 17.89 2.88 1.74 4.621995 19.72 3.52 16.67 20.19 4.11 3.05 7.161996 20.54 3.50 17.18 20.68 4.40 3.36 7.761997 21.41 3.29 17.88 21.17 4.41 3.53 7.941998 20.00 3.17 16.58 19.75 4.75 3.42 8.171999 21.24 3.15 17.73 20.88 4.60 3.51 8.11Annual growth rates (percent)1990-95 3.8 1.5 2.6 2.5 7.3 11.8 9.11996 4.2 -0.6 3.1 2.4 7.1 10.2 8.41997 4.2 -6.0 4.1 2.4 0.2 5.1 2.31998 -6.6 -3.6 -7.3 -6.7 7.5 -3.1 2.91999 6.2 -0.6 6.9 5.7 -3.2 2.6 -0.7
Source: Ministry of Agriculture and Forestry, Agricultural and Forestry StatisticalYearbook 2000.
As shown in Table 5, the share of intermediate goods in livestock production is over50 percent, much higher than in the crop production sector (15 percent in 1999). This rate,which was 55.6 percent in 1997, increased to 58.1 percent in 1999. As a result, economiccrisis in Korea caused the cost of intermediate goods to rise sharply, and led to the drop ofvalue-added output. This impact caused the production decline of crops and livestock by -7.3and -3.0 percent, respectively. However, the value-added output of livestock and crops in1999 returned to the level of 1997.2. Terms of Trade
The drop in value-added output in the agriculture sector occurred due to the followingtwo factors. One is the fall in total output caused by the drop in the total production amountor the fall of the total output value caused by the decline of price of products. The other is thedrop in value-added output caused by the increase in the price of intermediate goods. Theprice change of agricultural products and intermediate goods had an effect on these twofactors. The financial crisis influenced these two factors. The cost increase of importedmaterials, wages and the interest burden induced the rise in the price of intermediate goods,while total output value decreased due to price-drops stemming from decline in consumptionbecause of the economic depression. This is shown in the change in terms of trade inagriculture (Figure 4).

- 57 -
140
130Farm input prices
120
110
100 Farm products prices
90
80 Terms of trade
70 Year1995.01 ‘95.07 ‘96.01 ‘96.07 ‘97.01 ‘97.07 ‘98.01 ‘98.07 ‘99.01 ‘99.07 2000.01 ‘00.07
Figure 4. Terms of Trade in Agriculture, January 1995-July 2000
Source: Korea National Statistical Office, Korea Statistical Information System.
Figure 4 shows the terms of trade, consisting of an index of farm inputs price by usingthe index of farm purchasing prices and the index of farm selling prices. When the financialcrisis occurred in December 1997, the terms of trade deteriorated sharply but recoveredsomewhat in the second half of 1998. But until August 2000, it was still below 90. This wasbecause the farm purchasing prices index increased up to 130, and did not recover to the levelof pre-financial crisis.
The price of intermediate goods, which depend on imported raw materials, was mostvulnerable to the financial crisis. Figure 5 shows the change in the pattern of mainintermediate goods. The price of fuels increased most sharply. Price index of fuels was up 83percent, from 132 in November 1997 (before the crisis) to 241 in March 1998 (after thecrisis). Also, within a month from November 1997, the price index of feeds, machinery,fertilizer and chemicals increased by 35, 47, 41 and 34 percent, respectively. With anexception to the recovery of the price of feeds, this price increase had not yet returned to thelevel of pre-financial crisis. This caused the cost of farm management to rise, and led todeteriorated terms of trade.
The price index of farm selling price has however decreased. As shown in Figure 6,with the exception of the price of cereals (including paddy rice), livestock price index hasdecreased since the second half of 1997. The fruits price index has shown fluctuation,repeating a decline and a sharp rise rally. The decline in livestock price was attributed to adecrease in consumption caused by impacts of the financial crisis. It decreased until mid-1998 and again showed instability in early 2000. Price fluctuation of fruits still continuesbecause of the instability in the demand-supply balance. Such unstable changing patterns inthe farm selling price have effects on the farm gross income and cause terms of trade todeteriorate.

- 58 -
250
200
Fuels Fertilizer
150Machinery
Chemicals100
Feeds
Year501995.01 ‘95.06 ‘95.11 ‘96.04 ‘96.09 ‘97.02 ‘97.07 ‘97.12 ‘98.05 ‘98.10 ‘99.03 ‘99.08
150
140
130
Cereals120
110 Fruits andVegetables
100
90
80Livestock
Year701995.
01‘95.06 ‘95.11 ‘96.04 ‘96.09 ‘97.02 ‘97.07 ‘97.12 ‘98.05 ‘98.10 ‘99.03 ‘99.08 2000.
01‘00.06
Figure 5. Indices of Farm Purchasing Price by Commodity, 1995(year average = 100)
Source: Korea National Statistical Office, Korea Statistical Information System.
Figure 6. Indices of Farm Sealing Price by Sub-groups, 1995(year average = 100)
Source: Korea National statistical Office, Korea Statistical Information System.

- 59 -
U-turn farm number3,500
- 2930-393,000 40-4950-5960 -2,500
2,000
1,500
1,000
500
0 Year1990 1991 1992 1993 1994 1995 1996 1997 1998 1999
Change in the Labor MarketThe Korean financial crisis also affected on the labor market. The rise in
unemployment rate caused labor force to go to other industries. The agriculture sectorreceived the U-turn of this labor force. The number of U-turn farm increased from 371 in1990, to 922 in 1995 and to 1,841 in 1997. Annual growth rate from 1990 to 1997 increasedby 25.7 percent. But, in 1998 right after the crisis, it increased to 6,409 by 248 percent. Asa result, steadily decreasing employment in agriculture, forestry and fisheries in 1997increased to 2.48 millions in 1998. In 1999, the number of U-turn farms decreased to 4,118and employment in agriculture, forestry and fisheries went down 5.3 percent to 2.35 millions.
Figure 7 depicts trends of the number of U-turn farms by age group. The U-turnphenomenon is most common for people in their 30s and 40s. This reflects that it iscomparatively hard for the aged people to decide to U-turn.
Figure 7. Trends of U-turn Farm Number by Age Group
Source: Ministry of Agriculture and Forestry, Internet Home Page.
The financial crisis influenced the shift of labor force. The agriculture sector playeda role in easing the impacts on labor markets. However, in the agriculture sector, the increasein the number of U-turn farms caused labor productivity to decline.
Trade of Agricultural ProductsThe financial crisis had an effect on agricultural products trade. Heavy effects were
seen on the imported agricultural products market because Korea is an agricultural productsimporting country. In particular, the import of feed grain is so essential in Korean livestockthat a financial crisis is disastrous.
As shown in Table 6, the balance of payments (BOP) in Korea was all negative in1998. The deficit range of BOP of agricultural products decreased from US$6.1 billion in

- 60 -
1997, to US$4.0 billion in 1998. The import of agricultural products, crop products andlivestock products fell to 29, 26 and 43 percent, respectively. In particular, the import of feedgrain, fruits and meats decreased by 34, 44 and 44 percent, respectively, that stronglyinfluenced domestic consumption. The downfall in the value of the Won caused exportcompetitiveness to rise, and export of some goods (such as pork) to increase. However,because Korea is a net importer of agricultural products, imports increased again with therecovery of the exchange rate, after the financial crisis. In 1999, imports of all items, with theexception of grain and coffee, increased again. This result is very different from that of netexporter of agricultural products. In Korea, the negative effect of the financial crisis on thedomestic market was through agricultural products trading market.
Farm Income and Farm DebtsThe negative impact of the financial crisis on agricultural production, terms of trade
and trading market also led to negative influence on the farm economy, e.g., value-addedoutput, farm income and farm debts per average farm. As shown in Figure 8(a), averagevalue-added per farm was W= 9.27 million in 1998, down 30 percent from that of 1997. Overthe same period farm income was down 12 percent. As a result, farm debts went up 30percent. In particular, though farm income and value added output recovered somewhat in1999, farm debts increased by 18 percent (up to W= 10.6 million).
Farm debts have increased, due to more interest burdens since the financial crisis. Itis a big burden to the greenhouse horticultural farms and large-scale farms. Figure 8(b)depicts farm debt trends by farm scale. The large-scale farm income increased @21 percentin 1999 against 14 percent in 1998. The increase in farm debts has been one of the hot issuesof Korean agriculture since the crisis. While in 1999, the average income for farms with morethan 5 ha was W= 45.1 million, farm debts amounted to W= 73.8 million, which signify a seriousproblem. Such debt problems also exist in small-scale farms. As of 1999, the average incomefor farms with less than 0.5 ha was W= 2.8 million with an average debt of W= 13.1 million.Farm debts have added to the financial cost burden, and it has both direct and indirect effectson agricultural production activities.
Change in Agricultural ProductivityThe impact of the financial crisis on Korean agriculture caused value-added output to
decrease. This was due to the cost increase of intermediate goods, and also the price decreaseof agricultural products. These price changes led to the decline in agricultural productivity.Also, a recovering Korean economy boosted the value-added output in the agriculture sectoras well as a recovery in productivity. As a result, agricultural productivity experienced asharp drop in 1998, but a soaring recovery in 1999.
As shown in Table 7, agricultural value-added output fell in 1998 (-6.6 percent) anda recovery in 1999 (6.2 percent) was distinctively under way, while the input trend ofagricultural land was not so different from that of the past. However, labor input was up 5.4percent in 1998 with the increase in U-turn farms, for the first time since the mid-1970s. In1999, labor input decreased by 5.6 percent, slightly lower than the level of agricultural laborin 1997. The temporary increase in labor force in 1998 caused the land/labor ratio to decline,and then to rally again in 1999.

- 61 -
Table 6. Trends of Agricultural Products Trade, 1996-99
ProductNet Trade Value (US$ million)* Export Growth (percent) Import Growth (percent)
1996 1997 1998 1999 1997 1998 1999 1997 1998 1999Merchandise total -20,624 -8,452 39,031 23,933 5 -3 9 -4 -35 28Agricultural products: -6,728 -6,111 -4,033 -4,486 6 -8 4 -7 -29 9
Crops -5,748 -5,146 -3,691 -3,678 2 -15 0 -8 -26 0Cereals -2,591 -1,910 -1,630 -1,519 8 6 15 -26 -15 -7Feed grains -97 -110 -66 -99 2 -38 -8 8 -34 52Fruits -261 -283 -155 -250 -8 32 60 7 -44 48Vegetables -91 -102 -35 -11 -20 17 59 2 -23 27Coffee -119 -164 -127 -106 48 -38 -29 41 -27 -20
Livestock -980 -965 -342 -837 22 21 6 3 -43 71Meat -539 -547 -127 -449 21 28 8 7 -44 77Milk products -166 -150 -88 -129 26 5 -24 -8 -39 40
Source: Ministry of Agriculture and Forestry, Agricultural and Forestry Statistical Yearbook.Note: * Net trade value = total export value - total import value.


- 63 -
Table 7. Trends of Agricultural Productivity and Growth Rates, 1990-99
YearAgriculturalValue-added(W= trillion)
Land (000 ha)(A)
Labor (000 persons)(B)
Land per Labor(A/B)
ProductivityLand
(W= million/ha)Labor
(W= million/person)
1990 16.37 2,109 3,152 0.67 7.76 5.191995 19.72 1,985 2,419 0.82 9.93 8.151996 20.54 1,946 2,322 0.84 10.56 8.851997 21.41 1,924 2,276 0.85 11.13 9.411998 20.00 1,910 2,399 0.80 10.47 8.341999 21.24 1,899 2,264 0.84 11.19 9.38Annual growth rate (percent)1990-95 3.8 -1.2 -5.2 4.2 5.0 9.41996 4.2 -2.0 -4.0 2.1 6.3 8.51997 4.2 -1.1 -2.0 0.9 5.4 6.31998 -6.6 -0.7 5.4 -5.8 -5.9 -11.41999 6.2 -0.6 -5.6 5.3 6.8 12.5
Source: Ministry of Agriculture and Forestry, Agricultural and Forestry Statistical Yearbook.

- 64 -
Table 8. Indices and Growths of Agricultural Productivity by Farm Scale, 1995-99
YearLabor Productivity Land Productivity Capital Productivity
Average <1 ha 1-2 ha >2 ha Average <1 ha 1-2 ha >2 ha Average <1 ha 1-2 ha >2 ha1995 100 83 95 122 100 161 115 89 100 81 100 1051996 100 77 93 125 100 152 112 81 100 78 105 1031997 100 79 92 140 100 154 113 89 100 81 103 1101998 100 69 100 149 100 119 114 95 100 69 106 1241999 100 63 100 153 100 112 112 100 100 64 104 140Annual growth rate (percent)1996 12.6 4.5 10.5 15.2 4.9 -1.3 2.1 -4.3 -13.1 -16.2 -9.0 -15.11997 2.0 4.9 0.5 13.9 -3.0 -1.9 -2.4 6.7 -3.8 0.0 -5.4 3.71998 -29.9 -39.3 -23.6 -25.1 -30.8 -46.2 -30.1 -26.0 -37.3 -47.0 -35.2 -29.61999 16.4 6.2 15.7 19.5 19.4 12.4 17.0 24.8 15.6 6.8 13.2 30.3
Source: Ministry of Agriculture and Forestry, Agricultural and Forestry Statistical Yearbook.

- 65 -
Table 9 compares the increase in the rates of intermediate goods costs, the inputamount of the chemical fertilizer and labor input in 1998 and 1999. This will allow us to lookinto the trends of land and labor productivity. The financial crisis has had effects on thedecrease in value-added output. Also, it severely damaged the production of greenhousehorticulture. The decline in value-added output resulted from the increase in the cost ofintermediate goods, the drop in output price, as well as a decrease in factor input. As shownin Table 9, the decrease in the input of chemical fertilizers and labor was remarkable in 1998.In particular, the decline in the chemical fertilizer input continued in 1999. As a result, landproductivity of most commodities dropped sharply in 1998. Even in 1999, with the recovery,land productivity has not reached a satisfactory level. However, the recovery trend in 1999for land productivity was better than that of labor productivity.
In sum, the financial crisis had heavy impacts on agricultural productivity through theprice system. Korean agriculture depends heavily on imports, so the impacts of theproduction cost increase and value-added output decrease are highly reflected. As a result,agricultural productivity in 1998 fell sharply. Recovery is underway in 1999 in the economy,but it will be difficult to return to the pre-financial crisis level. Low productivity, decreasein farm incomes and increase in financial burdens have aggravated troubles of farms.
CONCLUSIONS
Starting from December 1997, the impacts of Korean financial crisis spreaded to allthe sectors of economy in 1998. The agriculture sector was not an exception, and in the darkatmosphere of economic recovery, the instability of this sector was getting more serious. In1999, the Korean economy experienced remarkable recovery in the indicators of macro-economy. However, as of December 2000, external and internal factors remained stumblingblocks to a prosperous future of Korean economy. External factors consisted of unstable oilprices, the long depression of the Japanese economy and the low growth of the US economy.Internal factors are the decline in the manufacturing operation capacity rate, a widening gapof income between the rich and the poor, and a fluctuating exchange rate.
Under these conditions, the financial crisis impacts on Korean agriculture have beenvery serious for the past three years. The impacts on the agriculture sector varied accordingto the level of agricultural production technology and the demand for agricultural products.In the midst of the economic crisis in 1997, Korean agriculture heavily relied on the importof agricultural intermediate goods, the capital-intensive agricultural production and theimport of various agricultural products such as grains, fruits and meats. GDP per capitareached the level of US$10,000 and food consumption was limited. Consumer needs changedfrom the demand for traditional foods to higher quality foods. The financial crisis caused theinput cost of agricultural intermediate goods such as fertilizer, fuel, pesticide and feed grainsto rise. Decrease in the demand of agricultural products caused prices to drop. Value-addedoutput of the agriculture sector fell sharply in 1998. Therefore, agricultural productivitydecreased rapidly. There was a recovery in the agricultural production sector, led byeconomic recovery in 1999, but it did not return to the pre-financial crisis level.
The impacts of the financial crisis varied with the farm scale and the type of farming.In Korea, large-scale farms and greenhouse horticultural farms suffered severely. Small-scalefarms could not recover yet because of their low productivity. Farm debts skyrocketed, whichwas caused by a worsening farm economy. There is a great possibility that the financial crisiscaused investments to decrease, which led to the downturn in the agricultural production

- 66 -
Table 9. Growth Rates of Agricultural Productivity by Products, 1998 and 1999(Unit: Percent)
ProductValue-added Intermediate
Goods CostChemical
Fertilizer (kg)Labor Input
(hour)Productivity
Labor Land1998 1999 1998 1999 1998 1999 1998 1999 1998 1999 1998 1999
Rice, paddy -2.5 7.6 19.6 1.5 2.5 4.2 6.1 -5.8 -8.1 14.2 -2.5 7.6Apple -1.1 6.8 18.1 5.3 1.7 -25.6 -9.2 -11.1 8.9 20.2 -1.1 6.8Pear -17.2 5.7 20.4 4.4 -15.9 -4.1 -8.8 -8.4 -9.1 15.3 -17.2 5.7Cucumber (GH) -29.6 5.4 12.4 -2.5 -19.7 -5.3 -0.9 4.8 -29.0 0.5 -29.6 5.4Tomato (GH) -12.5 -1.8 2.8 19.8 -1.3 -12.8 -24.9 22.3 16.6 -19.7 -12.5 -1.8Orange (GH) -54.5 43.9 2.6 -22.9 -11.4 74.8 24.9 2.4 -63.6 40.6 -54.5 43.9Grapes -16.8 -12.2 17.2 6.5 -8.7 -11.6 -9.5 -4.3 -8.0 -8.2 -16.8 -12.2Rose -14.2 19.4 18.0 5.5 -31.2 0.0 -3.0 -0.6 -11.5 20.1 -14.2 19.4
Source: Rural Development Administration Internet Home Page.Note: GH means greenhouse products.

- 67 -
sector. If the stability of the Korean economy is not to secured, agricultural input and outputprice will be unstable. This will pose an obstacle to technological development andagricultural investment that, in turn, will help in boosting productivity. In short, the impactof financial crisis on agricultural production is in sight and its recovery will be underway inthe long run. To overcome the impacts of the financial crisis, stable agricultural interest ratesmust be secured.
REFERENCES
Asian Development Bank. ‘The Financial Crisis in Asia’, “Asian Development Outlook1998”, ADB Home Page.
----------. ‘Republic of Korea’, “Asian Development Outlook 1998”, ADB Home Page.
----------. ‘The Financial Crisis in Asia’, “Asian Development Outlook 1999”, ADB HomePage.
----------. ‘Republic of Korea’, “Asian Development Outlook 2000”, ADB Home Page.
Franklin, Allen, 2000. “Financial Structure and Financial Crisis”, ADB Institute WorkingPaper 10, June 2000.
International Monetary Fund. ‘The Asian Crisis’, “Annual Report 1998”, IMF Home Page.
----------, 2000. “Republic of Korea: Statistical Appendix”, IMF Staff Country Report No.00/10, February, 2000.
Kim, M. H., 1998. “Korean Agriculture under the IMF Bailout Program – Grains Sector”,Korea Rural Economic Review 21 (in Korean).
Kim, Y. T., 1998. “Korean Agriculture under the IMF Bailout Program – AgriculturalFinancial Sector”, Korea Rural Economic Review 21 (in Korean).
Sung, M. H., 1999. “Effects of Exchange Rate Changes on Agricultural Prices under theFinancial Crisis in Korea”, Journal of Rural Development 22, Korea Rural EconomicInstitute.
Yoon, H. S., 1998. “Korean Agriculture under the IMF Bailout Program – AgriculturalSituation and Policies”, Korea Rural Economic Review 21 (in Korean).
Yu, Young-Bong, 2000. “Practical Measurement and Analysis of Agricultural Productivityin the APO Member Countries: 1961-98”, paper presented at the Advanced TrainingCourse on Agricultural Productivity Measurement and Analysis held in Malaysia, 20September to 1 October 1999, APO, Tokyo.

- 68 -
3. AN OVERVIEW OF THE IMPACT OFFINANCIAL CRISIS ON PRODUCTIVITY OFAGRICULTURE IN THE ASIA-PACIFIC REGION
Dr. Memed GunawanDirectorBureau of Planning and International CooperationMinistry of AgricultureJakartaIndonesia
INTRODUCTION
Since early 1980s, developing countries, especially in Asia, have shown remarkableeconomic growth. New industrialized countries such as Taiwan, Korea, and Singapore soaredwith double-digit economic growth, while agriculture-based economies like Indonesia,Malaysia, Thailand, the People’s Republic of China and the Philippines followed at 7-10percent (Table 1). These figures are much higher than those of the developing countries inFar East Asia, Africa and Latin America. During the same period, free market economies,especially in the United States and Western Europe, underwent a slower economic growth,around 1-3 percent per annum. Based on this trend, some futurists believed that Asia wouldbecome the most important part in the world economy. This hypothesis seemed to be trueuntil a severe financial crisis and economic recession hit some Asian countries.
Behind the remarkable growth of Asian countries, there are some weaknesses that havenot been properly addressed. There are potential external shocks related to open trade andinvestment. The domestic resource endowment, the state of dependency on external sources,the investment climate, the economic development stage and the income level are among themost important factors that determine the ability of a country to face external shocks.However, Asian domestic currencies were usually overvalued and had been maintained at alevel to support the importation of capital and the development of the manufacturing industrythough to the varying extent. The impacts emerged when the market mechanism operatedwithout any space or time barriers.
In 1997, the economic crisis started in Thailand, followed by Korea, Indonesia,Malaysia and the Philippines, respectively. Appreciation of the US dollar in these countriesaffected the whole economy at different intensities, depending on its economic condition,macro-economic fundamentals, and other burdens such as poverty alleviation, poor peopleincome generation, domestic industry promotion and other social concerns.
Since the carefully designed agricultural development in the latest 1960s, Indonesiahas made substantial agricultural infrastructure investments in irrigation, research, extensionand credit provision that moved the country from a state of food shortage in rice to one ofself-sufficiency in 1984. Since then, more attention has been paid to the development ofmanufacturing industries, and not agriculture-based industries (foot-loose industries). Almost

- 69 -
all of the manufacturing industries developed in the last two decades are supported by theheavy importation of capital and raw materials, and financed by foreign loans. The valuegained is related to the low domestic wage rate, which is certainly not considered ascomparative advantage.
Table 1. World Economic Growth Rates, 1995-99Country 1995 1996 1997 1998 1999
World 3.8 4.3 4.2 2.5 3.0Developed Countries: 2.6 3.2 3.2 2.2 2.8 Seven main countries 2.2 3.0 2.9 2.2 2.6
U.S.A. 2.3 3.4 3.9 3.9 3.7Japan 1.5 5.0 1.4 -2.8 0.8Germany 1.7 0.8 1.8 2.3 1.4France 2.1 1.6 2.3 3.2 2.5Italy 2.9 0.9 1.5 1.3 1.2United Kingdom 2.8 2.6 3.5 2.2 2.3Canada 2.8 1.7 4.0 3.1 3.6
Others 4.3 3.9 4.2 2.1 3.5Developing Countries: 6.1 6.6 5.8 3.2 3.5 Africa 3.0 5.9 3.1 3.4 3.1 Far East and Europe 3.7 4.7 4.5 3.2 1.8 Latin America 1.5 3.6 5.3 2.2 0.1 Asia 9.1 8.2 6.6 3.7 5.3 NIEs Asia 7.3 6.2 5.8 -1.8 5.2 People’s Republic of China 10.5 9.6 8.8 7.8 6.6 Indonesia 8.2 7.8 4.7 -13.2 0.2 Singapore 8.2 7.5 9.0 0.3 4.5 Malaysia 9.4 8.6 7.7 -6.7 2.4 Thailand 8.8 5.5 -1.3 -9.4 4.0 Philippines 4.7 5.8 5.2 -0.5 2.2 Vietnam 9.5 9.3 8.2 3.5 3.5Countries in Transition: -0.5 -0.3 2.2 -0.2 0.8 Middle and East Europe 1.6 1.6 3.0 2.2 1.0 Russia -2.4 -3.4 0.9 -4.6 - Trans-Caucasus and Middle Asia -4.4 1.6 2.5 2.2 2.0
Source: Bank Indonesia, 1999.
This paper provides an overview of the Asian financial crisis, factual conditions of thefinancial crisis, its evolution, its impacts, and the policy measures taken by the government.Although the paper does not discuss any country in particular, some illustrations are shownusing Indonesian case. A significant amount of data and citation have been taken from thepublications of the World Bank, Central Bank (Bank Indonesia), and books written byPrasetiantono (2000), Kwik Kian Gee (1998), and studies conducted by the Center for Agro-Socio-Economic Research.

- 70 -
EVOLUTION OF THE FINANCIAL CRISIS
Dynamic Changes in the World EconomyThe last decade was marked with several important changes, among others are:
(1) rapid development of ICT, and bio-technology that changed the direction of worldeconomic development and global economic situation; (2) new role of government in publicmanagement, as initiated by several noted writers such as David Osborn, Peter Plastrik, PeterSenge and many others has changed government management policies substantially. This isexpressed in the simple famous phrase of steering rather than rowing; (3) the implementationof multilateral and regional agreements on trade, tariff, and economic cooperation by theWorld Trade Organization (WTO), Asia-Pacific Economic Cooperation (APEC), ASEANFree Trade Area (AFTA), etc. has made every single country reevaluate its economicdevelopment policies in order to gain from the free trade; and (4) the growing concern aboutfood security, the environment, and human rights that to some extent affect the economicdecision and most certainly resource allocation. These changes have made what is it calleda borderless world and borderless economy come into reality.
No developing country should isolate itself from the world economy. However, bylinking itself to the world economy, a country also exposes itself to external shocks(Krugman, 1991). It can experience economic disturbances that originate from events outsideof the country. When the General Agreement on Tariffs and Trade (GATT) was signed inMarrakesh in 1994, new era of international trade and investment was born. The agreementis expected to benefit all countries. Every country in the world anticipates this by exploringand exploiting its most competitive sector of economy and using resources effectively toachieve comparative advantage. However, the implementation is not always smooth due tothe different readiness of each country and the further development of several socialmovements that limit the trade access such as environment, human right, and food securityand food safety. Up until now, there are some unfinished disputes that originated from theself-interest of individual countries. When the United States imposed a tariff on Japanesecars, Japan practiced a highly protective policy on its agricultural products. Other countriestry to be cautious in international trade by prioritizing their own interests. Food security andthe multi-functionality of agriculture are also among the many disputable issues between theWTO member countries.
Big problems currently being faced by most emerging markets, including ASEAN, arethe availability, accessibility and mobility of large short-term capitals as an alternative tosolve the domestic saving problem (saving-investment gap). This will be a potentialboomerang because it can be easily invested and withdrawn from a country. The Mexicocrisis in 1994 was basically a case of short-term capital investment. More intense moneymarkets and domestic currency speculation also add to the intense fluctuation of the exchangerate.
Process of the Financial CrisisCrisis in Asia was triggered by the regional contagion effect in Thailand. The
combination of overinvestment, bad debts, a huge foreign loan in the private sector (aroundUS$90 billion), and an overvalued exchange rate of the baht forced the Thai Government todevaluate the baht in July 1997. The crisis was expected to spread fast to the neighboringcountries, especially Indonesia because of the similarity in the characteristics and economic
- 71 -
fundamentals in the two countries. Both economies were characterized by over investment,high bad debts and large foreign loan.
Changes in the economic indicators in some Southeast Asian countries explain howthe financial crisis occurred in these areas (Table 2). Prior to the crisis, exchange rates,unemployment rates, and Consumers’ Price Index (CPI) were quite stable. Also real GDPincreased steadily. However, current account balances were mostly at deficits with relativelyhigh rates of 5-9 percent. The capital account balance rate was quite high, at 8-13 percent,and similarly investment rose at high rates and some economies overheated. Inflation ratesin the People’s Republic of China, Indonesia, and the Philippines were in double digits. MostAsian countries gained from the international trade.
Thailand’s economy increased by 8-9 percent per year, prior to the crisis in 1997, andinvestment grew at remarkable double digits. However, the current account deficit was high,more than 6 percent of the GDP. Upon entering the crisis, the current account deficit was 8.9percent. Inflation rose during the crisis, but declined sharply only in one year afterwards. Thebaht depreciated from B/ 25/US$1 to around B/ 31/US$1 in 1997 and reached the peak ofB/ 41.37/US$1 in 1998.
The financial crisis in Indonesia was first identified by the depreciation of Indonesia’sRupiah into US dollar in mid-1997, when the value of US$1 increased from Rp.2,383 in 1996to Rp.4,650 in 1997. Then, the value of the US dollar continued increasing until it reacheda peak of Rp.14,900 per US dollar in May 1998. Under this situation, international creditorsimmediately forced the Indonesian private sector to pay the loan, or at least reject theextension of the short term or extraordinary short-term maturity. Since then, the rupiahexchange rate declined rapidly.
Some Asian countries such as Thailand, the Philippines, and Indonesia have similareconomic characteristics, namely:
1. High economic growth (around 7-8 percent) was achieved by the high investment onproperties beyond the real demand, which resulted in bad debts (around 30 percent).Therefore, depreciation of the local currency has had a large domino impact on theeconomic activities.
2. Many physical constructions that encouraged imports were financed by foreign loan,some of them being short-term loans. The payment of short-term loans increased thedemand for the US dollar for a very short time, which further decreased the exchangerate of domestic currency.
3. Baht, peso and rupiah have been overvalued for a long period of time. Thailand andthe Philippines adopted a fixed exchange rate, under intervention from their CentralBank. In the case of Indonesia, an overvalued rupiah (in 1996 the exchange rate wasRp.2,300/US$1) stimulated the import-based industry, such as automotive andmanufacturing, and to some extent discouraged local resources that were based oninvestment and export. Import became cheaper and easier until the external shock.
4. Increasing wage rates gradually reduced the competitiveness of commodities of thethree countries in the international markets. Other countries such as Vietnam, China,Sri Lanka and Lao DPR have taken over the labor-intensive industries such as textileand foot-ware, due to the advantage of low labor wage rates.

- 72 -
Table 2. Macro Indicators of Selected Asian CountriesIndicators 1992 1993 1994 1995 1996 1997 1998 1999
People’s Republic of China:Real GDP 14.2 13.5 12.6 10.5 9.6 8.8 7.8 7.1Investment 12.9 24.9 15.6 15.5 10.4 7.1 14.4 5.2Current account balance 1.33 -1.98 1.42 0.23 0.89 3.29 3.03 1.58Capital account balance 0.05 3.91 4.68 4.74 4.89 2.54 0.00 0.08CPI 6.4 14.7 24.1 17.1 8.3 2.8 -0.8 -1.4Exchange rate 5.5 5.76 8.62 8.35 8.31 8.28 8.28 8.28Unemployment rate 2.3 2.6 2.8 2.9 3.0 3.1 3.1 3.1
Indonesia:Real GDP 7.2 7.3 7.5 8.2 7.8 4.7 -13.1 0.3Investment n.a. n.a. 13.8 14.0 -3.0 8.6 -33.0 -20.0Current account balance -2.2 -1.5 -1.7 -3.4 -3.5 -3.0 4.3 4.1Capital account balance 4.6 3.9 2.3 5.3 4.9 1.5 -4.1 -3.2CPI 4.9 9.8 9.2 8.6 6.5 11.1 77.6 2.0Exchange rate 2,030 2,087 2,200 2,308 2,383 4,650 8,025 7,050Unemployment rate 2.7 3.1 4.4 7.2 4.9 4.8 5.5 6.4
Republic of Korea:Real GDP 5.1 5.8 8.6 8.9 6.8 5.0 -5.8 10.7Investment 0.8 5.2 11.8 11.7 7.3 -2.2 -21.1 4.1Current account balance -1.5 0.1 -1.2 -1.9 -4.4 -1.7 12.5 6.1Capital account balance 2.1 0.8 2.7 3.6 -0.1 -0.1 0.1 -0.1CPI 6.2 4.8 6.2 4.5 5.0 4.4 7.5 0.8Exchange rate 788.4 808.1 788.7 774.7 804.5 951.3 1,401.4 1,188.6Unemployment rate 2.4 2.8 2.4 2.0 2.0 2.6 6.8 6.3
... To be continued

- 73 -
ContinuationIndicators 1992 1993 1994 1995 1996 1997 1998 1999
Malaysia:Real GDP 8.9 9.9 9.2 9.8 10.0 7.5 -7.5 5.4Investment 11.0 17.8 16.1 22.8 8.2 9.2 -43.0 -5.9Current account -3.9 -4.8 -7.9 -10.2 -4.6 -5.9 13.7 17.1Capital account 7.2 8.5 6.2 7.8 5.6 7.2 4.0 4.5CPI 4.7 3.6 3.7 3.4 3.5 2.7 5.3 2.8Exchange rate 2.5 2.6 2.6 2.5 2.5 2.8 3.9 3.8Unemployment rate 3.7 3.0 2.9 3.1 2.5 2.4 3.2 3.0
Philippines:Real GDP 0.3 2.1 4.4 4.7 5.9 5.2 -0.6 3.3Investment 7.8 7.9 8.7 3.5 12.5 11.7 -16.3 -1.7Current account -1.6 -5.5 -4.6 -4.4 -4.8 -5.3 2.4 9.5Capital account 3.5 5.2 7.1 4.6 13.4 8.0 0.7 -0.9CPI 8.6 7.0 8.3 8.0 9.1 6.0 9.8 6.6Exchange rate 25.5 27.1 26.4 25.7 26.2 29.5 40.9 39.1Unemployment rate 9.8 9.3 9.5 9.5 8.6 8.7 10.1 9.7
Thailand:Real GDP 8.1 8.4 9.0 8.9 5.9 -1.7 -10.2 4.2Investment n.a. n.a. 11.4 11.0 7.4 -21.7 -44.2 -4.8Current account -5.5 -4.9 -5.4 -7.9 -8.1 -0.9 13.3 9.1Capital account 8.49 8.4 8.4 13.0 10.7 -3.4 -8.9 -6.3CPI 4.1 3.3 5.0 5.8 5.9 5.6 8.1 0.3Exchange rate 25.4 25.32 25.15 24.92 25.34 31.37 41.36 37.84Unemployment rate 2.8 2.6 2.6 1.71 1.54 1.51 4.37 4.17
Source: Asian Development Bank.

- 74 -
The financial crisis also stuck the incredible economy of the Rep. of Korea. Strengthof the macro-economic foundations of the Korean economy, which supported its double-digiteconomic growth, was being questioned. Before the crisis, real GDP of the Rep. of Korearose between 5-9 percent and investment climbed up to 11.8 percent in 1995. The countrymanaged low inflation rates and its current account deficit was less than 2 percent, except in1996, when current account rose to a still-reasonable 4.4 percent. The Rep. of Korea’sagricultural infrastructure is one of the best in Asia. Hence, with these figures no oneexpected the financial crisis to hit this country. However, political and other internal businessproblems in the Rep. of Korea were expected to bring some serious economic problems. TheKorean won almost doubled in value within four years of economic instability. Similarly,unemployment jumped from 2 percent to 6.8 percent in 1998. In 1997, investment declinedby 43 percent. The Government of the Rep. of Korea finally requested for financial assistancefrom the International Monetary Fund (IMF). Remarkably, the Korean economy reboundedfrom the crisis in only six months. In early 1998, the country’s GDP moved from -5.8 to 10.7percent.
Japan experienced a much slower growth and an increase in unemployment, but it soonrecovered. However, the yen depreciation is one of the economic policies of Japan used toincrease exports. This policy has been very successful, as of 1998 and 1999, its exportsincreased tremendously. There was practically no significant financial problems in Japanduring the Asian economic crisis in 1997-99. The yen was devaluated from around ¥103-106/US$1 in 1996, to ¥120/US$1 in 1997 and 1998, and then reached the peak at more than¥140/US$1. But the yen was able to appreciate to reach the initial value of 1996 in early2000.
Malaysia was known to have no problems with foreign loans. It managed to have a lowinflation at the rate of 2 percent, an economic growth of 8 percent, and a per capita incomeof US$4,500. It seemed that the economic fundamentals of this country were very strong.However, the foreign account deficit was quite large (US$5.5-6 billion), which was around7-10 percent of GDP in 1994 and 1995. In comparison, Indonesia had less than 4 percent, andThailand had around 8 percent. Furthermore, foreign loans, especially of the private sector,have been very high for Indonesia (Table 3).
Table 3. Indonesia’s Foreign Loans, 1997-99(Unit: US$ million)
Item 1997 1998 1999Government 53,865 67,315 75,763Private 82,223 83,572 65,618Bank 14,364 10,769 10,063Non-bank 57,588 67,515 52,630Bond 10,271 5,288 2,915Total 218,311 234,459 206,989
Source: Bank Indonesia, 1999.
Malaysia was able to maintain high investment which declined by 43 percent precedingthe economic crisis. However, the capital account balance was maintained positive, at 4-7percent. Malaysia’s economy also recovered very fast. In 1999, its real GDP grew at 5.4percent.

- 75 -
Exchange RateDecline Inflation Increases Interest Rate
Increases
Loss of Reliability Banking SystemDeclines
Social ProblemsIncrease Business Declines
UnemploymentIncreases
EconomicContractions
The exchange rate of a currency is determined by the supply and demand for thatcurrency but the transactions also depend largely on non-economic factors. During the crisis,when political and social stability are quite unstable, any occurrence that may lead to positiveor negative market sentiment or expectation of future conditions of the country, directlyreflected in the exchange rate. This movement in the exchange rate is also accelerated by thehigher amount of activities in the money market and the improvement of the informationsystem; hence any changes will be transmitted immediately. Unfortunately, unstable currencyand fluctuating exchange rates, tend to be interesting field for speculation.
The Cyclic Effects of the Financial CrisisThe financial crisis has a substantial effect on the whole economy. For instance, a
weakening domestic currency has cyclic effects on other economic sectors, which in turnworsen the exchange rate (Figure 1).
Figure 1. The Process of Financial Crisis
1. Inflation Rate and Interest RateA declining exchange rate causes the inflation rate to increase, followed by an increase
in the interest rate as the logical policy to control inflation. Imported goods will be moreexpensive in local currency and therefore consumers will have to pay more for the sameamount of goods. This causes higher inflation. To control the inflation, the government/banks have to set a higher interest rate to control borrowing.2. Banking Systems are Severely Affected
A high interest rate and a low demand for money have negative impact on the bankingsystem because these will directly affect the lending and borrowing activities. In addition,bad debts due to bad banking management have lost credibility for a large number of banks.3. Investment and Business Activities
To the whole industry, this is a sign of low investment, low business activities, lowproduction, low input and a lowering of other related activities. Many businesses close down,reduce their activities, or operate under capacity so that they can maintain minimal loss. This

- 76 -
results in a contraction of the national economy, along with an increase in the unemploymentrate, and lowers the average income.4. Social Problems
To many countries, the whole adverse impacts might include an increase in socialproblems, disturbances, crimes, riots and social instability. When these problems arise, a lossof credibility might happen. This will in turn adversely affect the exchange rate, to causefurther vulnerability and instability.
Impacts of the Financial Crisis on the Whole EconomyFluctuations in the exchange rates have important effects on the price of exports and
imports. The direction of these effects depends on which currency one uses to measure prices.If movements in the US dollar affected import and export prices equally, an adverse importshock would be matched by a favorable export shock. Experience suggests that the effectsof the changes in the exchange rate in the export and import prices of developing countriesare not equal. When the US dollar rises, dollar import prices in developing countries seemto fall less than their export prices. The net effect is that when the US dollar rises, it worsensthe term of trade in the developing countries (Kruger, 1991). A possible explanation is that,whereas prices of commodities are highly flexible, prices of manufactures are often somewhatinflexible. Econometric evidence suggests that the rise of the dollar may be an importantfactor in the failure of commodity prices to rise during the 1982-85 period of recovery. Fordeveloping countries, when a country’s terms of trade decline, any given volume of exportpays only for a smaller volume of imports. Therefore, the country has to reduce importvolume, increase export volume, or increase borrowing. If the country does borrow abroador has engaged in such borrowing in the past, it becomes exposed to shocks that originatefrom the capital market.
Since the financial crisis is an external shock, the ability of a country to handle sucha crisis depends, among others, on its macro-economic foundation, its dependability onexternal resources, the intensity in resource usage by sectors of the economy, and the initialcondition of the economy.
Sectors of the economy may suffer or gain from the financial crisis, at least in a limitedregion during the short run. The agriculture sector in developing countries, due to itsabundance in natural products, uses relatively high portions of its domestic resources. Land,seed, labor, fertilizer, machinery, technology and other capital inputs, are traditionallydomestic inputs. In Indonesia, for instance, the impacts could be categorized based on thesource of inputs (domestic or import), and the target market of the outputs.
Since traditional agricultural commodities commonly use domestic inputs and are usedfor domestic consumption, they are not significantly affected by changes in exchange rates(Table 4). Because the cost of production and revenue to producers are in domestic currency,the fluctuation in exchange rates have less impact on agriculture sector. However, farmersgrowing exportable commodities (rubber, coffee, cocoa, tea, and palm oil) gained substantialprofit during the financial crisis.
The poultry farming in Indonesia is an example of an industry that uses a large portionof imported inputs but most of its products are directed for domestic consumption. Input costspaid in US dollar rose faster than the revenue received in domestic currency (rupiah) duringthe financial crisis. This industry collapsed immediately after dollar value doubled in termsof the rupiah.

- 77 -
Table 4. Impact of the Financial Crisis: Indonesian CaseSourceof Input
Market for OutputDomestic Export
Domestic Traditional commodities such asrice and other food crops werenot significantly affected by theexternal shock.
Rubber, coffee, tea, palm oil, and cocoa areexportable commodities. Farmers gainedmuch from the appreciation of the US dollar,although international prices slightlydeclined. Other industries survived duringthe crisis include handicraft, furniture andother art products.
Import Some imported raw materialssuch as corn, soybean meals, andfishmeals are used for the poultryindustry, where the product(chicken) is mostly for thedomestic market. This industrycollapsed as the US dollar appre-ciated.
More than 90 percent of raw materials areimported for the Indonesian textile industry.Since a large portion of the product is for thedomestic market, it has to compete withother lower wage rate countries such asChina, Bangladesh, Vietnam and Sri Lanka.Therefore, this industry has faced difficultiesduring the crisis.
THE ECONOMIC RECOVERY PROCESS INTHE REP. OF KOREA, MALAYSIA, AND THAILAND
In 1999, economic conditions of several Asian countries improved. In general, macro-economic policies implemented by these countries are relatively similar. Differences aremostly related to the intensity and degree of commitment to recovery and socio-politicalstability. These differences caused variations in the recovery progress between the countries.Significant progress in economic development in the Rep. of Korea, Malaysia, and Thailandmay be good examples of the high degree of political commitment to make the rebound fromthe crisis (Table 5).
With respect to monetary policies, the latter three countries successfully reduced theirinterest rates to relatively low levels. In the case of fiscal policy, government expenditureswere designed to be more expansive in order to balance the weakening private domesticdemand. In the banking sector, restructuring was carried out by separating strong financialliquidity from unviable financial institutions. In the mean time, the restructuring in thecorporate sector was activated to enhance business activities in the real sectors byencouraging big group companies to restructure their debt and divest their non-core companyactivities.
The process of economic recovery in the Rep. of Korea, Malaysia, and Thailandinitiated from the ability of these countries to take advantage of the opportunity of an increasein the international demand for electronics and computer related goods, and low interest ratesand expansive fiscal policies. This supported the recovery process of investment, reducedunemployment, and increased domestic demand. Despite the impressive achievement at themacro level, these countries have not been fully successful in restructuring their financialsystems, which would be a challenge to be resolved in the years ahead.

- 78 -
Table 5. Economic Recovery Process in the Rep. of Korea, Malaysia and ThailandRep. of Korea Malaysia Thailand
Monetary and FinancialC Reduced overnight call rates
when the exchange value ofthe Won was stronger.Overnight cal l ra tesdecreased from 25 percent(March 1998) to 15 percent(July 1998) and kept ondecreasing until it reachedthe level of 4.7 percent inApril 1999.
C Placed liquidity into bankingsystem.
C Strengthened the controlfunctions by consolidatingall activities for strengthen-ing financial institutions, i.e.,Financial SupervisionCommission (FSC), whichsplitted from the centralbank function. The tasks ofthis institution are to manageinsolvent bank and toevaluate CAR, to identifyviable institutions, and totake over non-performingloan (NPL) without anyconditions from the banksuntil 30 June 1998.
C Reduced interest rate from7.0 percent to 6.5 percent inApril 1999 and 5.0 percentsince May 1999.
C Reduced intervention rate inAugust 1999 at the amountof 50 BP into 5.5 percent, tomake a flexible lending rate.
C Implemented capital controlto prevent capital outflow.
C Implemented the fixed ex-change rate system.
C Restructured the bankingsector by establishing the“Danaharta” financial insti-tution to take over andmanage unresolved credit inthe financial system.
C Reduced the bank interestrate – after the inflation ratedecreased and exchange rateof Baht was relatively stablefrom 12.5 percent (July1997) to 7 percent (February1999) and finally reached12.5 percent again in July1999.
C Reduced the liquidity reserverequirement from 2 percentto 1 percent.
C Reformed the financialsector by establishing the‘Financial Sector Restructur-ing Authorities’; which func-tions to separate healthyfinancial institutions and in-solvent institutions, to in-crease control mechanismand to give guidance in therestructuring process of theprivate sector’s debt.
Real SectorC Required the big company
groups (chaebol) to divest asone way for capital re-structuring, and to focus thecompany groups on relatedbusiness activities.
C Amended regulations toallow foreign companies tocompete with domesticcompanies.
C Created new regulations toprotect minority capital shareand to support a more trans-parent management.
C Amendment of law toenforce companies toconduct debt restructuring,and to protect creditors andthe minority capital share.
C Practiced transparency in thecapital market.
C Established Corporate DebtRestructuring Committee toassist recapitulation of cor-porate sectors.
C Adjusted the ‘LendingCriteria’ in order to increaseexport credit.
C Reduced tariff on rawmaterials and value-addedtax (VAT) for exporters.
C Restructured private sector’sdebt by establishing ‘DebtRestructuring AdvisoryCommittee (CDRAC)’ andagreed on the conditions ofthe debtor-creditor and inter-creditor arrangement.
C Amendment on bankruptcyregulations, requirement onpublic companies and privatecompanies, as well as
... To be continued

- 79 -
ContinuationRep. of Korea Malaysia Thailand
regulations on land owner-ship by foreign companywere made.
Fiscal PolicyC Implemented fiscal policy to
speed up the financial sectorand corporation restructuringand to reduce unemploy-ment. Fiscal deficit in 1998was 4.9 percent of the GDPand in 1999 it was 4 percentof the GDP.
C Implemented a tight fiscalpolicy in 1997 (surplus 2.5percent of GDP) by postpon-ing several government pro-jects.
C Implemented an expansivefiscal policy in order tostimulate economic activi-ties. Fiscal deficit in 1998was 2.5 percent of the GDPand in 1999 it was 5.5percent of the GDP.
C Implemented an expansivefiscal policy in order tostimulate economic activitiesby increasing governmentexpenditure, and reducingtax. Fiscal deficit in 1998was 5 percent of the GDPand in 1999 it was 6 percent.Fiscal deficit will continue in2000.
Recovery ProgramC Economy of the Rep. of
Korea recovered in early1999.
C Improvement in export per-formance is the biggestcomponent in the increase ofGDP. Improved GDP wasstimulated by the Wondepreciation and increaseinternational demand.
C High international demandshifted the Korean positionfrom ‘price taker’ into ‘pricemaker’, which resulted in theincrease export volume andvalue.
C Capital account balance wasalso improved due to theavailability to ‘roll over’short-term loans and the in-crease in portfolio invest-ment flows into marketcapital and obligation.
C All mentioned above tookpart in increasing usableforeign reserve since June1998.
C The increase in privatesector consumption was
C Malaysia’s GDP standard toexpand during the secondquarter of 1999, which wassupported by the improve-ment in export performanceand a recovered domesticdemand.
C From the supply side, therecovery process wassupported by the expansionof the manufacturingindustry sector, especiallysemi-conductors and otherelectronic products. In themean time, performance inthe agriculture sector wasenhanced supported by palmoil production.
C The improvement in exportperformance caused asurplus in trade balance for24 months in a row.
C The improvements of theabove external factors alongwith capital inflow, and bothpublic and private sectors’loan, has advocated for theincrease in the foreign ex-change stock.
C Economic recovery startedsince the first quarter of1999 when economic pro-gress as recorded at 0.9percent.
C This economic expansionwas mainly supported by theimprovement in exportperformance and privateconsumption.
C M2 growth has slowed downsince September 1998.
C Baht appreciated fromB/54.9/US$1 (January 1998)to B/37.43/US$ 1 (December1999).
C Parallel with Baht apprecia-tion and the decrease ofinterest rate, the inflationrate was reduced from 10.7percent in June 1998 to -1.1percent in August 1999.
C The decrease in interest ratehas contributed to the in-crease in consumption.
C The problem of creditcrunch has indicated apositive development afterbanking recapitulation.
... To be continued

- 80 -
ContinuationRep. of Korea Malaysia Thailand
supported by a low interestrate, income effect andwealth effect.
C The enhancement of exportvolume and foreign demandalso supported the increasein investment and labor ab-sorption, and reduced theunemployment level.
C Labor absorption caused anincrease in income andpublic consumption.
C A strengthening domesticdemand since the second halfof 1998 was especiallypromoted by the decline inthe interest rate and theconsumer’s trust (consumerconfidence index).
C Inflation rate started todecline since the secondquarter of 1999, followed bythe decrease in inflation andexcessive production capa-city.
C NPL decreased since thethird quarter of 1999, in linewith the decline of loaninterest and the progress ofthe debt restructuring pro-cess.
Existing ProblemsC A continually appreciating
Won will become aconstraint that preventsexport, which is now thedriving force of the Koreaneconomy. Appreciation ofWon was due to high exportvalue until the third quarterof 1999 as well as massivecapital inflow.
C The banking restructuringprocess has not beenfinished.
C Impacts of fiscal stimulationpackage has not been asexpected.
C Banking restructuring pro-cess has not yet finished.
THE IMPACT OF THE FINANCIAL CRISIS ON AGRICULTURE:THE CASE OF INDONESIA
Agriculture cannot be described as a neglected sector in the Indonesian economy.Aggregate government spending on agriculture as a proportion of the total budget and as aproportion of GDP, is the highest in Southeast Asia. The rate of growth of yields has alsobeen among the highest in Southeast Asia. During the boom period, crop production grewsteadily, but more slowly than forestry, fisheries, or manufacturing. The crisis reduced thegrowth of all these sub-sectors, but their growth rate declined less than that of manufacturing.In 1998, output of crop sector was increasing despite the crisis, whereas it was severelycontracting in manufacturing. This drew government’s special attention to the agriculturesector of Indonesia, because it provides a form of economic ballast during hard times. Peoplecan return to agriculture when other industries contract.
The impacts of the financial crisis on agriculture could be summarized as follows:
1. Growth RatesAll sectors of the economy fell from 18 percent to 40 percent in 1998, except for
agriculture which grew at 1.1 percent. This was well below the growth rates of 3-4 percentagriculture had experienced in 1995-96, but that represented a small recovery from a growthrate of only 0.9 percent in 1997 during the El Niño drought. Within agriculture, food cropproduction increased at 1.7 percent. The net effects of the crisis for food crop output appeared

- 81 -
to be positive, due to an improvement in farmers’ terms of trade as a result of the depreciationof the rupiah. Estate crop production did not change much, however, rupiah income tofarmers increased significantly even though world prices declined. Some of the strongestevidence of the crisis impacts on rural households can be found in the sharp fall in livestockespecially poultry output in 1998 (7.1 percent). Poultry industry suffered due to the highimportation of input, that was non-profitable to supply to the domestic market.2. Food Prices
Food prices rose more rapidly than non-food prices, giving rise to concern about foodsecurity.3. Social Impacta. The urban areas, in general, were affected more severely than rural areas. This reflects
the fact that the crisis was initially an urban event. Effects on rural areas have been ofsecondary consequence to these urban effects. While the El Niño effects have beenmore severe in rural areas, urban effects have been their secondary consequence.
b. The effects varied widely across the country. Both urban and rural areas in Java werebadly affected. This result presumably reflects the high degree of integration betweenrural and urban areas in Java, shown in the high rates of labor mobility.
c. Areas that were badly affected by the crisis were uncorrelated with the initial levels ofpoverty. Areas badly affected included both areas initially better-off and poorer areas,while areas not badly affected included initially poorer and better-off areas. This hasgreat importance because this meant that the target of the crisis impact and poverty arenot the same.
d. Although urban areas were in general more severely affected, those urban areas thatwere more severely affected tended to be those where rural areas were also moreseverely affected, and vice versa.
4. EmploymentEarly reports on the impact of the crisis suggested large increases in unemployment but
actual unemployment appeared to have risen by only small amounts. The impact of the crisisis actually not on the levels of unemployment or on labor force participation, but rather onreal wages, which have fallen very significantly. These facts reflect the flexibility ofIndonesia’s labor markets. A collapse in the demand for labor has been expressed primarilyin the decline of its price, rather than in the level of employment. There has been a largesectoral reallocation of employment away from sectors of the economy that have contracted,including construction and services, and more towards sectors which have expanded, notablyagriculture.5. Rice Production
Rice production declined in 1997. The production in 1998 was 47 million mt, and thenincreased to around 50 million mt with more favorable climatic conditions in 1999. The crisiscreated problems of input marketing related to both the cost of imports, given the Rupiahdevaluation and the financing of domestic production. Uncertainty about the input pricingpolicy has also been a problem. At the same time, the subsidy for fertilizer was lifted whichdirectly increased the cost to farmers.6. Credit
The crisis led to a dramatic tightening of credit markets. Bank Indonesia raised interestrates substantially in a bid to attract capital back into the country, and to shore up theexchange rate. Interest rates were raised from about 11 percent to roughly 22 percent at thebeginning of the crisis, and then were increased sharply to 70 percent in mid-1998. Onceinflation began to cool, the government reduced interest rates to near pre-crisis levels in mid-

- 82 -
1999. To reduce the impact on farmers from the abolition of fertilizer subsidies, thegovernment expanded the existing program of subsidizing credit. A major change in farmcredit is that channeling banks are currently asked by the government to be executing banks.Therefore, the banks will be responsible for the process and risk of farm credit.7. Farm Prices
In general, the exchange rate depreciation increased the price of tradable products andfactors relative to non-tradables. This meant an increase in farm prices for commodities suchas cocoa, coffee, tea, and to a lesser extent, rice (whose domestic prices are determined inpart by world market prices). However, rural farmers also faced higher prices for importedinputs such as fertilizers and engineered seed varieties. Prices of most commodities rosesharply in early 1998 as the exchange rate depreciation caused the increases in tradableprices, and as the government removed subsidies on necessities such as rice and kerosene,as part of an IMF-sponsored reform program. Many non-tradable commodities alsoexperienced price increases, due to higher transport and processing costs. By mid-1999,prices had risen to roughly two-and-a-half times their pre-crisis levels.

1 Asia Week, October 2000.2 The income elasticity of demand for food (mostly rice) is variously estimated at 0.53-0.73.3 Of the three seasonal rice crops (Aus, Aman and Boro), Aman constitutes about 5 percent of
the total rice production and is planted from mid-July through mid-September.
- 85 -
1. BANGLADESH
Ishrat JahanDeputy Chief (Policy)Ministry of AgricultureDhaka
INTRODUCTION
Bangladesh, with an area of 147,570 km2 that supports 130 million people (January2000), has been classified as a least developed country (LDC) of Asia by the United Nations.Population is rapidly increasing at a growth rate of 1.5 percent per annum (Ministry ofFinance, 2000) with a density of 882/km2. The overwhelming majority of the population (80percent) live in the rural areas and depend primarily on agriculture for their livelihood. Theper capita income (US$299) is one of the lowest among the South Asian countries comparedto US$436, US$492, and US$827 for India, Pakistan and Sri Lanka, respectively.1 The peopleof Bangladesh spend more than half of their income on food.2
The 1997 Asian financial crisis has had an impact on the agriculture sector ofBangladesh. This paper attempts to discus such an impact and ways to enhance agriculturalproductivity.
ECONOMIC AND SOCIAL SITUATION
A look at the composition of the GDP in Table 1 makes it readily evident that theeconomy is characterized by its heavy dependence on agriculture. Even as late as 1999-2000,31.9 percent of the GDP originated from this sector though the sectoral share indicated adistinct declining trend during the 1990s. Many factors have inhibited the growth ofBangladesh’s overwhelmingly agricultural economy. These include a rapidly growing laborforce which cannot be fully absorbed by agriculture, a low level of industrialization andunderdeveloped energy resources.
The ratio of investment to GDP from both private and public sources estimated to beat a low 22.41 percent (private 15.68 percent and public 6.73 percent) during 1999-2000 and22.19 percent in 1998-99, from a level of 20.72 percent (private 13.70 percent and public7.03 percent) in 1996-97.
Inflation rose to 8.9 percent during 1998-99 from 2.52 percent in 1996-97, but starteddeclining in 1999-2000, which was estimated to be 4.11 percent. An upward trend wasobserved in the aggregate price level during the first six months of 1998. Prices of food andnon-food essential items escalated with the implementation of the pay scale for the publicsector employees, rise in the prices of electricity and energy, shortfall in the rice crop (Aman)3

- 86 -
Table 1. Growth and Composition of the GDP of Bangladesha
Itemsb 1990-91a 1996-97 1998-99 1999-2000GDP at constant price (1984-85) (Tk. million) 514,440 680,210 756,120 801,171GDP at current price (Tk. million) 834,390 1,403,050 1,737,620 1,982,990Composition of GDP (as percent of total GDP at constant price):
Agriculture 37.6 32.4 31.6 31.9Crop 29.7 23.8 22.6 22.9Fisheries 2.7 3.2 3.4 3.4Livestock 2.7 3.1 3.3 3.3Fishery 2.5 2.3 2.3 2.3
Manufacturing 9.8 11.1 11.2 11.1Large scale 5.7 7.2 7.5 7.4Small scale 4.1 3.9 3.7 3.7
Transport, storage and communication 11.8 12.2 12.4 12.4Trade services 9.1 10.1 10.3 10.2Banking and insurance 1.9 1.8 1.7 1.7Othersc 29.8 32.4 32.8 32.7
Annual growth rate (percent)GDP 3.4 5.9 5.2 6.0Agriculture 1.6 6.4 5.1 7.2
Crops 1.2 6.2 4.4 7.2Population 2.17 1.81 1.67 1.5
Source: Ministry of Finance, 2000.Notes: a Bangladesh fiscal year is 1 July through 30 June. Data for 1999-2000 are provisional; b foreign exchange rates are: 1990-91,
US$1 = Tk.35.68; 1996-97, US$1 = Tk.42.70; 1998-99, US$1 = Tk.48.06; and 1999-2000, US$1 = Tk.50.00; and c others of GDPincludes: (i) mining and quarrying; (ii) construction; (iii) power, gas, water and sanitary services; (iv) housing services; (v) publicadministration and defense; and (vi) professional and miscellaneous services.

4 Bangladesh currency (present exchange rate is US$1 = Tk.55).5 The Labor Force Survey has not been conducted after 1995-96.6 Household Expenditure Survey 1995-96, Bangladesh Bureau of Statistics. After that, no
survey has been conducted.
- 87 -
and the devastating flood of 1998. The devaluation of Taka,4 and the expansion of credit inthe private sector also influenced the price level. However, bumper food grain production andproper distribution led to a downward trend in food and non-food items prices during 1999-2000 and thus arrested the inflationary pressure.
The labor force in Bangladesh rose from 51 million (male 31 million and female 20million) in 1990-91 to 56 million (male 35 million and female 21 million) in 1995-96, a largenumber being engaged in agriculture (63.2 percent).5 However, the unemployment rateremained at 30 percent during the same period.
The total export receipts during 1998-99 increased by 20.3 percent to US$5,324million compared to US$4,427 million in 1996-97. However, import payments also increasedto US$8,018 million during 1998-99 from US$7,162 million in 1996-97 i.e., an increase of12 percent. Although foreign trade deficit was US$2,694 million, it had been reduced by 1percent from the level of US$2,735 million during 1996-97. This deficit has reduced furtherwith the bumper production of food grain during 1999-2000.
Poverty alleviation is one of the prioritized goals for the country’s developmentprogram. The present Fifth Five-Year Plan (1997-98 through 2001-02) has assigned highpriority to the poverty alleviation. However, it can be seen from Table 2 that although overa period of 12 years (1983-84 to 1995-96), both poverty and hardcore poverty in the urbanand rural areas was reduced by 24 percent to 33 percent,6 the poverty scenario is still bleak.About 27 percent of urban people and 25 percent of rural population are still under hardcorepoverty. However, as mentioned, the government is attaching top priority to alleviatingpoverty through the development of food safety net programs.
Table 2. Poverty and Hardcore Poverty in Bangladesh(Unit: Percent)
Nature ofPoverty
1983-84
1985-86
1988-89
1991-92
1995-96
Percent Decreasein 1995-96 com-pared to 1983-84
Povertya: Rural 61.9 54.7 47.8 47.6 47.1 24 Urban 67.7 62.6 47.6 46.7 49.7 27Hardcore povertyb: Rural 36.7 26.3 28.6 28.3 24.6 33 Urban 37.4 30.7 26.4 26.3 27.3 27
Source: Bangladesh Bureau of Statistics, Household Expenditure Survey 1995-96.Notes: a Poverty is measured in terms of daily per capita food intake of less than 2,122
kcal.b Hardcore poverty is measured in terms of daily per capita food intake of less than1,805 kcal.


7 The model focuses on real trade flows, trade balances, world prices and real exchange rates.It incorporates considerable detail on sectoral output, consumption and trade flows – bothbilateral and global. The model includes 17 regional models, each with 14 sectors, and fiveprimary factors of production: agricultural land, natural resources, capital, unskilled labor, andskilled labor. The report results in eight groups: combining Korea, Taiwan and Singapore intothe Asian newly industrialized countries (NICs); Indonesia, Malaysia, the Philippines andThailand into the Asian less developed countries (LDCs); and adding Latin America, Canada,South Asia and Mexico to rest of the world (ROW).
- 89 -
Indonesia, Malaysia and the Philippines, and then spread to the Rep. of Korea and, to a lesserextent, Singapore, Taiwan, and Japan. This situation forced these countries to slash theirpurchasing power by 20-50 percent. The value of stocks, real estate and other assets sharplydeclined. Interest rates and bad loans increased, which threatened many businesses,particularly banks, with grave ramifications. Unemployment was also raised.
Economists and financial analysts have differences in opinions on the exact causesof this crisis. While each country’s situation is distinct, most explanations center around thefollowing factors:
C Excessive dependence on foreign borrowing by business enterprises and banks, andespecially over-dependence on short-term debt.
C Too much investment in real estate and excess manufacturing capacity.C Inadequate supervision of financial institutions and politically influenced allocations
of credit to unsound companies.C Overly expensive fiscal and macro-economic policies.C Declining terms of trade for countries whose currencies have been pegged closely
to the US dollar.
The spillover effects of the Asian crisis transmitted to different countries by thechannels of trade and finance, have affected different countries in different ways and havebeen met with policy measures in the monetary, financial and trade spheres. The spilloveraffect, however, did not spread over to Bangladesh. Therefore, the Bangladesh agriculturehas not been directly affected by the currency crisis in Southeast Asia. This is becauseBangladesh has very little short-term external debt, no capital account convertibility (but theTaka is fully convertible for most current account transactions), low foreign exchangeexposure by the domestic commercial banks and a preponderance of long-term concessionaldevelopment assistance. Moreover, despite the government’s liberalized policy for increasingdirect foreign investment, very few companies, especially in the agriculture sector, haveinvested in the country. In addition, the government took initiatives to stop bad loans in thebanking institutions.
No study has yet been conducted to measure the impact of the Southeast Asianfinancial crisis on the productivity of agriculture in Bangladesh. However, the Institute forInternational Economics (IIE), the International Food Policy Research Institute (IFPRI) andthe Purdue University conducted a study in March 1999 to analyze the implications of theAsian financial crisis for both Asia and the rest of the world. This study used a multi-sectoral,multi-regional, computable general equilibrium (CGE) model to analyze the impact of theAsian crisis, thus highlighting the implications of possible future developments in Japan andChina.7 This study analyzed the results under different scenarios and summarized the impact

8 Under this scenario, the developed model is a combination of real exchange rate depreciationsand supply side contractions due to domestic financial disintermediation, which impeded theaffected countries ability to respond to the real exchange rate change. Under this scenario thestudy programmed a set of real exchange rate changes and supply side shocks approximatelywhat occurred between July 1997 and December 1998.
- 90 -
on agricultural development in some of the main producing and consuming areas. However,the author of this country paper tried to compare the situation that prevailed in Bangladeshwith only one scenario.8 Results of the study are presented in Table 3, which summarizes theimpacts of the Asian financial crisis on agriculture in terms of agricultural production,exports and imports. In this table, the South Asian countries have been put together alongwith some other countries under the category of other. Thus, an attempt has been made hereto compare the Bangladesh situation with the ‘other’ category.
Table 3. Changes in Agricultural Output, Exports and Imports(Unit: Percent)
Countries Production Exports ImportsU.S.A. -1.0 -4.4 2.9Western Europe -0.4 -2.7 1.8Australia and New Zealand 2.1 4.5 4.7Japan -0.1 -8.6 2.1China 0.4 -9.7 5.7Asian NICs -3.9 9.3 -12.6Asian LDCs -5.0 36.6 -25.9Others -0.1 -3.1 2.2
Bangladesh*: 1998-99 5.1 -15.9 501999-2000 7.2 0.9 -36
Sources: Institute of International Economics, 1999; and Bangladesh figures obtained fromthe Economic Survey, 2000, Ministry of Finance.
Note: For Bangladesh, the base year is 1997-98 and agricultural production includes allsub-sectors. Agricultural exports include raw jute, tea, frozen food, agriculturalproducts and other primary products.
In both the Asian LDCs and NICs, major currency devaluation led to significant importsubstitution and a decline in domestic production. As a result of the crisis, the decline inincome led to a decline in consumer demand and depressed agricultural production in mostparts of the world. In the Asian NICs and LDCs, the income effect complemented the importsubstitution effect. However, Australia/New Zealand’s case is exceptional. There, thedecision to accept a real depreciation boosted competitiveness, generated an increase inagricultural exports, and with exports being a large share of output, the net effect was toincrease supply. For the United States, exports declined and imports rose, and domesticoutput fell. For rest of the world (which also includes South Asian countries) exports alsowere estimated to decline, imports to rise and domestic outputs to fall. But, the extent of suchan impact appeared to be very low in these countries.

9 Data for crop and non-crop labor force is not available separately. This labor productivity isestimated for the agriculture sector as a whole.
- 91 -
In Bangladesh, it was observed that during the post-crisis year, agricultural productionincreased by 5.1 percent against an estimated negative growth of -0.1 percent, agriculturalexports reduced substantially and imports increased significantly. The main reason behindthis was not the Asian crisis, but rather the three months long and devastating flood, whichdeteriorated the overall economic situation. Additional food deficit amounted to more than2.0 million mt, despite an increase in agricultural production. The government was forced toresort to emergency import in order to meet the demand for food and essential commodities.The trade deficit widened and stood at US$2,694 million and the current account deficit wasat US$394 million. However, the situation changed during 1999-2000. Agriculturalproduction increased at an annual growth rate of 7.2 percent, exports increased by 0.9 percentand imports decreased by 36 percent. Appropriate policy measures and programs such asproviding loans on soft terms, especially to the small farmers, ensured the timely supply ofagricultural inputs by the public and private sectors. A liberalized fiscal policy by thegovernment has made this possible.
Here an attempt has also been made to briefly analyze agricultural productivity in termsof production, land, labor and total factor productivity using secondary information. This isbecause no organization has recently conducted any study to measure and analyzeagricultural productivity by using primary data and applying econometric models.
The overall performance of the agriculture sector in 1990s compared with the pre-Asian financial crisis and post-crisis period, is presented in Table 4. Annual compoundgrowth rate of the agriculture sector as a whole has been remarkable between the pre-crisisand post-crisis period at 4.02-5.06 percent compared to the 3.15-percent and 2.75-percentmedium-term trend since 1990-91 and the long-term trend since 1984-85, respectively.Although non-crop sectors’ performance was remarkable, the growth rate in GDP is stilllargely dominated by the growth in the crop sector.
Table 4. Performance of Agricultural Production in 1999-2000 Compared tothe Pre-crisis Period, Medium- and Long-term Trend Growth Rates(at the 1984-85 constant price)
(Unit: Percent)
Sector 1996-97 to1998-99
1996-97 to1999-2000
1990-91 to1999-2000
1984-85 to1999-2000
Agriculture 4.02 5.06 3.15 2.75Crop 2.88 4.31 3.89 2.06Others 7.07 7.06 6.54 4.96
Non-agriculture 6.10 5.90 6.08 5.72GDP 5.43 5.63 5.05 4.62
Source: Bangladesh Economic Survey, 2000.
An estimate of labor productivity in the agriculture sector9 (Table 5) indicates adowntrend from 1985-86 to 1990-91. Labor productivity remained almost the same duringpre- and post-crisis period. However, labor productivity did not change much during the

- 92 -
1990s. With the adoption of improved technology, the demand for labor in the agriculturesector is gradually declining. Labor has been shifting to non-agriculture sectors because realwages are higher in non-agriculture sectors than in the agriculture sector. The land-labor ratioalso showed a sharp decline from 0.68 in 1985-86 to 0.38 during 1995-96. This ratio did notchange during the pre- and post-crisis period.
Table 5. Trends in Labor Productivity and Land-Labor Ratios
Year
Agriculture GDPat 1984-85
Constant Price(Tk. million)
AgriculturalLabor Force
(million)
LaborProductivity
TotalCultivated
Land(million ha)
Land-LaborRatio
1985-86 175,555 20.03 8,765 13.54 0.681990-91 193,420 34.40 5,623 13.71 0.401995-96 207,130 35.39 5,853 13.51 0.381998-99* 226,960 36.58* 6,204 13.83 0.381999-2000* 238,530 37.13* 6,242 n.a.
Source: Calculated from the Bangladesh Economic Survey, 2000.Note: * Labor force in the year 1998-99 and 1999-2000 is estimated at an annual growth
rate of 1.67 and 1.5 percent, respectively.
Due to the non-availability of data, the total factor productivity is difficult to measurefor the pre- and post-crisis period. However, using the cost and return data of major rice andwheat crops, an attempt has been made to show the extent of the total factor productivityfrom 1987-88 to 1991-92 and for the year 1998-99 (Tables 6, 7 and 8). From the return costratio, respective indices have been prepared to get the approximate measures for total factorproductivity. It can be seen that total factor productivity during 1988-89 increasedconsiderably from the previous year for all three crops. This is mainly due to the fact that thegovernment undertook major policy initiatives during that year to privatize all agriculturalinputs, which created competition in the market and thus, reduced the prices of agriculturalinputs. This induced farmers to use more inputs and as a result, crop production increased.In some years, such as 1998-99, productivity declined mainly because of the loss in cropsfrom natural calamities such as floods, drought and cyclones, and the increase in prices ofagricultural inputs such as fuel, for irrigation purposes.
Table 6. Cost and Return Analysis of T. Aman RiceYear Return (Tk./ha) Cost (Tk./ha) Return/Cost Ratio Index
1987-88 12,772 12,325 1.04 1001988-89 14,196 12,632 1.12 1081989-90 18,087 13,672 1.32 1271990-91 15,228 13,771 1.11 1071991-92 17,819 14,285 1.25 1201996-99 24,670 21,143 1.17 113
Sources: Ministry of Agriculture, Handbook of Agriculture Statistics, 1999; and Ministryof Food, 1999.

- 93 -
Table 7. Cost and Return Analysis of Boro PaddyYear Return (Tk./ha) Cost (Tk./ha) Return/Cost Ratio Index
1987-88 25,896 21,013 1.23 1001988-89 27,579 21,041 1.31 1061989-90 28,069 22,412 1.25 1021990-91 28,289 23,531 1.20 981991-92 30,348 23,924 1.27 1031996-99 36,747 33,296 1.10 89
Sources: Ministry of Agriculture, Handbook of Agriculture Statistics, 1999; and Ministryof Food, 1999.
Table 8. Cost and Return Analysis of WheatYear Return (Tk./ha) Cost (Tk./ha) Return/Cost Ratio Index
1987-88 9,949 12,496 0.80 1001988-89 12,696 13,119 0.97 1211989-90 11,083 13,457 0.82 1031990-91 13,749 14,695 0.94 1181991-92 15,393 15,253 1.01 1261996-99 17,920 16,606 1.08 135
Sources: Ministry of Agriculture, Handbook of Agriculture Statistics, 1999; and Ministryof Food, 1999.
For measuring land productivity, an estimate was made by taking into considerationthe GDP from crop agriculture and total cropped area. It appears from Table 9 that landproductivity has been increasing, although many studies indicate the declining fertility ofland. Actually, land productivity has increased mainly because of the increased yields ofpaddy and wheat crops, due to the use of improved irrigation, fertilizer and seed technologiesand the increase in cropping intensity.
Other factors influencing productivity include:
C High risk in agriculture which is prone to natural calamities.C Lack of purchasing power for a majority of farmers to modernize and mechanize their
farming practices.C Highly fragmented landholdings.C Fully exploited natural resource bases such as land.
Landholdings in Bangladesh are generally too small, highly fragmented and too widelyscattered for the proper management and economical use of irrigation and other facilities. Theaverage landholding per farm family is less than 2 acres. The distribution of land is alsohighly skewed. A small group of only 11 percent of the rural farm households own more than50 percent of the total cultivable land, while 39 percent of the households have noagricultural land (Table 10). Disparity is also evident in income distribution. According toan estimate of the Bangladesh Bureau of Statistics, the highest 20 percent of the ruralpopulation earn more than 50 percent of total rural income while the lowest 20 percent earnless than 5 percent of the total income. However, the situation improved from the pre-crisis

- 94 -
period (April 1995) to the post-crisis period (April 1998). The Gini ratio was reduced from0.42 to 0.31 during this period. Still, the gap in income distribution is wide and therefore,poverty is acute in rural Bangladesh, mostly because of the lack of employment opportunitiesin the rural areas (Table 11).
Table 9. GDP from Crop Agriculture and Land Productivity
YearGDP from Crop
Agriculture(Tk. million)
TotalCropped Area(million ha)
LandProductivity
LandProductivity
Index
1984-85 13,503 13.15 1,026.84 100.001985-86 13,959 13.54 1,030.95 100.401986-87 13,959 13.34 1,046.40 101.901987-88 13,711 13.82 992.11 96.621988-89 13,450 13.71 981.04 95.541989-90 15,082 14.06 1,072.69 104.471990-91 14,995 14.03 1,068.78 104.081991-92 15,221 13.81 1,102.17 107.341992-93 15,639 13.71 1,140.70 111.091993-94 15,385 13.48 1,141.32 111.151994-95 14,806 13.52 1,095.12 106.651995-96 15,216 13.51 1,126.28 109.681996-97 16,157 13.80 1,170.80 114.021997-98 16,383 13.82 1,185.46 115.451998-99 17,094 13.83 1,236.01 120.37
Sources: Bangladesh Bureau of Statistics and Ministry of Agriculture.
Table 10. Land Ownership Pattern in the Rural Areas of Bangladesh(Unit: Percent)
Ownership* Number of People Share of LandLandless 39 0Small 50 45Medium 10 38Large 1 17
Total 100 100Source: Calculated by the author from the Agriculture Census Report, 1996, Bangladesh
Bureau of Statistics.Notes: * Small farms, 1.00 ha; medium farms, 1.00-3.03 ha; and large farms, 3.04 ha.
Considering this situation, the Bangladesh Government has undertaken strategies toincrease the growth and productivity of the agriculture sector. Continuous high populationgrowth has made Bangladesh an extremely land scarce country. Land can no longer becounted as an important source of growth for agricultural production. Therefore, abreakthrough in agriculture necessitated the development of a new technology package ofmodern inputs – irrigation, fertilizer and seed – popularly known as the Green Revolution.

- 95 -
The government implemented a number of policy measures and development projects toincrease the productivity of the agriculture sector. As food grains (rice and wheat) largelydominate the growth in agriculture, the policies and programs are mainly centered around thegrowth of food grain production. The government, from the early 1980s, started an openeconomic policy and gradually removed the control over the distribution of agriculturalinputs, such as irrigation, seeds, fertilizer and pesticides, promoted the input trade privatesector and also removed the subsidies on these inputs. As a result, food grain productionincreased considerably (Table 12). This has, to some extent reduced poverty in the ruralareas.
Table 11. Rural Income Distribution by Households(Unit: Percent)
HouseholdGroup
April 1998 April 1995No. of People Income No. of People Income
Decile-1 6.9 1.5 8.4 1.2Decile-2 7.9 3.1 7.9 2.7Decile-3 8.4 4.1 8.6 3.7Decile-4 9.2 5.2 8.9 4.7Decile-5 9.8 6.2 10.0 5.7Decile-6 10.1 7.6 9.9 6.9Decile-7 10.3 9.1 10.5 8.6Decile-8 11.4 11.7 11.4 11.1Decile-9 12.2 15.9 11.3 15.8Decile-10 13.8 35.6 12.5 39.2
Gini ratio 0.31 0.42Source: Bangladesh Bureau of Statistics.
Table 12. Trends in Food Grain Production in Bangladesh from 1971-72 to 1998-99(Unit: 000 mt)
Year Rice (A) Wheat (B) Total FoodGrain (A+B)
Percent Changeover Previous Year
1971-72 9,774 113 9,887 -1975-76 12,561 218 12,779 13.831980-81 13,883 1,093 14,976 12.081985-86 15,041 1,042 16,083 -0.021990-91 17,852 1,004 18,856 0.581995-96 17,687 1,369 19,056 5.411996-97 18,922 1,450 20,372 6.911997-98 18,862 1,803 20,665 1.441998-99 19,352 2,000* 21,352 3.32Annual average growth rate: 3.13
Source: Bangladesh Bureau of Statistics.Note: * Estimated of Department of Agricultural Extension (DAE).

- 96 -
ENHANCING AGRICULTURAL PRODUCTIVITYON A SUSTAINABLE BASIS
Although the Asian financial crisis did not have any direct impacts on the agriculturalproduction of Bangladesh, over the long term, however, the dramatic devaluation ofcurrencies by its neighbors may significantly erode Bangladesh’s competitive edge.Therefore, the steady and cautious devaluation of the Taka by the government has beencontinuing.
Bangladesh has been pursuing a liberal trade policy in keeping with the global marketeconomy. With this end in view, the government adopted a policy for the furtherliberalization of export and import regimes, including a reduction in tariff rates. Some of therecent policy measures include:
C ensuring quality controlC withdrawing restrictions on the country of origin for the industries enjoying bonded
warehouse facilitiesC easing the import of raw materials for export industriesC reducing import duties for a large number of agricultural inputs, agro-processing raw
materials and agro-machineriesC reducing tariff tabs to 5 from 8 in 1996-97C reducing the maximum rate of import duty to 37.5 percent.
The government realized that we still have many other structural issues to address, inorder to immunize ourselves as much as possible against a future crisis. Large capital inflowsand the sudden withdrawal of foreign capital were key features of the crisis, so themanagement of erratic and volatile short-term capital has become an important policy issue.Financial market globalization, therefore, promotes various policy issues.
Strengthening the domestic financial system should be the most important policy toenhance agricultural productivity on a sustainable basis. Establishing transparent accountingstandards and practices, and the public disclosure of information are important in improvingthe financial infrastructure. Strengthening banks’ profitability and capitalization, restrictingconnected lending, tightening asset classification, and loan loss provisions are essentialelements in the regulatory and supervisory framework. The government should also be morecautious in opening its capital market.
In Bangladesh, where nearly half of the total population live below the UN-definedabsolute poverty line, food security is a matter of great national importance. Rice is the staplefood of the country, and wheat and maize are gaining importance in the Bangladesh diet.About 85 percent of the calories and most of the protein in the average diet come from foodgrain (rice and wheat). It is therefore, understandable that “food security” has become defacto a quest for self-sufficiency in cereal grain production.
The promising ways of sustaining high levels of food production to ensure foodsecurity include:
C increasing productivity (yield/ha)C increasing cropping intensity without sacrificing the environmental basis of food
productionC maintaining soil fertility
- 97 -
C adopting integrated pest management practices and arresting environmentaldegradation
C diversifying crops within rice and outside of riceC developing physical and marketing infrastructureC providing output price support and post-harvest storage facilitiesC developing agro-product processing technologyC transforming subsistence agriculture into commercial agricultureC controlling population growth more effectively.
REFERENCES
Ali, Amm Shawkat, 2000. World Food Security, June 2000.
Food and Agriculture Organization, 2000. Perspective Plan for the National AgriculturalDevelopment Strategy – Horizon 2010, November 2000.
Institute of International Economics, IFPRI and Purdue University, 1999. “The ContinuingAsian Financial Crisis: Global Adjustment and Trade”, Working Paper 99-4, March1999.
Ministry of Finance, 2000. Bangladesh Economic Survey 2000.

- 98 -
2. REPUBLIC OF CHINA
Dr. York Yaw-chung LiaoDeputy Director GeneralEconomics and Planning DepartmentCouncil of AgricultureExecutive YuanTaipei, Taiwan
I. INTRODUCTION
The financial turmoil erupted in 1997 has hit most of East Asian economies muchharder than originally expected. The Republic of China (ROC) has not been immune, but hashad the good fortune to hurt less. This report will take an institutional and close perspectivein examining the issues. Section II will review the latest economic momentum in theRepublic of China. The impacts from the financial crisis on ROC economy will beinvestigated in Section III. The measures taken in ROC and lessons to be drawn will bereviewed in Section IV. The impacts on agriculture and its challenges will be discussed inSection V. Section VI will set forth the conclusions.
II. THE LATEST ECONOMIC MOMENTUMIN THE REPUBLIC OF CHINA
The ROC has not been unaffected, but has had good luck to hurt less in the Asianfinancial crisis. Our GDP growth rate reached 4.6 percent in 1998 and the consumer priceindex went up by only 1.7 percent in 1998, while the unemployment rate was recorded at 2.7percent (Table 1).
The ROC economy has again performed well in 1999. Real GDP rose 5.4 percent andexports grew 10 percent through the year. Foreign trade registered a surplus of US$10.9billion. As a result, foreign exchange reserves built up to US$106.2 billion by the end of1999, and foreign assets held by the private sector approached US$70 billion. Notsurprisingly, the level of our external debt is negligible.
Real GDP rose 6.7 percent in the first half of 2000 and the pace of growth wasexpected to slow to 6.5 percent in the second half of the year. For the year as a whole, theeconomy was expected to grow from 6.4 percent to 6.6 percent. The expansion in output hasbeen driven by strong external demand, and a stable increase in both private consumption andinvestment. In the meantime, prices have remained stable. The Consumers’ Price Index (CPI)went up by a mere annual rate of 1.97 percent, recorded in October 2000. Inflation shouldremain subdued and was projected to be a moderate 1.25 percent for the year. Unemploymentrate reached 3.1 percent in September or 3 percent on average, for the first nine months ofthis year. The Living Misery Index, as measured by the sum of the unemployment rate andthe inflation rate, gives the ROC a total of 4.85 percent as of the end of September 2000,much higher than the Misery index of 3.67 percent on 21 September 1999, time of theearthquake.

- 99 -
Table 1. Key Economic Indicators of the ROC
YearGDP
Growth(percent)
Change inFixed Capital
Formation(percent)
Merchandise Trade (US$ billion) Change in PriceIndex (percent) Unemployment
(percent)
ForeignExchangeReserve
(US$ billion)
Exports Imports Trade Surplus
Amount Percent Amount Percent Amount Percent WPI* CPI
1986 11.6 10.3 39.9 29.7 24.2 20.3 15.7 47.6 -3.3 0.7 2.66 46.311987 12.7 18.6 53.7 34.7 35.0 44.7 18.7 19.2 -3.3 0.5 1.97 76.751988 7.8 14.6 60.7 13.0 49.7 42.0 11.0 -41.2 -1.6 1.3 1.69 73.901989 8.2 14.8 66.3 9.3 52.3 5.2 14.0 27.7 -0.4 4.4 1.57 73.221990 5.4 7.6 67.2 1.4 54.7 4.7 12.5 -11.0 -0.6 4.1 1.67 72.441991 7.6 9.2 76.2 13.3 62.9 14.9 13.3 6.6 0.2 3.6 1.51 82.411992 7.5 18.5 81.5 7.0 72.0 14.5 9.5 -28.9 -3.7 4.5 1.51 82.311993 7.0 12.0 85.1 4.4 77.1 7.0 8.0 -15.1 2.5 2.9 1.45 83.571994 7.1 7.4 93.0 9.3 85.3 10.8 7.7 -4.1 2.2 4.1 1.56 92.451995 6.4 7.3 111.7 20.0 103.6 21.3 8.1 5.3 7.4 3.7 1.79 90.311996 6.1 1.7 115.9 3.9 102.4 -1.1 13.5 67.4 -1.0 3.1 2.60 88.041997 6.7 10.7 122.1 5.3 114.4 11.8 7.7 -43.6 -0.5 0.9 2.72 83.501998 4.6 8.0 110.6 -9.4 104.7 -8.5 5.9 -22.7 0.6 1.7 2.69 90.301999 5.4 1.8 121.6 10.0 110.7 5.8 10.9 84.8 -4.5 0.2 2.92 106.20
Source: Economic Research Department, Council for Economic Planning and Development (CEPD), Executive Yuan, Rep. of China.Note: * Wholesale Price Index.
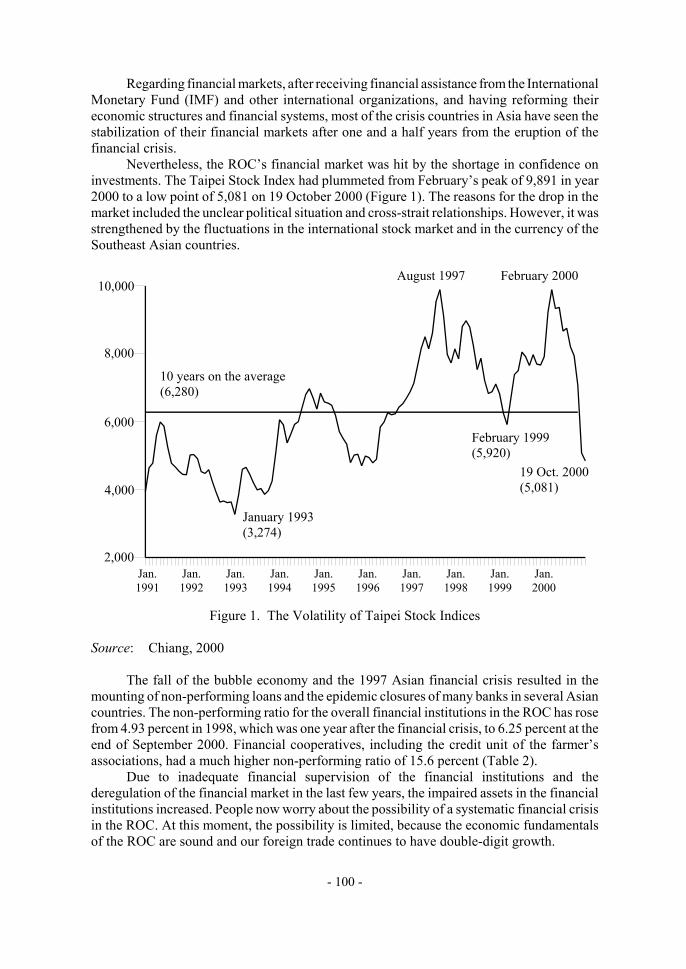
- 100 -
August 1997(9,890)
February 2000(9,891)10,000
10 years on the average(6,280)
February 1999(5,920)
8,000
19 Oct. 2000(5,081)
January 1993(3,274)
6,000
4,000
2,000Jan.1991
Jan.1992
Jan.1993
Jan.1994
Jan.1995
Jan.1996
Jan.1997
Jan.1998
Jan.1999
Jan.2000
Regarding financial markets, after receiving financial assistance from the InternationalMonetary Fund (IMF) and other international organizations, and having reforming theireconomic structures and financial systems, most of the crisis countries in Asia have seen thestabilization of their financial markets after one and a half years from the eruption of thefinancial crisis.
Nevertheless, the ROC’s financial market was hit by the shortage in confidence oninvestments. The Taipei Stock Index had plummeted from February’s peak of 9,891 in year2000 to a low point of 5,081 on 19 October 2000 (Figure 1). The reasons for the drop in themarket included the unclear political situation and cross-strait relationships. However, it wasstrengthened by the fluctuations in the international stock market and in the currency of theSoutheast Asian countries.
Figure 1. The Volatility of Taipei Stock Indices
Source: Chiang, 2000
The fall of the bubble economy and the 1997 Asian financial crisis resulted in themounting of non-performing loans and the epidemic closures of many banks in several Asiancountries. The non-performing ratio for the overall financial institutions in the ROC has rosefrom 4.93 percent in 1998, which was one year after the financial crisis, to 6.25 percent at theend of September 2000. Financial cooperatives, including the credit unit of the farmer’sassociations, had a much higher non-performing ratio of 15.6 percent (Table 2).
Due to inadequate financial supervision of the financial institutions and thederegulation of the financial market in the last few years, the impaired assets in the financialinstitutions increased. People now worry about the possibility of a systematic financial crisisin the ROC. At this moment, the possibility is limited, because the economic fundamentalsof the ROC are sound and our foreign trade continues to have double-digit growth.

- 101 -
Table 2. Non-performing Ratios of the ROC’s Financial Institutions, 1995-2000a
(Unit: Percent)
Year Overall BankingSectors
Domestic FinancialInstitutionsb
Local Branch ofForeign Banks
FinancialCooperatives
1995 3.00 2.88 0.82 4.021996 4.15 3.74 1.00 7.101997 4.18 3.74 1.07 8.531998 4.93 4.41 1.64 10.571999 5.67 4.96 3.20 13.70Sept. 2000 6.25 5.36 3.33 15.57
Source: Bureau of Monetary Affairs, Ministry of Finance, ROC.Notes: a The above figures represent numbers by the end of the respective years except the
year 2000; and b financial cooperatives include the credit unit of farmer’sassociations.
III. THE IMPACTS AND CAUSES OF THE FINANCIAL CRISIS
If we look at the period of mid-1997 to mid-1999, two features of the ROC economystand out. First, the ROC was the least affected economy from the Asian financial crisis andwas, moreover, able to maintain steady growth throughout the crisis. While most other Asianeconomies experienced sluggish or even negative growth, the ROC managed to register a 4.6-percent economic growth rate with a 1.7-percent inflation in 1998. Second, as the crisisgradually subsided, the ROC emerged as one of the few economies to recover strongly. Toput it simply, the most remarkable attribute of the ROC economy is its flexibility orresilience. It has proved itself capable of withstanding the onslaught of a financial crisis,while continuing to perform credibly.
Impacts of the Asian Financial CrisisAccording to a forecast made by the World Economic Forum, the ROC economy has
exhibited exceptional resilience and strong potential in the face of adversity (Table 3).From the end of June 1997 to June 1998, the combined rates of depreciation and the
decline in stock prices (so-called the volatility of financial markets) of East Asian countriesand economies ranged between 35 percent and 122 percent. The ROC’s financial marketswere the least affected (Table 4). However, by the end of 1999, countries in the region wereable to recuperate to the level before the crisis except for the ROC, the Philippines, Thailand,Malaysia and Indonesia. All of the countries had positive economic growth in 1999, but someof the economies still suffered from high unemployment ratios.
Causes of the Asian Financial CrisisThe countries hit hardest by the crisis shared the following characteristics: persistent
current account deficits, heavy reliance on foreign capital, inflexible exchange rate regimes,overvalued real exchange rates, etc. The factors, in a potent mixture, could give rise tofinancial crises.

- 102 -
Table 3. The Impacts of the Asian Financial Crisis on Economic Growth(Unit: Percent)
Country 1996 19971998 1999
(actual)Original (A) Actual (B) Difference (B - A)
ROC 5.8 6.8 6.1 4.6 -1.5 5.4Japan 3.9 0.9 3.2 -1.9 -5.1 0.3Hong Kong 4.9 5.2 5.6 -5.1 -10.7 2.9Singapore 6.9 7.8 7.2 0.3 -6.9 5.4Rep. of Korea 7.1 5.5 6.0 -6.7 -12.7 10.7Philippines 5.7 5.1 5.9 -0.5 -6.4 3.2Thailand 5.5 -0.5 6.8 -10.0 -16.8 4.2Malaysia 8.6 7.8 8.3 -7.5 -15.8 5.4Indonesia 8.0 4.6 7.4 -13.7 -21.1 0.2
Notes: a Original – WEFA (Wharton Economic Forecasting Association early and changeher name to Global Insight Co. nowadays), August 1997; and b revised: WEFA,February 1998.
1. Huge Movement of Cross-border CapitalNet private capital flows to emerging market countries (that is all developing, newly
industrialized and transition countries), encouraged by financial liberalization andglobalization, reached a record high of US$214 billion in 1996, with Asia attracting thelargest share by far.
The devaluated currency was used for risky and unproductive investment, particularlyin the securities and real estate markets, which caused financial instability.
Many of the crisis countries acted over-hastily and imprudently in liberalizing capitalflow. The broad opening of their stock markets to foreign investment resulted in huge inflowsof foreign money into properties and stocks, which helped fuel the creation of bubbleeconomies (Table 5). An excessive surge in capital inflows might plant the seeds of acurrency crisis by contributing to: (1) a real appreciation of the local currency; (2) a build-upof external debts; (3) an explosive growth in domestic credit and a current account deficit;(4) overinvestment in risky ventures; and (5) an equity or property market bubble.2. Overinvestment
The East/Southeast Asian countries pursued high rates of economic growth by favoringmassive investment. However, as domestic savings were insufficient to meet the demand forinvestment capital, serious internal imbalances arose (Table 6).3. Persistent Current Account Deficits
As their export competitiveness weakened and their rapidly expanding economiessucked in a sharply rising volume of imports, the ASEAN 4 and South Korea recordedgrowing trade deficits. Year after year of current account deficit gave rise to serious externalimbalances (Table 7).4. Heavy Reliance on Foreign Capital
Because of the insufficiency of domestic saving, the ASEAN 4 and the Rep. of Koreawere compelled to fund their excessive investment from foreign borrowing, which createda massive build-up of foreign debt (Table 8). Short-term capital tends to be highly volatilein nature. Massive and rapid movements of short-term capital can seriously undermine thestability of a financial system and ultimately affect the whole economy.

- 103 -
Table 4. Key Economic Indicators of Selected Countries(Unit: Percent)
IndicatorVolatility of Financial Markets Economic Growth Rate Unemployment Rate
July 1997-June 1998
July 1998-Dec. 1999
July 1997-Dec. 2000 1997 1998 1999 1997 1998 1999
ROC -35.4 21.3 -17.8 6.7 4.6 5.4 2.7 2.7 2.9Japan -41.5 56.7 3.9 1.4 -2.8 0.6 3.4 4.1 4.7Hong Kong -43.8 98.2 11.3 5.3 -5.1 2.9 2.2 4.7 6.2Singapore -61.9 134.2 10.5 8.0 0.3 5.4 2.4 3.2 2.9Philippines -74.6 26.2 -58.2 5.2 -0.5 3.2 8.7 10.1 9.7Thailand -88.0 95.9 -37.7 -1.8 -10.0 4.2 3.5 4.8 4.2Rep. of Korea -95.3 265.8 15.9 5.0 -5.8 10.7 2.6 6.8 6.3Malaysia -96.5 86.9 -58.2 7.7 -7.5 5.4 2.6 3.9 3.4Indonesia -122.1 161.7 -72.2 4.9 -13.5 0.2 4.7 17.1 -China - - - 8.8 7.8 7.1 3.1 3.1 3.1
Source: Economic Research Department, CEPD, Executive Yuan, ROC.

- 104 -
Table 5. Net Private Capital Flows to Developing Countries(Unit: US$ billion)
Year/Item/Region 1984-89 1990-96a 1996 1997 1998 1999
Total capitalb 12.6 141.8 214.9 117.8 69.5 89.8FDIc 13.1 64.6 121.1 145.0 127.3 119.2Portfolio 4.4 64.0 79.9 66.6 42.0 25.1Others -4.9 13.0 13.9 -93.8 -99.8 -54.5
Asia and NIEsd 9.9 58.3 108.1 -15.1 -49.5 -38.1Africa 2.3 3.7 5.1 14.1 7.3 14.2Middle East and Europe 2.3 22.9 3.9 7.9 24.9 21.9Latin America -0.2 46.1 81.7 88.3 73.6 75.3
Source: IMF, World Economic Outlook, December 1998.Notes: a Annual average; b net private capital flows comprise net direct investment, net
portfolio investment, and other long- and short-term net investment flows,including borrowing; c FDI = Foreign Direct Investment; and d NewlyIndustrialized Economies (NIEs) = Hong Kong, Rep. of Korea, Singapore, andTaiwan.
Table 6. Economic Growth, Investment and Savings of Selected Asian Countries,1990-96 Average
(Unit: Percent)
Country EconomicGrowth
Fixed CapitalFormation (A)
DomesticSaving (B)
Excess Saving(B - A)
Philippines 2.8 22.5 18.8 -3.7Thailand 8.6 40.4 34.2 -6.2Malaysia 8.8 38.3 32.1 -6.2Indonesia 8.0 27.4 28.9 1.5Rep. of Korea 7.7 36.7 35.0 -1.7ROC 6.3 22.6 28.0 5.4
Source: IMF, World Economic Outlook, December 1997.Note: All numbers are in percentage of GDP.
Table 7. Current Account Balance of Selected Countries(Unit: US$ billion)
Year Philippines Thailand Malaysia Indonesia Rep. of Korea ROC1990 -2.7 -7.3 -0.9 -3.0 -1.7 10.91991 -1.0 -7.6 -4.2 -4.3 -8.3 12.51992 -1.0 -6.3 -2.2 -2.8 -3.9 8.61993 -3.0 -6.4 -3.0 -2.1 1.0 7.01994 -3.0 -8.1 -4.5 -2.8 -3.9 6.51995 -2.0 -13.6 -7.4 -6.4 -8.5 5.51996 -4.0 -14.7 -3.6 -7.7 -23.0 11.01997 -4.3 -2.9 -4.8 -4.8 -8.2 7.71998 7.6 13.5 14.1 3.8 42.3 4.5
Sources: 1) International Statistics, IMF Publications, April 2000; and 2) the Central Bankof China, Financial Statistics.

- 105 -
Table 8. External Debt and Foreign Exchange Reserve of Selected Countries(as of June1997)
(Unit: US$ billion)End of Year
Country 1990 1995 1996 1997 1998
Rep. of Korea 35.0a 119.7b 157.5b 154.4b 151.5Indonesia 69.9 124.4 129.0 137.9b 145.9Thailand 28.1 83.2 90.8 93.4b 85.4Malaysia 15.3 34.3 39.8 43.4c 39.6Philippines 30.6 39.4 41.2 45.4c 47.4ROC 17.7a 27.0a 24.4 24.6 22.2*
Sources: World Bank, Global Development Finance 1998, March 1998; and a AsianDevelopment Bank, Key Indications of Developing Asian and Pacific Countries1997; b IMF, The IMF Response to the Asian Crisis, September 1998; and c Bankof International Settlement/OECD, Statistics on External Indebtedness, June 1998.
Note: * Figure for the end of June 1998. However, the public foreign debt is US$50million by the end of 1998.
5. Inflexible Exchange Rate RegimesMost of these countries pegged their exchange rates to the US dollar, with little room
for fluctuation. As the US dollar steadily strengthened from 1995 onward, the peggedcurrencies became overvalued. As a result, these countries’ export products lost theircompetitiveness, and their export growth rates showed a clear decline (Table 9).6. Unsound Financial System
Because of the high level of government protection and intervention in financialinstitutions in Asian countries, the market mechanism was seriously skewed. With unsoundfinancial supervision, also banks became encumbered with very high ratios of non-performing loans (Table 10).7. Weak Corporate Financial Structure
Corporations in the crisis countries funded operations through excessive borrowing,creating a highly unsound corporate financial structure (Table 11). In Thailand and Indonesia,for example, corporations had an average debt to equity (net worth) ratio of over 300 percent,while it was more than 400 percent in the Rep. of Korea.8. Other Factors
In some Asian countries frequent changes in the cabinets resulted in the inconsistencyof policies. In other countries, protracted one-party rule led to political and social instability.
Why the ROC Was Hit Less Severely
1. Sound Economic FundamentalsStrong economic fundamentals are the reasons why Taiwan has escaped the Asian
crisis relatively unscathed. In 1997, at the height of the financial crisis, the average non-performing loan ratio for the banking sector was 4 percent, much lower than that of the othercountries in the region. The average capital adequacy ratio stood at 11.4 percent, well abovethe 8-percent requirement set by the BIS. With steady improvements in the corporatefinancial structure, the average debt-to-equity ratio for listed companies has fallen to 78percent. Furthermore, companies in Taiwan are less susceptible to foreign exchangefluctuations because they do not rely on foreign borrowing. This in effect creates a firewallthat can shield Taiwan from the contagion of a financial crisis.

- 106 -
Table 9. Real Effective Exchange Rate Index and Export Growth Rate (1990 as base)(Unit: Percent)
YearPhilippines Thailand Malaysia Indonesia Rep. of Korea
ExchangeIndex
ExportGrowth
ExchangeIndex
ExportGrowth
ExchangeIndex
ExportGrowth
ExchangeIndex
ExportGrowth
ExchangeIndex
ExportGrowth
1992 107.1 2.8 99.7 13.6 109.7 9.7 100.8 16.6 87.8 6.61993 97.4 22.0 101.9 13.5 111.0 17.0 103.8 8.4 85.2 7.31994 111.6 15.5 98.3 21.6 107.1 26.8 101.0 8.8 84.7 16.81995 109.5 28.7 101.7 23.1 107.0 20.3 100.5 13.4 87.8 30.31996 116.0 18.8 107.6 0.5 107.0 6.5 105.1 9.7 86.8 3.7
Sources: IMF, International Financial Statistics Yearbook, 1998; and J. P. Morgan, Asian Financial Market, Q2 & Q3, 1998.Note: A real effective exchange rate index above 100 signifies overvaluation.
Table 10. Non-performing Loans (NPLs) of Selected Asian Countries(Unit: Percent)
Country Current NPLRatio
Estimated PeakNPL Ratio
Peak NPL asPercent of GDP
Singapore 2 >8 9Hong Kong 2 >8 13Philippines 3 10-15 7ROC 4 n.a. n.a.Malaysia 6 12-25 17Indonesia 9 >25 16Rep. of Korea 14 >25 34Thailand 18 >25 40
Source: Roy Ramos, Banks: A Critical Ingredient to Recovery for Asia, World Bank/Asian Development Bank Senior Policy Seminar, March 1998, Manila.

- 107 -
Table 11. International Bank Lending of Selected Developing Countries (as of the end of 1997)
Country Total External Debt(US$ billion)
Percent of Short-term External Debt
Sources (percent)European Banks Japanese Banks American Banks
A. Asia 389.4 n.a. 43.3 31.8 8.3Rep. of Korea 103.4 67.9 35.1 22.9 9.6Thailand 69.4 65.7 28.5 54.4 5.8Indonesia 58.7 59.0 38.3 39.4 7.8China 57.9 56.0 48.5 32.3 5.1Malaysia 28.8 52.0 44.0 36.4 8.3
B. Latin America 251.1 n.a. 58.2 5.8 24.0Brazil 71.1 62.2 45.0 6.9 22.8Mexico 62.1 n.a. 42.6 7.4 28.4
Source: Bank for International Settlements (BIS), 1998.

- 108 -
2. Orderly and Gradual Process of Economic and Financial LiberalizationInternational capital movements in the form of long-term FDI support economic
development in recipient countries by providing access to foreign savings. The investingcountry enjoys a higher rate of return on capital, creating a win-win situation. Short-termcapital, on the other hand, is highly volatile in nature. In most cases, the size of a developingor NIE is too small to withstand the effects caused by sudden financial reversals. It is thisreason that short-term capital inflows should be modulated, so that they do not impair theperformance of the domestic economy.
Financial liberalization in most of the East Asian countries tended to begin with theopening of the capital account and the loosely regulated flow of foreign capital into stockmarkets (foreign funds bought as much as 30-49 percent of all shares). In addition, heavyprotection of local financial intermediaries and restrictions on the establishment of foreignbanks reduced competition and weakened market forces. As regulation allowed foreigncapital to flow into real estate and equities, bubble economies arose. The bursting of thebubbles combined with weak financial structures resulted in the financial crisis.
The ROC has followed an appropriate sequence to open up its capital account over thelast 15 years. This orderly and gradual approach has lessened the impact of the recentfinancial crisis by giving the private sector more time to adjust and improve its ability tocompete.
That is, while strictly observing the precondition of keeping inflation under control,the government began with tariff-rate reductions and then proceeded with the sequentialliberalization of interest rates, exchange rates and capital movement, in that precise order. Atpresent, each individual can freely remit US$5 million and each company US$50 millionoverseas every year, without approval. Our securities markets are open to FDI and themaximum ratios of shareholding by foreign investors will be abolished at the beginning ofyear 2001.3. Flexible Industrial Structure
Small- and medium-sized enterprises (SMEs) make up the backbone of ROC’sindustrial structure, accounting for 98 percent of all firms. This makes country’s businesssector highly flexible, nimble and adaptable. Moreover, the close relationship and divisionof labor between the SMEs and large-scale enterprises gives ROC’s industrial structure anextremely firm “pyramid” or “cluster economy” form and allows for the full realization ofoperational efficiencies.4. Sound Corporate Capital Structure
In 1997, the capital-assets ratio of Taiwan corporations reached 53.9 percent, comparedto a 24-percent for the Rep. of Korea, a 32.6-percent for Japan, and a 38.5-percent for theUnited States. This low ratio enables our companies to avoid any serious impact of tighteningliquidity.5. Vigorous Venture Capital Industry
Venture capital companies play an important role in strengthening the competitivenessof the SMEs and promoting the development of the technology industry.6. Effective and Prompt Measures Taken by the Government
In order to dispose the turmoil, series of measures were taken by the ROC Government.
IV. MEASURES TAKEN AND LESSONS DRAWN FROM THE CRISIS
Measures Taken by the ROC GovernmentGiven our very close ties with other economies in East Asia, we must inevitably feel
some impact from the crisis afflicting the region. The sharp decline of demand in Asian

- 109 -
markets meant that our exports contracted last year, causing a downturn in our economicperformance. The economic growth rate dropped from 6.7 percent in 1997 to 4.6 percent in1998. As exports shrank by 9.4 percent, several business groups on the island ran intofinancial difficulties. To counter the adverse effects of the Asian crisis, our government hastaken a series of actions, shown in more detail in Appendix 1.
For domestic recovery, the following measures were taken:
1. On the Export FrontThe Ministry of Foreign Affairs introduced the “Global Export Promotion Package”
to help ROC’s businesses explore overseas markets. It includes the provision of marketinformation, management assistance, technical services, the expansion of export insurancecoverage, the set-up of trade exhibitions and greater participation in international trade fairs.2. On the Investment Front
We have taken action to stimulate domestic demand as a mean to offset the slowdownin export growth. Our approach is to boost the economy by making public investments ofNT$1,263 billion (or the equivalent of US$40 billion) in infrastructure projects, over the nexttwo fiscal years. The projects include independent power plants, naphtha-cracking plants, theNorth-South high-speed railway, and the MRT (Mass Rapid Transportation) link betweenChiang Kai Shek (CKS) Airport and Taipei. This should all contribute to stronger economicgrowth.3. On the Stock Market Front
The Ministry of Finance created the “Stock Market Stabilization Committee” and the“National Financial Stabilization Fund” to check speculation and reduce volatility in thestock market. The measures included:a) entitling companies in financial difficulties to apply for the stop-trading of their shares
on the stock market for a period of less than two months.b) opening off-board markets to finance financial institutions extending security.c) injecting more funds into security finance institutions.4. On the Financing Front
Despite the sound economic and financial fundamentals, two bill finance companiesand some other listed companies have defaulted on the payments for corporate checks andloan payments during the last few months. The onset of financial problems involved:(1) decreasing revenue for some listed companies due to the negative export growth;(2) improper financial management of some conglomerates which have raised short-termfunds from the money market to support long-term capital expenditure; (3) overexpansionand over-leverage of some corporations run by second-generation entrepreneurs, who areusually more aggressive than their fathers; and (4) extremely active involvement in stockmarket investment.
To ease businesses’ liquidity problems, the Ministry of Finance formed a specialcommittee to provide funds for the urgent needs of selected enterprises that were maintaininghealthy business operations. The cross-ministerial task force was set up to meet weekly tocoordinate and implement the bailout measures. The two principles of the government rescueprogram were: (1) to assist only the companies that have sound operations and fundamentals,but which have temporary liquidity problems; and (2) to assist only the enterprises and nottheir shareholders. The measures included:a) granting a grace period for corporations to repay their debts, a second grant to delay
the repayment was approved after the first. Based on the difficulty of corporation

- 110 -
financing, the government had to grant another six months for corporations to repaytheir debts, which were due on October 2000.
b) providing NT$40 billion for a special and emergency financing facility to SMEs.c) lowering the sales tax of the banking sector from 5 percent, before the crisis, to 2
percent, then waived from October 2000.5. On the Real Estate Front
Other steps taken included the injection of NT$150 billion (or US$4.6 billion) into thereal estate market, in the form of low-interest loans for first-time home purchasers, and newsocial security provisions strengthening assistance to the unemployed and those with lowincomes.6. On the Institutional Reform Front
The Cabinet also approved a long-term institutional reform package – the EconomicEnhancement Plan – designed to advance economic reconstitution and promote the pursuitof healthy growth. The Plan’s broad-ranging measures all adhere to the basic principles ofrespecting market mechanisms, enhancing the legal system and raising governmentefficiency.7. On the Monetary Front
Financial stability forms the bedrock of sustained economic development. It enablesthe private sector to choose production plans and trade decisions under a consistent macro-environment. The Central Bank of the ROC adopted a flexible exchange rate regime, whichallows market forces to determine the nominal exchange rate, while ensuring that the realexchange rate reflects economic fundamentals. Other features of ROC’s exchange rate policyindicate the nation’s resolve to remove distortions from the market, improve bank riskmanagement and offer market participants accurate and timely information.
With respect to monetary policy, the government closely monitors developments bothat home and abroad and fine-tune the country’s policies accordingly. By maintaining themoney stock within the target range, the country is not only able to meet the fundingrequirements of both private and public enterprises, but is also able to create a low-inflationenvironment. These policies had successfully preserved the stability of the domestic economyduring the Asian financial crisis in the short run, and had made important contributions toeconomic development in the long run.
Aside from acting to safeguard the health and dynamism of the domestic economy,ROC Government also worked out plans to contribute to the regional financial and economicstability, which helped Southeast Asia’s crisis-hit countries to the road of recovery. Theseplans included:
(1) the establishment of the Southeast Asia Investment Holding Company, with the capitalof US$930 million, for investment in Southeast Asia. The outstanding investmentreached US$230 million in October 2000.
(2) the provision of US$600 million by the Central Bank of the ROC for placement asforeign-exchange deposits in overseas branches and subsidiaries of Taiwan banks, witheach bank receiving US$30 million to be applied to alleviating difficulties of Taiwanbusinesses operating in those overseas markets.
(3) expansion of the Young Entrepreneurs Training Program, which provide training inall aspects of business operations, to give more opportunities for the participation ofyoung people from Southeast Asia. The Indonesian Young Entrepreneurs TrainingProgram is in progress at this moment.

- 111 -
(4) in addition to such unilateral assistance, the country had also contributed to theestablishment of a regional bailout mechanism. At the APEC Economic LeadersConference, held November 1998, we called for our fellow APEC members to supportthe issuance of Collateralized Bond Obligations (CBOs), as proposed by the APECBusiness Advisory Council (ABAC). The proposal of “Fostering Venture Capital toStabilize the APEC Economy” was raised by the ROC in the 1999 APEC AnnualMeeting and was accepted by the ministerial meeting so as to revitalize the economyby means of establishing start-up companies.
Lessons Drawn from the CrisisFrom the country’s experience in dealing with the recent financial crisis, we would like
to make the following policy recommendations:
1. The Paramount Importance of Maintaining a Sound Financial System(1) Giving full play to the market mechanism is essential to establish a free and fair
economic system that relies on market forces – only then will resource allocation beimproved and productivity raised.
(2) Creating a sound legal and regulatory system. However, to be fully effective andsuccessful, liberalization needs to take place in the context of a sound financial system.This requires effective supervision and management of financial institutions.
2. The Need to Carry Out A Thorough Revision of Economic Policy(1) Adopting sound and stable macro-economic policies: Macro-economic imbalance must
not be permitted to persist in the long term; appropriate policies must be adopted toimplement timely corrections.
(2) Maintaining a flexible foreign exchange policy: Sustained current account deficits areundesirable and should be corrected by appropriate policies. The nominal exchangerate should remain flexible, while the real exchange rate should reflect economicfundamentals.
(3) Implementing financial policy in the appropriate sequence: Financial liberalizationneeds to begin at home. The domestic financial market should be liberalized first, inorder to build up a strong financial structure.
Internationalization should then proceed in a gradual and orderly manner: first withthe current account, then with the capital account, and with long-term investmentpreceding short-term investment in the liberalization of the capital account. Domesticsavings should be the major source of capital formation. FDI and long-term foreignborrowing are suitable alternatives if domestic savings are insufficient to meet theneeds of domestic investment.
The supervision and monitoring of financial institutions should be bolstered. Todispose the impaired assets of those insolvent financial institutions, an earlyestablishment of the Resolution and Trust Corporation (RTC) is necessary. After thefinancial crisis, several asset management corporations were established in the Asiancountries, such as the Resolution and Collection Corporation (RCC) in Japan, KoreaAsset Management Corp. (KAMCO) in the Rep. of Korea, the Financial SupervisoryCommission (FSC) and Asset Management Corporation (AMC) in Thailand,Danaharta in Malaysia and the Indonesian Bank Restructuring Agency (IBRA) in theIndonesia. The ROC Government has declared to introduce the RTC operation inOctober 2000.

- 112 -
(4) Maintaining flexible industrial policies: These should focus especially onstrengthening business operations, improving the industrial structure, encouragingprivate investment in machinery and equipment and research and development (R&D),and promoting sustainable industrial development. Banks, importers and exportersshould be encouraged to reinforce risk management. Corporate governance also shouldbe strengthened.
Supply-side adjustments also explain why the ROC has consistently managed toproduce good results. The government and the private sector have worked together to alterthe structure of our manufacturing base, with far reaching consequences. Heavy and high-tech industries accounted for 79.2 percent of total industrial output in 1999, up from 64.6percent in 1989. Taiwan is now the world’s leading producer in 13 categories ofmanufacturing products. In terms of output, Taiwan’s information technology industry nowranks third in the world, while the semiconductor industry ranks fourth.
The structural changes that have taken place in Taiwan’s manufacturing base have alsoaltered the make-up of our exports. High-tech products accounted for 24.2 percent of totalexports in 1989. By 1999, this figure had risen to 42.1 percent. Conversely, the share of low-tech products fell from 37.7 percent to 16.9 percent over the same period.
V. THE IMPACTS ON AGRICULTURE AND ITS CHALLENGES
The Impacts of the Asian Financial Crisis on AgricultureBeginning in l953, the government carried out its First Four-Year Economic
Development Plan to strengthen agricultural development and raise national income. Thissuccessful land reform laid solid foundations for the ROC’s economic development.
As an indicator of the success of this plan, Taiwan doubled its agricultural output indexfrom 21.2 percent in l952 to 42.7 percent in l966; and further to 84.8 percent in l985 and 94.4percent in l999, with 1996 as the base year (Table 12).
However, as might be expected of the concept of diminishing returns, the growth rateof agricultural production has decreased from an average annual growth rate of 4.8 percentbetween 1952 and 1980, to 1.9 percent between 1981 and 1995, then to 0.16 percent in 1996before the eruption of the Asian financial crisis. The production posted negative growths inthe two years following the financial crisis, but some of the non-financial factors mightexplain the fluctuations in agricultural production.
1. Foot and Mouth Disease in 1997The Food and Mouth Disease (FMD) exploded in March 1997, right before the
eruption of the Asian financial crisis in July 1997. As a result, 3.85 million animals wereincinerated to prevent the contagion of the disease; exporting markets were lost because ofthe ban on importation by the importing countries, mainly the Japanese market. It wasestimated that the loss of the agricultural GDP amounted to NT$3.4 billion by the FMDimpacts of 1997. Meanwhile, pork exportation was eliminated and a total of NT$119.5 billionwas lost.2. Typhoon Zeb and Natural Disasters in 1998
Five typhoons and six other natural disasters damaged the agriculture sector in 1998.Typhoon Zeb, along with the following mudslide, seriously damaged the agriculture sector.The total agricultural production loss by the natural disasters was estimated at NT$12.1billion or NT$7 billion in agricultural value-added loss. Along with the ban in the exportationof pork, it meant that NT$28.1 billion was lost in the GDP.

- 113 -
Table 12. Major Agricultural Economic IndicatorsIndicator 1970 1980 1990 1995 1996 1997 1998 1999
Production index 60.0 76.4 94.5 99.8 100.0 98.7 93.3 94.4Change in production (percent) 6.90 1.10 2.10 3.70 0.16 -1.27 -5.63 1.19Real agriculture GDP(NT$ million) 163,562 201,293 238,879 246,007 245,184 241,562 225,635 229,654Agriculture GDPreal growth rate (percent) 4.8 -2.0 2.3 2.8 -0.3 -1.5 -6.6 2.7Agriculture GDP as percent oftotal GDP (percent) 15.5 7.7 4.2 3.5 3.2 2.6 2.5 2.6Agriculture fixed capital formation(NT$ million) 10,699 16,738 25,469 23,381 27,402 26,529 21,938 26,355Agriculture fixed capital formationas percent of total capital formation 6.7 3.0 2.5 1.4 1.6 1.4 1.1 1.1Agricultural labors (000 persons) 1,680 1,277 1,064 954 918 878 822 776Agricultural labors as percent oftotal employment (percent) 36.7 19.5 12.8 10.5 10.1 9.6 8.8 8.3
Sources: 1) Council of Agriculture, ROC, Basic Agricultural Statistics, 2000; CEPD, ROC, Taiwan Statistical Data Book, 2000; and3) Directorate-General of Budget, Accounting and Statistics (DGBAS), ROC, Statistical Abstract of National Income, Taiwan Area,ROC, 1951-2000, March 2000.
Note: At 1996 prices.

- 114 -
3. The 21 September 1999 EarthquakeThe earthquake struck Central Taiwan on 21 September 1999. More than 2,400 people
were dead or missing. One hundred thousand houses collapsed or were seriously damagedby the quake. The total capital loss amounted to NT$267.5 billion, and total production losswas estimated at NT$97.1 billion, which amounted to an NT$30 billion loss in GDP. Withregards to the agriculture sector, not only did it suffer a production loss, estimated at a totalof NT$2.1 billion equivalent to a NT$1.3-billion loss in GDP, but it also faced a seriouscapital loss, which amounted to NT$7.7 billion.
Experience from the Kobe Earthquake (1995) shows that replacement due to damageswill generate an expansion for demand, while recovering the loss of agricultural productioncapacity. After the immediate term, actual GDP growth will be higher than before theearthquake.
From the agricultural production change following the financial crisis, the agriculturaleconomy was damaged by other factors rather than the Asian crisis, and that the impacts ofthe Asian financial crisis to the small-sized farmers in the ROC was limited from thebeginning.
The Impacts on Agricultural ProductivityThe conceptual change in output per hour is primarily designed to reflect the accurate
trend of labor productivity, over a series of time, in order to indicate the flow and utilizationof resources and to project future trends.
Table 13 shows that in 1998, the labor productivity index in the agriculture sector was102.88 (with the base year of 1996 = 100), which declined 1.67 percent from the precedingyear. This was due to the agricultural output decline of 6.59 percent of the preceding year,which was higher than the decline of working-hour input of 1.59 percent.
The index of agricultural labor cost per unit output in 1998 was 101.24, showing a riseof 1.17 percent from the preceding year, owing to the decline in agricultural laborproductivity, which decreased faster than the employees’ earnings.
Overall, all of the industries combined had a rise of 4.75 percent growth in laborproductivity and a 0.73-percent decline in unit labor cost in 1998.
In 1999, the agricultural labor productivity had a growth of 6.81 percent, while theagricultural unit labor cost declined by 19.30 percent. The growth of agricultural laborproductivity seems to be unreasonable if we consider the serious impacts caused by the 21September Earthquake. The agricultural loss, damage by the quake, mainly focused on thecapital loss of NT$7.7 billion, instead of the output loss of NT$1.3 billion. Therefore, muchof the money for reconstruction and recovery was injected into the damaged areas andbecame the sources of GDP growth. The nature of the so-called “creative destruction” andKobe’s experience were proved in the ROC.
To sum up, agricultural labor productivity was not hurt much by the Asian financialcrisis in the ROC.

- 115 -
Table 13. Labor Productivity and Unit Labor Costs(Unit: Percent)
Year
All Industry AgricultureLabor Productivity(output per hour) Unit Labor Cost Labor Productivity
(output per hour) Unit Labor Cost
Index Annual Rateof Change Index Annual Rate
of Change Index Annual Rateof Change Index Annual Rate
of Change
1989 68.67 8.21 82.88 6.00 77.49 4.11 71.32 6.641990 72.52 5.61 90.89 9.66 78.89 1.81 79.25 11.121991 76.35 5.28 95.73 5.33 79.50 0.77 88.60 11.801992 80.62 5.59 98.64 3.04 80.89 1.75 93.84 5.911993 85.37 5.89 101.58 2.98 90.95 12.44 95.95 2.251994 89.36 4.67 102.57 0.97 91.80 0.93 105.37 9.821995 94.54 5.80 101.98 -0.58 95.94 4.51 99.90 -5.191996 100.00 5.78 100.00 -1.94 100.00 4.23 100.00 0.101997 106.46 6.46 97.72 -2.28 104.63 4.63 100.07 0.071998 111.52 4.75 97.01 -0.73 102.88 -1.67 101.24 1.171999 116.66 4.61 93.44 -3.68 109.89 6.81 81.70 -19.30
Source: DGBAS, Executive Yuan (Cabinet).Note: Base year: 1996 = 100 percent.

1 Investment efficiency ratio = denotes GDP growth, denotes∆ ∆ ∆YI
Y YI Y
YY
=/
/;
IY
investment ratio. Investment efficiency ratio which measures the marginal productivity ofcapital is also a reciprocal of MCOR.
- 116 -
1. Impacts on the Marginal Capital Output Ratio of AgricultureThe marginal capital-output ratio (MCOR), an inverse of the investment efficiency
ratio, shows the investment requirement per additional unit of GDP. Table 14 shows that theROC’s investment ratio has been lower than most of the crisis-hit East Asian countries overthe past two decades. The investment ratio of the ROC decreased from an average of 24.17percent during 1979-86, to 21.94 percent during 1987-97 and to 24.8 percent in 1998 and24.1 percent in 1999, while those of East Asian countries rose sharply. However, from 1987to 1997, the ROC’s investment-efficiency ratio1 averaged 0.31, considerably higher thanthose of the Rep. of Korea (0.24), Indonesia (0.21), Malaysia (0.24), and Thailand (0.25).
Table 14. A Comparison of Investment Ratios and Investment-Efficiency Ratios ofSelected East Asian Economies
ROC Rep. of Korea Indonesia Malaysia ThailandGDP growth rate (percent)
1979-86 7.5 7.4 5.7 5.5 5.41987-97 6.7 8.3 6.9 8.5 9.5
Investment ratio (percent)1979-86 24.17 29.69 26.33 31.75 27.281987-97 21.94 34.81 32.74 35.06 37.41
Investment efficiency ratio1979-86 0.31 0.25 0.22 0.17 0.201987-97 0.31 0.24 0.21 0.24 0.25
Sources: 1) IMF, International Financial Statistics Yearbook, 1998; and 2) Chi Schive,1999.
Note: The US dollar is used as the unit of account.
The MCOR of the ROC’s economy stayed unchanged during the two sub-periods of1979-86 and 1987-97, even though the economy underwent significant restructuring.
The enhancement of allocative efficiency over the past decade has strengthened theresilience of the ROC’s economy. It explains why the ROC was relatively unaffected by theAsian financial crisis. Unlike the ROC, most of the crisis-affected Southeast Asian countrieshad suffered resource misallocation stemming from structural weaknesses, such as amismatch between the industrial and financial structure (which led to an overinvestment inprotected or targeted industries), flawed financial policies and poor corporate governance.Studies of the Asian financial crisis have focused on the investment inefficiency in theaffected countries; all of these reasons are major causes of the crisis, and are impediments torecovery for the post-crisis period.
Analyzing changes in the MCOR of the ROC, between 1989-97 and 1998-99, wefound that all industries lost efficiency after the financial crisis (Table 15). The MCOR of theservice sector increased from 2.25 in 1989-97 to 3.60 in 1998-99; the industrial sector MCORraised from 4.74 to 9.18 and the agricultural sector from -2.86 to -0.27.

2 IY
IY
IY
YY
IY
YY
IY
IY
YY
a
a
a
a
a
a a
a
a
a a
a∆ ∆ ∆∆
∆ ∆∆∆ ∆ ∆
∆∆
−
= • − • = −
,
,
,
,
, ,
,
1 1
1
0
0
0
0
1
1
0
0
1
1
, 0 refers to period 1987-97, 1 refers to period 1998-99, a refers to+ −
∆∆
∆∆ ∆
YY
YY
IYa a
a1
1
0
0
0
0, ,
,
agriculture. The first item measures the MCOR (change) effect while the second one capturesthe output structure (change) effect.
- 117 -
Table 15. Changes in the Marginal Capital-Output Ratio of the ROC
Period
All Industries Agriculture Industry Services
IY∆
IY
YY
A
A
A
∆∆∆
•IY
YY
I
I
I
∆∆∆
•IY
YY
S
S
S
∆∆∆
•
1989-97 2.11 -2.86*(0.003) 4.74*(0.19) 2.25*(0.53)1998-99 5.05 -0.27*(0.013) 9.18*(0.25) 3.60*(0.77)
Source: DGBAS, National Income of Taiwan Area, ROC, various years, Executive Yuan,ROC.
Notes: 1) IY
IY
YY
IY
YY
IY
YY
A
A
A I
I
I S
S
S
∆ ∆∆∆ ∆
∆∆ ∆
∆∆
= • + • + •
I: real fixed investment; )Yt, j = Yt, j - Yt-1, i; Y: real GDP.2) A weighted annual average is used as the average MCOR for all industries inorder to avoid abnormal changes in ratio values caused by small values in thedenominator.3) Industry includes the mining, manufacturing, public utility and constructionsector.
The difference in the agricultural MCOR between the two periods observed may beattributed to two effects: a MCOR effect and an output-structure effect.2 Empirical resultsindicate that agricultural MCOR increased by 2.60 between 1989-97 and 1998-99, with theMCOR effect accounting for a decrease of 0.20 and the output-structure effect making annegative contribution of 2.40.
These results reflect the fact that the agriculture sector became less capital saving (orthat the trend of capital saving in agriculture decelerated) during the second sub-period.Nonetheless, the structural transformation of the agriculture sector in the economy did affectits average MCOR.2. Impacts on Food Self-sufficiency Ratios
The ratios of food self-sufficiency were adopted to describe the change in food securityof the ROC. Two concepts are used to measure the ratios of food self-sufficiency; one isweighted by the prices of foods consumed while the second is weighted by the energycontained in the food.
Table 16 shows that the ratio of food self-sufficiency declined after the financial crisis.However, was food security in the ROC threatened by the financial crisis? Up until now,there are no warning signs to affirm this. What we do find is the long-term decreasing trendof the food self-sufficiency ratios. Also, the declines in the ratio for meat were mainly causedby the FMD eruption in 1997.

- 118 -
Table 16. Food Self-sufficiency Ratios in the ROC(Unit: Percent)
Year Average Cereals StarchRoots Sugar Pulses and
Oilseeds Vegetables Fruits Meat Eggs Fish andSeafood Milk
Weighted by prices:1994 83.1 57.3 24.7 93.5 14.4 96.4 89.3 107.7 99.7 107.1 83.11995 85.4 56.3 34.6 83.6 14.8 96.3 88.6 110.2 99.7 113.6 85.41996 83.0 48.6 36.0 78.2 12.8 96.0 87.4 110.8 99.9 110.4 83.01997 79.5 53.9 34.3 70.7 11.2 94.7 86.2 96.7 100.0 115.8 79.51998 78.6 51.9 31.8 62.9 10.5 92.7 85.1 85.5 100.0 128.4 78.61999 77.1 58.0 33.4 55.9 9.3 93.9 85.1 80.5 100.0 118.3 77.1
Weighted by energy:1994 38.6 29.1 20.4 95.4 4.8 99.1 90.9 109.6 99.7 136.9 23.11995 37.4 28.2 25.8 84.7 4.7 99.5 89.8 115.2 99.7 143.0 25.41996 37.2 26.8 24.3 79.3 4.6 98.7 88.6 112.3 99.9 136.0 26.21997 37.1 30.2 21.6 71.0 4.1 96.9 87.2 100.2 100.0 132.5 26.11998 36.7 28.6 20.5 62.7 3.9 94.5 87.0 90.2 100.0 143.4 27.31999 35.6 29.8 22.1 54.2 3.3 96.3 86.4 86.6 100.0 131.3 26.9
Sources: 1) COA, Executive Yuan, The Agricultural Statistics Yearbook; and 2) Statistics Office, COA, Executive Yuan.

- 119 -
The Impacts and Challenges of Farmers’ AssociationsThe credit units of farmer’s associations play a very important role in agricultural
financing. There were 305,287 farmers’ associations installed with credit units, and 40,270fishermen’s associations installed with credit units by the end of 1999. As seen in Table 17,the balance of deposits registered to NT$138.4 billion or 7.7 percent of overall financialinstitutions and loans amounted to NT$77.7 billion or 5.6 percent of overall financialinstitutions by the end of 1999.
1. Impacts on the Financial Operations of Farmers’ AssociationsHit by the financial crisis, the net worth ratios of the credit units of the farmers’
associations declined from the peak of 25.7 percent in 1991 to 5.2 percent in 1999, and thereturn on assets declined from 1 percent to 0.3 percent during the same period.
The non-performing ratio of farmers’ and fishermen’s associations soared after theAsian financial crisis; it registered at 16.1 percent by the end of 1999, much higher than forthe overall financial sector (5.67 percent). The total non-performing loans were reported atNT$200 billion. At the end of 1999, 26 of the 314 credit units lost money, the total deficit ofwhich amounted to NT$3.8 billion.
Seventy percent of the profit from farmers’ associations, after accounting for the deficitin previous years, has to be disbursed for the purposes of promotion, training and welfareactivities regulated by the Statute for the Farmers’ Associations. While the credit units arethe major source of benefit in most of the farmers’ associations, the deficit in the credit unitsof some 20 farmers’ associations imply that they are not able to support the disbursement ofpromotional activities, etc.2. Causes for the Credit Units’ Poor Performance
What causes poor performance in the credit units nowadays? The reasons can bedivided into external and internal factors as follows:(1) The External Factors
The deregulation of the financial market and the emergence of new financialcommodities from the early 1990s, which included the abolition of the ban on theestablishment of new banks and the loosened regulation on the setting-up of branchesby foreign banks, created a keen competitive financial environment. The credit unitslost their competitiveness caused by the limitation of setting-up new branches, exceptin the rural areas and those operating on new financial commodities. To compete withother financial institutions, the credit units of farmers’ associations were forced toexpose themselves to business that involved higher risk and less competitiveness.Influence from the Asian financial crisis and the crash of bubble economy resulted inthe soar of non-performing loans.The second factor was the poor governance of the credit units. Three ministries are
involved in the governance of the farmers’ associations: the Ministry of Interior Affairs is incharge of association affairs; the Ministry of Finance rules the financial activities of the creditunits and the Council of Agriculture takes care of agricultural production activities. Very fewactions have been taken and the lack of division-of-labor between the ministries makesproblems even more serious than before.(2) The Internal Factors
The capital structure of farmers’ associations is not of corporate-like shares, andthere are no shareholders in the farmers’ associations. It is impossible for the farmers’associations to increase capital by issuing shares to improve their capital structure.

- 120 -
Table 17. Highlights of the Credit Units of Farmers’ AssociationsYear 1991 1992 1993 1994 1995 1996 1997 1998 1999
Deposits: Balance (NT$ billion)a 71.47 87.31 104.04 120.01 122.86 124.71 127.39 131.83 138.43 As percent of overall financial institutionsb 9.4 9.6 10.0 10.0 9.4 8.7 8.3 7.9 7.7Loans: Outstanding (NT$ billion) 38.53 53.87 68.84 80.22 88.24 84.37 82.37 80.35 77.72 As percent of overall financial institutions 6.8 7.4 8.2 8.1 8.2 7.5 6.6 6.1 5.6Profit (NT$ billion) 7.58 8.78 10.19 11.76 9.68 10.85 9.14 6.85 3.82Net worth ratio (percent)c 25.7 24.6 23.2 22.6 16.6 16.9 13.1 9.4 5.2Return on assets (percent)d 1.0 0.9 0.9 0.9 0.7 0.8 0.7 0.5 0.3Non-performing ratio (percent) - - 1.7 2.3 4.0 6.7 9.2 11.7 16.1Deposits loans ratio percent) 51.3 51.4 58.9 62.1 66.0 68.2 63.1 59.7 55.8
Sources: Central Bank of China, 1999; and Ministry of Finance, 1999.Notes: a US$1 = NT$31 on October 2000; b include the banking sectors and the postal savings system; c income before tax (net worth);
and d income before tax (assets of the financial institutions).

- 121 -
Seventy percent of the benefits from the credit units, regulated by the law, have tosupport promotional activities, so there is little left for the capitalization improvement.
Lack of financial expertise in the management team is another reason for the poorperformance of credit units. Moral hazard and political intervention weaken thestability and operation of credit units.
3. The Challenges and Government Strategies for the Farmers’ Financial SystemTo solve poor capital structure problems in some of the credit units, a task force,
chaired by the Vice-Premier, was set up under the Cabinet. The proposals recommended tosolve the problems include:(1) Establish a National and Local Farmers’ Financing System
A tentative proposal plans to transform the Cooperative Bank into the NationalFarmers’ Bank, and allow the credit units of farmers’ associations that have soundcapital structure or a reevaluation in assets, to be either the shareholders of the nationalor the local farmers’ bank. However, the proposal to set up a nationwide farmer bankhas been rejected by the employees of the Cooperative Bank and the Ministry ofFinance.
(2) Set Up an Exit MechanismTo solve the insolvency problem in some of the credit units, exit mechanism is
necessary. The government will assist the credit units in improving their capitalstructure and operation for three years. By the end of the assistance, if the units are notable to improve their capital structure or operation, the nationwide farmers’ bank willtake over the units.
(3) Upgrade the Financial Competitiveness of Farmers’ AssociationsThe credit units may be allowed to run new financial activities, such as those of the
commercial banks. The farmers’ associations are encouraged to merge either on aprefecture-basis or zone-basis, so that they can gain the benefit of scale economies.
(4) Strengthen the Financial GovernanceOn-the-job training will be implemented to improve the knowledge capacity and
ability within the credit units of farmers’ associations. An independent auditing unitwill be set up. An effort to elect leaders for the farmer’s associations is beingimplemented. To unify the governance system, the credit units are supposed to begoverned by the Ministry of Finance, while the other units in the associations will beunder the governance of the Council of Agriculture.
Congress approved a new version of the Statute for Farmers’ Association in December2000, and this new regulation would pave the way for the revitalization of farmers’associations. The government acknowledged the problems of the credit units of farmers’associations to have originated before 1997, due to too much political intervention and lateactions. Less political consideration and deregulation on financial activities, along with soundfinancial supervision and a healthy governance system will be beneficial to the improvementof farmers’ associations management.
VI. CONCLUSIONS
The ROC’s long-term approach to develop its small farm economy is a well-knownsuccess story. It started in the early 1950s with a peaceful land reform, followed by

- 122 -
improvements in farm resource utilization, building of rural infrastructure, provision ofagricultural extension services and introduction of production structure changes.
Over the years, the ROC’s agriculture has experimented with various adjustments infarm management to cope with fierce competition from other sectors for land, labor and otherresources, while minimizing the adverse effects of farmland fragmentation and small-scalefarming. Improvements have been introduced in the scale of farming, farm mechanization,farm organization, infrastructure development and farmer training. The results have enhancedfarm income and improved living conditions for farmers. In addition, the ROC has introduceda series of agricultural policies to balance the growth of agriculture and industries sectors.
Even with the occurrence of FMD in 1997 and other natural disasters within thefollowing two years, the labor productivity of the ROC’s agriculture rose 4.63 percent in1997, then decreased 1.67 percent in 1998, but soared again by 6.81 percent in 1999. Thesefigures indicate that agricultural labor productivity was adversely affected by the crisis butwas soon recovered. With regard to the capital investment efficiency, the agriculture sectorbecame less capital-saving after the eruption of the financial crisis. The structural changesin the ROC’s agriculture explained and dominated the change. With respect to the concernof food security, there are no warning signs to indicate that the self-sufficiency ratio of food,either weighted by prices or by energy contained, declined or was damaged by the financialcrisis.
The Asian financial crisis has underscored the importance of institutional reform inpreventing future crises. A good institutional framework is important for economic efficiencyand long-term financial health. The ROC’s more balanced approach to economicdevelopment, a better division-of-labor among SMEs and large enterprises, and the earlier,steady, and persistent financial reform with proper sequencing, had enabled the economy tosuffer relatively less from the crisis.
Nevertheless, the regulation that had accompanied the ROC’s liberalization from theearly 1980s has shown to be inadequate in dealing with current problems. It is never too latefor the overall economy and the agriculture sector to commit themselves to institutionalreform for the agricultural financial system, in order to tackle the financial crisis and theapproaching WTO accession.
The next few years will prove to be a critical and challenging period for the long-termdevelopment of Asia. For the people of Asia, there will be difficulties and hardships on theroad to recovery. But whatever lies ahead, I am sure that the people of Asia, by dint ofwisdom and hard work, will resolve all crises, overcome all obstacles and enjoy a brighteconomic outlook in the new millennium.
REFERENCES
Asian Development Bank, 1997. Key Indications of Developing Asian and Pacific Countries.
Central Bank of China, 1999. Annual Report of the Bureau of the Monetary Affairs.
Chen, Yen-pao, 2000. The Disposition of Impaired Assets I Financial Institutions: Lessonsfrom the U.S.A. and from Asian Countries, sponsored by CEPD, Executive Yuan, ROC(in Chinese).

- 123 -
Chiang, P. K., 2000. “Taiwan’s Experience Amid the Financial Crisis: What We Have Done& What We Have Still to Accomplish”, at the Conference on Responding to FinancialCrises: Challenges for Domestic Policy and International Cooperation, 22-23 March1999, Taipei, Taiwan, ROC.
Council of Agriculture (COA). Taiwan Agricultural Yearbook, 1997-99 editions.
----------, 1999. Basic Agricultural Statistics.
Council of Economic Planning and Development, 1997. Review of the National EconomicDevelopment Plan of the Republic of China 1997, pp. 57-67 (in Chinese).
----------, 2000. Taiwan Statistical Data Book.
Dessus, Sebastien, 1999. “Total Factor Productivity and Outward Orientation in Taiwan:What Is the Nature of the Relationship?” in Tsu-Tan Fu, Cliff J. Huang and C. A.Knox Lovel (eds.) Economic Efficiency and Productivity Growth in the Asia-PacificRegion.
Directorate-General of Budget, Accounting and Statistics, 1999. The Trends in Multi-factorProductivity, Taiwan Area, Republic of China.
----------, 1999. Yearbook of Earnings and Productivity Statistics, Taiwan Area, Republic ofChina.
----------, 2000. Statistical Abstract of National Income, Taiwan Area, ROC, 1951-2000,March 2000.
Hu, Sheng-cheng, 1999. The Key Element of Taiwan’s Total Factor Productivity, sponsoredby CEPD, Executive Yuan, ROC (in Chinese).
Huang, P. C., 1986. “The Study on the Agricultural Input and Output Flows and RelatedEconomic Indicators: the Establishment of Agricultural Productivity Indicators in theROC”, sponsored by COA, Executive Yuan, ROC (in Chinese).
IMF, 1998. World Economic Outlook, December, 1998.
Krugman, P., 1994. “The Myth of Asia’s Miracle”, Foreign Affairs, Vol.73(6), pp. 62-78.
Kuznets, S., 1973. “Modern Economic Growth: Findings and Reflections”, AmericanEconomic Review, Vol. 63, No. 3, pp. 247-258.
Lin, An-loh, 1998. A Study of Taiwan’s Total Factor Productivity and Its Competitiveness,sponsored by CEPD, Executive Yuan, ROC (in Chinese).
Ministry of Finance, 1999. The Financial Statistics Monthly Report, Bureau of the MonetaryAffairs.

- 124 -
Schive, Chi, 1998. Financial Liberalization and Financial Crisis: Rethinking RegionalFinancial Center, CEPD, Executive Yuan, Taiwan, Republic of China.
----------, 1999. Economic Efficiency and the Taiwan Economy, the 1999 Taipei InternationalConference on Efficiency and Productivity Growth, 29-31 July 1999, the Institute ofEconomics, Academia Sinica (IEAS), Taipei, Taiwan, Republic of China.
Sun, Paul M. H., 1998. The Experience of Agricultural Development In Taiwan, NationalPolicy Advisor, Office of the President, Republic of China.
World Bank, 1993. The East Asian Miracle, Economic Growth and Public Policy.

- 125 -
Economic Problems Actions AdoptedPackage
and Goals Principles Measures Targets
Symptoms Roots Reducing businessoperating costsR
espectingthe M
arketM
echanism
External Factors
Promoting
Corporate
Com
petitiveness
Decreasing exportDecreasing
domestic demandand imports
Domestic demandstimulus plan Assisting the development
of SMEsAdvancing Econom
ic Reconstitution,
Pursuing Health G
rowth
Econom
ic Enhancem
ent Plan
Slowdown businessconditions
Global exportpromotion packageImpact of the
financial crisis
Reformingthe financial system
Increasingunemployment rate
Task force forassisting corporate
financingPushing forward
business re-engineeringEnhancing
the Legal System
Insufficientfinancial
surveillance
Solving Up Institutional and
Structural Problems
Dom
estic Institutionaland Structural Factors
Increasing financialinstitution risk Weak corporate
governance
Stock marketstabilizationcommittee
Reforming housing andland use and
administration
Enterprisesfinancial crisis Unsound
stock market
Plan for therevitalization real
estate market
Re-regulating authorityand responsibility in
the investmentapproval process
Raising G
overnment
Efficiency
Stock paymentdefaults
Unsound land andhousing system
Unemploymentinsurance proposal
Improving labor lawsand regulationsOversupply of
housing
Outdated labor lawsand regulations
Appendix 1: The ROC’s Response to the Financial Crisis

- 126 -
3. INDIA
Sanjib Chandra HotaAgriculture Production Commissioner-cum-Additional Chief SecretaryGovernment of OrissaBhubaneswar
INTRODUCTION
The East Asian crisis burst onto the world scene almost like a bolt from the blue,affecting many rapidly growing Southeast Asian countries like Thailand, the Rep. of Korea,Malaysia, Indonesia, and the Philippines. Their reverberations have been felt by neighboringcountries, including India.
The crisis has given rise to many issues to the countries themselves and also to theinternational community. The question of restructuring the economy, revamping the financialsector and appropriating changes in exchange rates with transparent allocation of resourceson productive assets, in a manner to raise the productivity and return rate are matters to beaddressed by the concerned countries themselves. But this crisis has raised certain issuesrelating to international financial institutions like the International Monetary Fund (IMF), andthe revolution of international capital. As far as the first aspect is concerned, it may be saidthat the strategy of overnight deregulation does not provide the necessary rules andinfrastructure for financial markets to work well. At the same time, a system of extensivecontrol and government involvement as practiced in India is also not supportive of growthenhancement of financial markets. Government is needed to ensure thorough regulatedreforms to put the financial systems in order, so as to function in a manner supportive of thegrowth process of economy. This calls for a sound legal framework, governing contractssound banking, total transparency, and a vigilant central bank. Globalization of capitalmarkets has an effect of redistributing world savings and enabling the countries to takeadvantage of available savings. The East Asian economy clearly benefitted from suchglobalization of capital markets. But, keep in mind that the capital markets either overshootor undershoot. The East Asia experience clearly shows that with an open capital account, acountry must have strict monitoring of capital inflow and supervisory control of the financialsystem in order to insulate the economy from severe shocks. A loose domestic financialsystem with volatile capital inflows is the worst combination spelling danger and exposingthe economy to a sudden shock, which it cannot withstand.
HOW DID INDIA ESCAPE THE CRISIS?
India was not very much affected by the financial crisis of the East Asian countries.For this, one has to appreciate the macroeconomic aggregates of India and those of theaffected countries of East Asia in the year 1997 (Table 1). This Table clearly shows variouseconomic aggregates for the period preceding the economic crisis in 1990-96 and for the year1997. The GDP rate of India was lower and the inflation rate was higher, but it had less

- 127 -
current account deficit than the East Asian countries. This advantage in India was reversedby the lower rate of domestic savings, which lagged behind the East Asian countries in fixedcapital formation. The government deficit was very high, while East Asian countries hadsurpluses or lower deficits. The Indian financial system was also not sound. In March 1996,the non-performing assets were estimated to be as high as 23 percent of total assets of thestate-owned banks. The Non-Bank Financial Intermediaries (NBFIs), who proliferated duringthe proceeding decade, accounted for 17 percent of the household deposits against the banks’share of 33 percent. The number of NBFIs is estimated at 40,000 and has a wide range ofactivities like lease, hire purchase, stock brokering, etc. but their activities were totallyunregulated, which lent additional dimensions to a volatile financial scenario in the Indiancapital market. The merchant bankers, underwriters and advertisers also colluded to engineerinflating project costs through the over-invoicing of imported capital inputs and the fixingof high premiums. This resulted in a substantial amount of capital being used inefficientlyand also resulted in siphoning the capital market. People started loosing confidence. Indiaexperienced a crisis in 1993, due to a sudden depression in Indian currency. But, immediatesteps were taken to maintain the current account deficit at an appropriate level, based on therecommendations of a high-level committee under the chairmanship of Dr. C. Rangarajan,Governor of the Reserve Bank of India, on the balance of payment as a result of which, thecurrent account deficit was maintained at 1.6 percent of the GDP. Before the East Asiancrisis, India could manage the sale of Resurgent India Bonds to the amount of Rs.179,775million (US$4.23 billion). Further, the uncertainty in the finance system was caused by theeconomic sanctions imposed on India, due to the nuclear explosion at Pokhran in the middleof 1998 and the Kargil war in 1999. These greatly affected the Indian financial system; theIndian rupee further depreciated to 43.602 against US$1.00 in September 1998.
The problem of East Asian countries was the complete integration of their financialmarkets with the world market, which was not so in India. Not only was capital convertibilityabsent in India, but also the disallowance of foreign asset holdings by individuals. Capitalmovement across the borders was strictly regulated. All these measures helped to insulate theeconomy from the repercussions of the East Asian crisis. Depreciation of the Indian currency,due to nuclear experiment and the Kargil war, had nothing to do with the East Asian factor.One of the arguments is that East Asian countries had been fully exposed to the outsideworld. Most of their exports were directed to the developed countries. So, with the slowdownin the demand for Southeast Asian products, particularly from the United States and Japan,the East Asian countries suffered and their exports sharply declined. However, India, witha narrow foreign trade sector, did not have the exposure of similar magnitude to foreigneconomic disturbance. Private capital flow into India is still relatively small, in absolute termsand relative size of its economy. Net long-term private flows to India reached US$6.4 billionin 1996, which is a tiny fraction of the US$247 billion that went into the developing countriesthat year. This represented only 1.8 percent of the Indian GDP, less than half of the averageof the developing countries. For the first time in 1986, India received portfolio equity flows,which was substantially lower in 1993, raising to US$4.4 billion in 1996 or one half of allrecent net long-term private capital flows. FDI, which has been low, increased nine folds after1992 to reach US$2.6 billion in 1996. Long-term debt flow has been largely constant for thelast 15 years, but it has fallen from representing virtually all private capital flows. In India,though the domestic interest rate was higher than the foreign interest rate, a series of

- 128 -
Table 1. Selected Asian Economies: Basic Economic Data(Unit: Percent)
Macro Aggregate Year Indonesia Rep. of Korea Malaysia Philippines Singapore Thailand IndiaReal GDP growth ratea 1990-96 8.0 7.7 8.8 2.8 8.5 8.6 5.4
1997 5.0 6.0 7.0 4.3 7.2 0.6 5.8Inflationb 1990-96 8.6 6.4 3.5 10.5 2.5 5.1 9.8
1997 8.3 4.3 3.7 5.0 2.1 6.0 5.9Domestic savingc 1990-96 28.9 35.0 32.1 18.8 47.4 34.2 22.8
1997 27.3 32.9 37.0 21.0 50.0 31.8 25.2Fixed capital formationc 1990-96 27.4 36.7 38.3 22.5 34.2 40.4 23.0
1997 26.5 36.6 42.7 25.1 35.4 35.8 26.4General government balance 1990-96 0.2 -1.0 0.3 -1.7 11.6 2.8 -10.4
1997 2.0 0.0 1.6 -0.9 8.3 -0.4 -9.1Domestic credit growth 1990-96 25.7 17.7 18.3 38.2 13.0 21.3 12.8
1997 0.0 0.0 0.0 0.0 0.0 0.0 0.0Foreign liability of banksd 1990-96 10.0 8.5 11.5 14.0 35.7 14.1 9.8
1997 0.0 0.0 0.0 0.0 0.0 0.0 0.0Current account balancec 1990-96 -2.6 -1.9 -6.0 -4.2 12.4 -6.9 -1.5
1997 -2.9 -2.9 -5.8 -4.5 14.0 -3.9 -1.6Source: World Bank,1997.Note: a Annual percentage change; b percent change in Consumers’ Price Index (CPI); c percentage of GDP; and d percent of total liability
of banking system.

- 129 -
depreciation between 1991 and 1996 did not make capital inflow attractive. Subsequently,the interest rate was lowered below the foreign interest rate. This was to arrest industrialrecession, but it did not cause capital flight, due to the intervention of the central bank toincrease the values of domestic capital assets. India, thus, largely escaped the financial crisis,even though its economy has been affected indirectly in many ways. Capital inflow to Indiahas slowed down and its trade has also shrunk. Table 2 clearly indicates that both the growthof export and imports as a percentage of Balance of Payment (BOP) have declined over theperiod of 1990-91 to 1999-2000. However, exports as percentage of GDP over this period hasmarginally increased from 6.2 to 8.2, occasionally rising to higher levels of 8.9 and 9.2. Therehas not been a significant difference in the trade balance during 1990-91 to 1999-2000.Nonresident deposits as a part of total capital (TC) inflows, had gone up from 18.3 percentto as high as 37.1 percent, but started declining thereafter and have gone down to a level of21.9 percent in the year 1999-2000. However, one redeeming feature of the short-term debtas percentage of Foreign Exchange Reserves (FER), is that it has considerably declined overthe period. The decline in portfolio investment is attributed to the Asian financial crisis,which started misperceptions in emerging markets like India. But the most dominating factorinfluencing the direction of capital flow is the stability of stock prices. Of late, the Indianstock market has become volatile. To make things worse, the global scenario has been verydepressing and India’s rating in the international market as a debtor has been lowered.
India’s Foreign TradeThe East Asian countries had boomed since the beginning of 1990 and India exploited
their high growth by pushing exports into their markets. As a result, the growth rate of India’sexport to these countries was higher than that of the rest of the world. But, the crisis broughtabout a turnaround in this trend. The products that were affected were oil meals, gems andjewelry, machinery, iron ore and semi-finished iron ore, leather and leather goods and projectexports. The contractions in the East Asian countries, in the aftermath of the crisis, havecompelled them to generate surpluses in their trade balance by contracting their imports.India could not escape from this import compression. These countries, because of their higheconomic growth in 1990s, were significant destinations for Indian export. Indonesia,Malaysia, the Philippines, the Rep. of Korea and Thailand together accounted for 6.8 percentof India’s export in 1996-97, which decreased to 5.65 percent in 1997-98 and further to 3.79percent in 1998-99 (Table 3). The percentage change in Indian exports to East Asiancountries showed a sudden decline in the year 1996-97. From a level of 27.29 percent duringthe year 1994-95, it rose to a substantial level of 51.4 percent in the year 1995-96; butthereafter, it declined to 7.06 percent and then registered a negative growth as high as 36.36percent. It is heartening to note that for all the East Asian countries, the percentage changesin industrial export have registered substantial increase in 1999-2000 (Table 3).
India’s rupee depreciated by 17.6 percent, between the onset of the Asian financialcrisis in July 1997 and February 1999, when the crisis was over. But, this depreciation isquite modest compared to the other Asian countries. Competitions of imports from thesecountries have intensified in Indian markets. During and after the crisis in 1997-98 and 1998-99, imports to India from these countries increased by 15.9 percent and 30.42 percent,respectively, which are higher than the corresponding figures during the pre-crisis period of1996-97. It may also be noted that the growth rate of imports has slipped to 12 percent in1999-2000, when the impact from the crisis weakened the East Asian economies (Table 4).

- 130 -
Table 2. An Anatomy of the Indian External Economy during 1990-91 to 1999-2000Sl.No. Item 1990-
911993-
941994-
951995-
961996-
971997-
981998-
991999-2000
1. Growth of exports - BOP (percent)a 9.0 20.2 18.4 20.3 5.6 4.5 -3.9b 7.82. Growth of imports - BOP (percent)a 14.4 10.0 31.3 21.6 12.1 4.6 -7.1b 2.7
Of which: petroleum oil lubricant (percent) 60.0 -5.7 3.0 27.0 33.4 -18.7 -21.2 53.33. Exports/imports - BOP (percent) 66.2 84.8 74.8 74.0 69.7 69.7 72.1 70.34. Import cover of FERc (number of months) 2.5 8.6 8.4 6.0 6.5 6.9 8.2 7.95. External assistance (net/TCd) (percent)e 26.3 19.2 19.0 29.7 10.6 9.7 10.4 2.76. External commercial borrowing (net/TCd) (percent)e 26.8 6.1 12.9 42.9 27.3 42.6 55.4 1.57. Nonresident deposits/TCd (percent)e 18.3 12.2 2.1 37.1 32.1 12.0 22.1 21.98. Short-term debt/FERc (percent) 146.5 18.8 16.9 23.2 25.5 17.2 13.5 13.99. Debt service payments as percent of current receipts 35.3 25.6 26.2 24.3 21.2 19.1 18.0 18.7
As percent of GDPf
10. Exports 6.2 8.3 8.4 9.2 8.9 8.8 8.211. Imports 9.4 9.8 11.2 12.4 12.8 12.6 11.312. Trade balance -3.2 -1.5 -2.8 -3.2 -3.9 -3.8 -3.113. Invisible balance -0.1 1.1 1.8 1.6 2.7 2.4 2.214. Current account balance -3.2 -0.4 -1.0 -1.7 -1.2 -1.4 -1.0 -1.5g
15. External debt 30.4 33.8 30.9 27.1 24.7 24.4 23.5 23.3h
16. Debt service payment 3.0 3.1 3.4 3.4 3.0 2.7 2.6Source: Government of India.Notes: a Rupee equivalent of BOP components are used to arrive at foreign debt position ratios. All other percentages shown in the upper
panel of the Table are based on US dollar values; b growth rate of exports and imports during April-September 1999 are the growthrates over April-September 1999; c including gold and special drawing rights; d net; e as total capital flows are netted after takinginto account some capital outflows the ratios against items Nos. 5, 6 and 7 may, in some years, add up to more than 100 percent;f at current market prices; g annualized; and h debt stock at the end of September 1999 as a percent of estimated GDP for 1999-2000.

- 131 -
Table 3. India’s Exports to Selected East Asian Countries(Unit: US$ million)
Countries 1994-95 1995-96 1996-97 1997-98 1998-99 1999-2000Thailand 406.70 473.63 447.45 344.90 320.92 457.26
(1.54) (1.49) (1.34) (0.98) (0.97) (1.21)Malaysia 286.57 393.75 531.58 490.49 321.63 435.52
(1.09) (1.24) (1.59) (1.40) (0.97) (1.16)Rep. of Korea 332.53 448.93 518.91 468.12 307.46 428.81
(1.26) (1.41) (1.55) (1.34) (0.93) (1.14)Indonesia 277.77 663.40 592.34 437.78 185.23 326.83
(1.05) (2.08) (1.77) (1.25) (0.56) (0.87)Philippines 99.45 144.45 183.80 239.01 118.71 143.76
(0.38) (0.45) (0.55) (0.68) (0.36) (0.38)Total 1,403.02 2,124.16 2,274.08 1,980.30 1,253.95 1,792.18
(5.32) (6.67) (6.80) (5.65) (3.79) (4.76)Percentage change: Thailand 14.21 16.45 -5.53 -22.92 -6.95 42.48 Malaysia 16.00 37.40 35.00 -7.73 -34.43 35.41 Rep. of Korea 61.27 35.00 15.59 -9.79 -34.32 39.47 Indonesia 18.36 138.83 -10.71 -26.09 -57.69 76.45 Philippines 70.94 45.25 27.24 30.04 -50.33 21.10
Aggregate 27.29 51.40 7.06 -12.92 -36.68 42.92Source: Center for Monitoring Indian Economy (CMIE), 2000.Note: Figures in parentheses are percentage share of total exports.

- 132 -
Table 4. India’s Imports from Selected East Asian Countries(Unit: US$ million)
Countries 1994-95 1995-96 1996-97 1997-98 1998-99 1999-2000Thailand 171.65 169.95 197.36 233.60 273.05 321.34
(0.60) (0.46) (0.50) (0.56) (0.64) (0.68)Malaysia 490.21 904.08 1,042.24 1,180.32 1,610.38 2,059.34
(1.71) (2.46) (2.66) (2.84) (3.80) (4.36)Rep. of Korea 629.06 826.07 884.34 1,002.98 1,394.11 1,211.59
(2.19) (2.25) (2.26) (2.41) (3.29) (2.56)Indonesia 322.31 461.83 599.16 732.51 828.92 991.97
(1.12) (1.26) (1.53) (1.76) (1.96) (2.10)Philippines 11.78 21.50 16.46 27.77 37.25 56.67
(0.04) (0.06) (0.04) (0.07) (0.09) (0.12)Total 1,625.01 2,383.43 2,739.56 3,177.18 4,143.71 4,640.91
(5.66) (6.49) (6.99) (7.64) (9.78) (9.82)Percentage change: Thailand 200.37 -0.99 16.13 18.36 16.89 17.69 Malaysia 96.74 84.43 15.28 13.25 36.44 27.88 Rep. of Korea 11.59 31.32 7.05 13.42 39.00 -13.09 Indonesia 169.67 43.29 29.74 22.26 13.16 19.67 Philippines 98.18 82.52 -23.44 68.71 34.14 52.13
Aggregate 62.23 46.67 14.94 15.97 30.42 12.00Source: CMIE, 2000.Note: Figures in parentheses are percentage share of total exports.

- 133 -
Indian exports compete with the exports of other Asian countries in third worldcountries’ economies for goods like rice, cotton, textiles, textile garments, footwear, rubberand rubber products, electrical equipment like engineering goods, gems and jewelry. Becauseof the larger depreciation in these currencies, Indian exports had to face stiff competition inthe third world countries’ exports. Table 5 indicates that overall exports from India haveregistered lower and even negative growths after the crisis. The decline in agricultural andallied products is modest. While overall exports registered a negative growth rate in 1998-99,imports to India have been increasing over the years.
ECONOMIC IMPACT ON INDIAN AGRICULTURE
In the aftermath of the crisis, restraint is being observed in the Indian economy. Withthe onset of the crisis, the Indian rupee has been put under great pressure in the internationalmarket. The defense of the rupee, though not successful, by the Reserve Bank of India (RBI)has not stopped the depreciation. So, the rupee has constantly depreciated over this period.Further, due to contractions in foreign capital input, the government and the private sectorstried to boost investment through the conventional route of domestic borrowing. A largedemand along with limited loanable funds in the country has stiffened the interest rate, whichin turn damped the growth rate of the economy. Even though the Indian economyexperienced a high growth rate of more than 7 percent between 1995 and 1997, it suffereda sharp decline in 1997-98, to 5 percent. Table 6 depicts the real growth rate of the IndianGDP over the period of 1993-94 to 1999-2000. From this, it is clear that the agriculture andallied sectors, which were booming with a growth rate of 9.6 percent in 1996-97, immediatelyexhibited a negative growth rate of -1.9 percent. But, right after the crisis, it went up to 7.2percent but again came down to 0.8 percent in 1999-2000. In fact, the Table indicates atotally erratic growth rate in the agriculture sector and due to this erratic trend, it is difficultto estimate the effect of the Asian financial crisis on the Indian agriculture and the alliedsectors. Table 7 gives the cultivated area of agricultural commodities and from this it can beseen that there is an erratic trend in the area coverage of food grains as well as in non-foodgrains during the current decade. The areas covered under food grain fluctuate, registeringboth a positive and negative growth rates before and after the crisis. The same holds true forareas covered under non-food grains. So, no definite inference can be drawn to the East Asiancrisis. The production of major crops, which is presented in Table 8, also displays the sameerratic trend as the trend in the area coverage both for food grains and non-food grains. Itwould, therefore, be difficult to establish a direct relation between Indian agriculture and itsproductivity of different crops with the East Asian crisis.
Production trend and growth rate cannot be ascribed to external factors like thefinancial crisis in foreign countries, and the contraction and expansion of agricultural exportsand imports. Therefore, we have to look for some other determinants, like the pattern ofinvestment in agriculture, over a period of time. Investment in agriculture is a prerequisitefor its growth and is vital for the sustainable growth of the sector, in order to meet increasingdemands. The total investment in agriculture increased from Rs.12,240 million in 1950-51to Rs.25, 800 million in 1967-68, at the beginning of the Green Revolution. Table 9 presentsa picture of public and private investment during different time spans, and its impact on theproductivity growth of different types of crops. The early periods for growth rate areinfluenced by low base. The figures indicate considerable decline in public investment

- 134 -
Table 5. Commodity Composition of India’s Exports(Unit: US$ million)
Commodities 1994-95 1995-96 1996-97 1997-98 1998-99 1999-2000Agriculture and allied products 4,227.28 6,120.01 6,868.50 6,634.20 6,033.11 5,504.60
(16.06) (19.22) (20.50) (18.93) (18.17) (14.62)Ores and minerals 988.60 1,176.67 1,173.36 1,062.34 893.23 907.79
(3.75) (3.69) (3.50) (3.03) (2.69) (2.41)Manufactured goods 20,410.02 23,782.44 24,634.16 26,578.59 25,785.69 29,509.85
(77.49) (74.69) (73.54) (75.83) (77.64) (78.39)Petroleum and crude products 417.01 454.42 482.20 353.18 89.41 30.02
(1.58) (1.43) (1.44) (1.01) (0.27) (0.08)Other commodities 294.60 308.33 339.75 420.30 409.53 1,692.13
(1.12) (0.97) (1.02) (1.20) (1.23) (4.50)Total 26,337.51 31,841.87 33,497.97 35,048.67 33,210.97 37,644.39
(100.00) (100.00) (100.00) (100.00) (100.00) (100.00)Percentage Change:Agriculture and allied products 5.08 44.77 12.23 -3.41 -9.06 -8.76Ores and minerals 11.43 19.02 -0.28 -9.46 -15.92 1.63Manufactured goods 22.68 16.52 3.58 7.89 -2.98 14.44Petroleum and crude products 4.94 8.97 6.11 -26.76 -74.68 -66.42Other commodities 9.76 4.66 10.19 23.71 -2.56 313.19
All commodities 18.57 20.90 5.20 4.63 -5.24 13.35Source: CMIE, 2000.Note: Figures in parentheses are percentage share of total exports.

- 135 -
following the Green Revolution in 1967-68. The growth rate rose from 4.1 percent to 7.7percent over the period from 1950-51 to 1967-68 and for the period 1967-68 to 1980-81.Thereafter, there has been a sharp fall in public investment, registering a negative growthrate, which further accentuated during the period of 1986-87 to 1992-93. This negativegrowth rate in public investment came down during the period between 1992-93 to 1998-99.This definitely indicates less involvement of public sectors in the employment of capitalinvested in agriculture. It is interesting to note that during the same time frame, privateinvestment constantly registered a positive growth rate, although it had suffered a setbackduring the period of 1980-81 to 1986-87. Public investment in agriculture has a direct impacton agricultural productivity, of course with some time lag. The gestation period of capitalinvestment in agriculture is about 10-15 years, which is mainly in the area of irrigationprojects, fertilizer plants, pesticide plants, power transmission line to provide power to liftirrigation points and shallow tube-wells, agricultural research and extension. The investmentmade during the year 1967-68 to 1980-81 (period of Green Revolution) had a significantimpact on agriculture. During 1980-81 to 1990-93, the growth in productivity of almost allcrops (except coarse cereal) constantly showed an increasing trend.
Table 6. Sectoral Real Growth Rates(Unit: Percent)
Percentage Change overthe Previous Year
Agriculture andAllied Sector
IndustrySector Services Total GDP
1993-94 3.6 6.8 7.3 6.01994-95 5.0 9.2 7.0 7.01995-96 -0.9 11.8 10.3 7.31996-97 9.6 6.0 7.1 7.51997-98 -1.9 5.9 9.0 5.01998-99 7.2 4.0 8.3 6.81999-2000 0.8 6.9 8.2 5.9
Source: Government of India.
Agriculture’s share in gross domestic capital formation slid from 14.5 percent in 1980-81 to just 6.4 percent in 1998-99, while its share in GDP came down from 35 percent to 25percent during the same period. This speaks of the relative neglect of agriculture in theoverall capital formation of the economy, which in due course could jeopardize hard earnedfood security as well as the welfare of the masses residing in rural India. The terms of trade(TOT) as per latest information released by the Ministry of Agriculture have significantlyimproved from 86.5 percent in the Triennium Ending (TE) in 1989-90 to 93.4 percent in TEin 1999-2000. The 7-percent point gain in TOT emphasizes a significant improvement in theincentives for agriculture, triggering higher consumption as well as higher private investmentin agriculture. During the period from 1986-87 to 1998-99, private sector investment inagriculture has registered a positive and increasing growth rate, which has considerably upsetthe negative growth rate in public investment. Total investment has therefore maintained apositive growth rate during the same period, having a positive impact on agriculture (Figure1).

- 136 -
Table 7. Cultivated Area of Agricultural Commodities(Unit: 000 ha)
Year Cereals Pulses Total Food Grains Total Non-food Grains1990-91 103,173 24,662 127,835 37,7001991-92 99,330 (-3.72) 22,543 (-8.59) 121,873 (-4.66) 39,888 (5.80)1992-93 100,789 (1.47) 22,360 (-0.81) 123,149 (1.05) 39,300 (-1.47)1993-94 100,007 (-0.78) 22,434 (0.33) 122,441 (-0.57) 38,920 (-0.97)1994-95 100,834 (0.83) 23,028 (2.65) 123,862 (1.16) 39,445 (1.35)1995-96 98,732 (-2.08) 22,283 (-3.24) 121,015 (-2.30) 41,200 (4.45)1996-97 101,315 (2.62) 23,194 (4.09) 124,509 (2.89) 42,349 (2.79)Average annual growth rate -0.28 -0.93 -0.41 1.991997-98 100,521 (-0.78) 23,284 (0.39) 123,805 (-0.57) 40,787 (-3.69)1998-99 101,500 (0.97) 23,800 (2.22) 125,400 (1.29) 41,100 (0.77)Average annual growth rate 0.10 1.31 0.36 -1.46
Note: Figures in parentheses are percentage change over the previous year.
Table 8. Production of Major Agricultural Commodities(Unit: 000 mt)
Year Cereals Pulses Total Food Grains Total Non-food Grains1990-91 162,125 14,265 176,390 279,8551991-92 156,359 (-3.56) 12,015 (-15.77) 168,374 (4.54) 294,431 (5.21)1992-93 166,669 (6.59) 12,815 (6.66) 179,484 (6.60) 270,027 (-8.29)1993-94 169,022 (1.41) 13,100 (2.22) 182,122 (1.47) 269,748 (-0.10)1994-95 177,456 (4.99) 14,038 (7.16) 191,494 (5.15) 319,813 (18.56)1995-96 168,104 (-5.27) 12,310 (-12.31) 180,414 (-5.79) 326,893 (2.21)1996-97 184,862 (9.97) 14,460 (17.47) 199,322 (10.48) 329,591 (0.83)Average annual growth rate 2.36 0.91 2.23 3.071997-98 179,769 (-2.76) 13,349 (-7.68) 193,118 (-3.11) 308,741 (-6.33)1998-99 188,200 (4.69) 14,800 (10.87) 203,000 (5.12) 342,800 (11.03)Average annual growth rate 0.97 1.60 1.01 2.35
Note: Figures in parentheses are percentage change over the previous year.
Source: For Tables 7 and 8, Agricultural Statistics Division, Directorate of Economics and Statistics, Department of Agricultureand Cooperation, Ministry of Agriculture, Government of India, Agricultural Statistics At A Glance.

- 137 -
Rs. billion140
120
100
80Private GCFATOT
60Public GCFA
40
20
01980-
811982-
831984-
851986-
871988-
891990-
911992-
931994-
951996-
971998-
99
Table 9. Growth Rates of Agricultural Investment and Agricultural Productivityduring Different Periods of India
(Unit: Percent)
Particulars 1950/51-1967/68
1967/68-1980/81
1980/81-1986/87
1986/87-1992/93
1992/93-1998/99a
A. Investment Growth*:Total investment 3.83 4.64 -2.48 2.35 5.85Public investment 4.11 7.70 -4.40 -6.17 -0.98Private investment 3.78 3.11 -1.30 5.85 7.50
B. Agricultural Productivity Growthb:Food grains 1.59 1.87 2.32 4.12 1.54Rice 1.84 1.42 2.79 3.26 1.25Wheat 1.90 2.45 3.25 3.48 1.47Coarse cereals 1.44 1.74 -0.49 5.94 0.56Pulses -0.06 -0.95 1.67 1.47 0.64Oilseeds 0.23 0.53 1.26 3.74 1.57Sugarcane 2.31 1.38 0.74 1.53 -3.14Cotton 1.92 2.55 3.06 6.90 1.45
Sources: * Indian Journal of Agricultural Economics, October-December 1996, p. 547.Notes: a The investment growth for the period 1992/93 and 1998/99 has been estimated
by using linear function; and b agricultural productivity growth has been calculatedby using log-linear function, namely; Log Y = a + bt, where Y = productivity perha and t represents time variable. Growth rate is given by (eb - 1) x 100.
Figure 1. Incentives and Investments in Indian Agriculture, 1980-99TOT Trend (1971-71 base), Public and Private GCFA (Gross Capital Formation
in Agriculture) (1993-94 base)
Source: The Economic Times, 26 October 2000.

- 138 -
As the country faces emerging challenges of competition from other countries in thecost of production, a serious thought has to be given to allocating extra resources toagricultural research, education and extension.
REFERENCES
Baidyanathan, A., 2000. “India’s Agricultural Development Policy”, Economic and PoliticalWeekly, 13 May 2000.
Bhalla, A. S. and D. M. Nachane, 1998. “Asian Eclipses: India and China in Penumbra?”,Economic And Political Weekly 33 (36 & 37):2357-2378.
Bhole, L. M., 1995. “The Capital Markets at the Crossroads”, Vikalpa 20:29-41.
Center for Monitoring Indian Economy (CMIE), 2000. Foreign Trade and Balance ofPayment, July 2000.
Chand, R., 1998. “Removal of Import Restrictions and India’s Agriculture: The Challengeand Strategy”, Economic and Political Weekly 33 (15):850-854.
Chandrasekhar, C. P. and Jayati Ghosh, 1999. “Financial Crisis and Elusive RecoveryLesson from Thailand and South Korea”, Economic and Political Weekly, February1999.
Corden, M. The Asian Crisis: Is There A Way Out?, Institute of South-East Asian Studies.
Dickie, P., 1999. “Rebooting South-East Asia Causes – Effects and Remedies of Crisis”,Economic & Political Weekly 34 (21):1257-1263.
Fisher, S., 1998. “The Asian Crisis and the Changing Role of IMF”, Finance andDevelopment, Vol. 35(2):2-5.
Garnaut, R., 1998. “The Financial Crisis: A Watershed in Economic Thought about EastAsia”, Asian Pacific Economic Literature, May:1-8.
Government of India. Economic Survey – 1999-2000, New Delhi.
Goyal, A. and S. Dash, 1998. “Arbitrage: An Explanation for South-East Asian Crisis andIndian Immunity”, Economic and Political Weekly 33(31):2098-2104.
Gulati, Ashok and Seema Bathla, 2000. “Revolution Waiting in the Wings”, The EconomicTimes 26 October 2000.
Henderson, C. Asia Falling: Making Sense of the Asian Crisis and Its Aftermath, McGrowHill.
IMF, 1998. “The Asian Crisis: Causes and Cure”, Finance and Development, Vol. 35(2):18-21.

- 139 -
Jumo, K. S. Tigers in Trouble: Financial Governance, Liberalisation and Crisis in EastAsia, Zed Books.
Katyal, J. C., 1997. “Sustainability – Relevance of Integrated Concept”, Survey of IndianAgriculture, The Hindu, 25-31.
Khatkhate, D., 1998. “East Asian Financial Crisis and the IMF: Chasing Shadows”,Economic & Political Weekly 33(17):963-969.
Krugman, P., 1994. “The Myth of Asia’s Miracle”, Foreign Affairs, Vol.73(6):62-78.
Ministry of Agriculture, Government of India, 2000 Agricultural Policy, July 2000.
----------, 2000. Agricultural Statistics at a Glance, New Delhi.
Nayyar, D. and A. Sen, 1994. “International Trade and Agricultural Sector in India” in G.S. Bhalla (ed), Economic Liberalisation and Indian Agriculture, Institute for Studiesin Industrial Development, New Delhi.
Ozler B., G. Datt and M. Revalion, 1996. “A Database on Poverty and Growth in India”,World Bank Journal.
Paroda, R. S., 1995. “Sustainable Growth –- The Major Planks of Strategy”, Survey ofIndian Agriculture, The Hindu, 17-21.
----------1999. “Green Revolution – For A Food Secure Future”, Survey of IndianAgriculture, The Hindu, 17-23.
----------, 2000. “Farm Research – Policy Support Essential”, Survey of Indian Agriculture,The Hindu, 17-20.
Patnaik, U., 1996. “Export-oriented Agriculture and Food Security in Developing Countriesand India”, Economic and Political Weekly, Vol. XXXI, Nos. 35-37, Special Number,September 1996.
Pratibandla, M. and R. Prusty, 1998. “East Asian Crisis as a Result of Institutional Failures:Lessons for India”, Economic & Political Weekly, 28 February:469-73.
Rajan, K., 1997. “Farm Productivity – Time for Proper Linkages”, Survey of IndianAgriculture, The Hindu, 19-23.
Rangarajan, C. “Ex-Governor of Reserve Bank of India – East Asian Crisis and HotLessons?”, Kalinga Lecture Series, Nabakrushna Choudhury Centre forDevelopmental Studies.
Rao, Bhanoji V. V., 1998. “East Asian Economies Growth within an International Context”,Economic & Political Weekly, 7-13 February 1998.

- 140 -
Sathe, D., 1998. “Asian Currency Crisis and the Indian Economy”, Economic and PoliticalWeekly 33 (18):1003-1005.
Singh, A., 1997. “Catching up with the West: A Perspective on Asian EconomicDevelopment and Lessons for Latin America”, in L. Emmerji (ed.), Economic andSocial Development into the XXI Century, Inter-American Development Bank,Washington, D.C.
Stiglitz, Joseph. (Senior Vice President and Chief Economist), 1998. “The East Asian Crisisand Its Implication for India”, Commemorative Lecture for the Golden JubileeCelebration of Industrial Finance Corporation of India, the World Bank, 19 May1998.
Swaminathan, M. S., 1995. “Intensive Farming – Rationale of Integrated Systems”, Surveyof Indian Agriculture, The Hindu, 7-13.
----------, 2000. “For an Evergreen Revolution”, Survey of Indian Agriculture, The Hindu,9-15.
Venkataramani, G., 2000. “Overview – Scaling New Heights”, Survey of Indian Agriculture,The Hindu: 5-7.
World Bank, 1993. The East Asian Miracle: Economic Growth and Public Policy, OxfordUniversity Press, New York.
----------, 1997. Economic Outlook: Interim Assessment, December 1997.

- 141 -
4. INDONESIA
Djodi HidayatHeadDivision for Planning Program and EvaluationDirectorate General forChemical, Agriculture and Forest-based IndustryJakarta
INTRODUCTION
In mid-1997, the Indonesian economy experienced a hard trial. Since the fall of therupiah to the value of the US dollar, the Indonesian economy has been in an unstablecondition. The growth of the economy has declined dramatically, while the inflation rate hasincreased significantly. The interest rate has jumped to a very high level, which has causedthe Indonesian economy to be in a turbulent condition. In this situation, many companieshave had to stop their business activities because they could not pay their high debts. As aresult, many workers lost their jobs.
The financial crisis in Indonesia has led to include political instability. By the end of1997, many organizations, either political or non-political, had protested to the governmentabout this economic condition. This was expressed by many demonstrations initiated byuniversity students, NGOs, political organizations, scientists, lecturers and publicorganizations. This situation made national security unstable. As a result, many businessmenand foreign investors reconsidered their plans to invest in Indonesia. Beside this, manytourists avoided in coming to Indonesia because they were afraid that their security and safetymight be in jeopardy.
The financial crisis destroyed the Indonesian economy. This was indicated by thedeclining economic performance during the two years after the financial crisis. In the year1998, the economy growth rate was -13.1 percent, while the growth rate of the industrialsector was -11.44 percent. However, the growth rate of the agriculture sector was stillpositive, at 1.52 percent. In the same year, the interest rate climbed to 60 percent, while theinflation rate was 40 percent. The high interest rate caused many difficulties for companiesto borrow money for their business operation, while the high inflation rate reduced thepeople’s ability to buy necessities, such as food and other items.
The destruction of the Indonesian economy represents how weak the foundations ofthe Indonesian economy are. It was not built on basic, strong and sustainable fundamentals,but on the very weak base of the industrial sector, which focused its development on bigindustries. These industries were developed through government planning, which is not basedon national ability. Most of the big companies were established through governmentfacilities. Hence, they grew as big companies not because of their ability to operate andmanage their business, but because of government assistance in the form of capital. Also,many companies grew not because of their strong capital, strong human resources or strong

- 142 -
technological skills, but because of the money they borrowed from outside of the country, inthe form of the US dollar, to expand their business activities. As a result, these big companieswere very vulnerable to the fluctuations in the value of the US dollar. When the financialcrisis happened, companies that had foreign loans in terms of the US dollar had to pay morethan usual for their debts. Therefore, some big companies declared bankruptcy, because theyhad used all of their capital to pay for their high foreign debts.
In facing this situation, the new government has taken a strategic measure inreevaluating the concept of economic development in Indonesia. Through this strategy, allof the economic development planning will not be prioritized to the development of largeindustries, but rather, it will prioritize and focus on the development of small and mediumenterprises. This program has been determined as the long-term development program.
For the short-term program, the government has taken a policy to revitalize all businessactivities which have future prospects for development, by restructuring and recapitalizingthese companies. The restruction of companies is conducted by reorganizing businessactivities and business organizations, and is aimed to achieve efficiency. Recapitalization ofcompanies is done by providing companies with the capital necessary to operate theirbusinesses. Through this strategy, it is expected that all companies which were almostinactive could recover and operate again.
Even though the government has taken several strategies to overcome the financialcrisis, there have been no indications of a recovery in our economy. This can be understoodbecause recovery takes time and it is closely related to the problem of the low value of theIndonesian currency (rupiah) to the US dollar, the problem of low investment and thedifficulties in obtaining capital. To overcome these problems, the government has takenstrategic measures by implementing an export program, in which all companies are demandedto increase their exports, in order to raise the value of the Indonesian currency relative to theUS dollar. Meanwhile, to generate economic activities, the government has provided benefitsfor those who invest in Indonesia. The benefits include the ease of obtaining permanentbusiness permissions, selection of good locations, access to potential markets and exportfacilities. Furthermore, to overcome the problem of capital, the government has provideddomestic companies with low-interest loans, particularly for small and medium enterprises.
DEVELOPMENT IN THE AGRICULTURE SECTOR
In the 1970s, the agriculture sector became the main focus of national development.Most of the government’s programs were focused more on irrigation, extensification andintensification programs, which directly supported the agricultural development in Indonesia.As a result, the agriculture sector grew very rapidly. Many products from the agriculturesector were produced massively, such as vegetables, fruits, paddy and others, in order to meetnational demand.
In the 1990s, however, the Indonesian Government changed the strategy fromagricultural development to industrialization, which was directed to improve value-addedoutput. During the first phase, this program seemed to be very successful; many big- tomedium-sized industries were established. Unfortunately, the development of industries wasnot built on strong fundamentals, because most raw materials were imported and some ofthem were even financed by international loans in the form of the US dollar. As a result,when the financial crisis happened, industrial sectors suffered more than the other sectors.

- 143 -
All economic sectors suffered from the crisis except the agriculture sector that showednormal growth, even with the financial crisis situation. The reason is that the agriculturesector consists of thousands of farmers, who cultivate their land to support the agriculturaldevelopment. Most farmers who cultivate their land can be categorized as small and mediumcompanies, which have important roles in running village businesses. In operating theirbusiness and production activities, these farmers do not depend on imported materials ratherthey use domestic materials. This is why this sector remained strong when the monetary crisishappened. It was built by strong fundamental developments, which were focused on theextensification and intensification programs aimed to achieve self-sufficiency in the staplefoods.
As a sector of the economy, agriculture has played a great role in sustaining economicdevelopment in Indonesia, as 70 percent of the population work in the agriculture sector andlive as farmers in the villages. The agriculture sector has contributed highly to thedevelopment of the Indonesian economy. According to the statistical data from the Centerfor Statistical Bureau, in 1997, the agriculture sector contributed 8.31 percent to GDP. Thisshare increased to 9.20 percent in 1998, and to 10.11 percent in 1999.
In 1997, the GDP of the agriculture sector reached US$5.3 billion which increased toUS$9.1 billion in 1997, and further expanded to US$11.3 billion in 1999.
To understand the impact of the financial crisis on the development of the agriculturesector, we have to elaborate on the production pattern of major agricultural commodities,particularly paddy, maize, cassava, sweet potato and others.
1. PaddyFrom Table 1, we can see that in 1997, the production of paddy was 49,377,054 mt,
and in 1998, this decreased to 49,199,844 mt. However, in 1999, it rebounded to 50,866,387mt. Furthermore, the 1997 yield rate of paddy reached 4,432.2 kg/ha in 1998, it decreased to4,197.4 kg/ha, but in 1999, it increased again to 4,251.9 kg/ha. From the Table, we can seethat the impact of financial crisis to the productivity of paddy is not serious.
Table 1. Harvested Area, Yield Rate and Production of PaddyReference 1996 1997 1998 1999
Harvested area (ha) 11,569,729 11,140,594 11,716,499 11,963,204Yield rate (kg/ha) 4,416.8 4,432.2 4,199.2 4,251.9Production (mt) 51,101,506 49,377,054 49,199,844 50,866,387Production growth rate(percent) 2.73 -3.37 -0.36 3.39
2. MaizeMaize is most consumed by Indonesians because it tastes very good. This is the reason
why this commodity is also planted by many farmers. From Table 2, we can see that in 1997,the production of maize was 8,770,851 mt, and in 1998, it increased to 10,169,488 mt. Butin 1999, it declined to 9,204,036 mt. The yield of maize was 2,614.1 kg/ha in 1997, and itslightly increased to 2,642.9 kg/ha and to 2,662.9 kg/ha in 1998 and 1998, respectively,which indicated that the financial crisis had no impact on productivity of maize.

- 144 -
Table 2. Harvested Area, Yield Rate and Production of MaizeReference 1996 1997 1998 1999
Harvested area (ha) 3,288,451 3,355,244 3,847,813 3,456,357Yield rate (kg/ha) 2,600.1 2,614.1 2,642.9 2,662.9Production (mt) 8,550,451 8,770,851 10,169,488 9,204,036Production growth rate(percent) 2.8 2.6 15.9 -9.5
3. CassavaFrom Table 3, we can see that in 1997, the production of cassava was 15,134,021 mt,
and in 1998, it declined to 14,699,203 mt, but in 1999, it increased to 16,458,544 mt. Theyield was 12,171.8 kg/ha in 1997, and remained almost the same in 1998 and 1999. Thus theimpact of the financial crisis on the productivity of cassava was only slight.
Table 3. Harvested Area, Yield Rates and Production of CassavaReference 1996 1997 1998 1999
Harvested area (ha) 1,233,345 1,243,366 1,205,353 1,350,008Yield rate (kg/ha) 12,246.5 12,171.8 12,194.9 12,191.4Production (mt) 15,104,110 15,134,021 14,699,203 16,458,544Production growth rate(percent) 0.5 0.20 -2.9 12.00
4. Sweet PotatoIt is also a product preferred by many people. The development of this product can be
seen from Table 4. In 1997, the production of sweet potato was 1,847,492 mt. In 1998, itincreased to 1,935,044 mt, but lowered to 1,665,547 mt in 1999. The yield of sweet potatoreached 9,453.2 kg/ha in 1997, then increased to 9,575.1 and 9,669.8 kg/ha in 1998 and 1999,respectively.
Table 4. Harvested Area, Yield Rates and Production of Sweet PotatoesReference 1996 1997 1998 1999
Harvested area (ha) 194,422 195,436 202,092 172,243Yield rate (kg/ha) 9,507.9 9,453.2 9,575.1 9,669.8Production (mt) 1,848,544 1,847,492 1,935,044 1,665,547Production growth rate(percent) 2.2 -0.1 4.7 -13.9
5. Other Major CropsThe financial crisis did not have any serious impacts on the productivity of other major
crops in Indonesia, e.g., peanut, soybean, green soybean, tomato and broccoli. Although somefluctuations were discovered over the years, the production of various crops has been quitestable from 1996 to 1999.

- 145 -
IMPACT OF THE FINANCIAL CRISIS ON AGRICULTURE
In general, the impact of the financial crisis on farmers’ activities was not very serious.The production of major commodities, such as paddy, maize, cassava and others, are stillincreasing even though the increase may not be very significant. This is also shown by thefarmers’ income. The farmers’ income remains the same before and after the financial crisis.This is because farming is mostly a small business. Farms are mostly managed by traditionalfarmers who lack the capital, management skills and the knowledge. Most farmers inIndonesia are not real businessmen. They cultivate their land according to their ownknowledge and the production is mainly for their own family consumption. Only when theyhave spare production do they sell to traders. In cultivating their land, farmers do not requiremuch cost because they cultivate their own land, and are assisted only by their familymembers and their neighbors. Farmers make their own seeds for planting and plow their ownland. Only fertilizers are used to increase the productivity of land. Farmers buy fertilizers atvery normal prices from the producer because it is a State-owned company. The governmentalso provides low fertilizer prices for all farmers in Indonesia.
When the financial crisis happened in Indonesia, most farmers did not feel the impact.They only experienced the increase in the prices of goods and services, which diminishedtheir purchasing power. However, farmers in the villages seldom buy consumption goods.They only buy necessities, such as sugar and coffee, which are not produced in their villages.
For farmers, the financial crisis only impacted the prices of fertilizers and the costs ofproduction, but not their income because it is almost the same as their income from beforethe crisis. As an overview, let us see the development of farmers’ income based on eachcommodity (Table 5).
Table 5. The Income of Farmers According to Each Major Commodity(Unit: Rp. 000)
Commodity 1996 1997 1998 1999Paddy 590 685 725 820Maize 525 615 685 725Cassava 485 540 620 700Sweet potatoes 495 515 585 720Peanut 540 590 625 745Soybean 565 618 695 755Tomatoes 575 620 690 750
Source: Primary data from a survey in West Java, 1999.
From the table, we can see that the development of farmers’ incomes, based oncommodities, tend to increase. However, the highest income is in paddy followed by soybeanand tomatoes.
For the farmer, the increase in income does not impact their welfare because theirpurchasing power was almost the same before and after the crisis. The financial crisis did nothave much impact on the farmers because of the following reasons:
a. Most farmers in Indonesia do not use imported products, so when the value of the USdollar increased relative to the value of the rupiah, it did not impact their activities ortheir lives.

- 146 -
b. Most farmers in Indonesia use their own capital to buy fertilizer. Some obtain theirworking capital from the government bank with low interest rates.
c. The farmers in Indonesia never distribute their own products. When farmers harvesttheir agricultural products, traders pick them up.
d. The farmers in Indonesia are not consumptive people, which means that they never buyconvenience goods, they only buy things which are not produced in their villages.
e. Most farmers in Indonesia are traditional farmers. They manage their land based ontheir own knowledge and skill. The farmers are not educated people, but they have theexperience of cultivating their land.
f. They very often cultivate their land with other farmers in their neighborhood. Peoplein the villages always help each other.
g. Everyone cooperates in the villages to solve their problems together.
THE GOVERNMENT POLICY
Even though the financial crisis has had little impact on the agriculture sectorproductivity, the sector has received attention from the government to be developed as themain pillar of Indonesian economic development.
In developing the agriculture sector, the Indonesian Government has taken a policy toimprove the production and productivity of agriculture, and increase the income of farmersin Indonesia. This policy has been implemented through various programs which aim to:
1. disseminate the knowledge of agricultural technologies, which would improveproduction and productivity;
2. assist farmers in the form of working capital to allow for the cultivation of their land;3. provide farmers with adequate and cheap fertilizers;4. carry out the extensification program by opening up new agricultural and arable land
in Indonesia;5. improve the agricultural infrastructure to allow the distribution of agricultural products
to accelerate from villages to the markets;6. implement the intensification program to improve agricultural productivity; and7. conduct the diversification program to obtain various agriculture products.
The programs above have been carried out and have provided good results to fulfill thepeople’s needs. The programs have also become the foundation for building a strongagriculture sector that is not vulnerable to a financial crisis.
CONCLUSIONS
1. The financial crisis has had an impact on the economic performance of Indonesia.These effects are shown by the decline in Indonesia’s economic performance duringthe period of the financial crisis.
2. In 1998, the growth of the economy was -13.1 percent, and the growth rate ofindustrial development was also negative at -11.44 percent. However, the growth rateof the agriculture sector remained positive.
3. The interest rate soared to 60 percent, while the inflation rate climbed to 40 percent.The high interest rate caused difficulties for many companies in obtaining loans.

- 147 -
4. Even though the economic performance declined dramatically, the growth of theagriculture sector still remained positive. The agriculture sector contributed 8.31percent to total GDP in 1997, 9.20 percent in 1998, and 10.11 percent in 1999.
5. The impact of the financial crisis to the production of agricultural commodities was notvery serious. This was shown by the stable agricultural productivity of severalcommodities, such as paddy, soybean, cassava, peanut and others.
6. The reason why the impact of the financial crisis did not affect agricultural productscan be explained as follows:(1) Most farmers in Indonesia do not use imported products for production
activities.(2) Most farmers in Indonesia use their own capital to buy fertilizers. Some obtain
working capital from the government bank with very low interest rates.(3) The farmers in Indonesia are not consumptive. They seldom buy convenience
goods. They only buy necessities which are not produced in their villages.

- 148 -
5. ISLAMIC REPUBLIC OF IRAN
Jahangir Yadolahi FarsiExpert in Agricultural PlanningManagement and Planning OrganizationAgricultural BureauTehran
INTRODUCTION
The agriculture sector contributes to 25 percent of the GDP, 25 percent of the totalemployment, 80 percent of consumed food and 33 percent of non-oil exports. Some importantproducts in this sector are: wheat, barley, rice, corn, cereal, grass, potato, onion, sugar beetand cotton. Table 1 presents the trend in annual production of important agricultural products(Table 1).
Table 1. Annual Production of Main Agricultural ProductsProducts 1980 1985 1990 1995 1996 1997 1998 1999
Wheat 3,733 6,631 8,012 11,227 10,015 10,044 11,955 8,673Barley 979 2,297 3,548 2,952 2,736 2,498 3,300 1,998Rice 501 1,776 1,981 2,301 2,684 2,350 2,770 2,348Corn 0 138 145 234 210 267 329 271Cereal 249 343 324 676 704 545 576 471Grass 2,965 5,541 6,119 7,981 8,820 10,352 10,078 8,847Potato 1,338 1,726 2,516 3,074 3,139 3,284 3,430 3,433Onion 659 719 1,214 1,131 1,199 1,157 1,209 1,676Sugar beet 3,640 3,924 3,641 5,521 3,686 4,754 4,987 5,548Cotton 205 324 436 523 597 450 459 440
THE ROLE OF OIL IN THE ECONOMY
Oil revenues play a two-way role in our economy. In the case of high oil revenue, thelimit on production capacity is determined by the most limiting production factor. Byincreasing oil revenue, foreign currency is removed and other factors, such as human capitaland infrastructures, cannot support high public investment. For example, in 1973, the suddenincrease in oil revenue caused irrational structural change in the economy, which favored thegrowth of service sector, but led to decline in the growth of agriculture and industrial sectors.Roots of this situation stemmed from earlier decades. Our investment in human capital andinfrastructures were poor. Since the 1970s, the exchange rate has been directing the economyto higher consumption and lower production. Also, an artificial exchange rate has broughtinefficiency.
Decrease in the importance of the agriculture sector in the economy had started earlier,but in 1970, the decline was accelerated. During 1965-72, when oil growth was slow but

- 149 -
positive, the contribution of agriculture sector decreased by 4.4 percent annually. But, during1973-77, when oil growth was accelerated, the annual decline in agriculture reached 11.4percent.
As a trend, the agricultural GDP is inversely related to oil revenue. During 1979-81,due to the fall in oil revenue, the share of the agriculture sector in the GDP increased but in1982, with increase in oil revenue, the share of agriculture sector again decreased.
These results show that first, the agriculture sector has been less influenced by oilrevenue turbulence. Second, when oil revenue increase, the surplus revenue was directed tothe service sector, civil sector and other industries, which depends on foreign suppliers.Therefore, the growth in oil revenue led to a decline in the share of agriculture in the GDP.
The decline of the agricultural GDP and corresponding increase in the service GDPimplies that the labor force transferred from the agriculture sector to the service sector.Therefore, the service sector was the pivot point of economic growth. In the period of oilboom, the government price-control policy, besides structural factors, had limited the growthof agriculture sector.
The agriculture sector is actually independent from political issues and the oil crisis.In 1978, during the great Islamic Revolution, when all economic sectors showed negativegrowth, this sector grew by 3 percent. The only year when production of differentcommodities decreased was 1999, which was due to very low rainfall. Now, our agriculturesector is facing a water crisis.
THE RECENT OIL CRISIS
The oil crisis of 1996 was during our economic recession and this caused somefinancial difficulties for the country. The fall in oil price affected the import of intermediategoods and capital goods, and reduced state revenue. This resulted in less investment.
In 1996, the allocated budget was only around 66 percent of the planned amount. Inan oil economy, because tax and the exchange revenue depend on oil revenue, any turbulencein oil prices results in greater fluctuations of economic activities. An important point is thateven if the fall in oil revenue is for the short term, its impacts are for the long term. Thisimplies that we must plan for the long term in policy-making to prevent future oil crises.
Since 1995, oil revenues have been reducing annually by 19 percent, but agriculturalvalue-added (AVA) output has been increasing at a different growth rate (Table 2). Thelowest oil revenue was in the year 1998, which experienced the highest agriculture growthrate.
Table 2. Oil Revenue, Value-added and Government-fixed Investmentin the Agriculture Sector
Year 1995 1996 1997 1998Government-fixed investment in 648.7 464.9 521.2 439.7Agricultural value-added 3,738 3,896 3,981.5 4,277.8Rate of growth in AVA (percent) 3.7 3.5 1.5 7.8Portion of agriculture in GDP 26.9 26.5 25.7 25.4Oil revenue - 32,745 26,427 21,382Growth of oil revenue (percent) - - -19 -19

- 150 -
LABOR FORCE AND CAPITAL PRODUCTIVITY
From here on, labor force productivity will be defined as agricultural GDP divided bylabor force in this sector. Based on a survey, during 1966-96 the labor force productivitygrew annually by 5.4 percent, mainly due to the agricultural mechanization. Capitalproductivity over the same period declined by 0.07 percent annually. This implies thatinvestment in technology caused the growth in labor force productivity.
During the Asian financial crisis there were no signs of declining productivity inagriculture, in terms of labor force and capital. However, to obtain sustainable developmentin the agriculture sector, there are several challenges such as:
1. changing from monopolies in agriculture to one of market mechanism, which wouldpromote investment in this sector.
2. new technology developments, such as biotechnology.3. environmental protection and optimizing the use of base resources.4. changing the financing structure of the sector.5. privatization and promotion of higher private investment.6. extension of the export-oriented production.7. reduction in costs for small-size farms.
Regarding these challenges, the focus of the third year in the Five-Year DevelopmentPlan is on the restriction of economic activities and management development. Someimportant policies in the agriculture sector are as follows: i) privatization anddecentralization; ii) prevention of land fragmentation; iii) introduction of a comprehensiveland law; iv) optimization of water utilization; v) expansion land use by water infrastructuredevelopment; vi) standardization of resource productivity; vii) infrastructure development;viii) promotion of greenhouse production; ix) promotion of investment in the agriculturesector; x) to change the pricing policy to a market-based policy; xi) to improve agriculturalinsurance; xii) to decrease and remove subsidies; xiii) to empower producing communities,corporations, etc.; and xiv) to stop establishing industries in agricultural areas.
POLICIES TO CONTROL THE OIL CRISIS EFFECTS
A survey of the Iranian economy, its status in the world economy, and the effect of theoil crisis on different sectors of economy provides the planners, policy-makers andadministrators with the following lessons to streamline the national economy:
1. The effects from the fall in oil revenue are long-range and sustainable, therefore theproposed policies must be of long-range.
2. The oil crisis shock had undesirable effects on the economy and we could not controlall of the effects, but we can direct these effects to sectors that will create fewerdifficulties.
3. Any good policy will not transfer the shock to the poor.4. Our public budget is the origin of some inefficiencies. The huge body of the
government and its current costs impose inefficiencies to the economy. Thus, we needa radical structural change of downsizing the government and change the structure ofthe public budget.

- 151 -
5. The effects from the oil crisis can direct us to higher inflation. Therefore, we mighthave to promote production and control the money supply to restrict the inflation.
6. Non-oil exports can reduce the effects of the oil crisis by providing us with foreigncurrencies, so that we may support export-oriented production.
7. To leave the recession and unemployment, we should provide resources for thepromotion of production.
8. The government’s involvement in economic activities brought inefficiency to oureconomy and led to limited private activities. Therefore, we must transit our economyto a market economy and privatize socio-economic activities in order to promoteefficiency and the higher involvement of the private sector.
CONCLUSIONS
Agriculture sector was not affected by the Asian financial crisis due to the following:i) no capital account convertibility; ii) dominance of subsistence farming; iii) little integrationwith other Asian economies; iv) close monitoring of the flow of money; v) dependence ofagricultural production mainly on internal resources; and vi) supply of agricultural productsonly to the domestic market.
In light of the lessons learned from the past experience, some of the suggestions forsmooth development of Iranian economy/agriculture sector are as follows:
– The country should take a cautious approach in opening up her capital account to theinternational economy.
– Establishment of transparent accounting standards and practices, and the publicdisclosure of information are important in improving financial infrastructure.
– Strengthen the agricultural financial system by privatization.– All support and subsidies toward the consumption of agricultural products must be
shifted toward production.– Cooperatives should be empowered for higher involvement in policymaking and
agricultural operations.
Economy of Iran is in transition from a governed economy to one relying on marketmechanisms, which is the same as East Asian countries. We may experience financial crises,such as the recent financial crisis of Southeast-East Asia in the future. To avoid occurrenceof such financial crisis, countries like Iran can learn a lot from the Southeast Asian financialcrisis in order to ensure that appropriate policy measures are in place to build nationaleconomy on sound economic fundamentals.
- 152 -
6. REPUBLIC OF KOREA
Dr. Seong-Jae ParkDirectorDepartment of Rural DevelopmentKorea Rural Economic Institute (KREI)Seoul
INTRODUCTION
The currency crisis since 1997 has substantially affected the Korean agriculture sector,as well as non-agriculture sectors. The abrupt devaluation of the domestic currency causeda rise in production cost, while the shrunk economy through declining income and increasingunemployment, forced the prices of agricultural products down. To make things worse, alarge inflow of cheap foreign agricultural products increased annually, which causeddropping prices. Korean farmers were sandwiched between deteriorating terms of trade anda heavy debt burden.
However, the impact of the currency crisis on the agriculture sector was not assubstantial as non-agriculture sectors, since its linkage between domestic and foreign sectorsis relatively weaker. Among the agriculture sector, livestock is most sensitive to theinternational prices of feed grains and the variation in exchange rates, because the self-sufficiency ratio of feed grains is only 2.5 percent. Greenhouse farming is also sensitive tooil prices, but its share in the agriculture sector is small. Other sectors are sensitive to theprices of raw materials like chemical fertilizer, chemical pesticides and other inputs.
Fortunately, loanable funds for agriculture, such as policy loans and cooperative loans,were abundant even during the crisis. This made the credit crunch to be of very short-run.Farmers were able to maintain normal farming, compared to non-agriculture sectors. Thereis no evidence of declining agricultural productivity in quantity. However, the productivitymeasured by market value decreased significantly because of the deteriorated terms of trade.
This paper will describe roughly the evolution of the financial crisis in the next section,and the impact of the crisis on the agriculture sector in the third section. In the fourth section,policy imperatives will be explained very briefly. In fifth section, discussion about the effectsof the crisis on agricultural productivity will be presented and then concluding remarks onpolicy implications will follow.
FINANCIAL CRISIS OF KOREA IN 1997-99
Evolution of the CrisisThe Korean economy of 1997 was like a ship rocked by three-direction waves, that is
it was hit by a downturn in the business cycle, a successive corporate insolvency and anincrease in non-performing loans, and the contagion effects from the Southeast Asia currencycrisis. In 1996, firms encouraged by the relative boom of 1995 expanded investments, but thebusiness cycle went down and the real GDP growth rate slipped from 8.9 percent in 1995 to7.1 percent in 1996. Although this might seemed to indicate a soft-landing, the firms faced

- 153 -
rapid increase in inventories by the reduced demand and drop in profit rates, which causedinsolvency problems. The balance of payments severely deteriorated in 1996; that is thecurrent account deficit had widened from US$8.5 billion in 1995 to US$23.0 billion in 1996.This trend in economic recession continued for the first half of 1997 and resulted insuccessive bankruptcies of large conglomerates, which started at the end of 1996 by theHanbo Group, the 14th largest conglomerate.
After the collapse of Hanbo, bankruptcies of large enterprises followed, and theyresulted in a domino effect on the small and medium firms that subcontracted with theseenterprises. The bankruptcy of Kia Motors, one of the three largest auto companies and themain company in the eighth largest conglomerate, seriously affected the markets andcreditworthiness of the Korean economy. With the series of business insolvencies, thesoundness of financial institutions was substantially weakened and their non-performingloans abruptly piled up. The non-performing loans of commercial banks incremented fromW= 12.2 trillion as of the end of 1996 to W= 21.9 trillion in September 1997. Thus, the non-performing loan ratio to total credit rose from 3.9 percent to 6.4 percent.
The Southeast Asian currency crisis, which started with the plunge of Thai, Indonesianand Malaysian currencies in early July 1997 affected Korea in September. Some merchantbanking corporations that had been operating short-run financial intermediation in theSoutheast region, by using funds borrowed from Japan and Hong Kong, faced severe liquidityproblems. In addition to corporate insolvency, this made financial markets more unstable andresulted in the shortage of foreign currency in the Korean exchange market. As Korea andthe Southeast Asian economies became vulnerable, the leading international credit ratingagencies such as S&P’s and Moody’s downgraded Korea’s long-term sovereign rating verysharply in October. With these disturbance factors, foreign financial institutions turned downthe request for the rollover of Korean banks, and corporate and foreign investors withdrewtheir portfolio investments from the Korean capital market. The net inflow of foreigninvestment reversed from a positive US$2.1 billion in July 1997 to a negative US$0.8 billionin October.
A financial panic became a reality in November. The rollover ratio of the seven largestcommercial banks fell from 86.5 percent in October to 58.8 percent in November, and it wasalmost impossible to find other sources of foreign currency. Foreign exchange ratesskyrocketed and the foreign currency reserve declined sharply, as shown in Figure 1. TheBank of Korea supplied foreign exchange to corporate and financial institutions facingdefaults on their repayment obligations. However, it could not meet the demand for foreignexchange.
At last, the government requested for the IMF bailout loans on 21 November. Koreaand the IMF signed an agreement for a financial aid package totaling US$58.3 billion, underthe conditions of macroeconomic stabilization and structural reform.
Policies to Overcome the Crisis and Stabilization of the EconomyOn the brink of default for the nation’s economy, the government implemented a strong
macroeconomic policy to stabilize the economy. Since the signing of the IMF financial aidson 3 December 1997, the government implemented thorough structural reforms, such asfinancial sector restructure, corporate sector and labor market reforms, and capital accountliberalization, under a tight monetary policy. The government allocated W= 64 trillion in publicfunds for the financial sector restructure in May 1998, and, in addition, an extra public fundof W= 25.8 trillion was used from 1997 to 1999. The drive for financial sector restructure

- 154 -
W= /US$ US$ million100,0001,800
1,600 90,000
1,400 80,000Exchange rate
70,0001,200
1,00060,000
50,000800
Foreign exchange holdings 40,000600 30,000400 20,000200 10,000
0 0
1995
‘97.
8
‘97.
10
‘97.
12
‘98.
2
‘98.
4
‘98.
6
‘98.
8
‘98.
10
‘98.
12
‘99.
2
‘99.
4
‘99.
6
‘99.
8
‘99.
10
‘99.
12
‘00.
2
‘00.
4
‘00.
6
‘00.
8
focused on a shake-out among financial institutions, clearing of bad loans, the tightening ofprudential regulation, heightened transparency of financial information, and thereorganization of the corporate governance of financial institutions.
Figure 1. Trend of the Foreign Exchange Rate andForeign Currency Holdings in Korea
The first restructuring of the financial industry ended at the end of 1999 and the secondone is currently progressing. From the end of 1997 to April 2000, the banks and the non-bankfinancial institutions have disappeared by 30.3 (10 banks) and 20.8 (430 institutions) percent,respectively. As the financial market is being structurally changed and not yet stable, capitalflight to savings is substantially continuing. From the end of 1997 to June 2000, the depositsshare of the banking institutions, based on M3, increased from 33.0 percent to 44.2 percent,while the trust account of banking institutions dropped from 20.8 percent to 9.4 percent dueto the increasing vulnerability of the stock market.
The Korean economy had recovered rapidly until early this year, when it was comparedwith the other Asian countries suffering from the currency crisis. From the beginning of 1998,most people actively participated in the movement of collecting gold to overcome theshortage in foreign exchange, which strongly motivated the people’s will to “do anything toovercome the crisis”. With the inflow of foreign exchange due to IMF aids and an increasein exports, the exchange rate became stable again after the spring of 1998, and the foreignexchange reserve rapidly increased as shown in Figure 1. The current account or the balanceof payments, achieved US$40.4 trillion, the highest record in Korean history, in 1998, andUS$24.5 trillion in 1999 (Table 1). This set up a sound base for the Korean economy toreentering a growth path. However, this year, the Korean economy is still troubled byskyrocketing oil prices, another insolvency of large conglomerates, political scandals, andnon-performing loans of financial institutions.

- 155 -
Table 1. Changes in the Major Economic Index, 1995-991995 1996 1997 1998 1999
BOP (current account)(US$ million) -8,508 -23,005 -8,167 40,365 24,477Exports (US$ million) 124,632 129,968 138,619 132,121 1,451,637Imports (US$ million) 129,076 144,933 141,798 90,495 116,793GDP (W= billion) 377,350 402,821 423,007 394,710 436,799Agricultural products(W= billion) 23,354 24,120 25,234 23,569 24,666Unemployment (percent) 2.0 2.0 2.6 6.8 6.3
Source: The Bank of Korea.
THE IMPACT OF THE FINANCIAL CRISIS ONKOREAN AGRICULTURE AND THE RURAL ECONOMY
Paths of the Shock Affecting the Agriculture SectorWe may describe the path of the currency crisis shock to the agriculture sector as one
of three ways, i.e., agricultural production, consumption, and credit sectors. Devaluation ofthe domestic currency caused a rise in agricultural input prices, the tight money policy raisedinterest rates, and the shrunk in consumption demand for food resulted in the drop in theprices of agricultural products. Since the linkage of the agriculture sector with the foreignsector is relatively weak, the direct impact of the currency crisis was not severe, comparedto non-agriculture sectors. However, farmers’ sentiments are affected because of thevulnerability in the farm household economy.
In the production sector, farms suffered from the shortage of inputs due to skyrocketingprices, such as feeds and oil for heating, when the currency crisis began. The damages wereespecially prominent in both livestock and greenhouse farming. The prices of feed, oil andchemical fertilizer increased by 36, 107 and 29 percent, respectively. In winter of 1998, wecould not import feeds and oil due to the shortage in the US dollar, which led to the starvationof livestock and withered vegetables in greenhouses because no oil meant no heat. From thebeginning of the crisis (the end of 1997) to the spring of 1998, many farms became bankruptbecause of elevated managerial costs and drops in product prices.
As the economic recession deepened and unemployment increased, the income andconsumption level significantly shrank. In turn, this caused a reduction in the demand foragricultural products, which dropped their prices substantially. With a rise in production costsand lower revenues, the terms of trade for a farm household substantially deteriorated in1998, as shown in Figure 2. However, it recovered in 1999, though still lower than 1997, butthen declined again in 2000.
The severe credit crunch took place in rural financial markets as well, although it onlylasted for a very short period in the winter, because the government supplied emergency loansto import feeds from the United States. However, the direct impact of the crisis onagricultural credit was relatively weak, when compared with the other sectors. It wasrelatively easier for farmers to borrow money from agricultural cooperatives than firms in thenon-farm sectors, even though interest rates were higher than before. The market interest ratein rural areas rose from 13-14 percent to 18-19 percent, but it was still much lower than thatof urban areas, which soared from 10-12 percent before the crisis, to the peak of 40 percentin December 1997.

- 156 -
W= million25Farm household income
20
15
Revenue from non-farm employment
10Farm income
5Transfer revenue
0 Year1980 1982 1984 1986 1988 1990 1992 1994 1996 1998
Figure 2. Farm Household Income Trend
An Unstable Farm Household EconomyThe financial crisis severely affected the farm household economy, which was
sandwiched between increasing costs and declining income. In 1998, agricultural productionand income declined by 6.2 and 12.7 percent, respectively, while farm household debtincreased by 30.7 percent (Figure 2). The growth rates of farm and non-farm income were12.2 and -13.1 percent, respectively. In 1999, farm income and non-farm income increasedby 18.0 and 1.9 percent, respectively, which caused the total farm household income torecover by 8.9 percent, but still lower than that of 1997. As shown in Figure 3, it is expectedthat the farmer’s income level this year will be lower than that of last year because of thedeclining prices in agricultural products, which is related closely to the imports of foreignagricultural products and domestic overproduction.
The farm household economy became more vulnerable as the crisis shock spread.When not considering the principal repayments of mid- and long-term debts, it was 26.4percent of the total farm households in 1997 had more expenditures than income. Thisnumber increased to 40.3 percent in 1998. If we add the principal of debt repayment, 49.9percent of farm households could not save any money in 1998. Figure 4 shows that the trendin short-run debt repayment capability has declined rapidly in recent years. The short-runrepayment capability developed by Park and Hwang (1999a) indicates the amount of moneya farm household can save after paying for consumption expenditures and mid and long-termdebt principals.

- 157 -
100.01997
98.0
96.094.092.0
199990.0
200088.086.0
84.082.0
1998
80.0 Month1 2 3 4 5 6 7 8 9 10 11 12
W= thousand
Economic surplus (net saving)
Year‘75 ‘76 ‘77 ‘78 ‘79 ‘80 ‘81 ‘82 ‘83 ‘84 ‘85 ‘86 ‘87 ‘88 ‘89 ‘90 ‘91 ‘92 ‘93 ‘94 ‘95 ‘96 ‘97 ‘98
-4,000
-2,000
0
2,000
4,000
6,000
8,000
Borrowings for debt repayments
Short-run repayment capability
Figure 3. Trend of the Terms of Trade of Farm Households(Sales Price Index/Purchase Price Index)
Source: National Agricultural Cooperatives Federation, 2000.
Figure 4. The Trend of Short-run Repayment Capability of a Farm Household
Source: Park, Kim and Hwang, Policy Direction for Farm Household Debt Problems, p.57, Figures 3-7, KREI, 1999.
Major Policy Imperatives for Alleviating the Impact of the Financial Crisis on FarmersAt the beginning of the crisis, the government supplied emergency loans to firms
related to the agricultural input industry, as well as farm households suffering from theshortage of funds, and suspended debt repayments. In addition, it tried to get GSM (ExportCredit Guarantee Program of U.S.A.) 102 to guarantee the imports of agricultural productsfrom America at the end of 1997. With the feeds imported by the GSM 102, and the United

- 158 -
States and Canadian loans of US$880 million, we could stabilize the feeds market and rescuelivestock. In addition, the corporation for feeds was allowed to obtain credit guaranteedfunds. The tax exemption on the oil for agricultural uses, which was supposed to end by theend of 1997, was suspended. The same applied to the liquefied petroleum gas (LPG). Thegovernment asked the National Agricultural Cooperative Federation to increase thepurchasing amounts of fertilizer and pesticides, for the timely supply to farmers. The interestrate for farm machinery loans was lowered from 6.5 percent to 4.5 percent.
On the other hand, the Structural Adjustment Program, which started in 1992 and wasaccelerated from 1994 onwards, were steadily implemented along the time schedule, eventhough the budgets were reduced by a bit. The second Structural Adjustment Program, whichwill invest W= 45 trillion in the agriculture sector from 1999 to 2004, was launched in 1999.We can say that the Korean agriculture sector does not have credit crunch problems anylonger, since the large amount of policy loans and cooperative funds were applied. Currently,the agricultural cooperatives at the primary level can lend only about 60 percent of their totaldeposits. This loan capability was a very important factor to mitigate the shock of thecurrency crisis.
However, paradoxically, Korea has severe troubles with the farm household debts. Thedebt problem of farm households became a hot issue, ever sine the currency crisis shockedthe agriculture sector in 1998. With declining revenue, repayment of debts, which had beensupplied by the agricultural restructuring investment plans of 1994, began to increase sincethe grace period for a majority part of them ended and both principal and interests werescheduled to be repaid. Thus, most farmers asked the government to establish an effectivedebt measurement to mitigate the debt burden. The government made the Measure ofLessening Debt Burden of Farm Household in November 1998, which allowed farmers tosuspend the repayments of debts that were scheduled for 1998 and 1999, for two years.However, this did not satisfy farmers, so they protested against the government. Thegovernment had to make additional measures for 1999-2000. These included thepostponement of repayment, a supply of low interest policy loans to replace cooperative loans(of which the interest rate was higher), a supply of restructuring loans and the provision ofguaranteed credit by the credit guarantee fund to replace the debts privately guaranteed.
Financial Crisis Effects on Agricultural ProductivityIt is not easy to explore the exact effects of the crisis on agricultural productivity in the
respects of analysis methodology and data. It is certain that the crisis caused rises in inputprices and drops in output prices, so farmers had to reduced the input amount as shown inTable 2. However, it is ambiguous whether this resulted in lower productivity or not, sinceit depends on the degree of reduction in inputs and the characteristics of technology. If thereductions in utilized inputs were not critically substantial, the average productivity or themarginal productivity measured by quantity base would be improved. On the contrary, if wemeasure the productivity at the base of market value, the result might not be consistent withthe quantity base, it all depends on the degree of declining prices.
In 1998, some inputs, such as chemical fertilizer, chemical pesticides, oil and feedgrains, were reduced (Table 2). In contrast, the amount of major outputs has not declinedsince 1998 (Table 3). This means that the agricultural productivity at the quantity base didnot decline during the crisis. However, the productivity, as measured by market value, showsthat it is significantly lower than before the crisis (Table 4). This implies that the outputmarket condition substantially affected the farm household economy rather than the technicalproductivity itself.

- 159 -
Table 2. Use of Major Agricultural Inputs
Year ChemicalFertilizera (kg/ha)
ChemicalPesticidesa (kg/ha) Oilb (kR) Feed Grainsc
(000 mt)Labord
(days)1990 458 10.4 51,270 5,634 198.931991 349 11.7 6,769 181.321992 414 11.8 87,334 6,908 176.421993 424 11.4 103,034 8,182 174.321994 440 11.9 119,578 8,373 167.031995 434 11.8 128,567 8,510 163.461996 424 11.5 163,728 9,169 152.481997 421 11.8 197,453 9,170 143.731998 406 10.4 154,597 8,204 141.571999 398 12.2 175,966 8,549 136.84
Source: Ministry of Agriculture and Forestry, Major Statistics of Agriculture and Forestry,2000.
Note: a Component base; b supplied amounts by tax exemption; c total used amounts innationwide; and d converted labor days based on an adult.
Table 3. Amount of Major Agricultural Products(Unit: 000 mt; and 000 heads)
Year Grains Vegetables Fruits KoreanCattle
DairyCattle Hogs Fowls
1990 7,013 8,677 1,766 1,622 504 4,528 74,4631991 6,563 8,609 1,765 1,773 496 5,046 74,8551992 6,256 8,791 2,090 2,019 508 5,463 73,3241993 6,205 10,152 1,920 2,260 553 5,928 72,9451994 5,465 9,222 1,930 2,393 552 5,955 80,5691995 5,816 10,586 2,300 2,594 553 6,461 85,8001996 5,504 10,209 2,207 2,844 551 6,516 82,8301997 6,031 9,806 2,452 2,735 544 7,096 88,2511998 6,122 9,984 2,153 2,383 539 7,544 85,8471999 5,831 n.a. 2,385 1,952 535 7,864 94,587
Source: Ministry of Agriculture and Forestry, Major Statistics of Agriculture and Forestry,2000.
Note: Livestock statistics indicate the number of breeding.
In addition to the shrink in demand, the opening of agricultural product markets is animportant factor. The inflow of cheap foreign food is increasing annually, and farmers havehad to change crops according to the profitability of the previous year. The price fluctuationof outputs is very large, but input prices tend to be rigid. Many farmers are frustrated by thedeteriorating terms of trade in the farm household economy.

- 160 -
Table 4. Average Productivity of AgricultureYear Land (W= /10 a) Labor (W= /hour) Capital (W= /W= )
1990 624,893 4,932 0.701991 702,316 6,043 0.701992 746,082 6,462 0.631993 777,610 6,940 0.601994 929,183 8,714 0.651995 954,171 9,387 0.611996 1,000,652 10,573 0.531997 970,192 10,780 0.511998 671,771 7,559 0.321999 802,084 8,796 0.37
Source: National Statistical Office, Farm Household Survey Report, May 2000.
CONCLUDING REMARKS: POLICY IMPLICATIONS
The financial crisis damaged the agricultural sector through increasing input prices andlowering the demand for agricultural outputs. Agricultural production did not decline inquantity, although some input utilized in production was reduced. However, in terms ofmarket value, it decreased substantially. An important factor in maintaining the productionlevel was the smooth supply of agricultural funds through agricultural cooperatives duringthe crisis. Policy loans were supplied, according to the plan, and the agricultural cooperativesalso offered an abundance of loanable funds.
During the crisis, the farm household economy became substantially vulnerable, dueto deteriorating terms of trade, a drop in income, and heavy burden of debts. In addition tothe financial crisis shock, an inflow of cheap foreign agricultural products is also a disturbingfactor in decreasing output prices. It is expected that market competition between domesticand foreign agricultural products will accelerate in the future. In that case, the farm householdeconomy will become even more vulnerable and the government will not be able to makeappropriate policies to solve the problem within agricultural production. According to theaspects of the current situation, a stabilization policy for the farm household economy isrequired.
First, the government should provide proper measures to stabilize farm households thathave a heavy burden of debts. Most of the farms with debt problems are owned by young full-time farmers, who will likely succeed in agriculture in the future. With financial supports toalleviate debt burdens, services of management consulting and technology extension shouldbe provided. Income subsidies should be increased for low-income classes that consist ofaged farmers, small farms, and farmers in regions of unfavorable conditions. Without theexpansion in income subsidies, the problem will be very difficult to solve.
Second, technology and managerial innovation to raise efficiency and productivity arerequired. This will be achieved by the joint efforts of the government and the farmers. So far,Korea has invested a lot of money into the hardware of agriculture, but it has not broughtsuccessful results, owing to the lack of proper software in managerial technology,information distribution, consulting system, etc. This is a main source of criticism on theoverinvestment in agriculture and the misallocation of resources.

- 161 -
Third, the agricultural financial system needs to be reformed in order to enhanceefficiency in intermediation, market stability, and resource allocation efficiency. Althoughthe agricultural cooperatives responsible for agricultural finance have successfully mobilizedenough savings to supply them to the agriculture sector, their efficiency is not higher becauseof their small-scale, low-level technologies, and the lack in expertise. The operation systemof policy loans also has similar problems.
Fourth, we should continue the structural adjustment and expand the investments intothe export sector of agricultural products to have competitiveness in international markets.For agriculture to be viable, an appropriate market size as well as production scale should besecured. Some commodities have enough competitive edge for international markets, buttheir infrastructure and software for exports are relatively poor.
Lastly, it is important to raise the market value of commodities that depend on thequality and creditworthiness of markets. In the future, most customers will be concerned withfood safety, and will pay more for foods that are grown without contamination. In otherwords, producing high-value commodities is a way to enhance productivity. In this sense,environment-friendly agriculture will be a more important alternative for small farms.
REFERENCES
The Bank of Korea. Economic Statistics Yearbook, each year.
Kang, J. I., et al., 1998. The Impact of IMF Regime on the Agricultural Sector, Korea RuralEconomic Institute.
Lee, J. H., et al., 1999. 1999 Agricultural Outlook, Korea Rural Economic Institute.
Ministry of Agriculture and Forestry. A Guide Book of Agricultural Projects, 1996-98.
----------. Main Statistics of Agriculture and Forestry, each year
----------. Financial Handbook of Agriculture, Forestry, and Fisheries, each year.
National Agricultural Cooperatives Federation, 2000. Monthly Review, September 2000.
National Statistics Office. Report on the Farm Household Economy Survey, each year.
Park, J. J., 1998. “Financial Crisis in Korea – Why It Happened and How It Can BeOvercome –”, presented at the seminar of Financial Crisis in the Asian Region inMalaysia, July 1998, the Bank of Korea.
Park, S. J., 1998. “Issues of Farm Household Debt Problem”, Korea Rural EconomicInstitute (mimeo).
----------, 1999. “Outlook of Farm Household Income and Debts” in J. H. Lee, et al., 1999Agricultural Outlook, Korea Rural Economic Institute.
Park, S. J. and E. S. Hwang, 1999a. Mid- and Long-term Policy Direction of FarmHousehold Debts, Korea Rural Economic Institute,
----------, 1999b. “Financial System in Korea”.

- 162 -
7. MALAYSIA
Lew Leong PohManagerNational Productivity CorporationSelangor, andIsmail MatEconomic Affairs OfficerFisheries Development Authority of Malaysia (LKIM)Kuala Lumpur
INTRODUCTION
Malaysia, like some other Asian nations, suffered much from the economic andfinancial crisis, which started in July 1997. Before the crisis, Malaysia was proud to be acountry that is well placed in the developing economies, which had strong economicfundamentals and financial stability. The economic growth rates averaged 8.9 percentbetween the years of 1988 and 1996, while the inflation rate was only 3.5 percent.
The Role of Agriculture in the Malaysian EconomyThe current Malaysian economy is deeply rooted in three prime sectors, namely
manufacturing, services and agriculture. However, the present situations are the results ofevolutions and revolutions that occurred in the economy. In the 1970s or perhaps earlier, theMalaysian economy was totally dependent on agriculture.
Malaysia was well known for her exports of rubber, tin, and palm oil, and to a certainextent, cocoa. In fact, agriculture was the largest single contributor to GDP, with 29.1percent. The economic transformation, which took place through the years, diminished thecontribution of agricultural output to GDP to only 9.64 percent during the 1995-98 period.To date, agriculture is the third most important economic sector.
In the period of 1990-98, the agriculture sector experienced very minimal growth, ascan be seen from the following annual growth percentages (Table 1). The performance levelof 1996 was only a breather before the 1997 economic crisis.
Table 1. Annual Growth Rate of Agriculture Sector in Malaysia(Unit: Percent)
Year 1990 1991 1992 1993 1994 1995 1996 1997 1998Growth rate 0.4 0.0 4.7 4.3 -1.0 -2.5 4.5 0.4 -4.5
Broadly speaking, agriculture is still the most important sector in the context ofMalaysia’s socio-economic development. This sector absorbs a large part of the labor force.In 1995, about 1.4 million people, or 18 percent of the total workforce was involved inagriculture. Besides improving the income and livelihood of the masses, it also contributed

- 163 -
to the lowering of the poverty rate, especially in the rural areas. In 1990, the poverty rate inrural areas was 21 percent, compared to 15.3 percent in 1995.
Before the Economic CrisisAs mentioned earlier, Malaysia experienced a favorable economic growth before the
crisis. In terms of external debts, Malaysia was also favorable, compared to most of herneighbors and other East Asian countries. As of June 1997, her total external debts wereUS$45.2 billion, or 42.0 percent of the GDP. At the same time, Non-Performing Loans (NPL)in the banking sector were only 3.6 percent of the total loans disbursed.
Ringgit Malaysia (RM), the Malaysian currency, was also considered as strong andstable. In fact, some quarters considered it to be below its real worth at that time. Theexchange rate of RM2.48 to US$1 and its respectable position in the money market waspurely determined by market forces, devoid of any government intervention.
By 1997, Malaysia’s total external trade has exceeded US$158 billion. According tothe World Trade Organization (WTO), Malaysia was ranked as the 18th world’s largestexporter and the 17th world’s largest importer. The current account payments balance shrunkfrom 10 percent to 5 percent of the GDP. Meanwhile, the reserve was set at 38 percent of theGDP, which was one of the highest in the world.
The Economic CrisisThe economic crisis involving Thailand, Indonesia, the Philippines and Malaysia
started with the swift and sharp fall of the respective currencies. It forced the economicgrowth in this region to a stand still. Henceforth, various hypotheses and theories have beenformed to analyze the principal factors behind the crisis.
In the midst of the crisis, sources of credit diminished and some banks even withdrewtheir already-approved loans. The interest rate regularly increased, and within a short spanof time, it had exceeded 12 percent per annum. Even some companies with highly viableprojects and confirmed export demand had difficulties in getting bank guarantees. TheCentral Bank shortened the period of compliance for NPL from six months to three months.Banking control measures were tightened by increasing the bad debts allowance from 1percent to 1.5 percent of total loans disbursed. The repayment period for motor-vehicle loanswas limited to five years. Banks were not allowed to provide financial facilities to propertyprojects that have not taken off. Meanwhile, the maximum limit was decreased for thoseprojects which have started. As a consequence to the constraints and control measures beingimposed, many banks suffered losses and companies were forced to declare bankruptcy.
The government also took various precautionary measures to overcome the crisis.Public spending was cut by 21 percent, which worsened the situation. Trade and industrialactivities diminished and drove new employment opportunities to nil, while retrenchmentswere exercised.
The agriculture sector was also hit hard by the crisis. The total export for agriculturalproducts declined to 8.5 percent in 1999, from the 18.3 percent enjoyed in 1990. The totalcredit for agriculture and agriculture-related activities was only 1.8 percent in 1998 and 2.1percent in 1999, of total facilities given.
Factors Leading to the CrisisAccording to the International Monetary Fund (IMF), the principal factors leading to
the economic crisis, which has engulfed the South-East Asian region, were the inherent

- 164 -
weaknesses in the nations’ financial systems and administration structures. Among the mostimportant ones were ineffective financial control systems, inefficient management of high-risk financial portfolios and certain government policies of fixing the monetary rate ofexchange. The situation encouraged banking institutions and corporate sectors to borrowfrom international organizations. Apart from the factors mentioned, the slow economicgrowth experienced in Europe and Japan led to a dull global investment performance orclimate. The fall of Thailand’s Baht, followed by money market dealers’ speculations andfinancial merchants’ manipulations, has resulted in the plunge of the Malaysian Ringgit toRM4.48 per US$1.
THE EFFECTS OF THE FINANCIAL CRISISON THE AGRICULTURE SECTOR
As introduced in the earlier discussion, the crisis greatly affected the agriculture sector.The growth of 4.5 percent achieved in 1996 fell to 0.4 percent at the start of the crisis. Thesharp decline in the growth rate was directly related to the decrease in the availability ofcredit and the increase in the interest rate. The situations not only hampered further growthand development, but also eroded the confidence and participation of private sector. Inaddition, the government enforced a restraint expenditure policy in the agriculture sector. In1998, the government’s allocation for agricultural and rural development expenditures wasonly 5.3 percent of the total budget.
Implications to Farmers, Smallholders and FishermenThe economic crisis led to a very low monetary exchange rate, the decline in economic
growth, strict credit control measures, low returns on investments and a bizarre employmentmarket. As Malaysia’s principal trading partners of Eastern Asia were also experiencing sloweconomic growth, the demand for Malaysian exports was greatly affected. As such, the sharpincrease in the export value of Malaysian products, due to the downfall of the MalaysianRinggit, did not help in sectoral growth because of the decrease in production and theincrease in costs.
The agricultural production in 1998 decreased by 5.9 percent compared to the previousyear’s performance. The very high rate of interest, which reached 14.7 percent in June 1998,constrained agricultural activities further. The increase in the costs of imported agriculturalsupplies left this sector unattractive. Thus, farmers, small holders and fishermen were hit hardby the economic crisis. With low consumer purchasing power, the domestic demand foragricultural products also declined drastically, which has left the farmers and the fishermenpoorer.
The financial constraints led to less Research and Development (R&D) programs.Therefore, new technologies were achievable only at very high costs. This led to loweragricultural productivity, which also was of poorer quality. At the same time, importingcountries imposed a higher standard for their imported products, including agriculturalproducts. Hence, agriculture as part and parcel of the economy, was badly hit by theeconomic crisis. As most of the players in this sector of Malaysia are small farmers,smallholders and artisan fishermen, they are actually the ones who were damaged, and whosuffered the most during the economic crisis.

- 165 -
Major Policy Imperatives Taken to Alleviate the Impact ofthe Financial Crisis on Farmers
Realizing that the farmers were the worst affected group, several major policy optionswere implemented to alleviate their poverty. Some of these policy options include:
1. Fund for Food (3F) SchemeThe 3F was set up to help the rural communities that were financially affected by the
crisis. It is revolving fund whereby the objective is to promote large-scale cultivation andproduction of food crops, fruits, livestock and fisheries. Depending upon the nature of theprojects, the funds disbursed ranged from a minimum of RM10,000 (US$2,632) to amaximum of RM3 million (US$789,000), payable over a period of eight years at a lowinterest rate of 4 percent per annum. Unlike any other loans, financing from the 3F could beas high as 90 percent of the cost of the project.
Up until now, a total of RM1 billion (US$263.2 million) has been set aside for the 3Fscheme to help the farmers. Unfortunately, the response towards the 3F is not veryencouraging, due to the personal preference of the majority farmers toward patronizing theirlocal financial institutions, even though they charge a higher interest rate.2. Gazetting of Land for Agricultural Purposes
The main problems faced by the agriculture sector pertaining to land issues are thecontinuous conversion of prime agricultural land for industrial purposes and fragmentationof land ownership, which impede productivity improvement. Hence, the strategy adopted bythe government recently is the gazetting of some agricultural land as permanent agriculturezones to curb speculation and the conversion of agricultural land for other purposes. Lately,the government has identified about 40,000 ha of idle land suitable for agricultural purposes.This includes 10,290 ha suitable for vegetable growing and 29,630 ha for agriculture.
Another strategy adopted was to optimize land usage due to the scarcity of agriculturalland in certain areas. This could be achieved by introducing integrated farming. Integratedfarming has mushroomed throughout the years as a means to cut down on meat imports, andrefers to carrying out both agriculture and breeding in a given place. Currently, nearly 89percent of the domestic consumption of beef is imported. A total of 8,900 heads of cattle in1999 and another 14,756 heads by the year 2000 will successfully be bred under theintegrated farming programs nationwide. Land productivity can also be sustained through theplanting of high-yielding clone varieties. Table 2 shows the land productivity of the majorcrops in the country at both the value level and their growth rates.3. Enhancement of Group Farming Activities
To revitalize the farms which were badly affected by the crisis, various mini-estatesand group farming projects have been established by the relevant agencies within theMinistry of Agriculture. The purpose of such group farming projects and the mini-estateconcept is to consolidate all of the group farming activities within every locality in order toachieve the synergy effect.
According to studies carried out by the Department of Agriculture (DOA), thedifference between the income of farmers working in a group and farmers working alone isshown in Table 3. It shows that group farming can be a powerful tool to raise the productivityof farmers and to help modernize farming practices throughout the country in the absence ofland reform.

- 166 -
Table 2. Land Productivity of Major Crops, 1990-2000 (constant 1978 prices)(Unit: RM/ha)
YearCrop
1990 1995 2000Growth Rate (percent)1991-95 1996-2000
Rubber 1,565 2,014 2,325 5.17 2.91Oil palm 2,764 3,282 3,627 3.49 2.02Cocoa 2,725 3,181 3,634 3.14 2.70Pepper 11,661 12,256 13,962 1.00 2.64Paddy 1,569 n.a. 1,383 - -Coconut 612 626 639 0.43 0.42Vegetables 25,864 36,856 41,218 7.34 2.26
Source: Ministry of Agriculture, National Agriculture Policy (1992-2010), Malaysia.
Table 3. Farmers’ Income by Selected Food Crops(Unit: RM/farmer/year)
CropAverage Net Income
Group Farming Outside Group Farming
Paddy 5,733 (US$1,509) 3,765 (US$967)Sugarcane 5,327 (US$1,402) 3,044 (US$801)Chilies 14,222 (US$3,743) 8,520 (US$2,242)Brassica 9,811 (US$2,582) 6,703 (US$1,764)Cabbage 9,732 (US$2,561) 7,516 (US$1,978)
Source: Department of Agriculture, Malaysia (1998).
4. Greater Participation of Rural HousewivesTo lighten the financial problems of rural households, both the DOA and the Ministry
of Rural Development (MORD) established various Female Farmers Groups (FFG), underthe Integrated Local Community Development (ILCD) program. The objective of the FFGis to further promote the participation of housewives in pursuing various economic activitieswithin the community.
Through various economic activities organized by the FFG, a sense of self-awarenesswas created on the part of housewives, that they are able to contribute positively tosupplement their household incomes. Furthermore, such FFG activities provide a homelyatmosphere for the housewives to exchange their views and ideas. This results in a closerapport and bondage amongst themselves. Interviews with some of the FFG membersrevealed that each of them could easily earn an additional RM150-200 (US$40-53) per monthto supplement their family household income.
Long-term Effects of the Financial Crisis on the Productivity of AgricultureThe financial crisis, had serious repercussions which may affect long-term productivity
in the agriculture sector. Some of the long-term effects include:
1. Higher Costs in the National Food Import BillBefore the crisis, the average exchange rate of the Ringgit against the US dollar was
US$1 = RM2.60. However, during the crisis period, the Ringgit depreciated tremendously

- 167 -
in value, so that the Ringgit was pegged at US$1 = RM3.80. This means that the Ringgitdepreciated about 46 percent against the US dollar, in such a short time.
During the crisis period, the National Food Import Bill amounted to RM11.4 billion(US$2.94 billion) in 1997. Unless some drastic measures are taken to curtail food import, thenation will continue to suffer a substantial outflow of monetary reserves, as imports will costmore if the trend persists.2. Low Commodity Prices
Malaysia is the largest producer of oil palm and palm oil, which accounted for 64percent of the total value in agricultural exports. During the crisis period, the palm oilindustry enjoyed good commodity prices as crude palm oil (CPO) was traded in theinternational market in US dollars.
CPO prices went up to its all time high of RM2,377 (US$626) per mt during the boomdays of 1998. However, CPO prices eased to RM1,449 (US$381) per mt in 1999, beforelowering to the current level of RM800 (US$211) per mt. Table 4 shows the trend in palmoil prices.
Table 4. Trend in Palm Oil Production, Export and Prices, 1997-2001Year/Item 1997 1998 1999 2000 2001
Production (000 mt) 9,069 8,380 10,554 10,650 11,450Export (000 mt) 7,591 7,521 8,964 8,591 8,836(RM billion) (10.82) (17.79) (14.47) (10.12) (9.72)(US$ billion) (2.85) (4.68) (3.81) (2.26) (2.56)Price (RM/mt, local/delivery) 1,358 2,378 1,459 1,100 1,050(US$) (377.3) (383.9) (383.9) (289.5) (276.3)
Source: Bank Negara, Economic Report (2000).
At the moment, most of the plantation companies are either operating at a breakevenlevel or only earning marginal profits as the cost of production is RM650 (US$171) per mt.If such trend persists, plantation companies will be compelled to diversify into othereconomic activities, besides agriculture, for their survival.
The reasons for the low commodity prices are due to its vulnerability in theinternational market, as a result of strong competition from other CPO producing countries.Furthermore, the economy of the agriculture sector is over-dependent on the economicperformance of a single crop namely, oil palm, which has been unhealthy because of stiffcompetition in the international market and close substitutes such as soybean oil.3. Continuous Dependency on Foreign Labor
In the 1980s, when the country was moving toward industrialization, it resulted in anacute labor shortage in the agriculture sector. The alternative during that period was to recruitforeign workers in 1987, as a temporary measure to overcome the labor shortage. However,the continuous recruitment of foreign workers seemed to become a norm in the agriculturesector. If such trend persists, the financial stability of the country will be adversely affected,as massive remittance of our monetary reserves are sent by the foreign workers to their homecountries. Under such circumstances, productivity in the agriculture sector is completelydependent upon the foreign workers and any policy changes pertaining to the recruitment offoreign workers by the government will have serious repercussions for the agriculture sector.

- 168 -
4. Continuous Conversion of Prime Agricultural Land for Industrial PurposesDuring the boom time, there was massive conversion of prime agricultural land for
industrial purposes. However, during the financial crisis, agricultural activities were beingrevitalized in order to produce more food and to cut down food imports. Unfortunately,whenever there is a sign of economic recovery, agricultural land, which was undercultivation, are again subjected to continuous conversion for industrial purposes. Hence, itis not possible to sustain the productivity of agriculture in the long-run, as it is activated onlyduring the crisis period.
Strategies for Enhancing Agricultural Productivity on a Sustainable Basis,in Light of the Financial Crisis and Trends in the Economy
As identified under the Third National Agricultural Policy (NAP3), in effect from1998-2010, instead of adopting a commodity-based approach as practiced in the past, thecurrent focus is toward a product-based approach to further develop the value chain withinthe food processing sector. This is consistent with the cluster-based approach adopted in theIndustrial Master Plan 2 (IMP2), 1996-2005.
The objectives of such a food group policy is to ensure an adequate and stable supplyof quality, safe, nutritious and reasonably priced food and to position Malaysia as a globalsupplier of selected food products. Hence, some of the strategies adopted to achieveproductivity enhancement on a sustainable basis include:
1. Large-scale Commercial FarmingOver the years, 77 percent of total food crop production in the country was produced
by the small farmers who did not enjoy economies of scale due to the fragmentation of theirfarms. Hence, a two-prong approach has been adopted to promote large-scale commercialfarming:a) At the plantation level, there is a call by the government to some of the established
plantation companies to diversify into large-scale commercial cultivation of tropicalfruits, instead of just depending upon the mono-crop of oil palm. To achieve this,numerous fiscal and investment incentives are being offered to these plantationcompanies to promote fruit cultivation. Unfortunately, the response towards fruitcultivation is not encouraging, as all the plantation companies are complacent with thecultivation of perennial crops, such as the oil palm.
b) At the farm level, success of the group farming projects is a testimony that the futurebreed of farmers will work in groups rather than in isolation, in order to achieve thesynergy effect of productivity enhancement and higher farm income.
2. Greater Private Sector ParticipationIn order to accelerate the transformation of the agriculture sector into a modern,
dynamic, commercialized and productivity-driven sector, the investment in the private sectorsis very critical. Hence, to encourage greater private sector investment in agriculture, theadopted strategies include:
i. Establishment of a comprehensive databank of land that can be made available topotential investors. The databank will include information on land, ownership, termsand conditions of the lease or rental.
ii. Undertaking a review of the current rules and procedures that affect the operations andimpede investment in the private sector.

- 169 -
iii. Strengthening linkages with relevant international bodies to support Malaysianagricultural interests.
iv. Establishment of an institutional framework that will encourage greater linkagesbetween the farmers’ and fishermen’s institutions and other investors, including privatecorporations, which may lead to more joint ventures.
3. Improvement in Marketing ServicesOne of the biggest problems faced by the agriculture sector is the lack of coordination
and linkages between the producers and the exporters of agricultural products. Under suchcircumstances, the farmers are not getting fair prices for their products. Hence, there is a needto set up a comprehensive marketing intelligence network, in order to allow the farmers tohave direct access to the market rather than supplying their produce through different levelsof wholesalers and retailers.
Similarly, improvement in marketing services must be complemented by a goodinfrastructure. At the moment, there is a lack of refrigerated trucks and warehouse facilitiesfor the cold storage of processed food products. Unless there is improvement in theinfrastructure support, farmers would not be able to compete effectively in the internationalmarket. This is one of the main reasons why Malaysian agricultural products are not able toachieve competitiveness in the international market.4. Enhancing Food Security
Table 5 shows the trend of the estimated national self-sufficiency level of major foodcommodities over the next decade. As shown in the table, the self-sufficiency level for themajority of the food commodities is favorable except for beef and mutton. The self-sufficiency level for rice is being maintained at 70 percent, purely for food security reasonsas it is cheaper to import rice from neighboring countries.
Table 5. Self-sufficiency Level of Major Food Commodities, 1985-2010(Unit: Percent)
Items 1985 1990 1995 2000 2005 2010CropsRice 73.6 79.4 76.3 73.0 70.7 70.4Fruits 101.8 110.4 98.8 99.3 109.0 120.7Vegetables 80.8 75.2 71.6 75.0 79.5 89.5LivestockBeef 43.0 23.8 19.2 20.8 22.5 24.4Mutton 9.4 10.5 6.0 6.4 7.1 7.5Poultry 108.6 113.9 110.7 126.6 125.6 128.4Pork 103.3 106.3 104.0 80.0 87.5 84.6Eggs 103.3 109.4 110.3 113.0 112.2 113.9Milk 4.0 4.3 3.5 4.0 4.5 5.0Food fish 94.9 91.1 94.5 89.0 89.7 94.3
Source: Ministry of Agriculture.
Based upon such trend, the nation is able to sustain any financial crises in the future,as far as food commodities are concerned, except for beef and mutton. Hence, steps havealready been taken to increase the production of beef, such as the promotion of integratedfarming of cattle rearing within the oil palm smallholdings, which not only ensure doublesources of income for farmers, but also help to boost beef production.

- 170 -
CONCLUSION
The financial crisis has taught national policy makers a valuable lesson: even thoughthe nation is heading towards industrialization, there is still a need to have balanceddevelopment between the agriculture sector and other economic sectors. Such balanceddevelopment will ensure a consistent supply of food to feed the growing population, and atthe same time, it will provide a source of raw materials to the industrialized sector.
From a productivity perspective, the production of food should be the responsibilityof everyone, and not solely dependent upon the small farmers. Thus, this calls for greaterparticipation from the plantation companies to diversify into food production to allow for adecrease in food import. Similarly, the government should provide the necessary institutionalsupport to revitalize the agriculture sector. Hence, unless there is such integration betweenfarmers, plantation companies and the government, the nation will continue to suffer fromthe massive outflow of monetary reserves, which is caused by the continuous importation offood products.
The worst fear is that the nation would not be able to overcome the shock of anotherfinancial crisis in the future, if such trend of continuous importation of food persists. Hence,the best preventive measure is to start producing our own food supply.

- 171 -
8. PAKISTAN
Muhammad Rafiq SaroyaExecutive DirectorPersonnel DivisionAgricultural Development Bank of PakistanHead OfficeIslamabad
INTRODUCTION
Although the economic importance of agriculture, in terms of its contribution to GDP,has been declining over the last 25 years, this sector like many developing countries stillaccounts for a large share of the GDP and employment. In Pakistan, agriculture stillcontributes more than 25 percent to the GDP, employs around 47 percent of the work force,is the main source of foreign exchange earnings, and provides linkage through which it canstimulate growth in other sectors. Being in such a dominant position, the growth ofagriculture is itself a major component of overall economic growth. Over the last decade,agriculture grew at an annual average rate of 4.4 percent, with large fluctuations mainly onaccount of weather conditions and pest attacks on crops. Agriculture has also suffered fromvarious problems, such as the traditional methods of farming, low yields, shortage of keyinputs (credit, fertilizer, improved seed), adulterated pesticides, unstable market prices, andlittle attention to the sub-sectors other than crop farming.
The agriculture sector bounced back with a growth of 5.5 percent in 1999-2000compared to a relatively low growth of 1.9 percent of the preceding year. The sharp recoveryin agriculture owes mainly to the bumper cotton crop, good harvest of rice and wheat crops.However, the surge in agricultural growth was partly offset by a substantial decline in thesugarcane crop. Major crops as a whole registered a growth of 9.6 percent in 1999-2000against a growth of only 0.04 percent from the previous year. The growth of minor crops andlivestock slowed to 2.7 and 2.8 percent, respectively, compared to 4.3 and 3.2 percent theyear before last. Fisheries, however, posted a growth of 8.5 percent, compared with the 0.6-percent recorded in the preceding year.
AN OVERVIEW OF THE ECONOMY
The economic slide, in which Pakistan finds itself today, must be traced back to themid-1990s, after which the parameters of the economy demonstrated a downhill trend. By1994-95, workers’ remittances soared by 21 percent, gross fixed investment by 5 percent andforeign investment by 138 percent over the preceding year. In 1995-96, GDP growth rate was6.8 percent and exports grew by 7.1 percent. The economy was moving in a buoyant manner,as indicated by critical economic variables.
The subsequent period witnessed the chute in unmistakable terms. GDP growth ratesdecelerated to an annual 2.9-percent during 1995-96. Exports never touched the figure ofUS$8.7 billion of 1995-96 again. Similarly, workers remittances were lower than the peak

- 172 -
of US$1.3 billion during 1994-95. The trade gap widened over the period, resulting insuccessive devaluations. One US dollar, which valued Rs.33.6 in 1995-96, is now worthRs.58 in the inter-bank market (a rise of 72.6 percent). By March 1999, the general index ofshare prices stood at 103 compared to 290 in June 1994. The level of unemployment also roseafter 1996.
Investment in the public sector declined sharply in relation to the private sector.Normally at an average of 9 percent of the GDP, it declined to 6 percent in the second halfof the 1990s, while private sector investment remained around 8 percent during the sameperiod.
A large fiscal deficit continues to pose as a serious threat to the macro-economicstability. The trends in fiscal deficit, which existed in the 1980s, continued to persist in thefirst half of the 1990s. However, fiscal deficit was reduced to an average of 6.4 percent in thesecond half of the 1990s, mainly by cutting development expenditure.
A modest recovery in growth is certainly a positive development in the fiscal year of1999-2000. Real GDP grew by 4.5 percent compared to 3.2 percent of last year i.e., 1998-99,and an average of 4.0 percent for the second half of the 1990s. The modest recovery ingrowth is fully supported by an impressive recovery in agriculture, on account of bumpercotton and wheat crops, and a good rice crop. Agriculture grew by 5.5 percent compared to1.9 percent of last year.
Another positive development in the fiscal year 1999-2000 has been the fall ininflation. Inflation, measured on the basis of the Consumer Price Index, declined to 3.4percent during July 1999 to April 2000, from the 6.1 percent of the comparable period of lastyear. This has been the lowest inflation in the last two decades.
One of the most positive developments of the outgoing fiscal year has been a strongrebound in exports. At least three factors are responsible for a “V-shaped” recovery inexports. First, the bumper cotton crop and its reduced prices made the textile sector buoyant.Second, the policy of maintaining a stable and predictable exchange rate following the sharpdepreciation in previous years, helped Pakistan maintain its external competitiveness. Third,the strong recovery in the global economy made possible by the continued strong growth inthe United States, recovery in Europe, and stronger than anticipated recovery in the crisis-hitEast Asian economies, firmed up the demand for Pakistani exports in the major markets.Hence, the improved supply of exportable items, stronger demand in international marketsand a much more stable exchange rate have been mainly responsible for a strong recovery inexports for the outgoing fiscal year. Exports, during the first 10 months (July-April) of theyear 1999-2000, grew by almost 10 percent compared against a decline of almost 12 percentin the same period last year.
Like exports, imports have also picked up during the first 10 months (July-April) ofthe year 1999-2000; overall imports grew by 10.9 percent instead of a decline of 9.4 percentin the same period last year. Although, most of the increase in imports is mainly due to higherimport bills of petroleum products, non-food non-oil imports have also registered an increaseof 4.3 percent. This is an important development as it suggests that economic revival appearsto be taking place. The current account balance has improved by 34 percent during the firstnine months (July-March) of the year 1999-2000, declining from a deficit of US$1,812million to US$1,195 million.
With regard to the agriculture sector in 1999, it achieved a growth of 5.5 percentagainst the rate of 1.9 percent of the previous year. The production of rice increased to 5,156thousand mt from the 4,674 thousand mt last year, while the production of cotton reached to

- 173 -
11,240 thousand bales from 8,790 thousand bales. These show an increase of 10.3 and 27.9percent, respectively. The production of sugarcane is estimated at 46,363 thousand mt, whichis lower by about 16 percent compared to last year’s, due to delays in payments by the sugarmills, abolition of flat rates for electric tube-wells and less rainfall. We had a bumper wheatcrop in the year 1999-2000. This increase is attributed to the enhancement in the supportprice of wheat from Rs.240 to Rs.300 per 40 kg, and the timely disbursement of agriculturalcredit to the growers.
Agricultural credit, amounting to Rs.27,912.6 million, has been disbursed in 1999-2000(July-March), against Rs.30,652.0 million during the corresponding period last year, therebyregistering a decline of 8.9 percent. This decline is mainly due to a lower demand forproduction loans. The fertilizer offtake during the first nine months (July-March) of thecurrent year is 2,123 thousand nutrient mt, compared with 1,988 thousand nutrient mt for thesame period last year, showing an increase of 6.8 percent.
THE FINANCIAL CRISIS AND ITS OUTLOOK
Pakistan has been relatively insulated from the currency and capital market turmoil inSoutheast and East Asia by the fact that the country has not undergone significantliberalization of the financial sector and had low to moderate foreign debt exposure. The mainimpact of the crisis will be felt through a slow down in foreign direct investment (FDI)inflows from the crisis-affected countries.
Exports suffered a setback at the end of 1997, when East Asian economies sufferedcurrency turmoil. This adversely affected our exports and led to a hefty one-time devaluationof the Pakistani currency by 8 percent on 15 October 1997. This led to shrinking exports asthe international prices of goods fell, although imports also became cheaper such aspetroleum products during 1998-99.
Whatever the case may be, whenever there is a financial crisis in the country, itnormally leads to the devaluation of the local currency and the extent of devaluation dependsupon the severity of the crisis. The massive devaluation of currency not only harms nationalinterests but also those of the individual and commercial/business enterprises.
Although the agriculture sector consumes electricity and petroleum only by 17 and 2percent, respectively, the prices of various input like seed, chemical fertilizer, diesel oil,electric power, labor charges and canal water rates increased by various proportions as theresult of inflationary pressure on the economy. As a result, costs of production foragricultural products increased. The Government of Pakistan, therefore, has been revisingsupport prices of agricultural products.
Due to the introduction of improved tillage practices and new concepts in farmingtechniques, etc., the production per ha has increased, which has diluted/minimized the effectsof inflationary factors of the financial crisis. The offtake of fertilizer as well as the creditrequirement of the agriculture sector is expanding every year. The productivity of agricultureas a whole has increased significantly. Thus, the marginal effects of the financial crisis onfarming as well as the farming community has been minimized/nullified.
CONCLUSION
If we review the economy of Pakistan during the period of financial crisis, it transpiresthat the country was already not doing well; it had a huge debt problem, low foreignexchange reserves and a falling GDP. Basically, these economic indicators kept away major

- 174 -
foreign investments, and as a result, Pakistan was a bit insulated from the crisis. In fact, allthe basic problems, which triggered the economic crisis, as discussed above, were partlyalready prevailing to a certain extent in Pakistan. Economic development was already slowdue to many external and internal problems. However, due to economy being underdevelopment, there were no sudden consequences as in the case of the Asian tigers. But, dueto the crisis, 15 percent of total exports to the Far-Eastern region dried up, plus some majorprojects undertaken by Korean firms were effected. In all, from 1997 onward, negative trendswere seen. The agriculture sector did not suffer directly, but due to the economic problems,this sector was indirectly affected. Later, by various government interventions, the slide inagricultural productivity halted in 1999. In fact, the agriculture sector stabilized in the year2000.
REFERENCES
Bello, Walden, 1998. The End of the Asian Miracle (<http://www.stern.nyu.edu/~nroubini/asia/miracle.pdf>).
Ferguson, Martin. 1998. “The Asian Crisis: Lesson to be Learned and Relearned”, paperpresented to America’s Community Bankers, Washington, D.C., 4 March 1998(<http://www.bog.frb.fed.us/boarddocs/speeches/>).
Finance Division. Economic Survey 1999-2000, Government of Pakistan (monthly).
Fisher, Stanley, 1998a. “The Asian Crisis – A View from the IMF”, address to the MidwinterConference of the Banker’s Association for Foreign Trade, Washington, D.C., 22January 1998 (<http://www.imf.org/external/np/speeches/1998/012298.htm>).
Pakistan’s Journal of Economic Development, 1999. Economic Review 11/1999.
Radlet, Steven, 1998. “The Onset of the East Asian Financial Crisis”, first draft, 10 February1998 (<http://www.hiid.harvard.edu/pub/others/eaonset.pdf>).
- 175 -
9. PHILIPPINES
Sheila Marie M. EncaboSenior Economic Development SpecialistAgricultural StaffNational Economic and Development AuthorityPasig City
INTRODUCTION
Stiglitz (1998) accounted that in the last 20 years, there have been at least 10 countries,which suffered from the simultaneous onset of currency and banking crises. The result hasbeen full blown economic crises causing, in many cases, contractions of 5-12 percent in thefirst year of the crisis, and negative or only slightly positive growth for some yearsafterwards. In view of this general phenomenon, he raised the question: “Must financial crisesbe this frequent and this painful?”
In the Philippine economic history since the 1980s, several economic crises have beenexperienced, due to the occurrence of any or a combination of the following: (i) overspendingand overheating of the economy; (ii) financial crisis; (iii) crisis of confidence; and (iv) crisisfrom abroad or other countries. Financial crises are mainly caused by: (i) overexposure toforeign liabilities and lack of capacity to earn foreign exchange to pay for those debts; and(ii) financial bubbles created by over-investments in the equities and real estate sectors.Domestic or external shocks or circumstances can similarly contribute or trigger an economiccrisis.
For the period 1983-86, a combination of these crises brought havoc to the economy:the foreign debt crisis in the 1980s that started in Mexico and Brazil; assassination of aprominent political figure; and overheating of the economy. The crisis that hit the country in1989-92 resulted from overheating, foreign debt burden and domestic political instability.The 1997 crisis, on the other hand, was triggered by the economic crisis in Thailand, whichfollowed the opening of the country’s financial market. This resulted in the massive inflowand outflow of volatile short-term capital, consisting of short-term dollar-denominated debtand portfolio investments.
The ongoing crisis, on the other hand, is mainly due to the crisis of confidence in thecurrent administration, triggered by peace and order problems in the southern portion of thecountry, which took time to be resolved. This was further aggravated by the series of oil priceincreases, resulting from the deregulation of the oil industry. In view of the integration of thePhilippine economy in the global market, however, the financial sector is currently beingadversely affected.

- 176 -
ECONOMIC AND SOCIAL SITUATION OF THE COUNTRY
Economic Situation Prior to the 1997 Financial CrisisThree years before the 1997 crisis, the country enjoyed a steady and strong economic
growth compared to its sluggish pace in the early 1990s. Higher incomes, stable prices,favorable balance of payments (BOP) and fiscal positions result from the various policyreforms instituted, starting 1991 (Tables 1-3). These reforms encouraged greater privatesector involvement in the development process and opened up the economy. A macro-economic stabilization program was also put in place to reduce fiscal deficit. However, incomparison with countries such as Thailand, Indonesia, China, Malaysia and Singapore, thecountry’s performance still lagged behind.
Like other countries in the region, the Philippines experienced a substantial inflow offoreign capital, especially in portfolio investments in 1995-96 (Table 2). This resulted in thestrengthening of the peso, despite the country’s large trade deficit. The large proportion ofportfolio investments to total foreign investments, appreciation of the peso combined witha large trade and current account deficit, and the deterioration of the BOP position in early1997, made the economy vulnerable to speculative attacks on its currency.
However, as later confirmed by the country’s experience, the various policy reformsinstituted earlier, especially those which resulted in the strengthening of the banking system,made the country relatively more resilient to the impact of the crisis compared to somecountries in the region.
Agricultural Development Prior to the 1997 CrisisAgricultural development prior to the 1997 crisis was geared towards increasing
productivity, efficiency, competitiveness, market adaptability, and sustainability of thecountry’s agri-based industries. Growth in the sector averaged at 2.5 percent from 1990 to1996, with crop production constituting the bulk of the total agricultural output (Table 4 andFigure 1). It may be noted, however, that the livestock and poultry sub-sectors have been themost robust among the production sub-sectors, with annual average growth rates of 3.9 and6.6 percent, respectively. Fishery production, on the other hand, was hampered byenvironmental problems in the aquatic environment, thus the dismal 1.8 percent growthduring the same period.
The agriculture sector, however, remained vulnerable to adverse weather conditions.The drought in the early part of 1995 and a number of devastating typhoons toward the endof that year significantly affected the production of major crops e.g., rice and sugar. Thesector recovered in the following year, but was again battered by the El Niño in 1997, theworst to hit the country in 31 years.
IMPACT OF THE FINANCIAL CRISISON THE AGRICULTURAL/RURAL ECONOMY
Economic Impact of the CrisisThe most immediate impact of the financial crisis was manifested in the sudden
outflow of substantial amounts of foreign capital. This placed a heavy strain on the country’sdollar reserves and caused the depreciation of the peso (more than 62 percent within theseven months after the crisis struck). To ease the pressure on the exchange rate, interest rateswere increased by almost seven percentage points at their peak level.

- 177 -
Table 1. Real Sector Indicators, 1993-99, Growth RatesIndicator 1993 1994 1995 1996 1997 1998 1999
GNP 2.1 5.3 4.9 7.2 5.3 0.4 3.7GDP 2.1 4.4 4.7 5.8 5.2 (0.6) 3.3Agriculture, fishery and forestry 2.1 2.6 0.9 3.8 3.1 (6.5) (6.4)Industry 1.6 5.8 6.7 6.4 6.1 (2.1) 0.9
Mining 0.7 (7.0) (6.8) 1.3 1.7 2.8 (8.4)Manufacturing 0.7 5.0 6.8 5.6 4.2 (1.1) 1.6Construction 5.7 8.9 6.5 10.9 16.2 (9.6) (1.6)Utilities 2.9 13.9 13.0 7.5 4.8 3.3 3.1
Services 2.5 4.2 5.0 6.4 5.4 3.5 4.5GNP (P= billion at 1985 prices) 747 786 825 884 930 934 968
Sources: 1) National Economic and Development Authority; and2 National Statistical Coordination Board
Table 2. Selected Indicators for Monetary and External Sector, 1993-99Indicator 1993 1994 1995 1996 1997 1998 1999
Current account (US$ million) (3,016) (2,950) (3,297) (3,953) (4,351) 1,546 7,239As percent of GNP (5.4) (4.5) (4.3) (4.6) (5.1) 2.2 9Export growth 15.8 18.5 29.4 17.7 22.8 16.9 18.8Import growth 21.2 21.2 23.7 20.8 14.0 (18.8) 4.1Trade balance in goods (US$ million) (6,222) (7,850) (8,944) (11,342) (11,127) (28) 4,295
Capital and financial account (US$ million) 2,820 4,547 3,393 11,075 6,593 478 (1,007)Overall BOP position (US$ million) (166) 1,802 631 4,107 (3,363) 1,359 3,839Prices and interest rates
Inflation rate (1994 = 100) 6.9 8.4 8.0 9.1 6.0 9.8 6.6Ninety-one-day T-bill rate 12.3 13.6 11.3 12.4 13.1 15.3 10.2
Sources: Bangko Sentral ng Pilipinas, the National Economic and Development Authority and Bureau of the Treasury and the NationalStatistical Coordination Board.

- 178 -
Table 3. National Government Fiscal Position, 1993-98*(Unit: P= billion)
Indicator 1993 1994 1995 1996 1997 1998Total revenue 260.4 (17.4) 336.2 (19.4) 361.2 (18.4) 410.4 (18.2) 471.8 (18.7) 462.5 (16.6)Total disbursements 282.3 (18.8) 319.9 (18.4) 350.1 (17.8) 404.2 (17.9) 470.3 (18.6) 512.5 (18.3)Budgetary deficit (-)/surplus -21.9 (-1.5) 16.3 (0.9) 11.1 (0.6) 6.3 (0.2) 1.6 (0.1) -50.0 (-1.8)Deficit financing 21.9 -16.3 -11.0 -6.3 -1.6 50.0
Sources: Department of Finance and Department of Budget and Management.Note: Figures in parentheses are percent of GNP.
Table 4. Gross Value-added (GVA) in Agriculture, Fishery and Forestry by Industry Group at Constant 1985 Prices(Unit: P= million)
Industry/Industry Group 1990 1991 1992 1993 1994 1995 1996Agriculture Industry 153,414 158,205 159,385 163,556 168,419 171,069 177,553a. Agriculture 122,631 126,204 127,010 130,736 135,224 136,616 143,265
Crops 85,870 88,694 87,662 89,660 92,775 93,269 96,418Palay 24,873 25,868 24,412 25,228 28,182 28,189 30,175Corn 10,950 11,093 11,009 11,435 10,769 9,837 9,893Coconut 7,084 6,798 6,815 6,827 6,831 7,380 6,890Sugarcane 3,652 4,646 4,871 5,257 5,326 3,964 4,810Banana 2,698 2,691 2,789 2,798 2,836 2,809 3,011Other crops 36,613 37,598 37,766 38,115 38,831 41,090 41,639
Livestock 16,854 17,061 17,195 17,996 18,858 19,834 21,143Poultry 12,215 12,626 13,999 14,866 15,255 16,056 17,866Agricultural activities and services 7,692 7,823 8,154 8,214 8,336 7,457 7,838
b. Fishery 30,783 32,001 32,375 32,820 33,195 34,453 34,288Forestry 7,320 4,732 4,186 3,497 2,971 1,779 1,898GVA in agriculture, fishery and forestry 160,734 162,937 163,571 167,053 171,390 172,848 179,451
... To be continued

- 179 -
Table 4. Continuation(Unit: P= million)
Industry/Industry Group 1997 1998 1999Growth Rate
1990-96 1997-96 1998-97 1999-98Agriculture Industry 183,601 171,548 183,035 2.5 3.4 -6.6 6.7a. Agriculture 149,326 136,858 147,471 2.6 4.2 -8.3 7.8
Crops 99,973 87,118 96,367 2.0 3.7 -12.9 10.6Palay 30,135 22,877 31,516 3.4 -0.1 -24.1 37.8Corn 10,324 9,111 10,921 -1.6 4.4 -11.7 19.9Coconut 7,280 6,325 5,860 -0.4 5.7 -13.1 -7.4Sugarcane 4,828 4,164 5,109 6.2 0.4 -13.8 22.7Banana 3,206 3,020 3,222 1.9 6.5 -5.8 6.7Other crops 44,200 41,621 39,739 2.2 6.2 -5.8 -4.5
Livestock 22,273 23,196 24,277 3.9 5.3 4.1 4.7Poultry 19,088 19,023 19,186 6.6 6.8 -0.3 0.9Agricultural activities and services 7,992 7,521 7,641 0.5 2.0 -5.9 1.6
b. Fishery 34,275 34,690 35,564 1.8 0.0 1.2 2.5Forestry 1,112 897 747 -18.6 -41.4 -19.3 -16.7GVA in agriculture, fishery and forestry 184,713 172,445 183,782 1.9 2.9 -6.6 6.6
Source: Economic and Social Statistics Office, National Statistical Coordination Board.


* The 1998 annual Poverty Incidence Survey is a nationwide survey designed to provide accessand impact indicators that can be used as inputs to the development of an integrated povertyindicator and monitoring system. It provides data on the socio-economic profile of Filipinofamilies and other information relating to their living conditions. Relevant information on theimpact of the Asian economic crisis is likewise added in the survey. Specifically, the surveyaims to identify the poor families through the use of non-income-based indicators.
- 181 -
Deceleration in the GDP growth was experienced in the second semester of 1997, withthe agriculture sector registering flat growth and both the industrial and service sectorsshowing some signs of weakening. Nonetheless, the sector managed to grow by 4.3 percentin 1997 (Table 4). In 1998, however, the economy contracted by 6.6 percent, afterexperiencing adverse weather conditions: drought in the second quarter and two strongtyphoons in the fourth quarter. This resulted in a 1.28-percent reduction in the sector’scontribution in the 1998 GNP (Table 5). While the economic contraction was attributed tothe weather disturbances rather than to the financial crisis, the marked decline inmanufacturing and construction output during the period indicated that the adverse impactof the crisis was already being felt.
Closure and retrenchments of 3,072 establishments in 1998, affected 155,198 workers.Closures or shutdowns were common among small-sized establishments while retrenchments,rotations or reductions in working hours were prevalent among large-sized establishments.
Inflation slightly accelerated in the first few months after the crisis, with pressurescoming mainly from the service and housing sectors, while food prices were somewhat stable.However, when agricultural output dropped drastically during the second quarter of 1998,the increase in food prices accelerated and brought overall inflation to a double-digit level.
Based on the 1998 Annual Poverty Indicators Survey,* a total of 13.5 million families(or 93.8 percent of the total estimated number of families) were affected by the 1997 financialcrisis. Among the major coping mechanisms of the families reported include: (a) changes ineating pattern; (b) increases in working hours; and (c) searches for assistance fromgovernment or relatives.
In terms of the allocation of the National Government Expenditure, the agriculture,agrarian reform and natural resources sectors experienced lower shares in 1998, comparedto the average of the 1993-96 levels (Table 6).
Effects of the Financial Crisis on the Productivity of AgricultureThe long-term effects of the 1997 financial crisis on agricultural productivity have yet
to be studied in detail. However, data shows that a year after the 1997 crisis, much of theeconomic gains achieved in the preceding years have already eroded. As can be gleaned inTable 7, real labor productivity dropped immediately following the onset of the financialcrisis. In particular, agricultural labor productivity dropped by 3.4 percent in 1998. Caution,however, has to be applied in interpreting this data as the adverse impact of the El Niño,which hit the country during the same year, may be difficult to isolate.

- 182 -
Table 5. Contribution to GNP Growth at Constant 1985 Prices
Industry 1990 1991 1992 1993 1994 1995 1996 1997 1998 1999 Average1990-96
1. Agriculture, Fishery and Forestry 0.11 0.31 0.09 0.48 0.58 0.19 0.80 0.63 -1.28 1.10 0.36Agricultural industry 0.40 0.67 0.16 0.57 0.65 0.34 0.79 0.69 -1.28 1.17 0.51Forestry -0.28 -0.36 -0.08 -0.09 -0.07 -0.15 0.01 -0.06 0.00 -0.07 -0.15
2. Industry Sector 0.93 -0.95 -0.19 0.56 1.94 2.28 2.22 2.10 -0.73 0.30 0.97Mining and quarrying -0.04 -0.04 0.10 0.01 -0.11 -0.09 0.02 0.02 0.03 -0.10 -0.02Manufacturing 0.70 -0.11 -0.44 0.18 1.22 1.64 1.38 1.02 -0.27 0.38 0.65Construction 0.29 -0.92 0.14 0.28 0.46 0.35 0.59 0.90 -0.59 -0.09 0.17Electricity, gas and water -0.01 0.12 0.02 0.08 0.38 0.38 0.24 0.15 0.10 0.10 0.17
3. Service Sector 2.06 0.06 0.43 1.05 1.79 2.10 2.67 2.25 1.45 1.76 1.45Transportation, communication and storage 0.13 0.03 0.08 0.15 0.24 0.33 0.43 0.47 0.38 0.33 0.20Trade 0.69 0.08 0.25 0.37 0.59 0.83 0.83 0.57 0.36 0.72 0.52Finance 0.40 -0.12 0.01 0.09 0.22 0.29 0.57 0.57 0.21 0.09 0.21O. dwellings and R. estate 0.16 0.01 0.04 0.10 0.16 0.16 0.22 0.19 0.08 0.03 0.12Private services 0.27 -0.01 0.04 0.20 0.29 0.29 0.34 0.32 0.31 0.40 0.20Government services 0.43 0.08 0.01 0.14 0.28 0.19 0.30 0.13 0.11 0.18 0.20
GDP 3.1 -0.6 0.3 2.1 4.3 4.6 5.7 5.0 -0.6 3.2 2.79Net factor income from abroad 1.7 1.1 1.2 0.0 0.9 0.3 1.6 0.3 1.0 0.5 0.98GNP 4.8 0.5 1.6 2.1 5.3 4.9 7.2 5.3 0.4 3.7 3.76
Source: Economic and Social Statistics Office, National Statistical Coordination Board.

- 183 -
Table 6. Sectoral Allocation of National Government Expenditure, 1993-99a
Share to Total Budget 1993 1994 1995 1996 1997 1998 1999Economic Services 32.12 34.64 34.60 30.37 31.32 28.31 28.18
Agriculture, agrarian reform and natural 9.66 10.45 9.69 10.25 11.98 8.72 8.78Trade and industry 1.54 1.87 2.63 1.57 1.45 0.97 0.83Tourism 0.23 0.24 0.33 0.26 0.29 0.34 0.23Power and energy 3.51 1.34 1.43 0.39 0.48 0.55 0.97Water resources and flood control 2.25 1.81 1.62 0.96 1.92 1.77 1.57Communications and transportation 14.14 17.99 16.79 15.23 14.19 15.47 14.53Other economic services 0.79 0.94 2.11 1.71 1.00 0.50 1.27
Social Services 31.84 30.24 33.16 36.17 38.84 40.83 41.95Education 24.22 22.76 25.33 26.50 27.81 29.74 29.45Health 4.35 4.01 3.44 3.99 4.15 3.74 3.98Social services and welfare 2.03 2.46 2.84 3.58 5.94 6.33 6.62Housing and community development 1.04 0.81 1.35 1.83 0.71 0.78 1.10Land distributionb - - - - - - 0.59Other social services 0.21 0.21 0.20 0.26 0.22 0.21 0.22
Defense 14.43 11.66 11.29 10.99 8.56 8.77 8.77General Public Services 23.62 23.46 20.95 22.47 21.29 22.09 21.09
Public order and safety 9.77 9.22 9.37 10.03 9.81 10.42 10.86General administration 11.25 12.89 10.54 11.24 10.65 11.67 9.85Other general public services 2.59 1.35 1.05 1.20 0.83 - 0.39
Total expenditure 100.00 100.00 100.00 100.00 100.00 100.00 100.00Source: Department of Budget and Management.Notes: a Net of transfers to local government units, net lending and interest payments; and b less tan 0.01 percent.

- 184 -
Table 7. Labor and Productivity Indicators, 1993-99Indicator 1993 1994 1995 1996 1997 1998 1999
Labor force (000) 26,879 27,654 28,382 29,733 30,355 31,056 32,081Employment (000) 24,382 25,032 25,676 27,186 27,715 27,911 28,980
By sector:Agriculture 11,139 11,286 11,147 11,645 11,319 10,933 11,624Industry 3,804 3,948 4,139 4,430 4,631 4,583 4,533Services 9,439 9,798 10,391 11,112 11,771 12,395 12,823
Jobs created (000) 686 651 643 1,510 529 196 1,069By sector:
Agriculture 413 147 (139) 498 -331 -381 691Industry -19 142 193 291 201 -47 -50Services 292 372 591 721 659 624 428
Levels (P=)Real labor productivitya 30,634 31,405 32,113 32,525 33,569 33,361 30,191Real labor productivityb 30,111 30,616 31,234 31,234 32,221 31,818 28,595By sector:
Agriculture 14,997 15,186 15,506 15,410 16,326 15,773 15,778Industry 66,104 67,369 68,581 68,200 69,248 68,635 69,854Services 33,440 33,579 33,252 33,076 32,916 32,358 32,545
Sources: National Statistical Coordination Board, Medium-Term Philippine DevelopmentPlan (MTPDP) 1993-98 and Updated MTPDP 1996-98; and National StatisticsOffice, Labor Force Survey.
Notes: a Real GNP/total employment; and b real GDP/total employment.
Major Policy Imperatives Being Undertaken to Alleviate the Impact ofthe Financial Crisis on Farmers and Strategies for EnhancingSustainable Agricultural Productivity
The 1997 crisis served as a wake up call for the country’s macro-economicmanagement. The 1997 financial crisis exposed weaknesses in the Asian economies, whichmust be addressed for the regions to return to its high growth of recent years. While much hasbeen done to make the country’s financial system the most resilient among the crisis- affectedeconomies, reforms in the corporate and financial sector governance have to be sustained tominimize the country’s vulnerability to sudden movements in short-term capital.
The MTPDP 1999-2004 envisions a sustainable development path anchored by growthand social equity. The overall achievement will be measured in a large part by the reductionin poverty, especially in the rural areas, and an improvement in the distribution of income.Specifically for the agriculture sector, acceleration of growth is expected through theimplementation of a comprehensive modernization program. The objective is to foster aninternationally competitive agriculture sector that will increase earnings of farmers, from bothdomestic and export markets, and ensure food security, while meeting the objectives ofecological balance and environmental preservation. Thus, fiscal spending is geared towardsagricultural modernization, to achieve food security, and increase the productivity of the ruralsector, which accounts for the bulk of the poor.
The enactment of Agriculture and Fisheries Modernization Act (AFMA) in 1997, setsthe framework for the government’s centerpiece strategy for rural development. Among the

- 185 -
major strategies of AFMA: (a) enhancing productivity and competitiveness; (b) wideningpeople’s access to land and other productive resources; (c) promoting sustainable use ofnatural resources and protecting the environment; and (d) empowering stakeholders andrationalizing the functions of institutions. The Act prescribes urgent measures, such as theidentification of strategic agricultural and fisheries development zones (SAFDZs) and theformulation of modernization plans with budgetary support for irrigation, farm-to-marketroads and other rural infrastructure, research and development, extension, farmer credit,information and marketing support services, product standardization, and consumerprotection.
Despite budgetary constraints, the core components of the AFMA have been initiated,to include:
(a) completion of the Agriculture and Fisheries Modernization Plans in 13 of the 15regions;
(b) completion of the SAFDZ delineation after thorough conduct of public consultationsat the national and regional levels;
(c) launching of the Agriculturang Maka-Masa Program aimed to increase productivityof rice, corn, high value crops, livestock and fisheries through better irrigation, seedsand breeders, marketing systems and technology; and
(d) massive rehabilitation and construction of new irrigation facilities.
Various policy reforms have also been started and these include the following:
(a) Implementation of the Agro-Industry Modernization Credit and Financing Program,affecting the four-year phase-out plan of all directed credit programs, whose fundsshall be consolidated into the new program;
(b) Issuance of Bangkok Central ng Pilipinas Circular Number 217 allowing for longerand variable grace periods in the repayment of loans for long-gestating agriculture andfisheries projects;
(c) Issuance of Executive Order No. 133 which specifies the implementation of rules andregulations governing the exemption from the payment of tariffs and duties of inputsto agriculture and fisheries enterprises; and
(d) Preparation of a set of criteria for the selection and prioritization of irrigationinvestments. A guideline that would rationalize irrigation service fees is likewise beingcrafted with due emphasis on the importance of watersheds and cost recovery throughco-financing schemes in systems rehabilitation and maintenance.
In terms of institutional reforms, convergence effort among the three principalinstitutions of government i.e., Department of Agriculture (DA), Department of AgrarianReform (DAR), Department of Environment and Natural Resources (DENR), whosemandates primarily concern the development of the rural sector has been initiated. Thisinvolves the adoption and implementation of joint and complementary initiatives in the ruralareas. The roles of each department have been defined to operationalize the sustainabledevelopment paradigm in the rural sector through integration of the social, economic andenvironmental aspects of rural development.
Cost-sharing schemes with stakeholders have been institutionalized by the DA toencourage more meaningful and responsive participation in, and consequently ensure thesustainability of, programs and projects.

- 186 -
Growing recognition of the importance of budget and planning process linkage, on theother hand, recently paved the way for initiatives to improve existing practices in the variousoversight and line departments. These initiatives are geared toward more effective andefficient resource utilization and allocation, consistent with the government’s efforts toincrease expenditures towards desired government outcomes.
A project is currently being implemented by the National Economic and DevelopmentAuthority, the central planning agency of the country, to establish a database and informationbackbone to institutionalize economic surveillance and strengthen the agency’s planningcapability. It is envisioned that this initiative will enable the formulation of timely, analyticaland forward-looking policies. In addition to the regular monitoring of the economy’sperformance, the importance of including early warning indicators in the database,specifically forecast possible financial and economic collapse, has been recognized.However, full utilization of this system has yet to be realized as pilot testing is still waitingto be conducted in the next few months.
CONCLUSION
While individual country initiatives, such as the ones mentioned above, are needed tomitigate the impact of financial crises on all sectors of the economy, particularly on thefarmers. Coordinated efforts among affected economies could be a bigger step to be taken.The continuing international dialogues on these and other related issues offer some hope foreach of the affected economies. This particular meeting for the region promises a greatopportunity to foster collaborative efforts towards making financial crises less frequent andpainful, as they have been these past years. The sharing of country experiences in the regionis a big stride as possible networking activities may be initiated towards this end.
As Stiglitz (1998) emphasized, the challenge today is to prevent the pendulum fromswinging too far to the other side. There appears to be a huge task in the redesign ofinternational architecture for the integration of the economies in the global system, so thatit can work the way it was envisioned. What we may be able to accomplish at the end of themeeting may not be a perfect solution to this problem. But as Stiglitz (1998) puts itappropriately: “We must not let the perfect be the enemy of the good. In a downpour, it isbetter to have a leaky umbrella than no umbrella at all”.
REFERENCES
Medium-Term Philippine Development Plan, 1999-2004.
Reyes, Celia, et al., 1999. “The 1997 Regional Financial Crisis: Its Social Impact on thePhilippines”, Development Research News, Vol. XVII, No. 6, Nov.-Dec. 1999.
Stiglitz, Joseph, 1998. Must Financial Crises Be This Frequent and This Painful?
Sustainable Ecosystems International Corporation, 2000. Draft Information TechnologyBackbone, November 2000.
Sustaining Poverty Reduction through Growth and Other Supporting Policies, 2000.Consultative Meeting for the Philippines, 18-20 June 2000.

- 187 -
10. SRI LANKA
Thuiappu A. WimalasenaProvincial Director AgricultureSouthern Provincial CouncilMinistry of AgricultureFort-Galle
INTRODUCTION
The agriculture sector of Sri Lanka is responsible for food and export crop productionand it contributes to 16.4 percent of the GDP and 23.3 percent of the GNP in 1999. Thisprovides employment for one-third of the labor force, exceeding the provision of employmentcontribution of any other major sector. Tea, rubber, coconuts, flower and ornamental plants,cinnamon and other spices crops are the major exports of the agriculture sector in Sri Lanka.
THE AGRICULTURE SECTOR
The agriculture sector can be divided into a number of sub sectors, such as plantationcrops, food crops, export agricultural crops, animal production, fisheries, etc. The importanceof each sector is briefly discussed below.
The Plantation SectorTea, rubber and coconut are the three plantation crops.
1. TeaGNP of tea is 2.4 percent. There was US$162.38 million in export earning from tea
during 1999. Main importers of tea are the U.S.A., Russia, Turkey, Syria and U.K. There was1 percent growth in tea export during 1999. Financial crisis of Russia and increment ofpetroleum fuel price badly affected to tea industry. Rise in fertilizer prices caused thereduction of fertilizer application by 9 percent during 1999.2. Coconut
Coconut is used for local consumption and also export. The contribution to GNP bythe coconut is 2.9 percent. Sri Lanka is one of the principal exporters of desiccated coconut.The demand of coconut oil was reduced due to severe competition by vegetable oil in theopen market. This led to reduction in income for large plantation and oil producers, andcaused poor growth in the coconut industry.3. Rubber
Rubber is a primary raw material for industries. Over half (51 percent) of rubberproduction in Sri Lanka is used by local industries and the rest is exported. The Sri Lankannatural rubber market was badly affected by the synthetic rubber industry and the naturalrubber production of other East Asian countries. There are a number of rubber-basedindustries in Sri Lanka. Yet low prices in the world rubber market badly affected our rubber

- 188 -
industry. High price of fertilizer reduced fertilizer application by 3 percent, which resultedin the lowest productivity.
Food CropsThe Sri Lanka staple food crop is rice, in which the country is 90-95 percent self-
sufficient. Rice production in the year 1999 was 2,868 mt. The import volume of rice duringthis period was 214 mt. The average rice yield of Sri Lanka is 3.67 mt/ha. There are severalfactors causing the stagnation in rice yield. A large percentage of the expenditure wasincurred for the harvest of paddy. This operation is mainly done by manual labor power. Costfor paddy cultivation can be reduced by mechanizing the harvesting operations. Limitationsto this innovation are boggy soils and small and sloppy plot sizes of paddy fields. Alsoincrease in fertilizer prices in the world market increased the cost of cultivation of paddy.
Export CropsCrops, such as cinnamon, pepper coffee, cocoa, citronella, cloves are included in this
category. Sri Lanka is the principal producer of cinnamon, 70 percent of the world productionis made in Sri Lanka. The export of those crops is responsible for 2.4 percent of the GNP.Deteriorating economic situations in the importing countries adversely affected the exportof agricultural products. As an example, the financial crisis of Brazil badly influenced thecinnamon market of Sri Lanka during 1990.
Animal ProductionThe price of animal feed affected the cost of animal production. Price of animal
products increased during 1990-99 due to price hikes in animal feed. Sri Lanka imports 75-81percent of milk and milk products consumed in the country. Prices of this foodstuff increaseddue to the rise in world market prices.
FisheriesTotal fish products during 1999 were 280,000 mt, an 8-percent increase over
production level of 1998. Out of this production, 38 percent was harvested from deep sea.However, we still import some amount of fish products. There is a large potential to developdeep-sea fishing, but due to the limitations in capital and technology, it is stillunderdeveloped.
Flower and Ornamental PlantsThis is a new area for agricultural development. A substantial amount of export
earnings and employment generation is done by this sub sector. However, due to thelimitation of technology and difficulties in timely production, the growth has not beensignificant in this sub-sector. The production is limited also due to transportation problems.
Fruit CropsWe grow tropical fruit crops such as mango, banana, passion fruits, orange, rambutan,
etc. and some of them are exported. However, we also import a considerable amount ofapples, grapes, oranges, etc. and spend a large amount of foreign currency. Export of tropicalfruits is a new industry with a great potential to expand.

- 189 -
EFFECTS OF THE FINANCIAL CRISIS ON RESOURCE UTILIZATIONIN THE AGRICULTURE SECTOR
Financial crisis affects any kind of economic activity, so it also affects agriculturaloperations. The theme discussed here is in the view of resource utilization in the agriculturesector, under the sub-headings of land, labor, capital and technology.
LandLand is a fixed asset for Sri Lanka farmers, so they seldom change the ownership of
land. Therefore, the financial crisis did not affect the availability of land in agriculture.There are three kinds of landholding in agriculture, such as large landholdings (more
than 5 acres), medium-size landholdings (2-5 acres), and small landholdings (smaller than2 acres). Most of the landholdings in the food crop sector are small landholdings. Also threekinds of land ownership exist: i) owner farmers; ii) tenant farmers; and iii) rental farmers. Nostudies have been done on the effect of the financial crisis on the pattern of land ownership.However, there is evidence that this crisis decreased the profitability of agriculturalproduction, which resulted in the low rental value of land.
The financial crisis also adversely affected land improvement and developmentalactivities. Since most of the agricultural production activities gave low profitability,investment in land development activities such as soil erosion control and other means oflong-term investments were avoided. The usage of land for marginally profitable andunprofitable crops is reduced.
LaborAgricultural labor wages in Sri Lanka are continuously increasing. For example, labor
wages per day was Rs.100-125 during 1995, and presently it is Rs.250-275. Labor wages risebecause there is a shortage of laborers in the agriculture sector. This shortage is a result oflabor movement from the agriculture sector to other sectors, and the low preference toagricultural labor jobs by younger generation. There is a high labor demand for agriculturalactivities such as the harvesting of paddy and land preparation. Farm mechanization seemsto be a viable option.
Farmers have to invest more money to buy or hire tractors, or irrigation systems orchemical weedicides to replace labor. Since the prices for agricultural products are low, it isnot economical to invest more money in such enterprises. However, resourceful farmersinvest their own money on such activities and have achieved marginal profit. Other farmersuse family labor and a minimum amount of hired labor, so they may not complete theoperations on time, therefore, resulting in poor productivity.
Another constraint in agricultural mechanization in Sri Lanka is the inappropriatenessof machines in some soil conditions and farming situations. The financial crisis slows downthe process for mechanization by discouraging investment on machines.
CapitalCapital is not an important factor for traditional village farmers. But, now almost all
Sri Lanka farmers use capital as a resource, and sell some of their produce to the market toreimburse their investment. Most of our farmers treat farming as an economical activity, sothey invest capital and sell their produce to get profit. However, due to the financial crisis,the prices of the farm produce went down, which reduced the profits. This discouraged

- 190 -
capital investment on farming operations. Only resourceful farmers used capital during thecrisis situation because they invested their own money. However, farmers who borrowedmoney from formal or non-formal means to invest in agriculture, have the additional cost ofinterest, resulting in higher costs of production, and loss in profits in agricultural enterprises.Therefore, the financial crisis limited the use of capital in agriculture as a productionresource.
TechnologyTechnology is the most essential factor in commercial agricultural production.
Technology covers the operations of land preparation, seeds and planting materials, plantprotection, weed control irrigation and drainage, harvesting and post-harvest activities. Eachand every operation has various means of technological procedures, materials and tools. Onlytraditional village farmers use less technology and invest the least money. But, other farmersuse technology though to a varying extent.
However, the financial crisis reduced the profitability of agricultural activities, thus itreduced money investment in agriculture, resulting in low levels of technology utilization.Although the Department of Agriculture and other relevant agencies carried out technologydissemination, it is clear that technology usage is limited due to the shortage of funds and thelow profit margin in agricultural production.
EFFECTS OF THE FINANCIAL CRISIS ONPRODUCTIVITY OF AGRICULTURE
As discussed earlier, resource utilization was affected by the financial crisis. This inturn affected the productivity of agriculture as discussed below:
1. Food Crop SectorThis sector mainly comprises of small farm holdings farmers with less resources and
a few percentage of resource rich farmers. As discussed earlier, poor farmers do not use asufficient amount of fund for agriculture, resulting in poor productivity. As an example, suchfarmers did not use advance technology such as good seed and planting materials, agro-chemicals, or mechanization. They invested less money and got less return, causing poorproductivity. Only a few farmers have sufficient money to invest for new technologymechanization, etc. so that only a few percentage of farmers received higher productivity.2. Plantation Sector
This sector comprises of large holdings and resourceful farmers. But there are smallfarm holdings too. However, this sector has more resource compared to the food crop sector,so that these farmers can operate on rather good standards. Due to the financial crisis, pricesof rubber went down, so most of the cultivation’s were neglected, in order to follow a processof diversification. Price of tea also fluctuated, however, it presently exists at a fairly highprice. The price of all other export crops such as cinnamon, paper, etc. increased in price,thus they never received negative effects from the financial crisis.
Other than rubber, and to some extent the coconut, all other crops were not hit by thecrisis since these crops received higher foreign market demands. Therefore, the productivityof these crops were maintained.

- 191 -
3. Animal Production and Fishing IndustryComponents of animal production are poultry, dairy and beef production, goat farming
the buffalo industry. Only the poultry farmers use feeds and other ingredients such asmedicine, etc., which require the money that was effected by the financial crisis. Due to thefinancial crisis, consumers’ buying powers were slightly reduced, which slightly lowered thedemand of local animal products. This reduced the profitability of the animal industry.Although the profit margin has gone down, production practices are maintained in goodstandards. Therefore, the productivity of the animal industry was not affected by financialcrisis.
Fishery industry is comprised of motor boat fishing and manual fishing. About 90percent of fish products come from motor boat fishing. Therefore, fish production incursinvestment for boats and nets and also fuel. Most of the boat owners get loans to invest fortheir business. There is limited capacity to invest money in this sector, due to the financialcrisis. Therefore, the country has not reached full productivity in this industry due to thelimitations on investment.4. Non-traditional Agricultural Products
Ornamental plants, the flower industry and mushroom production, etc. come under thiscategory. Ornamental plants and flowers are mainly produced for foreign markets. Largerinvestors engage in this industry. They faced a reduced foreign demand, due to theinternational crisis, so they had to reduce their production accordingly. They have thecapacity to change their production tactics, according to the demand. Therefore, the financialcrisis did not affect the productivity of such products. There are a number of self-employersin the non-traditional sector. They also faced slightly lower demand for their products locally,so that their profit margin went down. The situation made them reduce production capacity,thus affected productivity.
SOLUTIONS FOR THE PROBLEMS
Main problems are declining prices of agricultural commodities, less demand for value-added products and low availability of funds for investment. To alleviate these problems thefollowing remedies are suggested:
Strengthening Farmer OrganizationsOrganized farmers can get more benefits from outside sources as well as from their
farming fields, than unorganized farmers. When farmers are in a group, they have a strongervoice, so that they are able to get formal economic benefits. These farmers can get formalloans easily. Also, they can sell their products in a competitive market, and to have inputs onwholesale prices. In addition, they can get more attention from service supply organizations.Protecting farmer organizations will allow these farmers to avoid shortages in funds and lowprices.
Forward ContractingThere are a number of producers and buyers in an open economy for every commodity.
When they are in an unorganized manner, production is not targeted for demand. So pricesfluctuate which have harmful effects on products and also on consumers. The financial crisisaffected to the demand volume and led to uncertain sale of products at the guaranteed price.This uncertainty can cause a stop in agricultural production by individual farmers. This

- 192 -
uncertainty could be eliminated by forward contracting, where producers, as a group, makean agreement with marketing organizations, who agree to buy items at a given prices. Thissituation is very comfortable for producers as well as sellers, and the fluctuations in price canbe eliminated.
Improve the Relationship between Farmer Organizations and the Financing SectorThis can be done by government department mediation. Farmer organizations are
accepted as institutions, so they can do various organizational activities. The governmentdepartment can coordinate farmer organizations and banks in order to keep betterrelationships between these two sectors. This will create an atmosphere for the smooth flowof financing activities, as stated by the agreements. We have evidence that 100 percent loanrecoveries were done by some banks after they worked with farmer organizations. Thiscondition makes it easier for farmers to get loans for agricultural activities under the financialcrisis situation.
Appropriate TechnologySome technologies require more funds, but they are not 100 percent effective for the
given conditions. If a farmer has invested on such a technology, he/she still has someuncertainties. Sometimes farmers can incur loss if the technology does not work. Therefore,only site-specific tested technologies should be disseminated to the farmers by theDepartment of Agriculture and other relevant organizations.
Introduction of More Production AlternativeIf the farmer has only one production alternative, he/she has to use it regardless its
impact on productivity. But, if there are a number of alternatives, he/she can select the mostsuitable one and practice it. This approach is convenient under the conditions of the financialcrisis.
Project-based Agricultural ProductionAgricultural practices can be evaluated before hand for their financial, economic,
social, technical, environmental and market aspects. Project cycle frameworks give betterevaluations of agricultural practices, so that farmers can see whether they are operating at aprofit or loss. By doing this with various agricultural enterprises, they can select the mostsuitable agricultural practice for their situation. This practice avoids ill-effects from thefinancial crisis on agricultural entrepreneurs.
CONCLUSION
Although the percentage of GNP on agriculture is diminishing, our economy still relieson the agricultural production. The current financial crisis affected Sri Lanka agriculturalentrepreneurs in various strengths. Farmers who borrowed money, used more inputs, andwere connected to the market, faced high stress from financial crisis. Conventional farmerswho were not connected to the market, were not affected by the financial crisis.
This phenomenon of the crisis reduced market demand and farm prices. It also reducedfunding for agricultural activities by banks and fluctuated the prices for commodities.
A number of remedial measures are suggested to overcome the above problems. Theyare: strengthening farmer organizations, forward contracting between producer groups andmarketing organizations, improve relationships between financing organizations and farmer

- 193 -
organizations, introducing more production alternatives to farmers, introducing project cycle-based agricultural production activities and introducing appropriate technologies foragricultural production. By introducing such activities, they will be able to control the pricesof agricultural commodities, increase the supply of fund to farmers and improve technologyadoption. These activities will minimize the ill-effects of the financial crisis on agriculture.

1 Agricultural employment increased slightly in the year 2000. However, even then the numberof farmers in the year 2000 is still less than in 1996.
- 194 -
11. THAILAND
Dr. Viroj NaRanongResearch SpecialistThailand Development Research Institute (TDRI)Bangkok
I. INTRODUCTION
For many foreign observers, the Asian crisis is now over. Earlier this year, the AsiaDevelopment Forum (ADF), held a workshop in Singapore, entitled “Beyond the AsianCrisis”. The workshop placed a lot of emphasis on ways to alleviate the adverse impact ofthe crisis, along with preventive measures for similar crises in the future. Many foreignanalysts are quick to point out that Thailand’s export has already picked up and is now backto pre-crisis level. However, in Thailand, this kind of euphoria is rarely seen. Manybusinesses could only breakeven with their cash flow. Many, including those with healthycash flows, are still in such great debt that even after debt restructuring/rescheduling, theywould not have healthy balance sheets until the year 2015 or beyond. This makes it difficultto measure the overall effects of this financial crisis at this stage.
Also not realized by many foreigners and Thais alike, the crisis did not adversely affecteveryone or every sector. This financial crisis came with a major devaluation of the Baht. TheBaht devaluation, along with the El Niño that took place then in several countries, had causedfood prices to increase substantially in the 1997/98 season. In a net food-exporting countrylike Thailand, the so-called “crisis” had become “a golden year” for the Thai agriculturesector, at least up until mid-1998. Effects of devaluation then subsided. The Baht began torevalue and the world prices of many agricultural products began to decrease, especially afterthe crisis had spread to a number of Asian and Latin-American countries. This all happenedwithin one year after the onset of the Thai crisis.
The crisis also affected the Thai rural economy in a less direct manner. Contrary toconventional beliefs, a large percentage of families in rural Thailand who identify themselvesas “farmers” actually draw their main income from non-farm activities. Remittance has longbeen another major source of income for these families. The crisis cut off the flow of non-farm income and remittance substantially. It also reversed the roles of members in manyfamilies. Many young family members, who moved out for employment in urban areas andsent home remittance, were laid off and had to return home for family support.
Due to the layoffs in the industrial sector and the high crop prices after the onset of thecrisis, conventional wisdom would expect massive urban-to-rural migration, which wouldincrease agricultural employment substantially. As it turns out, employment in agriculturecontinued to decline in 1998 and 1999.1 Apparently, most workers who returned to the rural


2 It implies that income of an average farmer would be only one-ninth of those outside of theagriculture sector.
3 Another result of the crisis was that more children went to school. This result is consistentwith what happened in the United States in the early 1990s, when the job market wasconsidered poor. Not many people predicted this ex ante, in the case of Thai crisis, becausethey cling to the belief that the crisis would affect a great many people so adversely that theywould not able to invest more in their children’s education.
- 196 -
Figure 1 indicates that the labor share of the agriculture sector is quite high, eventhough it continues to decline. The significance would be more pronounced when onecompares these figures with those of other developing countries which have similar levelsof per capita GDP as Thailand. This leads many Thais to believe in the high labor-absorptioncapacity of the agriculture sector. What many people overlook is that concentration of laborin one sector does not always mean that the sector would be able to absorb much morelaborers. One could also use simple mathematics to demonstrate that when one-half of thelabor force generates only one-tenth of the country’s GDP, not only is the level of inequalitydramatically high2 but the productivity in the agriculture sector must also be rather low.
In fact, it turns out that the Thai farmers do realize the limitations of the agriculturesector. Among those who are classified as “farmers”, based on their main activities duringthe rainy season, less than two-thirds draw their main income from farming. Seasonalmigration, specifically from rural to urban areas or to big cities in the dry season, is verycommon. A lot of families also send young members to work year-round, who then sendhome substantial remittance. In fact, if one changes the definition of “farmers” from thosewho spend most of their working times on farms to those whose main incomes are fromagricultural activities, the share of agriculture in employment would come down to about 30percent. A recalculation to compare the average income of farmers and non-farmers wouldbe much less dramatic than the one stated earlier. Nonetheless, the average income of a non-farmer would still be almost four times as much as income of an average farmer.
It should not come as a surprise that a great number of Thai farmers has made everyattempt to provide their children with higher education, so that they could get a better job andwould not have to follow the parents’ footsteps. Many children from farming families alsoprefer to escape from this occupation. This process has been ongoing in the past few decades,as partly shown in Figure 1. Apparently, the crisis slowed down the process to some extent.However, even with such a big financial crisis which hit the non-agriculture sector very hardand the rumor of a massive urban to rural migration, the net outcome of the crisis was rathersmall, as it would be more evident in Section IV.3
III. AGRICULTURAL PRODUCTIVITY ANDPROBLEMS ON PRODUCTIVITY MEASUREMENT
Low productivity has always been viewed as a major problem within the agriculturesector of Thailand. However, little attempt has been made to measure agriculturalproductivity. The only reported – and thus most frequently cited – productivity index is yieldper ha (or yield per rai; 1 rai = 0.16 ha). Very few researchers attempt to use other indexes.Siamwalla and NaRanong (1990) use yield per worker as an alternative of productivitymeasurement in their study on rice. Both measurements are, however, crude in the sense that

- 197 -
they reflect not only land or labor productivity, but also the effects of other inputs andweather conditions. Although there are many studies that estimate the effects of each of thesefactors on productivity, most of them use survey data that are area-specific or crop-specific.Many of these studies are also one-time cross-sectional studies.
Among the factors affecting agricultural productivity, weather conditions turn out tobe the most important one for Thai agriculture. Most of Thailand’s agricultural areas areprimarily rainfed, and only 22 percent of agricultural land are labeled irrigated area. Inreality, not all of this 22 percent receive “irrigated” water, even during the rainy season. Itis estimated that only 8 percent of the agricultural land receive irrigated water in the dryseason. Since crop yields in rainfed areas fluctuate from year to year, the overall crop yieldsalso fluctuate substantially.
In general, crop yields in Thailand are much lower than those in most of the developedand developing countries. For example, average rice yield per ha in Thailand is about one-half of rice yields in the United States, Japan, Rep. of Korea and China. Similarly, sugarcaneyield (in terms of sucrose per ha) is about one-half of that of Australia. Therefore, there hasbeen a lot of talk about the “potential” of the Thai agricultural sector. One factor mentionedby many academics is that levels of chemical fertilizer used in Thailand are much lower thanthose of other countries. However, a closer investigation would reveal that crop yields inirrigated areas are similar to the crop yields of other countries. Furthermore, one of the mainreasons that many farmers in rainfed areas are not willing to apply more fertilizers is that therisks of applying fertilizers are greater and the expected returns are generally lower than inthe irrigated areas.
IV. THE CRISIS AND ADJUSTMENTS
The big wave of the financial crisis appeared to hit Thailand in mid-1997, with theBaht floatation climax on 2 July. However, the crisis actually began to pronounce itself in1996, when it became clear that Thailand’s export started to lose its competitiveness in theworld market. The export growth rate, which used be in two-digit figures, sank to virtuallyzero in 1996. During the 1990s, Thailand has always had a huge current account deficit (closeto 10 percent of the GDP annually), but since export growth was normally at two-digits, theproblem was ignored by the Thai Government and international investors alike. Once theproblem was revealed, as early as November 1996, a leading international hedge fund beganto short sell the Baht, and soon other hedge funds followed suit. The Bank of Thailand foughtthem off vigorously and had “Won” some battles. However, eventually the bank used upalmost all of the country’s foreign exchange reserves and had to turn to the IMF forassistance.
The financial crisis and the accompanied credit crunch had led to the fall of manycompanies and a substantial amount of layoffs. Its impacts on agriculture were in four folds.First of all, the economic crisis lessened domestic demand for agricultural products. Second,devaluation of the Baht increased domestic prices of agricultural products, especially up untilthe first half of 1998. Third, the Baht devaluation increased prices of imported inputs suchas fertilizers, insecticides and some ingredients of animal feeds. Finally, the depression orstagnation of the non-agriculture sector decreased the wage rate and therefore released somelabor to the agriculture sector.
Up until the first half of 1998, the strongest effect was the Baht devaluation effect. Asof February 1998, the Baht had lost about 55 percent of its value (the exchange rate moved

4 The crisis affected the domestic consumption of all types of meats, with greater effects on themore expensive ones. Pork consumption decreased substantially, which led to a fall in theprice of pigs after devaluation. Beef consumption, which had begun to shrink even before thecrisis, continued to decrease. Even chicken consumption, which became the least expensivesource of protein, dropped by 20 percent in 1997.
- 198 -
from B/ 25 to B/ 55 per US$1). The devaluation effect, coupled with effects created by the ElNiño in several countries, made 1998 a golden year of tradable crops such as rice, maize,cassava and soybean. Livestock and aquaculture, such as chicken and shrimp, also benefittedgreatly during the period. Although the cost of many imported inputs also doubled, theincreased costs were more than offset by the increased prices. This was particularly the casefor the Thai agriculture sector, which uses relatively little import contents in production.Non-traded or lightly-traded agricultural products, i.e., most fruits and vegetables and certainlivestock products such as pork, were affected adversely by shrinking domestic demand.4
The sole exception of the price movement of tradable agricultural products was thecase of para-rubber price. The domestic price in Baht of para-rubber continued to fall in spiteof the Baht devaluation. Notably, the Southeast Asian countries, particularly Thailand,Indonesia and Malaysia, supply more than two-thirds of para-rubber to the world market.Shortly after the Thai crisis, both Indonesia and Malaysia fell into their own crisis and hadto devalue their currencies. The rubber case was an early warning sign for trouble in the Thaiagriculture sector. It was the first example of what would happen to the prices of manyagricultural products in 1999 and thereafter.
After Thailand, Indonesia and Malaysia, the next victims were Rep. of Korea andRussia. Then, several Latin American countries, especially Brazil, were affected adverselyfrom this “Asian” crisis. As the crisis spread to more and more countries, the worldagricultural prices in hard currencies began to fall. Coincidentally, after value of the Bahtrocked bottom in the first quarter of 1998, the Baht regained its value by almost 50 percent(from B/ 55 to B/ 37 per US$1) in less than one year. In 1999, prices (in Baht) of many tradablecrops fell back to pre-crisis level. Many farmers began to feel the impact of the crisis. Thismay be seen from the fact that 5 percent of farmers left the agriculture sector in 1999.
Although it is difficult to single out the impact of the financial crisis on the labor force,Table 1 should shed some light on how the labor market adjusted during the crisis. Asindicated previously in Figure 1, farmers and farm workers had been continually moving outof the agriculture sector long before the crisis. Table 1 indicates that in 1996, the number offarmers and farm workers decrease by more than 7 percent. The number of rice farmers –which accounts for three-fourths of all farmers – decreased even more. The decreasing trendsin 1996 were similar to the earlier years, specifically during the 1980s and 1990s. After theonset of the crisis, the trend reversed in 1997; the number of farmers increased by 4 percent(9 percent for rice farmers) and the number of farm workers also increased by 3 percent.
However, the reversal of the secular trend did not last long. As early as the second halfof 1998, which was the golden year of Thai agriculture, farmers – especially rice farmers –began to move out from the agriculture sector once again. Once crop prices plunged in 1999,a large number of farmers left the agriculture sector like they did in 1996. The trend wasslightly reversed in the year 2000, partly because the recovery in the non-agriculture sectorhas not come through as many had expected (the substantial increase in oil prices could beone of the major causes). However, the number of farmers in 2000 was still less than in 1996,which was a pre-crisis year.

- 199 -
Table 1. Employed Workers in the Agriculture Sector, 1995-2000Year 1995 1996 1997 1998 1999 2000
Farmers 13,591,039 12,597,547 13,123,132 13,051,870 11,910,953 12,091,476Rice farmers 10,389,873 9,301,794 10,155,874 9,703,129 8,529,948 9,014,906
Hired farm workers 1,565,193 1,426,751 1,468,560 1,589,359 1,706,924 2,141,357Fishermen and hunters 328,827 465,790 403,211 378,640 459,829 367,239Loggers 1,584,819 1,752,610 1,750,017 1,690,127 1,794,061 1,707,046Total 17,069,878 16,242,698 16,744,920 16,709,996 15,871,767 16,307,118
Percentage change from the previous yearFarmers -7.3 4.2 -0.5 -8.7 1.5
Rice farmers -10.5 9.2 -4.5 -12.1 5.7Hired farm workers -8.8 2.9 8.2 7.4 25.5Fishermen and hunters 41.7 -13.4 -6.1 21.4 -20.1Loggers 10.6 -0.1 -3.4 6.1 -4.9Total -4.8 3.1 -0.2 -5.0 2.7
Source: Compile by the author from raw data from the Labor Force Surveys Round 3 (August) (years 1995-2000) administered by theNational Statistical Office.

5 Numbers of workers in other crops are usually lumped together in a rougher category in theLabor Force Survey. Therefore, it is not possible to use the same measure I used here tomeasure (average) labor productivity of sugarcane farmers, for example.
6 It should be noted that when the second group (those who did not work during the surveyweek) was excluded, the results are almost exactly the same as when they were included.
- 200 -
One notable change in the labor force throughout the crisis is the number of hired farmworkers, which has continued to increase from 1997, even in 1999 when a lot of farmers-operators moved out of agriculture. Since hired farm workers usually are among the poorestgroups in the rural economy, the increase in their number creates an alarming possibility ofpoverty returning to the rural areas. This phenomenon also suggests job opportunities forunskilled labor in the non-agriculture sector is not sufficient to absorb as many workers asit used to during the pre-crisis years.
V. EFFECT OF THE FINANCIAL CRISIS ONAGRICULTURAL PRODUCTIVITY: A CASE STUDY OF RICE
Lack of relevant data makes it difficult, if not impossible, to measure the impacts ofthis financial crisis on agricultural productivity. This section attempts to explore this issuein the case of rice. Rice farming is still the most important agricultural activity in Thailand;more than three-fourths of Thai farmers are rice farmers. Rice is also the only crop that hasbeen studied by the National Statistical Office’s Labor Force Survey,5 in which the numberof workers can be found.
This section attempts to measure output per worker in the rice sector. The number ofworkers in the rice sector here comprise of workers who worked during the survey week(during rainy season in August) plus those who did not work during the survey week but whohad a regular job in the rice sector.6 Output per worker is then computed using the output ofwet-season rice from the corresponding crop year (e.g., output per worker for the crop year1993/94 is obtained by dividing output of that crop year by the number of rice farmers inAugust 1993).
As shown in Figure 2, output per worker in the rice sector had been climbingcontinually before the crisis. Apparently, as labor forces withdrew from the agriculture sectorduring the pre-crisis year, output per worker increased. It is possible that, during that period,the agriculture sector adjusted itself and became more efficient with less labor. Theadjustment might involve using more laborsaving production processes. As a result, when thecrisis hit in 1997 and a substantial number of workers returned to the agriculture sector,output per worker in the rice sector began to drop. Only when some workers once againmoved out from the rice sector in 1998 that output per worker began to rise again.
The study attempts to explore productivity changes in different regions of Thailand(Figure 3). A similar pattern is noticed for most regions. However, there are rather huge gapsbetween output per worker between the Central and the Southern regions on one end and theNorthern and Northeastern regions on the other end. While some factors, such as weather,might play significant roles in these differences – especially in case of the Northeasternregion, there might also be some systematic measurement errors of outputs and labors incertain regions as well.

- 201 -
mt (paddy)/worker2,500
2,000 Whole country
1,500
1,000 Year1993/94 1994/95 1995/96 1996/97 1997/98 1998/99
North NortheastSouth CentralTotal
7.00
6.00
5.00
4.00
3.00
2.00
1.00
0.001993/94 1994/95 1995/96 1996/97 1997/98 1998/99
Year
Figure 2. Wet Season Rice Yield in Thailand, Crop Year 1993/94 – 1998/99
Sources: Output: Office of Agricultural Economics, Agricultural Statistics of Thailand (yearspecified), several years; and number of rice farmers: compile by the author fromraw data from the Labor Force Surveys Round 3 (August) (years 1995-2000)administered by the National Statistical Office.
Figur
e 3. Wet-season Rice Yield by Region, Crop Years 1993/94-1998/99
Sources: Output: Office of Agricultural Economics, Agricultural Statistics of Thailand (yearspecified), several years; and number of rice farmers: compile by the author fromraw data from the Labor Force Surveys Round 3 (August) (years 1995-2000)administered by the National Statistical Office.

- 202 -
VI. CONCLUDING REMARKS
To date, there has been no study that focuses on the effects of the financial crisis onagricultural productivity in Thailand, partly because there are no such data. The author madea preliminary attempt to explore the productivity of rice, where data are most readilyavailable. The finding was that, during the pre-crisis years when workers were moving outfrom the agriculture sector, output per worker in the rice sector climbed continually. It ispossible that, during this period, the agriculture sector adjusted itself by using more labor-saving production processes. When the crisis hit in 1997 and some workers returned to theagriculture sector, output per worker in the rice sector dropped and would rise only whensome workers left the rice sector once again.
The findings from this study suggest that the rice sector’s labor absorption capacity israther limited now, of which the farmers themselves are well aware. Adding more able bodiesto this sector would probably result in a decrease in labor productivity. While the author wasunable to look at the effects of the crisis on other crops, due to data constraints, it is plausiblethat other traditional field crops share the same problem as rice. Although the crisis in thenon-agriculture sector of Thailand is far from over, there is no easy solution such aspersuading workers to return to the agriculture sector. The slogan, “grow rice to feed one’sself first”, which encourages farmers in backward areas to stick with rice, might not be of thefarmers’ best interest.
REFERENCES
Behrman, Jere R., Anil B. Deolalikar and Pranee Tinakorn with Worawan Chandoevwit,2000. “The Effects of the Thai Economic Crisis and of Thai Labor Market Policies onLabor Market Outcomes”, report prepared for the World Bank, Bangkok, TDRI.
Siamwalla, Ammar and Viroj NaRanong, 1990. Compendium on Rice, TDRI, Bangkok (inThai).
Siamwalla, Ammar and Orapin Sopchokchai, 1998. “Responding to the Thai EconomicCrisis”, a paper prepared for the United Nations Development Programme (UNDP/Thailand), Bangkok, UNDP.

- 205 -
APO Study Meeting on Effects of Financial Crisis on Productivity ofAgriculture, 6 - 13 December 2000, Japan
1. LIST OF PARTICIPANTS, RESOURCE SPEAKERSAND SECRETARIAT
A. PARTICIPANTS
Country Name/Official Address
Bangladesh Ms. Ishrat JahanDeputy Chief (Policy)Ministry of AgricultureBuilding No. 4, Room No. 508Bangladesh SecretariatDhaka
Republic of China Dr. York Yaw-chung LiaoDeputy Director GeneralEconomics and Planning DepartmentCouncil of AgricultureExecutive Yuan37 Nan Hai RoadTaipei, Taiwan 100
India Dr. Gopal S. KaushalDirector of AgricultureDepartment of AgricultureGovernment of Madhya PradeshVindhyachal BhawanBhopal
Mr. Sanjib Chandra HotaAgriculture Production Commissioner-cumAdditional Chief SecretaryGovernment of OrissaBhubaneswar
Indonesia Mr. Djodi HidayatHeadDivision for Planning Program and EvaluationDirectorate General for Chemical, Agriculture and Forest-based IndustryJl. Gatot Subroto Kav. 52-53Jakarta 12950

- 206 -
Islamic Republic of Iran Mr. Jahangir Yadolahi FarsiExpert in Agricultural PlanningManagement and Planning OrganizationAgricultural BureauBeharestan Sq., Tehran 11494
Republic of Korea Dr. Seong-Jae ParkDirectorDepartment of Rural DevelopmentKorea Rural Economic Institute (KREI)4-102 Hoigi-dong, Dongdaemoon-GuSeoul 130-050
Malaysia Mr. Lew Leong PohManagerNational Productivity CorporationP. O. Box 64Jalan Sultan, 46904 Petaling JayaSelangor
Mr. Ismail MatEconomic Affairs OfficerFisheries Development Authority of Malaysia (LKIM)7th Floor, Wisma Pkns, Jalan Raja Laut50350 Kuala Lumpur
Mongolia Mr. Dorj NyamrentsenEconomistTrade and Development Bank of MongoliaKhudaldaaug-7Ulaanbaatar 11
Nepal Mr. Buddhi N. MaharjanAssistant Agricultural EconomistMinistry of Agriculture and CooperativesSingh DurbarKathmandu
Pakistan Mr. Muhammad Rafiq SaroyaExecutive DirectorPersonnel DivisionAgricultural Development Bank of PakistanHead Office1 Faisal AvenueIslamabad

- 207 -
Philippines Ms. Sheila Marie M. EncaboSenior Economic Development SpecialistAgriculture StaffNational Economic and Development Authority12, Amber AvenuePasig City
Sri Lanka Mr. Thuiappu A. WimalasenaProvincial Director AgricultureSouthern Provincial CouncilMinistry of Agriculture26, Charch StreetFort-Galle
Thailand Dr. Viroj NaRanongResearch SpecialistThailand Development Research Institute565 Soi ThepleelaRam Kamhaeng Road, Wang Thong LangBangkok 10310
B. RESOURCE SPEAKERS (alphabetical)
Dr. Memed GunawanDirectorBureau of Planning and International CooperationMinistry of AgricultureJl. Harsono RM No. 3Pasar Minggu, Jakarta 12500Indonesia
Mr. Eikichi KoguchiDeputy-DirectorDepartment of 1st ResearchNorinchukin Research Institute Co., Ltd.1-8-3 Otemachi, Chiyoda-kuTokyo 100-0004Japan
Prof. Dr. Tongroj OnchanPresidentThe Mekong Environment and Resource Institute (MERI)93/1 Kensington Place, 4th FloorSoi 13-15, Chaengwattana RoadLak Si, Bangkok 10210Thailand

- 208 -
Dr. Young-Bong YuProfessorDepartment of Agricultural EconomicsCheju National UniversityAra 1-Dong, Cheju-Shi, 690-756Republic of Korea
C. SECRETARIAT
AICAF Mr. M. NakajimaManagerInternational Cooperation Division
Ms. Akiyo NishiyamaInternational Cooperation Division
Association for International Cooperation of Agriculture and Forestry (AICAF)Akasaka KSA Building 3F8-1039 Akasaka, Minato-kuTokyo 107-0052Japan
Tel: (813)5772-7670Fax: (813)5772-7680
APO Mr. Teruo MiyakeDirectorAgriculture Department
Dr. Muhammad SaeedProgram Officer (Agriculture)Agriculture Department
Asian Productivity OrganizationHirakawa-cho Dai-ichi Seimei Building 2F1-2-10, HirakawachoChiyodaku, Tokyo 102-0093, Japan
Tel: (81-3)5226-3920Fax: (81-3)5226-3950e-mail: [email protected]: www.apo-tokyo.org

- 209 -
2. PROGRAM OF ACTIVITIES(6 - 13 December 2000)
Date/Time Activity
Wed., 6 Dec.Forenoon Opening Ceremony
Presentation and Discussion on Topic I: Impact of the 1997Financial Crisis on Southeast Asia’s Farm Sector with A SpecialReference to Thailand
by Prof.Dr. Tongroj OnchanAfternoon Presentation and Discussion on Topic II: An Outline of the Credit
Business of Agricultural Cooperatives in Japanby Mr. Eikichi Koguchi
Presentation and Discussion on Topic III: Impact of FinancialCrisis on Productivity of Agriculture: Korean Case
by Dr. Young-Bong Yu
Thurs., 7 Dec.Forenoon Presentation of Country Reports by ParticipantsAfternoon Continuation of Presentation of Country Reports by Participants
Fri., 8 Dec.Forenoon Presentation and Discussion on Topic IV: An Overview of the
Impact of Financial Crisis on Productivity of Agriculture in theAsia-Pacific Region
by Dr. Memed GunawanAfternoon Continuation of presentation of Country Reports by Participants
Sat., 9 Dec.Forenoon WorkshopAfternoon Free
Sun., 10 Dec.Forenoon FreeAfternoon Leave Tokyo for Maebashi-shi, Gunma Prefecture
Mon., 11 Dec.Forenoon Visit JA Sawada (agricultural cooperative)Afternoon Visit JA Maebashi-shi (agricultural cooperative)
Tues., 12 Dec.Forenoon Visit JA Katashina-mura (agricultural cooperative)Afternoon Leave Takasaki, Gunma Prefecture for Tokyo
Wed., 13 Dec.Forenoon Summing-up Session
Closing Session