How smart are our environments? An updated look at the state of the art
Upload
independentCategory
view
1download
0
An Updated Look at the Recovery of Agricultural
Productivity in Sub-Saharan Africa
Alejandro Nin-Pratt
Bingxin Yu
Author Affiliation and Contact Information
Alejandro Nin-Pratt – Research Fellow, Development Strategy and Governance Division - IFPRI Address: 2033 K Street, NW – Washington DC, 20006 – USA. Phone: +1-(202)-862-5689. Email: [email protected]
Bingxin Yu - Postdoctoral Fellow, Development Strategy and Governance Division – IFPRI. Address: 2033 K Street, NW – Washington DC, 20006 – USA. Phone: +1-(202)-862-8114. Email: [email protected]
Contributed Paper prepared for presentation at the International Association of Agricultural Economists Conference, Beijing, China, August 16-22, 2009
Copyright 2009 by Alejandro Nin-Pratt and Bingxin Yu. All rights reserved. Readers may make verbatim copies of this document for non-commercial purposes by any means, provided that this copyright notice appears on all such copies.

ABSTRACT
We analyze the evolution of Sub-Saharan Africa‘s agricultural total factor productivity (TFP) over the past 40 years, looking for evidence of recent changes in growth patterns using a nonparametric Malmquist index. Our TFP estimates show a remarkable recovery in the performance of Sub-Saharan Africa‘s agriculture during between 1984 and 2003 after a long period of poor performance and decline. That recovery is the consequence of improved efficiency in production resulting from changes in the output structure and an adjustment in the use of inputs, including an overall net reduction in fertilizer use but increased fertilizer use in most of the best-performing countries. Policy changes implemented by African countries between the mid-1980s and the second half of the 1990s appear to have played an important role in improving agriculture‘s performance. As TFP growth in Sub-Saharan Africa is mainly a result of catching up to the frontier, we expect growth to slow down in the coming years unless African countries accelerate the incorporation of innovations into the production process and increase agricultural R&D investment and the speed of technical change.
Key words: agriculture, total factor productivity, Sub-Saharan Africa
JEL Codes: D24, Q18
1
An Updated Look at the Recovery of Agricultural Productivity in
Sub-Saharan Africa
1. INTRODUCTION
In recent years, ―an improvement in economic indicators throughout Africa led some observers
to argue that the region had finally solved its economic conundrums and could now expect
sustained economic growth‖ (van de Walle 2001). That optimism was fueled by the end of
several civil wars, a wave of democratization in numerous countries, the acceleration of
economic growth, and momentous improvements in the performance of the agricultural sector
across Africa. During the 1980s and 1990s, a significant increase in the rate of output growth
signaled a change in Sub-Saharan Africa‘s (SSA‘s) agricultural sector, after its worst
performance occurring between 1972 and 1983, when output growth was less than 1 percent.
This recovery of agriculture resulted in output growth rates of 3.2 percent per annum from 1984
to 2003. In the first half of this period (1984-1993), agricultural output growth in SSA was below
only growth in China, and despite a slowdown, it still compares with growth in other regions in
most recent years.
What are the factors behind the dynamism agriculture has shown in recent years? Can this
growth be sustained in the coming years? With a growing labor force in agriculture together with
land constraints, sustainable agricultural growth can be achieved only through increased total
factor productivity (TFP), the amount of output per unit of total factors used in the production
process. TFP can make a substantial contribution to economic growth and development by
increasing the welfare of agricultural workers and the rural population, allowing workers to
move away from agriculture to more productive sectors, and generating surpluses that can be
2
transferred to other sectors through prices, in particular at early stages of economic development
(see, for example, Winters et al. 1998).
Despite evidence of improved performance in the past 10 years, only a few studies have
attempted to analyze SSA‘s agricultural productivity changes and the factors explaining those
changes (see for example Block 1995, Lusigi and Thirtle 1997, and Fulginiti et al. 2004). This
paper contributes to the understanding of the recent changes in SSA‘s agriculture by analyzing
the evolution of the region‘s agricultural TFP in the past 40 years using a nonparametric
Malmquist index. We make four main contributions. First, we confirm the improved
performance of SSA‘s agriculture since the mid-1980s. Second, we determine the contributions
of individual countries to total TFP growth in SSA. Third, we show the contribution of different
groups of commodities to total output growth and changes in the use of inputs of best
performers. Finally, we analyze TFP time series for structural changes to find relationships
between TFP growth and policy changes in the 1980s and 1990s.
The paper is organized as follows. The next section presents the methodology employed and the
data used to estimate TFP. Section 3 presents productivity estimates and Section 4 discusses TFP
growth and policy changes in SSA. The last section concludes.
2. PRODUCTIVITY MEASURES AND METHODOLOGY
The Malmquist index measures the TFP change between two data points (e.g., those of a country
in two different time periods) by calculating the ratio of the distance of each data point relative to
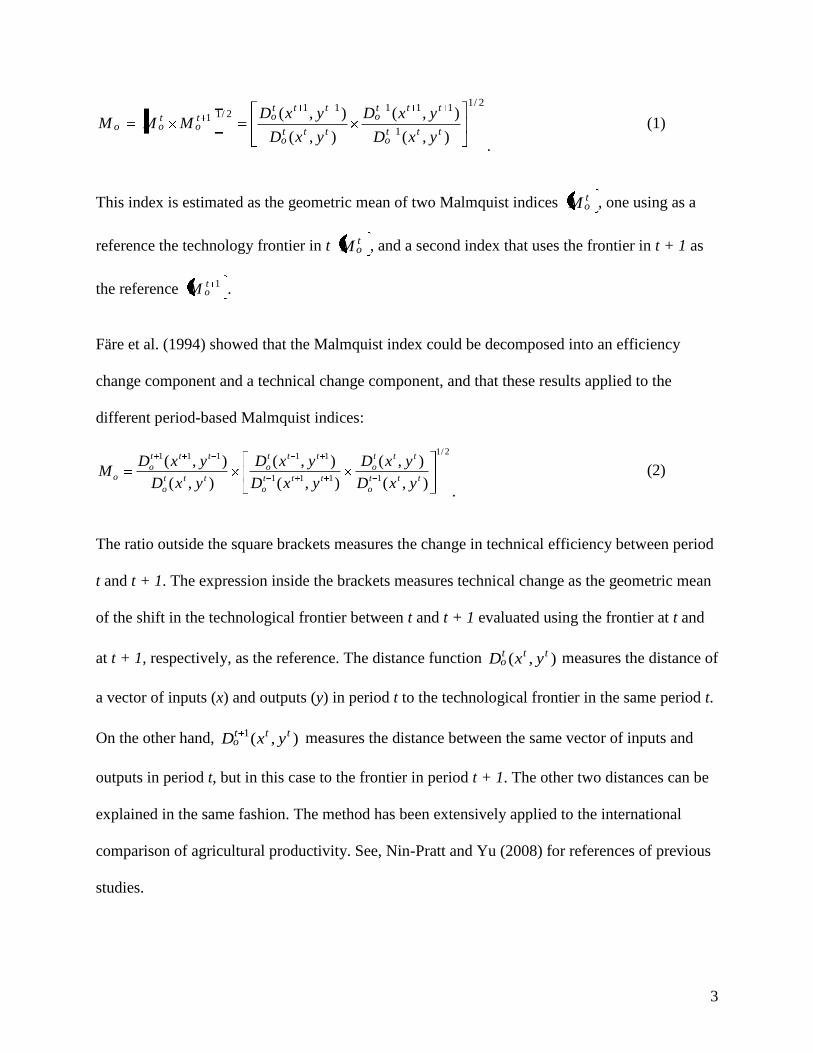
a common technological frontier. Following Färe et al. (1994), the Malmquist index between
period t and t + 1 is given by
3
2/1
1
111112/11
),(
),(
),(
),(ttt
o
ttto
ttto
tttot
otoo
yxD
yxD
yxD
yxDMMM
.
(1)
This index is estimated as the geometric mean of two Malmquist indices toM , one using as a
reference the technology frontier in t toM , and a second index that uses the frontier in t + 1 as
the reference 1toM .
Färe et al. (1994) showed that the Malmquist index could be decomposed into an efficiency
change component and a technical change component, and that these results applied to the
different period-based Malmquist indices:
2/1
1111
11111
),(
),(
),(
),(
),(
),(ttt
o
ttto
ttto
ttto
ttto
ttto
o yxD
yxD
yxD
yxD
yxD
yxDM
. (2)
The ratio outside the square brackets measures the change in technical efficiency between period
t and t + 1. The expression inside the brackets measures technical change as the geometric mean
of the shift in the technological frontier between t and t + 1 evaluated using the frontier at t and
at t + 1, respectively, as the reference. The distance function ),( ttto yxD measures the distance of
a vector of inputs (x) and outputs (y) in period t to the technological frontier in the same period t.
On the other hand, ),(1 ttto yxD measures the distance between the same vector of inputs and
outputs in period t, but in this case to the frontier in period t + 1. The other two distances can be
explained in the same fashion. The method has been extensively applied to the international
comparison of agricultural productivity. See, Nin-Pratt and Yu (2008) for references of previous
studies.
4
Two different approaches have been used to define the nonparametric distance functions
involved in the estimation of the Malmquist index: the envelope form and a dual equivalent
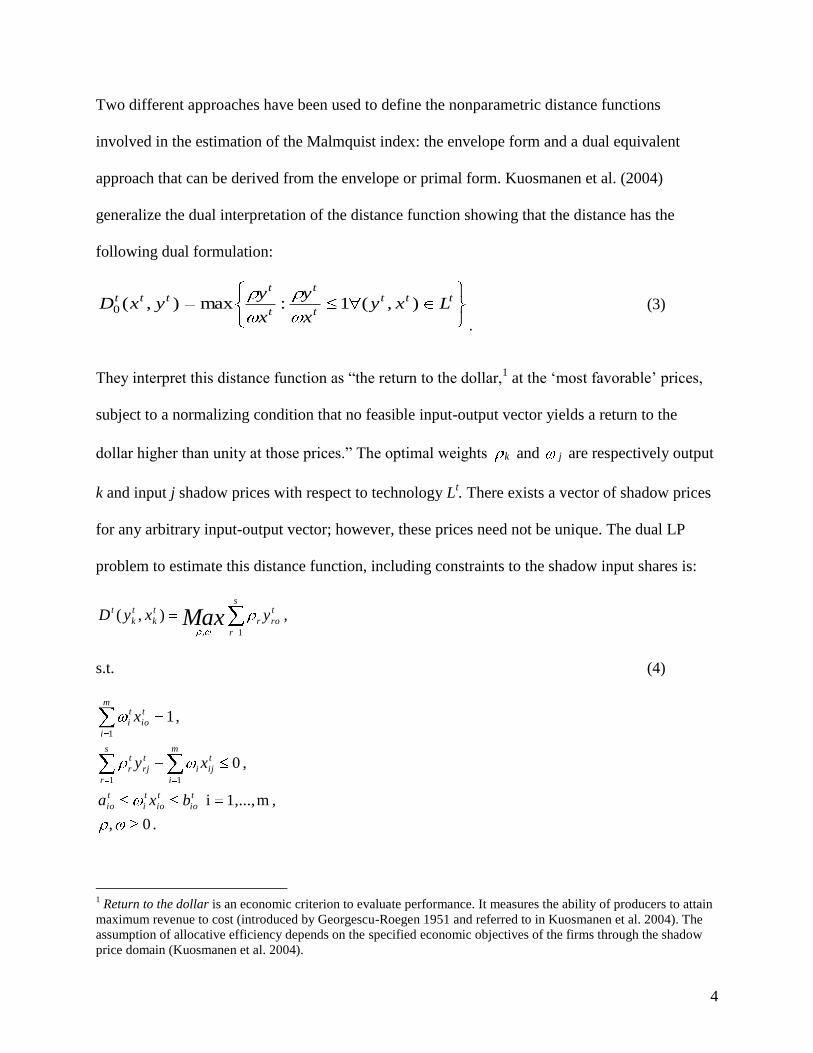
approach that can be derived from the envelope or primal form. Kuosmanen et al. (2004)
generalize the dual interpretation of the distance function showing that the distance has the
following dual formulation:
tttt
t
t
tttt Lxy
x
y
x
yyxD ),(1:max),(0
. (3)
They interpret this distance function as ―the return to the dollar,1 at the ‗most favorable‘ prices,
subject to a normalizing condition that no feasible input-output vector yields a return to the
dollar higher than unity at those prices.‖ The optimal weights k and j are respectively output
k and input j shadow prices with respect to technology Lt. There exists a vector of shadow prices
for any arbitrary input-output vector; however, these prices need not be unique. The dual LP
problem to estimate this distance function, including constraints to the shadow input shares is:
, ),(1,
s
r
tror
tk
tk
t yxyD Max
s.t. (4)
. 0,
, m1,...,i
, 0
, 1
11
1
tio
tio
ti
tio
m
i
tiji
s
r
trj
tr
m
i
tio
ti
bxa
xy
x
1 Return to the dollar is an economic criterion to evaluate performance. It measures the ability of producers to attain maximum revenue to cost (introduced by Georgescu-Roegen 1951 and referred to in Kuosmanen et al. 2004). The assumption of allocative efficiency depends on the specified economic objectives of the firms through the shadow price domain (Kuosmanen et al. 2004).
5
The introduction of bounds on shadow input shares constitutes additional constraints to the
original formulation.2 Restricted and unrestricted models will provide the same results only if all
the additional restrictions imposed are nonbinding.
In this study we estimate the distance functions needed to calculate the Malmquist index using
the dual approach imposing bounds to the shadow shares to assure that these shares are within
the expected range of shares for SSA countries. Information on the likely value of the shares of
the different inputs is from Evenson and Dias Avila (2007). These authors estimate crop input
cost shares for 32 Sub-Saharan African countries by adjusting carefully measured share
calculations for India. A detailed discussion of the methodology can be found in Nin-Pratt and
Yu (2008).
Data used is from the Food and Agriculture Organization of the United Nations (FAO) and
includes one output (agricultural production measured in international dollars) and five inputs
(labor, land, fertilizer, tractors, and animal stock) for 98 countries of which 30 are Sub-Saharan
African countries.
2 t
ioti x the input shadow prices multiplied by the input quantities) is equal to the implicit input shares as shown
in Coelli and Prasada Rao (2001)

6
3. TFP GROWTH AND PERFORMANCE OF SUB-SAHARAN AFRICA’S
AGRICULTURE, 1964–2003
Aggregated Results Using a Weighted Average of 30 Sub-Saharan African Countries
A weighted average of TFP measures at the country level for a sample of 30 Sub-Saharan
African countries shows that annual growth between 1964 and 2003 was 0.15 percent. This
average, however, hides significant variations across time, where two periods with contrasting
results can be distinguished (Figure 1). A first period of poor performance and decline stretches
from the mid-1960s to the mid-1980s, during which productivity growth in SSA was negative:
2.01 and 0.77 percent per annum if average TFP is estimated respectively including or
excluding Nigeria.3 That period is followed by a period of recovery and improved performance
that starts in 1984–1985 and extends up to 2003, the last year for which information is available.
During this period, TFP grows at an annual rate of 1.73 percent (1.18 percent excluding Nigeria),
with 1.65 percent growth in the first half of the period (1984–1993), compared with 1.67
percent between 1974 and 1983. TFP growth accelerates during the 1990s to 1.83 percent as
more countries improve their performance and speed up TFP growth.
3 Because of the size of Nigeria‘s agricultural sector relative to other countries, some of the aggregated results for SSA could be driven by that country. For that reason, some of the results are presented excluding Nigeria.

7
Figure 1. Index of cumulative TFP growth in SSA (1961 = 1)
Source: Estimated by authors.
The decomposition of SSA‘s TFP growth into efficiency and technical change shows that almost
all TFP growth of the last 20 years is the result of SSA catching up to the frontier after falling
behind during the 1964–1983 period (Table 1).
Table 1. TFP growth rate and decomposition for different periods (percentage)
TFP Efficiency Technical change
Sub-Saharan Africa 1964–1973 -2.35 -2.79 0.46 1974–1983 -1.67 -1.70 0.03 1984–1993 1.65 1.59 0.06 1994–2003 1.83 1.63 0.19 1964–1983 -2.01 -2.25 0.25 1984–2003 1.74 1.61 0.12 Sub-Saharan Africa excluding Nigeria 1964–1973 -0.99 -1.23 0.24 1974–1983 -0.55 -0.58 0.03 1984–1993 0.89 0.77 0.11 1994–2003 1.48 1.16 0.31 1964–1983 -0.77 -0.90 0.14 1984–2003 1.18 0.97 0.21
Source: Estimated by authors.

8
During the period of accelerated output growth, oil crops, roots and tubers, other cereals, pulses,
and milk increased their share while beef, tropical fruits, and traditional export crops reduced
their participation in total output. Maize, which showed growth rates of 3.5 percent from 1984 to
1993, reduced its growth to only 0.9 percent per annum in the 1990s.
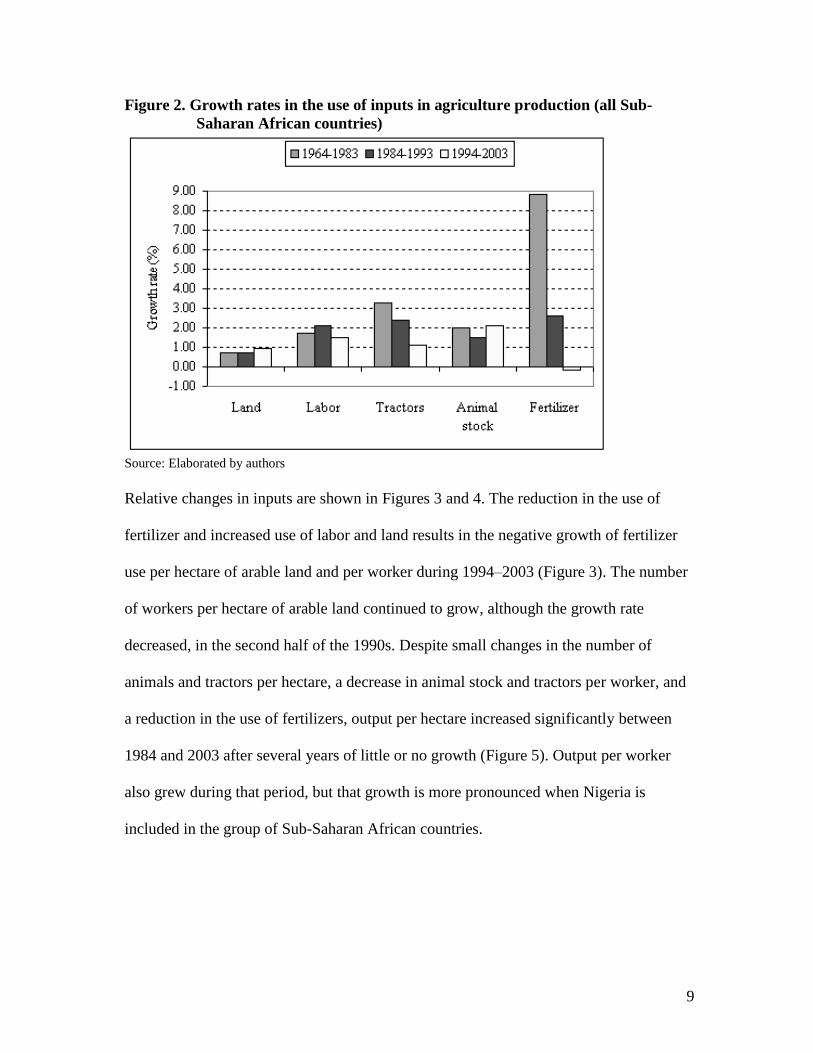
Agricultural TFP growth in SSA from 1984 to 2003 can be related from the input side to an
adjustment in the relative use of inputs in the production process (Figure 2). The most important
change at this level is an absolute reduction in the use of fertilizers. From 1964 to 1983, SSA saw
a fast expansion in the use of fertilizers, with growth rates of 8.81 percent on average for 20
years. Growth in fertilizer use falls to 2.62 percent between 1984 and 1993 and becomes
negative between 1994 and 2003. Four countries explain most of the reduction in the use of
fertilizer, with Nigeria alone explaining 72 percent of this reduction. On the other hand, 21
countries in our sample increased the use of fertilizer during this period. Labor continues to
increase faster than other factors, although it appears to be slowing down between 1994 and 2003
compared with previous years.
9
Figure 2. Growth rates in the use of inputs in agriculture production (all Sub-Saharan African countries)
Source: Elaborated by authors Relative changes in inputs are shown in Figures 3 and 4. The reduction in the use of
fertilizer and increased use of labor and land results in the negative growth of fertilizer
use per hectare of arable land and per worker during 1994–2003 (Figure 3). The number
of workers per hectare of arable land continued to grow, although the growth rate
decreased, in the second half of the 1990s. Despite small changes in the number of
animals and tractors per hectare, a decrease in animal stock and tractors per worker, and
a reduction in the use of fertilizers, output per hectare increased significantly between
1984 and 2003 after several years of little or no growth (Figure 5). Output per worker
also grew during that period, but that growth is more pronounced when Nigeria is
included in the group of Sub-Saharan African countries.

10
Figure 3. Indices of fertilizer use per hectare and worker (1961 = 1), weighted average of all SSA countries
Source: Authors, based on data from FAOSTAT 2007.
Figure 4. SSA: Indices of input use per hectare and worker (1961 = 1), weighted average of all SSA countries
Source: Elaborated by authors
0.00
1.00
2.00
3.00
4.00
5.00
6.00
19
61
19
63
19
65
19
67
19
69
19
71
19
73
19
75
19
77
19
79
19
81
19
83
19
85
19
87
19
89
19
91
19
93
19
95
19
97
19
99
20
01
20
03
Ind
ex
19
61
=1
Feritlizer/hectare Fertilizer/worker
0.6
0.8
1
1.2
1.4
1.6
1961 1966 1971 1976 1981 1986 1991 1996 2001
Tractors/hectare Stock/hectare Tractors/worker
Stock/worker Worker/hectare

11
Figure 5. Evolution of output per hectare and worker in SSA (I$) including all countries
Source: Elaborated by authors
Results at the Country Level4
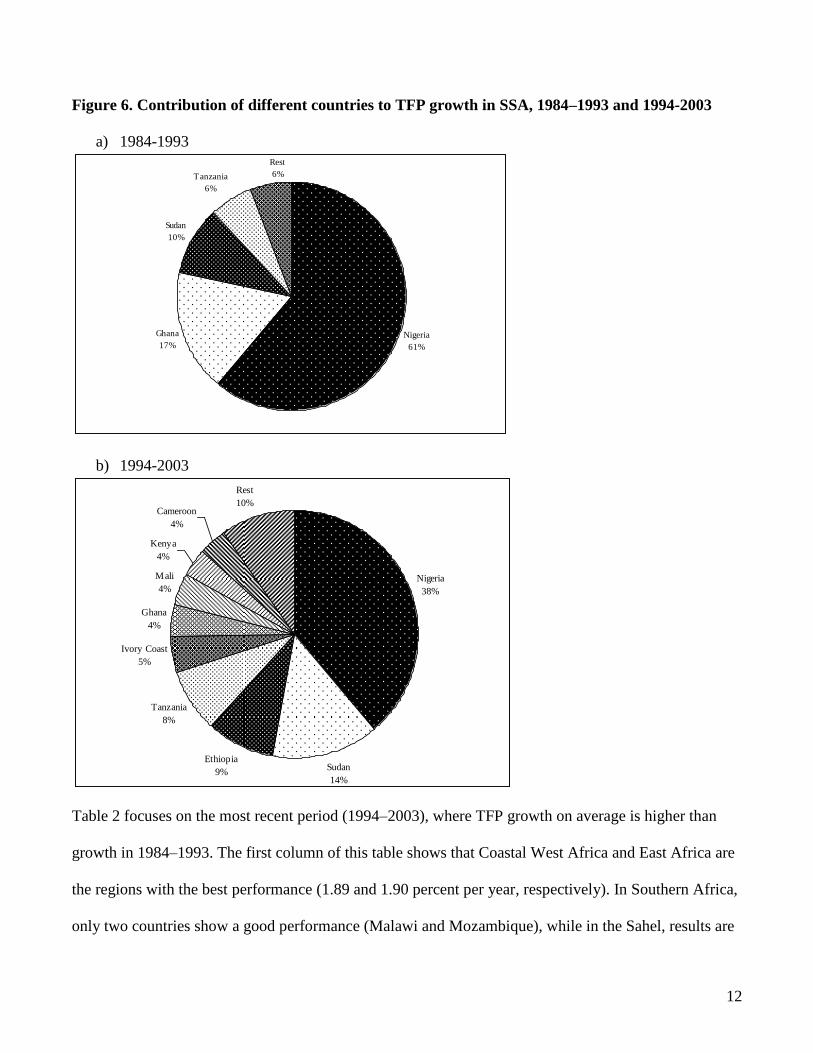
In the first 10 years after the region started implementing new policies, four countries explain most of
agricultural TFP growth: Nigeria and Ghana contributed 61 and 17 percent, respectively, of total TFP
growth occurring between 1984 and 1993. These two countries together with Sudan and Tanzania
(Figure 6) explain 94 percent of total TFP growth in SSA from 1984 to 1993. The number of countries
contributing to TFP growth increased significantly between 1994 and 2003, with nine countries
explaining 90 percent of TFP growth during that period. Nigeria and Ghana remain as major
contributors to TFP growth, but their contribution is down to 42 percent of total growth from 61 percent
in 1984–1993. Sudan, Ethiopia, Tanzania, Ivory Coast, Mali, Kenya, and Cameroon together explain
almost 40 percent of SSA‘s TFP growth between 1994 and 2003 (Figure 6b)
4 Appendix B presents trends in output, inputs, TFP, efficiency, and technical change for the period 1964–2003 for all countries in our sample.
12
Figure 6. Contribution of different countries to TFP growth in SSA, 1984–1993 and 1994-2003
a) 1984-1993
b) 1994-2003
Table 2 focuses on the most recent period (1994–2003), where TFP growth on average is higher than
growth in 1984–1993. The first column of this table shows that Coastal West Africa and East Africa are
the regions with the best performance (1.89 and 1.90 percent per year, respectively). In Southern Africa,
only two countries show a good performance (Malawi and Mozambique), while in the Sahel, results are
Nigeria61%
Ghana17%
Sudan10%
Tanzania6%
Rest6%
Nigeria38%
Sudan14%
Ethiopia9%
Tanzania8%
Ghana4%
Mali4%
Kenya4%
Cameroon4%
Rest10%
Ivory Coast5%

13
mixed, with two countries showing significant TFP growth (Mali and Chad) and two countries with a
good performance in historical terms (Mauritania and Burkina Faso).
Table 2. Annual TFP growth rate and TFP growth decomposition, 1994–2003 (percentage)
TFP Efficiency Technical change
Benin 1.67 0.00 1.67 Cameroon 1.84 0.86 0.98 Congo, Rep. 1.39 1.39 0.00 Ivory Coast 1.60 1.37 0.24 Gabon 2.31 2.31 0.00 Ghana 1.79 1.79 0.00 Guinea 0.42 0.42 0.00 Nigeria 2.12 2.10 0.02 Sierra Leone -0.75 -0.75 0.00 Togo 0.59 -0.19 0.78 Coastal W. Africa 1.89 1.71 0.17 Burkina Faso 1.32 1.24 0.09 Chad 2.48 2.06 0.42 Gambia -1.38 -1.38 0.00 Guinea-Bissau 0.45 0.34 0.11 Mali 2.85 2.77 0.09 Mauritania 1.44 1.42 0.01 Senegal -0.70 -0.91 0.21 Sahel 1.11 0.94 0.16 Botswana -3.99 -3.99 0.00 Lesotho -1.28 -1.93 0.65 Malawi 3.35 3.22 0.14 Mauritius 0.93 -0.39 1.31 Mozambique 3.32 3.32 0.00 Swaziland -0.19 -2.34 2.15 Zambia 0.03 0.03 0.00 Zimbabwe -0.50 -1.64 1.14 Southern Africa 1.48 1.16 0.31 Ethiopia 2.55 2.55 0.00 Kenya 1.05 0.37 0.68 Madagascar -0.03 -0.03 0.00 Sudan 3.19 3.19 0.00 Tanzania 2.79 2.77 0.02 East Africa 1.90 1.72 0.17
Source: Authors‘ estimation.
Decomposition of TFP growth into its components (second and third columns in Table 2) shows that in
general, most of TFP growth is explained by efficiency gains, which corresponds to the fact that most
countries are recovering from periods of negative productivity growth and reduction in efficiency. For

14
instance, in the case of Coastal West Africa, only 0.17 percentage points in 1.89 percent growth in TFP
(9 percent) results from technical change. A similar result is obtained in East Africa. The contribution of
technical change to TFP is most important in Southern Africa, with values that are twice those in other
regions. Swaziland, Lesotho, Zimbabwe, and Mauritius show a significant share of technical change in
TFP growth, but their performance was poor due to growing inefficiency. On the other hand Malawi and
Mozambique, two of the countries with better performance in the region, show very little incidence of
technical change on productivity growth. In East Africa, only Kenya shows a significant contribution of
technical change to total TFP growth.
In terms of the changes in the use of inputs, we are interested in how such changes affect labor and land
productivity and through them overall TFP. Increased labor productivity is needed to increase income of
agricultural workers, which means that yields need to increase faster than the number of workers per
hectare (Block 1995). Changes in the relative use of inputs for the group of best performing countries
are shown in Table 3.
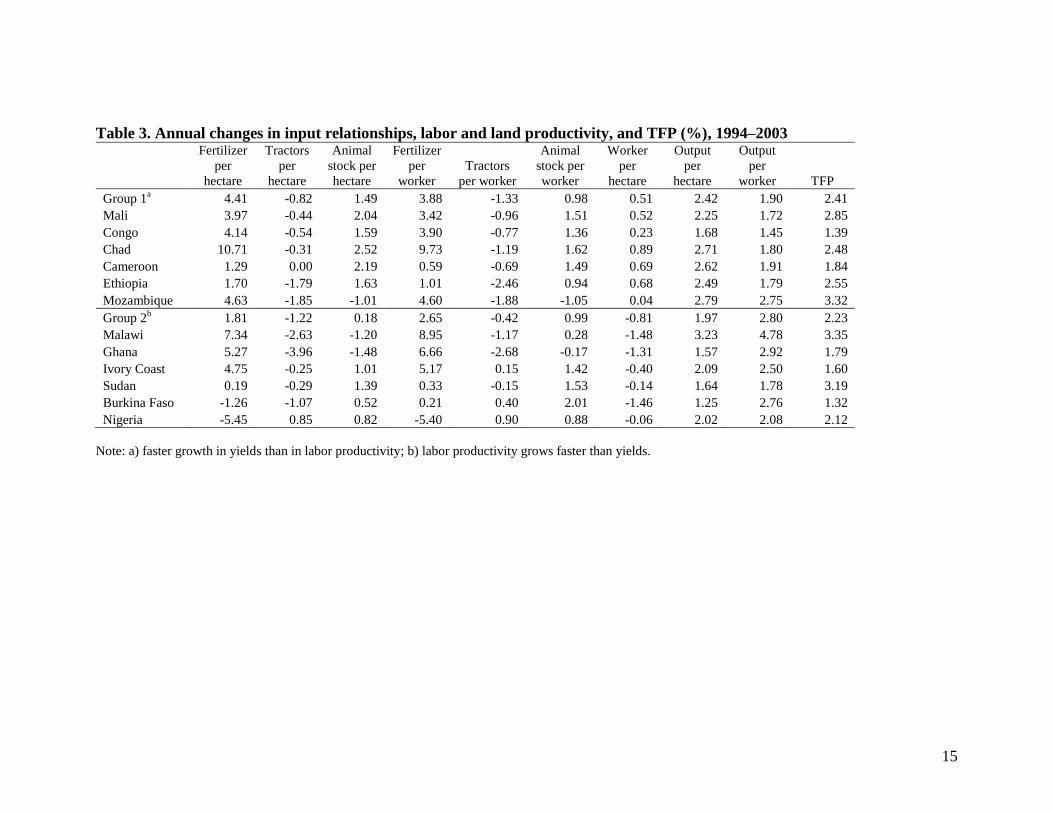
The best performing countries show on average similar growth in TFP and increased labor and land
productivity, which can be explained by increased used of fertilizer per hectare and worker (Table 3).
Some of these countries (Group 1) show a growing rural population (growing number of
workers/hectare), but increased yields faster than population (Mali, Congo, Chad, Cameroon, Ethiopia
and Mozambique).
15
Table 3. Annual changes in input relationships, labor and land productivity, and TFP (%), 1994–2003
Fertilizer per
hectare
Tractors per
hectare
Animal stock per hectare
Fertilizer per
worker Tractors
per worker
Animal stock per worker
Worker per
hectare
Output per
hectare
Output per
worker TFP Group 1a 4.41 -0.82 1.49 3.88 -1.33 0.98 0.51 2.42 1.90 2.41 Mali 3.97 -0.44 2.04 3.42 -0.96 1.51 0.52 2.25 1.72 2.85 Congo 4.14 -0.54 1.59 3.90 -0.77 1.36 0.23 1.68 1.45 1.39 Chad 10.71 -0.31 2.52 9.73 -1.19 1.62 0.89 2.71 1.80 2.48 Cameroon 1.29 0.00 2.19 0.59 -0.69 1.49 0.69 2.62 1.91 1.84 Ethiopia 1.70 -1.79 1.63 1.01 -2.46 0.94 0.68 2.49 1.79 2.55 Mozambique 4.63 -1.85 -1.01 4.60 -1.88 -1.05 0.04 2.79 2.75 3.32 Group 2b 1.81 -1.22 0.18 2.65 -0.42 0.99 -0.81 1.97 2.80 2.23 Malawi 7.34 -2.63 -1.20 8.95 -1.17 0.28 -1.48 3.23 4.78 3.35 Ghana 5.27 -3.96 -1.48 6.66 -2.68 -0.17 -1.31 1.57 2.92 1.79 Ivory Coast 4.75 -0.25 1.01 5.17 0.15 1.42 -0.40 2.09 2.50 1.60 Sudan 0.19 -0.29 1.39 0.33 -0.15 1.53 -0.14 1.64 1.78 3.19 Burkina Faso -1.26 -1.07 0.52 0.21 0.40 2.01 -1.46 1.25 2.76 1.32 Nigeria -5.45 0.85 0.82 -5.40 0.90 0.88 -0.06 2.02 2.08 2.12
Note: a) faster growth in yields than in labor productivity; b) labor productivity grows faster than yields.
16
Countries in Group 2 increase both labor and land productivity, but labor productivity grows
faster than yields (Malawi, Ghana, Ivory Coast, Sudan, Burkina Faso and Nigeria). That occurs
because these countries are increasing land productivity while the number of workers grows
slowly or because countries are still increasing the number of hectares of arable land at a fast
pace. In both cases the result is a slow growth of the number of workers per hectare. Countries in
this group are more likely to have increased rural living standards through increased labor
income in agriculture.
A caveat to these results is that in many of these countries labor per hectare increased slowly
because they were still able to incorporate more land into crop production. If the availability of
land decreases in the coming years, yields will need to increase faster to compensate for growth
in rural population and improve rural income.

17
4. POLICY CHANGE AND IMPROVED PERFORMANCE OF SUB-SAHARAN
AFRICA’S AGRICULTURE
A study by Block (1995) finds that technical change, measured by expenditures for agricultural
research, and macroeconomic reform which leads to improved economic incentives for
agriculture, might account for up to two-thirds of the recovery of agriculture in SSA. With new
evidence after more than a decade since the publication of Block‘s article, we explore in this
section the relationship between our TFP estimates and policy milestones affecting agricultural
TFP in SSA. We focus here on the analysis of macro and agricultural policy reform, comparing
major milestones in the process of policy reform in different countries with TFP changes in those
countries.
We look at the best-performing countries, separately analyzing the evolution of TFP in those
countries and relating that evolution to specific milestones in policy reform. Information on
policy and TFP relationships for 11 countries that together explain more than 90 percent of total
TFP growth in SSA in the period 1994–2003 can be found in the Appendix. We use the
information in the Appendix to verify the links between policy milestones and structural change
in the TFP series of those countries contributing the most to agricultural TFP growth in SSA. Of
the 11 best performing countries, only Kenya shows no correspondence between TFP growth and
policy changes, which suggests that for that country, other factors played a more significant role
than policy as determinants of TFP performance.
Table 4 presents the results of the analysis of structural change in the estimated TFP series. In
most cases the structural change coincides with the period of policy changes. The aggregated
TFP series for SSA shows evidence of a break in the 1980s, which reflects the fact that the
aggregated series is driven by Nigeria. When Nigeria is excluded, there is evidence of two breaks
in the series: the first in 1984 and a second in the early 1990s when the second wave of changes

18
and the devaluation of the CFA franc occurred. Considering individual countries, tests for
Nigeria and Ghana show evidence that structural change occurred in the mid-1980s, when policy
changes started. In Ivory Coast and Mali, structural change occurred in 1993–1994, coinciding
with the CFA franc devaluation. There is evidence of structural change during the 1990s in East
and Southern African countries, also coinciding with major policy changes in those countries:
Ethiopia, Sudan, Tanzania, Malawi, and Mozambique.
Table 4. Test for structural change in estimated agricultural TFP series
Additive outlier
Innovational outlier Additive outlier
Innovational outlier
Intercept and trend
break
Sudden change in
series
Gradual shift in the
mean Sudden change
in series Gradual shift in
the mean zandrews clemao1 clemio1 clemao2 clemio2 Nigeria 1985 1986 Ghana 1968, 1982 Ethiopia 1974, 1995 Sudan 1976, 1990 1977, 1991 Ivory Coast 1973, 1994 1974, 1993 Cameroon 1968 1965 Mali 1973, 1994 1974, 1995 Mozambique 1982, 1993 Malawi 1970, 1990 1971, 1991 Kenya 1978, 1994 1966, 1979 Tanzania 1992 1999 2000 SSA 1970, 1982 SSA excluding Nigeria 1984, 1991
Source: Authors‘ estimations. All values shown are significant at 5% level. Note: The series were tested for two structural breaks using Clemente, Montañés, and Reyes‘s test for additive outliers, which captures a sudden change in a series (clemio2), or innovational outliers, allowing for a gradual shift in the mean of the series (clemao2). If these estimates show no evidence of a second break in the series, then zandrews, clemio1, and clemao1 are used assuming one structural break in the series (Baum 2001).
19
5. CONCLUSIONS
Results of our TFP estimates show a remarkable recovery in the performance of SSA‘s
agriculture during 1984 and 2003, after a long period of poor performance and decline. This
accelerated TFP growth occurred simultaneously with rapid growth in output and changes in
output composition and in the use of inputs. Considering TFP growth together with balanced
growth in land and labor productivity as indicators of good agriculture performance, we find 12
countries (Nigeria, Ghana, Ivory Coast, Burkina Faso, Mali, Mozambique, Malawi, Ethiopia,
Sudan, Cameroon, Chad, and Congo) with relatively high TFP growth and sustained growth in
labor and land productivity from 1994 to 2003. In most of those countries, growth in land and
labor productivity can be explained by increased use of fertilizer per hectare and worker.
The evidence in this study points to policy change conducted by Sub-Saharan African countries
between the mid-1980s and the second half of the 1990s as one of the main factors determining
the agricultural sector‘s improved performance. Most countries significantly contributing to TFP
growth in SSA show structural breaks in their TFP series in the mid-1980s, the 1990s, or both,
coinciding with policy milestones and changes in those countries.
Despite improved agricultural performance between 1985 and 2003, several signs still exist
warning that SSA countries need to make more efforts to sustain TFP growth in the coming
years. The decomposition of TFP growth into efficiency and technical change shows that most
TFP growth in the last 20 years is the result of SSA catching up to the frontier after falling
behind during the 1964–1983 period. This structure of TFP growth in SSA differs substantially
from that of other regions, where a significant share of TFP growth is explained by technical
change. With a small contribution of technical change to TFP, we expect growth to slow down in
the coming years as countries catch up with efficiency levels at the production frontier.

20
According to our estimates, a slowdown in TFP growth is already apparent in the cases of
Nigeria and Ghana, who lead the recovery of SSA‘s agriculture in the mid-1980s.
Sustained growth in labor productivity faces the challenge of population growth and related
increases in agricultural labor per hectare. In many countries, expansion of labor productivity
was possible because those countries were still able to incorporate more land into crop
production. If the availability of land reduces in the coming years, yields will need to increase
faster to compensate for growth in rural population and improve rural income. Increased and
sustained TFP and labor productivity growth in the future will be possible only if policy
improvements are complemented by investments in agricultural R&D that accelerate the
expansion of SSA‘s technical frontier.

21
References
Block, S. A. 1995. The recovery of agricultural productivity in Sub-Saharan Africa.
Food Policy 20: 385–405. Coelli, T. J., and D. S. Prasada Rao. 2001. Implicit value shares in Malmquist TFP index
numbers. Centre for Efficiency and Productivity Analysis, Working Papers, No. 4/2001, School of Economic Studies, University of New England, Armidale.
Evenson, R. E., and A. F. Dias Avila. 2007. FAO data-based TFP measures.
In ch. 31of Handbook of agricultural economics, vol. 3., Agricultural development: Farmers, farm production, and farm markets, edited by R. E. Evenson, P. Pingali, and T. P. Schultz. Amsterdam North Holland.
FAO (Food and Agriculture Organization of the United Nations). 2007. FAOSTAT
database. http://www.fao.org/. Accessed May 5. Färe, R., S. Grosskopf, M. Norris, and Z. Zhang. 1994. Productivity growth, technical
progress, and efficiency change in industrialized countries. American Economic Review 84: 66–83.
Fulginiti, L. E., R. K. Perrin, and B. Yu. 2004. Institutions and agricultural productivity
in Sub-Saharan Africa. Agricultural Economics 4: 169–80. International Monetary Fund. 1998. Côte d‘Ivoire: Enhanced structural adjustment
facility. Policy Framework Paper, 1998–2001, Washington, D.C. Kuosmanen, T., T. Post, and T. Sipiläinen. 2004. Shadow price approach to total factor
productivity measurement: With an application to Finnish grass-silage production. Journal of Productivity Analysis 22: 95–121.
Lusigi, A., and C. Thirtle. 1997. Total factor productivity and the effects of R&D in
African agriculture. Journal of International Development 9: 529–38. Nin, A. and B. Yu. 2008. Developing Countries and Total Factor Productivity Growth in
Agriculture: New Evidence Using a Malmquist Index with Constrained Implicit Shadow Prices. Paper presented at the 11th Annual Conference on Global Economic Analysis, Helsinski, Finland, June 12-14.
Prasada Rao, D. S., and T. J. Coelli. 1998. Catch-up and convergence in global
agricultural productivity, 1980–1995. CEPA Working Papers, No. 4/98, Department of Econometrics, University of New England, Armidale, p. 25.
Van de Walle, N. 2001. African economies and the policy of permanent crisis, 1979–99.
Cambridge: Cambridge University Press.

22
Winters, P., A. de Janvry, E. Sadoulet, and K. Stamoulis. 1998. The role of agriculture in economic development: Visible and invisible surplus transfers. Journal of Development Studies 34 (5): 71–97.

23
APPENDIX
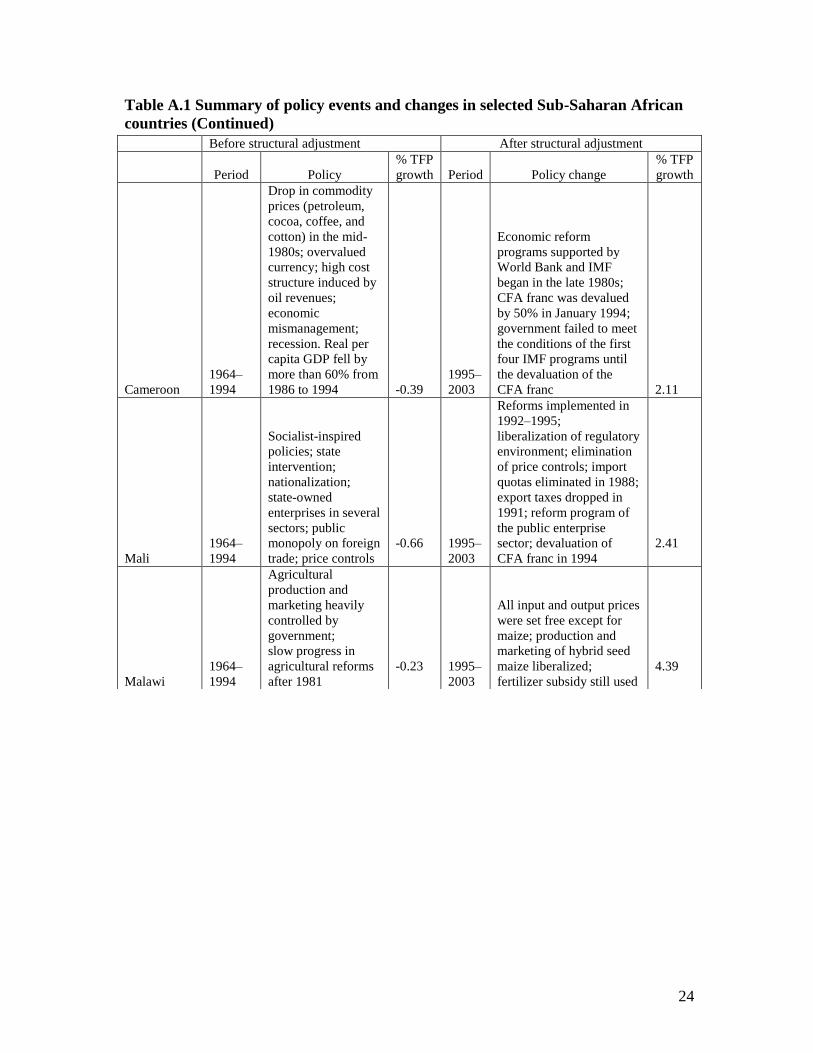
Table A.1 Summary of policy events and changes in selected Sub-Saharan African countries
Before structural adjustment After structural adjustment
Period Policy % TFP growth Period Policy changes
% TFP growth
Nigeria 1964–1984
Overvalued currency; public expenditure concentrated in sectors other than agriculture; price controls and trade restrictions; parastatal marketing boards; subsidized consumption; massive agricultural imports; fertilizer subsidy
-3.45
1985–2003
Structural adjustment program: devaluation of the naira; ban on food imports; Agricultural Development Projects (ADPs)—National Coordinated Research on Cassava Project was set up to coordinate on-farm adaptive research on cassava
3.43
Ghana 1964–1983
Socialist policy targeting food import substitution; promotion of mechanization; grain marketing board
-3.48
1984–2003
Economic recovery program; trade liberalization and foreign exchange controls lifted
4.52
Ethiopia 1974–1993
Command economy; recurrent drought; long and devastating civil war; narrow range of exports; very low technology base
-0.27
1994–2003
Package of economic reform measures implemented by the government that came to power in 1991
2.55
Sudan 1964–1992
Interventionist policy; distorted markets; war and rainfall fluctuations; several million displaced in the southern region
-0.88
1993–2003
Long-term plan with substantial economic reforms: currency devaluation; exchange rate liberalization; abolition of most export and import licenses; liberalization of most domestic markets
1.74
Ivory Coast
1964–1994
Ineffective policies; debt crisis in the 1980s; overvalued currency; little progress in reforms until 1994 -0.45
1995–2003
After adjustment program 1994–1996, Ivory Coast made considerable progress in reducing financial imbalances, controlling inflation, and liberalizing the economy (cocoa and coffee sectors); devaluation of CFA franc in 1994a 1.80
24
Table A.1 Summary of policy events and changes in selected Sub-Saharan African countries (Continued) Before structural adjustment After structural adjustment
Period Policy % TFP growth Period Policy change
% TFP growth
Cameroon 1964–1994
Drop in commodity prices (petroleum, cocoa, coffee, and cotton) in the mid-1980s; overvalued currency; high cost structure induced by oil revenues; economic mismanagement; recession. Real per capita GDP fell by more than 60% from 1986 to 1994 -0.39
1995–2003
Economic reform programs supported by World Bank and IMF began in the late 1980s; CFA franc was devalued by 50% in January 1994; government failed to meet the conditions of the first four IMF programs until the devaluation of the CFA franc 2.11
Mali 1964–1994
Socialist-inspired policies; state intervention; nationalization; state-owned enterprises in several sectors; public monopoly on foreign trade; price controls
-0.66
1995–2003
Reforms implemented in 1992–1995; liberalization of regulatory environment; elimination of price controls; import quotas eliminated in 1988; export taxes dropped in 1991; reform program of the public enterprise sector; devaluation of CFA franc in 1994
2.41
Malawi 1964–1994
Agricultural production and marketing heavily controlled by government; slow progress in agricultural reforms after 1981
-0.23
1995–2003
All input and output prices were set free except for maize; production and marketing of hybrid seed maize liberalized; fertilizer subsidy still used
4.39

25
Table A.1. Summary of policy events and changes in selected Sub-Saharan African countries (Continued)
Source: Elaborated by authors based on several sources: see Nin Pratt and Yu (2008) a International Monetary Fund (1998).
Before structural adjustment After structural adjustment
Period Policy % TFP growth Period Policy change
% TFP growth
Mozambique 1975-1992
Centrally planned economy after independence; 10-year plan launched in 1981; Economic problems; conflict and civil war; draught and collapse of the economy in 1986
-3.04
1993-2003
Economic and social rehabilitation program introduced reforms in 1989; price liberalization in 1989–1993; trade liberalization and simplified tariff structure since 1996; privatization program implemented (1989); end of civil war, 1993
4.14
Kenya 1964-1993
Structural reforms started in the 1980s but small improvement by 1991; slow pace in changing agricultural policy
2.24
1994-2003
Liberalization of maize market and abolition of maize movement controls, 1994; progress made on fertilizer policy, cereals marketing policy, and output marketing for a variety of enterprises including cotton, dairying, sugar, and coffee
1.05
Tanzania 1975-1985
Heavily state-controlled economy; inadequate policy led to economic stagnation; war with Uganda
-0.43
1986-2003
Economic recovery program began in mid-1986: currency devaluation; international and domestic trade and marketing liberalization; reduction of fiscal deficit; reduction in tariff levels; elimination of price controls; phasing out of petroleum and fertilizer subsidies; a hiring freeze and retrenchment in the civil service
2.79
Copyright © 2022 FDOKUMEN


![[Updated Constantly] - ITExamAnswers.net](https://static.fdokumen.com/doc/165x107/631602506ebca169bd0b61e0/updated-constantly-itexamanswersnet.jpg)