The f})eve[opment of 5tssays for Jltracty[osiae ana its ...
247
'The f})eve[opment of 5tssays for Jltracty[osiae ana its Localisation in 2(at TtSsue Pie termaritz6urg Sanara 9\(pe[ :Bye :BSc. :J{ons. (9{ata[) Su6mittea in partiaffulfi{ment of tfie requirements for tfie aegree of 'Doctor of PfiiIosopfiy in tfie 'Department of r.Biocfiemistry llniversity of 'J{ata{ 1991
-
Upload
khangminh22 -
Category
Documents
-
view
0 -
download
0
Transcript of The f})eve[opment of 5tssays for Jltracty[osiae ana its ...
'The f})eve[opment of 5tssays for Jltracty[osiae
ana its Localisation in 2(at TtSsue
Pie termaritz6urg
Sanara 9\(pe[ :Bye
:BSc. :J{ons. (9{ata[)
Su6mittea in partiaf fulfi{ment
of tfie requirements for tfie aegree
of 'Doctor of PfiiIosopfiy
in tfie
'Department of r.Biocfiemistry
llniversity of 'J{ata{
1991
This thesis is dedicated to Ron Berry
as a token of appreciation for all his
support, advice and assistance
during the course of this study

PREFACE
The experimental work described in this thesis was carried out in the Department of
Biochemistry, University of Natal, Pietermaritzburg from January 1987 to December 1991,
under the supervision of Prof. M.F. Dutton, the co-supervision of Dr T.R. Anderson, and at
the Roben 's Institute for Industrial and Environmental Health and Safety, University of
Surrey, Guildford, England under the direction of Dr Peter Bach.
The studies represent original work by the author and have not been submitted in any other
form to another University. Where use was made of the work of others, it has been duly
acknowledged in the text.
Sandra Noel Bye
Twelth day of December 1991.
I I
ABSTRACT
An extract of the tuber of Callilepis laureola is regarded as the source of a powerful
therapeutic agent, known as Impila. Its use is associated with fatal hepatic and renal
necrosis, the renal toxin being atractyloside (ATR). The aims of this study were three
fold . Firstly, to generate a model set of biological specimens (urine, serum, liver and
kidney) from rats dosed with 5-25 mg ATR/kg bwt. Secondly, to develop a competitive
ELISA and HPLC method for the diagnosis of ATR poisoning employing the model
specimens as test samples. Thirdly, to localise the target organs, cells and organelles of
ATR, in vivo.
The HPLC method necessitated the systematic development of the derivatisation of ATR
with 9-anthryldiazomethane, sample clean up employing hexane, methanolic hydro
chloric acid and a silica minicolumn, as well as the chromatographic conditions.
Optimal resolution was obtained with a 3.9 x 150 mm NovaPak reverse phase column,
fluorescence detection (excitation == 365 nm, emission == 425 nm) and a solvent system of
MeOH:1M ammonium acetate:1M glacial acetic acid:water (38:2:2:58). This method has
a detection limit of 0.001 ng ATR, shows a mean recovery of 89% and detected
approximately 6.7 ~g ATR/g wet weight of tuber tissue. The toxin was also detected in some
of the urine samples at levels of about 200 pg/ml, but not in the serum.
The production of antibodies to ATR for use in the ELISA and immunocytochemical
investigations required the investigation of the conjugation procedure, carrier type, host
species and immunization protocol. Optimal antibody yield, specificity and affinity was
obtained with an acid-treated Salmonella minnesota bacterial carrier conjugated to ATR
by carbodiimide, although there were indications of class switch inhibition and T
lymphocyte suppression by ATR. The development of the ELISA yielded a protocol
involving the coating with a bovine serum albumin-ATR conjugate, blocking with bovine
serum albumin, incubating the primary antibody at 4°C and detection with a secondary
antibody-alkaline phosphate conjugate. This method detected ATR in both urine and
serum from ATR-dosed rats and shows a detection limit of 10 ng. Since the less sensitive
ELISA detected ATR in samples where the HPLC did not, this suggested that ATR is
biotransformed in vivo, such that its retention time on a reverse phase column is affected,
but not its epitope determinants.
The results of the organ function assays demonstrated that, when administered intra
peritoneally, ATR is not hepatotoxic, but is a powerful nephrotoxin, targeting for the
microvilli of the brush border of the proximal tubules, and compromising glomerular
III
permselectivity and distal tubular function . In addition, this toxin inhibits proline
transport in the proximal tubule, and therefore probably affects protein biosynthesis.
Renal regeneration is noted 3 days post-dosing, as demonstrated by calcium excretion.
Immunocytochemistry was optimised on tuber tissue and necessitated the intracellular
fixation of the toxin, using carbodiimide, to prevent leaching out of the ATR. The toxin
was encapsulated in vesicles in the tuber tissue. Atractyloside was also located in the
kidney of ATR-treated rats, up to 72 hours after exposure, targeting the microvilli of the
proximal tubule brush border, the mitochondrial cristae and specific sites on the Golgi
apparatus membrane. Microvilli disruption and mitochondrial swelling was noted
within 24 hours after exposure to the toxin while after 72 hours, loss of mitochondrial
integrity was observed.
The development of these diagnostic assays for ATR have provided the means to monitor
the levels of this toxin in plant extracts and mammalian body fluids. Future work should
include the identification of the hepatotoxin associated with Impila, the effects of the route
of administration on the toxicity of this remedy and furthermore, the identification of a
suitable antidote, which could include the use of duramycin and stevioside. The
association between compounds blocking the ADP/ATP antiporter in the c-state and Reye's
syndrome should also provide an interesting area of research.
lV
ACKNOWLEDGE:MENTS
An undertaking of this magnitude is not completed singlehandedly, and I wish to express
my sincere gratitude to the following people for their contribution:-
My supervisor Prof. Mike Dutton, for his enthusiasm, support and open-mindedness in
allowing me the freedom to pursue my own field of interest, and also for encouraging and
enabling me to interact with overseas scientists, both at conferences and at the Robens
Institute for Industrial and Environmental Health and Safety, not to mention the
Haverigg Working Mens' Club;
My co-supervisor Dr Trevor Anderson, for his critical appraisal of the draft manuscript
and his encouragement;
Dr Clive Dennison, for all his advice and encouragement;
Theresa Coetzer, for introducing me to the field of immunology, her invaluable advice and
generous gifts of immunoreagents;
Edith Elliott, for her friendship , advice and assistance, particularly with the
immunocytochemistry, not to mention the generous gift of her precious gold probe;
Jenny Schwartz, Lesley Brown, Cheryl Brown, Mel Webber, Elias Mchunu and George
Mdladla, a very big thank you for all their patience and help during my five years in the
Departmen t;
John Geyser and Sherwin Chetty, for unflinchingly pandering to my whims, fixing the
equipment and, in particular, redecorating my laboratory red;
The librarians, who patiently accepted my overdue books and in particular the inter
library loan staff;
Tony Bruton, Vijay Bandu, Belinda White, Priscilla Donnelly and Geraldine Bruce of the
Electron Microscope Unit, Pietermaritzburg for their patience, concern and unstinting support;
v
AECI for their more than generous support for the major part of this study which enabled
me to attend the International Association of Forensic Scientists' Toxicology Congress in
Glasgow (1989), the First Ethnopharmacology Congress in Strasbourg (1990) and visit the
Robens Institute. Thanks also to my mentors, Les Pallent, Colin Kenyon and Rocky
Skeef;
The CSIR Foundation for Research and Development for the financial assistance at the
start and towards the end of this study;
Dr Peter Bach for generously inviting me to visit the Robens Institiute and for sharing his
knowledge with me. A special thanks to Dr Ligia Delacruz, Merce Moret, Sally Nicholls,
Ian MacManus, Gail Sutherland, Lisa Wilkes, Joanne, Monique, Margaret, Michelle
MacClean and Prof. Patricia Berjak (who first suggested the visit);
Dr Graham Thurman, Fred Kruger and the staff at the Biomedical Resource Centre,
University of Durban-Westville, for their professionalism, advice and assistance, far
beyond the call of duty;
Prof. J.P. Nel, who first suggested this project and who was a great source of inspiration;
Dr Linda-Gail Becker and the laboratory staff at the Eshowe Hospital for their co
operation;
Marion Hundley, for her encouragement and loan of the Beckman System Gold;
The staff at the King Edward VIII, hospital for willingly carrying out the AST and ALT
liver function tests;
In no specific order, a very big thank you to, the late Richard Butler (Premier
Technologies) for his interest, cheerfulness and support both to myself and the Department;
Nicci Difford (Weil Organisation) for her amazing information retrieval system and the
"trial packs"; Elaine Hampton (Protea) for her cheerfulness and allowing us the use of the
Kontron Integration Pack; Lizette Linder (Millipore Waters) for her friendship, use of the
photodiode array and capillary electrophoresis, as well as her relentless interest in this
project; Steve Walford (Millipore Waters) and Daniel Garside (Beckm"an) for their
relentless pursuit of an HPLC method for atractyloside; Lorraine Smith and Mike Adams
(Beckman) for their invaluable assistance, particularly in mediating the AST and ALT
analyses. Arthur Peterson (Perkin Elmer) for all his support and encouragement;
VI
My dear friends Jeanette Mackay, Janet Lee, Janet and Neville Spurr, Dr Andre van der
Hoven for all the support and encouragement; Sally Schwarbe, for her help with the
diagrams and both Jeanette Mackay and Jackie Woolfe-Piggott for their help with the
proof-reading;
My office mates Frieda Dehrmann and Ron Berry, for their friendship, patience and help
throughout the course of this study; it certainly made life much easier;
Finally to my grandparents, brothers Ian and Alan and my parents who never stopped
believing in me, my sincerest gratitude.
V II
LIST OF CONTENTS
PREFACE . . . ... .. . . ... .. .. .. .................................................. . .... ... ... . . . .. . .. . .
ABSTRACT............. ............ .. .... . .. . ........ . .... . ..... ... .. .. . ... ... .. . . ........ ........ II
ACKNOWLEDGEMENTS..... .... .. . ...... . . .......... . . .... ... . .. . ........ ... .......... . ..... I v
LIST OF CONTENTS .. ..... . ................... . ..... . . . .. . ... . .. . . . . . . ......... . . .. .. . . .. .. .... VII
LIST OF TABLES ........... . . . .. ................ . .. .. . ..... ... ..... . ... . ..... . ... . . . ...... ... .... Xl11
LIST OF FIGURES .. . ................. ..... ........... .... . ...... .. . .... . ......................... XIV
LIST OF ABBREVIATIONS ..................................................... .. .............. XVll
GLOSSARy .. ..... . . .. . ....... . ............................... .. . . . . . . .... . ....... . .......... . . .... xx
The Third Defence . . . ..... . .................................. . .......... . . ... ... . . ........ . ....... X X 1
Chapter
1: INTRODUCTION.... .... ... . .... . ... . .. . . .. .. .. . ... . .. . . .. . . . . . . .. . . .. . . .. ... . .. . ..... ... . . . 1
2: LITERATURE REVIEW . .. . . . .. . . . . . . . . . . . . . . . . . . . . . . . . . . . . . . . . . . . . . . . . . . . . . . . . . . . . . . .. . . . 4
2.1 Classification and distribution of Ca.llilepi .~ laureola. and its use in
herbal remedies. .. . .............................. . .. .. .. . . . . ...... .......... . ... 4
2.2 The clinicopathology of Impila poi soning. ... .... ........... .. ...... ....... 6
2.3 The chemistry and occurrence of the atractylosides .. . ........ . ... ... .. .... 11
2.4 The mechanisms of toxicity of atractylosides .. . .. . ............. . .. .. ..... . 14
2.4.1 The effect of atractyloside on mitochondrial function .... ......... 14
2.4.2 The effect of atractylo side on calcium accumulation ........ .. .... 19
2.4.3 The effect of the atractylosides on th e functioning of the Golgi
Apparatus. . . . .. . . . . . . . . . . . . . . . . . . . . . . . . . . . . . . . . . . . . . . . . . . . . . . . . . . . . . . . . . 24
3: MATERIALS AND METHODS .. .. ........................................ .... .. .. 27
3.1 Generation of a model set of ti ssue and urine sa mpl es from
atl'actyloside-treated rats . ...... . ......... . . . ... . . ...... ... . .. . . .. . .... .. . .. . . 28
3.1.1 Specialised chemical s and material s.. .. ........ .. . .. . .. .......... 28
3.1. 2 Urine samples...................... . .. . ..... .. ...... . ....... .. . . .. . .... 28
3.1.3 Serum samples......................... .. ..... ....... . .. . ... . .......... 29
3.1.4 Liver and kidney samples........ .. ... ......... ... .. . .......... .. . .. . 30
3.1.5 Dosing of animal s with atractyloside ... . . . ...... .. ................ 31
3.1.6 Sample preparation for thin layer a ni high performance liquid
chromatography and the immunoassay....... ......... ...... .. .. . .. 31
3.2 Thin layer chromatography.... . ............... . . ...... .. .. .... .. ........ ... .. 31
Vlll
3.3 High performance liquid chromatography of at ractyloside.. . ..... . ...... 32
3.3.1 Specialised chemicals. . ...... ... ... ... . . .... . .. ........ . . .. . ...... . .. 32
3.3 .2 Preparation of derivatising agent... . . .............. . .......... ... . 32
3.3 .3 Derivatisation of atractyloside and r,re-column clean up. ........ 33
3.3.4 Spectrophotometry and chromatographic conditions ... ...... . . ... 34
3.4 Antibody production .. . .. ... . .. . . . . . . . . . . . . . . .. . . ... . . .. . . ... . . . . . . . . . . . . .. . . . .. 34
3.4.1 Specialised chemicals , materials and equipment.... ... . . .. . ... .. 34
3.4 .2 Conjugation of atractyloside to Salmunella minnesota bacteria
and bovine serum albumin.. ... ....... . ..... . ...... . . ... ........ . . .. . 35
3.4.3 Immunization procedure .. .... ...... .. .. . .. ... .. ... .. ....... .. ........ 36
3.5 Enzyme-linked immunosorbent assay (ELISA)......... ....... ... ......... 38
3.5.1 Buffers . . .. .. . .... . .. .. . . .......... ......... . . . . .. . .. .. . . ... .. .. . . . . ...... 38
3.5.2 Immunoassay....................... .. .............. . .......... . . .. .... 38
3.6 Organ function assays .. . .... . ............. ... .... . ....... ..... ..... ..... ... ... 39
3.6.1 Specialised chemicals .... .. .. . ...... .. . . . ....... .... ..... ..... . ... .... 39
3.6.2 Kidney function assays ..... ... .. . .. .. . . ......... . ................ .... 39
3.6.3 Liver function tests ... . . .. . ......... . ... . . .. .. . ....................... 40
3.7 In vitro amino acid incorporation............ . ................. .. .. ...... .. . 40
3.7.1 Specialised chemicals and equipment.................. ... ...... ... 40
3.7.2 Preparation of proximal tubules .... .. .... ..... .............. ......... 40
3.7.3 Amino acid incorporation and experimental method. .... .... .... 41
3.7.4 Total protein determination.. .... .. .. . ........................... ... 43
3.7 .5 Calculation of results................... . . . . .... . . ..... .. ........... .. 43
3.8 Immunocytochemistry of tuber and kidney ti,.sue......... . . . . ...... . ..... . 44
3.8.1 Specialised chemicals and materials ....... .. ......... .. .......... 44
3.8.2 Fixation of tissue.. .... . ... . ............. ...................... . .. .... 44
3.8.3 Immunocytoch emical labelling . .... ....... .. .... . .... .... ....... 4.5
4: DEVELOPMENT OF A HIGH PERFOR~ANCE LIQUID
CHROMATOGRAPHY (HPLC) METHOD FOR THE ANALYSIS OF
ATRACTYLOSIDE . . .. . ... ... .. . ....... . .. . .. ........ .... . . .. . . . . . . ............... . .... .. .. . 46
4.1 Introduc tio n . ......... ... .... ..................... .. ... ........ . .......... . ....... 46
4.2 Preliminary in vestigations into chromat.)graphy conditions and
detection methods for atractyloside...... . .. .. . . .. . .. .... .. .............. . ... 47
4.3 Synthesis of derivatisation agent.... . .. .. . . ... ... . . .. .. ................. ... .. .53
4.3 .1 Introduction ... . ............. .. .. ........ .. ... . ......... . ... .. . . ........ 53
4.3.2 Method,s ................. ...... . ............... .. .. .. .... .............. 53
4.3.3 Results and discussion ..... . . .. ... ......................... 53
1 X
4.4 Optimi sation of the derivatl sation of at rac tyl(.sici e . ......... . ....... . ... .. 54
4.4 .1 Introduction . .... ...... .. .... . .... ... .. .... ... .. . .. . . .. ..... . ............ 54
4.4.2 Methods. .. . ....... .. ....... . ....... . ......... . .. .. ... . .. .. .. . . .. .... .... 55
4.4.3 Results and discussion.. . ... . . ...... ... ....... .. ........ . . ... . . . ... . . 55
4.5 Optimisation of sample clean up . . . ..... . ... ... . .... .... . ..................... 58
4.5.1 Introduction . . . ...... .. .... .. ... .. . . . .. . ... . ..... . .... ........ ........ .. . 58
4.5.2 Method s .... .. ... . ..... . ............... .. . . . .. . ... . .......... ... ....... . .. 59
4.5.3 Results and discussion ..... ... ...... . .. .. . .. . .... ...... . ......... .... 59
4.6 Optimisation of the HPLC procedure em0loying ATR-ADAM and
spiked biological samples .......... ....... .... ............... .... .. . .. ..... . . . . 60
4.6 .1 Introduction ...... . ..... . ......... .......... . . . .... .. . . .. .. .. . ... . ....... 60
4.6 .2 Methods . ...... . .. . ............. . .. . . . ........ ... .. ..... . . .. .. .. .. .... ... 61
4.6.3 Results and discussion .... .... ......... . ... . ...................... .. .. 62
4.7 Analysis of ATR in the tuber of Callilepis laureola ...... .. .. .............. 65
4.7.1 Introduction .. ............. .. .. ......................... .... .. .. ... ...... 65
4.7.2 Methods ... .... . . .. . ..... . ... .... .. . . ... .. . . .. ...... ........ .. ........... 66
4.7.3 Results and discussion . .. . . ...... ... . .. . .. . ........ . ..... ...... .. . ... 66
4.8 . Analysis of atractyloside in urine and serum from ATR-treated rats. .. 69
4.8 .1 Introduction ................... . ............... . ... ..... .. .. .. .. . .. ...... 69
4.8.2 Method .. ... . .......... . ........ . ....... . ........ ..... .. .. . ..... ... . . . .... 70
4.8.3 Results and discussion ..... .. . . ..... .. ........... ............ . . .... . .. 70
4.9 Overview of results and conclusions... . ...... ....... ....................... 74
5: THE PRODUCTION AND CHARACTERISATIOJ\' OF ANTIBODIES TO
ATRACTYLOSIDE . .. ..... ... . .... . .. .. ...... . . ..... . . . ................. ... ... . . . ..... . . . . . 78
5.1 In trod uction. ........................ .. ........................ .. .... . . ... .. .... .. 78
5.2 Preliminary investigations into antibody pro,luetion for aLracty loside . 79
5.3 Optimisation of th e conjugation of atract), loside to a carrier ancl
production of antibodies... .. . ..... ... . .... . .. ... . .. ... . ... ........ ... . .. ... . ... 80
5.3.1 Introduction ....... . ...... ... .. . .......... .. .................... . .. . ..... 80
5.3.2 Material s and meth ods.. .. . ... . . . . . .... ... . . . . .... . ....... . . . .... .... 82
5.3 .3 Results and di scussion.... ........ ... .. . ........... . ....... ........ . .. 84
5.4 Examination for possible autoimmunity in rabbits... . ........ . .......... . 87
5.4.1 Introduction ............. . . .. .. . .. . . . . ... . . ..... . . ........ .... ..... . ..... 87
5.4.2 Materials and methods........... . ..... . . . . . . . ..... ...... . . . . . ...... . . 88
5.4.3 Results and conclusions............... .... .. .. .. .. .... .. .... ........ 90
5.5 Characterization and selection of antisera.. . ....... ... ....... .... .. .. . .... 92
5.5.1 Introduction ...... ... ... ........... . .. .. ... . ........... .. . . . .... .. .... . . . 92
x
5.5.2 Determination of antibody affinity... .. ... .......... .. . . . . . . .. .. . . . 92
5.5.2.1 Introduction ................. . . ............... . .......... ···· 92
5.5.2.2
5.5.2.3
Methods and material s.................... ................. 93
Results and discussion. .... ....... .... .. ...... ... .. ........ 93
5.5.3 Precipitation in gels .................. . . ... ...... .. .......... ... . ..... . 94
5.5 .3.1 Introduction. .... ........ ... .. ............ . ... .. .... . . . . .... . 94
5.5 .3 .2 Meth od ...... . ............ ... .. ........... . ..... . . . .... .. .. ··· · 94
5.5.3.3 Results and discussion. .. . .................... ............. 95
5.5.4 Determination of cross-specificity of ~lntibodies protein coats .. . 96
5.5.4.1 Introduction .......... . ... . ........ . ... ...... ..... ..... . .... . 96
5.5.4.2 Method ............................... . . . .... .. ... ..... .... ... 97
5.5.4.3 Results and discu ssio n .... ...... . ... . .... .. ...... .......... 97
5.6 General discussion .... . .. .............. . .. . ..... . . .. .... . ...................... 100
6 : THE DEVELOPMENT OF AN ENZYME-LINKED IMMUNOSORBENT
ASSAY (ELISA) FOR ATRACTYLOSIDE. .................... ...... ................... . 106
6.1 Introduction ............ ..................................... .. .. .. . ........ ... .. . 106
6.2 Selection of a solid phase support ...... ... .... .. . . ......... .......... .. ....... 107
6.3
6.2.1 Introduction and general considerations .......... .. ....... . ....... 107
6.2.2 Method ....... ......... .. .. .. ........... . .. . .. . ...... . .......... .. ... ... .. 109
6.2.3 Results and conclusion s . . .... .. . ........ ... ........ . ..... ........ ... 110
Optimisation of coating conditions ......... . . . 110
6.3 .1
6.3.2
6.3.3
Introduction and general consideration s .......... . ............ .. .. 110
Methods ............ . ............ .. . .. ... . . .. ........ ...... .. ... . ....... . 112
Results ... ... .. . ................. . ... . .. . . 112
6.4 Determination of the binding of atractyloside to microtitre plates ... . .... 113
6.4.1 In trod uctio n ....... ........ .. . ..... ..... .......... ...... ....... ... . . ..... 113
6.4.2
6.4.3
Methods ............................ . ... ..
Results and conclusions .... .. ......... . ... . . . ........ ... ........... . .
6.5 Optimisation of the immunoassay conditions and relative
concentrations of coating antigen , primary a ntibody an d seco ndary
114
114
antibody-enzyme conjugate .. .. .... . ..... . . .. .. . .... . ...... .... .. .. ..... . .. . . 115
6.5.1 Introduction . . ... .. .... .... . .. . ....... . .. ..... . .. .. .. ...... .. .. . ......... 115
6.5.2 Method ...... ...... ........ ..... . .......... . ... .. .. . .. .. . .. ... . . .. ....... 116
6.5.3 Results and conclu sion s .............. ... . ... .. ... .... ... .. ... .. ..... 116
6.6 Optimisation of blocking agents ..... .... . .. .. ... .... ............. .. ......... 119
6.6.1 In troduction .... .... . . .... .. ... . .... .. ....... .. ...... . ......... . .... .. ... 119
6.6.2 Meth ods .... .... ... . . .. . .. . ........... . .. . 120
X l
6.6.3 Results and conclusion s . . ..... ... . .. . .... .. ....... ......... .. . .... . . 120
6.7 Application of the ELISA to the detection of atractylosides in rat serum
and urlne .. . .. . . ... . ..................... . .... . ..... ... ..... .. ... ..... . . .. .... ... 121
6.7.1 Introduction .... .. .......... . .. ... .. . .. . ..... ... ...... .... . .. ..... . ...... 121
6.7.2 Methods .................... ...... ...... . .... . .. ... ...................... 123
6.7 .3 Results and discussion ........... ... . .. . ... ... .. .... . . ....... . ....... . 124
7: LOCALISATION OF THE TARGET SITES ATRACTYLOSIDE .. .. ................ 131
7.1 Introduction ........................... .... .... . ......... .. . .. ............. ... .... 131
7.2 The effects of atractyloside on the appearance of kidney function
enzymes and markers in rat urine .... ..... .. . . ................... ... . .... ... 132
7.2.1 Introduction .. . .. . ... .... . . ... ... ... ... . ...... . .. . ........ . ............ . . 132
7.2.2
7.2.3
Methods .. .. ........ ...... . .. . ... ........ .
Resu Its .......... .. ... ...... . ..... ........ . ................. ..... ...... . . .
135
135
7.3 The effects of atractyloside on the appearanc~, of liver function enzymes
In rat serum .. ....... ...... .. ...... . ..... .. ............... . .. . ... .. ...... .. . . . .. . . 145
7.3.1
7.3.2
7.3.3
In troduction .... . ... ......... . . . ... . . ... ........ ...... .. ..... .. . . ... . ... . 145
Methods ....... ............... . ... . ...... .
Results and discussion .. . . ............. . ... .. ... ... .. .... ............ .
146
146
7.4 The effects of atractyloside on the incorporati'lI1 of proline into proximal
tubules . . . . . . . .. . . . . . . . . . . . . .. . . .. . . . . . . . . . . . . . . . . . . . . . . . . . .. . . . . . . . . . . . . . . . . . . . . .. 148
7.4.1 Introduction ......................... .... .......... .. ............... . .... 148
7.4.2 Methods .. ...... . ... .............. .. .. .. ... .. .. . . ...... . .. .. .. ... . ....... 149
7.4.3 Results and discussion ...... ..... . ............ .. ........ . ......... . .. 149
7.5 Development of an immunocytochemical protocol for atractyloside ..... 151
7.5.1 Introduction and general considerations ... ......... . . . ............ 151
7.5 .2 Optimisation of tuber tissue fixa :, ion ...... .... .... ... .... ...... ... ... 155
7.5.2 .1 Introduction ....... . ........ . ............................... 1.55
7.5.2 .2 Materials and meth ods ...... . .. .... ... ... .... ... .. . ... . .... 155
7.5.2.3 Results and discussion ... ....... ....... ..... ...... .. .... ... 156
7.5.3 Optimisation of th e intracellular fixation of atractyloside ....... 158
7.5 .3.1 Introduction .. . . .. ................ . . . . .. .. .... . ... ....... . . 158
7.5 .3 .2 Material s and methods ..... .................. . . .... ........ 158
7.5.3 .3 Resul ts an d di seu ss i on ..... ...... ..... .. ...... .... ..... .... 159
7.5.4 Determination of the recogniti on of rabbit antisera by Protein A-
gold probes as monitored by immull o-blotting ........... ........... 160
7.5.4.1 Introduction . . ... . .. . . . . ...... . ....... .... . . ..... .. ..... . ... 160
7.5.4.2 Material s and methods . ... .. ...... .. .. ... ..... ... ...... . ... 160
X II
7.5.4.3 Result s and discussion ............ ............ . ........ .. 161
7.6 Immunocytochemical localisation of atrac;;yloside in the tuber of
Caililepis laureola.... ... ... ........ . ............ .. ... . . . ...... .. ... . ..... . .... . 162
7.6.1 Introduction . .. . ......... .. . .. .. . .. . . .. ...... .. . .. . .. .. . . ... . ... . . .. .... . 162
7.6.2
7.6 .3
Materials and methods . . . . . ... .... .. ... . .......... ... ... ..... . . . .. . . . .
Results and discussion . . ............ .. . . ....... . ........ . . ...... . .. . . .
163
163
7.7 Immunocytochemical localisation of atractyloside in rat kidney ....... . 165
7.7. 1 I n t rod u c t ion. . . . . . . . . . . . . . . . . . . . . . . . . . . . . . . . . . . . . . . . . . . . . . . . . . . . . . . . . . . .. 165
7.7 .2 Materials and methods . .... . . . .... . ... . ... . . .. . . . ..... ..... .. . .... .. . . 165
7.7.3 Results and discussion .... ..... .. . . . ... . .. . ... .. . ... ... ...... . .. .. .. .. 165
7.8 General discussion ..... ..... . ....... ..... . ........... . . ... . ..... . . .. ... ... .... . 170
8: GENERAL DISCUSSION ..... ... . ....... . ............ . .. .. ...... . ................... . ........ 174
REFERENCES ....... . ....... . ...... . .. .... . . . ......... .......... . . ...................... .. ....... 188
PUBLICATIONS . .. . ...... ...... . .............. ...... ...... .. ...... . . ....... . ... . ....... ..... .. ... 204
X 111
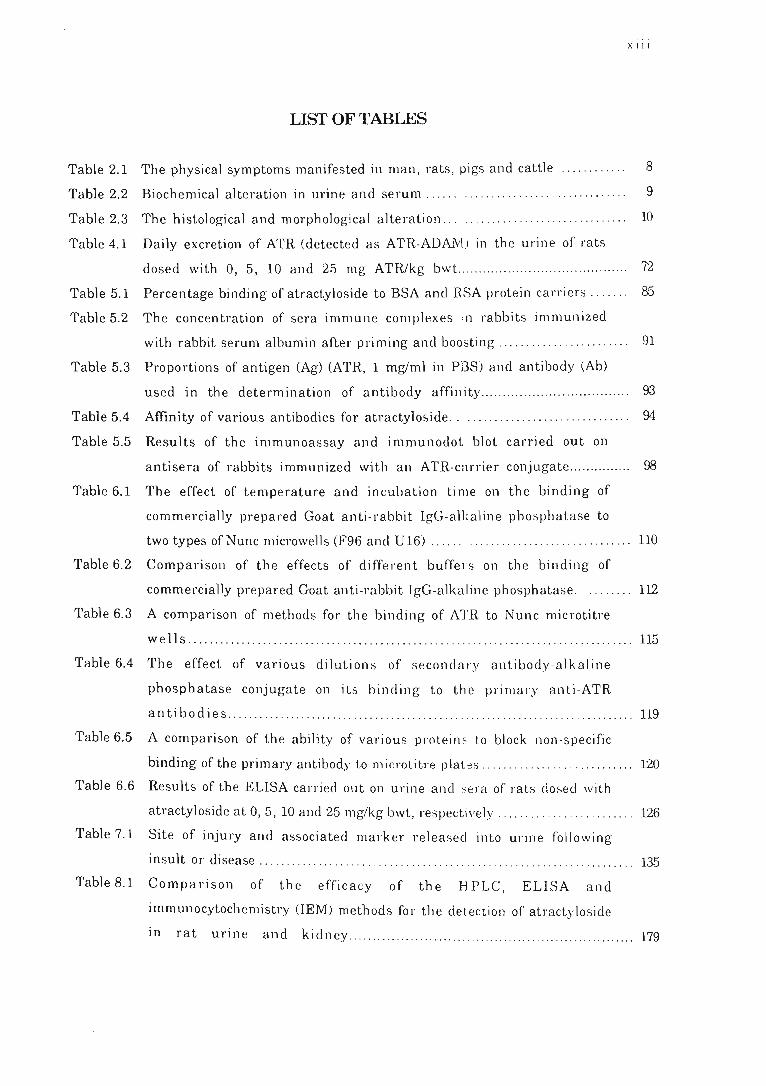
LIST OF TABLES
Table 2.1 The physical symptoms manifested in man, rats, pigs and cattle. . .......... 8
Table 2.2 Biochemical alteration in urine and serum ..... . 9
Table 2.3 The histological and morphological alteration.. . . .. ... ........... .. ... ... ... . . 10
Table 4.1 Daily excretion of ATR (detected as ATR-ADA1VU in the urine of rats
dosed with 0, 5, 10 and 25 mg ATRlkg bwt.. .... .... ............................ .. . 72
Table 5.1 Percentage binding of atractyloside to BSA and RSA protein carriers.... ... 8.5
Table 5.2 The concentration of sera immune complexes ,n rabbits immunized
with rabbit serum albumin after priming and boosting.... . ... . ... .. ..... ... .. 91
Table 5.3 Proportions of antigen (Ag) (ATR, 1 mg/ml in PBS) and antibody (Ab)
used in the determination of antibody affinity............ .. .................... . 93
Table 5.4 Affinity of various antibodies for atractyloside.. . .......... .. .... . ............ 94
Table 5.5 Results of the immunoassay and immunodot blot carried out on
antisera of rabbits immunized with an ATR-carrier conjugate............... 98
Table 6.1 The effect of temperature and incubation time on the binding of
commercially prepared Goat anti-rabbit IgG-alkaline phosphatase to
two types of Nunc microwells (F96 and U16) ... .... ... ......... . ................ 110
Table 6.2 Comparison of the effects of different buffers on the binding of
commercially prepared Goat anti-rabbit IgG-alkaline phosphatase. . ....... 112
Table 6.3 A comparison of methods for the binding of ATR to Nunc microtitre
wells .... ..... .......... . ... . ................ . ............. . .... . ...... ......... ........ 115
Table 6.4 The effect of various dilutions of secondary antibody-alkaline
phosphatase conjugate on its binding to the primary anti -ATR
ant i bod i e s .. . .. .. .. .. . .. .. . .. . .. .. .. .. .. .. .. .. .. .. .. .. . . . ............................. 119
Table 6.5 A comparison of the ability of various protein~ to block non-specific
binding of the primary antibody to microtitl'e plat ~s . . . .... . ....... . ............ 120
Table 6.6 Results of the ELISA carried out on urine and sera of rats dosed with
atractyloside at 0,5, 10 and 25 mglkg bwt, respectively . . .. . ... . ............ .. .. 126
Table 7.1 Site of injury and associated marker released into urine following
insult or disease... . . . . . . . . . . . . . . . . . . . . . . . . . . . . . . . . . . . . . . . . . . . . . . . . . . . . . . . . . . . . . . . . .. 135
Table 8.1 Comparison of the efficacy of the H PLC, ELISA and
immunocytochemistry OEM) methods for the detection of atractyloside
in rat urine and kidney .................................... . .. . ........... .. .. ..... 179
XIV
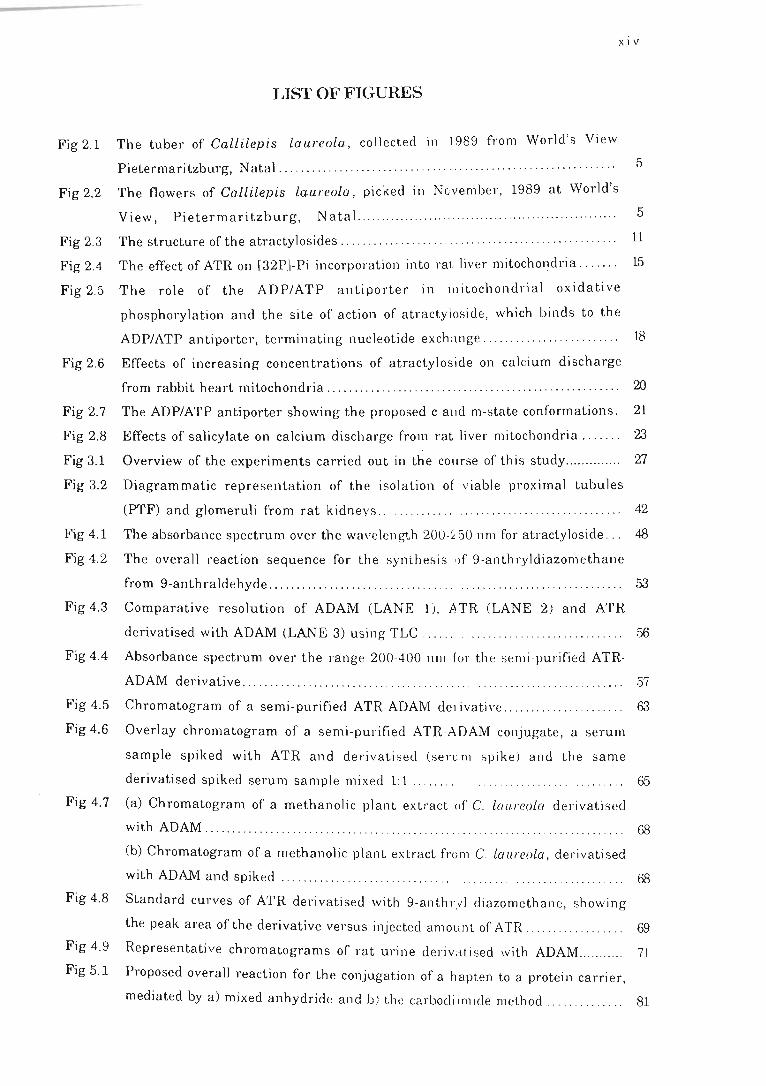
LIST OF FIGURES
Fig 2.1 The tuber of Callilepis laureola, collected in 1989 from World's View
Pietermaritzburg, Natal .. ........... . ......... .. .... . . · .. ···.······ · ····· · · · ··· ···· ·· 5
Fig 2.2 The flowers of Callilepis laureola , picked in November , 1989 at World's
View, Pietermaritzburg, NataL .. . .... .... . ....... .......... . . ... . ... ....... . ... . .. . . 5
Fig 2.3 The structure of the atractylosides . . .... . . . .. .... .. .. . . . . ...... .. ......... ·· ·· · ·· ···· 11
Fig 2.4 The effect of ATR on [32P)-Pi incorporation into rat liver mitocho~dria .. . .. .. 15
Fig 2.5 The role of the ADP/ATP antiporter in mitochondrial oxidative
phosphorylation and the site of action of atractyloside , which binds to the
ADP/ATP antiporter, terminating nucleotide exch;ll1ge . .. .......... . .. ...... ... 18
Fig 2.6 Effects of increasing concentrations of atractyloside on calcium discharge
from rabbit heart mitochondria .. .. ... . . .. . . .... . .. . . . . . . . . . . ... . . . .. . ... .... . ... . . . . 20
Fig 2.7 The ADP/ATP antiporter showing the proposed c and m-state conformations. 21
Fig 2.8 Effects of salicylate on calcium discharge from rat liver mitochondria .. . . . .. 23
Fig 3.1 Overview of the experiments carried out in the course of this study.............. 27
Fig 3.2 Diagrammatic representation of the isolation of viable proximal tubules
(PTF) and glomeruli from rat kidneys.............. ............ .... . . . .. ... . . . ... 42
Fig 4.1 The absorbance spectrum over the wavelength 200-~ 50 nm for atractyloside. .. 48
Fig 4.2 The overall reaction sequence for the synthesi s ·)f 9-anthryldiazomethane
from 9-anthraldehyde.. ..... . ... .. .. . .... .. .. . .... . . . . . . . ..... .... . ...... .. . ... .... . .. 53
Fig 4.3 Comparative resolution of ADAM (LANE 1), ATR (LANE 2) and ATR
derivatised with ADAM (LANE 3) using TLC ...... .. .... .. .. .......... .......... .56
Fig 4.4 Absorbance spectrum over the range 200-400 nm for the semi-purified ATR
ADAM derivative....... ........................ . .... . .. . .. .. ........ . . . . . . ..... . . ... . . 57
Fig 4.5 Chromatogram of a semi-purified ATR-ADAM delivative.. . ......... .......... 63
Fig 4.6 Overlay chromatogram of a semi-purified ATR-ADAM conjugate, a serum
sample spiked with ATR and derivati sed (se n : m spik e) and the same
derivatised spiked serum sample mixed 1:1 ........ ....... . ... ....... ......... ... 65
Fig 4.7 (a) Chromatogram of a methanolic plant extract of C. laureola derivatised
with ADAM ... .... ... ... . .. . ..... . .. ........... . . ........ ... . .... .. ..................... 68
(b) Chromatogram of a methanolic plant extract from C. lalll'eola , derivatised
with ADAM and spiked ....... . .. .. ..... ... . ........... ..... .. ......... .. .. .. ..... . .. 68
Fig 4.8 Standard curves of ATR derivati sed with 9-anthr:1'1 diazometh a ne, showing
the peak area of the derivative versus injected amount of ATR . ... . ........ . . ... 69
Fig 4.9 Representative chromatograms of rat urin e derivMi sed with ADAM.. ......... 71
Fig 5.1 Proposed overall reaction for the conjugation of a l1apten to a protein carrier,
mediated by a) mixed anhydride and b ) the carbodi imide method. .. .. . . . .. .... 81
Fig 5.2
Fig 5.3
Fig 6.1
Fig 6.2
xv
Titre responses in rabbits immunized with ATR carrier conjugates.. ....... .. 8.5
G~aphical representation of the single radial immunodiffusion area versus
concentration of a standard concentration series rabbit IgG. ... .. . . . . .. . . . . . .. .. 91
Comparison of the binding of bee venom phospholipase A2 .. . ... ..... . . . ......... 108
Comparison of the binding ability of bee venom phospholipase A2 (PLA2),
bovine serum albumin (BSA), bovine g-globulin (BGG) and b-Iactogloblin
CB-Lact) to microtitre plates ..................... .. ........................ .. .. ........ 109
Fig 6.3 A comparison of the effect of various primary fl ntibody dilution s on the
coating ability of a range of concentrations of BSA-ATR ......................... 118
Fig 6.4 Diagrammatic representation of the competitive 8LISA, developed for the
detection of atractyloside in biological fluids .... ... . .... .... ..... .. ... ........... 122
Fig 6.5 Representative standard curve for the enzyml! linked immunosorbent
determination of atracty loside . . .. . ... .. .. . . . .. . . .. .. . .. . . .. . . .. . . .. . .. . . . . .. . . .. .... 124
Fig 6.6 Daily percentage of atractyloside positive rat urine samples, monitored by
ELISA ........... .. .................... .. .. . ... ....... .. .. . ............ ... .. . .. ......... . 127
Fig 7.1 The structure of the nephron . .............................. . ... .. ... ....... . .. . ....... 133
Fig 7.2 The release of total protein into the urine of rats given a single i.p . dose of
ATR . ...... . . .... ...... .... ......................... .. ................. ...... .. . . .... .. .. 136
Fig 7.3 The release of albumin into the urin e of rat ::. given a single i.p. dose of ATR.. 137
Fig 7.4 The release of g-glutamyl transfera se (GGT) into the urine of rats given a
single i.p. dose of ATR .... . ................. . .... .. ... . .... .. ..... ... ... " . ....... ... . 139
Fig 7.5 The release of alkaline phosphatase (AP) into the l>rine of rats given a single
i.p. dose of ATR ................ ... . ... . .. . . .... ........ . .... ..... ... .......... . . . ...... 140
Fig 7.6 The release of glucose into the urine of rat s given a single i.p . dose of ATR . . . 141
Fig 7.7 The release of lactate dehydrogenase (LDH) into the urin e of rats given a
single i.p. dose of ATR .... .................. . ......... . .. . ..... .... .. ...... . .. .. ...... 143
Fig 7.8 The release of calcium into the urine of rats given a single i.p. dose of ATR .. 144
Fig 7.9 Results of the determination of serum aspartate and alanine tran saminase
(AST and ALT) monitored over a period of 4 days, at 24 hour intervals in rats
dosed with atractyloside ............ ............... .. .... . .. .... ... . . ............. ..... 147
Fig 7.10 The incorporation of l3'H]-L-prolin e into the pro Le in of iso lated proximal
tubules. . .. . . . . . . . . . . . . . . . . . . . . . . . . . . . . . . . . . . . . . . . . . . . . . . . . .. ... ... ............... .... .. . 1.50
Fig 7.11 The effect of ATR (1-6 ~M) on [3HJ-L-proline incorporation into isolated rat
proximal tubules . . . . .................................. . ............................. . .. 151
Fig 7.12 The principle of the immunocytoch emical location of a ti ssue-bound antigen
using a Protein A-colloidal gold particl e . . ..... ... ...... ...... .. .. . ... .... ........ 154 Plate I
• • •••••• • • • • •• •••••• ••••• 0 •• ' •••••• •••• • •••• • ••• • •••• •• ••• • • • •••••• • • • •• • ••••••••••••••••• , 157
X \1 1
Fig 7.13 Determination of the ability of sodium metaperioclate and carbodiimide to
couple atractyloside to ovalbumin , bound to a microt itre plate .. ... ... .. . . .. .... . 159
Fig 7.14 Photographic representation of the immunodot blot Lo Lest the recognition by
the Protein A gold probe for the rabbit antiserum . .. . ...... . . .. ... . .. .. . .. . ....... 162
Plate II . . . . . . . . . . . . . . . . . . . . . . . . . . . . . . . . . . . . . . . . . . . . . . . . . . . . . . . . . . . . . . . . . . . . . . . . . . . . . . . . . . . . . . . . . .. 166
Plate III . . . . . . . . . . . . . . . . . . . . . . . . . . . . . . . . . . . . . . . . . . . . . . . . . . . . . . . . . . . . . . . . . . . . . . . . . . . . . . . . . . . . . . . . . . . 169
,
®
a
Ab
ABTS
ACN
ADAM
ADP
Ag
ALT
AP
AST
ATP
ATR
ATR-ADAM
ATR-ovalbumin
B-B
BMRC
BSA
BSA-ATR
CAMOR
CATR
cone .
cv Da
Dept.
DMF
DNA
t.\jf
Earles' BSS
EDTA
ErA
ELISA
env
FP
LIST OF ABBREVIATIONS
registered trade mark
separation factor
antibody
2,2'-Azino-diC3-ethy Ibenzthiazoli ne sulphon ic acid)
aceton itri Ie
anthryldiazom ethan e
adenosine -5'-diphosphate
antigen
alanine transaminase
alkaline phosphatase
aspartate tran saminase
adenine-5'- triphosphate
atractyloside
atractyloside derivatised wi1.h anthryldiazomethane
atractyloside conjugated to (Ivalbumin
BSA reacted with carbodiimide
Biomedical Resource Centre
bovine serum albumin
bovine serum albumin -atractyloside conjugate
carrier agent-modifi ed residues
carboxy-atr acty lo side
concentrated
Coeffici ent of variati on
Dalton s
Department
N ,N-dimethyl form amide
deoxyribonucleic aci d
XV I I
m embrane potenti al; the diff erence in electri c potenti al
between two ph ases separa ted by a membrane
Earles' Buffered Salt So luti on
ethylen e diamin e te tra-ace ti c acid
enzym e immun oassay
enzyme-linked immun osorbent a ssay
envelope prote in from HIV
fal se posit ive
GA
GGT
GMT
GN
HEPES
HIV
HPLC
hr
i.p.
Ig
IgG
IgM
IgY
k'
KDO
kgbwt
A
LDH
MeOH
NAD+
NADH
NADP+
NADPH
0-0
PAPS
PBS
PEG
pel's. comm.
Pi
R-R
R.H.
RAST
RER
RIA
RIIEHS
RNA
Golgi Apparatus
y-glutamyl transferase
Greenwich Mean Time
glomerular nephritis
N -2-Hydroxyethylpiperazin{!-N' -ethanesulphonic
acid
human immunodeficiency virus
high performance liquid chromatography
hour
intraperitoneal
immunoglobulin
immunoglobulin G
immunoglobulin M
immunoglobulin isolated frc,m egg yolks
capacity factor
2-keto-deoxyoctonate
kilograms body weight
wavelength
lactate dehydrogenase
methanol
nicotinamide adenine dinu( leotide
X V111
nicotinamide adenine dinucleotide (reduced)
nicotinamide adenine nucleotide phosphate
nicotinamide adenine dinucleotide phosphate (reduced)
ovalbumin reacted with carhodiimide
adenosine-3 ' -phosphate-5 ' -phosphosul phate
phosphate-buffered saline
polyethylene glycol
personal communication
inorganic orthophopshate
RSA reacted with carbodiim ;de
relative humidity
radioall ergosorbent
Rough Endoplasmic ReticuLim
radioimmunoassay
Robens Institute for Industr' al and Environmental
Health and Safety
ribonucleic acid
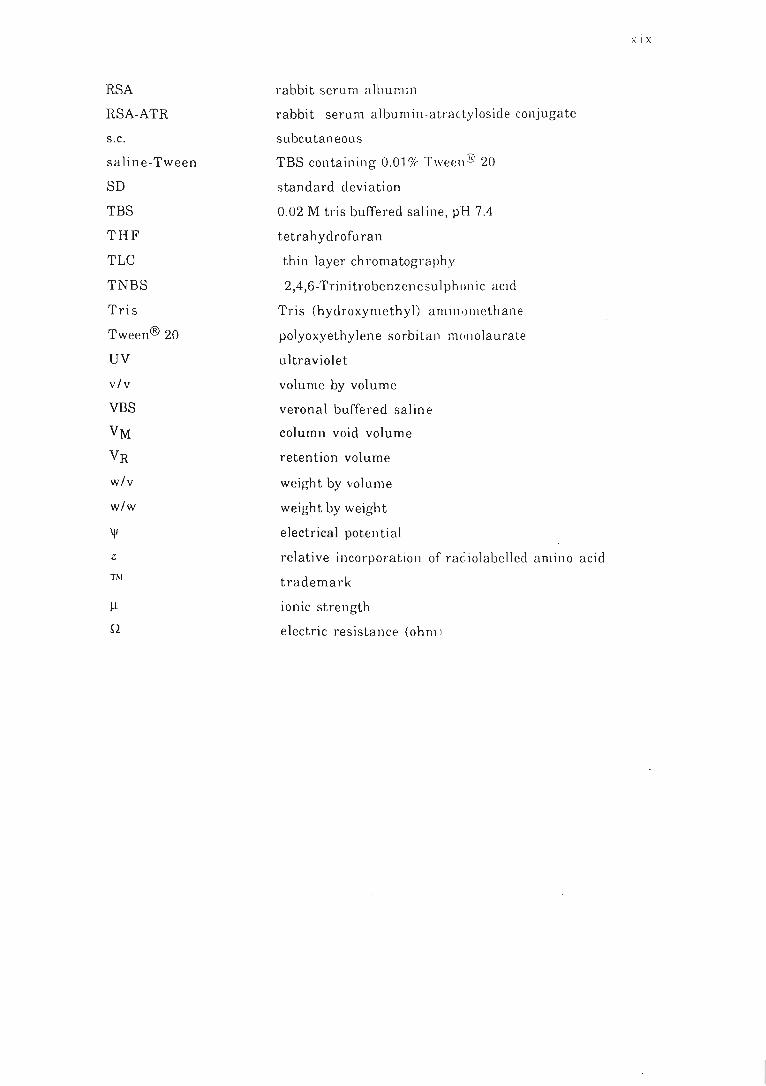
RSA
RSA-ATR
S.c.
saline-Tween
SD
TBS
THF
TLC
TNBS
Tris
Tween® 20
UV
v/v
VBS
VM
VR
w/v
w/w
z
TM
J.l.
Q
rabbit serum albumin
rabbit serum albumin-atractyloside conjugate
subcutaneous
TBS containing 0_010/(. Tweell E' 20
standard deviation
0 .02 M tris buffered saline, pH 7.4
tetrahydrofuran
thin layer chromatography
2,4,6-Trinitrobenzenesulphonic acid
Tris (hydroxymethyl) amin,)methane
polyoxyethylene sorbitan n1(,J1olaurate
ultraviolet
volume by volume
veronal buffered saline
column void volume
retention volume
weight by volume
weight by weight
electrical potential
relative incorporation of raciolabelled amino acid
trademark
ionic strength
electric re sistance (ohm)
X I X
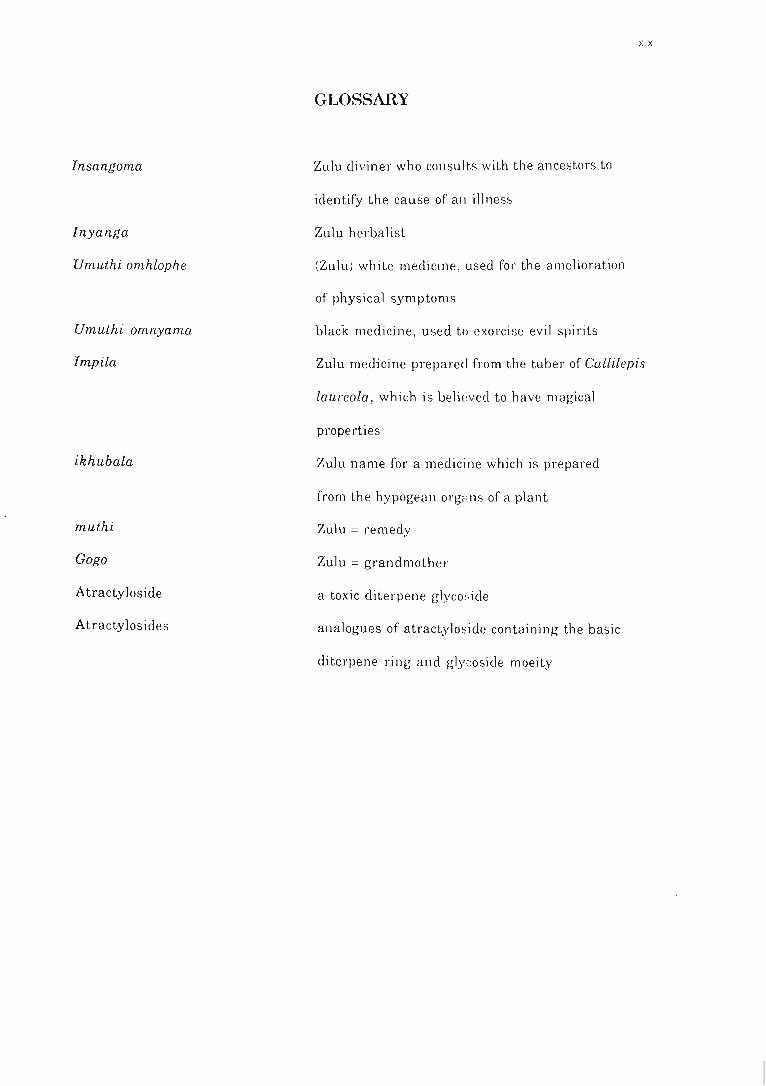
Insangoma
Inyanga
Umuthi omhlophe
Umuthi omnyama
Impila
ikhubala
muthi
Gogo
Atracty loside
Atractylosides
GLOSSARY
Zulu diviner who consults with the ancestors to
identify the cause of all illness
Zulu herbalist
(Zulu) white medicine, used for the amelioration
of physical symptoms
black medicine, used to exorcise evil spirits
xx
Zulu medicine prepared from the tuber of Callilepis
laureola, which is be1i(,vecl to have magical
properties
Zulu name for a medicine which is prepared
from the hypogean orgC:l. ns of a plant
Zulu = remedy
Zulu = grandmother
a toxic diterpene glyco!,ide
analogues of atractylo~ide containing the basic
diterpene ring and gly ::osicle moeity
X Xl
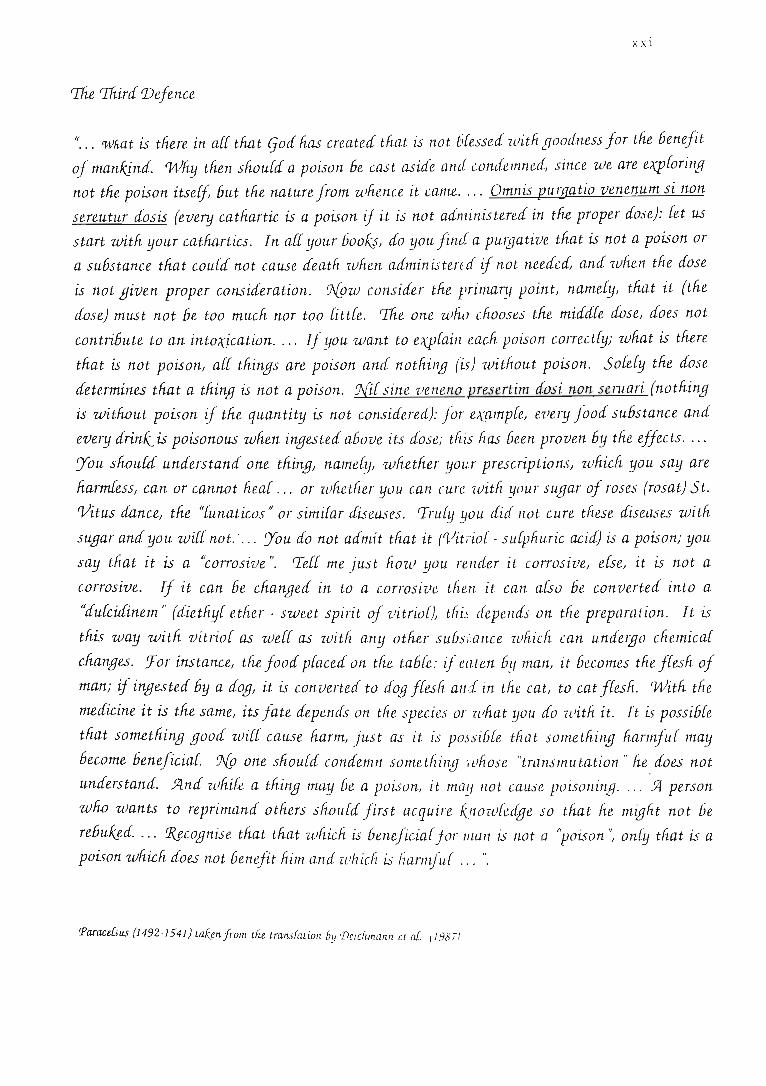
rrTie %in[ Vefence
If ••• 'WFiat is there in a[[ tfiat yoa fias createa tfiat is not 6[essea -witfi gooaness for tfie 6enefit
of manKjna. Wfiy tfien sfiou{tf a poison 6e cast asiae ante conaemne~ since we are eVJ[oring
not the poison itself 6ut the nature from wfience it came . ... Omnis pu rgatio venenum si non
sereutur aosis (every catfiartic is a poison if it is not aa111inisterea in the proper aose): ret us
start witfi your catfiartics. In a[[ your ooo~, ao you fina a pUlgative tfiat is not a poison or
a su6stance tfiat cou{tf not cause aeatfi wfien aaministeru[ if not neeaeC£ ana 'wfien the aose
is not given proper consitferation. ?{pw consiaer tfie primary point, namdy, tfiat it (tfie
aose) must not 6e too mucfi nor too atde. erfie one wfio cfiooses tfie miaa[e aose, aoes not
contri6ute to an into;ljcation . ... If you want to e{p[ain eacfi poison coITecdYi wfiat is tfiere
tfiat is not poison, a[[ tfiings are poison ana notfiing (is) witHout poison. So[dy tfie aose
aetermines tfiat a tfiing is not a poison. W[ sine 7Jeneno presertim aosi non semari (notfiing
is witfiout poison if tfie quantity is not consiaerea): for e?(!1mp{e, every fooa su6stance ana
every arink. is poisonous wfien ingestea a60ve its aosei tfiis fias oeen proven 6y tfie effects . ...
You sfiou{tf unaerstana one tfiing, namefy, wfietfier your prescriptions, wfiicfi you say are
fiarmfess, can or cannot fiea[ ... or wfietfier you can cure witH your sugar of roses (rosat) St.
o/itus aance, the "[unaticos JJ or simi[ar aiseases. 'Tru{y you aia not cure tfiese aiseases witfi
sugar ana you wire not . .... :You ao not aamit tfiat it (o/it/io[ - su[pfiuric acia) is a poisoni you
say tfiat it is a "corrosive JJ. rref[ me just fiow you renaa it corrosive, dse, it is not a
corrosive. If it can 6e cfiangea in to a corrosive tfien it can a[so 6e convertea into a
"aufcitfinem" (aietfiy[ etfier - sweet spirit of vitrion tfii~ aepenas on tfie preparation. It is
tfiis way witfi vitrio[ as were as witH any otfier su6swnce wfiicfi can untielgo cfiemica[
changes. lJor instance, tfie fooa p[acea on tfie ta6[e: if eaten 6y man, it 6ecomes tfie f[esfi of
mani if ingestea 6y a aog, it is convertea to aog f[esfi ani in tfie cat, to cat f[esfi. (Witfi tfie
meaicine it is tfie same, its fate aependS on tHe species or -wfiat you ao -witfi it. It is possi6[e
tfiat sometfiing gooa wire cause fiarm, just as it is possiMe tfiat sometfiing fiannfu[ may
Gecome 6eneficiar. ?{P one sfiou[a conaemn sometHing WHose ('transmutation" fie aoes not
unaerstana. Ylna wfiife a tfiing may 6e a poison, it may not cause poisoning . ... -Yl person
wfio wants to reprimana otfiers sfiou{tf first acquire k..n07.l.i{l!-age so tfiat fie migfit not 6e
reG uk..g. a. '" 1\f.cognise tfiat tfiat wfiicfi is oeneficia[ for I1LaIl is not a ('poison ", on[y tfiat is a
poison wfiicfi aoes not Genefit him ana IllfiicJ1 is fiannfu{ ... ".
Paracefsus (1492-1541) LaKs.n from tne transfation 6y 'Dcicfimanl! ct af (198 7)
1
CHAPTER 1
INTRODUCTION
Reliance on the therapeutic properties of indigenous plants is common to peoples of
developing countries, and the Zulu population of Southern Africa is no exception. These
people present the classic scenario of culture and economics influencing choice of health
care. The Zulus maintain disease to be a manifestation of disharmony between a person
and the ancestors (Bryant, 1909). Sorcery and medicine are inextricably linked and it is
the function of the traditional healers, regarded as the "protectors of society", to be
diagnosticians, apothecaries and diviners (Krige, 1981).
The Insangoma or diviner is the diagnostician and augur of society, identifying an affiic
tion by consulting with the spirits. The herbalist or Inyanga has no spiritual association,
merely dispensing various remedies prepared from roots, berries, animals and insects
(Kiernan, 1978). The tangible link between magic and medicine has resulted in two
distinct categories of traditional medicine. White medicine (Umuthi omhlophe) is used to
ameliorate physical symptoms, while black medicine (Umllthi omnyama) exorcises eyjl
spirits. Invariably umuthi omnyama is an emetic, prepared from leaves or roots which
are either bruised or powdered, prior to extraction in a suitabJe solvent (Krige, 1981).
Despite routine use of some 400 herbs for medicinal purposes, the pharmacological
properties are unknown and many contain toxic principles (Gundidza, 1985). While some
remedies are beneficial, or at worst innocuous, others are highly toxic. The precise
incidence of herbal-mediate~ deaths is unknown however, as no specific diagnostic
assays are available. Therefore, officially, such intoxications do not occur and the
indiscriminate fatalities continue unchecked.
One of the more popular Zulu umuthi omnyama , called Impila , is prepared from the tuber of
Callilepis laureola and there is evidence that each year this herb is responsible for
numerous deaths from liver and kidney necrosis. For instance, over the period 1971 to
1977, this remedy was reputed to be the major aetiological factor in at least 74 deaths at the
King Edward VIII Hospital, in Durban. Impila contains t.he nephrotoxin atractyloside
(ATR) which is believed to be the major causative agent for the high mortality rate among
patients using Impila (Bhoola, 1983). It was Prof. J .P. Nels (Head of the Dept. Forensic
Medicine, University of Natal, Durban) observations concerning the repeated incidences
of C. laureola-mediated deaths in Natal, that stimulated him to suggest the subject of this study.
2
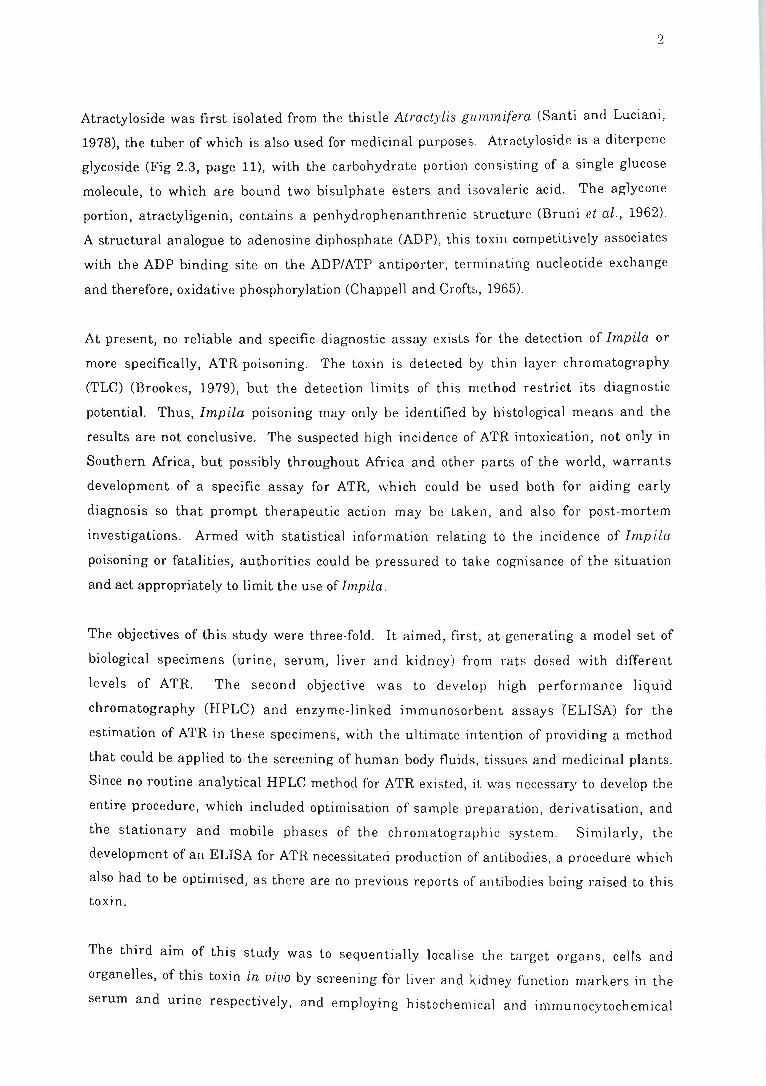
Atractyloside was first isolated from the thistle Atractylis gummifera (Santi and Luciani,
1978), the tuber of which is also used for medicinal purposes. Atractyloside is a diterpene
glycoside (Fig 2.3, page 11), with the carbohydrate portion consisting of a single glucose
molecule, to which are bound two bisulphate esters and isovaleric acid. The aglycone
portion, atractyligenin, contains a penhydrophenanthrenic structure (Bruni et al., 1962).
A structural analogue to adenosine diphosphate (ADP), this toxin competitively associates
with the ADP binding site on the ADP/ATP antiporter, terminating nucleotide exchange
and therefore, oxidative phosphorylation (Chappell and Crofts, 1965).
At present, no reliable and specific diagnostic assay exists for the detection of Impiia or
more specifically, ATR poisoning. The toxin is detected by thin layer chromatography
(TLC) (Brookes, 1979), but the detection limits of this method restrict its diagnostic
potential. Thus, Impila poisoning may only be identified by histological means and the
results are not conclusive. The suspected high incidence of ATR intoxication, not only in
Southern Mrica, but possibly throughout Africa and other parts of the world, warrants
development of a specific assay for ATR, which could be used both for aiding early
diagnosis so that prompt therapeutic action may be taken, and also for post-mortem
investigations. Armed with statistical information relating to the incidence of Impila
poisoning or fatalities, authorities could be pressured to take cognisance of the situation
and act appropriately to limit the use of Impila.
The objectives of this study were three-fold. It aimed, first, at generating a model set of
biological specimens (urine, serum, liver and kidney) from rats dosed with different
levels of ATR. The second objective was to develop high performance liquid
chromatography (HPLC) and enzyme-linked immunosorbent assays ~ELISA) for the
estimation of ATR in these specimens, with the ultimate intention of providing a method
that could be applied to the screening of human body fluids , tissues and medicinal plants .
Since no routine analytical HPLC method for ATR existed, it. was necessary to develop the
entire procedure, which included optimisation of sample preparation, derivatisation, and
the stationary and mobile phases of the chromatographic system. Similarly, the
development of an ELISA for ATR necessitated production of antibodies, a procedure which
also had to be optimised, as there are no previous reports of antibodies being raised to this
toxin.
The third aim of this study was to sequentially localise the target organs, cells and
organelles, of this toxin in vivo by screening for liver and kidney function markers in the
serum and urine respectively, and employing histochemical and immunocytochemical
3
techniques. Since immunocytochemical detection of ATR had not been carried out prior to
this study, a substantial amount of procedure optimisation was necessary, both on C.
laureola tuber and rat tissue.
This thesis deals with each aim in a separate chapter, the results of which are ultimately
correlated in the final discussion. As the study involved a considerable amount of method
development, only the final optimised procedures are detailed in the Materials and
Methods (Chapter 3), whereas the developmental aspects of the methodology are covered
separately in their respective chapters (4 to 8) .
4
CHAPTER 2
LITERATURE REVIEW
The high incidence of liver and renal necrosis in the Negroid population of Natal
prompted investigations aimed at identifying the causative agent. It was serendipitously
discovered that a herbal remedy called Impila was responsible for this pathology. The
purpose of this literature review is to give a description of the botanical characteristics and
geographical distribution of C. laureola, the herb from which Impila. is prepared, and the
alleged therapeutic benefits of this remedy. The description of the preparation and use of
this herb is in part the result of personal interviews with Insangoma.s and their clientele.
Thereafter, the clinicopathology of Impila poisoning is presented as a synopsis of the
currently available information pertaining to the physical symptoms, as well as the
biochemical and morphological alterations in humans and animals following exposure to
Impila, ATR or plants biosynthesising this toxin. The chemistry of ATR is outlined,
together with the incidence of ATR in plant species other than C. laureola. As a
conclusion, the chronological elucidation of the action of ATR is given, together with its
effects on intra-mitochondrial calcium stores and post-translational sulphation in the
Golgi apparatus (GA).
2.1 Classification and distribution of Callilepis laureola and its use
in herbal remedies
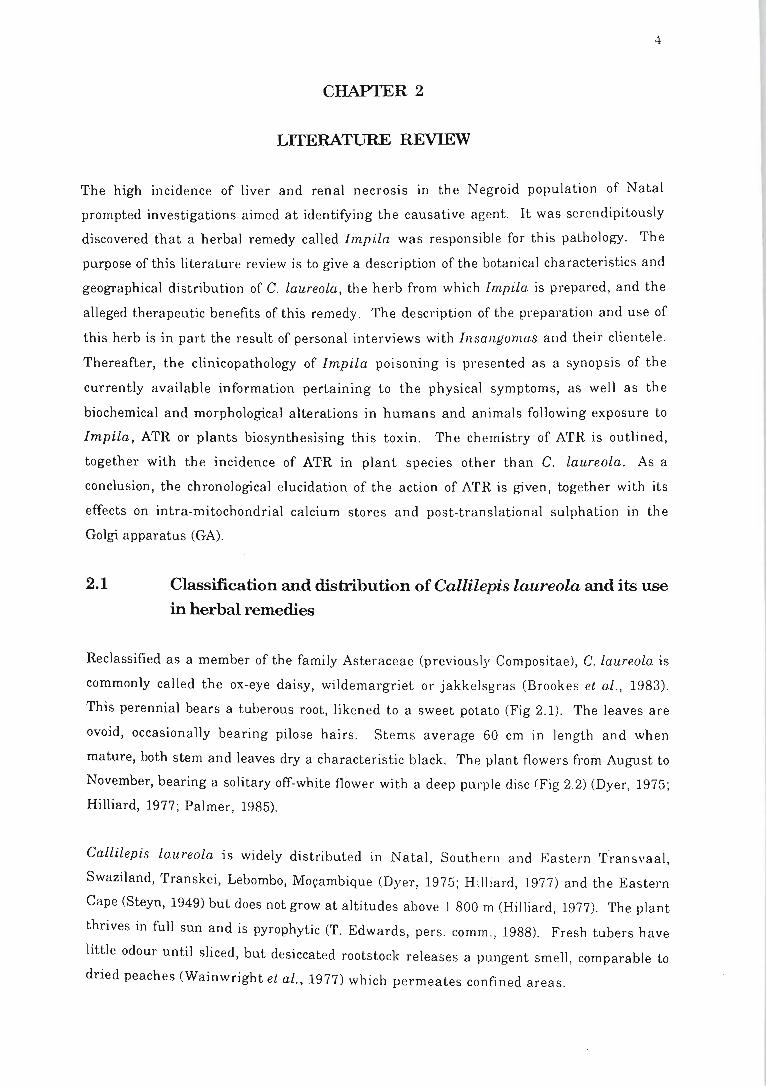
Reclassified as a member of the family Asteraceae (previously Compositae), C. laureola is
commonly called the ox-eye daisy, wildemargriet or jakkelsgras (Brookes et ai., 1983).
This perennial bears a tuberous root, likened to a sweet potato (Fig 2.1). The leaves are
ovoid, occasionally bearing pilose hairs . Stems average 60 cm in length and when
mature, both stem and leaves dry a characteristic black. The plant flowers from August to
November, bearing a sobtary off-white flower with a deep purple disc (Fig 2.2) (Dyer, 1975 ;
Hilliard, 1977; Palmer, 1985).
Callilepis laureola is widely distributed in Natal, Southern and Eastern Transvaal,
Swaziland, Transkei, Lebombo, Mo~ambique (Dyer, 1975; Hilliard, 1977) and the Eastern
Cape (Steyn, 1949) but does not grow at altitudes above 1 800 m (Hilliard, 1977). The plant
thrives in full sun and is pyrophytic (T. Edwards, pers. comm., 1988). Fresh tubers have
little odour until sliced, but desiccated rootstock releases a pungent smell, comparable to
dried peaches (Wainwright et ai., 1977) which permeates confined areas.
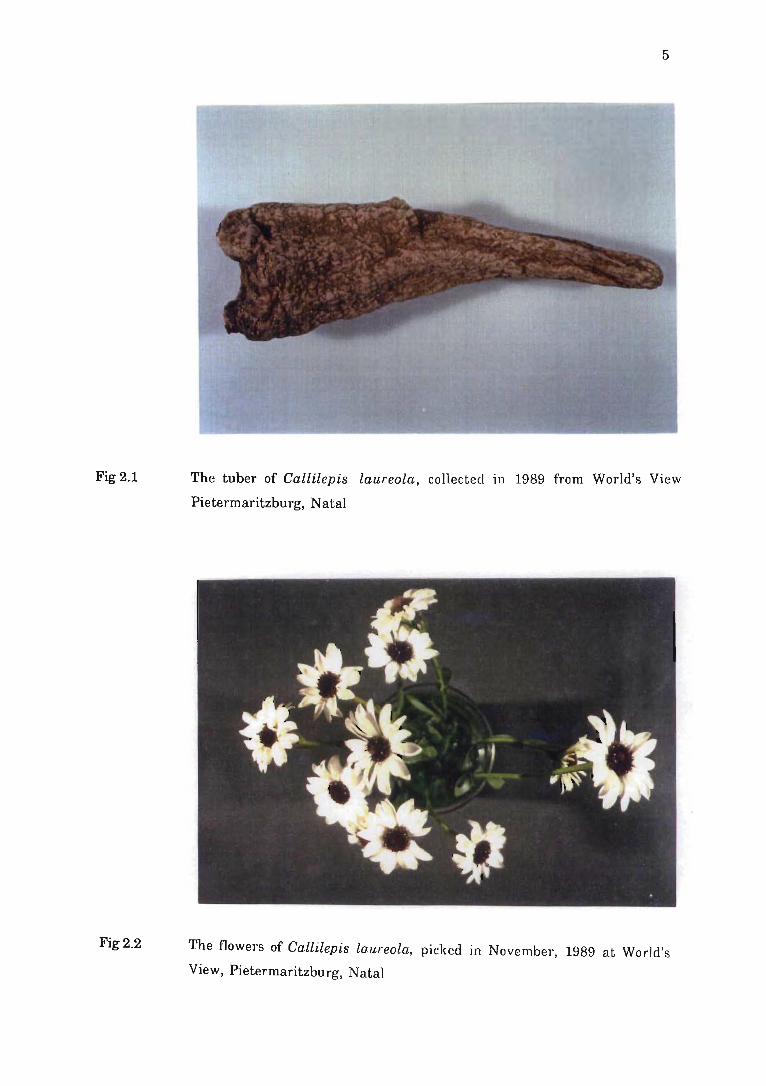
Fig 2.1
Fig 2.2
5
The tuber of Callilepis laureola, collected in 1989 from World's View
Pietermaritzburg, Natal
The flowers of Caliilepis laureola, picked in November, 1989 at World's
View, Pietermaritzburg, Natal
6
The Nguni people (includes Zulu and Sotho) regard C. la ureola as a valuable nwth i .
Random surveys in the Umlazi Township, Durban (urban) indicate that 30% of those
questioned valued C. laureola as a medicinal herb and furthermore, had used or, were
using it on a routine basis (Wainwright et ai., 1977). The decoction, which is known to the
Zulu as Impila and the Xhosa as "intsika yo:mhlaba", is prepared from the tuber (Debetto,
1978) although leaf infusions are reputed to have limited curative properties (Bryant, 1909).
Classified as an iKhubala or "medicine which is dug up", the tuber is harvested in winter
(June/July), dried, and crushed (Bryant, 1909; Ellis, 1986). Alternatively, a piece of fresh
tuber the size of a forefinger is bruised and chopped (Wainwright et al., 1977), whereupon
the pulp is boiled for 30 minutes in a suitable volume of water and the decoction given
orally or rectally (lnsangoma, pel's. comm., 1987). A warm effusion may be prepared in
milk, or the raw tuber simply chewed and swallowed (Ellis, 1986), but these methods are
less popular.
Essentially a broad spectrum muthi, Impila is taken to ameliorate gastrointestinal dis
orders and tapeworm infestations (Bryant, 1909), to promote fertility (Debetto, 1978), as an
expectorant and whooping cough remedy (Maberley, 1905) as well as an appetite promoter.
Of the twenty patients questioned in a Drakensburg hospital (rural), ten admitted using
Impila; eight for stomach disorders and two for coughs (Ellis, 1986). The protective powers
of the plant are, however, considered its greatest attribute with a tuber buried in the vicinity
of a home believed to intercept evil directed towards the household (C. Dlamini, pel's.
comm., 1988), while consumption of the liquor extract prior to celebrations is thought to
protect one from evil (Wainwright et al ., 1977). A daily spoonful of the infusion is
considered to promote well-being and may also be added to a child's bath water (Gogo
(grandmother), pel's. comm., 1987). Impila may also be prepared in conjunction with other
herbs (Bryant, 1909), or worn about the neck for protection .
Unfortunately, Impila is not an innocuous muthi, and there is evidence to implicate the use
of this decoction with a multiplicity of life-threatening conditions. These are discussed in
the next section.
2.2 The clinicopathology of lmpila poisoning
There has been a significant amount of research into the use of C. la.u.reola. in remedies
although one may question such general interest, since it is on Iy one of 400 herbs used for
medicinal purposes. In the mid-1970s the high incidence of centrilobular zonal liver
necrosis, regarded as the commonest cause of fatal hepatic necrosis in Negroid Natalian
residents, was cause for concern. Of unknown aetiology, over the period 1958 to 1977, this
7
necrOSIS, which was invariably accompanied by renal damage, accounted for 2.06% of
deaths at the King Edward VIII Hospital , Durban (Bhoola, 1983). Extensive hepatic zonal
necrosis can result from exposure to toxins (Netter, 1979). Since 85% of Negroid patients
have consulted a traditional healer prior to hospital admission (Bhoola, 1983), Wainwright
et al. (1977) were able to investigate the potential hepatotoxicity of five common herbal
remedies. All these remedies, however, failed to elicit the characteristic hepatic and renal
damage in laboratory animals.
Unfortunately, Impila was not included in the above studies. The nephrotoxicity of Impila
was first noted in 1971 when a man demonstrated renal failure after being treated with ,
this herb for impotence, by an Inyanga . As he survived and had no evidence of hepatic
damage, no correlation was made between the use of this herb and centrilobular liver
necrosis (Seedat and Hitchcock, 1971). The association was only made in 1977, when a six
month old child died from liver and renal failure after receiving a herbal enema. The
tuber used by the mother to prepare the enema was identified as C. laureola and subsequent
tests confirmed the toxicity of the herb (Wainwright et al., 1977; Bhoola, 1983).
A methanol extract from the tuber, and subsequent purification of the major extraction
product, indicated that the predominant toxin was the diterpene glycoside ATR, which is
produced by several species of Compositae (Wainwright et al., 1977). While it is
appreciated that plants containing atractylosides may biosynthesise other toxins, for the
sake of clarity, the clinicopathology presented by animals or humans poisoned by ATR
containing plants will be considered as if ATR is the primary source of toxification.
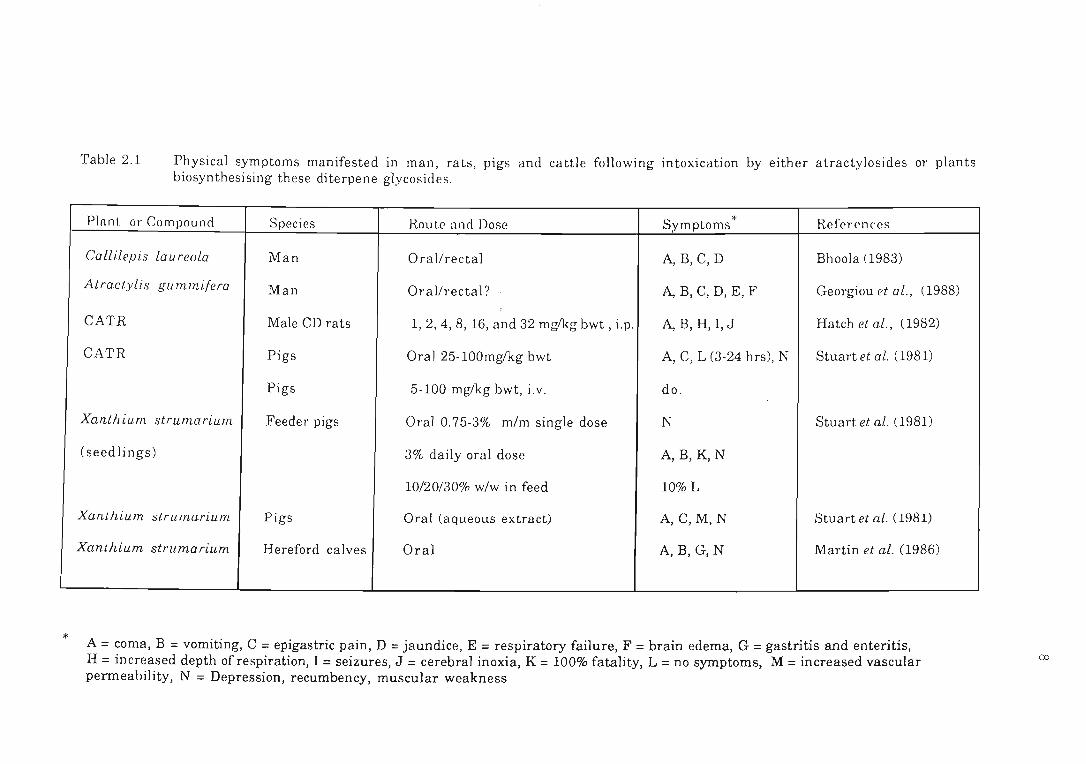
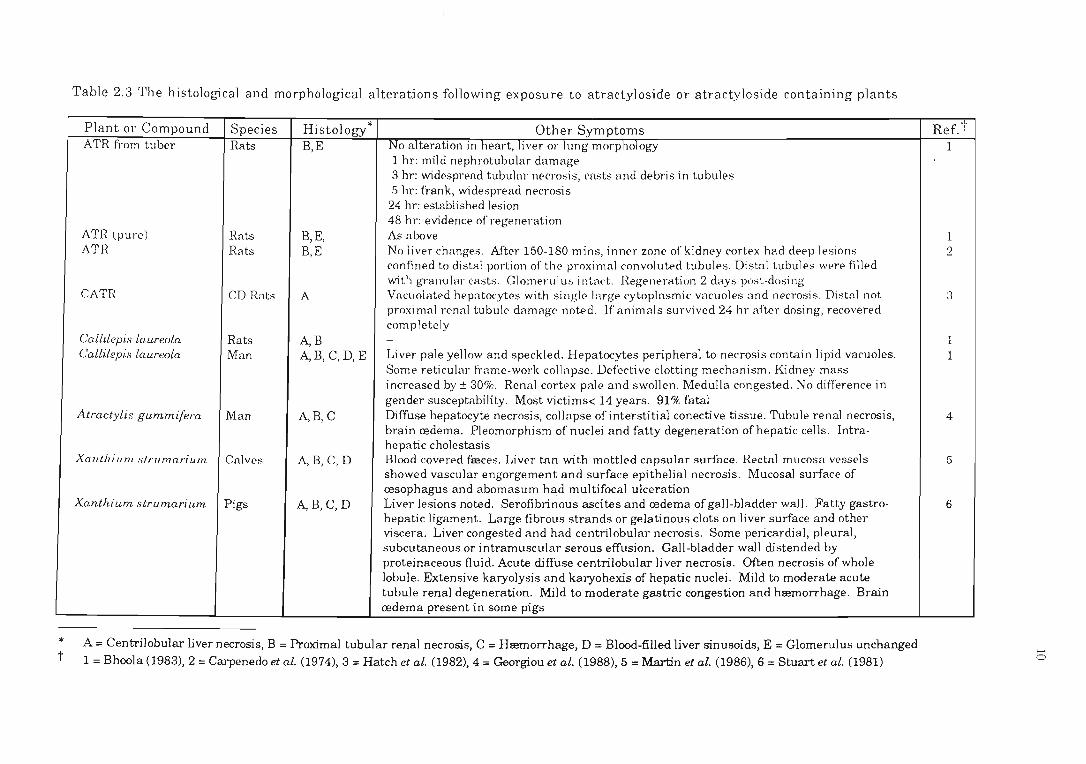
Tables 2.1 to 2.3 outline the clinicopathological changes in rats, man, calves and pigs,
following administration of ATR, carboxy-atractyloside (CATR), or plants known to
biosynthesise these toxins. The three tables, which constitute an extensive review by the
present author, cover physical manifestations of poisoning, biochemical changes in serum
or urine and morphological alterations, respectively. As seen in Table 2.1, coma is
common to all species, regardless of dose , form, or route of administration, while vomiting
is also prevalent. Hypoglycaemia is noted, as is liver and renal necrosis. There is a
dispute as to whether ATR per se is hepatotoxic and whether this diterpene specifically
targets the proximal renal tubule, as distal tubule alteration has also been observed in
rodents (Hatch et al., 1982). The main conclusions drawn are that regardless of the species
of mammal under investigation, atractylosides induce both hypoglycaemia and renal
necrosis. The nature of the hepatotoxic agent has not been clearly identified and it was
suggested that this could be a metabolite of ATR, as rats only demonstrated liver necrosis
24 hours after being given an Impila extract (Wainwright et al., 1977).
*
Table 2.1 Physical symptoms manifested in man, rats , pigs and cattle following intoxication by either atractylosides or plants biosynthesising these diterpene glycosides.
Plnnt or Compound Species
Callilep is la u reola Man
Atractylis gummifera Man
CATR Male CD rats
CATR Pigs
Pigs
Xanthium slrumarium Feeder pigs
(seedlings)
Xanthium :;trumarium Pigs
Xanthium strumarium Hereford calves
Route and Dose
Oral/rectal
Oral/rectal?
1, 2, 4, 8, 16, and 32 mg/kg bwt , i.p.
Oral 25-100mglkg bwt
5-100 mg/kg bwt, i.v.
Oral 0.75-3% m/m single dose
3% daily oral dose
10/20/30% wlw in feed
Oral (aqueous extract)
Oral
* Symptoms
A,B,C, D
A, B, C, D, E, F
A, B, H, I, J
A, C, L (3-24 hrs), N
do.
N
A,B,K,N
lO%L
A,C,M,N
A,B,G,N
References
Bhoola (1983)
Georgiou et al., (1988)
Hatch et al., (1982)
Stuart et al. (1981)
Stuart et al. (1981)
Stuart et at. (1981)
Martin et al. (1986)
A = coma, B = vomiting, C = epigastric pain, D = jaundice, E = respiratory failure, F = brain edema, G = gastritis and enteritis, H = increased depth of respiration, I = seizures, J = cerebral inoxia, K = 100% fatality, L = no symptoms, M = increased vascular permeability, N = Depression, recumbency, muscular weakness
00
*
t
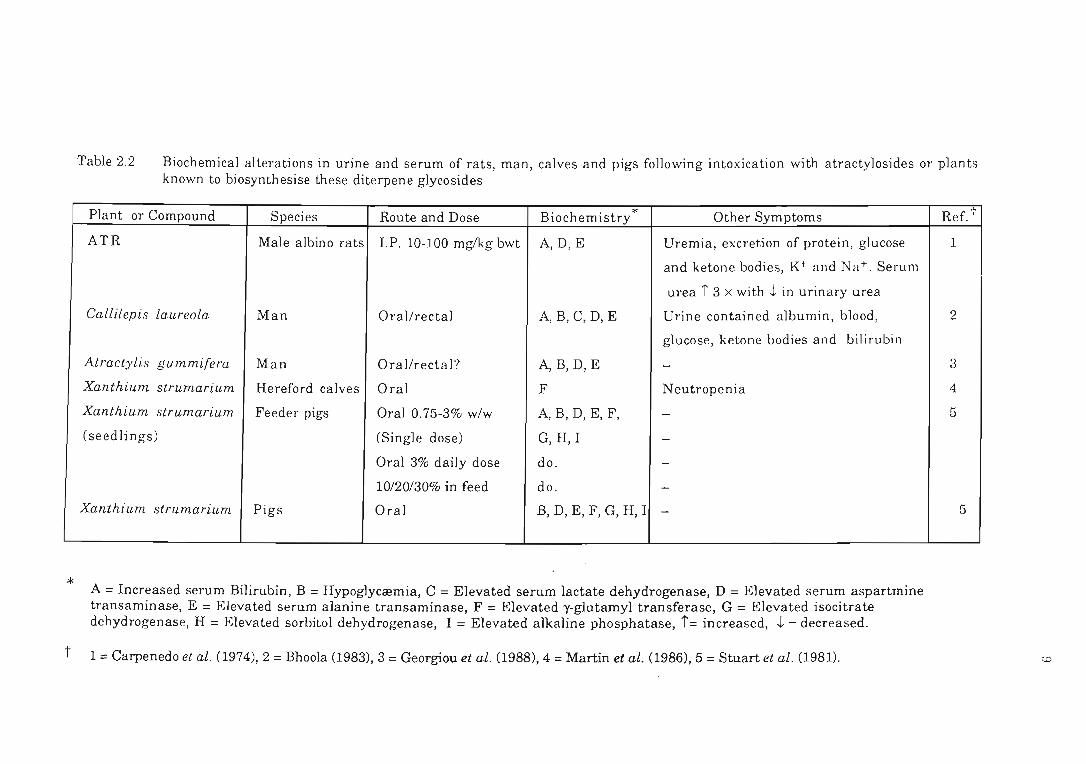
Table 2.2 Biochemical alterations in urine and serum of rats, man, calves and pigs following intoxication with atractylosides or plants known to biosynthesise these diterpene glycosides
Plant or Compound Species Route and Dose Biochemistry * Other Symptoms
ATR Male albino rats I.P. 10-100 mglkg bwt A,D,E Uremia, excretion of protein, glucose
and ketone bodies, K+ and Na+. Serum
urea i 3 x with .t in urinary urea
Callilepis laureola Man Oral/rectal A,B,C,D,E Urine contained albumin, blood,
glucose, ketone bodies and bilirubin
Atractylis gummifera Man Ora l/rectal? A,B,D,E -
Xanthium strumarium Hereford calves Oral F Neutropenia
Xanthium strumarium Feeder pigs Oral 0.75-3% wlw A,B,D,E,F, -
(seedlings) (Single dose) G, H, I -
Oral 3% daily dose do. -
10/20/30% in feed do. -Xanthium strumarium Pigs Oral B, D, E, F, G, H, I -
- -
A = Increased serum Bilirubin, B = Hypoglycremia, C = Elevated serum lactate dehydrogenase, D = Elevated serum aspartmine transaminase, E = Elevated serum alanine transaminase, F = Elevated y-glutamyl transferase, G = Elevated isocitrate dehydrogenase, H = Elevated sorbitol dehydrogenase, I = Elevated alkaline phosphatase, i = increased, .t = decreased.
1 = Carpenedo et al. (1974),2 = Bhoola (1983), 3 = Georgiou et al. (1988),4 = Martin et al. (1986),5 = Stuart et al. (1981).
Ref.'
1
2
3
4
5
5
~
* t
Table 2.3 The histological and morphological alterations following exposure to atractyloside or atractyloside containing plants
Plant or Compound Species Histology *' Other Symptoms ATR from tuber Rats B,E No a.lteration in heart, liver or lung.morpholob'Y
1 hr: mild nephrotubular damage 3 hr: wid('spreod tubular necrosis, casts and debl;s in tubul(>s 5 hr: frank , widespread necrosis
24 hr: established lesion 48 hr: evidence of regeneration
ATR lpure) Rats B, E, As above ATR Rats B,E No liver cha.nges. After 150-180 mins, inner zone of kidney cortex had deep lesions
confined to distal portion of th(' proximal convoluted tubul('s. Dist<'l.l tubules were filled with granular (·asts. Gloml:'l'ulu:; intal't. Regelwration 2 day:; post-dosing
CA'l'R CD Rnts A Vacliolat('d hepntocytes with single lnrge cytoplnsmic vacuoles nnd necrosis. Distal not proximal renal tubule damage noted. If animals survived 24 hr after dosing, r ecovered completely
Callilepl:s laureola Rats A,B -Callilepis la.ureola Man A,B, C, D,E Liver pale yellow and speckled. Hepatocytes peripheral to necrosis contain lipid vacuoles.
Some reticular frame-work collapse. Defective clotting mechanism . Kidney mass increased by ± 30%. Renal cortex pale and swollen. Medulla congested. No difference in gender susceptability. Most victims< 14 years. 91% fatal
Atractylis gummifera Man A,B, C Diffuse hepatocyte necrosis, collapse of interstitial conective tissue. Tubule renal necrosis, brain cedema. Pleomorphism of nuclei and fatty degeneration of hepatic cells . Intra-hepatic cholestasis
XanthiIJn7. strIJmarium Cnlves A,B, C, D Blood covered freel'S. Liver tnn with mottled cnpsular surface. Rectnl mucosn vessels showed vascular engorgement and surface epithelial necrosis . Mucosal surface of cesophagus and abomasum had multifocal ulceration
Xanthium strumarium Pigs A, B, C, D Liver lesions noted. Serofibrinous ascites and cedema of gall-bladder wall. Fatty gastro-hepatic ligament. Large fibrous strands or gelatinous clots on liver surface and other viscera. Liver congested and had centrilobular necrosis. Some pericardial, pleural, subcutaneous or intramuscular serous effusion. Gall-bladder wall distended by proteinaceous fluid. Acute diffuse centrilobular liver necrosis. Often necrosis of whole lobule. Extensive karyolysis and karyohexis of hepatic nuclei. Mild to moderate acute tubule renal degeneration. Mild to moderate gastric congestion and hremorrhage. Brain cedema present in some pigs
_.
A = Centrilobular liver necrosis, B = Proximal tubular renal necrosis, C = Hremorrhage, D = Blood-filled liver sinusoids, E = Glomerulus unchanged 1 = Bhoola (1983), 2 = Carpenedo et al. (1974), 3 = Hatch et al. (1982),4 = Georgiou et al. (1988),5 = Martin et al. (1986), 6 = Stuart et al. (1981)
.l.
Ref. I 1
I I
1 2
3
1 1
4
5
6
2)
11
Since ATR is the predominant toxin isolated from plants such as C. laureola,
consideration will be given to the chemistry and occurrence of this toxin and its associated
analogues in the next section.
2.3 The chemistry and occUITence of the atractylosides
For the purposes of clarity, ATR refers to the diterpene glycoside, atractyloside, while
atractylosides refers to analogues containing the penhydrophenanthrenic structure and
glycoside moiety. The first chemical investigation into the structure of ATR (Fi.g 2.3) was
made in 1867, by the French apothecary, Lefranc. Having isolated this toxin from the tuber
of Atractylis gummifera, Lefranc proposed the structure of ATR, but hi.s work was harshly
criticised and disregarded. Angelico renewed investigations in 1906 and confirmed
Lefranc's findings (Piozzi, 1978).
OH
R 'COOH
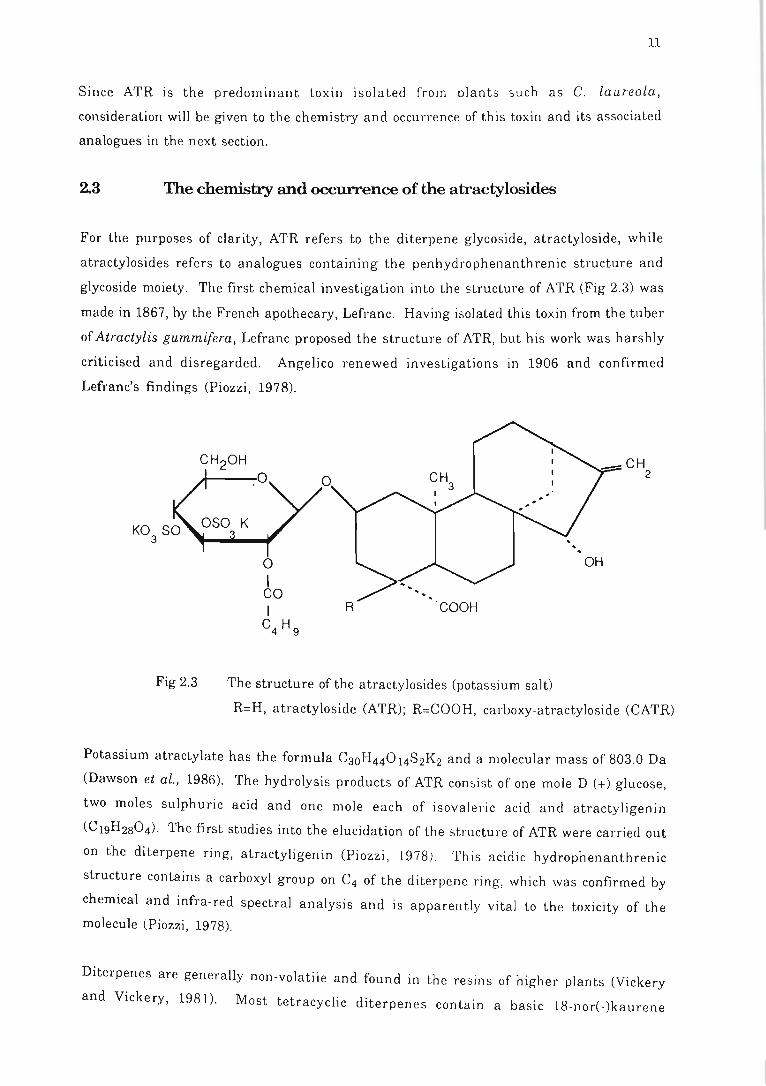
Fig 2.3 The structure of the atractylosides (potassium salt)
R=H, atractyloside (ATR); R=COOH, carboxy-atractyloside (CATR)
Potassium atractylate has the formula CaoH44014S2K2 and a molecular mass of 803.0 Da
(Dawson et al., 1986). The hydrolysis products of ATR conbist of one mole D (+) glucose,
two moles sulphuric acid and one mole each of isovaleric acid and atractyligenin
(C19H2S04). The first studies into the elucidation of the structure of ATR were carried out
on the diterpene ring, atractyligenin (Piozzi , 1978). Thi s acidi c hydrophenanthrenic
structure contains a carboxyl group on C4 of the diterpene ring, which was confirmed by
chemical and infra-red spectral analysis and is apparently vital to the toxicity of the
molecule (Piozzi, 1978).
Diterpenes are generally non-volatile and found in the re sins of higher plants (Vickery
and Vickery, 1981). Most ttl' d ' t . b e racyc IC I erpenes contall1 a asic 18-nor(-)kaurene
12
skeleton; kaurenes are a precursor to the gibberel1ins (Takahashi et al ., 1986) and
atractyligenin is no exception, comprising a nor-diterpenoid acid of (-)kaurene
(Ghisalberti et aI., 1968). Elucidation of the structure of atractyligenin was fol1owed by
work on ATR, specifically the glucose unit, and it was determined that the isovaleric acid
and bisulphate esters are situated on positions 2' , 3' and 4' respectively of the glucose
moiety. Atractyligenin is joined to the glucose moiety via a ~-glycosidic linkage
(Brookes, 1979; Brookes et al., 1983).
A precursor, carboxy-atractyloside (CATR) (Fig 2.3) has been extracted from thistle tubers
(Bombardel1i et aI., 1972). It has a second carboxyl group, on C4 of the diterpene ring, and is
40 times more toxic than ATR. Carboxy-atractyloside is predominant in fresh tubers and
undergoes decarboxylation during ageing or desiccation, to form ATR (Bombardelli et al .,
1972).
The toxicity of ATR is dependent upon the maintenance of its structural integrity (Vignais
et al., 1978). The aglycone is 150 times less toxic than ATR, indicating the importance of
the glycoside moiety in potentiating toxicity. Removal of the isovaleric acid (apo-ATR) or
the bisulphate esters reduces the toxicity some ten-fold. The carboxyl group on C4 of the
diterpene ring is, however, most crucial to ATR's inhibitory action, and reduction of this
group to, for example, an alcohol (atractylitriol) renders the molecule non-toxic (Vignais
et aI., 1978).
For centuries, the toxicity of A. gummifera has been documented and it has been used for
suicidal and criminal poisonings throughout the ages (Piozzi, 1978). In the first century
Discordes wrote of the toxicity and therapeutic properties of A. gummifera, in his "De
Materia Medica". Previously named Chamceleon (reflecting the changing colours of its
flowers), this plant was recommended as a treatment for drowsiness, depression, toothache
and bleeding gums, intestinal parasites, snake-bite, ulcers and oedema (dropsy). In the
sixteenth century an angel reputedly revealed Chamceleon to be a cure for bubonic plague.
Despite the therapeutic potential of this herb, Theophrastas noted as far back as 300 BC that
ChamceIeon was fatal to animals, and its toxicity has been a lluded to throughout the ages
(Santi and Luciani, 1978). Today, the plant is used for the treatment of syphilis, as an
abortifacient, to bleach teeth, for its emetic properties (Lemaigre et al ., 1975; Capdevielle
and Darracq, 1980) to stop haemorrhage, and to facilitate childbirth (Melek et al., 1989). A
gum secreted from the leaves is used by children as chewing gum and to capture bird s.
Atractylis gummifera is often mistaken for the innocuous Atractylis aucauIis, the latter
having anti-pyretic and diuretic properties (Georgiou et al., 1988 ).
13
Atractyloside has also been isolated from Wedelia. glauco , a plant indigenous to
Argentina, Uruguay and Southern Brazil, where it is known for its lethality to livestock
(Schteingart and Pomilio, 1984). The Australian plant Wedelia. asperima is also highly
toxic and synthesises wedelioside, an acylaminoglycoside diterpene related to ATR
(Eichholzer et al., 1981). The rhizomes of atractyloides (A. lallcea, A. japonica or A.
ovata) are used in Japan as diuretics and to stimulate gastric activity. Atractylis lancea
tubers contain several atractylosides whose structures have been elucidated (Yahara et al.,
1989). This Chinese medicinal plant is reputed to heal gastric ulceration (Kubo et al.,
1983), increase bile secretion (Yamahara et al., 1983), and is also used in China and Japan
for rheumatism, abdominal distension, poor appetite and nausea, fluid retention and
phlegm, oedema and mild diarrhoea . An acetone extract h as anti-anoxic effects
(Yamahara et a1., 1990), and interestingly, A. gummifera has been used to treat oxyurosis
(Georgiou et al, 1988), indicating that this species of plant has some effect on the oxygen
state in humans.
Coffea arabica L. beans contain atractylosides whose metabolites have been isolated from
the urine of coffee drinkers (Piozzi, 1978). These ATR analogues have been implicated as
mediators of pancreatic cancer in habitual coffee consumers CPegel, 1981), but thi s has yet
to be fully substantiated. The atractylosides derived from coffee beans differ from those
isolated from C. laureola and A. gummifera, in that the glucose moiety (Fig 2.3) is
replaced by glucuronic acid, which is devoid of the bisulphate esters and isovaleric group
(Piozzi, 1978). Atractylosides are also present in the cotyledonary seedlings of the burr
weed or cocklebur Xanthium strumarium (Craig et al ., 1976), and there have been repeated
reports of livestock poisoning by this plant (Stuart et al., 1981; Hatch et al., 1982; Martin et
al., 1986).
It is clear from the literature that atractylosides occur in a wide variety of plant species
which are frequently used for medicinal purposes, in many parts of the world , thus
emphasising the urgency for a diagnostic assay for ATR. The toxicity of these plants is
well documented, yet there are still reports of fatal intoxications CCapdeville and Darracq,
1980; Bhoola, 1983 ; Georgiou et al., 1988). It is a personal observation that Impila
poisonings are not uncommon in South Africa; the primary victims being infants. As
increasing numbers of native women are opting to give birth in hospitals, there are now
more opportunities to educate them on the dangers of administeri ng herbal remedies.
Blame would seem to lie, however, with the grandparents, who continue to value traditional
medical practices and often administer the remedies against the wishes of, or unbeknown
to, the parents. The situation is further exacerbated by th e economic si tuation as soon , ,
after giving birth, the mother returns to her place of employment and the child is left in the
14
care of the Gogo . It is a personal opinion , therefore , t11at on ly continued education will
limit the use of dangerous traditional remedies such as Impiia. and prevent these
unnecessary deaths, as there is little chance of antidotes to these "remedies" being
developed in the foreseeable future. The development of an antidote for ATR will be
particularly difficult, as this toxin apparently has a number of inhibitory effects on the
mitochondria, GA and mitochondrial calcium sequestration, and treatment would
therefore have to be approached multidirectionally. Details of the action of ATR on
subcellular function are presented in section 2.4.
2.4 The mechanisms of toxicity of atractylosides
The toxicity of ATR has been well documented over the centuries, but it was only in 1958
that the precise pharmacological action of this toxin was first investigated (Santi, 1958) .
Further elucidation of the precise inhibitory action of ATR resulted from its use as a
biochemical probe in the study of its chronic effects on mitochondrial and Golgi function,
as well as on calcium regulated systems. These effects are outlined in this section.
2.4.1 The effect of atractyloside on mitochondrial function
In 1958, Santi showed that when administered to rodents, rabbits and dogs, ATR induces
transient hyperglycaemia, followed by hypoglycaemia, acidosis and decreased oxygen
consumption (Santi, 1958; Luciani et al., 1978). Santi proposed that ATR acts at a
subcellular level, inhibiting the tricarboxylic acid cycle as well as systems regulating
oxidative phosphorylation, and adenine trinucleotid e synthesis (Santi, 1958).
Subsequently, mitochondria were identified as the target organelles of ATR (Vignais et
ai ., 1962) and at the same time it was noted that the inhibitory action of this toxin is
potentiated by magnesium ions. It was speculated that the magnesium ions neutrali se the
anionic sulphate esters on ATR, facilitating the binding of the toxin to the mitochondria
(Bruni et al., 1962).
Initially, the inhibitory action of ATR was considered to be similar to that of oligomycin
(Bruni et ai., 1962), which blocks the catalytic activity of ATPase by binding to the
hydrophobic region of the Fo particle (Gale et ai ., 1981), but subsequent experiments on liver
mitochondria demonstrated that a distinction could be made between the inhibitory action
of ATR and oligomycin (Chappell and Crofts, 1965). By 1965, it was established that ADP
and ATR have a common binding site on the inner mitochondrial membrane (Kemp and
Slater, 1964; Bruni et al., 1965). In their classic experiment, Kemp and Slater incubated rat
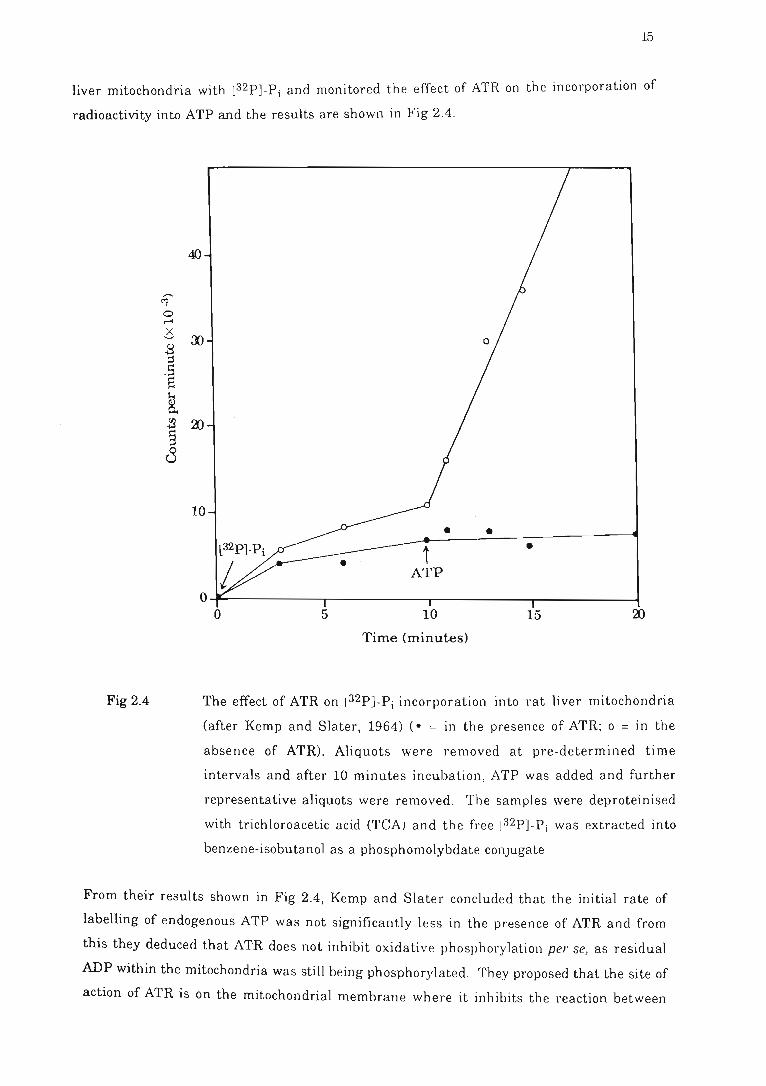
15
liver mitochondria with [32P]-P i and monitored the effect of ATR on the incorporation of
radioactivity into ATP and the results are shown in Fig 2.4.
~ 0 ,......
2S B :j
.§ s.. 8. ~ § 8
Fig 2.4
40
ro
ro
10
• • t •
ATP
0 0 5 10 15
Time (minutes)
The effect of ATR on [32p]_P j incorporation into rat liver mitochondria
(after Kemp and Slater, 1964) ( . = in the presence of ATR; 0 = in the
absence of ATR). Aliquots were removed at pre-determined time
intervals and after 10 minutes incubation, ATP was added and further
representative aliquots were removed. The samples were deproteinised
with trichloroacetic acid (TCA) and the free [32 p]-P i was extracted into
benzene-isobutanol as a phosphomolybdate conjugate
From their results shown in Fig 2.4, Kemp and Slater concluded that the initial rate of
labelling of endogenous ATP was not significantly less in the presence of ATR and from
this they deduced that ATR does not inhibit oxidative phosphorylation per se, as re sidual
ADP within the mitochondria was still being phosphorylated. They proposed that the site of
action of ATR is on the mitochondrial membrane where it inhibits the reaction between
16
intra-mitochondrial ATP and extra-mitochondrial ADP (Fig 2.5 ). This proposal was
later proven (Chappell and Crofts, 1965). From these results, it is personally believed that
there is little basis on which to identify the site of action of ATR, and all that can be
concluded is that ATR does not directly inhibit the synthesis of ATP, but rather prevents the
access of ADP to the site of phosphorylation.
The experiment of Kemp and Slater (1964) could have furnished more information had it
been further refined. Strictly speaking, after removal of the sample aliquot, the protein
should have been precipitated in a solution of TCA containing "cold"-P j to prevent non
specific adsorption of the radiolabel after sampling. In addition, a control devoid of
mitochondria, and another containing mitochondria pre-treated with TCA, should have
been included, to ensure that the measured radioactivity was truly representative of the
amount of labelled ATP, and was not residual [32Pl_Pj which had not been removed by the
extraction procedure. Nevertheless, the work of Kemp and Slater (1964) together with that of
Bruni et al. (1964) and Santi (1964) provided the first critical clue to the precise inhibitory
action of ATR. Further in depth studies by Chappell and Crofts (1965) demonstrated that
ATR did not affect metabolism of internalized adenine nuc1eotides, but prevented use of
cytoplasmic adenine nucleotides by the mitochondria. From these results it was concluded
that ATR either inhibited transfer of adenine nucleotides across the mitochondrial
membrane, or prevented inorganic phosphate from entering the mitochondrial matrix.
The data collected supported both hypotheses, but the final conclusion was that ATR
" ... perhaps revealed the existence of a 'permease' that allows adenine nucleotides to be
transferred across the mitochondrial membrane ... " (ChapPEdl and Crofts, 1965) and this
hypothesis was to become a very significant finding in the elucidation of the mechanism of
oxidative phosphorylation and cellular energy production .
It was proposed from the work of Chappell and Crofts (1965) and that of others, that ATR and
ADP have a common binding site on the inner mitochondrial membrane (Bruni et at.,
1965) but it was Allman et ai. (1967) who finally demonstrated that ATR binds to the
cytoplasmic side of the inner mitochondrial membrane. In their following experiment,
beef heart mitochondria were isolated ; part of which were sonicated to produce
submitochondrial particles. The intact mitochondria and submitochondrial particles
were incubated separately in the presence of ATR and the exchange of ATP-P j was
calculated as a percentage of nucleotide exchange relative to a sample devoid of toxin. The
results showed a 77% inhibition of ATP-P j exchange in mitochondria incubated with ATR,
whereas in the sonicated subparticles this inhibition was only 24%. Furthermore, in
mitochondria that were preincubated with ATR prior to sonication and reincubated with
ATR, the inhibition was 76%. Finally in submitochondrial particles where the inner
17
membrane was damaged, ATR inhibited ATP-P j exchange by only 15%. From these
results it was conclusively shown that the inhibitory action of ATR is dependent upon the
maintenance of the inner mitochondrial membrane integrity and that ATR binds to a site
on the cytoplasmic side of this inner mitochondrial membrane. Subsequently, it was also
proven that ATR binds to a inner mitochondrial membrane antiporter, which specifically
controls the permeability of the inner membrane (Poochiari and Silano, 1968). In doing so,
the toxin inhibits nucleotide exchange, as the inner mitochondrial membrane is
selectively impermeable to the passive transport of charged hydrophiles (Zalman et al.,
1980; Harold,1986).
As shown in Fig 2.5, ATP production and oxidative phosphorylation occur in the matrix of
the mitochondria. The proton-motive force , necessary for energy transduction and
oxidative phosphorylation, is dependent upon the establi ~hment of both a pH and an
electropotential gradient (~pH and ~\jI) across the inner mitochondrial membrane
(Klingenberg, 1978; Nicholls, 1982). Atractyloside competitively inhibits the transport of
endogenous (cytosolic) ADP across the inner mitochondrial membrane, by binding to the
ADP-binding site on the inner membrane antiporter. Consequently, in terminating the
passage of ADP across the inner membrane, ATP synthesis is prevented (Nicholls, 1982).
The ADP-binding site on the anti porter is blocked by virtue of the analogous size and
structure of ATR and ADP, as the phosphate esters, ribose moiety and purine ring of ADP
are similar to the sulphate esters, glycoside moeity and diterpene ring of ATR respectively
(Allman et aZ., 1967). The aglycone, atractyligenin, is significantly less toxic than ATR,
demonstrating the importance of the bisulphate ester-glycoside moiety and isovaleric acid
residue in potentiating toxicity. The hydrophobic diterpene ring penetrates the inner
mitochondrial membrane, but the strongly hydrophilic glucose moeity maintains ATR at
the surface of the membrane, locking the antiporter (Vignais et ai ., 1978).
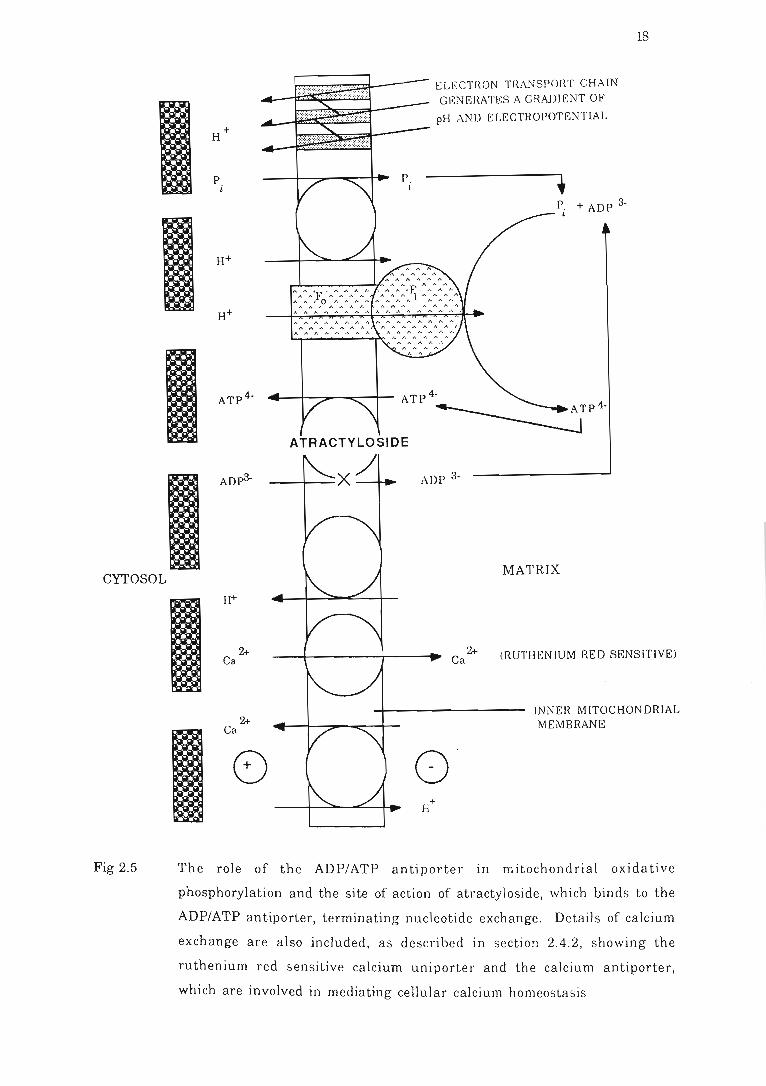
CYTOSOL
Fig 2.5
P
2+ Ca
2+ Ca
P
ATRACTYLO IDE
ELECTRON TRANSPORT CHAIN GENlmATES A GRADIENT OF
pH AND ELECTROPOTENTIAL
• p. + ADP 3-t
18
-~X/ ADP 3-
o
2+ Ca
MATRIX
(RUTHENIUM RED SENSlTIVE)
INNER MITOCHONDRIAL MEMBRANE
The role of the ADP/ATP antiporter in mitochondrial oxidative
phosphorylation and the site of action of atractyloside, which binds to the
ADP/ATP antiporter, terminating nucleotide exchange. Details of calcium
exchange are also included, as described in section 2.4.2, showing the
ruthenium red sensitive calcium uniporter and the calcium antiporter,
which are involved in mediating cellular calcium homeostasis
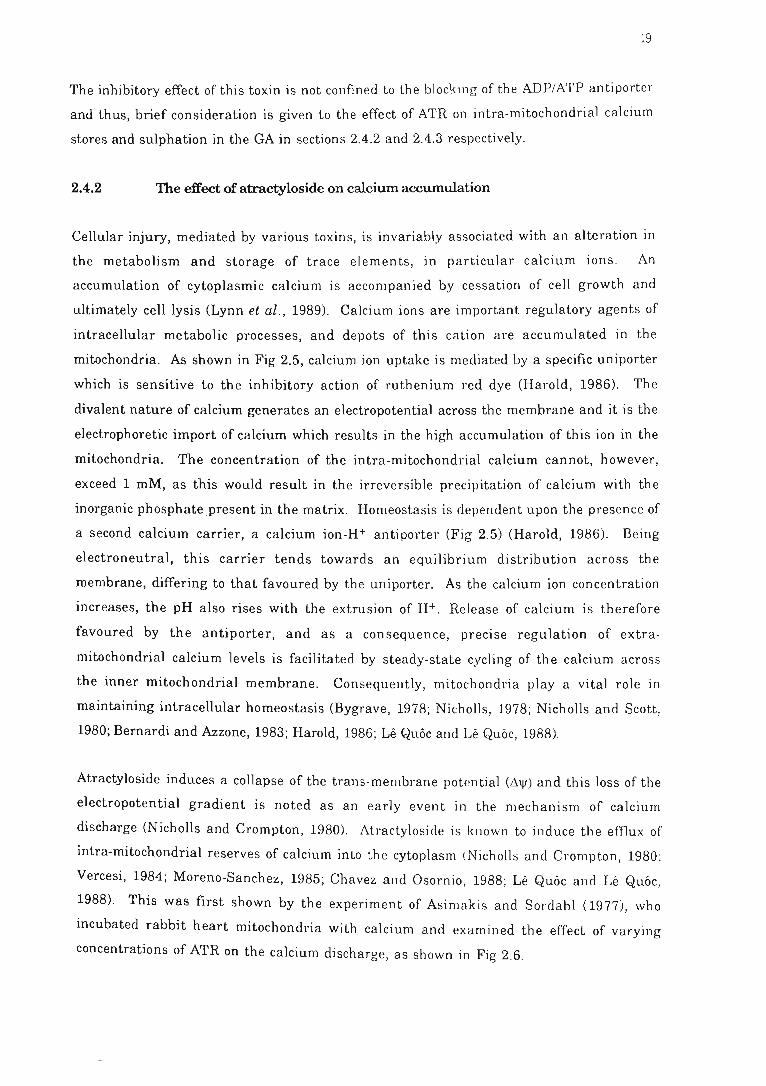
19
The inhibitory effect of this toxin is not confined to the blocking of the ADP/ATP antiporter
and thus, brief consideration is given to the effect of ATR on intra-mitochondrial calcium
stores and sulphation in the GA in sections 2.4.2 and 2.4.3 respectively.
2.4.2 The effect of atractyloside on calcium accumulation
Cellular injury, mediated by various toxins, is invariably associated with an alteration in
the metabolism and storage of trace elements, in particular calcium ions . An
accumulation of cytoplasmic calcium is accompanied by cessation of cell growth and
ultimately cell lysis (Lynn et al., 1989). Calcium ions are important regulatory agents of
intracellular metabolic processes, and depots of this cation are accumulated in the
mitochondria. As shown in Fig 2.5, calcium ion uptake is mediated by a specific uniporter
which is sensitive to the inhibitory action of ruthenium red dye (Harold, 1986). The
divalent nature of calcium generates an electropotential across the membrane and it is the
electrophoretic import of calcium which results in the high accumulation of this ion in the
mitochondria. The concentration of the intra-mitochondrial calcium cannot, however,
exceed 1 mM, as this would result in the irreversible precipitation of calcium with the
inorganic phosphate present in the matrix. Homeostasis is dependent upon the presence of
a second calcium carrier, a calcium ion-H+ antiporter (Fig 2.5) (Harold, 1986). Being
electroneutral, this carrier tends towards an equilibrium distribution across the
membrane, differing to that favoured by the uniporter. As the calcium ion concentration
increases, the pH also rises with the extrusion of H+. Release of calcium is therefore
favoured by the antiporter, and as a consequence, precise regulation of extra
mitochondrial calcium levels is facilitated by steady-state cycling of th e calcium across
the inner mitochondrial membrane. Consequently, mitochondria playa vital role in
maintaining intracellular homeostasis (Bygrave, 1978; Nicholls, 1978; Nicholls and Scott,
1980; Bernardi and Azzone, 1983; Harold, 1986; Le Quac and Le Quac, 1988).
Atractyloside induces a collapse of the trans-membrane potential (~"') and this loss of the
electropotential gradient is noted as an early event in the mechanism of calcium
discharge (Nicholls and Crompton, 1980). Atractyloside is known to induce the effiux of
intra-mitochondrial reserves of calcium into the cytoplasm (Nicholls and Crompton, 1980:
Vercesi, 1984; Moreno-Sanchez, 1985; Chavez and Osornio, 1988; Le Quac and Le Quiic ,
1988). This was first shown by the experiment of Asimakis and Sordahl (1977), who
incubated rabbit heart mitochondria with calcium and examined the effect of varying
concentrations of ATR on the calcium discharge, as shown in Fig 2.6.
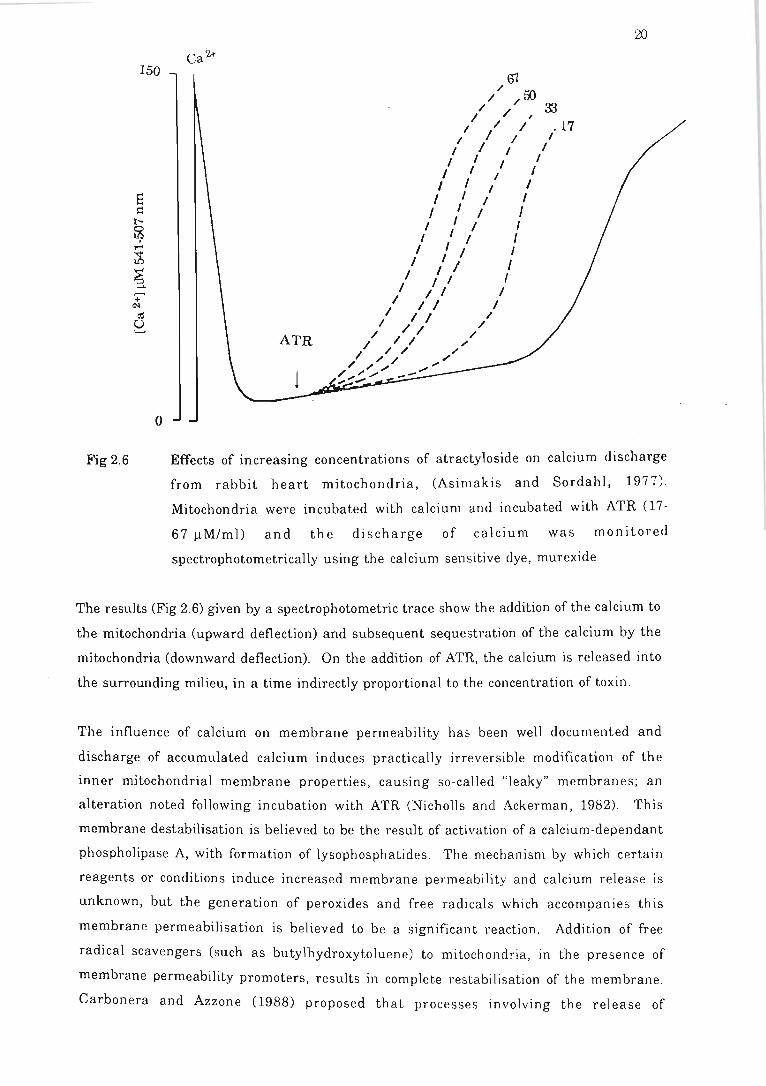
150
o
Fig 2.6
20
Ca2+
6i /
/ ,,00 / / 33
/ / ' I I / /17
I / / I I I I I
I I I I / I / I
I I I I I I / I
I I / I I I I I
I I / J I I I I
/ / I I / I / /
/ I / / / I / /
I / / / / I I /
I / / ,," / "/ " " " " .... ~ ~~:""" --
Effects of increasing concentrations of atractyloside on calcium discharge
from rabbit heart mitochondria, (Asimakis and Sordahl, 1977).
Mitochondria were incubated with calcium and incubated with ATR (17-
67 I1M/ml) and the discharge of calcium was monitored
spectrophotometrically using the calcium sensitive dye, murexide
The results (Fig 2.6) given by a spectrophotometric trace show the addition of the calcium to
the mitochondria (upward deflection) and subsequent sequestration of the calcium by the
mitochondria (downward deflection). On the addition of ATR, the calcium is released into
the surrounding milieu, in a time indirectly proportional to the concentration of toxin.
The influence of calcium on membrane permeability has been well documented and
discharge of accumulated calcium induces practically irreversible modification of the
inner mitochondrial membrane properties, causing so-called "leaky" membranes; an
alteration noted following incubation with ATR (Nicholls and Ackerman, 1982). This
membrane destabilisation is believed to be the result of activation of a calcium-dependant
phospholipase A, with formation of lysophosphatides . The mechanism by which certain
reagents or conditions induce increased membrane permeability and calcium release is
unknown, but the generation of peroxides and free radical s which accompanies this
membrane permeabilisation is believed to be a significant reaction. Addition of free
radical scavengers (such as butylhydroxytoluene) to mitochondria, in the presence of
membrane permeability promoters, results in complete restabilisation of the membrane .
Carbonera and Azzone (1988) proposed that processe s involving the release of
21
mitochondrial calcium and the increased perme.ability of the inner mitochondrial
membrane merge into a common step involving generation of free radicals. It is a
personal suggestion, therefore, that free radical scavengers could be administered to
patients with Impila poisoning, as this may promote recovery by restoring membrane
stability and preventing further calcium leaching.
The effects of ATR on membrane ~'" and calcium release point to a possible participation
of the antiporter in the regulation of mitochondrial permeability to cations (Chavez and
Orsonio, 1988). The dimeric ADP/ATP carrier protein spans the inner mitochondrial
membrane and, depending on the pre-treatment of mitochondria, the carrier can be
isolated in one of two distinct conformations (Fig 2.7). The antiporter exists in the c-state
conformation (i.e., the nucleotide binding site facing the cytosol) in the presence of ATR
and in the m-state (i.e., nucleotide binding site facing the matrix) after pre-treatment with
bongkrekic acid (Klingenberg et al., 1978).
Fig 2.7
Matrix
c Cytosol
ADp3-
The ADP/ATP antiporter showing the proposed c and m-state
conformations (Harold, 1986).
Palmitoyl eoA, like ATR, promotes c-state stabilization of the antiporter (Le Quac and Le
Quac, 1988). These two inhibitors induce alteration in the ability of the mitochondria to
control both cation storage and exchange, resulting in the leakage of accumulated
mitochondrial calcium and mitochondrial swelling. Only when the antiporter exists in
the c-state is calcium seen to exert an effect on membrane permeability, and from this it
has been concluded that the conformational state of the carrier could be regarded as the
primary factor allowing, or impeding, th e damaging effects of calcium on membrane
permeability. All agents which induce and block the anti porter in the costate, such as ATR,
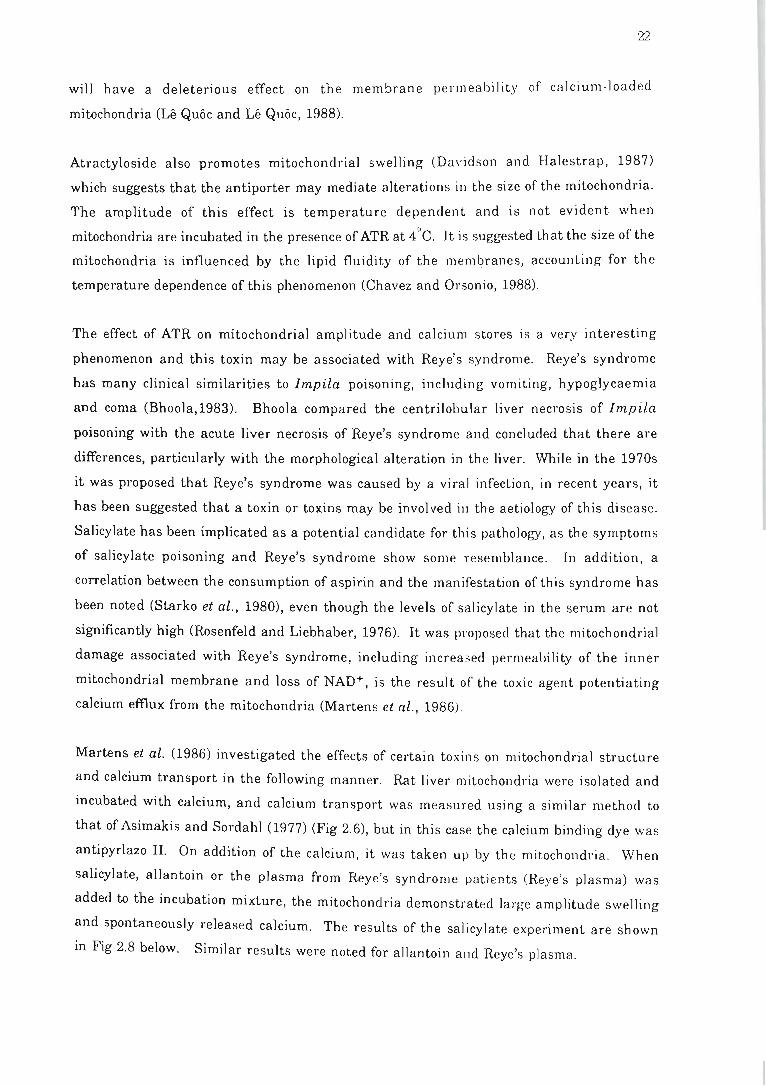
22
will have a deleterious effect on the membrane permeability of calcium-loaded
mitochondria (Le Quac and Le Quac, 1988).
Atractyloside also promotes mitochondrial swelling (Da\'idson and Halestrap, 1987)
which suggests that the antiporter may mediate alterations in the size of the mitochondria .
The amplitude of this effect is temperature dependent and is not evident when
mitochondria are incubated in the presence of ATR at 4°C. It is suggested that the size of the
mitochondria is influenced by the lipid fluidity of the membranes , accounting for the
temperature dependence of this phenomenon (Chavez and Orsonio, 1988).
The effect of ATR on mitochondrial amplitude and calcium stores is a very interesting
phenomenon and this toxin may be associated with Reye's syndrome. Reye's syndrome
has many clinical similarities to Impiia poisoning, including vomiting, hypoglycaemia
and coma (Bhoola,1983). Bhoola compared the centrilobular liver necrosis of Impila
poisoning with the acute liver necrosis of Reye's syndrome and concluded that there are
differences, particularly with the morphological alteration in the liver. While in the 1970s
it was proposed that Reye's syndrome was caused by a viral infection, in recent years, it
has been suggested that a toxin or toxins may be involved in the aetiology of this disease .
Salicylate has been implicated as a potential candidate for this pathology, as the symptoms
of salicylate poisoning and Reye's syndrome show some resemblance. In addition, a
correlation between the consumption of aspirin and the manifestation of this syndrome has
been noted (Starko et ai., 1980), even though the levels of salicylate in the serum are not
significantly high (Rosenfeld and Liebhaber, 1976). It was proposed that the mitochondrial
damage associated with Reye's syndrome, including increased permeability of the inner
mitochondrial membrane and loss of NAD+ , is the result of the toxic agent potentiating
calcium effiux from the mitochondria (Martens et ai., 1986).
Martens et ai. (1986) investigated the effects of certain toxins on mitochondrial structure
and calcium transport in the following mann er. Rat liver mitochondria were isolated and
incubated with calcium, and calcium transport was measured using a similar method to
that of Asimakis and Sordahl (1977) (Fig 2.6), but in thi s case the calcium binding dye was
antipyrlazo II. On addition of the calcium, it was taken up by the mitochondria . When
salicylate, allantoin or the plasma from Reye's syndrom e patients (Reye's pl asma) was
added to the incubation mixture, the mitochondria demon stra ted large am plitude swelling
and spontaneously released calcium. The results of the salicylate experiment are shown
in Fig 2.8 below. Similar results were noted for allantoin a nd Reye's plasma.
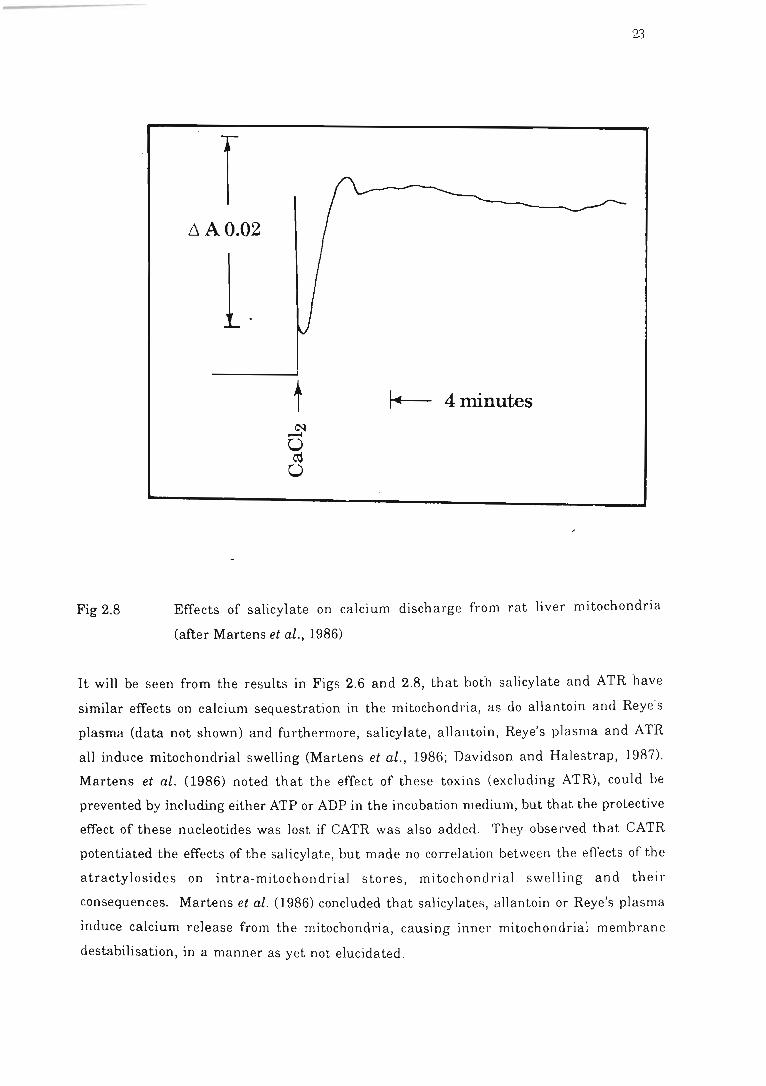
Fig 2.8
23
f 1:1 A 0.02
1. t I ... 4 minutes
Effects of salicylate on calcium discharge from rat liver mitochondria
(after Martens et al., 1986)
It will be seen from the results in Figs 2.6 and 2.8, that both salicylate and ATR have
similar effects on calcium sequestration in the mitochondria, as do allantoin and Reye's
plasma (data not shown) and furthermore, salicylate, allantoin, Reye's plasma and ATR
all induce mitochondrial swelling (Martens et al., 1986; Davidson and Halestrap, 1987).
Martens et al. (1986) noted that the effect of these toxins (excluding ATR), could be
prevented by including either ATP or ADP in the incubation medium, but that the protective
effect of these nucleotides was lost if CATR was also added. They observed that CATR
potentiated the effects of the salicylate, but made no correlation between the effects of the
atractylosides on intra-mitochondrial stores, mitoch ondrial swelling and their
consequences. Martens et al. (1986) concluded that salicylates, allantoin or Reye's plasma
induce calcium release from the mitochondria, causing inner mitochondrial membrane
destabilisation, in a manner as yet not elucidated.
24
It is present author 's view that these compounds may somehow induce the c-state
conformation of the antiporter, causing calcium release and membrane permeabilisation,
and that ATR may also induce Reye's syndrome. The correlation between lInpila
consumption and the incidence of this pathology should be thoroughly investigated, since
what is diagnosed as Reye's syndrome may be sub-chronic intoxication by Impila.
Furthermore, if toxins are involved in the aetiology of Reye's syndrome, it is a personal
opinion that it is probably a non-specific pathology caused by agents which lock the
ADP/ATP anti porter in the c-state conformation .
The present author also suggests that duramycin may provide a suitable therapeutic agent
for both Impila poisoning and Reye's syndrome. This polypeptide is produced by
Streptoverticillium cinnamomeus CSokolove et al., 1989), formerly Streptomyces
cinnamomeus, and is active against Gram-positive bacteria, some yeasts, and fungi
(Shotwell et al., 1958). Work on mitochondria isolated from rat cardiac tissue showed that
at low concentrations, duramycin increases the inner mitochondrial permeability to
monovalent cations, but when incubated with ATR, this increase in permeability is
blocked, suggesting that the ATR reverses the effects of the antibiotic CSokolove et al., 1989).
These results are confusing as, from the information detailed above, ATR ultimately has a
similar effect to duramycin, viz., increased . inner mitochondrial membrane
permeability. Yet apparently the duramycin-altered membrane is stabilised in the
presence of ATR (Sokolove et al., 1989). There has been no experimental work carried out
on the reverse reaction, i.e., incubation of mitochondria with ATR, followed by addition of
duramycin, but the results of such an analysis might reveal that duramycin is able to
stabilise the ATR-damaged mitochondrial membrane. It is the author's opinion therefore,
that this antibiotic may be useful as a therapeutic agent for the treatment of both Impila or
ATR poisoning, as well as Reye's syndrome, a possibility that certainly warrants future
investigation.
Although the effects of ATR on the mitochondria are quite well documented, the action of
this toxin is not confined to nucleotide exchange or calcium sequestration, but also affects
the GA, an aspect which is briefly reviewed in the next section.
2.4.3 The effect of the atractylosides on the functioning of the Golgi Apparatus
The GA and the Rough Endoplasmic Reticulum (RER) are sites of post-translational
processing, i.e., glycosylation and sulphation , primarily of secretory proteins. During
this processing, a protein enters the RER and is labelled with a precursor oligosaccharide. The 'd sugar reSl ues are transported as sugar-nucleotides across the the semi-permeable
25
RER membrane, in mechanisms only poorly elucidated. The glycoprotein complex is then
exported to the GA where further processing occurs, such as glycosylation and sulphation.
The sugar-nucleotides involved in these processes are transported across the GA
membrane by specific carriers (Lee et al ., 1984; Coste et al., 1986; Hirschberg and Snider,
1987). Adenosine-3'-phosphate-5'-phosphosulphate (PAPS) is the protein sulphate donor in
the GA. Both ATR and CATR inhibit the passage of PAPS across the GA membrane,
possibly by interacting with the PAPS translocase, which has structural features in
common with the ADP/ATP antiporter . Though of similar molecular mass to the
ADP/ATP antiporter, the PAPS carrier is not identical, as demonstrated by the fact that
PAPS per se cannot traverse across the inner mitochondrial membrane, despite the
presence of the ADP/ATP antiporter (Capasso and Hirschberg, 1984; Lee et al., 1984).
Temperature-dependent inhibition of casein kinase by ATR has also been noted in GA
isolated from mammary tissue of lactating rats. Casein kinase, present in the GA lumen,
requires both ATP and calcium for its catalytic activity (West and Clegg, 1984) and thus
this observed inhibition is hardly surprising considering the effects of ATR on both ATP
synthesis and cytoplasmic calcium.
In conclusion, it is clear that ATR inhibits processes involving the translocation of sugar
nucleotides across membranes, those requiring energy in the form of ATP, and reactions
which are either inhibited or enhanced by the presence of cytoplasmic calcium .
Atractyloside has been and continues to be used as a powerful biochemical tool in the
elucidation of various metabolic processes. It is a matter of concern that the rationale used
to explain the effects of ATR is superficial and classic cases are presented by the work of
Martens et al. (1986) and Sokolove et al. (1989). Despite kn6wledge of the primary
inhibitory action of this toxin, the cascade of secondary effects are quietly ignored. This is
certainly an area for future research and results obtained in the past need careful re
assessment.
Despite there being considerable information pertaining to the action of ATR in vivo, from
the South Mrican perspective, and in view of the potentially catastrophic effects of ATR,
there is clearly a need for an accurate and reliable assay for thi s toxin. In thi s manner,
potentially harmful muthi may be screened and diagnosis made where Impila poisoning
is suspected. At the time this study was initiated, the only mean s of detecting ATR was by
TLC (Brookes, 1979) but the detection limits of this method restlicted its applicability . The
next chapter (Chapter 3) outlines the final optimised methods used in this study for the
detection and cellular localisation of ATR, and this is follow ed by details of the sequential
development of a chromatographic and immunological detection method for ATR
26
(Chapters 4 to 6). Th e locali sation of th e ta rget organ(s), ce ll s and subcellul ar orga nell es
of ATR is described in Chapter 7 and the results of the entire study are correlated in the
final discussion (Chapter 8).
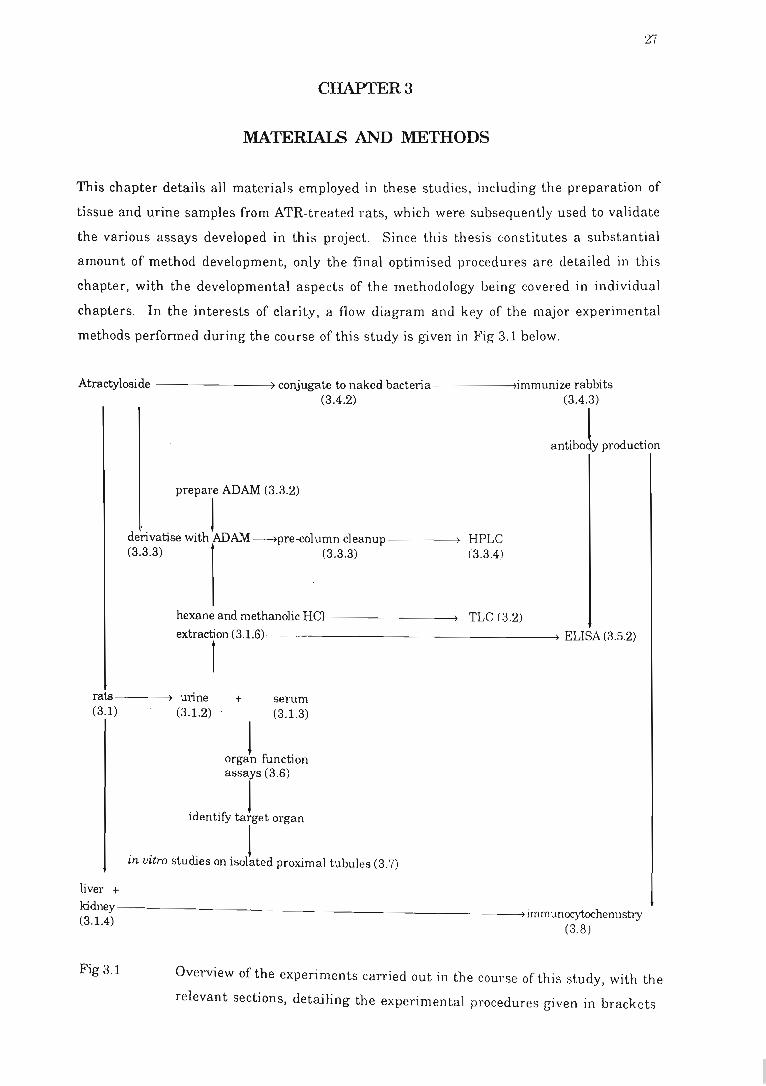
CHAPTER 3
MATERIALS AND METHODS
This chapter details all materials employed in these studies, including the preparation of
tissue and urine samples from ATR-treated rats, which were subsequently used to validate
the various assays developed in this project. Since this thesis constitutes a substantial
amount of method development, only the final optimised procedures are detailed in this
chapter, with the developmental aspects of the methodology being covered in individual
chapters. In the interests of clarity, a flow diagram and key of the major experimental
methods performed during the course of this study is given in Fig 3.1 below.
Atractyloside -------~) conjugate to naked bacteria------llimmunize rabbits (3.4.2) (3.4.3)
antiJy produ,tion
prepare ADAM (3.3.2)
J derivatise with ADAM----7pre-colurnn cleanup ------ll HPLC (3.3.3) (3.3.3) (3.3.4)
hexane and methanolic HCI ----___ --) TLC (3.2) extraction (3.1.6)-------------_____ __ll ELISA (3.5.2)
r
rats -----ll urine (3.1) (3.1.2)
+ serum (3.l.3)
liver +
ocg1 fun,tion assays (3.6)
'd 'f J 1 entI y target organ
. . tudi . 11 m uttro s es on ISO ated proximal tubules (3.7)
~dney-------------------__________________________ __l l immunocytochemistry
(3 .1.4) (3 .8)
Fig 3.1 Overview of the experiments carried out in the course of this study, with the
relevant sections, detailing the experimental procedures given in brackets
28
All dosing, tissue collection and processing for the urine and organ collection was carri ed
out at the Robens Institute for Industrial and Environmental Health and Safety (RIIEHS),
University of Surrey, Guildford, UK, while the serum collection was carried out at the
Biomedical Resource Centre (BMRC), University of Durban-Westville. Tissue
sectioning, immunolabelling, HPLC and the ELISA were performed at the University of
Natal, Pietermaritzburg. The housing of the rabbits and their immunization for anti-ATR
antibody production, was carried out at the University of Durban-Westville, BMRC.
3.1
3.1.1
Generation of a model set of tissue and urine samples from
atractyloside-treated rats
Specialised chemicals and materials
Atractyloside (potassium salt) (Sigma Chemical Company (LTD), Poole, Dorset, UK). All
other chemicals used in the study were of analytical grade and of the highest purity
commercially available.
3.1.2 Urine samples
Male Wi star rats (Porton Strain, random bred closed colony, maintained by Experimental
Biology Unit, University of Surrey, Guildford) were used for the urine and histological
analysis. Rats were handled regularly prior to dosing, to minimize stress responses
during experiments. Ordinarily, they were housed in translucent "shoebox" type cages
(North Kent Plastic Cages LTD, UK); dimensions 60 x 35 x 18 cm (up to nine rats per cage)
on sterile soft wood shavings (Lee and Son, Chertsey, Surrey, UK) and acclimatized to a
controlled environment (12 hours light:dark schedule with the light cycle starting at 07.30
hr GMT). The temperature of the room was maintained at 23 ± 1°C, humidity 40 ± 10% and
had 15 air changes per hour. To facilitate collection of urine, animals were housed in
metal metabolic cages (Metabowl™) designed for separate collection of urine and faeces.
Animals were marked on the tail by a colour coding system for each dose regime and with
a number for inter-group identification, which was renewed each day if the markings
were seen to be fading.
Dosing with ATR was performed as described in section 3.1.5 below. The 18 hour urine
samples were collected twice prior to dosing, i.e ., on day -1 and day o. Following dosing
(on day 0), the animals were immediately placed in the Metabo\Vls for 18 hours. The urine
samples were collected over ice to retain enzyme activity for the entire 18 hour period,
during which time the rats were fasted, but had free access to water at all times. When the
urine was harvested, the rats were given access to food for 6 hour periods each day (09.00 hr-
15.00 hr GMT) (Spratts Laboratory Animal Diet Number 1 obtained from Spratts, Barking,
UK) whereupon they were returned to the cleaned Metabowls. This procedure was repeated
until day 4, when the trial was terminated.
The urine was immediately centrifuged at 5 000 x g for 15 minutes, to separate debris and
particulate matter. The supernatant was collected and enzyme activity measured (section
3.6.2) on the day of collection. Samples were stored at _20°C for the calcium and glucose
analysis (section 3.6.2) which were performed within one week of collection . Prior to
analysis of the samples by TLC (section 3.2), HPLC (section 3.3) or ELISA (section 3.5),
sample clean up was performed as described in section 3.1.6 below.
3.1.3 Serum samples
Twenty male Wi star rats, both genetically and microbiologically defined, of mass 150-
200 g, were randomly selected from the stock at the BMRC, University of Durban
Westville. The procedure was approved by the Ethics Committee at the University of
Durban-Westville (Ethical clearance number 91023 B). Animals were housed 111
individual cages, conforming to nationally and internationally recognised standards, as
outlined in the National Code for Animal Use in Research, Education, Diagnosis and
Testing of Drugs and Related Substances in South Africa. The temperature remained at a
constant level, between 19-21°C and the relative humidity 50 ± 10% R.H. The filtered air
flow had 15-20 air changes per hour. Artificial lighting was adequate and remained a
constant 12-14 daylight hours per day. Diet consisted of irradiated standard commercial
pelleted rat feed (Epol, Pietermaritzburg, South Africa) and both water and feed were
available ad libitum . At initiation of the trial, animals were examined for their general
state of health. Following administration of toxin, the rats were monitored daily, to
observe any untoward effects of the toxin.
Animals were randomly allocated into four groups of five, designated control, low,
medium and high corresponding to the relative level of dosing with ATR, the details of
which are described in section 3.1.5 below. At the onset of the experiment (on Day 0)
animals were weighed, labelled individually with a colour code and a number, indicating
the dose level and inter-group identification respectively. Blood (1 ml per rat) was
aseptically collected from the tail-vein prior to dosing (represen ting the control) and
thereafter at 24,48,72 and 96 hours post-dosing. At termination of the trial, rats were
euthanased using CO2 and the carcasses were incinerated.
30
The collected blood was allowed to clot and centrifuged at 5000 x g for 10 minutes . Sera
aliquots (200 ~l) were taken to monitor serum aspartate transaminase (AST) and alanine
transaminase (ALT) levels (see liver function tests, section 3.6.3). Care was taken to
prevent haemolysis as this interferes with the enzymatic studies. The remainder of the
sample was stored at -20°C until analysed by HPLC or immunoassay (Sections 3.3 and 3.5
respectively).
3.1.4 Liver and kidney samples
Thirty six male Wi star rats (Porton Strain, random bred closed colony, maintained by
Experimental Biology Unit, University of Surrey, Guildford) were used for the analysis.
The rats were given ad libitum access to Spratts Laboratory Animal Diet Number 1
(Spratts, Barking, UK) and tap water. They were housed as described in section 3.l.2 in
translucent "shoebox" type cages. Rats were randomly divided into four groups of nine,
designated control, low, medium and high groups corresponding to the relative dosing with
ATR, the details of which are described in section 3.l.5 below. Three rats per dose level
were euthanased at 24 hour intervals for a total period of 72 hours.
Before euthanasia, rats were anaesthetised as follows. A measured volume of diethyl ether
(50 ml) was poured onto a cotton-wool pad, secured in a wire basket in an air-tight bucket,
which formed the anaesthetising chamber. Animals were placed in the chamber for a
suitable period until completely anaesthetised, removed and euthanasia was performed by
cervical dislocation.
Following euthanasia, the animal's abdominal cavity was opened vIa mid-line incision
from pubic symphis to xiphoid process and the peritoneum carefully incised with scissors.
This was carefully retracted, together with the skin flaps, to expose the intestines and the
intestinal and alimentary canal, which were removed to the left hand side of the animal
thus exposing the liver and kidneys. Extreme care was taken at all times to minimize
mechanical damage to the tissue during excision . The kidneys were dissected intact, after
surrounding fat and fascia had been removed by blunt dissection . Kidneys were depoled
using a single edged razor blade and the left kidney notched for identification. The liver
was also excised intact and a section 5 mm from the edge of the fourth lobe removed for
fixation .
31
Tissue was fixed according to the method of Bancroft and Stevens (1982) and Gregg et al.
(1990) for histological examination . Simultaneously, kidney tissue was collected for
fixation and embedding in preparation for immunocytochemistry (section 3.8).
3.1.5 Dosing of animals with atractyloside
The dosing regime was the same for all the above rat experiments. Animals were given a
single dose administered intraperitoneally (i.p.) of ATR (potassium salt) at dosages of 0,
5, 10 and 25 mg/kg bwt respectively (control, low, medium and high) dissolved in sterile
saline. A final volume of 1 ml was administered in the instance of the high dose regimen,
which is acknowledged as being a very large amount, but the poor solubility of the ATR
limited lower volumes being prepared. The medium and low dose regimen received
approximately 500 III of ATR.
3.1.6 Sample preparation for thin layer and high performance liquid
chromatography and the immunoassay
Serum (section 3.1.3) and urine (section 3.1.2) samples were defatted and deproteinized, as
follows, prior to being analysed by TLC, HPLC and ELISA. An aliquot (200 Ill) was
vortexed with an equal volume of hexane, allowed to settle and submerged in an acetone
dry ice-bath and the hexane layer containing extracted lipids was decanted from the frozen
aqueous sample (Lim, 1986). The sample was thawed and mixed with 400 III of a solution of
methanolic hydrochloric acid (2 ml conc. HCl/litre methanol) which ~esulted in the
spontaneous formation of a thick whit.e precipitate. The sample was vortexed for a further
30 seconds, centrifuged at 5 000 x g for 10 minutes and the supernatant removed for further
analysis. The extraction procedure did not interfere with any of the analyses performed.
All samples were stored at 4°C until analysed by TLC, HPLC or ELISA (section s 3.2, 3.3
and 3.5 respectively) .
3.2 Thin layer chromatography
Thin layer chromatography was used extensively in the present studies to assist in the
optimisation of the derivatisation of ATR (section 4.4) sample clean up (section 4.5) and the
HPLC method (section 4.6). Analytical TLC was carried out as described by Brookes (1979)
on 10 cm x 10 cm aluminium backed, non-fluorescent silica gel TLC plates (Merck ,
Germany). Atractyloside (1 mg/ml), urine, serum or derivatised toxin (ATR-ADAM,
section 4.4) was developed in a solvent system of freshly prepared butanol:glacial acetic
acid:chloroform:water (6:2 :2 :1). Saturation of the development tank was h aste ned by
32
insertion of filter paper discs into the solvent for 10 minutes prior to development of the
plate. Following development, the plates were sprayed with anisaldehyde spray reagent,
prepared by mixing anisaldehyde (500 111), glacial acetic acid (10 ml) , conc. sulphuric acid
(5 m]) and methanol (85 mI). Plates were heated to 100°C for a few minutes after spraying
and ATR or ATR-ADAM was visualised as a pink spot. Prior to anisaldehyde treatment,
the ATR-ADAM was also visualised as a blue fluorescent spot under UV light at a
wavelength of 365 nm.
3.3 High perlormance liquid chromatography of atractyloside
The first step in the chromatographic detection of ATR was preparation of the
derivatisation 'agent, 9-anthryldiazomethane (ADAM). Those aspects of the synthesis
involving method development are described in section 4.3, while the final optimised
method is detailed in section 3.3.2 below. Likewise for the derivatisation of ATR, sample
clean up and chromatographic conditions, the developmental aspects are described in
sections 4.4, 4.5 and 4.6, while optimised procedures are detailed in sections 3.3.2, 3.3.3,
and 3.3.3 again, respectively. High performance liquid chromatography was carried out
on all the urine and serum samples from the ATR-treated rats, the preparation of which is
described in section 3.1.2 and 3.1.3 respectively.
3.3.1 Specialised chemicals
All the chemicals used in the study were of analytical grade and of the highest purity
commercially available, unless otherwise stated. All solvents were prepared in ultra-pure
water, obtained from a Milli-Q plus system, which produces organic free 18 ncm- 1
resistivity water, filtered to 0.22 11m. Solvents for HPLC were degassed prior to use by
ultrasonication and stored in glass bottles. Plastic bottles were not used as organ ic
solvents can leach "plasticisers" from the containers, causing spurious peaks on the
chromatogram (Johnson and Stevenson, 1978). Anisaldehyde (BDH , Bucks., UK) ;
Anthracen-9-carbaldehyde, hydrazinium hydroxide (80%), reverse phase-18 F 254S TLC
plates, thickness 0.25 mm and aluminium backed silica ge l plates (Merck, Germany) ;
Mercuric oxides (Hopkins and Williams, Essex , UK); Silica gel 60 (for chromatography);
(Fluka, Switzerland).
3.3.2 Preparation of derivatising agent
The method of Nakaya et ai. (1967) for th e preparation of 9-anthrylhydrazone was
employed without modification . Unless otherwi se stated, all reactio ns were carried out at
33
room temperature. A solution of 8.8 g 9-anthryldehyde in 15 ml absolute ethanol was
stirred with 8.5 g hydrazine hydrate, for 3 hours. The solid product (9-anthrylhydrazone)
was removed by filtration, dried under vacuum and recrystallised from ethanol and
stored desiccated at 4°C until used. The synthesis of ADAM from the hydrazone is a
modified procedure of Miller (1959) and Nakaya et al. (1967) (section 4.3). Fresh catalyst
was prepared as follows. Mercuric chloride (10 g) was mixed with 50 ml of ethanol and
39 ml of a saturated solution of potassium hydroxide in distilled water. The resulting
yellow precipitate of mercuric oxide was filtered and dried under vacuum for immediate
use. To 2.9 g of 9-anthrylhydrazone was added 3 g anhydrous sodium sulphate, 40 ml of
diethyl ether, 1 ml of ethanol saturated with potassium hydroxide and the mercuric oxide
(approximately 7 g) prepared as described above . The solution was stirred for 5 hours, in a
pressure bottle wrapped in wet towels to contain a possible explosion . The reaction mixture
was filtered and the solvent was removed from the filtrate under reduced pressure to leave
a dark red oil which was dissolved in petroleum ether (boiling point 30-60°C) and filtered
through Whatman N°1 filter paper. The solvent was removed from the filtrate under
reduced pressure, yielding red 9-anthryldiazomethane (ADAM) crystals, which were not
recrystallised. The crystals were stored, desiccated at Lrc until they were used to
derivatise the ATR, details of which are given below in section 3.3.3.
3.3.3 Derivatisation of atractyloside and pre-column clean up
The derivatisation of ATR was a modification of the method of Matthees and Purdy (1979).
A 15% (v/v) solution of ADAM was prepared in diethyl ether and approximately 50 ~l was
added to 100 ~l of the serum, urine or standard ATR (prepared as described in section
3.1.6). If there was sufficient derivatisation agent, the sample solution turned bright red,
but on depletion of the derivatisation agent the solution turned yellow. More ADAM
solution was added until the solution remained red for at least one hour. The un reacted
reagent and decomposition products were removed from the sample in a pre-column clean
up step, using a pasteur pipette plugged with glass fibre and filled with silica gel 60. The
columns were activated with ethyl acetate:MeOH (3 :1) and the crude derivatised material
was applied to the column surface. The column was rinsed with approximately 7 ml of
ethyl acetate:MeOH (3:1) which resulted in the removal of yellow contaminant.
Application of 5 ml of a chloroform:MeOH (2:3) solvent resulted in the elution of the
derivatised ATR from the column. The sample was evaporated to dryness in a stream of
nitrogen with gentle heating and redissolved in 2 ml of mobil e phase (section 3.3.4) . The
derivatised sample was analysed by HPLC as described in sE'ction 3. 3.4 below.
34
3.3.4 Spectrophotometry and chromatographic conditions
All the UV spectrophotometric determinations as well as the absorption spectrum for ATR
and ATR-ADAM were carried out on a Hitachi 220 spectrophotometer. The excitation and
emission wavelengths for the ATR-ADAM derivative were determined on a Hitachi F2 000
fluorescent spectrophotometer and found to be 360 and 425 nm respectively. The HPLC was
carried out on Millipore Waters equipment (Millipore Corporation, Milford, USA) and
included the following: Mod. 710B WISP autosampler, Fluorescence detector Mod. 420-AC
(fitted with a 365 nm excitation filter and a 420 nm band-pass emission filter), Mod. 501
pump and a Mod. 994 programmable photodiode array detector. An in-line pre-column
guard filter was used at all times and all samples were filtered through Waters HV filters
(0.45 11m). Integration was carried out either using the Waters 840 chromatography data
station, Beckman System Gold or .a Kontron PC Integration Pack.
Separation was carried out at room temperature on 4 11m Nova-Pak® reverse phase CIS
columns of dimension 3.9 x 150 mm from Millipore Waters. An aliquot (20 Ill) of the semi
purified sample was injected directly onto the column and eluted at a flow rate of
1.5 mllminute in a solvent system of methanol :1 M ammonium acetate:glacial acetic
acid: water (38:2:2:58). The eluted solutes were monitored sequentially at a UV
wavelength of 254 nm and for fluorescence at an excitation wavelength of 360 nm and
emission wavelength of 425 nm.
3.4 Antibody production
Antibodies to ATR were produced for use in the ELISA (Chapter 6) and for
immunocytochemistry of tuber and kidney tissue (Chapter 7). Since the entire antibody
production protocol had to be optimised, the developmental aspects of the methodology are
given in the various materials and methods sections, in Chapter 5, whereas the final
optimised method is detailed in this section.
3.4.1 Specialised chemicals, materials and equipment
All the chemicals used in the study were of analytical grade and of the highest purity
commercially available, unless otherwise stated. All buffers were prepared in ultra-pure
water, filtered through a Milli-Q plus system, which produces organic free 18 Qcm-I
resistivity water, filtered to 0.22 11m. Acid treated Salmonella minnesota R595 (Bioclones,
South Africa); Agarose (for electrophoresis) (Unilab, South Africa);I-ethyl-3-(3-
dimethylaminopropyl) carbodiimide, dialysis tubing (D9652) , Freund's adjuvants
35
(complete and incomplete), goat anti-rabbit IgG-alkaline phosphatase conjugate, p
nitrophenyl phosphate tablets, rabbit serum albumin (RSA) Fraction V, 2,4,6-
trinitrobenzenesulphonic acid (TNBS) and Tris base (Sigma, St. Louis, MO);
polyethylene glycol (6000) (PEG) (Merck, West Germany J; bovine serum albumin
(BSA)(Fraction V) (Boehringer Manneheim, West Germany); Gelatin (Difco Bacto.,
UK); Nitrocellulose membranes (Schleider and Schnell, Dassel , West Germany); N,N'
dicyclohexylcarbodiimide, diethanolamine, N,N-dimethyl formamide (DMF) (British
Drug Houses (LTD) (BDH), Eastleigh, Hampshire , UK); NUNC microwell module U16
immunoquality (Weil, South Africa) ; Ovalbumin (Grade 111) (Koch Light Labs., Bucks,
UK). All ELISA plate readings were carried out on a Biotek microtitre spectrophotometer.
3.4.2 Conjugation of atractyloside to Salmonella minnesota bacteria and bovine
senun albumin
The procedure outlined below was a modification of the method of Bellstedt et al . (1987) and
P. Hoffman (pers. comm.,1988). Lyophilised naked bacteria (2.5 mg) were rehydrated for
1 hour at 37°C, in 0.1 M borate buffer, pH 8.5. Atractyloside (19 mg) was dissolved in a 66%
(v/v) solution of DMF and stirred for 30 minutes, at room temperature with 1-ethyl-3-(3-
dimethylaminopropyl) carbodiimide (12 mg) . This solution was added to the hydrated
"naked bacteria" and stirred overnight at 4°C. The naked bacteria were pelleted by
centrifugation at 5 000 x g for 10 minutes. The supernatant was removed and the pellet
washed twice in 0.1 M phosphate buffer, pH 7.0 and finally resuspended in this buffer
(1 ml). The conjugate was used to immunize rabbits and the dosing and bleeding regimen
are described in section 3.4.3.
A BSA-ATR conjugate was prepared for use as the coating antigen in the immunoassay,
using a modification of the method supplied by P. Hoffman (pers. comm ., 1989).
Atractyloside (120 mg) was dissolved in a solution of 66% (v/v) DMF. To this was added 1-
ethyl-3-(3-dimethylaminopropyl) carbodiimide (72 mg) and the solution was stirred for
30 minutes, at room temperature. Bovine serum albumin (100 mg) was dissolved in 0.5 M
borate buffer, pH 8.5 and the ATR solution was added dropwi se, with sti rring, the pH being
monitored and maintained above pH 8.0 throughout the procedure. The conjugate was
stirred overnight at 4°C and dialysed exhaustively against 0.1 M borate buffer, pH 8.0.
The degree of binding of ATR to BSA, or RSA, was monitored by the method of Habeeb
(1966) as follows: Protein solution (BSA or RSA, 1 mg/ml, 100 Ill) was diluted with 0.1 M
borate buffer, pH 8.5 (900 Ill) and mixed with 1 m I of 0.1% (v/v) 2,4 ,6-
trinitrobenzenesulfonic acid (TNBS) in distill ed water. Th e solution was incubated for
36
2 hours at 40°C and mixed with 1 ml of 10% (w/v ) SDS, prepared in the same borate buffer ,
followed by 0.5 ml of 0.1 M RCI. The absorbance of the solution was determined at 335 nm,
against a distilled water blank, treated as described above . The absorbance readings of the
conjugates were compared to that of the BSA and RSA controls, prepared simultaneously,
and from these results the degree of binding of ATR to th e BSA and RSA carriers was
determined.
3.4.3 Immunization procedure
New Zealand white rabbits randomly selected from the BMRC breeding stock, University
of Durban-Westville were used in the immunization procedure (Ethical Clearance
Number 90009 B). The animals were housed in individual cages, conforming to
internationally recognized standards. The temperature was kept between 16-20°C and the
relative humidity 50 ± 10% R.H. The filtered air flow was changed 10-20 times per hour.
Artificial light was adequate and was a constant 12-14 daylight hours, per day. The
animals were allowed ad libitum access to food and water, which consisted of irradiated
standard commercial pelleted feed and autoclaved Tef hay.
Pre-immune serum was collected prior to the rabbits being immunized with 0.2 ml of the
naked bacteria-conjugate (prepared as described in section 3.4.2). The antigen was
administered without emulsification in Freund's adjuvant, as the bacteria possess
adjuvant-like properties (Bellstedt et al ., 1987). Where a protein-hapten conjugate was
administered, rabbits were immunized with the conjugat e (1 mg protein) which had
previously been triturated with Freund's complete adjuvant. Care was taken to ensure that
a stable water-in-oil emulsion was formed, by periodically testing the emulsion in cold
water. The maintenance of a discrete drop of emulsion on the surface of the cold water,
without evidence of dispersion was considered "stable" and only this was used to
immunize the rabbits (Catty and Raykundalia, 1988). Rabbits were injected
subcutaneously using a 25 gauge needle at a single 'site, there being no advantage to
multiple site immunizations (Tijssen, 1985).
The bleeding procedure was optimised as follows . Rabbits " 'ere handled as regularly as
possible, to minimise the stress response and this negated their restraint for bleeding
purposes. Instead, they were placed on a table, preferably in the sun and if unconfined,
remained calm. Any apprehension by the bleeder result ed in spontaneous venous
constriction and a failure to bleed. Animals' ears were clipped free of hair with scissors,
swabbed with alcohol and a thin layer of petroleum jelly was applied to the prepared area.
This inhibits clotting and facilitates bleeding (Tijssen, 1985 ). If the central vein did not
37
dilate sufficiently, a cotton-wool swab, soaked in xylene \\a s applied to the dorsal and
lateral sides of the tip of the ear, causing dilation of the ear veins. Exposure of the rabbit to
the toxic xylene was only used in extreme cases. Often, allowing the animal to relax in a
warm environment was sufficient to dilate the veins. The syringe needle (25 gauge) was
bent slightly and inserted bevel up into the central ear vein, care being taken to ensure that
the needle remained as parallel as possible to the surface of the ear, and once the needle
was inserted under the skin it was lifted fractionally to ensure that it penetrated the vein.
Blood was allowed to flow freely into a sterile container and ap proximately 10-15 ml of
blood was collected.
Animals were bled from the central ear vein at fortnightly intervals and the blood allowed
to clot for 1 hour, at 37°C. Following release of the clot from the walls of the container, the
samples were left overnight at 4°C to permit further clot retraction . The red blood cells were
removed from the serum by centrifugation at 12 000 x g for 10 minutes. The antisera was
never pooled, but divided into 100 III aliquots and stored at -70"'C until used in the ELISA
(section 3.5) and immunocytochemistry (section 3.8.3). Titre was monitored using the
immunoassay of Bye et ai. (1990) (see details section 5.3.2 ), which was a preliminary
version of the immunoassay described in section 3.5. Only when the primary response
receded were animals boosted with the same concentration of antigen. When the
secondary response began to recede, animals were anaesthetised with Alphaxalone and
Alphadalone (Saffan, Galaxo), at a dosage of 9 mglkg bwt, administered in the marginal
ear vein an~ antisera was collected via cardiac puncture. The animals were not bled
when the secondary response peaked, but as this response began to recede , since it has been
observed that the affinity for the antigen is higher when the secondary respon se is
beginning to recede, as compared to when response is maximal (S. Fawaz, pers . comm.,
1990).
Thereafter, animals were rested for 6 months, immunized with fresh conjugate and the
procedure repeated. At termination of the experiment, animals were anaesthetised with
0.3 ml anaesthetic, given intravenously in the central ear vein and exsanguinated by
cardiac puncture. If necessary, euthanasia proceeded by barbiturate overdose, given intra
cardiac whilst animals remained under anaesthesia, following which the carcasses were
incinerated. If the animals died during exsanguination , the carcasses were fed to the
resident crocodiles at the BMRC.
The antibodies were characterised and the antisera with the best titre was used in the
ELISA described in section 3.5 as well as for immunocytochemistry, as described in section 3.8 below.
38
3.5 Enzyme-linked immunosorbent assay (ELISA)
The ELISA detailed in this section was applied to both the urine and serum samples, from
ATR-treated rats, as described in section 6.7. This method, however, required substantial
development, the details of which are given in the relevant methods sections in Chapter 6.
3.5.1 Buffers
0.05 M carbonate buffer. pH 9.6: Sodium carbonate (0.424 g) and sodium bicarbonate
(0.504 g) were dissolved in 1 litre of distilled water.
0.02 M Tris buffered saline. pH 7.4 (TBS); Tris base (2.42 g) and NaCI (9 g) were dissolved
in about 800 ml of distilled water, titrated to pH 7.4 with 1 M HCI and made up to l!itre with
distilled water.
0,02 M Tris buffered saline. pH 7.4 containing 0.01% Tween®20 (saline-Tween): Tris
base (2.42 g) and sodium chloride (9 g) were dissolved in about 800 ml of distilled water
with 100 III Tween 20, titrated to pH 7.4 with 1 M HCI and made up to 1 litre with distilled
water.
0.1 M diethanolamine buffer. pH 9.6: Diethano!amine (97 m]) was added to 800 m! of
distilled water containing MgC12.5H20 (101 mg), the pH adjusted to pH 9.6 with 1 M HCI
and the buffer made up to 1 litre with distilled water.
3.5.2 Immunoassay
Where appropriate, buffers were pre-equilibrated to the incubation temperature. Microtitre
plates were coated with a BSA-ATR conjugate (prepared as described in section 3.4.2) at a
concentration of 0.001 mglml in 0.05 M carbonate buffer, pH 9.6 (200 Illiwell). Plates were
covered with cling film and incubated overnight at 4°C. Plates were blocked for 1 hour at
room temperature with 200 Ill/well of 0.1% (w/v) BSA in TBS. The antisera (section 3.4.3)
were prediluted 1:150 in TBS. To each well was added 100 ~I sample (di luted 1:10 and
1:100, in TBS) or standard ATR (over the range 1 mg to 10 ng ATRlml) and an equal
volume of the appropriate antiserum to give a final primary antibody solution of 1:300. Atl
samples were tested in quadruplicate. Wells were incubated fo]' 16 hours at 4°C washed ,
thrice in saline-Tween and incubated for a further 2 hours, at 3T'C, with 200 Ill/well of a 1:5
500 dilution of goat anti-rabbit IgG-alkaline phosphatase conjugate , in TBS. Plates were
39
then washed three times in saline-Tween and incubated for a further two hours at 37°C with
p-nitrophenyl phosphate (1 mg/ml) in 0.1 M diethanolamine buffer, pH 9.6 (200 Ill/well) .
The absorbance was monitored using a Biotek spectrophotometer.
Results were determined by calculating the mean of the replicates and comparing the
mean absorbance of the 1:10 dilution with that of the 1:100 dilution. Theoretically, an
increase in absorbance is expected with an increase in dilution, as less atractylosides
would be present in the 1:100 dilution than in the 1:10 dilution and in the former, more
antibody would be available to bind to the coating antigen. The increase in absorbance
between the 1:10 and 1:100 dilution was calculated and a 10% or greater increase in
absorbance was classified as positive (+).
3.6 Organ function assays
Organ function assays were employed as described in sections 7.2 and 7.3, on urine and
serum, in order to gain information as to the target organ (kidney or liver) for ATR
toxicity. The assays described in this section were used without any significant
modification.
3.6.1 Specialised chemicals
Test kits for COBAS-BIO centrifugal analyzer: alkaline ph05phatase (AP), opt, Calibrator
I, 'Y-glutamyl transferase (GGT) Uni-Kit II, Glucose HK Un i-Kit II, lactate dehydrogenase
(LDH) opt. DGKC MA-Kit 10, Calcium, Protein, Albumin (Roche Products Ltd. Welwyn,
Herts., UK); Universal containers (30 ml) (Sterilin Ltd., Middlesex, UK); Decision
control serum, aspartate aminotransferase reagent (AST) and alanine aminotransferase
reagent (ALT) (Beckman Instruments, Durban, South Africa).
3.6.2 Kidney function assays
Metabolite and enzyme analyses were performed on a COBAS-BIO centrifugal
autoanalyzer. This enables sequential analysi s of several parameters in up to 24 samples
per rotor. Representative urine sample (150-200 Ill ), prepared as described in section 3.1.2,
were pipetted into sample vials, held in a plastic rotor. The reagent(s) required for the
analysis, a starter solution and, if necessary , standards, were placed in a suitable reagent
rack. Sample, reagent and starter were automatically tran sferred to plastic cuvettes and
centrifugally mixed. Glucose, albumin , total protein and calcium levels as well as GGT,
AP and LDH activity was measured using Roche diagnostic kits as detailed in section
40
3.6.1. The levels of AP, GGT and LDH were expressed as units of activityllitre of urine
(Ullitre) while glucose, calcium, albumin and total protein are given as mg/ml urine/18
hour urine volume.
3.6.3 Liver function tests
Aliquots (200 ~l) of sera (prepared as described in section 3.1.3) were taken to monitor AST
and ALT levels. Enzyme levels were monitored by staff at the King Edward VIII hospital,
Durban using an automated Beckman Synchron CX clinical system and Beckman
analytical test kits for AST and ALT as detailed in section 3.6.1. The results of these
analyses are given in Chapter 7.
3.7 In vitro amino acid incorporation
The following in vitro analytical method was carried out, whereby the effect of ATR on the
incorporation of tritium labelled proline into isolated viable proximal tubules was
monitored. It was envisaged that this experiment would yield further evidence as to the
specific target tissue of ATR toxicity and details of the in vitro method are given below.
3.7.1 Specialised chemicals and equipment
Atractyloside (potassium salt) (Sigma Chemical Company (LTD), Poole, Dorset, UK);
Optiphase "safe" scintillant liquid (LKB, Wallac, Finland); Plastic scintillation vials,
plastic cuvettes (FSA Laboratory Suppliers, Loughborough, Leics., UK); [3H]-L-proline-;
specific activity 555 GBq/mM (Amersham Int. pIc, Aylesbury, Buckinghamshire, UK);
stainless steel sieves, woven wire mesh series of diameter 100 m.m and pore size 75, 150
and 250 ~m (Endecotts, London, UK).
Earles' buffered salt solution <Earles' BSS): NaCI (6.8 g), KCI (0.4 g), CaCI2.2H20 (0.247 g),
MgS04 (0.1 g), NaH2P04 (0.125 g), Glucose (1.0 g), Phenol red (0.01 g) and HEPES (6 .7 g)
were dissolved in 1 litre of distilled water.
3.7.2 Preparation of proximal tubules
Groups of ten male Wistar rats (150-200 g) from the University of Surrey's breeding stock
were anaesthetised and killed by cervical dislocation (as described in section 3.1.4) .
Kidneys were immediately excised and placed in ice-cold Earles' BSS. Thereafter , the
kidneys were decapsulated, cut longitudinally and both the papilla and inner medullary
41
tissue discarded. The remaining tissue (approximately 20 g) was finely minced with a
single edge stainless steel blade and suspended in a minimum volume of fresh Earles'
BSS. The glomerular and proximal tubule fragments were isolated by forcing the tissue
through a series of three graduated sieves, of decreasing mesh size, viz., 75, 150 and
250 11m. Proximal tubules were retained by the 150 11m sieve, while the glomeruli were
harvested from the 75 11m sieve. Fractions were resuspended in a approximately 20 ml of
Earles' BSS, washed twice with the same buffer followed by centrifugation at 5 000 x g for
3 minutes, and finally resuspended in approximately 20 m 1 of ice cold buffer (Earles'
BSS). An overview of the procedure is given in Fig 3.2. Aliquots of the suspension were
used immediately for the amino acid incorporation experiment (section 3.7.3) and for
protein determination as described in section 3.7.4.
3.7.3 Amino acid incorporation and experimental method
As outlined in Fig 3.2, aliquots (500 Ill) of glomerular or tubular preparations were
incubated in a shaking water bath (120 cycles/min) at 37°C, in the absence or presence of
500 III of ATR solution of concentration ranging from 1-6 11M. To each vial of tubule
fractions was added 50 III of [3H]-L-proline (92.5 kBq, in Earles' BSS). Representative
control samples devoid of toxin were collected at times 0, 1, 2 and 3 hours respectively, to
ensure that the proximal tubules were viable for the entire incubation period, whereas the
tests samples containing the toxin were collected only at time 3 hours. Incubation was
terminated by addition of 3 ml of ice-cold TCA (6%, v/v) containing 1 mM of non-radio
labelled L-proline to prevent non-specific adsorption of the labelled compound. Samples
were stored at 4°C until processed. The samples were transferred to glass centrifuge tubes,
washed and centrifuged thrice for 5 minutes at 5 000 x g. A representative 250 III sample
was collected from each vial and transferred to plastic scintillation vials, to which was
added 200 III of 0.5 M NaOH. The sample was left to hydrolyse for 24 hours, mixed with
4 ml Optiphase "safe" scintillation fluid and counted on a LKB 1219 Scintillation counter.
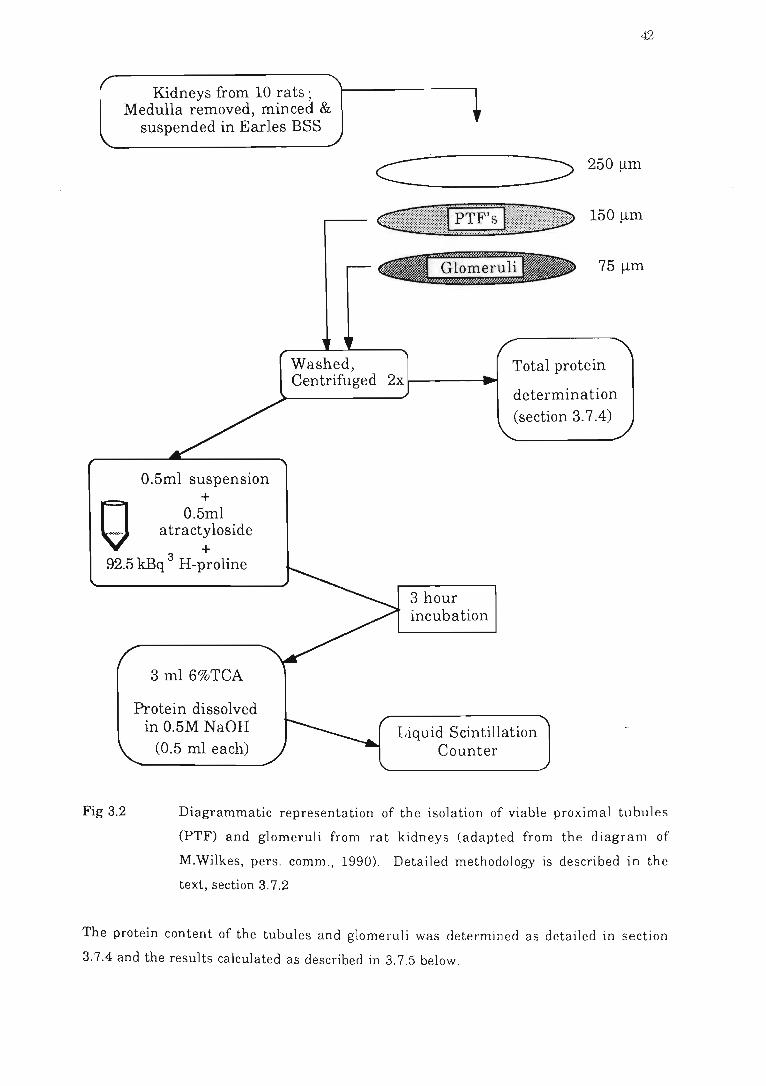
42
Kidneys from 10 rats; Medulla removed, minced &
suspended in Earles BSS
O.5ml suspension +
0.5ml a tracty loside
c::= ==:> 250~m -----..,.----
150 ~m
Glomeruli 75 ~m
Washed, Centrifuged 2x I-------tl ..
Total protein
determination (section 3.7.4)
3 + 92.5 kBq H-proline
Fig 3.2
3 ml6%TCA
Protein dissolved in 0.5M NaOH
(0.5 ml each)
3 hour incubation
Liquid Scintillation Counter
Diagrammatic representation of the isolation of viable proximal tubules
(PTF) and glomeruli from rat kidneys (adapted from the diagram of
M.Wilkes, pers . comm., 1990). Detailed methodology is described in the
text, section 3.7.2
The protein content of the tubules and glomeruli was determined as detailed in section
3.7.4 and the results calculated as described in 3.7.5 below.
43
3.7.4 Total protein determination
Aliquots (500 Ill) of the tubule or glomerular mixture were dissolved in 500 III 0.5 M NaOH
for 48 hours and protein content was measured in triplicate by the Coomassie blue method of
Bradford (1976).
Reagents
Coomassie Brilliant Blue G (100 mg), absolute alcohol (46.7 ml) and conc. orthophosphoric
acid (89 ron were made up to 1 litre with distilled water. The stock solution was filtered
through Whatman N0 1 filter paper after preparation and again immediately prior to use.
Procedure
Distilled water blanks, standards of BSA over the concentration range 25·200 mg/ml or
sample (200 Ill) were pipetted into plastic cuvettes. Glomerular samples were used
undiluted, while the tubule fractions were diluted 1:4 because of their higher protein
concentration. Filtered Coomassie blue stock solution (3.8 ml) was added to the cuvettes
and after 10 minutes equilibration the absorbance was read at a wavelength of 595 nm. The
final protein concentration was calculated from the standard curve for BSA and expressed
as mg total protein/ml. These values were used in the final calculation for the
determination of amino acid incorporation as detailed in section 3.7.5 below.
3.7.5 Calculation of results
Amino acid incorporation (z) was calculated from the following formula and expressed in
units of picomoles of L-proline incorporated/mg protein (P.Bach, per. comm.,1990):
[dpm sample-dpm background] x [4.5 x 10-41 z= specific activity of substance x [protein content]
The effects of ATR are expressed as the relative incorporation of [3H]-L-proline,
incorporated into the protein, at time three hours, as a percentage of the control, i.e., the z
value obtained for the ATR samples was calculated as a percentage of the z value for the
control after 3 hours incubation *. Relative toxicity is shown as the concentration of toxin
required to inhibit amino acid incorporation in the isolat.ed fragments by 50%, when
compared to the controls (lC50 ). Results are expressed as the mean of triplicate
determi nations.
*r1 ti· . f[3 zsample eave Incorporation 0 H]-L-proline in the presence of ATR = . xIOO z control at tIme 3 hours
44
3.8 Immunocytochemistry of tuber and kidney tissue
Immunocytochemistry was carried out on tuber tissue as well as on the kidney tissue from
the rats dosed with 25 mg/kg bwt ATR. This section details the optimised procedure for
immunocytochemistry, whereas the developmental aspects of the method are described in
the materials and methods sections in section 7.5.
3.S.1 Specialised chemicals and materials
All buffers and reagents were prepared in ultra-pure water , filtered through a Mi11i-Q plus
system, which produces organic free 18 ncm- 1 resistivity water, filtered to 0.22 11m .
Standard electron microscopy reagents for resin embedding were provided by the Electron
Microscope Unit of the University of Natal, Pietermaritzburg or the RIIEHS, University of
Surrey, Guildford, UK. Protein A-gold probe was prepared and supplied by E. Elliott (Dept.
Biochemistry, University of Natal, Pietermaritzburg). Tubers of C. laureola were
collected from World's View, Pietermaritzburg, Natal during the first quarter of 1989.
Tissue processing was initiated within an hour of collection. Rat kidney was collected as
described in section 3.1.4.
The anti-ATR antibodies were produced as described in section 3.4. The antisera was
stored at -'iD CC as small, undiluted aliquots. Once the antisera was thawed, it was not
refrozen and all antibody solutions were centrifuged for 1 minute at 5 000 x g , prior to use,
to remove all aggregates.
3.S.2 Fixation of tissue
The method of Sossountzov et at. (1988) was followed, with modifications (as detailed in
section 7.5). Tissue was sectioned into 3 mm3 pieces and fixed in 2% (w/v) 1-ethyl-3-(3-
dimethylamjnopropyl) carbodiimide in 0.05 M sodium cacodylate buffer, pH 6.87 (for plant
material) or in 0.02 M cacodylate buffer, pH 7.2 (for mammalian tissue) under a vacuum
of 750 mm Hg for 30 minutes. Thereafter the carbodiimide and cacodylate solution was
replaced and tissue was left for a further 4 hours at room temperature. Samples were fixed
in 3% glutaraldehyde, 0.05% caffeine and 0.05 M sodium cacodylate buffer, pH 6.87, (plant
tissue) or in Karnovsky's fixative (for animal tissue) (Karnovsky, 1965) at 4"C, overnight.
Samples were rinsed in two changes of the appropriate buffer (total period 1 hour) and
dehydrated for 10 minutes each in a graduated ethanol series of 10, 30, 40, 50, 60 and 70%
(v/v) ethanol. Tissue was stored in the 70% ethanol solution overnight at 4°C, and
thereafter dehydration continued in 80, 90 and 3 x 100% ethanol (10 minutes each) .
45
Specimens were incubated in two changes of propylene oxide (30 minutes each) and
infiltrated with 25 and 50% (v/v) Spurrs resin in propylene oxide for 1 hour each , overnight
in 75% Spurrs resin, 8 hours in 100% at room temperature and finally embedded overnight
in 100% resin, at 45°C.
Following embedding, the tissue was sectioned, etched and immunolabelled as described
in section 3.8.3.
3.8.3 Immunocytochemical labelling
The immunolabelling procedure is an adaptation of the method of E. Elliott (pel's. comm.,
1989). All labelling and washing steps were carried out at room temperature, unless
otherwise stated, on a piece of parafilmTM which was attached to the benchtop by a film of
water. Aliquots of the reagents (100 Ill, unless otherwise stated) were spotted onto the
parafilm, forming discrete droplets. The grids were floated , section-side down, on the
surface of the droplets. During the incubation procedure, the grids and reagents were
covered with a perspex lid to afford protection from dust and other particulate matter. A
2 mm loop was prepared from 0.2 mm diameter copper wire, and this was used to transfer
the grids to the reagents. The transfer loop was rinsed in distilled water and dried on
fibre-free paper between all steps, to minimise the chan ces of cross-contamination .
Similarly, the grids were briefly blotted onto fibre-free paper between all steps, to remove
residual reagent. Care was taken to ensure that the grids did not dry out.
The embedded samples were sectioned and the thickness of the section was judged by the
interference patterns given under an oblique light beam. By preference, gold sections of
approximately 150 nm thick (Hayat, 1986) were mounted on nickel grids and etched for
1 minute in bromine vapours. After etching, grids werE~ rinsed in eight changes of
distilled water (1 minute each), blocked with a solution of'rBS containing both 5% (w/v)
foetal calf serum and 0.02 M glycine (designated buffer A .I for 30 minutes. Primary
antiserum was diluted 1:100 in buffer A and aliquots of 100 III were spotted onto the
parafilm, on which the sections were incubated overnight at 4 :C. The grids were rinsed in
buffer A (2 x 2 minutes and 1 x 5 minutes). The Protein A-gold was diluted 1:200 in buffer
A and samples were incubated for an hour on 7 III aliquots of the probe. The grids were
washed in buffer A (6 x 3 minutes) and distilled water (4 x 2 minutes) and counterstained
in uranyl acetate and lead citrate before being viewed in a J eol TEM-IOO CX transmission
electron microscope.
4.1
CHAPI'ER4
DEVELOPMENT OF A HIGH PERFORMANCE LIQUID
CHROMATOGRAPHY (HPLC) METHOD FOR
THE ANALYSIS OF ATRACTYLOSIDE
Introduction
46
From personal observations and reports in the literature, it is apparent that the incidence of
ATR poisoning is not uncommon. The diagnosis of such intoxication is based on the
clinical symptoms demonstrated by the patient or histological investigations on post
mortem tissue, but the results are inconclusive. Until such time as a specific diagnostic
assay is produced and statistics on the incidence of such poisoning are available, the
indiscriminate deaths seem likely to persist. From a cultural perspective, it is unlikely
that the collection and retail of toxic herbal remedies such as Impila will ever be abolished,
and therefore a compromise must be made to prevent these needless fatalities.
The first priority is to determine the precise extent of ATR poisoning by positive diagnosis.
This information would also indicate if there is a correlation between the incidence of
Impila poisoning and the season . Callilepis laureola is usually gathered in winter
(Bryant, 1909) and deaths may be prevented simply by restricting collection periods to
summer months, as hypogean organs tend to accumulate secondary metabolites in winter.
Certainly, levels of ATR rise in the tuber of A. gUm.ntlrera during winter periods
(Contessa and Fassina, 1978) but whether the same pertains to C. laureola is not known. A
specific, quantitative analysis for ATR would provide such useful information and by
monitoring the seasonal variability of plant ATR levels, periods of low toxin
accumulation in the plant could be identified. Penalties could be imposed for collection of
the tuber during "peak" periods and in this manner, a compromise could be reached
without inhibiting cultural practices.
It is therefore important to develop some form of sensitive diagnostic assay for the
quantification of ATR in biological fluids or plant extracts . When this project was
initiated, TLC was the standard detection method for this toxin (Brookes, 1979), but this is
only semi-quantitative and furthermore, detection limits restrict the routine application of
this technique. Atractyloside may be resolved on silica gel plates in a solvent system of
butanol:glacial acetic acid :chloroform:water (6:2:2:1) and visualised by spraying with an
47
anisaldehyde spray reagent, which stains atractylosides pink (Brookes, 1979).
Anisaldehyde-sulphuric acid is a non-specific spray reagent which is used for the
detection of sugars, steroids and terpenes (Stahl, 1969).
Since HPLC is ideal for the analysis of compounds of molecular mass less than 1 000 Da
(Lim, 1986), it was proposed that this method could provide a sensitive detection system for
ATR, which has a molecular mass of 803.0 Da (Dawson et ai., 1986). There is a single
reference in the literature to the HPLC detection of ATR, in which thi.s toxin was
derivatised with dansyl chloride, for u se as a fluorescent probe to investigate the
mitochondrial ADP/ATP antiporter (Boulay et ai., 1983). The 6'-O-Dansyl ATR
derivative was purified on a IlBondapak CI8 column with a solvent system of glacial acetic
acid:1 M ammonium acetate:water (1:1:98, v/v) and a linear gradient of acetic acid:1 M
ammonium acetate :MeOH (1:1:98, v/v, 20-80% in 30 minutes) at a flow rate of
2 mllminute. The 6'-O-Dansyl ATR derivative had a retention time of approximately
35 minutes and was monitored at an absorbance of 260 nm (Boulay et ai., 1983). This
HPLC method, however, is only suitable for preparative purposes, and thus there are no
known reports of the routine analytical detection of ATR by HPLC.
In view of the properties of ATR, namely its small size, as well as the requirement for a
high resolution method to separate trace amounts of the toxin expected to be present in the
tissues or body fluids, HPLC could prove a most useful analytical method. The aims
therefore, were to develop an analytical HPLC method for the quantification of ATR. This
necessitated the systematic optimisation of every stage of the process, including sample
clean up, preparation of a derivatisation agent, derivati sation of the sample, further clean
up of the derivatised sample, as well as selection of the solvent, detector and stationary
phase. These aspects are reported in detail in separate subsections in this chapter, with the
final optimised procedure also included in Chapter 3, section 3.3.
4.2 Preliminary investigations into chromatography conditions and detection methods for atractyloside
In view of the fact that there was no known analytical HPLC procedure available for the
estimation of ATR, it was necessary to thoroughly investigate and test all possible
stationary and mobile phases and methods of toxin detection.
As a first priority it was necessary to investigate the spectroscopic properties of ATR to
establish whether the toxin could be detected after chromatography. Since ATR does not
fluoresce, the possibilities of fluorescence detection were ruled out. By contrast the
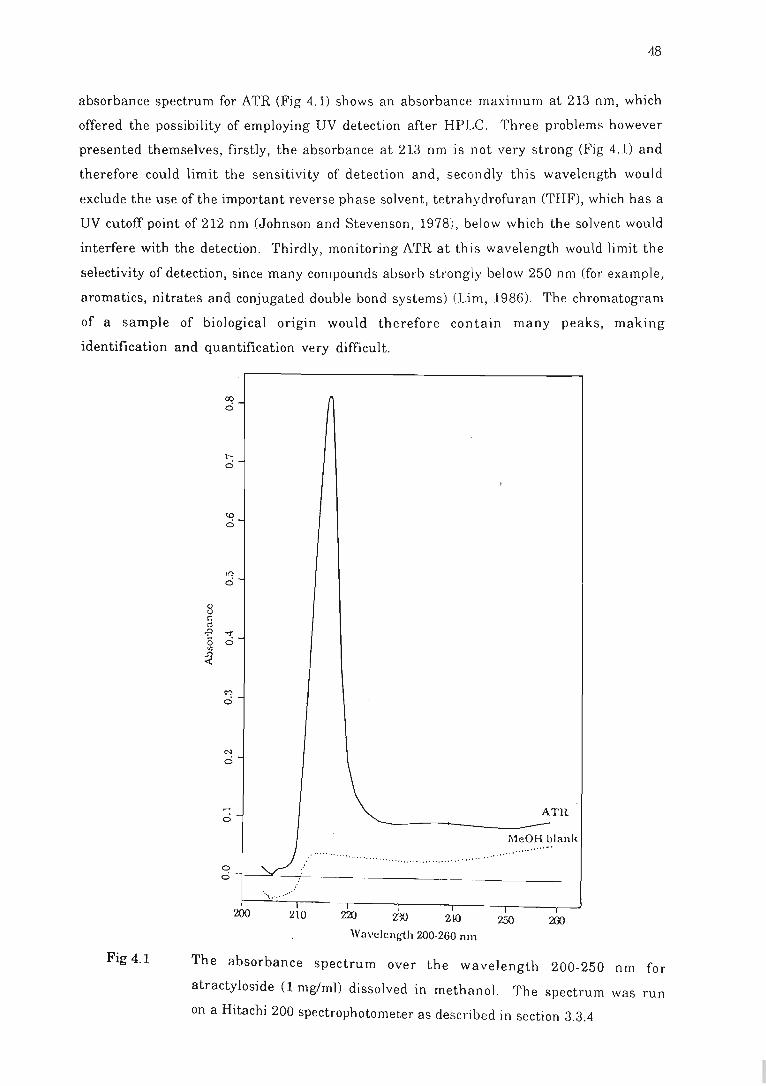
48
absorbance spectrum for ATR (Fig 4.1) shows an absorbance maximum at 213 nm, which
offered the possibility of employing UV detection after HPLC. Three problems however
presented themselves, firstly, the absorbance at 213 nm is not very strong (Fig 4.1) and
therefore could limit the sensitivity of detection and , secondly this wavelength would
exclude the use of the important reverse phase solvent, tetrahydrofuran (THF), which has a
UV cutoff point of 212 nm (Johnson and Stevenson , 1978; , below which the solvent would
interfere with the detection. Thirdly, monitoring ATR at thi s wavelength would limit the
selectivity of detection, since many compounds absorb strongly below 250 nm (for example,
aromatics, nitrates and conjugated double bond systems) (Lim , 1986). The chromatogram
of a sample of biological origin would therefore contain many peaks, making
identification and quantification very difficult.
Fig 4.1
ci- n
ci-
6-
II)
ci
8 § ~ ~-0
'J)
~
ci-
ATll
o ci ~
1\1~.?~. ~lanl{ .'-. . /., .... ...... .. .. .. .. .. ... ... .... ...... ...... .. ..... .. .. .... ... ... ..
.. , ..... -.' 200 2-10
I
250 Wavclcll{,'th 200·260 11m
The absorbance spectrum over the wavelength 200-250 nm for
atractyloside (1 mg/m1) dissolved in methanol. The spectrum was run
on a Hitachi 200 spectrophotometer as described in section 3.3.4
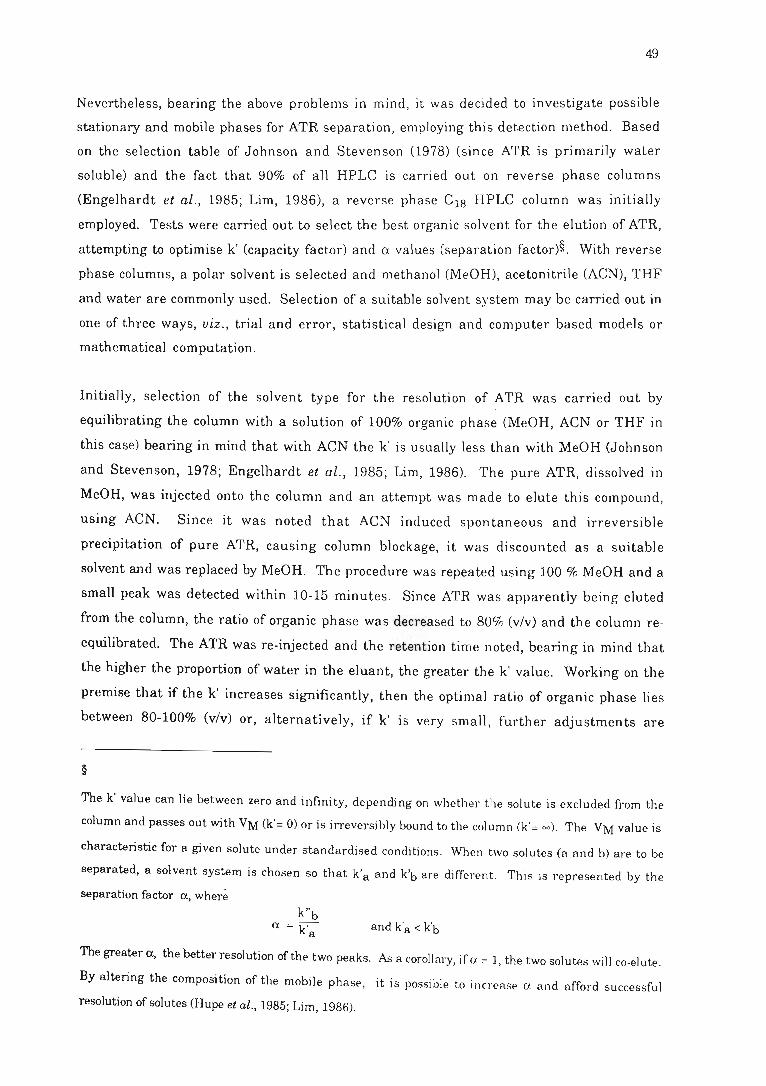
49
Nevertheless, bearing the above problems in mind, it was decided to investigate possible
stationary and mobile phases for ATR separation, employing this detection method. Based
on the selection table of Johnson and Stevenson (19 78) (since ATR is primarily water
soluble) and the fact that 90% of all HPLC is carried out on reverse phase columns
(Engelhardt et al., 1985; Lim, 1986), a reverse phase C18 HPLC column was initially
employed. Tests were carried out to select the best organic solvent for the elution of ATR,
attempting to optimise k' (capacity factor) and D. values (separation factor)§. With reverse
phase columns, a polar solvent is selected and methanol (MeOH), acetonitrile (ACN), THF
and water are commonly used. Selection of a suitable solvent system may be carried out in
one of three ways, viz., trial and error, statistical design and computer based models or
mathematical computation.
Initially, selection of the solvent type for the resolution of ATR was carried out by
equilibrating the column with a solution of 100% organic phase (MeOH, ACN or THF in
this case) bearing in mind that with ACN the k ' is usually less than with MeOH (Johnson
and Stevenson, 1978; Engelhardt et al., 1985 ; Lim, 1986). The pure ATR, dissolved in
MeOH, was injected onto the column and an attempt was made to elute this compound,
using ACN. Since it was noted that ACN induced spontaneous and irreversible
precipitation of pure ATR, causing column blockage, it was discounted as a suitable
solvent and was replaced by MeOH. The procedure was repeated using 100 % MeOH and a
sman peak was detected within 10-15 minutes . Since ATR was apparently being eluted
from the column, the ratio of organic phase was decreased to 80% (v/v) and the column re
equilibrated. The ATR was re-injected and the retention time noted, bearing in mind that
the higher the proportion of water in the eluant, the greater the k' value. Working on the
premise that if the k' increases significantly, then the optimal ratio of organic phase lies
between 80-100% (v/v) or, alternatively, if k' is very small, further adjustments are
§
The k' value can lie between zero and infinity, depending on whether the solute is excluded from the
column and passes out with VM (k'= 0) or is irreversibly bound to the column (k'= 00). The VM value is
characteristic for a given solute under standardised conditions. When two solutes (a and b) are to be
separated, a solvent system is chosen so that k'a and k'b are different. This is represented by the
separation factor a, where k "b
a=k' a and k'a < k'b
The greater a, the better resolution of the two peaks. As a corollary, if (I. = 1, the two solutes will co-elute .
By altering the composition of the mobile phase , it is possible to increase u. and afford successful
resolution of solutes (Hupe et at., 1985; Lim, 1986).
50
required by decreasing the solvent ratio to less than 80 % organic phase until a suitable k'
and a value are obtained, where 0.5 ~ k ';::>: 20, different solvent ratios were sequentially
tested. Generally, a 10% (v/v) change in the proportion of organic phase in the eluant
results in an effective two-fold change in k' (Johnson and Stevenson, 1978 ; Engelhardt et
al ., 1985; Lim, 1986). It was noted that by changing the MeOH ratio to 80 %, the k' for ATR
was still very small and thus further changes were impl emen ted, but the subsequent
chromatography runs still produced peaks with random reten tion times. Since the
addition of 1 % (v/v) glacial acetic acid to the eluant can improve resolution, particularly of
solutes containing carboxyl groups (Engelhardt et al., 1985), this acid was added to the
MeOH eluant, but results were not reproducible . The MeOH solvent system was replaced
by THF, but little improvement was afforded, also bearing in mind that the cutoff
wavelength of this solvent limited its applicability .
Since the determination of the optimal solvent ratios is also possible using linear
gradients by increasing the proportion of the organic phase from 10-100% over 20 minutes
(Johnson and Stevenson, 1978), gradients of MeOH, THF and mixtures of both solvents in
combination with acetic acid, were tested as potential eluants for ATR, but all failed to
afford good resolution of the toxin . However, since the use of gradi ents is not
recommended, unless absolutely necessary, due to complications with baseline drift and
the presence of spurious peaks (Johnson and Stevenson, 1978), attention was rather turned
to the mathematical determination of eluant ratios, based on the method of Snyder et al.
(1981). However, while in theory this equation is useful for method development, in
practice its application was found to be too complicated, especially if multicomponent
solvent systems are used. Alternative methods for the selection of suitable solvent system
were therefore sought. Since optimisation of a may also be afforded by changing the
stationary phase, the column temperature (limited applicability), the mobile phase flow
rate or the chemical nature ofthe eluant (Snyder et al., 1981), attention was turned to the use
of ion pair chromatography.
Ion-pair chromatography has had particular application in the separation of hydrophilic
organic acids; an ion bound to a matrix may be extracted into the mobile phase as a neutral
ion pair, in the presence of a counter ion such as tetra-alylammonium salts (Wahlund
1975; Lim, 1986). The principle of ion pair chromatography is theoretically suited to the
resolution of ATR (Hoffman and Liao, 1977; Wahlund, 1975) but despite altering various
parameters such as the buffer type and pH, solvent ratios and ion pair reagent, a
reproducible k' could not be obtained. Alternatively, ammonium acetate added to the
eluant can act as a counter ion, forming an ion pair with the solute, or the ammonium ions
may bind to the matrix, effectively resulting in a stationary phase with ion exchange
51
properties (Lim, 1986). When, however, ammonium acetate was added to the MeOH eluant,
it proved totally unsuccessful in the resolution of this toxin . It was suggested that ATR may
be randomly binding to residual silanol groups on the reverse phase matrix, thereby
rendering the results non-reproducible. The danger of chemically modifying silica bases
is that residual, unreacted silanol moieties on the packing can cause peak tailing and
variable k ' values. This may be overcome by reacting the bonded phase with
trimethylchlorosilane, which effectively "end-caps" the column , blocking potential non
specific binding sites (Engelhardt et al ., 1985). An end-capped ODS column (PhaseSep
Spherisorb ODS2) was tested for the resolution of ATR, but no improvement was observed.
Carbohydrates have been resolved on alkylamine or a lkylnitrile-substituted silica
columns (Hounsell, 1986). In view of the glycosidic nature of ATR it was suggested that the
separation of ATR might be possible on such a column . However, although many different
solvents were tested with an alkylamine bonded phase column (Varian MicroPak-NH2),
satisfactory resolution was not obtained. Since ion exchange columns have found
successful application in the resolution of amino acids and other charged molecular
species (Lim, 1986), and the anionic nature of ATR (Fig 2.3) tends towards the use of such a
column, a Waters IC-PAK anion exchange column was tested, but separation could not be
satisfactorily optimised. More recently, mixed-mode columns have been manufactured
which exhibit both reverse phase and ion exchange properties by virtue of bound octadecyl
(CIS) and amino-propyl residues. Such a mixed mode column (PhaseSep S5 MM) was also
tested using a variety of buffers, and while some success was afforded, retention times
were random and therefore, the method was abandoned. The first stationary phase for
HPLC was made of silica (Engelhardt et al ., 1985); separation being based on the
differences in affinities of the solutes for the acidic silanol groups on the silica
(Engelhardt et al., 1985). Since ATR may be resolved on silica gel TLC plates, normal
phase HPLC was attempted using a silica column (Waters IlPorasil) with hexane, iso
octane, heptane, methylene chloride and chloroform as solvents. Once again though the
resolution of peaks was unacceptable.
While selection of both the stationary and mobile phase is important for the resolution of a
specific solute, the efficiency of the separation process is negated if th e solutes cannot be
detected, or as mentioned above, if the solvent system s inhibit detection . In the present
studies the detectability of ATR at 213 nm was a major limiting factor, such that it was
decided to subject the toxin to either pre- or post-column derivatisation . A number of
diverse derivatisation agents are available, all of which wh en bound to the solute, impart
UV or fluorescent properties to the molecule of interest, thereby facilitating detection.
However, the derivatisation reaction must be rapid , must occur under mild conditions, be
52
reproducible and, above all, the derivatised compound must be stable (Johnson and
Stevenson, 1978).
Derivatisation occurs through functional groups inherent to the molecule of interest and
these include amines, alcohols, phenols, thiols, carboxylic acids, aldehydes and ketones
(Imai and Toyo'oka, 1988). Since fluorescent detection is more selective and sensitive
than UV detection, a fluorescent derivative ~as sought for the derivatisation of ATR which
would enhance its detection and, in doing so, slightly alter the chemistry of the molecule,
thereby facilitating chromatographic separation . Previously, ATR has been derivatised
through C6t on the glycoside moiety (Fig 2.3), using dansyl chloride (Boulay et al., 1983) but
when attempted by the present author, the method was not very successful. This failure was
attributed to an inability to maintain the strict anhydrous conditions required by the
reaction mechanism, when derivatising samples of biological origin. Therefore, this
method is not practicable for serum or urine samples, for which the assay is required .
Since the carboxyl group on the ring could also provide a suitable route for the
derivatisation of the ATR, a suitable derivatisation agent, for this group, was sought.
In 1979, Matthees and Purdy (1979) reported that the detection of fatty acids by HPLC is
facilitated by derivatising these molecules with aryldiazoalkanes. An example of such a
derivatisation agent is 9-anthryl diazomethane (ADAM) which reacts without a catalyst, at
room temperature with free carboxyl group to form esters C'J"imura and Kinoshita, 1980).
Advantages of this method are that it may be adapted for either UV or fluorescence
detection, ADAM is compatible with many organic solvents and anhydrous reaction
conditions are not necessary. Solutions of diazo alkanes are coloured red, but on reaction
with carboxylic acids, they turn yellow. Once the derivatising reagent is added to the
sample, the red colouration must be maintained for at least an hour, and should the
solution turn yellow within this period, more reagent must be added . In this manner it is
possible to determine the correct concentration of reagent to be added and ensure complete
derivatisation of the relevant solutes CMatthees and Purdy, 1979).
In view of the above considerations, it was decided to derivatise ATR with ADAiVl and
attempt HPLC on this derivative. Some of the studies below constitute the first description
of the anthryldiazomethane derivatisation of ATR and its resolution by HPLC. Since it
was necessary to develop and test each stage of the procedure, the following was
investigated: synthesis of ADAM, derivatisation of ATR, determination of detection
properties, sample clean up and finally, resolution by HPLC, both of standards and
authentic biological samples.
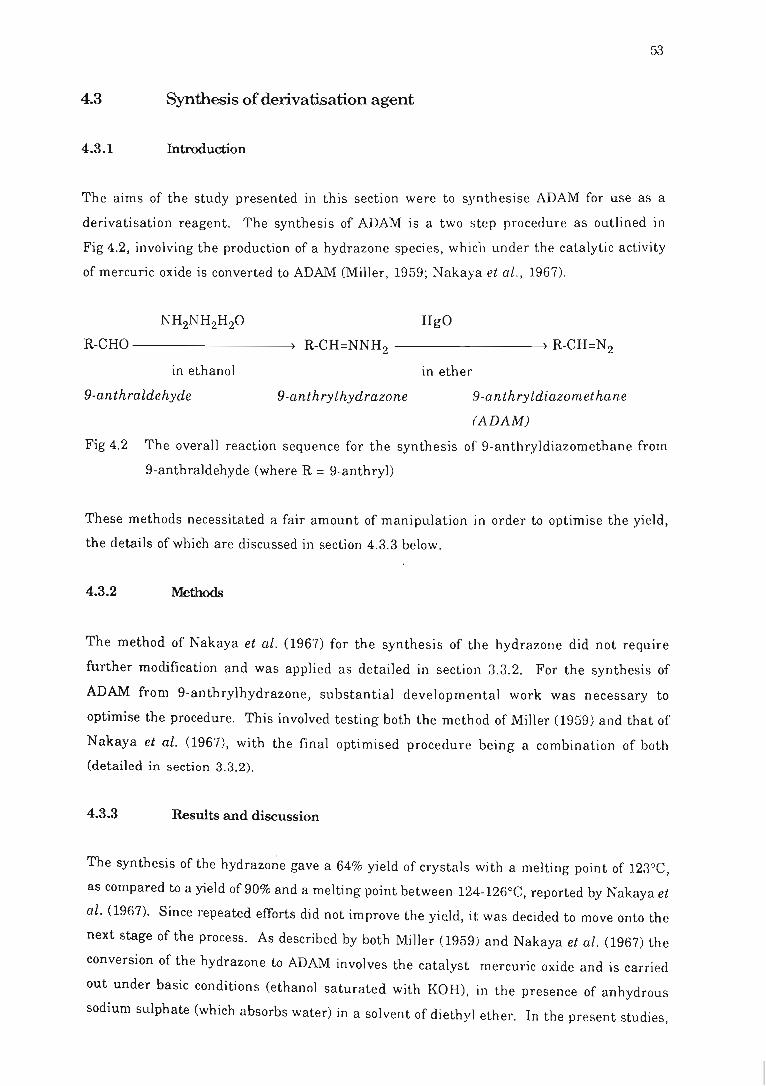
53
4.3 Synthesis of derivatisation agent
4.3.1 Introduction
The aims of the study presented in this section were to synthesise ADAM for use as a
derivatisation reagent. The synthesis of ADAM is a two step procedure as outlined in
Fig 4.2, involving the production of a hydrazone species, which under the catalytic activity
of mercuric oxide is converted to ADAM (Miller, 1959; Nakaya et aZ., 1967).
HgO
R-CHO --------~) R-CH=NNH2 -------~) R-CH=N2
in ethanol
9-anthraldehyde 9-anthryZhydrazone
in ether
9-anthryZdiazomethane
(ADAM)
Fig 4.2 The overall reaction sequence for the synthesis of 9-anthryldiazomethane from
9-anthraldehyde (where R = 9-anthryl)
These methods necessitated a fair amount of manipulation in order to optimise the yield,
the details of which are discussed in section 4.3.3 below.
4.3.2 Methods
The method of Nakaya et aZ. (1967) for the synthesis of the hydrazone did not require
further modification and was applied as detailed in section 3.3.2. For the synthesis of
ADAM from 9-anthrylhydrazone, substantial developmental work was necessary to
optimise the procedure. This involved testing both the method of Miller (1959) and that of
Nakaya et al. (1967), with the final optimised procedure being a combination of both
(detailed in section 3.3.2).
4.3.3 Results and discussion
The synthesis of the hydrazo~e gave a 64% yield of crystals with a melting point of 123°C,
as compared to a yield of 90% and a melting point between 124-126°C, reported by Nakaya et
ai. (1967). Since repeated efforts did not improve the yield, it was decided to move onto the
next stage of the process. As described by both Miller (1959) and Nakaya et al . (1967) the
conversion of the hydrazone to ADAM involves the catalyst mercuric oxide and is carried
out under basic conditions (ethanol saturated with KOH), in the presence of anhydrous
sodium sulphate (which absorbs water) in a solvent of diethyl ether. In the present studies,
54
the hydrazone was observed to be sparingly soluble in the diet!1Y! ether and it was presumed
that on conversion to the diazomethane, the compound went into solution. At termination of
the reaction period, there were low yields of ADAM and, it. was noted that considerable
amounts of unreacted hydrazone were still present in the reaction mixture, even if the
incubation time was increased to 5 hours. The low yields were presumed to be the result of
the poor solubility of the hydrazone in the diethyl ether and thus the solvent was
sequentially replaced by ethanol, MeOH, petroleum ether, hexane and chloroform, but with
no further success. Attention was, therefore, turned to the catalyst as a means of improving
the yield.
Initially only orange mercuric oxide was available which resulted in low yields of
diazomethane. Miller (1959) however investigated the use of mercuric oxides as catalysts
in the synthesis of diazomethane and concluded that yellow mercuric oxide was a more
efficient catalyst than the red oxide, for the synthesis of diphenyldiazomethane. This, in
part, was proposed to be due to the smaller particle size of the yellow oxide, but it was also
suggested that its method of synthesis could be of significance. Red mercuric oxide is
synthesised by igniting mercuric nitrate whereas yellow mercuric oxide is prepared by
adding base to a mercuric salt. Contaminating base in the yellow mercuric oxide is
thought to be important in the preparation of the diazomethane (Miller, 1959). As a trial, in
the present studies, both yellow and red mercuric oxide were used as catalysts in the
preparation of ADAM and, while the yield was improved in the presence of the yellow
mercuric oxide, particularly if freshly prepared, the final ADAM yield of 18% was
significantly lower than that quoted in the literature (65%, Nakaya et al., 1967) This result,
however, represented an improvement on previous efforts and provided sufficient reagent
to carry out the derivatisation steps. The ADAM crystals had a melting point of 63"C which
is in agreement with that quoted in the literature (63-64°C, Nakaya et al., 1967).
Once the synthesis of the ADAM crystals had been optimised (see details in section 3.3.2),
the reagent was used to derivatise ATR and this procedure, together with the monitoring of
the derivatisation, is given in section 4.4 below.
4.4 Optimisation of the derivatisation of atractyloside
4.4.1 Introduction
The derivatisation agent ADAM was initially developed for the detection of fatty acids
(Matthees and Purdy, 1979), its advantage being in its stability and high reactivity with
carboxylic acids. Previously, non-derivatised fatty acids were detected at 210 nm or below ,
55
but limited solvent selecbon and poor selectivity at this wavelength warranted
derivatisation of these acids (Nimura and Kinoshita, 1980) . As a similar detectabil1ty
problem was experienced with ATR, an attempt was made to derivatise this toxin with
ADAM, in the hope that the diazomethane would react with the carboxylic acid group on C4
of the diterpene ring (Fig 2.3), thus improving both the detect ability and the hydrophobicity
of ATR. The developmental work that was systematically undertaken to optimise this
derivatisation of ATR, is listed in section 4.4 .2 and the results are discussed in section
4.4.3 below.
4.4.2 ~
The following approaches were sequentially carried out :-
1. Selection of compatible solvents fo~ ATR and ADAM;
2. Determination of the extent of derivatisation, as monitored by TLC, employing the
method as detailed in section 3.2;
3. Preparative TLC (section 3.2) for the isolation of a semi-pure ATR-ADAM extract;
4. Determination of the absorbance spectrum and the excitation and emission
wavelengths of this semi-pure extract, by the methods described in section 3.3.4.
4.4.3 Results and discussion
Selection of the reaction solvent
Initially the derivatisation procedure of Matthees and Purdy (1979) was used, whereby the
ADAM was dissolved in hexane, chloroform or ether and added to the ATR solution
(prepared in buffer, water or methanol). However, phase separation frequently occurred,
particularly if the ATR was prepared in an aqueous solution . Some success was afforded if
the ATR was prepared in MeOH and thus attention was turned to the derivatisation
procedure of Nimura and Kinoshita (1980) who dissolved fatty acids in methanol, and
treated this with 0.1% (w/v) ADAM solution prepared in methanol. It was noted by the
present author that when preparing the 0.1% solution, that the ADAM did not readily
dissolve in the MeOH and, consequently, a considerable proportion of the reagent was
wasted. This problem was overcome by adding sufficient ADAM crystals directly to the
ATR test solution to maintain a dark red colour, for at least an hour and adding more
reagent if the solution turned yellow. It was subsequently found, however, that reaction
conditions were most successful if the ADAM was dissolved in diethyl ether and added to a
sample prepared in methanol.
This approach was incorporated into the final optimised method detailed in section 3.3.3.
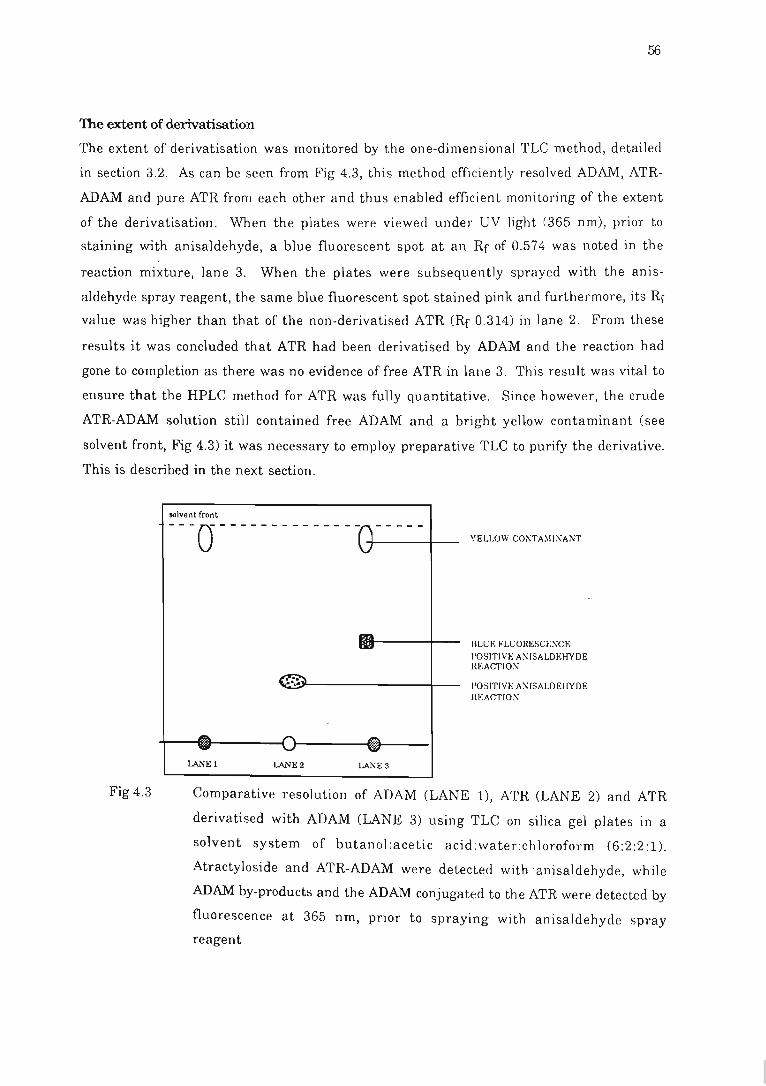
56
The extent of derivatisation
The extent of derivatisation was monitored by the one-dimensional TLC method, detailed
in section 3.2. As can be seen from Fig 4.3, this method efficiently resolved ADAM, ATR
ADAM and pure ATR from each other and thus enabled efficient monitoring of the extent
of the derivatisation. When the plates were viewed unde1' UV light (365 nm), prior to
staining with anisaldehyde, a blue fluorescent spot at an Rr of 0.574 was noted in the
reaction mixture, lane 3. When the plates were subsequently sprayed with the anis
aldehyde spray reagent, the same blue fluorescent spot stained pink and furthermore, its Rr
value was higher than that of the non-derivatised ATR (Rr 0.314) in lane 2. From these
results it was concluded that ATR had been derivatised by ADAM and the reaction had
gone to completion as there was no evidence of free ATR in lane 3. This result was vital to
ensure that the HPLC method for ATR was fully quantitative. Since however, the crude
ATR-ADAM solution still contained free ADAM and a bright yellow contaminant (see
solvent front, Fig 4.3) it was necessary to employ preparative TLC to purify the derivative.
This is described in the next section.
Fig 4.3
solvent front
---(J--------------+----------r--
LANE 2 LA;,E3
YELI.OW CO:\TA~IIl\ANT
BLCE I'LCOR~~SCEXCE I'O SITIVF~ AXISALDEHYDE HEACTIOX
I'OSITI V!<; AXISALDEHYDE HEACTIOX
Comparative resolution of ADAM (LANE 1), ATR (LANE 2) and ATR
derivatised with ADAM (LANE 3) using TLC on silica gel plates in a
solvent system of butanol:acetic acid:water:chloroform (6:2:2:1).
Atractyloside and ATR-ADAM were detected with 'anisaldehyde, while
ADAM by-products and the ADAM conjugated to the ATR were detected by
fluorescence at 365 11m, prior to spraying with anisaldehyde spray
reagent
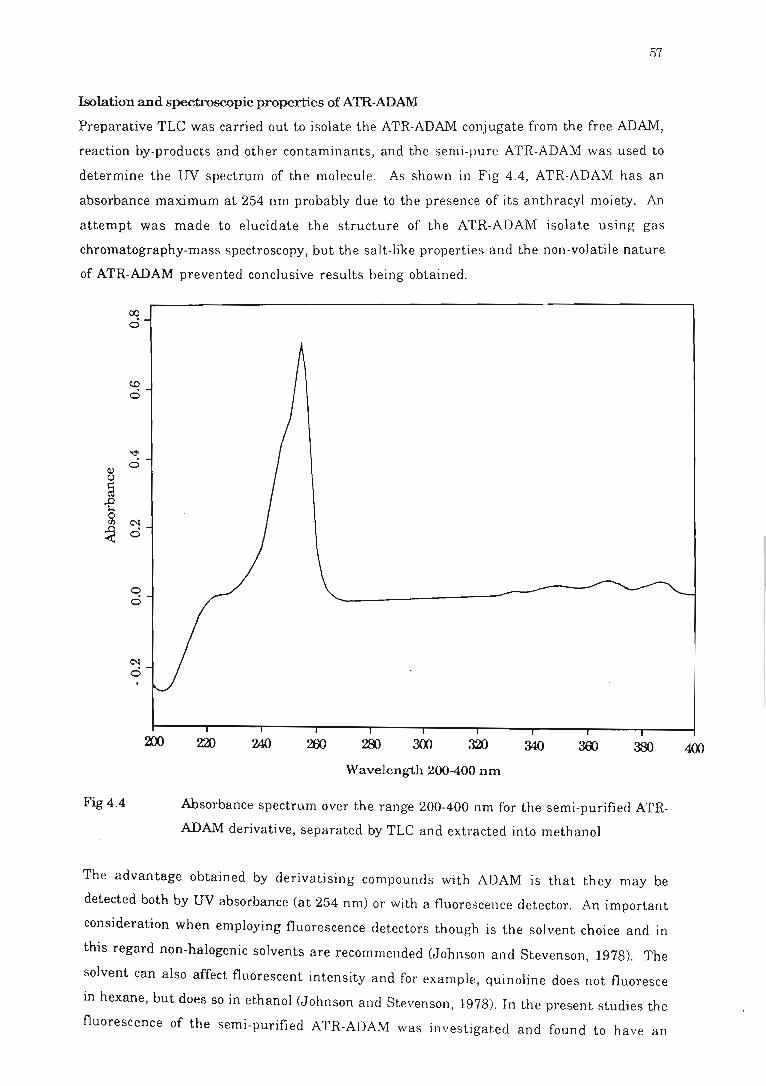
57
Isolation and spectroscopic properties of ATR-ADAM
Preparative TLC was carried out to isolate the ATR-ADAM conjugate from the free ADAM,
reaction by-products and other contaminants, and the semi-pure ATR-ADAM was used to
determine the UV spectrum of the molecule. As shown in Fig 4.4, ATR-ADAM has an
absorbance maximum at 254 nm probably due to the presence of its anthracyl moiety. An
attempt was made to elucidate the structure of the A'l'R-ADAM isolate using gas
chromatography-mass spectroscopy, but the salt-like properties and the non-volatile nature
of ATR-ADAM prevented conclusive results being obtained.
o o
Fig 4.4
300 340 300
Wavelength 2()()-400 nm
Absorbance spectrum over the range 200-400 11m for the semi-purified ATR
ADAM derivative, separated by TLC and extracted into methanol
The advantage obtained by derivati sing compounds with ADAM is that they may be
detected both by UV absorbance (at 254 nm) or with a fluorescence detector. An important
consideration when employing fluorescence detectors though is the solvent choice and in
this regard non-halogenic solvents are recommen ded (Johnson and Stevenson, 1978). The
solvent can also affect fluorescent intensity and for example , quinoline does not fluoresce
in hexane, but does so in ethanol (Johnson and Stevenson, 1978). In th e present studies the
fluorescence of the semi-purified ATR-ADAM was investigated and found to have an
400
58
excitation wavelength of 360 nm and an emission wavelength of 425 nm, in either ACN or
MeOH. It was also noted with interest that, while ATR precipitates in the presence of ACN
(see section 4.2), the ATR-ADAM derivative does not, thus permitting the use of ACN as a
solvent for the HPLC of this derivative.
To conclude, the above developmental studies resulted in a highly acceptable derivatisation
method with optimal modification of ATR and the resulting ATR-ADAM derivative had
ideal UV adsorption, fluorescence and solvent properties for HPLC. Since it was clear
from the TLC investigation that the sample derivatised with ADAM contained a number of
reaction by-products and other contaminants and, furthermore, that the 'biological samples
would contain fatty acids and other molecules which would react with the ADAlVI, it was
decided to eliminate some of these extraneous compounds. For this purpose, a sample clean
up protocol was developed which involved the defatting and deproteinisation of the sample
and removal of most of the reaction contaminants. The results of these studies are
presented in the next section.
4.5 Optimisation of sample clean up
4.5.1 Introduction
It was anticipated that the presence of contaminants in the biological fluids would interfere
with both the derivatisation and resolution of ATR. Thus, it was important to implement a
sample clean up procedure to remove as much of the contaminating protein as possible.
Two methods were considered. The first was the precipitation of proteins with a 10% (v/v)
TCA solution and, while this is a useful reagent for the denaturation and precipitation of
proteins, TCA is very corrosive of stainless steel, a common alloy used in HPLC
equipment (Johnson and Stevenson, 1978). An alternative protein denaturant 1S
methanolic hydrochloric acid which has been used by Flanagan and Ruprah (1989) to
extract herbicides from urine and serum. While hydrochloric acid is also corrosive of
stainless steel, the concentration used in the extraction procedure is only 0.2% and thus its
deleterious effect may be considered negligible.
Pilot studies were initiated to monitor the efficiency of methanolic hydrochloric acid as a
solvent for the extraction of ATR from biological fluids, together with the use of hexane as a
solvent for the extraction of fatty acids and removal of the derivatisation reaction by
products using a minicolumn system. The methods of this clean up system are described
in section 4.5.2 while the results are discussed in section 4.5.3.
59
4.5.2 Methods
Rat urine or serum (section 3.12 and 3.1.3), spiked with 1 mg ATR/ml, was first mixed
with hexane and plunged into an acetone ice-bath. This caused the serum sample to freeze,
but the hexane containing the extracted lipids remained in solution and thus could be
decanted off (Lim, 1986). Thereafter, methanolic hydrochloric acid solution was added
(Flanagan and Ruprah, 1989), briefly centrifuged in a bench top centrifuge and the
supernatant was collected while the pellet from the precipitated protein was discarded. The
defatted, deproteinised sample was derivatised with ADAM, and further sample clean up
was carried out on a silica minicolumn system, as described in section 3.3.3. One
dimensional TLC (section 3.2) was used to monitor the efficiency of the clean up steps.
Details of the final optimised sample clean up method are presented in section 3.3.3.
4.5.3 Results and discussion
When the extraction method of Flanagan and Ruprah (1989) was applied to spiked rat
serum or urine, the anisaldehyde test demonstrated that ATR had been extracted, although
steroids were also probably present, since they too are stained by anisaldehyde (Stahl,
1969). The process though had clearly removed significant quantities of protein from the
ATR preparation. The methanolic hydrochloric acid extraction, therefore, appears to be an
efficient and acceptable method for the extraction of ATR from biological material and
fortuitously, methanol is miscible with the derivatising solvent diethyl ether, thus
facilitating derivatisation of ATR.
When the extracted ATR in methanolic hydrochloric acid was derivatised with ADAl\1
and the sample monitored using TLC, it was found that the extraction solvent did not affect
the derivatisation procedure. However, when the spiked derivatised samples were
resolved on a CI8 column, it was apparent that the sample preparation method was
inadequate in removing certain contaminating molecules which had reacted with the
ADAM; presumed to be either lipids or fatty acids. This complicated interpretation of the
chromatogram and thus, as a preliminary clean up step before treatment with the
methanolic hydrochloric acid, the sample was pre-treated with hexane (see details in
section 3.1.6) which extracted the lipids (Lim, 1986).
Resolution of the sample, prepared as described above, using HPLC, demonstrated that the
hexane extraction had removed a significant proportion of contaminating molecules.
However, the low k' values obtained for the elution of ATR-ADAM from a reverse phase
column presented difficulties when the same method was attempted on spiked biological
/
60
samples. Despite altering the polarity of the eluant, the k ' value could not be changed
significantly and, when the derivatised samples were injected directly onto the column
without any form of pre-column clean up, the decomposed product of the ADAM and excess
ADAM was eluted with a k' very close to 0, in a manner comparable to that reported by
Matthees and Purdy (1979) . This meant that 0: was less than one as these reaction by
products were co-eluting with the ATR-ADAM, thus indicating that the sample still
required further clean up.
In an attempt to improve the purification of the crude ATR-ADAM derivative, a
mini column system filled with silica gel was employed (section 3.3.3). When the column,
loaded with sample, was rinsed with ethyl acetate:MeOH (3 :1) a yellow contaminant was
removed. Thin layer chromatography of the same sample on silica gel plates
demonstrated that this solvent system resulted in the deposition of ADAM by-products at the
solvent front, while the ATR-ADAM conjugate remained-fixed to the origin. Since it was
assumed that the ATR-ADAM had been attached to the silica column, it was decided to
investigate a second solvent for the elution of the ATR-ADAM. Thus, when further TLC
studies showed that the ATR-ADAM conjugate could be moved from the origin to the solvent
front in a solution of chloroform:MeOH (2:3), this solvent system was tested on the silica
column, after first washing with the ethyl acetate:MeOH solvent (3:1). The results showed
that the chloroform:MeOH (2:3) did indeed remove the ATR-ADAM from the column.
To conclude, treatment with hexane, then methanolic hydrochlol'ic acid and finally the
above two-solvent method on a silica column, thus provided an efficient procedure for the
clean up of ATR-ADAM from a crude serum or urine sample. At this stage therefore, the
semi-purified samples were ready for final separation and analysis by HPLC. Attention
was thus turned to the development of an HPLC method for the detection of the ATR-ADAM
derivative which is described in the next section.
4.6 Optimisation of the HPLC procedure employing ATR-ADAM and spiked biological samples
4.6.1 Introduction
From the results of the TLC (Fig 4.3) it was concluded that ADAl\1 successfully derivatises
ATR, in a stable and reproducible manner and not only imparts fluorescent properties to
the toxin, but in addition, as noted from the Rf values obtained by TLC, the diazomethane
alters the polarity of the ATR. Attention was therefore turned to the optimisation of the
solvent system for the resolution of ATR-ADAM by HPLC . Since the separation of fatty
61
acid-ADAM derivatives was carried out on a reverse phase CIS column using a solvent
system of ACN or MeOH (Matthees and Purdy, 1979; Nimura and Kinoshita, 1980), it was
decided to attempt the HPLC separation of ATR-ADAM on a reverse phase column, using a
similar system. Preliminary developmental work to identify the most suitable solvent
was carried out on the semi-purified ATR-ADAM extract using reverse phase CIS TLC
plates. Although separation was afforded by both ACN or MeOH, it was noted that the
results of the TLC experiments could not be directly extrapolated to HPLC. Further
developmental work was therefore done directly on the HPLC system and details of this
methodology are given in section 4.6.2.
4.6.2 Methods
Several alternative solvent systems were tested on a 3.9 x 150 mm NovaPak C1S column, at
a flow rate of 1.5 ml/minute, using both a UV detectol' set at 254 nm and a fluorescence
detector set at an excitation wavelength of 360 nm and an emission wavelength of 425 nm .
These included, in sequence of testing:-
1. 70-30% (v/v) ACN;
2. 45% (v/v) ACN;
3. 40% (v/v) MeOH;
4. 40% (v/v) MeOH with 1% (v/v) glacial acetic acid;
5. Ion pair chromatography
6. glacial acetic acid:l M ammonium acetate:water (1:1:98, v/v) with a linear gradient
of 20-80% glacial acetic acid: 1 M ammonium acetate: MeOH (1:1:98, v/v) (Boulay et
ai., 1983);
7. 30-70% (v/v) ACN with 2% (v/v) 1 M ammonium acetate and 2% (v/v) glacial acetic
acid;
8. 30-70% (v/v) MeOH with 2% (v/v) 1 M ammonium acetate and 2% (v/v) glacial acetic
acid;
9. MeOH :l M ammonium acetate:glacial acetic acid : water solvent mix (38:2:2:58,
v/v).
Method ' 1 was carried out on the semi-purified ATR-ADAM extract (section 4.5), while
methods 2-9 also involved work on rat serum and urine samples, from non-ATR treated
Wistar rats. Samples were first spiked with ATR and then derivatised. In the case of the
semi-purified ATR-ADAM extract, TLC (section 3.2) was used to identify the nature of the
resolved peaks. The results of the resolution of ATR·ADAM, and ATR-ADAM in
biological samples, using the above solvent systems, al'e discussed in section 4.6.3 below,
with the final optimised solvent system being detailed in secti on 3.3.4.
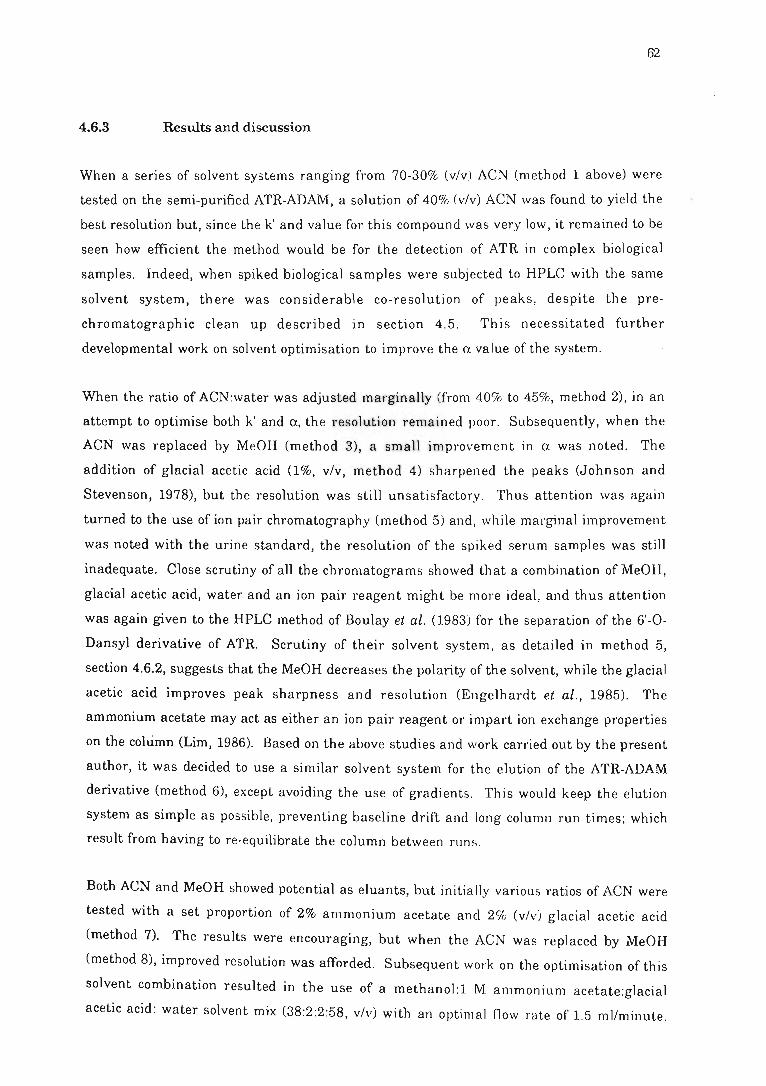
62
4.6.3 Results and discussion
When a series of solvent systems ranging from 70-30% (v/v) ACN (method 1 above) were
tested on the semi-purified ATR-ADAM, a solution of 40% (v/v) ACN was found to yield the
best resolution but, since the k' and value for this compound was very low, it remained to be
seen how efficient the method would be for the detection of ATR in complex biological
samples. Indeed, when spiked biological samples were subjected to HPLC with the same
solvent system, there was considerable co-resolution of peaks , despite the pre
chromatographic clean up described in section 4 .5. This necessitated further
developmental work on solvent optimisation to improve the a value of the system.
When the ratio of ACN:water was adjusted marginally (from 40% to 45%, method 2), in an
attempt to optimise both k ' and a, the resolution remained poor. Subsequently, when the
ACN was replaced by MeOH (method 3), a small improvement in (Y. was noted. The
addition of glacial acetic acid (1%, v/v, method 4) sharpened the peaks (Johnson and
Stevenson, 1978), but the resolution was still unsatisfactory . Thus attention was again
turned to the use of ion pair chromatography (method 5) and , while marginal improvement
was noted with the urine standard, the resolution of the spiked serum samples was still
inadequate. Close scrutiny of all the chromatograms showed that a combination of MeOH,
glacial acetic acid, water and an ion pair reagent might be more ideal, and thus attention
was again given to the HPLC method of Boulay et ai. (1983) for the separation of the 6'-0-
Dansyl derivative of ATR. Scrutiny of their solvent system, as detailed in method 5,
section 4.6.2, suggests that the MeOH decreases the polarity of the solvent, while the glacial
acetic acid improves peak sharpness and resolution (Engelhardt et ai ., 1985). The
ammonium acetate may act as either an ion pair reagent or impart ion exchange properties
on the column (Lim, 1986). Based on the above studies and work carried out by the present
author, it was decided to use a similar solvent system for the elution of the ATR-ADAM
derivative (method 6), except avoiding the use of gradients. This would keep the elution
system as simple as possible, preventing baseline drift and long column run times; which
result from having to re-equilibrate the column between run s.
Both ACN and MeOH showed potential as eluants, but initially various ratios of ACN were
tested with a set proportion of 2% ammonium acetate and 2% (v/v j glacial acetic acid
(method 7). The results were encouraging, but when the ACN was replaced by MeOH
(method 8), improved resolution was afforded. Subsequent work on the optimisation of this
solvent combination resulted in the use of a methanol :l M ammonium acetate:glacial
acetic acid: water solvent mix (38:2:2:58, v/v ) with an optim al now rate of 1.5 ml/minute.
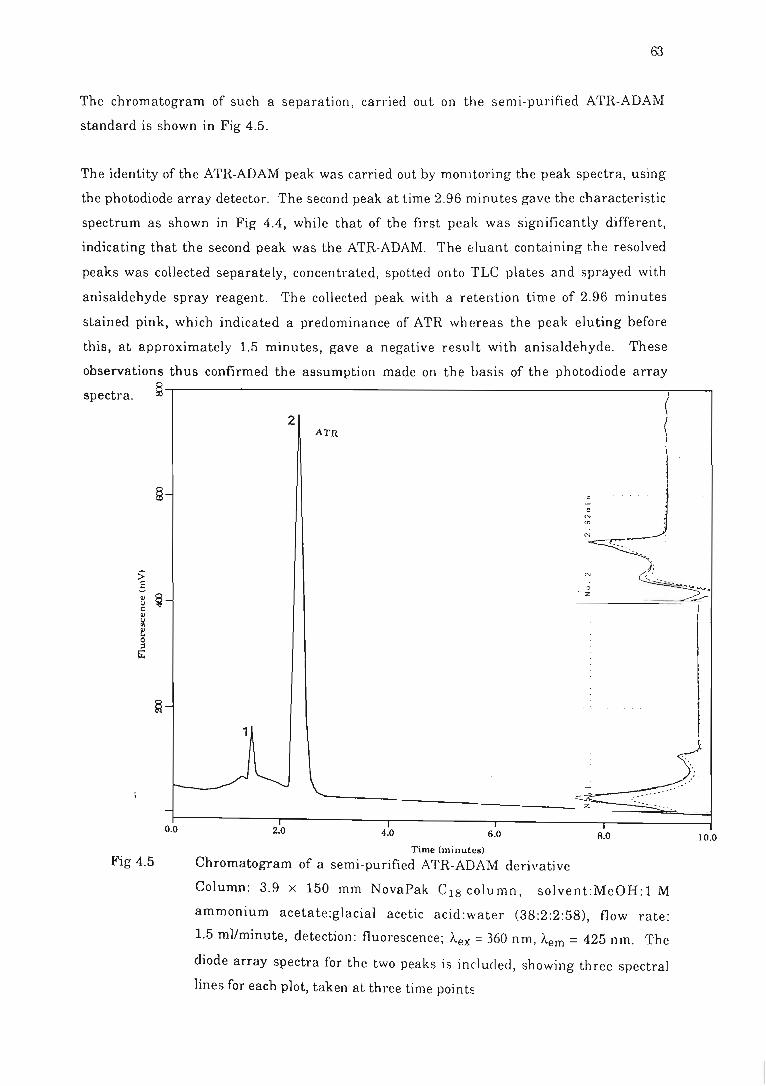
63
The chromatogram of such a separation, carried out on the semi-purified ATR-ADAM
standard is shown in Fig 4.5.
The identity of the ATR-ADAM peak was carried out by monitoring the peak spectra, using
the photodiode array detector. The second peak at time 2.96 minutes gave the characteristic
spectrum as shown in Fig 4.4, while that of the first peak was significantly different,
indicating that the second peak was the ATR-ADAM. The eluant containing the resolved
peaks was collected separately, concentrated, spotted onto TLC plates and sprayed with
anisaldehyde spray reagent. The collected peak with a retention time of 2.96 minutes
stained pink, which indicated a predominance of ATR whereas the peak eluting before
this, at approximately 1.5 minutes, gave a negative result with anisaldehyde. These
observations thus confirmed the assumption made on the basis of the photodiode array
spectra. ~'-. ----------------------------------------------------------~--==
Fig 4.5
2 ATR
§- , " -•
1
--------------~ ... .:.;.;. .. ... .
-~--------~--------~r_--------._--------_.~~~~~~~:=:=~ 0.0 2.0 4~O 6 0 T . 8.0
Time (minutes)
Chromatogram of a semi-purified ATR-ADAM derivative
Column: 3.9 x 150 mm NovaPak CI8 column, solvent:MeOH:l M
ammonium acetate:glacial acetic acid:water (38:2:2:58), flow rate:
1.5 mliminute, detection: fluorescence; )'ex = 360 nm, )"em = 425 nm. The
diode array spectra for the two peaks is included, showing three spectral
lines for each plot, taken at three time points
10.0
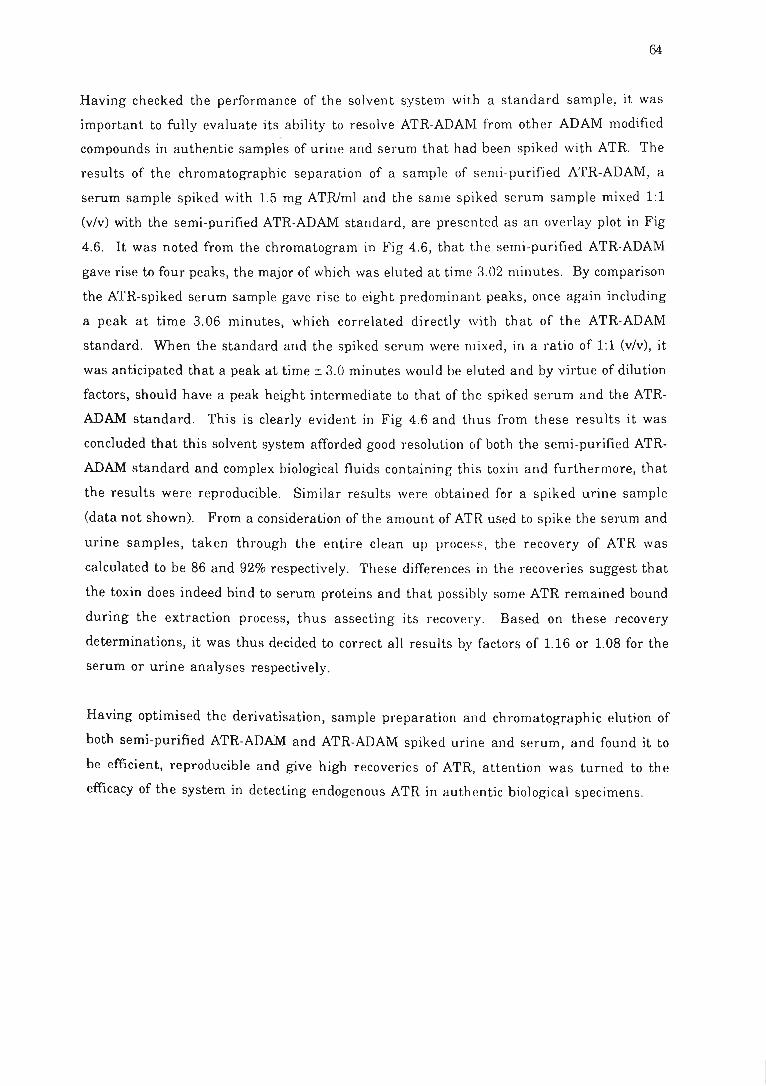
64
Having checked the performance of the solvent system with a standard sample, it was
important to fully evaluate its ability to resolve ATR-ADAM from other ADAM modified
compounds in authentic samples of urine and serum that had been spiked with ATR. The
results of the chromatographic separation of a sample of semi-purified ATR-ADAM, a
serum sample spiked with 1.5 mg ATRJml and the same spiked serum sample mixed 1:1
(v/v) with the semi-purified ATR-ADAM standard, are presented as an overlay plot in Fig
4.6. It was noted from the chromatogram in Fig 4.6, that the semi-purified ATR-ADAM
gave rise to four peaks, the major of which was eluted at time 3.02 minutes. By comparison
the ATR-spiked serum sample gave rise to eight predominant peaks, once again including
a peak at time 3.06 minutes, which correlated directly with that of the ATR-ADAM
standard. When the standard and the spiked serum were mixed, in a ratio of 1:1 (v/v), it
was anticipated that a peak at time ± 3.0 minutes would be eluted and by virtue of dilution
factors, should have a peak height intermediate to that of the spiked serum and the ATR
ADAM standard. This is clearly evident in Fig 4.6 and thus from these results it was
concluded that this solvent system afforded good resolution of both the semi-purified ATR
ADAM standard and complex biological fluids containing this toxin and furthermore, that
the results were reproducible. Similar results were obtained for a spiked urine sample
(data not shown). From a consideration of the amount of A'fR used to spike the serum and
urine samples, taken through the entire clean up process, the recovery of ATR was
calculated to be 86 and 92% respectively. These differences in the recoveries suggest that
the toxin does indeed bind to serum proteins and that possibly some ATR remained bound
during the extraction process, thus assecting its recovery. Based on these recovery
determinations, it was thus decided to correct all results by factors of 1.16 or 1.08 for the
serum or urine analyses respectively.
Having optimised the derivatisation, sample preparation and chromatographic elution of
both semi-purified ATR-ADAM and ATR-ADAM spiked urine and serum, and found it to
be efficient, reproducible and give high recoveries of ATR, attention was turned to the
efficacy of the system in detecting endogenous ATR in authentic biological specimens.
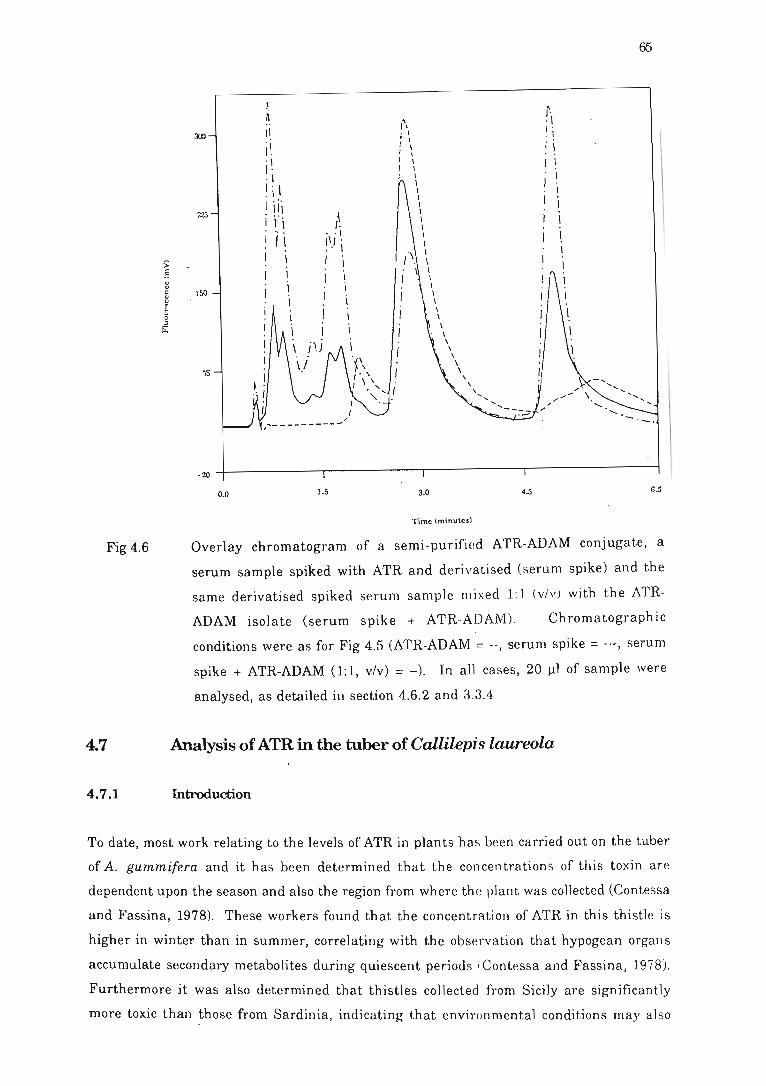
Fig 4.6
4.7
4.7.1
> .5 8 c
~ ? § Ii:
l h Jl
i ~ '1 ,. . \
~ i I ! \Ii 22.j
A I Iii
Ii .. , t\t. .' \ I
I \ 150
, I
75
, " I I I \
I ' I I \ / \ I \
\ , , , , , \ \ ,
.\ \ I . ,
\ , , \ \ \ , \ \
I \
I
t.\ /. . , Ii I ~
65
.ro~----------'-----------'-----------r-~-----------1
0.0 1.5 3.0 4.5 6.5
Time (minutes)
Overlay chromatogram of a semi-purified ATR-ADAM conjugate, a
serum sample spiked with ATR and derivatised (serum spike) and the
same derivatised spiked serum sample mixed 1:1 (v/v) with the ATR-
ADAM isolate (serum spike + ATR-ADAM) . Chromatographic
conditions were as for Fig 4.5 (ATR-ADAM= --, serum spike = -'-, serum
spike + ATR-ADAM (1:1, v/v) = -). In all cases, 20 III of sample were
analysed, as detailed in section 4.6.2 and 3.3.4
Analysis of ATR in the tuber of Callilepis laureola
Introduction
To date, most work relating to the levels of ATR in plants has been carried out on the tuber
of A. gummifera and it has been determined that the concentrations of this toxin are
dependent upon the season and also the region from where the plant was collected (Contessa
and Fassina, 1978). These workers found that the concentration of ATR in this thistle is
higher in winter than in summer, correlating with the observation that hypogean organ s
accumulate secondary metabolites during quiescent periods (Contessa and Fassina, 1978).
Furthermore it was also determined that thistles collected from Sicily are significantly
more toxic than those from Sardinia, indicating that environmental conditions may also
66
affect toxin production. This apparent increased biosynthesis and accumulation of
secondary metabolites is frequently associated with conditions of stress, a prime example
being the production of L\9-Tetrahydrocannabinol from the Cannabis species (Prof. J.P . .
Nel, pel's. comm, 1989). This plant is ubiquitous in the Tran skei , where the soils are very
poor, and it is a well known fact that marihuana originating from this area is of
exceptional quality (Anon. foreign tourist, pel's. comm., 1988\ Unfortunately, there are no
reports on the seasonal levels of ATR in C. laureola, information which may be of extreme
significance, since the herb is frequently gathered in winter (Bryant, 1909), when
essentially it could be most toxic . Thus, the aim of this investigation was to establish if
ATR could be detec'ted in an extract of the tuber of C. laUl·eola . Details of the methodology
are presented in section 4.7.2, with the results and discussion in section 4.7.3.
4.7.2 Methods
The HPLC determination of ATR was carried out on a methanolic extract of the tuber of C.
laureola, as prepared by F. Dehrmann (1991). Briefly, fresh tuber was milled, extracted
with methanol and the extract clarified by elution from an ~H2 solid phase column. The
semi-purified plant extract was derivatised and cleaned up as described in section 3.3.3.
Thereafter the sample was injected onto the HPLC column and subjected to HPLC as
described in section 3.3.4. Standard ATR-ADAM over the range 0.5 to 16 ng ATR was also
analysed by HPLC and a standard curve of the amount of ATR versus peak area was
generated.
4.7.3 Results and discussion
From the chromatogram shown in Fig 4.7 (a), for the derivatised tuber extract, it is clear
that this extract contains ATR, a fact which was confirmed by TLC . As further
confirmation that the peak eluting with a k' of ± 3.0 minutes was in fact ATR, the
derivatised plant sample was spiked with the semi-purified ATR-ADAM standard and
rechromatographed. The results presented in Fig 4.7 (b) show that the peak with an elution
time of approximately 3 minutes was observed to increase in height on addition of the
standard spike, thus confirming the presence of the ATR in the plant tuber.
In order to quantify the amount of ATR in the tuber, and correct for any losses of ATR due
to the clean up and chromatography process, it was necessary to prepare a standard curve
for graded amounts of toxin which also could be used to check the sensitivity of the detector
and the linearity of its response. Fig 4.8 shows a plot of peak area versus the amount of
ATR, derivatised with ADAM. From this figme it is apparent that a linear relationship
67
exists between the peak area and ATR concentration . The detection limit of this method is
0.001 ng ATR*. The standard curve was used to calculate the quantity of ATR in the tuber
and it was found that there was 6.7 I-lg ATR/g "wet weight" of tuber tissue . Assuming that
Impila is prepared from approximately 10 g of material, this would account for a dosage of
67 !-lg ATR. The LD 50 for ATR in rats, dosed i.p ., has been determined as 210 mglkg bwt
by Luciani et al. (1978), who state that "the toxicity increasing from mouse and rat to dog
suggests a very high ATR toxicity for man". Clearly though from the results of the HPLC
investigation, the levels of ATR administered in Impila, are significantly lower than the
levels discussed in the LD 50 investigation. Furthermore, the levels of toxin administered
to rats in this study, were significantly lower than the LD 50 quoted by Luciani et al. (1978)
and a level of 25 mg ATRlkg bwt was sufficient to induce severe kidney damage. This
emphasises the high toxicity of both ATR and Impila.
* Ifa sample of200 I-ll is injected onto the column and the deteclo)' is set to x 128
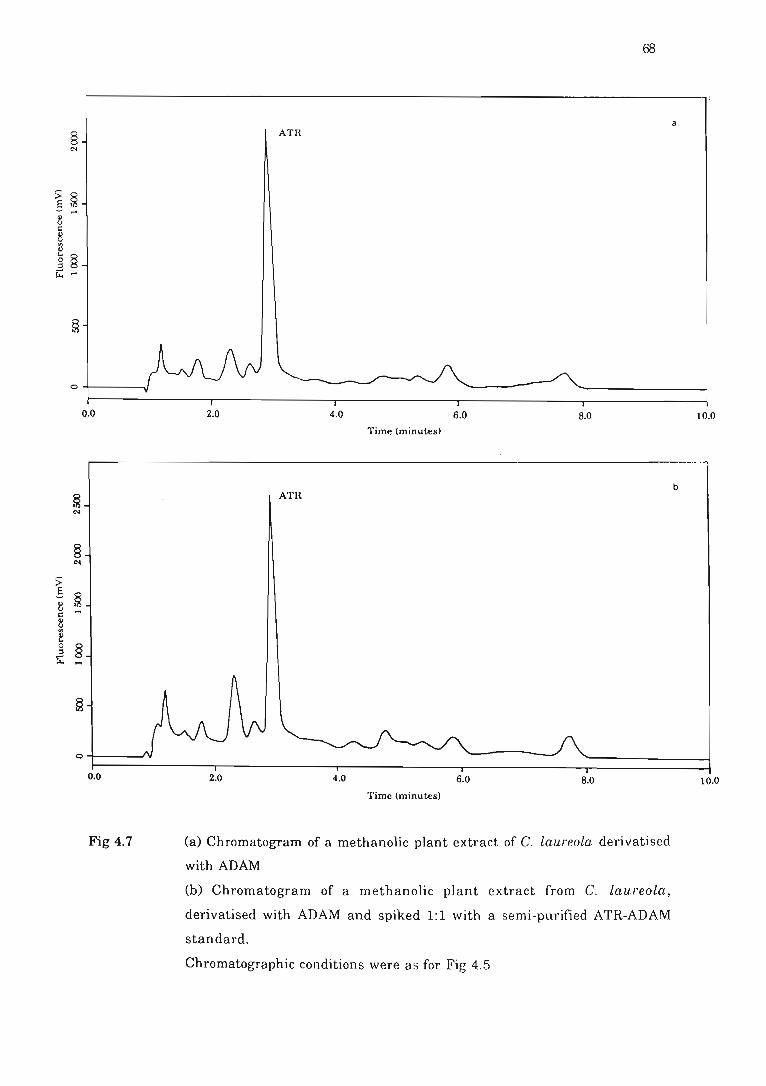
0+-----1
0.0
§ ~
§ ~
> E §
~ ~
" ()
'" ~ 0 § :s Ii: ....
o+--_...JV
0.0
Fig 4.7
68
a ATR
2.0 4.0 6.0 8.0
Time (minutes)
ATR
2.0 4.0 6.0 8.0
Time (minutes)
(a) Chromatogram of a methanolic plant extract of C. laureola derivatised
with ADAM
(b) Chromatogram of a methanolic plant extract from C. laureola,
derivatised with ADAM and spiked 1:1 with a semi-purified ATR-ADAM
standard.
Chromatographic conditions were a s for Fig 4.5
b
10.0
10.0
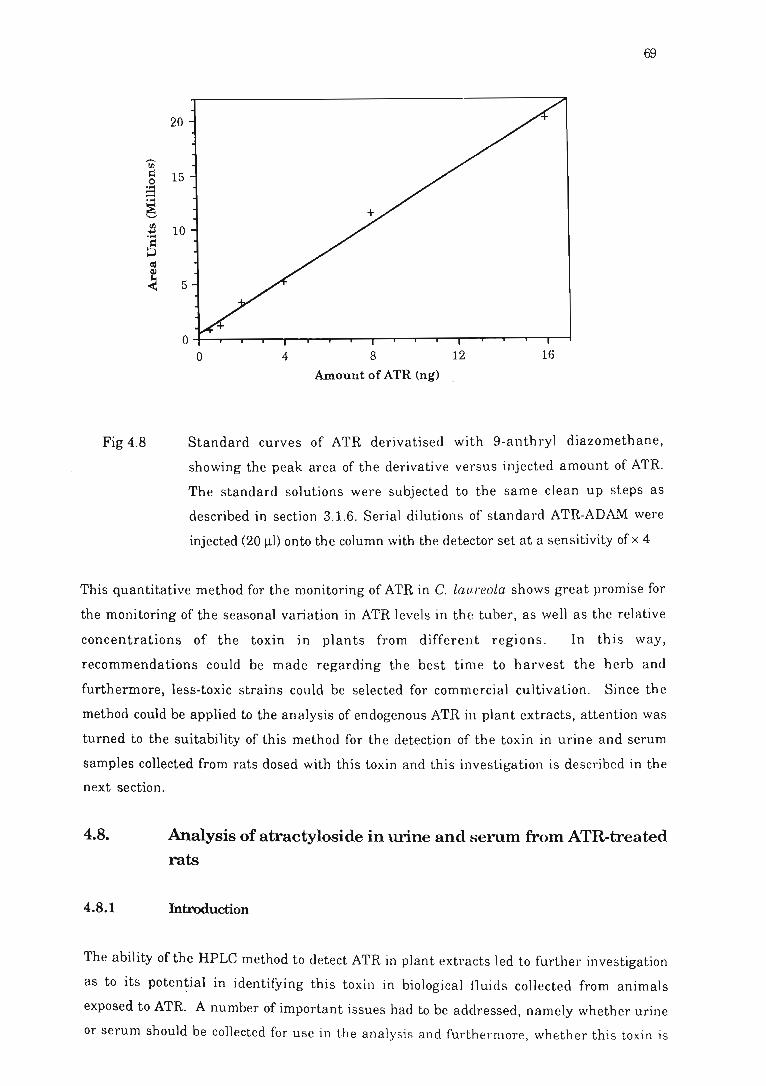
'il ~ 0 ;S ~ '-' II) .... .... ~
;:J o:s Ql
~
Fig 4.8
20
15
10
5
69
o 4 8 12 16
Amount of ATR (ng)
Standard curves of ATR derivatised with 9-anthryl diazomethane,
showing the peak area of the derivative versus injected amount of ATR.
The standard solutions were subjected to the same clean up steps as
described in section 3.1.6. Serial dilutions of standard ATR-ADAM were
injected (20 Ill) onto the column with the detector set at a sensitivity of x 4
This quantitative method for the monitoring of ATR in C. la.ureola. shows great promise for
the monitoring of the seasonal variation in ATR levels in the tuber, as well as the relative
concentrations of the toxin in plants from different regions . In this way,
recommendations could be made regarding the best time to harvest the herb and
furthermore, less-toxic strains could be selected for commercial cultivation. Since the
method could be applied to the analysis of endogenous ATR in plant extracts, attention was
turned to the suitability of this method for the detection of the toxin in urine and serum
samples collected from rats dosed with this toxin and this investigation is described in the
next section.
4.8. Analysis of atractyloside in urine and serum from ATR-treated rats
4.8.1 Introduction
The ability of the HPLC method to detect ATR in plant extracts led to further investigation
as to its poten~ial in identifying this toxin in biological fluids collected from animals
exposed to ATR. A number of important issues had to be addressed, namely whether urine
or serum should be collected for use in th e analysis and furth ermore, whether thi s toxin is
70
biotransformed in vivo. There has been no work of this nature carried out on ATR, but a
brief investigation was performed by Richter and Spiteller (1978) who isolated analogues of
ATR, originating from coffee beans, from the urine of coffee drinker s. The analogue, as
detected by gas chromatography, was excreted into the urin e having not been radically
altered in vivo, . Based on this work, it was decided that in the case of ATR, the toxin was
most likely to be found in the urine. The methodology for th e analysis of the rat urine and
serum is given in section 4.8.2 with the final results and di scussion in section, 4.8.3.
4.8.2 Method
The urine and serum samples collected from rats dosed with 0, 5, 10 and 25 mg ATRlkg bwt
(section 3.1) were cleaned up and derivatised with ADAM as described in section 3.3.3.
The samples were analysed by TLC, as described in section 3. 2 and by HPLC, as described
in section 3.3.4. The results are given in section 4.8.3 below.
4.8.3 Results and discussion
Although TLC was carried out on the derivatised urine and serum samples, the ATR
ADAM derivative could not be detected probably due to the poor detection limits of this
method. High performance liquid chromatography was performed on the serum and urine
samples but ATR could not be detected in the serum samples, either because it was present
in too Iowa concentration, i.e., less than 1 pg per ml, or the toxin was not present in the
serum after 24 hours. Atractyloside, was however present in some but not all of the urine
samples. Typical elution profiles of a control urine sample, collected from a rat prior to
dosing, and a sample collected from the same rat after do sing with ATR, are shown in
Fig 4.9 a and b respectively. The results show clearly that ATR (peak with a retention time
of ± 3.0 minutes) was present in high concentrations in the urine of ATR-treated rats but
not in the controls. Furthermore, it will be noted from the two chromatograms, that two
other peaks eluting at times of 6.56 and 7.04 minutes, re spectively , were detected in the
urine from rats dosed with toxin but were absent from th e control. Some of the urine
samples from rats dosed with ATR gave negative results for ATR, but still showed these
additional peaks eluting at about 7 minutes. It is the opinion of the author that the presence
of these peaks is in some way related to the dosing with ATR and are possible metabolites of
this toxin. Radiotracer studies will be necessary to confirm the identity of these peaks.
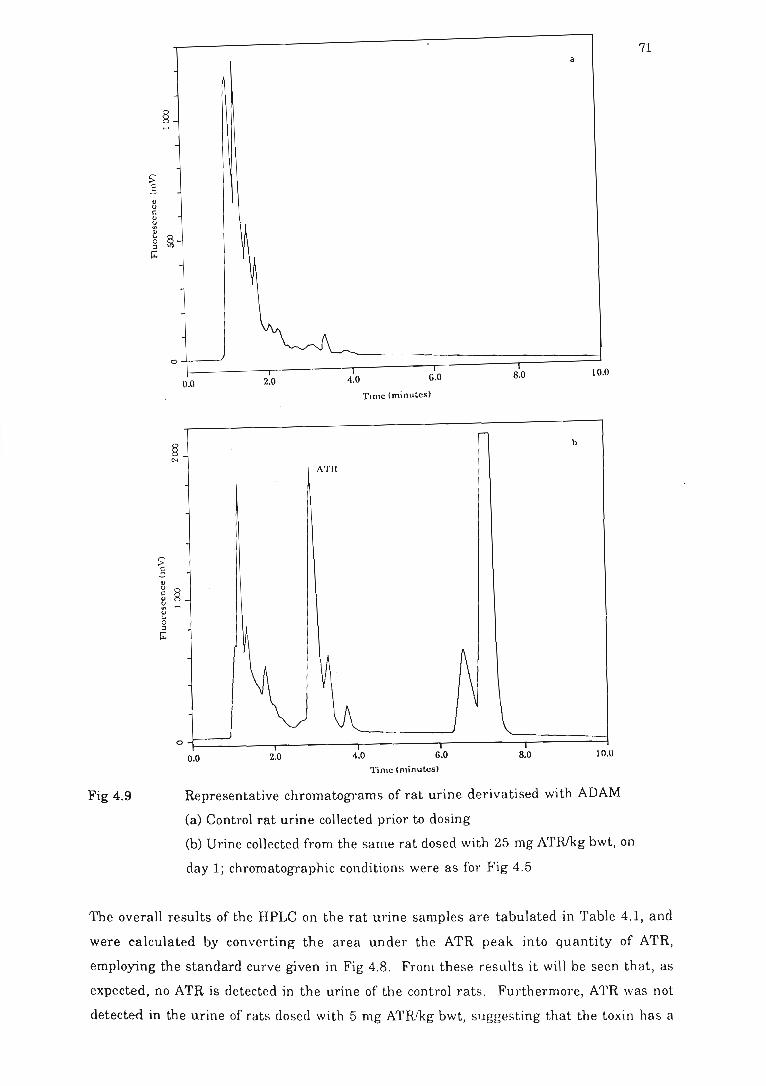
Fig 4.9
" (J
r:: " ~ "
a
g §-~
0.0 2.0
§ c-I
ATn
T 4.0 6.0
Time (minuLes)
Time (minules)
8.0 10.0
b
10.0
Representative chromatograms of rat urine derivatised with ADAM
(a) Control rat urine collected prior to dosing
(b) Urine collected from the same rat dosed with 25 mg ATRlkg bwt, on
day 1; chromatographic conditions were as foJ' Fig 4.5
71
The overall results of the HPLC on the rat urine samples are tabulated in Table 4.1, and
were calculated by converting the area under the ATR peak into quantity of ATR,
employing the standard curve given in Fig 4.8. From these results it will be seen that, as
expected, no ATR is detected in the urine of the control rats. Furthermore, ATR was not
detected in the urine of rats dosed with 5 mg ATRlkg bwt, suggesting that the toxin has a
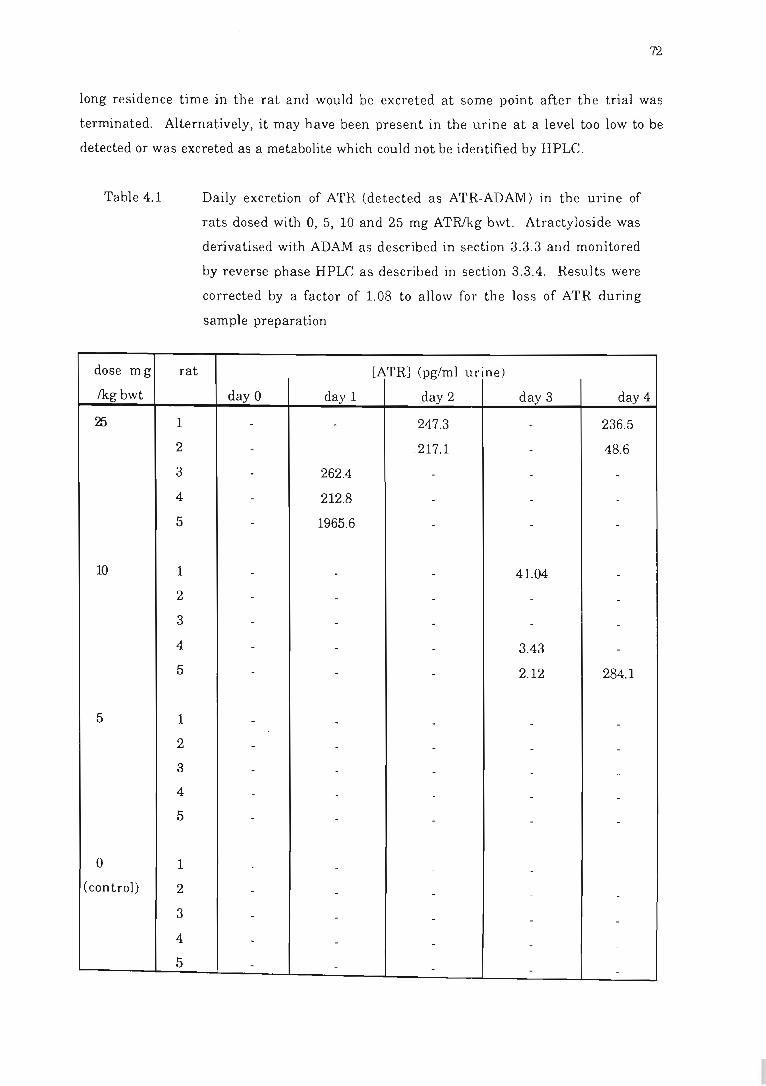
72
long residence time in the rat and would be excreted at some point after the trial was
terminated. Alternatively, it may have been present in the urine at a level too low to be
detected or was excreted as a metabolite which could not be identified by HPLC.
Table 4.1
dose mg rat
Ikgbwt
25 1
2
3
4
5
10 1
2
3
4
5
5 1
2
3
4
5
0 1
(control) 2
3
4
5
Daily excretion of ATR (detected as ATR-ADAM) in the urine of
rats dosed with 0, 5, 10 and 25 mg ATRlkg bwt. Atractyloside was
derivatised with ADAM as described in section 3.3.3 and monitored
by reverse phase HPLC as described in section 3.3.4. Results were
corrected by a factor of 1.08 to allow for the loss of ATR during
sample preparation
[ATR] (pg/ml urine)
day 0 day 1 day 2 day 3 day 4
- - 247.3 - 236.5
- - 217.1 - 48.6
- 262.4 - - -- 212.8 - - -- 1965.6 - - -
- - - 41.04 -
- - - - -- - - - -
- - - 3.43 -- - - 2.12 284.1
- - - - -- - - - -
- - - - -
- - - - -
- - - - -
- - - -
- - - - -
- - - - -
- - - - -- - - - -
73
The rats receiving the high dose of toxin (25 mg/kg bwt) could be divided into two groups .
The first group consisting of rat 1 and 2 were found to excrete ATR into the urine on day 2
post-dosing, and the concentrations of ATR were very similar (approximately 200 pg
ATRJm1). There was no evidence of ATR being excreted by these rats on day 3, but on day 4
when the trial was terminated, there was evidence of ATR being excreted again . The
second group comprising rats 3, 4 and 5, dosed with 25 mg AIRlkg bwt, excreted ATR into
the urine on day 1 post-dosing only. The levels excreted by rats 3 and 4 were similar to that
excreted by rats 1 and 2, but rat 5 apparently excreted a 10-fold higher amount of ATR than
the other rats in this dose regimen.
Toxin was only detected in the urine of the medium dosed (10 mg ATRlkg bwt) rats on day
3 (rats 1,4 and 5) and the peak areas were not very large, demonstrating that the levels of
excreted ATR were not very high. Rats 2 and 3 from the same dose group did not excrete
ATR after dosing. On day 4 however, when the trial ended, rat 5 excreted a considerable
proportion of toxin into the urine equivalent to that of the higher dose regimen, but this
pattern was not observed in any of the other medium dosed animals.
Although the results do not demonstrate any noticeable trend, the following four
explanations are possible. The first is that toxin was excreted each day, but not always at a
level high enough to be detected by this method. The second proposal was that the toxin is
excreted daily but was metabolised to the extent that the biotransformation altered the
molecule's k' under the HPLC conditions described, thus preventing positive
identification of the ATR metabolite. Work by Richter and Spiteller (1978) demonstrated
that ATR analogues in the urine of coffee drinkers were found to be slightly modified from
the parent molecule, and although this investigation was carried out on an ATR analogue
(Richter and Spiteller, 1978), it is likely that ATR may undergo a similar form of
biotransformation in vivo. The third proposal is that the toxin remains "fixed" or bound
within the animal, either in the kidney or in the serum, although the latter is unlikely as
the toxin was not detectable in the serum samples. The "fixed" ATR is then gradually
released from its site of binding, thus accounting for the random appearance of the toxin in
the urine samples. The fourth and perhaps the most likely possibility is that all three
situations may occur simultaneously, such that some AIR is released untransformed,
while some remains "fixed" in the tissue, only to be randomly excreted, while the
remaining toxin is biotransformed and thus not recognised as ATR when excreted in the
urine. It is interesting to note from Table 4.1, that those rats dosed with the highest level of
ATR excreted the toxin earlier than those rats receiving the medium dose . If this is indeed
a real trend, then it is possible that the rats dosed with 5 mg ATRlkg bwt released their ATR
sometime later than day 4.
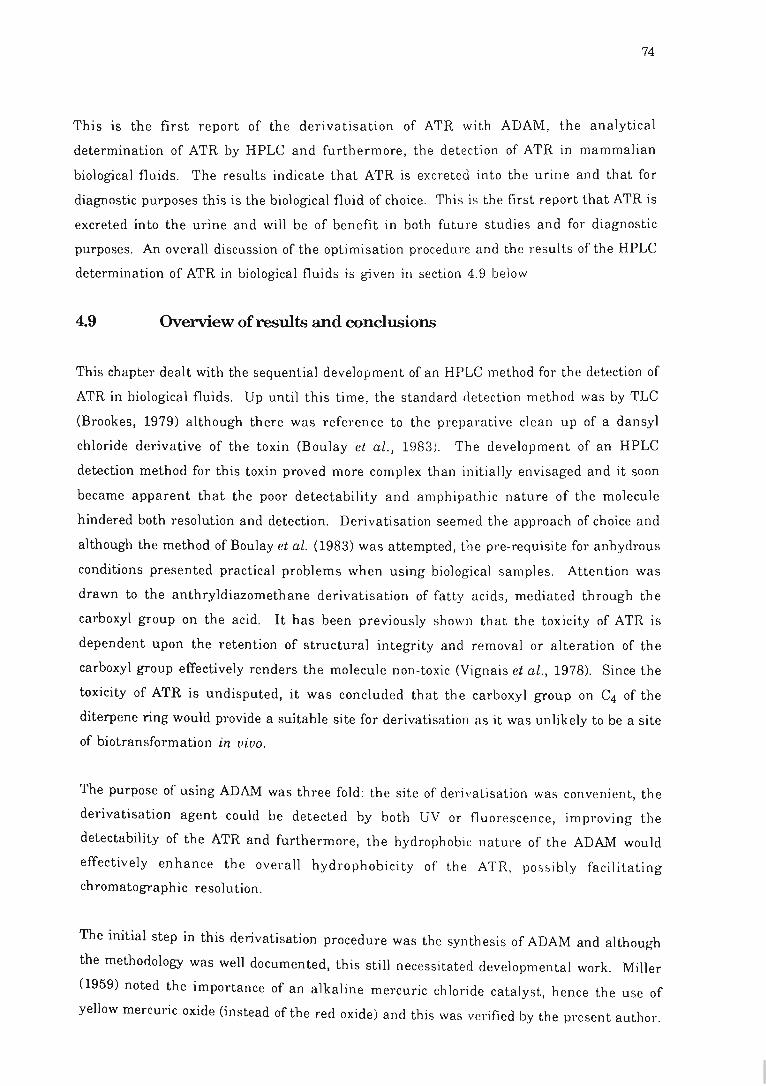
74
This is the first report of the derivatisation of ATR with ADAM, the analytical
determination of ATR by HPLC and furthermore, the detection of ATR in mammalian
biological fluids. The results indicate that ATR is excreted into the urine and that for
diagnostic purposes this is the biological fluid of choice. This is the first report that ATR is
excreted into the urine and will be of benefit in both future studies and for diagnostic
purposes. An overall discussion of the optimisation procedure and the results of the HPLC
determination of ATR in biological fluids is given in section 4.9 below
4.9 Overview of results and conclusions
This chapter dealt with the sequential development of an HPLC method for the detection of
ATR in biological fluids. Up until this time, the standard detection method was by TLC
(Brookes, 1979) although there was reference to the preparative clean up of a dansyl
chloride derivative of the toxin (Boulay et ai., 1983 ). The development of an HPLC
detection method for this .toxin proved more complex than initially envisaged and it soon
became apparent that the poor detectability and amphipathic nature of the molecule
hindered both resolution and detection . Derivatisation seemed the approach of choice and
although the method of Boulay et ai. (1983) was attempted, the pre-requisite for anhydrous
conditions presented practical problems when using biological samples. Attention was
drawn to the anthryldiazomethane derivatisation of fatty acids, mediated through the
carboxyl group on the acid. It has been previously shown that the toxicity of ATR is
dependent upon the retention of structural integrity and removal or alteration of the
carboxyl group effectively renders the molecule non-toxic (Vignais et ai., 1978). Since the
toxicity of ATR is undisputed, it was concluded that the carboxyl group on C4 of the
diterpene ring would provide a suitable site for derivatisation as it was unlikely to be a site
of biotransformation in vivo.
The purpose of using ADAM was three fold: the site of derivatisation was convenient, the
derivatisation agent could be detected by both UV or fluorescence, impJ'oving the
detectability of the ATR and furthermore , the hydrophobic nature of the ADAM would
effectively enhance the overall hydrophobicity of th e ATR, possibly facilitating
chromatographic resolution.
The initial step in this derivatisation procedure was the synthesis of ADAM and although
the methodology was well documented, this still necessitated developmental work. Miller
(1959) noted the importance of an alkaline mercuric chloride catalyst, hence the use of
yellow mercuric oxide (instead of the red oxide) and this was verified by the present author.
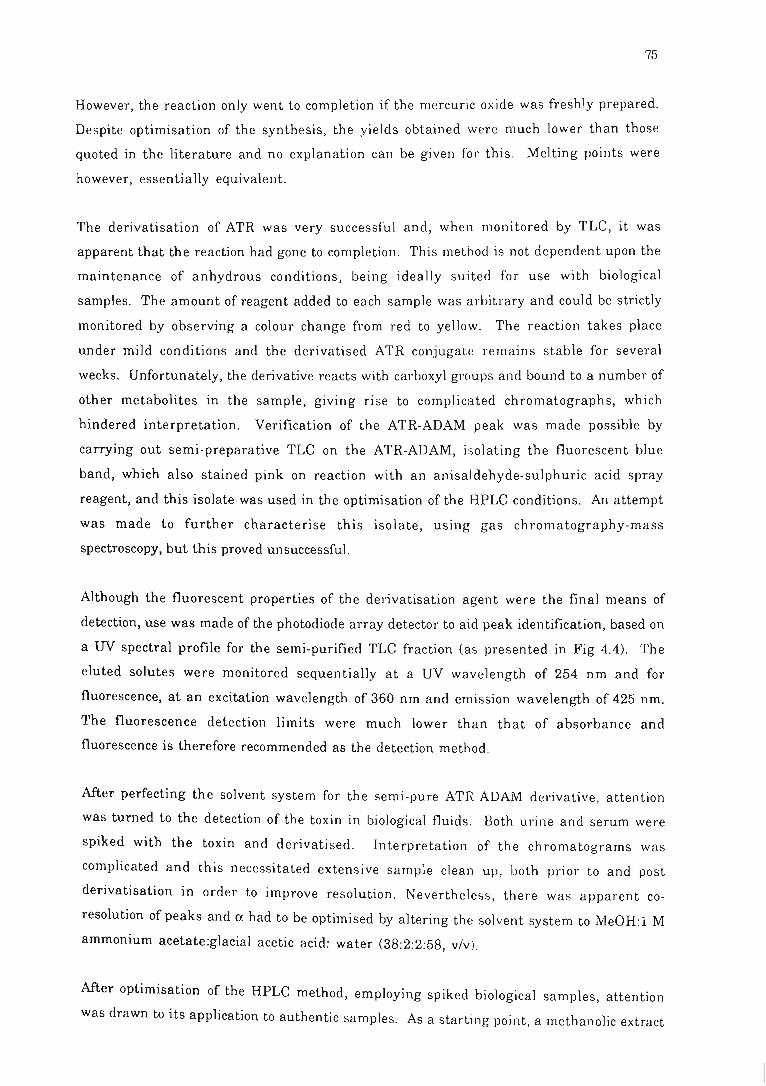
75
However, the reaction only went to completion if the mercuri c oxide was freshly prepared.
Despite optimisation of the synthesis, the yields obtained were much lower than those
quoted in the literature and no explanation can be given for this . Melting points were
however, essentially equivalent.
The derivatisation of ATR was very successful and, when monitored by TLC, it was
apparent that the reaction had gone to completion . This method is not dependent upon the
maintenance of anhydrous conditions, being ideally suited for u se with biological
samples. The amount of reagent added to each sample was a rbitrary and could be strictly
monitored by observing a colour change from red to yellow. The reaction takes place
under mild conditions and the derivatised ATR conjugate remains stable for several
weeks. Unfortunately, the derivative reacts with carboxyl grc,ups and bound to a number of
other metabolites in the sample, giving rise to complica ted chromatographs, which
hindered interpretation. Verification of the ATR-ADAM peak was made possible by
carrying out semi-preparative TLC on the ATR-ADAM, isolating the fluorescent blue
band, which also stained pink on reaction with an anisaldehyde-sulphuric acid spray
reagent, and this isolate was used in the optimisation of the HPLC conditions. An attempt
was made to further characterise this isolate, using gas chromatography-mass
spectroscopy, but this proved unsuccessful.
Although the fluorescent properties of the derivatisation agent were the final means of
detection, use was made of the photodiode array detector to aid peak identification, based on
a UV spectral profile for the semi-purified TLC fraction (as presented in Fig 4.4). The
eluted solutes were monitored sequentially at a UV wavelength of 254 nm and for
fluorescence, at an excitation wavelength of 360 nm and emission wavelength of 425 nm.
The fluorescence detection limits were much lower than that of absorbance and
fluorescence is therefore recommended as the detection method.
After perfecting the solvent system for the semi -pure ATR-ADAM derivative, attention
was turned to the detection of the toxin in biological fluids . Both urine and serum were
spiked with the toxin and derivatised. Interpretation of the chromatograms was
complicated and this necessitated extensive sample clean up , both prior to and post
derivatisation in order to improve resolution . Neverthel ess, there was apparent co
resolution of peaks and a had to be optimised by altering thE' solvent system to MeOH:l M
ammonium acetate:glacial acetic acid : water (38:2:2:58, v/v ).
After optimisation of the HPLC method, employing spiked biological samples, attention
was drawn to its application to authentic samples. As a starting point, a methanolic extract
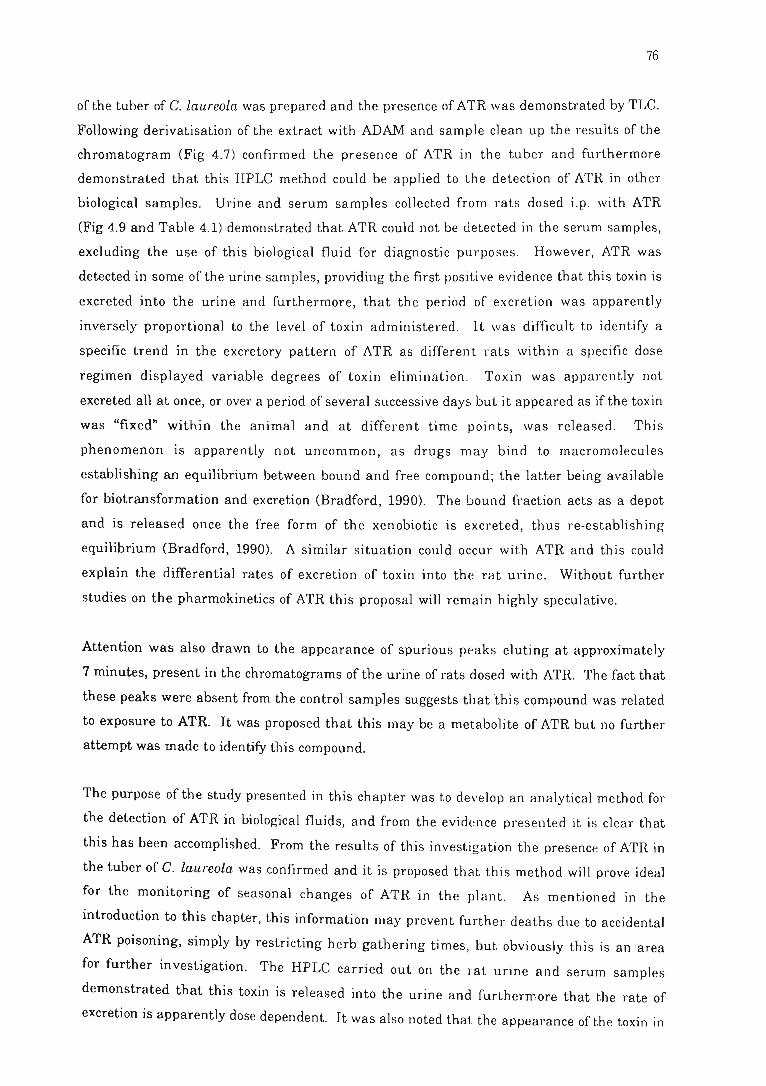
76
of the tuber of C. laureola was prepared and the presence of ATR was demonstrated by TLC.
Following derivatisation of the extract with ADAM and sample clean up the results of the
chromatogram (Fig 4.7) confirmed the presence of ATR in the tuber and furthermore
demonstrated that this HPLC method could be applied to the detection of ATR in other
biological samples. Urine and serum samples collected from rats dosed i.p. with ATR
(Fig 4.9 and Table 4.1) demonstrated that ATR could not be detected in the serum samples,
excluding the use of this biological fluid for diagnostic purposes . However, ATR was
detected in some of the urine samples, providing the first positi ve evidence that this toxin is
excreted into the urine and furthermore , that the period of excretion was apparently
inversely proportional to the level of toxin administered. It was difficult to identify a
specific trend in the excretory pattern of ATR as different r ats within a specific dose
regimen displayed variable degrees of toxin elimination . Toxin was apparently not
excreted all at once, or over a period of several successive days but it appeared as if the toxin
was "fixed" within the animal and at different time points, was released. This
phenomenon is apparently not uncommon, as drugs may bind to macromolecules
establishing an equilibrium between bound and free compound; the latter being available
for biotransformation and excretion (Bradford, 1990). The bound fraction acts as a depot
and is released once the free form of the xenobiotic is excreted, thus re-establishing
equilibrium (Bradford, 1990). A similar situation could occur with ATR and this could
explain the differential rates of excretion of toxin into th e rat urine. Without further
studies on the pharmokinetics of ATR this proposal will remain highly speculative.
Attention was also drawn to the appearance of spurious peaks eluting at approximately
7 minutes, present in the chromatograms of the urine of rats dosed with ATR. The fact that
these peaks were absent from the control samples suggests that this compound was related
to exposure to ATR. It was proposed that this may be a metabolite of ATR but no further
attempt was made to identify this compound.
The purpose of the study presented in this chapter was to develop an analytical method for
the detection of ATR in biological fluids, and from the evidE!l1ce presented it is clear that
this has been accomplished. From the results of this investigation the presence of ATR in
the tuber of C. laureola was confirmed and it is proposed that thi s method will prove ideal
for the monitoring of seasonal changes of ATR in the plant. As mentioned in the
introduction to this chapter, this information may prevent further deaths due to accidental
ATR poisoning, simply by restricting herb gathering times, but obviously this is an area
for further investigation. The HPLC carried out on the rat urine and serum samples
demonstrated that this toxin is released into the urine and furthermore that the rate of
excretion is apparently dose dependent. It was also noted that the appearance of the toxin in

77
the urine is not sequential over a period of several days but rather sporadic, suggesting that
the toxin is bound within the animal and released at different periods. The presence of
spurious peaks on the chromatograms of the urine from animals exposed to ATR intimated
that metabolites of this toxin were present and therefore that ATR undergoes some form of
biotransformation in vivo. In conclusion therefore, a sensitive method for the HPLC
detection of ATR has been developed and this method has proven suited to the detection of
ATR in plant extracts and mammalian biological fluids . Attention was then turned to the
development of an alternative assay for the detection of thi s toxin and the following two
chapters (5 and 6) describe the optimisation of antibody production and an immunoassay.
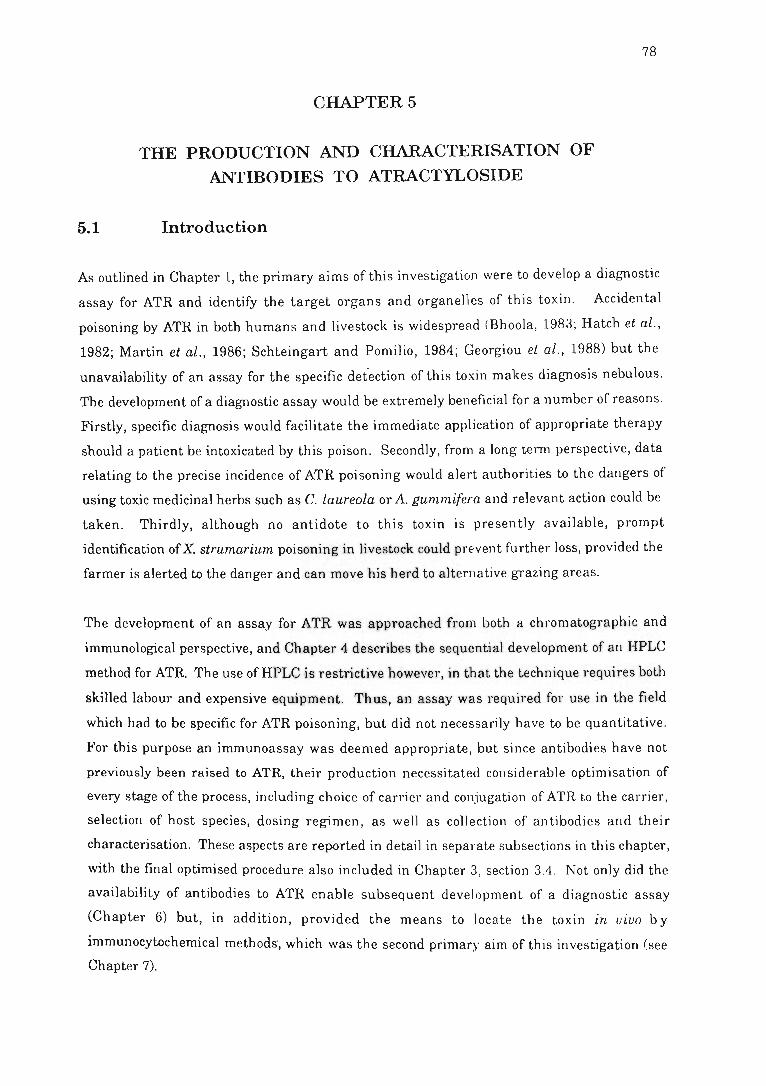
CHAPTER 5
THE PRODUCTION AND CHARACTERISATION OF ANrIBODIES TO ATRACTYLOSIDE
5.1 Introduction
78
As outlined in Chapter 1, the primary aims of this investigation were to develop a diagnostic
assay for ATR and identify the target organs and organelles of thi s toxin . Accidental
poisoning by ATR in both humans and livestock is widespread (Bhoola , 1983; Hatch et al.,
1982; Martin et at ., 1986; Schteingart and Pomilio, 1984; Georgiou et aZ., 1988) but the
unavailability of an assay for the specific detection of this toxin makes diagnosis nebulous .
The development of a diagnostic assay would be extremely beneficial for a number of reasons.
Firstly, specific diagnosis would facilit.ate the immediate application of appropriate therapy
should a patient be intoxicated by this poison . Secondly, from a long term perspective, data
relating to the precise incidence of ATR poisoning would alert authorities to the dangers of
using toxic medicinal herbs such as C. laureola or A. gummifera and relevant action could be
taken. Thirdly, although no antidote to this toxin is presently available, prompt
identification of X. strumarium poisoning in livestock could prevent further loss, provided the
farmer is alerted to the danger and can move his herd to alternative grazing areas.
The development of an assay for ATR was approached from both a chromatographic and
immunological perspective, and Chapter 4 describes the sequential development of an HPLC
method for ATR. The use of HPLC is restrictive however, in that the t.echnique requires both
skilled labour and expensive equipment. Thus, an assay was required for use in the field
which had to be specific for ATR poisoning, but did not necessarily have to be quantitative.
For this purpose an immunoassay was deemed appropriate, but since antibodies have not
previously been raised to ATR, their production necessitated considerable optimisation of
every stage of the process, including choice of carrier and conjugation of ATR to the carrier,
selection of host species, dosing regimen , as well as collection of antibodies and their
characterisation. These aspects are reported in detail in separate subsections in this chapter,
with the final optimised procedure also included in Chapter 3, section 3.4. Not only did the
availability of antibodies to ATR enable subsequent development of a diagnostic assay
(Chapter 6) but, in addition, provided the means to locate the toxin in vivo by
immunocytochemical methodS', which was the second primary aim of this investigation (see
Chapter 7).
79
5.2 Preliminary investigations into antibody production for
atractyloside
The immunogenicity of a molecule is reliant on it being foreign to the host species and
possessing sufficient structural complexity to stimulate an immune response. The ability to
initiate antibody production is not inherent to all non-self molecules. Compounds which are
antigenic (i.e., capable of reacting with antibodies) but are not immunogenic (i.e., incapable of
inducing an immune response unless coupled to a carrier) are classified as haptens (Bach,
1982; Tijssen, 1985). Generally haptens are molecules with a mass of less than 5 000 Da, but
sometimes even compounds with a mass exceeding this cut-off point are not immunogenic
(Bach, 1982; Tijssen, 1985; Catty and Raykundalia, 1988). By this definition, ATR is
classified as a hapten, as this molecule has a molecular mass of 803.0 Da (Dawson et al.,
1986). To be rendered immunogenic, a hapten such as ATR must be covalently coupled to a
carrier, the choice of carrier being essentially limitless.
In view of the fact that there was no known procedure available for the production of
antibodies to ATR, it was necessary to thoroughly investigate and test different carriers,
conjugation procedures, host species and the dosing regimen . Since this toxin contains an
ent-kaurene backbone (a precursor to the gibberellins) (Fig 2.3) it was decided to conjugate
ATR to the carrier using a modified procedure to that employed for the conjugation of
gibberellins to carriers (Fuchs and Fuchs, 1969). When, however, the efficacy of both BSA
and ovalbumin as immune carriers for ATR were tested, employing Ross brown hens,
antibodies (IgY) isolated from the egg yolks by the method of Polson et al . (1985) were of poor
quality. This prompted a change in host species from chicken to rabbit but once again it
became apparent that the quality of antibodies raised to both ATR-BSA and ATR-ovalbumin
conjugates were very poor with the resulting 1:40 working dilution of anti-ATR antibody
being inadequate for routine use (Bye et ai., 1990). These results led to serious consideration
of the entire immunization procedure and the factors influencing antibody titre and the
immune response in general.
Poor antibody titre may in part be attributed to ATR having an as yet unidentified inherent
immune toxicity; a phenomenon apparently not uncommon in toxic haptens (Hunter et al .,
1985; Ragelis, 1985). Hunter et al . (1985) demonstrated that spontaneous dissociation of the
mycotoxin T2-toxin from its protein carrier inhibited protein biosynthesis, and effectively
induced immunological paralysis. Similarly, it was noted that antibodies raised against a
conjugate of highly poisonous tetrodotoxin, coupled to BSA, were of low titre CRagelis, 1985;
Watabe et al., 1989). It was also demonstrated that an amanitin-BSA conjugate had a high
specific toxicity for sinusoidal cells of the liver, macrophages and the proximal tubules of the
80
kidney (Cessi and Fiume, 1969; Barbanti-Brodano and Fiume, 1973; Bonetti et a.l., 1974) and
that this conjugate induced very poor antibody response. It was only by altering the
conjugation procedure and foregoing boosting of the rabbits until seven weeks after priming,
that a final anti-amanitin antibody working dilution of only 1:200 was achieved. However, of
the eight rabbits immunised by Faulstich et al. (1975), four died within a week of priming, a
further two died after the fourth booster and the condition ofthe remaining two deteriorated
sufficiently to warrant euthanasia.
Like in the case of T2-toxin, tetrodotoxin or amanitin, low working dilutions of anti-ATR
antibodies may also be the result of this toxin being an immunosuppressant, a property
which is compounded by successive immunizations. Frequent boosting may render the
secondary response partially inoperative as a result of a high serum concentration of antigen
still in the process of being eliminated by primary antibodies. However, while an inherent
toxicity ofthe hapten and frequent immunization may result in a poor antibody response, the
metabolic fate of the antigen may also affect antibody production . In this regard, it is known
that antigens which are poorly metabolised in the body are poor immunogens (Bach, 1982),
and though little is known about the metabolic fate of ATR in ciuo, analogues of ATR isolated
from the urine of coffee drinkers appear to be only slightly modified from the parent molecule
(Richter and Spiteller, 1978). Hence, the effects of ATR toxicity , poor ATR metabolism and
too frequent immunization of the host species, may account for the low quality of antibody
produced.
In view of the above considerations, the procedure for the production of anti-ATR antibodies
was revised, with specific attention being given to the type of carrier, the conjugation
procedure, the host species and, above all, the immunization regimen.
5.3 Optimisation of the conjugation of atractyloside to a carrier and production of antibodies
5.3.1 Introduction
The first priority for the production of antibodies to ATR was the optimisation of the
conjugation procedure. The site of conjugation was an important consideration, particularly
for the immunocytochemical investigations which followed (Chapter 7). Landsteiner
observed that an antibody is generally directed to the (hydrophobic) region of the hapt~n,
furthest removed from the linkage (Tijssen, 1985), and it was speculated that anti-ATR
antibodies would therefore be directed towards the penhydro-region of the phenanthrenic
ring of ATR, should the carboxyl moeity be used as a site of conjugation. The carboxyl group
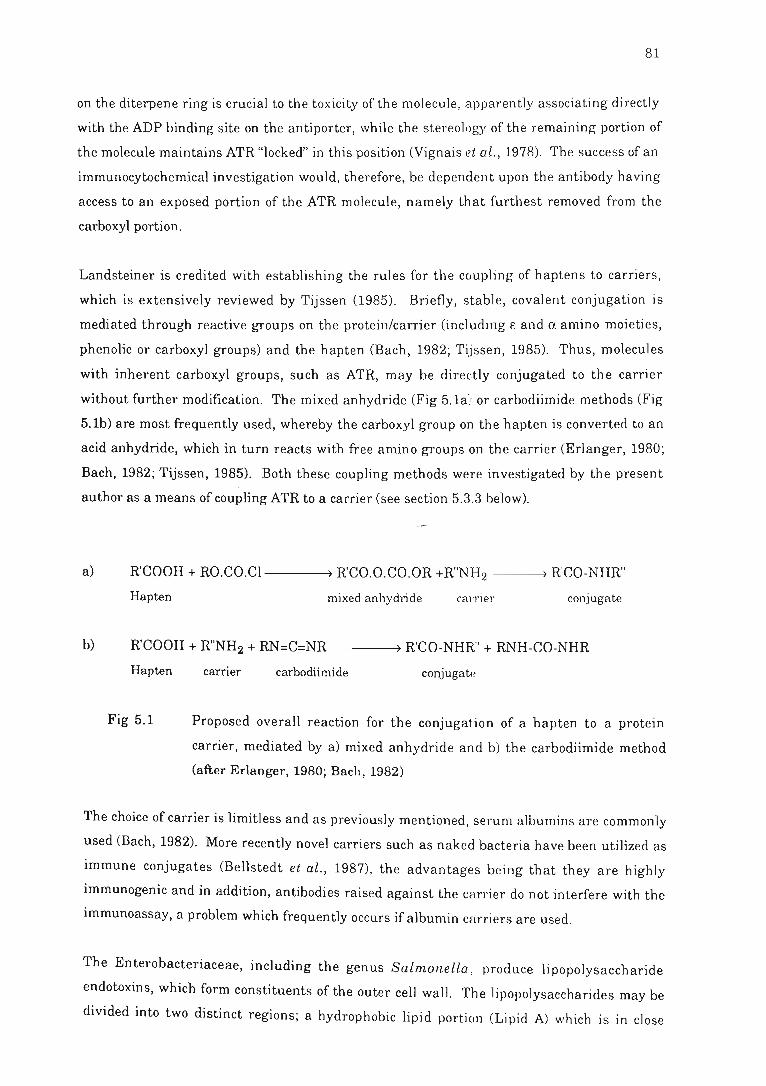
81
on the diterpene ring is crucial to the toxicity of the molecule , apparently associating directly
with the ADP binding site on the antiporter, while the stereology of the remaining portion of
the molecule maintains ATR "locked" in this position (Vignais et oZ ., 1978). The success of an
immunocytochemical investigation would, therefore, be dependent upon the antibody having
access to an exposed portion of the ATR molecule, namely that furthest removed from the
carboxyl portion.
Landsteiner is credited with establishing the rules for the coupling of haptens to carriers,
which is extensively reviewed by Tijssen (1985). Briefly, stable, covalent conjugation is
mediated through reactive groups on the protein/carrier (including £ and o. amino moieties,
phenolic or carboxyl groups) and the hapten (Bach, 1982; Tijssen, 1985). Thus, molecules
with inherent carboxyl groups, such as ATR, may be directly conjugated to the carrier
without further modification. The mixed anhydride (Fig 5.1a) or carbodiimide methods (Fig
5.1b) are most frequently used, whereby the carboxyl group on the hapten is converted to an
acid anhydride, which in turn reacts with free amino groups on the carrier (Erlanger, 1980;
Bach, 1982; Tijssen, 1985). Both these coupling methods were investigated by the present
author as a means of coupling ATR to a carrier (see section 5.3 .3 below).
a)
b)
R'COOH + RO.CO.Cl---~) R'CO.O.CO.OR +R"NH2 --~) RCO-NHR"
Hapten mixed anhydlide carrier conjugate
R'COOH + R"NH2 + RN=C=NR ---~) R'CO-NHR" + RNH-CO-NHR
Hapten
Fig 5.1
carrier carbodiimide conjugate
Proposed overall reaction for the conjugation of a hapten to a protein
carrier, mediated by a) mixed anhydride and b) the carbodiimide method
(after Erlanger, 1980; Bach, 1982)
The choice of carrier is limitless and as previously mentioned, serum albumins are commonly
used (Bach, 1982). More recently novel carriers such as naked bacteria have been utilized as
immune conjugates (Bellstedt et al., 1987), the advantages being that they are highly
immunogenic and in addition, antibodies raised against the carrier do not interfere with the
immunoassay, a problem which frequently occurs if albumin carriers are used.
The Enterobacteriaceae, including the genus Salmonella, produce lipopolysaccharide
endotoxins, which form constituents of the outer cell wall. The Iipopolysaccharides may be
divided into two distinct regions; a hydrophobic lipid portion (Lipid A) which is in close
82
contact with the cell wall and a hydrophilic polysaccharide portion . The hydrophilic region
comprises a basal core of branched polysaccharides containing N-acetylglucosamine, glucose,
galactose, heptose, 2-keto-deoxyoctonate (KDO) and O-specific chains. "It is the O-specific
polysaccharides which impart the serological specificity of both the lipopolysaccharide and
the bacterial parent strain and provide the basis for the Kauffmann-White classification
scheme (Galanos et al., 1971). R-mutant strains are devoid of the O-specific chains and
contain defective basal cores. Salmonella minnesota R595 contains acid labile ketocyclic
links between the KDO in the core region and Lipid A. Mild acid hydrolysis cleaves off the
hydrophilic portion, exposing the hydrophobic region of the bacterial cell wall, yielding so
called naked bacteria. Exposed functional groups on the bacteria may be used to chemically
couple haptens such as ATR to the bacteria and this complex is used to immunize animals. A
further benefit to the use of this carrier is that the lipoprotic nature ofthe bacteria functions
as an immune stimulant, obviating the need for adjuvants (Luderitz et al., 1966; Galanos et
aI., 1971; Bellstedt et aI., 1987).
Rabbits and chickens are most routinely used in polyclonal antibody production; the
antibodies being isolated from serum or egg yolks respectively. Both host species were used
by the present author. Site of immunization and dose regimen vary considerably depending
on the host, the antigen and the desired response . In the case of chickens, immunogen is
injected directly into the pectoral muscles, while rabbi t s are generally immunized
subcutaneously; the immunogens being emulsified in adjuvants which potentiate and prolong
the immune response (Tijssen, 1985; Catty and Raykundalia, 1988). Most adjuvants, such as
the routinely used Freund's adjuvants, are water-soluble sUlfactants or have the capacity to
form a surface interface (oil-emulsions) . This adjuvant can however, result in severe
granularmatomous inflammation and other undesirable effects, distressing the animal
(Woodard, 1989). Hence the added advantage of using naked bacterial carriers.
The objectives of this investigation were, therefore, to compare the mixed anhydride and
carbodiimide methods of conjugation, employing BSA and RSA as protein carriers and
secondly, to employ the selected conjugation method for the preparation of ATR conjugates
with BSA, RSA and naked bacteria, which would then be compared for their ability to
generate a strong immune response specific for ATR and not the carrier.
5.3.2 Materials and methods
Mixed anhydride procedure (Method I)
Atractyloside was conjugated to either BSA or RSA through the carboxyl group on C4
of the
diterpene ring, using a modified procedure of Fuchs and Fuchs (1969) . Atractyloside (60 mg)
83
was dissolved in 1,4 dioxan (0.5 m1). To this was added l\,N·-dicyclohexyl carbodiimide
(25 mg) and the solution stirred for 30 minutes, at room temperature. The resulting white
precipitate was removed by centrifugation for 1 minute, at 5 000 x g and the solution
(containing the acid anhydride) was added dropwise to a solution containing the protein
carrier (50 mg) dissolved in 0.1 M borate buffer, pH 8.5 (5 mI) . The solutions were stirred
overnight at 4°C and dialysed exhaustively against 0.1 M borate buffer, pH 8.0.
Carbodiimide procedure (Method II)
Atractyloside was coupled to BSA and RSA, using a modification of the method supplied by P.
Hoffman (pers. comm., 1988) for conjugating gibberellins to BSA. Atractyloside (120 mg) was
dissolved in a solution of 66% (v/v) DMF (the toxin appeared more soluble in this solvent than
in the 1,4 dioxan used in Method I). To this was added 1-ethyl-3-(3-dimethylaminopropyl)
carbodiimide (72 mg) and the solution was stirred for 30 minutes, B:t room temperature .
Protein carrier (RSA or BSA, 100 mg) was dissolved in 0.5 M borate buffer, pH 8.5 and the
ATR solution was added dropwise, with stirring; pH being monitored and maintained above
pH 8.0 throughout the procedure. The conjugate was stirred overnight at 4°C and dialysed
as for Method 1. A set of control conjugates, devoid of hapten, were prepared concomitantly.
Estimation of percentage of amino groups on the protein carriers occupied by
atractyloside
The two conjugation methods (l and II above), were compared by estimating the percentage
of amino groups on the proteins occupied by ATR, prior to dialysis, using the method of
Habeeb (1966), details of which are given in section 3.4.2. This procedu~e involves the
treatment of a protein solution with TNBS, which reacts specifically with free amino groups
on the surface of the protein, to give trinitophenyl derivatives which can in turn, be
measured colorimetrically. The control consisted of BSA or RSA, treated as described under
the methodology for Methods I and II, but in the absence of ATR.
Conjugation of atractyloside to Salmonella minnesota bacteria by Method II
A modification of the methods of Bellstedt et al. (1987) and P. Hoffman (pers. comm., 1988)
was employed as described in section 3.4.2.
Immunization procedure
The conjugates prepared as described above and detailed in section 3.4.2, were used to
immunise six New Zealand white rabbits by the procedure described in section 3.4.3. Two
rabbits were allocated for each carrier-hapten conjugate, i.e., rabbits 1 and 2 were immunized
with the ATR-BSA conjugate, rabbits 3 and 4 were immunized with the ATR-naked bacterial
conjugate and rabbits 5 and 6 were given the ATR-RSA conjugate. Briefly, animals were
84
dosed with the antigen and antisera were collected at fortnightly intervals and the titre was
monitored. When the primary response was seen to recede, the animals were boosted and
the titre was again monitored every fortnight . Once the secondary response had peaked and
then receded, antisera were collected by cardiac puncture whilst the animals remained under
anaesthesia (section 3.4.3). The collected antisera from these six rabbits was used in both
the titre determination and characterisation studies described in this chapter.
Titre determination
The titres for the six rabbit antisera were monitored fortnightly, as follows, using an
adaptation of the method of Bye et al . (1990) (see Appendix A).
An ATR-ovalbumin conjugate prepared using carbodiimide Method II, was diluted to a
concentration of 0.01 mg/ml in 0.05 M carbonate buffer, pH 9.6 (section 3.5.1). Microtitre
plates were coated overnight at 4°C with this conjugate (200 Ill/well). Antisera samples
collected from the six rabbits were serially diluted 10-fold in TBS containing 0.1% (w/v)
ovalbumin respectively. Plates were incubated overnight at 4°C, washed thrice with tap
water and incubated for a further 2 hours at 37°C with a 1:3 (100 dilution of Goat anti-rabbit
IgG-alkaline phosphatase. Ovalbumin controls were includf!d in each assay . Plates were
washed and incubated for 1 hour at 37°C with a solution of p-nitrophenyl phosphate
(1 mg/ml) in 0.1 M diethanolamine buffer , pH 9.6 (section 3.5 .1). The absorbance was
measured at 405 nm and results are given in section 5.3.3 below.
5.3.3 Results and discussion
The results for the percentage of amino groups on the BSA and RSA carrier proteins, bound
by ATR as compared to that of the controls, are shown in Table 5.1.
From these results it was concluded that Method II (the carbodiimide method) yielded the
most efficient binding of ATR to the protein carrier and would be the procedure of choice.
This was attributed in part to better solubility of the hapten in DMF, compared to 1,4 dioxan,
thus enhancing the reaction between hapten and carrier. A mean 6.61% binding for ATR to
BSA and RSA protein carriers was calculated, as monitored by the method of Habeeb (1966).
Assuming that there are 60 potential binding sites on a BSA molecule (Habeeb, 1966), a
6.61 % binding rate would represent the attachment of four molecules of ATR/molecule of
BSA. By the standards of Dintzis et al. (1989) this ratio is too low but Fuchs and Fuchs
(1969) reported a similar, low binding ratio of 6-14% for gibberellins bound to a protein
carrier and still succeeded in producing antibodies to the gibberellins.
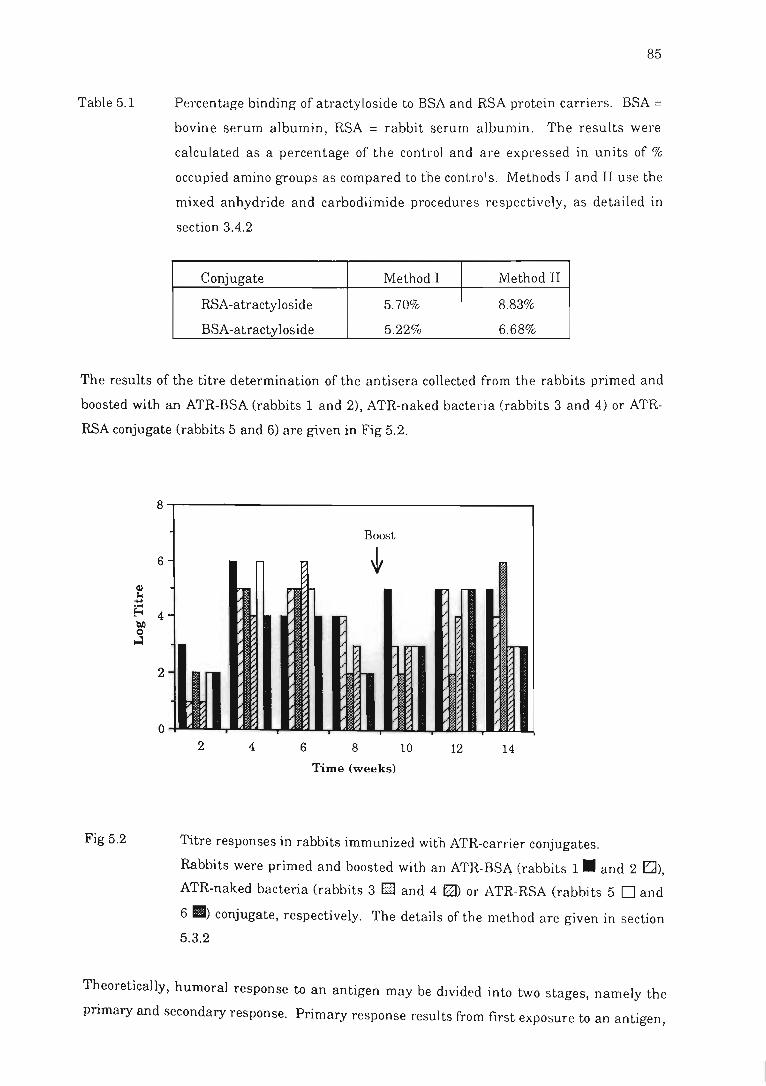
Table 5.1
85
Percentage binding of atractyloside to BSA and RSA protein carriers. BSA = bovine serum albumin, RSA = rabbit serum albumin. The results were
calculated as a percentage of the control and are expressed in units of %
occupied amino groups as compared to the controls. Methods I and II use the
mixed anhydride and carbodiimide procedures respectively, as detailed in
section 3.4.2
Conjugate Method I Method II
RSA-atractyloside 5.70% 8.83%
BSA-atractyloside 5.22% 6.68%
The results of the titre determination of the antisera collected from the rabbits primed and
boosted with an ATR-BSA (rabbits 1 and 2), ATR-naked bacteria (rabbits 3 and 4) or ATR
RSA conjugate (rabbits 5 and 6) are given in Fig 5.2.
8
6
~
'"' ~ ~ 4-boO 0
....:l
2-
0
Fig 5.2
Boost
~ .' >:
% ,.
., ,. x
~. ~ / :~ , .
.'
--.'
.' .' ~
.' : .' ," ,
.' .'
~ .' %
2 4 6 8 10 12 14
Time (weeks)
Titre responses in rabbits immunized with ATR-carrier conjugates.
Rabbits were primed and boosted with an ATH-BSA (rabbits 1. and 2 tJ),
ATR-naked bacteria (rabbits 3 (]] and 4 ~) or ATR-RSA (rabbits 5 0 and
611) conjugate, respectively. The details of the method are given in section
5.3.2
Theoretically, humoral response to an antigen may be divided into two stages, namely the
primary and secondary response. Primary response results from first exposure to an antigen,
86
and a predominant population of IgM molecules are produced. This antibody concentration
declines and, on subsequent exposure to the same antigen (boosting), a secondary response
occurs with an associated class switch and emergence of IgG antibodies (Tijssen, 1985). It
will be seen from Fig 5.2, that the primary response by the rabbits to their respective
antigens was not uniform, but generally, the titre peaked between weeks 4 and 6, post
priming. Specifically, the response by rabbit 1 (primed with an ATR-BSA conjugate) was
almost immediately discernible, as was the response by rabbits 3, 5 and 6 (primed with ATR
naked bacteria, RSA-ATR and RSA-ATR respectively). The response by rabbit 2 (primed
with BSA-ATR) and rabbit 4 (primed with an ATR-naked bacterial conjugate) was very low,
but rose sharply by week 4 and 6 respectively . Rabbit 1 had a maximal response at week 4,
but thereafter, although the response to the antigen decreased, it was still maintained at an
average above that of the remaining rabbits. Rabbits 5 and 6 had a maximal response by
week 4 and although this response was seen to decline in rabbit 5, the titre of the antiserum
from rabbit 6 was the same for weeks 4 and 6, after which time the response declined.
By week 8 the primary response had receded and thus the animals were boosted at week 9.
Subsequently rabbit 1 maintained a high titre for the remaining 5 weeks, while the titre of
the antiserum from rabbit 2 (dosed with ATR-BSA) peaked a t week 12, only tQ decline by
week 14. Rabbit 3, dosed with an ATR-naked bacterial conjugate had a delayed response
with the titre only increasing at week 14. Rabbit 4, dosed with the same conjugate had a
maximal response at week 12. Rabbits 5 and 6, which were both dosed with ATR-RSA,
showed very similar titre responses which peaked at week 12 and then receded.
The major conclusion that can be drawn from these results is. that, when rabbits were dosed
with an ATR-carrier, the secondary response was not significantly greater than the primary
response. Although this was seen as a general trend, the absolute titre from individuals
within a group, immunized with a given antigen, varied greatly. In addition it was also
established that the carbodiimide method was more efficient in conjugating ATR to a carrier.
Although three carriers were tested in their relative potential to produce antibodies to ATR,
at this point it was not possible to select the most suitable carrier based on the titre response
and this necessitated further characterisation of the antisera, as described in section 5.5.
During the course of this study, at different periods during the immunization regimen, the
two rabbits immunized with the RSA-conjugate died of unknown causes . Despite no evidence
to the contrary about the use of autologous protein carriers, the demise of these rabbits led to
serious consideration about the .effects of injecting RSA into rabbits and the autoimmune
response. This aspect is discussed in the next section .
87
5.4 Examination for possible autoimmunity in rabbits
5.4.1 Introduction
Generally, the immune system does not react against its own constituents, so the
phenomenon whereby an individual recognises self as non-self, is termed autoimmunity
(Bach, 1982). Autoantibodies are thought to be involved in the di sposal of cellular breakdown
products but when produced by humans, against soluble antigens in the cytoplasm, induce
systemic lupus erythmatosis, manifested by widespread pathological changes with non
specific lesions (Bach, 1982) . Autoimmunity may be induced if new epitopes appear on the
autologous antigen due to incomplete or incorrect synthesis, breakdown or cross-reactivity
with exogenous antigens. The incorporation of Freund's adjuvant also frequently causes the
stimulation of an immune response by autologous proteins since the essentially hydrophobic
environment induced by the oil-water emulsion may result in conformational changes in the
protein (Roitt, 1988). This alters the exposed epitopes on the protein, which are now
recognised as non-self.
Autoimmunity in rabbits may be identified in two ways: firstly, by an increase in the
presence of immune complexes in the serum and, secondly, by glomerular nephritis (GN)
(Bach, 1982). Autoimmunity manifested in the form of GN may be detected as early as day
10, post-priming and on day 5 after boosting. While GN is histologically detectable, provided
re-exposure to the antigen does not occur, this damage subsides within 2-3 weeks.
Practically, it is difficult to detect GN, and therefore measurement of any alteration in serum
immune complex levels may provide an easier means of monitoring autoimmunity (Bach,
1982).
Accurate measurement of serum immune complexes is, nevertheless, exceedingly difficult, as
it is hard to discriminate between complexed and normal immunoglobulin. The assays for
the detection of immune complexes, in the presence of native IgG, rely on the differences in
relative solubility and molecular mass between free and complexed immunoglobulins. These
procedures are more reliable than methods based on the radioallergosorbent (RAST) cell
assays or complement fixation assays but are less sensitive. For th e assay of immune
complexes, use is made of polyethylene glycol which precipitates proteins in proportion to
their molecular size and concentration. Thus 2% (w/v) PEG solubilises free IgG, but will
precipitate an immune complex. If the concentration of PEG is increased to 15% (w/v), both
free IgG and immune complexes will be precipitated. Thus, by manipulating the PEG
concentration it is possible to selectively precipitate out the immune complexes, to the
exclusion of the free IgG (Hudson and Hay, 1989).
88
As it is difficult to detect GN in the rabbit, the aim of this aspect of the work was to monitor
the levels of immune complexes in the blood, following exposure to RSA. Firstly fOUT rabbits
were immunized with RSA and twelve days later, sera was collected. The immune complexes
were precipitated from the sera and the concentration of the immune complexes (effectively
autoantibodies) were determined by a single immunodiffusion test. These results were
compared with the concentration of immune complexes five days after boosting with the same
antigen .
5.4.2 Materials and methods
Immunization protocol
Four adult New Zealand white male rabbits (designated a, b, c and d), from the BMRC,
University of Durban-Westville, were immunized subcutaneously with a stable emulsion of
RSA (1 mg/m}) in Freund's Complete adjuvant. The albumin was previously reacted with
carbodiimide (Method II, section 5.3.2), in the absence of ATR, to mimic any modifications
that may have been introduced by the coupling reaction. Twelve days post-priming,
approximately 5 ml of blood was collected from the marginal ear vein and allowed to clot.
Nine weeks after priming, animals were boosted with an emulsion ofthe albumin in Freund's
incomplete adjuvant. Five days post-boosting, blood was collected from the marginal ear
vein. After collection of sera and centrifugation at 5 000 x g for 10 minutes, the presence of
immune complexes was monitored as outlined below. Pre-immune rabbit serum was
collected from the four rabbits and used to isolate IgG as described below.
Isolation and quantification of rabbit IgG
Serum was mixed with two volumes of 0.05 M borate buffer, pH 8.35 and to this was added
15 % (w/v) PEG, the solution mixed well and centrifuged at 12 000 x g for 10 minutes. The
pellet was re-dissolved in one-fifth of the original serum volume, in the same borate buffer.
An aliquot was diluted 1:100 in borate buffer and the absorbance measured at 278 nm. The
extinction coefficient for rabbit IgG at 278 nm is given as 1.35 mg mJ-l cm-1 (Tijssen, 1985)
and from an absorbance of 0.124, as given by the antibody solution in question, the IgG
concentration was calculated as follows: -
absorbance
0.124
concentration
= concentration x extinction coefficient x path length
= concentration x 1.35 mg ml-1 cm- 1 x 1 em 0.124
= mg IgG/ml 1.35 mg mJ-l cm-1 x 1 em
= 0.092 m~ I~Glml,
but this is a 1: 100 dilution
therefore final concentration = 9. 2 m~ I~G Iml
89
From this a series of IgG solutions were prepared ranging from 23 to 184 ng IgG/ml
respectively for use in the radial immunodiffusion assay.
Immune complex determination
The following solutions were prepared for the isolation of the immune complex in rabbit
serum according to the method of Hudson and Hay (1989):
Yeronal buffered saline (VBS); Sodium chloride (85.0 g), sodium barbitone (3.75 g) and
barbitone (5.75 g) were dissolved in 2 litres of distilled water . This buffer is five times the
working concentration used in the assay, but is more stable when stored as a concentrated
stock and diluted appropriately before use.
Polyethylene 2"lycol solution (PEG solution): A 20% (w/v) PEG (6 000) stock solution was
prepared in VBS.
Ethylene diamine tetra-acetic acid (EDTA) disodium salt solution : A 0.2 M EDTA solution
was prepared and titrated to pH 7.6 with 0.1 M NaOH.
All reactions and centrifugation steps were carried out at 4°( unless otherwise stated. The
PEG solution was adjusted to a working concentration of 12% (w/v) by mixing 6 ml of the
PEG stock solution with 3 ml EDTA solution and 1 ml VBS. Duplicate aliquots of serum
(150 Ill) were mixed with the PEG working solution (30 Ill) and incubated overnight at 4°C.
Solutions were centrifuged at 2 000 x g for 20 minutes, the tubes placed on ice and the
supernatant carefully removed and discarded. The precipitate was resuspended in ice-cold
PEG working solution (2 m}) and centrifuged at 200 x g for 20 minutes following which, the
supernatant was again removed and the precipitate redissolved over 48 hours in VBS
(150 !ll), without stirring. To ensure complete dissolution of the precipitated immune
complexes, the solutions were incubated for a further hour at 37c,C and precipitated immune
complex levels were quantified by single radial immunodiffusion as outlined below.
Single radial immunodiffusion
The following procedure for the radial immunodiffusion assay represents a modification of
the procedures of Buttle et al. (1988) and Hudson and Hay (1989). Microscope slides were
washed in ethanol, dried and coated with a thin layer of 0.5% iw/v) agar in distilled water, to
ensure good adhesion of the next layer, i.e., the analytical agar gel. After the coating gel had
set, the analytical agar was prepared by dissolving 2 g of agar in 100 ml of 90 mM Tris/ 80
mM boric acid buffer, pH 8.3. The agar was dissolved by heating and allowed to cool to about
90
56°C. To 2 ml of the agar was added 30 ~l of a previously prepared sheep anti-rabbit IgG
serum (prepared by T.H.T Coetzer, Dept. of Biochemistry, University of Natal, 1988) in
3.8 ml of the Tris-borate buffer. This analytical agar was carefully layered onto the pre
coated microscope slides and allowed to cool, whereupon a gel punch was used to cut out
sufficient wells for analysis.
Duplicate samples (7 ~l) of each IgG standard solution (see above ) were added to each well on
the precoated slides, to form the standard concentration series, from which an estimate of
immune complex concentration in the unknown solutions could be determined. Remaining
wells were incubated with the unknown precipitin samples. Solutions were allowed to
infiltrate the gels at room temperature for 1 hour, before being incubated at 4°C. Since after
24 hours incubation, there was little evidence of precipitin band formation, the slides were
left to incubate for a further 24 hours. Free protein was n!moved by rinsing the gels in
repeated washes of PBS for 24 hours followed by a final wash for a further 24 hours in 0.9%
(w/v) saline. The gels were then stained in Coomassie brilliant blue for 10 minutes (Hudson
and Hay, 1989) and differentiated in a solution of 20% glacial acetic acid. Thereafter, the
slides were covered with a layer of lint-free, dampened filter paper and incubated for
24 hours at 37°C to dehydrate and preserve the slides. By measuring the mean diameter
(horizontal and vertical directions) of the precipitin rings, a standard curve was prepared of
ring area versus IgG concentration (Fig 5.3). The concentration of serum immune complexes
in the unknown samples was read from this graph , as was that of a control serum. The
procedure was repeated on samples collected after both priming and boosting and a
comparison of the immune complex concentrations was made.
5.4.3 Results and conclusions
The standard curve in which ring area was plotted against IgG concentration is depicted in
Fig 5.3. This curve was found to be considerably more linear than when ring diameter is
plotted instead of ring area. Two sets of data points are given for each IgG concentration and
these represent the areas obtained for two successive radial ring assays, i.e., the first after
priming and the second after boosting. This indicates that· although the diffusion assays
were carried out at different times, the results did not differ significantly and hence in any
alterations in the levels of immune complexes in the rabbit sera between priming and
boosting, would not be artifact.
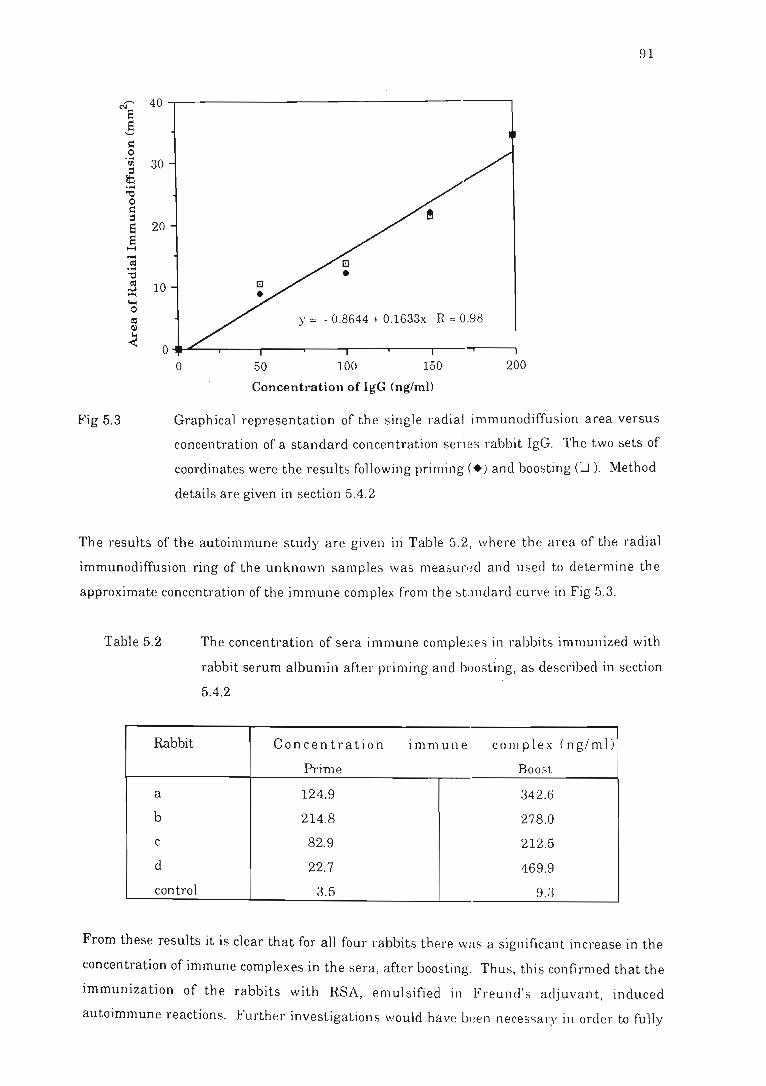
Fig 5.3
91
40.-----------------------------------~
30
20
10
Y = - 0.8644 + 0.1633x R = 0.98
o 50 100 150 200
Concentration of IgG (ng/ml)
Graphical representation of the single radial immunodiffusion area versus
concentration of a standard concentration series rabbit IgG. The two sets of
coordinates were the results following priming (. ) and boosting C:J). Method
details are given in section 5.4.2
The results of the autoimmune study are given in Table 5.2, where the area of the radial
immunodiffusion ring of the unknown samples was measurl!cl and used to determine the
approximate concentration of the immune complex from the st.mdard curve in Fig 5.3.
Table 5.2
Rabbit
a
b
c
d
control
The concentration of sera immune comple;;es in rabbits immunized with
rabbit serum albumin after priming and boosting, as described in section
5.4.2
Concentration immune complex (ng/ml)
Prime Boost
124.9 342.6
214.8 278.0
82.9 212.5
22.7 469.9
3.5 9.3
From these results it is clear that for all four rabbits there was a significant increase in the
concentration of immune complexes in the sera, after boosting. Thus, this confirmed that the
immunization of the rabbits with RSA, emul sified in Freund's adjuvant, induced
autoimmune reactions. Further investigation s would have bl!en necessary in order to fully
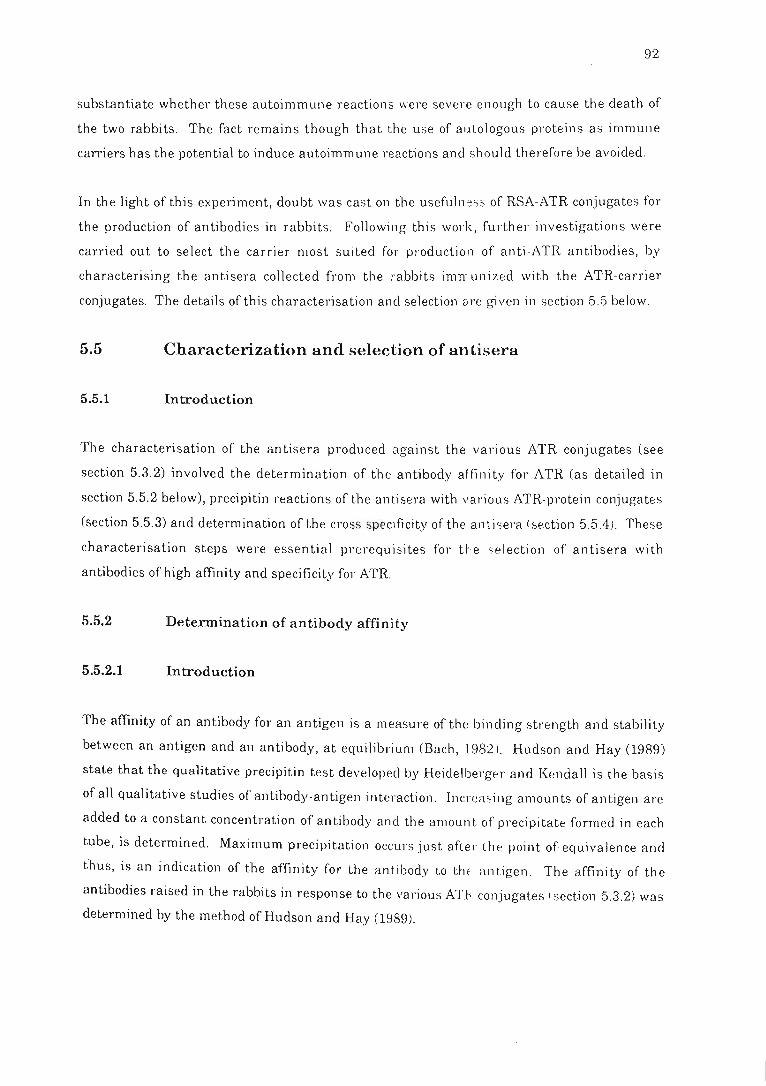
92
substantiate whether these autoimmune reactions were severe enough to cause the death of
the two rabbits. The fact remains though that the use of aULologous proteins as immune
carriers has the potential to induce autoimmune reactions and should therefore be avoided .
In the light of this experiment, doubt was cast on the usefuln ess of RSA-ATR conjugates for
the production of antibodies in rabbits. Following this work, further investigations were
carried out to select the carrier most suited for production of anti-ATR antibodies, by
characterising the antisera collected from the rabbits imn-unized with the ATR-carrier
conjugates. The details of this characterisation and selection are given in section 5.5 below.
5.5 Characterization and selection of an tisera
5.5.1 Introduction
The characterisation of the antisera produced against the various ATR conjugates (see
section 5.3.2) involved the determination of the antibody affinity for ATR (as detailed in
section 5.5.2 below), precipitin reactions of the antisera with various ATR-protein conjugates
(section 5.5.3) and determination of the cross specificity of the antisera (section 5.5.4). These
characterisation steps were essential prerequisites for the selection of antisera with
antibodies of high affinity and specificity for ATR.
5.5.2 Determination of antibody affinity
5.5.2.1 Introduction
The affinity of an antibody for an antigen is a measure of the binding strength and stability
between an antigen and an antibody, at equilibrium (Bach, 1982 ). Hudson and Hay (1989)
state that the qualitative precipitin test developed by Heidelberger and Kendall is the basis
of all qualitative studies of antibody-antigen interaction. lncren :::ing amounts of antigen are
added to a constant concentration of antibody and the amount of precipitate formed in each
tube, is determined. Maximum precipitation occurs just after the point of equivalence and
thus, is an indication of the affinity for the antibody Lo thE antigen. The affinity of the
antibodies raised in the rabbits in response to the various ATF~ conjugates (section 5.3.2) was
determined by the method of Hudson and Hay (989).
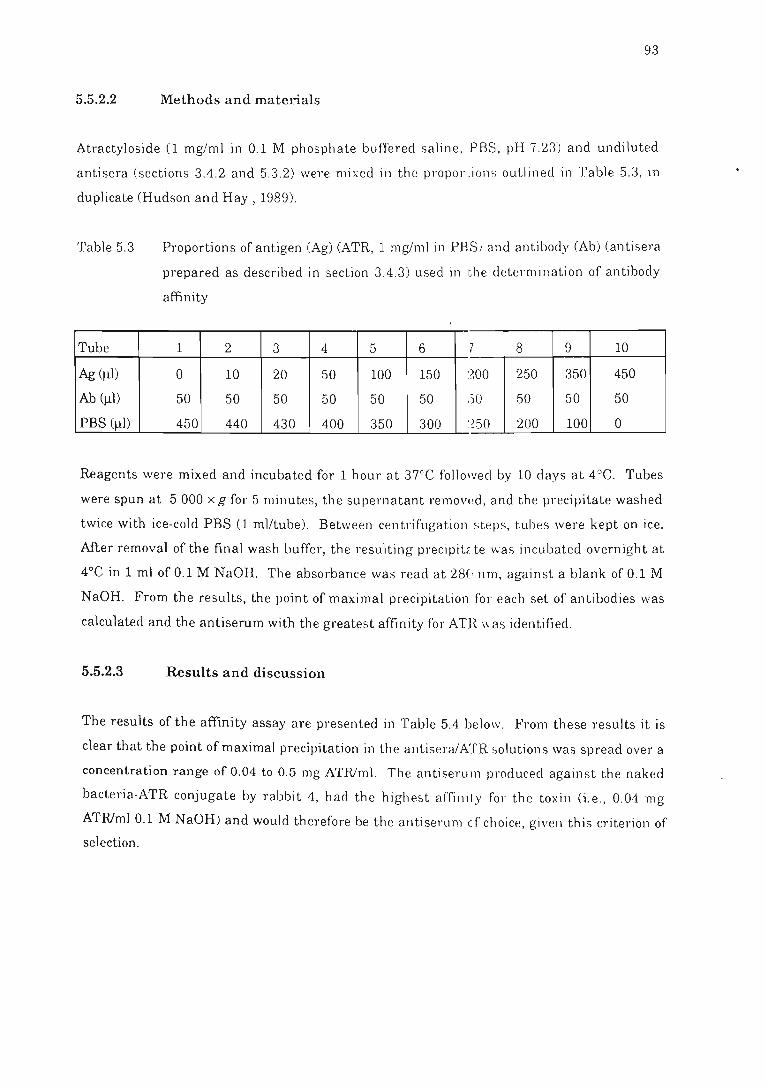
93
5.5.2.2 Methods and materials
Atractyloside (1 mg/ml in 0.1 M phosphate buffered saline , PBS, pH 7.23) a nd undiluted
antisera (sections 3.4.2 and 5.3.2) were mixed in the propor.ions outlined in Table 5.3, in
duplicate (Hudson and Hay, 1989).
Table 5.3
Tube
Ag(Jl1)
Ab(Jll)
PBS (Jll)
Proportion s of antigen (Ag) (ATR, 1 mg/ml in PBS) and antibody CAb) (antisera
prepared as described in section 3.4.3) used in th e determination of antibody
affinity
1 2 3 4 5 6 7 8 9 10
0 10 20 50 100 150 :200 250 350 450
50 50 50 50 50 50 .50 50 50 50
450 440 430 400 350 300 : ~50 200 100 0
Reagents were mixed and incubated for 1 hour at 37"C followed by 10 days at 4°C. Tubes
were spun at 5 000 x g for 5 minutes, th e supernatant removl!d, and the precipitate washed
twice with ice-cold PBS (1 ml/tube). Between centrifugation steps, tubes were k ept on ice.
After removal of the final wash buffer, the resulting precipitcte \vas incubated overnight at
4°C in 1 ml of 0.1 M NaOH. The absorbance was read at 28(- nm , against a blank of 0.1 M
NaOH. From the results, the point of maximal precipitation for each set of antibodies was
calculated and the antiserum with the greatest affinity for ATH \\'as identified .
5.5.2.3 Results and discussion
The results of the affinity assay are presented in Table 5.4 below. From these results it is
clear that the point of maximal precipitation in the a nti seralATR solution s was spread over a
concentration range of 0.04 to 0.5 mg ATRIml. The antiserum produced again st the naked
bacteria-ATR conjugate by rabbit 4, had the highest affi niLy for the toxin (i.e ., 0.04 mg
ATRlml 0.1 M NaOH) and would therefore be the antiserum cf choice, given thi s criterion of
selection.
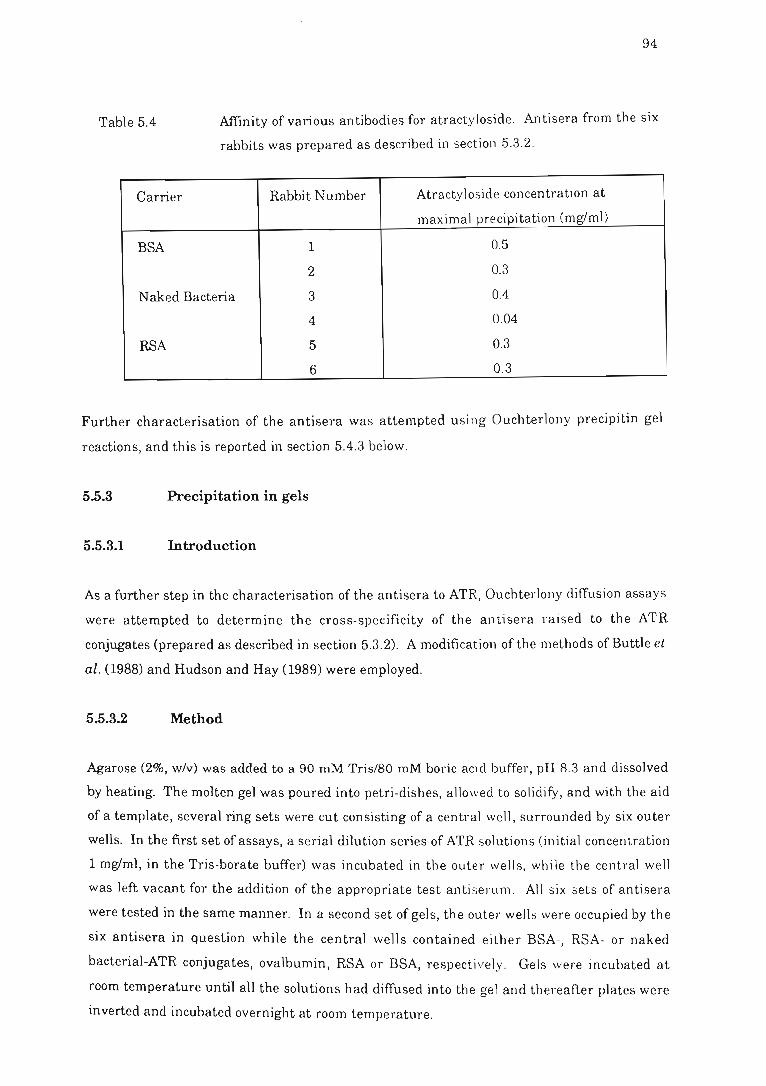
94
Table 5.4 Affinity of various antibodies for atractyloside. Antisera from the six
rabbits was prepared as described in section 5.3.2.
Carrier Rabbit Number Atractyloside concentration at
maximal precipitation (mg/ml)
BSA 1 0.5
2 0.3
Naked Bacteria 3 0.4
4 0.04
RSA 5 0.3
6 0.3
Further characterisation of the antisera was attempted usi ng Ouchterlony precipitin gel
reactions, and this is reported in section 5.4.3 below.
5.5.3 Precipitation in gels
5.5.3.1 Introduction
As a further step in the characterisation of the antisera to ATR, Ouchterlony diffusion assays
were attempted to determine the cross-specificity of the antisera raised to the ATR
conjugates (prepared as described in section 5.3.2). A modification of the methods of Buttle et
al. (1988) and Hudson and Hay (1989) were employed.
5.5.3.2 Method
Agarose (2%, w/v) was added to a 90 mM Tris/80 mM boric acid buffer, pH 8.3 and dissolved
by heating. The molten gel was poured into petri-dishes, allowed to solidify, and with the aid
of a template, several ring sets were cut consisting of a central well, surrounded by six outer
wells. In the first set of assays, a serial dilution series of ATR solutions (initial concentration
1 mg/ml, in the Tris-borate buffer) was incubated in the outer wells, while the central well
was left vacant for the addition of the appropriate test anti serum. All six sets of antisera
were tested in the same manner. In a second set of gels, the outer wells were occupied by the
six antisera in question while the central wells contained either BSA- RSA- or naked ,
bacterial-ATR conjugates, ovalbumin, RSA or BSA, respecti vely. Gels were incubated at
room temperature until all the solutions had diffused into the gel and thereafter plates were
inverted and incubated overnight at room temperature.
95
Since after incubation, there was no evidence of precipitin bands, gels were washed in several
changes of 0.15 M PBS, pH 7.2 for 24 hours, followed by 0.9 % (m/v) saline for a further 24
hours, to remove residual protein (Hudson and Hay, 1989). The gels were then stained in
Coomassie brilliant blue for 10 minutes (Hudson and Hay, 1989) and differentiated in a
solution of 20% glacial acetic acid. Since this approach still showed no evidence of precipitin
bands, despite repeated efforts, an alternative approach was tested . This involved the
addition of 4% (w/v) PEG (6 000) to the agarose, prior to casting the gel slabs. This can
improve the sensitivity of the assay, by enhancing precipitation (Hudson and Hay, 1989).
The results obtained are discussed below in section 5.5.3.3 below.
5.5.3.3 Results and discussion
Weak precipitin bands were evident between the wells containing anti-BSA-ATR antiserum
(raised in rabbit 1) and both BSA and BSA-ATR respectively . No other bands could be
visualised. This is, however, not altogether unexpected as Bach (1982) reported that
monovalent haptens do not bring about precipitation because each molecule binds to only one
oftwo possible antibody binding sites, and such complexes remain soluble . This explanation
would account for the lack of precipitin bands in the Ouchterlony test, but does not account
for the presence of the precipitation in the affinity test described in Section 5.5.2. Bach (1982)
further reputed that over a lengthy, but unspecified, period of time, aggregation of several
identical monovalent haptens may induce aggregation and precipitation. Since the affinity
assay proceeded over a period of 11 days, while the Ouchterlony was only carried out for 24
hours, this time difference could account for the precipitation in the affinity assay, but not in
the Ouchterlony assay.
The physicochemical aspects of the precipitation of antibody-antigen complexes have been
defined by Bach (1982) and are thought to occur in two phases. The first rapid phase
involves the formation of a soluble lattice. This in turn enters a slow phase, during which the
lattice complexes form aggregates, with tight ionic bonds and visible precipitates. These
precipitates may not be present when antibody-antigen complexes form cyclic complexes or
when determinants are closely repeated on an antigen surface, as is the case with a hapten
carrier conjugate (Bach, 1982). Thus prolonged incubation of the Ouchterlony gel over a
period of several weeks may indeed result in the formation of precipitin bands, but
logistically, the risk of microbial contamination would hampE'r such a method. This aspect
was not investigated any further.
96
The failure of the precipitin reaction to demonstrate any cross-reactivity of the anti sera
meant that an alternative method was required to test this cross-specificity. For this purpose
both an immunodot blot and an ELISA were tested, the results of which are presented and
compared in section 5.5.4 below.
5.5.4 Detennination of cross-specificity of antibodies protein coats
5.5.4.1 In trod uction
Theoretically, when ATR was coupled to the various carriers for immunization purposes,
antibodies would have been raised to both the hapten and the carrier . The purpose of this
study was, therefore, to determine the cross reactivity of the antisera to BSA, RSA and
ovalbumin.
Even coupling agents used to conjugate a hapten to a carri er have the potential to elicit
antibody production (Goodfriend et al ., 1964; Briand et al ., 1985), as these reagents can
modify carrier residues. When injected into animals , thl~ s e "coupling agent modifi ed
residues" (CAMOR) may induce anti-CAMOR antibody production, contributing to fal se
readings in immunoassays, especially if a protein-hapten conjugate is used to coat ELISA
plates. Such anti-CAMOR antibodies may also be elicited by carrier molecules that have
reacted with carbodiimides. These antibodies react with both the same carrier treated with
the conjugation reagent in the absence of bound hapten, and with unrelated carriers treated
with the same coupling compound. Since this phenomenon is often over-looked when
characterising antisera (Briand et al., 1985) it was thorough Iy investigated by the present
author.
The experiment described below, therefore, was designed to investigate the presence of anti
CAMOR antibodies, and to monitor the cross-reactivity of the antisera to different proteins.
Anti-CAMOR antibodies were tested by an ELISA, while cross-reactivity was determined by
both ELISA and an immunodot blot (section 5.5.4.2). The immunodot blot was developed by
F. Dehrmann (pers. comm., 1991).
97
5.5.4.2 Methods
Enzyme immunoassay
This immunoassay is a modification of the assay of Bye et al. (1990) (see Appendix A).
Ovalbumin, BSA and RSA were reacted with carbodiimide, as described in section 5.3 .2, but
in the absence of ATR, hereafter referred to as 0 -0, B-B and R-R respectively. Microtitre
wells were coated with 200 Ill/well of a 0.1 mg/ml solution of either unadulterated or
carbodiimide-modified protein, prepared in 0.05 M carbonatE buffer, pH 9.6 (section 3.5.1)
and the plates were incubated overnight at 4"C. Antisera, containing the primary antibody,
from each of the six rabbits (prepared as described in section 3.4.2) was diluted 1:500 or
1:1000 in TBS. A 200 III volume of each primary antibody was added to each well, for each
representative protein coat. Plates were incubated for 2 hOUl'S at 37"C, washed thrice with
tap water and incubated for a further 2 hours , under the same conditions, with a 1:3 000
dilution of goat anti-rabbit IgG-alkaline phosphatase conjugate. Plates were washed thrice
with tap water and incubated for 1 hour, at 37"C with p-nitrcphenyl phosphate (1 mg/ml in
0.1 M diethanolamine buffer, pH 9.6; section 3.5.1) and the absorbance was monitored using
a Biotek spectrophotometer.
Dot immunobinding assay
This method was developed by F. Dehrmann (pel's. comm., 1£190). Unless otherwise stated,
all incubations were carried out at room temperature, in the dHrk. Nitrocellulose membranes
were washed in distilled water for 5 minutes and air dried. A 1 III volume of protein (BSA,
RSA or ovalbumin,l mg/mn was spotted onto the membralw and dried . The sheets were
rinsed twice in TBS, once in TBS containing 0.05% (v/V) Tween 20 and again in TBS. The
free sites on the membrane were blocked with 3Ck (w/v) "Elite" milk powder in TBS, for
3 hours. Membranes were washed as described above and incubated with appropriate
antisera (prepared as described in section 3.4.2), diluled 1:20, 1:100 or 1:200 in the blocking
solution. Membranes were incubated overnight. Washing was repeated and membranes
were incubated for 3 hours with the secondary antibody-enzyme conjugate, diluted 1:4000, in
the blocking solution . The sheets were washed and incubated with 4-Bl'omo-3-chloro-indolyl
phosphate (1 mg/ml in 0.1 M diethanolam ine buffer, pH 9.6; section 3.5.1) for 1 hour. A
positive reaction was noted by development of a blue precipi teite. Appropriate con troIs were
included throughout. The results of the dot blot and the ELISA are summarized in section
5.5.4.3 below.
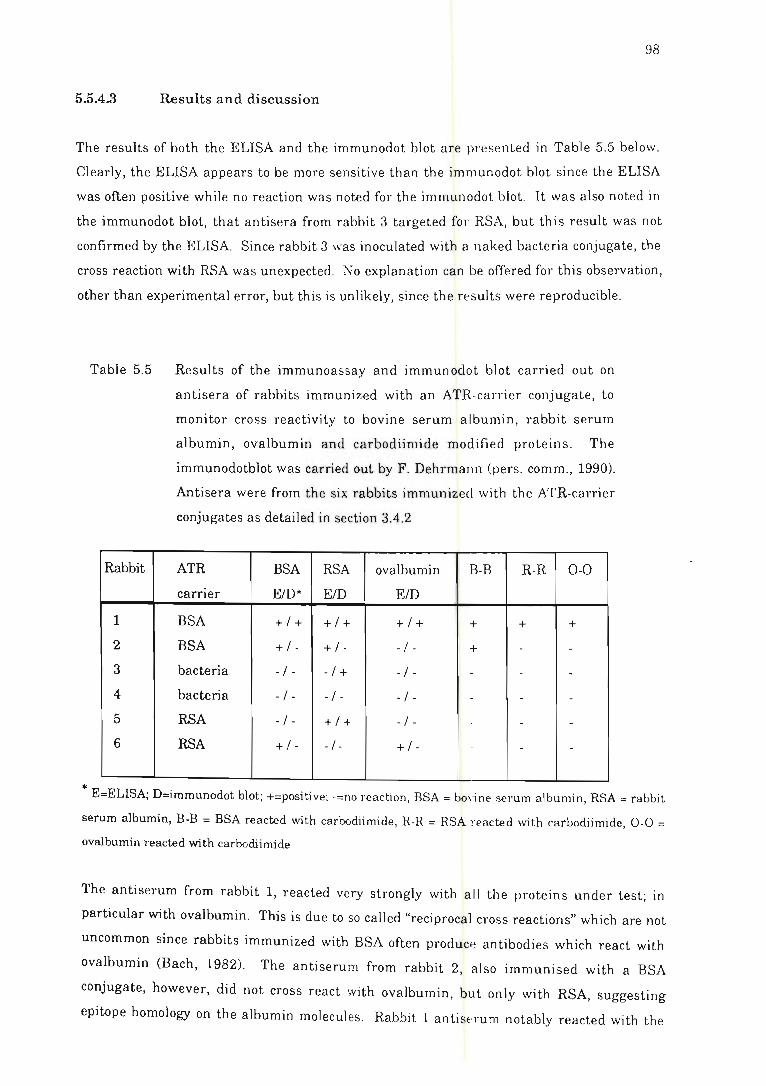
98
5.5.4.3 Results and discussion
The results of both the ELISA and the immunodot blot are presented in Table 5.5 below.
Clearly, the ELISA appears to be more sensitive than the immunodot blot since the ELISA
was often positive while no reaction was noted for the immunodot blot. It was also noted in
the immunodot blot, that antisera from rabbit 3 targeted for RSA, but this result was not
confirmed by the ELISA. Since rabbit 3 was inoculated with a naked bacteria conjugate, the
cross reaction with RSA was unexpected. No explanation can be offered for this observation,
other than experimental error, but this is unlikely, since the rE-sults were reproducible.
Table 5.5
Rabbit
1
2
3
4
5
6
Results of the immunoassay and immunodot blot carried out on
antisera of rabbits immunized with an ATR-carrier conjugate, to
monitor cross reactivity to bovine serum albumin, rabbit serum
albumin, ovalbumin and carbodiimide modified proteins. The
immunodotblot was carried out by F. Dehrmann (pel's. comm., 1990).
Antisera were from the six rabbits immunized with the ATR-carrier
conjugates as detailed in section 3.4.2
ATR BSA RSA ovalbumin B-B R-R 0-0
carrier EID* E/D EID
BSA +1+ +1+ +1+ + + +
BSA + 1- + I - - I - + - -
bacteria - I - -1+ - I - - - -
bacteria - I - - I - - I - - - -RSA - I - +1+ - I - - - -RSA + 1- - I - + 1- - - -
* . E=ELISA; D=lmmunodot blot; +=positive; ·= \10 reaction, BSA = bo\i ne serum albumin, RSA = rabbit
serum albumin, B-B = BSA reacted with carbodiimide, R-R = RSA reacted with carbodiimide, 0-0 =
ovalbumin reacted with carbodiimide
The antiserum from rabbit 1, reacted very strongly with all the proteins under test; in
particular with ovalbumin. This is due to so called "reciprocal cross reactions" which are not
uncommon since rabbits immunized with BSA often produce antibodies which react with
ovalbumin (Bach, 1982). The antiserum from rabbit 2, also immunised with a BSA
conjugate, however, did not cross react with ovalbumin, but on ly with RSA, suggesting
epitope homology on the albumin molecules. Rabbit 1 antisE·rum notably reacted with the
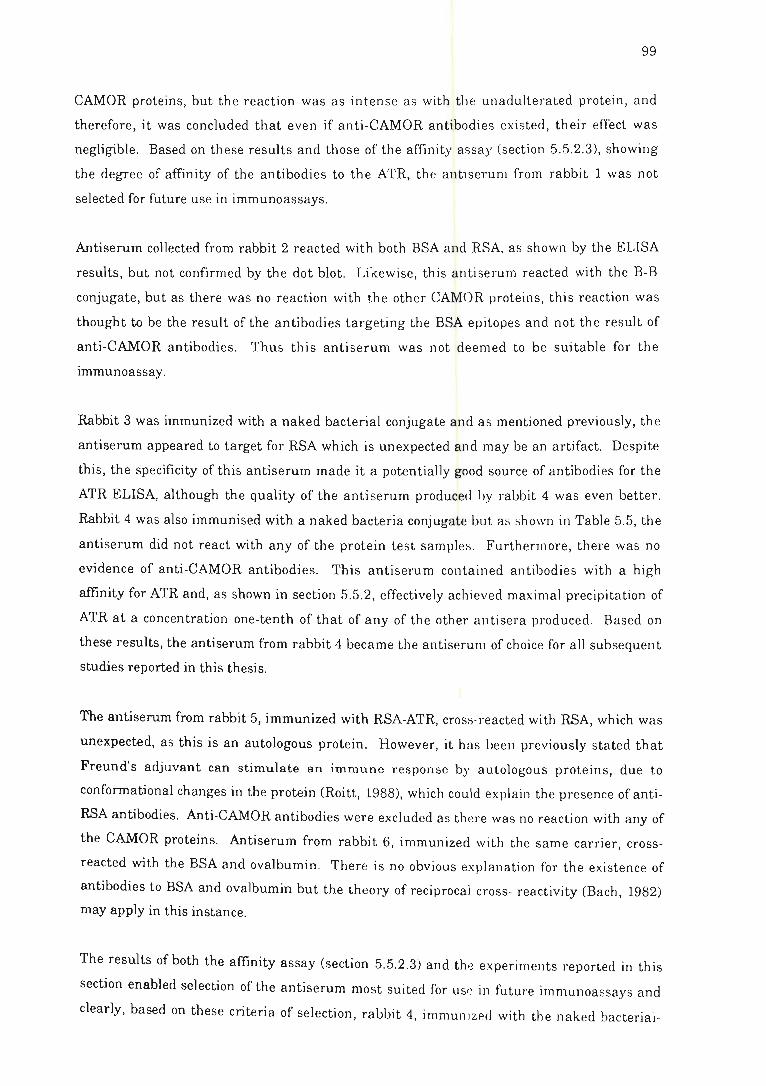
99
CAMOR proteins, but the reaction was as inten se as with tIl e unadulterated protein, and
therefore, it was concluded that even if anti-CAMOR antibodies existed, their effect was
negligible. Based on these results and those of the affinity assay (section 5.5.2.3), showing
the degree of affinity of the antibodies to the ATR, the anti serum from rabbit 1 was not
selected for future use in immunoassays.
Antiserum collected from rabbit 2 reacted with both BSA and RSA, as shown by the ELISA
results, but not confirmed by the dot blot. Likewise, this anti serum reacted with the B-B
conjugate, but as there was no reaction with the other CAMOR proteins, this reaction was
thought to be the result of the antibodies targeting the BSA epitopes and not the result of
anti-CAMOR antibodies. Thus this antiserum was not deemed to be suitable for the
immunoassay.
Rabbit 3 was immunized with a naked bacterial conjugate and as mentioned previously, the
antiserum appeared to target for RSA which is unexpected and may be an artifact. Despite
this, the specificity of this antiserum made it a potentially good source of antibodies for the
ATR ELISA, although the quality of the antiserum produce(l by rabbit 4 was even better.
Rabbit 4 was also immunised with a naked bacteria conjugate but as shown in Table 5.5, the
antiserum did not react with any of the protein test samples. Furthermore, there was no
evidence of anti-CAMOR antibodies . This antiserum contained antibodies with a high
affinity for ATR and, as shown in section 5.5.2, effectively achieved maximal precipitation of
ATR at a concentration one-tenth of that of any of the other antisera produced. Based on
these results, the antiserum from rabbit 4 became the antiserum of choice for all subsequent
studies reported in this thesis.
The antiserum from rabbit 5, immunized with RSA-ATR, cross-reacted with RSA, which was
unexpected, as this is an autologous protein. However, it has been previously stated that
Freund's adjuvant can stimulate an immune response by autologous proteins, due to
conformational changes in the protein (Roitt, 1988), which could explain the presence of anti
RSA antibodies. Anti-CAMOR antibodies were excluded as there was no reaction with any of
the CAMOR proteins. Antiserum from rabbit 6, immunized with the same carrier, cross
reacted with the BSA and ovalbumin . There is no obvious explanation for the existence of
antibodies to BSA and ovalbumin but the theory of reciprocal cross- reactivity (Bach, 1982)
may apply in this instance.
The results of both the affinity assay (section 5.5.2.3) and the experiments reported in this
section enabled selection of the antiserum most suited for use in future immunoassays and
clearly, based on these criteria of selection, rabbit 4, immul1Jzed with the naked bacterial -
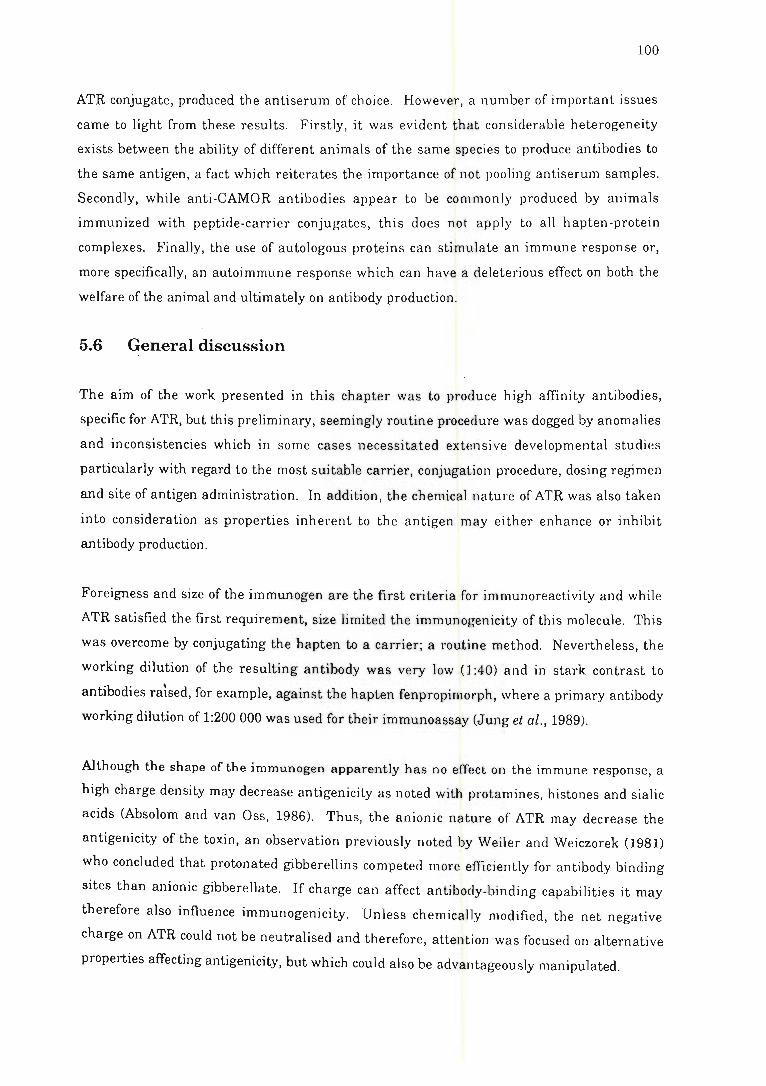
100
ATR conjugate, produced the antiserum of choice. However, a number of important issues
came to light from these results. Firstly, it was evident that considerable heterogeneity
exists between the ability of different animals of the same species to produce antibodies to
the same antigen, a fact which reiterates the importance of not pooling antiserum samples.
Secondly, while anti-CAMOR antibodies appear to be commonly produced by animals
immunized with peptide-carrier conjugates, this does not apply to all hapten-protein
complexes. Finally, the use of autologous proteins can stimulate an immune response or,
more specifically, an autoimmune response which can have a deleterious effect on both the
welfare of the animal and ultimately on antibody production.
5.6 General discussion
The aim of the work presented in this chapter was to produce high affinity antibodies,
specific for ATR, but this preliminary, seemingly routine procedure was dogged by anomalies
and inconsistencies which in some cases necessitated extensive developmental studies
particularly with regard to the most suitable carrier, conjugation procedure, dosing regimen
and site of antigen administration. In addition, the chemical nature of ATR was also taken
into consideration as properties inherent to the antigen may either enhance or inhibit
antibody production.
Foreigness and size of the immunogen are the first criteria for immunoreactivity and while
ATR satisfied the first requirement, size limited the immunogenicity of this molecule. This
was overcome by conjugating the hapten to a carrier; a routine method. Nevertheless, the
working dilution of the resulting antibody was very low (1 :40) and in stark contrast to
antibodies rrused, for example, against the hapten fenpropimorph, where a primary antibody
working dilution of 1:200000 was used for their immunoassay (Jung et ai., 1989).
Although the shape of the immunogen apparently has no effect on the immune response, a
high charge density may decrease antigenicity as noted with protamines, histones and sialic
acids (Absolom and van Oss, 1986). Thus, the anionic nature of ATR may decrease the
antigenicity of the toxin, an observation previously noted by Weiler and Weiczorek (1981)
who concluded that protonated gibberellins competed more efficiently for antibody binding
sites than anionic gibberellate. If charge can affect antibody-binding capabilities it may
therefore also influence immunogenicity. Unless chemically modified, the net negative
charge on ATR could not be neutralised and therefore, attention was focused on alternative
properties affecting antigenicity, but which could also be advantageously manipulated.
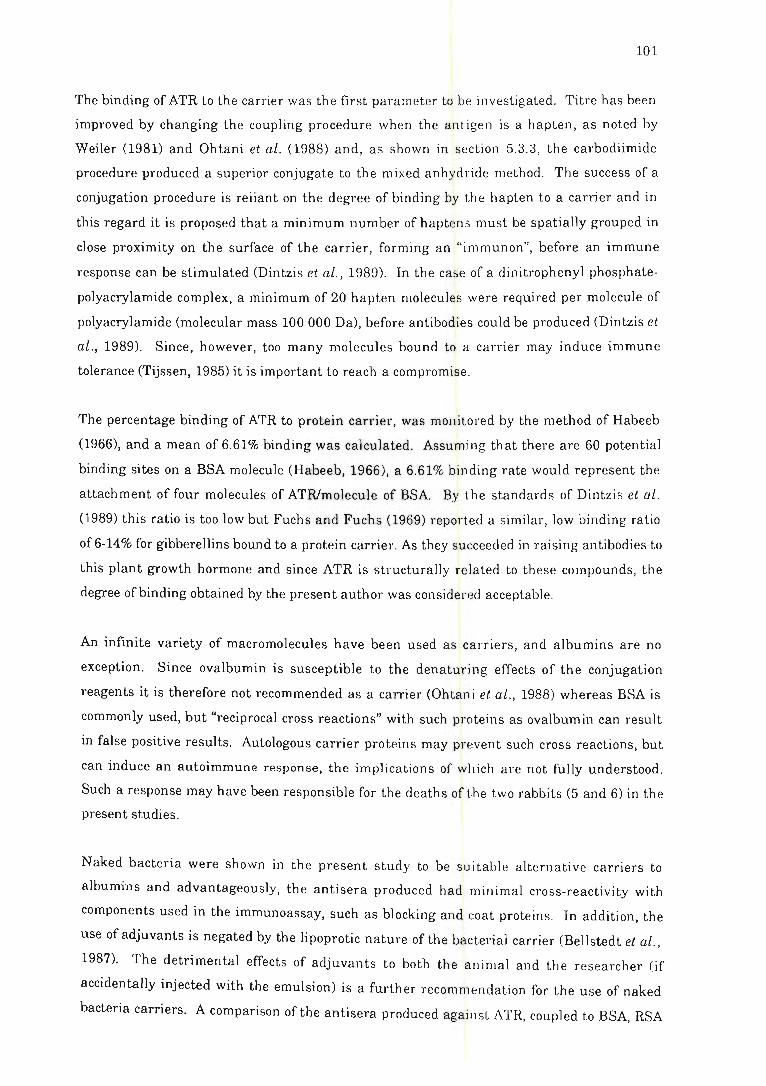
101
The binding of ATR to the carrier was the first parameter to be investigated. Titre has been
improved by changing the coupling procedure when the antigen is a hapten , as noted by
Weiler (1981) and Ohtani et ai. (1988) and, as shown in section 5.3.3, the carbodiimide
procedure produced a superior conjugate to the mixed anhydride method. The success of a
conjugation procedure is reliant on the degree of binding by the hapten to a carrier and in
this regard it is proposed that a minimum number of hapten s must be spatially grouped in
close proximity on the surface of the carrier, forming an "i mmunon", before an immune
response can be stimulated (Dintzis et al., 1989). In the case of a dinitrophenyl phosphate
polyacrylamide complex, a minimum of 20 hapten molecules were required per molecule of
polyacrylamide (molecular mass 100 000 Da), before antibodies could be produced (Dintzis et
ai., 1989). Since, however, too many molecules bound to a carrier may induce immune
tolerance (Tijssen, 1985) it is important to reach a compromi se.
The percentage binding of ATR to protein carrier, was monitored by the method of Habeeb
(1966), and a mean of 6.61 % binding was calculated. Assuming that there are 60 potential
binding sites on a BSA molecule (Habeeb, 1966), a 6.61% binding rate would represent the
attachment of four molecules of ATRlmolecule of BSA. By t he standards of Dintzis et ai .
(1989) this ratio is too low but Fuchs and Fuchs (1969) reported a similar, low binding ratio
of6-14% for gibberellins bound to a protein carrier. As they succeeded in raising antibodies to
this plant growth hormone and since ATR is structurally related to these compounds, the
degree of binding obtained by the present author was considered acceptable.
An infinite variety of macromolecules have been used as carriers, and albumins are no
exception. Since ovalbumin is susceptible to the denaturing effects of the conjugation
reagents it is therefore not recommended as a carrier (Ohtani et ai., 1988) whereas BSA is
commonly used, but "reciprocal cross reactions" with such proteins as ovalbumin can result
in false positive results. Autologous carrier protein s may prevent such cross reactions, but
can induce an autoimmune response, the implications of which are not fully understood .
Such a response may have been responsible for the deaths of the two rabbits (5 and 6) in the
present studies.
Naked bacteria were shown in the present study to be suitable alternative carriers to
albumins and advantageously, the antisera produced had minimal cross-reactivity with
components used in the immunoassay, such as blocking and coat proteins. In addition, the
use of adjuvants is negated by the lipoprotic nature of the bacterial carrier (Bellstedt et ai.,
1987). The detrimental effects of adjuvants to both the a nimal and the researcher (if
accidentally injected with the emulsion) is a further recomm en dation for the use of naked
bacteria carriers. A comparison of the antisera produced against ATR, coupled to BSA, RSA
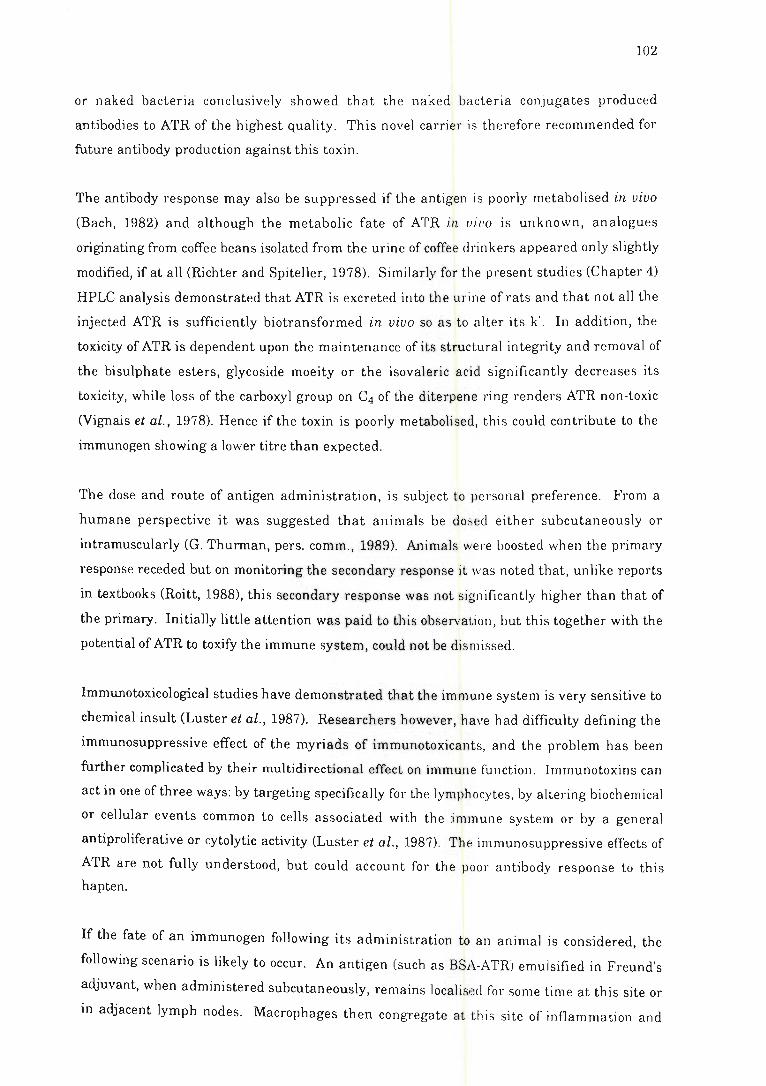
102
or naked bacteria conclusively showed that the naked bacteria conjugates produced
antibodies to ATR of the highest quality. This novel carrier is therefore recommended for
future antibody production against this toxin .
The antibody response may also be suppressed if the antigen is poorly metabolised in vivo
(Bach, 1982) and although the metabolic fate of ATR in vivo is unknown, analogues
originating from coffee beans isolated from the urine of coffee drinkers appeared only slightly
modified, if at all (Richter and Spiteller, 1978). Similarly for th e present studies (Chapter 4)
HPLC analysis demonstrated that ATR is excreted into the urine of rats and that not all the
injected ATR is sufficiently biotransformed in vivo so as to alter its k' . In addition, the
toxicity of ATR is dependent upon the maintenance of its structural integrity and removal of
the bisulphate esters, glycoside moeity or the isovaleric acid significantly decreases its
toxicity, while loss of the carboxyl group on C4 of the diterpene ring renders ATR non-toxic
(Vignais et al., 1978). Hence if the toxin is poorly metabolised, this could contribute to the
immunogen showing a lower titre than expected.
The dose and route of antigen administration, is subject to personal preference. From a
humane perspective it was suggested that animals be dosed eith er subcutaneously or
intramuscularly (G. Thurman, pel's. comm., 1989). Animals were boosted when the primal'y
response receded but on monitoring the secondary response it was noted that, un like reports
in textbooks (Roitt, 1988), this secondary response was not significantly higher than that of
the primary. Initially little attention was paid to this observation , but this together with the
potential of ATR to toxify the immune system, could not be dismissed.
Immunotoxicological studies have demonstrated that the immune system is very sensitive to
chemical insult (Luster et ai., 1987). Researchers however, have had difficulty defining the
immunosuppressive effect of the myriads of immunotoxicants, and the problem has been
further complicated by their multidirectional effect on immune function . Immunotoxins can
act in one of three ways: by targeting specifically for the lymphocytes, by altering biochemical
or cellular events common to cells associated with the immune system or by a general
antiproliferative or cytolytic activity (Luster et ai ., 1987). The immunosuppressive effects of
ATR are not fully understood, but could account for the poor antibody response to this
hapten.
If the fate of an immunogen following its administration to an animal is considered, the
following scenario is likely to occur. An antigen (such as BSA-ATR) emulsified in Freund's
adjuvant, when administered subcutaneously, remains localis,~ d for some time at this site or
in adjacent lymph nodes. Macrophages then congregate at thi s site of inflammation and
103
engulf the soluble antigen by pinocytosis (Weir, 1984). A close association between these
macrophages and lymphocytes (B- and T-cells), suggests that macrophages are involved in
stimulation of antibody production. This association has been confirmed experimentally,
since the removal of macrophages from a lymphocyte suspension is correlated with a
suppression in antibody production. This suppression of antibody production in the absence
of macrophages, is most notable with soluble, weakly immunogenic or thymus independent
antigens (Bach, 1982). It is possible that when ATR is phagocytosed by macrophages the
toxin may inhibit energy production in these mitochondrial-rich cells, thus either destroying
or depleting the macrophage population. Macrophages, in turn, are implicated in the
induction of antibody production by lymphocytes and, if macrophages are destroyed by ATR,
this would ultimately depress lymphocyte stimulation, and account for the poor antibody
response. Theoretically though, destruction of the macrophages would limit all antibody
production whereas the fact that antibody production to ATR was only depressed rather than
prevented, suggests that only inhibition of B- and T-cell function occuned.
B- and T-lymphocytes are involved in humoral and cell mediated immunity (Tijssen, 1985)
whereby B-cells are thought to produce antibodies to thymus dependent antigens, with the
help ofT-cells. However, if the antigen is a hapten-carrier, the response is shared by the B
and T-cells; B-cells producing anti-hapten antibodies and the T -cells anti-carrier antibodies.
Although a division oflabour exists between the T- and B-cell~ with respect to the production
of antibodies to a carrier and its hapten moieties, the two lymphocyte populations are
nevertheless closely associated (Bach, 1982).
It is feasible that ATR could prevent ATP synthesis in the T-cells, causing them to die but
this toxin also induces the release of intra-mitochondrial calcium into the cytoplasm, and this
may have a far more detrimental effect on the lymphocytes. Cytoplasmic calcium is thought
to be an intracellular signal for cell growth inhibition, and chronic levels of this cation in the
cell are an early indicator of cell injury, particularly in immune cells. It has been noted that
infection of T4+ lymphoid cells by the human immunodeficiency virus (HIV) (an
immunosuppressant) is associated with enhanced permeability of the cell membrane, causing
an influx of divalent ions, particularly calcium (Lynn et al., 1988). The envelope protein
(env) of the HIV or an env-gene product is thought to alter the membrane permselectivity,
resulting in this influx of calcium ions. Calcium impairs macromolecule anabolism and
depresses the uptake of other divalent ions, such as zinc. The activity of zinc-dependent
enzymes, involved in DNA and RNA replication and ultimately protein biosynthesis is,
therefore, suppressed. This increased concentration of cytoplasmic calcium causes cessation
of growth and ultimately, cell lysis (Lynn et al., 1988). Immu.ne suppression by HIV is well
104
documented and the elevation of cytoplasmic calcium levels is thought to be involved in this
inhibition (Lynn et al., 1989).
Atractyloside also alters membrane structure, inducing efflux of calcium from intra
mitochondrial stores into the cytoplasm, and thus effectively both HIV and ATR cause
cytoplasmic calcium concentrations to increase. It is feasible , therefore, that ATR may also
affect T-cells in the same manner as HIV and by suppressing T-cells, B-cells cannot produce
antibodies which decreases the immune response .
Although B-cells are mainly involved in the production of ant.ibodies to haptens, the T-cel1s
are apparently also required although their precise function is not known. The T-cells are
imperative in the stimulation of a secondary response, by the B-cells, to a hapten . It has
been demonstrated that when an animal is primed with a hapten conjugated to a carrier
(such as keyhole limpit haemocyanin), boosting with the same antigen induces a secondary
immune response, the result of immunological memory . This secondary response is
associated with antibody class switch from IgM to IgG antibodies and T-ceJJs are thought to
be imperative for this class switch to occur although T-cell memory is directed towards the
carrier, while that of the B-cells is directed towards the hapten. If however, the animal is
primed with a hapten-keyhole limpit haemocyanin conjugate and boosted with an
immunogen where the carrier is now ovalbumin, there is no secondary response since the T
cells do not recognise the carrier (Bach, 1982; Tijssen, 1985). Thus, T-cells are involved in
both class switch and promoting B-cell antibody production and consequently, if these T-cells
were destroyed by the ATR, this could suppress the antibody response to the hapten by the
B-cells and furthermore, T-cell memory could be lost. On subsequent boosting with the ATR
carrier, there should be a secondary response but if immunological memory was lost, the
apparent secondary response could be a primary response. This could account for the similar
titre levels in both the primary and secondary response to an ATR-carrier conjugate (section
5.3).
If the secondary response did not occur, then theoretically class switch would also not have
taken place. Therefore, the antibodies produced by the B-cells to ATR post-boosting would be
IgM not IgG antibodies. It was accidently found that the primary antibodies raised against
ATR only bind to the antigen at 4°C and not 37°C and these results are shown in Chapter 6.
So called "cold-antibodies" are usually IgM and not IgG antibodies and this would support
the proposal that ATR inhibits T-cell function and class switch.
Unfortunately, the phenomena of antibody production, class switch and immune suppression
are not fully elucidated and this makes interpretation of results very difficult. The proposals

105
presented are, therefore, highly speculative but it was nevertheless concluded from this study
that ATR is not a good immunogen and has the potential to act as an immunosuppressive
agent. Use was however made of the antiserum raised by the rabbit immunized with the
naked bacterial conjugate (Rabbit 4) for the development of an immunoassay, and the details
of the optimisation of this immunoassay are given in Chapter 6 and ultimately in the
immunocytochemical investigation detailed in Chapter 7.
CHAPTER 6
TIlE DEVELOPMENT OF AN ENZY.ME-LINKED IMlV1UNOSORBENT
ASSAY (ELISA) FOR ATRACTYLOSIDE
6.1 Introduction
The availability of antibodies to ATR (the production of which is described in Chapter 5),
provided the means to develop an immunological detection system for this toxin . Although,
historically, haptens have been detected by radioimmunoassays (RIA), the quantitative
determination of antigens by non-isotopic, enzyme immunoassays (EIA) has evolved as a
natural progression from RIA and provided an alternative, but not necessarily superior,
detection system (Engvall and Perlmann, 1971; Maggio, 1980)
106
Enzyme-bound immunoreactants were initially developed in the mid-sixties for
identification and localization of antigens in histological specimens, and for the
identification of immunodiffusion and immuno-electrophoresis precipitin bands
(Nakane and Pierce, 1967). It was only in the 1970s, however, that this technique was
routinely used as an analytical procedure, when it was noted that antigens and antibodies
could be immobilized onto solid phases (Engvall and Perlmann, 1971; Van Weemen and
SchuUTs, 1971; Maggio, 1980; Tijssen, 1985; Kemeny and Chantler, 1988). One such solid
phase technique that was developed is the enzyme-linked immunosorbent assay (ELISA)
(Engvall and Perlmann, 1971) where the basic principle may be divided into two
operations. The first involves the reaction of antibody with corresponding antigen, with
one of the immunoreactants being bound to an enzyme, while in the second phase, the
catalytic conversion of substrate to a coloured product by the bound enzyme is used to
monitor the degree of binding of antigen to antibody (Tijssen: 1985)
Since 1971, numerous ELISAs have been developed with an infinite number of variations
on the central theme to encompass the diverse nature of the antigens being assayed. In the
present studies, the ELISA developed for ATR is based on the competitive solid phase ELISA
of Engvall and Perlmann (1971). In their method, pure antigen is bound to the solid phase
while antibody is added in conjunction with free antigen (in the sample) causing the free
and bound antigen to compete directly for antibody. The antibody bound to the coating
antigen is then measured by the addition of a secondary antibody-enzyme conjugate
(specific for the primary antibody) and appropriate substrate. The coricentration of the
product, which is monitored colorimetrically is, therefore, inversely proportional to the
free antigen present in the standard or test sample (Tijssen, 1985).
Since there was no existing immunoassay for ATR, the present studies necessitated the
sequential optimisation of every stage of the ELISA proc:ess, including selection of a
suitable solid phase support, optimisation of the coating buffer pH and coating conditions,
selection of a suitable blocking agent and applicabon of the ELISA for the analysis of ATR
in biological fluids. These aspects are reported in detail in separate subsections of this
chapter, while the final optimised procedure is also detailed in section 3.5.2.
6.2 Selection of a solid phase support
6.2.1 Introduction and general considerations
107
In view of the fact that there was no known ELISA for the detection of ATR, it was first
necessary to select a suitable solid support, since the success of a solid phase immunoassay
is reliant on the stable binding of antigen or antibody to the solid phase . The coating
antigen or antibody is most frequently bound to a polyvinyl or polystyrene solid phase, but
cellulose nitrate, polyallommer centrifuge tubes, nylon and latex have also been employed
(Herrmann and Collins, 1976; Cantarero et al ., 1980; Urbanek et al., 1985). Cellulose
nitrate is however, a poor solid phase support and thus cellulose nitrate containers are
frequently employed for preparative work, since loss of immunoglobulins due to non
specific binding is minimal (Herrmann and Collins, 1976) .
The binding of an antibody or antigen to a solid phase may either be by passive adsorption
or active covalent linking. Passive adsorption involves exposure of the solid phase to the
immunoreactant for a few hours, permitting hydrophobic interaction and bonding
(Standefer, 1985). The process is divided into two distinct steps: the primary phase
involving adsorpbon of the molecule to the solid phase, followed by the secondary stage
which is associated with protein-protein interactions and development of multiple coating
layers. It is the detachment of the secondary coating phase which is invariably responsible
for random results (Cantarero et al., 1980; Tijssen, 1985). Although these observations
pertain to the coating of protein antigens, they are also of relevance to the ELISA for ATR, <
since this antigen was coated onto the solid phase as a protein-hapten conjugate. Active
covalent linking of the immunoreactant to the solid phase involves pre-treatment of the
support with, for example, 2% (v/v) glutaraldehyde prior to the addition of the
immunoreactant (Standefer, 1985; Tijssen, 1985). Such pre-treatment, as opposed to
merely adding the immunoreactant directly to the solid support, increases coating of the
solid phase some 2-5 fold over a period of one hour at 37°C (Standefer, 1985). In the present
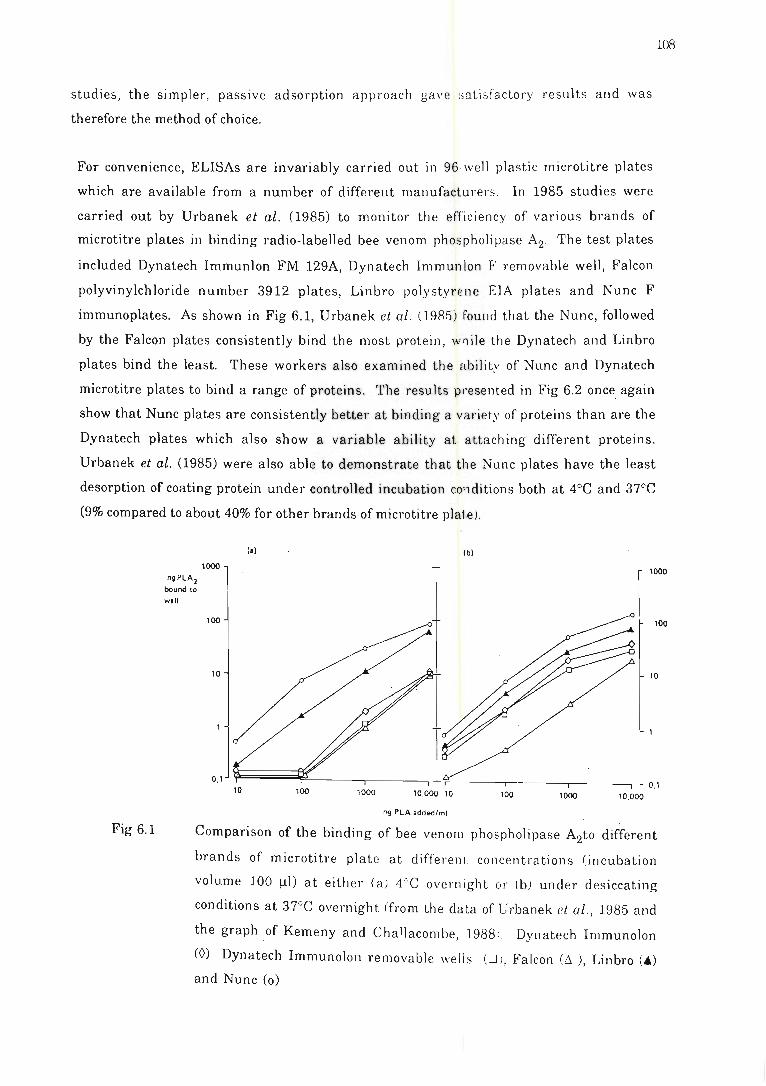
studies , the simpler, passive adsorption approach gave :;atisfactory r esults and was
therefore the method of choice.
For convenience, ELISAs are invariably carried out in 96·well plastic microtitre plates
which are available from a number of different manufacturers. In 1985 studies were
carried out by Urbanek et al. (1985) to monitor the effici ency of various brands of
microtitre plates in binding radio-labelled bee venom phospholipase A2. The test plates
included Dynatech Immunlon FM 129A, Dynatech Immunlon F removable well, Falcon
polyvinylchloride number 3912 plates , Linbro polystyrene EIA plates and Nunc F
immunoplates. As shown in Fig 6.1, Urbanek et ai. (1985) fo und that the Nunc, followed
by the Falcon plates consistently bind the most protei n, w'(}ile the Dynatech and Linbro
plates bind the least. These workers also examined the ability of Nunc .and Dynatech
micro titre plates to bind a range of proteins. The results presented in Fig 6.2 once again
show that Nunc plates are consistently better at binding a variety of proteins than are the
Dynatech plates which also show a variable ability at attaching different proteins.
Urbanek et at. (1985) were also able to demonstrate that the Nunc plates have the least
desorption of coating protein under controlled incubation cO"lditions both at 4°C and 37"'C
(9% compared to about 40% for other brands of microtitre plate).
ng PlA2
1000 1 bound to
well
100
10
(I) (b)
I
108
J I i -i 0.1
10 100
Fig 6.1
1000 10.000 10 100 1000 10,000
ng PlA added/ml
Comparison of the binding of bee venom phospholipase A2to different
brands of microtitre plate at differen1. concentrations (i ncubation
volume 100 Ill) at eith er (a ) 4'oC overnight or (b) under desiccating
conditions at 37°C overnight (from the data of urbanek et ai., 1985 and
the graph .of Kemeny and Chall acombe, 1988.1. Dynatech Immunolon
(0) Dynatech Immunolon removable \ve ll s C-J ), Falcon (6 ), Linbro (&)
and Nunc (0)
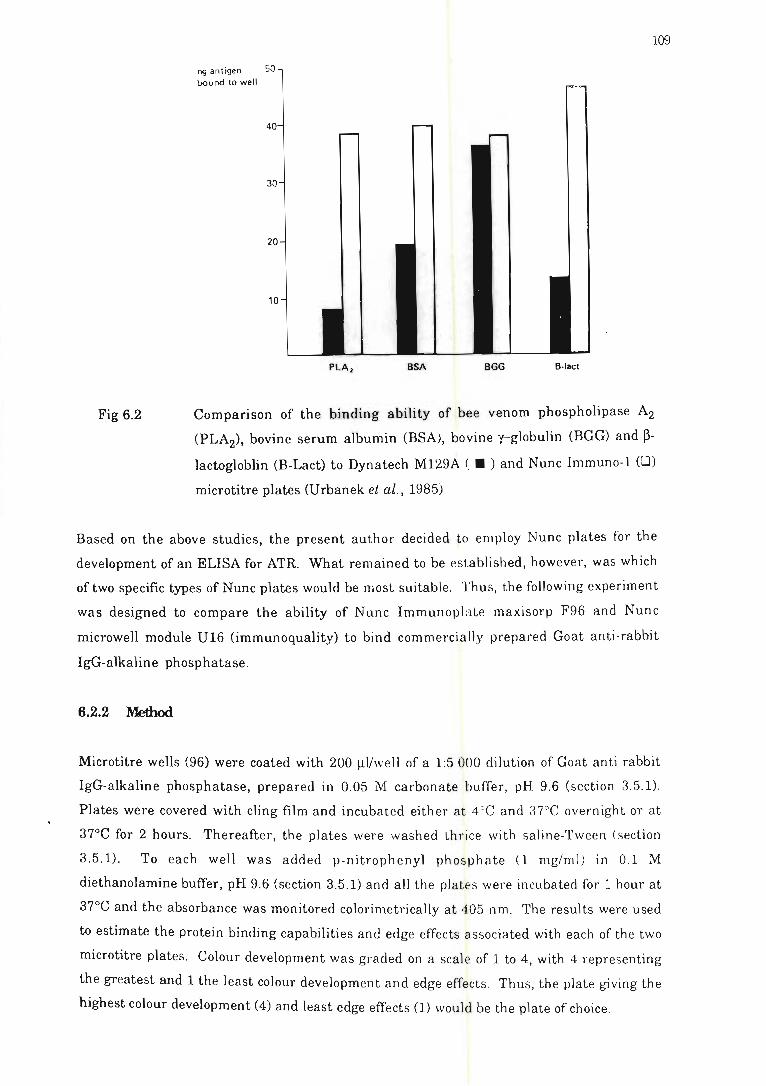
Fig 6.2
ng antigen 50 bound to well
20
10
PLA, BSA BGG B·lact
Comparison of the binding ability of bee venom phospholipase A2
(PLA2), bovine serum albumin (BSA), bovine y-globulin (BGG) and ~
lac~globlin (B-Lact) to Dynatech M129A ( • ) and Nunc Immuno-1 (0)
microtitre plates (Urbanek et al., 1985)
Based on the above studies, the present author decided to employ Nunc plates for the
development of an ELISA for ATR. What remained to be established, however, was which
of two specific types of Nunc plates would be most suitable. Thus, the following experiment
was designed to compare the ability of Nunc Immunoplate maxisorp F96 and Nunc
microwell module U16 (immunoquality) to bind commercially prepared Goat anti-rabbit
IgG-alkaline phosphatase.
6.2.2 Method
Microtitre wells (96) were coated with 200 Ill/well of a 1:5 ouo dilution of Goat anti .rabbit
IgG-alkaline phosphatase, prepared in 0.05 M carbonate buffer, pH 9.6 (section · 3.5.1).
Plates were covered with cling film and incubated either at 4"C and 37°C overnight or at
37°C for 2 hours. Thereafter, the plates were washed thri ce with saline-Tween (section
3.5.1). To each well was added p-nitrophenyl phosphate (1 mg/m I) in 0.1 M
diethanolamine buffer, pH 9.6 (section 3.5.1) and all the plates were incubated for 1 hour at
37°C and the absorbance was monitored colorimetrically at 405 nm . The results were used
to estimate the protein binding capabilities and edge effects as sociated with each of th e two
microtitre plates. Colour development was graded on a scal e of 1 to 4, with 4 representing
the greatest and 1 the least colour development and edge effects. Thus, the plate giving the
highest colour development (4) and least edge effects (1) would be the plate of choice.
109
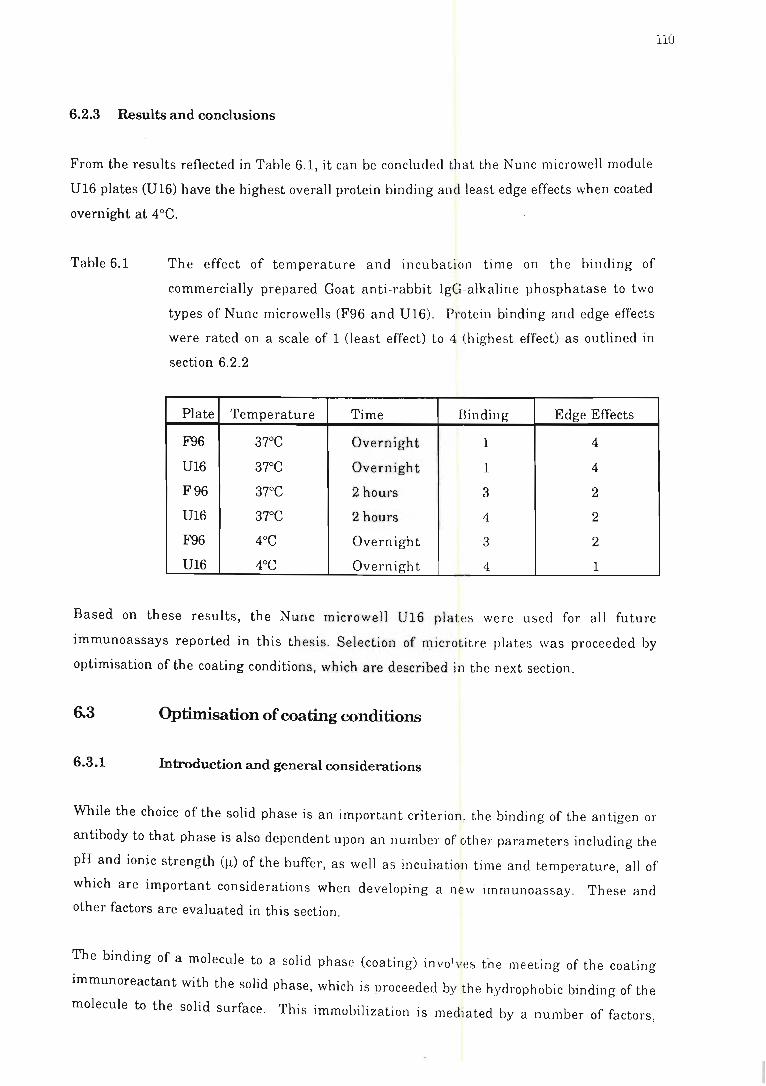
6.2.3 Results and conclusions
From the results reflected in Table 6.1, it can be concluded that the Nunc microwell module
V16 plates (V16) have the highest overall protein binding and least edge effects when coated
overnight at 4°C.
Table 6.1 The effect of temperature and incubation time on the binding of
commercially prepared Goat anti-rabbit IgG-alkaline phosphatase to two
types of Nunc microwells (F96 and V16) . Protein binding and edge effects
were rated on a scale of 1 (least effect) to 4 (highest effect) as outlined in
section 6.2.2
Plate Temperature Time Binding Edge Effects
F96 37°C Overnight 1 4
V16 37°C Overnight 1 4
F96 37°C 2 hours 3 2
V16 37°C 2 hours 4 2
F96 4°C Overnight 3 2
V16 4°C Overnight 4 1
110
Based on these results, the Nunc microwell V16 platE! s were used for all future
immunoassays reported in this thesis. Selection of microtitre plates was proceeded by
optimisation of the coating conditions, which are described in the next section.
6.3 Optimisation of coating conditions
6.3.1 Introduction and general considerations
While the choice of the solid phase is an important criterion , the binding of the antigen or
antibody to that phase is also dependent upon an number of other parameters including the
pH and ionic strength (I-L) of the buffer, as well as incubation time and temperature, all of
which are important consideration s when developing a new immunoassay. These and
other factors are evaluated in this section.
The binding of a molecule to a solid phase (coati ng) involves the meeting of the coating
immunoreactant with the solid phase, which is proceeded by th e hydrophobic binding of the
molecule to the solid surface. This immobilization is media ted by a number of factors,
including the volume of immunoreactant added and th l' surface a rea available for
binding (L!6vborg, 1984). The amount of immunoreactant attached to the solid phase will be
determined by the available surface area on the solid phase and therefore, the lower the
volume of immunoreactant used, the greater the surface area to volume ratio and the more
sensitive the ass.ay (Kemeny and Challacombe, 1988). An optimal surface area to volume
ratio exists for each assay and this ratio must be as high as possible, 'Until an area size is
reached which exhausts the solvent for molecules . Thereafter , a further increase in ratio
has no positive effect on results (L!6vborg, 1984). With regard to assay volume, Kemeny
and Challacombe (1988) found that an ELISA in which volumes of 50 IlVwell were used, is
more sensitive than the same assay where the volume is increased to 200 Ill/well.
However, in the present study, for ease of pipetting and monitoring the final absorbance, it
was decided that a standard volume of 200 Ill/well would be used throughout the ATR
immunoassay.
111
On consideration of the nature of the coating buffer, it is noted that in practice, a 0.05 M
carbonate buffer, pH 9.6 is most commonly used (Catty and Raykundalia, 1988). It has
been stated that the pH and 11 of the coating buffer apparently have no effect on the degree of
binding of a protein to the microtitre wells, as binding is a consequence of hydrophobic
interactions (Tijssen, 1985; Kemeny and Challacombe, HI88). This is unexpected as
clearly ionic strength (11) and pH will influence protein conformation , which in turn is
bound to influence hydrophobicity and consequently binding (Oreskes and Singer, 1961).
In theory, a protein will most likely bind to th e microtitre plates, when a net zero charge
exists on the surface of the protein molecule. Thus, primary binding will be maximal at the
protein's pI, resulting from reduced electrostatic repul sion between the proteins , while
secondary binding will be minimal due to decrea sed protein-protein interactions
(Standefer, 1985). Therefore, bearing the above reasoning in mind, a coating buffer should
be selected with a pH close to the pI of the protein coat (for example, BSA has a pI of 4.90), but
this is not applied in practice. Instead it is rather stressed, that once a buffer J.l has been
selected, that J.l must be maintained when changing between coating, washing and
incubation buffers as any alterations may disrupt hydrogen bonding, inducing
detachment and assay variability (L{6vborg, 1984). This concept was adhered to throughout
the development of the ATR ELISA by the present author. Thus whereas in earlier work
Bye et ai. (1990) took the advice of Weiler (1986) in using a tap water wash, in subsequent
assays this was replaced by a saline-Tween wash .
Despite the universal use of a carbonate coating buffer, pH 9.6 which is alluded to in the
literature (Catty and Raykundalia, 1988), the present author felt it impoJ·tant that the pH

and nature of the coating buffer be optimised in the present studies, the results of which are
presented below.
6.3.2 Methods
Microtitre wells (96) were coated with 200 Ill/well of a 1:5 000 dilution of Goat anti-rabbit
IgG-alkaline phosphatase, prepared in one of the following: 0.05 M carbonate buffer, pH
8.6 or 9.6,0.05 M TBS buffer, pH 7.4 or 0.15 M citrate buffer, pH 5.0. Plates were covered
with cling film and incubated overnight at 4°C. Thereafter, the plates were washed thrice
with saline-Tween (section 3.5.1). To each well was added p-nitrophenyl phosphate
(1 mg/ml) in 0.1 M diethanolamine buffer, pH 9.6 (section 3.5.1) and the plates were
incubated for 1 hour at 37°C and the absorbance was monitored colorimetrically at 405 nm .
6.3.3 Results
112
The results presented in Table 6.2 below show no significant difference in the effect of pH
and nature of the coating buffer on the degree of binding of the Goat anti-rabbit IgG
alkaline phosphatase to the solid phase, except in the case of the citrate buffer. Since the
carbonate buffer, pH 9.6, afforded slightly better binding th an the other buffer systems
tested, this was used in all future immunoassays described in thi s thesis .
Table 6.2 Comparison of the effects of different buffers on the binding of
commercially prepared Goat anti-rabbit IgG-alkaline phosphatase.
The results are presented as the mean absorbance of 24
determinations . The experiment was performed as de scribed in
section 6.3.2
Buffer Mean Absorbance %CV
0.05 M carbonate buffer, pH 9.6 1.247 3.89
0.05 M carbonate buffer, pH 8.6 1.045 7.29
0.05 M TBS buffer, pH 7.4 0.976 5.90
0.15 M citrate buffer, pH 5.0 0.768 12.47
Based on these results and those from section 6.2, it was decided to bind ATR to the Nunc
microwell module D16 plates, using a 0.05 M carbona te buffer, pH 9.6. Further
optimisation was carried out based on these defined parameters and details and results of
this development are given in the next section.
113
6.4 Detennination of the binding of atractyloside to microtitre plates
6.4.1 Introduction
The rate limiting step in many solid phase immunoassays is related to the slow kinetics of
macromolecular binding to the support, due to restricted diffusion and mas.s transfer
across the liquid solid interface (Litman, 1985). Ultrasound has been demonstrated to
accelerate coating of the solid phase and was investigated by the present author. Litman
(1985) noted that nearly all the immunoreactive human chorion gonadotrophin (HeG)
added to microtitre wells bound within the first 20 minutes in th e presence of ultrasound,
while in its absence, saturation was not achieved even after 150 hours exposure of the HeG
to the solid phase. This binding was independent of the initial coating concentration and
overall, ultrasound resulted in a 500-fold acceleration in the rate of HeG immobilization .
This enhanced binding appears restricted to solid-liquid interfaces and is not
demonstrated between antibodies binding to antigens in solution (Litman, 1985). It is
thought that the microscopic mixing enhances diffusion and interfacial mass transfer,
increasing the contact ofthe molecule to the support (Borisov and Stantnikov, 1966).
Any surface will bind a molecule to differing degrees , and if detachment occurs, exposed
free sites may be blocked. The time required for a molecule to meet a surface and bind will
be proportional to its size, taking into account that steric hindrance will also influence the
degree of binding. Smaller molecules will bind to a greater extent than larger molecules ,
but there is a greater risk of detachment by these smaller molecules , since they show
weaker binding. Furthermore, if an antibody is to bind to a compound of molecular mass
< 1000 Da (such as ATR), where the antigen exists as a monolayer on the surface of the
solid support, full utilization of the coated antigen molecules will be impossible, as the
large antibody molecules (> 150 000 Da) will sterically hinder each other. Only a few
antibody molecules will be bound and therefore, despite th E- greater degree of binding by
smaller molecules to solid phases, steric hindrance will result in inefficient use of the
coated antigen. This may be overcome by eith er binding th e hapten to spacer arms or by
covalently coupling the small antigen to a large mol ecul e such as albumin (L0vborg,
1984). It was proposed that the direct binding of ATR to th e pl ate would result in the steric
hindrance of the primary antibody and furth ermore, it wa s a nti cipated that the negative
charges on the ATR may cause repulsion of th e toxin from the pla te. This repulsion has
also been noted with DNA (Tijssen, 1985), which carries a net negative charge and is
poorly adsorbed to polystyrene. However, the binding of anionic antigen s to microtitre
wells has been reported by Engvall (1976) and Klotz (1982) to be significantly improved by
pre-treating the microtitre plates with 1% (w/v ) a~ueous protamin e sulph a te.
In view of the above considerations it was decided to design a series of experiments to test
the relative binding ability of free ATR and conjugated ATR to the solid support and the
effects of ultrasound and pre-coating with protamine sulphate on such binding. The
details of the methodology are given in 6.4.2 below while the results are presented in
section 6.4.3.
6.4.2 Methods
114
Atractyloside (0.25 mg/ml in 0.05 M carbonate buffer, pH 9.6) and ATR-BSA (0.25 mg/ml
in 0.05 M carbonate buffer, pH 9.6) were added directly to the microtitre wells (200 Ill/well)
and incubated overnight at 4°C. Another plate was pre-treated with a 0.1 % aqueous solution
of protamine sulphate for 90 minutes, and rinsed thrice with distilled water, prior to the
addition of 200 Ill/well ATR (0.25 mg/ml in 0.05 M carbonate buffer, pH 9.6). This plate
was incubated overnight at 4°C. A further set of wells were prepared whereby ATR-BSA
(0.25 mglml in 0.05 M carbonate buffer, pH 9.6) was added to each well (200 Ill/well) and
this plate was placed in an ultrasound bath (UM C2, 220 v, 50 Hz, Krugersdorp, South
Africa) for 20 minutes. Following coating, the plates were incubated overnight at 4"C with
a 1:300 dilution of primary antibody in TBS, then wa~hed with saline-Tween and
incubated with the secondary antibody-alkaline phosphatase conjugate (1: 5 000) for 2 hours
at 37°C. Plates were washed and incubated with p-nitrophenyl phosphate (1 mg/m]) in
0.1 M diethanolamine buffer, pH 9.6 (section 3.5.1) then incubated for 1 hour at 37°C and the
absorbance monitored colorimetrically at 405 nm. The mean results of the different
coating conditions were calculated, together with the coefficient of variation (%CV). A
%CV less than 10% is considered satisfactory (Feldkamp and Smith, 1987) although at
Newmarket Horse Forensic Laboratory (Newmarket, UK, pers. comm ., 1989) a %CV of
less than 5% is deemed acceptable .
6.4.3 Results and conclusions
The results of the ATR binding experiment are gwen 111 Table 6.3 below. The direct
binding of ATR to the plates gave very poor results as noted by th e low absorbance value
and very high %CV. This was probably due to the repulsion of the anio nic ATR molecules
which would have caused an unequal coating of the plates. It was hoped that this repulsion
could be overcome by pre-coating the plates with protamine sulphate but as shown in Table
6.3, there was only marginal improvement in the degree of binding and also in the %CV.
By contrast the binding of ATR to the plates as a toxin- BSA conjugate gave by far the
highest absorbance value with the lowest %CV. Furthermore, coating of the same ATR-
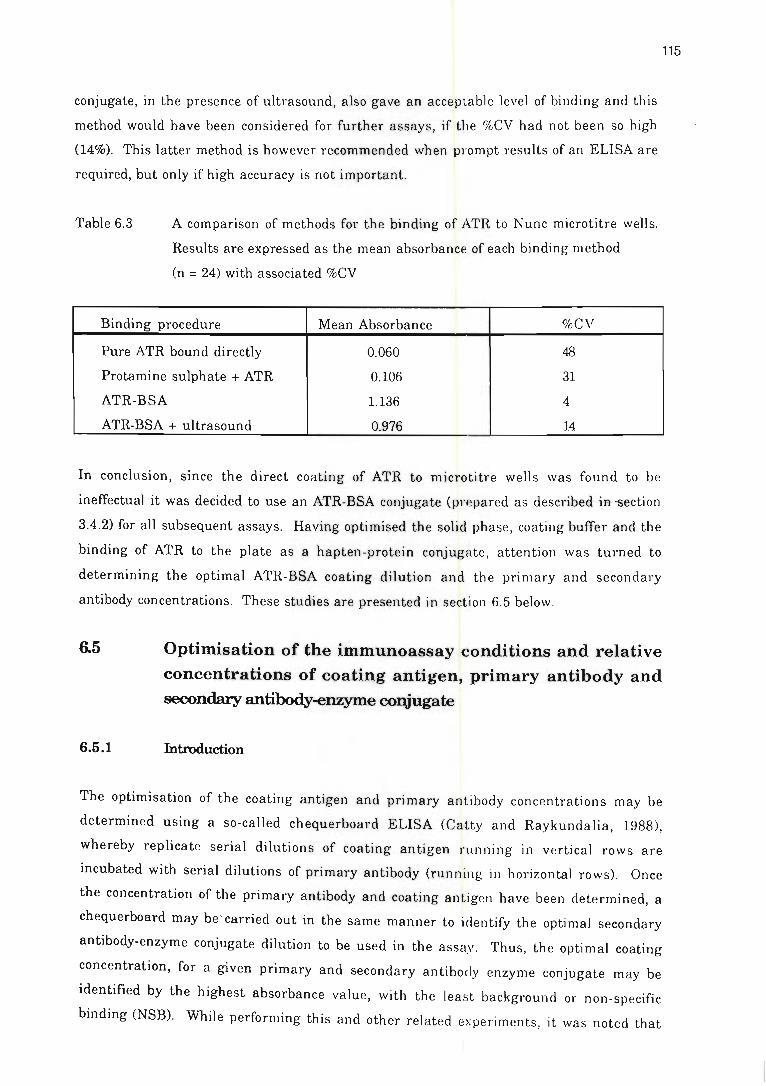
conjugate, in the presence of ultrasound, also gave an accep table level of binding and this
method would have been considered for further assays, if the %CV had not been so high
(14%). This latter method is however recommended when prompt results of an ELISA are
required, but only if high accuracy is not important.
Table 6.3 A comparison of methods for the binding of ATR to Nunc microtitre wells.
Results are expressed as the mean absorbance of each binding n<'ethod
(n = 24) with associated %CV
Binding procedure Mean Absorbance %CV
Pure ATR bound directly 0.060 48
Protamine sulphate + ATR 0.106 31
ATR-BSA 1.136 4
ATR-BSA + ultrasound 0.976 14
In conclusion, since the direct coatjng of ATR to microtitre wells was found to be
ineffectual it was decided to use an ATR-BSA conjugate (pr~pared as described ift -section
3.4.2) for all subsequent assays. Having optimised the solid phase, coating buffer and the
binding of ATR to the plate as a hapten-protein conjugate, attention was turned to
determining the optimal ATR-BSA coating dilution and the primary and secondary
antibody concentrations. These studies are presented in section 6.5 below.
6.5 Optimisation of the immunoassay conditions and relative
concentrations of coating antigen, primary antibody and
secondary antibody-enzyme conjugate
6.5.1 Introduction
115
The optimisation of the coating antigen and primary antibody concentrations may be
determined using a so-called chequerboard ELISA (Catty and Raykundalia, 1988),
whereby replicate serial dilutions of coating antigen running in vertical rows are
incubated with serial dilutions of primary antibody (running in horizontal rows). Once
the concentration of the primary antibody and coating antigen have been determined, a
chequerboard may be ' carried out in the same manner to identify the optimal secondary
antibody-enzyme conjugate dilution to be used in the assay. Thus, the optimal coating
concentration, for a given primary and secondary antibody enzy111e conjugate may be
identified by the highest absorbance value, with the least background or non-specific
binding (NSB). While performing this and other related ex periments, it was noted that
incubation temperature for the primary antibody had a significant effect on the entire
assay. Thus the aim of the present study was to optimise the incubation temperature and to
use these optimal conditions to, in turn, optimise the relative concentrations of the coating
antigen and the dilutions of the primary antibody and th e secondary antibody-enzyme
conjugate.
6.5.2 ~
116
Nunc microwell module U16 plates (referred hereafter as microtitre plates) were coated
with either BSA (representing the control) or BSA-ATR conjugate (200 Ill/well). The
starting concentrate of coating antigen (prepared as described in section 3.4.2) was pre
filtered using Millex HV 0.45 J..lm filters, before being 10-fold serially diluted over the
range 1 mg/ml to 1 x 10⁻⁷ mg/ml, in 0.05 M carbonate buffer, pH 9.6. Plates were covered
with cling film and incubated overnight at 4°C. Based on the affinity assay results and
characterisation tests (section 5.5) only antiserum from rabbit 4, raised against a naked
bacteria-ATR conjugate was used. The antiserum was diluted in TBS (section 3.5.1) over
the range 1:100 to 1:600 and to each well was added 200 III of the appropriate antiserum,
forming a chequerboard assay. Plates were incubated for 16 hours at 4~'C or at 3T'C for 2
hours (to monitor temperature effects), washed thrice in saline-Tween (section 3.5.1) and
incubated for a further 2 hours at 37°C with 200 J..ll/well of a 1:5 000; 1:5 500; 1:6 000 or 1:7 000
dilution of Goat anti-rabbit IgG-alkaline phosphatase diluted in TBS. Plates were washed
a further three times in saline-Tween and incubated for 30 minutes at 37°C with p
nitrophenyl phosphate (1 mg/ml) in 0.1 M diethanolamine buffer, pH 9.6 (section 3.5.1)
(200 J..ll/well). The absorbance was measured at 405 nm. Final results were calculated as
the mean absorbance ofthe test sample minus the absorbance value for a BSA control, at the
same coating concentration and primary antibody dilution.
6.5.3 Results and conclusions
When in the above experiment, the primary antibody was incubated at 37°C for 2 hours and
instead of 4°C for 16 hours, no colour development was observed on addition of the substrate.
This was initially thought to be due to experimental error, but the result was reproducible on
three successive attempts. Brief consideration was therefore given to the effects of
temperature' on the success of an immunoassay.
117
Temperature is an expression of molecular movement or velocity and at high temperatures
there is more chance of a molecule meeting a surface, due to increased velocity (L0vborg,
1984). Since adsorption of molecules is directly related to time and temperature and double
the binding occurs at 37°C than at 4°C (Cantarero et aZ ., 1980: Standefer, 1985), it would be
feasible to maximise binding by incubating the immunoplntes at 37"'C. Unfortunately,
however, edge effects are commonplace when plates are incubated at this temperature, due
to the establishment of thermal gradients (L0vborg, 1984; Tijssen, 1985). It is nevertheless
argued that since antibody-antigen reactions occur in vivo at body temperature, that all .
EIAs should be performed at 37°C. The use of this standard temperature may be a fallacy
though as it is only a pre-requisite for precipitin, agglutination and complement fixation
assays. So-called "cold-antibodies" have been identified, whereby binding of the antibody
to its corresponding antigen is enhanced at room temperature or 4°C and observed to be
depressed at 37°C (Tijssen, 1985).
"Cold-antibodies" are usually associated with auto-immune disease in humans, causing
cold-haemolytic anaemias. Such antibodies do not associate with their corresponding
antigen at 37°C, but do so at temperatures below 30°C. They are commonly IgM antibodies
and their titre appears to fan off exponentially when incubation temperatures increase
above 4°C (Dacie and Lewis, 1970). Since other current literature regarding these so called
"cold-antibodies" pertains primarily to the clinical implications of producing such
antibodies, no further comments can be made with regard to the apparent production of
"cold-antibodies" against ATR. The fact remains, however, that at 4"C there was no loss of
primary antibody activity, whereas at 37°C, no activity was recorded. From this result it
was suggested that IgM antibodies were raised against ATR, and that class switch had not
occurred, which could account for the apparent low titres of antibodies raised against this
toxin (Chapter 5).
The results of the chequerboard assay are given in Fig 6.3 (a to c). In most cases, the
highest absorbance was obtained with a coating concentration of 0.001 mg BSA-ATRlml.
When a primary antibody dilution of 1:100 was used (Fig 6.3a), the absorbance values were
very low and frequently no change in absorbance was noted despite an alteration in the
coat concentration. The trend for the 1:200 dilution of primary antibody, depicted in the
same graph, was more favourable, but the 1:300 dilution (Fig 6.3b) gave even higher overall
absorbance values. A. similar pattern was observed with the 1:400 dilution of primary
antibody, except that the absorbance value obtained for the coating concentration of 0.001
mg BSA-ATRlml was slightly lower than that of the 1:300 primary antibody dilution.
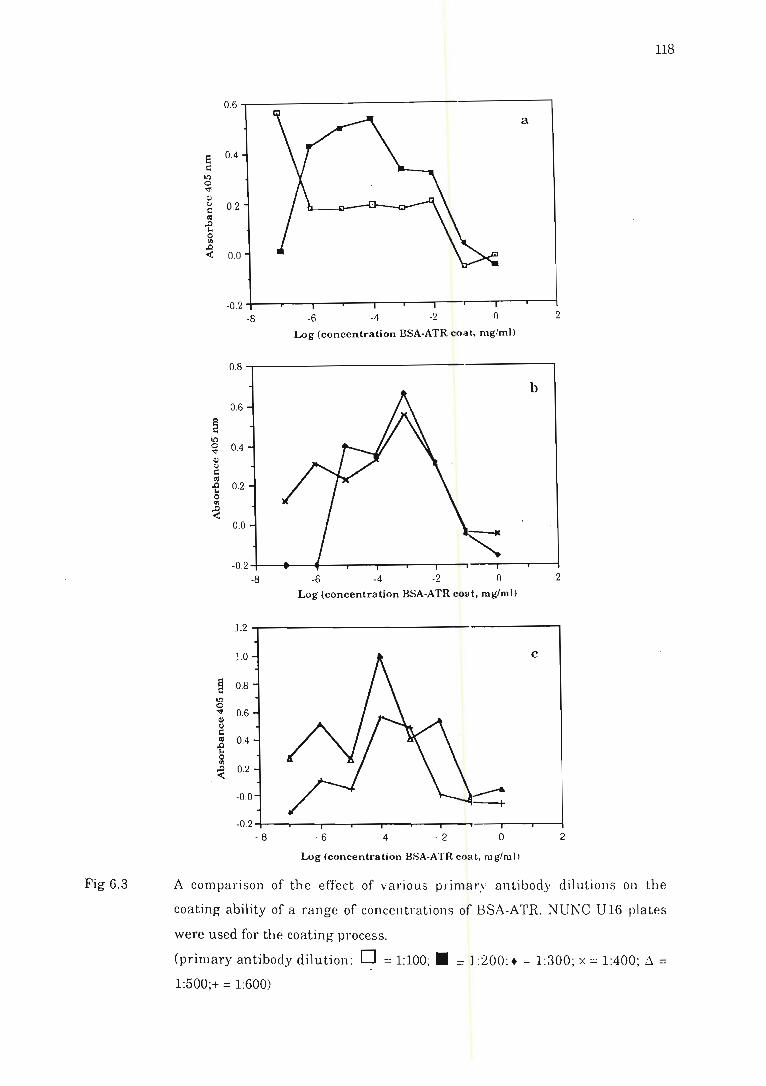
Fig 6.3
118
0.6
a
a 0.4 c:
lQ 0
'" Q) t) 0.2 c: <U
,C> ~
~ ~ 0.0
-0.2 -8 -6 -4 -2 o 2
Log (concentration BSA-ATR coat, mg/ml)
0.8
b 0.6
~ II)
~ 0.4 Q) t)
c: <U
of 0.2 0 til
~ 0.0
-0.2 -8 -6 -4 -2 o 2
Log (concentration BSA-ATR coat, rug/rull
1.2
1.0 c
~ 0.8 lQ 0
'" 0.6 Q) II c: <U 0.4 of ~ ~ 0.2
-0.0
-0.2 - 8 - 6 - 4 - 2 o 2
Log (concentration BSA-ATR coat, mg/mll
A compari son of the effect of various primary a nt ibody dilution s on the
coating ability of a range of concentration s of BSA-ATR. NUNC U16 plates
were used for the coating process.
(primary antibody dilution : 0 = 1:100; • = ] :200 ;+ = 1:300; x = 1:400; D. = 1:500;+ = 1:600)
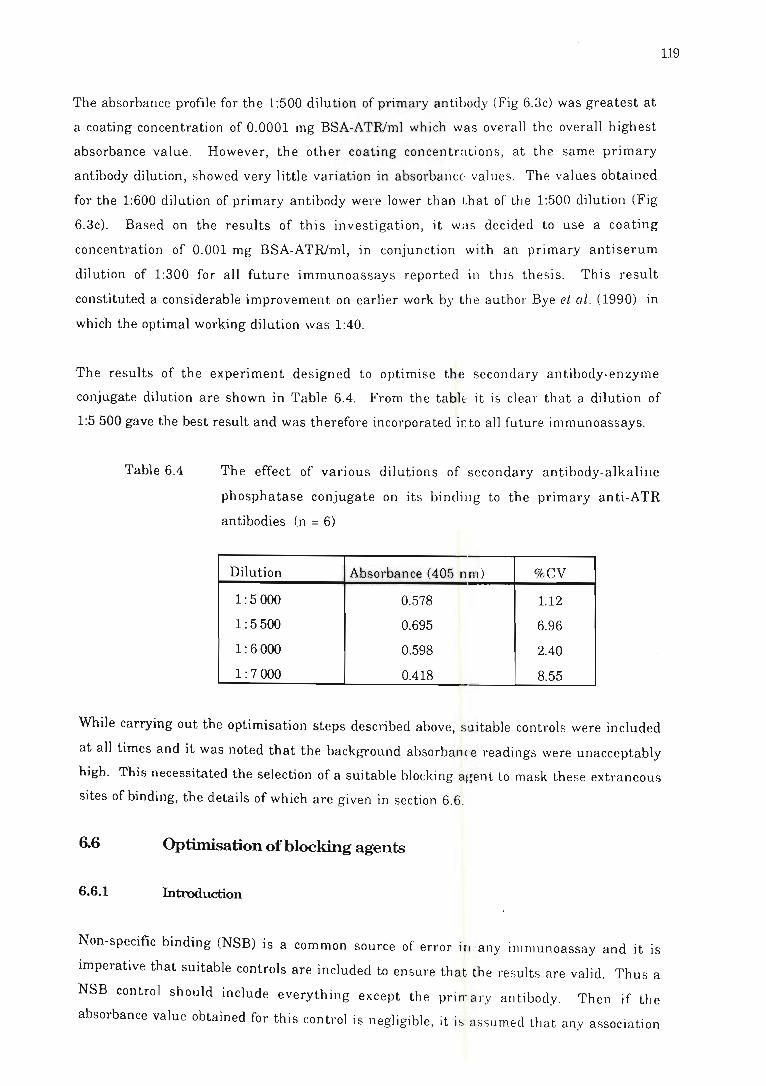
The absorbance profile for the 1:500 dilution of primary antibody (Fig 6.3c) was greatest at
a coating concentration of 0.0001 mg BSA-ATR/ml which was overall the overall highest
absorbance value. However, the other coating concentrations, at the same primary
antibody dilution, showed very little variation in absorbancE values. The values obtained
for the 1:600 dilution of primary antibody were lower than that of the 1:500 dilution (Fig
6.3c). Based on the results of this investigation, it was decided to use a coating
concentration of 0.001 mg BSA-ATR/ml, in conjunction with an primary antiserum
dilution of 1:300 for all future immunoassays reported in this thesis . This result
constituted a considerable improvement on earlier work by the author Bye et al . (1990) in
which the optimal working dilution was 1:40.
119
The results of the experiment designed to optimise the secondary antibody-enzyme
conjugate dilution are shown in Table 6.4. From the tablE· it is clear that a dilution of
1:5500 gave the best result and was therefore incorporated into all future immunoassays.
Table 6.4 The effect of various dilutions of secondary antibody-alkaline
phosphatase conjugate on its binding to the primary anti-ATR
antibodies (n = 6)
Dilution Absorbance (405 nm) %CV
1:5000 0.578 1.12
1: 5 500 0.695 6.96
1:6000 0.598 2.40
1:7000 0.418 8.55
While carrying out the optimisation steps described above, suitable controls were included
at all times and it was noted that the background absorbance readings were unacceptably
high. This necessitated the selection of a suitable blocking agent to mask these extraneous
sites of binding, the details of which are given in section 6.6.
6.6 Optimisation of blocking agents
6.6.1 Introduction
Non-specific binding (NSB) is a common source of error in any immunoassay and it is
imperative that suitable controls are included to ensure that the re sults are valid. Thus a
NSB control should include everything except the prill' ary antibody. Then if the
absorbance value obtained for this control is negligible, it is as sum ed that any association
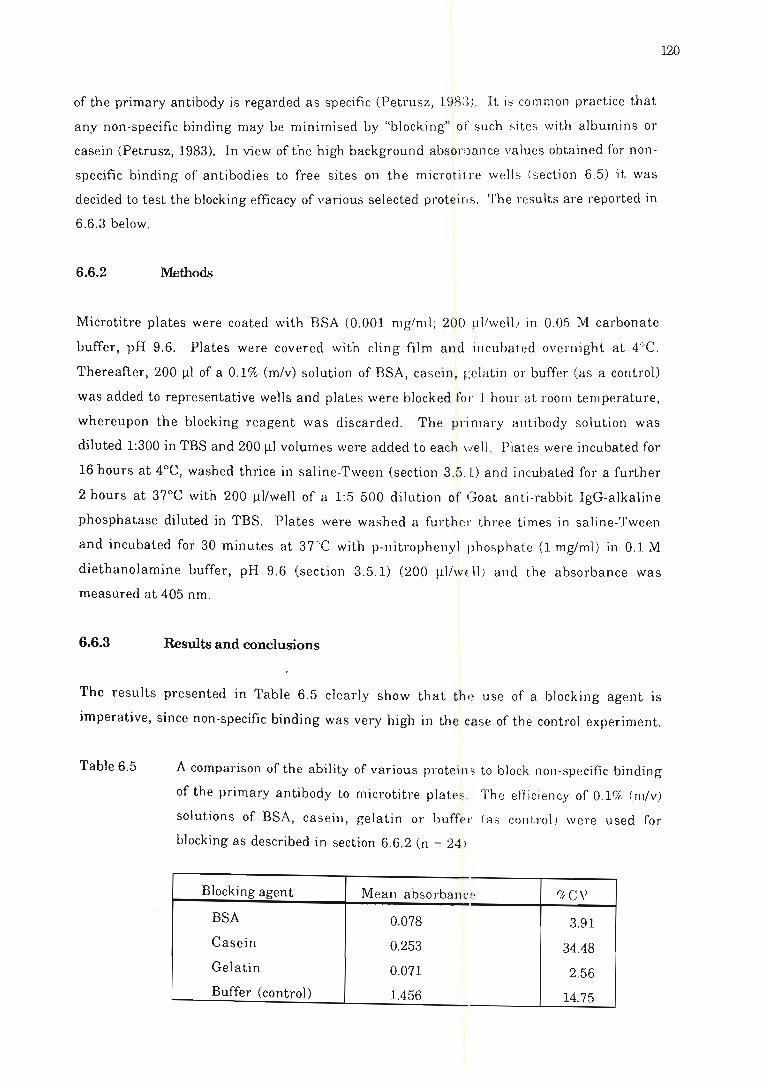
of the primary antibody is regarded a s specific (Petrusz, 198:3). It is common practice that
any non-specific binding may be minimi sed by "blocking" of such sites with albumins or
casein (Petrusz, 1983). In view of the high background absor~) an ce values obtained for non
specific binding of antibodies to free sites on th e microtiLre well s (section 6.5) it was
decided to test the blocking efficacy of various selected protein s. Th e results are reported in
6.6.3 below.
6.6.2 ~thods
120
Microtitre plates were coated with BSA (0.001 mg/ml ; 200 ~l /well ) in 0.05 M carbonate
buffer, pH 9.6. Plates were covered with cling film and incubated overnight at 4°C.
Thereafter, 200 111 of a 0.1% (m/v) solution of BSA, casein , gelatin or buffer (as a control)
was added to representative wells and plates were blocked for 1 hour at room temperature,
whereupon the blocking reagent was discarded. The prim ary antibody solution was
diluted 1:300 in TBS and 200 111 volumes were added to each well. Plates were incubated for
16 hours at 4°C, washed thrice in saline-Tween (section 3.5. 1) and in cubated for a further
2 hours at 37°C with 200 Ill/well of a 1:5 500 dilution of Goat anti-rabbit IgG-alkaline
phosphatase diluted in TBS. Plates were washed a furth er three times in saline-Tween
and incubated for 30 minutes at 3TC with p-nitrophenyl phosph ate (1 mg/ml) in 0.1 M
diethanolamine buffer, pH 9.6 (section 3.5.1) (200 lll/w E·ll) and th e absorbance was
measured at 405 nm.
6.6.3 Results and conclusions
The results presented in Table 6.5 clearly show that tho ~ use of a blocking agent is
imperative, since non-specific binding was very high in the case of th e control experiment.
Table 6.5 A comparison of the ability of various protein ~ to block non- specific binding
of the primary antibody to microtitre plates. Th e effi ciency of 0.1% (m/v)
solutions of BSA, casein , gelatin or buffer (as control ) were used for
blocking as described in section 6.6.2 (n = 24 )
Blocking agent Mean absorbance rlr CV
BSA 0.078 3.91
Casein 0.253 34.48
Gelatin 0.071 2.56
Buffer (control) 1.456 14.75
Casein was non-soluble in the buffer, requiring hydrolysis and was, therefore, abandoned
as a blocking agent. By contrast, gelatin proved to be the most efficient blocking agent, but
concern was voiced as to the possible solidification of this yl'otein during incubations at
4°C. Fortunately, BSA proved almost as efficient as gelatin and thus this protein was used
as the standard blocking agent for all subsequent assays This choice was also most
appropriate in view of the earlier selection (section 6.4.3: of ATR-BSA as the coating
conjugate, thus involving BSA in both instances. The advantage of this is that the
antiserum used in the assay (from rabbit 4) would not cross-react with BSA (section 5.5.4).
Following selection of the solid phase, coating antigen and buffer, incubation times and
temperatures as well as the concentration of the immunoreaC1.ants, the optimised ELISA for
ATR was tested by application to various biological samples. The results are given in the
next section.
6.7 Application of the ELISA to the detection of atractylosides in rat serum and urine
121
6.7.1 Introduction
In VIew of the high incidence of accidental ATR-relatel poisonings (Bhoola, 1983;
Georgiou et al., 1988), it was decided to develop a diagnostic :lssay for this intoxication . As
outlined in Chapter 4, the development of an assay initially involved the optimisation of a
HPLC method for the detection of ATR, but as this technique requires a skilled operator and
expensive equipment, it was decided to also develop an immunoassay, that would be
suitable for "in the field" screening of ATR poisoning.
Following the optimisation of the ELISA on pure ATR (sections 6.2 to 6.6), the aim was to
test this method on authentic urine and serum samples from ,oats dosed with 0, 5, 10 and 25
mg ATR/kg bwt, collected at 24, 48,72 and 96 hours post-dosin i5 with the hope that this wolud
also yield information as to the fate and excretion profile of ATR in rats.
A diagrammatical representation of the final optimised ELISA, for the detection of ATR, is
depicted in Fig 6.4 below. Briefly, this ELISA constitutes foUl' steps. The first involves the
coating of the ATR-BSA conjugate to the plate with the subse~uent addition of the standard
toxin or the sample, together with the primary antiserum. A competition arises between the
free and bound toxin for epitope binding sites on the primary antibody. Antibody bound to
the ATR-BSA conjugate will be retained, while antibody bound to free ATR in the sample
will be discarded.
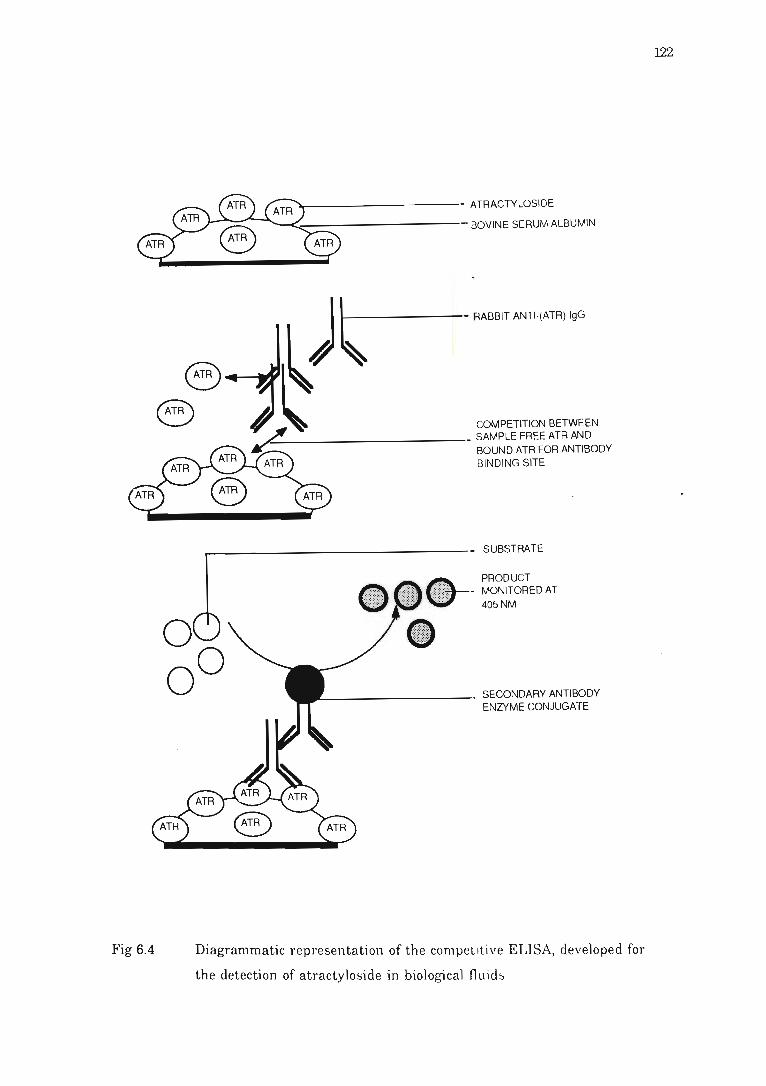
Fig 6.4
~---------- ATRACTYLOSIDE
-<.r------------ BOVINE SERUM ALBUMIN
J..--------- RABBIT ANTI-(ATR) IgG
COMPETITION BETWEEN ________________ SAMPLEFREEATRAND
BOUND ATR FOR ANTIBODY BINDING SITE
...-------------------- SUBSTRATE
~ ____________ • SECONDARY ANTIBODY
ENZYME CONJUGATE
Diagrammatic representation of the competitive ELISA, developed for
the detection of atractyloside in biological fluid s
122
Thus the more free toxin there is in the sample, the less primary antibody will be bound to
the ATR-BSA conjugate. In the third stage of the assay, a secondary antibody enzyme
conjugate is added. Since the secondary antibody is specific for the primary antibody, it
will in turn bind to the primary antibody bound to the ATR-BSA conjugate. Thus the less
free ATR there is in the sample, the more primary antibody will bind to the ATR-BSA
conjugate and hence the more secondary antibody enzyme conjugate will bind to the
primary antibody. An appropriate substrate is added in the fourth stage, which is converted
into a coloured product by the enzyme conjugate. The absorbance is monitored
colorimetrically at 405 nm and thus the absorbance value obtained will be indirectly
proportional to the amount of toxin present in the sample.
This ELISA was used for the detection of ATR in the biological samples collected from rats
dosed with this diterpene glycoside (section 3.1), the results of which are presented in
section 6.7.3 below.
6.7.2 Methods
123
Urine and serum samples from rats dosed with 0, 5, 10 and 25 mg ATRlkg bwt were
collected as described in section 3.1. The serum and urine samples were extracted in a
solution of methanolic hydrochloric acid (section 3.1.6), and then further diluted 1:10 and
1:100 in TBS (section 3.5.1) as suggested by staff at the Newmarket Horse Forensic
Laboratory (Newmarket, UK, pers. comm., 1989). The ELISA was pelformed as described
in section 3.5.2. Results were determined by calculating the mean of the replicates and.
comparing the mean absorbance of the 1:10 dilution with that of the 1:100 dilution.
Theoretically, an increase in absorbance is expected with an increase in dilution, as less
atractylosides would be present in the 1:100 dilution than in the 1:10 dilution. Thus in the
former, more antibody would be available to bind to the coating antigen. The change in
absorbance between the 1:10 and 1:100 dilution was calculated, and a 10% or greater
increase in absorbance was classified as positive (+). Positive results noted for control
samples were classified as "false positives" (FP). A corresponding blank of the
methanolic hydrochloric acid was prepared to determine the effect of the extraction solvent
on the immunoassay and the possible interference by glucose and ADP. The results of the
ELISA on the urine samples were transposed into a bar graph by determining the
percentage of positive results for each day.
A standard curve, for the determination of ATR, was constructed over the 10-fold dilution
series of ATR from 1 mg/ml to 1 ng/ml. The mean absorbance values for each
concentration were calculated and expressed as a percentage of the absorbance obtained for
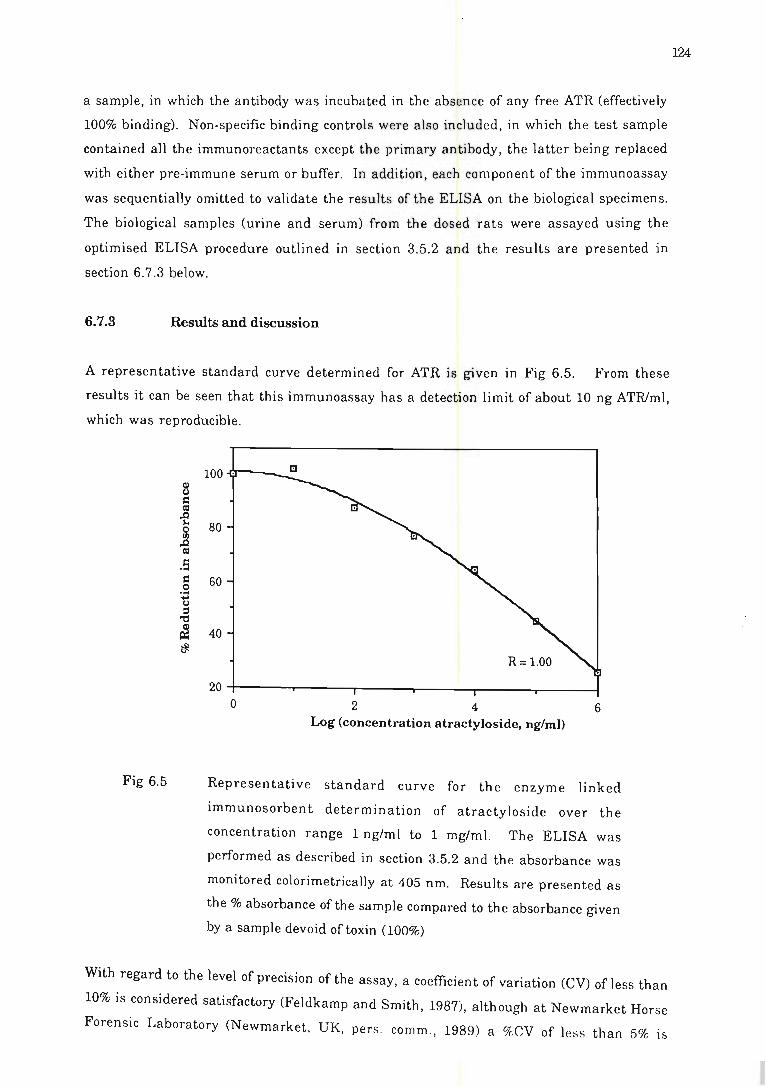
a sample, in which the antibody was incubated in the absence of any free ATR (effectively
100% binding). Non-specific binding controls were also included, in which the test sample
contained all the immunoreactants except the primary antibody, the latter being replaced
with either pre-immune serum or buffer. In addition, each component of the immunoassay
was sequentially omitted to validate the results of the ELISA on the biological specimens.
The biological samples (urine and serum) from the dosed rats were assayed using the
optimised ELISA procedure outlined in section 3.5.2 and the results are presented in
section 6.7.3 below.
6.7.3 Results and discussion
A representative standard curve determined for ATR is given in Fig 6.5. From these
results it can be seen that this immunoassay has a detection limit of about 10 ng ATRJml,
which was reproducible.
Fig 6.5
100.r.1·r---
80
60
40
20~-----r-----'------~----'-----~--__ -4 o 2 4 6
Log (concentration atractyloside, ng/ml)
Representative standard curve for the enzyme linked
immunosorbent determination of atractyloside over the
concentration range 1 ng/ml to 1 mg/m1. The ELISA was
performed as described in section 3.5.2 and the absorbance was
monitored colorimetrically at 405 nm . Results are presented as
the % absorbance of the sample compared to the absorbance given
by a sample devoid of toxin (100%)
With regard to the level of precision of the assay, a coefficient of variation (CV) of less than
10% is considered satisfactory (Feldkamp and Smith , 1987), although at Newmarket Horse
Forensic Laboratory (Newmarket , UK, pers. comm., 1989) a %CV of less than 5% is
124
deemed acceptable. For the present ATR immunoassay, the precision profile was
determined by evaluating the known concentrations of standard ATR with their
associated %CV values which enabled an assessment of the heteroscadasticity of the
standard curve (Feldkamp and Smith, 1987). A mean %CV of 3.97% was obtained over the
range 0.1 to 10 Ilg ATRJml, indicating that this is the working range of the immunoassay.
On either side of this working range, the %CV was unacceptably high, indicating that
beyond these limits, the ATR immunoassay is inaccurate.
125
The results of the ELISA carried out on the rat urine and serum are summarized in Table
6.6. Whereas only a single known false positive was recorded for the control urine
samples (control rat 4, day 4) there were six false positives for the control serum samples.
Furthermore, the serum samples only gave six positive readings which were randomly
distributed and this, together with the high incidence of false positive specimens, cast doubt
on the validity of the serum results. Serum was therefore discounted as a useful biological
fluid for the detection of ATR by ELISA, probably because the levels of ATR in the rat
samples were too low to be detected by this method. The controls included in the assay,
together with the work carried out on the charaterisation of the antiserum showed that the
antibodies are specific for atractylosides . Likewise, the use of a methanolic hydrochloric
acid extractant apparently did not affect the functioning of the assay. This is fortunate,
since this extraction process was deemed vital to the success of the ELISA as, it was noted in
the urinalysis studies (section 7.2) that, rats exposed to high doses of ATR release alkaline
phosphatase (AP) into the urine.
Since antibodies directed towards certain epitopes present on an antigen may cross react
with a number of antigens with common epitopes, the American Academy of Forensic
Sciences, Toxicology Section issued a statement in 1986, calling for the reporting of
immunoassay results to be restricted to positive or not detected, unless the results were
confirmed by alternative analytical methods such as HPLC (Baselt, 1989). In the present
studies, in view of the fact that the HPLC method (Chapter 4) did not detect ATR in all the
urine and serum samples, that gave positive ELISA results, it was considered
inappropriate to quantify the results obtained in this immunoassay.
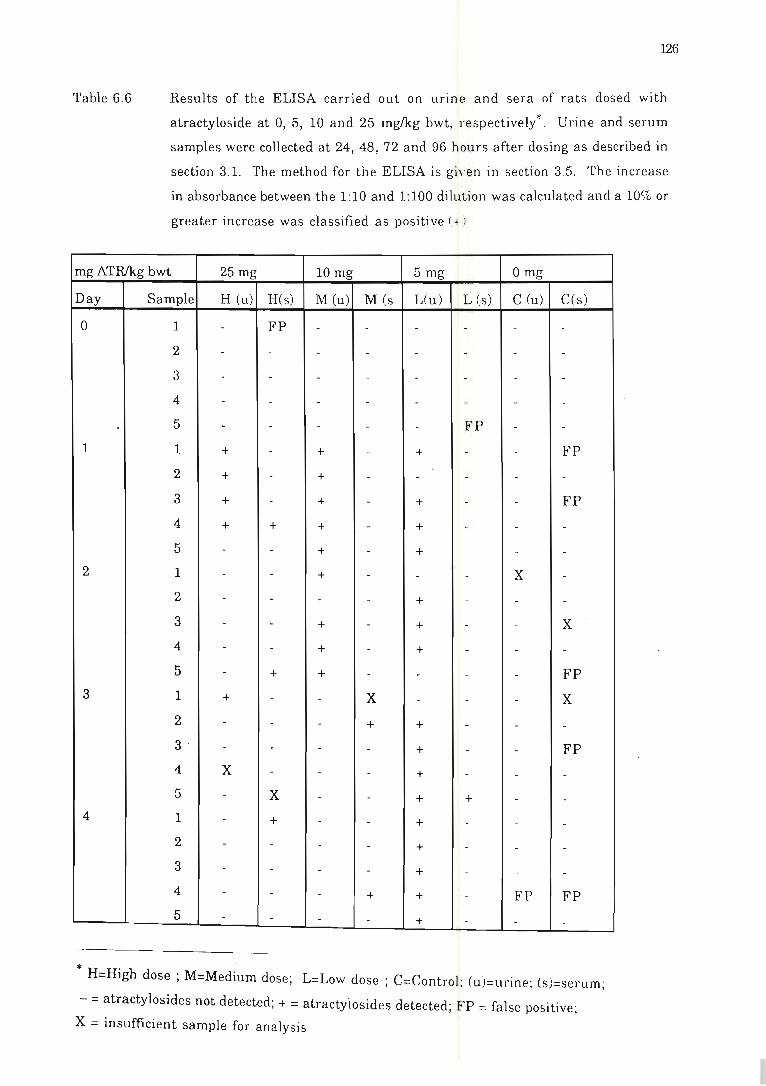
Table 6.6
126
Results of the ELISA carried out on unne and sera of rats dosed with
atractyloside at 0, 5, 10 and 25 mglkg bwt, respectively" . Urine and serum
samples were collected at 24, 48, 72 and 96 hours after dosing as described in
section 3.1. The method for the ELISA is gi\·en in section 3.5. The increase
in absorbance between the 1:10 and 1:100 dilut ion was calculated and a 10% or
greater increase was classified as positive (+,
mg ATRlkg bwt 25 mg 10 rng 5 mg o rng
Day Sample H (u) H(s) M (u) M (s L(u ) L (5) C (u) C(s)
0 1 - FP - - - - - -2 - - - - - - - -
3 - - - - - - - -
4 - - - - - - - -5 - - - - - FP - -
1 1 + - + - + - - FP
2 + - + - - - - -3 + - + - + - - FP
4 + + + - + - - -
5 - - + - + - - -2 1 - - + - - - X -
2 - - - - + - - -
3 - - + - + - - X 4 - - + - + - - -
5 - + + - - - - FP 3 1 + - - X - - - X
2 - - - + + - - -
3 · - - - - + - - FP 4 X - - - + - - -
5 - X - - + + - -
4 1 - + - - + - - -
2 - - - - + - - -
3 - - - - + - - -4 - - - + + - FP FP 5 - - - - + - - -
* H=High dose; M=Mediurn dose; L=Low dose; C=Control: (u)=urine; (s)=serurn;
- = atractylosides not detected; + = atractylosides detected; FP = false positive;
X = insufficient sample for analysis
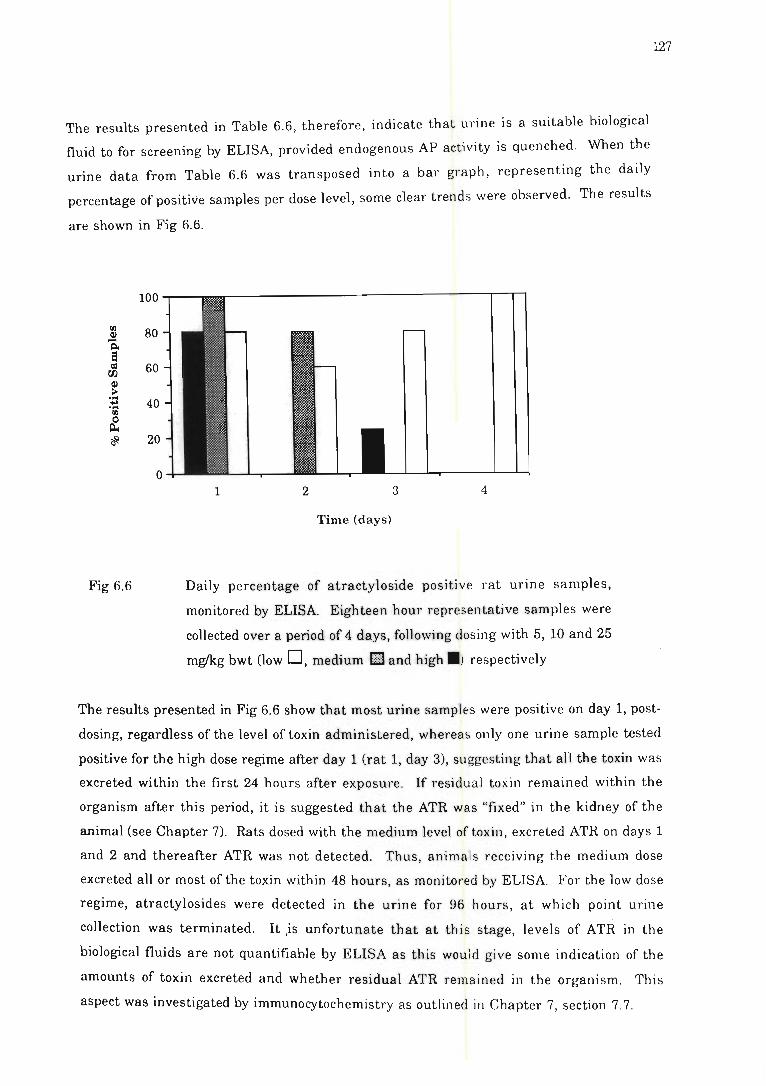
The results presented in Table 6.6, therefore, indicate that urine is a suitable biological
fluid to for screening by ELISA, provided endogenous AP activity is Quenched. When the
urine data from Table 6.6 was transposed into a bar gra ph , representing the daily
percentage of positive samples per dose level , some clear trends were observed. The results
are shown in Fig 6.6.
rIl
.Sl Po. a III
00. Q)
~ .... .. .... rIl
~ ~
Fig 6.6
100
80
60
40
20
0 1 2 3 4
Time (days)
Daily percentage of atractyloside positive rat urine samples,
monitored by ELISA. Eighteen hour representative samples were
collected over a period of 4 days, following dosing with 5, 10 and 25
mg/kg bwt (low 0, medium EJ and high.j respectively
127
The results presented in Fig 6.6 show that most urine samplE's were positive on day 1, post
dosing, regardless of the level of toxin administered, whereas only one urine sample tested
positive for the high dose regime after day 1 (rat 1, day 3), suggesting that all the toxin was
excreted within the first 24 hours after exposure. If residual toxil) remained within the
organism after this period, it is suggested that the ATR was "fixed" in the kidney of the
animal (see Chapter 7). Rats dosed with the medium level of toxin, excreted ATR on days 1
and 2 and thereafter ATR was not detected. Thus, animals recei ving the medium dose
excreted all or most of the toxin within 48 hours, as monitored by ELISA. For the low dose
regime, atr~ctylosides were detected in the urine for 96 hours, at which point urine
collection was terminated. It,is unfortunate that at this stage, levels of ATR in the
biological fluids are not quantifiable by ELISA as this would give some indication of the
amounts of toxin excreted and whether residual ATR rem ained in the organism. This
aspect was investigated by immunocytochemistry as outlined in Chapter 7, section 7.7.
It will be noted that the results ofthe ELISA do not strictly correlate with those of the HPLC
outlined in Chapter 4 and although this will be extensively discussed in Chapter 8, briefly
the ELISA was seen to detect atractylosides when the HPLC method did not and vice versa .
Although nothing is known of the pharmokinetics of ATR, it is suggested that on days
where the toxin was detected by ELISA and not HPLC, that ATR was sufficiently modified
in vivo to alter its retention time on a reverse phase HPLC column (hence it was not
detected chromatographically) but not enough to alter its epitope(s) so that the metabolite
was still recognised by the anti-ATR antibodies . Furthermore, when ATR was detected by
HPLC but not by ELISA it is suggested that the toxin was present in levels too low to be
detected by the immunoassay.
128
The fact that both the ELISA and HPLC results showed that ATR (or its metabolite) is
excreted into the urine over a time period inversely proportional to the dose, may be
explained as follows. A drug may be "lost" once admini~tered to an organism before
reaching its receptor site, by binding to macromolecules. For instance, neutral compounds
tend to associate with lipids, cations with ribonucleic acids or (Y.l acid glycoprotein, while
anions frequently bind to albumin. Acidic active substances (such as ATR) commonly
bind to serum albumin by virtue of van der Waals forces between the tryptoph an residue on
the albumin and the aromatic moieties on the drug (Albert, 1985). Albumin is thought to act
as a drug-depot (Albert, 1985) which can have serious repercussions if the compound is
suddenly released into the system. The proportion of the active compound bound to the
albumin is inversely proportional to the plasma concentration of the drug, as there are a
limited number of binding sites on the albumin. Once the binding residues on the protein.
have been saturated, residual drug present in the plasma cannot associate with the
albumin and is transported to its effective receptor or is excreted (Albert, 1985). If ATR
binds to serum albumin, this would account for the almost immediate release of all the
excretable toxin by the rats dosed with the high level of this compound. Conversely, the
lower the dose, the higher the proportion of toxin bound to the albumin and consequently, the
toxin will remain circulating in the organism, slowly being J'eleased and excreted.
Unfortunately this explanation is only valid to a point, since if ATR associates with serum
albumin, it should have been detected in the serum samples.
There are three possible explanations for this anomaly. Firstly, ATR was bound to the
serum albumin, but during the extraction procedure in metl)anolic hydrochloric acid, was
precipitated with the protein and therefore not detected by ELISA. Since, however, pilot
studies on sera spiked with ATR and extracted with the acidic methanol, detected positive
for ATR when monitored by TLC and HPLC (Chapter 4), this proposal is unlikely.
Secondly, ATR may have associated with the serum albumin but was present in the serum
at a concentration which is too low to be detected, a possibility which is highly feasible,
considering the relative high concentrations of serum albumin in the blood, which could
have significantly diluted the ATR. Thirdly, ATR may not have associated with the
serum albumin, nor did so transiently,but instead was transported directly to the target site
i.e., the kidney, a possibility that is also feasible considering the hydrophilic nature of
ATR, which could presumably be transported in the blood without the need of carrier
protein. The kidney provides a major route for the excretion of hydrophilic drugs and
hence this organ together with the liver, often contains high concentrations of drugs, as
these organs are responsible for biotransformation and excretion of xenobiotics. It will be
shown (Chapter 7, section 7.3) that despite being a potent inhibitor of oxidative
phosphorylation, ATR is not hepatotoxic suggesting that the toxin proceeds directly to the
kidneys and is excreted more rapidly into the urine.
129
Since the excretion of xenobiotics by the kidneys is influencE,d by urinary pH, the removal
of organic acids, such as salicylates would be significantly reduced if the urine is acidic,
whereas under alkaline conditions excretion would be promoted (Berndt, 1982 ; Barbieri,
1990). The average pH of human urine is pH 6.0, becoming more acidic under conditions
of starvation, due to the presence of ketone bodies (Tietz, 1976). Since the rats dosed with
ATR were fasted for the 18 hour period of urine collection it is conceivable that they would
have also excreted acidic urine, thereby retarding the excretion of ATR. Diet and drugs
can also influence urinary pH and, in retrospect, therefore , this parameter should have
been monitored when the rat urine was collected. Furthermore, since nephrosis has been
observed as early as 150 minutes after exposure to ATR (Carpenedo et ai., 1974) it is possible
that the induced necrosis is accompanied by an alkalisation of the urine, in a dose
responsive manner. Consequently, the higher the dose of ATR, the more kidney damage is
observed and thus, the more alkaline the urine will be and the faster the toxin is excreted.
Although highly speculative, this could account for the dose responsive excretionary rate of
ATR by the rats.
Although the data and conclusions drawn from the ELISA may not be directly extrapolated
to humans, it became apparent that the applicability of the ELISA as a diagnostic tool is
dependent upon the dose . If it is assumed that the greatest proportion of ATR will be
excreted within the first 24 hours after exposure, it is unlikely that the commercial
development of this assay can be justified. As noted in the introduction , rural populations
are forced to make use of alternative medical practices because of the shortage of western
practitioners and if a patient is admitted to a western hospital, it is usually as a last resort.
South Africa is a vast country and many of the people reside in isolated and inaccessible
areas. Consequently, there can be a significant lag period between the decision to take a
person to hospital and the time of actual admission. It is a personal opinion, therefore, that
the diagnostic potential of this ELISA is limited, but a definitive answer may only be
obtained if hospitals can be encouraged to participate in a screening programme of all
patients suspected of being poisoned by Impila .
130
The development of the ELISA and HPLC method, though possibly of limited usefulness
from the clinical sense, gave considerable insight into the detoxification and excretion of
ATR. Since the only previous work on the excretion of atractylosides was carried out on
analogues isolated from coffee beans (Richter and Spiteller, 1978), and this is the first
report that ATR per se is excreted into the urine. However, from a practical perspective it
was noted by the present author, when visiting rural hospitals, that patients suspected of
having Impila poisoning were usually babies in renal failure. Since in this situation,
urine collection is hampered, the use of this biological fluid in the ELISA is not ideal. The
fact that the period of ATR excretion is inversely proportional to the dose would also hamper
an estimation of the severity of the poisoning. Furthermore, it is intimated that if the
removal of this toxin is related to urinary pH, so physicians treating patients with
suspected Impila poisoning would be advised to administer urinary alkalisers, to promote
the rapid excretion of this toxin.
Since so little is known of the metabolic fate of ATR, many explanations for the observed
phenomena are highly speculative and will remain so until tracer studies are carried out,
using radio-labelled ATR. The availability of antibodies to this toxin, however, provided a
probe for the subcellular localisation of ATR in tuber and rat kidney by.
immunocytochemistry. The results are presented in the next chapter together with studies
on the localisation of the toxin by non-invasive methods, employing organ function
enzymes and markers in the urine and serum.
CHAPTER 7
LOCALISATION OF THE TARGET SITES
OF ATRACTYLOSIDE IN RATS
7.1 Introduction
131
Although the pharmacological action of ATR was first studied in 1958 (Santi, 1958) it wasn't
until 1974 that Carpenedo et ai. (1974) first reported that the kidney was the target organ for
ATR. Subsequently it was shown by a number of workers that specifically the renal proximal
tubules undergo gross changes in histology following exposure to ATR or plants containing
this toxin (Carpenedo et ai., 1974; Stuart et al., 1981; Hatch et ai., 1982; Bhoola, 1983; Martin
et al., 1986; Georgiou et al., 1988). These findings were in part corroborated with organ
function assays in both rats (Carpenedo et ai., 1974) or patients with suspected ATR
poisoning (Bhoola, 1983; Georgiou et ai., 1988) but there i~ little information regarding
further sites of action in the kidney or for that matter in the proximal tubule itself. In
addition, it has been suggested that the liver may also be susceptible to this toxin but this is
unconfirmed (Wainwright et ai., 1977; Georgiou et al., 1988). Work on the precise subcellular
site of action by this toxin has only been carried out on isolated organelles or organ
homogenates (Klingenberg, 1978; Luciani et ai., 1978) but there has been no localisation of
the target site of ATR in vivo.
The purpose of the study presented in this chapter was, therefore, to investigate whether the
kidney or the liver is the primary target organs and which cells and organelles within these
organs are specifically involved. The localisation of the primary target organs was carried
out by dosing rats with ATR and collecting both urine and serum samples (section 3.1.2 and
3.1.3) which were then assayed for the presence of organ specific enzyme markers as well as
urinary concentrations of albumin, glucose and calcium (section 7.2). As further confirmation
of the target organ, in vitro tests were performed whereby amino acid incorporation into
isolated viable cells from the target organ was monitored in the presence and absence of ATR
(section 3.7), the results of which are presented in section 7.4. The urinalysis and in vitro
studies were carried out at RIIEHS, University of Surrey, Guildford, under the direction of
Dr Peter Bach.
Having identified the target organs for ATR, the availability of specific antibodies to ATR
(developed as described in Chapter 5), enabled the subcellular localisation of ATR by
132
immunocytochemistry. As this is the first report of the immunocytochemical localisation of
ATR, this procedure demanded a considerable amount of method development and
optimisation. To assist this development, the immunocytochemical procedure was initially
optimised on the plant tuber of C. laureola, since this material was known to contain
significant amounts of the toxin (section 7.6). Subsequently, the optimised method was
applied to the localisation of ATR in rat tissue, the results of which are presented in section
7.7 below. As in previous chapters, the developmental aspects of the methodology are given
in the respective sections below, whereas the final optimised procedure is detailed in the
Materials and Methods, Chapter 3.
7.2 The effects of atractyloside on the appearance of kidney
function enzymes and markers in rat urine
7.2.1 Introduction
There is undisputed evidence in the literature that the accidental administration of the
diterpene glycoside ATR induces kidney necrosis (Bhoola, 1983). Structurally, the kidney
comprises two distinct organs; the cortex and the medulla, within which exist over 20
morphologically distinct cell types (Moffat, 1982; Bach and Kwizera, 1988). The kidney is
teleologically designed to simultaneously perform a myriad of diverse and complex functions,
such as filtration, concentration and excretion; thereby processing blood and removing waste
products as urine (Bonner et al ., 1982, Fowler, 1982). The kidney, together with the liver,
therefore, is paramount in mediating the biotransformation and excretion of xenobiotics.
The kidney is particularly susceptible to toxic insult and despite accounting for less than 1%
of the total body mass, continually receives 20% of the total cardiac output (Roxe, 1975).
Water-soluble drugs are freely filtered and reach concentrations within the tubular cells far
exceeding levels found elsewhere in the body. Many nephrotoxins are highly specific,
principally because the biochemical activity of a kidney cell predisposes it to the inhibitory
action of toxins, or because the cell is capable of transporting and concentrating the
xenobiotic. Furthermore, the metabolic activity of the kidney cell may render the now
modified molecule more toxic CRoxe, 1975; Bach and Kwizera, 1988; Boogaard et al., 1989a).
Injury to the kidney may be the result of primary inhibition within target cells, or may
manifest itself in adjacent cells, when the physiological modification in the target cell
generates a degenerative cascade effect in the cells working in tandem (Bach and Kwizera,
1988; Bach, 1989).
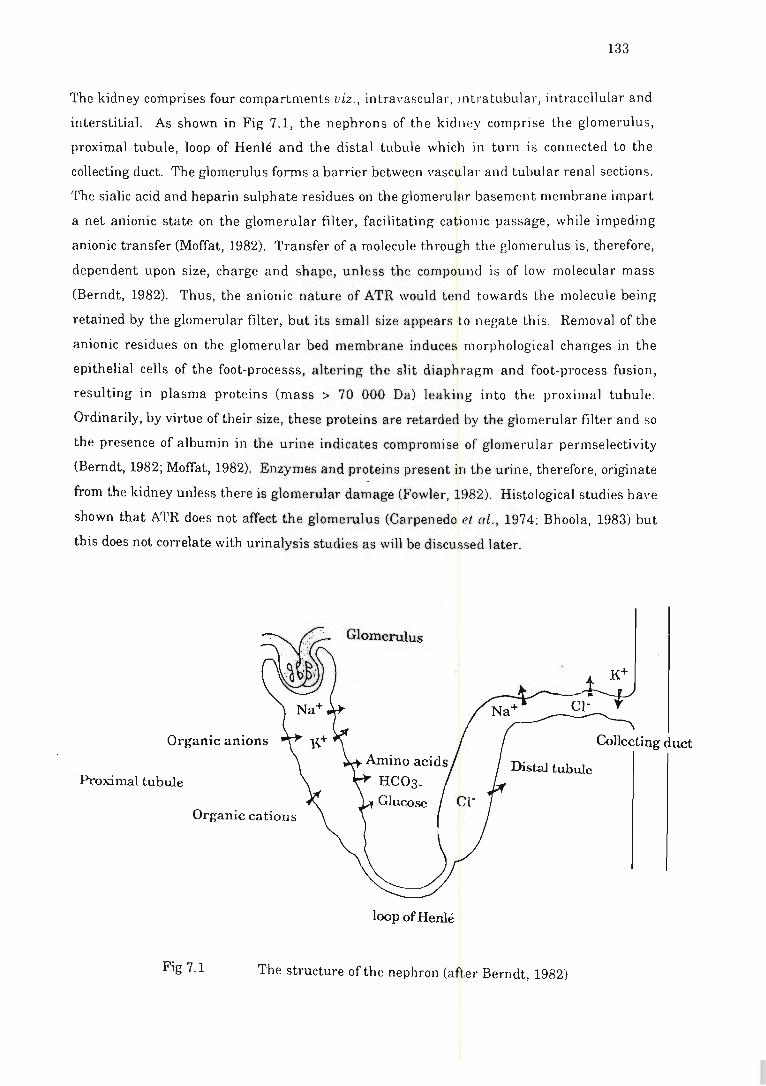
133
The kidney comprises four compartments viz ., intravascular, intratubular, intracellular and
interstitial. As shown in Fig 7.1, the nephrons of the kidney comprise the glomerulus,
proximal tubule, loop of Henle and the distal tubule which in turn is connected to the
collecting duct. The glomerulus forms a barrier between vascular and tubular renal sections.
The sialic acid and heparin sulphate residues on the glomerular basement membrane impart
a net anionic state on the glomerular filter, facilitating cationic passage, while impeding
anionic transfer (Moffat, 1982). Transfer of a molecule through the glomerulus is, therefore,
dependent upon size, charge and shape, unless the compound is of low molecular mass
(Berndt, 1982). Thus, the anionic nature of ATR would tend towards the molecule being
retained by the glomerular filter, but its small size appears to negate this. Removal of the
anionic residues on the glomerular bed membrane induces morphological changes in the
epithelial cells of the foot-processs, altering the slit diaphragm and foot-process fusion,
resulting in plasma proteins (mass > 70 000 Da) leaking into the proximal tubule.
Ordinarily, by virtue of their size, these proteins are retarded by the glomerular filter and so
the presence of albumin in the urine indicates compromise of glomerular permselectivity
(Berndt, 1982; Moffat, 1982). Enzymes and proteins present in the urine, therefore, originate
from the kidney unless there is glomerular damage (Fowler, 1982). Histological studies have
shown that ATR does not affect the glomerulus (Carpenedo et (Ii., 1974; Bhoola, 1983) but
this does not correlate with urinalysis studies as will be discussed later.
GlomelUlus
Organic anions Collecting duct
Proximal tubule
Organic cations
loop of Hen Ie
Fig 7.1 The structure of the nephron (aft.er Berndt, 1982)
134
Proximal tubules are of primary interest from a nephrotoxicological perspective, as tubule
cells are the first to be exposed to the glomerular ultrafiltrate . These cells are modified by
virtue of anionic microvilli brush borders and basal invaginations which impart a large
surface area to mass ratio to the cellular system. The cells isosmotically reabsorb solutes,
salts, water and any protein which surmounts glomerular filtration (Fowler, 1982; Boogaard
et al., 1989a). Rich in mitochondria (the primary target site of ATR) (Berndt, 1982), the cells
actively transport a variety of unrelated molecules and are capable of diverse metabolic
activity (Boogaard et al., 1989a,b). The proximal tubule is, therefore, highly susceptible to
nephrotoxic insult. In general, a nephrotoxin may alter fluid !:-tates or interfere with tubular
concentration, the latter dysfunction accounting for 60% of all renal injury by chemicals
(Moseley et al, 1981; Boogaard et al., 1989a,b). Atractyloside specifically causes proximal
tubule necrosis, and morphological damage to these tubules has been noted as early as 150-
180 minutes after dosing with 50 mg ATR/kg bwt (i.p.) in rats (Carpenedo et at., 1974). There
is however, a single allusion to the detrimental effect of atractylosides on the distal tubule
(Hatch et al., 1982), but this has yet to be substantiated and has been examined in section
7.2.3 below.
In the 1900s, renal disease was monitored by proteinuria (Piscator, 1989) and this was
superseded by measuring serum parameters, which, proving both insensitive and ambiguous,
were replaced by urine parameter assessment (Fowler, 1982). The monitoring of enzymes,
total protein, carbohydrates and inorganic salts in the urine, has provided "biochemical
biopsies" of the kidney (Dubach et at., 1988). These compounds in the urine provide non
invasive markers of renal damage or disease, and diagnosis is facilitated by the fact that
segments within the kidney are distinguishable on the basis of their specific enzymatic
activity (Dubach et al., 1988). Examples of some of the available markers are given in Table
7.1 below. Proteinuria can therefore provide a direct assessment . of glomerular integrity,
while evaluation of urinary enzyme excretion provides immediate and preliminary
information regarding onset and site of nephrotoxicity (Smith and Hook, 1982).
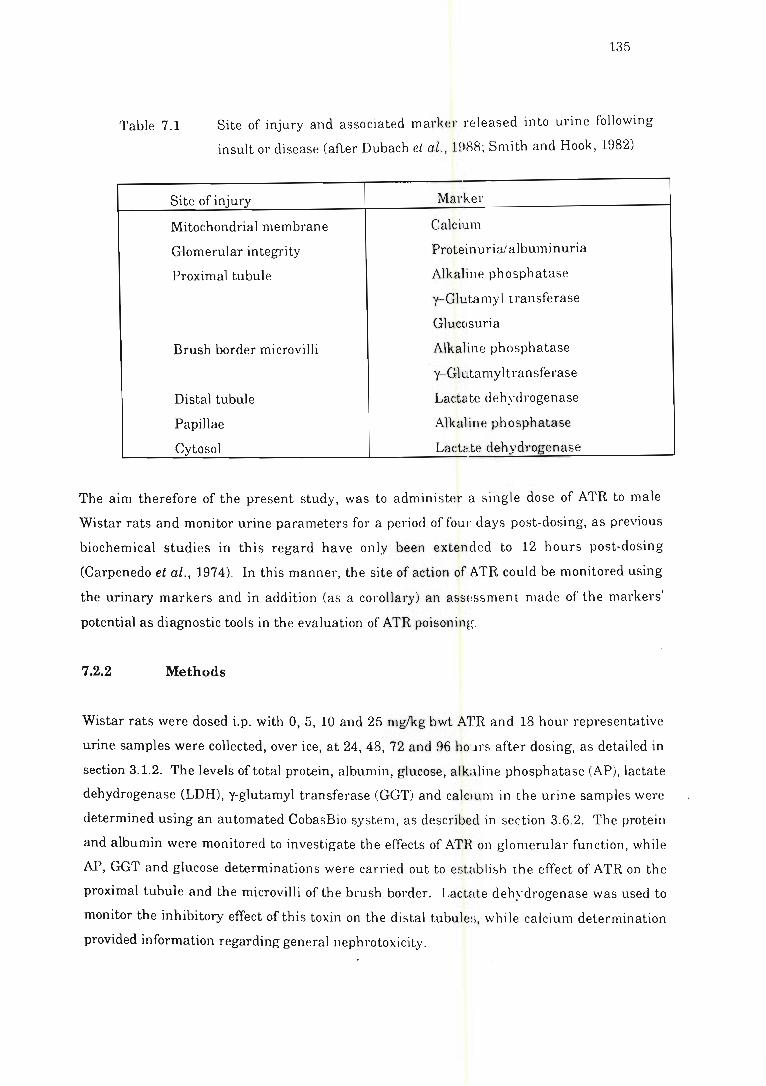
135
Table 7.1 Site of injury and associated marker released into urine following
insult or di sease (after Dubach et al., 1!188; Smith and Hook, 1982)
Site of injury Marker
Mitochondrial membrane Calcium
Glomerular integrity Proteinuria/albuminuria
Proximal tubule Alkaline phosphatase
y-Glutamyl transferase
Gluc(.suria
Brush border microvilli Alkaline phosphatase
y-Glutamyltransferase
Distal tubule Lactate dehydrogenase
Papillae Alkaline phosphatase
Cytosol Lactc.te dehydl'ogenase
The aim therefore of the present study, was to administer a si ngle dose of ATR to male
Wi star rats and monitor urine parameter s for a period of four days post-dosing, as previous
biochemical studies in this regard have only been extended to 12 hours post-dosing
(Carpenedo et al., 1974). In this manner, th e site of action of ATR could be monitored using
the urinary markers and in addition (as a corollary) an ass(~ssment made of the markers'
potential as diagnostic tools in the evaluation of ATR poisoning.
7.2.2 Methods
Wi star rats were dosed i.p. with 0, 5, 10 and 25 mglkg bwt ATR and 18 hour representative
urine samples were collected, over ice, at 24, 48, 72 and 96 ho.ll's after dosing, as detailed in
section 3.1.2. The levels of total protein , albumin, glucose, alkaline phosphatase (AP), lactate
dehydrogenase (LDH), y-glutamyl transferase (GGT) and calcium in the urine samples were
determined using an automated CobasBio system, as described in section 3.6.2. The protein
and albumin were monitored to investigate the effects of ATR on glomerular function, while
AP, GGT and glucose determination s were carried out to establi sh the effect of ATR on the
proximal tubule and the microvilli of the brush border. Lactate dehydrogenase was used to
monitor the inhibitory effect of this toxin on the distal tubule:;, while calcium determination
provided information regarding general nephrotoxicity.
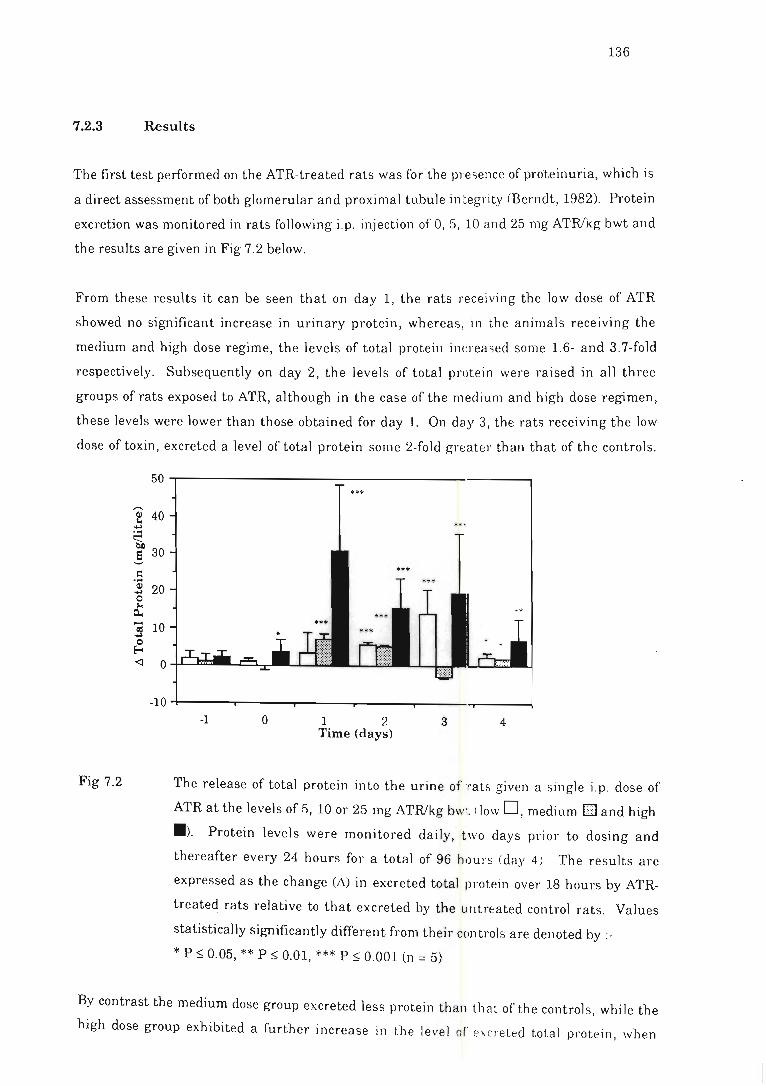
136
7.2.3 Results
The first test performed on the ATR-treated rats was for the presence of proteinuria, which is
a direct assessment of both glomerular and proximal tubule in tegrity (Berndt, 1982). Protein
excretion was monitored in rats followin g i.p . injection of 0,5, 10 and 25 mg ATRlkg bwt and
the results are given in Fig 7.2 below.
From these results it can be seen that on day 1, the rats receiving the low dose of ATR
showed no significant increase in urinary protein, whereas, in the animals receiving the
medium and high dose regime, the levels of total protein increased some 1.6- and 3.7-fold
respectively. Subsequently on day 2, the levels of total protein were raised in all three
groups of rats exposed to ATR, although in the case of the medium and high dose regimen,
these levels were lower than those obtained for day 1. On day 3, the rats receiving the low
dose of toxin, excreted a level of total protein some 2-fold greater than that of the controls.
50
,-...
f 40 ... ~ ! 30
= .... Q) 20 ... 0
'" ~ - 10 <II ... 0 ~ <I 0
-10
Fig 7.2
-1 o 1 2 3 4 Time (days)
The release of total protein into the urine of Tats given a single i.p. dose of
ATR at the levels of 5, 10 or 25 mg ATRlkg bw:; (Jow 0, medium El and high
. ). Protein levels were monitored daily, two days prior to dosing and
thereafter every 24 hours for a total of 96 h,)urs (day 4). The results are
expressed as the change (M in excreted total protein over 18 hours by ATR
treate~ rats relative to that excreted by the u.ntreated control rats. Values
statistically significantly different from their controls are denoted by :-
* P ~ 0.05, ** P ~ 0.01, *** P ~ 0.001 (n = 5)
By contrast the medium dose group excreted less protein than that of the control s, while the
high dose group exhibited a furth er increase in the level of excre ted total protein , when
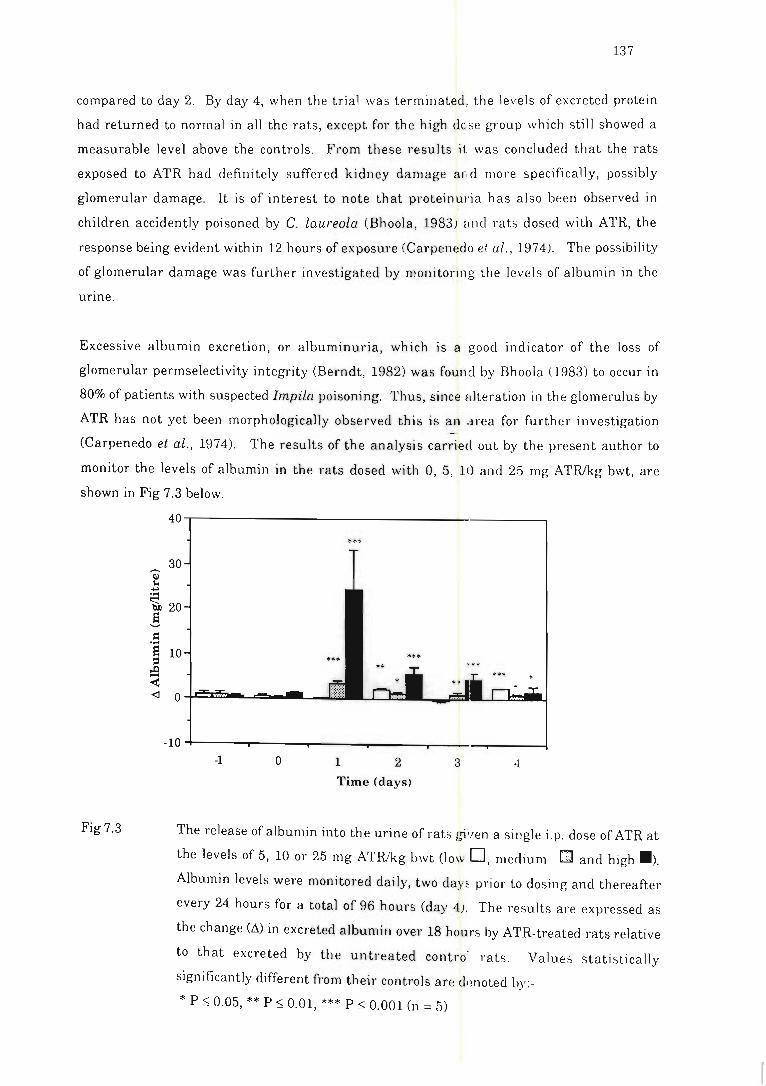
137
compared to day 2. By day 4, when the trial was terminated, the levels of excreted protein
had returned to normal in all the rats, except for the high dcse group which still showed a
measurable level above the controls. From these results it was concluded that the rats
exposed to ATR had definitely suffered kidney damage arid more specifically, possibly
glomerular damage. It is of interest to note that proteinuria has also been observed in
children accidently poisoned by C. laureola (Bhoola, 1983) and rats dosed with ATR, the
response being evident within 12 hours of exposure (Carpenedo el 01., 1974). The possibility
of glomerular damage was further investigated by monitoring the levels of albumin in the
urme.
Excessive albumin excretion, or albuminuria, which is a good indicator of the loss of
glomerular permselectivity integrity (Berndt, 1982) was found by Bhoola (1983) to occur in
80% of patients with suspected Impila poisoning. Thus, since alteration in the glomerulus by
ATR has not yet been morphologically observed this is an area for further investigation
(Carpenedo et al., 1974). The results of the analysis carried out by the present author to
monitor the levels of albumin in the rats dosed with 0, 5, 10 and 25 mg ATR/kg bwt, are
shown in Fig 7.3 below.
Fig 7.3
40,------------------------------------------~
-104-----~----~----~~----~----~----~ -1 o 1 2 3 4
Time (days)
The release of albumin into the urine of rats gi'len a single i.p. dose of ATR at
the levels of 5, 10 or 25 mg ATR/kg bwt (low 0, medium Q] and high . ).
Albumin levels were monitored daily, two daYE prior to dosing and thereafter
every 24 hours for a total of 96 hours (day 4). The results are expressed as
the change (M in excreted albumin over 18 hours by ATR-treated rats relative
to that excreted by the untreated contro· rats. Values statistically
significantly different from their controls are d,!noted by:-
* p ~ 0.05, ** P ~ 0.01, *** P ~ 0.001 (n = 5)
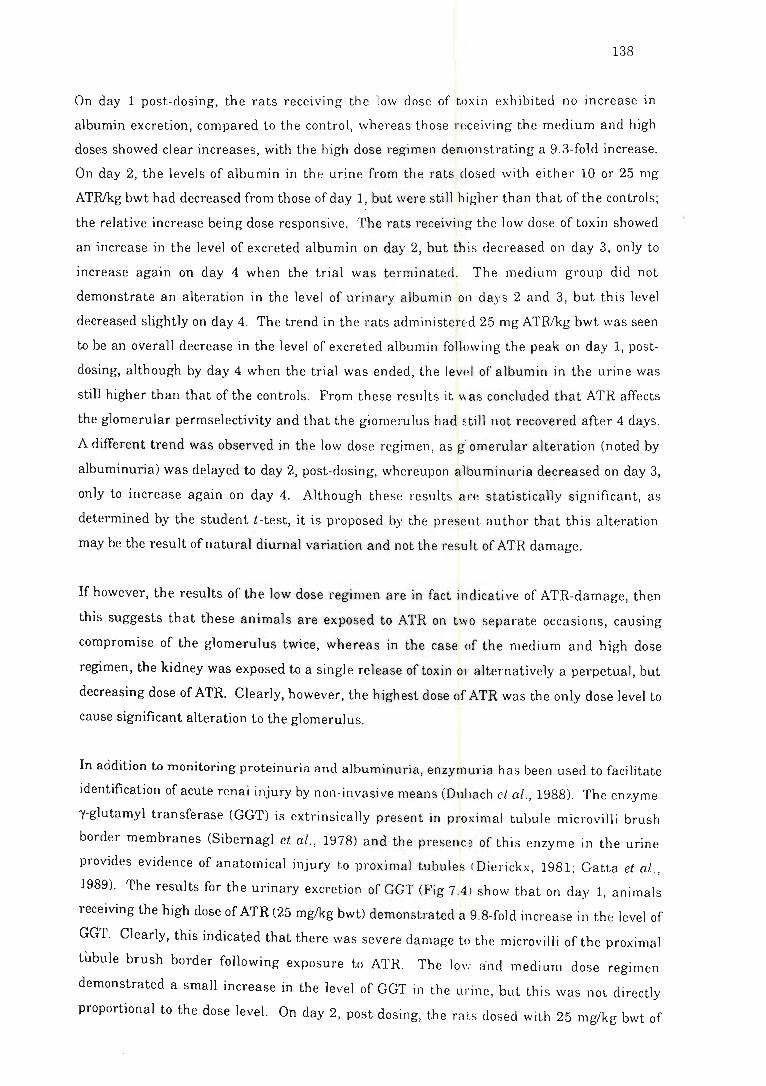
138
On day 1 post-dosing, the rats receiving the low dose of toxin exhibited no increase in
albumin excretion, compared to the control, whereas those n!ceiving the medium and high
doses showed clear increases, with the high dose regimen demonstrating a 9.3-fold increase.
On day 2, the levels of albumin in the urine from the rats closed with either 10 or 25 mg
ATRlkg bwt had decreased from those of day 1, but were still higher than that of the controls;
the relative increase being dose responsive. The rats receiving the low dose of toxin showed
an increase in the level of excreted albumin on day 2, but this decreased on day 3, only to
increase again on day 4 when the trial was terminated. The medium group did not
demonstrate an alteration in the level of urinary albumin on days 2 and 3, but this level
decreased slightly on day 4. The trend in the rats administerEd 25 mg ATRfkg bwt was seen
to be an overall decrease in the level of excreted albumin following the peak on day 1, post
dosing, although by day4 when the trial was ended, the levI!l of albumin in the urine was
still higher than that of the controls. From these results it \-\ as concluded that ATR affects
the glomerular perm selectivity and that the glomelUlus had ~till not recovered after 4 days.
A different trend was observed in the low dose regimen, as g' omerular alteration (noted by
albuminuria) was delayed to day 2, post-dosing, whereupon albuminuria decreased on day 3,
only to increase again on day 4. Although these results are statistically significant, as
determined by the student t-test, it is proposed by the present author that this alteration
may be the result of natural diurnal variation and not the resu It of ATR damage.
If however, the results of the low dose regimen are in fact indicative of ATR-damage, then
this suggests that these animals are exposed to ATR on two separate occasions, causing
compromise of the glomerulus twice, whereas in the case of the medium and high dose
regimen, the kidney was exposed to a single release of toxin 01 alternatively a perpetual, but
decreasing dose of ATR. Clearly, however, the highest dose of ATR was the only dose level to
cause significant alteration to the glomerulus.
In addition to monitoring proteinuria and albuminuria, enzymuria has been used to facilitate
identification of acute renal injury by non-invasive means (Duhach et ai ., 1988). The enzyme
y-glutamyl transferase (GGT) is extrinsically present in proximal tubule microvilli brush
border membranes (Sibernagl et ai., 1978) and the presenc·:! of this enzyme in the urine
provides evidence of anatomical injury to proximal tubules (Dierickx, 1981; Gatta et al.,
1989). The results for the urinary excretion of GGT (Fig 7.4) show that on day 1, animals
receiving the high dose of ATR (25 mg/kg bwt) demonstrated a 9.8-fold increase in the level of
GGT. Clearly, this indicated that there was severe damage to the microvilli of the proximal
tubule brush border following exposure to ATR. The 10Vl and medium dose regimen
demonstrated a sman increase in the level of GGT in the urii1e, but this was not directly
proportional to the dose level. On day 2, post-dosing, the ra ts dosed with 25 mg/kg bwt of
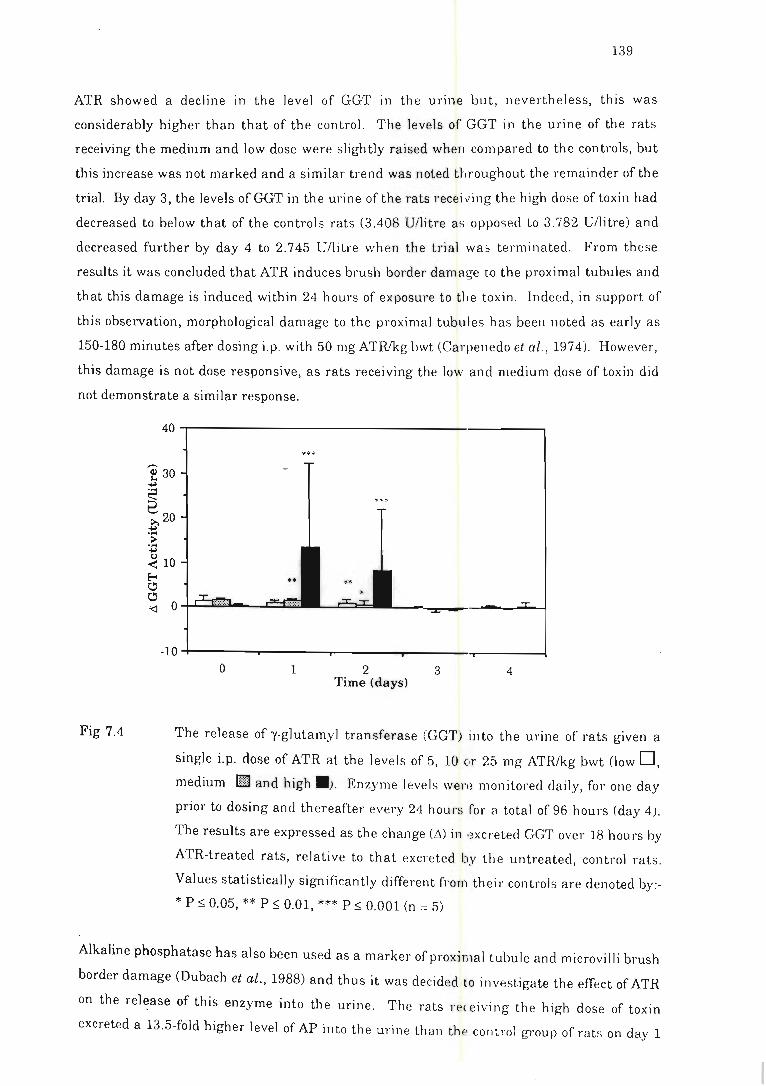
139
ATR showed a decline in the level of GGT in the urine but, nevertheless, this was
considerably higher than that of the control. The level s of GGT in the urine of the rats
receiving the medium and low dose were slightly raised when compared to the controls, but
this increase was not marked and a similar trend was noted tlwoughout the remainder of the
trial. By day 3, the levels ofGGT in the urine ofthe rats receiving the high dose of toxin had
decreased to below that of the controls rats (3.408 U/litre as opposed to 3.782 Ullitre) and
decreased further by day 4 to 2.745 Gl1itre when the trial was terminated. From these
results it was concluded that ATR induces brush border damage to the proximal tubules and
that this damage is induced within 24 hours of exposure to fhe toxin. Indeed, in support of
this observation, morphological damage to the proximal tubules has been noted as early as
150-180 minutes after dosing i.p. with 50 mg ATRlkg bwt (Carpenedo et ai., 1974). However,
this damage is not dose responsive, as rats receiving the low and medium dose of toxin did
not demonstrate a similar response.
Fig 7.4
40~--------------------------------------~
•••
-10~-------r------~------~-------T------~ o 1 2 3 4
Time (days)
The release of y-glutamyl transferase (GGT) into the urine of rats given a
single i.p. dose of ATR at the levels of 5, 10 c,r 25 mg ATRlkg bwt (low 0, medium EJ and high .). Enzyme level s weJ'l ~ monitored daily, for one day
prior to dosing and thereafter every 24 hours ror a total of 96 hours (day 4).
The results are expressed as the change (t.) in '~xcretecl GGT over 18 hours by
ATR-treated rats, relative to that excreted by the untreated, control rats.
Values statistically significantly different from their controls are denoted by :
* P ~ 0 .. 05, ** P ~ 0.01, *** P ~ 0.001 (n = 5)
Alkaline phosphatase has also been used as a marker of proximal tubule and microvilli brush
border damage (Dubach et al., 1988) and thus it was decided to investigate the effect of ATR
on the rel~ase of this enzyme into the urine. The rats receiving the high dose of toxin
excreted a 13.5-fold higher level of AP into the urine than th e control group of rats on day 1
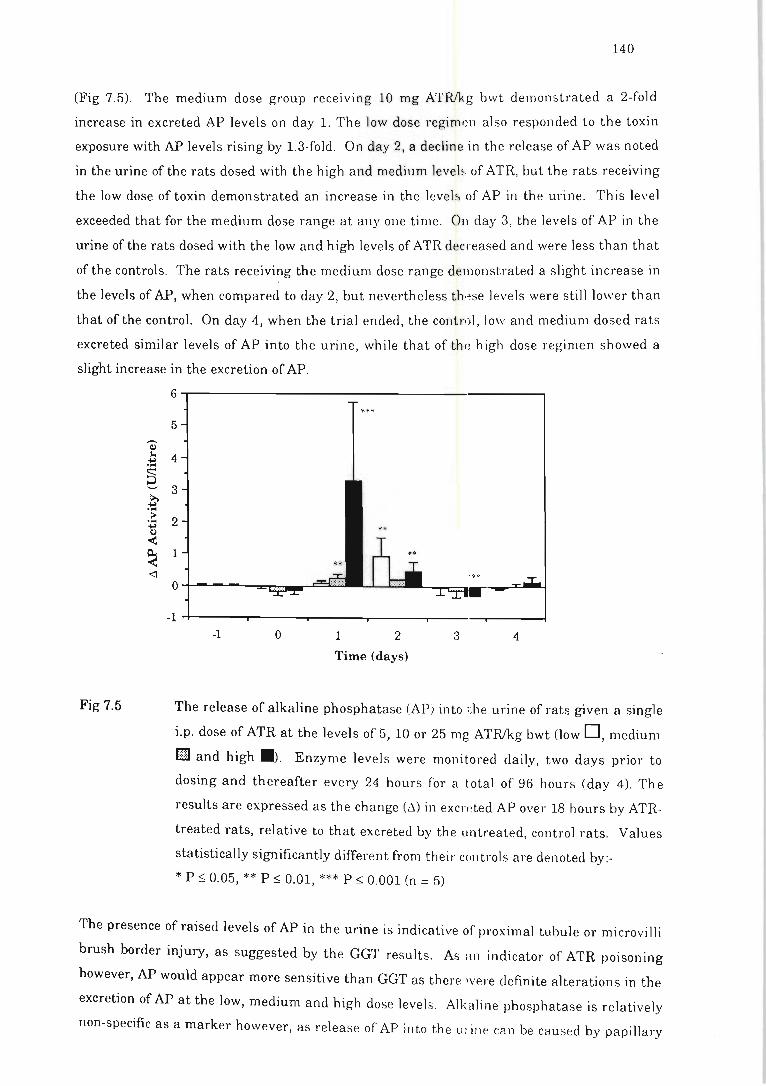
140
(Fig 7.5). The medium dose group receiving 10 mg ATMg bwt demon strated a 2-fold
increase in excreted AP levels on day 1. The low dose regim'~n also responded to the toxin
exposure with AP levels rising by 1.3-fold. On day 2, a decline in the release of AP was noted
in the urine of the rats dosed with the high and medium level ~ . of ATR, but the rats receiving
the low dose of toxin demonstrated an increase in the level s of AP in the urine. This level
exceeded that for the medium dose range at anyone time. 0" day 3, the levels of AP in the
urine of the rats dosed with the low and high levels of ATR decreased and were less than that
of the controls. The rats receiving the medium dose range demon strated a slight increase in
the levels of AP, when compared to day 2, but nevertheless th,~se levels were still lower than
that of the control. On day 4, when the trial ended, the control, low and medium dosed rats
excreted similar levels of AP into the urine, while that of th,! high dose regimen showed a
slight increase in the excretion of AP.
~ ,... .. ... § ...... >. .. ... :-... .. C.l
< ~ <l
Fig 7.5
6,------------------------------------------, ***
5
4
3
2
1
0
-1 -1 o 1 2 3 4
Time (days)
The release of alkaline phosphatase (APi into i;he urine of rats given a single
i.p. dose of ATR at the levels of 5, 10 or 25 mg ATRfkg bwt (low D, medium
[3 and high . ). Enzyme levels were monitored daily, two days prior to
dosing and thereafter every 24 hours for a total of 96 hours (day 4). The
results are expressed as the change (6) in excrded AP over 18 hours by ATR
treated rats, relative to that excreted by the untreated, control rats. Values
statistically significantly different from their c(lIltrols are denoted by:-
* P ~ 0.05, ** P ~ 0.01 , *** P ~ 0.001 (n = 5)
The presence of raised levels of AP in the urine is indicative of proximal tubule or microvilli
brush border injury, as suggested by the GGT results. As an indicator of ATR poisoning
however, AP would appear more sensitive than GGT as there 'vere definite alterations in the
excretion of AP at the low, medium and high dose level s. Alkalin e phosphatase is relatively
non-specific as a marker however, as release of AP into the Ul in e can be caused by papillary
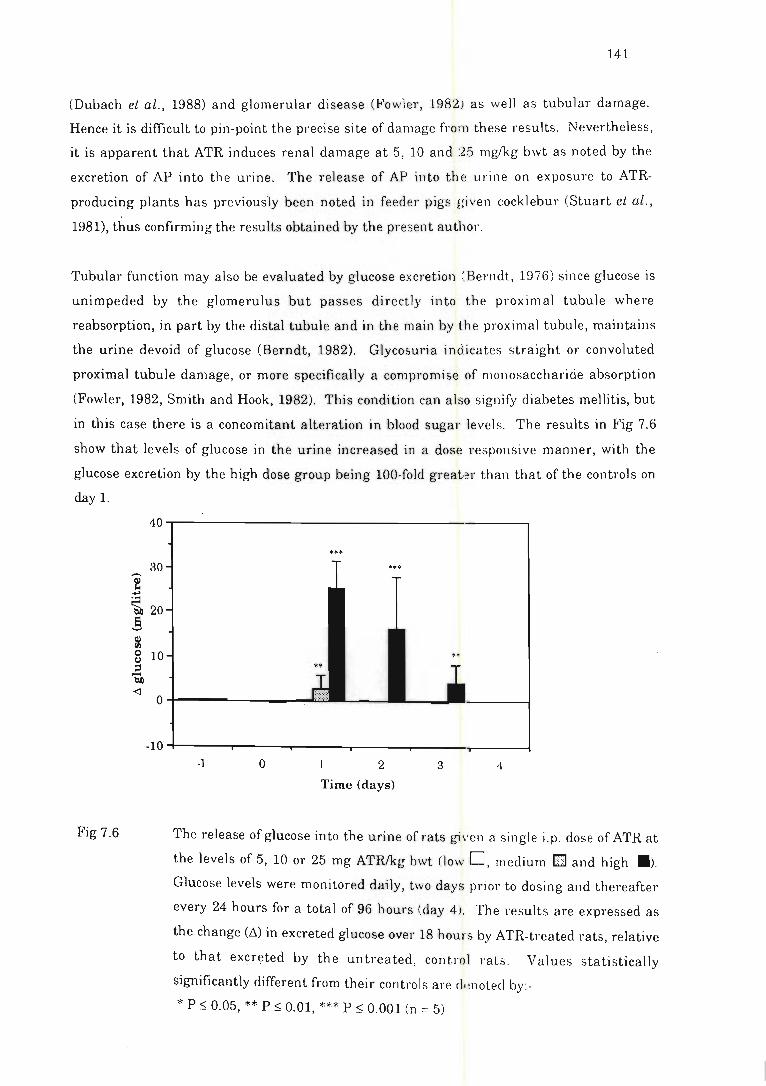
141
(Dubach et al., 1988) and glomerular disease (Fowler, 1982) as well as tubular damage.
Hence it is difficult to pin-point the preci se site of damage from th ese results. Nevertheless,
it is apparent that ATR induces renal damage at 5, 10 an d :25 mglkg bwt as noted by the
excretion of AP into the urine. The release of AP into the urine on exposure to ATR
producing plants has previously been noted in feeder pigs given cockl ebur (Stuart et ai.,
1981), thus confirming the results obtained by the present author.
Tubular function may also be evaluated by glucose excretion ~ Berndt, 1976) since glucose is
unimpeded by the glomerulus but passes directly into the proximal tubule where
reabsorption, in part by the distal tubule and in the main by th e proximal tubule, maintains
the urine devoid of glucose (Berndt, 1982). Glycosuria in dicates straight or convoluted
proximal tubule damage, or more specifically a compromise of monosaccharide absorption
(Fowler, 1982, Smith and Hook, 1982). This condition can also signify diabetes mellitis, but
in this case there is a concomitant alteration in blood sugar levels. The results in Fig 7.6
show that levels of glucose in the urine increased in a dose responsive manner, with the
glucose excretion by the high dose group being 100-fold great·~r than that of the contl'ols on
day 1.
Fig 7.6
40,------------------------------------------,
30
i .... ~ 20 a '-'
&l 8 10 ::s
b.o
•••
<l o+-----------~~
-10~----_r----~----~~----~-----~----~ -1 o 1 2 3 4
Time (days)
The release of glucose into the urine of rats g1\'en a si ngl e i.p. dose of ATR at
the levels of 5, 10 or 25 mg ATRlkg bwt (low D , medium El and high . ).
Glucose levels were monitored daily, two days prior to dosing and thereafter
every 2,4 hours for a total of 96 hours (day 4). The results are expressed as
the change (1.\) in excreted glucose over 18 hours by ATR-treated rats, relative
to that ex~reted by the untreated, control rats. Values statistical1y
significantly different from their controls are cl,motecl by:-
* P $ 0.05, ** P $ 0,01, *** P $ 0.001 (n = 5)
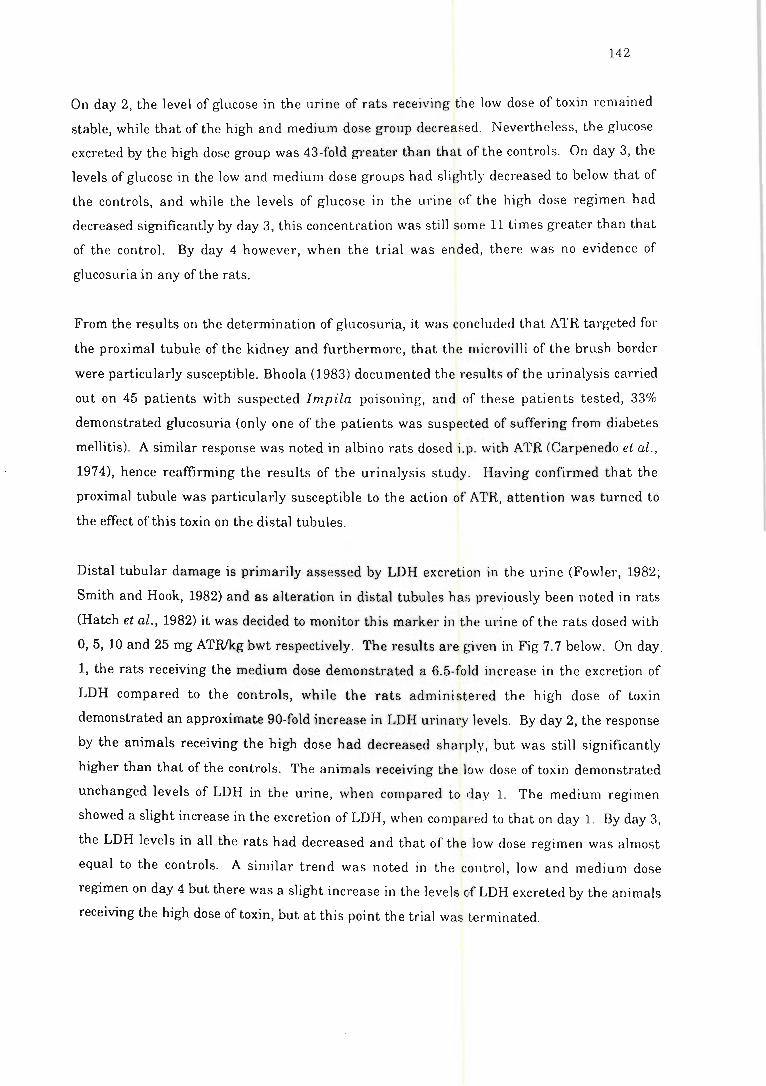
142
On day 2, the level of glucose in the urine of rats receiving the low dose of toxin remained
stable, while that of the high and medium dose group decreased. Nevertheless, the glucose
excreted by the high dose group was 43-fold greater than that of the controls. On day 3, the
levels of glucose in the low and medium dose groups had slightly decreased to below that of
the controls, and while the levels of glucose in the urine of the high dose regimen had
decreased significantly by day 3, this concentration was still some 11 times greater than that
of the control. By day 4 however, when the trial was ended, there was no evidence of
glucosuria in any of the rats.
From the results on the determination of glucosuria, it was concluded that ATR targeted for
the proximal tubule of the kidney and furthermore, that the microvilli of the brush border
were particularly susceptible. Bhoola (1983) documented the results of the urinalysis carried
out on 45 patients with suspected Impiia poisoning, and of these patients tested, 33%
demonstrated glucosuria (only one of the patients was suspeded of suffering from diabetes
mellitis). A similar response was noted in albino rats dosed i.p. with ATR (Carpenedo et al.,
1974), hence reaffirming the results of the urinalysis study. Having confirmed that the
proximal tubule was particularly susceptible to the action of ATR, attention was turned to
the effect of this toxin on the distal tubules.
Distal tubular damage is primarily assessed by LDH excretion in the urine (Fowler, 1982;
Smith and Hook, 1982) and as alteration in distal tubules has previously been noted in rats
(Hatch et al., 1982) it was decided to monitor this marker in the urine of the rats dosed with
0, 5, 10 and 25 mg ATR/kg bwt respectively. The results are given in Fig 7.7 below. On day .
1, the rats receiving the medium dose demonstrated a 6.5-fold increase in the excretion of
LDH compared to the controls, while the rats administered the high dose of toxin
demonstrated an approximate 90-fold increase in LDH urinary levels. By day 2, the response
by the animals receiving the high dose had decreased sharply, but was still significantly
higher than that of the controls. The animals receiving the low dose of toxin demonstrated
unchanged levels of LDH in the urine, when compared to day l. The medium regimen
showed a slight increase in the excretion of LDH, when compared to that on day l. By day 3,
the LDH levels in all the rats had decreased and that of the low dose regimen was almost
equal to the controls. A similar trend was noted in the control, low and medium dose
regimen on day 4 but there was a slight increase in the levels of LDH excreted by the animals
receiving the high dose of toxin, but at this point the trial was Lerminated.
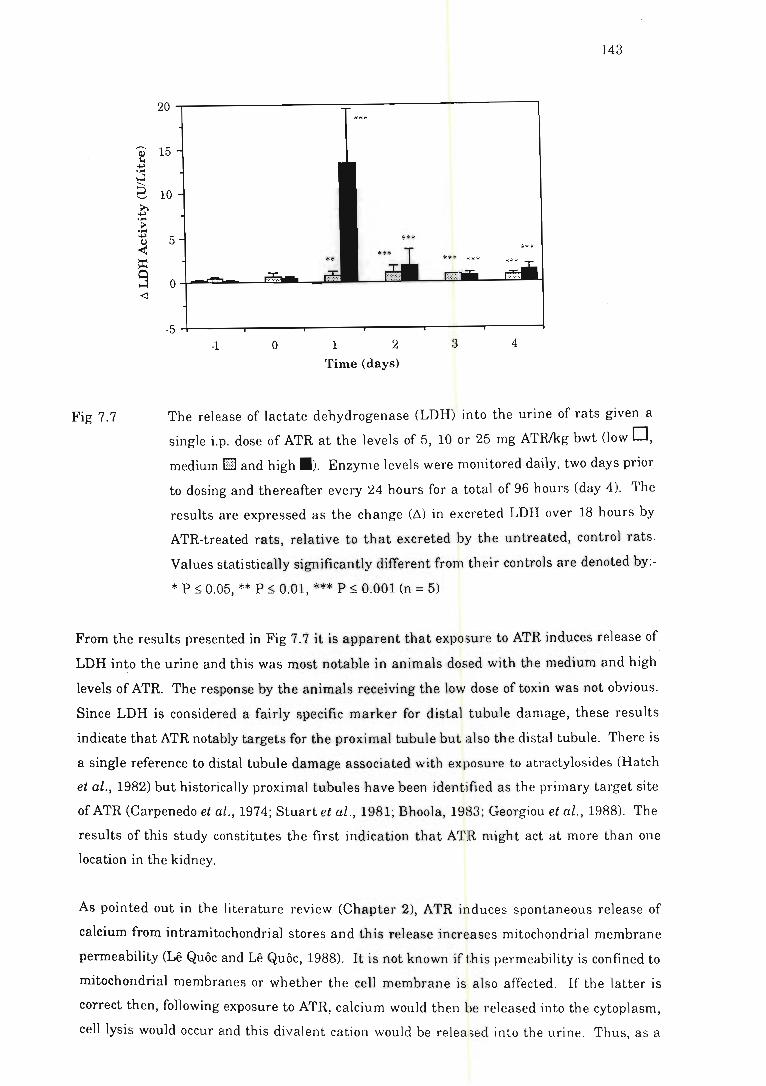
f ..., .... ~ ... ..., .... > .... ..., t)
< ~
9 <l
Fig 7.7
143
20 ***
15
10
5
0
-5 -I 0 1 2 3 4
Time (days)
The release of lactate dehydrogenase (LDH) into the urine of rats given a
single i.p. dose of ATR at the levels of 5, 10 or 25 mg ATRlkg bwt (low 0, medium 1m and high .). Enzyme levels were monitored daily, two days prioT:
to dosing and thereafter every 24 hours for a total of 96 hours (day 4). The
results are expressed as the change (~) in excreted LDH over 18 hours by
ATR-treated rats, relative to that excreted by the untreated, control rats.
Values statistically significantly different from their controls are denoted by:
* p ~ 0.05, ** P ~ 0.01, *** P ~ 0.001 (n = 5)
From the results presented in Fig 7.7 it is apparent that exposure to ATR induces release of
LDH into the urine and this was most notable in animals dosed with the medium and high
levels of ATR. The response by the animals receiving the low dose of toxin was not obvious.
Since LDH is considered a fairly specific marker for distal tubule damage, these results
indicate that ATR notably targets for the proximal tubule but also the distal tubule. There is
a single reference to distal tubule damage associated with exposure to atractylosides (Hatch
et al., 1982) but historically proximal tubules have been identified as the primary target site
of ATR (Carpenedo et at., 1974; Stuart et ai., 1981; Bhoola, 1983; Georgiou et ai ., 1988). The
results of this study constitutes the first indication that ATR might act at more than one
location in the kidney.
As pointed out in the literature review (Chapter 2), ATR induces spontaneous release of
calcium from intramitochondrial stores and this release increases mitochondrial membrane
permeability (Le QUQC and Le QUQC, 1988). It is not known if this permeability is confined to
mitochondrial membranes or whether the cell membrane is also affected . If the latter is
correct then, following exposure to ATR, calcium would then be released into the cytoplasm,
cell lysis would occur and this divalent cation would be relea;ed into th e urine . Thus, as a
144
general marker of cellular damage (Bach, pel's. comm. , 1990), the levels of calcium excreted
into the urine by rats dosed with ATR at 0, 5, 10 and 25 mglkg bwt, were measured, the
results for which are shown in Fig 7.8.
Fig 7.8
::::;a
b:o
0.5
! a =' .~ -0.5 ~
tIS o <I
-1.5 +----.------r------,~--_.__--_r_--__t
-1 o 1 2 3 4
Time (weeks)
The release of calcium into the urine of rats given a single i.p. dose of ATR at
the levels of 5, 10 or 25 mg ATRlkg bwt (low 0, medium [§] and high . ).
Calcium levels were monitored daily, two days prior to dosing and thereafter
every 24 hours for a total of 96 hours (day 4). The results are expressed as the
change (M in excreted calcium over 18 hours by ATR-treated rats, relative to
that excreted by the untreated, control rats. Values statistically significantly
different from their controls are denoted by:-
* p ~ 0.05, ** P ~ 0.01, *** P ~ 0.001 (n = 5)
The rats receiving the high dose of ATR showed a transient increase in calcium levels in the
urine on day 1 and thereafter, these levels decreased progressively over the next 2 days
reaching a level significantly below that of the control by day 3, and increasing slightly on
day 4. The rats receiving the medium dose of ATR excreted calcium into the urine at a level
significantly lower than that of the controls and this trend was maintained throughout the
trial. The rats given the low dose of toxin demonstrated a gradual increase in calcium
excretion from day 2, decreasing slightly on day 3, only to peak on day 4 when the trial was
terminated. Thus in summary, it is clear from Fig 7.8 that on day 3 and 4, the levels of
calcium secreted by t~e medium dose regimen were significantly lower than that of the
controls, while in the case ofthe high dose regimen, a sigmoidal response was noted, with the
levels of excreted calcium decreasing significantly on day 4, only to increase again . It is
proposed that this response is indicative of the effects of parathyroid hormones (PTH) on the
excretion of calcium in the urine as, clearly, if calcium is excreted into the urine , ultimately
serum calcium concentrations will decrease. In respon se, PTH secretion is stimul ated,
145
resulting in the increased hydroxylation of 1,25-dihydroxy-cholecalciferol, which increases
intestinal adsorption of calcium and also induces mobilisation of calcium from bone, thus re
establishing serum calcium levels . Following the increase in the serum calcium
concentration, there is a resulting increase in the level of excreted calcium in the urine, to re
establish homeostasis (Ungar, 1986). Thus, the response noted in the high dose regimen is
thought to be the result of PTH and 1,25-dihydroxycholecalciferol re-establishing
homeostasis.
It is evident from the urinalysis that ATR induces proximal tubule and microvilli brush
border injury and inhibits transport of glucose into the tubules, with possible glomerular
functional compromise and distal tubule damage. Proximal tubule injury by ATR has been
positively reaffirmed by the present author, but this is the first report of the inhibition of
glomerular and distal tubule function, a finding which requires further confirmation .
Collectively, the biochemical analyses carried out may aid diagnosis of ATR poisoning, but no
single analysis may be deemed ideal, nor specifically indicative of ATR exposure or injury .
Alternative, direct analyses for ATR, employing HPLC and ELISA (chapters 4 and 6)
provides a more sensitive and specific diagnosis of poisoning of this nature. Following
identification of the kidney as the target organ for ATR, attention was focused on the
possibility that the liver may also be a target for ATR.
7.3 The effects of atractyloside on the appearance of liver
function enzymes in rat serum
7.3.1 Introduction
The nature and extent of various lesions within the liver may be estimated using clinical
enzymology. In 1954, increased serum aldolase activity was correlated with viral hepatitis
infections and subsequently a number of other serum enzymes, including alcohol
dehydrogenase, malic dehydrogenase and both alanine and aspartate transaminases (ALT
and AST), became associated with liver disease (Hess, 1963). Serum transaminase activity
increases with toxic hepatic damage, subsiding only on cessation of toxin administration and
liver regeneration while most forms of histological damage to the liver is associated with
elevated serum ALT levels and if centrilobular necrosis is present, AST levels also rise (Hess,
1963).
Since ATR has usually been presumed to be a hepatotoxin, most studies into the action of
this toxin have been carried out on hepatocyte homogenates. In view of the inhibitory action
of ATR and its effect on the kidney, it was conceivable that th is' toxin could also induce the
146
liver damage. This aim of this aspect of the work was to monitor the effects of ATR on serum
transaminase activity, over a period of96 hours and is, therefore, an extension ofthe study of
Carpenedo et al. (1974), who monitored transaminase activity for only 12 hours after dosing.
Thus the rationale for this extended study was provided by Wainwright et al. (1977) who
observed liver alteration in rats only 24 hours after they were exposed to a semi-purified
extract of ATR obtained from C. laureola, indicating that the investigation by Carpenedo et
al. (1974) may have been prematurely terminated.
7.3.2 Methods
As a continuation of the study carried out in the United Kingdom, the experiment completed
at the Roben's Institute (see section 7.2) was repeated at the BMRC, University of Durban
Westville, whereby male Wi star rats were dosed i.p. with 0, 5, 10 and 25 mg ATRJkg bwt,
with serum instead of urine being collected over a period of 96 hours. At termination, the
hepatotoxicity of the toxin was monitored in serum by assaying for AST and ALT levels by
the methods described in sections 3.1.3 and 3.6 respectively.
7.3.3 Results and discussion
The results of the analyses on the rat sera are presented in Fig 7.9 and represent the mean of
the AST and ALT levels for each of the five rats allocated to a dose level, for days 0 - 4. From
the results it is evident that there was no significant alteration in the ALT and AST levels in
any of the rats, and it may be concluded that ATR, over the dose range 0 to 25 mg/kg bwt,
does not induce liver damage in rats.
By contrast, patients poisoned either by C. laureola or A. gummifera demonstrated elevated
serum ALT and AST levels (sometimes 800-fold) indicating liver damage associated with the
centrilobular area, and these clinical findings have been confirmed by histological
investigation (Georgiou et al., 1988; Bhoola, 1983). The nephrotoxicity of ATR has been well
documented but the hepatotoxicity of this diterpene glycoside.is not definitive. There is on ly
one reference to the monitoring of serum transaminase activity in animals dosed with ATR
(Carpenedo et ai., 1974). Serum samples were collected from rats at 4 hourly intervals for a
period of 12 hours, and ALT and AST levels monitored but there was no apparent alteration
in the levels of these enzymes in animals exposed to ATR. Although this was initially
thought that the trial of Carpenedo et ai. (1974) was terminated prematurely, the results of
the present investigation disagree with this supposition.
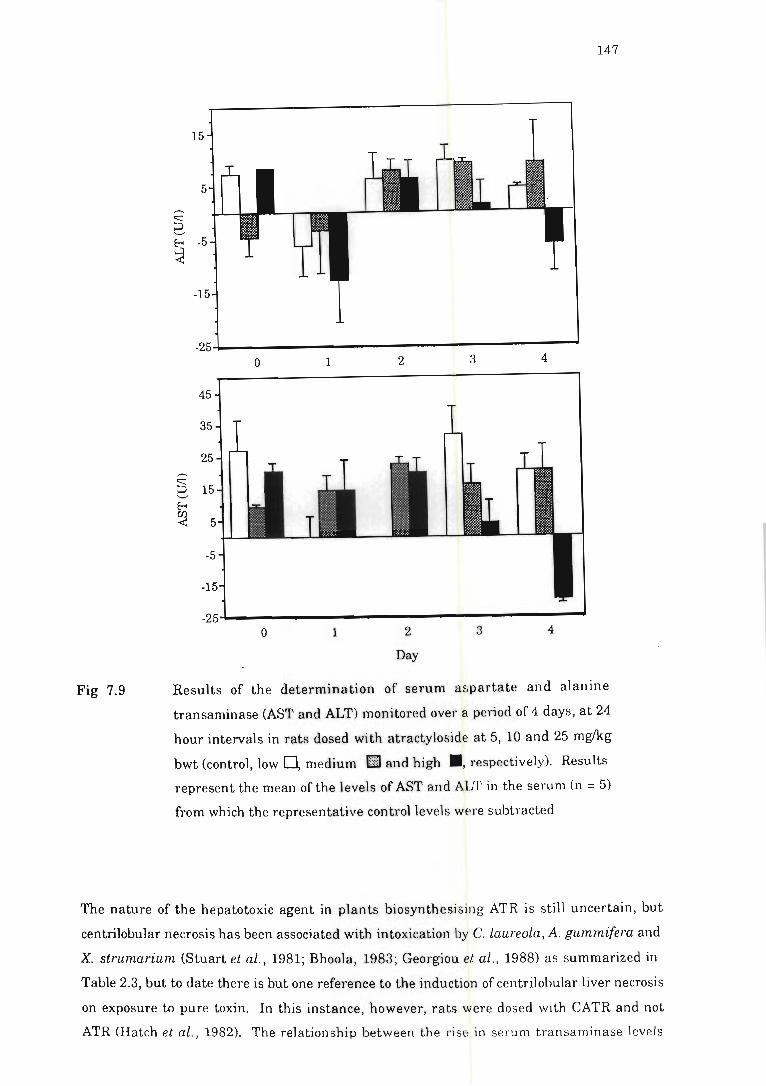
Fig 7_9
,-..
2 ~
~
15
5
-15
-25 0 1 2 3 4
45
35
25
15
5
-5
-25-'-------___________ .... o 1 2
Day
3 4
147
Results of the determination of serum aspartate and alanine
transaminase (AST and ALT) monitored over a period of 4 days, at 24
hour intervals in rats dosed with atractyloside at 5, 10 and 25 mglkg
bwt (control, low 0, medium lEI and high ., respectively). Results
represent the mean of the levels of AST and ALT in the serum (n = 5)
from which the representative control levels Wf~re subtracted
The nature of the hepatotoxic agent in plants biosynthesising ATR is sti ll ·uncertain, but
centrilobular necrosis has been associated with intoxication by C. laureola, A. gummifera and
X. strumarium (Stuart et al., 1981; Bhoola, 1983; Georgiou el al ., 1988) as summarized in
Table 2.3, but to date there is but one reference to the induction of centrilobular liver necrosis
on exposure to pure toxin. In this instance, however, rats were dosed with CATR and not
ATR (Hatch et al., 1982). The relationship between th e ri se in serum transaminase levels
148
and liver necrosis has been noted in patients and animals exposed to plants biosynthesising
atractylosides (as outlined in Table 2.2 and 2.3) (Stuart et aZ., 1981; Bhoola, 1983; Georgiou et
al., 1988) and this observation provided the rationale for this study . From the results ofthis
investigation it is concluded that the identity of the hepa~otoxin in Wainwright's ATR
preparation remains unknown and forms an area for future re~;earch.
In conclusion from the results of the urinalysis and serum enzyme activity determination, it
is clear that ATR affects the proximal tubule of the kidney, in particular the microvilli of the
brush border (confirming previous findings) but in addition, th is toxin appears to compromise
glomerular permselectivity and distal tubules. The results of ;:.he serum studies suggest that
ATR is not hepatotoxic, indicating that the effect of this toxin is localised to the kidney.
Based on the results of this serum study and the urinalysis, it was decided to further pursue
the nephrotoxicity of ATR by monitoring the effects of this toxin on the in vitro incorporation
of proline into isolated rat proximal tubules. This is the first known report of the effects of
ATR on in vitro amino acid incorporation in the kidney, the details of which are presented in
the next section.
7.4 The effect of atractyloside on proline incorporation in proximal tubules
7.4.1 Introduction
The complexity of the kidney, hampers the study of its fu.nctions and susceptibility to
nephrotoxins within defined areas of the intact organ, and thus the interpretation of in vivo
nephrotoxicity becomes very complicated, especially as it is difficult to account for all the
extraneous influences. The isolation of tissue and cell fracticns has facilitated the study of
each compartment in isolation, and for instance, the preparation of glomeruli and tubular
fragments, which has been well documented (Ormstad, 198~: ) is now routinely carried out
either by enzymatic or mechanical release of the tissue fragments rBoogaard et aZ ., 1989a,b).
A paramount function of the proxiI11al tubules is the active vectorial transport of compounds
from the glomerular filtrate to the blood and vice versa (Bt)ogaard et aZ ., 1989a,b), and
therefore the inhibition of such transport is frequently the first evidence of nephrotoxic
insult. Thus·, the in vitro isolation ofrat proximal tubules has provided the means to give an
early assessment of proximal tubular dysfunction in the pre~;ence ofaxenobiotic with this
system, and the transport of a number of different compounds may be monitored including
glucose and various amino acids (Boogaard et aZ., 1989a, bi. Proline is actively incorporated
into proximal tubules and from previous investigatiolls it has been proposed that entry into
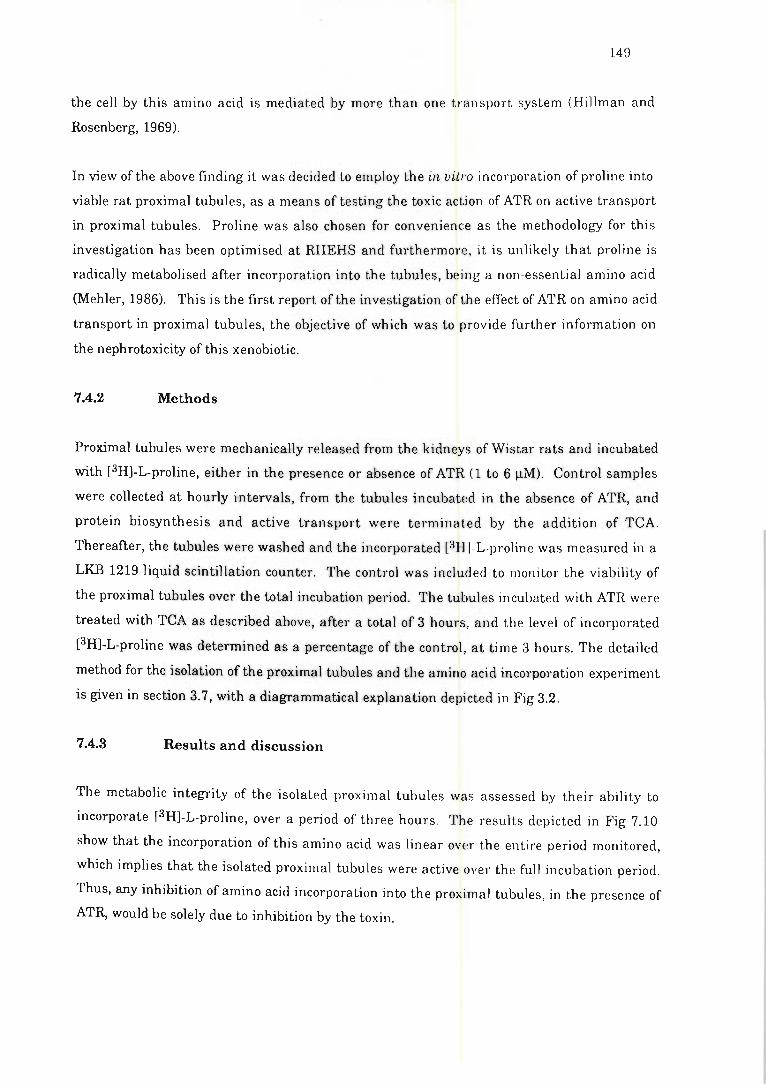
149
the cell by this amino acid is mediated by more than one transport system (Hillman and
Rosenberg, 1969).
In view of the above finding it was decided to employ the in vitro incorporation of proline into
viable rat proximal tubules, as a means of testing the toxic action of ATR on active transport
in proximal tubules. Proline was also chosen for convenience as the methodology for this
investigation has been optimised at RIIEHS and furthermore, it is unlikely that proline is
radically metabolised after incorporation into the tubules, being a non-essential amino acid
(Mehler, 1986). This is the first report of the investigation ofthe effect of ATR on amino acid
transport in proximal tubules, the objective of which was to provide further information on
the nephrotoxicity of this xenobiotic.
7.4.2 Methods
Proximal tubules were mechanically released from the kidneys of Wi star rats and incubated
with [3H]-L-proline, either in the presence or absence of ATR (1 to 6 11M). Control samples
were collected at hourly intervals, from the tubules incubated in the absence of ATR, and
protein biosynthesis and active transport were terminated by the addition of TCA.
Thereafter, the tubules were washed and the incorporated [3H I-L-proline was measured in a
LKB 1219 liquid scintillation counter. The control was included to monitor the viability of
the proximal tubules over the total incubation period. The tubules incubated with ATR were
treated with TCA as described above, after a total of 3 hours, and the level of incorporated
[3H]-L-proline was determined as a percentage of the control, at time 3 hours. The detailed .
method for the isolation of the proximal tubules and the amino acid incorporation experiment
is given in section 3.7, with a diagrammatical explanation depicted in Fig 3.2.
7.4.3 Results and discussion
The metabolic integrity of the isolated proximal tubules was assessed by their ability to
incorporate [3H]-L-proline, over a period of three hours. The results depicted in Fig 7.10
show that the incorporation of this amino acid was linear ov€~r the entire period monitored,
which implies that the isolated proximal tubules were active over the full incubation period.
Thus, any inhibition of amino acid incorporation into the proximal tubules, in the presence of
ATR, would be solely due to inhibition by the toxin.
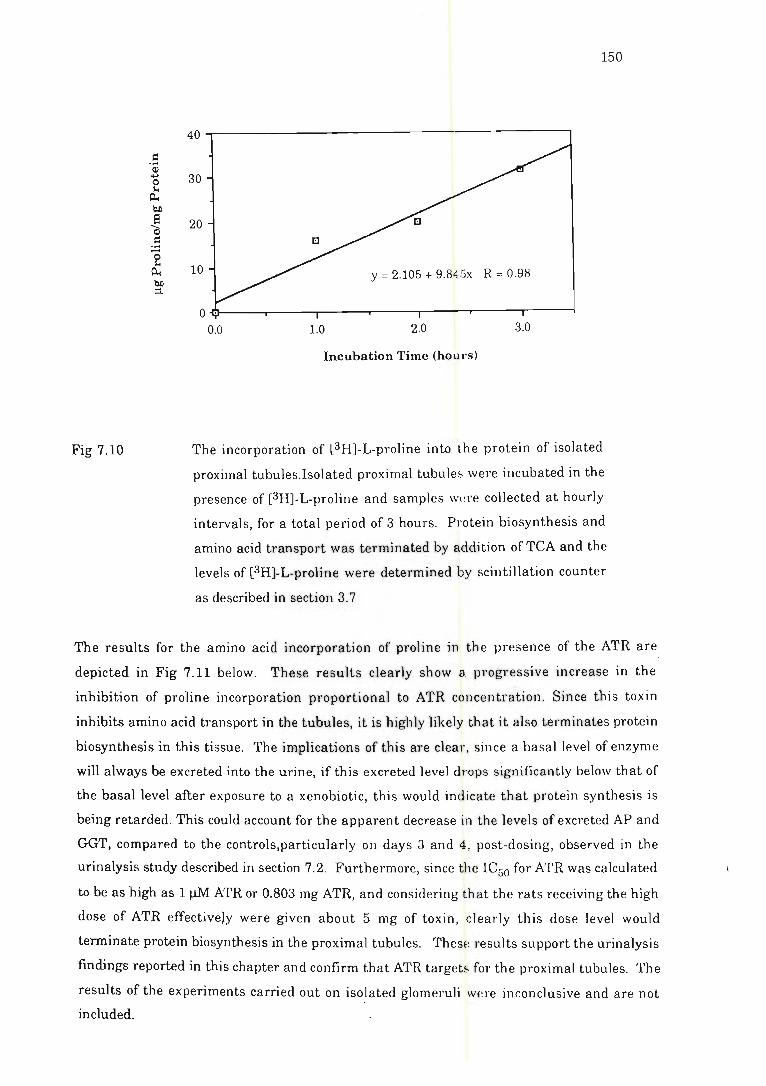
s:: .... Q) ... 0
'" ~ ~
a -... Q)
= .... -1: ~ ~ ::1.
Fig 7.10
150
40
30
20
10 y = 2.105 + 9.845x R = 0.98
o . 0.0 1.0 2.0 3.0
Incubation Time (hours)
The incorporation of [3H]-L-proline into the protein of isolated
proximal tubules.Isolated proximal tubules were incubated in the
presence of [3H)-L-proline and samples were collected at hourly
intervals, for a total period of 3 hours. Protein biosynthesis and
amino acid transport was terminated by addition of TCA and the
levels of [3H)-L-proline were determined by scintillation counter
as described in section 3.7
The results for the amino acid incorporation of proline in the presence of the ATR are
depicted in Fig 7.11 below. These results clearly show a progressive increase in the
inhibition of proline incorporation proportional to ATR concentration. Since this toxin
inhibits amino acid transport in the tubules, it is highly likely that it also terminates protein
biosynthesis in this tissue. The implications of this are clear, since a basal level of enzyme
will always be excreted into the urine, if this excreted level drops significantly below that of
the basal level after exposure to a xenobiotic, this would indicate that protein synthesis is
being retarded. This could account for the apparent decrease in the levels of excreted AP and
GGT, compared to the controls,particularly on days 3 and 4, post-dosing, observed in the
urinalysis study described in section 7.2. Furthermore, since the lC50 for ATR was calculated
to be as high as 1 ~ ATR or 0.803 mg ATR, and considering that the rats receiving the high
dose of ATR effective)y were given about 5 mg of toxin, clearly this dose level would
terminate protein biosynthesis in the proximal tubules. ThesE: results support the urinalysis
findings reported in this chapter and confirm that ATR targets for the proximal tubules. The
results of the experiments carried out on isolated glomeruli were inconclusive and are not
included.
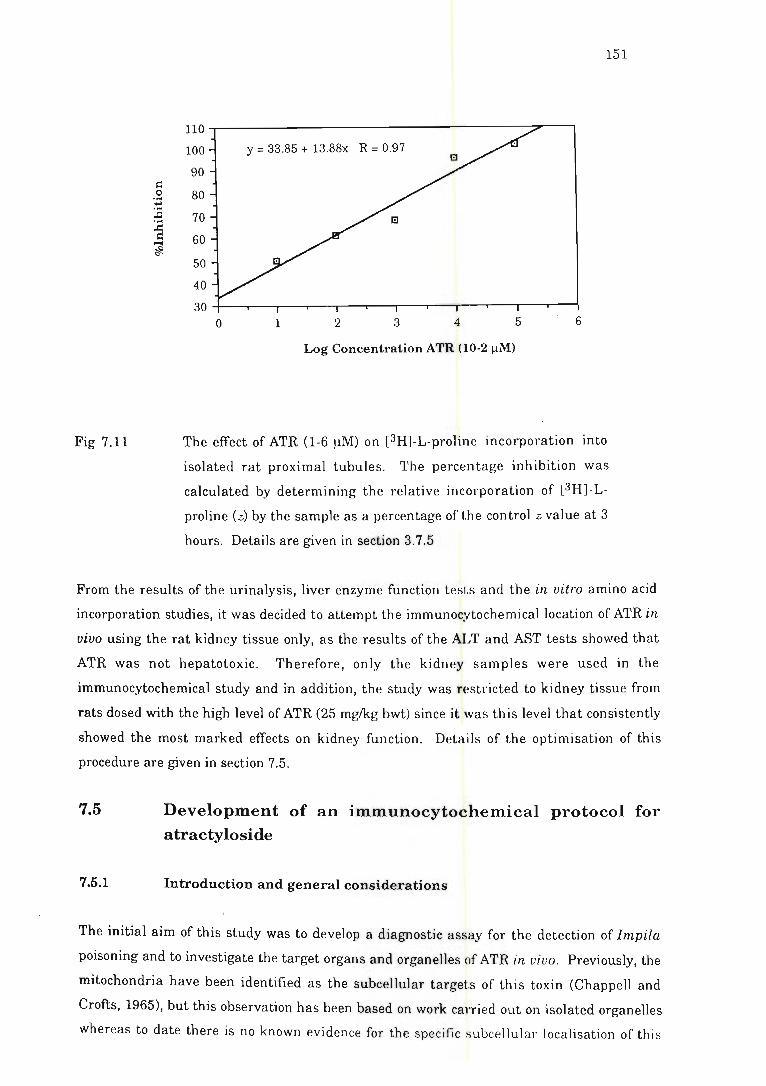
c:: 0 .... .... ....
,!:/ .... .c:
c:: ... *
Fig 7.11
151
110
100 y = 33.85 + 13.88x R = 0.97
90
80
70
60
50
40
30 0 1 2 3 4 5 6
Log Concentration ATR (10-2 ~lM)
The effect of ATR (1-6 11M) on [3H]-L-proline incorporation into
isolated rat proximal tubules. The percentage inhibition was
calculated by determining the relative incorporation of [3H]-L
proline (z) by the sample as a percentage of the control z value at 3
hours. Details are given in section 3.7.5
From the results of the urinalysis, liver enzyme function tests and the in vitro amino acid
incorporation studies, it was decided to attempt the immunocytochemical location of ATR in
vivo using the rat kidney tissue only, as the results of the ALT and AST tests showed that
ATR was not hepatotoxic . Therefore, only the kidney samples were used in the
immunocytochemical study and in addition, the study was restricted to kidney tissue from
rats dosed with the high level of ATR (25 mg/kg bwt) since it was this level that consistently
showed the most marked effects on kidney function. Details of the optimisation of this
procedure are given in section 7.5.
7.5 Development of an immunocytochemical protocol for
atractyloside
7.5.1 Introduction and general considerations
The initial aim of this study was to develop a diagnostic assay for the detection of Impila
poisoning and to investigate the target organs and organelles of ATR in vivo. Previously, the
mitochondria have been identified as the subcellular targets of this toxin (Chappell and
Crofts, 1965), but this observation has been based on work carried out on isolated organelles
whereas to date there is no known evidence for the specific subcel1ular localisation of this
152
toxin in vivo. Concomitant to the collection of the urine specimens, liver and kidney samples
were collected from the dosed rats and fixed in calcium formaldehyde at 4°C, to retain
enzyme activity. Histochemical analysis was carried out on the representative samples and
cursory examination by the present author demonstrated that there was severe renal
necrosis at all dose levels and furthermore, there was no evidence of regeneration in the
kidney even 96 hours after animals were exposed to the toxin. The liver superficially
appeared to be unaffected by the ATR. The sections were retained in the United Kingd~m for
evaluation by a pathologist and unfortunately at the time of submission of this thesis, the
results were unavailable. Nevertheless , since the results of the urinalysis, liver enzyme
function tests and the in vitro amino acid incorporation studies pointed clearly to the kidney
as the main target organ for ATR, it was decided to perform immunocytochemical location of
ATR in vivo employing rat kidney tissue since the development of antibodies to ATR
(Chapter 5) provided the means to visually locate this toxin. In addition, the study also
afforded the opportunity to observe more detailed morphological changes.
Immunocytochemistry involves the localisation of a target antigen within a tissue or cell and
the principle is based on the specificity of an antibody for an antigen. Electron-dense
material, bound to the immunoreactants, permits the localisation of the antigen using the
electron microscope. The success of this method is, however, dependent upon the
preservation of both cellular ultrastructure and antigenicity although the retention of tissue
integrity is often compromised in favour of preserving the epitope determinants on the
antigen (Hayat, 1986).
The quality of the antisera used to locate the antigen is also important since it is vital that
the antibody specifically targets for the antigen. Thus, monoelonal antibodies were thought
to be ideally suited to this purpose, but since these antibodif!s recognise a single antigenic
determinant, the chance of the antibody not recognising this solitary epitope, which may be
lost or denatur~d during tissue processing, is far greater than if the antibody targeted a
number of antigenic determinants, as is the case with polyclonal antibodies. The use of
polyclonal antibodies therefore, increases the likelihood of the antigen being located in the
tissue (Polak and Van Noorden, 1987). Unfortunately, the incidence of non-specific binding
when using the polyclonal antibodies is increased and it is crucial therefore that the , ,
specificity of the antibodies are known in order to validate the immunolabelling. Firstly, the
antiserum must target for the antigen of interest "to the exclusion of all others" and this may
be verified by ELISA (Chapter 6). Secondly, one of the major concerns when developing the
method for the immunocytochemical localisation of ATR, was the specific form of the toxin in
vivo, as it was not certain if the molecule was biotransfornled. The results of HPLC
suggested that ATR is at least partly biotransformed in vivo but, nevertheless, it was
153
apparent from the ELISA (Chapter 6), that the antibodies raised against this toxin could
detect the toxin, whether biotransformed or not, indicating that the major epitope of ATR
remained intact.
The non-specific association of the primary antiserum with the tissue is considered the most
likely source of false-positive labelling and this may be tested by substituting the primary
antiserum with an inappropriate or pre-immune serum from the same species. If negligible
binding occurs, this indicates that any association of the primary antibody may be regarded
as specific. The specificity of the antibody-antigen reaction may also be tested by including
an adsorption control. This involves the overnight incubation of primary antiserum, at 4°C,
in the presence of excess pure antigen. The solution is centrifuged and the adsorbed
antiserum is used for labelling. Theoretically, the antigen should bind to the antibody, thus
blocking antibody binding sites and in this manner the specificity of the antiserum may be
assessed (Petrusz, 1983). Another site of non-specific interaction of the primary antiserum is
with free aldehydes on the tissue . These are by-products of glutaraldehyde fixation and it is
not uncommon for antibodies to bind non-specifically to these aldehydes, causing non-specific
endogenous labelling. This may be overcome by quenching the aldehydes~by incorporating
glycine into all the immunoreagents (Bendayan and Zollinger, 1983). In addition, non
specific binding sites on the tissue may also be minimised by "blocking" the tissue with
albumins, gelatin or foetal calf serum.
Once the antibody has reacted with the tissue-bound antigen, the complex may be visualised
by electron-dense labels, such as the frequently used particulate gold label (Horisberger,
1981). A diffuse enzyme-product label has also had application in the field of
immunocytochemistry (Graf and Strauli, 1983) but for the purposes of this study, discussion
oflabels will be restricted to colloidal gold markers, as this was determined to be the label of
choice by the present author. Colloidal gold particles are produced from the reduction of gold
chlorides, their particle size being modulated by manipulation of the reaction conditions
(Beesley, 1987). Non-covalent electrostatic adsorption of either a secondary antibody,
directed against the primary antibody, or Protein A, to the colloidal particle provides an
electron-dense immunoprobe. Bivalent Protein A is rel€:ased from the cell walls of
Staphylococcus aureus and has a strong binding affinity for the Fe portion of most classes of
human IgG, as well as immunoglobulins from rabbits, pigs, dogs and guinea pigs (Langone,
1978). This binding is significantly depressed with immunoglobulins derived from bovine,
murine and equine sources and is almost nonexistent with sheep, goat, rat and chicken
immunoglobulins (Langone, 1982). Thus Protein A is ideally suited for work on rat tissue
and when adsorbed to colloidal gold particles has proved to be a powerful immunoprobe for
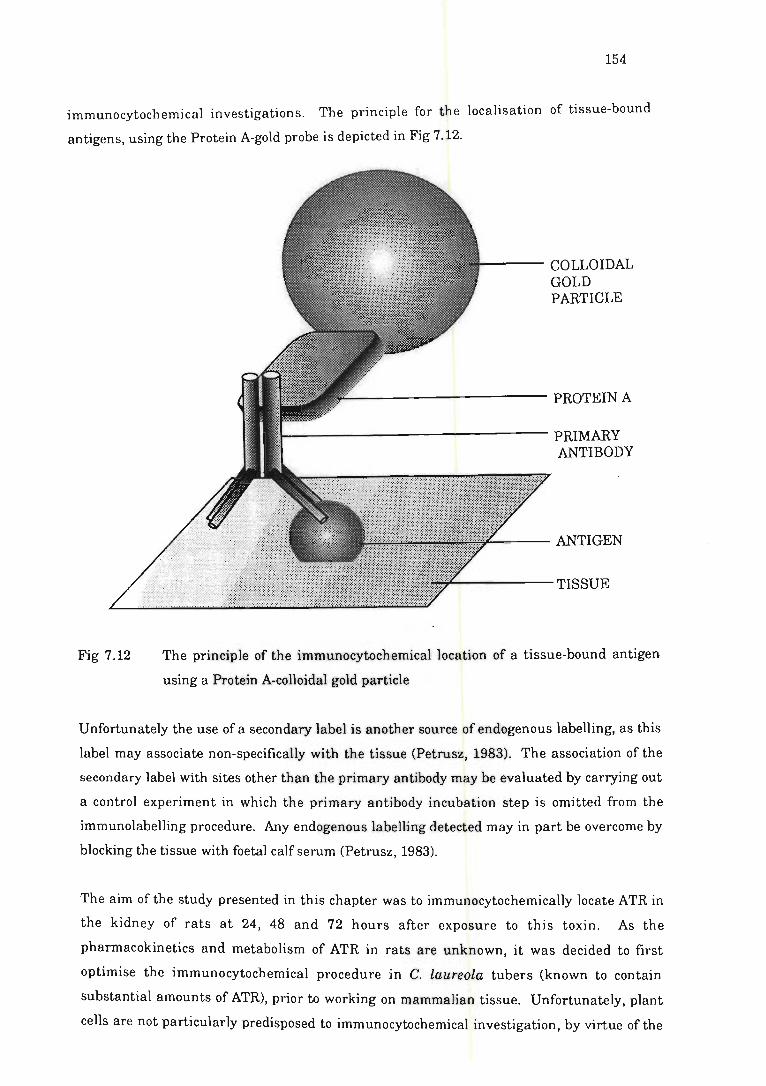
154
immunocytochemical investigations. The principle for the localisation of tissue-bound
antigens, using the Protein A-gold probe is depicted in Fig 7.12.
Fig 7.12
COLLOIDAL GOLD PARTICLE
PROTEIN A
PRIMARY ANTIBODY
~~-- ANTIGEN
::~"----- TISSUE
The principle of the immunocytochemical location of a tissue-bound antigen
using a Protein A-colloidal gold particle
Unfortunately the use of a secondary label is another source of endogenous labelling, as this
label may associate non-specifically with the tissue (Petrusz, 1983). The association of the
secondary label with sites other than the primary antibody may be evaluated by carrying out
a control experiment in which the primary antibody incubation step is omitted from the
immunolabelling procedure. Any endogenous labelling detected may in part be overcome by
blocking the tissue with foetal calf serum (Petrusz, 1983).
The aim of the study presented in this chapter was to immunocytochemically locate ATR in
the kidney of rats at 24, 48 and 72 hours after exposure to this toxin. As the
pharmacokinetics and metabolism of ATR in rats are unknown, it was decided to first
optimise the immunocytochemical procedure in C. laureola tubers (known to contain
substantial amounts of ATR), prior to working on mammalian tissue. Unfortunately, plant
cells are not particularly predisposed to immunocytochemical investigation, by virtue of the
I I I I
155
impermeable cell wall, which inhibits adequate tissue preservation and antibody penetration
(Knox et al., 1980). Thus, this necessitated considerable optimisation work before ATR could
be immunocytochemically detected in the tuber.
Since this is the first report of the immunocytochemical localisation of ATR in tissue, a
considerable amount method development was necessary, particularly as ATR, being a small
molecule, is not readily accessible to its primary antibody. Consequently, the fixation of the
tissue had to be optimised to ensure that not only was structural integrity maintained, but in
addition that the epitope determinants on the toxin were not altered by the fixation
procedure. Furthermore, the optimisation was hampered by the fact that the ATR was
leached from the cell during the fixation and dehydration procedure, and thus, prior to
preservation of ultrastructure, it was necessary to optimise the fixation of th e toxin to
subcellular proteins. This section therefore reports the optimi sation of the entire protocol for
the immunocytochemical detection of ATR.
7.5.2 Optimisation of tuber tissue fixation
7.5.2.1 Introduction
At the outset of the investigation, it was important to optimise fixation of the tuber for
routine electron microscopy. This involved the testing of a variety of fixing agents and
buffers while at the same time ensuring that the ultrastructural damage was kept to a
minimum and there was no leaching out of ATR from the tuber tissue. Details of the various.
reagents tested are given in the materials and methods section below.
7.5.2.2 Materials and methods
In an attempt to develop a suitable fixing medium, the following protocols were tested in
sequence:-
1. Tuber was fixed in 3% glutaraldehyde in 0.05 M cacodylate buffer, pH 6.96 , osmicated,
dehydrated and embedded in Epon resin;
2. Tuber was fixed in 3% glutaraldehyde in 0.05 M cacodylate buffer, pH 6.96, osmicated,
dehydrated and embedded in Spurrs resin;
3. Tuber was fixed in 3% glutaraldehyde in 0.05 M cacodylate buffer, pH 6.96 containing
caffeine (0.05%, w/v), dehydrated and embedded in Spun"s resin;
4. As in 3, sections being incubated with primary antiserum produced as described by By~ et
al. (1990), with visualisation mediated by a secondary antibody-horse radish peroxidase;
5. As in 4, but colloidal gold instead of horseradish peroxidase;
156
6. Tuber was pre-treated with ACN prior to fixation in a 3% glutaraldehyde solution in 0.05
M cacodylate buffer, pH 6.96.
7.5.2.3 Results and discussion
When the tuber was fixed in glutaraldehyde and embedded in Epon resin (procedure 1,
section 7.5.2.2), it was observed that inadequate tissue preservation and resin penetration
had occurred. As an alternative therefore, fresh tuber was fixed, osmicated, dehydrated and
embedded in Spurrs resin (procedure 2), but again there was evidence of poor resin
penetration, possibly due to the presence of phenolics in the tuber which could be interfering
with fixation. To counteract this problem, caffeine (0.05%, w/v) was added to the fixative and
osmication was omitted (procedure 3) as this could make the tissue brittle (V. Bandu, pers.
comm., 1989). Since this appeared to improve the tissue fixation, immunocytochemistry was
carried out on this tissue, at the light microscope level employing visualization by a
secondary antibody-horse radish peroxidase conjugate and precipitating substrate (3'3-
diaminobenzenidine tetrahydrochloride) (procedure 4). Despite quenching of endogenous
peroxidase in the tissue, by etching with 3% hydrogen peroxide, these results showed
significant background staining confined to the cell wall. The method was therefore repeated
with a secondary antibody-colloidal gold particle (procedure 5), with visualization being
enhanced by means of silver amplification. The results obtained were difficult to interpret
and suggested that the solvent-soluble ATR was being leached from the tissue during fixation
and dehydration. Thus, the next task was to optimise the fixation of ATR in vivo.
While attempting to detect ATR by HPLC, it was noted that ACN induced spontaneous and
irreversible precipitation of the toxin. Since it was postulated that pre-treatment of the tuber
tissue with ACN may prevent leaching of the toxin during subsequent fixation and
dehydration, tuber was incubated with ACN (procedure 6) and the results were compared
with untreated tuber, as monitored by scanning electron microscopy. The results are shown
on plate 1, micrographs 1 and 2. Micrograph 1 shows untreated tuber tissue, where the cells
are clearly visible. Some structural damage is noted to the cell wall and cell membrane,
probably during specimen collection, but in general the tissue is intact. By contrast, the '
tuber tissue pre-treated with ACN (shown in micrograph 2) shows that this solvent induces
precipitation of the cytoplasmic contents of the cell onto the sides of the cells. Clearly
significant ultrastructural damage occurs in the presence of ACN and thus this method was
abandoned as a possible means of preventing the leaching of ATR out of the tissue during
fixation and dehydration.
Plate I
1. Control scanning electron micrograph of Callilepis laureola
tuber showing cellular integrity . The methodology is detailed
in section 7.5.2.2
2. Scanning electron micrograph of Callilepis laureola tuber,
pre-treated with acetonitrile, showing encrustation and
deposition of cellular contents on the cell walls. The method
was carried out as described in section 7.5.2.2
3. Caliilepis laureola tuber, pre-fixed with carbodiimide and
embedded in Spurrs resin. Tuber was immunolabelled with
protein A-colloidal gold particles of size 6 nm as detailed in
section 7.6.2. Labelling is concentrated and may be enclosed
in a vesicle
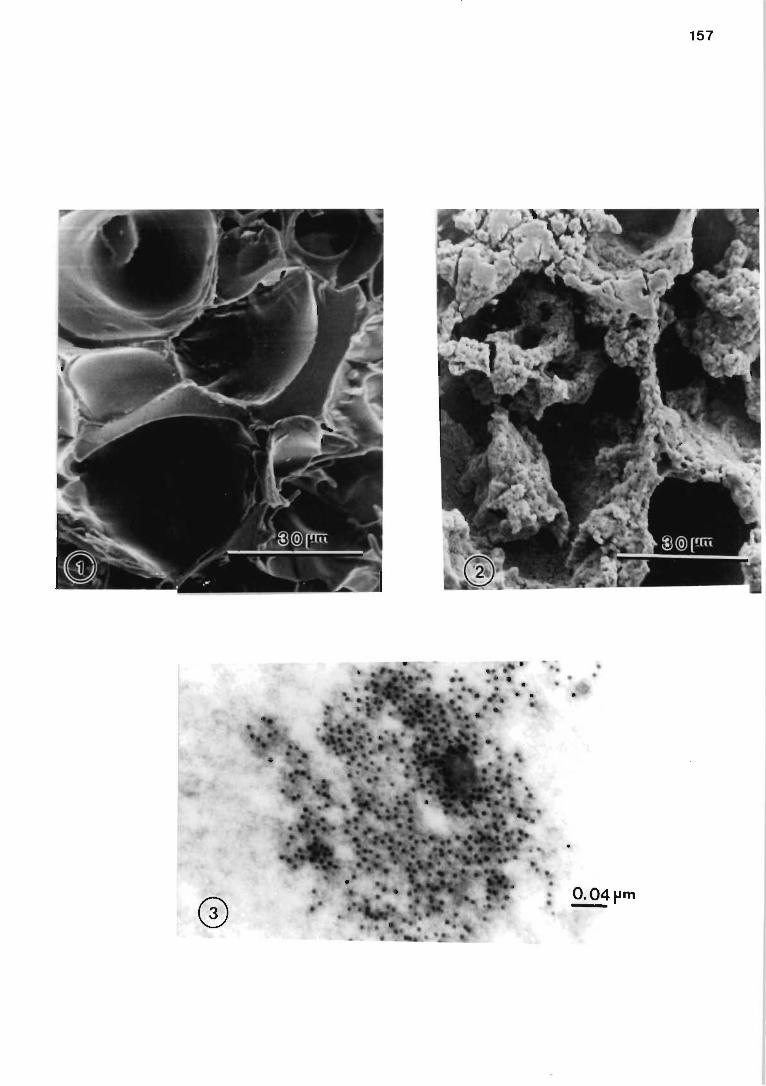
157
•
•
O.04pm -
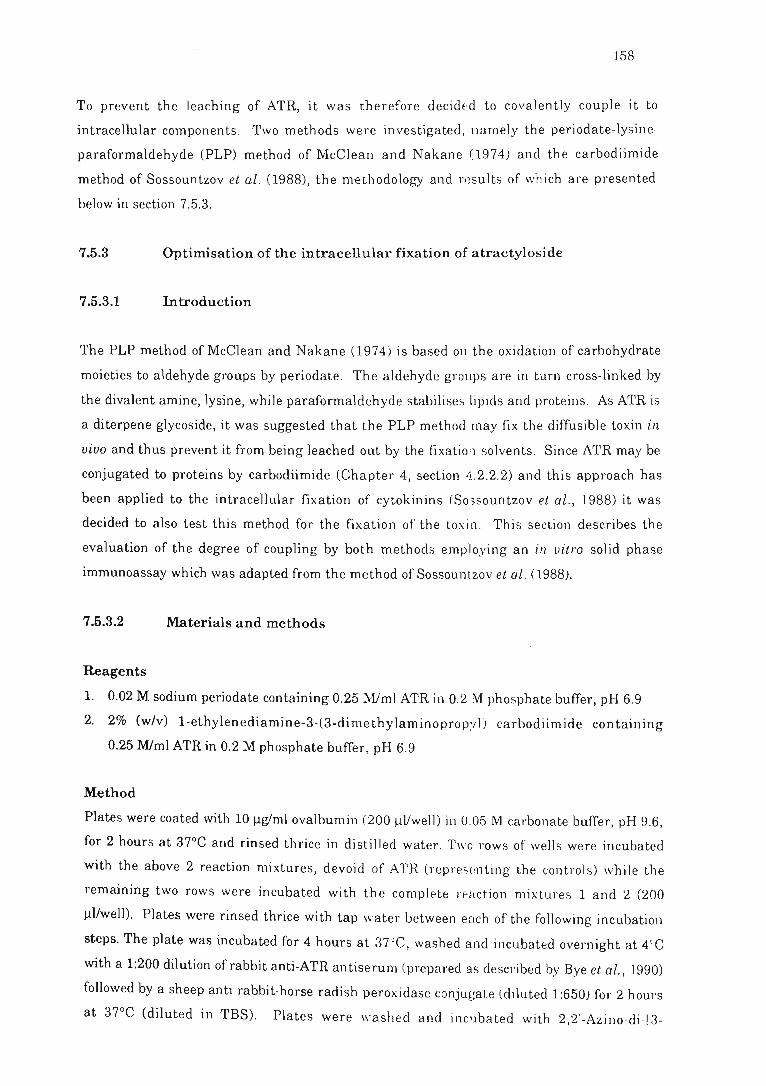
158
To prevent the leaching of ATR, it was therefore decidE~ d to covalently couple it to
intracellular components . Two methods were investigated, namely the periodate-lysine
paraformaldehyde (PLP) method of McCl ean and Nakane (1974) and the carbodiimide
method of Sossountzov et al. (1988), the methodology and ]"I~5ults of wh ich are presented
below in section 7.5.3.
7.5.3 Optimisation of the intracellular fixation of atractyloside
7.5.3.1 Introduction
The PLP method of McClean and Nakane (1974) is based on the oxidation of carbohydrate
moieties to aldehyde groups by periodate. The aldehyde groups are in turn cross-linked by
the divalent amine, lysine, while paraformaldehyde stabi li ses lipids and proteins. As ATR is
a diterpene glycoside, it was suggested that the PLP meth od may fix th e diffusible toxin in
vivo and thus prevent it from being leached out by-the fixatio·'l solvents. Since ATR may be
conjugated to proteins by carbodiimide (Chapter 4, section 4.2.2.2) and this approach has
been applied to the intracellular fixation of cytokinin s ( So~sountzov et ai ., 1988) it was
decided to also test this method for the fixation of th e toxin. This section describes the
evaluation of the degree of coupling by both methods employing an in vitro solid phase
immunoassay which was adapted from the method of Sossountzov et ai. (1988).
7.5.3.2 Materials and methods
Reagents
1. 0.02 M sodium periodate containing 0.25 MimI ATR in 0.2 M phosphate buffer, pH 6.9
2. 2% (w/v) l-ethylenediamine-3-(3-dimethylaminoproP:/1) carbodiimide containing
0.25 MImI ATR in 0.2 M phosphate buffer, pH 6.9
Method
Plates were coated with 10 ~g/ml ovalbumin (200 Ill/well) in 0.05 M carbonate buffer, pH 9.6,
for 2 hours at 37°C and rinsed thrice in di sti lled water. Two rows of wells were incubated
with the above 2 reaction mi xtures, devoid of ATR (repres(!nting the cont rol s) while the
remaining two rows were incubated with the complete reaction mixtures 1 and 2 (200
Ill/well). Plates were rinsed thrice with tap water between eHch of the following incubation
steps. The plate was incubated for 4 hours at 3T·C, washed and incubated overnight at 4(C
with a 1:200 dilution of rabbit anti-ATR antiserum (prepared as described by Bye et ai., 1990)
followed by a sheep anti rabbit-horse radish peroxidase conjugate (di luted 1:650) for 2 hours
at 37°C (diluted in TBS). Plates were washed and in cubated with 2,2'-Azino-di-1 3-
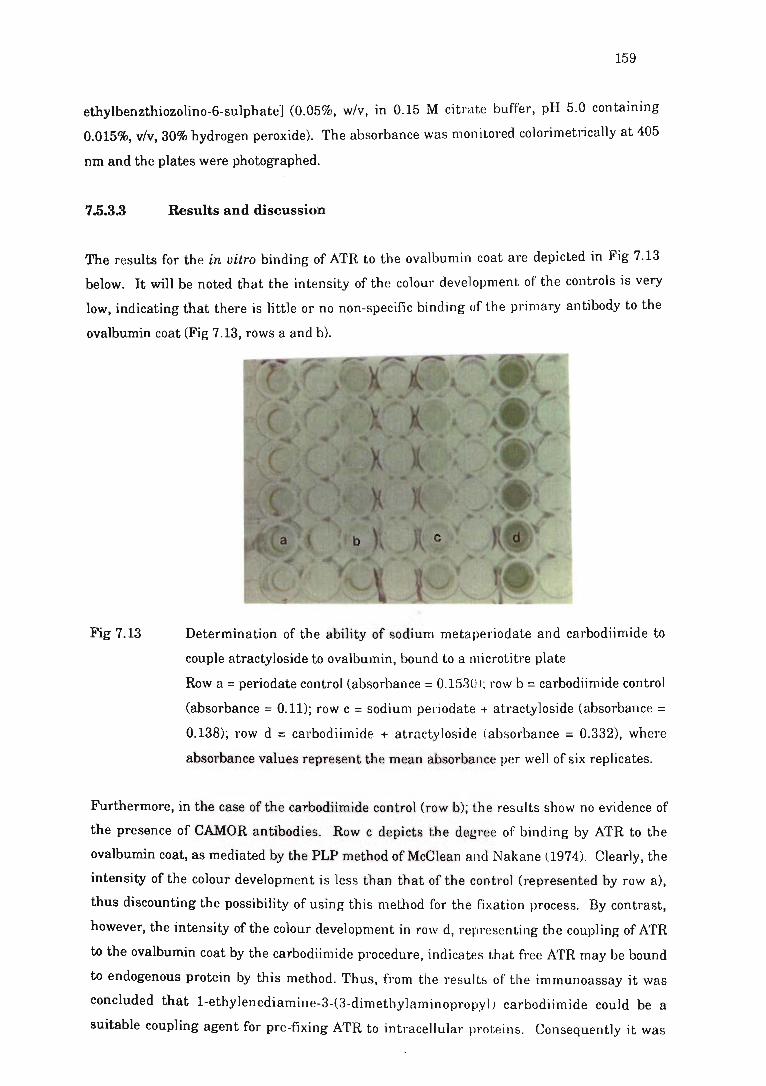
159
ethylbenzthiozolino-6-sulphateJ (0.05%, wiv, in 0.15 M citrate buffer, pH 5.0 containing
0.015%, viv, 30% hydrogen peroxide). The absorbance was monitored colorimetrically at 405
nm and the plates were photographed.
7.5.3.3 Results and discussion
The results for the in vitro binding of ATR to the ovalbumin coat are depicted in Fig 7.13
below. It will be noted that the intensity of the colour development of the controls is very
low, indicating that there is little or no non-specific binding of the primary antibody to the
ovalbumin coat (Fig 7.13, rows a and b).
Fig 7.13 Determination of the ability of sodium metaperiodate and carbodiimide to
couple atractyloside to ovalbumin, bound to a microtitre plate
Row a = periodate control (absorbance = 0.1530); row b = carbodiimide control
(absorbance = 0.11); row c = sodium periodate + atractyloside (absorbance = 0.138); ~ow d = carbodiimide + atractyloside (absorbance = 0.332), where
absorbance values represent the mean absorbance per well of six replicates.
Furthermore, in the case of the carbodiimide control (row b); the results show no evidence of
the presence of CAMOR antibodies. Row c depicts the degl"ee of binding by ATR to the
ovalbumin coat, as mediated by the PLP method of McClean and Nakane (1974). Clearly, the
intensity of the colour development is less than that of the control (represented by row a),
thus discounting the possibility of using this method for the fixation process. By contrast,
however, the intensity of the colour development in row d, representing the coupling of ATR
to the ovalbumin coat by the carbodiimide procedure, indicates that free ATR may be bound
to endogenous protein by this method. Thus, fl'om the l'esults of the immunoassay it was
concluded that 1-ethylenediamine-3-(3-dimethylaminopropyl) carbodiimide could be a
suitable coupling agent for pre-fixing ATR to intracellular proteins. Consequently it was
160
decided incubate C. laureola tuber with carbodiimide, as de~cribed in section 3.8, prior to
fixation and embedding in resin.
Prior to the immunolabelling of ATR in plant and mammalian tissue, however, it was
necessary to ensure the recognition of the rabbit antiserum by the Protein A-gold probe and
this was tested using an immuno-dot blot, as described in section 7.5.4.
7.5.4 Determination of the recognition of rabbit antisera by Protein A-gold
probes as monitored by immuno-blotting
7.5.4.1 In trod uction
The recognition of the rabbit antiserum by the immunogold probe was tested using an
immuno-dot blot. Briefly, the rabbit serum was "dotted" onto a nitrocellulose membrane and
incubated in the presence of the gold probe. The binding of Protein A-gold to the rabbit
antibodies is indicated by the presence of a pink colour on the membrane, in the region of the
"dotted" sample. Visualisation of this is facilitated by silver amplification. The procedure
described below is based on the method of Moeremans et al . (1984) as modified by E. Elliott
(pers. comm., 1989).
7.5.4.2
Reagents
Buffer 1:
Buffer 2:
Buffer 3:
Materials and methods
0.05 M Tris buffer, pH 7.4 containing 2.5% (w/v) sodium chloride
and 0.05 % Tween 80
0.05 M Tris buffer, pH 8.2 containing 0.9% (w/v) sodium chloride
Buffer 2 containing 1% (w/v) BSA
Physical silver developer:
All reagents were prepared in scrupulously clean glassware, which had been washed with
detergent, rinsed in distilled water, acetone and finally air-dried. Citrate buffer of pH 3.5
(approximately) was prepared by dissolving trisodium citrate dihydrate (2.3 g) and citric acid
(2.55 g) in distilled water (85 mI). Hydraquinone (0.85 g) was added, forming solution A.
Solution B was prepared by dissolving silver lactate (0.11 g) in distilled water (15 mI). As
silver lactate is photosensitive, all solutions were protected from light. Immediately before
use, solutions A and B were mixed together.
161
Immuno-dot blot procedure
All incubations were carried out at room temperature in the dark. The nitrocellulose
membrane (5 cm x 2 cm) was rinsed in distilled water (2 x 5 minutes) and air-dried. The
rabbit antiserum was diluted 1:40 and 1:100 in buffer 2. Aliquots (5 Ill) of each dilution as
well as a control of buffer 2 only, were "dotted" onto the nitl'ocellulose membrane. The
membrane was air-dried for 15 minutes, blocked with a solution of 5% (wiv) "Elite" milk
powder in buffer 2 and washed in buffer 1 (2 x 5 minutes) followed by buffer 2 (1 x 5
minutes). The Protein A-gold was diluted to 1:20 in buffer 3. The dilution factor was
determined spectrophotometrically by preparing a dilution series of the gold probe, in buffer
3 and monitoring the absorbance at 520 nm. The dilution factor giving an absorbance closest
to 0,018, at this wavelength was the correct dilution for use in the immuno-dot blot (E.Elliott,
pers, comm., 1990).
The appropriately diluted gold-probe (300 111) was incubated with the membrane for 2 hours,
rinsed in buffer 3 (3 xl0 minutes) and final1y in distilled water (4 x 5 minutes). The
membrane was incubated for 4 to 8 minutes in the freshly prepared silver developer, the time
being dependent upon the degree of development after which the reaction was terminated by
transferring the membrane to a solution of 5% (wiv) aqueous sodium thiosulphate for
2 minutes. Finally the membrane was washed in numerous changes of distilled water, air
dried and viewed, As the silver staining fades in the presence of light, care was taken to
store the membrane in the dark.
7.5.4.3 Results and discussion
The results of the immuno-dot blot are shown in Fig 7.14 and demonstrate that the rabbit
antiserum was indeed recognised by the Protein A-gold probe. Binding was most notable
when the rabbit antiserum was diluted 1:40 (a) and only weakly discernible at a dilution of
1:100 (b) (although in the photograph the binding is not visibl e) . As expected, there was no
reaction with the buffer "dot" or control sample. When the procedure was repeated with
fresh rabbit antiserum, (produced as described in section 5.3), the gold-probe also targeted for
this antiserum. Based on these results the Protein A-gold probe was deemed suitable for use .
in the immunocytochemical location of ATR since the Protein A clearly recognised the rabbit
antiserum.
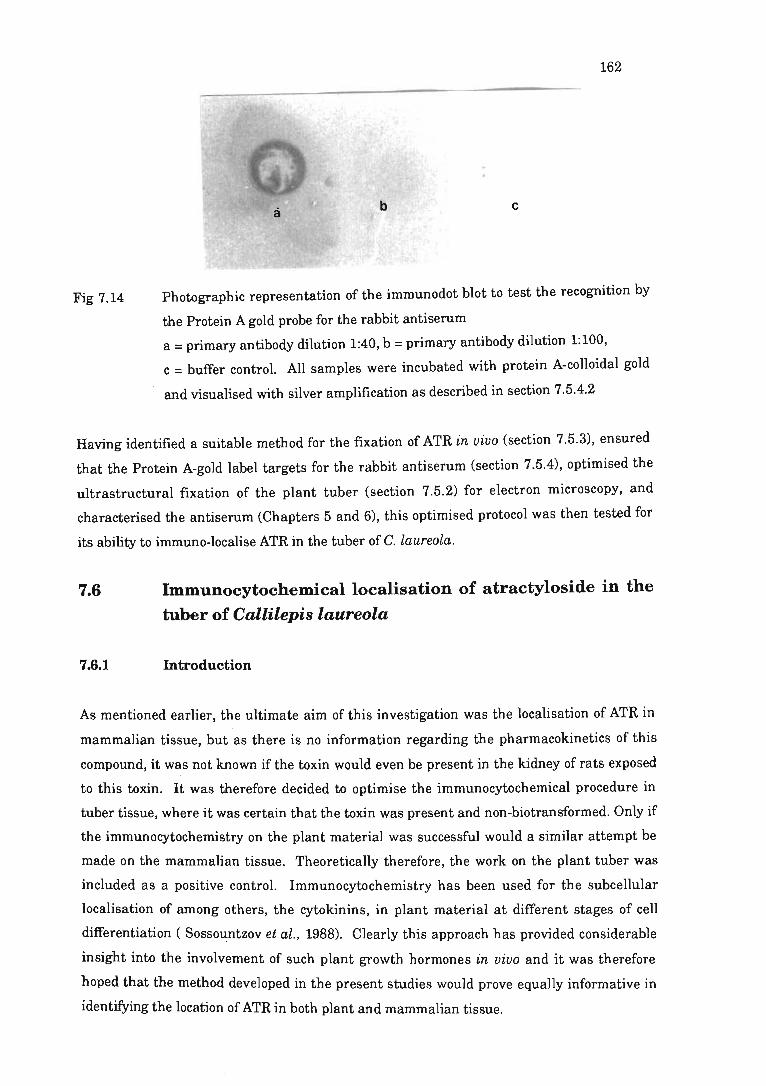
Fig 7.14
162
b c
Photographic representation of the immunodot blot to test the recognition by
the Protein A gold probe for the rabbit antiserum
a = primary antibody dilution 1:40, b = primary antibody dilution 1:100,
c = buffer control. All samples were incubated with protein A-colloidal gold
and visualised with silver amplification as described in section 7.5.4.2
Having identified a suitable method for the fixation of ATR in vivo (section 7.5.3), ensured
that the Protein A-gold label targets for the rabbit antiserum (section 7.5.4), optimised the
ultrastructural fixation of the plant tuber (section 7.5.2) for electron microscopy, and
characterised the antiserum (Chapters 5 and 6), this optimised protocol was then tested for
its ability to immuno-Iocalise ATR in the tuber of C. laureola.
7.6 Immunocytochemical localisation of atractyloside in the
tuber of Callilepis laureola
7.6.1 Introduction
As mentioned earlier, the ultimate aim of this investigation was the localisation of ATR in
mammalian tissue, but as there is no information regarding the pharmacokinetics of this
compound, it was not known if the toxin would even be present in the kidney of rats exposed
to this toxin. It was therefore decided to optimise the immunocytochemical procedure in
tuber tissue, where it was certain that the toxin was present and non-biotransformed. Only if
the immunocytochemistry on the plant material was successful would a similar attempt be
made on the mammalian tissue. Theoretically therefore, the work on the plant tuber was
included as a positive control. Immunocytochemistry has been used for the subcellular
localisation of among others, the cytokinins, in plant material at different stages of cell
differentiation ( Sossountzov et al., 1988). Clearly this approach has provided considerable
insight into the involvement of such plant growth hormones in vivo and it was therefore
hoped that the method developed in the present studies would prove equally informative in
identifying the location of ATR in both plant and mammalian tissue.
163
7.6.2 Materials and methods
The protocol followed was that of Sossountzov et al. (1988) but included the modifications
developed as described in section 7.5 above. The details of the final optimised fixation and
immunolabelling procedure are given in section 3.8. Briefly though, sections were mounted
on copper grids and etched for 1 minute in bromine vapours but unfortunately the bromine
had a deleterious effect on the grids and thus subsequently, on ly nickel grids were used .
Thereafter grids were sequentially incubated with primary antibody and the protein A-gold
label, with the grids being copiously washed between all ~ teps. Suitable controls were
included throughout, namely, the primary antiserum was included at different dilution s to
identify the dilution giving maximal binding with the least non-speci fic labelling, primary
antiserum was replaced with pre-immune serum , the primary antiserum was omitted and an
adsorption control was included. The control grids were observed under the electron
microscope and photographed at a magnification of x 10 000. The photograph negatives were
evaluated for the degree of non-specific labelling in the conLrol sections using a Bell and
Howell microfiche reader. The results of the immunolabelling on the plant material are given
in section 7.6.3 below.
7.6.3 Results and discussion
Some difficulty was experienced with sectioning of the plant material , a phenom enon
previously noted by other researchers using this method (Craig and Goodchild, 1982; Herman
and Shannon, 1984) but the immunolabelling was nevertheless carried out on these sections.
At the outset it should be noted that since the precise localisation of the gold-particles can be
very difficult, areas of tissue were randomly selected, when \·iewed under the transmission
electron microscope, and photographed at a magnification of about x 10000. The negatives of
these photographs were also viewed in a microfiche reader, which readily facilitate s the
resolution of the gold probes, as clearly demarcated white sph eres against an essentially
black background.
The results of the immunolabelling carried out on C. iaureair) tuber samples are shown in
Plate) , micrograph 3. Since the tuber cells contain few organelles but only large areas of
cytoplasm and vacuole, it was difficult to di scern any form of cellular structure. However,
there were areas of gold-probe "clumping" as shown in microijraph 3, which were absent in ·
the control sections. The controls showed a very low degree of non -specific labelling and thus .
the specificity of the antiserum and the colloidal gold label \'las concluded to be very good.
Tuber tissue fixed with PLP, was also included, but littl e or no lahelling was noted,
indicating the success and necessity of the carbodiimide fixat ion step. Since the tuber had
164
been treated with carbodiimide, concern was expressed at the endogenous labelling by
CAMOR antibodies, but this was shown to be unfounded by the results of the
characterisation assays detailed in section 5.5. Since the control sections showed only
cytoplasm with little or no non-specific labelling, these micrographs are not included.
From these results it was concluded that the probe had located areas occupied by ATR which
could be either for storage or processing. It was suggested by F. Dehrmann (pers. comm.,
1990) that the ATR appeared encapsulated in vesicles and it was speculated that these
vesicles may be involved in toxin processing or storage. Th e site of ATR biosynthesis and
storage in the plant is unknown, but being water soluble it was suggested that the toxin is
sequestrated to the vacuole. Storage of ATR in the vacuole would also be a way in which the
plant could avoid the risk of self-intoxication . Such self intoxication of the plant is not
unrealistic when one considers the reports of the inhibitory effects of ATR on mitochondria
isolated from cauliflower or broccoli tissue (Jung and Hanson, 1973).
Thus, it was demonstrated that the immunocytochemical location of ATR in the plant is
possible. While the development of this methodology provided a means of investigating the
biosynthesis and storage of ATR in C. laureola, this was essentially performed as a means of
optimising the detection of the toxin in mammalian tissue. Consequently, further work on
the tuber was abandoned, although having laid the groundwork in this area, it would be
relatively easy to continue an investigation into the biosynthE·sis and storage of the toxin in
the plant, a possible future project. Information pertaining to the methods whereby the plant
synthesises the toxin, would also facilitate the understanding of the functional role of thi!?
secondary metabolite in the plant. Furthermore, the methods the plant has for limiting self
intoxication may provide an antidote for Impila poisoning, unless of course the toxin is
simply sequestrated to the vacuoles or vesicles. While this is a vast area for future re~earch, the specific aims of this study were to investigate the site of the toxin in rat kidney and thus
subsequent work concentrated on this aspect.
165
7.7 Immunocytochemical localisation of atractyloside in rat
kidney
7.7.1 Introduction
The science of immunocytochemistry has provided insight into the subcellular localisation of
antigens, in both plant and mammalian tissue. To date, most of the work has been carried
out on protein antigens, although more recently work on the immunocytochemical detection
of haptens has also been undertaken . Localisation of haptens, such as ATR, has however
often been hampered by them being leached from the tissue during fixation and dehydration
steps. As demonstrated in section 7.6, this problem was overcome in the case of ATR and
thus based on the success of the immunocytochemical work on the tuber of C. la.ureola., it was
decided to investigate the target sites of this toxin in mammalian tissue.
7.7.2 Materials and methods
Rats were dosed with 25 mg ATR/kg bwt and representative animals, euthanased at 24,48
and 72 hours post-dosing and the kidney excised and fixed as described in section 3.8.2. The
dosing, tissue collection and processing was carried out at the RIIEHS, University of Surrey,
Guildford, UK, while the tissue sectioning and immunolabelling was carried out at the
University of Natal, Pietermaritzburg. Details of the tissue collection and fixation, as well as
the immunolabelling procedure are given in sections 3.1.4, 3.8.2 and 3.8.3 respectively and
represent the final optimised procedure which was developed from the work reported in
section 7.5, as wen as the experience gained from the tuber 'York, section 7.6. As with the
tuber investigation, control grids were observed under the electron microscope and
photographed at a magnification of x 10 000. The photograph negatives were evaluated for
the degree of non-specific labelling in the control sections using a Bell and Howell microfiche
reader. The results of this immunocytochemical investigation are presented in section 7.7.3
below.
7.7.3 Results and discussion
As with the immunocytochemical work on the tuber, appropriate controls were included
throughout, which were randomly photographed at low magnification and the degree of non
specific labelling estimated from the photograph negatives, as described in section 7.6.2.
These included control kidney tissue (from a rat not exposed to the toxin) (Plate II,
micrograph 4 and 5) and kidney tissue from a rat exposed to ATR, in which the primary
antibody was replaced by pre-immune serum (Plate II, microgJ aph 7).
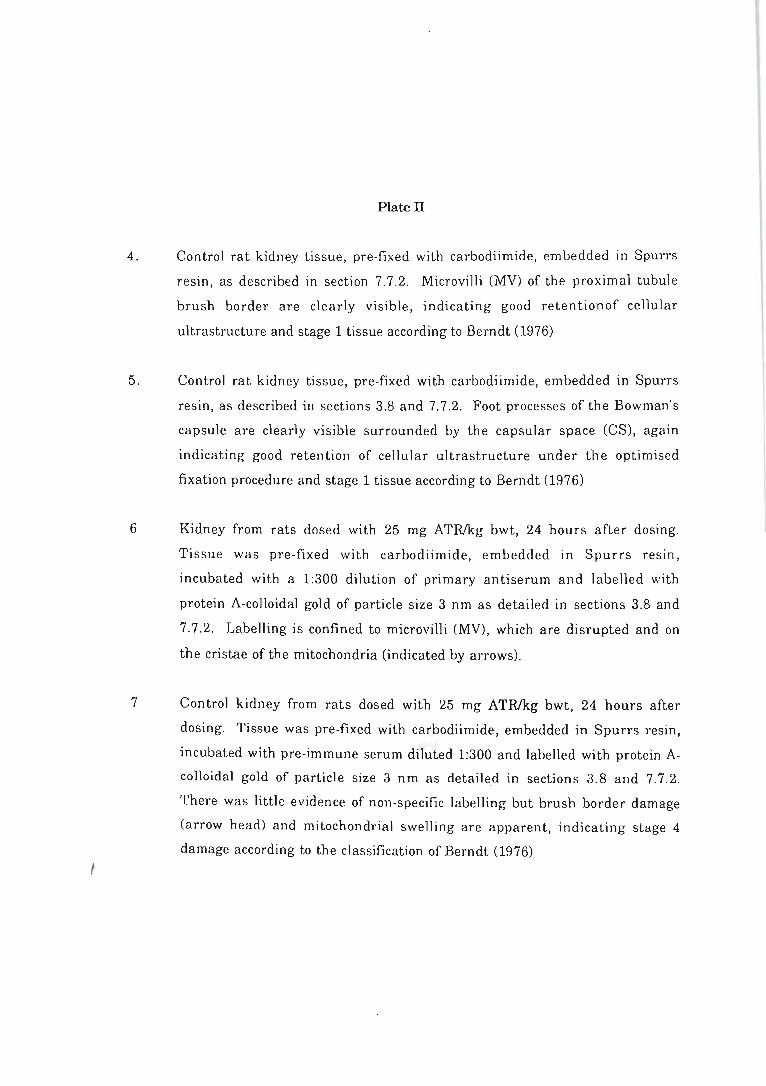
Plate II
4 . Control rat kidney tissue, pre-fixed with carbodiimide, embedded in Spurrs
resin, as described in section 7.7.2. Microvilli (MV) of the proximal tubule
brush border are clearly visible, indicating good retentionof cellular
ultrastructure and stage 1 tissue according to Berndt (1976)
5. Control rat kidney tissue, pre-fixed with carbodiimide, embedded in Spurrs
resin, as described in sections 3.8 and 7.7.2. Foot processes of the Bowman's
capsule are clearly visible surrounded by the capsular space (CS), again
indicating good retention of cellular ultra structure under the optimi sed
fixation procedure and stage 1 tissue according to Berndt (1976)
6 Kidney from rats dosed with 25 mg ATRJkg bwt, 24 hours after dosing.
Tissue was pre-fixed with carbodiimide, embedded in Spurrs resin,
incubated with a 1:300 dilution of primary antiserum and labelled with
protein A-colloidal gold of particle size 3 nm as detailed in sections 3.8 and
7.7.2. Labelling is confined to microvilli (MV), which are disrupted and on
the cristae of the mitochondria (indicated by arrows).
7 Control kidney from rats dosed with 25 mg ATRJkg bwt, 24 hours after
dosing. Tissue was pre-fixed with carbodiimide, embedded in Spurrs resin,
incubated with pre-immune serum diluted 1:300 and labelled with protein A
colloidal gold of particle size 3 nm as detailed in sections 3.8 and 7.7.2.
There was littl e evidence of non -specific labelling but brush border damage
(arrow head) and mitochondri al swelling are apparent, indicating stage 4
damage according to the classification of Berndt (1976)
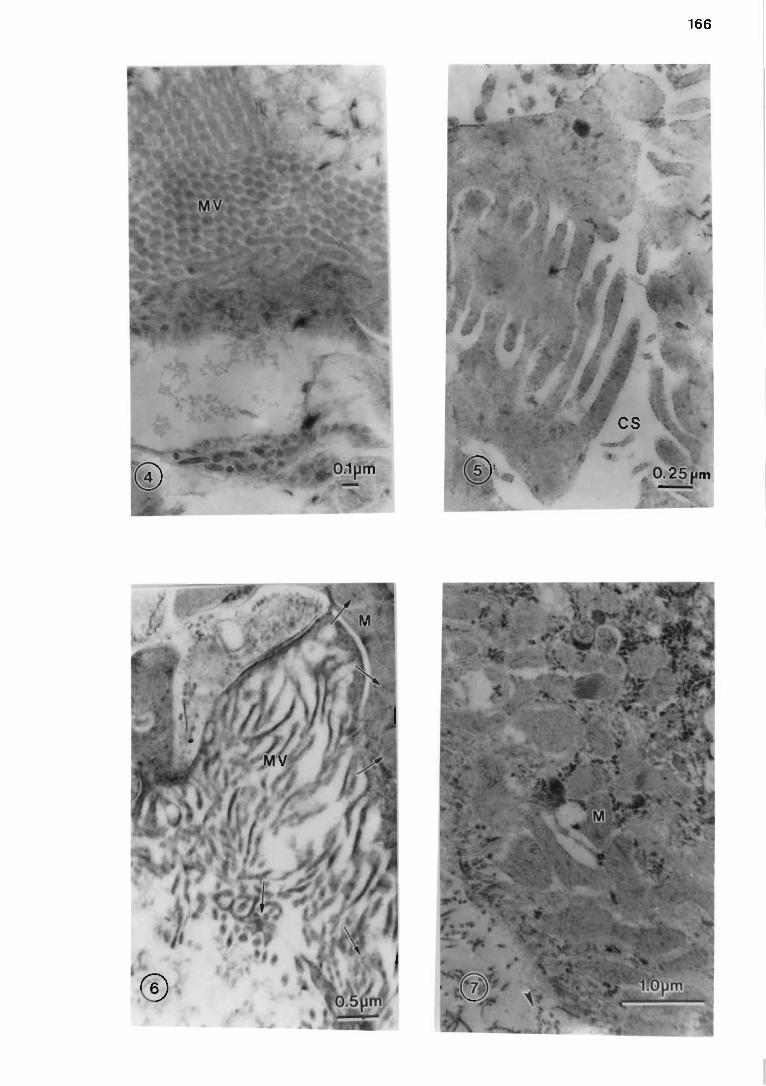
166
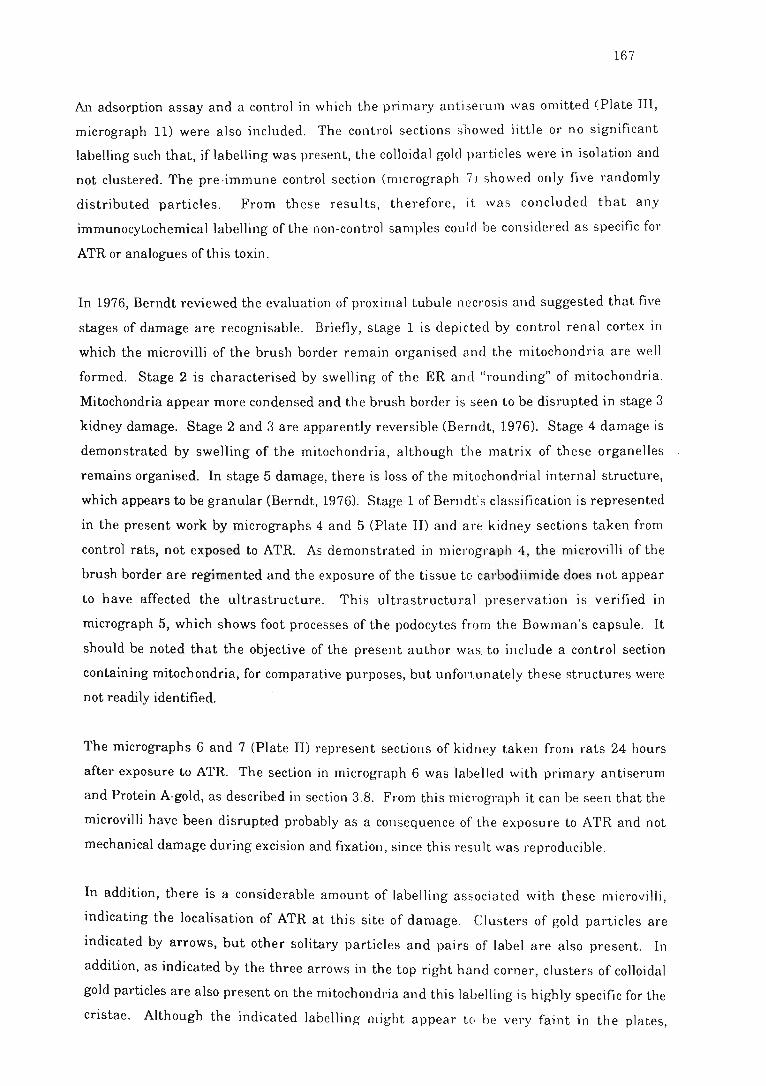
167
An adsorption assay and a control in which the primary anti serum was omitted (Plate III ,
micrograph 11) were also included. The control sections showed little or no significant
labelling such that, if labelling was present, the colloidal gold particles were in isolation and
not clustered. The pre-immune control section (micrograph 7) showed only five randomly
distributed particles. From these results, therefore, it was concluded that any
immunocytochemical labelling of the non-control samples could be considered as specific for
ATR or analogues ofthis toxin.
In 1976, Berndt reviewed the evaluation of proximal tubule necrosis and suggested that five
stages of damage are recognisable . Briefly, stage 1 is depicted by control renal cortex in
which the microvilli of the brush border remain organised and the mitochondria are well
formed. Stage 2 is characterised by swelling of the ER and "rounding" of mitochondria.
Mitochondria appear more condensed and the brush border is seen to be disrupted in stage 3
kidney damage. Stage 2 and 3 are apparently reversible (Berndt, 1976). Stage 4 damage is
demonstrated by swelling of the mitochondria, although the matrix of these organelles
remains organised. In stage 5 damage, there is loss of the mitochondrial internal structure,
which appears to be granular (Berndt, 1976). Stage 1 of Berndt" s classification is represented
in the present work by micrographs 4 and 5 (Plate II) and are kidney sections taken from
control rats, not exposed to ATR. As demonstrated in micrograph 4, the microvilli of the
brush border are regimented and the exposure of the tissue to carbodiimide does not appear
to have affected the ultrastructure. This ultrastructural preservation is verified m
micrograph 5, which shows foot processes of the podocytes from the Bowman's capsule. It
should be noted that the objective of the present author was. to include a control section
containing mitochondria, for comparative purposes, but unfortunately these structures were
not readily identified.
The micrographs 6 and 7 (Plate II) represent sections of kidney taken from rats 24 hours
after exposure to ATR. The section in micrograph 6 was labelled with primary antiserum
and Protein A-gold, as described in section 3.8. From this micrograph it can be seen that the
microvilli have been disrupted probably as a consequence of the exposure to ATR and not
mechanical damage during excision and fixation, since this result was reproducible .
In addition, there is a considerable amount of labelling aS50ciated with these microvilli,
indicating the localisation of ATR at this site of damage. Clusters of gold particles are
indicated by arrows, but other solitary particles and pairs of label are also present. In
addition, as indicated by the three arrows in the top right hand corner, clusters of colloidal
gold particles are also present on the mitochondria and this labelling is highly specific for the
cristae. Although the indicated labelling might appear tCI be very faint in the plates,
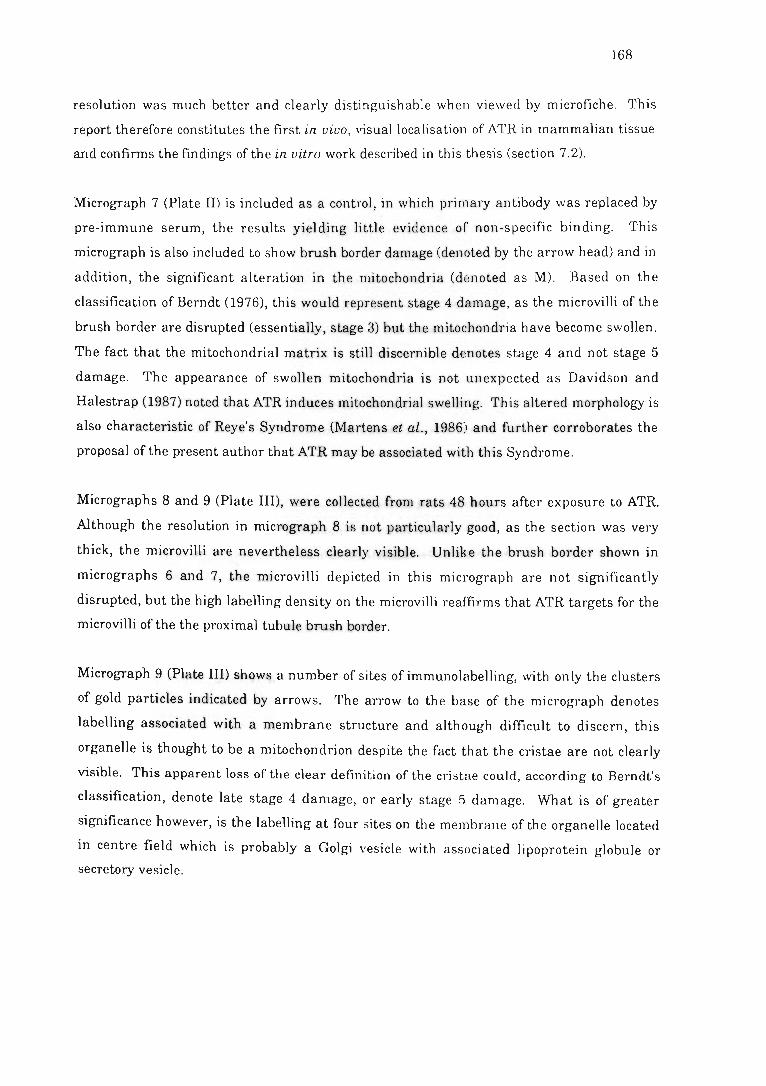
168
resolution was much better and clearly distinguishable when viewed by microfiche. This
report therefore constitutes the first in vivo, visual localisation of ATR in mammalian tissue
and confirms the findings of the in vitro work described in this thesis (section 7.2).
Micrograph 7 (Plate II) is included as a control, in which primary antibody was replaced by
pre-immune serum, the results yielding little evidence of non-specific binding. This
micrograph is also included to show brush border damage (denoted by the arrow head) and in
addition, the significant alteration in the mitochondria (denoted as M). Based on the
classification of Berndt (1976), this would represent stage 4 damage, as the microvilli of the
brush border are disrupted (essentially, stage 3) but the mitochondria have become swollen.
The fact that the mitochondrial matrix is still discernible denotes stage 4 and not stage 5
damage. The appearance of swollen mitochondria is not unexpected as Davidson and
Halestrap (1987) noted that ATR induces mitochondrial swelling. This altered morphology is
also characteristic of Reye's Syndrome (Martens et al ., 1986) and further corroborates the
proposal of the present author that ATR may be associated with this Syndrome.
Micrographs 8 and 9 (Plate II!), were collected from rats 48 hours after exposure to ATR.
Although the resolution in micrograph 8 is not particularly good, as the section was very
thick, the microvilli are nevertheless clearly visible. Unlike the brush border shown in
micrographs 6 and 7, the microvilli depicted in this micrograph are not significantly
disruJ?ted, but the high labelling density on the microvilli reaffirms that ATR targets for the
microvilli of the the proximal tubule brush border.
Micrograph 9 (Plate III) shows a number of sites of immunolabelling, with only the clusters
of gold particles indicated by arrows. The arrow to the base of the micrograph denotes
labelling associated with a membrane structure and although difficult to discern, this
organelle is thought to be a mitochondrion despite the fact that the cristae are not clearly
visible. This apparent loss of the clear definition of the cristae could, according to Berndt's
classification, denote late stage 4 damage, or early stage 5 damage. What is of greater
significance however, is the labelling at four sites on the membrane of the organelle located
in centre field which is probably a Golgi vesicle with associated lipoprotein globule or
secretory vesicle.
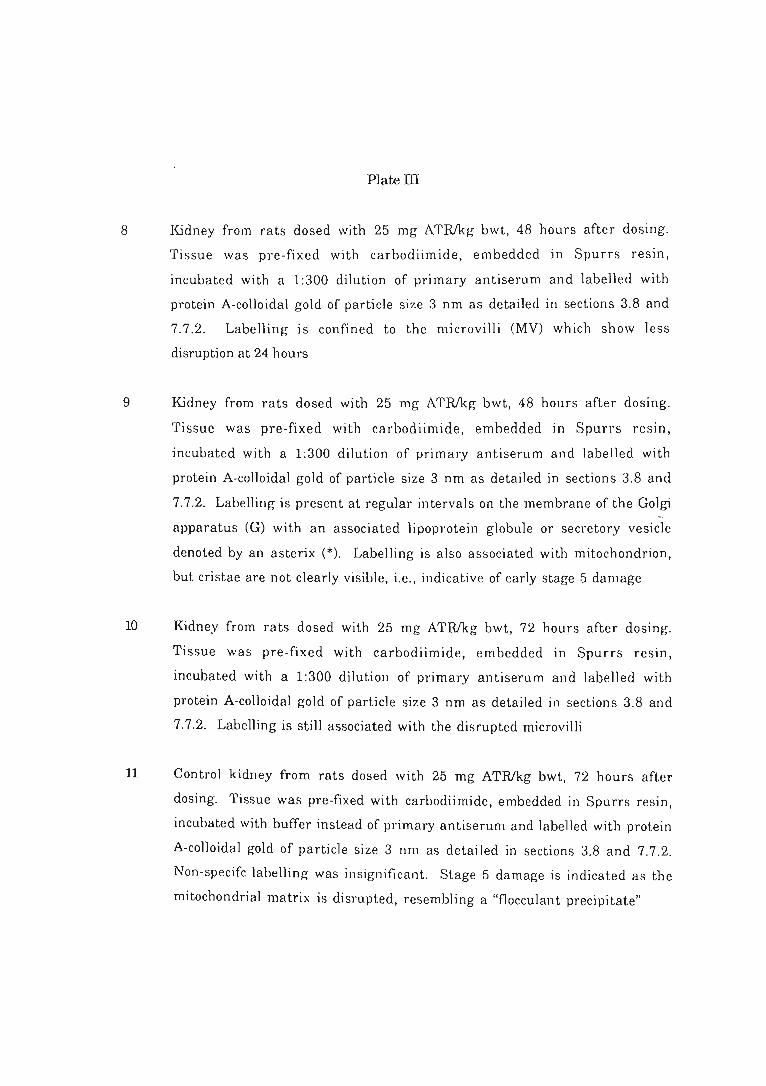
Plate III
8 Kidney from rats dosed with 25 mg ATRJkg bwt, 48 hours after dosing.
Tissue was pre-fixed with carbodiimide, embedded in Spurrs resin,
incubated with a 1:300 dilution of primary antiserum and labelled with
protein A-colloidal gold of particle size 3 nm as detailed in sections 3.8 and
7.7.2. Labelling is confined to the microvilli (MV) which show less
disruption at 24 hours
9 Kidney from rats dosed with 25 mg ATRJkg bwt, 48 hours after dosing.
Tissue was pre-fixed with carbodiimide, embedded in Spun's resin,
incubated with a 1:300 dilution of primary antiserum and labelled with
protein A-colloidal gold of particle size 3 nm as detailed in sections 3.8 and
7.7.2. Labelling is present at regular intervals on the membrane of the Golgi
apparatus (G) with an associated lipoprotein globule or secretory vesicle
denoted by an asterix (*). Labelling is also associated with mitochondrion,
but cristae are not clearly visible, i.e., indicative of early stage 5 damage
lO Kidney from rats dosed with 25 mg ATRJkg bwt, 72 hours after dosing.
Tissue was pre-fixed with carbodiimide, embedded in Spurrs resin,
incubated with a 1:300 dilution of primary antiserum and labelled with
protein A-colloidal gold of particle size 3 nm as detailed in sections 3.8 and
7.7.2. Labelling is still associated with the disrupted microvilli
11 Control kidney from rats dosed with 25 mg ATRlkg bwt, 72 hours ' after
dosing. Tissue was pre-fixed with carbodiimide, embedded in Spurrs resin,
incubated with buffer instead of primary antiserum and labelled with protein
A-colloidal gold of particle size 3 nm as detailed in sections 3.8 and 7.7.2.
Non-specifc labelling was insignificant. Stage 5 damage is indicated as the
mitochondrial matrix is disrupted, resembling a "f1occulant precipitate"
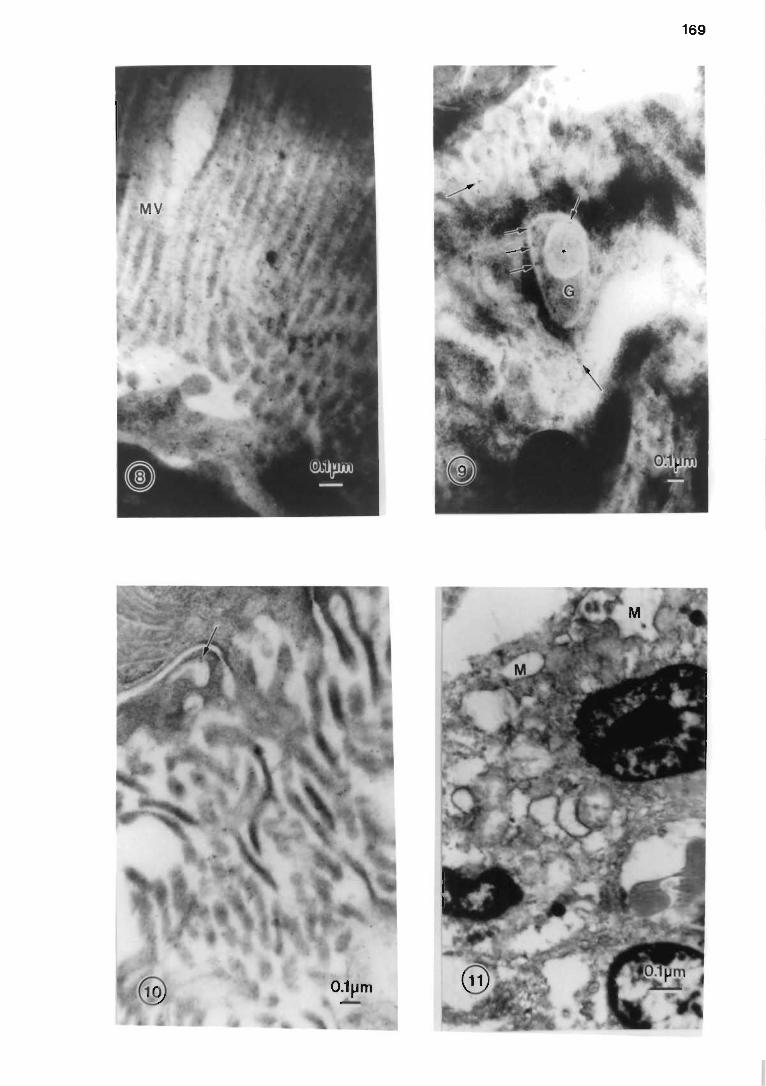
169
170
Since both the GA and mitochondrion are associated with lipoprotein globules or secretory ,
vesicles (Theron, 1979), an organelle such as that in centre field (micrograph 9) is not
uncommon. This was initially presumed to be a mitochondrion, wi th an associated secretory
vesicle (denoted in the micrograph with an asterix), h owever, careful study of the
micrographs of Theron (1979) and Sandborn (1970) showed th at thi s organelle was not a
mitochondrion but a Golgi vesicle. From micrograph 9, it was clear that ATR associates with
specific sites, at regular intervals along the membrane of thE: Golgi vesicle . It was pointed
out in the literature review that in vitro, ATR and CATR inhibit the transport of PAPS across
the Golgi membrane "possibly by interacting with the PAPS translocase which has structural
features in common with the ADP/ATP antiporter" (Capasso and Hirschberg, 1984). Thus,
from micrograph 9 it is clear that ATR does bind to specific sites on the GA membrane and
this result is therefore of extreme significance.
Micrographs 10 and 11 (Plate III) are taken from the kidney of rats, 72 hours after exposure
to ATR. Micrograph 10 shows that labelling is still associated with the disrupted microvilli
(indicated by an arrow) and with other membrane bound structures, which are not readily
identifiable. Micrograph ~1 was included as a control , in which primary antibody was
excluded. Clearly there was minimal labelling, reiterating the specificity of the
immunocytochemical localisation of ATR. It was noted in thi s section, however, that the
tissue showed stage 5 damage, as the matrix of the mitochondria (M) is di srupted and, in the
words of Berndt (1976), resembles a "flocculant precipitate".
Thus from the micrographs it was concluded that the immunocytochemical labelling was
highly specific and furthermore, ATR targets for the microvilli of the proximal tubule brush
border, the mitochondria and the GA. In addition, it was also noted that, unlike the
observations of Carpenedo et al. (1974) and Bhoola (1983), regeneration was not apparent 48
hours after exposure to the toxin. Berndt (1976) warns however , that the analysis of
morphological changes is only of value if these alterations can be correlated with disruption
in function (as monitored by organ function assays) . Thi s important corroboration of
morphological changes, immunocytochemical location and orga n function assessment will be
presented in the general discussion (section 7.8) below.
7.8 General discussion
Up until the time of this study, details pertaining to the inhibitory effect of ATR had only
been identified by histological observation or in vitro assays. Nevertheless it had been
established that this toxin was nephrotoxic, targeting for th e proxi mal tubules in rats, pigs
and humans (Carpenedo et al., 1974; Stuart et al., 1981; Bhoola, 1983). These workers noted
171
regeneration 48 hours after exposure to ATR (Carpenedo et ai., 1974; Bhoola, 1983). The
glomerulus was morphologically unaffected and distal tubular dam age was only observed
after exposure to CATR (Hatch et ai ., 1982). Furthermore, it was established by in vitro
assay that ATR inhibited the transfer of adenine nucleotides across the inner mitochondrial
membrane, by binding to the ADP/ATP antiporter (Nicholl s, 1982). This toxin also induced
mitochondrial swelling (Davidson and Halestrap, 1987) and the release of intra mitochondrial
calcium stores into the cytoplasm (Asimakis and Sordahl, 1977: Le Quac and Le Quac, 1988).
It was also noted, that ATR inhibited post-translational sulphation , probably by inhibiting
the translocation of the sulphate donor, PAPS, across the GA membrane (Capasso and
Hirschberg, 1984; Lee et ai ., 1984). Based on these results it was decided by the present
author to investigate whether these in vitro findings were applicable to the in vivo situation.
To achieve this, the target sites of ATR were localised using organ function assays and
immunocytochemistry. For the purposes of this general di scussion, only the results of the
high dose regimen (25 mg ATRlkg bwt) will be considered since they showed more significant
tissue damage.
At the outset, organ function assays were carried out and these included monitoring the
effects of ATR on the appearance of protein , albumin, AP, GGT, LDH , glucose and calcium in
the urine of rats. Proteinuria which is not only indicative of renal damage per se, but more
specifically of any compromise in glomerular permselectivity (Smith and Hook, 1982), has
been noted in rats exposed to" ATR as well as children accidently poisoned by C. laureola
(Carpenedo et al ., 1974; Bhoola, 1983). Similar proteinuria was also observed in the present
studies (Fig 7.2) as well as albuminuria (Fig 7.3 ) which has been used to assess glomerular
integrity in the presence of ATR (Berndt, 1982). Bhoola (1983) also noted albuminuria in
cases of suspected Impi/a poisoning and a similar response wa:; noted in rats exposed to ATR
(Carpenedo et al., 1974). Thus, from the present reported results, as well as that of others it
was concluded that ATR induces renal damage and affects glomerular permselectivity. While
this renal damage was confirmed by the micrographs (Plates II and III) , the effect of ATR on
the glomerulus was not observed by the present author.
As a means of monitoring the effect of ATR on the proximal tubule and, more specifically, the
microvilli of the brush border, the presence of AP and GGT in the urine of dosed rats was
investigated. Alkaline phosphatase excretion into the urine has been associated with
exposure to X. strumarium (Stuart et aI., 1981) and in the pre~ent studies a similar response
was noted (Fig 7.5). This response was evident up to 48 hours after exposure to ATR and
thereafter, the level of excreted AP dropped below that of th e control , suggesting some form
of recovery. The marker GGT was also monitored as an indicator of proximal tubule and
brush border damage and this enzyme was also detected in the ~rine of the intoxicated rats ,
172
up to 48 hours after exposure (Fig 7.4). Thus, this enzymuria demonstrated that ATR
induces damage to the microvilli of the proximal tubule brush border which was positively
confirmed by the immunocytochemical invesbgations (micrographs 7, 8, 9 and 11). Apart
from micrograph 7, the microvilli were clearly disrupted, but furthermore ATR was
immunocytochemically located on these microvilli and not located in the surrounding milieu.
Clearly, therefore, ATR targets for the proximal tubule, but the microvilli appear to be
particularly susceptible, an observabon not previously noted.
The effect of ATR on proximal tubule transport was monitored by glucosuria and proline
incorporation. Glucosuria has been detected in patients who were accidently poisoned by
Impila, and in rats dosed with ATR (Carpenedo et al., 1974: Bhoola, 1983). These results
were corroborated by the present author (Fig 7.6) . In addition , ATR also inhibited the
transport of proline in the proximal tubules, further suggesting that this toxin terminates
active transport and seriously interferes with proximal tubule function.
Lactate dehydrogenase in the urine was monitored as a marker of distal tubule damage, and
while this enzymuria has been noted in rats dosed with CATR (Hatch et ai ., 1982), this was
also observed for ATR in the present studies (Fig 7.7). By contrast this effect of ATR on the
distal tubules was not readily apparent in the micrographs and therefore constitutes an area
for future investigation.
Thus, apart from the LDH and albumin investigation, the results of the organ function
assays were corroborated by the findings in the immunocytochemical investigations.
Attention was therefore turned to the subcellular targeting of ATR. It has previously been
established in vitro, that ATR inhibits the translocation of adenine nucleotides and PAPS
across the inner mitochondrial and GA membranes respectively, by binding to the ADP/ATP
antiporter and the PAPS translocase (Nicholls, 1982; Capasso and Hirschberg, 1984, Lee et
al., 1984). In addition, this toxin induces mitochondrial swelling and release of
intramitochondrial calcium stores (Asimakis and SOl'dahl, 1977). From the present
immunocytochemical studies, it was firstly observed that ATR induces mitochondrial
swelling within 24 hours after exposure to this toxin (micrograph 7, Plate II ) and
furthermore, that this toxin binds to the cristae . Atractyloside was also observed to bind to
the cytoplasmic side of the GA membrane, confirming the proposal of Capasso and
Hirschberg (1984). Thus, the immunocytochemical investigation confirmed the previous
findings on the subcellular localisation of ATR which, up until this time, had only been
demonstrated in vitro.
173
It is hoped that these findings will significantly contribute to a better understanding of the
effects of ATR and furthermore, that this work will warn researchers using ATR as a
biochemical probe, that the interpretation of their results may not take into account all the
effects of ATR on cellular function . As mentioned in the introduction, this study involved the
development of smtable detection methods for ATR and the in (,iva localisation of the toxin in
rats with each investigation being designated to a separate chapter. Chapter 8 (General
Discussion) will therefore serve as a means of collating these findings as well as providing
suggestions for further areas of research and possible therapeutic agents which may prevent
additional ATR-induced deaths.
174
CHAPrER 8
GENERAL DISCUSSION
The primary objectives of this study were to develop a diagnostic assay for ATR, the
primary toxic component of Impila and furthermore, to localise the target sites of ATR at
an organ, cellular and organelle level. In this regard, these studies succeeded in
achieving the following original results:-
1. The development of an HPLC method for ATR and detection of this toxin in extracts
of C. laureola tuber and urine from ATR-dosed rats;
2. Optimisation and production of antibodies to ATR for use in both an ELISA and
immunocytochemical investigations;
3. Identification of the immunosuppressive action of ATR, probably on the T-
lymphocytes;
4. Development of an ELISA and detection of ATR in rat urine and serum;
s. Provided preliminary evidence that this toxin is biotransformed in vivo;
6. Identified the microvilli of the proximal tubule brush border, glomerulus and distal
tubules as target sites of this toxin, where previously only proximal tubule damage
has been alluded to (Carpenedo et al. , 1974);
7. When administered i.p., ATR is not significantly hepatotoxic;
8. This toxin also targets for the cristae of the mitochondria and specific sites on the
GA membrane.
The development of a suitable assay was approached both immunologically and
chromatographically. Since antibodies had not previously been raised to ATR, this process
necessitated a considerable amount of method development before they could be applied to
an immunoassay. Atractyloside is categorised as a hapten and thus, as a first priority, to
be rendered immunogenic, it had to be conjugated to a suitable carrier. Initially a
modification of the method of Fuchs and Fuchs (1969) was uSE~d to couple ATR to either BSA
or ovalbumin but when the resulting conjugates were used to immunize chickens, the
antibody response was very poor. Subsequent antibody production was therefore carried out
in rabbits, but despite the change in host species, there was no significant improvement in
the antibody response. It was therefore suggested, that like other toxic haptens such as
amanitin, T2-toxin and tetrodotoxin (Faulstich et al., 1975 ; Hunter et a/., 1985; Ragelis,
1985), ATR may be an immunosuppressant, probably inhibiting T-Iymphocytes. Thus, it
is proposed that ATR could inhibit T-cell activity by suppressing ATP synthesis.
Furthermore, this toxin also induces the release of intramitochondrial calcium into the
175
cytoplasm, which may have a far more detrimental effect on the lymphocytes. The
presence of calcium in the cytoplasm is thought to be an intracellular signal for inhibition
of cell growth, and chronic levels of this cation in the cell are an early indicator of cell
injury, particularly in immune cells (Lynn et aZ., 1988). In this regard it has been noted
that infection of T4+ lymphoid cells by the human immunodeficiency virus (HIV) (an
immunosuppressant) is associated with enhanced permeability of the cell membrane,
causing an influx of divalent ions, particularly calcium. The envelope protein (env) of the
HIV or an env-gene product is thought to alter the membrane permselectivity, resulting in
this influx of calcium ions . This increased concentration (If cytoplasmic calcium causes
cessation of growth and, ultimately, cell lysis (Lynn et al ., 1988). Immune suppression by '
HIV is well documented and the elevation of cytoplasmic calcium levels is thought to be
involved in this inhibition (Lynn et al., 1989). Since ATR alters mitochondrial
membrane structure and thereby induces efflux of calcium from intramitochondrial
stores into the cytoplasm, it is feasible that ATR may aho affect T-cells in the same
manner as HIV. Thus, by suppressing T-cells , B-cells would not produce antibodies and
this would account for the poor immune response observed for the ATR-conjugates.
Any inherent immune toxicity of ATR which might exist, may be further enhanced by
virtue of the high charge density associated with its two hisulphate esters, as this has
previously been associated with immune suppression in such immunogens as protamine,
histones and sialic acid (Absolom and van Oss, 1986). Similarly, an immunogen which is
not readily metabolised in vivo, such as ATR, is also obsel'ved to suppress the immune
response (Bach, 1982). Thus it can be concluded that the toxicity of ATR, its poor
metabolism in vivo, its inherent charge density, as well as the too frequent immunization
of the host species, may collectively account for the low quality of antibody produced.
Since the antibody response to a hapten may be improved by changing the coupling
procedure (Weiler, 1981; Ohtani et al., 1988), consideratlon was given to alternative
conjugation procedures, carriers and dosing protocols. Th e site of conjugation was the
first factor to be addressed and since the antibodies were required for use in both the
immunoassay and immunocytochemical studies, the method for coupling ATR to the
carrier was an important consideration. Landsteiner is reputed to have observed that an
antibody is generally directed to the (hydrophobic) region of the hapten, furthest removed
from the linkage (Tijssen, 1985), and thus it was specula;:ed that anti-ATR antibodies
would be directed towards the penhydro-region of the phenallthrenic ring of ATR (Fig 2.3),
should the carboxyl moiety be used as a site of conjugation. The carboxyl group on the
diterpene ring is crucial to the toxicity of the molecule, apparently associating directly with
the ADP binding site on the anti porter (Nicholls, 1982), while the stereology of the
176
remaining portion of the molecule maintains ATR "locked" in this position (Vignais et
ai ., 1978). The success of an immunocytochemical investigation would, therefore, be
dependent upon the antibody having access to an exposed portion of the ATR molecule,
namely that furthest removed from the carboxyl portion. Based on this consideration, only
the carbodiimide (P . Hoffman, peTS. comm ., 1989) and mixed anhydride methods were
compared (Fuchs and Fuchs, 1969) as procedures for the conjugation of ATR to a carrier. It
was found that the carbodiimide method yielded the most efficient binding of ATR to the
protein carrier and would be the procedure of choice, particularly since ATR was observed
to be more soluble in the DMF solvent, compared to 1,4 dioxan, promoting the reaction of the
hapten with the coupling reagents.
The rabbit antiserum with the highest affinity and selectivity for ATR was identified by
carrying out affinity assays and characterisation tests, employing both immunoassays
and immuno-dot blots. From these results it was concluded that a naked bacterial carrier
was most suited to the production of antibodies to ATR since, advantageously, the
antiserum produced had minimal cross-reactivity with components used in the
immunoassay, such as blocking and coating proteins. This novel carrier is therefore
recommended for future antibody production against this toxin . By contrast, BSA is only
recommended as an alternative in extreme cases, since evidence of "reciprocal cross
reactions" (Bach, 1982) with such proteins as ovalbumin could result in false positive
results. Since it was postulated that these "reciprocal cross reactions" may occur with a
BSA carrier, an autologous carrier protein was also tested. Rabbit serum albumin (RSA)
carriers, however, when injected into rabbits, have the potential to induce an autoimmune _
response (Bach, 1982; Roitt, 1988; Hudson and Hay, 1989) as was noted by an increase in the
concentration of immune complexes in the sera after boosting with pure RSA, and should
therefore be avoided.
Apart from identifying the carrier most suited for antibody production to ATR, namely
naked bacteria, a number of other observations were made _ Firstly, it was evident that
considerable heterogeneity exists between the ability of different animals to produce
antibodies to the same antigen, and this reiterates the importance of not pooling antiserum
samples (Catty and Raykundalia, 1988). Secondly, and more importantly, it was also
noted that the secondary response was not significantly greater than the primary response
in any of the animals 'immunized with the ATR-carrier conjugates. Since the secondary
antibody response is associated with an antibody class switch from IgM to IgG and, T-cells
are thought to be imperative for this class switch to occur (Bach, 1982; Tijssen, 1985), any
destruction of T-cells by ATR, could result in a persistent primary response and a
predominant population of anti-ATR IgM antibodies. Characteristically, IgM antibodies
177
bind to their cOTTesponding antigen at temperatures below 30°C, with binding being
enhanced at room temperatUTe or 4°C and depressed at 3TC (Dacie and Lewis, 1970;
Tijssen, 1985). During the course of the development of the immunoassay by the present
author, it was noted that activity was lost if the primary antibody was incubated at
temperatures above 4°C, suggesting that IgM were indeed the predominant antibodies
present in the rabbit seTUm. Since the class switch did not apparently OCCUT, this reaffirms
the proposal that ATR targets for the T-cells. Nevertheless, despite the problems associated
with antibody production, a 5-fold improvement in antibody response was obtained with a
second attempt at raising antibodies, in rabbits, to the ATR -naked bacterial conjugates.
The antibodies raised against ATR were used in the development of an ELISA for ATR
which necessitated the selection of a suitable solid phase and coating buffer and the
optimisation of primary and secondary antibody concentrations, the incubation conditions
and most importantly, the manner in which ATR was bound to the microtitre plates. The
resulting assay has a detection limit of 10 ng ATR/ml, and 8. sensitivity range of 0.1 to 10
~g ATR/ml. This is essentially 10 OOO-fold less sensitive than that for fenpropimorph
(Jung et aI., 1989) but since these workers achieved a primary antibody working dilution of
1: 200 000, the sensitivity achieved in this assay is adequate for the titre of antibody
produced. The inclusion of suitable controls verified that the assay was specific for ATR
and no cross-reaction was observed with ADP or glucose. The assay was used for the
detection of ATR in serum and urine samples, from rats do<;ed with ATR and the results
for which are discussed further and evaluated against that of the HPLC study, later in this
section.
As mentioned earlier, the development of a diagnostic assay for ATR and hence, Impita
poisoning, was approached both immunologically and chromatographically. Previously,
ATR has been detected by TLC (Brookes, 1979), but the detection limits of this method
prevent its practical application as a diagnostic tool. The HPLC determination of this
compound was hindered by the fact that ATR contains .no chromophore and is amphipathic
(Allman et at., 1967), but it was proposed that these shortcomings could be overcome by
forming dansyl derivatives of this toxin using the method of Boulay et at. (1983).
Unfortunately, the reaction is dependent upon the maintenance of anhydrous conditions,
limiting its application to biological samples. For this reason, ATR was derivatised with
ADAM, a compound frequently used for the derivatisation of fatty acids for subsequent
HPLC analysis (Matthees and Purdy, 1979). The advantage:" of this derivatisation reagent
are that the reaction may be caTTied out under aqueous conditions, the derivative may be
detected by both fluorescence or UV (the former being more sensitive, thus greatly
improving detection limits), the derivative is stable and the reaction is reproducible
178
(Matthees and Purdy, 1979). Furthermore, it was established that the derivatisation of ATR
by ADAM went to completion, as free toxin could not be detected by TLC after
derivatisation. A suitable solvent combination was optimised, but the resolution of ATR in
biological samples by HPLC was only achieved if the specimen was cleaned up both prior to
derivatisation and again pre-HPLC analysis. A detection limit of 0.001 ng ATRlml was
determined, representing a detection limit of some 10 OOO-fold more sensitive than the
immunoassay and is significantly more sensitive than the HPLC method for the detection
of Oo-acetyldigoxin in Digitalis lantana of Ikeda et al. (1991), who quote a standard
calibration curve over the range 1-12 Ilg Oo-acetyldigoxin/m1. Since Oo-acetyldigoxin is
monitored using a UV detection system, when comparing the detection limits of this assay
and the HPLC method developed in this study, clearly this reiterates the sensitivity of
fluorescent detection. Atractyloside was positively detected in the extract of a tuber of C.
laureola by HPLC at a level of approximately 6.7 Ilg/g of fresh tuber, and the presence of
this toxin was confirmed by TLC. Thus, assuming that a person will consume an extract
prepared from about 10 g of tuber (Insangoma, pers. comm., 1988), this l"epresents a dose of
67 I!g of ATR. This is significantly lower than that given to the rats used during the course
of this study, but reiterates the toxicity ofthis compound to humans.
It was noted on application of the HPLC method and ELISA to urine and serum samples
from ATR-treated rats, that the results of the ELISA do not strictly correlate with those of the
HPLC, since the ELISA was occasionally seen to detect at.ractylosides when the HPLC
method did not and vice versa. In the case where ATR was detected by HPLC but not by
ELISA, it is suggested that the toxin was present at a level too low to be detected by the
immunoassay and as demonstrated in Table 4.1, the levels of ATR excreted into the urine,
as detected by HPLC were in the order of 0.02 to 0.2 Ilg ATRlml which are essentially less
than the detection limits of the ELISA (0.1 to 10 j.lg!ml).
A comparative summary of the HPLC and ELISA results are presented in Table 8.1,
together with those of the immunocytochemical investigation. As noted from Table 8.1, the
ELISA method detected of ATR in more of the samples over the entire dose range than did
the HPLC despite the greater sensitivity of the latter method . This was probably due to the
altered structure of ATR whose metabolites would probably show different retention times
on HPLC, but might retain the epitope(s) recognised by the primary antibody. If this
reasoning is correct, then the ELISA would be the method of choice if it were immaterial
whether ATR or its metabolites were detected. However, if a quantitative analysis was
required, then HPLC would be most suitable. In the case of the high dose regimen, the
immunocytochemical method is the most suitable method for the diagnosis of ATR
poisoning since from these results it evident that ATR remains "fixed" within the
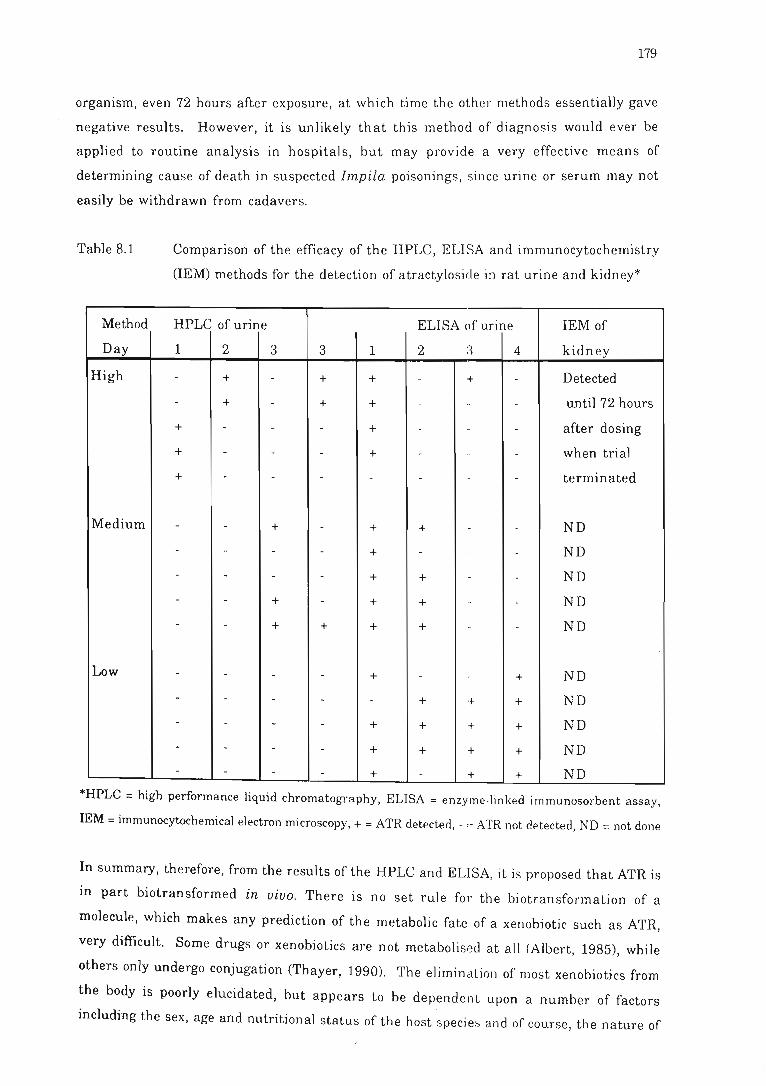
179
organism, even 72 hours after exposure, at which time the other methods essentially gave
negative results. However, it is unlikely that this method of diagnosis would ever be
applied to routine analysis in hospitals, but may provide a very effective means of
determining cause of death in suspected ImpiZa poisonings , since urine or serum may not
easily be withdrawn from cadavers.
Table 8.1
Method
Day
High
Medium
Low
Comparison of the efficacy of the HPLC, ELISA and immunocytochemistry
ClEM) methods for the detection of atractyloside in rat urine and kidney*
HPLC of urine ELISA of urine IEM of
1 2 3 3 1 2 ;~ 4 kidney
- + - + + - + - Detected
- + - + + - - - until 72 hours
+ - - - + - - - after dosing
+ - - - + - .. - when trial
+ - - - - - - - terminated
- - + - + + - - ND
- - - - + - .. - ND
- - - - + + - - ND
- - + - + + .. - ND
- - + + + + - - ND
- - - - + - - + ND
- - - - - + + + ND
- - - - + + + + ND - - - - + + + + ND - - - - + - + + ND
*HPLC = high performance liquid chromatography, ELISA = enzyme-linked immunosorbent assay,
IEM = immunocytochemical electron microscopy, + = ATR detected, - ,= ATR not detected, ND = not done
In summary, therefore, from the results of the HPLC and ELISA, it is proposed that ATR is
in part biotransformed in vivo. There is no set rule for the biotransformation of a
molecule, which makes any prediction of the metabolic fate ofaxenobiotic such as ATR,
very difficult. Some drugs or xenobiotics are not metabolised at all (Albert, 1985), while
others only undergo conjugation (Thayer, 1990). The elimination of most xenobiotics from
the body is poorly elucidated, but appears to be dependent upon a number of factors
including the sex, age and nutritional status of the host speci es a nd of course, the nature of
180
the drug or toxin. The metabolic fate of the xenobiotic in one species is also not strictly
applicable to another species; thalidomide being a case in point (Albert, 1985).
It is well known that ATR induces kidney necrosis and, from the results of the ELISA and
HPLC, is released into the urine. The body is designed to eliminate xenobiotics from the
system and this may involve biotransformation to promote excretion. Such biochemical
alterations occur primarily in the liver, but may also occur in the plasma, lungs or
kidney. Ultimately, bi.otransformation increases the polarity of the molecule and by
enhancing its hydrophilicity, promotes excretion (usually in the urine).
Biotransformation reactions occur in two phases. The first involves the oxidation,
reduction or hydrolysis of the xenobiotic which all promote hydrophilicity (Albert, 1985).
Phase II reactions involve the conjugation of the compound to metabolites such as
glucuronate, sulphate, glycine or glutathione (Barbieri , 1990). Coupling is mediated
through amine, alcohols, phenols, amides or carboxylic acid moieties present on the
xenobiotic (Albert, 1985; Barbieri, 1990; Thayer, 1990). In humans, glucuronate is most
frequently conjugated to the xenobiotic, and this involves the activation of glucose-1-
phosphate by uridine diphosphate in a series of reaction steps to ultimately produce
glucuronate (Thayer, 1990). A microsomal glucuryl transferase catalyses the transfer of
the glucuronate to a polar group on the xenobiotic, frequen tly a hydroxyl group (Thayer,
1990). Sulphate may also be conjugated to the xenobiotic, usually through a hydroxyl group,
by the intermediate PAPS and catalysed by a cytoplasmic sulphotransferase. Sulphation is
less common than glucuronidation, owing to the limited in vivo availability of inorganic
sulphate (Thayer, 1990).
It is unclear from the literature precisely in which cellular compartment
biotransformation occurs, except that most of the enzymes are cytoplasmic, although
organic acids are conjugated to glycine in the mitochondria (Albert, 1985). The results of
the HPLC analyses indicate that ATR is at least partially metabolised in vivo, but the
question remains as to whether this occurs in the liver or kidney . The results of the liver
enzyme profile presented in section 7.4, show that ATR doe s not induce liver damage.
This fact could be interpreted to mean that the toxin is not metabolised or biotransformed in
the liver, otherwise some damage would have been expected to occur. Therefore, it may be
speculated that biotransformation of the ATR, at least when administered i.p., does not
occur in the liver, but rather elsewhere, possibly in the plasma or even in the kidney itself.
It is apparent from the literature, however, that the hydroxyl group is the preferential site of
attachment (Albert, 1985; Barbieri, 1990; Thayer, 1990). Although this moiety is in fact
hydrophilic, should conjugation of a glucuronide or glycine molecule occur at this site,
then this would serve to increase the hydrophilicity of the toxin, promoting excretion, while
181
still enabling derivatisation with ADAM. This alteration in the polarity of the toxin would
change its k' on a reverse phase column, resulting in an altered retention time, which
could account for the failure to detect the molecule in some of the representative urine and
serum samples. Sulphation is also a feasible method of biotransforming the ATR, but
sulphation is mediated by PAPS and since it was pointed out in the literature review
(section 2.4.3) that ATR inhibits the translocation of PAPS into the GA (Capasso and
Hirschberg, 1984), theoretically, ATR may inhibit its own biotransformation and therefore
this method of alteration is considered to be unlikely .
From Fig 2.3, it will be noted that ATR contains a hydroxyl and carboxyl group on the
diterpene ring structure as well as a sugar moiety and two bisulphate esters. As the goal of
biotransformation is to increase hydrophilicity, it is proposed that ATR is un likely to be
deglycosylated to form the aglycone, atractyligenin, but rather is conjugated to a
metabolite either through the carboxyl or hydroxyl moiety on the diterpene ring. This site
of biotransformation is supported by the fact that the antibodies raised aga'inst this toxin
still recognised a metabolic product. Tijssen (1985) states that antibodies raised against
haptens bind to epitopes furthest away from the point of binding of the hapten to the carrier
(in this case the carboxyl group was used). For instance, if glycine is bound to the hydroxyl
group, this would not alter the the epitope determinants. Thus, while it was suggested that
the aglycone may be the primary metabolic product of ATR biotransformation . This is
considered unlikely, since the aglycone is essentially hydrophobic . The identity of the
metabolite(s) of ATR is a subject for future work, which will involve radiotracer studies
and chemical identification of the products using nuclear magnetic resonance
spectroscopy.
Apart from the observation that ATR is excreted into the urine and is apparently
biotransformed in vivo, the results of the HPLC and ELISA assays showed that the period
over which ATR was excreted into the urine was inversely proportional to the initial level
of toxin administered and this may be explained as follow s. With a high dose of toxin,
more tubular damage will occur, resulting in inhibition of tubular active transport and
ultimately excretion of xenobiotics and metabolites will be uncontrolled . Thus, at high
doses of toxin, excretion will occur more rapidly . With a low dose of ATR, less tubular
damage will occur, active transport and filtration will remain functional, albeit it
depressed, and consequently, the excretion of xenobiotics will be more controlled. This
parallels the typical excretion profiles of protein and albumin (Figs 7.2 and 7.3) which
show damage followed by recovery. Some ATR may in fact be re -adsorbed into the
proximal tubules and then enter the hepatic portal system, where the toxin will be
182
transported to the liver. Once in the liver, the toxin may undergo biotransformation only to
be returned to the kidney, for excretion.
Toxin was apparently not excreted all at once or over a period of several successive days,
but it appeared to be "fixed" within the animal and then at different time points, was
released. This phenomenon is apparently not uncommon , as drugs may bind to
macromolecules, to a point where all their binding sites are saturated, after which any
free, unbound xenobiotic will be excreted (Bradford, 1990). An equilibrium will therefore
be established between bound and free compound; the latter being available for
biotransformation and excretion. The bound fraction acts as a depot and is released once
the free form of the xenobiotic is excreted, thus re-establishing equilibrium (Bradford,
1990). A similar situation could occur with ATR which could explain the differential rates
of excretion of toxin into the rat urine . However, without further studies on the
pharmacokinetics of ATR, this proposal will remain highly speculative.
Although xenobiotics frequently associate with serum albumins, the results of the
immunocytochemical investigation demonstrated that even 72 hours after an initial
exposure to ATR, toxin was resident in the kidney, indicating that this was the primary
depot site. This site of binding may be related to the route of toxin administration, since as
ATR was administered i.p. it will bypass the portal blood system and enter the general
circulatory system, probably being transported almost directly to the kidney, in a manner
analogous to that of rectal administration of toxins (Barbieri, 1990). It is proposed that, in
the main, the toxin is not bound to serum albumins, but remains bound in the kidney,
hence the failure to detect it in the serum. As with the association of the xenobiotics with
serum albumins, it is proposed that an equilibrium is established between bound ATR in
the kidney and toxin excreted into the urine. Thus, as a consequence of damage and non
specific dissociation, ATR is excreted into the urine in a dose responsive manner. This
would account for the appearance of ATR in the urine over a period inversely proportional
to the dose administered.
In conclusion, with reference to the diagnostic assays, it is proposed that both the HPLC
method and ELISA may be used for the detection of ATR, but the HPLC method, being
expensive, is best applied to research orientated investigations, including pharmokinetic
studies and monitoring the levels of ATR in plant extracts. Alternatively, the
immunoassay is more suited for use as a diagnostic tool for ATR and its metabolites and
may be easily converted into a field-test kit such as that described by Chan tIer and Hurrell
(1982) for the diagnosis of snake envenomation , which requires no expertise nor expensive
equipment. As with all diagnostic assays, th ere is a limited time period after exposure
183
when the assay may be used to detect ATR poisoning and thereafter, false negative results
are likely. In the case of the assays for ATR, this is proposed to be within the first 24-48
hours after exposure (i.e., the period of during which ATR is not bound within the kidney
but is excreted) despite the fact that the immunocytoche~ical investigation demonstrated
that ATR is still resident in the kidney, 72 hours after exposure.
The conclusions regarding this study are limited by the fact that so little is known of the
pharmacokinetics of ATR in vivo . Nevertheless, use was made of urinalysis and
immunocytochemistry as an indication of both the pharmacokinetics of ATR in the rat, as
well as the location of the target sites of this toxin . The results of the urinalysis
demonstrated that ATR compromises glomerular permselectivity and distal tubular
function, but this observation was not confirmed histologically. Atractyloside related
proteinuria and albuminuria have previously been alluded to in the literature (Bhoola,
1983), but this is the first correlation between the appearance of protein and albumin in the
urine and a compromise of glomerular perm selectivity. It is also apparent that ATR
inhibits the transport of glucose and amino acids in the proximal tubule, as indicated by
glucosuria and the in vitro study of proline incorporation into isolated proximal tubule
fragments. Hence, ATR is also likely to inhibit protein biosynthesis in the proximal
tubule as a consequence of the inhibition of amino acid transport; the mechanisms of which
would be an interesting project.
The abnormal excretion by ATR-treated rats of elevated levels of GGT and AP suggest that
ATR targets for. the proximal tubule, specifically the microvilli of the brush border.
Similarly, it was also evident that on day 3 post-dosing, the levels of excreted GGT in the
high and medium dose regimen were lower than that of the control group. This was also
exhibited on day 4 in the high dose regimen. Similarly, AP was excreted into the urine on
day 3, at a concentration less than that of the control, by all the rats exposed to ATR, and on
day 4 this phenomenon was only seen in the low dose regimen. This "undershoot" may be
attributed to an inhibition of protein biosynthesis by ATR, as suggested by the in vitro test
on proline incorporation. The subsequent increase in the levels of enzyme excretion on
day 4 in some dose regimens is indicative of cellular and tissue regeneration and hence
recovery. The proposed tissue regeneration in the rats employed in the present study was
apparently delayed, compared to that reported by Carpenedo et al . (1974) and Bhoola (1983)
who noted renal repair within 48 hours after exposure.
Clearly some form of recovery is occurring, as demonstrated by the levels of calcium
excreted by the ATR-treated rats, particularly the high dose regimen (Fig 7.8), since these
levels rise after initial exposure to the toxin, indicating cellular damage, and then are
184
seen to decrease to a minimum level significantly less than that of the controls on day 3.
Homeostasis is re-established in the organism under the control of parathyroid hormones,
which leach available calcium from such areas as the bone, in order to return the serum
calcium levels to above acceptable limits (noted in Fig 7.8 on day 3, when the levels of
excreted calcium are significantly lower than basal (:ontrol levels). This over
compensation of calcium retention is rectified by the subsequent excretion of calcium into
the urine within 12 hours (Ungar, 1986) which is clearly demonstrated in Fig 7.8, where on
day 4, levels of excreted calcium were seen to rise again.
The results of the urinalysis were confirmed immunocytochemically. As
immunocytochemistry had previously not been used for the determination of ATR in vivo,
the method was optimised on C. laureola tuber, essentially providing a positive control.
Unfortunately, the tuber cells contain few organelles and seemed to consist of large areas
of cytoplasm or vacuole and thus it was difficult to discern any form of cellular structure.
However, there were areas of gold-probe "clumping", and from this it was suggested that
ATR was encapsulated in vesicles. The difficulty experienced in preserving good cellular
ultrastructure of the tuber limited further discussion and speculation on the storage site of
the toxin in the tuber, but nevertheless it was demonstrated that the immunocytochemical
detection of ATR in the plant is possible. As this investigation constitutes a very new area
of research, little comment may be added, but it is anticipated that immunocytochemistry
will provide the means to investigate the metabolism of ATR and related metabolites in the
plant. Hence if ATR is synthesised and stored in the tuber, it may be possible to identify
sites of synthesis and if the enzymes 'involved in this reaction may be inhibited, it is
possible that significantly less toxic strains of C. laureola may be cultivated for
commercial use.
A number of problems were experienced during the optimisation of the
immunocytochemical ' procedure, notwithstanding the leaching of the toxin during fixation
and dehydration of the tissue. This necessitated the carbodiimide-mediated coupling of
ATR to intracellular proteins. Provided this pre-fixation step was carried out, the
immunocytochemical localisation of ATR rat kidney was possible and the incorporation
of relevant controls (Petrusz, 1983) validated the results. Up until the time of this study,
details pertaining to the inhibitory effect of ATR had only been identified by histological
observation (Carpenedo et at., 1974) or in vitro assays (Klingenberg, 1978). In the present
studies, immunolabelling of rat kidney specimens, demonstrated for the first time that
ATR directly induces disruption of the microvilli within 24 hours after exposure, and is
closely associated with these structures. Furthermore, mitochondrial swelling was noted,
with the simultaneous localisation of ATR on the mitochondrial cristae. Mitochondrial
185
swelling is frequently associated with toxic insult and has been identified as a
characteristic alteration in Reye's syndrome (Martens et ai. , 1986). It was mentioned in
the literature review (Chapter 2), that there may be some connection between Reye's
syndrome and ATR intoxication, since the two present very similar biochemical and
subcellular alterations. This is however, an area for extensive research . At 48 hours after
exposure to ATR, this toxin was still detected on the microvilli and furthermore, was found
to be associated with the GA membrane, confirming the proposal of Capasso and
Hirschberg (1984) that ATR binds to the PAPS translocation on the GA membrane and
further reiterating that sulphation is unlikely to be the means by which ATR is
biotransformed in vivo.
Thus, the immunocytochemical investigation provided indisputable evidence that ATR
targets for the proximal tubule of the kidney, specifically the microvilli of the brush border
and furthermore, also binds to mitochondria and GA, the latter of which had only been
demonstrated in vitro, with isolated organelles (Klingenberg, 1978; Capasso and
Hirschberg, 1984). Atractyloside has usually beer presumed to be a hepatotoxin, but it was
evident from the results of the AST and ALT study, that the hepatotoxicity of ATR is
insignificant, if the toxin is administered i.p., but this may not be the case should the toxin
be administered orally, since the ATR will proceed directly from the intestinal tract via
the hepatic portal system to the liver (Barbieri, 1990). Thus it is proposed by the present
author, that when Impila is administered orally, ATR is transported directly to the liver,
where it causes some damage before being biotransformed and ATR is possibly rendered
less toxic, whereupon, the metabolised molecule is excreted in the urine. However, if
Impila is administered rectally, it is proposed that in avoiding the portal circulatory
system, the ATR is transported directly to the kidney where necrosis occurs. Being an
ADP analogue, ATR may be reabsorbed into the circulatory system, entering the portal
system and transported to the liver. Here, biotransformation occurs, whereupon ATR is
returned to the kidney and it is excreted. This explanation could account for the fact that
the rectal administration is more toxic than the oral route. Thus, in conclusion, if Impila
is administered orally it is likely to be less nephrotoxic than if administered as an enema.
This proposal also still holds if ATR is not the primary hepatotoxic principle in Impila, but
some other active compound. By administering ATR i.p., as was carried out in this study,
it is proposed that the toxin will follow a similar route to that of ATR administered rectally
and thus, it is possible that this could account for the failure of ATR to induce liver necrosis
in the present study. Thus, ATR may be significantly more hepatotoxic if administered
orally, than i.p., or rectally.
186
Statistically, more deaths occur in children than in adults, following administration of
Impila (Bhoola, 1983) but whether this is a consequence of more children actually taking
the herbal remedy than adults, is a contentious point. )Jevertheless, from extensive
consultation with Insangomas and herbalists, it is apparent that the remedy is most likely
to be administered to children as an enema and to adults per as and this may be a
significant observation.
The dangers associated with the use of Impila have been confirmed by this study and
although the ultimate aim was to develop an assay for ATR, bearing in mind that the assay
would have international application since ATR is present in a number of plant species
(Debetto, 1978) and also to localise the target sites of ATR, during the course of the
investigation thought was given to potential therapeutic agents for the treatment of Impila
poisoning. The reversal of T2-toxin inhibition has been observed following
administration of anti-T2-toxin monoclonal antibodies to T2-toxin treated cells (Hunter et
al., 1990) and these authors have proposed that these antibodies may find clinical
application. Thus, if anti-ATR monoclonal antibodies were prepared instead of
polyclonal antibodies to ATR, these may provide a means to prevent further ATR-related
deaths if administered in a similar manner to anti-snake venom antiserum. The
limitations of this would be that the patient could only be treated 0nce in this manner since
repeated therapy of this nature would induce anaphylactic shock (Tijssen, 1985). While
this suggestion is very much for long term consideration, in the short term, duramycin
may provide a potential antidote to Impila poisoning (section 2.4.2), since puramycin and
ATR act synergistically, inducing stabilisation of the mitochondrial membrane
(Sokolove et ai., 1989). To reiterate, duramycin induces destabilisation of the
mitochondrial membrane, resulting in the removal of sequestrated intramitochondrial
calcium. This calcium is deposited in the cytoplasm where it ultimately causes cell death
and lysis. It was noted by Sokolove et al . (1989) that restabilisation of the mitochondrial
membrane occurs when ATR is added to a cell preparation previously treated with
duramycin. Hence, the converse may also apply, namely that ATR-induced
destabilisation of the mitochondrial membrane may be reverted in the presence of
duramycin. In view of the deleterious effect of calcium on the cell, it is proposed that the
effect of ATR on intracellular calcium levels may be of more significance tha·n the fact
that this toxin ultimately inhibits oxidative phosphorylation . In this regard it may be of
benefit in future, to administer duramycin to rabbits in conjunction with the ATR-naked
bacteria conjugate, as a means of preventing the deleterious effects of this toxin on
lymphocytes and thus, improving antibody response. Furthermore, it is proposed that the
administration of free radical scavengers could protect patients against ATR poisoning,
as ATR-induced damage to the mitochondria is associated with the generation of free
187
radicals, which exert a deleterious effect on the cell, in particular cell membranes .
Furthermore, and probably of more therapeutic benefit, would be the administration of the
the non-caloric sweetener, stevioside (Ishii and Bracht, 1986). This analogue of ATR also
inhibits adenine nucleotide transport in the mitochondria (but only in intact cells, since
the molecule cannot traverse the cell membrane) but is significantly less toxic than ATR
(Ishii and Bracht, 1986). If rat livers are perfused with ATR, the deleterious effects of this
toxin are reversed when stevioside is also perfused into the liver (Ishii and Bracht, 1986), a
fact which certainly warrants further investigation .
The above paragraph refers to possible therapeutic agents which may reverse the effects of
ATR, but the adage of "prevention being better than cure" is thought to be more applicable in
this instance. From extensive consultation with traditional healers and western
physicians it became apparent that the cultural belief of the Zulus "runs too deep" to ever be
able to totally eradicate the use of Impila. The accidental deaths resulting from the use of
Impila appear more commonplace than in previous years, and this is in part attributed to
the fact that the retail of traditional medicines has become a very lucrative enterprise (see
review by Bye and Dutton, 1991) analogous to the peddling of drugs of abuse. Hence, many
herbal retailers have only a rudimentary knowledge of the therapeutic benefits of the
remedies, and are particularly ignorant of the correct dosage .
Thus, it is the personal opinion of the present author that the only means left for the
prevention of indiscriminate herbal-mediated deaths is to educate the herbalists of the
potential dangers of such herbs, particularly if the incorrect dosage is given Or
alternatively if the remedy is scientifically demonstrated to be too toxic for routine use,
then it must be declared "illegal". Undoubtedly, many of the herbal remedies in daily use
contain beneficial active ingredients, which, if the practice of traditional medicine is
terminated would be lost forever. It is the task of scientists and traditional healers alike to
somehow collate this to the benefit of all and to conclude, therefore, in the words of
Paracelsus:-
"'What is tfiere that is not poison?
Jl[{ things are poison and nothing (is)
without poison. So[eCy tfie dose
detennines that a thing is not a poison" . .
From the translation by Deichmann et at. (1986)
188
REFERENCES
Absolom, D. R. and van Oss, C. J. (1986) The nature of the antigen-antibody bond and the
factors affecting its association and disassociation In : CRC Critical Reviews in
Immunology, Vol 6 Issue 1, CRC, Boca Raton, pp 1-46
Albert, A. (1985) In: Selective Toxicity, 7th Ed., Chapman and Hall, London, pp 56-174
Allman, D.W., Harris, R.A. and Green, D.E. (1967) Arch. Biochim. Biophys., 122, 766
Asimakis, G.K. and Sordahl, L. A. (1977) Arch. Biochim. Biophys., 179, 200
Bach, J-F. (1982) In: Immunology, 2nd Ed., Wiley, New York , pp 60-105; 129-162; 285-345;
530-592; 794-853
Bach, P.H. (1990) Robens Institute for Industrial and Environmental Health and Safety,
University of Surrey, Guildford, Surrey. Personal communication
Bach, P.H. and Kwizera, E.N. (1988) Xenobiotica, 18, 685
Bach, P.H.(1989) Marine Environmental Research, 28, 351
Bancroft, J.B. and Stevens, A. (1982) In: Theory and Practice of Histological Techniques,
2nd Ed., Churchill and Livingstone, London, pp 379-405
Bandu, V. (1989) Electron Microscope Unit, University of Natal, Pietermaritzburg.
Personal communication
Barbanti-Brodano, G. and Fiume, L. (1973) cited by Faulstich et al. (1975)
Barbieri, E.J. (1990) Pharmokinetics In : Basic Pharmacology in Medicine, 3rd Ed.,
(DiPalma, J .R. and DiGregorio, G.J., eds) MacGraw-Hill, New York, pp 31-51
Baselt, R.C. (1989) Journal of Analytical Toxicology, 13, 1
Beesley, J.E. (1987) Sero-Diagnosis and Immunotherapy, 1, 239
189
Bellstedt, D.U., Human , P.A., Rowland , G.F. and Van der Merwe, K.J . (1987) J.
Immunol. Methods, 98, 249
Bendayan, M. and Zollinger, M. (1983) J. Histochem. Cytochem., 31,101
Bernardi, P . and Azzone, G.F. (1983) Eur. J. Biochem ., 134, 377
Berndt, W.O. (1976) Environmental Health Perspectives, 15, 55
Berndt, W.O. (1982) Renal methods in toxicology In: Principles and Methods of
Toxicology (Hayes, AW., ed.) Raven press, New York , pp 447-473
Bhoola, K.D .N. (1983) A clinico-pathologlcal and biochemical study of the toxicity of
Callilepis laureola (Impila). Thesi s for Doctor of Medicine, University of Natal,
Durban, pp 1-144
Bombardelli, E., Bonati, A and Gabetta, B. (1972) Phytochem. , 11, 3501
Bonetti, F., Derenzini, M. and Fiume, L. (1974) cited by Faulstich et al. (1975)
Bonner, F.W., Bach, P.H. and Dobrota, M. (1982) The Bioch emistry of the Kidney In :
Nephrotoxicity - Assessment and Pathogenesis (Bach, P.H ., Bonner, F.W.,
Bridges, J.W. and Lock, E .A, eds) Wiley, Chichester, pp 437-459
Boogaard, P.J., Mulder, G.J. and Nagelkerke, J.F. (1989a) Tox. Appl. Pharmacol. , 101 ,
135
Boogaard, P.J., Mulder, G.J . and Nagelkerke, J.F. (1989b) Tox. Appl. Pharmacol., 101,
144
Borisov, Y.Y. and Statnikov, Y.G. (1966) cited by Litman (1985 )
Boulay, F., Brandolin, G., Lauquin , G.J.M. and Vignai s, P .V. (1983) Anal. Biochem. ,
128,323
Bradford, M.M. (1976) Anal. Biochem. , 72, 248
190
Bradford, P.G. (1990) Molecular models of receptors and t ransduction mechanisms In:
Basic Pharmacology in Medicine, 3rd Ed., (DiPalma, J.R. and DiGregorio, G.J .,
eds) MacGraw-Hm, New York, pp 16-30
Briand, J.P., Muller, S., Van Regenmortel, M.H.V. (1985) J. lmmunol. lvfethods, 78, 59
Brookes, K.B . (1979) A Chemical study of th e rootstock of Callilepi s laureola. M.Sc.
Thesis, Department of Chemistry, University of Natal , Durban, pp 1-125
Brookes, K.B., Candy, H.A and Pegel, K.H. (1983) S . Afr. J . Chem. , 36, 65
Bruni, A, Contessa, AR. and Luciani, S. (1962) Biochirn. Biophys. Acta , 60, 301
Bruni, A, Luciani, S. and Bortignon, C. (1965) Biochim. Biophys. Acta, 97, 434
Bruni, A, Luciani, S. and Contessa, AR. (1964) Nature, 201, 1219
Bryant, AT (1909) Ann. Natal Mus., 2, 1
Buttle, D.J., Bonner, B.C., Burnett, D. and Barrett, AJ. (1988; Biochem. J. , 254, 693
Bye, S.N., Coetzer, T.H.T. and Dutton, M.F.(1990) Toxicon, 28, 997
Bye, S.N. and Dutton, M.F. (1991) J . Ethnopharm ., 34, 253
Bygrave, F.L. (1978) cited by Nicholls and Scott, (1980)
Cantarero, L.A., Butler, J.E. and Osborne, J .W. (1980) Anal. Biochem., 105, 375
Capasso, J.M. and Hirschberg, C.B. (1984) J. Biol. Chern ., 259, 4263
Capdevielle, P. and Darracq, R. (1980) Medecine Tropicale, 40, 137
Carbonera, D. and Azzone, G.F. (1988)Biochim .Biophys. Acta, 943, 245
Carpenedo, F., Luciani, S., Scaravilli, F ., Palatini, P. and Santi, R. (1974) Arch. Toxicol.,
32,169
191
Catty, D. and Raykundalia, C. (1988) Production and quality control of polyc1onal
antibodies In: Antibodies Vol. I: A Practical Approach (Catty, D., ed) IRL Press,
Oxford, pp 19-79
Cessi, G. and Fiume, L. (1969) cited by Faulstich et al. (1975 )
Chantler, H.M. and Hurrell, J .G.R (1982) Clinica Chimica Acta, 121 , 225
Chappell, J.B. and Crofts, AR (1965) Biochem. J . , 95, 707
Chavez, E. and Osornio, A (1988) Int. J . Biochem., 20, 731
Coetzer, T.H.T (1988) Dept. Biochemi stry,Un iversity of Natal, Pietermaritzburg.
Personal communication
Contessa, AR and Fassina, G. (1978) Pharmacognosy of Atractylis gumm.ifera. LIn :
Atractyloside: Chemistry, Biochemistry and Toxicology (Santi, R and Luciani ,
S., eds.)Piccin, Padova, pp 1-12
Coste, H., Martel, M.B. and Got, R (1986) Biochim. Biophys. Acta, 858, 6
Craig, J.C., Mole, M.L., Billets, S. and EI-Feraly, F. (1976) Phytochem., 15, 1178
Craig, S. and Goodchild, D.J. (1982) Eur. J. Cell Bioi ., 28, 251
Dacie, J.V. and Lewis, S.M. (1970) In: Practical Haematology, 4th Ed. , Churchill, London,
pp 190-191
Davidson, AM. and Halestrap, AP. (1987) Biochem. J., 246, 715
Dawson, RM.C., Elliott, D.C., Elliott, W.H. and Jon es, KM. (1986) In : Data For
Biochemical Research, Clarendon, Oxford, pp 292-29:3
Debetto, P. (1978) Plants recently found to contain atractylosides In : Atractyloside:
Chemistry, Biochemistry and Toxicology (Santi, R and Luciani, S., eds.)Piccin,
Padova, pp 125-129
192
Dehrmann, F.M. (1990) Dept. Biochemistry , University of Natal, Pietermaritzburg.
Personal communication
Dehrmann, F.M. (1991) An investigation into the plant toxin atractyloside in Callilepis
laureola, M.Sc. Thesis, Dept. Biochemistry, University of Natal,
Pietermaritzburg, pp 1-128
Deichmann, W.B., Henschler, D., Holmstedt, B. and Keil, G. (1986) Arch. Toxicol., 58,
2m
Dierickx, P.J. (1981) Arch. Toxicol., 47,209
Dintzis, RZ., Okajima, M., Middleton, M.H., Greene, G. and Dintzis, H.M. (1989) J .
Immunol., 143, 1239
Dlamini, C. (1988) Dept. Biochemistry, university of Natal, Pietermaritzburg. Personal
communication
Dubach, U.C., Le Hir, M. and Gandhi, R (1988) Toxicol . Lett., 46, 193
Dyer, RA. (1975) In: The Genera of Sou.th Africa.n Flowering Pla.nts (Vol I, Dicots) ,
Department of Agricultural Technical Services, RSA, p 694
Edwards, T. (1988) Herbarium, University of Natal, Pietermaritzburg. Personal
communication
Eichholzer, J.V., Lewis, LA.S., MacLeod, J .K. and Oelrichs, P.B. (1981) Tetrahedron, 37,
1881
Elliott, E. (1989) Dept. Biochemistry, University of Natal, Pietermaritzburg. Personal
communication
Ellis, C.G. (1986) Veld and Flora 72 72 , ,
Engelhardt, H., Muller, H. and Schon, U. (1985) The column In: High Performance
Liquid Chromatography in Biochemistry (Henschen, A., Hupe, K-P., Lottspeich,
F. and Voelter, W., eds) VCH, Weinheim, pp 15-78
193
Engvall, E. (1976) cited by Tijssen (1985)
Engvall, E. and Perlmann, P. (1971) Immunochemist ry, 8 ,871
Erlanger, B.F. (1980) Methods in Enzymology , 70 , 85
Faulstich, H., Trischmann , H. and Zobeley , (1975) FEBS Lett .. 56, 312
Fawaz, S. (1990) Dept. Biochemistry, University of Surrey , Guilford, Surrey . Personal
communication
Feldkamp, C.S. and Smith, S.W. (1 987) Practical Guide to Immunoassay Method
Evaluation In: Immunoassay, A Practical Guide (D.W. Chan and Perlstein,
M.T., eds) Academic Press, San Diego, pp 49-96
Flanagan, R.J. and Ruprah, M. (1989) Clin. Chem., 37, 1342
Fowler, J .S.1. (1982) Micro-, Middle and Macromolecules in Blood and Urine In :
Nephrotoxicity - Assessment and Pathogenesis 'Bach, P.H. , Bonner, F.W.,
Bridges, J.W. and Lock, E.A., eds) Wiley, Chichester, pp 66-77
Fuchs, S. and Fuchs, Y. (1969) Biochim. Biophys. Acta, 192,528
Galanos, C., Luderitz, O. and Westphal, O. (1971) Eur. J . Biochem ., 24, 116
Gale, E.F., Cundliffe, E. , Reynolds, P.E., Richmond , M.H. and Waring, M.J. (1981) In:
Molecular Basis of Antibiotic Action, 2nd Ed. , Wiley , London , pp 243-245
Gatta, A., Bazzerla, G., Amodio, P. , Menon, F ., Angeli, P., Schiaffino, E. and Schmid, C.
(1989) Nephron, 51, 20
Georgiou, M., Biol, D., Sianidou, 1., Hatzis, T., Papadatos , J . and Koutselinis, A.(1988)
Clin. Toxicol., 26, 487
Ghisalberti, E.L., Jefferies, P.R., Passannanti , S. and Piozzi. F . (1968) Au.st. J . Chem. , 21,
459
Goodfriend , T.1., Levine, 1. and Fasman, G.D. (1964) Science. 144, 1344
194
Graf, F.M. and Straull, P. (1983) J . Histochem. Cytochem ., 31 , 803
Gregg, N.J ., Courtauld, E.A. and Bach, P .H. (1990) Toxic . Path. , 18,47
Gundidza, M. (1985) Cent. Afr. J. Med., 31,238
Habeeb, AF.S.A (1966) Anal. Biochem. ,14, 328
Harold, F.M. (1986) In: The Vital Force.A study of Bioenergetics, Freeman, New York, pp
197-386
Hatch, RC., Jain, A.V., Weiss, R and Clark, J .D. (1982) Am. J . Vet . Res., 43, 111
Hayat, M.A. (1986) In: Basic Techniques for Transmission Electron Microscopy,
Academic Press, Orlando, Florida, pp 1-55
Herman, E.M. and Shannon, L.M. (1984) Protoplasma, 121, 163
Herrmann, J.E. and Collins, M.F. (1976) J. bnmunol. Methods, 10, 363
Hess, B. (1963) In: Enzymes in Blood Plasma, Academlc Pre~s, New York, p 19
Hilliard, O.M. (1977) In: Compositae Ln Natal, University of Natal Press,
Pietermaritzburg, pp 287-288
Hillman, RE. and Rosenberg, L.E. (1969) J . Biol. Chem., 244, 4494
Hirschberg, C.B. and Snider, M.D. (1987) Ann. Rev. Biochem., 56, 63
Hoffman, N.E. and Liao, J.C. (1977) Anal. Chem., 49,2231
Hoffman, P. (1988) Dept. Hortlculture, University of Natal, Pietermaritzburg. Personal
communication
Horisberger, M. (1981) Scanning Electron Microsc., 11, 9
195
Hounsell, E.F. (1986) Carbohydrates In : HPLC of small molecules (Lim C.K, ed) IRL,
Oxford, pp 49-68
Hudson, L. and Hay, F.C. (1989) In: Practical Immunology, 3rd Ed., Blackwell , Oxford,
pp 224-236; 455-456
Hunter, KW., Brimfield, A.A., Knower, A.T., Po well , J.A. and Feuerstein, G.A. (1990)
Journal of Pharmacology and Experimental Therapeutics, 255 , 1183
Hunter, KW., Brimfield, A.A., Miller, M., Finkelman, F.D. and Chu, S.F. (1985) Appl.
Environ. Micro., 49, 168
Hupe, K-P. (1985) Fundamental Chromatographic Relation sh ips. In: High Performance
Liquid Chromatography in Biochemistry (Henschen, A. , Hupe , K-P., Lottspeich, F.
and Voelter, W., eds) VCH, Weinheim, pp 1-14
Hupe, K-P., Rozing, G. and Schrenker, H. (1985) Instrumentation . In : High Performance
Liquid Chromatography in Biochemistry (Henschen , A., Hupe , K-P. , Lottspeich, F.
and Voelter, W., eds) VCH, Weinheim , pp 79-138
Ikeda, Y., Fujii, Y. and Yamazaki, M. (1991) Anal. Biochem., 196, 451
Imai, K and Toyo'oka, T. (1988) Design and choice of suitable labelling reagents for
liquid chromatography In: Selective Sample Handling and Detection in High
Performance Liquid Chromatography (Frei, R.W. and Zech, K., eds.) Elsevier,
Amsterdam, pp 209-288
Ishii, E.L. and Bracht, A. (1986) Res. Commun. Chem. Pathol . Pharmacol., 53, 79
Johnson, E.L. and Stevenson, R. (1978) In : Basic Liquid Chromatography , Varian,
California, pp 1-344
Jung, D.W. and Hanson, J.B. (1973) Biochim. Biophys. Acta, 325, 189
Jung, F., Meyer, H.H.D. and Hamm, R.T. (1989) J . Agric. Food Chern., 37, 1183
Karnovsky, M.J. (1965) J .Cell Biol., 27, 137A
196
Kemeny, D.M. and Challacombe, S.J. (1988) Microtitre plates and other solid phase
supports In: Elisa and other solid phase immunoassays (Kemeny, D.M. and
Challacombe, S.J., eds) Wiley, Oxford, pp 31-55
Kemeny, D.M. and Chantler, S. (1988) An introduction to ELISA In: Elisa and other solid
phase immunoassays (Kemeny, D.M. and Challacombe, S.J., eds) Wiley, Oxford,
pp 1-27
Kemp, A and Slater, E.C. (1964) Biochim. Biophys. Acta, 92, 178
Kiernan, J.P. (1978) S . Afr. Med. J ., 53, 1072
Klingenberg, M. (1978) The ADP, ATP translocator in mitochondria with particular
attention to the effects of the atractylates . In: Atractyloside: Chemistry,
Biochemistry and Toxicology (Santi , R and Luciani, S., eds.)Piccin, Padova, pp
69-107
Klingenberg, M., Riccio, P. and Aquila, H. (1978) Biochim. Biophys. Acta, 503, 193
Klotz, J .L. (1982) cited by Tijssen (1985)
Knox, RB., Vithanage, H.I.M.V. and Howlett, B.J. (1980) Histochem. J ., 12, 247
Krige, E.J. (1981) In: The Social System of the Zulus, Shuter and Shooter, Pietermaritzburg,
pp297-335
Kubo, M., Nogami, H., Nishimura, H., Moriura, T. and Arichi, S . (1983) cited by
Yamahara et al . (1990)
Langone, J.J. (1978) J. Immunol., 24, 269
Langone, J.J. (1982) Adv. Immunol ., 32, 157
Lee, RW.H., Suchanek, C. and Huttner, W.B. (1984) J. Bioi. Chem., 259, 11153
Lemaigre, G., Tebbi, Z., Galinsky, R, Michowitcz, S. and Abelanet, R (1975) cited by
Georgiou et al. (1988)
197
Le Quoc, K and Le Quoc, D. (1988) Arch . Biochim. Biophys., 265 , 249
Lim, C.K (1986) Introduction to HPLC of small molecul es In: HPLC of small molecules
(Lim C.K, ed) IRL, Oxford, pp 1-12
Litman, D.J. (1985) Test strip enzyme immunoassay In : Enzyme-mediated immunoassay
(Ngo, T.T. and Lenhoff, H.M. , eds) Plenum, New York, pp 155-190
Luciani, S., Carpenedo, F. and Tarjan, E .M. (1978) Effects of atractyloside and
carboxyatractyloside in the whol e animal In: Atractyioside: Chemistry ,
Biochemistry and Toxicology (Santi, R. and Luciani , S., eds.)Piccin, Padova, pp
109-l23
Luster, M.L, Blank, J .A. and Dean, J.H . (1987) Ann. R ev . Pharmacol. Toxicol . 27, 23
Liideritz, 0., Staub, AM., and Westphal, O. (1966) Bacteriol. R ev., 30, 192
Lynn, W.S, Tweedale, A, Cloyd, M. (1988) cited by Lynn et al . (1989)
Lynn, W.S., Mathews, D., Cloyd, M., Wallwork , J.C., Thompson, A and Sachs, C. (1989)
Archives of Environmental Health ,44 , 323
L~wborg, U. (1984) In: Guide to Solid Phase Imnwno Assays , ;.June, Denmark, pp 1-38
Maberley, J. (1905) cited by Watt and Breyer-Brandwijk (1962)
Maggio, T. (1980) Introduction In: The Enzyme Immunoassay , CRC, Boca Raton, pp 1-19
Martens, M.E., Chang, C.H. and Lee, C.P. (1986) Arch. Biochim . Biophys., 244, 773
Martin, T., Stair, E.L. and Dawson, L. (1986) JAVMA., 189, 562
Matthees, D.P. and Purdy, W.C. (1979) Analytica Chimica Acta, 109, 61
McClean LW. and Nakane, P.K (1974) J . Histochem. Cytochem ., 22, 1077
Mehler, AH. (1986) Amino acid metabolism II In: Textboo/? of Biochemistry, Wevlin,
T.M., ed) Wiley, New York, p 461
198
Melek, F.R, Radwaan, A.S., Ahmed, A.A., Hamman, A.A. and Aboutabl, E.A. (1989)
Pharmazie, 44, HI0
Miller, J.B. (1959) J . Org. Chem., 24, 560
Moeremans, M., Daneels, G., Van Dijk, A. , Langanger , G. and DeMey, J . (1984) J.
Immunol. Methods, 74, 353
Moffat, D.B. (1982) Morphology of the Kidney in Relation to Nephrotoxicity In:
Nephrotoxicity - Assessment and Pathogenesis (Bach, P .H., Bonner, F.W.,
Bridges, J.W. and Lock, E.A., eds) Wiley, Chichester, pp 10-26
Moreno-Sanchez, R (1985) J. Biol. Chem., 260, 4028
Moseley, M.J., Sawminat, R and Morgan, B. (1981) Arch. Intern. Med., 141, 438
Nakane, P.K. and Pierce, G.B. (1967) J. Cell. Biol., 33, 307
Nakaya, T., Tomomoto, T. and Imoto, M. (1967 ) Bull. Chem. Soc. Jpn., 40,691
Nel, J.P. (1989) Dept. Forensic Medicine , University of Natal, Durban. Personal
communication
Netter, F.M. (1979) In: The CIBA Collection of Medical Illustrations, Vol. 3, The Digestive
System, ClBA, New York, p 64, 90-91
Newmarket Horse Forensic Laboratory (1989) Newmarket, England. Personal
communication
Nicholls, D.G. (1978) Biochem. J., 176,463
Nicholls, D.G. (1982) In: Bioenergetics . An Introduction to the Chemiosmotic Theory,
Academic Press, London, p 177
Nicholls, D.G. and Akerman, K. (1982) Biochim. Biophys. Act.a , 683, 57
Nicholls, D.G. and Crompton, M. (1980) FEBS. Lett. 111 , 261
199
Nicholls, D.G. and Scott, LD . (1980) Biochem. J., 186, 833
Nimura, N. and llinoshita, T. (1980) Anal. Lett ., 13, 191
Ohtani, K, Kawamura, O. and Ueno, Y. (1988) Toxicon, 26, 1107
Oreskes,L and Singer, J .M. (1961) J. Immunol ., 86, 338
Ormstad, K (1982) The use of isolated kidney cells, glomeruli and subcellular fractions
for assessing renal function In: Nephrotoxicity - Assessment and Pathogenesis
(Bach, P.H., Bonner, F.W., Bridges, J.W. and Lock, E .A., eds) Wiley, Chichester,
pp 161-168
Palmer, E. (1985) In: The South African Herbal , Tafelberg, Cape Town, p 139
Pegel, K. H., (1981) Chem. Eng. News, 59, 4
Petrusz, P. (1983) J. Histochem. Cytochem., 31, 177
Piozzi, F . (1978) The chemistry of atractyloside In : Atra cty loside : Chemistry,
Biochemistry and Toxicology (Santi, R. and Luciani , S ., eds.) Piccin, Padova, pp
13-32
Piscator, M. (1989) Toxicol. Lett., 46, 197
Pocchiari, F. and Silano, V. (1968) Biochem. J., 107, 305
Polak, J.M. and Van Noorden, S. (1987) In : An Introduction to Immunocytochemistry :
Current Techniq ues and Problems. , Oxford Press, Oxford, pp 2-7
Polson, A., Coetzer, T.H.T., Kruger, J. , von Maltzahn, E . and van der Merwe , J .K. (1985)
Immunol. Invest ., 14, 323
Ragelis, E.P. (1985) J. Ass. Analyt. Chem., 68, 252
Richter, H. and Spiteller, G. (1978) Chem. Be,.. , 111, 3506
200
Roitt, I.M. (1988) In: Essential Immunology, 6th Ed., Blackwell, Oxford, pp321-325
Rosenfeld, RG and Liebhaber, M.l. (1976) cited by Martens et. al . (1986)
Roxe, D.M. (1975) Rational drug therapy, 9, 1
Sandborn, E.B. (1970) In: Cells and Tissues by Light and Electron Microscopy, Volume II,
Academic Press, New York, pp 134-156
Santi, R. (1958) Nature, 182, 257
Santi, R (1964) J. Pharm. Pharmacol., 16, 437
Santi, R and Luciani, S. (1978) Introduction In: Atractyloside: Chemistry, Biochemistry
and Toxicology (Santi, R and Luciani , S., eds.)Piccin, Padova, pp IX-XI
Schteingart, C.D. and Pomilio, A.B. (1984) J. Nat. Prod., 47, 1046
Seedat, Y.K. and Hitchcock, P.J. (1971) S. A. Med. J., 45, 832
Shotwell, O.L., Stoldola, F.H., Michael, W.R, Lindenfelser. L.A., Dworschack, RG. and
Pridham, T.G. (1958) J. Am. Chem. Soc., 80,3912
Silbernagl, S., Pfaller, W., Heinle, H., Wendal, A. (1978) Topology and function of renal
'Y-glutamyl transpeptidase In: Functions of Glutathione in Liver and Kidney (Sies,
H. and Wendel, A., eds) Springer, Berlin, pp 60-69
Smith, J.H. and Hook, J.B. (1982) ExperimentalNephrotoxic-ity in uivo In: Nephrotoxicity
- Assessment and Pathogenesis (Bach, P.H., Bonner, F.W., Bridges, J.W. and
Lock, E.A., eds) Wiley, Chichester, pp 117-127
Snyder, L.R, Glajch, J.L. and Kirkland, J.J. (1981) J . Chrom., 218, 299
Sokolove, P.M., Westphal, P.A., Kester, M.B., Wierwille, R and Sikora-van Meter, K.
(1989) Biochim. Biophys. Acta, 983, 15
Sossountzov, L.,Maldiney, R, Sotta, B., Sabbagh, 1., Habricot, Y., Bonnet, M. and
Miginiac, E. (1988) Planta, 175, 291
201
Stahl, E . (1969) In: Thin Layer Chromatography, Springer-Verlag, Berlin, p 857
Standefer, J.C. (1985) Separation-required (heterogeneou s) enzyme immunoassay for
haptens and antigens In: En zy me-Mediated Immunoassay (Ngo, T.T. and
Lenhoff, H.M., eds) Plenum, New York, pp 203-222
Stanislas, E. and Vignais, P .M. (1964) C.R. Acad. Sci., 259, 4872
Starko, K.M., Ray, C.G., Dominguez, L.B., Stromberg, W.L. and Woodall, D.F. (1980)
cited by Martens et al . (1986)
Steyn, D.G. (1949) In: Vergiftig Van Mens en Dier, Van Schaik, Pretoria, pp 184-189
Stuart, B.P., Cole, RJ. and Gosser, H.S. (1981) Vet. Pathol. , 18, 368
Takahashi, N., Yamaguchi, I. and Hisakazu, Y. (1986) Gibberillins In : The Chemistry of
Plant Hormones (Takahashi, N., ed.) CRC, Boca Raton , pp 57-151
Thayer, W.S. (1990) Biotransformation In : Basic Pharmacology in Medicine, 3rd Ed.,
(DiPalma, J.R and DiGregorio, G.J., eds) MacGraw-Hill, New York, pp 52-61
Theron, J.J. (1979) In: Die ultrastruktuur van die sel, Butterworth , Durban, pp 101-120
T!lUrman, G. (1989) Biomedical Resource Centre, University of Durban-Westville.
Personal communication
Tietz, N.W. (1976) In : Fundamentals of Clinical Chemistry , Saunders, Philadelphia, p
982
Tijssen, P. (1985) In: Practice and Theory of Immunoassays, El sevier, Amsterdam, pp 1-
421
Ungar, F. (1986) Biochemistry of Hormones II . Peptide hormones In : Textbook of
Biochemistry, (Devlin, T.M., ed) Wiley, New York, pp 601-604
Urbanek, R, Kemeny, D.M. and Samuel, D. (1985) J. bnmunol. Methods , 79, 123
202
Van Weemen, B.K and Schuurs, A.H.W.M. (1971) FEBS. Lett., 15,232
Vercesi, AE. (1984) Biochim. Biophys. Res. Commun. , 119,305
Vickery, M.L. and Vickery, B. (1981) In: Secondary Plant l'1{etabolism, MacMillan , Hong
Kong, pp 125-127
Vignais, P.M , Vignais, P.V. and Defaye, G. (1978) Structure activity relation ship of
atractyloside and diterpenoid derivatives on oxidative phosphorylation and
adenine nucleotide translocation in mitochondria. In: Atractyloside: Chemistry,
Biochemistry a.nd Toxicology (Santi , R. and Luciani , S., eds.)Piccin, Padova, pp
39-68
Vignais, P .V , Vignais, P .M. and Stanislas, E. (1962) Biochim. Biophys. Acta., 60, 284
Wahlund, K-G. (1975) J. Chromatog., 115, 411
Wainwright, J ., Schonland, M.M. and Candy, H.A (1977) S.A. Med. J . , 52,313
Watabe, S., Sato, Y., Nakaya, M., Hashimoto, K., Enomoto, A, Kamanogawa, S. and
Yamaguchi, K. (1989) Toxicon, 27,265
Watt, J.M. and Breyer-Brandwijk, M.G. (1962) In : The Medicina.l and Poisonous Plants
of Southern and Ea.st Africa, Livingstone, Edinburgh, p 208
Weiler, E.W. (1981) Planta., 153, 319
Weiler, E.W. (1986) Plant hormone immuoassays based on monoclonal and polyclonal
antibodies In: Immunology in Plant Sciences (Lin skens, H.F. and Jackson , J.F .,
eds) Springer-Verlag, Berlin, p 11
Weiler, E.W. and Weiczorek, U. (1981) Planta, 152, 159
Weir, D.M. (1984) In: Immunology, 5th Ed. , Churchill Livingston e, Edinburgh, pp 36-103
West, D.W. and Clegg, R.A (1984) Biochem. J ., 219, 181
203
Wilkes, M. (1990) Robens Institute for Industrial and Environmental Health and Safety,
University of Surrey, Guildford , Surrey. Personal communication
Woodard, L.F. (1989) Laboratory Animal Science, 39, 222
Yahara, S., Higashi, T., Iwaki , K. , Nohal'a, T., Marubaya'5hi , N., Ueda, 1., Kohda, M.,
Goto, K., Izumi, H., Nuno, M., Katsuki, S. , Isoda , S. and Satake, M. (1989) Chem .
Pharm. Bull., 37, 2995
Yamahara, J., Matsuda, H., Huang, Q., Li , Y. and Fujimura, H. (1990) J. Ethnopharm.,
29,341
Yamahara, J., Matsuda, H., Kobayashi , M., Sawada, T. and Fujimura, M. (1983) cited by
Yamahara et al. (1990)
Zalman, L.S., Nikaido, H. and Kagawa, Y. (1980) J . BioI. Chent. , 255 , 1771
204
PUBLICATIONS
Appendix A:
Bye, S.N., Coetzer, T.R.T. and Dutton, M.F. (1990) An Enzyme Immunoassay for Atractyloside,
the Nephrotoxin of Callilepis laureola (lmpila) Taxieon, 28, 997
AppendixB:
Bye, S.N. and Dutton, M.F. (1991) The inappropriate use of Traditional medicines In South
Africa, Jnl . Ethnopharm, 34, 253
AppedixC:
Dehrmann, F.M., Bye, S.N. and Dutton, M.F. (1991) The isolation of a storage organelle of
atractyloside in Ca11ilepis laureola, Jnl. Ethnopharm, 34, 247
Submitted:
Thompson, M.C., Dutton, M.F., Bye, S.N . and Dehrmann, F.M. (1991) An investigation into the
passage of selected natural toxins across the digestive tract wall using the everted sac technique,
Journal of Natural Toxins -submitted
In preparation:
Bye, S.N., Berry, R.K., Anderson, T.R. and Dutton, M.F.
The RPLC determination of atractyloside in body fluids
Bye, S.N., Kruger, F., Thurman, G.D. and Dutton, M.F.
An improved method for the production of antibodies to atractyloside using a Salmonella
minnesota carrier
Bye, S.N. and Dutton, M.F.
The detection of atractyloside in body fluids using ELISA
Bye, S.N., Delacruz, L., Moret, M. and Bach, P .R.
An investigation into the effect of atractyloside on kidney morphology and the appearance of
urinary markers
Bye, S.N., Dehrmann, F., Elliott, E. and Dutton, M.F.
The immunocytochemical localisation of atractyloside in rat tissue
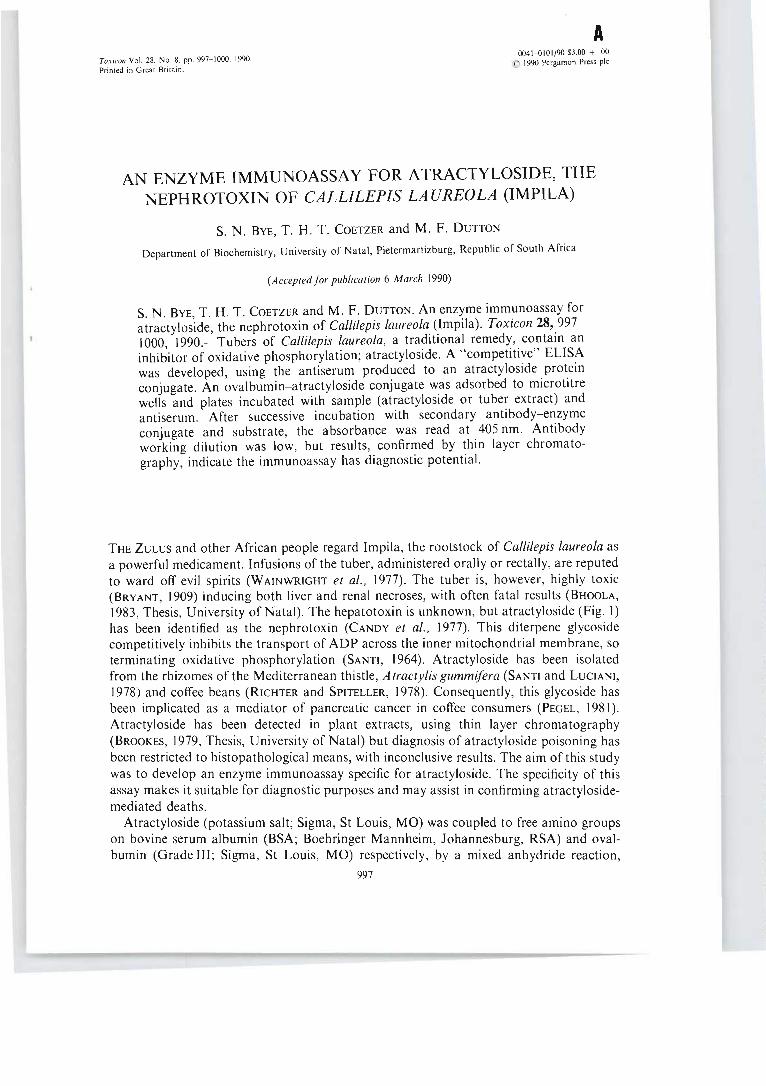
A Toxicoll Vol. 28, No.8, pp. 997- 1000, 1990. Printed in Great Britain.
0041-0101/90 $3.00 + .00 © 1990 Pergamon Press pIc
AN ENZYME IMMUNOASSAY FOR ATRACTYLOSIDE, THE NEPHROTOXIN OF CALLILEPIS LAUREOLA (lMPILA)
S, N, BYE, T. H, T. COETZER and M, F, DUTTON
Department of Biochemistry, University of Natal , Pietermartizburg, Republic of South Africa
(Acceptedfor publication 6 March 1990)
S. N . BYE, T. H. T . COETZER and M. F . DUTTON. An enzyme immunoassay for atractyloside, the nephrotoxin of Callilepis laureola. <.Impila). Toxicon 28,.997-1000 1990.-Tubers of Callilepis laureola , a traditional remedy, contain an inhibitor of oxidative phosphorylation; atractyloside. A " competitive" ELISA was developed, using the antiserum produced to an atractyloside-:-pro~ein conjugate. An ovalbumin- atractyloside conjugate was adsorbed to mlcrotltre wells and plates incubated with sample (atractyloside or tuber extract) and antiserum. After successive incubation with secondary antibody-enzyme conjugate and substrate, the absorbance was read at 405 nm. Antibody working dilution was low, but results, confirmed by thin layer chromatography, indicate the immunoassay has diagnostic potential.
THE ZULUS and other African people regard Impila, the rootstock of Callilepis laureola as a powerful medicament. Infusions of the tuber, administered orally or rectally, are reputed to ward off evil spirits (WAINWRIGHT et al., 1977). The tuber is, however, highly toxic (BRYANT, 1909) inducing both liver and renal necroses, with often fatal results (BHOOLA, 1983, Thesis, University of Natal). The hepatotoxin is unknown, but atractyloside (Fig. I) has been identified as the nephrotoxin (CANDY et ai., 1977). This diterpene glycoside competitively inhibits the transport of ADP across the inner mitochondrial membrane, so terminating oxidative phosphorylation (SANTI, 1964). Atractyloside has been isolated from the rhizomes of the Mediterranean thistle, Atractylis gummifera (SANTI and LUCIANI, 1978) and coffee beans (RICHTER and SPITELLER, 1978). Consequently, this glycoside has been implicated as a mediator of pancreatic cancer in coffee consumers (PEGEL, 1981). Atractyloside has been detected in plant extracts, using thin layer chromatography (BROOKES, 1979, Thesis, University of Natal) but diagnosis of atractyloside poisoning has been restricted to histopathological means, with inconclusive results. The aim of this study was to develop an enzyme immunoassay specific for atractyloside. The specificity of this assay makes it suitable for diagnostic purposes and may assist in confirming atractylosidemediated deaths.
Atractyloside (potassium salt; Sigma, St Louis, MO) was coupled to free amino groups on bovine serum albumin (BSA; Boehringer Mannheim, Johannesburg, RSA) and ovalbumin (Grade III; Sigma, St Louis, MO) respectively, by a mixed anhydride reaction,
997
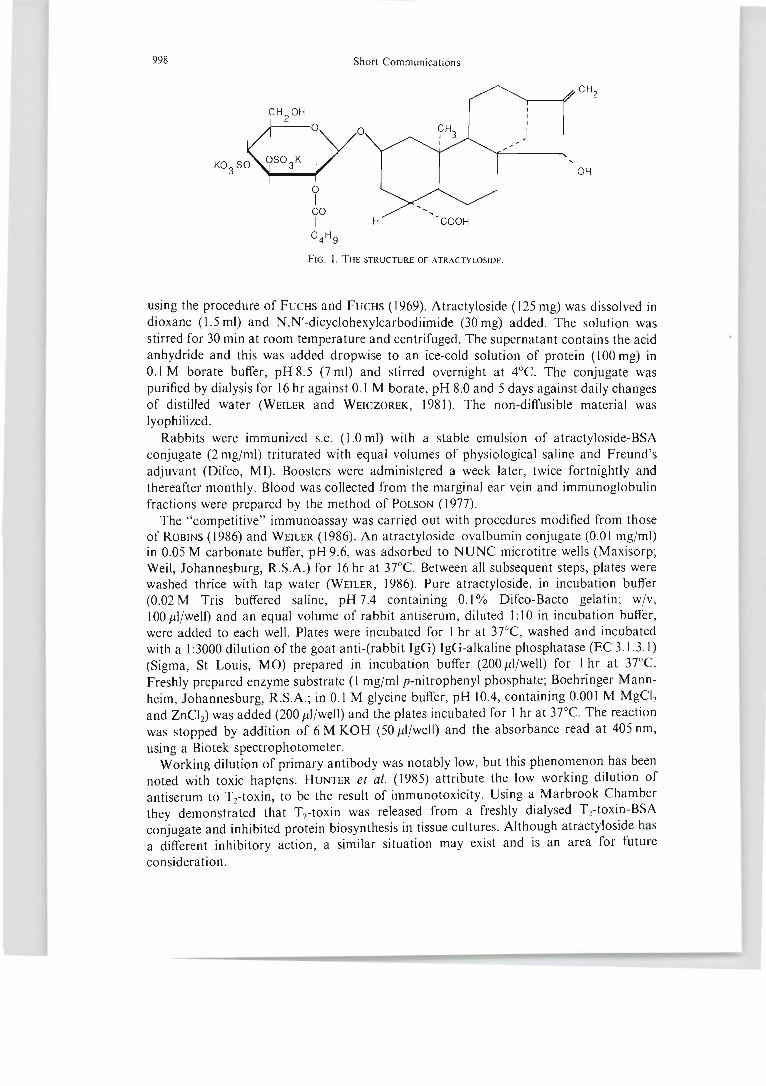
998 Short Communications
I
-'
OH
FIG . I. THE STRUCTURE OF ATRACTYLOSIDE.
using the procedure of FUCHS and FUCHS (1969). Atractyloside (125 mg) was dissolved in dioxane (1.5 ml) and N,N'-dicyclohexylcarbodiimide (30 mg) added. The solution was stirred for 30 min at room temperature and centrifuged. The supernatant contains the acid anhydride and this was added dropwise to an ice-cold solution of protein (100 mg) in 0.1 M borate buffer, pH 8.5 (7 ml) and stirred overnight at 4°C. The conjugate was purified by dialysis for 16 hr against 0.1 M borate, pH 8.0 and 5 days against daily changes of distilled water (WEILER and WEICZOREK, 1981). The non-diffusible material was lyophilized .
Rabbits were immunized s.c. (1.0 m!) with a stable emulsion of atractyloside-BSA conjugate (2 mg/ml) triturated with equal volumes of physiological saline and Freund's adjuvant (Difco, MI). Boosters were administered a week later, twice fortnightly and thereafter monthly. Blood was collected from the marginal ear vein and immunoglobulin fractions were prepared by the method of POLSON (1977).
The " competitive" immunoassay was carried out with procedures modified from those of ROBINS (1986) and WEILER (1986). An atractyloside- ovalbumin conjugate (0.01 mg/ml) in 0.05 M carbonate buffer, pH 9.6, was adsorbed to NUNC microtitre wells (Maxisorp; Weil, Johannesburg, R.S.A.) for 16 hr at 37°C. Between all subsequent steps, plates were washed thrice with tap water (WEILER, 1986). Pure atractyloside, in incubation buffer (0.02 M Tris buffered saline, pH 7.4 containing 0.1 % Difco-Bacto gelatin; w/v, 100 J.tI/well) and an equal volume of rabbit antiserum, diluted I: lOin incubation buffer, were added to each well . Plates were incubated for I hr at 37°C, washed and incubated with a I :3000 dilution of the goat anti-(rabbit JgG) IgG-alkaline phosphatase (EC 3.1.3.1) (Sigma, St Louis, MO) prepared in incubation buffer (200 Ill/well) for I hr at 37°C. Freshly prepared enzyme substrate (I mg/ml p-nitrophenyl phosphate; Boehringer Mannheim, Johannesburg, R .S.A.; in 0.1 M glycine buffer, pH 10.4, containing 0.00 I M MgCI2 and ZnCI2) was added (200 Ill /well) and the plates incubated for 1 hr at 37°C . The reaction was stopped by addition of 6 M KOH (50 Ill /well) and the absorbance read at 405 nm, using a Biotek spectrophotometer.
Working dilution of primary antibody was notably low, but this phenomenon has been noted with toxic haptens. HUNTER et al. (1985) attribute the low working dilution of antiserum to T2-toxin, to be the result of immunotoxicity. Using a Marbrook Chamber they demonstrated that Tz-toxin was released from a freshly dialysed T2-toxin-BSA conjugate and inhibited protein biosynthesis in tissue cultures. Although atractyloside has a different inhibitory action, a similar situation may exist and is an area for future
consideration.
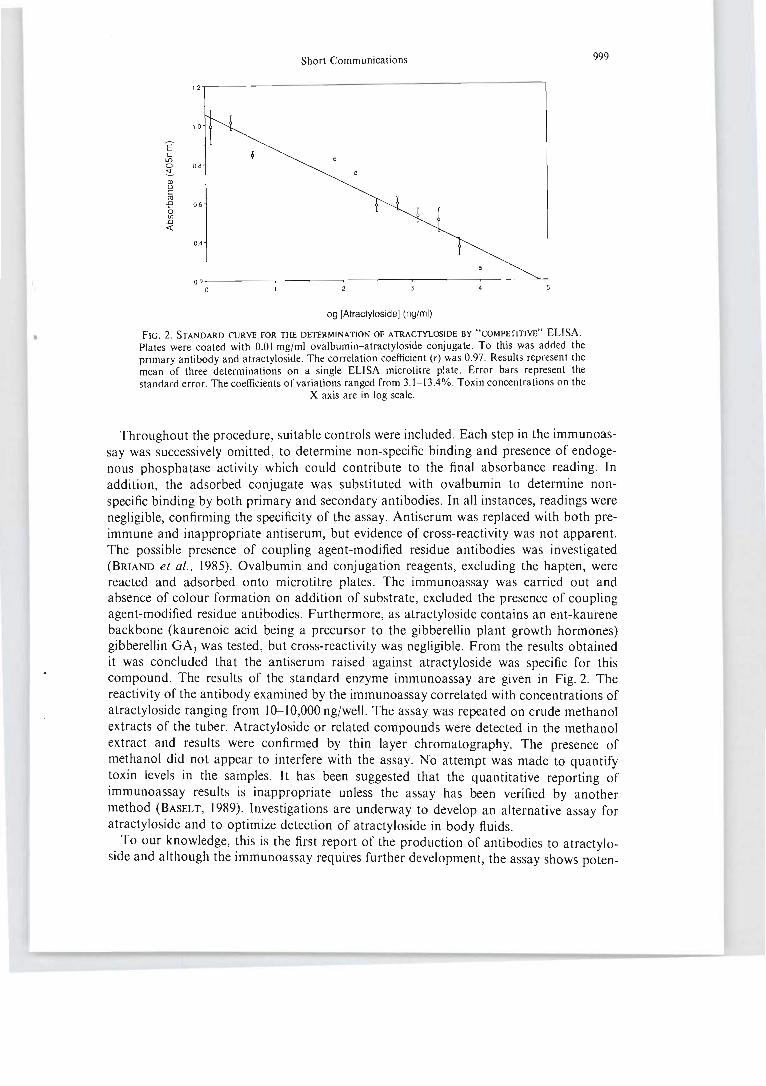
Short Communications
1.2
1.0
E c::
II") 0 O.S ~ OJ (J c:: ro .0 0.6 (; Ul .0 ~
0.4
0.2 0
log [Atractylosidej (ng/ml)
FIG. 2. STANDARD CURVE FOR THE DETERMINATION OF ATRACTYLOSlDE BY "COMPETITIVE" ELISA.
Plates were coated with 0.01 mg/ml ovalbumin- atractyloside conjugate. To this was added the primary antibody and atractyloside. The correlation coefficient (r) was 0.97. Results represent the mean of three determinations on a single ELISA microtitre plate. Error bars represent the standard error. The coefficients of variations ranged from 3.1 - 13.4%. Toxin concentrations on the
X axis are in log scale.
999
Throughout the procedure, suitable controls were included. Each step in the immunoassay was successively omitted, to determine non-specific binding and presence of endogenous phosphatase activity which could contribute to the final absorbance reading. In addition, the adsorbed conjugate was substituted with ovalbumin to determine nonspecific binding by both primary and secondary antibodies. In all instances, readings were negligible, confirming the specificity of the assay. Antiserum was replaced with both preimmune and inappropriate antiserum, but evidence of cross-reactivity was not apparent. The possible presence of coupling agent-modified residue antibodies was investigated (BRIAND et aI. , 1985). Ovalbumin and conjugation reagents, excluding the hapten, were reacted and adsorbed onto microtitre plates. The immunoassay was carried out and absence of colour formation on addition of substrate, excluded the presence of coupling agent-modified residue antibodies. Furthermore, as atractyloside contains an ent-kaurene backbone (kaurenoic acid being a precursor to the gibberellin plant growth hormones) gibberellin GA3 was tested, but cross-reactivity was negligible. From the results obtained it was concluded that the antiserum raised against atractyloside was specific for this compound. The results of the standard enzyme immunoassay are given in Fig. 2. The reactivity of the antibody examined by the immunoassay correlated with concentrations of atractyloside ranging from 10-10,000 ng/well. The assay was repeated on crude methanol extracts of the tuber. Atractyloside or related compounds were detected in the methanol extract and results were confirmed by thin layer chromatography. The presence of methanol did not appear to interfere with the assay. No attempt was made to quantify toxin levels in the samples. It has been suggested that the quantitative reporting of immunoassay results is inappropriate unless the assay has been verified by another method (BASEL T, 1989). Investigations are underway to develop an alternative assay for atractyloside and to optimize detection of atractyloside in body fluids.
To our knowledge, this is the first report of the production of antibodies to atractyloside and although the immunoassay requires further development, the assay shows poten-
1000 Short Communications
tial for diagnostic purposes and immunocytochemical investigations. The latter should reveal sites of storage of toxin in the tuber and the pathophysiology of the glycoside in humans.
Acknowledgements-The authors thank Mr R. K. BERRY, Mr L. JACKSON and STEVE WOZNIAK for their advice and assistance.
REFERENCES
BASELT, R. C. (1989) Inappropriate use of immunoassays as a quantitative tool. J. Analyt. Toxic. 13, I. BRIAND, J. P. , MULLER, J. and VAN REGENMORTEL, H. M. V. (1985) Synthetic pep tides as antigens: pitfalls of
conjugation methods. J. Immunol. Methods 78, 59-69. BRYANT, A. T. (1909) Zulu medicine and medicine-men. Ann. Natal Mus. 2, 1- 103. CANDY, H. A., PEGEL, K. H. , BROOKES, B. and RODWELL, H. (1977) The occurrence of atractyloside in Callilepis
laureola. Phytochem. 16, 1308- 1309. CONTESSA, A. R. and FASSINA, G. (1978) Pharmacognosy of Atractylis gummifera L. In: Atroctyloside: Chemistry,
Biochemistry and Toxicology, pp. 1- 12 (SANTI, R. and LUCIANI, S., Eds). Padova: Piccin. FUCHS, S. and FUCHS, Y. (1969) Immunological assay for plant hormones using specific antibodies to
indoleacetic acid and gibberellic acid. Biochim. biophys. Acta 18, 384-530. HUNTER, K. W., BRIMFIELD, A. A. , MILLER, M., FINKELMAN, F. D. and CHU, S. F. (1985) Preparation and
characterization of monoclonal antibodies to the Tricothecene mycotoxin, T,. Appli. En vir. Microbiol. 49, 168- 172.
POLSON, A. (1977) A theory for the displacement of proteins and viruses with polyethylene glycol. Prep. Biochem. 7, 129- 154.
PEGEL, K. H. (1981) Coffee's link to cancer. Chem. Engng News 59, 4. RICHTER, H. and SPITELLER, G. (1978) Uber ein neues Atractyligenin Glycosid griinen Kaffee-bohnen. Chem.
Ber. 111, 3506--3509. ROBINS, R. J. (1986) Measurement of low molecular weight, non-immunogenic compounds by immunoassay. In:
Immunology in Plant Sciences, pp. 86--141 (LINSKENS, H. F. and JACKSON, J. F., Eds). Berlin: Springer. SANTI, R. (1964) Pharmacological properties and mechanisms of action of atractyloside. J. Pharm. Pharmacol.
16, 437-438 . SANTI, R. and LUCIANI, S. (1978) Introduction In: Atractyloside: Chemistry, Biochemistry and Toxicology
pp. 9-22 (SANTI, R. and LUCIANI, S., Eds). Padova: Piccin. WAINWRIGHT, J., SCHONLAND, M. M. and CANDY, M. A. (1977) Toxicity of Callilepis laureola. S.A. Med. J. 52,
313- 315. WEILER, E. W. (1986) Plant hormone assays based on monoclonal and polyclonal antibodies. In: Immunology in
Plant Sciences, pp. 1- 17 (LINSKENS, H. F. and JACKSON, J. F., Eds). Berlin: Springer. . .. . WEILER, E. W. and WEICZOREK, U. (1981) Determination of femtomol quantities of gibberellIc aCid by radIO
immunoassay. Planta 152, 159- 167.
Journal of Ethnopharmacology. 34 (1991) 253- 259 Elsevier Scientific Publishers Ireland Ltd.
B 253
The inappropriate use of traditional medicines in South Africa
S.N. Bye and M.F. Dutton
Department of Biochemistry. University of Natal. P.o. BiJx 375. Pietermaril;burg 3200 (Soulh Africa )
(Accepted May 29, 1991)
Traditional medicines are culturally very important to the Zulu population of Southern Africa. The inappropriate use of herbs has
however, resulted in numerous fatalities , invariably in children. This paper briefly summarises the belief of the Zulu population in traditional remedies, together with an outline of the problems at present being experienced in South Africa. A further note on the personal impressions and experiences of the authors and description of one such toxic herbal remedy, including use, toxic action and
research carried out to date , are also given.
Key words: herbalism; Zulu medicine; atractyloside, nephrotoxin.
Introduction
Western ideology has largely underestimated the inordinate belief in traditional medicines by many people, particularly those from developing countries. The reliance of the Zulu population on traditional remedies is no exception (Wainwright et aI., 1977; Ellis, 1986).
Geographically, the Zulus are concentrated in the north-east of South Africa, namely the Natal/KwaZulu region. Culturally, the Zulus believe disease to be a manifestation of disharmony between a person and the ancestors (Bryant, 1909). Sorcery and medicine are hence intrinsically linked and it is the function of the traditional healer, regarded as the protector of society, to act as diagnostician, apothecary and diviner (Krige, 1981).
The Isangoma, or diviner, is the diagnostician and augur of society and consults with the spirits to identify the source of an affliction. The herbalist, or Inyanga, claims no affiliation to the spirits, however, but functions as an apothecary,
Correspondence to: S.N. Bye, Department of Biochemistry, University of Natal, P.O. Box 375, Pietermaritzburg 3200, South Africa.
0378·8741 /$03.50 © 1991 Elsevier Scientific Publishers Ireland Ltd. Published and Printed in Ireland
preparing and dispensing various herbal remedies (Kiernan, 1978). Conceivably, the link between magic and medicine has resulted in two distinct categories of traditional medicine. White medicine (Umuthi omhlophe) is used for the amelioration of physical afflictions, while black medicine (Umuthi omynama) is thought to exorcise evil spirits (Krige, 1981).
Despite the westernization of the Zulus through urbanization and education, the belief in traditional remedies and healers remains firm. A dire shortage of western doctors in the rural areas, estimated in 1982 to be in the ratio of one medical practitioner for every 17,500 people (Savage, 1985) has forced rural inhabitants to consult with traditional healers, if not by choice, then certainly by necessity. With the exponential population growth rate, the demand for traditional remedies is increasing at an insatiable rate, placing severe strain on already depleted natural resources (Cunningham, 1988).
Efforts are in progress to rationalise conservation policies regarding the gathering of herbs for medicinal purposes. Such local organizations as the KwaZulu Bureau of Natural Resources, Natal Parks Board, and the Durban Municipality, in conjunction with the Institute of Natural
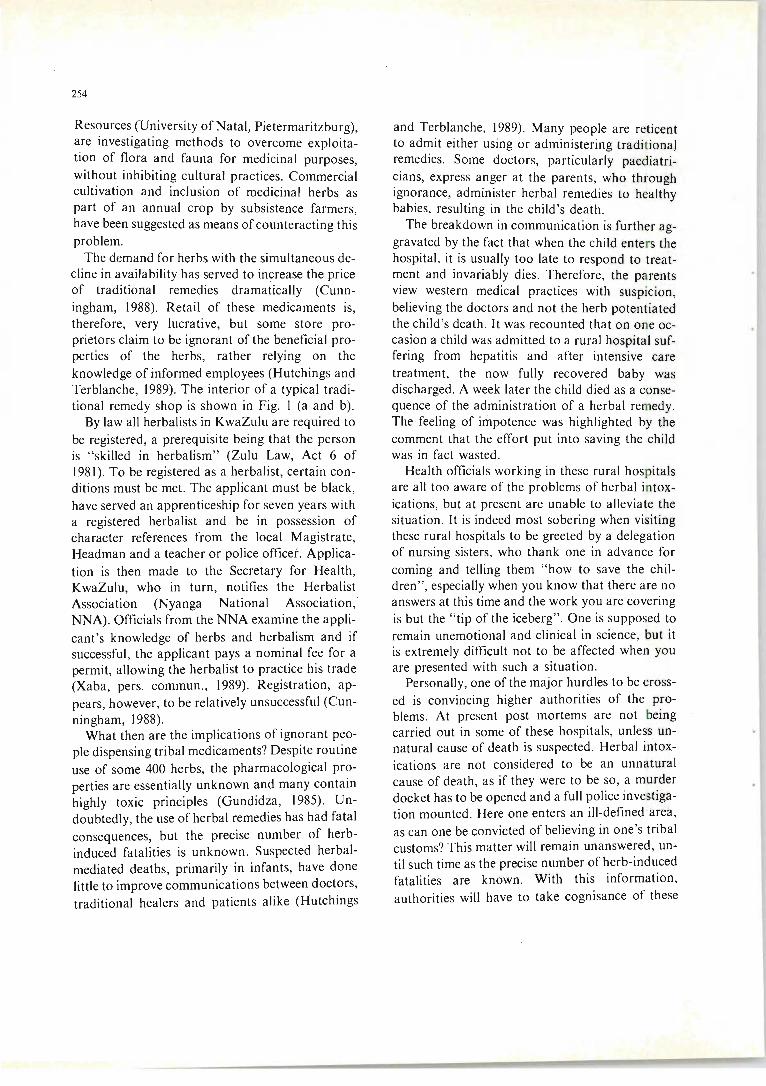
254
Resources (University of Natal, Pietermaritzburg), are investigating methods to overcome exploitation of flora and fauna for medicinal purposes, without inhibiting cultural practices. Commercial cultivation and inclusion of medicinal herbs as part of an annual crop by subsistence farmers, have been suggested as means of counteracting this problem.
The demand for herbs with the simultaneous decline in availability has served to increase the price of traditional remedies dramatically (Cunningham, 1988). Retail of these medicaments is, therefore, very lucrative, but some store proprietors claim to be ignorant of the beneficial properties of the herbs, rather relying on the knowledge of informed employees (Hutchings and Terblanche, 1989). The interior of a typical traditional remedy shop is shown in Fig. I (a and b).
By law all herbalists in KwaZulu are required to be registered, a prerequisite being that the person is "skilled in herbalism" (Zulu Law, Act 6 of 1981). To be registered as a herbalist, certain conditions must be met. The applicant must be black, have served an apprenticeship for seven years with a registered herbalist and be in possession of character references from the local Magistrate, Headman and a teacher or police officer. Application is then made to the Secretary for Health, KwaZulu, who in turn, notifies the Herbalist Association (Nyanga National Association,· NNA). Officials from the NNA examine the applicant's knowledge of herbs and herbalism and if successful, the applicant pays a nominal fee for a permit, allowing the herbalist to practice his trade (Xaba, pers. commun., 1989). Registration, appears, however, to be relatively unsuccessful (Cunningham, 1988).
What then are the implications of ignorant people dispensing tribal medicaments? Despite routine use of some 400 herbs, the pharmacological properties are essentially unknown and many contain highly toxic principles (Gundidza, 1985). Undoubtedly, the use of herbal remedies has had fatal consequences, but the precise number of herbinduced fatalities is unknown. Suspected herbalmediated deaths, primarily in infants, have done little to improve communications between doctors, traditional healers and patients alike (Hutchings
and Terblanche, 1989). Many people are reticent to admit either using or administering traditional remedies. Some doctors, particularly paediatricians, express anger at the parents, who through ignorance, administer herbal remedies to healthy babies, resulting in the child's death .
The breakdown in communication is further aggravated by the fact that when the child enters the hospital , it is usually too late to respond to trea"tment and invariably dies. Therefore, the parents view western medical practices with suspicion, believing the doctors and not the herb potentiated the child 's death. It was recounted that on one occasion a child was admitted to a rural hospital suffering from hepatitis and after intensive care treatment, the now fully recovered baby was discharged. A week later the child died as a consequence of the administration of a herbal remedy. The feeling of impotence was highlighted by the comment that the effort put into saving the child was in fact wasted.
Health officials working in these rural hospitals are all too aware of the problems of herbal intoxications, but at present are unable to alleviate the situation. It is indeed most sobering when visiting these rural hospitals to be greeted by a delegation of nursing sisters, who thank one in advance for coming and telling them " how to save the children", especially when you know that there are no answers at this time and the work you are covering is but the " tip of the iceberg". One is supposed to remain unemotional and clinical in science, but it is extremely difficult not to be affected when you are presented with such a situation.
Personally, one of the major hurdles to be crossed is convincing higher authorities of the problems. At present post mortems are not being carried out in some of these hospitals, unless unnatural cause of death is suspected. Herbal intoxications are not considered to be an unnatural cause of death, as if they were to be so, a murder docket has to be opened and a full police investigation mounted. Here one enters an ill-defined area, as can one be convicted of believing in one's tribal customs? This matter will remain unanswered, until such time as the precise number of herb-induced fatalities are known. With this information, authorities will have to take cognisance of these
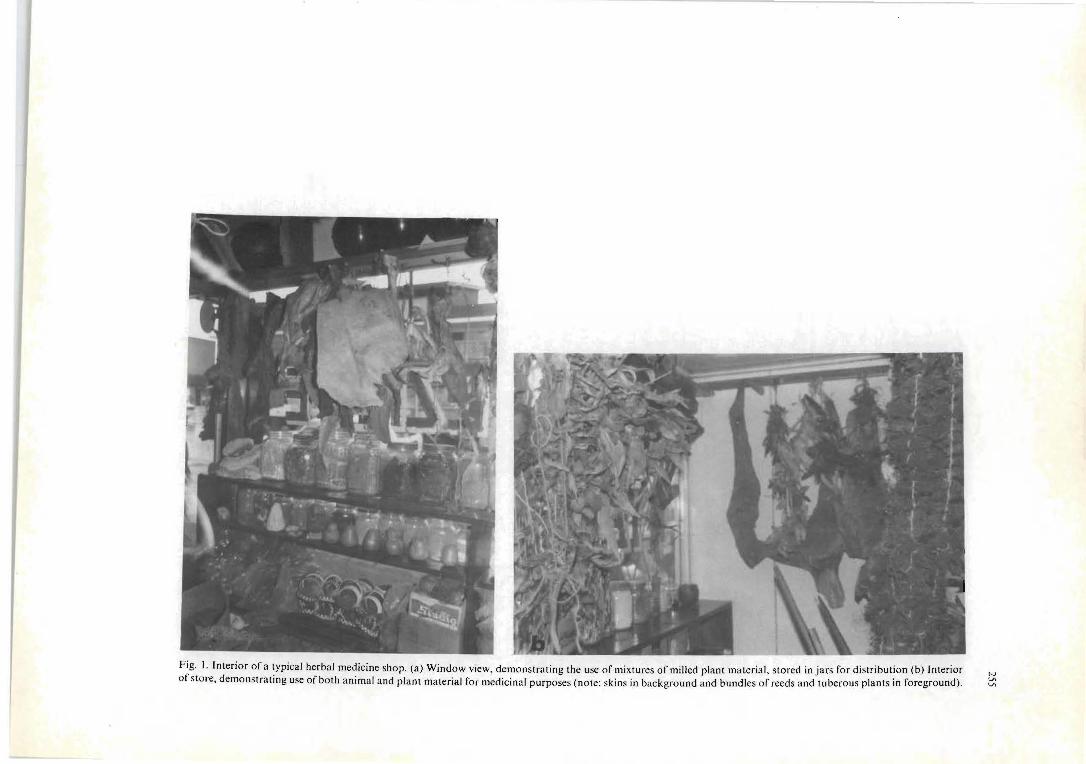
Fig. I. Interior of a typical herbal medicine shop. (a) Window view, demonstrating the use of mixtures of milled plant material , stored in jars for distribution (b) Interior of store, demonstrating use of both animal and plant material for medicinal purposes (note: skins in background and bundles of reeds and tuberous plants in foreground) .
N V> V>
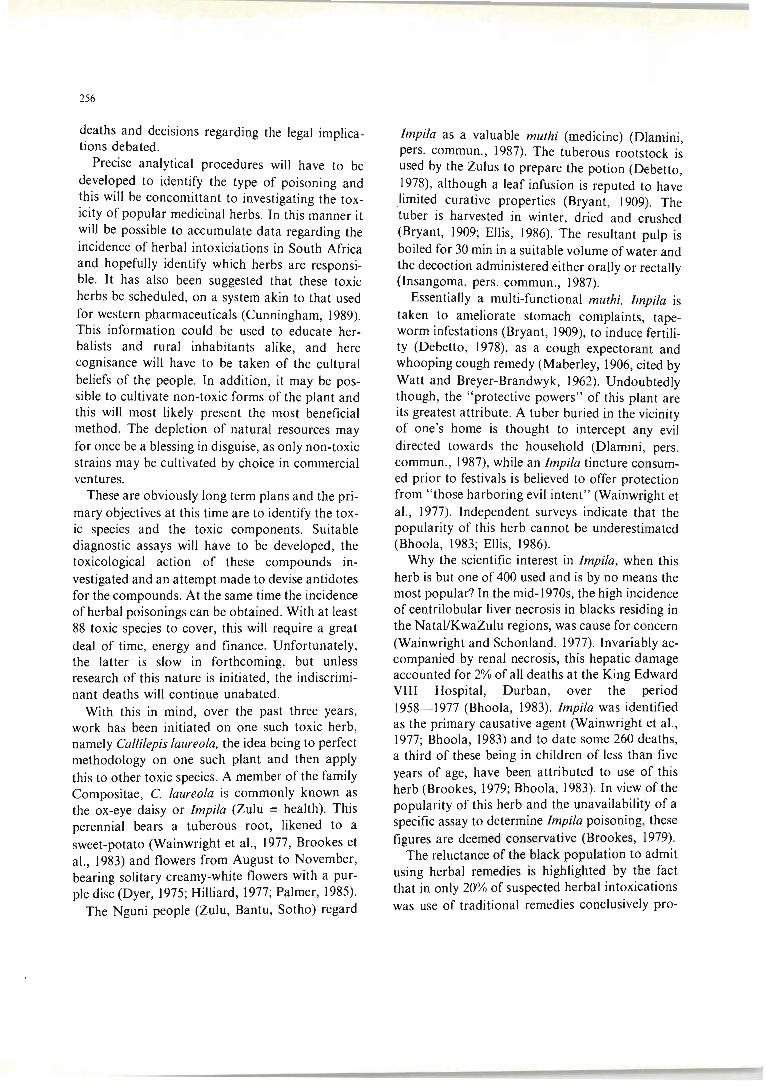
256
deaths and decisions regarding the legal implications debated.
Precise analytical procedures will have to be developed to identify the type of poisoning and this will be concomittant to investigating the toxicity of popular medicinal herbs. In this manner it will be possible to accumulate data regarding the incidence of herbal intoxiciations in South Africa and hopefully identify which herbs are responsible. It has also been suggested that these toxic herbs be scheduled, on a system akin to that used for western pharmaceuticals (Cunningham, 1989). This information could be used to educate herbalists and rural inhabitants alike, and here cognisance will have to be taken of the cultural beliefs of the people. In addition, it may be possible to cultivate non-toxic forms of the plant and this will most likely present the most beneficial method. The depletion of natural resources may for once be a blessing in disguise, as only non-toxic strains may be cultivated by choice in commercial ventures.
These are obviously long term plans and the primary objectives at this time are to identify the toxic species and the toxic components. Suitable diagnostic assays will have to be developed, the toxicological action of these compounds investigated and an attempt made to devise antidotes for the compounds. At the same time the incidence of herbal poisonings can be obtained. With at least 88 toxic species to cover, this will require a great deal of time, energy and finance. Unfortunately, the latter is slow in forthcoming, but unless research of this nature is initiated, the indiscriminant deaths will continue unabated.
With this in mind, over the past three years, work has been initiated on one such toxic herb, namely Callilepis laureola. the idea being to perfect methodology on one such plant and then apply this to other toxic species. A member of the family Compositae, C. laureola is commonly known as the ox-eye daisy or Impila (Zulu = health). This perennial bears a tuberous root, likened to a sweet-potato (Wainwright et aI. , 1977, Brookes et aI., 1983) and flowers from August to November, bearing solitary creamy-white flowers with a purple disc (Dyer, 1975; Hilliard, 1977; Palmer, 1985).
The Nguni people (Zulu, Bantu, Sotho) regard
Impila as a valuable muthi (medicine) (Dlamini, pers. commun. , 1987). The tuberous rootstock is used by the Zulus to prepare the potion (Debetto, 1978), although a leaf infusion is reputed to have limited curative properties (Bryant, 1909). The tuber is harvested in winter, dried and crushed (Bryant, 1909; Ellis, 1986). The resultant pulp is boiled for 30 min in a suitable volume of water and the decoction administered either orally or rectally (Insangoma, pers. commun., 1987).
Essentially a multi-functional muthi, Impila is taken to ameliorate stomach complaints, tapeworm infestations (Bryant, 1909), to induce fertility (Debetto, 1978), as a cough expectorant and whooping cough remedy (MaberJey, 1906, cited by Watt and Breyer-Brandwyk, 1962). Undoubtedly though, the " protective powers" of this plant are its greatest attribute. A tuber buried in the vicinity of one 's home is thought to intercept any evil directed towards the household (Dlamini, pers. commun., 1987), while an Impila tincture consumed prior to festivals is believed to offer protection from "those harboring evil intent" (Wainwright et aI., 1977). Independent surveys indicate that the popularity of this herb cannot be underestimated (Bhoola, 1983; Ellis, 1986).
Why the scientific interest in Impila, when this herb is but one of 400 used and is by no means the most popular? In the mid-1970s, the high incidence of centrilobular liver necrosis in blacks residing in the Natal/KwaZulu regions, was cause for concern (Wainwright and Schonland, 1977). Invariably accompanied by renal necrosis, this hepatic damage accounted for 2% of all deaths at the King Edward VIII Hospital, Durban, over the period 1958- 1977 (Bhoola, 1983). Impila was identified as the primary causative agent (Wainwright et aI. , 1977; Bhoola, 1983) and to date some 260 deaths, a third of these being in children of less than five years of age, have been attributed to use of this herb (Brookes, 1979; Bhoola, 1983). In view of the popularity of this herb and the unavailability of a specific assay to determine Impila poisoning, these figures are deemed conservative (Brookes, 1979).
The reluctance of the black population to admit using herbal remedies is highlighted' by the fact that in only 20% of suspected herbal intoxications was use of traditional remedies conclusively pro-
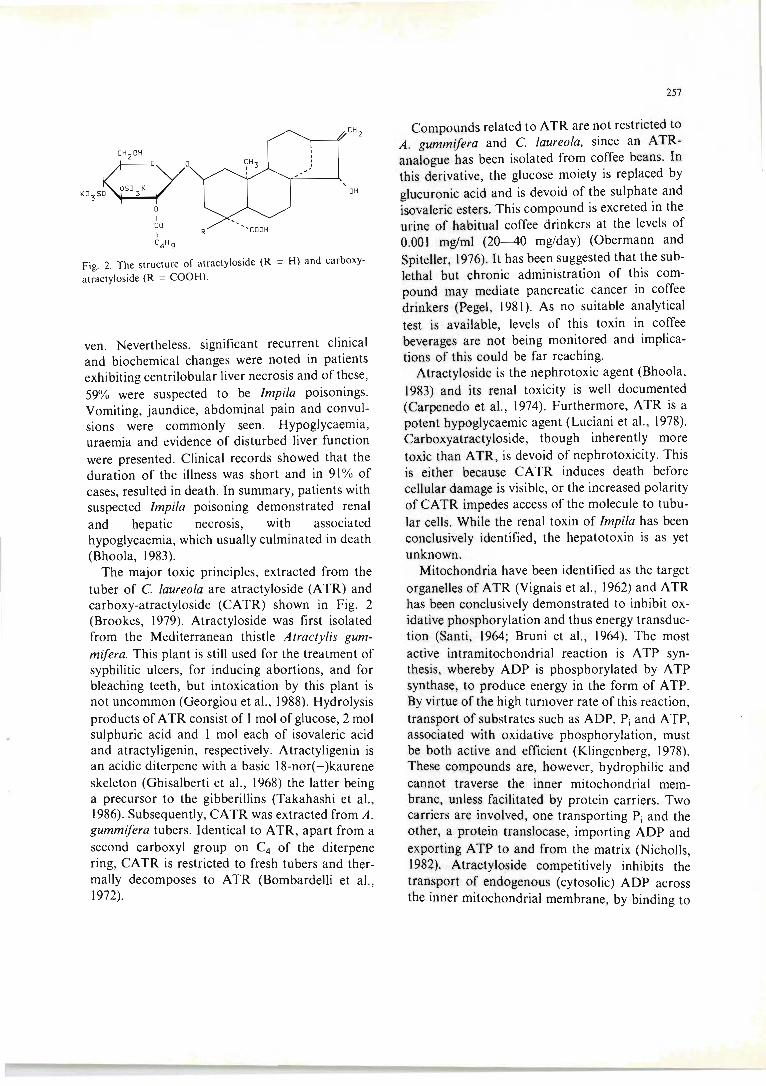
rovo K03S~~
° I CO I C4 H 9
OH
R
Fig. 2. The structure of atractyloside (R = H) and carboxyatractyloside (R = COOH).
ven. Nevertheless, significant recurrent clinical and biochemical changes were noted in patients exhibiting centrilobular liver necrosis and of these, 59% were suspected to be Impila poisonings. Vomiting, jaundice, abdominal pain and convulsions were commonly seen. Hypoglycaemia, uraemia and evidence of disturbed liver function were presented. Clinical records showed that the duration of the illness was short and in 91 % of cases, resulted in death. In summary, patients with suspected Impi/a poisoning demonstrated renal and hepatic necrosis, with associated hypoglycaemia, which usually culminated in death (Bhoola, 1983).
The major toxic principles, extracted from the tuber of C. laureola are atractyloside (ATR) and carboxy-atractyloside (CATR) shown in Fig. 2 (Brookes, 1979). Atractyloside was first isolated from the Mediterranean thistle Atractylis gummifera. This plant is still used for the treatment of syphilitic ulcers, for inducing abortions, and for bleaching teeth, but intoxication by this plant is not uncommon (Georgiou et aI. , 1988). Hydrolysis products of A TR consist of I mol of glucose, 2 mol sulphuric acid and I mol each of isovaleric acid and atractyligenin, respectively. Atractyligenin is an acidic diterpene with a basic 18-nor( - )kaurene skeleton (Ghisalberti et aI., 1968) the latter being a precursor to the gibberillins (Takahashi et aI. , 1986). Subsequently, CA TR was extracted from A. gummifera tubers. Identical to A TR, apart from a second carboxyl group on C4 of the diterpene ring, CA TR is restricted to fresh tubers and thermally decomposes to ATR (Bombardelli et aI., 1972).
257
Compounds related to A TR are not restricted to A. gummifera and C. laureola, since an ATRanalogue has been isolated from coffee beans. In this derivative, the glucose moiety is replaced by glucuronic acid and is devoid of the sulphate and isovaleric esters. This compound is excreted in the urine of habitual coffee drinkers at the levels of 0.001 mg/ml (2~0 mg/day) (Obermann and Spiteller, 1976). It has been suggested that the sublethal but chronic administration of this compound may mediate pancreatic cancer in coffee drinkers (Pegel, 1981). As no suitable analytical test is available, levels of this toxin in coffee beverages are not being monitored and implications of this could be far reaching.
Atractyloside is the nephrotoxic agent (Bhoola, 1983) and its renal toxicity is well documented (Carpenedo et aI., 1974). Furthermore, ATR is a potent hypoglycaemic agent (Luciani et aI., 1978). Carboxyatractyloside, though inherently more toxic than A TR, is devoid of nephrotoxicity. This is either because CA TR induces death before cellular damage is visible, or the increased polarity of CA TR impedes access of the molecule to tubular cells. While the renal toxin of Impila has been conclusively identified, the hepatotoxin is as yet unknown.
Mitochondria have been identified as the target organelles of A TR (Vignais et aI. , 1962) and A TR has been conclusively demonstrated to inhibit oxidative phosphorylation and thus energy transduction (Santi, 1964; Bruni et aI., 1964). The most active intramitochondrial reaction is A TP synthesis, whereby ADP is phosphorylated by A TP synthase, to produce energy in the form of ATP. By virtue of the high turnover rate of this reaction, transport of substrates such as ADP, Pi and ATP, associated with oxidative phosphorylation, must be both active and efficient (Klingenberg, 1978). These compounds are, however, hydrophilic and cannot traverse the inner mitochondrial membrane, unless facilitated by protein carriers. Two carriers are involved, one transporting Pi and the other, a protein translocase, importing ADP and exporting A TP to and from the matrix (Nicholls, 1982). Atractyloside competitively inhibits the transport of endogenous (cytosolic) ADP across the inner mitochondrial membrane, by binding to
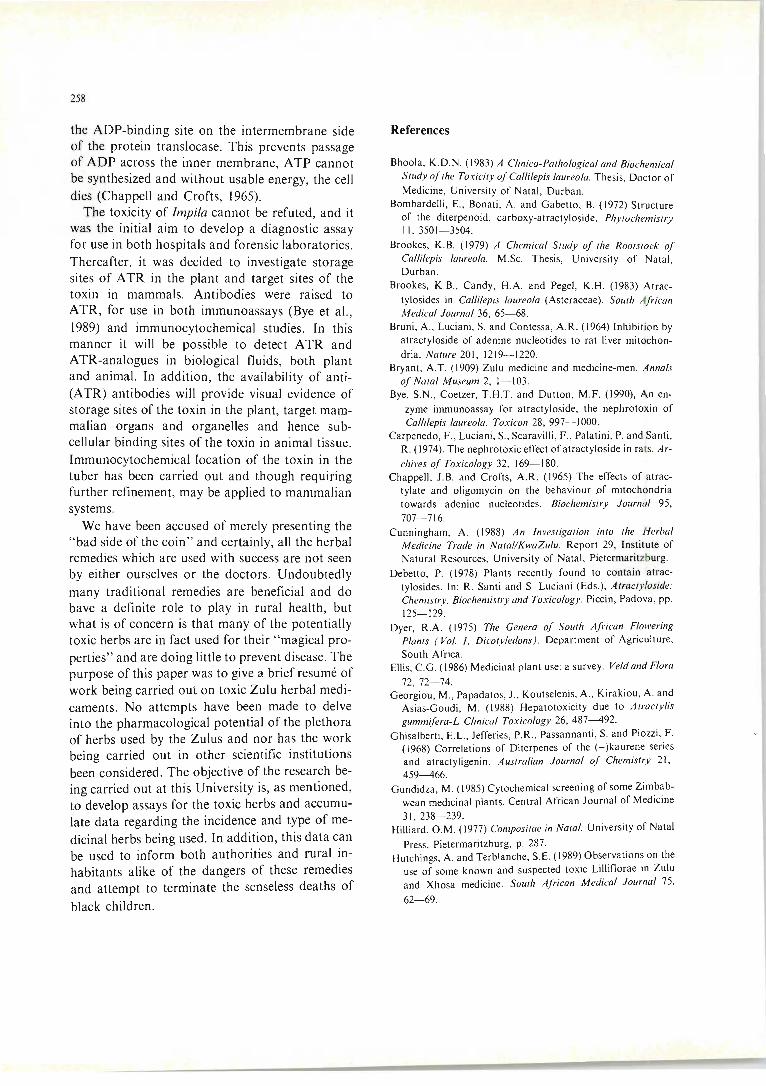
258
the ADP-binding site on the intermembrane side of the protein translocase. This prevents passage of ADP across the inner membrane, A TP cannot be synthesized and without usable energy, the cell dies (Chappell and Crofts, 1965).
The toxicity of Impi/a cannot be refuted, and it was the initial aim to develop a diagnostic assay for use in both hospitals and forensic laboratories. Thereafter, it was decided to investigate storage sites of A TR in the plant and target sites of the toxin in mammals. Antibodies were raised to ATR, for use in both immunoassays (Bye et aI., 1989) and immunocytochemical studies. In this manner it will be possible to detect ATR and ATR-analogues in biological fluids, both plant and animal. In addition, the availability of anti(A TR) antibodies will provide visual evidence of storage sites of the toxin in the plant, target mammalian organs and organelles and hence subcellular binding sites of the toxin in animal tissue. Immunocytochemical location of the toxin in the tuber has been carried out and though requiring further refinement, may be applied to mammalian systems.
We have been accused of merely presenting the "bad side of the coin" and certainly, all the herbal remedies which are used with success are not seen by either ourselves or the doctors. Undoubtedly many traditional remedies are beneficial and do have a definite role to play in rural health, but what is of concern is that many of the potentially toxic herbs are in fact used for their "magical properties" and are doing little to prevent disease. The purpose of this paper was to give a brief resume of work being carried out on toxic Zulu herbal medicaments. No attempts have been made to delve into the pharmacological potential of the plethora of herbs used by the Zulus and nor has the work being carried out in other scientific institutions been considered. The objective of the research being carried out at this University is, as mentioned, to develop assays for the toxic herbs and accumulate data regarding the incidence and type of medicinal herbs being used. In addition, this data can be used to inform both authorities and rural inhabitants alike of the dangers of these remedies and attempt to terminate the senseless deaths of
black children.
References
Bhoola, K.D.N. (1983) A Clinico-Pathological and Biochemical Study of the Toxicity of Callilepis laureola. Thesis, Doctor of Medicine, University of Natal, Durban.
Bombardelli, E. , Bonati, A. and Gabetto, B. (1972) Structure of the diterpenoid, carboxy-atractyloside. Phytochemistry II, 3501- 3504.
Brookes, K.B. (1979) A Chemical Study of the Rootstock of Callilepis laureola. M.Sc. Thesis, University of Natal, Durban .
Brookes, K.B., Candy, H.A. and Pegel, K.H. (1983) Atractylosides in Callilepis laureola (Asteraceae). South African Medical Journal 36, 65- 68 .
Bruni, A., Luciani, S. and Contessa, A.R. (1964) Inhibition by atractyloside of adenine nucleotides to rat liver mitochondria. Nature 201, 1219- 1220.
Bryant, A.T. (1909) Zulu medicine and medicine-men. Annals of Natal Museum 2, 1- 103.
Bye, S.N., Coetzer, T.H.T. and Dutton, M.F. (1990), An enzyme immunoassay for atractyloside, the nephrotoxin of Callilepis laureola. Toxicon 28, 997-1000.
Carpenedo, F. , Luciani , S., Scaravilli, F., Palatini, P. and Santi, R. (1974). The nephrotoxic effect of atractyloside in rats. Archives of Toxicology 32, 169- 180.
Chappell, J.B. and Crofts, A.R. (1965) The effects of atractylate and oligomycin on the behaviour ,of mitochondria towards adenine nucleotides. Biochemistry Journal 95, 707-716.
Cunningham, A. (1988) An Investigation into the Herbal Medicine Trade in NatallKwaZulu. Report 29, Institute of Natural Resources, University of Natal, Pietermaritzburg.
Debetto, P. (1978) Plants recently found to contain atractylosides. In: R. Santi and S. Luciani (Eds.), Atractyloside: Chemistry. Biochemistry and Toxicology. Piccin, Padova, pp. 125- 129.
Dyer, R.A. (1975) The Genera of South African Flowering Plants ( Vol. I, Dicotyledons) . Department of Agriculture, South Africa.
Ellis, e.G. (1986) Medicinal plant use: a survey. Veld and Flora
72,72- 74. Georgiou, M., Papadatos, J. , Koutselenis, A. , Kirakiou, A. and
Asias-Goudi, M. (1988) Hepatotoxicity due to Atractylis gummifera-L Clinical Toxicology 26, 487-492.
Ghisalberti , E.L., Jefferies, P.R ., Passannanti , S. and Piozzi, F. (1968) Correlations of Diterpenes of the (- )kaurene series and atractyligenin. Australian Journal of Chemistry 21, 459-466.
Gundidza, M. (1985) Cytochemical screening of some Zimbabwean medicinal plants. Central African Journal of Medicine 31 , 238- 239.
Hilliard, O.M. (1977) Compositae in Natal. University of Natal
Press, Pietermaritzburg, p. 287. Hutchings, A. and Terblanche, S.E. (1989) Observations on the
use of some known and suspected toxic Lilliflorae in Zulu and Xhosa medicine. South African Medical Journal 75,
62- 69.
Kiernan, J.P. (1978) Is the witchdoctor medically competent? South African Medical Journal 53, 1072- 1073.
Klingenberg, M. (1978) The ADP, ATP translocator in mitochondria with particular attention to the effects of the atractylates. In : R. Santi and S. Luciani (Eds.), Atractyloside: Chemistry, Biochemistry and Tox icology. Piccin , Padova, pp. 69- 107.
Krige, E.J . (1981) The Social System oflhe Zulus. Shuter and Shooter, Pietermartizburg, p. 297 .
Luciani , S., Carpenedo, F. and Tarjan, E.M . (1978) The effects of atractyloside and carboxyatractyloside in the whole animal. In: R . Santi and S. Luciani (Eds.), Atraclyloside: Chemislry, Biochemistry and Toxicology. Piccin, Padova, pp. 109- 123.
Nicholls, D.G. (1982) Bioenergetics - An introduction to the Chemiosmotic Theory. Academic Press, London.
Obermann, H. and Spiteller, G . (1976) Die Strukturen der "Kaffee-Atractyloside". Chemica Berlin 109, 3450- 3461.
Palmer, E. (1985) The South African Herbal. Tafelberg, Cape Town, p. 169.
Pegel , K.H. (1981) Coffee's link to cancer. Chemical and Engineering News 59, 4.
259
Santi , R. (1964) Pharmacological properties and mechanisms of
action of atractyloside. Journal of Pharmacy and Plll/rmacology 16, 437-438.
Savage, M.T .D. (1985) Health: Basic needs in rural areas. Soulh African National Scientific Programmes Report 116,49- 66.
Takahashi, N., Yamaguchi, I. and Hisakazu, Y. (1986) Gibberellins. In : N. Takahashi (Ed.), Chemislry 0/ Plant Hormones. C RC: Boca Raton, FL, pp. 57- 151.
Yignais, P. Y. , Yignais, P.M. and Stanislas, E. (1962) Action of potassium atractylate on oxidative phosphorylation in the mitochondria and sub-mitochondrial particles. Biochimica et Biophysica Acta 60, 284-300.
Wainwright, J . and Schonland, M.M . (1977) Toxic hepatitis in
Black patients in Natal. South Aji'ican Medical Journal 51, 571 - 573 .
Wainwright, J ., Schonland, M.M . and Candy, M.A. (1977) Toxicity of Callilepis laureola. SOUlh A/rican Medical Journal 52, 313- 315.
Watt , J.M. and Breyer-Brandwyk, M.G. (1962) Medicinal and Poisonous Plants 0/ Southern and Easl Africa. Livingstone, Edinburgh.

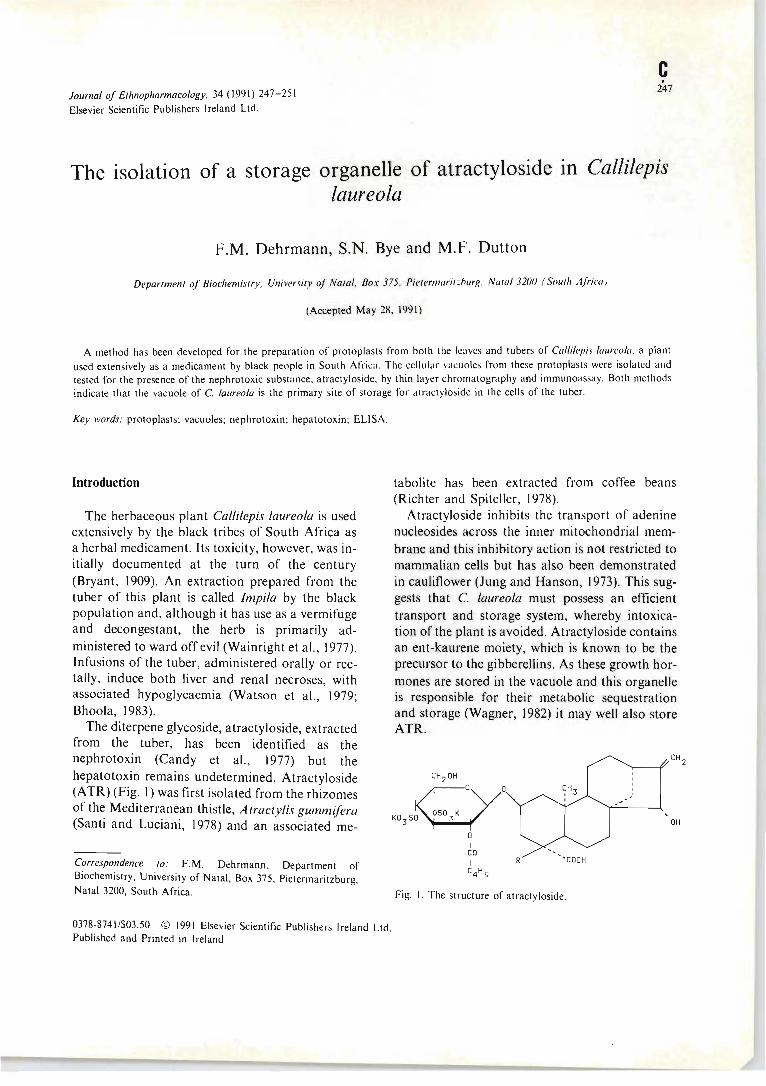
Journal of Ethnopharmacology. 34 (1991) 247-251
Elsevier Scientific Publishers Ireland Ltd.
The isolation of a storage organelle of atractyloside laureola
In Callilepis
F.M. Dehrmann, S.N. Bye and M.F. Dutton
Department of Biochemistry . University of Natal. Box 375. Pietermarit=hurg. Na tal 3200 (South A./i'ica)
(Accepted May 28, 1991 )
A method has been developed for the preparation of protoplasts from both the leaves and tubers of Callilepis laureola. a plant used extensively as a medicament by black people in South Africa. The cellular vacuoles from these protoplasts were isolated and tested for the presence of the nephrotoxic substance, atractyloside. by thin layer chromatography and immunoassay. Both methods indicate that the vacuole of C. laureola is the primary site of storage fo r atractyloside in the cells of the tuber.
Key words: protoplasts; vacuoles; nephrotoxin; hepatotoxin; ELISA.
Introduction
The herbaceous plant Callilepis laureola is used extensively by the black tribes of South Africa as a herbal medicament. Its toxicity, however, was initially documented at the turn of the century (Bryant, 1909). An extraction prepared from the tuber of this plant is called Impila by the black population and, although it has use as a vermifuge and decongestant, the herb is primarily administered to ward off evil (Wainright et aI. , 1977). Infusions of the tuber, administered orally or rectally, induce both liver and renal necroses, with associated hypoglycaemia (Watson et aI. , 1979; Bhoola, 1983).
The diterpene glycoside, atractyloside, extracted from the tuber, has been identified as the nephrotoxin (Candy et aI. , 1977) but the hepatotoxin remains undetermined. Atractyloside (A TR) (Fig. I) was first isolated from the rhizomes of the Mediterranean thistle, A tractylis gummifera (Santi and Luciani, 1978) and an associated me-
Correspondence to: F.M. Dehrmann, Department of Biochemistry, University of Natal , Box 375, Pietermaritzburg. Natal 3200, South Africa.
0378-8741 /$03.50 © 1991 Elsevier Scientific Publishers Ireland Ltd . Published and Printed in Ireland
tabolite has been extracted from coffee beans (Richter and Spiteller, 1978).
Atractyloside inhibits the transport of adenine nuc1eosides across the inner mitochondrial membrane and this inhibitory action is not restricted to mammalian cells but has also been demonstrated in cauliflower (J ung and Hanson, 1973). This suggests that C. laureola must possess an efficient transport and storage system, whereby intoxication of the plant is avoided . Atractyloside contains an ent-kaurene moiety, which is known to be the precursor to the gibberellins. As these growth hormones are stored in the vacuole and this organelle is responsible for their metabolic sequestration and storage (Wagner, 1982) it may well also store ATR.
r ov o K0 3S~~
° I co I C4 H g
Fig. 1. The structure of atractyloside.
248
The aim of the work reported here was to establish and optimise a protocol for the isolation of vacuoles from the tubers of C. laureola, via the intermediate step of forming protoplasts; and to identify the vacuole as a possible storage organelle of A TR in this plant.
Materials and Methods
Materials C. laureola specimens were collected from
Eshowe, Natal. The pectinase Macerozyme and cellulase Onozuka RS enzymes were purchased from Yakult Honsha (Japan). Mannitol, ficoll , goat anti-(rabbit IgG) IgG-alkaline phosphatase conjugate and A TR (potassium salt) were obtained from Sigma Chemical Co, St Louis, U.S.A. Rabbit anti-atractyloside antibodies were prepared as described by Bye et al. (1990). Anisaldehyde was purchased from Merck (R .S.A.) and NUNC microtitre plates were obtained from Weil (Johannesburg, R.S.A.). All other reagents were of analytical grade.
Protoplast production Fresh C. laureola tuber (I g) was chopped (± 2
mm3) and surface sterilized in sodium hypochlorite and Tween 80 (I % and 0.1 %, respectively) solution for 10 min at room temperature. Sterilized tissue pieces were washed thoroughly with basal medium (0.5 M mannitol , I mM each of magnesium chloride and potassium dihydrogen phosphate and 0.002 g/ml each of citric acid and ascorbic acid, pH 5.6) to remove all traces of sterilants. The washed tissue was incubated for 6 h at 26°C at 70 strokes/min in 20 ml of basal medium containing 2% Macerozyme and 4% Onozuka RS (w/v), respectively. The solution was filtered through a 220-J.tm mesh filter and pooled with the initial filtrates. Aliquots (0.5 ml) of this suspension were added to equal volumes of Evan 's blue dye (2% w/v in basal medium) and average yields determined by counting on an Improved Neaubauer Haemocytometer. Centrifugation of the filtrate at 100 X g for 10 min caused viable protoplasts and cellular debris to sediment. The supernatant was discarded, the pellet resuspended in basal medium and overlayed onto a 0.6 M sor-
bitol solution contammg 25 mM potassium dihydrogen phosphate and titrated to pH 5.5 with citric acid. Centrifugation at 100 x g for 3 min allowed intact protoplasts to band at the interface and purity was evaluated microscopically.
Vacuole isolation Various protocols were tested but that of
Grandstedt and Huffaker (1982) proved most reproducible. Purified protoplasts from the tuber were removed from the interface with a pasteur pipette and resuspended in 6 equal volumes of 12% ficoll (w/v) containing 60 mM potassium dihydrogen phosphate (pH 8.0) and I mM dithiothreitol (OTT). Repeated inversions of the tube for 5 min caused protoplasts to lyse and the solution was overlayed with 2 volumes of 0.6 M mannitol solution with 50 mM potassium dihydrogen phosphate (PH 7.0) and I mM EOTA (sodium salt). Centrifugation at 1000 x g for 10 min caused vacuoles to migrate to the top 1- 2 volumes (0% ficoll fraction) while cellular debris sedimented. Vacuoles were visualised with acidophilic neutral red dye.
The 0% ficoll phase, interphase and pellet fractions were removed for analysis by thin layer chromatography and immunoassay.
Thin layer chromatography Samples of the resuspended pellet, interface and
0% ficoll fractions (20 J.tl) were spotted onto the origins of two-dimensional thin layer chromatography (TLC) plates (10 x 10 cm aluminium backed silica gel G 60, Merck). Suitable controls, i.e. , a standard A TR solution (1 mg/ml), and a standard sugar solution containing equal amounts of basal medium, sorbitol solution and vacuole isolating medium, were also subjected to the same TLC system. All the chromatograms were developed in chloroform/methanol (3:2 v/v) in the first dimension and butanol/acetic acid/water/chloroform (6:2:2: I v/v/v/v) in the second dimension. The chromatograms were air dried, sprayed with anisaldehyde reagent (Brookes, 1979) and heated at 120°C for 3 min.
Enzyme immunoassay A competitive immunoassay was carried out, as
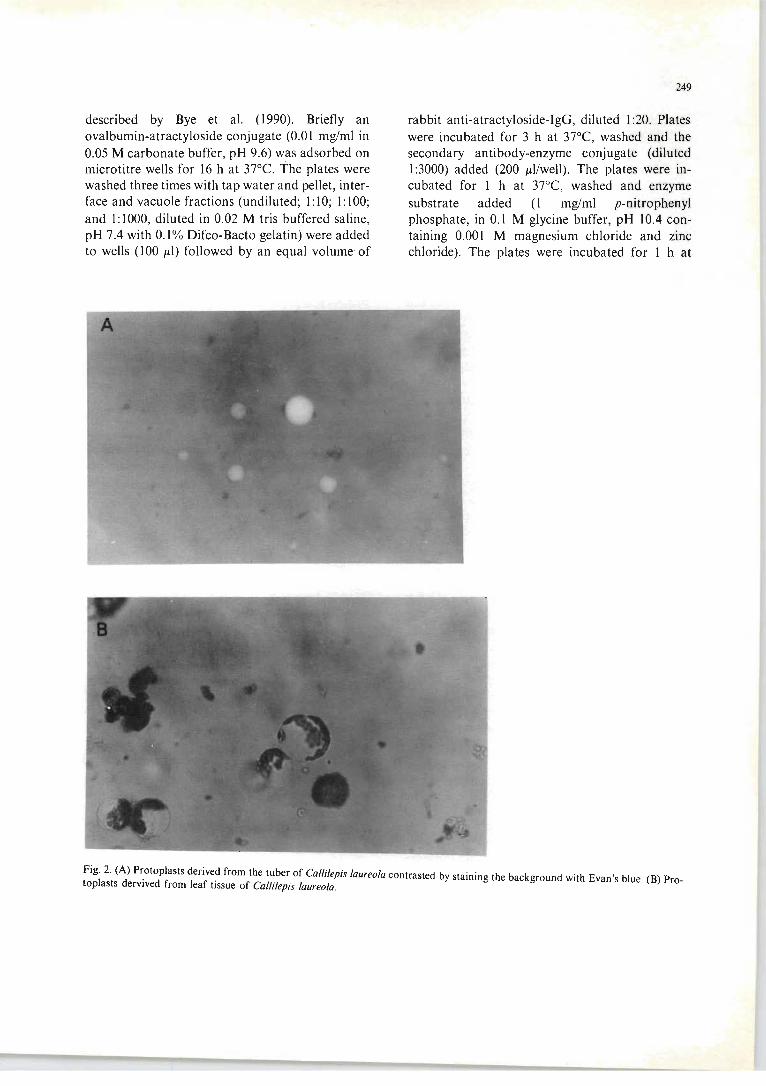
described by Bye et al. (1990). Briefly an ovalbumin-atractyloside conjugate (0.01 mglml in 0.05 M carbonate buffer, pH 9.6) was adsorbed on microtitre wells for 16 h at 37°C. The plates were washed three times with tap water and pellet, interface and vacuole fractions (undiluted; I: 10; 1: 100; and I: 1000, diluted in 0.02 M tris buffered saline, pH 7.4 with 0.1% Difco-Bacto gelatin) were added to wells (100 J.L1) followed by an equal volume-of
249
rabbit anti-atractyloside-IgG, diluted 1 :20. Plates were incubated for 3 h at 37°C, washed and the secondary antibody-enzyme conjugate (diluted 1 :3000) added (200 J.Ll/well). The plates were incubated for 1 h at 37°C, washed and enzyme substrate added (I mglml p-nitrophenyl phosphate, in 0.1 M glycine buffer, pH 10.4 containing 0.001 M magnesium chloride and zinc chloride). The plates were incubated for 1 h at
Fig. 2. (A) P~otoplasts derive~ from the tuber of Callilepis laureola contrasted by staining the background with Evan's blue. (8) Protoplasts dervlved from leaf tissue of Callilepis laureola.
250
37°C and the reaction was stopped by the addition of 6 M potassium hydroxide (50 ttl/well) and the absorbance read at 405 nm, using a Biotek spectrophotometer.
Results and Discussion
Optimisation of protoplast production Protoplasts were isolated from the tuber of C.
laureola (Fig. 2A) but initial yields were low (4 X
10 3 to 4 X 10⁴ protoplasts/ml). This in part was attributed to the presence of plant phenolics and to negate the effects of these, citric and ascorbic acids (0.002 glml) were added. This, together with the omission of the purification step using the sorbitol gradient, resulted in improved yields of 1-2 X 10⁶ protoplasts/ml.
An additional optimisation involved the determination of the most effective sterilant concentration, which was found to be I % sodium hypochlorite and 0.1°1<) Tween 80 and became the treatment of choice.
Reduction of Onozuka RS (cellulase) from 4% to 2% (w/v) using the same protocol as applied to tuber tissue, enabled the production of protoplasts from leaf tissue at a level of 4--5 X 10⁶ protoplasts/ml (Fig. 2B).
Subcellular fractionation and vacuole isolation Samples of the vacuole fraction stained with
equal volumes of neutral red solution, enable visualisation of vacuoles as bodies stained dark red. Microscopic examination revealed that the vacuoles were free from other plant material and debris and, therefore, constituted a pure fraction. Yields were low (3--4 X 10² vacuoles/ml) due in part to the passage of neutral red dye into the vacuole upsetting the osmotic balance and causing the vacuole to collapse.
Location of atractyloside in the vacuole Examination of the various fractions by TLC,
showed that the vacuole fraction gave a pink spot with the anisaldehyde reagent at Rj values of 0.36 and 0.74 in the first and second dimensions, respectively. These values coincided with those obtained for standard ATR and were not observed on any of the other control or pellet and interface fraction chromatograms.
The results from the immunoassay indicated that A TR was present in all three fractions, i.e. , vacuole, interface and pellet. Although the immunoassay is only semi-quantitative it did show, however, that the levels of ATR in the vacuole were much higher than in the other two fractions. This result was expected, as the immunoassay is much more sensitive than the TLC-spray reagent and ATR must be present in the other fractions, if only from vacuoles ruptured in the isolation procedure. It can be concluded that ATR is present in far higher concentrations in the vacuole than other parts of the cell and this, therefore, appears to act as the storage organelle in the plant.
This is the first report of the determination of the sub-cellular localisation of A TR in the vacuole of Callilepis laureola. Although more work is required to optimise the isolation of viable vacuoles in higher yields, their production from tubers and, in particular, leaves of the plant is reproducible and should, therefore, allow the mechanism of concentration of the toxin in the organelle to be elucidated.
Acknowledgements
The authors wish to thank Dr P. Watt and Mr R. Berry, University of Natal for their assistance and time; and the University of Natal for funds to support the work.
References
Bhoola, K.D.N. (1985) A Clinico-Pathological Study in the Toxicology of Callilepis laureola. Thesis for Doctor of Medicine, University of Natal, Durban, pp. 1- 151.
Brookes, K.B. (1970) A Chemical Study of tlze Rootstock of Callilepis laureola. M.Sc. Thesis. Department of Chemistry, University of Natal, Durban, pp. 1- 112.
Bryant, A.T. (1909) Zulu medicine and medicine men . Annales of the Natal Museum 2, 1- 103.
Bye, N.S., Coetzer, T.H.T. and Dutton, M.F. (1990) An enzyme immunoassay for atractyloside in Callilepis laureola.
Toxicon, 128, 997-1000. Candy, H.A., Pegel, K.H. , Brookes, B. and Rodwell , H. (1977)
The occurrence of atractyloside in Callilepis laureola.
Phy tochemistry 16, 1308- 1309. Contessa, A.R. and Fassina, G. (1978) Pharmacognosy of
Atractylis gummifera. In: R. Sarti and S. Luciani (Eds.), Atractylostde: Chemistry. Biochemistry and Toxicology. Padora, Piccin, pp. 1- 12.
..
Fuchs, S., Haimovich, J.J. and Fuchs, Y. (1971) Immunological studies of plant hormones. European Journal of Biochemistry 18, 384-390.
Granstedt, R.C. and Huffaker, R.C. (1982) Identification of the leaf vacuole as a major nitrate storage pool. Plant Physiology 70, 410-413.
Jung, D.W. and Hanson, J .B. (1973) Atractyloside inhibition of adenine nucleotide transport in the mitochondria of plants. Biochimica et Biophysica Acta 92, 178--180.
Richter, H. and Spiteller, G. (1978) Uber ein neues atractyligenin glycosid aus grunen kaffeebohnen. Chemica Berliner III , 3506-3509.
Santi, R (1964) Pharmacological properties and mechanism of action of atractyloside. Journal of Pharmacy and Pharmacology 16, 437--438 .
Santi, R. and Luciani, S. (1978) Introduction. In : R. Santi and
251
S. Luciani (Eds.), Atraety/oside: Chemistry, Biochemistry and Toxicology. Padora, Piccin, p. ix.
Wagner, G.c. (1982) Higher plant vacuoles and tonoplasts. In: J.L. Hall and A.L. Moore (Eds.) , Isolation of Membranes and
Organelles from Plant Cells. Academic Press, London, pp. 83- ll8.
Wainwright, J. , Schon land, M.M. and Candy, M.A. (1977) Toxicity of Callilepis laureola. South African Medical Journal
52,313- 315. Watson, A.R. , Coovadia, H.M. and Bhoola, K.D. (1979) The
clinical syndrome of Impila poisoning in children. South African Medical Journal 24, 290-292.
Weiler, E.W. and Weizczorek, U. (1981) Determination offemtomol quantities of gibberellic acid by radio immunoassay. Planta 152, 159- 167.


![[Barbara Dancygier, Eve Sweetser] Mental Spaces in Grammar](https://static.fdokumen.com/doc/165x107/6322f845807dc363600aad9d/barbara-dancygier-eve-sweetser-mental-spaces-in-grammar.jpg)