THE EXTRACTION OF IRON, COBALT, AND NICKEL ...
159
THE EXTRACTION OF IRON, COBALT, AND NICKEL SULFATES Dissertation Presented in Partial Fulfillment of the Requirements for the Degree Doctor of Philosophy in the Graduate School of The Ohio State University By CARL SOLOMON SCHLEA, B.Ch.E., M.Sc. The Ohio State University 1955-- Approved by • \ C , Dr. C. J. Geankoplis, Adviser Chemical Engineering Department
-
Upload
khangminh22 -
Category
Documents
-
view
1 -
download
0
Transcript of THE EXTRACTION OF IRON, COBALT, AND NICKEL ...
THE EXTRACTION OF IRON, COBALT, AND NICKEL SULFATES
DissertationPresented in Partial Fulfillment of the Requirements
for the Degree Doctor of Philosophy in the Graduate School of The Ohio State University
By
CARL SOLOMON SCHLEA, B.Ch.E., M.Sc.The Ohio State University
1955--
Approved by• \
C ,Dr. C. J. Geankoplis, Adviser Chemical Engineering Department
i
Acknowledgement
The author would like to express his appreciation to his adviser, Dr. C. J. Geankoplis, for his very generous assistance and helpful advice.
Grateful acknowledgement is made to the Battelle Memorial Institute for their financial assistance by means of a fellowship for the years 1952-1955.
TABLE OP CONTENTS
PageABSTRACT................ 1INTRODUCTION ....................................... 4LITERATURE REVIEW.................................. 10
1. The Extraction of Metal Halides . . . . . . . . . . 102. The Extraction of Metal Nitrates ........ 183. The Extraction of Thiocyanates............... 24-4-. The Extraction of Metal Sulfates . . . . . . . . . 265. The Extraction of Cobalt and Nickel Acetates and. . 28
the Separation of Chromium and Vanadium6. The Extraction of Chelate Compounds . . . . . . . . 28.
STATEMENT OF THE PROBLEM............................. 30THEORY...................... 32ANALYTICAL METHODS.................................. 36
1. Aqueous-Phase Analyses .......... . . . . . . . 362. Organic-Phase Analyses................. 4&
EXPERIMENTAL PROCEDURE .............................. 621. Equipment.................. 622. Extraction Procedure.................. 653. Phase Diagram Determination ................ . 714-. Materials Used................... 72
EXPERIMENTAL D A T A ............. 771. Solvent and Additive Search D a t a ......... . 772. Extractions With Normal Butyl Alcohol..... 94.3. Solubility Determinations With Normal Butyl Alcohol 94.
TREATMENT AND DISCUSSION OF DATA.................... . 1061. Calculations . . . . . . . . . . . . . . . . . . . 1062. Discussion of Solvent Search and Additive Search. . 108
Data
iiiTABLE OF CONTENTS (Continued)
Pagea. Solvent Search . . . . . . . . . . . . . . . . 10Sb. Additive Search............. 113c. Selection of the Solvent......... . . . . . 114
3. Correlation and Discussion of Distribution Data . . 115a. Effect of Sulfuric A c i d ............... 116b. Effect of Metal and Metal Composition . . . . 120c. Effect of Temperature.................126d. The Distribution of Sulfuric Acid............ 129e. Distribution in Mixtures................... 132f. Density Correlations . . . . . . . . . . . . . I36
4» Solubility Determinations....................... 136CONCLUSIONS. .................................... 144SUGGESTIONS FOR FURTHER INVESTIGATIONS .................. 147NOMENCLATURE......................... .............149autobiography:........................................151
TABLE 1.
TABLE 2.
TABLE 3. TABLE A.
TABLE 5.
TABLE 6.
TABLE 7.
TABLE 8.
TABLE 9.
TABLE 1C
TABLE 13
TABLE 12
ivLIST OF TABLES
Page
ERRORS IN COLORIMETRIC ANALYSES.............. 51
MATERIALS U S E D .......... . . .......... 74
SOLVENT SEARCH DATA AT 25.0°C................ 78DISTRIBUTION IN SYSTEMS: METAL SULFATE - . . . . 90WATER - SOLVENT - ADDITIVE AT 25.0°C.
DISTRIBUTION IN SYSTEMS: NICKEL SULFATE - . , ; 95SULFURIC ACID - WATER - NORMAL BUTYL ALCOHOL -AT 25.0°C.
DISTRIBUTION IN THE SYSTEM: COBALT SULFATE - i . 96SULFURIC ACID - WATER - NORMAL BUTYL ALCOHOL AT 25.0°C.
DISTRIBUTION IN THE SYSTEM: FERRIC SULFATE - . ♦ 97SULFURIC ACID - WATER - NORMAL BUTYL ALCOHOL AT 25.0°C.
DISTRIBUTION IN THE SYSTEM: SULFURIC ACID - . . 98. WATER - NORMAL BUTYL ALCOHOL AT 25.0°C.DISTRIBUTION IN THE SYSTEM: NICKEL SULFATE - . . 99SULFURIC ACID - WATER - NORMAL BUTYL ALCOHOL AT VARIOUS TEMPERATURES
. DISTRIBUTION IN THE SYSTEM: COBALT SULFATE - . . 100SULFURIC ACID - WATER - NORMAL BUTYL ALCOHOL AT VARIOUS TEMPERATURES
. DISTRIBUTION IN THE SYSTEM: FERRIC SULFATE - . . ”101 SULFURIC ACID - WATER - NORMAL BUTYL ALCOHOL AT VARIOUS TEMPERATURES
.. DISTRIBUTION IN THE SYSTEM: NICKEL SULFATE - . . 102COBALT SULFATE - FERRIC SULFATE - SULFURIC ACID - WATER - NORMAL BUTYL ALCOHOL AT 25.0°C.
TABLE 13. SOLUBILITY ENVELOPE FOR THE SYSTEM: SULFURIC . . 103ACID - WATER - NORMAL BUTYL ALCOHOL AT 25.0°C.
VLIST OP TABLES (Continued)
PageTABLE 14. THE EFFECT OF METAL SULFATES ON THE.............104
SOLUBILITY OF NORMAL BUTYL ALCOHOL IN AQUEOUS SULFURIC ACID SOLUTIONS AT 25.0°C.
TABLE 15. THE EFFECT OF NICKEL SULFATE ON THE.............105SOLUBILITY OF WATER IN SULFURIC ACID SOLUTIONS OF NORMAL BUTYL ALCOHOL AT 25.0°C.
TABLE 16. SEPARATION FACTORS AT 25.0°C....................121
TABLE 17. EXTRACTION IN MIXTURES COMPARED TO THAT......134WHEN SALTS EQUILIBRATED SEPARATELY AT 25.0°C.
TABLE IS. TIE LINE DATA FOR THE SYSTEM: SULFURIC.....140ACID - WATER - NORMAL BUTYL ALCOHOL AT 25.0°C.
FIGURE 10.
FIGURE 2„
FIGURE 3o FIGURE lw
FIGURE 5.
FIGURE 6*.
FIGURE 7*
FIGURE 8 ,.
FIGURE 9o
FIGURE 10*
FIGURE 11*. FIGURE 12 o.
viLIST OF FIGURES
PageTHE DISTRIBUTION OF CHROMIC SULFATE AND . . . . 27 SULFATE BETWEEN NORMAL BUTYL ALCOHOL AND AQUEOUS SULFURIC ACID
THE EFFECT OF METAL SULFATES AND NORMAL BUTYL . 1(3 ALCOHOL ON SULFURIC ACID NEUTRALIZATION * ’ '
ERRORS IN COLORIMETRIC ANALYTICAL PROCEDURES . h9THE DISTRIBUTION OF NICKEL SULFATE BETWEEN. . 0H7 NORMAL BUTYL ALCOHOL AND AQUEOUS SULFURIC ACID
THE DISTRIBUTION OF COBALT SULFATE BETWEEN. • .118 NOMAL BUTYL ALCOHOL AND AQUEOUS SULFURIC ACID
THE DISTRIBUTION OF FERRIC SULFATE BETWEEN. . .119 NORMAL BUTYL ALCOHOL AND AQUEOUS SULFURIC ACID
THE EFFECT OF SULFURIC ACID ON THE. . . . . . .122 SEPARATION FACTOR BETWEEN IRON AND NICKEL AT 25.0°C.
THE EFFECT OF SULFURIC ACID ON THE. . . . . . ,123 SEPARATION FACTOR BETWEEN IRON AND COBALT AT 25.0°C.
THE EFFECT OF SULFURIC ACID ON THE........ .121*SEPARATION FACTOR BETWEEN COBALT AND NICKEL AT 25.0°C*
THE EFFECT OF METAL CONCENTRATION ON. . . . . .125 DISTRIBUTION AT CONSTANT ACID CONCENTRATIONS
THE EFFECT OF TEMPERATURE ON DISTRIBUTION . . 0127THE EFFECT OF TEMPERATURE ON DISTRIBUTION , . ,128
FIGURE 13.
FIGURE lUo
FIGURE 1$. FIGURE 160
FIGURE 17*
FIGURE 18*.
FIGURE 19+
FIGURE 20*
FIGURE 21,
viiLI SI’ OF FIGURES (Continued)
THE DISTRIBUTION OF SULFURIC ACID BETWEEN . , * 130 • WATER AND NOMAL BUTIL ALCOHOL AT 25.0°C.,FERRIC SULFATE PRESENT
THE DISTRIBUTION OF SULFURIC ACID BETWEEN o . o 131 WATER AND NORMAL BUTYL ALCOHOL AT 25a0°Co,COBALT SULFATE AND NICKEL SULFATE PRESENT
DISTRIBUTION IN MIXTURES AT 2$.0°C, 133EXTRACTION IN MIXTURES COMPARED TO THAT WHEN. ,13$ EACH SALT EQUILIBRATED SEPARATELY
DENSITY OF THE WATER PHASE IN THE SYSTEM. 0 • » 137 HgSOj - NiSO - HgO - nC^HpOH AT 2S.0°C»
DENSITY OF THE WATER PHASE IN THE SYSTEM* , . 0 138 HgSO - NiSO - HgO - nC^OH AT 20.0°C*
DENSITY OF THE N-BUTYL ALCOHOL PHASE IN THE „ * 139 SYSTEM* H2SO - NiSO - HgO - nC^OH AT 20 .0 °C*.
PHASE DIAGRAM FOR THE SfSTEM:' SULFURIC ACID lUl WATER - NORMAL BUTYL ALCOHOL AT 25,0°C„
THE EFFECT OF METAL SULFATES ON THE , , . . . „ 1 2 SOLUBILITY OF NORMAL BUTYL ALCOHOL IN WATER AT 25bO°C.
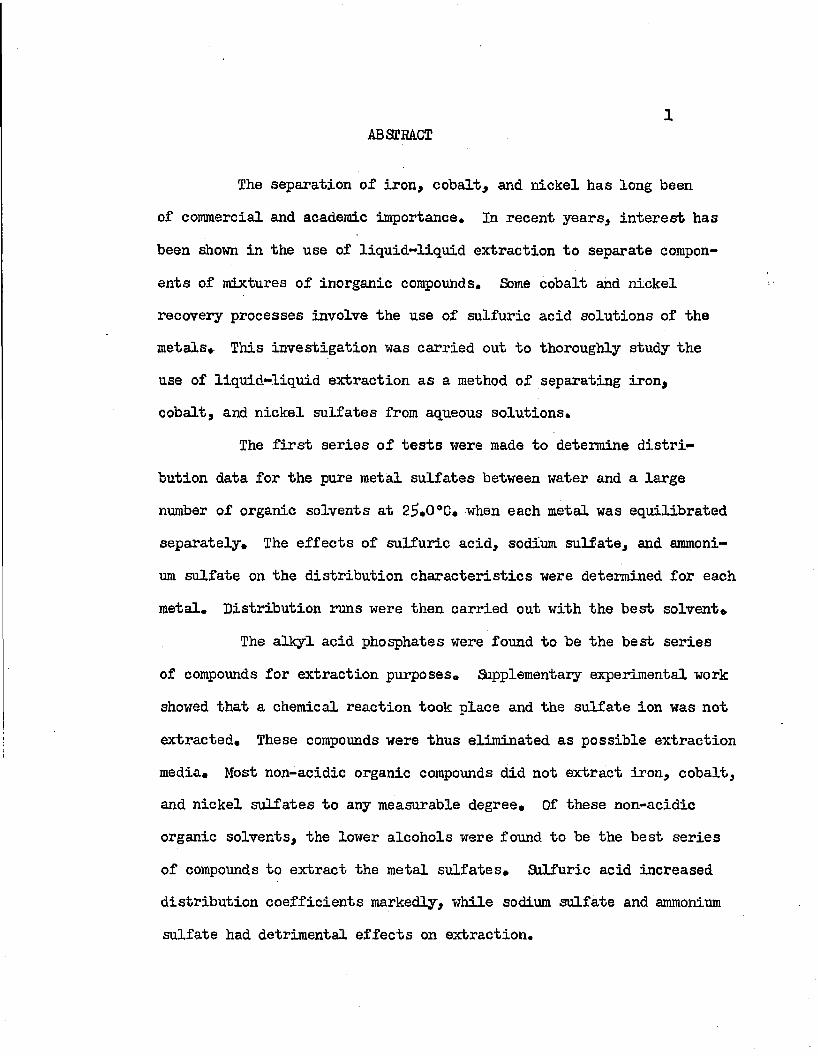
ABSTRACT1
The separation of iron, cobalt, and nickel has long been of commercial and academic importance. In recent years, interest has been shown in the use of liquid-liquid extraction to separate components of mixtures of inorganic compounds. Some cobalt and nickel recovery processes involve the use of sulfuric acid solutions of the metals* This investigation was carried out to thoroughly study the use of liquid-liquid extraction as a method of separating iron, cobalt, and nickel sulfates from aqueous solutions.
The first series of tests were made to determine distribution data for the pure metal sulfates between water and a large number of organic solvents at 2£.Q°C. when each metal was equilibrated separately. The effects of sulfuric acid, sodium sulfate, and ammonium sulfate on the distribution characteristics were determined for each metal. Distribution runs were then carried out with the best solvent*
The alkyl acid phosphates were found to be the best series of compounds for extraction purposes* Supplementary experimental work showed that a chemical reaction took place and the sulfate ion was not extracted. These compounds were thus eliminated as possible extraction media. Most non-acidic organic compounds did not extract iron, cobalt, and nickel sulfates to any measurable degree. Of these non-acidic organic solvents, the lower alcohols were found to be the best series of compounds to extract the metal sulfates. Sulfuric acid increased distribution coefficients markedly, while sodium sulfate and ammonium sulfate had detrimental effects on extraction.

2Electrostatic considerations of ions in solution could not
explain the extraction,* Solvents with high dielectric constants extracted less than some with considerably lower dielectric constants# Also, extraction could not be correlated with the degree of water solubility in the organic phase# Although no quantitative information of the strength of hydrogen bonds is available, the relative order of magnitude of distribution coefficients changed in much the same manner as relative strengths of hydrogen bonding characteristics of the organic solvents#
Normal butyl alcohol was chosen in conjunction with sulfuric acid to determine extraction characteristics with iron, cobalt, and mickel sulfates# Distribution coefficients, when each metal was equilibrated separately, were on the order of magnitude of 0.0001 at 25#0°C# By adding up to 250 grams sulfuric acid per liter of the water phase, these distribution coefficients increased over 100 times, values over 0.01 being obtained* Separation factors were low and varied with acid and metal concentrations# Maximum cobalt-to-nickel separation factors were about 1*1+# Maximum iron-to-hickel and iron-to- cobalt separation factors were about two# Separation factors varied only slightly with increased sulfuric acid concentrations when metal concentrations were high but increased when metal concentrations were low# Distribution coefficients could be doubled by increasing the temperature from 25.0°C# to about 70°C. Distribution coefficients, when the metals were equilibrated together, were 50 to 80 per cent lower than when each metal was equilibrated alone#
3
It was concluded from the experimental work that the separation of iron, cobalt, and nickel sulfates by liquid-liquid extraction is not commercially feasible# These conclusions were reached on bases of the distribution of these metal sulfates between water and a wide variety of organic solvents# Distributions in favor of the organic phase were very low# Solvents which extracted one of the metals also extracted the others# Snail separations could be obtained, but such large volumes of solvent would be required that the cost of such an operation would be prohibitive* The addition of sulfuric acid increased extraction, but, again, such large amounts would be required that the cost of the additive would again prohibit commercial use of such a system#
4
INTRODUCTION.
Iron, cobalt, and nickel are usually associated together in
nature arid.alloyed in consumer products. Yet, market specifications
demand that cobalt and nickel be available in comparatively pure forms,
Chemical separation processes, currently ■■used, have been proven
inadequate to recover all metal content from the same ore® '.In recent
years, interest has been given to supplementing chemical, separation
processes with liquid-liquid extraction operations* Nostudies on the
separation of iron, cobalt, and nickel sulfates have been made* A study
is justified, since many processes currently used involve sulfuric acid
solutions of the metals.
Iron, cobalt, and nickel are metals basic to commerce and
essential in time of war* Although existing and predicted markets
and supplies indicate sufficient iron reserves are readily available,
present day shortages of cobalt and nickel may become more severe
unless new technology is introduced for the recovery of these
metals (1, 2), Primary cobalt and nickel productions, currently
about 160,000 tons nickel and U£0 tons cobalt per year, are expected
(1) U* S* Department of the Interior, Bureau of Mines Report,Materials Survey - Nickel^ pp, 1-H, ?I-5, 6 (May, 19£>2)0
\ _
(2) Uo So Department of the Interior, Bureau of Mines Report, Materials 1 Survey - Cobalt, pp, 1-3, V-l (Feb., 19^2),
1
5
to increase about 3l*l* per cent for cobalt and 100 per cent for nickel
by 1975 (3, 10.The United States consumes over 5>0 per cent of the free
world's supply of cobalt and nickel but produces only a small fraction
of this amount. Over 90 per cent of the free world's supply of nickel
is obtained from Canadian sulfide deposits, in which nickel is
associated with copper, iron, lead, manganese, cobalt, and small amounts
of the platinum metals. Over three-fourths of the free world's supply
of cobalt is obtained from African sulfide and arsenide ores, as a by
product from copper recovery processes. Cobalt ores rarely contain
more than 0.2 per cent cobalt. Nickel contents of several per cent
have been noted in some cases*
In the United States, a great deal of interest has been
centered on the enormous nickeliferrous iron ores of Cuba. Esti
mated to be the world's largest nickel reserve, nickel is associated
with silica, iron, magnesium, cobalt, chromium, manganese, and small
amounts of other metals. Snail quantities of nickel were produced from these ores during emergencies by extracting nickel from the
partially reduced ore with an ammoniacal solution of ammonium
carbonate. It is reported that an economically feasible processing of
metals from Cuban deposits should take into consideration the recovery
(3) Stanford Research Institute, Chemical Economics Handbook, Vol. 2,pp. 1*00.10, 1*21.20, 1*21.20, 1*76.20, 1*76.50 (1952).
(1*) President's Materials Policy Commission Report, Resources for Freedom. Vol. 1*, p. 2$ (June, 19 2).
of many of the associated metals in comparatively pure forms. Such recoveries are particularly difficult, as the best deposits, although extensive, contain only about 1.5 per cent nickel, 0.2 per cent
cobalt, and 4-0 to 50 per cent iron (5).Major cobalt and nickel processing techniques, presently
used, vary depending upon associated and combined elements. In general, these processes include a combination of pyrometallurgy, hydrometallurgy, and chemical processes. In these cases, both cobalt
and nickel are rarely produced from the same ore. Separations which are made for the recovery of both metals are carried out by treating an acid solution of the divalent salts with an alkaline oxidizing
agent. Under such conditions, cobalt is differentially oxidized and precipitated. This process is applicable only on cobalt-rich solutions.
The Sherritt Gordon Mines, Limited, Canada, started operation, in 1954-j of a plant designed to produce cobalt, nickel, and copper from sulfide ores. The process involves treating the nickel- copper-cobalt-iron sulfide concentrates under pressure with air and ammonia to dissolve the valuable metals and most of the sulphur,
leaving the iron and other impurities in a tailing, which is discarded.
The copper is first separated from the solution as sulfide by a boiling operation, the nickel is then precipitated by hydrogen under
pressure, the cobalt removed and purified, and the end solutions
(5) Kirk, R. E., and Othmer, D. F., Encyclopedia of Chemical Technology. Vol. 9, pp. 271-287, The Interscience Encyclopedia, N. Y., (1952).
7
evaporated to produce ammonium sulfate (6)* A number of other processes have been proposed for the recovery of cobalt and nickel
from ores. These are outlined in References 7 and 8* Notable among these is that used by the Calera Mining Company, which operated a plant for a short period of time at the Blackbird District, Lehmi County, Idaho. The process was based on separating chalcopyrite and cobaltite from iron sulfide by selective flotation followed by differential reduction of cobalt. The process, as started, has proven uneconomic and has been discontinued*
Liquid-liquid extraction is a unit operation of chemical engineering which has been used extensively for separating organic compounds from mixtures. The operation has been applied to the separation of inorganic mixtures in only recent years. Treybal (9) has summarized typical extraction equipment and has discussed process variables and applications. Evaluations of liquid-liquid extraction, as a potential operation for separating components of inorganic mixtures, have been limited by the lack of equilibrium data in multi- liquid phase systems. Moreover, it has only been in recent years that knowledge of interactions affecting the distribution of an
(6) Forward, F. A*. Can. Inst. Mining and Metallurgy, U6, 677 (1953)•(7) Materials Survey - Cobalt, loc. cit*(8) Materials Survey - Nickel, loc. cit.
(9) Treybal, R., Liquid Extraction, McGraw Hill Book Co., Inc. (1951).
8
inorganic substance between two liquid phases has become available* Much of this information is yet of a conjectory nature and requires experimental evaluations
A number of metal extraction studies have been made, but few of these studies have resulted in applications to the inorganic chemicals industry. Probably the most significant industrial application has been the purification of uranium for the processing of nuclear fuels,. The lanthanide elements have been subjected to liquid-liquid extraction on a small scale, A substantial amount of laboratory work has been done on the extraction of the chlorides of iron, cobalt, and nickel, with favorable results reported. No commercial applications have been reported.
In many of the major cobalt and nickel recovery processes, sulfuric acid solutions of the sulfates are used. Contrasted to studies made on the separation of cobalt and nickel chlorides, no work on an evaluation of the separation of the sulfates by liquid-liquid extraction has been reported. It is believed to be of importance to study the extraction of iron, cobalt, and nickel sulfates, so that an evaluation for commercial application can be made and also to compare results with those of other systems.
The solubility of inorganic sulfates in organic solvents is very small. This fact may well have deterred investigators from studying the extraction of any inorganic sulfate. However, such a study, even if it does not prove to be of commercial significance, would add to the fundamental knowledge of solute behavior in systems
9
containing more than one liquid phase. It would form a basis from which extensions to the study of different cations and anions could be made, JInally, such a study would present information which may well be applied at some future time to the behavior of ions in solutions.
10
LITERATURE REVIEW
1, The Extraction of Metal Halides
Many studies on the liquid-liquid extraction of metal halides have been made0 Although no evidence is available to suggest that any has been applied commercially, the separation of iron, cobaltj and nickel chlorides appears to have some promise0
a*. The Extraction of Ferric Chloride
The distribution of ferric chloride between aqueous hydrochloric acid solutions and isopropyl ether has been extensively investigated., Fundamental distribution data, the extracted compound, and transfer rate data in a continuous counter-current extraction column have been determined.
Dodson, Forney, Axelrod, and Swift (1, 2) found that the distribution coefficient, defined as the ratio of iron concentration in the isopropyl ether phase to that in the aqueous phase, reached a maximum corresponding to about 99*9 per cent extraction when the aqueous phase hydrochloric acid was 7*75-8 molar.. Below five molar hydrochloric acid, the distribution coefficient was negligible, and above eight molar acid, the distribution coefficient steadily decreased from the maximum value with increasing acid concentrations.
(1) Dodson, R. W., Forney, F. J«, and Swift, E. Ho, Jo Am. Chem. Sbc., 58, 2573 (1936).,(2) Axelrod, J, and StdJt, E*. H., Jo Am. Chem. Sbc*, 62, 33 (19 0).
11
The distribution •coefficient increased with increasing total iron at constant acid concentrations Temperature correlations made by Nachtrieb and Conway (3) agreed well with the van’t Hoff correlation It was concluded that iron (III) could be satisfactorily separated from cobalt., nickel, and a number of other elements*. Using isopropyl ether in a continuous counter-current extraction column, Geankoplis and Hixson (U) found that a 99*7 per cent extraction of ferric chloride could easily be obtained with only two per cent of the hydrochloric acid removed by the organic phase. They also extended the distribution data of Nachtrieb and Conway.
A considerable amount of work has been done to explain this abnormal distribution of ferric chloride. From ultra-violet absorption spectra, Nachtrieb and Conway showed that, in the ether phase, iron was in the complex form, FeCl3»HCl, regardless of hydrochloric acid concentration. The reaction could be represented by an equation of the type
n Fe (aq) * 11 H+(aq) + n tWeC%(ether)and, therefore,
9 (1) M ( ether) / 27“ (aq) ' K 7 ^ 7 ( a q )
where the bracketed terms represent activities and "n" the number of associated FeCl^’HCl units in the organic phase, Campbell and
(3) Nachtrieb, N. H. and Conway, J, G., J.. Am. Chem. Sbc., 70.3&7 (19U8).(I*) Geankoplis, C, J.. and Hixson, J. A., Ind. Eng. Chem., Ii2,111*1 (19f?0).
12
Clark (5) explained that at about seven molar hydrochloric acid, all aqueous phase water was combined as hydronium ions. Further hydrogen
chloride addition then greatly increased hydrogen chloride activity0 The net effect at high-acid concentrations was increased concentration
of the neutral complex FeCl3*HCl and, hence, increased extraction.For acid concentrations greater than eight molar, HCl/FeCl^ ratios were greater than one. The increased ether phase hydrogen chloride concen-
trations, corresponding to these higher aqueous-phase acid concentrations, were caused by anomalous solubility of the hydrogen chloride* This
additional chloride was associated with coordinated water or ether and
not directly to the iron* Additional acid then caused a 11 salting-out"
of the complex, decreasing extraction*At low iron concentrations, the Nernst ideal distribution
law was obeyed, and "h" of Equation 1 was shown to be equal to one*.With higher iron concentrations, at constant acid, the distribution coefficient was greater* Nachtrieb and Fryxell (6) found from ultra
violet absorption spectra that Beer's law was obeyed, and absorption peaks corresponding to only those indicated by the compound
FeCl^'HGl could be located* Based on electromotive force measurements of the ether phase, they found that iron activity in the ether phase increased less rapidly with concentration than in the aqueous phase*.
(5) Campbell, E*. E., Laurene, A. H,, and Clark, H, M*, J* Am* Chem. Soc., Tk, 6193 (1952).(6) Nachtrieb, N* H. and Fryxell, R* E*, J* Am* Chem* Soc,, 897(1952)o
13
S-rift, Myers, and Metzler (7, 8) concluded from isopiestic molecular weight studies that the ether phase iron was in the for (FeCl3»SCl)n, where "n" was a continuous function of iron concentration* let,
magnetic susceptibility measurements, which showed ether phase iron,
had a magnetic moment of 5.96 Bohr magnetons, excluded iron bonds
causing this polymerization.
The iron activity decrease in the ether phase was caused
by generalized hydrogen bond links between chloroferric acid and
ethereal oxygen to form unstable "oxoniura11 salts, polymerization taking
place through multiple hydrogen bonding. Such strong dipole inter
actions between ether molecules and chloroferric acid produced
clusters of indefinite size and structure without demanding new iron
linkages.. Under conditions for formation of these hydrogen bonds, the
iron activity in the ether phase was very low, thus giving high
extractions.
Isopropyl ether was not singular in ability to extract ferric chloride*. Isopropyl ether extracted other chlorides, and other
solvents extracted ferric chloride. In general, ethers, ketones,
(7) Swift, E. H*, Myers, R. J., and.Metzler, D* E., J. ilm. Chem, See., 72, 3767 (1950).
(8) Myers, R. J* and Metzler, D. E., J. M, Chem. Soc*, 72, 3772 (1950),
14
alcohols, and esters exhibited much the same behavior (9, 10)*Maximum distribution coefficients occurred at six to eight molar
hydrochloric acid in the aqueous phase, the value of the maxima
varying with the solvent. The complex, EeCl^HCl, was assumed to be
active with all solvents which gave high extractions of iron.
b*. The Extraction of Cobalt and Nickel
Garwin and Hixson (11) found that solvents having a polar
functional group dissolved anhydrous cobalt chloride, while only low
molecular weight alcohols dissolved anhydrous nickel chloride to any
appreciable extent. Based on cobalt and nickel solubility ratios,
capryl alcohol was chosen as the most promising solvent to be used in a liquid-liquid extraction operation separating these two elements.
Capryl alcohol preferentially extracted cobalt chloride from
aqueous solutions when certain inorganic chlorides were present as additives. The additives most beneficial to cobalt extraction were
chlorides, such as hydrochloric acid and calcium chloride, which have
high activity coefficients in aqueous solutions. It was noted that
(9) Kuzenetsov, V. I,, J. Gen. Chem. (U.S.S.R.), 175 (19U7)» Chemical Abstracts 19 6, 18a.
(10) Taketsu, R, J., Chem. Soc. Jap., Pure Chem. Sect., Jkf 82 (1953)3 Chemical Abstracts 1953» 79k&g»
(11) Garwin, L. and Hixson, A., Ind. Eng. Chem., Ul, 2298, 2303 (19 9).
15
these additives turned red-colored aqueous cobalt chloride solutions blue. No corresponding color changes of nickel chloride solutions were noted.
Without additives in the system., cobalt and nickel distribution coefficients-were on the order of magnitude of 0.001,.With additives present, distribution coefficients increased greatly with increasing total chloride concentration in the aqueous phase.At about 20 per cent hydrochloric acid, increases of the cobalt distribution coefficient on the order of 1000 times were noted. The corresponding nickel coefficient increased about 100 times, giving separation factors of almost 100, with cobalt being preferentially extracted. At corresponding calcium chloride concentrations, distribution coefficients and separation factors were somewhat lower than these. It was concluded, however, that either additive could be used to satisfactorily separate cobalt and nickel by extraction. At constant hydrochloric acid concentrations, the cobalt distribution coefficient increased greatly with increasing total cobalt. For example, at 16 per cent hydrochloric acid in the aqueous phase, the cobalt distribution coefficient increased 10 times when the total chloride concentration was increased from 18 to 28 per cent. The corresponding nickel coefficient increased only about two times over the same concentration range. Distribution coefficients were slightly higher when both cobalt and nickel were present together than when extracted separately* Temperature had varying effects on extraction, depending upon total chloride concentration.
16
Kylan.der and Garwin (12) used capryl alcohol to separate cobalt and nickel chlorides in a continuous counter-current extraction tower at 85° F. Aqueous feed contained about 25 per cent hydrochloric acid and 10 per cent metal salts, with almost equal amounts of cobalt and nickel. Separation factors averaging 200 to 1 were obtained with up to 85 per cent of the cobalt extracted. Less than 0o2 per cent nickel was removed from the aqueous phase.
No determinations of the extracted compound have been reported. However, the phenomenon of red cobalt solutions turning blue in the presence of certain chlorides, such as hydrochloric acid or calcium chloride, has been investigated independently. Numerous data are available to suggest formation of a complex anion, as represented by the following equation:
Co(H20)+ (red) ■' CoCljj" (blue) (2)Dawson and Chaudet (13) explain that the degree of formation of the blue anion depends on the solvating power of the added cation. Upon adding a cation with high solvating power to the aqueous cobalt chloride solution, solvation of the added cations is accompanied by desolvation of cobalt ions, Removal of the water molecules around cobalt allows electrostatic forces to bring chloride into the
(12) Kylander, R, L. and Garwin, L,, Chem. Eng, Progress, li7, 186 (1951)o(13) Dawson, L. R» and Chaudet, J. Ho, J. Chem. Phys,, 19, 771 (1951),
17
vicinity of cobalt, with subsequent interaction by exchange forces re suiting in the blue solutions*
Although no determinations of the structure of cobalt in capryl alcohol have been made, it appears reasonable to assume from Dawson and Chaudet's explanation that the compound CoCl I is involved. Such a compound would probably be more ionic than the corresponding iron compound, FeCl^’HCl, resulting in a lower distribution coefficient at corresponding acid concentrations*.
Kitahara (lit, 15) found that iodides and fluorides of cobalt and nickel could not be extracted by diethyl ether from, aqueous solutions of the corresponding acids*, This corroborates the inability to extract the chlorides with this solvent*.
c. The Extraction of Metal Halides Other Than Iron,Cobalt, and Nickel
A comparatively large amount of scattered information on the extraction of many metal halides is available* Almost all literature data refers to the use of ethers or ketones as solvents to extract the halides from aqueous solutions containing the acid of the halide involved* The data for different cations are difficult to compare, since, in some cases, only semi-quantitative results are given. Although, not without exception, it appears that the cations amenable to
(lU) Kitahara, 5*, Septs. Sci. Hesearch Inst, (Tokyo), 2 , k$h (19U8)5 Chemical Abstracts 1951, 2291 a*(15) Kitahara, S«, Repts. Sci* Research Inst. (Tokyo), 25, 165 (±9k9)j Chemical Abstracts 1951, 37U3 F*
I
IS
extraction have electron distributions of the types (n « 1) d-* ns np or (n - 1) d ° ns np, where the n orbitals are completely or partially vacated through ionization* In some cases, chloro-complexes similar to those formed with iron were noted* In many cases, maximum distribution coefficients were obtained when the aqueous phase acid was between six and eight molar*
Summaries of information on the extraction of halides are given in the following references: chlorides (16, 17, 18, 1?, 20,21), iodides (22, and fluorides (20, 23)*
2* The Extraction of Metal Nitrates
Mosb studies on the extraction of metal nitrates from aqueous solutions have been done in connection with the purification of lanthanide and actinide elements*. A comparatively small amount of work has been done on the extraction of cobalt and nickel nitrates* Ferric nitrate has been considered only in connection with the purification of uranium*
(16) S*ift, E* H«, J* Am* Chera* Soc*, U6, 2375 (192U).(17) Fischer, W., Z. Anorg* Chem., 70, 203 (1911)*(18) Nachtrieb, N* and Fryxell, R*, J* Am. Chem. See., 71, U035 (19U9)*(19) Edwards, F* and Voift, A*, Anal* Chem., 21, 120k (19b9)»(20) Higbie, K., Weming, J*, Grove, J,, Spiece, B„, and Gilbert, H., Ind. Sag* Chem., U6, 6I4I4. (195 )*(21) Holmquist, A*, Svensk Ken. Tid., U6, 2 (193U)o(22) Kitahara, S., Repts. Sci. Research Inst. (Tokyo), 2lj_, h$h (19U8).(23) Kitahara, S., Repts. Sci* Research Inst* (Tokyo), 25, 165 (19li9)*-
19
a. The Extraction of Cobalt and Nickel Nitrates
Templeton and Daly (21;, 25) made a number of studies on systems of the type metal nitrate-water-n«hexyl alcohol up to
saturation in the two liquid phase regions at 25°C0 Metals studied were calcium, cobalt, nickel, aluminum, manganese, zinc, and lanthanum.
In all cases, it was noted that the distribution coefficients were
proportional to some high power of the aqueous-phase metal concen
trations and approached one at the point of saturation* In all cases,
a solid phase appeared before the two liquid phase region dissappeared.
Cobalt and zinc nitrates were about per cent more extract able than magnesium nitrate* Calcium nitrate was only about one-tenth as
extractable as this*, Nickel was 50 per cent less extractable than
cobalt at low aqueous-phase concentrations but was more extractable
near the point of saturation* In qualitative experiments, it was
concluded that calcium nitrate could be used to "salt-out" cobalt nitrate from the aqueous phase.
No work on the structure of the extracted compound has been reported. However, in a spectrophotometric study of solutions of cobalt nitrate in t-butyl alcohol (containing up to six per cent
(2h) Templeton, C0 C* and Daly, L* K., J. Am. Chem. Soc<>, 7J3*3989 (195l)j J. Phys. Chem., 56, 215 (1952).
(25) Templeton, C. C*, J, Phys* Colloid Chem., 5H, 1255 (1950),
20
water), Katzin and Gebert (26) postulated a hexasolvated, but not
necessarily completely ionized, species 00X5(1 3)2* where X represents either water or alcohol molecules, existed.
The Separation of Hare Earth-lTitrates
Studies on nuclear and extra-nuclear properties of the rare
earths demand pure species. Since the rare earths occur together in
nature, they have to be separated* These separations were formerly
accomplished by fractional crystallisation, hundreds of recrystalli
zations often being required* In recent years, liquid-liquid
extraction of the rare-earth nitrates from aqueous solutions has proven
useful, saving time and energy in comparison to fractional crystalli
zation operations.
The majority of rare-earth extractions have been made using
micro-quantities of materials* In general, the degree of extraction
varied extremely with metal and nitric acid concentrations in the
aqueous phase. Distribution coefficients up to one or more were ob
tained. Tributyl phosphate was shown to be useful for separating
microamounts of most of the rare earth nitrates (27). Ethers, ketones,
. 1
(26) Katzin, L. I. and Gebert, E. J., Am. Chem. Soc., 72, 51+55 (1952),
(27) Peppard, D* F., Faris, J. P., Gray, P. R., and Mason, G. W,,J. Phys. Chem., 57, 29!+ (1953)*
21
esters, and alcohols could also be used (28, 29, 30). Separation factors of elements adjacent in the periodic table up to two could be obtained in some cases® The explanation for the cause of distribution preferential to the organic phase has not been noted, however, there are indications that neutral covalent structures in the organic phase are the cause.
Industrial operations using extraction to purify the rare earths cannot be expected, since large amounts are not available.Weaverj et al,, (31) recently reported the preparation of the first kilogram of gadolinium oxide by tributyl phosphate extraction from a mixture of rare-earth nitrates. It is also reported that the Oak Ridge National Laboratory has glass columns with sufficient throughput to make appreciable quantities of these elements available (32)®
c. The Extraction of Actinide Nitrates
In the atomic energy program, uranium fuel impurities having high-neutron absorption cross sections are necessarily decreased to minute amounts, 0,0001 per cent or less. Customarily, this purification
(28) Templeton, C® C. and Peterson, J. A., J. Am. Chem® Soc., 70,3967 (19U8).(29) Templeton, C, C., J. Am, Chem® Soc., 71, 2190 (I9U9),(30) Bock, R.. and Bock, E., Z. anorg, u. allgem. chem., 263, lU6 (19!?0)j Naturwissenshaften, 36, 3UU (19 9)®(31) Weaver, B,., Kappelman, F. A®, and Topp, A* C., J. Am. Chem. Soc®, 7£, 39U3 (19 3).(32) Chem. Eng., 61, No. 13, 76 (19#0.
22
is carried out by diethyl ether extraction of uranyl nitrate from an aqueous solution containing nitric acid and other inorganic nitrates to increase extraction A number of investigators have made fundamental studies on the extraction system* Warner (33) summarizes these and states that organic compounds containing 11 donor-type" groups such as oxygen were found best for extraction purposes. When the solvent molecular weight was low and steric hindrance effects negligible, the extraction was most favorable* Despite distribution coefficients; somewhat inferior to other solvents, diethyl ether was considered the best solvent, based on selectivity, cost, and availability.
Studies on the compound extracted indicate that, in organic solvents, uranyl nitrate is substantially unionized (3ll)« In esters, ketones, and ethers, an average of four water molecules of hydration water accompanied each molecule of uranyl nitrate, A probable structure for the uncharged, covalent molecule present would be Evidence suggested that solvent molecules:, by coordination through the donor nature of the oxygen atom, are attached either directly to the central uranium atom or by hydrogen bonding to the water molecules directly coordinated with the uranium atom. This neutral, solvated molecule with solvent-like properties accounts for the abnormal solubility of uranyl nitrate in many organic solvents. The relative extraction properties of different solvents could be predicted from
(33) Warner, R,. K,, Australian J* Applied Science, 3, 156 (1952),(3k) McKay, H, A, and Mathieson, A. R., Trans, Faraday Soc., k7} Ij.28, i+37 (1^1)*
23
solubilities of the hexahydrated salt. In all cases, solubility of the anhydrous salt in the anhydrous solvents were negligible (3?), Ammonium nitrate was shown to be a strong salting-out agent in all solvents exhibiting extraction. Ferric nitrate also greatly enhanced extraction. The effect of temperature on the degree of extraction was shown to be negligible (35)*
The extent to which diethyl ether extraction is used for uranium purification is not known, but operation on a large industrial basis has been reported (36, 37 j 38), Thorium nitrate can also be extracted by diethyl ether or tributyl phosphate in the presence of nitric acid and inorganic nitrates,. The separation of uranium and thorium is easily obtained (39)*- This separation is necessary if thorium is to be irradiated to produce high concentrations of U^3# Both thorium nitrate and uranyl nitrate can be extracted from water solutions, and since their distribution coefficients are different, they can be separated by this means,
(39) Warner, R. E., op, cit,(36) Treybal, R, E,, Liquid Extraction, p 392, McGraw Hill Book Co., Inc, (1991)*(37) Chemical Engineering, 61, Mo0 13, 80 (199U),(38) Irvine, J, W,, In The Science and Engineering of Nuclear Power, Co Goodman, Editor, Vol. 1, Addison-Wesley Press, Inc0, Cambridge, Mass, (191+7)»(39) Anderson, M. R., U.S.A.E.C., I.S.C,, 116, 3-18 (1990).Chemical Abstracts, 1991+, 7399 d.
24
3, The Extraction of Thiocyanates
It has long been-known that thiocyanate ions form covalent complexes with metal ions in aqueous solutions. The covalancy has led many workers to study the possibility of separating metals by extracting their complexes. Without elaborate schemes for the extraction system, however, only small quantities of materials could be handled, since the thiocyanates are only slightly soluble in water,. As a result, the operation has been mainly limited to the separation of microamounts of materials for analytical purposes, fibme analytical methods for analyzing microamounts of ferric iron involve extraction by such solvents as tributyl phosphate or ether (I4.O, Ul)* Rigamonti and Marchetti (lj.2) recently compiled available literature on the extraction of macroamounts of materials,
a. The Ssparation of Cobalt and Nickel
Rigamonti and Marchetti (1*2) recently demonstrated that large quantities of cobalt and nickel could be separated by amyl alcohol extraction of the thiocyanates. The systems studied were of the type, metal sulfate-ammonium thiocyanate-amyl alcohol-water at 25°C,, where the metal sulfates involved were cobalt and nickel0 By increasing
(I4O) Boclc, R., J, Anal, Chem,, 133, 110 (1951),(111) Melnick, L., Preiser, H», and Berghly, H,, Anal, Chem., 25, 856(1953), ~(I+2) Rigamonti, R* and Spaceamela-Marchetti, E», Chimica e industria-. (Milan), 36, 9I-8 (19510*

SCNCo + Ni ratios from 1 to 2k, cobalt distribution coefficients ranged from O.U). to 2.68, and nickel distribution coefficients ranged from 0.17 to 0o£„ Corresponding separation factors were 0.85 and $.20. These values varied only about 10 per cent when aqueous phase metal concentrations were varied.
By using counter-current flow in 19 stagewise contacts, with introduction of the cobalt and nickel mixture at the middle stage and introduction of the solvent and aqueous thiocyanate phases at opposite extreme ends, a 90 per cent separation was obtained* For example, in one run, the cobalt to nickel ratio in the extract was 0,89/0.11, and the same ratio in the raffinate was 0,099/0.901*
It was noted that the cobalt distribution coefficient variation with increasing thiocyanate concentration was much greater then the corresponding nickel coefficient. This was attributed to cobalt complexes of the type Co(SCN)n+2# whereas, nickel formed only Ni(SCN)2-
b. The Separation of Zirconium, Hafnium, and Rare Earths
Fischer and co-workers (it3j UU) studied the separation of zirconium and hafnium by diethyl ether extraction of the thiocyanate complexes. Although studies were not as complete as those on the separation of cobalt and nickel, much the same results were obtained,
(1j3) Fischer, W. and Chalybaeus, W., Zeitschrift fur anorg, chemie, 2# 3 No. 1-3, 79 (19U7).(ill;) Fischer, W., Chalybaeus, W., and Zunbusch, ■ M., Zeitschrift fur anorg. chemie, 25£, No, U-5, 277 (19U8)o
26
Appleton and Selwood (U5) attempted to extract the rare earth thiocyanates by n-butyl alcohol, They' found that good distributions were obtained, but maximum separation factors between elements adjacent in the periodic table were only on the order of 1.06* This separation was far below that encountered with extraction of rare earth nitrates*
U. The Extraction of Metal Sulfates
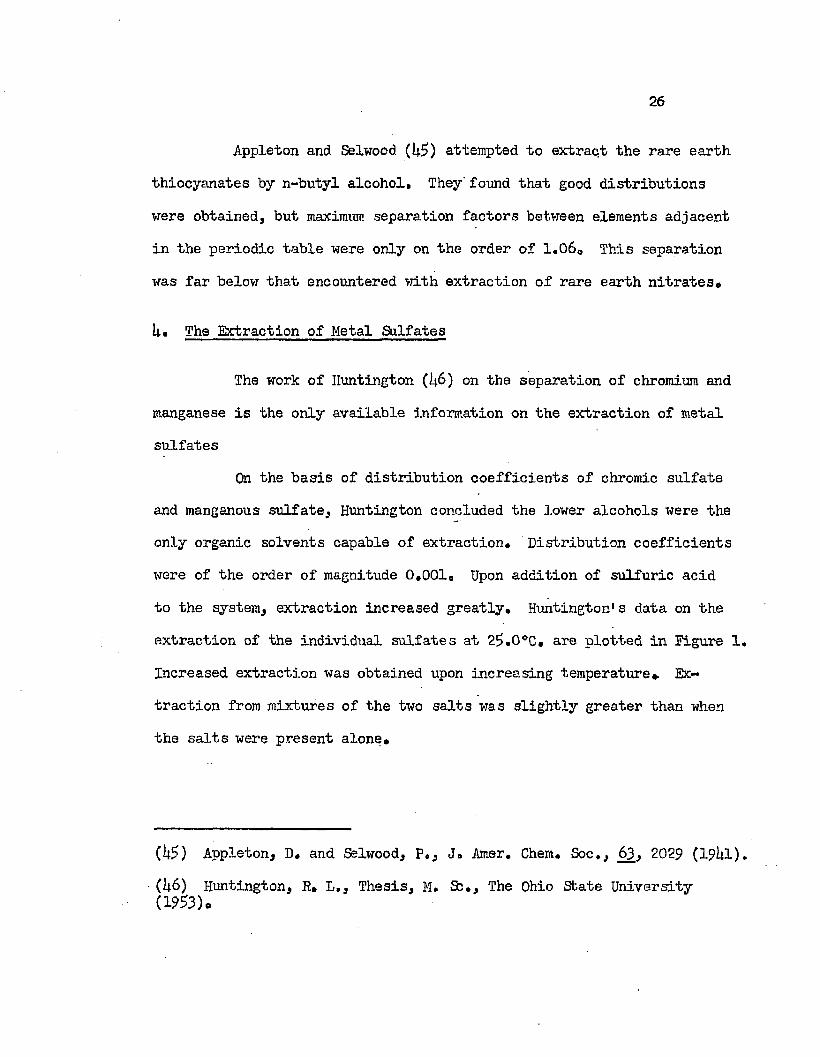
The work of Huntington (2+6) on the separation of chromium and manganese is the only available information on the extraction of metal sulfates
On the basis of distribution coefficients of chromic sulfate and manganous sulfate, Huntington concluded the lower alcohols were the only organic solvents capable of extraction* Distribution coefficients were of the order of magnitude 0.001* Upon addition of sulfuric acid to the system, extraction increased greatly. Huntington's data on the extraction of the individual sulfates at 2!?.0oC* are plotted in Figure 1. Increased extraction was obtained upon increasing temperature*. Extraction from mixtures of the two salts was slightly greater than when the salts were present alone*
(1*5) Appleton, D. and Selwood, P., J. Amer. Chem. Soc., 63, 2029 (192+1).(1*6) Huntington, R. L., Thesis, M. S3., The Ohio State University (1953)o
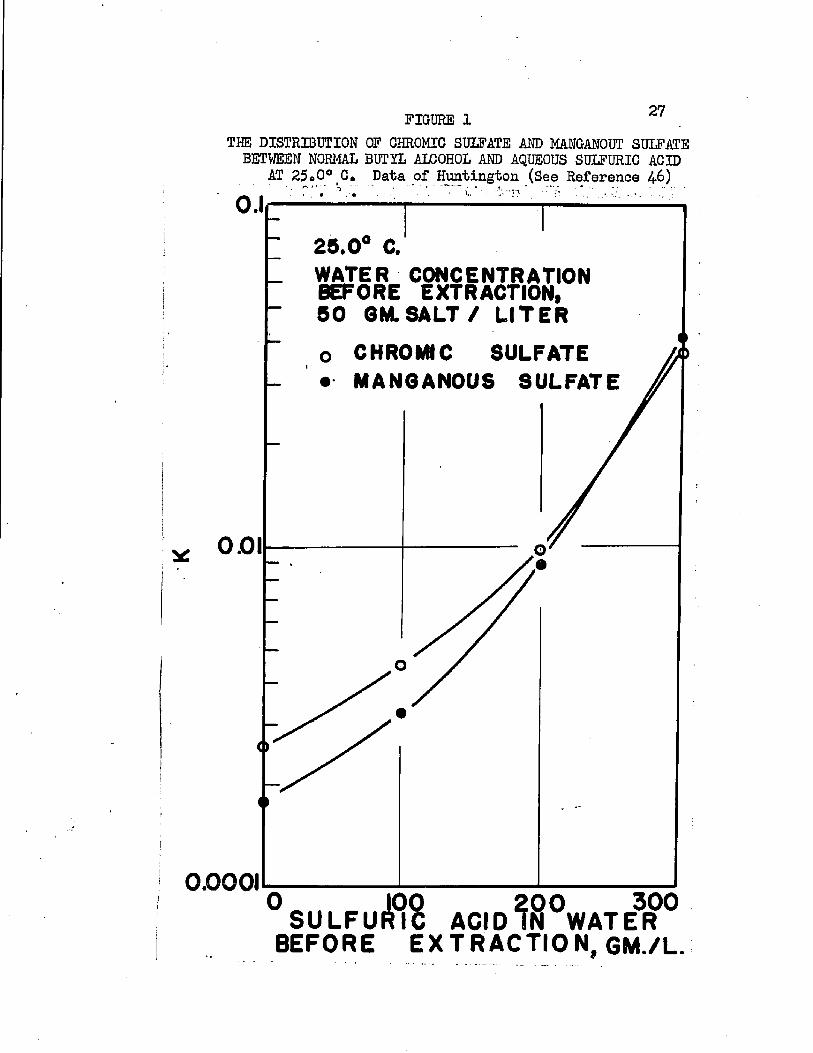
FIGURE 1 27THE DISTRIBUTION OF CHROMIC SULFATE AND MANGANOUT SULFATE BETWEEN NORMAL BUTYL ALCOHOL AND AQUEOUS SULFURIC ACID
AT 25oO° C. Data of Huntington (See Reference 46)' ■-- S - ' • ' - • ■; • .t. ..,., •0.125.0° C.WATER CONCENTRATION BEFORE EXTRACTION,50 GM. SALT / LITER
o CHROMIC SULFATE • MANGANOUS SULFATE
001
0.0001
° SULFUfflS ACID^S°WATE3R ° BEFORE E X TR A C TIO N , GM./L.
28
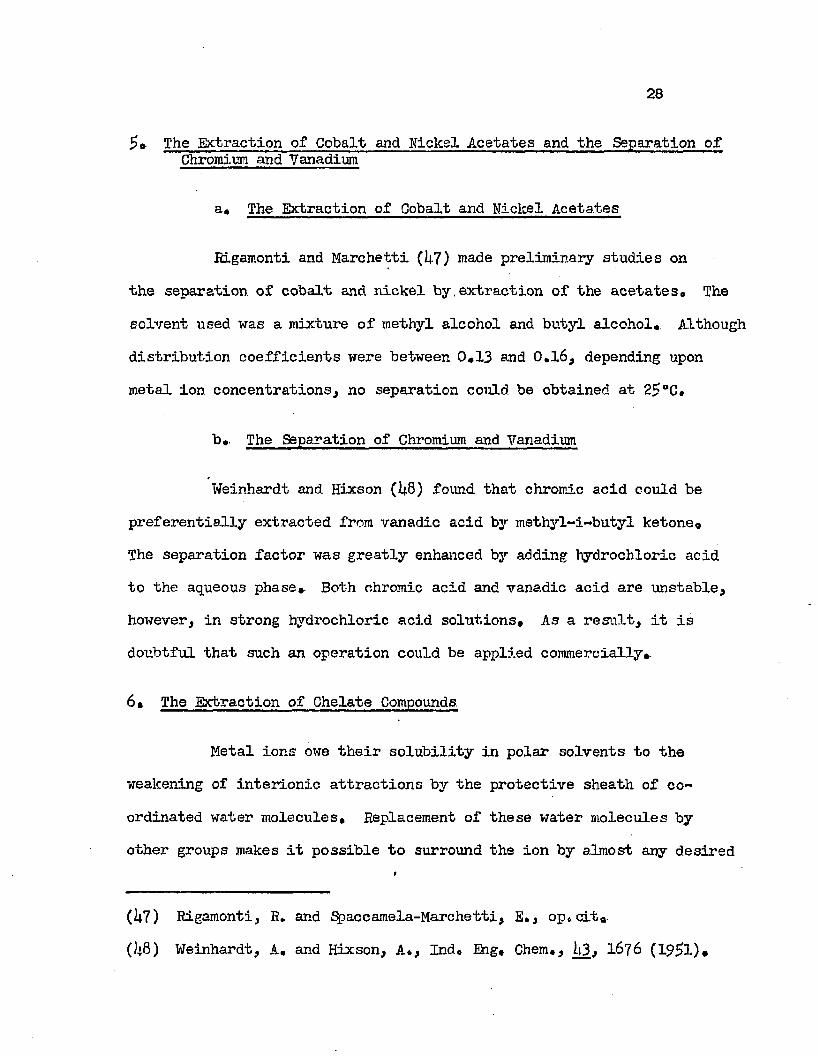
5* The Extraction of Cobalt and Nickel Acetates and the Separation of Chromium and Vanadium
a. The Extraction of Cobalt and Niclcel Acetates
Rigamonti and Marchetti (1+7) made preliminary studies on the separation of cobalt and nickel by, extraction of the acetates. The solvent used was a mixture of methyl alcohol and butyl alcohol. Although distribution coefficients were between 0.13 and 0.16, depending upon metal ion concentrations,, no separation could be obtained at 25°C.
b. The Separation of Chromium and Vanadium
Weinhardt and Hixson (1+8) found that chromic acid could be preferentially extracted from vanadic acid by methyl-i-butyl ketone*The separation factor was greatly enhanced by adding hydrochloric acid to the aqueous phase* Both chromic acid and vanadic acid are unstable,, however, in strong hydrochloric acid solutions. As a result, it is doubtful that such an operation could be applied commercially*
6. The Extraction of Chelate Compounds.
Metal ions owe their solubility in polar solvents to the weakening of interionic attractions by the protective sheath of coordinated water molecules. Replacement of these water molecules by other groups makes it possible to surround the ion by almost any desired
t
(k7) Rigamonti, R. and Spaccamela-Marchetti, E., op* cit*(1+8) Weinhardt, A, and Hixson, A., Indo Big, Chem., U3, 1676 (195>1)*
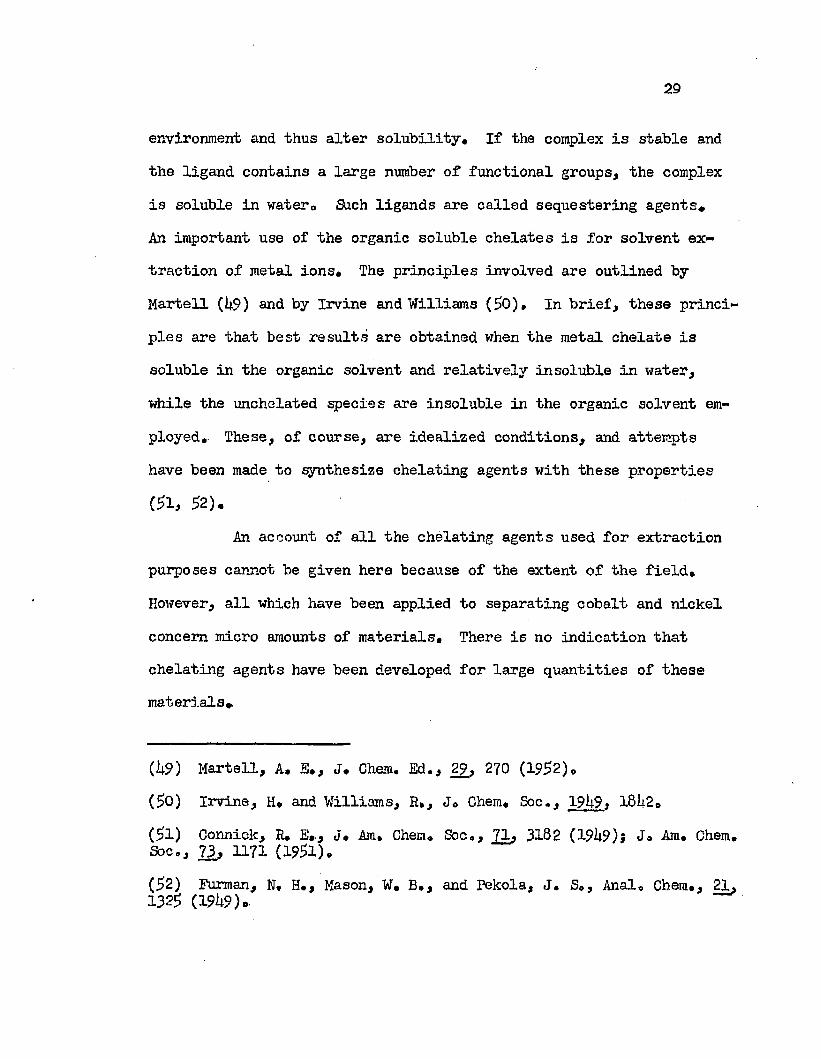
29
environment and thus alter solubility. If the complex is stable and the ligand contains a large number of functional groups, the complex is soluble in water0 Such ligands are called sequestering agents*An important use of the organic soluble chelates is for solvent extraction of metal ions. The principles involved are outlined by Martell (1*9) and by Irvine and Williams (50). In brief, these principles are that best results are obtained when the metal chelate is soluble in the organic solvent and relatively insoluble in water, while the unchelated species are insoluble in the organic solvent employed, These, of course, are idealized conditions, and attempts have been made to synthesize chelating agents with these properties
(51, 52),An account of all the chelating agents used for extraction
purposes cannot be given here because of the extent of the field. However, all which have been applied to separating cobalt and nickel concern micro amounts of materials. There is no indication that chelating agents have been developed for large quantities of these materials.
(1*9) Martell, A, E., J, Chem. Ed., 29, 270 (1952),(50) Irvine, H, and Williams, R,, Jo Chem* Soc., 191*9 j 181*20(51) Connick, R, E,, J, Am, Chem, Soc., 71, 3182 (19l*9)j J» Am, Chem, Soc., 73, 1171 (1951).(52) Furman, N. H,, Mason, W. B., and Pekola, J. S,, Anal, Chem,, 21, 1325 (19l*9)o.
30
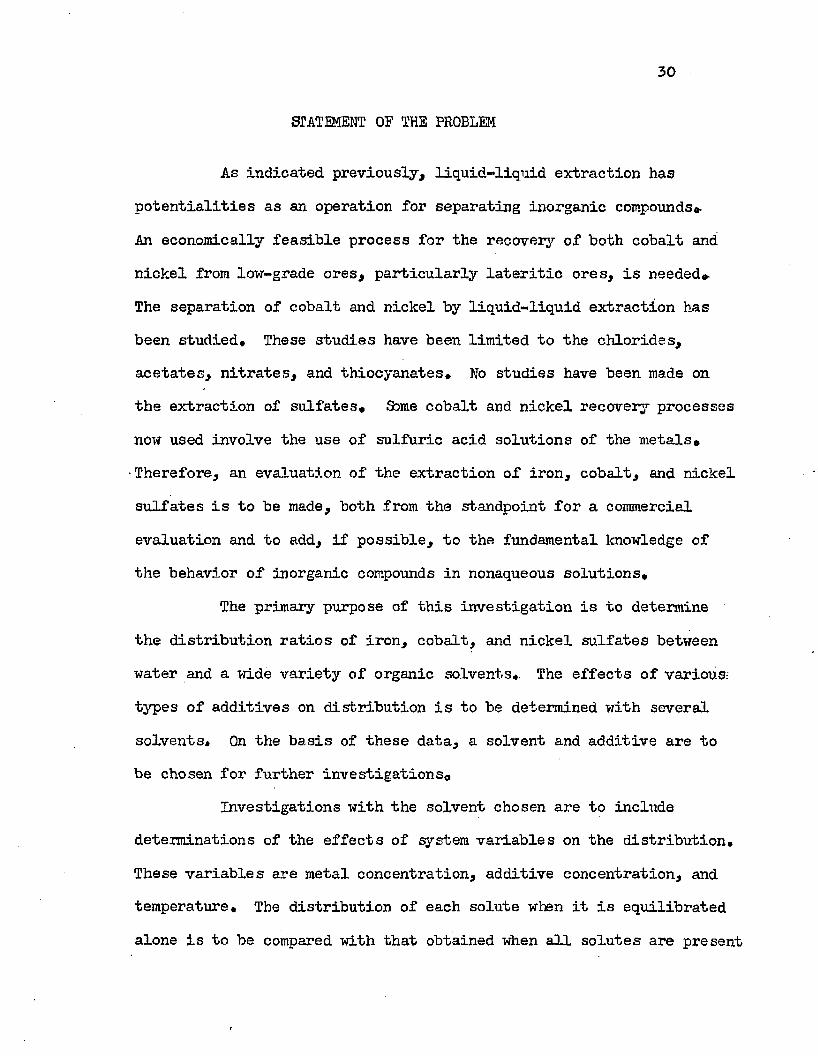
STATEMENT OF THE PROBLEM
As indicated previously, liquid-liquid extraction has potentialities as an operation for separating inorganic compounds*.An economically feasible process for the recovery of both cobalt and nickel from low-grade ores, particularly lateritic ores, is needed*.The separation of cobalt and nickel by liquid-liquid extraction has been studied* These studies have been limited to the chlorides, acetates, nitrates, and thiocyanates. No studies have been made on the extraction of sulfates. Some cobalt and nickel recovery processes now used involve the use of sulfuric acid solutions of the metals, ■Therefore, an evaluation of the extraction of iron, cobalt, and nickel sulfates is to be made, both from the standpoint for a commercial evaluation and to add, if possible, to the fundamental knowledge of the behavior of inorganic compounds in nonaqueous solutions.
The primary purpose of this investigation is to determine the distribution ratios of iron, cobalt, and nickel sulfates between water and a wide variety of organic solvents,. The effects of various; types of additives on distribution is to be determined with several solvents. On the basis of these data, a solvent and additive are to be chosen for further investigations*
Investigations with the solvent chosen are to include determinations of the effects of system variables on the distribution. These variables are metal concentration, additive concentration, and temperature. The distribution of each solute when it is equilibrated alone is to be compared with that obtained when all solutes are present
31
in the system simultaneously* The amounts of organic solvent entering the water phase and of water entering the organic phase upon extraction are then to be determined.
In summary, the over-all objectives of the problem are to comprehensively investigate the extraction of iron, cobalt, and nickel sulfates between water and various organic solvents and then to investigate the effects of several variables on the extraction with one solvent* Any leads which might add to the fundamental knowledge of solubility relationships are to be pointed out.
32
theory:
The simple distribution law is represented by the Nemst ideal distribution equation
Co/Cw, - K (1)where,
C0 * equilibrium concentration of solute in the organic phase.
Ctf * equilibrium concentration of solute in the water phase#
K " distribution coefficient.This relation has been found to apply only in very dilute solutions and in those systems where dissociation or association of the solute are negligible (1), Since ionic compounds are dissociated in the aqueous phase, Equation 1 cannot be expected to hold# If dissociation or association occurs in only the water phase, the relation becomes
Co/Cw?1 " K (2)where,
n “ dissociation or association number.Although Equation 1 is not applicable to ionic solutions, it still finds use for semi-quantit ative evaluations of solvents# If the variation of the distribution coefficient with concentration is known, the evaluation becomes more quantitative.
(1) Glasstone, 3,, Textbook of Physical Chemistry, Stecond Edition, p. 735> D. Van Nostrand Co,, N. Y. (19i|f>)0
33
The term selectivity is defined in the following manner:
@ " Kl/K2 C3)where,
@ * selectivity.= distribution coefficient of one solute.
Kg ” distribution coefficient of a second solute.The selectivity, consequently, gives a measure of the ease of separation in a fractional extraction process. The larger the value of the
estimated from the distribution coefficients of the solutes when the distribution coefficients are obtained from measurements on individual components of solutions. Sich is particularly true if the mechanisms of extraction are different for each solute. Experimental check on this assumption is always required.
obeys Raoult’s or Henry’s laws that a special case of the van’t Hoff equation can be written as
selectivity, <3> , the easier the separation. The value of may be
It can be shown for distribution systems in which the solute
d In K *» Cfc)where,
ALS = energy of solute transference from one phaseto the other.
This can be integrated directly, if the texm A L S is assumed to beconstant* Upon integration, Equation Ij. becomes
m “ a constant
(«
34
Since the original equation is based on Eaoult's or Henry* s laws, ionic compounds cannot be expected to obey this* In addition, the term A Ls cannot be expected to be constant unless the system obeys the simple distribution law*. Although Equation 5 is not applicable to ionic solutions, it still finds use for correlating data representing the effect of temperature on distribution. A plot of log K vs. l/T should give a straight line over short ranges where A Ls is essentially constant* This should be considered to be of an empirical nature, unless determinations on the system indicate otherwise.
Complex theories on the electrostatic effects of ions in solutions have been presented (2, 3). These theories are applicable quantitatively only to simplified systems under idealized conditions* Qualitatively, use can be made of the relationship expressing the energy required to remove an ion with valence *' z *» and radius "r" from a dielectric to a vacuum*. An equation representing this relationship is given as follows:
(*e>2 £ - 1/27 (6)Zr
where,e => electric charge.D ** dielectric constant
(2) Gurney, R. W., Ionic Processes in Solution., McGraw-Hill Book Company, Inc. (1953)*(3) Harned, H. S. and Owen, B. B., The Physical Chemistry of Electrolytic Solutions, Second Edition, Reinhold Publishing Corporation, N. Y., (1950)*
35
From this it follows that the energy required to transfer an ion with valence ’’z*1 and radius ,lr" from water to an alcohol is given by the relation
( S e )2 r I - i 1 (7)2r I Dale % \
where,Dale * dielectric constant of the alcoholo Dw « dielectric constant of water*
The above equations can be used to compare the distribution relationships between water and organic solvents with different dielectric constants and to compare the difference in dsitribution relationships among different ions.
36
ANALYTICAL METHODS
Analytical procedures were developed and verified by analyzing known standards. These involved analyses of relatively concentrated aqueous-phase and dilute organic-phase samples,* Procedures were chosen on the bases of simplicity and accuracy of method and interference of other components likely to be present. In some cases, alternate procedures were developed to check and use, if the primary methods were not applicable. Use of a particular procedure was dictated by the metal, by the metal concentration, and by other components present,
1, Aqueous-Phase Analyses
a. Aqueous-phase Nickel in the Absence of Cobalt and Iron
Aqueous-phase nickel, in the absence of cobalt and iron, was volumetrically determined with cyanide or gravimetric ally determined with dimethyl glyoxime, Any sulfuric acid present was neutralized prior to treatment*
Except in the presence of some alkyl acid phosphates,, nickel was determined by a variation of the cyanide volumetric method (1), The method used was found to give endpoint characteristics better than methods given in the literature,. Nickel solutions
(1) Kolthoff, I, M, and Sandell, E, B., Textbook of Quantitative Inorganic Analysis, 3rd Edition, p, 5k7> The MacMillan Co., New York ^ 2 ) ,
37
containing 0.01 to 0#!? gra. nickel were consecutively treated with 1.0:ml. of 0.1 M. silver nitrate, one drop of concentrated hydrochloric acid, and 2 ml. concentrated ammonium hydroxide in excess of that required to dissolve the silver chloride precipitate. The remainder of the scheme was carried out at about 10°Co Five ml. of 10 per cent potassium iodide were added and the solution titrated to clearness with 0.09 to 0.3 M. potassium cyanide, chosen so that 20 to £0 ml. cyanide solution were required. These cyanide solutions contained one gram potassium hydroxide per liter to inhibit cyanic acid formation.
After the cyanide endpoint was reached, a little of the organic compound involved was added, along with more silver nitrateand cyanide. In this manner, it was determined that the organiccompounds used had negligible effects on this determination. The main reactions in the determination are as follows:
Ag* +2CN“ — >■ Ag(CN)2“ (1)Ni++ - CN” — ■ Ni(CN)^= (2)
Calculations based on these equations showed that no titration blank was required.
The cyanide method for nickel determination was checked on a weighed sample of nickel ammonium sulfate and also independently by the analytical laboratory of the Battelle Memorial Institute# In 13 verification analyses on solutions containing 0.01 to 0 gm. nickel, maximum error was O.89 per cent, while average error was 0.21 per cent. Average deviation from the arithmetic mean was 0.20 per cento Sbdium sulfate had no effect on the determination*
38
In the presence of some alkyl acid phosphates, nickel was determined gravimetric ally by the standard dimethyl glyoxime method# Kolthoff and Sandell outline the method used (2)#
b. Aqueous-Phase Cobalt in the Absence of Iron and Nickel
Aqueous-phase cobalt, in the absence of iron and nickel, was determined colorimetric ally# In the solvent search program, cobalt was determined by measuring light absorption of the aqueous solutions by a method outlined by Gagnon (3)# The procedure essentially involved diluting the cobalt sulfate solution to a concentration of one to three mg. cobalt per ml. and measuring light absorption at a wave length of 530 mu., using water as reference. The absorption equation, for solutions containing less than 300 mg. cobalt per 100 ml,, could be represented by the following:
C - 1.358 530 (3)where, ^530 * optical density of the solution at a
wave length of 530 mu.Color was stable for at least 2l+ hours and was assumed to be indefinitely stable. Up to five per cent sulfuric acid or sodium sulfate had no effect on absorption characteristics. The effect of organic compounds was ascertained by saturating a standard and diluting tnis in the same manner as the unknown* No large deviations were noted*
(2) Kolthoff, I. M* and Sandell, E. B., op. cit., p, 689.(3) Gagnon, J., Chemist-Analyst, U3, No. 1, 15 (March, 19514)•
39
All determinations by measuring 530 mu. light absorption were made on solutions containing 150 to 300 mg. cobalt per 100 ml.In 17 verification analyses on solutions containing up to five per cent sulfuric acid or sodium sulfate, average error was 0.32 per cent* Maximum error was 1.70 per cent. These determinations were made on cobalt sulfate solutions determined independently by the analytical laboratory of the Battelle Memorial Institute and by O^-nitroso- 0“ naphthol gravimetrically by the procedure given by Kolthoff and Sandell (1+) •
In measuring the distribution between water and n-butyl alcohol, cobalt was determined by measuring the light absorption of a concentrated hydrochloric solution of cobalt. The sample was treated by evaporating the water from about 20 mg. cobalt, dissolving the residue in hydrochloric acid, and measuring light absorption at 650 mu. using concentrated hydrochloric acid in the reference cell* The absorption equation, for solutions containing less than 3 mg* cobalt per 50 ml. hydrochloric acid, could be represented by the following:
c = 0.565 f 650 (10where, C ■ mg. cobalt per $0 ml.
^650 = optical density at 650 mu.The method is outlined by Yoe (5).
(U) Kolthoff, I. M* and Sandell, E. B., op. cit., p. 92,(5) Xoe, J. H., Photometric Chemical Analysis, Vol. 1, p. 172, John "Wiley and Sons, Inc., (192&)'*
40
All aqueous-phase cobalt determinations by the chloride method were made on solutions containing more than one mg. cobalt per $0 ml. hydrochloric acid solution. In this range, on 11 verification analyses, average error was 0.61 per cent. Maximum error was 1.69 per cent. Cobalt samples used in these verification determinations were checked by a weighed amount of cobalt chloride and by the light absorption of the aqueous solutions at $30 mu.
c. Aqueous-Phase Iron
Aqueous-phase iron was determined by the standard dichromate method as outlined by Kolthoff and Sandell (6). The method is based on the quantitative oxidation of ferrous to ferric ions in strong acid solutions containing the sodium salt of diphenylamine sulfonate as indicator. The procedure involved reduction of ferric iron to the ferrous state with stannous chloride in strong acid solution, oxidizing excess stannous chloride with mercuric chloride, and titrating with standard potassium dichromate after adjustment of pH. The effects of organic solvents on the endpoint were noticed by behavior at the end point. Titration blanks, run on saturated aqueous solutions, showed normal butyl alcohol had no effect on the determination. In cases where the solvent did interfere with the titration,, no further analyses attempts were made, since those solvents had other
(6) Kolthoff, I. M., and Sandell, E. B., op0 cit., p. £80.
41
characteristics detrimental to extraction. Titration blank was 0.08 ml. when 0.02 normal dichromate was used and negligible when 0.1 normal dichromate was used.
If no sulfuric acid was present in the system, the aboveprocedure was applied directly to an aliquot of the aqueous phase*If sulfuric acid was present* the acid was neutralized and the iron precipitated with ammonium hydroxide. The precipitate was filtered* dissolved in hydrochloric acid, and treated by dichromate0. The filtrate was saved for total sulfate determination.
Standard dichromate was prepared by diluting a weighed amount of dry potassium dichromate. This calculated concentration was checked by analyzing dried and weighed samples of ferrous ammonium sulfate. In five verification determinations on solutions containing 0.02 to 0.3 gm. iron, average error was 0.11 per cento Maximum errorwas 0.2 per cent. ■
This standardized dichromate was used to analyze a sample of stock ferric sulfate solution. In seven verification determinations on solutions containing 0.01 to 0.2 gram ferric iron, and up to 0.3 gram sulfuric acid, average deviation from the arithmetic mean was less than 0.2 per cent* Maximum deviation was 1.0 per cento Analyzed iron in a mixture composed of 0.0200 gram each of iron, cobalt, and nickel, and 0.300 gram sulfuric acid was 0.5 per cent greater than the mean value without these added salts present*
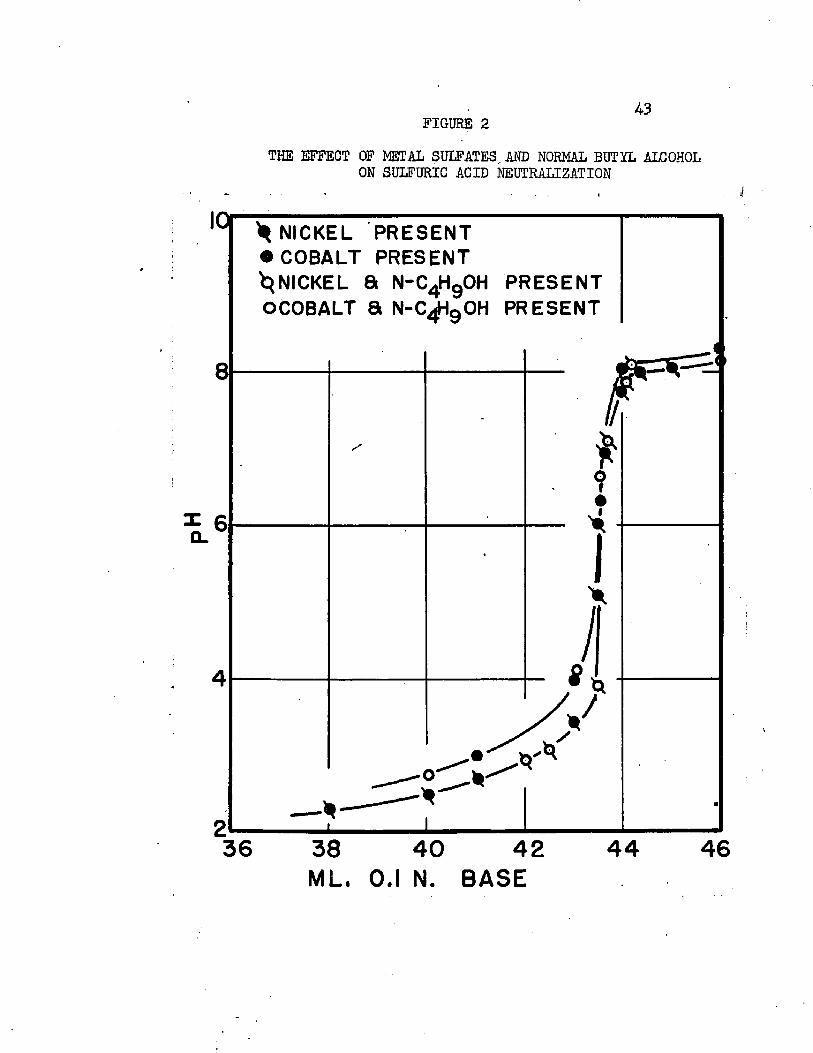
FIGURE 243
THE EFFECT OF METAL SULFATES, AND NORMAL BUTYL ALCOHOL ON SULFURIC ACID NEUTRALIZATION
^ NICKEL PRESENT • COBALT PRESENT ^NICKEL 8 N-C4Hg0H PRESENT OCOBALT a N-C^HgOH PRESENT
3836 4440 42 46ML. 0.1 N. BASE

44
e* Aqueous-Phase Total Sulfate
Total sulfate was determined by precipitating barium sulfate by the procedure outlined by Kolthoff and Sandell (7), The procedure involved pH adjustment and precipitation of barium sulfate in hot solution* Digestion of the precipitate was carried out for 8 hours or more. Ignition of the precipitate was made overnight at 900°G* in a temperature-controlled muffle furnace. In two verification determinations on known standards containing 0.05 gm, cobalt and O.Oi; gm'. nickel, maximum error in total sulfate was 0.3 per cent,. In four verification determinations on solutions containing OoOl to 0.01; gm, iron, up to 0,3 gm, sulfuric acid, and 0,5 ml, n-butyl alcohol, maximum error in total sulfate was 0,3 per cent,
f, Aqueous-Phase MixturesAqueous-phase samples containing mixtures of iron, cobalt,
nickel, and sulfuric acid were analyzed in part by the analytical laboratory of the Battelle Memorial Institute, The procedures used are presented here*
Two 10.0 ml, aqueous-phase samples were taken. The first of these was treated for iron and sulfuric acid analyses, and the other was sent to the analytical laboratory.
The first samples for iron and sulfuric acid analyses were diluted to 100.0 ml. and aliquot portions taken for analyses. Iron
(7) Kolthoff, I. M. and Sandell, E. B., op. cit., p. 322.
45
analyses were made by the dichromate method, as outlined previously. Sulfuric acid analyses were made by a total sulfate determination, as outlined previously. Sulfuric acid was determined by subtracting the theoretical sulfate accompanying all metal cations in the system from the total*
The second samples for cobalt and nickel analyses by the analytical laboratory were first heated with nitric acid until fumes were evolved, removing any organic compound present. These were than diluted and aliquot portions taken for analyses. In excess of 3$ ml. of ammonium hydroxide, above that required to neutralize the acid, were added to each sample* Two grams sodium disulfite were added and cobalt and nickel plated out of solution on tared platinum electrodes. The electrodes were weighed and stripped of metal content with nitric acid. Aliquot portions of each sample were than treated with hydrogen peroxide in acidic cyanide solutions to oxidize cobalt* The method is complex, involving the safe removal of cyanide funes. The procedure is outlined by Diehl (8). Final nickel separation was made by dimethyl glyoxime precipitation. Cobalt was determined by difference from the weight of the total metal electrolyzed in a preliminary step.
Evaluations for the determination of iron and sulfuric acid have been presented previously. Known standards were run concurrent with cobalt and nickel unknowns. Eesults for two determinations are given below:
(8) Diehl, H., The Application of the Dioximes to Analytical Chemistry, The G. Frederick Snith Chemical Co0, Columbus, Ohio*
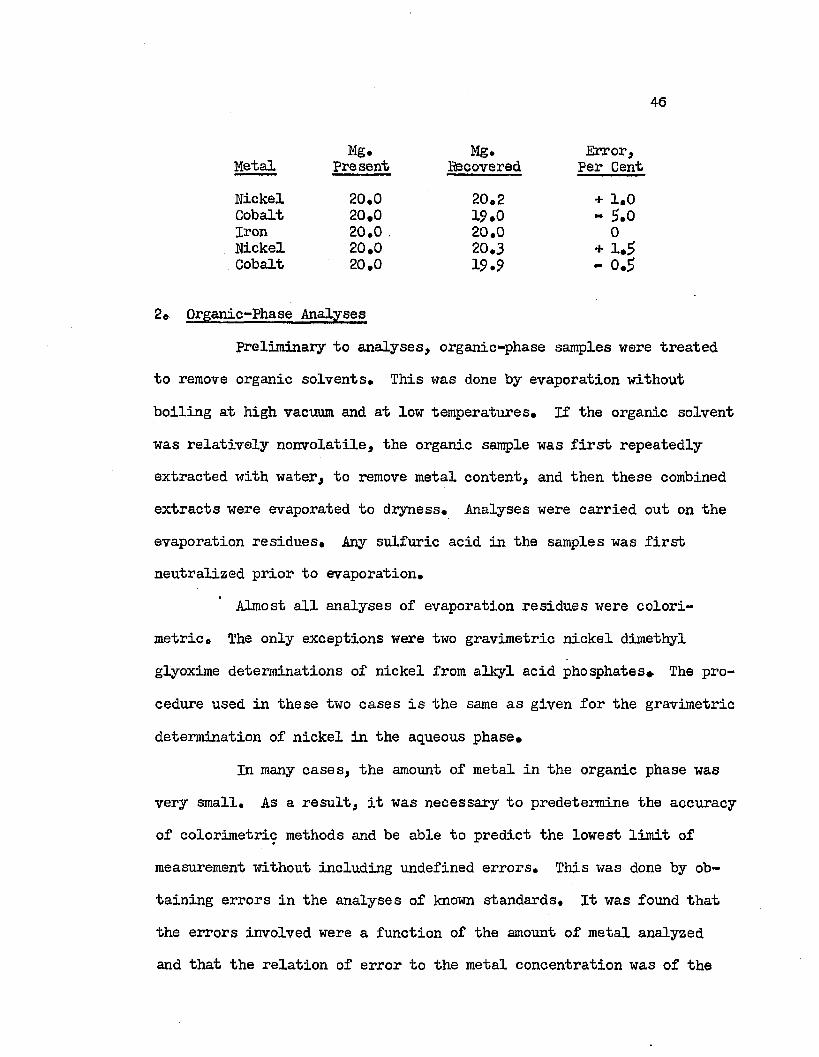
46
Mg. Mg. Error,Metal Present Hecovered Per CentNickel 20.0 20.2 + 1.0Cobalt 20.0 19.0 - 5.0Iron 20.0 . 20.0 0Nickel 20.0 20.3 + 1.5Cobalt 20.0 19.9 - 0.5
2» Qrganic-Phase AnalysesPreliminary to analyses, organic-phase samples were treated
to remove organic solvents. This was done by evaporation without boiling at high vacuum and at low temperatures. If the organic solvent was relatively nonvolatile, the organic sample was first repeatedly extracted with water, to remove metal content, and then these combined extracts were evaporated to dryness. Analyses were carried out on the evaporation residues. Any sulfuric acid in the samples was first neutralized prior to evaporation.
Almost all analyses of evaporation residues were colorimetric. The only exceptions were two gravimetric nickel dimethyl glyoxime determinations of nickel from alkyl acid phosphates* The procedure used in these two cases is the same as given for the gravimetric determination of nickel in the aqueous phase*
In many cases, the amount of metal in the organic phase was very small. As a result, it was necessary to predetermine the accuracy of colorimetric methods and be able to predict the lowest limit of measurement without including undefined errors. This was done by obtaining errors in the analyses of known standards. It was found that the errors involved were a function of the amount of metal analyzed and that the relation of error to the metal concentration was of the

47same form, regardless of the metal analyzed or the procedure used, fibmi- theoretical relationships were developed which described this relationship of error to concentration. This is discussed below, along with applications to each individual metal analysis procedure.
a. Colorimetric Error
Maximum errors in colorimetric procedures were found to obeya hyperbolic relationship when the error was plotted on coordinate scales against the metal concentration. This was determined in the analyses of a large number of known standards. To correlate these maximum errors, the absorption equations were examined to find an equation which would express this hyperbolic relationship, An equation was found and is derived.
C = metal concentration in the analysis sample, (p * the optical density of the analysis sample, lc = a constantI = transmission of the analysis sample,*I0“ transmission of the reference cell.
Differentiating Equation 5 and combining the result with Equation 5,
Beer's law is expressed by the equation
(*)where,
(6)
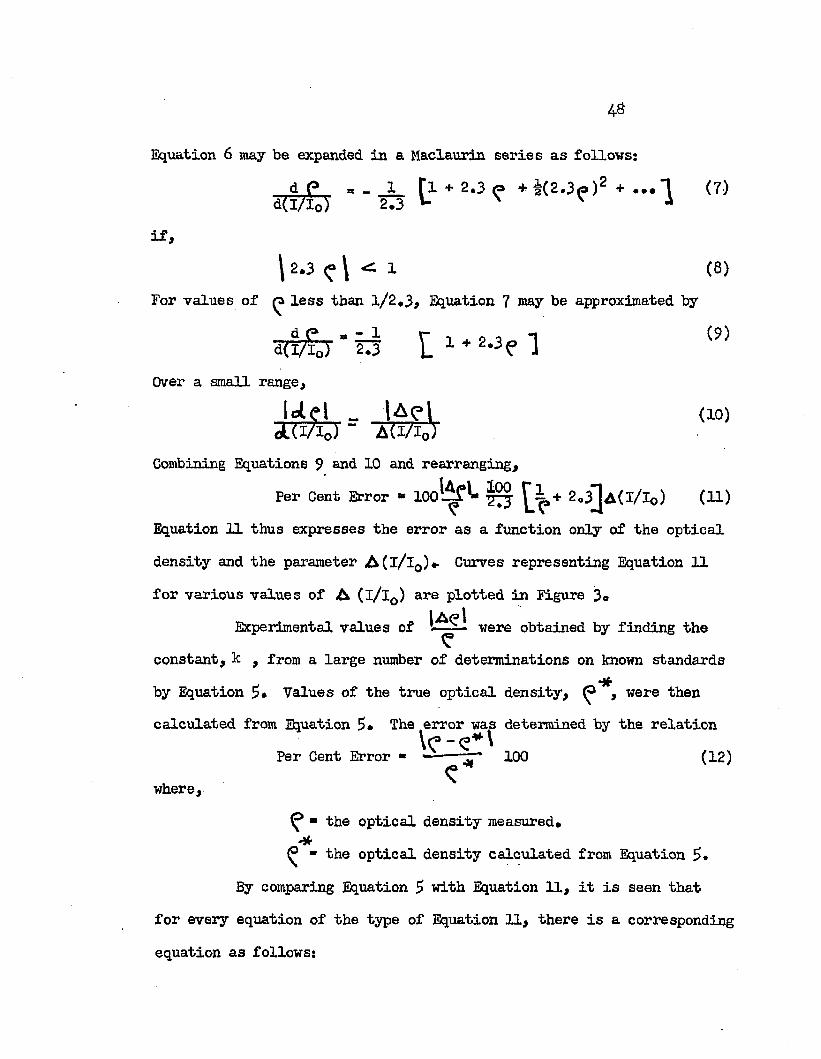
Equation 6 may be expanded in a Maclaurin series as follows:d (=> - - J L ri + 2.3<=> + i(2.3p )2 + *..1 (7)
d(l/l0) 2.3 *- X Vif,
\ 2.3 ? \ 1 (8)For values of less than 1/2.3, Equation 7 may be approximated by
£ l * 2 j e 1 <»>
Over a small range,
JdgL r -lAel do)U m J A(i/I0)
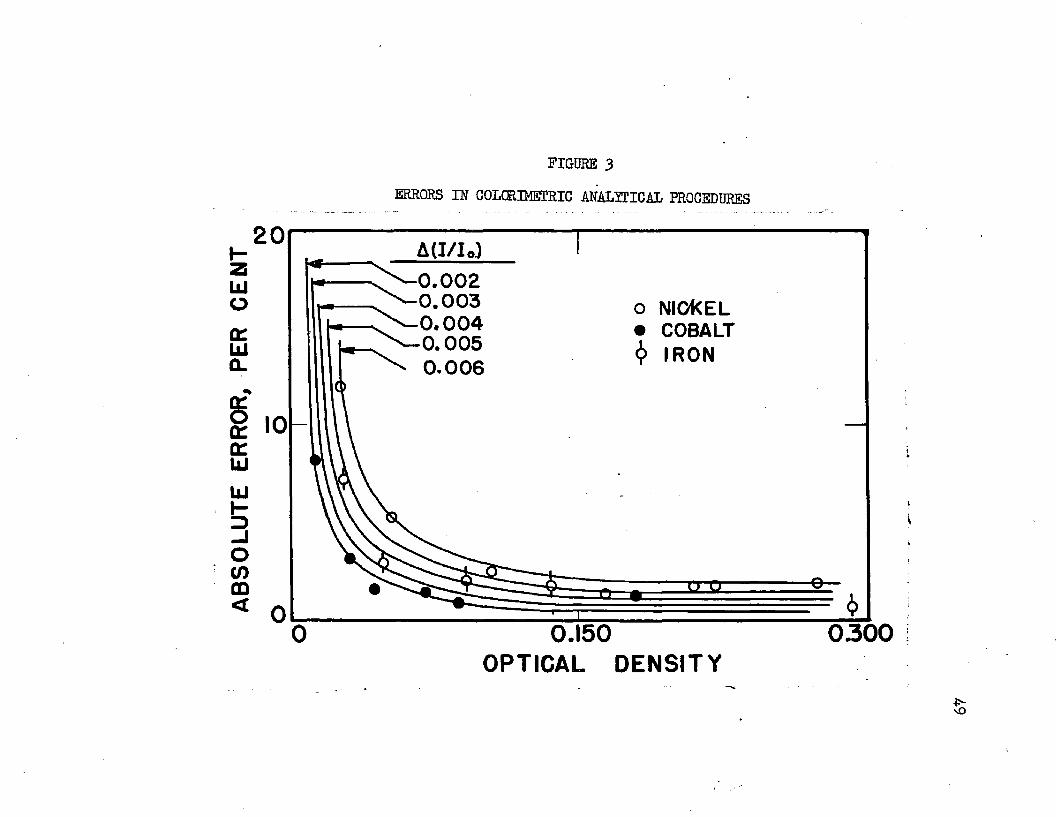
Combining Equations 9 and 10 and rearranging,Per Cent Error « 10o!*f^ § 3 2.3[]a(I/Io) (U)
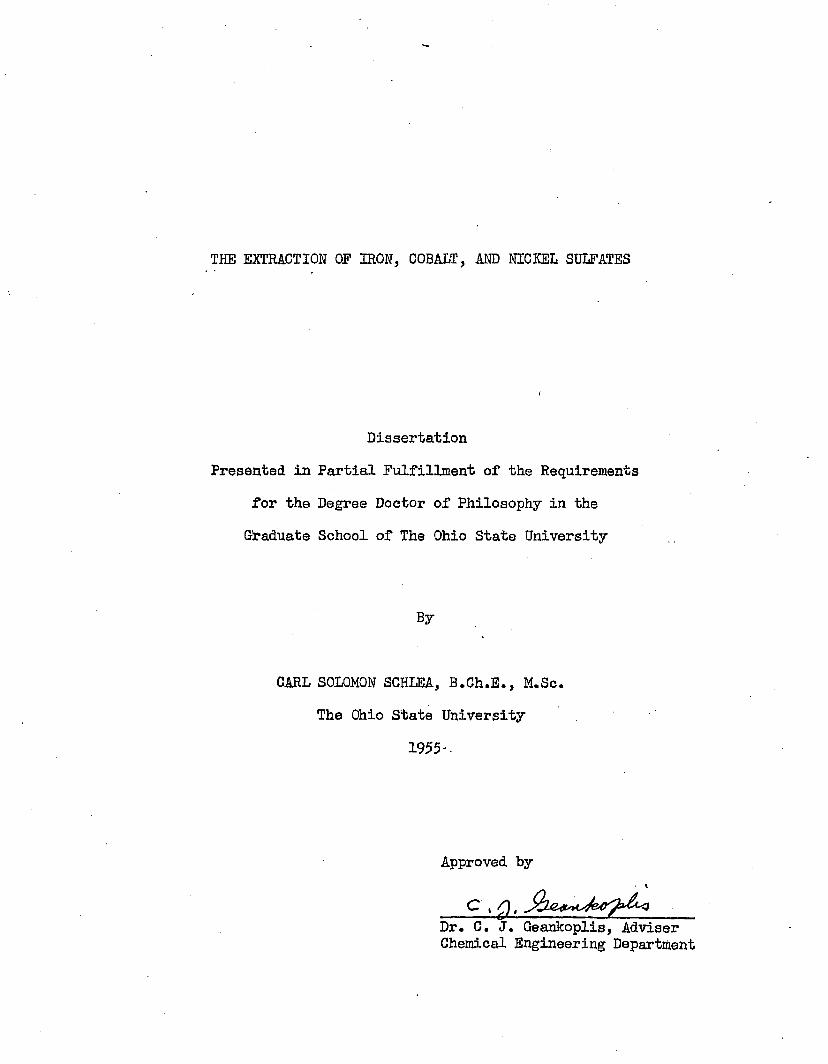
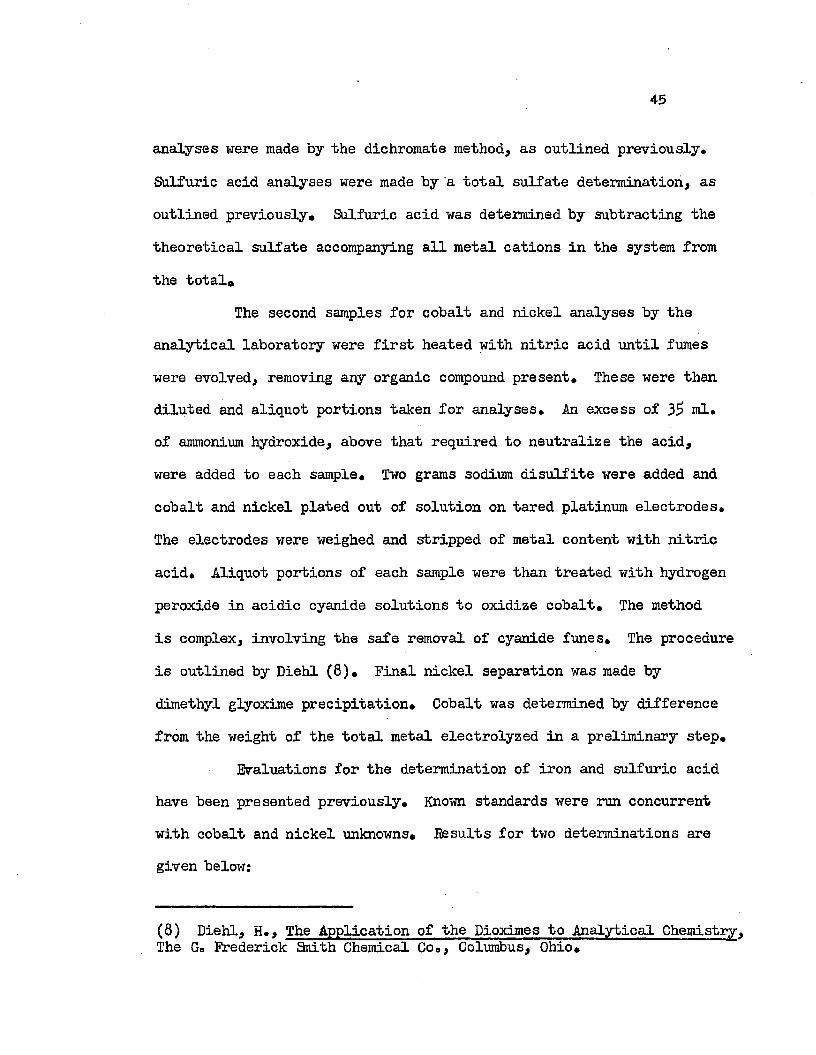
Equation 11 thus expresses the error as a function only of the opticaldensity and the parameter A(l/l0)*- Curves representing Equation 11for various values of A (l/l0) are plotted in Figure 3o
lA(?lExperimental values of — were obtained by finding the constant, k , from a large number of determinations on known standards by Equation Values of the true optical density, (p , were then calculated from Equation 5* The error was determined by the relation
Per Cent Error ■ - 100 (12)where,
^ ■ the optical density measured.* the optical density calculated from Equation £•
By comparing Equation £ with Equation 11, it is seen that for every equation of the type of Equation 11, there is a corresponding equation as follows:
42
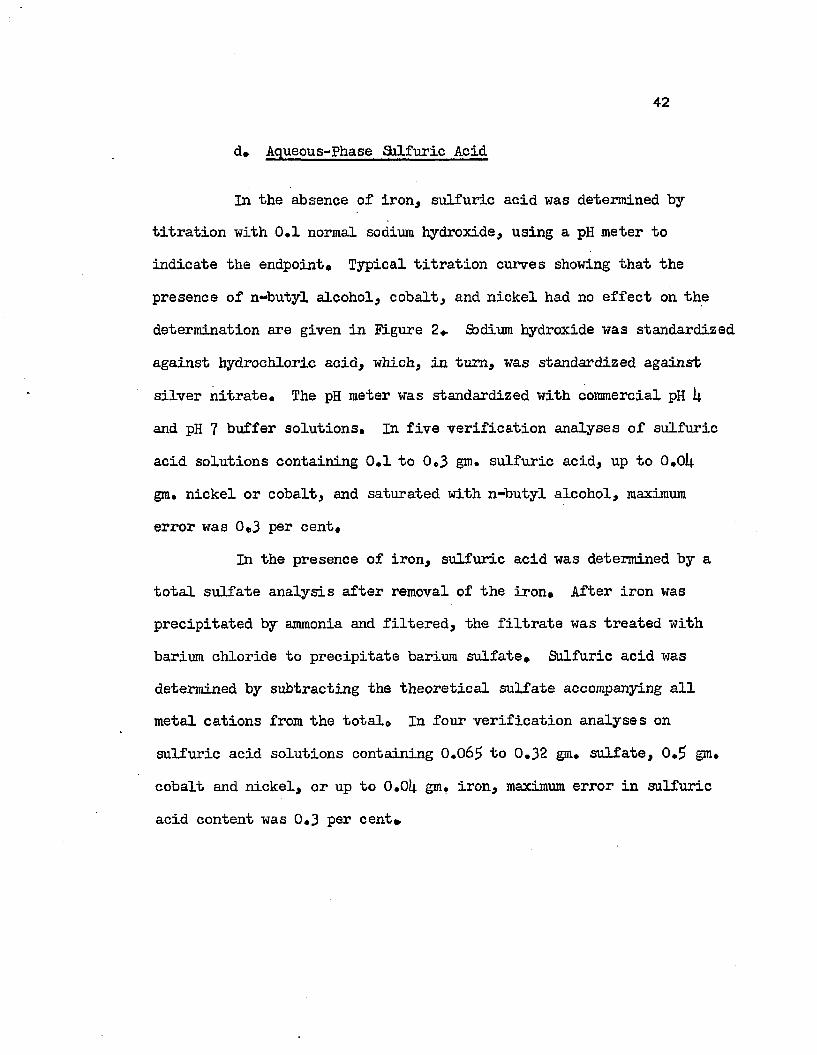
d. Aqueous-Phase Saif uric Acid
In the absence of Iron, sulfuric acid was determined by titration with 0.1 normal sodium hydroxide, using a pH meter to indicate the endpoint. Typical titration curves showing that the presence of n-butyl alcohol, cobalt, and nickel had no effect on the determination are given in Plgure 2* Sodium hydroxide was standardized against hydrochloric acid, which, in turn, was standardized against silver nitrate. The pH meter was standardized with commercial pH k and pH 7 buffer solutions. In five verification analyses of sulfuric acid solutions containing 0.1 to 0.3 gm. sulfuric acid, up to O.0I4. gm. nickel or cobalt, and saturated with n-butyl alcohol, maximum error was 0.3 per cent.
In the presence of iron, sulfuric acid was determined by a total sulfate analysis after removal of the iron. After iron was precipitated by ammonia and filtered, the filtrate was treated with barium chloride to precipitate barium sulfate. Sulfuric acid was determined by subtracting the theoretical sulfate accompanying all metal cations from the total0 In four verification analyses on sulfuric acid solutions containing 0.065 to 0.32 gm. sulfate, 0.5 gm. cobalt and nickel, or up to O.Oij. gm. iron, maximum error in sulfuric acid content was 0.3 per cent*
ABSO
LUTE
ER
ROR,
PE
R C
EN
T
FIGURE 3ERRORS IN COLORIMETRIC ANALYTICAL PROCEDURES
A(I/Io)0.002 0.003
> ^ - 0.004 0.0050.006
o NICKEL COBALT
6 IRON
0.150 OPTICAL DENSITY
0300£-vO
50
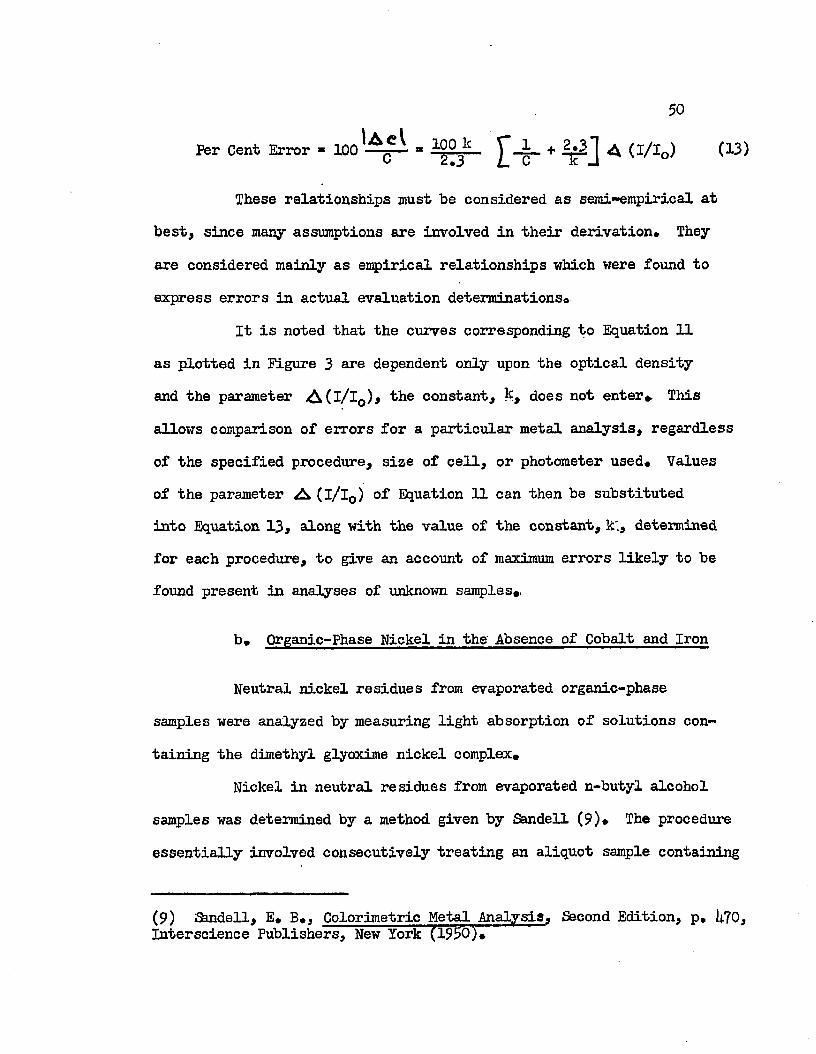
Per Cent Error ■ 100^ ^ + ^ (l/lo)
These relationships must he considered as serai-empirical at best, since many assumptions are involved in their derivation* They are considered mainly as empirical relationships which were found to express errors in actual evaluation determinations®
It is noted that the curves corresponding to Equation 11 as plotted in Figure 3 are dependent only upon the optical density and the parameter A(l/lQ)j the constant, does not enter*. This allows comparison of errors for a particular metal analysis, regardless of the specified procedure, size of cell, or photometer used* Values of the parameter A (l/l0) of Equation 11 can then be substituted into Equation 13, along with the value of the constant, k'., determined for each procedure, to give an account of maximum errors likely to be found present in analyses of unknown samples*.
b* Qrganic-Phase Nickel in the Absence of Cobalt and Iron
Neutral nickel residues from evaporated organic-phase samples were analyzed by measuring light absorption of solutions containing the dimethyl glyoxime nickel complex*
Nickel in neutral residues from evaporated n-butyl alcohol samples was determined by a method given by Sandell (9)* The procedure essentially involved consecutively treating an aliquot sample containing
(9) Shndell, E* B*, Colorimetric Metal Analysis* Second Edition, p. 1*70, Interscience Publishers, New York (19 0)*

51
less than 0*12 mgo nickel, with nine ml. of one N, hydrochloric acid, 20 drops bromine water, one ml* ammonia in excess of that required to decolorize the solution, and one ml, of a one per cent solution of dimethyl glyoxime in alcohol* This was then diluted to 50 ml, and the optical density measured after five minutes, using a 530 mu* filter and water in the reference cell* A Lumetron Colorimeter with 18 mm. cells was used for this work* The color was found to be stable for at least 15 minutes.
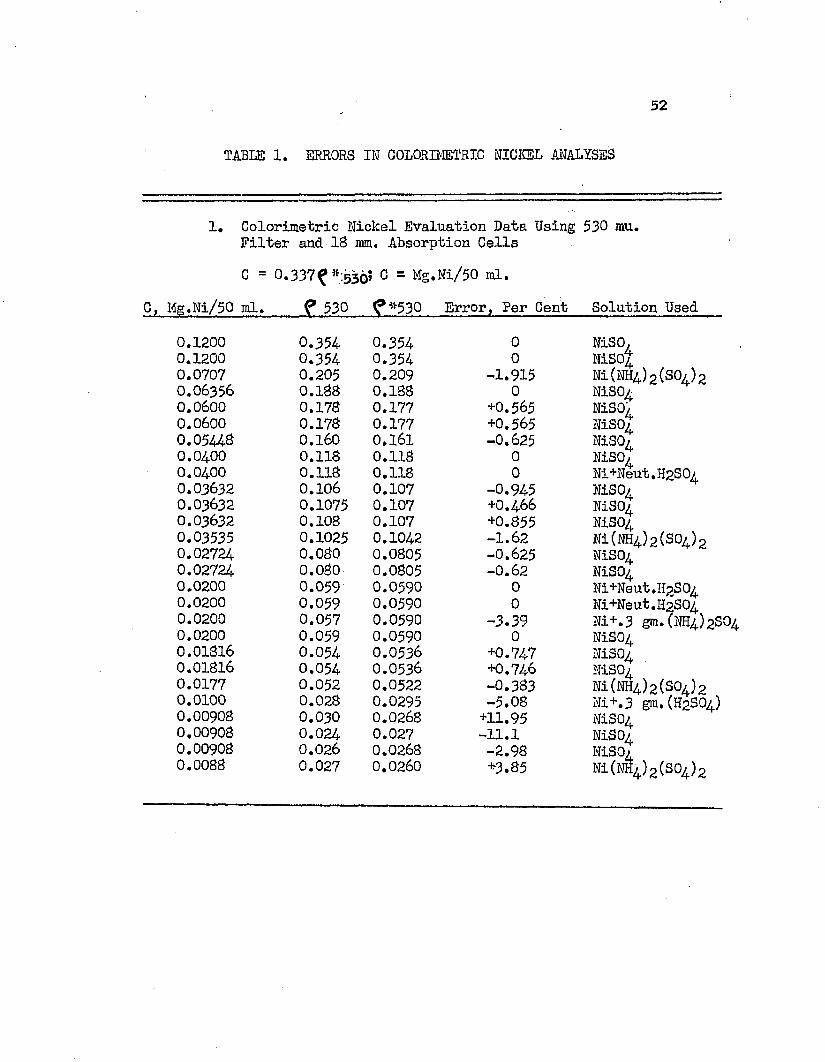
The standard color curve was prepared from nickel solutions determined by cyanide titration and from weighed amounts of nickel ammonium sulfate* These data, along with that used to determine the order of magnitude of errors, are given in Table 1* Maximum errors in these determinations are plotted in Figure 3* These errors show that A (l/l0) of Equation 11 was 0*006, and the error equation was
Per Cent Error ** + 0.60 (ll*)cwhere, C * mg, Ni/50 ml.Typical values of error, as calculated from Equation ll*, aretabulated below:
Cj Mg«rNi/5Q ml. Absolute Error3 Per Cent0.10 1.1*80.05 2*350*025 1**110.020 k*990.010 9.370.005 2i*,ll*0.0025 U7o7
52
TABLE 1. ERRORS IN COLORIMETRIC NICKEL ANALYSES
1. Colorimetric Nickel Evaluation Data Using 530 mu. Filter and 18 mm. Absorption CellsC = 0,337^ m;536? C = Mg.Ni/50 ml.
C, Mg.Ni/50 ml. ? 530 ^*530 Error, Per (
0.1200 0.354 0.354 00.1200 0.354 0.354 00.0707 0.205 0.209 -1.9150.06356 0.188 0.188 00.0600 0.178 0.177 +0.5650.0600 0.178 0.177 +0.5650.05448 0.160 0.161 -0.6250.0400 0.118 0.118 00.0400 0.118 0.118 00.03632 0.106 0.107 -0.9450.03632 0.1075 0.107 +0,4660.03632 0.108 0.107 +0.8550.03535 0.1025 0.1042 -1.620.02724- 0.080 0.0805 -0.6250.02724. 0.080 0.0805 -0.620.0200 0.059 0.0590 00.0200 0.059 0.0590 00.0200 0.057 0.0590 -3.390.0200 0.059 0.0590 00.01816 0.054 0.0536 +0.7470.01816 0.054 0.0536 +0.7460.0177 0.052 0.0522 -0.3830.0100 0.028 0.0295 -5.080.00908 0.030 0.0268 +11.950.00908 0.024 0.027 -11.10.00908 0.026 0.0268 -2.980.0088 0.027 0.0260 +3.85
NiSO,NiS0tNi(NH4.)2(S0/)2NiSONiSO/NLSO4NiSO/NiSO/Ni+Neut.H2S0/NiSO/MSO4NiS04Ni(NH4)2(S04)2NiS04MSO4Ni+Neut.H2S04Ni+Neut.H2S04Ni+.3 gm.(NH4)2S04NiS04MSO4NiS04Ni(M4)2(S04)2Ni+,3 gm,(H2SO4)MSO4NiS04NLSQ4Ni(NS4)2(S04)2
53
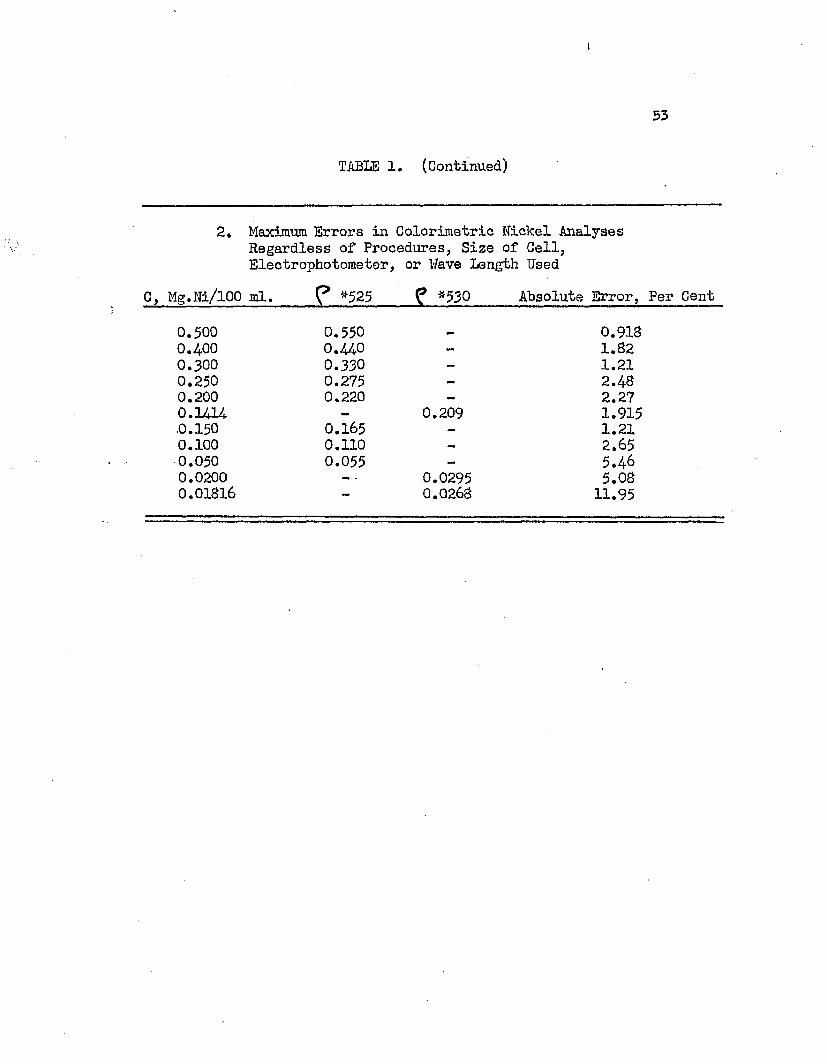
TABLE 1. (Continued)
2. Maximum Errors in Colorimetric Nickel Analyses Regardless of Procedures, Size of Cell,Electrophotometer, or Wave Length Used
C, Mg.Ni/lOO ml. *525 f *530 Absolute Error, Per Cent
0.500 0.550 - 0.9130.400 0.440 - 1.320.300 0.330 - 1.210.250 0.275 - 2.480.200 0.220 — 2.270.1414 — 0.209 1.915.0.150 0.165 — 1.210.100 0.110 — 2.650.050 0.055 - 5.460.0200 — - 0.0295 5.080.01816 - 0.0268 11.95
54
The tabulated data of Table 1 show that sodium sulfate and ammonium sulfate in the analysis sample had no detrimental effect on the determination*
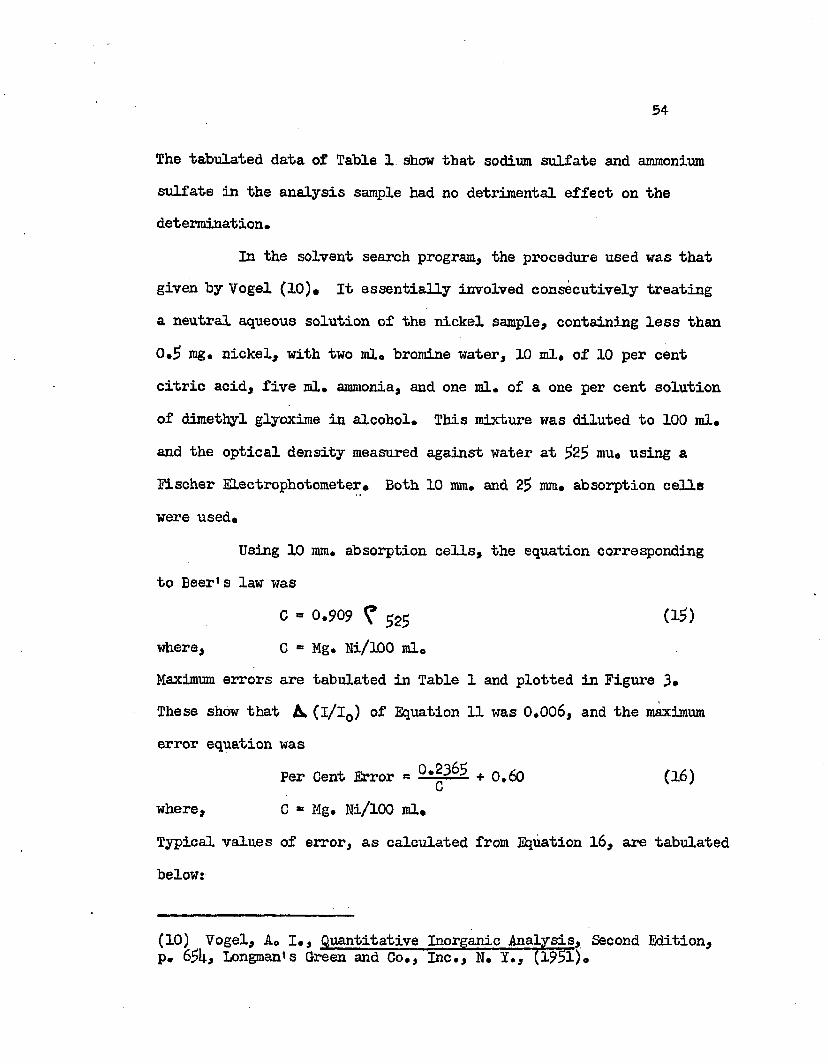
In the solvent search program, the procedure used was that given by Vogel (10)* It essentially involved consecutively treating a neutral aqueous solution of the nickel sample, containing less than 0*5 mg* nickel, with two ml* bromine water, 10 ml* of 10 per cent citric acid, five ml* ammonia, and one ml* of a one per cent solution of dimethyl glyoxime in alcohol* This mixture was diluted to 100 ml* and the optical density measured against water at $25 mu* using a Fischer Electrophotometer* Both 10 mm* and 25 mm* absorption cells were used*
Using 10 mm* absorption cells, the equation corresponding to Beer1s law was
C = 0.909 ^ 525 (15)where, G = Mg. Ni/100 mloMaximum errors are tabulated in Table 1 and plotted in Figure 3*These show that (l/l0) of Equation 11 was 0*006, and the maximum error equation was
Per Cent Error = ^ + 0*60 (16)cwhere, C ■ Mg, Ni/100 ml*Typical values of error, as calculated from Equation 16, are tabulated below:
(10) Vogel, A* I,, Quantitative Inorganic Analysis, Second Edition, p* 651;, Longman’s Green and Co., Inc., N* I., (1951)*
55
C» Mg* Ni/100 ml. Absolute Error, Per Cent
0.3 1*390.1 2.970.05 5.330.025 10.10.010 2k,2
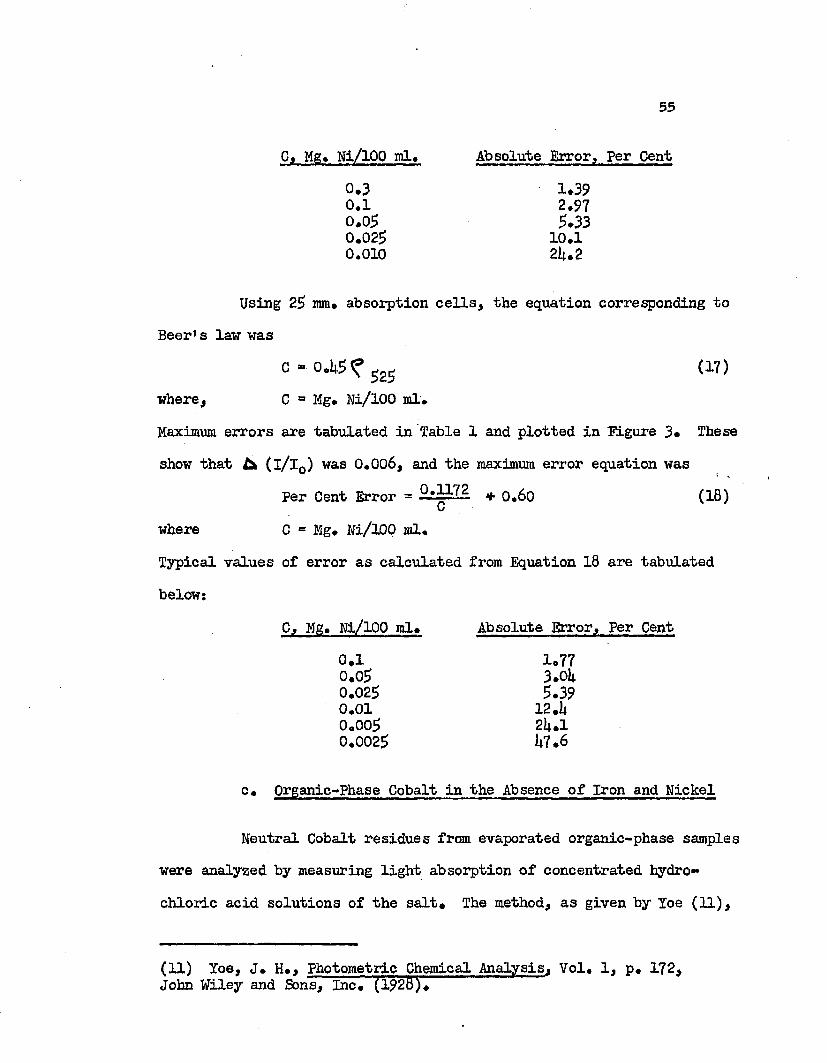
Using 25 mm. absorption cells, the equation corresponding to Beer's law was
C- 0.1|5<? 025 (17)where, C a Mg. Ni/100 ml*Maximum errors are tabulated in Table 1 and plotted in Plgure 3. Theseshow that & (l/l0) was 0.006, and the maximum error equation was
Per Cent Error = * 0.60 (18)cwhere C = Mg. Ni/100 ml.Typical values of error as calculated from Equation 18 are tabulated below:
Cj Mg. Ni/100 ml. Absolute Error. Per Cent0.1 1.770.05 3 .Oil0.025 5.390.01 12 .ll0.005 2li.l0.0025 U7.6
c. Qrganic-Phase Cobalt in the Absence of Iron and Nickel
Neutral Cobalt residues from evaporated organic-phase samples were analyzed by measuring light absorption of concentrated hydrochloric acid solutions of the salt* The method, as given by Toe (11),
(11) Toe, J. H., Photometric Chemical Analysis, Vol. 1, p. 172, John Wiley and Sons, Inc. (1928).
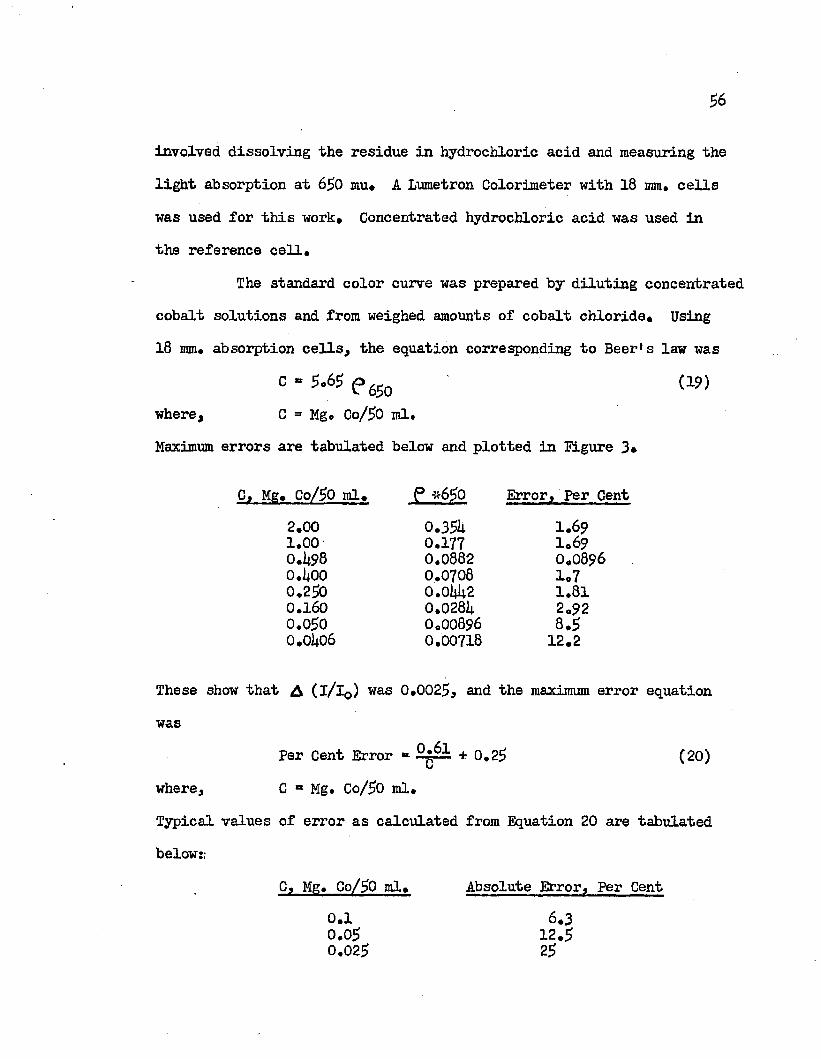
56
involved dissolving the residue in hydrochloric acid and measuring the light absorption at 650 mu* A Lumetron Colorimeter with 18 mm. cells was used for this work* Concentrated hydrochloric acid was used in the reference cell.
The standard color curve was prepared by diluting concentrated cobalt solutions and from weighed amounts of cobalt chloride* Using 18 mm* absorption cells, the equation corresponding to Beer* s law was
0 " 5*6S P650 {19)where, C = Mg. Co/50 ml.Maximum errors are tabulated below and plotted in Figure 3*
C, Mg* Co/50 ml* P »650 Error. Per Cent2.00 0.351* 1.691.00 0.177 1*690.1*98 0.0882 0*08960.1*00 0.0708 1.70.250 0.01*1*2 1.810.160 0.0281* 2.92o.o5o O0OO896 8.50.01*06 0.00718 12.2
These show that A (i/lo) was 0*0025, and the maximum error equation was
Per Cent Error »■ + 0.25 ( 20)where, C ** Mg. Co/50 ml.Typical values of error as calculated from Equation 20 are tabulated below:;
C, Mg. Co/50 ml* Absolute Error, Per Cent0.1 6.3 0.05 12.50.025 25
57
Standards run on hydrochloric acid solutions saturated with ammonium sulfate or sodium sulfate showed these salts had no effect on the determination, although sulfuric acid did. As a result, all sulfuric acid in the organic-phase samples was neutralized prior to evaporation. Residues from evaporated n-butyl alcohol samples did not change these color characteristics. In the solvent search program, standards were run on almost every solvent to ascertain the effect of any solvent which might be left in the residue. In most cases, these effects were not noticeable, Any change in absorption characteristics was noted*
d, Organic-Phase Iron in the Absence of Cobalt and Nickel
Iron residues from evaporated organic-phase samples were analyzed by measuring light absorption of solutions containing the ferric thiocyanate complex. The method, as given by Vogel (12), involved adding two ml, of 1:1 hydrochloric acid, five ml, of a liO per cent potassium thiocyanate solution, diluting to £0,0 ml,, and measuring the optical density at 1*90 mu.
The standard color curve was prepared from iron solutions determined by the dichromate volumetric method and from weighed amounts of ferrous ammonium sulfate. The light absorption of the thiocyanate complex was found to vary with time. Typical data showing the effect of time on the light absorption are given below:
(12) Vogel, A, L., op, cit., p, 6 6,
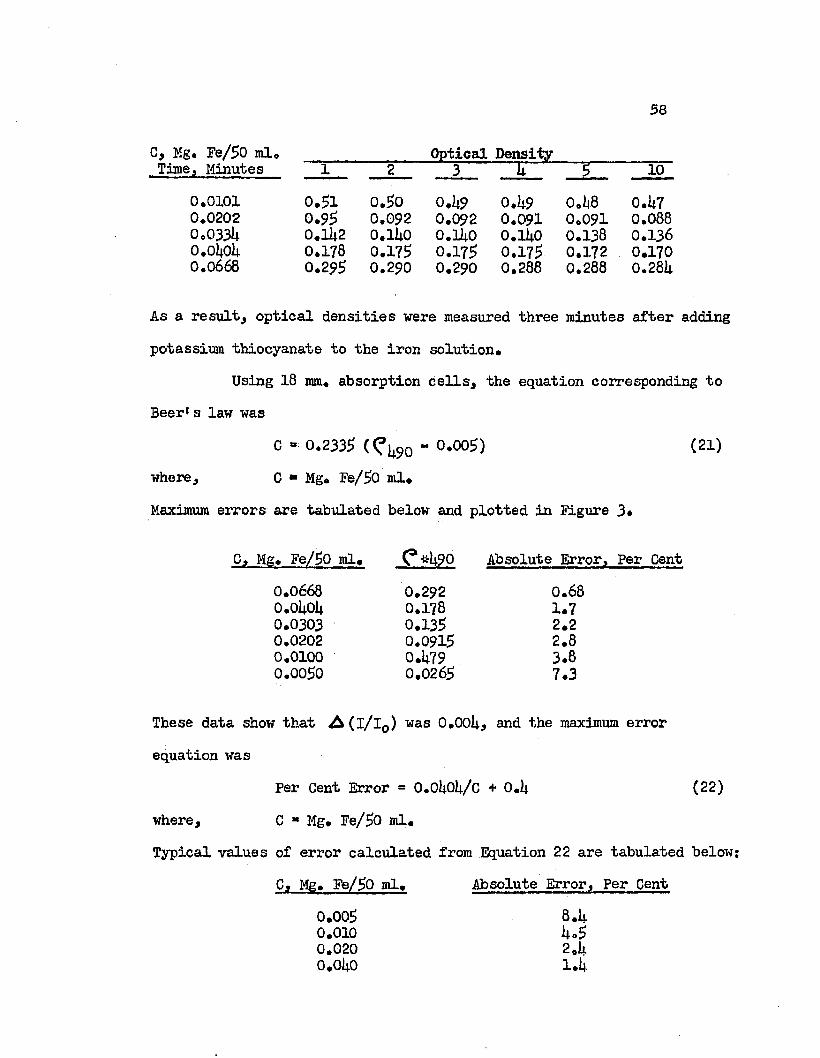
58
C, Mg. Fe/50 ml.!, Minutes 1 2 3 1* 5 100.0101 o.5l o.?o 0.1*9 0.1*9 0.1j8 0.1*70.0202 0.9? 0.092 0.092 0.091 0.091 0.0880.0331* 0.11*2 0.11*0 0.11*0 0.11*0 0.138 0.136o.ol*ol* 0.178 0.17? 0.17? 0.17? 0.172 0.1700.0668 0.29? 0.290 0.290 0.288 0.288 0.281*
As a result, optical densities were measured three minutes after adding potassium thiocyanate to the iron solution.
Using 18 mm. absorption cells, the equation corresponding to Beer* s law was
C “ 0.233? (<?U90 - 0.00?) (21)where, C ■ Mg. Fe/50 ml.Maximum errors are tabulated below and plotted in Figure 3.
C, Mg. Fe/?0 ml. ^ *1*90 Absolute Error, Per Cent0.0668 0.292 0.680. ol*ol* 0.178 1.70.0303 0.13? 2.20.0202 0.0915 2.80.0100 0.1*79 3.8o.oo5o 0.0265 7.3
These data show that & (l/l0) was O.OOl*, and the maximum error equation was
Per Cent Error = 0.0l*0l*/c + 0.1* (22)where, C * Mg. Fe/?0 ml.Typical values of error calculated from Equation 22 are tabulated below;
C, Mg. Fe/?0 ml. Absolute Error, Per Cent0.00? 8.L*0.010 1*.?0.020 2.1*0.01*0 1.1*
59
Standards run on organic solutions containing n-butyl alcohol and neutralized sulfuric acid showed no effect on color absorption.
eQ Organic-Phase Sulfuric Acid
Analyses of sulfuric acid in the organic phase were made only on solutions of n-butyl alcohol* In the absence of iron, sulfuric acid was determined by dissolving a $ or 10 ml. sample in water and titrating this with standard sodium hydroxide in the same manner as that used in aqueous-phase sulfuric acid determinations.
In the presence of iron, sulfuric acid was determined on a sample, separate from that used for iron determination, by dissolving a £ or 10 ml. sample in water and precipitating the sulfate content with barium chloride. The procedure used was that used in the aqueous- phase sulfuric acid determination in the presence of iron,
f, Qrganic-Phase Total Sulfate
Organic-phase total sulfate determinations were made in the presence of n-butyl alcohol and with some alkyl acid phosphates.
In both cases, the sulfate was transferred to an aqueous solution and the sulfate precipitated with barium chloride in the same manner as discussed in total sulfate determination in the aqueous phase. The sulfate content of n-butyl alcohol solutions was transferred to aqueous solution by dissolving a £ or 10 ml. sample in water. The sulfate content of alkyl acid phosphates was removed by repeated extraction with water, until a spot test showed no more sulfate present.
60
The spot test used consisted of treating a few drops of water extract with a small portion of barium chloride. Failure to give a precipitate indicated the lack of sulfate ion in the solution.
go Organic-Phase Mixtures
Organic-phase sulfuric acid samples containing iron, cobalt, and nickel were determined for sulfuric acid content by total sulfate determinations, as outlined previously. Metal analyses were made on separate samples by the analytical laboratory of the Battelle Memorial Institute, The procedure used is given below:
Samples were first repeatedly heated with nitric acid to remove all organic compounds which might have been present. Aluminum was dissolved into remaining acid of an aliquot portion and precipitated along with iron by adding ammonium hydroxide. This was filtered to recover the precipitate. The precipitate was removed from the paper with nitric acid and analyzed colorimetric ally by the thiocyanate colorimetric method outlined previously.
Another aliquot portion was heated with nitric acid to remove the organic compound. An aliquot of this solution was treated with five ml. of 10 per cent sodium citrate, made slightly ammohiacal, and two ml. of one per cent dimethyl glyoxime in alcohol, in addition to 3*5 ml, for each five mg. cobalt present. This solution was extracted with chloroform to remove nickel content. The chloroform extracts were washed with five ml. of 1:5(0 ammonia and then treated with five ml. of 0.5 N. hydrochloric acid to extract nickel out of
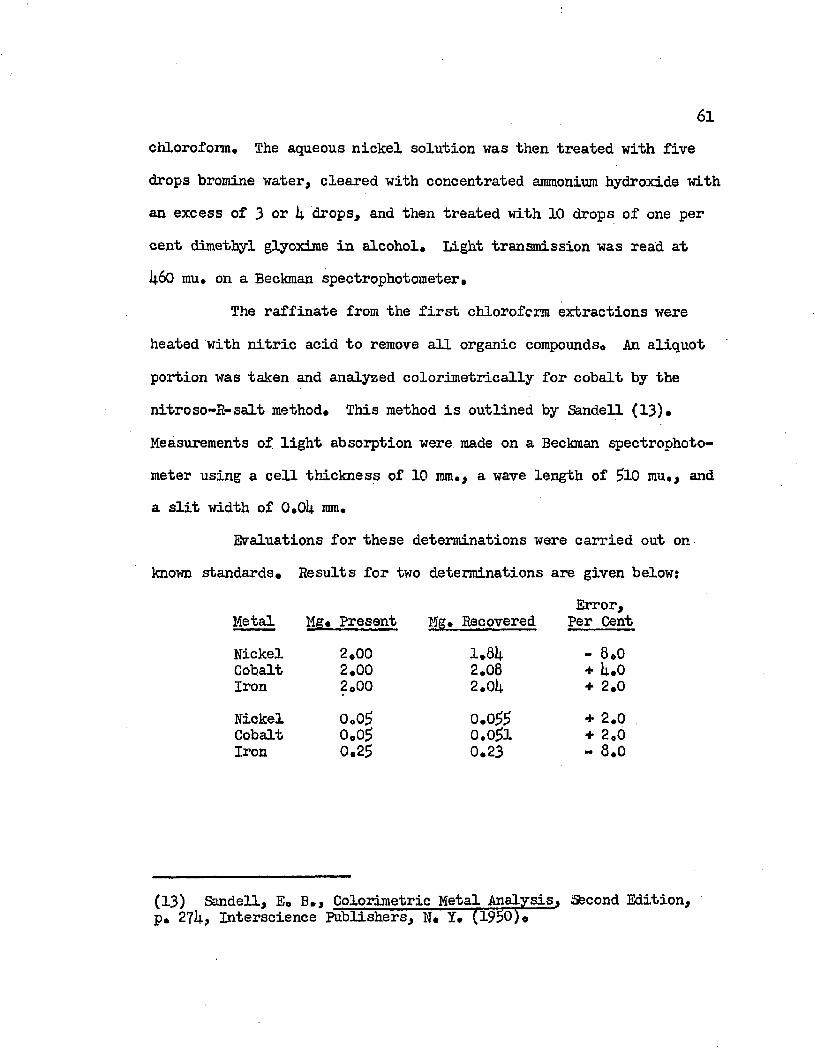
61chloroform. The aqueous nickel solution was then treated with five drops bromine water, cleared with concentrated ammonium hydroxide with an excess of 3 or 1; drops, and then treated with 10 drops of one per cent dimethyl glyoxime in alcohol® Light transmission was read at 1*60 mu, on a Beckman spectrophotometer®
The raffinate from the first chloroform extractions were heated with nitric acid to remove all organic compounds® An aliquot portion was taken and analyzed colorimetrically for cobalt by the nitroso-R-salt method® This method is outlined by Sandell (13)® Measurements of light absorption were made on a Beckman spectrophotometer using a cell thickness of 10 mm*, a wave length of $10 mu,, and a slit width of 0.01+ mm.
Evaluations for these determinations were carried out on known standards® Results for two determinations are given below:
Error,Metal Mg® Present Mg. Recovered Per CentNickel 2*00 1.81+ - 8*0Cobalt 2,00 2.08 + 1+.0Iron 2®00 2.01+ + 2.0Nickel 0®0$ 0.0$$ + 2.0Cobalt 0®0$ 0.0$1 + 2®0Iron 0.2$ 0.23 - 8.0
(13) Sandell, E® B®, Colorimetric Metal Analysis, ifecond Edition, p® Interscience Publishers, N® Y® (19$0)®
62
EXPERIMENTAL PROCEDURE
1. Equipment
Major equipment requirements in this work consisted of extraction equipment to ensure distribution equilibrium at a constant temperature and analytical equipment.
a. Extraction Equipment
Extractions were carried out in 250 ml. glass stoppered Erlen- meyer flasks immersed in a constant temperature bath. The bath, made by the Precision Scientific Company, was of pyrex glass 12 inches high and 16 inches in diameter. A one-third horsepower sparkless stirring motor was used to agitate water in the bath. The bath water was heated by a knife heater and cooled by recirculating ice water through one- fourth inch copper coils suspended in the bath. Temperature control was maintained with a merc-to-merc thermoregulator in conjunction with a normally closed circuit mercury relay. The load of this relay was either .the knife heater or a normally closed circuit solenoid relay operating power supply to the ice water pump. Toggle switches in 110 volt power lines to the heater and pump allowed either or both to be used depending upon the control temperature and ambient conditions.
The thermoregulator consisted essentially of a pair of mercury columns, the upper extremities of which were the actual contacts. Microcurrents through this regulator controlled the 110 volt relay load.
63
Inherent sensitivity of the regulator was specified to be +.03°G.All mercury contacts were sealed in dry hydrogen to prevent oxidation and arcing.
The relays and auxiliary electrical equipment were contained in a box remote from the bath. This box also contained controls for an auxiliary heater to be used when the controlled heater was insufficient to maintain the desired temperature, Variacs were inserted in power lines supplying the heaters to regulate the on-off cycle to approximately equal intervals, A valve was inserted in the ice water pump outlet for the same purpose,
A thermometer with 0,1°C, graduations was calibrated against a Bureau of Standards thermometer and used to indicate the bath temperature, The temperature assembly was found to control within +.05C. at 25°C., variations throughout the bath being negligible.
Magnetic stirrers were mounted under the constant temperature bath, These stirrers consisted essentially of a horizontal magnetic bar rotated by a variable speed motor. The magnetic flux actuated a glass sealed magnetic bar inside a 250 ml, glass stoppered Erlenmeyer flask centered in the bath over the stirring apparatus. The action of this rotating magnetic bar was used to agitate the two liquid phase mixture in the flask, No temperature rise caused by agitation was noted with mixtures of water with benzene, carbon tetrachloride, and normal butyl alcohol.
The 250 ml, flasks were totally immersed in the bath. Two rubber finger stalls were placed over the flask neck to exclude bath
64
water from entering the flask. In preliminary tests, hath water did not leak into flasks when the dry, hooded flasks were immersed for 50 consecutive hours*
b. Analytical Equipment
Analyses were colorimetric, gravimetric, and volumetric. In addition to the major equipment items discussed below, a variety of ordinary laboratory glassware, an analytical balance, and other miscellany were used.
Three electrophotometers were used in making colorimetric measurements. Two were Fisher Model A. C. electrophotometers and the other was a Lumetron Colorimeter, All were of the two photoelectric cell type. The Fisher instruments were supplied with 10 and 25 mm. absorption cells while the Lumetron Colorimeter was supplied with IS mm. cells. A H absorption cells were checked for optical distortion and matched for light absorption before being used.
Acid-bas.e titration endpoints were determined with a Beckman model H-2 pH meter. A glass electrode was used as reference and a saturated calomel electrode as the indicating lectrode. The pH meter was standardized with commercial pH 4 and pH 7 buffer solutions.
Evaporations were carried out in a Thelco model vacuum oven made by the Precision Scientific Company. The oven door was equipped with a glass pane to facilitate observation of the oven interior while samples were being evaporated. Samples were heated by radiation from the oven walls. Temperature was controlled by a bimetallic thermostat
65v
enclosed in a well inside the oven, control being changed by tension on the thermostat elements. Pressure control inside the oven was maintained by a Pressovac vacuum pump exhausting vapors from the oven and a needle valve allowing air into the oven. The exhaust from the oven was passed through a dry ice-acetone condenser before allowing
- noncondensables to pass through the pump.
c. Glassware
All volumetric glassware were calibrated for use at the temperature involved. This glassware was of the Exac blue line variety. Calibrations were made by delivering water from the particular piece of glassware to a tared weighing flask. The volume was calculated from the density of water and the weight of water delivered at this temperature. Corrections at 2J>°C. were negligible. At higher and lower temperatures, corrections were taken into account in calculations*
2. Extraction Procedure
a. Procedure
The procedure used in measuring distribution coefficients consisted of four operation, as followsj 1) contacting of phases at a constant temperature with mixing to ensure the attainment of equilibrium} 2) allowing the phases to separate} 3) sampling the phases} and U) treating the samples for analyses purposes.
66
Contacting of phases until equilibrium conditions were reached was accomplished in 2$0 ml. glass-stoppered Erlenmeyer flasks.A 2^,0 or $0,0 ml. portion of aqueous solution containing known amounts of materials and an equal volume of organic solvent were pipetted into a flask. A pyrex glass sealed magnetic stirring bar was placed in the flask and the flask stoppered. Two rubber finger stalls were placed over the stopper and neck of the flask to exclude water from entering the flask* The flask was then immersed into the constant- temperature bath and the magnetic stirrer started, the extent of agitation being controlled by a variac on the stirrer motor power line, so that the interface between the two liquid layers was continually broken* Agitation was carried out for one or two hours*,
After the requisite interval of agitation, the flask was removed from the bath: and dried. The contents of the flask were quickly poured into a $0 ml. graduated cylinder or an 8-by 1-inch- diameter test tube suspended in the bath. These containers were stoppered and hooded and the contents allowed to separate* Unless noted in the data, a period of time for separation not less than 90 minutes or 10 times the interval for visual separation was allowed for complete phase separation*
After the requisite period of time for complete phase separation, samples of both phases were taken* The top phase was analyzed by pipetting predetermined volumes into suitable containers. Then more of the top phase was pipetted off, until that remaining coalesced into a bubble* Samples of the bottom phase were then pipetted into suitable containers for further analyses* When the
67
densities of the phases were taken, the sample was first pipetted into a clean, dry, tared vessel and weighed# The density was obtained from the volume of the pipette and the weight of its contents#
Treatment of the aqueous-phase samples for analyses consisted of taking.an aliquot sample for either a volumetric or colorimetric analysis. If the organic compound was found to interfere with the determination, the sample was evaporated and the residue redissolved*
Treatment of the organic-phase samples consisted of removing the organic solvent. The solvent was removed by vacuum evaporation if it was volatile or by repeated extractions with water if it could not be readily evaporated. These combined extracts were then evaporated. All evaporations were carried out without boiling at as low a temperature as possible. Usually a five ml. sample required 12 to 2k hours to evaporate. Any sulfuric acid in the sample was neutralized with concentrated sodium hydroxide before evaporation. The evaporation residues were treated by dissolving in an appropriate reagent for analytical purposes,
b* Verification of Extraction Procedure
Verification of the extraction procedure consisted of determining the following: 1) time to reach equilibrium} 2) time forcomplete phase separation} and 3) effect of the magnetic field caused by the magnetic stirrer.
Determinations of the time to reach distribution equilibrium and the time necessary for phase separation were made on the extraction
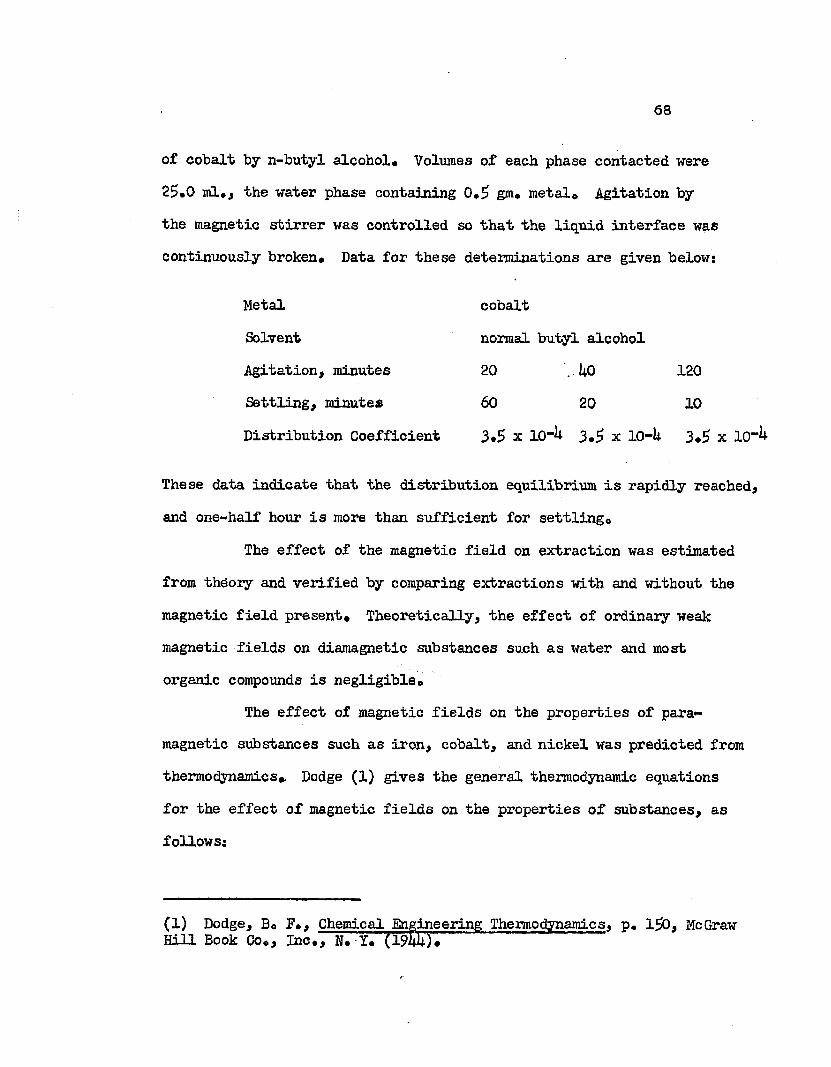
68
of cobalt by n-butyl alcohol* Volumes of each phase contacted were25.0 ml., the water phase containing 0.5 gm. metal* Agitation bythe magnetic stirrer was controlled so that the liquid interface was continuously broken* Data for these determinations are given below:
cobaltnormal butyl alcohol 20 . kQ 12060 20 103.5 x 10-k 3.5 x 10-U 3.5 x 10-
These data indicate that the distribution equilibrium is rapidly reached* and one-half hour is more than sufficient for settling*
The effect of the magnetic field on extraction was estimated from theory and verified by comparing extractions with and without the magnetic field present* Theoretically* the effect of ordinary weak magnetic fields on diamagnetic substances such as water and most organic compounds is negligible*
The effect of magnetic fields on the properties of paramagnetic substances such as iron* cobalt* and nickel was predicted from thermodynamics*. Dodge (1) gives the general thermodynamic equations for the effect of magnetic fields on the properties of substances* as follows:
MetalSolventAgitation* minutes Settling* minutes Distribution Coefficient
(1) Dodge* Bo F., Chemical Engineering Thermodynamics* p. l5t), McGraw Hill Book Co., Inc., N. T. (19hh)*
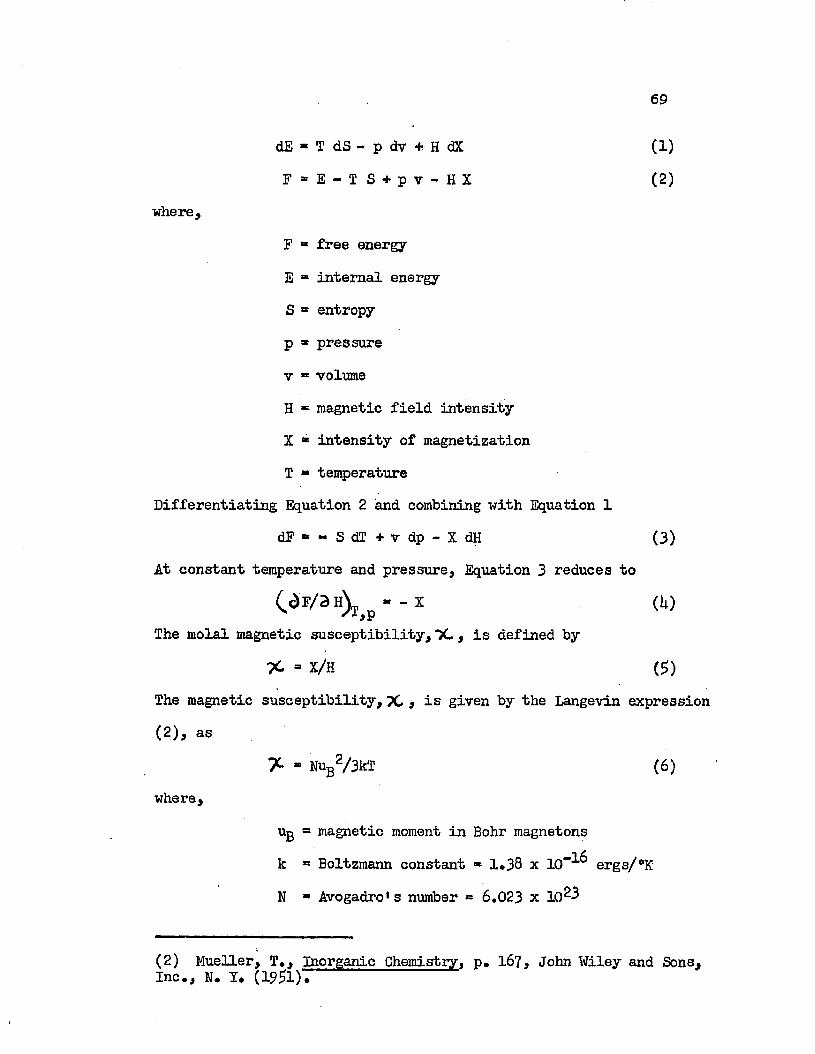
69
dE - T dS - p dv + H dX (1)F = E - T S + p v - H X (2)
where,F » free energy E = internal energy S » entropyp * pressurev ** volumeH ■= magnetic field intensity X * intensity of magnetization T ■ temperature
Differentiating Equation 2 and combining with Equation 1dF**“ S d T + v d p - X d H (3)
At constant temperature and pressure, Equation 3 reduces to
' ■ 1 (lt)The molal magnetic susceptibility, ”JC } is defined by
X - X/H ($)The magnetic susceptibility,X j is given by the Langevin expression(2), as
7- ” N u B 2 / 3 k T ( 6 )
where,Ug = magnetic moment in Bohr magnetons k = Boltzmann constant » 1*38 x 10"^ ergs/°K N ■ Avogadro's number ® 6.023 x 10 3
(2) Mueller, T., Inorganic Chemistry, p. 167, John Wiley and Sons, Inc., N. Y, (19 1).
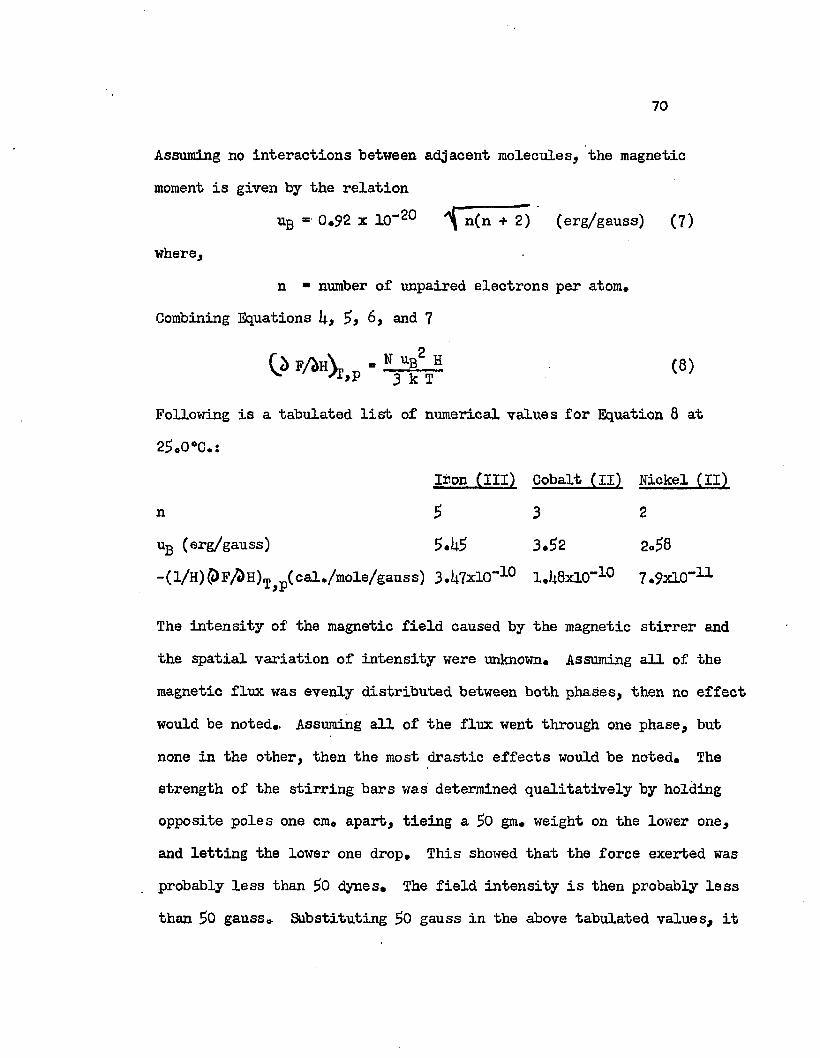
70
Assuming no interactions between adjacent molecules, the magnetic moment is given by the relation
ug * 0*92 x 10“^ n(n + 2) (erg/gauss) (7)where,
n “ number of unpaired electrons per atom.Combining Equations 5, 6, and 7
0> * / * & „ - HjSls (8)
Following is a tabulated list of numerical values for Equation 8 at 2f?oO°C*:
Iron (III) Cobalt (II) Nickel (II)n 5 3 2uB (erg/gauss) 5.U5 3.52 2.58-(l/H)$>F^H)T#p(cal./mole/gauss) 3.U7xlO"10 l.U8xlCT10 7.9xlO~11
The intensity of the magnetic field caused by the magnetic stirrer and the spatial variation of intensity were unknown. Assuming all of the magnetic flux was evenly distributed between both phases, then no effect would be noted,. Assuming all of the flux went through one phase, but none in the other, then the most drastic effects would be noted. The strength of the stirring bars was determined qualitatively by holding opposite poles one cm, apart, tieing a 50 gm, weight on the lower one, and letting the lower one drop. This showed that the force exerted was probably less than 50 dynes. The field intensity is then probably less than 50 gauss* Substituting 50 gauss in the above tabulated values, it
71
is seen that the free energy change would be less than about 10** cal./mole. Such accuracy is nonexistent elsewhere in this work#
The effect of the magnetic field on extraction was determined in the laboratory by making some extractions without the field present. In these determinations, agitation was accomplished by shaking the solutions vigorously at 10-minute intervals for one hour. The extraction in these determinations was compared with the extraction obtained when the magnetic stirrer was used. All of the data given below refer to solutions containing 20,0 gm, metal and 200 gm, sulfuric acid per liter of water phase before extraction*
___________ Distribution_Coefficient____________Metal With Magnetic Stirrer Without Magnetic StirrerCobalt 7.90 x 10“3 7.95 x 10~3Nickel 6.30 x 10"3 6.28 x 10"3
As predicted, these determinations show that effects of the magnetic field were negligible, or at least within experimental error.
3o Phase-Diagram Determination
The liquid region of the phase diagram of the ternary system: water-sulfuric acid-normal butyl alcohol was determined at25>.0°C, The procedure used consisted of adding one component to a mixture of known quantity and composition until a change in phase was noticed® All measurements were made using micro-burets0 Prior to use, each buret was calibrated for weight delivery of the components used* These components were water, n-butyl alcohol, and 95.2 per cent sulfuric acid.
72
The effect of metal sulfates on the solubility of n-butyl alcohol in the water-rich phase was determined on solutions of sulfuric acid and water containing 20.0 gm. metal per liter* Normal butyl alcohol was added dropwise to these solutions until the solutions turned cloudy, indicating the presence of two liquid phases*
The effect of metal sulfates on the solubility of water in n-butyl alcohol-rich phase was determined on solutions of sulfuric acid and n-butyl alcohol* Water containing small quantities of the metal sulfate involved was used for titration purposes*. The concentration of metal sulfate in the water was set at values such that the final metal content was the same, or nearly the same, as that determined in distribution measurements,
lu Materials Used
All inorganic and analytical reagents used in this work were of Analytical Eeagent grade* A sample of distilled water was evaporated to 0*01 of its original volume and tested for chloride by silver nitrate, for sulfate by barium chloride, for nickel by dimethyl glyoxime, and for iron by potassium thiocyanate* No positive results were obtained*
Stock solutions of iron, cobalt, and nickel sulfates were prepared by dissolving the analytical reagent grade salts in water and analyzing for metal content* These analyses were checked independently by the analytical laboratory of the Battelle Memorial Institute*. Solutions of desired metal content were prepared from these stock solutions by diluting to a calculated volume*
73
All materials used in this work are tabulated in Table 2 with a reference to the manufacturer and the grade, if it was available*
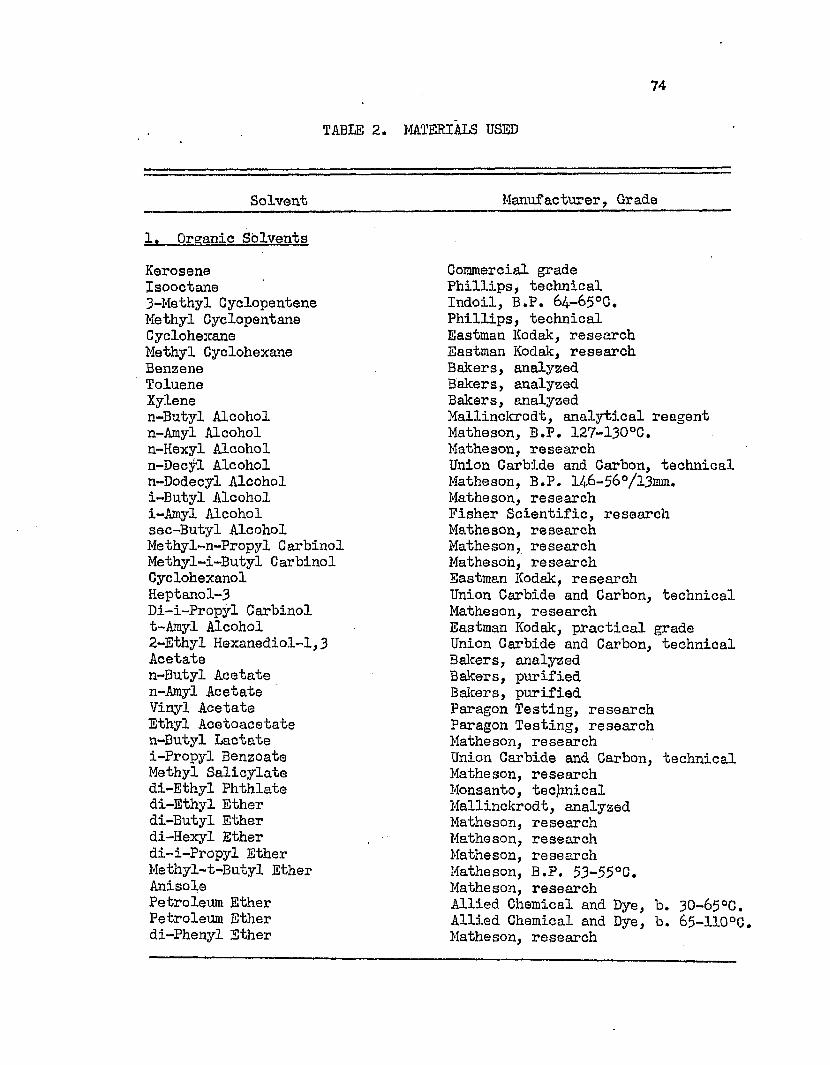
74
TABLE 2. MATERIALS USED
Solvent Manufacturer, Grade
1. Organic SolventsKerosene Commercial gradeIsooctane Phillips, technical3-Methyl Gyclopentene Indoil, B.P, 64-65°C.Methyl Cyclopentane Phillips, technicalCyclohexane Eastman Kodak, researchMethyl Gyclohexane Eastman Kodak, researchBenzene Bakers, analyzedToluene Bakers, analyzedXylene Bakers, analyzedn-Butyl Alcohol Mallinckrodt, analytical reagentn-Amyl Alcohol Matheson, B.P. 127-130°C.n-Hexyl Alcohol Matheson, researchn-Decyl Alcohol Union Carbide and Carbon, technicaln-Dodecyl Alcohol Matheson, B.P. 146-56°/l3mm.i-Butyl Alcohol Matheson, researchi-Amyl Alcohol Fisher Scientific, researchsec-Butyl Alcohol Matheson, researchMethyl-n-Propyl Carbinol Matheson, researchMethyl-i-Butyl Carbinol Matheson, researchCyclohexanol Eastman Kodak, researchHeptanol-3 Union Carbide and Carbon, technicalDi-i-Propyl Carbinol Matheson, researcht-Arnyl Alcohol Eastman Kodak, practical grade2-Ethyl Hexanediol-1, 3 Union Carbide and Carbon, technicalAcetate Bakers, analyzedn-Butyl Acetate Bakers, purifiedn-Amyl Acetate Bakers, purifiedVinyl Acetate Paragon Testing, researchEthyl Acetoacetate Paragon Testing, researchn-Butyl Lactate Matheson, researchi-Propyl Benzoate Union Carbide and Carbon, technicalMethyl Salicylate Matheson, researchdi-Ethyl Phthlate Monsanto, technicaldi-Ethyl Ether Mallinckrodt, analyzeddi-Butyl Ether Matheson, researchdi-Hexyl Ether Matheson, researchdi-i-Propyl Ether Matheson, researchMethyl-t-Butyl Ether Matheson, B.P. 53-55°C.Anisole Matheson, researchPetroleum Ether Allied Chemical and Dye, b. 30-65°CPetroleum Ether Allied Chemical and Dye, b. 65-110°idi-Phenyl Ether Matheson, research
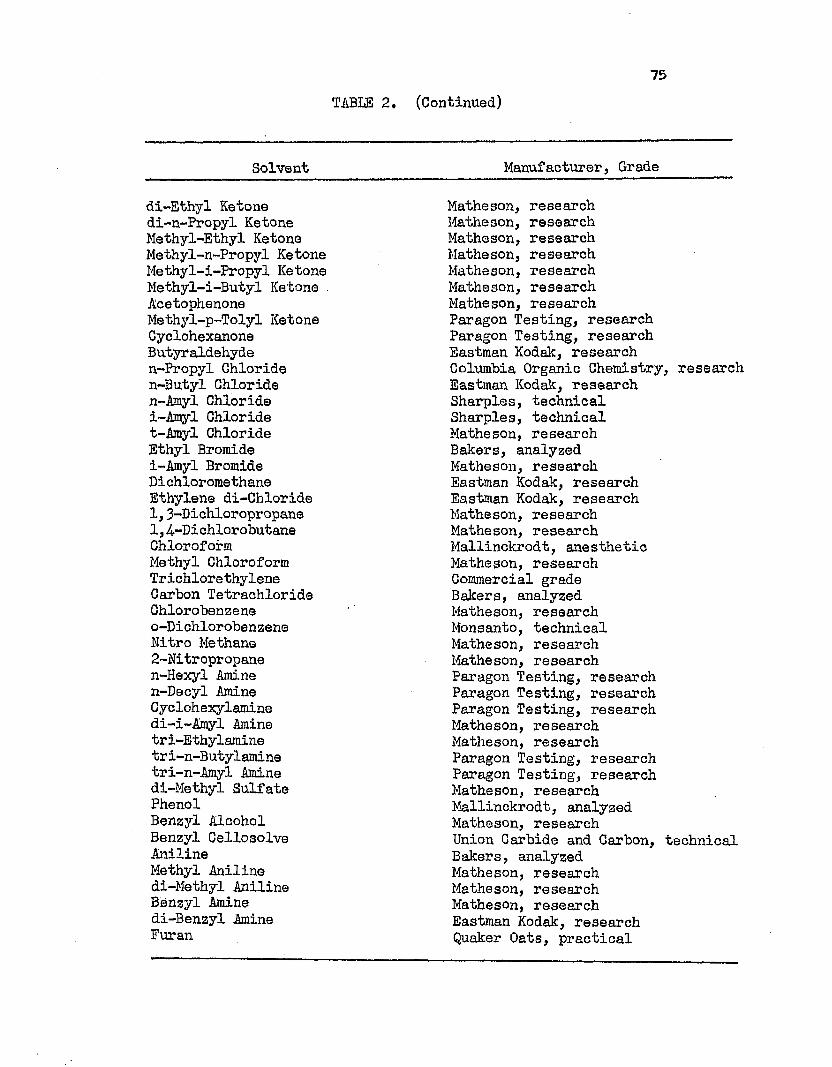
TABLE 2. (Continued)75
Solvent Manufacturer, Grade
di-Ethyl Ketone Matheson, researchdi-n-Propyl Ketone Matheson, researchMethyl-Ethyl Ketone Matheson, researchMethyl-n-Propyl Ketone Matheson, researchMethyl-i-Propyl Ketone Matheson, researchMethyl-i-Butyl Ketone Matheson, researchAcetophenone Matheson, researchMethyl-p-Tolyl Ketone Paragon Testing, researchCyclohexanone Paragon Testing, researchButyraldehyde Eastman Kodak, researchn-Propyl Chloride Columbia Organic Chemistry, researchn-Butyl Chloride Eastman Kodak, researchn-Amyl Chloride Sharpies, technicali-Amyl Chloride Sharpies, technicalt-Amyl Chloride Matheson, researchEthyl Bromide Bakers, analyzedi-Amyl Bromide Matheson, researchDichloromethane Eastman Kodak, researchEthylene di-Chloride Eastman Kodak, research1,3-Dichloropropane Matheson, research1,4-Di chlorobutane Matheson, researchChloroform Mallinckrodt, ane stheticMethyl Chloroform Matheson, researchTrichlorethylene Commercial gradeCarbon Tetrachloride Bakers, analyzedChlorobenzene Matheson, researcho-Di chloroben zene Monsanto, technicalNitro Methane Matheson, research2-Nitropropane Matheson, researchn-Hexyl Amine Paragon Testing, researchn-Decyl Amine Paragon Testing, researchCyclohexylamine Paragon Testing, researchdi-i-Amyl Amine Matheson, researchtr i-Ethylamine Matheson, researchtri-n-Butylamine Paragon Testing, researchtri-n-Amyl Amine Paragon Testing, researchdi-Methyl Sulfate Matheson, researchPhenol Mallinckrodt, analyzedBenzyl Alcohol Matheson, researchBenzyl Cellosolve Union Carbide and Carbon, technicalAniline Bakers, analyzedMethyl Aniline Matheson, researchdi-Methyl Aniline Matheson, researchBenzyl Amine Matheson, researchdi-Benzyl Amine Eastman Kodak, researchEuran Quaker Oats, practical
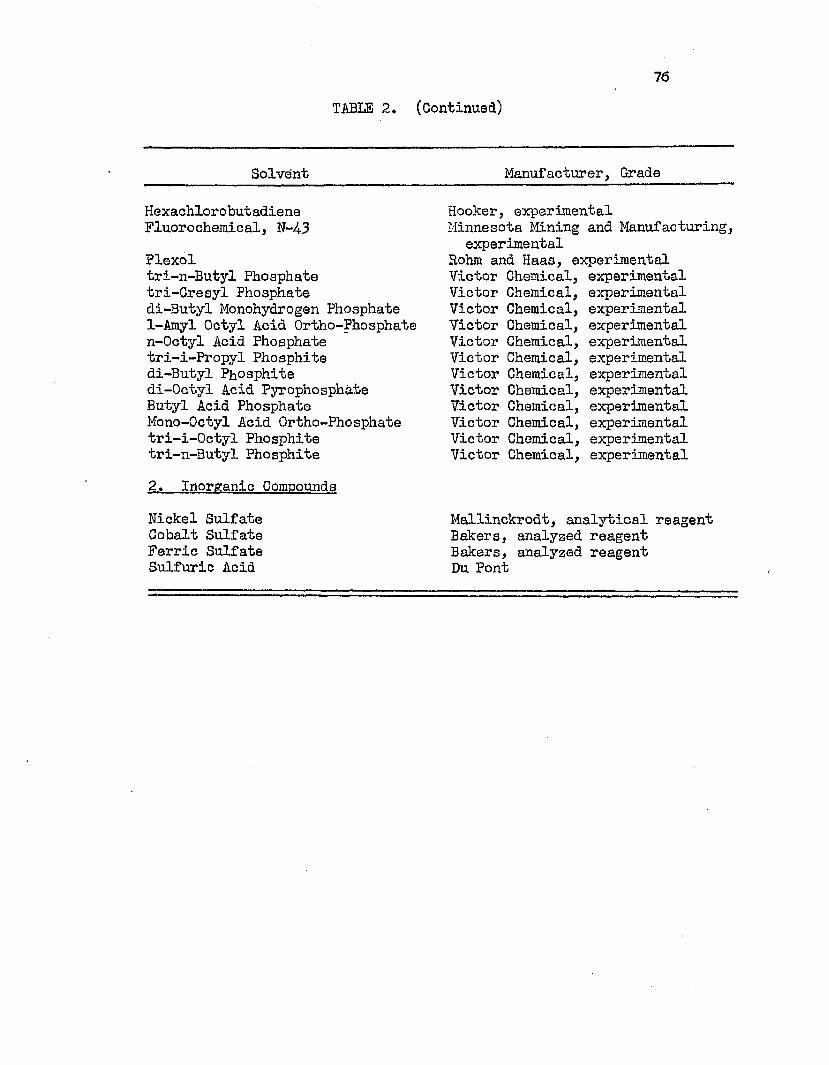
76TABLE 2. (Continued)
Solvent
Hexachlorobutadiene Fluorochemical, N-43Plexoltri-n-Butyl Phosphate tri-Cresyl Phosphate di-Butyl Monohydrogen Phosphate 1-Amyl Octyl Acid Ortho-Phosphate n-Octyl Acid Phosphate tri-i-Fropyl Phosphite di-Butyl Phosphite di-Octyl Acid Pyrophosphate Butyl Acid Phosphate Mono-Octyl Acid Ortho-Phosphate tri-i-Octyl Phosphite tri-n-Butyl Phosphite2. Inorganic CompoundsNickel Sulfate Cobalt Sulfate Ferric Sulfate Sulfuric Acid
Manufacturer, Grade
Hooker, experimental Minnesota Mining and Manufacturing, experimental
Rohm and Haas, experimental Victor Chemical, experimental Victor Chemical, experimental Victor Chemical, experimental Victor Chemical, experimental Victor Chemical, experimental Victor Chemical, experimental Victor Chemical, experimental .Victor Chemical, experimental Victor Chemical, experimental Victor Chemical, experimental Victor Chemical, experimental Victor Chemical, experimental
Mallinckrodt, analytical reagent Bakers, analyzed reagent Bakers, analyzed reagent Du Pont
77
EXPERIMENTAL DATA
1. Solvent and Additive Search Data
a. Solvent Search
The first phase of the experimental program was to obtain distribution ratios of iron, cobalt, and nickel sulfates between water and a wide variety of organic solvents. The. purpose of this was to be able to select the solvent or groups of solvents that showed the best promise as extracting agents. These data, at 25.0°C. are tabulated in Table 3. All concentrations refer to gm. metal/liter solution.
b. Additive Search
The effects of additives were investigated with some of the solvents from the original distribution runs. Additives were limited to the sulfate system of compounds. The only cations investigated were those which proved useful in increasing the extraction of compounds other than sulfates. Literature references indicated that sulfuric acid, sodium sulfate, and ammonium sulfate might prove useful in this respect. Table U gives the effects of these additives on distribution coefficients at 25.0°C. All metal concentrations refer to gm. metal/liter solution.
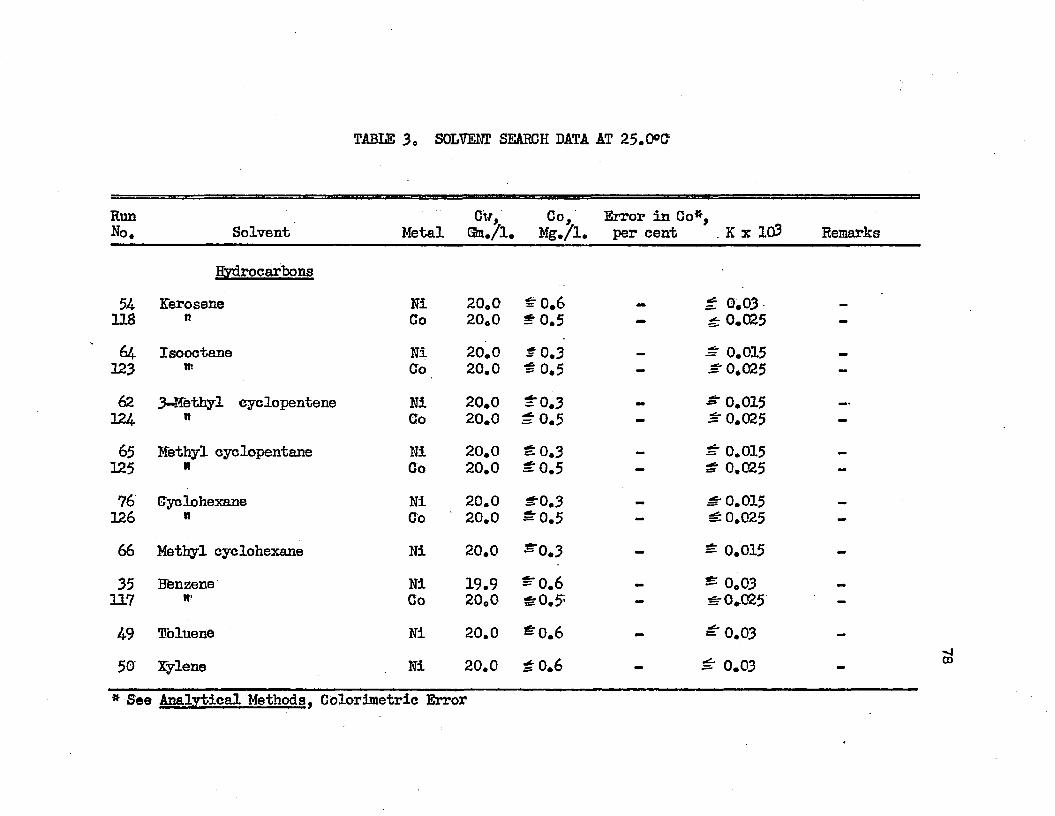
TABLE 3„ SOLVENT SEARCH DATA AT 25.0®C
RunNo. Solvent Metal
Cv,Gta./1.
Co,Mg./l.
Error in Co*, per cent . K x 103 Remarks
54
HydrocarbonsKerosene Ni 20.0 = 0.6 £ 0*03
118 n Co 20.0 *0.5 - - 0.025 -
64 Isooctane Ni 20.0 £0.3 * 0.015123 nt Co 20.0 £0.5 - £ 0.025 -62 3-J!ethyl cyclopentene Ni 20.0 = 0.3 .. - 0.015124 n Co 20.0 = 0.5 - £0.025 -65 Methyl cyclopentane Ni 20.0 £0.3 _ £ 0.015125 it Co 20.0 = 0.5 - £ 0.025 —76 Cyclehexane Ni 20.0 £■0.3 £ 0.015126 n Co 20.0 £0.5 — £ 0.025 -66 Methyl eyclohexane Ni 20.0 “ 0.3 - £ 0.015 -
35 Bfenzene Ni 19.9 £"0.6 £ 0.03117 H' Co 20.0 SrO.5- - #-0.025 -
49 Toluene Ni 20.0 £0.6 - £ 0.03 -50 Xylene Ni 20.0 1 0.6 - £ 0.03 -* See Analytical Methods. Colorimetric Error
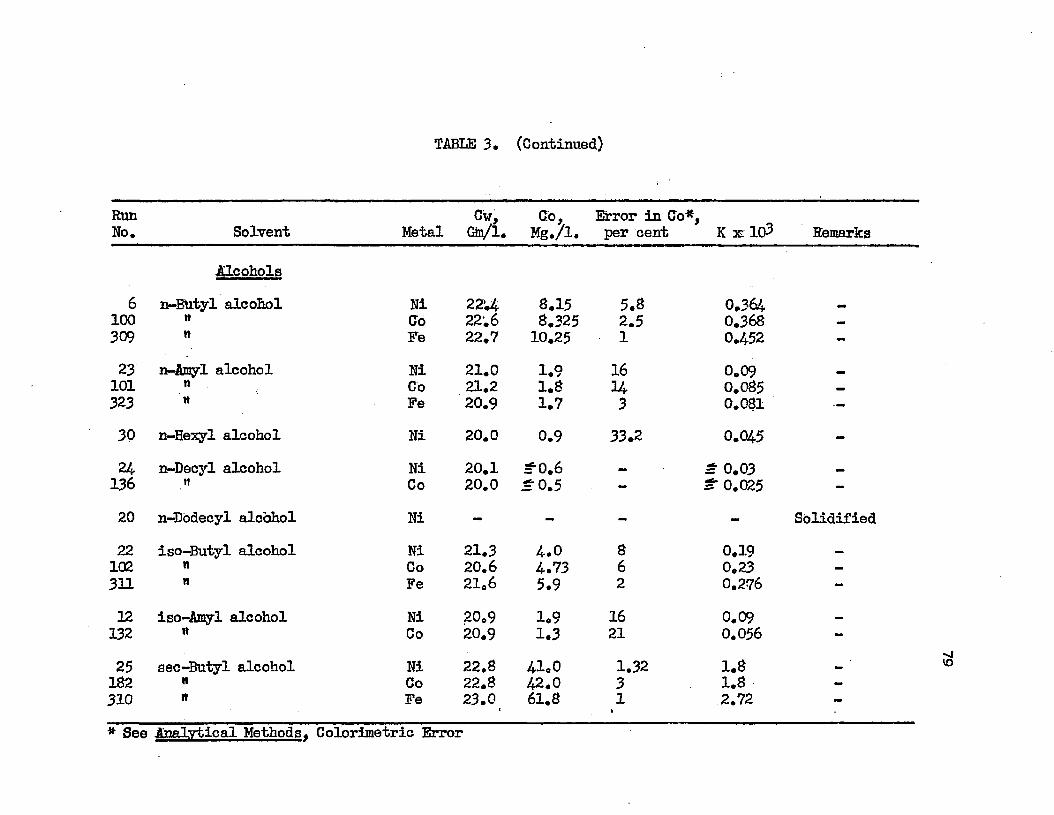
TABLE 3. (Continued)
RunNo. Solvent Metal
Cw,Gm/1.
Co,Mg./l.
Error in Co*, per cent K xrlo3 Remarks
6Alcohols
n-BUtyl alcohol Ni 22’.4 8.15 5.8 0.364100 H (Jo 22.6 8.325 2.5 0.368 —
309 tt Fe 22.7 10.25 1 0.452 -23 n-Amyl alcohol Ni 21.0 1.9 16 0.09101 n Co 21.2 1.8 04 0.085 _323 M Fe 20.9 1.7 3 0.081 —30 n-Hexyl alcohol Ni 20.0 0.9 33.2 O.Q45 -
24 n-Decyl alcohol Ni 20.1 ^0.6 _ * 0.03 ..136 tt Co 20.0 *0.5 - 0.025 -20 n-Dodecyl alcohol Ni - - - - Solidified22 iso-Butyl alcohol Ni 21.3 4.0 8 0.19102 n Go 20.6 4.73 6 0.23 —311 n Fe 21.6 5.9 2 0.276 -12 iso-Amyl alcohol Ni 20.9 1.9 16 0.09132 n Co 20.9 1.3 21 0.056 -
25 sec-Butyl alcohol Ni 22.8 41.0 1.32 1.8182 n Co 22.8 42.0 3 1.8 -310 it Fe 23.0t 61.8 1t 2.72* See Analytical Methods. Colorimetric Error
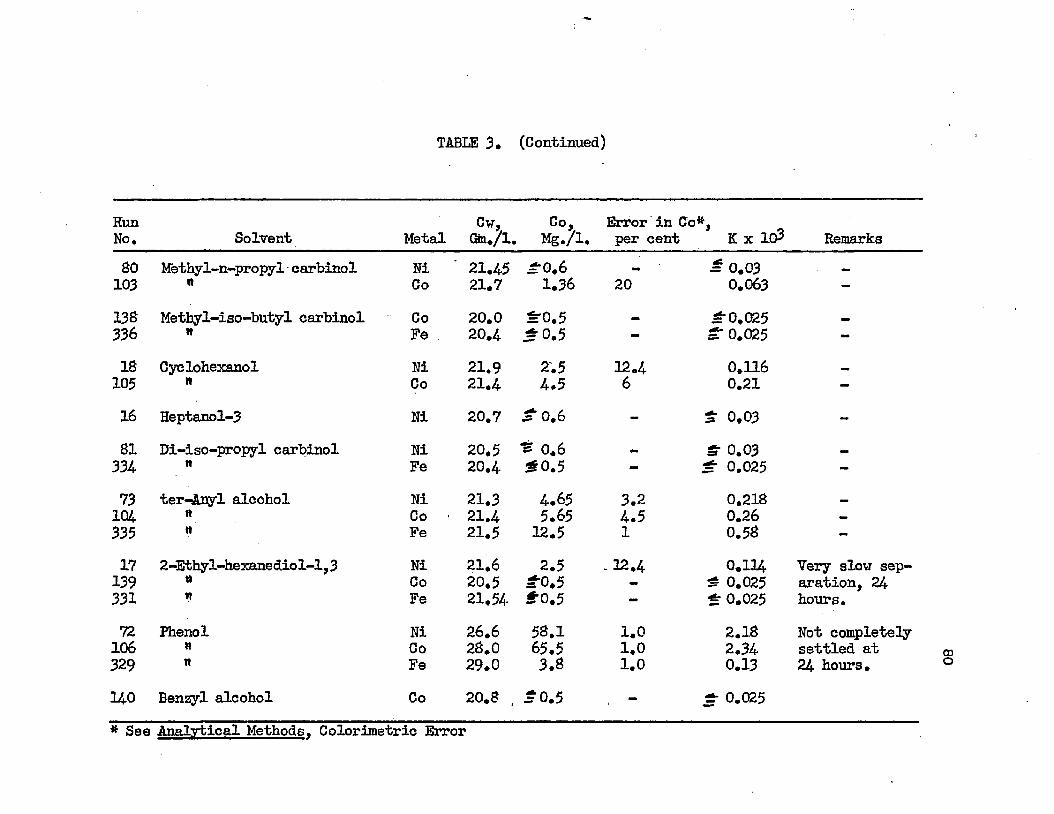
TABLE 3. (Continued)
RunNo. Solvent Metal
Cw,C&u/l.
CoMg./l.
Error in Co*, per cent K x 10 Remarks
80 Methyl-n-propyl carbinol Ni 21.45 *0.6 = 0.03 _,
103 n Co 21.7 1.36 20 0.063 —
138 Methyl-iso-butyl carbinol Co 20.0 = 0.5 *0.025336 n Fe 20.4 *0.5 * 0.025 -18 Cyelohexanol Ni 21.9 2.5 12.4 0.116 _,
105 n Co 21.4 4.5 6 0.21 -16 Heptanol-3 Ni 20.7 = 0.6 - t 0,03 -81 Di-iso-propyl carbinol Ni 20.5 » 0.6 ¥m $ 0.03334 it Fe 20.4 $0.5 - * 0.025 -
73 ter-Anyl alcohol Ni 21.3 4.65 3.2 0.218 _
104 n Co • 21.4 5.65 4.5 0.26 —
335 n Fe 21.5 12.5 1 0.58 -17 2-Ethyl-hexanediol-l,3 Ni 21.6 2.5 -12.4 0.114 Very slow sep139 » Co 20.5 *0.5 - ^ 0.025 aration, 24331 *» Fe 21.54 to .5 - * 0.025 hours.72 Phenol Ni 26.6 58.1 1.0 2.18 Not completely106 n Co 28,0 65.5 1.0 2.34 settled at329 n Fe 29.0 3.8 1.0 0.13 24 hours.14.0 Benzyl alcohol Co 20.8 = 0.5 - * 0.025# See Analytical Methods. Colorimetric Error
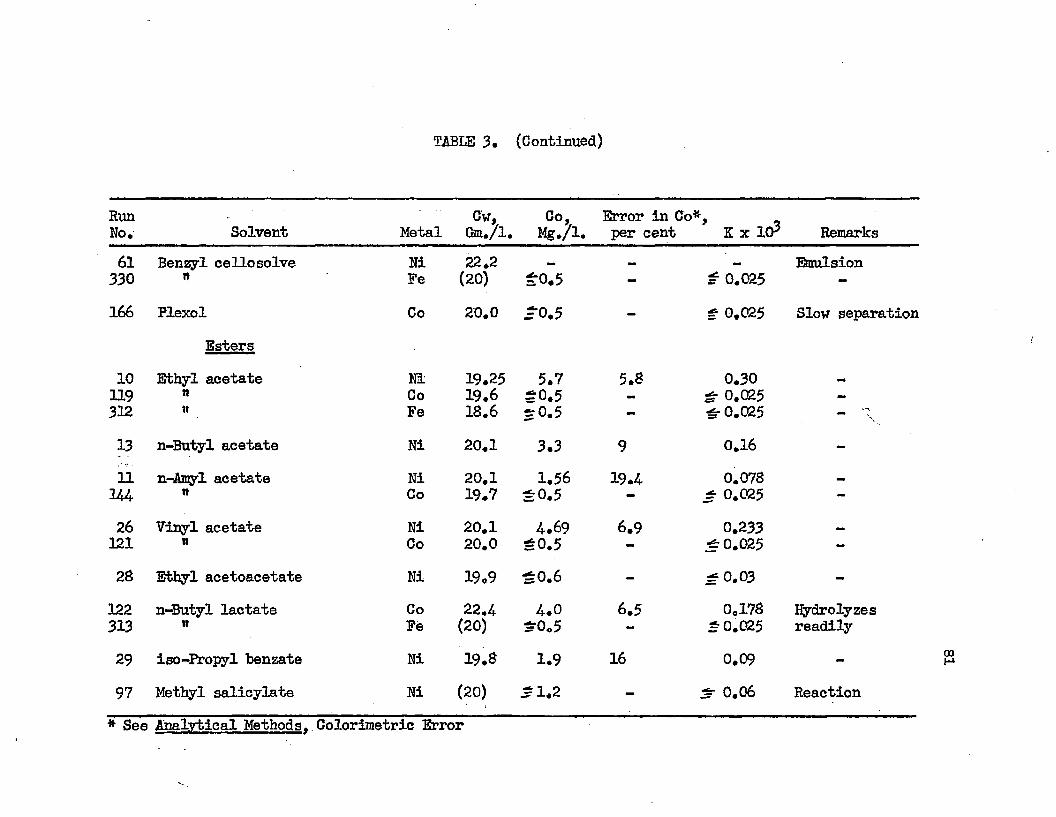
TABLE 3. (Continued)
RunNo. Solvent Metal
Cw,Gm./l.
Co,Mg./l.
Error in Co*, per cent K x 103 Remarks
61 Benzyl cellosolve Ni 22.2 Emulsion330 n Fe (20) £0.5 - t 0.025 -
166 PlexolEsters
Co 20.0 £0.5 — t 0.025 Slow separation
10 Ethyl acetate Ni 19.25 5.7 5.8 0.30119 n Co 19.6 £0.5 .. £ 0.025 —
322 « Fe 18.6 £0.5 - £0.025 -
13 n-Butyl acetate Ni 20.1 3.3 9 0.16 -
11 n-Amyl acetate Ni 20.1 1.56 19.4 0.078 _244 n Co 19.7 £0.5 — £ 0.025 —
26 Vinyl acetate Ni 20.1 4-69 6.9 0.233121 tt Co 20.0 £0.5 - £ 0.025 -
28 Ethyl acetoacetate Ni 19.9 £0.6 - £0.03 -
122 n-Butyl lactate Co 22.4- 4-0 6.5 0.178 Hydrolyzes313 n Fe (20) £0.5 - £0.025 readily
29 iso-Eropyl benzate Ni 19.8 1.9 16 0.09 -
97 Methyl salicylate Ni (20) ~ 1.2 - £ 0.06 Reaction* See Analytical Methods. Colorimetric Error
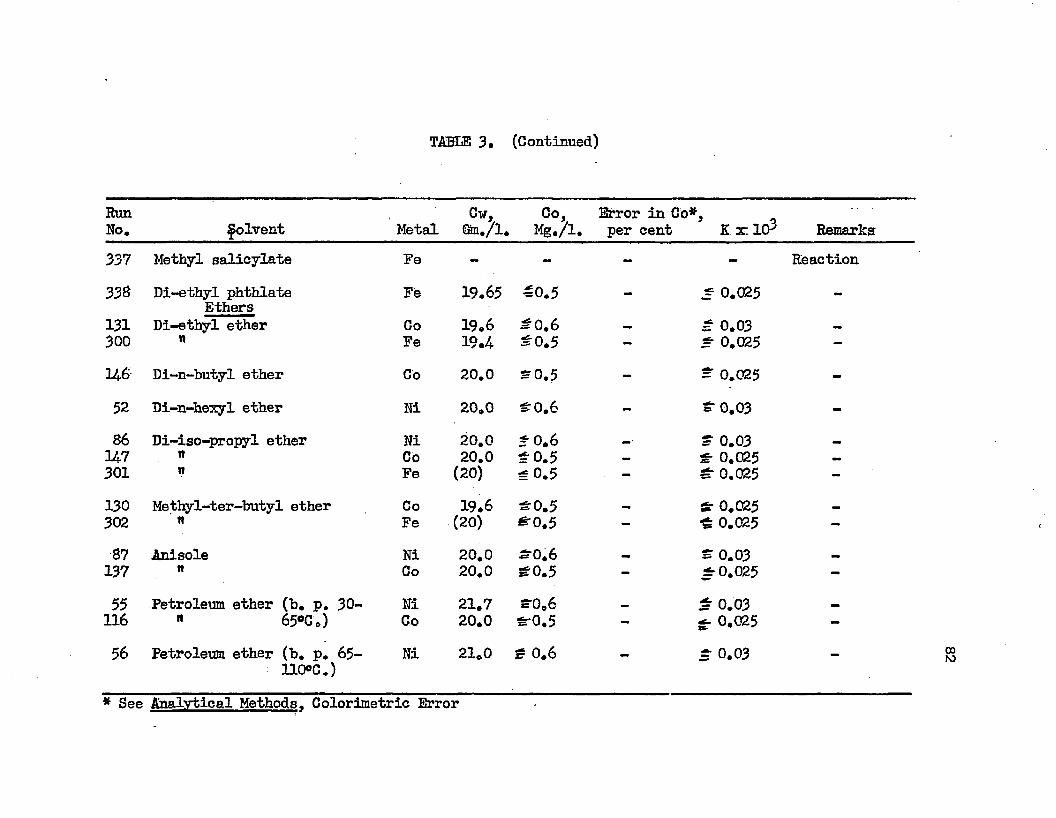
TABLE 3. (Continued)
RunNo. Solvent Metal
Cw,Shu/1.
Co,Mg./l.
Error in Co* per cent K x. 103 Remarks'
337 Methyl salicylate Fe - - - - Reaction338 Di-ethyl phthlate
EthersFe 19.65 £0.5 - * 0.025 -
131 Di-ethyl ether Co 19.6 = 0.6 — = 0.03300 n Fe 19 .A -0.5 - 0.025 —
U6 Di-n-butyl ether Co 20.0 = 0.5 - = 0.025 -52 Di-n-hexyl ether Ni 20.0 = 0.6 - = 0.03 -86 Di-iso-propyl ether Ni 20.0 1 0.6 = 0.03M-7 n Co 20.0 = 0.5 — £- 0.025 _
301 Fe (20) ^ 0.5 - 0.025 -130 Methyl-ter-butyl ether Co 19.6 = 0.5 S- 0.025 _302 n Fe (20) ^0.5 - 0.025 -87 Anisole Ni 20,0 = 0.6 = 0.03137 n Co 20.0 = 0.5 - ir 0.025 -55 Petroleum ether (b. p. 30- Ni 21.7 =■0.6 * 0.03116 rt 65°Co) Co 20.0 Sr0.5 - -- 0.025 -56 Petroleum ether (b. p. 65-
110°C.)Ni 21.0 = 0.6 - 5- 0.03 —
* See Analytical Methods. Colorimetric Error
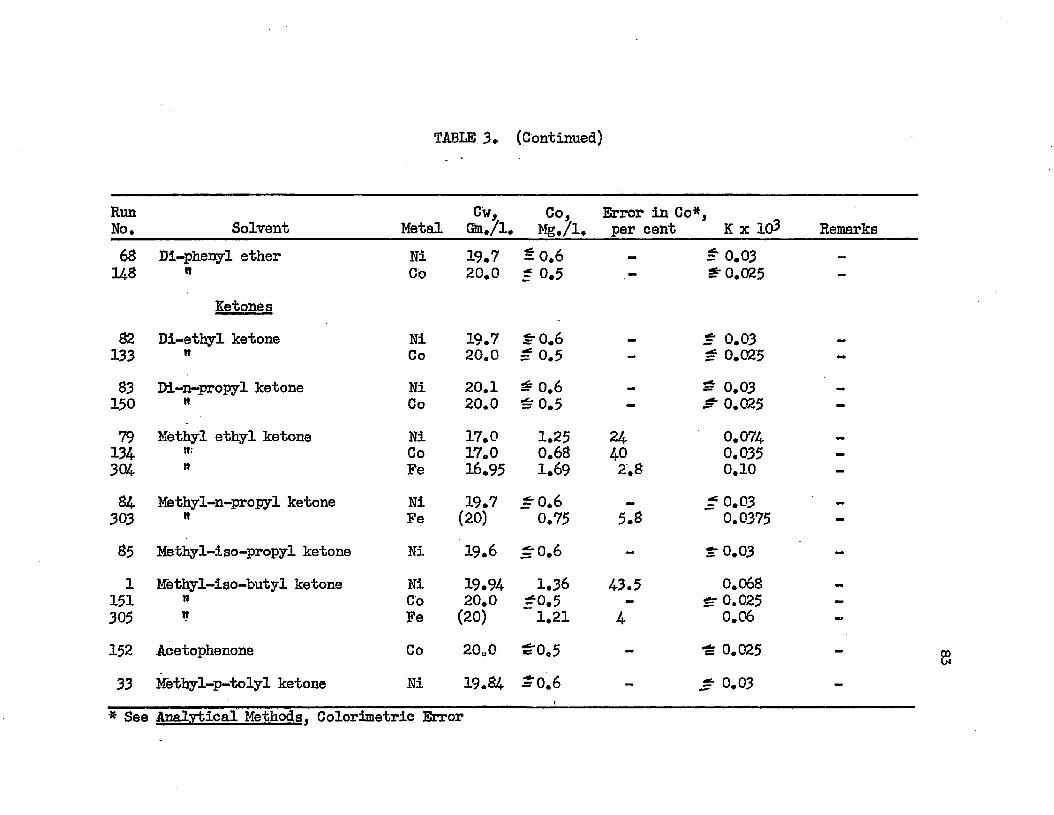
TABLE 3. (Continued)
RunNo. Solvent Metal
Cw,Qn,/1.
Co,Mg./l.
Error in Co*, per cent K x ic£ Remarks
68 Di-phenyl ether Ni 19.7 *0.6 = 0.03 —
U8 n
KetonesCo 20.0 t 0.5 = 0.025
82 Di-ethyl ketone Ni 19.7 = 0.6 * 0.03133 tt Co 20.0 ^ 0.5 - * 0.025 -83 Di-n-propyl ketone Ni 20.1 # 0.6 = 0.03150 n Co 20.0 = 0.5 - 0.025 -
79 Methyl ethyl ketone Ni 17.0 1.25 24 0.074134 tr Co 17.0 0.68 40 0.035 -
304 tt Fe 16.95 1.69 2.8 0.10 mm
84 Methyl-n-propyl ketone Ni 19.7 .r 0.6 t 0.03303 » Fe (20) 0.75 5.8 0.0375 —
85 Metbyl-iso-propyl ketone Ni 19.6 ±-0.6 - tr 0.03 -1 Methyl-iso-butyl ketone Ni 19.94 1.36 43.5 0.068
151 n Co 20.0 ^0.5 - 0.025 -305 n Fe (20) 1.21 4 0.06 mo
152 Acetophenone Co 20.0 ^0.5 - -Sr 0.025 -
33 Methyl-p-tolyl ketone Ni 19.84 ~0.6i
- * 0.03 -
* See Analytical Methods. Colorimetric Error
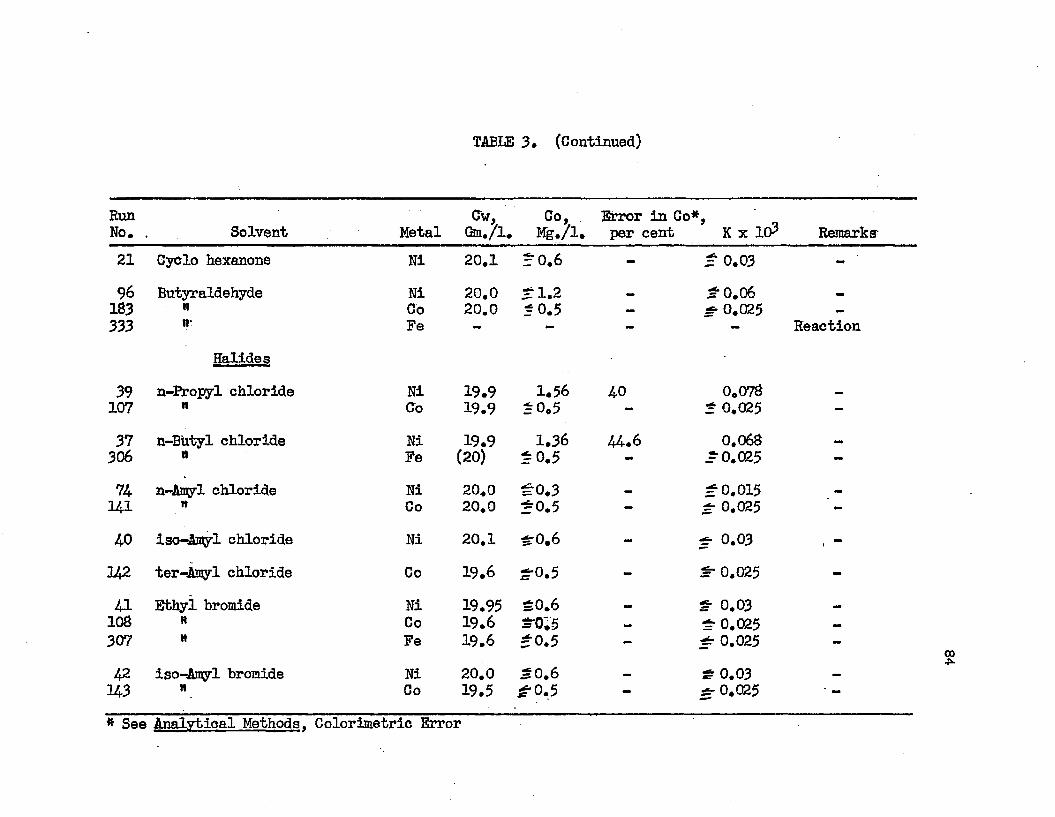
TABLE 3* (Continued)
RunNo. Solvent Metal
Cw,G a . / l .
Go,M g . A .
Error in Co*, per cent K x 10 Remarkg
21 Gyclo hexanone Ni 20.1 r 0.6 - £0.03 -96 Butyr aldehyde Ni 20.0 £1.2 *0.06183 n Co 20.0 r 0*5 — £■ 0.025 —
333Halides
Fe mm Reaction
39 n-Propyl chloride Ni 19.9 1.56 40 0.078107 n Co 19.9 = 0o5 - * 0.025 -37 n-BUtyl chloride Ni 19.9 1.36 44*6 0.068 —306 tt Fe (20) = 0.5 - =•0.02574. n-Amyl chloride Ni 20.0 £0.3 _ £0.01514-1 tt Co 20.0 *0.5 - £ 0.025 *4-0 iso-Amyl chloride Ni 20.1 $•0.6 - £ 0.03342 ter-Amyl chloride Co 19.6 ?0,5 - *• 0.025
41 Ethyl bromide Ni 19.95 £0.6 — * 0.03108 tt Co 19.6 £0;5 — £0.025 —
307 tt Fe 19.6 *0.5 - £ 0.025 -
42 iso-Amyl bromide Ni 20.0 £0.6 £0.03 _
143 it Co 19.5 £0.5 £-0.025* See Analytical Methods. Colorimetric Error
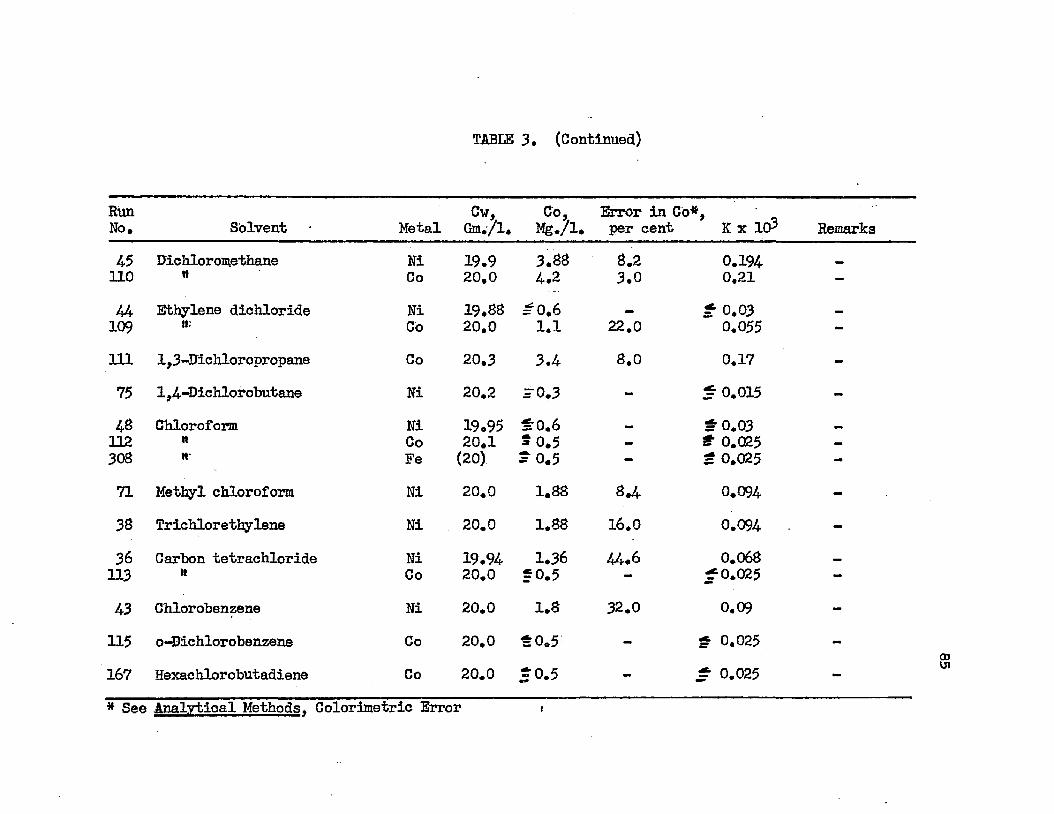
TABLE 3. (Continued)
RimNo. Solvent Metal
Cw,Gm./l.
Co,Mg./l.
Error in Co#, per cent K x ICk Remarks
45 Dichloromethane Ni 19.9 3.88 8.2 0.194110 It Co 20.0 4.2 3.0 0.21 —
44 Ethylene dichloride Ni 19.88 = 0.6 t 0.03109 II: Co 20.0 1.1 22.0 0.055 -
111 1,3-Dichloropropane Co 20.3 3.4 8.0 0.17 -
75 1,4-Dichlorobutane Ni 20.2 =-0.3 - ^ 0.015 -48 Chloroform Ni 19.95 1-0.6 10.03112 n Co 20.1 ? 0.5 — 1 0.025 —308 «• Fe (20) = 0.5 - 1 0.025 -71 Methyl chloroform Ni 20.0 1.88 8.4 0.094 -38 Trichlorethylene Ni 20.0 1.88 16.0 0.094 -36 Carbon tetrachloride Ni 19.94 1.36 44.6 0.068113 n Co 20.0 f 0.5 - ^0.025 —
43 Ghloroben zene Ni 20.0 1.8 32.0 0.09 -
115 o-Bichlorobenzene Co 20.0 10.5 - * 0.025 -
167 Hexachlorobutadiene Co 20.0 0.5 - £ 0.025 -
* See Analytical Methods. Colorimetric Error
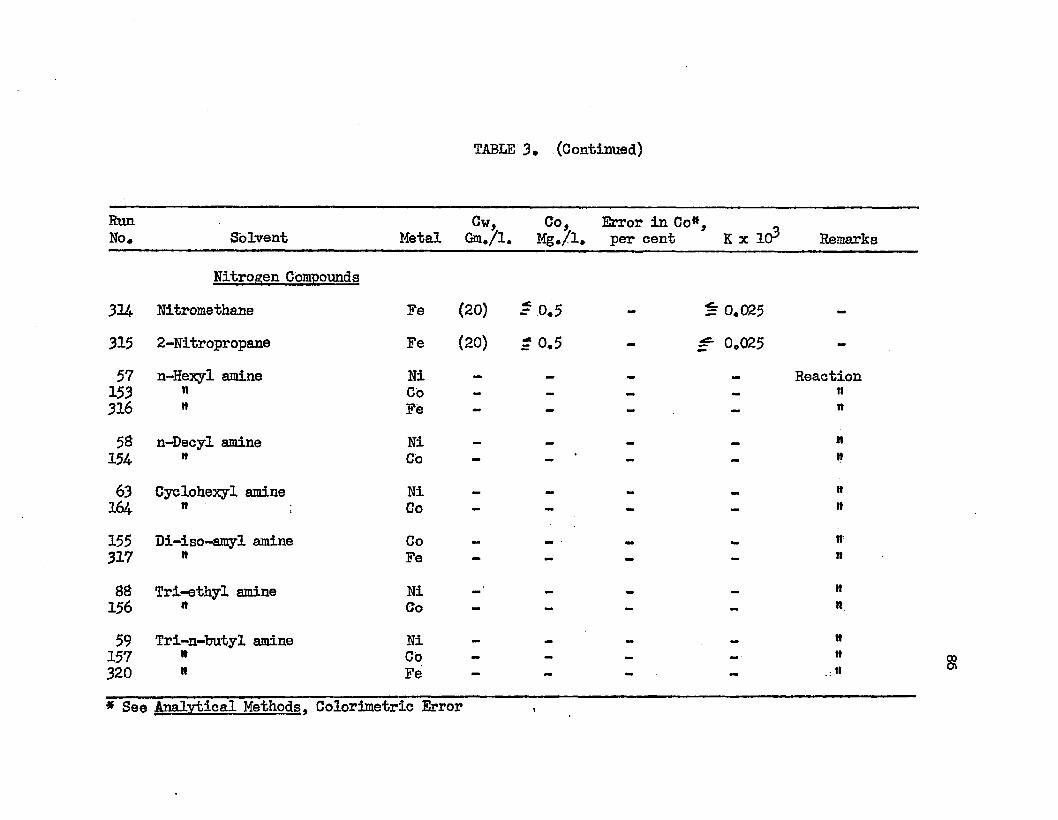
TABLE 3 • (Continued)
RunNo. Solvent Metal
Cw,Gm./l.
Co,Mg./l.
Error in Co#, per cent K x 10 Remarks
3U
Nitrogen Compounds Nitromethane Fe (20) * 0.5 = 0.025
315 2-Nitropropane Fe (20) £ 0.5 £- 0,025 -57 n-Hexyl amine Ni <_ _ Reaction153 n Co — — — — it
316 it Fe - - - n
58 n-Decyl amine Ni — _ _ tt
154 tt Co - - - - n
63 Cyelohexyl amine Ni n
164 » Co - - ■ n
155 Di-iso-amyl amine Co M • a
317 n Fe — - ■ »
88 Tri-ethyl amine Ni _ —. ii
156 it Co — - “ - it
59 Tri-n-butyl amine Ni _ — w157 tt Co - - - _ ii320 tt Fe — *• — “ «•
♦ See Analytical Methods. Colorimetric Error
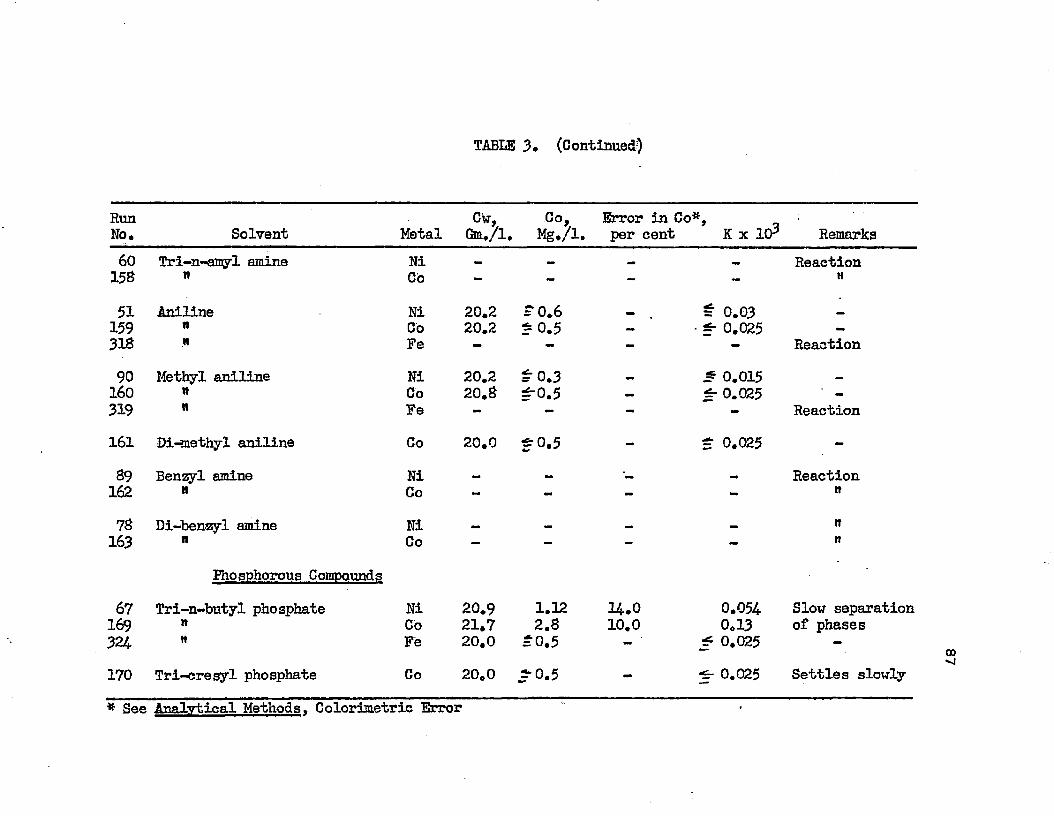
TABLE 3. (Continued)
RunNo. Solvent Metal
Cw,Gm,/i,
Co,Mg./l.
Error in Co#, per cent K x 10 Remarks
60 Tri-n-amyl amine Ni Reaction158 n Co - - - - tt
51 Aniline Ni 20.2 ?0.6 = 0.03159 n Go 20.2 * 0.5 — - * 0.025 -318 tt Fe - — - - Reaction90 Methyl aniline Ni 20.2 = 0.3 * 0.015160 » Co 20.8 ^0.5 — ± 0.025 -
319 n Fe - - - - Reaction161 Di-methyl aniline Co 20.0 r °*5 - £ 0.025 -
89 Benzyl amine Ni Reaction162 n Co - - - - tt
78 Di-ben^yl amine Ni tt
163 tt
Phosphorous CompoundsCo tt
67 Tri-n-butyl phosphate Ni 20.9 1.12 14.0 0.054 Slow separation169 tt Co 21.7 2.8 10.0 0.13 of phases324 w Fe 20.0 = 0.5 - ± 0.025 —
170 Tri-cresyl phosphate Co 20.0 ^0.5 - 0.025 Settles slowly# See Arfllvhiftal Methods. Colorimetric Error
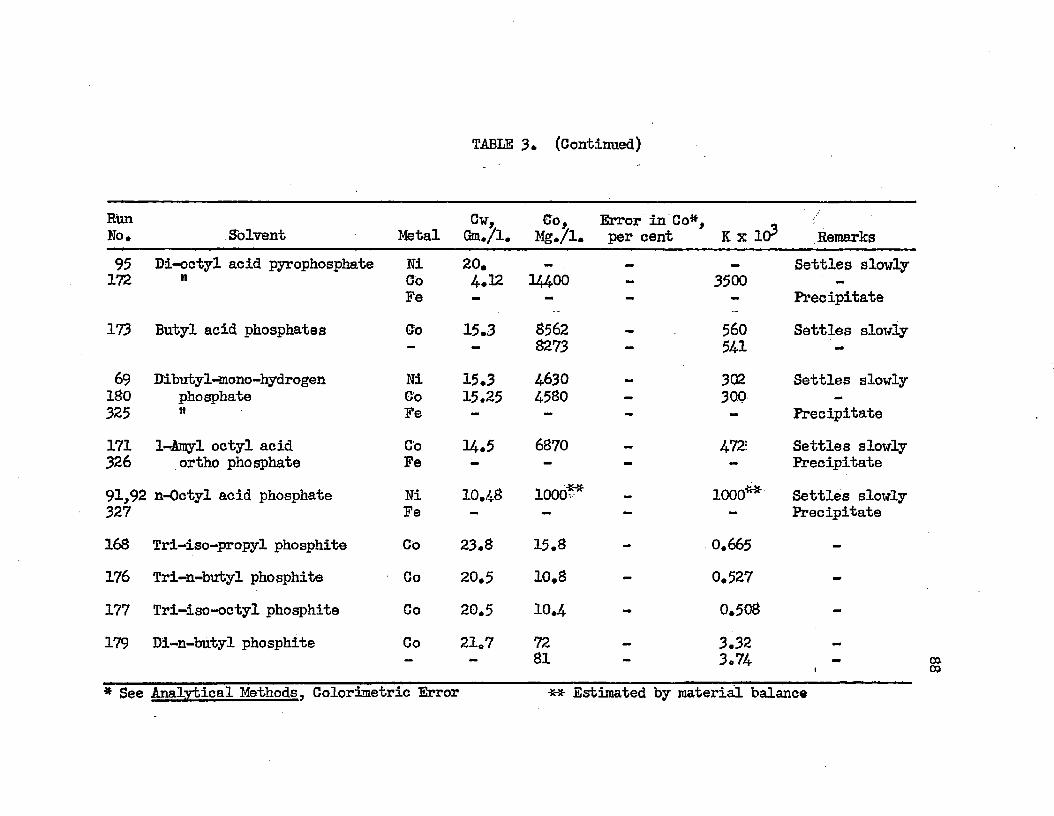
TABLE 3* (Continued)
HunNo, Solvent Metal
Cw,Gffl./l.
Co,Mg./l.
Error in Co#, per cent K x 103 Remarks
95 Di-octyl acid pyrophosphate Ni 20. — Settles slowly172 n Co
Fe4.12 14400 — 3500
Precipitate173 Butyl acid phosphates (Jo 15.3 8562
8273 —560541
Settles slowly
69 Dibutyl-mono-hydrogen Ni 15.3 4630 302 Settles slowlyISO phosphate Co 15.25 4580 — 3Q0 -325 tt Fe — — - - Precipitate171 1-Amyl octyl acid CO 14.5 6870 4721 Settles slowly326 ortho phosphate Fe mm — - - Precipitate91,92 n-Octyl acid phosphate Ni 10.48 1000?* _ 1000** Settles slowly327 Fe — — — — Precipitate168 Tri-iso-propyl phosphite co 23.8 15.8 - 0.665 -176 Tri-n-butyl phosphite Co 20.5 10.8 - 0.527 -177 Tri-iso-octyl phosphite Co 20.5 10.4 - 0.508 -179 Di-n-butyl phosphite Co 21.7 72
81— 3.32
3.74 |# See Analytical Methods. Colorimetric Error ** Estimated by material balance
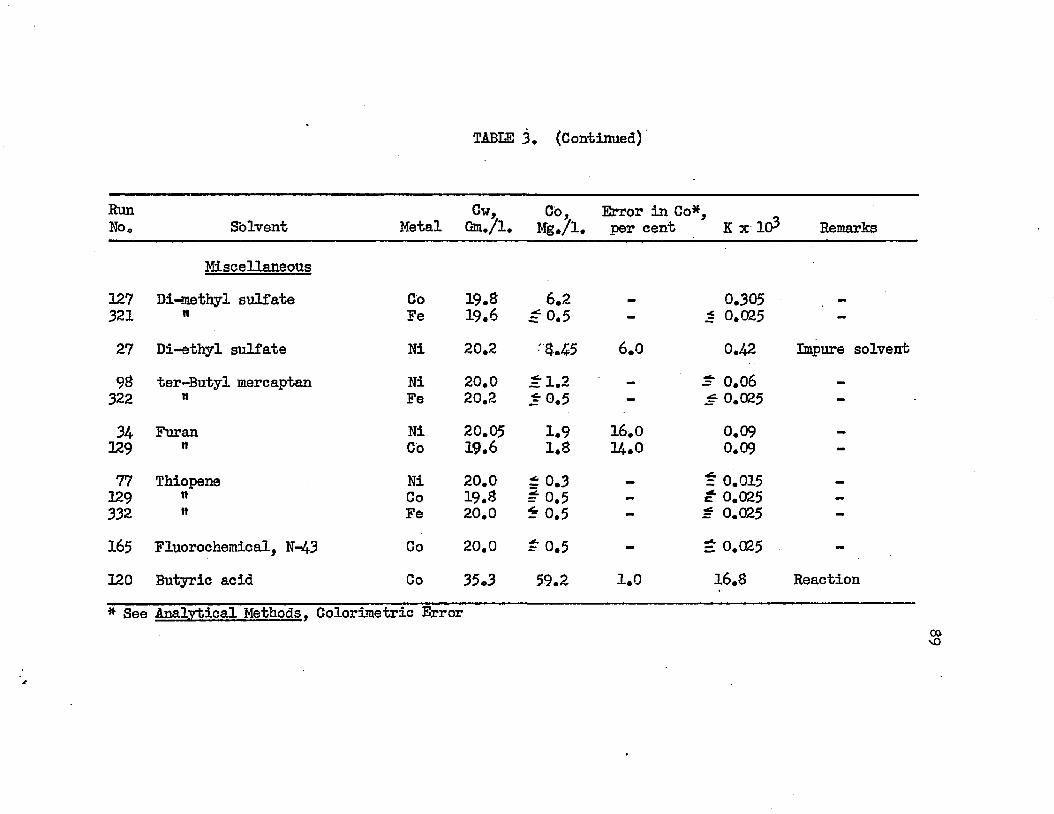
TABLE 3. (Continued)
RunNo, Solvent Metal
Cw,Gm./l.
Go,Mg./l.
Error in Co* per cent KxlO3 Remarks
Miscellaneous127 Di-methyl sulfate Co 19.8 6.2 0.305321 tt Fe 19.6 = 0.5 - i 0.025 -27 Di-ethyl sulfate Ni 20.2 •8.45 6.0 0.42 Impure solvent
98 ter-Butyl mereaptan Ni 20.0 = 1.2 # 0.06 _322 it Fe 20.2 = 0,5 - ± 0.025 —
34 Fur an Ni 20.05 1.9 16.0 0.09 _129 n Co 19.6 1.8 14.0 0.09 -
77 Thiopene Ni 20.0 ± 0.3 mm t 0.015129 n Co 19.8 #0.5 — C 0.025 —
332 tt Fe 20.0 * 0.5 — * 0.025 —
165 Fluorochemical, N-43 Co 20.0 # 0.5 t. 0.025 -120 Butyric acid Co 35.3 59.2 1.0 16.8 Reaction* See Analytical Methods. Colorimetric Error
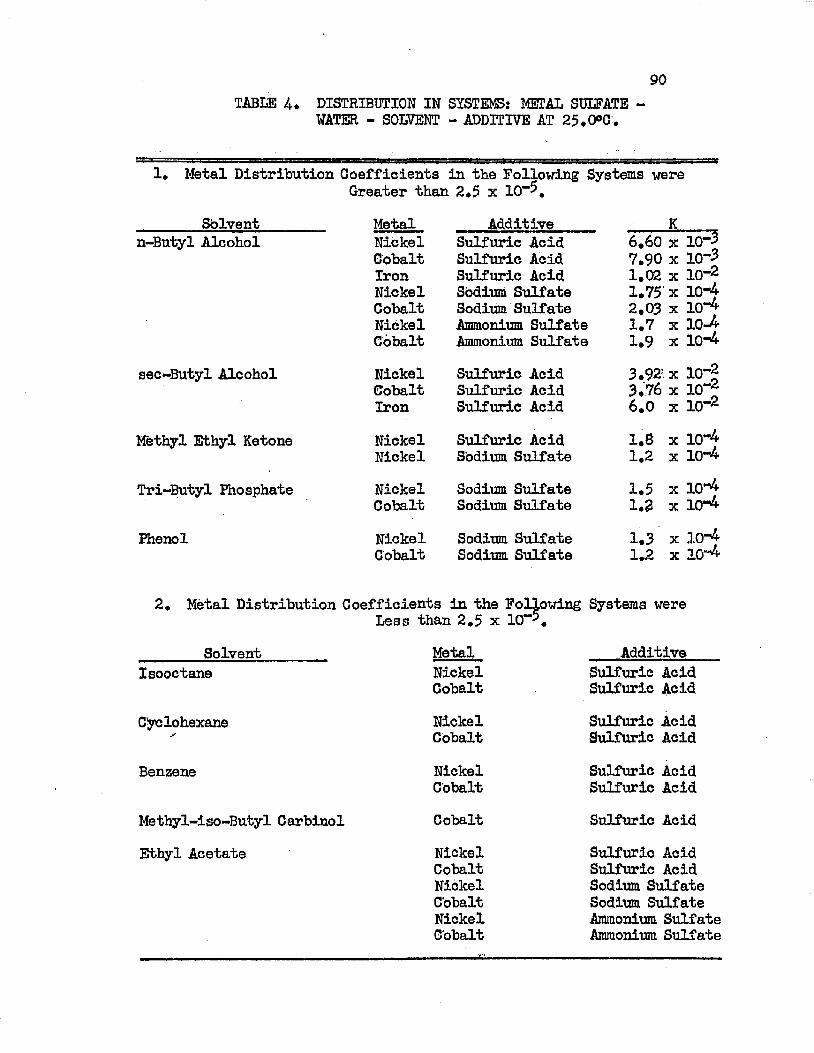
TABLE A* DISTRIBUTION IN SYSTEMS: METAL SULFATE -WATER - SOLVENT - ADDITIVE AT 25.0°C.
1. Metal Distribution Coefficients in the Following Systems wereGreater than 2*5 x 10"5.
Sblvent Metal Additive Kn-Butyl Alcohol Nickel Sulfuric Acid 6,60 x
Cobalt Sulfuric Acid 7.90 xIron Sulfuric Acid 1.02 xNickel Sodium Sulfate 1.75' xCobalt Sodium Sulfate 2.03 xNickel Ammonium Sulfate 1.7 xCobalt Ammonium Sulfate 1.9 x
sec-Butyl Alcohol Nickel Sulfuric Acid 3.92’ xCobalt Sulfuric Acid 3.76 xIron Sulfuric Acid 6.0 x
Methyl Ethyl Ketone Nickel Sulfuric Acid 1.8 xNickel Sodium Sulfate 1.2 x
Tri-Butyl Phosphate Nickel Sodium Sulfate 1.5 xCobalt Sodium Sulfate 1.2 x
Phenol Nickel Sodium Sulfate 1.3 xCobalt Sodium Sulfate 1.2 x
10-410 410-410*4
10“210”210*410-410*410“410^-10*4
2. Metal Distribution Coefficients in the Following Systems wereLess than 2,5 x 10“*,
Solvent Metal AdditiveIsooctane Nickel Sulfuric Acid
Cobalt Sulfuric Acid
Cyclohexane Nickel Sulfuric AcidCobalt Sulfuric Acid
Benzene Nickel Sulfuric AcidCobalt Sulfuric Acid
Methyl-lso-Butyl Carbinol Cobalt Sulfuric AcidEthyl Acetate Nickel Sulfuric Acid
Cobalt Sulfuric AcidNickel Sodium SulfateCobalt Sodium SulfateNickel Ammonium SulfateCobalt Ammonium Sulfate
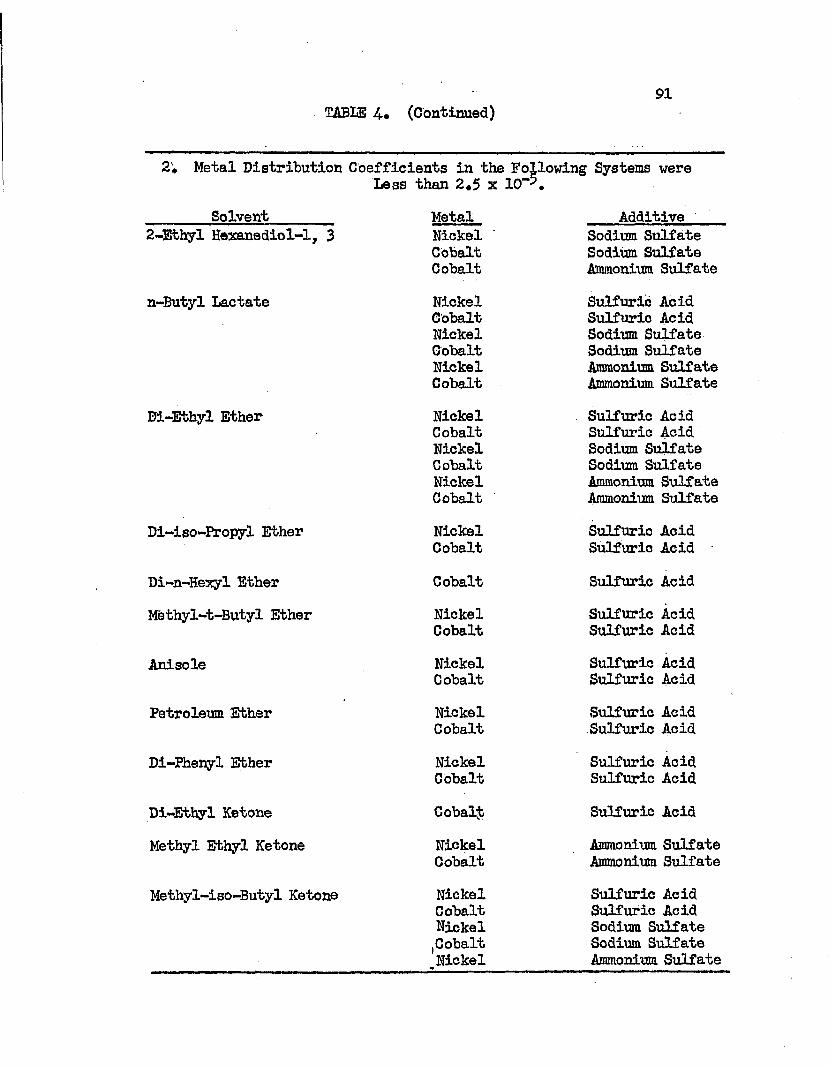
TABLE A* (Continued)91
2'* Metal Distribution Coefficients in the Following Systems wereLess than 2.5 x 10“*.
Solvent Metal Additive2-Ethyl Hexanediol-1, 3 Nickel Sodium Sulfate
Cobalt Sodium SulfateCobalt Ammonium Sulfate
n-Butyl Lactate Nickel Sulfuric AcidCobalt Sulfuric AcidNickel Sodium SulfateCobalt Sodium SulfateNickel Ammonium SulfateCobalt Ammonium Sulfate
Di-Ethyl Ether Nickel Sulfuric AcidCobalt Sulfuric AcidNickel Sodium SulfateCobalt Sodium SulfateNickel Ammonium SulfateCobalt Ammonium Sulfate
Di-iso-Eropyl Ether Nickel Sulfuric AcidCobalt Sulfuric Acid
Di-n-Hexyl Ether Cobalt Sulfuric AcidMethyl-t-Butyl Ether Nickel Sulfuric Acid
Cobalt Sulfuric Acid
Anisole Nickel Sulfuric AcidCobalt Sulfuric Acid
Petroleum Ether Nickel Sulfuric AcidCobalt Sulfuric Acid
Di-Phenyl Ether Nickel Sulfuric AcidCobalt Sulfuric Acid
Di-Etbyl Ketone Cobalt Sulfuric AcidMethyl Ethyl Ketone Nickel Ammonium Sulfate
Cobalt Ammonium SulfateMethyl-iso-Butyl Ketone Nickel Sulfuric Acid
Cobalt Sulfuric AcidNickel Sodium Sulfate,Cobalt Sodium SulfateNickel Ammonium Sulfate
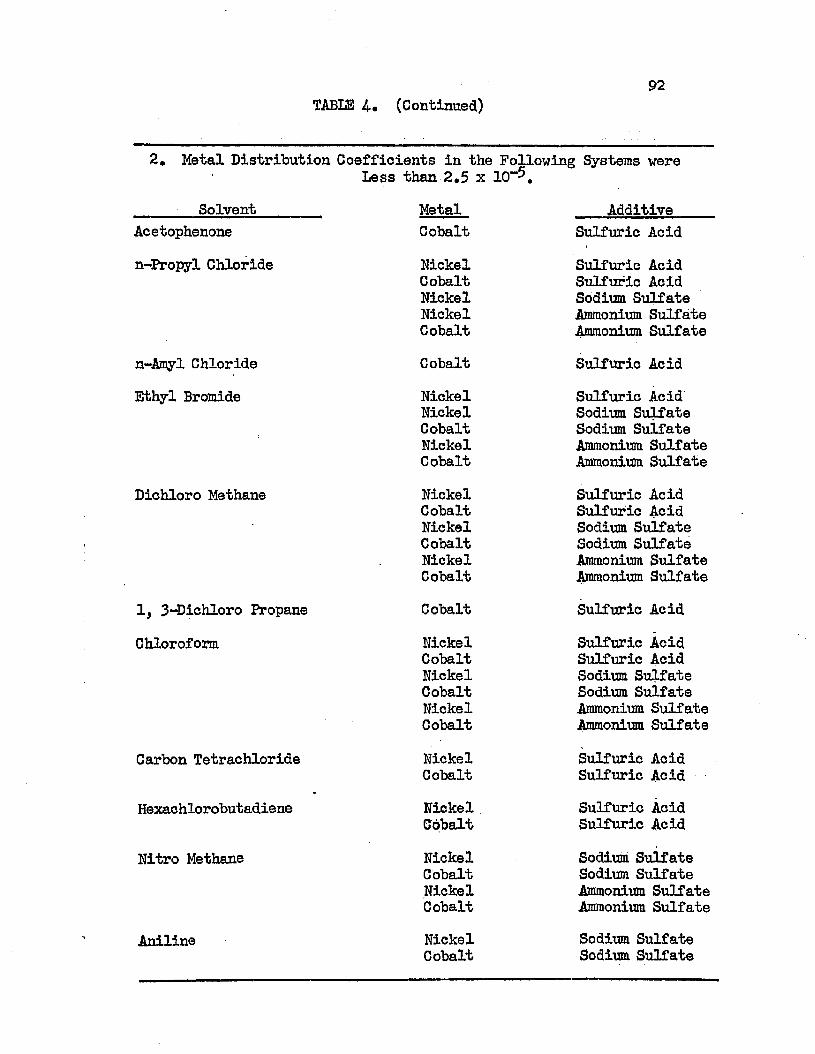
TABLE A* (Continued)92
2* Metal Distribution Coefficients in the Following Systems wereLess than 2.5 x 10” .
SolventAcetophenone n-Propyl Chloride
n-Amyl Chloride Ethyl Bromide
Diehloro Methane
1, 3-Dichloro Propane Chloroform
Carbon Tetrachloride
Hexachlorobutadiene
Nitro Methane
Aniline
MetalCobaltNickelCobaltNickelNickelCobaltCobaltNickelNickelCobaltNickelCobaltNickelCobaltNickelCobaltNickelCobaltCobaltNickelCobaltNickelCobaltNickelCobaltNickelCobaltNickelCobaltNickelCobaltNickelCobaltNickelCobalt
AdditiveSulfuric AcidSulfuric Acid Sulfuric Acid Sodium SuLfate Ammonium Sulfate Ammonium SulfateSulfuric AcidSulfuric Acid Sodium Sulfate Sodium Suifate Ammonium Sulfate Ammonium SulfateSulfuric Acid Sulfuric Acid Sodium Sulfate Sodium Sulfate Ammonium Sulfate Ammonium SulfateSulfuric AcidSulfuric Acid Sulfuric Acid Sodium Sulfate Sodium Suifate Ammonium Sulfate Ammonium SulfateSulfuric Acid Sulfuric AcidSulfuric Acid Sulfuric AcidSodium Sulfate Sodium Sulfate Ammonium Sulfate Ammonium SulfateSodium Sulfate Sodium Sulfate
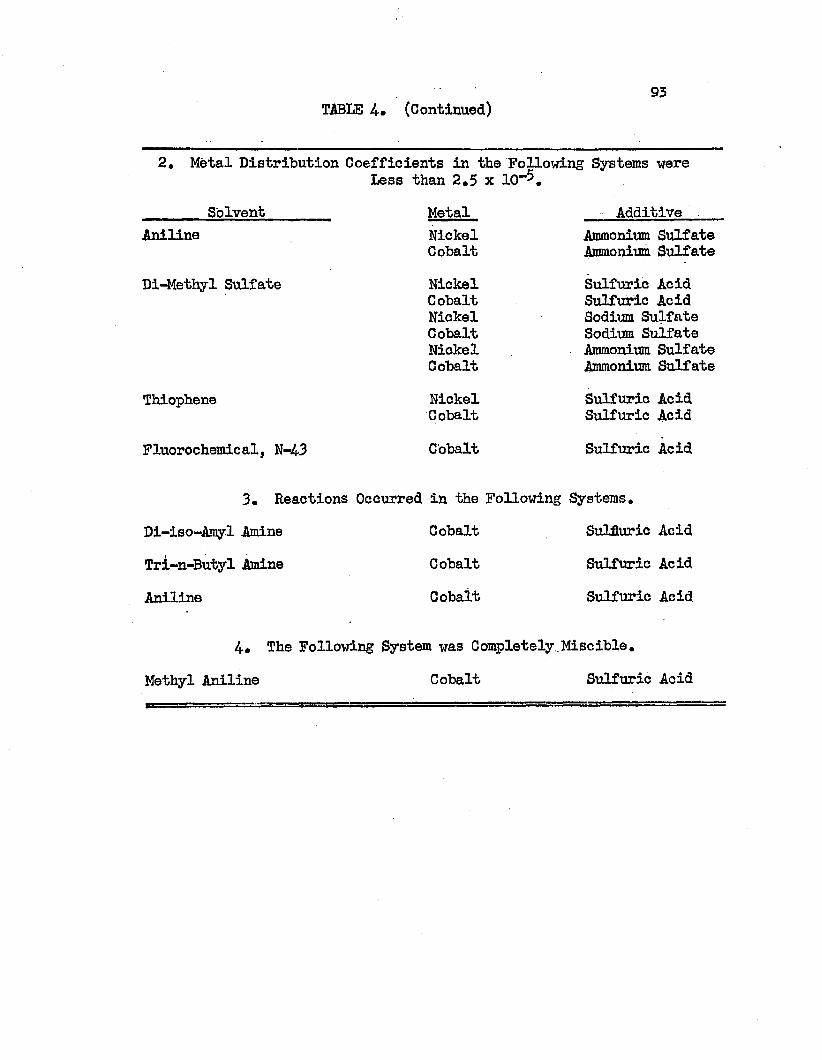
TABLE 4* (Continued)93
2. Metal Distribution Coefficients in the Following Systems wereLess than 2.5 x 10“ .
SolventAniline
Di-Methyl Sulfate
Thiophene
Fluorochemical, N-43
MetalNickelCobaltNickelCobaltNickelCobaltNickelCobaltNickelCobaltCobalt
AdditiveAmmonium Sulfate Ammonium SulfateSulfuric Acid Sulfuric Acid Sodium Sulfate Sodium Suifate Ammonium Sulfate Ammonium SulfateSulfuric Acid Sulfuric AcidSulfuric Acid
3. Reactions Occurred in the Following Systems. Di-iso-Amyl Amine Cobalt Sulfuric AcidTri-n-Butyl Amine Cobalt Sulfuric AcidAniline Cobait Sulfuric Acid
4. The Following System was Completely .Miscible.
Methyl Aniline Cobalt Sulfuric Acid
94
2. Extraction With Normal Butyl Alcohol
Normal butyl alcohol was used to determine the effects of sulfuric acid concentration and metal concentration on the distribution coefficients. Data for the distribution at 25.0°C. of the individual sulfates are given in the following tables: nickel,Table 5; cobalt, Table and iron, Table 7. The distribution of sulfuric acid between water and n-butyl alcohol is represented by data in Table 8. The effect of temperature on the distribution of the individual sulfates is shown in Tables 9, 10, and 11, Distributions in the complex mixture nickel sulfate-cobalt sulfate-ferric sulfate-sulfuric acid-water-normal butyl alcohol at 25.0°C. are given in Table 12. All concentrations are given in terms of grams per liter. Acid concentrations are given in gm. H SO /liter while metal concentrations are given in gm. metal/liter, not metal sulfate.
3. Solubility Determinations With Normal Butyl Alcohol
The liquid region of the phase diagram representing the system sulfuric acid-water-normal butyl alcohol at 25.0°G. was ascertained. These data are given in Table 13. Data showing the effects of iron, cobalt, and nickel sulfates on this phase diagram are given in Table 14 and Table 15.
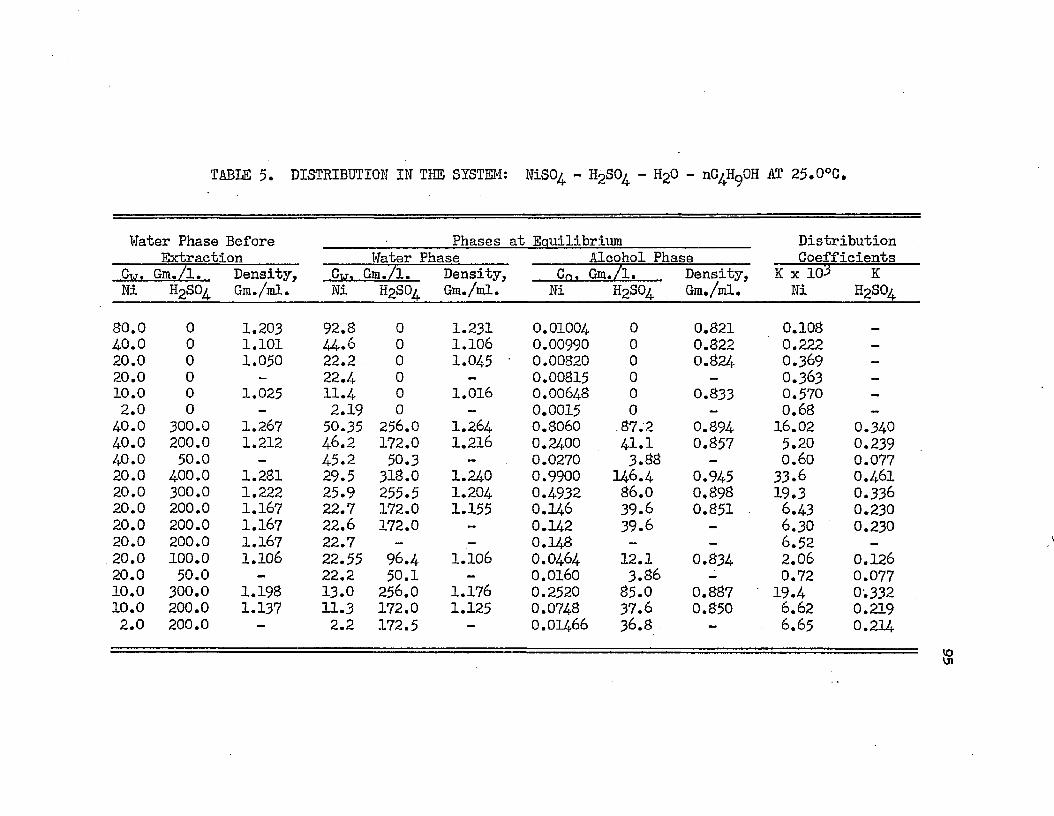
TABLE 5. DISTRIBUTION IN THE SYSTEM: NiSO^ - H2S0^ - H20 - nC^HgOH AT 25.0°C.
Water Phase Before Phases at Eauilibrium DistributionExtraction Water Phase Alcohol Phase Coefficients
Cw. Gm./l. Density. Cw. Gm./l. Density, Cn. Gm./l. Density. K x 105 KNi H2S0^ Gm./ml. Ni H2S0 Gm./ml. Ni H2S0^ Gm./ml. Ni H2S080.0 0 1.203 92.8 0 1.231 0.01004 0 0.821 0.1084-0.0 0 1.101 44.6 0 1.106 0.00990 0 0.822 0.222 —
20.0 0 1.050 22.2 0 1.045 • 0.00820 0 0.824 0.369 —
20.0 0 - 22.4 0 — 0.00815 0 — 0.363 —
10.0 0 1.025 11.4 0 1.016 O.OO648 0 0.833 0.570 —
2.0 0 - 2.19 0 — 0.0015 0 — 0.68 —
40.0 300.0 1.267 50.35 256.0 1.264 0.8060 87.2 0.894 16.02 0.34040.0 200.0 1.212 46.2 172.0 1.216 0.2400 41.1 0.857 5.20 0.23940.0 50.0 45.2 50.3 - 0.0270 3.88 — 0.60 0.07720.0 400.0 1.281 29.5 318.0 1.240 0.9900 I46.4 0.945 33.6 0.46120.0 300.0 1.222 25.9 255.5 1.204 0.4932 86.0 0.898 19.3 0.33620.0 200.0 1.167 22.7 172.0 1.155 0.146 39.6 0.851 ■ 6.43 0.23020.0 200.0 1.167 22.6 172.0 - 0.142 39.6 — 6.30 0.23020.0 200.0 1.167 22.7 — — 0.148 — — 6.52 —
20.0 100.0 1.106 22.55 96.4 1.106 0.0464 12.1 0.834 2.06 0.12620.0 50.0 - 22.2 50.1 — 0.0160 3.86 — 0.72 0.07710.0 300.0 1.198 13.0 256.0 1.176 0.2520 85.0 0.887 19.4 0.33210.0 200.0 1.137 11.3 172.0 1.125 0.0748 37.6 0.850 6.62 0.2192.0 200.0 — 2.2 172.5 — 0.01466 36.8 — 6.65 0.214
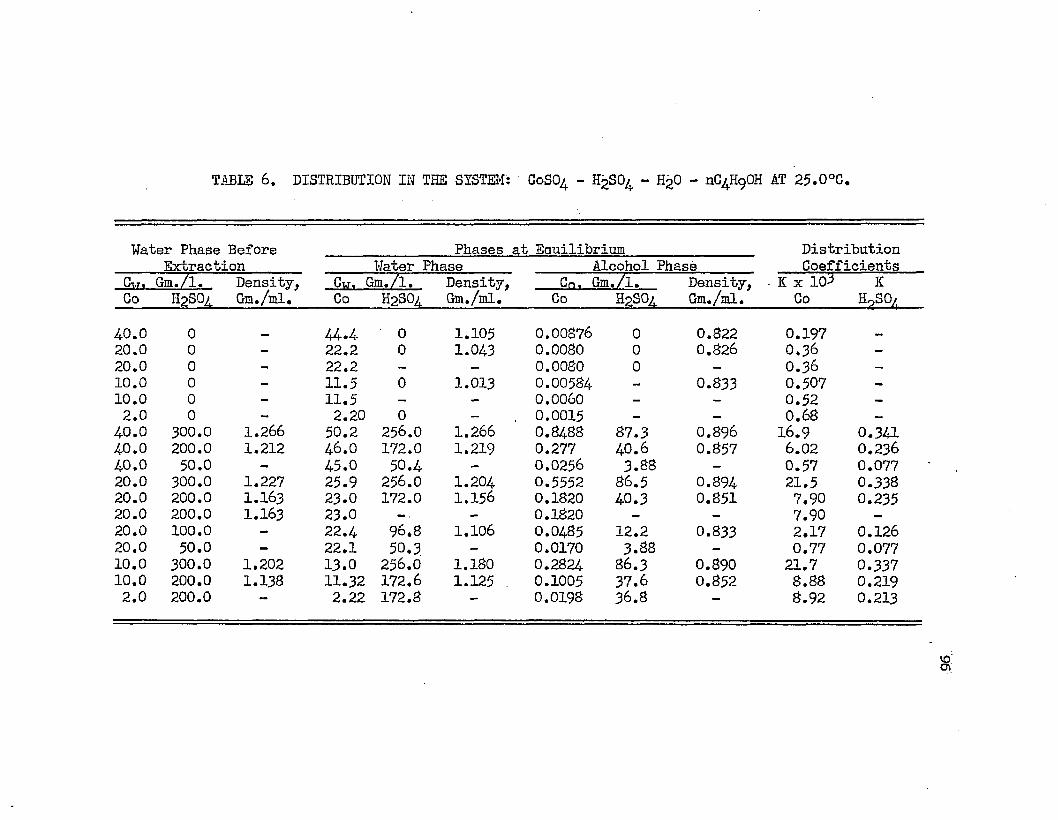
TABES 6 . DISTRIBUTION IN THE SI5TEM: G0SO4 - H2S0^ - H20 - nC HgOH AT 25.0°C.
Water Phase Before Extraction
Phases at Eauilibrium DistributionCoefficientsWater Phase Alcohol Phase
Cv. Gm./l. Density,Gm./ml.
Cu, (3m./l. Density,Gm./ml.
Cn. Gm./l. Density,Gm./ml.
• IC x 105 Co
KH9S0ACo H2S0a Co H2S0A Co H2SO4.
40.0 0 4-4*4 0 1.105 0.00376 0 0.822 0.19720.0 0 - 22.2 0 1.043 0.0030 0 0.826 O.36 -20.0 0 - 22.2 — — 0.0030 0 — 0.36 —10.0 0 - 11.5 0 1.013 0.00534 — 0.833 0.507 —10.0 0 - 11.5 — — 0.0060 — — 0.52 —2.0 0 - 2.20 0 — 0.0015 — — 0.68 —40 ■ 0 300.0 1.266 50.2 256.0 1.266 0.8488 87.3 0.896 16.9 0.34140.0 200.0 1.212 46.0 172.0 1.219 0.277 40.6 0.857 6.02 0.2364.0.0 50.0 - 45.0 50.4 — 0.0256 3.88 — 0.57 0.07720.0 300.0 1.227 25.9 256.0 1.204 0.5552 86.5 0.894 21.5 0.33820.0 200.0 I.I63 23.0 172.0 1.156 0.1820 40.3 0.851 7.90 0.23520.0 200.0 1.163 23.0 - . - 0.1820 — — 7.90 —20.0 100.0 - 22.4 96.8 1.106 0.0485 12.2 0.833 2.17 0.12620.0 50.0 - 22.1 50.3 - 0.0170 3.88 - 0.77 0.07710.0 300.0 1.202 13.0 256.0 1.180 0.2824 86.3 0.890 21.7 0.33710.0 200.0 1.133 11.32 172.6 1.125 0.1005 37.6 0.852 8.88 0.2192.0 200.0 - 2.22 172.8 - 0.0198 36.8 - 8.92 0.213
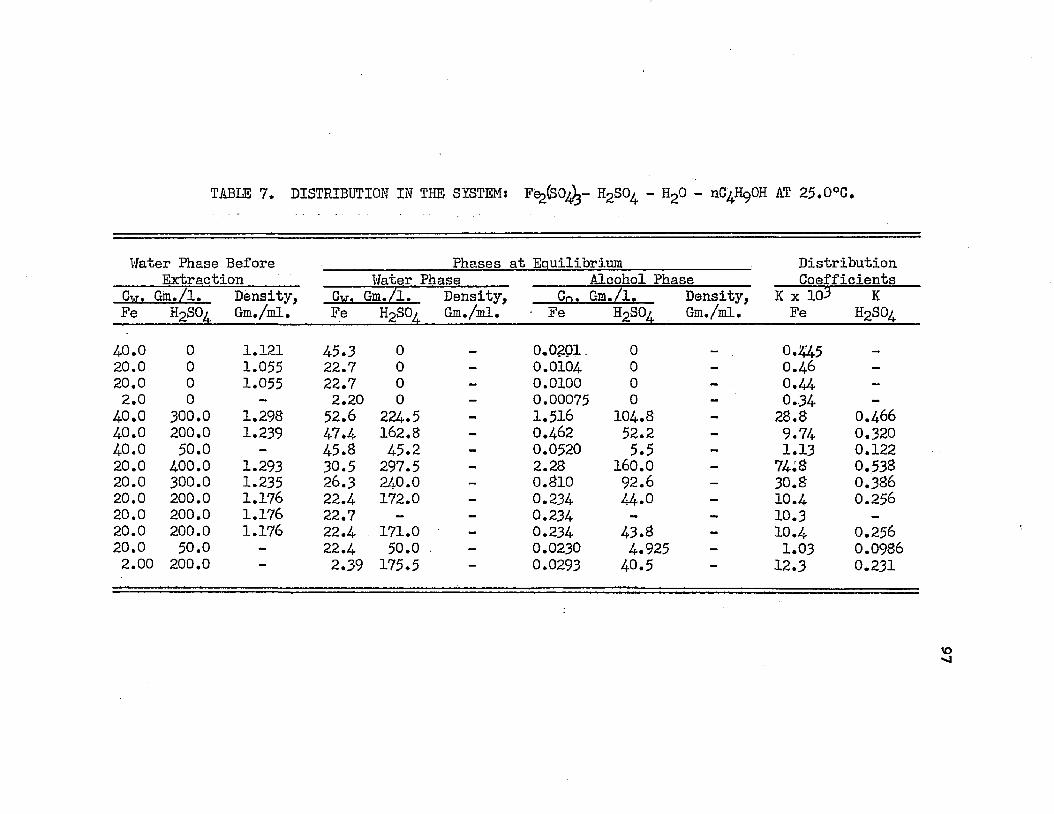
TABLE 7. DISTRIBUTION IN THE SISTEM: FsjfcO^- H2S0 - H20 - nC HgOH AT 25.0°C.
Water Phase Before Extraction
Phases at Eauilibrium DistributionCoefficientsWater Phase Alcohol Phase
Cw, Gm./l. Density,Gm./ml.
Cw. <jm./l. Density,Gm./ml.
C n. Gm./l. Density,Gm./ml.
* CDs U: K
H2SO4Fe h2sol Fe h2s°l - Fe H2S0440.0 0 1.121 45.3 0 0.0201 0 0.445 _20.0 0 1.055 22.7 0 - 0.0104 0 - 0.46 -20.0 0 1.0 55 22.7 0 - 0.0100 0 - 0.44 -2.0 0 - 2.20 0 - 0.00075; 0 - 0.34 —4-0.0 300.0 1.298 52.6 224.5 - 1.516 104.8 - 2 8.8 O.4664-0.0 200.0 1.239 47.4 162.8 - 0.462 52.2 _ 9.74 0.32040.0 50.0 - 45.8 45.2 - 0.0520 5.5 - 1.13 0.12220.0 4.00.0 1.293 30.5 297.5 — 2.28 160.0 - 74:8 0.53820.0 300.0 1.235 26.3 240.0 - 0.810 92.6 — 30.8 0.38620.0 200.0 1.176 22.4 172.0 — 0.234 44.0 — 10.4 0.25620.0 200.0 1.176 22.7 — — 0.234 — — 10.3 —20.0 200.0 1.176 22.4 171.0 - 0.234 43.8 - 10.4 0.25620.0 50.0 - 22.4 50.0 . - 0.0230 4.925 - 1.03 0.09862.00 200.0 2.39 175.5 — 0.0293 40.5 12.3 0.231
«3-J
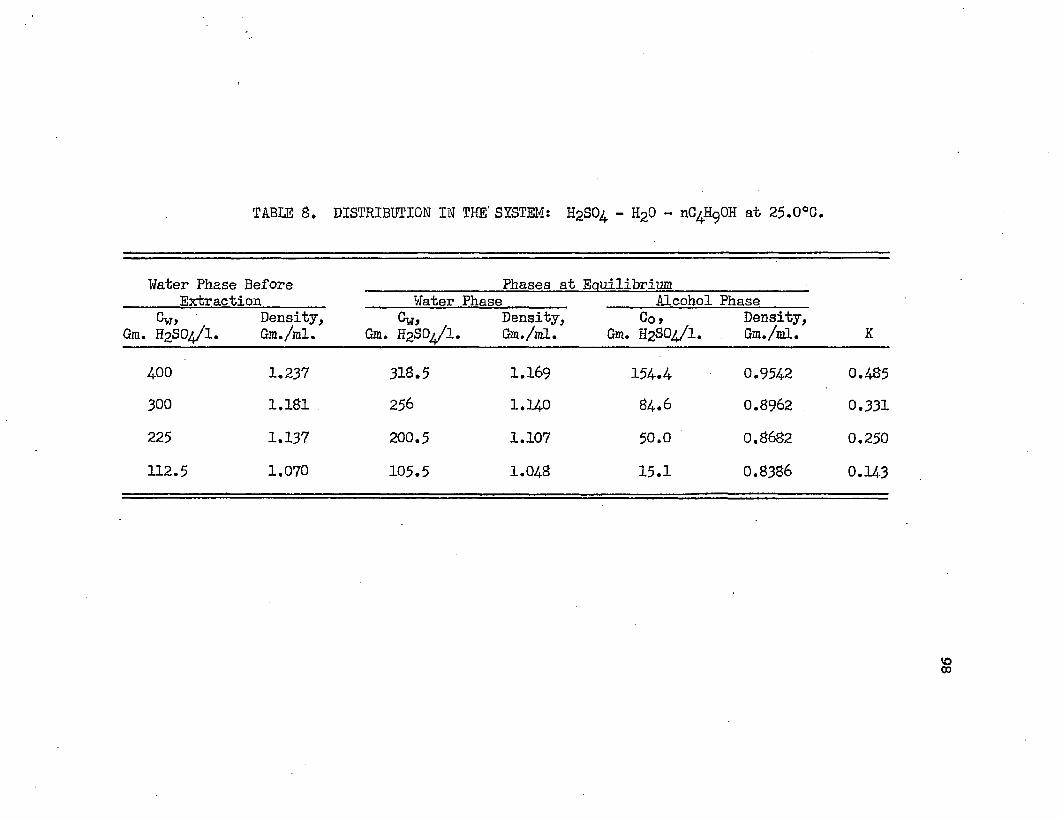
TABLE 8 . DISTRIBUTION IN THE' SYSTEM: H2SO4 - H20 - nC^OH at 25.0°C.
Water Phase Before Extraction
Phases at Eauilibrium
KWater Phase Alcohol Phase
Gm. H2SO4/I.Density,Gm./ml.
Gw>Gm. H2SO4/I.Density,Gm./ml.
Co tGm. H2SO4/I.
Density,Gm./ml.
4.00 1.237 318.5 1.169 154.4 0.9542 0.485300 1.181 256 1.14-0 84.6 0.8962 0.331225 1.137 200.5 1.107 50.0 0.8682 0.250112.5 1.070 105.5 1.048 15.1 0.8386 0.143
<0CD
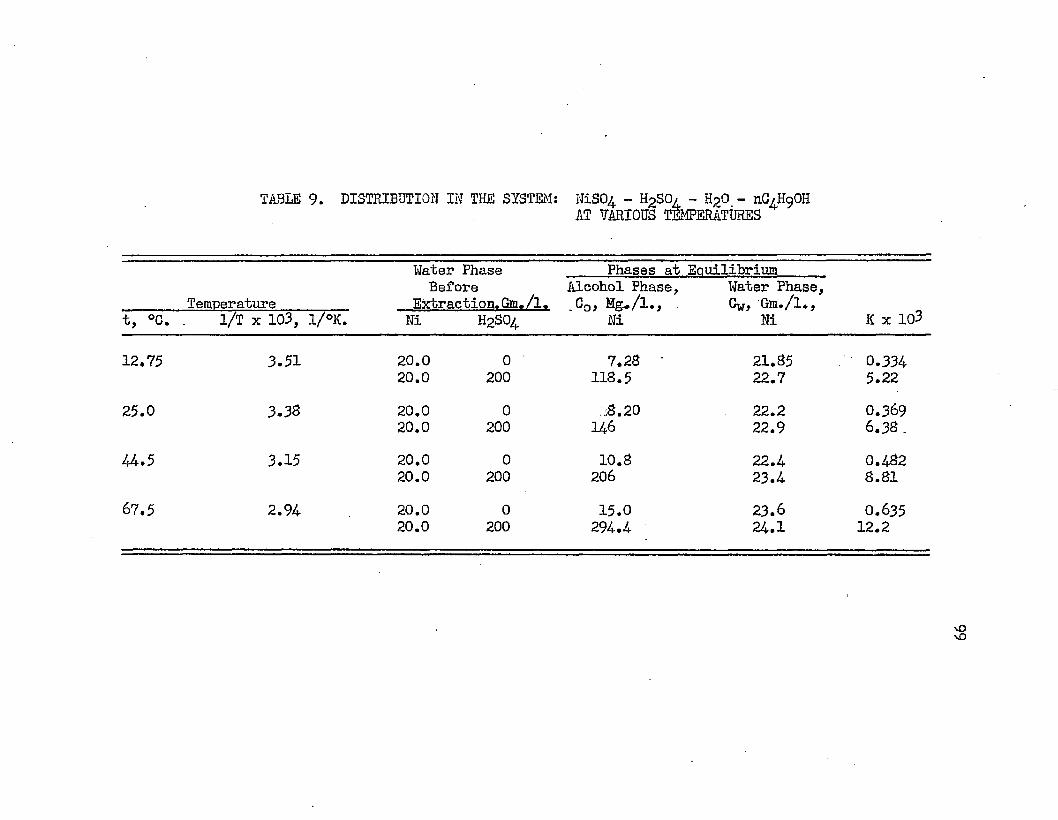
TABLE 9. DISTRIBUTION IN THE SYSTEM: NiSO - H2S0/ - H20 - nC/HgOHAT VARIOUS TEMPERATURES
TemperatureWater Phase Before
Extraction.Gm./l.Phases at Eauilibrium
Alcohol Phase, Water Phase, .Co, Mg»/l., Cyr, Gm./l.,
Ni Ni K x 103•o0•p 1/T x 103, l/°K. Ni H2SO4
12.75 3.51 20.0 0 7.28 ' 21.85 0.33420.0 200 118.5 22.7 5.2225.0 3.38 20.0 0 '8.20 22.2 0.36920.0 200 146 22.9 6.38 .44.5 3.15 20.0 0 10.8 22.4 0.482
20.0 200 206 23.4 8.8167.5 2.94- 20.0 0 15.0 23.6 0.63520.0 200 294.4 24.1 12.2
vO
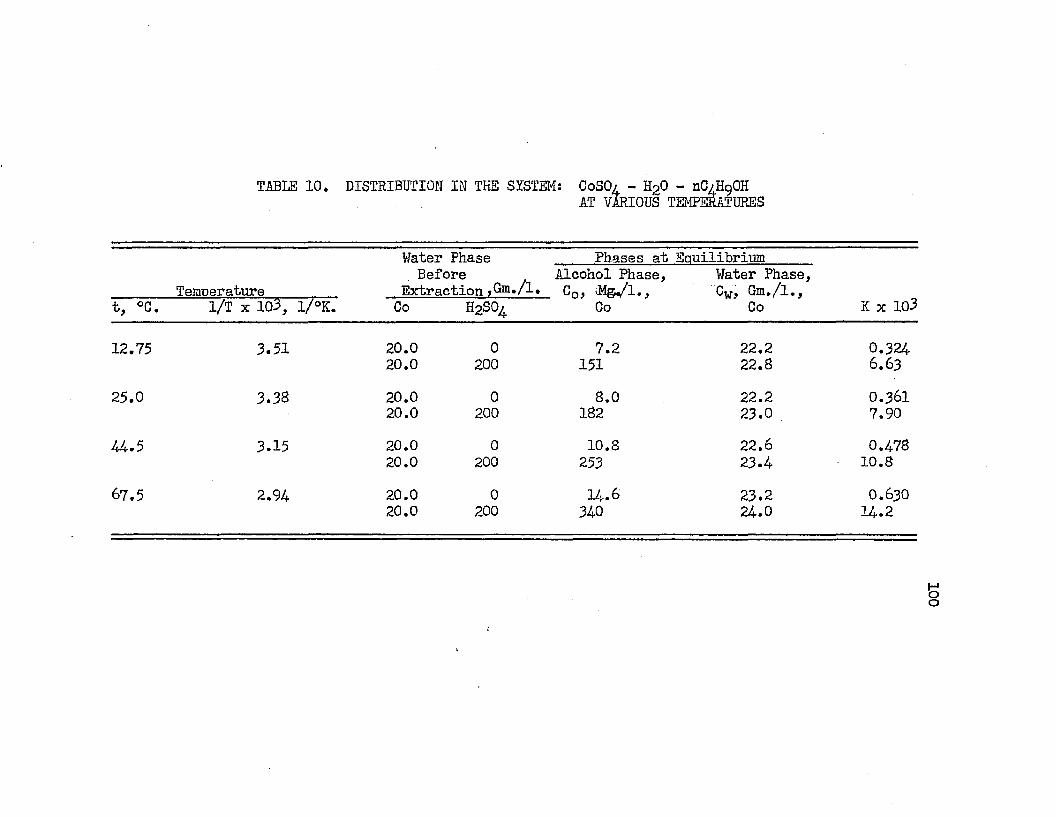
TABLE 10. DISTRIBUTION IN THE SXSTEM: CoSO/ - H20 - 11C/H9OHAT VARIOUS TEMPERATURES
TenroeratureWater Phase Before
Extraction,Gm./l.Phases at Eauilibrium
Alcohol Phase, Water Phase, _ C0, MaJl,, C„, Gm./l.,
t, °G. 1/T x 103, l/°K. Co H2S04 Co Co K x 103
12.75 3.51 20.0 0 7.2 22.2 0.32420.0 200 151 22.8 6.6325.0 3.38 20.0 0 8.0 22.2 0.361
20.0 200 182 23.0 7.9044.5 3.15 20.0 0 10.8 22.6 0.478
20.0 200 253 23.4 10.867.5 2.94 20.0 0 14.6 23.2 0.630
20.0 200 340 24.0 14.2
100
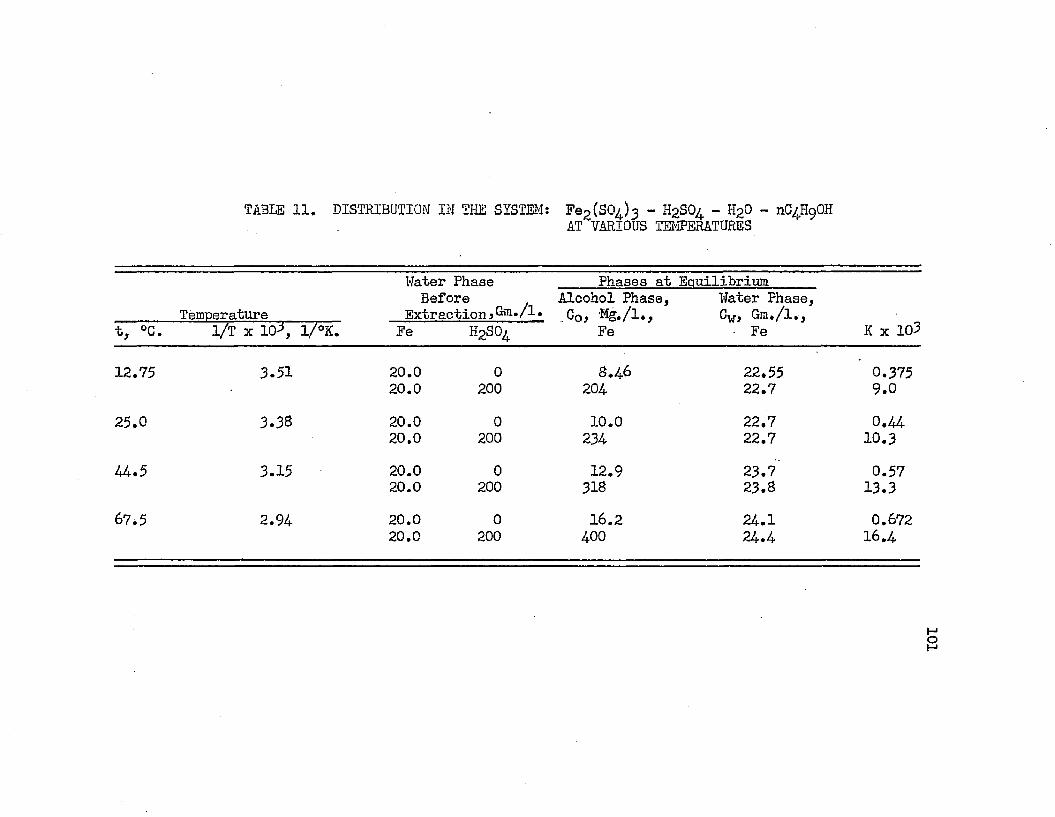
TABLE 11. DISTRIBUTION IN THE SYSTEM: i W S O ^ - HgSO^ - H20 - 11C4.H9OHAT VARIOUS TEMPERATURES
Water Phase Phases at EauilibriumTemperature
Before Extraction?Gm./l.
Alcohol Phase, Co, Mg,/l.,
Water Phase, Gy, Gm./l.,
t, °C. 1/T x 1 0 l/°K. Fe H2S0^ Fe Fe K x 103
12.75 3.51 20.0 0 6.46 22.55 0.37520.0 200 204 22.7 9.0
25.0 3.38 20.0 0 10.0 22.7 0.4420.0 200 234 22.7 10.3
44.5 3.15 20.0 0 12.9 23.7 0.5720.0 200 318 23.8 13.3
67.5 2.94 20.0 0 16.2 24.1 0.67220.0 200 400 24.4 16.4
101
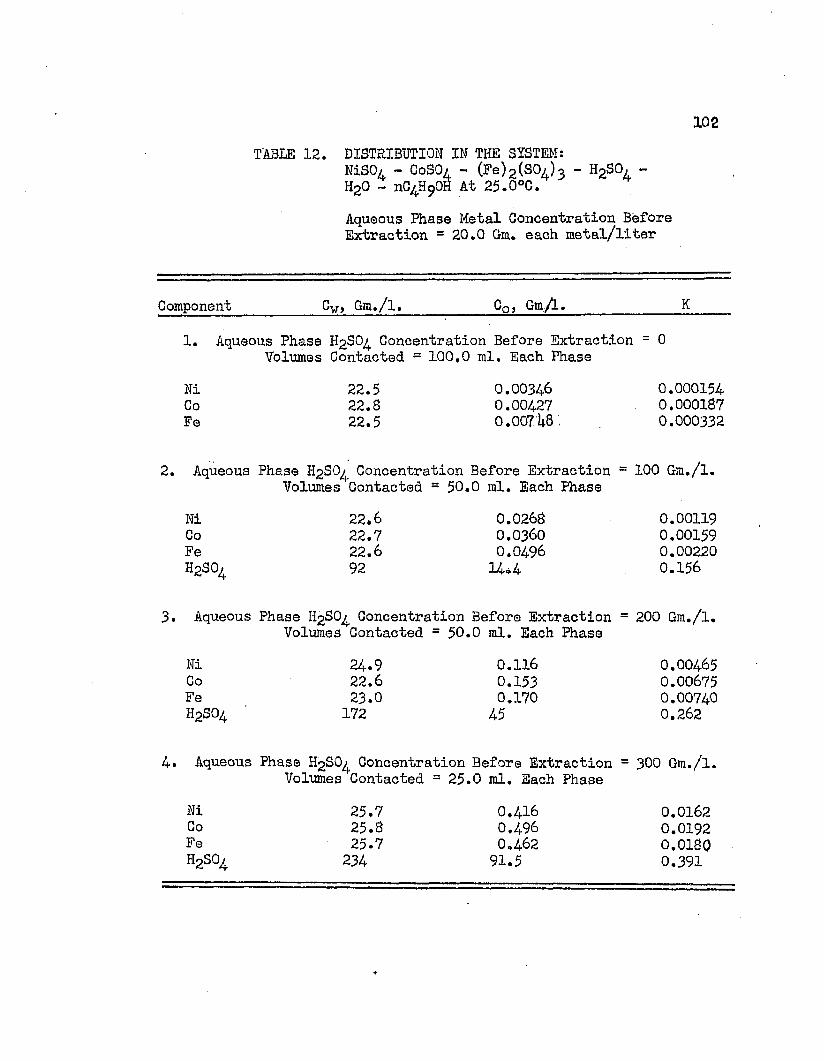
102TABLE 12. DISTRIBUTION IN THE SYSTEM:
NiSO/ - CoSO/ - (Fe)2 (SOj3 - H2S0, -H20 - nG^H OH At 25.0°C.Aqueous Phase Metal Concentration Before Extraction = 20.0 Gm. each metal/liter
Component Cy, Gm./l. Cqj Gm/L. K
1. Aqueous Phase H2S0 Concentration Before Extraction Volumes Contacted = 100,0 ml. Each Phase
= 0
Ni 22.5 0.0034-6 0.000154Co 22.8 0.004-27 0.000187Fe 22.5 0.007 U8, 0.000332
2. Aqueous Phase H2SQ Concentration Before Extraction - Volumes Contacted = 50.0 ml. Each Phase
100 Gm./l.
Ni 22.6 0.0268 0.00119Co 22.7 0.0360 0.00159Fe 22.6 0.04-96 0.00220H2SO4 92 14.* 4 0.156
3. Aqueous Phase H2S0 Concentration Before Extraction = 200 Gm./l. Volumes Contacted = 50.0 ml. Each Phase
Ni 24.9 0.116 0.00465Co 22.6 0.153 0.00675Fe 23.0 0.170 0.00740h2so4 172 45 0.262
4. Aqueous Phase H2S0 Concentration Before Extraction = 300 Gm./l. Volumes Contacted = 25.0 ml. Each Phase
Ni 25.7 0.416 0.0162Co 25.8 0.496 0.0192Fe 25.7 0.462 0.0180h2so^ 234 91.5 0.391
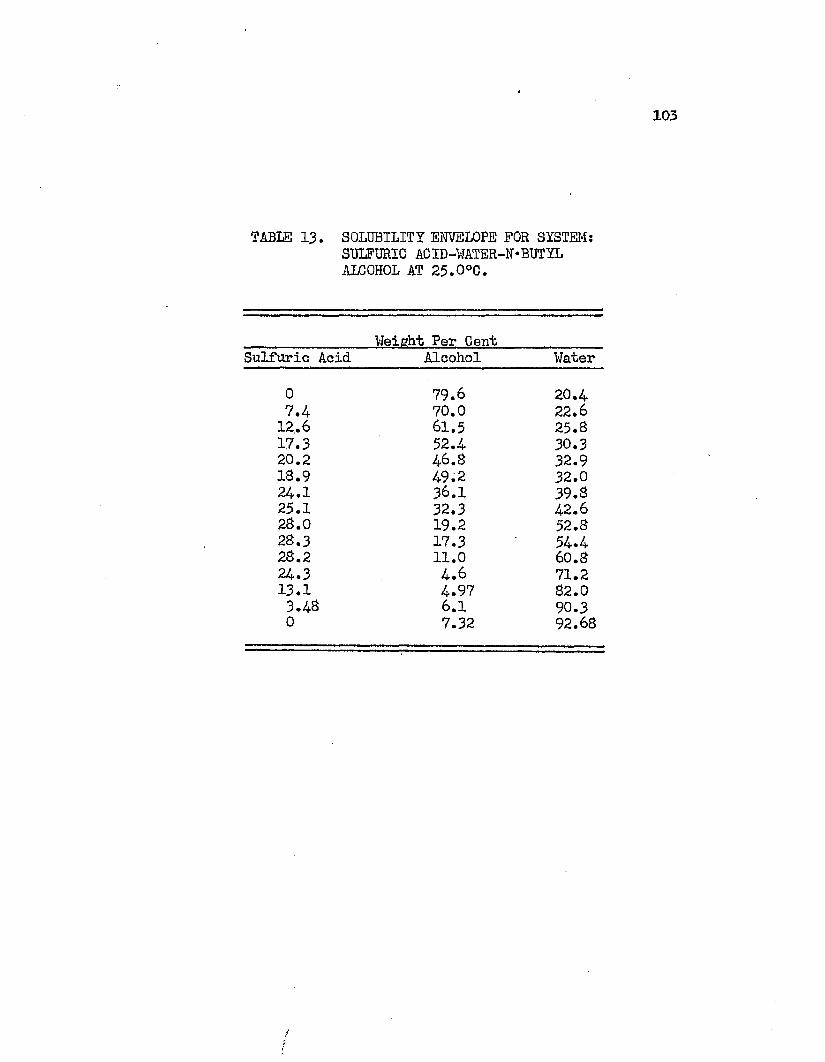
103
TABLE 13. SOLUBILITY ENVELOPE FOR SYSTEM: SULFURIC ACID-WATER-N•BUTYL ALCOHOL AT 25.0°C.
Weieht Per CentSulfuric Acid Alcohol Water
0 79.6 20.47.4 70.0 22.612.6 61.5 25.817.3 52.4 30.320.2 46.8 32.918.9 49.2 32.024.1 36.1 39.825.1 32.3 42.628.0 19.2 52.828.3 17.3 54.428.2 11.0 60.824.3 4.6 71.213.1 4.97 82.03.48 6.1 90.30 7.32 92.68
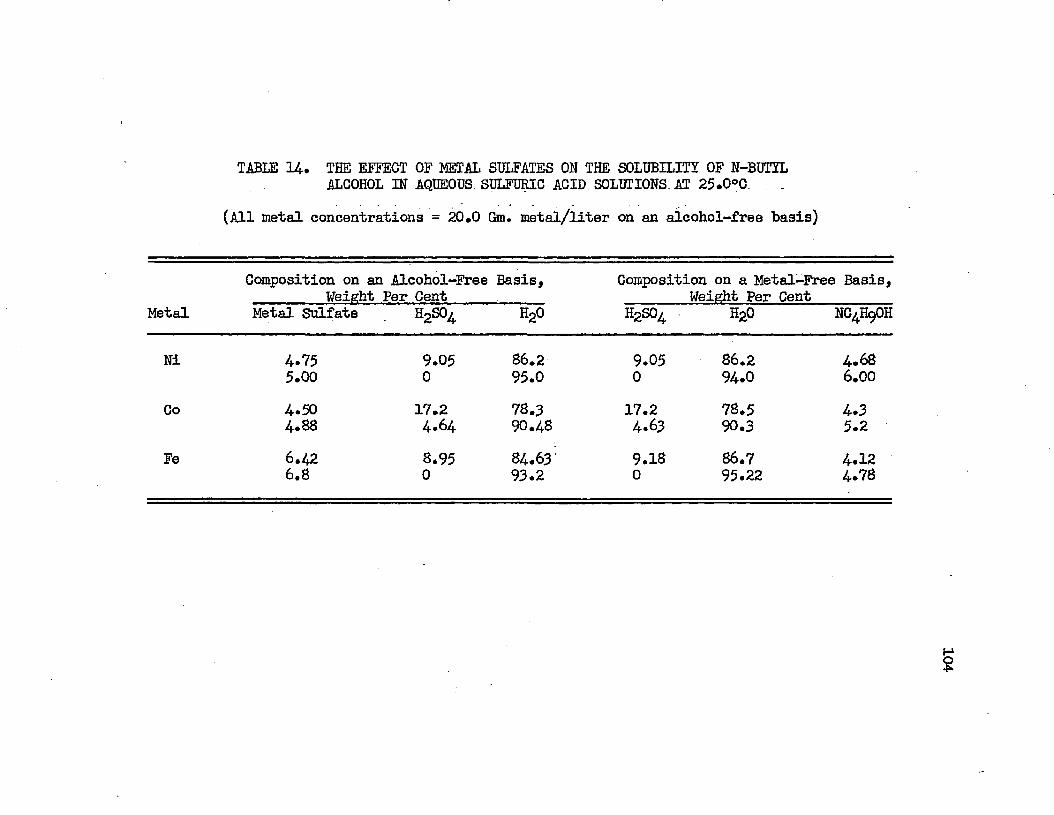
TABLE 14. THE EFFECT OF METAL SULFATES ON THE SOLUBILITY OF N-BUTYL ALCOHOL IN AQUEOUS SULFURIC ACID SOLUTIONS AT 25.0°C
(All metal concentrations = 20.0 Gm. metal/liter on an aicohol-free basis)
Composition on an Alcohol-Free Basis, Weight Per Cent
Composition on a Metal-Free Basis, Weight Per Cent
Metal Metal Sulfate . h2so^ h2o H2S0A H20 NC4H9OH
Ni 4.75 9.05 86.2 9.05 86.2 4.685.00 0 95.0 0 94.0 6.00
Co 4.50 17.2 78.3 17.2 78.5 4.34.68 4.64 90.48 4.63 90.3 5.2Fe 6.42 8.95 84.63 9.18 86.7 4.126.8 0 93.2 0 95.22 4.78
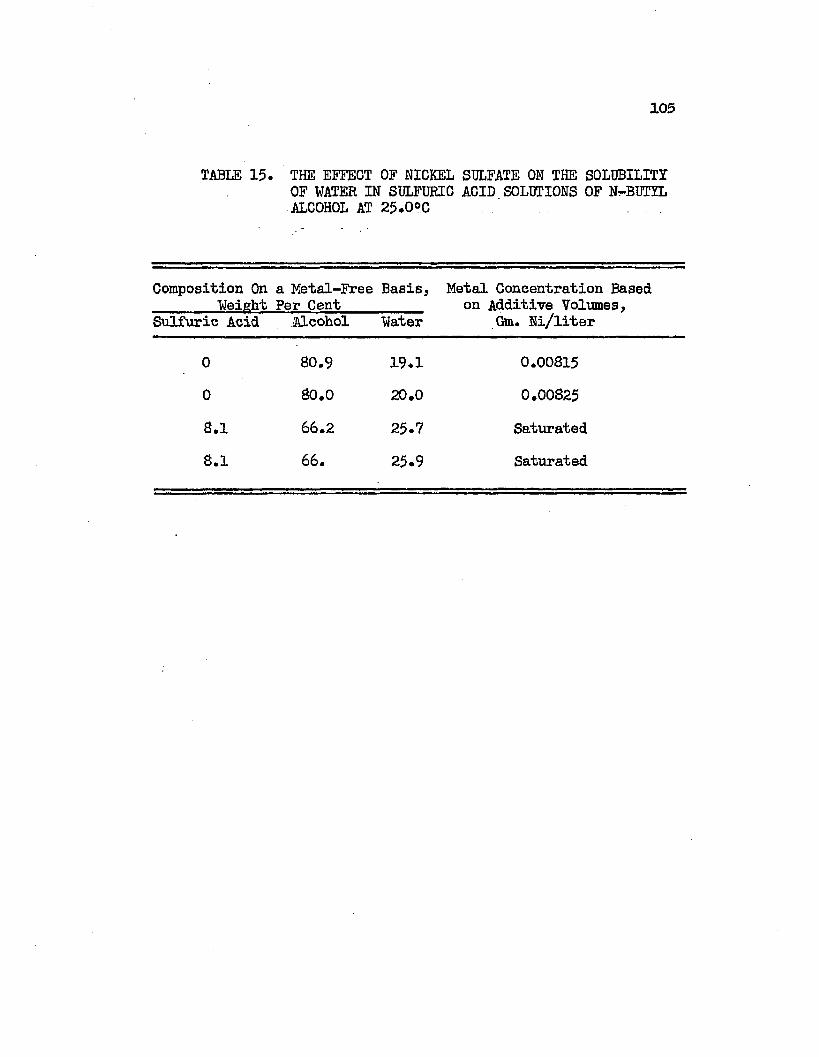
105
TABLE 15. THE EFFECT OF NICKEL SULFATE ON THE SOLUBILITY OF WATER IN SULFURIC ACID SOLUTIONS OF N-BUTYL ALCOHOL AT 25.0°C
Composition On a Metal-Free Basis, Metal Concentration Based______ Weight Per Cent________ on Additive Volumes,Sulfuric Acid Alcohol Water Gm. Ni/liter
0 80.9 19.1 0.008150 80.0 20.0 0.008258.1 66.2 25.7 Saturated8.1 66. 25.9 Saturated
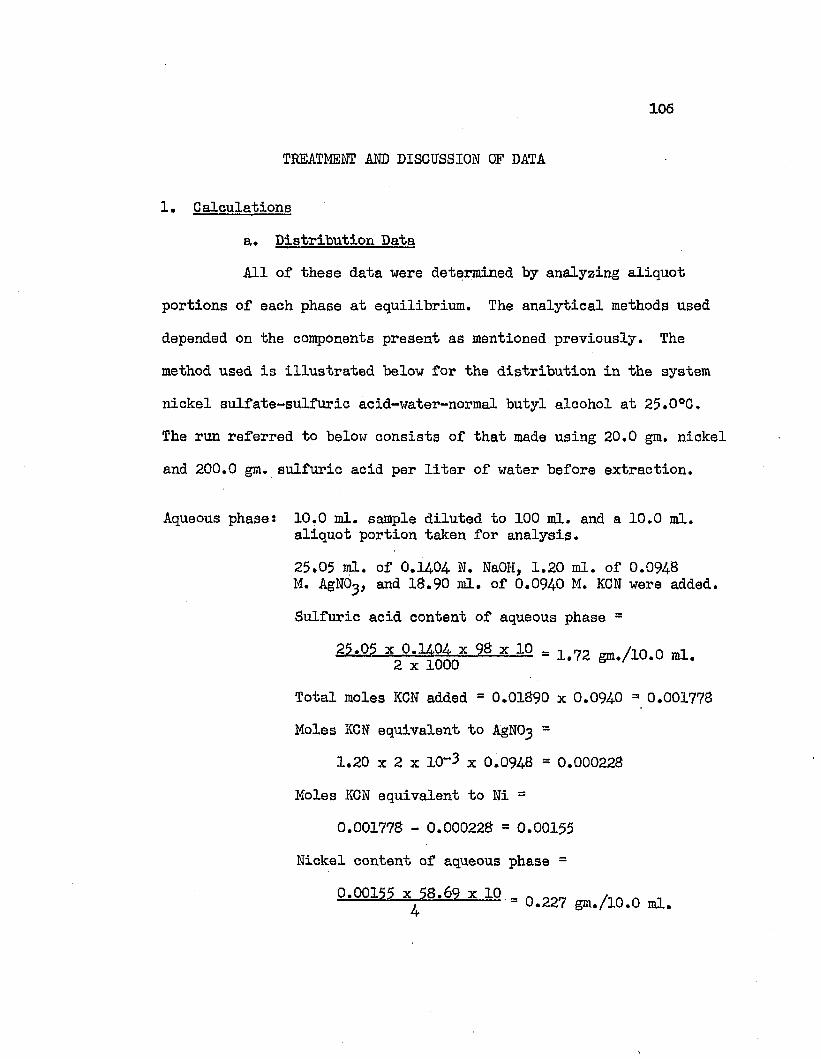
106
TREATMENT AND DISCUSSION OF DATA
1 . Calculationsa. Distribution DataAll of these data were determined by analyzing aliquot
portions of each phase at equilibrium. The analytical methods used depended on the components present as mentioned previously. The method used is illustrated below for the distribution in the system nickel sulfate-sulfuric acid-water-normal butyl alcohol at 25.0°C,The run referred to below consists of that made using 20.0 gm. nickel and 200.0 gm. sulfuric acid per liter of water before extraction.
Aqueous phase: 10.0 ml. sample diluted to 100 ml. and a 10.0 ml.aliquot portion taken for analysis.25.05 ml. of 0.14.04 N. NaOH, 1.20 ml. of 0.0948 M. AgNO j and 18.90 ml. of 0.0940 M. KCN were added.Sulfuric acid content of aqueous phase =
21.05 * 9-1494 .x 98 x 10 s 1/?z gm./io.o ml.2 x 1000 ^ '
Total moles KCN added = 0.01890 x 0.0940 = 0.001778Moles KCN equivalent to AgNO =
1.20 x 2 x 10“3 x 0.0948 = 0.000228Moles KCN equivalent to Ni =
0.001778 - 0.000228 = 0.00155Nickel content of aqueous phase =
0.00155 x 58.69 x 10 _ . ___ ,_n . _■ " — -g-- *----- 0.227 gm./lO.O ml.
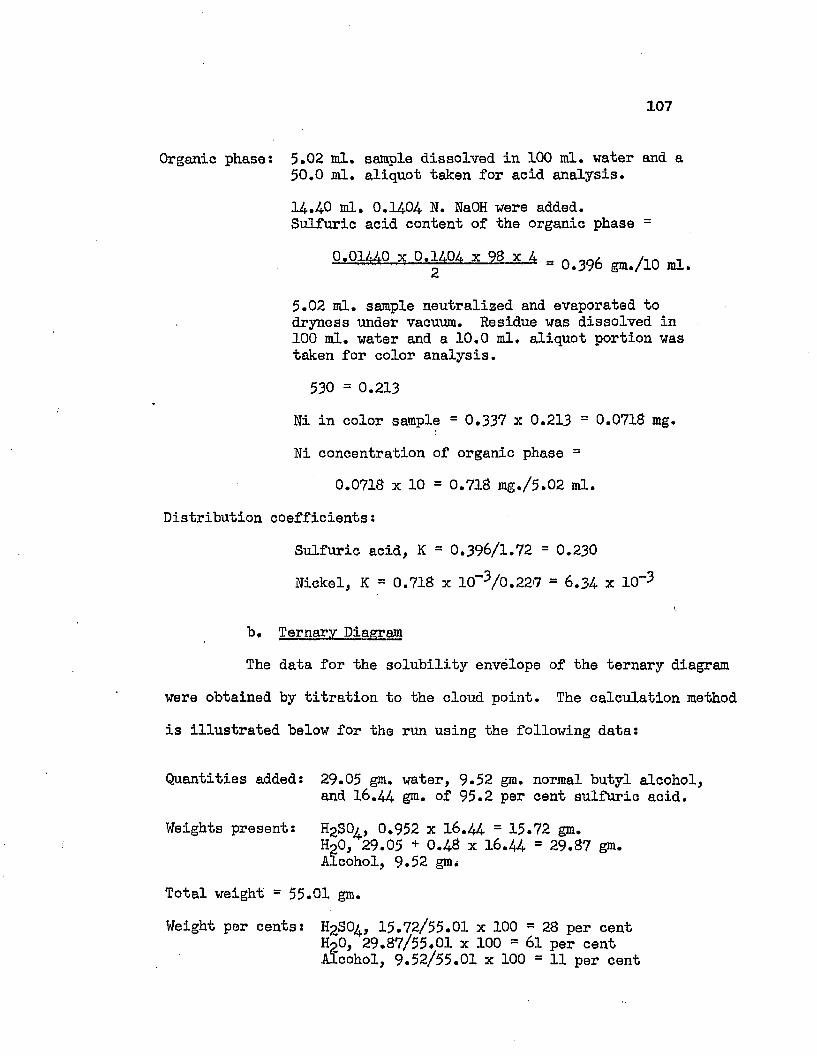
107
Organic phase: 5.02 ml. sample dissolved in 100 ml. water and a50.0 ml. aliquot taken for acid analysis.14..4-0 ml. 0.14.04 N. NaOH were added.Sulfuric acid content of the organic phase =
0.01M0 :<.0aA0„ X ,8. .4 . 0.396 ^
5.02 ml. sample neutralized and evaporated to dryness under vacuum. Residue was dissolved in 100 ml. water and a 10.0 ml. aliquot portion was taken for color analysis.530 =0.213
Ni in color sample = 0.337 x 0.213 = 0.0718 mg. Ni concentration of organic phase =
0.0718 x 10 = 0.718 mg./5.02 ml. Distribution coefficients:
Sulfuric acid, K = 0.396/1.72 = 0.230 Nickel, K = 0.718 x 10"3/0.227 = 6.34- x 10“3
b. Ternary DiagramThe data for the solubility envelope of the ternary diagram
were obtained by titration to the cloud point. The calculation method is illustrated below for the run using the following data:
Quantities added: 29.05 gm. water, 9.52 gm. normal butyl alcohol,and 16.44. gm. of 95.2 per cent sulfuric acid.
Weights present: H2S0/, 0.952 x 16.44 = 15.72 gm.H20, 29.05 + 0.48 x 16.44 = 29.87 gm.Alcohol, 9.52 gnu
Total weight = 55.01 gm.Weight per cents: H2S0/, 15.72/55.01 x 100 = 28 per cent
H20, 29.87/55.01 x 100 = 61 per centAlcohol, 9.52/55.01 x 100 = 11 per cent
108
2. Discussion of Solvent and Mditive Search Dataa. Solvent SearchThe object of the solvent search was to determine how dis
tribution coefficients varied with type and position of functional groups of organic compounds. A test on every compound was impossible and unwarranted. As a result, as many deletions as possible, without sacrificing completeness, were made. Solvents were chosen on the bases of non-miscibility characteristics with water, acceptable melting and boiling points compared with room temperature, non-reactivity with water and metal salts, and the position and type of functional group located in the molecules. Metal concentrations were limited to20.0 gm. metal per liter of the aqueous phase before extraction.
Data of the solvent search are tabulated in Table 3* This table lists the solvent, the metal sulfate in solution, the concentrations of the metals in conjugate phases, and the distribution coefficients at 25.0°C. In addition, errors in the colorimetric analysis of low metal content organic phases are listed. These errors are the estimated maximum errors involved in that particular determination based on the analytical evaluations outlined previously. Use was made of the semi-empirical error equations in arriving at the values listed. The tabulation of errors is of singular importance in this case since many of the analyses were made on extremely low quantities of metal. Comparisons of distribution coefficients must necessarily, take into consideration the accuracy of each particular analysis. If the error involved was greater than 50 per cent, the distribution coefficient was tabulated as less than or equal to that value which
109
would have been obtained with an organic phase analysis error of 50 per cent and an aqueous phase metal concentration of 20,0 gm, metal per liter. The value of 50 per cent error was chosen because the error increased rapidly with yet decreasing metal content after this point, and also because doubt as to the true optical density measured was noted even before the semi-empirical error equations were developed. Wo attempt was made to include errors of more concentrated solutions analyses since they had been proven to be low in the evaluations of analytical procedures previously discussed.
Organic acids were shown to have the greatest solvent power for cobalt and nickel. Of these organic acids, the alkyl acid orthophosphate compounds extracted considerably greater quantities of cobalt and nickel than the alkyl acid tried. Iron was precipitated by acids. Di-octyl acid pyrophosphate was singular in its ability to extract more metal than any other solvent tested. Failure of tri-alkyl phosphates to extract these metals indicated that the acidic hydrogen was involved. This was verified upon analyzing the
i
phases for sulfate content and finding that no sulfate was in the organic phase. By material balances, over 95 per cent of the sulfate ions in the system could be accounted for in the aqueous phase. Since these material balances were based on inaccurate conjugate phase volume measurements, this value along with the absence of any sulfate in the organic phase led to the conclusion that the sulfate was not extracted. Instead, the metal extracted from the aqueous phase was replaced by a hydrogen ion from the acid. The compound extracted
110
could then be considered to be the salt of the acidic solvent. In no case could cobalt and nickel separation factors other than one be obtained.
In general, organic compounds not containing strongly acidic hydrogen showed very poor extraction characteristics. Of these, the alcohols were the best, extraction decreasing with increasing molecular weight of the organic solvent. A few of the halides showed a preferential nickel extraction; however, the errors involved in the organic phase analyses were too great to make an exact conclusion of this. Greatest separation factors were obtained with esters. Esters showed a consistent preference to extract nickel without extracting any cobalt or iron. Regardless of separation factors, all extractions obtained were very low and methods of increasing extraction were required.
Attempts to correlate the degree of extraction with solvent properties were made. Since correlations of the behavior of ionic compounds in non-aqueous solvents are semi-quantitative under idealized conditions, it must be concluded at the outset that extraction correlations can be qualitative at the best.
Considering only electrostatic interactions, the distribution coefficients should have increased with increased dielectric constant of the solvent. Dimethyl sulfate and the nitroparaffins, with high dielectric constants, extracted less than the butyl alcohols which have low dielectric constants. In addition, the dielectric constant of i-butyl alcohol is greater than that of n-butyl alcohol and sec- butyl alcohol. Yet,the distribution coefficient is lower.
Ill
Considering only the solubility of water in the organic compound, the distribution should increase with increased water solubility. These conclusions may be reached by considering the exhibited ability to dissolve water primarily and also, any dissolved water would in turn increase the dielectric constant of the medium.The distribution coefficients did increase in much the same order as water solubility; however, the extent of increase in water solubility was not accompanied by a corresponding increase in the distribution coefficients.
Considering only coordination between metal ion and sulfate ion to enhance extraction, the extraction should have increased with increased total sulfate ion concentration and the addition of a dehydrating agent to the aqueous phase. This is discussed below when considering the effects of additives. It may be noted that under conditions such that coordination is the reason for extraction, iron should have been extracted to a degree greater than cobalt and nickel. This was true. The degree of extraction should not have changed materially with a change of the solvent to an isomer. As noted, the degree of extraction was highly dependent upon the particular isomer of organic compound used. This, along with the fact that the sulfate ion is only difficultly entered into the coordination sphere of a cation, tended to repudiate cation-anion coordination as causing extraction.
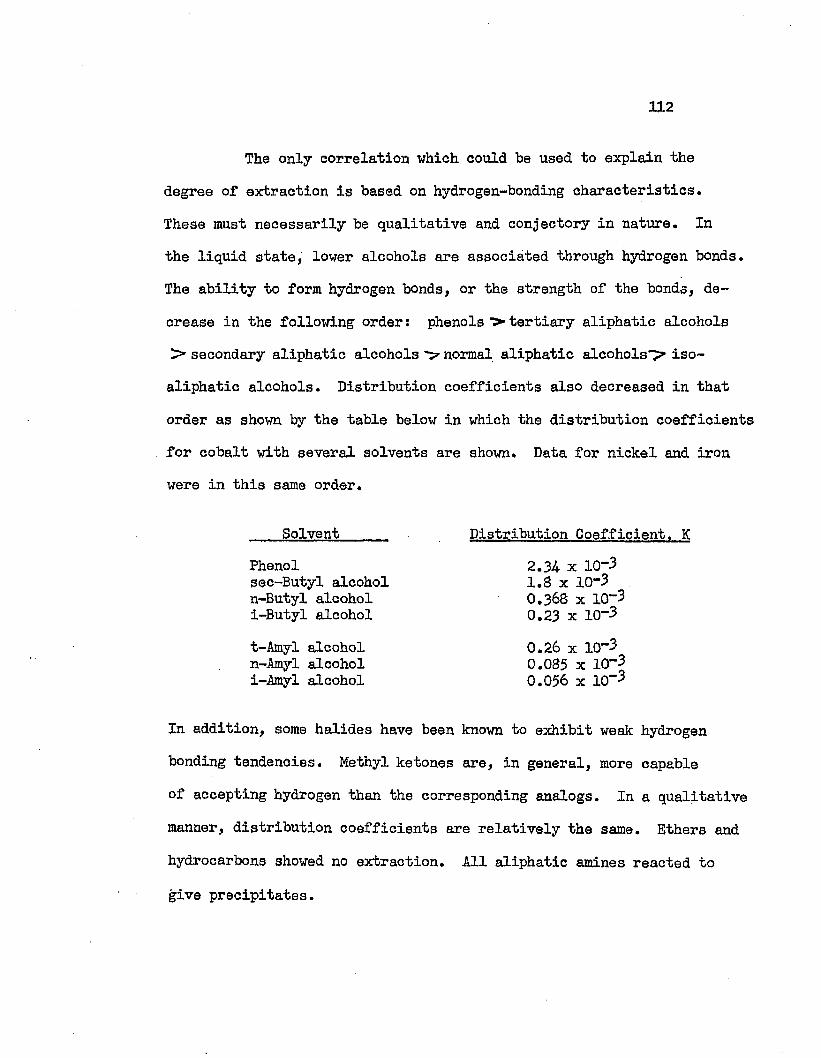
112
The only correlation which could be used to explain thedegree of extraction is based on hydrogen-bonding characteristics.These must necessarily be qualitative and conjectory in nature. In the liquid state, lower alcohols are associated through hydrogen bonds. The ability to form hydrogen bonds, or the strength of the bonds, decrease in the following order: phenols ">tertiary aliphatic alcohols> secondary aliphatic alcohols ■>normal aliphatic alcohols’ iso- aliphatic alcohols. Distribution coefficients also decreased in that order as shown by the table below in which the distribution coefficients for cobalt with several solvents are shown. Data for nickel and iron, were in this same order.
In addition, some halides have been known to exhibit weak hydrogen bonding tendencies. Methyl ketones are, in general, more capable of accepting hydrogen than the corresponding analogs. In a qualitative manner, distribution coefficients are relatively the same. Ethers and hydrocarbons showed no extraction. All aliphatic amines reacted to give precipitates.
Solvent Distribution Coefficient. KPhenolsec-Butyl alcohol n-Butyl alcohol i-Butyl alcohol
2.34- x 10-3 1.8 x 10⁻³ 0.368 x 10“3 0.23 x 10⁻³
t-Amyl alcohol n-Amyl alcohol i-Amyl alcohol
0.26 x 10⁻³ 0.085 x 10⁻³ 0.056 x 10"3
113
b. Additives
The object of the additive search was to determine whether or not other sulfates in the aqueous phase could be used to increase extraction. Additives were chosen on the bases of additives known to increase extraction in chloride and nitrate systems. A search of the literature showed that sulfates having appreciable water solubility all had low activity coefficients and that activity-concentration relationships were very similar. As a result, sulfuric acid, sodium sulfate, and ammonium sulfate were chosen for experimental purposes.
Data of the additive search are tabulated in Table A. This table lists the solvent, the metal sulfate, the additive, and the distribution coefficients at 25.0°C, Metal concentrations in the aqueous phase were 20.0 gm. metal per liter of aqueous solution before extraction. Sulfuric acid and sodium sulfate concentrations in the aqueous phase were limited to 200 gm. per liter of aqueous solution before extraction. Ammonium sulfate concentrations were limited to 33 gm. per liter by the solubility of the double salts. Wo additive analyses were made.
In all cases, data show that sodium sulfate and ammonium sulfate not only failed to increase extraction but decreased extraction, Sulfuric acid increased extraction with the alcohols, but decreased extraction with other compounds which showed a slight degree' of extraction without the additives present. Alkyl acid orthophosphate compounds were precipitated by sodium, ammonium, and ferric ions. The
114
degree of extraction with additives present varied with the solvent used in the same manner as extractions without additives present. Extractions were decreased with increased molecular weight of the solvent.
Sodium and ammonium sulfates are dehydrating agents and also increase the total sulfate ion content of the system. If coordination between metal cation and the sulfate anion were the cause of extraction, then distribution coefficients should be increased with these salts present. Since this was not true, this tends to repudiate any assumption that cation-anion coordination exists to any appreciable extent.
c. Solvent Selection
Possible solvents and additives which could be used for further work were limited. Considerations were necessarily given to the degree of extraction, since separation factors were small in all cases. The alkyl acid orthophosphates were eliminated from a possible choice because of their failure to extract the sulfate anion and exhibited a chemical reaction.
The only additive which increased extraction was sulfuric acid. The only solvents which exhibited readily measurable extractions were the alcohols, flienol was eliminated as a possible solvent because of its high melting point, 4-0°C., and because it separated from water only very slowly. This left only the lower alcohols. The secondary
115
alcohols showed greater extraction ability than the corresponding primary alcohols. Accompanying this was a corresponding increase in solubility of the alcohol in water. Considering this and Huntington's work on the extraction of chromic sulfate and manganous sulfate by normal butyl alcohol (see Literature Review). normal butyl alcohol was chosen as the solvent to be used for further investigations.
3. Correlation and Discussion of Distribution Data
Distribution data for the individual sulfates are given in Tables 5 to 7. Based on previously discussed analytical evaluations, all analyses, except those in the case of mixtures of iron, cobalt, and nickel, were considered to be accurate to less than two per cent. Aqueous-phase metal analyses and sulfuric acid analyses were considered to be accurate to less than one per cent. Organic phases with low metal contents were analyzed by using large volumes of solution to increase the total amount of metal analyzed. In this way, colorimetric errors were reduced. Some reruns were made to check questionable data and accuracy. These data are given in Tables 5 to 7.
Extensive evaluations of the analyses of mixtures of iron, cobalt, and nickel were not made. In the evaluation determinations discussed previously, maximum errors were on the order of magnitude of eight per cent. This was also considered to be the magnitude of error in the unknown determinations.
116
a. Effect of Sulfuric Acid
The effect of sulfuric acid on the distribution coefficientsof the individual metals at 25.0°C. when distributed alone, are tabulated in Tables 5, 6, and 7. Distribution coefficients are plotted against aqueous-phase sulfuric-acid concentrations in Figures 4, 5, and 6. These indicate that the distribution coefficients were increased greatly with increased sulfuric acid content of the system.The increases were on the order of magnitude of one hundred-fold when the sulfuric-acid concentration in the aqueous phase was about 250 gm. sulfuric acid per liter. These increases parallel those obtained by Huntington in the distribution of chromic and manganous sulfates between aqueous sulfuric-acid solutions and n-butyl alcohol*. An analogy is also found in the distribution of cobalt and nickel chlorides between aqueous hydrochloric-acid solutions and capryl alcohol. Corresponding increases in distribution coefficients with increases of aqueous-phase acid composition were substantially greater with chlorides than with the sulfates.
Comparing data on the extraction of cobalt and nickel sulfates in systems containing sulfuric acid with those of Garwin and Hixson* on the extraction of the corresponding chlorides from aqueous hydrochloric-acid solutions, it was found that behaviors in the two systems are different. The effect of added acid to the aqueous phase on the distribution coefficients were greater with chlorides than with
* See Literature Review.
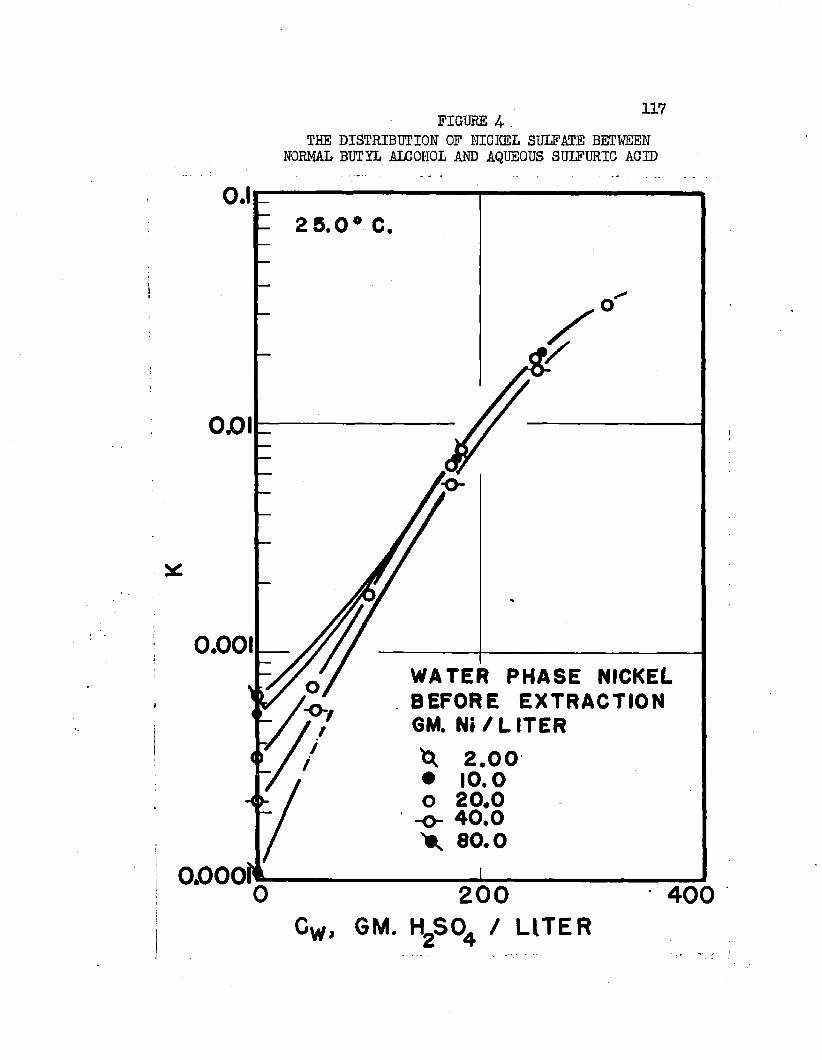
117FIGURE U .THE DISTRIBUTION OF NICKEL SULFATE BETWEEN
NORMAL BUTYL ALCOHOL AND AQUEOUS SULFURIC ACID
2 5.0
0,01
0.001WATER PHASE NICKEL BEFORE EXTRACTION GM. N i/L ITERV 2.00O 20.0
-O- 40,0 X 80.0
0.0001% 200Cw, GM. H S0A / LITER
400
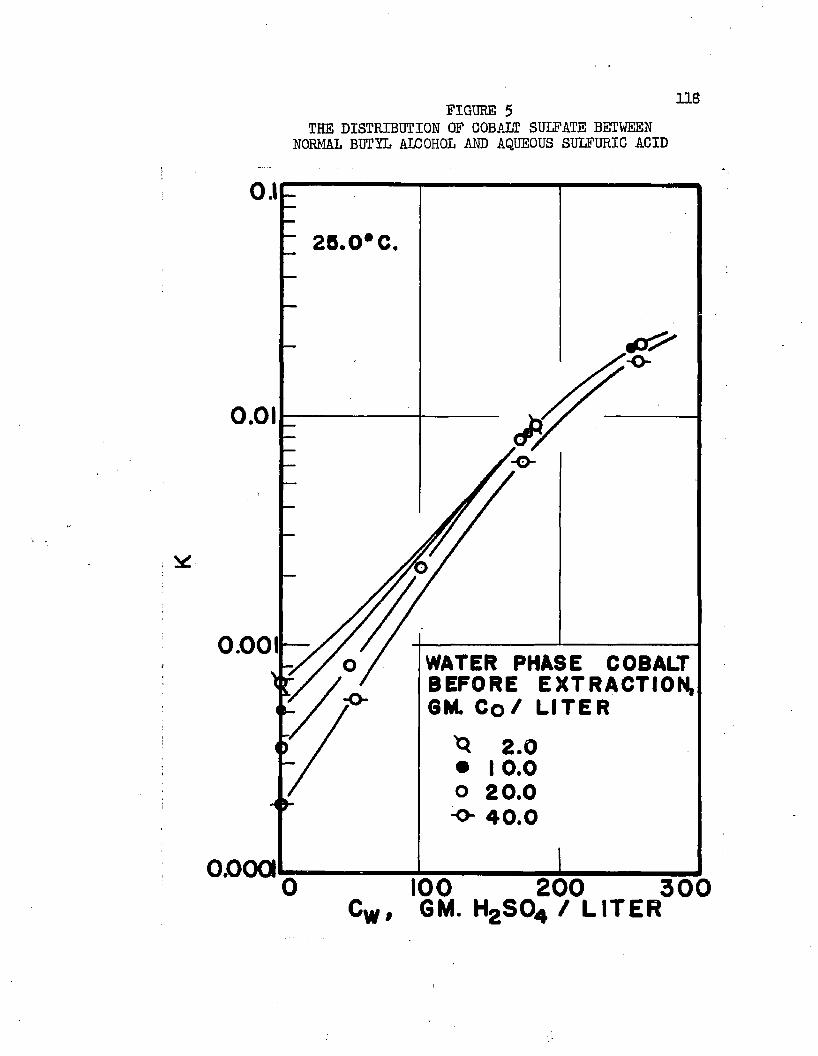
FIGURE 5THE DISTRIBUTION OF COBALT SULFATE BETWEEN
NORMAL BUTYL ALCOHOL AND AQUEOUS SULFURIC ACID
0.1
o-
0.01
-o-
0.001WATER PHASE COBALT BEFORE EXTRACTION, GM. C o / LITER-O-
o 20.0 O 40 .0
200100Cw , GM. H2S04 / L ITER
3 0 0
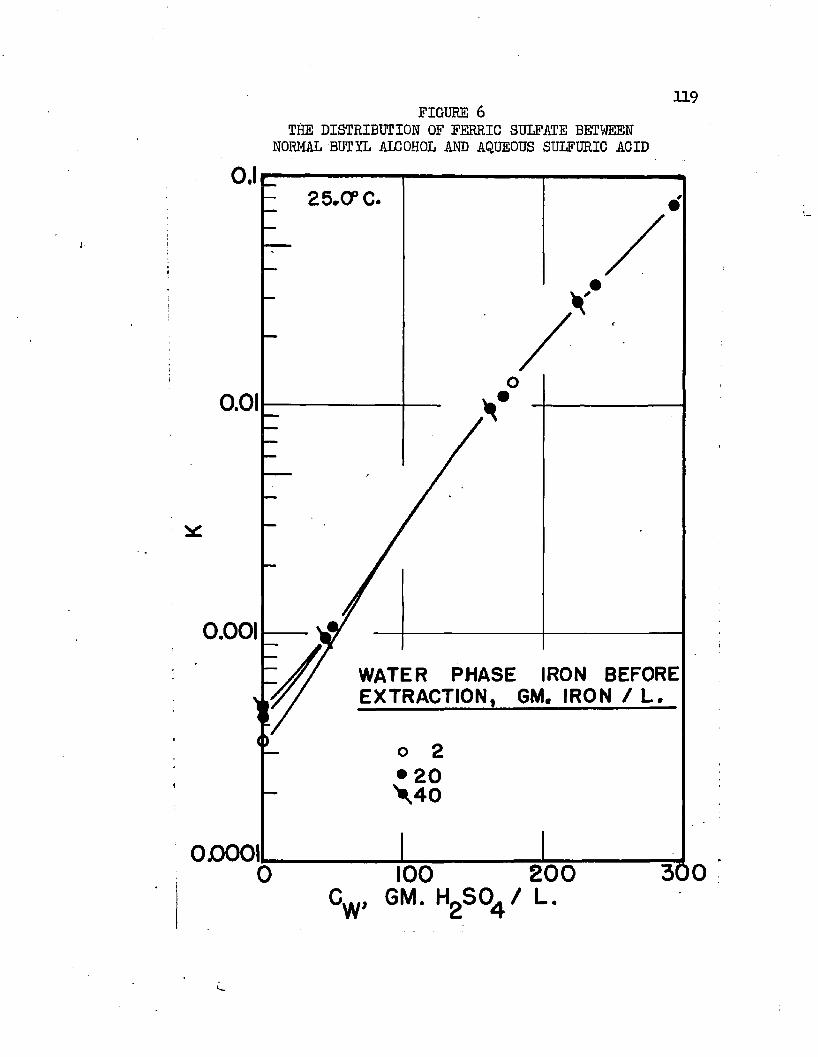
119FIGURE 6
THE DISTRIBUTION OF FERRIC SULFATE BETWEEN NORMAL BUTYL ALCOHOL AND AQUEOUS SULFURIC ACID
0.01
0.001WATER PHASE IRON BEFORE EXTRACTION, GM. IRON / L .
OOOOI300200
/ L.100
C,.,, GM. H_SO
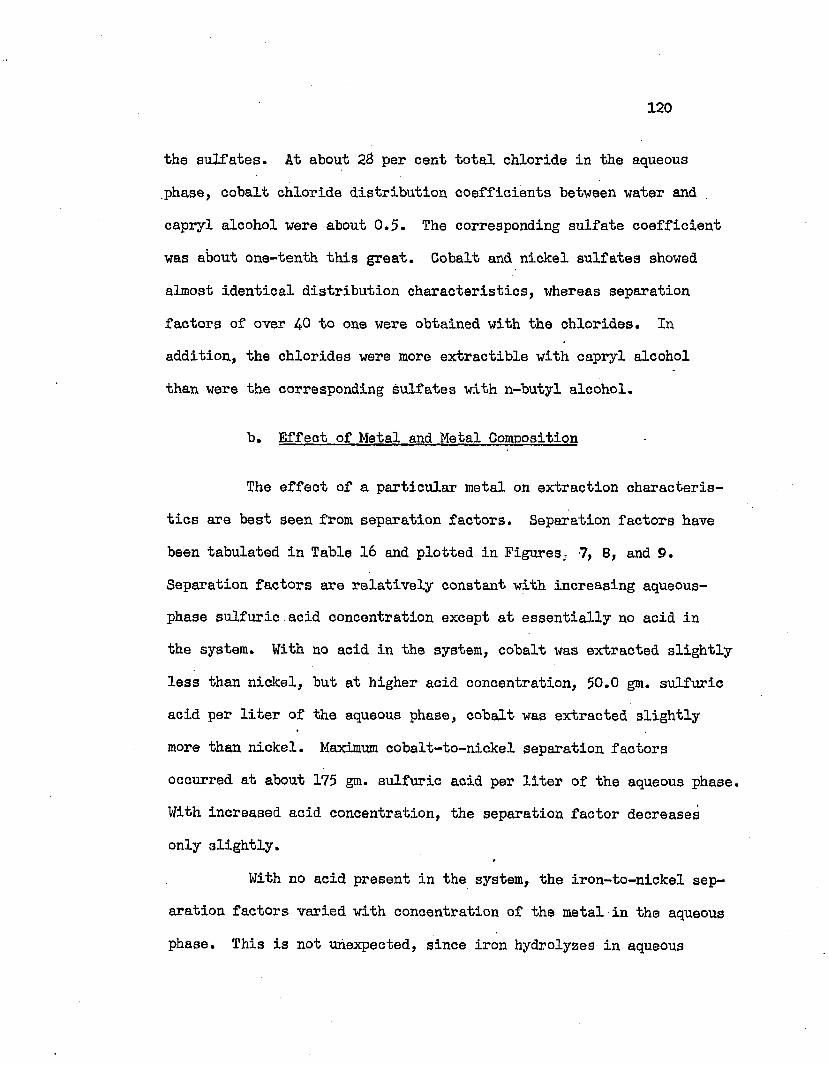
120
the sulfates. At about 28 per cent total chloride in the aqueous phase, cobalt chloride distribution coefficients between water and capryl alcohol were about 0.5. The corresponding sulfate coefficient was about one-tenth this great. Cobalt and nickel sulfates showed almost identical distribution characteristics, whereas separation factors of over 40 to one were obtained with the chlorides. In addition, the chlorides were more extractible with capryl alcohol than were the corresponding sulfates with n-butyl alcohol.
b. Effect of Metal and Metal Composition
The effect of a particular metal on extraction characteristics are best seen from separation factors. Separation factors have been tabulated in Table 16 and plotted in Figures, 7, 8, and 9. Separation factors are relatively constant with increasing aqueous- phase sulfuric acid concentration except at essentially no acid in the system. With no acid in the system, cobalt was extracted slightly less than nickel, but at higher acid concentration, 50.0 gm. sulfuric acid per liter of the aqueous phase, cobalt was extracted slightly more than nickel. Maximum cobalt-to-nickel separation factors occurred at about 175 gm. sulfuric acid per liter of the aqueous phase. With increased acid concentration, the separation factor decreases only slightly.
With no acid present in the system, the iron-to-nickel separation factors varied with concentration of the metal in the aqueous phase. This is not unexpected, since iron hydrolyzes in aqueous
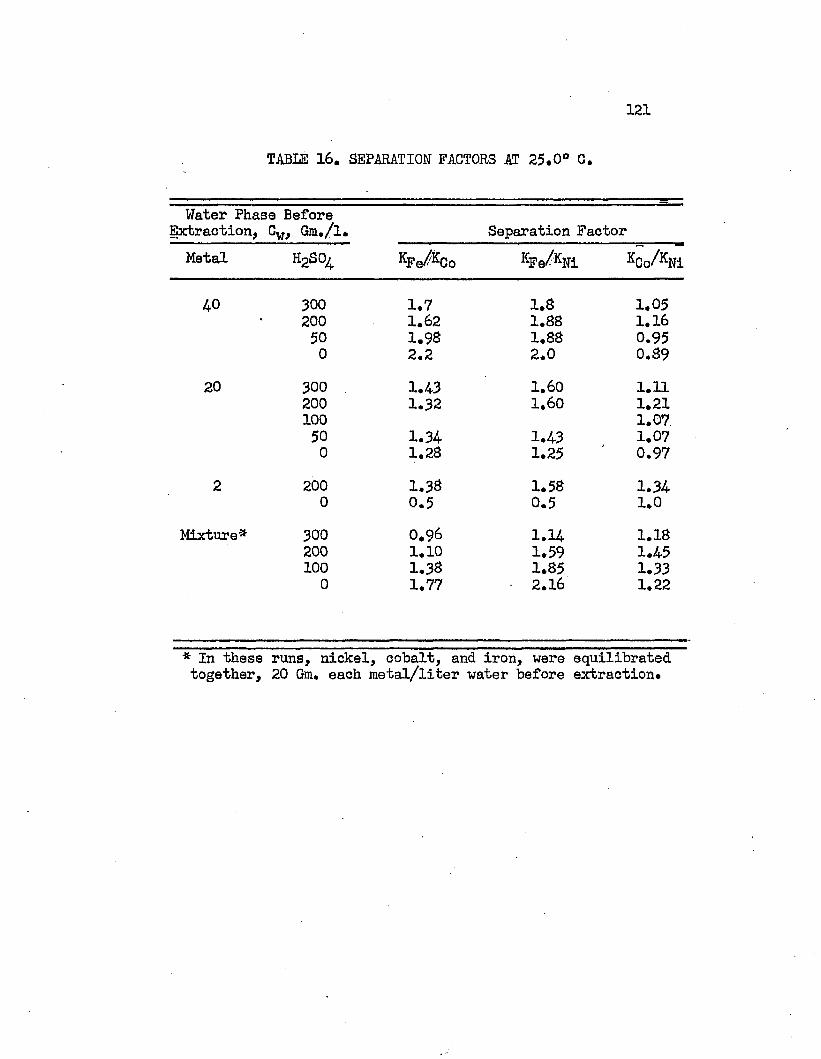
1 2 1
TABLE! 16. SEPARATION FACTORS AT 25.0° C.
Water Phase Before Extraction, Cw, Gm./l* Separation FactorMetal HgSO* KPs/KCo W % i
4-0 300 1.7 1.8 1.05- 200 1.62 1.88 1.1650 1.98 1.88 0.950 2.2 2.0 0.89
20 300 1.4-3 1.60 1.11200 1.32 1.60 1.21100 1.07.50 1.34 1.43 1.070 1.28 1.25 0.97
2 200 1.38 1.58 1.340 0.5 0.5 1.0
Mixture* 300 0.96 1.14 1.18200 1.10 1.59 1.45100 1.38 1.85 1.330 1.77 2.16 1.22
* In these runs, nickel, cobalt, and iron, were equilibrated together, 20 Gm. each metal/liter water before extraction*

122
FIGURE 7THE EFFECT OF SULFURIC ACID ON THE
SEPARATION FACTOR BETWEEN IRON AND NICKELAT 25.0° C.
WATER PHASE METAL CONTENT BEFORE EXTRACTION. GM. METAL/L. • MIXTURES, 2 0 GM. EACH METAL ^ 4 0020 -o2
4 ~
10 200 CW,GM. H2S04 /L . BEFORE
EXTRACTION
400
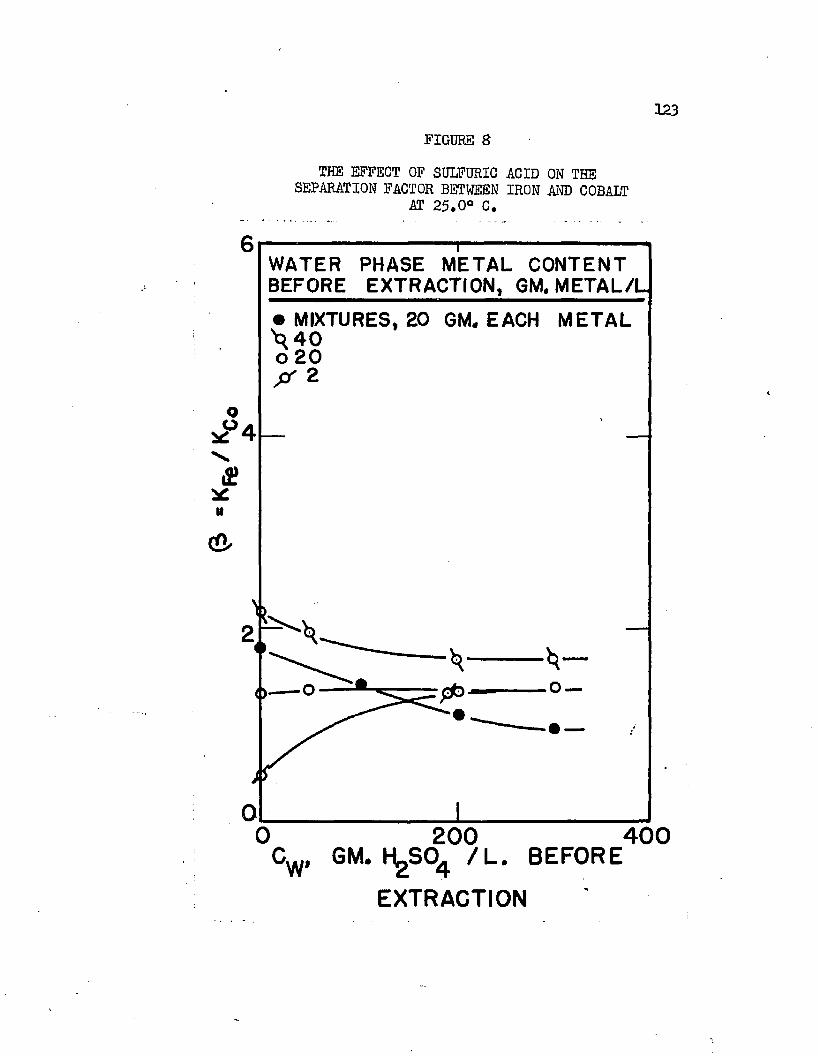
123FIGURE 8
THE EFFECT OF SULFURIC ACID ON THESEPARATION FACTOR BETWEEN IRON AND COBALT
AT 25.0° C.
1 — ■
WATER PHASE METAL CONTENT BEFORE EXTRACTION, GM. METAL/L
• MIXTURES, 20 GM. EACH METAL ^ 4 0 o 20P 2
o* ° 4
£ xit
200;w, GM. HgSO /l.EXTRACTION
BEFORE400
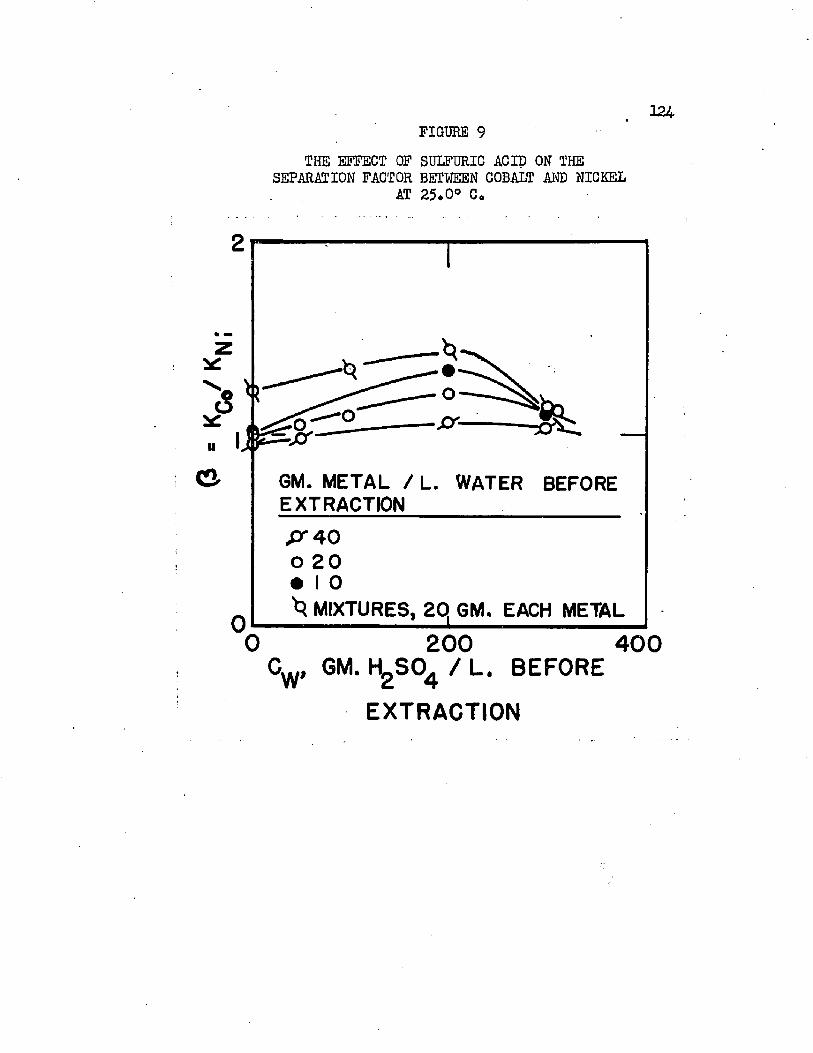
FIGURE 9124-
THE EFFECT OF SULFURIC ACID OK THESEPARATION FACTOR BETWEEN COBALT AND NICKEL
AT 25.0° C.
J IB S *
GM. METAL / L. WATER BEFORE EXTRACTION_________ ___
p " 4 0 o 20 • I 0
MIXTURES, 20 GM. EACH METAL
0 200 400Cw, GM. HLSO / L. BEFORE
EXTRACTION
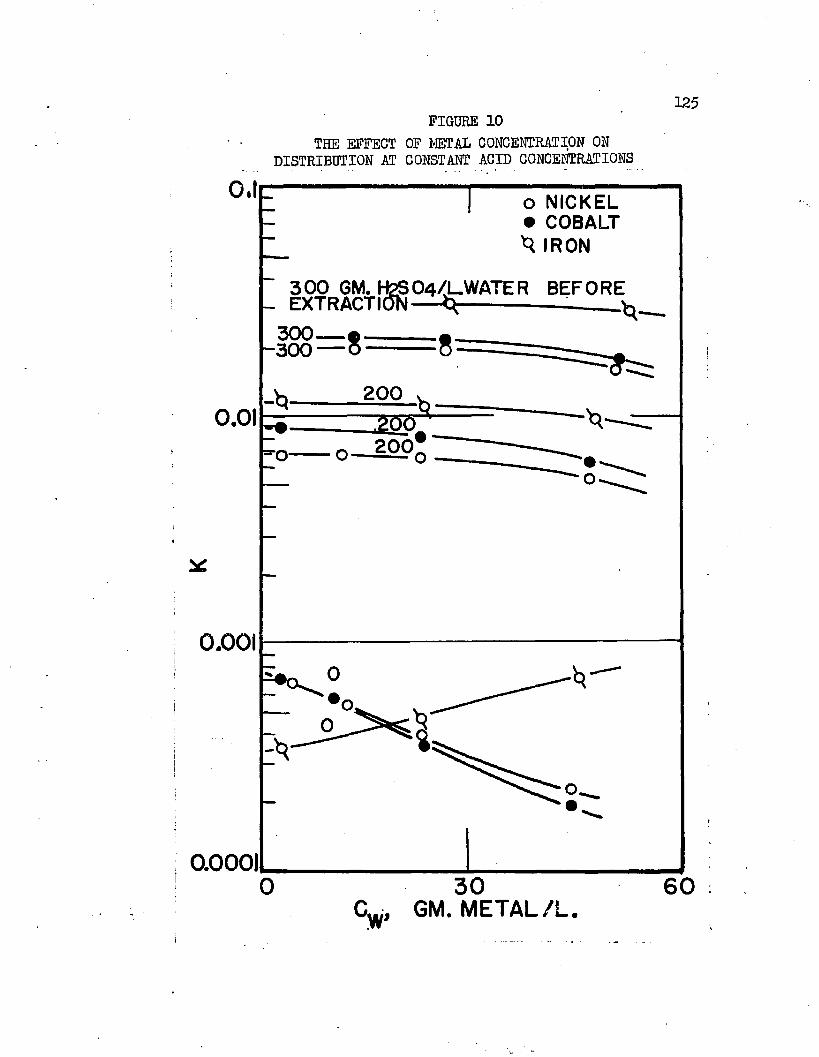
FIGURE 10125
THE EFFECT OF METAL CONCENTRATION ON DISTRIBUTION AT CONSTANT ACID CONCENTRATIONS
0,1 O NICKEL • COBALT ^ IRON
~ 3 00 GM. * - EXTRACTI
300 * —- 3 0 0 — O -
O4/L.WATER BEFORE
2000.01
0.001
0.000130
GM. METAL / I60
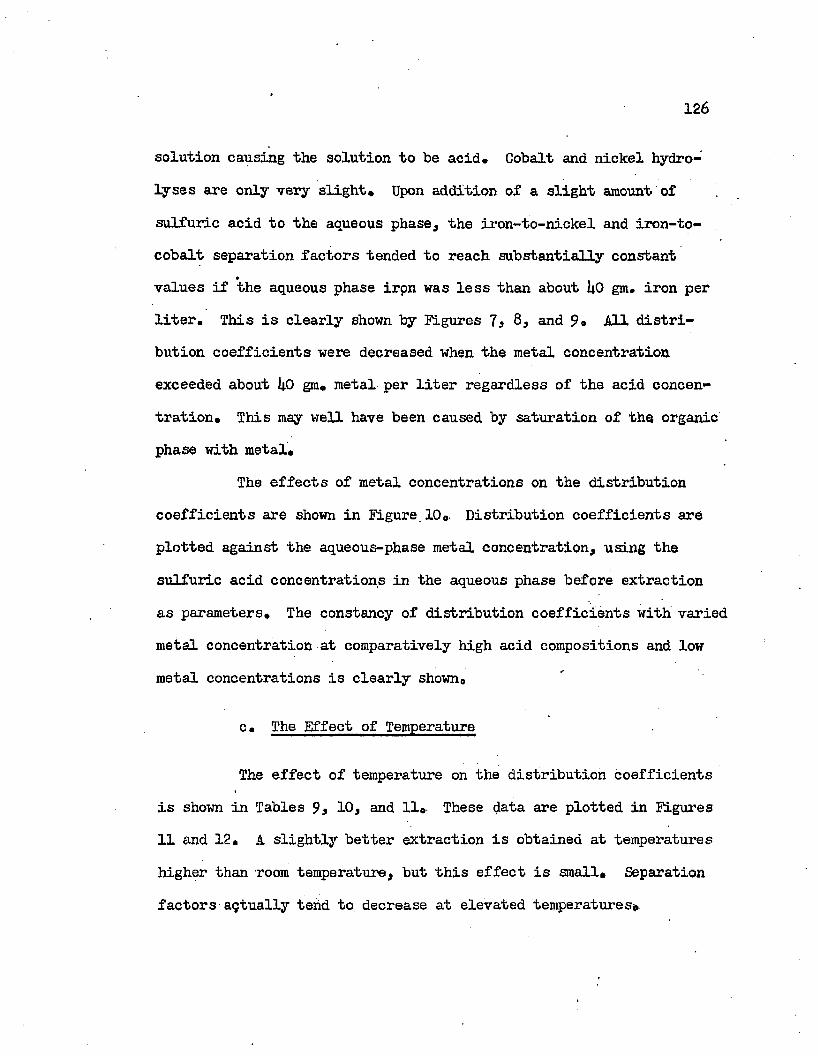
126
solution causing the solution to be acid. Cobalt and nickel hydrolyses are only very slight. Upon addition of a slight amount of sulfuric acid to the aqueous phase, the iron-to-nickel and iron-to- cobalt separation factors tended to reach substantially constant values if the aqueous phase iron was less than about UO gm. iron per liter. This is clearly shown by Figures 7} 8, and 9. All distribution coefficients were decreased when the metal concentration exceeded about ij.0 gm, metal per liter regardless of the acid concentration. This may well have been caused by saturation of the organic phase with metal.
The effects of metal concentrations on the distribution coefficients are shown in Figure.10» Distribution coefficients are plotted against the aqueous-phase metal concentration, using the sulfuric acid concentrations in the aqueous phase before extraction as parameters. The constancy of distribution coefficients with varied metal concentration at comparatively high acid compositions and low metal concentrations is clearly shown0
c. The Effect of Temperature
The effect of temperature on the distribution coefficients is shown in Tables 9> 10, and 11,. These data are plotted in Figures 11 and 12. A slightly better extraction is obtained at temperatures higher than room temperature, but this effect is small* Separation factors actually tend to decrease at elevated temperatures*
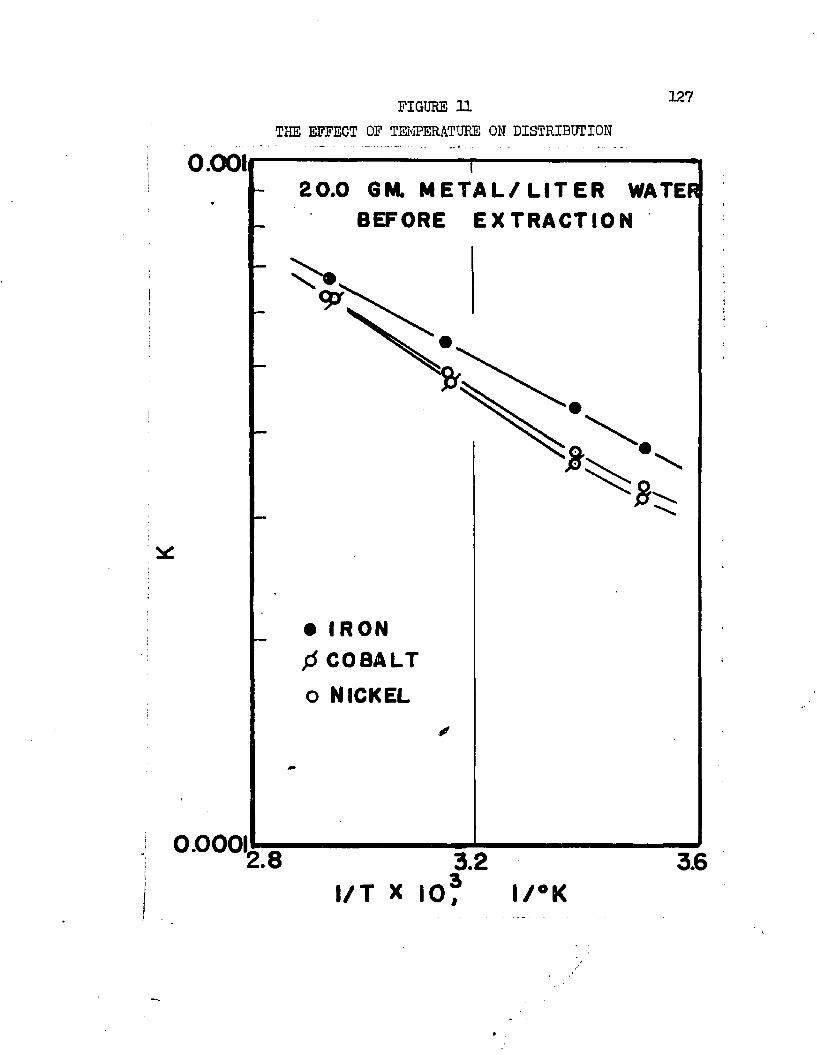
FIGURE 11THE EFFECT OF TEMPERATURE ON DISTRIBUTION
O.OOI20.0 GM. M E T A L /L IT E R WATER
BEFORE EXTRACTION
• IRON 0 COBALTo NICKEL
0.000!2.8 3.23l / T X | 0
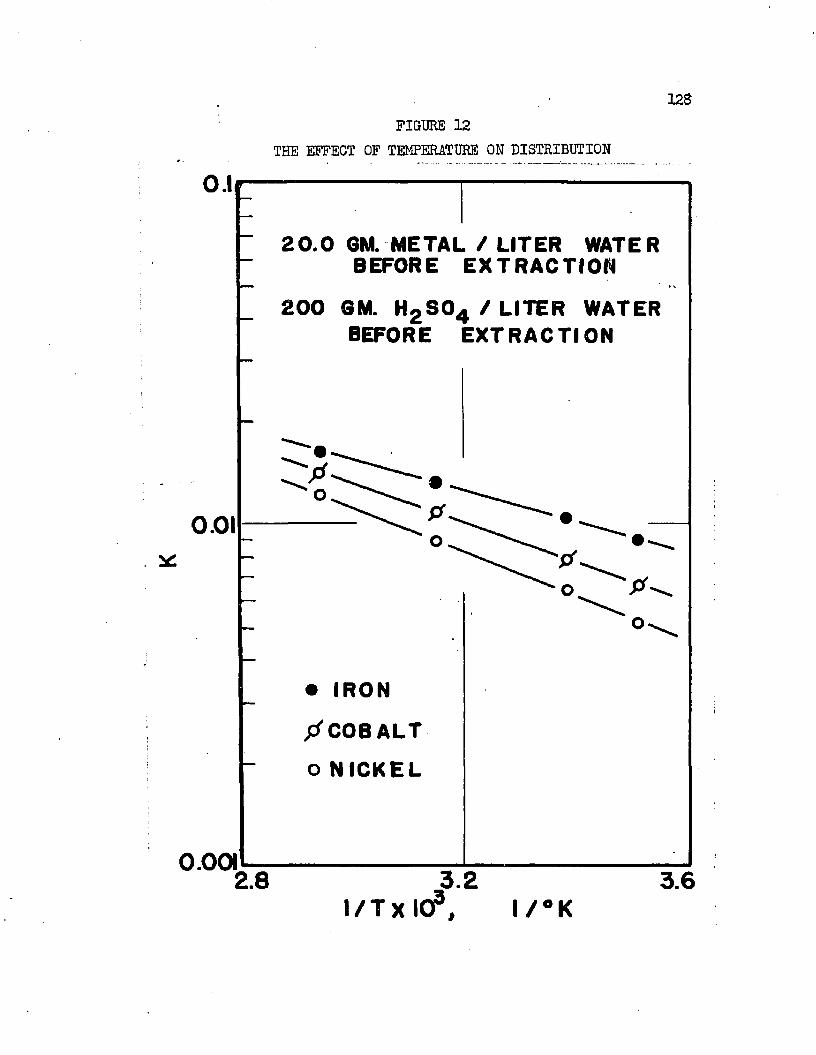
128FIGURE 12
THE EFFECT OF TEMPERATURE ON DISTRIBUTION
0.lr
20 .0 GM. METAL / LITER WATER BEFORE EXTRACTION
200 GM. H2 S04 / LITER WATER BEFORE EXTRACTION
0.01
• IRON
COBALT
o NICKEL
3.22.8 3.61 /T x lO 3
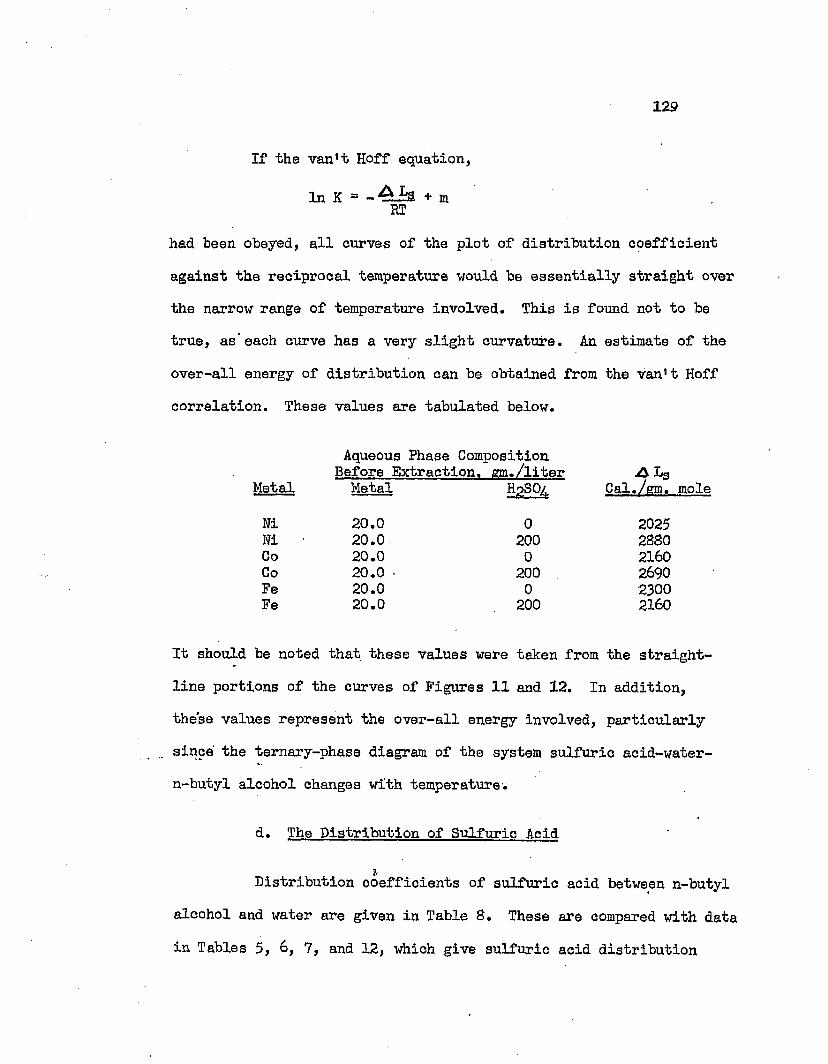
129
If the van't Hoff equation,
In K = - + mRThad been obeyed, all curves of the plot of distribution coefficient against the reciprocal temperature would be essentially straight over the narrow range of temperature involved. This is found not to be true, as’each curve has a very slight curvature. An estimate of the over-all energy of distribution can be obtained from the van't Hoff correlation. These values are tabulated below.
Aqueous Phase Composition Before Extraction, gm./liter & 13
Metal Metal h2so4 Cal./em.
Ni 20.0 0 2025Ni ■ 20.0 200 2880Co 20.0 0 2160Co 20.0 ■ 200 2690Fe 20.0 0 2300Fe 20.0 200 2160
It should be noted that these values were taken from the straight- line portions of the curves of Figures 11 and 12. In addition, these values represent the over-all energy involved, particularly since the ternary-phase diagram of the system sulfuric acid-water- n-butyl alcohol changes with temperature:.
d. The Distribution of Sulfuric Acid
2.Distribution coefficients of sulfuric acid between n-butyl alcohol and water are given in Table S. These are compared with data in Tables 5, 6, 7, and 12, which give sulfuric acid distribution
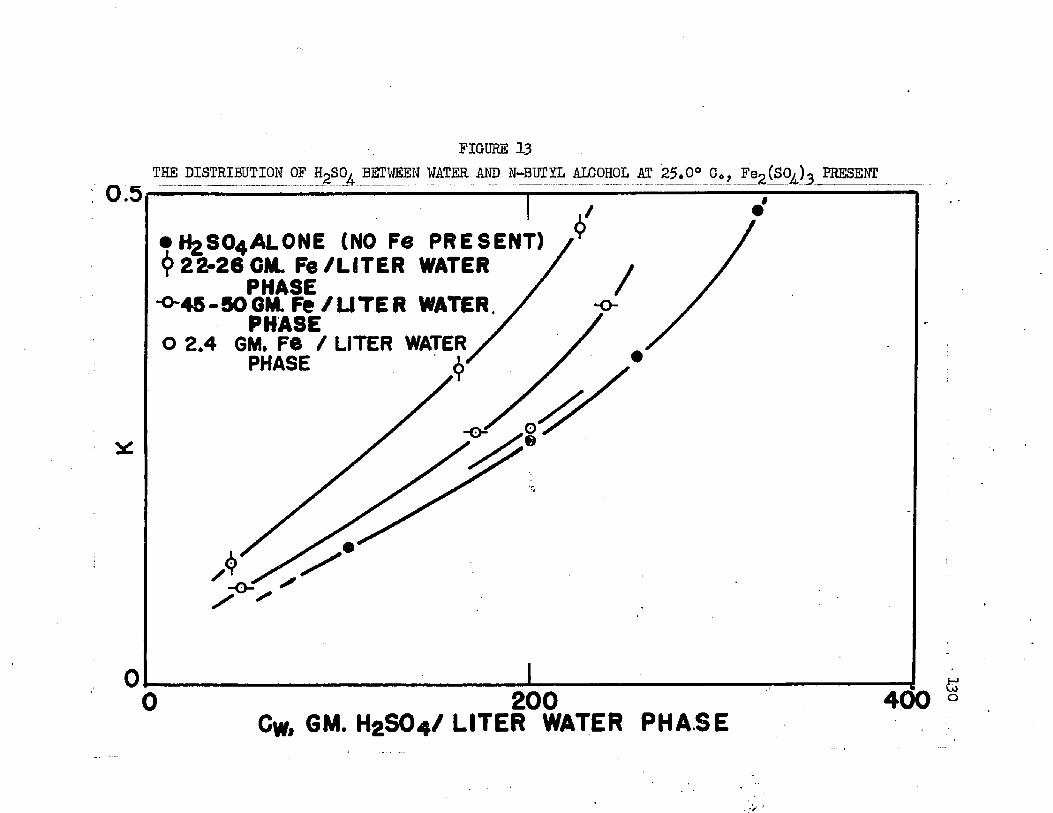
0.5
FIGURE 13THE DISTRIBUTION OF H?SO^ BETWEEN WATER AND N-BUTYL ALCOHOL AT 25.0° Ca, Fe?(S0z)g PRESENT
• H2 SO4 ALONE (NO Fe PRESENT) (j> 22-26 GM. Fe/LITER WATER
PHASE'O~45-50GM.Fe/UTER WATER.PHASE
o 2 .4 GM. Fe / LITER WATER PHASE
1200 Cw, GM. H2SO4 / LITER WATER PHASE
400
* 130

0.5
0
FIGURE 14-THE DISTRIBUTION OF H SO, BETWEEN WATER AND N-BUTYL ALCOHOL AT 25.0° C., CoSO. AND NiSO, PRESENT2 4 . 4 4•.H9SO4 ALONE (NO METALS PRESENT)• 44 GM. N i/ L WATER PHAS E• 22 "9.11 “944 GM. Co/L WATER PHASE<f2 2 11o|| «
-•22 -26 GM. EACH METAL/ LITER WATER PHASE
<J>cT)
l200 Cw GM. tfeS04 / LITER WATER PHASE
4 0 0 J - ‘ 1 M V.Oi-> H

132
coefficients when metals are present in the system. Distribution coefficient data are plotted on Figures 13, and 14.
Sulfuric acid distribution coefficients were far greater than metal sulfate distribution coefficients. The sulfuric acid distribution coefficient was highly dependent upon aqueous-phase acid concentration. Cobalt and nickel apparently had very little effect of sulfuric acid distribution, but iron did. Supplementary work indicated no evidence of a chemical reaction between sulfuric acid and n-butyl alcohol, but that the high concentrations of sulfuric acid in the aqueous phase were caused by extraction.
e. Distribution in Mixtures
Distribution coefficients in the complex system nickel sulfate-cobalt sulfate-ferric sulfate-sulfuric acid-water-n-butyl alcohol at 25.0°C. are given in Table 11. All work on mixtures was done using 20.0 gm. each metal per liter of aqueous phase before extraction. Distribution coefficients were obtained without sulfuric acid present and with up to 300 gm. sulfuric acid per liter of aqueous phase solution before extraction.
Distribution coefficients for all three metals are plotted against aqueous-phase sulfuric acid concentration in Figure 15. These data corroborated that obtained when each metal was equilibrated sep
arately. The distribution coefficients for each particular metal were lower than when equilibrated alone, but the order of extractibil- ity, iron > cobalt > nickel, was the same in both cases. This was
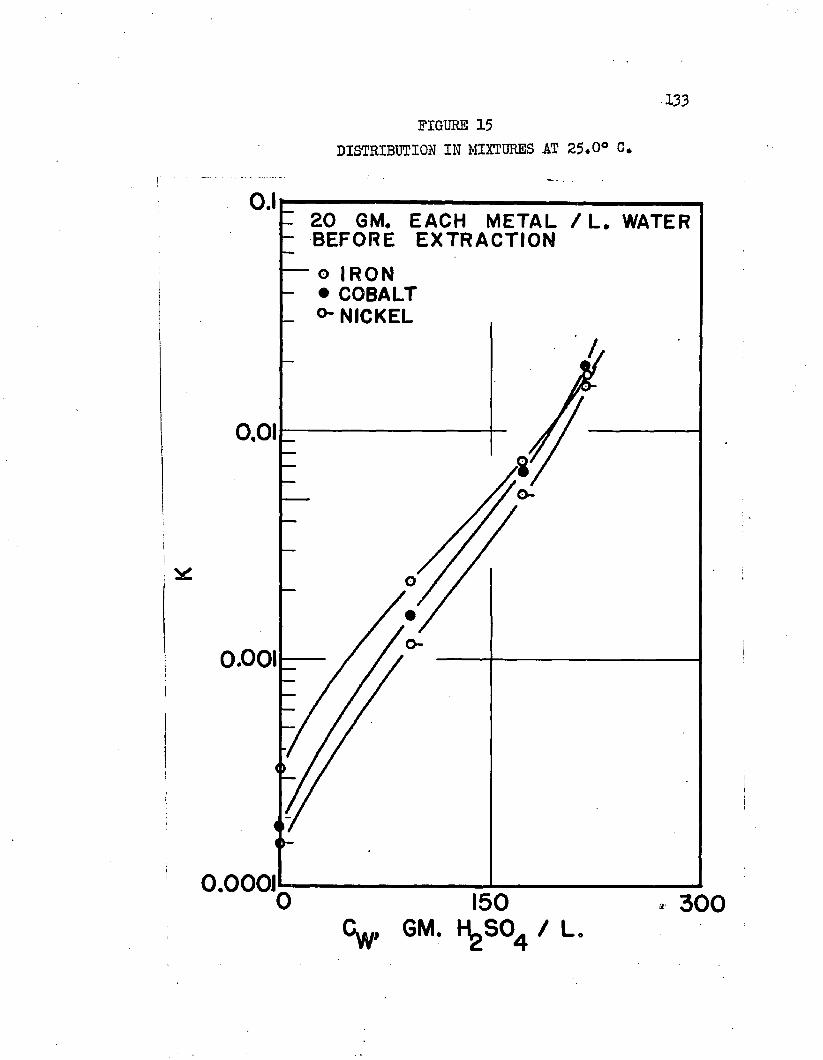
133FIGURE 15
DISTRIBUTION IN MIXTURES AT 25*0° C.
- 20 GM. EACH METAL / L. WATER- BEFORE EXTRACTION- o IRON- • COBALT _ NICKEL
0,01
o-
o-0.001
( h-
O.OOOJ 150GM. I^ S 0 4 / L
300
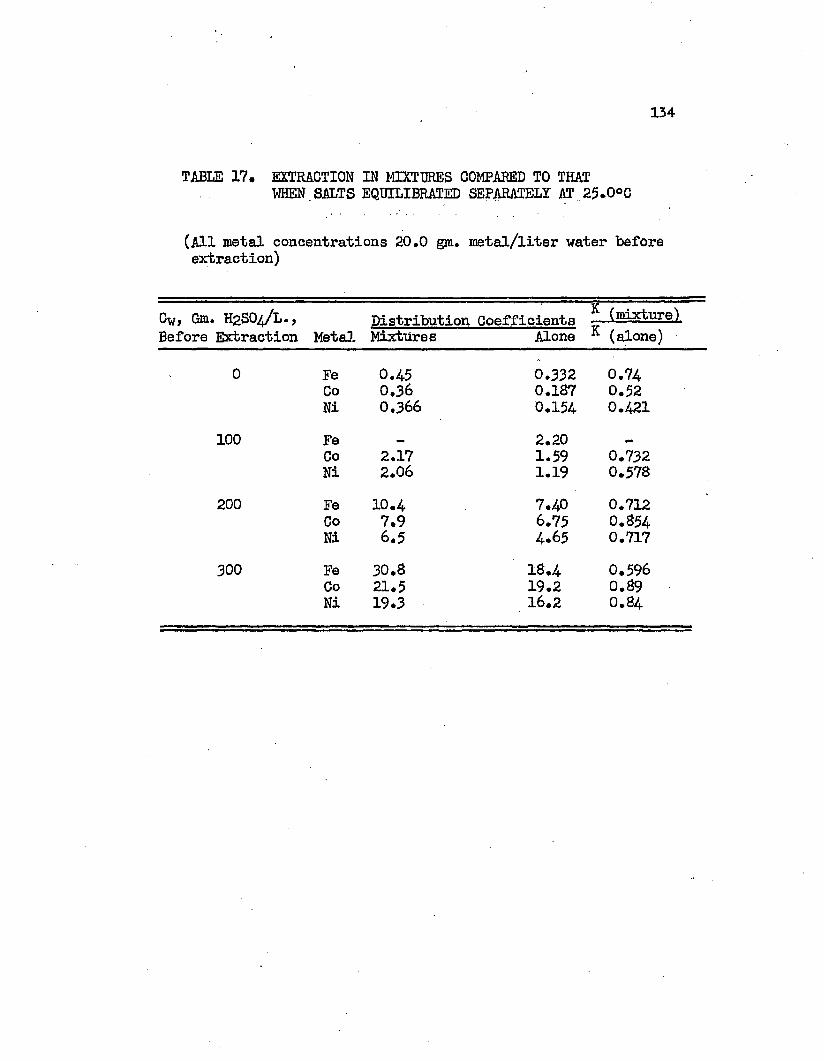
134
TABLE 17, EXTRACTION IN MIXTURES COMPARED TO THATWHEN SALTS EQUILIBRATED SEPARATELY AT 25.0°C
(All metal concentrations 20.0 gm. metal/liter water before extraction)
Cwj Gm. H2SO4/L., Distribution Coefficients „■ (mi^,ure.)Before Extraction Metal Mixtures Alone ^ (alone)
0 Fe 0.45 0.332 0.74Co 0.36 0.187 0.52Ni 0.366 0.154 0.421
100 Fe 2.20Co 2.17 1.59 0.732Ni 2.06 1.19 0.578
200 Fe 10.4 7.40 0.712Co 7.9 6.75 0.854Ni 6.5 4.65 0.717
300 Fe 30.8 18.4 0.596Co 21.5 19.2 0.89Ni 19.3 16.2 O.84
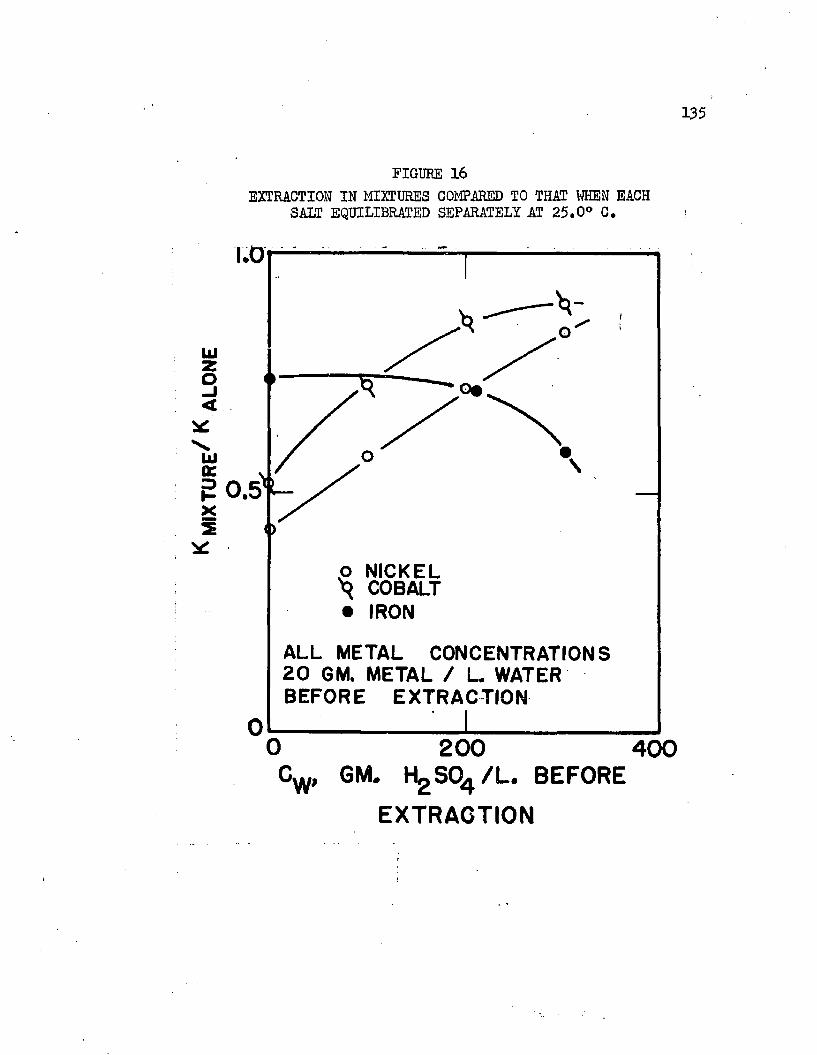
135
FIGURE 16EXTRACTION IN MIXTURES COMPARED TO THAT WHEN EACH
SALT EQUILIBRATED SEPARATELY AT 25.0° C.
p NICKEL ^ COBALT• IRON
ALL METAL CONCENTRATIONS 20 GM. METAL / L. WATER BEFORE EXTRACTION
200 400;w, GM. HgSQ^/L. BEFORE
EXTRACTION
1
136
expected, since distribution coefficients were shown to decrease with increased total metal concentration in the aqueous phase.
f• Density Correlations
Densities of aqueous and organic solutions at 25.0°G. were taken and are given in Tables 5, 6, 7, and 8. These are plotted for
f
nickel in Figures 17-, 16, and 19. Remaining data for cobalt were not plotted because they were almost identical to these, at least within experimental error. In general, densities were consistent with that expected. The density increased with metal and/or sulfuric acid concentration. In many cases, slight curvatures in the lines existed. These were not drawn as such, however, since the extent of these curvatures were so slight.
4* Solubility Determinations
The data, representing the liquid region of the phase diagram of the system sulfuric acid-water-n-butyl alcohol at 25.0°C., are given in Table 13. These data are plotted in Figure 20. Tie- line data were obtained from measurements of the distribution of sulfuric acid. Tie-line data were calculated from that in Table 13 and are tabulated in Table 18. The effects of metal sulfates on the solubility of n-butyl alcohol in the aqueous solutions containing 20.0 gm. metal per liter of solution on an alcohol-free basis were determined by data given in Table 14. These data, along with solubility data when no metals were present, are plotted in Figure 20 on a metal-free basis.
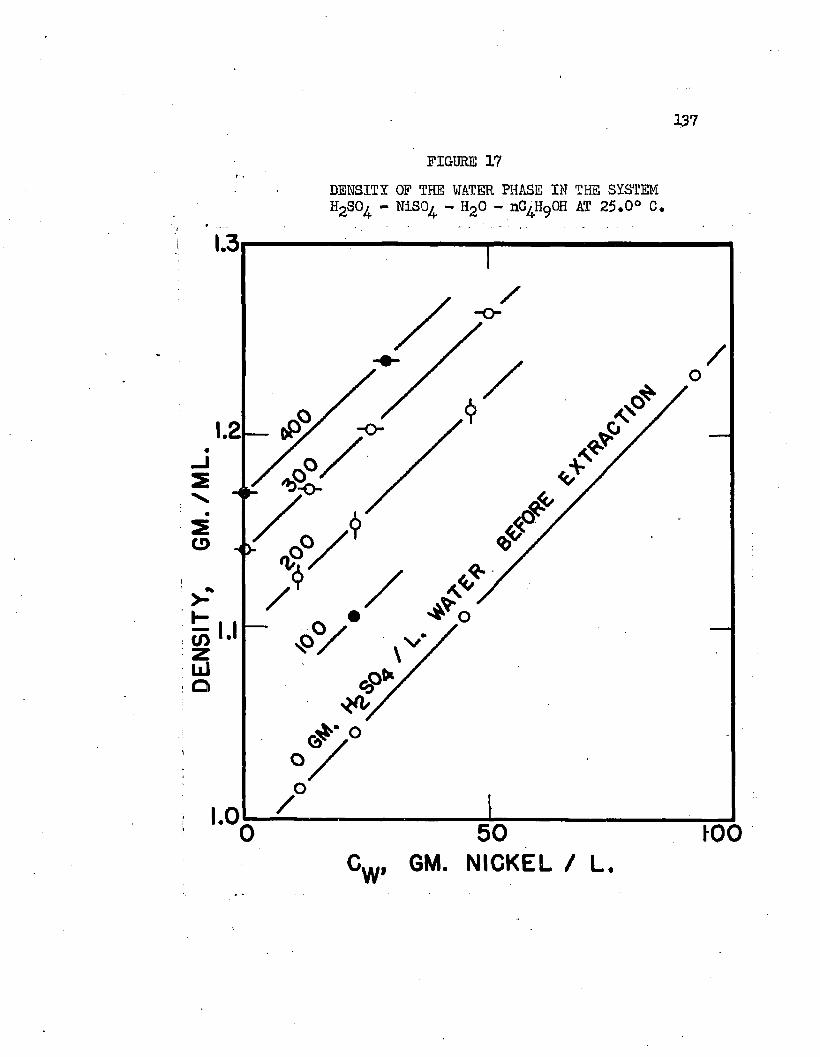
DEN
SITY
. GM
. /M
L
137
FIGURE 17DENSITY OF THE WATER PHASE IN THE SYSTEMH2S°4 - NiSO^ - H20 - nC HgOH AT 25.0° C.
- op - o
1.050
GM. NICKEL / L100
GW
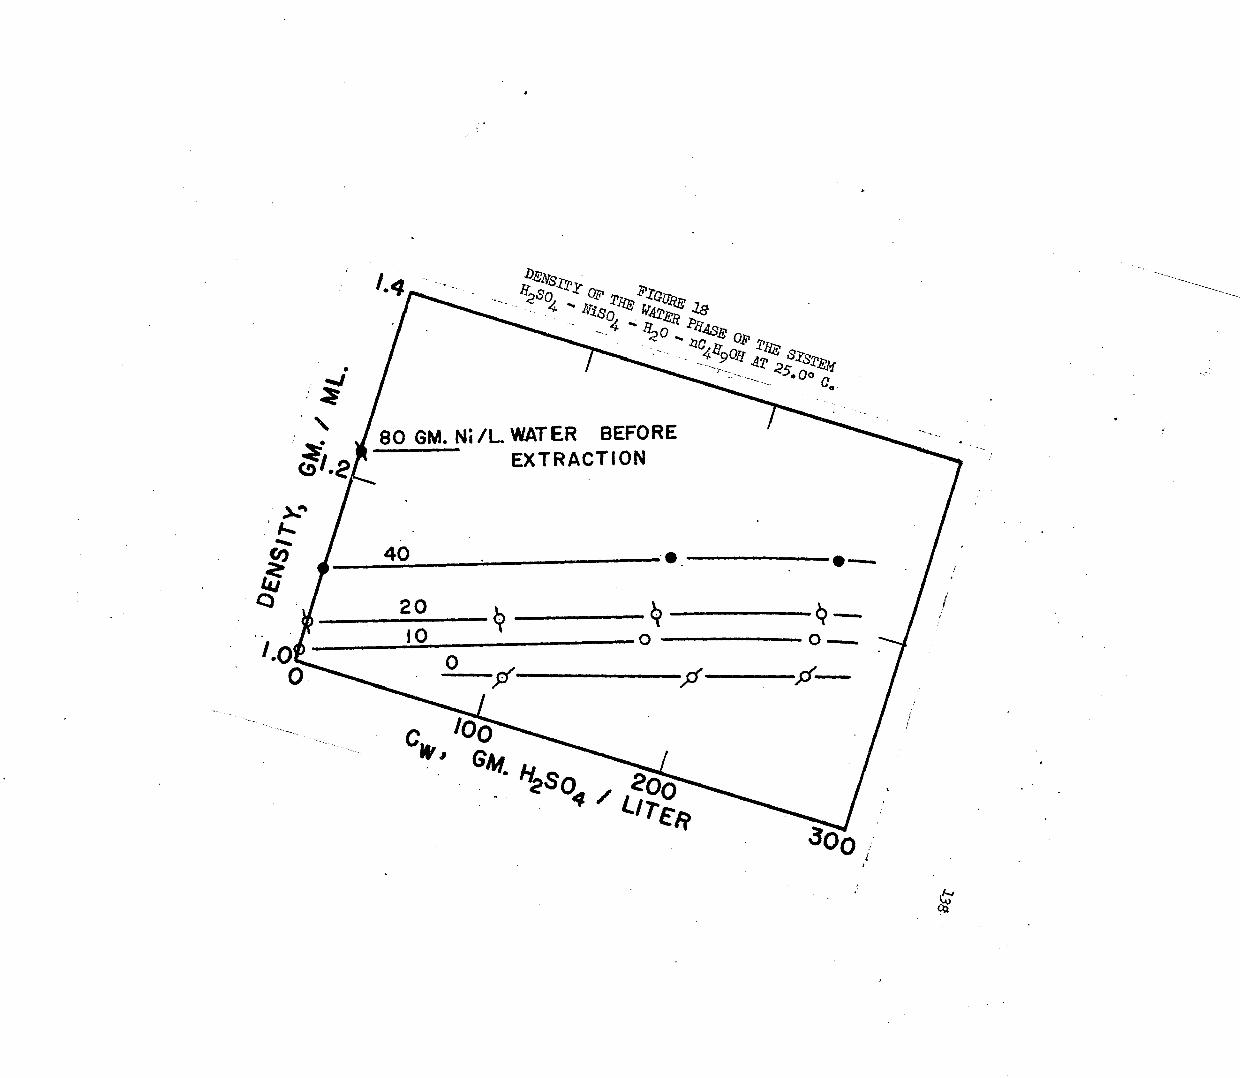
80 GM. Ni /L . WATER BEFORE EXTRACTION
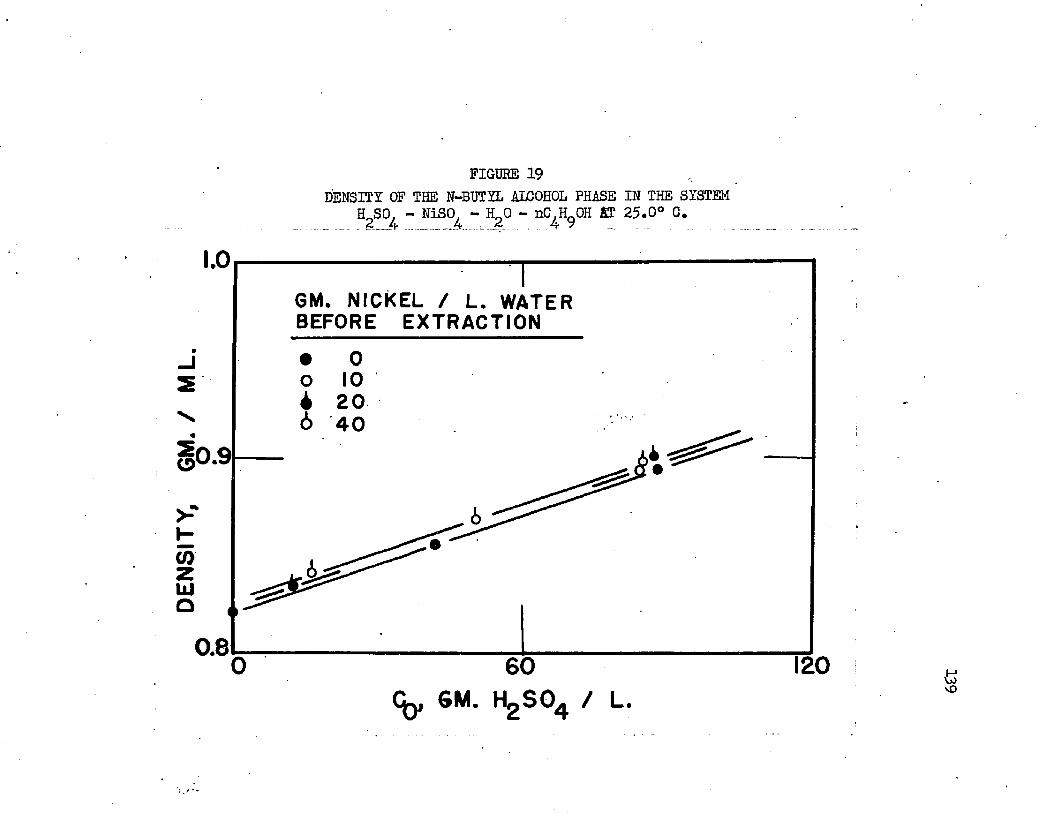
DEN
SITY
, GM
. /
ML.
FIGURE 19DENSITY OF THE N-BUTYL ALCOHOL PHASE IN THE SYSTEM
H SO, - NiSO, - H_0 - nC,HqQH AT 25.0° C. 2 4 _________ 4 2 4 7 ..
GM. NICKEL / L. WATER BEFORE EXTRACTION
6 4 0
0.8 12060Cq, GM. H2 S04 / L.
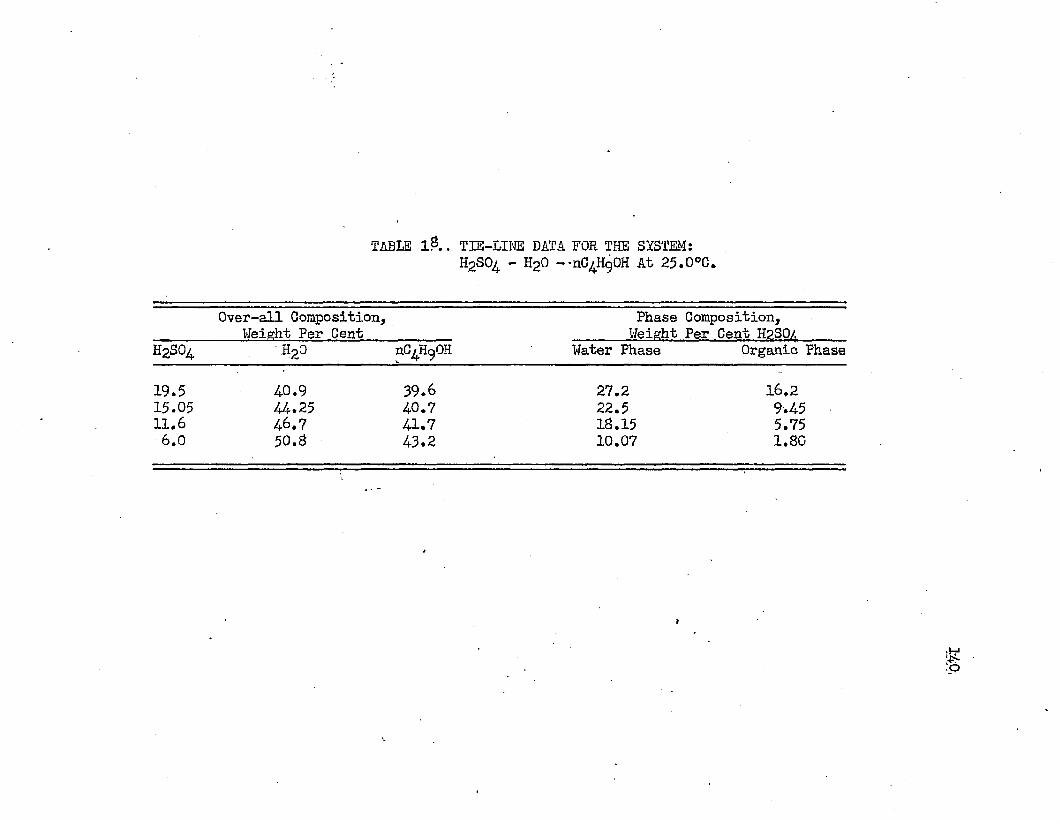
TABLE OA . TIE-LINE DATA FOR THE SYSTEM:H2SO4 - H20 --nG HgOH At 25.0°C.
Over-all Composition, Weight Per Cent
Phase Composition, Weight Per Cent H2.S0/
H2S04 h 2o nC^HgOH Water Phase Organic Phase
19.5 4-0.9 39.6 27.2 16.215.05 44.25 4-0.7 22.5 9.4511.6 46.7 41.7 IS.15 5.756.0 50.8 43.2 10.07 1.80
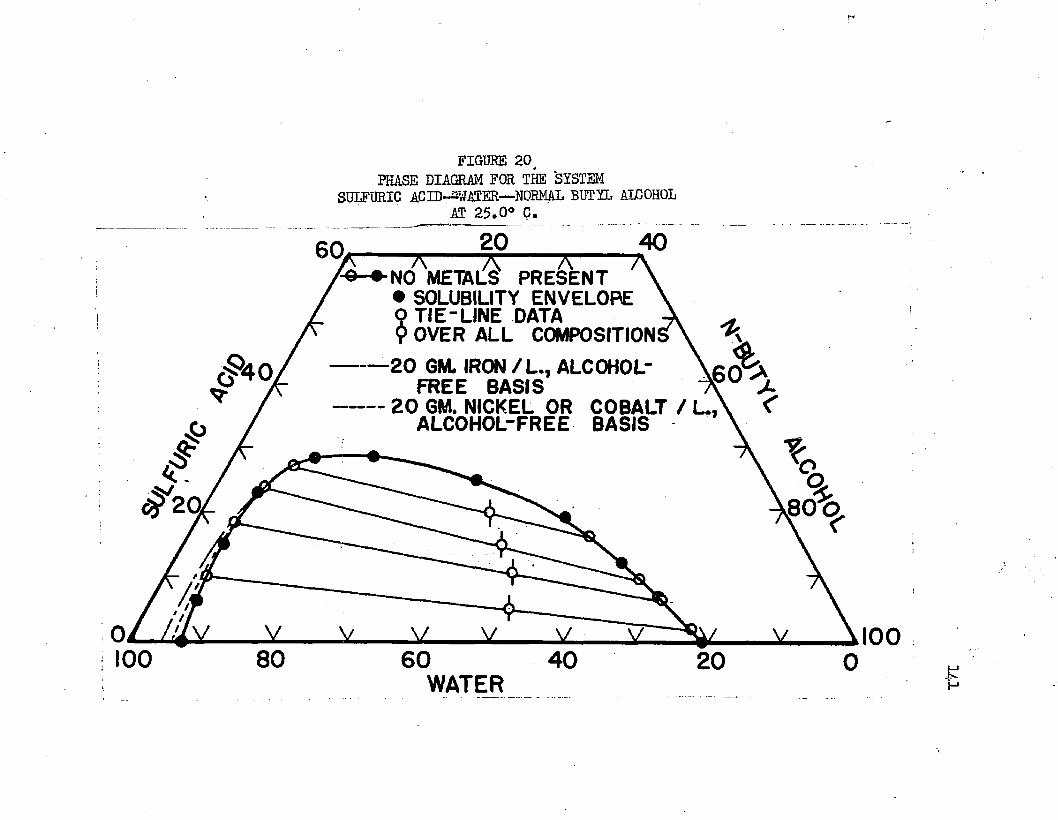
FIGURE 20 4 PHASE DIAGRAM FOR THE SYSTEM
SULFURIC ACID— WATER— NORMAL BUTYL ALCOHOL AT 25.0° C.
60, 20A 7V"NO METALS
40 A -----PRESENT
• SOLUBILITY ENVELOPE 0 TIE-LINE DATA 9 OVER ALL COMPOSITION
-20 GM/IRON/L., ALCOHOL-FREE BASIS
20 GM. NICKEL OR COBALT / LALCOHOL-FREE BASIS
V V V80 60
WATER
v40 20
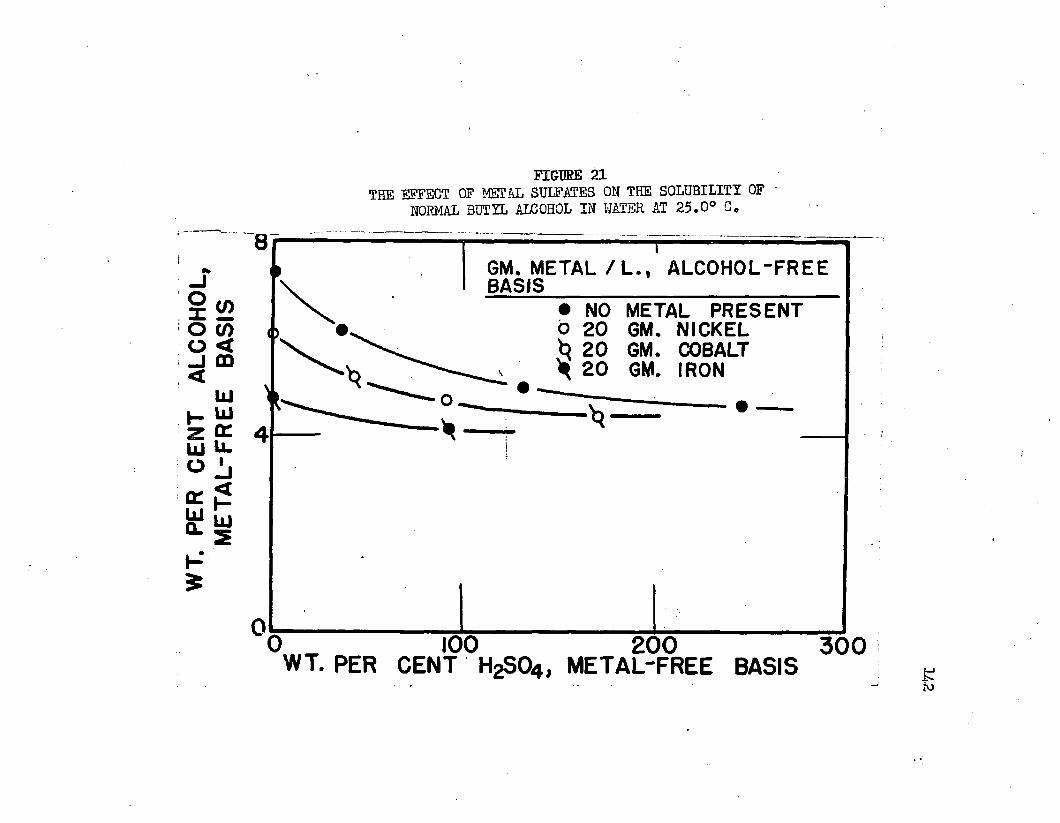
WT.
PE
R CE
NT
ALC
OH
OL
MET
AL-
FREE
B
ASI
S
FIGURE 21THE EFFECT OF METAL SULFATES ON THE SOLUBILITY OF
NORMAL BUTYL ALCOHOL IN WATER AT 25.0° 0.
8r
0
GM. M E T A L /L ., ALCOHOL'FREE BASIS____________________________
• NO METAL PRESENT O 20 GM. NICKEL ^ 20 GM. COBALT ^ 20 GM. IRON
(> 100 200 300 WT. PER CENT H2SO4 , METAL'FREE BASIS
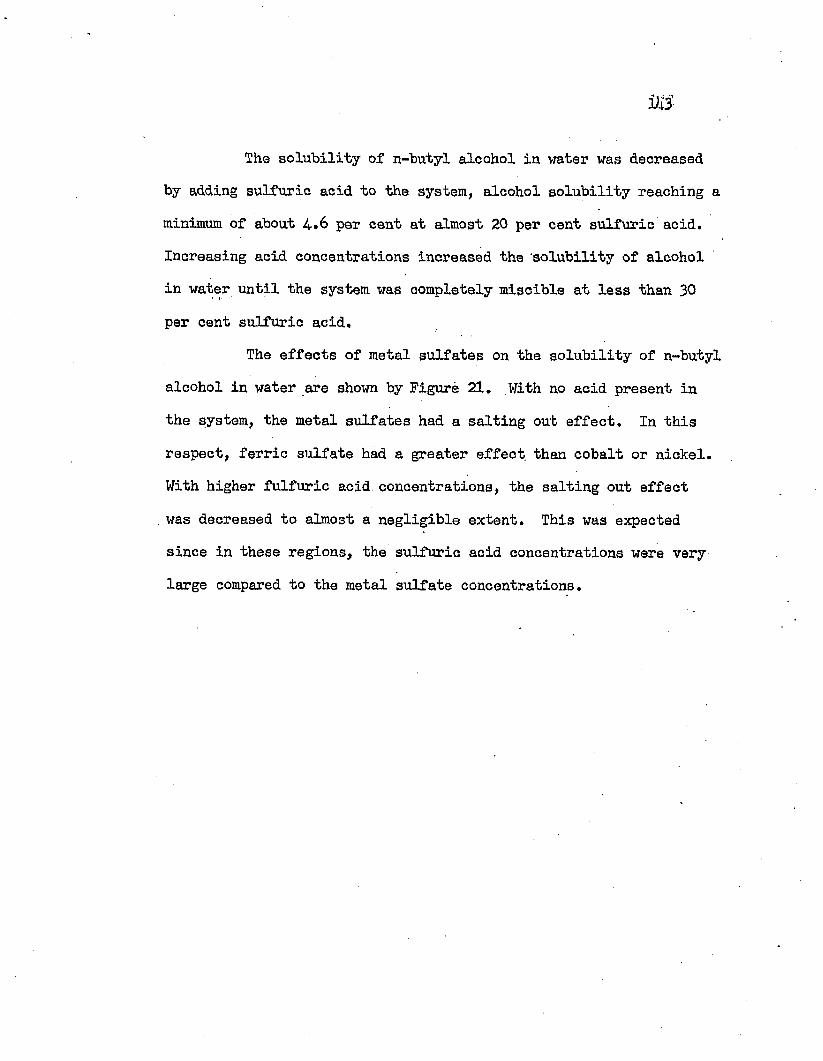
The solubility of n-butyl alcohol in water was decreased by adding sulfuric acid to the system, alcohol solubility reaching a minimum of about 4-. 6 per cent at almost 20 per cent sulfuric acid. Increasing acid concentrations increased the solubility of alcohol in water until the system was completely miscible at less than 30 per cent sulfuric acid.
The effects of metal sulfates on the solubility of n-butyl alcohol in water are shown by Figure 21. With no acid present in the system, the metal sulfates had a salting out effect. In this respect, ferric sulfate had a greater effect, than cobalt or nickel. With higher fulfuric acid concentrations, the salting out effect . was decreased to almost a negligible extent. This was expected since in these regions, the sulfuric acid concentrations were very large compared to the metal sulfate concentrations.
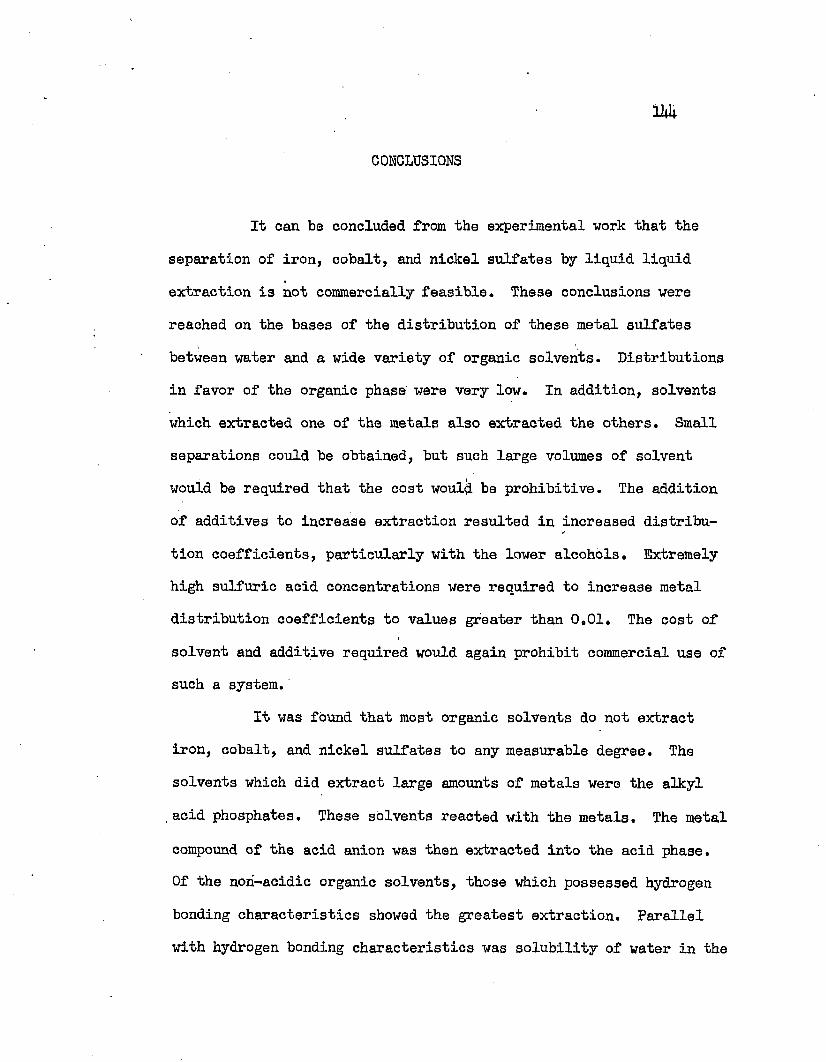
11*
CONCLUSIONS
It can be concluded from the experimental work that the separation of iron, cobalt, and nickel sulfates by liquid liquid extraction is not commercially feasible. These conclusions were reached on the bases of the distribution of these metal sulfates between water and a wide variety of organic solvents. Distributions in favor of the organic phase were very low. In addition, solvents which extracted one of the metals also extracted the others. Small separations could be obtained, but such large volumes of solvent would be required that the cost would be prohibitive. The addition of additives to increase extraction resulted in increased distribution coefficients, particularly with the lower alcohols. Extremely high sulfuric acid concentrations were required to increase metal distribution coefficients to values greater than 0.01. The cost of solvent and additive required would again prohibit commercial use of such a system.
It was found that most organic solvents do not extract iron, cobalt, and nickel sulfates to any measurable degree. The solvents which did extract large amounts of metals were the alkyl . acid phosphates. These solvents reacted with the metals. The metal compound of the acid anion was then extracted into the acid phase.Of the nori-acidic organic solvents, those which possessed hydrogen bonding characteristics showed the greatest extraction. Parallel with hydrogen bonding characteristics was solubility of water in the
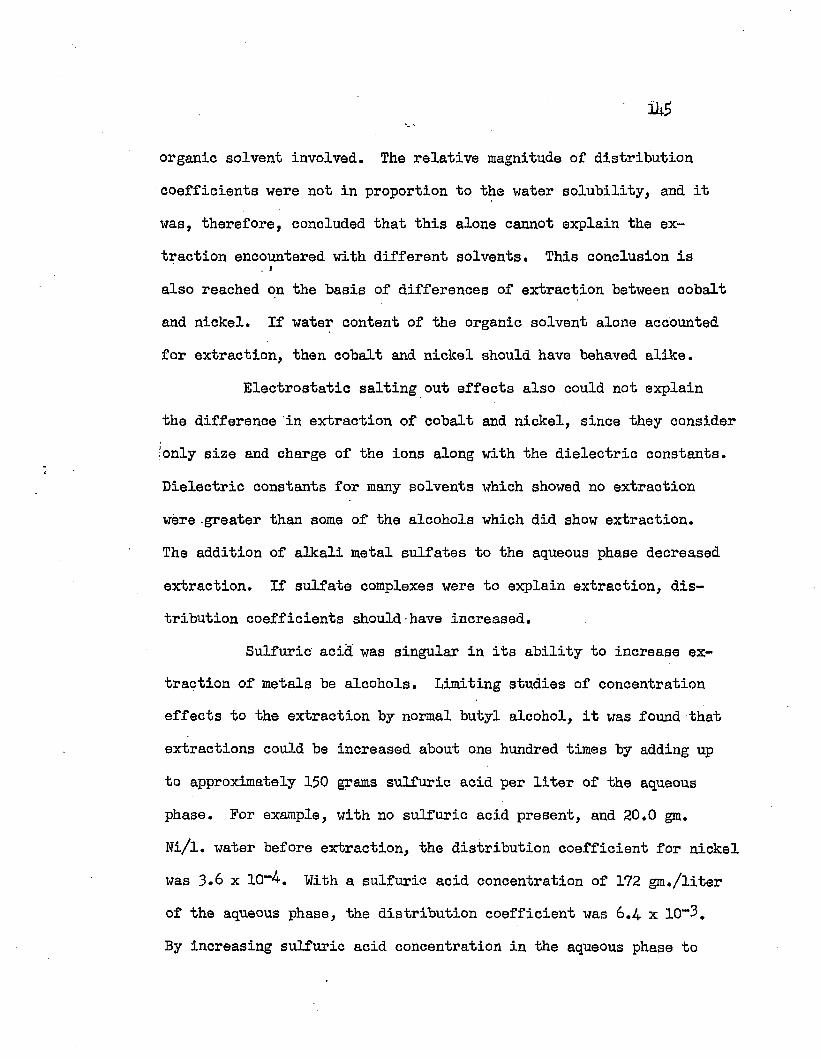
organic solvent involved. The relative magnitude of distribution coefficients were not in proportion to the water solubility, and it was, therefore, concluded that this alone cannot explain the extraction encountered with different solvents. This conclusion is
, Ialso reached on the basis of differences of extraction between cobalt and nickel. If water content of the organic solvent alone accounted for extraction, then cobalt and nickel should have behaved alike.
Electrostatic salting out effects also could not explain the difference in extraction of cobalt and nickel, since they consider ionly size and charge of the ions along with the dielectric constants. Dielectric constants for many solvents which showed no extraction were greater than some of the alcohols which did show extraction.The addition of alkali metal sulfates to the aqueous phase decreased extraction. If sulfate complexes were to explain extraction, distribution coefficients should have increased.
Sulfuric acid was singular in its ability to increase extraction of metals be alcohols. Limiting studies of concentration effects to the extraction by normal butyl alcohol, it was found that extractions could be increased about one hundred times by adding up to approximately 150 grams sulfuric acid per liter of the aqueous phase. For example, with no sulfuric acid present, and 20.0 gm.Ni/l. water before extraction, the distribution coefficient for nickel was 3.6 x 10⁻⁴. With a sulfuric acid concentration of 172 gm./liter of the aqueous phase, the distribution coefficient was 6.4- x 10“3.By increasing sulfuric acid concentration in the aqueous phase to
318 gm./liter, the distribution coefficient was 3*36 x 10“ . Cobalt and iron exhibited much this same behavior. Paralleling these increased distribution coefficients of the metal sulfates, sulfuric acid became highly concentrated in the organic phase. Acid distribution coefficients reached values of almost 0.5 at high metal and acid concentrations. Such high acid concentrations in n-butyl alcohol were probably conducive for oxonium ion formation. High concentrations of sulfuric acid would have certainly tended to dehydrate the metal cations. Such dehydration would be followed by solvation by the alcohol with subsequent increased extraction into the alcohol phase.The net effect would be aqueous-phase dehydration, solvation of the metal by alcohol, increased oxonium ion formation, with subsequent increased extraction.
The difference in extraction between cobalt or nickel and iron can be tentatively justified by the difference in charge and size of the cation. Such an explanation could not be given for the difference in extraction between cobalt and nickel. A number of possibilities exist, but require experimental evaluation outside the field of extraction. Some of these are tendency toward alcohol solvation, acidity of the hydrogen attached to the oxygen next to the metal cations, and structures of the metals in the organic phase.
Ui7
SUGGESTIONS FOR FURTHER INVESTIGATION
Many studies of the type carried out in this work are required in order that the reason for differences in extraction of iron, cobalt, and nickel sulfates in different solvents can be explained. Such explanations would, without a doubt, add to an understanding of the liquid phase. In this respect, knowledge of behavior in the liquid phase is far underdeveloped compared to that available on the gas and solid phases.
All theoretical and experimental studies made in this work indicate that separations of transition metals, adjacent in the periodic table, by liquid liquid extraction are based on the extraction of neutral complexes. Quite often, if these neutral complexes were easily formed, they were insoluble in water. If they were soluble in water, the ligand concentrations had to be high in order to form the neutral compound.
If separation of adjacent transition metals in the periodic table is to be accomplished, advantage must be taken of the differences in cation properties. These properties are often so similar that they are difficult to separate by other means. The property which is different in most cases, is the difference of electronic structures of the inner electron shells. Since these electrons rarely enter into chemical reactions, other than complex formation, chemical separations are difficult unless the oxidation states can be changed.
Complexes often involve the buried electrons. To separate metals commercially by liquid liquid extraction, the ideal case would
D+8
be a ligand forming a neutral water soluble complex which is preferentially extracted by an organic phase. The ligand-to-metal concentration ratio required should be very nearly equal to one so as not to lose the ligand in effluent water.
Based on data obtained in this investigation, the separation of iron, cobalt, and nickel sulfates by liquid liquid extraction is not commercially feasible. The work may well be continued from a fundamental standpoint. Such continuations should involve determining the behavior of the metal salts in the organic phase. This information lies in the realm of non-aqueous solvents and the interactions between organic compounds and metals. Information on the behavior of metal in organic solvents should be obtained from spectroscopic and magnetic data as well as solubility data. These data, along with the information presented here on the behavior of metals in two phase systems, would present valuable information to the field.
Sulfates other than iron, cobalt, and nickel should be studied. These studies should be extended to cations having unfilled "f” orbitals available for coordination. The extraction of actinide elements should be of paramount importance in this respect.
In summary, many studies on the behavior of inorganic compounds in non-aqueous solvents are needed. Commercially, many of these studies may not be feasible. However, this need not detract from the studies for their availability may well cast further light on interactions in solutions.
NOMENCLATURE
C = ConcentrationCQ = Equilibrium concentration of solute in organic phase,
Gm./liter. Metal concentrations are expressed, in gm. metal/liter.
Cw = Equilibrium concentration of solute in eater phase,Gm./liter. Metal concentrations are expressed in gm. metal/liter.
D = Dielectric constante = Electric chargeE = Internal energyF = Free energyH = Magnetic field intensityI = Light transmission of colorimetric analytical sampleI0 - Light transmission of reference cellK = Distribution coefficient = C0/CwKpe = Iron distribution coefficientKq0 = Cobalt distribution coefficient
= Nickel distribution coefficientKaione = Distribution coefficients when each metal equilibrated
separatelyKjnixt. = Distribution coefficient when all metals equilibrated
togetherk = ConstantLs = Constantm = Constantn - ConstantN = Avogadro's number
p = Pressurer = RadiusR = Gas law constantS = Entropyt = Temperature, ° G,T = Temperature, ° K.v = VolumeX = Intensity of magnetization
z = ValenceQ . = Separation factor of selectivity = Kl/K2
A = Incremental -change= Optical density measured
(O# = True optical density calculated from concentrations= Magnetic susceptibility = Magnetic moment
Subscripts
1 = Component of solution2 = Component of solution490 = Wave length in millimicrons525 = Wave length in millimicrons .530 = Wave length in millimicrons650 - Wave length in millimicronso = Organic phasew = Water phase
\
AUTOBIOGRAPHY151
I, Carl Solomon Schlea, was born in Sandusky County, Ohio, November IS, 1929. I received my secondary school education in the public schools of the village of Woodville, Ohio. My undergraduate training was obtained at The Ohio State University, from which I
received the combined degrees Bachelor of Chemical Engineering and
Master of Science, in 1952. During the Summer Quarter of 1952, I
held an assistantship as I started my work for the degree Doctor of Philosophy in the Department of Chemical Engineering at Ohio State
University. While completing the requirements for this degree, I
received a Battelle Memorial Institute Fellowship from the academic year 1952-53 until the completion of my graduate work.