COPPER, NICKEL, AND COBALT
93
This document is made available electronically by the Minnesota Legislative Reference Library as part of an ongoing digital archiving project. http://www.leg.state.mn.us/lrl/lrl.asp Volume S-Chapter 14 CHARACTERISTICS OF THE MINERAL COPPER, NICKEL, AND COBALT Minnesota Environmental Ouality Board Regional Copper-Nickel Stuuy Author: Mark Donaldson* *Please contact Royden E. Tull regarding questions or comments.on this chapter of the reporto
-
Upload
khangminh22 -
Category
Documents
-
view
0 -
download
0
Transcript of COPPER, NICKEL, AND COBALT

This document is made available electronically by the Minnesota Legislative Reference Library as part of an ongoing digital archiving project. http://www.leg.state.mn.us/lrl/lrl.asp
Volume S-Chapter 14
CHARACTERISTICS OF THE MINERAL INDUSTRY~
COPPER, NICKEL, AND COBALT
Minnesota Environmental Ouality BoardRegional Copper-Nickel StuuyAuthor: Mark Donaldson*
*Please contact Royden E. Tull regarding questionsor comments.on this chapter of the reporto

TABLE OF CONTENTS
Volume 5-Chapter 14 CHARACTERISTICS OF THE MINERAL INDUSTRY: COPPER,NICKEL, AND COBALT
1481 INTRODUCTION AND SUMMARY OF FINDINGS
14.2 COPPER INDUSTRY 'STRUCTURE
14.3 NICKEL INDUSTRY STRUCTURE
14.4 COBALT INDUSTRY STRUCTURE
14 .. 5 CHARACTERISTICS OF SUPPLY, DEMAND, PRICE14 .. 5.1 Copper
14 .. 5.1.1 Supply14.5·.1.2 Demand14.5.1.3 Price14 .. 5.1.4 Copper Forecasts
14.5 .. 2 Nickel14.5.2.1 Supply14 .. 5.2.2 Demand14.5 .. 2 .. 3 Price14.5 .. 2.4 Nickel Forecasts .... ,
14 .. 5.3 Cobalt14 .. 5 .. 3 .. 1 Supply14 .. 5.3.2 Demand14.5.3 .. 3 Price14 .. 5.,3.4 Cobalt Forecasts
.14 .. 6 SUMHARY
.',

REGIONAL COPPER-NICKEL STUDY REPORT OUTLINE
Volume 1 - Introduction to Regional Copper-Nickel Study/Executive SummaryChapter 1 Historical PerspectiveChapter 2 Study Goals and ObjectivesChapter 3 $tudy Region and Copper-Nickel Resources
. Chapter 4 Copper-Nickel Development AlternativesChapter 5 Environmental ImpactsChapter 6 Socio-Economics ImpactsChapter 7 Report Organization and Supporting Documentation
Volume 2 - Technical Assessment- Introduction and Summary to VolumeChapter 1 ExplorationChapter 2 Mineral Extraction (Mining)Chapter 3 Mineral ProcessingChapter 4 Smelting and RefiningChapter 5 Integrated Development Models
Volume 3 - Physical Environment- Introduction and Summary to VolumeChapter 1 Geology and Mineralogy
~
Chapter 2 Mineral Resources PotentialChapter 3 Air ResourcesChapter 4 Water ResourcesChapter 5 Noise
Volume 4 - Biological Environment- Introduction and Summary to VolumeChapter 1 Aquatic BiologyChapter 2 Terrestrial Biology
Volume 5 - Human Environment- Introduction and Summary of VolumeChapter 1 Human PopulationsChapter 2 Public HealthChapter 3 Land Use OverviewChapter 4 Lands and Minerals OwnershipChapter 5 Mine Lands,Chapter 6 Foreit Lands and ProductionChapter 7 Residential SettlementChapter 8 TransportationChapter 9 Outdoor RecreationChapter 10 Natural, Scientific and Historical AreasChapter 11 EnergyChapter 12 Government Revenues/TaxesChapter 13 Community Services, Costs and Revenue SourcesChapter 14 Mineral EcorlomicsChapter 15 Regional EconomicsChapter 16 Local Economics

A NOTE ABOUT UNITS
This report, which in total covers some 36 chapters in 5 volumes, is both inter-
national and interdisciplinary in scope. As a result, the problem of an
appropriate and consistent choice of units of measure for use throughout the
entire report proved insurmountable. Instead, most sections use the system of
'\units judged most common in the science or profess~on under discussion.
However, interdisciplinary tie-ins complicated this simple objective, and
resulted in the use of a mix of units in many sections. A few specific comments
will hopefully aid.the reader in coping with the resulting melange (which is a
reflection of the international multiplicity of measurement systems):
1) Where reasonable, an effort has been made to use the metric system (meters,·
kilograms, kilowatt-hours, etc.) of units which is widely used in the physical""
and biological sciences, and is slowly becoming accepted in the United States.
2) In several areas, notably engineering discussions, the use of many English
~nits (feet, pounds, BTU's, etc.) is retained in the belief that this will
better serve most readerso
"3) Notable among the units used to promote the. metric system is the metric ton,
~which consists of 2205 pounds and is abbreviated as mte The metric. ton (1000
kilograms) is roughly 10% larger (10.25%) than the common or short ton (st) of
2000 pounds. The metric ton is "quite comparable to the long ton (2240 pounds)
~ommonly used in the iron ore industryo (Strictly speaking, pounds and kilograms
are totally different animals, but since this report is not concerned with
~mining in outer space away 'from the earth's surface, the distinction is purely
academic and of no practical importance here).

4) lbe hectare is a unit of area In the metric system which will be encountered
throughout this report. It represents the area of a square, 100 meters on a
side (10000 m2), and is roughly equivalent to 21/2 acres (actually 2.4710
acres). Thus, one square mile, which consists of 640 acres, contains some 259
hectares.
The attached table includes conversion factors for some common units used in
this report. Hopefully, with these aids and a bit of patience, the reader will
succeed in mastering the transitions between measurement systems that a full
reading of this report requires. Be comforted by the fact that measurements of
time are the same in all systems, and that all economic units are expressed in
terms of United States dollars, eliminating the need to convert from British
Pounds, Rands, Yen, Kawachas, Rubles, and so forth!
Conversions for Common Metric Units Used in the Copper-Nickel Reports
-1 meter
1 centimeter
1 kilometer
1 hectare
1 sq. meter
1 sq. kilometer
1 gram
1 kilogram
1 metric ton
1 liter
1 liter/minute
= 3.28 feet = 1.094 yards
= 0.3931 inches
= 0.621 miles
= 10,000 sq. meters = 2.471 acres
= 10.764 sq. feet = 1.196 sq. yards
= 100 hectares = 0.386 sq. miles
~ 0.037 oz. (avoir.) = 0.0322 Troy oz.
= .2.205 .pounds
= 1000 kilograms = 0.984 long tons ~ 1~1025 short tons
= 1.308 yd 3 = 35.315 ft 3
= 0.264 u.s. gallons
= 0.264 u.s. gallons/minute = 0.00117 acre-feet/day
1 kilometer/hour = 0.621 miles/hour
degrees Celsius = (5/9)(degrees Fahrenheit -32)

Volume S-Chapter 14' CHARACTERISTICS OF THE MINERAL INDUSTRY: COPPER,
NICKEL, AND COBALT
14.1 INTRODUCTION AND SUMMARY OF FINDINGS
Minnesota's copper-nickel resource development depends on many factors, among
them the state's attitude toward mineral development in the Study Area, mineral
development company policy, and, perhaps most importantly, market conditions for
the mineral commodities which would be produced by a Minnesota operation--copper,
nickel, cobalt, and other precious metals. ~,rhe attitude of the state is.,0;';
determined by its legislators, administrat~on, .and agency representatives"
Through their actions, the behavior of mineral development companies can be
influenced to a degree. The state, however, can do little to influence the
markets in which the state's mineral resources will be traded" Therefore, this
paper presents the potential metal commodity background against which state
actions must take place.
A mi~eral' development company must make a return from the large capital invest-
ment committed to successfully mine and market the state's mineral resource" An
operation's profitability is first and foremost dependent on the market con-
ditions in which it operates--supply, demand, and co~modity prices" This section
examines the past, present, and forecasted'market conditions for copper, nickel,r'
and cobalt to characterize ,the factors which may influence the development of
Minnesota's resources"
The mineral industry is basic to the economy of all developed countries and many
developing countries" In the developing countries of Africa and South America,
1

exports of copper, nickel, and cobalt provide a primary source of foreign
exchange and are crucial to the maintenance of governmental expenditures. The
forces which affect this industry are essentially the same as those which shape
the world economy as a whole. Growth in the mineral industry is inexorably tied
to growth of industrial activity and consumer spending. The demand for, supply
and price of mineral commodities are elements of the industry which must be exa-
mined to set the stage upon which Minnesota's' potential copper-nickel industry
will act.
Copper, nickel, and cobalt supplies in the U.S. have significantly different
characteristics. The U.S. is the world's leading primary (from mines) producer
of copper with about 20 percent of total world primary production. Primary pro-
duction of nickel in the u.S. is extremely small, with a single mine in Oregon
~
the only currently producing operation. At present there is no primary produc-
~tion of cobalt in the U.S. Wo~ld~ide, the copper-and nickel markets are suf-
fering from large oversupplies of the two metals, though these are slowiy being
reduced. Because cobalt is predominantly found in association with copper and
nickel, ,its production is related to the production of its host metals.
However, recent demand for cobalt has b~en strong, resulting in a relative shor-
tage of cobalt in the U.S. and worldwide.
Minnesota's copper-nickel resource represents approximately 6 percent of United~
States copper resources and little more than 1 percent. of world copper resources
-(including seabed resources). Minnesota's nickel resource is much more signifi-
cant, accounting for approximately 60 percent of United States resources but
less than 1 percent of the world nickel resource (including seabed resources).
The estimated cobalt content at Minnesota's copper-nickel resource represents 75
2

'.' .
percent of identified United States cobalt resource and approximately 13 D~~~ent
of the world resource.
The demand for copper, nickel, and cobalt is closely tied to industrial and con-
sumer activity. However, because of the effects of substitution and reduced
intensity of use, the demand for coppe~ and nickel in the u.s. has remained
relatively stable over the recent past. The demand for cobalt moves independently
of the forces which effect copper and nickel and has shown some increase in the
past ten years. It is projected that by the late 1980's the demand for u.s.
produced copper will exceed the available copper capacity of the U.S., given
present trends in capacity expansion and U.S.B.M. demand projections.
A single Minnesota copper-nickel operation, as described in Volume 2, could
contribute about one-third the necessary capacity expansion required to meet
projected copper demand for the late 1980s.
0:\
The interaction of demand and' supply determines the price at 'which mineral '~Ot~-
modities are traded. The present oversupply of copper and nickel has resulted
in a slump of their respective prices, while the price of cobalt has been on the
rise due to its strong demand relative to supply. The low copper and nickel
prices experienced in the past few years due to an inbalance of supply and
.. -demand has resulted in an accumulation of metal stockpiles within the industry.
Over this period of declining price, in an effort to redu,ce its stockpiles , the
industry has attempted to reduce'its surplus capacity by closing down many
existing operations and postponing plans for capacity expansion.
3

Commodities Research Unit, Inc. (an international minerals consulting firm) has
projected copper prices to most likely be $.91 per pound (in $1977) by 1985 and
the nickel price (in $1977) to fall to $1.99 per pound by 1985. Other sources
indicate a much higher copper price by the late 1980s.
The mineral industry is dominated by la~ge, fully-integrated corporations, which
often ~ave interests in several minerals and other natural resources. Within the
last ten'years, the oil companies of the u.s. have made a move into the copper
industry, acquiring as much as 40 percent of u.s. capacity. A major question in
the future of domestic copper, nickel, and cobalt supply is the likelihood of
,deep-sea mining of manganese nodules deposited on the ocean floor which are high
in copper, nickel, and cobalt content. The copper and nickel industries, though
presently in a slump, remain optimistic for the period beginning in the mid-~
1980s when present oversupplies of mineral stocks are expected to be reduced and
supply and demand should again be in balance. Historically the copper industry
is characterized as a relatively instable indus,try which is subject to periodic
.cycles of excess capacity and low prices followed by periods of inadequate
supplies and higher prices.
14.2 COPPER INDUSTRY STRUCTURE
-The United States is the leading copper producer in the world (see Table 1)
"accounting for about 20 per~ent 'of world production; ahead of Chile, the USSR,
Canada, Zambia, and Zaire. Within the country, Arizona is by far the dominant
copper-producing state (see Table 2), with the remainder provided by Utah, New
Mexico, Montana, Nevada, Michigan, Missouri, and Tennessee.
Tables 1 and 24

Table 1. World copper metal production capacities t 1975, 1976, and 1980(thousand metric tonnes).
1975 1976 1980
North America:United States:
Mine 1,814 1,814 1,950Smelter 1,814 1,814 1,905Refinery 2,594 2,630 2,630
Other North America:Mine 989 1,016 1,261Smelter 744 744 1,043Re'finery 698 698 939
South America:Mine 1,107 1,252 1,615Smel ter 1,034 1,034 1,306Refinery 1,025 1,025 1,306
. Europe: 1Mine 254 254 272Smelter 717 717 753Refinery 1,651 1',651 1,714
Africa:Mine 1,651 i',651 1,814Smelter2 1,696 1,696 1,787Refinery 1,152 1,152 1,651
Asia: lMine 599 535 862Smelter 1,388 1,388 1,814Refinery 1,370 1,370 1,596
Oceania:Mine, 435 435 454Smelter 227 227 227Refinery 209 209 209
Centrally Planned Economies:Mine 1,5423 1,6333 2,268
,.- Smelter 1,6783 1,7693 1,950Refinery
,.'16783 1',7693 1,950,
World Total:Mine 8,391 8,590 10,496Smelter 9,298 9,389 10,785Refinery 10,377 10,504 11,995
SOURCE: USBM 19770
1Market economy countries.2Includes electrowinning capacity in Zaire and Zambia.3Estimated.

Table 2. 1977 u.s. copper mine production (metric tonnesof metal) ..
STATE PRODUCTION PERCENT SHARE
Arizona 845,355 61.4
Michigan 39,365 2.9
Missouri 11,065 e8
Montana 80,725 5.9
Nevada 60,635 4.4
New Mexico 151,565 11.0
Utah 175,690 12.8\
Other States 12,500 .S"
TOTAL 1,376,900 100
SOURCE: USBM 1978 ..0>,
",

Minnesota's resource, estimated to contain 26,340,000 metric ·tonnes of copper,
is approximately one-quarter the size of total u.s. reserves and one-twentieth
the size of world reserves.
If Minnesota's copper-~ickel resource is developed with annual production of
254,000 metric tonnes of copper (the eq?ivalent of threi hypothetical mine, mill,.:.:..
smelter-refinery complexes at full .production in;th~·?t~dy.Area) the st~te would
have approximately 10 percent of 1977 u.s. refinery capacity (CRU 1977) and 19
percent of 1977 u.s. refinery production (USBM 1978). This amount of production
would make Minnesota the second leading copper-p~oducing state in thp, ~.~.,
based on 1977 production levels, with 15.6 perce~t of total u.s. mine'prod~ction
and would represent 13 percent of USBM forecasted 1985 primary copper demand.
~
.Copper production requires three stages: mining, smelting, and refinings These
stages can operate independently but most often are par~ of an integrated cor-
porate operation.
World copper mine, smelter, and refinery capacities are expected by 1980 to
expand 22, 15, and 14 percent, respectively, from 1976 levels. South America
and Asia are projected to expand mine capacity by about 350,000 metric tonnes
each by 1980. The largest share of mine growth, however, is seen to be in the
Centrally Planned Economi~s, with 635,000 metric tonnes expansion. The largest
smelter capacity expansion is expected to develop in Asia, particularly Japan,
where much ore from Australia, New Guinea, and other oceanic developments is
smelted. Africa leads the way in new refinery capacity as the developing
countries with rich copper deposits seek to capture more of its value. Refinery
products are the major commodities which are traded on the international
5

markets. They appear in forms which are usable by particular consumers, such as
brass, wire or powder mills, foundries and forging, or chemical plants. Copper
may appear as refinery cathodes or cast or extended into wirebars, billets, tube
billets, cakes or ingots.
Copper is commonly used 1n alloys such ,as brass and bronze, but also is used in
alloy with nickel, aluminum, cadmiu~, and tellurium. Its largest use, due to
its high degree of conductivity (see Table 13), is in the electrical and
electronic industry. Many construction and machine products depend on copper
because of its corrosion-resistant properties.
The 'five leading copper-producing companies are Kennecott, Phelps Dodge,
Anaconda (Atlantic Richfield Company), Newmont, and Duval (Pennzoil). Many U.S.
companies have interests in' foreign copper operations, though these have been
decreased in recent years due to nationalization of mineral operations in such
countries as Chile, Peru, Zambia, and Zaire. Recent ~ctions by Exxon in Chile
imply a possible change in this trend.
)
Major oil companies have been acquiring 'copper interests at a growing pace. The
copper industry, because of the current (1977-1978) slump in prices and stock
value, are attractive takeover targets for the capital-rich oil companies.
Sin~e 1963, oil companies have purchased 6 of the 13 largest U.S& copper firms.
In addition to its currently low prices, the copper industry is being eyed by
the oil industry because of the similarity between the two industries. 'Bo.th ,are...' ........." ....
vertically integrated industries involved in the extraction, refinement, 'a~d:'
marketing of a natural resource •. oi 1 companies now control about 40 percent of
the u.s. copper industry (Minneapolis Star 1978). Atlantic Richfield bought
6

~.,."..
Anaconda, the fourth largest u.s. copper company, in 1976. Exxon Corporation is
investing large amounts of money in its own mining ventures. Pennzoil owns
Duval Corporation, the fifth largest copper company in the U.S. Standard oil of
Cali~ornia presently has a 20 percent interest and recently attempted to acquire
a controlling interest in AMAX, Inc. In ·1978 Superior Oil Company purchased
Hecla Mining Company, one of the ten l&rgest u.s. copper companies.
Many oil companies are developing internal mining divisions 'to explore for
copper. Exxon, Continental, Gulf, and Standard are each gearing up for copper
production.
Internationally, a potentially dominate force in the copper mar~ets is the
Intergovernmental Council of Copper Exporting Countries (CIPEC), made up of
Chile, Peru, Zambia, Zaire, Indonesia, Australia, Papua New Guinea, and. .
Mauritania. CIPEC was formed in 1967 and presently its members control 38 per-
cent of world mine production and 72 percent of the export trade of mine and
smelter products (USBM 1977). In 1974 CIPEC acted to reduce its export ship-
ments by 15 percent; however, it is not certain whether compliance resulted, as
there was no change in copper prices. Because of the significance of copper as
a source of foreign exchange for these countries and because of the large
variation in production costs between these countries, united actions affecting
the production, trade lev~is an~ prices of copper are rare.
Although relatively ineffective as a force in copper trading to this point,
CIPEC carries with it a tremendous potential through its share of world copper
reserves. CIPEC reports that CIPEC members control 196 million metric tonnes
or 43 percent of total world copper reserves. In addition, CIPEC countries
7

generally control much higher-grade ore than the world average of .53 percent.
Chile, for example, claims an average ore grade of 1.7 per~ent, declining to 1.0
percent by 2000 (Mining Journal 1978)Q
Table 3
Some developing countries. in South America and Africa enjoy a tremendous com-
petitive advantage over U.S. copper with respect to production cost and ore
grade. The United States in 1975 and 1976 mined copper with an average grade of
~6 percent and production cost of 48.5 cents per .pound .of finished copper.
Zaire, on the other hand, mined 5.1 percent copper and had production costs of
48.5 cents per pound of copper; Chile mined 1.6 percent copper and had produc-
tion costs of only 37.5 cents per pound.
An operation in Minnesota is estimated to have production costs, at full produc-
tion, of 94 cents per pound of co~bined copper and nickel metal produced for an
ope? pit" complex and 98 cents per pound fo! underground mining. Allowing a
nickel and precious metals credit against the cost gives a production cost of 62
cents per pound of copper for open pit and 67 cents per pound for an underground
operation.
Thi-relative production costs of foreign copper provides an incentive for U.S.o ~ '. :
consumers to import copper from these developing countries. These countries a~i
extremely dependent on copper exports due to their demands for foreign exchange
and have been impelled to sell copper at less than production costs. This would
further put U.SQ producers at a competitive disadvantage in the international
markets for copper.
Tables 4 and 58

Table 3. World copper resources (million metric tonnes of metal).
North America:MinnesotaOther United States
----- -CanadaOther
Total
South 'America:ChilePeruOther
Total
.Europe: Total
Africa:ZaireZambiaOther
Total
Asia: Total
Oceania: Total
~entrally Planned Economies
'Sea Nodules3
WORLD TOTAL
SOURCE: USBM 1977.
RESERVESI
00843130
145
843220
136
6
2529
963
27
18
,60
455
OTHER2 TOTALRESOURCES RESOURCES
26 26264 375109 14027 57
426 593
118 20236 6863 83
217 353
36 43
27 5363 9318 27
c.~108 173
63 91
54 73
172 232
689 689
1,765 2,252
10f the listed reserves, approximately one-third of the copper contained in the U.S. and market economy counting totals is located in under~eveloped deposits. These deposits can move between reserve and resourceclassifications depending on pr~vailing legal and economic conditions.
2Includes undiscovered (hypothetical and speculative) deposits.
3Estimate based on average of 1 percent copper per dry ton ofnodules.

Table 4. Average 1976 copper ore grade mined (percent copper).
Africa 3.5Zaire 5.1Zambia 2.6
Australia 1.7
Asia 1.6
South America 1.5Chile 1.6Peru 1.25
Europe 1.5
North America 0.7Canada 1.12u.S. .6
World 1.45
SOURCE: CRU 1977. '"
Table 5. Average 1975 copper net operating costs(cents per pound of primary refined copper).
48.5·
Africa
Canada
Non-Socialist World
48 0 5
44.5
44.5
Western Europe 39.0
Central and South America 37.5
Asia and Australia
SOURCE: CRU 1977.
34.0 ".:',. ~ ~. .
Copper is traded on two organized markets, the London Metal Exchange (LME) and
the New York Commodity Exchange (COMEX), and these markets help determine its
price. The LME is generally considered to be most important as to its influence
on prices. These markets are principally hedge and speculation oriented and do
not deal exclusively 1n actual physical units. Domestic primary producers
generally determine the l'rice at which ,they se 11 their produc t but are closel y
tied t~ the price established by the exchanges. Producer prices are generally
set by the major producers with others falling in line, although premiums and
discounts can make selling more competitive.
"~~"~"
·In the United States, Kennecott and Asarco are commonly price leaders.
Kennecott, early in 1978, changed its pricing poli~y so that its price for
copper cathodes is set equal to the daily New York Commodities Exchange price
plus a 21h cent-a-pound premium (WSJ 1978). When enacted, this policy had the
effect of raising Kennecott's price by three cents. Anaconda, a division of
Atlantic Richfield Company and a leading copper producer, in July, 1978, adapted
.8 pricing policy similar to that of Kennecott.
14.3 NICKEL INDUSTRY STRUCTURE
Nickel plays an important role in the steel and aerospace industries. As an
.alloy with other materials, its strength and corrosion resistance are of great
"value. The United States l~ th~ world's leading consumer of nickel (see Table
6), yet has very small reserves of the mineral. Only one domestic mine, at
Riddle, Oregon, operated by Hanna Mining Company, is currently producing ore.
This mine produced less than 4 percent of total U.S. supply in 1976~ Nickel
resources, though unmined at present, do exist in lateritic deposits in
9

California, Oregon, and Washington and in sulfide deposits in Minnesota,
Montana, and Alaska.
Minnesota's copper-nickel resource would become the nation's largest nickel
reserve when development becomes economically feasible. Ninnesota has 8 .. 0
million metric' tonnes of nickel with an, average grade of .2 percent (DNR 1977).
This would dwarf the existing u.s. reserves of 181,000 metric tonnes and would
be approximately one-eighth the size of world reserves estimated in 1978 (USBH
1978).
'If three hypothetical copper-nickel operations are developed in Minnesota,
annual production of 46,000 metric tonnes of nicke~ would more than double the
1975 u.s. nickel refinery production and would represent 6 percent of 1975 world'
nickel production (CRU 1977). This amount. of production would represent
ap?roximately one half of the U.S.R.M. forecasted 1985 primary nickel
produc",tion.
Table 6
Examination of world nickel resources shows that the U.S. has less than one per-
cent of total world reserves) given the present conditions of the nickel market.
The'picture with regard to. resources, given a c~ange in the real price of
nickel, is not much brighter. The U.S. controls only 1.3 percent of total world
resources--according to the USBM.
Table 7
10

Table 6. 1976 nickel metal consumption.
Percent Share
U.S.A.
Japan
Eastern European Countries
U.K ..
Sweden
Others
Total Non-Socialist World
SOURCE: CRU 19770
( thousand metric tonnes)
187.3
113.6
108.2
34.9
25.1
47.5
516.6
":.' .
36
". .: ::' .
5
9.
,.'

,Table .7. World nickel resources (thousand metric tonnes of. metal).
North America:MinnesotaOther United StatesCanada
Total
Africa
OTHER TOTALRESERVES RESOURCESl RESOURCES 1
000 8,000 8,000181 5,515 5,696
8,707 10,522 19,2298,888 24,037 32,925
2,086 6,077 8,163
IDerived'in consultation with U.s. Geological Surveyo2Est imate based on average 1.3% nickel content of nodels.
Central' America andCaribbean Islands:
CubaDominican RepublicGuatemala
,Puerto RicoTotal
Europe: U.S.S.R.
Oceania:AustraliaIndonesiaNew CaledoniaPhilippines
Total
South America:Brazil
~ Col~mbiaVenezuela
Total
Sea Nodules
World Total (rounded)
SOURCE: USBM 1977 •.'
3,084998272
4,354
7,347
5,0797,075
13,6054,898
30,657
181816
997
54,329
12,88091
816816
14,603
11,973
2,~02
5,98628,390,5,261
42',539
2,99351..4635
4,172
895,7002
999,101
15,9641,0881,088
81618,956
19,320
7,98213,06141,99510, 15973,197
2,1751,361
6355,171
1,053,432

The leading suppliers of u.s. nickel are Canada, New Caledonia, Norway, the
Dominican Republic, and Australia. Canada is the leading nickel producer in the
world (producing nearly one-third the world's nickel), dominating the industry
with the International Nickel Company (INCO) and Falconbridge Nickel Mines Ltd.
f<
As with the copper industry, the production of nickel requires mining, smelting,
and refining stages to produce a marketable product. AMAX, Inco owns a nickel-
copper refinery in Louisiana which began production in 1974 based on a nickel-
copper matte imported from Africa, producing 18,140 metric tonnes of nickel in
1976 (USBM 1977) •. Many companies such as AMAX operate single stages of the pro-
.duction process, but the dominant companies such' as INca and Falconbridge are
vertically integrated and operate mines, smelters, and refineries and fabri-
eating facilities allover the world.
Nickel is commonly found in stainless steel and other alloys and "super" alloys.
Nickel's corrosion resistant and strength prop~rties lead to its use in chemical
oand petroleum production, fabrication of metal products, aircraft and other
transportation equipment, and many consumer and production goods~
By 1980, nickel mine, smelter, and refinery capacities are expected to expand
from 1976 levels by 15, 18, and 6 percent, respectively (see Table 8).
Acc~rding to estimates, nO,capasity expansion in North America can be expected.. l. •
in the very near future. The largest expansion of mine capacity is expected in
Latin America and Asia, while Europe joins with Latin America as the site of
p!ojected smelter capacity.expansione There is very little refinery expansion
expected, with Asia being responsible for most of the small projected increase
in capacity. Much of the new expansion may be delayed due to low nickel prices
and present surplus supplies of this metal.
11

Of interest are the inbalances which exist in some areas of the world with
respect to mine, smelter, and refinery capacity. Latin America and
Australia/Oceania are exporters of unfinished material, while Europe depends
heavily. on imports to fill its refinery capacity.
Table 8
1he concentration of the industry by the dominant Canadian firms leads to a very
tight pricing structure (CRU 1977). INca is the price leader and other firms
adjust their prices accordingly. INCa recently curtailed its policy of
~ublishing its nickel prices because their openly published price had become the
target for discounts offered by competitors.
Minnesota operations, regardless of the cost associated with it nickel produc-
tion, would be compelled to price its produc~ in line with the prev,ailing INCa
dominated markets.
The potential of ocean mining of mineral nodules may result in nickel production
by 1985. Negotiations currently ongoing in the United Nations Law of the Seas
Conference revolve around two opposing methods for developing deep-sea resour-
ces. One proposal would create an international organization, termed the
Enterprise, to control all.sea-b~d mining. Thi~ would benefit those countries
which have neither the technical or financial resources to undertake such a
development, as the Enterprise would carry out its role "on the behalf of
mankind." A countering proposal under discussion would allow parallel develop-
ment by private, state, and international organ~zationso This would favor the
technical- and capital-rich developed countries and insure their continued domi-
12

Table 8. World nickel production capacities(thousand metric tonnes of metal) •..
1976 1980
North America:Mine 380 380Smel ter 320 320Refinery 238 238
Latin America:Mine 39 83Smel ter 40 83Refinery 4 10
Europe:Mine 25 48Smelter 25 48Refinery 118 118
Africa:Mine 60 60Smel ter 52 ~ 52Refinery 28 28
Asia:.....
Mine 75 121Smel ter 166 212Refinery 85 112
Australia/Oceania:Mine 240 250Smelter 130 148Refinery 38 38
WO.rld Total:Mine 819 942Smelter 733 863Refinery 511 544
SOURCE: USBM 1977","
..

nance of the coppe~, nickel, and cobalt markets~ Agreement between Canada, tht'
world's largest nickel producer, and the United States, the worlds's largest
nickel consumer, stipulates that seabed production be limited to 60 percent of
the increase in annual world consumption. This would reinforce the position "
the leading land-base~ producers,allowing them to maintain present producti,
levels plus guaranteeing 40 percent of the increase in consumption. Develo 1
under the "parallel" scenario it is estimated, would allow the U.S. to redl'
its imports of nick~l by 25 percent (Mining Journal 1978).. Several consor
of mineral companies have joined to initiate investment in ocean mining.
is part of a group called Ocean Management, Inc. {OMI) along with Germ
Japanese interests. OMI is capable of producing 2 million metric tor
by 1985 (Li 1977), a~though the continuing slump in the nickel market
considerable delay in investment.
A 3 million metric tonne per year nodule ope~ation is capable of producin
nickel at $2.00 per pound, ($1977), compared to a cost of $2 .. 73 per pound
laterite'nickel and $1.27 per pound for Canadian sulfides (CRU 1977).
An operation in Minnesota is estimated to have annual production costs of 9'1
cents per pound of ~otal metal produced at full production for an open pit mi:l',
m"ill and smelter/r.efinery complex and 98 cents per pound of combined copper Ail'i
nickel metal produced for an unaerground operation.. ~llowing a credit for
copper and precious metals gives a nickel production cost of 49 cents per pound
for open pit and 77 cents per pound for underground.
13

14.4 COBALT INDUSTRY STRUCTURE
The United States ceased producing primary cobalt in 1971. Since then it has
depended on imports, primarily from southern Africa countries for its cobalt
supply. Cobalt production is concentrated in Africa with Zaire (53%), Zambia
(9%), and Morrocco (6%) dominating the industry. Australia (7%) and New
Caledonia (6%) complete the top five cobalt-producing countries.
Cobalt is used primarily as an alloy in heat and corrosion resistant materials,
although about 25 percent of cobalt is consumed in nonmetallic compounds such as
paint, ceramics, and other chemicals (USBM 1977). Its primary use is in magne-
,tic components in the electri~al and electronic industry. Cobalt is also used
in aircraft and other engine parts where strength and heat and corrosion
resistance are important.
Minnesota's copper-nickel resource is estimated to contain approximately 573,000
metric tonnes of cobalt. The United States pre~ently has no classified reserves
.of cobalt, but Minnesota's cobalt would be about one-fifth the s1ze of estimated
world cobalt reserves. Three hypothetical mines operating in Minnesota would' ,
produce 5,500 metric tonnes of cobalt. The U.S.B.M. estimates that U.S. primary
production in 2000 will be approximately 6800 metric tonnes, indicating that
Minnesota could be the leading, if not only, cobalt producing state by that
time. Minnesota production of 5,500 metric tonnes would Tepresent approximatelyI'
one-third the U.S. primary demand in 2000.
Table 9
14

Table 9. World cobalt resources (thousand metric tonnes of metal).
North America:Minnesota 573 573Other U.S. 191 191Canada 30 220 250Cuba 109 940 1,049
Total 139 1,924 2,063
Europe:Finland 18 5 23USSR 209 18 227
. Total 227 23 250
Africa:Botswana 26 5 32Morocco 13 1 14Zaire 454 227 680Zambia 113 234 347
Total 606 467 1,073
Oceania:Austrialia 49 246 295New Caledonia 272 113 "'. 385Ph illippines 190 14 204
Total 512 373 884
World Total 1,483 2,787 4,270
Source: USBM 1977
..

14.5 CHARACTERISTICS OF SUPPLY, DEMAND, PRICE
14.5.1 Copper
The copper industry' is extremely competitive within the United States, with many
large mineral development companies continually seeking to increase their market
positions. The u.s. is both the largest consumer and supplier of copper in the
world. However, the trend over the recent past has been a loss of competitive
supply position to foreign sources while u.S. demand has been steady and strong.
Domestic' sources of copper are coming into much higher favor due to the unstable
and risky nature of foreign investments over the past 20 years •
.Minnesota's copper resource, given the credits it would receive from nickel,
cobalt, and other precious metals, can be produced at costs which make it a
marginal domestic source of the metal. Further, the· slump that currently has~
produced depressed copper prices around the world is expected to have reversed
itself by the mid-1980s as current production cutbacks and investment cur-
tailment produce supply conditions which meet t~e expected demand. Due to the
.long lead-time necessary to bring a sizable mining operation on line, the
earliest Minnesota can expect to have a producing copper-nickel operation is the
mid- to late-1980s~
Should the demand for copper grow faster than expected or the pressure for a
.domestic source of the metal increase, Minnesota can expect to be strongly urged
to allow development of it~ mine~al resources.
14.5.1.1 Supply--The supply of copper in the United States comes from three
principle sources: sulfid~ copper, oxide copper, and recycled scrap. The
majority of u.S. domestic reserves are in the form of sulfide copper which tend
to be large, low-grade deposits. The Minnesota copper-nickel deposits are
15
sulfides. Less important to domestic supply are the spotty, but higher-grade
oxides. However, the production from this source has been increasing over the
past few years. Of growing importance is the supply of copper coming from new
and old scrap. New sqrap 1S recovered directly from the manufacturing process,
while old scrap is recovered from obsolete equipment. Presently, scrap accounts
for about 40 percent of domestic consumption (A.D. Littie 1978) and· has been a
relatively stable source in the paste
A large potential source of copper is the sea bed mining of nodules along the
ocean floor which 'are high in manganese, copper, and nickel content (Table 10)0
. Technological problems of ocean mining are rapidly being overcome so that the
sole remaining pr~blem will be political in nature~
Because nodule deposits are located throughout the oceans of the world, juris-
diction over these areas and resulting economic benefits is being debated in the
forum of the United Nations, Law of the Seas Conference. Nodule mining may be a
·major competitor to Minnesota copper-nickel development. Sources indicate that
ocean mining could occur by 1990 (CRU 1977).
If five nodule mining operations are in operation by 1985, their production
would add 19 percent to the world's production of manganese, 3 percent to the.
copper production, 32 percent tu nickel, and 86 percent to world cobalt produc-
tion (USGS 1977).
However, recent reports indicate that the present slump in copper and nickel
prices are causing the estimat~d start-up date for deep-sea mining to slip,
possibly to 1990 (WSJ 1978).
16
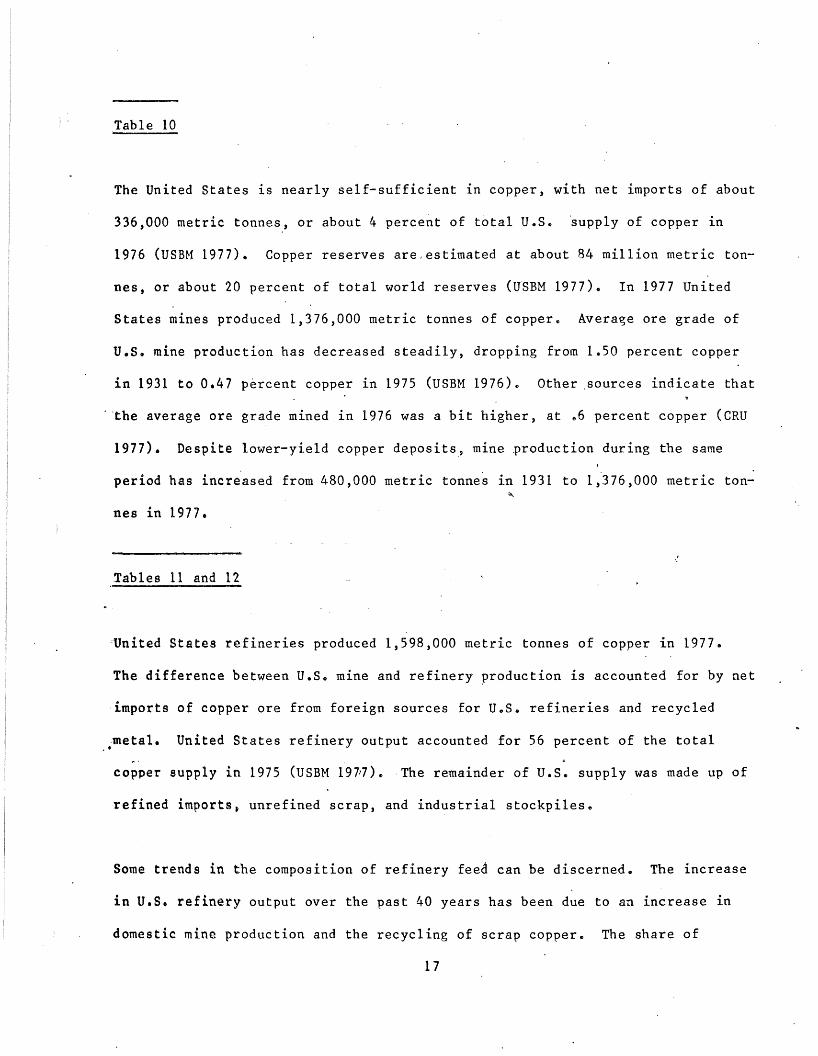
Table 10
The United States is nearly self-sufficient in copper, with net imports of about
336,000 metric tonnes, or about 4 percent of total U.SG 'supply of copper in
1976 (USBM 1977). Copper reserves are,estimated at about 84 million metric ton-
nes, or about 20 percent of total world reserves (USBM 1977). In 1977 United
States mines produced 1,376,000 metric tonnes of copper~ Avera~e ore grade of
u.s. mine production has decreased steadily, dropping from 1.50 percent copper
in 1931 to 0.47 percent copper in 1975 (USBM 1976). Other sources indicate that
-the average ore grade mined in 1976 was a bit higher, at .6 percent copper (CRU
1977). Despite lower-yield copper deposits., mine production during the same
period has increased from 480,000 metric tonne~ in 1931 to l,j76,000 metric to~
nes in 1977.
Tables 11 and 12
~United States refineries produced 1,598,000 metric tonnes of copper in 1977.
The difference between u.s. mine and refinery production is accounted for by net
imports of copper ore from foreign sources for U.S. refineries and recycled
metal. United States refinery output accounted for 56 percent of the total..copper supply in 1975 (USBM 19p7). The remainder of u.s. supply was made up of
refined imports. unrefined scrap, and industrial stockpiles.
Some trends in the composition of refinery feed can be discerned. The increase
in U.s. refinery output over the past 40 years has been due to an increase in
domestic mine production and the recycling of scrap copper. The share of
17

Table 10. Sample nodule ore grades. 1
11anganese 24.6 percent
Nickel 1.28 percent0(,
Copper 1.16 percent
Cobalt 0.23 percent
SOURCE: World Mining 1977.
1Average analysis for North Pacific, siliceous ooze.
"'.

Table 11. u.s. copper supply, 1965-76 (thousand metric tonnes of metal).
1965 1966 1967 1968 1969 1970 1971 1972 1973 1974 . 1975 i976
Components of u.s. supply(primary and old scrap):
Refined production:
Domestic mines 1,212 1,227 768 1,052 1,332 1,380 1,280 1,524 1,540 1,289 1,178 1,288
Old scrap 194 220 172 210 258 252 189 192 . 219 143 195 204
Imports of are,blister, etc. 341 325 259 250 249 221 164 175 154 212 131 100
Sales of Government ~.
stockpile excesses 109 363 135 --- --- --- --- --- --- 229
Imports of refined 124 149 300 363 119 120 149 174 182 285 133 336
Old ~crap (unrefined) 271 266 . 266 263 264 205 215 223 222 195 140 150
Industry stocks, Jan. 1 424 452 546 460 511 491 585 532 469 414 541 420
TOTAL U.S. SUPPLY 2,675 3,000 2,447 2,599 2',732 2,668 2,581 2,820 2)787 2,866 2,318 2,497
SOURCE: USBM 1977

Table 12. Copper ore grade, annual mine production.
}UNE PRODUCTIONAVERAGE ORE COPPER METAL-
YEAR GRADE MINED (000 rot)
1931 1.50 479.7
1936 1..54 557.4
1941 1.15 869.1
1946 .91 552.1
1951 e90 842.0
1956 .78 1001.5
1961 .75 1056.8
1966' .67 1296.3
1971 .55 1380.7
1972 .55 1510.1 '>\
1973 .53 -1558.2....,rI 1974 .49 1448 .. 5
1975 .47 1281 .. 9
1976 .51 1456 .. 7
1977 .52 1376.9
'SOURCE: USBM 1976 t 1978.

foreign ores going to u.s. refineries has decreased quite steadily in the past
20 years.
Other components of total u.s. copper supply include refined imports (6% of
total in 1975), refined and unrefined production from old scrap (14% in 1975),
and stocks from the industry (23% in 1975). The present slump has resulted in a
reduction of industrial stocks in 1977 and 1978 ~nd concomitant increase in
refinery stockpiles and cutbacks in mine and refinery production.
14.5.1.2 Demand--The demand for u.s. copper production comes in three forms:
industrial stock, refined exports, and industrial consumption. In 1976, 18 per-
cent of annual production was retained as industrial stock. From 1971 to 1973
the industry reduced its stock as a result of favorable copper prices. Since~
1973, however, the depressed price for copper has resulted in a net annual
increase in industrial stocks. This trend has slowed in 1977 and 1978 as com-
panies have cut back on mine and refinery production in order to reduce the
existing buildup of co~per stocks.
Another component of total u.s. demand is that of refined exports. Exports of
copper have steadily decreased over the past twelve years. In 1965 u.s. exports
were 295,000 metric tonnes, or 11 percent of total u.s. supply of copper. By~ .
1976 the U.S. was exporting only 100,000 metric tonnesof copper-4 percent of
u.s. supply (USBM 1977)~
By far the largest part of total u.s. ~emand [78% in 1976 (USBM 1977)] is that
which is consumed by various segments of the U.S. economy. The use of copper by
the el~ctrical and ~lectronics related industries is the largest end-use cate-
18

gory and in recent years these industries have been expanding their share of
total consumption. Other end-use industries include building construction,
transportation, ind~strial machinery and equipment, and consumer and general
products.
Table 13
Copper consumption is subject to substitution by other products. Copper faces
competition from aluminum, plastics, steel, glass fibers, and other minerals.
Because the modification of systems from the use of one product to another is
slow, the changes in substitution lag behind the incentive to substitute pro
vided by relative price, availability or technical- developments 0 For this
reason, substitution is hard to quantify and even~~arder to predict. The
electrical industry has seen a rise in the use of aluminum and fibre optics in
the transmission of energy. Substitution is also occurring rapidly in the field
of heat exchangers with aluminum again replacing copper.
Due in part to substitution, the U.So demand for copper has remained relatively
stable while in the recent past GNP and other economic indicators have risen
rapidly. In 1965 industrial use amounted to 1,928,000 metric tonnes (72% of total
. U.S. supply). By 1976 industrial use had only grown to 1,956,000 metric tonnes or
78 percent of available su~ply tUSBM 1977).
In summary, copper demand can be characterized by a stable industrial end use, a
volatile stock held within the industry but relatively stable over the long term
and decreasing exports of copper. The result has been a nearly constant supply
and demand over the recent past. Since 1931, however, both supply and consump-
19

Table 13. u.s. copper demand, 1965-76 (thousand metric tonnes of metal).
1965 1966 1967 1968 1969 1970 1971 1972 1973 1974 1975 1976
Distribution of U.S. supply:
Industry stocks, Dec. 31 452 546 460 511 491 585 532 469 414 541 642 442
Exports (refined) 295 248 144 219 181 200 171 166 171 115 156 100
Industrial demand 1,928 2,207 1,843 1,869 2,060 1,878 1,879 2,185 2,202 2,210 1,520 1,956
U.S. demand pattern:
Electrical 1,932 1,068 1,010 949 1,082 999 1,010 1,1136 1,311 1,134 880 1,052-#
Oonstruction 376 372 251 287 309 298 318 392 322 385 218 302
Machinery 277 287 189 217 230 228 220 272 229 308 187 263
Transportation 206 205 132 175 180 157 174 206 180 233 130 209
Ordinance 41 165 171 149 156 108 63 71 52 38 31 32
Other 96 110 92 93 102 94 94 109 109 III 75 98¥'
TOTAL DEMAND 1,928 2,207 1,843 1,869 2,060 1,878 1,879 2,185 2,202 2,210 1,520 1,956
TOTAL U.S. PRIMARY DEMAND(industrial demand lessold scrap) 1,463 1,721 1,405 1,397 1,558 1,426 1,476 1,770 1,761 1,771 1,185 1,602
SOURCE: USBM 1977

tion increased threefold.
Figure 1
14.5.1.3 Price--Copp~r prices, which reflect the interaction between copper
supply and copper demand, in constant dollars have been relatively stable over
the past 20 years and, in fact, have been on a downward trend over the past 200
years (Douglas 1977).
Copper prices in the short-term tend to be relatively volatile. Because copper
is traded on the open market as a commodity, it is subject to speculation as
events which may effect supply and demand occur and as rumors of potential
events circulate throughout the copper-trading co~munity. The recent military~
. action in Zaire demonstrates this sort of phenomenon. Rebel forces stopped
activity in the copper mines of Zaire and cut off the flow of copper to the
coast for shipmento The day following this action the price of copper jumped
th~ee cents per pound on the LME as news of the military action leaked out of the
country. This was in response to the expectation that Zaire copper would no longer
be available and worldwide copper supply would be decreased. Other events of
short-term nature can also effect prices very quickly. Such things as country-wide
strikes, news of copper finds or long-term contracts and possible curtailment of
individual projects can all feea the short-term fire~ of speculation in the copper
markets.
In the long run, copper prices are subject to more macroeconomic trends.
Substitution of other materials for copper in many of its uses, increased reco-
very of copper from secondary sources, and a lower intensity-of-use as countries
20·


become increasingly developed all lead to a downward trend in the price of
copper. On the other hand, the scarcity of finite minerals is always pushing
the value of copper upward. As well, the factors of increasing production costs
and decreasing are grade tend to push prices higher. Three elements of produc-
tion cost seem destined to pull the price of copper over the long-run to higher
levels: the cost of energy, labor, an~ pollution control. Each of these have
increased dramatically in the recent past and give every indication of con~
tinuing'to rise.
Countering the economic forces which would determine the price of copper in a
completely free-market situation are the actions of some developing, copper-
exporting countries. Third world nations which de?end upon copper exports to
generate foreign exchange and which enjoy lower than average ·production.costs~
(especially in the area of pollution control, occupation health and safety and
labor) are willing to produce and trade copper at less than the prevailing
market prices. Thus, countries such as this exert a downward influence on the
. copper price.
Each of the long-term factors discussed above add to the current short-range
hedge and speculation forces to chart the path of copper prices (see Figure 2).I
The trend over the past 200 years shows a roller-coaster effect which has been
generally downward, indicating that substitution, lower intensity-of-use, and
third-world pressures have dom~nated the marke~ during this period.
Figure 2, Table 14
14.5.1.4 Copper Forecasts--Forecasts of future copper supply, demand, and price
are available from a variety of sources. Information discussed above indicates
21


Table 14. u.s. producer copper prices, 1954-1977.
CONSTANTACTUAL PRICES $1975 PRICES
<U.S. producer prices, cents per pound)
1954 29.5 62.9
1959 30.7 57.9
1964 .32.6 r 57 G1
1969 47.9 70.3
1970 .58.2 81.1
1971 52.0 68.9
1972 51.2 65.2
1973 59.5 71.6
1974 71.3 84G5
1975 6402 6402 .....
·1976 . 69.6 66e2
1977 66.8 60.1
SOURCE: USBM 1977"

that total world resources of copper are adequate to meet long-term needs,
therefore, the key to these forecasts is projected demand; as over time supply
will adjust to meet demand and a corresponding price will result. Since the
demand for copper is largely from economic sectors such as electrical and
electronics, construction, and transportation, forecasts will be closely tied to
forecasted changes in gross national p~oduct.
Presented below are forecasts from the U.S. Bureau of Mines (USBM), University of
Pennsylvania professor Wilfred Malenbaum, the Commodities Research Unit (CRU),
and the A.D. Little Company. Projections vary, due to the various sets of
assumptions used and the forecasting methodology employed. For example, the
USBM presents a straightline projection from the 1975 point on a 1965-1976 trend
. line of data. Malenbaum, on the other hand, indicates that in 1985 there will
be a change in the slope of the demand schedules for copper, nickel, and cobalt.
In these cases the annual change in demand for the minerals will be less for the
_period 1985-2000 than for the period 1975-1985. This reflects a continuing
decreased intensity-of-use of these minerals in developed economies such as the
United States~ CRU and A.De Little each use econometric models to forecast changes
in demand and prices of these minerals. These models depend upon a myriad of
historical data and assumptions about consumption behavior. A discussion of these
forecast methods is beyond the scope of this study, but the reader is referred
to~the references for more infofmationo
Dome~tic copper supplies are constrained in the short-term by the existing capacity
of u.s. mines. smelters. and refineries. In the lopg-term, supplies are limited to
exi~tifig and potential mineral resources and the price the market will bare before
8ub8titution of other commodities takes place.
22
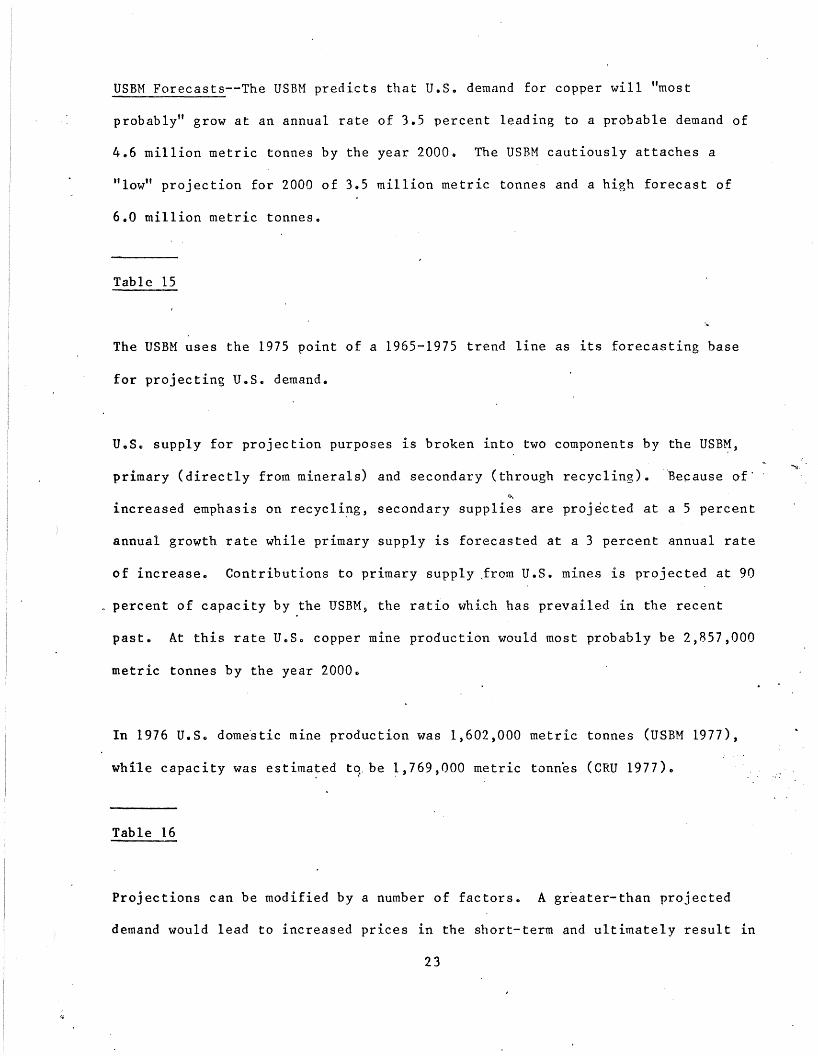
USBM Forecasts--The USBH predicts that U.S. demand for copper will "most
probably" grow at an annual rate of 3.5 percent leading to a probable demand of
4.6 million metric tonnes by the year 2000. The USBM cautiously attaches a
"low" projection for 2000 of 3.5 million metric tonnes and a high forecast of
6.0 million metric tonnes.
Table 15
The USBM uses the 1975 point of a 1965-1975 trend line as its forecasting base
for projecting u.s. demand.
u.s. supply for projection purposes is broken into two components by the USB~,
primary (directly from minerals) and secondary (through recycling). ~ecause of'"'-
increased emphasis on recycli~g, secondary supplies are projected at a 5 percent
annual growth rate while primary supply is forecasted at a 3 percent annual rate
of increase. Contributions to primary supply .from u.s. mines is projected at 90
percent of capacity by the USBM, the ratio which has prevailed in the recent
past. At this rate u.s. copper mine production would most probably be 2,857,000
metric tonnes by the year 2000.
In 1976 U.S. dome~tic mine production was 1,602,000 metric tonnes (USBM 1977),
while capacity was estimated tq. be ~,769,OOO m~tric tonnes (CRU 1977).
Table 16
Projections can be modified by a number of factors. A greater-than projected
demand would lead to increased prices in the short-term and ultimately result in
23

Table 15. Projections of u.s. copper demand (thousandmetric tonnes of metal).
1975
1,520
2000-------- FORECAST RANGE --------LOW PROBABLE HIGH
3,500 4,600 6,000
SOURCE: USBM 1977.
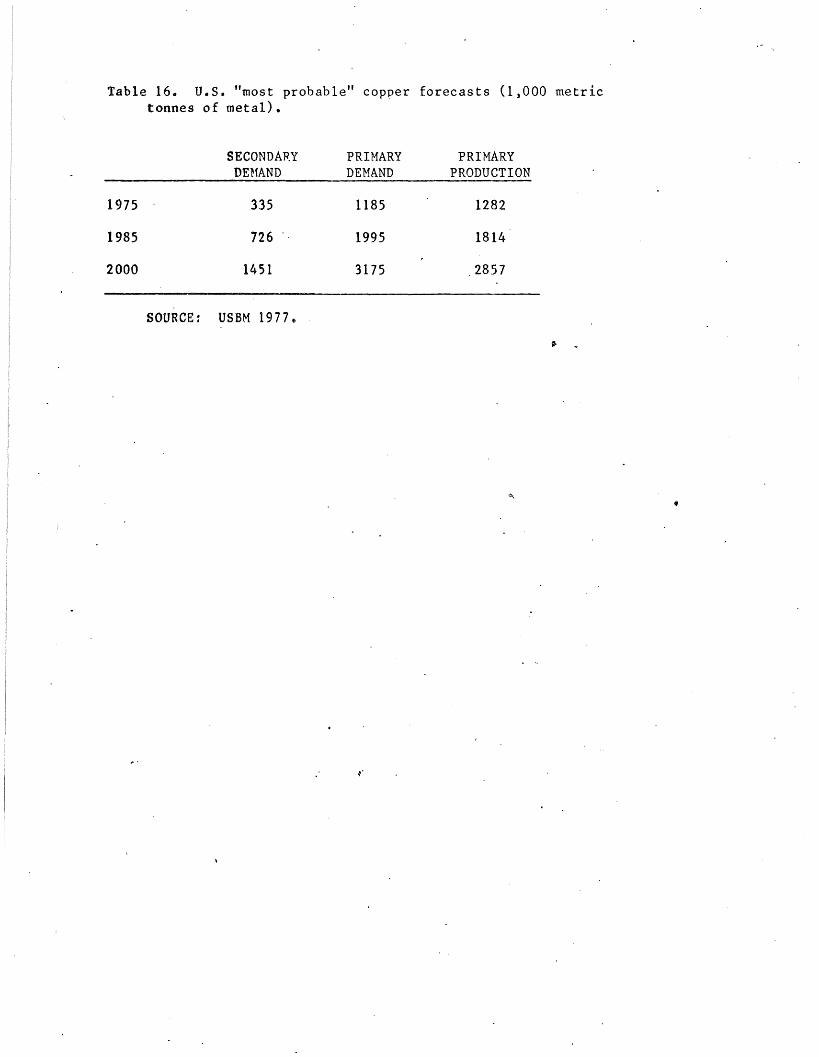
Table 16. u.s. "most probable" copper forecasts (1,000 metrictonnes of metal).
SECONDARY PRIMARY PRIMARYDEHAND DEMAND PRODUCTION
1975 335 1185 1282
1985 726 1995 1814
2000 1451 3175 2857
SOURCE: USBM 1977e
'" ..

a surge of supply to meet that demand. Increased prices would mak~ many pre-
sently classified submarginal resources economically feasible, thus shifting
them to the reserve classification and increasing the potential mineral supply.
Increased prices would also lead to a spurt in exploration and improved tech-
nology, both of which would have the affect of increasing supply. The most
likely perturbation to the supply curve is the potential of ocean floor mining
of nodules containing high grades of manganese, .copper, nickel, and other
minerals. Should sea mining prove economical, by 1985 it is estimated that
copper output from nodules could amount to 109,000 metric tonnes for a single
mining venture (Tinsley 1977). This represents less than one percent of total
world consumption predicted for 1985.
Also effecting the supply-demand relationship is the possibility of the CIPEC
copper cartel exerting trade pressures. Zambia, Zaire, Peru, and Chile control
a sizeable percentage of world" production and have made overtures of
strengthening the now-loose alliance which they have formed. CIPEC could arti-
ficially constrain copper supplies which would lead to increased prices. But
these countries also need copper dollars for foreign trade purposes and it is
unlikely that this carte~ in the near-term will be very successful in
controlling prices.
Malenbaum Forecasts--Forecasts of world demand for raw materials in 1985 and,,"
2000 made by Wilfred Malenbaum of the University of Pennsylvania for the•
National Science Foundation are keyed to Gross Domestic Product (GDP) and
Intensity-of-Use indicators for each area of the world. Malenbaum shows U.S.
demand for refined copper to be 2,610,000 metric tonnes in 1985 and 3,202,000
metric tonnes by 2000. These figures are significantly lower than those projected

by the USBH, representing an annual growth in total demand of 2.6 percent from 1975
to 1985 and 1.9 percent from 1975 to 2000.
In order to understand why Malenbaum forecasts lower demand than the USBM "most
probable" forecast, his assumptions about changes in GDP and Intensity-of-Use of
I
metals must be examined. For the period 1975-1985 a GpP growth rate of 3.3 per-
cent for the u.s. is projected. But for the longer period at 1975-2000 the
growth tate is smaller, 3.2 percent. This represents a significantly smaller
rate from 1985-2000 to achieve an overall 3.2 percent rate for the 1975~2000
period. Intensity-of-Use figures are projected to decline from the 1,681 metric
tonnes per billion dollars of GDP 1n 1975 to 1,550 metric tonnes per billion
dollars GDP in 1985 and 1,200 metric tonnes per billion dollars GDP by 2000.
Table 17
Malenbaum argues for a decreasing intensity-of-use for refined copper on two
points •. One, historically, developing countries have had a growing
intensity-of-use figure but at some point (after they have become developed)
this curve reaches a peak and then steadily begins to fallo The u.s. has passe~
the peak and is on the downward slope of this curve, while such areas of the
world as Africa and Asia are on the upward slope of the curve 0
Figures 3 and 4
Also, the demand for copper is highly susceptible to substitution. Aluminum and
plastics are compatible replacements for many uses of copper.
25

Table 17. Nalenbaum copper forecasts.
1975
1985
2000
u.s.PER CAPITA u.s. U.S.
GROSS DOMESTIC INTENSITY- COPPERPRODUCTIONa OF-USEb DEMANDc
5250 1681. 1886
6959 1550 2610
9495 1200 3202
SOURCE: Malenbaum 1977.
81971 prices.bMetric tonnes of copper per billion $ GDP, 1971 pricesecIOOO metric tonnes of metal.
",

FIGURE 3
~ GENERALIZED INTENSITY OF USE
>t-(5ZW...2:
GOP J CAPITA ($)
SOURCE: MALENBAUM
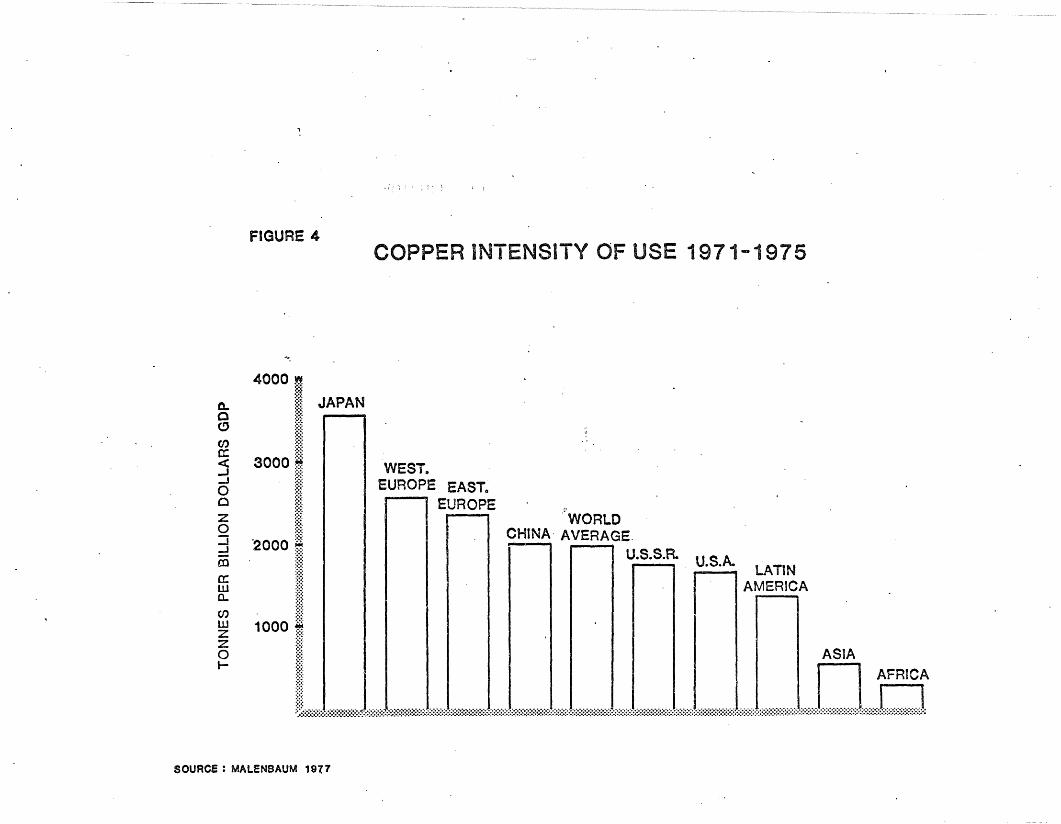
FIGURE 4COPPER INTENSITY OF USE 1971-1975
0..o(!J
encr:<C..J..Joozo:J-Jroa:w0-
WWZZo...
4000 ;~:~ JAPAN
~ WEST.EUROPE EAST..
EUROPE PWORLD~J CHINA AVERAGE
·2000Inn1"S'S'1 rSAI A~~I~A~~~~:
j~ ASIA1000 i AFRICA
}
SOURCE: MAlENBAUM 1917

Commodities Research Unit Forecasts--Commodities Research Unit (CRU), a mineral
commodity consulting firm under contract to the Regional Copper-Nickel Study
provides forecasts of copper prices and U.S. mine production capacity to 1985.
CRU predicts that U.S. mine production capacity will reach 2,011,000 metric ton-
nes by 1985. This is about 11 percent greater than projections of copper demand
made by the USBM, 1,814,000 metric tonnes for 1985, reflecting the historical
idle capacity experienced by the industry.
Figure 5
CRU projects a "most probable" price of 91 cents (in $1977) per pound of copper
in 1985 with a forecasted price' range of 144¢ to 87¢. This is the cash price
for copper wirebar on the London Metals Exchange. The LME price generally leads
the u.S. producer price in changes and is higher than producer prices during
periods of excessive demand and lower during periods 0.£ weak demand. The LME
price, except in the mid to late 1960's and 1973-1974 when LME prices leaped
above producer prices by a large amount, has typically remained within 10 per-
cent of U.So producer prices.
Figure 6
A.D. Little Forecasts--The A.D. Little Company, 'in a study of the copper
industry completed for the Federal Bnvironmental Protection Agency, projects to
1985 such variables as total u.S. copper consumption, primary refined copper
production, production from scrap, and copper prices.
26 .

FIGURE 5PROJECTED
U. S. COPPER ~JllNE PRODUCTION CAPACITY
SOURCE : CRU 1977

FIGURE 6
~
SOURce: CRU 1977
LME COPPER PRICE
::;: ($1977)
140 -I l ..l!~l~:~: .... HISTORICAL - I - PROJECTED - .::::::::::::
::: j .A i :~!~:'IIIIIIIIIIII!1~- f\ LIME PRICE /_ \ J\ ~ I :~~l~::::l:::::::::::!~
A\ [/\,'\ " \..;. I I
J - // .. 'I70 ;::: __ "
~~:i " fIllIP " z.:;:;;;'
60 .; I "./' U.S. PRODUCER PRICE V: '":~:~ / ..... ,. I~ , I
50! .1~ I
40J ijjjj . . ..- :
304 SOURCE: ~. D. LITTLE 1977 I
~j~~' :20~ I
~ I~ 1t I
~~~~::::::::::l:::::::::::::::::::::::::::::::::::::::::::::::::::::::J:::::::::::::::::::::::::::::::::::::::::::;::::::::::::f:::::::::::::::::::::::::::::::::::::::::::::::::::::::J:::::::::::::::::::::::::::::::::::::::::::::::::::::::t.:::::::::::::::::::::::::::::::::::::::::::::::::::::::t::::::::~:::::::::::::::::::::::::::::::::::::::::::::::(::::::::::::::::::::::::::::::::::::::::::::::::::::::::$:::::::::::::::::::::1950 1955 1960 1965 . 1970 1975 1980 1985
-cz::>oa..a:UJa..en~LUo-wo
'0:a..

A.D. Little projects u.s. consumption in 1985 to be 4,143,000 metric tonnes, an
increase of 32 percent, from the 1977 value of 3,134,000 metric tonnes.
Table'18. u.s. total copper consumption (000 metric tonnes) •
1977
3133.8
1979
3439.8
. 1981
3652.9
1983
3829.3
1985
~143.2
These figures represent a declining growth rate from 1977 to 1983 and then an
upswing to 1985.
Domestic production of refined copper by primary producers from all sources,
according to A.D. Little, will increase by 30 percent from the 1977 value of
1,869,000 metric tonnes to 2,438,000 metric tonnes in 1985.
Table 19. u.s. primary copper production (000 metric tonnes).
1977
1869.1
1979
1987.8
1981
2099.5
1983
2247.2
1985
2438.5
This forecast indicates a declining growth rate from 1977 to 1981 but a more
rapid rate from 1981 to 1985. ",
A.D. Little shows little or no growth in the production of refined copper from
scrap and the total quantity of scrap generated. This is contrary to the
assumed annual growth rate for uS.e of scrap of 5 percent presented by the USBM.
27

Table 20. Projected copper production from scrap (000 metric tonnes).
1977
214.,3
1979
220.4
1981
221.2
1983
226.8
1985
225.4
Proj~ctions by A.D. Little show that copper prices reached a low point in 1977
and §hould climb steadily until 1983 before dropping off to a 1985 price of 74.8
eent§ per pound of primary refined copper (in $1974)~ Using an inflator of
1.,218 from the Department of Commerce Implicit Price Deflators to convert $1974
to $1977 1 A.D. Little's forecast of 74.8 cents per pound corresponds exactly
with th~ p-rice project~d by CRU of 91 cents per 'pound of copper o A more opto-
mi§tic price of $1.36 per pound (in $1977) by 1985 is offered by Chase
Econ~~tri~ Associates, Inc. (Adams 1979)0
TAbl~ 21, projected copper prices ($1974).
1911 1979
68.9(83.9)
1981
72.9(88.8)
1983
76.6(9303)
1985
74.8(91.1)
Summary
,-
DeHHIY§@ the forecas ts prese~ted' here are from a vari.ety of sources, different
d@fiftiti~fts, assumptions, and parameters are incorporated into the projections,
m§kift~ ~~fflparisons of the forecasts tenuous. Presented below is a matrix which. .§h~w§ ~h@ 1985 forecasts made by each of the four sourcese
28

Table 22. Summary of 1985 u.S. copper forecasts (1000 metric tonnes of metalunless otherwise noted).
Per capita grossdomestic product
Primary copper demand
Secondary copper demand
Total copper demand
Total copper consumption
Primary copper production
Primary production capacity
Secondary copper production
Total copper production
Copper price
. ;-~--
USBM
1,995
726
2,721
1,814
MALENBAUH
$6,959
2,610
CRU
2,011
91¢
A.D. LITTLE
225
91¢
,._.• T __ +
--""~'---_.-

The figures shown above provide comparison for only a fe", eI"ements. Forecasts
of total demand for u.s. copper by the U.S.B.M. and Malenbaum are within 5 per-
cent of each other at about 2.6 to 2.7 million metric tonnes. Malenbaum's fore-
cast is lower than that of the U.S.B.M. due to his assumption about u.s. copper
intensity-of-use, but. it fits within the forecast range of the U.S.B.M. As
indicated above, the figure projected for u.s. primary production capacity by
CRU is approximately 11 percent higher than the demand for primary copper as
predicted by the U.S.B.H. The difference would represent idle capacity within
the industry in 1985. Historically, the industry has experinced idle capacity
of the same magnitude. The 91 cent per pound copper prices as predicted by the
econometric models of CRU and A.D. Little are, of course, identical. The pro-
jected increase in ~r~ce reflects that the present imbalance of supply over
demand should have begun to correct itself by 1985.
If demand for u.s., primary copper, as projected by U.S.B.M., is compared with the
U.S.H.M. forecast for UoS., mine production in 1985, a 9 percent shortfall of
d~~estic production is predicted. Howeve~, the CRU forecast of primary produc·f
tion is nearly identical to the U.SeB.Me , projection of primary demand. This
indicates that there will be very little change in the present u.s. copper
import/export/domestic production relationship by 1985.
Consumption of copper, as .·forec,-ast by A.D. Little, seems higher than would be
expected in comparison with data from other sources. A reason for this lies in
the baseline data used by A.D. Little versus the baseline used by the U.S.B.M.,
for example. The key to a consumption forecast is the pattern and level of
industrial demand in the u.s. 1974 d~ta from the U.S.B.M. shows total u.s.
industrial demand to be 2.2 million metric tonnes with 51 percent of demand from
29·

the electrical sectoro A.D. Little baseline data for the same year shows 2.8
million metric tonnes (a 27 percent difference) of industrial demand in the U.S.
with only 33 percent of demand from the electrical sector. Understanding this
divergence of data baselines a1ds in explaining why U.s. consumption of copper
as projected for 1985 by A.ri. Little seems inordinately high.
Compa~ing demand for secondary copper (recycled either in the manufacturing pro-
cess or/after end-use), as projected by the U.S.B.M. to the A.D. Little projec-
tion of secondary copper production indicates ~hat the industry will not keep
pace with the demand for secondary products. This may be explained by the lead
time required in the mineral industry to adjust 'to changes in demand patternso
The U.SoB.M. figure reflects a 117 percent increase in demand for secondary
copper in 10 years while A.D. Little projects only a 5 'percent increase in
secondary production from 19770
According to CRU, there will be an expansion oJ 242,000 metric tonnes of mine
. production capacity from 1976 to 19850 Identified u.S. resources other than,
Minnesota are approximately 5.1 billion metric tonnes of copper are with an
average ore grade of 062 percent copper. The Minnesota resource of 4.0 billion
metric ~onnes of copper are with an average grade of ~66 percent copper, when
added to other U.So sources yields a tot~l resource of 9.1 billion metric ton-
nes~ Thus, the expansion requ~~ements of u.S. copper producers will represent
less than 3 percent of available domestic resources. In other words, given that
potential resources become actual reserves, there will be no shortage of alter-
~ative projects open to copper producers in 1985. Even though Hinnesota copper
resources represent 44 percent of total identified resources, development com-
petition from other alternative copper ventures ,~ill be stiff.
30

Table 23
The CRU projection of u.s. mine capacity (domestic copper supply) shows an
annual growth of about 1.5 percent (~ee Figure 7). The U.S.B.M., on the other
hand, projects that demand for u.s. pr~mary copper production will grow at a 3
percent annual rate. The lower path of capacity expansion charted by CRU is in
effect absorbing the idle capacity experienced by the industry in the mid 1970s.
By 1985 the CRU and U.S.B.M. forecasts combine to indicate an 11 percent idle
capacity for the industry, in line with historic trends.
Figure 7 shows what will happen to the demand/cap~city relationship should the
growth rates used for 1975-1985 continue to 2000. It also shows altern8tive rates~
of growth for capacity expansion.
Figures 7 and 8
Taking, for example the 2 percent growth curve of mine capacity, greater than
the CRU forecast but less than the predicted growth rate of demand, it is shown
that demand for u.s. primary copper will become greater than the u.s. capacity
to provide primary copper in the late 1980s. Once this occurs the price of
copper will undoubtedly r~seJ ~esulting in several possible scenarios. u.s.
smelters and refiners may turn to imports as a source of copper, there may be
increased effort to produce copper products from secondary copper or the
increased copper price could boost the expansion of primary domestic capacity as
once-marginal resources become economically viable with higher copper prices.
The time lag necessary for the industry to respond is often up to 10 years. It
31

Table 23. u.s. identified copper resources.
,RESOURCE AVERAGE(106 mt) Ore Grade
Arizona 2,662 .. 63
Montana 1,498 .71
Nevade 925 .40
Wisconsin . 67 097
I 15,143 .62Total u.s.
Minnesota 3,991 .. 66
SOURCE: CRU 1977" .
lOther than Minnesota"
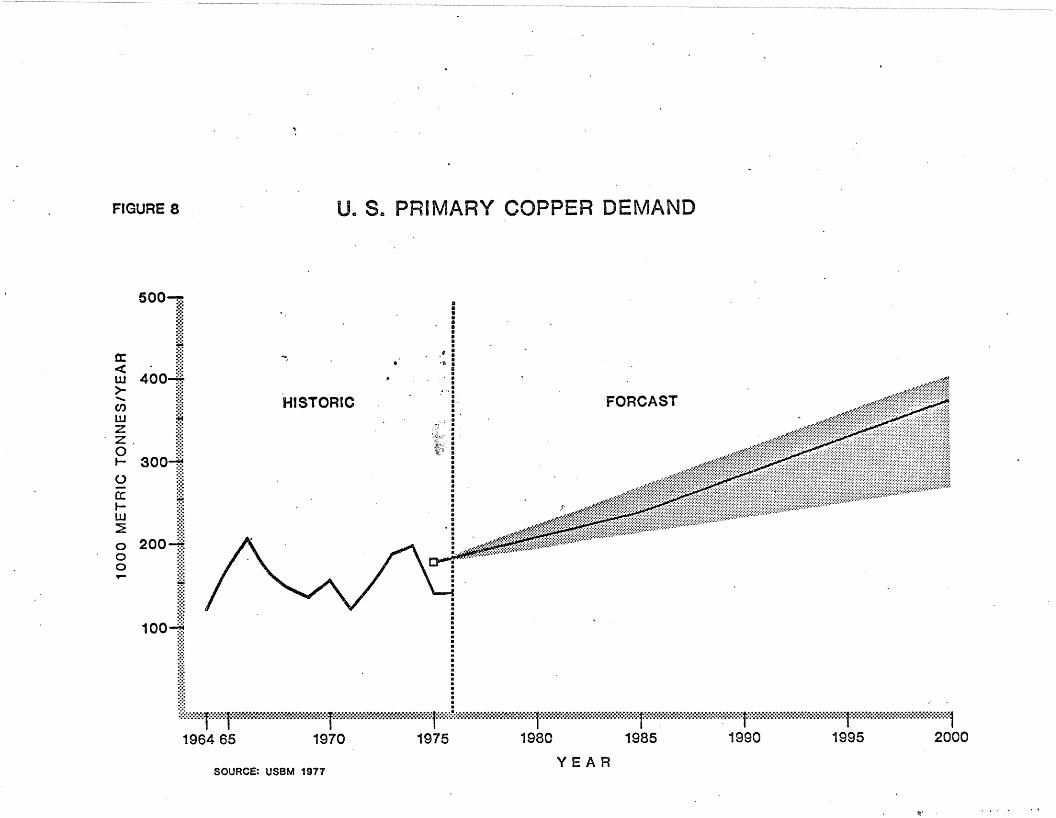
FIGURE 8 u. So PRIMARY COPPER DEMAND
FORCAST
't>"
HISTORIC
....
500,.:-::-:.::::~~~
"a: ~~~j< ....w 400";>- ;::;...... ::::(f) ;:::w :i:O
. ~ , ~j~~o ::::t- 300-f.!
~ I~ ~~~~:i: ....
o 200-4
~ I100~
Ii,~::>':iil<";'fiW._&_W~::'fx-m:«""---"*"<"'<t';::=:::'::::'~;::=:,,,"!i:::::_~%>.=r),::::>;;:':':':::«::<"'Wi::::~o/."'r::!iiiii::!ii"')'«"'""":<"::!::'lii;::=:>':'~<::::>;ii*:X-)'::::<';:'~T*>.«:.,..::::"*::::":::::-,x:,,,,,*:il196465 1970 1975 1980 1985 1990 1995 2000
YEARSOURCE: USBM 1977

..
S3NNO.l OI~.l3~ 000 ~

is just such a demand/capacity situation that AMAX, for example, may be hedging
against with its potential Minnesota operation.
A Minnesota mine, as described in Volume 2 of this report, would produce 84,600
metric tonnes of copp~r. This represents about 5 percent of the U.S.B.M. pro-
jected 1985 domestic primary copper production. More importantly, one ~1innesota
mine would contribute about 35 percent of the capacity increase projected by eRU
for the period 1976-1985. In order to capture its share of expansion, a
Minnesota project must compete economically with all the other identified
resources in the U.S.
By the year 2000 demand for u.S. primary copper is- expected to reach 3.2 million
metric tonnes, an increase of 1.6 million metric tonues over the U.S.B.M. 1975
·projection base. Three Minnesota copper-nickel operations at that time would
have a capacity of 254,000 metric tonnes of copper annually, or 16 percent of
the projected increase from 1976 in u.S. primary copper demand. However, many
copper development projects, including ocean-floor mining, will compete for
their respective market shares of this expanding demand for domestically pro-
duced copper.
In sum, it is possible that U.S. primary copper demand may exceed primary
capacity by the time a Minnesota operation is likely to be in the production
stage. Minnesota owns a sizeaole share of competitive, known U.S. resources and
would be more subject to development should demand outpace capacity. A single
operation in Minnesota would represent more than one-third the predicted capa
~ity expansion by that ti~e. Projedting to 2000, three Minnesota operations
would result in a 16 percent share of U.S. primary copper demand.
32

14.5.2 Nickel
·With the United States' only source of primary nickel scheduled to be depleted
by 1990, the pressure for a domestic source of this strategic metal takes on
increasing importance. Canadian companies dominate the nickel industry and
represent a relatively safe, though increasingly parochial in attitude, source
of the metal. However, in the ever competitive field of natural resources, the
importance of domestic capabilities looms large.
In this light, Minnesota's copper-nickel resource represents the.1argest poten
tial producer of nickel in the country. And because its production costs are in
part underwritten by the production of copper, cobalt, and other precious
metals, it appears that Minnesota nickel can be produced on very competitive
terms relative to other sources
14.502.1 Supply--The UoS. supply of nickel is extremely dependent on ~oreign
sources. Supplies of primary nickel are expec'ted to be about 13,600 metric ton
e nes through 1985 when the only domestic source of nickel in Oregon is projected
to be depleted. This represents only 5 percent of 1975 total .supply of nickel
in the U.So (USBM 1977).
Most of the U.So nickel imports come from Canada (33% of u.s. supply in 1975),
with other large sources being ~ew Caledonia (6.0% of supply in 1975), Norway
(3.7% of supply in 1975), and the Dominican Republic (2.7% of 1975 supply).
T~ble 24
33
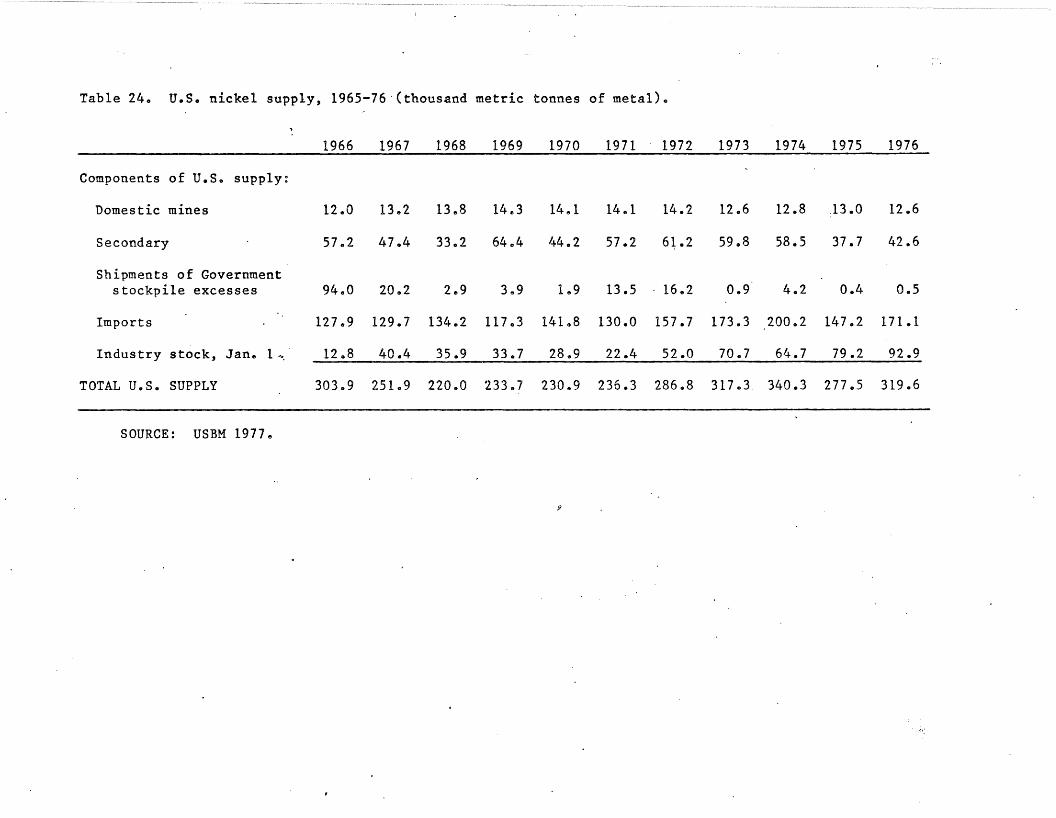
Table 24. u.s. nickel supply, 1965-76·(thousand metric tonnes of metal).
~
1966 1967 1968 1969 1970 1971 1972 1973 1974 1975 1976
Components of u.s. supply:
Domestic mines 12.0 13.2 13.8 14.,3 14 .. 1 14 .. 1 14.2 12.6 12.8 13.0 12.6
Secondary 57 .. 2 47 .. 4 33 .. 2 64 .. 4 44.2 57.2 61.2 59.8 58.5 37.7 42.6
Shipments of Governmentstockpile excesses 94.0 20.2 2 .. 9 3 .. 9 1 .. 9 13.5 . 16.2 0.9 4.2 0.4 0.5
Imports 127.9 129.7 134.2 117.,3 141.8 130.0 157.7 173.3 200.2 147.2 171.1
Industry stock, Jan. l~ 12.8 40.4 35.9 33.7 28.9 22.4 52.0 70.7 64.7 79.2 92.9
TOTAL U.S. SUPPLY 303 .. 9 251 .. 9 220 .. 0 233,,7 230.9 236.3 286.8 317.3 340.3 277.5 319.6
SOURCE: USBM 1977.
J?
From 1966 to 1976 domestic contributions were steadily about 13,600 metric
tonnes, while impbrts rose from 127,900 metric tonnes in 1966 to 171,000 metric
tonnes in 1976. During that period, imports peaked in 1974 at 200,200 metric
tonnes.
Second only to import's as a component of annual nickel availability is the
stock maintained by the industry. This has been a rapidly growing share of
supply., In 1966 industrial stocks amounted to only 4.2 percent of total u.s.
supply. By 1976 this share had risen to 29.1 percent, a sevenfold increase.
This is explained by the decrease in demand for nickel by the industrial sectors
of the economy, to be discussed below. Because 'supply has been greater than
industrial demand in recent years, th~ surplus has been absorbed into industrial
stocks. Growth in industrial stocks also represents an effort on the part of
the suppliers to maintain a constant or increasing price.
Recycled nickel makes up a significant percentage of total u.s. supply. About
~4 percent of supply (three times the primary production) is from secondary. (
sources. This includes scrap generated in fabricating plants as' well as scrap
from obsolete goods and equipment.
In the past the u.s. has maintained a government stockpile of various forms of
ni~kel for strategic and defense purposes. In 1966 the stockpile contained",
94,000 metric tonnes, but by 1976 the stockpile had dwindled to only 454 metric
tonnes. In 1976 the government set a new goal of 185,000 metric tonnes, but in
1977 the Administration called an indefinite halt to the acquisition and sale of
nickel for stockpiles.
34

',' ",~.-
~ .....
14.5.2.2 Demand--Industrial stocks make up a large portion of t6tal U.S. demarid
at the present time. As mentioned above, nearly 30 percent of u.S. suppl~ ha~. ~ ..\.
been maintained as industrial stockpiles. Only in 1977 and 1978 have Canadian
producers begun to cut back production in an effort to reduce current stocks.
An additional distribution of the U.S., supply of nickel is in the form of
exports. In 1975 this amounted to only 2.4 percent of total available nickel.
In 1976 exports more than doubled to 14,300 metric tonnes or about the equiva-
lent of domestic primary production.
Demand by the industrial segments of the U.S. economy make up the largest share
of the distribution of U.S. nickel supply. About .90 percent of the nickel con-
surned in the U.S. is used in alloys with other metals. Nickel's corrosive
resistance, strength, and chemical properties make it extremely valuable in the
manufacture of a wide variety of producer and consumer goods •
. The largest demand for nickel from the industrial sectors is that of the
transportation industry. Nickel in the form of stainless steels and other
alloys is also consumed by the fabricated metal products, electrical, construc-
tion, machinery, and household appliances. Industrial demand since 1966 has
actually decreased although it has been subject to a rapidly fluctuating pat-
tern. Total 1976 demand of 191,400 metric tonues is 27 percent less than the
total industrial demand of 264,800 metric tonnes in 1966~
Table 25
35

Table 25. u.s. nickel demand, 1965-76 (thousand metric tonnes of metal).'
1966 1967 1968 1969 1970 1971 1972 1973 1974 1975 1976
Distribution of U.S. supply:Industry stock, Dec. 31 ••• 28.4 31.4 33.8 28.9 22.4 52.0 70.7 64.7 79.2 92.9 111.9Exports ••••••••••••••••••• 10.7 7.3 5.9 2.1 5.9 4.2 2.7 4.5 3.9 6.7 14.3Industrial demand ••••••••• 264.8 213.2 180.3 202.6 202.6 180.1 213.4 248.1 257.2 177.9 193.4
u.s. demand pattern:Chemicals ••••••••••••••••• 19.4 23.6 20.3 31.1 30.3 26.9 31.9 37.4 39.0 25.4 28.2P~troleum••••••••••••••••• 10.6 12.8 11.2 15.7 16.1 16.2 19.3 22.4 23.7 ,- 16.8 16.9Fabricated metal products 26.0 36.6 22.7 17.0 19.3 18.4 21.4 24.9 23.7 15.7 17.0Transportation .
Aircraft'............. '••• e 27.6 15.0 22.0 13.5 12.2 12.6 14.7 17.4 15.4 10.8 16.4Motor vehicles
and equipment ........,. •• e 33.0 21.8 30.0 21.2 24 .. 2 19.8 23 .. 9 27.4 26.7 19.5 20.6Ship and boat
building and repa~rs ... 10.6 6.6 8.3' 7.8 6.0 5.5 6.2 7.6 12.2 9.3 7.9
Total .................. e 71.2 43 .. 4 50.4 42.5 42.4 37.9 44.8 52.4 54.2 39.5 44.9
Electrical .................. 31.5 18.3 18.8 27.2 26.1 23.3 27.8 32.3 31.2 23.2 24.4Household appliances •••••• 26.2 16.7 17.0 12.4 13.2 12.3 15.0 17.4 19.7 11.5 13.7Machinery.................. 38.6 11.7 11.9' 14.8 15.0 12.4 15.0 17 .4 20.9 14.9 14.7Construction•••••••••••••• 12.5 10.0 9.8 14.6 19.3 16.2 19.3 22.4 25.9 16.7 17.8Other ••••••••••••••••••••• 28.7 40.3 18.2 27.3 21.0 16.3 19.0 21.4 19.0 14.1 15.9
Total Industrial Demand 264.8 213.2 180.3 202.6 202.6 180.1 213.4 248.1 257.2 177.9 193.4
Total u.S. Primary Demand 207.5 165,,8 147.1 138.2 158.5 122.9 152.2 188.3 198.7 140.1 150.7
--SOURCE: USBM 1977.

A major reason for the decline in nickel demand over the rec.ent past must be the
effects of substitution. The rate of substitution of nickel with other metals
in making alloys and with plastic coatings of materials previously using nickel
alloys to resist corrosion most likely has more than offset the gains in con-
Bumption of producer and consumer goods made during this same period. Nickel
demand is also felt to be extremely income elastic, meaning that consumers will
delay purchases of nickel-containing items during a depressed economic period
such as,the last ten years (Cameron 1976).
In summary, like copper, demand for nickel can be seen to be closely tied to
movements in the national economy, and demand for nickel can be reduced by
substitution with other commodities. u.s. supply is highly dependent on
Canadian and other imports with only about 5 percent coming from domestic pri-
mary production, and 14 percent from secondary production.
Table 26
14.5.2.3 Price--Nickel prices in constant dollars have increased substantially
in the past 20 years. The 1976 average annual price of $2.09 per pound was 51
percent greater than the price of nickel in 1954. The period from 1954 to 1965
was marked by very stable prices, but between 1965 and 1968 nickel price
in~reased dramatically, reflecting the boom in the national economy resulting
from the Vietnam war. The price then stabilized unti'l 1973, when it once again
began to climb. However, since a peak price of $2.41 per pound in early 1977,
the nickel price has declined steadily to a year-end 1978 price of $2.03 per
pound (in current dollars).
Table 27
36

Table 26. U.S. Nickel demand, production, 1954-1976 (thousandmetric tonnes of metal).
,.
U.S. PRIMARY U.S. PRIMARYDEMAND PRODUCTION
1954 76.1 07
1959 83.7 10.5
1964 119.8 11.1
1969 138.2 14.3J
,."1970 158.5 14.1
1971 122.9 14.1
1972 152.2 14.2
1973 188.3 1206
1974 19807 12.8
1975 140.1 13.0 ':1\
1976 14409 13.1
SOURCE: USBM 19770

Table 27. Nickel price, 1954-1978.
ACTUAL· CONSTANTPRICE* $1975 PRICE*
1954 64 138
1959 74 139
1964 79 138,
1969 128 188
1970 128 178
1971 133 176
1972 140 178
1973 153 184
1974 174 190
1975 203 203
1976 220 209
1977 230 204
1978 208 1714
SOURCE: USBM 1979.
*Average annual price, cents per pound ..

14.5.2.4 Nickel Forecasts--Forecasts of future nickel supply, demand, and price
are available from a number of sources. As mentioned above, nickel demand is
closely tied to movements in the national eco~omy. Use of national economic
indicators such as Gross National Product, Federal Reserve "Board's Index of
Industrial Production, and the Index of Gross Private Domestic Investment to
forecast change in mi~era1 commodities demand is common.
Presented below are nickel forecasts from the U.s. Bureau of Mines (USBM),
University of Pennsylvania professor Wilfred Mal enbaum , and the Commodities
Research Unit (CRU). Projections vary, in general, due to the various sets of
assumptions used and the forecasting methodology' employed. The experience'
discussed with copper forecasts applies equally to the projection of nickel
parameters. Nickel forecasts suffer also because there is relatively less data
on nickel than exists for cppper and other minerals which are more actively pro-
duced in the u.s. The dominance of the nickel industry by INca and other
Canadian firms and active participation in the industry by the U.S. Government
also makes interpretation of the data on nickel much more tenuous.
INCO dominates the nickel industry and sets the price of nickel with other firms) .
falling in line. The u.s. government was responsible for the development of
much nickel capacity in the 1950s by offering long-term contracts and premium
prices to competitors of INca in an effort to boost the North American industry~"
and reduce INCa's dominance.
Domestic nickel reserves, based on present prices, are extremely limited so that
growth in nickel supply will, by necessity, come from changes in secondary
(recycled) production and from imports. Increased prices could significantly
37'

increase domestic reserves with the reclassification of Minnesota copper-nickel
and other known deposits from resources to reserves. Developments in sea bed
mining of manganese nodules high in nickel content could alter the supply
outlook if investment and political problems can be overcome.
USBM Forecasts--The Bureau of Mines predicts a growth in total u.s. nickel
demand at an annual rate of 3.1 percent between 1975 and 2000. Primary nickel
demand (~emand for production from mines) is projected at 3.0 percent annual
growth, while the projected annual growth rate for secondary (recycled) demand
is 3.5 percent~ At these rates, probable total nickel demand for 2000 would be
526,000 metric tonnes~
Table 28
The U.S. growth rates are significantly lower than those for world nickel
demand, reflecting the developed nature of the U.S. econorny~
The'USBM predicts that at the present rate of production, the only u.s. domestic
nickel reserves at Riddle, Oregon, will be exhausted in 10 to 12 years (USBM
1977)~ This means that unless additional reserves are discovered--Minnesota's
copper-nickel resource, others in Califor~ia, Montana and Alaska and sea bed
min~.ng are potential reserves--the U.S. will be completely dependent on importsr
of nickel and secondary production. The USBM offers no projection of supply
from secondary sources~
If these potential reserves prove feasible, the USBM projects that primary
supply will be 245,000 metric tonnes per year in 2000. This would represent 65
38

Table 28. Projection of U.Su nickel demand (thousandmetric tonnes of metal).
1975
178
2000------- FORECAST RANGE -------LOW PROBABLE HIGH
381 526 580
SOURCE: USBM 1977.
percent of total ~.S. primary demand, or more than 7 times the contribution made
by domestic primary production in 1975.
Despite the expected growth in domestic primary production, the figures indicate
that the demand for U~S. produced nickel will outrun anticipated production by a
considerable margin. This would create' a favorable market for the development of
domestic nickel capacity in Minnesota.
If three operations of the magnitude described in Volume 2 of this report are in
operation by the year 2000, Minnesota would produce 46,200 metric tonnes of
nickel annually. Minnesota, ~hen, would account for nearly 20 percent of the
estimated domestic p~imary supply and 12 percent of u.s. primary demand. This
indicates that development of Minnesota's copper-n~ckel deposits would have a
·signifi~ant impact.on the U.S. nickel industry.
Table 29
Malenbaum Forecasts--Wilfred Malenbaum, of the University of Pennsylvania,
offers forecasts of demand for nickel based on assumptions about growth in GDP
and Intensity-of-Use for nickel. u.s. demand for nickel is projected by
'Malenbaum to be 280,100 metric tonnes in 2000. As is the case with copper, the
Malenbaum projection for total tr.S. demand is signifi~antly lower than the fore
casts of the USBM (Table 26). His annual growth rate for the period from 1975
to 1985 is 2.2 percent and declines to 2.0 percent for the longer 1975 to 2000
time period.
39

Table 29. u.s. nickel demand, production forecasts.
u.s. SECONDARY . U.S. PRIMARYDEMAND* DEMAND*
U.S. PRIMARYPRODUCTION*
1975
1985
2000
37.7
90.7.
149.7
SOURCE: USBM 1977.
*1000 metric tonnes of metal.
140.1
240.4
376.4
13.0
90.7
244.9

The basis for Malenbaum's lower demand projection lies in his· assumptions about
GDP and Intensity-of-Use. The U.S. GDP growth rate of 3.2 .percent for 1975-2000
versus the 3.3 percent rate for 1975-1985 represents a significant slowing of
growth after 1985. As well, the Intensity-of-Use for nickel in the U.S. decli-
nes as the country becomes more and more developed (as mentioned above).
Table 30
Malenbaum projects a declining Intensity-of-Use for the u.S. and the world
through 2000. Also, many other areas of the world use nickel much more inten-
sely than does the U.S. Japan, for example, has nearly three times the use of
nickel per billion dollars of GDP than the U.S.
Commodities Research Unit (CRU) Forecasts-~CRU makes projections of nickel con-
sumption and prices for 1985.
United Stptes nickel consumption is forecast by CRU to reach 293,500 metric ton-,"
nes by 1985. This represents an annual growth rate of 304 percent from 1974 to
1980 and 4.4 percent from 1980 to 1985~ The eRU forecast is 11 percent lower
than the demand projection made by the USBM, but 39 percent higher than the u.s.
demand predicted by Malenbaum.
Table 31
CRU projects a declining real nickel price through 1985 largely due to severe
world excess nickel production capacity resulting in forecasted supply/demand
imbalance.
40

Table 30. Malenbaum nickel forecasts.
1975
1985
2000
u.s.PER CAPITA U.S. U.S.
GROSS DOMESTIC INTENSITY- NICKELPRODUCTIONa OF-USEb DEMANDc
5250 143.1 160.5
6959 125.0 210.5
9495 105.0 280.1
SOURCE: Malenbaum 1977.
a1971 prices.bMetric tonnes of metal per billion $ GDP, 1971 pricesccIOOO metric tonnes of metal •
.'\
f~-~·-·-

Table 31. Projected U.S. nickel consumption (1000metric tonnes of metal).
u.s. CONSUMPTION
1976 187.3
1977 202.6
1978 214.9
1979 226.1
1980 237.1
1981 247.5
1982 258.4
.1983 269.7
1984 281.4
1985 29305
SOURCE: CRU 1977"

Table 32
Summary
Because the forecasts presented here are from a variety of sources, using dif-
ferent d~ta, assumptions, and looking at different parameters, comparis9ns are
difficult to make. Below is a matrix which summarizes the projections for 1985
made by each of the sources. There is little overlap to provide comparison.
Table 33
The only comparison of available forecasts which can be made is of total u.s.
nickel demand for 1985. The U.S.B.M. forecast is more than 50 percent higher
than the projection made by Malenbaumn, reflecting the Malenbaum assumption of a
decreasing intensity-of-use of nickel for the U.S. Total U.S. demand, as fore-
cast by U.S.B.Mo, is 13 percent higher than the CRU projection of total u.s.
nickel consumption.
Of interest to Minnesota is the wid~ difference between u.s. primary nickel
demand and u.s. primary nickel production. Demand is more than 2 1h times the~.
production anticipated by the U.S.B.M. in 1985. Excess demand will spur an
increase in production capacity and Minnesota possesses approximately 80% of the
identified u.s. nickel resources.
Table 34
41

Table 32. Nickel price forecast ..
Current $1977prices prices
1977 2.28 2.04
1978 2.42 2.04
1979 2.64 ,2.10
1980 2.76 2007
1981 2.76 2006
1982 2.96 2.04--
-
1983 3.20 '2.02
1984 3.36 2.00
1985 3.15 1.99
SOURCE: CRU 1977. ~-

0,
Table 33. Summary of 1985 U. ~ nickel forecasts (1000 metric tonnesof metal unless otherwise noted).
USBH HALENBAUM CRU
Per capita grossdomestic product $6959
Primary nickel demand 240.4
Secondary nickel demand 90.7
Total nickel demand 331.1 210.5
Total nickel consumption 293.5
Pr imary nicke 1 production 90.7
Nickel price 199¢
., .

Table 34. u.s. identifi~d nic~el resources*
RESOURCE AVERAGE(106 lOt) Ore grade
Alaska 20 .. 51-', .32
California .1 1 1.5027.0 2 .71
Colorado 4.6 1 .46
Maine .91 .60
Montana 90.7 1 040
North Carolina .92 100
O'regon 51.92 .89... .-.-- '-- -----. ------ ---·-1----- -~---.----...--- ...-----..~----.-.--.----- -- _.....
Pennsylvania .7 .69
Puerto Rico 181.42 .58
Washington .7 1 .51 '::".
2687 2" 060"
. u •S•To ta13 406ot1 ,,58
Minnesota 4.400.0 1 G20
·SOURCE: CRU 1977.,
lSu1fide resources.20x ide resources.30ther than Minnesota.

The gap between 1985 projected demand and production, i50,000'metric tonnes,
represents less than 2 percent of U.S. resources. A single Minnesota mine
operating in 1985 is expected to produce 15,400 metric tonnes of nickel or
approximately 10 percent of the anticipated produ~tion shortfall. Since
Minnesota controls a tremendous share of U.S. nickel resources the potential for
Minnesota development is very high.
The key to development of Mi~nesota nic~el resources is more-than-likely the~
attitude of the industry toward development of domestic nickel production capa-
city. Should the industry feel the necessity to ~ave a domestic source of
nickel, Minnesota is a prime candidate for development. Minnesota controls most
of the u.s. resource and the nickel production costs, as estimated above, are
very attractive. Ocean mining of nickel bearing nodules appears to offer
Minnesota its greatest competition for a share of the expected nickel production
capacity expansion~ but Minneosta's production costs appear more favorable.
14.5.3 Cobalt
Current United States dependence on foreign sources for its supply of cobalt
places Minnesota's resource in national importance. Because of its relationship'
with copper and nickel in the Minnesota ore body, the cost of producing cobalt
may be underwritten by the production of the other metals, thus making the pro-
duction of cobalt in Minnes9ta c0mpetitive with ,other sources. Production of
Minnesota's cobalt will make the U.S. mineral markets much less subject to the
whims and vagaries of foreign mineral producers.
14.5.3.1 Supply--The United States is almost entirely dependent on foreign
sources for its supply of cobalt. Currently, there is no cobalt being mined in
42 ,

the U.S.) and in r976 only 1 percent of total supply came from secondary
(recycled) production. In 1976, about two-thirds of the U,S. cobalt supply ori
ginated in the Zambia-Zaire area of Africa) with other supply from Finland, New
Caledonia, Canada, and other countries.
The U.S. government maintains a stockpile of cobalt) with a goal of 84.4 million
pounds (nearly twice the current balance) announced in 1976. Previous to this
date) the excesses from the stockpile were used to modulate the supply of cobalt
and constituted an important source of supply in the u.s. (28% in 1976).
14.5.3.2 Demand--Cobalt has many important and strategic properties and is used
as an alloy in materials to provide strength, corrosion-resistance, and magneti
zation. Although similar to and often substituted for nickel, the demand for
cobalt operates independently of nickel and copper. Cobalt's major end uses are
in the electrical, transportation, machinery, paints, ceramics, and chemical
segments of the economy.
In 1976 total U.S. cobalt demand was over 13,80Q metric tonnes, representing a
33 percent gain from the previous year and near recovery to the peak .demand of
1974.
Tables 35 and 36
14.5.3.3 Price--Because the supply of cobalt is associated very closely to the
production of copper and nickel, yet the demand for cobalt ope~ates indepen
dently of its host metals, the recent slump in the production of copper and
nickel has resulted in dramatic increases in the price of cobalt. In the last
43

Table 35.- u.s. cobalt supply, 1965~76 (thousand pounds of metal).,
1966 1967 1968 1969 1970 1971 1972 1973 1974 1975 1976
Components of u.s. supply:
Domestic mines 1,215 1,168 1,176 1,003 697 690
Secondary 48 120 143 328 69 125 197 264 270 342 3.29Shipments of Governmentstockpile excesses 762 6,189 4,953 6,007 5,162 1,683 5,945 8,569 8,936 6,346 6,698
Imports 18,823 8,215 9,068 12,911 12,417 10,912 13,915 19,238 16,122 6,608 16,487
Industry Stocks, Jan. 1 3_? 600 6,400 6,552 5,888 5,128 5,733 5,235 4,534 9,184 9,467 6,902
TOTAL U.S. SUPPLY 24,448 22,092 21,892 26,137 23,473 19,143 25,292 32,605 34,512 22,763 30,416
SOURCE: USBM 1977
J'
--.-------------~--~--. ~.......~~~- ~.~~.~~~~_~~~~:r:~-~,~.'?.;,""'1

Table 36" U.S. cobalt demand, 1965-76 (thousand pounds of metal).
1966 1967 1968 1969 1970 1971 1972 1973 1974 1975 1976
u.s. demand patternNonmetal:
Paints •••••••• $ •••••••• 1,451 1,044 1,451 1,285 2,152 2,042 2,323 2,646 2,807 i,965 2,943Chemicals •••••••••••••• 753 696 882 1,382 538 707 1,270 1,635 1,959 1,523 1,783Ceramics & glass ••••••• 1,580 1,135 1,281 858 1,890 1,768 1,982 2,228 2,331 1,630 2,348
Total Nonmetal 3,784 2,875 3,614 3,525 4,580 4,517 5,575 6,509 7,097 5., 118 7,074
Metal:Transport.: Aircraft •• ., 4,482 3,575 2,544 4,046 3,297 2,518 4,294 4,023 5,290 2,636 3,458Electrical ••••••••• ., ••• 5,387 4,160 5,100 4,024 4,589 3,633 6,069 6,460 5,628 3,166 5,513
'.Machinery:
Machine tools ........... Cl 2,152 1,628 1,616 1,911 1,882 1,376 1,717 2,449 2,853 1,356 1,537Construc., machinery ••• 1,685 1,623 998 1,268 1,179 1,080 l,190 2,034 2,211 1,355 1,608
Total 3,837 3,251 2~~14 3,179 3,061 2,456 2,907 4,.483 5,064 2~711 3,145
Coating & plating...... --- --- --- 3,351Other ••••••••• o ••••• ~. 458 1 ,/1-79 712 1,387 735 419 620 637 618 425 611
Total Metal 14,164 12,465 10,970 15,987 11,682 9,026 13,890 15,603 16,600 8,938 12,727
Total u.s. primary demand(total demand lesssecondary supply) ••••••••• a 17,900 15,220 14,441 19,184 16,193 13,418 19,268 21,848 23,427 13,71419,472
Total u.s. demand forprimary metal •••••••••••••• 14,116 12,345 10,827 15,659 11,613 8,901 13,693 15,339 16,330 8,596 12,398
SOURCE: USBM 1977.
15 years the price for a pound of cobalt had more than tripled to $5.20 in 1977.
By January, 1979 the price has increased to $20.00.
Table 37
14.5.3.4 Cobalt Forecasts--The USBM provides forecasts for cobalt demand and
supply.
The USBM forecasts a "most probable" demand for cobalt of 39.4 million pounds by
2000, an annual growth rate of 2.9 percent for the U.S. The growth rate for the
world is projected at 3.3 percent per year. In the short-run, unless new copper
and nickel developments are undertaken, demand will outrun supply and cause
price to continue to climb ..
As the price of cobalt rises, resources in the United States may become economi-
cally feasible to mine. The potential of sea b,ed mining of cobalt in manganese
~odules looms large in the supply picture "after 1985. Secondary production has
the potential to provide up to ten percent of total u.S .. supply in the future.
By 1985 the USBM predicts domestic primary production of 15 million pounds of
cobalt from the following sources:
OregonIdahoMinnesotaPacific Ocean
"5 m1.11io~ pounds3 miilion pounds2 million pounds5 million pounds
44

Tab 1e 3 7• Co balt. price, 1954- 197 8 •
1954
,1959
1964
1969
1970
1971
1972
1973
1974
1975
1976
1977
1978
ACTUALPRICE*
2.60
1.77 .
1.50
1.89
2.20
2.20
2.45
3.00
3.46
3.98
4.44
lL,53
CONSTANT$1975 PRICE*
5~54
2.77
3.06
2.92
3.12
3;,61
3.78
3.98
4.22
4.98
9.56
.. SOURCE: USBM 1979~
*Average annual price, dollars per pound.
,"\

The value of cobalt production shown here for Minpesota is equivalent to half
tbe output of one 100,000 metric lonnes/year copper-nickel refinery. It is
likely that this level of development could be est~blished in Hinnesota by 1985
to 1990.
In summary, cobalt presents an extremely volatile picture due to several
reasons. There is no domestic primary production at present, though rising
cobalt prices could make knDwn resources feasible for mining. The supply of,
cobalt is dependent.on the production of copper and ni~kel. But because cobalt
demand functions independently, rapidly-rising prices during periods of copper
and nickel slump could result. Decreasing pricei during periods of copper and
nickel production booms could also result. In addition, ocean mining has the
potential to provide·a sizable share of supply should political and technical
problems be solved.
With the increase in cobalt supply resulting in any ocean mining operation
would come a concomitant slump in cobalt price. This would in turn make the
potential of land-based cobalt-producing operations much less attractive.
Malenbaum Forecasts--Forecasts of demand for cobalt by Wilfred Malenbaum of the
University of Pennsylvania show a demand for cobalt of 16,608 metric tonnes
in the u.s. by 20008 Malenbaum makes his projections on the basis of a rising
"gross domestic product (GDP)~ b~t a declining Intensity-of-Use. His projections
indicate that population and GDP overwhelm the decline in use of cobalt to pro-
duce a dramatic growth in demand for the metals.
Table 38
45

14.6 SUMMARY
Demand for each of these metals has been shown to be clo~ely related .to
industrial activity. Past patterns have been generally steady and strong~ The
future looks bright in spite of inroads made by substitution, with the USBH pro-
jecting a 3.5 percent annual growth rate for copper demand through the year
2000, an annual nickel growth rate of 3.1 percent and 2.9 percent for cobalt.
In each case the growth rate for the United States, presently the leading world-
wide consumer of each of these commodities, is expected to be less than the
worldwide average •. This is corroborated by the decreasing intensity-·of-·use for
,the U.S. as predicted by Professor Malenbaum in his worko However, the u.S.
will remain the largest free-economy world market for these commodities.~4~:"::':;;
The picture of mineral supply is not quite so clear, nor is it as easily deter-
mined because it depends on the ability. of mineral development companies to~
first of all, find mineral resources and then t? produce th~ metal economically.
The U.s. is presently the world's largest ~upplier of copper, producing nea~ly
as much as it consumes. But for nickel and cobalt, U.s. production at present'It
is quite small. The nickel market is dominated by Canadian firms while
two-thirds of U.88 cobalt supply comes from Zambia and Zaire,
tile source of the metal. In the U.S., recycling of these
significant and growing source of supply.~.
Prices, of course, represent the interaction between demand and supply.
Presently, the copper and nickel prices are very depressed while cobalt, because
its supply is closely tied to copper and nickel production' yet independent in
demand, is doing well. Copper price is forecast by CRU to increase to about 91
46
cents per pound (constant $1977) compared to its present price of about 70
cents. Nickel, on the other hand, is predicted by CRU to decline in real terms
to $1.99 per pound ($1977) from its current price of about $2.05 per pound.
Cobalt is presently at about $12 per pound, a phenomenal increase in the last 20
years.
If the desire to develop domestic sources of these metals takes hold, Minnesota
represents a significant and highly competitive resource. Three Minnesota
operations the size of those hypothesized in Volume 2 would represent 8, 12, and
31 percent, respectively, of the predicted u.s. primary copper, nickel, and
cobalt demand for the year 2000e
It appears likely that, because of the variety of metals available in the are
which may be credited agains.t the production costs of anyone metal, Minnesota
metals can be econo~ically produced at costs competitive with other potential
new sources of the minerals. As described above, copper can be produced at
about 65 cents per pound, with credits for nickel and precious metals, compared
with a current price of about 70 cents per pounde Nickel is predicted to have
production costs of about 50 to 75 cents. per pound compared with a current price
of about $2.05 per pound.
These factors indicate that Minnesota's copper-nickel resource is a relatively,,'
attractive development possibility. It represents a sizable share of the
nation's copper, nickel, and cobalt resources. Even though these markets are
international in nature, there is a strong demand for domestic primary minerals
and Minnesota's minerals represent a significant source of supply to meet that
demand.
47

•
•
REFERENCES
Adams, Robin. Why Copper Prices are Going to Triple Over the Next Decade, 1979,Chase Econometric Associates, Inc., Bala Cynwyd, PAD
Arthur, D. Little, Inc. Economic Impact of Environmental Regulations on theUnited States Copper Industry, 1978, Cambridge, Mass.
Cameron, J.I. and W. Vogely. Interim Report -- Investment in the Nickel Industry1950-1875, The Pennsylvania State pniversity, December 1976.
Commodities Research Unit Ltd. Survey of Four Metals, 1977, London and NewYor,k.
Corrick, J.D., Nickel-1977, U.S. Department of Interior, Bureau of Mines, 1977,Washington, D.C.
Douglas, H. The Long Term Outlook for Copper Prices·";·'Datfi~.s~:'·an.d Moore, March1977.
Lawson, H.G., Sea Bed Slowdown, Wall Street Journal, July 31, 1978, New York~
Li, T.M., and Tinsley, C.R., Meeting the Challenge of Material Demands from theOceans, World Mining, 1977.
,Malenbaum, W., et al., World Demand for Raw Materials in 1985 and 2000,University of Pennsylvania, 1977, Philadelphia, PaD
Mathews, N.A. Monthly Nickel Production Series, U.S. Dept. of Interior, Bureauof Mines, 1976-1978, Washington, D.C.
Mining Journal, Back to the Bottom of the ~ea, Volume 290, No. 7441, March 31,, 1978, London.,
Mining Journal, World's Greatest Copper Reserves, June 30, 1978, London~
Minneapolis Star, Oil Firms Getting a Grip on Copper, April 4, 1978,Minneapolis, Minnesota.
S'chroeder, H.J .. , Copper-1977, U.S .. Dept., of Interior, Bureau of'Mines, 1977.Washington D.C.
r"" iJ. -
Sibley, S.F. Cobalt-1977, u.S. Dept. of Interior, Bureau of Mines, 1977,Washington D.C ..
Simpson, J.C., Producer Price for Copper May be Ended, Wall Street Journal,August 1, 1978.. New York.
Tinsley, C.R., Economics of Deep Ocean Resources, World Mining, 1977.
World Mining, Seabed Mining, December 1977 •