Urban Development and the (Re)use of the Communist-Built ...
Research ArticleThe Evolution of the Sustainability Assessment ToolSBToolPT: From Buildings to the Built Environment
Guilherme Castanheira1 and Luís Bragança2
1 Laboratory of Building Physics and Construction Technology, Department of Civil Engineering, School of Engineering,University of Minho, 4800-058 Guimaraes, Portugal
2 Department of Civil Engineering, School of Engineering, University of Minho, 4800-058 Guimaraes, Portugal
Correspondence should be addressed to Guilherme Castanheira; [email protected]
Received 23 August 2013; Accepted 25 November 2013; Published 27 January 2014
Academic Editors: K. M. Bang and J. Fu
Copyright © 2014 G. Castanheira and L. Braganca. This is an open access article distributed under the Creative CommonsAttribution License, which permits unrestricted use, distribution, and reproduction in any medium, provided the original work isproperly cited.
This paper analyses the current trends in sustainability assessment. After about 15 years from the launch of sustainability assessmenttools, focused on buildings evaluation, the paradigm of sustainability assessment tools is changing from the building scale to thebuilt environment scale. Currently European cities and cities around the world are concerned with sustainable development, as wellas its evolution. Cities seek a way to adapt to contemporary changes, in order to meet the required needs and ensure population’swell-being. Considering this, the new generations of sustainability assessment tools are being developed to be used to guide andhelp cities and urban areas to become more sustainable. Following the trend of the most important sustainability assessment tools,the sustainability assessment tool SBToolPT is also developing its version for assessing the sustainability of the built environment,namely, the urban planning projects and the urban regeneration projects, to be developed in Portugal, the SBToolPT-UP. Theapplication of the methodology to three case studies will demonstrate its feasibility; at the same time this will identify the bestpractices which will serve as reference for new projects, thereby assisting the development of the tool.
1. Introduction
Under these last two decades a significant number of environ-mental and sustainability assessment tools for buildings havebeen developed. Tools such as Building Research Establish-ment’s Environmental Assessment Method (BREEAM), Sus-tainable Building Tool (SBTool), and Leadership in Energyand Environmental Design (LEED) constitutes the basis forthe other approaches used throughout the world [1]. Usuallythese methods are characterized by evaluating a series ofpartial and aggregate features of construction, resulting inenvironmental ratings or sustainability scores [2].
According to Haapio and Viitaniemi [3], the exist-ing building environmental assessment methods and toolsshould not be underestimated but should not be consid-ered the only possibility for sustainability assessment; one
must widen the viewpoint. The requirements for buildingsustainability assessment (BSA) tools have increased andnowadays it is not enough to evaluate building componentsor the building separately [4]. The built environment, neigh-bourhoods, public transport, and services should also beconsidered simultaneously in these assessments, since thenumber of people living in urban areas is high and increasingrapidly. Current trends predict that this number will keeprising, reaching almost 5 billion by 2030 out of a world totalof 8.1 billion [5].
The incorporation and integration of the urban dimen-sion have been gaining importance over the last decades dueto the process of building of the sustainable developmentparadigm.Thus, emerged different methods, techniques, andtools for urban sustainable assessment, seeking to discoverhow cities can becomemore sustainable [6]. It is believed that
Hindawi Publishing Corporatione Scientific World JournalVolume 2014, Article ID 491791, 10 pageshttp://dx.doi.org/10.1155/2014/491791
2 The Scientific World Journal
cities will give answers to a sustainable future, since they arethe largest resources consumers of the planet and the largestgenerators of waste [7], but cities are also the place whereit is possible to act more effectively to save the planet fromourselves [8].
2. From Sustainable Building toSustainable City
2.1. Buildings Sustainability Assessment. The sustainabilitylevel assessment tools began to be used primarily for theevaluation of buildings. Numerous assessment tools havebeen developed for the construction sector, aiming to gatherand report information for decision making during thedifferent phases of construction, design and use of a building[9]. The variety of tools is large, with LCA-based tools,rating systems, technical guidelines, assessment frameworks,checklists, and certificates [4].
The first available environmental assessment tool forbuildings was the Building Research Establishment Assess-ment Method [10]. This method was established in UK in1990 and together with the following two rating and certifi-cation systems provided the basis for the other approachesused throughout the world: SBTool, developed through thecollaborative work of representatives from 20 countries [11],and LEED, developed in the USA [12].
In Portugal, a building sustainability assessment methodhas been developed: SBToolPT [13]. Sustainable Building Toolfor Portugal (SBToolPT) was developed by the Laboratoryof Building Physics and Construction Technology of theUniversity of Minho, in coordination with the nonprofitassociation International Initiative for a Sustainable BuiltEnvironment-Portugal (iiSBE-Portugal) and the private con-sulting company Ecochoice SA.
The wide dissemination of these assessment tools iscontributing to understanding the impacts of the buildingsector. Assessment tools are proven to provide unique oppor-tunities for designers, owners, contractors, and users to makedecisions and choices during the project and construction ofbuildings, in order to increase their sustainability level [14].
2.2. From Building Sustainability Assessment to Urban Plan-ning Assessment. The impacts of the building sector are avery well documented fact, which can be addressed through-out measures that are included in building sustainabilityassessment tools. However, these impacts can be addressedin a more adequate way if the sustainability measures areimplemented in a larger scale such as the urban planning.
Nowadays, the goal is to achieve the Zero Impact BuiltEnvironment. Solutions should not only focus on zero energy,materials, water, or food but also on the integrated manage-ment of all resources that have a major impact on the builtenvironment.The challenge is to achieve a built environmentas much as possible sustainable, that is, to achieve a builtenvironment that has the lowest possible environmentalimpacts, that provides the best living conditions, and that isaffordable to the population.
How to achieve all these objectives? No doubt that thebuildings are one of the most important components ofthe built environment but a “built environment” is muchmore than the agglomeration of buildings. Systems suchas transportation, energy production, resources distribution,and waste management, among others, have high impactsand go out of the scope of buildings. Therefore, it is neededto consider the interaction between the buildings and theirsurroundings, taking into account the life style of the popu-lation. Buildings can be very efficient but hardly sustainablebecause sustainability is a broader concept that can only beimplemented at a larger scale. For example, it is very hardto achieve the goal of net zero energy buildings withoutconsidering energy efficiency and clean energy production atthe urban scale. The same applies to water, materials, food,and so forth. Furthermore, the current populationmove fromrural to urban environments also stresses that sustainabilitystudies have to be performed at the urban scale.
Additionally, the rapid growth of cities and the urbanregeneration of degraded and/or abandoned areas are thecurrent concerns of authorities, both at international andlocal levels. These concerns have directed the focus ondeveloping assessment frameworks and tools for urbancommunities, such as BREEAM Communities [15], LEED-ND (Neighborhood Development) [16], SCTool (Sustain-able Communities Tool, in development) [17], CASBEE-UD (Urban Development) [18], EarthCraft Communities[19] or Green Star Communities [20]. The interest in eval-uation systems is increasing among authorities, investors,and especially developers [4], since these systems allow thecomparison of municipalities and urban areas, serving tosupport decision making processes, benefiting authorities,planners, and designers during this process.
These tools were designed to give opportunity for projectsto demonstrate their environmental, economic, and socialbenefits to the local community, in all the planning stagesof development processes. These tools’ system consists offrameworks with several indicators, which are grouped intocategories. These tools, while evaluating and ranking thesustainability of urban developments, are also instrumentsthat guide and encourage the process of design and devel-opment of sustainable, smart, and high quality communitiesthroughout the promotion of reference best practices.
2.3. Sustainability Assessment Tool for Urban Planning:SBToolPT-UP. One example of the evolution of the focus ofsustainable assessment tools from buildings to urban plan-ning operations is the Portuguese sustainability assessmentmethod, SBToolPT. A sustainability assessment tool for urbanplanning operations is being developed under the scopeof the urban scale, SBToolPT for urban planning. The toolSBToolPT-UPwill follow the steps of the overallmethodology,which considers a set of indicators related by categories andevaluated by a set of parameters. These indicators along withtheir categories represent the three dimensions of sustainabledevelopment: environmental, social, and economic.
The structure of this methodology is being developed andadapted to the Portuguese context by the authors, based on
The Scientific World Journal 3
the work of Salat et al. [21] and on the work of the iiSBEworking group SBTool Urban, which is also in development.A cooperative effort is being made for the improvement ofthese methodologies taking into account the latest scientificdevelopments in sustainability at the urban scale.
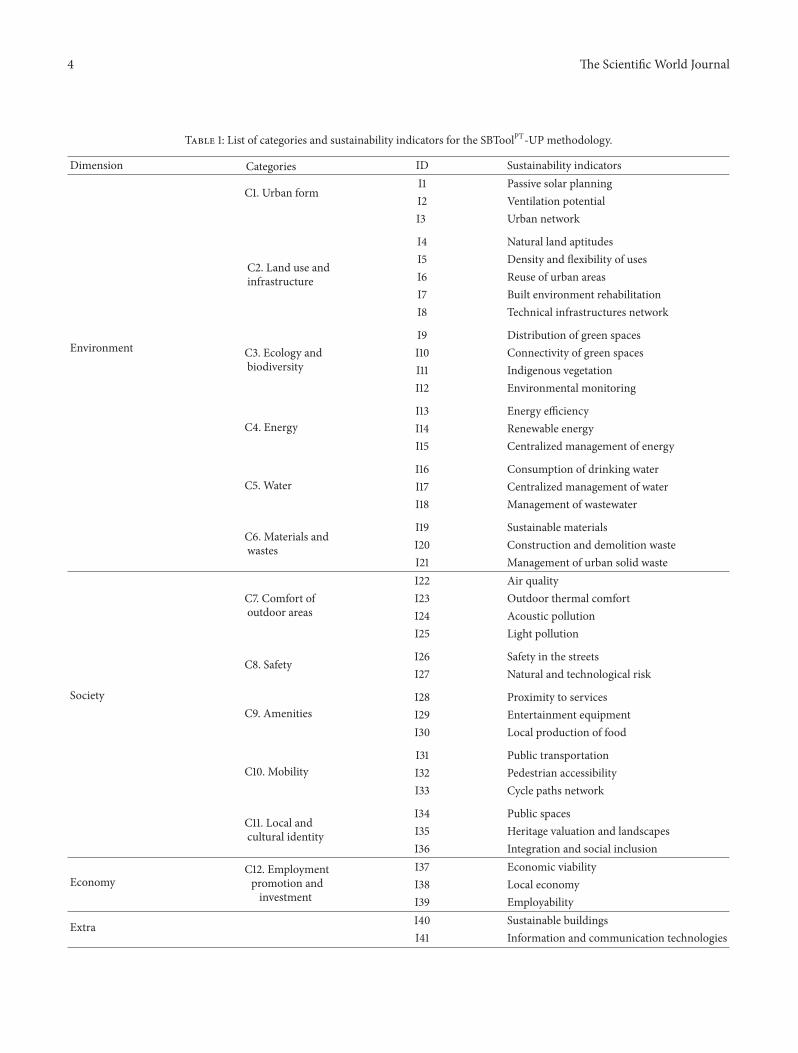
During the process of developing indicators fromSBToolPT-UP methodology care was taken to create a list ofindicators that were organized, transparent, objective, andcorrect as possible. This list was developed based upon thecurrent state-of-the-art of existing methodologies to assessthe sustainability of urban projects and urban communitiesand based upon the indicators of overall system SBToolversion. Subsequently the list was harmonized following thediscussions inside the working groups (national and inter-national) consisting of civil and environmental engineers,architects, and urban planners, in order to suit the nationalcontext. This tool encompasses twelve categories under thescope of the main sustainability dimensions, environment,society, and economy. Additionally, an extra category isconsidered covering the sustainability of buildings and theinformation and communication technologies at urban scale.The forty-one indicators included in this tool, as well asthe respective categories and dimensions, are presented inTable 1.
2.3.1. Category 1—Urban Form. The urban form assessedaspects are the following: the passive solar planning, con-sidering the suitability of thermal energy conservation andthe production of renewable solar energy; the promotionof natural ventilation of urban spaces, taking into accountthe dominant winds of the geographic area; and the urbannetwork, to promote connectivity between routes of differenthierarchies, to a human scale, reducing distances and traveltimes in order to facilitate the movement and commuting tofoot and bike lanes.
2.3.2. Category 2—Land Use and Infrastructure. It assessedhow the urban spaces are defined in conformity with thenatural land aptitudes, promoting land use efficiency. Thereis also a promotion of flexibility of uses of the different areas,as well as an incentive to reuse and rehabilitate or regeneratepreexisting urban areas such as abandoned urban centres.The objective is to avoid urban expansion or urban sprawlthat has many impacts such as the construction of longnetworks of technical infrastructures, which encompasseshigh environmental impacts.
2.3.3. Category 3—Ecology and Biodiversity. The assessmentof this category covers the management of green spaces,promoting the protection and increase in local biodiversityby rewarding varied distribution of green spaces within theurban fabric and designing of urban green spaces networkarticulated with ecological corridors.The selection of indige-nous species for plants and vegetation in these green spacesand the development of an environmental management planare also promoted.
2.3.4. Category 4—Energy. The main aspects of the assess-ment methods are related to the implementation of measuresthat improve energy efficiency of the public energy consum-ing equipment and of systems that produce energy fromrenewable sources. It also promoted the central managementand monitoring of energy consumption in order to identifyproblems in time and to disclose consumption data so thatdecision making and problem solving are made based onknowledge of inhabitants, enabling attitude changing by thepopulation.
2.3.5. Category 5—Water. Themain aspects in considerationare the assessment of drinking water consumption and thetreatment of wastewater, while the central management ofwater is also promoted. The objective is to reduce the waterconsumption in public spaces through the use of efficientequipments. This will reduce the production of wastewaterand reduce the pressure on the drainage systems. Localtreatment of effluents will also be promoted, as well as theimplementation of a monitoring system.
2.3.6. Category 6—Materials and Wastes. The indicatorsrelated to the materials’ life cycle are included here. In thiscategory the responsible selection of sustainable materialsand the destiny of construction and demolition wastes, aswell as the management of urban solid wastes are accessed.It is promoted the selection of materials with lower lifecycle environmental impacts and the reuse and recycling ofRCDs, as well as the selective separation of urban wastes.Theobjective is to lower the landfill of residue and to reduce theneed for the extraction of raw materials.
2.3.7. Category 7—Comfort of Outdoor Areas. The socialdimension is related to the health and comfort of inhabitantsregarding the air quality and thermal, acoustic and visualcomfort. In this category the reduction of pollutants andodours in the public spaces (including the use of transporta-tion using alternative fuels), the reduction of the heat islandeffect and the application of rain protection systems, and thereduction of exterior noise and the reduction of glare andnocturnal light pollution are promoted.
2.3.8. Category 8—Safety. The safety of inhabitants isaddressed in this category, where the pedestrian safetyis assessed, taking into account public health and crimeprevention through urban design, by promoting andproviding the correct distribution and orientation ofstreets as well as adequate nocturnal illumination levels,discouragement of high speed traffic and the safety againstnatural or technological disasters.
2.3.9. Category 9—Amenities. The proximity between theresidential areas and working places to key amenities (basicnecessity goods), as well as for entertainment equipments,is accessed. The assessment is related to the promotion ofthe reduction of travel distances and consequently travellingtimes, contributing to the easy access of inhabitants to
4 The Scientific World Journal
Table 1: List of categories and sustainability indicators for the SBToolPT-UP methodology.
Dimension Categories ID Sustainability indicators
Environment
C1. Urban formI1 Passive solar planningI2 Ventilation potentialI3 Urban network
C2. Land use andinfrastructure
I4 Natural land aptitudesI5 Density and flexibility of usesI6 Reuse of urban areasI7 Built environment rehabilitationI8 Technical infrastructures network
C3. Ecology andbiodiversity
I9 Distribution of green spacesI10 Connectivity of green spacesI11 Indigenous vegetationI12 Environmental monitoring
C4. EnergyI13 Energy efficiencyI14 Renewable energyI15 Centralized management of energy
C5. WaterI16 Consumption of drinking waterI17 Centralized management of waterI18 Management of wastewater
C6. Materials andwastes
I19 Sustainable materialsI20 Construction and demolition wasteI21 Management of urban solid waste
Society
C7. Comfort ofoutdoor areas
I22 Air qualityI23 Outdoor thermal comfortI24 Acoustic pollutionI25 Light pollution
C8. Safety I26 Safety in the streetsI27 Natural and technological risk
C9. AmenitiesI28 Proximity to servicesI29 Entertainment equipmentI30 Local production of food
C10. MobilityI31 Public transportationI32 Pedestrian accessibilityI33 Cycle paths network
C11. Local andcultural identity
I34 Public spacesI35 Heritage valuation and landscapesI36 Integration and social inclusion
EconomyC12. Employmentpromotion andinvestment
I37 Economic viabilityI38 Local economyI39 Employability
Extra I40 Sustainable buildingsI41 Information and communication technologies
The Scientific World Journal 5
services. the creation of public spaces dedicated to the pro-duction of organic food, such as community gardens is alsopromoted.
2.3.10. Category 10—Mobility. This category assesses thepromotion of public transport and thus the reduction of theneed for the use of private vehicles. With this objective, thecreation of a pedestrian network and cycling networks thatnot only increase inhabitants’ satisfaction but also are goodfor the environment is also promoted.
2.3.11. Category 11—Local and Cultural Identity. This categoryaddresses the issues related to the cultural identity of theurban spaces, promoting the maintenance of key identifiedarchitectural styles in existing heritage locations, and theimprovement of the use and stimulation of these publicspaces. The existence of housing affordable to a wide spec-trum of social classes (also age, religion, race, genre, etc.) andthe civil participation in public affairs are also promoted.
2.3.12. Category 12—Employment Promotion and Investment.The economic dimension is assessed in this category. Aspectssuch as the economic viability of constructions, including theanalysis of life cycle costs, the promotion of the local econ-omy, and the creation of local opportunities for employmentand professional education, are assessed in this category.
2.3.13. Extra Category. Additionally, another two indicatorsare assessed in the methodology in an extra category. Thiscategory was created in order to promote some measuresthat are good to the sustainability of urban areas but aremore difficult to implement. Achieving a good grade inthese indicators will improve the sustainability rate of theurban area. The first indicator in this category is “sustainablebuildings” and its goal is to promote the sustainability ofbuildings through the implementation of sustainable buildingassessment tools.With the “information and communicationtechnologies” indicator it is intended to promote the inte-grated management of the functional aspects of the city inorder to facilitate the urban functions and to improve thequality of life in cities.
3. Application to Case Studies
In order to improve the development of themethodology andverify its framework, the authors chose three case studies forthe first tests.The case studies chosen are 3 European projectsof urban regeneration: Nations Park, Lisbon (Portugal); LaConfluence, Lyon (France); and Queen Elizabeth OlympicPark, London (England). Europe is the continent with thelargest experience in urban regeneration, prominently UK,Germany, and France [22]; thus, a project that was insertedwithin the national territory (Lisbon) and two other projectsthat represent the experience of the highlighted countries(London and Lyon) were selected. Despite being the oldestproject, the Nations Park (1993–2007) represents one of thebest examples of urban regeneration at international level andlarger scale at national level.
Lyon and London projects represent the current urbanregeneration projects in Europe and the latest urbanismstrategic trends. With different objectives and proposals,these projects along with the national case study will beimportant for the definition of best practices, which will helpthe development of the tool, by making it more competitivewith respect to other methodologies.
Located in the eastern area of Lisbon, the Nations Parkis an ambitious project that came up with the city’s bidto organize the last World Exposition of the twentiethcentury, the EXPO’98, with the purpose of regenerating adegraded industrial port area. The former industrial area,which had been abandoned, was totally obsolete, presentingsoil contamination problems due the heavy metals and oil,but held, however, great development potential due to itsproximity to the Tagus River. The project consisted of urbanand environmental regeneration froman area of 340 ha,mod-ernization and internationalization of Lisbon, restructuringand rehabilitation, and installation of new access, transport,facilities, services, and infrastructure, by demonstrating greatcare with the urban fabric.
La Confluence is a contemporary proposal, whichrespects the historical legacy of the region. Located at thesouth end of Lyon’s central peninsula, at the confluence ofthe Rhone and Saone Rivers, it is a project that aims atthe renovation of an area of 150 ha characterized by thedevelopment of an industrial suburb. Among the designprinciples is the extension of the current centre of the city,with the creation of generous public spaces, making the placeaccessible to all citizens and ensuring the social mix, balanceof functions (housing, offices, leisure, and commerce), andthe sustainability of the city.
The Queen Elizabeth Olympic Park is a project thatdemonstrates UK experience in urban regeneration. Thepark is located in East London, more precisely in a regionknown as Lower Lea Valley, characterized by retaining thepoorest neighbourhoods of the city. It was considered anarea with the highest UK rate of unemployment and lowaccess to open spaces, isolated by poor access, the river, andderelict land, although not far from the centre of London.The project combines the rehabilitation and decontaminationof an area of 226 ha, providing a new public infrastructurethat will provide long term benefits to the residents of thecity, including employment, housing, and educational andrecreational opportunities, and the development of sport andassurance to come to host the most sustainable olympicgames to date.
Urban regeneration projects are generally linked to vacantspaces and or brownfield sites, regarded as urban voids, andits principles revolve around the attempt to solve urban prob-lems through economic, social, environmental and physicalimprovements [23]. Therefore based on these arguments,it can be said that the more sustainable urban planningprojects tend to be the urban regeneration projects, sincethey are responsible for some benefits to the built environ-ment: land reuse, by avoiding urban sprawl and preservinggreenfield sites; restoration of former landscapes; renewal ofurban cores; reuse of unoccupied buildings, by reducing theconsumption of energy and new materials; and increases in
6 The Scientific World Journal
the utilization of existing municipal services, by reducingspending on public infrastructure [24].
The case studies chosen feature common characteristicsare designed to rehabilitate old industrial areas that weredisabled or degraded and are considered by responsibleauthorities as sustainable projects. However only after theapplication of the methodology to case studies, both fornew urban projects and urban regeneration projects, suchideologies can be confirmed.
It is known that the urban regeneration projects have notbeen evaluated or influenced by any of the methodologies forevaluating the sustainability previously described. However,according to authors’ analysis, it is verified that some ofthe design strategies are based on sustainability indicatorsproposed by the tool SBToolPT-UP.
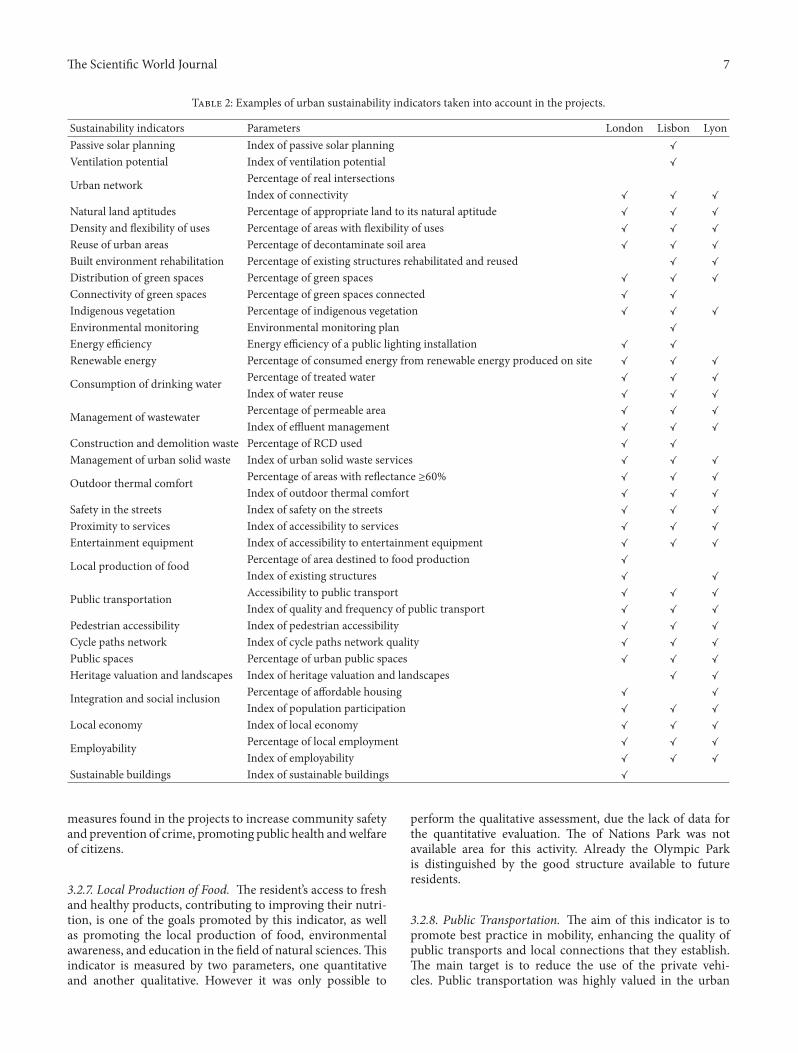
3.1. Identifying Indicators. This step consists in analyzing theproject informationwith reference to some of the sustainabil-ity indicators developed by the tool. Once the projects werenot influenced by this assessment methodology and even bya similar one, it was expected that not all the parameters andindicators would be addressed. Therefore from the list of 41indicators suggested by the tool SBToolPT-UP, 31 indicatorswere identified in the projects (Table 2). According to thistable one can also check the parameters that may have servedas support to drafting the strategies of the projects, which areused by this tool for assessing the sustainability of the builtenvironment.
3.2. Analysis and Results of the Indicators Set. Among the31 indicators identified in Table 2, only 13 indicators wereanalyzed. In order to validate the methodology and seekingto achieve a meaningful set of results, the authors have hada strict care to ensure that the basic characteristics of thechosen indicators were present in each project case study inorder to provide conditions for a proper comparison betweenthem. Likewise, just the parameters whose data projects wereconsistent with the assessment methods proposed by thetool underwent evaluation. Table 3 presents the results fromthe analysis of sustainability indicators and their parameters.The scores will be presented in percentage for a betterunderstanding.
3.2.1. Reuse of Urban Areas. This indicator promotes therestraint of urban sprawl through the reuse of previously builtareas and adequate treatment of contaminated soils (if any).All the projects feature the reuse and soil decontamination;however, in Lyon the development is partly in an existingarea of the city with dwellings fulfilling nearly half thetotal area of intervention and another parcel previouslyoccupied by industrial activities. Thus, their percentage ofsoil decontamination is less than the other projects, 61% ofdecontaminated soil area for 100% in London and Lisbon.
3.2.2. Built Environment Rehabilitation. This indicator aimsto promote the rehabilitation and reconstruction instead ofbuilding from scratch, conserving the legacy of each site andits built heritage through sustainable practices rehabilitation.
Thereby it promotes the efficiency of material resources,energy, and water. In London, projects were not identifiedactions to preserve and rehabilitate existing buildings, sincethere are no buildings with architectural value on site. Lisbonpractically has the same situation, only has reusing an oldtower refinery and the recoveries of Olive Groves Dock andBeirolas Sanitary Landfill—two important infrastructures forthe area. Lyon stands out for the large number of buildingswith historical and architectural value, since sustainablerehabilitation practices are promoted, providing differentuses to the buildings through their adaptation to currentneeds.
3.2.3. Distribution of Green Spaces. To promote the protec-tion and enhancement of local biodiversity constitutes a pri-mary objective of this indicator. Nevertheless also promotesother benefits of urban green spaces, which include physicaland psychological health of the inhabitants, social cohesion,climate change mitigation, pollution reduction, biodiversityconservation, improvement of urban microclimate and airquality, increase of permeable areas of the city, aestheticbenefits, and so forth.The Lisbon project presents the highestpercentage of green spaces, although the Olympic Parkand La Confluence contemplate green spaces more evenlydistributed.
3.2.4. Consumption of Drinking Water. The reduction ofpotable water consumption in public places, while decreasingthe production of effluents and pressure on urban drainagesystems, is one of the goals that this indicator promotes. Thisindicator is measured by two parameters, one quantitativeand another qualitative. It was only possible to performthe qualitative assessment, due the lack of data for thequantitative evaluation. Both projects have the same level ofresources adopted to reduce the use of potable water in theiroutdoor public spaces.
3.2.5. Management of Wastewater. The purpose is to reducethe use of sewage systems and main drains, providing asystem in situ in order to clean and drain out the wastewaterand rainwater, reusing it for irrigation, and helping reduce theoccurrence of floods and the level of water pollution. Thisindicator is also rated by two parameters, one quantitativeand another qualitative. In general, the urban regenerationprojects analyzed feature concerns about effluent manage-ment. In both projects the wastewater and stormwater aretreated on site or nearby and reused mostly for irrigation, ofurban green spaces.
3.2.6. Safety in the Streets. This indicator aims to promotethe safety of users of the urban area and crime preventionthrough urban design. The concern of pedestrian’s safety ispresent in all projects, especially the Olympic Park whichuses the Secured by Design Principles as the basis of project.Designing mixed-use zones that allow natural surveillance,provides safe and attractive sidewalks that encourage walkingor cycling; encouraging the reduction in car use and imple-mentation of strategies to reduce high speeds are examples of
The Scientific World Journal 7
Table 2: Examples of urban sustainability indicators taken into account in the projects.
Sustainability indicators Parameters London Lisbon LyonPassive solar planning Index of passive solar planning ✓
Ventilation potential Index of ventilation potential ✓
Urban network Percentage of real intersectionsIndex of connectivity ✓ ✓ ✓
Natural land aptitudes Percentage of appropriate land to its natural aptitude ✓ ✓ ✓
Density and flexibility of uses Percentage of areas with flexibility of uses ✓ ✓ ✓
Reuse of urban areas Percentage of decontaminate soil area ✓ ✓ ✓
Built environment rehabilitation Percentage of existing structures rehabilitated and reused ✓ ✓
Distribution of green spaces Percentage of green spaces ✓ ✓ ✓
Connectivity of green spaces Percentage of green spaces connected ✓ ✓
Indigenous vegetation Percentage of indigenous vegetation ✓ ✓ ✓
Environmental monitoring Environmental monitoring plan ✓
Energy efficiency Energy efficiency of a public lighting installation ✓ ✓
Renewable energy Percentage of consumed energy from renewable energy produced on site ✓ ✓ ✓
Consumption of drinking water Percentage of treated water ✓ ✓ ✓
Index of water reuse ✓ ✓ ✓
Management of wastewater Percentage of permeable area ✓ ✓ ✓
Index of effluent management ✓ ✓ ✓
Construction and demolition waste Percentage of RCD used ✓ ✓
Management of urban solid waste Index of urban solid waste services ✓ ✓ ✓
Outdoor thermal comfort Percentage of areas with reflectance ≥60% ✓ ✓ ✓
Index of outdoor thermal comfort ✓ ✓ ✓
Safety in the streets Index of safety on the streets ✓ ✓ ✓
Proximity to services Index of accessibility to services ✓ ✓ ✓
Entertainment equipment Index of accessibility to entertainment equipment ✓ ✓ ✓
Local production of food Percentage of area destined to food production ✓
Index of existing structures ✓ ✓
Public transportation Accessibility to public transport ✓ ✓ ✓
Index of quality and frequency of public transport ✓ ✓ ✓
Pedestrian accessibility Index of pedestrian accessibility ✓ ✓ ✓
Cycle paths network Index of cycle paths network quality ✓ ✓ ✓
Public spaces Percentage of urban public spaces ✓ ✓ ✓
Heritage valuation and landscapes Index of heritage valuation and landscapes ✓ ✓
Integration and social inclusion Percentage of affordable housing ✓ ✓
Index of population participation ✓ ✓ ✓
Local economy Index of local economy ✓ ✓ ✓
Employability Percentage of local employment ✓ ✓ ✓
Index of employability ✓ ✓ ✓
Sustainable buildings Index of sustainable buildings ✓
measures found in the projects to increase community safetyand prevention of crime, promoting public health andwelfareof citizens.
3.2.7. Local Production of Food. The resident’s access to freshand healthy products, contributing to improving their nutri-tion, is one of the goals promoted by this indicator, as wellas promoting the local production of food, environmentalawareness, and education in the field of natural sciences.Thisindicator is measured by two parameters, one quantitativeand another qualitative. However it was only possible to
perform the qualitative assessment, due the lack of data forthe quantitative evaluation. The of Nations Park was notavailable area for this activity. Already the Olympic Parkis distinguished by the good structure available to futureresidents.
3.2.8. Public Transportation. The aim of this indicator is topromote best practice in mobility, enhancing the quality ofpublic transports and local connections that they establish.The main target is to reduce the use of the private vehi-cles. Public transportation was highly valued in the urban

8 The Scientific World Journal
Table 3: Projects analysis—sustainability indicators scoring performance.
Sustainability indicators Parameters London Lisbon LyonReuse of urban areas Percentage of decontaminated soil area 100% 100% 61%Built environment rehabilitation Percentage of existing structures rehabilitated and reused 0% 10, 15% 44%Distribution of green spaces Percentage of green spaces 19, 91% 32, 35% 20%Consumption of drinking water Index of water reuse 70% 70% 70%
Management of wastewater Percentage of permeable area 19, 91% 32, 35% 20%Index of effluent management 57% 43% 57%
Safety in the streets Index of safety on the streets 94% 88% 82%Local production of food Index of existing structures 80% 0% 60%Public transportation Index of quality and frequency of public transport 77, 33% 76% 82, 67%Pedestrian accessibility Index of pedestrian accessibility 100% 78% 67%Cycle paths network Index of cycle paths network quality 87, 5% 75% 94%Public spaces Percentage of urban public spaces 45% 57% 43%
Integration and social inclusion Percentage of affordable housing 34% 0% 25%Index of population participation 75% 33% 92%
Employability Index of employability 100% 83% 50%
regeneration projects. A wide range of transport modes arefound, aswell as great investment in infrastructure to improvequality or to create new means of transport, routes, andaccesses.
3.2.9. Pedestrian Accessibility. The purpose of this indicatoris to promote pedestrian mobility and accessibility for peoplewith reduced mobility, with emphasis on reducing the use ofthe private vehicles. Ensuring the accessibility of pedestriansis a basic principle respected by projects. Safe and comfortablestreets are common features of the projects; however, thesafety of the streets is more evident in the design of theOlympic Park, due the orientations of Secured by DesignPrinciples.
3.2.10. Cycle Paths Network. The objective of this indicator isto promote the use of bicycles as a viable option of transport(safety and quality) for displacements between residential,educational, commercial, and industrial areas. Thus the useof no-pollutant means of transportation is promoted, servingas an alternative to the use of polluting transport. The threeprojects provide bicycle paths to their residents and visitors.Lyon Confluence, however, stands out by the quality of cyclepaths offered with an index of 94%.
3.2.11. Public Spaces. The aim of this indicator is to promotethe identity and sense of local community through the allo-cation of quality public urban spaces. According to projectsdata, it is verified that a large percentage of the areas weredestined to urban public spaces, with an average exceeding43%.
3.2.12. Integration and Social Inclusion. One of this indicatorgoals is to promote affordable housing to a broad spectrum ofpeople (age, social class, religion, ethnicity, etc.), along withpromoting the participation of the population.This indicatoris measured by two parameters, one quantitative and another
qualitative. Both the Olympic Park and La Confluence hadgreat concern to promote social housing, allocating muchof the new construction to this typology. The design of theNations Park did not allocate a percentage of dwellings forsocial housing and public participation in the project waslittle.
3.2.13. Employability. The aim of this indicator is to promote,through the urban regeneration design, the growth of localemployment and professional training of residents. It isintended that the project has competence to create strategiesto promote local employment (temporary and permanent),during the construction and operation phases. This indicatoris evaluated by two parameters, one quantitative and anotherqualitative. However it was only possible to perform thequalitative assessment, due to lack of data for the quantitativeevaluation. London once more showed better results, toconfirm the concern of solving a major problem of the LowerLea Valley region, the high rate of unemployment. The Lon-don Employment Skills and Action Plan for 2012 promotedtraining courses and provided a National Skills Academyfor Construction at the Olympic Park site which helped theLondoners to get employment with local contractors.
4. Discussion
The analysis concluded that many of the measures imple-mented in the urban regeneration projects of the threecities are coincident with the indicators evaluated by thesustainability assessment tool for urban planning. Table 2establishes a comparison between the sustainability princi-ples, which served as the strategies for each city and thesustainability indicators identified and suggested by the toolSBToolPT-UP. Practically 83% of sustainable principles arerelated to these indicators and their parameters, demonstrat-ing the current concern of the entities responsible for theprojects of these cities with the sustainability of the built
The Scientific World Journal 9
environment.The comparative analysis also indicates that theurban regeneration plans of these cities can be evaluated bysustainability assessment tools. However, as previously stated,the sustainability evaluation depends on a few key databases.Thus the available data from projects have conditionedthe evaluation of only 15 parameters from 13 sustainabilityindicators (Table 3).
Following the application of the SBToolPT-UPmethodol-ogy to the projects, evaluations have pointed to London as theprojectwith the best sustainability performance by presentingthe best averages, although the projects of Lisbon and Lyonalso result in good evaluations. Even without a concise anal-ysis of the 41 proposed sustainability indicators, the projectshave presented in their results the expected equilibriumof thethree dimensions of sustainable development.
Since this is the first test of the tool SBToolPT-UP, it is tobe expected that not all the parameters and indicators wouldbe addressed in the projects, since they were not influencedby this assessment methodology and even by a similar one.The analysis of case studies aroused questions regarding theassessment methods of some sustainability indicators pro-posed by the tool SBToolPT-UP, due the reduced number ofsustainability indicators evaluated. After discussion betweenthe work groups responsible for developing the methodology(national and international), new tests and evaluations willbe conducted at national level, with appropriate adjustmentsas needed. The hypothesis that some indicators shall beprerequisites and other optional is no ruled out, since themethodology SBTool is a generic framework that takes intoaccount region-specific and site-specific context factors, inwhich the scope of the system can bemodified to be as narrowor as broad as desired [11]. Despite these facts, the tool provedto be very important to give a clear idea on how to approachsustainability; however, the authors believe that it could beused in these cities to increase the number of measures,further improving sustainability levels already achieved. Inaddition to the assessment, the tool can also provide guidancefor the implementation of best practices, serving as a guideand/or manual.
The best results from the analysis will help define thebenchmarks of best practice, whichwill be useful in preparingthe assessment tool guide. In the SBTool methodology, bestpractices are represented as goals to be achieved, serving asan incentive for new projects and also for evaluating them bycomparing solutions.
The guide then will serve to assist the development ofmore sustainable cities and helping the regeneration of cities,serving as support to designers, architects, urban plannersand government entities to achieve sustainability of the builtenvironment desired.
5. Conclusions
Sustainability principles can lead and are leading some citiestowards sustainability, despite the fact that the majority ofcities’ regeneration plans are not subject to sustainabilityassessments.This indicates that urban sustainability tools canbe improved by being transformed in sustainability guides for
the improvement of cities or urban areas while providing atthe same time assessmentmethods that allow the comparisonand consequent selection of the best sustainable solutions.This conceptual change in sustainability assessment tools(from building to urban and from assessment focus to bestpractice manual) not only allows boosting their applicationbut alsowould improve the sustainability of the built environ-ment, guiding and helping designers, engineers, architects,urban planners, and politicians to develop urban regenera-tion plans, defining sustainability principles/indicators thatshould be addressed and allowing the comparison of differentmeasures.
This paper presented the SBToolPT-UP methodology,whose scope is to assess the sustainability of the builtenvironment, including projects for urban planning andurban regeneration, specifically in the Portuguese context.Although this paper has only presented the sustainabilityevaluation of urban regeneration projects, the approach usedfor new urban planning projects will be based on the sameframework.
SBToolPT-UP methodology aims to develop Portuguesecities to be more sustainable. It will support professional andgovernment entities through its best practices guide for easyunderstanding, which will support the development of urbanintervention strategies seeking for more sustainable cities,considering the concern about their future, the demand fora better quality of life, and healthier environments for people.
Conflict of Interests
The authors declare that there is no conflict of interestsregarding the publication of this paper.
References
[1] L. Braganca, R.Mateus, andH. Koukkari, “Building sustainabil-ity assessment,” Sustainability, vol. 2, no. 7, pp. 2010–2023, 2010.
[2] G. Assefa,M.Glaumann, T.Malmqvist, andO. Eriksson, “Qual-ity versus impact: comparing the environmental efficiency ofbuilding properties using the EcoEffect tool,” Building andEnvironment, vol. 45, no. 5, pp. 1095–1103, 2010.
[3] A. Haapio and P. Viitaniemi, “A critical review of building envi-ronmental assessment tools,” Environmental Impact AssessmentReview, vol. 28, no. 7, pp. 469–482, 2008.
[4] A. Haapio, “Towards sustainable urban communities,” Environ-mental Impact Assessment Review, vol. 32, no. 1, pp. 165–169,2012.
[5] UN-Habitat, State of the World’s Cities 2006/7, Earthscan,London, UK, 2006.
[6] N. Rosales, “Towards the modeling of sustainability into urbanplanning: using indicators to build sustainable cities,” ProcediaEngineering, vol. 21, pp. 641–647, 2011.
[7] C. L. Souza and J. M. Awad, Cidades Sustentaveis, CidadesInteligentes, Bookman, Sao Paulo, Brazil, 2012.
[8] P. Khanna, “Beyond City Limits. The Global Cities Issue,”Foreign Policy, 2010.
[9] L. Braganca, H. Koukkari, and R. Blok, COST Action C25,Sustainability of Constructions—Integrated Approach towardsSustainable Constructions. Summary Report of Co-OperativeActivities, vol. 1, Gutenberg Press, 2011.
10 The Scientific World Journal
[10] BREEAM, “BREEAM—the world’s leading design and assess-ment method for sustainable buildings,” 2013, http://www.breeam.org/.
[11] iiSBE, “iiSBE—International Initiative for a Sustainable BuiltEnvironment, SB Method and SBTool,” 2013, http://www.iisbe.org/sbmethod.
[12] LEED, “Homepage of LEED,” 2013, http://www.usgbc.org/leed.[13] R. Mateus and L. Braganca, SBTool—Ferramenta para a
Construcao Sustentavel. Guia deAvaliacao SBToolPT-H, EdicoesiiSBE Portugal, 20092009.
[14] R. Mateus and L. Braganca, “Sustainability assessment andrating of buildings: developing the methodology SBToolPT-H,”Building and Environment, vol. 46, no. 10, pp. 1962–1971, 2011.
[15] BRE, BREEAM Communities Technical Manual, 2012.[16] LEED, LEED 2009 for Neighborhood Development, The U.S.
Green Building Council, 2009.[17] iiSBE, “International Initiative for a Sustainable Built Environ-
ment: Working Groups,” 2013, http://www.iisbe.org/r-n-d.[18] CASBEE, “CASBEE—Comprehensive Assessment System for
Built Environment Efficiency,” 2013, http://www.ibec.or.jp/CASBEE/english/index.htm.
[19] EarthCraft, “The EarthCraft Communities Program,” 2013,http://www.earthcraft.org/communities.
[20] GBC Australia, “Green Star—Communities,” 2013, http://www.gbca.org.au/green-star/green-star-communities/.
[21] S. Salat, F. Labbe, and C. Nowacki, Cities and Forms—OnSustainable Urbanism, Hermann, Paris, France, 2011.
[22] C. Couch,O. Sykes, andW. Borstinghaus, “Thirty years of urbanregeneration in Britain, Germany and France: the importance ofcontext and path dependency,” Progress in Planning, vol. 75, no.1, pp. 1–52, 2011.
[23] P. Roberts andH. Sykes,UrbanRegeneration: AHandbook, Sage,London, UK, 2000.
[24] C. A. de Sousa, “Turning brownfields into green space in theCity of Toronto,” Landscape and Urban Planning, vol. 62, no. 4,pp. 181–198, 2003.
Copyright © 2022 FDOKUMEN