The Evaluation of Microneedle Performance on a ...
274
The Evaluation of Microneedle Performance on a Representative In Vitro Skin Model Kikelomo Vanessa Moronkeji School of Engineering University of Liverpool A thesis submitted for the degree of Doctor of Philosophy May 2017
-
Upload
khangminh22 -
Category
Documents
-
view
1 -
download
0
Transcript of The Evaluation of Microneedle Performance on a ...
The Evaluation of Microneedle
Performance on a Representative In
Vitro Skin Model
Kikelomo Vanessa Moronkeji
School of Engineering
University of Liverpool
A thesis submitted for the degree of
Doctor of Philosophy
May 2017

i
Acknowledgements
A PhD is like going on a journey of a thousand days that culminates at a final destination. As
with any journey, there have been many individuals along the way that have helped to make
the process as seamless as possible, though I must add that it has been fraught with
challenges. It is them that I must now thank and truly show my gratitude for their support.
I would like to acknowledge the Centre for Global Eco-Innovation in conjunction with the
European Regional Development Fund and Renephra Ltd for their financial facilitation of
this project and therefore affording me the opportunity to undertake this PhD.
I would like to thank my primary supervisor, Dr Riaz Akhtar for his knowledge, diligence,
calmness and openness. I really admire his work ethics and have learnt so much from him
over the past four years. I must thank Professor Ahmed Elsheikh, my secondary supervisor
for ensuring that there was order and structure in our large team that made up the
Biomechanical Engineering Group. I would like to thank Professor Eithne Comerford who
taught me how to hold the scalpel knife in order to harvest pig skin. Thanks to Dr Rob Birch
who assisted with the early impact tests, which was a struggle to setup. He was so patient
with me and I was at his door numerous times for him to help resolve a problem with either
the oscilloscope readings or the accelerometer. Thanks to Mr Derek Neary for his technical
assistance in the middle through to the latter stages of my testing, he was always so gracious
and willing to help with whatever device that I could think up to make my experimental setup
function better. I would also like to thank Mr Steve Bode for his support with my
experimental setup. I would like to acknowledge Mr John Curran, Mr Jiji Mathew and the
rest of the team in the workshop for helping to make the components that went with my
experimental setup. I would also like to thank Mr Lee Moore at the Veterinary Teaching
Suite for sourcing the neonatal pigs and providing access to his facilities at my convenience.

ii
At Renephra, I would like to thank Dr Simon Todd for his technical expertise in guiding the
direction of my project during the early days, when I was such a novice. I would also like to
thank Dr Idalia Dawidowska for her expertise as a clinician particularly in explaining pitting
and non-pitting oedema and finally I would also like to thank Dr Mark Rahn for his insight
on the few occasions we had meetings together.
I would like to thank Dr Matt Fulton for his project management of the Centre for Global
Eco-Innovation team and making sure that all the researchers were looked after and to Mr
Doug McInnes, thank you for all your efforts in purchasing the materials and equipment
needed for my project, as well as regularly chasing for time-sheets.
I would like to thank Dr Tom McDonald for his help with SEM imaging of my microneedles,
who was gracious and always willing to help. I would also like to thank Dr Steve Barrett for
writing the ImageSXM software code, which I used for my work on image analysis. I must
thank Mr Dave Atkinson, who has been such a wonderful support and always willing to help.
He gave me access to his labs, particularly the fume cupboards for all the super-cooling of
isopentane in liquid nitrogen in order to preserve my skin samples whenever I needed. I
cannot forget to thank Ms Marion Pope for her help in sectioning and staining my
microneedle perforated skin samples. I would like to thank Ms Gemma Charlesworth for
showing me how to section and stain my tissue samples, wax embed some of them and
prepare PFA solution. To my colleagues, Rosti, Charlie, Sherif, Junjie, Mars, Zhuola,
Brendan, Akram and Ahmed in Ocular and Biomaterial and Biomechanics Group, thank you
so much for your support.
Thank you Dr Sunday Adelaja for giving me the nudge to pursue this PhD, I have gained
such invaluable knowledge and skills these last four years. Thank you Mary Cliff and Cath
Cliff for your support, you are my extended family. I appreciate them for all those times that I

iii
was either stuck in the lab or on the motorway and could not make it in time to pick my
daughter from after school club. I could always count on them, in my desperate time to pick
her up for me and they were always so jolly about it. For me, that was a great stress relief,
knowing that I could rely on them to care for my precious child.
I would like to thank my husband, Damola for his support. He heard my frustrations and
encouraged me to keep going. He made many sacrifices too, by having to leave work
impromptu numerous times when I was stuck on campus trying to finish my testing, or
sample preservation. I would like to thank him for his patience and understanding and I
cannot say it enough how much I love and appreciate him. I would also like to thank my
daughter, Imisi, who has such a cheerful disposition. She missed many parties because
mummy had to read numerous journals in order to complete a PhD related task. I will make it
up to her and I would like to thank her for being so understanding and not throwing her “toys
out of the cot”. I would like to thank my son, Olumakin for being such a joyful baby because
from babyhood to now being a toddler, he has had to share me with my thesis write-up. I
must thank my parents, my daddy, who is retired but would come up to Burnley whenever
required to help with babysitting in the first year of my studies, when my daughter was
poorly and could not go to nursery. He has been such a great help and I cannot thank him
enough. Thank you mummy, who has been such an encouragement to me and I thank her for
her insight. I would also like to thank my brothers and sister for their support and
encouragement. It definitely takes a community to complete a PhD. And finally, thank you
Eledumare for helping me see this PhD to fruition.
iv
Dedication
I dedicate this thesis to my dearest cousin, Dr Johnson Ayodele Olorunfemi, who passed
away on 29th
September 2014. You were the reason I decided to undertake this PhD, which
would have been a promising fluid overload management therapy to your health battles with
kidney disease. I had hoped that you would be a beneficiary of Renephra’s Trandermal Fluid
Removal technology once it became commercially available. Sadly, it was not to be.
Nonetheless it is my hope that millions of people suffering from fluid overload or oedema
due to kidney or heart disease will benefit from this technology.
RIP

v
Abstract
The skin is an extremely complex organ and its natural function is to act as a barrier by
restricting the entry of foreign substances as well as preventing the loss of water and other fluids.
Transdermal microneedle arrays provide a minimally invasive means of delivering drugs into the
body via the skin. The challenge to effective microneedle penetration is to bypass the inherent
elasticity of the stratum corneum, the skin’s uppermost layer. The advent of microneedle
technology is promising and numerous studies have been conducted on its applications to skin,
with most of the work centred on skin models that have inadequate underlying substrates to
support skin.
In this thesis, a representative experimental model of skin was developed accounting for
mechanical contributions from subcutaneous layers comprising tissue fluid and muscle mimics in
order to characterise skin’s interaction with microneedles in vitro. Neonatal porcine skin from the
abdominal and back regions, several concentrations of porcine-derived gelatine gels acted as the
subcutaneous tissue fluid mimic and Perma-Gel®, a type of polymer used in ballistics testing was
the muscle mimic. These layers of biological material made up the representative in vitro skin
model. Micromechanical tests using a dynamic nanoindentation technique was conducted on the
individual layers that made up the skin model in order to establish their mechanical
characteristics such as elastic modulus, shear storage modulus, shear loss modulus and loss
factor. The average elastic modulus was 24.49 ± 5.47 kPa for abdominal skin and 45.89 ± 9.61
kPa for back skin; for the gelatine gels at 67%, 80% and 88%, it was 63.11 ± 6.23 kPa, 34.56 ±
3.16 kPa and 11.3 ± 1.64 kPa respectively; the Perma-Gel® exhibited the highest elastic modulus
of 80.73 ± 2.67 kPa in the skin model. The overall mechanical behaviour of these layers in the
skin model contributed to its interaction with microneedles.
Two types of polymethylmethacrylate microneedles were used for the work in this thesis i.e.
Design 1 and Design 2; the microneedles varied in height, needle density, base diameter and
interspacing. Design 1 and 2 microneedles were applied to the skin model using a custom-made
impact test setup system. The results of the initial tests using Design 1 microneedles on back skin
model at 88% gelatine gel concentration demonstrated that optimal penetration was achieved with
9.33 ± 2.76 N insertion force and at an insertion velocity of 2.96 ms-1. Methylene blue, histology
staining and quantitative image analysis were used to analyse microneedle perforation quality.
The microneedle penetration studies using Design 1 microneedles were reproducible and laid out
the optimal conditions for the tests that involved the Design 2 microneedles on abdominal and
back skin models at all gelatine gel concentrations. The mechanical properties for the skin models
influenced the outcome of the penetration tests, as smaller deformations occurred within the
stiffer back skin model as compared to the abdominal skin model. It was also found that for the
impact test setup, microneedle geometry in terms of projections did not play a significant role in
how microneedles interfaced with skin, as other parameters such as the insertion force and
insertion velocity were more paramount.
Further tests were carried out using a clinical applicator provided by Renephra in order to
compare results of their in vivo studies with the in vitro work carried out in this thesis. Although
the insertion force produced by the clinical applicator was 2–7 times the magnitude of the
insertion produced by the impact applicator, reproducible penetration of skin occurred. A
comparison study was carried out on the clinical applicator and the impact applicator and it was
found that the impact applicator was the preferred approach for microneedle application to skin
because more effective microneedle penetration of skin could be achieved at a relatively low
insertion force and a low insertion velocity as compared to the clinical applicator.

vi
List of Publications
A. Papers and Book Chapter
[1] Moronkeji, K., Todd, S., Dawidowska, I., Barrett, S. D. and Akhtar, R. (2016) ‘The
Role of Subcutaneous Tissue Stiffness on Microneedle Performance in a Representative
In Vitro Model of Skin’, In: Journal of Controlled Release.
[2] Moronkeji, K., Todd, S., Dawidowska, I., and Akhtar, R. (2015) ‘In Vitro
Quantification of Optimal Impact Properties for Microneedle Penetration’, pp. 39-49 In:
Proceedings of Society of Experimental Mechanics 2015 Annual Conference and
Exposition on Experimental and Applied Mechanics.
[3] Moronkeji, K. and Akhtar, R. (2015) ‘Mechanical Properties of Aging Human Skin’,
pp. 237-263, In: Mechanical Properties of Aging Soft Tissues. Editors: Derby, B.,
Akhtar, R. (Eds), Springer International Publishing.
B. International Conference Presentations
[1] Oral Presentation: ‘In Vitro Quantification of Optimal Impact Properties for
Microneedle Penetration into Skin’, SEM 2015 12th
International Annual Conference &
Exposition on Experimental and Applied Mechanics, Costa Mesa, CA, USA (8–11th
June 2015).
[2] Oral Presentation: ‘Overcoming the Stratum Corneum Barrier for Microneedle
Application’, 26th Annual Conference of the European Society for Biomaterials,
Liverpool, UK (31st August–3rd September 2014).
[3] Poster Presentation: ‘Impact Testing of Skin: Overcoming the Stratum Corneum Barrier
for Microneedle Application’, 5th International Conference on Mechanics of
Biomaterials and Tissues, Sitges, Spain (8–12th December 2013).

vii
Contents
Acknowledgements ..................................................................................................................... i
Dedication ................................................................................................................................ iv
Abstract ...................................................................................................................................... v
List of Publications .................................................................................................................. vi
Contents .................................................................................................................................. vii
List of Figures ........................................................................................................................ xvi
List of Tables ....................................................................................................................... xxix
Abbreviations ......................................................................................................................... xxx
1. Introduction ........................................................................................................................ 1
1.1 General Introduction ................................................................................................... 1
1.2 The Effects of Fluid Overload and Oedema................................................................ 1
1.2.1 Overview of current fluid overload assessment methodologies .......................... 5
1.2.2 Overview of current fluid overload management therapies ................................. 6
1.3 Proposed Novel Solution for Fluid Overload Relief ................................................... 7
1.3.1 Access to interstitial fluid via skin ....................................................................... 8
1.3.2 Microneedle arrays to breach skin’s barrier......................................................... 8
1.3.3 Transdermal Fluid Removal technology .............................................................. 8

viii
1.4 Research Project Plan ................................................................................................ 14
1.4.1 Aims and Objectives .......................................................................................... 14
2. Literature Review ............................................................................................................. 15
2.1 Introduction .................................................................................................................. 15
2.2 The Anatomy of Skin ................................................................................................... 15
2.2.1 Epidermis .............................................................................................................. 16
2.2.2 Dermis .................................................................................................................. 17
2.2.3 Hypodermis .......................................................................................................... 17
2.3 The Mechanical Characteristics of Skin....................................................................... 18
2.3.1 In vitro techniques ................................................................................................ 21
2.3.1.1 Uniaxial tensile tests ......................................................................................... 22
2.3.1.2 Indentation tests ................................................................................................ 22
2.3.2 In vivo techniques ................................................................................................. 26
2.4 In Vitro Biomechanical Experiment on Skin and its Sub-layers .................................. 28
2.4.1 The skin mimic ..................................................................................................... 28
2.4.2 The subcutaneous mimic ...................................................................................... 29
2.4.3 The muscle mimic ................................................................................................ 32
2.4.4 Summary of experimental models of skin and its sub-layers ............................... 33
2.4.5 Limitations of the experimental model ................................................................. 34
2.5 Microneedle Arrays ...................................................................................................... 34

ix
2.5.1 Microneedle designs ............................................................................................. 34
2.5.2 Microneedle fabrication methods and materials ................................................... 36
2.5.3 Application of microneedles in fluid extraction ................................................... 38
2.6 The Mechanics of Microneedle Perforation of Skin .................................................... 39
2.6.1 Insertion force as determined numerically ........................................................... 40
2.6.2 Microneedle insertion force and insertion velocity .............................................. 41
2.6.3 Microneedle applicators ....................................................................................... 42
2.6.4 Microneedle geometry .......................................................................................... 44
2.6.5 Microneedle studies on in vitro skin models ........................................................ 46
2.7 Assessment of Microneedle Perforation of Skin .......................................................... 48
2.7.1 Dye staining .......................................................................................................... 49
2.7.2 Histological staining ............................................................................................. 50
2.7.3 3D image analysis ................................................................................................. 51
2.8 Summary ..................................................................................................................... 52
3. Material and Methods ....................................................................................................... 55
3.1 Introduction .................................................................................................................. 55
3.2 The In Vitro Skin Model .............................................................................................. 55
3.2.1 Neonatal porcine skin ........................................................................................ 55
3.2.2 Gelatine gels as a representation of subcutaneous tissue fluid .......................... 56
3.2.2.1 Determination of gelatine gels concentration ................................................... 56
x
3.2.2.2 Preparation technique of gelatine gels .............................................................. 58
3.2.3 Perma-Gel® as muscle mimic ............................................................................ 58
3.2.4 Classification of the various in vitro skin models .............................................. 59
3.2.5 Micromechanical characterisation of the layers of the skin model .................... 60
3.2.5.1 Dynamic indentation principles ........................................................................ 60
3.2.5.2 Theory ............................................................................................................... 62
3.2.5.3 Experimental setup............................................................................................ 64
3.3 The Microneedle Arrays............................................................................................... 66
3.3.1 Polyetheretherketone microneedle arrays .......................................................... 66
3.3.2 Polymethylmethacrylate microneedle arrays ..................................................... 67
3.3.3 Scanning Electron Microscopy of microneedle arrays ...................................... 68
3.4 The Microneedle Applicators ....................................................................................... 68
3.4.1 Impact applicator system ................................................................................... 69
3.4.1.1 Determination of the dropping heights ............................................................. 69
3.4.1.2 Theory ............................................................................................................... 69
3.4.1.3 First generation impact applicator .................................................................... 72
3.4.1.4 Improved impact applicator .............................................................................. 73
3.4.1.5 Calibration of the impact applicator ................................................................. 75
3.4.2 Clinical applicator system ....................................................................................... 76
3.4.2.1 Clinical applicator mechanism .......................................................................... 76
xi
3.4.2.2 Determination of the clinical applicator force .................................................. 77
3.5 Imaging Techniques for Assessing Microneedle Perforation of Skin.......................... 79
3.5.1 Visual examination and penetration efficiency calculation of microneedle
perforated skin .................................................................................................................. 79
3.5.2 Histology examination of the microneedle perforated skin ............................... 81
3.5.3 Quantitative image analysis using Image SXM software .................................. 83
3.5.3.1 Assessment of microneedle perforation depth .................................................. 84
3.5.3.2 Breach area classification ................................................................................. 85
3.6 Statistical Analysis ....................................................................................................... 86
3.7 Summary ...................................................................................................................... 86
4. Results .............................................................................................................................. 88
4.1 Introduction .................................................................................................................. 88
4.2 Micromechanical Characterisation of Skin’s Sub-layers ............................................. 88
4.2.1 Indentation tests on abdominal and back skin samples ..................................... 88
4.2.2 Indentation tests on gelatine gel samples ........................................................... 90
4.2.3 Indentation tests on Perma-Gel® samples .......................................................... 93
4.2.4 Summary of the micromechanical properties of the sub-layers of the skin model
............................................................................................................................ 94
4.3 Development of the Impact Applicator ........................................................................ 97
4.3.1 Preliminary tests using the impact applicator .................................................... 97
4.3.2 Skin penetration tests using PEEK microneedles .............................................. 99

xii
4.3.2.1 SEM imaging of PEEK microneedles following multiple applications ........... 99
4.3.2.2 The effects of differences in skin properties ................................................... 100
4.3.2.3 Contributions from the subcutaneous mimic .................................................. 101
4.3.2.4 Impact velocity................................................................................................ 103
4.3.3 Summary of the development of the impact applicator ................................... 103
4.4 Impact Applicator Studies .......................................................................................... 104
4.4.1 Visual examination of Design 2 microneedles using SEM imaging ............... 104
4.4.2 Penetration efficiency ...................................................................................... 106
4.4.3 The effects of differences in skin properties .................................................... 109
4.4.4 The role of the subcutaneous mimic property on microneedle performance ... 111
4.4.5 Impact applicator force and velocity ................................................................ 116
4.4.6 The effects of microneedle geometry on skin penetration ............................... 119
4.4.6.1 Microneedle penetration on skin Model 3B.................................................... 119
4.4.6.1.1 Comparison between visual examination and perforation depth ................. 119
4.4.6.1.2 Histological examination of breach area ...................................................... 121
4.4.6.2 Impact force and velocity for skin Model 3B ................................................. 122
4.4.6.2.1 Variation of the velocity and force .............................................................. 122
4.4.6.2.2 Graphical output........................................................................................... 125
4.4.7 Summary of impact applicator studies ............................................................. 126
4.5 Clinical Applicator Studies ........................................................................................ 128

xiii
4.5.1 Penetration efficiency ...................................................................................... 128
4.5.2 The effects of differences in skin properties .................................................... 132
4.5.3 The role of the subcutaneous mimic property on microneedle performance ... 134
4.5.4 Clinical applicator force ................................................................................... 138
4.5.5 The effects of microneedle geometry on skin penetration ............................... 140
4.5.5.1 Microneedle penetration on skin Model 3B.................................................... 140
4.5.5.1.1 Comparison between visual examination and perforation depth ................. 140
4.5.5.1.2 Histological examination of breach area ...................................................... 142
4.5.5.2 Clinical applicator force on skin Model 3B .................................................... 142
4.5.6 Summary of clinical applicator studies ............................................................ 142
4.6 Comparison between Impact and Clinical Applicator Studies................................... 144
4.6.1 Penetration efficiency ...................................................................................... 144
4.6.2 The effects of differences in skin properties .................................................... 146
4.6.3 The role of the subcutaneous mimic property on microneedle performance ... 150
4.6.4 The effects of microneedle geometry on skin penetration ............................... 154
4.6.4.1 Comparison between visual examination and perforation depth .................... 154
4.6.4.2 Histological examination of breach area......................................................... 157
4.6.5 Impact and clinical applicator force ................................................................. 158
4.6.6 Summary of the comparison between impact and clinical applicator studies . 159
5. Discussion .......................................................................................................................... 161
xiv
5.1 Introduction ................................................................................................................ 161
5.2 Micromechanical Characterisation of Skin’s Sub-layers ........................................... 162
5.3 Impact Applicator Studies .......................................................................................... 166
5.3.1 Visual examination of microneedles using SEM imaging ............................... 166
5.3.2 Penetration efficiency ...................................................................................... 167
5.3.3 The effects of differences in skin properties .................................................... 169
5.3.4 The role of the subcutaneous mimic property on microneedle performance ... 171
5.3.5 Impact applicator force and velocity ................................................................ 172
5.3.6 The effects of microneedle geometry on skin penetration ............................... 175
5.4 Clinical Applicator Studies ........................................................................................ 179
5.4.1 Penetration efficiency ...................................................................................... 179
5.4.2 The effects of differences in skin properties .................................................... 179
5.4.3 The role of the subcutaneous mimic property on microneedle performance ... 180
5.4.4 Clinical applicator force ................................................................................... 181
5.4.5 The effects of microneedle geometry on skin penetration ............................... 182
5.5 Comparison between Impact and Clinical Applicator Studies................................... 185
5.5.1 Penetration efficiency ...................................................................................... 185
5.5.2 The effects of differences in skin properties .................................................... 186
5.5.3 The effect of the subcutaneous mimic property on microneedle performance 186
5.5.4 Impact and clinical applicator force ................................................................. 188

xv
5.5.5 The effect of microneedle geometry ................................................................ 190
5.6 Summary .................................................................................................................... 193
6. Conclusions and Further Work .......................................................................................... 195
6.1 Summary .................................................................................................................... 195
6.2 Conclusions ................................................................................................................ 196
6.2.1 Experimental analysis of the mechanical properties of skin .............................. 196
6.2.2 Development of the impact applicator system ................................................... 197
6.2.3 The clinical applicator system ............................................................................ 198
6.2.4 Quantitative image analysis of microneedle treated skin ................................... 199
6.3 Further Work .............................................................................................................. 200
6.3.1 3D image analysis of microneedle treated skin .................................................. 201
6.3.2 Optical Coherence Tomography studies of microneedle application to skin ..... 201
6.3.3 Impact applicator ................................................................................................ 202
7. References ......................................................................................................................... 204
8. Appendix ............................................................................................................................ 229
8.1 3D Image Analysis using XMT ................................................................................. 229
8.2 ImageSXM Software Code ........................................................................................ 233

xvi
List of Figures
Figure 1 Renephra’s wearable transdermal microneedle fluid overload relief technology. ... 10
Figure 2 The Transdermal Fluid Removal technology (a) microneedle placed on patient, (b)
clinical applicator used to insert microneedles into skin, (c) skin after microneedle treatment
with no bleeding or lasting damage to skin (d) gauze placed on skin to absorb some of the
ISF, (e) fluid extraction using negative pressure therapy and (f) extracted fluid passing
through tube. ............................................................................................................................ 12
Figure 3 Schematic diagram showing skin layers: hypodermis, dermis and epidermis. (a)
represents blood vessels, (b) lymph vessels, (c) nerve endings and (d) hair follicles. Sweat
glands and sense receptors have not been shown in the figure. ............................................... 16
Figure 4 Schematic diagram showing the layers of the epidermis: stratum corneum, stratum
granulosum, stratum spinosum and the basal layer. ................................................................ 16
Figure 5 Hysteresis as observed in the stress-strain behaviour of a viscoelastic material
during cyclic loading................................................................................................................ 19
Figure 6 Typical stress-strain relation for skin in uniaxial tension obtained at a constant rate.
The curve is subdivided into three sections in accordance with the mechanism of
deformation. (Figure adapted from (Gibson et al., 1968)). ...................................................... 20
Figure 7 Stress-strain curve of skin obtained from the abdominal region of a 45 year old
female subject (Daly and Odland, 1979). The graph shows the skin’s profile as nonlinear with
its mechanical behaviour falling into 3 different categories (where A = phase 1, B = phase 2
and C = phase 3). ..................................................................................................................... 22
Figure 8 The stress–strain curve illustrating an abdominal porcine skin sample under uniaxial
loading (Reproduced from (Zak et al., 2011)). ........................................................................ 24

xvii
Figure 9 The four main types of microneedle design: (a) solid array inserted into skin; solid
array coated with therapeutic compound; dissolving microneedles; hollow microneedles (b)
drug is applied after perforation created by solid array; therapeutic compound is released with
insertion; biodegradable microneedles are absorbed by skin along with therapeutic
compound; therapeutic compound is released via the hollow area in the microneedle. (Figure
adapted from (Kim et al., 2012)). ............................................................................................ 35
Figure 10 Microneedle application using (a) silicon microneedle array mounted on a manual
insertion device, (b) an impact-insertion applicator, (c) perforations created using the impact-
insertion applicator on the stratum corneum and (d) after stratum corneum removal showing
that the perforations travelled beyond this layer (Reproduced from (van der Maaden et al.,
2014)). ...................................................................................................................................... 42
Figure 11 Microneedle applicators (a) Microstructured Transdermal System (MTS), (b)
microinfusor, (c) Macroflux®, (d) Microneedle Therapy System (MTS Roller™), (e)
Microtrans™, (f) h-patch™ , (g) micronjet and (h) Intanza® (Reproduced from (Indermun et
al., 2014)). ................................................................................................................................ 44
Figure 12 Dye staining shows the effect of microneedle interspacing perforation quality on
rat skin (a) 250 m (b) 300 m (c) 350 m and (d) 400 m. Scale bar represents 500 m
(Reproduced from (Xiang et al., 2015))................................................................................... 45
Figure 13 Dissolving microneedle arrays perforation of 6–8 weeks old female mice skin
under various loads and stained with Trypan blue. (a) 1 N, (b) 2 N and (c) 4 N (Reproduced
from (Qiu et al., 2015)). ........................................................................................................... 49
Figure 14 Solid maltose microneedle perforation of hairless rat skin and stained with
methylene blue. (a) Array of microneedles perforations and (b) magnified view of the
perforations (Reproduced from (Kolli and Banga, 2008))....................................................... 50

xviii
Figure 15 Images of H&E sections of previous studies (a) black arrow indicates microneedle
perforation in rat skin (Reproduced from (Kochhar et al., 2013a)) (b) black arrow indicates
microneedle perforation in rat skin (Reproduced from (Li et al., 2015)) (c) cross-section of
porcine skin (Reproduced from (Dabboue et al., 2015)) and (d) cross-section of human skin
(Reproduced from (Dabboue et al., 2015)). ............................................................................. 51
Figure 16 Diagram of the representative in vitro skin model showing the skin as the top
layer, with gelatine gel as a second layer and Perma-Gel® as the third layer. ......................... 59
Figure 17 The mechanical clamp (a) top view of the assembled clamp (b) side view of the
assembled clamp and (c) individual components of the clamp. .............................................. 59
Figure 18 A schematic representation of a typical load versus indenter displacement curve.
Pmax and hmax are the load and displacement at highest load respectively and a is the radius of
the contact circle. hf is the final depth of the contact impression after unloading and S is the
initial unloading stiffness. (Figure reproduced from (Oliver and Pharr, 1992)). ..................... 61
Figure 19 A schematic of the DCM-II head. (Figure reproduced from (Hay, 2012)). ........... 62
Figure 20 Profile of phase angle as a function of time that is used for accurate surface
detection of 67% gelatine gel. Point SD is the surface detection, which starts with a gradient
increase in the phase angle. ...................................................................................................... 65
Figure 21 Medical grade PEEK microneedles, where (a) drawing including dimensions and
(b) image of the array. .............................................................................................................. 66
Figure 22 Medical grade Design 2 PMMA microneedle array, where (a) drawing including
dimensions and (b) as compared to a £1 coin (Renephra, 2015). ............................................ 67
Figure 23 Schematic of the potential energy due to gravity and the energy stored up in a
spring energy indicating the compression distance (x). ........................................................... 70
Figure 24 Schematic diagram of the early dropped weight impact-testing rig. ...................... 73
xix
Figure 25 The improved impact applicator, where (a) is the schematic diagram and (b)
includes complimentary pictures of the setup. ......................................................................... 74
Figure 26 Diagram of Renephra’s clinical applicator. (a) Side view of the applicator. (b) top
view of the applicator and (c) the internal components of the applicator. (Courtesy Renephra
Ltd). .......................................................................................................................................... 76
Figure 27 Schematic diagram of the clinical applicator setup. ............................................... 78
Figure 28 Diagram of the elevated profile of the skin model. ................................................ 78
Figure 29 Methylene blue stained images of 9 × 9 PEEK microneedle array on abdominal
skin model at 67% gelatine gel concentration, where (a) 5 ms-1
, (b) 4 ms-1
and (c) 3 ms-1
. .... 80
Figure 30 Inspection technique of the perforated tissue using H&E staining, where (a) is the
untreated sectioned tissue showing the three histological layers of skin and (b) is the
sectioned tissue already treated with the hair removal agent. Scale bar represents 100 m. .. 82
Figure 31 Labelling of the H&E stained images, where (a) blue arrow indicates disruption to
the stratum corneum, (b) red arrow indicates that the breach is contained within the
epidermis, (c) black arrow indicates that breach has extended into the dermis and (d) key
describing the colour coded arrows. Scale bar represents 100 m. ......................................... 83
Figure 32 Quantitative image analysis results using ImageSXM of back skin model. (a)
Grayscale of histology image. (b) Red pixel saturation of the histology image. (c)
Quantification of the breach area. Scale bar represents 100 m. ............................................ 84
Figure 33 Image analysis results of the perforation depth of Model 3B using ImageJ for
impact tests with (a) Design 2 microneedles and (b) Design 1 microneedles. Scale bar
represents 100 m. ................................................................................................................... 85
Figure 34 The H&E images illustrate breach area groupings. The area shaded in black
represents the breach area size, where (a) 0 < breach area < 10 000 m2 small deformation
within the epidermis (b) 10 000 < breach area < 20 000 m2 large deformation within the

xx
epidermis and (c) 20 000 < breach area < 50 000 m2 deformation within the dermis. Scale
bar represents 100 m. ............................................................................................................. 85
Figure 35 Micromechanical properties of neonatal porcine abdominal and back skin, with the
number of indentations (n) listed above each bar chart. (a) Storage modulus, G´ (b) loss
modulus, G˝ and (c) loss factor. Error bars depict SD. ............................................................ 89
Figure 36 Elastic modulus of neonatal porcine abdominal and back skin following
micromechanical tests, with the number of indentations (n) listed above each bar chart. Error
bars depict SD. ......................................................................................................................... 90
Figure 37 Micromechanical properties of gelatine gels for 67%, 80% and 88% water content,
with the number of indentations (n) listed above each bar chart. (a) Storage modulus, G´ (b)
loss modulus, G˝ and (c) loss factor. Error bars depict SD. ..................................................... 91
Figure 38 Elastic modulus of the different gelatine gels following micromechanical tests,
with the number of indentations (n) listed above each bar chart. Error bars depict SD. ......... 92
Figure 39 Optical images showing the residual impression left visible in the gelatine gels
following indentation with water content of (a) 67%, (b) 80% and (c) 88%........................... 92
Figure 40 Micromechanical properties of Perma-Gel®, with the number of indentations (n)
listed above each bar chart. (a) Storage modulus, G´, (b) loss modulus, G˝ and (c) loss factor.
Error bars depict SD................................................................................................................. 93
Figure 41 Elastic modulus of Perma-Gel® following micromechanical tests, with the number
of indentations (n) listed above the bar chart. Error bar depicts SD. ....................................... 94
Figure 42 Optical image of Perma-Gel® following indentation test. ...................................... 94
Figure 43 Linear relationship between elastic modulus and gel water content following
micromechanical tests. Error bars depict SD. .......................................................................... 96
Figure 44 Linear plots of velocity as a function of force for impact tests of Perma-Gel® using
various drop masses, (a) 36 g (b) 17 g and (c) 7g. ................................................................... 98
xxi
Figure 45 Linear plots of velocity as a function of force for impact tests with Design 1
microneedles on clamped Perma-Gel® using various drop masses weighing, (a) 36 g (b) 17 g
and (c) 7g. ................................................................................................................................ 99
Figure 46 Comparison of SEM images for PEEK microneedles before and after impact tests.
(a) before test and (b) after five applications. ........................................................................ 100
Figure 47 Methylene blue stained images of microchannels created by PEEK microneedles at
a velocity of 5 ms-1
on abdominal skin model, where (a) 67%, (b) 80%, (c) 88%, (d) 96% gel
water content and back skin model, where (e) 67%, (f) 80%, (g) 88%, (h) 96% gel water
content. ................................................................................................................................... 100
Figure 48 Methylene blue stained images of the microchannels created by PEEK
microneedles on abdominal skin model comprising different amounts of water content in its
gelatine gels at a velocity of 5 ms-1
, where (a) 67%, (b) 80%, (c) 88%, (d) 96% and (e) no
gelatine gel as an underlying substrate. ................................................................................. 101
Figure 49 Methylene blue stained images of the microchannels created by PEEK
microneedles on back skin model comprising different amounts of water content in its
gelatine gels at a velocity of 5 ms-1
, where (a) 67%, (b) 80%, (c) 88% and (d) 96%. ........... 102
Figure 50 H&E images of back skin model with 88% water content in its gelatine gel at a
velocity of 5 ms-1
. Red arrows indicate that the breach is contained within the epidermis and
the black arrows indicate that the breach has extended into the dermis. Scale bar represents
100 m. .................................................................................................................................. 103
Figure 51 Comparison of SEM images for Design 2 PMMA microneedles before and after
impact tests. (a) before test, (b) after single application and (c) after five applications. ....... 105
Figure 52 Inspection technique of impact applicator tests on Models 1A–4A for penetration
efficiency with methylene blue staining where the whole disc provides visual confirmation of
penetration and the cropped image, which is the selection highlighted in red is 5 × 5 mm in
xxii
size and was used for calculating penetration efficiency for (a) 67%, (b) 80%, (c) 88% and (d)
96% of water content in the gelatine gels. The diameter of the microneedle disc is 30.1 mm.
................................................................................................................................................ 106
Figure 53 Inspection technique of impact applicator tests on Models 1B–4B for penetration
efficiency with methylene blue staining where the whole disc provides visual confirmation of
penetration and the cropped image, which is the selection highlighted in red is 5 × 5 mm in
size and was used for calculating penetration efficiency for (a) 67%, (b) 80%, (c) 88% and (d)
96% of water content in the gelatine gels. The diameter of the microneedle disc is 30.1 mm.
................................................................................................................................................ 107
Figure 54 Penetration efficiency determined from the methylene blue images for impact
applicator tests on 3 samples each of Models 1A–4B. Error bars depict SD. ....................... 108
Figure 55 Comparison of perforation depths (H&E staining) using the impact applicator for
abdominal and back skin models with respect to altering the water content in gelatine gels.
Red arrows indicate that the breach is contained within the epidermis and the black arrows
indicate that the breach has extended into the dermis. Scale bar represents 100 m and the
diameter of Design 2 microneedle disc is 30.1 mm. .............................................................. 110
Figure 56 Perforation depth data for impact applicator tests using 36 g drop mass at a
velocity of 3 ms-1
, where (a) abdominal skin models and (b) back skin models, with the
number of images (n) in each group listed above each box and whisker plot. ...................... 112
Figure 57 Breach area data for impact applicator tests using 36 g drop mass at a velocity of 3
ms-1
, where (a) abdominal skin models and (b) back skin models, with the number of images
(n) in each group listed above each box and whisker plot. .................................................... 113
Figure 58 Frequency distribution of the breach area for impact applicator tests on (a)
abdominal skin models and (b) back skin models. ................................................................ 115

xxiii
Figure 59 Impact tests of Design 2 microneedles on Model 2B, where (a) force–time plot and
(b) the description of points along the force–time curve. The impact occurred at 0.9 ms,
where the velocity was approximately 2.5 ms-1
, the force was 37.1 N and the maximum force
reached was 107 N. The data suggest that the initial insertion occurred at 0.9 ms. Hence, at
this point the velocity was approximately 2.5 ms-1
, the force was 37.1 N and the maximum
velocity and force reached were 3 ms-1
and 107 N respectively. In the absence of any
microneedles, a smooth force-time plot up to the maximum load would be expected for a
drop mass impacting on a tissue sample (Burgin and Aspden, 2007). .................................. 117
Figure 60 Force data for impact applicator tests, where n = 5 for each skin model (a)
insertion force data for abdominal and back skin models, (b) variation of the maximum force
as a function of gel water content in abdominal skin Models 1A–4A and (c) maximum force
for Models 1A–4A vs elastic modulus of the gelatine gels. Error bars depict SD. ............... 118
Figure 61 Design 1 and 2 microneedles comparison on perforation quality (methylene blue
staining) and perforation depth (H&E staining) for impact applicator tests on Model 3B. (a)
Design 2 (b) Design 1. The diameter of Design 2 microneedle disc is 30.1 mm. The diameter
of Design 1 microneedle disc is 15.8 mm. Red arrows indicate that the breach is contained
within the epidermis. Scale bar represents 100 m. .............................................................. 120
Figure 62 Perforation depth data for impact applicator tests comparing results of Design 1
and 2 microneedles on Model 3B, with the number of images (n) in each group listed above
each box and whisker plot...................................................................................................... 120
Figure 63 Frequency distribution for impact tests at 3 ms-1
using a 36 g drop mass on Design
1 and 2 microneedles on Model 3B. ...................................................................................... 121
Figure 64 Example images of methylene blue stained skin model 3B following impact tests
at various velocities with (a) 36 g drop mass (b) 17 g drop mass. Diameter of Design 1
microneedle disc is 15.8 mm. ................................................................................................ 123

xxiv
Figure 65 Histology images of skin following microneedle application at a constant velocity
(2 ms-1
), using Design 1 microneedles under various loads (a) 36 g (b) 17 g (c) 7 g. Blue
arrows indicate disruption to the stratum corneum and the red arrows indicate that the breach
is within the epidermis. Scale bar represents 100 m. ........................................................... 124
Figure 66 The influence of velocity on perforation quality (methylene blue staining) and
perforation depth (H&E staining), with the impact applicator at 3 ms-1
(a) methylene blue
stained image (b) and (c) example histology images. The influence of velocity on perforation
quality (methylene blue staining) and perforation depth (H&E staining), with the impact
applicator at 2 ms-1
(d) methylene blue stained image (e) and (f) example histology images.
Blue arrows indicate disruption to the stratum corneum and the red arrows indicate that the
breach is contained within the epidermis. Scale bar represents 100 m and diameter of
Design 1 microneedle disc is 15.8 mm. ................................................................................. 125
Figure 67 Impact tests of Design 1 microneedles on Model 3B, where (a) force–time plot and
(b) the description of points along the force–time curve. The impact occurred at 0.13 ms,
where the velocity was approximately 4.96 ms-1
, the force was 17.5 N and the maximum
force reached was 84.4 N. The data suggest that the initial insertion occurred at 0.13 ms.
Hence, at this point the velocity was approximately 4.96 ms-1
, the force was 17.5 N and the
maximum velocity and force reached were 5 ms-1
and 84.4 N respectively. ........................ 126
Figure 68 Inspection technique of clinical applicator tests on Models 1A–4A for penetration
efficiency with methylene blue staining where the whole disc provides visual confirmation of
penetration and the cropped image, which is the selection highlighted in red is 5 × 5 mm in
size and was used for calculating penetration efficiency for (a) 67%, (b) 80%, (c) 88% and (d)
96% of water content in the gelatine gels. The diameter of Design 2 microneedle disc is 30.1
mm. ........................................................................................................................................ 129

xxv
Figure 69 Inspection technique of clinical applicator tests on Models 1B–4B for penetration
efficiency with methylene blue staining where the whole disc provides visual confirmation of
penetration and the cropped image, which is the selection highlighted in red is 5 × 5 mm in
size and was used for calculating penetration efficiency for (a) 67%, (b) 80%, (c) 88% and (d)
96% of water content in the gelatine gels. The diameter of Design 2 microneedle disc is 30.1
mm. ........................................................................................................................................ 130
Figure 70 Penetration efficiency determined from the methylene blue images for clinical
applicator tests on 3 samples each of Models 1A–4B. Error bars depict SD. ....................... 131
Figure 71 Comparison of perforation depths (H&E staining) using the clinical applicator for
abdominal and back skin models with respect to altering the water content in gelatine gels.
Red arrows indicate that the breach is contained within the epidermis and the black arrows
indicate that the breach has extended into the dermis. Scale bar represents 100 m and
diameter of Design 2 microneedle disc is 30.1 mm. .............................................................. 133
Figure 72 Perforation depth data for clinical applicator tests, where (a) abdominal skin
models and (b) back skin models, with the number of images (n) in each group listed above
each box and whisker plot...................................................................................................... 135
Figure 73 Breach area data for clinical applicator tests, where (a) abdominal skin models and
(b) back skin models, with the number of images (n) in each group listed above each box and
whisker plot. ........................................................................................................................... 136
Figure 74 Frequency distribution of the breach area for clinical applicator tests on (a)
abdominal skin models and (b) back skin models. ................................................................ 137
Figure 75 The force–time plot for clinical applicator tests of Design 2 microneedles on
Model 1A. The impact occurred at 4.62 s, where the force was 61.8 N and the maximum
force reached was 80.8 N. The data suggests that the initial insertion occurred at 4.62 s.
Hence, at this point the force was 61.8 N and the maximum force reached 80.8 N. ............. 138
xxvi
Figure 76 Force data for clinical applicator tests, where n = 4 for each skin model (a)
insertion force data for the abdominal and back skin models, (b) maximum force–gel water
content for Models 1A–4A and (c) maximum force for Models 1A–4A vs elastic modulus of
the gelatine gels...................................................................................................................... 139
Figure 77 Clinical applicator studies for the comparison of Design 1 and 2 microneedles on
perforation confirmation (methylene blue staining) and perforation depth (H&E staining), on
Model 3B. (a) Design 2 and (b) Design 1. The diameter of Design 1 microneedle disc is 15.8
mm. The diameter of Design 2 microneedle disc is 30.1 mm, Red arrows indicate that the
breach is contained within the epidermis and the black arrows indicate that the breach has
extended into the dermis. Scale bar represents 100 m. ........................................................ 141
Figure 78 Perforation depth data for clinical applicator tests comparing results of Design 1
and 2 microneedles on Model 3B, with the number of images (n) in each group listed above
each box and whisker plot...................................................................................................... 141
Figure 79 Frequency distribution for clinical applicator studies using Design 1 and 2
microneedles on Model 3B. ................................................................................................... 142
Figure 80 Penetration efficiency as determined from the methylene blue images for impact
and clinical applicator tests on abdominal skin models (Model 1A–4A). ............................. 144
Figure 81 Penetration efficiency determined from the methylene blue images for impact and
clinical applicator tests on back skin models (Model 1B–4B). ............................................. 145
Figure 82 Impact and clinical applicators interaction with abdominal skin models by varying
the gel water content to determine that perforation is achieved (methylene blue staining) and
perforation depth (H&E staining) using Design 2 microneedles. (a) 67% (b) 80% (c) 88% and
(d) 96% gel water content. Red arrows indicate that the breach is contained within the
epidermis and the black arrows indicate that the breach has extended into the dermis. Scale
bar represents 100 m and diameter of Design 2 microneedle disc is 30.1 mm. .................. 147

xxvii
Figure 83 Impact and clinical applicators interaction with back skin models by varying the
gel water content to determine that perforation is achieved (methylene blue staining) and
perforation depth (H&E staining) using Design 2 microneedles. (a) 67% (b) 80% (c) 88% and
(d) 96% gel water content. Red arrows indicate that the breach is contained within the
epidermis and the black arrows indicate that the breach has extended into the dermis. Scale
bar represents 100 m and diameter of the microneedle disc is 30.1 mm. ............................ 149
Figure 84 Perforation depth data for impact and clinical applicator tests comparison on
abdominal skin models, where 1A–4A refers to Models 1A–4A, with the number of images
(n) in each group listed above each box and whisker plot. .................................................... 150
Figure 85 Perforation depth data for impact and clinical applicator tests comparison on back
skin models, where 1B–4B refers to Models 1B–4B, with the number of images (n) in each
group listed above each box and whisker plot. ...................................................................... 151
Figure 86 Breach area data comparison between impact and clinical applicator tests on
abdominal skin models, with the number of images (n) in each group listed above each box
and whisker plot. .................................................................................................................... 151
Figure 87 Breach area data comparison between impact and clinical applicator tests on back
skin models, with the number of images (n) in each group listed above each box and whisker
plot. ........................................................................................................................................ 152
Figure 88 Frequency distribution for impact and clinical applicator studies using Design 2
microneedles on (a) abdominal skin models and (b) back skin models. ............................... 153
Figure 89 Impact and clinical applicator studies for the comparison of Design 1 and 2
microneedles on perforation confirmation (methylene blue staining) and perforation depth
(H&E staining), on Model 3B. (a) Design 1 and (b) Design 2. The diameter of Design 1
microneedle disc is 15.8 mm. The diameter of Design 2 microneedle disc is 30.1 mm. Red
xxviii
arrows indicate that the breach is contained within the epidermis and the black arrows
indicate that the breach has extended into the dermis. Scale bar represents 100 m. ........... 155
Figure 90 Perforation depth data for impact and clinical applicator tests comparing results of
Design 1 and 2 microneedles on Model 3B, with the number of images (n) in each group
listed above each box and whisker plot. ................................................................................ 156
Figure 91 Frequency distribution for impact and clinical applicator studies using Design 2
microneedles. ......................................................................................................................... 157
Figure 92 Force data comparison between the impact and clinical applicator tests on (a)
abdominal skin models and (b) back skin models. ................................................................ 159
Figure 93 Optical Coherence Tomography images of skin, where (a) palmar region of skin
with no microneedle perforations and (b) skin from the inner wrist with microneedles
embedded. (Courtesy Renephra Ltd). .................................................................................... 202
Figure 94 Breach area selection on XMT image of microneedle treated skin. Scale bar
represents 100 m. ................................................................................................................. 230
Figure 95 Volume rendering showing the output of the segmentation process on microneedle
treated Model 3A, showing the stratum corneum and epidermal layers only. Scale bar
represents 100 m. ................................................................................................................. 231
Figure 96 Volume rendering showing the various orthogonal layouts of the 3D image of the
skin, where (a) XY, (b) XZ and (c) YZ. Scale bar represents 100 m. ................................. 231
Figure 97 Comparison of imaging techniques on Model 3A, where (a) XMT images and (b)
H&E images. Scale bar represents 100 m. .......................................................................... 232

xxix
List of Tables
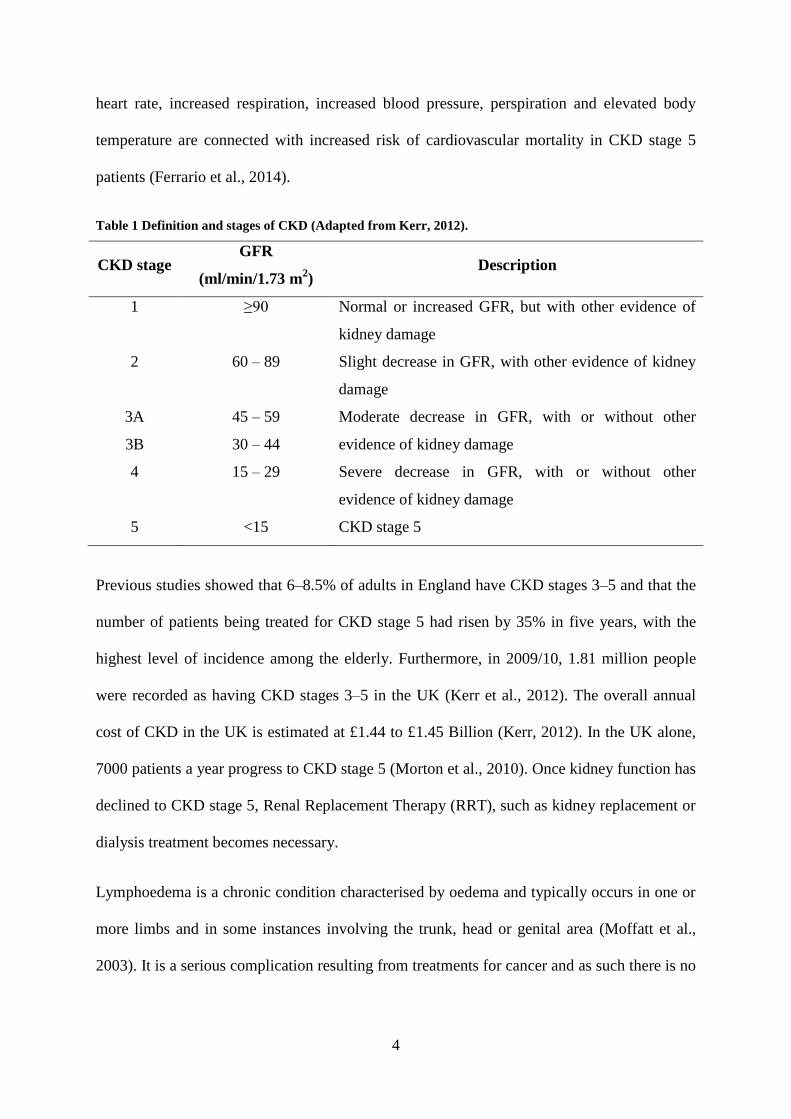
Table 1 Definition and stages of CKD (Adapted from Kerr, 2012). ......................................... 4
Table 2 Average elastic modulus of each probe size for nanoindentation tests performed on
mice ears (Reproduced from (Crichton et al., 2013)). ............................................................. 24
Table 3 Average elastic modulus for in vitro tests of human and porcine skin. In cases, where
the elastic modulus has not been reported, the UTS values have been used and is denoted by
*. ............................................................................................................................................... 25
Table 4 Comparison of published elastic modulus results on the volar forearm of human skin
using indentation methods in vivo............................................................................................ 27
Table 5 The interstitial fluid pressures as they relate to oedema (Guyton et al., 1971). ......... 30
Table 6 The elastic modulus of skin and its sub-layers obtained from the literature, * denotes
reduced elastic modulus and ** denotes pressure values. ....................................................... 33
Table 7 Examples of previous published work on microneedles manufacturing processes. .. 37
Table 8 Composition of gelatine powder and water. .............................................................. 58
Table 9 The categories of two anatomical sites of neonatal porcine skin at various gelatine
gel concentrations and Perma-Gel®. A = Abdominal skin and B = Back skin. ....................... 60
Table 10 PMMA microneedles specification. ......................................................................... 68
Table 11 Velocity as a function of dropping height. ............................................................... 69
Table 12 Micromechanical properties of the different layers of the skin model (Mean ± SD).
.................................................................................................................................................. 95

xxx
Abbreviations
ANOVA Analysis of Variance
BCM Body Composition Monitor
CKD Chronic Kidney Disease
CMFT Manchester Royal Infirmary
GFR Glomerular Filtration Rate
HCI Hydrochloric acid
HD Haemodialysis
IMS Industrial Methylated Spirit
ISF Interstitial Fluid
ns Not Significant
PBS Phosphate Buffered Sulphate
PE Penetration Efficiency
PEEK PolyEtherEtherKetone
PMMA PolyMethylMethAcrylate
RRT Renal Replacement Therapy
SD Standard Deviation
TEWL TransEpidermal Water Loss
TFR Transdermal Fluid Removal
UTS Ultimate Tensile Strength
XMT X-ray Micro Computed Tomography

1
Chapter 1
1. Introduction
1.1 General Introduction
There are a number of diseases like kidney failure, heart failure that lead to a build-up of fluid
and oedema in the body. Fluid overload assessment therapies, which are mentioned in more
detail in Section 1.2.1 and fluid overload management, mentioned in greater detail in Section
1.2.2 have advantages and disadvantages to their use, however, to improve patient prognosis
and long-term recovery, the development of technologies that maintain the fluid volume level
as close to the normal body fluid of the patient is necessary (Elsayed and Stack, 2015).
Hence, Renephra Ltd is developing a novel approach using microneedles to address the issue
of fluid overload, which involves a minimally invasive means of accessing the interstitial
fluid (ISF) in the skin. This new approach involves the slow removal of fluids and toxins
from the body. Renephra’s technology would be sympathetic towards the environment as it
does not require water usage, minimal power required to operate, is portable (Wang et al.,
2005) and will therefore not contribute to the carbon footprint. Outside the UK, the
technology will have a significant potential in developing countries with weak healthcare
infrastructure and inability to implement energy-intensive and costly medical interventions
(Wang et al., 2005). The aim of this project was to understand the insertion parameters
required to obtain optimal insertion of microneedles into skin in order to facilitate fluid
removal. The proposed novel solution is covered in Section 1.3.
1.2 The Effects of Fluid Overload and Oedema
The accumulation of fluid around the lungs, the heart and pericardium or the abdominal
cavity and subcutaneous tissues can cause peripheral oedema because abnormal levels of

2
fluid can move from the intravascular space and build-up in the interstitial space (Lo Gullo et
al., 2015). Therefore, oedema can be defined as a substantial swelling caused by a build-up of
ISF (Ely et al., 2006). The build-up of ISF takes place in the pleural, pericardial and
peritoneal spaces and subcutaneous tissue planes (Lo Gullo et al., 2015).
Within the interstitial space, there is transportable free fluid like water, collagen, elastin and
gel-like ground substances. The combination of these components influence the mechanical
behaviour of tissues (Guyton et al., 1971). In oedematous tissue, the interstitial spaces contain
an abnormally high quantity of fluid, which affects its mechanical characteristics. This excess
fluid creates stress and strain within the collagen and elastin fibres in the skin and diminishes
the elasticity of the tissue and lowers the viscosity in ground substance (Guyton et al., 1971).
Moreover, the severity and speed at which oedema develops affects the structural and
mechanical integrity of the tissue (Guyton et al., 1971). Oedema in skin can be described as
subcutaneous pitting or subcutaneous non-pitting oedema. The glycosaminoglycan content in
healthy tissue enables it to produce a high resistance to displacement of ISF (Levick, 1987).
To establish whether a patient has subcutaneous pitting oedema, a finger is pressed to the area
of skin with swelling for 10 seconds, which leaves a dent. The dent will slowly fill back in,
with the skin returning to its original state (Renephra, 2015). For subcutaneous non-pitting
oedema however, after depressing the area affected by swelling, no dent is observed in the
skin. Subcutaneous non-pitting oedema is usually hard and can be attributed to fibrous or
fatty tissue growth (Bates et al., 1994).
Furthermore, fluid overload in the interstitial space can be caused by liver failure, renal
failure, heart failure, protein loss, dietary noncompliance (Cho and Atwood, 2002) or drug
induced (Singh et al., 2007). Some of the medical symptoms of fluid overload are weight gain
(Nesto et al., 2003), oedema (Ely et al., 2006), loud snoring (Ely et al., 2006), sleep apnoea
(Parker, 2003) or shortness of breath (Flores and Rider, 2016).

3
Fluid overload can be used as a biomarker for indicating heart failure in patients (Chin et al.,
2014). A significant proportion of hospital admissions for heart failure are due to fluid
overload (Peacock et al., 2009) and findings by Adams et al. indicated that the manifestations
of peripheral oedema occurred in 66% of hospitalised patients with heart failure (Adams et
al., 2005). Furthermore, globally heart failure is a common occurrence (Mendez and Cowie,
2001) that increasingly affects an ageing population (McMurray and Stewart, 2000). Despite
the reduction in the number of deaths caused by cardiovascular disease, the frequency of
heart failure however is on the rise (Gibbs et al., 1998) and the long-term prospects of
recovery poor (Croft et al., 1999). Additionally, heart failure poses a major economic burden,
with it accounting for 1–2% of health care expenditure in the UK and some developed
countries (Berry et al., 2001). The health care expenditure for heart failure in the UK is a
combination of direct and indirect cost, which is circa £1.12 Billion (Cook et al., 2014). In his
study, Sutton (1990) projected that hospital admissions for heart failure would be between
100 000 to 200 000 admissions annually (Sutton, 1990). Over a decade later, Stewart et al.
reported 140 000 hospital admissions (Stewart et al., 2002).
Fluid overload is also linked with mortality or cardiovascular morbidity in patients with
advanced Chronic Kidney Disease (CKD) (Tsai et al., 2015). The rates of prevalence of CKD
appear to be increasing globally and are likely to increase further as a consequence of ageing
populations and the increased prevalence of Type II diabetes mellitus (Hamer and El-Nahas,
2006). CKD is characterised depending on the stage at which the disease has progressed to
(see Table 1 for definitions). The Glomerular Filtration Rate (GFR), which is a measure of
the amount of blood that passes through the glomerulus, the filtering unit of the kidney each
minute falls as the disease progresses (Kerr, 2012). Fatality could occur within a few months
of a patient reaching CKD stage 5 if untreated. Ferrario et al. demonstrated how fluid
overload coupled with factors such as hyper-sympathetic activity, which include increased
4
heart rate, increased respiration, increased blood pressure, perspiration and elevated body
temperature are connected with increased risk of cardiovascular mortality in CKD stage 5
patients (Ferrario et al., 2014).
Table 1 Definition and stages of CKD (Adapted from Kerr, 2012).
CKD stage GFR
(ml/min/1.73 m2)
Description
1 ≥90 Normal or increased GFR, but with other evidence of
kidney damage
2 60 – 89 Slight decrease in GFR, with other evidence of kidney
damage
3A 45 – 59 Moderate decrease in GFR, with or without other
evidence of kidney damage 3B 30 – 44
4 15 – 29 Severe decrease in GFR, with or without other
evidence of kidney damage
5 <15 CKD stage 5
Previous studies showed that 6–8.5% of adults in England have CKD stages 3–5 and that the
number of patients being treated for CKD stage 5 had risen by 35% in five years, with the
highest level of incidence among the elderly. Furthermore, in 2009/10, 1.81 million people
were recorded as having CKD stages 3–5 in the UK (Kerr et al., 2012). The overall annual
cost of CKD in the UK is estimated at £1.44 to £1.45 Billion (Kerr, 2012). In the UK alone,
7000 patients a year progress to CKD stage 5 (Morton et al., 2010). Once kidney function has
declined to CKD stage 5, Renal Replacement Therapy (RRT), such as kidney replacement or
dialysis treatment becomes necessary.
Lymphoedema is a chronic condition characterised by oedema and typically occurs in one or
more limbs and in some instances involving the trunk, head or genital area (Moffatt et al.,
2003). It is a serious complication resulting from treatments for cancer and as such there is no
5
proven drug treatment for it (Moffatt et al., 2003). Hence, novel fluid removal treatments,
such as Renephra’s device would be extremely beneficial for lymphoedema patients.
There are a number of treatment therapies available for assessing and managing fluid
overload and a brief overview is discussed in the next section.
1.2.1 Overview of current fluid overload assessment methodologies
Despite significant developments in science, there remains a significant barrier in dispensing
effective treatment options for fluid overload. Furthermore, the clinical evaluation of fluid
overload caused by cardiac failure is expensive and challenging (Frank Peacock and Soto,
2010). Moreover, as heart failure predominantly affects the ageing population (adults over 75
years old), this means that clinical trials of potential assessment or treatment therapies are
often performed on younger, healthier subjects and as such the outcomes of these endeavours
may not be applicable (Kitzman and Rich, 2010; Rich et al., 2016).
Measuring a patient’s dry weight is a potential assessment solution for fluid overload. The
accurate estimation of dry weight is necessary in reaching a state of normal body fluid; this is
because the symptoms of hypervolemia exhibit inadequately low sensitivity rates (Frank
Peacock and Soto, 2010). There are issues however surrounding the optimal approach of
assessing dry weight and using this approach on its own could lead to a patient’s demise.
Another approach is thermo-dilution, which is the measurement of the quantity of
extravascular lung water present in the lung. This method has not gained significant
popularity due to clinicians’ reluctance in depending solely on lung water measurements
(Brown et al., 2009).
Body Composition Monitor (BCM) is a well-known method of fluid overload assessment.
BCM measures the hydration levels in CKD patients (Hung et al., 2014). It works because of
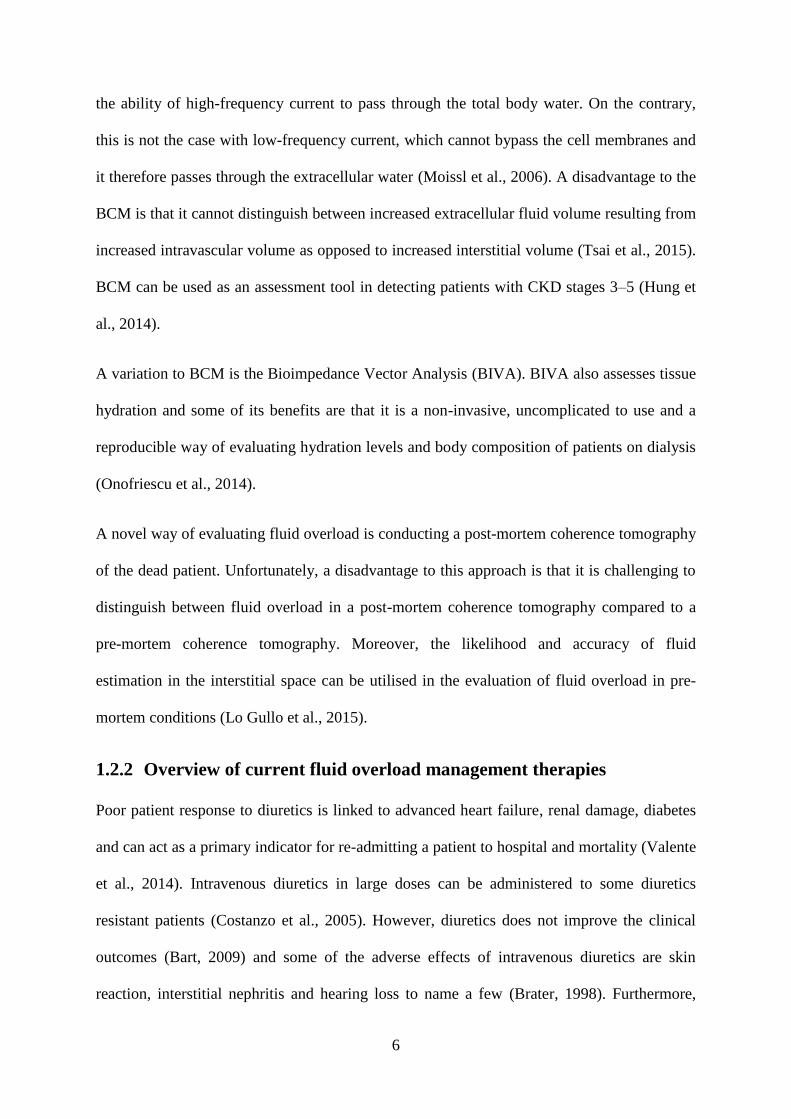
6
the ability of high-frequency current to pass through the total body water. On the contrary,
this is not the case with low-frequency current, which cannot bypass the cell membranes and
it therefore passes through the extracellular water (Moissl et al., 2006). A disadvantage to the
BCM is that it cannot distinguish between increased extracellular fluid volume resulting from
increased intravascular volume as opposed to increased interstitial volume (Tsai et al., 2015).
BCM can be used as an assessment tool in detecting patients with CKD stages 3–5 (Hung et
al., 2014).
A variation to BCM is the Bioimpedance Vector Analysis (BIVA). BIVA also assesses tissue
hydration and some of its benefits are that it is a non-invasive, uncomplicated to use and a
reproducible way of evaluating hydration levels and body composition of patients on dialysis
(Onofriescu et al., 2014).
A novel way of evaluating fluid overload is conducting a post-mortem coherence tomography
of the dead patient. Unfortunately, a disadvantage to this approach is that it is challenging to
distinguish between fluid overload in a post-mortem coherence tomography compared to a
pre-mortem coherence tomography. Moreover, the likelihood and accuracy of fluid
estimation in the interstitial space can be utilised in the evaluation of fluid overload in pre-
mortem conditions (Lo Gullo et al., 2015).
1.2.2 Overview of current fluid overload management therapies
Poor patient response to diuretics is linked to advanced heart failure, renal damage, diabetes
and can act as a primary indicator for re-admitting a patient to hospital and mortality (Valente
et al., 2014). Intravenous diuretics in large doses can be administered to some diuretics
resistant patients (Costanzo et al., 2005). However, diuretics does not improve the clinical
outcomes (Bart, 2009) and some of the adverse effects of intravenous diuretics are skin
reaction, interstitial nephritis and hearing loss to name a few (Brater, 1998). Furthermore,

7
studies have shown that diuretic resistance develops in some heart failure patients (Kramer et
al., 1999).
Dialysis is a machine-assisted blood filtration technique that removes waste and excess fluid
from the blood in a dialyser. It requires surgical intervention, whereby a doctor creates
permanent access to the blood stream, via the arm or thigh (Roth et al., 2012). Dialysis is an
invasive treatment option for acute renal failure and has grown to become the leading rescue
therapy for patients with CKD stage 5, without which would lead to a patient’s imminent
demise (Cavalli et al., 2010). For patients on dialysis, fluid overload is a common occurrence
as well as other risk factors such as hypertension, left ventricular hypertrophy and death due
to cardiac failure (Kalantar-Zadeh et al., 2009; Seibert et al., 2013). Antlanger et al. suggests
that achieving a state of normal body fluid volume is key for maintaining the well-being of
patients on dialysis (Antlanger et al., 2013). A drawback to dialysis is that it is related to poor
long term clinical outcomes, high risk of death (Bleyer et al., 1999), expensive (Feest et al.,
2004), is also one of the most water and power intensive of all healthcare therapies and
disregards the environmental impact it creates (Agar, 2012).
This project aims to conduct a fundamental study on microneedles interaction with skin for
the purpose of advancing Renephra’s novel device. Microneedle technology is discussed in
more detail in Section 2.5.
1.3 Proposed Novel Solution for Fluid Overload Relief
The novel medical device is for the relief of fluid overload, which should reduce the amount
of oedema and lead to improved patient well-being. Fluid overload is associated with kidney
and heart failure diseases (Peacock et al., 2009; Tsai et al., 2015), which affects a significant
proportion of patients who are unresponsive to diuretic treatment (Valente et al., 2014).
Consequently, the patients need hospitalisation for intravenous diuretics (Costanzo et al.,

8
2005) and in extreme cases requires the invasive dialysis treatment option (Grassmann et al.,
2005).
1.3.1 Access to interstitial fluid via skin
One of the health challenges associated with heart and kidney disease is the onset of oedema.
Removing ISF from skin in oedematous patients instead of blood via dialysis is feasible
because blood and ISF are dynamic and interconnected compartments hence, fluid and toxins
are shared between compartments (Ebah, 2012). Thus, extracting the ISF from skin
eliminates the surgical intervention required to access the blood. The challenge however is
overcoming the uppermost layer of skin (stratum corneum), which is designed to act as a
barrier to prevent foreign objects from gaining entry and fluid loss by the body. A suitable
device for bypassing the barrier characteristics of the stratum corneum, the skin’s uppermost
layer are microneedle arrays.
1.3.2 Microneedle arrays to breach skin’s barrier
Microneedles are suitable to breach the stratum corneum in order to access the ISF in skin’s
epidermal layer, dermal layer and fluid located subcutaneously. Microneedle arrays for
transdermal drug delivery purposes were first patented by Gerstel and Place in 1976 (Gerstel
and Place, 1976). It was not until the advancements in the micro-fabrication industry in the
1990s however that the devices could be manufactured and tested (Henry et al., 1998). To
date, microneedles are primarily used for drug delivery (Kim et al., 2012). Renephra has
therefore found an innovative use for microneedles for the purpose of ISF extraction and the
anticipation is for this approach to be used at a commercial level.
1.3.3 Transdermal Fluid Removal technology
The first generation Transdermal Fluid Removal (TFR) technology for fluid extraction was a
combination of a hollow microneedle array with a fluid capturing hydrogel pouch able to

9
absorb large capacities of fluid. When the microneedle array is inserted into skin, the fluid is
drawn up the microneedles by capillary action and captured by the hydrogel pouch. The
initial application of the microneedle array to skin was by manual approach and then later
with a spring-driven applicator. The preliminary study using human subjects highlighted that
TFR required further development to make it a suitable device for managing fluid overload
(Renephra, 2012). In particular, the unreliability and unpredictability associated with manual
application of microneedles such as, dependence on fluid pressure and the inability to
quantify insertion force demonstrated the limitations with this approach. Furthermore, the
spring-driven microneedle applicator was also a crude way of controlling the insertion force
or insertion velocity.
Ebah (2012) demonstrated the feasibility of TFR technology on 6 healthy volunteers and 37
CKD patients attending renal clinics or wards at Manchester Royal Infirmary (CMFT). ISF
was extracted from 68.8% of patients, where successful microneedle penetration occurred
and showed that microneedles caused no pain or bleeding in over 95% of applications (Ebah,
2012). Ebah (2012) also noted that CKD patients had raised interstitial pressures and ISF
volumes compared to healthy subjects. The raised level of interstitial pressure in CKD
patients with obvious oedema is a combination of a build-up of interstitial compartment fluid
volume, pre-existing oedema and tissue mechanical characteristics. In addition, Ebah (2012)
noted that the time taken for oedema to refill the depressed area could be a significant
parameter in the clinical assessment of oedema.
The latest generation of the device uses microneedles to access fluid located in the
epidermis/dermis and negative pressure used to extract fluid from skin and subdermis. The
microneedle array is applied to the skin using an applicator. Once applied, it is removed after
several seconds and microchannels are created in the top layers of the skin allowing for fluid
to flow. Negative pressure is then applied to remove excess ISF and collect it in a canister
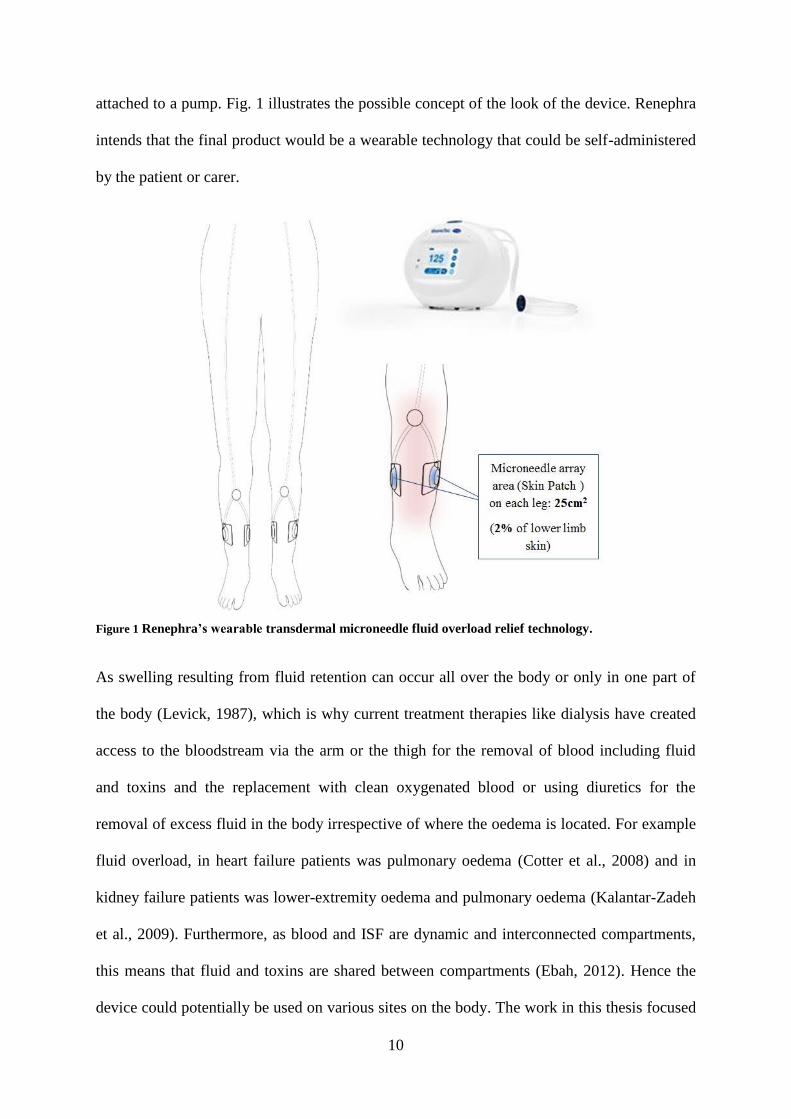
10
attached to a pump. Fig. 1 illustrates the possible concept of the look of the device. Renephra
intends that the final product would be a wearable technology that could be self-administered
by the patient or carer.
Figure 1 Renephra’s wearable transdermal microneedle fluid overload relief technology.
As swelling resulting from fluid retention can occur all over the body or only in one part of
the body (Levick, 1987), which is why current treatment therapies like dialysis have created
access to the bloodstream via the arm or the thigh for the removal of blood including fluid
and toxins and the replacement with clean oxygenated blood or using diuretics for the
removal of excess fluid in the body irrespective of where the oedema is located. For example
fluid overload, in heart failure patients was pulmonary oedema (Cotter et al., 2008) and in
kidney failure patients was lower-extremity oedema and pulmonary oedema (Kalantar-Zadeh
et al., 2009). Furthermore, as blood and ISF are dynamic and interconnected compartments,
this means that fluid and toxins are shared between compartments (Ebah, 2012). Hence the
device could potentially be used on various sites on the body. The work in this thesis focused

11
on two anatomical regions of neonatal porcine skin i.e. the abdominal tissue and back tissue
due to their differences in thickness and stiffness. The physiological properties of neonatal
porcine skin are similar to human skin (Lo Presti et al., 2012) and the stiffness is within the
range of values for the stiffness of human tissue (Groves, 2011).
The device will use technology developed by Renephra Ltd where the skin is pierced with a
small cluster of microneedles. More recent studies by Renephra demonstrated that following
the bypass of the stratum corneum by microneedle intervention, this fluid is readily
accessible. Using microneedles and negative pressure, the fluid extraction rates of 2
ml/cm2/hr were achieved along with fluid volume extracted, which was > 5 ml in patients
with severe oedema. The fluid extraction process lasted over four hours, with approximately
60 ml of fluid removed over 7 cm2 small surface area in some patients. The extracted fluid
volume increased linearly with time (r=0.24, p=0.008). This indicates that an appropriate
microneedle surface area of 50 cm2 used for a period of 8 hours could result in the extraction
of up to 800 ml and could be potentially clinically significant. Furthermore, clinicians
estimate that a significant volume for such a device will be between 250 and 1000 ml per day
(Renephra, 2015).
Fig. 2 shows the most recent progress with the proposed TFR technology, using a clinical
applicator that comprises a spring and hammer driven mechanism (Renephra, 2015). The
proposed device removes excess fluid from the body via the skin. A vacuum chamber is then
placed over the microneedle perforated site to draw up liquid, which is collected in a canister.
The images show the successful extraction of ISF from a patient in a clinical research at the
CMFT. The potential device if developed would be a huge benefit to thousands of patients in
the UK and hundreds of thousands globally. It would enable patients take advantage of a
home/community based, minimally invasive, bloodless and self-administered fluid removal
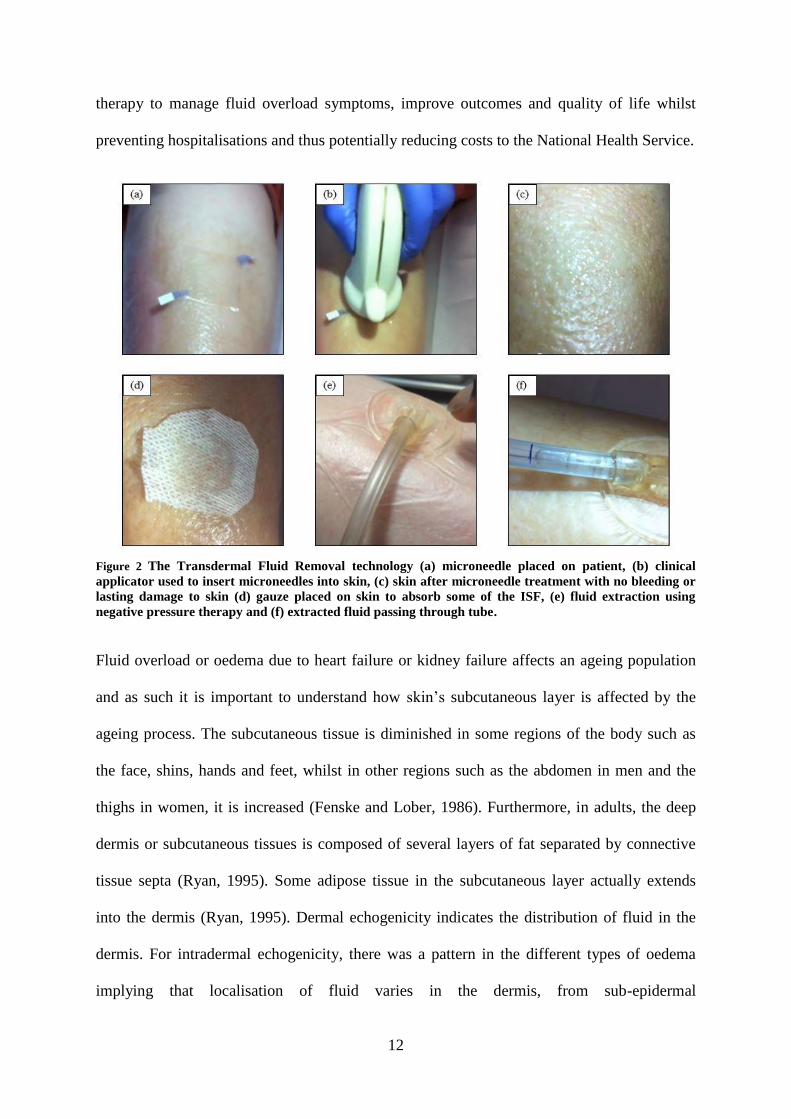
12
therapy to manage fluid overload symptoms, improve outcomes and quality of life whilst
preventing hospitalisations and thus potentially reducing costs to the National Health Service.
Figure 2 The Transdermal Fluid Removal technology (a) microneedle placed on patient, (b) clinical
applicator used to insert microneedles into skin, (c) skin after microneedle treatment with no bleeding or
lasting damage to skin (d) gauze placed on skin to absorb some of the ISF, (e) fluid extraction using
negative pressure therapy and (f) extracted fluid passing through tube.
Fluid overload or oedema due to heart failure or kidney failure affects an ageing population
and as such it is important to understand how skin’s subcutaneous layer is affected by the
ageing process. The subcutaneous tissue is diminished in some regions of the body such as
the face, shins, hands and feet, whilst in other regions such as the abdomen in men and the
thighs in women, it is increased (Fenske and Lober, 1986). Furthermore, in adults, the deep
dermis or subcutaneous tissues is composed of several layers of fat separated by connective
tissue septa (Ryan, 1995). Some adipose tissue in the subcutaneous layer actually extends
into the dermis (Ryan, 1995). Dermal echogenicity indicates the distribution of fluid in the
dermis. For intradermal echogenicity, there was a pattern in the different types of oedema
implying that localisation of fluid varies in the dermis, from sub-epidermal

13
(lipodermatosclerosis), uniform (lymphoedema), to deep dermal (heart failure) (Gniadecka,
1996). Furthermore, magnetic resonance imaging showed that water content is particularly
increased in the sub-epidermal layer of aged skin and decreased echogenicity (Gniadecka et
al., 1994). Decreased echogenicity may also be attributed to changes in the collagen fibre
arrangement (Gniadecka et al., 1994). The work in this thesis focused on a skin model that
comprised a full thickness skin sample, a subcutaneous mimic of varying water content
concentration and a muscle mimic. There are many limitations with developing an in vitro
model of skin that can adequately mimic the in vivo behaviour of oedematous skin, however,
in future; fluid could be injected into a membrane placed within the subcutaneous layer of the
in vitro model.

14
1.4 Research Project Plan
This research programme will build on Renephra’s background Intellectual Property and
early stage TFR technology by conducting comprehensive experimental studies focusing on
the biomechanical interaction of the microneedle device with skin. CMFT’s preliminary
study using human subjects however, has identified several areas where the technology needs
further development to make it a robust fluid overload management treatment therapy.
1.4.1 Aims and Objectives
The overall aim of this project was to determine quantitatively the parameters for repeatable
and reproducible insertion of microneedles into skin. The specific objectives were:
The first objective was to conduct an experimental analysis of the mechanical properties of
skin. This involved the determination of an ideal skin model and micromechanical
characterisation of each of the layers in the skin model and their contribution to the overall
properties of the skin.
The second objective was to develop an in vitro impact applicator system for microneedles to
quantify the optimal insertion force and insertion velocity. This involved the use of three
types of microneedles to determine the optimum system for skin penetration.
The third objective was to determine the insertion force from the clinical applicator used in
CMFT study. The results from the clinical applicator study were compared with the results of
the impact applicator study.
The fourth objective was to assess the perforated skin model through various image analysis
techniques. This involved the visual examination of the perforated skin following staining
and analysis of the histology images of breach area created in skin with microneedles.

15
Chapter 2
2. Literature Review
2.1 Introduction
This section will detail the relevant literature. It will provide an overview of skin and its
mechanical properties. In addition, it will also review and discuss various types of
microneedle devices, microneedle applicators, mechanics of skin penetration and techniques
for imaging perforated skin.
2.2 The Anatomy of Skin
Skin is the largest organ of the human body and covers a surface area of between 1.5–2 m2
and functions as a regulator of heat and water loss from the body (Pegoraro et al., 2012). The
large surface area of skin offers ideal and multiple sites to administer therapeutic compounds
for both local and systemic actions. Furthermore, due to skin’s highly efficient self-repairing
barrier, it is designed to keep the internal organs protected and prevent foreign matter from
entering the body. In vivo, skin is in a process of continually regenerating itself and provides
immunological and histological reactions to external insults such as infection, temperature
extremes, dehydration and mechanical trauma (Williams, 2004).
The skin is composed of three primary layers, which are the epidermis, dermis and
hypodermis (Pegoraro et al., 2012) as represented schematically in Fig. 3.
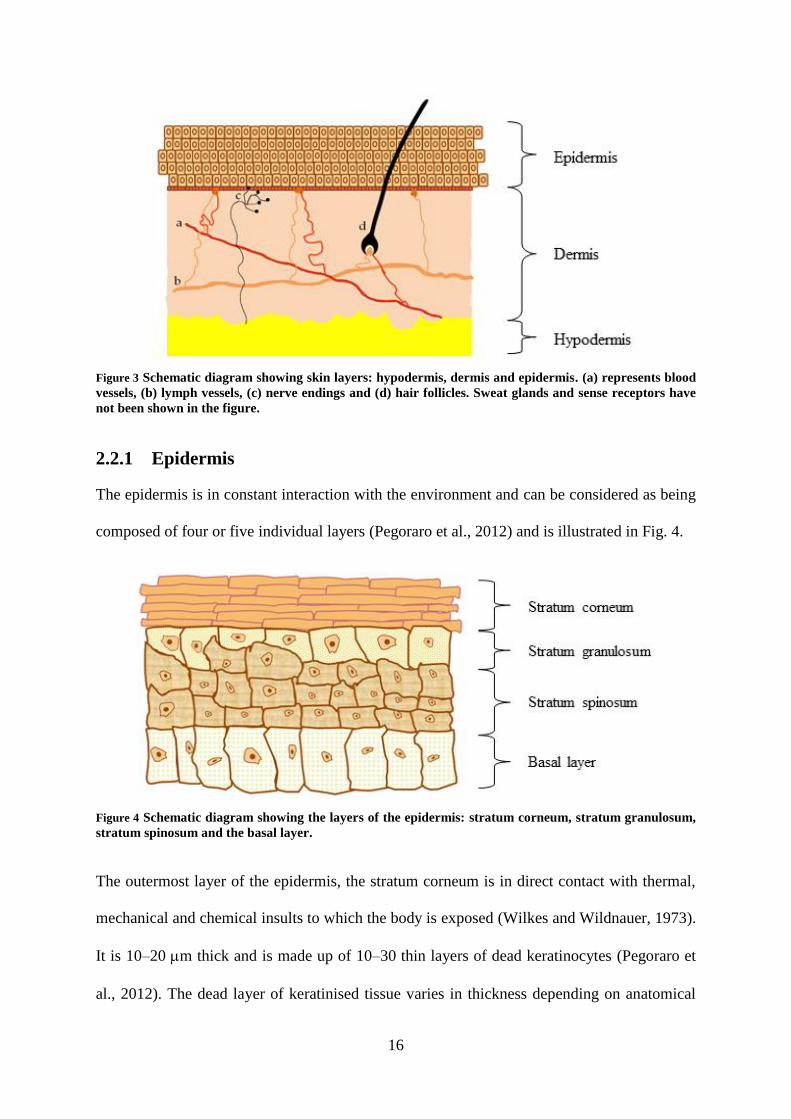
16
Figure 3 Schematic diagram showing skin layers: hypodermis, dermis and epidermis. (a) represents blood
vessels, (b) lymph vessels, (c) nerve endings and (d) hair follicles. Sweat glands and sense receptors have
not been shown in the figure.
2.2.1 Epidermis
The epidermis is in constant interaction with the environment and can be considered as being
composed of four or five individual layers (Pegoraro et al., 2012) and is illustrated in Fig. 4.
Figure 4 Schematic diagram showing the layers of the epidermis: stratum corneum, stratum granulosum,
stratum spinosum and the basal layer.
The outermost layer of the epidermis, the stratum corneum is in direct contact with thermal,
mechanical and chemical insults to which the body is exposed (Wilkes and Wildnauer, 1973).
It is 10–20 m thick and is made up of 10–30 thin layers of dead keratinocytes (Pegoraro et
al., 2012). The dead layer of keratinised tissue varies in thickness depending on anatomical
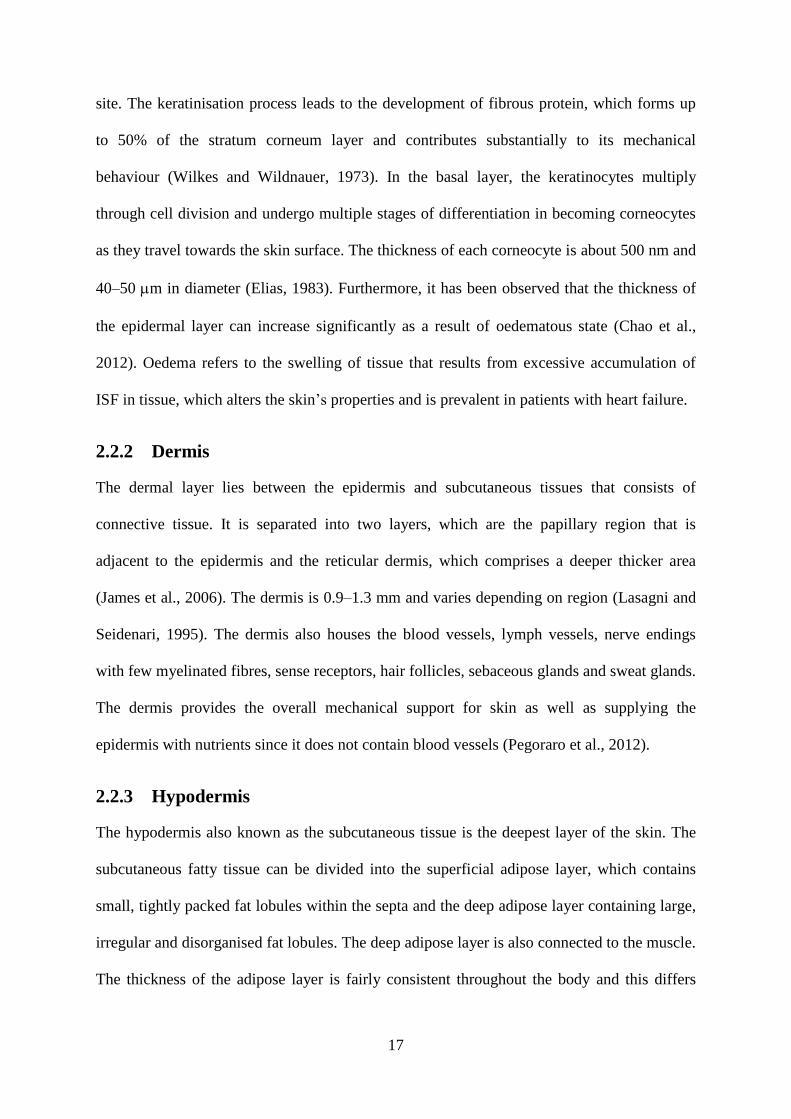
17
site. The keratinisation process leads to the development of fibrous protein, which forms up
to 50% of the stratum corneum layer and contributes substantially to its mechanical
behaviour (Wilkes and Wildnauer, 1973). In the basal layer, the keratinocytes multiply
through cell division and undergo multiple stages of differentiation in becoming corneocytes
as they travel towards the skin surface. The thickness of each corneocyte is about 500 nm and
40–50 m in diameter (Elias, 1983). Furthermore, it has been observed that the thickness of
the epidermal layer can increase significantly as a result of oedematous state (Chao et al.,
2012). Oedema refers to the swelling of tissue that results from excessive accumulation of
ISF in tissue, which alters the skin’s properties and is prevalent in patients with heart failure.
2.2.2 Dermis
The dermal layer lies between the epidermis and subcutaneous tissues that consists of
connective tissue. It is separated into two layers, which are the papillary region that is
adjacent to the epidermis and the reticular dermis, which comprises a deeper thicker area
(James et al., 2006). The dermis is 0.9–1.3 mm and varies depending on region (Lasagni and
Seidenari, 1995). The dermis also houses the blood vessels, lymph vessels, nerve endings
with few myelinated fibres, sense receptors, hair follicles, sebaceous glands and sweat glands.
The dermis provides the overall mechanical support for skin as well as supplying the
epidermis with nutrients since it does not contain blood vessels (Pegoraro et al., 2012).
2.2.3 Hypodermis
The hypodermis also known as the subcutaneous tissue is the deepest layer of the skin. The
subcutaneous fatty tissue can be divided into the superficial adipose layer, which contains
small, tightly packed fat lobules within the septa and the deep adipose layer containing large,
irregular and disorganised fat lobules. The deep adipose layer is also connected to the muscle.
The thickness of the adipose layer is fairly consistent throughout the body and this differs
18
from the deep adipose layer, where there are variations with respect to anatomical site
(Markman and Barton, 1987). The subcutaneous layers play an important role in the
mechanical properties of skin. In the body, subcutaneous adipose tissue contributes to skin
deformation during loading and load transfer from skin to deeper layers (Geerligs et al.,
2010a). The main functions of the subcutaneous layer are insulation and shock absorption. Its
abundance in collagen and fat means that it acts as an energy reservoir (Pegoraro et al.,
2012).
2.3 The Mechanical Characteristics of Skin
There is increased interest in the mechanical behaviour of skin due to the development of
micro-devices for drug delivery into the upper layers of skin (Crichton et al., 2013). Skin
provides a mechanical defence and acts as a chemical barrier, limiting infiltration by foreign
substances (Hendriks, 2005). It is subjected to pre-stress and exhibits anisotropic (Lanir and
Fung, 1974; Fung, 1993), non-linear (Barbenel and Evans, 1977) and viscoelastic (Agache et
al., 1980; Khatyr et al., 2004) characteristics. These mechanical characteristics are influenced
by elastin, proteoglycan, collagen and ISF (Lanir and Fung, 1974; Oomens et al., 1987) and
also differs due to age (Daly and Odland, 1979; Leveque et al., 1980), anatomical site
(Sandby-Moller et al., 2003) and level of hydration (Tagami et al., 1980). Although the
overall mechanical behaviour of skin is dominated by the dermal layers, the influence of the
stratum corneum on the global behaviour of skin cannot be ignored (De Rigal and Leveque,
1985; Hendriks, 2005). The general behaviour of the stratum corneum is highly influenced by
environmental properties such as temperature and relative humidity, both in vivo and in vitro
(Hendriks, 2005). In addition, mechanical disturbances to the stratum corneum are used to
highlight metabolic activities in order to preserve its barrier function (Yuan and Verma,
2006).

19
Early research demonstrated that skin is non-linear, viscoelastic and anisotropic (Veronda and
Westmann, 1970). The viscoelastic property of skin means that the mechanical response to
loading involves both a viscous component associated with hysteresis or energy dissipation
and an elastic component associated with energy storage, as shown in Fig. 5. The stratum
corneum is the stiffest of the skin’s layers and is therefore the least extendable under applied
load. It also exhibits less viscoelasticity and pre-conditioning behaviour compared to the
other layers but still maintains a non-linear stress-strain relationship under applied load.
Figure 5 Hysteresis as observed in the stress-strain behaviour of a viscoelastic material during cyclic
loading.
An observation made by Agache et al. for a strain–time curve showed that if a load was
applied to skin, the curve obtained could be split into three parts. The first part corresponded
to a purely elastic deformation, the second part of variable creep corresponded to the
viscoelastic phase and the third corresponded to a constant creep phase (Agache et al., 1980;
Khatyr et al., 2004). The typical stress-strain curve of human skin showed a gross re-
alignment of the collagen fibres in the direction of extension in phase 1, while phase 3
illustrated the stress-strain characteristics of aligned collagen fibres. Phase 2 demonstrated the
progressive alignment within the dermis. The tangent AB gave a measure of the elastic
Strain
Str
ess
Loading
Hysteresis
Unloading
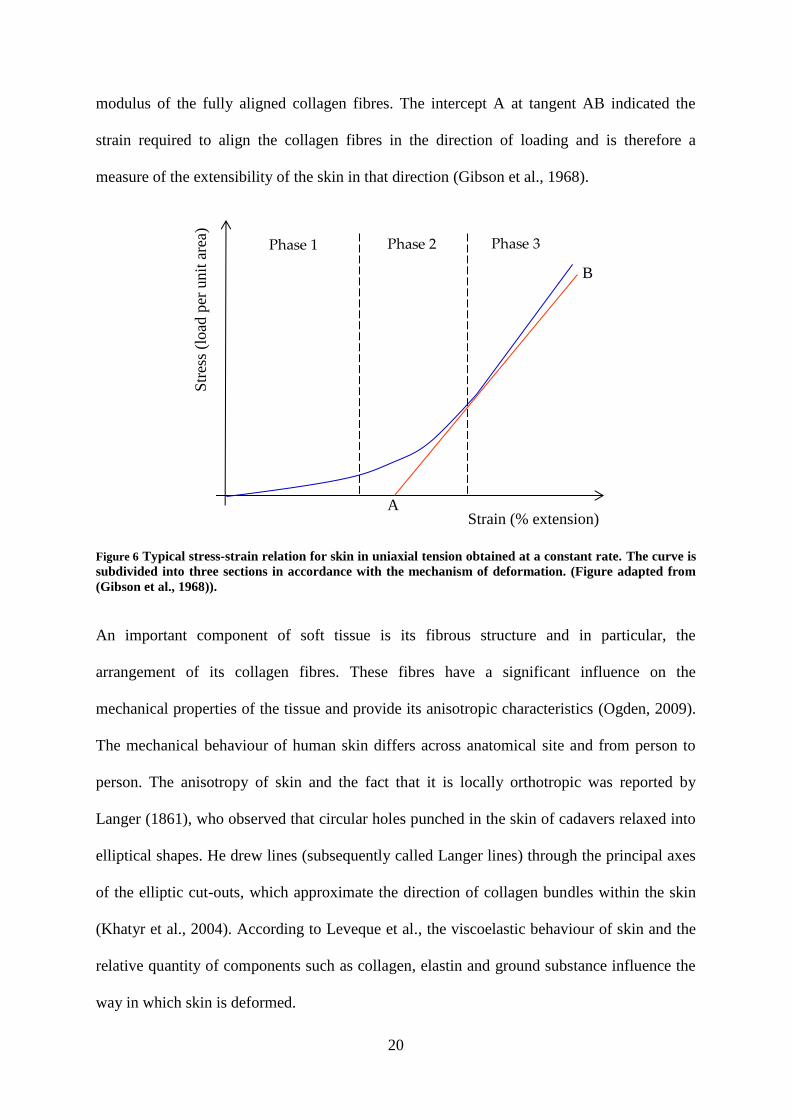
20
modulus of the fully aligned collagen fibres. The intercept A at tangent AB indicated the
strain required to align the collagen fibres in the direction of loading and is therefore a
measure of the extensibility of the skin in that direction (Gibson et al., 1968).
Figure 6 Typical stress-strain relation for skin in uniaxial tension obtained at a constant rate. The curve is
subdivided into three sections in accordance with the mechanism of deformation. (Figure adapted from
(Gibson et al., 1968)).
An important component of soft tissue is its fibrous structure and in particular, the
arrangement of its collagen fibres. These fibres have a significant influence on the
mechanical properties of the tissue and provide its anisotropic characteristics (Ogden, 2009).
The mechanical behaviour of human skin differs across anatomical site and from person to
person. The anisotropy of skin and the fact that it is locally orthotropic was reported by
Langer (1861), who observed that circular holes punched in the skin of cadavers relaxed into
elliptical shapes. He drew lines (subsequently called Langer lines) through the principal axes
of the elliptic cut-outs, which approximate the direction of collagen bundles within the skin
(Khatyr et al., 2004). According to Leveque et al., the viscoelastic behaviour of skin and the
relative quantity of components such as collagen, elastin and ground substance influence the
way in which skin is deformed.
Phase 3 Phase 1 Phase 2
Str
ess
(load
per
unit
are
a)
Strain (% extension) A
B

21
It has been established in the literature that skin is in tension in the natural “relaxed” state’ in
vivo (Alexander and Cook, 1977; Holt and Evans, 2009), thereby making accurate predictions
of the mechanical behaviour of the skin challenging (Wilkes et al., 1973). Additionally, skin
elastic tension is lower in childhood and higher adulthood; however, it declines in old age
(Kirk and Kvorning, 1949).
In order to measure the biomechanical properties of skin, the techniques and interpretation of
two distinct categories of in vitro and in vivo methodologies must be considered.
2.3.1 In vitro techniques
In vitro testing contributes significantly to the characterisation of skin and developing
constitutive models to understand its mechanical behaviour. The advantages of experimental
testing in vitro skin sections is that it is relatively inexpensive, ethical considerations play a
minor role in obtaining samples and the test results can be used as an indicator for in vivo
tests. The disadvantages however are that the skin sections are treated in isolation away from
its normal setting and as such is not connected to surrounding tissue, nutrients or blood
supply. This makes replicating skin’s in vivo behaviour with in vitro techniques challenging.
Typically, in vitro techniques can be used to define three mechanical properties of soft tissue,
which are its elastic modulus, creep and breaking strains (Edwards and Marks, 1995).
Furthermore, in vitro techniques test property rather than function (Edwards and Marks,
1995). Generally, in vitro tests are performed on excised strips of skin from deceased or
biopsy samples from living human subjects.
As the various techniques of in vitro testing have already been extensively covered in other
literature e.g. Moronkeji and Akhtar (2015), only a brief overview of uniaxial tensile and
indentation tests are provided in this section.

22
2.3.1.1 Uniaxial tensile tests
Uniaxial testing is easily one of the most accessible methods of mechanically testing skin. It
has been used over the last 50 years to determine the material behaviour of skin in vitro.
Previous studies by Ridge and Wright on strips of biopsy and autopsy skin demonstrated the
relationship between the properties of skin and the alignment of collagen fibres (Ridge and
Wright, 1966). Later, tests by Dunn and Silver (1983) showed the extensibility of skin, which
reached an engineering strain of 100% and that the difference between the maximum elastic
modulus for constant strain rate tests was 1.59 MPa ± 47% and 3.16 MPa ± 62% for the
stress-relaxation tests (Dunn and Silver, 1983). A typical stress-strain curve is shown in Fig.
7, the different phases have been previously described in Section 2.3.
Figure 7 Stress-strain curve of skin obtained from the abdominal region of a 45 year old female subject (Daly and
Odland, 1979). The graph shows the skin’s profile as nonlinear with its mechanical behaviour falling into 3 different
categories (where A = phase 1, B = phase 2 and C = phase 3).
2.3.1.2 Indentation tests
Within biomechanics and biomaterials characterisation, indentation has become a feasible
technique for the local mechanical evaluation of tissue. For in vitro characterisation of skin
biomechanics, indentation testing is a valuable technique. This is because it offers the

23
opportunity to determine the mechanical properties of very localised regions of skin
compared to in vivo methods (Ebenstein and Pruitt, 2004).
Some examples of indentation tests of skin include its use to characterise the
micromechanical properties of murine skin (Kendall et al., 2007), porcine skin (Jee and
Komvopoulos, 2014) and stratum corneum samples of human skin (Pailler-Mattei et al.,
2007b). The spatial resolution of the indentation measurements can be controlled by changing
the indenter tip size. For example, Geerligs et al. used a 500 µm radius tip to characterise ex
vivo abdominal skin obtained from patients undergoing abdominoplasty surgery (Geerligs et
al., 2011). Their aim was to characterise the entire epidermis (stratum corneum and
epidermis) rather than to assess a specific, localised region of the skin. In contrast, using a
small tip (1–10 m) results in very local properties being determined, particularly as the
diameter of each corneocyte (40–50 m) is larger than a small tip (Elias, 1983; Pailler-Mattei
et al., 2007a).
Furthermore, Crichton et al. demonstrated that the mechanical characteristics of skin are
influenced by the diameter of the probe used for indentation. Their work showed that the
elastic modulus reduces with increased probe size and the data has been presented in Table 2.
They suggest that the larger diameter probes are likely to cause a larger skin deflection before
puncture and that the smaller probes will require greater structural integrity to bear the greater
skin stiffness and forces. It was also postulated that the variation of elastic modulus with
diameter of the probe may have been due to an aspect of stress-distribution within the skin by
the stratum corneum and viable epidermis. The viable epidermis comprises the remaining
layers that make up the epidermis and serve to regularly renew the stratum corneum
(Prausnitz and Langer, 2008).

24
Table 2 Average elastic modulus of each probe size for nanoindentation tests performed on mice ears
(Reproduced from (Crichton et al., 2013)).
Probe Size (m) Elastic Modulus, Mean ± SD (MPa)
0.5 29.70 ± 21.26
1.0 11.15 ± 4.90
2.5 8.19 ± 5.26
5.0 3.26 ± 2.01
10.0 1.31 ± 0.80
20.0 0.86 ± 0.44
The stress-strain curve in Fig. 8 depicts the locations along the curve where the elastic
modulus or ultimate tensile strength (UTS) was taken for each study in Table 4.
Figure 8 The stress–strain curve illustrating an abdominal porcine skin sample under uniaxial loading (Reproduced
from (Zak et al., 2011)).
Table 3 presents a summary of the in vitro tests for human and porcine skin using indentation
and tension methodologies. The table demonstrates that skin site, orientation and test
approach influence the results of the mechanical characterisation of skin.
Ultimate Tensile Strength (D)
Elastic Modulus (B)
Elastic Modulus (C)
Elastic Modulus (A)
Str
ess
Strain

25
Table 3 Average elastic modulus for in vitro tests of human and porcine skin. In cases, where the elastic
modulus has not been reported, the UTS values have been used and is denoted by *.
Experimental
Technique
Elastic
Modulus
/ UTS*
(MPa)
Location
on Stress
/ Strain
Curve
Skin Site
Skin
Details
Orientation References
Tension
83.3±
34.9 B Back Human
Perpendicular
Parallel
45 degrees
(Ni Annaidh
et al., 2012)
(2.50 ±
2.10)
B
Abdomen
Porcine Parallel (Zak et al.,
2011) (7.17 ±
2.84) Back
3 ± 1.5*
D Forehead
Human
Perpendicular (Jacquemoud
et al., 2007)
5–1000*
1–25 *
D Stratum
corneum
Parallel
Perpendicular
(Wu et al.,
2006)
Indentation
0.6
-
Abdomen
(ex vivo)
-
(Geerligs et
al., 2011)
0.0085 Dermal
equivalents
(Zahouani et
al., 2009)
100–
1000 Various
(Wilkes and
Wildnauer,
1973)
Ni Annaidh et al. reported significant variations in the mechanical properties between
samples of human skin from the back region at different orientations in terms of elastic
modulus and the maximum tensile strength. In contrast, there were comparable results at
ultimate failure and this was attributed to the interplay between orientation and skin site.
Tests on abdominal and back neonatal porcine skin produced different values of elastic
modulus (Zak et al., 2011), indicating that the back skin with the higher elastic modulus is
stiffer than the abdominal skin. Zahouani et al. used dermal equivalents, which were made

26
from human fibroblasts put on a dermal substrate to demonstrate the contributions of the
dermis and their results were comparable with the in vivo study of indentation tests on the
volar forearm (see Table 4). Generally, the outcome of the mechanical characterisation of
skin demonstrates how skin region, test approach, indenter type and size influence the results
of the elastic modulus.
2.3.2 In vivo techniques
In vivo tests are useful because it provides information of how the skin reacts to the
application of external forces such as compression and indentation on the body (Edwards and
Marks, 1995). Several non-invasive techniques have been developed for measuring the
mechanical properties of skin in vivo. The values obtained from these techniques are mainly
descriptive (Hendriks et al., 2003a) and as Pailler-Mattei et al. demonstrated the large
variation of elastic modulus for skin is profoundly influenced by the technique used (Pailler-
Mattei et al., 2008).
Attempts have been made more recently to develop indentation testing as a tool for
determining the in vivo properties of skin in a more quantitative manner (Pailler-Mattei et al.,
2008a). Indentation tests involve the application of a known load (Bader and Bowker, 1983),
or displacement to the skin, where the elastic modulus and other parameters are determined
using contact mechanics models. In addition, uniaxial tensile testing on skin in vivo, also
provides useful mechanical data as demonstrated by Meijer et al., whereby a tension test
device was developed where pads were attached to human skin to induce deformation (Meijer
et al., 1999).
As the various techniques of in vivo testing have already been extensively covered in other
literature (Moronkeji and Akhtar, 2015), this section is a brief overview of the outcome of
previous indentation studies and have been presented in Table 4. Nachman and Franklin

27
(2016) conducted indentation tests on the volar forearm of a healthy subject and obtained the
reduced elastic modulus. Their results were comparable to the outcome of the indentation
tests by Pailler et al. When their results were compared to reduced elastic modulus in the
study by Groves (2011), the outcome was a significant difference. This wide variation in the
reduced elastic moduli may be attributed to the size of the indenter head, where a large
indenter head produces a low reduced elastic modulus, whilst a small indenter head produces
a high value. Furthermore, Groves (2011) used two geometrically different indenter heads of
varying sizes. It was observed that the reduced elastic modulus for the spherical indenter on
skin was lower than that of the cylindrical indenter. Thus, the variation in the values for the
reduced elastic modulus is typical for biological material; however, the characterisation of the
mechanical properties of skin is also influenced by indenter size and type.
Table 4 Comparison of published elastic modulus results on the volar forearm of human skin using
indentation methods in vivo.
Indenter Elastic
Modulus
(kPa)
Reduced Elastic
Modulus
(kPa) References
Spherical
(R = 2 mm) - 8.9–9.7
(Nachman and
Franklin, 2016)
Spherical (R = 3.175 mm)
-
9.5 (Pailler-Mattéi and
Zahouani, 2006)
Conical 12.5 (Pailler-Mattei et
al., 2008)
Spherical (R = 3.175 mm)
8.3 (Zahouani et al.,
2009)
Spherical (R = 0.7938 mm)
39.64 ± 10.19 47.19
(Groves, 2011) Cylinder
(R = 0.25 mm) 65.86 ± 13.37 78.41

28
2.4 In Vitro Biomechanical Experiment on Skin and its Sub-
layers
In this section, the different experimental tissues and materials that have been used to
biomechanically represent human skin are reviewed.
2.4.1 The skin mimic
Murine and porcine skins have been used increasingly in the literature as a substitute for
human skin. According to Fourtanier and Berrebi (1989), neonatal porcine skin is a superior
model for human skin in terms of hair sparseness and physical properties (Fourtanier and
Berrebi, 1989); hence, neonatal porcine skin is preferred over tissue from older pigs.
Neonatal porcine skin also exhibits close biomechanical properties to human skin (Shergold
et al., 2006) and is readily available. Donnelly et al. also used neonatal porcine skin for their
microneedle application studies due to these reasons (Donnelly et al., 2010). Furthermore, as
mentioned in the previous section, Zak et al. carried out uniaxial tests on neonatal porcine
skin and documented the elastic modulus for various skin locations.
The literature also suggests that murine skin behaves similar to human skin for microneedle
penetration studies (Kochhar et al., 2013b). There is an apparent difference in biomechanical
behaviour for murine skin compared to human skin ex vivo. This is because under low loads
human skin undergoes more extension than murine skin (Groves et al., 2013). Also, murine
skin is thinner than human skin (Ding et al., 2009) with a significantly thinner epidermal
layer (Li et al., 2015). It is therefore important that these factors are taken into consideration.
Crichton et al. also stated that the mechanical behaviour of mice skin was comparable to
human skin and cited the similarity in their results with indentation test results carried out by
Geerligs et al. on frozen human tissue (Geerligs et al., 2011). Geerligs et al. used an ex vivo
abdominal human tissue and reported that the elastic modulus of the stratum corneum (2.6 ±

29
0.6 MPa) was greater than the epidermis (1.1 ± 0.2 MPa). They also showed that a reduction
in the stiffness of the viable epidermis causes an increase in indentation depth.
Zahouani et al. showed that the dermis made a significant contribution to skin because of its
load bearing capabilities and reported the importance of a full thickness skin sample
(Zahouani et al., 2009). Other work demonstrated the similarity in stiffness between dermal
equivalents and the volar forearm (Pailler-Mattéi and Zahouani, 2006; Pailler-Mattei et al.,
2008), which indicated that during in vivo tests, the mechanical contribution from the dermis
was prominent. Furthermore, it is easier to penetrate the human epidermis without the dermal
layer (Li et al., 2015). Pailler-Mattei et al. ex vivo tests on the stratum corneum layer only,
yielded a low elastic modulus (7–8 kPa) as compared to the result of the indentation test on
abdominal tissue shown in Table 3.
Based on the literature, neonatal porcine skin appears to be a more suitable substitute
compared to murine skin because of its similarities to human skin in terms of its mechanical
behaviour and physiological structure (Fourtanier and Berrebi, 1989; Shergold et al., 2006).
2.4.2 The subcutaneous mimic
As previously stated, the subcutaneous layers play a vital role in the mechanical properties of
skin. The thickness of the subcutaneous layer varies between 5.0–15.0 mm in the elderly
(Renephra, 2012). Using an ultrasound indentation system, Zheng et al. reported that the
effective elastic modulus of the subcutaneous tissue of the forearm increased from 14.0 ± 5.0
kPa to 58.8 ± 1.7 kPa during contraction of the muscles. This indicated that soft tissues
increase in stiffness as the corresponding muscles contract (Zheng et al., 1999).
As early as 1912, Schade (1912) discovered that there was a significant difference in
behaviour of normal tissue compared to oedematous tissue, as the time required for the skin
to return to its initial condition following the removal of a weight took longer for the

30
oedematous tissue (Schade, 1912). Using the same approach, Kirk and Kvorning (1949)
demonstrated the contrast between young and old subjects. Following the removal of a
weight on the skin, the indentation was greater in the young subjects compared to the old
subjects and there was an almost instantaneous recovery of the skin to its original state in
young subjects compared to the old subjects (Kirk and Kvorning, 1949). In their study,
Radhakrishnan et al. demonstrated that acute intestinal oedema causes a decrease in tissue
stiffness (Radhakrishnan et al., 2007). Therefore, tissue stiffness is influenced by fluid
content. Furthermore, Guyton et al. carried out an extensive study on ISF pressure (Guyton et
al., 1971), where he recorded the pressures for the various kinds of oedema and ISF (see
Table 5).
Table 5 The interstitial fluid pressures as they relate to oedema (Guyton et al., 1971).
Fluid Content Pressure (mmHg) Pressure (kPa)
Subcutaneous pitting oedema 0 – 6 0 – 0.8
Subcutaneous pitting oedema following
fluid injection in tissues 15 – 20
2.0 – 2.67
Non-pitting oedema 12 – 15 1.6 – 2.0
In tissue engineering applications, gelatine gel is often used as a mimic for natural tissues
(Ahearne et al., 2005), as it can be used to simulate the viscosity and density of living human
tissue and therefore, acts as a good representation for human tissue (Kwon and Subhash,
2010). Awad et al. demonstrated that the collagenous material present in gelatine gel
provided its stiffness and mechanical strength (Awad et al., 2004). Mridha and Odman,
(1985) and Mridha et al. used two mechanical techniques to determine the mechanical
behaviour of subcutaneous pitting oedema. Their first technique, the mechanical impedance
method is a semi-quantitative method that describes the inertial, elastic and frictional
properties of tissues subjected to external deformation. Mridha and Odman (1985)

31
demonstrated the difference in mechanical impedance of subcutaneous oedematous tissues
compared to normal tissue. A compression was applied to gelatine gel concentrations of 80%,
84%, 88%, 92% & 96% water content by weight and the static force was measured from the
resulting deformation of the gelatine gel. They observed that softer structures, such as high
water content gelatine gels and subcutaneous pitting oedema tissues had lower mechanical
impedance compared to non-pitting oedema, which exhibited higher mechanical impedance.
The water content in the gelatine gels highly influenced the outcome of the mechanical
impedance tests (Mridha and Odman, 1985).
The second technique, which is the mechanical pulse wave propagation method, uses
velocity, attenuation and frequency to assess the mechanical behaviour of soft tissues. This is
because the mechanical properties of skin are linked to its water content and as a
consequence, the propagation velocity, attenuation and frequency in the gelatine gels are
influenced by its water content. The technique was used to determine the mechanical
behaviour of the same specific concentrations of the gelatine gels mentioned above, normal
tissues from several anatomical regions and oedematous tissue from different patients. The
propagation velocity for 80%, 84%, 88%, 92% and 96% gelatine gel concentrations were
3.05 ± 0.10 ms-1
, 2.02 ± 0.38 ms-1
, 1.13 ± 0.21 ms-1
, 0.77 ± 0.08 ms-1
and 0.33 ± 0.03 ms-1
respectively. The results showed that an increase of water content in the gelatine gel
concentrations resulted in a decrease of the propagation velocity. For the tests carried out on
10 healthy subjects, the velocity varied from 1.72–8.18 ms-1
; for pitting oedema, it ranged
from 1.19–3.18 ms-1
and for non-pitting oedema, it was between 13.27–14.70 ms-1
. Based on
their findings, velocities for pitting oedema compared to the velocities of 80%, 84% and 88%
gelatine gel concentrations. Overall, the propagation velocity of mechanical pulse waves was
found to be lower in pitting oedema than for normal tissues and higher in non-pitting oedema
(Mridha et al., 1992). Finally, their study demonstrated that subcutaneous pitting oedema

32
could be characterised by measuring the velocity of the mechanical pulse wave propagation.
It should be noted however that the mechanical pulse wave propagation method only applies
to subcutaneous pitting oedema, where techniques based on the displacement of fluid due to
external compression are not pertinent (Mridha et al., 1992).
By altering the water content of these gels and subsequently varying its mechanical
properties, the opportunity to determine experimentally the influence of subcutaneous tissue
on microneedle performance could be investigated.
2.4.3 The muscle mimic
Pailler-Mattei et al. showed that the mechanical properties of the subcutaneous layers and the
muscles influence the mechanical properties of skin. Their work involved indentations to
assess the impact of the subcutaneous layers and muscles. The outcome was a reduced elastic
modulus of the muscle, which was between 32 kPa and 96 kPa. Tsaturyan et al. also showed
that the elasticity modulus for the papillary muscle of a rat decreased with increased quantity
of sodium chloride and increased with reduced quantity of sodium chloride (Tsaturyan et al.,
1984). Based on these findings, it is important to take into consideration the contributions
from the subcutaneous layers and muscles to the elastic modulus of skin.
Generally, ballistic gelatin can be used to simulate the behaviour of a projectile on human
tissue (Thali et al., 2002). Kwon and Subhash (2010) showed that the initial elastic modulus
for ballistic gelatin was 10.9 kPa. They also reported that when loading rate increased, the
compressive strength increased from 3 kPa at a strain rate of 0.0013 s-1
to 6 MPa at a strain
rate of 3200 s-1
(Kwon and Subhash, 2010). A material similar to ballistic gelatine, Perma-
Gel® is also a suitable substitute for muscle. Although Perma-Gel
® is not ballistic gelatine, its
advantages are that it can be used at room temperature unlike ballistic gelatine that has to be
used at 4°C or lower. In addition, it has many of the same characteristics as 10% ballistic

33
gelatine (Moy et al., 2011) and is used for ballistic testing of ammunition (Ryckman et al.,
2012). Therefore, Perma-Gel®
is an ideal candidate as a muscle mimic (Caron-Laramee and
Brouillette, 2014).
2.4.4 Summary of experimental models of skin and its sub-layers
The summary of the elastic moduli of skin and its sub-layers are presented in Table 6. The
wide variation of values for skin and each sub-layer is typical for biological material. The
data presented was used to develop the representative in vitro skin model, with elastic
modulus properties in the range of 39.64–65.86 kPa for skin, 14.0–58.8 kPa for subcutaneous
tissue mimic and 32–96 kPa for muscle mimic for the microneedle penetration studies carried
out in this thesis.
Table 6 The elastic modulus of skin and its sub-layers obtained from the literature, * denotes reduced
elastic modulus and ** denotes pressure values.
Material Region Elastic Modulus
(kPa) References
Skin
Neonatal porcine
abdomen 2.50 ± 2.10 × 10
3
(Zak et al., 2011) Neonatal porcine
back 7.17 ± 2.84 × 10
3
Human back 83.3± 34.9 × 10³
(Ni Annaidh et al.,
2012)
Human forearm 39.64 ± 10.19
65.86 ± 13.37 (Groves, 2011)
Human abdomen 0.6 × 10³ (Geerligs et al., 2011)
Subcutaneous tissue
Human forearm 14.0 ± 5.0
58.8 ± 1.7 (Zheng et al., 1999)
Pitting oedema 0–0.8**
(Guyton et al., 1971) Pitting oedema with
fluid injected 2.0–2.67
**
Non-pitting oedema 1.6–2.0**
Muscle
Human forearm 32–96*
(Pailler-Mattei et al.,
2008)
Ballistic gelatine 10.9 (Kwon and Subhash,
2010)

34
2.4.5 Limitations of the experimental model
The work in this thesis focused on a skin model that comprised a full thickness skin sample, a
subcutaneous mimic of varying water content concentration and a muscle mimic. There are
many limitations with developing an in vitro model of skin that can adequately mimic the in
vivo behaviour of oedematous skin. For example, the way in which the subcutaneous tissue
changes with disease (Section 1.3.3) was beyond the scope of this thesis.
Furthermore, the natural tension of skin (as discussed in Section 2.3) was not considered in
this experimental model due to the number of variables that were already under consideration
for the experimental analysis. A postulation would be that due to the varied mechanical
properties of the different water content gelatine gels, the skin tension would vary due to the
contributions from the different gelatine gels.
2.5 Microneedle Arrays
This section introduces the various types of microneedles and its manufacturing process. An
overview of how microneedles are applied to skin is mentioned as well as a review of its role
in delivering drugs and extracting fluid from the body.
2.5.1 Microneedle designs
Microneedle arrays are a promising minimally invasive means of delivering drugs into the
body via skin or extracting ISF from skin, for example for glucose measurement (Mukerjee et
al., 2003). They are sub-millimetre projections capable of penetrating the stratum corneum
and are typically made from a range of different materials including silicon (Henry et al.,
1998), polysilicon (Zahn et al., 2000), polymers (Park et al., 2005), metal (Martanto et al.,
2004) and sugars (Lee et al., 2011).
Most types of microneedles are typically fabricated as an array of up to hundreds of needles
over a base substrate. Solid arrays, solid arrays coated with therapeutic compound,

35
biodegradable arrays of microneedles and hollow microneedles are the four main categories
of microneedles, as shown in Fig. 9. Solid arrays can be used to pierce skin, discarded and the
drug applied to the perforated area (Arora et al., 2008). For the coated microneedles with
therapeutic compound, the drug is released upon successful penetration of skin.
Biodegradable microneedle arrays are made from biodegradable or water soluble polymers
that dissolve readily in skin. Hollow arrays, which use the same concept as the hypodermic
needle can be used to access the fluid bed in the epidermis (Kim et al., 2012).
Figure 9 The four main types of microneedle design: (a) solid array inserted into skin; solid array coated
with therapeutic compound; dissolving microneedles; hollow microneedles (b) drug is applied after
perforation created by solid array; therapeutic compound is released with insertion; biodegradable
microneedles are absorbed by skin along with therapeutic compound; therapeutic compound is released
via the hollow area in the microneedle. (Figure adapted from (Kim et al., 2012)).
Microneedles are designed to bypass the stratum corneum in order to transport therapeutic
compound into the epidermal layer. Microneedle drug delivery is not associated with pain or
bleeding compared to conventional hypodermic needles because there are no nerve endings
or vasculature within the epidermis (Arora et al., 2008). Moreover, the microchannels in skin
created by the microneedles perforating the stratum corneum offers a user-friendly means of
drug delivery (Prausnitz, 2001).
The design of the microneedle can increase skin permeability for drug delivery, with
particular attention given to parameters such as tip radius, base radius, interspacing, number
(a)
(c)
(b)
(d)

36
of needles per array and penetration depth (Olatunji et al., 2009), as well as the mechanical
behaviour of skin during its interaction with microneedles.
2.5.2 Microneedle fabrication methods and materials
Microneedle arrays have been manufactured using a variety of materials including silicon
(Henry et al., 1998), polysilicon (Zahn et al., 2000), polymers (Park et al., 2005) and
electrodeposited metals (Davis et al., 2005). Although there are advantages to using different
materials to fabricate microneedles, each material has its own limitations which affect
microneedle performance and effectiveness. Brittle materials such as silicon and glass can
affect the structural integrity of the microneedle whereas polymers possess low elastic moduli
and hardness. Electrodeposited metals such as nickel are known skin irritants (Garner, 2004).
Hence, the use of biocompatible bulk titanium substrates eradicates fracture-induced failure
common in more brittle elements while retaining adequate mechanical rigidity. Therefore,
biocompatible bulk titanium is an ideal material for use in drug delivery applications (Parker
et al., 2007). Moreover, polymer microneedles are easily fabricated and cost effective (Barrett
et al., 2015) and are also an ideal material for the manufacture of microneedles.
Based on the attributes of polymers, microneedles manufactured from polymers were used
for the work carried out in this thesis.
Table 7 provides a summary of the fabrication process and materials of the four main types of
microneedle designs.
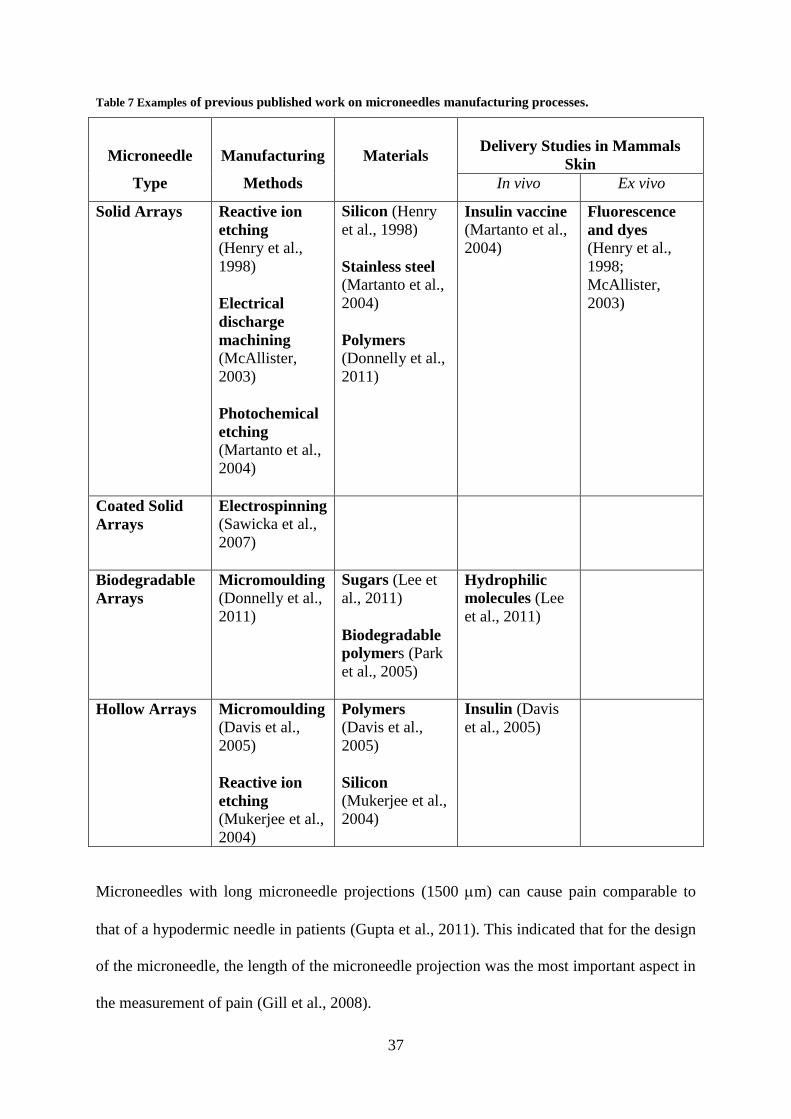
37
Table 7 Examples of previous published work on microneedles manufacturing processes.
Microneedle
Type
Manufacturing
Methods
Materials
Delivery Studies in Mammals
Skin
In vivo Ex vivo
Solid Arrays Reactive ion
etching
(Henry et al.,
1998)
Electrical
discharge
machining
(McAllister,
2003)
Photochemical
etching
(Martanto et al.,
2004)
Silicon (Henry
et al., 1998)
Stainless steel (Martanto et al.,
2004)
Polymers
(Donnelly et al.,
2011)
Insulin vaccine (Martanto et al.,
2004)
Fluorescence
and dyes (Henry et al.,
1998;
McAllister,
2003)
Coated Solid
Arrays
Electrospinning (Sawicka et al.,
2007)
Biodegradable
Arrays
Micromoulding (Donnelly et al.,
2011)
Sugars (Lee et
al., 2011)
Biodegradable
polymers (Park
et al., 2005)
Hydrophilic
molecules (Lee
et al., 2011)
Hollow Arrays Micromoulding
(Davis et al.,
2005)
Reactive ion
etching
(Mukerjee et al.,
2004)
Polymers (Davis et al.,
2005)
Silicon
(Mukerjee et al.,
2004)
Insulin (Davis
et al., 2005)
Microneedles with long microneedle projections (1500 m) can cause pain comparable to
that of a hypodermic needle in patients (Gupta et al., 2011). This indicated that for the design
of the microneedle, the length of the microneedle projection was the most important aspect in
the measurement of pain (Gill et al., 2008).

38
In this project three different geometries of polymeric microneedles were utilised of which
one was for a pilot study (polyetheretherketone/PEEK) and the other two
(polymethylmethacrylate/PMMA) were primarily used to determine penetration intensity and
effectiveness. These microneedles were chosen because they have previously been used in
medical application studies carried out by Renephra. During the pilot study, the PEEK
microneedles caused damage to the tissue and it was hard to reproduce perforations, therefore
PMMA microneedles were used for the bulk of the work in this thesis.
2.5.3 Application of microneedles in fluid extraction
A study by Mukerjee et al. describes the use of an array of hollow silicon microneedles for
effective transdermal extraction of minute samples of human ISF (Mukerjee et al., 2003).
Further work by Wang et al. provided the first demonstration of ISF extraction from skin’s
dermis following microneedles insertion in hairless rats and human subjects in vivo. The ISF
glucose concentration measured with a conventional electrochemical glucose monitor was
commensurate with glucose levels in blood (Wang et al., 2005). Later, studies by Khanna et
al. used microneedles for ISF sampling, by accessing the fluid in the dermal layer (Khanna et
al., 2008).
There are several mechanisms through which fluid can be extracted using microneedles,
which are capillary action, osmosis and negative pressure therapy. These fluid removal
mechanisms are governed by some equations (Samant and Prausnitz, 2016). The relationship
between flux (Q), diffusion (De), surface area (A), concentration difference (C) and the
thickness of the barrier to diffusion (L) is described in Equation 1 for capillary action using
Fick’s Law.
𝑄 = 𝐷𝑒 . ∆𝐶
𝐿 . 𝐴 Equation 1

39
The influence of the osmotic permeability coefficient (Pw) for permeation under osmotic
gradient is shown in Equation 2.
𝑄 = 𝑃𝑤 . 𝐴 . ∆𝐶 Equation 2
Using Darcy’s Law, the relationship between permeability (), the viscosity () and change
in pressure (P) for negative pressure therapy is given by Equation 3.
𝑄 = 𝐾
𝜇 .
∆𝑃
𝐿 . 𝐴 Equation 3
Using these equations, Samant and Prausnitz stated that the predicted flow rate using
capillary action is 0.09 nL/min/MN, it is 1 nL/min/MN for osmosis and for negative pressure
therapy is 12.6 nL/min/MN. The negative pressure therapy is potentially an ideal option for
ISF extraction as it could yield more than 12 times the amount of fluid compared to the other
mechanisms (Samant and Prausnitz, 2016). Therefore, the potential predicted flow rate for a
PMMA array of 1316 microneedles is 118.44 nL/min for capillary action, 1316 nL/min for
osmosis and 16581.6 nL/min for negative pressure therapy. For a PMMA array of > 6000
microneedles is 540 nL/min for capillary action, 6000 nL/min for osmosis and 75600 nL/min
for negative pressure therapy.
The main motivation of this project is to obtain a greater understanding of microneedle
interaction with skin to facilitate better fluid removal.
2.6 The Mechanics of Microneedle Perforation of Skin
The penetration of soft tissue by sharp implements is of widespread importance, particularly
for technological applications such as the perforation of human skin by microneedles for
administering drugs or fluid extraction. To date, in vitro tests using microneedles have been
performed on various skin models. The challenge of mimicking the mechanical properties of
skin with consideration given to contributions from skin’s individual layers coupled with its

40
interaction with microneedles remains. This section considers the mechanics behind
microneedles interaction with skin.
2.6.1 Insertion force as determined numerically
Kong et al. reported the outcome of numerical simulations of a single microneedle insertion
into a multi-layered human skin. The outcome of their study demonstrated the feasibility of
predicting the deformation and failure of skin. In addition, the insertion force of a
microneedle during the insertion process was determined as ≈0.35 N and the point of
insertion into skin was identified as a sudden decrease in force on the force–displacement
curve. This result was in agreement with experimental studies by Bischoff et al. and Davis et
al. (Bischoff et al., 2000; Davis et al., 2004). Furthermore, the numerical results showed that
the stiffness, failure stress, thickness of the stratum corneum, needle tip area and the needle
wall angle are primary control parameters for insertion of the tapered microneedles used in
their study into the multi-layered human skin (Kong et al., 2011). For hollow microneedles
with a large tip diameter however, a large wall thickness resulted in a high insertion force and
for hollow microneedles with a small tip diameter, the wall thickness had almost no effect on
the insertion force (Kong et al., 2011). This indicated the influence of microneedle geometry
on insertion force. It appeared that contributions from parameters such as dermal thickness
and the hypodermis was almost negligible (Kong et al., 2011). This observation was not
consistent with work by other researchers. According to Zahouani et al. contributions from
the dermal layer should not be ignored (Zahouani et al., 2009). More recently, Li et al. in
their study further added that full thickness skin was paramount to understanding microneedle
application to skin (Li et al., 2015).
Moreover, Groves et al. developed a numerical multi-layered skin model i.e. epidermis,
dermis and hypodermis using the Ogden material model to describe the hyperelastic
properties of each layer of human skin. Further, it was successfully used for a single
41
microneedle application to skin and the results showed that it could predict skin deformation
at a micron scale (Groves et al., 2012). A combination of work by Kong et al. and Groves et
al. could lead to promising outcomes in the development of specific microneedle geometries
for various skin types, as the numerical analysis has demonstrated the importance of
microneedle geometry for successful microneedle perforation of skin.
A detailed coverage of the numerical modelling of microneedle studies is beyond the scope of
this thesis.
2.6.2 Microneedle insertion force and insertion velocity
Davis et al. demonstrated using several microneedle geometries that insertion force varied
linearly with the effective area of contact between the needle tip and skin. The measured
insertion forces were between 0.1–3 N for manual application (Davis et al., 2004). Verbaan et
al. conducted a study, which demonstrated that with an electrical applicator, microneedle
penetration could be improved with a higher insertion velocity. Their setup provided the
ability to deliver low density microneedle arrays into dermatomed human skin at 1 or 3 ms-1
(Verbaan et al., 2008). Donnelly et al. noted that an adequate insertion force and insertion
velocity was required to overcome the inherent elasticity present in the stratum corneum for
successful microneedle application. It was reported that a large insertion force applied at low
speed barely penetrated the stratum corneum, however, a smaller force at a higher speed
perforated it (Donnelly et al., 2010). Further studies by Donnelly et al., in which a
compression force was used for microneedle application, showed that 600 m and 900 m
needle projections perforated neonatal porcine skin at a low application force of > 0.03
N/microneedle. In addition, Olatunji et al. conducted similar tests using a compression force
at low insertion velocities of 1 mms-1
to determine the influence of microneedle interspacing

42
on insertion force and found that insertion force was dependent upon microneedle
interspacing and the number of microneedles.
More recently, van der Maaden et al. demonstrated that the stratum corneum layer could be
overcome in a reproducible manner using an impact-insertion applicator at a fixed insertion
velocity of 3 ms-1
and insertion forces ranging from 3.43–22.1 N. Their study showed that
when microneedles were manually inserted onto ex vivo human skin, perforations were
visible following staining indicating approximately 81% microneedle penetration. However,
after the stratum corneum was stripped, only 46% microneedle penetration was visible.
Furthermore, it was also demonstrated that the manual application device resulted in low
penetration efficiencies. In contrast, with a microneedle impact-insertion applicator efficient
and reproducible penetration of high-density microneedles into skin was found. Fig. 10 shows
both microneedle applicators and their perforations on skin.
Figure 10 Microneedle application using (a) silicon microneedle array mounted on a manual insertion device, (b) an
impact-insertion applicator, (c) perforations created using the impact-insertion applicator on the stratum corneum
and (d) after stratum corneum removal showing that the perforations travelled beyond this layer (Reproduced from
(van der Maaden et al., 2014)).
2.6.3 Microneedle applicators
Microneedles puncture skin by overcoming the inherent elasticity of the stratum corneum to
create temporary microchannels for fluid to travel through (Kochhar et al., 2013b). However,
43
for effective and reproducible performance of these microneedles in drug delivery
applications or fluid extraction, irrespective of design constraints such as, material, height
and needle density, it is imperative that they successfully penetrate skin (Davis et al., 2004).
The irregular surface topography of skin remains a significant challenge for reproducible
microneedle penetration. It is for this reason that an appropriate device is required to ensure
that microneedle penetration of skin occurs in a repeatable and predictable manner (Bouwstra
et al., 2009).
Various designs of the microneedle delivery apparatus have been developed in the literature
such as a Dermaroller® (Badran et al., 2009), syringe applicators (Haq et al., 2009), actuator
driven applicator (Bouwstra et al., 2009), electrically driven applicator (Verbaan et al., 2008)
and an impact applicator (van der Maaden et al., 2014) to determine a suitable way of
breaching skin’s barrier. In some instances manual application of the microneedle was
introduced to skin (Verbaan et al., 2007; Verbaan et al., 2008), however, this approach did
not always yield reproducible penetration. Fig. 11 shows several examples of microneedle
applicators. There have been several review papers on microneedle applicators and therefore
detailed coverage of it is beyond the scope of this project.

44
Figure 11 Microneedle applicators (a) Microstructured Transdermal System (MTS), (b) microinfusor, (c)
Macroflux®, (d) Microneedle Therapy System (MTS Roller™), (e) Microtrans™, (f) h-patch™ , (g) micronjet and (h)
Intanza® (Reproduced from (Indermun et al., 2014)).
2.6.4 Microneedle geometry
Design considerations of the microneedle in terms of its length, pitch, density, radius and
shape are important because it affects its interaction with skin and how readily the drug is
permeated (Olatunji et al., 2009; Olatunji et al., 2013). These parameters also contribute to
the force at which the microneedle is fractured. The sharpness of the microneedle tip is
another significant geometrical feature as it has a direct effect on the insertion force into skin
(Davis et al., 2004; Park et al., 2005). Another microneedle design feature that is subject to
various definitions is the aspect ratio, which has been described as the base over tip diameter
(Huang and Fu, 2007). It has also been defined as the ratio of the microneedle length to the
tip diameter and as the length over width of the microneedles (Davis et al., 2005). Al Qallaf
et al. have said that the aspect ratio relates to the ratio of the pitch between two microneedles

45
to the microneedle radius. The aspect ratio is an important design feature that should not
exceed 2.0 to avoid overlapping between microneedles. Furthermore, if the value < 2.0, the
needles are placed too close to each other (Al-Qallaf and Das, 2008). Microneedle geometries
can differ from 50–250 m in base width, 150–1500 m in length and 1–25 m in tip
diameter (Arora et al., 2008).
Fig. 12 shows the dye stained images from the study by Xiang et al., whereby it was revealed
that if the spacing between two adjacent microneedles was larger than 400 μm, more than
95% of the microneedles successfully perforated the tissue. If however, there was smaller
spacing between the microneedles, there was reduced penetration. Previous work indicated
that increasing the number of needles on an array can lead to an increase in the rate of
transdermal drug delivery (Yan et al., 2010). Later on, Section 2.7.1 explains dye staining
techniques in more detail.
Figure 12 Dye staining shows the effect of microneedle interspacing perforation quality on rat skin (a) 250 m (b) 300
m (c) 350 m and (d) 400 m. Scale bar represents 500 m (Reproduced from (Xiang et al., 2015)).
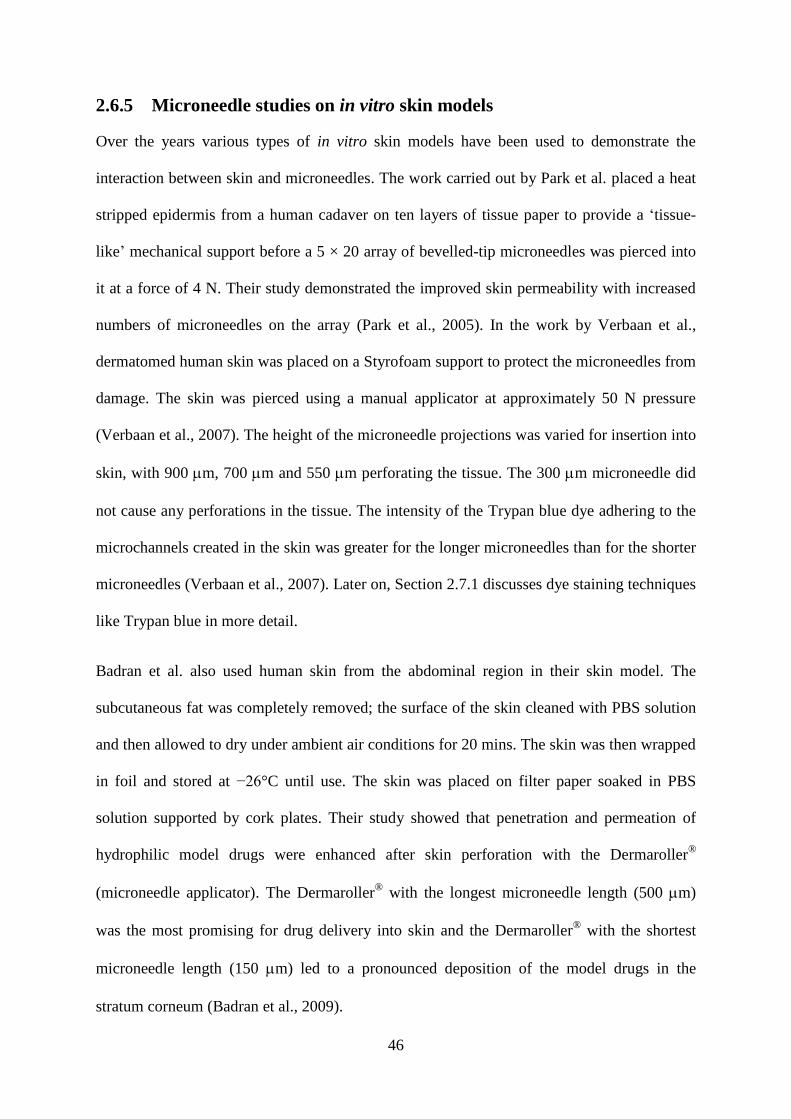
46
2.6.5 Microneedle studies on in vitro skin models
Over the years various types of in vitro skin models have been used to demonstrate the
interaction between skin and microneedles. The work carried out by Park et al. placed a heat
stripped epidermis from a human cadaver on ten layers of tissue paper to provide a ‘tissue-
like’ mechanical support before a 5 × 20 array of bevelled-tip microneedles was pierced into
it at a force of 4 N. Their study demonstrated the improved skin permeability with increased
numbers of microneedles on the array (Park et al., 2005). In the work by Verbaan et al.,
dermatomed human skin was placed on a Styrofoam support to protect the microneedles from
damage. The skin was pierced using a manual applicator at approximately 50 N pressure
(Verbaan et al., 2007). The height of the microneedle projections was varied for insertion into
skin, with 900 m, 700 m and 550 m perforating the tissue. The 300 m microneedle did
not cause any perforations in the tissue. The intensity of the Trypan blue dye adhering to the
microchannels created in the skin was greater for the longer microneedles than for the shorter
microneedles (Verbaan et al., 2007). Later on, Section 2.7.1 discusses dye staining techniques
like Trypan blue in more detail.
Badran et al. also used human skin from the abdominal region in their skin model. The
subcutaneous fat was completely removed; the surface of the skin cleaned with PBS solution
and then allowed to dry under ambient air conditions for 20 mins. The skin was then wrapped
in foil and stored at −26°C until use. The skin was placed on filter paper soaked in PBS
solution supported by cork plates. Their study showed that penetration and permeation of
hydrophilic model drugs were enhanced after skin perforation with the Dermaroller®
(microneedle applicator). The Dermaroller® with the longest microneedle length (500 m)
was the most promising for drug delivery into skin and the Dermaroller® with the shortest
microneedle length (150 m) led to a pronounced deposition of the model drugs in the
stratum corneum (Badran et al., 2009).

47
Yan et al. also considered the effects of microneedle length and density on microneedle
perforation quality. The difference with the above mentioned studies was that the human
epidermal membrane was placed on a soft sponge pad as an underlying substrate. Their study
showed that the longer microneedle length (650 m) resulted in a pronounced deposition of
the model drug across skin compared to the shorter microneedle length (≤ 300 m). In
addition, the increase of the microneedle length beyond 650 m did not produce a significant
increase in drug delivery and that the less dense microneedle arrays were more effective in
boosting drug delivery (Yan et al., 2010).
Studies by Donnelly et al. and Olatunji et al. used dental wax as their underlying substrates
for neonatal porcine skin. The tissue was preserved at −20°C until use. The skin model was
perforated at low compression forces of approximately 0.03 N/microneedle.
An 8 × 8 microneedle array was inserted into excised pig skin cadaver. The hair was removed
using an electric hair clipper and then hair removal cream. The skin samples were cleaned
and stored at −80°C until use. The subcutaneous fat was removed using a scalpel and the skin
fixed fully stretched on a thin 7–8 mm thick layer of modelling clay to act as the tissue-like
mechanical support. The microneedles were manually inserted by applying thumb pressure
for approximately 1 min. The tissue was stained with Trypan blue dye for 5 mins to highlight
perforations in the stratum corneum. Haematoxylin and Eosin (H&E) staining were used to
visualise the perforation detail and showed that skin layers had been breached. This therefore
suggested that the encapsulated drug could be delivered efficiently. In addition, it also
demonstrated that thumb pressure provided adequate force to penetrate skin (Kochhar et al.,
2013a; Kochhar et al., 2013b).
As microneedle length affects its performance in skin, the microneedles used in this thesis
were in a range of 352–650 m long. Additionally, the spacing was kept between 360–1000
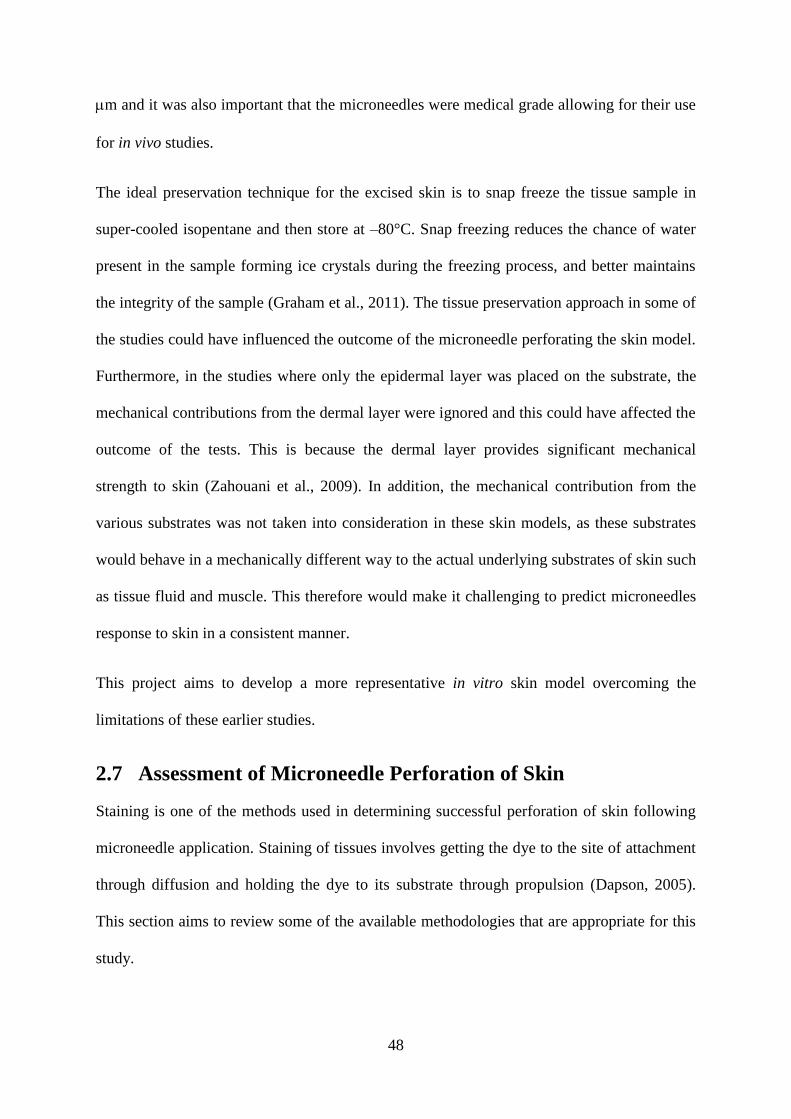
48
m and it was also important that the microneedles were medical grade allowing for their use
for in vivo studies.
The ideal preservation technique for the excised skin is to snap freeze the tissue sample in
super-cooled isopentane and then store at –80°C. Snap freezing reduces the chance of water
present in the sample forming ice crystals during the freezing process, and better maintains
the integrity of the sample (Graham et al., 2011). The tissue preservation approach in some of
the studies could have influenced the outcome of the microneedle perforating the skin model.
Furthermore, in the studies where only the epidermal layer was placed on the substrate, the
mechanical contributions from the dermal layer were ignored and this could have affected the
outcome of the tests. This is because the dermal layer provides significant mechanical
strength to skin (Zahouani et al., 2009). In addition, the mechanical contribution from the
various substrates was not taken into consideration in these skin models, as these substrates
would behave in a mechanically different way to the actual underlying substrates of skin such
as tissue fluid and muscle. This therefore would make it challenging to predict microneedles
response to skin in a consistent manner.
This project aims to develop a more representative in vitro skin model overcoming the
limitations of these earlier studies.
2.7 Assessment of Microneedle Perforation of Skin
Staining is one of the methods used in determining successful perforation of skin following
microneedle application. Staining of tissues involves getting the dye to the site of attachment
through diffusion and holding the dye to its substrate through propulsion (Dapson, 2005).
This section aims to review some of the available methodologies that are appropriate for this
study.

49
2.7.1 Dye staining
The more commonly used dyes for staining microneedle perforated skin samples are Trypan
blue and methylene blue dyes. 0.4% Trypan blue solution is normally used as a cell stain to
examine cell viability using the dye exclusion test. This test can be carried out whenever cell
viability is required to be established in a prompt and thorough manner. Moreover, the dye
exclusion test is based upon the principle that viable cells do not absorb impermeable dyes
such as Trypan blue, but instead dead cells are permeable and absorb the dye (Strober, 2001).
Fig. 13 shows images of microneedle perforations stained with Trypan blue.
Figure 13 Dissolving microneedle arrays perforation of 6–8 weeks old female mice skin under various loads and
stained with Trypan blue. (a) 1 N, (b) 2 N and (c) 4 N (Reproduced from (Qiu et al., 2015)).
Methylene blue is used as a histological stain in biological experiments. At room
temperature, it appears as a dark green powder that dissolves moderately in water to form a
deep blue solution. The perforated tissue is soaked in methylene blue solution for a given
duration in order to detect if any microchannels have been created. The staining is as a result
of the methylene blue dye attaching itself to the proteins that exist within the tissue (Jones et
al., 2008). Fig. 14 presents images of methylene blue staining.
50
Figure 14 Solid maltose microneedle perforation of hairless rat skin and stained with methylene blue. (a) Array of
microneedles perforations and (b) magnified view of the perforations (Reproduced from (Kolli and Banga, 2008)).
Both Trypan blue and methylene blue provide the same level of information when used for
the assessment of microneedle perforation. The limitation with both dye techniques is that it
is impossible to determine how deeply the microneedles have travelled through the layers.
2.7.2 Histological staining
The Haematoxylin and Eosin stain (H&E) is the most widely used stain in histological
laboratories. It has the ability to demonstrate a wide range of normal, abnormal cell and tissue
components. It is a relatively simple stain useful for conducting microscopic examination of
tissue that has been paraffin embedded or cryosectioned (Larson et al., 2011). It can be
performed manually or by automation and typically the manual technique is usually carried
out for economic reasons and sample volume (Fischer et al., 2008). Haematoxylin exhibits a
deep blue-purple colour and stains nucleic acids by a complex, incompletely understood
reaction. Eosin is pink and stains proteins non-specifically. For example, in a typical tissue
the nuclei are stained blue, compared to the cytoplasm and extracellular matrix that are
stained in varying degrees of pink. Thus, this dye combination is capable of emphasising the
fine structures of cells and tissues (Chan, 2014). Careful adherence to H&E staining protocol
allows for the detection of many tissue subtleties that are necessary for accurate analysis
(Cardiff et al., 2014).
51
Histology evaluation using H&E staining can also be used to define the layers of skin such as
the stratum corneum, epidermis, dermis and hypodermis. An advantage to H&E staining is
that the depth of microchannels created by microneedles within skin’s layers can be readily
assessed (Li et al., 2015). Fig. 15 shows examples of H&E sections of skin.
Figure 15 Images of H&E sections of previous studies (a) black arrow indicates microneedle perforation in
rat skin (Reproduced from (Kochhar et al., 2013a)) (b) black arrow indicates microneedle perforation in
rat skin (Reproduced from (Li et al., 2015)) (c) cross-section of porcine skin (Reproduced from (Dabboue
et al., 2015)) and (d) cross-section of human skin (Reproduced from (Dabboue et al., 2015)).
The disadvantages to this method is that only a small portion of the tissue can be sectioned,
which means that useful information is lost with the tissue that is discarded. It involves time-
consuming fixing, sectioning and staining steps. By comparing histological results with non-
invasive imaging technique, Coulman et al. reported that histological measurements lead to
overestimation of measurements (Birchall et al., 2005; Coulman et al., 2010). Furthermore,
there are slight inaccuracies with the measurements of the microchannels created in skin
following microneedle application due to skin retraction caused by the removal of the
microneedles before staining (Donnelly et al., 2010; Loizidou et al., 2016). Despite these
limitations, using histology for the light microscopic assessment of skin biopsies is still
regarded as the benchmark in dermatology (Holme et al., 2014; Newton et al., 2015).
2.7.3 3D image analysis
The emergence of Optical Coherence Tomography (OCT) and micro X-ray Computed
Tomography (XMT) as imaging tools for soft tissue could provide the opportunity to image a

52
whole sample of microneedle treated tissue, without going down the laborious route of H&E
staining.
Fercher et al. first suggested the use of OCT for medical diagnostic applications in order to
visualise transparent tissues of the eye (Fercher et al., 1988). OCT can produce high
resolution cross-sectional imaging of biological tissues in vivo and in real time (Huang et al.,
1991; Liu et al., 2013). The major advantage of OCT is that it is capable of penetrating depths
of 2 mm within skin and it can provide cross-sectional imaging of the epidermis and upper
dermis in vivo (Fercher, 2010).
XMT is another powerful method for non-destructive imaging of soft tissue that involves a
high resolution imaging technique, which has gained wide use within the scientific
community (Schambach et al., 2010). Traditionally, XMT has been predominantly used for
the imaging of bone structures (Buie et al., 2007). The challenge with XMT of soft tissue is
as a result of its low inherent X-ray contrast (Pauwels et al., 2013; Walton et al., 2015). The
use of contrast agents on soft tissue can overcome this limitation. However, there is still
limited knowledge about contrast agents or staining protocol for XMT compared to light and
electron microscopy imaging (Pauwels et al., 2013). Recently, Loizoudou et al. used XMT
scanning in their work for the 3D visualisation of microneedle skin penetration (Loizidou et
al., 2016).
2.8 Summary
This chapter has reviewed literature relevant to the anatomy of skin, mechanical properties of
skin, microneedles and its application as a device to infuse or extract fluid in skin, as well as
techniques for determining successful microneedle perforation of skin. Microneedles are a
suitable tool for enabling the administration of therapeutic compounds to the ideal site
provided by skin. To accomplish reproducible microneedle interaction with skin, an

53
understanding of the mechanical characterisation of skin is necessary. This literature review
gave an overview of in vitro and in vivo techniques for the mechanical testing of skin, which
indicated that test methodology, skin site, test condition and indenter type significantly
influenced the outcome of the elastic modulus.
The mechanical contributions from the skin’s sub-layers such as the dermis can influence
microneedle performance. The role of the subcutaneous fluid and muscle to the overall
mechanical behaviour of skin is also important and could determine microneedles interaction
with skin.
The review has also highlighted the need to establish a mechanism for reproducible
microneedle perforation of skin, with particular attention given to the design of the
microneedle applicator. The different types of microneedle applicators varied from a manual
applicator using thumb pressure to a spring-driven applicator to an electric-driven applicator
or an impact applicator. Evidently, for successful and reproducible microneedle perforation
of skin, an external delivery device for microneedle application is necessary. Furthermore, an
adequate insertion force and insertion velocity is necessary for successful microneedle
application to skin.
The skin models used in several of the studies lacked representative underlying substrates for
the skin. In some instances, only the epidermal layer and underlying substrates were
considered, thus ignoring significant mechanical contributions from the dermal layer. Sample
preservation also varied for each study, as the tissue was not snap frozen in super-cooled
isopentane before it was stored at temperatures of −20°C, −26°C and −80°C following
excision. This may have introduced some level of compromise to the integrity of the tissue
and therefore, may have potentially influenced the outcome of the experimental analysis.

54
A number of approaches were used for assessing successful microneedle perforation of skin,
with dye staining being the most common in establishing disruption to the stratum corneum.
One study stripped the stratum corneum following microneedle application to determine if
the perforations had travelled beyond the layer. In addition, histological staining techniques
were also used to determine the penetration depth through the layers of skin. Moreover,
emerging technologies within biomedical research such as OCT and XMT could also be
utilised in providing this detail.
Based on the literature review, this study will develop a representative in vitro model of skin
that is within the range of elastic moduli in the literature, then using indentation techniques to
determine the biomechanical properties of each layer in the skin model and developing a
microneedle applicator that involves the use of force and velocity. The outcome of
microneedle application to skin would be determined using imaging techniques such as
methylene blue and histology staining.

55
Chapter 3
3. Material and Methods
3.1 Introduction
The details of the experimental work of microneedle perforation of skin are discussed in this
section. Based on the review of previous studies, it is clear that microneedle geometry,
applicator insertion force or velocity and skin model play a major role in achieving successful
interaction between microneedles and skin. This chapter provides a detailed description of the
skin model, microneedles, microneedle applicators, experimental methods and image analysis
techniques used not only to achieve the primary aims and objectives established in Section
1.3 but to also address the topics summarised in Section 2.8.
3.2 The In Vitro Skin Model
In this thesis, a representative in vitro skin model was developed for microneedle application
and is explained in detail in this subsection.
3.2.1 Neonatal porcine skin
Five fresh suckling pigs (7–10 weeks old) were obtained from a local abattoir. Skin samples
from the back and abdomen were dissected within 3–4 hours and immediately snap-frozen by
placing in super-cooled isopentane and were subsequently stored at –80°C until required.
Prior to testing, the skin tissue was de-thawed for 30 mins. Commercial hair removal cream
for normal skin (Veet, Reckitt Benckiser Group, Berkshire, UK) was applied to the skin
surface for 5 mins to remove any hair. The samples were kept hydrated in PBS solution.
As stated in Section 1.3.3. Renehpra’s device could potentially be used on various sites in the
human body. It is for this reason that the work in this thesis focused on two anatomical

56
regions of neonatal porcine skins i.e. the abdominal tissue and back tissue due to their
differences in thickness and stiffness. Skin properties such as thickness various considerably
across different regions of the human body (Lee and Hwang, 2002); hence these two types of
porcine skin provide a useful method of determining how the device may work in different
parts of the human body. The physiological properties of neonatal porcine skin are similar to
human skin (Lo Presti et al., 2012) and the stiffness is within the range of values for the
stiffness of human tissue (Groves, 2011).
3.2.2 Gelatine gels as a representation of subcutaneous tissue fluid
Gelatine gel is formed because of the structural and chemical degradation of collagen (Lee
and Mooney, 2001). Gelatine powder is a translucent, colourless, brittle solid substance and
the type used in this study was derived from collagen obtained from porcine extract (Sigma-
Aldrich 48723-500G-F, Fluka).
3.2.2.1 Determination of gelatine gels concentration
The primary application of the TFR technology is to use microneedles to gain access to the
epidermis in the skin in order to extract fluid from patients with fluid overload or oedema.
For the effective application of microneedles to skin, consideration must be given to how
fluid overload in the in vitro skin model is represented. As mentioned in the literature review,
gelatine gels present an ideal approach for mimicking oedema in the in vitro skin model.
There are two forms of oedema, subcutaneous pitting oedema and subcutaneous non-pitting
oedema as previously described in Section 1.1. There lies a significant challenge in
quantitatively or semi-quantitatively depicting subcutaneous non-pitting oedema and it was
for this reason that this project focused solely on establishing gelatine gel mimics for various
severities of subcutaneous pitting oedema following the relevant literature studies.

57
Mridha et al. conducted two different mechanical tests, which were the mechanical
impedance test and the mechanical pulse wave propagation test on various concentrations of
gelatine gels and this has been previously covered in more detail in Section 2.4.2. The
gelatine gel concentrations of 80%, 84%, 88%, 92% & 96% water content by weight
represented the different severities of subcutaneous pitting oedema. By conducting these
mechanical tests, they were able to determine the mechanical behaviour of subcutaneous
pitting oedema. For mechanical impedance tests, high water content gelatine gels and
subcutaneous pitting oedema tissues had lower mechanical impedance compared to
subcutaneous non-pitting oedema, which exhibited higher mechanical impedance (Mridha
and Odman, 1985). Conversely, for the mechanical pulse wave propagation tests, the
propagation velocity of mechanical pulse waves was found to be lower in subcutaneous
pitting oedema than for normal tissues and higher in subcutaneous non-pitting oedema
(Mridha et al., 1992).
For normal, ‘healthy’ skin, the gelatine gel concentration was 67% water content by weight.
This was based on a study by Caspers et al. where an in vivo Raman microspectroscopy
technique was used to non-invasively determine the water content in healthy skin below the
stratum corneum to be around 67%, with the value varying slightly depending on anatomical
region (Caspers et al., 2000).
Based on these studies, four gelatine gel concentrations were used in this thesis and are
presented in Table 8. The mild-severe oedema characterisation is based on the Mridha et al.
studies (Mridha and Odman, 1985; Mridha et al., 1992). The lowest water content gel has the
highest stiffness, whilst the highest water content gel has the lowest stiffness.

58
Table 8 Composition of gelatine powder and water.
Gelatine powder
(g)
Water
(mL)
Gelatine gel
(water content
by weight)
Subcutaneous mimic
20 58 67% Normal
10 45 80% Mild subcutaneous pitting oedema
5 37 88% Moderate subcutaneous pitting oedema
5 120 96% Severe subcutaneous pitting oedema
3.2.2.2 Preparation technique of gelatine gels
Several factors such as gel preparation, curing duration, cooling and measurement
temperatures can influence the mechanical properties of gelatine gels (Markidou et al., 2005).
Therefore, each gel concentration was prepared in a consistent manner that involved using an
electronic stirrer to mix a mass of gelatine powder along with the requisite volume of distilled
boiling water until all gel powder had dissolved. Several homogeneous mixtures were made
for the four gelatine gel concentrations (see Table 8). The gel solution was left to cool for 1
hour, before it was cured at 5°C for 4–5 hours.
All tests were carried out within 2 hours using the same batch of samples.
3.2.3 Perma-Gel® as muscle mimic
As previously discussed in Section 2.4.3, Perma-Gel® (Perma-Gel, Inc., Albany, OR, USA) is
an ideal muscle mimic. Perma-Gel® which is similar to ballistic gelatine, is used as muscle
mimic (Caron-Laramee and Brouillette, 2014). Furthermore, synthetic thermoplastic
materials such as Perma-Gel® are stable at room temperature and can be stored for long
periods of time (Moy et al., 2011).

59
Perma-Gel® was obtained as a test block form (445 mm × 292 mm × 127 mm) from a third
party distributor (MidwayUSA, Columbia, USA). The Perma-Gel® was cut in small
specimens to fit the mechanical clamps.
3.2.4 Classification of the various in vitro skin models
A diagram of the representative in vitro skin model comprising the three layers is shown in
Fig. 16.
Figure 16 Diagram of the representative in vitro skin model showing the skin as the top layer, with gelatine
gel as a second layer and Perma-Gel® as the third layer.
The skin model was secured in mechanical clamps and the mechanical clamps are shown in
Fig. 17.
Figure 17 The mechanical clamp (a) top view of the assembled clamp (b) side view of the assembled clamp and (c)
individual components of the clamp.

60
The in vitro skin models have been categorised according to anatomical site, gelatine gel
concentration and Perma-Gel® and are presented in Table 9. The classification of skin model
names i.e. Model 1A, Model 2A will be used for the remainder of the work carried out in
later chapters of this thesis.
Table 9 The categories of two anatomical sites of neonatal porcine skin at various gelatine gel
concentrations and Perma-Gel®. A = Abdominal skin and B = Back skin.
Types of Skin Model
Classification
Abdominal skin with 67% gel concentration and Perma-Gel®
Model 1A
Abdominal skin with 80% gel concentration and Perma-Gel®
Model 2A
Abdominal skin with 88% gel concentration and Perma-Gel®
Model 3A
Abdominal skin with 96% gel concentration and Perma-Gel®
Model 4A
Back skin with 67% gel concentration and Perma-Gel®
Model 1B
Back skin with 80% gel concentration and Perma-Gel®
Model 2B
Back skin with 88% gel concentration and Perma-Gel®
Model 3B
Back skin with 96% gel concentration and Perma-Gel®
Model 4B
3.2.5 Micromechanical characterisation of the layers of the skin model
A general overview of the indentation technique is mentioned along with the theory. In
addition, the experimental approach is also detailed in this section.
3.2.5.1 Dynamic indentation principles
Indentation or depth-sensing instrumentation is a technique for determining localised
mechanical properties of materials. With indentation, a prescribed load is applied to an
indenter in contact with a specimen. As the load is applied, the depth of penetration is
measured. The area of contact at full load is determined by the depth of the impression and
indenter geometry (Oliver and Pharr, 1992). A schematic of a typical load-displacement

61
curve is shown in Fig. 18. It also involves small scale mechanical testing, which presents
several advantages in the characterisation of biological materials. One of which is the small
volume of material required for testing, thereby minimal sample preparation is required.
Furthermore, with instrumented indentation it is possible to map out the spatial differences of
properties in the sample and is a key requirement for characterising biological material (Hay,
2011). Typically, quasi-static indentation is used for testing biological tissues (Ebenstein and
Pruitt, 2006). However, there are a number of challenges including difficulties in accurately
detecting sample surface (Akhtar et al., 2015).
Figure 18 A schematic representation of a typical load versus indenter displacement curve. Pmax and hmax
are the load and displacement at highest load respectively and a is the radius of the contact circle. hf is the
final depth of the contact impression after unloading and S is the initial unloading stiffness. (Figure
reproduced from (Oliver and Pharr, 1992)).
In this thesis, dynamic indentation has been utilised with a 100 m flat punch tip, therefore
resulting in micron resolution. Dynamic instrumented indentation provides a simple way to
accurately measure the mechanical properties of soft biological material like skin and gelatine
gels (Hay and Cherneva, 2013). Furthermore, indentation is used a lot for skin and has
advantages over tensile testing. In addition, tips of this geometry (100 m flat punch tip) are

62
typically used to improve surface detection with compliant materials, hence, micro-sized tips
for indentation. For the characterisation of time-dependent behaviour, dynamic indentation
has its advantages over quasi-static indentation because it significantly reduces the testing
time through the measurement of properties over a range of frequencies rather than extended
time (Odegard et al., 2005).
3.2.5.2 Theory
With the Keysight Technologies DCM-II head, as shown in Fig. 19, it is possible to perform
dynamic (oscillatory) indentation and determine the complex shear modulus (G*), which
exhibits real and imaginary components and gives the shear storage modulus (G´), which
depicts the energy stored and viscous or the shear loss modulus (G˝), which depicts the
energy dissipated as heat. Therefore, the relationship between the elastic and viscous
properties of the material is shown in Equation 4:
G* = G´ + i G˝ Equation 4
Figure 19 A schematic of the DCM-II head. (Figure reproduced from (Hay, 2012)).
The theory is covered in greater detail in Hay (2011) and Hay and Cherneva (2013). In brief,
by indenting samples with a flat-ended cylindrical punch, the relationship between the shear

63
modulus (G´), Poisson’s ratio () , elastic contact stiffness (S) and punch diameter (D) can be
determined using the analysis developed by Sneddon, (1965) as shown in Equation 5:
𝐺´ = 𝑆(1−𝑣)
2𝐷 Equation 5
The influence of contact damping, C on the viscous properties, G˝ is given by the following
equation:
𝐺˝ = 𝐶𝜔(1−𝑣)
2𝐷 Equation 6
The contact stiffness, S, must be obtained by subtracting the instrument stiffness, Ki from the
total measured stiffness, Ks and is given by the following equation:
𝑆 = 𝐾𝑠 − 𝐾𝑖 Equation 7
Likewise, the contact damping, C must be obtained by subtracting the instrument damping,
Ci from the total measured damping, Cs and is given by the following equation:
𝐶𝜔 = 𝐶𝑠𝜔 − 𝐶𝑖𝜔 Equation 8
By oscillating the indenter electromagnetically, the stiffness and damping are obtained. To
begin with, the same conditions (e.g. same position, frequency and oscillation amplitude) that
are used to measure the stiffness and damping of the head only are subsequently used for
testing. The indenter head is moved down towards the sample until contact is made. During
this period, a pre-compression is applied so that the indenter maintains total contact with the
sample surface. The indenter is then vibrated at a fixed frequency and oscillation amplitude.
Therefore, at the initial oscillation cycle, the indenter head is calibrated in situ. The stiffness
and damping inputs from the head can then be deducted from the measured signal in order to

64
find the contact only response. Afterwards, the second oscillation cycle acquires the material
properties (Akhtar et al., 2015).
3.2.5.3 Experimental setup
All indentation experiments were carried out on gelatine gels, Perma-Gel® and fresh full
thickness skin samples. The tissue was hydrated in PBS solution. Indentation tests were
conducted using a Keysight indenter G200 (Keysight Technologies, Chandler, AZ, USA)
instrument with an ultra-low load dynamic contact module indentation head (DCM-II
actuator). The indentations were performed at ambient temperature (24.3–27.2ºC), using a
100 m flat punch indenter tip (Synton-MDP Ltd, Nidau, Switzerland). A custom sample
holder was designed in to which the gelatine gel samples were placed. The well in the sample
holder was 1 cm2 and 4 mm deep.
For the experiments conducted in this thesis, a pre-compression of 5 m for the gelatine gels
and Perma-Gel® were selected, whilst 8 m was used for the skin samples. The indenter was
fully in contact with the sample surface. The indenter was then vibrated at a frequency of 110
Hz (the resonant frequency of the indenter) and with an oscillation amplitude of 500 nm. To
obtain the response of the contact only, the stiffness and damping contributions from the
indenter are subtracted from the measured signal. This means that the second oscillation
sequence acquires the material properties. 10 different sites were tested on each sample, with
100 m spacing between each indent on the sample. The tip of the indenter head was cleaned
by indenting a piece of double-sided Scotch tape positioned on an adjacent sample puck
before repositioning on a new area on the sample following each indent.
A Poisson's ratio, , of 0.5 was chosen because skin is regarded as fully incompressible
(Bhushan et al., 2010) and this value was used to calculate the elastic modulus, E, which was
subsequently, determined using the formula in Equation 9.
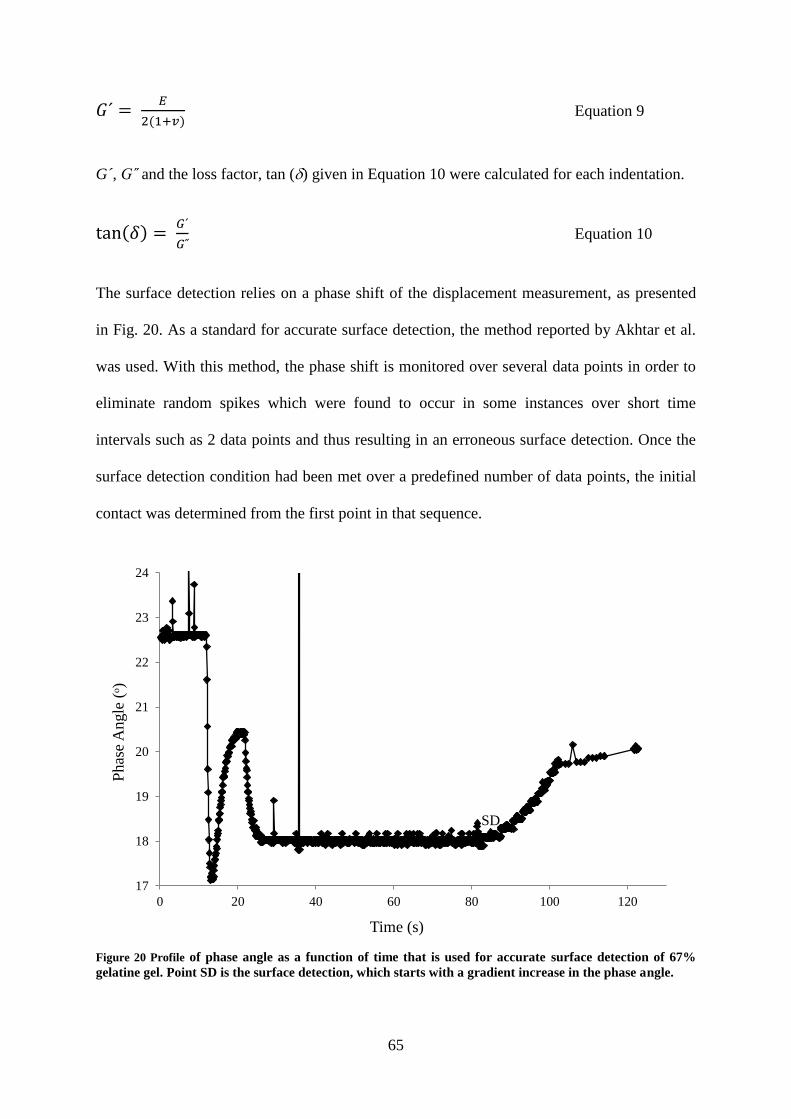
65
𝐺´ = 𝐸
2(1+𝑣) Equation 9
G´, G˝ and the loss factor, tan () given in Equation 10 were calculated for each indentation.
tan(𝛿) = 𝐺´
𝐺˝ Equation 10
The surface detection relies on a phase shift of the displacement measurement, as presented
in Fig. 20. As a standard for accurate surface detection, the method reported by Akhtar et al.
was used. With this method, the phase shift is monitored over several data points in order to
eliminate random spikes which were found to occur in some instances over short time
intervals such as 2 data points and thus resulting in an erroneous surface detection. Once the
surface detection condition had been met over a predefined number of data points, the initial
contact was determined from the first point in that sequence.
Figure 20 Profile of phase angle as a function of time that is used for accurate surface detection of 67%
gelatine gel. Point SD is the surface detection, which starts with a gradient increase in the phase angle.
17
18
19
20
21
22
23
24
0 20 40 60 80 100 120
Phas
e A
ngle
(ᵒ)
Time (s)
SD

66
3.3 The Microneedle Arrays
This section provides details about the types of microneedles used in this thesis, the material
they were made from, their manufacturing process and design. These specific medical grade
microneedles were sourced because of their intended use on human subjects.
3.3.1 Polyetheretherketone microneedle arrays
Custom manufactured polyetheretherketone (PEEK) microneedle arrays (Laser
Micromachining Ltd, St Asaph, UK) were used for the early experimental analysis. These
were hollow microneedles as shown in Fig. 21 and were manufactured using laser etching or
laser finishing following injection moulding to a height, width and 1 mm interspacing
between the microneedles.
Figure 21 Medical grade PEEK microneedles, where (a) drawing including dimensions and (b) image of the array.
(a)
(b)
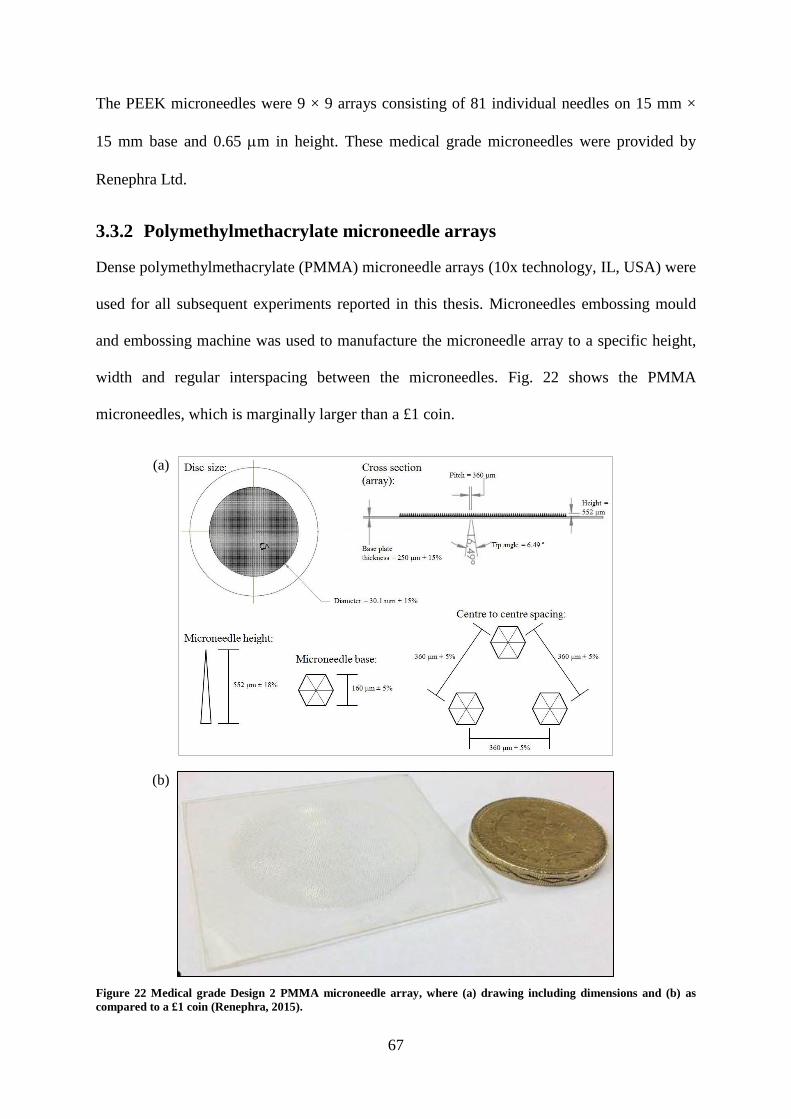
67
The PEEK microneedles were 9 × 9 arrays consisting of 81 individual needles on 15 mm ×
15 mm base and 0.65 m in height. These medical grade microneedles were provided by
Renephra Ltd.
3.3.2 Polymethylmethacrylate microneedle arrays
Dense polymethylmethacrylate (PMMA) microneedle arrays (10x technology, IL, USA) were
used for all subsequent experiments reported in this thesis. Microneedles embossing mould
and embossing machine was used to manufacture the microneedle array to a specific height,
width and regular interspacing between the microneedles. Fig. 22 shows the PMMA
microneedles, which is marginally larger than a £1 coin.
Figure 22 Medical grade Design 2 PMMA microneedle array, where (a) drawing including dimensions and (b) as
compared to a £1 coin (Renephra, 2015).
(a)
(b)

68
The full specifications for the PMMA microneedles are presented in Table 10. These
microneedles are medical grade and have been used in in vivo patient tests since 2014 by
Renephra Ltd.
Table 10 PMMA microneedles specification.
Type
Height (m)
Disc size
diameter (mm)
Needles
per unit
area
(mm2
)
Base (m)
Centre-to-
centre
spacing
(m)
No. of
needles
per
array
Design 1 356 15.8 6.7 177 386 1316
Design 2 552 30.1 7.7 160 360 >6000
3.3.3 Scanning Electron Microscopy of microneedle arrays
Consideration was given to microneedle integrity to determine the number of times it could
be used on tissue. Scanning Electron Microscopy (SEM) images of microneedles were
recorded using a Hitachi S-4800 FE-SEM at 3 kV with 1.5 kV deceleration (Tokyo, Japan).
The PEEK or PMMA samples were fixed onto the aluminium stubs with carbon tabs. The
samples were gold coated using a sputter-coater (EMITECH K550X) prior to imaging.
Impact tests with microneedles on tissue were carried out once and SEM images were taken.
Further impact tests were repeated five times using the same microneedle and SEM images
taken.
3.4 The Microneedle Applicators
This section details the two types of microneedle applicators used for microneedle applications to
the skin model. All impact tests were conducted at ambient temperature, which was ideal for
maintaining the stability of the gelatine gels used in the models.

69
3.4.1 Impact applicator system
The governing principles of a dropped weight impact-testing rig have been detailed in this
section and the experimental setup described extensively in Sections 3.4.1.3. and 3.4.1.4.
3.4.1.1 Determination of the dropping heights
The dropping heights were calculated by inputting values for velocity in the simple motion
equation, where v is velocity, g is acceleration due to gravity and h is the dropping height.
𝑣 = √2 𝑔 ℎ Equation 11
Table 11 shows the equivalent dropping heights for the velocities calculated from Equation
11. Each dropping height was marked along the length of the drop tower guide.
Table 11 Velocity as a function of dropping height.
Velocity (ms-1
) 1 2 3 4 5
Dropping height (m) 0.05 0.20 0.46 0.82 1.27
3.4.1.2 Theory
Impact acceleration occurs whenever there is an abrupt change in velocity, such as an
instantaneous deceleration in a car crash or the sudden halt of a falling lift down a shaft. As a
consequence, impact forces are usually in milliseconds and human tolerance to them is
determined by the mechanical strength of body tissues (Glaister, 1975). Therefore, the
perforation potential of microneedles in skin during a given impact is related to the amount of
work done or energy absorbed by the tissue.
During impact, some compression of the tissue occurs and there may also be a rebound of the
drop mass as residual energy is dissipated, however, for simplicity purposes, rebound is
ignored in this theory. Furthermore, there is an elastic potential energy (Equation 12), which

70
is the stored energy the drop mass (m) possesses due to its position in a stressed elastic
system. Conversely, because the drop mass is released from a known height it also has
potential energy, which is the energy stored up in the drop mass as a result of its position in a
gravitational field (Equation 13).
𝐸𝑙𝑎𝑠𝑡𝑖𝑐 𝑃𝑜𝑡𝑒𝑛𝑡𝑖𝑎𝑙 𝐸𝑛𝑒𝑟𝑔𝑦 = 1
2 𝑘 𝑥2 Equation 12
𝑃𝑜𝑡𝑒𝑛𝑡𝑖𝑎𝑙 𝑒𝑛𝑒𝑟𝑔𝑦 = 𝑚 𝑔 ℎ Equation 13
The spring potential energy is obtained from Equations 12 and 13, and is given by Equation
14, where x is the compression distance and k is the spring constant.
𝑚 𝑔 ℎ = 1
2 𝑘 𝑥2 Equation 14
By rearranging Equation 14, the compression distance (x) is given by Equation 15
𝑥 = √2 𝑚 𝑔 ℎ
𝑘 Equation 15
Fig. 23 illustrates the relationship between the elastic potential energy and the potential
energy due to gravitational fields using a simple spring.
Figure 23 Schematic of the potential energy due to gravity and the energy stored up in a spring energy indicating the
compression distance (x).

71
Using Hooke’s Law in Equation 16 to establish a relationship between force (F) and
compression distance (x).
𝐹 = 𝑘 𝑥 Equation 16
Substituting the compression distance (x) in Equation 15 into Equation 16 gives the
expression
𝐹 = 𝑘 𝑥 = √2 𝑚 𝑔 ℎ 𝑘 Equation 17
The velocity for microneedle perforation of skin can be derived from the conservation of
energy principle because the potential energy is converted into kinetic energy.
𝐾𝑖𝑛𝑒𝑡𝑖𝑐 𝑒𝑛𝑒𝑟𝑔𝑦 = 1
2 𝑚 𝑣2 Equation 18
Equating the kinetic energy and the potential energy gives the expression in Equation 19
1
2 𝑚 𝑣2 = 𝑚 𝑔 ℎ Equation 19
Making the velocity (v) the subject of the formula gives
𝑣 = √2 𝑔 ℎ Equation 20
The force can be obtained by substituting Equation 20 into Equation 17
𝐹 = 𝑣 √𝑚 𝑘 Equation 21
Based on the interpretation of Equations 12–21, the following conclusions were drawn:
A low mass object will produce a lower magnitude of force compared to a large mass
object.
An increase in the force will result in an increase in velocity.

72
Increasing the dropping heights will result in an increase in velocity. There is
contribution from the acceleration due to gravity as the drop mass is released from
rest.
The mass of the object influences the impact energy; a small mass will release less
energy, whilst a large mass will expend more energy.
3.4.1.3 First generation impact applicator
The early dropped weight impact testing rig comprised a drop tower of height 1.86 m, with a
drop tower guide of height 1.78 m, a piezoelectric accelerometer of 10.96 mV/g sensitivity
(Unit Type A/126/S, Serial No. 035, Birchall Instruments) connected to a power supply,
which was connected to a digital oscilloscope (Part No. 54641A, Agilent Technologies) along
with the proprietary Agilent IntuiLink software (Version 3.1). The accelerometer was
fastened to one end of the 36 g drop mass and the microneedle array fixed to the free end of
the drop mass using superglue. The experimental setup is shown in Fig. 24.
The early impact tests were conducted on only skin and gelatine gels. Five repeats of the
impact tests were performed on eight different skin models i.e. back skin with four gelatine
gel concentrations and abdominal skin with four gelatine gel concentrations. The acceleration
is captured on the oscilloscope as voltage–time plots, which is then converted to an
acceleration–time plot using the accelerometer sensitivity before it is eventually converted to
a velocity–time plot.

73
Figure 24 Schematic diagram of the early dropped weight impact-testing rig.
3.4.1.4 Improved impact applicator
The improved impact test setup included the addition of a force transducer, power units and a
beam detector to the early impact applicator system.
The setup used a piezoelectric accelerometer with 10.71 mV/g sensitivity (Model 3225F-1,
Dytran Instruments, Inc., CA, USA) and a piezoelectric force transducer with 22.4 mV/N
sensitivity (Model 1022V, Dytran Instruments, Inc., CA, USA). Both the accelerometer and
the force transducer were connected to their respective amplifiers (Model 4105C, Dytran
Instruments, Inc., CA, USA), which had a frequency response of 0.1–100 000 Hz gain ×1
used for velocities 1–2 ms-1
and 0.1–50 000 Hz gain ×10 used for velocities 3–5 ms-1
. This
was then connected to a digital oscilloscope (54641A, Keysight Technologies, Berkshire,
UK) and utilised with Keysight IntuiLink software (Version 3.1). The sampling rate was 20
kHz. The accelerometer was connected to the top of the custom-made drop mass, whilst the
force transducer was fastened to its bottom end. Two 630–650 nm wavelength (red) with a
power output <1mW laser diode modules (PL-Series, Hero Electronics, Dunstable, UK) were
attached to two drill holes on the lower part of the drop tower guide so that a break in signal,
caused when the drop mass is released, was captured by a beam detector, thus activating the

74
external trigger on the oscilloscope. Subsequently, the force and acceleration outputs were
captured on the oscilloscope. The experimental setup is shown in Fig. 25.
Figure 25 The improved impact applicator, where (a) is the schematic diagram and (b) includes
complimentary pictures of the setup.
The relevant dropping heights in Table 11 were marked along the length of the drop tower
guide. The opening in the drop tower guide as shown in Fig. 25b allowed for the movement
(a)
(b)

75
of the cables fastened to the accelerometer and force transducer. The drop mass along with
the accelerometer and force transducer were positioned at the appropriate dropping height
and held in place with the aid of a flat-head screwdriver via the opening along the length of
the drop tower guide. The screwdriver was removed, thus releasing the drop mass along with
the accelerometer and force transducer to impact the microneedles placed on the skin model
at the bottom of the drop tower guide.
For this research work, five repeats of impact tests using the improved impact applicator were
conducted on individual samples of skin for Models 1A–4B i.e. five repeats of individual
samples of skin Model 1A or five repeats of individual samples of skin Model 2A etc. (see
Table 9 in Section 3.2.4 for skin model classification). The acceleration and the force are
captured on the oscilloscope as voltage–time plots, which are then converted to acceleration–
time plots and force–time plots using the sensitivities of the accelerometer and force
transducer respectively. The acceleration–time plot is then converted to a velocity–time plot.
3.4.1.5 Calibration of the impact applicator
The results of tests utilising a loadcell or a force transducer is dependent on the accuracy of
the loadcell and how it is used. A simple and accurate measure of loadcell evaluation is to
compare the output of the loadcell against a reference mass. For the calibration tests, a mass
of 5 kg was mounted onto the loadcell and the results captured on the PC as a force–time
graph. Then, the second law of motion was used to work out the mass registered by the
loadcell, which was equivalent to the mass of the known weight.
A vibration calibrator (Bruel & Kjaer, Type 4294, Serial No. 1683419) was used to check the
accuracy of the accelerometer. The vibration calibrator produces an acceleration of 10 ms-2
equivalent to an acceleration level of 140 dB re 1 × 10⁻⁶
ms-2
, at a frequency of 159 Hz (1
radian). The accelerometer was fixed to the vibrating surface of the calibrator using beeswax.

76
The calibration signal was then used to check the measurement chain from the accelerometer
to the display in order to confirm that it was at the correct calibration level.
3.4.2 Clinical applicator system
For their in vivo patient tests, Renephra used a clinical applicator for microneedle perforated
skin. The clinical applicator was also used for some of the in vitro work presented in this
thesis. The perforation tests using the clinical applicator was conducted at ambient
temperature, which was ideal for maintaining the stability of the gelatine gels used in the skin
models. The clinical applicator setup is detailed in this section.
3.4.2.1 Clinical applicator mechanism
A schematic of the clinical applicator, which is based on a spring and hammer-driven
mechanism, is shown in Fig. 26.
Figure 26 Diagram of Renephra’s clinical applicator. (a) Side view of the applicator. (b) top view of the
applicator and (c) the internal components of the applicator. (Courtesy Renephra Ltd).
In order to use the clinical applicator, the patch button shown in Fig. 25c was placed onto the
microneedles resting on the skin model. Prior to use, the applicator was first cocked into

77
position by lifting the lever. The cocked lever returned on the spring and was ready for use.
The applicator was then pressed onto the patch button and this triggered the hammer, which
was launched to impact the patch button, thereby making contact with the microneedles on
the skin model lying beneath the patch button.
3.4.2.2 Determination of the clinical applicator force
Although the clinical applicator has been used for in vivo patient tests by Renephra, the
device does not measure the insertion force. Hence, in order to determine the force produced
by the clinical applicator, the clamped skin model was fastened onto a 20 kg loadcell
(CZL635 micro loadcell, Active Robots, Somerset, UK). The loadcell was connected to a
data acquisition tool (i100 instruNet network device, GW Instruments, Inc., Massachusetts,
USA). The instruNet was used to process the loadcell data output and was also connected to
a PC setup so as to obtain the graphical output. During testing, the microneedle array was
placed onto the skin model with the patch button placed directly onto the microneedle array.
The clinical applicator was cocked into position and then pressed onto the patch button until
the trigger was released. The force produced by the applicator was detected by the loadcell
and the data captured on the instruNet/PC setup. The diagram of the clinical applicator
system is shown in Fig. 27.

78
Figure 27 Schematic diagram of the clinical applicator setup.
However, it was found following initial tests that the clinical applicator failed to trigger and
launch the hammer onto the patch button on the skin model shown in Fig. 19. Therefore, the
patch button had to be placed onto an elevated profile of the skin model. The elevated profile
of the skin model was achieved by using double the amount of Perma-Gel®, as shown in Fig.
28. The elevated profile of the skin did not influence the outcome of the interaction between
the microneedles and skin as determined from the methylene blue and H&E stained images.
Four repeats of clinical applicator tests were conducted on individual samples of skin for
Models 1A–4B i.e. four repeats on individual samples of skin Model 1A or four repeats on
individual samples of skin Model 2A etc.
Figure 28 Diagram of the elevated profile of the skin model.

79
3.5 Imaging Techniques for Assessing Microneedle Perforation
of Skin
Various imaging techniques were used to assess the depth and extent of the deformation
resulting from microneedle perforation of skin. This section details the specific imaging
techniques.
3.5.1 Visual examination and penetration efficiency calculation of
microneedle perforated skin
Methylene blue staining is used to detect microneedle perforations of skin. The staining of
tissues occurs because the methylene blue dye binds itself to the proteins that are found in
tissue (Jones et al., 2008). The image of methylene blue staining indicates successful breach
of the stratum corneum and the creation of microchannels on skin. Typically, the
hydrophobic nature of the stratum corneum cannot absorb the hydrophilic low molecular
weight of the methylene blue solution, however, once the stratum corneum has been
disrupted by microneedle assault, the methylene blue diffuses through the skin (Li et al.,
2009).
For all experiments, a 2% weight to volume solution was prepared for methylene blue dye.
The microneedle treated tissue was soaked in methylene blue solution for 30 mins for the
purpose of detecting microchannels created following penetration tests. The tissue was
removed from the methylene blue solution and the tissue surface wiped down with ethanol so
that any microchannels were detected. Methylene blue stained skin samples were imaged
with Nikon digital camera D5100 (Surrey, UK), as shown in Fig. 29.

80
Figure 29 Methylene blue stained images of 9 × 9 PEEK microneedle array on abdominal skin model at 67%
gelatine gel concentration, where (a) 5 ms-1
, (b) 4 ms-1
and (c) 3 ms-1
.
In order to determine the Penetration Efficiency (PE) from the methylene blue stained
images, a method similar to that of van der Maaden et al. was used (van der Maaden et al.,
2014). PE can be defined as the percentage of the number of blue spots from the methylene
blue staining of microchannels created by a microneedle array on the stratum corneum,
divided by the total number of microneedles on the array.
The size of the microneedle array for Design 1 microneedles was 15.8 mm in diameter and
the density of the microneedles was 1316. Therefore, PE is given by the formula in Equation
22.
𝑃 𝐸 = 𝑛𝑢𝑚𝑏𝑒𝑟 𝑜𝑓 𝑏𝑙𝑢𝑒 𝑠𝑝𝑜𝑡𝑠
1316 × 100% Equation 22
where 1316 represents the total number of microneedles on a 15.8 mm diameter microneedle
disc.
In contrast, the size of the microneedle array for Design 2 microneedles was 30.1 mm in
diameter and the density of microneedles > 6000, therefore, it proved challenging to quantify
PE following methylene blue staining for the entire disc. As a consequence, for quantitative
analysis, a central region of 5 × 5 mm was cropped for each image and used for determining
the PE. The revised formula for calculating PE is given in Equation 23.

81
𝑃 𝐸 = 𝑛𝑢𝑚𝑏𝑒𝑟 𝑜𝑓 𝑏𝑙𝑢𝑒 𝑠𝑝𝑜𝑡𝑠
193 × 100% Equation 23
where 193 represents the expected number of microneedles for a 25 mm2 area of the sample
given that there are 7.7 microneedles per unit mm2 as presented in Table 10.
3.5.2 Histology examination of the microneedle perforated skin
After impact testing, the tissue was prepared for cryosectioning by freezing in Optimal
Cutting Temperature resin (Sakura Fintek Europe B.V, Alphen aan den Rijn, The
Netherlands) and then snap frozen in super-cooled isopentane (Graham et al., 2011). The
perforated skin was snap frozen immediately following removal of the microneedles to
minimise skin retraction as well as maintain the sample’s integrity. The tissue was then
sectioned to fit in a cryomold.
For this project, a standard process used in dermatology for skin histology was used based on
an established protocol (Watson, 2013). Histology evaluation using H&E staining was used
to define the layers of skin and for the purpose of this study was useful in assessing the depth
of the microchannels created and the extent of the deformation within skin. The perforated
tissue was sectioned using a Leica CM1850 cryostat (Milton Keynes, UK). The thickness of
the cryosections was optimised via trial and error, therefore, it was determined that a
thickness of 12 m was appropriate. The sectioned tissue was stained with H&E using a
standard protocol, which is summarised here: the sectioned tissue was fixed in 4%
paraformaldehyde for 10 mins, rehydrated in distilled water for 2 mins, immersed in
haematoxylin for 3 mins before running tap water over it for 5 mins. The glass slide was
placed in 1% hydrochloric acid (HCl)/70% industrial methylated spirit (IMS) acid/alcohol for
10 seconds before running tap water over it for a further 5 mins. The glass slide was then
immersed in eosin for 1 minute, rinsed in distilled water for 1 min, rinsed in 70% IMS for 1
min and then rinsed in 95% IMS for another minute. The sectioned tissue was rehydrated at

82
100% IMS for 4 mins, then cleared in Histo-Clear (National Diagnostics, Atlanta, GA, USA)
and mounted in Depex mounting medium (Electron Microscopy Sciences, Washington, PA,
USA).
The stained tissue was imaged with a Nikon Eclipse Ci microscope (Surrey, UK). Fig. 30a
shows the H&E staining of a section of skin that has not undergone hair removal treatment.
The image shows an intact stratum corneum as well as epidermis and dermis. The image in
Fig. 30b is of a section of skin that has been pre-treated with hair removal agent. The image
also shows an intact stratum corneum as well as epidermis and dermis and therefore
demonstrates that the tissue has borne no adverse effects from the application of the
chemical.
Figure 30 Inspection technique of the perforated tissue using H&E staining, where (a) is the untreated
sectioned tissue showing the three histological layers of skin and (b) is the sectioned tissue already treated
with the hair removal agent. Scale bar represents 100 m.
Throughout this thesis, the following colour coded arrows on the H&E stained images shown
in Fig. 31 have been used to denote the disruptions through the stratum corneum, epidermis
and dermis.

83
Figure 31 Labelling of the H&E stained images, where (a) blue arrow indicates disruption to the stratum
corneum, (b) red arrow indicates that the breach is contained within the epidermis, (c) black arrow
indicates that breach has extended into the dermis and (d) key describing the colour coded arrows. Scale
bar represents 100 m.
The improvements on the conventional methods of measurement from histological images
are to utilise a custom image analysis routine for determining breach area.
3.5.3 Quantitative image analysis using Image SXM software
A custom routine was written in Image SXM (Heilbronner and Barrett, 2014) for semi-
automated analysis of the histology images to determine the breach area within the skin
following microneedle application. The optical microscopy images were found to vary in
contrast, brightness and colour balance and hence a histogram of pixel values was used to
determine the optimum threshold in order to highlight the pixels above the epidermal layer.
For images in which the epidermal layer had not been breached, it was found that combining
the red and blue colour channels of the images produced the most reliable discrimination of
the edge of the epidermal layer. For images in which the epidermal layer was breached, it was
found that the green channel gave the most reliable discrimination. Automatic detection of a
breach was not possible with the routine; hence the most appropriate mode was selected for

84
each image. Only those images in which the epidermal layer was clearly discriminated from
the rest of the image could be analysed to determine the breach area. For these images, the
extent of the microneedle puncture was marked by clicking on the two points (Fig. 32a) that
delineate the puncture at the upper surface of the epidermal layer (Fig. 32b). The area of the
puncture was measured and logged (Fig. 32c). Subsequently, the next image was loaded and
displayed ready for user input.
Figure 32 Quantitative image analysis results using ImageSXM of back skin model. (a) Grayscale of
histology image. (b) Red pixel saturation of the histology image. (c) Quantification of the breach area.
Scale bar represents 100 m.
Over 500 images were analysed for the quantification of the breach areas, as more than 30
images of impact tests with the Design 2 microneedles on eight skin models i.e. Models 1A–
4B selected at random were assessed. Additionally, more than 30 images of Design 1
microneedles penetration of Model 3B selected at random were analysed.
3.5.3.1 Assessment of microneedle perforation depth
ImageJ (Version 1.48, National Institutes of Health) (Abramoff et al., 2004) was used to
assess the perforation depth of the histology image as shown in Figs 33a and 33b. Similarly,
approximately 30 images of impact tests with Design 2 microneedles on eight skin models
i.e. Models 1A–4B and Design 1 microneedles on Model 3B selected at random were
assessed. The user-defined line was drawn from the stratum corneum to the maximum point
of penetration in the skin, which was either located within the epidermis or the dermis.

85
Figure 33 Image analysis results of the perforation depth of Model 3B using ImageJ for impact tests with
(a) Design 2 microneedles and (b) Design 1 microneedles. Scale bar represents 100 m.
3.5.3.2 Breach area classification
To better analyse the outcome of the image analysis, the breach areas were placed into three
groups comprising 0 < breach area < 10 000 m2, which indicates that the perforation has
travelled through the stratum corneum and just interfaces with the epidermis; 10 000 < breach
area < 20 000 m2, which indicates that there is a significant level of deformation within the
epidermis and 20 000 < breach area < 50 000 m2, which indicates that the perforation has
gone beyond the epidermis into the dermis. Examples of the three groups have been
illustrated in Fig. 34. The breach area was measured in the way specified in order to
determine the extent of the perforation and if the perforation varied due to contributions from
gelatine gels with its different stiffness.
Figure 34 The H&E images illustrate breach area groupings. The area shaded in black represents the
breach area size, where (a) 0 < breach area < 10 000 m2 small deformation within the epidermis (b) 10
000 < breach area < 20 000 m2 large deformation within the epidermis and (c) 20 000 < breach area < 50
000 m2 deformation within the dermis. Scale bar represents 100 m.

86
As stated in the literature review regarding the histology process being time consuming,
labour intensive and resulting in slight inaccuracies of the measurements of the
microchannels due to skin retraction caused by the removal of the microneedles before
staining (Donnelly et al., 2010; Loizidou et al., 2016), using 3D imaging techniques could
lead to improved accuracies of measuring the deformations in microneedle treated skin.
Furthermore, the microneedles could be imaged with the skin in situ.
3.6 Statistical Analysis
Statistical analysis for the determination of differences in the measured properties between
and within groups was accomplished using a single factor analysis of variance (ANOVA)
utilising Microsoft Excel Data Analysis ToolPak.
All data were presented as a mean value with its standard deviation indicated (Mean ± SD).
For all the tests in this thesis, the following notations for probability were used:
p > 0.05 – not significant (ns)
p ≤ 0.05 – statistically significant (*)
p ≤ 0.01 – statistically significant (**)
p ≤ 0.001 – statistically significant (***)
p ≤ 0.0001 – statistically significant (****)
3.7 Summary
The chapter has detailed the experimental approach for determining the biomechanical
interaction between skin and microneedles. This was based on the outcome of the literature
review, which described neonatal porcine skin as an ideal substitute for human skin and for
its close biomechanical properties to human skin. It also demonstrated the significance of a
representative underlying substrate in the skin model. Moreover, it highlighted the
importance of tissue preservation in maintaining the integrity of the sample, as this could

87
influence the outcome of the experimental analysis. For microneedle application studies of
skin, the challenge to effective microneedle penetration is to bypass the inherent elasticity of
the stratum corneum. Previous studies indicated that insertion velocity and insertion force
influence perforation of the stratum corneum with microneedles. Furthermore, the
introduction of microneedles in skin to any depth requires the assistance of external pressure
using a microneedle delivery apparatus.

88
Chapter 4
4. Results
4.1 Introduction
In this chapter, the results from all the experimental work will be presented. In Section 4.2,
the results obtained from the dynamic nanoindentation tests to determine the mechanical
properties of each of the different layers that make up the in vitro skin model are presented.
In Section 4.3, the results obtained from the preliminary studies of microneedles on skin
using the impact applicator during the early stage of its development are detailed. In Section
4.4, data obtained using the fully developed impact applicator on the in vitro skin models are
presented. Results from studies using clinical applicator on in vitro skin models are presented
in Section 4.5. The section concludes with a comparison between the performance of the
impact and clinical applicators (Section 4.6).
4.2 Micromechanical Characterisation of Skin’s Sub-layers
The outcome of indentation tests on abdominal skin, back skin, 67%, 80%, 88% gelatine gels
and Perma-Gel® are presented in this section.
4.2.1 Indentation tests on abdominal and back skin samples
Fig. 35 shows the storage modulus, loss modulus and loss factor for abdominal and back skin
samples following 38 successful indentations. It was found that for the abdominal skin
samples, the loss modulus (G˝) dominates over the storage modulus (G´). In contrast, for
back skin, the storage modulus dominates over the loss modulus (Fig. 35b). Back skin
exhibited a much higher elastic modulus component compared to abdominal skin. For the
viscous component, back skin was higher than abdominal skin. Abdominal skin was found to

89
have a higher damping capacity, as determined from the loss factor in Fig. 35c. The storage
and loss factor results were statistically significant, whilst there was no statistically
significant difference between the samples for the loss modulus.
Figure 35 Micromechanical properties of neonatal porcine abdominal and back skin, with the number of
indentations (n) listed above each bar chart. (a) Storage modulus, G´ (b) loss modulus, G˝ and (c) loss
factor. Error bars depict SD.
As shown in Fig. 36, the back skin samples (45.89 ± 9.61 kPa), produced a higher elastic
modulus compared to the abdominal skin samples (24.49 ± 5.47 kPa). The variation between
groups for abdominal and back skin groups was found to be statistically significant.
****
ns
****

90
Figure 36 Elastic modulus of neonatal porcine abdominal and back skin following micromechanical tests,
with the number of indentations (n) listed above each bar chart. Error bars depict SD.
4.2.2 Indentation tests on gelatine gel samples
Fig. 37 presents the mechanical properties for each of the gelatine gels following 40
successful indentations. The storage modulus (G´) dominates over the loss modulus (G˝) for
each of the gelatine gels (Figs 37a & 37b). The gelatine gel with the lowest water content
(67%) had the highest elastic component, whilst the gelatine gel with the highest water
content (88%) had the lowest elastic component. Similarly, the gelatine gel with the lowest
water content (67%) had the highest viscous component, whilst the gelatine gel with the
highest water content (88%) had the lowest viscous component. The gelatine gel at 88%
concentration was found to have the highest damping capacity, as determined from the loss
factor in Fig. 37c. Unfortunately, it was challenging conducting tests on 96% gelatine gel
concentration because of the high water content in the gel. The gel was too compliant to test
with the indenter and thus produced spurious results. Hence, no data for this gel concentration
were obtained. The storage modulus, loss modulus and loss factor between groups for the
gelatine gels was statistically significant.
0
10
20
30
40
50
60
70
Ela
stic
Mo
dulu
s, E
(kP
a)
Abdomen Back
n = 38
n = 38 ****

91
Figure 37 Micromechanical properties of gelatine gels for 67%, 80% and 88% water content, with the
number of indentations (n) listed above each bar chart. (a) Storage modulus, G´ (b) loss modulus, G˝ and
(c) loss factor. Error bars depict SD.
Fig. 38 shows the elastic modulus for the gelatine gels. The comparison between repetitions
showed close agreement for each of the samples of the different gelatine gels. Predictably, the
gelatine gel with the highest water content (88%) had the lowest elastic modulus. The
variation between groups for gelatine gels was found to be statistically significant.
****
****
****

92
Figure 38 Elastic modulus of the different gelatine gels following micromechanical tests, with the number
of indentations (n) listed above each bar chart. Error bars depict SD.
Fig. 39 presents an image of the residual impression in the gelatine gel following indentation.
These appear to be more pronounced in the gelatine gel with 67% water content.
Figure 39 Optical images showing the residual impression left visible in the gelatine gels following
indentation with water content of (a) 67%, (b) 80% and (c) 88%.
0
10
20
30
40
50
60
70
80
90
Ela
stic
Mo
dulu
s, E
(kP
a)
67% 80% 88%
Gel Water Content
n = 40
n = 40
n = 40
****

93
4.2.3 Indentation tests on Perma-Gel® samples
Fig. 40 presents the mechanical properties determined for Perma-Gel®. Similar to the gelatine
gels, the storage modulus (G´) dominates over the loss modulus (G˝). Perma-Gel® exhibited a
higher elastic component compared to its viscous component. The damping capacity was
determined from the loss factor in Fig. 40c.
Figure 40 Micromechanical properties of Perma-Gel®, with the number of indentations (n) listed above
each bar chart. (a) Storage modulus, G´, (b) loss modulus, G˝ and (c) loss factor. Error bars depict SD.
The data obtained from a typical indentation experiment on Perma-Gel®
are shown in Fig. 41.
The comparison between repetitions showed close agreement for each of the samples used in
the indentation tests.

94
Figure 41 Elastic modulus of Perma-Gel® following micromechanical tests, with the number of
indentations (n) listed above the bar chart. Error bar depicts SD.
Fig. 42 shows an optical image of a sample of Perma-Gel® following indentation tests and
unlike the gelatine gels no residual impression was observed under the optical microscope.
Figure 42 Optical image of Perma-Gel® following indentation test.
4.2.4 Summary of the micromechanical properties of the sub-layers of the
skin model
The summary of the average micromechanical properties of four individual samples of
abdominal skin, back skin, three different gelatine gels of varying water content and Perma-
Gel® is presented in Table 12. Of all the sub-layers in the skin model, it was found that
0
10
20
30
40
50
60
70
80
90
Ela
stic
Mo
dulu
s, E
(kP
a)
Perma-Gel®
n = 40

95
Perma-Gel® had the highest elastic component, whilst the 88% gelatine gel had the lowest
elastic component. Back skin had the highest viscous component, whilst 88% gelatine gel had
the lowest viscous component. Abdominal skin exhibited the highest damping capacity,
whilst Perma-Gel® had the lowest damping capacity.
Table 12 Micromechanical properties of the different layers of the skin model (Mean ± SD).
Material
Storage
Modulus
(kPa)
Loss Modulus
(kPa)
Loss Factor
Elastic
Modulus
(kPa)
Abdominal skin
8.16 ± 1.82 9.96 ± 3.88 1.11 ± 0.26 24.49 ± 5.47
Back skin
15.3 ± 3.20 10.71 ± 2.74 0.70 ± 0.06 45.89 ± 9.61
67% (w/v) gel
21.04 ± 2.08 3.77 ± 0.24 0.18 ± 0.01 63.11 ± 6.23
80% (w/v) gel
11.52 ± 1.05 2.01 ± 0.16 0.17 ± 0.01 34.56 ± 3.16
88% (w/v) gel
3.77 ± 0.55 0.94 ± 0.23 0.26 ± 0.07 11.30 ± 1.64
Perma-Gel®
26.91 ± 0.89 2.66 ± 0.81 0.10 ± 0.02 80.73 ± 2.67
An increase in water content in the gelatine gels resulted in a subsequent reduction in the
magnitude of the respective elastic modulus, which is depicted in a linear relationship shown
in Fig. 43. G´ and G˝ both decreased with increasing water content. The damping factor also
decreased with increasing water content. Interestingly, the normal tissue fluid mimic (67%)
had higher mechanical properties compared to either abdominal or back skin.
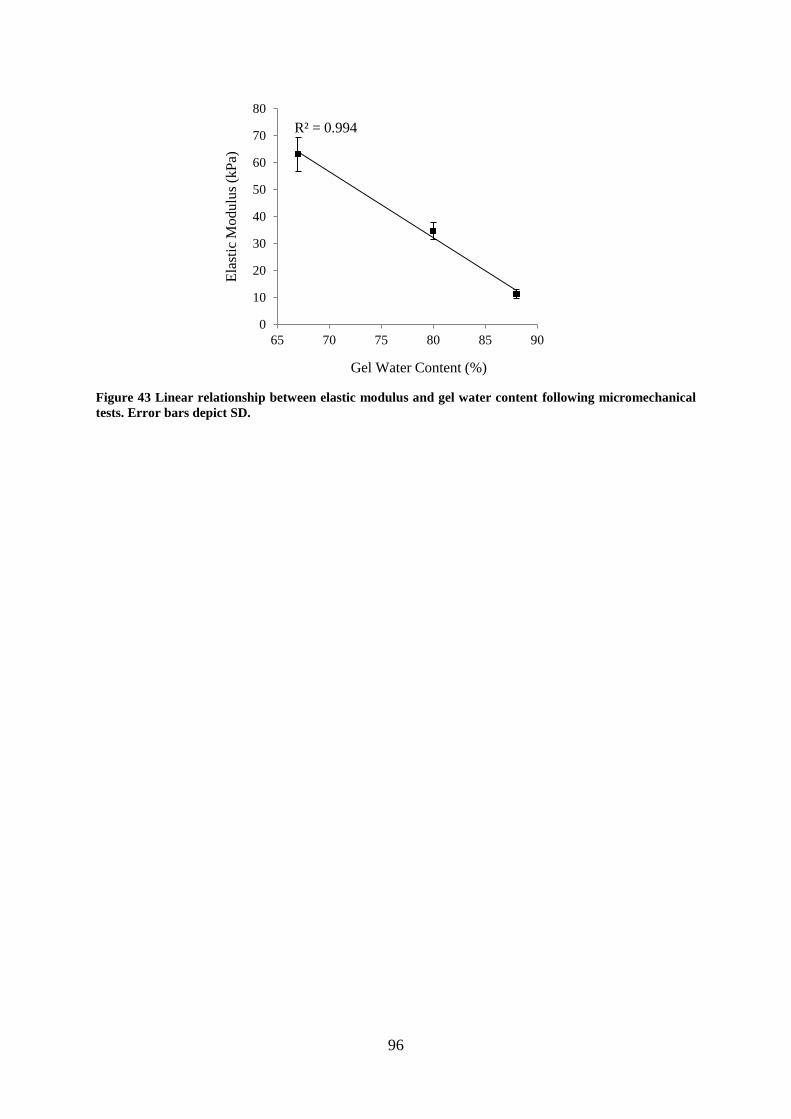
96
Figure 43 Linear relationship between elastic modulus and gel water content following micromechanical
tests. Error bars depict SD.
R² = 0.994
0
10
20
30
40
50
60
70
80
65 70 75 80 85 90
Ela
stic
Modulu
s (k
Pa)
Gel Water Content (%)
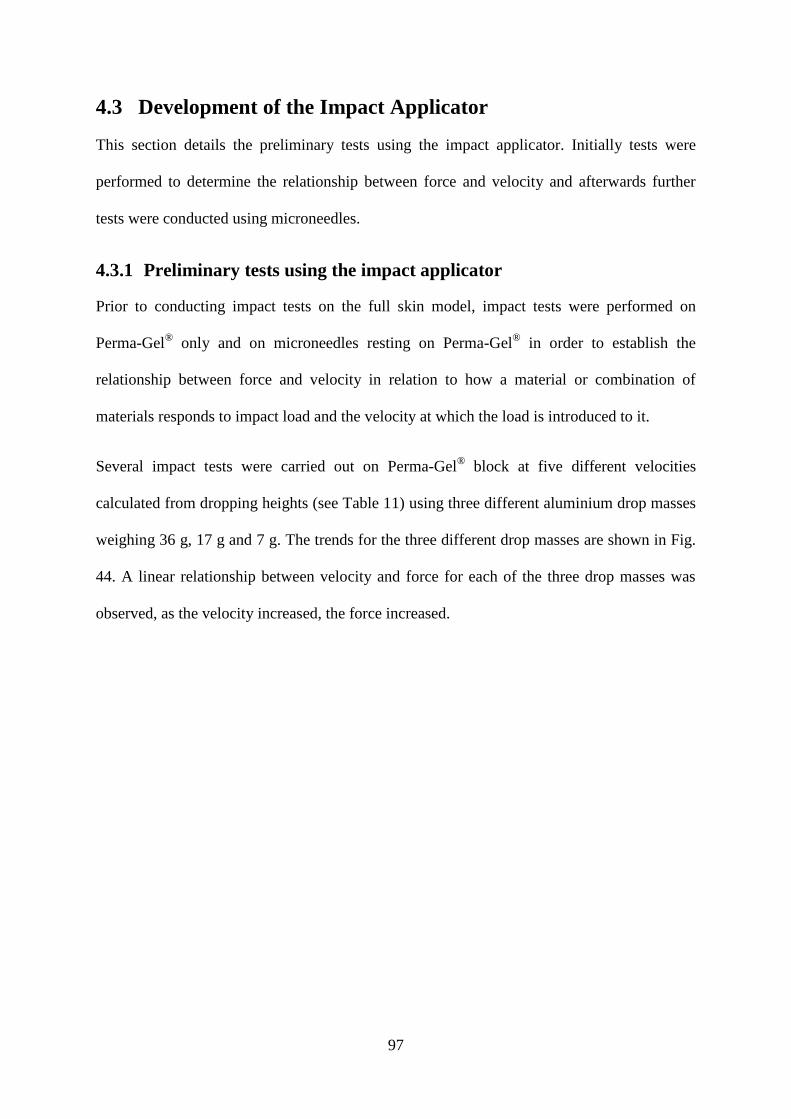
97
4.3 Development of the Impact Applicator
This section details the preliminary tests using the impact applicator. Initially tests were
performed to determine the relationship between force and velocity and afterwards further
tests were conducted using microneedles.
4.3.1 Preliminary tests using the impact applicator
Prior to conducting impact tests on the full skin model, impact tests were performed on
Perma-Gel® only and on microneedles resting on Perma-Gel
® in order to establish the
relationship between force and velocity in relation to how a material or combination of
materials responds to impact load and the velocity at which the load is introduced to it.
Several impact tests were carried out on Perma-Gel® block at five different velocities
calculated from dropping heights (see Table 11) using three different aluminium drop masses
weighing 36 g, 17 g and 7 g. The trends for the three different drop masses are shown in Fig.
44. A linear relationship between velocity and force for each of the three drop masses was
observed, as the velocity increased, the force increased.

98
Figure 44 Linear plots of velocity as a function of force for impact tests of Perma-Gel® using various drop
masses, (a) 36 g (b) 17 g and (c) 7g.
Additional testing was conducted by placing Design 1 microneedles on Perma-Gel®. Fig. 45
shows the relationship between velocity and force. The linear relationship shows that as
velocity increases, the force also increases. Furthermore, more than twice the force was
observed for impact tests of microneedles on Perma-Gel® as compared to on Perma-Gel
®
only.

99
Figure 45 Linear plots of velocity as a function of force for impact tests with Design 1 microneedles on
clamped Perma-Gel® using various drop masses weighing, (a) 36 g (b) 17 g and (c) 7g.
4.3.2 Skin penetration tests using PEEK microneedles
A pilot study of impact tests using the impact applicator on full thickness skin on different
gelatine gels was carried out using PEEK microneedles, which have been used for in vivo
studies on patients and the results are detailed in this section. Visual examination of the
microneedles was performed in order to determine how often the microneedles could be used
for impact tests on the skin models.
4.3.2.1 SEM imaging of PEEK microneedles following multiple applications
SEM imaging of PEEK microneedles were taken before and after they were applied to the
skin and the images are presented in Fig. 46. The images show the profile of the needle tips.
The figure also shows that the uneven profile of the microneedles was consistent for both
images, indicating no change of shape to the tip and surrounding areas. The microneedles
remained intact after impact tests on tissue and therefore were suitable for repeated use.
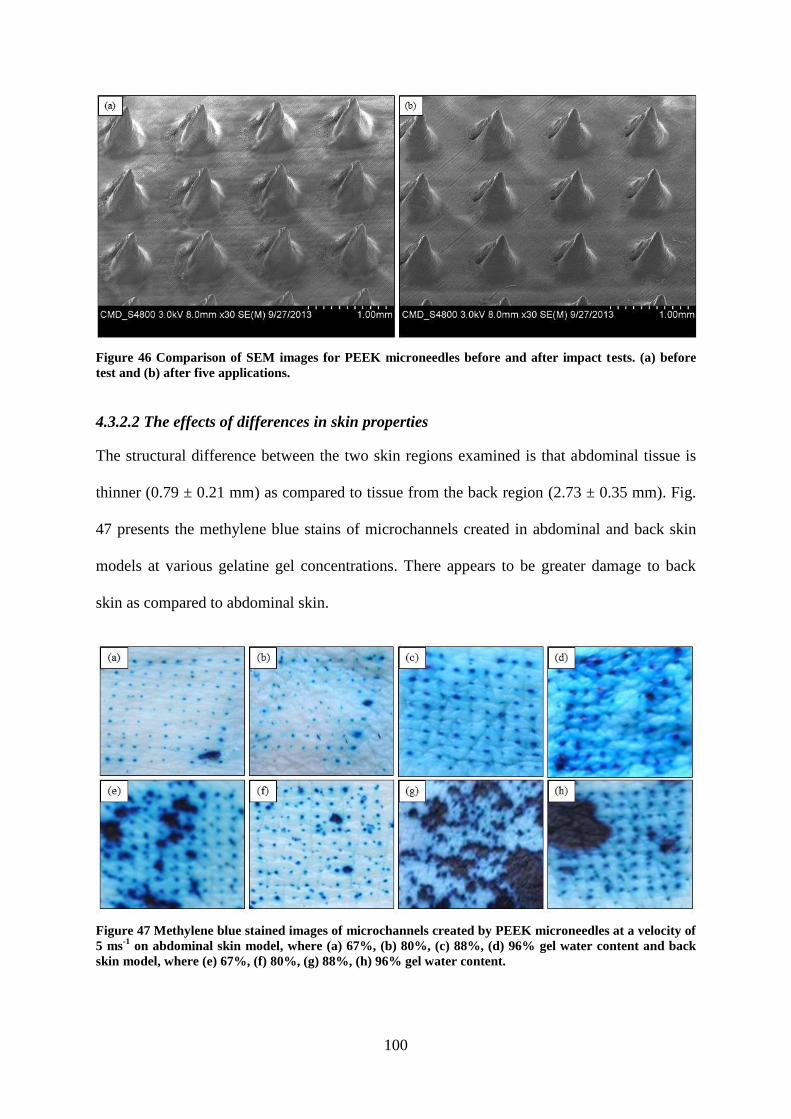
100
Figure 46 Comparison of SEM images for PEEK microneedles before and after impact tests. (a) before
test and (b) after five applications.
4.3.2.2 The effects of differences in skin properties
The structural difference between the two skin regions examined is that abdominal tissue is
thinner (0.79 ± 0.21 mm) as compared to tissue from the back region (2.73 ± 0.35 mm). Fig.
47 presents the methylene blue stains of microchannels created in abdominal and back skin
models at various gelatine gel concentrations. There appears to be greater damage to back
skin as compared to abdominal skin.
Figure 47 Methylene blue stained images of microchannels created by PEEK microneedles at a velocity of
5 ms-1
on abdominal skin model, where (a) 67%, (b) 80%, (c) 88%, (d) 96% gel water content and back
skin model, where (e) 67%, (f) 80%, (g) 88%, (h) 96% gel water content.

101
4.3.2.3 Contributions from the subcutaneous mimic
Fig. 48 shows that the intensity of the methylene blue stain appears to increase with
increasing water content in the gelatine gels. Fig. 48e also shows a significant reduction in
the number of perforations on the stratum corneum, where there was an absence of a bed of
gelatine gel to act as underlying substrate.
Figure 48 Methylene blue stained images of the microchannels created by PEEK microneedles on
abdominal skin model comprising different amounts of water content in its gelatine gels at a velocity of 5
ms-1
, where (a) 67%, (b) 80%, (c) 88%, (d) 96% and (e) no gelatine gel as an underlying substrate.
Again, it was noted that for back skin, the quality of penetration appeared to improve with
increasing water content in the gelatine gels (see Fig. 49). At 88% gelatine gel concentration
however, no penetration was observed due to tissue damage, as shown in Fig. 49c. It was
unclear, if the tissue damage was due to the impact of the microneedles or caused by existing
bruising on the skin.

102
Figure 49 Methylene blue stained images of the microchannels created by PEEK microneedles on back
skin model comprising different amounts of water content in its gelatine gels at a velocity of 5 ms-1
, where
(a) 67%, (b) 80%, (c) 88% and (d) 96%.
Representative histology images of back skin model at 88% gelatine gel water content are
shown in Fig. 50. Most of the perforations are contained within the epidermis, with the
disruption extending into the dermis for two of the images. Although, successful breach of
the epidermis occurred with PEEK microneedles for back skin model, it was challenging to
consistently reproduce these perforations.

103
Figure 50 H&E images of back skin model with 88% water content in its gelatine gel at a velocity of 5 ms-
1. Red arrows indicate that the breach is contained within the epidermis and the black arrows indicate
that the breach has extended into the dermis. Scale bar represents 100 m.
4.3.2.4 Impact velocity
No penetration was achieved on the back skin model with 67% water content gelatine gel at
velocities of 1–3 ms-1
following methylene blue staining. At velocities of 4–5 ms-1
, however
there was perforation. For the abdominal skin model containing 67% water content in its
gelatine gel, penetration was achieved at velocities of between 3–5 ms-1
. It was noted that
even when the microneedle remained in tissue for two minutes following impact, it had no
bearing on the quality of penetration.
4.3.3 Summary of the development of the impact applicator
Microneedle application on skin was achieved using an early development impact applicator.
The parameters for penetration were a drop mass of 36 g, 3–5 ms-1
velocity on abdominal
skin models and 4–5 ms-1
velocity on back skin models. The challenges with reproducible
back skin perforations using PEEK microneedles meant that a different design of polymer
microneedles were utilised for the work with the improved impact applicator.

104
4.4 Impact Applicator Studies
Reproducibly perforating the stratum corneum, epidermis and dermis was challenging with
PEEK microneedles and therefore they were not used for further tests in this thesis to
evaluate microneedles interaction with skin. The results however did provide velocity and
force parameters, which were used as a basis for subsequent tests involving skin Models 1A–
4B (see Table 9 in Section 3.2.4 for skin model classification) and PMMA microneedles (see
Table 10 in Section 3.3.2 for PMMA microneedles details). Both designs of PMMA
microneedles were medical grade.
Design 1 and 2 microneedles have been used for in vivo tests with patients (Renephra, 2015)
and were the microneedles used for the bulk of the work carried out in this thesis. Moreover,
Renephra conducted in vivo studies using these PMMA microneedles and the results from
this thesis would complement and enhance their work, as the in vitro tests could be performed
indiscriminately on neonatal porcine skin. Visual examination using SEM imaging was
carried out on Design 2 microneedles in order to determine the frequency of use during
testing. These tests were only conducted on Design 2 microneedles and not on Design 1
microneedles since the former arrays were used more extensively in testing. Furthermore,
Design 2 microneedles were also used by Renephra for most of the clinical studies.
4.4.1 Visual examination of Design 2 microneedles using SEM imaging
SEM images of the Design 2 microneedles are shown in Fig. 51. With these microneedles it
was found that with a single impact test on tissue, the needle tips had deformed (Fig. 51b).
When five tests were carried out using the same microneedle array on five different skin
models, the tips had broken off in some rows of needles as shown in Fig. 51c. To standardise
testing as far as possible, Design 1 and 2 microneedles were only used once.

105
Figure 51 Comparison of SEM images for Design 2 PMMA microneedles before and after impact tests.
(a) before test, (b) after single application and (c) after five applications.
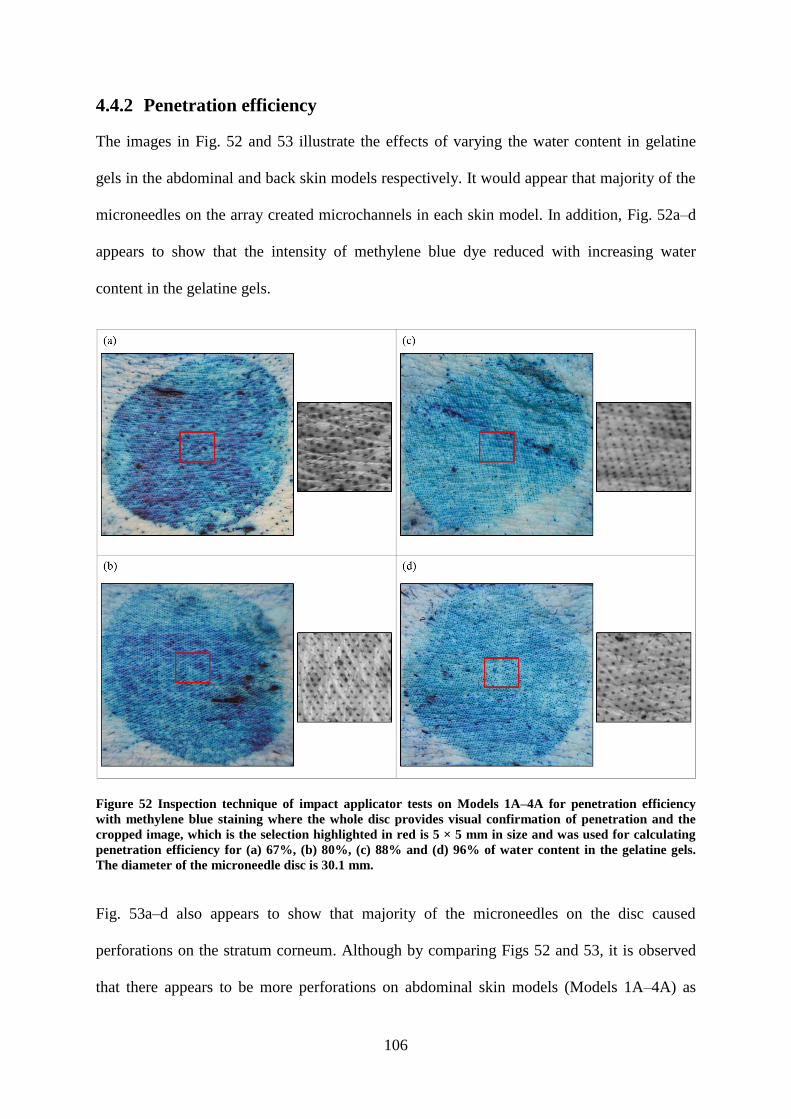
106
4.4.2 Penetration efficiency
The images in Fig. 52 and 53 illustrate the effects of varying the water content in gelatine
gels in the abdominal and back skin models respectively. It would appear that majority of the
microneedles on the array created microchannels in each skin model. In addition, Fig. 52a–d
appears to show that the intensity of methylene blue dye reduced with increasing water
content in the gelatine gels.
Figure 52 Inspection technique of impact applicator tests on Models 1A–4A for penetration efficiency
with methylene blue staining where the whole disc provides visual confirmation of penetration and the
cropped image, which is the selection highlighted in red is 5 × 5 mm in size and was used for calculating
penetration efficiency for (a) 67%, (b) 80%, (c) 88% and (d) 96% of water content in the gelatine gels.
The diameter of the microneedle disc is 30.1 mm.
Fig. 53a–d also appears to show that majority of the microneedles on the disc caused
perforations on the stratum corneum. Although by comparing Figs 52 and 53, it is observed
that there appears to be more perforations on abdominal skin models (Models 1A–4A) as

107
compared to back skin models (Models 1B–4B). It should also be noted that there is a
physiological difference between abdominal and back skin, as full thickness abdominal tissue
(≈ 0.79 mm) is thinner as compared to full thickness back tissue (≈ 2.43 mm). For human
abdominal skin, the thickness varies from 1.71 ± 0.27 mm in children to 2.15 ± 0.42 mm in
adults (Lo Presti et al., 2012), which is similar to the thickness of neonatal porcine back skin.
Figure 53 Inspection technique of impact applicator tests on Models 1B–4B for penetration efficiency
with methylene blue staining where the whole disc provides visual confirmation of penetration and the
cropped image, which is the selection highlighted in red is 5 × 5 mm in size and was used for calculating
penetration efficiency for (a) 67%, (b) 80%, (c) 88% and (d) 96% of water content in the gelatine gels.
The diameter of the microneedle disc is 30.1 mm.
Again, visual quantification of the entire methylene blue stained image was challenging using
imaging software, which was due to the densely populated number of individual
microneedles on Design 2 (> 6000 on array). The cropped area of 5 × 5 mm were selected
from the centre of the images (Figs 52 & 53) and assessed to determine penetration efficiency

108
for abdominal and back skin models. The results of the penetration efficiency are presented in
Fig. 54. As expected, 100 % penetration efficiency was not achieved (van der Maaden et al.,
2014). There was no significant difference between abdominal and back skin samples.
Figure 54 Penetration efficiency determined from the methylene blue images for impact applicator tests
on 3 samples each of Models 1A–4B. Error bars depict SD.
0
20
40
60
80
100
67 80 88 96
Pen
etra
tion
Eff
icei
ncy
(%
)
Gel Water Content (%)
Abdomen Backns
ns
ns ns ns

109
4.4.3 The effects of differences in skin properties
Although the methylene blue staining provided quick visual confirmation that the majority of
the microneedles had successfully penetrated the stratum corneum, the H&E images provided
additional details in terms of the deformation extent. In addition, the H&E images also
showed that not all perforations observed actually propagated through the stratum corneum to
the epidermis or dermis. The H&E images in Fig. 55a–b show that both the abdominal and
back tissue respond in a similar way to microneedle application with the deformation
extending into the epidermis. However, the deformation in Models 1A & 2A was observed
deep in the layers, whilst the deformation within Models 1B & 2B was predominantly
contained within the epidermis. Fig. 55c shows the comparison between Models 3A and 3B,
which is 88% water content in the gelatine gels. At this gelatine gel concentration, there
appears to be a more significant deformation through the layers for Model 3A as compared to
Model 3B. The comparison between Models 4A & 4B, which is depicted in Fig. 55d shows
that the abdominal and back tissue exhibited a similar response to microneedle application as
significant deformations were observed through the skin, extending into the dermis.

110
Figure 55 Comparison of perforation depths (H&E staining) using the impact applicator for abdominal
and back skin models with respect to altering the water content in gelatine gels. Red arrows indicate that
the breach is contained within the epidermis and the black arrows indicate that the breach has extended
into the dermis. Scale bar represents 100 m and the diameter of Design 2 microneedle disc is 30.1 mm.

111
4.4.4 The role of the subcutaneous mimic property on microneedle
performance
The depth of penetration for each of the skin models is shown in Fig. 56. For Models 1A–4A
(Fig. 56a), the depth of penetration increased with gel water content (from Models 1A to 3A)
but was lowest for Model 4A at its highest gel water content. For the back skin models, the
depth of penetration was lower at each gel concentration relative to the abdominal skin
models except for Model 4B. The values for Model 3B with 88% gel water content were
lower following the trends observed with qualitative assessment of the H&E images
mentioned in Section 4.4.3 and insertion force data in Section 4.4.6.
Generally, the perforation depth for abdominal skin models was marginally greater than back
skin models as shown in Fig. 56, with Model 4A the exception. For the mean breach areas in
Fig. 57 however, there was no evident trend between abdominal and back skin models.

112
Figure 56 Perforation depth data for impact applicator tests using 36 g drop mass at a velocity of 3 ms-1
,
where (a) abdominal skin models and (b) back skin models, with the number of images (n) in each group
listed above each box and whisker plot.
The overall trends in the breach area for Models 1A–4B are shown in Fig. 57 and are similar
to those for penetration depth (shown in Fig. 56). In Fig. 57a, the mean breach area for
Models 1A–4A increased with gel water content but reduced for Model 4A at its highest gel
water content. In Fig. 57b, the mean breach area for Models 1B–4B, the depth of penetration
was slightly higher at each gel concentration relative to the abdominal skin models except for
0
100
200
300
400
500
600
700
800
Model 1A Model 2A Model 3A Model 4A
Per
fora
tion D
epth
(
m)
(a)
n = 31
0
100
200
300
400
500
600
700
800
Model 1B Model 2B Model 3B Model 4B
Per
fora
tion D
epth
(
m)
(b)
n = 32
n = 25
n = 21
n = 39
n = 25
n = 22
n = 32
*
****
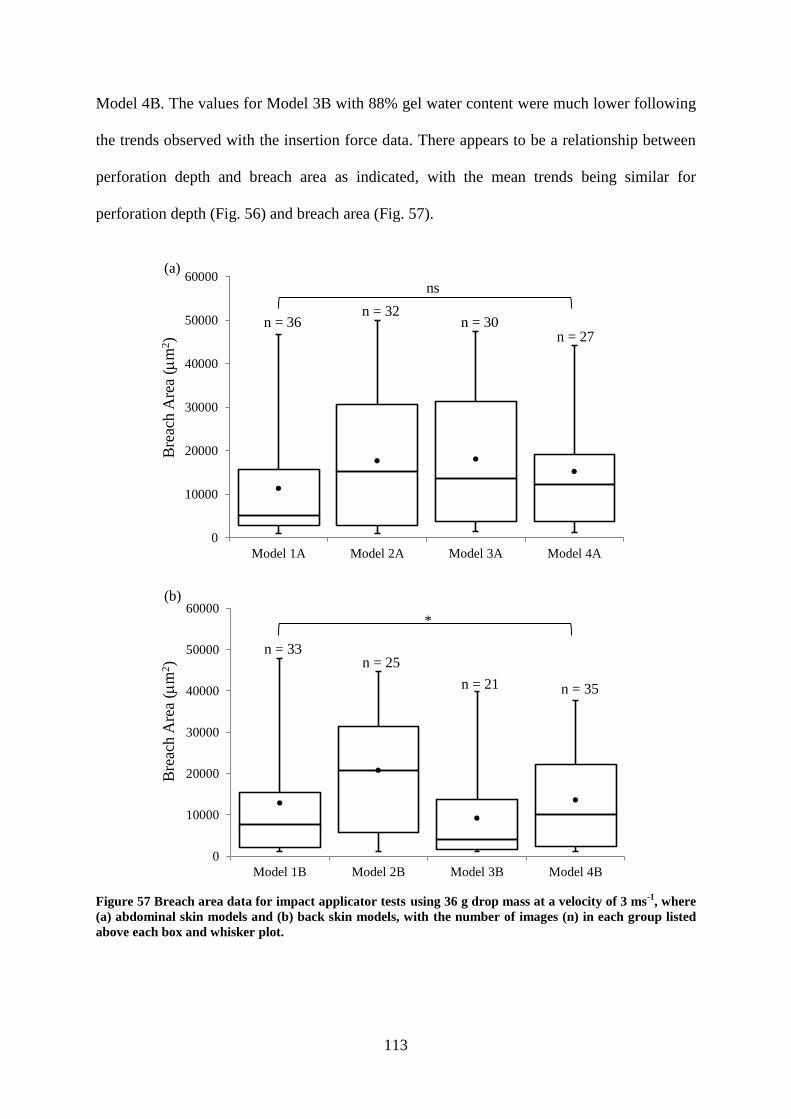
113
Model 4B. The values for Model 3B with 88% gel water content were much lower following
the trends observed with the insertion force data. There appears to be a relationship between
perforation depth and breach area as indicated, with the mean trends being similar for
perforation depth (Fig. 56) and breach area (Fig. 57).
Figure 57 Breach area data for impact applicator tests using 36 g drop mass at a velocity of 3 ms
-1, where
(a) abdominal skin models and (b) back skin models, with the number of images (n) in each group listed
above each box and whisker plot.
0
10000
20000
30000
40000
50000
60000
Model 1A Model 2A Model 3A Model 4A
Bre
ach A
rea
(m
2)
(a)
n = 36 n = 32
n = 30 n = 27
0
10000
20000
30000
40000
50000
60000
Model 1B Model 2B Model 3B Model 4B
Bre
ach A
rea
(m
2)
(b)
n = 33 n = 25
n = 21 n = 35
*
ns
114
For the abdominal skin models, over 60% of the measured perforations were 0 < breach area
< 10 000 m2 for Model 1A, which is the model with the lowest water content gel (Fig. 58a).
There was over 70% for Model 3B in this category, which had a higher water content gel
(Fig. 58b). The frequency of the breach area reduced at > 10 000 m2 for all skin models,
Therefore, the majority of microneedles interaction with skin occurs at the stratum corneum–
epidermal interface (as defined in Section 3.5.3.2). A contrast between abdominal skin model
compared to back skin model was that perforations occurred in each breach area category,
whilst there was no breach areas observed in some categories for back skin model. Generally,
as epidermal breach occurs at 10 000 < breach area < 20 000 m2 (as previously described in
Section 3.5.3.2), therefore, it can be said that both anatomical regions appear to be ideal sites
for microneedle application for fluid extraction on neonatal porcine skin, whilst the breach
areas in excess of 10 000 m2 could indicate penetration effectiveness.

115
Figure 58 Frequency distribution of the breach area for impact applicator tests on (a) abdominal skin
models and (b) back skin models.
0
20
40
60
80
100
10000 20000 30000 40000 50000
Fre
quen
cy (
%)
Breach Area (m2)
Model 1A Model 2A Model 3A Model 4A
0
20
40
60
80
100
10000 20000 30000 40000 50000
Fre
quen
cy (
%)
Breach Area (m2)
Model 1B Model 2B Model 3B Model 4B(b)
(a)
10000 20000 30000 40000 50000 0
10000 20000 30000 40000 50000 0
****
****

116
4.4.5 Impact applicator force and velocity
As mentioned in the literature, the introduction of microneedles in biological tissue to any
depth requires the assistance of external pressure to penetrate skin. This required assistance
can be achieved using a microneedle delivery apparatus. Work by Bouwstra et al. suggests
that the optimal method for microneedle application requires velocities in excess of 2 ms-1
(Bouwstra et al., 2009). Firstly, the challenge to effective microneedle penetration is to
bypass the inherent elasticity of the stratum corneum (Bal et al., 2008). Secondly, the
appropriate insertion velocity and insertion force to achieve penetration of the stratum
corneum with microneedles is necessary (Donnelly et al., 2011).
Typical force and velocity plots obtained with Design 2 microneedles are shown in Fig. 59.
Due to the high velocity from the impact test setup, it was difficult to precisely determine the
exact moment that the microneedles penetrated through the skin. However, due to the
characteristics of the plots shown in Fig. 59a and 59b, the insertion force and insertion
velocity could be inferred.
The insertion force, which was 37.1 N and the insertion velocity, which was 2.5 ms-1
were
obtained from the force–time see Fig. 59a. The maximum force reached was 107 N.
Accounting for some elastic recovery of skin and to ensure that the microneedles were fully
embedded in the skin (Lara et al., 2012), the microneedles were left in the skin for
approximately 2 mins prior to removal for subsequent imaging, so as to minimise skin
retraction following removal of microneedles (Donnelly et al., 2010; Loizidou et al., 2016).

117
Figure 59 Impact tests of Design 2 microneedles on Model 2B, where (a) force–time plot and (b) the
description of points along the force–time curve. The impact occurred at 0.9 ms, where the velocity was
approximately 2.5 ms-1
, the force was 37.1 N and the maximum force reached was 107 N. The data
suggest that the initial insertion occurred at 0.9 ms. Hence, at this point the velocity was approximately
2.5 ms-1
, the force was 37.1 N and the maximum velocity and force reached were 3 ms-1
and 107 N
respectively. In the absence of any microneedles, a smooth force-time plot up to the maximum load would
be expected for a drop mass impacting on a tissue sample (Burgin and Aspden, 2007).
The insertion force which was inferred from the force-time plots (Fig. 59a) did not vary with
gel water content for the skin models, but was approximately 10 N higher for most of the
back skin models as compared to the abdominal skin models (Fig. 60a). Fig. 60b shows the
variation of the maximum force across the different abdominal skin models and as can be
seen decreased progressively with increasing water content of the subcutaneous mimic. This
was found to be related to the elastic modulus of these gels (Fig. 60c). For back skin models,
the maximum force was relatively constant for most of the gel water content except for
Model 3B, which contained 88% gel water content (Model 1B/67% - 102 N, Model 2B/80% -
100 N, Model 3B/88% - 46 N, Model 4B/96% - 102 N). Furthermore, histological
examinations of perforation depths and breach area also showed a small depth and area for
Model 3B as compared to Models 1B, 2B and 4B, which indicate that the size of the force is
commensurate with the size of the deformation. For Models 1A and 1B, which contained
67% gel water content, there was no difference in the maximum force with the two different
types of skin i.e. the thicker and stiffer back skin did not require a larger insertion force. The
difference in the force values for the two different anatomical skin models was more
pronounced at higher water contents in the subcutaneous mimic.
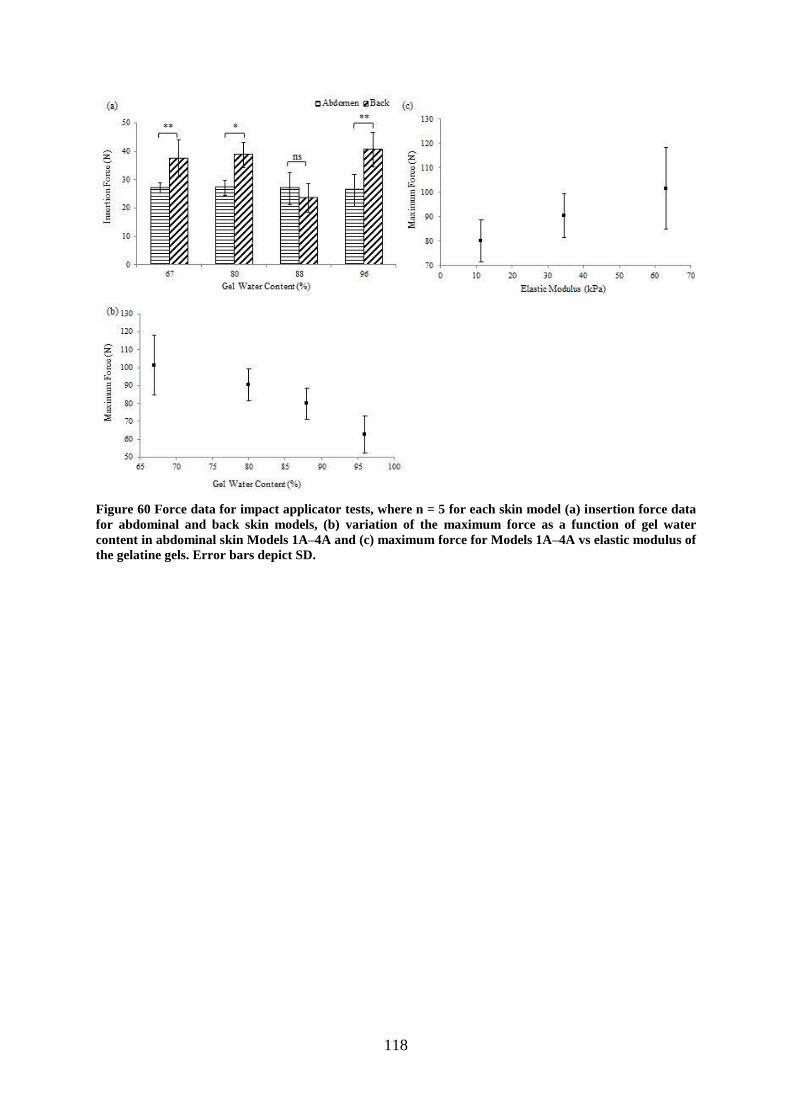
118
Figure 60 Force data for impact applicator tests, where n = 5 for each skin model (a) insertion force data
for abdominal and back skin models, (b) variation of the maximum force as a function of gel water
content in abdominal skin Models 1A–4A and (c) maximum force for Models 1A–4A vs elastic modulus of
the gelatine gels. Error bars depict SD.

119
4.4.6 The effects of microneedle geometry on skin penetration
Neonatal porcine back skin bears similar thickness to human skin (Lo Presti et al., 2012) as
compared to abdominal skin. Further, neonatal porcine back skin has similar mechanical
properties to human skin (Groves, 2011) and was chosen for tests involving the two designs
of PMMA microneedles. A high water content gel was selected for all the tests comparing the
two microneedle designs on back skin. This was because of the relevance to oedema to this
project (Section 1.2). Hence, the 88% gelatine gel was selected as the 96% gelatine gel was
too compliant. Thus, skin Model 3B was used for these tests. This section compares impact
applicator tests for Design 1 (1316 microneedles on the array/356 m length) with Design 2
(> 6000 microneedles on the array/552 m length) microneedles using this model.
4.4.6.1 Microneedle penetration on skin Model 3B
This section details the results of impact tests using Design 1 and Design 2 microneedles on
skin Model 3B.
4.4.6.1.1 Comparison between visual examination and perforation depth
Representative methylene blue and histology images of impact applicator tests on Model 3B
using Design 1 and 2 microneedles are presented in Fig. 61. As shown in Figs 61a–b, the
methylene blue staining confirmed the successful perforation of the stratum corneum, whilst
the histology showed the depth of perforation through the layers. In Fig. 61a, image analysis
using ImageJ showed that 80% of Design 2 microneedles perforated the stratum corneum of
Model 3B compared to 55% of Design 1 microneedles in Fig. 61b. The H&E images show
comparable levels of deformation within the layers.

120
Figure 61 Design 1 and 2 microneedles comparison on perforation quality (methylene blue staining) and
perforation depth (H&E staining) for impact applicator tests on Model 3B. (a) Design 2 (b) Design 1. The
diameter of Design 2 microneedle disc is 30.1 mm. The diameter of Design 1 microneedle disc is 15.8 mm.
Red arrows indicate that the breach is contained within the epidermis. Scale bar represents 100 m.
The depth of penetration in Model 3B for Design 1 and 2 microneedles is shown in Fig. 62.
The greatest perforation depth was 351 m for Design 1 microneedles as compared to 288
m for Design 2 microneedles. In addition, the mean penetration depth is greater for Design 1
microneedles as compared to Design 2 microneedles.
Figure 62 Perforation depth data for impact applicator tests comparing results of Design 1 and 2
microneedles on Model 3B, with the number of images (n) in each group listed above each box and
whisker plot.
0
100
200
300
400
Design 1 Design 2
Per
fora
tion D
epth
(
m)
n = 22
n = 19
ns

121
4.4.6.1.2 Histological examination of breach area
The results of the breach area on model 3B for Design 1 and 2 microneedles are shown in
Fig. 63. The percentage frequency of perforations shows that the highest number of
perforations occurred between 0 < breach area < 10 000 m2 range and the lowest number of
perforations occurred between 40 000 < breach area < 50 000 m2 range. The frequency chart
shows that there is a decline in the frequency of perforations at increased breach area. The
chart also highlighted a higher proportion of breach area (10 000 m2) for Design 2
microneedles as compared to Design 1 microneedles.
The general trend for the frequency distribution of deformation within Model 3B, showed
that Design 2 microneedles produced the greatest deformation area at 0 < breach area < 10
000 m2, however, at categories > 10 000 m
2, Design 1 microneedles created greater breach
areas.
Figure 63 Frequency distribution for impact tests at 3 ms-1
using a 36 g drop mass on Design 1 and 2
microneedles on Model 3B.
0
20
40
60
80
10000 20000 30000 40000 50000
Fre
quen
cy (
%)
Breach Area (m2)
Design 1 Design 2
20000 30000 40000 50000 10000 0
*

122
4.4.6.2 Impact force and velocity for skin Model 3B
This section presents the force and velocity outcome of Design 1 microneedles on skin Model
3B. Later in the section, the force and velocity outputs are compared to the results of Design
2 microneedles.
4.4.6.2.1 Variation of the velocity and force
Penetration of the stratum corneum was assessed qualitatively from the methylene blue
images shown in Fig. 64. Following visual examination, a greater concentration of
methylene blue dye was observed on Model 3B after the application of Design 1
microneedles using 36 g and 17 g drop masses at velocities of 5 and 4 ms-1
. At 3 ms-1
, a
significant proportion of the microneedles penetrated the stratum corneum with the 36 g
drop mass shown in Fig. 64a. However, at the same velocity penetration appeared lower
with the 17 g drop mass shown in Fig. 64b. At 2 ms-1
, the intensity of methylene blue
staining was further reduced with the 36 g drop mass shown in Fig. 64a but minimal
staining was observed at this velocity with the 17 g drop mass shown in Fig. 64b. These
images demonstrated that the microneedle arrays successfully perforated Model 3B at
velocities ≥ 3 ms-1
with the highest drop mass used in this study, which could be useful
details in the development of Renephra’s applicator. The quality of penetration in terms of
perforations on the stratum corneum and intensity of the methylene blue dye decreased with
the lower drop mass weights.

123
Figure 64 Example images of methylene blue stained skin model 3B following impact tests at various
velocities with (a) 36 g drop mass (b) 17 g drop mass. Diameter of Design 1 microneedle disc is 15.8 mm.
Microneedles are designed to effectively penetrate the stratum corneum without causing any
damage to the dermal layer (Kim et al., 2012). Hence, histological staining was used to
examine the penetration profile, complementing the methylene blue assessment. In some
cases, only minute breaches in the epidermal layer were found as shown in Fig. 65.
Although under all the tested parameters some damage to the stratum corneum layer was
consistent and repeatable, epidermal breach (illustrated in Fig. 30) was not consistent when
the velocity was < 3 ms-1
or with drop masses 7 g and 17 g.

124
Figure 65 Histology images of skin following microneedle application at a constant velocity (2 ms-1
), using
Design 1 microneedles under various loads (a) 36 g (b) 17 g (c) 7 g. Blue arrows indicate disruption to the
stratum corneum and the red arrows indicate that the breach is within the epidermis. Scale bar
represents 100 m.
A comparison between the methylene blue and histology images are shown in Fig. 66. By
comparing the methylene blue stained images in Figs 66a and 66d and the histological
cross-sections in Figs 66b–c and 66e–f, a more holistic insight into the interaction between
microneedles and skin was obtained. The methylene blue stains confirmed successful
perforation of the stratum corneum with a sizeable quantity of microneedles at 2 ms-1
using
the 36 g drop mass (Fig 66d). The histology images however in Figs 66e–f showed that
there was minimal disruption to the stratum corneum. In contrast, there was substantial
breach to the epidermal layer at 3 ms-1
as shown in Figs 66b–c.

125
Figure 66 The influence of velocity on perforation quality (methylene blue staining) and perforation
depth (H&E staining), with the impact applicator at 3 ms-1
(a) methylene blue stained image (b) and (c)
example histology images. The influence of velocity on perforation quality (methylene blue staining) and
perforation depth (H&E staining), with the impact applicator at 2 ms-1
(d) methylene blue stained image
(e) and (f) example histology images. Blue arrows indicate disruption to the stratum corneum and the red
arrows indicate that the breach is contained within the epidermis. Scale bar represents 100 m and
diameter of Design 1 microneedle disc is 15.8 mm.
4.4.6.2.2 Graphical output
Fig. 67 shows the force and velocity graphs for impact tests on Model 3B at 5 ms-1
, using a
drop mass load of 36 g with Design 1 microneedles. The insertion force, which was 17.5 N
and the insertion velocity, which was 4.96 ms-1
were obtained from the force–time plot
shown in Fig. 67a. The maximum force reached was 84.4 N. Design 2 microneedles
remained in skin for around 2 mins before removal for staining and imaging in order to
account for skin’s elastic recovery.

126
Figure 67 Impact tests of Design 1 microneedles on Model 3B, where (a) force–time plot and (b) the
description of points along the force–time curve. The impact occurred at 0.13 ms, where the velocity was
approximately 4.96 ms-1
, the force was 17.5 N and the maximum force reached was 84.4 N. The data
suggest that the initial insertion occurred at 0.13 ms. Hence, at this point the velocity was approximately
4.96 ms-1
, the force was 17.5 N and the maximum velocity and force reached were 5 ms-1
and 84.4 N
respectively.
The maximum force value was 90.67 ± 10.68 N (n = 5) at 5 ms-1
velocity, 49.83 ± 15.74 N (n
= 5) at 4 ms-1
and 42.93 ± 11.08 N (n = 5) at 3 ms-1
. The insertion force values were around
27.13 ± 11.05 N at 4.96 ms-1
insertion velocity, 13.40 ± 3.70 N at 3.83 ms-1
, 9.33 ± 2.76 at
2.96 ms-1
. At 1–2 ms-1
, it was challenging to determine insertion force values and maximum
force values using the impact applicator.
The insertion force for Design 1 microneedles was 9.33 ± 2.76 N (n = 5) as compared to that
of Design 2, which was 23.50 ± 4.97 N (n = 5). Therefore, Design 1 microneedles required a
lower insertion force for microneedle application on Model 3B as compared to Design 2
microneedles. The maximum force for Design 1 microneedles was 42.93 ± 11.08 N, whilst
that of Design 2 was greater at 46.24 ± 8.57 N. The insertion velocity for Design 1
microneedles was 2.96 ms-1
as compared to Design 2 microneedles, which was 2.64 ms-1
.
4.4.7 Summary of impact applicator studies
Reproducible microneedle penetration of skin was achieved with the improved impact
applicator using Design 1 and 2 microneedles. Methylene blue staining confirmed breach of
the stratum corneum, however, H&E staining provided details of the extent of the breach
through the layers. 100% penetration was not achieved for both skin models, with the size of

127
perforations larger in abdominal skin as compared to back skin. PE for abdominal skin
models decreased with increasing fluid content in the subcutaneous layer. Furthermore, the
insertion force was relatively constant for both skin models, however, the maximum force
acting on back skin did not vary with fluid content in the subcutaneous layer except for
Model 3B.
Design 1 microneedles produced larger perforation depths as compared to Design 2
microneedles, therefore highlighting the role that microneedle geometry plays in skin
penetration studies. It was also noted that the size of the deformation is related to the
magnitude of the force, thus a small force results in a small deformation and a high force in a
large deformation. Majority of the deformation through the layers of skin occurs past the
stratum corneum bordering the epidermis, with the frequency of perforations reducing at
higher breach areas.

128
4.5 Clinical Applicator Studies
As previously mentioned clinical applicator tests were conducted so as to compare with
experimental results in vitro using the impact applicator. Furthermore, as the clinical
applicator was used for in vivo studies carried out by Renephra, it was necessary to
understand the penetration effectiveness and efficiency using both methods of application.
Due to the fact that the position of the loadcell in the impact and clinical setup differed,
impact tests using the force transducer and loadcell was conducted in order to establish
whether the results from the two experimental setups (Fig. 24 and Fig. 26) were comparable.
In order to achieve this, the clinical applicator’s loadcell was fastened to the mechanical
clamps and placed at the bottom of the drop tower guide; the setup was similar to the impact
applicator setup in Fig. 24. The tests (n = 7) were conducted on only Perma-Gel® placed in
the clamps. The mean force transducer force output was 24.41 ± 0.76 N. By comparison, the
clinical applicator (n = 7), yielded a mean loadcell force output of 29.80 ± 6.90 N. Statistical
analysis (Student’s t-Test) was conducted in order to determine if there was any statistically
significant difference between the force transducer (impact applicator setup) and loadcell
(clinical applicator setup) force outputs. The outcome of the t-Tests produced p = 0.063 for
the tests conducted on Perma-Gel®. Hence, there was no statistically significant difference
between both data sets.
4.5.1 Penetration efficiency
Visual examination of abdominal skin models in Fig. 68 shows that successful perforation of
the stratum corneum occurred. Ideally, an even spread of perforations across the circular
impression created by the microneedles on the stratum corneum is expected. The skin model
setup, however, resulted in a raised profile of the skin (see Fig. 27), therefore, the entire disc
of Design 2 microneedles was not flush against skin before the clinical applicator was

129
utilised. This setup resulted in some instances, in partial perforation on the stratum corneum
as shown in Figs 68b and 68d.
Figure 68 Inspection technique of clinical applicator tests on Models 1A–4A for penetration efficiency
with methylene blue staining where the whole disc provides visual confirmation of penetration and the
cropped image, which is the selection highlighted in red is 5 × 5 mm in size and was used for calculating
penetration efficiency for (a) 67%, (b) 80%, (c) 88% and (d) 96% of water content in the gelatine gels.
The diameter of Design 2 microneedle disc is 30.1 mm.
Fig. 69 also confirms the successful disruption to the stratum corneum. By comparing Figs 68
and 69, it was observed that the intensity of the methylene blue dye appeared to be greater in
back skin models (Models 1B–4B) as compared to abdominal skin models (Models 1A–4A).
As already mentioned, the variation in perforation density in different regions of the same
skin as shown in Figs 69b, 69c and 69d is due to the skin setup. The central region was still
cropped for PE analysis as majority of the perforations covered at least two-thirds of skin for
abdominal tissue. Although this was not the case with back tissue, however for consistency
and comparison purposes, the reduced number of perforations on back skin was an important

130
result, as it may have been due to the clinical applicator performance or a combination of the
clinical applicator performance on the thicker back skin.
Figure 69 Inspection technique of clinical applicator tests on Models 1B–4B for penetration efficiency
with methylene blue staining where the whole disc provides visual confirmation of penetration and the
cropped image, which is the selection highlighted in red is 5 × 5 mm in size and was used for calculating
penetration efficiency for (a) 67%, (b) 80%, (c) 88% and (d) 96% of water content in the gelatine gels.
The diameter of Design 2 microneedle disc is 30.1 mm.
In order to validate the visual observations of perforation density and assess PE, a cropped
central location of the perforations on abdominal and back skin models were analysed using
imaging techniques. PE results are presented in Fig. 70 and show that it decreased with
increasing water content for abdominal (Models 1A–4A) and back skin (Models 1B–4B).
Again as expected, 100 % penetration efficiency was not achieved.
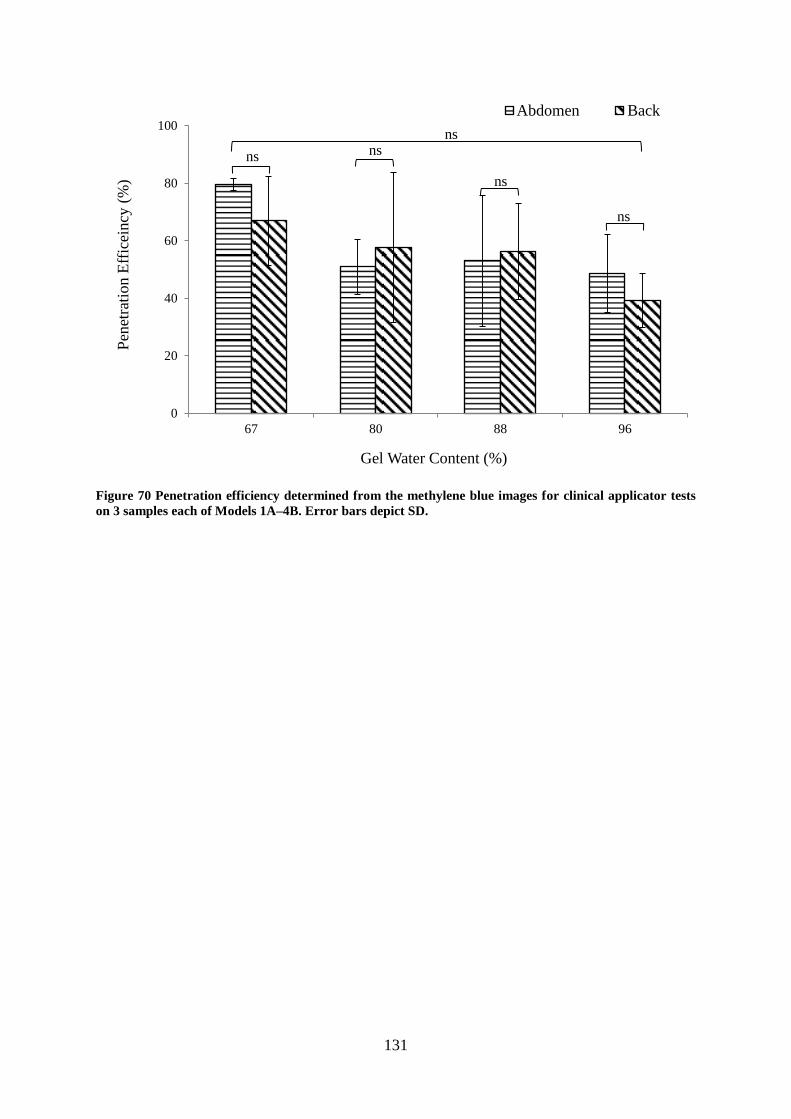
131
Figure 70 Penetration efficiency determined from the methylene blue images for clinical applicator tests
on 3 samples each of Models 1A–4B. Error bars depict SD.
0
20
40
60
80
100
67 80 88 96
Pen
etra
tion E
ffic
eincy
(%
)
Gel Water Content (%)
Abdomen Back
ns
ns ns
ns
ns

132
4.5.2 The effects of differences in skin properties
The H&E stained images are presented in Fig. 71. There was significant deformation within
all of the abdominal skin models (Models 1A–4A), with the extent of the perforations
propagating deep into the dermis. For back skin models (Models 1B–4B) however, the
deformation was predominantly within the epidermis and just interfacing with the dermis.
The application of Design 2 microneedles using the clinical applicator on abdominal skin
models caused greater deformation as compared to back skin models.
There was no obvious relationship between PE from methylene blue images and perforation
depth from H&E stained images. The H&E stained images indicated that the microneedles
interacted differently through the layers of abdominal and back skin models. The perforation
profile of the back skin model was narrower and barely interfaced with the dermal layer,
whilst the perforation profile of the abdominal skin was wider and extended into the dermis.
This contrasts the PE determined from the methylene blue stained images, which showed that
PE decreased with increasing gel water content for both skin models.

133
Figure 71 Comparison of perforation depths (H&E staining) using the clinical applicator for abdominal
and back skin models with respect to altering the water content in gelatine gels. Red arrows indicate that
the breach is contained within the epidermis and the black arrows indicate that the breach has extended
into the dermis. Scale bar represents 100 m and diameter of Design 2 microneedle disc is 30.1 mm.
134
4.5.3 The role of the subcutaneous mimic property on microneedle
performance
The methylene blue stained images in Fig. 68 showed that by varying the gel water content in
the subcutaneous mimic, the perforation density appears consistent for Models 2A–4A, the
exception being Model 1A, which seemed to be more densely perforated. A similar trend was
observed for back skin models (Models 1B and 4B differed). Conversely, the H&E images in
Fig. 71a–d showed that with the increase in the gel water content in the subcutaneous mimic,
the needles fully opened up the epidermis and the dermis in the abdominal skin model. This
trend was not apparent in back skin models, as the deformation appeared narrower and in
some instances extended into the dermis (Fig. 71a–c).
In terms of penetration depth for each skin model, which is shown in Fig. 72, there was no
apparent trend for varying the gel water content in the subcutaneous mimic. For abdominal
skin models presented in Fig. 72a, the mean penetration depth increases with increased gel
water content. For the back skin models, the depth of penetration did not follow this trend and
showed an increase in penetration depth from Model 1B to 2B, followed by a decline from
Model 2B to 3B and then an increase from Model 3B to 4B.
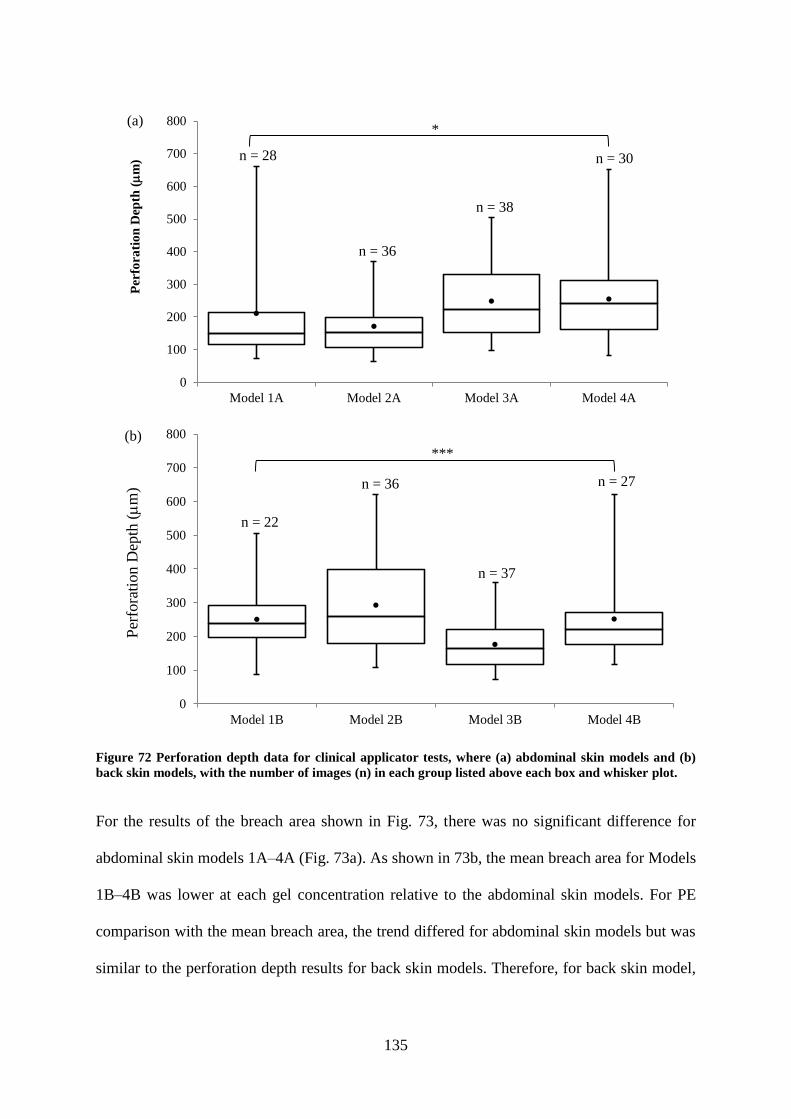
135
Figure 72 Perforation depth data for clinical applicator tests, where (a) abdominal skin models and (b)
back skin models, with the number of images (n) in each group listed above each box and whisker plot.
For the results of the breach area shown in Fig. 73, there was no significant difference for
abdominal skin models 1A–4A (Fig. 73a). As shown in 73b, the mean breach area for Models
1B–4B was lower at each gel concentration relative to the abdominal skin models. For PE
comparison with the mean breach area, the trend differed for abdominal skin models but was
similar to the perforation depth results for back skin models. Therefore, for back skin model,
0
100
200
300
400
500
600
700
800
Model 1A Model 2A Model 3A Model 4A
Per
fora
tio
n D
epth
(
m)
(a)
n = 28
n = 36
n = 38
n = 30
0
100
200
300
400
500
600
700
800
Model 1B Model 2B Model 3B Model 4B
Per
fora
tion D
epth
(
m)
(b)
n = 22
n = 36
n = 37
n = 27
*
***
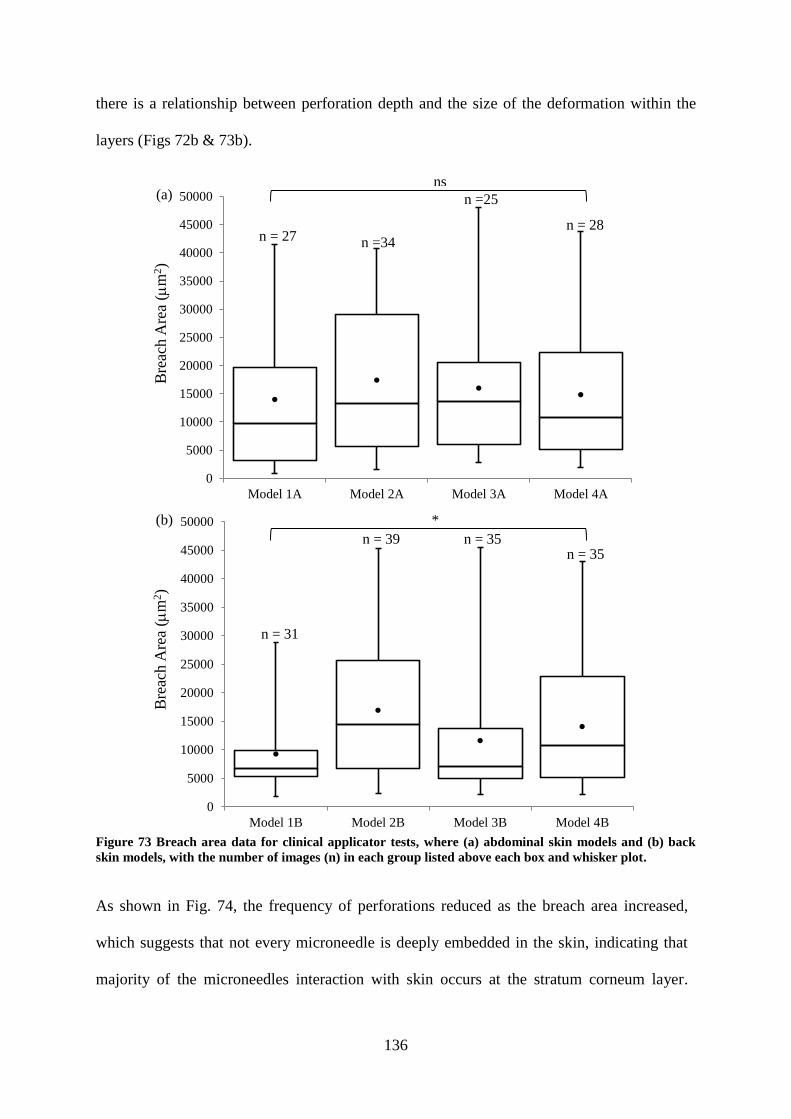
136
there is a relationship between perforation depth and the size of the deformation within the
layers (Figs 72b & 73b).
Figure 73 Breach area data for clinical applicator tests, where (a) abdominal skin models and (b) back
skin models, with the number of images (n) in each group listed above each box and whisker plot.
As shown in Fig. 74, the frequency of perforations reduced as the breach area increased,
which suggests that not every microneedle is deeply embedded in the skin, indicating that
majority of the microneedles interaction with skin occurs at the stratum corneum layer.
0
5000
10000
15000
20000
25000
30000
35000
40000
45000
50000
Model 1A Model 2A Model 3A Model 4A
Bre
ach A
rea
(m
2)
(a)
n = 27 n =34
n =25
n = 28
0
5000
10000
15000
20000
25000
30000
35000
40000
45000
50000
Model 1B Model 2B Model 3B Model 4B
Bre
ach A
rea
(m
2)
(b)
n = 31
n = 39 n = 35 n = 35
ns
*

137
There was a higher incidence of perforations in the abdominal skin models as compared to
the back skin models. Model 1A (Fig. 74a) & 1B (Fig. 74b) had the highest frequencies for
breach area, where the gel water content in the subcutaneous mimic is for normal skin.
Again, perforations occurred in each breach area category for the abdominal skin models,
whilst there was no breach area observed in some categories for the back skin model. There
was no obvious correlation between perforation areas and variation of the gel water content
in the subcutaneous mimic. As expected, there were very few perforations at the larger
sizes.
Figure 74 Frequency distribution of the breach area for clinical applicator tests on (a) abdominal skin
models and (b) back skin models.
0
20
40
60
10000 20000 30000 40000 50000
Fre
qu
ency
(%
)
Breach Area (m2)
Model 1A Model 2A Model 3A Model 4A(a)
0
20
40
60
80
10000 20000 30000 40000 50000
Fre
quen
cy (
%)
Breach Area (m2)
Model 1B Model 2B Model 3B Model 4B(b)
10000 20000 30000 40000 50000 0
10000 20000 30000 40000 50000 0
****
****

138
4.5.4 Clinical applicator force
The force results obtained from clinical applicator studies on skin Models 1A–4B are detailed
in this section.
An example force–time plot is shown in Fig. 75a. The insertion force was 61.8 N and the
maximum force achieved was 80.8 N. In order to account for elastic recovery of skin, the
microneedles remained embedded in skin for approximately 2 mins before removal and the
skin prepared for staining and imaging.
Figure 75 The force–time plot for clinical applicator tests of Design 2 microneedles on Model 1A. The
impact occurred at 4.62 s, where the force was 61.8 N and the maximum force reached was 80.8 N. The
data suggests that the initial insertion occurred at 4.62 s. Hence, at this point the force was 61.8 N and the
maximum force reached 80.8 N.
Fig. 76a details the insertion force for the abdominal and back skin models. The trend shows
that the insertion force increases at higher gel water content in the subcutaneous mimic of the
skin models for all skin models. The insertion force for Models 4A and 4B are higher than for
all other skin models. The insertion force was low for Model 1A as compared to the other
skin models considering that this model contains the lowest gel water content in its
subcutaneous mimic and therefore, has a higher elastic modulus. In addition, the insertion
force is influenced by skin site, with the back skin models requiring greater insertion force as
compared to the abdominal skin models, with the exception being Models 4A and 4B, where
the insertion force values are in close agreement. Fig. 76b shows the variation of the

139
maximum force across the different abdominal skin models and as can be seen is an almost
constant value with increasing water content of the subcutaneous mimic, except for Model
4A, which is greater. A similar trend was observed with back skin models. There was no
relationship between gel water content and elastic modulus and a trend could not be
determined, as error bars for the maximum force were high (Fig. 76c). A similar trend was
also observed with back skin models.
Figure 76 Force data for clinical applicator tests, where n = 4 for each skin model (a) insertion force data
for the abdominal and back skin models, (b) maximum force–gel water content for Models 1A–4A and (c)
maximum force for Models 1A–4A vs elastic modulus of the gelatine gels.

140
4.5.5 The effects of microneedle geometry on skin penetration
This section compares clinical applicator studies for Design 1 (1316 microneedles on the
array/356 m length) with Design 2 (> 6000 microneedles on the array/552 m length)
microneedles on Model 3B.
4.5.5.1 Microneedle penetration on skin Model 3B
Microneedle perforation of skin Model 3B is detailed here using Design 1 and 2
microneedles.
4.5.5.1.1 Comparison between visual examination and perforation depth
The results of clinical applicator tests using Design 1 and 2 microneedles on Model 3B are
presented in Fig. 77. Methylene blue staining in Figs 77a and 77b showed the disruptions to
the stratum corneum, whilst histology showed the extent of the deformation through the
layers. In Fig. 77a, image analysis using ImageJ to assess PE showed that 56% of Design 2
microneedles perforated the stratum corneum of Model 3B as compared to 64% of Design 1
microneedles in Fig. 77b. The H&E images showed greater deformation within the layers for
Design 1 microneedles as compared to Design 2 microneedles.

141
Figure 77 Clinical applicator studies for the comparison of Design 1 and 2 microneedles on perforation
confirmation (methylene blue staining) and perforation depth (H&E staining), on Model 3B. (a) Design 2
and (b) Design 1. The diameter of Design 1 microneedle disc is 15.8 mm. The diameter of Design 2
microneedle disc is 30.1 mm, Red arrows indicate that the breach is contained within the epidermis and
the black arrows indicate that the breach has extended into the dermis. Scale bar represents 100 m.
The penetration depth in Model 3B for Design 1 and 2 microneedles is shown in Fig. 78. The
greatest perforation depth was 360 m for Design 2 microneedles as compared to 311 m for
Design 1 microneedles. In addition, the mean penetration depth was similar for both types of
microneedles.
Figure 78 Perforation depth data for clinical applicator tests comparing results of Design 1 and 2
microneedles on Model 3B, with the number of images (n) in each group listed above each box and
whisker plot.
0
100
200
300
400
Design 1 Design 2
Per
fora
tion D
epth
(
m)
n = 22
n = 37
ns

142
4.5.5.1.2 Histological examination of breach area
The general trend for the frequency distribution of deformation within Model 3B presented in
Fig. 79 showed that Design 2 microneedles produced the highest frequency of deformations
at 0 < breach area < 10 000 m2. At categories > 10 000 m
2 however Design 1 microneedles
created greater breach areas.
Figure 79 Frequency distribution for clinical applicator studies using Design 1 and 2 microneedles on
Model 3B.
4.5.5.2 Clinical applicator force on skin Model 3B
The insertion force for Design 1 microneedles was 66.70 ± 3.11 N (n = 4) as compared to that
of Design 2, which was 68.00 ± 8.77 N (n = 4). Therefore, Design 1 microneedles required a
similar magnitude of insertion force for microneedle application on skin Model 3B as
compared to Design 2 microneedles. The maximum force for Design 1 microneedles was
91.00 ± 2.83 N, whilst that of Design 2 was lower at 77.30 ± 15.55 N.
4.5.6 Summary of clinical applicator studies
The results of the clinical applicator studies showed that reproducible microneedle
penetration of skin occurred for all the skin models using Design 1 and 2 microneedles.
Visual examination of methylene blue images for the clinical applicator showed that the
0
20
40
60
80
10000 20000 30000 40000 50000
Fre
qu
ency
(%
)
Breach Area (m2)
Design 1 Design 2
10000 20000 30000 40000 50000 0
*
143
intensity of the methylene blue dye appeared greater on abdominal skin models as compared
to back skin models. PE for the clinical applicator was between 39–80%, indicating that not
all the microneedles perforated skin.
The insertion force increased with increasing water content in the gelatine gels for both
abdominal and back skin models, with the insertion force on back skin greater than the
insertion force on abdominal skin. This result showed that altering the fluid content in the
subcutaneous layer had an effect on the insertion force. The maximum force on the skin
models was relatively constant for both abdominal and back skin models, with no particular
trend observed.
In addition, the performance of the clinical applicator was affected by microneedle geometry,
as it produced poorer perforation results with Design 1 microneedles as compared to Design 2
microneedles, with a higher proportion of the perforations occurring in the region of ≤ 10 000
m2 breach area.

144
4.6 Comparison between Impact and Clinical Applicator Studies
Impact and clinical applicators were used to insert microneedles into abdominal and back
skin models. The force and velocity were obtained from the impact applicator, whilst only the
force was obtained from the clinical applicator. The impact applicator was developed for in
vitro tests on neonatal porcine skin, whilst the clinical applicator has been used for in vivo
tests on patients by Renephra. Therefore, it was necessary to perform in vitro tests with the
clinical applicator and compare the results to the results of the impact applicator tests. This
section compares the effect of the impact and clinical applicators on the microneedle treated
skin models.
4.6.1 Penetration efficiency
With respect to PE, it can be seen in Fig. 80 that the impact applicator produces a better result
for Design 2 microneedle application to abdominal skin models as compared to the clinical
applicator. It also appears that the clinical applicator plateaus around 50% PE for Models
2A–4A. The results also show that for the impact applicator, PE reduces with increased water
content in the subcutaneous mimic.
Figure 80 Penetration efficiency as determined from the methylene blue images for impact and clinical
applicator tests on abdominal skin models (Model 1A–4A).
0
20
40
60
80
100
Model 1A Model 2A Model 3A Model 4A
Pen
etra
tion E
ffic
eincy
(%
)
Impact Applicator Clinical Applicator
*
ns *
ns
ns

145
The PE data for back skin models is presented in Fig. 81 and showed that for impact
applicator tests, an increase in gel water content in the subcutaneous mimic leads to higher
PE values, which was not the case for abdominal skin models. In contrast, for the clinical
applicator however, an increase in gel water content leads to a decline in PE.
Figure 81 Penetration efficiency determined from the methylene blue images for impact and clinical
applicator tests on back skin models (Model 1B–4B).
0
20
40
60
80
100
Model 1B Model 2B Model 3B Model 4B
Pen
etra
tion E
ffic
eincy
(%
)
Impact Applicator Clinical Applicator
ns
ns ns ns
*
146
4.6.2 The effects of differences in skin properties
The images in Fig. 82 present a comparison of the methylene blue and H&E staining for
impact and clinical applicator tests on abdominal skin models (Models 1A–4A). Fig. 82a
appears to show a greater intensity in the methylene blue dye for the clinical applicator tests
as compared to the impact applicator tests. Furthermore, the microneedle perforations
travelled beyond the epidermis into the dermis. The H&E images for the impact applicator
showed that most of the disruption through the layers was contained within the epidermis,
with exception to the last image.
In Fig. 82b–d, the intensity of the methylene blue dye appeared to be greater for the clinical
applicator as compared to the impact applicator. For the impact applicator, the H&E images
showed that the deformation was contained mainly within the epidermis, barely interfacing
with the dermis as the gel water content increased. The deformation within Model 4A in Fig.
82d extended more into the dermis. On the other hand, the H&E images for the clinical
applicator showed that the microneedle perforations extended into the dermis.

147
Figure 82 Impact and clinical applicators interaction with abdominal skin models by varying the gel
water content to determine that perforation is achieved (methylene blue staining) and perforation depth
(H&E staining) using Design 2 microneedles. (a) 67% (b) 80% (c) 88% and (d) 96% gel water content.
Red arrows indicate that the breach is contained within the epidermis and the black arrows indicate that
the breach has extended into the dermis. Scale bar represents 100 m and diameter of Design 2
microneedle disc is 30.1 mm.

148
In Fig. 83a, the intensity of the methylene blue dye appears deeper for the clinical applicator
as compared to the impact applicator. The disruptions through the layers for both applicators
were predominantly contained within the epidermis, except with the second image for the
impact applicator and the third image for the clinical applicator. As shown in Fig. 83b, the
methylene blue stained images was comparable for both applicators and so were the
deformations caused by microneedle interference through the layers in the H&E images. Fig.
83c showed that the intensity of the blue dye for the clinical applicator was greater than that
of the impact applicator. In Fig. 83d, the methylene blue stained images showed similar dye
intensity for both applicators. It was also found that for the clinical applicator, not all the
microneedles on the array perforated the stratum corneum, although more than 50%
perforations were seen on the stratum corneum.

149
Figure 83 Impact and clinical applicators interaction with back skin models by varying the gel water
content to determine that perforation is achieved (methylene blue staining) and perforation depth (H&E
staining) using Design 2 microneedles. (a) 67% (b) 80% (c) 88% and (d) 96% gel water content. Red
arrows indicate that the breach is contained within the epidermis and the black arrows indicate that the
breach has extended into the dermis. Scale bar represents 100 m and diameter of the microneedle disc is
30.1 mm.

150
4.6.3 The role of the subcutaneous mimic property on microneedle
performance
The impact applicator produced the highest perforation depth in the abdominal skin model
(Model 2A), as shown in Fig. 84. Conversely, the smallest perforation depth was produced by
the clinical applicator on Model 2A. Generally, the impact applicator produced higher values
for mean perforation depths across all abdominal skin models.
Figure 84 Perforation depth data for impact and clinical applicator tests comparison on abdominal skin
models, where 1A–4A refers to Models 1A–4A, with the number of images (n) in each group listed above
each box and whisker plot.
In Fig. 85, there was no significant difference between the impact and clinical applicator on
back skin Models 1B–4B. Therefore, it is likely that the thicker and higher elastic modulus of
the back skin model could be a contributory factor.
0
100
200
300
400
500
600
700
800
Impact
(1A)
Clinical
(1A)
Impact
(2A)
Clinical
(2A)
Impact
(3A)
Clinical
(3A)
Impact
(4A)
Clinical
(4A)
Per
fora
tion D
epth
(
m)
n = 31
n = 28
n = 32
n = 36
n = 25
n = 38
n = 21
n = 30
ns *
****
ns

151
Figure 85 Perforation depth data for impact and clinical applicator tests comparison on back skin
models, where 1B–4B refers to Models 1B–4B, with the number of images (n) in each group listed above
each box and whisker plot.
In terms of the breach area, the overall trends seen on the skin models showed that there was
no significant difference between impact and clinical applicator performance on abdominal
skin models as shown in Fig. 86.
Figure 86 Breach area data comparison between impact and clinical applicator tests on abdominal skin
models, with the number of images (n) in each group listed above each box and whisker plot.
0
100
200
300
400
500
600
700
Impact
(1B)
Clinical
(1B)
Impact
(2B)
Clinical
(2B)
Impact
(3B)
Clinical
(3B)
Impact
(4B)
Clinical
(4B)
Per
fora
tion D
epth
(
m)
0
10000
20000
30000
40000
50000
Impact
(1A)
Clinical
(1A)
Impact
(2A)
Clinical
(2A)
Impact
(3A)
Clinical
(3A)
Impact
(4A)
Clinical
(4A)
Bre
ach A
rea
(m
2)
n = 34 n = 27
n = 36 n = 30 n = 25
n = 27 n = 28
n = 32
n = 39 n = 22
n = 25 n = 36
n = 22
n = 37
n = 32 n = 27
ns ns
ns ns
ns
ns
ns
ns

152
There was no significant difference in breach area between the impact and clinical applicator
performance on back skin models as shown in Fig. 87.
Figure 87 Breach area data comparison between impact and clinical applicator tests on back skin models,
with the number of images (n) in each group listed above each box and whisker plot.
Histogram distribution of the breach area is shown in Fig. 88. The impact applicator produced
greater breach area frequency as compared to the clinical applicator for the abdominal skin
model. For the back skin models however, the clinical applicator performed better than the
impact applicator.
0
10000
20000
30000
40000
50000
Impact
(1B)
Clinical
(1B)
Impact
(2B)
Clinical
(2B)
Impact
(3B)
Clinical
(3B)
Impact
(4B)
Clinical
(4B)
Bre
ach A
rea
(m
2)
n = 39
n = 31
n = 33
n = 21
n = 35
n = 35
n = 35 n = 25
ns ns ns
ns

153
Figure 88 Frequency distribution for impact and clinical applicator studies using Design 2 microneedles
on (a) abdominal skin models and (b) back skin models.
0
20
40
60
80
10000 20000 30000 40000 50000
Fre
quen
cy (
%)
Breach Area (m2)
Impact (Model 1A) Clinical (Model 1A)
Impact (Model 2A) Clinical (Model 2A)
Impact (Model 3A) Clinical (Model 3A)
Impact (Model 4A) Clinical (Model 4A)
(a)
0
20
40
60
80
10000 20000 30000 40000 50000
Fre
quen
cy (
%)
Breach Area (m2)
Impact (Model 1B) Clinical (Model 1B)
Impact (Model 2B) Clinical (Model 2B)
Impact (Model 3B) Clinical (Model 3B)
Impact (Model 4B) Clinical (Model 4B)
(b)
10000 20000 30000 40000 50000 0
10000 20000 30000 40000 50000 0
****
****

154
4.6.4 The effects of microneedle geometry on skin penetration
This section details the comparison between the impact and clinical applicators on Design 1
and 2 microneedles using skin Model 3B.
4.6.4.1 Comparison between visual examination and perforation depth
The images in Fig. 89 compare perforation success using methylene blue staining and
perforation depth using H&E staining for Design 1 and 2 microneedles on Model 3B. For
Design 1 microneedles, the clinical applicator caused more disruptions to the stratum as
majority of the microneedles perforated this layer as compared to the impact applicator. The
H&E images show that the deformation was contained within the epidermis for the impact
applicator and that the breach size was narrower. In contrast, for the clinical applicator, the
deformation extended deep into the dermal layer in some instances and slightly interfaced
with the dermis (Fig. 89a).
For Design 2 microneedles, shown in Fig. 89b, the intensity of the methylene blue dye was
greater for the clinical applicator treatment as compared to the impact applicator. The H&E
stained images showed that the breach was contained within the epidermis for both
applicators.
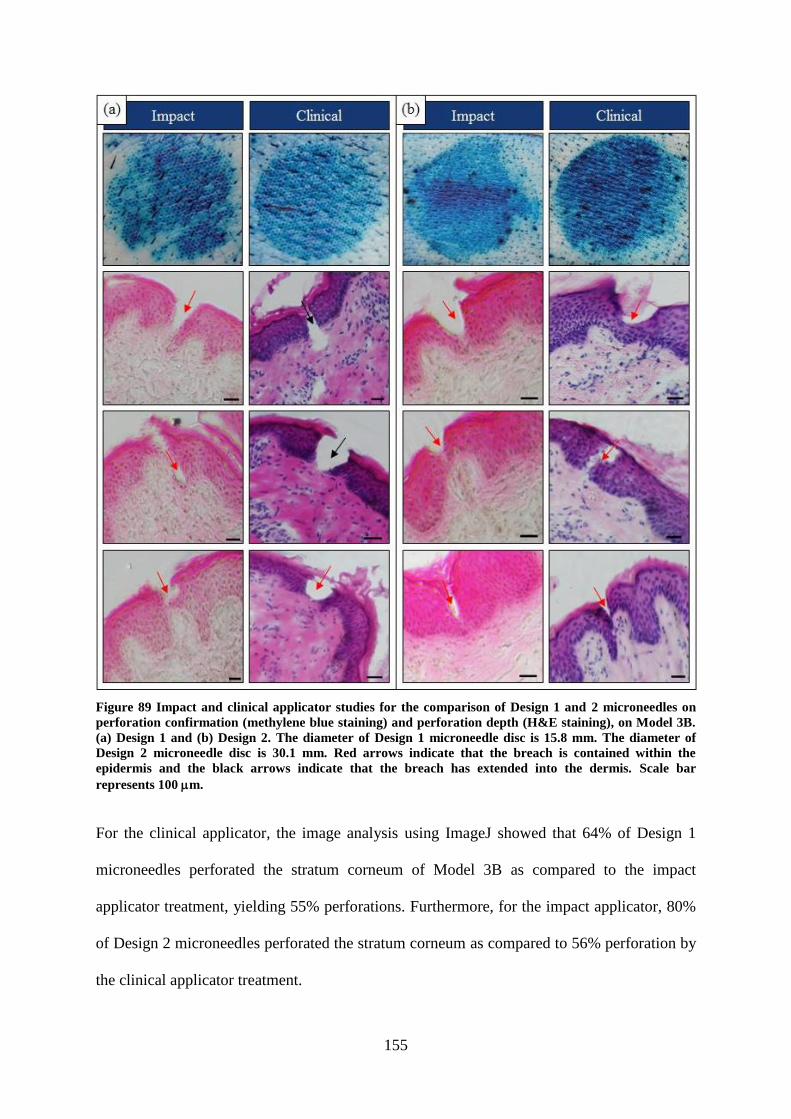
155
Figure 89 Impact and clinical applicator studies for the comparison of Design 1 and 2 microneedles on
perforation confirmation (methylene blue staining) and perforation depth (H&E staining), on Model 3B.
(a) Design 1 and (b) Design 2. The diameter of Design 1 microneedle disc is 15.8 mm. The diameter of
Design 2 microneedle disc is 30.1 mm. Red arrows indicate that the breach is contained within the
epidermis and the black arrows indicate that the breach has extended into the dermis. Scale bar
represents 100 m.
For the clinical applicator, the image analysis using ImageJ showed that 64% of Design 1
microneedles perforated the stratum corneum of Model 3B as compared to the impact
applicator treatment, yielding 55% perforations. Furthermore, for the impact applicator, 80%
of Design 2 microneedles perforated the stratum corneum as compared to 56% perforation by
the clinical applicator treatment.

156
The perforation depth due to impact and clinical applicator treatment is shown in Fig. 90. The
trend shows that the mean perforation depth is relatively close in value for the impact and
clinical applicators. The impact applicator appears to produce a consistent performance in
skin irrespective of microneedle geometry as compared to the clinical applicator which
appeared to be more affected by microneedle geometry. This is because with similar
magnitude of force, the clinical applicator produced a smaller perforation depth for Design 1
microneedles as compared to Design 2 microneedles. In contrast, the impact applicator
produced a higher perforation depth at a relatively low force for Design 1 microneedles as
compared to Design 2 microneedles. The impact applicator insertion force was also lower
than the clinical applicator insertion force, which indicates that at a higher insertion force
comparable to the clinical applicator insertion force, greater perforation depths could be
achieved, since it has already been demonstrated that the magnitude of force is commensurate
with the size of the deformation.
Figure 90 Perforation depth data for impact and clinical applicator tests comparing results of Design 1
and 2 microneedles on Model 3B, with the number of images (n) in each group listed above each box and
whisker plot.
0
100
200
300
400
Impact (Design 1) Clinical (Design 1) Impact (Design 2) Clinical (Design 2)
Per
fora
tion D
epth
(
m)
n = 19
n = 22
n = 22
n = 37 ns
ns

157
4.6.4.2 Histological examination of breach area
For Design 2 microneedles, the clinical applicator produced a greater breach area as
compared to the impact applicator at ≤ 10 000 m2 as shown in Fig. 91. As expected, there
were less perforation areas for larger breach area categories.
Figure 91 Frequency distribution for impact and clinical applicator studies using Design 2 microneedles.
0
20
40
60
80
10000 20000 30000 40000 50000
Fre
quen
cy (
%)
Breach Area (m2)
Impact (Design 1) Clinical (Design 1)
Impact (Design 2) Clinical (Design 2)
10000 20000 30000 40000 50000 0
**
158
4.6.5 Impact and clinical applicator force
For the impact applicator, the insertion force for Design 1 microneedles was 9.33 ± 2.76 N (n
= 5) as compared to that of the clinical applicator, which was 66.70 ± 3.11 N (n = 4). For
Design 2 microneedles, the insertion force was 23.50 ± 4.97 N for the impact applicator and
68.00 ± 8.77 N for the clinical applicator. The maximum force for Design 1 microneedles
was 46.24 ± 8.57 N for the impact applicator and it was 91.00 ± 2.83 N for the clinical
applicator. For Design 2 microneedles, the maximum force was 42.93 ± 11.08 N for the
impact applicator as compared to 77.30 ± 15.55 N for the clinical applicator.
The insertion force comparison between the impact and clinical applicators for tests on all the
skin models provide an interesting insight into the influence of skin’s properties with respect
to microneedle application. Fig. 92a shows a constant insertion force value for skin Models
1A–4A for the impact applicator and an increase in insertion force values for the clinical
applicator with increased water content in the subcutaneous mimic. A similar trend was also
observed for back skin model in Fig. 92b, except that Model 3B exhibited the lowest
insertion force produced by the impact applicator.

159
Figure 92 Force data comparison between the impact and clinical applicator tests on (a) abdominal skin
models and (b) back skin models.
4.6.6 Summary of the comparison between impact and clinical applicator
studies
Impact and clinical applicator studies of microneedle penetration of skin were reproducible as
detailed in previous sections. 100% penetration was not achieved on all skin models for the
clinical applicator and this was also observed with the impact applicator studies as well as
mentioned in the literature. Furthermore, PE reduced with increasing fluid content in the
subcutaneous layer for the clinical applicator as compared to the impact applicator.

160
For both applicators, the mean breach area for all skin models increased with an increase
fluid content of the subcutaneous layer.
Microneedle geometry also highlighted how each applicator influenced skin penetration with
the impact applicator demonstrating that the magnitude of force played a major role in the
size of the deformation through the layers. Whilst the clinical applicator showed that with a
similar magnitude of force on both Design 1 and 2 microneedles, Design 2 microneedles
produced higher perforation depths in skin.
Finally, in terms of insertion force, for the impact applicator, abdominal and back skin was
relatively constant. However, for the clinical applicator the insertion force increased with
increasing fluid content in its subcutaneous layer.

161
Chapter 5
5. Discussion
5.1 Introduction
The results presented in Chapter 4 demonstrate that the micromechanical properties of the
skin model with respect to anatomical region and altering the fluid content in the
subcutaneous layer influence the effectiveness of microneedle perforation of skin. In the
body, subcutaneous adipose tissue contributes to skin deformation during loading and load
transfer from skin to deeper layers (Geerligs et al., 2010b). To date, the role of subcutaneous
tissue on microneedle performance has largely been ignored due to incomplete in vitro skin
models. Therefore, the work carried out in this thesis using a representative skin model shows
the importance of the role of the subcutaneous layer for determining microneedle
performance. Furthermore, although skin thickness is related to elastic modulus because the
thinner abdominal skin produces a lower elastic modulus as compared to the thicker back
skin with a higher elastic modulus, nonetheless, contributions from the subcutaneous layer,
particularly the compliant 96% gel water content yielded comparable maximum force values
for both abdominal and back skin models using the clinical applicator. This result however
was not observed with the impact applicator. Additionally, microneedle geometry and
microneedle applicator also contributed to microneedle performance in skin. The study found
that microneedle penetration of skin was reproducible and repeatable, however the extent of
the deformation through the layers varied according to microneedle geometry and
microneedle applicator. Further, the mechanical properties of the various layers was
quantified and related to microneedle performance. Insertion force, insertion velocity and
maximum force values were obtained for the impact and clinical applicators as these

162
influenced effective microneedle penetration of skin. The findings from these studies are now
discussed in further detail and as it relates to previous findings reported in the literature.
5.2 Micromechanical Characterisation of Skin’s Sub-layers
The mechanical behaviour of skin varies due to various factors including age (Daly and
Odland, 1979; Leveque et al., 1980), pathology such as scleroderma, polyfibromatosis
(Pierard and Lapiere, 1977), species (e.g. human, porcine or murine) and anatomical site.
Data reported in the literature also varies depending on test conditions (e.g. in vivo or in vitro)
and test type e.g. indentation (Pailler-Mattei et al., 2007b), suction (Diridollou et al., 2000) or
tension (Manschot and Brakkee, 1986).
The micromechanical tests using the nanoindentation setup allowed for the characterisation
of the different layers of the skin model and thereby comparison with values reported in the
literature for skin’s subcutaneous and muscle tissue. The difference in elastic modulus for
abdominal skin compared to back skin was consistent with published data (Zak et al., 2011).
The storage modulus (elastic properties) was greater than the loss modulus (viscous
properties) for both abdominal and back skin. This result was consistent with the work
carried out utilising nanoindentation testing on murine skin (Kendall et al., 2007). The
importance of a full thickness skin sample in the skin model was reinforced by Zahouani et
al. who showed that the dermis made a significant contribution to skin because of its load
bearing capabilities (Zahouani et al., 2009). Furthermore, it is easier to penetrate the human
epidermis without the dermal layer (Li et al., 2015), which would not be an ideal way to
demonstrate successful microneedle interaction with skin. For the work carried out in this
thesis, unlike in some studies, a full thickness skin sample comprising the stratum corneum,
epidermis and dermis as well as subcutaneous layers represented by gelatine gels and Perma-
Gel® as muscle mimic were used. The mechanical tests on three concentrations of gelatine

163
gels (67%, 80% and 88%) showed that the elastic modulus decreased with increased fluid
content in the gelatine gels matching trends reported by Mridha and Odman (1985) and
Mridha et al. The storage modulus was significantly greater than the loss modulus for the
gelatine gels. In the literature, for subcutaneous tissue, G´ of 7.5 kPa for porcine tissue was
reported (Geerligs et al., 2008). For the work in this thesis, G´ ranged from 3.8–21 kPa,
which was also comparable with the literature given the much higher frequency that was
utilised during testing i.e. 110 Hz for this study as compared to approximately 1.6 Hz in the
rheology study by Geerligs et al. The tests on Perma-Gel® yielded a mean G´ of 29.9 ± 0.9
kPa, which matched values reported in the literature for the shear modulus of muscle (Pailler-
Mattei et al., 2008).
As already reported, skin site, test method and test condition influence the outcome of skin’s
mechanical characterisation. The study by Zahouani et al. also demonstrated the similarity in
stiffness between dermal equivalents and volar forearm (Pailler-Mattéi and Zahouani, 2006;
Pailler-Mattei et al., 2008; Zahouani et al., 2009), which suggests that during in vivo tests, the
mechanical contribution from the dermis is prominent. Ex vivo tests on the stratum corneum
layer only, yielded a low elastic modulus (Pailler-Mattei et al., 2007b). This single layer of
tissue is not ideal for microneedle penetration studies as the key mechanical strength
provided by the dermis is absent. Uniaxial tensile tests confirmed that back tissue was stiffer
and has a higher elastic modulus than abdominal tissue (Zak et al., 2011), which was also
demonstrated in this study. The values of the elastic modulus in the Zak et al. study using
tensile testing techniques were between 100–200 times greater than results obtained from the
dynamic nanoindentation tests carried out in this thesis. The disparity in mechanical property
data reported for various biomechanical studies in the literature highlights complexities due
to different tissue types and testing methodologies.
164
Another noteworthy observation was that the range of elastic modulus obtained lay within the
range of mechanical properties of previous studies listed in Table 3 (Section 2.3.1.2) and
Table 4 (Section 2.3.2), with particular reference to the values from Groves (2011) and
Zahouani et al. in vivo studies. Therefore, the micromechanical properties of skin in this
study were comparable to the results of the in vivo studies.
As previously mentioned in the literature review in Chapter 2 (Section 2.3.1.2, Table 2),
Crichton et al. demonstrated the effects of varying the indentation probe diameter and its
influence on the elastic modulus of murine ear skin. They found that the elastic modulus
increased with the smaller probe diameters and decreased with the larger probe diameters
(Crichton et al., 2013). Kendall et al. previously found a similar trend in a nanoindentation
study of murine skin using two different probe diameters (Kendall et al., 2007). Crichton et
al. also stated that the mechanical behaviour of mice skin was comparable to human skin and
cited indentation tests carried out by Geerligs et al. on frozen human tissue (Geerligs et al.,
2011). Geerligs et al. used an ex vivo abdominal human tissue and reported that the elastic
modulus of the stratum corneum (2.6 ± 0.6 MPa) was greater than the epidermis (1.1 ± 0.2
MPa). They also showed that a reduction in the stiffness of the viable epidermis causes an
increase in indentation depth.
Another study by Kocchar et al., which focused on microneedle tests on soft tissue, also used
rat skin and argued that for microneedle penetration studies, rat skin behaved similar to
human skin (Kochhar et al., 2013b). Groves et al. demonstrated in their study involving ex
vivo murine and human skin that under low loads, the extension in human skin was
significantly greater as compared to murine skin and careful consideration should be taken
when using murine skin as a biomechanically representative model of human skin (Groves et
al., 2013). Ding et al. also found mouse skin to be thinner but more flexible than human skin
(Ding et al., 2009).

165
Furthermore, Li et al. in their study of microneedle interaction with skin showed that the
epidermal thickness of rat skin (≈ 15 m) was very different to human skin (≈ 100–200 m),
which made it easier to strain rat skin following microneedle application (Li et al., 2015).
They also found that it was easier to deeply penetrate rat skin due to its thinner epidermis.
Therefore, rat skin may not be a suitable soft tissue model for microneedle application
studies. Moreover, the work in this thesis using neonatal porcine skin has shown that the
thickness of abdominal skin (≈ 0.79 mm) and back skin (≈ 2.43 mm) does contribute to
microneedle performance, therefore, microneedle perforation of abdominal skin occurred
more readily and is an ideal site for microneedle application. The micromechanical tests
highlighted the difference in elastic modulus for the back skin (45.89 ± 9.61 kPa), which was
almost twice that of abdominal skin (24.49 ± 5.47 kPa). The depth of penetration was
typically lower in the back skin at lower gel water content i.e. Models 1B and 2B relative to
the abdominal skin (Fig. 56 Section 4.4.4). In addition, the elastic component (G´) and
viscous component (G˝) was also lower for abdominal skin compared to back skin.
Furthermore, neonatal porcine skin exhibits close biomechanical properties to human skin
(Shergold et al., 2006; Cilurzo et al., 2007) as well as similar histological, physiological and
immunological properties (Avon and Wood, 2005). Therefore, if access to human tissue is
challenging, then neonatal porcine skin can be used as a suitable substitute.
The variation of the elastic modulus in soft tissue demonstrated in several studies also
highlighted the extremely variable nature of biological material in general.

166
5.3 Impact Applicator Studies
A number of different methods have been employed in the literature to apply microneedles to
skin. Dermaroller® (Badran et al., 2009), syringe applicators (Haq et al., 2009), actuator
driven applicator (Bouwstra et al., 2009) and an electrically driven applicator (Verbaan et al.,
2008) have all been used for microneedle application to skin. The more commonly used
microneedle applicators are the spring-driven applicators; however, some studies have shown
that the impact applicator setup is a more suitable option for microneedle application in soft
tissue as compared to manual application (Burgin and Aspden, 2007). Furthermore, van der
Maaden et al. used an impact applicator for reproducible perforation of skin (van der Maaden
et al., 2014).
In this thesis, impact applicator studies support the assertion in the literature that reproducible
microneedle perforation of both abdominal and back skin models are achievable at velocities
in excess of 2 ms-1
. As a consequence, attempts have been made to relate the force, velocity,
mechanical properties of the skin model layers, microneedle geometry to microneedle
penetration results. Therefore, the findings of impact applicator tests on all skin models are
discussed in this section.
5.3.1 Visual examination of microneedles using SEM imaging
SEM images showed that PEEK microneedles remained intact after five applications during
impact tests on skin, whilst the tips of Design 2 PMMA microneedles deformed after single
application and completely fractured following five applications. The elastic modulus for
PEEK is 4.1 GPa (Victrex, 2014) and 1.7 GPa for PMMA (Ianches, 2015), which suggests
that PEEK microneedles were more robust in its design because of its higher elastic modulus
and due to its construction had design integrity. Furthermore, in the polymer family, PEEK
167
also has the highest fracture toughness, a value of 2.73–4.30 MPa√m (Granta, 2003), which
also explains why it exhibits superior design integrity.
Design 2 PMMA microneedle tips were sharper than PEEK microneedle tips. Therefore,
these design intricacies could explain why PEEK microneedles produced poor perforation
results as compared to Design 1 and Design 2 PMMA microneedles. The tip sharpness of the
PMMA microneedles as compared to the PEEK microneedles may have influenced the
integrity of the needles during multiple uses i.e. a small diameter tip is more likely to deform
after a single insertion than a blunter, larger diameter tip. In addition, Renephra’s clinical
trials by Ebah (2012) using PEEK microneedles also reported that the design of the
microneedles may have hindered its performance in skin in vivo.
5.3.2 Penetration efficiency
Visual examination using methylene blue staining and histological examination using H&E
images showed that with Design 1 and 2 PMMA microneedles, 100% penetration was not
observed. These results were consistent with findings from other researchers who had less
densely populated arrays i.e. 16–576 microneedles on the array (van der Maaden et al., 2014;
van der Maaden et al., 2015) as compared to Design 1 microneedles (1316 microneedles on
the array) and Design 2 microneedles (> 6000 microneedles on the array) used in this study.
Furthermore, the PE determined from methylene blue staining varied from 43–93% for the
regions analysed. For this reason, the expected frequency of microneedle breaches i.e. with
clearly visible breaches every 360 µm were not seen during the analysis of H&E images. In
addition, this may also be attributable to the substantial irregular surface topography of skin
(see Figs 95 and 96 in the Appendix). Moreover, there may be unavoidable issues due to the
tissue sectioning process (see Fig. 97 in the Appendix).

168
PE as determined in other studies has largely relied on methylene blue or Trypan blue
staining to assess penetration efficiency (Park et al., 2005; Verbaan et al., 2008; Haq et al.,
2009; Kochhar et al., 2013b; Olatunji et al., 2013; van der Maaden et al., 2014; Qiu et al.,
2015; van der Maaden et al., 2015), however as shown in Fig. 66, a combination of
methylene blue staining with histology is required to fully assess the extent of microneedle
penetration of skin. In the study by van der Maaden et al., the stratum corneum was stripped
from the skin in order to effectively determine that the perforations had propagated through to
the epidermis (van der Maaden et al., 2014). As already established the methylene blue
staining only confirms disruption to the stratum corneum layer and not perforation depth,
which is why it should not be considered as a technique for measuring successful epidermal
penetration. Microneedle penetration success should be defined as the complete breach of the
stratum corneum that extends to the epidermal layers. This is because in this study, there have
been instances where some microneedles on the array have only caused dents in the stratum
corneum, thus creating a temporary pocket that carries the methylene blue solution. This
would be observed as successful methylene blue staining through visual examination,
however, there is no breach in skin. van der Maaden et al. also noted a similar occurrence in
their study, as some of the dye solution was stored in dents in the stratum corneum. A further
observation was that not every microneedle on the array seemed to fully penetrate through to
the epidermis; however, the majority of the microneedles did deform the stratum corneum
layer, as shown in Figs 66d–f. This phenomenon was also observed in other methylene blue
or Trypan blue stained image studies, where every single microneedle on the arrays did not
perforate the stratum corneum (Haq et al., 2009; Qiu et al., 2015; Xiang et al., 2015).
Moreover, emerging technologies within biomedical research such as OCT and XMT could
also be utilised in providing this detail.
169
5.3.3 The effects of differences in skin properties
There are currently only a few studies which have explored how microneedles performance is
influenced by the physiological and mechanical properties of skin. In this thesis, it was
observed that microneedle perforation occurred more readily in the thinner abdominal skin as
compared to the thicker back skin. This occurrence was similar to the study by Al-Qallaf and
Das (2008), who demonstrated that increasing drug permeability in skin with microneedles
varied due to differences in epidermal thickness between Caucasian and Korean groups. The
thicker epidermis found in the Korean group exhibited lower skin permeability as compared
to the thinner epidermis in the Caucasian group, which had higher skin permeability (Al-
Qallaf and Das, 2008). As already noted that neonatal porcine back skin bears similar
thickness (Lo Presti et al., 2012) and has a comparable mechanical property to human skin
(Groves, 2011), therefore, the outcome of studies on neonatal back skin provides details of
how microneedles could interact in human skin. In addition to skin thickness, Verbaan et al.
postulated that age and skin region due to the variation in the elasticity of skin makes
microneedle perforation of skin less reproducible (Verbaan et al., 2008). Furthermore,
Olatunji et al. showed computationally that the insertion force for microneedles was
significantly higher for aged human skin as compared to younger skin (Olatunji et al., 2013).
As fluid overload and oedema are conditions common to elderly patients suffering from heart
or kidney failure (McMurray and Stewart, 2000), it is therefore important to address the
likely effects of microneedle application to ageing skin. Although no study was carried out on
ageing skin in this thesis, contributions from insertion force and insertion velocity could play
a role in the postulations by Verbaan et al. and Olatunji et al. regarding the reproducibility of
microneedle perforations in ageing skin. According to Kelchen et al. for their in vivo
comparison study between elderly and young subjects, manual application of microneedle
created microchannels in skin for both subjects. The difference noted was the time taken for

170
microchannel closure, which was longer in elderly subjects as compared to young subjects
(Kelchen et al., 2016). Furthermore, ageing skin is thinner due to epidermal thinning
(Kelchen et al., 2016) as compared to younger skin; hence, the structural differences between
ageing and young skin could influence microneedle performance. This thesis demonstrated
that structural differences between abdominal and back skin resulted in different outcomes,
with more deformation occurring in abdominal skin as compared to back skin. Likewise, the
thicker back skin required a higher insertion force as compared to the thinner abdominal skin.
The difference between the insertion force of abdominal and back skin indicates that
microneedle penetration of skin is influenced by the difference in thickness at different
anatomical sites.
Another factor for microneedle performance in different skin regions could be due to
variation in skin topography. Skin has a natural undulation, which varies in size and depth
(see Figs 94 and 95 in the Appendix). This could explain why some of the microneedles
perforated deeper into skin in some regions as compared to other regions. The histology
images also illustrated 2D profiles of skin’s topography, with some cross-sections having
flatter ridges as compared to other cross-sections having more pronounced ridges.
There are certain disadvantages associated with the analysis of histology images. This is
because only a small portion of the tissue can be sectioned during histology, which means
that useful information is lost with the tissue that is discarded. Furthermore, it involves time-
consuming fixing, sectioning and staining steps. Coulman et al. demonstrated that
histological measurements of microneedle penetration led to an overestimation (Birchall et
al., 2005; Coulman et al., 2010). This error is also compounded by the introduction of slight
inaccuracies due to skin retraction caused by the removal of the microneedles before staining
(Donnelly et al., 2010; Loizidou et al., 2016). Despite these limitations, using histology for
the light microscopic assessment of skin biopsies is still regarded as the benchmark in

171
dermatology (Holme et al., 2014; Newton et al., 2015). In order to improve on conventional
methods of measurement from histological images, a custom image analysis routine was used
for all measurements of breach area from histology images.
5.3.4 The role of the subcutaneous mimic property on microneedle
performance
As mentioned previously in Section 2.6.5, several microneedle in vitro studies have used skin
models with underlying substrates that do not provide a true representation of the mechanical
characteristics of skin’s underlying layers (Park et al., 2005; Verbaan et al., 2007; Badran et
al., 2009; Yan et al., 2010; Donnelly et al., 2011; Kochhar et al., 2013a; Kochhar et al.,
2013b; Olatunji et al., 2013). Hence, the additional novelty of the approach outlined in this
thesis was that microneedle tests were performed on a more representative in vitro skin model
that incorporated a subcutaneous tissue layer and muscle mimic that were comparable in
mechanical behaviour to skin’s underlying layers. Early on, the role of gelatine gels as an
underlying substrate for skin in the study involving PEEK microneedles showed that
penetration was marginal when skin was not placed on a gelatine gel bed. Typically, the
human anatomy contains organs, muscles, fat and is supported by a skeleton, which gives
skin support. Understandably, the lack of a gelatine gel bed reinforces the requirement for the
in vitro tissue to have a representative layer that can mimic the subcutaneous layers of skin.
For methylene blue staining utilising Design 2 microneedles with back skin models, it was
observed that penetration quality improved with increasing water content in the gelatine gels.
As noted by Mridha et al. gelatine gels with high water content have low mechanical
impedance and this phenomenon could explain the improved penetration of skin with high
water content gelatine gels following microneedle application. Although skin tension with
respect to oedema was not measured during experimental investigation, contributions from
the subcutaneous layer cannot be ignored as, the influence of the lowest stiffness gelatine gels

172
was prominent for skin Models 4A and 4B, where the deformation in abdominal and back
skin were significant in terms of their large breach sizes. Typically, the stiffer back tissue
contained most of the deformation within the epidermis for Models 1B, 2B and 3B. It was
also noted that the thinner abdominal tissue produced deeper breach sizes that extended into
the dermis with increased fluid content in the gelatine gels.
Overall, it was found that for abdominal skin model, increased fluid content in the gelatine
gels resulted in larger deformations in terms of breach area. Therefore, manipulating the
water content in the gelatine gels compromised the integrity of the skin model. Additionally,
it was found that the mechanical performance of abdominal skin model was influenced by the
mechanical contribution from the gelatine gel layer, as an increase in water content affected
its interaction with microneedles. Moreover, as abdominal tissue is thinner and has a lower
elastic modulus, it offers all the right components to make it easy for microneedles to bypass
its skin barrier and cause deformation. This could mean that microneedles could cause greater
deformation in patients with oedematous tissues or epidermal thinning associated with ageing
(Kelchen et al., 2016). The histograms presented in Section 4.4.4 showed that there were
more perforations for a breach size of 10 000–20 000 m2 in the abdominal skin relative to
the back skin. This could also be related to the thickness of the abdominal skin, which means
that it has a reduced ability to resist the disruptive influence of microneedle assault as
compared to back skin.
5.3.5 Impact applicator force and velocity
The impact applicator used for the work carried out in this thesis allowed for both force and
velocity to be varied. This was in contrast to other studies which have tended to use a fixed
force (van der Maaden et al., 2014) or only considered the application velocity (Verbaan et
al., 2008; Ding et al., 2009).

173
At higher drop mass loads and higher velocities, as shown in Figs 64a–b, the intensity of the
methylene blue dye increased for Design 1 microneedle penetration on the stratum corneum
of skin Model 3B. Verbaan et al. used intensity of Trypan blue dye as an assessment of
perforation effectiveness in their study. In addition, they also quantified their Trypan blue
intensity tests by conducting separate transepidermal water loss (TEWL) studies on samples
of microneedle perforated tissues without dye staining. TEWL is a standardised way of
measuring the changes in skin barrier properties (Treffel et al., 1994; Rosado et al., 2005) and
can be used as an additional indicator of stratum corneum disruption (Haq et al., 2009). Their
TEWL results were consistent with the results obtained from their visual observation studies
using Trypan blue (Verbaan et al., 2007). The methylene blue staining results also
highlighted the influence of force and velocity on the quality and consistency of
incorporation of the high-density Design 1 microneedles into Model 3B. Furthermore, the
quality of perforation through skin improved at a higher velocity of 3 ms-1
as compared to 2
ms-1
. This observation was in line with the study by Donnelly et al., which concluded that
perforation of skin could occur at high velocities and low loads (Donnelly et al., 2010).
Furthermore, van der Maaden et al. achieved perforation of skin at 3 ms-1
and at a force in the
range of 3.43–22.1 N (van der Maaden et al., 2014). The insertion force, which is indicated in
Figs 59 and 67, is likely to be the point at which the force exerted on the microneedles causes
piercing of the skin, as described by Olatunji et al. (Olatunji et al., 2013). Therefore, the
optimal parameters of insertion velocity and insertion force for reproducible and predictable
penetration of skin Model 3B using Design 1 microneedles were 2.96 ms-1
and 9.33 ± 2.76 N
respectively.
There was some correlation between insertion force and the extent of the deformation in skin,
as the size of the insertion force used for microneedle application was commensurate with the
size of the deformation. This was particularly evident in skin Model 3B, whereby a low

174
insertion force resulted in a small breach size as compared to the breach size observed in
Models 1B, 2B and 4B (Fig. 55c). The insertion force using Design 2 microneedles on Model
3B was 23.50 ± 4.97 N, which was lower than the insertion forces of 37.52–40.72 N on
Models 1B, 2B and 4B (Fig. 67a). These skin models produced higher breach areas as
compared to Model 3B (Fig. 55). This also suggests that the size of the insertion force is
important for ideal microneedle interaction within skin. Furthermore, Donnelly et al., used a
spring-driven applicator of varying forces (4.4–16.4 N/array) to demonstrate that increasing
the insertion force led to a significant enhancement in the depth of microneedle penetration
into skin (Donnelly et al., 2010).
In comparison to back skin models, a lower insertion force and insertion velocity was
required for microneedle penetration of abdominal skin models. It has already been
established that the elastic modulus as well as the elastic and viscous effects for back skin is
higher than for abdominal skin, therefore, it is for this reason that the stiffer back skin
requires a higher insertion force as compared to the less stiff abdominal skin. The insertion
force values were not overly influenced by the subcutaneous mimic properties in any of the
abdominal skin models because as the fluid content increased in the gelatine gels, the
insertion force remained relatively constant. The maximum force however increased with
increasing water content in the gelatine gels, which indicates the prominent role played by the
subcutaneous mimic in microneedle interaction with skin. This would indicate that at greater
force values, the integrity of the gelatine gels becomes compromised and disintegrates,
unable to withstand the force. It was noted that the maximum force measured by the force
transducer decreased by approximately 37% from Model 1A containing 67% gel water
content to Model 4A containing 96% gel water content. Although PE decreased marginally
with gel water content, the average depth size and breach area increased with gel water
content. Also noteworthy, was the reduction in these parameters with Model 4A containing

175
96% gel water content. It appears that the high compliance of the subcutaneous mimic in this
model seems to result in poorer microneedle interaction with skin, the histogram data
however (Fig. 58a) shows that the distribution of small (< 10,000 µm) and large breach areas
(> 20,000 µm) is comparable to Models 2A and 3A containing 80% and 88% gel water
content respectively.
The maximum force did not decrease for back skin models as in the case of abdominal skin
models with increasing compliance of the subcutaneous mimic. Again, this can be related to
the relative stiffness and thickness of back skin. The overall trends for average depth size and
breach area matched those found in abdominal skin. The key difference between abdominal
and back skin was the average data reported for Model 3B containing 88% gel water content.
The histogram data for back skin models (Fig. 58b), however, also demonstrates that the
overall trends are relatively consistent in terms of microneedle performance as compared to
gel water content. The inherent issues with histological assessment of microneedle
perforation of skin cannot be ignored as contributory factors for some of the disparities.
5.3.6 The effects of microneedle geometry on skin penetration
The stratum corneum is the stiffest layer in skin and the least extendable under applied load
(De Rigal and Leveque, 1985; Hendriks, 2001). It is also the first surface that comes into
contact with microneedles. Thus, the stratum corneum remains a barrier against the
application of microneedles (Prausnitz, 2001). PEEK and PMMA microneedles successfully
bypassed the stratum corneum, with the deformation extending into the epidermis. The
reproducible perforation of skin was an issue with PEEK microneedles and may have been
due to its method of manufacture, laser machining, as its original design was for sharper tips.
For the PMMA microneedles however, reproducible and repeatable perforation of skin
occurred for both abdominal and back skin models due to consistency of tip sharpness
attributable to its microfabrication process.

176
For the work in this thesis, the microneedle tip diameters were of similar construction and its
size was ≈ 10 m for Design 1 and 2 PMMA microneedles. The variation in needle length
was 356 m for Design 1 microneedles and 552 m for Design 2 microneedles. In terms of
needle density, it was 1316 for Design 1 microneedles and > 6000 for Design 2. The
difference in interspacing was 386 m for Design 1 microneedles and 360 m for Design 2
microneedles.
Design 1 microneedles penetrated through the stratum corneum to the epidermal layer and in
some instances caused deformation to the dermal layer. The objective of microneedle
penetration studies is to achieve epidermal breach, since this layer contains few nerve endings
or blood vessels. It was noted by Henry (1998) that even though microneedles are long
enough to penetrate the dermis, they are however short and narrow enough to avoid
stimulating dermal nerves (Henry et al., 1998). Although the histological images in Fig. 61
did not show any significant difference between Design 1 and 2 microneedles interaction
with skin, the insertion force for Design 2 microneedles was more than twice the magnitude
required for Design 1 microneedles. Therefore, this increase in insertion force for the more
densely populated, longer length Design 2 microneedles (> 6000) as compared to the less
densely populated, shorter length Design 1 microneedles (1316) demonstrates that
microneedle geometry plays a role in the force outputs for microneedle interaction with skin.
Liu et al. also showed that insertion force varies with microneedle geometry (Liu et al.,
2016). Furthermore, Loizidou et al. demonstrated that design elements such as microneedle
length, interspacing, base diameter that affect microneedle geometry are critical parameters
that influence skin penetration (Loizidou et al., 2016). The differences in interspacing
between individual microneedles for Design 1 microneedles (386 m) and Design 2
microneedles (360 m) as well as differences in needle density for Design 2 microneedles (>

177
6000), which is approximately four times that of Design 1 microneedles (1316) were factors
in determining how both microneedles behaved in skin.
For Model 3B, Design 2 microneedles produced a greater number of perforations ≤ 10 000
m2 however, Design 1 microneedles produced perforations in skin at all measurement
ranges, whilst there were some ranges where no perforations were recorded for Design 2
microneedles. This observation suggests that despite the lower insertion force of the Design 1
microneedles as compared to Design 2 microneedles, Design 1 microneedles were completely
embedded in skin at its highest perforation depth of 351 m (Fig. 62). However, the insertion
force per microneedle highlights that almost two times the insertion force per microneedle is
acting on Design 1 microneedles (0.007 N/microneedle) as compared to Design 2
microneedles (0.004 N/microneedle). This was further corroborated by other studies in which
microneedle perforation depth improves with insertion force (Donnelly et al., 2010) and
insertion velocity (Crichton et al., 2010).
Another design difference between Design 1 and 2 microneedles is the height, where Design
1 microneedles were 356 m in height as compared to Design 2 microneedles height of 552
m. As already mentioned in Section 5.3.2, following microneedle interaction with skin, the
skin is initially indented before perforation of the stratum corneum occurs. Consequently,
several studies have reported that microneedle perforation depth varies widely from 10–80%
of the length of the microneedle (Coulman et al., 2010; Donnelly et al., 2010; Kalluri et al.,
2011). This could perhaps explain the observation in this study why Design 2 microneedles
did not penetrate as deeply into skin.
Verbaan et al. demonstrated using the same design of microneedles, which were a 4 × 4 array
of lengths 300 m, 550 m, 700 m and 900 m that TEWL increased with the increasing
length of the microneedle. The 900 m microneedle produced the best TEWL results. The

178
only variable with their microneedles was its length, as needle density and interspacing were
the same. This made it possible in determining that increased microneedle length resulted in
increased perforation of skin (Verbaan et al., 2007). On the other hand, Yan et al. conducted
several tests on a wide number of microneedle lengths with various needle densities. In their
study, they found that the longer microneedle length (650 m) with needle density of 400 or
900 resulted in increased skin perforation as compared to the shorter microneedle length (≤
300 m) with needle density of 11 900 (Yan et al., 2010). Moreover, Romgens et al. further
stated that the length of the microneedle also influenced the perforation depth, in contrast to
the interspacing between individual microneedles on an array and that microneedles with a
tip diameter of < 15 m insert microneedles to a desired perforation depth (Romgens et al.,
2014). In this thesis, PMMA microneedle tip diameters were of similar construction,
however, there were variations in needle length, needle density and interspacing. These
differences further influenced microneedles performance in Model 3B, with Design 1
microneedles producing larger perforation depths and breach areas as compared to Design 2
microneedles.
Due to the significant differences in microneedle length, needle density and interspacing
between Design 1 and Design 2 microneedles, it is difficult to separate out the effects of each
of these variables. However, as stated in this section, length and the number of needles on the
array appears to have the greatest effect on microneedle performance. It was beyond the
scope of the thesis to investigate each of these effects separately. Testing was only conducted
on those arrays being utilised by Renephra for clinical trials.
Overall, for the desired application it would seem that Design 1 microneedle is most suitable
because it produced more consistent deformations within skin following successfully
bypassing the stratum corneum layer and PE ≥ 30%.

179
5.4 Clinical Applicator Studies
Clinical applicator induced microneedle tests were conducted on abdominal and back skin
models using Design 1 and 2 microneedles. Therefore, the findings of the clinical applicator
tests are discussed in this section.
5.4.1 Penetration efficiency
In order for the hammer mechanism to be launched when the clinical applicator was used, the
microneedles were placed flush on the raised profile of skin, which ensured that the hammer
mechanism of the clinical applicator depressed the microneedles into skin. The PE
determined from methylene blue staining varied from 39–80% for the regions analysed.
Although the raised profile of skin may have contributed to the reduced number of
perforations observed, however, as already noted from previous studies that not every
microneedle on the array will perforate skin, this reduced frequency means that breaches
were not observed for every 360 µm of interspacing on the array during assessment of the
H&E images. Moreover, a further reason why not every microneedle perforated skin may be
due to the irregular surface topography of skin.
5.4.2 The effects of differences in skin properties
The deformation created within the abdominal skin model was wider and extended into the
dermis as compared to the back skin model, where the deformation was narrow and on
occasion also stretched into the dermis. This may be attributed to physiological differences
between abdominal tissue and back tissue, as abdominal tissue is thinner than back tissue.
In addition to physiological differences between abdominal and back skin, the difference in
their mechanical characteristics could also explain the ease with which microneedle insertion
instigated by the clinical applicator caused significant deformation in abdominal tissue as
compared to back tissue. Furthermore, back tissue has a higher elastic modulus as compared

180
to abdominal tissue (Zak et al., 2011). Similarly, in this thesis, the elastic modulus of back
skin was higher than abdominal skin as reported in Section 5.2. Moreover, in the literature, it
was mentioned that the difference in skin thickness was found to affect its viscoelastic
characteristics (Nguyen and Banga, 2015), as a full thickness skin sample was found to be
more elastic and more resistant to microneedle insertion force (Nguyen and Banga, 2015).
The mechanism of the clinical applicator required manual pressure to be applied on the
microneedles in addition to the clinical applicator force. Therefore, this added manual
pressure may have also contributed to the extent of the deformation within the thinner
abdominal tissue as compared to the thicker back tissue. There was also a difference in
insertion force for abdominal and back skin models, with a higher insertion force required for
back skin and a lower insertion force required for abdominal skin. This suggests that insertion
force varies according to skin site, even though a similar magnitude of maximum force was
applied on both skin models.
5.4.3 The role of the subcutaneous mimic property on microneedle
performance
The mean penetration depth increased with increasing water content in the subcutaneous
mimic, which were similar to the results of the impact applicator studies. The breach area
increased with increasing water content in gelatine gels for abdominal skin, however, at the
most compliant gel water content (96%), it reduced. This trend was not observed for back
skin model and therefore, a plausible explanation for this outcome would be that back skin is
stiffer and thicker.
The median values of breach areas for the abdominal skin model was around 10 000 m2 as
compared to the back skin model, which was circa 5000 m2 for Models 1B and 3B. There
appeared to be no obvious trend for the effects of the influence of the subcutaneous mimic. It

181
was noted however, that in terms of the length of the microneedle embedded in skin that at
least 50–60% of the microneedle length breached skin’s layers, which was in accordance with
trends observed (Coulman et al., 2010; Donnelly et al., 2010; Kalluri et al., 2011),
irrespective of fluid content in the subcutaneous layer
5.4.4 Clinical applicator force
There was an increase in insertion force with increased gel water content for abdominal and
back skin models. This trend was also observed for the maximum force on both skin models.
Although, there were no successful micromechanical tests conducted on the 96% gelatine gel
because of its extremely high water content, logically, it can be assumed that it would have
exhibited the lowest elastic modulus of the gelatine gels. Likewise, it can also be stated that at
the lower water content gelatine gel such as 67%, its higher elastic modulus would require a
higher insertion force. As reported by Cheung et al. a high elastic component (G´) indicates
that the skin will be more resistant to microneedle insertion (Cheung et al., 2014). It was
found that the insertion force was lowest on Model 1A, containing the lowest water content
gelatine gel and could be due to the elastic modulus of skin being lower than that of the 67%
gelatine gel. Furthermore, as skin is the first surface that experiences the effects of the
clinical applicator force could explain why a low insertion force was required for the
microneedle to perforate skin for Model 1A. Therefore, the contributions from varying the
water content in the gelatine gels is more pronounced in terms of how the clinical applicator
insertion force is applied on the microneedle. Therefore for Model 4A, the highest insertion
force recorded may have been as a result of the compliant nature of the 96% gelatine gel
which led to the clinical applicator probably interfacing with the Perma-Gel®
. A similar trend
was also observed for back skin models.
In the study by Donnelly et al., it was reported that microneedle penetration could occur at a
relatively low insertion force of 4.4 N/array (0.49 N/microneedle) using a spring-driven

182
applicator. The clinical applicator used in this study is also spring-driven; however, the
addition of a hammer in its design means that it performs differently to a solely spring-driven
applicator. The clinical applicator produced an insertion force of ≈68 N/array (0.011
N/microneedles) for Design 2 microneedles on skin Model 3B. Furthermore, other
microneedle applicator types that are not spring-driven yielded low insertion forces (Olatunji
et al., 2013; van der Maaden et al., 2014; Qiu et al., 2015). For example, in the study by
Olatunji et al. their applicator device produced an insertion force of 0.03 N/microneedle,
which is in the same order of magnitude as the clinical applicator insertion force. Although
Donnelly et al. reported a low insertion force, their insertion force per microneedle was
considerably greater than the insertion force utilised in this study.
5.4.5 The effects of microneedle geometry on skin penetration
Visual assessment of methylene blue images showed comparable microneedle performance
on the stratum corneum for Design 1 and 2 microneedles. The analysis of H&E images
indicated that Design 1 microneedles were completely embedded in Model 3B at a
perforation depth of 311 m considering the microneedle length is 356 m (Fig. 78). Hence
the deformations were more significant as compared to those caused by Design 2
microneedles, which had a perforation depth of 360 m, approximately 65% of its length
travelled within skin. This may have been as a result of the number of microneedles on the
array for Design 2 microneedles as compared to less densely populated Design 1
microneedles.
The insertion force applied on Design 1 and 2 microneedles were of similar magnitude,
which meant that the same amount of force was acting on the less densely populated Design 1
microneedles (0.051 N/microneedles) as compared to the more densely populated Design 2
microneedles (0.011 N/microneedles). As already stated in Section 5.3.5, several studies have

183
been conducted in the literature with respect to microneedle length and its influence on
perforation depth. Furthermore, according to Kochhar et al., a decrease in the number of
microneedles on an array and increased spacing, produced an incremental force per needle
and a higher percentage of microneedle penetration (Kochhar et al., 2013b), which was
consistent with the findings in this section on the variation of microneedle length. The
general conclusion from the literature is that variables such as needle density, interspacing
and needle length contribute significantly to perforation depth. Therefore, for the work in this
study, it was observed that the size of the deformations caused in skin was not commensurate
with the size of the insertion force imposed upon the microneedles by the clinical applicator
as compared to the impact applicator.
For the clinical trials, an understanding of the role of microneedle length is important for in
vivo work. Nguyen and Banga showed that as the microneedle length increased, drug delivery
increased and was as a result of microneedle treatment duration and equilibration time
(Nguyen and Banga, 2015). Although this implies that the microneedles travelled deeper into
skin, however, consideration must be given to the duration that the microneedles were left in
skin as this could explain the improved drug delivery in their study. This is because the
duration of the microneedles in skin results in more time for the drug to have diffused into
skin and not necessarily improved microneedle penetration of skin. Gupta et al. demonstrated
that extremely long microneedle projections (1500 m) can cause pain comparable to that of
a hypodermic needle in patients (Gupta et al., 2011). This observation was also consistent
with previous literature that indicated that for the design of the microneedle, the length of the
microneedle projection was the most important aspect in the measurement of pain (Gill et al.,
2008). Furthermore, clinical trials using the clinical applicator on Design 2 microneedles
produced minimal pain and bleeding in patients (Renephra, 2015).

184
In terms of breach areas, Design 2 microneedles produced a higher number of perforations in
the breach area category where the stratum corneum was fully bypassed and the deformation
extended into the epidermis. At breach areas greater than this, Design 1 microneedles
performed considerably better than Design 2 microneedles. Therefore, as there is a higher
insertion force per microneedle acting on Design 1 microneedles as compared to Design 2
microneedles would explain the greater deformation produced by Design 1 microneedles as
compared to Design 2 microneedles. This result demonstrates that the clinical applicator is
affected by microneedle geometry and therefore, the clinical applicator should be used on
Design 2 microneedles.

185
5.5 Comparison between Impact and Clinical Applicator Studies
Two types of microneedle applicators were used to insert microneedles into the abdominal
and back skin models for the work in this thesis. The microneedle applicators employed
different mechanisms for operation; the impact applicator depended on impact acceleration to
drive the microneedles into skin, whilst the clinical applicator design was based on a spring
and hammer mechanism. Therefore, it was important to assess microneedles interaction with
the skin models by comparing the results from both applicators. The impact applicator setup
allowed for measurements of insertion force and insertion velocity, whilst only measurements
of insertion force were obtained from the clinical applicator setup. A comparison of impact
and clinical applicator tests are discussed in this section.
5.5.1 Penetration efficiency
PE can be defined as the percentage of the number of blue spots from the methylene blue
staining of microchannels created by a microneedle array on the stratum corneum, divided by
the total number of microneedles on the array. It was found that 100% penetration was not
observed using both applicators and these results were consistent with findings from other
researchers using different designs of applicators (Kolli and Banga, 2008; van der Maaden et
al., 2014; Xiang et al., 2015). PE varied from 43–93% for the regions analysed using the
impact applicator to 39–80% for the regions analysed using the clinical applicator, thus, these
ranges are similar. The results in study were better as the arrays used were more densely
populated. Likewise, for both applicators it was not possible to observe microneedle
perforations every 360 µm during the analysis of H&E images.
Furthermore, for the impact applicator, PE reduced for abdominal skin models and increased
for back skin models with increasing water content in the subcutaneous mimic. Conversely,
for the clinical applicator, PE reduced for both skin models with increasing water content in
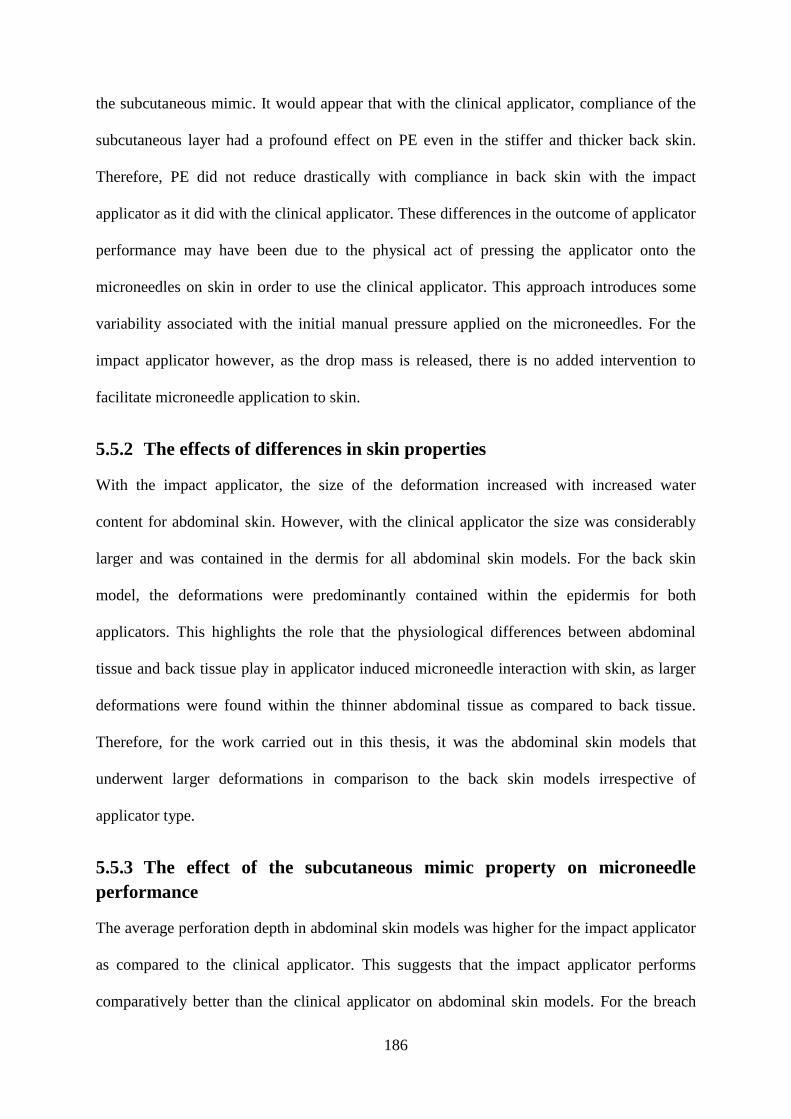
186
the subcutaneous mimic. It would appear that with the clinical applicator, compliance of the
subcutaneous layer had a profound effect on PE even in the stiffer and thicker back skin.
Therefore, PE did not reduce drastically with compliance in back skin with the impact
applicator as it did with the clinical applicator. These differences in the outcome of applicator
performance may have been due to the physical act of pressing the applicator onto the
microneedles on skin in order to use the clinical applicator. This approach introduces some
variability associated with the initial manual pressure applied on the microneedles. For the
impact applicator however, as the drop mass is released, there is no added intervention to
facilitate microneedle application to skin.
5.5.2 The effects of differences in skin properties
With the impact applicator, the size of the deformation increased with increased water
content for abdominal skin. However, with the clinical applicator the size was considerably
larger and was contained in the dermis for all abdominal skin models. For the back skin
model, the deformations were predominantly contained within the epidermis for both
applicators. This highlights the role that the physiological differences between abdominal
tissue and back tissue play in applicator induced microneedle interaction with skin, as larger
deformations were found within the thinner abdominal tissue as compared to back tissue.
Therefore, for the work carried out in this thesis, it was the abdominal skin models that
underwent larger deformations in comparison to the back skin models irrespective of
applicator type.
5.5.3 The effect of the subcutaneous mimic property on microneedle
performance
The average perforation depth in abdominal skin models was higher for the impact applicator
as compared to the clinical applicator. This suggests that the impact applicator performs
comparatively better than the clinical applicator on abdominal skin models. For the breach

187
areas, the impact applicator had a higher percentage in the category where the stratum
corneum is disrupted and extends to the epidermis in the abdominal skin model (Fig. 88a),
whilst the clinical applicator had a higher percentage of breaches in the category where the
epidermis is fully opened up.
There was no obvious trend for perforation depth for back skin models and this indicated that
there was a higher degree of variability associated with back skin models. The clinical
applicator had higher percentages of breaches for ≤ 10 000 m2 as compared to the impact
applicator (Fig. 88b) for the back skin models. This also implies that the clinical applicator is
able to overcome the elastic modulus of the stiffer back tissue as compared to the impact
applicator. Although, it must be noted that the clinical applicator produced a higher number
of smaller perforations in back skin as compared to the impact applicator’s lower frequency
of larger perforations in back skin. Ideally, larger perforations are preferred, as there are
higher chances that the perforations have extended beyond the stratum corneum into the
epidermis, where the fluid bed can be accessed for fluid extraction.
The analysis of H&E images showed that with the impact applicator larger deformations
were made as determined by the breach area with increasing fluid content in the abdominal
skin models. It was therefore established that manipulating the water content in the gelatine
gels compromised the integrity of the abdominal skin model. In contrast, the size of the
breach area in the back skin model reduced with increased fluid content in the gelatine gels
and may be due to a combination of the magnitude of the insertion force per microneedle as
well as its higher elastic modulus. For the clinical applicator however, smaller breach areas
were seen in the abdominal skin model across all gelatine gel concentrations for deformations
contained within the epidermis as compared to back skin model. For deformations that
extended into the dermis however, larger breach areas were seen in the abdominal skin model

188
as compared to back skin model. These observations have highlighted the influence of
applicator input in perforation quality, where it appears that the size of the breach area
produced by the impact applicator is influenced by the mechanical strength of the skin model,
which was not the case with the clinical applicator. The contrast in applicator performance
may be due to application technique, for instance, the impact applicator’s drop mass is
released from a height to make contact with the microneedles and skin model. In the case of
the clinical applicator, the patch button is placed onto the microneedles and skin model, with
an initial manual pressure applied onto the patch button before the trigger is released and
therefore could be a likely explanation for the difference in perforation quality between both
applicators. Furthermore, the results of clinical applicator studies showed large SD values
(Fig. 81), which imply the high degree of variability linked to use of the clinical applicator as
compared to the impact applicator.
5.5.4 Impact and clinical applicator force
For the impact applicator, an insertion force of ≈0.005 N/microneedle was required to
perforate Models 1A–4A. In contrast, for the clinical applicator, an insertion force of 0.006–
0.016 N/microneedle was required for Models 1A–4A. Conversely, for the back skin models,
a slightly higher insertion force (0.004–0.007 N/microneedle) was required for microneedle
application using the impact applicator. For the clinical applicator, an insertion force of
0.009–0.016 N/microneedle was required. It was observed that the clinical applicator’s
performance was hugely influenced by fluid content in the gelatine gels, as it produced its
highest insertion force on Models 4A (94. 03 N) and Model 4B (96.05 N). Therefore, it was
postulated that due to the compliant nature of the 96% gelatine gel concentration, it is
plausible that the clinical applicator interfaced with the Perma-Gel® layer in the skin model.
Notably, the Perma-Gel®
also had the highest elastic modulus in the skin model, as shown in
Table 12.

189
The ability to vary the insertion force and insertion velocity for the impact applicator is a
significant advantage over the clinical applicator, where the insertion force cannot be varied.
Furthermore, only a relatively low insertion force and a low insertion velocity as compared to
the clinical applicator’s comparatively higher insertion force was required to successfully
penetrate skin irrespective of the level of fluid content in the underlying subcutaneous layer.
Albeit, this limitation with the design of the clinical applicator has demonstrated how the
application of an insertion force on biological tissue such as skin is absorbed, since it appears
that the underlying subcutaneous layer of the gelatine gel at its highest fluid content was
unable to withstand the clinical applicator’s insertion force. Generally, the clinical
applicator’s insertion force was higher than the impact applicator’s insertion force and was in
the order of 2–7 times the force produced by the impact applicator. In this thesis, both devices
produced reproducible microneedle penetration of both skin models. Therefore, the impact
applicator at a relatively lower insertion force yielded similar if not better results when
compared to the outcome of tests involving the clinical applicator.
The other parameter that contributed to the impact applicator performance was the influence
of insertion velocity. Most microneedle studies have relied on only insertion force (Park et
al., 2005; Donnelly et al., 2010; Kochhar et al., 2013b; Olatunji et al., 2013) or only insertion
velocity (Verbaan et al., 2008; van der Maaden et al., 2014) to assess successful microneedle
perforation of skin. The novelty of the work carried out in this thesis was the ability to vary
insertion force and insertion velocity using the impact applicator setup.
Furthermore, the relatively low insertion force and low insertion velocity using the impact
applicator system provides an alternative applicator design for Renephra to achieve
reproducible perforation of skin.

190
5.5.5 The effect of microneedle geometry
For the impact and clinical applicator, reproducible penetration occurred in abdominal and
back skin models at all gelatine concentrations with Design 2 microneedles. The clinical
applicator produced better perforation results with Design 2 microneedles as compared to
Design 1 microneedles. This could be due to an inherent design feature of the clinical
applicator, as it has already been demonstrated through the work carried out in this thesis that
the clinical applicator produced a higher frequency of smaller perforations in skin with
Design 2 microneedles. This outcome indicates that for the clinical applicator, the length of
the microneedles is important for effective skin penetration. Hence, as the results have
shown, the length of the shorter Design 1 microneedles is not adequate for effective skin
penetration using the clinical applicator.
Although the magnitude of force produced by the clinical applicator was similar for both
Design 1 and 2 microneedles, variables such as needle density differed. This difference meant
that a greater insertion force per microneedle was acting on Design 1 microneedles (0.051
N/microneedle) as compared to Design 2 microneedles (0.011 N/microneedle). Despite the
lower force applied to Design 2 microneedles, it still produced better penetration results when
compared to the penetration results of Design 1 microneedles. Therefore, the result reinforces
the fact that clinical applicator performance is influenced by microneedle geometry.
Contrastingly, the impact applicator system was not influenced by microneedle geometry,
which means that both Design 1 and 2 microneedles can be successfully applied to skin.
Furthermore, comparing the insertion force per microneedle applied to Design 1
microneedles by both applicators showed an insertion force of 0.007 N/microneedle for the
impact applicator as compared to the clinical applicator’s insertion force of 0.051
N/microneedle. The value of the clinical applicator’s insertion force was more than 7 times
that of the impact applicator. Despite this difference in insertion force per microneedle, the

191
impact applicator still had a higher perforation depth as compared to the clinical applicator.
The better perforation depth produced by the impact applicator could also be due to
contributions from insertion velocity.
Moreover, the highest perforation depth for Design 1 microneedles (Fig. 90) showed that the
impact applicator caused 98% of the microneedle length to disrupt skin’s layers as compared
to the deformation caused by the clinical applicator which only involved 56% of the
microneedle length. In addition, for Design 2 microneedles, the insertion force per
microneedle for impact applicator was 0.004 N/microneedle as compared to 0.011
N/microneedle for the clinical applicator. Again, the value of the clinical applicator insertion
force per microneedle was more than twice that of the impact applicator. Furthermore, the
highest perforation depth for Design 2 microneedles (Fig. 90) showed that at this
comparatively lower insertion force, the impact applicator caused 52% of the microneedle
length to disrupt skin’s layers. For the clinical applicator however, with more than twice the
insertion force as compared to the impact applicator only caused deformation in tissue
utilising 65% of the Design 2 microneedle length. Therefore, the insertion force and the
geometry of the microneedles (i.e. needle density, interspacing and needle length) influence
how microneedles interact with skin for the clinical applicator.
Generally, a higher number of deformations caused by the clinical applicator were found in
the first category at a measurement range of ≤ 10 000 m2, where the stratum corneum is
disrupted and the deformation extends into the epidermis. And the more significant
deformations caused by the impact applicator were located within the epidermis at a
measurement range of 10 000–20 000 m2. This observation was consistent with the result of
the perforation depth, which showed that for the highest perforation depth, some of Design 1

192
microneedles were fully embedded in skin for the impact applicator as compared to more
than half the length of Design 2 microneedles embedded in skin for the clinical applicator.
Although, it was not possible to test whether or not the nerves were stimulated due to
microneedle application for either in vitro applicator studies, the literature has already
established that microneedle projections of 1500 m or more will stimulate the nerves in skin
and thus cause pain as they reach into the dermis (Gill et al., 2008; Gupta et al., 2011),
therefore, Design 1 and Design 2 microneedles of length 356 m and 552 m respectively
were not within the threshold to cause pain. Furthermore, in vivo studies using Design 2
microneedles inserted into skin with the comparatively higher insertion force of the clinical
applicator demonstrated that patients experienced minimal pain (Renephra, 2015).

193
5.6 Summary
Several factors need to be considered for successful microneedle application to skin.
Parameters such as microneedle geometry, microneedle applicator, insertion force and
insertion velocity, influence of anatomical site and altering the fluid content in the
subcutaneous layer of skin were investigated so as to determine effective microneedle
penetration of skin.
The work in this thesis demonstrated that reproducible microneedle penetration was achieved
utilising the impact and clinical applicators. Based on the outcome of individual studies of the
impact and clinical applicator performance, the results showed that the impact applicator
produced better penetration results as compared to the clinical applicator, as it produced
better PE and caused more deformation in skin at a lower insertion force. In addition, a
disadvantage of the clinical applicator was that its performance was dependent on
microneedle design. The clinical applicator produced better results for Design 2 microneedles
as compared to Design 1 microneedles. For the impact applicator however, its performance
was not microneedle geometry dependent.
The insertion force was considerably higher for the clinical applicator as compared to the
impact applicator. Despite the fact that more than twice the insertion force was produced by
the clinical applicator on Design 2 microneedles as compared to the impact applicator, the
magnitude of the insertion force was not commensurate with the size of the deformation
created by the clinical applicator. In the case of the impact applicator, the magnitude of the
force was commensurate with the size of the resulting deformation in skin.
The viscoelastic properties of skin contributed to microneedle performance, as thinner
regions of skin such as abdominal tissue were less resistant to microneedle intervention.

194
Furthermore, the results of impact applicator studies showed that the insertion force applied
to abdominal tissue was lower as compared to the force applied to back tissue.
The influence of the subcutaneous mimic was observed in the abdominal skin models
following impact applicator tests, as the maximum force declined with increasing fluid
content. Furthermore, a relationship between maximum force and the elastic modulus of the
gelatine gels of the subcutaneous mimic was also established, because an increase in the
elastic modulus of the gelatine gels resulted in an increase in maximum force. Hence, for
microneedle application studies, contributions from the subcutaneous layer of skin should not
be ignored as it affects parameters such as force, which influence microneedle behaviour in
skin.
For effective microneedle application to skin, the impact applicator is a more suitable device
because it operates at a relatively low insertion force and insertion velocity as compared to
the clinical applicator. It also produced larger deformations within skin, which is important
for the success of microneedle technology like the TFR, as fluid can be more readily
extracted from the larger fissure. Furthermore, the ability to control the force and velocity
means that the parameters of the impact applicator can be tailored to suit specific patient
requirements.

195
Chapter 6
6. Conclusions and Further Work
6.1 Summary
Fluid overload or oedema is associated with heart and kidney failure and remains a global
challenge. Based on work by Renephra, a novel medical device, the TFR utilising
microneedle technology is under development for the relief of fluid overload. TFR could lead
to a reduction in the amount of fluid overload or oedema and improved patient prognosis. As
such, there was a need to understand the mechanical behaviour of skin and how it influences
the performance of microneedle devices. In order to investigate this, microneedle tests on
skin were necessary, however, most in vitro and ex vivo experimentation studies used to
evaluate microneedle performance do not consider the biomechanical properties of skin or
that of its subcutaneous layers. Therefore, a representative in vitro skin model was developed
for microneedle application studies. Typically, microneedles are not designed to travel
beyond the epidermis to the dermis where nerve endings may be stimulated or blood vessels
damaged. Hence, minimal or no pain or bleeding occurs to the patient following microneedle
application. Despite significant advances in the field of microneedles, the complexity of the
mechanical behaviour of skin coupled with the inherent elasticity of the stratum corneum still
pose a challenge for microneedle application.
The primary aim of the work carried out in this thesis was to investigate microneedle
performance in a representative in vitro skin model by establishing the optimal parameters for
reproducible penetration of skin. Furthermore, by altering the fluid content in the
subcutaneous layer of the skin model, an understanding of the interaction between the
biomechanics of the skin layer and microneedles was revealed. Additional parameters such as

196
microneedle geometry, applicator type further established the intricacies associated with
producing repeatable perforation of skin.
6.2 Conclusions
The aims and objectives of this study were achieved using a range of techniques, namely;
impact applicator tests, clinical applicator tests, micromechanical tests using dynamic
nanoindentation, methylene blue staining, H&E image analysis and Image SXM custom
image analysis software. Consequently, the results of the experimental phase of the study
using the aforementioned techniques and material acquired within the literature led to the
following conclusions:
6.2.1 Experimental analysis of the mechanical properties of skin
Micromechanical tests were conducted on skin samples from the abdominal and back regions
of neonatal pigs; on three concentrations of the gelatine gels, as the fourth gelatine gel
concentration was too compliant and on Perma-Gel®. Perma-Gel
® produced the highest
elastic modulus, which showed that it made a significant contribution to the other layers in
the skin model. Of the gelatine gels, the gel with the lowest water content produced the
highest elastic modulus. Furthermore, the elastic modulus decreased with increasing water
content in the gelatine gels. This observation demonstrated that excessive fluid in the skin
model compromised its mechanical integrity. The back region of skin produced a higher
elastic modulus as compared to the abdominal region. The physical attributes of the back
region were also different from the abdominal region and could also explain the difference in
their mechanical properties. For instance, back tissue was thicker and stiffer than abdominal
tissue.
Skin is an extremely complex functional system made of three stratified layers that are made
up of sub-layers. The natural function of skin is to act as a chemical barrier, limiting

197
penetration by foreign substances and preventing loss of water and other fluids. The barrier
function is located in the stratum corneum. In order to breach the stratum corneum for
microneedle application, numerous in vitro tests using microneedles were carried out on a
variation of abdominal and back skin models. The literature review highlighted that
unrepresentative or even inappropriate experimental skin models had been used previously in
other studies. The main drawback with the skin models used in the literature was that the
material used as underlying substrates were not representative of biological material and
would therefore exhibit a different mechanical behaviour as compared to a biological material
like tissue fluid or muscle found in skin’s underlying layers. Therefore, the representative in
vitro skin model used in this thesis comprised neonatal porcine skin, gelatine gels at various
concentrations to mimic the subcutaneous layer and Perma-Gel® to mimic muscle behaviour
and to also provide adequate support. Furthermore, for a reasonable evaluation of
microneedle interaction with skin, it was important to establish this type of representative
skin model.
6.2.2 Development of the impact applicator system
The second objective was to develop an impact applicator system. The literature covered
numerous designs for a microneedle delivery device such as an electrically driven
applicator, an actuator driven applicator, a Dermaroller® and syringe applicators etc. For
reproducible microneedle application to skin, an external force was required. After careful
consideration of these various designs, it was imperative to develop an impact applicator
that was suitable for purpose. The literature recommended a velocity in excess of 2 ms-1
as a
reasonable microneedle insertion velocity. Therefore, a dropped weight impact-testing rig
was developed that could produce velocities in excess of 1 ms-1
. Furthermore, the force
could be measured from the drop mass using a force transducer.
The optimal parameters for reproducible microneedle penetration of skin utilising the
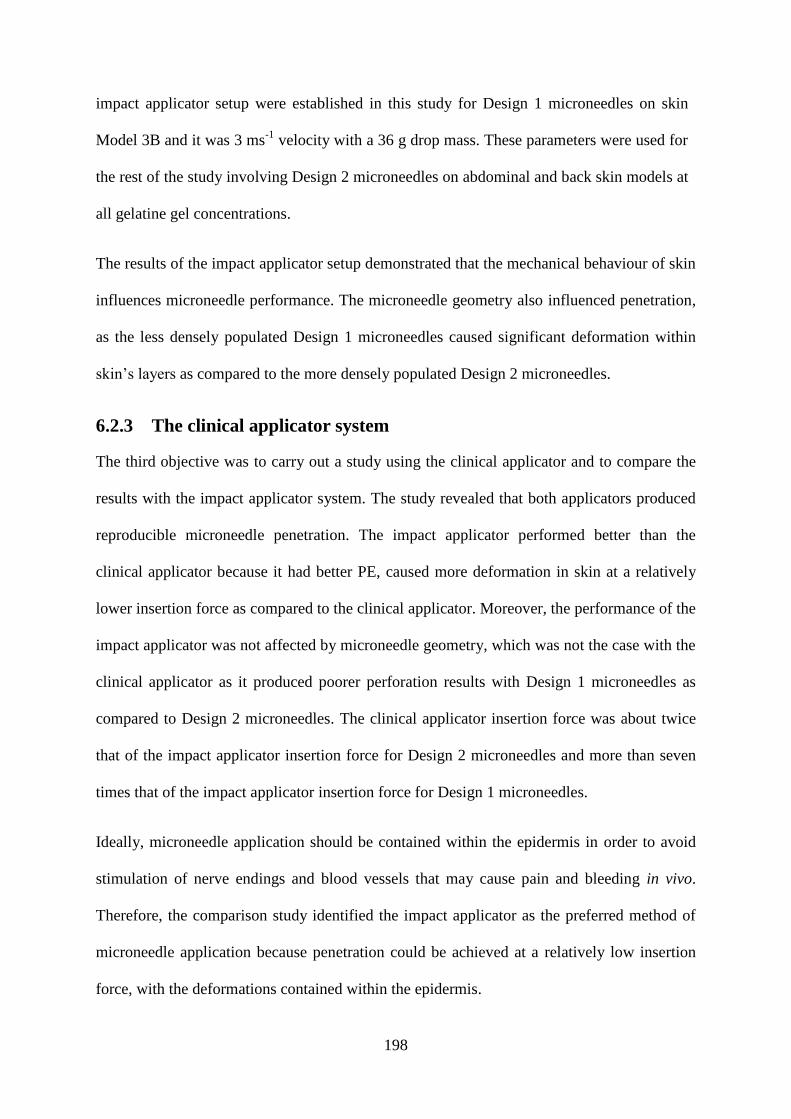
198
impact applicator setup were established in this study for Design 1 microneedles on skin
Model 3B and it was 3 ms-1
velocity with a 36 g drop mass. These parameters were used for
the rest of the study involving Design 2 microneedles on abdominal and back skin models at
all gelatine gel concentrations.
The results of the impact applicator setup demonstrated that the mechanical behaviour of skin
influences microneedle performance. The microneedle geometry also influenced penetration,
as the less densely populated Design 1 microneedles caused significant deformation within
skin’s layers as compared to the more densely populated Design 2 microneedles.
6.2.3 The clinical applicator system
The third objective was to carry out a study using the clinical applicator and to compare the
results with the impact applicator system. The study revealed that both applicators produced
reproducible microneedle penetration. The impact applicator performed better than the
clinical applicator because it had better PE, caused more deformation in skin at a relatively
lower insertion force as compared to the clinical applicator. Moreover, the performance of the
impact applicator was not affected by microneedle geometry, which was not the case with the
clinical applicator as it produced poorer perforation results with Design 1 microneedles as
compared to Design 2 microneedles. The clinical applicator insertion force was about twice
that of the impact applicator insertion force for Design 2 microneedles and more than seven
times that of the impact applicator insertion force for Design 1 microneedles.
Ideally, microneedle application should be contained within the epidermis in order to avoid
stimulation of nerve endings and blood vessels that may cause pain and bleeding in vivo.
Therefore, the comparison study identified the impact applicator as the preferred method of
microneedle application because penetration could be achieved at a relatively low insertion
force, with the deformations contained within the epidermis.

199
Although, the research in this thesis did not involve ISF extraction, the microneedle
penetration studies in vitro were important in determining the effects of Design 2
microneedles perforations across the layers through histology staining and image analysis to
complement the in vivo work carried out by Renephra Ltd. Their recent studies show that ISF
was extracted following the application of Design 2 microneedles and negative pressure
therapy in 56% cases as compared to the use of a hypodermic needle, which gave a 10%
success rate. The ISF extracted was 800 mL over 4 hours using a 10 × 10 cm surface
(Renephra, 2015). Mukerjee et al. was arguably the first to successfully demonstrate the
feasibility of using hollow microneedles and capillary action to extract ISF from skin
(Mukerjee et al., 2004). Furthermore, Wang et al., (2005) extracted a considerably small
amount of ISF (1–10 L) for glucose monitoring using solid microneedles and negative
pressure therapy.
6.2.4 Quantitative image analysis of microneedle treated skin
The fourth objective was to conduct extensive image analysis of the perforated skin. The
evaluation of the microchannels created in the skin following microneedle treatment was
determined through methylene blue staining, H&E staining and quantitative image analysis.
The methylene blue dye adhered to the microchannels created in the tissue, the histology
images showed the depth of microneedle penetration through skin’s sub-layers and image
analysis provided the size of the deformation area within the H&E stained images.
Although the methylene blue stained images confirmed successful breach of the stratum
corneum, it was the H&E stained images that indicated that in some instances not all the
microneedles had completely bypassed the stratum corneum to fully perforate the epidermis.
Furthermore, the H&E stained images also revealed those instances where the deformation
caused by microneedle intervention had travelled beyond the epidermis into the dermis.

200
For a complete analysis of the H&E stained images, it was important to carry out image
analysis of over 30 images per skin model in order to better determine the effects of the
microneedle deformation through skin’s layers. Interestingly, the image analysis
demonstrated that the clinical applicator device is affected by microneedle geometry as
demonstrated by the differences in magnitude of the deformations caused by Design 1 and 2
microneedles in Model 3B.
A pilot study of 3D imaging of microneedle treated skin was conducted using XMT to
compliment the analysis of H&E images. The results of the XMT analysis showed that it was
a promising technique for microneedle application to skin. Further details of XMT can be
found in Section 8.1 of the Appendix.
Finally, the findings in this project such as the optimal parameters for reproducible
microneedle penetration of skin, the contribution of skin’s mechanical properties, the effects
of a variation of the water content in the gelatine gels as a mimic for tissue fluid in the skin
model, the influence of anatomical site, microneedle geometry and the magnitude of
deformations caused by microneedle treatment of skin could be used to aid the development
of Renephra’s microneedle fluid extraction device (TFR). Based on the outcome of the study,
Renephra could develop an applicator similar to the impact applicator that can measure the
insertion force and insertion velocity, as it has been demonstrated that the clinical applicator
produces high forces and is affected by microneedle geometry.
6.3 Further Work
The work carried out during this study provides important information related to the
mechanical behaviour of skin and how it affects microneedle performance. Based on the
work carried out during this study, there are still many opportunities for further advances
through research and a few potential studies are mentioned in this section.

201
6.3.1 3D image analysis of microneedle treated skin
The emergence of micro XMT as an imaging tool for soft tissue could provide the
opportunity to image a whole sample of microneedle treated tissue, without going down the
laborious route of H&E staining. The limitation with H&E staining is that it affords only a
small area for sectioning, with the remaining tissue containing vital information discarded.
The main drawback of micro XMT imaging of soft tissue is that grayscale colour contrast is
challenging to decipher. The non-destructive method of examining skin using XMT is a
promising technique for determining microneedle induced breach in skin. The challenge
remains that consideration needs to be given to an adequate staining protocol in order to
achieve good contrast definition between skin’s layers without having to undergo the arduous
and time-consuming task of having to carry out a significant amount of manual segmentation
of the images caused by noise in the data or poor contrast.
Further, development of the staining and image segmentation methods for soft tissue XMT
may make this a powerful technique for microneedle research.
6.3.2 Optical Coherence Tomography studies of microneedle application
to skin
The primary focus of this thesis was on the in vitro studies of microneedle performance in a
representative skin model. The data obtained from the work carried out on the representative
in vitro skin model is useful for improving the microneedle device, however, the in vitro skin
model still has a limitation in that it cannot in its entirety fully mimic all the mechanical
characteristics of the in vivo skin such as anisotropy, viscoelasticity, non-linearity, patient
age, progression of the disease. These factors contribute to the overall behaviour of skin and
its interaction with microneedles.

202
Therefore, an exhaustive in vivo investigation into microneedles interaction with skin should
be conducted using techniques like OCT as shown in Fig. 93. The stratum corneum is visible
in the image; however, it is challenging to determine the epidermal and dermal layers in Fig.
93b. Therefore, further work is required to ascertain whether OCT can be utilised for in vivo
studies of microneedle perforated skin.
Figure 93 Optical Coherence Tomography images of skin, where (a) palmar region of skin with no
microneedle perforations and (b) skin from the inner wrist with microneedles embedded. (Courtesy
Renephra Ltd).
6.3.3 Impact applicator
The results produced by the impact applicator demonstrated that reproducible penetration of
skin could be achieved at a relatively low force. It was further demonstrated that penetration
was achieved irrespective of Design 1 or Design 2 microneedles, which is a good indication
that it can perform well with some changes in microneedle design. As the applicator system
was a rather large setup that was difficult to move to various locations, it would be
advantageous for a smaller device to be manufactured in its place. The new device could be
based on the parameters of the improved impact applicator setup, thus having the ability to
vary its velocity and force. This device could then be used for further in vitro studies,
whereby the design of microneedles are restricted to just one variable i.e. varying only the
interspacing between individual microneedles or only the height of the microneedles. As a

203
further improvement to the subcutaneous mimic in the in vitro skin model, fluid could be
injected into a membrane placed within the subcutaneous layer. Furthermore, the device
could possibly be utilised for in vivo studies.

204
Chapter 7
7. References
Abramoff MD, Magalhaes PJ, Ram SJ. 2004. Image Processing with ImageJ. Biophotonics
International 11:36-42.
Adams KF, Jr., Fonarow GC, Emerman CL, LeJemtel TH, Costanzo MR, Abraham WT,
Berkowitz RL, Galvao M, Horton DP. 2005. Characteristics and Outcomes of Patients
Hospitalized for Heart Failure in the United States: Rationale, Design, and
Preliminary Observations from the First 100,000 Cases in the Acute Decompensated
Heart Failure National Registry (ADHERE). American Heart Journal 149:209-216.
Agache PG, Monneur C, Leveque JL, de Rigal J. 1980. Mechanical Properties and Young's
Modulus of Human Skin In Vivo. Archives of Dermatological Research 269:221-232.
Agar JWM. 2012. Personal Viewpoint: Hemodialysis-Water, Power and Waste Disposal:
Rethinking our Environmental Responsibilities. Hemodialysis International 16:6-10.
Ahearne M, Yang Y, El Haj AJ, Then KY, Liu KK. 2005. Characterizing the Viscoelastic
Properties of Thin Hydrogel-Based Constructs for Tissue Engineering Applications.
Journal of the Royal Society Interface 2:455-463.
Akhtar R, Draper ER, Adams DJ, Pfaff H. 2015. Complex Shear Modulus of Hydrogels
Using a Dynamic Nanoindentation Method. In: Tekalur SA, Zavattieri, Pablo,
Korach, Chad S editor. 5th International Symposium on the Mechanics of Biological
Systems and Materials, Volume 6 of the Proceedings of the 2015 SEM Annual
Conference & Exposition on Experimental and Applied Mechanics. Costa Mesa,
USA: Springer. p 141-145.
205
Al-Qallaf B, Das DB. 2008. Optimization of Square Microneedle Arrays for Increasing Drug
Permeability in Skin. Chemical Engineering Science 63:2523-2535.
Alexander H, Cook TH. 1977. Accounting for Natural Tenson in the Mechanical Testing of
Human Skin. The Journal of Investigative Dermatology 69:310-314.
Antlanger M, Hecking M, Haidinger M, Werzowa J, Kovarik JJ, Paul G, Eigner M,
Bonderman D, Hörl WH, Säemann MD. 2013. Fluid Overload in Hemodialysis
Patients: A Cross-Sectional Study to Determine its Association with Cardiac
Biomarkers and Nutritional Status. BioMed Central Nephrology 14:1-10.
Arora A, Prausnitz MR, Mitragotri S. 2008. Micro-Scale Devices for Transdermal Drug
Delivery. International Journal of Pharmaceutics 364:227-236.
Avon SL, Wood RE. 2005. Porcine Skin as an In Vivo Model for Ageing of Human Bite
Marks. The Journal of Forensic Odonto-Stomatology 23:30-39.
Awad HA, Wickham MQ, Leddy HA, Gimble JM, Guilak F. 2004. Chondrogenic
Differentiation of Adipose-Derived Adult Stem Cells in Agarose, Alginate and
Gelatin Scaffolds. Biomaterials 25:3211-3222.
Bader DL, Bowker P. 1983. Mechanical Characteristics of Skin and Underlying Tissues In
Vivo. Biomaterials 4:305-308.
Badran MM, Kuntsche J, Fahr A. 2009. Skin Penetration Enhancement by a Microneedle
Device (Dermaroller) In Vitro: Dependency on Needle Size and Applied Formulation.
European Journal of Pharmaceutical Sciences 36:511-523.
Barbenel JC, Evans JH. 1977. The Time-Dependent Mechanical Properties of Skin. The
Journal of Investigative Dermatology 69:318-320.
Barrett C, Dawson K, O'Mahony C, O'Riordan A. 2015. Development of Low Cost Rapid
Fabrication of Sharp Polymer Microneedles for In Vivo Glucose Biosensing
Applications. ECS Journal of Solid State Science and Technology 4:S3053-S3058.

206
Bart BA. 2009. Treatment of Congestion in Congestive Heart Failure: Ultrafiltration is the
Only Rational Initial Treatment of Volume Overload in Decompensated Heart
Failure. Circulation: Heart Failure 2:499-504.
Bates DO, Levick JR, Mortimer PS. 1994. Quantification of Rate and Depth of Pitting in
Human Edema using an Electronic Tonometer. Lymphology 27:159-172.
Berry C, Murdoch DR, McMurray JJ. 2001. Economics of Chronic Heart Failure. European
Journal of Heart Failure 3:283-291.
Bhushan B, Tang W, Ge S. 2010. Nanomechanical Characterization of Skin and Skin Cream.
Journal of Microscopy 240:135-144.
Birchall J, Coulman S, Pearton M, Allender C, Brain K, Anstey A, Gateley C, Wilke N,
Morrissey A. 2005. Cutaneous DNA Delivery and Gene Expression in Ex Vivo
Human Skin Explants via Wet-Etch Micro-Fabricated Microneedles. Journal of Drug
Targeting 13:415-421.
Bischoff JE, Arruda EM, Grosh K. 2000. Finite Element Modelling of Human Skin using an
Isotropic Nonlinear Elastic Constitutive Model. Journal of Biomechanics 33:645-652.
Bleyer AJ, Russell GB, Satko SG. 1999. Sudden and Cardiac Death Rates in Haemodialysis
Patients. Kidney International 55:1553-1559.
Bouwstra JA, Verbaan FJ, Van den Berg DJ. 2009. Microneedle Injecting Apparatus. In.
Netherlands.
Brater DC. 1998. Diuretic Therapy. The New England Journal of Medicine 339:387-395.
Brown LM, Liu KD, Matthay MA. 2009. Measurement of Extravascular Lung Water using
the Single Inidcator Method in Patients: Research and Potential Clinical Value.
American Journal of Physiology Lung Cellular and Molecular Physiology 297:L547-
L558.
207
Buie HR, Campbell GM, Klinck RJ, MacNeil JA, Boyd SK. 2007. Automatic Segmentation
of Cortical and Trabecular Compartments Based on a Dual Threshold Technique for
In Vivo Micro-CT Bone Analysis. Bone 41:505-515.
Burgin LV, Aspden RM. 2007. A Drop Tower for Controlled Impact Testing of Biological
Tissues. Medical Engineering and Physics 29:525-530.
Cardiff RD, Miller CH, Munn RJ. 2014. Manual Hematoxylin and Eosin Staining of Mouse
Tissue Sections. Cold Spring Harbor Protocols 2014:655-658.
Caron-Laramee A, Brouillette M. 2014. Spherical Indentation Testing on Ballistic Gelatin
and Perma-Gel. In: Proceedings of the ASME 2014 International Mechanical
Engineering Congress and Exposition. Montreal, Quebec, Canada: ASME. p 1-6.
Caspers PJ, Lucassen GW, Bruining HA, Puppels GJ. 2000. Automated Depth-Scanning
Confocal Raman Microspectrometer for Rapid In Vivo Determination of Water
Concentration Profiles in Human Skin. Journal of Raman Spectroscopy 31:813-818.
Cavalli A, DelVecchio L, Manzoni C, Locatelli F. 2010. Haemodialysis: Yesterday, Today
and Tomorrow. Minerva Urologica E Nefrologica 62:1-12.
Chan JK. 2014. The Wonderful Colors of the Hematoxylin-Eosin Stain in Diagnostic
Surgical Pathology. International Journal of Surgical Pathology 22:12-32.
Chao CY, Zheng YP, Cheing GL. 2012. The Association between Skin Blood Flow and
Edema on Epidermal Thickness in the Diabetic Foot. Diabetes Technology and
Therapeutics 14:602-609.
Chin MP, Wrolstad D, Bakris GL, Chertow GM, de Zeeuw D, Goldsberry A, Linde PG,
McCullough PA, McMurray JJ, Wittes J, Meyer CJ. 2014. Risk Factors for Heart
Failure in Patients with Type 2 Diabetes Mellitus and Stage 4 Chronic Kidney
Disease Treated with Bardoxolone Methyl. Journal of Cardiac Failure 20:953-958.

208
Cho S, Atwood JE. 2002. Peripheral Edema. The American Journal of Medicine 113:580-
586.
Cilurzo F, Minghetti P, Sinico C. 2007. Newborn Pig Skin as a Model Membrane in In Vitro
Drug Permeation Studies: A Technical Note. PharmSciTech 8:E1-E4.
Cook C, Cole G, Asaria P, Jabbour R, Francis DP. 2014. The Annual Global Economic
Burden of Heart Failure. International Journal of Cardiology 171:368-376.
Costanzo MR, Saltzberg M, O'Sullivan J, Sobotka P. 2005. Early Ultrafiltration in Patients
with Decompensated Heart Failure and Diuretic Resistance. Journal of the American
College of Cardiology 46:2047-2051.
Cotter G, Metra M, Milo-Cotter O, Dittrich HC, Gheorghiade M. 2008. Fluid Overload in
Acute Heart Failure - Re-Distribution and Other Mechanisms Beyond Fluid
Accumulation. European Journal of Heart Failure 10:165-169.
Coulman SA, Birchall JC, Alex A, Pearton M, Hofer B, O’Mahony C, Drexler W, Považay
B. 2010. In Vivo, In Situ Imaging of Microneedle Insertion into the Skin of Human
Volunteers Using Optical Coherence Tomography. Pharmaceutical Research 28:66-
81.
Crichton ML, Ansaldo A, Chen X, Prow TW, Fernando GJ, Kendall MA. 2010. The Effect of
Strain Rate on the Precision of Penetration of Short Densely-Packed Microprojection
Array Patches Coated with Vaccine. Biomaterials 31:4562-4572.
Crichton ML, Chen X, Huang H, Kendall MA. 2013. Elastic Modulus and Viscoelastic
Properties of Full Thickness Skin Characterised at Micro Scales. Biomaterials
34:2087-2097.
Croft JB, Giles WH, Pollard RA, Keenan NL, Casper ML, Anda RF. 1999. Heart Failure
Survival Among Older Adults in the United States. The Journal of the American
Medical Association Internal Medicine 159:505-510.
209
Dabboue H, Builles N, Frouin É, Scott D, Ramos J, Marti-Mestres G. 2015. Assessing the
Impact of Mechanical Damage on Full-Thickness Porcine and Human Skin using an
In Vitro Approach. BioMed Research International 2015:1-10.
Daly CH, Odland GF. 1979. Age-Related Changes in Mechanical Properties of Human Skin.
The Journal of Investigative Dermatology 73:84-87.
Dapson RW. 2005. Dye-Tissue Interactions: Mechanisms, Quantification and Bonding
Parameters for Dyes used in Biological Staining. Biotechnic and Histochemistry
80:49-72.
Davis SP, Landis BJ, Adams ZH, Allen MG, Prausnitz MR. 2004. Insertion of Microneedles
into Skin: Measurement and Prediction of Insertion Force and Needle Fracture Force.
Journal of Biomechanics 37:1155-1163.
Davis SP, Martanto W, Allen MG, Prausnitz MR. 2005. Hollow Metal Microneedles For
Insulin Delivery To Diabetic Rats. IEEE Transactions on Biomedical Engineering
52:909-915.
De Rigal J, Leveque JL. 1985. In Vivo Measurement of the Stratum Corneum Elasticity.
Bioengineering and Skin 1:13-23.
Ding Z, Verbaan FJ, Bivas-Benita M, Bungener L, Huckriede A, van den Berg DJ, Kersten
G, Bouwstra JA. 2009. Microneedle Arrays for the Transcutaneous Immunization of
Diphtheria and Influenza in BALB/c Mice. Journal of Controlled Release 136:71-78.
Diridollou S, Patat F, Gens F, Vaillant L, Black D, Lagarde JM, Gall Y, Berson M. 2000. In
Vivo Model of The Mechanical Properties of Human Skin Under Suction. Skin and
Research Technology 6:214-221.
Donnelly RF, Garland MJ, Morrow DIJ, Migalska K, Singh TRR, Majithiya R, Woolfson
AD. 2010. Optical Coherence Tomography is a Valuable Tool in the Study of the
210
Effects of Microneedle Geometry on Skin Penetration Characteristics and In-Skin
Dissolution. Journal of Controlled Release 147:333-341.
Donnelly RF, Majithiya R, Singh TRR, Morrow DIJ, Garland MJ, Demir YK, Migalska K,
Ryan E, Gillen D, Scott CJ, Woolfson AD. 2011. Design, Optimization and
Characterisation of Polymeric Microneedle Arrays Prepared by a Novel Laser-Based
Micromoulding Technique. Pharmaceutical Research 28:41-57.
Dunn MG, Silver FH. 1983. Viscoelastic Behaviour of Human Connective Tissue: Relative
Contribution of Viscous and Elastic Components. Connective Tissue Research 12:59-
70.
Ebah LM. 2012. Extraction and Analysis of Interstitial Fluid and Characterisation of the
Interstitial Compartment in Kidney Disease. In: School of Biomedicine. Manchester:
University of Manchester. p 1 - 274.
Ebenstein DM, Pruitt LA. 2004. Nanoindentation of Soft Hydrated Materials for Application
to Vascular Tissues. Journal of Biomedical Materials Research Part A 69:222-232.
Ebenstein DM, Pruitt LA. 2006. Nanoindentation of Biological Materials. Nano Today 1:26-
33.
Edwards C, Marks R. 1995. Evaluation of Biomechanical Properties of Human Skin. Clinics
in Dermatology 13:375-380.
Elias PM. 1983. Epidermal Lipids, Barrier Function and Desquamation. The Journal of
Investigative Dermatology 80:44s-49s.
Ely JW, Osheroff JA, Chambliss ML, Ebell MH. 2006. Approach to Leg Edema of Unclear
Etiology. Journal of the American Board of Family Medicine 19:148-160.
Feest TG, Rajamahesh J, Byrne C, Ahmad A, Ansell D, Burden R, Roderick PJ. 2004. Trends
in Adult Renal Replacement Therapy in the UK: 1982-2002. QJM 98:21-28.

211
Fenske NA, Lober CW. 1986. Structural and Functional Changes of Normal Aging Skin.
Journal of the American Academy of Dermatology 15:571-585.
Fercher AF. 2010. Optical Coherence Tomography – Development, Principles, Applications.
Zeitschrift für Medizinische Physik 20:251-276.
Fercher AF, Mengedoht K, Werner W. 1988. Eye-length Measurement by Interferometry
with Partially Coherent Light. Optics Letters 13:186-188.
Ferrario M, Moissl U, Garzotto F, Cruz DN, Clementi A, Brendolan A, Tetta C, Gatti E,
Signorini MG, Cerutti S, Ronco C. 2014. Effects of Fluid Overload on Heart Rate
Variability in Chronic Kidney Disease Patients on Hemodialysis. BMC Nephrology
15:1-11.
Fischer AH, Jacobson KA, Rose J, Zeller R. 2008. Hematoxylin and Eosin Staining of Tissue
and Cell Sections. CSH Protocols 3:1-2.
Flores S, Rider AC. 2016. Mesoamerican Nephropathy: A Novel Case of Kidney Failure in a
US ED. American Journal of Emergency Medicine 34:1323.e1325-1323.e1326.
Fourtanier A, Berrebi C. 1989. Miniature Pig as an Animal Model to Study Photoaging.
Photochemistry and Photobiology 50:771 - 784.
Frank Peacock W, Soto KM. 2010. Current Technique of Fluid Status Assessment.
Congestive Heart Failure 16 Suppl 1:S45-S51.
Fung YC. 1993. Biomechanics: Mechanical Properties of Living Tissues, 2nd ed. New York:
Springer-Verlag.
Garner L. 2004. Contact Dermatitis To Metals. Dermatologic Therapy 17:321-327.
Geerligs M, Peters GW, Ackermans PA, Oomens CW, Baaijens FP. 2010b. Does
Subcutaneous Adipose Tissue Behave as an (Anti-)Thixotropic Material? Journal of
Biomechanics 43:1153-1159.

212
Geerligs M, Peters GWM, Ackermans PAJ, Oomens CWJ, Baaijens FPT. 2008. Linear
Viscoelastic Behavior of Subcutaneous Adipose Tissue. Biorheology 45:677-688.
Geerligs M, van Breemen L, Peters G, Ackermans P, Baaijens F, Oomens C. 2011. In vitro
Indentation to Determine the Mechanical Properties of Epidermis. Journal of
Biomechanics 44:1176-1181.
Gerstel MS, Place VA. 1976. Drug Delivery Device. In. United States: Alza Corporation.
Gibbs LME, Addington-Hall J, Gibbs JSR. 1998. Dying from Heart Failure: Lessons from
Palliative Care. British Medical Journal 317:961-962.
Gibson T, Stark H, Evans JH. 1968. Directional Variational in Extensibility of Human Skin
In Vivo. Journal of Biomechanics 2:201-204.
Gill HS, Denson DD, Burris BA, Prausnitz MR. 2008. Effect of Microneedle Design on Pain
in Human Volunteers. Clinical Journal of Pain 24:585-594.
Glaister DH. 1975. Human Tolerance to Impact Acceleration. Injury: The British Journal of
Accident Surgery 9:191-198.
Gniadecka M. 1996. Localisation of Edema in Lipodermasclerosis, Lymphedema and
Cardiac Insufficency. Journal of American Academy of Dermatology 35:37-41.
Gniadecka M, Serup J, Sondergaard J. 1994. Age-Related DIurnal Changes of Dermal
Oedema: Evaluation by High-Frequency Ultrasound. British Journal of Dermatology
131:849-855.
Graham HK, Akhtar R, Kridiotis C, Derby B, Kundu T, Trafford AW, Sherratt MJ. 2011.
Localised Micro-Mechanical Stiffening in the Ageing Aorta. Mechanisms of Ageing
and Development 132:459-467.
Granta LD. 2003. Material Data Book. In. Cambridge University Engineering Department. p
1-37.
213
Grassmann A, Gioberge S, Moeller S, Brown G. 2005. ESRD Patients in 2004: Global
Overview of Patient Numbers, Treatment Modalities and Associated Trends.
Nephrology Dialysis Transplantation 20:2587-2593.
Groves RB. 2011. Quantifying the Mechanical Properties of Skin In Vivo and Ex Vivo to
Optimise Microneedle Device Design. In: Cardiff University.
Groves RB, Coulman SA, Birchall JC, Evans SL. 2012. Quantifying the Mechanical
Properties of Human Skin to Optimise Future Microneedle Device Design. Computer
Methods in Biomechanics and Biomedical Engineering 15:73-82.
Groves RB, Coulman SA, Birchall JC, Evans SL. 2013. An Anisotropic, Hyperelastic Model
for Skin: Experimental Measurements, Finite Element Modelling and Identification of
Parameters for Human and Murine Skin. Journal of Mechanical Behaviour of
Biomedical Materials 18:167-180.
Gupta J, Gill HS, Andrews SN, Prausnitz MR. 2011. Kinetics of Skin Resealing after
Insertion of Microneedles in Human Subjects. Journal of Controlled Release 154:148-
155.
Guyton AC, Granger HJ, Taylor AE. 1971. Interstitial Fluid Pressure. Physiological Reviews
51:527 - 563.
Hamer RA, El-Nahas AM. 2006. The Burden of Chronic Kidney Disease. British Medical
Journal 332:563-564.
Haq MI, Smith E, John DN, Kalavala M, Edwards C, Anstey A, Morrissey A, Birchall JC.
2009. Clinical Administration of Microneedles: Skin Puncture, Pain and Sensation.
Biomedical Microdevices 11:35-47.
Hay J. 2011. Complex Shear Modulus of Commerical Gelatin by Instrumented Indentation.
In: Agilent Technologies, Inc.

214
Hay J. 2012. Rapid Characterisation of Elastic Modulus and Hardness via Express Test. In:
Agilent Technologies, Inc.
Hay J, Cherneva S. 2013. In Vitro Complex Shear Modulus of Bovine Muscle Tissue (Steak).
In: Agilent Technologies, Inc.
Heilbronner R, Barrett S. 2014. Image Analysis in Earth Sciences. Springer Berlin
Heidelberg.
Hendriks FM. 2001. Mechanical Behaviour of Human Skin In Vivo - A Literature Review.
Koninklijke Philips Electronics NV.
Hendriks FM. 2005. Mechanical Behaviour of Human Epidermal and Dermal Layers In
Vivo. In. Eindhoven: Eindhoven University of Technology.
Henry S, McAllister DV, Allen MG, Prausnitz MR. 1998. Microfabricated Microneedles a
Novel Approach to Transdermal Drug Delivery. Journal of Pharmaceutical Sciences
87.
Holme MN, Schulz G, Deyhle H, Weitkamp T, Beckmann F, Lobrinus JA, Rikhtegar F,
Kurtcuoglu V, Zanette I, Saxer T, Muller B. 2014. Complementary X-ray
Tomography Techniques for Histology-Validated 3D Imaging of Soft and Hard
Tissues using Plaque-Containing Blood Vessels as Examples. Nature protocols
9:1401-1415.
Holt CA, Evans SL. 2009. Measuring the Mechanical Properties of Human Skin In Vivo
using Digital Image Correlation and Finite Element Modelling. The Journal of Strain
Analysis for Engineering Design 44:337-345.
Huang D, Swanson EA, Lin CP, Schuman JS, Stinson WG, Chang W, Hee MR, Flotte T,
Gregory K, Piuliafito CA, Fujimoto JG. 1991. Optical Coherence Tomography.
Science, New Series 254:1178-1181.

215
Huang H, Fu C. 2007. Different Fabrication Methods of Out-of-Plane Polymer Hollow
Needle Arrays and their Variations. Journal of Micromechanics and Microengineering
17:393-402.
Hung SC, Kuo KL, Peng CH, Wu CH, Lien YC, Wang YC, Tarng DC. 2014. Volume
Overload Correlates with Cardiovascular Risk Factors in Patients with Chronic
Kidney Disease. Kidney International 85:703-709.
Ianches M. 2015. PMMA Microneedles Specifications. In: 10x Technology.
Indermun S, Luttge R, Choonara YE, Kumar P, du Toit LC, Modi G, Pillay V. 2014. Current
Advances in the Fabrication of Microneedles for Transdermal Delivery. Journal of
Controlled Release 185:130-138.
Jacquemoud C, Bruyere-Garnier K, Coret M. 2007. Methodology to Determine Failure
Characteristics of Planar Soft Tissues using a Dynamic Tensile Test. Journal of
Biomechanics 40:468-475.
James W, Berger T, Elston D. 2006. Andrew's Diseases of the Skin: Clinical Dermatology.
In, Eleventh ed: Saunders.
Jones ML, Bancroft JD, Gamble M. 2008. Theory and Practice of Histological Techniques.
In: Elsevier, editor. Connective Tissue and Stains, 6th ed: Elsevier.
Kalantar-Zadeh K, Regidor DL, Kovesdy CP, Van Wyck D, Bunnapradist S, Horwich TB,
Fonarow GC. 2009. Fluid Retention is Associated with Cardiovascular Mortality in
Patients Undergoing Long-Term Hemodialysis. Circulation 119:671-679.
Kalluri H, Kolli CS, Banga AK. 2011. Characterization of Microchannels Created by Metal
Microneedles: Formation and Closure. AAPS Journal 13:473-481.
Kelchen MN, Siefers KJ, Converse CC, Farley MJ, Holdren GO, Brogden NK. 2016.
Micropore Closure Kinetics are Delayed following Microneedle Insertion in Elderly
Subjects. Journal of Controlled Release 225:294-300.

216
Kendall MA, Chong YF, Cock A. 2007. The Mechanical Properties of the Skin Epidermis in
Relation to Targeted Gene and Drug Delivery. Biomaterials 28:4968-4977.
Kerr M. 2012. Chronic Kidney Disease in England: The Human Financial Cost. NHS Kidney
Care.
Kerr M, Bray B, Medcalf J, O'Donoghue DJ, Matthews B. 2012. Estimating the Financial
Cost of Chronic Kidney Disease to the NHS in England. Nephrology Dialysis
Transplantation 0:1-8.
Khanna P, Strom JA, Malone JI, Bhansali S. 2008. Microneedle-Based Automated Therapy
for Diabetes Mellitus. Journal of Diabetes Science and Technology 2:1122-1129.
Khatyr F, Imberdis C, Vescovo P, Varchon D, Lagarde J. 2004. Model of the Viscoelastic
Behaviour of Skin In Vivo and Study of Anisotropy. Skin and Research Technology
10:96-103.
Kim YC, Park JH, Prausnitz MR. 2012. Microneedles for Drug and Vaccine Delivery.
Advanced Drug Delivery Reviews 64:1547-1568.
Kirk E, Kvorning SA. 1949. Quantitative Measurements of the Elastic Properties of the Skin
and Subcutaneous Tissue in Young and Old Individuals. Journal of Gerontology
4:273-284.
Kitzman DW, Rich MW. 2010. Age Disparities in Heart Failure Research. Journal of
American Medical Association 304:1950-1951.
Kochhar JS, Goh WJ, Chan SY, Kang L. 2013a. A Simple Method of Microneedle Array
Fabrication for Transdermal Drug Delivery. Drug Development and Industrial
Pharmacy 39:299-309.
Kochhar JS, Quek TC, Soon WJ, Choi J, Zou S, Kang L. 2013b. Effect of Microneedle
Geometry and Supporting Substrate on Microneedle Array Penetration into Skin.
Journal of Pharmaceutical Sciences 102:4100-4108.

217
Kolli CS, Banga AK. 2008. Characterization of Solid Maltose Microneedles and their Use for
Transdermal Delivery. Pharmaceutical Research 25:104-113.
Kong XQ, Zhou P, Wu CW. 2011. Numerical Simulation of Microneedles' Insertion into
Skin. Computer Methods in Biomechanics and Biomedical Engineering 14:827-835.
Kramer BK, Schweda F, Riegger GAJ. 1999. Diuretic Treatment and Diuretic Resistance in
Heart Failure. The American Journal of Medicine 106:90-96.
Kwon J, Subhash G. 2010. Compressive Strain Rate Sensitivity of Ballistic Gelatin. Journal
of Biomechanics 43:420-425.
Lanir Y, Fung YC. 1974. Two-Dimensional Mechanical Properties of Rabbit Skin -
Experimental System II. Journal of Biomechanics 7:171-184.
Lara MF, Gonzalez-Gonzalez E, Speaker TJ, Hickerson RP, Leake D, Milstone LM, Contag
CH, Kaspar RL. 2012. Inhibition of CD44 Gene Expression in Human Skin Models,
using Self-Delivery Short Interfering RNA Administered by Dissolvable Microneedle
Arrays. Human gene therapy 23:816-823.
Larson K, Ho HH, Anumolu PL, Chen TM. 2011. Hematoxylin and Eosin Tissue Stain in
Mohs Micrographic Surgery: A Review. Dermatological Surgery 37:1089-1099.
Lasagni C, Seidenari S. 1995. Echographic Assessment of Age-Dependent Variations of Skin
Thickness. Skin and Research Technology 1:81-85.
Lee JW, Choi SO, Felner EI, Prausnitz MR. 2011. Dissolving Microneedle Patch for
Transdermal Delivery of Human Growth Hormone. Small 7:531-539.
Lee KY, Mooney DJ. 2001. Hydrogels for Tissue Engineering. Chemical Reviews 101:1869-
1879.
Lee Y, Hwang K. 2002. Skin Thickness of Korean Adults. Surgical and Radiologic Anatomy
24:183-189.

218
Leveque JL, de Rigal J, Agache PG, Monneur C. 1980. Influence of Ageing on the In Vivo
Extensibility of Human Skin at a Low Stress. Archives of Dermatological Research
269:127-135.
Levick JR. 1987. Flow Through Interstitium and Other Fibrous Matrices. Quarterly Journal
of Experimental Physiology 72:409-438.
Li G, Badkar A, Nema S, Kolli CS, Banga AK. 2009. In Vitro Transdermal Delivery of
Therapeutic Antibodies using Maltose Microneedles. International Journal of
Pharmaceutics 368:109-115.
Li H, Low YS, Chong HP, Zin MT, Lee CY, Li B, Leolukman M, Kang L. 2015.
Microneedle-Mediated Delivery of Copper Peptide Through Skin. Pharmaceutical
Research 32:2678-2689.
Liu R, Zhang M, Jin C. 2016. In Vivo and In Situ Imaging of Controlled-Release Dissolving
Silk Microneedles into the Skin by Optical Coherence Tomography. Journal of
Biophotonics.
Liu X, Lu Z, Lewis R, Carré MJ, Matcher SJ. 2013. Feasibility of using Optical Coherence
Tomography to Study the Influence of Skin Structure on Finger Friction. Tribology
International 63:34-44.
Lo Gullo R, Mishra S, Lira DA, Padole A, Otrakji A, Khawaja RD, Pourjabbar S, Singh S,
Shepard JA, Digumarthy SR, Kalra MK, Stone JR. 2015. Quantification of Interstitial
Fluid on Whole Body CT: Comparison with Whole Body Autopsy. Forensic Science
Medicine and Pathology 11:488-496.
Lo Presti D, Ingegnosi C, Strauss K. 2012. Skin and Subcutaneous Thickness at Injecting
Sites in Children with Diabetes: Ultrasound Findings and Recommendations for
Giving Injection. Pediatric diabetes 13:525-533.

219
Loizidou EZ, Inoue NT, Ashton-Barnett J, Barrow DA, Allender CJ. 2016. Evaluation of
Geometrical Effects of Microneedles on Skin Penetration by CT Scan and Finite
Element Analysis. European Journal of Pharmaceutics and Biopharmaceutics 107:1-6.
Manschot JFM, Brakkee AJM. 1986. The Measurement and Modelling of the Mechanical
Properties of Human Skin In Vivo - Part I Journal of Biomechanics 19:511-515.
Markidou A, Shih WY, Shih WH. 2005. Soft-Materials Elastic and Shear Moduli
Measurement using Piezoelectric Cantilevers. Review of Scientific Instruments
76:064302-064301 - 064302-064307.
Markman B, Barton FE. 1987. Anatomy of the Subcutaneous Tissue of the Trunk and Lower
Extremity. Plastic and Reconstructive Surgery 80:248-254.
Martanto W, Davis SP, Holiday NR, Wang J, Gill HS, Prausnitz MR. 2004. Transdermal
Delivery Of Insulin Using Microneedles In Vivo. Pharmaceutical Research 21:947-
952.
McAllister DV. 2003. From the Cover: Microfabricated Needles for Transdermal Delivery of
Macromolecules and Nanoparticles: Fabrication Methods and Transport Studies.
Proceedings of the National Academy of Sciences 100:13755-13760.
McMurray JJ, Stewart W. 2000. Epidemiology, Aetiology, and Prognosis of Heart Failure.
Heart 83:596-602.
Meijer R, Douven LF, Oomens CWJ. 1999. Characterisation of Anisotropic and Non-linear
Behaviour of Human Skin In Vivo. Computer Methods in Biomechanics and
Biomedical Engineering 2:13-27.
Mendez GF, Cowie MR. 2001. The Epidemiological Features of Heart Failure in Developing
Countries: A Review of the Literature. International Journal of Cardiology 80:213-
219.

220
Moffatt CJ, Franks PJ, Doherty DC, Williams AF, Badger C, Jeffs E, Bosanquet N, Mortimer
PS. 2003. Lymphoedema: An Underestimated Health Problem. Quarterly Journal of
Medicine 96:731-738.
Moissl UM, Wabel P, Chamney PW, Bosaeus I, Levin NW, Bosy-Westphal A, Korth O,
Muller MJ, Ellegard L, Malmros V, Kaitwatcharachai C, Kuhlmann MK, Zhu F,
Fuller NJ. 2006. Body Fluid Volume Determination via Body Composition
Spectroscopy in Health and Disease. Physiological Measurement 27:921-933.
Moronkeji K, Akhtar R. 2015. Mechanical Properties of Aging Human Skin. In: Derby B,
Akhtar R, editors. Mechanical Properties of Aging Soft Tissues: Springer
International Publishing. p 237-263.
Morton RL, Tong A, Howard K, Snelling P, Webster AC. 2010. The Views of Patients and
Carers in Treatment Decision Making for Chronic Kidney Disease: Systematic
Review and Thematic Synthesis of Qualitative Studies. British Medical Journal
340:c112-c112.
Moy P, Foster M, Gunnarsson CA, Weerasooriya T. 2011. Loading Rate Effect on Tensile
Failure Behavior of Gelatins under Mode I.15-23.
Mridha M, Odman S. 1985. Characterisation of Subcutaneous Oedema by Mechanical
Impedance Measurements. Journal of Investigative Dermatology 85:575-578.
Mridha M, Odman S, Oberg PA. 1992. Mechanical Pulse Wave Propagation in Gel, Normal
and Oedematous Tissues. Journal of Biomechanics 25:1213-1218.
Mukerjee EV, Collins SD, Isseroff RR, Smith RL. 2004. Microneedle Array for Transdermal
Biological Fluid Extraction and In Situ Analysis. Sensors and Actuators A: Physical
114:267-275.
Mukerjee EV, Isseroff RR, Collins SD, Smith RL. 2003. Microneedle Array with Integrated
Microchannels for Transdermal Sample Extraction and In Situ Analysis. In: 12th

221
International Conference on Solid State Sensors, Actuators and Mircosystems.
Boston. p 1439-1441.
Nachman M, Franklin SE. 2016. Artificial Skin Model Simulating Dry and Moist In Vivo
Human Skin Friction and Deformation Behaviour. Tribology International 97:431-
439.
Nesto RW, Bell D, Bonow RO, Fonseca V, Grundy SM, Horton ES, Le Winter M, Porte D,
Semenkovich CF, Smith S, Young LH, Kahn R. 2003. Thiazolidinedione Use, Fluid
Retention, and Congestive Heart Failure: A Consensus Statement from the American
Heart Association and American Diabetes Association. Circulation 108:2941-2948.
Newton VL, McConnell JC, Hibbert SA, Graham HK, Watson REB. 2015. Skin Aging:
Molecular Pathology, Dermal Remodelling and the Imaging Revolution. Giornale
Italiano Di Dermatologia E Venereologia 150:665-674.
Nguyen HX, Banga AK. 2015. Enhanced Skin Delivery of Vismodegib by Microneedle
Treatment. Drug delivery and translational research 5:407-423.
Ni Annaidh A, Bruyere K, Destrade M, Gilchrist MD, Ottenio M. 2012. Characterization of
the Anisotropic Mechanical Properties of Excised Human Skin. Journal of the
Mechanical Behavior of Biomedical Materials 5:139-148.
Odegard GM, Gates TS, Herring HM. 2005. Characterisation of Viscoelastic Properties of
Polymeric Materials through Nanoindentation. Experimental Mechanics 45:130-136.
Ogden RW. 2009. Anisotropy and Nonlinear Elasticity in Arterial Wall Mechanics. In:
Gerhard A. Holzapfel RWO, editor. Biomechanical Modelling at the Molecular,
Cellular and Tissue Levels: Springer Vienna. p 179-258.
Olatunji O, Das DB, Al-Qallaf B. 2009. Simulation Based Optimisation of Microneedle
Geometry to Improve Drug Permeability in Skin. In: The European Multidisciplinary
Society for Modelling and Simulation Technology. Loughborough, UK. p 1-8.

222
Olatunji O, Das DB, Garland MJ, Belaid L, Donnelly RF. 2013. Influence of Array
Interspacing on the Force Required for Successful Microneedle Skin Penetration:
Theoretical and Practical Approaches. Journal of Pharmaceutical Sciences 102:1209-
1221.
Oliver WC, Pharr GM. 1992. An Improved Technique for Determining Hardness and Elastic
Modulus using Load and Displacement Sensing Indentation Experiments. Journal of
Materials Research 7:1564-1583.
Onofriescu M, Hogas S, Voroneanu L, Apetrii M, Nistor I, Kanbay M, Covic AC. 2014.
Bioimpedance-Guided Fluid Management in Maintenance Hemodialysis: A Pilot
Randomized Controlled Trial. American Journal of Kidney Diseases 64:111-118.
Oomens CWJ, Van Campen DH, Grootenboer HJ. 1987. A Mixture Approach to the
Mechanics of Skin. Journal of Biomechanics 20:877-885.
Pailler-Mattei C, Bec S, Zahouani H. 2008. In Vivo Measurements of the Elastic Mechanical
Properties of Human Skin by Indentation Tests. Medical Engineering and Physics
30:599-606.
Pailler-Mattei C, Pavan S, Vargiolu R, Pirot F, Falson F, Zahouani H. 2007a. Contribution of
Stratum Corneum in Determining Bio-Tribological Properties of the Human Skin.
Wear 263:1038-1043.
Pailler-Mattei C, Pavan S, Vargiolu R, Pirot F, Falson F, Zahouani H. 2007b. Contribution of
Stratum Corneum in Determining Bio-Tribological Properties of the Human Skin. In:
16th International Conference on Wear of Materials. p 1038-1043.
Pailler-Mattéi C, Zahouani H. 2006. Analysis of Adhesive Behaviour of Human Skin In Vivo
by an Indentation Test. Tribology International 39:12-21.
Park JH, Allen MG, Prausnitz MR. 2005. Biodegradable Polymer Microneedles: Fabrication,
Mechanics and Transdermal Drug Delivery. Journal of Controlled Release 104:51-66.

223
Parker ER, Rao MP, Turner KL, Meinhart CD, C. MN. 2007. Bulk Micromachined Titanium
Microneedles. Journal of Microelectromechanical Systems 16:289-295.
Parker KP. 2003. Sleep Disturbances in Dialysis Patients. Sleep Medicine Reviews 7:131-
143.
Pauwels E, Van Loo D, Cornillie P, Brabant L, Van Hoorebeke L. 2013. An Exploratory
Study of Contrast Agents for Soft Tissue Visualization by Means of High Resolution
X-ray Computed Tomography Imaging. Journal of Microscopy 250:21-31.
Peacock WF, Costanzo MR, De Marco T, Lopatin M, Wynne J, Mills RM, Emerman CL.
2009. Impact of Intravenous Loop Diuretics on Outcomes of Patients Hospitalized
with Acute Decompensated Heart Failure: Insights from the ADHERE Registry.
Cardiology 113:12-19.
Pegoraro C, MacNeil S, Battaglia G. 2012. Transdermal Drug Delivery: From Micro to Nano.
Nanoscale 4:1881-1894.
Pierard GE, Lapiere CM. 1977. Physiopathological Variations in the Mechanical Properties
of Skin. Archives of Dermatological Research 260:231-239.
Prausnitz MR. 2001. Overcoming the Skin's Barrier: The Search for Effective and User-
Friendly Drug Delivery. Diabetes Technology and Therapeutics 3:233-236.
Prausnitz MR, Langer R. 2008. Transdermal Drug Delivery. Nature Biotechnology 26:1261-
1268.
Qiu Y, Guo L, Zhang S, Xu B, Gao Y, Hu Y, Hou J, Bai B, Shen H, Mao P. 2015. DNA-
Based Vaccination against Hepatitis B Virus using Dissolving Microneedle Arrays
Adjuvanted by Cationic Liposomes and CpG ODN. Drug Delivery:1-8.
Radhakrishnan RS, Radhakrishnan HR, Xue H, Moore-Olufemi SD, Mathur AB, Weisbrodt
NW, Moore FA, Allen SJ, Laine GA, Cox CS, Jr. 2007. Hypertonic Saline Reverses

224
Stiffness in a Sprague-Dawley Rat Model of Acute Intestinal Oedema, Leading to
Improved Intestinal Function. Critical Care Medicine 35:538-543.
Renephra. 2012. Transdermal Fluid Removal Part I (Microneedle Technology). In.
Renephra. 2015. Transdermal Fluid Removal Part II (MicroneedleTechnology). In.
Rich MW, Chyun DA, Skolnick AH, Alexander KP, Forman DE, Kitzman DW, Maurer MS,
McClurken JB, Resnick BM, Shen WK, Tirschwell DL. 2016. Knowledge Gaps in
Cardiovascular Care of the Older Adult Population. Journal of the American College
of Cardiology 67:2419-2440.
Ridge MD, Wright V. 1966. Mechanical Properties of Skin: A Bioengineering Study of Skin
Structure. Journal of Applied Physiology 21:1602-1606.
Romgens AM, Bader DL, Bouwstra JA, Baaijens FP, Oomens CW. 2014. Monitoring the
Penetration Process of Single Microneedles with Varying Tip Diameters. Journal of
the Mechanical Behavior of Biomedical Materials 40:397-405.
Rosado C, Pinto P, Rodrigues LM. 2005. Modelling TEWL-Desorption Curves: A New
Practical Approach for the Quantitative In Vivo Assessment of Skin Barrier.
Experimental Dermatology 14:386-390.
Ryan TJ. 1995. Lymphatics and Adipose Tissue. Clinics in Dermatology 13:493-498.
Ryckman RA, Powell DA, Lew A. 2012. Ballistic Penetration of Perma-Gel. In: AIP
Conference Proceedings. p 143-148.
Samant P, Prausnitz MR. 2016. Microneedle Patches for Point-of-Care Diagnostics. In: The
4th International Conference on Microneedles. GSK House, London: Microneedles
2016.
Sandby-Moller J, Poulsen T, Wulf HC. 2003. Epidermal Thickness at Different Body Sites:
Relationship to Age, Gender, Pigmentation, Blood Content, Skin Type and Smoking
Habits. Acta Dermatological Venereol 83:410-413.

225
Sawicka KM, Roemer EJ, Simon SR. 2007. Enzyme Composite Nanofibers as Novel
Transdermal Delivery Coating. IEEE Xplore:232-233.
Schade H. 1912. Studies on the Organ Function of Connective Tissue I. Communication of:
The Elastic Function of the Connective Tissue and the Intravital Measurement of their
Disorders. Journal of Experimental Pathology and Therapy 11:369-399.
Schambach SJ, Bag S, Schilling L, Groden C, Brockmann MA. 2010. Application of Micro-
CT in Small Animal Imaging. Methods 50:2-13.
Seibert E, Muller SG, Fries P, Pattmoller J, Kuss O, Heine GH, Girndt M, Schneider G,
Kotanko P, Zhu F, Levin NW, Kuhlmann MK. 2013. Calf Bioimpedance
Spectroscopy for Determination of Dry Weight in Hemodialysis Patients: Effects on
Hypertension and Left Ventricular Hypertrophy. Kidney and Blood Pressure Research
37:58-67.
Shergold OA, Fleck NA, Radford D. 2006. The Uniaxial Stress versus Strain Response of Pig
Skin and Silicone Rubber at Low and High Strain Rates. International Journal of
Impact Engineering 32:1384-1402.
Singh S, Loke YK, Furberg CD. 2007. Thiazolidinediones and Heart Failure: A Teleo-
Analysis. Diabetes care 30:2148-2153.
Stewart S, Jenkins A, Buchan S, McGuire A, Capewell S, McMurray JJ. 2002. The Current
Cost of Heart Failure to the National Health Service in the UK. European Journal of
Heart Failure 4:361-371.
Strober W. 2001. Trypan Blue Exclusion Test of Viability. Current Protocols in
Immunology:21:23B:A.23B.21–A.23B.22.
Sutton GC. 1990. Epidemiologic Aspects of Heart Failure. American Heart Journal
120:1538-1540.

226
Tagami H, Ohi M, Iwatsuki K, Kanamaru Y, Yamada M, Ichijo B. 1980. Evaluation of the
Skin Surface Hydration In Vivo by Electrical Measurement. Journal of Investigative
Dermatology 75:500-507.
Thali MJ, Kneubuehl BP, Zollinger U, Dirnhofer R. 2002. The ‘‘Skin–Skull–Brain Model’’:
A New Instrument for the Study of Gunshot Effects. Forensic Science International
125:178-189.
Treffel P, Panisset F, Faivre B, Agache P. 1994. Hydration, Transepidermal Water Loss, pH
and Skin Surface Parameters: Correlations and Variations between Dominant and
Non-Dominant Forearms. British Journal of Dermatology 130:325-328.
Tsai YC, Chiu YW, Tsai JC, Kuo HT, Hung CC, Hwang SJ, Chen TH, Kuo MC, Chen HC.
2015. Association of Fluid Overload with Cardiovascular Morbidity and All-cause
Mortality in Stages 4 and 5 CKD. Clinical Journal of the American Society of
Nephrology 10:39-46.
Tsaturyan AK, Izacov VJ, Zhelamsky SV, Bykov BL. 1984. Extracellular Fluid Filtration as
the Reason for the Viscoelastic Behaviour of the Passive Myocardium. Journal of
Biomechanics 17:749-755.
Valente MAE, Voors AA, Damman K, Van Veldhuisen DJ, Massie BM, O’Connor CM,
Metra M, Ponikowski P, Teerlink JR, Cotter G, Davison B, Cleland JGF, Givertz
MM, Bloomfield DM, Fiuzat M, Dittrich HC, Hillege HL. 2014. Diuretic Response in
Acute Heart Failure: Clinical Characteristics and Prognostic Significance. European
Heart Journal 35:1284-1293.
van der Maaden K, Luttge R, Vos PJ, Bouwstra J, Kersten G, Ploemen I. 2015. Microneedle-
Based Drug and Vaccine Delivery via Nanoporous Microneedle Arrays. Drug
Delivery and Translational Research 5:397-406.

227
van der Maaden K, Sekerdag E, Jiskoot W, Bouwstra J. 2014. Impact-Insertion Applicator
Improves Reliability of Skin Penetration by Solid Microneedle Arrays. AAPS Journal
16:681-684.
Verbaan FJ, Bal SM, van dB, Dijksman JA, van Hecke M, Verpoorten H, Luttge R, Bouwstra
JA. 2008. Improved Piercing of Microneedle Arrays in Dermatomed Human Skin by
an Impact Insertion Method. Journal of Controlled Release 128:80-88.
Verbaan FJ, Bal SM, van dB, Groenink WHH, Verpoorten H, Luttge R, Bouwstra JA. 2007.
Assembled Microneedle Arrays Enhance the Transport of Compounds Varying over a
Large Range of Molecular Weight across Human Dermatomed Skin. Journal of
Controlled Release 117:238-245.
Veronda DR, Westmann RA. 1970. Mechanical Charcterisation of Skin - Finite
Deformations. Journal of Biomechanics 3:111-124.
Victrex. 2014. Victrex® High Performance PEEK Polymers. In: Victrex plc.
Walton LA, Bradley RS, Withers PJ, Newton VL, Watson RE, Austin C, Sherratt MJ. 2015.
Morphological Characterisation of Unstained and Intact Tissue Micro-Architecture by
X-ray Computed Micro- and Nano-Tomography. Scientific Reports 5:1-14.
Wang PM, Cornwell M, Prausnitz MR. 2005. Minimally Invasive Extraction of Dermal
Interstitial Fluid for Glucose Monitoring using Microneedles. Diabetes Technology
and Therapeutics 7:131-141.
Watson REB. 2013. Histology Protocol. In.
Wilkes GL, Brown IA, Wildnauer RH. 1973. The Biomechanical Properties of Skin. CRC
Critical Reviews in Bioengineering 1:453-495.
Wilkes GL, Wildnauer RH. 1973. Structure-Property Relationships of the Stratum Corneum
of Human and Neonatal Rat II. Dynamic Mechanical Studies. Biochimica et
Biophysica Acta 304:276-289.

228
Williams AC. 2004. Structure and Function of Human Skin. In: Transdermal and Topical
Drug Delivery: From Theory to Clinical Practice: Pharmaceutical Press. p 1-25.
Wu KS, van Osdol WW, Dauskardt RH. 2006. Mechanical Properties of Human Stratum
Corneum: Effects of Temperature, Hydration and Chemical Treatment. Biomaterials
27:785-795.
Xiang Z, Wang H, Murugappan SK, Yen S-C, Pastorin G, Lee CY. 2015. Dense Vertical SU-
8 Microneedles Drawn from a Heated Mold with Precisely Controlled Volume.
Journal of Micromechanics and Microengineering 25:1-10.
Yan G, Warner KS, Zhang J, Sharma S, Gale BK. 2010. Evaluation Needle Length and
Density of Microneedle Arrays in the Pretreatment of Skin for Transdermal Drug
Delivery. International Journal of Pharmaceutics 391:7-12.
Yuan Y, Verma R. 2006. Measuring Microelastic Properties of Stratum Corneum. Colloids
and Surfaces B: Biointerfaces 48:6-12.
Zahn JD, Talbot D, Liepmann D, Pisano AP. 2000. Microfabricated Polysilicon Microneedles
For Minimally Invasive Biomedical Devices. Biomedical Microdevices 2:295-303.
Zahouani H, Pailler-Mattei C, Sohm B, Vargiolu R, Cenizo V, Debret R. 2009.
Characterization of the Mechanical Properties of a Dermal Equivalent Compared with
Human Skin In Vivo by Indentation and Static Friction Tests. Skin Research and
Technology 15:68-76.
Zak M, Kropka P, Kobielarz M, Dudek A, Kaleta-Kuratewicz K, Szotek S. 2011.
Determination of the Mechanical Properties of the Skin of Pig Foetuses with Respect
to its Structure. Acta of Bioengineering and Biomechanics 13:37-43.
Zheng Y, Mak FT, Lue B. 1999. Objective Assessment of Limb Tissue Elasticity:
Development of a Manual Indentation Procedure. Journal of Rehabilitation Research
and Development 36:71-85.

229
Chapter 8
8. Appendix
8.1 3D Image Analysis using XMT
XMT imaging was performed on skin Model 3A. The staining and wax embedding protocol
is summarised as follows: full thickness microneedle treated skin was soaked in
paraformaldehyde for 4 hours and then rehydrated in PBS solution for 5 mins. The tissue was
then subsequently stained with Lugol’s contrasting agent for 21 hours. After staining, the
sample was washed three times in water and placed in 70% ethanol for 15 mins, then in 90%
IMS for 15 mins, followed by 15 mins in 100% ethanol and then 3 xylene washes of 30 mins.
Finally, it was placed on the processor for wax embedding for 30 mins.
The skin was then imaged on a Carl Zeiss Xradia MicroXMT-500 system using 4× objective,
with a source voltage of 45 kV, a source current of 78 A and a power source of 3.5 W. The
sample was positioned 8 mm from the source and 45 mm from the detector.
The size of the sample was approximately 2 × 2 mm, 1015 TIFF images were obtained using
Avizo 8 imaging software (FEI™
, Oregon, USA). The image stacks were opened in ImageJ
using the orthogonal selection. The XY view showed the vertical cross-section of the skin
through the stratum corneum, epidermis and dermis, whilst the XZ view showed the planar
cross-section of the skin through the dermis. In the case where the XY view showed that
there was no breach of skin’s layers, no disruption was seen in XZ view. When there was a
breach, this was observed in the XY view and confirmed by the disruption in the XZ view. A
single image was analysed following confirmation of the breach in skin as shown in the
region shaded red in Fig. 94.
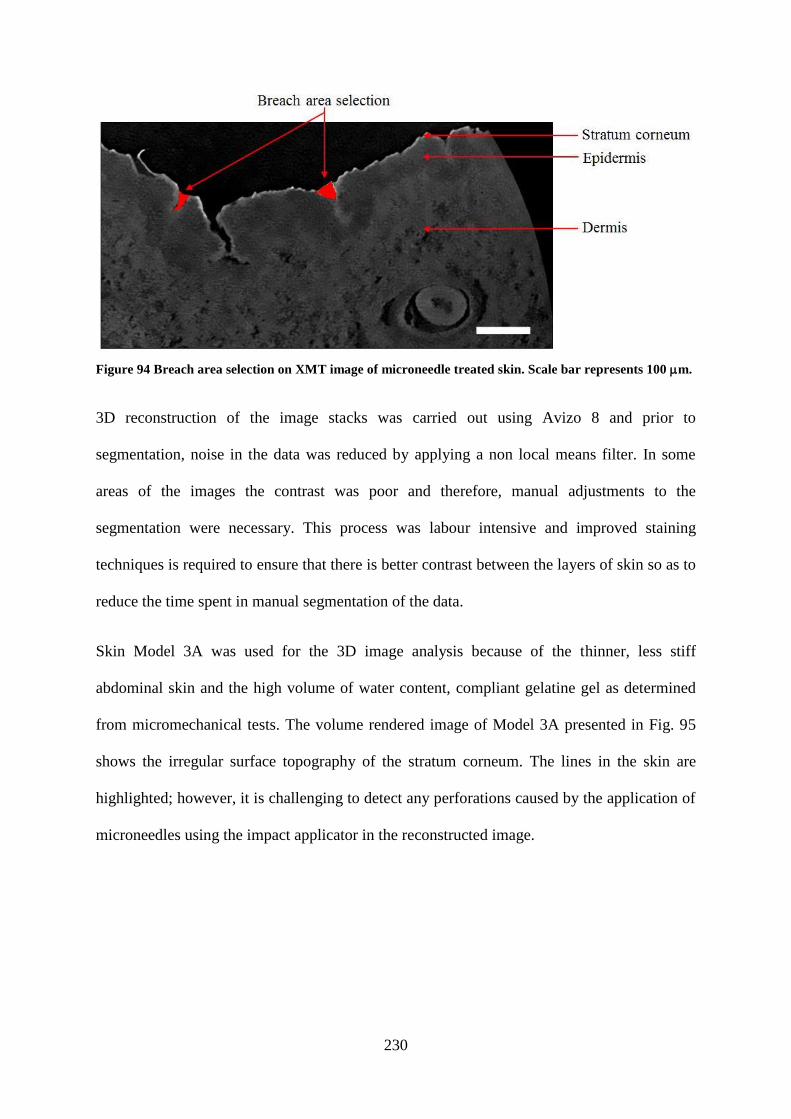
230
Figure 94 Breach area selection on XMT image of microneedle treated skin. Scale bar represents 100 m.
3D reconstruction of the image stacks was carried out using Avizo 8 and prior to
segmentation, noise in the data was reduced by applying a non local means filter. In some
areas of the images the contrast was poor and therefore, manual adjustments to the
segmentation were necessary. This process was labour intensive and improved staining
techniques is required to ensure that there is better contrast between the layers of skin so as to
reduce the time spent in manual segmentation of the data.
Skin Model 3A was used for the 3D image analysis because of the thinner, less stiff
abdominal skin and the high volume of water content, compliant gelatine gel as determined
from micromechanical tests. The volume rendered image of Model 3A presented in Fig. 95
shows the irregular surface topography of the stratum corneum. The lines in the skin are
highlighted; however, it is challenging to detect any perforations caused by the application of
microneedles using the impact applicator in the reconstructed image.

231
Figure 95 Volume rendering showing the output of the segmentation process on microneedle treated
Model 3A, showing the stratum corneum and epidermal layers only. Scale bar represents 100 m.
In addition, Fig. 96 shows the various orthogonal views of the reconstructed image. The
different views show that skin is not a flat surface, but consists of many undulations. These
undulations vary in size and depth.
Figure 96 Volume rendering showing the various orthogonal layouts of the 3D image of the skin, where
(a) XY, (b) XZ and (c) YZ. Scale bar represents 100 m.

232
Furthermore, a comparison of the breach area for the XMT image analysis and H&E staining
is shown in Fig. 97. The stratum corneum, epidermis and dermis are well defined for the
H&E images (Fig. 97a) and are comparable to the XMT images (Fig. 97b). The H&E stained
skin appears to be prone to sectioning induced artefacts (Fig 97a), which does not appear to
be the case for the XMT image (Fig. 97b). The microneedle induced disruption through the
layers in the XMT image visually appears to be similar to what is observed in the H&E
images. The delamination to the stratum corneum seen in the H&E images is also observed in
the XMT images. 7 images were analysed for the XMT and H&E images. The breach area for
the XMT images was 1921 ± 1682 m2 compared to that of the H&E images, which was
3417 ± 2178 m2. The breach profiles observed with the two techniques appear comparable
hence providing validation of the measurements from the H&E images.
Figure 97 Comparison of imaging techniques on Model 3A, where (a) XMT images and (b) H&E images.
Scale bar represents 100 m.
This pilot study demonstrates the feasibility of utilising XMT for 3D analysis of microneedle
perforation of skin.

233
8.2 ImageSXM Software Code
/Volumes/Home/Image SXM dev/SXM 198 CW 2 Sep/Source files/MIASMA src files/Microneedles.pas Page:
1Thursday, September 24, 2015 / 15:34
{ = = = = = = = = = = = = = = = = = = = = = = = = = = = = = = = = = = = = = = = = = = = = = } { } { File: Microneedles.p Date: 30 Jul 2015 } { } { Project: Image SXM Author: S D Barrett } { } { } { Routines for analysis of microneedles images } { } { Created in collaboration with: Dr Riaz Akhtar [email protected] } { University of Liverpool } { } { = = = = = = = = = = = = = = = = = = = = = = = = = = = = = = = = = = = = = = = = = = = = = } { } { Version History } { } { v1 Beta of MNA code tested by Riaz Dec 2014 } { } { v2 Modified to calculate area above epidermal layer Jan 2015 } { } { v3 Modified to handle epidermal layer breach 25 Jun 2015 } { } { = = = = = = = = = = = = = = = = = = = = = = = = = = = = = = = = = = = = = = = = = = = = = } {$propagate-units} unit Microneedles; interface uses Background, FileUtils, Math, MIASMAutils, SXMcomp; { –––––––––––––––––––––––––––––––––––––––––––––––––––––––––––––––––––––––––––––––––––– } function GetMNAver: integer; procedure MicroneedleSingle; { analyse a single image } procedure MicroneedleAnalysis; { analyse images in folder(s) } { –––––––––––––––––––––––––––––––––––––––––––––––––––––––––––––––––––––––––––––––––––– } implementation const MNAver = 3; { microneedle analysis algorithm version num } var MNAsingle: boolean; MNAstr: GPCstr; TempHistoMag: integer; UseThisInfo: InfoPtr; { –––––––––––––––––––––––––––––––––––––––––––––––––––––––––––––––––––––––––––––––––––– } function GetMNAver: integer;

234
/Volumes/Home/Image SXM dev/SXM 198 CW 2 Sep/Source files/MIASMA src files/Microneedles.pas Page: 2
Thursday, September 24,: 2015;15:34
begin GetMNAver := MNAver; { make version available to other routines } end; { –––––––––––––––––––––––––––––––––––––––––––––––––––––––––––––––––––––––––––––––––––– } procedure PreambleMNA; begin DoingMIASMA := true; DoingMNA := true; SuppressLog := true; { keep Session Log clear of clutter } SuppressMessages := true; { neater to not update Info window } SXMwindow := true; AbortAnalysis := false; OpeningCellRGBimage := true; Measurements := [XYLocM, AreaM]; TempHistoMag := HistoMag; HistoMag := 1; end; { –––––––––––––––––––––––––––––––––––––––––––––––––––––––––––––––––––––––––––––––––––– } procedure FilePreambleMNA (Folder: integer); begin SLogArrayOnReset; DiagnosticLog(stringOf('Microneedle Analysis v', MNAver : 1)); DiagnosticLog('+'); DiagnosticLog('+Load: ' + AbbrevPathName(CellsLoadFolder, true, 50)); DiagnosticLog('+Save: ' + AbbrevPathName(CellsSaveFolder, true, 50)); DiagnosticLog('+'); DiagnosticLog('+'); { spreadsheet tabs } DiagnosticLog(stringOf('+', tab, 'Area in sq.μm')); DiagnosticLog(stringOf('+', tab, '-------------')); RefreshSessionLog; { dummy call to update SLog window } SuppressLog := true; { keep Session Log clear of clutter } SuppressMessages := true; { neater to not update Info window } SXMwindow := true; end; { –––––––––––––––––––––––––––––––––––––––––––––––––––––––––––––––––––––––––––––––––––– } procedure UpdateMNAinfoWindow (MessageText: GPCstr); var FilesDoneInThisFolder, FilesDone, FilesToDo: longint; begin FilesDoneInThisFolder := FileIndexInThisFolder - 1; { index = number in this folder } FilesDone := FilesDoneInPrevFolders + FilesDoneInThisFolder; FilesToDo := NumFilesInBatch - FilesDone;

235
/Volumes/Home/Image SXM dev/SXM 198 CW 2 Sep/Source files/MIASMA src files/Microneedles.pas Page: 3
Thursday, September 24, 2015 / 15:34
MNAstr := stringOf('Microneedle Analysis', cr, cr); MNAstr := stringOf(MNAstr, 'Analysing image ', FilesDone + 1 : 1, ' of ', NumFilesInBatch : 1, cr); MNAstr := MNAstr + cr + MessageText + cr; ShowInInfo(MNAstr); end; { –––––––––––––––––––––––––––––––––––––––––––––––––––––––––––––––––––––––––––––––––––– } procedure MNAdiagnostics; begin end; { –––––––––––––––––––––––––––––––––––––––––––––––––––––––––––––––––––––––––––––––––––– } procedure AnalyseMicroneedles (ImageNum: integer); var InfoR, InfoB: InfoPtr; ScaleBarPixels: integer; WinLeftEdge, WinBotEdge, WinRightEdge, dX, dY: integer; Bin, LocalMin, FirstMax, FirstMin, LastMax: integer; { SDB 25 Jun 15 } SaveSliceStart: integer; { SDB 25 Jun 15 } NumFound, xClick4, yClick4: integer; DistToClick4, MinDistSoFar: extended; i, Damage: integer; { –––––––––––––––––––––––––––––––––––––– } procedure MakeLineInScaleBar (x1, x2, y: integer); begin with Info^ do begin KillRoi; LX1 := PixelsPerLine + x1; LY1 := nLines + y; LX2 := PixelsPerLine + x2; LY2 := nLines + y; RoiType := LineRoi; MakeRegion; RoiShowing := true; end; end; { –––––––––––––––––––––––––––––––––––––– } procedure SetScaleFromBar; const SmallxScaleBox = 200; { rectangle in bottom right that contains scale bar } SmallyScaleBox = 125; LargexScaleBox = 300; { rectangle in bottom right that contains scale bar } LargeyScaleBox = 150; var xScaleBox, yScaleBox: integer; y, i, LeftEdge, RightEdge, ScaleBarWidth, ScaleBarSum, ScaleBarNum: integer; MNApixPerMicron: real; begin
236
/Volumes/Home/Image SXM dev/SXM 198 CW 2 Sep/Source files/MIASMA src files/Microneedles.pas Page: 4
Thursday, September 24, 2015 / 15:34
RemoveZcalib; { otherwise PlotLineProfile gives odd z values } ScaleBarPixels := 100; { default scale 100 pix = 100 μm } ScaleBarSum := 0; ScaleBarNum := 0; if Info^.PixelsPerLine < 800 then begin xScaleBox := SmallxScaleBox; yScaleBox := SmallyScaleBox; end else begin xScaleBox := LargexScaleBox; { make search region for scale bar a bit bigger } yScaleBox := LargeyScaleBox; end; for y := -yScaleBox to -yScaleBox div 3 do begin MakeLineInScaleBar(-xScaleBox, -5, y); { take profile close to bottom right corner } ShowPlot := false; PlotLineProfile; ShowPlot := true; RightEdge := 0; for i := 1 to xScaleBox - 10 do if PlotData^[i] > 250 then { scale bar is usually black = 255 } RightEdge := i; LeftEdge := xScaleBox; for i := xScaleBox - 10 downto 1 do if PlotData^[i] > 250 then { scale bar is usually black = 255 } LeftEdge := i; ScaleBarWidth := RightEdge - LeftEdge; if (ScaleBarWidth > 25) and (ScaleBarWidth < 125) then begin ScaleBarSum := ScaleBarSum + ScaleBarWidth; ScaleBarNum := ScaleBarNum + 1; end; if ScaleBarNum > 4 then begin ScaleBarPixels := round(ScaleBarSum / ScaleBarNum); leave; end; end; MNApixPerMicron := ScaleBarPixels / 100; { scale bar always = 100 μm? } with Info^ do begin xScale := MNApixPerMicron; yScale := xScale; xInc := 1 / xScale; yInc := 1 / yScale; xSize := PixelsPerLine / xScale; ySize := nLines / yScale; xUnit := 'μm'; yUnit := 'μm'; SpatiallyCalibrated := true; end; KillRoi; end;

237
/Volumes/Home/Image SXM dev/SXM 198 CW 2 Sep/Source files/MIASMA src files/Microneedles.pas Page: 5
Thursday, September 24, 2015 / 15:34
{ –––––––––––––––––––––––––––––––––––––– } function Get2clicks (var Click: ClickArray): boolean; var i: integer; { –––––––––––––––––––––––––––––––––––––– } procedure DrawCross (mouseLoc: point); { draw cross at mouse loc } const box = 5; begin with mouseLoc do begin MoveTo(h - box, v); LineTo(h + box, v); MoveTo(h, v - box); LineTo(h, v + box); end; end; { –––––––––––––––––––––––––––––––––––––– } procedure GetClickPos (i: integer); var mouseLoc: point; begin WaitForMouse; GetMouse(mouseLoc); DrawCross(mouseLoc); ScreenToOffscreen(mouseLoc); Click[i].pt := mouseLoc; end; { –––––––––––––––––––––––––––––––––––––– } begin Get2clicks := false; SetPortWindowPort(Info^.wRef); { ensures that click coords are local, ie relative to window } SetCursor(ToolCursor[SelectionTool]); { make sure cursor is a cross } for i := 1 to 2 do begin SuppressMessages := false; ClearInfoWindow; ShowMessage(stringOf(MNAstr, cr, 'Waiting for click ', i : 1, '...')); GetClickPos(i); ShowMessage(' '); SuppressMessages := true; if not PtInRect(Click[i].pt, Info^.PicRect) then begin FlushEvents(EveryEvent, 0); { don't act on this click } exit; end; end; FlushEvents(EveryEvent, 0); { discard mouse clicks from event buffer }

238
/Volumes/Home/Image SXM dev/SXM 198 CW 2 Sep/Source files/MIASMA src files/Microneedles.pas Page: 6
Thursday, September 24, 2015 / 15:34
dX := Click[2].pt.h - Click[1].pt.h; dY := Click[2].pt.v - Click[1].pt.v; Click[4].pt.h := (Click[1].pt.h + Click[2].pt.h) div 2; { centre of line } Click[4].pt.v := (Click[1].pt.v + Click[2].pt.v) div 2; SuppressBeachBall; { allows cosses to show } Get2clicks := true; end; { –––––––––––––––––––––––––––––––––––––– } procedure TakeOutBaseline; { –––––––––––––––––––––––––––––––––––––– } procedure MakeBaseline; begin with Info^ do begin KillRoi; LX1 := Click[1].pt.h; LY1 := Click[1].pt.v; LX2 := Click[2].pt.h; LY2 := Click[2].pt.v; RoiType := LineRoi; MakeRegion; RoiShowing := true; end; end; { –––––––––––––––––––––––––––––––––––––– } begin Click[1].pt.h := Click[1].pt.h - dX div 2; { extend line from click 1 to click 2 } Click[1].pt.v := Click[1].pt.v - dY div 2; Click[2].pt.h := Click[2].pt.h + dX div 2; Click[2].pt.v := Click[2].pt.v + dY div 2; MakeBaseline; DoClear; { draw white line to separate damaged tissue from background } Click[1].pt.v := Click[1].pt.v - 1; { nudge up and do again } Click[2].pt.v := Click[2].pt.v - 1; MakeBaseline; DoClear; { draw white line to separate damaged tissue from background } KillRoi; SuppressBeachBall; { allows cosses to show } end; { –––––––––––––––––––––––––––––––––––––– } begin

239
/Volumes/Home/Image SXM dev/SXM 198 CW 2 Sep/Source files/MIASMA src files/Microneedles.pas Page: 7
Thursday, September 24, 2015 / 15:34
OrigInfo := Info; ResetToColour(R); SetScaleFromBar; if MNAbreach then begin { SDB 25 Jun 15 } ResetToColourBlind(G); UseThisInfo := Info; end else begin Info := OrigInfo; ResetToColourBlind(R); MedianFilter; Smooth; { prep R channel } SOK := DuplicateOffscreen(''); InfoR := Info; Info := OrigInfo; ResetToColourBlind(B); MedianFilter; Smooth; { prep B channel } SOK := DuplicateOffscreen(''); InfoB := Info; SOK := DuplicateOffscreen(RemoveSuffix(OrigInfo^.Title)); { use orig title (without suffix) } UseThisInfo := Info; { to ensure log displays correctly } CurrentMathOp := MinMath; RealImageMath := false; MathGain := 1.0; MathOffset := 0.0; DoMath(InfoR^.PicNum, InfoB^.PicNum, UseThisInfo, Info^.PicRect); { min of R and B ch } GetRidOfWindow(OrigInfo); GetRidOfWindow(InfoR); GetRidOfWindow(InfoB); Info := UseThisInfo; end; with Info^ do if nLines < ScreenHeight div 2 then ResizeSXMwindow(0) { 200% } else if nLines < ScreenHeight then ResizeSXMwindow(1) { 100% } else if nLines < ScreenHeight * 2 then ResizeSXMwindow(2) { 50% } else ResizeSXMwindow(3); { 33% } with Info^ do begin { reposition image } WinLeftEdge := rleft + rwidth + 16; MoveWindow(wRef, WinLeftEdge, PicBaseTop, false); WinBotEdge := PicBaseTop + round(nLines * magnification); WinRightEdge := WinLeftEdge + round(PixelsPerLine * magnification); DoHistogram; { generate histogram before smoothing it } GetSmoothHistogram; if PixelsPerLine > nLines then { put Histogram below image } MoveWindow(HistoWindow, WinLeftEdge, WinBotEdge + 32, true) else { or to right of image if image is 'portrait' } MoveWindow(HistoWindow, WinRightEdge + 32, PicBaseTop, true); DrawHistogram; end; if MNAbreach then begin { SDB 25 Jun 15 } FirstMax := 0; for Bin := 80 downto 1 do { find first local max in smoothed histogram } if (Histogram[Bin] > 2000) and (Histogram[Bin] >= Histogram[Bin - 1])

240
/Volumes/Home/Image SXM dev/SXM 198 CW 2 Sep/Source files/MIASMA src files/Microneedles.pas Page: 8
Thursday, September 24, 2015
and (Histogram[Bin] >= Histogram[Bin + 1]) then FirstMax := Bin; for Bin := FirstMax to 250 do { find last local maximum in smoothed histogram } if (Histogram[Bin] > 2000) and (Histogram[Bin] >= Histogram[Bin - 1]) and (Histogram[Bin] >= Histogram[Bin + 1]) then LastMax := Bin; for Bin := 250 downto FirstMax do { find first local minimum in smoothed histogram } if (Histogram[Bin] <= Histogram[Bin - 1]) and (Histogram[Bin] <= Histogram[Bin + 1]) then FirstMin := Bin; SliceStart := FirstMin + (LastMax - FirstMin) div 3 - 10; { colour epidermal layer in red } end else begin LocalMin := 0; for Bin := 240 downto 80 do { find last local minimum in smoothed histogram } if (Histogram[Bin] > 2000) and (Histogram[Bin] <= Histogram[Bin - 1]) and (Histogram[Bin] <= Histogram[Bin + 1]) then begin LocalMin := Bin; end; if LocalMin = 0 then begin { if that didn't work because of the smoothing then... } GetRectHistogram; { find last local minimum in unsmoothed histogram } for Bin := 240 downto 80 do if (Histogram[Bin] > 2000) and (Histogram[Bin] <= Histogram[Bin - 1]) and (Histogram[Bin] <= Histogram[Bin + 1]) then begin LocalMin := Bin; end; end; if LocalMin = 0 then begin LocalMin := 150; { histogram had no valley so } Beep; { set to something sensible } end; SliceStart := LocalMin; { colour epidermal layer in red } end; SliceEnd := 255; EnableDensitySlice; if not Get2clicks(Click) then begin ShowMessage('Microneedle analysis aborted'); exit; end; SaveSliceStart := SliceStart; SliceStart := 0; { colour everything but epidermal layer in red } SliceEnd := SaveSliceStart; ThresholdToForeground := true; { density slice red -> black } NonThresholdToBackground := true; { everything else -> white } Macro := true; ApplyLookupTable; { apply without dlog box } Macro := false;

241
/Volumes/Home/Image SXM dev/SXM 198 CW 2 Sep/Source files/MIASMA src files/Microneedles.pas Page: 9
Thursday, September 24, 2015 / 15:34
TakeOutBaseline; DoOpeningWithCount(3); { tidy rough edges of damage } CellsIncEdges := false; { ensure objects at edge are ignored } DoParticleAnalysisXY(-1, 999, 999999, NumFound); Measurements := [AreaM, xyLocM, LengthM]; { make sure Area is displayed in Results } if InvertYCoordinates then Click[4].pt.v := Info^.nLines - 1 - Click[4].pt.v; { for comparison with xyCenter values } xClick4 := round(Click[4].pt.h / OrigInfo^.xScale); yClick4 := round(Click[4].pt.v / OrigInfo^.yScale); MinDistSoFar := 999999; { find object closest to click 4 } for i := 1 to NumFound do begin DistToClick4 := (xCenter^[i] - xClick4) * (xCenter^[i] - xClick4) + (yCenter^[i] - yClick4) * (yCenter^[i] - yClick4); PerimLen^[i] := round(sqrt(DistToClick4)); { for diagnostics } if DistToClick4 < MinDistSoFar then begin Damage := i; MinDistSoFar := DistToClick4; end; end; { padding gives neater } DiagnosticLog(stringOf(tab, mArea^[Damage] : 6 : 0, tab, ' ', tab)); { spreadsheet output } RefreshSessionLog; { dummy call to update SLog window } Wait(60); { pause to allow user to see result } end; { –––––––––––––––––––––––––––––––––––––––––––––––––––––––––––––––––––––––––––––––––––– } procedure FilePostambleMNA (Folder: integer); begin if DoingMNAbatch then GetRidOfWindow(UseThisInfo) else ResetGrayMap; { ensures next image loads with default greyscale LUT } end; { –––––––––––––––––––––––––––––––––––––––––––––––––––––––––––––––––––––––––––––––––––– } procedure PostambleMNA; var SLogTitleStr: GPCstr; begin if DoingMNAbatch then CloseSessionLog; err := CloseAWindow(HistoWindow); HistoMag := TempHistoMag; RestoreCompensation; DoingMNA := false; DoingMNAbatch := false;

242
/Volumes/Home/Image SXM dev/SXM 198 CW 2 Sep/Source files/MIASMA src files/Microneedles.pas Page: 10
Thursday, September 24, 2015
DoingMIASMA := false; OpeningCellRGBimage := false; SuppressLog := false; SuppressMessages := false; SXMwindow := false; if AbortAnalysis then MNAstr := stringOf('Microneedle Analysis', cr, cr, 'Analysis aborted') else MNAstr := stringOf('Microneedle Analysis', cr, cr, 'Analysis complete'); SLogTitleStr := 'MNA-' {+ NaToStr(CellsLoadFolder.name)} + MakeDateTimeSuffix; SLogArrayFSpec := MakeFSpecInFolder(SLogTitleStr, CellsSaveFolder); SaveSLogToArray := false; SaveSLogArray; { save SLog Array to same folder as folder of images } ShowMessage(MNAstr); end; { –––––––––––––––––––––––––––––––––––––––––––––––––––––––––––––––––––––––––––––––––––– } procedure MicroneedleSingle; { open and analyse a single image } begin { for diagnostics and calibration } PreambleMNA; MNAsingle := true; NavServWinTitle := 'Open One Image For MNA'; SOK := DoOpenNavServ; { open single image } if not SOK then exit; CellsTotalNumImages := 1; CellsLoadFolder := GetFolderSpec(FileSpec); CellsSaveFolder := CellsLoadFolder; FilePreambleMNA(-1); DoingMNAbatch := false; NumFilesInBatch := 1; { set for single-image analysis } FileIndexInThisFolder := 1; AnalyseMicroneedles(1); FilePostambleMNA(-1); PostambleMNA; end; { –––––––––––––––––––––––––––––––––––––––––––––––––––––––––––––––––––––––––––––––––––– } procedure MicroneedleAnalysis; var Folder, NumFiles, ImageNum: integer;

243
/Volumes/Home/Image SXM dev/SXM 198 CW 2 Sep/Source files/MIASMA src files/Microneedles.pas Page: 11
Thursday, September 24, 2015
begin PreambleMNA; MNAsingle := false; if not NavServChooseFolder(FolderSpec) then exit; CellsLoadFolder := GetFolderSpec(FolderSpec); CellsSaveFolder := GetFolderSpec(CellsLoadFolder); { get specs of files in selected folder and } if not GetAllCellsFSpecs then exit; { files in folders within selected folder } DoingMNAbatch := true; NumFilesInBatch := CellsTotalNumImages; { set global var for other routines } for Folder := 0 to CellsNumFolders do begin { for each folder... } NumFiles := CellsNumFilesInFolder[Folder]; FilesDoneInPrevFolders := CellsNumFilesInPrev[Folder]; { set global var } FilePreambleMNA(Folder); if (NumFiles > 0) and not AbortAnalysis then for ImageNum := 1 to NumFiles do begin { for each image in folder... } FileIndexInThisFolder := ImageNum; { set global var } MNAstr := NaToStr(CellsSortDirRec[Folder, ImageNum].RecFileSpec.name); UpdateMNAinfoWindow(MNAstr); with CellsSortDirRec[Folder, ImageNum] do begin FileSpec := RecFileSpec; SOK := DoOpen(FileSpec); end; AnalyseMicroneedles(ImageNum); FilePostambleMNA(Folder); if AbortMIASMA then leave; { pressing 'esc' will abort } end; if AbortMIASMA then leave; { pressing 'esc' will abort } end; PostambleMNA; end; { –––––––––––––––––––––––––––––––––––––––––––––––––––––––––––––––––––––––––––––––––––– } end.