
The European Research Journal - DergiPark
153
-
Upload
khangminh22 -
Category
Documents
-
view
5 -
download
0
Transcript of The European Research Journal - DergiPark
The European Research Journal
Aim and Scope
The European Research Journal (EuRJ) is an international, independent, double-blind peer reviewed,Open Access and online publishing journal, which aims to publish papers on all the related areas of basic andclinical medicine.
Editorial Board of the European Research Journal complies with the criteria of the International Councilof Medical Journal Editors (ICMJE), the World Association of Medical Editors (WAME), and Committee onPublication Ethics (COPE).
The journal publishes a variety of manuscripts including original research, case reports, invited reviewarticles, technical reports, how-to-do it, interesting images and letters to the editor. The European ResearchJournal has signed the declaration of the Budapest Open Access Initiative. All articles are detected for similarityor plagiarism. Publication language is English. The journal does not charge any article submission or processingcharges.
EuRJ recommends that all of our authors obtain their own ORCID identifier which will be included ontheir article.
The journal is published bimonthly (January, March, May, July, September, and November).
Abstracting and Indexing
The journal is abstracted and indexed with the following: TR Index (ULAKBİM TR Dizin), GoogleScholar, Index Copernicus (ICV 2017: 100), EMBASE, ProQuest Central, ROAD, SciLit, MIAR, J-Gate,SHERPA/RoMEO, BASE, EZB, CrossRef, JournalTOCs, WorldCat, TURK MEDLINE, Turkish CitationIndex.
Publisher
The European Research Journal (EuRJ)The Association of Health Research & StrategyKırcaali Mah. Fevziçakmak Cd. Göktaş İş Mrk. Kat:3 No:62/12Osmangazi/BURSA-TURKEYwww.dergipark.gov.tr/eurj/
e-ISSN: 2149-3189
The European Research Journal, hosted by Turkish JournalPark ACADEMIC, is licensed under a Creative Commons Attribution-NonCommercial-NoDerivatives 4.0 International License.
I

II
Editorial BoardFOUNDER EDITOR
Rustem ASKIN, MD,Professor,
University of Health Sciences, Department of Psychiatry, Istanbul, TurkeyHead of the Association of Health Research & Strategy, Bursa, Turkey
EDITOR-IN-CHIEFSenol YAVUZ, MD,
Professor,University of Health Sciences, Bursa Yuksek Ihtisas Training and Research Hospital,
Department of Cardiovascular Surgery, Bursa, Turkey,
EDITORSDavut AKDUMAN, MD,
Associate Professor,Duzce University School of Medicine,
Department of Otorhinolaryngology, Duzce, Turkey
Nizameddin KOCA, MD,Assistant Professor,
University of Health Sciences, Bursa Yuksek Ihtisas Training and Research Hospital,Department of Internal Medicine, Bursa, Turkey
ASSOCIATE EDITORS
Soner CANDER, MD,Associate Professor,
Uludag University School of Medicine,Department of Endocrinology and Metabolism, Bursa, Turkey
Omer SENORMANCI, MDAssociate Professor,
University of Health Sciences, Bursa Yuksek Ihtisas Training and Research Hospital,Department of Psychiatry, Bursa, Turkey
Evren DILEKTASLI, MD,Associate Professor,
Hayat Hospital Depertment of General Surgery, Bursa, Turkey
Rahmi DUMAN, MD,Associate Professor,
LIV HospitalDepartment of Ophthalmology, Ankara, Turkey
Ali ASAN, MDAssistant Professor,
University of Health Sciences, Bursa Yuksek Ihtisas Training and Research Hospital,Department of Infectious Disease Bursa, Turkey
Meliha KASAPOGLU AKSOY, MDAssistant Professor,
University of Health Sciences, Bursa Yuksek Ihtisas Training and Research Hospital,Department of Physical Thearapy and Rehabilitation, Bursa, Turkey
STATISTICS EDITORGokhan OCAKOGLU, PhD,
Associate Professor,Uludag University School of Medicine,
Department of Biostatistics, Bursa, Turkey
LANGUAGE EDITORNazmi ZENGIN, MD,
Professor,Necmettin Erbakan University School of Medicine, Konya, Turkey
EDITORIAL ASSISTANTUgur BOLUKBAS

III
INTERNATIONAL EDITORIAL BOARD MEMBERSAhmet KIZILAY, MDProfessor, Inönü University School of Medicine, Department of Otorhinolaryngology, Malatya, TurkeyAlparslan ERSOY, MDProfessor, Uludag University School of Medicine, Department of Nephrology & Transplantation, Bursa, TurkeyAyse TOPCU AKDUMAN, MDAtaturk State Hospital, Department of Obstetrics & Gynecology, Duzce, TurkeyAron Frederik POPOV, MDProfessor, University of Frankfurt, Department of Cardiothoracic Surgery, Frankfurt, GermanyCanan CELIK, MDProfessor, Giresun University School of Medicine, Department of Physical Medicine & Rehabilitation, Giresun, TurkeyCristina Florescu, MDAssociate Professor, University of Craiova, Department of Medicine & Pharmacy, RomaniaCuma Bulent GUL, MDAssociate Professor, University of Health Sciences, Bursa Yuksek Ihtisas Training & Research Hospital, Department of Nephrology & Transplantation, Bursa,TurkeyDemet CANSARAN DUMAN, PhDAssoicate Professor, Ankara University, Department of Biology, Ankara, TurkeyElif Ekinci, MDMBBS, FRACP, PhD, University of Melbourne, Department of Medicine, Melbourne, AustraliaEmel YILMAZ, MDProfessor, Uludag University School of Medicine, Department of Infectious Disease, Bursa, TurkeyEmin USTUNYURT, MDAssociate Professor, University of Health Sciences, Bursa Yuksek Ihtisas Training & Research Hospital, Department of Obstetrics & Gynecology, Bursa, TurkeyEnder GUCLU, MDProfessor, Medipol University School of Medicine, Department of Otorhinolaryngology, Istanbul, TurkeyErdem CUBUKCU, MDAssociate Professor, Uludag University School of Medicine, Department of Medical Oncology, Bursa, TurkeyEssam M MAHFOUZ, MDProfessor, University of Mansoura School of Medicine, Department of Cardiology, Mansoura, EgyptFrancesco CARELLI, MDProfessor, University of Milan School of Medicine, Department of Family Medicine, Milan, ItalyGary TSE, MD, PhDAssistant Professor, The Chinese University of Hong Kong, Department of Medicine and Therapeutics, Hong Kong, ChinaHaci Murat CAYCI, MD,Associate Professor, University of Health Sciences, Bursa Yuksek Ihtisas Training & Research Hospital, Department of Gastrointestinal Surgery, Bursa, TurkeyHasan ARI, MD,Associate Professor, University of Health Sciences, Bursa Yuksek Ihtisas Training & Research Hospital, Department of Cardiology, Bursa, TurkeyIbrahim TAYMUR, MD, Associate Professor, University of Health Sciences, Bursa Yuksek Ihtisas Training and Research Hospital, Department of Psychiatry, Bursa, TurkeyKendra J. Grubb, MD, MHA, FACCAssistant Professor, Emory University School of Medicine, Department of Cardiovascular Surgery, Atlanta, GA, USAKoray AYAR, MDAssistant Professor, University of Health Sciences, Bursa Yuksek Ihtisas Training and Research Hospital, Department of Rheumatology, Bursa, TurkeyMetin GUCLU, MDAssociate Professor, University of Health Sciences, Bursa Yuksek Ihtisas Training & Research Hospital, Department of Endocrinology & Metabolism, Bursa,TurkeyMuhammet GUZELSOY, MDAssociate Professor, University of Health Sciences, Bursa Yuksek Ihtisas Training & Research Hospital, Department of Urology, Bursa, TurkeyMuzaffer DEMIR, MDProfessor, Trakya University School of Medicine, Department of Hematology, Edirne, TurkeyNader D NADER, MDProfessor, University of Buffalo School of Medicine, Department of Anesthesiology, NY, USANesrin COBANOGLU, MDProfessor, Gazi University School of Medicine, Department of Medical Ethics and History, Ankara, TurkeyOmer Fatih OLMEZ, MDAssociate Professor, Medipol University School of Medicine, Department of Medical Oncology, Istanbul, TurkeyOmer YALCIN, MDAssociate Professor, University of Health Sciences, Bursa Yuksek Ihtisas Training & Research Hospital, Department of Pathology, Bursa, TurkeyOzen OZ GUL, MDAssociate Professor,Uludag University School of Medicine, Department of Endocrinology and Metabolism, Bursa, TurkeyOzkan KANAT, MD,Professor, Uludag University School of Medicine, Department of Medical Oncology, Bursa, TurkeySafa KAPICIOGLU, MDProfessor, Yildirim Bayezid University School of Medicine, Department of Orthopedics & Traumatology, Ankara, TurkeySait Ait BenAli, MDProfessor, Cadi Ayyad University School of Medicine, Department of Neurosurgery, Marrakech, MoroccoSedat ALTIN, MDProfessor, University of Health Sciences,Yedikule Training & Research Hospital, Department of Chest Diseases, Istanbul, TurkeySemih HALEZEROGLU, MD, FETCSProfessor, Acibadem University School of Medicine, Department of Thoracic Surgery, Istanbul, TurkeyVeysel Tahan, MD, FACP, FACG, FESBGHAssistant Professor, University of Missouri, Division of Gastroenterology and Hepatology, Columbia, Missouri, USAYYenal DUNDAR, MDUniversity of Liverpool School of Medicine, Department of Psychiatry, Liverpool, UK
Table of Contents
Original Articles
Is there a difference in 25-hydroxyvitamin D levels between female university students with andwithout joint hypermobility?Filiz Tuna, Hande Özdemir, Derya Demirbağ Kabayel, Zeynep Banu Doğanlar
Bacterial contamination of ultrasound probes and coupling gels in a university hospital in TurkeyHakan Kıran, Murat Aral, Gürkan Kıran, Salih Serin, Deniz Cemgil Arıkan, Uğurkan Erkayıran,Hasan Çetin Ekerbiçer
Comparing the effect of two different exercise types, mini-trampoline and fast-walking togastrocnemius/soleus muscle elasticity by sonoelastrographyTuba Tülay Koca, Murat Baykara, Adnan Demirel, Ejder Berk
An assessment of vertigo patients presenting to the otorhinolaryngology and neurology outpatientclinicsSelman Sarıca, Yılmaz İnanç, Yusuf İnanç
The role of ultrasound imaging at detecting aortic aneurysm in emergency departmentSuna Eraybar, Şule Akköse Aydın, Meral Leman Özkan, Serhat Atmaca, Yasemin Nennicioglu
Relationship between students’ performance on weekly task assessments and final practical exam atthe preclinical restorative dentistry courseMuhammet Kerim Ayar
How accurate is the urine dipstick test for diagnosing urinary tract infection?Esra Paydaş Hataysal, Beyza Saraçlıgil, Hatice Türk Dağı, Hüsamettin Vatansev
Effect of an adapted physical activity program on the morphological and physiological profile ofhypertensive patients of University Clinics of KinshasaTeddy Bofosa, Betty Miangindula, Godefroid Kusuayi, Nicaise Kiana, Constant Nkiama
The correlation between red cell distribution width, autoimmunity and nail involvement in alopeciaareataGülhan Gürel
The role of inflammation markers in predicting the prognosis of Bell's palsyBülent Ulusoy, Kazım Bozdemir, Hayati Kale, Mehmet Hakan Korkmaz
Does laparoscopic appendectomy increase the risk of intra-abdominal abscess in children who haveperforated appendicitisFatih Akbıyık, Günay Ekberli, Yusuf Hakan Çavuşoğlu
Investigation of effects of neurotrophic factors on painful diabetic neuropathy: an experimentalstudyFaruk Kılınç, Ramis Çolak, Mete Özcan, Ahmet Ayar
Cardioprotective effect of vitamin D and melatonin on doxorubicin-induced cardiotoxicity in ratmodel: an electrocardiographic, scintigraphic and biochemical studySerdar Savaş Gül, Hatice Aygün
IV
576-581
582-587
588-593
594-598
599-606
607-612
613-617
618-622
623-628
629-635
636-640
641-648
649-657
Clinical and functional outcomes of extracorporeal shock wave therapy in isolated medialepicondylitisYalçın Turhan, Mehmet Arıcan, Zekeriya Okan Karaduman
Mesenteric panniculitis - a rare disorder: radiological featuresGhanshyam Dev, Anshita Gupta, Mohd Ilyas
Investigation of the comorbidity of dissociative disorders in patients with bipolar disorderAtilla Tekin, Esra Özdil Demiryürek, Mehmet Diyaddin Güleken, Bahadır Bakım, Ömer Akil Özer,Oğuz Karamustafalıoğlu
Examination of surgical and conservative treatment effects on depression of patients with moderatecarpal tunnel syndromeKenan Güvenç, Mustafa Kemal İlik, Faik İlik, Murat Gönen, Fatih Kayhan
The relationship between atherogenic index of plasma and major risk factors of cardiovasculardisease in obese and non-obese individualsSeher Sayın, Ruhuşen Kutlu, Ahmet Koçak
The alteration of first trimester screening markers in fresh and frozen-thawed blastocyst transfersNur Dokuzeylül Güngör, Tuğba Gürbüz, Ayşe Filiz Gökmen Karasu, Aynur Erşahin
Increased P wave duration and dispersion is associated with catheter-related atrial fibrillationduring electrophysiological studyYahya Kemal İçen, Hilmi Erdem Sümbül, Mevlüt Koç
Effectiveness of balance training with kinesthetic ability trainer (KAT 2000) in patients withperipheral neuropathic pain: a randomised controlled studyDuygu Kerim, Aslıhan Uzunkulaoğlu, Saime Ay
Reviews
Statin-associated myopathy: a general overviewAllam Harfoush
Case Report
Mood disorder following traumatic brain injury: a case reportBuket Koparal, Behçet Coşar
Balo’s concentric sclerosis: a case reportMeltem Özdemir, Aynur Turan, Alper Dilli
Letter to the Editor
Spinal malignant triton tumor in a patient with neurofibromatosis type 1Sevgi Kulaklı, Fazıl Kulaklı, İlker Fatih Sarı, Samet Tatlı, İlker İlhanlı, Canan Çelik
V
658-662
663-666
667-672
673-677
678-685
686-690
691-696
697-706
707-711
712-714
715-718
719-721
Is there a difference in 25-hydroxyvitamin D levels betweenfemale university students with and without jointhypermobility?Filiz Tuna1 , Hande Özdemir2 , Derya Demirbağ Kabayel2 , Zeynep Banu Doğanlar3
1Department of Physical Therapy and Rehabilitation, Trakya University School of Health Sciences, Edirne, Turkey2Department of Physical Therapy and Rehabilitation, Trakya University School of Medicine, Edirne, Turkey3Department of Medical Biology, Trakya University School of Medicine, Edirne, Turkey
ABSTRACTObjectives: Individuals with joint hypermobility (JH) constitute a sensitive group with regard tomusculoskeletal problems. This study aimed to investigate whether females with generalized jointhypermobility (GJH) are at risk of hypovitaminosis D compared with non-GJH female participants and whetherthere is a relationship between vitamin D levels, Beighton score and musculoskeletal complaints. Methods: In this cross-sectional, descriptive and case-control study, 76 female participants aged 18-25 yearswere included. The Beighton score with a cut-off of 4/9 was applied for defining GJH. In addition, serumbiochemical (the enzymatic colorimetric method) and hormonal (the electrochemiluminescence method)parameters were evaluated. Results: The mean serum 25-hydroxyvitamin D (25[OH]D) levels of GJH (n = 38) and non-GJH (n = 38)groups were 15.70 ± 7.96 ng/mL and 16.80 ± 5.45 ng/mL, respectively. There was no statistically significantdifference between the groups in terms of biochemical and hormonal parameters. We found vitamin Ddeficiency in 89.5% of participants with GJH, and 84.2% of controls. There was no correlation between vitaminD, Brighton criteria, and musculoskeletal complaints. Conclusion: The female participants with GJH showed similar frequency of musculoskeletal complaints andsimilar low level of 25(OH)D in relation to controls.
Keywords: female, joint hypermobility, musculoskeletal complaints, 25-hydroxyvitamin D deficiency
Address for correspondence: Filiz Tuna, MD., Trakya University School of Health Sciences, Department of Physical Therapy and Rehabilitation,Edirne, TurkeyE-mail: [email protected]
Copyright © 2019 by The Association of Health Research & StrategyAvailable at http://dergipark.org.tr/eurj
The European Research Journal 2019;5(4):576-581
oint hypermobility or laxity is having a range ofmotion beyond the limits of normal joint. It can
affect one or more joints. Beighton scoring (BS),where in nine joints are evaluated, is used to define JHand BS 4-6/9 is reported as generalized joint hyper-mobility (GJH) [1, 2]. Hypermobility brings with itmany problems as musculoskeletal or systemic mani-festations. Musculoskeletal manifestations are trau-
mas, degenerative joint and bone diseases, disturbedproprioception, muscle weakness and musculoskeletaltraits. Systemic manifestations are cardiovascular in-volvements, skin, mucosae, fascia involvement, andnervous system involvement [2]. These manifestationswere included easily under the umbrella named hyper-mobility syndrome or hypermobile Ehlers-Danlos syn-drome (hEDS) with Brighton criteria until the 2017
J
ORIGINAL A RTICLE
e-ISSN: 2149-3189
DOI: 10.18621/eurj.411056
Received: March 30, 2018; Accepted: May 19, 2018; Published Online: September 15, 2018
The European Research Journal Volume 5 Issue 4 July 2019 576
Eur Res J 2019;5(4):576-581 25(OH)D levels in female university students with and without joint hypermobility
International Classification of EDS that were based onstrict criteria [3].
According to updated classification hEDS is aconnective tissue disorder simultaneously comprised;1) Beighton score ≥ 5/9, 2) At least two of of featureA (at least 5 meets of a 12 systemic features of a con-nective tissue), feature B (positive family history) andfeature C (at least one existence of three muscu-loskeletal complications), and 3) Exclusion of extraor-dinary skin fragility, further connective tissuedisorders, and another diseases with JH. However, fea-ture B was accepted enough for the diagnosis [3].
Although Vitamin D is a hormone that is es-sential for functioning of muscles, as well as bonemineralization [4], until now, no study has reported vi-tamin D levels in GJH and its correlation with muscu-loskeletal complaints. Hypermobile EDS with GJH isreported as risk for chronic pain, fatigue [5], low bonedensity, osteoporosis, and fractures [6, 7]. While man-agement suggestions include considering 25-hydrox-yvitamin D (25[OH]D) deficiency, there is no enoughdata on levels of 25(OH)D in EDS groups as well asGJH [8-11]. Considering the possibility that individu-als with GJH differ from controls in mean of level of25(OH)D and some biochemical parameters (sodium,potassium, chlorine, alkaline phosphatase, calcium,phosphorus, magnesium, iron, and iron binding capac-ity levels) we aimed to evaluate them and comprisewith controls.
METHODS
Patients For the aims of this study, we selected femaleswith definition of GJH according to the Beightonscoring, aged between 18-25 years. Participants wereselected from a total of 221 female students from theHealth Sciences Faculty of Trakya University (Edirne,Turkey). A group of students with Beighton score ≤3/9 and no any genetic disorder, chronic drug use andchronic disease of locomotor system was selected ascontrol. All participant were selected from the samesources. Controls were matched by age and sex withindividuals with GJH. Participants with a Beightonscore of ≥ 4/9 were included in the GJH group andthose with a score ≤ 3/9 were included in the controlgroup (non-GJH) [12]. Exclusion criteria were male
sex, drug use, and the presence of a known disease inboth groups (Figure 1). Based on the mean 25(OH)Dvitamin level 26.3 in the control group [13] andminimum difference between groups of 25%, an αerror of 5%, SD of 10%, and power 80% we defineda sample of 38 participants for each group. Thisobservational, cross-sectional (between February 2017and July 2017), controlled, quantitative study wasapproved by the Ethics Committee of the TrakyaUniversity Medical Faculty (TÜTF-BAEK-2016/105)and written informed consent was obtained from eachparticipants. Edirne is city in the Marmara Region of Turkey,latitudes 40°30-42°00 North l and 26°00-27°00 East.Average maximum temperatures range between 6.5°Cin winter and 31.7°C in summer, with annual averageof 19.6°C [14].
Clinical Evaluation A total of 221 female students from HealthScience Faculty of Trakya University (Edirne, Turkey)underwent an initial clinical interview and Beightonscoring. Beighton scoring was performed byevaluating nine joints and the following items:I- Placement of hands flat on the floor without bendingthe kneesII- Hyperextension of the elbow to ≥ 10°III- Hyperextension of the knee to ≥ 10°IV- Opposition of the thumb to the volar aspect of theipsilateral forearmV- Passive dorsiflexion of the fifthmetacarpophalangeal joint to ≥ 90° [15]. Duringphysical examination, we investigated the presence offeatures used in the diagnosis of hEDS according tothe 2017 International Classification of EDS [3]. Datacollected included age, sex, height, weight, BMI,clothing style, and history of musculoskeletalcomplaint. To evaluate history of the musculoskeletalcomplaint, participants were questioned aboutthe jointpain, widespread musculoskeletal pain and soft tissueinjuries. Clothing style of the participants wasregistered by researchers based on their observationsas veiled or not.
Laboratory Evaluation After 10-12 h fasting, venous blood samplesfromthe antecubital area were taken from allparticipants between 08.30 and 9.00 in the morning
577 The European Research Journal Volume 5 Issue 4 July 2019
Eur Res J 2019;5(4):576-581 Tuna et al
from April 2017 to May 2017. Serum sodium,potassium, chlorine, alkaline phosphatase, calcium,phosphorus, magnesium, iron, and iron bindingcapacity levels were measured using the enzymaticcolorimetric method (Beckman Coulter AU 5800), andserum 25(OH)D, folic acid, and ferritin levels wereevaluated using the electrochemiluminescence method(Beckman Coulter UniCelDxI 600). 25(OH)D levelsof participants were classified according to theEndocrine Society asdeficiency (< 20 ng/mL),insufficiency (21-29 ng/mL), normallevels (30-39ng/mL), and preferred levels (40-60 ng/mL) [16].
Statistical Analysis Statistical evaluation was performed by the IBMSPSS version 20.0 statistics software package (IBMCorporation, Armonk, NY, USA). Descriptivevariables were reported within groups according tofrequency, means, standard deviation, andpercentages. Normal distribution were evaluated bythe Shapiro-Wilk test. T test was used for normallydistributed data. Spearman’s rho correlation analysistest was used to assess correlations between variables.A p value of < 0.05 was considered statisticallysignificant.
The European Research Journal Volume 5 Issue 4 July 2019 578
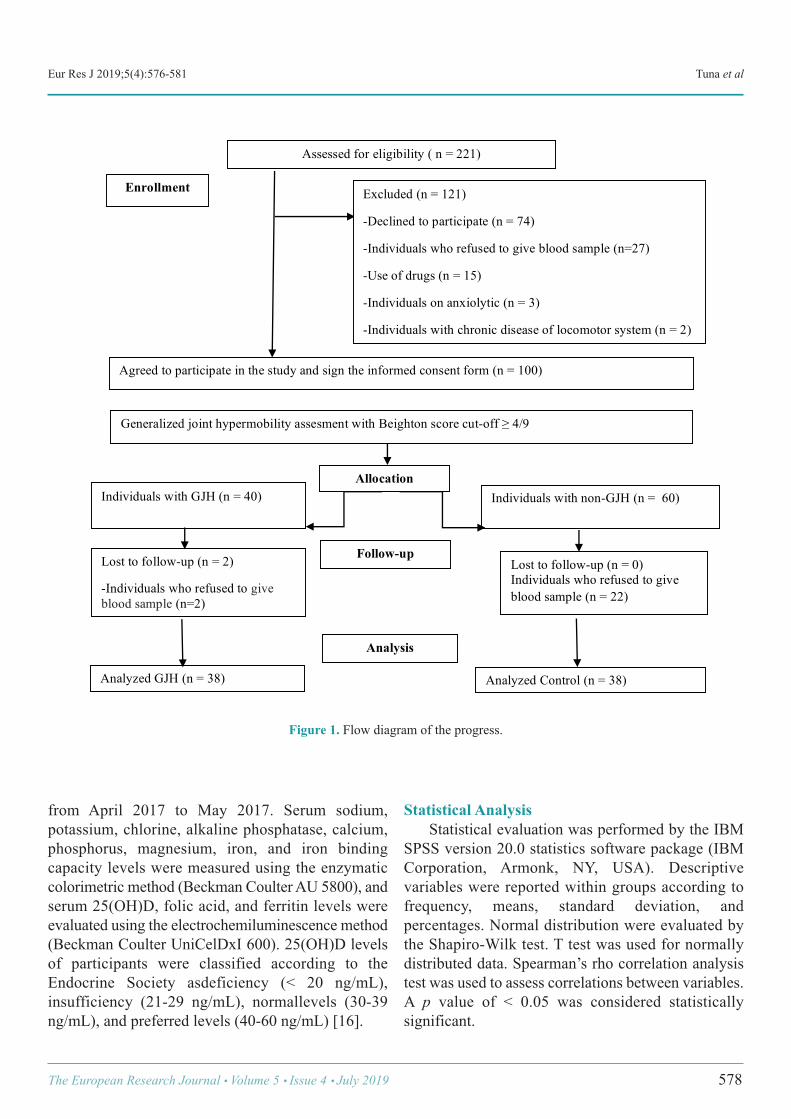
Generalized joint hypermobility assesment with Beighton score cut-off ! 4/9
Assessed for eligibility ( n = 221)
Individuals with GJH (n = 40)
Individuals with non-GJH (n = 60)
Analyzed GJH (n = 38) Analyzed Control (n = 38)
Enrollment
Agreed to participate in the study and sign the informed consent form (n = 100)
Allocation
Follow-up Lost to follow-up (n = 2)
-Individuals who refused to give blood sample (n=2)
Lost to follow-up (n = 0) Individuals who refused to give blood sample (n = 22)
Analysis
Excluded (n = 121)
-Declined to participate (n = 74)
-Individuals who refused to give blood sample (n=27)
-Use of drugs (n = 15)
-Individuals on anxiolytic (n = 3)
-Individuals with chronic disease of locomotor system (n = 2)
Figure 1. Flow diagram of the progress.
Eur Res J 2019;5(4):576-581 25(OH)D levels in female university students with and without joint hypermobility
RESULTS
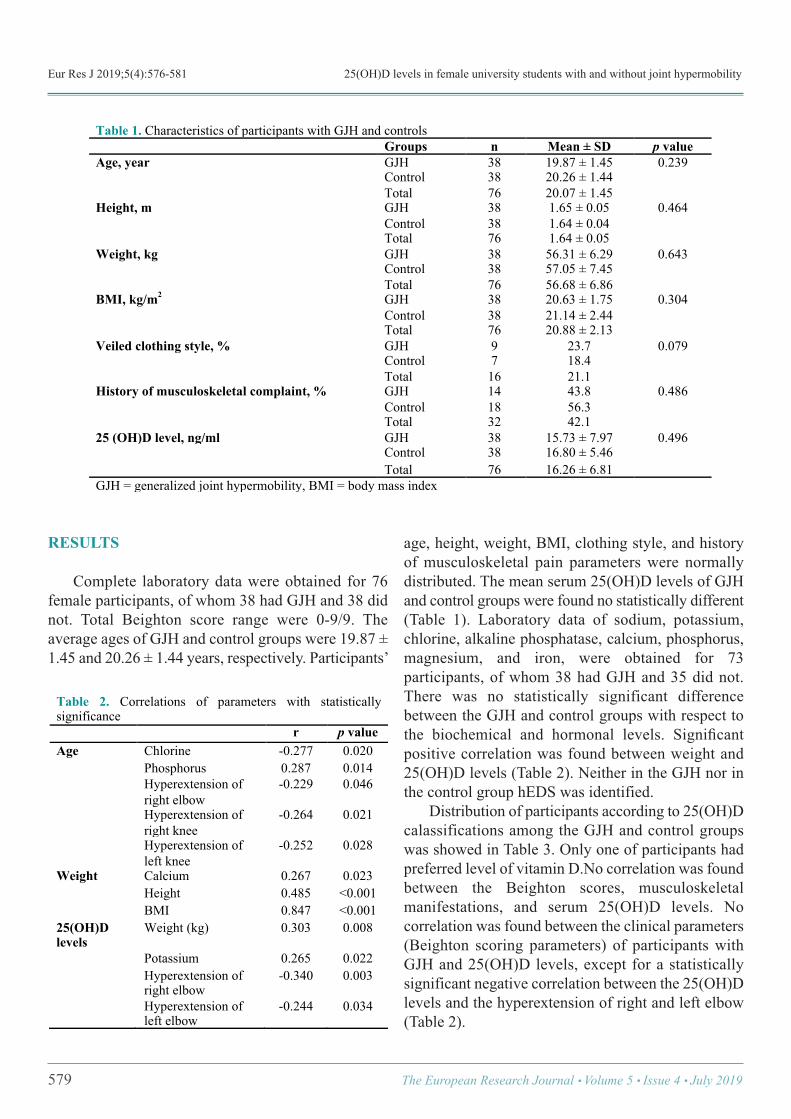
Complete laboratory data were obtained for 76female participants, of whom 38 had GJH and 38 didnot. Total Beighton score range were 0-9/9. Theaverage ages of GJH and control groups were 19.87 ±1.45 and 20.26 ± 1.44 years, respectively. Participants’
age, height, weight, BMI, clothing style, and historyof musculoskeletal pain parameters were normallydistributed. The mean serum 25(OH)D levels of GJHand control groups were found no statistically different(Table 1). Laboratory data of sodium, potassium,chlorine, alkaline phosphatase, calcium, phosphorus,magnesium, and iron, were obtained for 73participants, of whom 38 had GJH and 35 did not.There was no statistically significant differencebetween the GJH and control groups with respect tothe biochemical and hormonal levels. Significantpositive correlation was found between weight and25(OH)D levels (Table 2). Neither in the GJH nor inthe control group hEDS was identified. Distribution of participants according to 25(OH)Dcalassifications among the GJH and control groupswas showed in Table 3. Only one of participants hadpreferred level of vitamin D.No correlation was foundbetween the Beighton scores, musculoskeletalmanifestations, and serum 25(OH)D levels. Nocorrelation was found between the clinical parameters(Beighton scoring parameters) of participants withGJH and 25(OH)D levels, except for a statisticallysignificant negative correlation between the 25(OH)Dlevels and the hyperextension of right and left elbow(Table 2).
579 The European Research Journal Volume 5 Issue 4 July 2019
Table 1. Characteristics of participants with GJH and controls Groups n Mean ± SD p value Age, year GJH 38 19.87 ± 1.45 0.239
Control 38 20.26 ± 1.44 Total 76 20.07 ± 1.45
Height, m GJH 38 1.65 ± 0.05 0.464 Control 38 1.64 ± 0.04 Total 76 1.64 ± 0.05
Weight, kg GJH 38 56.31 ± 6.29 0.643 Control 38 57.05 ± 7.45 Total 76 56.68 ± 6.86
BMI, kg/m2 GJH 38 20.63 ± 1.75 0.304 Control 38 21.14 ± 2.44 Total 76 20.88 ± 2.13
Veiled clothing style, % GJH 9 23.7 0.079 Control 7 18.4 Total 16 21.1
History of musculoskeletal complaint, % GJH 14 43.8 0.486 Control 18 56.3 Total 32 42.1
25 (OH)D level, ng/ml GJH 38 15.73 ± 7.97 0.496 Control 38 16.80 ± 5.46 Total 76 16.26 ± 6.81 GJH = generalized joint hypermobility, BMI = body mass index !
Table 2. Correlations of parameters with statistically significance r p value Age Chlorine -0.277 0.020 Phosphorus 0.287 0.014 Hyperextension of
right elbow -0.229 0.046
Hyperextension of right knee
-0.264 0.021
Hyperextension of left knee
-0.252 0.028
Weight Calcium 0.267 0.023 Height 0.485 ˂0.001 BMI 0.847 ˂0.001 25(OH)D levels
Weight (kg) 0.303 0.008
Potassium 0.265 0.022 Hyperextension of
right elbow -0.340 0.003
Hyperextension of left elbow
-0.244 0.034
!
Eur Res J 2019;5(4):576-581 Tuna et al
DISCUSSION
Present study shows that mean 25(OH)D levelsare low, but not statistically different in females withGJH. We also found no statistically significantassociation between Beighton scoring andneitherhistory of musculoskeletal complaint nor25(OH)D levels. While GJH is widely known aspredisposing to musculoskeletal pain, neither vitaminD deficiency nor insufficiency is not sufficientlyresearched in this population. Significant positivecorrelation was found between weight, BMI and25(OH)D levels. These results are not consistent withprevious studies reporting negative correlationbetween BMI and vitamin D in healthy adults [17].This wasprobably due to both groups having normalmean BMI. The lack of association between 25(OH)D levelsand musculoskeletal complaints was probably becauseof both groups having levels below normal limits.These results are uniform with other studies that alsoreported no association between these variables. Inretrospective multicenter study on patients whoapplied to physical medicine and rehabilitationoutpatient clinics with non-specific muscle pain,vitamin D deficiency was detected in 70.9% ofpatients (without information about whether patientsare hypermobile or not). However, vitamin Ddeficiency in this population was reported notassociated with the severity and duration of pain [18]. Hypermobility, vitamin D deficiency, and female sexare risk factors for idiopathic musculoskeletal pain[11]. Of these, hypermobility and female sex arestructural unchanging factors. However, it is possibleto misdiagnosed musculoskeletal pain associated with
vitamin D deficiency as a pain syndrome associatedwith joint laxity or vice versa. There are limitednumber of publications on the role of 25(OH)D inhEDS, defined by the Brighton criteria, where GJHand various symptoms as joint pain are questionedtogether [6, 9, 19, 20]. Some publications suggest thatvitamin D should be observed in painful individualswith hEDS [9, 20]. We found similar serum 25(OH)Dlevels between the groups and deficiency was foundin 89.5% of participants with GJH, and 84.2% ofcontrols. These findings are consistent with lowvitamin D levels in eight of 14 cases with vasculartype EDS with mean age of 37 ± 16 years [21].Vitamin D levels < 30 ng/mL were reported to besimilar in classical and hypermobility type EDS (86%)and control (82%) groups with a mean age of 40.3 ±5.9 years. Mean serum 25(OH)D levels of individualswith classical or hypermobility type EDS have beenreported as 20.2 ± 12.9 ng/mL [6]. The participants with GJH showed no higherfrequency of musculoskeletal complaints in relation tocontrol participants, refusing the profile waited for thispopulation, according to the literature. It was probablydue to 25(OH)D in both groups below therecommended levels.
Limitations A potential limitation of this study was limitednumber of participants. Current study did not includequestionnaires interesting in socioeconomic status andvitamin D intake in the diet. In addition, our study wasmainly female student-based and the need to establishknowledge on GJH and hEDS require studies withlarge population.
The European Research Journal Volume 5 Issue 4 July 2019 580
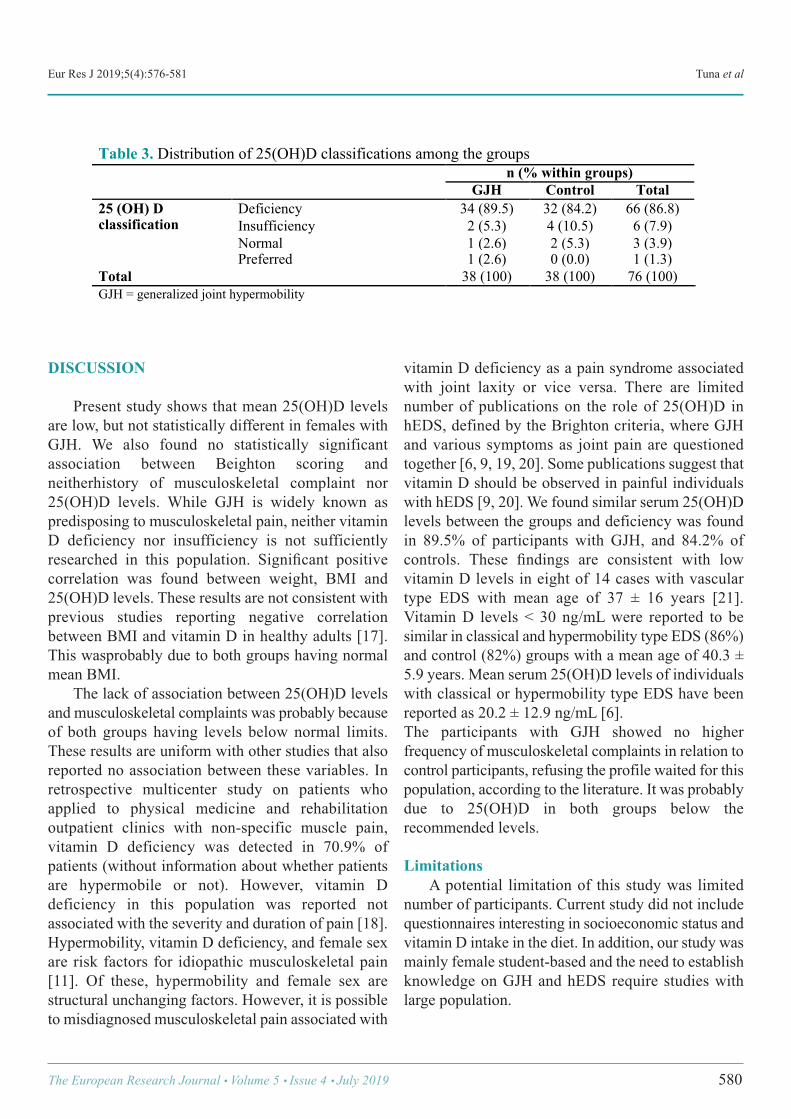
Table 3. Distribution of 25(OH)D classifications among the groups n (% within groups)
GJH Control Total 25 (OH) D classification
Deficiency 34 (89.5) 32 (84.2) 66 (86.8) Insufficiency 2 (5.3) 4 (10.5) 6 (7.9) Normal 1 (2.6) 2 (5.3) 3 (3.9)
Preferred 1 (2.6) 0 (0.0) 1 (1.3) Total 38 (100) 38 (100) 76 (100) GJH = generalized joint hypermobility !
Eur Res J 2019;5(4):576-581 25(OH)D levels in female university students with and without joint hypermobility
CONCLUSION
The female participants with GJH showed similarfrequency of musculoskeletal complaints and low25(OH)D levels in relation to controls. The frequencyof deficiency and insufficiency of 25(OH)D in currentstudy is parallel to studies, reporting a high frequencyof vitamin D below normal limits, even in places withplenty sunlight.
Conflict of interest The authors disclosed no conflict of interest duringthe preparation or publication of this manuscript.
Financing This study was supported by the TrakyaUniversity Research Project Foundation (ProjectNumber: TÜBAP-2017/08), Edirne, Turkey.
Acknowledgements We are particularly grateful to all individuals whovolunteered to participate in this study. We also thankProf. Dr. Necdet Süt, who performed the statisticalanalysis of the study.
REFERENCES
[1] Beighton P, De Paepe A, Steinmann B, Tsipouras P, WenstrupRJ. Ehlers-Danlos syndromes: revised nosology. Villefranche,1997. Ehlers-Danlos National Foundation (USA) and Ehlers-Danlos Support Group (UK). Am J Med Genet 1988;77:31-7. [2] Castori M, Tinkle B, Levy H, Grahame R, Malfait F, HakimA. A framework for the classification of joint hypermobility andrelated conditions. Am J Med Genet C Semin Med Genet CSemin Med Genet 2017;175:148-57. [3] Malfait F, Francomano C, Byers P, Belmont J, Berglund B,Black J, et al. The 2017 international classification of the Ehlers-Danlos syndromes. Am J Med Genet 2017;175:8-26. [4] Wintermeyer E, Ihle C, Ehnert S, Stöckle U, Ochs G, de ZwartP, et al. Crucial role of vitamin D in the musculoskeletal system.Nutrients 2016;8. pii:E319. [5] Rombaut L, Scheper M, De Wandele I, De Vries J, Meeus M,Malfait F, et al. Chronic pain in patients with the hypermobilitytype of Ehlers–Danlos syndrome: evidence for generalizedhyperalgesia. Clin Rheumatol 2015;34:1121-9. [6] Eller-Vainicher C, Bassotti A, Imeraj A, Cairoli E, UlivieriFM, Cortini F, et al. Bone involvement in adult patients affectedwith Ehlers-Danlos syndrome. Osteoporosis Int 2016;27:2525-
31. [7] Gulbahar S, Sahin E, Baydar M, Bircan C, Kizil R, ManisaliM, et al. Hypermobility syndrome increases the risk for low bonemass. Clin Rheumatol 2006;25:511-4. [8] Scheper MC, de Vries JE, de Vos R, Verbunt J, Nollet F,Engelbert RH. Generalized joint hypermobility in professionaldancers: a sign of talent or vulnerability? Rheumatology2013;52:651-8. [9] Kumar B, Lenert P. Joint hypermobility syndrome:recognizing a commonly overlooked cause of chronic pain. AmJ Med 2017;130:640-7. [10] Engelbert RH, Juul-Kristensen B, Pacey V, de Wandele I,Smeenk S, Woinarosky N, et al. The evidence-based rationalefor physical therapy treatment of children, adolescents, and adultsdiagnosed with joint hypermobility syndrome/hypermobileEhlers Danlos syndrome. Am J Med Genet C Semin Med Genet2017;175:158-67. [11] Joghee S, Dewan V, Chhabra A, Jahan A, Sharma N, YadavTP. Vitamin D levels in children with idiopathic musculoskeletalpain. Int J Basic Appl Sci 2014;3:21-7. [12] Juul-Kristensen B, Røgind H, Jensen DV, Remvig L. Inter-examiner reproducibility of tests and criteria for generalized jointhypermobility and benign joint hypermobility syndrome.Rheumatology (Oxford) 2007;46:1835-41. [13] Kasapoğlu Aksoy M, Altan L, Ökmen Metin B. Therelationship between balance and vitamin 25(OH)D infibromyalgia patients. Mod Rheumatol 2017;27:868-74. [14] [cited 2018 20/03/2018]; Available from:https://mgm.gov.tr/veridegerlendirme/il-ve-ilceler-istatistik.aspx?m=EDIRNE. [15] Beighton P, Solomon L, Soskolne C. Articular mobility inan African population. Ann Rheum Dis 1973;32:413-8. [16] Holick MF, Binkley NC, Bischoff-Ferrari HA, Gordon CM,Hanley DA, Heaney RP, et al. Evaluation, treatment, andprevention of vitamin D deficiency: an Endocrine Society clinicalpractice guideline. J Clin Endocrinol Metab 2011;96:1911-30. [17] Parikh SJ, Edelman M, Uwaifo GI, Freedman RJ, Semega-Janneh M, Reynolds J, et al. The relationship between obesityand serum 1, 25-dihydroxy vitamin D concentrations in healthyadults. J Clin Endocrinol Metab 2004;89:1196-9. [18] Karahan AY, Hüner B, Kuran B, Sezer N, Çelik C, SalbaşE, et al. [Assessment of the relationship between vitamin D leveland non-specific musculoskeletal system pain: a multicenterretrospective study (Stroke Study Group)]. Turk J Osteoporos2017;23:61-6. [Article in Turkish] [19] Holick M, Hossein-Nezhad A, Tabatabaei F. Multiplefractures in infants who have Ehlers-Danlos/hypermobilitysyndrome and or vitamin D deficiency: a case series of 72 infantswhose parents were accused of child abuse and neglect.Dermatoendocrinol 2017;9:e1279768. [20] Busch A, Hoffjan S, Bergmann F, Hartung B, Jung H, HanelD, et al. Vascular type Ehlers-Danlos syndrome is associated withplatelet dysfunction and low vitamin D serum concentration.Orphanet J Rare Dis 2016;11:111.
581 The European Research Journal Volume 5 Issue 4 July 2019
This is an open access article distributed under the terms of Creative CommonAttribution-NonCommercial-NoDerivatives 4.0 International License.
Bacterial contamination of ultrasound probes and couplinggels in a university hospital in TurkeyHakan Kıran1 , Murat Aral2 , Gürkan Kıran1 , Salih Serin1 , Deniz Cemgil Arıkan1 , UğurkanErkayıran1 , Hasan Çetin Ekerbiçer3
1Department of Obstetrics and Gynecology, Sütçü İmam University School of Medicine, Kahramanmaraş, Turkey 2Department of Microbiology, Sütçü İmam University School of Medicine, Kahramanmaraş, Turkey 3Department of Public Health, Sütçü İmam University School of Medicine, Kahramanmaraş, Turkey
ABSTRACTObjectives:Nosocomial outbreaks of infection originating from ultrasound probes and contaminated couplinggels have been reported. It was reported that the ultrasound probe, if cultured after routine scanning of intactskin, may become colonized with skin flora. Methods: Culture swabs from 22 probes of the 9 ultrasound machines and from the gels in the 10 gel folderswere taken. All swabs taken from probe head, probe holder and the coupling gel in the folder at the beginningof the day were cultured. After fifth scanning and after wiping off the gel with a dry, nonsterile paper towel,cultures were again obtained from probe head and probe holder. Results: A total of 98 culture results were included of which 42.8% were positive for bacterial growth. Therate of bacterial contamination from probes at morning before the start of examination and after scanning were34.1% and 56.8%, respectively and this difference was statistically significant (p = 0.023). Conclusions: We think that using nonsterile, dry, soft and absorbent paper towel after each procedure, couldbe inadequate for disinfection of probe head. Especially, good hand hygiene could decrease the rate of growthof bacterial colony at probe handle.
Keywords: Bacterial contamination, ultrasound, coupling gel, nosocomial infections
Address for correspondence: Uğurkan Erkayıran, MD., Sütçü İmam University School of Medicine, Department of Obstetrics and Gynecology,Kahramanmaraş,TurkeyE-mail: [email protected]
Copyright © 2019 by The Association of Health Research & StrategyAvailable at http://dergipark.org.tr/eurj
The European Research Journal 2019;5(4):582-587
nosocomial infection which means “hospital ac-quired infection” can be defined as: an infection
acquired in hospital by a patient who was admitted fora reason other than that infection [1]. Nosocomial in-fections are hospital-acquired infections that occur 48hrs after the admission of the patients to the hospital[2]. They occur worldwide and affect both developedand resource-poor countries. A prevalence survey con-ducted under the auspices of WHO in 55 hospitals of
14 countries showed an average of 8.7% of hospitalpatients had nosocomial infections [3]. The hospital environment plays a crucial role inthe transmission of organisms associated with noso-comial infections [4]. Nosocomial infections have be-come an increasingly recognised problem and medicaldevices can be one of the vehicles for the spread ofthese infections. Medical equipments including bron-choscopes, gastrointestinal endoscopes, stethoscopes
A
ORIGINAL A RTICLE
e-ISSN: 2149-3189
DOI: 10.18621/eurj.401327
Received: March 5, 2018; Accepted: August 9, 2018; Published Online: November 6, 2018
The European Research Journal Volume 5 Issue 4 July 2019 582
Eur Res J 2019;5(4):582-587 Bacterial contamination of ultrasound probes and coupling gels
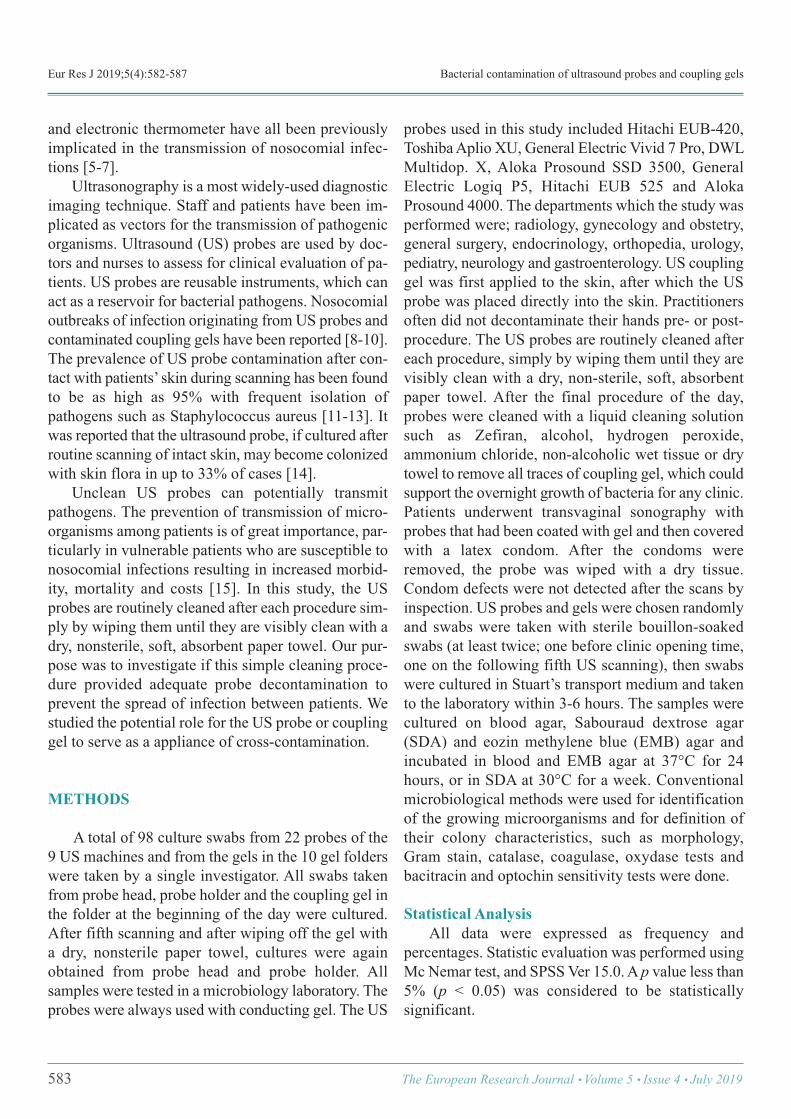
and electronic thermometer have all been previouslyimplicated in the transmission of nosocomial infec-tions [5-7]. Ultrasonography is a most widely-used diagnosticimaging technique. Staff and patients have been im-plicated as vectors for the transmission of pathogenicorganisms. Ultrasound (US) probes are used by doc-tors and nurses to assess for clinical evaluation of pa-tients. US probes are reusable instruments, which canact as a reservoir for bacterial pathogens. Nosocomialoutbreaks of infection originating from US probes andcontaminated coupling gels have been reported [8-10].The prevalence of US probe contamination after con-tact with patients’ skin during scanning has been foundto be as high as 95% with frequent isolation ofpathogens such as Staphylococcus aureus [11-13]. Itwas reported that the ultrasound probe, if cultured afterroutine scanning of intact skin, may become colonizedwith skin flora in up to 33% of cases [14]. Unclean US probes can potentially transmitpathogens. The prevention of transmission of micro-organisms among patients is of great importance, par-ticularly in vulnerable patients who are susceptible tonosocomial infections resulting in increased morbid-ity, mortality and costs [15]. In this study, the USprobes are routinely cleaned after each procedure sim-ply by wiping them until they are visibly clean with adry, nonsterile, soft, absorbent paper towel. Our pur-pose was to investigate if this simple cleaning proce-dure provided adequate probe decontamination toprevent the spread of infection between patients. Westudied the potential role for the US probe or couplinggel to serve as a appliance of cross-contamination.
METHODS
A total of 98 culture swabs from 22 probes of the9 US machines and from the gels in the 10 gel folderswere taken by a single investigator. All swabs takenfrom probe head, probe holder and the coupling gel inthe folder at the beginning of the day were cultured.After fifth scanning and after wiping off the gel witha dry, nonsterile paper towel, cultures were againobtained from probe head and probe holder. Allsamples were tested in a microbiology laboratory. Theprobes were always used with conducting gel. The US
probes used in this study included Hitachi EUB-420,Toshiba Aplio XU, General Electric Vivid 7 Pro, DWLMultidop. X, Aloka Prosound SSD 3500, GeneralElectric Logiq P5, Hitachi EUB 525 and AlokaProsound 4000. The departments which the study wasperformed were; radiology, gynecology and obstetry,general surgery, endocrinology, orthopedia, urology,pediatry, neurology and gastroenterology. US couplinggel was first applied to the skin, after which the USprobe was placed directly into the skin. Practitionersoften did not decontaminate their hands pre- or post-procedure. The US probes are routinely cleaned aftereach procedure, simply by wiping them until they arevisibly clean with a dry, non-sterile, soft, absorbentpaper towel. After the final procedure of the day,probes were cleaned with a liquid cleaning solutionsuch as Zefiran, alcohol, hydrogen peroxide,ammonium chloride, non-alcoholic wet tissue or drytowel to remove all traces of coupling gel, which couldsupport the overnight growth of bacteria for any clinic.Patients underwent transvaginal sonography withprobes that had been coated with gel and then coveredwith a latex condom. After the condoms wereremoved, the probe was wiped with a dry tissue.Condom defects were not detected after the scans byinspection. US probes and gels were chosen randomlyand swabs were taken with sterile bouillon-soakedswabs (at least twice; one before clinic opening time,one on the following fifth US scanning), then swabswere cultured in Stuart’s transport medium and takento the laboratory within 3-6 hours. The samples werecultured on blood agar, Sabouraud dextrose agar(SDA) and eozin methylene blue (EMB) agar andincubated in blood and EMB agar at 37°C for 24hours, or in SDA at 30°C for a week. Conventionalmicrobiological methods were used for identificationof the growing microorganisms and for definition oftheir colony characteristics, such as morphology,Gram stain, catalase, coagulase, oxydase tests andbacitracin and optochin sensitivity tests were done.
Statistical Analysis All data were expressed as frequency andpercentages. Statistic evaluation was performed usingMc Nemar test, and SPSS Ver 15.0. A p value less than5% (p < 0.05) was considered to be statisticallysignificant.
583 The European Research Journal Volume 5 Issue 4 July 2019
Eur Res J 2019;5(4):582-587 Kıran et al
RESULTS
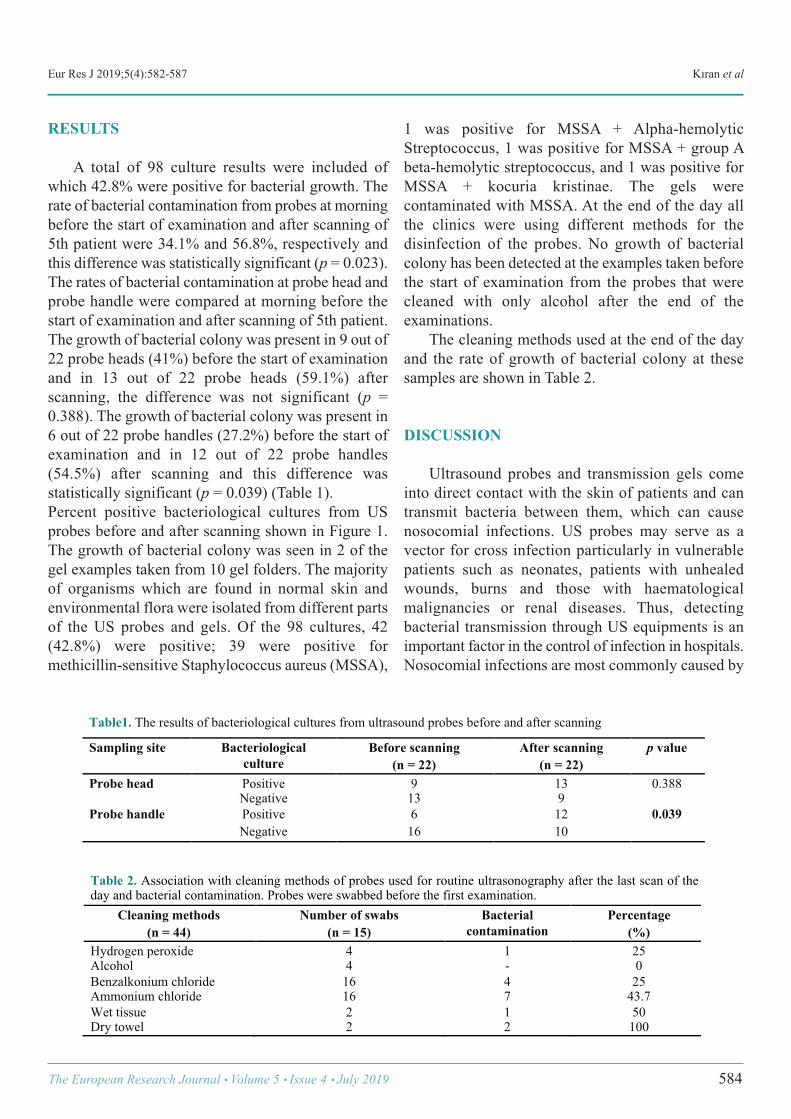
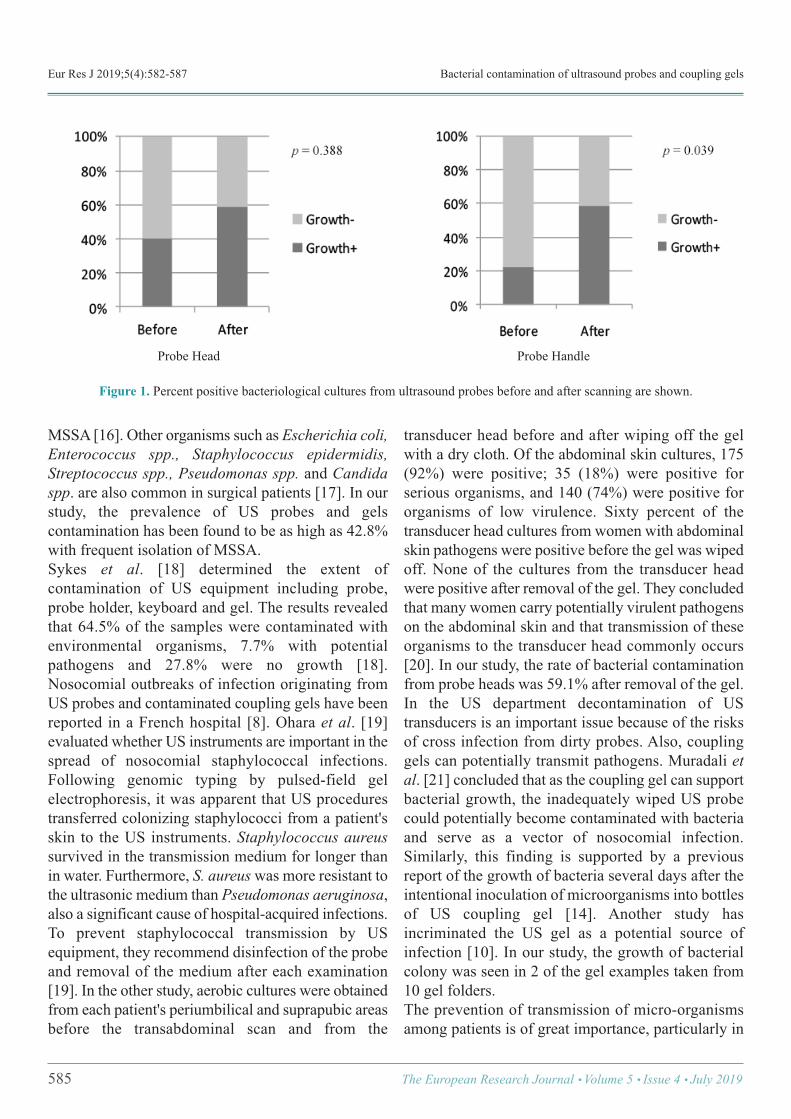
A total of 98 culture results were included ofwhich 42.8% were positive for bacterial growth. Therate of bacterial contamination from probes at morningbefore the start of examination and after scanning of5th patient were 34.1% and 56.8%, respectively andthis difference was statistically significant (p = 0.023).The rates of bacterial contamination at probe head andprobe handle were compared at morning before thestart of examination and after scanning of 5th patient.The growth of bacterial colony was present in 9 out of22 probe heads (41%) before the start of examinationand in 13 out of 22 probe heads (59.1%) afterscanning, the difference was not significant (p =0.388). The growth of bacterial colony was present in6 out of 22 probe handles (27.2%) before the start ofexamination and in 12 out of 22 probe handles(54.5%) after scanning and this difference wasstatistically significant (p = 0.039) (Table 1). Percent positive bacteriological cultures from USprobes before and after scanning shown in Figure 1.The growth of bacterial colony was seen in 2 of thegel examples taken from 10 gel folders. The majorityof organisms which are found in normal skin andenvironmental flora were isolated from different partsof the US probes and gels. Of the 98 cultures, 42(42.8%) were positive; 39 were positive formethicillin-sensitive Staphylococcus aureus (MSSA),
1 was positive for MSSA + Alpha-hemolyticStreptococcus, 1 was positive for MSSA + group Abeta-hemolytic streptococcus, and 1 was positive forMSSA + kocuria kristinae. The gels werecontaminated with MSSA. At the end of the day allthe clinics were using different methods for thedisinfection of the probes. No growth of bacterialcolony has been detected at the examples taken beforethe start of examination from the probes that werecleaned with only alcohol after the end of theexaminations. The cleaning methods used at the end of the dayand the rate of growth of bacterial colony at thesesamples are shown in Table 2.
DISCUSSION
Ultrasound probes and transmission gels comeinto direct contact with the skin of patients and cantransmit bacteria between them, which can causenosocomial infections. US probes may serve as avector for cross infection particularly in vulnerablepatients such as neonates, patients with unhealedwounds, burns and those with haematologicalmalignancies or renal diseases. Thus, detectingbacterial transmission through US equipments is animportant factor in the control of infection in hospitals.Nosocomial infections are most commonly caused by
The European Research Journal Volume 5 Issue 4 July 2019 584
Table1. The results of bacteriological cultures from ultrasound probes before and after scanning
Sampling site Bacteriological culture
Before scanning (n = 22)
After scanning (n = 22)
p value
Probe head Positive 9 13 0.388 Negative 13 9
Probe handle Positive 6 12 0.039 Negative 16 10
!
Table 2. Association with cleaning methods of probes used for routine ultrasonography after the last scan of the day and bacterial contamination. Probes were swabbed before the first examination.
Cleaning methods (n = 44)
Number of swabs (n = 15)
Bacterial contamination
Percentage (%)
Hydrogen peroxide 4 1 25 Alcohol 4 - 0 Benzalkonium chloride 16 4 25 Ammonium chloride 16 7 43.7 Wet tissue 2 1 50 Dry towel 2 2 100 !
Eur Res J 2019;5(4):582-587 Bacterial contamination of ultrasound probes and coupling gels
MSSA [16]. Other organisms such as Escherichia coli,Enterococcus spp., Staphylococcus epidermidis,Streptococcus spp., Pseudomonas spp. and Candidaspp. are also common in surgical patients [17]. In ourstudy, the prevalence of US probes and gelscontamination has been found to be as high as 42.8%with frequent isolation of MSSA. Sykes et al. [18] determined the extent ofcontamination of US equipment including probe,probe holder, keyboard and gel. The results revealedthat 64.5% of the samples were contaminated withenvironmental organisms, 7.7% with potentialpathogens and 27.8% were no growth [18].Nosocomial outbreaks of infection originating fromUS probes and contaminated coupling gels have beenreported in a French hospital [8]. Ohara et al. [19]evaluated whether US instruments are important in thespread of nosocomial staphylococcal infections.Following genomic typing by pulsed-field gelelectrophoresis, it was apparent that US procedurestransferred colonizing staphylococci from a patient'sskin to the US instruments. Staphylococcus aureussurvived in the transmission medium for longer thanin water. Furthermore, S. aureuswas more resistant tothe ultrasonic medium than Pseudomonas aeruginosa,also a significant cause of hospital-acquired infections.To prevent staphylococcal transmission by USequipment, they recommend disinfection of the probeand removal of the medium after each examination[19]. In the other study, aerobic cultures were obtainedfrom each patient's periumbilical and suprapubic areasbefore the transabdominal scan and from the
transducer head before and after wiping off the gelwith a dry cloth. Of the abdominal skin cultures, 175(92%) were positive; 35 (18%) were positive forserious organisms, and 140 (74%) were positive fororganisms of low virulence. Sixty percent of thetransducer head cultures from women with abdominalskin pathogens were positive before the gel was wipedoff. None of the cultures from the transducer headwere positive after removal of the gel. They concludedthat many women carry potentially virulent pathogenson the abdominal skin and that transmission of theseorganisms to the transducer head commonly occurs[20]. In our study, the rate of bacterial contaminationfrom probe heads was 59.1% after removal of the gel. In the US department decontamination of UStransducers is an important issue because of the risksof cross infection from dirty probes. Also, couplinggels can potentially transmit pathogens. Muradali etal. [21] concluded that as the coupling gel can supportbacterial growth, the inadequately wiped US probecould potentially become contaminated with bacteriaand serve as a vector of nosocomial infection.Similarly, this finding is supported by a previousreport of the growth of bacteria several days after theintentional inoculation of microorganisms into bottlesof US coupling gel [14]. Another study hasincriminated the US gel as a potential source ofinfection [10]. In our study, the growth of bacterialcolony was seen in 2 of the gel examples taken from10 gel folders. The prevention of transmission of micro-organismsamong patients is of great importance, particularly in
585 The European Research Journal Volume 5 Issue 4 July 2019
Figure 1. Percent positive bacteriological cultures from ultrasound probes before and after scanning are shown.
Probe Head Probe Handle
Eur Res J 2019;5(4):582-587 Kıran et al
vulnerable patients who are susceptible to nosocomialinfections, resulting in increased morbidity, mortalityand costs [15]. The literature on US probe cleaningand minimising the risks of cross infection agrees thatcleaning and sterilising is essential [22]. Aylirffe et al.[23] summarized the infection control guidelines inhospitals, which needs to be tailored in sonographicalpractice and there are no clear international guidelinesregarding the cleaning methods of the US probes. Several methods have been used for US probedisinfection, including single-paper and double-paperwiping and disinfection with alcohol, antisepticsolutions or ultraviolet C technology (UVC).Conflicting results have been obtained concerning therespective efficacy of these cleaning methods underroutine conditions [21, 24, 26]. Some authors haveconsidered that simple wiping of the probe with apaper towel is enough to avoid cross-contamination,whereas others found that bacteria were still presentafter dry-wiping and considered this methodinadequate [21, 24, 25]. Muradali et al. [21] suggestedthat simply wiping the probe with a dry towel appearsto be sufficient to remove the gel and to decontaminatethe probe. The additional use of an antiseptic solutionafter each routine scanning procedure does not offerany additional benefit [21]. Tarzmani et al. [27] foundthat the probes that were cleaned by cloth soaked inalcohol, showed the growth of bacterial colony to bezero. In their study, in the probes cleaned by non-sterile cloth, the bacterial count was 48.38%, 22.6%,9.7% for the Staphylococcus epidermidis,Staphylococcus aureus and Pseudomas aeruginosa,respectively. They concluded that cleaning the probeand US gel as a device of bacterial growth is timesaving and cost effective. They recommenddisinfection of probes using alcohol in patients proneto infection [27]. Similarly, in our study, no growth ofbacterial colony has been detected at the examplestaken before the start of examination from the probesthat were cleaned with only alcohol after the end ofscanning. On the other hand, routine alcohol wipingis not recommended because of possible degradationof the rubber seal and shortening of the working lifeof the probe [25, 28]. Recently, Kac et al. [26] shown that US probes maycarry nosocomial pathogens unless properly cleanedafter each patient. Treatment of carefully dry-wipedprobes in a UVC-chamber significantly reduced
bacterial load. UVC disinfection of US probes mayreduce cross-transmission of pathogenic bacteria [26].Bello et al. [13] concluded that single paper wipe isadequate for outpatients, but for inpatients, especiallythose with high risk of cross infection, double paperwipe is preferred with probe thoroughly wiped untilvisibly clean. The use of dry wipe is effective forabdominal scanning, whereas alcohol wipes arerecommended for the axillar and the inguinal regions[25]. Mirza et al. [29] determined the effectiveness ofthree different methods of US probe cleaning for theprevention of nosocomial infections. Culture was sentbefore and after using three different techniques ofcleaning US probe, which included sterilized papertowel, 0.9% saline and swipe over with standard bathsoap applied on patients respectively. The overallreduction in pathogenic bacterial count afterperforming each cleaning method was 45%, 76% and98% for paper cleaning, normal saline and soapcleaning method respectively. They concluded that,soap cleaning technique is the most effective methodfor reducing bacterial count acquired due to patientsbody contact with the US probes [29].
CONCLUSION
The US equipments may be a potential vector fornosocomial infection in staff and patients. In thisstudy, the bacterial contamination was still present in59.1% of probe heads after dry-wiping. In this context,we think that using nonsterile, dry, soft and absorbentpaper towel after each procedure, could be inadequatefor disinfection of probe head. Concerning probehandle; the rate of bacterial contamination afterscanning was significantly higher than the rateobtained from the samples before the start of theexamination (p = 0.039). Especially, good handhygiene could decrease the rate of growth of bacterialcolony at probe handle.
Conflict of interest The authors disclosed no conflict of interest duringthe preparation or publication of this manuscript.
Financing The authors disclosed that they did not receive anygrant during conduction or writing of this study.
The European Research Journal Volume 5 Issue 4 July 2019 586
This is an open access article distributed under the terms of Creative CommonAttribution-NonCommercial-NoDerivatives 4.0 International License.
Eur Res J 2019;5(4):582-587 Bacterial contamination of ultrasound probes and coupling gels
REFERENCES
[1] Ducell G, Fabry J, Nıcoll L. Prévention des infectionsnosocomiales, Guide pratique, 2nd ed., Organisation mondialede la Santé. WHO. 2008. [2] Brachman PS. Epidemiology infections. In: Bennett JV,Brachmann PS, eds. Hospital infections, 3rd ed. Boston: Little,Brown, 1993:3-20. [3] Tikhomirov E. WHO Programme for the Control of HospitalInfections. Chemiotherapia 1987;3:148-51. [4] Bures S, Fishbain JT, Uyehara CF, Parker JM, Berg BW.Computer keyboards and faucet handles as reservoirs ofnosocomial pathogens in the intensive care unit. Am J InfectControl 2000;28:465-71. [5] Spach DH, Silverstein FE, Stamm WE. Transmission ofinfection by gastrointestinal endoscopy and bronchoscopy. AnnIntern Med 1993;118:117-28. [6] Steinberg PJ, de Hoop D. [The stethoscope as a vehicle ofpathogenic microorganisms in the hospital]. Ned TijdschrGeneeskd 1978;122:303-5. [Article in Dutch] [7] Livornese LL Jr, Dias S, Samel C, Romanowski B, Taylor S,May P, et al. Hospital-acquired infection with vancomycin-resistant Enterococcus faecium transmitted by electronicthermometers. Ann Intern Med 1992;117:112-6. [8] Gaillot O, Maruéjouls C, Abachin E, Lecuru F, Arlet G,Simonet M, et al. Nosocomial outbreak of Klebsiella pneumoniaeproducing SHV-5 extended-spectrum beta-lactamase, originatingfrom a contaminated ultrasonography coupling gel. J ClinMicrobiol 1998;36:1357-60. [9] Weist K, Wendt C, Ptersen LR, Versmold H, Rüden H. Anoutbreak of pyodermas among neonates caused by ultrasound gelcontaminated with methicillin-susceptible Staphylococcusaureus. Infect Control Hosp Epidemiol 2002;21:761-4. [10] Hutchinson J, Runge W, Mulvey M, Norris G, Yetman M,Valkova N, et al. Burkholderia cepacia infections associated withintrinsically contaminated ultrasound gel: the role of microbialdegradation of parabens. Infect Control Hosp Epidemiol2004;25:291-6. [11] Ohara T, Itoh Y, Itoh K. Contaminated ultrasound probes: asource of nosocomial infections. J Hosp Infect 1999;43:73. [12] Kibria SM, Kerr KG, Dave J, Gough MJ, Homer-Vanniasinkam S, Mavor AI. Bacterial colonization of Dopplerprobes on vascular surgical wards. Eur J Vasc Endovasc Surg2002;23:241-3. [13] Bello TO, Taiwo SS, Oparinde DP, Hassan WO, Amure JO.Risk of nosocomial bacteria transmission: evaluation of cleaningmethods of probes used for routine ultrasonography. West Afr JMed 2005;24:167-70.
[14] Spencer P, Spencer RC. Ultrasound scanning of post-operative wounds--the risks of cross-infection. Clin Radiol1988;39:245-6. [15] Burke J. Infection control: a problem for patient safety. NEngl J Med 2003;348:651-6. [16] Marroni M, Fiorio M, Cao P, Parlani G, Morosi S, Stagni G.[Nosocomial infections in vascular surgery: 1-year surveillance].Recenti Prog Med 2003;94:430-3. [Article in Italian] [17] Valero LF, Sáenz MC. [The etiology of nosocomial infectionin surgery: comparison of 2 years (1988 and 1996)]. EnfermInfecc Microbiol Clin 1998;16:79-82. [Article in Spanish] [18] Sykes A, Appleby M, Perry J, Gould K. An investigation ofthe microbiological contamination of ultrasound equipment. JInfect Prevent 2006;7:16-20. [19] Ohara T, Itoh Y, Itoh K. Ultrasound instruments as possiblevectors of staphylococcal infection. J Hosp Infect 1998;40:73-7. [20] Patterson SL, Monga M, Silva JB, Bishop KD, Blanco JD.Microbiologic assessment of the transabdominal ultrasoundtransducer head. South Med J 1996;89:503-4. [21] Muradali D, Gold WL, Phillips A, Wilson S. Can ultrasoundprobes and coupling gel be a source of nosocomial infection inpatients undergoing sonography? An in vivo and in vitro study.AJR Am J Roentgenol 1995;164:1521-4. [22] Grouden MC, Keogh E, Colgan MP, Moore DJ, Shanik DG.Results of an infection control survey in ultrasound departmentsand recommended guidelines. BMUS Bulletin 1999;7:15-18. [23] Aylirffe G, Babb J, Taylor L. Cleaning, disinfection orsterilization? Hospital acquired infection. 3rd ed. London:Arnold; 2001;1448. [24] Tesch C, Froschle G. Sonography machines as a source ofinfection. Am J Roentgenol 1997;168:567-8. [25] Karadeniz YM, Kiliç D, Kara Altan S, Altinok D, Güney S.Evaluation of the role of ultrasound machines as a source ofnosocomial and cross-infection. Invest Radiol 2001;36:554-8. [26] Kac G, Gueneret M, Rodi A, Abergel E, Grataloup C,Denaire N, et al. Evaluation of a new disinfection procedure forultrasound probes using ultraviolet light. J Hosp Infect2007;65:163-8. [27] Tarzmani MK, Eshraghi N, Asghari PB, Estakhri R,Eshraghi A. Role of ultrasound probes in transmission of hospitalinfections. Casp J Intern Med 2010;1:134-6. [28] Fowler C, McCracken D. US probes: risk of cross-infectionand ways to reduce it-comparison of cleaning methods.Radiology 1999;213:299-300. [29] Mirza WA, Imam SH, Kharal MS, Aslam M, Ali SA,Masroor I, et al. Cleaning methods for ultrasound probes. J CollPhys Surg Pak 2008;18:286-9.
587 The European Research Journal Volume 5 Issue 4 July 2019
Comparing the effect of two different exercise types, mini-trampoline and fast-walking to gastrocnemius/soleus muscleelasticity by sonoelastrographyTuba Tülay Koca1 , Murat Baykara2 , Adnan Demirel1 , Ejder Berk1
1Department of Physical Medicine and Rehabilitation, Sütçü İmam University School of Medicine, Kahramanmaraş, Turkey 2Department of Radiology, Sütçü İmam University School of Medicine, Kahramanmaraş, Turkey
ABSTRACTObjectives: Sonoelastography is a newly introduced ultrasound technique that evaluates tissue elasticity andthus provides additional information to that offered by conventional ultrasound images. Here, we comparedthe effect of ballistic jumping on mini-trampolin with walk exercise to the elasticity of gastrocnemius/soleusmuscles with quantitative measurements by sonoelastography. Methods: Forty volunteer healty male cases between the ages of 20-22 years were included the study. Initially,both exercise groups were subjected to joint warm-up movements for 8 minutes. Twenty of the cases (40 legs)had mini-trampoline (balistic jumping) exercise for 15 minutes. Another 20 cases (40 legs) had 15 minutesfast-walk exercise. Measurements were made immediately before and after the procedure (within 5 minutes)with the sonoelastography. Results: A statistically significant difference was observed in the gastrocnemius/soleus muscles after exercisein the trampoline group according to sonoelastography strain value (SESV) data separately (p = 0.0001 / p =0.0001). According to this, when the SESV values evaluated after 15 minutes of jump with the trampoline, weobtained that the elasticity increases and stifness decreases in the calf muscles. In the walking group, nostatistically difference was observed in the gastrocnemius/soleus muscles after exercise separately (p = 0.7925/ p = 0.1879). Conclusions: According to the study, in the trampoline group in general, a decrease in strain values and anincrease in elasticityin muscle groups were found; in the walking group, a decrease in muscle elasticity, anincrease in stiffness and muscle strain were found eventually. We found that the 15-minutes exercise programon the mini-trampoline is more effective as a heating technique and has more positive effect on muscle elasticitythan the 15-minutes walking exercise.
Keywords: sonoelastography, trampoline, walk, exercise, muscle, stifness, strain
Address for correspondence: Tuba Tülay Koca, MD., Assistant Professor, Sütçü İmam University School of Medicine, Department of Physical Medicineand Rehabilitation, Kahramanmaraş,Turkey E-mail: [email protected]
Copyright © 2019 by The Association of Health Research & StrategyAvailable at http://dergipark.org.tr/eurj
The European Research Journal 2019;5(4):588-593
onoelastography (SE) is a newly introduced ul-trasound technique that evaluates tissue elasticity
and thus provides additional information to that of-fered by conventional ultrasound images [1]. It is a
noninvasive method for measuring tissue elasticitywhereby a quantitative estimate is obtained of the elas-ticity of various soft tissues, including muscles, ten-dons, salivary glands, and abdominal organs. The
S
ORIGINAL ARTICLE
e-ISSN: 2149-3189
DOI: 10.18621/eurj.407527
Received: March 19, 2018; Accepted: July 5, 2018; Published Online: November 12, 2018
The European Research Journal Volume 5 Issue 4 July 2019 588
Eur Res J 2019;5(4):588-593 Sonoelastographic evaluation of muscle elasticity
imaging method is based on acoustic radiation forceimpulses through the tissue to obtain an elastic mod-ulus. The result is a local measurement of the tissueelasticity at each point of interest of an organ. This im-aging method is operator independent, reproducible,and quantitative [2-4]. It has been documented that exercises on a mini-trampoline involve a multi-component approach, in-cluding muscle coordination, strength and balancetraining, body stability, and joint flexibility training[5]. Muscle action and coordination in the lower ex-tremities were continuously facilitated by maintainingbody balance on an elastic surface. In general, the abil-ity to maintain balance is based on three mechanisms,including increasing the base of support, counter-ro-tating segments around the center of mass, and apply-ing an external force other than the ground reactionforce. In performing the mini-trampoline exercise, theparticipants were challenged to stabilize their bodywhile keeping the center of mass over the base of thesupport. They needed to exert muscle force and neu-romuscular responses to stiffen their legs in order toovercome the unstable conditions [6]. The effect of different exercise types on muscleelasticity has not been studied sufficiently. To best ofour knowledge, there is no study about mini-trampolinexercise's acute effect to gastroknemius/soleus muscle'elasticity, and the comparison of the results with fast-walk exercise by SE. Here, we compared the effect ofmini-trampolin exercise with fast-walk exercise to thegastrocnemius/soleus muscles with quantitative meas-urements by SE.
METHODS
Study Population Forty volunteer healty male cases between theages of 20-22 years were included the study. Initially,both exercise groups were subjected to joint warm-upmovements for 8 minutes. Twenty of the cases (40legs) had mini-trampoline (balistic jumping) exercisefor 15 mınutes. Another 20 cases (40 legs) had 15minutes fast-walk exercise. Measurements were madeimmediately before and after the procedure (within 5minutes) with the SE.
Sonoelastography
SE is an ultrasound-based technique that determinesmechanical properties of the tissue quantitatively,visually, and qualitatively compared with the B-modeanalysis (acoustic impedance) or the color Dopplerultrasound (vascular blood flow). The diagnosticdifficulties can be overcome by using the SE method,which is increasingly used in the recent years. Strainelastography is the most commonly used measurementtechnique among several others, and the externallyapplied pressure causes more deformation in the softtissues and less deformation in the hard tissues. Thisinformation is color-coded on a screen, and thequantitative data are obtained by measurements fromthe region of interest (ROI) [2-4]. A high-resolution ultrasonography system (Aplio™ 400 Platinum, Toshiba Medical SystemsCorporation, Tochigi, Japan) and a broad band linearprobe (PLT-704SBT) were used. When thegastrocnemius / soleus muscles were visualized on agray scale ultrasonography image of the areasymmetrically, bilaterally and separately, elastographywas inserted into the apparatus and pressure wasapplied. The SE strain value (SESV) of thesubcutaneous fat tissue in the same image and SESVof the central segments of the muscles were detectedusing by measurements from ROI. Thesonoelastography strain ratio (SESR) of the muscleswas calculated by dividing the fat values by the musclevalues. All procedures were performed by the sameexperienced radiologist who was kept uninformedabout the clinical diagnosis.
Statistical Analysis The approval for this study was granted by theInstitutional Ethics Committee. Measurements andcalculations derived from SE were expressed as mean± standard deviation. Categorical data were presentedas numbers and percentages. The Shapiro–Wilk testwas used to examine the fitness of the variables for thenormal distribution. Comparisons of the obtainedstrain rates were made by independent Student's t test.When P value was less than 0.05, the result wasconsidered statistically significant.
RESULTS
Forty male cases (80 legs) between 20-22 years of
589 The European Research Journal Volume 5 Issue 4 July 2019
Eur Res J 2019;5(4):588-593 Koca et al
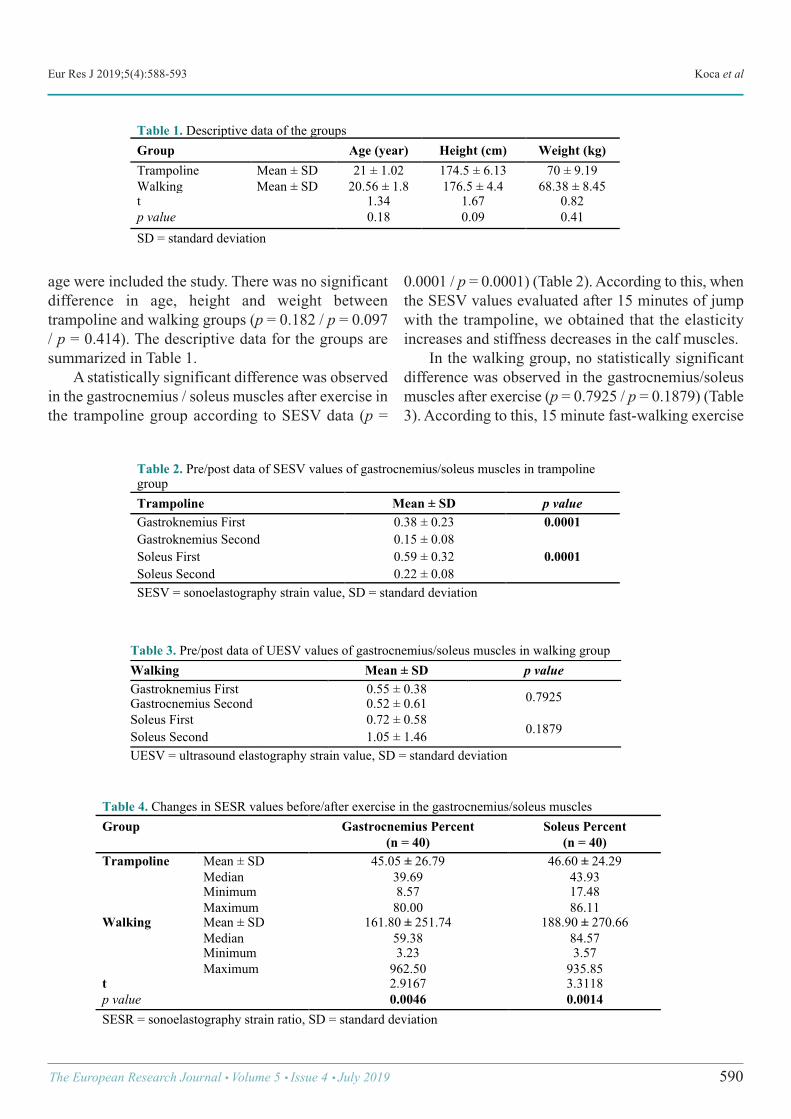
age were included the study. There was no significantdifference in age, height and weight betweentrampoline and walking groups (p = 0.182 / p = 0.097/ p = 0.414). The descriptive data for the groups aresummarized in Table 1. A statistically significant difference was observedin the gastrocnemius / soleus muscles after exercise inthe trampoline group according to SESV data (p =
0.0001 / p = 0.0001) (Table 2). According to this, whenthe SESV values evaluated after 15 minutes of jumpwith the trampoline, we obtained that the elasticityincreases and stiffness decreases in the calf muscles. In the walking group, no statistically significantdifference was observed in the gastrocnemius/soleusmuscles after exercise (p = 0.7925 / p = 0.1879) (Table3). According to this, 15 minute fast-walking exercise
The European Research Journal Volume 5 Issue 4 July 2019 590
Table 1. Descriptive data of the groups Group Age (year) Height (cm) Weight (kg) Trampoline Mean ± SD 21 ± 1.02 174.5 ± 6.13 70 ± 9.19 Walking Mean ± SD 20.56 ± 1.8 176.5 ± 4.4 68.38 ± 8.45 t 1.34 1.67 0.82 p value 0.18 0.09 0.41 SD = standard deviation !
Table 2. Pre/post data of SESV values of gastrocnemius/soleus muscles in trampoline group Trampoline Mean ± SD p value Gastroknemius First 0.38 ± 0.23 0.0001 Gastroknemius Second 0.15 ± 0.08 Soleus First 0.59 ± 0.32 0.0001 Soleus Second 0.22 ± 0.08 SESV = sonoelastography strain value, SD = standard deviation !
Table 3. Pre/post data of UESV values of gastrocnemius/soleus muscles in walking group Walking Mean ± SD p value Gastroknemius First 0.55 ± 0.38 0.7925 Gastrocnemius Second 0.52 ± 0.61 Soleus First 0.72 ± 0.58
0.1879 Soleus Second 1.05 ± 1.46 UESV = ultrasound elastography strain value, SD = standard deviation !
Table 4. Changes in SESR values before/after exercise in the gastrocnemius/soleus muscles Group Gastrocnemius Percent
(n = 40) Soleus Percent
(n = 40) Trampoline Mean ± SD 45.05 ± 26.79 46.60 ± 24.29
Median 39.69 43.93 Minimum 8.57 17.48 Maximum 80.00 86.11
Walking Mean ± SD 161.80 ± 251.74 188.90 ± 270.66 Median 59.38 84.57 Minimum 3.23 3.57 Maximum 962.50 935.85
t 2.9167 3.3118 p value 0.0046 0.0014 SESR = sonoelastography strain ratio, SD = standard deviation !
Eur Res J 2019;5(4):588-593 Sonoelastographic evaluation of muscle elasticity
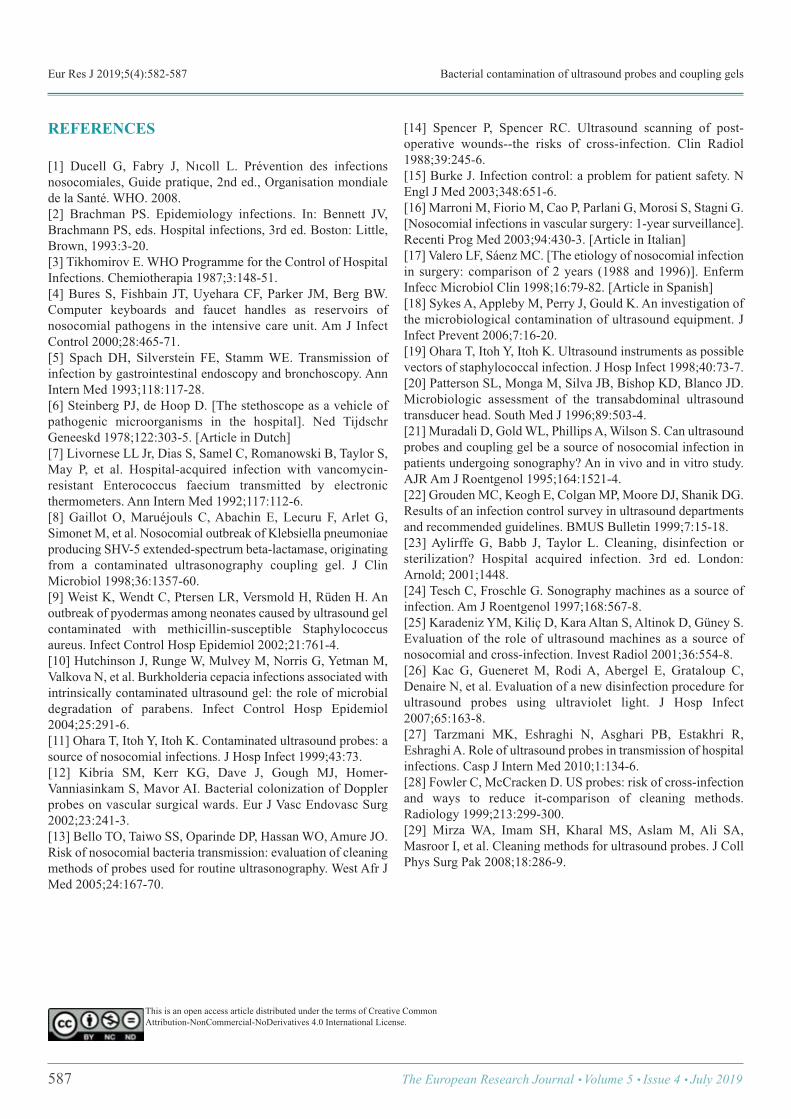
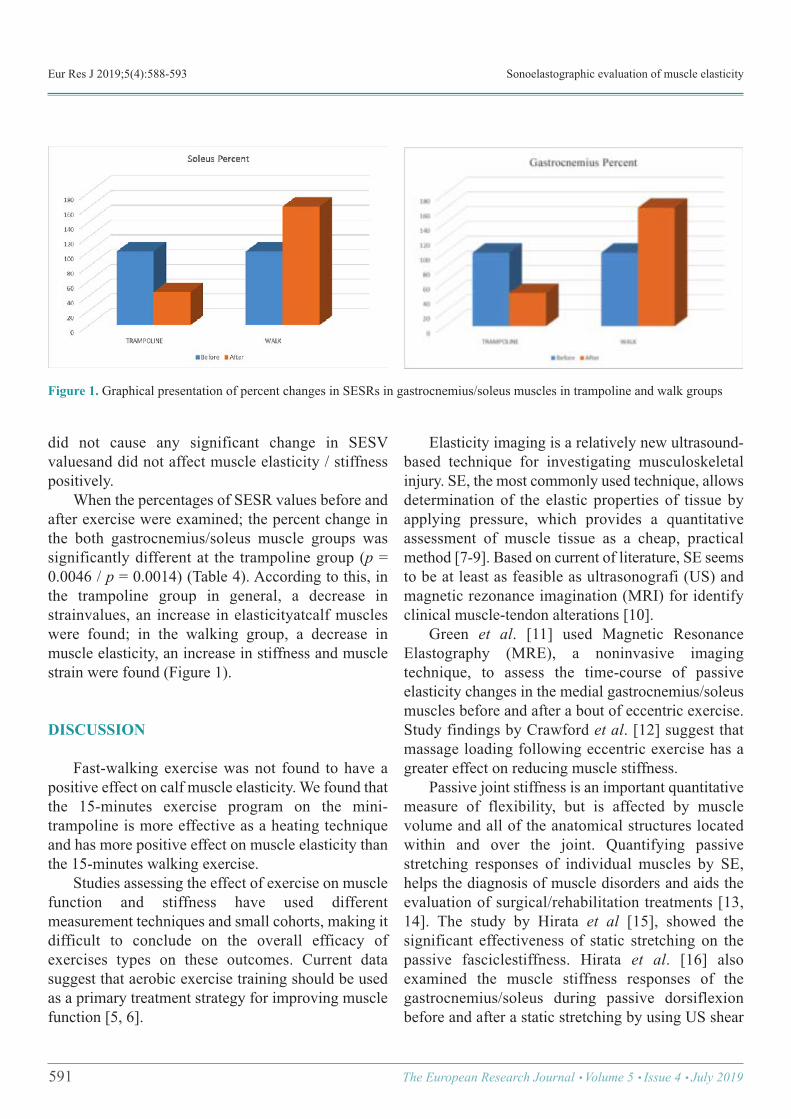
did not cause any significant change in SESVvaluesand did not affect muscle elasticity / stiffnesspositively. When the percentages of SESR values before andafter exercise were examined; the percent change inthe both gastrocnemius/soleus muscle groups wassignificantly different at the trampoline group (p =0.0046 / p = 0.0014) (Table 4). According to this, inthe trampoline group in general, a decrease instrainvalues, an increase in elasticityatcalf muscleswere found; in the walking group, a decrease inmuscle elasticity, an increase in stiffness and musclestrain were found (Figure 1).
DISCUSSION
Fast-walking exercise was not found to have apositive effect on calf muscle elasticity. We found thatthe 15-minutes exercise program on the mini-trampoline is more effective as a heating techniqueand has more positive effect on muscle elasticity thanthe 15-minutes walking exercise. Studies assessing the effect of exercise on musclefunction and stiffness have used differentmeasurement techniques and small cohorts, making itdifficult to conclude on the overall efficacy ofexercises types on these outcomes. Current datasuggest that aerobic exercise training should be usedas a primary treatment strategy for improving musclefunction [5, 6].
Elasticity imaging is a relatively new ultrasound-based technique for investigating musculoskeletalinjury. SE, the most commonly used technique, allowsdetermination of the elastic properties of tissue byapplying pressure, which provides a quantitativeassessment of muscle tissue as a cheap, practicalmethod [7-9]. Based on current of literature, SE seemsto be at least as feasible as ultrasonografi (US) andmagnetic rezonance imagination (MRI) for identifyclinical muscle-tendon alterations [10]. Green et al. [11] used Magnetic ResonanceElastography (MRE), a noninvasive imagingtechnique, to assess the time-course of passiveelasticity changes in the medial gastrocnemius/soleusmuscles before and after a bout of eccentric exercise.Study findings by Crawford et al. [12] suggest thatmassage loading following eccentric exercise has agreater effect on reducing muscle stiffness. Passive joint stiffness is an important quantitativemeasure of flexibility, but is affected by musclevolume and all of the anatomical structures locatedwithin and over the joint. Quantifying passivestretching responses of individual muscles by SE,helps the diagnosis of muscle disorders and aids theevaluation of surgical/rehabilitation treatments [13,14]. The study by Hirata et al [15], showed thesignificant effectiveness of static stretching on thepassive fasciclestiffness. Hirata et al. [16] alsoexamined the muscle stiffness responses of thegastrocnemius/soleus during passive dorsiflexionbefore and after a static stretching by using US shear
591 The European Research Journal Volume 5 Issue 4 July 2019
!Figure 1. Graphical presentation of percent changes in SESRs in gastrocnemius/soleus muscles in trampoline and walk groups
Eur Res J 2019;5(4):588-593 Koca et al
wave elastography. They indicated that passive musclestiffness differs among the triceps surae, and that theacute effect of a static stretching is observed only inthe stiff muscle. Chino and Takahashi [17], determinedmuscle elasticity, measured independent of theconfounding effects of muscle volume and the othernearby anatomical structures, is associated withpassive joint stiffness in the joint position where themuscle is sufficiently lengthened. Chino andTakahashi [18] indicated that variations in theelasticity of other tissues, including medialgastroknemius aponeuroses or the ligaments and jointcapsule of the ankle, would be associated with thevariations in joint stiffness. Similar to our study, Yanagisawa et al. [19]assessed the feasibility of SE for measuring exercise-induced changes in muscle stiffness and to comparethe findings of it with those of a tissue stiffness forsemi-quantitative assessment. They made participantsto perform an arm-curl exercise. They found the strainratio and the value obtained using the tissue stiffnesssignificantly decreased, after exercise. In our study, we observed a significant differencein elasticity and stiffness values in the calf musclegroups after 15 minutes on trampoline jumpingexercise by SE. When we looked at the strainpercentile changes, we also observed a significantdecrease in total muscle strains in the trampolinegroup. We found jumping exercise with mini-trampoline as effective as a muscle heating technique.It has been observed in the literature that trampolinestudies have resulted an increase in muscle strength,speed, jump, anerobic physical capacity, motorperformance, balance and proprioception in long term[20-22]. We measured the positive effect of trampolineon muscle elasticity in the acute phase (in 5 minutes).At 15-minutes fast-walking group a decrease inmuscle elasticity, an increase in stiffness and strainwere found. Fast-walking exercise was found to be anineffective heating method compared to trampoline. SE has to be viewed as an experimental techniquewithout sufficient supporting evidence to be used as aroutine examination equivalent to US and MRI inmusculoskeletal analysis. The usefulness of SE can beexpected to increase rapidly in the musculoskeletalfield, as soon as we learn to interpret elastographicartifacts as well as to take advantage of the newinformation provided by SE [23, 24].
Limitations Small sample size and that ultrasoundelastography standards have not been established yetin the literature are the limitations of the study.
CONCLUSION
Elasticity imaging is a relatively new ultrasound-based technique for investigating musculoskeletalinjury. SE, the most commonly used technique, allowsdetermination of the elastic properties of tissue byapplying pressure, which provides a quantitativeassessment of muscle tissue as a cheap, practicalmethod. Heating with trampoline exercise is aneffective, reliable method that generally increaseselasticity and reduces stifness in calf muscles. Thetrampoline-jumping exercise was found to be superiorto the fast-walking exercise in acute period.
Conflict of interest The authors disclosed no conflict of interest duringthe preparation or publication of this manuscript.
Financing The authors disclosed that they did not receive anygrant during conduction or writing of this study.
REFERENCES
[1] Pedersen M, Fredberg U, Langberg H. Sonoelastography asa diagnostic tool in the assessment of musculoskeletal alterations:a systematic review. Ultraschall Med 2012;33:441-6. [2] Demirel A, Baykara M, Koca TT, Berk E. Ultrasoundelastography-based assessment of the elasticity of thesupraspinatus muscle in impingement syndrome: doeselastography has any diagnostic value? Clin Rheumatol2018;37:1661-5. [3] Xiang X, Yan F, Yang Y, Tang Y, Wang L, Zeng J, et al.Quantitative assessment of healthy skin elasticity: reliability andfeasibility of shear wave elastography. Ultrasound Med Biol2017;43:2:445-52. [4] Hou SW, Merkle AN, Babb JS, McCabe R, Gyftopoulos S,Adler RS. Shear wave ultrasound elastographic evaluation of therotator cuff tendon. J Ultrasound Med 2017;36:95-106. [5] Miklitsch C, Krewer C, Freivogel S. Effects of a predefinedmini-trampoline training programme on balance, mobility andactivities of daily living after stroke: a randomized controlledpilot study. Clin Rehabil 2013;27:939-47. [6] Giagazoglou P, Kokaridas D, Sidiropoulou M. Effects of a
The European Research Journal Volume 5 Issue 4 July 2019 592
This is an open access article distributed under the terms of Creative CommonAttribution-NonCommercial-NoDerivatives 4.0 International License.
Eur Res J 2019;5(4):588-593 Sonoelastographic evaluation of muscle elasticity
trampoline exercise intervention on motor performance andbalance ability of children with intellectual disabilities. Res DevDisabil 2013;34:2701-7.[7] Rosskopf AB, Ehrmann C, Buck FM, Gerber C, Flück M,Pfirrmann CW. Quantitative shear-wave US elastographyof thesupraspinatus muscle: reliability of the method and relation totendon integrity and muscle quality. Radiology 2016;278:465-74. [8] Hoskins PR, Martin K, Thrush A. Diagnostic ultrasound :physics and equipment. 2nd ed. Cambridge medicine.Cambridge, UK; New York: Cambridge University Press. xi,2010: p.263. [9] Hasegawa H. Kanai H. Ultrasonic methods for measurementof small motion and deformation of biological tissues forassessment of viscoelasticity. Biomedical & NanomedicalTechnologies. Momentum Press: New York, 2015: p.45. [10] Gonzalez Hidalgo M, Torres AM, Varona Gomez J.Deformation models : tracking, animation, and applications.Lecture notes in computational vision and biomechanics.Dordrecht; New York: Springer. xiv, 2013:p.297. [11] Green MA, Sinkus R, Gandevia SC, Herbert RD, BilstonLE. Measuring changes in muscle stiffness after eccentricexercise using elastography. NMR Biomed 2012;25:852-8. [12] Crawford SK, Haas C, Butterfield TA, Wang Q, Zhang X,Zhao Y, et al. Effects of immediate vs. delayed massage-likeloading on skeletal muscle viscoelastic properties followingeccentric exercise. Clin Biomech (Bristol, Avon) 2014;29:671-8. [13] Koo TK, Guo JY, Cohen JH, Parker KJ. Quantifying thepassive stretching response of human tibialis anterior muscleusing shear wave elastography. Clin Biomech (Bristol, Avon)2014;29:33-9. [14] Terada S, Miaki H, Uchiyama K, Hayakawa S, Yamazaki T.Effects of isokinetic passive exercise and isometric musclecontraction on passive stiffness. J Phys Ther Sci 2013;25:1347-52. [15] Hirata K, Kanehisa H, Miyamoto N. Acute effect of staticstretching on passive stiffness of the human gastrocnemiusfascicle measured by ultrasound shear wave elastography. Eur J
Appl Physiol 2017;117:493-9. [16] Hirata K, Miyamoto-Mikami E, Kanehisa H, Miyamoto N.Muscle-specific acute changes in passive stiffness of humantriceps surae after stretching. Eur J Appl Physiol 2016;116:911-8. [17] Chino K, Takahashi H. Measurement of gastrocnemiusmuscle elasticity by shear wave elastography: association withpassive ankle joint stiffness and sex differences. Eur J ApplPhysiol 2016;116:823-30. [18] Chino K, Takahashi H. The association ofmuscleand tendonelasticity with passive joint stiffness: in vivo measurements usingultrasound shear wave elastography. Clin Biomech (Bristol,Avon) 2015;30:1230-5. [19] Yanagisawa O, Niitsu M, Kurihara T, Fukubayashi T.Evaluation of human muscle hardness after dynamic exercisewith ultrasound real-time tissue elastography: a feasibility study.Clin Radiol 2011;66:815-9. [20] Aalizadeh B, Mohammadzadeh H, Khazani A, Dadras A.Effect of a trampoline exercise on the anthropometric measuresand motor performance of adolescent students. Int J Prev Med2016;7:91. [21] Karakollukçu M, Aslan CS, Paoli A, Bianco A, Sahin FN.Effects of minitrampoline exerciseon male gymnasts'physiological parameters: a pilot study. J Sports Med PhysFitness 2015;55:730-4. [22] Giagazoglou P, Kokaridas D, Sidiropoulou M, PatsiaourasA, Karra C, Neofotistou K. Effects of a trampoline exerciseintervention on motor performance and balance ability ofchildren with intellectual disabilities. Res Dev Disabil2013;34:2701-7. [23] Melo X, Fernhall B, Santos DA, Pinto R, Pimenta NM,Sardinha LB, et al. The acute effect of maximal exercise oncentral and peripheral arterial stiffness indices andhemodynamics in children and adults. Appl Physiol Nutr Metab2016;41:266-76. [24] Klauser AS, Faschingbauer R, Jaschke WR. Issonoelastography of value in assessing tendons? SeminMusculoskelet Radiol 2010;14:323-33.
593 The European Research Journal Volume 5 Issue 4 July 2019
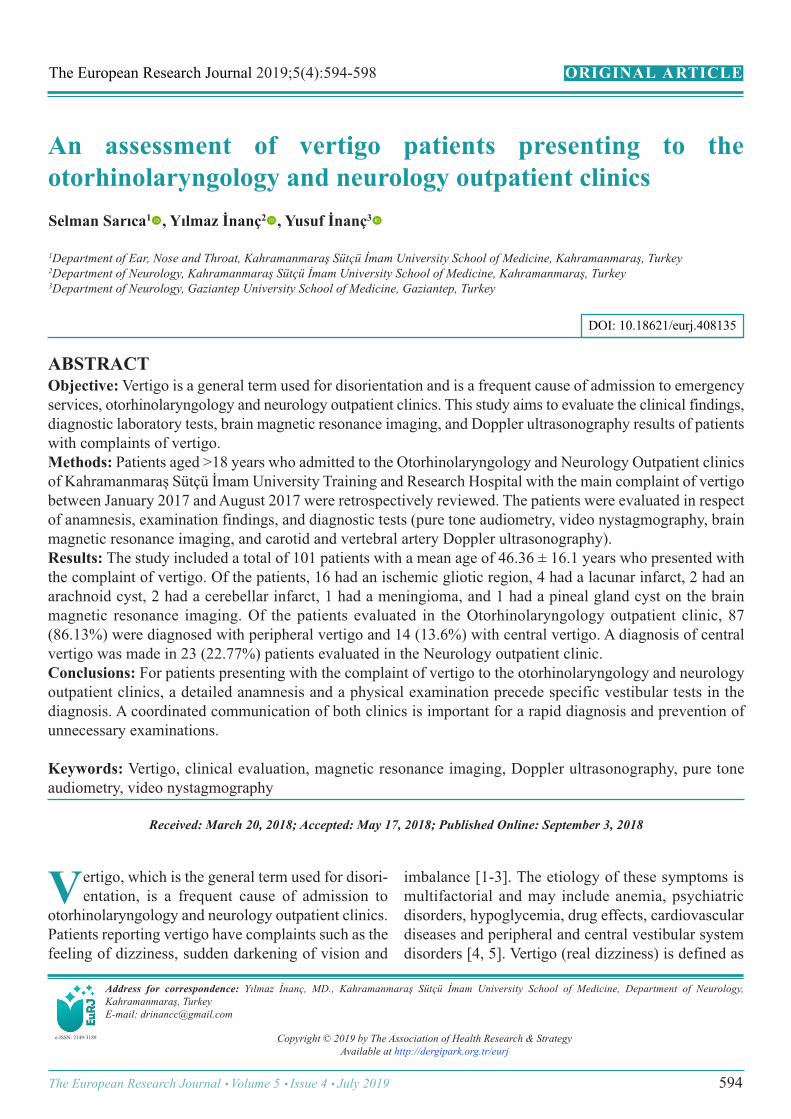
An assessment of vertigo patients presenting to theotorhinolaryngology and neurology outpatient clinicsSelman Sarıca1 , Yılmaz İnanç2 , Yusuf İnanç3
1Department of Ear, Nose and Throat, Kahramanmaraş Sütçü İmam University School of Medicine, Kahramanmaraş, Turkey 2Department of Neurology, Kahramanmaraş Sütçü İmam University School of Medicine, Kahramanmaraş, Turkey 3Department of Neurology, Gaziantep University School of Medicine, Gaziantep, Turkey
ABSTRACTObjective: Vertigo is a general term used for disorientation and is a frequent cause of admission to emergencyservices, otorhinolaryngology and neurology outpatient clinics. This study aims to evaluate the clinical findings,diagnostic laboratory tests, brain magnetic resonance imaging, and Doppler ultrasonography results of patientswith complaints of vertigo. Methods: Patients aged >18 years who admitted to the Otorhinolaryngology and Neurology Outpatient clinicsof Kahramanmaraş Sütçü İmam University Training and Research Hospital with the main complaint of vertigobetween January 2017 and August 2017 were retrospectively reviewed. The patients were evaluated in respectof anamnesis, examination findings, and diagnostic tests (pure tone audiometry, video nystagmography, brainmagnetic resonance imaging, and carotid and vertebral artery Doppler ultrasonography). Results: The study included a total of 101 patients with a mean age of 46.36 ± 16.1 years who presented withthe complaint of vertigo. Of the patients, 16 had an ischemic gliotic region, 4 had a lacunar infarct, 2 had anarachnoid cyst, 2 had a cerebellar infarct, 1 had a meningioma, and 1 had a pineal gland cyst on the brainmagnetic resonance imaging. Of the patients evaluated in the Otorhinolaryngology outpatient clinic, 87(86.13%) were diagnosed with peripheral vertigo and 14 (13.6%) with central vertigo. A diagnosis of centralvertigo was made in 23 (22.77%) patients evaluated in the Neurology outpatient clinic. Conclusions: For patients presenting with the complaint of vertigo to the otorhinolaryngology and neurologyoutpatient clinics, a detailed anamnesis and a physical examination precede specific vestibular tests in thediagnosis. A coordinated communication of both clinics is important for a rapid diagnosis and prevention ofunnecessary examinations.
Keywords: Vertigo, clinical evaluation, magnetic resonance imaging, Doppler ultrasonography, pure toneaudiometry, video nystagmography
Address for correspondence: Yılmaz İnanç, MD., Kahramanmaraş Sütçü İmam University School of Medicine, Department of Neurology,Kahramanmaraş, Turkey E-mail: [email protected]
Copyright © 2019 by The Association of Health Research & StrategyAvailable at http://dergipark.org.tr/eurj
The European Research Journal 2019;5(4):594-598
ertigo, which is the general term used for disori-entation, is a frequent cause of admission to
otorhinolaryngology and neurology outpatient clinics.Patients reporting vertigo have complaints such as thefeeling of dizziness, sudden darkening of vision and
imbalance [1-3]. The etiology of these symptoms ismultifactorial and may include anemia, psychiatricdisorders, hypoglycemia, drug effects, cardiovasculardiseases and peripheral and central vestibular systemdisorders [4, 5]. Vertigo (real dizziness) is defined as
V
ORIGINAL A RTICLE
e-ISSN: 2149-3189
DOI: 10.18621/eurj.408135
Received: March 20, 2018; Accepted: May 17, 2018; Published Online: September 3, 2018
The European Research Journal Volume 5 Issue 4 July 2019 594
Eur Res J 2019;5(4):594-598 Vertigo - clinical and radiological findings
the illusion of movement which is not real, where thepatient feels that they or the surroundings are turning[6]. Vertigo occurs with an asymmetrical involvementof any of the peripheral or central vestibular pathwaysof the vestibular system [7]. It should be focused onthe vestibular system in every patient with a rotationanamnesis [6].
Vertigo is a symptom that should be attachedimportance because it affects a wide section of thepopulation up to 20%-30%, causes loss of workforce,and can be a symptom of illnesses that may be life-threatening [3, 8, 9]. In studies conducted on emer-gency departments, it is reported that the rate ofpatients presented to emergency departments vary be-tween 3% and 6.7% [2, 8, 10, 11]. In the evaluation ofpatients presenting with the complaint of vertigo, thereis a need for various radiological and vestibular testsin addition to the anamnesis and physical examination.The main aim is to determine the etiology by differ-entiating whether the disease is of peripheral or centralorigin, to establish a diagnosis, and to apply a treat-ment [12, 13]. The physician should reach the correctdiagnosis by correctly interpreting the anamnesis, andphysical examination and test results and combiningthese with the symptoms of the patient. Despite all ef-forts of the clinician, difficulties may be experiencedin the diagnosis and the determination of whether thedisease is peripheral or central in some patients pre-senting with vertigo. In this period, patients tend toconsult more than one physician for their diseases.This study aims to compare the clinical findings, di-agnostic laboratory tests and imaging results of pa-tients presenting to the Otorhinolaryngology andNeurology outpatient clinics with the complaint ofvertigo.
METHODS
Patients aged >18 years who admitted to theOtorhinolaryngology and Neurology Outpatientclinics of Kahramanmaraş Sütçü İmam UniversityTraining and Research Hospital with the maincomplaint of vertigo between January 2017 andAugust 2017 were retrospectively reviewed. Theapproval for the study was granted by the EthicsCommittee of Kahramanmaraş Sütçü İmamUniversity School of Medicine in the meeting dated
06.12.2017 (session no:2017/04, decision no: 20).Patients with a neuropsychiatric disorder, systemicdisease, history of chronic drug use or a diagnosis ofmalignancy were excluded from the study. Detailed neurological and otorhinolaryngologyexamination findings were recorded and compared.Detailed diagnostic tests applied in respect of theetiology (pure tone audiometry, videonystagmography, brain magnetic resonance imaging(MRI), and carotid and vertebral artery Dopplerultrasonography) were reviewed. The patients weredivided into groups according to the diagnosis asperipheral, central, and undefined on the basis of theclinical evaluations in the Otorhinolaryngology andNeurology outpatient clinics. Patients were treatedaccording to the etiology. The Dix-Hallpike maneuver was performed onpatients applied to the Otorhinolaryngology outpatientclinic. The acetylsalicylic acid treatment was initiatedin patients with stroke etiology in the Neurologyoutpatient clinic.
Statistical Analysis The statistical analyses of the study data were madeusing the IBM SPSS for Windows Version 21.0program. Numerical variables were reported as themean ± standard deviation (SD) and the minimum andmaximum values. Categorical variables were stated asnumber (n) and percentage (%). Before thecomparison of the groups in terms of numericalvariables, the parametric test assumptions werechecked (conformity to normal distribution andhomogeneity of variance). The diagnostic andsymptom groups were compared in respect of ageusing the One-Way Variance Analysis. Pairedcomparisons were made with the Tukey’s HSD test.Whether there is a difference between the groupsinrespect of categorical variables or not was examinedusing the Chi-square test. A value of p < 0.05 wasaccepted as statistically significant.
RESULTS
A total of 101 patients admitted to theOtorhinolaryngology and Neurology Outpatientclinics with the complaint of vertigo. The patientscomprised of 35 (31.65%) males and 66 (65.35%)
595 The European Research Journal Volume 5 Issue 4 July 2019
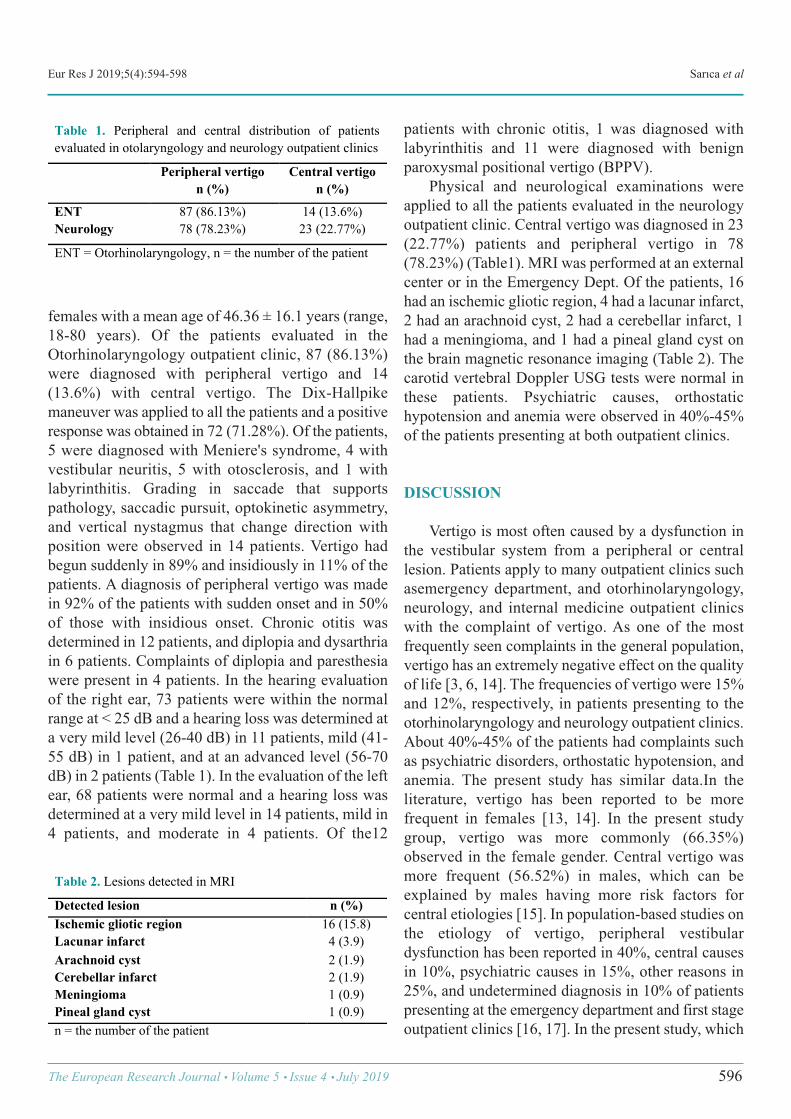
Eur Res J 2019;5(4):594-598 Sarıca et al
females with a mean age of 46.36 ± 16.1 years (range,18-80 years). Of the patients evaluated in theOtorhinolaryngology outpatient clinic, 87 (86.13%)were diagnosed with peripheral vertigo and 14(13.6%) with central vertigo. The Dix-Hallpikemaneuver was applied to all the patients and a positiveresponse was obtained in 72 (71.28%). Of the patients,5 were diagnosed with Meniere's syndrome, 4 withvestibular neuritis, 5 with otosclerosis, and 1 withlabyrinthitis. Grading in saccade that supportspathology, saccadic pursuit, optokinetic asymmetry,and vertical nystagmus that change direction withposition were observed in 14 patients. Vertigo hadbegun suddenly in 89% and insidiously in 11% of thepatients. A diagnosis of peripheral vertigo was madein 92% of the patients with sudden onset and in 50%of those with insidious onset. Chronic otitis wasdetermined in 12 patients, and diplopia and dysarthriain 6 patients. Complaints of diplopia and paresthesiawere present in 4 patients. In the hearing evaluationof the right ear, 73 patients were within the normalrange at < 25 dB and a hearing loss was determined ata very mild level (26-40 dB) in 11 patients, mild (41-55 dB) in 1 patient, and at an advanced level (56-70dB) in 2 patients (Table 1). In the evaluation of the leftear, 68 patients were normal and a hearing loss wasdetermined at a very mild level in 14 patients, mild in4 patients, and moderate in 4 patients. Of the12
patients with chronic otitis, 1 was diagnosed withlabyrinthitis and 11 were diagnosed with benignparoxysmal positional vertigo (BPPV). Physical and neurological examinations wereapplied to all the patients evaluated in the neurologyoutpatient clinic. Central vertigo was diagnosed in 23(22.77%) patients and peripheral vertigo in 78(78.23%) (Table1). MRI was performed at an externalcenter or in the Emergency Dept. Of the patients, 16had an ischemic gliotic region, 4 had a lacunar infarct,2 had an arachnoid cyst, 2 had a cerebellar infarct, 1had a meningioma, and 1 had a pineal gland cyst onthe brain magnetic resonance imaging (Table 2). Thecarotid vertebral Doppler USG tests were normal inthese patients. Psychiatric causes, orthostatichypotension and anemia were observed in 40%-45%of the patients presenting at both outpatient clinics.
DISCUSSION
Vertigo is most often caused by a dysfunction inthe vestibular system from a peripheral or centrallesion. Patients apply to many outpatient clinics suchasemergency department, and otorhinolaryngology,neurology, and internal medicine outpatient clinicswith the complaint of vertigo. As one of the mostfrequently seen complaints in the general population,vertigo has an extremely negative effect on the qualityof life [3, 6, 14]. The frequencies of vertigo were 15%and 12%, respectively, in patients presenting to theotorhinolaryngology and neurology outpatient clinics.About 40%-45% of the patients had complaints suchas psychiatric disorders, orthostatic hypotension, andanemia. The present study has similar data.In theliterature, vertigo has been reported to be morefrequent in females [13, 14]. In the present studygroup, vertigo was more commonly (66.35%)observed in the female gender. Central vertigo wasmore frequent (56.52%) in males, which can beexplained by males having more risk factors forcentral etiologies [15]. In population-based studies onthe etiology of vertigo, peripheral vestibulardysfunction has been reported in 40%, central causesin 10%, psychiatric causes in 15%, other reasons in25%, and undetermined diagnosis in 10% of patientspresenting at the emergency department and first stageoutpatient clinics [16, 17]. In the present study, which
The European Research Journal Volume 5 Issue 4 July 2019 596
Table 1. Peripheral and central distribution of patients evaluated in otolaryngology and neurology outpatient clinics
Peripheral vertigo n (%)
Central vertigo n (%)
ENT 87 (86.13%) 14 (13.6%) Neurology 78 (78.23%) 23 (22.77%) ENT = Otorhinolaryngology, n = the number of the patient !
Table 2. Lesions detected in MRI
Detected lesion n (%) Ischemic gliotic region 16 (15.8) Lacunar infarct 4 (3.9) Arachnoid cyst 2 (1.9) Cerebellar infarct 2 (1.9) Meningioma 1 (0.9) Pineal gland cyst 1 (0.9) n = the number of the patient !
Eur Res J 2019;5(4):594-598 Vertigo - clinical and radiological findings
was more specific as it only included patientspresenting to the Otorhinolaryngology and neurologyoutpatient clinics with the complaint of vertigo,peripheral causes were seen to be the primary cause,which was consistent with the literature. Patients withpsychiatric causes were referred to the relevantdepartments in the neurology or otorhinolaryngologydepartment at the first visit. Therefore, this study hadno cases of vertigo due to psychiatric reasons. Thecentral vertigo ratios in both departments were foundto be 13.6% and 23%, respectively. The ratios in theneurology department were slightly higher than ratesreported in the literature. The difference in the rate ofperipheral and central vertigo in the same patientgroup presenting to the Otorhinolaryngology andneurology outpatient clinics was found to be a centralrate of 13.6% in the otorhinolaryngology and 23% inneurology outpatient clinics and this could beattributed to a false negative on the diffusion-weightedMRI in patients with a cerebellar lesion or a brain stemlesion of small dimensions in the first few hours ofischemic stroke. In addition new clinic findings,thiscan be explained by the inclusion of the ischemicgliotic areas, developing in some regions of the brainconjunction with age and other risk factors, to theetiology group by the neurology outpatient clinic aftermaking other differential diagnoses [18, 19]. Inpatients with a migraine, there are complaints ofvertigo and imbalance at the rate of 70% eitherbetween or during the attacks. Vertigo alternatelyoccurs with concomitant nausea. Just as it can followthe onset of a headache, it can also start during therecovery period [20]. The patients who presented withmigrainous vertigo and peripheral vertigo were firstevaluated in the present study. A diagnosis ofmigrainous vertigo was made in 4 patients with ahistory of a migraine in both the otorhinolaryngologyand neurology outpatient clinics. Previous studieshave reported migrainous vertigo betweenthe rates of0.1% to 9% [21, 22]. Peripheral vertigo can be seenindependently of a migraine in migraine patients. Theperipheral vertigo was determined in 5 of the 9patients in the present study with a history of amigraine. While the diagnosis of vestibular neuritis iseasy with its typical clinical presentation, it is possibleto confuse the pathologies at the level of eighth cranialnerve, vestibular nucleus or brain stem with thevestibular neuritis particularly during the Meniere’s
disease with recurrent vertigo episodes [23, 24]. In thediagnosis of Meniere’s disease, detailed anamnesis(clinical findings such as dizziness, hearing loss, andfullness at the ear) and examination are important.Some of the patients in this study had findings thatrequiredimaging and other examinations. Diplopia anddysarthria were determined in 6 patients and 4 patientscomplained of diplopia and paresthesia.In both clinics,the treatments for patients presenting with vertigowere in three main categories as symptomatic, specificand rehabilitation treatments. For this purpose,vestibular suppressants such as meclizine,dimenhydrinate, promethazineand diazepam and anti-emetic drugs such as metoclopramide are used. Forthis purpose, anti-emetic drugs are used such asmetoclopramide and vestibular suppressants such asmeclizine, dimenhydrinate, promethazine anddiazepam. Long-term use of drugs is notrecommended and the formation of a normalcompensation mechanism is preferred. Patientsdiagnosed with central vertigo in theotorhinolaryngology outpatient clinic are referred totheneurology department for the specific treatment.Although medical treatment for peripheral vertigo isgiven in the neurology outpatient clinic, patients arereferred to the otorhinolaryngology outpatient clinicfor rehabilitation. The Epley, Semont and Barbecuemaneuvers are applied in patients with a specificdiagnosis in the otorhinolaryngology outpatient clinic.
CONCLUSION
For patients presenting with the complaint ofvertigo to the otorhinolaryngology and neurologyoutpatient clinics, a detailed anamnesis and a physicalexamination precede specific vestibular tests in thediagnosis. It was seen that the vast majority of patientsthat applied to both outpatient clinics had peripheralvertigo, especially BPPV. The use of maneuvers ispromising in the BPPV treatment. A coordinatedcommunication of both clinics is important for a rapiddiagnosis and prevention of unnecessaryexaminations.
Conflict of interest The authors disclosed no conflict of interest duringthe preparation or publication of this manuscript.
597 The European Research Journal Volume 5 Issue 4 July 2019
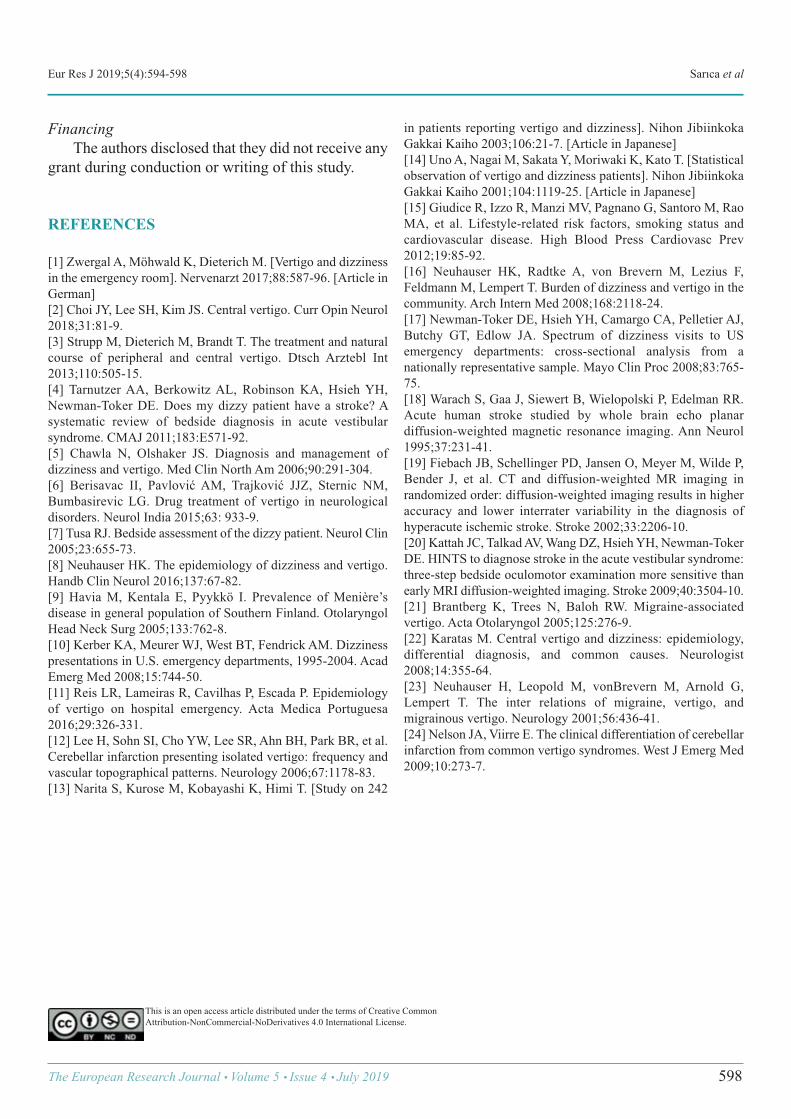
Eur Res J 2019;5(4):594-598 Sarıca et al
Financing The authors disclosed that they did not receive anygrant during conduction or writing of this study.
REFERENCES
[1] Zwergal A, Möhwald K, Dieterich M. [Vertigo and dizzinessin the emergency room]. Nervenarzt 2017;88:587-96. [Article inGerman][2] Choi JY, Lee SH, Kim JS. Central vertigo. Curr Opin Neurol2018;31:81-9. [3] Strupp M, Dieterich M, Brandt T. The treatment and naturalcourse of peripheral and central vertigo. Dtsch Arztebl Int2013;110:505-15. [4] Tarnutzer AA, Berkowitz AL, Robinson KA, Hsieh YH,Newman-Toker DE. Does my dizzy patient have a stroke? Asystematic review of bedside diagnosis in acute vestibularsyndrome. CMAJ 2011;183:E571-92. [5] Chawla N, Olshaker JS. Diagnosis and management ofdizziness and vertigo. Med Clin North Am 2006;90:291-304. [6] Berisavac II, Pavlović AM, Trajković JJZ, Sternic NM,Bumbasirevic LG. Drug treatment of vertigo in neurologicaldisorders. Neurol India 2015;63: 933-9. [7] Tusa RJ. Bedside assessment of the dizzy patient. Neurol Clin2005;23:655-73. [8] Neuhauser HK. The epidemiology of dizziness and vertigo.Handb Clin Neurol 2016;137:67-82. [9] Havia M, Kentala E, Pyykkö I. Prevalence of Menière’sdisease in general population of Southern Finland. OtolaryngolHead Neck Surg 2005;133:762-8. [10] Kerber KA, Meurer WJ, West BT, Fendrick AM. Dizzinesspresentations in U.S. emergency departments, 1995-2004. AcadEmerg Med 2008;15:744-50. [11] Reis LR, Lameiras R, Cavilhas P, Escada P. Epidemiologyof vertigo on hospital emergency. Acta Medica Portuguesa2016;29:326-331. [12] Lee H, Sohn SI, Cho YW, Lee SR, Ahn BH, Park BR, et al.Cerebellar infarction presenting isolated vertigo: frequency andvascular topographical patterns. Neurology 2006;67:1178-83. [13] Narita S, Kurose M, Kobayashi K, Himi T. [Study on 242
in patients reporting vertigo and dizziness]. Nihon JibiinkokaGakkai Kaiho 2003;106:21-7. [Article in Japanese][14] Uno A, Nagai M, Sakata Y, Moriwaki K, Kato T. [Statisticalobservation of vertigo and dizziness patients]. Nihon JibiinkokaGakkai Kaiho 2001;104:1119-25. [Article in Japanese][15] Giudice R, Izzo R, Manzi MV, Pagnano G, Santoro M, RaoMA, et al. Lifestyle-related risk factors, smoking status andcardiovascular disease. High Blood Press Cardiovasc Prev2012;19:85-92. [16] Neuhauser HK, Radtke A, von Brevern M, Lezius F,Feldmann M, Lempert T. Burden of dizziness and vertigo in thecommunity. Arch Intern Med 2008;168:2118-24. [17] Newman-Toker DE, Hsieh YH, Camargo CA, Pelletier AJ,Butchy GT, Edlow JA. Spectrum of dizziness visits to USemergency departments: cross-sectional analysis from anationally representative sample. Mayo Clin Proc 2008;83:765-75. [18] Warach S, Gaa J, Siewert B, Wielopolski P, Edelman RR.Acute human stroke studied by whole brain echo planardiffusion-weighted magnetic resonance imaging. Ann Neurol1995;37:231-41. [19] Fiebach JB, Schellinger PD, Jansen O, Meyer M, Wilde P,Bender J, et al. CT and diffusion-weighted MR imaging inrandomized order: diffusion-weighted imaging results in higheraccuracy and lower interrater variability in the diagnosis ofhyperacute ischemic stroke. Stroke 2002;33:2206-10. [20] Kattah JC, Talkad AV, Wang DZ, Hsieh YH, Newman-TokerDE. HINTS to diagnose stroke in the acute vestibular syndrome:three-step bedside oculomotor examination more sensitive thanearly MRI diffusion-weighted imaging. Stroke 2009;40:3504-10. [21] Brantberg K, Trees N, Baloh RW. Migraine-associatedvertigo. Acta Otolaryngol 2005;125:276-9. [22] Karatas M. Central vertigo and dizziness: epidemiology,differential diagnosis, and common causes. Neurologist2008;14:355-64. [23] Neuhauser H, Leopold M, vonBrevern M, Arnold G,Lempert T. The inter relations of migraine, vertigo, andmigrainous vertigo. Neurology 2001;56:436-41. [24] Nelson JA, Viirre E. The clinical differentiation of cerebellarinfarction from common vertigo syndromes. West J Emerg Med2009;10:273-7.
This is an open access article distributed under the terms of Creative CommonAttribution-NonCommercial-NoDerivatives 4.0 International License.
The European Research Journal Volume 5 Issue 4 July 2019 598
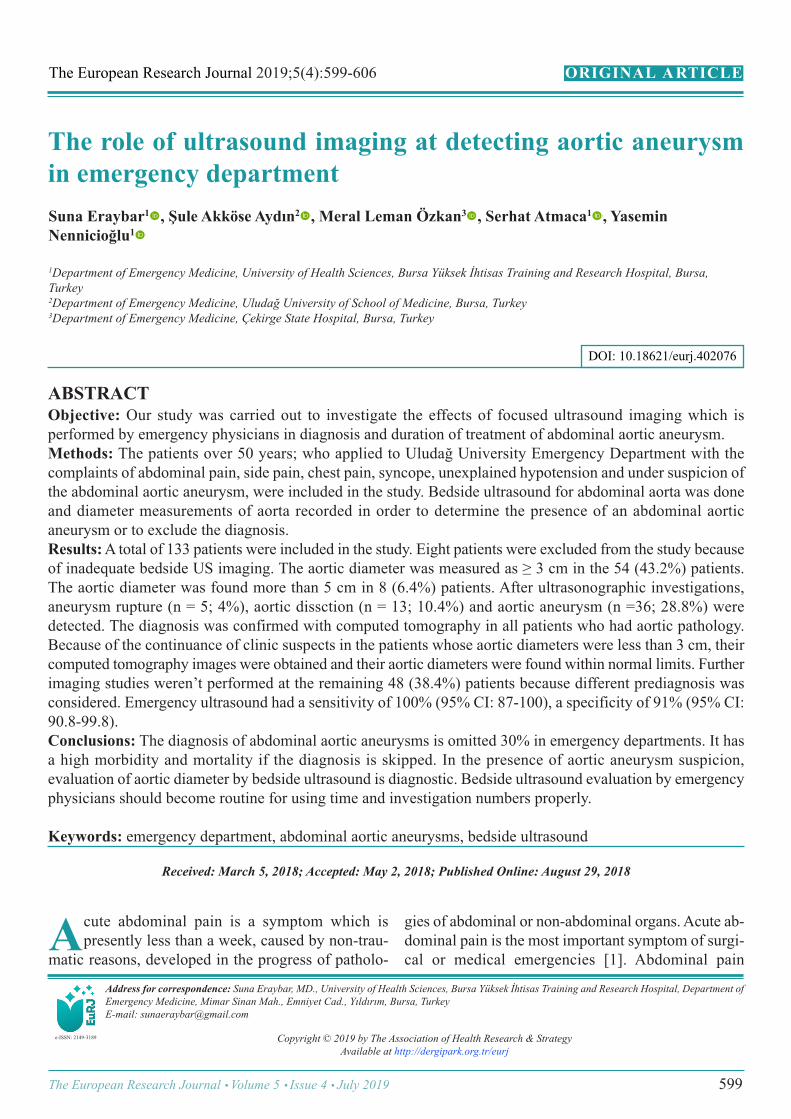
The role of ultrasound imaging at detecting aortic aneurysmin emergency departmentSuna Eraybar1 , Şule Akköse Aydın2 , Meral Leman Özkan3 , Serhat Atmaca1 , YaseminNennicioğlu1
1Department of Emergency Medicine, University of Health Sciences, Bursa Yüksek İhtisas Training and Research Hospital, Bursa,Turkey 2Department of Emergency Medicine, Uludağ University of School of Medicine, Bursa, Turkey 3Department of Emergency Medicine, Çekirge State Hospital, Bursa, Turkey
ABSTRACTObjective: Our study was carried out to investigate the effects of focused ultrasound imaging which isperformed by emergency physicians in diagnosis and duration of treatment of abdominal aortic aneurysm. Methods: The patients over 50 years; who applied to Uludağ University Emergency Department with thecomplaints of abdominal pain, side pain, chest pain, syncope, unexplained hypotension and under suspicion ofthe abdominal aortic aneurysm, were included in the study. Bedside ultrasound for abdominal aorta was doneand diameter measurements of aorta recorded in order to determine the presence of an abdominal aorticaneurysm or to exclude the diagnosis. Results: A total of 133 patients were included in the study. Eight patients were excluded from the study becauseof inadequate bedside US imaging. The aortic diameter was measured as ≥ 3 cm in the 54 (43.2%) patients.The aortic diameter was found more than 5 cm in 8 (6.4%) patients. After ultrasonographic investigations,aneurysm rupture (n = 5; 4%), aortic dissction (n = 13; 10.4%) and aortic aneurysm (n =36; 28.8%) weredetected. The diagnosis was confirmed with computed tomography in all patients who had aortic pathology.Because of the continuance of clinic suspects in the patients whose aortic diameters were less than 3 cm, theircomputed tomography images were obtained and their aortic diameters were found within normal limits. Furtherimaging studies weren’t performed at the remaining 48 (38.4%) patients because different prediagnosis wasconsidered. Emergency ultrasound had a sensitivity of 100% (95% CI: 87-100), a specificity of 91% (95% CI:90.8-99.8). Conclusions: The diagnosis of abdominal aortic aneurysms is omitted 30% in emergency departments. It hasa high morbidity and mortality if the diagnosis is skipped. In the presence of aortic aneurysm suspicion,evaluation of aortic diameter by bedside ultrasound is diagnostic. Bedside ultrasound evaluation by emergencyphysicians should become routine for using time and investigation numbers properly.
Keywords: emergency department, abdominal aortic aneurysms, bedside ultrasound
Address for correspondence: Suna Eraybar, MD., University of Health Sciences, Bursa Yüksek İhtisas Training and Research Hospital, Department ofEmergency Medicine, Mimar Sinan Mah., Emniyet Cad., Yıldırım, Bursa, TurkeyE-mail: [email protected]
Copyright © 2019 by The Association of Health Research & StrategyAvailable at http://dergipark.org.tr/eurj
The European Research Journal 2019;5(4):599-606
cute abdominal pain is a symptom which ispresently less than a week, caused by non-trau-
matic reasons, developed in the progress of patholo-
gies of abdominal or non-abdominal organs. Acute ab-dominal pain is the most important symptom of surgi-cal or medical emergencies [1]. Abdominal pain
A
ORIGINAL A RTICLE
e-ISSN: 2149-3189
DOI: 10.18621/eurj.402076
Received: March 5, 2018; Accepted: May 2, 2018; Published Online: August 29, 2018
The European Research Journal Volume 5 Issue 4 July 2019 599
Eur Res J 2019;5(4):599-606 Detecting aortic aneurysm by bedside ultrasound
constitutes 5-10% of all emergency care applications[2]. Diagnosis and treatment of acute abdominal painat emergency departments; is still one of the importantclinical problems despite all the technological ad-vancement. Especially at the situations when the pa-tient is not stable, there are some problems at usingimaging methods which origin from transporting dif-ficulties.
Aortic aneurysms are at the 13th rank of mostcommon death reasons in the USA [3]. Appraisal rateis 10/100.000 per year and it’s estimated higher inelder groups. The frequency of acute aortic dissectionis approximately 5.2 in a million [4] and detected as1.5% at 60-80 age group in Turkey [5]. The frequencyof aortic dissection is 2 to 5 times more in men thanwomen. The diameter of an aneurysm is an importantfactor at detecting the rupture risk [6]. At many stud-ies, it is shown that smoking affects the enlargementof an aneurysm [7-10]. It is detected that chronic ob-structive lung disease increases the risk of aorticaneurysm rupture approximately 3.6 times [11]. Most of the patients who applied with acute aortic dis-section describe a chest pain in a tearing character. Thecharacter of pain and radiating from chest to back andsometimes to waist is a very important clinical sign[10, 12]. If aortic dissections are left to their own nat-ural course, they become substantially life threating.So, it must be diagnosed quickly and life-saving inter-ventions must be started urgently. At this point, usageof diagnostic imaging methods at the emergency de-partment has vital importance.
Ultrasound (US) is a conventional imagingmethod at differentiating between aneurysmatic andnormal aorta. It has many important advantages like;no exposure to ionising radiation during imaging orany usage of contrast substances and it can be per-formed at the bedside [14]. The aim of the our studywas investigate the effects of focused ultrasound im-aging which is performed by emergency physicians indiagnosis and duration of treatment of abdominal aor-tic aneurysm (AAA) suspicion.
METHODS
Our study was performed prospectively for oneyear period at the Emergency Department of UludağUniversity School of Medicine. Institutional ethics
committee approval was taken for our study. The patients over 50 years old; who admitted tothe emergency department with the complaints ofabdominal pain, side pain, chest pain, syncope,unexplained hypotension and who are under suspicionfor an aortic aneurysm, were included to study.Diameter measurement and abdominal aorta imagingwere performed by bedside ultrasound for detectingor excluding the abdominal aortic aneurysm in thesepatients. Patients age, application clinics, vital signs,smoking history, co-morbidities, the presence of theabdominal aortic aneurysm in family history, knownabdominal aortic aneurysm history, undergone aorticand other cardiac surgeries were recorded. Informations like advanced age; hypertensionhistory; severe abdominal, back and side pain intearing character, syncope after abdominal pain,unexplained hypotension and also some physicalexamination signs like pulsatile mass at abdomen,tension arterial difference between right and left arm,difference at peripheral pulses, presence of focalneurologic deficit were noted as a value in suspicionof AAA. Abdominal aortic diameter measurement wasperformed by bedside ultrasound imaging afterstabilization of patients. Measurements wereperformed by emergency physicians who finishedtraining course which is proper to US usage atemergency department protocol of American Collegeof Emergency Physicians and that is arranged byEmergency Medicine Physicians Association ofTurkey. US measurements were performed withSiemens Digital Color Doppler Ultrasound SIUIApogee 3500 device, measurements were done atmode B with 3.5 MHz convex probe. Abdominal aorta measurement was performed atthe grey window, from diaphragmatic hiatus to aorticbifurcation on the transverse and longitudinal planes.Wall-to-wall diameter measurements from the widestarea of aorta were recorded as < 3 cm, 3-5 cm, and >5 cm. Measurements which are ≥ 3 cm were acceptedas aneurysmatic dilatation. Aneurysm area wasdefined as suprarenal or infrarenal according to renalartery exit point. When the aneurysmatic segment wasdetected; its progress, presence of flap and intraaorticthrombus were recorded. Hepatorenal, splenorenal andpelvic regions were investigated ultrasonographically
600 The European Research Journal Volume 5 Issue 4 July 2019
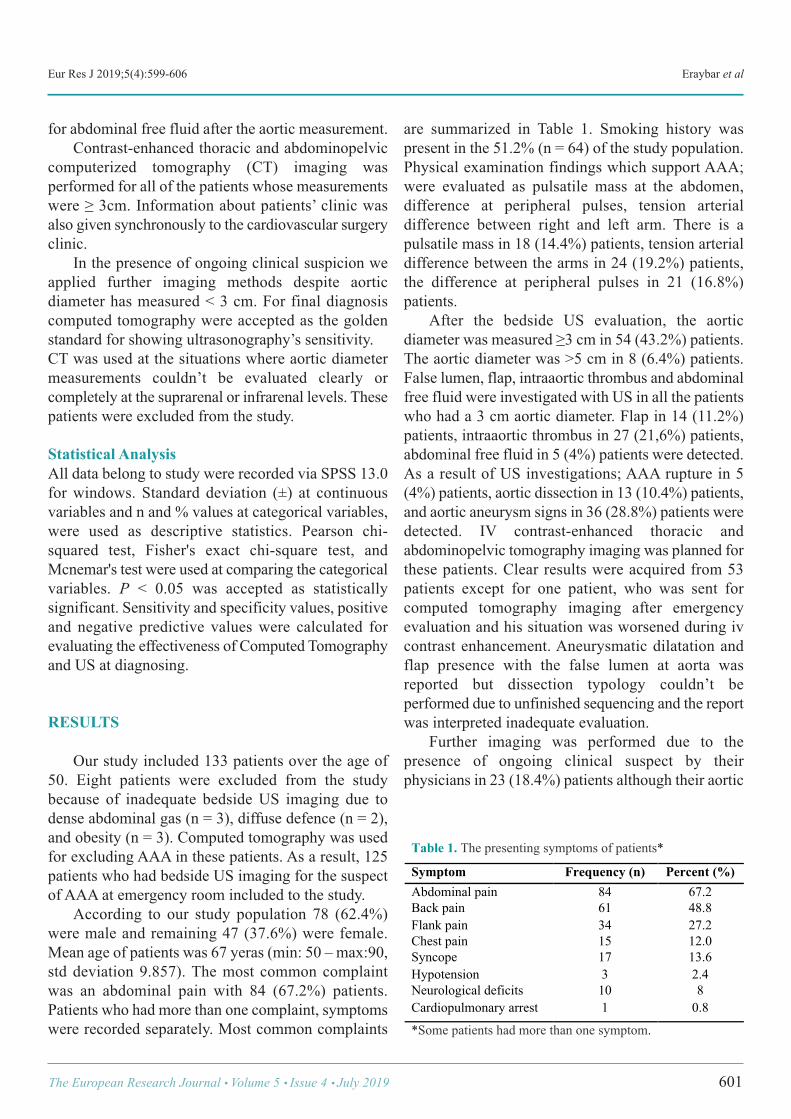
Eur Res J 2019;5(4):599-606 Eraybar et al
for abdominal free fluid after the aortic measurement. Contrast-enhanced thoracic and abdominopelviccomputerized tomography (CT) imaging wasperformed for all of the patients whose measurementswere ≥ 3cm. Information about patients’ clinic wasalso given synchronously to the cardiovascular surgeryclinic. In the presence of ongoing clinical suspicion weapplied further imaging methods despite aorticdiameter has measured < 3 cm. For final diagnosiscomputed tomography were accepted as the goldenstandard for showing ultrasonography’s sensitivity. CT was used at the situations where aortic diametermeasurements couldn’t be evaluated clearly orcompletely at the suprarenal or infrarenal levels. Thesepatients were excluded from the study.
Statistical Analysis All data belong to study were recorded via SPSS 13.0for windows. Standard deviation (±) at continuousvariables and n and % values at categorical variables,were used as descriptive statistics. Pearson chi-squared test, Fisher's exact chi-square test, andMcnemar's test were used at comparing the categoricalvariables. P < 0.05 was accepted as statisticallysignificant. Sensitivity and specificity values, positiveand negative predictive values were calculated forevaluating the effectiveness of Computed Tomographyand US at diagnosing.
RESULTS
Our study included 133 patients over the age of50. Eight patients were excluded from the studybecause of inadequate bedside US imaging due todense abdominal gas (n = 3), diffuse defence (n = 2),and obesity (n = 3). Computed tomography was usedfor excluding AAA in these patients. As a result, 125patients who had bedside US imaging for the suspectof AAA at emergency room included to the study. According to our study population 78 (62.4%)were male and remaining 47 (37.6%) were female.Mean age of patients was 67 yeras (min: 50 – max:90,std deviation 9.857). The most common complaintwas an abdominal pain with 84 (67.2%) patients.Patients who had more than one complaint, symptomswere recorded separately. Most common complaints
are summarized in Table 1. Smoking history waspresent in the 51.2% (n = 64) of the study population. Physical examination findings which support AAA;were evaluated as pulsatile mass at the abdomen,difference at peripheral pulses, tension arterialdifference between right and left arm. There is apulsatile mass in 18 (14.4%) patients, tension arterialdifference between the arms in 24 (19.2%) patients,the difference at peripheral pulses in 21 (16.8%)patients. After the bedside US evaluation, the aorticdiameter was measured ≥3 cm in 54 (43.2%) patients.The aortic diameter was >5 cm in 8 (6.4%) patients.False lumen, flap, intraaortic thrombus and abdominalfree fluid were investigated with US in all the patientswho had a 3 cm aortic diameter. Flap in 14 (11.2%)patients, intraaortic thrombus in 27 (21,6%) patients,abdominal free fluid in 5 (4%) patients were detected.As a result of US investigations; AAA rupture in 5(4%) patients, aortic dissection in 13 (10.4%) patients,and aortic aneurysm signs in 36 (28.8%) patients weredetected. IV contrast-enhanced thoracic andabdominopelvic tomography imaging was planned forthese patients. Clear results were acquired from 53patients except for one patient, who was sent forcomputed tomography imaging after emergencyevaluation and his situation was worsened during ivcontrast enhancement. Aneurysmatic dilatation andflap presence with the false lumen at aorta wasreported but dissection typology couldn’t beperformed due to unfinished sequencing and the reportwas interpreted inadequate evaluation. Further imaging was performed due to thepresence of ongoing clinical suspect by theirphysicians in 23 (18.4%) patients although their aortic
The European Research Journal Volume 5 Issue 4 July 2019 601
Table 1. The presenting symptoms of patients*
Symptom Frequency (n) Percent (%) Abdominal pain 84 67.2 Back pain 61 48.8 Flank pain 34 27.2 Chest pain 15 12.0 Syncope 17 13.6 Hypotension 3 2.4 Neurological deficits 10 8 Cardiopulmonary arrest 1 0.8
*Some patients had more than one symptom. !
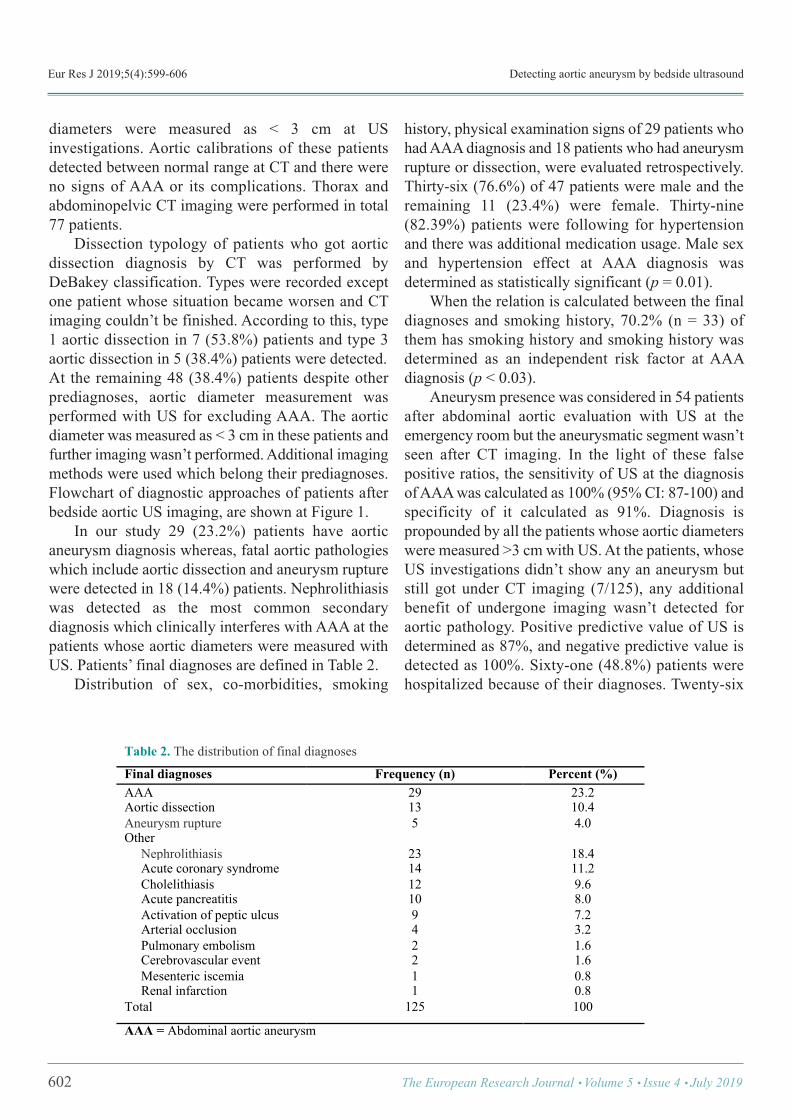
Eur Res J 2019;5(4):599-606 Detecting aortic aneurysm by bedside ultrasound
diameters were measured as < 3 cm at USinvestigations. Aortic calibrations of these patientsdetected between normal range at CT and there wereno signs of AAA or its complications. Thorax andabdominopelvic CT imaging were performed in total77 patients. Dissection typology of patients who got aorticdissection diagnosis by CT was performed byDeBakey classification. Types were recorded exceptone patient whose situation became worsen and CTimaging couldn’t be finished. According to this, type1 aortic dissection in 7 (53.8%) patients and type 3aortic dissection in 5 (38.4%) patients were detected. At the remaining 48 (38.4%) patients despite otherprediagnoses, aortic diameter measurement wasperformed with US for excluding AAA. The aorticdiameter was measured as < 3 cm in these patients andfurther imaging wasn’t performed. Additional imagingmethods were used which belong their prediagnoses.Flowchart of diagnostic approaches of patients afterbedside aortic US imaging, are shown at Figure 1. In our study 29 (23.2%) patients have aorticaneurysm diagnosis whereas, fatal aortic pathologieswhich include aortic dissection and aneurysm rupturewere detected in 18 (14.4%) patients. Nephrolithiasiswas detected as the most common secondarydiagnosis which clinically interferes with AAA at thepatients whose aortic diameters were measured withUS. Patients’ final diagnoses are defined in Table 2. Distribution of sex, co-morbidities, smoking
history, physical examination signs of 29 patients whohad AAA diagnosis and 18 patients who had aneurysmrupture or dissection, were evaluated retrospectively.Thirty-six (76.6%) of 47 patients were male and theremaining 11 (23.4%) were female. Thirty-nine(82.39%) patients were following for hypertensionand there was additional medication usage. Male sexand hypertension effect at AAA diagnosis wasdetermined as statistically significant (p = 0.01). When the relation is calculated between the finaldiagnoses and smoking history, 70.2% (n = 33) ofthem has smoking history and smoking history wasdetermined as an independent risk factor at AAAdiagnosis (p < 0.03). Aneurysm presence was considered in 54 patientsafter abdominal aortic evaluation with US at theemergency room but the aneurysmatic segment wasn’tseen after CT imaging. In the light of these falsepositive ratios, the sensitivity of US at the diagnosisof AAA was calculated as 100% (95% CI: 87-100) andspecificity of it calculated as 91%. Diagnosis ispropounded by all the patients whose aortic diameterswere measured >3 cm with US. At the patients, whoseUS investigations didn’t show any an aneurysm butstill got under CT imaging (7/125), any additionalbenefit of undergone imaging wasn’t detected foraortic pathology. Positive predictive value of US isdetermined as 87%, and negative predictive value isdetected as 100%. Sixty-one (48.8%) patients werehospitalized because of their diagnoses. Twenty-six
602 The European Research Journal Volume 5 Issue 4 July 2019
Table 2. The distribution of final diagnoses
Final diagnoses Frequency (n) Percent (%) AAA 29 23.2 Aortic dissection 13 10.4 Aneurysm rupture 5 4.0 Other Nephrolithiasis 23 18.4 Acute coronary syndrome 14 11.2 Cholelithiasis 12 9.6 Acute pancreatitis 10 8.0 Activation of peptic ulcus 9 7.2 Arterial occlusion 4 3.2 Pulmonary embolism 2 1.6 Cerebrovascular event 2 1.6 Mesenteric iscemia 1 0.8 Renal infarction 1 0.8 Total 125 100
AAA = Abdominal aortic aneurysm !
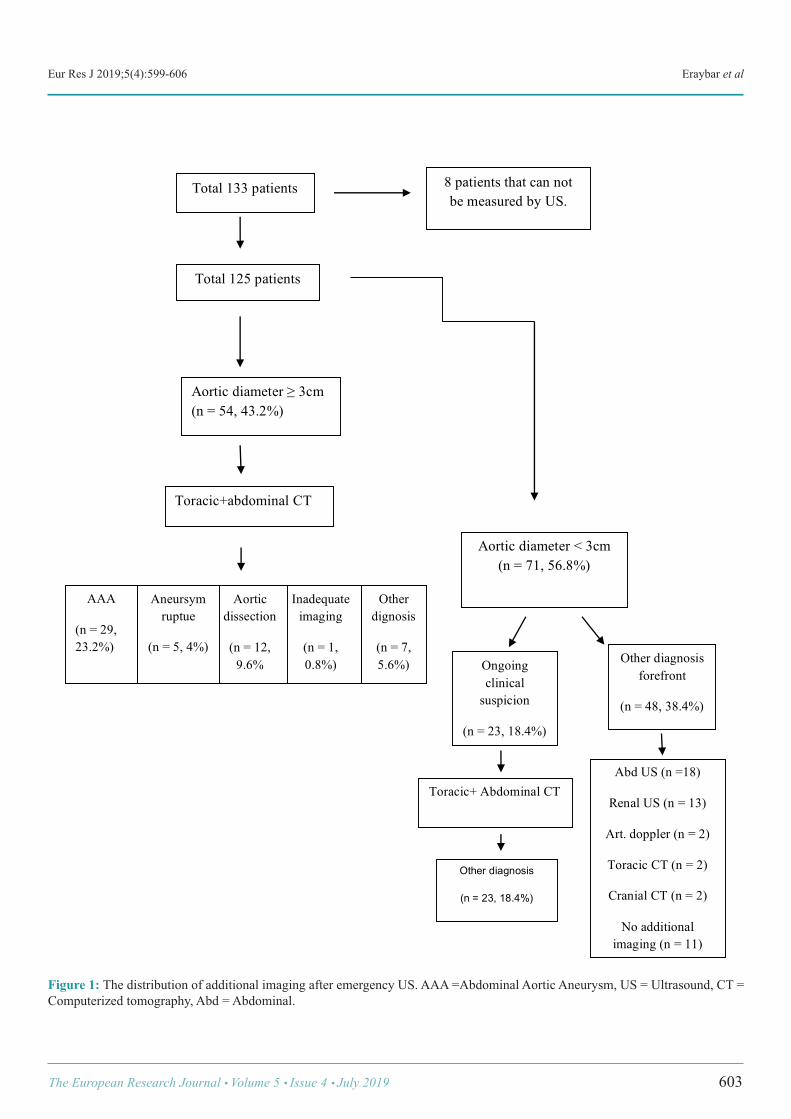
Eur Res J 2019;5(4):599-606 Eraybar et al
The European Research Journal Volume 5 Issue 4 July 2019 603
!
8 patients that can not be measured by US.
Total 133 patients
Total 125 patients
Aortic diameter ! 3cm (n = 54, 43.2%)
Toracic+abdominal CT
Other dignosis
(n = 7, 5.6%)
Inadequate imaging
(n = 1, 0.8%)
Aortic dissection
(n = 12, 9.6%
AAA
(n = 29, 23.2%)
Aneursym ruptue
(n = 5, 4%)
Aortic diameter < 3cm (n = 71, 56.8%)
Other diagnosis forefront
(n = 48, 38.4%)
Ongoing clinical
suspicion
(n = 23, 18.4%)
Toracic+ Abdominal CT Abd US (n =18)
Renal US (n = 13)
Art. doppler (n = 2)
Toracic CT (n = 2)
Cranial CT (n = 2)
No additional imaging (n = 11)
!"#$%&'()*+,-(-&
.+&/&012&345678&
Figure 1: The distribution of additional imaging after emergency US. AAA =Abdominal Aortic Aneurysm, US = Ultrasound, CT =Computerized tomography, Abd = Abdominal.
Eur Res J 2019;5(4):599-606 Detecting aortic aneurysm by bedside ultrasound
(20.8%) patients were admitted to cardiovascularsurgery intensive care unit and 14 (11.2%) patienswere admitted to coronary intensive care unit. Onepatient who got mesenteric ischemia diagnosis andtotal 7 (5.6%) patients who had acute cholecystitis andacute pancreatitis diagnoses were admitted to generalsurgery service. One patient who admitted to emergency roomwith hypotension and abdominal pain, and bedside USaortic diameter measurement was >3 cm, also flap andintraaortic thrombus in US imaging detected weretaken to CT imaging with the prediagnosis of aorticdissection but during imaging, arrest developed. Therewas another patient, who applied with the complaintsof syncope and right leg pain and right leg femoralartery and distal couldn’t be palpated; aortic diameterwas measured as <3 cm but the clinical exclusion ofdiagnosis couldn’t be done so CT imaging wasperformed. Thrombus was detected in the iliac artery.Both of these patients were resuscitated at theemergency room but they didn’t respond and they’reaccepted as exitus. Five (4%) patients left the emergency room duringtheir follow up despite all of the risks and life threatingcharacter of their situation were told them. First ofthese patients were applied with back pain andsyncope, the aortic diameter was measured betweennormal range and was followed by electrocardiogramand prediagnosis was the acute coronary syndrome.Three of the remaining 4 patients aortic dissectionwere detected by imaging (2 of them were DeBakeytype 3, one of them was DeBakey type 1). The lastpatient had AAA diagnosis with intraaortic thrombus.
DISCUSSION
AAA is a true surgical emergency which is neededto diagnose urgently and has high mortality when it’smissed, its morbidity and mortality can be reducedwith early intervention [15]. In a cohort study, whichincludes 73,450 patients and evaluates prevalence andrisk factors of AAA, smoking incidence was found as75%. In our study smoking incidence was found as70.2% at AAA patients and it is determined as animportant factor. Hypertension is also evaluated as theindependent risk factor for the rupture and dissectionof AAAs [16]. Hypertension accompanied in the
82.9% of 47 AAA patients in our study. This ratio issimilar with other studies. In Edinburg study whichinvestigates peripheral artery diseases, hypertensionaccompanied to AAA in the 34 patients of 1,592 [17].In our study, known peripheral artery disease wasrecorded at two patients and after investigations, AAAwas detected at these patients. Another risk factor ispositive family history for AAA [18]. There was nofamily history in patients who included our study. US is an imaging method which is commonlypreferred at AAA diagnosis. It is a non-invasive, low-cost and accessible method so it has application areafor diagnosis at emergency departments. US’s primarybenefit is abdominal aortic aneurysm can beinvestigated correctly, quickly and sensitively at thebedside [13]. US sensitivity for detecting AAA is found as100% in many studies [15, 18, 19]. In obese peopleand at the presence of severe abdominal gas,inadequate imaging can be performed and US isdependent to the person who performs it. In the study of Kuhn et al. [15]; AAA detectingsensitivity and specificity of US at patients who hadabdominal pain and are more than 50 years old werefound as 100%, which is performed by emergencyphysicians who finished 3 days education program. Inanother study which was performed by Tayal et al.[20], US’s positive predictive value was detected as95% and the negative predictive value was detected as100%. In our study, ultrasound was performed by threeyears emergency medicine residents and they finishedone-day US education program. US sensitivity wasdetected as 100% and specificity was detected as 91%at AAA detecting in the emergency department in ourstudy. In suspected cases, the aneurysm can be excludedif aortic diameter is evaluated as normal with US [21,22]. In our study, patients who had aneurysmaticdilatation diagnosis with bedside ultrasound could befollowed up by cardiovascular surgery service.Detecting operation needs according to annual growthrate provided a base for viewing mortality rates atfollow-ups. Nephrolithiasis took the first place atmisdiagnoses [23]. In our study after the clinicalsuspect, we performed CT imaging to some patientsand 10% of them had nephrolithiasis. The similarityof pain characteristic and not the occurrence of co-
604 The European Research Journal Volume 5 Issue 4 July 2019
Eur Res J 2019;5(4):599-606 Eraybar et al
symptoms at the presence of risk factors cause theneed of additional imaging methods for confirming thediagnosis. Co-diagnoses which were achieved by CTimaging which was performed for the suspect of AAA,was nephrolithiasis (13%), cholelithiasis (2.6%) andrenal infarct (1.3%) respectively. Usage of US as a screen test for AAA diagnosiswas considering in a close future [13]. Early surgicalconsultation and intervention can be possible in thepresence of rupture or dissection with abdominalaortic evaluation by US. At the presence ofuncomplicated aneurysms, US can be used for followup and detecting the time of elective surgery. Bedside US can be done simultaneously withresuscitation or after the proper treatment because itis non-invasive and easily applicable. As a result, the most important role of theemergency physician is detecting if there is a need foremergent surgical intervention or medical treatment.Etiology can be detected in many of the patients withdetailed anamnesis which includes all of the pain’scharacteristics, proper physical examination,laboratory and radiologic investigations which arerequested with correct indications. At this stage,patient’s present clinical situation must be taught fordeciding usage of imaging methods and if the patientis unstable could not be taken from the emergencyroom.
Limitations This study has some limitations which have to bepointed out. First the small patient population do notallow us to draw any conclusion about theeffectiveness of this technique. Furthermore, thefollow-up was limited. Larger series are needed toconfirm the effectiveness of the bedside ultrasoundimaging in detecting aortic aneurysms. Second wehave high aortic aneurysm and dissection ratesaccording to the literatüre this may be due to narrowrange of age and symptomatology of selected patients.
CONCLUSION
If there is AAA in the suspected diagnosis list,evaluation of an aortic aneurysm with bedside US isnecessary and diagnostic. Aortic imaging in patientsenables detecting of AAA, dissection diagnoses and
rupture presence. Evaluating aorta as normal indicatesthe necessity of considering additional pathologies inthe differential diagnosis. Thus, investigation and timecan be used properly and adequate treatment steps canbe chosen for patients. Bedside ultrasonographicimaging must be routinized by emergency medicinephysicians for using time and investigation numbersproperly.
Conflict of interest The authors disclosed no conflict of interest duringthe preparation or publication of this manuscript.
Financing The authors disclosed that they did not receive anygrant during conduction or writing of this study.
REFERENCES
[1] Graff LG 4th, Robinson D. Abdominal pain and emergencydepartment evaluation. Emerg Med Clin North Am 2001;19:123-36. [2] Lameris W, Randen A, Dijkdraaf MG, Bossuyt PM, Stoker J,Boermeester MA. Optimization of diagnostic imaging use inpatients with acute abdominal pain (OPTIMA): Design andrationale. BMC Emerg Med 2007;7:9. [3] Majumper PP, St Jean PL, Ferrell RE, Webster MW, SteedDL. On the inheritance of abdominal aortic aneurysm. Am J HumGenet 1991;48:164-70. [4] Bickerstaff LK, Pailero PC, Hollier LH, Melton LJ, VanPeenen HJ, Cherry KJ, et al. Thoracic aortic aneurysms: apopulation based study. Surgery 1982;92:1103-8. [5] Soysal M, Denizci U, Bayar R, Keşmer Y, Ulusoy M,Söylemez H, et al. Yaşlı popülasyonda abdominal aortanevrizmasısıklığının ve kardiyovasküler risk faktörleri ileilişkisinin belirlenmesi. Klinik Gelişim 1996;9:4110-5. [6] Coady A, Rizza JA, Hammond GL, Mandapati D, Darr U,Kopf GS, et al. What is appropriate size criterion for resection ofthoracic aortic aneurysm? J Thorac Cardiovasc Surg1997;113:476-91. [7] Pasipoularides A, Murgo JP, Bird JJ, Craig WE. Fluiddynomics of aortic stenosis: mehanisms for the presence ofsubvalvular pressure gradients. Am J Physiol 1984;246(4 Pt2):H542-50. [8] Svensson LG Crawford ES (eds). Cardiovascular and vasculardisease of the aorta. 1st edition. Philidelphia: WB SaundersCompany; 1997. [9] Strachan DP. Predictors of death from aortic aneurysm amongmiddle-aged men: the White Hall Study. Br J Surg 1991;78:401-4. [10] MacSeveney ST, Ellis M, Worrell PC, Greenhalgh RM,Powell JT. Smoking and growth rate of small abdominal aortic
The European Research Journal Volume 5 Issue 4 July 2019 605
Eur Res J 2019;5(4):599-606 Detecting aortic aneurysm by bedside ultrasound
aneurysms. Lancet 1994;344:651-2. [11] Lobato AC, Puceh-Leao P. Predictive factors for rupture ofthoracoabdominal aortic aneurysms. J Vasc Surg 1998;27:446-53. [12] DeSanctis RW, Doroghazi RM, Austen WG, Buckley MJ.Aortic dissection. N Engl J Med 1987;317:1060-67. [13] Barkin AZ, Rosen CL. Ultrasound detection of abdominalaortic aneurysm. Emerg Med Clin North Am 2004;22:675-8. [14] American College of Emergency Physicians. Emergencyultrasonography imaging criteria compendum. ACEP PolicyStatements. Ann Emerg Med 2009;53:550-70. [15] Kuhn M, Bonnin RLL, Davey MJ, Rowland JL, LangloisSL. Emergency department ultrasound scanning for abdominalaortic aneurysm: accessible, accurate and advantageous. AnnEmerg Med 2000;36:219-23. [16] Rodin MB, Daviglus ML, Wong GC, Liu K, Garside DB,Greenland P, et al. Middle age cardiovasculer risk faktors andabdominal aortic aneurysm in older age. Hypertension2003;42:61-8. [17] Fowkes FG, Housley E, Cawosa FH, Macintyre CC,Ruckley CV, Prescott RJ. Edinburg Artery Study: prevelance of
asymptomatic and symptomatic peripheral arterial disease in thegeneral population. Int J Epidemiol 1991;20:384-92. [18] Vowden P, Wilkinson D, Ausobsky JR, Kester RC. Acomparison of three imaging techniques in the assessment of anabdominal aortic aneurysm. J Cardiovasc Surg (Torino)1989;30:891-6. [19] Ernst CB. Abdominal aortic aneurysm. N Engl J Med1993;328:1167-72. [20] Tayal VS, Graf CD, Gibbs MA. Prospective study ofaccuracy and outcome of emergency ultrasound for abdominalaortic aneurysm over two years. Acad Emerg Med 2003;10:867-71. [21] Knaut AL, Kendall JL, Patten R, Ray C. Ultrasonographicmeasurement of aortic diameter by emergency physiciansapproximates results obtained by computed tomography. J EmergMed 2005;28:119-26. [22] Walker A, Brenchley J, Sloan JP, Lalanda M, Venables H.Ultrasound by emergency physicians to detect abdominal aorticaneurysms: a UK case series. Emerg Med J 2004;21:257-9. [23] Rose WM III, Ernst CB. Abdominal aortic aneurysm. CompTher 1995;21:339-43.
606 The European Research Journal Volume 5 Issue 4 July 2019
This is an open access article distributed under the terms of Creative CommonAttribution-NonCommercial-NoDerivatives 4.0 International License.
Relationship between students’ performance on weekly taskassessments and final practical exam at the preclinicalrestorative dentistry courseMuhammet Kerim Ayar
Department of Restorative Dentistry, Biruni University, Faculty of Dentistry, İstanbul, Turkey
ABSTRACTObjectives: The purpose of this study was to examine the relationships between dental students’ performanceon weekly practical task assessments, midterm practical exam and final practical exam in the preclinicalrestorative dentistry course.Methods: Scores of final practical exam, midterm practical exam and weekly practical task assessments in therestorative dentistry preclinical course in the half year of the third year of the curriculum at Biruni UniversityFaculty of Dentistry were compared. It was hypothesized that students that performed highly on weekly taskassessments would perform highly on the midterm and final practical exams.Results: The results showed that the weekly practical task assessment scores were correlated with the midtermpractical exam and final practical exam scores and were a positive predictor. However, final practical examscores were significantly lower than midterm practical exam and weekly practical task assessment scores.Conclusions: The quality assessments of students’ weekly tasks would be an effective predictor to assessstudent’s preclinical performance. Thus, it would be recommended that integrating weekly task assessmentinto the preclinical restorative dentistry curriculum as an effective assessment tool.
Keywords: Preclinical examination, restorative dentistry, dental education
Address for correspondence: Atilla Tekin, DDS, PhD., Biruni University, Faculty of Dentistry, Department of Restorative Dentistry, 10. Yıl Cad., No:45,34010 İstanbul, Turkey, E-mail: [email protected], Phone: +90 2124448276, Fax: +90 2124164646
Copyright © 2019 by The Association of Health Research & StrategyAvailable at http://dergipark.org.tr/eurj
The European Research Journal 2019;5(4):607-612
he one of the important components ofpreclinical dental education is a restorative
dentistry course. Preclinical restorative dentistrycourses enable students acquire and develop theirmanual dexterity and gain knowledge about theclinical aspects of to restoring carious and/or defectiveteeth [1]. Manual dexterity is a fundamentalcomponent in restorative dentistry, as fine motor skillsare necessary to carry out complex treatments in small dimensions, withlimited space and visibility in the oral cavity [2, 3].
Dental students learn these fundamental skills throughsimulated exercise in preclinical courses using eitherartificial teeth mounted in phantom head or extractednatural teeth, before delivering actual patient care inthe clinic. Therefore, dental students should acquire ofthese psychomotor skills during the preclinical courseof restorative dentistry to be prepared to deliver realpatient care in the clinics [4]. The final practical examination has generally agreatest influence for assessing students’ preclinicalsuccess in restorative dentistry courses. Students must
T
ORIGINAL ARTICLE
e-ISSN: 2149-3189
DOI: 10.18621/eurj.400696
Received: March 2, 2018; Accepted: June 10, 2018; Published Online: June 23, 2018
The European Research Journal Volume 5 Issue 4 July 2019 607
Eur Res J 2019;5(4):607-612 Weekly task assessments and final practical exam
take at least 50 out of 100 points in the final exam topass the restorative practical lesson in the faculty ofdentistry at Biruni University. The score on the finalexam on the year-end grade is 60%. The effect of themidterm exam was determined as 40% on the year-end grade. Weekly task assessments have not a directnumerical effect on the year-end score, but thecompletion of these tasks is a prerequisite for enteringthe final exam at the Biruni University. However,measuring student performance at a particular time,provide information about only single specificperformance and not about psychomotor learningcurve [3]. Therefore, validity of the final practicalexam to assess whether student gained objectivelearning of restorative dentistry through the whole ofpreclinical course would be questionable. The purpose of the present study was to determineif any correlations existed between dental students’final and midterm practical exam scores and theirweekly task assessment scores in restorative dentistrypreclinical course. It was hypothesized that students'performance in the preclinical restorative dentistrycourse would predict how successful they were in theclinic, using their weekly task assessment scores as ameasure of performance instead of, or similar to finalpractical exam scores. It was claimed that studentswho did poorly work on weekly task assessmentswould receive low grades in the final exam in thepresent study. This correlation would recommend thatweekly task assessment in a preclinical course iscrucial in the improvement of manual dexterity andgaining dental knowledge needed for success in theclinic.
METHODS
Third-year students at dental school participate ina 16-week restorative dentistry preclinical course inthe one semester during the Restorative DentistryPractical Course at the Faculty of Dentistry of BiruniUniversity in Istanbul, Turkey. A total of 84 dentalstudents (50 females, 34 males) participated in thestudy. The participation of all students in the study wasvoluntary. Preclinical courses consisting of phantomhead simulation sessions. The course curriculumthrough the semester was given in Table 1. The weeklytask assessments were conducted each week after the
course sessions. All of weekly assessment scores (ninein total) were averaged to calculate the mean weeklyassessment scores. All weekly assessments wereequally weighted. Additional to completion of all ofweekly assessments, students have to pass midtermand final practical exams (a scale of 0 to 100). Amidterm practical exam was conducted at the 7thweek. The final practical exam was conducted in thelast week of course. All assessments were performedby the same rater (M.K.A). Faculty and teachingassistants were available for additional feedbackduring preclinical course sessions. As usual, nofeedback to students from the faculty stuff was givenduring mid and final practical exams. Students were divided into three subgroupsaccording to their weekly task assessment mean asfollowing, lowest third, middle third and upper thirdto determine trends related to the midterm and finalexams.
Statistical Analysis Means and standard deviations were calculated forweekly task assessments, midterm exam and finalexams. Comparison was made among averagedweekly task assessment scores, midterm exam andfinal exam scores, respectively. Paired t-tests wereused for statistical analysis and the p-level was set at0.05. Also, mean weekly task assessments of eachstudent was correlated with his or her midterm andfinal exam scores, respectively to assess the strengthof the relationship. Statistical analysis was carried outusing SPSS version 18.0 for Windows statisticalsoftware (SPSS Inc., Chicago, IL, USA).
RESULTS
The means and standard deviations of weekly taskassessment scores, midterm exam scores and finalexam scores of the students on the preclinicalrestorative dentistry course throughout the 16-weekstudy are shown in Table 2 and Figure 1. For the meanweekly task assessment, the mean score was 84.2 ±8.7 with a range of 64.4 to 99.4. For the midtermexam, the mean score was 76.7 ± 13.7 with a range of40 to 95. For the final exam, the mean score was 67.8± 13.7 with a range of 35 to 100. The coefficient ofvariation, a comparison measure of relative dispersion,
608 The European Research Journal Volume 5 Issue 4 July 2019
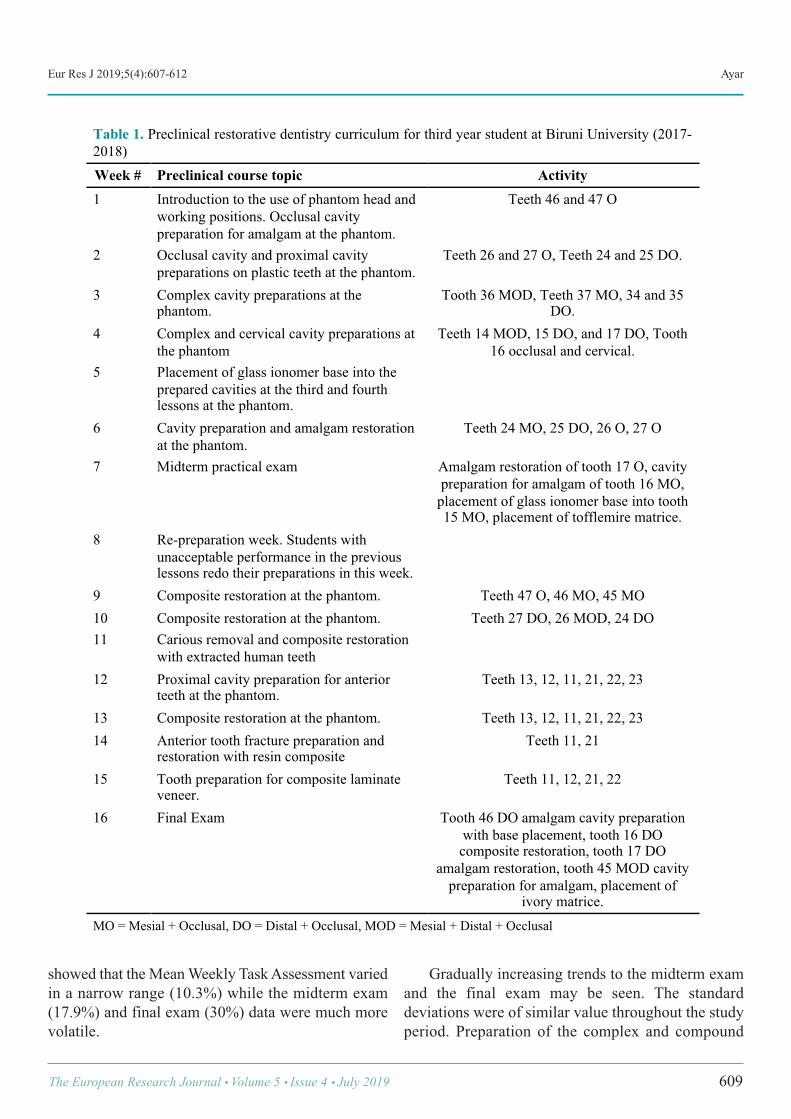
Eur Res J 2019;5(4):607-612 Ayar
showed that the Mean Weekly Task Assessment variedin a narrow range (10.3%) while the midterm exam(17.9%) and final exam (30%) data were much morevolatile.
Gradually increasing trends to the midterm examand the final exam may be seen. The standarddeviations were of similar value throughout the studyperiod. Preparation of the complex and compound
The European Research Journal Volume 5 Issue 4 July 2019 609
!
Table 1. Preclinical restorative dentistry curriculum for third year student at Biruni University (2017-2018) Week # Preclinical course topic Activity 1 Introduction to the use of phantom head and
working positions. Occlusal cavity preparation for amalgam at the phantom.
Teeth 46 and 47 O
2 Occlusal cavity and proximal cavity preparations on plastic teeth at the phantom.
Teeth 26 and 27 O, Teeth 24 and 25 DO.
3 Complex cavity preparations at the phantom.
Tooth 36 MOD, Teeth 37 MO, 34 and 35 DO.
4 Complex and cervical cavity preparations at the phantom
Teeth 14 MOD, 15 DO, and 17 DO, Tooth 16 occlusal and cervical.
5 Placement of glass ionomer base into the prepared cavities at the third and fourth lessons at the phantom.
6 Cavity preparation and amalgam restoration at the phantom.
Teeth 24 MO, 25 DO, 26 O, 27 O
7 Midterm practical exam Amalgam restoration of tooth 17 O, cavity preparation for amalgam of tooth 16 MO,
placement of glass ionomer base into tooth 15 MO, placement of tofflemire matrice.
8 Re-preparation week. Students with unacceptable performance in the previous lessons redo their preparations in this week.
9 Composite restoration at the phantom. Teeth 47 O, 46 MO, 45 MO 10 Composite restoration at the phantom. Teeth 27 DO, 26 MOD, 24 DO 11 Carious removal and composite restoration
with extracted human teeth
12 Proximal cavity preparation for anterior teeth at the phantom.
Teeth 13, 12, 11, 21, 22, 23
13 Composite restoration at the phantom. Teeth 13, 12, 11, 21, 22, 23 14 Anterior tooth fracture preparation and
restoration with resin composite Teeth 11, 21
15 Tooth preparation for composite laminate veneer.
Teeth 11, 12, 21, 22
16 Final Exam Tooth 46 DO amalgam cavity preparation with base placement, tooth 16 DO composite restoration, tooth 17 DO
amalgam restoration, tooth 45 MOD cavity preparation for amalgam, placement of
ivory matrice. MO = Mesial + Occlusal, DO = Distal + Occlusal, MOD = Mesial + Distal + Occlusal
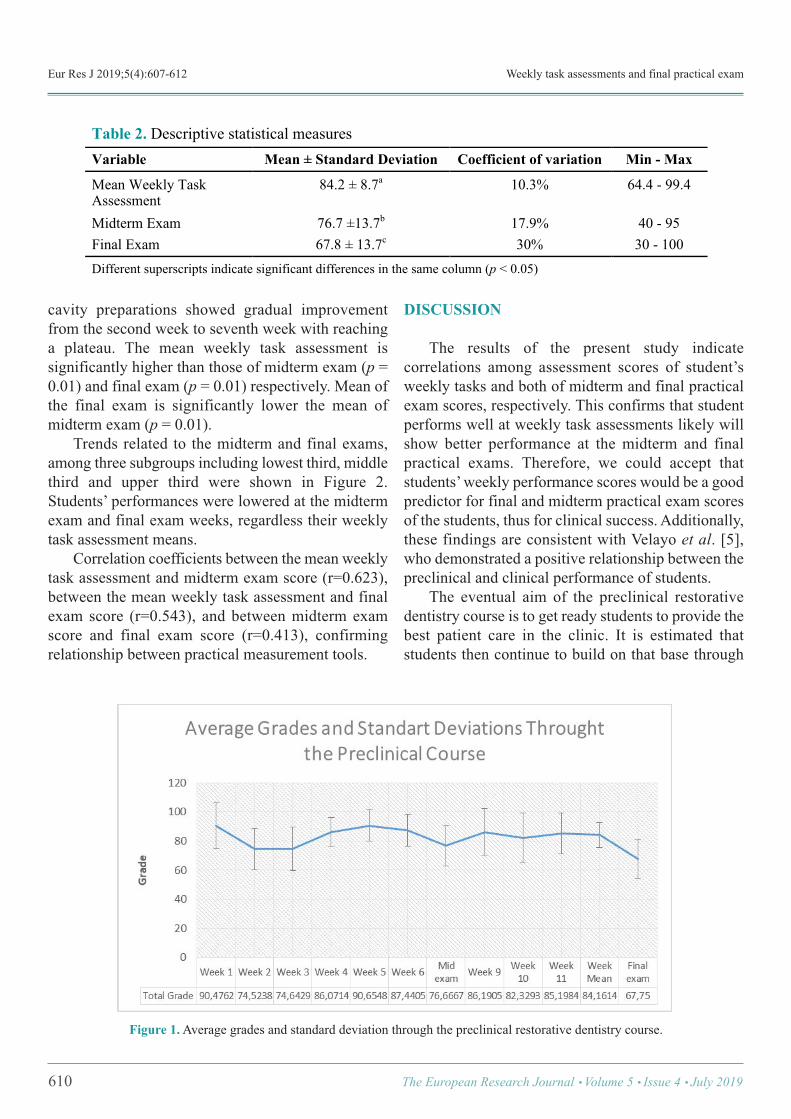
Eur Res J 2019;5(4):607-612 Weekly task assessments and final practical exam
cavity preparations showed gradual improvementfrom the second week to seventh week with reachinga plateau. The mean weekly task assessment issignificantly higher than those of midterm exam (p =0.01) and final exam (p = 0.01) respectively. Mean ofthe final exam is significantly lower the mean ofmidterm exam (p = 0.01). Trends related to the midterm and final exams,among three subgroups including lowest third, middlethird and upper third were shown in Figure 2.Students’ performances were lowered at the midtermexam and final exam weeks, regardless their weeklytask assessment means. Correlation coefficients between the mean weeklytask assessment and midterm exam score (r=0.623),between the mean weekly task assessment and finalexam score (r=0.543), and between midterm examscore and final exam score (r=0.413), confirmingrelationship between practical measurement tools.
DISCUSSION
The results of the present study indicatecorrelations among assessment scores of student’sweekly tasks and both of midterm and final practicalexam scores, respectively. This confirms that studentperforms well at weekly task assessments likely willshow better performance at the midterm and finalpractical exams. Therefore, we could accept thatstudents’ weekly performance scores would be a goodpredictor for final and midterm practical exam scoresof the students, thus for clinical success. Additionally,these findings are consistent with Velayo et al. [5],who demonstrated a positive relationship between thepreclinical and clinical performance of students. The eventual aim of the preclinical restorativedentistry course is to get ready students to provide thebest patient care in the clinic. It is estimated thatstudents then continue to build on that base through
610 The European Research Journal Volume 5 Issue 4 July 2019
!
Table 2. Descriptive statistical measures Variable Mean ± Standard Deviation Coefficient of variation Min - Max
Mean Weekly Task Assessment
84.2 ± 8.7a 10.3% 64.4 - 99.4
Midterm Exam 76.7 ±13.7b 17.9% 40 - 95 Final Exam 67.8 ± 13.7c 30% 30 - 100 Different superscripts indicate significant differences in the same column (p < 0.05)
Figure 1. Average grades and standard deviation through the preclinical restorative dentistry course.
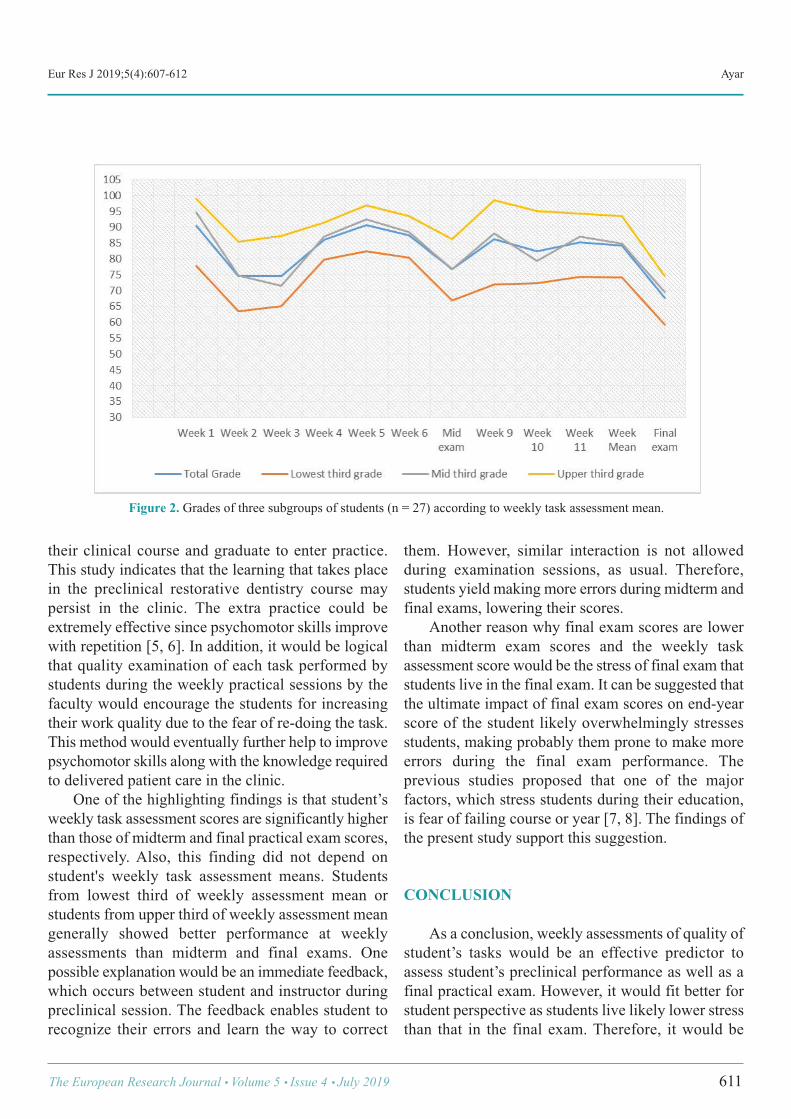
Eur Res J 2019;5(4):607-612 Ayar
their clinical course and graduate to enter practice.This study indicates that the learning that takes placein the preclinical restorative dentistry course maypersist in the clinic. The extra practice could beextremely effective since psychomotor skills improvewith repetition [5, 6]. In addition, it would be logicalthat quality examination of each task performed bystudents during the weekly practical sessions by thefaculty would encourage the students for increasingtheir work quality due to the fear of re-doing the task.This method would eventually further help to improvepsychomotor skills along with the knowledge requiredto delivered patient care in the clinic. One of the highlighting findings is that student’sweekly task assessment scores are significantly higherthan those of midterm and final practical exam scores,respectively. Also, this finding did not depend onstudent's weekly task assessment means. Studentsfrom lowest third of weekly assessment mean orstudents from upper third of weekly assessment meangenerally showed better performance at weeklyassessments than midterm and final exams. Onepossible explanation would be an immediate feedback,which occurs between student and instructor duringpreclinical session. The feedback enables student torecognize their errors and learn the way to correct
them. However, similar interaction is not allowedduring examination sessions, as usual. Therefore,students yield making more errors during midterm andfinal exams, lowering their scores. Another reason why final exam scores are lowerthan midterm exam scores and the weekly taskassessment score would be the stress of final exam thatstudents live in the final exam. It can be suggested thatthe ultimate impact of final exam scores on end-yearscore of the student likely overwhelmingly stressesstudents, making probably them prone to make moreerrors during the final exam performance. Theprevious studies proposed that one of the majorfactors, which stress students during their education,is fear of failing course or year [7, 8]. The findings ofthe present study support this suggestion.
CONCLUSION
As a conclusion, weekly assessments of quality ofstudent’s tasks would be an effective predictor toassess student’s preclinical performance as well as afinal practical exam. However, it would fit better forstudent perspective as students live likely lower stressthan that in the final exam. Therefore, it would be
The European Research Journal Volume 5 Issue 4 July 2019 611
Figure 2. Grades of three subgroups of students (n = 27) according to weekly task assessment mean.
Eur Res J 2019;5(4):607-612 Weekly task assessments and final practical exam
recommended that integrating weekly task assessmentinto the preclinical restorative dentistry curriculum asan effective assessment tool.
Conflict of interest The author disclosed no conflict of interest duringthe preparation or publication of this manuscript.
Financing The author disclosed that he did not receive anygrant during conduction or writing of this study.
REFERENCES
[1] Ayar MK. Dental students’ perceptions on preclinical restorative
dentistry course: Biruni University case. Eur Res J 2018;4:199-204. [2] Luck O, Reitemeier B, Scheuch K. Testing of fine motor skills indental students. Eur J Dent Educ 2000;4:10-4. [3] Ben-Gal G, Katorza L, Weiss EI, Ziv A. Testing motor learningcurves among dental students. J Dent Educ 2017;81:1171-8. [4] Suksudaj N, Townsend G, Kaidonis J, Lekkas D, Winning T.Acquiring psychomotor skills in operative dentistry: do innate abilityand motivation matter? Eur J Dent Educ 2012;16:e187-94. [5] Velayo BC, Stark PC, Eisen SE, Kugel G. Using dental students’preclinical performance as an indicator of clinical success. J Dent Educ2014;78:823-8. [6] Chaiken SR, Kyllonen PC, Tirre WC. Organization and componentsof psychomotor ability. Cogn Psychol 2000;40:198-226. [7] Polychronopoulou A, Divaris K. Perceived sources of stress amongGreek dental students. J Dent Educ 2005;69:687-92. [8] Abu-Ghazaleh SB, Sonbol HN, Rajab LD. A longitudinal study ofpsychological stress among undergraduate dental students at theUniversity of Jordan. BMC Med Educ 2016;16:90.
612 The European Research Journal Volume 5 Issue 4 July 2019
This is an open access article distributed under the terms of Creative CommonAttribution-NonCommercial-NoDerivatives 4.0 International License.
How accurate is the urine dipstick test for diagnosing urinarytract infection? Esra Paydaş Hataysal1 , Beyza Saraçlıgil2 , Hatice Türk Dağı3 , Hüsamettin Vatansev1
1Department of Biochemistry, Selçuk University School of Medicine, Konya, Turkey2Department of Biochemistry, Karatay University School of Medicine, Konya, Turkey3Department of Microbiology, Selçuk University School of Medicine, Konya, Turkey
ABSTRACTObjectives: Urine dipstick is the first step laboratory test to diagnose a urinary tract infection (UTI) which isa common infectious disease diagnosed in the laboratories. Early treatment of UTI is very important in orderto prevent long-term complications. The gold standard to diagnose UTI is urine culture so there are a numberof unnecessary urine culture requests. However, urine culture results are not available earlier than 24-36 hours.Besides, urine culture is expensive and causes time-consuming of treatment. Our aim in this study was tocompare urine leukocyte esterase test and nitrite test of urine dipstick with urine culture to determinate thesensitivity, specificity, positive predictive value (PPV) and negative predictive value (NPV).Methods: Urine culture results and urine dipstick test results of patients who admitted to Selçuk UniversityHospital between May 2016 and May 2017 were collected retrospectively. The study included 11.169 patientsand 3299 of them have positive urine cultures.Results: In total, 3299 (29.5%) patients have positive urine culture. Out of these culture positive samples,positive dipstick results’ ratios for leukocyte esterase and nitrite were 82.8% (n = 2733) and 22.4% (n = 774).Leukocyte esterase had 82.8% sensitivity and 68.1% specificity, with PPVs and NPVs of 52.1% and 90.5%,respectively.Conclusions: The NPVs are found significantly higher than PPVs and it shows that urinary dipstick is morereliable to exclude disease than to diagnose the disease. Clinicians should not order urine culture from allpatients without ant clinic signs.
Keywords: Urine culture, nitrite, leukocyte esterase, urine dipstick, urine analysis
Address for correspondence: Esra Paydaş Hataysal, MD., Selçuk University School of Medicine, Department of Biochemistry, Konya, Turkey E-mail: [email protected]
Copyright © 2019 by The Association of Health Research & StrategyAvailable at http://dergipark.org.tr/eurj
The European Research Journal 2019;5(4):613-617
rinary tract infection (UTI) is one of the mostcommon infection diseases. Its’ clinical
symptoms vary from minimal dysuria to septic shock.UTI is the most common bacterial infection whichdiagnoses with the aid of clinical laboratories in youngwomen and in the elderly [1].The second mostcommon cause of bacteremia is UTI in hospitalized
patients [2]. Many women experience UTI at leastonce in their whole lifetime [3]. The gold standard to diagnose UTI is urine cultureso there are a number of unnecessary urine culturerequests. However, urine culture results are notavailable earlier than 24 hours and this causes todelayed or inappropriate treatment [4]. Early treatment
U
ORIGINAL A RTICLE
e-ISSN: 2149-3189
DOI: 10.18621/eurj.406215
Received: March 15, 2018; Accepted: June 22, 2018; Published Online: June 29, 2018
The European Research Journal Volume 5 Issue 4 July 2019 613
Eur Res J 2019;5(4):613-617 Urine dipstick tests in urinary tract infection
of UTI is important to prevent long-termcomplications. Additionally, urine culture test isexpensive and causes delay of treatment [5]. Becauseof all these causes, a fast, easy, reliable, practicableand sensitive screening test is needed to begintreatment or rule out UTI as early as possible [3, 6]. Although the most common examination findingin patients with UTI is dysuria, dysuria is also thepresenting complaint in another disease such asvaginitis. Patients with UTI sometimes show notypical symptoms and signs. Because of the fact thatclinical symptoms or medical history are usually notenough to diagnose UTI, clinicians order lots oflaboratory tests including urine culture, routineautomated urinalysis even radiological tests todiagnose UTI. Nevertheless, suspected UTI is one ofthe most common indications for antimicrobial drugsuse, with much prescribing of antimicrobials based onclinical symptoms and signs without confirmation byculture [7, 8]. Urine dipstick analysis is a quick, cheap and auseful test in predicting UTI. Because of the abovementioned limitations, urine analysis a preferred first-step investigation among clinicians. The most frequently determined microorganism inurine culture is Escherichia coli in patients with UTI.Contamination is another frequently seen reason thatcauses positive culture results with a ratio of 29%-32%[3]. If the results of both nitrites and leukocyte esteraseare negative, urine dipstick tests alone are useful in allpopulations to exclude the presence of infection ratherthan diagnose UTI in the presence of positive dipsticktests [9]. Several studies have examined the use ofurinary dipstick tests to diagnose or rule out in UTI. We aimed to compare urine leukocyte esterase testand nitrite test of urine dipstick with urine culture todeterminate the sensitivity, specificity, positivepredictive value (PPV) and negative predictive value(NPV).
METHODS
Dates are obtained between May, 2016 and May,2017 from laboratory information systems of SelçukUniversity School of Medicine which is a centralhospital with 934 beds. The study was approved bySelçuk University Defense research ethics committee.
Our electronic database (Enlil LIS) includes age, sex,main diagnosis, urine culture results andsimultaneously automated urinalysis results. In thetime period of our study, 15.487 requests ofsimultaneous urine cultures and urine dipstick tests.The dates of subjects who had simultaneously bothurine dipstick test and urine culture test were evaluatedin this study. All urine samples were completed withinone hour after arrival to the laboratory in order toprevent contamination and overgrowth. If there is apatient with more than one request, only the firstrequest evaluated. For collection of the urine samples, sterile plasticurine sampling containers (Fırat MedPlastik, Ankara,Turkey) were used. After the spot mid-stream urinesamples arrived to laboratory, every specimen wasanalyzed within 1 hour. For the urine dipstick chemical analysis, DiruiH800 (Dirui Industrial Co, Ltd, Zhengzhou China)was used. LE and Nitrite was measured with DiruiH11-800 strips(Dirui Industrial Co, Ltd, ZhengzhouChina). Nitrite in the urine is diazotized to form adiazonium compound and the diazonium compoundreacting with tetrahydro-benzo-quinolin-3-phenolcauses the color change. Granulocyte leukocytes inurine contain catalyze that catalyze the hydrolysis ofpyrrole amino change acid ester to 3-hydroxy-5-phenypyrrole. This pyrrole reacting with diazonium forms apurple colour. LE results were reported as negative,trace, 1 (+),2 (+) and 3 (+). The nitrite results were reported asnegative and positive. Cut-off values for a positivedipstick result was at least LE (+) or nitrite (+). TraceLE results were evaluated in a different category. Forquality control, we made daily internal controls and 6times in a year external quality control. (RandoxLaboratories, Riqas, Ireland). Urine cultures were performed in theMicrobiology Laboratory of Selçuk University Schoolof Medicine. Urine samples were inoculated inColumbia agar with 5% sheep blood and eosinmethylene blue agar (bioMerieux, France) bycalibrated sterile loops. The plates were aerobicallyincubated 24-48 hours at 35-370C. The colonies werethen counted and 105cfu/ml was consideredsignificant. Bacterial identification was performedwith standard microbiological procedures and VITEK
614 The European Research Journal Volume 5 Issue 4 July 2019
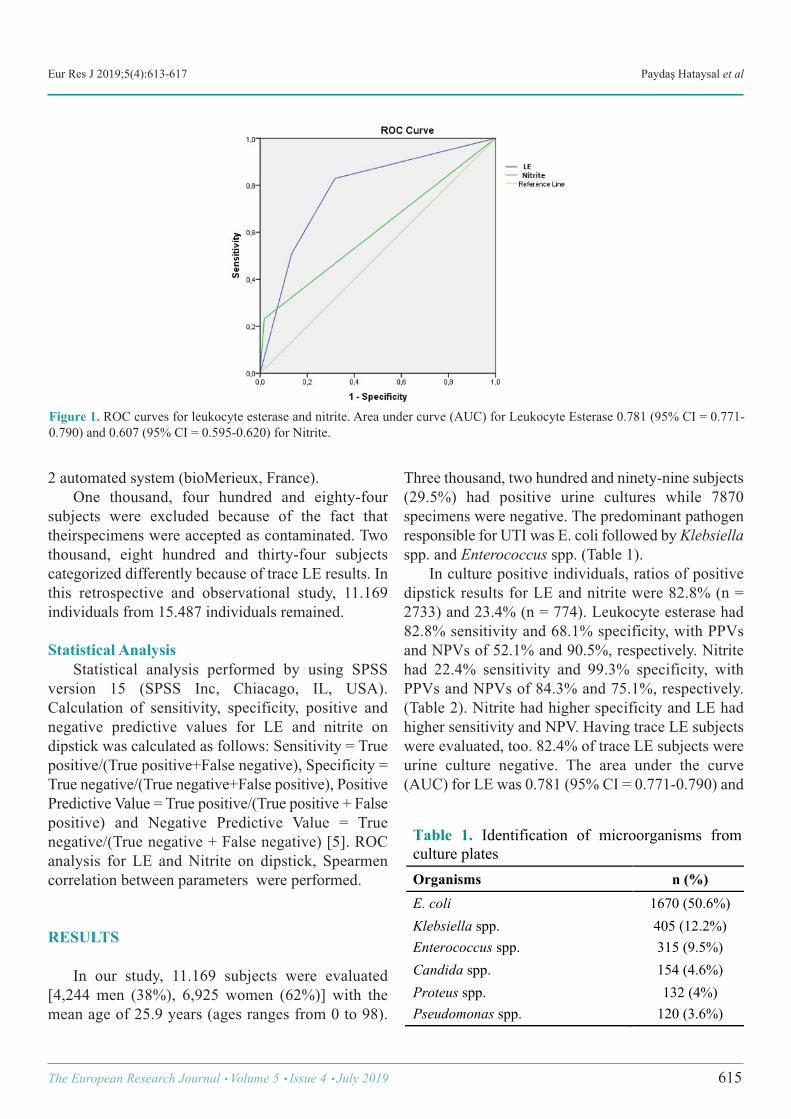
Eur Res J 2019;5(4):613-617 Paydaş Hataysal et al
2 automated system (bioMerieux, France). One thousand, four hundred and eighty-foursubjects were excluded because of the fact thattheirspecimens were accepted as contaminated. Twothousand, eight hundred and thirty-four subjectscategorized differently because of trace LE results. Inthis retrospective and observational study, 11.169individuals from 15.487 individuals remained.
Statistical Analysis Statistical analysis performed by using SPSSversion 15 (SPSS Inc, Chiacago, IL, USA).Calculation of sensitivity, specificity, positive andnegative predictive values for LE and nitrite ondipstick was calculated as follows: Sensitivity = Truepositive/(True positive+False negative), Specificity =True negative/(True negative+False positive), PositivePredictive Value = True positive/(True positive + Falsepositive) and Negative Predictive Value = Truenegative/(True negative + False negative) [5]. ROCanalysis for LE and Nitrite on dipstick, Spearmencorrelation between parameters were performed.
RESULTS
In our study, 11.169 subjects were evaluated[4,244 men (38%), 6,925 women (62%)] with themean age of 25.9 years (ages ranges from 0 to 98).
Three thousand, two hundred and ninety-nine subjects(29.5%) had positive urine cultures while 7870specimens were negative. The predominant pathogenresponsible for UTI was E. coli followed by Klebsiellaspp. and Enterococcus spp. (Table 1). In culture positive individuals, ratios of positivedipstick results for LE and nitrite were 82.8% (n =2733) and 23.4% (n = 774). Leukocyte esterase had82.8% sensitivity and 68.1% specificity, with PPVsand NPVs of 52.1% and 90.5%, respectively. Nitritehad 22.4% sensitivity and 99.3% specificity, withPPVs and NPVs of 84.3% and 75.1%, respectively.(Table 2). Nitrite had higher specificity and LE hadhigher sensitivity and NPV. Having trace LE subjectswere evaluated, too. 82.4% of trace LE subjects wereurine culture negative. The area under the curve(AUC) for LE was 0.781 (95% CI = 0.771-0.790) and
The European Research Journal Volume 5 Issue 4 July 2019 615
Figure 1. ROC curves for leukocyte esterase and nitrite. Area under curve (AUC) for Leukocyte Esterase 0.781 (95% CI = 0.771-0.790) and 0.607 (95% CI = 0.595-0.620) for Nitrite.
Table 1. Identification of microorganisms from culture plates Organisms n (%) E. coli 1670 (50.6%) Klebsiella spp. 405 (12.2%) Enterococcus spp. 315 (9.5%) Candida spp. 154 (4.6%) Proteus spp. 132 (4%) Pseudomonas spp. 120 (3.6%) !
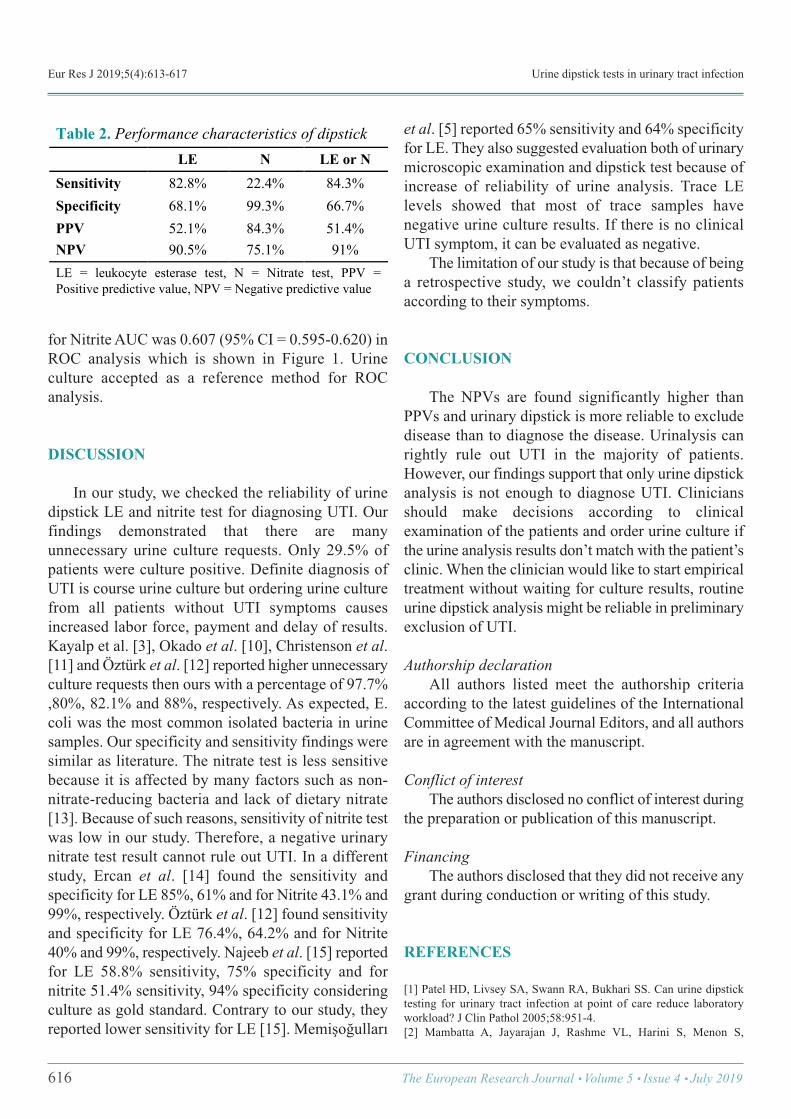
Eur Res J 2019;5(4):613-617 Urine dipstick tests in urinary tract infection
for Nitrite AUC was 0.607 (95% CI = 0.595-0.620) inROC analysis which is shown in Figure 1. Urineculture accepted as a reference method for ROCanalysis.
DISCUSSION
In our study, we checked the reliability of urinedipstick LE and nitrite test for diagnosing UTI. Ourfindings demonstrated that there are manyunnecessary urine culture requests. Only 29.5% ofpatients were culture positive. Definite diagnosis ofUTI is course urine culture but ordering urine culturefrom all patients without UTI symptoms causesincreased labor force, payment and delay of results.Kayalp et al. [3], Okado et al. [10], Christenson et al.[11] and Öztürk et al. [12] reported higher unnecessaryculture requests then ours with a percentage of 97.7%,80%, 82.1% and 88%, respectively. As expected, E.coli was the most common isolated bacteria in urinesamples. Our specificity and sensitivity findings weresimilar as literature. The nitrate test is less sensitivebecause it is affected by many factors such as non-nitrate-reducing bacteria and lack of dietary nitrate[13]. Because of such reasons, sensitivity of nitrite testwas low in our study. Therefore, a negative urinarynitrate test result cannot rule out UTI. In a differentstudy, Ercan et al. [14] found the sensitivity andspecificity for LE 85%, 61% and for Nitrite 43.1% and99%, respectively. Öztürk et al. [12] found sensitivityand specificity for LE 76.4%, 64.2% and for Nitrite40% and 99%, respectively. Najeeb et al. [15] reportedfor LE 58.8% sensitivity, 75% specificity and fornitrite 51.4% sensitivity, 94% specificity consideringculture as gold standard. Contrary to our study, theyreported lower sensitivity for LE [15]. Memişoğulları
et al. [5] reported 65% sensitivity and 64% specificityfor LE. They also suggested evaluation both of urinarymicroscopic examination and dipstick test because ofincrease of reliability of urine analysis. Trace LElevels showed that most of trace samples havenegative urine culture results. If there is no clinicalUTI symptom, it can be evaluated as negative. The limitation of our study is that because of beinga retrospective study, we couldn’t classify patientsaccording to their symptoms.
CONCLUSION
The NPVs are found significantly higher thanPPVs and urinary dipstick is more reliable to excludedisease than to diagnose the disease. Urinalysis canrightly rule out UTI in the majority of patients.However, our findings support that only urine dipstickanalysis is not enough to diagnose UTI. Cliniciansshould make decisions according to clinicalexamination of the patients and order urine culture ifthe urine analysis results don’t match with the patient’sclinic. When the clinician would like to start empiricaltreatment without waiting for culture results, routineurine dipstick analysis might be reliable in preliminaryexclusion of UTI.
Authorship declaration All authors listed meet the authorship criteriaaccording to the latest guidelines of the InternationalCommittee of Medical Journal Editors, and all authorsare in agreement with the manuscript.
Conflict of interest The authors disclosed no conflict of interest duringthe preparation or publication of this manuscript.
Financing The authors disclosed that they did not receive anygrant during conduction or writing of this study.
REFERENCES
[1] Patel HD, Livsey SA, Swann RA, Bukhari SS. Can urine dipsticktesting for urinary tract infection at point of care reduce laboratoryworkload? J Clin Pathol 2005;58:951-4. [2] Mambatta A, Jayarajan J, Rashme VL, Harini S, Menon S,
616 The European Research Journal Volume 5 Issue 4 July 2019
Table 2. Performance characteristics of dipstick LE N LE or N Sensitivity 82.8% 22.4% 84.3% Specificity 68.1% 99.3% 66.7% PPV 52.1% 84.3% 51.4% NPV 90.5% 75.1% 91% LE = leukocyte esterase test, N = Nitrate test, PPV = Positive predictive value, NPV = Negative predictive value !
Eur Res J 2019;5(4):613-617 Paydaş Hataysal et al
Kuppusamy J. Reliability of dipstick assay in predicting urinary tractinfection. J Family Med Prim Care 2015;4:265-8. [3] Kayalp D, Dogan K, Ceylan G, Senes M, Yucel D. Can routineautomated urinalysis reduce culture requests? Clin Biochem2013;46:1285-9. [4] Williams GJ, Macaskill P, Chan SF, Turner RM, Hodson E, CraigJC. Absolute and relative accuracy of rapid urine tests for urinary tractinfection in children: a metaanalysis. Lancet Infect Dis 2010;10:240-50. [5] Memişoğulları R, Yüksel H, Ak Yıldırım H, Yavuz Ö. Performancecharacteristics of dipstick and microscopic urinalysis for diagnosis ofurinary tract infection. Eur J Gen Med 2010;7:174-8. [6] Whiting P, Westwood M, Watt I, Cooper J, Kleijnen J. Rapid testsand urine sampling techniques for the diagnosis of urinary tract infection(UTI) in children under five years: a systematic review. BMC Pediatr2005;5:4. [7] John AS, Boyd JC, Lowes AJ, Price CP. Clinical Chemistry/Use ofdipstick testing to rule out UTI. Am J Clin Pathol 2006;126:428-36. [8] Fahey T, Webb E, Montgomery AA, Heyderman RS. Clinicalmanagement of urinary tract infection in women: a prospective cohortstudy. Fam Pract 2003;20:1-6. [9] Devillé W, Yzermans JC, van Duijn NP, Bezemer PD, wan der WindtD, Bouter LM. The urine dipstick test useful to rule out infections. Ameta-analysis of the accuracy. BMC Urol 2004;4:4.
[10] Okada H, Sakai Y, Miyazaki S, Arakawa S, Hamaguchi Y,Kamidono S. Detection of significant bacteriuria by automatedurinalysisusing flow cytometry. J Clin Microbiol 2000;38:2870-2. [11] Christenson RH, Tucker JA, Allen E. Results of dipstick tests, visualinspection, microscopic examination of urine sediment, andmicrobiological cultures of urine compared for simplifying urinalysis.Clin Chem 1985;31:448-51. [12] Öztürk A, Gınıs Z, Hancı T, Yıldız Z, Taşlıpınar MY, Uçar F, et al.Evaluation of diagnostic performance of routine automated urinalysisand association between urinary tract infection and leukocytosis. ActaMedica 2015;4: 42-7. [13] Mambatta AK, Jayarajan J, Rashme VL, Harini S, Menon S,Kuppusamy J. Reliability of dipstick assay in predicting urinary tractinfection. J Family Med Prim Care 2015;4:265-8. [14] Ercan Ş, Yücel N, Özer RS, Kaptanağası Orçun A. [Evaluation ofdiagnostic performances of nitrite and leukocyte esterase with respectto age and gender]. Türk Klinik Biyokimya Derg 2014;12:91-8. [Articlein Turkish] [15] Najeeb S, Munir T, Rehman S, Hafiz A, Gilani M, Latif M.Comparison of urine dipstick test with conventional urine culture indiagnosis of urinary tract infection. J Coll Physicians Surg Pak2015;25:108-10.
This is an open access article distributed under the terms of Creative CommonAttribution-NonCommercial-NoDerivatives 4.0 International License.
The European Research Journal Volume 5 Issue 4 July 2019 617
Effect of an adapted physical activity program on themorphological and physiological profile of hypertensivepatients of University Clinics of KinshasaTeddy Bofosa , Betty Miangindula , Godefroid Kusuayi , Nicaise Kiana , Constant Nkiama
Department of Physical Medicine and Rehabilitation, University Clinics of Kinshasa, University of Kinshasa School of Medicine,Kinshasa, Democratic Republic of Congo
ABSTRACTObjectives: The treatment of arterial hypertension requires a comprehensive care because it is necessary notonly to take the prescribed medication but also to apply certain rules of hygiene. The purpose of this study wasto evaluate the effect of a program of physical activity adapted to the morphological and physiological state ofthe hypertensive patients. Methods: An experimental study was conducted on a sample of 31 male hypertensive patients with an averageage of 58.16 ± 3.7 years undergoing an aerobic and anaerobic physical activity program treadmill walking,cycling, ergonomics and aerobic exercise and muscle building exercises of moderate intensity, duration offorty-five minutes and a frequency of three times a week associated with low calorie nutrition education lowin cholesterol and saturated fatty acids (bad fats) , low sodium rich in vegetables, fruits and vitamins for 4months at the University Clinics of Kinshasa between January 2017and May 2017. Results: After 4 months of intervention, we found statistically significant reductions in weight -7.2 kg, waistcircumference -7.61 cm, body mass index -5.42 kg/m2, visceral fat percentage -1.4%, systolic blood pressure-6 mmHg, low-density lipoprotein -22 mg/dL, triglyceride -26.7 mg/dL with the exception of high-densitylipoprotein and muscle that statistically increased +7.42 mg/dL and +15.3% while diastolic blood pressure -3.4 mmHg was not statistically modified. Conclusion: The practice of adapted physical activities combined with nutritional education improves themorphological and physiological status of hypertensive patients.
Keywords: Adapted physical activity, morphological state, physiological
Address for correspondence: Teddy Bofosa, MD., Medical Fitness Laboratory and Functional Exercises, University Clinics of Kinshasa, KinshasaUniversity School of Medicine, Department of Physical Medicine and Rehabilitation, Kinshasa, Democratic Republic of Congo E-mail: [email protected], Tel: +243 85 014 32 32
Copyright © 2019 by The Association of Health Research & StrategyAvailable at http://dergipark.org.tr/eurj
The European Research Journal 2019;5(4):618-622
t was stated that non-communicable diseases (car-diovascular diseases and related risk factors in
2020) would create problems in sub-Saharan Africancountries [1]. In addition, the prevalence of arterial hy-pertension in the Democratic Republic of the Congohas been reported to be high in both rural areas and
urban areas of Kinshasa, while it has been reported tocause cerebrovascular disease and infarction. Three-step screening was performed in chronic diseasesusing the world health organization (WHO) STEPS[2-5]. As a result, the prevalence of hypertension was11% in diabetic adults and 15.5% in diabetic patients
I
ORIGINAL ARTICLE
e-ISSN: 2149-3189
DOI: 10.18621/eurj.415593
Received: April 16, 2018; Accepted: November 21, 2018; Published Online: December 3, 2018
The European Research Journal Volume 5 Issue 4 July 2019 618
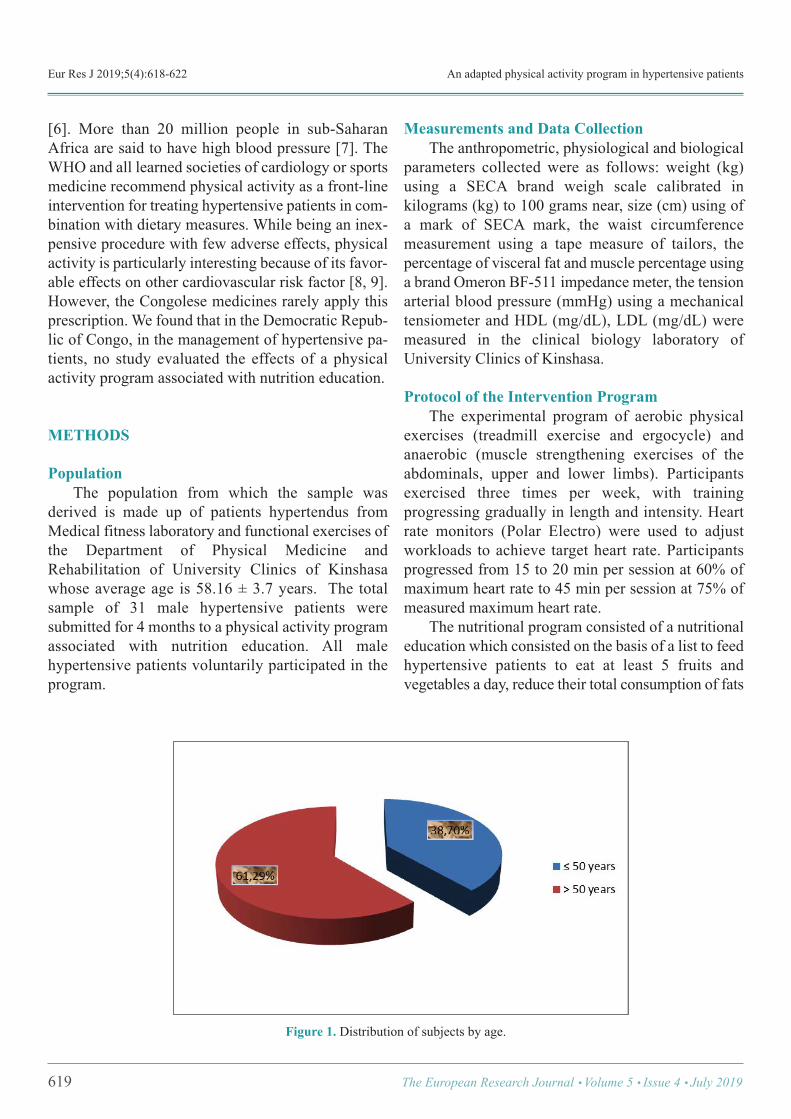
Eur Res J 2019;5(4):618-622 An adapted physical activity program in hypertensive patients
[6]. More than 20 million people in sub-SaharanAfrica are said to have high blood pressure [7]. TheWHO and all learned societies of cardiology or sportsmedicine recommend physical activity as a front-lineintervention for treating hypertensive patients in com-bination with dietary measures. While being an inex-pensive procedure with few adverse effects, physicalactivity is particularly interesting because of its favor-able effects on other cardiovascular risk factor [8, 9].However, the Congolese medicines rarely apply thisprescription. We found that in the Democratic Repub-lic of Congo, in the management of hypertensive pa-tients, no study evaluated the effects of a physicalactivity program associated with nutrition education.
METHODS
Population The population from which the sample wasderived is made up of patients hypertendus fromMedical fitness laboratory and functional exercises ofthe Department of Physical Medicine andRehabilitation of University Clinics of Kinshasawhose average age is 58.16 ± 3.7 years. The totalsample of 31 male hypertensive patients weresubmitted for 4 months to a physical activity programassociated with nutrition education. All malehypertensive patients voluntarily participated in theprogram.
Measurements and Data Collection The anthropometric, physiological and biologicalparameters collected were as follows: weight (kg)using a SECA brand weigh scale calibrated inkilograms (kg) to 100 grams near, size (cm) using ofa mark of SECA mark, the waist circumferencemeasurement using a tape measure of tailors, thepercentage of visceral fat and muscle percentage usinga brand Omeron BF-511 impedance meter, the tensionarterial blood pressure (mmHg) using a mechanicaltensiometer and HDL (mg/dL), LDL (mg/dL) weremeasured in the clinical biology laboratory ofUniversity Clinics of Kinshasa.
Protocol of the Intervention Program The experimental program of aerobic physicalexercises (treadmill exercise and ergocycle) andanaerobic (muscle strengthening exercises of theabdominals, upper and lower limbs). Participantsexercised three times per week, with trainingprogressing gradually in length and intensity. Heartrate monitors (Polar Electro) were used to adjustworkloads to achieve target heart rate. Participantsprogressed from 15 to 20 min per session at 60% ofmaximum heart rate to 45 min per session at 75% ofmeasured maximum heart rate. The nutritional program consisted of a nutritionaleducation which consisted on the basis of a list to feedhypertensive patients to eat at least 5 fruits andvegetables a day, reduce their total consumption of fats
619 The European Research Journal Volume 5 Issue 4 July 2019
Figure 1. Distribution of subjects by age.
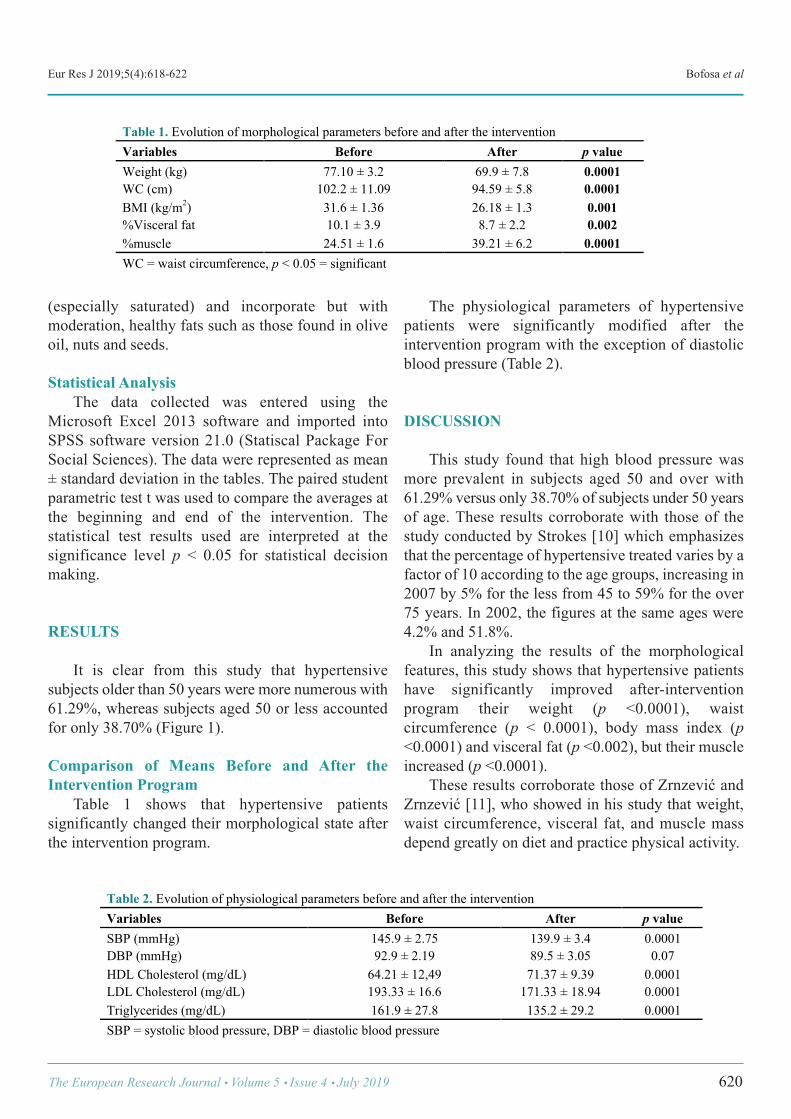
Eur Res J 2019;5(4):618-622 Bofosa et al
(especially saturated) and incorporate but withmoderation, healthy fats such as those found in oliveoil, nuts and seeds.
Statistical Analysis The data collected was entered using theMicrosoft Excel 2013 software and imported intoSPSS software version 21.0 (Statiscal Package ForSocial Sciences). The data were represented as mean± standard deviation in the tables. The paired studentparametric test t was used to compare the averages atthe beginning and end of the intervention. Thestatistical test results used are interpreted at thesignificance level p < 0.05 for statistical decisionmaking.
RESULTS
It is clear from this study that hypertensivesubjects older than 50 years were more numerous with61.29%, whereas subjects aged 50 or less accountedfor only 38.70% (Figure 1).
Comparison of Means Before and After theIntervention Program Table 1 shows that hypertensive patientssignificantly changed their morphological state afterthe intervention program.
The physiological parameters of hypertensivepatients were significantly modified after theintervention program with the exception of diastolicblood pressure (Table 2).
DISCUSSION
This study found that high blood pressure wasmore prevalent in subjects aged 50 and over with61.29% versus only 38.70% of subjects under 50 yearsof age. These results corroborate with those of thestudy conducted by Strokes [10] which emphasizesthat the percentage of hypertensive treated varies by afactor of 10 according to the age groups, increasing in2007 by 5% for the less from 45 to 59% for the over75 years. In 2002, the figures at the same ages were4.2% and 51.8%. In analyzing the results of the morphologicalfeatures, this study shows that hypertensive patientshave significantly improved after-interventionprogram their weight (p <0.0001), waistcircumference (p < 0.0001), body mass index (p<0.0001) and visceral fat (p <0.002), but their muscleincreased (p <0.0001). These results corroborate those of Zrnzević andZrnzević [11], who showed in his study that weight,waist circumference, visceral fat, and muscle massdepend greatly on diet and practice physical activity.
The European Research Journal Volume 5 Issue 4 July 2019 620
Table 1. Evolution of morphological parameters before and after the intervention Variables Before After p value Weight (kg) 77.10 ± 3.2 69.9 ± 7.8 0.0001 WC (cm) 102.2 ± 11.09 94.59 ± 5.8 0.0001 BMI (kg/m2) 31.6 ± 1.36 26.18 ± 1.3 0.001 %Visceral fat 10.1 ± 3.9 8.7 ± 2.2 0.002 %muscle 24.51 ± 1.6 39.21 ± 6.2 0.0001 WC = waist circumference, p < 0.05 = significant !
Table 2. Evolution of physiological parameters before and after the intervention Variables Before After p value SBP (mmHg) 145.9 ± 2.75 139.9 ± 3.4 0.0001 DBP (mmHg) 92.9 ± 2.19 89.5 ± 3.05 0.07 HDL Cholesterol (mg/dL) 64.21 ± 12,49 71.37 ± 9.39 0.0001 LDL Cholesterol (mg/dL) 193.33 ± 16.6 171.33 ± 18.94 0.0001 Triglycerides (mg/dL) 161.9 ± 27.8 135.2 ± 29.2 0.0001 SBP = systolic blood pressure, DBP = diastolic blood pressure
!
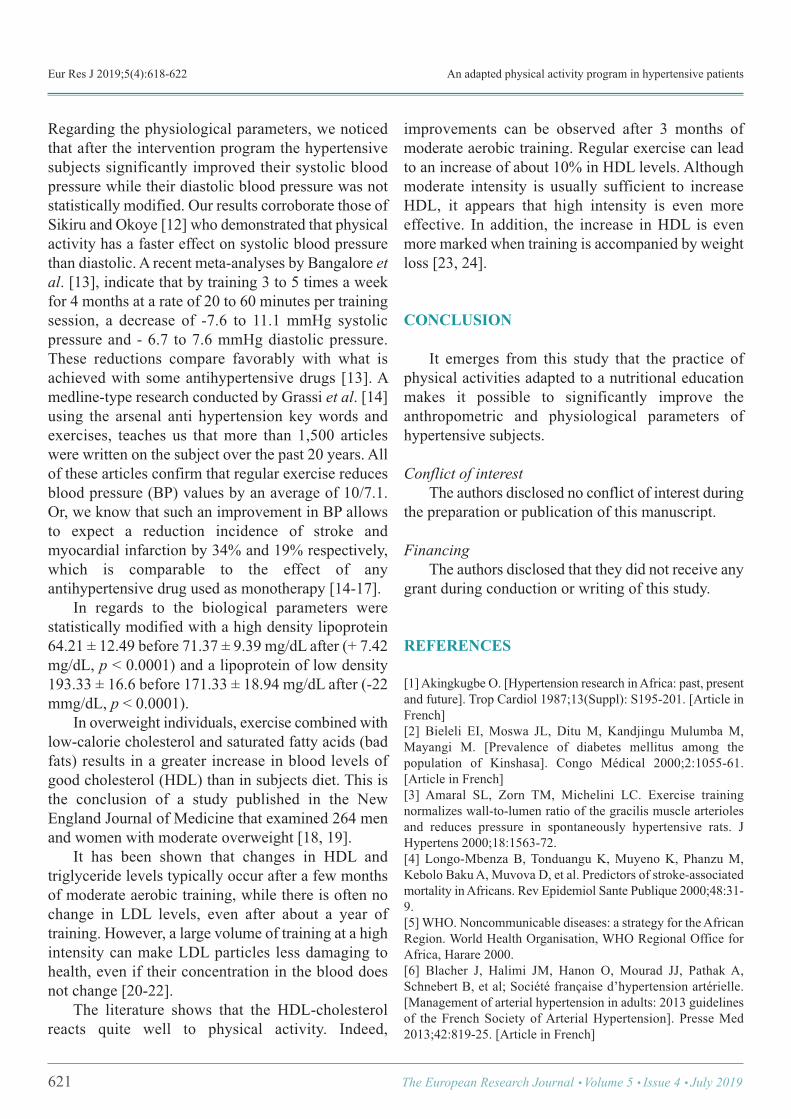
Eur Res J 2019;5(4):618-622 An adapted physical activity program in hypertensive patients
Regarding the physiological parameters, we noticedthat after the intervention program the hypertensivesubjects significantly improved their systolic bloodpressure while their diastolic blood pressure was notstatistically modified. Our results corroborate those ofSikiru and Okoye [12] who demonstrated that physicalactivity has a faster effect on systolic blood pressurethan diastolic. A recent meta-analyses by Bangalore etal. [13], indicate that by training 3 to 5 times a weekfor 4 months at a rate of 20 to 60 minutes per trainingsession, a decrease of -7.6 to 11.1 mmHg systolicpressure and - 6.7 to 7.6 mmHg diastolic pressure.These reductions compare favorably with what isachieved with some antihypertensive drugs [13]. Amedline-type research conducted by Grassi et al. [14]using the arsenal anti hypertension key words andexercises, teaches us that more than 1,500 articleswere written on the subject over the past 20 years. Allof these articles confirm that regular exercise reducesblood pressure (BP) values by an average of 10/7.1.Or, we know that such an improvement in BP allowsto expect a reduction incidence of stroke andmyocardial infarction by 34% and 19% respectively,which is comparable to the effect of anyantihypertensive drug used as monotherapy [14-17]. In regards to the biological parameters werestatistically modified with a high density lipoprotein64.21 ± 12.49 before 71.37 ± 9.39 mg/dL after (+ 7.42mg/dL, p < 0.0001) and a lipoprotein of low density193.33 ± 16.6 before 171.33 ± 18.94 mg/dL after (-22mmg/dL, p < 0.0001). In overweight individuals, exercise combined withlow-calorie cholesterol and saturated fatty acids (badfats) results in a greater increase in blood levels ofgood cholesterol (HDL) than in subjects diet. This isthe conclusion of a study published in the NewEngland Journal of Medicine that examined 264 menand women with moderate overweight [18, 19]. It has been shown that changes in HDL andtriglyceride levels typically occur after a few monthsof moderate aerobic training, while there is often nochange in LDL levels, even after about a year oftraining. However, a large volume of training at a highintensity can make LDL particles less damaging tohealth, even if their concentration in the blood doesnot change [20-22]. The literature shows that the HDL-cholesterolreacts quite well to physical activity. Indeed,
improvements can be observed after 3 months ofmoderate aerobic training. Regular exercise can leadto an increase of about 10% in HDL levels. Althoughmoderate intensity is usually sufficient to increaseHDL, it appears that high intensity is even moreeffective. In addition, the increase in HDL is evenmore marked when training is accompanied by weightloss [23, 24].
CONCLUSION
It emerges from this study that the practice ofphysical activities adapted to a nutritional educationmakes it possible to significantly improve theanthropometric and physiological parameters ofhypertensive subjects.
Conflict of interest The authors disclosed no conflict of interest duringthe preparation or publication of this manuscript.
Financing The authors disclosed that they did not receive anygrant during conduction or writing of this study.
REFERENCES
[1] Akingkugbe O. [Hypertension research in Africa: past, presentand future]. Trop Cardiol 1987;13(Suppl): S195-201. [Article inFrench] [2] Bieleli EI, Moswa JL, Ditu M, Kandjingu Mulumba M,Mayangi M. [Prevalence of diabetes mellitus among thepopulation of Kinshasa]. Congo Médical 2000;2:1055-61.[Article in French] [3] Amaral SL, Zorn TM, Michelini LC. Exercise trainingnormalizes wall-to-lumen ratio of the gracilis muscle arteriolesand reduces pressure in spontaneously hypertensive rats. JHypertens 2000;18:1563-72. [4] Longo-Mbenza B, Tonduangu K, Muyeno K, Phanzu M,Kebolo Baku A, Muvova D, et al. Predictors of stroke-associatedmortality in Africans. Rev Epidemiol Sante Publique 2000;48:31-9. [5] WHO. Noncommunicable diseases: a strategy for the AfricanRegion. World Health Organisation, WHO Regional Office forAfrica, Harare 2000. [6] Blacher J, Halimi JM, Hanon O, Mourad JJ, Pathak A,Schnebert B, et al; Société française d’hypertension artérielle.[Management of arterial hypertension in adults: 2013 guidelinesof the French Society of Arterial Hypertension]. Presse Med2013;42:819-25. [Article in French]
621 The European Research Journal Volume 5 Issue 4 July 2019
Eur Res J 2019;5(4):618-622 Bofosa et al
[7] Collier SR, Kanaley JA, Carhart Jr R, Frechette V, Tobin MM,Hall AK, et al. Effect of 4 weeks of aerobic or resistance exercisetraining on arterial stiffness, blood flow and blood pressure inpre- and stage-1 hypertensives. J Hum Hypertens 2008;22:678-86. [8] Godet-Thobie H, Vernay M, Noukpoape A, Salavane B,Malon A, Castetbon K, et al. [Mean blood pressure level andprevalence of hypertension in 18 to 74 year-old adults]. ENNSSurvey 2006-2007]. BEH 2008;49-50:478-83. [Article in French][9] Cornelissen VA, Fagard RH. Effects of endurance training onblood pressure, blood pressure-regulating mechanisms, andcardiovascular risk factors. Hypertension 2005;46:667-75. [10] Strokes GS. Management of hypertension in the elderlypatient. Clin Interv Aging 2009;4:379-89. [11] Zrnzević N, Zrnzević JE. [Effects of teaching physicaleducation on the functional abbilities of female students ofyounger school]. J Anthropol Soc Serbia 2015;50:1-9. [12] Sikiru L, Okoye GC. Effect of interval training programmeon pulse pressure in the management of hypertension : arandomized controlled trial. Afr Health Sci 2013;13:571-8. [13] Bangalore S, Kumar S, Wetterslev J, Messerli FH.Angiotensin receptor blockers and risk of myocardial infarction:meta-analyses and trial sequential analyses of 147 020 patientsfrom randomised trials. BMJ 2011;342:d2234. [14] Grassi, G, Servalle, G, Calhoun, D, Bolla GB, Mancia G.Physical exercise in essential hypertension. Chest 1992;101(5Suppl):312S-14S. [15] Guimaraes GV, Ciolac EG, Carvalho VO, D’Avila VM,Bortolotto LA, Bocchi EA. Effects of continuous vs. intervalexercise training on bloodpressure and arterial stiffness in treatedhypertension. Hypertens 2010;33:627-32. [16] 1999 World Health Organisation - International Society ofHypertension. Guidelines for the Management of Hypertension.
Guidelines Subcommittee. J Hypertens 1999;17:151-83. [17] Halliwill JR, Buck TM, Lacewell AN, Romero SA.Postexercise hypotension and sustained postexercisevasodilatation: what happens after we exercise? Exp Physiol2013;98:7-18. [18] Higashi Y, Yoshizumi M. Exercise and endothelial function:role of endothelium-derived nitric oxide and oxidative stress inhealthy subjectsand hypertensive patients. Pharmacol Ther2004;102:87-96. [19] Kawano H, Tanaka H, Miyachi M. Resistance training andarterial compliance : Keeping the benefits while minimizing thestiffening. J Hypertens 2006;24:1753-9. [20] Mancia G, Fagard R, Narkiewicz K, Redon J, Zanchetti A,Bohm M, et al. 2013 ESH/ESC guidelines for the managementof arterial hypertension: the Task Force for the Management ofArterial Hypertension of the European Society of Hypertension(ESH) and of the European Society of Cardiology (ESC). EurHeart J 2013;34:2159-219. [21] Reddy KS, Yusuf S. Emerging epidemic of cardiovasculardisease in developing countries. Circulation 1998;97:596-601. [22] Williams PT. Lower prevalence of hypertension,hypercholesterolemia, and diabetes in marathoners. Med SciSports Exerc 2009;41:523-9. [23] Beck DT, Martin JS, Casey DP, Braith RW. Exercise trainingreduces peripheral arterial stiffness and myocardial oxygendemand in young pre-hypertensive subjects. Am J Hypertens2013;26:1093-102. [24] Yoshizawa S, Maeda S, Miyaki A, Misono M, Saito Y,Tanabe K, et al. Effect of 12 weeks of moderate-intensityresistance training on arterial stiffness : a randomised controlledtrial in women aged 32-59 years. Br J Sports Med 2009;43:615-8.
The European Research Journal Volume 5 Issue 4 July 2019 622
This is an open access article distributed under the terms of Creative CommonAttribution-NonCommercial-NoDerivatives 4.0 International License.
The correlation between red cell distribution width,autoimmunity and nail involvement in alopecia areata Gülhan Gürel
Department of Dermatology, Bozok University School of Medicine, Yozgat, Turkey
ABSTRACTObjectives: Alopecia areata is a widespread autoimmune disease that targets hair follicles, and is characterizedby nonscarring patches of hair loss. Red cell distribution width (RDW) is a routinely analyzed parameter duringcomplete blood count, and indicates variations in diameters of red blood cells. Elevated RDW levels areassociated with high level of inflammation and oxidative stress. In this study, we aimed to demonstrate thecorrelation between RDW levels, autoimmunity, and nail involvement in alopecia areata. Methods: Medical records of 170 patients who were admitted to our dermatology clinic between May 2016and May 2017 were retrospectively evaluated. A total of 170 patients with alopecia areata diagnosis wereevaluated. Results: The mean age of the patients was 24.61 ± 12.62 years (3-59 years). Sixty patients (35.3%) werefemale, and 110 patients (64.7%) were male. Twenty-seven patients (15.9%) had nail involvement, and 24patients (14.1%) had a history of an autoimmune disease. RDW levels were significantly higher in patientswith nail involvement and history of an autoimmune disease. Conclusion: RDW can be used as a simple, cheap, and readily available marker of inflammation in patientswith alopecia areata.
Keywords: Alopecia areata, red cell distribution width, autoimmunity
Address for correspondence: Gülhan Gürel, MD., Bozok University School of Medicine, Department of Dermatology, Yozgat, TurkeyE-mail: [email protected], Tel: +90 354 2127060, Fax: +90 354 2177150
Copyright © 2019 by The Association of Health Research & StrategyAvailable at http://dergipark.org.tr/eurj
The European Research Journal 2019;5(4):623-628
lopecia areata (AA) is a common autoimmunedisease that targets hair follicles, and is charac-
terized by nonscarring patches of hair loss [1]. AA af-fects only 0.1-0.2% of the general population, and canbe seen in both genders and at all ages [2]. The exactcause of AA is not known; still, AA is considered asan autoimmune disease resulting from damage to hairfollicles by T lymphocytes. The disease with localizedhair loss is manifested by severe lymphocytic infiltra-tion around the hair follicle [3, 4]. Genetic back-ground, atopy, nonspecific immune reactions,
organ-specific autoimmune reactions, emotional stressfactors, infections, and neuropeptides are consideredto play a role in disease etiology [5]. Red cell distri-bution width (RDW) is a routinely reported parameterin complete blood count, and represents the variationin diameters of red blood cells (RBCs) [6]. In additionto RDW, mean platelet volume (MPV) is also consid-ered as a marker of inflammation, and indicates theaverage size of platelets in blood. Both parameters canbe analyzed easily in a routine complete blood count[7]. RDW has been studied in several diseases, such
A
ORIGINAL ARTICLE
e-ISSN: 2149-3189
DOI: 10.18621/eurj.408089
Received: March 20, 2018; Accepted: November 22, 2018; Published Online: November 23, 2018
The European Research Journal Volume 5 Issue 4 July 2019 623
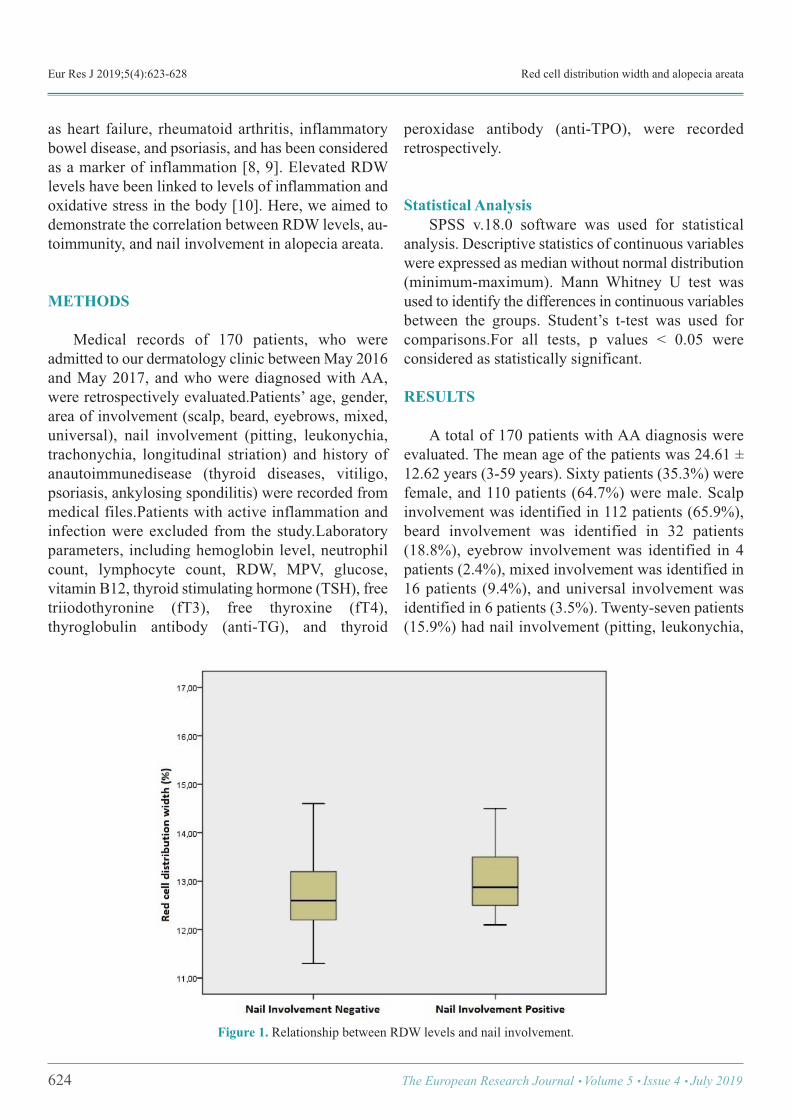
Eur Res J 2019;5(4):623-628 Red cell distribution width and alopecia areata
as heart failure, rheumatoid arthritis, inflammatorybowel disease, and psoriasis, and has been consideredas a marker of inflammation [8, 9]. Elevated RDWlevels have been linked to levels of inflammation andoxidative stress in the body [10]. Here, we aimed todemonstrate the correlation between RDW levels, au-toimmunity, and nail involvement in alopecia areata.
METHODS
Medical records of 170 patients, who wereadmitted to our dermatology clinic between May 2016and May 2017, and who were diagnosed with AA,were retrospectively evaluated.Patients’ age, gender,area of involvement (scalp, beard, eyebrows, mixed,universal), nail involvement (pitting, leukonychia,trachonychia, longitudinal striation) and history ofanautoimmunedisease (thyroid diseases, vitiligo,psoriasis, ankylosing spondilitis) were recorded frommedical files.Patients with active inflammation andinfection were excluded from the study.Laboratoryparameters, including hemoglobin level, neutrophilcount, lymphocyte count, RDW, MPV, glucose,vitamin B12, thyroid stimulating hormone (TSH), freetriiodothyronine (fT3), free thyroxine (fT4),thyroglobulin antibody (anti-TG), and thyroid
peroxidase antibody (anti-TPO), were recordedretrospectively.
Statistical Analysis SPSS v.18.0 software was used for statisticalanalysis. Descriptive statistics of continuous variableswere expressed as median without normal distribution(minimum-maximum). Mann Whitney U test wasused to identify the differences in continuous variablesbetween the groups. Student’s t-test was used forcomparisons.For all tests, p values < 0.05 wereconsidered as statistically significant.
RESULTS
A total of 170 patients with AA diagnosis wereevaluated. The mean age of the patients was 24.61 ±12.62 years (3-59 years). Sixty patients (35.3%) werefemale, and 110 patients (64.7%) were male. Scalpinvolvement was identified in 112 patients (65.9%),beard involvement was identified in 32 patients(18.8%), eyebrow involvement was identified in 4patients (2.4%), mixed involvement was identified in16 patients (9.4%), and universal involvement wasidentified in 6 patients (3.5%). Twenty-seven patients(15.9%) had nail involvement (pitting, leukonychia,
624 The European Research Journal Volume 5 Issue 4 July 2019
Figure 1. Relationship between RDW levels and nail involvement.
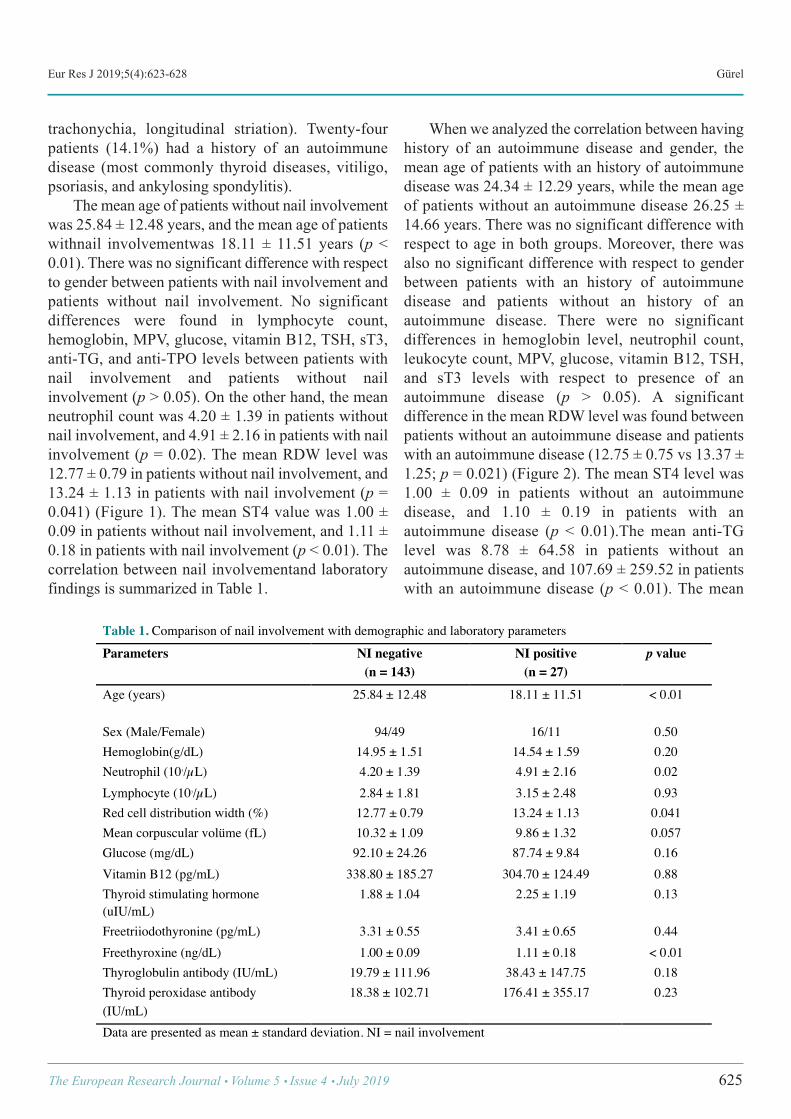
Eur Res J 2019;5(4):623-628 Gürel
trachonychia, longitudinal striation). Twenty-fourpatients (14.1%) had a history of an autoimmunedisease (most commonly thyroid diseases, vitiligo,psoriasis, and ankylosing spondylitis). The mean age of patients without nail involvementwas 25.84 ± 12.48 years, and the mean age of patientswithnail involvementwas 18.11 ± 11.51 years (p <0.01). There was no significant difference with respectto gender between patients with nail involvement andpatients without nail involvement. No significantdifferences were found in lymphocyte count,hemoglobin, MPV, glucose, vitamin B12, TSH, sT3,anti-TG, and anti-TPO levels between patients withnail involvement and patients without nailinvolvement (p > 0.05). On the other hand, the meanneutrophil count was 4.20 ± 1.39 in patients withoutnail involvement, and 4.91 ± 2.16 in patients with nailinvolvement (p = 0.02). The mean RDW level was12.77 ± 0.79 in patients without nail involvement, and13.24 ± 1.13 in patients with nail involvement (p =0.041) (Figure 1). The mean ST4 value was 1.00 ±0.09 in patients without nail involvement, and 1.11 ±0.18 in patients with nail involvement (p < 0.01). Thecorrelation between nail involvementand laboratoryfindings is summarized in Table 1.
When we analyzed the correlation between havinghistory of an autoimmune disease and gender, themean age of patients with an history of autoimmunedisease was 24.34 ± 12.29 years, while the mean ageof patients without an autoimmune disease 26.25 ±14.66 years. There was no significant difference withrespect to age in both groups. Moreover, there wasalso no significant difference with respect to genderbetween patients with an history of autoimmunedisease and patients without an history of anautoimmune disease. There were no significantdifferences in hemoglobin level, neutrophil count,leukocyte count, MPV, glucose, vitamin B12, TSH,and sT3 levels with respect to presence of anautoimmune disease (p > 0.05). A significantdifference in the mean RDW level was found betweenpatients without an autoimmune disease and patientswith an autoimmune disease (12.75 ± 0.75 vs 13.37 ±1.25; p = 0.021) (Figure 2). The mean ST4 level was1.00 ± 0.09 in patients without an autoimmunedisease, and 1.10 ± 0.19 in patients with anautoimmune disease (p < 0.01).The mean anti-TGlevel was 8.78 ± 64.58 in patients without anautoimmune disease, and 107.69 ± 259.52 in patientswith an autoimmune disease (p < 0.01). The mean
The European Research Journal Volume 5 Issue 4 July 2019 625
Table 1. Comparison of nail involvement with demographic and laboratory parameters Parameters NI negative
(n = 143) NI positive
(n = 27) p value
Age (years) 25.84 ± 12.48 18.11 ± 11.51 < 0.01
Sex (Male/Female) 94/49 16/11 0.50 Hemoglobin(g/dL) 14.95 ± 1.51 14.54 ± 1.59 0.20 Neutrophil (103/µL) 4.20 ± 1.39 4.91 ± 2.16 0.02 Lymphocyte (103/µL) 2.84 ± 1.81 3.15 ± 2.48 0.93 Red cell distribution width (%) 12.77 ± 0.79 13.24 ± 1.13 0.041 Mean corpuscular volüme (fL) 10.32 ± 1.09 9.86 ± 1.32 0.057 Glucose (mg/dL) 92.10 ± 24.26 87.74 ± 9.84 0.16 Vitamin B12 (pg/mL) 338.80 ± 185.27 304.70 ± 124.49 0.88 Thyroid stimulating hormone (uIU/mL)
1.88 ± 1.04 2.25 ± 1.19 0.13
Freetriiodothyronine (pg/mL) 3.31 ± 0.55 3.41 ± 0.65 0.44 Freethyroxine (ng/dL) 1.00 ± 0.09 1.11 ± 0.18 < 0.01 Thyroglobulin antibody (IU/mL) 19.79 ± 111.96 38.43 ± 147.75 0.18 Thyroid peroxidase antibody (IU/mL)
18.38 ± 102.71 176.41 ± 355.17 0.23
Data are presented as mean ± standard deviation. NI = nail involvement !
Eur Res J 2019;5(4):623-628 Red cell distribution width and alopecia areata
anti-TPO value was 15.22 ± 88.19 in patients withoutan autoimmune disease, and 215.40 ± 383.98 inpatients with an autoimmune disease (p < 0.01).Thecorrelations between having a history of anautoimmune disease and laboratory findings issummarized in Table 2. Overall, these results indicate that RDW levels aresignificantly higher in patients with nail involvementand a history of an autoimmune disease.
DISCUSSION
AA can be seen in both men and women. Whilesome studies have reported an equal prevalencebetween women and men, others have reported thatAA is more prevalent in women. Goh et al. [11] foundthe prevalence of AA in women and men to be 74.3%and 25.7%, respectively. The study by Kavak et al.[12] showed that the prevalence of AA in females and
626 The European Research Journal Volume 5 Issue 4 July 2019
Figure 2. Relationship between RDW levels and autoimmunity.
Table 2. Comparison of autoimmunitywithdemographicandlaboratoryparameters Parameters Autoimmunity negative
(n = 146) Autoimmunity positive
(n = 24) p value
Age (years) 24.34 ± 12.29 26.25 ± 14.66 0.49 Sex (Male/Female) 94/52 16/8 0.83 Hemoglobin(g/dL) 14.90 ± 1.53 14.76 ± 1.48 0.67 Neutrophil (103/µL) 4.23 ± 1.42 4.81 ± 2.14 0.09 Lymphocyte (103/µL) 2.91 ± 1.93 2.77 ± 1.94 0.36 Red cell distribution width (%) 12.75 ± 0.75 13.37 ± 1.25 0.021 Mean corpuscular volüme (fL) 10.31 ± 1.02 9.89 ± 1.65 0.09 Glucose (mg/dL) 91.62 ± 24.03 90.13 ± 10.88 0.82 Vitamin B12 (pg/mL) 337.56 ± 182.04 307.95 ± 144.53 0.65 Thyroid stimulating hormone (uIU/mL) 1.89 ± 1.01 2.26 ± 1.35 0.11 Freetriiodothyronine (pg/mL) 3.35 ± 0.57 3.22 ± 0.59 0.36 Freethyroxine (ng/dL) 1.00 ± 0.09 1.10 ± 0.19 < 0.01 Thyroglobulinantibody (IU/mL) 8.78±64.58 107.69±259.52 < 0.01 Thyroidperoxidaseantibody (IU/mL) 15.22 ± 88.19 215.40 ± 383.98 < 0.01 Data are presented as mean±standard deviation. !
Eur Res J 2019;5(4):623-628 Gürel
males were 38.2% and 61.8%, respectively. Theprevalence of AA in the current study also showed asimilar pattern; 35.3% of the patients were female, and67.7% of the patients were male. While AA can beseen at almost all ages, it is reported to be morecommon in patients younger than 40 years, usuallyoccurring in the first 3 decades of life [13]. Seyrafi etal. [14] found the mean age of AA patients to be 24.05± 9.98years. In the present study, the mean age of thepatients was 24.61 ± 12.62 years, and this finding wasconsistent with the literature. While AA affects all, most commonly affectedregions are scalp, beard, and other regions [15].Consistent with the literature, we identified scalpinvolvement in 65.9% of the patients, beardinvolvement in 18.8% of the patients, eyebrowinvolvement in 2.4% of the patients, mixedinvolvement in 9.4% of the patients, and universalinvolvement in 3.5% of the patients. Nail involvement in AA is seen in 7-66% of the cases,and it is reported that nail involvement is morecommon in cases of severe hair loss [16, 17].Similarly, we identified nail involvement in 15.9% ofthe patients. AA can be seen together with several organ-specific autoimmune diseases. Thyroid diseases andvitiligo are the most common diseases which are seentogether with AA [3]. It is reported that 5-17.5% of thepatients with AA also have other autoimmune diseases[18]. Similarly, 14.1% of the patients in the currentstudy had a history of an autoimmune disease (mostcommonly thyroid diseases). RDW and MPV have been defined as markers ofinflammation, and are used to predict prognosis ofvarious diseases, includingcardiac diseases,inflammatory bowel diseases, psoriasis, rheumatoidarthritis, Behçet’s disease, brucellosis, and vasculitis[19].To best of our knowledge, the correlation betweennail involvement, history of autoimmune disease, andRDW in AA has not been investigated previously. Thisstudy shows that RDW levels are significantly high inpatients with nail involvementand history ofanautoimmune disease. Inflammation is considered to play an importantrole in elevated RDW levels. Inflammatory cytokines(such as interferon-ɣ, TNF-α, IL-1, IL-6, and IL-10)alters half-life of RBCs by causing changes inprecursor cells and erythropoietin, thereby causing
elevated RDW levels [20, 21]. Kim et al. [22] determined that patients withpsoriasis have significantly higher RDW levelscompared to healthy control subjects. At the sametime, the authors revealed a correlation between RDWlevels and disease severity; RDW levels weresignificantly higher in patients with moderate orsevere psoriasis, compared to patients with mildpsoriasis. Poor prognostic factors in AA include earlydisease onset, long disease duration, presence ofalopecia totalis and alopecia universalis, nailinvolvement, comorbid atopical dermatitis, familyhistory, and presence of other autoimmune disease [3].Based on these studies, high RDW levels can beattributed to severe inflammation and poor prognosisin case of nail involvement and autoimmune diseasein AA. Another study by Kim et al. [8] showed thatpatients with systemic vasculitis have higher RDWlevels, compared to patients with localized cutaneousvasculitis. In addition, the authors identified RDW asan independent predictor of cutaneous vasculitisprogression to systemic vasculitis. Farkas et al. [23] demonstrated that RDW is avaluable parameter for multiple pathological processes(vasculopathy, fibrosis, and inflammation) in systemicsclerosis. In another study, Lou et al. [24] measuredRDW levels in patients infected with hepatitis B virus,and determined a correlation between RDW levels andmortality. Based on these findings, RDW may serveas a valuable parameter to predict prognosis of AA.
CONCLUSION
Taken together, this study shows that RDW valuesare significantly high in patients with nail involvementand history of an autoimmune disease. RDW mayserve as a simple, cheap, and easily accessible markerto indicate inflammation in patients with AA.Considering that the current study is a retrospective,single-center study, multi-center, prospective studiesinvolving healthy control groups are required tovalidate these findings in AA.
Conflict of interest The authors disclosed no conflict of interest duringthe preparation or publication of this manuscript.
The European Research Journal Volume 5 Issue 4 July 2019 627
Eur Res J 2019;5(4):623-628 Red cell distribution width and alopecia areata
Financing The authors disclosed that they did not receive anygrant during conduction or writing of this study.
REFERENCES
[1] Alexis AF, Dudda-Subramanya R, Sinha AA. Alopecia areata:autoimmune basis of hair loss. Eur J Dermatol 2004;14:364-70. [2] Kyriakis KP, Paltatzidou K, Kosma E, Sofouri E, Tadros A,Rachioti E. Alopecia areata prevalence by gender and age. J EurAcad Dermatol Venereol 2009;23:572-3. [3] Cotsarelis G, Botchkarev V. Biology of hair follicles. In:WolffK, Katz SI, Goldsmith LA, Goldsmith L, Gilchrest B, Paller A,Leffell D, et al. Fitzpatrick’s Dermatology in General Medicine.7th ed. New York: Mc Graw Hill, 2007:pp. 39-9. [4] Hordinsky MK. Alopecias. In:Horn, TD, Mascaro JM,Mancini AJ, et al. Dermatology. 1st ed. London: Mosby, 2003:pp.1033-59. [5] Wasserman D, Guzman-Sanchez DA, Scott K, McMichael A.Alopecia areata. Int J Dermatol 2007;46:121-31. [6] Seçkin HY, Bütün I, Baş Y, Takcı Z, Kalkan G. Effects ofcolchicine treatment on mean platelet volume and theinflammatory markers in recurrent aphthous stomatitis. JDermatolog Treat 2016;27:389-91. [7] Schoorl M, Schoorl M, van Pelt J, Bartels PC. Application ofinnovative hemocytometric parameters and algorithms forimprovement of microcytic anemia discrimination. Hematol Rep2015;7:5843. [8] Kim DS, Shin D, Kim TG, Kim SH, Kim DY, Kim SM, et al.Red blood cell distribution width as a useful indicator to predictsystemic vasculitis in patients with cutaneous vasculitis.Rheumatol Int 2015;35:719-25. [9] Felker GM, Allen LA, Pocock SJ, Shaw LK, McMurray JJ,Pfeffer MA, et al; CHARM Investigators. Red cell distributionwidth as a novel prognostic marker in heart failure: data from theCHARM Program and the Duke Databank. J Am Coll Cardiol2007;50:40-7. [10] Kurtul BE, Kabatas EU, Boybeyi SD, Caglar AA, Ozer PA.Increased red cell distribution width levels in children withseasonal allergic conjunctivitis. Int Ophthalmol 2018;38:1079-84. [11] Goh C, Finkel M, Christos PJ, Sinha AA. Profile of 513patients with alopecia areata: associations of disease subtypes
with atopy, autoimmune disease and positive family history. J EurAcad Dermatol Venereol 2006;20:1055-60. [12] Kavak A, Yeşildal N, Parlak AH, Gökdemir G, Aydoğan I,Anul H, et al. Alopecia areata in Turkey: demographic andclinical features. J Eur Acad Dermatol Venereol 2008;22:977-81. [13] Blaumeiser B, van der Goot I, Fimmers R, Hanneken S,Ritzmann S, Seymons K, et al. Familial aggregation of alopeciaareata. J Am Acad Dermatol 2006;54:627-32. [14] Seyrafi H, Akhiani M, Abbasi H, Mirpour S,Gholamrezanezhad A. Evaluation of the profile of alopecia areataand the prevalence of thyroid function test abnormalities andserum autoantibodies in Iranian patients. BMC Dermatol2005;5:11. [15] Berker DAR, Messenger AG, Sinclair RD. Disorders of hair.In: Rook’s Textbook of Dermatology. Burns T, Breathnach S, CoxN, Griffiths C, eds. 7th ed. Oxford: Blackwell Science, 2004:pp.1-63. [16] Gandhi V, Baruah MC, Bhattacharaya SN. Nail changes inalopecia areata: incidence and pattern. Indian J DermatolVenereol Leprol 2003;69:114-5. [17] Kasumagic-Halilovic E, Prohic A. Nail changes in alopeciaareata: frequency and clinical presentation. J Eur Acad DermatolVenereol 2009;23:240-1. [18] Sharma VK, Dawn G, Kumar B. Profile of alopecia areatain Northern India. Int J Dermatol 1996;35:22-7. [19] Pancar GS, Eyupoglu O. Red cell distribution width andmean platelet volume in patients with pityriasis rosea. J Clin MedRes 2016;8:445-8. [20] Lippi G, Targher G, Montagnana M, Salvagno GL, ZoppiniG, Guidi GC. Relation between red blood cell distribution widthand inflammatory biomarkers in a large cohort of unselectedoutpatients. Arch Pathol Lab Med 2009;133:628-32. [21] Weiss G, Goodnough LT. Anemia of chronic disease. N EnglJ Med 2005;352:1011-23. [22] Kim DS, Shin D, Jee H, Kim TG, Kim SH, Kim DY, et al.Red blood cell distribution width is increased in patients withpsoriasis vulgaris: a retrospective study on 261 patients. JDermatol 2015;42:567-71. [23] Farkas N, Szabó A, Lóránd V, Sarlós DP, Minier T,Prohászka Z, et al. Clinical usefulness of measuring red bloodcell distribution width in patients with systemic sclerosis.Rheumatology (Oxford) 2014;53:1439-45. [24] Lou Y, Wang M, Mao W. Clinical usefulness of measuringred blood cell distribution width in patients with hepatitis B.PLoS One 2012;7:e37644.
628 The European Research Journal Volume 5 Issue 4 July 2019
This is an open access article distributed under the terms of Creative CommonAttribution-NonCommercial-NoDerivatives 4.0 International License.
The role of inflammation markers in predicting the prognosisof Bell's palsyBülent Ulusoy1 , Kazım Bozdemir2 , Hayati Kale3 , Mehmet Hakan Korkmaz2
1Department of Otorhinolaryngology-Head and Neck Surgery, Selçuk University School of Medicine, Konya, Turkey 2Department of Otorhinolaryngology-Head and Neck Surgery, Yıldırım Beyazıt University School of Medicine, Ankara, Turkey 3Department of Otorhinolaryngology-Head and Neck Surgery, Dr. Sami Ulus Training and Research Hospital, Ankara, Turkey
ABSTRACTObjectives: This study aimed to investigate the relationship between the neutrophil-to-lymphocyte ratio (NLR)and the platelet-to-lymphocyte ratio (PLR) and Bell’s palsy in addition to the usability of these markers topredict prognosis. Methods: In this prospective study, the patient group included 24 patients that were diagnosed with Bell’spalsy and 29 healthy volunteers that had similar characteristics to them regarding age and gender with patientgroup as the control group. The temporal gadolinium-enhanced magnetic resonance imaging (TGd-MRI) wasperformed to all patients. The complete blood count was also obtained from both the patient and the controlgroups, and these two groups were compared for NLR and PLR, mean platelet volume (MPV), plateletdistribution width (PDW), and platelet count. The relationship between these markers and Bell’s paralysisprognosis was also investigated. Results: The patient and control groups were similar in age and gender (p > 0.05). NLR was significantlyhigher in the patient group compared with the control group (p = 0.016). There was no correlation between theNLR value and the prognosis of Bell’s Palsy. The PDW and white blood cell count (WBC) were significantlyhigher in the patient group than the control group (p = 0.023 and p = 0.012, respectively). A comparison of therecovered and unrecovered patients revealed that the PDW value was significantly higher and the platelet countwas lower in the recovered patients than the unrecovered patients (p = 0.009 and p = 0.003 respectively). TheMPV value was higher in the recovered patients, though not statistically significant (p = 0.063). Based on thecut-off values determined in the receiver operator characteristic (ROC) curve analysis, a comparison of therecovered and unrecovered patients reveals that the likelihood of not healing was significantly higher in thosethat had normal PDW values (p = 0.036). Conclusion: These results might support the theory of inflammation in patients with Bell’s palsy.
Keywords: Bell palsy, inflammation, mean platelet volume, prognosis, platelet activation, ROC curve,neutrophil
Address for correspondence: Bülent Ulusoy, MD., Assistant Professor, Selçuk University School of Medicine, Department of Otorhinolaryngology-Head and Neck Surgery, Konya, TurkeyE-mail: [email protected], Tel: +90 332 2412181-43920, Fax: +90 332 2412184
Copyright © 2019 by The Association of Health Research & StrategyAvailable at http://dergipark.org.tr/eurj
The European Research Journal 2019;5(4):629-635
ell’s palsy is defined as an acute peripheral facialpalsy, usually affecting one half of the face [1,
2]. The facial nerve provides the sense of a specific
part of the auriculus, the sense of taste in two-thirdsof the anterior tongue, and the autonomous innervationof the lacrimal and mandibular glands in addition to
B
ORIGINAL ARTICLE
e-ISSN: 2149-3189
DOI: 10.18621/eurj.404778
Received: March 12, 2018; Accepted: August 15, 2018; Published Online: September 14, 2018
The European Research Journal Volume 5 Issue 4 July 2019 629
Eur Res J 2019;5(4):629-635 Inflammation markers in predicting the prognosis of Bell's palsy
the motor innervation of the facial muscles; thus, thereare certain symptoms and findings (e.g., sudden-onsetvisual impairment on one side of the faces, dry eye,and incomplete eyes and mouth closure) emerging inrelation to these functions [1]. Bell’s palsy has an an-nual incidence of 15-30/100,000, which correspondsto 60-75% of all unilateral facial palsies [2]. Some pa-tients reported being exposed to the air condition oran open window before the paralysis [1]. Although theetiology of facial paralysis is still unclear, viral infec-tion, vascular ischemia, or autoimmunity are thoughtto be the causes of this disease [1, 2].
The neutrophil-to-lymphocyte ratio (NLR) andthe platelet-to-lymphocyte ratio (PLR) have recentlybeen used frequently as a new marker of inflammation[3-5]. This study aimed to investigate the relationshipbetween NLR and PLR values and Bell’s palsy, andthe usability of these markers to predict the prognosis.
METHODS
This study was conducted with 24 patients thatwere diagnosed with Bell’s palsy between the years2015 and 2016, and 29 healthy volunteers (the controlgroup) with similar age and gender characteristics. Theexclusion criteria included the following: patients withacute infection, diabetes mellitus, systemichypertension, hyperlipidemia, acute or chronic renalfailure, chronic liver disease, chronic obstructivepulmonary disease, coronary artery disease,connective tissue disease, inflammatory boweldisease, allergic rhinitis, smoking history, chronicotitis media and otosclerosis, and other otic diseasessuch as acoustic trauma, patients who are performedotological surgery before, and tumors or cochlearpathology detected on the temporal gadolinium-enhanced magnetic resonance imaging (TGd-MRI). The stage of Bell’s palsy was determinedaccording to the House-Brackmann staging system [2]at the time of diagnosis and 1 month after thetreatment. A complete ear-nose-throat and head andneck examinations were performed for all patients.Some tests, such as the complete blood count (CBC),pure tone audiometry, stapes reflex, routine bloodbiochemistry, and viral serological markers, wereobtained from the patients diagnosed with unilateralperipheral facial paralysis before the treatment.
Additionally, TGd-MRI was obtained from all patientsat the onset of the treatment. In the control group wasperformed only CBC. A systemic steroid (methylprednisolone) treatmentat a dose of 1 mg/kg was started routinely for patientsdiagnosed with Bell’s palsy, and the dose was reducedand terminated in 10 days. At the end of the treatment,the House-Brackmann grade 1-2 was regarded as asatisfactory recovery and grade 3-6 was regarded asunsatisfactory recovery [3]. Patients who did notchange according to the pre-treatment stage weredefined as unrecovered. The patient and control groups were compared forNLR, PLR, mean platelet volume (MPV), and plateletdistribution width (PDW). These markers were alsoevaluated for their usability in predicting theprognosis.
Hematological Analysis NLR was calculated as a simple ratio between theabsolute neutrophil and the absolute lymphocytecounts in the CBC. PLR was also calculated as asimple ratio between the absolute platelet count andthe absolute lymphocyte count. Moreover, the MPVand PDW values were determined from the CBC. TheNLR, PLR, MPV, and PDW values were calculated inthe control group in a similar manner. An automatedblood cell counter (Sysmex XE-2100; Kobe, Japan)was used for the analyses.
Approval of the Research Ethics Committee The study was carried out with the permission(26379996/177) of the Clinical Research EthicsCommittee.
Statistical Analysis SPSS for Windows 11.5 package program(Chicago, Inc, USA) for statistical analysis was used.In the analyses, independent samples t test was usedfor the comparison of the variables in two groups aswell as the variables with normal distribution. Mann-Whitney U Test was used for the variables that did nothave a normal distribution. The receiver operator characteristics (ROC) curveanalysis was applied to determine the most appropriatecut-off values for the statistically significant variablesamong the groups. The chi-square and Fisher’s exacttests were used to compare the cut-off values obtained
630 The European Research Journal Volume 5 Issue 4 July 2019

Eur Res J 2019;5(4):629-635 Ulusoy et al
as a result of these analyses. The statisticalsignificance threshold was accepted as 0.05.
RESULTS
The mean age was 45.12 ± 12.34 years in thepatient group and 44.34 ± 9.97 years in the controlgroup with no statistically significant differencebetween these two groups (p > 0.05). The female/maleratio was 13/16 in the control group and 13/11 in thepatient group, and when the groups comparedaccording to gender were similar. (p > 0.05) (Table 1).Five patients who did not participate in the controlexamination after the treatment were excluded fromthe study. Satisfactory recovery was detected in 16
patients. Since the stage of the disease did not changebefore and after the treatment in three patients, theywere classified under the unrecovered group. The mean NLR was 2.86 ± 2.01 in the patientgroup and 1.68 ± 0.34 in the control group, and NLRwas found to be significantly higher in the patientgroup compared with the control group (p = 0.016).The PDW value was 13.46 ± 2.40 fl in the patientgroup and 12.31 ± 1.02 fl in the control group. Thewhite blood cell (WBC) count was 9.13 ± 3.33 (×109/l)in the patient group and 7.40 ± 1.22 (×109/l) in thecontrol group. The PDW and WBC values weresignificantly higher in the patient group comparedwith the control group (p = 0.023 and p = 0.012,respectively). The PLR value was 121.90 ± 52.87 inthe patient group and 99.98 ± 16.93 in the control
The European Research Journal Volume 5 Issue 4 July 2019 631
!
Table 1. Comparison between patient and control groups according to age and sex Control (n = 29) Patient (n = 24) p value Sex Male/Female
13/16
13/11
0.498
Age (years) (Mean ± SD) 44.34 ± 9.97 45.12 ± 12.34 0.800
SD = standard deviation
Table 2. Comparison of the patient and control groups in terms of variables Control (n = 29) Patient (n = 24) p value PLR 99.98 ± 16.93 121.90 ± 52.87 0.133 NLR 1.68 ± 0.34 2.86 ± 2.01 0.016 MPV (fl) 10.46 ± 0.54 10.23 ± 1.25 0.378
Platelet count (!109
/l) 247.59 ± 43.20 245.58 ± 62.44 0.891 PDW (fl) 12.31 ± 1.02 13.46 ± 2.40 0.023 WBC (!10
9
/l) 7.40 ± 1.22 9.13 ± 3.33 0.012 Data are shown as mean ± standard deviation. MPV = mean platelet volume, NLR = neutrophil-to-lymphocyte ratio, PDW = platelet distribution width, PLR = platelet-to-lymphocyte ratio, WBC = white blood cell !
Table 3. Comparison of the recovery results in the patient group
Present (n = 16) Absent (n = 3) p value PLR 132.16 ± 58.83 92.96 ± 30.89 0.211 NLR 2.89 ± 2.28 1.90 ± 0.68 0.793 MPV (fl) 10.30 ± 1.11 8.90 ± 1.15 0.063
Platelet counts (!109
/l) 240.63 ± 55.01 289.00 ± 2.00 0.003 PDW (fl) 13.91 ± 1.80 10.63 ± 1.69 0.009
WBC (!109
/l) 8.56 ± 3.62 10.12 ± 1.79 0.481
Data are shown as mean ± standard deviation. MPV = mean platelet volume, NLR = neutrophil-to-lymphocyte ratio, PDW = platelet distribution width, PLR = platelet-to-lymphocyte ratio, WBC = white blood cell
!
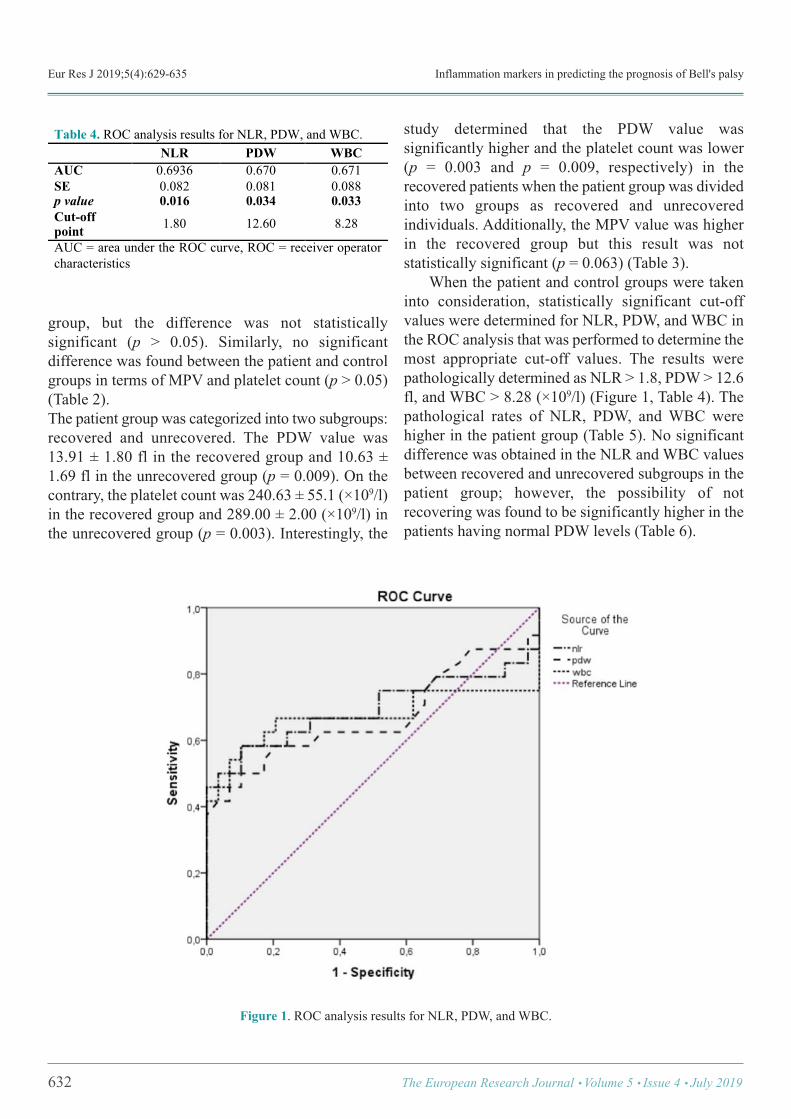
Eur Res J 2019;5(4):629-635 Inflammation markers in predicting the prognosis of Bell's palsy
group, but the difference was not statisticallysignificant (p > 0.05). Similarly, no significantdifference was found between the patient and controlgroups in terms of MPV and platelet count (p > 0.05)(Table 2). The patient group was categorized into two subgroups:recovered and unrecovered. The PDW value was13.91 ± 1.80 fl in the recovered group and 10.63 ±1.69 fl in the unrecovered group (p = 0.009). On thecontrary, the platelet count was 240.63 ± 55.1 (×109/l)in the recovered group and 289.00 ± 2.00 (×109/l) inthe unrecovered group (p = 0.003). Interestingly, the
study determined that the PDW value wassignificantly higher and the platelet count was lower(p = 0.003 and p = 0.009, respectively) in therecovered patients when the patient group was dividedinto two groups as recovered and unrecoveredindividuals. Additionally, the MPV value was higherin the recovered group but this result was notstatistically significant (p = 0.063) (Table 3). When the patient and control groups were takeninto consideration, statistically significant cut-offvalues were determined for NLR, PDW, and WBC inthe ROC analysis that was performed to determine themost appropriate cut-off values. The results werepathologically determined as NLR > 1.8, PDW > 12.6fl, and WBC > 8.28 (×109/l) (Figure 1, Table 4). Thepathological rates of NLR, PDW, and WBC werehigher in the patient group (Table 5). No significantdifference was obtained in the NLR and WBC valuesbetween recovered and unrecovered subgroups in thepatient group; however, the possibility of notrecovering was found to be significantly higher in thepatients having normal PDW levels (Table 6).
632 The European Research Journal Volume 5 Issue 4 July 2019
!
Table 4. ROC analysis results for NLR, PDW, and WBC. NLR PDW WBC AUC 0.6936 0.670 0.671 SE 0.082 0.081 0.088 p value 0.016 0.034 0.033 Cut-off point 1.80 12.60 8.28
AUC = area under the ROC curve, ROC = receiver operator characteristics
Figure 1. ROC analysis results for NLR, PDW, and WBC.
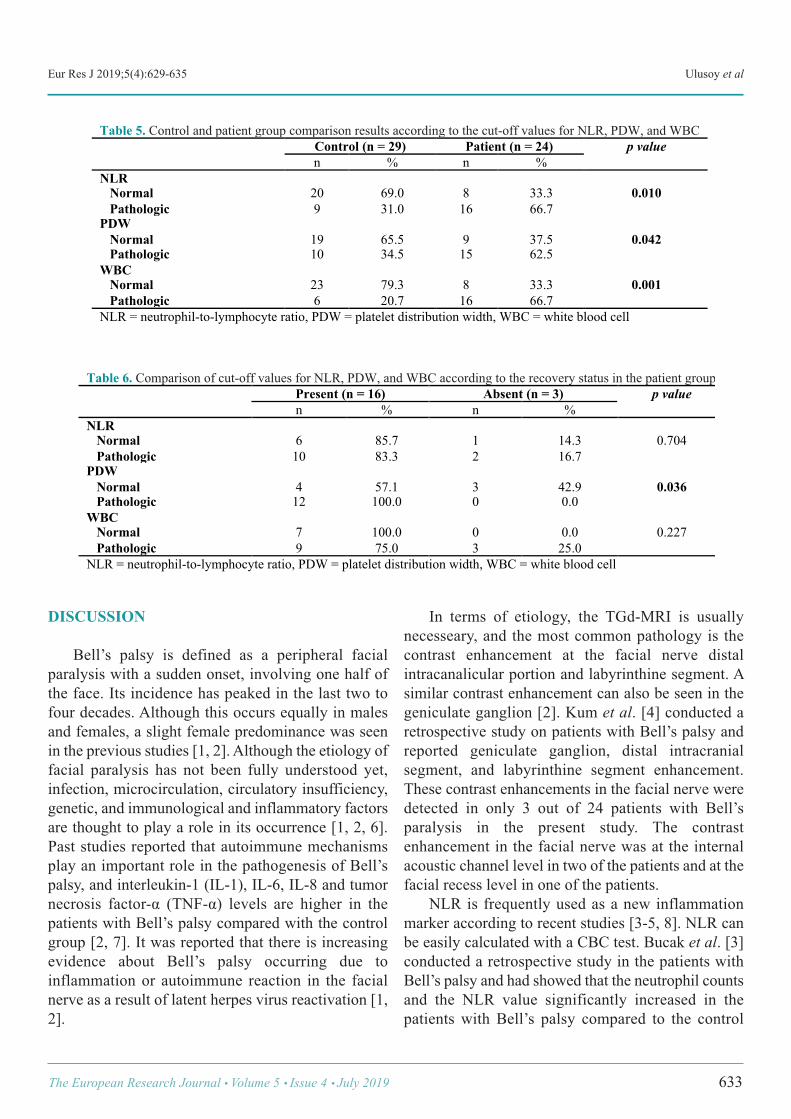
Eur Res J 2019;5(4):629-635 Ulusoy et al
DISCUSSION
Bell’s palsy is defined as a peripheral facialparalysis with a sudden onset, involving one half ofthe face. Its incidence has peaked in the last two tofour decades. Although this occurs equally in malesand females, a slight female predominance was seenin the previous studies [1, 2]. Although the etiology offacial paralysis has not been fully understood yet,infection, microcirculation, circulatory insufficiency,genetic, and immunological and inflammatory factorsare thought to play a role in its occurrence [1, 2, 6].Past studies reported that autoimmune mechanismsplay an important role in the pathogenesis of Bell’spalsy, and interleukin-1 (IL-1), IL-6, IL-8 and tumornecrosis factor-α (TNF-α) levels are higher in thepatients with Bell’s palsy compared with the controlgroup [2, 7]. It was reported that there is increasingevidence about Bell’s palsy occurring due toinflammation or autoimmune reaction in the facialnerve as a result of latent herpes virus reactivation [1,2].
In terms of etiology, the TGd-MRI is usuallynecesseary, and the most common pathology is thecontrast enhancement at the facial nerve distalintracanalicular portion and labyrinthine segment. Asimilar contrast enhancement can also be seen in thegeniculate ganglion [2]. Kum et al. [4] conducted aretrospective study on patients with Bell’s palsy andreported geniculate ganglion, distal intracranialsegment, and labyrinthine segment enhancement.These contrast enhancements in the facial nerve weredetected in only 3 out of 24 patients with Bell’sparalysis in the present study. The contrastenhancement in the facial nerve was at the internalacoustic channel level in two of the patients and at thefacial recess level in one of the patients. NLR is frequently used as a new inflammationmarker according to recent studies [3-5, 8]. NLR canbe easily calculated with a CBC test. Bucak et al. [3]conducted a retrospective study in the patients withBell’s palsy and had showed that the neutrophil countsand the NLR value significantly increased in thepatients with Bell’s palsy compared to the control
The European Research Journal Volume 5 Issue 4 July 2019 633
Table 5. Control and patient group comparison results according to the cut-off values for NLR, PDW, and WBC Control (n = 29) Patient (n = 24) p value
n % n % NLR Normal Pathologic
20 9
69.0 31.0
8 16
33.3 66.7
0.010
PDW Normal Pathologic
19 10
65.5 34.5
9 15
37.5 62.5
0.042
WBC Normal Pathologic
23 6
79.3 20.7
8 16
33.3 66.7
0.001
NLR = neutrophil-to-lymphocyte ratio, PDW = platelet distribution width, WBC = white blood cell
!
Table 6. Comparison of cut-off values for NLR, PDW, and WBC according to the recovery status in the patient group Present (n = 16) Absent (n = 3) p value
n % n % NLR Normal Pathologic
6 10
85.7 83.3
1 2
14.3 16.7
0.704
PDW Normal Pathologic
4 12
57.1 100.0
3 0
42.9 0.0
0.036
WBC Normal Pathologic
7 9
100.0 75.0
0 3
0.0 25.0
0.227
NLR = neutrophil-to-lymphocyte ratio, PDW = platelet distribution width, WBC = white blood cell
!
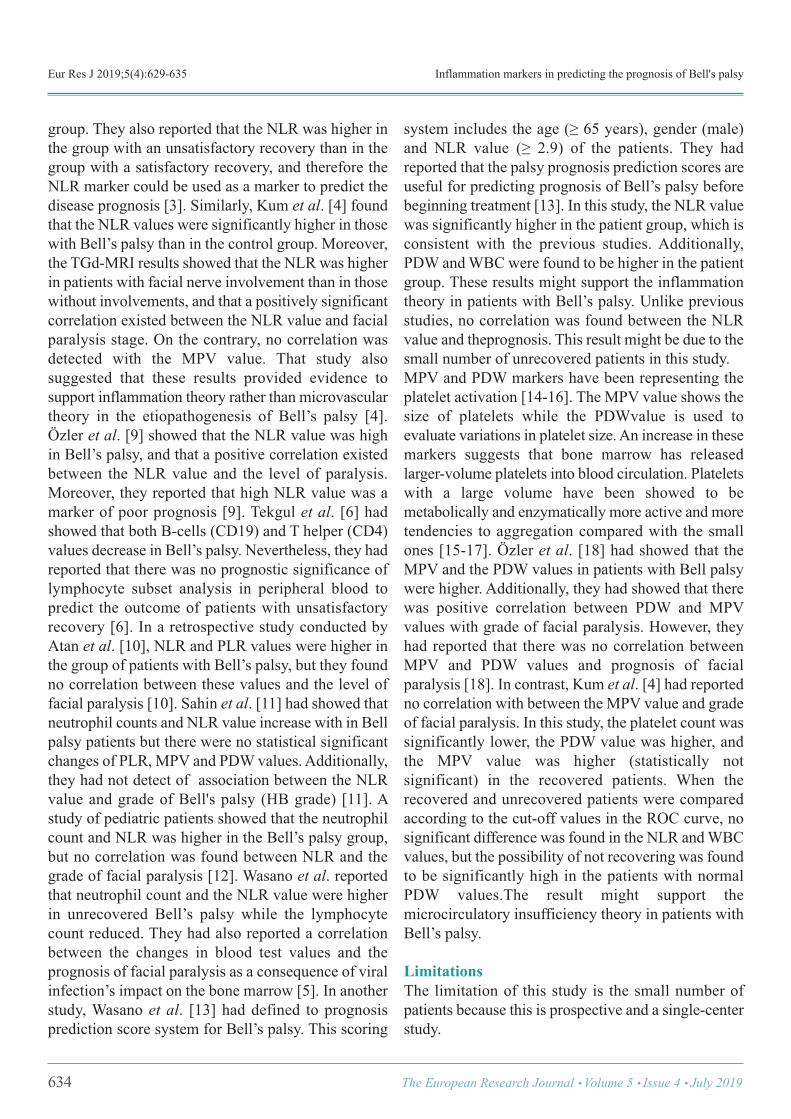
Eur Res J 2019;5(4):629-635 Inflammation markers in predicting the prognosis of Bell's palsy
group. They also reported that the NLR was higher inthe group with an unsatisfactory recovery than in thegroup with a satisfactory recovery, and therefore theNLR marker could be used as a marker to predict thedisease prognosis [3]. Similarly, Kum et al. [4] foundthat the NLR values were significantly higher in thosewith Bell’s palsy than in the control group. Moreover,the TGd-MRI results showed that the NLR was higherin patients with facial nerve involvement than in thosewithout involvements, and that a positively significantcorrelation existed between the NLR value and facialparalysis stage. On the contrary, no correlation wasdetected with the MPV value. That study alsosuggested that these results provided evidence tosupport inflammation theory rather than microvasculartheory in the etiopathogenesis of Bell’s palsy [4].Özler et al. [9] showed that the NLR value was highin Bell’s palsy, and that a positive correlation existedbetween the NLR value and the level of paralysis.Moreover, they reported that high NLR value was amarker of poor prognosis [9]. Tekgul et al. [6] hadshowed that both B-cells (CD19) and T helper (CD4)values decrease in Bell’s palsy. Nevertheless, they hadreported that there was no prognostic significance oflymphocyte subset analysis in peripheral blood topredict the outcome of patients with unsatisfactoryrecovery [6]. In a retrospective study conducted byAtan et al. [10], NLR and PLR values were higher inthe group of patients with Bell’s palsy, but they foundno correlation between these values and the level offacial paralysis [10]. Sahin et al. [11] had showed thatneutrophil counts and NLR value increase with in Bellpalsy patients but there were no statistical significantchanges of PLR, MPV and PDW values. Additionally,they had not detect of association between the NLRvalue and grade of Bell's palsy (HB grade) [11]. Astudy of pediatric patients showed that the neutrophilcount and NLR was higher in the Bell’s palsy group,but no correlation was found between NLR and thegrade of facial paralysis [12]. Wasano et al. reportedthat neutrophil count and the NLR value were higherin unrecovered Bell’s palsy while the lymphocytecount reduced. They had also reported a correlationbetween the changes in blood test values and theprognosis of facial paralysis as a consequence of viralinfection’s impact on the bone marrow [5]. In anotherstudy, Wasano et al. [13] had defined to prognosisprediction score system for Bell’s palsy. This scoring
system includes the age (≥ 65 years), gender (male)and NLR value (≥ 2.9) of the patients. They hadreported that the palsy prognosis prediction scores areuseful for predicting prognosis of Bell’s palsy beforebeginning treatment [13]. In this study, the NLR valuewas significantly higher in the patient group, which isconsistent with the previous studies. Additionally,PDW and WBC were found to be higher in the patientgroup. These results might support the inflammationtheory in patients with Bell’s palsy. Unlike previousstudies, no correlation was found between the NLRvalue and theprognosis. This result might be due to thesmall number of unrecovered patients in this study. MPV and PDW markers have been representing theplatelet activation [14-16]. The MPV value shows thesize of platelets while the PDWvalue is used toevaluate variations in platelet size. An increase in thesemarkers suggests that bone marrow has releasedlarger-volume platelets into blood circulation. Plateletswith a large volume have been showed to bemetabolically and enzymatically more active and moretendencies to aggregation compared with the smallones [15-17]. Özler et al. [18] had showed that theMPV and the PDW values in patients with Bell palsywere higher. Additionally, they had showed that therewas positive correlation between PDW and MPVvalues with grade of facial paralysis. However, theyhad reported that there was no correlation betweenMPV and PDW values and prognosis of facialparalysis [18]. In contrast, Kum et al. [4] had reportedno correlation with between the MPV value and gradeof facial paralysis. In this study, the platelet count wassignificantly lower, the PDW value was higher, andthe MPV value was higher (statistically notsignificant) in the recovered patients. When therecovered and unrecovered patients were comparedaccording to the cut-off values in the ROC curve, nosignificant difference was found in the NLR and WBCvalues, but the possibility of not recovering was foundto be significantly high in the patients with normalPDW values.The result might support themicrocirculatory insufficiency theory in patients withBell’s palsy.
Limitations The limitation of this study is the small number ofpatients because this is prospective and a single-centerstudy.
634 The European Research Journal Volume 5 Issue 4 July 2019
Eur Res J 2019;5(4):629-635 Ulusoy et al
CONCLUSION
Based on these results, this study showed thatbone marrow functions may be affected in patientswith Bell’s palsy; however, there is need forprospective studies that more patients are included toconfirm this possibility.
Conflict of interest The authors disclosed no conflict of interest duringthe preparation or publication of this manuscript.
Financing The authors disclosed that they did not receive anygrant during conduction or writing of this study.
Acknowledgements We would like to thank Assoc. Prof. Dr. SerdalKenan Köse for the statistical analysis of the work. This study was presented as E-poster at the 38th
Turkish National Congress of Otorhinolaryngology-Head and Neck Surgery. 26-30 October 2016, Antalya,Turkey
REFERENCES
[1] Finsterer J. Management of peripheral facial nerve palsy. EurArch Otorhinolaryngol 2008; 265:743-52. [2] Greco A, Gallo A, Fusconi M, Marinelli C, Macri GF, deVincentiis M. Bell's palsy and autoimmunity. Autoimmun Rev2012;12:323-8. [3] Bucak A, Ulu S, Oruc S, Yucedag F, Tekin MS, Karakaya F,et al. Neutrophil-to-lymphocyte ratio as a novel-potential markerfor predicting prognosis of Bell palsy. Laryngoscope2014;124:1678-81. [4] Kum RO, Yurtsever Kum N, Ozcan M, Yilmaz YF, GungorV, Unal A, et al. Elevated neutrophil-to-lymphocyte ratio in Bell'spalsy and its correlation with facial nerve enhancement on MRI.Otolaryngol Head Neck Surg 2015;152:130-5. [5] Wasano K, Kawasaki T, Yamamoto S, Tomisato S, ShindenS, Ishikawa T, et al. Pretreatment hematologic findings as novelpredictive markers for facial palsy prognosis. Otolaryngol Head
Neck Surg 2016;155:581-7. [6] Tekgul H, Polat M, Serdaroğlu G, Ikizoğlu T, Yalaz M,Kutukculer N, et al. Lymphocyte subsets in Bell's palsy: immunepathogenesis and outcome prediction. Pediatr Neurol2004;31:258-60. [7] Yilmaz M, Tarakcioglu M, Bayazit N, Bayazit YA, NamiduruM, Kanlikama M. Serum cytokine levels in Bell's palsy. J NeurolSci 2002;15:69-72. [8] Küçük E, Kocayiğit I, Günel C, Düzenli H. Neutrophil-to-lymphocyte ratio in occlusive vascular diseases: the literaturereview of the past 10 years. World J Emerg Med 2016;7:165-72. [9] Özler GS, Günak G. Neutrophil-lymphocyte ratio: a newpredictive and prognostic factor in patients with Bell palsy. JCraniofac Surg 2014;25:944-5. [10] Atan D, Ikinciogullari A, Koseoglu S, Ozcan KM, CetinMA, Ensari S, et al. New predictive parameters of Bell's palsy:neutrophil to lymphocyte ratio and platelet to lymphocyte ratio.Balkan Med J 2015;32:167-70. [11] Sahin C, Varım C. Neutrophil to lymphocyte ratio, plateletto lymphocyte ratio, mean platelet volume and red celldistribution width measures in Bells palsy. Open Access MacedJ Med Sci 2017;15:14-8. [12] Eryilmaz A, Basal Y, Tosun A, Kurt Omurlu I, Basak S. Theneutrophil to lymphocyte ratios of our pediatric patients withBell's palsy. Int J Pediatr Otorhinolaryngol 2015;79:2374-7. [13] Wasano K, Ishikawa T, Kawasaki T, Yamamoto S, TomisatoS, Shinden S et al. Novel pre-therapeutic scoring system usingpatient and haematological data to predict facial palsy prognosis.Clin Otolaryngol 2017;42:1224-8. [14] Chen Y, Xiao Y, Lin Z, Xiao X, He C, Bihl JC et al. The roleof circulating platelets microparticles and platelet parameters inacute ischemic stroke patients. J Stroke Cerebrovasc Dis2015;24:2313-20. [15] Martin JF, Trowbridge EA, Salmon G, Plumb J. Thebiological significance of platelet volume: its relationship tobleeding time, platelet thromboxane B2 production andmegakaryocyte nuclear DNA concentration. Thromb Res1983;32:443-60. [16] Vagdatli E, Gounari E, Lazaridou E, Katsibourlia E,Tsikopoulou F, Labrianou I. Platelet distribution width: a simple,practical and specific marker of activation of coagulation.Hippokratia 2010;14:28-32. [17] Sevuk U, Bahadir MV, Altindag R, Baysal E, Yaylak B, AyN, et al. Value of serial platelet indices measurements for theprediction of pulmonary embolism in patients with deep venousthrombosis. Ther Clin Risk Manag 2015;11:1243-9. [18] Özler GS, Okuyucu S. Increased mean platelet volume inpatients with Bell’s palsy. Int Adv Otol 2014;10: 281-3.
The European Research Journal Volume 5 Issue 4 July 2019 635
This is an open access article distributed under the terms of Creative CommonAttribution-NonCommercial-NoDerivatives 4.0 International License.
Does laparoscopic appendectomy increase the risk of intra-abdominal abscess in children who have perforatedappendicitis?Fatih Akbıyık1 , Günay Ekberli1 , Yusuf Hakan Çavuşoğlu2
1Department of Pediatric Surgery, Ankara Children’s Hematology and Oncology Training and Research Hospital, Ankara, Turkey 2Department of Pediatric Surgery, Gazi University School of Medicine, Ankara, Turkey
ABSTRACTObjective: The aim of this study is to compare the rates of intraabdominal abscesses (IAAs), in laparoscopicappendectomy (LA) and open appendectomy (OA) for perforated appendicitis in children. Methods: A retrospective database search of consecutive cases of children with a diagnosis of perforatedappendicitis who underwent OA or LA by the first author or were operated under his supervision diagnosedwith appendicitis between 2011 and 2014 and who underwent surgery as treatment was conducted.Results: Seventy-eight patients were included in our study. Forty-two and 36 patients underwent LA and OA,respectively. One case was converted from LA to OA. There was no statistically significant difference atsuperficial incisional surgical-site infections and IAA between groups but drain placement ratio and length ofhospital stay was higher in OA group.Conclusions: The lack of difference in postoperative incidence of IAA supports the idea that LA does notincrease the risk of IAA in perforated appendicitis. Although LA for perforated appendicitis in children hasbeen intensely debated, our findings indicate that laparoscopic procedures performed by experienced pediatricsurgeons will decrease the risk of complication and conversion to OA. Laparoscopy in children is a safeprocedure for perforated, complicated appendicitis.
Keywords: appendicitis, abdominal abscess, laparoscopy, child
Address for correspondence: Yusuf Hakan Çavuşoğlu, MD., Professor, Gazi University School of Medicine, Department of Pediatric Surgery, Ankara,Turkey E-mail: [email protected]
Copyright © 2019 by The Association of Health Research & StrategyAvailable at http://dergipark.org.tr/eurj
The European Research Journal 2019;5(4):636-640
ppendicitis is resulting from luminal obstructionand continuation of simple inflammation to per-
foration and subsequent abscess formation. Appendec-tomies are performed frequently in pediatric surgicalpractice. The use of laparoscopy by surgeons to man-age appendicitis is increasing because laparoscopy of-fers the advantages of abdominal explorationassociated with open procedures, along with decreasedpostoperative analgesic requirements, decreased
length of hospital stay, and better cosmetic results,partly because of the technical advances in terms ofrefinements in instruments and increased technical ex-perience of surgeons with the technique [1-3]. How-ever, there is an intense debate regarding theoccurrence of intraabdominal abscesses (IAAs) afterlaparoscopy, especially in cases of complicated appen-dicitis [4-6].
The aim of this study is to compare the rates
A
ORIGINAL A RTICLE
e-ISSN: 2149-3189
DOI: 10.18621/eurj.412177
Received: April 3, 2018; Accepted: May 11, 2018; Published Online: August 13, 2018
The European Research Journal Volume 5 Issue 4 July 2019 636
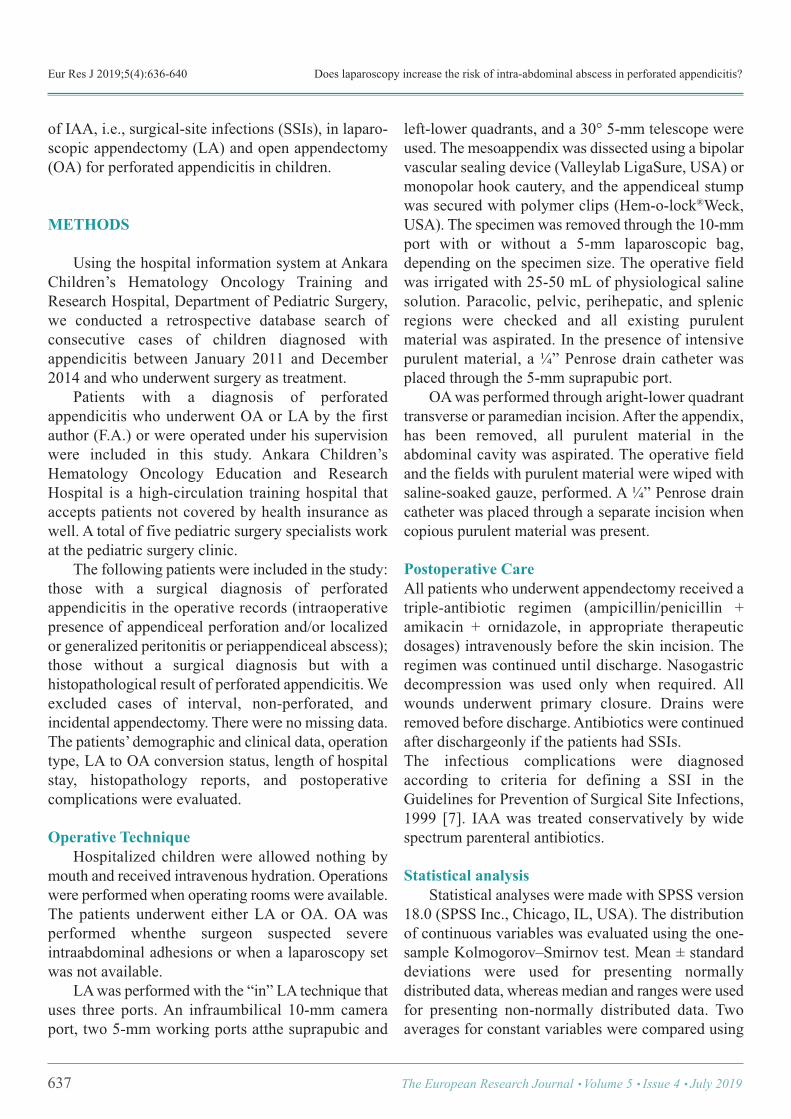
Eur Res J 2019;5(4):636-640 Does laparoscopy increase the risk of intra-abdominal abscess in perforated appendicitis?
of IAA, i.e., surgical-site infections (SSIs), in laparo-scopic appendectomy (LA) and open appendectomy(OA) for perforated appendicitis in children.
METHODS
Using the hospital information system at AnkaraChildren’s Hematology Oncology Training andResearch Hospital, Department of Pediatric Surgery,we conducted a retrospective database search ofconsecutive cases of children diagnosed withappendicitis between January 2011 and December2014 and who underwent surgery as treatment. Patients with a diagnosis of perforatedappendicitis who underwent OA or LA by the firstauthor (F.A.) or were operated under his supervisionwere included in this study. Ankara Children’sHematology Oncology Education and ResearchHospital is a high-circulation training hospital thataccepts patients not covered by health insurance aswell. A total of five pediatric surgery specialists workat the pediatric surgery clinic. The following patients were included in the study:those with a surgical diagnosis of perforatedappendicitis in the operative records (intraoperativepresence of appendiceal perforation and/or localizedor generalized peritonitis or periappendiceal abscess);those without a surgical diagnosis but with ahistopathological result of perforated appendicitis. Weexcluded cases of interval, non-perforated, andincidental appendectomy. There were no missing data. The patients’ demographic and clinical data, operationtype, LA to OA conversion status, length of hospitalstay, histopathology reports, and postoperativecomplications were evaluated.
Operative Technique Hospitalized children were allowed nothing bymouth and received intravenous hydration. Operationswere performed when operating rooms were available.The patients underwent either LA or OA. OA wasperformed whenthe surgeon suspected severeintraabdominal adhesions or when a laparoscopy setwas not available. LA was performed with the “in” LA technique thatuses three ports. An infraumbilical 10-mm cameraport, two 5-mm working ports atthe suprapubic and
left-lower quadrants, and a 30° 5-mm telescope wereused. The mesoappendix was dissected using a bipolarvascular sealing device (Valleylab LigaSure, USA) ormonopolar hook cautery, and the appendiceal stumpwas secured with polymer clips (Hem-o-lock®Weck,USA). The specimen was removed through the 10-mmport with or without a 5-mm laparoscopic bag,depending on the specimen size. The operative fieldwas irrigated with 25-50 mL of physiological salinesolution. Paracolic, pelvic, perihepatic, and splenicregions were checked and all existing purulentmaterial was aspirated. In the presence of intensivepurulent material, a ¼” Penrose drain catheter wasplaced through the 5-mm suprapubic port. OA was performed through aright-lower quadranttransverse or paramedian incision. After the appendix,has been removed, all purulent material in theabdominal cavity was aspirated. The operative fieldand the fields with purulent material were wiped withsaline-soaked gauze, performed. A ¼” Penrose draincatheter was placed through a separate incision whencopious purulent material was present.
Postoperative Care All patients who underwent appendectomy received atriple-antibiotic regimen (ampicillin/penicillin +amikacin + ornidazole, in appropriate therapeuticdosages) intravenously before the skin incision. Theregimen was continued until discharge. Nasogastricdecompression was used only when required. Allwounds underwent primary closure. Drains wereremoved before discharge. Antibiotics were continuedafter dischargeonly if the patients had SSIs. The infectious complications were diagnosedaccording to criteria for defining a SSI in theGuidelines for Prevention of Surgical Site Infections,1999 [7]. IAA was treated conservatively by widespectrum parenteral antibiotics.
Statistical analysis Statistical analyses were made with SPSS version18.0 (SPSS Inc., Chicago, IL, USA). The distributionof continuous variables was evaluated using the one-sample Kolmogorov–Smirnov test. Mean ± standarddeviations were used for presenting normallydistributed data, whereas median and ranges were usedfor presenting non-normally distributed data. Twoaverages for constant variables were compared using
637 The European Research Journal Volume 5 Issue 4 July 2019

Eur Res J 2019;5(4):636-640 Akbıyık et al
the t-test for normally distributed data and the Mann–Whitney U-test for non-normally distributeddata.Categorical variables were analyzed using thechi-square test and Fisher’s exact test when required.A p value of < 0.05 was considered significant.
RESULTS
A total of 1793 patients underwent surgerybetween 2011 and 2014. Of these, 215 were diagnosedwith perforated appendicitis. The first authorperformed or supervised surgery on 78 of thesepatients, and these were included in our study. Forty-two and 36 patients underwent LA and OA,respectively. One case was converted from LA to OA. Patients had a mean age of 9.5 ± 4.2 (range; 2-18years) and 10.0 ± 3.8 (range; 2-18 years) years in theLA and OA groups, respectively. The age differencebetween groups was not statistically significant (p =0.530). Demographic data and patient characteristicsare presented in Table 1. One case was converted from LA to OA becauseof difficult dissection. There were no intraoperativecomplications or deaths in either group. There was no statistically significant difference inthe rates of superficial incisional SSI and IAA betweengroups but drain placement ratio and length of hospitalstay was higher in the OA group (Table 1). There was
a urinary tract infection at LA group as postoperativecomplication other than SSI. There were no otherpathologies except appendicitis at histopathologyreports. The mean follow-up period was 3.6 ± 1.7months.
DISCUSSION
LA has the following advantages: lesspostoperative pain, decreased length of hospital stay,and better cosmetic results. In addition, it allows thesurgeon to perform a whole-abdomen examination andpelvic examination in girls [1, 2]. These advantagesincreased the frequency at which laparoscopicsurgeries have been performed for the treatment ofappendicitis in children. Cheong et al. [3] reportedincreased LA rates from 28.8% to 66.4% between2004 and 2010 in Canada. Although Lin et al. [4]noted that althoughthe LA rates for perforatedappendicitis have increased from 9.9% in 1999 to46.6% in 2007 in the United States, there is still debateabout performing laparoscopy in complicatedappendicitis. The subject discussed most frequently byinvestigators who object to LA for perforatedappendicitis is IAA. Gupta et al. [5] argued that usingtoo much irrigation fluid and aggressive manipulationof the infected appendix increased the incidence of
The European Research Journal Volume 5 Issue 4 July 2019 638
Table 1. Characteristics of patients who underwent laparoscopic versus open appendectomy
Laparoscopic Appendectomy (n = 42)
Open Appendectomy (n = 36)
p
Age (range), years 9.5 ± 4.2 (2-18) 10.0 ± 3.8 (2-18) 0.530*
Male/Female 24/18 26/10 0.166**
Operative time (min) 39.3 ± 12.6 41.5 ± 9.6 0.381*
Drain placement 3 (7.1%) 10 (27.8%) 0.015**
Removing time of drain (days) 2.7 ± 1.5 3.6 ± 2.6 0.577*
Superficial Incisional SSI 2 (4.8%) 4 (11.1%) 0.267***
IAA 2 (4.8%) 1 (2.8%) 0.558***
Length of stay (range), days 3.2 ± 1.3 (2-8) 4.4 ± 2.6 (3-15) 0.018*
IAA = Intra-abdominal abscess, SSI = Surgical site infection, *t-test, **chi-square, ***Fisher's exact test
!
Eur Res J 2019;5(4):636-640 Does laparoscopy increase the risk of intra-abdominal abscess in perforated appendicitis?
IAA. Memon et al. [6] argues that pneumoperitoneumcreated by carbondioxide increased bacterialtranslocation. Moore et al. [8] reported in a studyrecently done that IAA rates increased if irrigation wasdone in LA. Another study found that irrigation didnot change the ratio of abscess, but it prolongedoperation time [9]. The authors of the current studytended to avoid intense irrigation, and they usedirrigation only for hemostasis in the operative field.The purulent material is aspirated in LA and OA, andthe abdominal cavity is wiped with wet sponge gauzein OA. Some authors such as Pokala et al. [10] arguedthat IAAs, which have never been observed in OA,occurred in 14% of LA cases. Moreover, Paik et al.[11] argued that LA was inconvenient in complicatedappendicitis. Recently, Ferranti et al. [12] comparedthe LA and OA techniques for perforated appendicitisin a study on adults, and observed that IAA was foundin 16.6% and 5% of LA and OA cases, respectively,difference between the groups was not statisticallysignificant and he suggested that laparoscopicapproach is a safe procedure for the treatment ofuncomplicated appendicitis, but LA should be usedwith caution, or even avoided, in the cases ofperforated appendicitis. Esposito et al. [13] reportedthat there was no difference in terms of formation ofabscess between both techniques in a meta-analysis of26 studies in children, which included over 1,00,000cases. According to an analysis of results from morethan one hundred thousand cases, Markar et al. [14]reported that although LA decreased the overallmorbidity, it increased the risk of IAA. Chang et al.[15] found in a study done on children that the ratesof IAA is 3% in LA and 2% in OA. In our study, thedifference in IAA rates were not significant as in thisanalysis. Li et al. [16] mentioned that as the surgeonsbecame more experienced, they did more complicatedoperations laparoscopically, which might haveincreased complications and conversion rates[16].Akkoyun et al. [17] and Narci et al. [18] haveconcluded that irrigation and drainage were notnecessary. The authors of the current study did not usedrainage cathetersin cases of perforated appendicitis.In this study, drainage catheters were used in threepatients (3/42) in LA and 10 patients (10/36) in OA.The lack of difference in postoperative incidence ofIAA supports the idea that laparoscopy provides better
aspiration of purulent material.
CONCLUSION
Although LA for perforated appendicitis inchildren has been intensely debated, our findingsindicate that laparoscopic proceduresperformed byexperienced pediatric surgeons will decrease the riskof complication and conversion to OA. Laparoscopyin children is a safe procedure for perforated,complicated appendicitis.
Authors' Contributions F.A: Study conception and design, acquisition ofdata, analysis and interpretation of data, drafting ofmanuscript, critical revision; G.E: Acquisition of data,analysis and interpretation of data, drafting ofmanuscript; Y.H.Ç: Study conception and design,analysis and interpretation of data, drafting ofmanuscript, critical revision.
Conflict of interest The authors disclosed no conflict of interest duringthe preparation or publication of this manuscript.
Financing The authors disclosed that they did not receive anygrant during conduction or writing of this study.
REFERENCES
[1] Guller U, Anstrom KJ, Holman WL, Allman RM, Sansom M,Peterson ED. Outcomes of early extubation after bypass surgeryin the elderly. Ann Thorac Surg 2004;77:781-8. [2] Croce E, Olmi S, Bertolini A, Magnone S. Laparoscopicsurgery of pancreatic cancer: state of the art.Hepatogastroenterology 2005;52:1889-94. [3] Cheong LH, Emil S. Pediatric laparoscopic appendectomy: apopulation-based study of trends, associations, and outcomes. JPediatr Surg 2014;49:1714-8. [4] Lin HF, Lai HS, Lai IR. Laparoscopic treatment of perforatedappendicitis. World J Gastroenterol 2014;20:14338-47. [5] Gupta R, Sample C, Bamehriz F, Birch DW. Infectiouscomplications following laparoscopic appendectomy. Can J Surg2006;49:397-400. [6] Memon MA, Fitztgibbons RJ, Jr. The role of minimal accesssurgery in the acute abdomen. Surg Clin North Am1997;77:1333-53. [7] Mangram AJ, Horan TC, Pearson ML, Silver LC, Jarvis WR.
639 The European Research Journal Volume 5 Issue 4 July 2019
Eur Res J 2019;5(4):636-640 Akbıyık et al
Guideline for prevention of surgical site infection, 1999. HospitalInfection Control Practices Advisory Committee. Infect ControlHosp Epidemiol 1999;20:250-78; quiz 79-80. [8] Denning DW, Park S, Lass-Florl C, Fraczek MG, Kirwan M,Gore R, et al. High-frequency triazole resistance found Innonculturable Aspergillus fumigatus from lungs of patients withchronic fungal disease. Clin Infect Dis 2011;52:1123-9. [9] Adibe OO, St Peter SD. Equipoise, ethics, and the necessityof randomized trials in surgery. Arch Surg 2012;147:899-900. [10] Pokala N, Sadhasivam S, Kiran RP, Parithivel V.Complicated appendicitis--is the laparoscopic approachappropriate? A comparative study with the open approach:outcome in a community hospital setting. Am Surg 2007;73:737-41; discussion 41-2. [11] Paik PS, Towson JA, Anthone GJ, Ortega AE, Simons AJ,Beart RW, Jr. Intra-abdominal abscesses following laparoscopicand open appendectomies. J Gastrointest Surg 1997;1:188-92;discussion 92-3. [12] Siani LM, Ferranti F, De Carlo A, Quintiliani A. Completelylaparoscopic versus open total gastrectomy in stage I-III/C gastriccancer: safety, efficacy and five-year oncologic outcome.Minerva Chir 2012;67:319-26.
[13] Caputo I, Secondo A, Lepretti M, Paolella G, Auricchio S,Barone MV, et al. Gliadin peptides induce tissue transglutaminaseactivation and ER-stress through Ca2+ mobilization in Caco-2cells. PLoS One 2012;7:e45209. [14] Markar SR, Koehler R, Low DE, Ross A. Novelmultimodality endoscopic closure of postoperative esophagealfistula. Int J Surg Case Rep 2012;3:577-9. [15] Chang HK, Han SJ, Choi SH, Oh JT. Feasibility of alaparoscopic approach for generalized peritonitis from perforatedappendicitis in children. Yonsei Med J 2013;54:1478-83. [16] Li X, Zhang J, Sang L, Zhang W, Chu Z, Li X, et al.Laparoscopic versus conventional appendectomy--a meta-analysis of randomized controlled trials. BMC Gastroenterol2010;10:129. [17] Akkoyun I, Tuna AT. Advantages of abandoning abdominalcavity irrigation and drainage in operations performed onchildren with perforated appendicitis. J Pediatr Surg2012;47:1886-90. [18] Narci A, Karaman I, Karaman A, Erdogan D, CavusogluYH, Aslan MK, et al. Is peritoneal drainage necessary inchildhood perforated appendicitis?--a comparative study. JPediatr Surg 2007;42:1864-8.
This is an open access article distributed under the terms of Creative CommonAttribution-NonCommercial-NoDerivatives 4.0 International License.
The European Research Journal Volume 5 Issue 4 July 2019 640

Investigation of effects of neurotrophic factors on painfuldiabetic neuropathy: an experimental studyFaruk Kılınç1 , Ramis Çolak2 , Mete Özcan3 , Ahmet Ayar4
1Department of Endocrinology, Fırat University School of Medicine, Elazığ, Turkey 2Department of Endocrinology, Ondokuz Mayıs University School of Medicine, Samsun, Turkey 3Department of Physiology, Fırat University School of Medicine, Elazığ, Turkey 4Department of Physiology, Karadeniz Technical University School of Medicine, Trabzon, Turkey
ABSTRACTObjective: We have studied the effects of neurotrophin-4 (NT-4) different doses on the pain levels ofstreptozocin-induced diabetic rats. Methods: Thirty-five 3-week-old male rats were used. After induction of diabetes in rats with streptozocin(nearly 4 weeks); diabetic animals were divided into 4 groups. The first group; healthy control group (n = 15),the second group; diabetic control group (n = 10 ), the third group; low dose (0.3 mg/ kg ) recombinant humanNT-4 was applied (n = 4 ) and the fourth group; high dose recombinant human NT-4 was applied (n = 6). Results: In the low-dose NT-4 group, the pain threshold values did not differ from the diabetic control andhealthy control groups. In the high dose NT-4 group, a rise was observed in the pain threshold values of hotplate in comparison with the healthy control group, diabetic control group and low dose applied group and thisrise reached at the level of statistical significance (p < 0.05).Conclusion: Neurotrophic factors (neurotrophin-4) have been shown to be effective on painful diabeticneuropathy in streptozocin-induced diabetic rats. However, there is a need for larger-scale and longer-termstudies for clinical use.
Keywords: Diabetic neuropathy, hot plate, neurotrophin-4, streptozocin
Address for correspondence: Faruk Kılınç, MD., Assistant Professor, Fırat University School of Medicine, Department of Endocrinology, 23100, Elazığ,TurkeyE-mail: [email protected], Tel: +90 424 2333555 (2453) Fax: +90 424 233 3558
Copyright © 2019 by The Association of Health Research & StrategyAvailable at http://dergipark.org.tr/eurj
The European Research Journal 2019;5(4):641-648
iabetes mellitus (DM) is a chronic metabolicdis-order characterized by hyperglycemia that
caused by a defect in insulin secretion, insulin action,or both; this results in carbohydrate, lipid, and proteinmetabolism disorders; accelerated atherosclerosis; andmicrovascular and macrovascular complications [1].
Diabetic neuropathy is a clinically or subclin-ically detectable disorder of the somatic or au-tonomous parts of the peripheral nervous system
occurring in the presence of DM [2].Diabetic neuropathy is the most frequent cause
of neuropathy in developed countries, and it accountsfor 50-75% of non-traumatic amputations. It is themost important cause in the etiology of diabetic footproblems [2].
Neurotrophic factors are small proteins sup-porting the survival and growth of neurons [3]. Thesefactors constitute the neurotrophin (NT) group of pro-
D
ORIGINAL ARTICLE
e-ISSN: 2149-3189
DOI: 10.18621/eurj.414105
Received: April 10, 2018; Accepted: June 11, 2018; Published Online: August 7, 2018
The European Research Journal Volume 5 Issue 4 July 2019 641
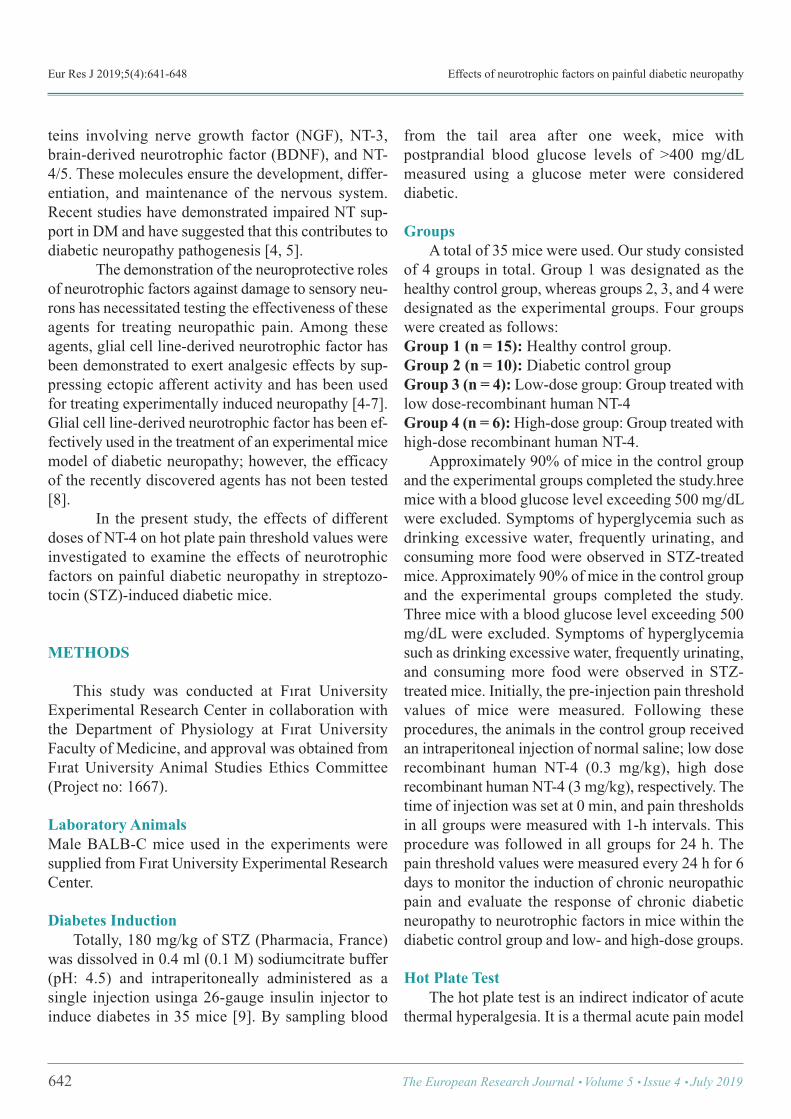
Eur Res J 2019;5(4):641-648 Effects of neurotrophic factors on painful diabetic neuropathy
teins involving nerve growth factor (NGF), NT-3,brain-derived neurotrophic factor (BDNF), and NT-4/5. These molecules ensure the development, differ-entiation, and maintenance of the nervous system.Recent studies have demonstrated impaired NT sup-port in DM and have suggested that this contributes todiabetic neuropathy pathogenesis [4, 5].
The demonstration of the neuroprotective rolesof neurotrophic factors against damage to sensory neu-rons has necessitated testing the effectiveness of theseagents for treating neuropathic pain. Among theseagents, glial cell line-derived neurotrophic factor hasbeen demonstrated to exert analgesic effects by sup-pressing ectopic afferent activity and has been usedfor treating experimentally induced neuropathy [4-7].Glial cell line-derived neurotrophic factor has been ef-fectively used in the treatment of an experimental micemodel of diabetic neuropathy; however, the efficacyof the recently discovered agents has not been tested[8].
In the present study, the effects of differentdoses of NT-4 on hot plate pain threshold values wereinvestigated to examine the effects of neurotrophicfactors on painful diabetic neuropathy in streptozo-tocin (STZ)-induced diabetic mice.
METHODS
This study was conducted at Fırat UniversityExperimental Research Center in collaboration withthe Department of Physiology at Fırat UniversityFaculty of Medicine, and approval was obtained fromFırat University Animal Studies Ethics Committee(Project no: 1667).
Laboratory Animals Male BALB-C mice used in the experiments weresupplied from Fırat University Experimental ResearchCenter.
Diabetes Induction Totally, 180 mg/kg of STZ (Pharmacia, France)was dissolved in 0.4 ml (0.1 M) sodiumcitrate buffer(pH: 4.5) and intraperitoneally administered as asingle injection usinga 26-gauge insulin injector toinduce diabetes in 35 mice [9]. By sampling blood
from the tail area after one week, mice withpostprandial blood glucose levels of >400 mg/dLmeasured using a glucose meter were considereddiabetic.
Groups A total of 35 mice were used. Our study consistedof 4 groups in total. Group 1 was designated as thehealthy control group, whereas groups 2, 3, and 4 weredesignated as the experimental groups. Four groupswere created as follows: Group 1 (n = 15): Healthy control group.Group 2 (n = 10): Diabetic control groupGroup 3 (n = 4): Low-dose group: Group treated withlow dose-recombinant human NT-4Group 4 (n = 6):High-dose group: Group treated withhigh-dose recombinant human NT-4. Approximately 90% of mice in the control groupand the experimental groups completed the study.hreemice with a blood glucose level exceeding 500 mg/dLwere excluded. Symptoms of hyperglycemia such asdrinking excessive water, frequently urinating, andconsuming more food were observed in STZ-treatedmice. Approximately 90% of mice in the control groupand the experimental groups completed the study.Three mice with a blood glucose level exceeding 500mg/dL were excluded. Symptoms of hyperglycemiasuch as drinking excessive water, frequently urinating,and consuming more food were observed in STZ-treated mice. Initially, the pre-injection pain thresholdvalues of mice were measured. Following theseprocedures, the animals in the control group receivedan intraperitoneal injection of normal saline; low doserecombinant human NT-4 (0.3 mg/kg), high doserecombinant human NT-4 (3 mg/kg), respectively. Thetime of injection was set at 0 min, and pain thresholdsin all groups were measured with 1-h intervals. Thisprocedure was followed in all groups for 24 h. Thepain threshold values were measured every 24 h for 6days to monitor the induction of chronic neuropathicpain and evaluate the response of chronic diabeticneuropathy to neurotrophic factors in mice within thediabetic control group and low- and high-dose groups.
Hot Plate Test The hot plate test is an indirect indicator of acutethermal hyperalgesia. It is a thermal acute pain model
642 The European Research Journal Volume 5 Issue 4 July 2019
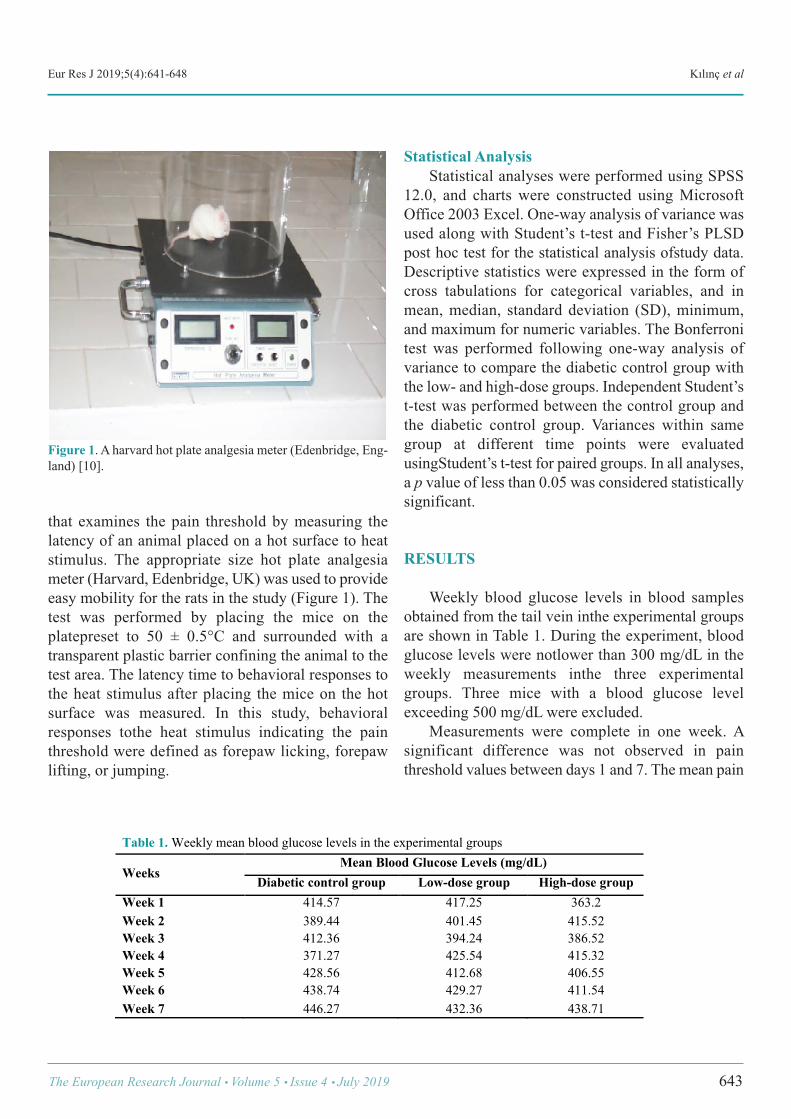
Eur Res J 2019;5(4):641-648 Kılınç et al
that examines the pain threshold by measuring thelatency of an animal placed on a hot surface to heatstimulus. The appropriate size hot plate analgesiameter (Harvard, Edenbridge, UK) was used to provideeasy mobility for the rats in the study (Figure 1). Thetest was performed by placing the mice on theplatepreset to 50 ± 0.5°C and surrounded with atransparent plastic barrier confining the animal to thetest area. The latency time to behavioral responses tothe heat stimulus after placing the mice on the hotsurface was measured. In this study, behavioralresponses tothe heat stimulus indicating the painthreshold were defined as forepaw licking, forepawlifting, or jumping.
Statistical Analysis Statistical analyses were performed using SPSS12.0, and charts were constructed using MicrosoftOffice 2003 Excel. One-way analysis of variance wasused along with Student’s t-test and Fisher’s PLSDpost hoc test for the statistical analysis ofstudy data.Descriptive statistics were expressed in the form ofcross tabulations for categorical variables, and inmean, median, standard deviation (SD), minimum,and maximum for numeric variables. The Bonferronitest was performed following one-way analysis ofvariance to compare the diabetic control group withthe low- and high-dose groups. Independent Student’st-test was performed between the control group andthe diabetic control group. Variances within samegroup at different time points were evaluatedusingStudent’s t-test for paired groups. In all analyses,a p value of less than 0.05 was considered statisticallysignificant.
RESULTS
Weekly blood glucose levels in blood samplesobtained from the tail vein inthe experimental groupsare shown in Table 1. During the experiment, bloodglucose levels were notlower than 300 mg/dL in theweekly measurements inthe three experimentalgroups. Three mice with a blood glucose levelexceeding 500 mg/dL were excluded. Measurements were complete in one week. Asignificant difference was not observed in painthreshold values between days 1 and 7. The mean pain
The European Research Journal Volume 5 Issue 4 July 2019 643
Figure 1. A harvard hot plate analgesia meter (Edenbridge, Eng-land) [10].
Table 1. Weekly mean blood glucose levels in the experimental groups
Weeks Mean Blood Glucose Levels (mg/dL)
Diabetic control group Low-dose group High-dose group Week 1 414.57 417.25 363.2 Week 2 389.44 401.45 415.52 Week 3 412.36 394.24 386.52 Week 4 371.27 425.54 415.32 Week 5 428.56 412.68 406.55 Week 6 438.74 429.27 411.54 Week 7 446.27 432.36 438.71 !
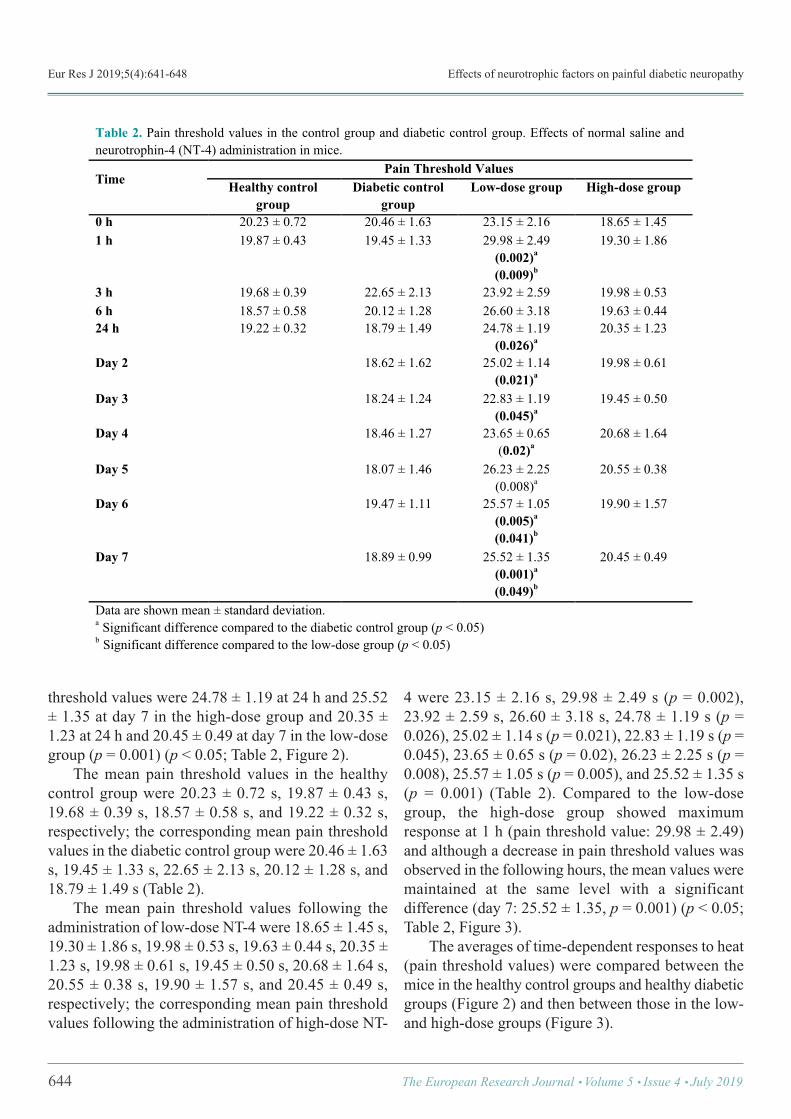
Eur Res J 2019;5(4):641-648 Effects of neurotrophic factors on painful diabetic neuropathy
threshold values were 24.78 ± 1.19 at 24 h and 25.52± 1.35 at day 7 in the high-dose group and 20.35 ±1.23 at 24 h and 20.45 ± 0.49 at day 7 in the low-dosegroup (p = 0.001) (p < 0.05; Table 2, Figure 2). The mean pain threshold values in the healthycontrol group were 20.23 ± 0.72 s, 19.87 ± 0.43 s,19.68 ± 0.39 s, 18.57 ± 0.58 s, and 19.22 ± 0.32 s,respectively; the corresponding mean pain thresholdvalues in the diabetic control group were 20.46 ± 1.63s, 19.45 ± 1.33 s, 22.65 ± 2.13 s, 20.12 ± 1.28 s, and18.79 ± 1.49 s (Table 2). The mean pain threshold values following theadministration of low-dose NT-4 were 18.65 ± 1.45 s,19.30 ± 1.86 s, 19.98 ± 0.53 s, 19.63 ± 0.44 s, 20.35 ±1.23 s, 19.98 ± 0.61 s, 19.45 ± 0.50 s, 20.68 ± 1.64 s,20.55 ± 0.38 s, 19.90 ± 1.57 s, and 20.45 ± 0.49 s,respectively; the corresponding mean pain thresholdvalues following the administration of high-dose NT-
4 were 23.15 ± 2.16 s, 29.98 ± 2.49 s (p = 0.002),23.92 ± 2.59 s, 26.60 ± 3.18 s, 24.78 ± 1.19 s (p =0.026), 25.02 ± 1.14 s (p = 0.021), 22.83 ± 1.19 s (p =0.045), 23.65 ± 0.65 s (p = 0.02), 26.23 ± 2.25 s (p =0.008), 25.57 ± 1.05 s (p = 0.005), and 25.52 ± 1.35 s(p = 0.001) (Table 2). Compared to the low-dosegroup, the high-dose group showed maximumresponse at 1 h (pain threshold value: 29.98 ± 2.49)and although a decrease in pain threshold values wasobserved in the following hours, the mean values weremaintained at the same level with a significantdifference (day 7: 25.52 ± 1.35, p = 0.001) (p < 0.05;Table 2, Figure 3). The averages of time-dependent responses to heat(pain threshold values) were compared between themice in the healthy control groups and healthy diabeticgroups (Figure 2) and then between those in the low-and high-dose groups (Figure 3).
644 The European Research Journal Volume 5 Issue 4 July 2019
Table 2. Pain threshold values in the control group and diabetic control group. Effects of normal saline and neurotrophin-4 (NT-4) administration in mice.
Time Pain Threshold Values
Healthy control group
Diabetic control group
Low-dose group High-dose group
0 h 20.23 ± 0.72 20.46 ± 1.63 23.15 ± 2.16 18.65 ± 1.45 1 h 19.87 ± 0.43 19.45 ± 1.33 29.98 ± 2.49
(0.002)a (0.009)b
19.30 ± 1.86
3 h 19.68 ± 0.39 22.65 ± 2.13 23.92 ± 2.59 19.98 ± 0.53 6 h 18.57 ± 0.58 20.12 ± 1.28 26.60 ± 3.18 19.63 ± 0.44 24 h 19.22 ± 0.32 18.79 ± 1.49 24.78 ± 1.19
(0.026)a 20.35 ± 1.23
Day 2 18.62 ± 1.62 25.02 ± 1.14 (0.021)a
19.98 ± 0.61
Day 3 18.24 ± 1.24 22.83 ± 1.19 (0.045)a
19.45 ± 0.50
Day 4 18.46 ± 1.27 23.65 ± 0.65 (0.02)a
20.68 ± 1.64
Day 5 18.07 ± 1.46 26.23 ± 2.25 (0.008)a
20.55 ± 0.38
Day 6 19.47 ± 1.11 25.57 ± 1.05 (0.005)a (0.041)b
19.90 ± 1.57
Day 7 18.89 ± 0.99 25.52 ± 1.35 (0.001)a (0.049)b
20.45 ± 0.49
Data are shown mean ± standard deviation. a Significant difference compared to the diabetic control group (p < 0.05) b Significant difference compared to the low-dose group (p < 0.05) !
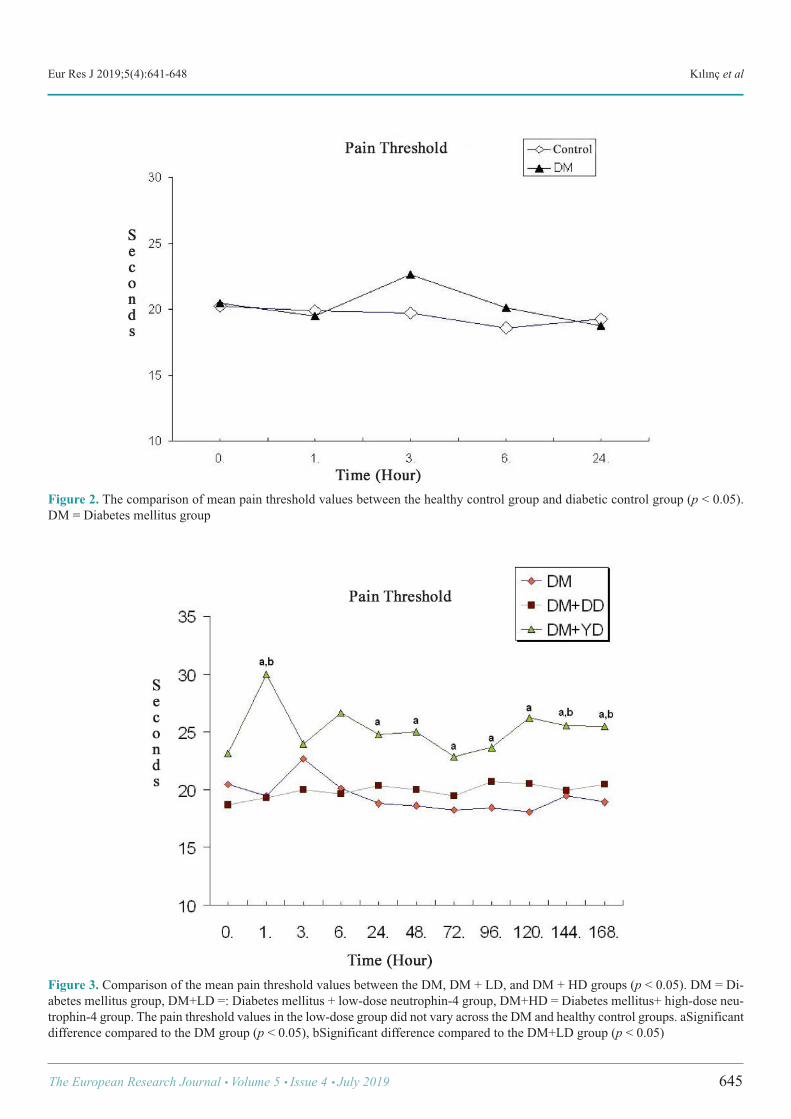
Eur Res J 2019;5(4):641-648 Kılınç et al
The European Research Journal Volume 5 Issue 4 July 2019 645
Figure 2. The comparison of mean pain threshold values between the healthy control group and diabetic control group (p < 0.05).DM = Diabetes mellitus group
Figure 3. Comparison of the mean pain threshold values between the DM, DM + LD, and DM + HD groups (p < 0.05). DM = Di-abetes mellitus group, DM+LD =: Diabetes mellitus + low-dose neutrophin-4 group, DM+HD = Diabetes mellitus+ high-dose neu-trophin-4 group. The pain threshold values in the low-dose group did not vary across the DM and healthy control groups. aSignificantdifference compared to the DM group (p < 0.05), bSignificant difference compared to the DM+LD group (p < 0.05)
Eur Res J 2019;5(4):641-648 Effects of neurotrophic factors on painful diabetic neuropathy
DISCUSSION
Diabetic neuropathy is a chronic complication thatseriously affects the quality of life of diabetic people;it occurs in 60-70% of patients with symptomsincluding spontaneous pain, hyperalgesia, anddiminished sensation [11, 12]. Currently, the onlyeffective therapy to prevent or retard the developmentof diabetic neuropathy and alleviate its symptoms isglucose control and pain management [13]. Recently,some new antiepileptic agents have been reported tobe good for neuropathic pain. However, an optimaltreatment has not been developed yet. STZ administration to mice and rats is widelyperformed to induce diabetic neuropathy [14, 15]. InSTZ-induced diabetic mice, hyperalgesia begins todevelop at day 8 after STZ injection and lasts for atleast four weeks [16]. STZ impairs pain thresholdresponses in diabetic mice by increasing the actionpotential of C fibers [17]. In our study, we induceddiabetes and hyperalgesia at a dose and within theperiod stated in the literature using 180 mg/kg STZ. Studies on pain threshold in diabetic mice haveyielded controversial results. Among mechanicalhyperalgesia studies, one large series demonstrated a30-40% decrease in nociceptive threshold values [18].Increased hypersensitivity responses have beenobserved in experimental models created withformalin injection [19, 20]. Changes in thermalnociceptive threshold values observed in hyperalgesiaconsiderably varied across studied models [21, 22]. In experimental animal models, amongnociceptive test models, the hot plate and tail-flicktests are used to evaluate thermal acute pain responses.The tail-flick test is performed by touching a 16.5-Vheat source to a rat’s tail. The baseline value is 20 s inthe hot plate test and 12 s in the tail-flick test. Themechanical pain test is another nociceptive testperformed by applying pressure to a rat’s hind paws[23]. The hot plate test is an indirect in vivo method;results are quantitatively evaluated. It has beenreported that pain threshold responses help obtainindirect information on diabetic neuropathic pain [18].In our study, we used the hot plate test. As the neuroprotective roles of neurotrophicfactors against damage to sensory neurons have beenrevealed, this has necessitated determining whetherthese agents are effective for treating neuropathic pain.
Glial cell line-derived neuropathic factor is one ofthese agents showing analgesic effects in the treatmentof experimental neuropathy by suppressing theafferent ectopic activity [4-7]. Most neurotrophic factors have been discoveredbecause of their effects on specific neural populationsin the peripheral nervous system. It has been provedthat some of these factors are beneficial in thetreatment of diabetic peripheral neuropathy. Mostmembers of the neuropathic gene family (NGF,BDNF, NT-3 and NT-4/5, insulin-like growth factor[IGF]-1, IGF-II, and glial cell line-derivedneurotrophic factor) have been extensively studied inanimal models of diabetic neuropathy and have shownencouraging results. Recombinant human nervegrowth factor was tested in phase II clinicalexperiments in the treatment of diabetic patients [24]. NT-4 is primarily effective on peripheral sensoryneurons as well as many other neurons such ascortical, hippocampal, and basal forebrain cholinergicneurons. NT-4 is synthesized in the form of a 30 kDaprecursor protein and is transformed to a 13-kDamature form [25]. In our study, we used the newlydiscovered NT-4 belonging to a family of neurotrophicfactors that has rarely been studied in the literature. Studies in diabetic animal models have yielded similarevidence to that obtained from diabetic humansubjects with regard to the contribution ofneurotrophic factors in the pathogenesis of diabeticperipheral neuropathy. In both in vivo and animalmodels of neuropathy conducted using NT-4, NGF,NT-3, IGF-1 and IGF-II, it has been demonstrated thatthese factors improve nerve degeneration [26]. Christianson et al. [8] evaluated behavioralresponses to different harmful stimuli in the treatmentof STZ-induced diabetic mice. The differences inresponses to harmful heat (radiant heat), cold(acetone), and harmful mechanical stimuli applied tothe hind paws of nondiabetic and diabetic mice wereevaluated. NGF and glial cell line-derivedneurotrophic factor) were administered intrathecallyto three-week-old mice to determine whether the NTtherapy normalizes neuropathic deficits. The micereceiving NT therapy were also compared withdiabetic mice receiving insulin for three weeks. It wasdetermined that both NGF and insulin therapyimproved the mechanical and chromegenic behaviorsof mice. Therefore, the sensitivity caused by
646 The European Research Journal Volume 5 Issue 4 July 2019
Eur Res J 2019;5(4):641-648 Kılınç et al
mechanical and chemical stimuli was decreased indiabetes-induced mice and the dorsal root ganglionnerves of diabetic mice gave response to NGF or glialcell line-derived neurotrophic factor therapy [8]. In ourstudy, the treatment was not administered to STZ-induced diabetic mice. The animals with a bloodglucose level between 200 and 500 mg/dL wereincluded in the study. It was reported that the painthreshold significantly increased particularly in micereceiving high dose NT-4. Akkina et al. [27] administered nonpeptidergicunmyelinated primary afferents rescue therapy of glialcell line-derived neurotrophic factor in STZ-induceddiabetic mice. Within a four-week period followingdiabetes induction, a decrease was detected in isolectinthiamine monophosphate (TMP) activity in lamina IIof the lumbar dorsal horn, particularly on distal sciaticafferents in the medial area. It was found that TMPhealed spinal deficits in central afferents and that thatboth glial cell line-derived neurotrophic factor andNGF/NT-4 may repair spinal deficits onnonpeptidergic afferents in STZ-induced diabetic micereceiving glial cell line-derived neurotrophic factor orNT-4/NGF for two weeks. The results demonstratedthat the administration of both glial cell line-derivedneurotrophic factor and NGF/NT-4 selectivelyimproved diabetes-related deficits in the TMPsubpopulation of sensitive diabetics withnonpeptidergic unmyelinated sensory neurons [27]. Apfel et al. [28] conducted a study on the effectsof neurotrophic factors in peripheral neuropathy anddemonstrated that these factors contribute to thepathophysiology and treatment of various types ofneuropathy, particularly of diabetic neuropathy; theysuggested the efficacy of NT-3 in fibril neuropathy, ofNT-4/5 IGF-1, CNTF and BDNF in motor neurondisease, and of NGF in small fibril sensory neuropathy[28]. In a randomized placebo controlled studyconducted by Wellmer et al. [29], the subcutaneousadministration of recombinant BDNF for three monthsimproved the threshold values for cold sensation; thissuggests that BDNF has some neuroprotective effectson neurons sensitive to thermal stimuli [29]. Siuciaket al. [30] found that NT-3 has an effect on spinalinterneurons through a naloxone-sensitive mechanism.NT-3 triggered long-term analgesia in pathways
involving serotonergic and opioid mechanisms whenit was injected at the midbrain level [30]. As there are a very limited number of studiesinvestigating the role of NT-4 on the development ofspinal pain, we cited studies conducted using NT-4 andother members of the NT gene family having effectsand structures similar to NT-4 (NGF, BDNF, CNTF,glial cell line-derived neurotrophic factor, NT-3, NT-5) in the discussion section. In our study, we referredto papers using BDNF and NGF along with NT-4 asNGF structurally resembles NT-4 and BDNF showsan effect over tyrosine kinase B receptor as NT-4.Most studies have been conducted using NGF, whichwas the first neurotrophic factor to be discovered;studies on the recently discovered NT-3and NT 4/5 arestill continuing, and we suggest that there is a need fordetermining the efficacy of these recently discoveredneurotrophic factors in experimental and clinicalstudies using different pain models and differentdoses. In line with the literature, the present study foundthat recombinant human NT-4 at a dose of 3 mg/kg(high dose) significantly increased pain thresholdvalues in the hot plate test, which measures painthreshold values for acute thermal stimuli; however,these effects did not occur at low doses (0.3 mg/kg).The hot plate test was performed with the aim ofinvestigating the effects of neurotrophic factors onpainful diabetic neuropathy in STZ-induced diabeticmice and the following are the important findings ofthe present study: Hyperglycemia was induced to anextent that would lead to diabetic neuropathy. Theperiod of time required to develop diabetic neuropathywas completed. The pain threshold values in the low-dose group were not different than from those in thediabetic control and healthy control groups (Table 2,Figure 2). An increase was observed in the hot platepain threshold values in the high-dose group comparedto that in the healthy control group, diabetic controlgroup, and low dose group; this difference reachedstatistical significance (p < 0.05, Table 2, Figure 3).
CONCLUSION
In conclusion, neurotrophic factors (neurotrophin-4) have been shown to be effective on painful diabetic
The European Research Journal Volume 5 Issue 4 July 2019 647
This is an open access article distributed under the terms of Creative CommonAttribution-NonCommercial-NoDerivatives 4.0 International License.
Eur Res J 2019;5(4):641-648 Effects of neurotrophic factors on painful diabetic neuropathy
neuropathy in streptozocin-induced diabetic rats.However, there is a need for larger-scale and longer-term studies for clinical use.
Conflict of interest The authors disclosed no conflict of interest duringthe preparation or publication of this manuscript.
Funding Statement This work was partially supported by grants fromFırat University School of Medicine.
REFERENCES
[1] Chawla A, Chawla R, Jaggi S. Microvasular andmacrovascular complications in diabetes mellitus: Distinct orcontinuum. Indian J Endocrinol Metab 2016;20:546-51. [2] Davon A. M, Chronic pain. A primary Care Guide to PracticalManagement, second ed., Human Pres: Totawa, NJ. 2005;114-5. [3] Price RD, Milne SA, Sharkey J, Matsuoka N, Advances insmall molecules promoting neurotrophic function. PharmacolTher 2007;115:292-306. [4] Bennett DL. Neurotrophic factors important regulators ofnociceptive function. Neuroscientist 2001;7:13-7. [5] Skaper SD. The neurotrophin family of neurotrophic factors:an overview. Methods Mol Biol 2012;846:1-12. [6] Kerr BJ, Bradbury EJ, Bennett DL, Trivedi PM, Dassan P,French J, et al. Brain-derived neurotrophic factor modulatesnociceptive sensory inputs and NMDA-evoked responses in therat spinal cord. J Neurosci 1999;19:5138-48. [7] Chen SQ, Cai Q, Shen YY, Cai XY, Lei HY. Combined useof NGF/BDNF/bFGF promotes proliferation and differentiationof neural stem cells in vitro. Int J Dev Neurosci 2014;38:74-8. [8] Christianson JA, Ryals JM, McCarson KE, Wright DE.Beneficial actions of neurotrophin therapy on diabetes-inducedhypoalgesia in mice. J Pain 2003;4:493-504. [9] Christianson JA, Ryals JM, Johnson MS , Dobrowsky RT,Wright DE. Neurotrophic modulation of myelinated cutaneousinnervation and mechanical sensory loss in diabetic mice.Neuroscience 2007;145:303-13. [10] Handwerker HO, Kobal G. Psychophysiology ofexperimentally induced pain. Physiol Rev 1993;73:639-71. [11] Deli G, Bosecyak E, Pusch G, Komoly S, Feher G. Diabeticneuropathies: diagnosis and management. Neuroendocrinology2013;98:267-80. [12] Vinik AI, Park TS, Stansberry K B, Pittenger GL. Diabeticneuropathies. Diabetologia 2000;43;957-73. [13] Callaghan BC, Cheng HT, Stables CL, Smith AL, FeldmanEL. Diabetic neuropathy: clinical manifestations and current
treatments. Lancet Neurol 2002;11:521-34. [14] Rees DA, Alcolado JC. Animal models of diabetes mellitus.Diabet Med 2005;22:359-70. [15] Malik RA. Current and future strategies for the managementof diabetic neuropathy. Treat Endocrinol 2003;2:389-400. [16] Ahlgren SC, Levine JD. Mechanical hyperlgesia instreptozocin diabetic rat is not sympathetically maintained. BrainRes 1993;616:171-5. [17] Ahlgren SC, White DM, Levine JD. Increasedresponsiveness of sensory neurons in the saphenous nerve of thestreptozotocin-diabetic rat. J Neurophysiol 1992;68:2077-85. [18] Piercy V, Banner SE, Bhattacharyya A, Parsons AA, SangerGJ, Smith SA, et al. Thermal but not mechanical, nociceptivebehavior is altered in the Zucker Diabetic Fatty rat and isindependent of glycemic status. J Diabetes Complications1999;13:163-9. [19] Zhuang HX, Secyder CK, Pu SF, Ishii DN. Insulin-likegrowth factors reverse or arrest diabetic neuropathy: effects onhyperalgesia and impaired nerve regeneration in rats. Exp Neurol1996;140:198-205. [20] Calcutt NA, Jorge MC, Yaksh TL, Chaplan SR. Tactileallodynia and formalin hyperalgesia in streptozotocin-diabeticrats: effects of insulin, aldose reductase inhibition and lidocaine.Pain 1996;68 293-9. [21] Fox A, Eastwood C, Gentry C, Manning D, Urban L. Criticalevaluation of the streptozotocin model in the rat. Pain1999;81:307-16. [22] Raz I, Hasdai D, Seltzer M, Melmed RN. Effect ofhyperglycemia on pain perception and on efficacy of morphineanalgesia in rats. Diabetes 1988;37:1253-9. [23] Klitgaard H, Matagne A, Gobert J, Wülfert E. Evidence fora unique profile of levetiracetam in rodent models of seizures andepilepsy. Eur J Pharmacol 1998;353:191-206. [24] Apfel SC. Neurotrophic factors in the therapy of diabeticneuropathy. Am J Med 2000;107:34-42. [25] Schuman EM. Neurotropin regulation of synaptictransmission. Curr Opin Neurobiol 1999;9:105-9. [26] Apfel SC. Neurotrophic factors and diabetic peripheralneuropathy. Eur Neurol 1999;41:27-34. [27] Akkina SK, Patterson CL, Wright DE. GDNF rescuesnonpeptidergic unmyelinated primary afferents in streptozotocin-treated diabetic mice. Exp Neurol 2001;167:173-82. [28] Apfel SC, Kessler JA. Neurotrophic factors in the therapyof peripheral neuropathy, Baillieres Clin Neurol 1995;4:593-606. [29] Wellmer A, Misra VP, Sharief MK, Kopelman PG, AnandP. A double-blind placebo-controlled clinical trial of recombinanthuman brain-derived neurotrophic factor (rhBDNF) in diabeticpolyneuropathy. J Peripher Nerv Syst 2001;6:204-10. [30] Siuciak JA, Wong V, Pearsall D, Wiegand SJ, Lindsay RM.BDNF produces analgesia in the formalin test and modifiesneuropeptide levels in rat brain and spinal cord areas associatedwith nociception. Eur J Neurosci 1995;7663-70.
648 The European Research Journal Volume 5 Issue 4 July 2019
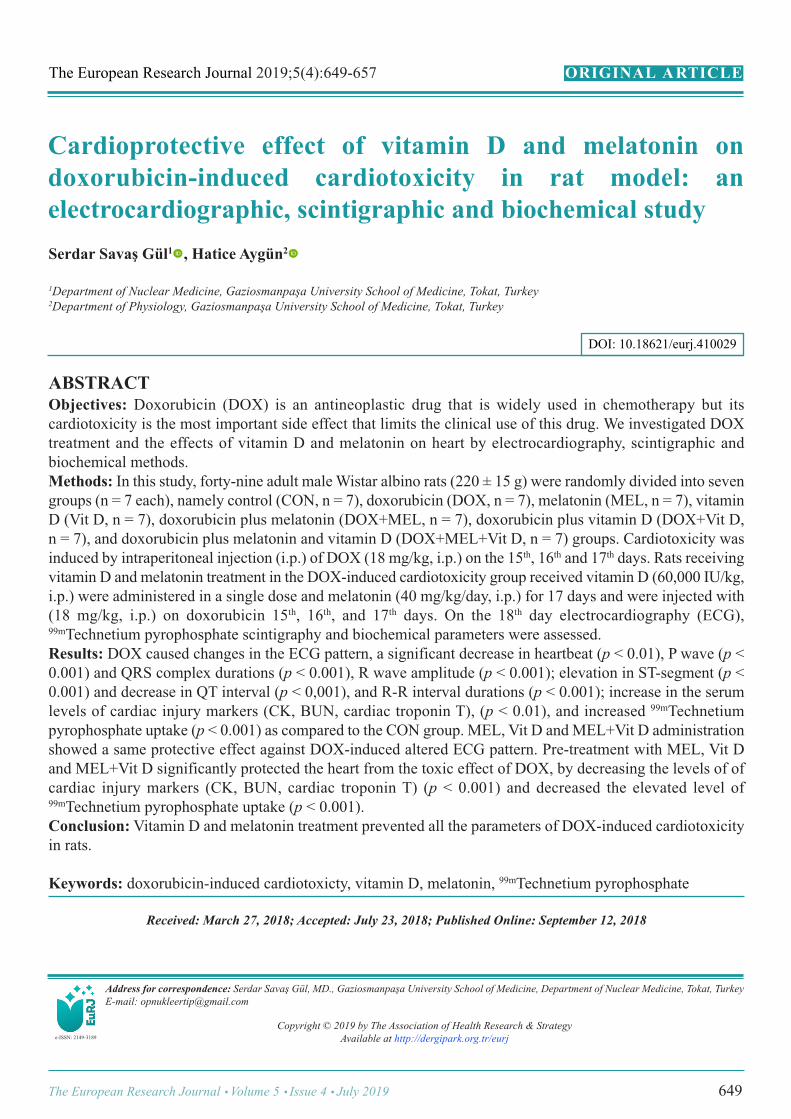
Cardioprotective effect of vitamin D and melatonin ondoxorubicin-induced cardiotoxicity in rat model: anelectrocardiographic, scintigraphic and biochemical study Serdar Savaş Gül1 , Hatice Aygün2
1Department of Nuclear Medicine, Gaziosmanpaşa University School of Medicine, Tokat, Turkey 2Department of Physiology, Gaziosmanpaşa University School of Medicine, Tokat, Turkey
ABSTRACTObjectives: Doxorubicin (DOX) is an antineoplastic drug that is widely used in chemotherapy but itscardiotoxicity is the most important side effect that limits the clinical use of this drug. We investigated DOXtreatment and the effects of vitamin D and melatonin on heart by electrocardiography, scintigraphic andbiochemical methods. Methods: In this study, forty-nine adult male Wistar albino rats (220 ± 15 g) were randomly divided into sevengroups (n = 7 each), namely control (CON, n = 7), doxorubicin (DOX, n = 7), melatonin (MEL, n = 7), vitaminD (Vit D, n = 7), doxorubicin plus melatonin (DOX+MEL, n = 7), doxorubicin plus vitamin D (DOX+Vit D,n = 7), and doxorubicin plus melatonin and vitamin D (DOX+MEL+Vit D, n = 7) groups. Cardiotoxicity wasinduced by intraperitoneal injection (i.p.) of DOX (18 mg/kg, i.p.) on the 15th, 16th and 17th days. Rats receivingvitamin D and melatonin treatment in the DOX-induced cardiotoxicity group received vitamin D (60,000 IU/kg,i.p.) were administered in a single dose and melatonin (40 mg/kg/day, i.p.) for 17 days and were injected with(18 mg/kg, i.p.) on doxorubicin 15th, 16th, and 17th days. On the 18th day electrocardiography (ECG),99mTechnetium pyrophosphate scintigraphy and biochemical parameters were assessed. Results: DOX caused changes in the ECG pattern, a significant decrease in heartbeat (p < 0.01), P wave (p <0.001) and QRS complex durations (p < 0.001), R wave amplitude (p < 0.001); elevation in ST-segment (p <0.001) and decrease in QT interval (p < 0,001), and R-R interval durations (p < 0.001); increase in the serumlevels of cardiac injury markers (CK, BUN, cardiac troponin T), (p < 0.01), and increased 99mTechnetiumpyrophosphate uptake (p < 0.001) as compared to the CON group. MEL, Vit D and MEL+Vit D administrationshowed a same protective effect against DOX-induced altered ECG pattern. Pre-treatment with MEL, Vit Dand MEL+Vit D significantly protected the heart from the toxic effect of DOX, by decreasing the levels of ofcardiac injury markers (CK, BUN, cardiac troponin T) (p < 0.001) and decreased the elevated level of99mTechnetium pyrophosphate uptake (p < 0.001).Conclusion: Vitamin D and melatonin treatment prevented all the parameters of DOX-induced cardiotoxicityin rats.
Keywords: doxorubicin-induced cardiotoxicty, vitamin D, melatonin, 99mTechnetium pyrophosphate
Address for correspondence: Serdar Savaş Gül, MD., Gaziosmanpaşa University School of Medicine, Department of Nuclear Medicine, Tokat, TurkeyE-mail: [email protected]
Copyright © 2019 by The Association of Health Research & StrategyAvailable at http://dergipark.org.tr/eurj
The European Research Journal 2019;5(4):649-657 ORIGINAL A RTICLE
e-ISSN: 2149-3189
DOI: 10.18621/eurj.410029
Received: March 27, 2018; Accepted: July 23, 2018; Published Online: September 12, 2018
The European Research Journal Volume 5 Issue 4 July 2019 649
Eur Res J 2019;5(4):649-657 Cardioprotective effect of vitamin D and melatonin on doxorubicin-induced cardiotoxicity in rat model
650 The European Research Journal Volume 5 Issue 4 July 2019
oxorubicin (DOX) is an anthracycline derivativeantibiotic commonly used for the treatment of
leukemias, malignant lymphoma and various solid tu-mors. However, its clinical use is limited because ofdose-dependent cardiotoxicity [1]. DOX causes vari-ous toxic effects, the most common of which is car-diotoxicity that can be divided into acute effects(electrocardiogram changes), late effect of DOX ad-ministration is cardiomyopathy and congestive heartfailure [2].
The pathogenesis of DOX-induced cardiotox-icity is acted by different mechanisms; thought thatoxidative stres induced cell injury, lipid peroxidation,mitochondrial damage, inflammation, and apoptosisplay a role. However, the most popular hypothesis isthat it should be noted that DOX increased free radicalproduction and oxidative stress, play a major role inDOX-induced cardiotoxicity [3]. Oxidative stress ischaracterized as an imbalance between antioxidant de-fense systems and reactive oxygen species. DOX-in-duced oxidative stress has been shown to be inhibitedby the administration of certain antioxidants to exper-imental animals [2, 4, 5].
Melatonin as an important natural antioxidant,may reduce DOX-induced oxidative stress [6]. Theprotective effect of melatonin on cardiotoxicity in-duced by DOX has been demonstrated [2]. Ahmed etal. [7] demonstrated that treatment with melatonincould reduce DOX-induced cardiotoxicity by reducedoxidative stress and increased activity of the antiox-idative enzymes.
Vitamin D (Vit D) plays regulatory activity inbody function including the cardiovascular system. Itis known that the pleiotropic effects of Vit D regula-tory activation are responsible for the distribution ofVit D regulatory activity every where in the humanbody nervous system, intestine, kidney, bone, parathy-roid gland, cardiovascular systemand myocardium [8-10]. A lot of study has shown that Vit D deficiency issignificantly associated with cardiovascular disease[11, 12]. Vit D deficiency leads to increase in serumparathyroid hormone (PTH) [13]. Increased PTH lev-els were reported to be associated with left ventricularhypertrophy and increased risk of heart failure [14].In addition, treatment with Vit D decreased blood pres-sure in patients with hypertension and modified theheart failure, decrease in cardiovascular mortality [15-17].
Although many previous studies have exam-ined the role of Vit D in cardiovascular disease, ac-corfing to our knowledge none have studied withexamined the effects of Vit D on DOX-induced car-diotoxicity. This study was conducted to investigatethe potential protective effects of melatonin plus VitD on DOX-induced cardiotoxicity manifested bychanges in the ECG pattern, changes in biochemicalparameters such as serum creatine kinase (CK), bloodurea nitrogen (BUN), and cardiac troponin T (cTnT)and changes in 99mTechnetium pyrophosphate (99mTcPYP) scintigraphy. 99mTc PYP radiopharmaceuticalsare involved in the necrotic tissue by binding to thecalcium complex. It is routinely used in necrosis im-aging in the nuclear medicine department. Addition-ally, our recent study has shown that combinedmelatonin plus Vit D treatment was superior to eitherone alone for protecting DOX-induced cardiotoxicity.
METHODS
Study Design This is a randomized controlled experimentalstudy.
Animal Selection Forty-nine adult male Wistar albino rats (220 ± 15g) were kept seven per cage, under standardizedconditions of equal periods of light and dark in a roomwith lighting control (12-hour light/dark cycle, 24 ±2ºC) and had free access to food and water. All theexperimental procedures were approved by the AnimalEthics Committee of Gaziosmanpaşa University.
Experimental Procedures The animals were randomly divided into 7 groupsof 7 rats in each: Group 1: Rats received standard laboratory dietand drinking water ad libitum, and received normalsaline 5 ml/kg body weight intraperitoneal (i.p.) andserved as normal control (CON) groups. Group 2: Rats were injected with a DOX at acumulative dose of 18 mg/kg, i.p. at an interval of 24h on the 15th, 16th and 17th days and served as thedoxorubicin (DOX) group. Group 3: Rats were injected melatoninat a dose of 40mg/kg/day, i.p., (sigma, soluble in pure water) for 17
D
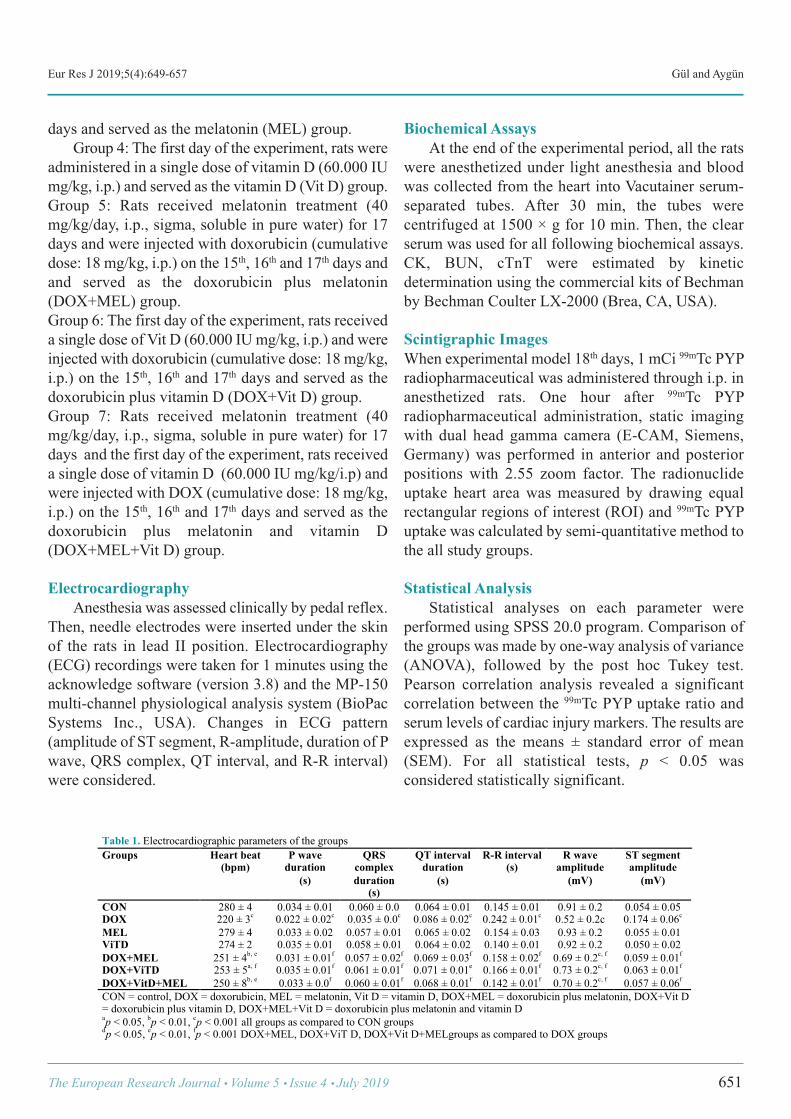
Eur Res J 2019;5(4):649-657 Gül and Aygün
days and served as the melatonin (MEL) group. Group 4: The first day of the experiment, rats wereadministered in a single dose of vitamin D (60.000 IUmg/kg, i.p.) and served as the vitamin D (Vit D) group. Group 5: Rats received melatonin treatment (40mg/kg/day, i.p., sigma, soluble in pure water) for 17days and were injected with doxorubicin (cumulativedose: 18 mg/kg, i.p.) on the 15th, 16th and 17th days andand served as the doxorubicin plus melatonin(DOX+MEL) group. Group 6: The first day of the experiment, rats receiveda single dose of Vit D (60.000 IU mg/kg, i.p.) and wereinjected with doxorubicin (cumulative dose: 18 mg/kg,i.p.) on the 15th, 16th and 17th days and served as thedoxorubicin plus vitamin D (DOX+Vit D) group. Group 7: Rats received melatonin treatment (40mg/kg/day, i.p., sigma, soluble in pure water) for 17days and the first day of the experiment, rats receiveda single dose of vitamin D (60.000 IU mg/kg/i.p) andwere injected with DOX (cumulative dose: 18 mg/kg,i.p.) on the 15th, 16th and 17th days and served as thedoxorubicin plus melatonin and vitamin D(DOX+MEL+Vit D) group.
Electrocardiography Anesthesia was assessed clinically by pedal reflex.Then, needle electrodes were inserted under the skinof the rats in lead II position. Electrocardiography(ECG) recordings were taken for 1 minutes using theacknowledge software (version 3.8) and the MP-150multi-channel physiological analysis system (BioPacSystems Inc., USA). Changes in ECG pattern(amplitude of ST segment, R-amplitude, duration of Pwave, QRS complex, QT interval, and R-R interval)were considered.
Biochemical Assays At the end of the experimental period, all the ratswere anesthetized under light anesthesia and bloodwas collected from the heart into Vacutainer serum-separated tubes. After 30 min, the tubes werecentrifuged at 1500 × g for 10 min. Then, the clearserum was used for all following biochemical assays.CK, BUN, cTnT were estimated by kineticdetermination using the commercial kits of Bechmanby Bechman Coulter LX-2000 (Brea, CA, USA).
Scintigraphic Images When experimental model 18th days, 1 mCi 99mTc PYPradiopharmaceutical was administered through i.p. inanesthetized rats. One hour after 99mTc PYPradiopharmaceutical administration, static imagingwith dual head gamma camera (E-CAM, Siemens,Germany) was performed in anterior and posteriorpositions with 2.55 zoom factor. The radionuclideuptake heart area was measured by drawing equalrectangular regions of interest (ROI) and 99mTc PYPuptake was calculated by semi-quantitative method tothe all study groups.
Statistical Analysis Statistical analyses on each parameter wereperformed using SPSS 20.0 program. Comparison ofthe groups was made by one-way analysis of variance(ANOVA), followed by the post hoc Tukey test.Pearson correlation analysis revealed a significantcorrelation between the 99mTc PYP uptake ratio andserum levels of cardiac injury markers. The results areexpressed as the means ± standard error of mean(SEM). For all statistical tests, p < 0.05 wasconsidered statistically significant.
The European Research Journal Volume 5 Issue 4 July 2019 651
!Table 1. Electrocardiographic parameters of the groups Groups Heart beat
(bpm) P wave
duration (s)
QRS complex duration
(s)
QT interval duration
(s)
R-R interval (s)
R wave amplitude
(mV)
ST segment amplitude
(mV)
CON 280 ± 4 0.034 ± 0.01 0.060 ± 0.0 0.064 ± 0.01 0.145 ± 0.01 0.91 ± 0.2 0.054 ± 0.05 DOX 220 ± 3c 0.022 ± 0.02c 0.035 ± 0.0c 0.086 ± 0.02c 0.242 ± 0.01c 0.52 ± 0.2c 0.174 ± 0.06c
MEL 279 ± 4 0.033 ± 0.02 0.057 ± 0.01 0.065 ± 0.02 0.154 ± 0.03 0.93 ± 0.2 0.055 ± 0.01 ViTD 274 ± 2 0.035 ± 0.01 0.058 ± 0.01 0.064 ± 0.02 0.140 ± 0.01 0.92 ± 0.2 0.050 ± 0.02 DOX+MEL 251 ± 4b, e 0.031 ± 0.01f 0.057 ± 0.02f 0.069 ± 0.03f 0.158 ± 0.02f 0.69 ± 0.2c, f 0.059 ± 0.01f
DOX+ViTD 253 ± 5a, f 0.035 ± 0.01f 0.061 ± 0.01f 0.071 ± 0.01e 0.166 ± 0.01f 0.73 ± 0.2c, f 0.063 ± 0.01f
DOX+VitD+MEL 250 ± 8b, e 0.033 ± 0.0f 0.060 ± 0.01f 0.068 ± 0.01f 0.142 ± 0.01f 0.70 ± 0.2c, f 0.057 ± 0.06f
CON = control, DOX = doxorubicin, MEL = melatonin, Vit D = vitamin D, DOX+MEL = doxorubicin plus melatonin, DOX+Vit D = doxorubicin plus vitamin D, DOX+MEL+Vit D = doxorubicin plus melatonin and vitamin D ap < 0.05, bp < 0.01, cp < 0.001 all groups as compared to CON groups dp < 0.05, ep < 0.01, fp < 0.001 DOX+MEL, DOX+ViT D, DOX+Vit D+MELgroups as compared to DOX groups
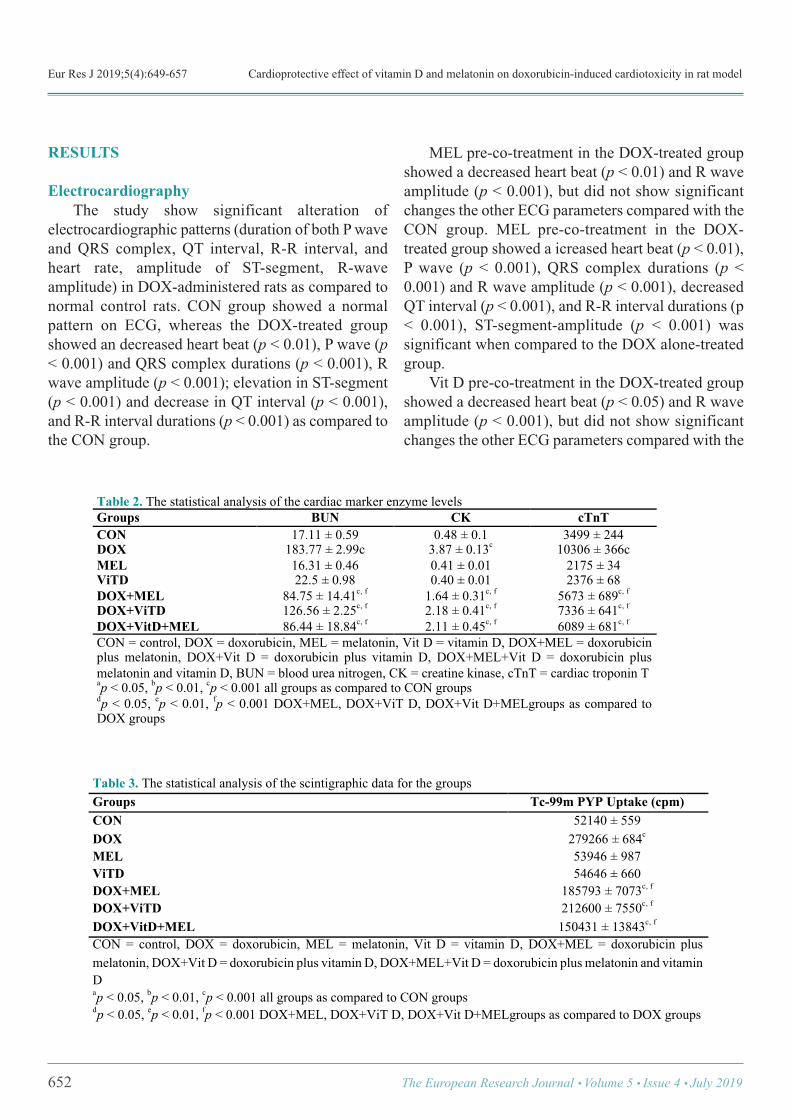
Eur Res J 2019;5(4):649-657 Cardioprotective effect of vitamin D and melatonin on doxorubicin-induced cardiotoxicity in rat model
RESULTS
Electrocardiography The study show significant alteration ofelectrocardiographic patterns (duration of both P waveand QRS complex, QT interval, R-R interval, andheart rate, amplitude of ST-segment, R-waveamplitude) in DOX-administered rats as compared tonormal control rats. CON group showed a normalpattern on ECG, whereas the DOX-treated groupshowed an decreased heart beat (p < 0.01), P wave (p< 0.001) and QRS complex durations (p < 0.001), Rwave amplitude (p < 0.001); elevation in ST-segment(p < 0.001) and decrease in QT interval (p < 0.001),and R-R interval durations (p < 0.001) as compared tothe CON group.
MEL pre-co-treatment in the DOX-treated groupshowed a decreased heart beat (p < 0.01) and R waveamplitude (p < 0.001), but did not show significantchanges the other ECG parameters compared with theCON group. MEL pre-co-treatment in the DOX-treated group showed a icreased heart beat (p < 0.01),P wave (p < 0.001), QRS complex durations (p <0.001) and R wave amplitude (p < 0.001), decreasedQT interval (p < 0.001), and R-R interval durations (p< 0.001), ST-segment-amplitude (p < 0.001) wassignificant when compared to the DOX alone-treatedgroup. Vit D pre-co-treatment in the DOX-treated groupshowed a decreased heart beat (p < 0.05) and R waveamplitude (p < 0.001), but did not show significantchanges the other ECG parameters compared with the
652 The European Research Journal Volume 5 Issue 4 July 2019
Table 2. The statistical analysis of the cardiac marker enzyme levels Groups BUN CK cTnT CON 17.11 ± 0.59 0.48 ± 0.1 3499 ± 244 DOX 183.77 ± 2.99c 3.87 ± 0.13c 10306 ± 366c MEL 16.31 ± 0.46 0.41 ± 0.01 2175 ± 34 ViTD 22.5 ± 0.98 0.40 ± 0.01 2376 ± 68 DOX+MEL 84.75 ± 14.41c, f 1.64 ± 0.31c, f 5673 ± 689c, f
DOX+ViTD 126.56 ± 2.25c, f 2.18 ± 0.41c, f 7336 ± 641c, f
DOX+VitD+MEL 86.44 ± 18.84c, f 2.11 ± 0.45c, f 6089 ± 681c, f
CON = control, DOX = doxorubicin, MEL = melatonin, Vit D = vitamin D, DOX+MEL = doxorubicin plus melatonin, DOX+Vit D = doxorubicin plus vitamin D, DOX+MEL+Vit D = doxorubicin plus melatonin and vitamin D, BUN = blood urea nitrogen, CK = creatine kinase, cTnT = cardiac troponin T ap < 0.05, bp < 0.01, cp < 0.001 all groups as compared to CON groups dp < 0.05, ep < 0.01, fp < 0.001 DOX+MEL, DOX+ViT D, DOX+Vit D+MELgroups as compared to DOX groups
!
Table 3. The statistical analysis of the scintigraphic data for the groups Groups Tc-99m PYP Uptake (cpm) CON 52140 ± 559 DOX 279266 ± 684c
MEL 53946 ± 987 ViTD 54646 ± 660 DOX+MEL 185793 ± 7073c, f
DOX+ViTD 212600 ± 7550c, f
DOX+VitD+MEL 150431 ± 13843c, f
CON = control, DOX = doxorubicin, MEL = melatonin, Vit D = vitamin D, DOX+MEL = doxorubicin plus melatonin, DOX+Vit D = doxorubicin plus vitamin D, DOX+MEL+Vit D = doxorubicin plus melatonin and vitamin D ap < 0.05, bp < 0.01, cp < 0.001 all groups as compared to CON groups dp < 0.05, ep < 0.01, fp < 0.001 DOX+MEL, DOX+ViT D, DOX+Vit D+MELgroups as compared to DOX groups
!
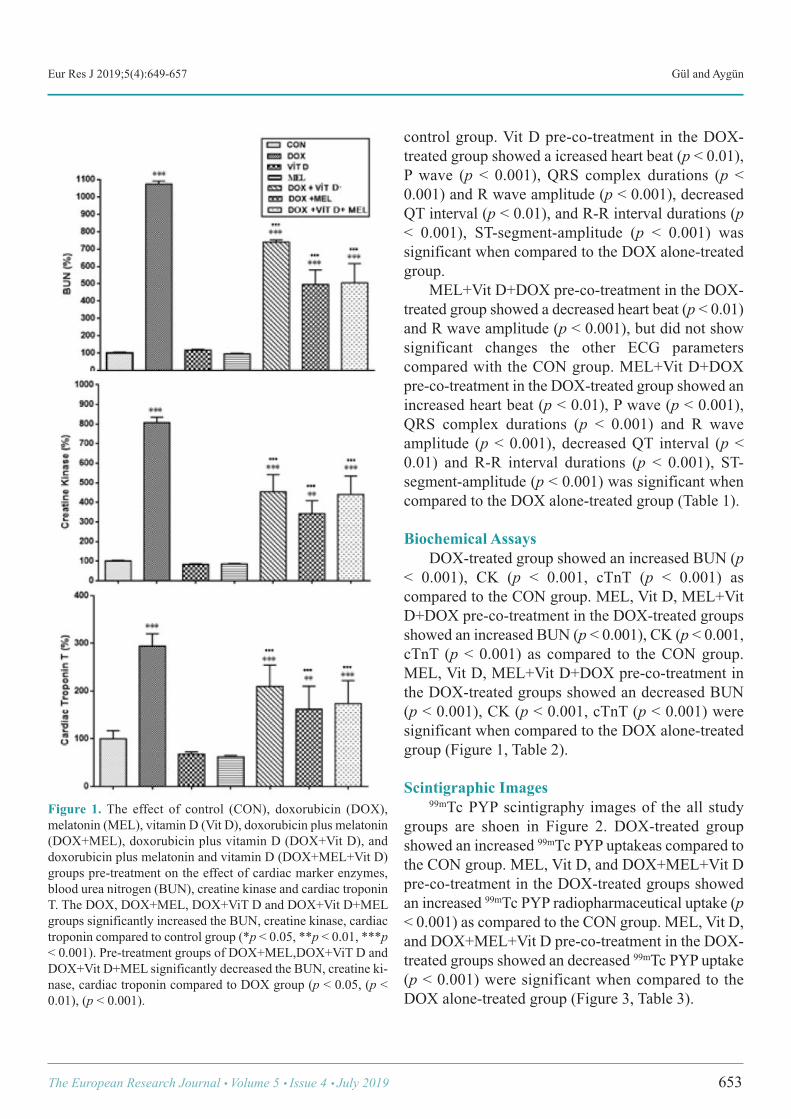
Eur Res J 2019;5(4):649-657 Gül and Aygün
control group. Vit D pre-co-treatment in the DOX-treated group showed a icreased heart beat (p < 0.01),P wave (p < 0.001), QRS complex durations (p <0.001) and R wave amplitude (p < 0.001), decreasedQT interval (p < 0.01), and R-R interval durations (p< 0.001), ST-segment-amplitude (p < 0.001) wassignificant when compared to the DOX alone-treatedgroup. MEL+Vit D+DOX pre-co-treatment in the DOX-treated group showed a decreased heart beat (p < 0.01)and R wave amplitude (p < 0.001), but did not showsignificant changes the other ECG parameterscompared with the CON group. MEL+Vit D+DOXpre-co-treatment in the DOX-treated group showed anincreased heart beat (p < 0.01), P wave (p < 0.001),QRS complex durations (p < 0.001) and R waveamplitude (p < 0.001), decreased QT interval (p <0.01) and R-R interval durations (p < 0.001), ST-segment-amplitude (p < 0.001) was significant whencompared to the DOX alone-treated group (Table 1).
Biochemical Assays DOX-treated group showed an increased BUN (p< 0.001), CK (p < 0.001, cTnT (p < 0.001) ascompared to the CON group. MEL, Vit D, MEL+VitD+DOX pre-co-treatment in the DOX-treated groupsshowed an increased BUN (p < 0.001), CK (p < 0.001,cTnT (p < 0.001) as compared to the CON group.MEL, Vit D, MEL+Vit D+DOX pre-co-treatment inthe DOX-treated groups showed an decreased BUN(p < 0.001), CK (p < 0.001, cTnT (p < 0.001) weresignificant when compared to the DOX alone-treatedgroup (Figure 1, Table 2).
Scintigraphic Images 99mTc PYP scintigraphy images of the all studygroups are shoen in Figure 2. DOX-treated groupshowed an increased 99mTc PYP uptakeas compared tothe CON group. MEL, Vit D, and DOX+MEL+Vit Dpre-co-treatment in the DOX-treated groups showedan increased 99mTc PYP radiopharmaceutical uptake (p< 0.001) as compared to the CON group. MEL, Vit D,and DOX+MEL+Vit D pre-co-treatment in the DOX-treated groups showed an decreased 99mTc PYP uptake(p < 0.001) were significant when compared to theDOX alone-treated group (Figure 3, Table 3).
The European Research Journal Volume 5 Issue 4 July 2019 653
Figure 1. The effect of control (CON), doxorubicin (DOX),melatonin (MEL), vitamin D (Vit D), doxorubicin plus melatonin(DOX+MEL), doxorubicin plus vitamin D (DOX+Vit D), anddoxorubicin plus melatonin and vitamin D (DOX+MEL+Vit D)groups pre-treatment on the effect of cardiac marker enzymes,blood urea nitrogen (BUN), creatine kinase and cardiac troponinT. The DOX, DOX+MEL, DOX+ViT D and DOX+Vit D+MELgroups significantly increased the BUN, creatine kinase, cardiactroponin compared to control group (*p < 0.05, **p < 0.01, ***p< 0.001). Pre-treatment groups of DOX+MEL,DOX+ViT D andDOX+Vit D+MEL significantly decreased the BUN, creatine ki-nase, cardiac troponin compared to DOX group (p < 0.05, (p <0.01), (p < 0.001).
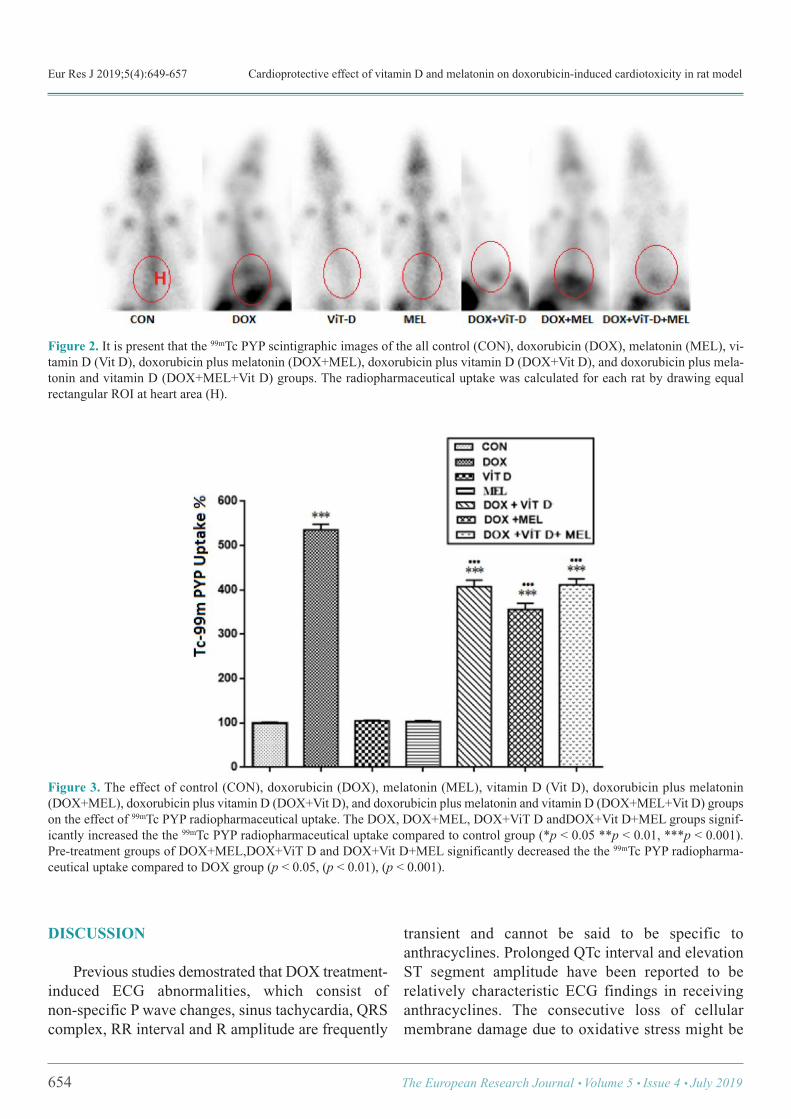
Eur Res J 2019;5(4):649-657 Cardioprotective effect of vitamin D and melatonin on doxorubicin-induced cardiotoxicity in rat model
654 The European Research Journal Volume 5 Issue 4 July 2019
Figure 2. It is present that the 99mTc PYP scintigraphic images of the all control (CON), doxorubicin (DOX), melatonin (MEL), vi-tamin D (Vit D), doxorubicin plus melatonin (DOX+MEL), doxorubicin plus vitamin D (DOX+Vit D), and doxorubicin plus mela-tonin and vitamin D (DOX+MEL+Vit D) groups. The radiopharmaceutical uptake was calculated for each rat by drawing equalrectangular ROI at heart area (H).
Figure 3. The effect of control (CON), doxorubicin (DOX), melatonin (MEL), vitamin D (Vit D), doxorubicin plus melatonin(DOX+MEL), doxorubicin plus vitamin D (DOX+Vit D), and doxorubicin plus melatonin and vitamin D (DOX+MEL+Vit D) groupson the effect of 99mTc PYP radiopharmaceutical uptake. The DOX, DOX+MEL, DOX+ViT D andDOX+Vit D+MEL groups signif-icantly increased the the 99mTc PYP radiopharmaceutical uptake compared to control group (*p < 0.05 **p < 0.01, ***p < 0.001).Pre-treatment groups of DOX+MEL,DOX+ViT D and DOX+Vit D+MEL significantly decreased the the 99mTc PYP radiopharma-ceutical uptake compared to DOX group (p < 0.05, (p < 0.01), (p < 0.001).
DISCUSSION
Previous studies demostrated that DOX treatment-induced ECG abnormalities, which consist ofnon-specific P wave changes, sinus tachycardia, QRScomplex, RR interval and R amplitude are frequently
transient and cannot be said to be specific toanthracyclines. Prolonged QTc interval and elevationST segment amplitude have been reported to berelatively characteristic ECG findings in receivinganthracyclines. The consecutive loss of cellularmembrane damage due to oxidative stress might be
Eur Res J 2019;5(4):649-657 Gül and Aygün
characterized by ST elevation and prolonged QTcinterval [18-21]. Our results confirmed that a cumulative dose ofDOX (18 mg/kg) induces cardiotoxicity in rats asevidenced by ECG changes, 99mTc PYP scintigraphicimages and increased levels of cardiac biomarkerenzymes. In the present study MEL and Vit D treatedrats demonstrates several major findings regarding theeffects of DOX-induced cardiotoxicity. First, we foundthat all of the ECG parameters changed significantlyin the DOX-treated group as compared to the CONgroup, but MEL and Vit D restored the changes inECG parameters in the DOX group to the pattern ofthe CON group. Second, cardiac marker enzymes(BUN, CK, cTnT) of the DOX-treated group increasedsignificantly when compared with the CON group,whereas MEL and Vit D treatment could be attributedin part to the suppression of DOX-induced elevationin the levels of these cardiac marker enzymes. Third,99mTc PYP scintigraphic images of the DOX-treatedgroup was significantly changed as compared to theCON group, but MEL and Vit D treatment restored thechanges in 99mTc PYP scintigraphic images of theDOX group to the compared of the CON group. In this study, ECG after DOX administrationshowed significant changes. DOX treatment inducesa decrease P wave, QRS complex, in the amplitude ofR wave, an increase in QT interval, R-R interval andST segment which may link to its degenerative effecton cell membrane [22, 23]. Treatment with MEL, VitD and combination MEL and Vit D groups causedincreased in P-wave, QRS complex, R amplitude anddecreased QT interval, R-R interval, ST segment wasalso near to normal. These changes in theelectrocardiogram pattern induced by MEL andVitamin D may be due to its membrane stabilizingaction. One of the major toxic effects of DOX is inducinglipid peroxidation. Its activation leads to acutemembrane damage and releasing of cellular enzymeswhich decreased supply of oxygen to the myocardialcell leading to hypoxia [24-26]. The degree of DOX-induced cardiotoxicity can be estimated in serum andused as biomarkers to check the damage caused to themyocardium [27]. Several investigators reported thatDOX causes elevation in the levels of CK-MB, BUNand cTnT serum biomarker activities after DOXadministration [28, 29]. In comparison to the CON
group, the DOX-treated group showed significantelevation in the levels of cardiac marker enzymes inthe serum. Treatment with MEL and Vit D caused asignificant decrease in the levels of troponin T, BUNand CK-MB enzymes. This effect shows that MELand Vit D can be prevent damage to the ratmyocardium and stabilized the membrane. As phosphorous compounds have high affinity forhydroxyapatite crystals, 99mTc PYP scintigraphy hasbeen widely used in the detection of bone tumors andmetabolic bone diseases. 99mTc PYPradiopharmaceutical accumulates predominantly asapatite-like crystals in mitochondria and cytoplasm ofinfarcted myocardial cells. Therefore, it has beenconsidered beneficial in the diagnosis of acute phasemyocardial infarction and quantification of the infarctsize in the clinical setting [30-33]. Previous studieshave also suggested that the degree ofradiopharmaceutical accumulation such as 99mTc-labeled phosphonates, and 99mTc PYP is a good indexof the severity of tissue damage [34-38]. In the presentstudy, we observed increased 99mTc PYPradiopharmaceutical uptake on heart area in the DOX-induced cardiotoxicity rat model.
Limitations This study was conducted to investigate thepotential protective effects of melatonin plus Vit D onDOX-induced cardiotoxicity manifested by changesin the ECG pattern, changes in biochemicalparameters and changes in 99mTc PYP scintigraphy.Histopathological examination was not performed inthis study.
CONCLUSION
The results of the present study revealed thatsubchronic and systemic administration of Vit D dosesshowed a considerable cardioprotective effect similarto MEL on DOX-induced cardiotoxicityin rat model.MEL is an antioxidant agent that prevents apoptosisin in experimental toxic animal models. Cardiotoxicityinduced by DOX ECG findings are very variable andchemical biomarkers alone are not sufficient, thereforeadditional diagnostic methods are needed. As a resultof the study, it was thought that MEL and Vit Dadministration may be effective in preventing DOX-
The European Research Journal Volume 5 Issue 4 July 2019 655
Eur Res J 2019;5(4):649-657 Cardioprotective effect of vitamin D and melatonin on doxorubicin-induced cardiotoxicity in rat model
induced cardiotoxicity and that 99mTc PYP scintigraphycould be used in the follow-up of chemotherapypatients using DOX.
Authorship declaration All authors listed meet the authorship criteriaaccording to the latest guidelines of the InternationalCommittee of Medical Journal Editors, and all authorsare in agreement with the manuscript.
Conflict of interest The authors disclosed no conflict of interest duringthe preparation or publication of this manuscript.
Financing The authors disclosed that they did not receive anygrant during conduction or writing of this study.
REFERENCES
[1] Lefrak EA, Pitha J, Rosenheim S, Gottlieb JA. Aclinicopathologic analysis of adriamycin cardiotoxicity. Cancer1973;32:302-14. [2] Bilginoğlu A, Aydın D, Ozsoy S, Aygün H. Protective effectof melatonin on adriamycin-induced cardiotoxicity in rats. TurkKardiyol Dern Ars 2014;42:265-73. [3] Swamy AH, Wangikar U, Koti BC, Thippeswamy AH, RonadPM, Manjula DV. Cardioprotective effect of ascorbic acid ondoxorubicin-induced myocardial toxicity in rats. Indian JPharmacol 2011;43:507-11. [4] Anjos Ferreira AL, Russell RM, Rocha N, Placido LadeiraMS, Favero Salvadori DM, Oliveira Nascimento MC, et al. Effectof lycopene on doxorubicin-induced cardiotoxicity: anechocardiographic, histological and morphometrical assessment.Basic Clin Pharmacol Toxicol 2007;101:16-24. [5] Xin Y, Zhang S, Gu L, Liu S, Gao H, You Z, et al.Electrocardiographic and biochemical evidence for thecardioprotective effect of antioxidants in acute doxorubicin-induced cardiotoxicity in the beagle dogs. Biol Pharm Bull2011;34:1523-6. [6] Othman AI, El-Missiry MA, Amer MA, Arafa M. Melatonincontrols oxidative stress and modulates iron, ferritin, andtransferrin levels in adriamycin treated rats. Life Sci2008;83:563-8. [7] Ahmed HH, Mannaa F, Elmegeed GA, Doss SH.Cardioprotective activity of melatonin and its novel synthesizedderivates on doxorubicin-induced cardiotoxicity. Bioorg MedChem 2005;13:1847-57. [8] Prufer K, Veenstra TD, Jirikowski GF, Kumar R. Distributionof 1,25- dihydroxyvitamin D3 receptor immunoreactivity in therat brain and spinal cord. J Chem Immunol 1999;16:135-45.
[9] Langub MC, Herman JP, Malluche HH, Koszewski NJ.Evidence of functional vitamin D receptors in rat hippocampus.Neuroscience 2001;104:49-56. [10] Walbert T, Jirikowski GF, Prufer K. Distribution of 1,25-dihydroxyvitamin D3 receptor immunoreactivity in the limbicsystem. Horm Metab Res 2001;33:525-31. [11] Kunadian V, Ford GA, Bawamia B, Qiu W, Manson JE.Vitamin D deficiency and coronary artery disease: a review ofthe evidence. Am Heart J 2014;167:283-91. [12] Majumdar V, Prabhakar P, Kulkarni GB, Christopher R.Vitamin D status, hypertension and ischemic stroke: a clinicalperspective. J Hum Hypertens 2015;29: 669-74. [13] Holick MF, Binkley NC, Bischoff-Ferrari HA, Gordon CM,Hanley DA, Heaney RP, et al. Guidelines for preventing andtreating vitamin D deficiency and insufficiency revisited. J ClinEndocrinol Metab 2012;97:1153-8. [14] Bansal N, Zelnick L, Robinson-Cohen C, Hoofnagle AN, IxJH, Lima JA, et al. Serum parathyroid hormone and 25-hydroxyvitamin D concentrations and risk of incident heartfailure: the Multi-Ethnic Study of Atherosclerosis. J Am HeartAssoc 2014;3:e001278. [15] Park CW, Oh YS, Shin YS, Kim CM, Kim YS, Kim SY, etal. Intravenous calcitriol regresses myocardial hypertrophy inhemodialysis patients with secondary hyperparathyroidism. AmJ Kidney Dis 1999;33:73-81. [16] Shoji T, Shinohara K, Kimoto E, Emoto M, Tahara H,Koyama H, et al. Lower risk forcardiovascular mortality in oral1-alpha-hydroxy vitamin D3 users in a haemodialysis population.Nephrol Dial Transplant 2004;19:179-84. [17] Nemerovski CW, Dorsch MP, Simpson RU, Bone HG,Aaronson KD, Bleske BE. Vitamin D and cardiovascular disease.Pharmacotherapy 2009;29:691-708. [18] Suzuki J, Yanagisawa A, Shigeyama T, Tsubota J, YasumuraT, Shimoyama K, et al. Early detection of anthracycline-inducedcardiotoxicity by radionuclide angiocardiography.Angiology1999;50:37-45. [19] Kelishomi RB, Ejtemaeemehr S, Tavangar SM, RahimianR, Mobarakeh JI, Dehpour AR. Morphine is protective againstdoxorubicin-induced cardiotoxicity in rat. Toxicology2008;243;96-104. [20] Koti BC, Nagathan S, Vishwanathswamy A, Gadad PC,Thippeswamy A. Cardioprotective effect of Vedic Guard againstdoxorubicin-induced cardiotoxicity in rats: A biochemical,electrocardiographic, and histopathological study. PharmacognMag 2013;9:176-81. [21] Bhatt L, Joshi V. Mangifera indica L. leaf extract alleviatesdoxorubicin induced cardiac stress. J Intercult Ethnopharmacol2017;6:284-9. [22] Rossi F, Filippelli W, Russo S, Filippelli A, Berrino L.Cardiotoxicity of doxorubicin: Effects of drugs inhibiting therelease of vasoactive substances. Pharmacol Toxicol 1994;75:99-107.[23] Holland RP, Brooks H. TQ-ST segment mapping: Criticalreview and analysis of current concepts. Am J Cardiol1977;40:110-29. [24] Villani F, Monti E, Piccinini F, Favalli L, Lanza E, Rozza
656 The European Research Journal Volume 5 Issue 4 July 2019
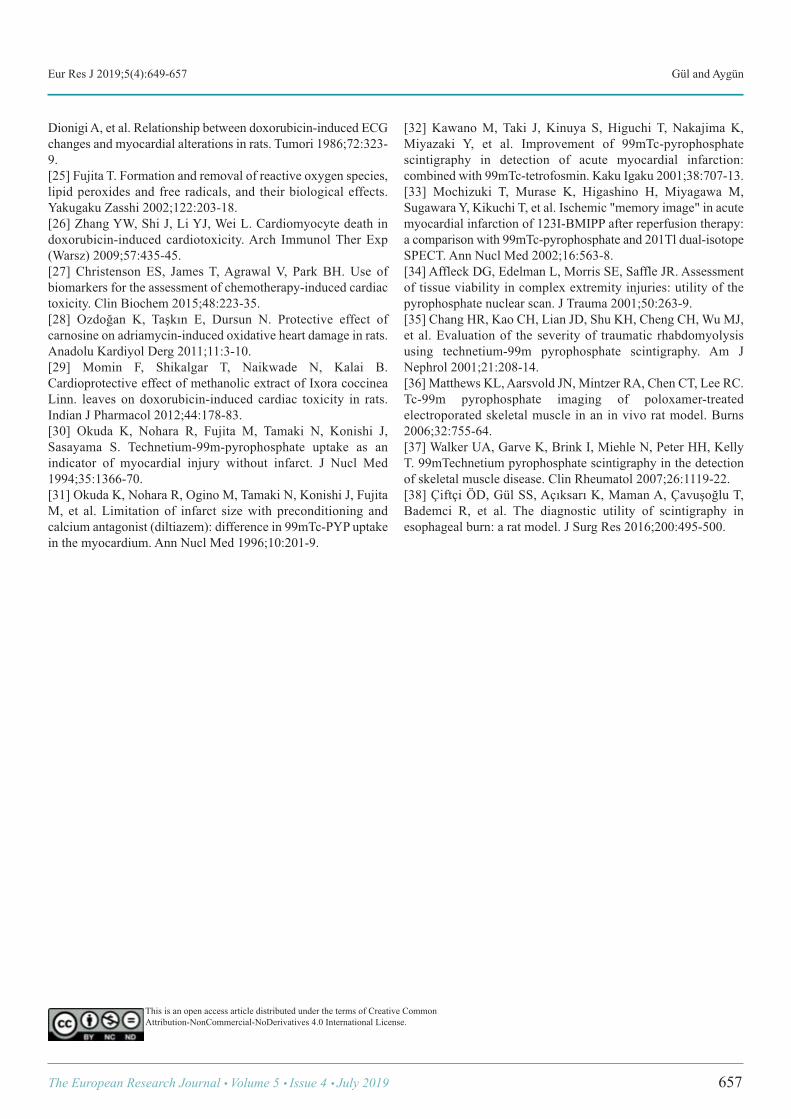
Eur Res J 2019;5(4):649-657 Gül and Aygün
Dionigi A, et al. Relationship between doxorubicin-induced ECGchanges and myocardial alterations in rats. Tumori 1986;72:323-9. [25] Fujita T. Formation and removal of reactive oxygen species,lipid peroxides and free radicals, and their biological effects.Yakugaku Zasshi 2002;122:203-18. [26] Zhang YW, Shi J, Li YJ, Wei L. Cardiomyocyte death indoxorubicin-induced cardiotoxicity. Arch Immunol Ther Exp(Warsz) 2009;57:435-45. [27] Christenson ES, James T, Agrawal V, Park BH. Use ofbiomarkers for the assessment of chemotherapy-induced cardiactoxicity. Clin Biochem 2015;48:223-35. [28] Ozdoğan K, Taşkın E, Dursun N. Protective effect ofcarnosine on adriamycin-induced oxidative heart damage in rats.Anadolu Kardiyol Derg 2011;11:3-10. [29] Momin F, Shikalgar T, Naikwade N, Kalai B.Cardioprotective effect of methanolic extract of Ixora coccineaLinn. leaves on doxorubicin-induced cardiac toxicity in rats.Indian J Pharmacol 2012;44:178-83. [30] Okuda K, Nohara R, Fujita M, Tamaki N, Konishi J,Sasayama S. Technetium-99m-pyrophosphate uptake as anindicator of myocardial injury without infarct. J Nucl Med1994;35:1366-70. [31] Okuda K, Nohara R, Ogino M, Tamaki N, Konishi J, FujitaM, et al. Limitation of infarct size with preconditioning andcalcium antagonist (diltiazem): difference in 99mTc-PYP uptakein the myocardium. Ann Nucl Med 1996;10:201-9.
[32] Kawano M, Taki J, Kinuya S, Higuchi T, Nakajima K,Miyazaki Y, et al. Improvement of 99mTc-pyrophosphatescintigraphy in detection of acute myocardial infarction:combined with 99mTc-tetrofosmin. Kaku Igaku 2001;38:707-13. [33] Mochizuki T, Murase K, Higashino H, Miyagawa M,Sugawara Y, Kikuchi T, et al. Ischemic "memory image" in acutemyocardial infarction of 123I-BMIPP after reperfusion therapy:a comparison with 99mTc-pyrophosphate and 201Tl dual-isotopeSPECT. Ann Nucl Med 2002;16:563-8. [34] Affleck DG, Edelman L, Morris SE, Saffle JR. Assessmentof tissue viability in complex extremity injuries: utility of thepyrophosphate nuclear scan. J Trauma 2001;50:263-9. [35] Chang HR, Kao CH, Lian JD, Shu KH, Cheng CH, Wu MJ,et al. Evaluation of the severity of traumatic rhabdomyolysisusing technetium-99m pyrophosphate scintigraphy. Am JNephrol 2001;21:208-14. [36] Matthews KL, Aarsvold JN, Mintzer RA, Chen CT, Lee RC.Tc-99m pyrophosphate imaging of poloxamer-treatedelectroporated skeletal muscle in an in vivo rat model. Burns2006;32:755-64. [37] Walker UA, Garve K, Brink I, Miehle N, Peter HH, KellyT. 99mTechnetium pyrophosphate scintigraphy in the detectionof skeletal muscle disease. Clin Rheumatol 2007;26:1119-22. [38] Çiftçi ÖD, Gül SS, Açıksarı K, Maman A, Çavuşoğlu T,Bademci R, et al. The diagnostic utility of scintigraphy inesophageal burn: a rat model. J Surg Res 2016;200:495-500.
This is an open access article distributed under the terms of Creative CommonAttribution-NonCommercial-NoDerivatives 4.0 International License.
The European Research Journal Volume 5 Issue 4 July 2019 657
Clinical and functional outcomes of extracorporeal shock wavetherapy in isolated medial epicondylitis Yalçın Turhan , Mehmet Arıcan , Zekeriya Okan Karaduman
Department of Orthopedics and Traumatology, Düzce University School of Medicine, Düzce, Turkey
ABSTRACTObjective: To evaluate the effectiveness of extracorporeal shock wave therapy (ESWT) for the patients withisolated medial epicondylitis refractory to other conservative methods. Methods:A retrospective analysis of 57 patients with the diagnosis of isolated medial epicondylitis refractoryto conservative measures was done. 36 of them who met our eligibility criteria were included. Patients weresubjected to three sessions of extracorporeal shock wave therapy with 2000 pulses per a session in a dose of0.06-0.12 mJ/mm2. Pain and clinical/functional scores were measured by visual analogue scale (VAS) andQuick-Disabilities of the Arm, Shoulder and Hand (Q-DASH) respectively before the treatment and at 1st weekand 12th week of the last session. Results:Mean age of the patients was 47.3 (25-67) years and there was a higher female presentation (24 femaleand 12 male patients). The VAS scores were improved from a mean of 7.8 before the treatment to 5.3 at 1stweek (p < 0.001) and to 2.9 at 12th week (p < 0.001). Also the results of the Q-DASH showed a meanimprovement from 50.4 before the treatment to 27.1 at 1st week (p < 0.001) and 9.6 at 12th week (p < 0.001).There were no significant differences in the improvements of VAS and Q-DASH scores by the time betweenthe male and female patients. Conclusion:According to the results of this study which will be one of the limited studies about isolated medialepicondylitis; ESWT is a good conservative treatment option for medial epicondylitis in refractory cases likein lateral epicondylitis.
Keywords:Medial epicondylitis, extracorporeal shock wave therapy, visual analogue scale, quick-disabilitiesof the arm shoulder and hand
Address for correspondence: Yalçın Turhan, MD., Assistant Professor, Düzce University School of Medicine, Department of Orthopedics andTraumatology, Düzce, TurkeyE-mail: [email protected]
Copyright © 2019 by The Association of Health Research & StrategyAvailable at http://dergipark.org.tr/eurj
The European Research Journal 2019;5(4):658-662
edial epicondylitis with the other popular name“golfer’s elbow” is common orthopedic prob-
lem. The prevalence is about 1% in population [1, 2].With the result of repetitive micro-trauma over yearsto the common flexor origin of the humeral medialepicondyle, it typically occurs in the 4th-6th decades oflife [3]. There are some treatment modalities for this
condition including resting, physical therapy, non-steroidal anti-inflammatory drug (NSAID) usage,steroid injection, exercise therapy and orthosis. Al-though there are a lot of treatment options, the optimaltreatment modality remains unclear [4, 5]. While initial conservative therapy and if failedopen surgical management are the most popular treat-
M
ORIGINAL ARTICLE
e-ISSN: 2149-3189
DOI: 10.18621/eurj.448849
Received: July 29, 2018; Accepted: August 19, 2018; Published Online: January 8, 2019
The European Research Journal Volume 5 Issue 4 July 2019 658
Eur Res J 2019;5(4):658-662 Extracorporeal shock wave therapy in isolated medial epicondylitis
ment modalities; some of non-traditional methods likeextracorporeal shock wave therapy (ESWT) have beenused widely in orthopedic field. ESWT had been com-monly used in the treatment of urolithiasis and chole-docholithiasis. After the 1990’s, it has been using forthe common musculoskeletal disorders like plantarfasciitis and epicondylitis [6, 7]. Most of the previousstudies were conducted to patients who failed to re-spond to conservative treatment modalities after theacute phase. Also the effectiveness of ESWT in thenewly diagnosed lateral epicondylitis or medial epi-condylitis was investigated in 2012 [8]. There are littlestudies showing the effectiveness of ESWT only in themanagement of medial epicondylitis. This study aimed to evaluate the outcomes ofESWT in the treatment of isolated medial epicondyli-tis and to show its clinical and functional outcomes.
METHODS
The present study was designed as a retrospectiveobservational study and was approved by ethicscommittee of our university with a number of 2018/64.A total of 57 patients were admitted to our outpatientclinics with the diagnosis of medial epicondylitis andtreated with ESWT in the period between January2010 and September 2017. The data of all of thepatients were analyzed and the 36 patients who meetour criteria (patients with; unilateral and isolatedmedial epicondylitis, ESWT treatment was appliedonce in a week for three times and between the agesof 18-70) were included in our study. The exclusioncriteria of the study were; presence of pregnancy,active infection or fracture around elbow joint,cervical radiculopathy, coagulopathy, upper extremitynerve entrapment syndrome, ipsilateral lateralepicondylitis or patients who were treated with localsteroid injections, platelet rich plasma (PRP) etc. in 6weeks of first ESWT application. In all cases medial epicondylitis diagnosis wereverified before the treatment by clinical tests, i.e. apainful local palpation at humeral medial epicondyleand positive “golfer’s elbow test”. Indications forESWT involved persistence of pain and functionimpairment refractory to rest, ice, sling,pharmacological therapies (systemic and /or local non-steroidal anti-inflammatory drugs) or local steroid
injections. All patients provided informed consentregarding that their medical records would be used inscientific studies.
Treatment Treatments were performed using Swiss DolorclastMaster® ESWT machine (EMS Electro MedicalSystems, Nyon, Switzerland), which produces radialshockwaves. Three sessions of radial ESWT (2000pulses per a session in a dose of 0.06-0.12 mJ/mm2)were administered weekly for three weeks in everypatient.
Clinical Evaluation Pain intensity and clinical/functional scores weremeasured by Visual Analogue Scale (VAS) and Quick-Disabilities of the Arm, Shoulder and Hand(Q-DASH) scoring systems respectively. The scoringrecords were subsequently obtained just before thetreatment, at 1st week and at 12th week of the lastsession. VAS is a scale and is useful for measuringpain that is believed to range across a continuum ofvalues and cannot easily be directly measured. Thesimplest VAS is a straight horizontal line of fixedlength, usually 100 mm. The Q-DASH is anabbreviated version of the original DASH outcomemeasure. In comparison to the original 30 item DASHoutcome measure, the Q-DASH only contains 11items. It is a questionnaire that measures anindividual’s ability to complete tasks, absorb forces,and severity of symptoms. The Q-DASH tool uses a5-point scale from which the patient can select anappropriate number corresponding to his/her severityand function level. Like the original version, the Q-DASH score ranges from 0 (no disability) to 100(severest disability) [9, 10].
Statistical Analysis One-way repeated measure of variance analysis wasused in the analysis of the change of the time-dependent measurements. Two-way repeatedmeasures of variance analysis was used to examine thevariation of time-dependent measures relative togroups All analyses were performed with theStatistical Package for Social Sciences (SPSS)software ver. 22 (SPSS, Chicago, IL, USA). The p-values < 0.05 were considered statistically significant.
659 The European Research Journal Volume 5 Issue 4 July 2019
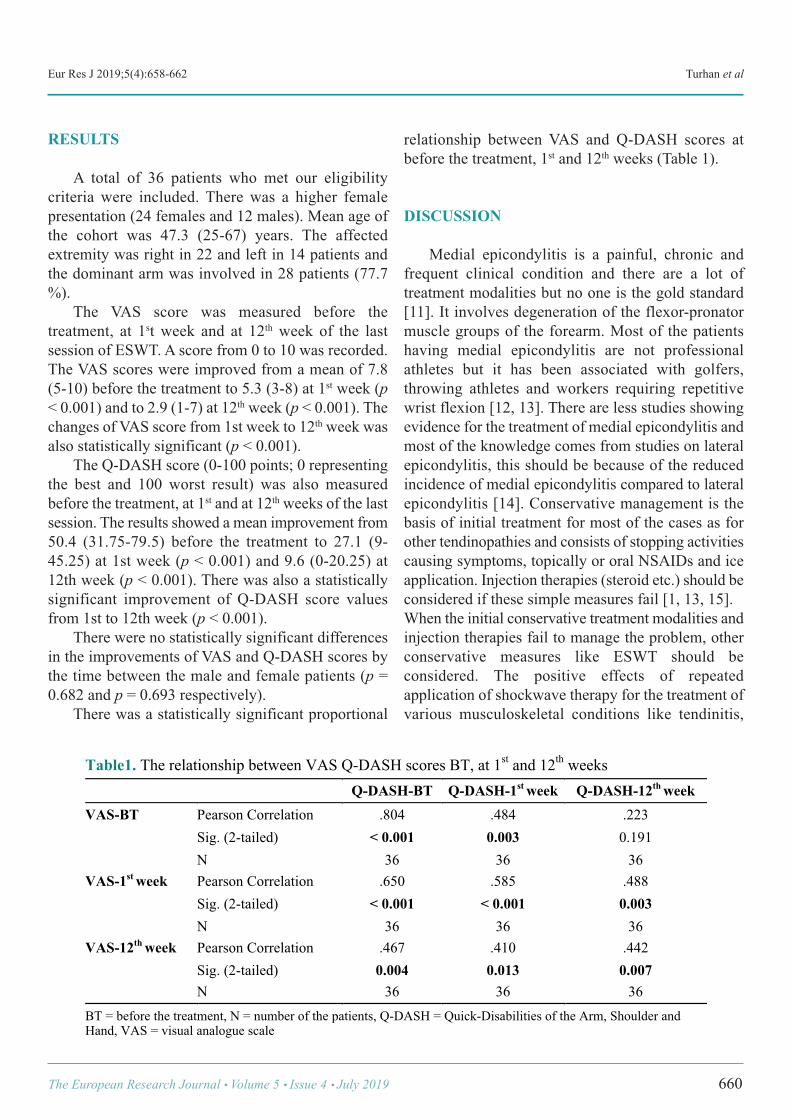
Eur Res J 2019;5(4):658-662 Turhan et al
RESULTS
A total of 36 patients who met our eligibilitycriteria were included. There was a higher femalepresentation (24 females and 12 males). Mean age ofthe cohort was 47.3 (25-67) years. The affectedextremity was right in 22 and left in 14 patients andthe dominant arm was involved in 28 patients (77.7%). The VAS score was measured before thetreatment, at 1st week and at 12th week of the lastsession of ESWT. A score from 0 to 10 was recorded.The VAS scores were improved from a mean of 7.8(5-10) before the treatment to 5.3 (3-8) at 1st week (p< 0.001) and to 2.9 (1-7) at 12th week (p < 0.001). Thechanges of VAS score from 1st week to 12th week wasalso statistically significant (p < 0.001). The Q-DASH score (0-100 points; 0 representingthe best and 100 worst result) was also measuredbefore the treatment, at 1st and at 12th weeks of the lastsession. The results showed a mean improvement from50.4 (31.75-79.5) before the treatment to 27.1 (9-45.25) at 1st week (p < 0.001) and 9.6 (0-20.25) at12th week (p < 0.001). There was also a statisticallysignificant improvement of Q-DASH score valuesfrom 1st to 12th week (p < 0.001). There were no statistically significant differencesin the improvements of VAS and Q-DASH scores bythe time between the male and female patients (p =0.682 and p = 0.693 respectively). There was a statistically significant proportional
relationship between VAS and Q-DASH scores atbefore the treatment, 1st and 12th weeks (Table 1).
DISCUSSION
Medial epicondylitis is a painful, chronic andfrequent clinical condition and there are a lot oftreatment modalities but no one is the gold standard[11]. It involves degeneration of the flexor-pronatormuscle groups of the forearm. Most of the patientshaving medial epicondylitis are not professionalathletes but it has been associated with golfers,throwing athletes and workers requiring repetitivewrist flexion [12, 13]. There are less studies showingevidence for the treatment of medial epicondylitis andmost of the knowledge comes from studies on lateralepicondylitis, this should be because of the reducedincidence of medial epicondylitis compared to lateralepicondylitis [14]. Conservative management is thebasis of initial treatment for most of the cases as forother tendinopathies and consists of stopping activitiescausing symptoms, topically or oral NSAIDs and iceapplication. Injection therapies (steroid etc.) should beconsidered if these simple measures fail [1, 13, 15]. When the initial conservative treatment modalities andinjection therapies fail to manage the problem, otherconservative measures like ESWT should beconsidered. The positive effects of repeatedapplication of shockwave therapy for the treatment ofvarious musculoskeletal conditions like tendinitis,
The European Research Journal Volume 5 Issue 4 July 2019 660
Table1. The relationship between VAS Q-DASH scores BT, at 1st and 12th weeks Q-DASH-BT Q-DASH-1st week Q-DASH-12th week VAS-BT Pearson Correlation .804 .484 .223
Sig. (2-tailed) < 0.001 0.003 0.191 N 36 36 36
VAS-1st week Pearson Correlation .650 .585 .488 Sig. (2-tailed) < 0.001 < 0.001 0.003 N 36 36 36
VAS-12th week Pearson Correlation .467 .410 .442 Sig. (2-tailed) 0.004 0.013 0.007 N 36 36 36
BT = before the treatment, N = number of the patients, Q-DASH = Quick-Disabilities of the Arm, Shoulder and Hand, VAS = visual analogue scale !
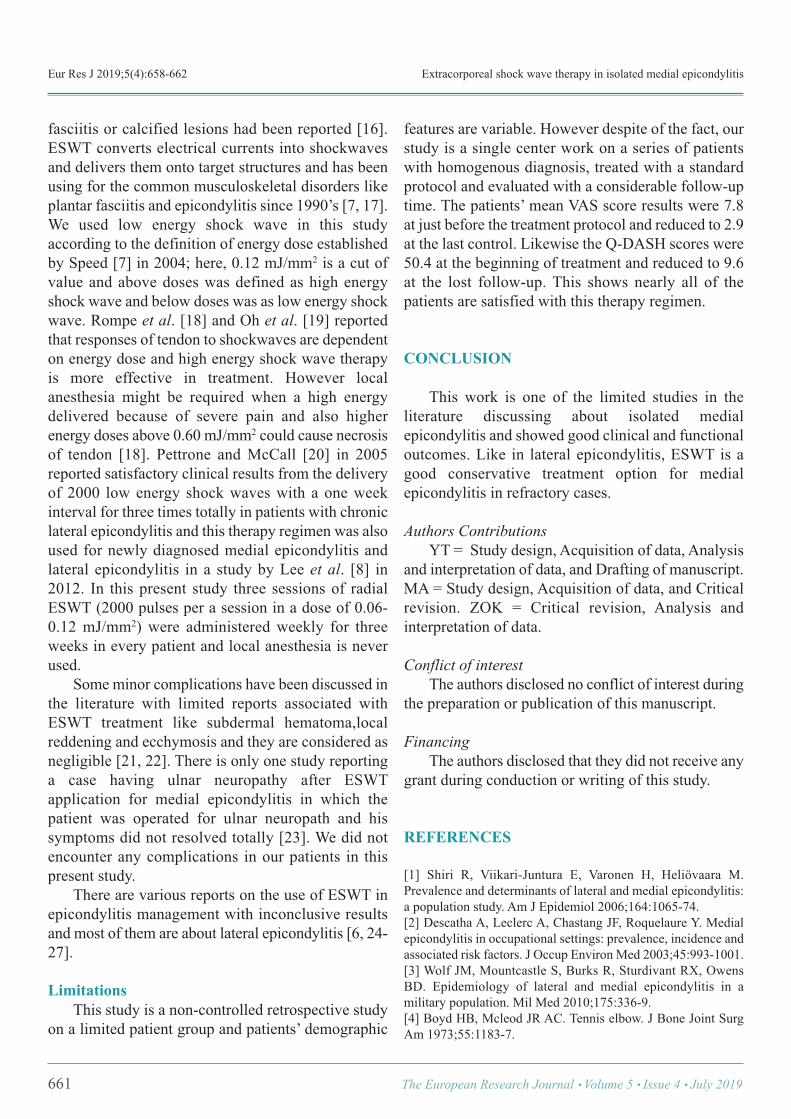
Eur Res J 2019;5(4):658-662 Extracorporeal shock wave therapy in isolated medial epicondylitis
fasciitis or calcified lesions had been reported [16].ESWT converts electrical currents into shockwavesand delivers them onto target structures and has beenusing for the common musculoskeletal disorders likeplantar fasciitis and epicondylitis since 1990’s [7, 17]. We used low energy shock wave in this studyaccording to the definition of energy dose establishedby Speed [7] in 2004; here, 0.12 mJ/mm2 is a cut ofvalue and above doses was defined as high energyshock wave and below doses was as low energy shockwave. Rompe et al. [18] and Oh et al. [19] reportedthat responses of tendon to shockwaves are dependenton energy dose and high energy shock wave therapyis more effective in treatment. However localanesthesia might be required when a high energydelivered because of severe pain and also higherenergy doses above 0.60 mJ/mm2 could cause necrosisof tendon [18]. Pettrone and McCall [20] in 2005reported satisfactory clinical results from the deliveryof 2000 low energy shock waves with a one weekinterval for three times totally in patients with chroniclateral epicondylitis and this therapy regimen was alsoused for newly diagnosed medial epicondylitis andlateral epicondylitis in a study by Lee et al. [8] in2012. In this present study three sessions of radialESWT (2000 pulses per a session in a dose of 0.06-0.12 mJ/mm2) were administered weekly for threeweeks in every patient and local anesthesia is neverused. Some minor complications have been discussed inthe literature with limited reports associated withESWT treatment like subdermal hematoma,localreddening and ecchymosis and they are considered asnegligible [21, 22]. There is only one study reportinga case having ulnar neuropathy after ESWTapplication for medial epicondylitis in which thepatient was operated for ulnar neuropath and hissymptoms did not resolved totally [23]. We did notencounter any complications in our patients in thispresent study. There are various reports on the use of ESWT inepicondylitis management with inconclusive resultsand most of them are about lateral epicondylitis [6, 24-27].
Limitations This study is a non-controlled retrospective studyon a limited patient group and patients’ demographic
features are variable. However despite of the fact, ourstudy is a single center work on a series of patientswith homogenous diagnosis, treated with a standardprotocol and evaluated with a considerable follow-uptime. The patients’ mean VAS score results were 7.8at just before the treatment protocol and reduced to 2.9at the last control. Likewise the Q-DASH scores were50.4 at the beginning of treatment and reduced to 9.6at the lost follow-up. This shows nearly all of thepatients are satisfied with this therapy regimen.
CONCLUSION
This work is one of the limited studies in theliterature discussing about isolated medialepicondylitis and showed good clinical and functionaloutcomes. Like in lateral epicondylitis, ESWT is agood conservative treatment option for medialepicondylitis in refractory cases.
Authors Contributions YT = Study design, Acquisition of data, Analysisand interpretation of data, and Drafting of manuscript.MA = Study design, Acquisition of data, and Criticalrevision. ZOK = Critical revision, Analysis andinterpretation of data.
Conflict of interest The authors disclosed no conflict of interest duringthe preparation or publication of this manuscript.
Financing The authors disclosed that they did not receive anygrant during conduction or writing of this study.
REFERENCES
[1] Shiri R, Viikari-Juntura E, Varonen H, Heliövaara M.Prevalence and determinants of lateral and medial epicondylitis:a population study. Am J Epidemiol 2006;164:1065-74. [2] Descatha A, Leclerc A, Chastang JF, Roquelaure Y. Medialepicondylitis in occupational settings: prevalence, incidence andassociated risk factors. J Occup Environ Med 2003;45:993-1001. [3] Wolf JM, Mountcastle S, Burks R, Sturdivant RX, OwensBD. Epidemiology of lateral and medial epicondylitis in amilitary population. Mil Med 2010;175:336-9. [4] Boyd HB, Mcleod JR AC. Tennis elbow. J Bone Joint SurgAm 1973;55:1183-7.
661 The European Research Journal Volume 5 Issue 4 July 2019
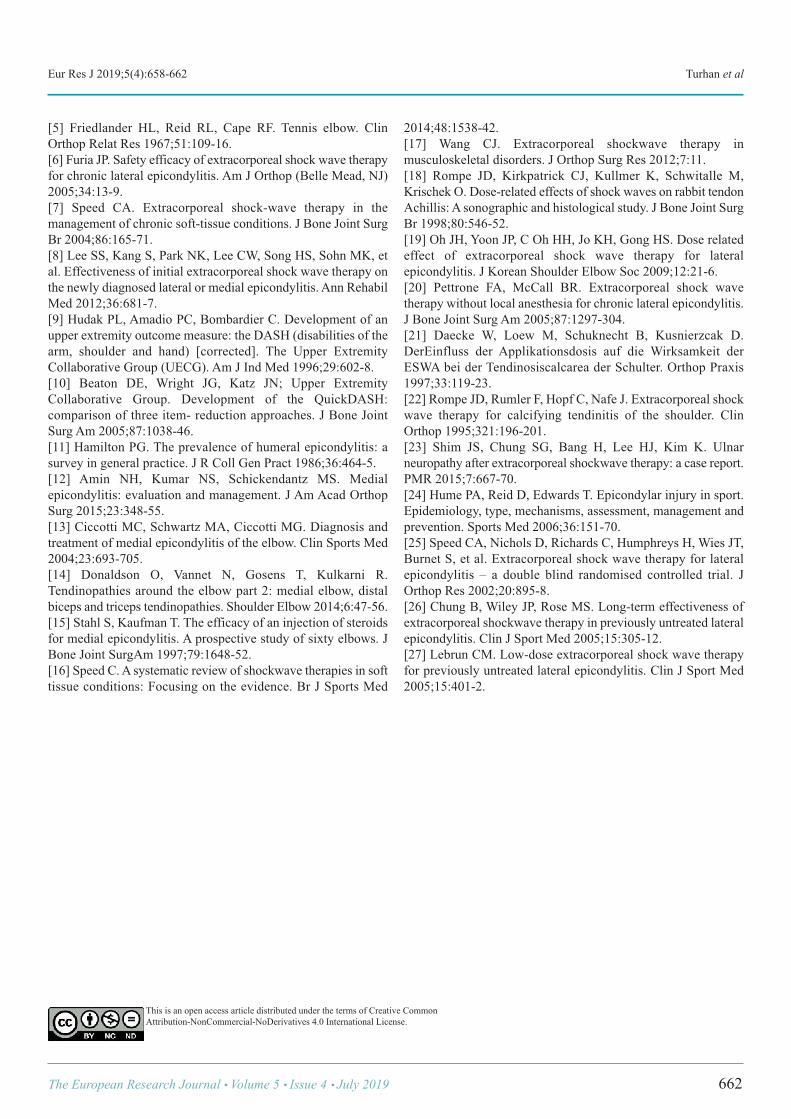
Eur Res J 2019;5(4):658-662 Turhan et al
[5] Friedlander HL, Reid RL, Cape RF. Tennis elbow. ClinOrthop Relat Res 1967;51:109-16. [6] Furia JP. Safety efficacy of extracorporeal shock wave therapyfor chronic lateral epicondylitis. Am J Orthop (Belle Mead, NJ)2005;34:13-9. [7] Speed CA. Extracorporeal shock-wave therapy in themanagement of chronic soft-tissue conditions. J Bone Joint SurgBr 2004;86:165-71. [8] Lee SS, Kang S, Park NK, Lee CW, Song HS, Sohn MK, etal. Effectiveness of initial extracorporeal shock wave therapy onthe newly diagnosed lateral or medial epicondylitis. Ann RehabilMed 2012;36:681-7. [9] Hudak PL, Amadio PC, Bombardier C. Development of anupper extremity outcome measure: the DASH (disabilities of thearm, shoulder and hand) [corrected]. The Upper ExtremityCollaborative Group (UECG). Am J Ind Med 1996;29:602-8. [10] Beaton DE, Wright JG, Katz JN; Upper ExtremityCollaborative Group. Development of the QuickDASH:comparison of three item- reduction approaches. J Bone JointSurg Am 2005;87:1038-46. [11] Hamilton PG. The prevalence of humeral epicondylitis: asurvey in general practice. J R Coll Gen Pract 1986;36:464-5. [12] Amin NH, Kumar NS, Schickendantz MS. Medialepicondylitis: evaluation and management. J Am Acad OrthopSurg 2015;23:348-55. [13] Ciccotti MC, Schwartz MA, Ciccotti MG. Diagnosis andtreatment of medial epicondylitis of the elbow. Clin Sports Med2004;23:693-705. [14] Donaldson O, Vannet N, Gosens T, Kulkarni R.Tendinopathies around the elbow part 2: medial elbow, distalbiceps and triceps tendinopathies. Shoulder Elbow 2014;6:47-56. [15] Stahl S, Kaufman T. The efficacy of an injection of steroidsfor medial epicondylitis. A prospective study of sixty elbows. JBone Joint SurgAm 1997;79:1648-52. [16] Speed C. A systematic review of shockwave therapies in softtissue conditions: Focusing on the evidence. Br J Sports Med
2014;48:1538-42. [17] Wang CJ. Extracorporeal shockwave therapy inmusculoskeletal disorders. J Orthop Surg Res 2012;7:11. [18] Rompe JD, Kirkpatrick CJ, Kullmer K, Schwitalle M,Krischek O. Dose-related effects of shock waves on rabbit tendonAchillis: A sonographic and histological study. J Bone Joint SurgBr 1998;80:546-52. [19] Oh JH, Yoon JP, C Oh HH, Jo KH, Gong HS. Dose relatedeffect of extracorporeal shock wave therapy for lateralepicondylitis. J Korean Shoulder Elbow Soc 2009;12:21-6. [20] Pettrone FA, McCall BR. Extracorporeal shock wavetherapy without local anesthesia for chronic lateral epicondylitis.J Bone Joint Surg Am 2005;87:1297-304. [21] Daecke W, Loew M, Schuknecht B, Kusnierzcak D.DerEinfluss der Applikationsdosis auf die Wirksamkeit derESWA bei der Tendinosiscalcarea der Schulter. Orthop Praxis1997;33:119-23. [22] Rompe JD, Rumler F, Hopf C, Nafe J. Extracorporeal shockwave therapy for calcifying tendinitis of the shoulder. ClinOrthop 1995;321:196-201. [23] Shim JS, Chung SG, Bang H, Lee HJ, Kim K. Ulnarneuropathy after extracorporeal shockwave therapy: a case report.PMR 2015;7:667-70. [24] Hume PA, Reid D, Edwards T. Epicondylar injury in sport.Epidemiology, type, mechanisms, assessment, management andprevention. Sports Med 2006;36:151-70. [25] Speed CA, Nichols D, Richards C, Humphreys H, Wies JT,Burnet S, et al. Extracorporeal shock wave therapy for lateralepicondylitis – a double blind randomised controlled trial. JOrthop Res 2002;20:895-8. [26] Chung B, Wiley JP, Rose MS. Long-term effectiveness ofextracorporeal shockwave therapy in previously untreated lateralepicondylitis. Clin J Sport Med 2005;15:305-12. [27] Lebrun CM. Low-dose extracorporeal shock wave therapyfor previously untreated lateral epicondylitis. Clin J Sport Med2005;15:401-2.
The European Research Journal Volume 5 Issue 4 July 2019 662
This is an open access article distributed under the terms of Creative CommonAttribution-NonCommercial-NoDerivatives 4.0 International License.
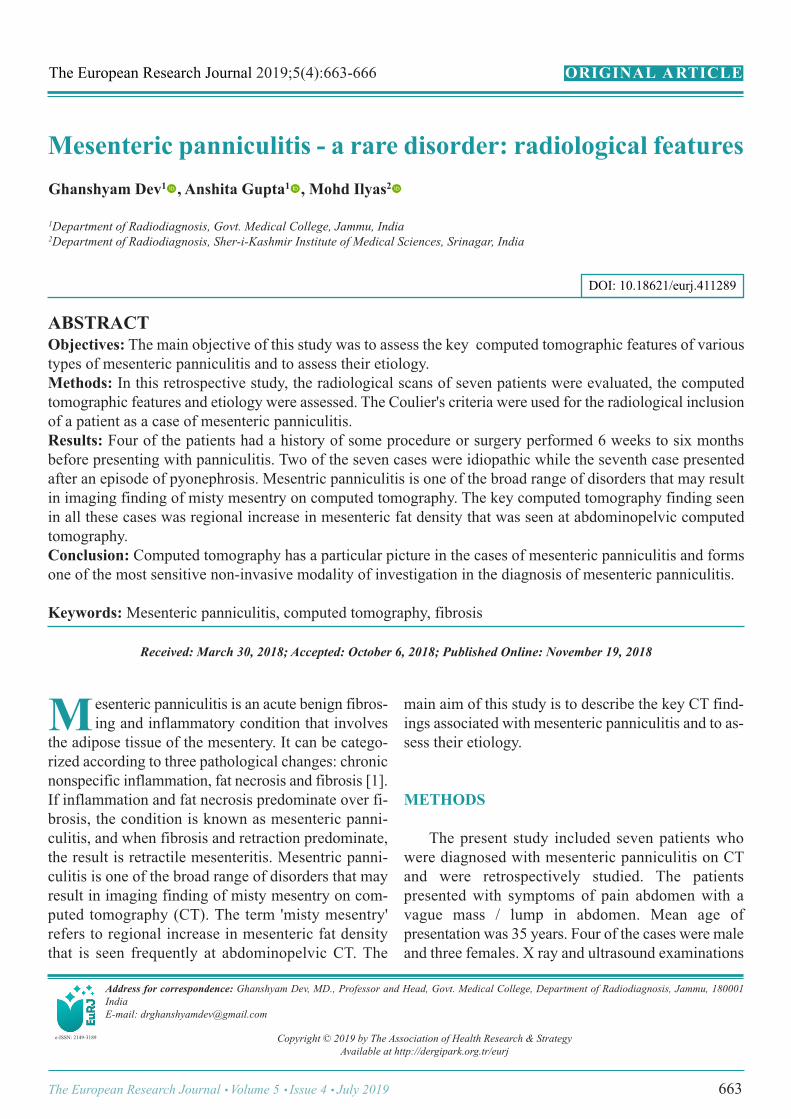
Mesenteric panniculitis - a rare disorder: radiological features Ghanshyam Dev1 , Anshita Gupta1 , Mohd Ilyas2
1Department of Radiodiagnosis, Govt. Medical College, Jammu, India2Department of Radiodiagnosis, Sher-i-Kashmir Institute of Medical Sciences, Srinagar, India
ABSTRACTObjectives: The main objective of this study was to assess the key computed tomographic features of varioustypes of mesenteric panniculitis and to assess their etiology. Methods: In this retrospective study, the radiological scans of seven patients were evaluated, the computedtomographic features and etiology were assessed. The Coulier's criteria were used for the radiological inclusionof a patient as a case of mesenteric panniculitis. Results: Four of the patients had a history of some procedure or surgery performed 6 weeks to six monthsbefore presenting with panniculitis. Two of the seven cases were idiopathic while the seventh case presentedafter an episode of pyonephrosis. Mesentric panniculitis is one of the broad range of disorders that may resultin imaging finding of misty mesentry on computed tomography. The key computed tomography finding seenin all these cases was regional increase in mesenteric fat density that was seen at abdominopelvic computedtomography. Conclusion: Computed tomography has a particular picture in the cases of mesenteric panniculitis and formsone of the most sensitive non-invasive modality of investigation in the diagnosis of mesenteric panniculitis.
Keywords:Mesenteric panniculitis, computed tomography, fibrosis
Address for correspondence: Ghanshyam Dev, MD., Professor and Head, Govt. Medical College, Department of Radiodiagnosis, Jammu, 180001India E-mail: [email protected]
Copyright © 2019 by The Association of Health Research & StrategyAvailable at http://dergipark.org.tr/eurj
The European Research Journal 2019;5(4):663-666
esenteric panniculitis is an acute benign fibros-ing and inflammatory condition that involves
the adipose tissue of the mesentery. It can be catego-rized according to three pathological changes: chronicnonspecific inflammation, fat necrosis and fibrosis [1].If inflammation and fat necrosis predominate over fi-brosis, the condition is known as mesenteric panni-culitis, and when fibrosis and retraction predominate,the result is retractile mesenteritis. Mesentric panni-culitis is one of the broad range of disorders that mayresult in imaging finding of misty mesentry on com-puted tomography (CT). The term 'misty mesentry'refers to regional increase in mesenteric fat densitythat is seen frequently at abdominopelvic CT. The
main aim of this study is to describe the key CT find-ings associated with mesenteric panniculitis and to as-sess their etiology.
METHODS
The present study included seven patients whowere diagnosed with mesenteric panniculitis on CTand were retrospectively studied. The patientspresented with symptoms of pain abdomen with avague mass / lump in abdomen. Mean age ofpresentation was 35 years. Four of the cases were maleand three females. X ray and ultrasound examinations
M
ORIGINAL ARTICLE
e-ISSN: 2149-3189
DOI: 10.18621/eurj.411289
Received: March 30, 2018; Accepted: October 6, 2018; Published Online: November 19, 2018
The European Research Journal Volume 5 Issue 4 July 2019 663
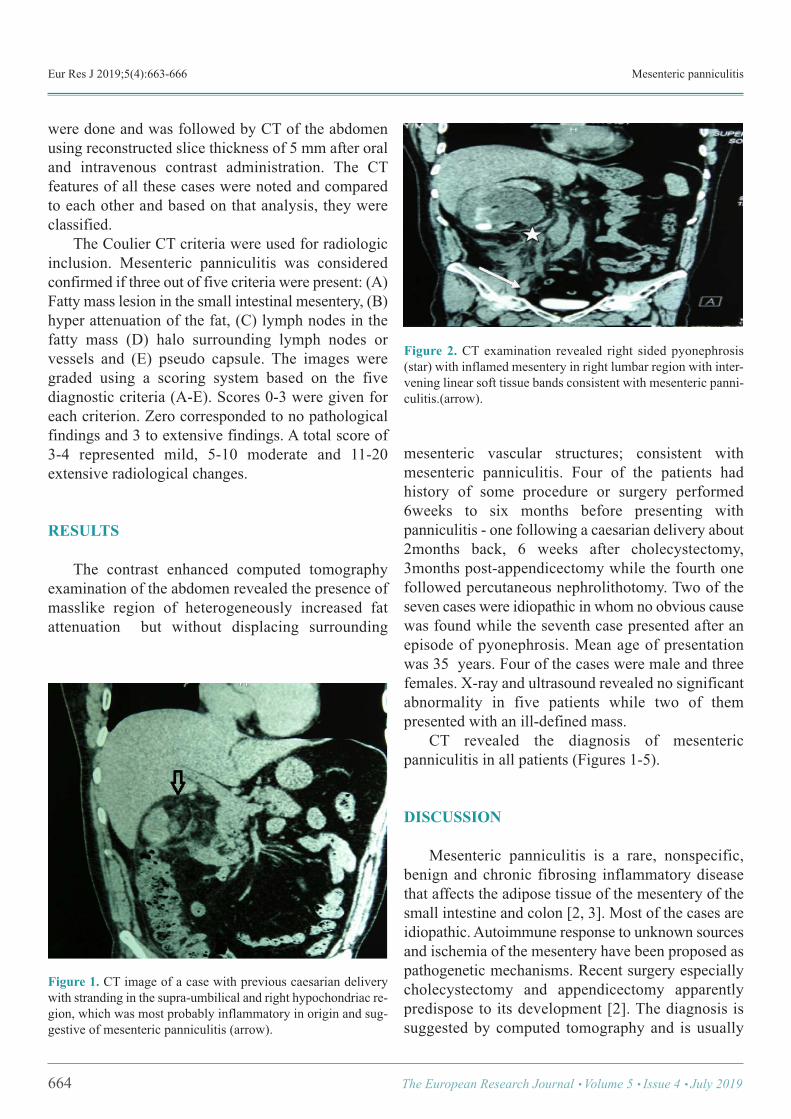
Eur Res J 2019;5(4):663-666 Mesenteric panniculitis
were done and was followed by CT of the abdomenusing reconstructed slice thickness of 5 mm after oraland intravenous contrast administration. The CTfeatures of all these cases were noted and comparedto each other and based on that analysis, they wereclassified. The Coulier CT criteria were used for radiologicinclusion. Mesenteric panniculitis was consideredconfirmed if three out of five criteria were present: (A)Fatty mass lesion in the small intestinal mesentery, (B)hyper attenuation of the fat, (C) lymph nodes in thefatty mass (D) halo surrounding lymph nodes orvessels and (E) pseudo capsule. The images weregraded using a scoring system based on the fivediagnostic criteria (A-E). Scores 0-3 were given foreach criterion. Zero corresponded to no pathologicalfindings and 3 to extensive findings. A total score of3-4 represented mild, 5-10 moderate and 11-20extensive radiological changes.
RESULTS
The contrast enhanced computed tomographyexamination of the abdomen revealed the presence ofmasslike region of heterogeneously increased fatattenuation but without displacing surrounding
mesenteric vascular structures; consistent withmesenteric panniculitis. Four of the patients hadhistory of some procedure or surgery performed6weeks to six months before presenting withpanniculitis - one following a caesarian delivery about2months back, 6 weeks after cholecystectomy,3months post-appendicectomy while the fourth onefollowed percutaneous nephrolithotomy. Two of theseven cases were idiopathic in whom no obvious causewas found while the seventh case presented after anepisode of pyonephrosis. Mean age of presentationwas 35 years. Four of the cases were male and threefemales. X-ray and ultrasound revealed no significantabnormality in five patients while two of thempresented with an ill-defined mass. CT revealed the diagnosis of mesentericpanniculitis in all patients (Figures 1-5).
DISCUSSION
Mesenteric panniculitis is a rare, nonspecific,benign and chronic fibrosing inflammatory diseasethat affects the adipose tissue of the mesentery of thesmall intestine and colon [2, 3]. Most of the cases areidiopathic. Autoimmune response to unknown sourcesand ischemia of the mesentery have been proposed aspathogenetic mechanisms. Recent surgery especiallycholecystectomy and appendicectomy apparentlypredispose to its development [2]. The diagnosis issuggested by computed tomography and is usually
664 The European Research Journal Volume 5 Issue 4 July 2019
Figure 1. CT image of a case with previous caesarian deliverywith stranding in the supra-umbilical and right hypochondriac re-gion, which was most probably inflammatory in origin and sug-gestive of mesenteric panniculitis (arrow).
Figure 2. CT examination revealed right sided pyonephrosis(star) with inflamed mesentery in right lumbar region with inter-vening linear soft tissue bands consistent with mesenteric panni-culitis.(arrow).
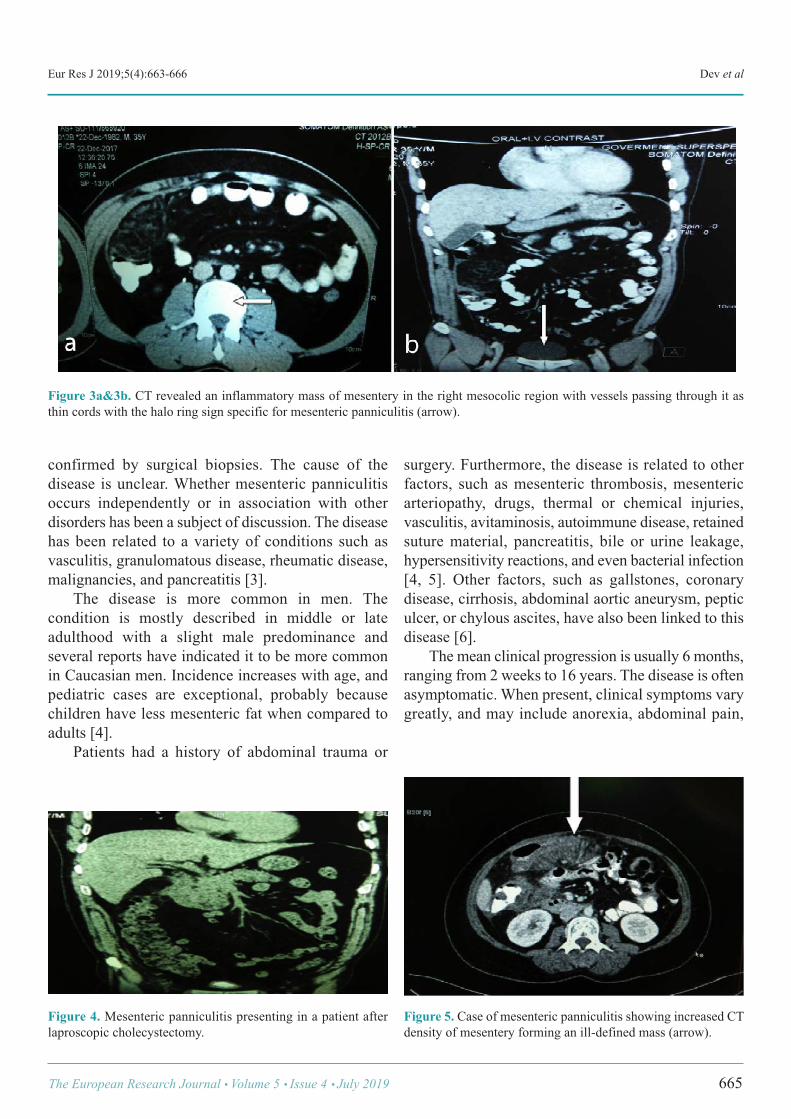
Eur Res J 2019;5(4):663-666 Dev et al
confirmed by surgical biopsies. The cause of thedisease is unclear. Whether mesenteric panniculitisoccurs independently or in association with otherdisorders has been a subject of discussion. The diseasehas been related to a variety of conditions such asvasculitis, granulomatous disease, rheumatic disease,malignancies, and pancreatitis [3]. The disease is more common in men. Thecondition is mostly described in middle or lateadulthood with a slight male predominance andseveral reports have indicated it to be more commonin Caucasian men. Incidence increases with age, andpediatric cases are exceptional, probably becausechildren have less mesenteric fat when compared toadults [4]. Patients had a history of abdominal trauma or
surgery. Furthermore, the disease is related to otherfactors, such as mesenteric thrombosis, mesentericarteriopathy, drugs, thermal or chemical injuries,vasculitis, avitaminosis, autoimmune disease, retainedsuture material, pancreatitis, bile or urine leakage,hypersensitivity reactions, and even bacterial infection[4, 5]. Other factors, such as gallstones, coronarydisease, cirrhosis, abdominal aortic aneurysm, pepticulcer, or chylous ascites, have also been linked to thisdisease [6]. The mean clinical progression is usually 6 months,ranging from 2 weeks to 16 years. The disease is oftenasymptomatic. When present, clinical symptoms varygreatly, and may include anorexia, abdominal pain,
The European Research Journal Volume 5 Issue 4 July 2019 665
Figure 3a&3b. CT revealed an inflammatory mass of mesentery in the right mesocolic region with vessels passing through it asthin cords with the halo ring sign specific for mesenteric panniculitis (arrow).
Figure 4. Mesenteric panniculitis presenting in a patient afterlaproscopic cholecystectomy.
Figure 5. Case of mesenteric panniculitis showing increased CTdensity of mesentery forming an ill-defined mass (arrow).
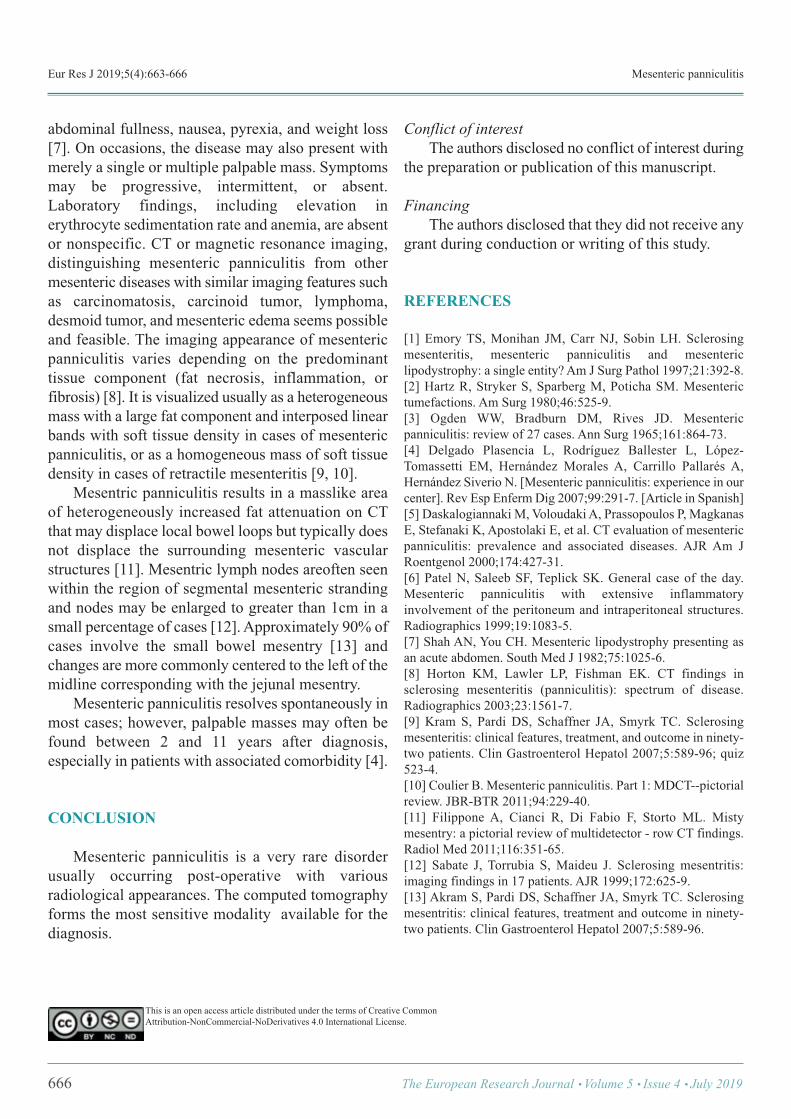
Eur Res J 2019;5(4):663-666 Mesenteric panniculitis
abdominal fullness, nausea, pyrexia, and weight loss[7]. On occasions, the disease may also present withmerely a single or multiple palpable mass. Symptomsmay be progressive, intermittent, or absent.Laboratory findings, including elevation inerythrocyte sedimentation rate and anemia, are absentor nonspecific. CT or magnetic resonance imaging,distinguishing mesenteric panniculitis from othermesenteric diseases with similar imaging features suchas carcinomatosis, carcinoid tumor, lymphoma,desmoid tumor, and mesenteric edema seems possibleand feasible. The imaging appearance of mesentericpanniculitis varies depending on the predominanttissue component (fat necrosis, inflammation, orfibrosis) [8]. It is visualized usually as a heterogeneousmass with a large fat component and interposed linearbands with soft tissue density in cases of mesentericpanniculitis, or as a homogeneous mass of soft tissuedensity in cases of retractile mesenteritis [9, 10]. Mesentric panniculitis results in a masslike areaof heterogeneously increased fat attenuation on CTthat may displace local bowel loops but typically doesnot displace the surrounding mesenteric vascularstructures [11]. Mesentric lymph nodes areoften seenwithin the region of segmental mesenteric strandingand nodes may be enlarged to greater than 1cm in asmall percentage of cases [12]. Approximately 90% ofcases involve the small bowel mesentry [13] andchanges are more commonly centered to the left of themidline corresponding with the jejunal mesentry. Mesenteric panniculitis resolves spontaneously inmost cases; however, palpable masses may often befound between 2 and 11 years after diagnosis,especially in patients with associated comorbidity [4].
CONCLUSION
Mesenteric panniculitis is a very rare disorderusually occurring post-operative with variousradiological appearances. The computed tomographyforms the most sensitive modality available for thediagnosis.
Conflict of interest The authors disclosed no conflict of interest duringthe preparation or publication of this manuscript.
Financing The authors disclosed that they did not receive anygrant during conduction or writing of this study.
REFERENCES
[1] Emory TS, Monihan JM, Carr NJ, Sobin LH. Sclerosingmesenteritis, mesenteric panniculitis and mesentericlipodystrophy: a single entity? Am J Surg Pathol 1997;21:392-8. [2] Hartz R, Stryker S, Sparberg M, Poticha SM. Mesenterictumefactions. Am Surg 1980;46:525-9. [3] Ogden WW, Bradburn DM, Rives JD. Mesentericpanniculitis: review of 27 cases. Ann Surg 1965;161:864-73. [4] Delgado Plasencia L, Rodríguez Ballester L, López-Tomassetti EM, Hernández Morales A, Carrillo Pallarés A,Hernández Siverio N. [Mesenteric panniculitis: experience in ourcenter]. Rev Esp Enferm Dig 2007;99:291-7. [Article in Spanish][5] Daskalogiannaki M, Voloudaki A, Prassopoulos P, MagkanasE, Stefanaki K, Apostolaki E, et al. CT evaluation of mesentericpanniculitis: prevalence and associated diseases. AJR Am JRoentgenol 2000;174:427-31. [6] Patel N, Saleeb SF, Teplick SK. General case of the day.Mesenteric panniculitis with extensive inflammatoryinvolvement of the peritoneum and intraperitoneal structures.Radiographics 1999;19:1083-5. [7] Shah AN, You CH. Mesenteric lipodystrophy presenting asan acute abdomen. South Med J 1982;75:1025-6. [8] Horton KM, Lawler LP, Fishman EK. CT findings insclerosing mesenteritis (panniculitis): spectrum of disease.Radiographics 2003;23:1561-7. [9] Kram S, Pardi DS, Schaffner JA, Smyrk TC. Sclerosingmesenteritis: clinical features, treatment, and outcome in ninety-two patients. Clin Gastroenterol Hepatol 2007;5:589-96; quiz523-4. [10] Coulier B. Mesenteric panniculitis. Part 1: MDCT--pictorialreview. JBR-BTR 2011;94:229-40. [11] Filippone A, Cianci R, Di Fabio F, Storto ML. Mistymesentry: a pictorial review of multidetector - row CT findings.Radiol Med 2011;116:351-65. [12] Sabate J, Torrubia S, Maideu J. Sclerosing mesentritis:imaging findings in 17 patients. AJR 1999;172:625-9. [13] Akram S, Pardi DS, Schaffner JA, Smyrk TC. Sclerosingmesentritis: clinical features, treatment and outcome in ninety-two patients. Clin Gastroenterol Hepatol 2007;5:589-96.
666 The European Research Journal Volume 5 Issue 4 July 2019
This is an open access article distributed under the terms of Creative CommonAttribution-NonCommercial-NoDerivatives 4.0 International License.
Investigation of the comorbidity of dissociative disorders inpatients with bipolar disorderAtilla Tekin1 , Esra Özdil Demiryürek2 , Mehmet Diyaddin Güleken3 , Bahadır Bakım4 , ÖmerAkil Özer5 , Oğuz Karamustafalıoğlu5
1Department of Psychology, Haliç University, Faculty of Arts and Sciences, İstanbul, Turkey 2Department of Psychiatry, Sakarya Training and Research Hospital, Sakarya, Turkey3Department of Psychiatry, Gazi Yaşargil Training and Research Hospital, Diyarbakır, Turkey 4Department of Psychiatry, Yeni Yüzyıl University School of Medicine, İstanbul, Turkey 5Department of Psychiatry, Şişli Hamidiye Etfal Training and Research Hospital, İstanbul, Turkey
ABSTRACTObjectives: The aim of this study was to investigate the comorbidity of dissociative disorders in patients withbipolar disorder.Methods: Fifty-one patients who are diagnosed with bipolar disorder in euthymic state and forty-nine healtycontrols were included in the study. The Structured Clinical Interview for DSM-IV Axis I Disorders (SCID-I),Structured Clinical Interview for DSM-IV Dissociative Disorders (SCID-D), Dissociative Experiences Scale(DES) and Childhood Trauma Questionnaire (CTQ-28) were administered to all participants with asociodemographic form.Results: Mean DES and CTQ-28 total scores were statistically higher in patients group than control group (p< 0.001 and p < 0.001, respectively). Emotional abuse, emotional neglect, physical abuse, physical neglectand sexual abuse subscale scores of CTQ-28 were higher in patients group than healthy controls group (p =0.002, p < 0.001, p = 0.005, p < 0.001 and p < 0.021, respectively). The rate of any dissociative disordercomorbidity was 35.4% in patients with bipolar disorder. The most frequent dissociative disorder in patientwith bipolar disorder was depersonalization disorder (17.6%). There was a positive correlation between DESscore and number of suicidal attempts (r = 0.284). Negative correlations were found between DES score andage of disease onset, and CTQ-28 total score and age of disease onset (r = -0.332 and r = -0.291).Conclusion: Our results have shown that dissociative disorders may be frequently accompanied in patientswith bipolar disorder. Dissociation and childhood traumatic events can be related with clinical features inpatients with bipolar disorder.
Keywords: childhood trauma, dissociation, bipolar disorder
Address for correspondence: Atilla Tekin, MD., Assist. Prof., Haliç University, Faculty of Arts and Sciences, Department of Psychology, İstanbul,Turkey, E-mail: [email protected], Phone: +90 212 9242444, Fax: +90 212 999787852
Copyright © 2019 by The Association of Health Research & StrategyAvailable at http://dergipark.org.tr/eurj
The European Research Journal 2019;5(4):667-672
raumatic experiences during childhood arefrequently emphasized in the aetiology of bipolar
disorder as well as many other psychiatric disorders.In bipolar patients with a history of childhood trauma,
studies have shown that the age of disease onset ageis earlier, the number of affective episodes is higher,the rate of rapid cycling is increased and psychoticsymptoms as well as suicide attempts are more
T
ORIGINAL A RTICLE
e-ISSN: 2149-3189
DOI: 10.18621/eurj.412272
Received: April 3, 2018; Accepted: May 2, 2018; Published Online: June 22, 2018
The European Research Journal Volume 5 Issue 4 July 2019 667
Eur Res J 2019;5(4):667-672 Dissociative disorders in patients with bipolar disorder
common [1-8]. Dissociation, which is characterized with changesin or deterioration of the normal integrative functionsof memory, identity and consciousness, manifests inmany psychiatric disorders. Some studies havedemonstrated dissociative symptoms to be present inpsychotic disorders such as schizophrenia, anxietydisorders and in borderline personality disorders andthat there is a relationship between childhoodtraumatic experiences and dissociative symptoms. Itseems that the comorbidity of dissociative disorder isrelated with poor prognostic features in otherpsychiatric disorders [9, 10]. However, it is notablethat the dissociative disorders in bipolar disorders havebeen less evaluated in literature [11, 12]. We hypothesized that dissociative disorders maybe accompanied in patients with bipolar disordersfrequently, and comorbidity of dissociative disordersis related with poor clinical features in patients withbipolar disorder. The primary aim of this study was toinvestigate the comorbidity rate of dissociativedisorders in patients with bipolar disorder. The secondaim of the study was to investigate the relationshipbetween dissociation and childhood traumas, andclinical features in patients with bipolar disorder.
METHODS
This study included 51 bipolar patients in aeuthymic state, who had previously been diagnosedaccording to the DSM-IV-TR diagnostic criteria, whowere being followed at Şişli Hamidiye Etfal Trainingand Research Hospital Psychiatry Outpatient Clinic,and 49 healthy volunteers with no psychiatricdiagnosis. The research protocol was approved by theŞişli Hamidiye Etfal Education and Research HospitalEthics Committee. Each study participant signed aninformed consent form that was approved by the ethicscommittee. The research was carried out in accordancewith the World Medical Association Code of Ethicsfor Medical Research Involving Human SubjectsDeclaration of Helsinki Good Clinical PracticeGuidelines.
Patients The patient group of this study were volunteereuthymic individuals between the ages 18-65, at least
primary school graduates, had no severe neurologicand internal diseases, had no current other Axis-Idiagnosis, did not have coexisting schizophrenia orany other psychotic disorder, had no alcohol orsubstance addiction or abuse and had been diagnosedas bipolar according to the DSM-IV diagnosticcriteria. Excluding criteria for the patient groupincluded those younger than 18 years and older than65 years of age, illiterate individuals, those with severeneurologic or internal disease and those with alcoholor substance abuse or addiction.
Clinical evaluation Each participant who volunteered to participate inthis study was asked to fill out a sociodemographicsdata form, a Childhood Traumatic Questionnaire(CTQ) and a Dissociative Experiences Scale (DES).The Structured Clinical Interview for DSM-IV Axis IDisorders (SCID-I) and Structured Clinical Interviewfor DSM-IV Dissociative Disorders (SCID-D) wasapplied by the interviewer to each participant. SCID-I is a clinical interview structured by Firstet al. [13] for DSM-IV Axis I disorders. Theadaptation and reliability studies of SCID-I for Turkeywere performed by Çorapçıoğlu et al. [14]. SCID-Dis a structured clinical interview chart for DSM-IVdissociative disorders developed by Steinberg [15]. Itcan be used to evaluate the dissociative symptoms anddisorders of the subject in various psychiatric diseases.The reliability and validity studies for Turkey havebeen conducted by Kundakçı et al. [16]. DES is a scale consisting of 28 items developedby Bernstein and Putnam [17]. For each item of thescale, subjects give points between 0-100 and theresult is obtained by calculating the average of thetotal scores. Total scores that are higher than 30, areindicative of a dissociative disorder. The reliability andvalidity studies for Turkey were performed by Yargıçet al. [18]. CTQ was developed by Bernstein et al.[19]. It is a self- reported quintet Likert type scale. Itincludes questions for evaluating childhood emotional,physical and sexual abuse and physical and emotionalneglect. The reliability and validity studies for Turkeywere performed by Şar et al. [20].
Statistical Analysis Statistical analyses of the present study wereperformed with the SPSS 16.0 program. Descriptive
668 The European Research Journal Volume 5 Issue 4 July 2019
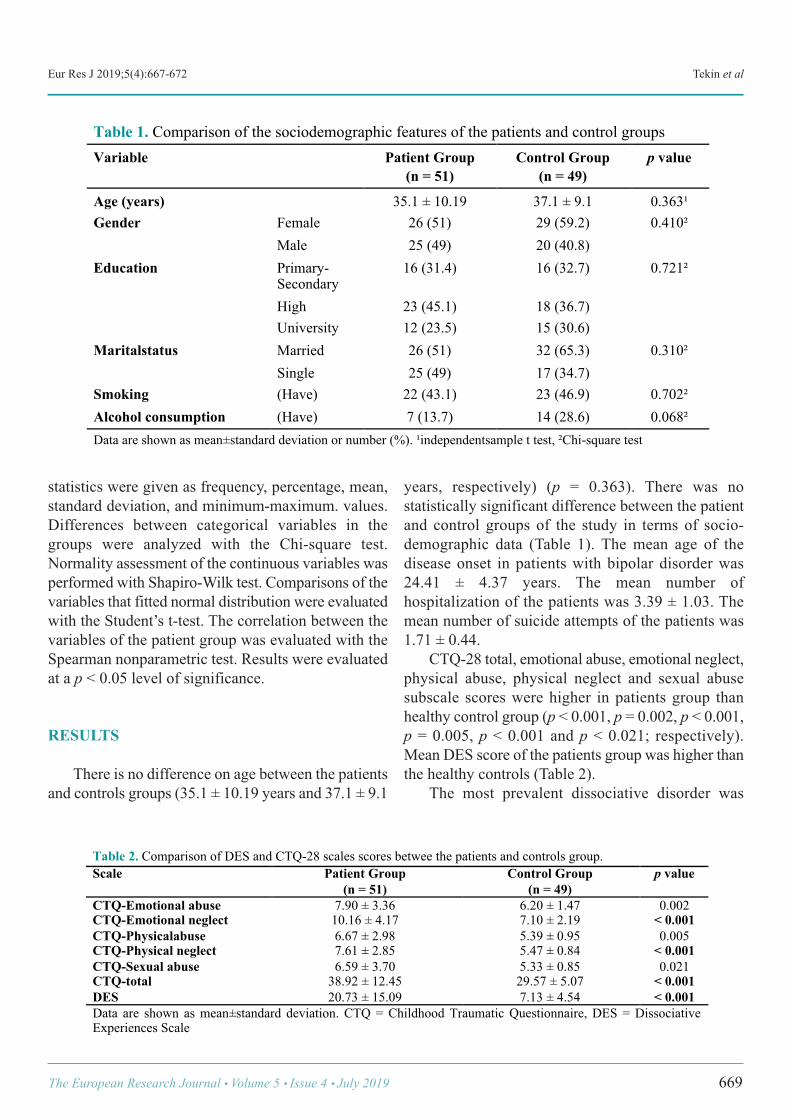
Eur Res J 2019;5(4):667-672 Tekin et al
statistics were given as frequency, percentage, mean,standard deviation, and minimum-maximum. values.Differences between categorical variables in thegroups were analyzed with the Chi-square test.Normality assessment of the continuous variables wasperformed with Shapiro-Wilk test. Comparisons of thevariables that fitted normal distribution were evaluatedwith the Student’s t-test. The correlation between thevariables of the patient group was evaluated with theSpearman nonparametric test. Results were evaluatedat a p < 0.05 level of significance.
RESULTS
There is no difference on age between the patientsand controls groups (35.1 ± 10.19 years and 37.1 ± 9.1
years, respectively) (p = 0.363). There was nostatistically significant difference between the patientand control groups of the study in terms of socio-demographic data (Table 1). The mean age of thedisease onset in patients with bipolar disorder was24.41 ± 4.37 years. The mean number ofhospitalization of the patients was 3.39 ± 1.03. Themean number of suicide attempts of the patients was1.71 ± 0.44. CTQ-28 total, emotional abuse, emotional neglect,physical abuse, physical neglect and sexual abusesubscale scores were higher in patients group thanhealthy control group (p < 0.001, p = 0.002, p < 0.001,p = 0.005, p < 0.001 and p < 0.021; respectively).Mean DES score of the patients group was higher thanthe healthy controls (Table 2). The most prevalent dissociative disorder was
The European Research Journal Volume 5 Issue 4 July 2019 669
!
Table 1. Comparison of the sociodemographic features of the patients and control groups Variable Patient Group
(n = 51) Control Group
(n = 49) p value
Age (years) 35.1 ± 10.19 37.1 ± 9.1 0.363¹ Gender Female 26 (51) 29 (59.2) 0.410²
Male 25 (49) 20 (40.8) Education Primary-
Secondary 16 (31.4) 16 (32.7) 0.721²
High 23 (45.1) 18 (36.7) University 12 (23.5) 15 (30.6)
Maritalstatus Married 26 (51) 32 (65.3) 0.310² Single 25 (49) 17 (34.7)
Smoking (Have) 22 (43.1) 23 (46.9) 0.702² Alcohol consumption (Have) 7 (13.7) 14 (28.6) 0.068² Data are shown as mean±standard deviation or number (%). ¹independentsample t test, ²Chi-square test
!
Table 2. Comparison of DES and CTQ-28 scales scores betwee the patients and controls group. Scale Patient Group
(n = 51) Control Group
(n = 49) p value
CTQ-Emotional abuse 7.90 ± 3.36 6.20 ± 1.47 0.002 CTQ-Emotional neglect 10.16 ± 4.17 7.10 ± 2.19 < 0.001 CTQ-Physicalabuse 6.67 ± 2.98 5.39 ± 0.95 0.005 CTQ-Physical neglect 7.61 ± 2.85 5.47 ± 0.84 < 0.001 CTQ-Sexual abuse 6.59 ± 3.70 5.33 ± 0.85 0.021 CTQ-total 38.92 ± 12.45 29.57 ± 5.07 < 0.001 DES 20.73 ± 15.09 7.13 ± 4.54 < 0.001 Data are shown as mean±standard deviation. CTQ = Childhood Traumatic Questionnaire, DES = Dissociative Experiences Scale
Eur Res J 2019;5(4):667-672 Dissociative disorders in patients with bipolar disorder
depersonalization disorder in patients with bipolardisorder (17.6%). Other comorbid dissociativedisorders in patients with bipolar were shown at theTable 3. There was a positive correlation between DESscore and number of suicidal attempt (r = 0.284). Anegative relationship was found between DES scoreand age of the disease (r = -0.332). Emotional neglectscore was correlate with number of suicide attemptand age of the disease onset (r = 0.328 and r = -0.333).CTQ-total score was negatively correlate with age ofthe disease onset (r = -0.291) (Table 4).
DISCUSSION
The primary aim of the present study was toinvestigate the comorbidity of dissociative disordersin patients with bipolar disorder. The second aim ofthe study was to investigate the relationship betweendissociation and childhood traumatic events, andclinical features of the patients. Many studies have emphasized the relationshipbetween bipolar disorder and childhood trauma [21-24]. In a study conducted by Garno et al. [24], it has
been reported that there are at least one type ofchildhood trauma in almost half of bipolar patients andtwo or more types in about one third of them. In astudy conducted by Leboyer et al. [22], bipolarpatients and healthy individuals were compared forchildhood traumatic experiences. According to theirresults, while the incidence of at least one type ofchildhood trauma in bipolar patients was 54.4%, thisincidence was found to be 31.9% in healthyindividuals [22]. The results of our study are similarto those of other studies in literature. Indeed,according to the results of our study, each CTQsubscale score (emotional abuse, physical abuse,physical neglect, emotional neglect and sexual abuse)was significantly higher in patients with bipolardisorder than in the healthy volunteers. The fact thatchildhood traumas are seen more frequently in bipolarpatients brings to mind the question of how thesechildhood traumas affect the clinical course. Manystudies have shown that there is a relationship betweenchildhood trauma and the early age of disease onset,more suicidal attempts, more psychotic symptoms,higher rates of rapid cycling and more substance abusein patients with bipolar disorder [6, 23-26]. Leverichet al. [26] have indicated that there is a relationshipbetween physical and sexual abuse with early age ofdisease onset, rapid cycling and increased suicidalattempts in patients with bipolar disorder. Garno et al.[24] have found that in bipolar patients with childhoodtrauma, the age of disease onset was earlier and thatpatients with a history of sexual abuse were found tohave more suicidal attempts. In a study conducted byBrown et al. [6], it has been found that the number ofhospitalizations is higher in bipolar patients withchildhood trauma and alcohol abuse was more in thosewith a history of sexual and physical abuse. Romeroet al. [27] have found that there is more suicidalattempts and substance abuse in bipolar patients with
670 The European Research Journal Volume 5 Issue 4 July 2019
!
Table4. Correations of DES and CTQ-28 scale scores with clinical features in patients with bipolar disorder DES Emotional
Abuse Emotional
Neglect Physical Abuse
Physical Neglect
Sexual Abuse
CTQ-28 Total
Number of Hospitalization
r=0.148 r=0.139 r=0.106 r=0.002 r=0.048 r=0.155 r=0.097
Number of SuicideAttempt
r=0.284* r=0.106 r=0.328* r=0.092 r=0.046 r=0.205 r=0.219
Age of Onset r=-0.332* r=-0.264 r=-0.333* r=-0.174 r=-0.029 r=-0.240 r=-0.291* DES = Dissociative Experiences Scale, CTQ = Childhood Traumatic Questionnaire, *p < 0.05
!
Table 3. Comorbid dissociative disorders in patients with bipolar disorder (by using SCID-D)
Dissociative Disorders Data n (%)
Dissociative amnesia 4 (7.8%) Dissociative fugue 1 (1.9%) Dissociative idendity disorder 2 (3.9%) Depersonalization disorder 9 (17.6%) Dissociative disorder not otherwise specified
8 (15.6%)
Eur Res J 2019;5(4):667-672 Tekin et al
childhood trauma. According to the results of thepresent study, CTQ-28 total and emotional neglectsubscale scores are correlated with early onset of thedisease. Additionally, we have found that emotionalneglect score was positively correlate with number ofsuicidal attempt in patients with bipolar disorder. Thenegative effects of childhood trauma on the clinicalcourse of bipolar disease may be associated withvarious neurobiological impairments. Indeed, it hasbeen demonstrated that childhood traumas leads todisruptions in the sensitivity of the neuroendocrinestress response and activity of the hypothalamic-pituitary-adrenal axis and damages in the cortical areassuch as the hippocampus and amygdala that have animportant role in cognitive and emotional functions[4, 28, 29]. There are less studies in literature that investigatethe relationship between bipolar disorder anddissociation. In a study conducted by Latalova et al.[11], bipolar patients and healthy individuals werecompared for level of dissociation. Latalova et al. [11]have found that DES score was higher in patients withbipolar disorder than healthy controls. Coryell [30]reported in a case report that multiple personality mayoccur as an epiphenomenon of the affective disorderor of other illnesses. Steingard and Frankel [31]reported a patient with a diagnosis of bipolar disorder,rapid cycling type, who in fact was experiencingdissociative episodes manifested as psychotic states.We have found that the mean DES score of the patientswith bipolar disorder was higher than healthy controls. The most important result of the present study is thatdissociative disorders are frequently accompanying tobipolar disorder. According to our results, the mostprevalent dissociative disorders that accompanied tobipolar disorder are depersonalization disorder anddissociative disorder not otherwise specified (17.6%and 15.6%, respectively). According to the results of the previous studies, itcan be said that higher levels of dissociation hasnegatively affect the clinical course of bipolardisorder. Latalova et al. [11] have found that there isa relationship between higher levels of dissociationand earlier onset of the disease in patients with bipolardisorder. Spitzer et al. [32] have demonstrated lowertreatment responses in bipolar patients with highdissociation scores. Bakım et al. [33] have found therelationship between higher DES scores and duration
hospital stay in patients with bipolar disorder. In ourstudy, we found the age of disorder onset to be earlierand number of suicide attempts to be higher in bipolarpatients with high dissociation scores. Consequently,it can be said that the results of the present study havesupported the results of previous studies.
Limitations The present study has some limitations. Firstly,sample size of the present study was relatively smaller.Second limitation of the present study is that thecorrelation coefficients between our variables weresmaller than 0.4. Namely, our results need to confirmwith larger sample.
CONCLUSION
In conclusion, dissociative disorders arefrequently observed in bipolar patients. In bipolardisorder patients with childhood trauma or highdissociation scores, the onset of the disease may beearlier and the number of suicide attempts may begreater.
Authorship declaration All authors listed meet the authorship criteriaaccording to the latest guidelines of the InternationalCommittee of Medical Journal Editors, and all authorsare in agreement with the manuscript.
Conflict of interest The authors disclosed no conflict of interest duringthe preparation or publication of this manuscript.
Financing The authors disclosed that they did not receive anygrant during conduction or writing of this study.
REFERENCES
[1] Fisher HL, Hosang GM. Childhood maltreatment and bipolardisorder: a critical review of the evidence. Mind Brain 2010;1:750-85. [2] Larsson S, Aas M, Klungsøyr O, Agartz I, Mork E, Steen NE, et al.Patterns of childhood adverse events are associated with clinicalcharacteristics of bipolar disorder. BMC Psychiatry 2013;13:97. [3] Daruy-Filho L, Brietzke E, Lafer B, Grassi-Oliveira R. Childhoodmaltreatment and clinical outcomes of bipolar disorder. Acta PsychiatrScand 2011;124:427-34.
The European Research Journal Volume 5 Issue 4 July 2019 671
Eur Res J 2019;5(4):667-672 Dissociative disorders in patients with bipolar disorder
[4] Etain B, Mathieu F, Henry C, Raust A, Roy I, Germain A, et al.Preferential association between childhood emotional abuse and bipolardisorder. J Trauma Stress 2010;23:376-83. [5] Janssen I, Krabbendam L, Bak M, Hanssen M, Vollebergh W, DeGR, et al. Childhood abuse as a risk factor for psychotic experiences.Acta Psychiatr Scand 2004;109:38-45. [6] Brown GR, McBride L, Bauer MS, Williford WO; CooperativeStudies Program 430 Study Team. Impact of childhood abuse on thecourse of bipolar disorder: a replication study in U.S. veterans. J AffectDisord 2005;89:57-67. [7] Alvarez MJ, Roura P, Oses A, Foguet Q, Sola J, Arrufat FX.Prevalence and clinical impact of childhood trauma in patients withsevere mental disorders. J Nerv Ment Dis 2011;199:156-61. [8] Holowka DV, King S, Sahep D, Pukal M, Brunet A. Childhood abuseand dissociative symptoms in adult schizophrenia. Schizophr Res 2003;60:87-90. [9] Zanarini MC, Ruser T, Frankenburg FR, Hennen J. The dissociativeexperiences of borderline patients. Compr Psychiatry 2000;41:223-7. [10] Sar V, Taycan O, Bolat N, Ozmen M, Duran A, Ozturk E, et al.Childhood trauma and dissociation in schizophrenia. Psychopathology2010;43:33-40. [11] Latalova K, Prasko J, Pastucha P, Grambal A, Kamaradova D,Diveky T, et al. Bipolar affective disorder and dissociation - comparisonwith healthy controls. Biomed Pap Med Fac Univ Palacky OlomoucCzech Repub 2010;155:181-6. [12] Hariri AG, Yazıcı-Güleç M, Cengiz-Örengül FF, Aydın-Sümbül A,Yeni-Elbay R, Güleç H. Dissociation in bipolar disorder: relationshipsbetween clinical variables and childhood trauma. J Affect Disord2015;184:104-10. [13] First MB, Spitzer RL, Gibbon M, Williams JBW. StructuredClinical Interview for DSM-IV Axis I Disorders (SCID-I), ClinicalVersion. Washington: American Psychiatric Press, 1997. [14] Çorapçıoğlu A, Aydemir O, Yıldız M, Danacı AE, Köroğlu E. DSM-IV Eksen-I Bozuklukları için Yapılandırılmış Klinik Görüşme. Ankara:HYB, 1999. [15] Steinberg M, Cicchetti DV, Buchanan J, Hall PE, Rounsaville B.Clinical assessment of dissociative symptoms and disorders. TheStructured Clinical Interview for DSM-IV Dissociative Disorders(SCID-D). Dissociation 1993;6:3-15. [16] Kundakci T, Şar V, Kiziltan E, Yargic LI, Tutkun H. The reliabilityand validity of the Turkish Version of the Structured Clinical Interviewfor DSM-IV Dissociative Disorders (SCID-D): A preliminary study. JTrauma Dissociation 2014;15:24-34. [17] Bernstein EM, Putnam PW. Development, reliability and validityof a dissociation scale. J Nerv Ment Dis 1986;174:727-35. [18] Yargıç LI, Tutkun H, Şar V. The reliability and validity of theTurkish version of the dissociative experiences scale. Dissociation
1995;8:10-3. [19] Bernstein DP, Fink L, Handelsman L, Foote J, Lovejoy M, WenzelK, et al. Initial reliability and validity of a new retrospective measure ofchild abuse and neglect. Am J Psychiatry 1994;151:1132-6. [20] Şar V, Öztürk E, İkikardeş E. Çocukluk Çağı Ruhsal TravmaÖlçeğinin Türkçe uyarlamasının geçerlilik ve güvenilirliği. TurkiyeKlinikleri J Med Sci 2012;32:1054-63. [21] Hyun M, Friedman SD, Dunner DL. Relationship of childhoodphysical and sexual abuse to adult bipolar disorder. Bipolar Disord2000;2:131-5. [22] Leboyer M, Etain B, Mathieu F, Henry C, Jamain S, Bellivier F.Childhood affective trauma in bipolar affective disorder. Bipolar Disord2007; 9(Suppl 1):9. [23] Leverich GS, Post RM. Course of bipolar illness after history ofchildhood trauma. Lancet 2006;367:1040-2. [24] Garno JL, Goldberg JF, Ramirez PM, Ritzler BA. Impact ofchildhood abuse on the clinical course of bipolar disorder. Br JPsychiatry 2005;186:121-5. [25] Hammersley P, Dias A, Todd G, Bowen-Jones K, Reilly B, BentallRP. Childhood trauma and hallucinations in bipolar affective disorder:preliminary investigation. Br J Psychiatry 2003;182:543-7. [26] Leverich GS, Mcelroy SL, Suppes T, Keck PE, Denicoff KD, NolenWA, et al. Early physical and sexual abuse associated with an adversecourse of bipolar illness. Biol Psychiatry 2002;51:288-297. [27] Romero S, Birmaher B, Axelson D, Goldstein T, Goldstein BI, GillMK, et al. Prevalence and correlates of physical and sexual abuse inchildren and adolescents with bipolar disorder. J Affect Disord2009;112:144-50. [28] Heim C, Mletzko T, Purselle D, Muselman DL, Nemeroff CB. Thedexamethasone/corticotropin-releasing factor test in men with majordepression: role of childhood trauma. Biol Psychiatry 2008;63:398-405. [29] Teicher MH, Anderson CM, Polcari A. Childhood maltreatment isassociated with reduced volume in the hippocampal subfields CA3,dentate gyrus, and subiculum. Proc Natl Acad Sci U S A 2012;109:E563-72. [30] Coryell W. Single case study. Multiple personality and primaryaffective disorder. J Nerv Ment Dis 1983;171:388-390. [31] Steingard S, Frankel FH. Dissociation and psychotic symptoms.Am J Psychiatry 1985;142:953-5. [32] Spitzer C, Barnow S, Freyberger HJ, Grabe HJ. Dissociationpredicts symptom-related treatment outcome in short-term inpatientpsychotherapy. Aust N Z J Psychiatry 2007;41:682-7. [33] Bakım B, Baran E, Güleken MD, Tankaya O, Yayla S, Akpınar A,et al. Comparison of the patient groups with and without dissociativedisorder comorbidity among the inpatients with bipolar disorder. FamPract Palliat Care 2016;1:35-42.
672 The European Research Journal Volume 5 Issue 4 July 2019
This is an open access article distributed under the terms of Creative CommonAttribution-NonCommercial-NoDerivatives 4.0 International License.
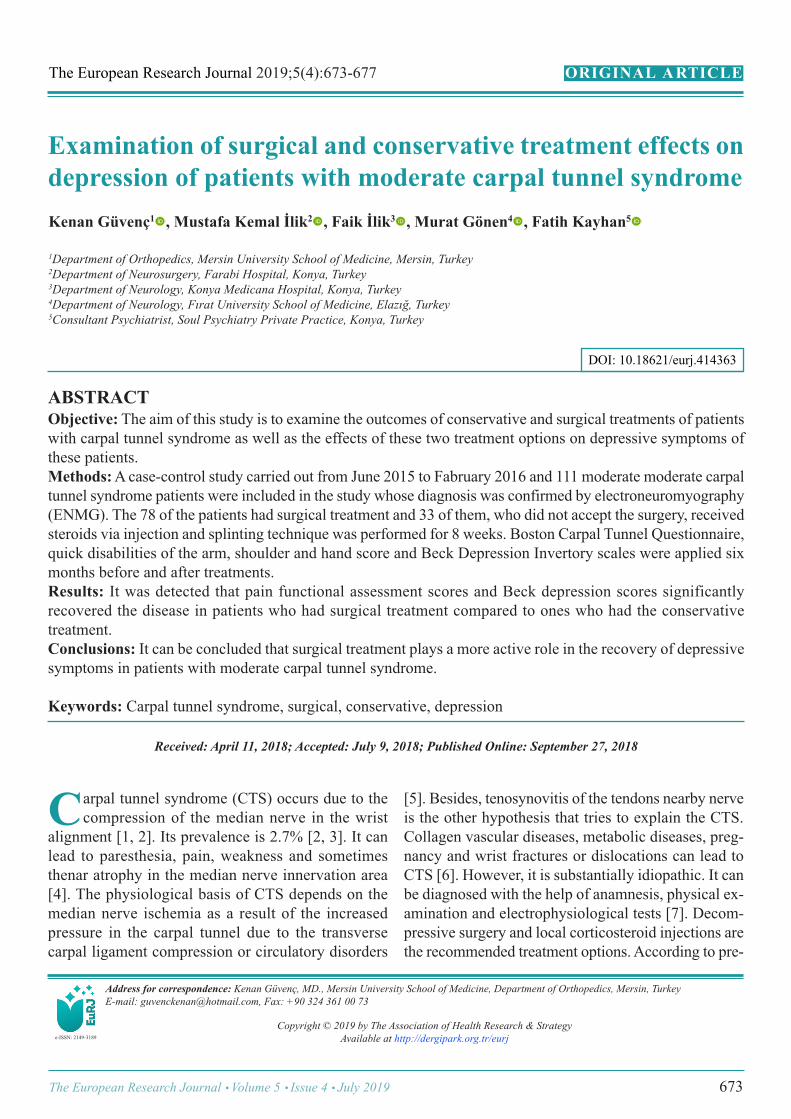
Examination of surgical and conservative treatment effects ondepression of patients with moderate carpal tunnel syndromeKenan Güvenç1 , Mustafa Kemal İlik2 , Faik İlik3 , Murat Gönen4 , Fatih Kayhan5
1Department of Orthopedics, Mersin University School of Medicine, Mersin, Turkey 2Department of Neurosurgery, Farabi Hospital, Konya, Turkey 3Department of Neurology, Konya Medicana Hospital, Konya, Turkey 4Department of Neurology, Fırat University School of Medicine, Elazığ, Turkey 5Consultant Psychiatrist, Soul Psychiatry Private Practice, Konya, Turkey
ABSTRACTObjective: The aim of this study is to examine the outcomes of conservative and surgical treatments of patientswith carpal tunnel syndrome as well as the effects of these two treatment options on depressive symptoms ofthese patients. Methods: A case-control study carried out from June 2015 to Fabruary 2016 and 111 moderate moderate carpaltunnel syndrome patients were included in the study whose diagnosis was confirmed by electroneuromyography(ENMG). The 78 of the patients had surgical treatment and 33 of them, who did not accept the surgery, receivedsteroids via injection and splinting technique was performed for 8 weeks. Boston Carpal Tunnel Questionnaire,quick disabilities of the arm, shoulder and hand score and Beck Depression Invertory scales were applied sixmonths before and after treatments. Results: It was detected that pain functional assessment scores and Beck depression scores significantlyrecovered the disease in patients who had surgical treatment compared to ones who had the conservativetreatment. Conclusions: It can be concluded that surgical treatment plays a more active role in the recovery of depressivesymptoms in patients with moderate carpal tunnel syndrome.
Keywords: Carpal tunnel syndrome, surgical, conservative, depression
Address for correspondence: Kenan Güvenç, MD., Mersin University School of Medicine, Department of Orthopedics, Mersin, Turkey E-mail: [email protected], Fax: +90 324 361 00 73
Copyright © 2019 by The Association of Health Research & StrategyAvailable at http://dergipark.org.tr/eurj
The European Research Journal 2019;5(4):673-677
arpal tunnel syndrome (CTS) occurs due to thecompression of the median nerve in the wrist
alignment [1, 2]. Its prevalence is 2.7% [2, 3]. It canlead to paresthesia, pain, weakness and sometimesthenar atrophy in the median nerve innervation area[4]. The physiological basis of CTS depends on themedian nerve ischemia as a result of the increasedpressure in the carpal tunnel due to the transversecarpal ligament compression or circulatory disorders
[5]. Besides, tenosynovitis of the tendons nearby nerveis the other hypothesis that tries to explain the CTS.Collagen vascular diseases, metabolic diseases, preg-nancy and wrist fractures or dislocations can lead toCTS [6]. However, it is substantially idiopathic. It canbe diagnosed with the help of anamnesis, physical ex-amination and electrophysiological tests [7]. Decom-pressive surgery and local corticosteroid injections arethe recommended treatment options. According to pre-
C
ORIGINAL A RTICLE
e-ISSN: 2149-3189
DOI: 10.18621/eurj.414363
Received: April 11, 2018; Accepted: July 9, 2018; Published Online: September 27, 2018
The European Research Journal Volume 5 Issue 4 July 2019 673
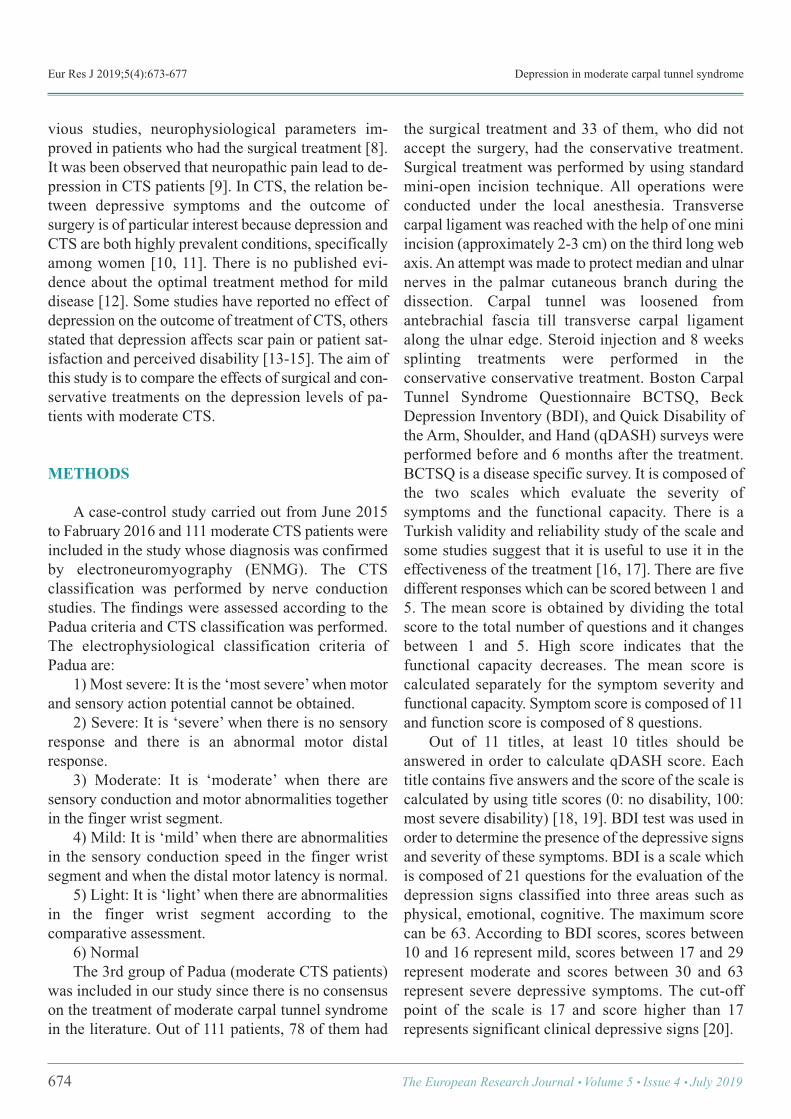
Eur Res J 2019;5(4):673-677 Depression in moderate carpal tunnel syndrome
vious studies, neurophysiological parameters im-proved in patients who had the surgical treatment [8].It was been observed that neuropathic pain lead to de-pression in CTS patients [9]. In CTS, the relation be-tween depressive symptoms and the outcome ofsurgery is of particular interest because depression andCTS are both highly prevalent conditions, specificallyamong women [10, 11]. There is no published evi-dence about the optimal treatment method for milddisease [12]. Some studies have reported no effect ofdepression on the outcome of treatment of CTS, othersstated that depression affects scar pain or patient sat-isfaction and perceived disability [13-15]. The aim ofthis study is to compare the effects of surgical and con-servative treatments on the depression levels of pa-tients with moderate CTS.
METHODS
A case-control study carried out from June 2015to Fabruary 2016 and 111 moderate CTS patients wereincluded in the study whose diagnosis was confirmedby electroneuromyography (ENMG). The CTSclassification was performed by nerve conductionstudies. The findings were assessed according to thePadua criteria and CTS classification was performed.The electrophysiological classification criteria ofPadua are: 1) Most severe: It is the ‘most severe’ when motorand sensory action potential cannot be obtained. 2) Severe: It is ‘severe’ when there is no sensoryresponse and there is an abnormal motor distalresponse. 3) Moderate: It is ‘moderate’ when there aresensory conduction and motor abnormalities togetherin the finger wrist segment. 4) Mild: It is ‘mild’ when there are abnormalitiesin the sensory conduction speed in the finger wristsegment and when the distal motor latency is normal. 5) Light: It is ‘light’ when there are abnormalitiesin the finger wrist segment according to thecomparative assessment. 6) Normal The 3rd group of Padua (moderate CTS patients)was included in our study since there is no consensuson the treatment of moderate carpal tunnel syndromein the literature. Out of 111 patients, 78 of them had
the surgical treatment and 33 of them, who did notaccept the surgery, had the conservative treatment.Surgical treatment was performed by using standardmini-open incision technique. All operations wereconducted under the local anesthesia. Transversecarpal ligament was reached with the help of one miniincision (approximately 2-3 cm) on the third long webaxis. An attempt was made to protect median and ulnarnerves in the palmar cutaneous branch during thedissection. Carpal tunnel was loosened fromantebrachial fascia till transverse carpal ligamentalong the ulnar edge. Steroid injection and 8 weekssplinting treatments were performed in theconservative conservative treatment. Boston CarpalTunnel Syndrome Questionnaire BCTSQ, BeckDepression Inventory (BDI), and Quick Disability ofthe Arm, Shoulder, and Hand (qDASH) surveys wereperformed before and 6 months after the treatment.BCTSQ is a disease specific survey. It is composed ofthe two scales which evaluate the severity ofsymptoms and the functional capacity. There is aTurkish validity and reliability study of the scale andsome studies suggest that it is useful to use it in theeffectiveness of the treatment [16, 17]. There are fivedifferent responses which can be scored between 1 and5. The mean score is obtained by dividing the totalscore to the total number of questions and it changesbetween 1 and 5. High score indicates that thefunctional capacity decreases. The mean score iscalculated separately for the symptom severity andfunctional capacity. Symptom score is composed of 11and function score is composed of 8 questions. Out of 11 titles, at least 10 titles should beanswered in order to calculate qDASH score. Eachtitle contains five answers and the score of the scale iscalculated by using title scores (0: no disability, 100:most severe disability) [18, 19]. BDI test was used inorder to determine the presence of the depressive signsand severity of these symptoms. BDI is a scale whichis composed of 21 questions for the evaluation of thedepression signs classified into three areas such asphysical, emotional, cognitive. The maximum scorecan be 63. According to BDI scores, scores between10 and 16 represent mild, scores between 17 and 29represent moderate and scores between 30 and 63represent severe depressive symptoms. The cut-offpoint of the scale is 17 and score higher than 17represents significant clinical depressive signs [20].
674 The European Research Journal Volume 5 Issue 4 July 2019
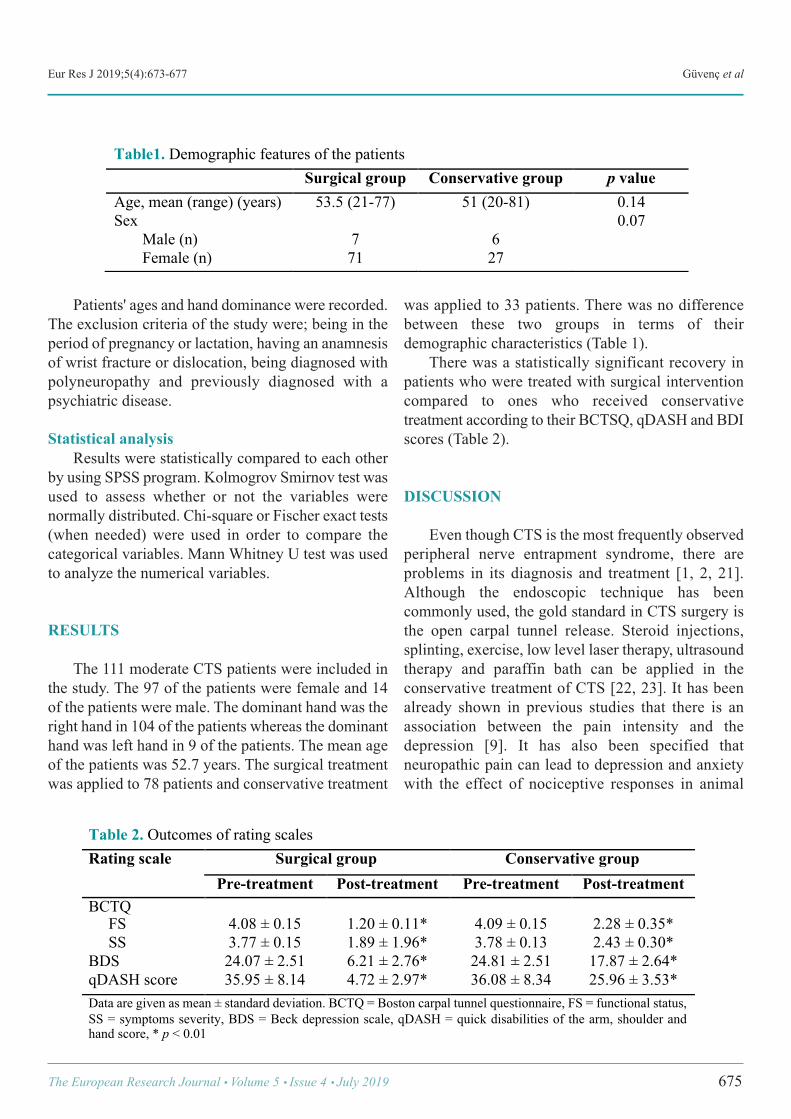
Eur Res J 2019;5(4):673-677 Güvenç et al
Patients' ages and hand dominance were recorded.The exclusion criteria of the study were; being in theperiod of pregnancy or lactation, having an anamnesisof wrist fracture or dislocation, being diagnosed withpolyneuropathy and previously diagnosed with apsychiatric disease.
Statistical analysis Results were statistically compared to each otherby using SPSS program. Kolmogrov Smirnov test wasused to assess whether or not the variables werenormally distributed. Chi-square or Fischer exact tests(when needed) were used in order to compare thecategorical variables. Mann Whitney U test was usedto analyze the numerical variables.
RESULTS
The 111 moderate CTS patients were included inthe study. The 97 of the patients were female and 14of the patients were male. The dominant hand was theright hand in 104 of the patients whereas the dominanthand was left hand in 9 of the patients. The mean ageof the patients was 52.7 years. The surgical treatmentwas applied to 78 patients and conservative treatment
was applied to 33 patients. There was no differencebetween these two groups in terms of theirdemographic characteristics (Table 1). There was a statistically significant recovery inpatients who were treated with surgical interventioncompared to ones who received conservativetreatment according to their BCTSQ, qDASH and BDIscores (Table 2).
DISCUSSION
Even though CTS is the most frequently observedperipheral nerve entrapment syndrome, there areproblems in its diagnosis and treatment [1, 2, 21].Although the endoscopic technique has beencommonly used, the gold standard in CTS surgery isthe open carpal tunnel release. Steroid injections,splinting, exercise, low level laser therapy, ultrasoundtherapy and paraffin bath can be applied in theconservative treatment of CTS [22, 23]. It has beenalready shown in previous studies that there is anassociation between the pain intensity and thedepression [9]. It has also been specified thatneuropathic pain can lead to depression and anxietywith the effect of nociceptive responses in animal
The European Research Journal Volume 5 Issue 4 July 2019 675
!
Table1. Demographic features of the patients Surgical group Conservative group p value Age, mean (range) (years) 53.5 (21-77) 51 (20-81) 0.14 Sex
Male (n) Female (n)
7 71
6 27
0.07
Table 2. Outcomes of rating scales Rating scale Surgical group Conservative group
Pre-treatment Post-treatment Pre-treatment Post-treatment BCTQ FS SS
4.08 ± 0.15 3.77 ± 0.15
1.20 ± 0.11* 1.89 ± 1.96*
4.09 ± 0.15 3.78 ± 0.13
2.28 ± 0.35* 2.43 ± 0.30*
BDS 24.07 ± 2.51 6.21 ± 2.76* 24.81 ± 2.51 17.87 ± 2.64* qDASH score 35.95 ± 8.14 4.72 ± 2.97* 36.08 ± 8.34 25.96 ± 3.53* Data are given as mean ± standard deviation. BCTQ = Boston carpal tunnel questionnaire, FS = functional status, SS = symptoms severity, BDS = Beck depression scale, qDASH = quick disabilities of the arm, shoulder and hand score, * p < 0.01 !
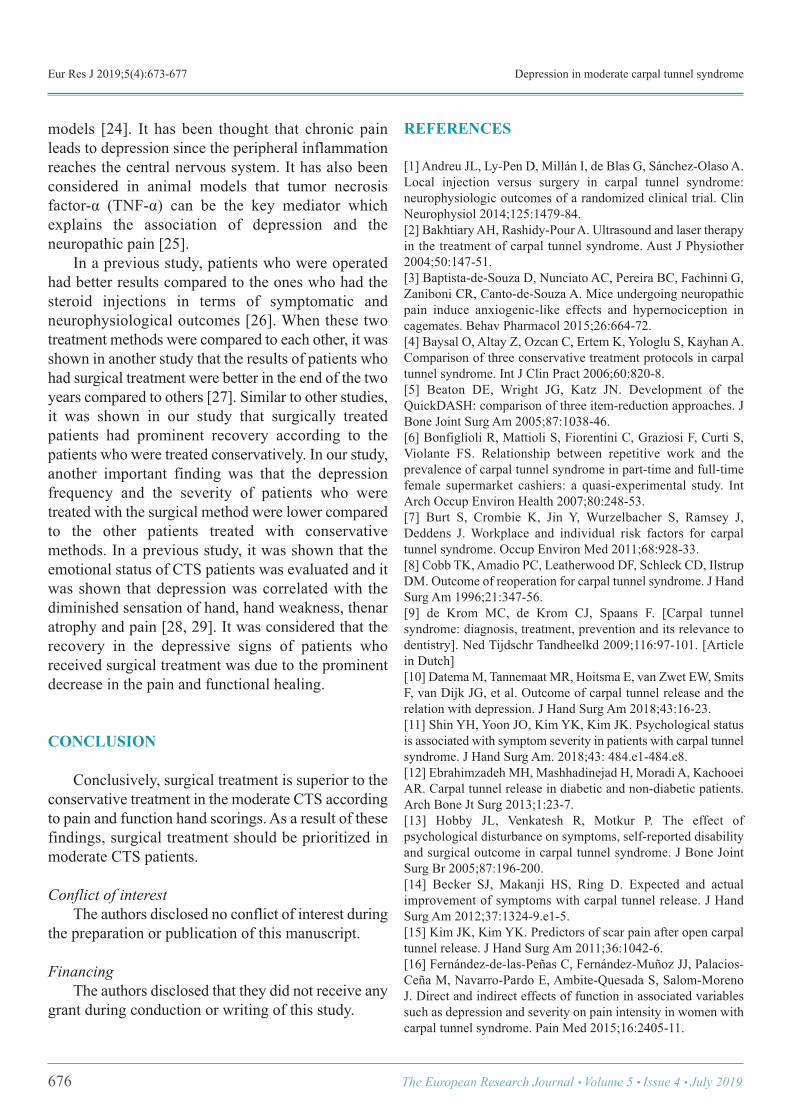
Eur Res J 2019;5(4):673-677 Depression in moderate carpal tunnel syndrome
models [24]. It has been thought that chronic painleads to depression since the peripheral inflammationreaches the central nervous system. It has also beenconsidered in animal models that tumor necrosisfactor-α (TNF-α) can be the key mediator whichexplains the association of depression and theneuropathic pain [25]. In a previous study, patients who were operatedhad better results compared to the ones who had thesteroid injections in terms of symptomatic andneurophysiological outcomes [26]. When these twotreatment methods were compared to each other, it wasshown in another study that the results of patients whohad surgical treatment were better in the end of the twoyears compared to others [27]. Similar to other studies,it was shown in our study that surgically treatedpatients had prominent recovery according to thepatients who were treated conservatively. In our study,another important finding was that the depressionfrequency and the severity of patients who weretreated with the surgical method were lower comparedto the other patients treated with conservativemethods. In a previous study, it was shown that theemotional status of CTS patients was evaluated and itwas shown that depression was correlated with thediminished sensation of hand, hand weakness, thenaratrophy and pain [28, 29]. It was considered that therecovery in the depressive signs of patients whoreceived surgical treatment was due to the prominentdecrease in the pain and functional healing.
CONCLUSION
Conclusively, surgical treatment is superior to theconservative treatment in the moderate CTS accordingto pain and function hand scorings. As a result of thesefindings, surgical treatment should be prioritized inmoderate CTS patients.
Conflict of interest The authors disclosed no conflict of interest duringthe preparation or publication of this manuscript.
Financing The authors disclosed that they did not receive anygrant during conduction or writing of this study.
REFERENCES
[1] Andreu JL, Ly-Pen D, Millán I, de Blas G, Sánchez-Olaso A.Local injection versus surgery in carpal tunnel syndrome:neurophysiologic outcomes of a randomized clinical trial. ClinNeurophysiol 2014;125:1479-84. [2] Bakhtiary AH, Rashidy-Pour A. Ultrasound and laser therapyin the treatment of carpal tunnel syndrome. Aust J Physiother2004;50:147-51. [3] Baptista-de-Souza D, Nunciato AC, Pereira BC, Fachinni G,Zaniboni CR, Canto-de-Souza A. Mice undergoing neuropathicpain induce anxiogenic-like effects and hypernociception incagemates. Behav Pharmacol 2015;26:664-72. [4] Baysal O, Altay Z, Ozcan C, Ertem K, Yologlu S, Kayhan A.Comparison of three conservative treatment protocols in carpaltunnel syndrome. Int J Clin Pract 2006;60:820-8. [5] Beaton DE, Wright JG, Katz JN. Development of theQuickDASH: comparison of three item-reduction approaches. JBone Joint Surg Am 2005;87:1038-46. [6] Bonfiglioli R, Mattioli S, Fiorentini C, Graziosi F, Curti S,Violante FS. Relationship between repetitive work and theprevalence of carpal tunnel syndrome in part-time and full-timefemale supermarket cashiers: a quasi-experimental study. IntArch Occup Environ Health 2007;80:248-53. [7] Burt S, Crombie K, Jin Y, Wurzelbacher S, Ramsey J,Deddens J. Workplace and individual risk factors for carpaltunnel syndrome. Occup Environ Med 2011;68:928-33. [8] Cobb TK, Amadio PC, Leatherwood DF, Schleck CD, IlstrupDM. Outcome of reoperation for carpal tunnel syndrome. J HandSurg Am 1996;21:347-56. [9] de Krom MC, de Krom CJ, Spaans F. [Carpal tunnelsyndrome: diagnosis, treatment, prevention and its relevance todentistry]. Ned Tijdschr Tandheelkd 2009;116:97-101. [Articlein Dutch] [10] Datema M, Tannemaat MR, Hoitsma E, van Zwet EW, SmitsF, van Dijk JG, et al. Outcome of carpal tunnel release and therelation with depression. J Hand Surg Am 2018;43:16-23. [11] Shin YH, Yoon JO, Kim YK, Kim JK. Psychological statusis associated with symptom severity in patients with carpal tunnelsyndrome. J Hand Surg Am. 2018;43: 484.e1-484.e8. [12] Ebrahimzadeh MH, Mashhadinejad H, Moradi A, KachooeiAR. Carpal tunnel release in diabetic and non-diabetic patients.Arch Bone Jt Surg 2013;1:23-7. [13] Hobby JL, Venkatesh R, Motkur P. The effect ofpsychological disturbance on symptoms, self-reported disabilityand surgical outcome in carpal tunnel syndrome. J Bone JointSurg Br 2005;87:196-200. [14] Becker SJ, Makanji HS, Ring D. Expected and actualimprovement of symptoms with carpal tunnel release. J HandSurg Am 2012;37:1324-9.e1-5. [15] Kim JK, Kim YK. Predictors of scar pain after open carpaltunnel release. J Hand Surg Am 2011;36:1042-6. [16] Fernández-de-las-Peñas C, Fernández-Muñoz JJ, Palacios-Ceña M, Navarro-Pardo E, Ambite-Quesada S, Salom-MorenoJ. Direct and indirect effects of function in associated variablessuch as depression and severity on pain intensity in women withcarpal tunnel syndrome. Pain Med 2015;16:2405-11.
676 The European Research Journal Volume 5 Issue 4 July 2019
Eur Res J 2019;5(4):673-677 Güvenç et al
[17] Heybeli N, Ozerdemoglu RA, Aksoy OG, Mumcu EF.[Functional and symptomatic scoring used for the assessment ofoutcome in carpal tunnel release]. Acta Orthop Traumatol Turc2001; 35:147-51. [Article in Turkish] [18] Hisli N. A study about validity of Beck depression inventory.J Psychol 1988;6:118-22. [19] Hui AC, Wong S, Leung CH, Tong P, Mok V, Poon D, et al.A randomized controlled trial of surgery vs steroid injection forcarpal tunnel syndrome. Neurology 2005;64:2074-8. [20] Koldas Dogan S, Ay S, Evcik D, Baser O. Adaptation ofTurkish version of the questionnaire Quick Disability of the Arm,Shoulder, and Hand (Quick DASH) in patients with carpal tunnelsyndrome. Clin Rheumatol 2011;30:185-91. [21] Ly-Pen D, Andréu JL, Millán I, de Blas G, Sánchez-OlasoA. Comparison of surgical decompression and local steroidinjection in the treatment of carpal tunnel syndrome: 2-yearclinical results from a randomized trial. Rheumatology (Oxford)2012;51:1447-54. [22] Papanicolaou GD, McCabe SJ, Firrell J. The prevalence andcharacteristics of nerve compression symptoms in the generalpopulation. J Hand Surg Am 2001;26:460-6. [23] Pogorzelski R, Kułakowska A, Halicka D, Drozdowski W.
[Neurological and emotional profile of carpal tunnel syndromepatients]. Przegl Lek. 2011;68:269-73. [Article in Polish] [24] Robert A, Werner R, Andray M. Electrodiagnostic evaluationof carpal tunnel syndrome. Muscle Nerve 2011;44:597-607. [25] Salaffi F, De Angelis R, Grassi W; MArche Pain Prevalence;Investigation Group (MAPPING) study. Prevalence ofMusculoskeletal conditions in an Italian population sample:results of a regional community-based study. I. The MAPPINGstudy. Clin Exp Rheumatol 2005;23:819-28. [26] Sen D, Chhaya S, Morris VH. Carpal tunnel syndrome. HospMed 2002;63:392-5. ]27] Verdugo RJ, Salinas RS, Castillo J, Cea JG. Surgical versusnon-surgical treatment for carpal tunnel syndrome. CochraneDatabase Syst Rev. 2003;(3):CD001552. Review. Update in:Cochrane Database Syst Rev 2008;(4):CD001552. [28] Yücel H, Seyithanoğlu H. Choosing the most efficaciousscoring method for carpal tunnel syndrome. Acta OrthopTraumatol Turc 2015;49:23-9. [29] Lozano Calderon SA, Paiva A, Ring D. Patient satisfactionafter open carpal tunnel release correlates with depression. JHand Surg Am 2008;33:303-7.
This is an open access article distributed under the terms of Creative CommonAttribution-NonCommercial-NoDerivatives 4.0 International License.
The European Research Journal Volume 5 Issue 4 July 2019 677
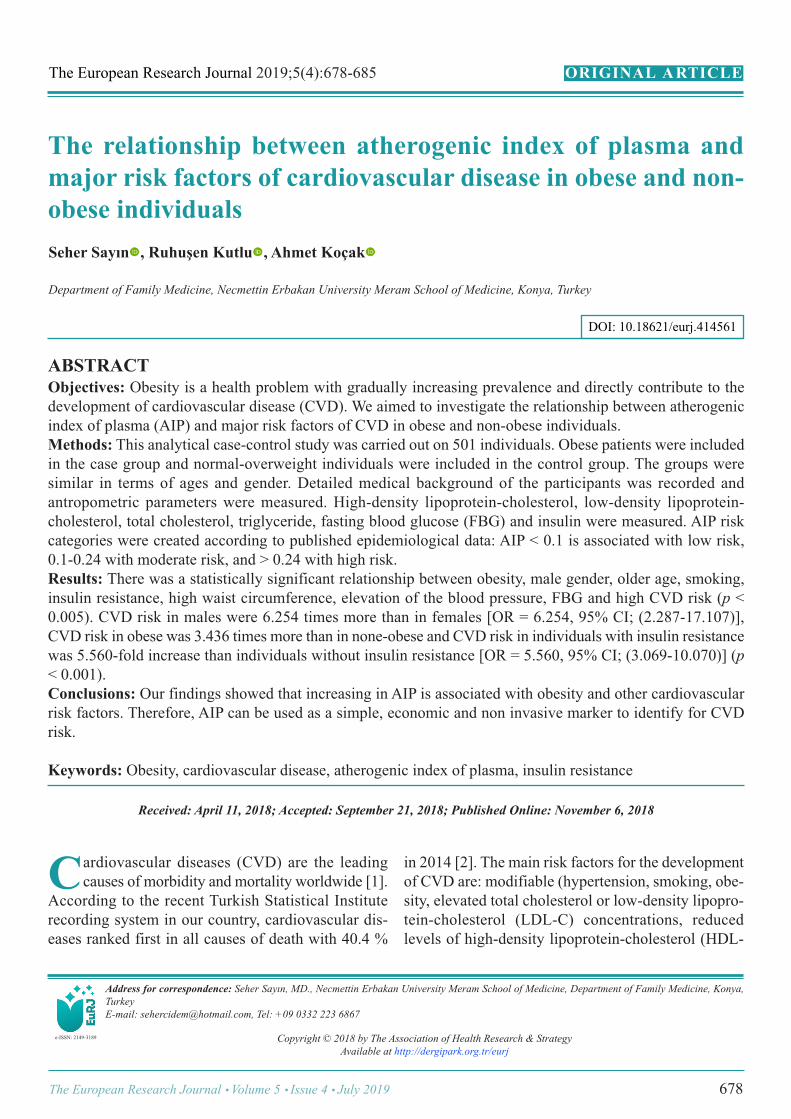
The relationship between atherogenic index of plasma andmajor risk factors of cardiovascular disease in obese and non-obese individualsSeher Sayın , Ruhuşen Kutlu , Ahmet Koçak
Department of Family Medicine, Necmettin Erbakan University Meram School of Medicine, Konya, Turkey
ABSTRACTObjectives: Obesity is a health problem with gradually increasing prevalence and directly contribute to thedevelopment of cardiovascular disease (CVD). We aimed to investigate the relationship between atherogenicindex of plasma (AIP) and major risk factors of CVD in obese and non-obese individuals. Methods: This analytical case-control study was carried out on 501 individuals. Obese patients were includedin the case group and normal-overweight individuals were included in the control group. The groups weresimilar in terms of ages and gender. Detailed medical background of the participants was recorded andantropometric parameters were measured. High-density lipoprotein-cholesterol, low-density lipoprotein-cholesterol, total cholesterol, triglyceride, fasting blood glucose (FBG) and insulin were measured. AIP riskcategories were created according to published epidemiological data: AIP < 0.1 is associated with low risk,0.1-0.24 with moderate risk, and > 0.24 with high risk. Results: There was a statistically significant relationship between obesity, male gender, older age, smoking,insulin resistance, high waist circumference, elevation of the blood pressure, FBG and high CVD risk (p <0.005). CVD risk in males were 6.254 times more than in females [OR = 6.254, 95% CI; (2.287-17.107)],CVD risk in obese was 3.436 times more than in none-obese and CVD risk in individuals with insulin resistancewas 5.560-fold increase than individuals without insulin resistance [OR = 5.560, 95% CI; (3.069-10.070)] (p< 0.001). Conclusions: Our findings showed that increasing in AIP is associated with obesity and other cardiovascularrisk factors. Therefore, AIP can be used as a simple, economic and non invasive marker to identify for CVDrisk.
Keywords: Obesity, cardiovascular disease, atherogenic index of plasma, insulin resistance
Address for correspondence: Seher Sayın, MD., Necmettin Erbakan University Meram School of Medicine, Department of Family Medicine, Konya,Turkey E-mail: [email protected], Tel: +09 0332 223 6867
Copyright © 2018 by The Association of Health Research & StrategyAvailable at http://dergipark.org.tr/eurj
The European Research Journal 2019;5(4):678-685
ardiovascular diseases (CVD) are the leadingcauses of morbidity and mortality worldwide [1].
According to the recent Turkish Statistical Instituterecording system in our country, cardiovascular dis-eases ranked first in all causes of death with 40.4 %
in 2014 [2]. The main risk factors for the developmentof CVD are: modifiable (hypertension, smoking, obe-sity, elevated total cholesterol or low-density lipopro-tein-cholesterol (LDL-C) concentrations, reducedlevels of high-density lipoprotein-cholesterol (HDL-
C
ORIGINAL A RTICLE
e-ISSN: 2149-3189
DOI: 10.18621/eurj.414561
Received: April 11, 2018; Accepted: September 21, 2018; Published Online: November 6, 2018
The European Research Journal Volume 5 Issue 4 July 2019 678
Eur Res J 2019;5(4):678-685 AIP and major risk factors of CVD in obese individuals
C), type 2 diabetes) and nonmodifiable (age, sex, ge-netic predisposition) [3]. The American Heart Associ-ation (AHA) has classified obesity as a major,modifiable risk factor for CVD in 1988 (4). The riskof CVD is significantly increased in obese patients, re-gardless of other risk factors. In particular, abdominalobesity is recognized as an independent risk factor ofobesity-related diseases and death [5]. Atherogenic dyslipidemia that often accompanyobesity is also associated cardiovascular diseases.Atherogenic dyslipidemia is characterized by low lev-els of HDL-C, high levels of triglycerides and LDL-C[6]. Although the concentrations of LDL-C continueto hold a principal role in the association of lipids toCVD, the atherogenic potential of a high TG: HDL-Cmolar ratio is now recognized by the National Choles-terol Education Program (NCEP) Adult TreatmentPanel III [7]. Atherogenic index of plasma (AIP), anew marker of atherogenicity, has been shown to sig-nificantly increase with cardiovascular risk. It has beensuggested that AIP < 0.1 is associated with low risk,0.1-0.24 with moderate risk, and > 0.24 with high risk(8). As AIP is a strong marker to predict the risk of ath-erosclerosis and CVD, we aimed to investigate the re-lationship between AIP and major risk factors of CVDin obese and non-obese individuals.
METHODS
Study Design, Setting and PopulationThis analytical case-control study was constituted of501 individuals aged 18 and older between 25.04.2017and 01.08.2017. The study population was chosenrandomly from the patients who applied with anyproblem to Family Medicine Outpatient Clinic. Atfirst, the female and male subjects were matchedaccording to their ages and gender. After calculatingtheir body mass indexes (BMIs), the participants werecategorized as nonobese and obese. Obese patientswere included in the case group and normal-overweight individuals were included in the controlgroup. In the previous studies, obesity prevalence inour country was found to be 35% [9]. In our study, thenumber of the subjects that had to be included in thestudy was calculated by using n = t².p.q/d² formulabecause the number of the individuals in the universe
was not known. According to this calculation, 501individuals aged 18 and older were included in ourstudy.
Exclusion Criteria Those with CVD, hypertension, diabetes mellitus,liver and kidney failure; patients who have beendiagnosed with hyperlipidemia previously and whouse antihyperlipidemic drugs; those who werepregnant, lactating women, and those who did notagree to participate in the study were not included inthe research.
Ethical Considerations The study protocol was approved by the EthicsCommittee of Medical Faculty (Number: 2017/896)before participation in this study. All of theparticipants were volunteers. The participants wereduly informed and written, and oral consent wasobtained from volunteers according to the Principlesof the Helsinki Declaration.
Collection of Data The questionnaire prepared by the researcher wasfilled in with face to face interview technique. Thequestion form was prepared to determine demographicfeatures (age, gender, marital status, occupation,education, smoking status etc.). Of all the patients,systolic (SBP) and diastolic blood pressures (DBP)were measured by a sphygmomanometer in the supineposition after at least 5 min of resting.
Major Risk Factors of CVD The cardiovascular risk factors of the patientswere determined in the direction of the 2018 guidelineof the European Society of Cardiology.
Risk Factors• Male sex• Smoking• Waist circumference (female) > 88 cm• Waist circumference (male) > 102 cm• BMI ≥ 30 kg/m2• HOMA-IR ≥ 2.5• Systolic blood pressure ≥ 140 mmHg• Diastolic blood pressure ≥ 90mmHg• Fasting blood glucose ≥ 100mg/dl
679 The European Research Journal Volume 5 Issue 4 July 2019
Eur Res J 2019;5(4):678-685 Sayın et al
Antropometric Measurements Anthropometric parameters including height,weight, and waist circumference (WC) weremeasured. Weight was measured while subjects woreonly light clothing; height was assessed without shoes,back squared against the wall tape, eyes lookingstraight ahead using a stadiometer. WC (at the smallestpoint between lower costal and 10th rib border) wasdetermined using a nonelastic fiberglass measuringtape. All of these measurements were done by thesame researcher. BMI was calculated by dividing bodyweight in kilograms to square of body height in metersand expressed in units of (kg/m2). They were classifedas normal weight if BMI value was between 18.50-24.99 kg/m2, overweight if BMI value was between25.0-29.99 kg/m2 and obese if it was higher than 30.0kg/m2. According to WHO obesity criteria, waistcircumference cut off value was accepted to be 88 cmin women and 102 cm in men [10]. Waistcircumference was measured using a non-flexibletape, in the standing position and in midway betweenthe lowest rib and the superior border of iliac crest.
Laboratory Analyses In all subjects, a fasting blood sample wascollected in the morning after fasting at least 10-12 hfor analysis of the following biochemical parametersusing standard techniques: Total cholesterol (TC), TG,LDL-C, HDL-C, FBG and insulin.
Atherogenic Index of Plasma (AIP) AIP was calculated as the logarithmicallytransformed ratio of TG to HDL-C [log (TG/HDL-C)]measured in mmol/L. AIP risk categories were createdaccording to published epidemiological data: AIP <0.1 is associated with low risk, 0.1-0.24 with moderaterisk, and > 0.24 with high risk [8].
Insulin Resistance Homeostasis model assessment as an index ofinsulin resistance (HOMA-IR) test which wasdeveloped by Matthews et al. [11] is a simple test toshow insulin resistance. For insulin resistance,HOMA-IR was calculated with the formula below byusing fasting plasma glucose and insulin levels. Cut-off value of HOMA-IR was taken as 2.5. HOMA-IR= Serum glucose (mg/dL) × plasma insulin (μU/mL) /405.
Statistical Aanalysis While evaluating the results obtained in the study,SPSS 20.0 packet program was used for statisticalanalyses. Descriptive statistics for continuousvariables were given in terms of average and standarddeviation; and descriptive statistics for categorical datawere given in terms of frequency and percentage. Tocompare quantitative data in doublet groups; student-t test was used if they corresponded normaldistribution hypothesis and Mann-Whitney U test wasused if they did not correspond normal distributionhypothesis and if they showed a skew distribution. Chisquare test was used to compare categorical data.Results were evaluated at 95% confidence interval andsignificance was evaluated in p < 0.05 level.
RESULTS
Of all the participants, 372 (74.3%) were female,129 (25.7%) were male, the mean age was 35.47 ±10.91 years (34.16 ± 10.75 years in female, 39.26 ±10.48 years in male), 389 (77.6%) were married, 164(32.7%) primary school graduate, 192 (38.3%)university graduate, 203 (40.5%) were housewives.The frequency of smoking was 16.6% (n = 83). Of theparticipants, 127 (25.3%) were normal weight, 150(29.9%) were overweight and 224 (44.7%) wereobese. When sociodemographic characteristics werecompared with obesity; the prevalence of obesity wassignificantly higher in individuals aged 35 years andolder (p = 0.005). The prevalence of obesity inindividuals who were married, had low education andwho were non-working were higher. This differencewas statistically significant (p < 0.001). There was nota significant relationship between obesity and smoking(p > 0.05) (Table 1). When investigating the relationship between BMIand insulin resistance; insulin resistance in obesegroup was significantly higher than normal weightgroup. This difference was statistically significant (p< 0.001). Systolic (p < 0.001) and diastolic (p = 0.007)blood pressures in obese group were significantlyhigher than non obese group. In the obese group, therisk of CVD was significantly higher than in the non-obese group (p <0.001) (Table 1). When we compared with FBG, serum lipids and BMI
The European Research Journal Volume 5 Issue 4 July 2019 680

Eur Res J 2019;5(4):678-685 AIP and major risk factors of CVD in obese individuals
in our study; while the levels of FBG (p < 0.001), totalcholesterol (p = 0.026), LDL-C (p = 0.004) andtriglyceride (p < 0.001) were significantly higher, thelevel of HDL-C (p < 0.001) was significantly lower in
the obese group (Table 2). The CVD risk was significantly higher inindividuals aged 35 years and older (p = 0.003), insmokers (p = 0.002), in male gender (p < 0.001) and
681 The European Research Journal Volume 5 Issue 4 July 2019
Table 1. Comparison of sociodemographic characteristics and BMI Sociodemographic characteristics Non-obese group
(n = 277) Obese group
(n = 224) χ²
p value
n % n % Age
< 35 years 157 61.3 99 38.7 7.722 0.005 ! 35 years 120 49.0 125 51.0 Gender
Female 214 57.5 158 42.5 2.926 0.087 Male 63 48.8 66 51.2
Marital status Married 193 49.6 196 50.4 22.670 < 0.001 Single 84 75.0 28 25.0
Education level " Secondaryeducation 74 33.9 114 66.1
71.126 < 0.001 ! High schooleducation 203 71.7 80 28.3 Working status
Working 193 68.9 87 31.1 47.767 < 0.001 Non-working 84 38.0 137 62.0
Smoking Yes 52 62.7 31 37.3 2.181 0.140 No 225 53.8 193 46.2
HOMA-IR <2.5 250 64.8 136 35.2 61.102 < 0.001 !2.5 27 23.5 88 76.5
Systolic blood pressure <140 mmHg 251 60.3 165 39.7 25.267 < 0.001 !140 mmHg 26 30.6 59 69.4
Diastolic blood pressure < 90 mmHg 263 57.0 198 43.0 7.239 0.007 ! 90 mmHg 14 35.0 26 65.0
AIP <0.1 low CVD risk 75 80.6 18 19.4
42.669 < 0.001 0.1-0.24 moderate CVD risk 59 66.3 30 33.7 >0.24 high CVD risk 143 44.8 176 55.2
AIP = atherogenic index of plasma, CVD = cardiovascular disease, BMI = body mass index, HOMA-IR = homeostasis model assessment as an index of insulin resistance !Table 2. Comparison of FBG and serum lipids in obese and non-obese groups Parameters Non-obese group
(n = 277) Obese group
(n = 224)
Mean ± SD Mean ± SD t p value FBG (mg/dL) 91.11 ± 9.00 94.85 ± 9.03 -4.624 < 0.001 Total cholesterol (mg/dL) 185.42 ± 41.14 193.53 ± 39.57 -2.231 0.026 LDL-C (mg/dL) 114.12 ± 36.53 123.13 ± 33.25 -2.854 0.004 HDL-C (mg/dL) 49.40 ± 12.17 43.62 ± 9.26 5.862 < 0.001 Triglyceride (mg/dL) 105.72 ± 59.76 135.57 ± 67.80 -5.233 < 0.001 FBG = fasting blood glucose, HDL-C = high-density lipoprotein-cholesterol, LDL-C = low-density lipoprotein-cholesterol
!
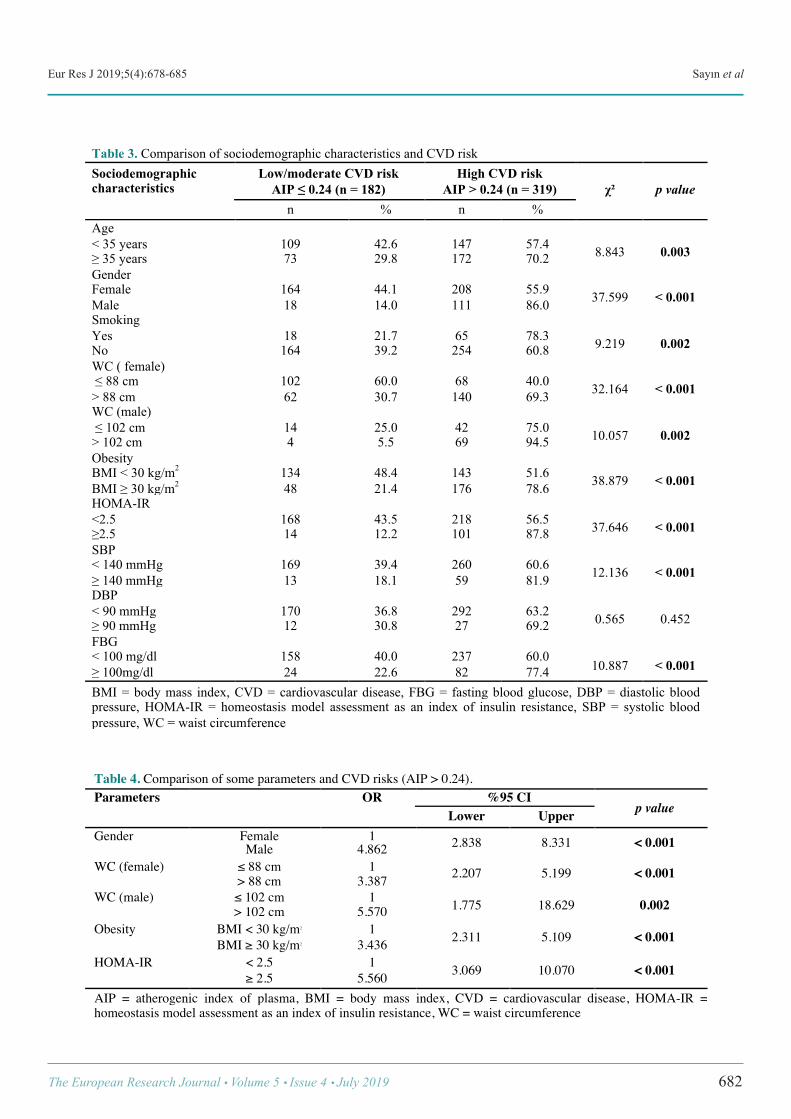
Eur Res J 2019;5(4):678-685 Sayın et al
The European Research Journal Volume 5 Issue 4 July 2019 682
Table 3. Comparison of sociodemographic characteristics and CVD risk Sociodemographic characteristics
Low/moderate CVD risk AIP ! 0.24 (n = 182)
High CVD risk AIP > 0.24 (n = 319)
χ²
p value
n % n % Age < 35 years 109 42.6 147 57.4 8.843 0.003 ! 35 years 73 29.8 172 70.2 Gender Female 164 44.1 208 55.9 37.599 < 0.001 Male 18 14.0 111 86.0 Smoking Yes 18 21.7 65 78.3 9.219 0.002 No 164 39.2 254 60.8 WC ( female) " 88 cm 102 60.0 68 40.0 32.164 < 0.001 > 88 cm 62 30.7 140 69.3 WC (male) " 102 cm 14 25.0 42 75.0 10.057 0.002 > 102 cm 4 5.5 69 94.5 Obesity BMI < 30 kg/m2 134 48.4 143 51.6 38.879 < 0.001 BMI ! 30 kg/m2 48 21.4 176 78.6 HOMA-IR <2.5 168 43.5 218 56.5 37.646 < 0.001 !2.5 14 12.2 101 87.8 SBP < 140 mmHg 169 39.4 260 60.6 12.136 < 0.001 ! 140 mmHg 13 18.1 59 81.9 DBP < 90 mmHg 170 36.8 292 63.2 0.565 0.452 ! 90 mmHg 12 30.8 27 69.2 FBG < 100 mg/dl 158 40.0 237 60.0
10.887 < 0.001 ! 100mg/dl 24 22.6 82 77.4 BMI = body mass index, CVD = cardiovascular disease, FBG = fasting blood glucose, DBP = diastolic blood pressure, HOMA-IR = homeostasis model assessment as an index of insulin resistance, SBP = systolic blood pressure, WC = waist circumference !
!
Table 4. Comparison of some parameters and CVD risks (AIP > 0.24). Parameters OR %95 CI p value Lower Upper Gender Female 1 2.838 8.331 < 0.001 Male 4.862 WC (female) ! 88 cm 1 2.207 5.199 < 0.001 > 88 cm 3.387 WC (male) ! 102 cm 1 1.775 18.629 0.002 > 102 cm 5.570 Obesity BMI < 30 kg/m2 1 2.311 5.109 < 0.001 BMI " 30 kg/m2 3.436 HOMA-IR < 2.5 1 3.069 10.070 < 0.001 " 2.5 5.560 AIP = atherogenic index of plasma, BMI = body mass index, CVD = cardiovascular disease, HOMA-IR = homeostasis model assessment as an index of insulin resistance, WC = waist circumference

Eur Res J 2019;5(4):678-685 AIP and major risk factors of CVD in obese individuals
in individuals with insulin resistance (p < 0.001)(Table 3). CVD risk in males were 6.254 times more than infemales [OR = 6.254, 95% CI; (2.287-17.107)], andthis differance was found to be statistically significant(p < 0.001). CVD risk in individuals with insulinresistance was 5.560-fold increase than individualswithout insulin resistance [OR = 5.560, 95% CI;(3.069-10.070)] and this difference was found to be
highly statistically significant (p < 0.001). The oddsratios of the other parameters were shown in Table 4. When the correlation between AIP and waistcircumference is examined; AIP was correlated withwaist circumference (r = 0.456, p < 0.001) (Table 5).When linear regression analysis is performed; 20.8%of the increase in AIP is attributed to the increase inwaist circumference (R2 = 0.208, p < 0.001) (Figure1).
683 The European Research Journal Volume 5 Issue 4 July 2019
Table 5. Correlations of some parameters in obese and non-obese groups PARAMETERS 1 2 3 4 5 6 1. AIP r 1
p 2. Age (year) r 0.190 1
p < 0.001 3. BMI (kg/m2) r 0.354 0.165 1
p < 0.001 < 0.001 4. WC (cm) r 0.456 0.293 0.819 1
p < 0.001 < 0.001 < 0.001 5. Insulin r 0.266 -0.102 0.311 0.275 1
p < 0.001 0.024 < 0.001 < 0.001 6. HOMA-IR r 0.261 -0.070 0.299 0.258 0.983 1
p < 0.001 0.112 < 0.001 < 0.001 < 0.001 AIP = atherogenic index of plasma, BMI = body mass index, HOMA-IR = homeostasis model assessment as an index of insulin resistance, WC = waist circumference !
Figure 1. Linear regression analysis between waist circumference and AIP. R2= Regression determinant coefficient (R2=0.208, p <0.001)
Eur Res J 2019;5(4):678-685 Sayın et al
DISCUSSION
Before mentioning the conclusions, the limitationsof the study should be considered. Although theoverall sample was relatively large, we reached a smallgroup. In addition, although a quite close match, thisstudy group is not entirely representative of theTurkish population. The study includes only thecitizens of Konya. The most important limitation ofour study is that the physical activity and nutritionalstatus have not been assessed. Obesity is a complicated and multifactorial diseasewhich provides a basis for many diseases, reduces lifequality and longevity of individuals and it causesdeaths. Overweight and obesity directly contribute tothe development of cardiovascular diseases and type2 diabetes mellitus. For this reason, it has become animportant public health concern on a global scale [12].In this study, we assessed the correlation between AIPand the major risk factors of CVD in obese and non-obese individuals. When we looked at the relation between obesityand cardiovascular risks in our study, it was seen thatas BMI increased, cardiovascular risk increased aswell. Cardiovascular risk in obese individuals was3.436 times more than in none-obese individuals.Chhezom et al. [12] found out in their study that obeseindividuals had significantly higher cardiovascularrisk. It was discovered in many studies that waistcircumference as a marker of abdominal obesity is abetter marker to reveal cardiovascular risk than BMI[13]. In our study, there was a significant relationbetween WC and cardiovascular risks. Shen et al. [14]showed that there was a positive relationship betweenwaist circumference and AIP in their studies. Ying Leeet al. [15] stated in their meta-analysis study thatpreventing abdominal obesity is especially moreimportant to reduce cardiovascular risk. The strongest independent risk factor for CVDdevelopment is age. It was discovered in our study thatcardiovascular risk in individuals above 35 years ofage is 4.862 times more than in ones under 35 yearsof age. In women in premenopausal period, CVD isseen 10 years later compared to men. The reason ofthis delay is attributed to protective effect of estrogen[16]. The risk increases in women duringpremenopausal period but this risk is lower than inmen when making an evaluation between age groups.
In the study performed by Yıldız et al. [16] in ourcountry, it was shown that cardiovascular riskincreases significantly in postmenopausal womencompared to premenopausal women. The studiesindicate that cardiovascular risk in men is significantlyhigher than in women in all groups of age [17, 18]. Wealso determined that cardiovascular risk is 5.570 timesmore in men than in women. In our study, cardiovascular risk in smokers wassignificantly higher than in non-smokers. Smokingincreases CVD risk 2-3 times and causes the risk toincrease more by interacting with other risk factors.Smoking stimulates sympathetic nervous system,increases blood pressure and reduces oxygen deliveryin myocardium. Besides, it has also effects onatherosclerosis. A decrease is observed in eventsrelated to CVD when smoking is given up [19]. It has long been known that hypertension plays animportant role in pathogenesis of coronary arterydisease and other cardiovascular diseases.Hypertension is responsible for 35% of allatherosclerotic cardiovascular events [20]. In ourstudy, CVD risk is significantly higher in individualswhose systolic blood pressure was higher. Onat [21],stated in their study that high blood pressure increasescardiovascular risk significantly. In our study, we determined that cardiovascularrisk was 5.560 times more in individuals with highinsulin resistance. Insulin resistance makes asignificant contribution to atherosclerosis even beforethe occurrence of overt diabetes. In meta-analysisstudies, it was seen that increased insulin and fastingblood glucose in non-diabetic patients increase CVDrisk significantly [22, 23]. It was found out in ourstudy that CVD risk was significantly higher inindividuals with high FBG. Similiar to our study,Oluyombo et al. [24] showed that as FBG levelincreases, cardiovascular risk increases in individualsas well. The studies indicate that mortality risk relatedto cardiovascular events in diabetic patients was 2-6times more than in non-diabetic patients [25].
CONCLUSION
FBG, insulin resistance, high waist circumference,elevation of the blood pressure, LDL-C, totalcholesterol, triglyceride in obese group were
The European Research Journal Volume 5 Issue 4 July 2019 684

This is an open access article distributed under the terms of Creative CommonAttribution-NonCommercial-NoDerivatives 4.0 International License.
Eur Res J 2019;5(4):678-685 AIP and major risk factors of CVD in obese individuals
significantly higher than non obese group. Only, thelevel of HDL-C was significantly lower in the obesegroup. AIP, a new marker of atherogenicity, has beenshown to significantly increase with cardiovascularrisks. AIP could be a convenient and practicalapproach for assessment of CVD risks in public healthsettings and primary health centers. In this study, therewas a statistically significant relationship betweenobesity, male gender, older age, smoking, insulinresistance, high waist circumference, elevation of theblood pressure, FBG and AIP > 0.24 (high CVD risk).
Conflict of interest The authors disclosed no conflict of interest duringthe preparation or publication of this manuscript.
Financing The authors disclosed that they did not receive anygrant during conduction or writing of this study.
REFERENCES
[1] WHO. World health statistics 2015. Geneva: World HealthOrganization; 2015e. [2] Statistics of causes of death, 2015. [Internet] Available from:www.turkstat.gov.tr Accessed: 26.5.2017. [3] Després JP, Arsenault BJ, Côté M, Cartier A, Lemieux I.Abdominal obesity: the cholesterol of the 21st century? Can JCardiol 2008;24:7-12. [4] Eckel RH, Krauss RM. American Heart Association call toaction: obesity as a major risk factor for coronary heart disease.AHA Nutrition Committee. Circulation 1998;97:2099-100. [5] Pi-Sunyer X. The medical risks of obesity. Postgrad Med2009;121:21-33. [6] Manjunath CN, Rawal JR, Irani PM, Madhu K. Atherogenicdyslipidemia. Indian J Endocrinol Metab 2013;17:969-76. [7] Executive Summary of The Third Report of The NationalCholesterol Education Program (NCEP) Expert Panel onDetection, Evaluation, and Treatment of High Blood Cholesterolin Adults (Adult Treatment Panel III). JAMA 2001;285:2486-97. [8] Dobiasova M. Atherogenic index of plasma as a significantpredictor of cardiovascular risk: from research to practice. VnitrLek 2006;52:64-71. [9] Bahceci M. Obesity. In: TEMD Obesity, Dyslipidemia.Hypertension Study Group eds. Turkish Association ofEndocrinology and Metabolism. Hypertension, Obesity and LipidMetabolism Diagnosis and Treatment Guide 2011;50-80. [10] WHO. Obesity: preventing and managing the global
epidemic. Report of a WHO Consultation. WHO TechnicalReport Series 894. Geneva: World Health Organization, 2011. [11] Matthews DR, Hosker JP, Rudenski AS, Naylor BA,Treacher DF, Turner RC. Homeostasis model assessment: insulinresistance and beta-cell function from fasting plasma glucose andinsulin concentrations in man. Diabetologia 1985;28:412-9. [12] Chhezom K, Arslan MI, Hoque MM, Biswas SK.Biomarkers of cardiovascular and metabolic diseases inotherwise healthy overweight subjects in Bangladesh. DiabetesMetab Syndr 2017;11 Suppl 1;S381-4. [13] Guasch-Ferré M, Bulló M, Martínez-González MÁ, CorellaD, Estruch R, Covas MI, et al. Waist-to-height ratio andcardiovascular risk factors in elderly individuals at highcardiovascular risk. PLoS One 2012;7:e43275. [14] Shen SW, Lu Y, Li F, Yang CJ, Feng YB, Li HW, et al.Atherogenic index of plasma is an effective index for estimatingabdominal obesity. Lipids Health Dis 2018;17:11. [15] Ying Lee CM, Huxley RR, Wildman RP, Woodward M.Indices of abdominal obesity are better discriminators ofcardiovascular risk factors than BMI: a meta-analysis. J ClinEpidemiol 2008;61:646-53. [16] Yıldız C, Yıldız A, Tekiner F. Comparison of serum lipidprofile and plasma atherogenic index between premenopausaland postmenopausal women. Dicle Medical Journal 2015;42:36-40. [17] Niroumand S, Khajedaluee M, Khadem-Rezaiyan M,Abrishami M, Juya M, Khodaee G, et al. Atherogenic Index ofPlasma (AIP): A marker of cardiovascular disease. Med J IslamRepub Iran 2015;29:240. [18] Andreeva-Gateva PA, Konsulova P, Orbetzova M,Georgieva-Nikolova R, Tafradjiiska-Hadjiolova R, Angelova V,et al. Differentiation of obese patients at moderate or higherFindrisc score based on their atherogenic index. Postgrad Med2016;128:790-6. [19] Buğan B, Çelik T. Risk factors for coronary artery disease.J Clin Anal Med 2014;5:159-63. [20] Abacı A. The current status of cardiovascular risk factors inTurkey. Arch Turk Soc Cardiol 2011;39:1-5. [21] Onat A. Dynamics in cardiometabolic risk among Turkishadults: similarities to that in Iranians? Int J Prev Med 2011;2:56-63. [22] Gast KB, Tjeerdema N, Stijnen T, Smit JW, Dekkers OM.Insulin resistance and risk of incident cardiovascular events inadults without diabetes: meta-analysis. PLoS One2012;7:e52036. [23] Young EE, Okafor CN, Iroezindu MO, Agbalu IS. Insulinresistance, metabolic syndrome, and lipids in African women.Niger J Clin Pract 2016;19:793-8. [24] Oluyombo R, Akinwusi PO, Olamoyegun MO, Ayodele OE,Fawale MB, Okunola OO, et al. Clustering of cardiovascular riskfactors in semi-urban communities in south-western Nigeria.Cardiovasc J Afr 2016;27:322-7. [25] Gaede P, Vedel P, Larsen N, Jensen GV, Parving HH,Pedersen O. Multifactorial intervention and cardiovascular
685 The European Research Journal Volume 5 Issue 4 July 2019
The alteration of first trimester screening markers in fresh andfrozen-thawed blastocyst transfers Nur Dokuzeylül Güngör1 , Tuğba Gürbüz2 , Ayşe Filiz Gökmen Karasu³ , Aynur Erşahin¹
1Department of In Vitro Fertilization Center, Bahçeşehir University, Medical Park Göztepe Hospital, İstanbul, Turkey 2Department of Gynecology and Obstetrics, Bahçeşehir University, Medical Park Göztepe Hospital, İstanbul, Turkey3Department of Gynecology and Obstetrics, Bezmialem University School of Medicine, İstanbul, Turkey
ABSTRACTObjectives: The aim of this study was to investigate whether first trimester combined screening for major fetaltrisomies is influenced by assisted reproduction techniques (ART) from blastocyst transfer, with or withoutcryopreservation.Methods: This study is a retrospective analysis involving 115 singleton pregnancies with euploid fetusesrecruited between January 2017 and December 2017. Sixty-five women conceived with fresh blastocysts fromin vitro fertilization (IVF) cycles (fresh-blasto), 50 with frozen-thawed blastocysts. All cases underwentultrasound assessment at 11+0 - 13+6 weeks with measurements of crown rump length, nuchal translucency(NT) , free beta-human chorionic gonadotrophin (free β-hCG) and pregnancy-associated plasma protein A(PAPP-A) concentrations.Results: Baseline characteristics and pregnancy outcomes did not differ substantially among the study groups.The NT was not significantly different in the frozen-thawed -blasto compared to the fresh-blasto group (p =0.741). The free β-hCG levels was not significantly different in frozen-thawed-blasto group compared to fresh-blasto group (p = 0.495). The two groups showed no significant difference in the PAPP-A levels (p = 0,139).The median delta crown rump length was also not significantly different among the two groups (p = 0.758).Conclusions: In ART pregnancies from blastocyst transfer, with or without cryopreservation, the NTmeasurement, free β-hCG concentration and PAPP-A levels did not show any significant difference. Thesefeatures are apparently unrelated to the outcome of pregnancy and may be due to alterations or delays inembryogenesis or placentation with potential relevance for the screening test performance.
Keywords: Assisted reproductive technique, blastocyst, first trimester screening, frozen-thawed embryotransfer, fresh embryo transfer
Address for correspondence: Tuğba Gürbüz, MD., Bahçeşehir University, Medical Park Göztepe Hospital, Department of Gynecology and Obstetrics,23 Nisan Cad., No: 17, Merdivenköy /Kadıköy, İstanbul, Turkey E-mail: [email protected]
Copyright © 2019 by The Association of Health Research & StrategyAvailable at http://dergipark.org.tr/eurj
The European Research Journal 2019;5(4):686-690
omen with pregnancies achieved by assistedreproduction techniques (ART) are older than
average and are therefore at higher risk for Downsyndrome and other aneuploidies [1]. An effectivescreening test with a low false-positive rate (FPR)
should be applied to these patients. Combined firsttrimester screening, utilizing maternal age, nuchaltranslucency (NT) measurement and maternalbiochemistry (free beta-human chorionicgonadotrophin [free β-hCG] and pregnancy-associated
W
ORIGINAL A RTICLE
e-ISSN: 2149-3189
DOI: 10.18621/eurj.400462
Received: March 2, 2018; Accepted: March 21, 2018; Published Online: June 19, 2018
The European Research Journal Volume 5 Issue 4 July 2019 686
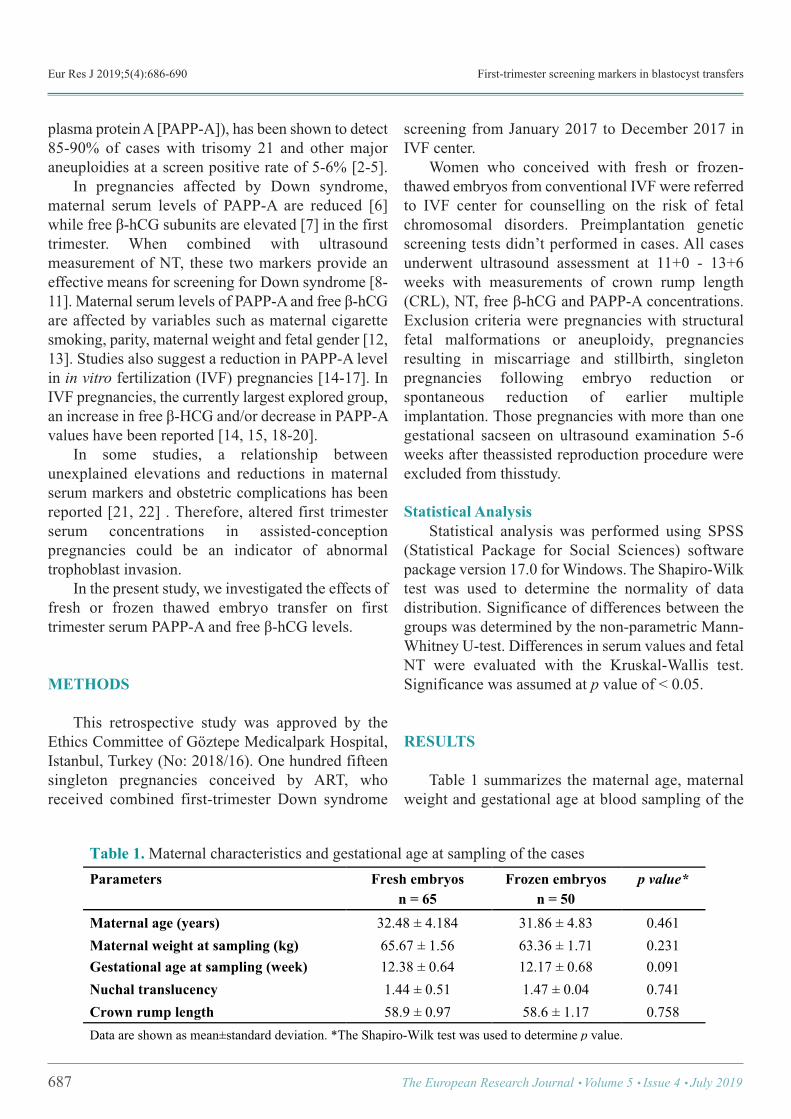
Eur Res J 2019;5(4):686-690 First-trimester screening markers in blastocyst transfers
plasma protein A [PAPP-A]), has been shown to detect85-90% of cases with trisomy 21 and other majoraneuploidies at a screen positive rate of 5-6% [2-5]. In pregnancies affected by Down syndrome,maternal serum levels of PAPP-A are reduced [6]while free β-hCG subunits are elevated [7] in the firsttrimester. When combined with ultrasoundmeasurement of NT, these two markers provide aneffective means for screening for Down syndrome [8-11]. Maternal serum levels of PAPP-A and free β-hCGare affected by variables such as maternal cigarettesmoking, parity, maternal weight and fetal gender [12,13]. Studies also suggest a reduction in PAPP-A levelin in vitro fertilization (IVF) pregnancies [14-17]. InIVF pregnancies, the currently largest explored group,an increase in free β-HCG and/or decrease in PAPP-Avalues have been reported [14, 15, 18-20]. In some studies, a relationship betweenunexplained elevations and reductions in maternalserum markers and obstetric complications has beenreported [21, 22] . Therefore, altered first trimesterserum concentrations in assisted-conceptionpregnancies could be an indicator of abnormaltrophoblast invasion. In the present study, we investigated the effects offresh or frozen thawed embryo transfer on firsttrimester serum PAPP-A and free β-hCG levels.
METHODS
This retrospective study was approved by theEthics Committee of Göztepe Medicalpark Hospital,Istanbul, Turkey (No: 2018/16). One hundred fifteensingleton pregnancies conceived by ART, whoreceived combined first-trimester Down syndrome
screening from January 2017 to December 2017 inIVF center. Women who conceived with fresh or frozen-thawed embryos from conventional IVF were referredto IVF center for counselling on the risk of fetalchromosomal disorders. Preimplantation geneticscreening tests didn’t performed in cases. All casesunderwent ultrasound assessment at 11+0 - 13+6weeks with measurements of crown rump length(CRL), NT, free β-hCG and PAPP-A concentrations.Exclusion criteria were pregnancies with structuralfetal malformations or aneuploidy, pregnanciesresulting in miscarriage and stillbirth, singletonpregnancies following embryo reduction orspontaneous reduction of earlier multipleimplantation. Those pregnancies with more than onegestational sacseen on ultrasound examination 5-6weeks after theassisted reproduction procedure wereexcluded from thisstudy.
Statistical Analysis Statistical analysis was performed using SPSS(Statistical Package for Social Sciences) softwarepackage version 17.0 for Windows. The Shapiro-Wilktest was used to determine the normality of datadistribution. Significance of differences between thegroups was determined by the non-parametric Mann-Whitney U-test. Differences in serum values and fetalNT were evaluated with the Kruskal-Wallis test.Significance was assumed at p value of < 0.05.
RESULTS
Table 1 summarizes the maternal age, maternalweight and gestational age at blood sampling of the
687 The European Research Journal Volume 5 Issue 4 July 2019
Table 1. Maternal characteristics and gestational age at sampling of the cases Parameters Fresh embryos
n = 65 Frozen embryos
n = 50 p value*
Maternal age (years) 32.48 ± 4.184 31.86 ± 4.83 0.461 Maternal weight at sampling (kg) 65.67 ± 1.56 63.36 ± 1.71 0.231 Gestational age at sampling (week) 12.38 ± 0.64 12.17 ± 0.68 0.091 Nuchal translucency 1.44 ± 0.51 1.47 ± 0.04 0.741 Crown rump length 58.9 ± 0.97 58.6 ± 1.17 0.758 Data are shown as mean±standard deviation. *The Shapiro-Wilk test was used to determine p value. !
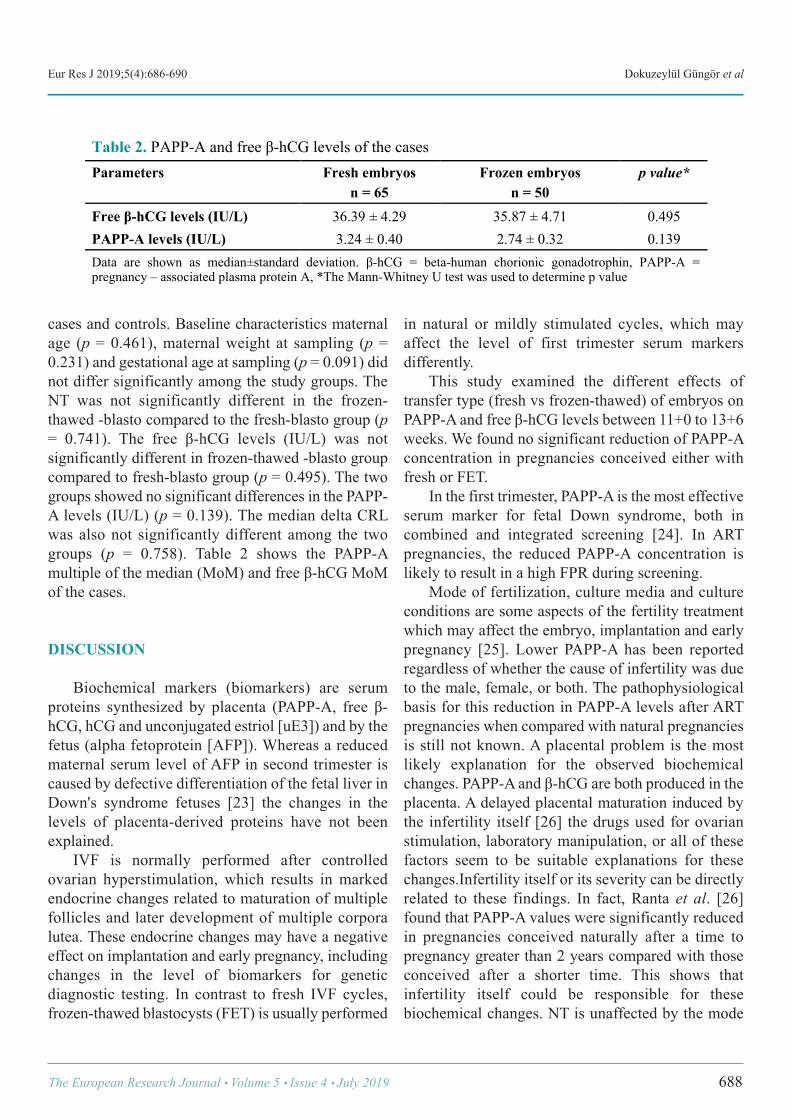
Eur Res J 2019;5(4):686-690 Dokuzeylül Güngör et al
cases and controls. Baseline characteristics maternalage (p = 0.461), maternal weight at sampling (p =0.231) and gestational age at sampling (p = 0.091) didnot differ significantly among the study groups. TheNT was not significantly different in the frozen-thawed -blasto compared to the fresh-blasto group (p= 0.741). The free β-hCG levels (IU/L) was notsignificantly different in frozen-thawed -blasto groupcompared to fresh-blasto group (p = 0.495). The twogroups showed no significant differences in the PAPP-A levels (IU/L) (p = 0.139). The median delta CRLwas also not significantly different among the twogroups (p = 0.758). Table 2 shows the PAPP-Amultiple of the median (MoM) and free β-hCG MoMof the cases.
DISCUSSION
Biochemical markers (biomarkers) are serumproteins synthesized by placenta (PAPP-A, free β-hCG, hCG and unconjugated estriol [uE3]) and by thefetus (alpha fetoprotein [AFP]). Whereas a reducedmaternal serum level of AFP in second trimester iscaused by defective differentiation of the fetal liver inDown's syndrome fetuses [23] the changes in thelevels of placenta-derived proteins have not beenexplained. IVF is normally performed after controlledovarian hyperstimulation, which results in markedendocrine changes related to maturation of multiplefollicles and later development of multiple corporalutea. These endocrine changes may have a negativeeffect on implantation and early pregnancy, includingchanges in the level of biomarkers for geneticdiagnostic testing. In contrast to fresh IVF cycles,frozen-thawed blastocysts (FET) is usually performed
in natural or mildly stimulated cycles, which mayaffect the level of first trimester serum markersdifferently. This study examined the different effects oftransfer type (fresh vs frozen-thawed) of embryos onPAPP-A and free β-hCG levels between 11+0 to 13+6weeks. We found no significant reduction of PAPP-Aconcentration in pregnancies conceived either withfresh or FET. In the first trimester, PAPP-A is the most effectiveserum marker for fetal Down syndrome, both incombined and integrated screening [24]. In ARTpregnancies, the reduced PAPP-A concentration islikely to result in a high FPR during screening. Mode of fertilization, culture media and cultureconditions are some aspects of the fertility treatmentwhich may affect the embryo, implantation and earlypregnancy [25]. Lower PAPP-A has been reportedregardless of whether the cause of infertility was dueto the male, female, or both. The pathophysiologicalbasis for this reduction in PAPP-A levels after ARTpregnancies when compared with natural pregnanciesis still not known. A placental problem is the mostlikely explanation for the observed biochemicalchanges. PAPP-A and β-hCG are both produced in theplacenta. A delayed placental maturation induced bythe infertility itself [26] the drugs used for ovarianstimulation, laboratory manipulation, or all of thesefactors seem to be suitable explanations for thesechanges.Infertility itself or its severity can be directlyrelated to these findings. In fact, Ranta et al. [26]found that PAPP-A values were significantly reducedin pregnancies conceived naturally after a time topregnancy greater than 2 years compared with thoseconceived after a shorter time. This shows thatinfertility itself could be responsible for thesebiochemical changes. NT is unaffected by the mode
The European Research Journal Volume 5 Issue 4 July 2019 688
Table 2. PAPP-A and free β-hCG levels of the cases Parameters Fresh embryos
n = 65 Frozen embryos
n = 50 p value*
Free β-hCG levels (IU/L) 36.39 ± 4.29 35.87 ± 4.71 0.495 PAPP-A levels (IU/L) 3.24 ± 0.40 2.74 ± 0.32 0.139 Data are shown as median±standard deviation. β-hCG = beta-human chorionic gonadotrophin, PAPP-A = pregnancy – associated plasma protein A, *The Mann-Whitney U test was used to determine p value
!
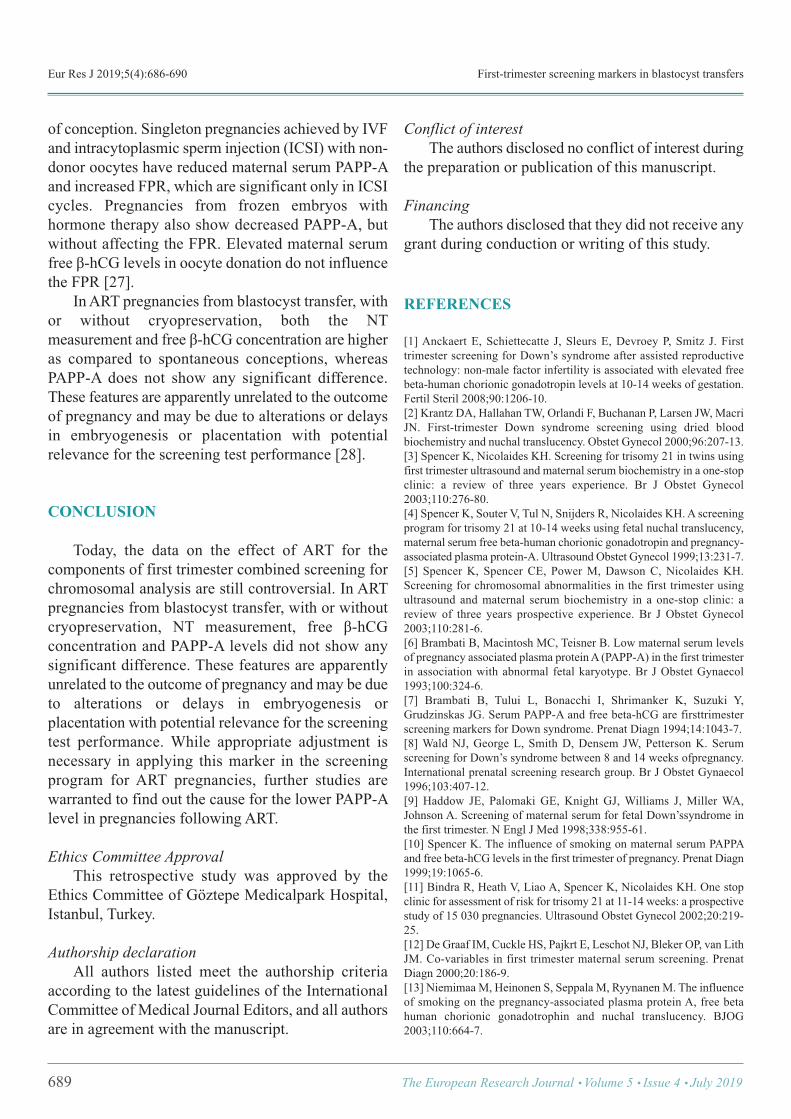
Eur Res J 2019;5(4):686-690 First-trimester screening markers in blastocyst transfers
of conception. Singleton pregnancies achieved by IVFand intracytoplasmic sperm injection (ICSI) with non-donor oocytes have reduced maternal serum PAPP-Aand increased FPR, which are significant only in ICSIcycles. Pregnancies from frozen embryos withhormone therapy also show decreased PAPP-A, butwithout affecting the FPR. Elevated maternal serumfree β-hCG levels in oocyte donation do not influencethe FPR [27]. In ART pregnancies from blastocyst transfer, withor without cryopreservation, both the NTmeasurement and free β-hCG concentration are higheras compared to spontaneous conceptions, whereasPAPP-A does not show any significant difference.These features are apparently unrelated to the outcomeof pregnancy and may be due to alterations or delaysin embryogenesis or placentation with potentialrelevance for the screening test performance [28].
CONCLUSION
Today, the data on the effect of ART for thecomponents of first trimester combined screening forchromosomal analysis are still controversial. In ARTpregnancies from blastocyst transfer, with or withoutcryopreservation, NT measurement, free β-hCGconcentration and PAPP-A levels did not show anysignificant difference. These features are apparentlyunrelated to the outcome of pregnancy and may be dueto alterations or delays in embryogenesis orplacentation with potential relevance for the screeningtest performance. While appropriate adjustment isnecessary in applying this marker in the screeningprogram for ART pregnancies, further studies arewarranted to find out the cause for the lower PAPP-Alevel in pregnancies following ART.
Ethics Committee Approval This retrospective study was approved by theEthics Committee of Göztepe Medicalpark Hospital,Istanbul, Turkey.
Authorship declaration All authors listed meet the authorship criteriaaccording to the latest guidelines of the InternationalCommittee of Medical Journal Editors, and all authorsare in agreement with the manuscript.
Conflict of interest The authors disclosed no conflict of interest duringthe preparation or publication of this manuscript.
Financing The authors disclosed that they did not receive anygrant during conduction or writing of this study.
REFERENCES
[1] Anckaert E, Schiettecatte J, Sleurs E, Devroey P, Smitz J. Firsttrimester screening for Down’s syndrome after assisted reproductivetechnology: non-male factor infertility is associated with elevated freebeta-human chorionic gonadotropin levels at 10-14 weeks of gestation.Fertil Steril 2008;90:1206-10. [2] Krantz DA, Hallahan TW, Orlandi F, Buchanan P, Larsen JW, MacriJN. First-trimester Down syndrome screening using dried bloodbiochemistry and nuchal translucency. Obstet Gynecol 2000;96:207-13. [3] Spencer K, Nicolaides KH. Screening for trisomy 21 in twins usingfirst trimester ultrasound and maternal serum biochemistry in a one-stopclinic: a review of three years experience. Br J Obstet Gynecol2003;110:276-80. [4] Spencer K, Souter V, Tul N, Snijders R, Nicolaides KH. A screeningprogram for trisomy 21 at 10-14 weeks using fetal nuchal translucency,maternal serum free beta-human chorionic gonadotropin and pregnancy-associated plasma protein-A. Ultrasound Obstet Gynecol 1999;13:231-7. [5] Spencer K, Spencer CE, Power M, Dawson C, Nicolaides KH.Screening for chromosomal abnormalities in the first trimester usingultrasound and maternal serum biochemistry in a one-stop clinic: areview of three years prospective experience. Br J Obstet Gynecol2003;110:281-6. [6] Brambati B, Macintosh MC, Teisner B. Low maternal serum levelsof pregnancy associated plasma protein A (PAPP-A) in the first trimesterin association with abnormal fetal karyotype. Br J Obstet Gynaecol1993;100:324-6. [7] Brambati B, Tului L, Bonacchi I, Shrimanker K, Suzuki Y,Grudzinskas JG. Serum PAPP-A and free beta-hCG are firsttrimesterscreening markers for Down syndrome. Prenat Diagn 1994;14:1043-7. [8] Wald NJ, George L, Smith D, Densem JW, Petterson K. Serumscreening for Down’s syndrome between 8 and 14 weeks ofpregnancy.International prenatal screening research group. Br J Obstet Gynaecol1996;103:407-12. [9] Haddow JE, Palomaki GE, Knight GJ, Williams J, Miller WA,Johnson A. Screening of maternal serum for fetal Down’ssyndrome inthe first trimester. N Engl J Med 1998;338:955-61. [10] Spencer K. The influence of smoking on maternal serum PAPPAand free beta-hCG levels in the first trimester of pregnancy. Prenat Diagn1999;19:1065-6. [11] Bindra R, Heath V, Liao A, Spencer K, Nicolaides KH. One stopclinic for assessment of risk for trisomy 21 at 11-14 weeks: a prospectivestudy of 15 030 pregnancies. Ultrasound Obstet Gynecol 2002;20:219-25. [12] De Graaf IM, Cuckle HS, Pajkrt E, Leschot NJ, Bleker OP, van LithJM. Co-variables in first trimester maternal serum screening. PrenatDiagn 2000;20:186-9. [13] Niemimaa M, Heinonen S, Seppala M, Ryynanen M. The influenceof smoking on the pregnancy-associated plasma protein A, free betahuman chorionic gonadotrophin and nuchal translucency. BJOG2003;110:664-7.
689 The European Research Journal Volume 5 Issue 4 July 2019
Eur Res J 2019;5(4):686-690 Dokuzeylül Güngör et al
[14] Liao AW, Heath V, Kametas N, Spencer K, Nicolaides KH. First-trimester screening for trisomy 21 in singleton pregnancies achieved byassisted reproduction. Hum Reprod 2001;16:1501-4. [15] Maymon R, Shulman A. Serial first- and second-trimester Down’ssyndrome screening tests among IVF-versus naturally conceivedsingletons. Hum Reprod 2002;17:1081-5. [16] Orlandi F, Rossi C, Allegra A. First trimester screening with freebeta-hCG, PAPP-A and nuchal translucency in pregnancies conceivedwith assisted reproduction. Prenat Diagn 2002;22:718-21. [17] Bersinger NA, Wunder D, Vanderlick F. Maternal serum levels ofplacental proteins after in vitro fertilisation and their implications forprenatal screening. Prenat Diagn 2004;24:471-7. [18] Niemimaa M, Heinonen S, Seppala M, Hippelainen M, MartikainenH, Ryynanen M. First-trimester screening for Down’s syndrome in in-vitro fertilization pregnancies. Fertil Steril 2001;76:1282-83. [19] Maymon R, Shulman A. Integrated first- and second-trimesterDown syndrome screening test among unaffected IVF pregnancies.Prenat Diagn 2004;24:125-9. [20] Ghisoni L, Ferrazzi E, Castagna C, Levi Setti PE, Masini AC,PigniA. Prenatal diagnosis after ART success: the role of early combinedscreening tests in counselling pregnant patients. Placenta 2003;24:99-103. [21] Ong CY, Liao AW, Spencer K, Munim S, Nicolaides KH. Firsttrimester maternal serum free beta human chorionic gonadotrophin and
pregnancy associated plasma protein A as predictors of pregnancycomplications. Br J Obstet Gynecol 2000;107:1265-70. [22] Phil K, Larsen T, Krebs L, Christiansen M. First trimester maternalserum PAPP-A, β-hCG and ADAM12 in prediction of small-for-gestational-age fetuses. Prenat Diagn 2008;28:1131-5. [23] Chen H, Egan JO, Ohlu JF. Regulation and activities of alpha-fetoprotein. Crit Rev Eukaryot Gene Expr 1997;7:11-41. [24] Gardner DK, Balaban B. Choosing between day 3 and day 5 embryotransfers. Clin Obstet Gynecol 2006;49:85-92. [25] Dumoulin JC, Land JA, Van Montfoort AP, Nelissen EC, CoonenE, Derhaag JG, et al. Effect of in vitro culture of human embryos onbirthweight of newborns, Hum Reprod 2010;25:605-12. [26] Ranta JK, Raatikainen K, Romppanen J, Pulkki K, Heinonen S.Increased time-to-pregnancy and first trimester Down's syndromescreening. Hum Reprod 2010;25:412-7. [27] Bellver J, Casanova C, Garrido N, Lara C, Remohí J, Pellicer A, etal. Additive effect of factors related to assisted conception on thereduction of maternal serum PAPP-A concentrations and theincreasedfalse-positive rates in first-trimester Down syndromescreening. Fertil Steril 2013;100:1314-20. [28] Cavoretto P, Dallagiovanna C, Vigano P, Somigliana E, Persico N,Papaleo E, et al. First trimester combined screening test in pregnanciesderived from blastocyst transfer. Eur J Obstet Gynecol Reprod Biol2016;198:50-5.
This is an open access article distributed under the terms of Creative CommonAttribution-NonCommercial-NoDerivatives 4.0 International License.
The European Research Journal Volume 5 Issue 4 July 2019 690

Increased P wave duration and dispersion is associated withcatheter-related atrial fibrillation during electrophysiologicalstudyYahya Kemal İçen1 , Hilmi Erdem Sümbül2 , Mevlüt Koç1
1Department of Cardiology, University of Health Sciences, Adana City Training and Research Hospital, Adana, Turkey 2Department of Internal Medicine, University of Health Sciences, Adana City Training and Research Hospital, Adana, Turkey
ABSTRACTObjectives: Catheter-related atrial fibrillation (AF) is a common cause during electrophysiological study (EPS)and prolongs the duration of the procedure. In our study, we compared P wave duration and dispersion inpatients with and without catheter-related atrial fibrillation during EPS. Methods: One hundred forty five patients who had normal EPS findings and who were found to have catheterrelated atrial fibrillation were included in our study. Electrocardiogram was performed in all patients and thepulse rate, the longest P wave duration (Pmax), the shortest P wave duration (Pmin) and the difference betweenof those (P wave dispersion: Pdisp) were recorded. EPS was performed in all patients. The patients were dividedinto two groups as the group 1 (without catheter-related AF) and group 2 (with catheter-related AF). Results: In group 2, EPS time was significantly longer, Pmax and Pdisp were found to be significantly higher,Pmin was found to be significantly lower. Binominal logistic regression analysis revealed that, Pmax (OR:1.077, 95% CI: 1.043-1.112, p < 0.001), Pmin (OR: 0.889, 95% CI: 0.853-926, p < 0.001) and Pdisp (OR:1.125, 95% CI: 1.080-1.173, p < 0.001) were all independent predictors for catheter-related AF. In ROCanalyses, Pmax cut-off value of 120 ms determined the catheter-related AF with 61% sensitivity and 67%specificity, Pdisp cut-off value of 35 ms determined the catheter-related AF with 80% sensitivity and 71%specificity. Conclusion: Patients with longer Pdisp and Pmax and shorter Pmin may develop catheter-related AF duringEPS.
Keywords: Atrial fibrillation, P wave dispersion, electrophysiological study
Address for correspondence: Yahya Kemal İçen, MD., Assistant Professor, University of Health Sciences, Adana City Training and Research Hospital,Department of Cardiology, Adana, TurkeyE-mail: [email protected]
Copyright © 2019 by The Association of Health Research & StrategyAvailable at http://dergipark.org.tr/eurj
The European Research Journal 2019;5(4):691-696
lectrophysiological study (EPS) is a common in-vasive method that is used for diagnosis and
treatment of arrhythmic patients which was recom-mended by guidelines [1]. If ablation is not performed,the diagnostic EPS can be done in a short time. Insome patients, arrhythmias including dual pathway,accessory pathway or atrial tachycardia are not found
and only catheter-related atrial fibrillation (AF)episodes may develop. This episodes may lead to pro-longation of the EPS time and more radiation expo-sure.
P wave dispersion (Pdisp) is calculated as thedifference between the longest P wave duration andthe shortest P wave duration on 12 lead surface elec-
E
ORIGINAL A RTICLE
e-ISSN: 2149-3189
DOI: 10.18621/eurj.412058
Received: April 2, 2018; Accepted: July 21, 2018; Published Online: September 10, 2018
The European Research Journal Volume 5 Issue 4 July 2019 691
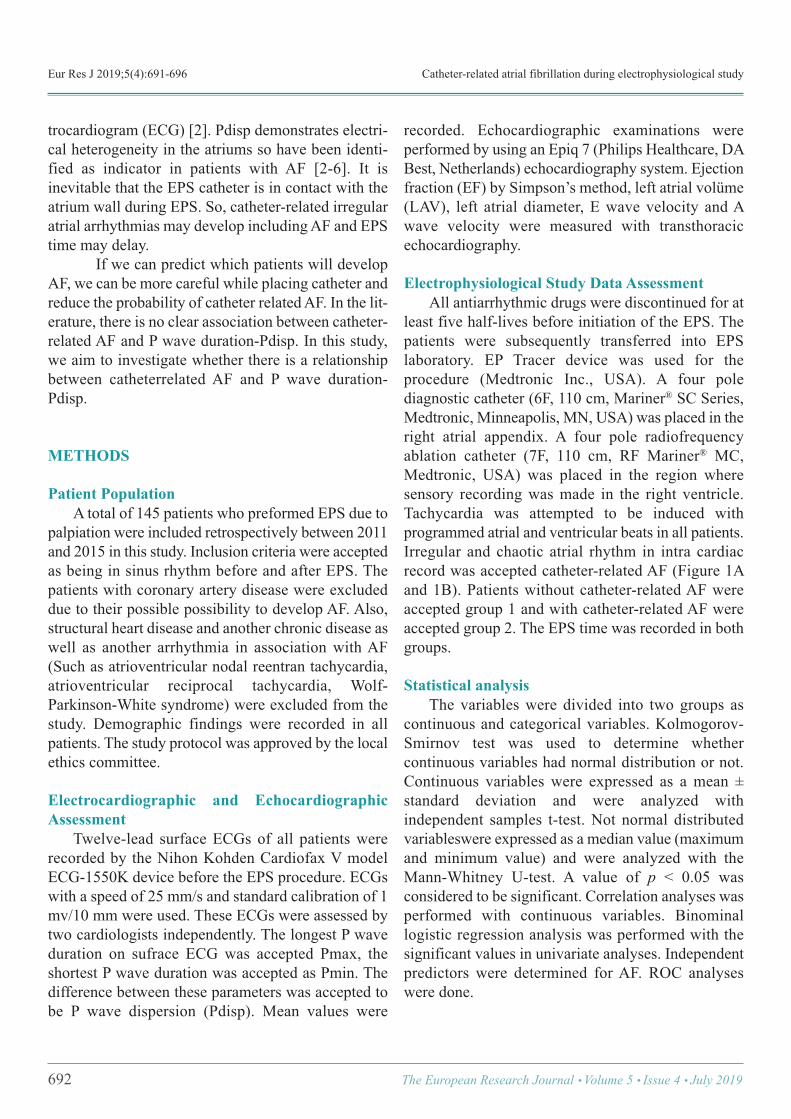
Eur Res J 2019;5(4):691-696 Catheter-related atrial fibrillation during electrophysiological study
trocardiogram (ECG) [2]. Pdisp demonstrates electri-cal heterogeneity in the atriums so have been identi-fied as indicator in patients with AF [2-6]. It isinevitable that the EPS catheter is in contact with theatrium wall during EPS. So, catheter-related irregularatrial arrhythmias may develop including AF and EPStime may delay.
If we can predict which patients will developAF, we can be more careful while placing catheter andreduce the probability of catheter related AF. In the lit-erature, there is no clear association between catheter-related AF and P wave duration-Pdisp. In this study,we aim to investigate whether there is a relationshipbetween catheterrelated AF and P wave duration-Pdisp.
METHODS
Patient Population A total of 145 patients who preformed EPS due topalpiation were included retrospectively between 2011and 2015 in this study. Inclusion criteria were acceptedas being in sinus rhythm before and after EPS. Thepatients with coronary artery disease were excludeddue to their possible possibility to develop AF. Also,structural heart disease and another chronic disease aswell as another arrhythmia in association with AF(Such as atrioventricular nodal reentran tachycardia,atrioventricular reciprocal tachycardia, Wolf-Parkinson-White syndrome) were excluded from thestudy. Demographic findings were recorded in allpatients. The study protocol was approved by the localethics committee.
Electrocardiographic and EchocardiographicAssessment Twelve-lead surface ECGs of all patients wererecorded by the Nihon Kohden Cardiofax V modelECG-1550K device before the EPS procedure. ECGswith a speed of 25 mm/s and standard calibration of 1mv/10 mm were used. These ECGs were assessed bytwo cardiologists independently. The longest P waveduration on sufrace ECG was accepted Pmax, theshortest P wave duration was accepted as Pmin. Thedifference between these parameters was accepted tobe P wave dispersion (Pdisp). Mean values were
recorded. Echocardiographic examinations wereperformed by using an Epiq 7 (Philips Healthcare, DABest, Netherlands) echocardiography system. Ejectionfraction (EF) by Simpson’s method, left atrial volüme(LAV), left atrial diameter, E wave velocity and Awave velocity were measured with transthoracicechocardiography.
Electrophysiological Study Data Assessment All antiarrhythmic drugs were discontinued for atleast five half-lives before initiation of the EPS. Thepatients were subsequently transferred into EPSlaboratory. EP Tracer device was used for theprocedure (Medtronic Inc., USA). A four polediagnostic catheter (6F, 110 cm, Mariner® SC Series,Medtronic, Minneapolis, MN, USA) was placed in theright atrial appendix. A four pole radiofrequencyablation catheter (7F, 110 cm, RF Mariner® MC,Medtronic, USA) was placed in the region wheresensory recording was made in the right ventricle.Tachycardia was attempted to be induced withprogrammed atrial and ventricular beats in all patients.Irregular and chaotic atrial rhythm in intra cardiacrecord was accepted catheter-related AF (Figure 1Aand 1B). Patients without catheter-related AF wereaccepted group 1 and with catheter-related AF wereaccepted group 2. The EPS time was recorded in bothgroups.
Statistical analysis The variables were divided into two groups ascontinuous and categorical variables. Kolmogorov-Smirnov test was used to determine whethercontinuous variables had normal distribution or not.Continuous variables were expressed as a mean ±standard deviation and were analyzed withindependent samples t-test. Not normal distributedvariableswere expressed as a median value (maximumand minimum value) and were analyzed with theMann-Whitney U-test. A value of p < 0.05 wasconsidered to be significant. Correlation analyses wasperformed with continuous variables. Binominallogistic regression analysis was performed with thesignificant values in univariate analyses. Independentpredictors were determined for AF. ROC analyseswere done.
692 The European Research Journal Volume 5 Issue 4 July 2019
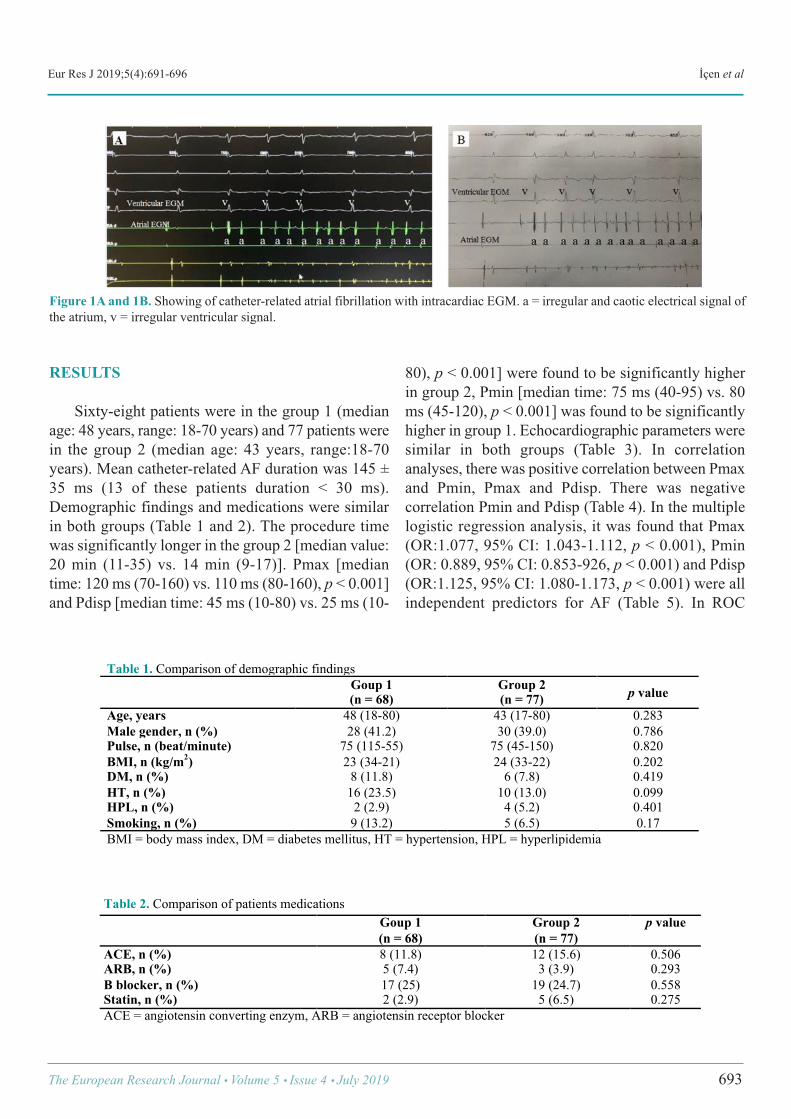
Eur Res J 2019;5(4):691-696 İçen et al
RESULTS
Sixty-eight patients were in the group 1 (medianage: 48 years, range: 18-70 years) and 77 patients werein the group 2 (median age: 43 years, range:18-70years). Mean catheter-related AF duration was 145 ±35 ms (13 of these patients duration < 30 ms).Demographic findings and medications were similarin both groups (Table 1 and 2). The procedure timewas significantly longer in the group 2 [median value:20 min (11-35) vs. 14 min (9-17)]. Pmax [mediantime: 120 ms (70-160) vs. 110 ms (80-160), p < 0.001]and Pdisp [median time: 45 ms (10-80) vs. 25 ms (10-
80), p < 0.001] were found to be significantly higherin group 2, Pmin [median time: 75 ms (40-95) vs. 80ms (45-120), p < 0.001] was found to be significantlyhigher in group 1. Echocardiographic parameters weresimilar in both groups (Table 3). In correlationanalyses, there was positive correlation between Pmaxand Pmin, Pmax and Pdisp. There was negativecorrelation Pmin and Pdisp (Table 4). In the multiplelogistic regression analysis, it was found that Pmax(OR:1.077, 95% CI: 1.043-1.112, p < 0.001), Pmin(OR: 0.889, 95% CI: 0.853-926, p < 0.001) and Pdisp(OR:1.125, 95% CI: 1.080-1.173, p < 0.001) were allindependent predictors for AF (Table 5). In ROC
The European Research Journal Volume 5 Issue 4 July 2019 693
Figure 1A and 1B. Showing of catheter-related atrial fibrillation with intracardiac EGM. a = irregular and caotic electrical signal ofthe atrium, v = irregular ventricular signal.
!
Table 1. Comparison of demographic findings
Goup 1 (n = 68)
Group 2 (n = 77) p value
Age, years 48 (18-80) 43 (17-80) 0.283 Male gender, n (%) 28 (41.2) 30 (39.0) 0.786 Pulse, n (beat/minute) 75 (115-55) 75 (45-150) 0.820 BMI, n (kg/m2) 23 (34-21) 24 (33-22) 0.202 DM, n (%) 8 (11.8) 6 (7.8) 0.419 HT, n (%) 16 (23.5) 10 (13.0) 0.099 HPL, n (%) 2 (2.9) 4 (5.2) 0.401 Smoking, n (%) 9 (13.2) 5 (6.5) 0.17 BMI = body mass index, DM = diabetes mellitus, HT = hypertension, HPL = hyperlipidemia
Table 2. Comparison of patients medications Goup 1
(n = 68) Group 2 (n = 77)
p value
ACE, n (%) 8 (11.8) 12 (15.6) 0.506 ARB, n (%) 5 (7.4) 3 (3.9) 0.293 Β blocker, n (%) 17 (25) 19 (24.7) 0.558 Statin, n (%) 2 (2.9) 5 (6.5) 0.275 ACE = angiotensin converting enzym, ARB = angiotensin receptor blocker
!
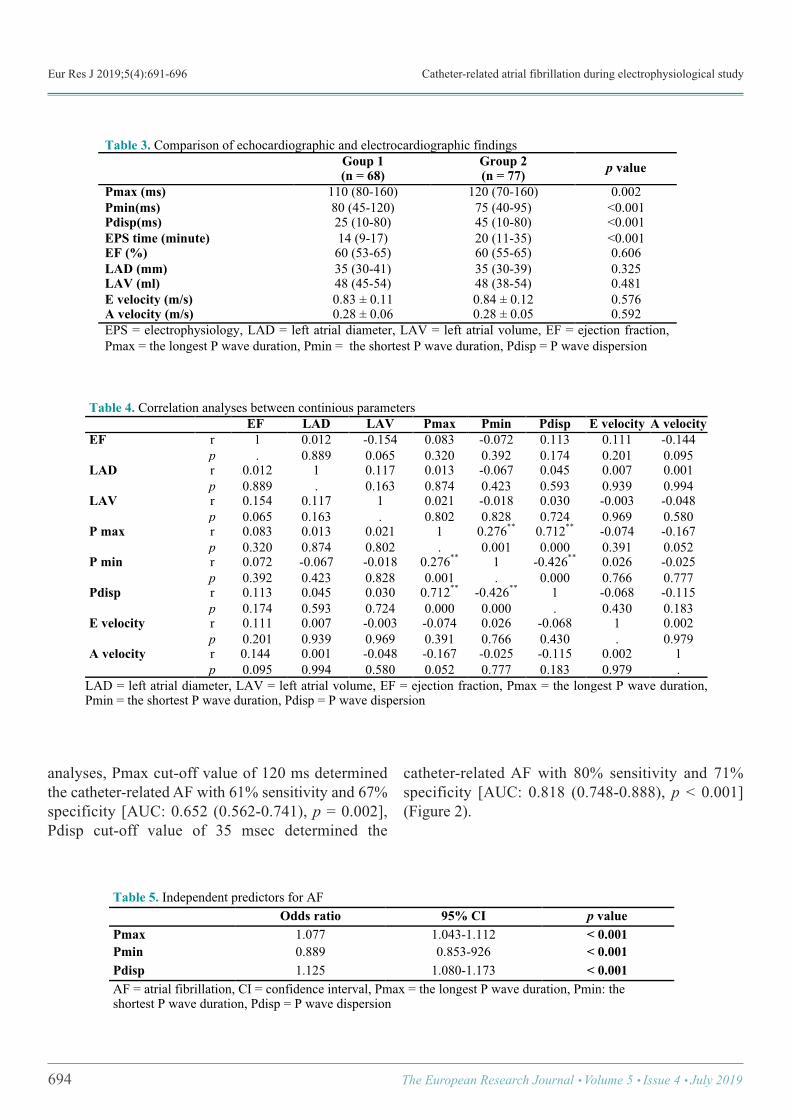
Eur Res J 2019;5(4):691-696 Catheter-related atrial fibrillation during electrophysiological study
analyses, Pmax cut-off value of 120 ms determinedthe catheter-related AF with 61% sensitivity and 67%specificity [AUC: 0.652 (0.562-0.741), p = 0.002],Pdisp cut-off value of 35 msec determined the
catheter-related AF with 80% sensitivity and 71%specificity [AUC: 0.818 (0.748-0.888), p < 0.001](Figure 2).
694 The European Research Journal Volume 5 Issue 4 July 2019
!Table 3. Comparison of echocardiographic and electrocardiographic findings Goup 1
(n = 68) Group 2 (n = 77) p value
Pmax (ms) 110 (80-160) 120 (70-160) 0.002 Pmin(ms) 80 (45-120) 75 (40-95) <0.001 Pdisp(ms) 25 (10-80) 45 (10-80) <0.001 EPS time (minute) 14 (9-17) 20 (11-35) <0.001 EF (%) 60 (53-65) 60 (55-65) 0.606 LAD (mm) 35 (30-41) 35 (30-39) 0.325 LAV (ml) 48 (45-54) 48 (38-54) 0.481 E velocity (m/s) 0.83 ± 0.11 0.84 ± 0.12 0.576 A velocity (m/s) 0.28 ± 0.06 0.28 ± 0.05 0.592 EPS = electrophysiology, LAD = left atrial diameter, LAV = left atrial volume, EF = ejection fraction, Pmax = the longest P wave duration, Pmin = the shortest P wave duration, Pdisp = P wave dispersion
!Table 4. Correlation analyses between continious parameters EF LAD LAV Pmax Pmin Pdisp E velocity A velocity EF r 1 0.012 -0.154 0.083 -0.072 0.113 0.111 -0.144
p . 0.889 0.065 0.320 0.392 0.174 0.201 0.095 LAD r 0.012 1 0.117 0.013 -0.067 0.045 0.007 0.001
p 0.889 . 0.163 0.874 0.423 0.593 0.939 0.994 LAV r 0.154 0.117 1 0.021 -0.018 0.030 -0.003 -0.048
p 0.065 0.163 . 0.802 0.828 0.724 0.969 0.580 P max r 0.083 0.013 0.021 1 0.276** 0.712** -0.074 -0.167
p 0.320 0.874 0.802 . 0.001 0.000 0.391 0.052 P min r 0.072 -0.067 -0.018 0.276** 1 -0.426** 0.026 -0.025
p 0.392 0.423 0.828 0.001 . 0.000 0.766 0.777 Pdisp r 0.113 0.045 0.030 0.712** -0.426** 1 -0.068 -0.115
p 0.174 0.593 0.724 0.000 0.000 . 0.430 0.183 E velocity r 0.111 0.007 -0.003 -0.074 0.026 -0.068 1 0.002
p 0.201 0.939 0.969 0.391 0.766 0.430 . 0.979 A velocity r 0.144 0.001 -0.048 -0.167 -0.025 -0.115 0.002 1 p 0.095 0.994 0.580 0.052 0.777 0.183 0.979 .
LAD = left atrial diameter, LAV = left atrial volume, EF = ejection fraction, Pmax = the longest P wave duration, Pmin = the shortest P wave duration, Pdisp = P wave dispersion
Table 5. Independent predictors for AF Odds ratio 95% CI p value Pmax 1.077 1.043-1.112 < 0.001 Pmin 0.889 0.853-926 < 0.001 Pdisp 1.125 1.080-1.173 < 0.001 AF = atrial fibrillation, CI = confidence interval, Pmax = the longest P wave duration, Pmin: the shortest P wave duration, Pdisp = P wave dispersion
!
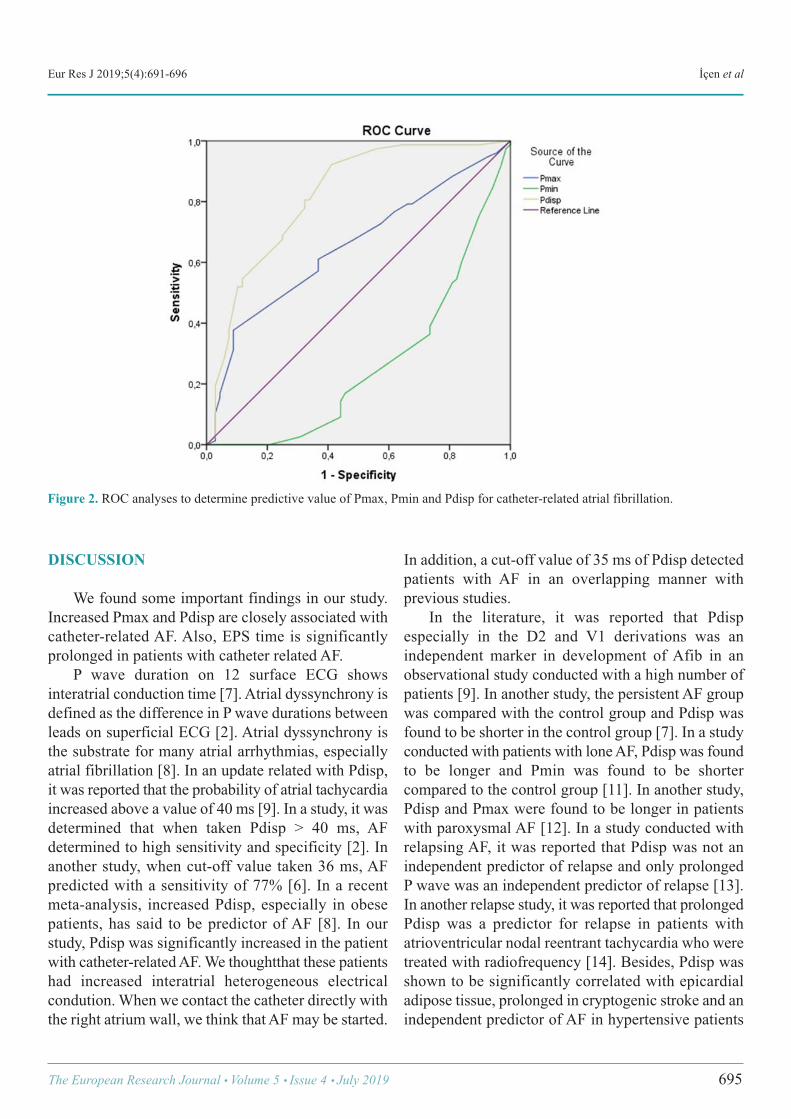
Eur Res J 2019;5(4):691-696 İçen et al
DISCUSSION
We found some important findings in our study.Increased Pmax and Pdisp are closely associated withcatheter-related AF. Also, EPS time is significantlyprolonged in patients with catheter related AF. P wave duration on 12 surface ECG showsinteratrial conduction time [7]. Atrial dyssynchrony isdefined as the difference in P wave durations betweenleads on superficial ECG [2]. Atrial dyssynchrony isthe substrate for many atrial arrhythmias, especiallyatrial fibrillation [8]. In an update related with Pdisp,it was reported that the probability of atrial tachycardiaincreased above a value of 40 ms [9]. In a study, it wasdetermined that when taken Pdisp > 40 ms, AFdetermined to high sensitivity and specificity [2]. Inanother study, when cut-off value taken 36 ms, AFpredicted with a sensitivity of 77% [6]. In a recentmeta-analysis, increased Pdisp, especially in obesepatients, has said to be predictor of AF [8]. In ourstudy, Pdisp was significantly increased in the patientwith catheter-related AF. We thoughtthat these patientshad increased interatrial heterogeneous electricalcondution. When we contact the catheter directly withthe right atrium wall, we think that AF may be started.
In addition, a cut-off value of 35 ms of Pdisp detectedpatients with AF in an overlapping manner withprevious studies. In the literature, it was reported that Pdispespecially in the D2 and V1 derivations was anindependent marker in development of Afib in anobservational study conducted with a high number ofpatients [9]. In another study, the persistent AF groupwas compared with the control group and Pdisp wasfound to be shorter in the control group [7]. In a studyconducted with patients with lone AF, Pdisp was foundto be longer and Pmin was found to be shortercompared to the control group [11]. In another study,Pdisp and Pmax were found to be longer in patientswith paroxysmal AF [12]. In a study conducted withrelapsing AF, it was reported that Pdisp was not anindependent predictor of relapse and only prolongedP wave was an independent predictor of relapse [13].In another relapse study, it was reported that prolongedPdisp was a predictor for relapse in patients withatrioventricular nodal reentrant tachycardia who weretreated with radiofrequency [14]. Besides, Pdisp wasshown to be significantly correlated with epicardialadipose tissue, prolonged in cryptogenic stroke and anindependent predictor of AF in hypertensive patients
The European Research Journal Volume 5 Issue 4 July 2019 695
Figure 2. ROC analyses to determine predictive value of Pmax, Pmin and Pdisp for catheter-related atrial fibrillation.
Eur Res J 2019;5(4):691-696 Catheter-related atrial fibrillation during electrophysiological study
in some studies [15-17]. Our study showed nosignificant correlation between P wave and otherparameters.
Limitations The duration of AF in our 13 patients is less than 30sec. In these patients, there is no definition in theguidelines [1]. The radiation dose received by thepatients whose EPS lasted longer was not recorded.The patients who developed AF during the procedurewere not followed up later. The CHA₂DS₂-VAScscore was not calculated after the procedure in thepatients with AF. No anticoagulant treatment wasinitiated. Because our study was retrospective, we didnot know if they became symptomatic after theprocedure? and if they had a complication due to AF?
CONCLUSION
Patients with longer Pdisp and Pmax and shorterPmin may develop AF more frequently during EPSand their procedure times may delay. Physician shouldbe careful when placing catheter in these patients.
Conflict of interest The authors disclosed no conflict of interest duringthe preparation or publication of this manuscript.
Financing The authors disclosed that they did not receive anygrant during conduction or writing of this study.
REFERENCES
[1] Page RL, Joglar JA, Caldwell MA, Calkins H, Conti JB, DealBJ, et al. 2015 ACC/AHA/HRS guideline for the management ofadult patients with supraventricular tachycardia: Executivesummary: A Report of the American College ofCardiology/American Heart Association Task Force on ClinicalPractice Guidelines and the Heart Rhythm Society. Heart Rhythm2016;13:e92-135. [2] Dilaveris PE, Gialafos JE. P-wave dispersion: a novelpredictor of paroxysmal atrial fibrillation. Ann NoninvasiveElectrocardiol 2001;6:159-65. [3] Yoshizawa T, Niwano S, Niwano H, Igarashi T, Fujiishi T,
Ishizue N, et al. Prediction of new onset atrial fibrillation throughP wave analysis in 12 lead ECG. Int Heart J 2014;55:422-7. [4] Nussinovitch U. Meta-analysis of p-wave dispersion valuesin healthy individuals: the influence of clinical characteristics.Ann Noninvasive Electrocardiol 2012;17:28-35. [5] Perez MV, Dewey FE, Marcus R, Ashley EA, Al-Ahmad AA,Wang PJ, et al. Electrocardiographic predictors of atrialfibrillation. Am Heart J 2009;158:622-8. [6] Aytemir K, Ozer N, Atalar E, Sade E, Aksöyek S, Ovünç K,et al. P wave dispersion on 12-lead electrocardiography inpatients with paroxysmal atrial fibrillation. Pacing ClinElectrophysiol 2000;23:1109-12. [7] Censi F, Corazza I, Reggiani E, Calcagnini G, Mattei E,Triventi M, et al. P-wave variability and atrial fibrillation. SciRep 2016;6:26799. [8] Aizawa Y, Watanabe H, Okumura K. Electrocardiogram(ECG) for the prediction of incident atrial fibrillation: anoverview. J Atr Fibrillation 2017;10:1724. [9] Perez-Riera AR, de Abreu LC, Barbosa-Barros R, Grindler J,Fernandes-Cardoso A, Baranchuk A. P-wave dispersion: anupdate. Indian Pacing Electrophysiol J 2016;16:126-33. [10] Yoshizawa T, Niwano S, Niwano H, Igarashi T, Fujiishi T,Ishizue N, et al. Prediction of new onset atrial fibrillation throughP wave analysis in 12 lead ECG. Int Heart J 2014;55:422-7. [11] Chang IC, Austin E, Krishnan B, Benditt DG, Quay CN,Ling LH, Chen LY. Shorter minimum p-wave duration isassociated with paroxysmal lone atrial fibrillation. Electrocardiol2014;47:106-12. [12] Dilaveris PE, Gialafos EJ, Sideris SK, Theopistou AM,Andrikopoulos GK, Kyriakidis M, et al. Simpleelectrocardiographic markers for the prediction of paroxysmalidiopathic atrial fibrillation. Am Heart J 1998;135(5 Pt 1):733-8. [13] Dilaveris PE, Gialafos EJ, Andrikopoulos GK, Richter DJ,Papanikolaou V, Poralis K, et al. Clinical andelectrocardiographic predictors of recurrent atrial fibrillation.Pacing Clin Electrophysiol 2000;23:352-8. [14] Amasyali B, Kose S, Aytemir K, Kilic A, Turhan H, CelikT, et al. P wave dispersion predicts recurrence of paroxysmalatrial fibrillation in patients with atrioventricular nodal reentranttachycardia treated with radiofrequency catheter ablation. AnnNoninvasive Electrocardiol 2006;11:263-70. [15] Çiçek Y, Doğan S, Durakoğlugil ME, Balcıoğlu AS, ErdoğanT, Şatıroğlu Ö, et al. The relationship between epicardial adiposetissue and P wave and QT dispersions. Turk Kardiyol Dern Ars2015;43:621-9. [16] Vural MG, Cetin S, Yilmaz M, Akdemir R, Gunduz H.Relation between left atrial remodeling in young patients withcryptogenic stroke and normal inter-atrial anatomy. J Stroke2015;17:312-9. [17] Tsioufis C, Syrseloudis D, Hatziyianni A, Tzamou V,Andrikou I, Tolis P, et al. Relationships of CRP and P wavedispersion with atrial fibrillation in hypertensive subjects. Am JHypertens 2010;23:202-7.
696 The European Research Journal Volume 5 Issue 4 July 2019
This is an open access article distributed under the terms of Creative CommonAttribution-NonCommercial-NoDerivatives 4.0 International License.
Effectiveness of balance training with kinesthetic abilitytrainer (KAT 2000) in patients with peripheral neuropathicpain: a randomised controlled studyDuygu Kerim , Aslıhan Uzunkulaoğlu , Saime Ay
Department of Physical Medicine and Rehabilitation, Ufuk University School of Medicine, Ankara, Turkey
ABSTRACTObjectives: The aim of this study isto determine the effectiveness of balance training with Kinesthetic AbilityTrainer (KAT 2000) in patients with peripheral neuropathic pain related balance disorder. Methods: Sixty patients were included into this controlled prospective study and randomized into either balanceexercises group (Group 1) or KAT 2000 exercises group (Group 2). Balance exercises were given to allpatients.Also, KAT 2000 balance exercises were given all patients in Group 2 (n = 30). All patients received45-min individualized training session for three times a week for 4 weeks. Douleur Neuropathique 4 (DN4)questionnaire for neuropathic pain; visual analogue scale (VAS) for pain severity; KAT 2000 for static anddynamic balance; Nottingham Health Profile (NHP) for Quality of Life (QoL) was used. Dynamic balance andmobility also was assessed using the Berg Balance Scale (BBS) and Time Up and Go (TUG) test. Patientswere evaluated at baseline and the end of the 4-week exercise program. Results: At the end of the treatment; VAS, BBS, KAT 2000, TUG, NHP, physical activity, NHP pain, NHPsocial isolation and NHP emotional reactions scores improved significantly in both groups (p < 0.05) exceptNHP sleep and NHP energy level scores in balance exercises group (p > 0.05). Statistical differences in VASpain on movement, global assessment of patient, global assessment of doctor, NHP energy level scores werefound between the groups (p < 0.05); but there were no statistical difference in VAS at rest, VAS at night, BBS,KAT 2000, TUG, NHP physical activity, NHP pain, NHP sleep, NHP social isolation and NHP emotionalreactions scores between the groups (p > 0.05). Conclusion: When combined with the KAT 2000 device, positive effects of balance-coordination exerciseson pain on movement and energy level are more evident in patients with peripheral neuropathic pain.
Keywords: Neuropathic pain, balance, KAT 2000, quality of life
Address for correspondence: Aslıhan Uzunkulaoğlu, MD., Assistant Professor, Ufuk University School of Medicine, Department of Physical Medicineand Rehabilitation, Dr. Rıdvan Ege Hastanesi, 06520 Balgat, Ankara, TurkeyE-mail: [email protected], Tel: +90 312 2044358, Fax:+90 312 2872390
Copyright © 2019 by The Association of Health Research & StrategyAvailable at http://dergipark.org.tr/eurj
The European Research Journal 2019;5(4):697-706
europathic pain is a chronic pain disorder causedby a lesion or disease of the somatosensory sys-
tem [1]. Neuropathic pain syndromes can be dividedinto two general categories as consequences of a pe-ripheral or central lesion or peripheral or central dis-
ease [2]. Neuropathic pain affects millions of peopleall over the world. Patients experience one of manysymptoms, such as pain, paresthesia, dysesthesia, hy-peralgesia, and allodynia [3]. Balance disorders are more common as people get
N
ORIGINAL A RTICLE
e-ISSN: 2149-3189
DOI: 10.18621/eurj.408381
Received: March 21, 2018; Accepted: July 14, 2018; Published Online: November 23, 2018
The European Research Journal Volume 5 Issue 4 July 2019 697
Eur Res J 2019;5(4):697-706 Kinesthetic ability trainer for peripheral neuropathic pain
older. It can reduce mobility and independence in theelderly and can cause substantial morbidity and mor-tality [4, 5]. The fact that an increased incidence ofnerve conduction abnormalities has been found in eld-erly with a history of balance impairment also suggeststhat peripheral nerve dysfunction can contribute to bal-ance impairments [6]. It is known that distal sensoryperipheral neuropathy and motor impairments maycause postural instability in elderly [7]. The associa-tion between peripheral neuropathy and balance im-pairments has been noted by many authors. It is knownthat subjects with peripheral neuropathy balanced lessreliably on one foot for three seconds than did matchedcontrol subjects without peripheral neuropathy [8]. In treatment, various exercise programs should begiven to treat the balance impairments identified in theelderly people with peripheral neuropathy. KinestheticAbility Trainer (KAT 2000) is a device which consistsof two components including a movable platform anda tilt sensor connected to a computer and evaluates andimproves the balance ability. In static balance exer-cises with KAT 2000; patients try to keep the red Xsymbol located in the center of the computer screen,while in dynamic balance exercises they try to followthe red X symbol moving clockwise or counterclock-wise. In this study, we aimed to evaluate the effective-ness of KAT 2000 in the treatment of patients withperipheral neuropathic pain related balance disorder.
METHODS
Experimental Approach to the Problem This placebo randomized controlled trial wascarried out in a university hospital and was conductedin accordance with the Declaration of Helsinki. Thestudy protocol was approved by the university ethicscommittee with 30112015-4 registry number. A totalof 60 patients who developed peripheral neuropathicpain-related balance impairment were included intothis study and randomized into either balanceexercises groups or KAT 2000 exercises groups. Allparticipants were informed about the study and signedwritten informed consent forms before interventions.Outcome variables were selected to provide scores andbefore and after treatment these scores werecompared.
Subjects A total of 60 patients who developed peripheralneuropathic pain-related balance impairment in thechronic phase due to lumber disc herniation, lumberspondylosis and gonarthrosis were included in thestudy. Patients had neuropathic pain for more than 3months. Neuropathic pain was diagnosed if DouleurNeuropathique 4 (DN4) score was ≥ 4. Balanceassessment was done with the Berg Balance Scale.Individuals were included in the study who had DN4scores ≥ 4 and moderately impaired balance with ascore of 21-40 points on the Berg Balance Scale.Individuals were excluded in the study who hadhistory of previous cerebrovascular events; otherneurological, musculoskeletal, inner ear or eye diseasethat may lead to impaired vision or standing balance.Because it may affect balance tests; lower extremitysurgery history, knee infection, inflammatory diseaseslike rheumatoid arthritis and spondyloarthropathies,another cause of polyneuropathy like diabetesmellitus, vitamin B 12 deficiency, toxic orneurological disease like stroke, spinal cord injury,sedative drug use story, heart failure not under activecontrol, malignancy or active systemic disease. Detailed anamnesis of all patients were obtained.Number of falls, associated systemic diseases andmedications were recorded. All patients wereexaminedin detail with musculoskeletal andneurological examination. After physical examinationall patients were received complete blood count, C-reactive protein (CRP), erythrocyte sedimentation rate(ESR) and biochemical markers were evaluated.Patients whose test results were within the normalrange were included in the study. By using the website randomizer.org methodparticipants were randomly assigned into two eitherbalance exercises (n = 30) or KAT 2000 balanceexercise (n = 30) group [9]. All of the patients wereblinded to training allocation but the physiotherapistwho applied thebalance training program was awareof the procedure. Also physiatrist who made theexamination and evaluations were blinded to trainingallocation.
Outcome Measures Patients were evaluated at baseline and 4 weekslater. The outcome measures used in the study arelisted below.
698 The European Research Journal Volume 5 Issue 4 July 2019
Eur Res J 2019;5(4):697-706 Kerim et al
Neuropathic Pain Neuropathic pain was determined by the DouleurNeuropathique 4 (DN4) questionnaire. The DN4questionnaire was originally developed forneuropathic pain diagnosis [10]. DN4 consists sevenitems related to symptoms and three related to clinicalexamination. For each item, a score of ‘‘1’’ is given ifthe response is ‘‘yes’’ and a score of ‘‘0’’ is given if itis ‘‘no’’. The patient is considered to have neuropathicpain if the total score is calculated to be 4 or more. Thereliability and validity study of Turkish version ofDN4 was performed by Cevik et al. [11].
Pain Intensity Pain intensity was evaluated on visual analogscale (VAS), where 0 = no pain and 10 = worstpossible pain (12). VAS consists of three mean scores;at rest, on movement and pain at night scores. Allpatients completed this scale.
Quality of Life The quality of life was assessed using NottinghamHealth Profile (NHP). All patients completed the NHP.This contains 38 statements (answered ‘yes’ or ‘no’)that assess subjective distress in six sections: physicalactivity (eight items), pain (eight items), sleep (fiveitems), emotional reactions (nine items), socialisolation (five items) and energy level (three items)[13]. O'Brien’s method was used in NHP scorecalculation. In order to calculate the overall score; theitem weights for items answered affirmatively areadded, and this total score is divided by 600 (the sumof all item weights); the result is subtracted from 1.Inorder to calculate the score for each section, totalweight score of each section is divided by 100, theresult is subtracted from 1 [14, 15]. According to thesemethods, when the evaluation score is close to ‘zero’,it shows poor health status and when it is close to‘one’, it shows good health status. The methodsdescribed above were used in NHP score calculationin this study.
Static and Dynamic BalanceKinesthetic Ability Trainer 2000 (KAT 2000) The KAT2000 device consists of two componentsincluding a movable platform and a tilt sensor
connected to a computer. In static balancemeasurement, patients were instructed to cross theirarms against their chest and maintain body equilibriumwithout changing feet on the platform. During the test,patients were asked to keep the red X symbol locatedin the middle of the computer screen.In dynamicbalance measurement, patients were instructed tofollow the red X symbol located in the center of thecomputer screen. During the test, circling in theclockwise direction, counterclockwise rotation in theclockwise direction, square drawing, eight strokeswere performed. All patients performed each test for30 s and repeated three times. The best of the threescores was considered as the final score. In calculatingtest scores, low scores indicate that the balance indexis good. The reliability of the balance data with the useof the KAT has been explained previously [16].
Berg Balance Scale Dynamic balance and mobilitywas also evaluatedusing the Berg Balance Scale (BBS) and Time Up andGo (TUG) test. The BBS consists of 14 simpledifferent balance-related tasks and evaluates the abilityof the subject’s static, dynamic, and functionalbalance. The success of each task was evaluated usinga scoring scale between zero (unable) and four(independent). Total scores was calculated out of amaximum of 56 points (17). The validity andreliability of the Turkish version of the BBS wasstudied byŞahin et al (18).
Time Up and Go (TUG) The TUG test is a simple test used to evaluatemobility [19]. Patients were instructed to rise from achair, walk 3 m on the floor at a normal pace, turnaround, walk back to the chair, and sit down [20]. Theresearcher observed the patient’s postural stability, gaitand stride length while the participants were walking.One source proposes that scores of 10 seconds (sec)or less indicate normal mobility, 11-20 sec normallimits for frail elderly subjects, and scores of 30 sec ormore propose that the subjects may fall [21, 22].
Procedures Before balance training, warm-up and stretchingexercises (paraspinal stretching, gluteus maximus andhip flexors stretching, hamstring stretching,
The European Research Journal Volume 5 Issue 4 July 2019 699
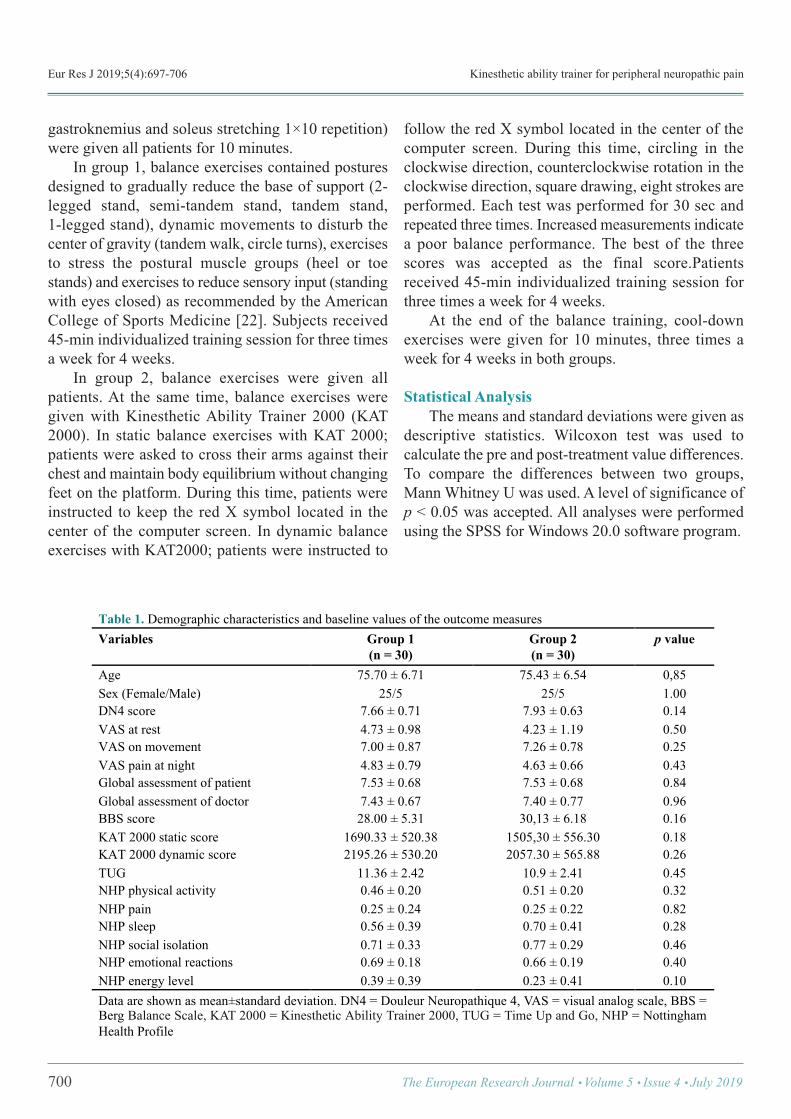
Eur Res J 2019;5(4):697-706 Kinesthetic ability trainer for peripheral neuropathic pain
gastroknemius and soleus stretching 1×10 repetition)were given all patients for 10 minutes. In group 1, balance exercises contained posturesdesigned to gradually reduce the base of support (2-legged stand, semi-tandem stand, tandem stand,1-legged stand), dynamic movements to disturb thecenter of gravity (tandem walk, circle turns), exercisesto stress the postural muscle groups (heel or toestands) and exercises to reduce sensory input (standingwith eyes closed) as recommended by the AmericanCollege of Sports Medicine [22]. Subjects received45-min individualized training session for three timesa week for 4 weeks. In group 2, balance exercises were given allpatients. At the same time, balance exercises weregiven with Kinesthetic Ability Trainer 2000 (KAT2000). In static balance exercises with KAT 2000;patients were asked to cross their arms against theirchest and maintain body equilibrium without changingfeet on the platform. During this time, patients wereinstructed to keep the red X symbol located in thecenter of the computer screen. In dynamic balanceexercises with KAT2000; patients were instructed to
follow the red X symbol located in the center of thecomputer screen. During this time, circling in theclockwise direction, counterclockwise rotation in theclockwise direction, square drawing, eight strokes areperformed. Each test was performed for 30 sec andrepeated three times. Increased measurements indicatea poor balance performance. The best of the threescores was accepted as the final score.Patientsreceived 45-min individualized training session forthree times a week for 4 weeks. At the end of the balance training, cool-downexercises were given for 10 minutes, three times aweek for 4 weeks in both groups.
Statistical Analysis The means and standard deviations were given asdescriptive statistics. Wilcoxon test was used tocalculate the pre and post-treatment value differences.To compare the differences between two groups,Mann Whitney U was used. A level of significance ofp < 0.05 was accepted. All analyses were performedusing the SPSS for Windows 20.0 software program.
700 The European Research Journal Volume 5 Issue 4 July 2019
Table 1. Demographic characteristics and baseline values of the outcome measures Variables Group 1
(n = 30) Group 2 (n = 30)
p value
Age 75.70 ± 6.71 75.43 ± 6.54 0,85 Sex (Female/Male) 25/5 25/5 1.00 DN4 score 7.66 ± 0.71 7.93 ± 0.63 0.14 VAS at rest 4.73 ± 0.98 4.23 ± 1.19 0.50 VAS on movement 7.00 ± 0.87 7.26 ± 0.78 0.25 VAS pain at night 4.83 ± 0.79 4.63 ± 0.66 0.43 Global assessment of patient 7.53 ± 0.68 7.53 ± 0.68 0.84 Global assessment of doctor 7.43 ± 0.67 7.40 ± 0.77 0.96 BBS score 28.00 ± 5.31 30,13 ± 6.18 0.16 KAT 2000 static score 1690.33 ± 520.38 1505,30 ± 556.30 0.18 KAT 2000 dynamic score 2195.26 ± 530.20 2057.30 ± 565.88 0.26 TUG 11.36 ± 2.42 10.9 ± 2.41 0.45 NHP physical activity 0.46 ± 0.20 0.51 ± 0.20 0.32 NHP pain 0.25 ± 0.24 0.25 ± 0.22 0.82 NHP sleep 0.56 ± 0.39 0.70 ± 0.41 0.28 NHP social isolation 0.71 ± 0.33 0.77 ± 0.29 0.46 NHP emotional reactions 0.69 ± 0.18 0.66 ± 0.19 0.40 NHP energy level 0.39 ± 0.39 0.23 ± 0.41 0.10 Data are shown as mean±standard deviation. DN4 = Douleur Neuropathique 4, VAS = visual analog scale, BBS = Berg Balance Scale, KAT 2000 = Kinesthetic Ability Trainer 2000, TUG = Time Up and Go, NHP = Nottingham Health Profile !
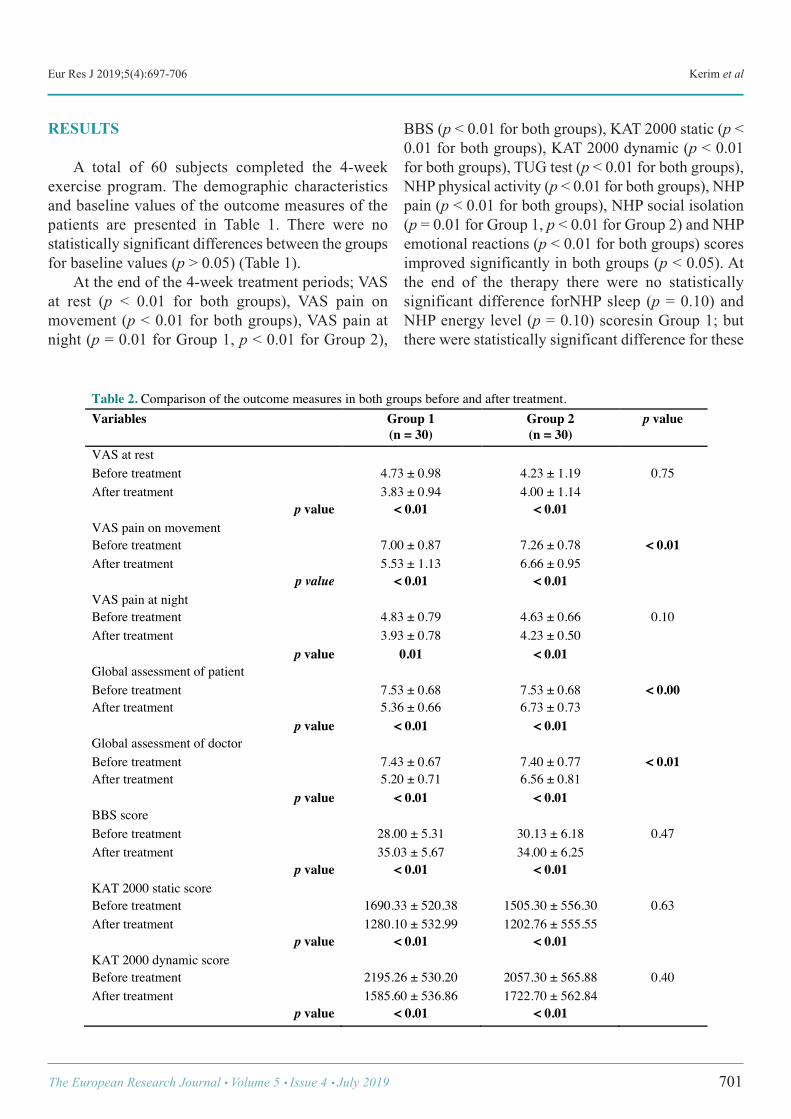
Eur Res J 2019;5(4):697-706 Kerim et al
RESULTS
A total of 60 subjects completed the 4-weekexercise program. The demographic characteristicsand baseline values of the outcome measures of thepatients are presented in Table 1. There were nostatistically significant differences between the groupsfor baseline values (p > 0.05) (Table 1). At the end of the 4-week treatment periods; VASat rest (p < 0.01 for both groups), VAS pain onmovement (p < 0.01 for both groups), VAS pain atnight (p = 0.01 for Group 1, p < 0.01 for Group 2),
BBS (p < 0.01 for both groups), KAT 2000 static (p <0.01 for both groups), KAT 2000 dynamic (p < 0.01for both groups), TUG test (p < 0.01 for both groups),NHP physical activity (p < 0.01 for both groups), NHPpain (p < 0.01 for both groups), NHP social isolation(p = 0.01 for Group 1, p < 0.01 for Group 2) and NHPemotional reactions (p < 0.01 for both groups) scoresimproved significantly in both groups (p < 0.05). Atthe end of the therapy there were no statisticallysignificant difference forNHP sleep (p = 0.10) andNHP energy level (p = 0.10) scoresin Group 1; butthere were statistically significant difference for these
The European Research Journal Volume 5 Issue 4 July 2019 701
Table 2. Comparison of the outcome measures in both groups before and after treatment. Variables Group 1
(n = 30) Group 2 (n = 30)
p value
VAS at rest Before treatment 4.73 ± 0.98 4.23 ± 1.19 0.75 After treatment 3.83 ± 0.94 4.00 ± 1.14
p value < 0.01 < 0.01 VAS pain on movement Before treatment 7.00 ± 0.87 7.26 ± 0.78 < 0.01 After treatment 5.53 ± 1.13 6.66 ± 0.95
p value < 0.01 < 0.01 VAS pain at night Before treatment 4.83 ± 0.79 4.63 ± 0.66 0.10 After treatment 3.93 ± 0.78 4.23 ± 0.50
p value 0.01 < 0.01 Global assessment of patient Before treatment 7.53 ± 0.68 7.53 ± 0.68 < 0.00 After treatment 5.36 ± 0.66 6.73 ± 0.73
p value < 0.01 < 0.01 Global assessment of doctor Before treatment 7.43 ± 0.67 7.40 ± 0.77 < 0.01 After treatment 5.20 ± 0.71 6.56 ± 0.81
p value < 0.01 < 0.01 BBS score Before treatment 28.00 ± 5.31 30.13 ± 6.18 0.47 After treatment 35.03 ± 5.67 34.00 ± 6.25
p value < 0.01 < 0.01 KAT 2000 static score Before treatment 1690.33 ± 520.38 1505.30 ± 556.30 0.63 After treatment 1280.10 ± 532.99 1202.76 ± 555.55
p value < 0.01 < 0.01 KAT 2000 dynamic score Before treatment 2195.26 ± 530.20 2057.30 ± 565.88 0.40 After treatment 1585.60 ± 536.86 1722.70 ± 562.84
p value < 0.01 < 0.01 !
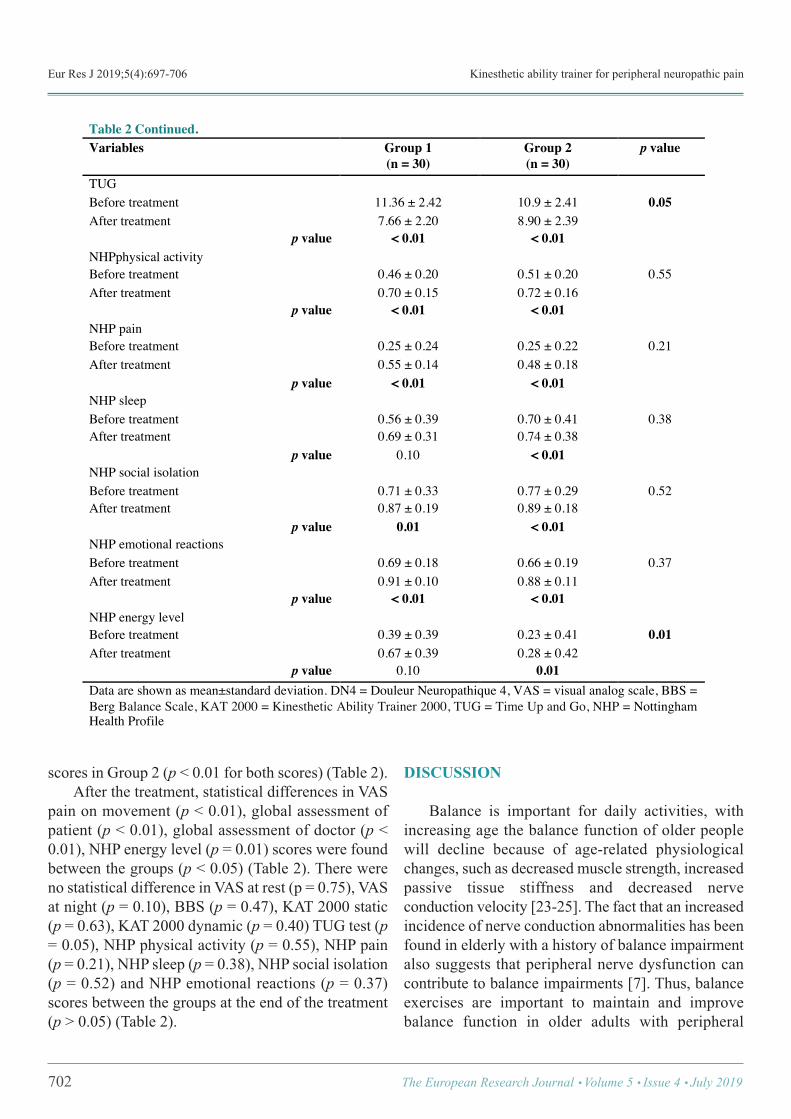
Eur Res J 2019;5(4):697-706 Kinesthetic ability trainer for peripheral neuropathic pain
scores in Group 2 (p < 0.01 for both scores) (Table 2). After the treatment, statistical differences in VASpain on movement (p < 0.01), global assessment ofpatient (p < 0.01), global assessment of doctor (p <0.01), NHP energy level (p = 0.01) scores were foundbetween the groups (p < 0.05) (Table 2). There wereno statistical difference in VAS at rest (p = 0.75), VASat night (p = 0.10), BBS (p = 0.47), KAT 2000 static(p = 0.63), KAT 2000 dynamic (p = 0.40) TUG test (p= 0.05), NHP physical activity (p = 0.55), NHP pain(p = 0.21), NHP sleep (p = 0.38), NHP social isolation(p = 0.52) and NHP emotional reactions (p = 0.37)scores between the groups at the end of the treatment(p > 0.05) (Table 2).
DISCUSSION
Balance is important for daily activities, withincreasing age the balance function of older peoplewill decline because of age-related physiologicalchanges, such as decreased muscle strength, increasedpassive tissue stiffness and decreased nerveconduction velocity [23-25]. The fact that an increasedincidence of nerve conduction abnormalities has beenfound in elderly with a history of balance impairmentalso suggests that peripheral nerve dysfunction cancontribute to balance impairments [7]. Thus, balanceexercises are important to maintain and improvebalance function in older adults with peripheral
702 The European Research Journal Volume 5 Issue 4 July 2019
Table 2 Continued. Variables Group 1
(n = 30) Group 2 (n = 30)
p value
TUG Before treatment 11.36 ± 2.42 10.9 ± 2.41 0.05 After treatment 7.66 ± 2.20 8.90 ± 2.39
p value < 0.01 < 0.01 NHPphysical activity Before treatment 0.46 ± 0.20 0.51 ± 0.20 0.55 After treatment 0.70 ± 0.15 0.72 ± 0.16
p value < 0.01 < 0.01 NHP pain Before treatment 0.25 ± 0.24 0.25 ± 0.22 0.21 After treatment 0.55 ± 0.14 0.48 ± 0.18
p value < 0.01 < 0.01 NHP sleep Before treatment 0.56 ± 0.39 0.70 ± 0.41 0.38 After treatment 0.69 ± 0.31 0.74 ± 0.38
p value 0.10 < 0.01 NHP social isolation Before treatment 0.71 ± 0.33 0.77 ± 0.29 0.52 After treatment 0.87 ± 0.19 0.89 ± 0.18
p value 0.01 < 0.01 NHP emotional reactions Before treatment 0.69 ± 0.18 0.66 ± 0.19 0.37 After treatment 0.91 ± 0.10 0.88 ± 0.11
p value < 0.01 < 0.01 NHP energy level Before treatment 0.39 ± 0.39 0.23 ± 0.41 0.01 After treatment 0.67 ± 0.39 0.28 ± 0.42
p value 0.10 0.01 Data are shown as mean±standard deviation. DN4 = Douleur Neuropathique 4, VAS = visual analog scale, BBS = Berg Balance Scale, KAT 2000 = Kinesthetic Ability Trainer 2000, TUG = Time Up and Go, NHP = Nottingham Health Profile !
Eur Res J 2019;5(4):697-706 Kerim et al
neuropathic pain. In peripheral neuropathy, patients experiencebalance impairment during stance and gait because ofthe sensory proprioception system of the lowerextremity that plays a key role in balance control isaffected and also the afferent conduction of tactile andproprioceptive information is impaired [26-28]. Balance exercises are important to maintain andimprove balance function in older adults withperipheral neuropathic pain. Allet et al. [29] reportedthat strength and balance training significantlyimproved balance and strength, increased walkingspeed, and decreased fear of falling in patients withperipheral neuropathy. In this study, we included the patients withperipheral neuropathic pain-related balanceimpairment in the chronic phase due to lumber discherniation, lumber spondylosis and gonarthrosis. Frostet al. mentioned that radiculopathy may affect balancecontrol the result of delaying muscle activation timingin patients with low back pain [30]. In the presentstudy,we found that balance exercises and KAT 2000exercises significantly improved VAS, KAT 2000,BBS, TUG, NHP physical activity, NHP pain, NHPsocial isolation and NHP emotional reactions scores.In that study, static balance test was performed withthe person standing on the dominant leg and thedynamic balance test was performed with the personstanding on both feet. It was mentioned that there wasa learning effect on balance when the patients wereretested, especially in the dynamic test and the greatestdifferences was seen in the static test. This wasexplained that standing on one leg was a daily livingactivity, while the skills required in the dynamicbalance test were new because patient must convert avisual task into a set of coordinated movements [16].On the other hand, there are many different systemsthat have been used in improvement of balance exceptKAT 2000. Nardone et al. [31] reported that balancetraining with either specific physical exercises or apowered platform is effective in patients with balancedisorders of neuropathic origin; thus, they contributeto improving balance and potentially decreasing therisk of falling in patients with neuropathy. In anotherstudy, Lindemann et al. [32] compared theeffectiveness Biodex stability system (BSS) balancetraining with a home-based exercise program innondisabled elderly subjects. At the end of the study,
it was shown that computer-assisted balance training,even if focused on one motor skill, was more effectivethan a home-based exercise program [32]. KAT 2000can also be used as a tool for static anddynamic balance exercises [34]. There are only a fewstudy using the KAT 2000 in balance impairments andin these studies it is used as only a testing device [33-35]. As far as we know there is no other study thatKAT 2000 has been used as a tool for static anddynamic balance exercises. Therefore we used KAT2000 as an exercise program to improve static anddynamic balance in patients with peripheralneuropathic pain.In our study, both balance and KAT2000 exercises significantly improved KAT 2000static and dynamic scores. On the other hand, KAT2000 exercise group did not score better than balanceexercise group with KAT 2000. So we can concludethat there is no learning effect.Additionally, there wereno statistical difference between the groupsat the endof the 4-week.As a result, we can conclude that thecombined use of balance and KAT 2000 exercisesdoes not improve neither static nor dynamic balancefurther. The BBS and TUG tests are most commonly usedto predictdynamic and functional balance in theelderly. In the study of Kruse et al. [36], efficacy of ahome-based exercise program in patients with diabeticneuropathy was evaluated and the balancemeasurements which included the BBS, TUG andone-leg static stance (OLS) tests were collected at thebaseline assessment and after 6 and 12 months ofparticipation. No significant differences were notedbetween groups in neither BBS nor TUG; only OLStest was better in leg strengthening and balanceexercises group than motivational telephone callsgroup. The training program had a minimal effect onparticipants' static balance [36]. In another study; Songet al. [37] assessed the effects of the balance exerciseprogram on balance and trunk proprioception in theolder adults with neuropathies. The BBS and TUGscores which assessed the dynamic balance,significantly increased in the exercise group but didnot improve in the controlgruop which did not takeexercise program. In that study, balance exercises haveshown a positive effect by improving balance andtrunk proprioception in older people with neuropathy[37]. In our study, after a 4-week balance trainingprogram, patients increased their BBS scores by 7.0
The European Research Journal Volume 5 Issue 4 July 2019 703
Eur Res J 2019;5(4):697-706 Kinesthetic ability trainer for peripheral neuropathic pain
points in balance exercises groupand 3.8 points inKAT2000 exercises group. The minimum detectablechange of the BBS has been reported to be 7 pointsfor older adults with an initial score of 25-34 [38].Significant improvement in BBS scores was observedin both groups. All patients decreased their TUG timescores below 13.5 sec, a suggested cutoff point for fallrisk in the elderly [39]. On the other hand, there wereno statistical difference in BBS and TUG time scoresbetween the groups at the end of the 4-week. Thissituation suggests that the combined use of balanceandKAT 2000 exercises does not improve the dynamicbalance further as mentioned before. Recently, a series of high-quality studies havebeen published that examine the relationship betweenneuropathic pain and health-related quality of life. Thedescriptive studies show that neuropathic pain isreported by patients to have a significant negativeimpact on sleep, physical functioning, emotionalfunctioning and social functioning [40, 41]. Patientsdescribe pain-related interference in multiple health-related quality of lifeand functional domains, as wellas reduced ability to work and reduced mobility dueto pain [42]. Disturbed sleep is always among the mostcommon pain-related problems reported byindividuals with neuropathic pain [41]. Benbow et al.[43] conducted a study on 79 diabetic and 39 non-diabetic patients were assessed using the NottinghamHealth Profile (NHP) for the quality of life. Diabeticneuropathy patients had significantly higher scores in5/6 NHP subgroups than either the other diabeticpatients or the non-diabetic control patients. Thesesubgroups were emotional reaction, energy, pain,physical mobility and sleep [43]. In our study, wedetermined significant improvements at quality of lifein both groups except NHP sleep and NHP energylevel scores in balance exercise group but thisimprovement was more significant in KAT 2000exercise group. There were statistically significantdifferences in only NHP energy level between thegroups. So we can conclude that combined use ofbalance and KAT 2000 exercises are effective forimprovement of sleep and energy level in patients withperipheral neuropathic pain. There are very few studies on the effect of balanceexercise on neuropathic pain. Therefore, it is difficultto compare this study with other studies. In the future,
we need to develop different kinds of balanceexercises that will improve balance disorder in patientswith peripheral neuropathic pain. So research studiesshould be done continuously to improve the balanceand quality of life in patients with peripheralneuropathic pain.
Limitations Short duration of exercise programs and follow-up were the major limitations of the study. In thisstudy, we analyzed only the short-term effects ofbalance exercise programs, therefore further studiesexamining the long-term effects should be considered.
CONCLUSION
The results of our study confirm that 4-weekbalance and KAT 2000 balance exercise programs areeffective in improving pain, static and dynamicbalance and quality of life in adults with peripheralneuropathic pain. When combined with the KAT 2000device, positive effects of balance-coordinationexercises on global assessment of patient and doctor,pain on movement and energy level are more evidentin patients with peripheral neuropathic pain. So, in ancontrolled setting; this combined exercise programmeimproves this burden complication.
Ethical approval The project was approved by university EthicalCommittee. All procedures were performed inaccordance with the ethical standards of theinstitutional research committee and with the 1964Helsinki Declaration and its latter amendments.
Informed consent Informed consent was obtained from individualparticipants included in the study.
Conflict of interest The authors disclosed no conflict of interest duringthe preparation or publication of this manuscript.
Financing The authors disclosed that they did not receive anygrant during conduction or writing of this study.
704 The European Research Journal Volume 5 Issue 4 July 2019
Eur Res J 2019;5(4):697-706 Kerim et al
REFERENCES
[1] Jensen TS, Baron R, Haanpää M, Kalso E, Loeser JD, RiceAS, et al. A new definition of neuropathic pain. Pain2011;152:2204-5. [2] Meacham K, Shepherd A, Mohapatra DP, Haroutounian S.Neuropathic pain: central vs. peripheral mechanisms. Curr PainHeadache Rep 2017;21:28. [3] Backonja MM, Serra J. Pharmacologic management part 1:Better studied neuropathic pain diseasese. Pain Med 2004;5:528-47. [4] Gryfe CI, Amies A, Ashley MJ. A longitudinal study of fallsin an elderly population: I. Incidence and morbidity. Age Ageing1977;6:201-10. [5] Tinetti ME, Speechley M, Ginter SF. Risk factors for fallsamong elderly persons living in the community. N Engl J Med1988;319:1701-7. [6] Pack DR, Wolfson LI, Amerman P, Whipple R, Kaplan JG.Peripheral nerve abnormalities and falling in the elderly.Neurology 1985;35 Suppl 1:79. [7] Van de Bosh C, Gilsing MG, Lee SG, Richardson JK, AshtonMiller JA. Peripheral neuropathy effect on ankle inversion andeversion thresholds. Arch Phys Med Rehabil 1995;76:850-6. [8] Richardson JK, Ashton-Miller JA, Lee SG, Jacobs K.Moderate peripheral neuropathy impairs weight transfer andunipedal balance in the elderly. Arch Phys Med Rehabil1996;77:1152-6. [9] www.randomizer.org [10] Bouhassira D, Attal N, Alchaar H, Boureau F, Brochet B,Bruxelle J, et al. Comparison of pain syndromes associated withnervous or somatic lesions and development of a new neuropathicpain diagnostic questionnaire (DN4). Pain 2005;114:29-36. [11] Unal Cevik I, Sarioglu Ay S, Evcik D. A comparison of theDN4 and LANSS questionnaires in the assessment of neuropathicpain: validity and reliability of the Turkish version of DN4. J Pain2010;11:1129-35. [12] Breivik H, Borchgrevink PC, Allen SM, Rosseland LA,Romundstad L. Assessment of pain. Br J Anaesth 2008;101:17-24. [13] Hunt SM, McEwen J. The development of a subjectivehealth indicator. Sociol Health Illn 1980;2:231-46.[14] McDowell I. Measuring health: a guide to rating scales andquestionnaires. 3rd ed. Oxford University Press. 2006:pp. 780.[15] O’Brien BJ, Buxton MJ, Ferguson BA. Measuring theeffectiveness of heart transplant programmes: quality of life dataand their relationship to survival analysis. J Chronic Dis1987;40:S137-53. [16] Hansen MS, Dieckmann B, Jensen K, Jakobsen BW. Thereliability of balance tests performed on the kinesthetic abilitytrainer (KAT 2000). Knee Surg Sports Traumatol Arthrosc2000;8:180-5. [17] Berg KO, Wood-Dauphinee SL, Williams JI, Maki B.Measuring balance in the elderly: validation of an instrument.Can J Public Health 1992;83(Suppl 2):S7-S11. [18] Sahin F, Yilmaz F, Ozmaden A, Kotevolu N, Sahin T, KuranB. Reliability and validity of the Turkish version of the BergBalance Scale. J Geriatr Phys Ther 2008;31:32-7.
[19] Podsiadlo D, Richardson S. The timed “Up & Go”: a test ofbasic functional mobility for frail elderly persons. J Am GeriatrSoc 1991;39:142-8. [20] Shumway-Cook A, Brauer S, Woollacott M. Predicting theprobability for falls in community-dwelling older adults usingthe Timed Up & Go Test. Phys Ther 2000;80:896-903. [21] Bohannon RW. Reference values for the timed up and gotest: a descriptive meta-analysis. J Geriatr Phys Ther 2006;29:64-8. [22] American College of Sports Medicine, Chodzko-Zajko WJ,Proctor DN, Fiatarone Singh MA, Minson CT, Nigg CR, SalemGJ, et al. American College of Sports Medicine position stand.Exercise and physical activity for older adults. Med Sci SportsExerc 2009;41:1510-30. [23] Valerio BC, Nobrega JA, Tilbery CP. Neural conduction inhand nerves and the physiological factor of age. ArqNeuropsiquiatr 2004;2:114-8. [24] Perry MC, Carville SF, Smith IC, Rutherford OM, NewhamDJ. Strength, power output and symmetry of leg muscles: effectof age and history of falling. Eur J Appl Physiol 2007;100:553-61. [25] DeVita P, Hortobagyi T. Age increases the skeletal versusmuscular component of lower extremity stiffness during steppingdown. J Gerontol Ser A Biol Sci Med Sci 2000;55:B593-600. [26] Nardone A, Godi M, Artuso A, Schieppati M. Balancerehabilitation by moving platform and exercises in patients withneuropathy or vestibular deficit. Arch Phys Med Rehabil2010;91:1869-77. [27] Horlings CG, Kung UM, Bloem BR, Honegger F, Van AlfenN, Van Engelen BG, et al. Identifying deficits in balance controlfollowing vestibular or proprioceptive loss using posturographicanalysis of stance tasks. Clin Neurophysiol 2008;119:2338-46. [28] Van Deursen RW, Simoneau GG. Foot and ankle sensoryneuropathy, proprioceptionand postural stability. J Orthop SportsPhys Ther 1999;29:718-26. [29] Allet L, Armand S, de Bie RA, Golay A, Monnin D, AminianK, de Bruin ED. The gaitand balance of patients with diabetescan be improved: a randomised controlled trial. Diabetologia2010;53:458-66. [30] Frost, Lydia R., Brown, Stephen H.M. Muscle activationtiming and balance response inchronic lower back pain patientswith associated radiculopathy. Clinical Biomechanics2016;32:124-30. [31] Nardone A, Godi M, Artuso A, Schieppati M. Balancerehabilitation by moving platformand exercises in patients withneuropathy or vestibular deficit. Arch Phys Med Rehabil2010;91:1869-77. [32] Lindemann U, Rupp K, Muche R, Nikolaus T, BeckerC. Improving balance byimproving motor skills. Z GerontolGeriatr 2004;37:20-6. [33] France P, Derscheid G, Irrgang J, Malone T, Petersen R,Tippett S et al. Preliminary clinical evaluation of the Breg K.A.T.:effects of training in normals. Isokinet Exerc Sci 1992;2:133-9. [34] Crawford C, Fleming K, Karabatsos P, Volkmann C,Williams K, Newton R. Normative values for healthy young and
The European Research Journal Volume 5 Issue 4 July 2019 705
Eur Res J 2019;5(4):697-706 Kinesthetic ability trainer for peripheral neuropathic pain
elderly adult populations on the KAT balance system. IssuesAging 1995;18:10-4. [35] Johnston RB, Howard ME, Cawley PW, Losse GM. Effectof lower extremity muscular fatigue on motor controlperformance. Med Sci Sports Exerc 1998;30:1703-7. [36] Kruse RL, LeMaster JW, Madsen RW. Fall and balanceoutcomes after an intervention to promote leg strength, balance,and walking in people with diabetic peripheral neuropathy: “FeetFirst” randomized controlled trial. Phys Ther 2010;90:1568-79. [37] Song CH, Petrofsky JS, Lee SW, Lee KJ, Yim JE. Effects ofan exercise program onbalance and trunk proprioception in olderadults with diabetic neuropathies. Diabetes Technol Ther2011;13:803-11. [38] Donoghue D; Physiotherapy Research and Older People(PROP) group, Stokes EK. Howmuch change is true change? The
minimum detectable change of the Berg Balance Scale inelderlypeople. J Rehabil Med 2009;41:343-6. [39] Shumway-Cook A, Brauer S, Woollacott M. Predicting theprobabilityfor falls incommunity-dwelling older adults using theTimed Up & Go Test. Phys Ther 2000;80:896-903. [40] David J. Rowbotham. Neuropathic pain and quality of life.European Journal of Pain 2002;6 (Suppl. B):19-24. [41] Jensen MP, Chodroff MJ, Dworkin RH. The impact ofneuropathic pain on health-relatedquality of life: review andimplications. Neurology 2007;68:1178-82. [42] O'Connor AB. Neuropathic pain: quality-of-life impact,costs and cost effectiveness of therapy. Pharmacoeconomics2009;27:95-112.[43] Benbow SJ, Wallymahmed ME, MacFarlane IA. Diabeticperipheral neuropathy and quality of life. OJM 1998;91:733-7.
706 The European Research Journal Volume 5 Issue 4 July 2019
This is an open access article distributed under the terms of Creative CommonAttribution-NonCommercial-NoDerivatives 4.0 International License.
Statin-associated myopathy: a general overviewAllam Harfoush
Department of Cardiovascular Diseases, Tishreen Hospital, Lattakia, Syria
ABSTRACTAmong the amazing turn of events in preventing and reducing the risk of cardiovascular diseases since thediscovery of statins, thousand of physicians started to prescribe it as a regular life-long treatment, but regardingthe expanding number of patients on statin therapy, a wide spectrum of side effects started to appear. Statin-associated myopathy considered as one of the most common side effects and could be subtle for a long time,we performed a review to provide a clinical summary of statin-associated myopathy and to discuss possiblemechanisms of risk factors and management of statin-associated myopathy.
Keywords: Statin-associated myopathy, myalgia, myositis, rhabdomyolysis
Address for correspondence: Allam Harfoush, MD., Tishreen Hospital, Department of Cardiovascular Diseases, Lattakia, Syria E-mail: [email protected]
Copyright © 2019 by The Association of Health Research & StrategyAvailable at http://dergipark.org.tr/eurj
The European Research Journal 2019;5(4):707-711
lthough that cardiovascular diseases consideredas the most common cause of death worldwide,
but since 2003; death rate has dropped about 38% [1],due to the significant advance in the medical field.However, it has always been the #1 priority is to re-duce the incidence and control different risk factors byboth life style changes and medical interventions(Drugs, Percutaneous coronary intervention, Surgery). Guidelines from all over the world (NICE guide-lines) consider statins as the drug of choice to controllow-density lipoprotein level and reduce the incidenceof atherosclerosis which is the most important causeof angina pectoris, myocardial infarction and stroke,but according to the expanding burden of patients withthis daily pharmaceutical regime, side effects of thissafe groups start to be noticed; as Statin-AssociatedMyopathy (SAM) considered as one of the most im-portant cause for cessation of the therapy [2].
What is SAM? Although there is not a universally accepted defi-nition of SAM but it is agreed to refer to any muscular
symptoms occurring during therapy despite of creatinelevel , and resolve on treatment cessation [3, 4]. SAMconsidered as one of the most common/severe side ef-fects, the clinical spectrum of SAM include: myalgia,myositis, rhabdomyolysis and asymptomatic elevationof CK [5, 6].
Myalgia It is the most common condition related to SAM,but as myalgia is frequently reported in hospitals andgeneral clinics and it could for many different reasons, thus statin therapy is not necessarily the cause ofmyalgia even with the patients on statins therapy [7,8]. The definition of myalgia is unexplained musclepain or discomfort, may be described as 'flu-like' gen-eral symptoms with normal Creatine Kinase (CK) [8,9]. The wide spectrum of symptoms include: musclepain, cramps and maybe associated with weakness [7,9, 10]. Tenderness after the many articles we reviewed is usu-ally proximal, maybe symmetrical with the involve-
A
REVIEW
e-ISSN: 2149-3189
DOI: 10.18621/eurj.416772
Received: April 19, 2018; Accepted: August 16, 2018; Published Online: November 6, 2018
The European Research Journal Volume 5 Issue 4 July 2019 707
Eur Res J 2019;5(4):707-711 Statin-associated myopathy
ment of the large muscle groups such as: the thighs,back muscles and buttocks [11]. Some patients re-ported legs cramps, difficulty climbing stairs , gettingup after sitting. This symptoms aggravated especiallyduring or after exercise, but predominantly withoutCK elevation [9, 11]. In a review of a database of 508patients with familial hypercholesterolemia treatedwith simvastatin (80 mg/day) for two years , myalgianoted in 45 patients with 8.86% [12]. In another observation study (PRIMO), muscle re-lated symptoms was reported by 832 patients out of7,942 patients with hyperlipidemia receiving statins inan unselected group , with 10.49%, which is rela-tively close to the percentage of the past study [13].In general; discomfort or the associated weakness typ-ically occur within the first month (4-6 weeks) afterstarting the therapy , or symptoms may occur after in-creasing the dose in a patient who is already on statins, symptoms maybe more frequent in physically activeindividuals treated with statins [10, 14].
Myositis Myositis is defined as a muscle inflammation, it isusually accompanied with serum CK elevation; symp-toms include pain and weakness and it is typically gen-eralized and proximal (like myalgia) [7, 9, 10].Skeletal muscle biopsies shows different findings ,such as polymyositis and myolysis, however it is notone of the criteria to diagnosis myositis and biopsy isnot a routine procedure [6]; so the diagnosis should beconsidered in any patient with statin therapy in thepresence of CK elevation even without any physicalor pathological findings [11].
Rhabdomyolysis It is a rare, life threatening side effect with severegeneral devastation of the muscles, elevation of serumCK more than 10× of the normal limit, decreased renalfunction or even failure, myoglobinuria, disseminatedintravascular coagulation and maybe death. Symptomsmay include: severe muscle pain , muscle weaknessthrough the entire body, dark urine, vomiting, malaiseand tachycardia, however patients with rhabdomyol-ysis may not report any muscular symptoms. Pathologically biopsies shows myonecrosis andsignificant inflammation [7, 9, 10, 15]. In one studythat included 252,460 patients showed that the averageincidence of hospitalization for rhabdomyolysis was
0.44 per 10,000 patients treated with statins (atorvas-tatin, pravastatin, simvastatin), however; cerivastatinwhich was withdrawn in 2001 has a 12 fold increasedrisk in the incidence of rhabdomyolysis. In USA; re-ported death due to statins induced rhabdomyolysiswas over 0.15 per 1000,000 [14, 16, 17]. However ; this not a standard universal classifica-tion of SAM, and it may be difficult to set a final di-agnosis because of the similarity of symptoms andlaboratory findings between this three types, and alsobetween other differential diagnosis that mimic SAMfindings, and could be much more common.
What are the mechanism of SAM? Although there is a lot of theories to explain themechanism of SAM, the etiology still poorly under-stood , and seems to be multifactorial which needmore studies and some of the proposed mechanisms[5, 9, 10, 18, 19].
Membrane ion channels theory This proposed theory is that impaired synthesis ofcholesterol may lead to a different changes in the mus-cle cell membrane, which may affect membrane flu-idity altering ion channels behavior (like sodium,potassium and chloride) affecting the muscle mem-brane excitability. In an animal study results showeda dose-dependent reduction of membrane chlorideconductance in rats treated with simvastatin, while theresting membrane was not affected.
Apoptosis theory Another proposed theory is statin-induced apop-tosis; statin interfere with the synthesis of cholesterol,thus may lead to a pre-cholesterol products depletionsuch as isoprenoid-lipid. Isoprenoid-lipid depletion in-volves with myofiber apoptosis. In 'in vivo' studies ,statin manage to induce apoptosis in myo cells , but itstill not established this particular mechanism 'in vit-ro'.
Ubiquinine theory As isoprenoid; ubiquinine (CoQ10) considered asone of the products of cholesterol synthesis pathway,and the depletion of ubiquinine could lead to impairedenzymes activity in mitochondria. However; althoughlow serum concentration of ubiquinine have beennoted in patients with statin therapy but the concen-
708 The European Research Journal Volume 5 Issue 4 July 2019
Eur Res J 2019;5(4):707-711 Harfoush
tration of ubiquinine in muscles have not alwaysshowed that. In general myocellular concentration ofubiquinine in patients with statins therapy haveshowed unchanged , increased and decreased levels.In one small randomized blind trial , 41 patient onstatin therapy who had muscle pain , divided into twogroups first group (21 patients) received ubiquinine,the other group (20 patients) received vitamin E; afterone month of therapy results showed that (18 of 21 pa-tients) who received ubiquinine report improvementin muscle symptoms , compared to (3 of 20 patients)who received vitamin E [20]. However; more studiesstill needed to confirm the important role of ubiqui-nine.
Other proposed mechanisms Autoimmune mechanism, calcium homeostasisimpairment and genetics interference.
What are the risk factors of SAM? Determining and detecting risk factors of SAM be-fore starting statin therapy may help physicians tomake more effective and efficient decisions consider-ing statin therapy [2, 4, 6, 9-11]. Risk factors catego-rized into two types: Patients-related risk factors andtherapy-related risk factors.
Patients-related risk factorsThis group could be categorized into subtypes: Demographic: The risk of SAM is higher in: >Elderly patients >Female sex >People with heavy exercise >Low body mass index >Alcoholism >Heavy consumption of grape fruit Genetics: This is considered as a rare risk factor , itincludes such as: >Inherited muscle diseases (McArdle, Pompe) >Variations in the enzymes system that is responsibleof the metabolism of statins (CYP enzymes system) Co morbidities: Many diseases interfere with statinmyotoxicity such as:>Renal failure >Hepatic failure >Hypothyroidism >Diabetes mellitus >Infections
>Recent major surgery
Therapy-related risk factorsThis type divided into subtypes too: Statin dose:Although the mechanism is unknown; theincidence of SAM increase gradually among the doseand the concentration of statins. Drugs that interferewith CYP2C9 (responsible for the metabolism of ro-suvastatin, fluvastatin) such as ranitidine, fluconazole,amiodaron [9, 19]. Combination therapy: Some drugs may increase theincidence of SAM if it was administrated with statinssuch as fibrates, cyclosporine. Using statins therapy atthe same time with gemfibrozile (fibrate) may increasethe incidence of rhabdomyolysis approximately 10×higher [9]. Pharmacokinetics: In general; hydrophilic statins areless likely to enter different cells such myocytes , andthus may have less risk of myopathy. However, it isknown that hydrophilic statins are as likely aslipophilic statins to cause myotoxicity. Drug interactions: Interactions with the metabo-lism of statins (CYP enzymes system): Drugs that in-terfere with CYP3A4 (responsible for the metabolismof lovastatin, atorvastatin, simvastatin) such as pro-tease inhibitors, macrolide, and diltiazem [9, 19].
What should physicians do to manage SAM? When patients on statins complain muscle symp-toms, detailed history should be taken and physical ex-amination should be done; this procedure covers twogoals: first to exclude other more common differentialdiagnosis, second is to determine the risk factors ofSAM [3, 21, 22]. Blood tests, CK and thyroid func-tion (TFT) should be done( hypothyroidism may pres-ents with only hypercholesteremia, raised CK andmyalgia), renal function and urine analysis. The firstline management is to stop statins, monitor CK andobserve symptoms. If muscular symptoms are tolera-ble and CK is raised less than 10× statin therapy maybe continued among with a constant observation. Butif there is any signs for rhabdomyolysis or CK level ismore than 10× statin therapy should be stopped.
Should physicians monitor CK on a regular basisafter statin therapy started? In general, routine monitoring of CK level is notrecommended, but it is useful to obtain a baseline CK
The European Research Journal Volume 5 Issue 4 July 2019 709
Eur Res J 2019;5(4):707-711 Statin-associated myopathy
level for comparing purposes prior the starting ofstatin therapy [3, 11, 22]. For patients receiving statintherapy with an interacting medications it may be nec-essary to monitor CK level, due to the increased riskof SAM. However; serum CK level does not neces-sarily exclude muscle damage.
CONCLUSION
Although statins considered as a safe group ofdrugs , and its benefits of reducing cardiovasculardiseases morbidity and mortality , it is still associatedwith muscular side effects ranging from discomfort tothe life-threatening rhabdomyolysis; thus it isimportant to consider the risk factors of SAM, andassess the advantages and disadvantages for eachpatient individually before initiating the therapy.Management options for statin-intolerant patientsinclude statin switching, especially to low-dose, non-daily doses of long-acting statins, such as rosuvastatinand atorvastatin. In conclusion, statin-inducedmyopathy is a significant clinical problem thatcontributes considerably to statin therapydiscontinuation. However, there exist multiple andeffective management options for statin intolerantpatients [9].
Conflict of interest The authors disclosed no conflict of interest duringthe preparation or publication of this manuscript.
Financing The authors disclosed that they did not receive anygrant during conduction or writing of this study.
REFERENCES
[1] Mozaffarian D, Benjamin EJ, Go AS, Arnett DK, Blaha MJ,Cushman M, et al; American Heart Association StatisticsCommittee; Stroke Statistics Subcommittee. Heart Disease andStroke Statistics-2016 Update: A Report From the AmericanHeart Association. Circulation 2016;133:e38-360. [2] Baigent C, Keech A, Kearney PM, Blackwell L, Buck G,Pollicino C, et al; Cholesterol Treatment Trialists' (CTT)Collaborators. Efficacy and safety of cholesterol-loweringtreatment: prospective meta-analysis of data from 90,056participants in 14 randomised trials of statins. Lancet2005;366:1267-78.
[3] Stroes ES, Thompson PD, Corsini A, Vladutiu GD, Raal FJ,Ray KK, at al; European Atherosclerosis Society ConsensusPanel. Statin-associated muscle symptoms: impact on statintherapy-European Atherosclerosis Society Consensus PanelStatement on Assessment, Aetiology and Management. Eur HeartJ 2015;36:1012-22. [4] Hansen KE, Hildebrand JP, Ferguson EE, Stein JH. Outcomesin 45 patients with statin-associated myopathy. Arch Intern Med2005;165:2671-6. [5] Thompson PD, Clarkson P, Karas RH. Statin-associatedmyopathy. JAMA 2003;289:1681-90. [6] Sathasivam S, Lecky B. Statin induced myopathy. BMJ2008;337:a2286. [7] Rosenson RS, Baker SK, Jacobson TA, Kopecky SL, ParkerBA, The National Lipid Association's Muscle Safety ExpertPanel. An assessment by the Statin Muscle Safety Task Force:2014 update. J Clin Lipidol 2014;8(3 Suppl):S58-71. [8] Fernandez G, Spatz ES, Jablecki C, Phillips PS. Statinmyopathy: a common dilemma not reflected in clinical trials.Cleve Clin J Med 2011;78:393-403. [9] Abd TT, Jacobson TA. Statin-induced myopathy: a review andupdate. Expert Opin Drug Saf 2011;10:373-87. [10] Tomaszewski M, Stępień KM, Tomaszewska J, CzuczwarSJ. Statin-induced myopathies. Pharmacol Rep 2011;63:859-66. [11] Best tests: Investigating myalgia in patients taking statins,The Best Practice Advocacy Centre New Zealand (bpacnz).August 2014. [12] de Sauvage Nolting PR, Buirma RJ, Hutten BA, KasteleinJJ; Dutch ExPRESS Investigator Group. Two-year efficacy andsafety of simvastatin 80 mg in familial hypercholesterolemia (theExamination of Probands and Relatives in Statin Studies WithFamilial Hypercholesterolemia [ExPRESS FH]). Am J Cardiol2002;90:181-4. [13] Bruckert E, Hayem G, Dejager S, Yau C, Bégaud B. Mild tomoderate muscular symptoms with high-dosage statin therapy inhyperlipidemic patients--the PRIMO study. Cardiovasc DrugsTher 2005;19:403-14. [14] Staffa JA, Chang J, Green L. Cerivastatin and reports of fatalrhabdomyolysis. N Engl J Med 2002;346:539-40. [15] Graham DJ, Staffa JA, Shatin D, Andrade SE, Schech SD,La Grenade L, et al. Incidence of hospitalized rhabdomyolysis inpatients treated with lipid-lowering drugs. JAMA2004;292:2585-90. [16] Graham DJ, Staffa JA, Shatin D, Andrade SE, Schech SD,La Grenade L, et al. Incidence of hospitalized rhabdomyolysis inpatients treated with lipid-lowering drugs. JAMA2004;292:2585-90. [17] Joy TR, Hegele RA. Narrative review: statin-relatedmyopathy. Ann Intern Med 2009;150:858-68. [18] Jacobson TA. NLA Task Force on Statin Safety--2014update. J Clin Lipidol 2014;8(3 Suppl):S1-4. [19] Vrablik M, Zlatohlavek L, Stulc T, Adamkova V, PrusikovaM, Schwarzova L, et al. Statin-associated myopathy: fromgenetic predisposition to clinical management. Physiol Res2014;63 Suppl 3:S327-34. [20] Parker BA, Thompson PD. Effect of statins on skeletalmuscle: exercise, myopathy, and muscle outcomes. Exerc Sport
710 The European Research Journal Volume 5 Issue 4 July 2019

Eur Res J 2019;5(4):707-711 Harfoush
Sci Rev 2012;40:188-94. [21] Schuster B. Monitorıng of creatine kinase (CK) in patientson statin therapy. The Rx Files: Q&A Summary, March 2002.
[22] Husband A. Managing statin-induced myopathy. ClinPharmacist 2009;1:319-20.
This is an open access article distributed under the terms of Creative CommonAttribution-NonCommercial-NoDerivatives 4.0 International License.
The European Research Journal Volume 5 Issue 4 July 2019 711
Mood disorder following traumatic brain injury: a case report
Buket Koparal1 , Behçet Coşar2
1Department of Psychiatry, Recep Tayyip Erdogan University Training and Research Hospital, Rize, Turkey 2Department of Psychiatry, Gazi University School of Medicine, Ankara, Turkey
ABSTRACTTraumatic brain injury is a clinical situation that generally affects young people aged 45 years or younger andcauses mortality and critical functional losses. The most common psychiatric disorder following taumatic braininjury is depression. Although the relationship between depression and organic diseases has been studied a lot,there is less data about mania. Secondary mania differs from primary mania with advanced beginning age,absence of family history, more difficult and slower response to treatment; and secondary mania usually hasno recurrence. In this report, secondary mania and its clinical features are discussed in light of a mood disorderfollowing a trauma case. The case is still followed with mood stabilizer treatment and the patient is euthymic.
Keywords: Traumatic brain injury, secondary mania
Address for correspondence: Buket Koparal, MD., Recep Tayyip Erdogan University Training and Research Hospital, Department of Psychiatry, Rize,Turkey E-mail: [email protected]
Copyright © 2019 by The Association of Health Research & StrategyAvailable at http://dergipark.org.tr/eurj
The European Research Journal 2019;5(4):712-714
raumatic brain injury (TBI) affects young peopleaged 45 years and younger and causes mortality
and morbidity [1]. The most essential factors that af-fect quality of life in the long term are cognitive andbehavioral changes in these patients. Trauma has pri-mary and secondary impacts; while primary impactsare contusion and diffuse axonal injury emerging atthe moment of accident, changes emerging as a re-sponse to primary injury are considered secondary im-pacts (intracranial pressure increase, parenchymaledema, inflammation, glial proliferation, etc.) [2].Neuronal degeneration and the repair process follow-ing trauma cause changes in neuronal activity and neu-ronal circuits in the long term. Posttraumatic changesin the neurotransmitter system are also associated withmood disorders following trauma [3]. Various psychiatric disorders may develop aftertrauma depending on the affected region of the brain[1]. The lateral orbitofrontal cortex is associated withirritability, impulsivity and emotional lability; anterior
cingulate cortex with apathy and akinetic mutism;temporal lobe with lability, aggression and psychosis;and hypothalamus with sexual behavior and aggres-sion [4]. In one case changes in the right hemispherewere detected on MR imaging of a 17-year-old patientwith mania after TBI and in another case left hemi-sphere lesion was associated with mania. Additionally,a case of mania following bilateral temporal hemor-rhage was also reported [5]. In this case report, mood disorders followingtrauma and clinical features of secondary mania arediscussed in the light of a case about a patient withbipolar disorder following trauma.
CASE PRESENTATION
The patient was a 25-year-old single male,working as a salesman in a company. He hadgraduated from university and lived with his family in
T
CASE REPORT
e-ISSN: 2149-3189
DOI: 10.18621/eurj.434311
Received: June 17, 2018; Accepted: September 6, 2018; Published Online: November 7, 2018
The European Research Journal Volume 5 Issue 4 July 2019 712
Eur Res J 2019;5(4):712-714 Mood disorder following traumatic brain injury
a small city. He was taken to hospital involuntarily by familymembers with complaints of insomnia, increased self-confidence, and excessive passion for spendingmoney. According to the family members and thepatient himself, he had no previous psychiatricdisorder and drug use. He had no psychiatric familyhistory. He had subarachnoid hemorrhage after fallingfrom a height two years previously. He was treated inthe intensive care unit for a period. After dischargefrom hospital, he had a period of depressionaccompanying unhappiness, pessimism, andunwillingness to live which lasted 4-5 months. He wastreated with sertraline 50 mg and entered a remissionperiod. He had a period of increased mobility, self-confidence and uncontrolled behaviors thereafter,treatment was completed and medicines were stopped.The patient was treated with low dosage risperidone.In follow-up, he had one more manic period thatsubsided in a short time. The patient whose complaintsrecurred in spite of medical treatment in the last 15days was admitted to our clinic. In his psychiatric examination psychomotoractivity was increased, he exhibited grandiose attitudeand he was irritable. He had flighty ideas and hisspeaking was fast and speed was increased. YoungMania Rating Scale (YMRS) was 32 points.Laboratory studies were in normal range. On MR imaging, posttraumatic sequelae weredetected in the right temporal lobe, bilateral basalganglion levels, right corpus callosum splenium,thalamus, bilateral frontal lobe and subcortical whitesubstance. The patient’s treatment was arranged as 30mg/day olanzapine and 1000 mg/day valproic acid. Inthe second week of treatment, clonazepam 6 mg/dayand haloperidol were added because he did notrespond to treatment with olanzapine and valproicacid. Haloperidol was increased to 30 mg andolanzapine was decreased step by step and stopped.The patient subsided and his YMRS regressed to 6points. The patient was discharged in the end of thefourth week. After discharge from hospital, akathisiaoccurred due to haloperidol, so haloperidol treatmentwas stopped and his treatment was resumed withtrifluoperazine 2 mg. The patient is still euthymic.
DISCUSSION
Depression is the most common psychiatricdisorder after trauma [4]. Anxiety disorders and maniafollow depression. Although correlations betweendepression and organic diseases have been commonlystudied, there is less data about mania. In a previousstudy, the rate of mania was detected as 9% in one-year follow-up of TBI patients [6]. Psychiatric symptoms after trauma vary accordingto the affected region of the brain. Prefrontal cortex,temporal cortex and hypothalamus are the mostcommon regions associated with psychiatric disordersfollowing trauma [4]. Bilateral orbitofrontal and righttemporoparietal, right basal and medial temporal lobe,basal ganglions, thalamus and right frontotemporallesions have been associated with mania [5-7]. In ourcase, there were posttraumatic lesions in the righttemporal lobe, basal ganglions and bilateral frontalarea, in line with literature. Although mania is usually associated with bipolardisorder, there are many etiological causes [6].However mania induced by bipolar affective disorderis called primary mania, whereas mania induced byneurological, metabolic or pharmacological causes iscalled secondary mania [8]. Secondary mania comprises 1.75% of alladmissions for psychiatric reasons, and affects 4.67%of all manic patients [9]. It is more prevalent thanprimary mania in later ages. Usually these patientshave no family history of primary or secondary mania.In psychiatric examination of these patients, irritabilityis more common than euphoria. Even though theresponse to treatment is more difficult, the totaldisease period is shorter than primary mania.Treatment protocol is similar to primary mania. Forthis patient, treatment was started with olanzapine. Itis known that in bipolar affective disorder long termuse of first generation antipsychotics is associated withincreased risk of dyskinesia and neuroleptic malignantsyndrome. However, we needed sedation for thepatient. Haloperidol was added after insufficientresponse to olanzapine. Haloperidol was then changedwith trifluoperazine because akathisia occurred withhaloperidol treatment. Maintenance treatment is not
713 The European Research Journal Volume 5 Issue 4 July 2019
Eur Res J 2018 Koparal and Çoşar
necessary in secondary mania because secondarymania usually does not recur [10]. In this case, moodstabilizer was used due to both depression andrecurrent mania. Valproic acid was selected due to itsneuroprotective effect to protect patient from potentialepileptic seizures.
CONCLUSION
This case report differs from other cases due tolonger disease and treatment period, more difficultresponse to treatment, recurrence and necessity ofmaintenance treatment [8]. A confusing factor iswhether the use of antidepressants caused mania inthis patient.
Informed consent Written informed consent was obtained from thepatient for publication of this case report and anyaccompanying images.
Conflict of interest The authors declared that there are no potentialconflicts of interest with respect to the research,authorship, and/or publication of this article.
REFERENCES
[1] Mortensen PB, Mors O, Frydenberg M, Ewald H. Head injuryas a risk factor for bipolar affective disorder. J Affect Disord2003;76:79-83. [2] Rutherford GW, Wlodarczyk RC. Distant sequelae oftraumatic brain injury: premature mortality and intracranialneoplasms. J Head Trauma Rehabil 2009;24:468-74. [3] Bhalerao SU, Geurtjens C, Thomas GR, Kitamura CR, ZhouC, Marlborough M. Understanding the neuropsychiatricconsequences associated with significant traumatic brain injury.Brain Inj 2013;27:767-74. [4] Zgaljardic DJ, Seale GS, Schaefer LA, Temple RO, ForemanJ, Elliott TR. Psychiatric disease and post-acute traumatic braininjury. J Neurotrauma 2015;32:1911-25. [5] Starkstein SE, Boston JD, Robinson RG. Mechanisms ofmania after brain injury. 12 case reports and review of theliterature. J Nerv Ment Dis 1988;176:87-100. [6] Jorge RE, Robinson RG, Starkstein SE, Arndt SV, ForresterAW, Geisler FH. Secondary mania following traumatic braininjury. Am J Psychiatry 1993;150:916-21. [7] Starkstein SE, Pearlson GD, Boston J, Robinson RG. Maniaafter brain injury. A controlled study of causative factors. ArchNeurol 1987;44:1069-73. [8] Mendez MF. Mania in neurologic disorders. Curr PsychiatryRep 2000;2:440-5. [9] Shukla S, Cook BL, Hoff AL, Aronson TA. Failure to detectorganic factors in mania. J Affect Disord 1988;15:17-20. [10] David AFS, Kopelman MD. Lishman’s Organic Psychiatry:A Textbook of Neuropsychiatry. 4th edition ed. UK: Wiley-Blackwell; 2009.
This is an open access article distributed under the terms of Creative CommonAttribution-NonCommercial-NoDerivatives 4.0 International License.
The European Research Journal Volume 5 Issue 4 July 2019 714
Balo’s concentric sclerosis: a case reportMeltem Özdemir , Aynur Turan , Alper Dilli
Department of Radiology, Dışkapı Yıldırım Beyazıt Training and Research Hospital, Ankara, Turkey
ABSTRACTBalo’s concentric sclerosis is a rare variant of multiple sclerosis which is characterized by lesions consistingrings of demyelination alternating with areas of relatively preserved myelin. These pathological changes arereflected by characteristic magnetic resonance imaging findings. We present the imaging findings of a case ofBCS who presented with an acute neurological disturbance, showed a dramatical recovery followingcorticosteroid therapy, and remained free of relapse for more than 1 year. Although previously considered as afulminant and fatal disease, characteristic MRI findings of Balo’s concentric sclerosis enable earlier diagnosisand treatment, and better prognosis.
Keywords: Balo’s concentric sclerosis, multiple sclerosis, demyelination
Address for correspondence: Aynur Turan, MD., Associate Professor, Dışkapı Yıldırım Beyazıt Training and Research Hospital, Department ofRadiology, 06010 Ankara, Turkey E-mail: [email protected], Phone: +90 312 3198908
Copyright © 2019 by The Association of Health Research & StrategyAvailable at http://dergipark.org.tr/eurj
The European Research Journal 2019;5(4):715-718
alo’s concentric sclerosis (BCS) is a rare variantof multiple sclerosis which is characterized by a
lesion formed by alternating rings of demyelinationand relatively preserved myelin, reminding an onionring appearance. Previously BCS was regarded to bean invariably fatal disorder. However, with the adventof magnetic resonance imaging (MRI), the earlier di-agnosis and management of the disease offered a bet-ter prognosis [1]. On MRI, acute BCS lesions are seenas T2-hyperintense lamellae surrounding a T2-hyper-intese core which is called ‘storm centre’. The areasof active demyelination within the lesion show re-stricted diffusion, and the peripheral aspect of the le-sion enhances following gadolinium administration[2]. Correct characterization of the lesion enables ac-curate diagnosis and allows prompt treatment of BCS.Most of the patients who develop symptomatic BCSare shown to make a substantial or complete recoveryfollowing convenient treatment [1]. We herein presentthe imaging findings of a case of BCS who presented
with an acute neurological disturbance, showed a dra-matical recovery following corticosteroid therapy, andremained free of relapse for more than 1 year.
CASE PRESENTATION
A previously healthy 25-year-old womanpresented with acute onset of headache, dysarthria andbilateral upper extremity weakness. MRIdemonstrated two round lesions with well-definedborders in the right frontoparietal region and in thecorpus callosum (Figure 1). The lesions showed aconcentric lamellar appearance on all pulse sequences.The concentric rings were; hypointense and isointenseon T1-weighted images (Figures 2a and 3a),hyperintense and isointense on T2-weighted images(Figures 2b and 3b). There was neither surroundingedema nor mass effect accompanying the lesions. Ondiffusion weighted imaging (DWI); the right
B
CASE REPORT
e-ISSN: 2149-3189
DOI: 10.18621/eurj.434730
Received: June 19, 2018; Accepted: August 8, 2018; Published Online: September 19, 2018
The European Research Journal Volume 5 Issue 4 July 2019 715
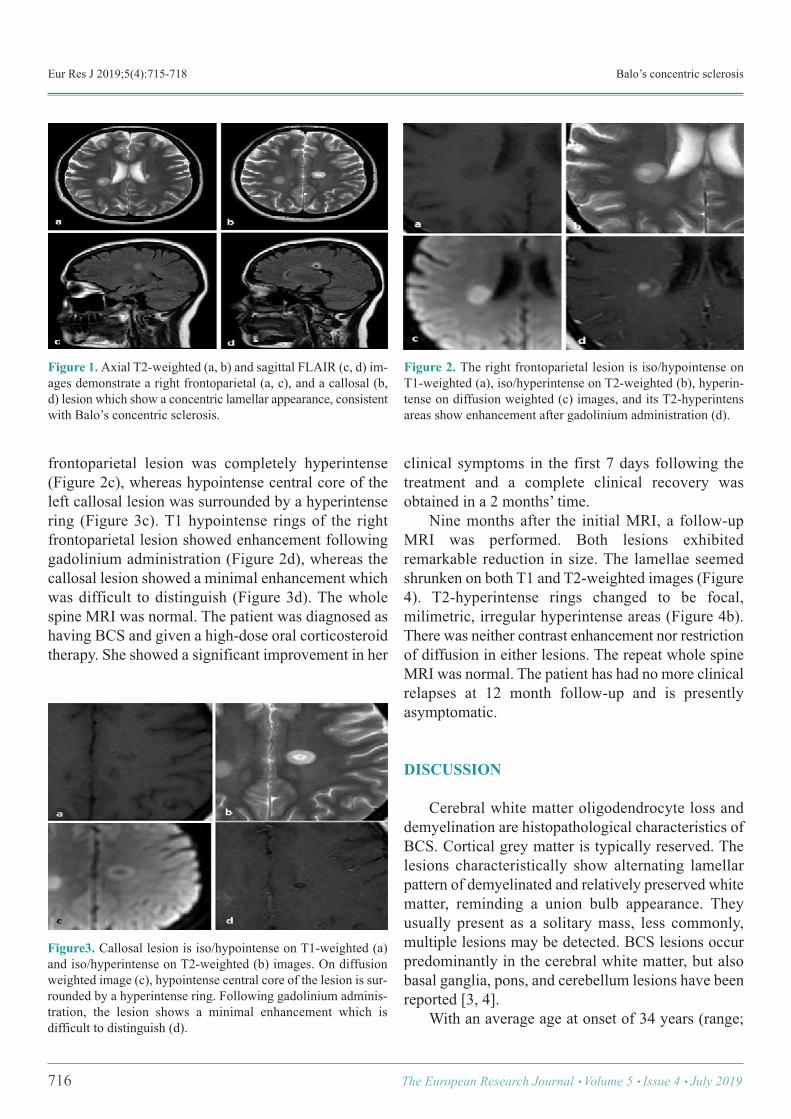
Eur Res J 2019;5(4):715-718 Balo’s concentric sclerosis
frontoparietal lesion was completely hyperintense(Figure 2c), whereas hypointense central core of theleft callosal lesion was surrounded by a hyperintensering (Figure 3c). T1 hypointense rings of the rightfrontoparietal lesion showed enhancement followinggadolinium administration (Figure 2d), whereas thecallosal lesion showed a minimal enhancement whichwas difficult to distinguish (Figure 3d). The wholespine MRI was normal. The patient was diagnosed ashaving BCS and given a high-dose oral corticosteroidtherapy. She showed a significant improvement in her
clinical symptoms in the first 7 days following thetreatment and a complete clinical recovery wasobtained in a 2 months’ time. Nine months after the initial MRI, a follow-upMRI was performed. Both lesions exhibitedremarkable reduction in size. The lamellae seemedshrunken on both T1 and T2-weighted images (Figure4). T2-hyperintense rings changed to be focal,milimetric, irregular hyperintense areas (Figure 4b).There was neither contrast enhancement nor restrictionof diffusion in either lesions. The repeat whole spineMRI was normal. The patient has had no more clinicalrelapses at 12 month follow-up and is presentlyasymptomatic.
DISCUSSION
Cerebral white matter oligodendrocyte loss anddemyelination are histopathological characteristics ofBCS. Cortical grey matter is typically reserved. Thelesions characteristically show alternating lamellarpattern of demyelinated and relatively preserved whitematter, reminding a union bulb appearance. Theyusually present as a solitary mass, less commonly,multiple lesions may be detected. BCS lesions occurpredominantly in the cerebral white matter, but alsobasal ganglia, pons, and cerebellum lesions have beenreported [3, 4]. With an average age at onset of 34 years (range;
716 The European Research Journal Volume 5 Issue 4 July 2019
Figure 1. Axial T2-weighted (a, b) and sagittal FLAIR (c, d) im-ages demonstrate a right frontoparietal (a, c), and a callosal (b,d) lesion which show a concentric lamellar appearance, consistentwith Balo’s concentric sclerosis.
Figure 2. The right frontoparietal lesion is iso/hypointense onT1-weighted (a), iso/hyperintense on T2-weighted (b), hyperin-tense on diffusion weighted (c) images, and its T2-hyperintensareas show enhancement after gadolinium administration (d).
Figure3. Callosal lesion is iso/hypointense on T1-weighted (a)and iso/hyperintense on T2-weighted (b) images. On diffusionweighted image (c), hypointense central core of the lesion is sur-rounded by a hyperintense ring. Following gadolinium adminis-tration, the lesion shows a minimal enhancement which isdifficult to distinguish (d).
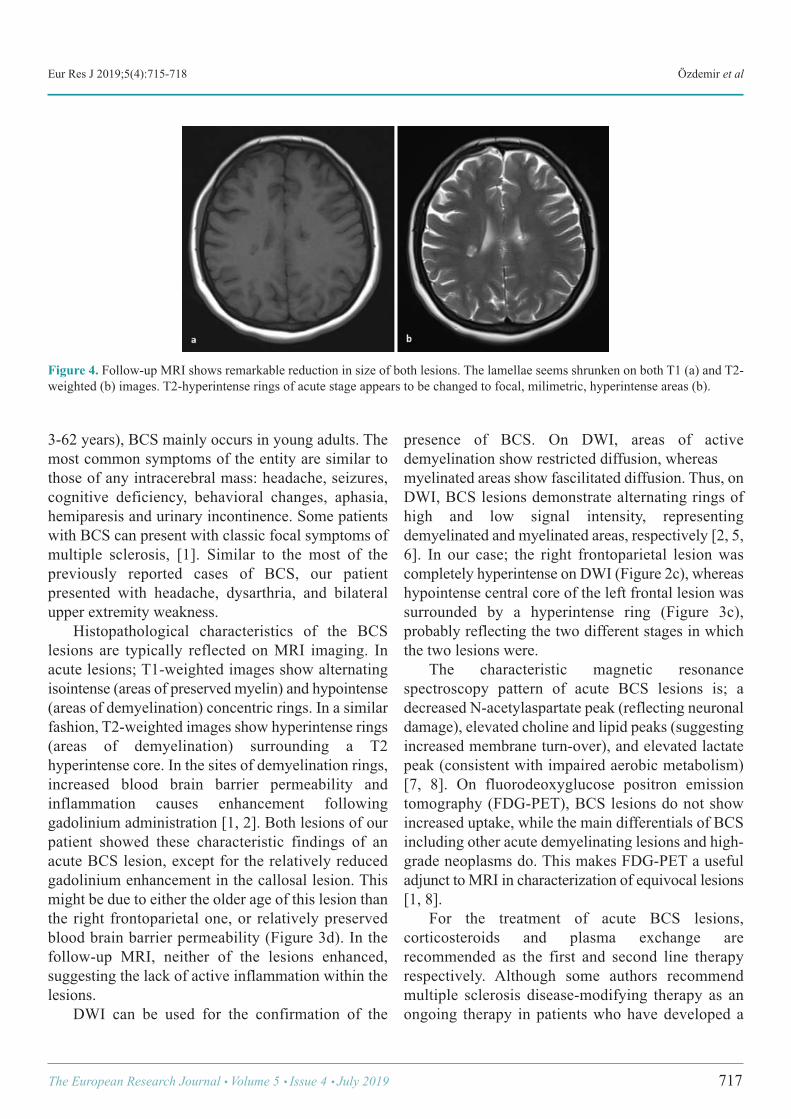
Eur Res J 2019;5(4):715-718 Özdemir et al
3-62 years), BCS mainly occurs in young adults. Themost common symptoms of the entity are similar tothose of any intracerebral mass: headache, seizures,cognitive deficiency, behavioral changes, aphasia,hemiparesis and urinary incontinence. Some patientswith BCS can present with classic focal symptoms ofmultiple sclerosis, [1]. Similar to the most of thepreviously reported cases of BCS, our patientpresented with headache, dysarthria, and bilateralupper extremity weakness. Histopathological characteristics of the BCSlesions are typically reflected on MRI imaging. Inacute lesions; T1-weighted images show alternatingisointense (areas of preserved myelin) and hypointense(areas of demyelination) concentric rings. In a similarfashion, T2-weighted images show hyperintense rings(areas of demyelination) surrounding a T2hyperintense core. In the sites of demyelination rings,increased blood brain barrier permeability andinflammation causes enhancement followinggadolinium administration [1, 2]. Both lesions of ourpatient showed these characteristic findings of anacute BCS lesion, except for the relatively reducedgadolinium enhancement in the callosal lesion. Thismight be due to either the older age of this lesion thanthe right frontoparietal one, or relatively preservedblood brain barrier permeability (Figure 3d). In thefollow-up MRI, neither of the lesions enhanced,suggesting the lack of active inflammation within thelesions. DWI can be used for the confirmation of the
presence of BCS. On DWI, areas of activedemyelination show restricted diffusion, whereas myelinated areas show fascilitated diffusion. Thus, onDWI, BCS lesions demonstrate alternating rings ofhigh and low signal intensity, representingdemyelinated and myelinated areas, respectively [2, 5,6]. In our case; the right frontoparietal lesion wascompletely hyperintense on DWI (Figure 2c), whereashypointense central core of the left frontal lesion wassurrounded by a hyperintense ring (Figure 3c),probably reflecting the two different stages in whichthe two lesions were. The characteristic magnetic resonancespectroscopy pattern of acute BCS lesions is; adecreased N-acetylaspartate peak (reflecting neuronaldamage), elevated choline and lipid peaks (suggestingincreased membrane turn-over), and elevated lactatepeak (consistent with impaired aerobic metabolism)[7, 8]. On fluorodeoxyglucose positron emissiontomography (FDG-PET), BCS lesions do not showincreased uptake, while the main differentials of BCSincluding other acute demyelinating lesions and high-grade neoplasms do. This makes FDG-PET a usefuladjunct to MRI in characterization of equivocal lesions[1, 8]. For the treatment of acute BCS lesions,corticosteroids and plasma exchange arerecommended as the first and second line therapyrespectively. Although some authors recommendmultiple sclerosis disease-modifying therapy as anongoing therapy in patients who have developed a
The European Research Journal Volume 5 Issue 4 July 2019 717
Figure 4. Follow-up MRI shows remarkable reduction in size of both lesions. The lamellae seems shrunken on both T1 (a) and T2-weighted (b) images. T2-hyperintense rings of acute stage appears to be changed to focal, milimetric, hyperintense areas (b).
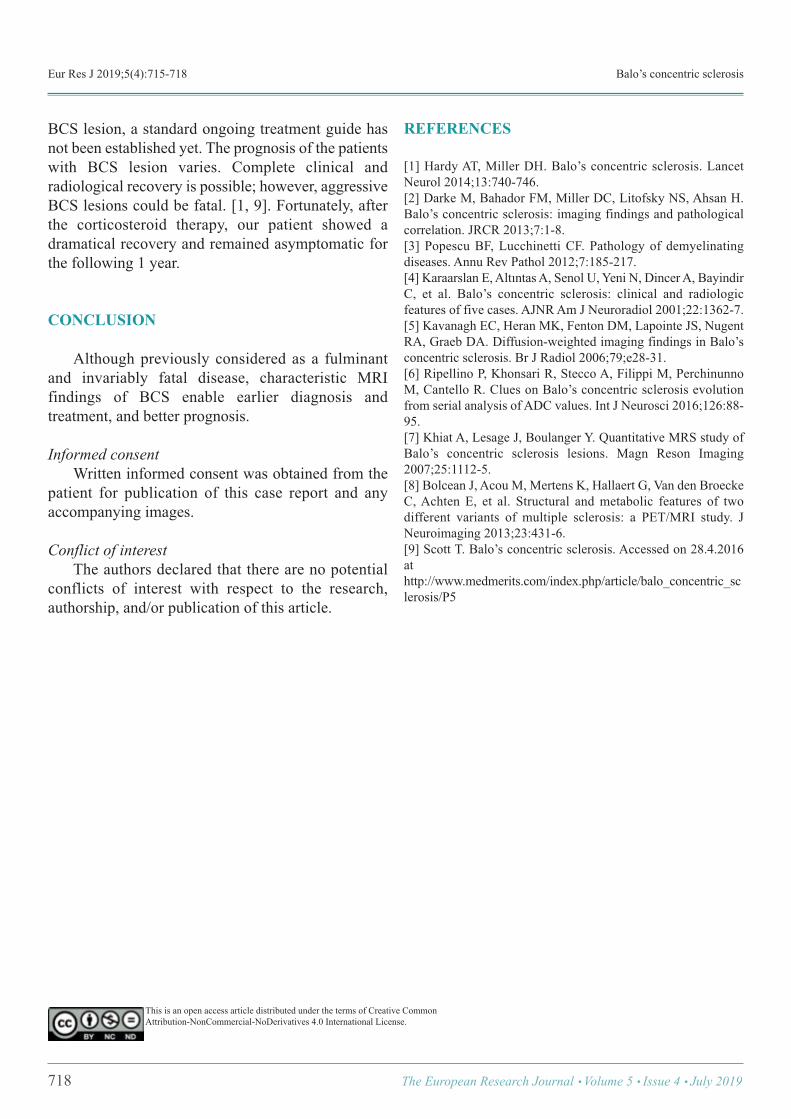
Eur Res J 2019;5(4):715-718 Balo’s concentric sclerosis
BCS lesion, a standard ongoing treatment guide hasnot been established yet. The prognosis of the patientswith BCS lesion varies. Complete clinical andradiological recovery is possible; however, aggressiveBCS lesions could be fatal. [1, 9]. Fortunately, afterthe corticosteroid therapy, our patient showed adramatical recovery and remained asymptomatic forthe following 1 year.
CONCLUSION
Although previously considered as a fulminantand invariably fatal disease, characteristic MRIfindings of BCS enable earlier diagnosis andtreatment, and better prognosis.
Informed consent Written informed consent was obtained from thepatient for publication of this case report and anyaccompanying images.
Conflict of interest The authors declared that there are no potentialconflicts of interest with respect to the research,authorship, and/or publication of this article.
REFERENCES
[1] Hardy AT, Miller DH. Balo’s concentric sclerosis. LancetNeurol 2014;13:740-746. [2] Darke M, Bahador FM, Miller DC, Litofsky NS, Ahsan H.Balo’s concentric sclerosis: imaging findings and pathologicalcorrelation. JRCR 2013;7:1-8. [3] Popescu BF, Lucchinetti CF. Pathology of demyelinatingdiseases. Annu Rev Pathol 2012;7:185-217. [4] Karaarslan E, Altıntas A, Senol U, Yeni N, Dincer A, BayindirC, et al. Balo’s concentric sclerosis: clinical and radiologicfeatures of five cases. AJNR Am J Neuroradiol 2001;22:1362-7. [5] Kavanagh EC, Heran MK, Fenton DM, Lapointe JS, NugentRA, Graeb DA. Diffusion-weighted imaging findings in Balo’sconcentric sclerosis. Br J Radiol 2006;79;e28-31. [6] Ripellino P, Khonsari R, Stecco A, Filippi M, PerchinunnoM, Cantello R. Clues on Balo’s concentric sclerosis evolutionfrom serial analysis of ADC values. Int J Neurosci 2016;126:88-95. [7] Khiat A, Lesage J, Boulanger Y. Quantitative MRS study ofBalo’s concentric sclerosis lesions. Magn Reson Imaging2007;25:1112-5. [8] Bolcean J, Acou M, Mertens K, Hallaert G, Van den BroeckeC, Achten E, et al. Structural and metabolic features of twodifferent variants of multiple sclerosis: a PET/MRI study. JNeuroimaging 2013;23:431-6. [9] Scott T. Balo’s concentric sclerosis. Accessed on 28.4.2016athttp://www.medmerits.com/index.php/article/balo_concentric_sclerosis/P5
718 The European Research Journal Volume 5 Issue 4 July 2019
This is an open access article distributed under the terms of Creative CommonAttribution-NonCommercial-NoDerivatives 4.0 International License.
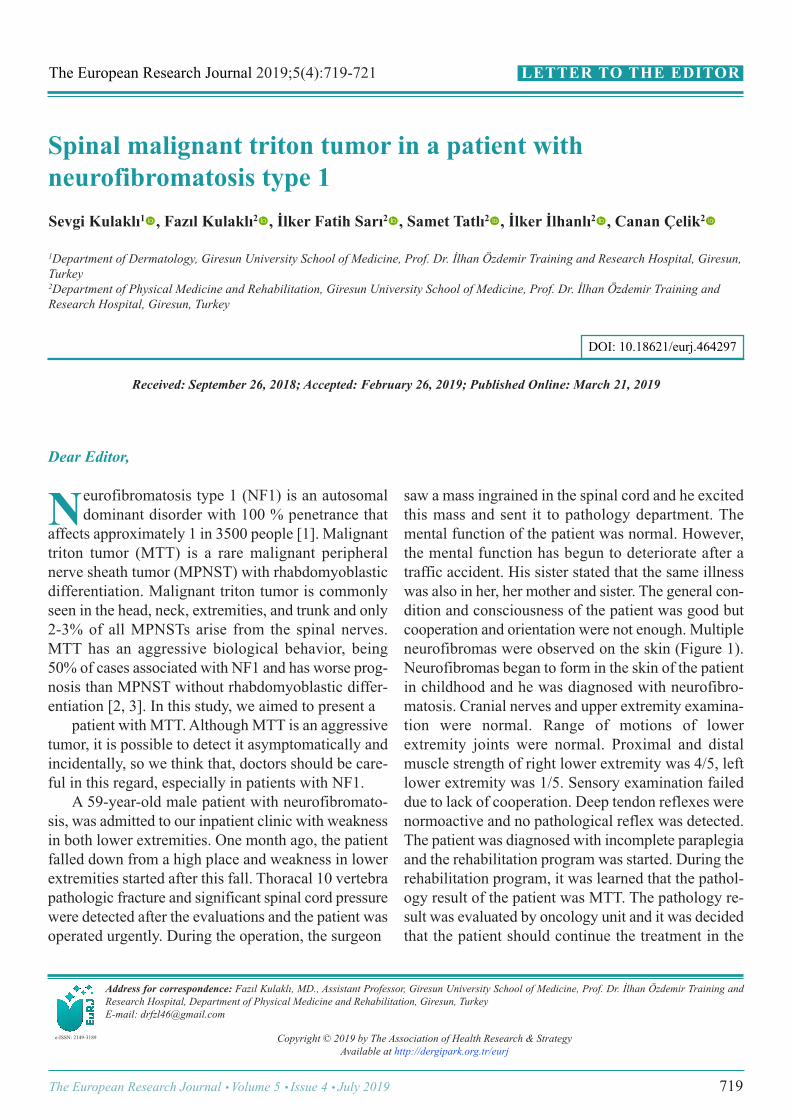
Spinal malignant triton tumor in a patient withneurofibromatosis type 1Sevgi Kulaklı1 , Fazıl Kulaklı2 , İlker Fatih Sarı2 , Samet Tatlı2 , İlker İlhanlı2 , Canan Çelik2
1Department of Dermatology, Giresun University School of Medicine, Prof. Dr. İlhan Özdemir Training and Research Hospital, Giresun,Turkey 2Department of Physical Medicine and Rehabilitation, Giresun University School of Medicine, Prof. Dr. İlhan Özdemir Training andResearch Hospital, Giresun, Turkey
Address for correspondence: Fazıl Kulaklı, MD., Assistant Professor, Giresun University School of Medicine, Prof. Dr. İlhan Özdemir Training andResearch Hospital, Department of Physical Medicine and Rehabilitation, Giresun, TurkeyE-mail: [email protected]
Copyright © 2019 by The Association of Health Research & StrategyAvailable at http://dergipark.org.tr/eurj
The European Research Journal 2019;5(4):719-721
Dear Editor,
eurofibromatosis type 1 (NF1) is an autosomaldominant disorder with 100 % penetrance that
affects approximately 1 in 3500 people [1]. Malignanttriton tumor (MTT) is a rare malignant peripheralnerve sheath tumor (MPNST) with rhabdomyoblasticdifferentiation. Malignant triton tumor is commonlyseen in the head, neck, extremities, and trunk and only2-3% of all MPNSTs arise from the spinal nerves.MTT has an aggressive biological behavior, being50% of cases associated with NF1 and has worse prog-nosis than MPNST without rhabdomyoblastic differ-entiation [2, 3]. In this study, we aimed to present a patient with MTT. Although MTT is an aggressivetumor, it is possible to detect it asymptomatically andincidentally, so we think that, doctors should be care-ful in this regard, especially in patients with NF1. A 59-year-old male patient with neurofibromato-sis, was admitted to our inpatient clinic with weaknessin both lower extremities. One month ago, the patientfalled down from a high place and weakness in lowerextremities started after this fall. Thoracal 10 vertebrapathologic fracture and significant spinal cord pressurewere detected after the evaluations and the patient wasoperated urgently. During the operation, the surgeon
saw a mass ingrained in the spinal cord and he excitedthis mass and sent it to pathology department. Themental function of the patient was normal. However,the mental function has begun to deteriorate after atraffic accident. His sister stated that the same illnesswas also in her, her mother and sister. The general con-dition and consciousness of the patient was good butcooperation and orientation were not enough. Multipleneurofibromas were observed on the skin (Figure 1).Neurofibromas began to form in the skin of the patientin childhood and he was diagnosed with neurofibro-matosis. Cranial nerves and upper extremity examina-tion were normal. Range of motions of lowerextremity joints were normal. Proximal and distalmuscle strength of right lower extremity was 4/5, leftlower extremity was 1/5. Sensory examination faileddue to lack of cooperation. Deep tendon reflexes werenormoactive and no pathological reflex was detected.The patient was diagnosed with incomplete paraplegiaand the rehabilitation program was started. During therehabilitation program, it was learned that the pathol-ogy result of the patient was MTT. The pathology re-sult was evaluated by oncology unit and it was decidedthat the patient should continue the treatment in the
N
LETTER TO THE EDITOR
e-ISSN: 2149-3189
DOI: 10.18621/eurj.464297
Received: September 26, 2018; Accepted: February 26, 2019; Published Online: March 21, 2019
The European Research Journal Volume 5 Issue 4 July 2019 719
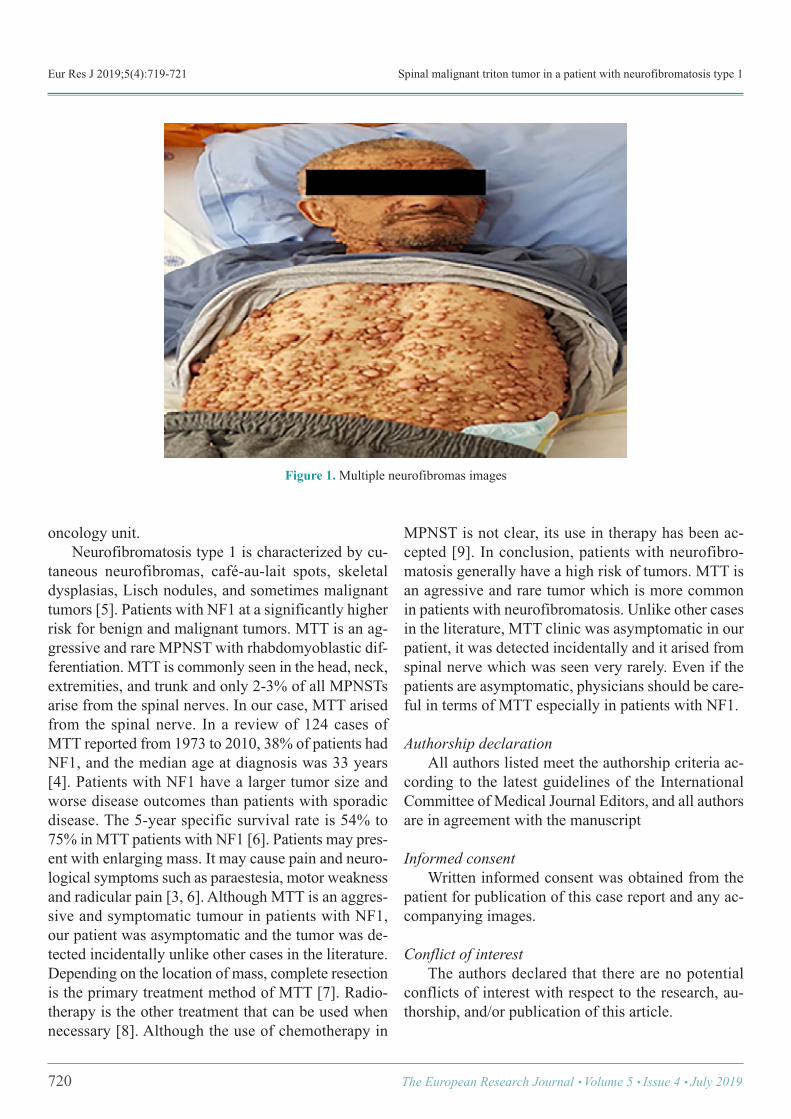
Eur Res J 2019;5(4):719-721 Spinal malignant triton tumor in a patient with neurofibromatosis type 1
oncology unit. Neurofibromatosis type 1 is characterized by cu-taneous neurofibromas, café-au-lait spots, skeletaldysplasias, Lisch nodules, and sometimes malignanttumors [5]. Patients with NF1 at a significantly higherrisk for benign and malignant tumors. MTT is an ag-gressive and rare MPNST with rhabdomyoblastic dif-ferentiation. MTT is commonly seen in the head, neck,extremities, and trunk and only 2-3% of all MPNSTsarise from the spinal nerves. In our case, MTT arisedfrom the spinal nerve. In a review of 124 cases ofMTT reported from 1973 to 2010, 38% of patients hadNF1, and the median age at diagnosis was 33 years[4]. Patients with NF1 have a larger tumor size andworse disease outcomes than patients with sporadicdisease. The 5-year specific survival rate is 54% to75% in MTT patients with NF1 [6]. Patients may pres-ent with enlarging mass. It may cause pain and neuro-logical symptoms such as paraestesia, motor weaknessand radicular pain [3, 6]. Although MTT is an aggres-sive and symptomatic tumour in patients with NF1,our patient was asymptomatic and the tumor was de-tected incidentally unlike other cases in the literature.Depending on the location of mass, complete resectionis the primary treatment method of MTT [7]. Radio-therapy is the other treatment that can be used whennecessary [8]. Although the use of chemotherapy in
MPNST is not clear, its use in therapy has been ac-cepted [9]. In conclusion, patients with neurofibro-matosis generally have a high risk of tumors. MTT isan agressive and rare tumor which is more commonin patients with neurofibromatosis. Unlike other casesin the literature, MTT clinic was asymptomatic in ourpatient, it was detected incidentally and it arised fromspinal nerve which was seen very rarely. Even if thepatients are asymptomatic, physicians should be care-ful in terms of MTT especially in patients with NF1.
Authorship declaration All authors listed meet the authorship criteria ac-cording to the latest guidelines of the InternationalCommittee of Medical Journal Editors, and all authorsare in agreement with the manuscript
Informed consent Written informed consent was obtained from thepatient for publication of this case report and any ac-companying images.
Conflict of interest The authors declared that there are no potentialconflicts of interest with respect to the research, au-thorship, and/or publication of this article.
720 The European Research Journal Volume 5 Issue 4 July 2019
Figure 1.Multiple neurofibromas images

Eur Res J 2019;5(4):719-721 Kulaklı et al
REFERENCES
[1] Jouhilahti EM, Peltonen S, Heape AM, Peltonen J. Thepathoetiology of neurofibromatosis 1. Am J Pathol2011;178:1932-9. [2] Engel EE, Brassesco MS, Valera ET, BarbosaMHN,Yamashita MEAS, Scrideli CA, et al. Clinico-geneticaspects of a pediatric non-neurofibromatosis type 1 malignanttriton tumor with loss of chromosome X. Pediatr Blood Cancer2012;59:1320-3. [3] Kamran SC, Howard SA, Shinagare AB, Krajewski KM.Malignant peripheral nerve sheath tumors: prognostic impact ofrhabdomyoblastic differentiation (malignant triton tumors),neurofibromatosis 1 status and location. EJSO 2013;39:46-52. [4] McConnell YJ, Giacomantonio CA. Malignant triton tumors--complete surgical resection and adjuvant radiotherapy associatedwith improved survival. J Surg Oncol 2012;106:51-6. [5] Lee MJ, Stephenson DA. Recent developments in
neurofibromatosis type 1. Curr Opin Neurol 2007;20:135-41. [6] Stucky CC, Johnson KN, Gray RJ, Pockaj BA, Ocal IT, RosePS, et al. Malignant peripheral nerve sheath tumors (MPNST):the Mayo Clinic experience. Ann Surg Oncol 2012;19:878-85. [7] Grobmyer SR, Reith JD, Shahlaee A, Bush CH, HochwaldSN. Malignant peripheral nerve sheath tumor: molecularpathogenesis and current management considerations. J SurgOncol 2008;97:340-9. [8] Ferner RE, Gutmann DG. International consensus statementon malignant peripheral nerve sheath tumors inneurofibromatosis 1. Cancer Res 2002;62:1573-7. [9] Moretti VM, Crawford EA, Staddon AP, Lackman RD,Ogilvie CM.. Early outcomes for malignant peripheral nervesheath tumor treated with chemotherapy. Am J Clin Oncol2011;34:417-21.
This is an open access article distributed under the terms of Creative CommonAttribution-NonCommercial-NoDerivatives 4.0 International License.
The European Research Journal Volume 5 Issue 4 July 2019 721