THE ELECTRICITY YEAR Operations
64
20 12 & THE ELECTRICITY YEAR Operations
-
Upload
khangminh22 -
Category
Documents
-
view
0 -
download
0
Transcript of THE ELECTRICITY YEAR Operations

20 12
&the electricity year Operations

&The Electricity YearOperations
– contents on page 4
– 12 pages starting after page 50
© Svensk Energi – Swedenergy – ABGraphic design: formiografTranslation: GH Language SolutionsPrinting: Exakta Printing, 600 copies, Oct 2013Photos: Mostphotos


4
ELÅRET 2012 | Året som gick
5
15
21
22
25
38
44
49
CONTENTS OF
THE ELECTRICITY YEAR 2012
THE YEAR IN REVIEW
THE ELECTRICITY MARKET
SWEDEN’S TOTAL ENERGY SUPPLY
ELECTRICITY USAGE
ELECTRICITY PRODUCTION
ENVIRONMENT – ECONOMIC CRISIS HAS EPERCUSSIONS FOR ENVIRONMENTAL AND CLIMATE POLICY STEERING INSTRUMENTS
TAXES, CHARGES AND RENEWABLE ENERGY CERTIFICATES (2013)
ELECTRICITY NETWORKS

the electricity year 2012 leads to triple record: “take advantage of the strong power balance!”total electricity production, wind power output and the export volume broke records by a wide margin in 2012. Hydropower output was also very close to setting a new record – reaching the second highest level of all time.
good access to hydropower, improved availability in the nuclear power plants and the international recession led to low spot prices for electricity. Furthermore, this trend clearly underlines how tangibly the temperature influences the swedish and Norwe-gian electricity price. the average system price on Nord Pool spot was just over sek 0.27 per kWh, a decrease of one third compa-red to 2011 and nearly one half compared to 2010.
Swedenergy’s Managing Director Kjell Jansson summed up the electricity year 2012 by emphasizing that the strong power balance must be utilized:
“It is enormously encouraging that we now have such an excellent power balance in both Sweden and the Nordic region. And it goes without saying that other countries should also be able to benefit from our good balance of electricity with low CO
2 emissions. But this will require
reinforcement of transmission capacity to our neighbouring countries. The need for
more electricity networks is therefore a top priority for Swedenergy in the years ahead.”
HIGH POWER OUTPUTAnnual hydropower power output reached approximately 78 TWh, compa-red to the average of just over 65 TWh. Wind power output set a new production record of over 7 TWh (6 TWh in 2011). The availability of nuclear power impro-ved and production rose to over 61 TWh (58). Warmer weather and lower electri-
city prices pushed down production of other thermal power (primarily CHP) to a level of 15.5 TWh (16.8).
Sweden’s aggregate electrical output was thus around 162 TWh, exceeding the earlier record of 157 TWh in 2001. Hydropower accounts for most of the large production volume. In compari-son, the year 2001 was also an abundant hydropower year with an output of close to 79 TWh. On the average, truly wet years occur at 15 to 20-year intervals.
The country’s total electricity usage was just over 142 TWh (140 in 2011) – an increase of 1.5%. However, this is a low level that is mainly explained by milder weather during the autumn and some cyclical slowing in the industrial sector in the second half of the year.
Sweden’s net export of 7 TWh in 2011 increased to nearly 20 TWh in 2012, which is yet another new record. The pre-vious record, from 1998, is 10 TWh. One effect of the strong Swedish power balance is that the Nordic region as a whole had a net export of 14 TWh, compared to a net import of 5 TWh in 2011.
Fluctuations in hydropower output have been significant. Reservoir storage levels
Supply2011TWh
2012*TWh
Change from 2011
Hydropower 66.7 78.0 16.9%Wind power 6.1 7.2 18.0%Nuclear power 58.0 61.4 5.9%Other thermal power 16.8 15.5 -7.7%
Total electrical power output 147.5 162.0 9.8%
Net import/export** -7.2 -19.6
Total domestic electricity usage 140.3 142.4 1.5%
Temperature-adjusted electricity usage 143.5 143.4 0%
* Preliminary data from Swedenergy** A negative value is equal to export
5
tHe year iN revieW | THE ELECTRICITY YEAR 2012
TABLE 1
ELECTRICITY STATISTICS FOR 2012, TWh
Sources: Swedenergy, Statistics Sweden
THE YEAR IN REVIEW
THE ELECTRICITY MARKET
SWEDEN’S TOTAL ENERGY SUPPLY
ELECTRICITY USAGE
ELECTRICITY PRODUCTION
ENVIRONMENT – ECONOMIC CRISIS HAS EPERCUSSIONS FOR ENVIRONMENTAL AND CLIMATE POLICY STEERING INSTRUMENTS
TAXES, CHARGES AND RENEWABLE ENERGY CERTIFICATES (2013)
ELECTRICITY NETWORKS

were very low at the beginning of 2011 and runoff was meager during the autumn and winter of 2010/2011, creating a dry year situation. Conditions then changed in the second half of 2011 and shifted to a wet year that persisted throughout much of 2012. At the end of 2012 the reservoir storage level was 67% in Sweden and a few percentage units higher for the Nordic region as a whole. For Sweden, this is around 1 percen-tage unit higher than average.
HISTORICALLY LOW ELECTRICITY PRICES – GERMAN PRICE SIGNIFICANTLY HIGHERWith the exception of a cold snap in early February and low temperatures during the Lucia holiday in December, spot prices in the Nordic electricity market were essenti-ally lower than SEK 0.30 per kWh throug-hout 2012. The average price in July was just below SEK 0.12 per kWh, which is the lowest monthly price recorded since 2000. In this context, it should be noted that the prices of oil and coal have more than tripled since 2000 and that the EU Emis-sions Trading Scheme (EU ETS) has been introduced. For that reason, the prices are not directly comparable.
The average system price on Nord Pool Spot in 2012 was just over SEK 0.27 per kWh, which is nearly SEK 0.15 lower
than in 2011 and a full SEK 0.23 lower than in 2010.
The year’s ample access to water also meant that the average price in the Nordic market fell below that in Ger-many. The average price on the German power exchange EEX in 2012 was just under SEK 0.38 per kWh, i.e. more than 40% higher than in the Nordic region.
The strong power balance and good availability in the national grid led to minor differences in electricity prices within Sweden. According to preliminary figures, the price was identical in all four Swedish bidding areas during more than 80% of the year’s hours. On average, the electricity price in Malmö was SEK 0.017 per kWh higher than in Stockholm and SEK 0.021 per kWh higher than in northern Sweden during 2012. On a monthly basis, the dif-ference was most marked in June when the price in Malmö was more than SEK 0.07 higher than in the rest of the country.
Developments in the past three years clearly show how the electricity price is affec-ted by changes in both supply and demand.
NUCLEAR POWER SAFETY IN THE LONG TERM AND AFTER FUKUSHIMA Operating safety in the Swedish nuclear power industry can be maintained even
in the long term, provided that the plants implement additional safety improvements and reinforce their measures for inspection and maintenance of the reactors. This is the conclusion of an analysis that was conduc-ted by the Swedish Radiation Safety Aut-hority (SSM) at the request of the Swedish Government, and for which the results were submitted on 31 October.
This not only includes measures by the power companies to modernize their facilities and implement upgrades based on the lessons learned from the nuclear disaster in Fukushima, Japan, on 11 March 2011, and the subsequent stress tests (see next page). It is also vital for the companies to improve their inspection and maintenance programs and increase the replacement of components when the reactors have passed the 40-year mark, according to the SSM.
On 1 January 2005, regulations went into force stipulating the type of safety improvement upgrades required by the power companies in order to operate their reactors for an extended period of time into the future. According to plan, the decided measures must be fully imple-mented during 2013. By 30 June 2012, around 60% of these had been completed.
The power companies must also implement programs to reinforce inspec-
6
THE ELECTRICITY YEAR 2012 | tHe year iN revieW

tion and maintenance of reactors that they plan to operate for a period of more than 40 years. When the Swedish power plants were designed and built, an operating life of around 40 years was assumed. In 2012 the nuclear power plants were between 27 and 40 years old, and the companies have announced that they intend to operate these plants for at least 50 years.
In response to the nuclear disaster in Japan, the SSM drafted a national action plan for additional safety improvement measures to be taken by the power com-panies.
The results of the stress tests in the Swedish nuclear power plants were pre-sented in mid-May 2012. The stress tests studied the possible consequences of even more extreme events than the facilities are built to withstand. These can include earthquakes of a higher magnitude or more powerful floods than have previously been factored in. In the stress tests, the facili-ties have been theoretically stressed to the point at which loss of power and/or loss of core cooling systems occurs. The tests also investigated the facilities’ preparedness for emergency response when several reactors are put out of commission simultaneously, the surrounding infrastructure is destroyed and the site contaminated.
The stress tests were performed by all
EU member states with nuclear power. At the end of the year, the national action plans were submitted to ENSREG (the European Nuclear Safety Regulators Group). The Swedish action plan des-cribes the measures to be taken by the nuclear power plants at the general level. One such example is that the power plants must implement an independent system to pump water into the reactor pressure vessel. According to the national action plan, the nuclear power plants must report the details of such a solution to the SSM by 31 December 2013 at the latest.
The matter of the operating life of the existing Swedish reactors came into focus at the end of July. Vattenfall applied for a permit from the SSM to build one or two reactors as replacements for the current nuclear reactors. The aim was to push for more clearly defined rules governing future nuclear power projects in Sweden. Swedenergy acknowledged this as the start of the important process of securing the need for base power in Sweden starting at the end of the 2020s, when decommissio-ning of the current reactors is expected to begin for reasons of age.
FIRST FULL YEAR WITH BIDDING AREAS IN SWEDEN On 1 November 2011, Sweden was split
into four bidding areas by Svenska Kraft-nät (the Swedish transmission system operator, SvK). 2012 was thus the first full year with different electricity prices in Sweden. Electricity customers in southern Sweden saw the price differences as unfair when the bidding areas were introduced, and the division was therefore criticized. The strongest critique came from politici-ans and companies who see it as unjust to force residents and businesses in southern Sweden to pay for the shortage of electri-city existing there.
The Swedish Government commis-sioned the Energy Markets Inspectorate (Ei) to analyze the division into bidding areas. In its report from May 2012, the Ei stated among other things:
� There are clear structural price differences in the power exchange between northern and southern Sweden.
� Price development in the end user market for consumers differs between the difference bidding areas.
� The competitive conditions in the wholesale market have improved markedly. Competition in the end user market is unchanged.
� New conditions for financial risk optimization have led to additional price increases in power contracts for consumers and businesses in bidding area 4 (Malmö).
� The division into bidding areas has led to a more effectively functioning market for trading for electricity, but has had negative economic conse-quences for customers in southern Sweden.
� The bidding areas will remain in place into the foreseeable future, but the effects will most likely be reduced over time.
In October the Ministry of Enterprise, Energy and Communications held a con-sultation regarding the Ei’s report. Most players in the electricity market felt that there are steps that can and should be taken to reduce the price differences that have periodically arisen between bidding areas 3 (Stockholm) and 4 (Malmö). Several of the presented actions requi-red more in-depth investigation, and in November Björn Hagman was tasked by
7
tHe year iN revieW | THE ELECTRICITY YEAR 2012

the Government to analyze measures to reduce these price differences.
After having analyzed developments during the first year, and with the help of simulations, Björn Hagman proposed that:
� Svenska Kraftnät should guarantee a transmission capacity of at least 4,000 MW between bidding areas 3 (Stockholm) and 4 (Malmö) in southern Sweden.
� Svenska Kraftnät should make NASDAQ/OMX Commodities responsible for auctioning CfDs (Contracts for Differences) on a trial basis according to an established plan.
� The model with several bidding areas within a single electricity spot area should not be implemented.
� Svenska Kraftnät should publish a weekly report containing information about current transmission capacities.
Swedenergy welcomed the inquiry leader’s proposals, but feels that guaran-teed capacity would not accurately reflect the existing transmission constraints. According to Swedenergy, it is therefore preferable that Svenska Kraftnät increase liquidity in the financial market by auc-tioning CfDs.
Svenska Kraftnät compiled electricity prices during the year in a report to the Ministry of Enterprise, Energy and Com-munications. Bidding areas 4 (Malmö) and 3 (Stockholm) had a common spot price during 89% of the hours in 2012. The average price difference was SEK 0.017/kWh. Bidding areas 2 (Sundsvall) and 4 (Malmö) had a common price during 85% of the hours in 2012. The average price difference here was SEK 0.021/kWh.
The largest price variations as a monthly average arose in June, when the difference was SEK 0.072/kWh between bidding areas 4 (Malmö) and 3 (Stock-holm) and SEK 0.080/kWh between bid-ding areas 4 (Malmö) and 2 (Sundsvall).
Protests against the bidding areas were ongoing throughout the year. Vär-namo Elnät hired the legal firm of A1 to study whether the implementation of bidding areas could be considered erro-neous. If the procedure can be defined as a “civil law regulation”, it may, according
to the Instrument of Government, only be enacted through a law passed by the Swedish Parliament. No such law was ever passed, since Svenska Kraftnät considers the introduction of bidding areas to be an “administrative decision” that does not require any legal amendment.
In January 2013, the Swedish Court of Appeal passed a judgement stating that Svenska Kraftnät’s decision to divide Sweden into four bidding areas may be appealed. Värnamo Elnät had com-plained that the division has affected the company’s costs. The company was initially given a negative ruling by the Administrative Court, which found that Svenska Kraftnät’s division did not have sufficient impact on the company to make this an appealable ruling. However, the Court of Appeal decided otherwise and the case ended up back in the Admi-nistrative Court.
ELECTRICITY CONTRACTS WITH HOURLY METERING – NEW STUDY ON NET BILLINGA number of measures were carried out during the year to develop the electricity market. In a report circulated for consi-deration to the Council on Legislation in February, the Swedish Government proposed among other things that active
electricity customers be given the option of choosing hourly metering. The inten-tion was to improve electricity consumers’ opportunities to enter into new types of contracts in which power usage is measu-red by the hour, without any additional charge to the customers.
Swedenergy meant that the Govern-ment’s assessment – that much of the exis-ting metering system is already capable of handing hourly metering – is incorrect. Furthermore, the actual additional costs for achieving the reform widely exceed those stated in the Government’s mate-rial. What’s more, greater consideration should be given to the implementation of a Nordic end-user market and the demands placed on electricity metering from a common Nordic perspective, according to Swedenergy.
In mid-June the Swedish Parliament passed the Government’s bill “Hourly Metering for Active Electricity Con-sumers”, under which customers with contracts based on hourly metering must be offered this service at no extra cost. Swedenergy supports the idea that custo-mers should have access to more detailed information about their electricity usage. The goal should be to give customers direct access to their meter data so that they themselves can choose which supp-
8
THE ELECTRICITY YEAR 2012 | tHe year iN revieW

were around 850 installations in Sweden, of which 70% were solar-based, 17% were small water-powered units and 13% were small wind turbines. The combined instal-led capacity was around 5,450 kW.
The power industry is working along-side its customers to find models for net metering of microgeneration against elec-tricity usage, which would make it more profitable for those who want to produce their own electricity. With regard to net metering of electricity, Swedenergy poin-ted out the need for a change in the law.
This issue has been studied earlier, and at that time fell through as a result of con-voluted tax legislation. In May 2012 the Government appointed a public inquiry (SOU), “Net Billing of Electricity and Liability for Energy Tax on Electricity”. The inquiry leader will draft a proposed law for a system with net billing that also includes netting of energy tax and VAT. Here, net billing refers to a system in which renewable electricity that is produ-ced by private consumers or companies and is fed into the grid is netted against other electricity that is used from the grid. The inquiry leader will also analyze and present proposals for who should be liable for tax on electricity.
The main purpose of the inquiry is to strengthen the position of electricity
consumers in the electricity market by making it easier for individuals to deliver self-produced renewable electricity into the grid. The inquiry is scheduled for completion in June 2013. Swedenergy welcomed the inquiry and pointed out a survey which indicates that a full 70% of Sweden’s DSOs would offer net billing if the existing law did not create financial obstacles.
DEVELOPED ELECTRICITY MARKET – RENEWABLE ENERGY CERTIFICATES, CONTRACTUAL TERMS, ORIGIN LABELLINGSince 1 January 2012, Sweden and Norway have a joint market for renewa-ble energy certificates, which means that RECs can now be traded across national borders. The goal for the joint market is to increase renewable electricity pro-duction by 26.4 TWh between 2012 and 2020. This is equal to around 10% of total electricity production in both countries.
The basic principles are the same for both countries but there are certain dif-ferences, such as:
� In Sweden, peat also grants entitle-ment to RECs.
� RECs are issued for the biomass share of mixed waste in Norway.
� Facilities commissioned in Sweden after 2020 receive RECs, but not in Norway.
� Certain minor differences in the exception rules for electricity-inten-sive industries.
� It is possible to receive RECs follo-wing extensive rebuilding in Sweden, but not in Norway.
At the beginning of the year, Sweden-ergy and the Swedish Consumer Agency reached an agreement on new general contractual terms that went into force on 1 April 2012. This applies to contractual terms for the sale of electricity to consu-mers (EL 2012 K), for connection and transmission of electricity to consumers (NÄT 2012 K), and special conditions for the sale of electricity by assigned elec-tricity suppliers to consumers. In order to apply the new terms, the consumers must be informed about the changes three months in advance, through a special
lier they want to deliver so-called smart services and energy efficiency measures in the home.
In this context, Swedenergy referred to a collaboration with EL (Elmateriel-leverantörerna) called “Proactive Forum for Electricity Metering”. Efforts here are aimed at creating a standardized and cost-effective metering platform that provides easy access to meter data via a computer or smartphone for customers seeking smart services.
The new law went into force on 1 October, after which electricity customers have the option of signing an hourly-based electricity contract with their electricity supplier. This means that the electricity price can vary more than monthly, for example from hour to hour, or that the electricity price can differ between the day and night. After two months, more than 1,000 Swedish customers changed to hourly-based contracts. According to Swedenergy, this was to be expected since this is a new type of contract. However, the industry’s ambition is to generate greater interest.
In connection with this and in general during the year, Swedenergy highlighted the matter of household microgeneration. A mapping carried out by Swedenergy at the end of November 2012 showed that there
9
tHe year iN revieW | THE ELECTRICITY YEAR 2012

notice. The terms for businesses and high voltage customers have also been revised.
Swedenergy’s guidance for origin labelling of electricity was updated for the last time during the year, and this assignment has now been completed. On 1 January 2013 the Energy Markets Inspectorate’s (Ei) new regulations and general recommendations EIFS 2011:4 went into effect. The regulations and general recommendations clarify the Swe-dish Electricity Act’s provisions on origin labelling of electricity for electricity supp-liers, and the Ei has been authorized to oversee compliance. In addition, the Ei is responsible for calculating and publishing the so-called residual mix and its environ-mental impact.
NEW ENERGY EFFICIENCY DIRECTIVE AT THE EU LEVEL Following intensive negotiations between the Council of the European Union, the European Parliament and the European Commission, the new Energy Efficiency Directive was finally adopted in June 2012. For Sweden, the new directive will most likely not call for any radical chan-ges in the already pursued Swedish policy for energy efficiency. The directive covers virtually all sectors aside from the trans-port sector. At the same time, not all of
the measures are new and to a large extent Sweden already has rules corresponding to those stated in the directive, for example that electricity bills should be based on actual electricity usage.
That which had been previously demanded by the European Parliament, that the member states set binding tar-gets for “primary energy savings” (supp-lied energy), was instead adopted in the form of a request to set national targets for energy efficiency. The European Parliament’s proposal would have had enormous consequences for Swedish industries and consumers. Now, Sweden can in all likelihood retain its national target to reduce energy intensity by 20% by 2020.
The other major issue for the energy companies was a proposal to introduce tradable white certificates – a quota system for energy saving obligations. In the directive, this is optional and the member states are permitted to use alter-native steering instruments to achieve average savings of 1.5% at the end user level. In Swedenergy’s opinion, white cer-tificates are not necessary.
Swedish rules and steering instruments are planned to be in place by June 2014 at the latest. The Ministry of Enterprise, Energy and Communications is taking
part in an in-depth analytical review in close collaboration with the Energy Mar-kets Inspectorate, the Swedish Energy Agency and the Swedish National Board of Housing, Building and Planning. Swe-denergy has high hopes that it will be pos-sible to develop services through which the energy companies will also be able to assist customers in the market to improve their energy efficiency.
CHANGES IN THE EU EMISSIONS TRADING SCHEME In late 2012, the European Commis-sion took steps to correct the growing imbalance between supply and demand for emission allowances in the EU Emis-sions Trading Scheme, EU ETS. As an immediate measure, it was proposed that auctioning of 900 emission allowances from the years 2013–2015 be postponed until 2019–2020, an approach known as back-loading. One factor behind the surplus of allowances is the economic crisis, but it has also been exacerbated by other steering instruments such as sup-port for renewable energy that is not in synch with the ETS. Industries have cut back their emissions more than anticipa-ted, which has led to lower demand for allowances. The EC’s proposal is under consideration.
10
THE ELECTRICITY YEAR 2012 | tHe year iN revieW

Phase two of the European Commission’s action plan is to introduce structural reforms in the ETS. The EC wishes to launch a debate on what these measures should consist of, among other things to address the large build-up of emission allowances. In a report published at the end of 2012, the EC specified six different conceivable options for the second phase of the EC’s action plan:
� One option is to increase the EU’s greenhouse gas emissions reduction target from 20% to 30%.
� Another option is to set aside a number of allowances from the market during the period 2013–2020, a so-called ”set-aside”.
� A third option is an early revision (before 2020) of the linear reduction factor of 1.74%, which regulates the system’s annual reduction in the emission cap.
� A fourth option is to limit access to international credits from so-called CDM projects.
� A fifth option is to expand the ETS to include other sectors in order to increase demand in the system.
� The final option is to introduce other price mechanisms, such as a lowest price or a flexibility mechanism on the supply side.
TRANSPARENCY AND INFORMATION MANAGEMENT FOR THE EUROPEAN MARKET The role and development of the market-places are essential for the formation of a common European electricity market. Here, one central issue is the regulatory framework regarding transparency and information management for physical and financial electricity trading. An energy-specific regulation, “Regulation on Energy Market Integrity and Trans-parency (REMIT)”, went into force at the end of 2011. The aim was to prevent market abuse and use of insider infor-mation in trading of wholesale energy products. Among other things, the regu-lation:
� Prohibits the use of insider informa-tion and attempted market manipula-tion in wholesale energy markets, i.e. the physical and financial contracts and derivatives related to the supply, production and delivery of gas and electricity in the EU.
� Gives ACER (Agency for the Cooperation of Energy Regulators) a key role as the authority responsible for monitoring all transactions and managing the information database. The Energy Markets Inspectorate oversees the Swedish energy markets
and collaborates with ACER and the regulatory authorities of our neigh-bouring countries in order to prevent market abuse and promote efficient energy markets.
In the wake of the economic crisis, the EU has drafted a new regulation to miti-gate the risks in trading of derivative cont-racts outside the regulated markets and to tighten the requirements for the regulated exchanges’ handling of collateral.
The regulation went into effect in August 2012 and states among other things that trading of OTC derivatives by non-financial counterparties’ (which do not require permits from the Swedish Financial Supervisory Authority, FI) must exceed certain threshold values in order to be subject to clearing obligations, and that only non-financial counterparties will be permitted to continue using bank guaran-tees as collateral. In reality, the conditions for use of bank guarantees are so strict it will be difficult or extremely costly to use bank guarantees as collateral. However, trading in wholesale derivative contracts has been given a three-year exemption before the conditions start to apply.
FRAMEWORK GUIDELINES & NET-WORK CODES STARTED IN EARNEST The Framework Guidelines & Network Codes, sometimes called Grid Codes, con-tain a new set of rules that will contribute to attaining the EU’s goal for a common European market for electricity. This was expressed by the European Commission for the first time in 2009, within the so-called Third Internal Energy Market Package. Via the framework, the objec-tive is to realize the European internal market for electricity. With the new EU-wide principles, all member states will be subject to regulations to ensure that their production, distribution and supply of electricity are designed to promote this. The rules are also formulated to address the major challenges involved in handling all additional electricity generation from renewable sources.
One imperative in creating an internal market is to maintain operational security in the system in this new situation. All DSOs, electricity suppliers and owners of production facilities are affected by
11
tHe year iN revieW | THE ELECTRICITY YEAR 2012

the new rules, and the customers will also have a role to play in this context.
Aside from the European Commis-sion, this work is being carried out in two European organizations. The first of these is ENTSO-E, a cooperative body for Svenska Kraftnät and Europe’s other transmission system operators (TSOs). The other is ACER, an EU body esta-blished to assist the Energy Markets Inspectorate and the national regulatory authorities of the other member states. The European Commission has manda-ted these two bodies to develop the rules. ACER will draft the guidelines and create the framework, after which ENTSO-E’s task is to work out the details, i.e. the actual code which will then become a law following a decision by the EC.
The regulation will be drafted mainly during the period 2012–2014. This work has started and the first code was circulated for consultation in February 2012. This applies to the so-called Network Code on Requirements for Generators (RfG) that primarily concern significant production plants with a capacity of 800 Watts or more, but also DSOs. Several other codes followed during the year, including codes for electricity trading, electricity system operation with security of supply, capacity allocation and congestion management (customers), and electricity grid connec-tion. Swedenergy coordinated the consul-tation process and was also responsible for joint handling within the Swedish power industry and the Nordic electricity indu-stry association Nordenergi. Swedenergy has also been active in the European lob-bying arena, among other things through Eurelectric and GEODE.
EX ANTE REGULATION OF NET-WORK TARIFFS INTRODUCED – TIME-DIFFERENTIATED TARIFFS PROPOSEDAs of 2012 network tariffs are approved in advance by the Energy Markets Inspecto-rate (Ei), which sets a revenue cap for a four-year regulatory period. The revenue cap is set according to the Ei’s supervisory model, which gives consideration to the DSO’s capital costs, day-to-day non-avoidable and avoidable costs, and quality. A rate of return – the so-called WACC (weighted average cost of capital) – is calculated by the Ei to apply for the entire four-year period.
On 31 October 2011 the Ei announ-ced its decisions on the revenue caps to apply for the period from 2012 to 2015. At that time, the majority of Sweden’s DSO were assigned lower revenue caps than they requested. The companies’ requested caps amounted to a total of SEK 183 billion for the four-year period 2012–2015. The Ei’s decision limited the revenue caps to SEK 150 billion for all of the companies combined.
At the beginning of 2012, 86 compa-nies had chosen to appeal the Ei’s deci-sions. Most of these appeals were handled via the legal representative appointed by Swedenergy, while five companies opted to lodge their appeals independently. In May 2012 the DSOs submitted their claims to the Administrative Court. The Ei submitted its petitions regarding the DSO’s appeal of revenue caps to the court in October. The Ei held to its position on the transitional rule and WACC, but admitted a few changes in its methodo-logy. Among other things, non-avoidable costs are compensated in full.
Network tariffs were also in focus for other reasons. At the beginning of January 2013, the Ei proposed that the DSOs be required to design network tariffs so that they contribute to efficient utilization of grid capacity. On behalf of the Swedish
Government, the Ei had studied rules on structuring of electricity tariffs to facilitate the introduction of renewable electricity generation, electrification of the transport sector and energy efficiency improve-ments among consumers. From a societal perspective, the Ei felt that it would be effective to use time-differentiated net-work tariffs with charges for the amount of used power or installed capacity. The Ei proposed that the new rules be imple-mented in three years to give the DSOs time to successively adapt their tariffs.
Swedenergy pointed out that these requirements will not make things easier for the customers before the model for the joint Nordic end-user market has been finalized, a process which could lead to additional change in the requirements.
POWER INDUSTRY INVESTMENTS REACH NEW RECORD LEVEL In 2012 the power industry invested in Sweden at an unprecedented level. For the first time, the industry’s annual capital spending reached nearly SEK 42 billion according to Statistics Sweden’s investment survey. Compared to 2011, the power industry increased its investments by 20%. The power industry’s growing role as an economic engine became clear in compa-rison with investments by other industries,
12
THE ELECTRICITY YEAR 2012 | tHe year iN revieW

whose spending of SEK 55 billion in 2012 was equal with the previous year.
Swedenergy expressed concern about a possible decrease in spending over the next few years in view of the Energy Markets Inspectorate’s (Ei) decision to lower the margin for investment in connection with transition to ex ante regulation of the DSOs. As a result of the Ei’s decision on revenue caps for the years 2012–2015, the DSOs lost more than SEK 30 billion in scope for investment for the period in question.
The investment figures for 2012 represent the power industry’s combined capital spending. This includes Svenska Kraftnät’s expansion of the national grid, the infrastructure for gas and district heating, measures to improve delivery reliability in the transmission system, the roll-out of new wind generating capacity, and upgrading of nuclear and hydropo-wer plants. The figures also include water and wastewater treatment plants and facilities for waste management, recycling and decontamination.
TAX NEWS IN 2013: CHP TAX ABOLISHED – TAX ON HYDROPOWER RAISED In its budget bill from September, the Government proposed that the carbon dioxide tax on CHP be abolished, a move
that was welcomed by Swedenergy, and the Swedish Parliament approved the proposal at the end of 2012. At the same time, with effect from 2013 the taxable values of all energy installations were raised by 50–70%. Consequently, power producers on the whole will be subject to higher taxes as of 2013. Added to this, the industry is expected to be burdened by additional taxes at least SEK 2.5 billion. The energy industry and its customers already pay SEK 40 billion in annual taxes and charges, which will increase to SEK 42 billion in 2013.
For hydropower, the higher taxable values will have a severe impact. The pro-perty tax for 2012 at a tax rate of 2.8% amounted to around SEK 4 billion. With the new taxable values in 2013 and the same tax rate, this amount will be pushed up to SEK 6 billion. This is equal to approximately SEK 0.09 per kWh in pro-perty tax on hydropower as of 2013. The sharp increase will act as a disincentive for investments in hydropower.
Swedenergy feels that fiscal taxes should be placed on electricity consumers and not the production sector. A higher tax on electricity generation undermines the promotion of new power produc-tion with low emissions of greenhouse gases (GHGs). Among other things, the
industry has written to the Swedish Tax Agency’s regarding a correction of interest on the property tax that would limit the tax increase to SEK 1 billion, a request which the Agency dismissed without motivation. The industry has also written to the Ministry of Finance but received no response.
The energy tax on electricity that is paid by customers has been adjusted for indexation. For households, this has resulted in an increase of SEK 0.003 per kWh in southern Sweden and SEK 0.002 per kWh in northern Sweden for 2013. Following index-based increases, most Swedes will be subject to an energy tax on electricity of SEK 0.293 per kWh. In northern Sweden the total tax is SEK 0.194 per kWh. VAT of 25 per cent is added to this amount.
RECHARGE SWEDEN – INDUSTRY CONFIDENCE UPIn 2012 the power industry was engaged in a project called Recharge Sweden, an initiative to profile electricity as a pro-duct. A report on the Swedish public’s attitudes towards electricity and the climate was presented as an important cornerstone of this work. Swedenergy has been active in internal efforts in the industry to promote Recharge Sweden’s
13
tHe year iN revieW | THE ELECTRICITY YEAR 2012

message, where the aim is to change the image of electricity from “expensive and environmental threat to reasonably priced and hero”. In 2013 the project will build further on already completed initiatives, such as the large-scale study carried out by Kairos Future and Swedenergy’s 2050 scenarios.
The industry’s annual opinion poll, which was published in October 2012, showed a clear shift in a positive direc-tion. The low and stable electricity prices are naturally one reason for more positive attitudes among electricity customers. However, there was a significant trend break; for the first time in ten years more customers took an active position in favour of the power industry than earlier. In addition, more customers perceived the industry as having a strong environmental focus – which is a multi-year trend. Swe-denergy hopes that the Recharge Sweden project can contribute to further growth in Swedish confidence in the industry.
LIGHTING UP AFRICADuring the year, the Swedish power indu-stry initiated a collaboration with the non-profit organization GIVEWATTS, whose mission is to donate solar-powered lanterns to impoverished areas of Africa. The lanterns are distributed via schools and clinics, and are rotated around so that more people can benefit from their use. Aside from providing light, those who have lanterns can also use them to charge mobile phone batteries. This can be likened to building a power system from the bottom up, based on human needs, without major power plants and transmission networks – a needs-adapted electrification based on sustainable and eco-friendly technology.
Swedenergy urged the Swedish power companies to donate solar-powered lan-terns both for Earth Hour under the motto “Turn on there – turn off here” and for Christmas under slogan “Lighting a thousand solar lights”. Through these efforts, 1,000 lanterns were collected during the year. The lanterns have a direct impact on the health of around 5,000 people, since they replace indoor burning of kerosene and wood. They also affect the study environment of 1,000 pupils and improve their school results. An equal
number of households benefit financially, since kerosene makes up a large share of their living expense. The collaboration will continue in 2013 when even more lanterns will be donated, among other things in connection with Earth Hour.
Tack, din solenergilampa ger ovärderlig kunskap!
”Turn on there – turn off here”. ”Lighting a thousand solar lights”.
14
THE ELECTRICITY YEAR 2012 | tHe year iN revieW

15
tHe eLectricity market | THE ELECTRICITY YEAR 2012
DIAGRAM 1
TRADING ON THE SPOT AND FORWARD MARKETS
Source: Nord Pool Spot
DIAGRAM 2
ELECTRICITY USAGE IN THE NORDIC REGION SINCE 1996, TWh
Source: Nord Pool Spot
the electricity marketaccess to reliable and neutral marketplaces is essential for achieving a well functioning electricity market. Physical power trading in the Nordic electricity market takes place on Nord Pool spot, while financial products are offered via NasDaQ omX commodities. trading in the spot market enables players to plan their physical balance for the coming 24-hour period, while trading in the financial market is used for price hedging of future power volumes. Price formation in these marketplaces provides a basis for all power trading in the Nordic electri-city market. in addition to trading via these two marketplaces, buyers and sellers can also enter into bilateral contracts.
LITHUANIA NOW A BIDDING AREA ON NORD POOL SPOTThe Nordic power exchange Nord Pool Spot conducts day-ahead and intra-day trading for physical delivery of electricity, enabling market participants to maintain a supply-demand balance in their obligations as electricity suppliers or producers. Elspot conducts daily auction trading of hourly power cont-racts for physical delivery in the next 24-hour period, while Elbas is a continuous cross-border intra-day market that allows market participants to adjust their balances up to one hour before delivery.
Financial trading, also known as the forward market, provi-des opportunities to trade with a horizon of up to five years and gives an indication of long-term spot price development. In addition, financial trading functions as an instrument for risk management. Furthermore, NASDAQ OMX Commodities is also able to clear bilateral contracts.
The volume of spot market trading in 2012 increased to 337 TWh (see Diagram 1), which can be compared to 297 TWh in 2011. Increased trading on the Elbas market contributed to the higher volume, as did the incorporation of Lithuania as a new bidding area in the spot market. The traded volume in the forward market declined by close to 10% to 927 TWh, down from 1,028 TWh the year before. The total volume of cleared contracts fell from 1,723 TWh to 1,663 TWh.
The year was marked by an ongoing global recession and a strong hydrological balance, and for several months the spot price was below SEK 0.30 per kWh. In the first half of Febru-ary however, a cold front moved in and the Nordic region’s second highest electricity usage of all time was recorded during week 5, at 10,088 GWh, and the year’s highest hourly rate of

16
THE ELECTRICITY YEAR 2012 | tHe eLectricity market
DIAGRAM 3
ELECTRICITY SPOT PRICES ON NORD POOL SPOT AND EEX (german electricity price)
Sources: Nord PooL Spot, EEX
SEK 2.00 per kWh was noted on 2 February. The year’s spring flood was largely normal in terms of volume, but a few weeks of rain during the summer produced powerful runoff at the end of June and beginning of July, which pushed down the average monthly price for July to SEK 0.118 per kWh, the lowest level since 2000. During much of the autumn, reservoir levels were nearly 10 percentage points higher than normal. The absence of severe cold during the autumn and early winter resulted in both relatively low usage and abundant runoff. In December, however, the temperature dropped and in week 49 the weighted temperature in Sweden was more than 7 degrees below normal and Nordic electricity usage climbed to over 9,900 GWh, the fifth highest level ever. Despite this, good availability in the Swedish nuclear power plants helped to hold back prices and the average price in December was SEK 0.405 per kWh.
Although Nordic electricity usage was somewhat lower than normal in December 2011, it was considerably higher in December 2012 due to the cold weather. As a result, Nordic demand for electricity rose by close to 5 TWh on an annual basis and reached nearly 383 TWh, calculated as a 52-week total at the beginning of January. Nonetheless, this is still below the 395 TWh that was recorded in the summer of 2008, just before the financial crisis (see Diagram 2). In 2012 electricity usage in Sweden rose from slightly over 140 TWh to just over 142 TWh, while temperature-adjusted usage was steady at a level of 143.5 TWh.
The average system price on Nord Pool Spot was SEK 0.275 per kWh, down by 35% compared to 2011 when the average price was SEK 0.423 per kWh, and a decrease of nearly half compared to 2010. The price on the German power exchange (EEX) was around SEK 0.38 per kWh, i.e. nearly 40% higher, calculated as an annual average. In 2012 the Nordic system price reached a high of SEK 2.00 per kWh and a low of SEK
0.03 per kWh. The corresponding hourly prices on EEX were a high of SEK 1.85 and a low of SEK -1.99 per kWh.
ELECTRICITY PRICE INFLUENCED BY MANY FACTORSFrom a historical standpoint, prices in the Nordic electricity market have been primarily determined by the amount of pre-cipitation. Access to cheap hydropower in the Nordic power system has been decisive for the extent to which other and costlier production capacity has been needed to meet demand. The Nordic region’s rising demand for electricity has necessita-ted increased operation of coal-fired condensing power plants, above all in Denmark and Finland. Low precipitation or tem-peratures mean greater utilization of coal-fired power, while the opposite is true in years with ample runoff and high temperatu-res. This, in turn, affects the average price over the year.
In pace with a growing volume of electricity trade with nearby countries, the Nordic market is increasingly influenced by electricity prices on the continent. This means that Nordic prices are now also shaped by factors such as shrinking margins in the European power balance, cold weather on the continent and runoff in countries like Spain. Diagram 3 shows the spot price trend in the Nordic and German markets expressed as a weekly average.
Continental electricity prices are closely tied to production costs in coal-fired condensing power plants. Following imple-mentation of the EU Emissions Trading Scheme (EU ETS) on 1 January 2005, the price of emission allowances must be added to the production cost for fossil-based electricity genera-tion. Because of this, the price of emission allowances has a direct impact on both the spot and forward price of electricity.
The combination of low electricity usage and high wind power production during Christmas and the days before the New Year holiday led to such low negative prices in Germany
DIAGRAM 4
ELECTRICITY SPOT PRICE, FORWARD PRICE AND PRICE OF EMISSION ALLOWANCES
Source: Nord PooL Spot

17
tHe eLectricity market | THE ELECTRICITY YEAR 2012
for several hours that the average spot price for the week was SEK -0.09 per kWh.
Diagram 4 shows that the price of emission allowances has a clearly formative effect on Nord Pool’s forward price, while the link to the spot price varies mainly with respect to runoff and water supplies. In periods with high runoff, for example, it is not possible to store all water and the producers are forced to either generate electricity or spill excess water, with direct implications for the spot price.
FALLING PRICES FOR EMISSION ALLOWANCESEmission trading is one of the so-called flexible mechanisms defined in the Kyoto Protocol. The goal of this trading is to enable countries and companies to choose between carrying out their own emission-reducing measures or buying emis-sion allowances which then generate emission reductions somewhere else. The idea is for the least expensive measures to be taken first, thus keeping the total cost of meeting Kyoto targets as low as possible.
The first budget period of the trading scheme (EU ETS), Phase I, ran from 2005 to the end of 2007 and the second, Phase II, from 2008 to the end of 2012. Only emissions of carbon dioxide were covered by the EU ETS during Phase I. As of 2008, nitrous oxide is included in a few member states. The aviation sector has been covered by the system since 1 January 2012, but in November 2012 the European Commission pro-posed that flights between the EU and non-EU countries be exempted from surrendering emission allowances for 2012, while flights between airports in the EU are not affected by the proposal.
As of 1 January 2013, the start of Phase III, EU ETS will also include production of bulk organic chemicals, non-ferrous and aluminium, among other things. Emissions of GHGs are
limited by a predetermined emissions cap that will decrease the average annual allocation for 2008–2012 by a linear reduction factor of 1.74% to achieve a 21% reduction in GHG emissions in the system by 2020 relative to 2005.
For the trading period from 2008 to 2012, Phase II, one requirement was that at least 90% of the emission allowances must be allocated free of charge to the affected installations, while the member states could choose for example to auction the remaining share. For the period from 2013 to 2020, the auctioned share of allowances will be increased and the rules for free allocation have been revised. Free allocation will be determined according to predetermined EU-wide benchmarks. These will be primarily based on product benchmarks, which have been drawn up for 52 products. In cases where this is not applicable, the benchmarks for heat production or fuel usage are used. No free allocation of emission allowances will be per-mitted for electricity production.
The aftershocks of the financial crisis are a one of the key contributors to the surplus of 955 million emission allowances in the system at the beginning of 2012. During the year this supply increased further, partly due to the European Invest-ment Bank’s sale of allowances to finance research products and the fact that auctioning of allowances for the third trading period started in the autumn of 2012. The surplus led to falling prices during the year. The price peaked at EUR 9.5 in Febru-ary, but dropped to EUR 6.2 in November. In 2011 the price varied between EUR 7 and EUR 17 per tonne (see Diagram 5).
The low prices have sparked a lively debate in the EU on the need for long-term measures to strengthen the allowance market by changing the auctioning calendar or setting aside allowances (known as backloading or set-aside). The discus-sions themselves were among the most significant price-affec-ting factors during the year.

18
Due to the high proportion of fossil-fired power in Ger-many, there is a significantly stronger link between the German spot price and the emission allowance price. Diagram 6 shows the difference between Nordic and German spot and forward prices, as well as the price of emission allowances. As the allo-wance price falls, this also narrows the gap between the spot price on Nord Pool and EEX.
The Nordic region’s abundant supply of hydropower gene-rally results in a lower price relative to Germany. The difference can be equated with the price gap between forward contracts on the respective exchanges, which in February 2013 was SEK 0.05 per for low load and SEK 0.16 per kWh for high load factor usage for the full year 2013.
BIDDING AREAS ON NORD POOL SPOTThe system price on Nord Pool Spot serves as a price reference for the financial electricity market and is a price that is cal-culated for the entire Nordic power exchange area, assuming that no transmission constraints exist. However, because all transmission grids are subject to physical limitations, situations can arise when transmission capacity is not adequate to meet market demand for inter-area trading.
To manage these transmission bottlenecks, Nord Pool’s power exchange area has been divided into so-called bidding areas. Historically, Sweden and Finland have each formed sepa-rate areas, while Denmark has been divided into two and the number of areas in Norway has varied between 2 and 5. When transmission capacity is insufficient to ensure equal prices throughout the power exchange area, separate area prices are calculated. A price area can consist of one or several bidding areas. Over the years, Sweden has very rarely constituted a sepa-
rate price area. In 2010, for example, Sweden was a separate price area for only one of the year’s total of 8,760 hours.
Table 2 shows area prices since deregulation in 1996. The differences between the various price areas are primarily depen-dent on the generation capacity available in each area. Price differences are caused mainly by large variations in the supply of hydropower, which is also reflected in the system price. Unusually low or high runoff also increases the frequency of fragmentation into separate price areas. In a wet year, the price will be lowest in Norway and then Sweden, while the opposite is true in periods with lower runoff.
In November 2011 Sweden was divided into four bidding areas (see Diagram 7). The introduction coincided with a drop in temperature to more normal levels and a standstill in all reactors at Ringhals, which meant that the initial price diffe-rences were relatively large, but the price differences between the various areas were comparatively small during the year. All areas in Sweden had a common price for 83% of the hours during 2012. Luleå and Sundsvall had a common price for 98% of the hours, while the corresponding figure for Malmö and Stockholm was 89%. On the average, the price difference between Malmö and Stockholm was SEK 0.017 per kWh.
The most significant price differences arose in connection with a cold period in the first half of February. At most, the hourly price difference between northern and southern Sweden was SEK 1.14 per kWh, while the largest difference between Malmö and Stockholm was SEK 0.82 per kWh. However, most price differences were seen June and July in connection with planned maintenance work on the transmission grid, and 24-hour price differences of nearly SEK 0.19 per kWh arose periodically between the various Swedish areas.
DIAGRAM 5
PRICE OF EMISSION ALLOWANCES ON NASDAQ OMX COMMODITIES
Source: Nord Pool Spot
DIAGRAM 6
PRICE OF EMISSION ALLOWANCES AND PRICE DIFFERENCES BETWEEN THE NORDIC REGION AND GERMANY
Sources: Nord Pool Spot, EEX
THE ELECTRICITY YEAR 2012 | tHe eLectricity market

19
TABLE 2
AVERAGE AREA PRICES ON NORD POOL SPOT, SEK 0.01 PER kWh
Oslo Stockholm* Finland Jutland Zealand System
2012 25.80 33.79 31.91 31.64 32.71 27.222011 41.75 43.08 44.42 43.26 44.59 42.342010 51.74 54.25 54.07 44.26 54.36 50.592009 35.90 39.28 39.24 38.28 42.26 37.222008 37.85 49.15 49.05 54.14 54.50 43.122007 23.82 28.01 27.78 29.98 30.55 25.852006 45.56 44.53 44.95 40.89 44.93 44.972005 27.05 27.64 28.36 34.63 31.43 27.242004 26.83 25.62 25.25 26.28 25.87 26.392003 33.87 33.29 32.22 30.74 33.58 33.482002 24.27 25.23 24.92 23.28 26.12 24.592001 21.30 21.09 21.07 21.92 21.73 21.362000 10.21 12.04 12.58 13.86 10.791999 11.52 11.94 12.00 11.841998 12.21 12.04 12.26 12.261997 14.86 14.37 14.591996 26.61 26.00 26.30* in connection with the implementation of bidding areas in sweden, the definition of the stockholm area was changed as of 1 November 2011.
Source: Nord Pool Spot
tHe eLectricity market | THE ELECTRICITY YEAR 2012
DIAGRAM 7
HOURLY AREA PRICES IN SWEDEN
Source: Nord Pool Spot
The prices in Malmö and Copenhagen were the same for 68% of the hours during the year. The average price difference was SEK 0.029 per kWh. The largest differences arose during the Christmas holiday and amounted to over SEK 2.00 per kWh when high wind power production and low demand resulted in negative prices in the Danish bidding areas.
GREATER CUSTOMER MOBILITYSince April 2004 Statistics Sweden compiles monthly statis-tics on the number of supplier switches (changes of electricity seller) and the spread of customers between different contract types (see Diagrams 8 and 9).
The ability to change supplier depends on contracts in force, which means that not all customers have the opportunity to switch during the year. It is therefore difficult to draw any real conclusions due to the relatively short time span for data on supplier switches.
The number of supplier switches during the year declined marginally compared to 2011. The average number of switches in 2012 was just under 42,700 per month, of which household customers accounted for more than 37,800. This can be com-pared to an average of 38,900, including 33,600 households, since the start. The average total volume in 2012 was close to 800 GWh per month, of which around 340 GWh was attribu-table to household customers. The corresponding averages for the entire period are 1,000 and 320 GWh, respectively.
In 2012 the share of customers with standard rate cont-racts, i.e. those who have not made an active choice, continued to decrease and made up 18.5% of the total in January 2013. At the same time, it must be considered likely that these custo-mers have deliberately refrained from making a choice. The
range of contracts has grown over time and the newer types do not fit into the traditional model, such as contracts containing a mix of fixed and variable rates. Since January 2008, Statistics Sweden includes these in the category “Other”.
CONSUMER PRICES FOR ELECTRICITYConsumer prices for electricity vary between customer cate-gories, between rural and urban areas and between the Nordic countries. They are influenced by varying distribution costs, differences in taxation, subsidies, government regulations and the structure of the electricity market.
Consumer electricity prices basically consist of three main components:
� A supply charge for the use of electricity, the portion of the electricity bill that is subject to competition.
� A distribution charge to cover the cost of network services, i.e. power distribution.
� Taxes and charges such as energy tax, VAT and fees to government agencies.
The example in Diagram 10 shows the development of elec-tricity prices (single-family home with electrical heating) for a “variable rate” contract, one of many contract types. One observation is that in 1970, less than 7% of the consumer price went to the Government as tax. In January 2012, energy tax, VAT and REC charges made up 45% of the consumer price. Large fluctuations in the electricity price cause these percenta-ges to vary proportionately. It should also be noted that produ-cer surcharges account for part of the electricity price, such as the cost of emission allowances.

20
DIAGRAM 8
NUMBER OF SUPPLIER SWITCHES PER YEAR
Source: Statistics Sweden
DIAGRAM 9
CUSTOMER MOBILITY, JANUARY 2001–2013
Source: Statistics Sweden
DIAGRAM 10
BREAKDOWN OF TOTAL ELECTRICITY PRICE FOR A SINGLE- FAMILY HOME WITH ELECTRICAL HEATING AND A VARIABLE RATE CONTRACT, CURRENT PRICES, IN JANUARY OF EACH YEAR
Sources: Swedish Energy Agency, Statistics Sweden
THE ELECTRICITY YEAR 2012 | tHe eLectricity market

21
sWeDeN’s totaL eNergy sUPPLy | THE ELECTRICITY YEAR 2012
sweden’s total energy supplyENERGY SUPPLYSweden’s energy requirements are covered partly by imported energy sources – mainly oil, coal, natural gas and nuclear fuel – and partly by domestic energy in the form of hydropower, wood, peat and wood waste from the forest products industry (bark and lignin). Development of the energy supply since 1973 is shown in Diagram 11. The most significant changes between 1973 and 2012 are that the share of oil in the energy mix has fallen from just over 75% to 27%, which has been made possible by a concurrent increase in nuclear power from 1% to 34%. With normal availability in the nuclear power plants, and taking ongoing upgrades into consideration, the share of nuclear power is close to 40%. Sweden’s total energy supply in 2012 amounted to a preliminary 590 TWh, compa-red to 569 TWh the year before1. The increased energy supply can be primarily attributed to high production in both the hydropower and nuclear power plants, where the latter also leads to greater conversion losses (waste heat).1
ENERGY USAGESteady growth in society’s demand for goods and services has historically generated stronger demand for energy. Diagram 12 shows energy usage in relation to gross national product (kWh/GNP SEK). Although the Swedish statistics previously disre-garded conversion losses in the nuclear power plants, Sweden now applies the standard international method based on the energy content of the fuel.
1 Excluding net electricity imports, bunkering for international ship-ping and usage for non-energy purposes.
It can be noted that energy usage calculated according to the older Swedish method has fallen since 1973, but did not start to decrease according to the international method until the mid-1990s. The moderate economic growth Sweden during 2012 can be largely attributed to a continued weak global eco-nomy, which is affecting Swedish exports and therefore also industrial development. Lower activity in the industrial sector led to decreased usage of fossil fuels, but high production in the hydropower and nuclear power plants also contributed to this trend. Energy usage in relation to GNP rose in 2012, mainly due to higher nuclear power output with a resulting rise in conversion losses.
In absolute terms, energy usage among end users has been relatively constant since 1973. At the same time, usage in rela-tion to GNP has fallen by over 40% according to the inter-national calculation method. Excluding conversion losses in nuclear power plants, this is equal to an improvement in energy efficiency by nearly 60%. This is partly due to greater usage of processed energy in the form of electricity and district heating, and partly to better energy-efficiency in general. The oil share of energy usage has fallen sharply in the industrial, residential and service sectors, etc., while oil-dependency is still considera-ble in the transport sector.
According to preliminary figures from Statistics Sweden, final energy usage in 2012 was 392 TWh, which is on par with 2011. Electricity usage increased by just under 1% and use of district heating by 7%. The use of oil products declined by 6%, while gas products rose by 9%. Coal usage fell by 12%, while the use of biomass and peat, etc., was up by 6%.
DIAGRAM 11
TOTAL ENERGY SUPPLY IN SWEDEN 1973–2012
Source: Statistics Sweden
DIAGRAM 12
TOTAL SUPPLIED ENERGY IN RELATION TO GNP 1973–2012 (1995 PRICES)
Source: Statistics Sweden
22
THE ELECTRICITY YEAR 2012 | eLectricity Usage
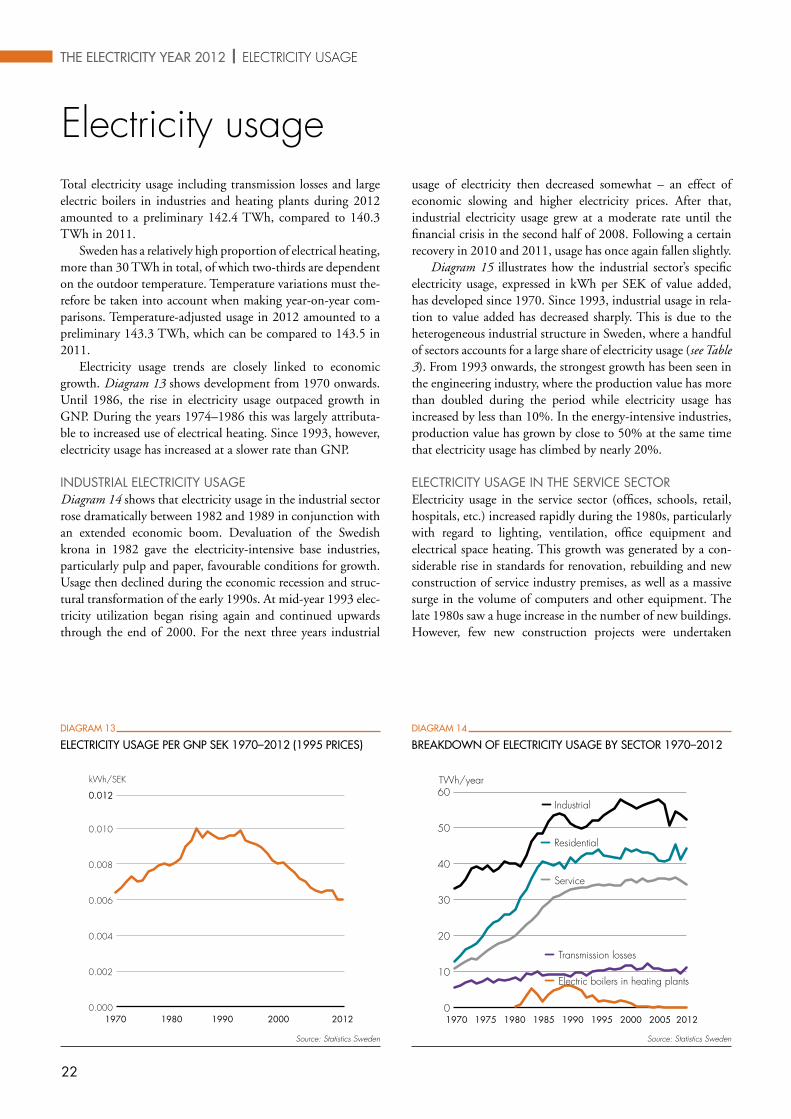
electricity usageusage of electricity then decreased somewhat – an effect of economic slowing and higher electricity prices. After that, industrial electricity usage grew at a moderate rate until the financial crisis in the second half of 2008. Following a certain recovery in 2010 and 2011, usage has once again fallen slightly.
Diagram 15 illustrates how the industrial sector’s specific electricity usage, expressed in kWh per SEK of value added, has developed since 1970. Since 1993, industrial usage in rela-tion to value added has decreased sharply. This is due to the heterogeneous industrial structure in Sweden, where a handful of sectors accounts for a large share of electricity usage (see Table 3). From 1993 onwards, the strongest growth has been seen in the engineering industry, where the production value has more than doubled during the period while electricity usage has increased by less than 10%. In the energy-intensive industries, production value has grown by close to 50% at the same time that electricity usage has climbed by nearly 20%.
ELECTRICITY USAGE IN THE SERVICE SECTORElectricity usage in the service sector (offices, schools, retail, hospitals, etc.) increased rapidly during the 1980s, particularly with regard to lighting, ventilation, office equipment and electrical space heating. This growth was generated by a con-siderable rise in standards for renovation, rebuilding and new construction of service industry premises, as well as a massive surge in the volume of computers and other equipment. The late 1980s saw a huge increase in the number of new buildings. However, few new construction projects were undertaken
DIAGRAM 13
ELECTRICITY USAGE PER GNP SEK 1970–2012 (1995 PRICES)
Source: Statistics Sweden
DIAGRAM 14
BREAKDOWN OF ELECTRICITY USAGE BY SECTOR 1970–2012
Source: Statistics Sweden
Total electricity usage including transmission losses and large electric boilers in industries and heating plants during 2012 amounted to a preliminary 142.4 TWh, compared to 140.3 TWh in 2011.
Sweden has a relatively high proportion of electrical heating, more than 30 TWh in total, of which two-thirds are dependent on the outdoor temperature. Temperature variations must the-refore be taken into account when making year-on-year com-parisons. Temperature-adjusted usage in 2012 amounted to a preliminary 143.3 TWh, which can be compared to 143.5 in 2011.
Electricity usage trends are closely linked to economic growth. Diagram 13 shows development from 1970 onwards. Until 1986, the rise in electricity usage outpaced growth in GNP. During the years 1974–1986 this was largely attributa-ble to increased use of electrical heating. Since 1993, however, electricity usage has increased at a slower rate than GNP.
INDUSTRIAL ELECTRICITY USAGEDiagram 14 shows that electricity usage in the industrial sector rose dramatically between 1982 and 1989 in conjunction with an extended economic boom. Devaluation of the Swedish krona in 1982 gave the electricity-intensive base industries, particularly pulp and paper, favourable conditions for growth. Usage then declined during the economic recession and struc-tural transformation of the early 1990s. At mid-year 1993 elec-tricity utilization began rising again and continued upwards through the end of 2000. For the next three years industrial

23
eLectricity Usage | THE ELECTRICITY YEAR 2012
during the economic slump of the early 1990s, which together with more efficient appliances and equipment has caused electricity usage excluding large electric boilers to stabilize at 33–34 TWh per annum.
Most buildings in the non-residential sector use district heating. Electrical heating as the principal heat source is used in around 9% of the total building area, but accounts for around 20% of the total heating energy due to widespread use of electrical heating as a complement.
The service sector also includes technical services such as district heating plants, water utilities, street and road lighting and railways. These areas also underwent powerful growth during the 1980s, when the district heating plants introduced large heat pumps that used over 2 TWh of electricity in 2000. Usage in this sector has levelled out at around 0.5 TWh per year since 2003, with high electricity prices as one of the con-tributing factors.
RESIDENTIAL ELECTRICITY USAGEThe residential sector includes single-family homes, farms, multi-dwelling units and holiday/summer homes. Electricity for agricultural activities is attributed to the service sector. Elec-tricity usage, excluding electrical heating, has increased at an even pace since the 1960s, with the exception of the oil crisis in 1973–74 and a temporary conservation campaign in 1980–81 when the upward trend was temporarily curbed.
Usage of household and operating electricity for multi-dwelling units has risen steadily, partly due to the growing number of homes and partly to a higher standard of electri-cal appliances and equipment. However, the rate of increase has slowed in recent years and is today essentially linked to the renovation of old apartment buildings and the fact that
households are acquiring more appliances such as dishwash-ers, freezers, and home computers. In all housing types, the replacement of old equipment, like refrigerators and washing machines, with more modern and energy-efficient models is offsetting the increase. Diagram 16 provides a breakdown of household electricity usage.
Electrical heating accounts for 30% of all heating energy used in the residential sector, primarily in single-family homes. A large number of single-family homes with electrical hea-ting were built during 1965–1980. After 1980 the majority of newly built single-family homes have been equipped with electric boilers for hot water systems. In order to reduce oil-dependency after the second oil crisis in the early 1980s, a very large number of single-family homes converted from oil-fired to electric boilers during 1982–1986. In recent years, the number of heat pumps has risen dramatically, thereby reducing the need to purchase energy for residential heating and hot water.
The preferred choice in new construction and conversion of apartment buildings has been district heating, where availa-ble. Outside the district heating networks, however, electrical heating has been installed, primarily in new construction. Elec-trical heating as a complement to other forms of heating is also widespread, and around 4% of the surface area in apartment buildings relies mainly on electrical heating.
Table 4 shows the number of subscribers and average usage for various categories in the residential sector. The table exclu-des homes in the agriculture, forestry and similar sectors since it is not possible to distinguish residential usage from that for commercial activities.
DIAGRAM 15
INDUSTRIAL ELECTRICITY USAGE IN RELATION TO VALUE ADDED 1970–2012 (1991 PRICES)
Source: Statistics Sweden
DIAGRAM 16
HOUSEHOLD ELECTRICITY USAGE BY APPLICATION (RESULTS FOR 2007)
Source: Swedish Energy Agency

24
TABLE 4
NUMBER OF SUBSCRIBERS AND AVERAGE HOUSEHOLD ELECTRICITY USAGE IN 2011 (AT END OF YEAR)
No. of subscribers GWh* MWh/s
Single-family homes with usage of > 10 MWh 1,143,218 19,435 17.0
Single-family homes with max. usage of 10 MWh 755,123 4,531 6.0
Multi-dwelling units, direct delivery, with usage of > 5 MWh 186,521 1,679 9.0
Multi-dwelling units, direct delivery, with max. usage of 5 MWh 1,992,461 3,985 2.0
Multi-dwelling units, aggregate deliveries 8,340 581 69.6
Holiday/summer homes 499,763 2,999 6.0
Total, residential according to the above 4,706,886 39,734 8.4
Share of total number of subscribers 89.4% 31.0% 34.7%
Total number of subscribers 5,265,155 128,230 24.4* 1 GWh = 1/1000 TWh
Source: Statistics Sweden
TABLE 3
INDUSTRIAL ELECTRICITY USAGE BY SECTOR 2000–2012, TWh
2000 2005 2006 2007 2008 2009 2010 2011 2012prel.
Mining 2.6 2.6 2.5 2.7 2.8 2.4 3.2 3.3 3.5
Food and beverages 3.0 2.4 2.4 2.6 2.5 2.4 2.5 2.5 2.5
Textiles and clothing 0.4 0.2 0.2 0.2 0.2 0.2 0.2 0.2 0.2
Wood products 2.3 2.2 2.2 2.2 2.2 2.1 2.1 2.0 1.9
Pulp and paper, graphics industry 24.1 24.2 24.5 24.6 24.2 22.6 23.0 22.9 21.5
Chemicals 7.6 7.6 7.4 7.3 7.1 6.6 7.1 6.8 7.1
Soil and stone products 1.2 1.1 1.1 1.1 1.2 1.0 1.0 1.0 1.0
Iron, steel and metalworking 8.2 8.5 8.4 8.4 8.0 6.0 7.4 8.0 7.4
Engineering industry 7.5 6.9 7.4 7.0 6.9 5.4 5.7 5.8 6.0
Small industries, craftsmen, etc. 1.0 1.0 1.5 1.8 1.5 2.1 1.4 1.4 1.4
TOTAL, incl. disconnectable electric boilers 57.8 56.7 57.7 57.9 56.6 50.7 53.4 53.9 52.5
Source: Statistics Sweden
THE ELECTRICITY YEAR 2012 | eLectricity Usage

electricity productionIn the 1960s Sweden decided to develop nuclear technology
and was thus able to phase out fossil-based (coal, oil) condensing power from the system. Nuclear and thermal power, together with much of the country’s hydropower capacity, today supply baseload power in the Swedish system. In addition to its baseload function, hydropower also plays an important role as regulating power.
The term “regulatable hydropower” means that water can be stored in reservoirs to be drawn down at a later time when the need for power is greater. The regulatability of hydropower fluctuates over the year, for example at times of high runoff in the system there is little opportunity to regulate hydropower. The greatest regulatability normally arises during the winter when runoff is lower, which pro-vides greater opportunity to decide on the draw-down level. Regula-tability is also limited by the speed at which production levels must be adjusted from one day to the next, since the flow rates of water in the long Swedish waterways must be taken into account.
The various power types differ in nature and generally work best in combination with each other. Diagram 19 shows the respective power types’ percentual share of the total installed capacity and the volume of electricity produced. The split bet-ween the different power types, and the total capacity, affect the stability of the power system and its ability to deliver the right amount of electricity at any given time. The actual breakdown by type is dependent on the conditions in each country or region. Other key parameters that affect the design of the power system are the structure of the transmission grid, steering of electricity usage and, in the future, also other energy storage possibilities that complements the attributes of traditional hydropower.
Wind, solar and nuclear power are all built to extract as much energy as possible, but they differ widely. Nuclear power is normally always operated at full load, while wind and solar power have very
Electricity production in Sweden is dominated by CO2-free
hydro and nuclear power. The rate of wind energy expansion has accelerated in recent years and wind-generated power currently makes up more than 4% of Sweden’s total electrical output. The rate of expansion for thermal power may not be as high as for wind power percentage-wise, but the change is greater in terms of the volume of generated electricity. Thermal power produced with biomass fuels accounted for 7% of total electrical output and fossil-fired production for around 3% of output in 2012.
Sweden’s aggregate domestic electrical output in 2012 amounted to 162.0 TWh (147.5 in 2011), an increase of just over 10% compared to the prior year. In 2012, a new annual high for electricity production was set in Sweden. The country’s electricity generation by power type during the period from 1950 to 2012 is shown in Diagram 17.
The Nordic electricity market and the exchange of electricity between neighbouring countries are of crucial importance for Sweden’s electricity supply. Sweden’s production mix differs from that in the neighbouring countries, whose conditions for power generation also vary from one another (see Diagram 18). For many years the Nordic countries have cooperated by utilizing their different production potentials. In good hydropower years, the import of hydroelectric power to Finland and Denmark ena-bles these countries to reduce their production of condensing power, and the reverse is true in dry years when they can export condensing power to compensate for the decrease in hydropower output. In recent years Germany has also participated equally in these flows in both directions. Greater production of wind power has increased the need for more short-term regulation of the power balance. This leads to more exchanges between the countries, which can change direction several times per day.
25
DIAGRAM 17
TOTAL ELECTRICITY SUPPLY IN SWEDEN 1950–2012
Source: Swedenergy
eLectricity ProDUctioN | THE ELECTRICITY YEAR 2012
DIAGRAM 18
NORMALIZED ELECTRICITY PRODUCTION MIX IN THE NORDIC REGION
Source: Swedenergy

few hours at full capacity and instead produce electricity across the entire range of virtually 0% to 100%. Furthermore, solar power output at our latitude is highest during the spring/summer and in the daytime, while wind power can just as easily produce most at night. One positive aspect of wind power is that electricity produc-tion is greater in the autumn/winter when electricity usage is higher. Another distinctive characteristic of wind power is that it is intermit-tent and will nearly always require some kind of regulation (to stop, start, increase or decrease production) in another power type or in the future’s smart energy services that adapt electricity usage to the available supply of electricity. This in itself is nothing new, since the power load also varies from hour to hour and with larger voltage steps, though with the difference that it is easier to forecast varied electricity usage in the short and long term.
Thermal power plants also have the desirable ability to produce when the need for electricity is higher. Their electricity production is governed by the need for heating, but there are certain degrees of freedom to reduce or increase, since demand for heating has an inner inertia. Condensing power and gas turbines are used mostly as back-up power in the event of disruptions and temporary peak loads. A major advantage of these facilities is that they can operate independently as long as there is fuel available.
Hydropower has a roughly equal power output and electricity generation share, which is a result of the earlier need for baseload and regulating power. In a power system with a greater need for output capacity, many facilities would have been uprated with more or larger turbines and their annual operating time would have been longer. The differences between hydropower plants can be signifi-cant, depending on where along a waterway they are located. Close to the source flow and large reservoirs, one power station may ope-rate for 3,000 hours per year at full capacity, while another station near the outflow to the sea may have 6,000 hours at full capacity. To a large extent, the Swedish hydropower plants make up an energy dimensioned system, i.e. an optimization where the goal is to handle most of the normal inflow. Sweden has a total installed hydropower
capacity of approximately 16,000 MW, which can vary between 2,500–13,700 MW in operating output. Within a 24-hour week-day period, the normal variation is 6 –7,000 MW.
Sweden and many of its neighbouring countries are in the process of increasing the volume of wind and solar power – inter-mittent power types that require regulation. The first step is taken through the spot market (day-ahead), since supply and demand set prices that result in measures to increase or decrease genera-tion other than wind power. The next step is the regulating power market (intra-day), which handles forecast errors for production, usage and other imbalances. At the domestic level, Sweden has capacity for regulation with hydropower during much of the year. It is not easy to assess how much wind and solar power can be handled by the hydropower plants, since many parameters must be taken into account. These include variations in wind power amplitude and wind speed from one hour to the next, the amount of surplus wind power from other countries, the level of electricity usage and runoff levels in the waterways.
ELECTRICITY PRODUCTION IMPACTED BY WEATHERWeather conditions have a major influence on Sweden’s power supply. Outdoor temperatures affect electricity usage, parti-cularly for heating of homes and other premises.
The amount of precipitation, and subsequently also runoff to the reservoirs and hydropower stations, is decisive for hydro-power production. With an increased share of wind power, varia-tions in wind speed will also be of greater importance. There is a certain correlation between precipitation and wind speed.
2012 was the tenth year in a row with above-normal tem-peratures (1961–1990), by about 0.5 degrees. It also showed one of the highest levels of precipitation in more than a 100 years. Several weather stations throughout the country set new records and only the month of March could be regarded as predominantly dry. In other respects, 2012 contained an unu-sually large number of days with precipitation.
DIAGRAM 19
BREAKDOWN OF INSTALLED POWER CAPACITY AND ANNUAL ELECTRICITY OUTPUT FOR DIFFERENT POWER TYPES IN 2012
Source: Swedenergy
DIAGRAM 20
RUNOFF VARIATIONS IN RELATION TO MEDIAN VALUE 1960–2012
Source: Swedenergy
26
THE ELECTRICITY YEAR 2012 | eLectricity ProDUctioN

RUNOFF AND RESERVOIR LEVELSTotal runoff in 2012 was 76.6 TWh (not adjusted for spill), and was thus above the average for the past 53 years.
Annual runoff variations in relation to the median value for the period 1960–2012 are shown in Diagram 20.
Runoff variations in 2012 are shown in Diagram 21. The grey field shows runoff with a probability rate of between 10% and 90%. There is a 10% probability that runoff will exceed the upper limit, and 90% probability that it will exceed the lower limit in the grey field. The thinner black curve represents normal runoff (50% proba-bility) and the blue curve shows actual weekly runoff during 2012.
As seen in Diagram 21, runoff during the winter was above normal. The spring flood started very early but lost momentum, only to resume somewhat later, at a more normal time, with a volume that was slightly higher than normal. As in 2011, the period after the spring flood and up to the end of the year was high in precipitation and runoff was far above the median value.
The country’s aggregate reservoir storage is shown in Diagram 22. At the beginning of the year the storage level was 75%, which is around 12 percentage units above the average for the compari-son period 1960–2011. Unlike 2011, when reservoir levels were below average and very low before the spring flood, 2012 showed the opposite trend and the reservoirs began filling at an unusually high level. The rest of the year continued in the same manner and reservoir levels remained above average throughout the period.
The spring flood does not start simultaneously throughout the country, see Diagram 23 which shows storage levels by bidding area. As a result, it is not possible for all reservoirs to be drawn down during the spring flood since there are always some reser-voirs in the process of being either filled or emptied at any given time. At year-end 2012 the storage level for the country was just over 67%, which is a few percentage units higher than average.
Overall, the water year 2012 can be characterized as an unusually good year with abundant runoff throughout the year and a record level of hydropower production.
TABLE 5
HYDROPOWER PRODUCTION
Breakdown by river in 2012, TWh
River Net productionLule älv 16.4 (12.9)
Skellefte älv 5.5 (3.9)
Ume älv 9.4 (8.0)
Ångermanälven 9.0 (7.5)
Faxälven 4.5 (4.2)
Indalsälven 11.5 (10.0)
Ljungan 2.3 (2.1)
Ljusnan 4.1 (4.1)
Dalälven 5.8 (4.8)
Klarälven 2.0 (1.7)
Göta älv 1.9 (1.7)
Other rivers 5.6 (5.8)
Total production 78.0 (66.7)(Data for 2011 in brackets)
Source: Swedenergy
DIAGRAM 21
RUNOFF VARIATIONS IN THE POWER-GENERATING RIVERS
Source: Swedenergy
DIAGRAM 22
STORAGE LEVELS IN THE REGULATING RESERVOIRS
Source: Swedenergy
DIAGRAM 23
STORAGE LEVELS IN THE REGULATING RESERVOIRS IN 2012 BY BIDDING AREAS
Source: Swedenergy
27
eLectricity ProDUctioN | THE ELECTRICITY YEAR 2012

TABLE 6
HYDROPOWER, INSTALLED CAPACITY ON 31 DECEMBER Output, MW
Waterway 2010 2011 2012
Upper Norrland 7,138 7,138 7,138Lule älv 4,196 4,196 4,196Pite älv 50 50 50Skellefte älv 1,016 1,016 1,016Rickleån 10 10 10Ume älv excl. Vindelälven 1,765 1,765 1,765Öreälven 6 6 6Gideälv 70 70 70Moälven 6 6 6Nätraån 12 12 12Small rivers 8 8 8
Central and lower Norrland 6,125.7 6,127.7 6,127
Ångermanälven incl. Faxälven 2,578 2,589 2,590Indalsälven 2,107 2,095 2,095Ljungan 601 603 603Delångersån 19 19 19Ljusnan 817 817 817Small rivers 4 4 4
Gästrikland, Dalarna and Mälardalen region
1,294 1,294 1,301
Gavleån 24 24 24Dalälven 1,149 1,149 1,155Eskiltunaån 9 9 9Arbogaån 35 35 35Hedströmmen 7 7 7Kolbäcksån 57 57 58Nyköpingsån 6 6 6Small rivers 8 8 8
Southeastern Sweden 416 415 415
Vättern-Motala ström 163 163 163Emån 23 23 23Alsterån 7 7 7Ronnebyån 14 14 14Mörrumsån 21 21 21Helgeån 33 32 32Lagan 134 134 134Small rivers 22 22 22
Western Sweden 1,226 1,222 1,221
Nissan 55 55 55Ätran 68 64 64Viskan 28 28 28Upperudsälven 25 25 25Byälven 72 72 72Norsälven 126 126 126Klarälven 388 388 388Gullspångsälven 128 128 127Tidan 8 8 8Göta älv 303 303 303Small rivers 27 27 26
Entire country 16,200 16,197 16,203
Source: Swedenergy
INVESTMENTS IN ELECTRICITY PRODUCTIONInvestments in electricity production and other parts of the energy industry’s infrastructure are almost always of a very long-term nature, up to 50 years, and typically demand substantial capital. Diagram 24 shows the energy industry’s gross investments in current prices star-ting in 1985. The data comes from SCB (Statistics Sweden) and presents total investment spending by the energy industry but with no breakdown among the individual players, which are classified for example as real estate companies that invest in wind power. Further-more, the forestry industry’s investments, which affect electricity production, are not included in the investment amounts.
The tendency has been for the energy industry to increase its investments in recent years. An independent survey conducted by Swedenergy in 2008 indicated a total investment volume of SEK 300 billion during the period to 2018, conditional on the continued expansion of wind power to a level of around 17 TWh by 2020. Wind power accounts for around one third of the total volume.
The investments are made up of different parts: � Modernization of existing power stations. � Whole new power stations. � Modernization of transmission, regional and distribution
networks. � Facilities for heat generation and heat distribution.
The transmission system is of critical importance in delivering the generated electricity to the end users. In today’s more inter-national electricity market there is a greater need for multiple interconnections, but also new potential to handle different power balance situations such as dry years, wet years, etc. A higher share of wind power, solar power and other varying electricity production is also increasing the need for capacity to move electric power in many directions, both geographically and between voltage levels. The latter is of growing importance, since much of the new renewable electricity production is con-nected at a lower voltage than the transmission network.
MODERNIZATION OF POWER STATIONSSweden’s hydropower production in 2012 amounted to 78.0 TWh (66.7 in 2011), which is 17% higher than in the pre-vious year and the second highest level on record. Hydropower accounted for 48% of Sweden’s total electrical output in 2012.
The spread of hydropower production among the country’s main rivers is shown in Table 5. The four largest rivers – Luleälven, Umeälven, Ångermanälven including Faxälven, and Indalsälven – together represented 65% of total hydropower production.
At the end of 2012, the maximum quantity of water that could be stored if the regulation reservoirs were used at full capacity corresponded to an energy volume of 33.7 TWh – which was largely on par with 2011. The electricity production capacity of the country’s hydropower stations in a normal year is 65.5 TWh, according to calculations based on runoff data for the years 1960–2010.
The Eldsforsen power station on the Västerdalälven River has undergone extensive reinvestment in which the existing unit from 1935 has been replaced with a turbine with double the previous capacity. Otherwise, no major hydropower sta-
28
THE ELECTRICITY YEAR 2012 | eLectricity ProDUctioN

TABLE 8
NUCLEAR POWER PLANT ENERGY AVAILABILITY FACTOR AND PRODUCTION
Net Energy availability ProductionTotal production
from start-up output 2007 2008 2009 2010 2011 2012 2007 2008 2009 2010 2011 2012 to 2012
Reactor MW Start-up % % % % % % TWh TWh TWh TWh TWh TWh TWhBarsebäck 1 (600) 1975 92.7Barsebäck 2 (600) 1977 107.6Forsmark 1 984 1980 81.3 81.4 90.1 93.8 79.2 88.4 7.0 7.0 7.6 8.0 6.8 7.6 220.3Forsmark 2 996 1981 85.7 79.7 64.1 38.5 93.9 85.7 7.5 6.9 5.5 3.3 8.1 7.5 210.1Forsmark 3 1,170 1985 88.2 69.7 86.1 81.4 85.4 93.1 9.0 7.1 8.8 8.3 8.7 9.5 235.2Oskarshamn 1 473 1972 64.1 88.3 70.5 79.0 73.3 0.0 2.6 3.5 2.8 3.2 3.0 0.0 99.1Oskarshamn 2 638 1974 77.7 88.7 77.9 92.0 76.6 72.4 4.0 4.5 3.9 5.0 4.2 4.0 152.3Oskarshamn 3 1,400 1985 89.5 71.4 15.2 32.0 70.3 70.0 8.8 7.1 1.7 3.8 8.3 8.4 217.3Ringhals 1 854 1976 81.4 62.0 17.4 48.7 81.6 72.5 6.0 4.5 1.3 3.6 6.0 5.5 173.2Ringhals 2 865 1975 85.0 79.6 39.1 80.3 24.9 48.5 6.4 5.7 2.8 5.6 1.7 3.6 185.2Ringhals 3 1,048 1981 66.7 88.5 91.3 83.7 79.3 91.2 6.0 7.6 8.1 7.6 7.1 8.3 195.2Ringhals 4 934 1983 90.8 91.0 92.8 89.3 50.1 85.2 7.2 7.3 7.5 7.2 4.1 7.0 186.3
9,363 83.3 79.0 64.0 70.1 72.0 75.2 64.3 61.3 50.0 55.6 58.0 61.4 2,074.7
Sources: OKG, Ringhalsgruppen, Forsmarks Kraftgrupp
DIAGRAM 24
ENERGY INDUSTRY GROSS INVESTMENT IN CURRENT PRICES
Source: Statistics Sweden
DIAGRAM 25
INSTALLED WIND POWER CAPACITY IN MW FOR THE PAST 11 YEARS
Source: Swedenergy
DIAGRAM 26
AVERAGE MONTHLY GENERATION OF WIND POWER FOR THE PAST TEN YEARS IN RELATION TO THE ANNUAL ELECTRICITY USAGE PROFILE
Source: Swedenergy
TABLE 7
WIND POWER PLANTS IN 2012
Installed capacity MWelFacility Owner 2012 Total
Lillgrund Vattenfall AB 110Jädraås Jädraås Vindkraft AB +102 102Havsnäs Havsnäs Vindkraft AB 95Sjisjka Sjisjka Vind AB +78 78Åmliden Åmliden Vindkraft AB 52Töftedal 1-24 Several 48Gabrielsberget syd Gabrielsberget Syd Vind AB 46Tolvmanstegen Several +22 44Ytterberg Vindkraft i Ytterberg AB 44Stor Rotliden Vattenfall AB 40Trattberget Vindin AB +39 39Bodön 1-14 Bodön Vindkraftpark 35Gabrielsberget nord Gabrielsberget Nord Vind AB +35 35Näsudden Brattön Vind AB 33Bliekevare Vind Bliekevare Vind AB 32Gässlingegrund Several 30Hedbodberget Vind Several 30Storrun Storrun Vindkraft AB 30Uljabuouda Skellefteå Kraft AB 30
Others, not specified +570 2,791Decommissioned (mothballed, scrapped or sold) n.d.Total +846 3,745
n.d.= no data available Sources: Swedish Energy Agency, Swedenergy
29
eLectricity ProDUctioN | THE ELECTRICITY YEAR 2012

tions were built during the year, although far-reaching rein-vestment programs are being carried out in existing facilities.
The installed capacity in the country’s hydropower stations at year-end 2012 was approximately 16,200 MW. Many smaller power plants were built during the year. Table 6 provides more detai-led information about the installed hydropower capacity per river.
INSTALLATION RECORD FOR WIND POWERThe contribution of wind power to Sweden’s electricity produc-tion in 2012 was 7.2 TWh, up by approximately 18% over the preceding year and equal to 4.4% of the country’s annual elec-trical generation. More than 350 new wind power plants went into operation during the year and at the end of 2012 there were over 2,400 wind turbines in the country with an output of more than 50 kW each. Net generating capacity of around 850 MW was added and the total installed wind power capacity at year-end 2012 was approximately 3,750 MW. Wind generating capa-city has grown at rate of around 10% annually in recent years, but increased significantly more during 2012. The major wind power farms and data on changes in 2012 are shown in Table 7. Diagram 25 shows the trend over the past few years.
The average monthly values for wind-generated power during the period 2003–2012 show how closely wind power output matches the electricity user profile during the year (see Diagram 26). Wind power output is somewhat higher at the end of the year when all of the year’s new generation capacity is included in the total.
In a future system with increased wind power output, it will be necessary to have a greater interplay with other power types and an exchange of electricity with neighbouring countries. It is primarily in the short-term perspective (hours, up to a few days) that wind power must be coordinated with other electri-city generation, of which hydropower will play a key role.
NUCLEAR POWER – A YEAR WITH BETTER AVAILABILITY Sweden’s nuclear power output in 2012 reached 61.4 TWh (58.0
TWh in 2011). Table 8 shows the nuclear power plants’ Energy Availability Factor (EAF) and output for the years 2007–2012, as well as total production per reactor from the year of start-up.
The average EAF at the ten Swedish reactors in 2012 was a low 75.2%, but was higher than in the past few years. If Oskarshamn 1 is omitted from the calculations, EAF increases to around 79%, since Oskarshamn 1 was in operation for only a few days during 2012. The curve is moving in the right direc-tion and when the majority of modernizations are completed, EAF is expected to rise further to the level of over 80% that was previously the norm. This can be compared to a global average of 75% for nuclear power plants of similar types. The country’s installed nuclear power capacity was 9,363 MW the beginning of 2012 and was unchanged at the end of the year.
BarsebäckFor the new few years Barsebäck will be in service operation, i.e. a situation in which the owners are managing the plant in the safest possible manner until it can be demolished. According to plans, the demolition will begin around 2020 at the earliest.
Forsmark In 2012 Forsmark had a total electrical production of 24.6 TWh, which is the best production result for the nuclear power plant since 2005. Forsmark met its goal – safe and secure production.
Forsmark’s three reactors enjoyed reliable and stable operation during 2012 and the output for all three was higher than planned.
Forsmark had an EAF of 89.3%. The Energy Availability Factor (EAF) is a performance indicator that describes the actual energy generation in a power plant during a given period in relation to the maximum energy that could have been pro-duced. Planned shutdowns and production disturbances have a negative impact on EAF and production.
One key reason why Forsmark has once again taken a strong international position is that the strategic program of
DIAGRAM 27
INSTALLED POWER GENERATION CAPACITY IN COGENERATION DISTRICT HEATING (AT LEFT) AND INDUSTRIAL BACK-PRESSURE PLANTS 2002–2012
Source: Swedenergy
30
THE ELECTRICITY YEAR 2012 | eLectricity ProDUctioN

TABLE 9
COMMISSIONED COGENERATION PLANTS IN DISTRICT HEATING SYSTEMS IN 2012Plant Owner Installed capacity, MWel
Filborna Öresundskraft Produktion AB +20Mältan Affärsverken i Karlskrona +14Vetlanda Vetlanda Energi & Teknik +7Energiknuten Landskrona Energi AB +8Decommissioned (reduced, mothballed, scrapped or sold) -35Total +14
Source: Swedenergy
TABLE 10
COMMISSIONED COGENERATION PLANTS IN INDUSTRIAL PROCESSES IN 2012Plant Owner Installed capacity, MWel
Iggesund Holmen +75Bomhus Bomhus Energi AB +80other changes, not specified +0Decommissioned (mothballed, scrapped or sold) +0Total +155
Source: Swedenergy
modernizations and service life extensions in Sweden’s reactors is now starting to have positive effects.
Production at the Forsmark nuclear power plant accounts for one sixth of Sweden’s annual electricity usage.
Production in 2012, (TWh)Forsmark 1: 7.6 TWhForsmark 2: 7.5 TWhForsmark 3: 9.5 TWhTotal production in all reactors: 24.6 TWh
OskarshamnOKG delivered 12.4 TWh, which made up around 8% of Sweden’s total electrical power production in 2012. This is a slightly lower share than normal and was noted despite the fact that Oskarshamn 3 (O3) was able to gradually start producing at the new maximum capacity in 2012 following the completed upgrade.
However, the target for the year was somewhat higher. On three occasions, units were temporarily taken offline in order to repair a number of valves and some minor fuel damage. In addi-tion, the annual maintenance shutdown was extended by three weeks when one of the company’s subcontractors went on strike.
With the exception of December, O2 had a good produc-tion year in 2012 with few operating disturbances. The annual maintenance work was completed more quickly than planned and total production was close to 4 TWh. The standstill at the end of the year was due to inspection of the backup diesel generator units at O2, as a condition for the Swedish Radiation Safety Authority’s dispensation to continue production until next summer.
However, most of the drop in deliveries from OKG during 2012 was attributable to an unsatisfactory situation at O1. Recurring problems with turbine vibrations, the backup diesel generators’ starter motors and defects in the feed water system meant that the facility was in operation for a combined total of less than one week.
DIAGRAM 28
POWER PRODUCTION BY FUEL TYPE IN COGENERATION DISTRICT HEATING AND INDUSTRIAL BACK-PRESSURE PLANTS 2002–2012
Source: Swedenergy
TABLE 11
DECOMMISSIONED CONDENSING POWER PLANTS IN 2012
Plant Owner Installed capacity, MWel
Fuel
Karskärsverket G4 BillerudKorsnäs -125 oilTotal -125
Source: Swedenergy
31
eLectricity ProDUctioN | THE ELECTRICITY YEAR 2012

TABLE 13
MEMBER COMPANY POWER ASSETS IN SWEDEN, MW, 1 JANUARY 2013
Company
Hydro-power
Nuclearpower
Windpower
Other thermal power
Solarpower Total
Vattenfall AB 7,947 4,687 241 928 0 13,803E.ON Sverige AB 1,781 2,774 115 2,051 0 6,721Fortum Power and Heat AB 3,108 1,787 30 945 0 5,870Statkraft Sverige AB 1,261 0 0 1 0 1,262Skellefteå Kraft AB 655 62 87 77 0 881Mälarenergi AB 57 0 0 513 0 570Göteborg Energi AB 0 0 35 286 0 321Jämtkraft AB 213 0 53 46 0 312Holmen Energi AB 253 0 0 0 0 253Tekniska Verken i Linköping AB 93 0 0 156 0 249Umeå Energi AB 153 0 23 57 0 233Öresundskraft AB 0 0 0 141 0 141Arise Elnät AB 0 0 139 0 0 139Karlstads Energi AB 24 53 0 34 0 111Söderenergi AB 0 0 0 99 0 99Wallenstam NaturEnergi AB 0 0 96 0 0 96LuleKraft AB 0 0 0 90 0 90Sundsvall Elnät AB 0 0 0 74 0 74Övik Energi AB 0 0 0 52 0 52Växjö Energi AB 1 0 0 50 0 51Sollefteåforsens AB 49 0 0 0 0 49Borås Elnät AB 12 0 0 34 0 46Eskilstuna Energi & Miljö AB 0 0 0 42 0 42Jönköping Energi Nät AB 20 0 0 20 0 40Gävle Energi AB 15 0 0 23 0 38Other member groups 159 0 65 263 0 487Total 15,801 9,363 884 5,982 0 32,030
NON-MEMBER COMPANIESSvenska Kraftnät 0 0 0 640 0 640BillerudKorsnäs 0 0 0 313 0 313Södra Cell 0 0 0 235 0 235Stora Enso 0 0 0 150 0 150Holmen 0 0 0 145 0 145SCA 0 0 0 97 0 97Other 402 0 2,861 486 24 4,015Total Sweden 16,203 9,363 3,745 8,018 24 37,353
Source: Swedenergy
TABLE 12 B
INSTALLED CAPACITY IN SWEDISH POWER PLANTS BY FUEL TYPE, MW
31 Dec. 2011 31 Dec. 2012Nuclear power 9,363 9,363Fossil power 4,793 4,636Renewable power 22,307 23,354 - hydropower 16,197 16,203 - waste 325 346 - biomass 2,870 3,036 - solar power 16 24 - wind power 2,899 3,745
Total 36,463 37,353Added +1,072 +1,055Subtracted -329 -170
Source: Swedenergy
TABLE 12 A
INSTALLED CAPACITY IN SWEDISH POWER PLANTS, MW
31 Dec. 2011 31 Dec. 2012Hydropower 16,197 16,203Wind power 2,899 3,745Nuclear power 9,363 9,363Solar power 16 24Other thermal power 7,988 8,018 - cHP, industrial 1,240 1,375 - cHP, district heating 3,551 3,571 - condensing power 1,623 1,498 - gas turbines, etc. 1,574 1,574
Total 36,463 37,353Added +1,072 +1,055Subtracted -329 -170
Source: Swedenergy
TABLE 12 C
INSTALLED CAPACITY BY BIDDING AREA ON 1 JANUARY 2013, MWel
LuleåSE1
SundsvallSE2
StockholmSE3
MalmöSE4
SverigeSE
Hydropower 5,255 8,014 2,593 341 16,203Nuclear power 9,363 9,363Wind power 363 665 1,563 1,154 3,745Other thermal power 282 579 4,306 2,846 8,013 cHP, district heating system 160 263 2,219 929 3,571 cHP, industrial 122 316 602 335 1,375 condensing power 493 1,005 1,498 gas turbines 992 577 1,569Solar power n.d. n.d. n.d. n.d. 24Other 1 1 1 2 5Entire country 5,900 9,258 17,825 4,341 37,353
Source: Swedenergy
n.d.= no data available
32
THE ELECTRICITY YEAR 2012 | eLectricity ProDUctioN

Production in 2012, (TWh)O1: 0.03 TWhO2: 4.0 TWhO3: 8.4 TWhTotal production in all reactors: 12.4 TWh
Ringhals In 2012 Ringhals produced a combined 24.4 TWh and accounted for 15% of Sweden’s total electrical production during the year. The focus during the year was on comprehensive maintenance and ongoing safety enhancements. Ringhals had its best production year of all time in 2004 when it generated a total of more than 28 TWh, which is the highest electrical output since the reactors were started up in 1975.
It was a calm year with no unpredicted events in either ope-ration or maintenance. Ringhals 3 recorded its best year ever with production of more than 8.3 TWh and an EAF of over 91%. Production at Ringhals 2 was lower than normal, since the reactor was shut down among other things for cleanup acti-vities after a fire and replacement of a transformer.
Production in 2012, TWh R1: 5.5 TWhR2: 3.6 TWhR3: 8.3 TWhR4: 7.0 TWhTotal production in all reactors: 24.4 TWh
FUEL-BASED PRODUCTION DOWN SLIGHTLY Fossil fuels include oil, coal and natural gas. Peat is normally also regarded as a fossil fuel but is classified separately in Sweden. Bio-mass fuels include wood waste, energy forest, one-year crops, agri-cultural waste and recycled lignin (a by-product extracted from wood chips during cooking of pulp in the cellulose industry).
Combustion of biomass fuels offers environmental advan-tages in that the amount of carbon dioxide stored in trees and other plants as they grow is equal to the amount they release when burned. Provided that this balance is maintained, bio-mass fuels make a zero contribution to the greenhouse effect.
In 2012 electricity generated from other thermal power (fossil and biomass fuels) amounted to 15.5 TWh (16.8 in 2011), equal to just under 9% of Sweden’s total electrical production. Of this, 8.7 TWh (9,6) was produced in cogeneration district heating plants and 6.2 TWh (6.4) in industrial CHP (back-pressure) plants.
Diagrams 27 and 28 show the installed capacity and power generation by fuel type used in cogeneration district heating and industrial back-pressure plants. As a rule, the instal-led capacity (Diagram 27) is determined by the primary fuel type used in the plant. The energy statistics can be somewhat misleading, depending on how the fuel is allocated between electrical power and heat generation. Prior to the introduction of renewable energy certificates (RECs), a large share of fossil fuels was allocated to power production. In other words, the trends are reinforced by the fact that statistics providers must take other steering instruments into account.
The condensing power plants and gas turbines, which gene-rate only electricity, produced a total of 0.6 TWh (0.8) in 2012.
A few new power plants were commissioned during 2012, three of which by companies with no previous ownership in electricity generation. Table 9 shows capacity additions and other changes during the year. A few major plants are under construc-tion and are expected to go into operation during 2013, such as Tranås (6 MWel), Brista 2 in Sigtuna (20 MWel), Torsvik 2 in Jönköping (30 MWel), Hedenverket in Karlstad (30 MWel), Värnamo (3.6 MWel), Sandvik 3 in Växjö (39 MWel). The last four will be completed in 2014.
The Swedish forestry industry’s previously ambitious invest-ment spending on new turbines and generators has decreased. Bomhus Energi AB has built a new CHP plant that provides district heating to Gävle and process steam to the BillerudKors-näs paper mill (80MWel). Holmen’s facility in Iggesund added a turbine and a generator (75 MWel), (see Table 10).
Table 11 shows changes in condensing power plants during the year.
INSTALLED CAPACITYThe aggregate installed capacity in the country’s power stations at the end of the year was 37,353 MW (excluding diesel backup gene-rators in hospitals, water purification plants, etc.), divided between the various types listed in Table 12A, or by fuel type according to Table 12 B. The total installed capacity consists of 43% hydropo-wer, 10% wind power, 25% nuclear power and 22% other thermal power. Installed capacity by bidding area is shown in Table 12 C.
Table 12 B, showing installed capacity by fuel type, is somewhat misleading since the primary fuel is denoted for the entire capacity while in reality many plants use several different fuels simultaneously.
Due to hydrological limitations, etc., it is not possible to utilize the entire installed capacity at the same time. During certain parts of the year, there are also constraints in physical grid transmission from northern to central and southern Sweden. Furthermore, some capacity must be reserved to regu-late voltage in the power grid and deal with disturbances.
In order to continuously secure the power supply and avoid power shortages, reserve power at least equivalent to the output of one of the country’s largest power plants must always be avai-lable. International connections enable neighbouring countries to quickly assist each other in the event of contingencies.
Table 13 also shows how the installed capacity in the country’s power stations is divided between the member com-panies in Swedenergy and other companies.
RENEWABLE ELECTRICITY GENERATION Diagram 29 shows that the percentage of renewable electri-city generation in the form of hydro, wind and biomass-based thermal power (blue bar) in Sweden is clearly over 50%. If nuclear power is included, the percentage of CO
2-free electri-
city generation is 97%, which means that only 3% of Sweden’s electricity generation utilizes fossil-based or other fuels. This percentage is difficult to reduce since the fuel is used mainly in gas turbines, condensing power plants and as support fuels for start-up of cogeneration plants, of which the first two belong to the category of contingency and capacity reserves.
33
eLectricity ProDUctioN | THE ELECTRICITY YEAR 2012

34
THE ELECTRICITY YEAR 2012 | eLectricity ProDUctioN
TABLE 16
ELECTRICAL BALANCE 2007–2012, NET TWh, ACCORDING TO STATISTICS SWEDEN
2007 2008 2009 2010 2011 2012*
Domestic production 145.0 146.0 133.7 144.9 147.5 162.0Hydropower 65.6 68.6 65.3 66.8 66.7 78.0Wind power 1.4 2.0 2.5 3.5 6.1 7.2Nuclear power 64.3 61.3 50.0 55.6 58.0 61.4Other thermal power 13.7 14.1 15.9 19.1 16.8 15.5
cHP, industrial 6.1 6.2 5.9 6.2 6.4 6.2cHP, district heating 7.1 7.2 9.3 12.4 9.6 8.7condensing power 0.5 0.7 0.7 0.5 0.8 0.6gas turbine, diesel, etc. 0.03 0.02 0.02 0.03 0.01 0.01
Pump power -0.03 -0.03 -0.03 -0.02 -0.05 -0.03Domestic usage 146.3 144.0 138.4 147.0 140.3 142.4
transmission losses 10.7 10.5 10.2 10.7 9.7 11.0Electricity from neighbouring countries 18.5 15.6 16.4 17.6 14.8 13.1Electricity to neighbouring countries (-) -17.2 -17.6 -11.7 -15.6 -22.0 -32.7Net exchange with neighbouring countries ** 1.3 -2.0 4.7 2.1 -7.2 -19.6
* Preliminary data from Swedenergy, **Negative values are equivalent to exportSources: Swedenergy, Statistics Sweden
TABLE 14
LARGEST ELECTRICITY PRODUCERS IN SWEDEN – PRODUCTION IN SWEDEN 2000–2012, TWh
2000 2002 2004 2006 2007 2008 2009 2010 2011 2012
Vattenfall 69.3 70.3 70.4 63.8 64.4 66.0 58.7 61.5 59.9 71.4Fortum, Sverige 27.8 24.5 24.0 27.1 26.0 27.9 25.1 26.7 28.9 29.9
Birka energi 21.4stockholm energigullspång kraftstora kraft 6.4
E.ON 30.4 30.9 33.9 30.0 31.9 29.8 22.3 27.7 27.4 27.2sydkraft 27.2 28.5graninge 3.2 2.4
Statkraft Sverige 1.2 1.3 1.3 5.3 5.4 5.5 6.4Skellefteå Kraft 2.9 3.4 3.1 3.1 3.4 3.3 3.3 3.2 3.4 4.0Total 130.4 129.1 131.4 125.2 127.0 128.3 114.7 124.5 125.1 138.9
Share of total 91.9% 90.1% 88.3% 89.2% 87.6% 87.9% 85.8% 85.9% 84.8% 85.7%
Total output 141.9 143.3 148.8 140.4 145.0 146.0 133.7 145.0 147.5 162.0
Generation in wholly owned, partly owned with a deduction for minority shares and addition/subtraction of replacement power.Source: Swedenergy
TABLE 15
LARGEST ELECTRICITY PRODUCERS IN SWEDEN – PRODUCTION IN THE NORDIC REGION 2000–2012
2000 2002 2004 2006 2007 2008 2009 2010 2011 2012
Vattenfall 70.6 70.9 68.3 72.7 73.5 67.0 70.3 66.8 76.6
Fortum 46.5 50.7 51.8 49.3 49.9 46.2 48.5 39.7 49.2Statkraft – 26.2 38.6 35.8 41.9 42.0 45.0 47.0 47.4E.ON 30.9 34.0 30.1 32.4 30.2 22.6 28.1 28.8 28.6Skellefteå Kraft 3.5 3.5 3.5 3.9 3.8 4.1 3.6 3.8 4.2Total 151.5 185.3 192.3 194.1 199.3 181.9 195.5 186.1 206.0
Share of total 39.6% 48.9% 50.8% 48.8% 50.1% 49.3% 51.0% 49.2% 50.7%
Total output 383.5 382.8 379.2 383.9 397.3 397.5 368.8 383.1 378.6 406.4
Generation in wholly owned, partly owned with a deduction for minority shares and addition/subtraction of replacement power.Source: Swedenergy

ELECTRICITY PRODUCERSIn total, the Swedish state owns approximately 39% of the country’s installed power generation capacity, non-Swedish owners around 39%, municipalities around 12% and others roughly 10% (see Diagram 30). Diagram 31 shows that the ear-lier rising trend in foreign ownership has been replaced by an increase in municipal and other ownership.
Acquisitions and mergers have progressively reduced the number of major electricity producers over the past 20 years, a structural rationalization that has led to a strong concentration of power generation assets. The Nordic region’s five largest electricity producers with operations in Sweden accounted for around 139 TWh, or 85.7%, of Sweden’s total electrical output in 2012.
In the production figures shown in Table 14, minority shares have been omitted and leased electricity production is included only for the company utilizing this production. Table 15 shows the same companies from a Nordic perspective. Their share of total Nordic electricity generation is 50.7%.
Diagram 32 shows the five largest electricity producers active in Sweden and their total output in the Nordic region during 2012.
THE POWER BALANCEThe weekly power balance for the years 2010–2012 is shown in Diagrams 33 and 34. Production is divided between hydro-power, wind power, nuclear power and other thermal power. Development since 2007 is shown in Table 16.
Diagram 33 shows the spread of electricity production over the past three years to cover the domestic power requirement and variations in Sweden’s net electricity exchange with neighbou-ring countries during the year. The difference between electricity usage and total electricity production represents the net inflow of electricity to Sweden (when electricity usage exceeds total pro-duction) or the net outflow of electricity from Sweden (when total production exceeds usage).
Hydropower is utilized relatively evenly over the year in that the reservoirs are filled during the spring and summer and the energy stored in the reservoirs is used throughout the winter until the next year’s spring flood. Maintenance shutdowns at the nuclear power plants are carried out during the summer, when electricity usage is low. Other thermal power consists almost entirely of CHP plants with the bulk of production during the winter when the district heating requirement is high.
Of total electricity output in 2012, hydropower accounted for 48%, wind power for around 4.4%, nuclear power for 38% and other thermal power for just under 10%.
Diagram 34 shows how electricity production is spread over the year in order to cover the power requirement in the Nordic market. The most significant differences in the production mix compared to Sweden are a larger share of other thermal power and a proportionately higher share of wind power in the Nordic region.
The peak hourly load in the electricity system during 2012 was recorded on 13 December 2012 between 4 and 5 p.m. and reached approximately 26,200 MWh per hour. This can be com-pared to the previous year’s peak of 26,000 MWh per hour.
DIAGRAM 29
DEVELOPMENT OF RENEWABLE ELECTRICITY GENERATION 2006–2012
Source: Swedenergy
DIAGRAM 30
OWNERSHIP OF GENERATION CAPACITY, VALUES FOR 2012
Source: Swedenergy
DIAGRAM 31
CHANGES IN OWNERSHIP OF ELECTRICITY GENERATION 1996–2012
Source: Swedenergy
35
eLectricity ProDUctioN | THE ELECTRICITY YEAR 2012

DIAGRAM 32
FIVE LARGEST ELECTRICITY PRODUCERS IN SWEDEN – PRODUCTION IN NORDIC REGION IN 2012
Source: Swedenergy
DIAGRAM 33
ELECTRICITY GENERATION AND USAGE IN SWEDEN 2010–2012, TWh PER WEEK
Source: Swedenergy
DIAGRAM 34
ELECTRICITY GENERATION AND USAGE IN NORDIC REGION 2010–2012, TWh PER WEEK
Source: Nord Pool
The weighted average daily temperature in the country on 13 December 2012 was -9.0 °C, which is 8.0 °C colder than normal. The hourly load profile for 13 December 2012 is shown in Diagram 35, where two typical 24-hour periods, one winter and one summer, are presented for the sake of comparison.
Electricity usage on weekdays generally has two peaks, one at 8 a.m. and one at 5 p.m. Due to the use of electric heating, the temperature has a strong influence on electricity usage in Sweden. The amount of electricity used on a winter weekday is twice that used on a Saturday or Sunday during the summer.
The rise in electricity usage on a warm summer day due to increased use of fans and air conditioning, irrigation, etc., is still insignificant compared to the effects of a winter month in the form of higher electricity usage for heating.
ELECTRICITY EXCHANGEFollowing deregulation of the Swedish electricity market in 1996, the country’s exchange of electricity with neighbouring countries is accounted for in terms of physical (measured) values by country, with the sum of net exchanges specified by the hour and point of exchange. Svenska Kraftnät (SvK) is responsible for this reporting.
Graph 1 shows the Swedish national grid’s transmission capacity to the respective neighbouring countries defined in MW. As a result of constraints in the interconnecting grids, the capacity of cross-border connections can differ depending on the direction in which electricity is transmitted. The graph is a schematic representation; in reality Sweden has a number of separate links to each country.
In 2012 Sweden’s inflow of electricity from neighbouring countries decreased to 13.1 TWh (14.8 in 2011). The outflow of electricity from Sweden increased to 32.7 TWh (22.0 in 2011), resulting in a net outflow of 19.6 TWh (net outflow of 7.2 in 2011), (see Table 17).
The net outflow set a new record – never before has so much electricity flowed out of the country during a year. The previous highest level was 10 TWh. The electricity flow data for 2012 shows that Sweden had a varied inflow and outflow during the year (see also Diagram 36).
Graph 2 shows the Swedish national grid placed within the Nordic transmission system. This expansion also increases the number of neighbouring countries to include interconnections with Russia, Estonia and in 2009 also the Netherlands. The link with Russia has been, and is currently, a one-way export to the Nordic region. Depending on developments in the Rus-sian electricity market, however, it is conceivable that electric power could be transmitted in both directions in the future. In the past year, variations in the exchange with Russia have been substantial.
Within the Nordic region, not only Sweden but also Norway had very high hydropower production. Furthermore, the record hydropower output in Sweden and Norway had an inhibiting effect on other thermal power (mainly fossil fuel) production primarily in Finland and Denmark. The exchange between the Nordic region and other countries resulted in a net export of approximately 14 TWh (see Table 18).
36
THE ELECTRICITY YEAR 2012 | eLectricity ProDUctioN

DIAGRAM 35
HOURLY LOAD PROFILE FOR ELECTRICITY USAGE WITH PEAK DEMAND IN 2012 AND TYPICAL 24-HOUR PERIOD IN WINTER AND SUMMER
Sources: Svenska Kraftnät, Swedenergy
DIAGRAM 36
NET FLOW OF ELECTRICITY TO AND FROM SWEDEN PER COUNTRY IN 2012, GWh PER WEEK
Source: Svenska Kraftnät
GRAPH 1
TRANSMISSION CAPACITY BETWEEN SWEDEN AND NEIGH-BOURING COUNTRIES, MW
Source: Svenska Kraftnät
GRAPH 2
TRANSMISSION CAPACITY BETWEEN THE NORDIC REGION AND NEIGHBOURING COUNTRIES, MW
Source: Svenska Kraftnät
37
eLectricity ProDUctioN | THE ELECTRICITY YEAR 2012
TABLE 17
ANNUAL VALUES FOR SWEDEN’S ELECTRICITY EXCHANGE WITH DIFFERENT COUNTRIES IN 2012
TWh To Sweden From Sweden
Denmark 1.6 (2.8) 9.1 (5.3)
Finland 0.4 (4.0) 14.7 (6.1)
Norway 10.7 (7.1) 3.2 (7.0)
Poland 0.1 (0.3) 2.7 (1.5)
Germany 0.3 (0.6) 2.9 (2.1)
Total 13.1 (14.8) 32.7 (22.0)
(Data for 2011 in brackets).Source: Svenska Kraftnät
TABLE 18
ANNUAL VALUES FOR NORDIC ELECTRICITY EXCHANGE WITH DIFFERENT COUNTRIES IN 2012
TWh + To/ – From Nordic region
Estonia -1.1 (1.2)
Netherlands -5.6 (-2.1)
Poland -2.5 (-1.2)
Russia 4.5 (10.8)
Germany -9.4 (-3.8)
Total -14.1 (4.9)
(Data for 2011 in brackets).Source: Nord Pool

TABLE 19
AIRBORNE EMISSIONS FROM SWEDEN’S ELECTRICITY PRODUCTION IN 2011
Emissions Total emissions from electricity production (tonnes)
Emissions per kWh of produced electricity
Share of total emis-sions in Sweden [%]
Nitrogen oxides (NOx) 4,870 0.03 g 3.3
Sulphur dioxide (SO2) 2,523 0.02 g 8.5
Carbon dioxide (CO2)* 3,187,591 21.6 g 6.5
Carbon monoxide (CO) 15,142 0.10 g 2.7
Volatile organic compounds (NMVOC) 1,206 0.01 g 0.7
Methane (CH4) 1,577 0.01 g 0.03
Particulates (PM 10) 2,286 0.02 g 5.7
Nitrous oxide (N2O) 471 3 mg 0.01
Ammonia (NH3) 132 1.0 mg 0.3
Lead (Pb) 1,0 6 µg 0.01
Mercury (Hg) 0.03 0.2 µg 0.005
*fossil CO2 emissions
Sources: Statistics Sweden, Swedish Environmental Protection Agency
38
THE ELECTRICITY YEAR 2012 | eNviroNmeNt
environment – economic crisis has an impact on environmental and climate policy steering instrumentsThe economic crisis dominated the political landscape during 2012, above all in the EU. The crisis had powerful impact on the EU’s climate policy flagship – the EU Emissions Trading Scheme (EU ETS). A large surplus of issued emission allowan-ces has accumulated in pace with declining demand, and prices have fallen steadily. Finally, the European Commission decided to tackle this problem by presenting a proposal for withholding of emission allowances from the auction timetable, known as backloading or set-aside.
The EC also issued a report on possible future reforms in the EU ETS in which everything from reducing the emissions cap in the EU ETS and expanding the scope of the EU ETS to include other sectors, to price floors and price management reserves, were discussed.
At the domestic level, government authorities and the Ministry of the Environment drew up a roadmap to achieve an emissions-neutral Sweden by 2050. At the end of the year, the Swedish Environmental Protection Agency (SEPA) presented its proposal. The SEPA’s conclusion is that the Government’s mission is attainable but will require major adjustments in society, with the most extensive changes called for in the indu-
strial and transport sectors. The role of electricity as enabler for this process was highlighted to a certain extent in the proposal.
In 2012, the Government, the SEPA and a government inquiry drafted proposals for implementation of the Indu-strial Emissions Directive (IED). The big question is whether it is possible to meet the timetable in the directive with indi-vidual permitting or if general regulations must be adopted. The Government has chosen to go with the latter. Since the directive can lead to more frequent reassessment of permit con-ditions than at present, Swedenergy feels it is vital that the rele-vant authorities be equipped for this and that the temporary exemption for district heating facilities be utilized.
Whether or not biomass fuels are climate-neutral and sustainable is being increasingly questioned in Europe. The scientific debates have provided no clear answers and biomass-fuelled countries like Sweden are anxiously awaiting a proposal from the European Commission on sustainability criteria for solid biomass.
The environmental aspects of hydropower remained a hot topic for debate in Sweden, at the same time that many envi-ronmental upgrades are being made in the country’s hydropo-

39
eNviroNmeNt | THE ELECTRICITY YEAR 2012
wer stations. The Government appointed an inquiry on water operations where the aim is to propose legal amendments to ensure that all permit-requiring water operations have permits in compliance with the environmental requirements stipula-ted in the Swedish Environmental Code and EU legal regu-lations. Other goals are to maintain effective ground drainage and continued high regulation and production capacity in the Swedish hydropower generating facilities. The inquiry will present its findings to the Government on 31 May 2014. The parliamentary all-party committee on environmental objecti-ves was tasked with drawing up a strategy for a coherent and sustainable water policy. The committee will present its report on 9 June 2014.
ENVIRONMENTAL ASPECTS OF ELECTRICITYAll extraction, conversion and usage of energy have some effect on the environment. Burning of fuels gives rise to emissions of substances such as sulphur dioxide and nitrogen oxides. However, even non combustion-based power genera-tion, such as hydro and wind power, has an impact on the local environment. For example, construction of wind farms along the coast alters the visual landscape and hydropower plants lead to changed and irregular water flows, which affect biodiversity, the habitats of shoreline flora and the migratory paths of fish.
Environmental consideration has always been a natural part of the power industry’s responsibilities but is now pursued in a more structured manner than before. Virtually all companies in the industry are certified according to the ISO 14001 envi-ronmental standard, which ensures that environmental issues are addressed systematically in order to continuously reduce negative environmental effects. Electricity production in
Sweden has a generally low environmental impact in the form of emissions since it is based primarily on hydro and nuclear power, which generate no combustion-related emissions at all.
Table 19 shows the trend for a few combustion-related emissions from electricity generation. Emissions are calculated based on electricity generation data per fuel type, which is con-verted to total fuel usage for each power plant unit with the help of average efficiency rates for the plants. Emission factors are then applied to the fuel usage data to obtain total emissions.
ACIDIFICATION AND SULPHUR DIOXIDE Acidification is counted among the more regional environmen-tal problems, and sulphur fallout is the primary cause of acidifi-cation in Swedish soil and waterways. Since Scandinavian soils are particularly sensitive to acidification, this problem attracted attention at an early stage in Sweden. Sulphur dioxide (SO
2) is
a transboundary airborne pollutant and approximately 90% of fallout in Sweden originates from Central Europe and the UK.
Sulphur dioxide emissions in Sweden have decreased sharply from a high of 925,000 tonnes in 1970 to less than 30,000 tonnes in 2011. Of total SO
2 emissions, around 70% is att-
ributable to combustion of oil and coal. The few power and heat generation facilities that still use coal or oil have installed desulphurization plants or now use low-sulphur oil. Further-more, many of these are used primarily for peak loads when the need for capacity is highest. Emissions of SO
2 from Sweden’s
electricity production in 2011 amounted to 2,523 tonnes, equal to around 8.5% of Sweden’s total SO
2 emissions (Table 19).
EUTROPHICATION AND NITROGEN OXIDES The primary effect of nitrogen oxide (NOx) fallout into the soil is to promote the growth of nitrogen-loving plants at the

DIAGRAM 37
AIRBORNE EMISSIONS OF NOX AND SO2 FROM ELECTRICITY PRODUCTION 2000–2011, TONNES PER YEAR
Sources: Statistics Sweden, Swedish Environmental Protection Agency, Swedenergy
DIAGRAM 38
ELECTRICITY PRODUCTION IN CHP PLANTS, TWh
Source: Swedenergy
40
THE ELECTRICITY YEAR 2012 | eNviroNmeNt
expense of indigenous flora such as blueberries and lingonber-ries. So far, NOx fallout in Sweden has caused only minor leaching into the country’s waterways. Nitrogen oxides are transboundary airborne pollutants and only around 17% of fallout is of domestic origin.
NOx emissions also lead to the formation of ground-level ozone. In Sweden, this type of ozone causes both negative health effects and damage to trees and crops costing billions per year. Sweden’s ozone levels are largely of foreign origin and are result of NOx fallout from Germany, the UK and Poland. International cooperation is therefore needed to deal with eutrophication problems, an area where the UN Convention on Long-range Transboundary Air Pollution and various EU directives, such as the recently adopted IED (Industrial Emis-sions Directive) and ongoing revision of the National Emission Ceiling Directive, are playing a central role.
NOx emissions in Sweden have declined in recent years but have proven more difficult to reduce than SO
2 emissions. In 2011
Sweden’s total NOx emissions amounted to 145,500 tonnes. Of total emissions, the bulk is attributable to traffic, primarily pas-senger cars and trucks, but also machinery, equipment and sea-going vessels. The majority of power and heat generating facilities have installed denitrification scrubbers. Sweden’s NOx emissions from electricity production in 2011 amounted to 4,870 tonnes, i.e. 3.3% of Sweden’s total emissions (Table 19). Diagram 37 shows the trend in emissions of NOx and SO
2 since 2000. The
rise in NOx emissions in recent years is due to increased power generation from CHP plants. In 2010, production in combustion plants increased more than usual due to the cold winter and ope-rating problems in the nuclear power plants, while a lack of similar extreme conditions in 2011 led to lower emissions. The trend for electricity production in CHP plants is shown in Diagram 38.
CLIMATE CHANGE AND GREENHOUSE GASES Certain gases in the Earth’s atmosphere allow the sun’s rays to pass through while at the same time absorbing the energy reflected back by the Earth’s surface. This so-called “greenhouse effect” is a natu-ral phenomenon that keeps the Earth’s mean global temperature at +15°C instead of the -18°C which would otherwise be the case.
However, increased anthropogenic CO2 emissions are alte-
ring the chemical composition of the atmosphere and affecting its radiation balance.
There are both natural and unnatural greenhouse gases (GHGs), all of which have varying degrees of climate impact. The greatest attention has been focused on carbon dioxide, since concentrations of CO
2 in the atmosphere have risen dra-
matically. Prior to industrialization the atmospheric concentra-tion of CO
2 was approximately 280 ppm (parts per million),
but has since then risen to around 390 ppm. Combustion of fossil fuels such as oil, gas and coal and deforestation are the main causes of increased CO
2 in the atmosphere.
Sweden has relatively low emissions of GHGs, in 2011 amounting to 61.5 Mtonnes in 2011 (1 megatonne = 1 million tonnes) of CO
2 equivalents (climate-affecting gases converted
into CO2), while CO
2 emissions at the beginning of the 1970s
exceeded 100 Mtonnes per year. The difference is mainly due to a drastic decrease in the use of oil in favour of electricity generated from nuclear power. At around 5 tonnes per year, Sweden’s per capita emissions of CO
2 equivalents are low in
comparison with other industrialized nations. The OECD average is around 10 tonnes per capita and year.
Climate change is a global issue that must be addressed at the global level. Swedish emissions of CO
2 equivalents make
up only 0.2% of annual global emissions. The United Nations Framework Convention on Climate Change was signed in

DIAGRAM 39
AIRBORNE EMISSIONS OF CO2 FROM ELECTRICITY PRODUCTION IN 2000–2011
Sources: Statistics Sweden, Swedish Environmental Protection Agency, Swedenergy
DIAGRAM 40
SF6 LEAKAGE (% OF TOTAL USAGE IN PRODUCTION AND TRANSMISSION OPERATIONS)
Source: Swedenergy
41
eNviroNmeNt | THE ELECTRICITY YEAR 2012
1992 and in 1997 led to the Kyoto Protocol, for which the commitment period ran from 2008-2012. Under the Protocol the industrialized nations must reduce their GHG emissions by at least 5% below 1990 levels. Since 1990, Sweden has reduced its emissions by 16%.
At the end of 2008 the EU agreed on new climate targets. Emissions of GHGs will be cut by 20% between 1990 and 2020. In the non-ETS sector, overall emissions in the EU will be reduced by 10% between 2005 and 2020 and the corresponding target for Sweden is 17%. The Swedish Parliament has set a national target to reduce emissions in the non-ETS sector (primarily transports, agricultures, housing and commercial premises) by 40% between 1990 and 2020. In the ETS sector, emissions will be reduced by 21% between 2005 and 2020. If a new international climate treaty is signed, the EU’s reduction target for 2020 will be raised to 30%.
In 2011 electricity production accounted for approxima-tely 3.2 million tonnes, or around 6.5%, of total Swedish CO
2
emissions (Table 19). Emissions vary dramatically in relation to the weather and runoff to the reservoirs. CO
2 emissions rose
sharply in 2010, largely as a result of the cold winter and ope-rating difficulties in the nuclear power plants, but once again fell in 2011 (see Diagram 39).
Electricity production also produces emissions of methane and nitrous oxide. In 2011 methane emissions from electri-city production accounted for roughly 0.03% and emissions of nitrous oxide for around 0.01% of Sweden’s total emissions.
Aside from the GHGs that are released in production of electricity, emissions of the greenhouse gas SF6 arise through leakage from power transmission facilities. In 2011 there were just over 104,159 kg of SF6 in Swedish transmission facilities. Emissions from these in 2011 were estimated at 327 kg, or around 0.31%, of the total usage (see Diagram 40).
OTHER AIRBORNE EMISSIONS FROM ELECTRICITY PRODUCTION Combustion of fossil fuels for electricity production gives rise to emissions of CO
2, volatile organic compounds (VOCs),
particulates, ammonia, lead and mercury to varying degrees – depending on the fuel type.
CO2 and VOCs are produced in incomplete combustion
and have negative effects on human health.Particulate emissions depend on the ash content of the fuel
as well as the combustion and cleaning technology in the faci-lity. Particulates have significant health effects when inhaled.
Ammonia arises as a result of the addition of ammonia in the use of certain cleaning technologies to eliminate other types of emissions from the process. The ammonia that is emitted has not reacted with the substance, such as NOx, to be cleaned.
Heavy metals are emitted due to the varying heavy metal contents of the fuels, although emissions from electricity pro-duction are low (see Table 19).
ENVIRONMENTAL ASPECTS OF HYDROPOWER From a historical standpoint, hydropower has been an important driver for development and prosperity in Sweden and today accounts for nearly half of the country’s electricity generation in normal year conditions. Aside from its important function as a source of base and regulating power, hydropower is playing an increasingly vital role as an instantaneous peak load reserve and means for frequency control throughout the electrical system.
Hydropower spares the environment from harmful emis-sions such as acidifying substances and their detrimental effects on soil and water. At the same time, the country’s early hydro-electric development led to impacts on biotopes and species,

42
THE ELECTRICITY YEAR 2012 | eNviroNmeNt
both locally and regionally. In this context, public interest has been concentrated mainly on fish and related issues.
In 2000 a research program co-funded by hydropower pro-ducers and the Swedish Government was launched to provide a platform for environmental improvements in the currently exploited waterways. In 2010 the final results were presented from stage 3 of this research project – “HYDROPOWER – Environmental Impacts, Remedial Measures and Costs in Regulated Waters”. The program has now been completed and planning of a new research program is underway, “Power and Life in Water” (KLIV).
The program is intended as a collaborative project between power companies and public authorities in a joint effort to pro-mote power extraction and biodiversity in Swedish waters. The program will develop methods and analytical tools and increase knowledge about the effects of environmental improvement measures in hydropower facilities.
Environmental actions that lead to changed flow regimes can result in serious economic, legal, technical and other environ-mental problems for both the affected companies and society in general, and therefore involve careful weighing of pros and cons between different aspects. Such measures require in-depth ana-lysis before proceeding and extensive follow-up after completion.
The national environmental objectives, the EU’s Water Framework Directive, the Swedish water management plan-ning and activities related to biodiversity have highlighted the importance of ongoing attention to environmental issues in existing and new hydropower facilities.
ENVIRONMENTAL ASPECTS OF NUCLEAR POWER Unlike fossil fuels, nuclear generation of electricity produces virtually no emissions into the air. At the same time, the use of nuclear power entails responsibility for the radioactive spent fuel, which must be stored separately from the surrounding envi-ronment for a very long time. Nuclear power plants are subject to rigorous security and safety precautions, since malfunctions, transport accidents, etc. can have devastating consequences.
The environmental aspects of nuclear power can be divided into:
Fuel supply Most extraction, conversion and enrichment of uranium for Swedish reactor fuel take place in other countries. Fuel ele-ments are manufactured in a fuel factory. In Sweden there is a factory for production of fuel elements in Västerås.
Uranium for the Swedish reactors is purchased from mining companies on the global market, for example in Australia and Canada. Enrichment services for Swedish reactor fuel are also purchased on the global market, primarily from France, the Netherlands and the UK. Sweden consumes approximately 2,000 tonnes of uranium annually. This naturally requires long-distance transports that produce climate-affecting emissions. Like other mining operations, uranium mines give rise to local environmental impact and occupational hazards. A uranium mine must have highly effective ventilation, since the maximum permitted radon level in the mines is equal to that in Swedish
homes. All modern mines have invested in extensive protective systems for the natural and working environments in accordance with the norms established by the relevant authorities.
OperationThe radioactive emissions into the environment produced by reactor operation are very small and carefully monitored. According to the regulatory authorities, these should not exceed a maximum does of 0.1 mSv (millisieverts). The nuclear disaster in Fukushima, Japan, leading to increased radiation levels and very high emissions into the air and ocean, also had repercussions for the Swedish nuclear power plants in that all EU member states were ordered to carry out comprehensive risk and safety assessments of their nuclear power plants, so-called stress tests. The Swedish Radiation Safety Authority (SSM) reviewed the nuclear power industry’s analyses and pre-sented a Swedish national report to the EU at year-end 2011.
In its report, the SSM found that the Swedish nuclear power plants are robust and resilient to most kinds of extreme events, but that improvements are necessary for a few events. The nuclear power plants are not fully dimensioned to withstand an accident scenario in which several reactors are put out of commission simultaneously, or for situations with an extended sequence of events. The European Commission presented its overall assess-ment during the year, including a list of measures that should be taken in all European nuclear power plants. Forsmark 1 and 2 have also been identified out as reactors that are not equipped to withstand a total loss of electrical power for more than one hour.
CO2 emissions from nuclear power are around 3 grams per
kWh from a life cycle perspective. The corresponding figure for coal-fired power is 800 grams of CO
2 per kWh. Hydro and wind
power produce emissions of between 5 and 10 grams per kWh from a life cycle perspective.
Sweden’s nuclear generation facilities are of the condens-ing power plant type, whose operation produces warm water emissions (waste heat) that affect areas a few square kilometers in size outside the point of emission. It is possible to utilize the waste heat among other things in district heating systems, which has been discussed in connection with the expansion of nuclear power in Finland and previously also in Sweden.
WasteThe Swedish nuclear power plants produce electricity, but also radioactive waste. If the 10 reactors still in operation are used for another 50 to 60 years, Sweden’s aggregate nuclear waste will have a volume equal to more than one third of the Globen arena in Stockholm. Spent nuclear fuel must be depo-sited in a final repository and isolated from the surrounding environment for up to 100,000 years. For the first 30 to 40 years the fuel is placed in interim storage during which time its radioactivity decreases to a few percent of the level directly after operation. The interim storage facility has been located in Oskarshamn since 1985.
The Swedish Nuclear Fuel and Waste Management Com-pany (SKB) plans to build a deep repository that will isolate the fuel for a very long time – 100,000 years. The repository

43
eNviroNmeNt | THE ELECTRICITY YEAR 2012
will be placed at a depth of around 450 meters in the Swedish crystalline basement rock, which is highly stable and has been in place for more than a billion years. The only thing that can transport radioactive substances from the repository is ground water, but this is prevented through the use of multiple pro-tective barriers. The first is an impermeable copper canister in which the radioactive material is stored. The second is a layer of bentonite clay that protects the canister from corrosion and movement, and the third barrier is the Swedish crystalline bed-rock that functions as a filter and keeps the spent fuel separate from humans and the environment.
The choice of location for the final repository for storage of spent nuclear fuel from the Swedish nuclear power plants was between Forsmark in the municipality of Östhammar and Laxe-mar in the municipality of Oskarshamn. For several years the SKB has carried out extensive site surveys, including bore hole sampling, analyses and 600 reports in each of the two locations. All known factors have been analyzed, evaluated and compared.
In June 2009 the board of the SKB made a unanimous deci-sion to propose that a deep repository for spent nuclear fuel be sited in Uppland County, in the municipality of Östhammar, next to the Forsmark nuclear power plant. In March 2011, the SKB submitted an application for a permit to build the facility and expects to receive final permission from the Government after three years at the earliest. Construction of the repository
is expected to begin around 2019 so that the first canisters can be deposited around 2027.
Although the repository is being built in Forsmark, a close collaboration with Oskarshamn will be developed, among other things with the planned encapsulation facility that is being built by the interim storage site. In addition, a collaboration agree-ment has been signed that includes investments in infrastructure and business development in both municipalities.
ENVIRONMENTAL ASPECTS OF WIND POWERWind power produces no emissions into the environment during operation. It creates no environmentally hazardous waste and its operating sites are easily restored. The environ-mental impacts of wind power mainly consist of anticipated negative effects on the landscape, i.e. aesthetic values that are difficult to assess objectively. Other considerations include noise emissions and visual impact.
Among the potential ecological disadvantages, critics have mainly focused on damage and disruptions in the spawning and nursery areas of fish, collision risks for birds and bats, etc. Research shows that few humans are bothered by the noise of wind turbines, that wind turbines cast no light reflections, that the collision risk for birds is minor and that no negative effects on fish have been found. On the contrary, there are certain positive effects for fish.
ENVIRONMENTAL ASPECTS OF POWER DISTRIBUTION Distribution of electricity also has an impact on the environ-ment. Cables, power lines and switches are made of metals that are extracted from mines and give rise to environmental effects.
Transmission networks give off electromagnetic radiation, but the levels fall of rapidly with increasing distance from the power line. If needed, shields are set up and the lines are placed so as to limit exposure.
To protect them from rot and insect damage, wood utility poles are impregnated with various chemicals such as creosote and salt compounds containing chromium, copper and arse-nic, which are highly toxic. The question of prohibiting the use of creosote has been under discussion for many years. In 2011 the EC gave the green light for continued use of creosote at least until the spring of 2018. But in order to use creosote in poles for use class 4 after 2013, creosote users must be able to show an acceptable level of leaching from the poles.
The greenhouse gas SF6 is used as an insulating gas in switchgears and circuit breakers. Although this greenhouse gas has a very high global warming factor, there is currently no alter-native. Swedenergy is monitoring developments in the industry with regard to use of the gas and leakage during handling.
Leakage has gradually decreased over the past ten years and recovery of gas from retired equipment is also taking place. Research is underway to find alternative gases that have the same performance but less environmental impact.
New power lines lead to changes in the natural environ-ment that can have a negative impact on biodiversity. At the same time, existing power line areas have proven to be a haven for certain species and steps are being taken to species inven-tory and manage these.

44
THE ELECTRICITY YEAR 2012 | taXes, cHarges aND reNeWaBLe eLectricity certiFicates (2013)
TABLE 21
GENERAL TAX ON FUELS IN 2013*
Energy tax Carbon dioxide taxFuel oil ** SEK 0.083/kWhfuel SEK 817/m3 SEK 0.312/kWhfuel SEK 3,093/m3
Crude tall oil *** SEK 3,910/m3
Coal SEK 0.083/kWhfuel SEK 621/tonne SEK 0.359/kWhfuel SEK 2,691/tonneNatural gas SEK 0.083/kWhfuel SEK 903/1000m3 SEK 0.214/kWhfuel SEK 2,316/1000m3
* Exception for electricity production and reduction for the ETS sector, see section on tax on electricity production with fossil fuels.
** Fuel oil to which a dye or chemical marker has been added or which produces less than 85 volume percent distillate at 350 oC.
*** Crude tall oil (CTO) used for energy purposes in levied with a special energy tax equivalent to the combined energy and carbon dioxide on low-taxed fuel oil, i.e. SEK 817 + SEK 3,093 = SEK 3,910/m3.
Source: Swedenergy
TABLE 20
TAX BURDEN ON THE ELECTRIC POWER SECTOR IN 2013 (FORECAST)
Miljoner kr
Property tax, hydropower 6,000
Property tax, nuclear power 300Property tax, CHP 150Nuclear power tax and Studsvik charge 4,500Fees for financing of government agencies, nuclear power producers 300Electrical safety fee, network monitoring fee and electricity preparedness fee 300Tax on fossil fuels 100
Energy tax on electricity 20,000
Total 31,650
Source: Swedenergy
taxes, charges and renewable energy certificates (2013)TOTAL BURDEN OF TAXES AND CHARGES ON ELECTRICITY SUPPLYIn many ways, the supply of electricity is subject to a heavier burden of taxation and charges than other areas of Swedish industry and commerce. For 2013 taxes and charges particular to electricity supply are estimated as follows (excluding VAT), see Table 20. Energy taxes and carbon dioxide tax are indexed annu-ally, upwards or downwards, depending on inflation or deflation.
Including VAT, total taxes and charges on the electricity sector in 2013 are estimated at more than SEK 42 billion.
Added to this are energy and climate policy steering instru-ments in the form of emissions allowances and RECs, which are also part of the electricity price.
PROPERTY TAX RAISEDAll electricity generation facilities are subject to a general indu-strial property tax. In 2011 the property tax for hydropower was raised by 0.6% from 2.2% till 2.8% of the taxable value of the property (both land and buildings, Act on National Real Estate Tax [1984:1052]). As of 2013 the taxable values of hydropower plants have been increased further, which has raised the tax to
a record level of around SEK 0.089 per kWh. This is the result of a review of tax assessment values by the Swedish Tax Agency. Tax revenue from the property tax on hydropower plants will thus increase from SEK 4 billion to SEK 6 billion per year. With effect from 2013, the taxable values of nuclear power plants will be raised by around 100% and the taxable values of CHP plants by around 75%. For CHP plants, the value of the RECs should also be included.
NUCLEAR POWERElectricity produced in nuclear power plants has been taxed since 1984, initially in the form of a production tax. In 2000 this taxation was restructured as an output tax based on the thermal output of the reactors, and is thus unrelated to the amount of electricity generated. As of 1 January 2008 the output tax amounts to SEK 12,648 per MW and month, equal to an average of around SEK 0.055 per kWh. If a reactor has been out of operation for a contiguous period of more than 90 days, a deduction of SEK 415 per MW is permitted for the number of calendar days in excess of 90. In 2013 the output tax is expected to contribute SEK 4,271 billion to the state treasury.

45
taXes, cHarges aND reNeWaBLe eLectricity certiFicates (2013) | THE ELECTRICITY YEAR 2012
Electricity produced from nuclear power sources is also levied with a charge of SEK 0.003/kWh according to the so-called Studsvik Act, to cover the costs arising from Studsvik’s previous operations.
In order to cover future costs for final storage of spent fuel, each nuclear power plant is charged an individual fee. For Fors-mark this fee corresponds to SEK 0.021 per kWh, for Oskars-hamn to SEK 0.020 per kWh and for Ringhals to approximately SEK 0.024 per kWh. As a weighted average for Swedish nuclear power, this is equal to SEK 0.022 per kWh as of 1 January 2013. For Barsebäck the fee amounts to SEK 842 million per year. For 2013 these fees will bring in a forecasted total of SEK 1,239 billion to the Nuclear Waste Fund. Furthermore, the reactor owners are required to pledge collateral to the Government – each plant in an individual amount – for a total of around SEK 19.3 billion for the period 2012–2014.
Nuclear power producers also pay fees for financing of the Swedish Radiation Safety Authority (SSM) in a total amount of approximately SEK 300 million per year.
TAX RATES ON USE OF FOSSIL FUELS
Uniform energy tax, etc.On 1 January 2011 a uniform general energy tax of approximately SEK 0.08 per kWh was introduced on all fossil fuels. The change led to a dramatic increase in the energy tax on natural gas. This level corresponds to the energy tax on oil of SEK 797 per m3 for 2011. For industrial installations, CHP plants, etc., included in the EU ETS, the level is 30% of the general energy tax.
For crude tall oil, the level for industries participating in the EU ETS is 30% of the general level of the energy tax on oil, i.e. 30% of SEK 817 per m3.
Tax on electricity production with fossil fuelsAccording to the Energy Taxation Act, no tax is levied (i.e. a deduction is allowed) on fuels used for the production of taxa-ble electricity. However, for fossil fuel-fired condensing power production, a standard 5% of electricity production is classified as untaxed internal electricity usage, for which reason 5% of the supplied fuel is taxed. For fossil fuel-fired CHP, 1.5% of the fuel for electricity generation is classified as internal usage and is taxed.
The rates for energy and carbon dioxide tax have been adjusted for indexation according to government bill 2012/13:1 and SFS 2012:700. The increase is 4.76%. Table 21 shows the tax rates applied for use of fossil fuels in 2013.
As of 1 January 2013 the full carbon dioxide tax amounts to approximately SEK 1.10 per kg CO
2. Biofuels and peat are
not taxed.
Sulphur taxSulphur tax is levied at SEK 30 per kg of sulphur in SO
2 emis-
sions from combustion of solid fossil fuels and peat. For liquid fuels, the tax is SEK 27 per cubic meter for each tenth of one weight percent of sulphur in fuel exceeding 0.05%. If the sulp-hur content is higher than 0.05% but lower than 0.2%, it is rounded up to 0.2%.

DIAGRAM 41
DEVELOPMENT OF ELECTRICITY TAX* (ENERGY TAX ON ELECTRICITY) SINCE 1951*
Sources: Statistics Sweden, Swedish Energy Agency
46
THE ELECTRICITY YEAR 2012 | taXes, cHarges aND reNeWaBLe eLectricity certiFicates (2013)
Nitrogen oxide taxA nitrogen oxide tax is levied at SEK 50 per kg of nitrogen oxides (designated as NO
2) from use of boilers and gas turbines
with a utilized energy output of more than 25 GWh per year. The bulk of the fees are repaid to the taxable entities in propor-tion to their share of utilized energy.
CHP TAXWith effect from 1 January 2011, the qualifying limit for tax abatement in CHP plants has been set at an electrical efficiency rate of at least 15% according to the bill “Certain Selective Tax Issues in Respect of the Budget Bill 2010” (govt. bill 2009/10:41). In cases where multiple fuels are used, the order of fuels for taxation may no longer be chosen freely but is ins-tead subject to rules for proportioning.
For industrial operations, CHP and other facilities inclu-ded in the EU ETS, the level is equal to 30% of the general energy tax according to Table 21.
For CHP outside the EU ETS, the carbon dioxide tax was reduced by 70% of the general level with effect from 1 January 2011. For pure heat production, the carbon dioxide tax was reduced by 6%. For delivery of heat to manufacturing proces-ses in industrial operations, it is possible to obtain an additio-nal 70% exemption from the carbon dioxide tax via a refund.
Individual taxation of CHP abolishedThe tax abatement rules for CHP have differed from those for the manufacturing industry, including so-called industrial back pressure plants. The industries that are covered by the EU ETS have full exemption from the carbon dioxide tax since 1 January 2011. Other CHP installations have paid carbon dioxide tax equal to 7% of the general level. In the national budget for 2013, the Swedish Parliament decided to abolish the carbon dioxide tax for CHP plants within the EU ETS. The carbon dioxide tax has also been abolished for fuels used in CHP or district heating facilities to generate heat that is delivered to industrial operations within the EU ETS. These changes went into force on 1 January 2013.
WIND POWERCommercial suppliers of wind-generated electricity produ-ced in Swedish offshore wind farms were previously allowed to deduct part of the energy tax on electricity. The deduction amounted to SEK 0.12 per kWh during 2009, but was abolis-hed as of 1 January 2010.
Electricity is exempt from taxation if it is produced in Sweden in a wind farm by a non-commercial supplier (Energy Tax Act, Chapter 11, § 2).
USAGE TAXES ON ELECTRICITYFor 2013, the tax on electricity has been adjusted for indexa-tion according to the consumer price index, based on the actual change in the index during the period from June 2009 to June 2012 applied to the tax rates for 2010. The index has risen by 4.76% during the period.
On 1 January 2012 Sweden introduced a reduced rate of electricity tax for electric power used in seagoing vessels with a
gross tonnage of at least 400, when the vessel is lying at berth in a port and the voltage of the electric power transmitted to the vessel is at least 380 volts. By using shore-side electricity is it pos-sible to avoid air pollution from burning of bunker fuel to gene-rate electricity on board vessels in the port, thereby improving the local air quality in the port cities. Through use of electricity from the Nordic electricity market, this also leads to lower CO
2
emissions. The tax reduction was approved (2011/384/EU) by the Council of the European Union on 20 June 2011 in accor-dance with Article 19 of Directive 2003/96/EC. The decision is valid for a limited period and applies until 25 June 2014.
After indexation (SFS 2012:700), energy tax on the use of electri-city is levied according to the following as of 1 January 2013:
1. SEK 0.005 per kWh for electricity used in industrial ope-rations, in the manufacturing process or for professional greenhouse cultivation.
2. SEK 0.005 per kWh for shoreside electricity used in seagoing vessels with a gross tonnage of at least 400 and a voltage of at least 380 volts.
3. SEK 0.194 per kWh for electricity other than that referred to under 1) and which is used in certain municipalities in northern Sweden.
4. SEK 0.293 per kWh for electricity used for other purposes.
The energy tax trend is illustrated in Diagram 41. Compared to 2012, the indexation meant that the tax rates on electricity for 2013 were raised for households and the service sector by SEK 0.003 per kWh in southern Sweden and SEK 0.002 per kWh in northern Sweden. The previous reduction for electricity used in the supply of electricity, gas, heat or water was abolished as of 1 January 2006. Taxation of the electricity suppliers’ own usage of electricity was introduced and the increased energy tax on elec-

47
taXes, cHarges aND reNeWaBLe eLectricity certiFicates (2013) | THE ELECTRICITY YEAR 2012
tricity used in large electric boilers during the winter months was abolished. The reason for these changes is that the EU Energy Tax Directive no longer permits special rules in these cases. Agricul-tural, forestry and aquacultural operations are allowed an electri-city tax refund for the difference between amount of tax paid and an amount computed according to a tax rate of SEK 0.005 per kWh. A refund is permitted for that part of the difference excee-ding SEK 500 on an annual basis. If the sum exceeds SEK 500 for a calendar year, a refund is permitted for the full amount.
Under the Program for Improving Energy Efficiency Act (PFE) that came into force on 1 January 2005, energy-intensive companies that use electricity in the manufacturing process can qualify for tax-exemption by participating in a five-year energy efficiency program. However, the program will be terminated within a few years since a review by the European Commission found that the program is in violation of the EU’s government assistance guidelines. As of 1 January 2013, no new companies can enter the program. At present, analysis and discussion are underway regarding a new version of PFE that may replace the current program.
Electricity customers also pay fees for financing of certain government agencies. All in all, high voltage customers will pay SEK 3,577 and low voltage customers SEK 54 in elec-trical safety, network monitoring and electricity preparedness fees in 2013. Of these, low voltage customers will pay SEK 6 to finance the National Electrical Safety Board, SEK 3 to the Energy Markets Inspectorate and SEK 45 to cover costs for measures and activities under the Electricity Contingency Act (1977:288). For high voltage customers, the corresponding amounts are SEK 500, SEK 600 and SEK 2,477.
The Government has appointed an inquiry to study the conditions and draft a bill for the implementation of a system with net billing of electricity including netting of energy tax and VAT. The inquiry leader will also analyze and present pro-
posals on who should be liable for energy tax on electricity. The inquiry will present its report on 14 June 2013 at the latest.
RENEWABLE ENERGY CERTIFICATESRenewable Energy Certificates (RECs) were introduced in 2003 as a new support system for promoting the use of electri-city from renewable sources. The system replaced earlier subsi-dies on renewable electricity production.
The initial aim of the REC system was to bring about a 17 TWh increase in annual electricity generation from rene-wable energy sources by 2016 compared to the 2002 level.
The basic principle behind the system is that producers are issued an REC by the Government for every MWh of renewable electricity generated. At the same time, electricity suppliers are obligated to purchase RECs for a certain quota/percentage of their total electricity sales and usage, a so-called quota obligation. The sale of RECs gives electricity producers an extra source of revenue aside from electricity sales, thereby improving the abi-lity of renewable energy to compete with non-renewable sour-ces. The energy sources entitled to allocation of RECs are wind power, certain hydropower, biofuel, solar energy, geothermal energy, wave energy and peat in CHP plants.
For 2012 the quota obligation was 0.179, or 17.9%. In 2011 the average REC cost for electricity consumers was SEK 0.0442 per kWh, excluding VAT and transaction costs.
EXCEPTIONSFree power (agreement between a property owner and an electricity producer in which the former grants the use of its riparian rights in exchange for electric power from the electricity producer) and electricity used as auxiliary power in electric power generation are exempted from the quota obligation, as are the transmission losses that are required to maintain transmission network function.
Electricity-intensive industries are exempted from the quota

48
obligation for electricity used in manufacturing processes, but not for their other electricity usage.
With effect from 1 January 2009, a company is defined as electricity-intensive if it conducts and has during the past three years conducted industrial manufacturing in a process that uses an average of at least 190 MWh of electricity for every SEK 1 million of the total sales value of the electricity-intensive industry’s production, or conducts new operations with industrial manufacturing in a process that uses an average of at least 190 MWh of electricity for every SEK 1 million of the total sales value of the electricity-intensive industry’s production, or conducts operations for which a deduction is permit-ted for tax on electric power in accordance with Chapter 11, 9 §, 2, 3 or 5 of the Act on Excise Duties on Energy (LSE, 1994:1776).
EXTENSION OF THE REC SYSTEM AND NEW TARGETOn 10 March 2010 the Swedish Government presented a bill calling for further development of the renewable energy certifi-cate system. The REC system has been extended until the end of 2035 and the new target for production of renewable electricity has been raised by 25 TWh by 2020 compared to the level in 2002. The quota obligation will be calculated according to new quotas that apply as of 2013. The amendments are effective as of 1 July 2010. So far the system is estimated to have resulted in the addition of around 13 TWh in renewable electricity production.
JOINT REC MARKET WITH NORWAYOn 7 September 2009 the then Swedish Minister for Enter-prise and Energy Maud Olofsson met with her Norwegian colleague Terje Riis-Johansen and agreed to aim for the esta-blishment of a common REC market as of 1 January 2012, a market that should be technology-neutral. Norway intended to adopt an equally ambitious commitment as Sweden. The trans-mission connections that have already been agreed on between the Nordic TSOs will be implemented as quickly as is feasible.
On 8 December 2010 the establishment of a common REC market was secured through the signing of a joint proto-col by the two ministers. The level of ambition in the common system is to build 26.4 TWh of new renewable electricity pro-duction between 1 January 2012 and 2020. On 29 June 2011, Maud Olofsson and the Norwegian Minister of Petroleum and Energy Ola Borten Moe signed a binding agreement for a joint Swedish-Norwegian REC market.
The Norwegian-Swedish REC system was introduced on 1 January 2012. This is the EU’s first example of use of the coopera-tion mechanisms provided for in the Renewable Energy Directive.
In 2015 control station will be carried out within the fram-ework of the REC system. The Swedish Energy Agency and its Norwegian counterpart, NVE, have been assigned the task of com-piling data in preparation for the control station. This refers to the possible need for adjustment of the quota curve and analysis of the risk that the target for 2020 will not be met, etc. The results will be reported to the Government by 14 February 2014 at the latest.
CHANGED CERTIFICATE CONDITIONS FOR HYDROPOWERIn 2010 the Swedish Energy Agency proposed certain changes for REC qualification of hydropower plants. According to the
THE ELECTRICITY YEAR 2012 | taXes, cHarges aND reNeWaBLe eLectricity certiFicates (2013)
proposal, only additional hydroelectric power production in a location where hydropower operations have been previously conducted are eligible for RECs.
EMISSIONS TRADINGThe EU Emissions Trading Scheme (EU ETS) was launched on 1 January 2005. The goal of this trading is to enable countries and companies to choose between carrying out their own emis-sion- reducing measures or buying emission allowances which then generate emission reductions somewhere else. The idea is for the least expensive measures to be taken first, thus keeping the total cost of meeting Kyoto targets as low as possible.
The scheme started with a trial phase, Phase I, between 2005 and 2007. The second trading period, Phase II, ran bet-ween 2008 and 2012 and parallel with the Kyoto Protocol’s commitment period.
At present the system covers electricity and heating genera-tion and energy-intensive industries. As of 2012, the aviation industry is also included in the EU ETS.
In December 2008 the EU Parliament and the Council of Ministers agreed on a revised EU ETS Directive to apply for the 2013–2020 budget period. A total emissions cap equal to a 21% decrease in emissions has been set for the period bet-ween 2005 and 2020. Furthermore, emission allowances in the power sector will be awarded through auctioning, with certain exceptions, in contrast to the current free allocation. In 2013, auctioning of emission allowances to the power sector will deliver an estimated SEK 1,239 billion to state coffers. In the industrial sector, emission allowances will be initially allocated free of charge but with a successive transition to auctioning.
In 2010 the European Commission approved a draft regu-lation on auctioning of emission allowances and started a pro-curement for an EU-wide auctioning platform. The EC has also adopted rules for free allocation of emission allowances, which are based on a number of product benchmarks. In addition, the EC has decided to ban the use of offsetting credits from specific CDM (Clean Development Mechanism) projects for the destruction of industrial gases HFC-23 and N
2O (nitrous
oxide) in production of adipic acid within the EU ETS. In 2011 the price of European allowances fell by around 45%
compared to 2010. In January 2011 the price was just over EUR 14 per tonne but decreased to a record low of EUR 7 per tonne in mid-December. The price continued to fall during 2012. The price peaked at EUR 9.5 in February but dropped to EUR 6.2 in November. The recession was a key factor behind the low prices, which have sparked concerns that something must be done to keep up the price of allowances. In the summer of 2012 the EC released a proposal to withhold a volume of allowances from auctioning in the Phase III timetable. The proposal is still under discussion. At the end of the year the EC presented a report on other possible structural reforms that could be made in the emis-sions trading scheme, such as adjusting the overall cap in the EU ETS, permanent retirement of a number of allowances from the market, expansion of the scope of the EU ETS to other sectors, various types of price mechanisms, etc.

49
Electricity networksThe Swedish power system can be divided into three levels – local networks, regional networks and the national grid.
Most electricity users are connected to a local network, which in turn is connected to a regional network.
The regional networks are then connected to the national grid. There are around 160 local distribution system operators (DSOs) in Sweden.
The networks owned by these DSOs vary considerably in size. The smallest has a line length of around 3 km, and the largest over 115,000 km.
The local networks are normally divided into low voltage (400/230 V) and high voltage networks (typically 10–20 kV). The total line length of Sweden’s low voltage networks is over 306,000 km, of which 70,000 km consist of overhead lines and 236,000 km of underground cable. The local high vol-tage networks, also referred to as medium voltage networks, are made up of 90,000 km of overhead lines and 103,000 km of underground cable. Some 5.3 million electricity users are connected to the low voltage networks and 6,500 to the high voltage networks. The regional grids are owned mainly by three DSOs and have a combined line length of around 30,000 km. The Swedish national grid is owned and operated by the public utility Svenska Kraftnät, and is made up primarily of 400 kV and 220 kV lines with a total length of around 15,000 km. In total, the Swedish electricity grid contains 543,000 km of power lines, including 339,000 km of underground cable. If the Swedish grid were stretched out in one long line, it would extend more than thirteen times around the earth (source: Energy Markets Inspectorate, Svenska Kraftnät).
Delivery reliability in the Swedish grid is 99.98% (see Dia-gram 42).
OPERATING EVENTS STATISTICS (DARWIN) The statistics include the 105 DSOs that have provided com-plete material covering all of 2011 (the figures for 2012 are not yet available, see Table 22). These DSOs represent 93% of Sweden’s 5.3 million electricity customers and are relatively evenly spread between urban and rural networks.
2011 was a difficult year with many severe storms (of which storm Dagmar was the worst) and total delivery reliability was 99.96%. However, it is apparent that the major investments in weatherproofing of the grid have been effective, since the
TRANSMISSION NETWORKS | THE ELECTRICITY YEAR 2012
areas where weatherproofing has been completed experienced few disruptions compared to nearby areas.
ELECTRICITY PREPAREDNESSOn 1 July 2012 Sweden passed a new Electricity Preparedness Act in which among other things Svenska Kraftnät, (SvK) was given a more clearly defined mandate with regard to risk and sensitivity analyses, RSA. Those who are covered by the law, i.e. electricity producers, electricity suppliers and DSOs, are requi-red to carry out an RSA of safety in their own operations and provide information needed for the electricity preparedness authority (SvK) to prepare a national RSA for the power sector. In 2013 this will be stipulated in new provisions. Furthermore, the RSA that must be submitted to the Energy Markets Inspec-torate (Ei) in accordance with the Swedish Electricity Act will be integrated to avoid unnecessary redundancy.
2012 saw the completion of a second mobile switching station (Skalman) that has been optimized to replace a non-functioning 130 kV station in southern Sweden. It will com-plement the existing station (Bamse) that is optimized for northern Sweden.
To improve the efficiency of Elsam, a voluntary organiza-tion for collaboration during outages, a new version of the Elsam collaboration portal Susie has been introduced. The new system contains many new features and the intention is for this to be a useful tool in both everyday and crisis situations.
REGULATION OF TARIFFS FOR 2011 The Energy Markets Inspectorate (Ei) has chosen 28 local DSOs for in-depth review of revenues for 2011. In addition, the revenue levels of all regional DSOs will be subject to further assessment. The Ei plans to carry out an final evaluation of the results for the years from 2008 to 2011 for the DSOs that have been given notice of further supervision. The Ei intends to await the outcome of the appeals of the revenue caps for 2012–2015 before conducting this final evaluation. The reason for this is that the Ei has applied the same method used for the years 2010 and 2011 when setting the revenue caps for 2012–2015.
PROACTIVE FORUM AND SMART ELECTRICITY METERS Efforts to produce the Swedish industry recommendation for smart electricity meters were completed during the summer and were well received by the industry. During the summer Swed-energy visited the European Commission, which is responsible for Smart Grids, to discuss the Swedish initiative. They were highly interested and surprised that no Swedish model has been presented earlier, given Sweden’s status as a forerunner when it comes to energy metering.
Since the M441 Directive has singled out standardization as the solution for smart metering, it is vital that the Swedish initiative is in line with the European standards. The next

DIAgRAm 42
DELIVERY RELIABILITY IN THE SWEDISH ELECTRICITY NETWORKS
Source: Swedenergy
50
THE ELECTRICITY YEAR 2012 | TRANSMISSION NETWORKS
TABLE 22
KEY STATISTICS FOR OPERATINg INTERRUPTIONS IN LOCAL NETWORKS WITH A DURATION OF mORE THAN 3 mINUTES IN 2011
2011 INDEX: SAIFI SAIDI CAIDI ASAIOwn networks System Average
Interruption Frequency Index
no./year
System Average Interruption
Duration Index min./year
Customer Average Interruption
Duration Index min./year
Average Service Availability Index
%
Total no. of interruptions
Total number of customers affected
24 kV 0.50 60.24 120.13 99.99 6,650 2,425,97312 kV 0.89 114.35 129.02 99.98 18,180 4,288,191
<10 kV 0.00 0.13 64.52 1 42 9,7430,4 kV 0.03 10.07 293.50 99.99 33,081 166,031
Total 1.42 184.79 129.76 99.96 57,953 6,889,938All networks 1.81 200.89 110.76 99.96 61,789 8,775,045
Source: Swedenergy
step is therefore to try to establish the Swedish vision as the European standard. The goal is for electricity end users and service suppliers to have access to information about energy usage in close to real time. Not until this is a reality will we have the conditions for broad implementation of simple and cost-effective solutions for load steering and demand flexibility.
RANDOM INSPECTIONSIn 2012 SWEDAC requested information about how the DSOs are meeting the requirements for handling quality control of their household meters. In the autumn of 2012 SWEDAC performed inspections at six companies that are participating in the national random inspection program. SWEDAC found areas of criticism in nearly one fourth of the companies that participated in the survey and among all of the companies that underwent on-site visits. The national random inspections for 2012 included 1.3 million meters and testing of around 4,000 meters in 46 homo-genous test groups. Of these, five test groups were failed to meet the requirements, mainly because too few meters were left in ope-ration as most meters of these types have already been scrapped.

VD HAR ORDET
OPERATIONS
20 12
Message from the Managing Director ......... 2
Recharge Sweden .......... 3
Good practice for sales .. 4
Emissions trading ........... 5
European electricity market .......................... 6
EU activities ................... 7
Nordic market ............... 8
Transmission regulation ... 9
Energy competence ...... 10
Industry recruitment ...... 11
Board of Directors and Management ............... 12

2 SWEDENERGY | oPeratioNs 2012
MESSAGE FROM THE MANAGING DIRECTOR
A NEW WORLD ORDER EMERGINGa new world order is rapidly emerging in the energy area and a frenzied hunt for shale gas is underway at the global level. at the same time, renewable energy sources are advancing steadily. in this scenario, a firm grasp of the big picture is more important than ever.
A GREAT DEAL HAS ALREADY HAPPENED in North America – but a similar tendency is being seen around the world, not least in China. This has already led to lower coal prices, since gas is being used instead of coal. For us as an industry with an explicit focus on climate issues, this is an alarming trend since the climate aspect may be forced to take a back seat in the foreseeable future. Climate considerations have been overshadowed by other issues and the financial crisis, in particular, has higher political priority at present.
Our industry has a winning concept – with electricity, anything is possible. Above all, it enables us to build a sustai-nable society. With electricity, we can realize our visions for the future. Electricity can be used to transport energy from a wide range of different energy sources. As regular citizens, we hope to exploit the exciting ongoing advances in solar energy techno-logy. In a longer perspective, solar energy is a crucial foundation of an energy system that is both renewable and sustainable.
However, we need to keep both feet on the ground avoid rushing off in different directions. We must maintain a power system that is in continuous balance. To achieve this we need a baseload production system – today consisting of hydropower and nuclear power – that is capable of regulating the weather-dependent power generation. We need to constantly take a holistic approach so that the power system is in balance at any given time. Recent years have seen many encouraging developments in the solar energy area – which is becoming increasingly competitive. But it is at least equally important that we safeguard the long-term development of our baseload production capacity. Anything else would be to play Russian roulette or bury our heads in the sand.
We are still awaiting a credible energy policy strategy to address Sweden’s long-term security of supply issues. With what will we replace our nuclear power in 15 to 20 years, when the existing reactors must be taken out of commission? Are the newly built facilities replacement reactors? Or will we be forced to turn to Russian gas as the solution? The Parliamentary elec-tion in September 2014 will be undeniably consequential if we are to succeed in reaching consensus on a viable energy policy in Sweden – preferably with the widest possible political base.
At the European level we are also seeing the gradual implemen-tation of an extensive new regulatory system – Framework Guide-lines & Network Codes – that is aimed at enabling the realization of a free inner market with an unimpeded flow across borders. And the basic assumption is that new weather-dependent power production – primarily wind- and solar-based – should be given
precedence in the transmission networks. A new and different pro-duction system is being built in which more power is connected at lower voltage levels than before. Old, established truths no longer apply to the same extent. New rules – that cover all parts of the energy industry, including household customers – are being written in order to handle this new renewable production without jeopar-dizing the balance in the transmission system. This is also creating a whole new situation with regard to cost-benefit analyses for major power plants, both existing and new. It has been questioned if it is even feasible to build large new power plants – since the operating hours for baseload power are becoming too short.
After a couple of winters with market turbulence – a weak hydrological balance and disruptions in the nuclear power indu-stry – we saw more normal conditions in the past year. Last winter the nuclear power plants performed at a high level and Sweden and the Nordic region can look forward to a strong power balance at least until the end of the current decade. It is therefore imperative that we make good use of this time to dis-cuss the urgent long-term issues with a focus on the big picture.
Current trends in the transmission network area are also important and exciting. Around the world there is a formidable race to build smart grids. Phase 1 of the new ex ante regulation of network tariffs for the years 2012-2015 has unfortunately become ensnared in new legal disputes. The DSOs are key players in the ongoing creation of both smart grids and sustainable energy sys-tems. I sincerely hope that we can find a constructive solution with-out being bogged down in legal disputes for many years to come.
The energy industry must find a way to deal with the new situa-tion. Global developments in shale gas prospecting affect us, and the same applies to new rules and regulations at the EU level. In order to exert an influence, and be taken seriously, the industry must be represented by a strong voice. Swedenergy has built up an effective monitoring and lobbying process in the EU. In addition to our own staff on site in Brussels, we have six-seven employees at the Secretariat who are more or less devoted to EU issues full time.
Swedenergy is a weighty and important voice in the day-to-day debate and news flow. And it is through cooperation – with wide-front participation throughout the association – that we have the best opportunities to make our voice heard. I have seen a growing insight about this among the member companies, which has been visible not least in my dialogue as Managing Director during the past year.
The Recharge Sweden project is off to a good start and has found effective methods for its work. The goal is to encourage the industry to communicate with its customers in a new way. By creating a posi-tive image for electricity and the power industry, we win new friends
and can join forces to highlight the value and importance of access to electricity. Recharge Sweden is serving as a vital engine for the industry. If we can inspire more employees to feel pride in their work, we have accom-plished a great deal.
kjeLL jaNssoN, maNagiNg Director, sveNsk eNergi

oPeratioNs 2012 | SWEDENERGY 3
RECHARGE SWEDEN
“Recharge Sweden” – all change starts from withinthat all change starts from within is a truth that can also be app-lied to the energy industry to a large extent. motivated by the criticism that was expressed during 2010–2011 and the low confidence in the industry that became so clear at that time, a decision was made to launch an initiative that we have named recharge sweden.
WITHIN A FEW YEARS, the goal is for the majority of electricity users in Sweden to be aware that electricity in Sweden is produced in a climate-friendly manner and that electricity is a good solution for many of society’s needs. Recharge Sweden is not a traditional industry-wide cam-paign and the focus is instead on encou-raging the member companies to rethink the way they talk about electricity and its role in a sustainable society.
Most of the efforts in 2012 were devo-ted to launching Recharge Sweden. Project
Manager Malin Thorsén says that around half of Swedenergy’s member companies have taken part in the regional meetings that were held during the autumn. In addi-tion, several useful tools have been develo-ped for the industry’s companies:
“To get an up-to-date picture of how the average electricity customer thinks and which issues are in focus, we compi-led a report based on 3,000 individuals’ views on electricity, electricity usage and its climate impact. During the year we created additional materials, among other
things inspired by good examples from the member companies.”
In the first year the project was mainly targeted towards those who work with information, marketing and customer service among the members. And while the reception has exceeded expectations, there are also some challenges. It’s not just a matter of finding new words, although words are important, the foremost objec-tive is a change of attitude.
“When we start talking about smarter ways to use electricity instead of saving electricity, we open the door for whole new discussions that more effectively highlight the value of electricity,” says Malin.
A change of attitude takes time, but communication that is more clearly aimed at establishing good customer relations and creating a greater understanding of and knowledge about electricity usage is only natural, since it is positive for all parties involved. In this respect, Recharge Sweden serves as an engine for the industry’s process of change. It is a journey that has just begun.
“With electricity, everything is pos-sible. That is something we should be proud of and talk about,” concludes Malin Thorsén.

4 SWEDENERGY | oPeratioNs 2012
GOOD PRACTICE FOR SALES
Swedenergy and the Swedish Consumer Agency agree on good practice for direct sales
the industry-wide guidelines governing which information should be provided to consumers in connection with direct sales of electricity were elevated to good practice on 1 march 2012 through an agreement with the swedish consumer agency. an important step, according to catherine Lillo, who is respon-sible for issues related to direct sales at swedenergy.
“THE PURPOSE OF THE GUIDELINES has been to offer a simple and straight-forward tool that encourages sellers to provide a good level of information. This creates conditions for the electricity com-panies to be clear and honest in their sales, so that the customers feel secure in their purchase. Unfortunately, players who are not members of the industry association have not been required to apply the guide-lines. But through the agreement with the Swedish Consumer Agency these guideli-nes have been elevated to good practice, which essentially means that they apply to everyone,” explains Catherine Lillo.
A commitment to good ethics is clo-sely tied to confidence in the industry and the agreement marked the culmination of a process that was started already in 2010. “At the same time, there is some remain-ing frustration with unreliable sellers,” says Catherine, who explains that in addition to the member companies, she often has contact with representatives for consumers and the Energy Markets Inspectorate.
Many people have called for some type of certification of the electricity suppliers’ sales activities. In response to this, Swed-energy has launched an effort to study the possible routines and costs for certifica-tion. In this process, the industry will be assisted by an expert group of represen-
tatives from the member companies, the sales companies’ industry associations and consumers.
One area that Swedenergy is moni-toring closely is the matter of power of attorney. Guidelines have been drawn up, but it is important that this growing concern is handled in view of the transi-tion to a Nordic end user market. This is an issue that directly affects Swedenergy,
since changes of power of attorney are an increasingly time-consuming administra-tive procedure, not least for the DSOs.
“Swedenergy and its members want to get rid of the unreliable sellers, since they often put the customers in a diffi-cult situation. And by doing so they also undermine confidence in the industry,” says Catherine Lillo.
© c
orbis

oPeratioNs 2012 | SWEDENERGY 5
EMISSIONS TRADING
Swedenergy advocates single climate target rather than several conflicting targets
the eU emissions trading scheme had a very turbulent year when prices for emission allowances fell to unacceptably low prices. swedenergy supports the eU ets and feels that one climate target is sufficient, without the addition of separate renewability or energy efficiency targets.
IN 2012 THE EU EMISSIONS TRA-DING SCHEME, EU ETS, was the object of intense political debate, mainly triggered by the low prices. At the end of the year the European Commission presented a report containing possible structural measures; to set aside a number of emission allowances to the end of the budget period, to adjust the emissions cap, etc. This resulted in a proposal for postponing allowances, so-called backloading. However, in the pro-cess leading up to a Parliamentary decision in April 2013, the proposal did not receive adequate support to be taken up for voting.
“At Swedenergy we support the pro-posed first step of postponing, or backlo-ading, a number of allowances, but feel that allowances should instead be cancelled permanently,” says Cecilia Kellberg, who works with these issues at Swedenergy. “The reason for this is that in order to make the
leap from the targets for 2020 to those for 2050, we need to reduce the emissions cap at a faster rate.” Cecilia anticipates conti-nued discussion of this matter although the backloading proposal did not win support.
Phase III of the EU ETS began in 2013 and one new feature is that waste-fired CHP is now included. Several member companies have been involved in the pro-cess of drawing up guidelines and met-hods for calculating emissions. One issue that is up for consideration is whether purely biomass-fired facilities should be excluded from the ETS. The Swedish Government has continued to drive this matter in dealings with the EC, which is expected to announce its decision during 2013. The reason for the Government’s position on this issue is that the part of production that consists of heat is eligible for free emission allowances.
Cecilia Kellberg explains that there are many opposing views on what will happen after 2020 at the EU level and the planned control station for renewable energy certifi-cates (RECs) in 2015. Swedenergy is of the opinion that no new targets should be set for renewable energy or energy efficiency for the period after 2020. Cecilia Kellberg says:
“I am concerned that we are working with different targets that conflict with each other in many ways. Swedenergy has a clear precedent of working with only one climate (emissions) target in combination with the phaseout of the support systems. Special renewability and energy efficiency targets are not needed. Targets for things like energy efficiency may seem attractive, but in reality they undermine the effectiveness of emis-sions trading. These are issues that I expect to be given a lot of attention in 2013.”
2012 was also the first year for the joint Swedish-Norwegian REC market. Overall, the preparations have proceeded according to plan. According to Cecilia Kellberg, not until the annual cancellation dates (the next of which will take place in March 2013) will it be possible to draw any real conclu-sions about how the start of the joint REC market with Norway turned out.

6 SWEDENERGY | oPeratioNs 2012
EUROPEAN ELECTRICITY MARKET
Single European market for electricity drawing closera new comprehensive regulation is taking shape as part of the so-called third energy Package in preparation for the transition to a single market for electricity in the eU. it is also aimed at meeting the political objectives to achieve a large share of renewable production with maintained operating reliability, all without losing customer focus. the bulk of the new regulation, consisting of the Framework guidelines and Network codes, will be completed and approved at the eU level before 2015.
JOHAN LUNDQVIST is responsible for activities related to the new regulation at Swedenergy. He points out that the indu-stry is fundamentally positive to a more open and flexible electricity market:
“The European power system is undergoing major changes, some of which are not taking place on market-based terms. However, work on the regu-lation is based on the assumption that the internal market is imperative for the EU to meet its energy and climate policy
objectives. It is from this perspective that the new regulation should be regarded.”
The first parts of the regulation are expected to go into force between the last quarter of 2013 and the first quarter of 2014; CACM (Capacity Allocation and Conges-tion Management), then RfG (Requirements for Generators) and DCC (Demand Con-nection). These will be followed by a number of other codes in the main areas of electricity balancing, transmission technology and electricity system operation. Added to this
are several codes related to issues like third-party access, energy efficiency in transmis-sion networks, etc. Parallel to activities at the EU level, national efforts were also launched in 2012. Johan explains that these mainly consist of lobbying, issuing statements of opinion and providing industry information:
“Aside from giving the customers a more active role and the way in which this will impact electricity suppliers, the DSOs and all owners of new production facilities will also be affected by the new codes and guidelines. It may turn out that the existing production can also be included,” says Johan, and points out that this is something that applies to all com-panies, large and small. He adds:
“We have really made a difference in this work so far. It is easy to forget that most countries in the EU do not have well functioning electricity markets today. The experience from the common Nordic elec-tricity market that we have gained over the past fifteen years is highly valuable.”
Although the European Commission has authority for adopting the codes, they are first drawn up as non-binding fram-ework guidelines by ACER, the Agency for the Cooperation of Energy Regulators, and are later formulated as network codes by ENTSO-E, the European Network for Transmission System Operators for Elec-tricity. On Sweden’s part, the participants are the Electricity Markets Inspectorate and Svenska Kraftnät. Swedenergy is involved in several ways, for example through partici-pation in ENTSO-E’s reference groups and also took part in lobbying activities through Eurelectric and GEODE during 2012.
The steps being taken are aimed at integrating the national electricity markets with each other while at the same time creating a regulatory framework that essen-tially gives small-scale weather-dependent production precedence over large-scale production and, first thereafter, over tra-ditional baseload power. The dramatic expansion that is underway in several countries means that we may be approach-ing a situation with dramatically reduced operating hours for baseload power.
“It is vital to discuss this in parallel to the regulation,” says Johan, who hopes that more of the member companies will become involved and focus on these issues in 2013. There is an urgent need for this.

oPeratioNs 2012 | SWEDENERGY 7
EU ACTIVITIES
“Customer perspective increasingly part of EU work”the pace is high in Brussels and swedenergy is there to keep an eye on things. it is satisfying to see that swedenergy’s member companies have started to contact us, seeking information at an early stage so that they can make the right decisions on important issues as quickly as possible.
JOAKIM BOGDANOFF was Swed-energy’s man in Brussels throughout 2012. There have been a number of electricity trading issues during the year and another key focus area was the Fram-ework Guidelines and Network Codes. Joakim explains:
“This was far and away the most important issue during the year. Here, we feel that we have contributed a great deal, not least through our discussions with ENTSO-E (the European Network for Transmission System Operators for Electricity).
Swedenergy has worked actively on several fronts and in several constellations to influence this work in the right direction. Among other things, the association is active
in the ENTSO-E working groups where the network codes are being formulated.
Among significant advances during the year, Joakim Bogdanoff points out that the EU has also started to talk about customer perspective, for example in relation to smart grids. This has been noted among Swedenergy’s members, whose efforts in the customer area have in many cases been presented in Brussels. Swedenergy has been armed with an array of good examp-les from the member companies that have helped to lighten up the climate more towards framework legislation rather than detail regulation. This has also contributed to a good tone in discussions with the EC.
“In general, the members have become
much better at contacting us sponta-neously. In addition, the blog that we write here is being read to a growing extent. It is vital that the member companies stay informed about the decision-making pro-cess so that they are prepared for whatever lies ahead,” says Joakim Bogdanoff.
And work continues to move forward in Brussels. A full 80% of all legislation in the energy area comes from Brussels, com-pared to 10 to 15 years ago when almost nothing came through those channels. Joakim Bogdanoff once again highlights the members’ important role in activities in Brussels and that the members have a good relationship/dialogue with their local political representatives back at home. Several new regulations are in the pipe-line, now also focusing on the period after 2020, which is the target date for much of the current EU initiatives.
“Now we have also set our sights beyond 2030. If we can continue to show good examples from the domestic sphere with the help of our members in the areas of customer empowerment and smart grids that benefit both society and the custo-mers, it will have a major impact on the EU’s long-term efforts. We have only seen the top of the iceberg when it comes to regulations,” says Joakim Bogdanoff.

8 SWEDENERGY | oPeratioNs 2012
NORDIC MARKET
“Not everyone is enthusiastic about the Nordic end user market – but changes lie ahead in 2015”
the Nordic end user market is drawing closer. Before the summer of 2013, most of the ongoing studies and inquiries will be completed. after this, Nordreg (a cooperative organization for the energy markets inspectorate and its Nordic counterparts) is expected to submit its recommendations in a number of key areas. Nordreg’s role thereafter is to monitor compliance so that the recommen-dations are implemented in each Nordic country.
GUNILLA STAWSTRöM, who is respon-sible for these issues at Swedenergy, notes that this process has taken longer than anticipated:
“In the past year, things have chugged along within the framework of NordREG’s activities. And before the summer we can look forward to an eagerly awaited overview of what NordREG has envisioned. The next step will be to work out the details, a process where the industry will play an important role. The goal of the Nordic energy ministers is still to achieve some type of harmonization in the Nordic end user market by 2015. But there will obviously be a lot left to do even after 2015.”
In recent years Gunilla Stawström has experienced the explosive nature of this issue among the member companies at close range. She says:
“The cornerstones for the Nordic market are that the electricity supplier is the customer’s main point of contact and that there will be mandatory combined billing. These are topics that stirred up internal disagreement in the industry at an early stage. NordREG has not backed down on this ambition and neither has the Swedish Government. Minister of Information Technology and Energy Anna-Karin Hatt has made it very clear that this is this is what will apply.” Gunilla Stawström continues:
“In the past few months I feel like most people have accepted this turn of events. Not everyone is enthusiastic, but they realize that this is what lies ahead.”
In light of the difference of opinion in the member companies, Swedenergy’s role has been to make the best of the situation, take part in the ongoing activities and in this way contribute to the best possible solution. After all, it is the member com-
panies that will have to handle the coming reality in their day-to-day work. Conse-quently, Swedenergy has not been a dri-ving force in matters of principle but has instead focused on practical aspects based on the interests of the member companies.
Gunilla Stawström mentions that in the past year, the Energy Markets Inspectorate (Ei) took several initiatives of its own – and at the request of the Government – with a bearing on the Nordic end user market. There is a risk for national decisions that are not wholly in line with the recommen-dations that can be anticipated. The Ei will propose amendments to the Swedish Electricity Act already in June 2013 at the same time that NordREG presents its final recommendations. “And,” says Gunilla, “it was NordREG’S recommendations that were supposed to form the foundation for the regulatory system.”
Gunilla Stawström sums up the situa-tion:
“In light of the national initiatives that are begin taken, not only in Sweden, the ques-tion is how far-reaching the Nordic harmo-nization will actually be. The most obvious example is Denmark, which passed amend-ments in the Danish Electricity Act already in June 2012. And the Danes have already launched their data hub – their system for managing information and meter data.”
Gunilla Stawström doesn’t dare to speculate about when all pieces of the puzzle will finally be in place:
“I think we can count on some kind of harmonization being realized by 2015. It is easy to assume that we will have com-bined billing and that customers will have contact with their electricity supplier in issues related to the electricity market.”

oPeratioNs 2012 | SWEDENERGY 9
TRANSMISSION REGULATION
Revenue regulation – a difference of perspectives?
one key area of attention for swedenergy’s members in the past year was the process surrounding the introduction of a new model for financing operation, maintenance and investments in the trans-mission system. many companies have appealed the revenue caps assigned by the energy markets inspectorate.
IN THE WORDS OF Anders Pettersson, who works with these issues at Swedenergy:
“The industry feels that the transition itself is urgent. The earlier model where the reasonableness of revenue levels was assessed retroactively had its shortco-mings. With the new model, the custo-mers have more stable fees and know in advance that they are paying reasonable prices. And the DSOs are given clearer financial playing rules since the revenue caps for the coming years are known.”
However, the Energy Markets Inspectorate (Ei), which determines the revenue caps, chose to supplement its calculation model with a transitional rule under which the revenue cap for the first supervision period is largely based on the DSO’s historical revenue for the years 2006–2009. But relying extensively on historical revenue for calculation of future revenue leads to problems, particularly in areas undergoing expansive development.
The revenue caps will not be adequate to cover the costs for the larger transmis-sion networks that now exist. One con-sequence of this is that over half of the DSOs have appealed the decisions to the Administrative Court. A concerted effort has been made to prepare persua-sive claims that describe the DSOs stand-points to the court. This work has already paid off.
“The Ei has made concessions in some areas, for example that the full amount
of unavoidable costs is now included in the revenue cap and new investments grant entitlement to the full amount of accepted compensation. This has also prompted Swedenergy to supplement the appeals. The same applies to E.ON and Fortum, which have chosen to drive their own legal processes.
The results of the negotiations will affect all DSOs, not only in this period but also in the next. Here, the industry sees an obvious problem – that the reve-nue caps really only provide scope for operation and maintenance of existing networks, and financing of these. Parallel to this, an intensive effort is underway to interconnect Europe’s energy markets and create a common regulatory system – an area that is expected to require additional investments by the companies.
“This failure to give any consideration to R&D or the future’s smart grids, in a situation where we are facing a dramatic transformation of the energy system, is very hard to grasp,” says Anders. At the same time, he finds it encouraging that the gap between the industry’s perspective and the Ei:s has now narrowed by SEK 8–9 billion, equal to almost one third of the original amount. Anders Petterson concludes:
“I hope we can bring a fast end to the legal process. It only leads to an uncer-tainty that is not constructive for anyone.”

10 SWEDENERGY | oPeratioNs 2012
ENERGY COMPETENCE
Generational shift in the industry creating powerful demand for competence development
“The generational shift is in full swing!” says Eva Elfgren, Head of the Competence & Publishing unit at Swedenergy. “This is visible in demand for training and other competence development services”.
WIDE OFFERING OF COURSES AND CONFERENCESIn 2012 Swedenergy held 276 courses and conferences with a total of 5,183 partici-pants. Close to half of the courses were held locally and regionally, while the rest were carried out in Stockholm. 145 courses were held internally within specific companies and 131 were offered as open events.
NEW CRISIS TRAINING COURSESFor more than ten years we have offered training crisis management in collaboration with Svenska Kraftnät (Swedish National Grid) and PTS (The Swedish Post and Telecom Authority). In 2012 these courses were relaunched – now as two-day courses in four stages. The target group consists of the individuals included in the energy companies’ crisis management teams and those who are in some other way involved when the company is hit by a crisis.
ELECTRICAL SAFETY IN PRACTICEThe ESA in Practical Application course, which is held at training facilities in Åsbro and Vindeln, continued to be highly appreciated and popular. The courses are offered both as open events and company-specific courses.
INDUSTRY MAGAZINESOne good way to maintain effective market monitoring is to read the indu-stry magazine ERA. ERA was published in ten issues during 2012. The verified circulation for ERA in 2012 was 11,800 copies and it has thus retained its posi-tion as the Nordic region’s leading power industry magazine.
Tidningen EL, which reaches the end-users, was published in three issues and reached an annual circulation of nearly one million copies.
EFFEKT – DEVELOP YOUR TALENTS More and more energy companies are realizing the importance of getting a grip on competence development in the com-pany in preparation for retirement att-rition, recruitment of new staff and new initiatives. Effekt is the name of a tool and working method for both managers and employees who are interested in working with stra-tegic skills development. Effekt has been developed by energy companies and this makes it easy to get started.
Two new modules in Effekt were introduced during 2012: Development Planning and Certificates and Licenses. Efforts to keep track all of the statutory training courses and certifications availa-ble for the energy companies’ employees is facilitated by the new certificate module in which each employee’s data is gathered. In addition, the employee and manager are given a reminder when it’s time to renew these.
The Development Planning module is used to document plans, goals and activities that are agreed on by the manager and employee during the performance review. This ensures more effective monitoring of goal attainment and easier follow-up.
QUALITY ASSURED COURSESSwedenergy’s educational activities are authorized by the Swedish Association of Authorized Educational Companies (SAUF). We comply with their criteria regarding goals and methods for teach-ing, routines for evaluation, booking conditions, customer satisfaction obligations, etc.

oPeratioNs 2012 | SWEDENERGY 11
INDUSTRY RECRUITMENT
Mission to secure the industry’s need to recruit new staff
swedenergy’s latest market analysis shows that the industry is facing a major recruitment challenge in the years ahead. close to 8,000 new employees with energy and electric power expertise are needed by 2016, not least because the average age in the industry is so high, but also owing to a rising demand for new competencies in pace with the introduction of new technology and working methods.
SOFIA BLOMMé SEKUND, who is responsible for industry recruitment issues at Swedenergy, says that from her perspective, 2012 was a year that was largely devoted to managing, developing and supplementing ongoing projects.
“But my impression is that there is a positive trend in the way technology and technological education in a wider sense are being discussed in society, a trend that was strengthened in 2012,” says Sofia pointing out that both Swedenergy and our members have a lot to contribute.
“We as an industry are facing a long-term need and to meet this, we need to work with all aspects. Efforts to improve confidence in the industry and increase knowledge about our important role in sustainable development are part of this, since they also help to make our members
more attractive as employers. At the same time, it is important to develop offers that make it easier for people to change to our industry, for example through the speci-ally developed BSc program in electric power engineering whose second batch of applicants started in 2012,” says Sofia.
The BSc program in electric power engineering, or HING as it is commonly known, is the result of a collaboration bet-ween Swedenergy and 13 member compa-nies with production interests in northern Sweden together with Mid-Sweden Uni-versity, Umeå University and Luleå Uni-versity of Technology. There is a powerful demand for these specific skills among the member companies and by custom-desig-ning an educational program, they have ensured that the participants have the right competence immediately after graduating.
Sofia Blommé Sekund says that inte-rest in the program is keen, attracting nearly two first-choice applicants per avai-lable spot. The program is carried out by distance learning, which results in a wide spread both geographically and age-wise. It has also been noted that many people with a background as electricians are inte-rested in changing careers, which is good for our industry and for the electrician industry, which anticipates a surplus of manpower.
Initiatives to interest a younger target group are also being taken. In 2012 Swed-energy chose to take part as a co-organizer of Future City, a nationwide competition for grades 6–9 where the educational and business communities join forces to build the cities of the future. The Swedish Energy Agency is also participating, alongside the Swedish Construction Federation and the Swedish Transport Administration. The competition was completed in April 2013 with Viktor Rydbergs Samskola in Dande-ryd as the winner.
Sofia explains that the aim of the com-petition is to stimulate ideas and build up knowledge about sustainability, urban planning and other aspects of regional and community development.
“I see it as an effective way to show how we use electricity today and how it can be used in the future. Of the competition entries I have seen so far, there have been several interesting examples of how pupils are able to think along whole new lines.”

Board of Directors
secretariat manage-ment
regional managers
anders olsson,First vice chariman,e.oN
anders ericsson,chairman,jämtkraft
tomas eriksson,emmaboda elnät
anna karlsson,second vice chariman,kalmar energi
Per Langer,Fortum Power & Heat
christian schwartz,mölndal energi
göran sörell,sundsvall elnät
torbjörn Wahlborg,vattenfall
kjell jansson,managing Director
karima Björk, (on leave of absence), trading & sales
eva elfgren, competence & Publishing
catharina götbrant,administration
kalle karlsson,communication
christer Larsson,accounting & Finance
anders richert,Distribution, trading & sales
Bosse andersson,Production
mats andersson,region North
annica Lindahl,region central
johan Lundqvist,region West
Paul andersson,region south
(at 31 December 2012)
Pia Brül–Hjort,göteborg energi Nät
joacim cederwall,gislaveds energi
anders jonsson,tekniska verken i Linköping
alfons kubulenso, sandviken energiHas resigned during the year.
monica granlund,söderhamn NÄra
inger abrahamson, saco (the swedish confederationof Professional associations)/sveriges ingenjörer (the swedishassociation of graduate engineers),employee representative
sara Wannehed, Unionen (Union for White-collarWorkers in the Private sector),employee representative (replace-ment for inger abrahamson


Svensk Energi – Swedenergy – AB SE-101 53 Stockholm • Visiting address: Olof Palmes Gata 31
Tel: +46 (0)8 677 25 00 • Fax: +46 (0)8 677 25 06E-mail: [email protected] • Website: www.svenskenergi.se