The efficiency of different simulation-based design methods in improving building performance
11
Nguyen A. T., Reiter S., 2014. The efficiency of different simulation-based design methods in improving building performance. In: Brebbia C.A., Pulselli R., WIT Transactions on Ecology on the Built Environment, vol. 142. WITpress: UK. p. 139-149. The efficiency of different simulation-based design methods in improving building performance Anh-Tuan Nguyen 1 & Sigrid Reiter 2 1 Faculty of Architecture, Danang University of Science and Technology, Viet Nam 2 LEMA, Faculty of Applied Sciences, University of Liege, Belgium Abstract This paper presents a pioneering effort to define the efficiency of the most common simulation-based design methods, namely the parametric simulation method (PSM) and the simulation-based optimization method (SOM), in improving two building performance indicators: thermal comfort and energy consumption. Three case-study houses were selected and their indoor conditions were continuously monitored during one summer month in 2012. Computer EnergyPlus models of these houses were established and then carefully calibrated by the monitoring data to improve the reliability of the numerical methods. Thermal performances of these houses during a year were simulated, then improved by the PSM and finally optimized by the SOM. By comparing the results of these two simulation-based design methods, this research found that both the PSM and SOM were very effective in improving these building performance indicators. This study found that the SOM is almost two times more efficient than the PSM in improving thermal comfort in naturally ventilated (NV) houses and life cycle cost in air-conditioned (AC) houses. In average, the discomfort period in NV houses could be reduced by 44.9% by the PSM while as high as 86.1% by the SOM, compared with the reference cases. The life cycle cost of AC houses had smaller reductions with 6.2% and 14.6% cut-off by the PSM and SOM, respectively. The results of this work give a strong and explicit insight of the actual efficiency of each design method. This work also shows great advantages of applications of advanced numerical approaches in the design of high performance buildings. Keywords: Simulation efficiency, simulation-based method, building
Transcript of The efficiency of different simulation-based design methods in improving building performance

Nguyen A. T., Reiter S., 2014. The efficiency of different simulation-based
design methods in improving building performance. In: Brebbia C.A., Pulselli
R., WIT Transactions on Ecology on the Built Environment, vol. 142. WITpress:
UK. p. 139-149.
The efficiency of different simulation-based
design methods in improving building
performance
Anh-Tuan Nguyen1 & Sigrid Reiter
2
1Faculty of Architecture, Danang University of Science and Technology,
Viet Nam 2LEMA, Faculty of Applied Sciences, University of Liege, Belgium
Abstract
This paper presents a pioneering effort to define the efficiency of the most
common simulation-based design methods, namely the parametric simulation
method (PSM) and the simulation-based optimization method (SOM), in
improving two building performance indicators: thermal comfort and energy
consumption. Three case-study houses were selected and their indoor conditions
were continuously monitored during one summer month in 2012. Computer
EnergyPlus models of these houses were established and then carefully
calibrated by the monitoring data to improve the reliability of the numerical
methods. Thermal performances of these houses during a year were simulated,
then improved by the PSM and finally optimized by the SOM. By comparing the
results of these two simulation-based design methods, this research found that
both the PSM and SOM were very effective in improving these building
performance indicators. This study found that the SOM is almost two times more
efficient than the PSM in improving thermal comfort in naturally ventilated (NV)
houses and life cycle cost in air-conditioned (AC) houses. In average, the
discomfort period in NV houses could be reduced by 44.9% by the PSM while as
high as 86.1% by the SOM, compared with the reference cases. The life cycle
cost of AC houses had smaller reductions with 6.2% and 14.6% cut-off by the
PSM and SOM, respectively. The results of this work give a strong and explicit
insight of the actual efficiency of each design method. This work also shows
great advantages of applications of advanced numerical approaches in the design
of high performance buildings.
Keywords: Simulation efficiency, simulation-based method, building

Nguyen A. T., Reiter S., 2014. The efficiency of different simulation-based
design methods in improving building performance. In: Brebbia C.A., Pulselli
R., WIT Transactions on Ecology on the Built Environment, vol. 142. WITpress:
UK. p. 139-149.
optimization, numerical calibration.
1 Introduction and research objective
Numerical simulation has become more and more common in building research,
design and consultancies. However, it is still unclear whether a simulation-based
design method can help designers to satisfy a certain threshold of building
performance. It is important to know the capability of simulation-based
optimization methods in improving a design objective such as indoor
environment quality or building energy consumption. This allows designers to
choose an appropriate method among a number of available approaches that can
satisfy their time budget, resources and design objectives.
To accurately give an answer to this question, this research developed a
comprehensive framework through which the efficiency of two major
simulation-based design methods, i.e. the parametric simulation method (PSM)
and simulation-based optimization method (SOM), in improving building
performance could be accurately quantified. The results presented in this paper
are part of a larger research project aimed to optimize indoor thermal comfort
and energy consumption in residential buildings. We only performed the survey
on residential buildings in hot humid climates. Nevertheless, the procedure
applied in this paper can be used for the same purposes in other climatic regions
and other building types.
2 Methodology
The reliable results of this study were based on several stringent evaluation
criteria:
The reference performance of case-study buildings must be carefully defined.
The design targets to be improved, the building styles, the climates to be
investigated must be abundant to avoid exceptional bias.
The authors first developed the reference performance of a number of residential
buildings by selecting 3 case-study houses, including a row house, a detached
house and an apartment (See Fig.1). These case-study houses are located in
Danang, Vietnam where the climate is hot and humid all year round. They are
typical in style and size in the region and were designed by CAD-based
techniques without using building performance simulation tools.
Thermal conditions in representative zones of these houses were continuously
monitored during one summer month (1st to 31
st May 2012) by using HOBO data
loggers (see locations in Fig. 1). Hourly outdoor conditions during the
monitoring period were booked and obtained from a national meteorological
station in Danang city. Computer thermal models of these houses were
established using EnergyPlus simulation program. The monitoring data were
then used to calibrate these models using the method of Nguyen and Reiter [1].
Nguyen A. T., Reiter S., 2014. The efficiency of different simulation-based
design methods in improving building performance. In: Brebbia C.A., Pulselli
R., WIT Transactions on Ecology on the Built Environment, vol. 142. WITpress:
UK. p. 139-149.
The case-study houses were assumed being located in 3 climatic regions of
Vietnam, including Hanoi (21° North), Danang (16° North) and Hochiminh city
(10° North). 1-year EnergyPlus simulation results of calibrated computer thermal
models were considered as the reference performances of the case-study houses.
Thermal performances of the case-study houses were improved by the PSM and
the SOM. The efficiency of the PSM and SOM can, therefore, be derived by
comparing the improved performances with the reference counterparts.
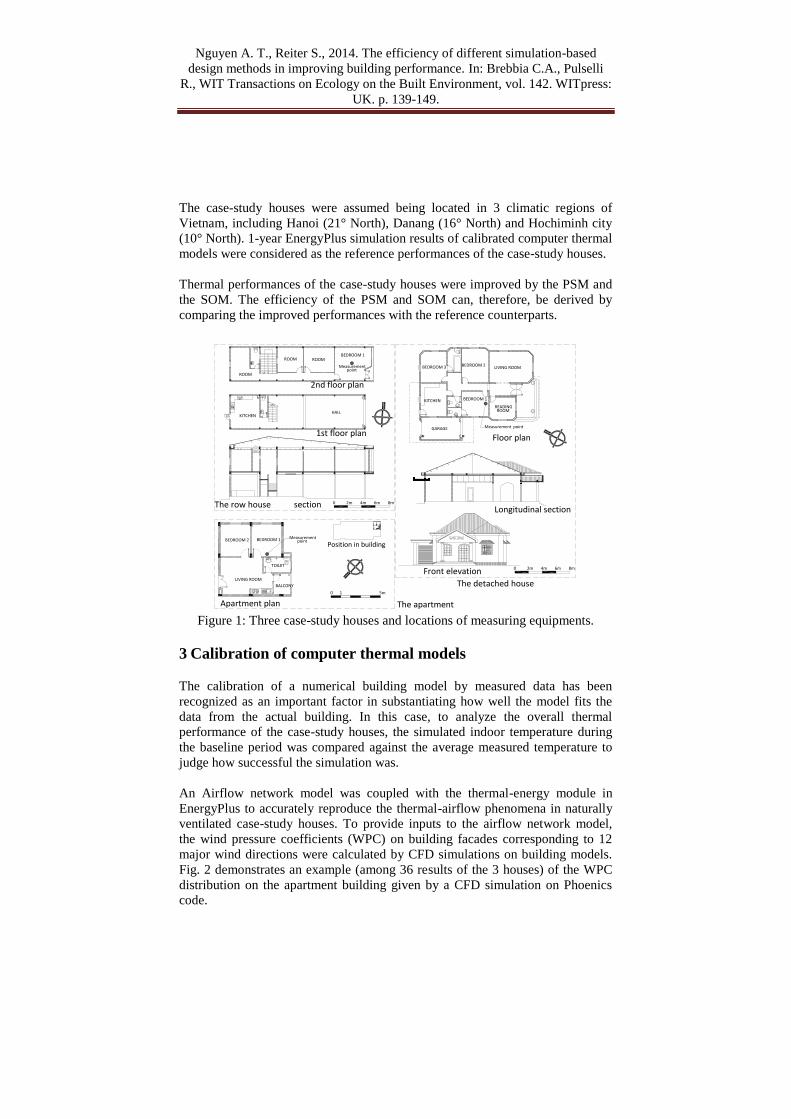
Figure 1: Three case-study houses and locations of measuring equipments.
3 Calibration of computer thermal models
The calibration of a numerical building model by measured data has been
recognized as an important factor in substantiating how well the model fits the
data from the actual building. In this case, to analyze the overall thermal
performance of the case-study houses, the simulated indoor temperature during
the baseline period was compared against the average measured temperature to
judge how successful the simulation was.
An Airflow network model was coupled with the thermal-energy module in
EnergyPlus to accurately reproduce the thermal-airflow phenomena in naturally
ventilated case-study houses. To provide inputs to the airflow network model,
the wind pressure coefficients (WPC) on building facades corresponding to 12
major wind directions were calculated by CFD simulations on building models.
Fig. 2 demonstrates an example (among 36 results of the 3 houses) of the WPC
distribution on the apartment building given by a CFD simulation on Phoenics
code.
D1
0 2m 4m 6m 8m
Measurement
sectionThe row house
1st floor plan
0.8
1x2
.45
1.2
5x1
.55
1.2
5x1
.55
0.6
x0.8
LIVING ROOM
READING
BEDROOM 1
BEDROOM 2BEDROOM 3
KITCHEN
GARAGE
0 2m 4m 6m 8m
Floor plan
Longitudinal section
Front elevation
ROOM
BEDROOM 2 BEDROOM 1
BALCONY
TOILET
LIVING ROOM
Apartment plan
0 1 5m
BEDROOM 1ROOMROOM
ROOM
HALLKITCHEN
2nd floor plan
point
Position in building
Measurement point
Measurementpoint
The detached house
The apartment

Nguyen A. T., Reiter S., 2014. The efficiency of different simulation-based
design methods in improving building performance. In: Brebbia C.A., Pulselli
R., WIT Transactions on Ecology on the Built Environment, vol. 142. WITpress:
UK. p. 139-149.
Figure 2: Simulated WPC surface contours of the wind from the South - the
apartment is on the 4th floor of the building on the left.
The agreement between measured and simulated air temperature of the houses
was assessed by two statistical indicators, namely Normalized Mean Bias Error
(NMBE) and Coefficient of Variation of Root Square Mean Error CV(RMSE),
defined as follows:
1( ) 1
(%) 100%1
n
ip imi
m
t tNMBE
n t
(1)
2
1( ) 1
( )(%) 100%1
n
ip imi
m
t tCV RMSE
n t
(2)
where tip is the ith predicted temperature by the simulation; tim is the ith measured
temperature; tm is the arithmetic mean of the sample of n measurements and n is
the number of data points (temperature) in the measurement.
These indicators were iteratively improved by adjusting inputs of the EnergyPlus
models until NMBE and CV(RMSE) reach convergence (no or very small
change). Ideally, both NMBE and CV(RMSE) should be zero, indicating a
perfect “goodness-of-fit”. Fig. 3 shows the improvement process of NMBE and
CV(RMSE) and the “goodness-of-fit” between simulated and measured
temperature in the calibration of the row house.
4 Reference performance of the case-study houses
After the calibration was finished, calibrated models were run for 1-year period
using TMY weather files of 3 locations. The case-study houses were assumed
that they could be operated in two separated operation modes: naturally
ventilated (NV) and air conditioned (AC). In the NV mode, all windows are
always opened to allow natural ventilation (except that they are closed during
November, December, January and February in Hanoi). All doors are normally
opened during day time and closed during nighttime. In the AC mode, each

Nguyen A. T., Reiter S., 2014. The efficiency of different simulation-based
design methods in improving building performance. In: Brebbia C.A., Pulselli
R., WIT Transactions on Ecology on the Built Environment, vol. 142. WITpress:
UK. p. 139-149.
thermal zone was equipped with a Packed Terminal Air Conditioner (PTAC).
Each PTAC consists of an electric heating coil, a single-speed cooling coil, a
‘draw through’ fan, an outdoor air mixer, a thermostat control and a temperature
sensor. Total energy consumption of the houses is the sum of electricity
consumed by the lighting system, equipments and the PTACs.
Figure 3: Tuning progress with input modifications and linear regression analysis
of run #1 vs. run #9 - row house.
Two building performance indicators were used in this study. The first is the
Total Discomfort Hours (TDH) applied to the NV houses which are defined
by cumulative uncomfortable hours in a year (average of all thermal zones) with
respect to the adaptive thermal comfort criterion developed in [2]:
0.341 18.83comf outT T (3)
where Tout is monthly mean outdoor temperature; Tcomf is predicted comfort
temperature.
The second indicator is the Life Cycle Cost (LCC) applied to the AC houses
which is defined by the sum of initial construction cost, energy cost and other
maintenance cost during 50 years (in US dollar). References [3] and [4] describe
these indicators in detail. A low TDH or LCC is obviously preferred.
The TDHs and the LCCs of the case-study houses under the 3 climatic regions
are shown in Fig. 4 and Fig. 5. These data give an estimate of how well the case-
study houses are. As can be seen, the TDHs of all reference cases were not
acceptable and were classified as “POOR” (TDH >10%) [5].
5 Efficiency of the PSM
This section looks for climate responsive design strategies and building control
with an aim of improving the reference TDHs and LCCs. Following a trial-and-
error procedure of numerical simulations, the parametric simulation method
(PSM) allows users to explore the effect of each design variable on the
simulation outputs; hence it is able to provide improved solutions to the problem.
-5
-4
-3
-2
-1
0
1
2
3
4
5
Run#1
Run#2
Run#3
Run#4
Run#5
Run#6
Run#7
Run#8
Run#9
Pe
rcen
t (%
)
NMBE
CV(RMSE)
y = 1,05x - 3,07 R² = 0,85
y = 0,94x + 2,04 R² = 0,92
28
29
30
31
32
33
34
35
36
28 29 30 31 32 33 34 35 36P
red
icti
on
(°C
)
Measurement (°C)
Run #1
Run #9
Linear run#1

Nguyen A. T., Reiter S., 2014. The efficiency of different simulation-based
design methods in improving building performance. In: Brebbia C.A., Pulselli
R., WIT Transactions on Ecology on the Built Environment, vol. 142. WITpress:
UK. p. 139-149.
In this study, a number of common strategies were subsequently applied to
improve the TDHs and LCCs as listed below:
- Changing the structure of external walls,
- Installing thermal insulation beneath the roof,
- Changing the color of external walls (changing solar absorptance),
- Controlling openings according to different ventilation schemes,
- Other strategies, i.e. adjusting: window overhang, size of glazing area,
glazing type, air infiltration rate, and internal thermal mass.
In each house after exploring all these solutions separately, a combined solution
which was constituted from all positive solutions was applied to obtain the
maximum improvement. Fig. 4 and 5 compares the reference TDHs and LCCs
with the improved counterparts given by the PSM.
Figure 4: Comparison of the TDHs in the NV houses. The horizontal line
indicates the acceptable threshold of the TDH.
Figure 5: Comparison of the LCCs in the AC houses.
In improved NV houses, the TDHs were considerably reduced. The largest
reduction of 70% was observed in the detached house under the climate of
Danang. The smallest reduction was 19%, observed in the apartment in
3247
1788
1534
2634
1358
949
2278
953
1285
2441
870
746
1926
410
337
1505
359
1041
985
38
10
1483
14
1
514
21 12
8
0
400
800
1200
1600
2000
2400
2800
3200
Hanoi Danang Hochiminh Hanoi Danang Hochiminh Hanoi Danang Hochiminh
Tota
l dis
com
fort
ho
urs
Reference case Improved case Optimal case
ROW HOUSE DETACHED HOUSE APARTMENT
102,
0
96,3
112,
0
154,
2
141,
5 164,
8
44,0
44,5
54,0
93,1
90,4
103,
4
138,
5
136,
3 157,
4
40,8
43,0
52,1
84,6
84,3
91,8
127,
7
124,
2
133,
7
38,7
40,4
46,4
0
50
100
150
200
Hanoi Danang Hochiminh Hanoi Danang Hochiminh Hanoi Danang Hochiminh
LCC
(1
000
$) Reference case Improved case Optimal case
ROW HOUSE DETACHED HOUSE APARTMENT

Nguyen A. T., Reiter S., 2014. The efficiency of different simulation-based
design methods in improving building performance. In: Brebbia C.A., Pulselli
R., WIT Transactions on Ecology on the Built Environment, vol. 142. WITpress:
UK. p. 139-149.
Hochiminh city. In average, a 44.9% reduction of the THD was obtained. Using
the PSM, the TDHs of 5/9 cases was classified as “GOOD” (TDH ≤10% with
mean exceeding temperature smaller than 1°C) [5].
In improved AC houses, the LCCs were not reduced significantly as expected
from the improvement in NV houses. The average reduction of LCCs was only
6.1%.
6 Efficiency of the SOM
The PSM is usually time-consuming while it might yield only partial
improvements because of the complex non-linear interactions of input variables
on simulated results. To achieve an optimal (or near optimal) solution to a
problem with less time and labor, the design target of a numerical building
model is usually “solved” by iterative methods on computers, which construct
infinite sequences, of progressively better approximations to a “solution”, often
known as the numerical optimization or the simulation-based optimization
method (SOM).
This study used a two-step optimization method according to which the
optimization procedure will be conducted through two phases, namely (i)
sensitivity analysis and (ii) optimization.
Sensitive analysis (SA)
The philosophy of SA is that if we understand the relationships and the relative
importance of design parameters on the building performance, we can easily
improve the building performance by selecting appropriate design parameters.
This study used the SA to eliminated unimportant (or low influential) design
variables from the optimization. This helps to limit the number of optimization
variables within an acceptable range (e.g. on the order of 10 [6]) associated with
the solving capability of optimization algorithms.
Figure 6: The full process of a SA using SimLab and EnergyPlus applied to this
study.
This study used a Monte Carlo-based technique to perform the SA. Fig. 6
presents the procedure of SA applied to this study that employed SimLab

Nguyen A. T., Reiter S., 2014. The efficiency of different simulation-based
design methods in improving building performance. In: Brebbia C.A., Pulselli
R., WIT Transactions on Ecology on the Built Environment, vol. 142. WITpress:
UK. p. 139-149.
(Available at http://ipsc.jrc.ec.europa.eu [Accessed 10/4/2013]) and EnergyPlus.
The Standardized rank regression coefficient (SRRC) [7] was used to measure
the sensitivity of a variable. The SA was performed on both the NV and AC
houses. Highly influential design variables were included in the optimization
phase. More details of the SA and selected variables can be found in [8]. Fig. 7
shows an example of the SA result of the NV apartment.
Figure 7: Variable sensitivity ranking using the SRRC in NV apartment under
Danang climate.
Optimization
The optimization was done by coupling EnergyPlus and GenOpt [6] – a generic
optimization tool. The optimization algorithm used was the hybrid form of the
Particle swarm optimization and Generalized pattern search Hooke-Jeeves
algorithm. This hybrid algorithm is capable to work efficiently on detailed
building simulation problems where simulation outputs are generally non-linear,
multi-model and highly discontinuous [9]. Optimization variables and settings of
the optimization algorithm can be found in reference [8]. Objective functions to
be minimized are the TDH and the LCC, applied to the NV and AC houses,
respectively. The optimization was also performed on these housing models
under 3 climates.
Fig. 4 and 5 compared the TDHs / LCCs in optimal houses given by the SOM
and the reference counterparts. In NV cases, it can be observed that the optimal
cases offered great reductions of the TDH. The largest reduction of 99.9%
occurred in the detached house in Hochiminh city. The smallest reduction of
43.7% can be observed in the detached house in Hanoi. The optimal cases
always outperform the improved cases. Average TDH reduction given by the
-0,5 -0,4 -0,3 -0,2 -0,1 0 0,1 0,2 0,3 0,4 0,5 0,6
Concrete slab densityDischarge coefficient window – living room
Max equipment power – living room Max equipment power – bedroom 2
Discharge coefficient windows - bedroomEPS Insulation conductivitySize of window bedroom 1
Crack of window – living room Power of gas stove
Thickness - brickDischarge coefficient door – living room
Brick density (external wall)Concrete slab thickness
Size overhang windows - bedroomMax equipment power – bedroom 1
Thickness of brick internal massCrack of door – living room Size of window bedroom 2Max number of occupant
Crack of windows - bedroomExternal wall type
Window typeVentilation strategy
External wall color
SRRC ranking
Naturally ventilated apartment

Nguyen A. T., Reiter S., 2014. The efficiency of different simulation-based
design methods in improving building performance. In: Brebbia C.A., Pulselli
R., WIT Transactions on Ecology on the Built Environment, vol. 142. WITpress:
UK. p. 139-149.
SOM was 86.1% while that of the PSM was only 44.9%. It is worthy of note that
seven of the optimal houses were nearly perfect, in term of the TDH.
In AC cases, it can be observed that the LCC reductions were not as
significant as the TDH reductions. The reduction amounts by the optimization
were fairly uniform with an average reduction of 14.6% of the LCC.
7 Discussion
Firstly, this work considers the results from some studies in cold and temperate
climate. In [10], the authors found that a reduction of 23–49% in the space
heating energy for the optimized house could be achieved compared with the
reference detached house. Most optimal solutions could be seen as Finnish low-
energy houses. Similar to these results, Suh et al. [11] found 24% and 33%
reduction of heating and cooling energy in a post office building in Korea using
a knowledge-based design method and the SOM, respectively. By performing
optimization on EnergyPlus models of an office under 3 climates of the U.S.,
Wetter and Wright [12] found a saving of an order of 7% to 32% of primary
energy consumption, depending on the building location. In [13], optimal
settings of optimization algorithms led to a reduction of 20.2% to 29.6% of the
primary energy use by a large office building in temperate climates of the U.S.
From these results, it is very likely that a reduction of 20% - 30% of building
energy consumption is an achievable target using the SOM.
However, the situation of warmer climates is likely not the same. In a study
related to a large office building in the warm climate of Florida, U.S., Kampf et
al. [13] found a reduction of total energy consumption of 7.1%. This result
shares the same trend found by this study in which the average reduction of
LCCs was only 14.6%.
Cost reduction in optimization of high-performance buildings seems to be very
minor. Salminen et al. [14] tried to improve energy consumption of a LEED-
certified commercial building in Finland. They found that the optimization
method could further reduce up to 10% of the annual energy consumption,
accompanied by an additional investment of about 0.6 million Euros. Without
the additional investment, improvement could only reach 1.1%.
Cost reductions by the SOM clearly depend on the objective function to be
minimized and many other factors (climates, building models, optimization
algorithms…). Due to very limited results from the literature and the variety of
the design objectives in optimization studies, a robust quantification of
optimization efficiency needs further investigations.

Nguyen A. T., Reiter S., 2014. The efficiency of different simulation-based
design methods in improving building performance. In: Brebbia C.A., Pulselli
R., WIT Transactions on Ecology on the Built Environment, vol. 142. WITpress:
UK. p. 139-149.
8 Conclusion
This study reports a comprehensive framework developed to quantify the
efficiency of the PSM and SOM in improving building performance. The
performances of the reference cases (base cases) were carefully defined by the
calibrated EnergyPlus models. The efficiencies of the PSM and SOM were
obtained by applying these methods to 3 housing models, under 3 climate
patterns in the tropic.
This study found that the SOM is almost 2 times more efficient than the PSM in
improving thermal comfort in NV houses and life cycle cost in AC houses. In
average, the TDH could be reduced by 44.9% by the PSM while as high as
86.1% by the SOM, compared with the reference cases. The LCC had smaller
reductions with 6.2% and 14.6% cut-off by the PSM and SOM, respectively.
However, it is important to stress that the efficiency of the PSM and SOM still
depends on many other aspects of the study, especially the design objective to be
improved. Results from other studies found in the literature also indicate that the
cost reduction may also depend on the climate where cold climates tend to offer
greater chances to reduce building energy cost.
By applying the SOM in design of NV buildings, the TDH of optimal solutions
can be minimized for six of the nine case studies to nearly zero, revealing a
significant potential of energy saving and the great feasibility of “zero energy
buildings” concept in warm climates.
Acknowledgements
This research was financially supported by the Ministry of Education and Training of Vietnam and partly by Wallonie Bruxelles International.
References
[1] Nguyen, A.T. & Reiter, S., An investigation on thermal performance of a low
cost apartment in hot humid climate of Danang. Energy and Buildings, 47,
pp. 237-246, 2012.
[2] Nguyen, A.T., Singh, M.K. & Reiter, S., An adaptive thermal comfort model
for hot humid South-East Asia. Building and Environment, 56, pp. 291-300,
2012.
[3] Nguyen, A.T. & Reiter, S., Passive designs and strategies for low-cost
housing using simulation-based optimization and different thermal comfort
criteria. Journal of Building Performance Simulation,7(1), pp. 68-81, 2014.
[4] Nguyen, A.T. & Reiter, S., Optimum design of low-cost housing in
developing countries using nonsmooth simulation-based optimization.

Nguyen A. T., Reiter S., 2014. The efficiency of different simulation-based
design methods in improving building performance. In: Brebbia C.A., Pulselli
R., WIT Transactions on Ecology on the Built Environment, vol. 142. WITpress:
UK. p. 139-149.
Proceedings of the 28th International PLEA Conference, Lima, Peru,
November 7-9, 2012.
[5] van der Linden, A.C., Boerstra, A.C. & Kurvers, S.R., Thermal indoor
climate as a building performance - Proposal for new criteria, design aids
and assessment methods in The Netherlands. Proceedings of the
International Conference on Advances in Building Technology, Hongkong,
China, December 4–6, 2002.
[6] Wetter, M., GenOpt, Generic optimization program - User manual, version
3.0.0. Technical report LBNL-5419, Lawrence Berkeley National
Laboratory, 2009.
[7] Joint Research Centre - European Commission, Simlab 2.2 Reference
Manual, Brussels: JRC, 2008.
[8] Nguyen, A.T., Sustainable housing in Vietnam: climate responsive design
strategies to optimize thermal comfort, PhD thesis: Université de Liège,
2013.
[9] Wetter, M. & Wright, J.A., A comparison of deterministic and probabilistic
optimization algorithms for nonsmooth simulation-based optimization.
Building and Environment, 39, pp. 989 – 999, 2004.
[10] A. Hasan, A., Vuolle, M. & Sirén, M., Minimisation of life cycle cost of a
detached house using combined simulation and optimisation. Building and
Environment, 43(12), pp. 2022-2034, 2008.
[11] Suh, W.J., Park, C.S. & Kim, D.W., Heuristic vs. meta-heuristic
optimization for energy performance of a post office building. Proceedings
of the 12th Conference of International Building Performance Simulation
Association, Sydney, Australia, November 14-16, 2011.
[12] Wetter, M. & Wright, J.A., Comparison of a generalized pattern search and
a genetic algorithm optimization method. Proceedings of the 8th IBPSA
Conference, Eindhoven, Netherland, August 11-14, 2003.
[13] Kampf, J., Wetter, M. & Robinson, D., A comparison of global optimisation
algorithms with standard benchmark functions and real-world applications
using EnergyPlus. Journal of Building Performance Simulation, 3, pp. 103-
120, 2010.
[14] Salminen, M., Palonen, M. & Sirén, K., Combined energy simulation and
multi-criteria optimisation of a LEED-certified building. Proceedings of the
building simulation and optimization conference, Loughborough, UK,
September 10-11, 2012.