Efficiency of Corrugated Cardboard as a Building Material
19
1 Efficiency of Corrugated Cardboard as a Building Material Morad Abdel-Kader Abdel-Mohsen 1 , Ahmed A. Faggal 2 and Yara S. El-Metwally 3 1 Professor, 2 Associate Prof., Dept of Architectural Engineering, Ain Shams University 3 Teaching Assistant, Dept of Architectural Engineering, British University Abstract This study examines the feasibility of using corrugated cardboard as a building material in order to develop an efficient design for an emergency portable shelter. Corrugated Cardboard has great potentials that enable it to be an alternative to the existing materials for temporary structures. Due to its light weight, it can be easily assembled, disassembled and relocated to other destinations. In this paper a literature review on corrugated cardboard, presenting its historical background, its characteristics, potentials and limitations, is given. Next, an analytical study is presented, from which a cardboard shelter is proposed as a solution for the lack of adequate emergency shelters in Egypt. By using Design Builder software as a simulation tool, the thermal performance of the building envelope of the shelter is evaluated in order to examine the adaptability of using cardboard in Egypt. Different alternatives are tested one by one over the year on 21 st of March, June, September and December. The output data is analyzed and compared with each other to address which of these systems tends to achieve better indoor thermal temperature. A comparison between the proposed systems and an economic brick shelter with the same dimensions is also conducted to evaluate the thermal performance of each. The results show that corrugated cardboard has the ability to adapt to Egypt's climate and to be a feasible construction material. Keywords: corrugated cardboard, shelter, building envelope, thermal performance. 1. Introduction Nowadays, corrugated cardboard is not just limited to packaging purposes, but it is more being involved in other different fields as in construction and indoor furniture. Recently, constructing shelters from corrugated cardboard panels represents an innovative approach in the construction industry, although it appeared many years ago. Cardboard structures can be used for permanent living purposes or as temporary emergency houses in disasters, which could be a solution for the
Transcript of Efficiency of Corrugated Cardboard as a Building Material

1
Efficiency of Corrugated Cardboard as a Building
Material
Morad Abdel-Kader Abdel-Mohsen1
, Ahmed A. Faggal2
and Yara S. El-Metwally3
1 Professor,
2Associate Prof., Dept of Architectural Engineering, Ain Shams University
3Teaching Assistant, Dept of Architectural Engineering, British University
Abstract
This study examines the feasibility of using corrugated cardboard as a building
material in order to develop an efficient design for an emergency portable shelter.
Corrugated Cardboard has great potentials that enable it to be an alternative to the
existing materials for temporary structures. Due to its light weight, it can be easily
assembled, disassembled and relocated to other destinations. In this paper a
literature review on corrugated cardboard, presenting its historical background, its
characteristics, potentials and limitations, is given. Next, an analytical study is
presented, from which a cardboard shelter is proposed as a solution for the lack of
adequate emergency shelters in Egypt. By using Design Builder software as a
simulation tool, the thermal performance of the building envelope of the shelter is
evaluated in order to examine the adaptability of using cardboard in Egypt.
Different alternatives are tested one by one over the year on 21st
of March, June,
September and December. The output data is analyzed and compared with each
other to address which of these systems tends to achieve better indoor thermal
temperature. A comparison between the proposed systems and an economic brick
shelter with the same dimensions is also conducted to evaluate the thermal
performance of each. The results show that corrugated cardboard has the ability to
adapt to Egypt's climate and to be a feasible construction material.
Keywords: corrugated cardboard, shelter, building envelope, thermal performance.
1. Introduction
Nowadays, corrugated cardboard is not just limited to packaging purposes, but it
is more being involved in other different fields as in construction and indoor
furniture. Recently, constructing shelters from corrugated cardboard panels
represents an innovative approach in the construction industry, although it appeared
many years ago. Cardboard structures can be used for permanent living purposes or
as temporary emergency houses in disasters, which could be a solution for the
2
insufficient tents offered to homeless after a disaster, that are neither comfortable
nor safe. Selecting an adequate material for emergency shelters is one of the main
parameters that affect its success. Emergency shelters should be flexible, portable,
light weight and economically efficient structures. Corrugated cardboard adopts a
variety of these characteristics and has much more potentials that could motivate
expertise to develop it further. In structural terms, cardboard has considerable
strength, stability and stiffness in comparison to other building materials. All these
potentials, as well as, the limitations such as its weakness to humidity and fire are
introduced in the paper to reflect cardboard's performance as a building material.
The empirical part of this study is the evaluation of the thermal performance of
the envelope of three different cardboard shelters that vary in their thicknesses and
their panels' layers and a brick shelter. The target of this variation is testing the
influence of the different panel's thickness, as well as, examining the impact of air
gap between the layers of the cardboard panels. In addition, the cardboard shelter is
compared with economic brick shelter to testify the thermal adaptability of both
systems along the year without using any kind of insulation or shading devices.
2. Historical Background of Cardboard in Construction
The application of cardboard in construction began many years ago, since the 2nd
World War and was developed through the years. This development can be
summarized in three main periods:
1. The birth of cardboard building prototypes from 1944 till 1990;
2. The appearance of the Japanese Architect Shigeru Ban; and
3. The development of contemporary prototypes and approaches during the last
decade.
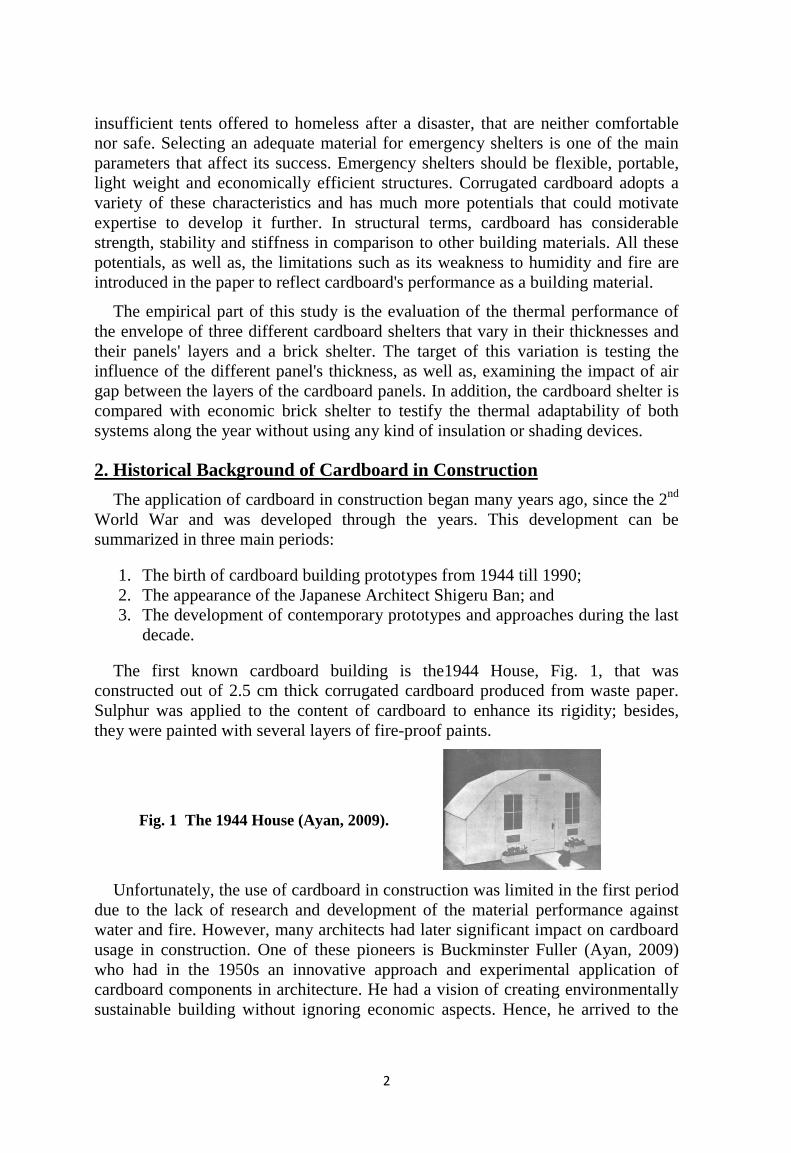
The first known cardboard building is the1944 House, Fig. 1, that was
constructed out of 2.5 cm thick corrugated cardboard produced from waste paper.
Sulphur was applied to the content of cardboard to enhance its rigidity; besides,
they were painted with several layers of fire-proof paints.
Fig. 1 The 1944 House (Ayan, 2009).
Unfortunately, the use of cardboard in construction was limited in the first period
due to the lack of research and development of the material performance against
water and fire. However, many architects had later significant impact on cardboard
usage in construction. One of these pioneers is Buckminster Fuller (Ayan, 2009)
who had in the 1950s an innovative approach and experimental application of
cardboard components in architecture. He had a vision of creating environmentally
sustainable building without ignoring economic aspects. Hence, he arrived to the

3
philosophy more-with-less aiming to solve global problems. Fuller was concerned
with ecological sustainable building materials and renewable energy sources
challenging traditional building methods. The choice of cardboard was due to its
low cost, its suitability for mass production and its minimal environmental impact.
Architects and engineers were inspired by Fuller innovative ideas of using
cardboard in the construction and started their research on maintaining the structural
strength and stiffness of cardboard when exposed to external weather conditions,
humidity and fire. In these experimental early prototypes, cardboard was used
structurally either as the primary element or as secondary supporting element. They
found out that geodesic domes and other polyhedral macro forms of cardboard are
efficient solutions for rigidity. As for weatherproofing and sealing they added
substances such as boiled linseed oil, copal varnish, polyurethane paints, resin-
based paints, fiberglass and concrete on the outer surface of the structure.
Nevertheless, the success of these early cardboard buildings did not continue long,
it was not further developed despite these efforts. Another reason beyond the drop
off cardboard usage in buildings is the introduction of other new alternative
building materials in the late 1950’s, as laminated plastic and Formica.
The second period of cardboard development (Shigerubanarchitects.com, 2013)
was under the leadership of the Japanese humanitarian architect Shigeru Ban, who
is well known throughout the world for his innovative designs. Ban established in
1995 an NGO for the sake of providing cheap housing for the victims of natural
disasters that have minimal environmental impact. He created a number of
successful emergency shelters out of cardboard; one of the most known projects is
the “Paper Log House" in Japan, shown in Fig. 2.
Fig. 2 Paper Log House in Japan (House, 2014).
Ban projects succeeded to prove cardboard's structural strength and stiffness.
Several of his projects have been certified by local and state official authorities
worldwide. In the last decade an increased interest in cardboard experiments in
architecture had been noticed after Ban's successful work. The Westborough
Primary School in England, designed by architects Cotterel & Vermeulen in 2001
and the Cardboard House, designed by architects Stutchbury and Pape in 2004 are
examples of modern applications.
3. Characteristics of Corrugated Cardboard
Cardboard is a paper production with a number of different layers of fibers. New
virgin fibers such as cellulose (sulphate or sulphite, bleached or non-bleached) can
be added to wood pulp, recycled fibers and other additives such as aluminum
sulphate, kaolin, starch and synthetic latex to produce cardboard. Corrugated

4
cardboard is composed of a sandwich structure; a corrugated medium layer (flipped
layer) of paper called "fluting" placed between two layers of flat paper called
"liners" or "plies", as shown in Fig. 3.
top outer liner
Flute
bottom outer liner
Fig. 3 Basics of corrugated cardboard (Ayan, 2009).
4. Classification of Corrugated Cardboard
There are a variety of corrugated cardboards that can be classified according to
several different characteristics, including construction (single face, single wall,
double wall, etc), flute size, burst strength, edge crush strength, flat crush strength,
basis weights of its components, surface treatments, impregnation, printing and
coatings (Ayan, 2009). In the following, the classification of cardboard according to
fluting and according to form are discussed.
Classification according to form
Corrugated Cardboard can be formed in tubes with a maximum thickness of
16mm and a maximum diameter of 600mm.The tube length is not limited by the
manufacture process, but by transportation. It can also be produced as panels with a
variety of forms; they may appear as simple corrugated panels or as a corrugated
honeycomb panels that are made by sandwiching a honeycomb structure between
sheets of paper. The Panels have a width between 1.2m and 1.5m and a length
between 2.4m to 3.6m. The thickness differs from single layer sheets of 1mm thick
to 65mm thick sheets.
Fig. 4 Stacked cardboard tubes
(ALMUT, 2009).
Fig. 5 Honeycomb structure produced by
corrugated cardboard machine (Ayan, 2009).
Classification according to fluting
Corrugated cardboard consists of multiple layers of fluting with a variety of flute
sizes, table 1. The most basic type is the single wall cardboard that consists of one
piece of fluted paper sandwiched between two linerboards (Lithotech.ca, 2013). The
Flute's thickness may range from 0.8-4.8mm and weights between 112-180g/m2,
while liner weights between 115-350g/m2 (Paulapuro, 2000).

5
Table 1 Flute Types of corrugated cardboard sheets (O'neil, 2009)
Type Description Image
A-Flute The original flute and has the
highest arch height with 110± 10
flutes per meter. It has excellent
stiffness and short column crush
resistance.
(Packaging-gateway.com, 2014)
B-Flute Thinner than A-type, but has good
compression strength, compactness,
printability and is cost effective. It
has around154 ± 10 flutes per meter.
(Packaging-gateway.com, 2014)
C-Flute Thicker than B-flute but thinner than
A-flute. It is the most commonly
used flute type. It consists of around
128 ± 10 flutes per meter.
(Packaging-gateway.com, 2014)
E-Flute A very thin flute and has about 290
flutes per meter. It offers excellent
crush resistance and printability. (Packaging-gateway.com, 2014)
F-Flute The newest type in the packaging
industry and is just over half the
thickness of E-flute. It consists of
the lowest fiber content of all other
flutes.
(Packaging-gateway.com, 2014)
BC-Flute
(double
wall)
The combination of B and C flutes
offers greater compression and
stacking strength.
(Dotorial.com, 2014)
5. Potentials of Corrugated Cardboard
Corrugated cardboard is provided with multi characteristics that justify its use a
proper building material. This is illustrated in the following.
Weight
Cardboard has a light weight which facilitates its transport, assembly and
disassembly.
Durability
Experiments prove that corrugated cardboard has considerable strength, stability
and stiffness in comparison with other common building materials; it can resist
significant structural loads. The existence of wood fibers in its content improves its
strength and resilience. Cardboard is puncture resistant and does not tear easily. The
arched design of the interior fluting enhances its durability to resist more external
force. The liners of the corrugated cardboard provide bending stiffness, while flutes
provide shear stiffness. (ALMUT, 2009)

6
Recycability
Cardboard is produced using virgin cellulose fibers containing 43% recycled
fibers. After usage of cardboard it can be recycled or reused for other purposes. The
Cardboard School Project in the U.K. has proven that 90 percent of the corrugated
cardboard are recyclable, the fibers may be recycled up to seven times before it
loses its resilience. (Gribbon and Foerster, 2008)
Flexibility
Corrugated cardboard is a very flexible material; it can be cut and folded into
infinite sizes and shapes. Prefabricated cardboard buildings will offer flexibility in
the design which allows users to adapt by adjusting the space according to their
needs. The space can be easily extended by attaching cardboard units to it.
Environmental impact
Cardboard has minimal impact on the environment during the production
process; it does not consume much energy if compared with other materials. Hence,
less emission is expected to be produced. In addition, it is produced from a
renewable resource, which limits the depletion of non-renewable resources. All
materials used in the manufacturing of cardboard are natural and non-toxic.
Prefabrication, pre-assembly and mass customization allow optimum usage of the
material, and minimize onsite waste and labor. Moreover, lightweight cardboard
components and panels decrease the transportation costs.
Construction efficiency
Prefabricated cardboard building elements allow a fast, simple, inexpensive
manufacturing, and also minimize time spent on the construction site.
Efficiency is gained by decreasing the number of building materials, as cardboard
alone can satisfy all the functions of a building’s exterior skin. This elimination of
multi-layering saves costs and simplifies the construction process. (Ayan, 2009)
Cost Efficiency
Cardboard as a raw material is relatively inexpensive. However, cost efficiency
can be achieved by mass production of repetitive and standardized shapes. (Gribbon
and Foerster, 2008, p.98)
Thermal insulation
Corrugated cardboard has insulating properties due to the fluting design of its
interior. The flutes catch air between the two liners, extending the amount of time
needed to transfer heat energy from the exterior to the interior; it stores heat
temporarily. Another aspect is the cellulose fibers that are used in the cardboard
production have low thermal conductivity and strong insulating properties.
Acoustic insulation
Extensive layering of corrugated cardboard and specially the air gaps between
7
flutes or honeycomb structure allows significant acoustical insulation.
(Schreuders and Salmon et al., 2008)
6. Limitations of Corrugated Cardboard
Cardboard has some limitations that can affect its performance if not treated
properly, some of this limitations are given in the following.
Moisture Resistance
Moisture has a negative impact on cardboard's strength (Ayan, 2009). When
cardboard is exposed to humidity or direct water, the bonds between the paper
fibers can be destroyed. To enhance cardboard water resistance, chemical additives
can be used during the pulp production process. The only disadvantage of these
chemical treatments is that it affects its recyclability. Another option is adding a
coating on top of the cardboard, as a thin layer of recycled Polyethylene
Terephthalate (PET). This coatings protect cardboard from moisture as well as from
chemical dangers. Besides, the roof should have an angle of slope, even a flat roof
has a slope.
Fire Resistance
Cardboard reacts in a similar way to fire as wood; it is flammable if not treated
appropriately. Fortunately, cardboard contains a certain amount of chalk-like
material, an excellent fire retardant, as a result from the ink traces left in the
recycling process, which slightly enhances its fire resistivity. Besides, cardboard
can be made with extra protection, that are based on (boric) salts. Adding these
materials does not affect the ability to recycle the material.
Insects
Cardboard is a cellulose material that requires protection from insects.. This can
also be solved by applying additives during manufacturing process. (Van Dooren
and Van Iersel, 2008)
7. Simulation of a Cardboard shelter in Egypt
With the use of Design builder software the thermal performance of three
different corrugated cardboard shelters have been tested and then compared to an
economic brick shelter without changing the shelter dimension and openings. The
three initial models, as well as, the brick shelter were tested over the year on 21st
of
March, June, September, and December. The aim of this simulation is to test the
adaptability of cardboard shelters in Egypt and to compare the results of the
different wall and roof panels to visualize their effect upon the indoor thermal
comfort1.
1 According to Givoni chart in his book" Climate in Building and Urban Design, p.38", the thermal comfort
limits in a hot developing country ranges from 20˚C to 29˚C. The upper limit decreases gradually to 27˚C, if
the relative humidity exceeds 50%.

8
The proposed initial model consists of a single living space with an area of 14m2.
According to the United Nations High Commissioner for Refugees (UNHCR)
standards, this space is adequate for a family of 4 persons, where each person has an
area of 3.5m2. The shelter is assumed to take a rectangular form. Hence, its
dimensions are worked out as 4m (L) × 3.5m (w) × 2.8m (h). The 4m wall side is
directed towards the north. In all case studies the skin is the structure. Fig. 6 shows
a primary plan for proposed living space in the simulation. The construction details
of the different proposed shelters, as well as, the brick shelter and openings details
are introduced in Table 2.
Fig. 6 Plan of the Simulation model and its Orientation.
Table 2 Proposed dimensions for Living Space as used in simulations
Shelter parameters
Location Cairo, Egypt
Dimensions 4m (L)×3.5m (w)×2.8m (h) Floor Area = 14 m2 Volume = 39.2 m
3
Construction
of cardboard
shelter
Walls and roof consist of panels of corrugated Cardboard:
Case A - 3.92cm wall thickness consisting of a honeycomb sandwich
structure 3cm between two A-Flute boards with a thickness of 0.46cm
each. The roof consists of the same panels of the wall.
Case B - 5.76cm wall and roof thickness consisting of honeycomb
sandwich structure 3cm between triple layers of A-Flute boards on
each side.
Case C - A 5.76 wall and roof system of a triple A-flute with an air
gap of 3cm in between instead of the honeycomb structure.
Construction
of brick
shelter
Wall Layers: 25cm brick, 2cm mortar and 2cm paint
Roof Layers: 12cm concrete slab, 6cm Sand, 2cm Mortar, 2cm tiles
Openings Window: single blue glazing with a thickness of 6mm
Window Frame: wooden frame, Window height: 1.5m, Sill height:
0.8m
Door: Cardboard door.
The door is above floor level with 0.1m and is 2.1m high.
9
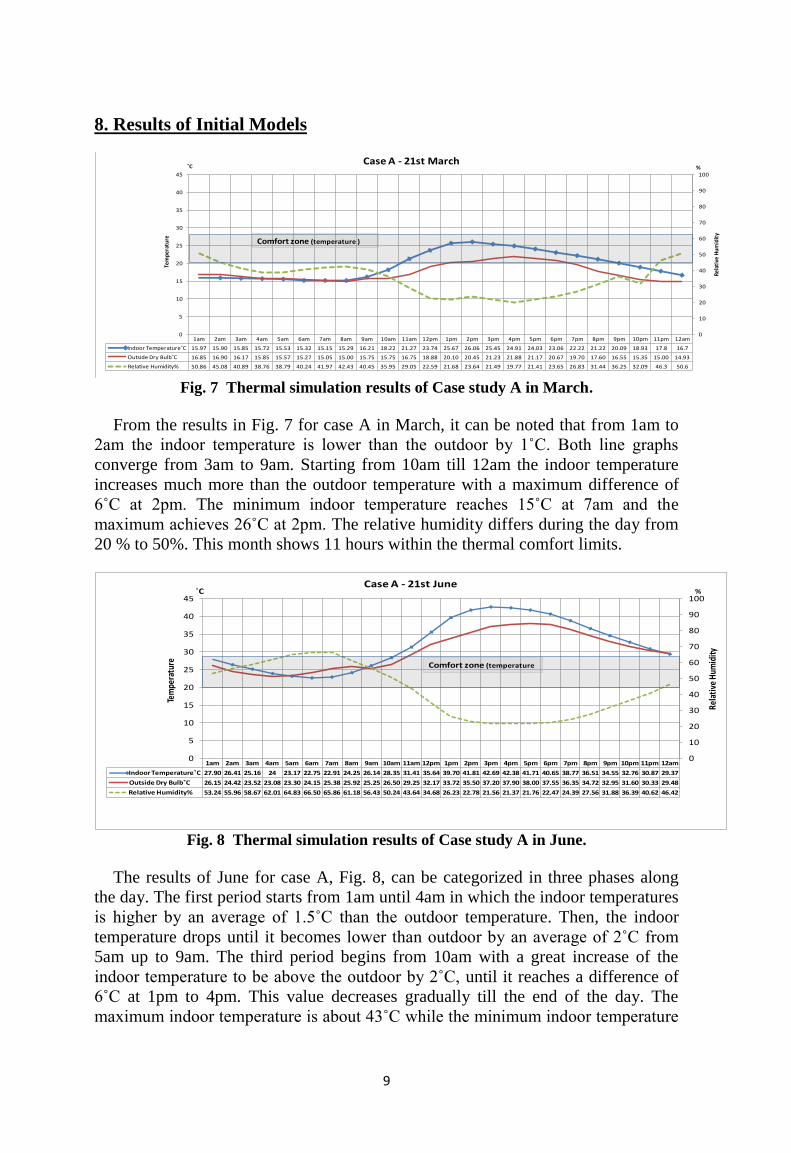
8. Results of Initial Models
1am 2am 3am 4am 5am 6am 7am 8am 9am 10am 11am 12pm 1pm 2pm 3pm 4pm 5pm 6pm 7pm 8pm 9pm 10pm 11pm 12am
Indoor Temperature˚C 15.97 15.90 15.85 15.72 15.53 15.32 15.15 15.29 16.21 18.22 21.27 23.74 25.67 26.06 25.45 24.91 24.03 23.06 22.22 21.22 20.09 18.93 17.8 16.7
Outside Dry Bulb˚C 16.85 16.90 16.17 15.85 15.57 15.27 15.05 15.00 15.75 15.75 16.75 18.88 20.10 20.45 21.23 21.88 21.17 20.67 19.70 17.60 16.55 15.35 15.00 14.93
Relative Humidity% 50.86 45.08 40.89 38.76 38.79 40.24 41.97 42.43 40.45 35.95 29.05 22.59 21.68 23.64 21.49 19.77 21.41 23.65 26.83 31.44 36.25 32.09 46.3 50.6
0
10
20
30
40
50
60
70
80
90
100
0
5
10
15
20
25
30
35
40
45
˚C
Rela
tive
Hum
idit
y
%Te
mpe
ratu
reCase A - 21st March
Comfort zone (temperature )
Fig. 7 Thermal simulation results of Case study A in March.
From the results in Fig. 7 for case A in March, it can be noted that from 1am to
2am the indoor temperature is lower than the outdoor by 1˚C. Both line graphs
converge from 3am to 9am. Starting from 10am till 12am the indoor temperature
increases much more than the outdoor temperature with a maximum difference of
6˚C at 2pm. The minimum indoor temperature reaches 15˚C at 7am and the
maximum achieves 26˚C at 2pm. The relative humidity differs during the day from
20 % to 50%. This month shows 11 hours within the thermal comfort limits.
1am 2am 3am 4am 5am 6am 7am 8am 9am 10am 11am 12pm 1pm 2pm 3pm 4pm 5pm 6pm 7pm 8pm 9pm 10pm 11pm 12am
Indoor Temperature˚C 27.90 26.41 25.16 24 23.17 22.75 22.91 24.25 26.14 28.35 31.41 35.64 39.70 41.81 42.69 42.38 41.71 40.65 38.77 36.51 34.55 32.76 30.87 29.37
Outside Dry Bulb˚C 26.15 24.42 23.52 23.08 23.30 24.15 25.38 25.92 25.25 26.50 29.25 32.17 33.72 35.50 37.20 37.90 38.00 37.55 36.35 34.72 32.95 31.60 30.33 29.48
Relative Humidity% 53.24 55.96 58.67 62.01 64.83 66.50 65.86 61.18 56.43 50.24 43.64 34.68 26.23 22.78 21.56 21.37 21.76 22.47 24.39 27.56 31.88 36.39 40.62 46.42
0
10
20
30
40
50
60
70
80
90
100
0
5
10
15
20
25
30
35
40
45˚C
Rela
tive
Hum
idity
%
Tem
pera
ture
Case A - 21st June
Comfort zone (temperature
Fig. 8 Thermal simulation results of Case study A in June.
The results of June for case A, Fig. 8, can be categorized in three phases along
the day. The first period starts from 1am until 4am in which the indoor temperatures
is higher by an average of 1.5˚C than the outdoor temperature. Then, the indoor
temperature drops until it becomes lower than outdoor by an average of 2˚C from
5am up to 9am. The third period begins from 10am with a great increase of the
indoor temperature to be above the outdoor by 2˚C, until it reaches a difference of
6˚C at 1pm to 4pm. This value decreases gradually till the end of the day. The
maximum indoor temperature is about 43˚C while the minimum indoor temperature

10
is 23˚C. The relative humidity varies along the day from 21% to 66%. Thermal
comfort is achieved during 10 hours through the day.
The results of September for case A, Fig. 9, indicate a slight difference between
indoor temperatures and outdoor temperatures from 1am till 9am. From 10am the
two line graphs start to diverge with a minor indoor heat gain. From 12pm to 4pm
the indoor temperature increases rapidly by an average of 6.5˚C compared to the
outdoor. This gain starts to reduce slightly from 5pm till the end of the day, when
both line graphs meet again. The minimum indoor temperature is 20˚C at 6am
while the maximum reached is 38˚C at 3pm. The relative humidity varies along the
day from 30-87%. Comparing the above results with the thermal comfort, 15 hours
were obtained within the comfort limits considering the temperature and relative
humidity comfort limits.
1am 2am 3am 4am 5am 6am 7am 8am 9am 10am 11am 12pm 1pm 2pm 3pm 4pm 5pm 6pm 7pm 8pm 9pm 10pm 11pm 12am
Indoor Temperature˚C 23.74 22.9 22.06 21.28 20.74 20.29 20.31 20.37 21.66 24.41 28.96 33.04 35.92 37.59 37.67 36.58 35.08 33.17 31.15 29.58 28.15 27.01 25.67 24.65
Outside Dry Bulb˚C 23.25 22.25 21.55 21.1 21 20.4 19.98 20.42 21.65 23.5 26.1 27.7 29.5 30.75 30.55 30.85 31 30.1 28.45 27.25 26.25 25.25 25 24.25
Relative Humidity% 68.75 72.95 77.64 82.13 84.66 86.97 87.36 87.69 81.38 69.67 53.71 42.13 35.23 31.55 30.73 31.94 33.9 37.72 41.82 44.84 48.88 53.36 58.78 63.84
0
10
20
30
40
50
60
70
80
90
100
0
5
10
15
20
25
30
35
40
45˚C
Re
lati
ve H
um
idit
y
%
Tem
pe
ratu
re
Case A - 21st September
Comfort zone (temperature )
Fig. 9 Thermal simulation results of Case study A in September.
1am 2am 3am 4am 5am 6am 7am 8am 9am 10am 11am 12pm 1pm 2pm 3pm 4pm 5pm 6pm 7pm 8pm 9pm 10pm 11pm 12am
Indoor Temperature˚C 12.4 12.2 12.08 12.01 11.87 11.73 11.57 11.85 12.06 12.49 13.42 14.91 16.55 17.75 18.24 17.94 17.33 16.32 15.45 14.71 14.17 13.8 13.5 12.87
Outside Dry Bulb˚C 11.85 11.25 11.3 11.1 11 10.4 10.05 11.05 10.35 10 11.5 12.45 12.9 13.75 13.85 13.95 14 13.02 12.18 12 12.15 12.05 12 11.55
Relative Humidity% 65.78 68.26 69.35 68.72 68.19 67.74 66.89 65.3 64.78 61.22 56.32 50.9 44.83 40.85 39.49 40.07 41.09 43.67 47.94 50.77 52.86 57.02 60.61 63.25
0
10
20
30
40
50
60
70
80
90
100
0
5
10
15
20
25
30
35
40
45˚C
Rela
tive
Hum
idity
%
Tem
pera
ture
Case A - 21st December
Comfort zone (temperature )
Fig. 10 Thermal simulation results of Case study A in December.
The results of December for case A, Fig. 10, show higher values of the indoor
temperature than the outdoor's during the day. From 1am to 12pm it is by an
average of 1.5˚C higher than the outdoor, this value increases to 4˚C from 1pm till
7pm, then it falls to 1.5˚C at the end of the day. The minimum indoor temperature is
about 12˚C and the maximum is 18˚C. The relative humidity ranges from 40-69%.
This month is out of comfort range according to the comfort limits.

11
1am 2am 3am 4am 5am 6am 7am 8am 9am 10am 11am 12pm 1pm 2pm 3pm 4pm 5pm 6pm 7pm 8pm 9pm 10pm 11pm 12am
Indoor Temperature˚C 17.53 17.17 16.82 16.56 16.31 16.06 15.84 15.75 16.13 17.16 18.92 21.34 22.79 23.75 23.99 24.10 23.80 23.44 23.04 22.47 21.54 20.57 19.59 18.22
Outside Dry Bulb˚C 16.85 16.90 16.17 15.85 15.57 15.27 15.05 15.00 15.75 16.75 18.88 20.10 20.45 20.42 21.23 21.88 21.17 20.67 19.70 17.60 16.55 15.35 15.00 14.93
Relative Humidity% 46.66 41.76 38.53 36.77 36.91 38.40 40.17 41.19 40.79 38.68 34.03 27.40 26.40 27.48 23.44 20.73 21.73 23.26 25.75 28.33 33.31 38.83 42.41 46.77
0
10
20
30
40
50
60
70
80
90
100
0
5
10
15
20
25
30
35
40
45
Re
lati
ve
Hu
mid
ity
%
Tem
pe
ratu
re
˚CCaseB -21stMarch
Comfort zone ( temperature)
Fig. 11 Thermal simulation results of Case B in March.
For case B in March, Fig. 11, heat gain is noticed along the day with variation; in
the first 12 hours of the day the indoor temperature is a little higher than the outdoor
by 0.6˚C. In the remaining 12 hours the difference increases to be around 3.5˚C.
The minimum indoor temperature is 16˚C at 8am and the maximum is 24 ˚C at
4pm. The relative humidity differs through the day from 21 % to 47%. 11 hours
are achieved within the comfort limits.
1am 2am 3am 4am 5am 6am 7am 8am 9am 10am 11am 12pm 1pm 2pm 3pm 4pm 5pm 6pm 7pm 8pm 9pm 10pm 11pm 12am
Indoor Temperature˚C 29.83 28.47 27.20 26 25.13 24.45 24.17 24.49 25.35 26.72 28.90 31.68 34.72 37.25 39.03 39.87 40.22 40.00 39.04 37.55 36.01 34.40 32.78 31.29
Outside Dry Bulb˚C 26.15 24.42 23.52 23.08 23.30 24.15 25.38 25.92 25.25 26.50 29.25 32.17 33.72 35.50 37.20 37.90 38.00 37.55 36.35 34.72 32.95 31.60 30.33 29.48
Relative Humidity% 47.76 49.65 51.81 54.70 57.66 60.01 61.07 60.30 58.87 54.95 48.99 42.53 34.64 28.89 26.15 24.41 23.45 23.21 23.56 25.81 29.32 33.41 36.72 41.82
0
10
20
30
40
50
60
70
80
90
100
0
5
10
15
20
25
30
35
40
45
Re
lati
ve
Hu
mid
ity
%
Tem
pe
ratu
re
˚CCase B- 21st June
Comfort zone ( temperature)
Fig. 12 Thermal simulation results of Case B in June.
Four time frames are noticed in Fig. 12, for case B in June, in which 6am, 9am,
1pm are considered as turning points. The first frame is from 1am to 5am, where the
indoor temperature has a higher value than the outdoor by an average value of
3.2˚C. From 6am to 8am a heat loss indoors occurs by 1.3˚C. Indoor and outdoor
temperature remains almost similar 9am until 12pm. The curves exchange their
positions again from 1pm till 12am, so that the indoor temperature gets higher than
the outdoor by 2.2˚C. The maximum indoor temperature in this month is 40˚C from
5pm to 6pm; which are also the peak hours outdoors and the minimum reaches
24˚C. The relative humidity varies from 23 % to 61%. 9 hours are within the
comfort limits.

12
1am 2am 3am 4am 5am 6am 7am 8am 9am 10am 11am 12pm 1pm 2pm 3pm 4pm 5pm 6pm 7pm 8pm 9pm 10pm 11pm 12am
Indoor Temperature˚C 25.02 24.2 23.4 22.65 22.01 21.43 21.41 21.3 21.69 23.01 25.38 28.31 30.87 32.84 33.89 34.23 33.88 33.11 31.92 30.71 29.55 28.44 27.06 25.98
Outside Dry Bulb˚C 23.25 22.25 21.55 21.1 21 20.4 19.98 20.42 21.65 23.5 26.1 27.7 29.5 30.75 30.55 30.85 31 30.1 28.45 27.25 26.25 25.25 25 24.25
Relative Humidity% 63.63 67.45 71.53 75.51 78.3 81.08 81.63 82.77 81.25 75.65 66.1 55.06 46.51 40.58 37.55 35.9 35.81 37.53 39.7 41.58 45.09 49.08 54.28 59.28
0
10
20
30
40
50
60
70
80
90
100
0
5
10
15
20
25
30
35
40
45
Re
lati
ve H
um
idit
y
%
Tem
pe
ratu
re
˚CCase B - 21st September
Comfort zone ( temperature)
Fig. 13 Thermal simulation results of Case B in September.
The results of Fig. 13 for case B in September, show higher values in the indoor
temperatures compared to the outdoor by except from 9am to11am where both line
graphs are almost alike. From 1am to 8am and from 12pm to 12am the indoor
temperature is above the outdoor by an average of 2.3˚C .The minimum indoor
temperature is 21˚C and the maximum 34˚C. The relative humidity ranges from
36% to 83%. 15 hours are within the thermal comfort limits.
1am 2am 3am 4am 5am 6am 7am 8am 9am 10am 11am 12pm 1pm 2pm 3pm 4pm 5pm 6pm 7pm 8pm 9pm 10pm 11pm 12am
Indoor Temperature˚C 13.38 13.06 12.85 12.7 12.55 12.37 12.2 12.53 12.58 12.76 13.26 14 14.98 16.05 16.84 17.14 17.17 16.78 16.28 15.76 15.32 14.93 14.57 13.89
Outside Dry Bulb˚C 11.85 11.25 11.3 11.1 11 10.4 10.05 11.05 10.35 10 11.5 12.45 12.9 13.75 13.85 13.95 14 13.02 12.18 12 12.15 12.05 12 11.55
Relative Humidity% 61.76 64.54 65.93 65.68 65.22 64.96 64.16 62.48 62.62 59.78 56.47 53.77 49.46 45.34 42.83 41.97 41.3 42.25 45.37 47.59 49.35 53.25 56.82 59.3
0
10
20
30
40
50
60
70
80
90
100
0
5
10
15
20
25
30
35
40
45
Re
lati
ve
Hu
mid
ity
%
Tem
pe
ratu
re
˚CCase B- 21st December
Comfort zone ( temperature)
Fig. 14 Thermal simulation results of Case B in December.
The results of December for case B, Fig. 14, show higher values in the indoor
temperatures compared to the outdoor by an average of 2.5˚C through the day. The
minimum indoor temperature is 12˚C at 7am and the maximum 17˚C. The relative
humidity ranges from 41% to 67%. This month did not fulfill thermal comfort.
1am 2am 3am 4am 5am 6am 7am 8am 9am 10am 11am 12pm 1pm 2pm 3pm 4pm 5pm 6pm 7pm 8pm 9pm 10pm 11pm 12am
Indoor Temperature˚C 19.17 18.72 18.24 17.87 17.56 17.27 17.01 16.84 16.97 17.45 18.41 19.53 20.62 21.54 22.07 22.42 22.52 22.55 22.68 22.53 22.04 21.49 20.64 19.71
Outside Dry Bulb˚C 16.85 16.90 16.17 15.85 15.57 15.27 15.05 15.00 15.75 16.75 18.88 20.10 20.45 20.42 21.23 21.88 21.17 20.67 19.70 17.60 16.55 15.35 15.00 14.93
Relative Humidity% 42.20 37.89 35.23 33.84 34.09 35.56 37.29 38.44 38.75 38.06 35.00 30.60 28.69 26.26 26.98 23.40 23.47 24.65 26.50 29.29 33.10 36.72 40.43 43.18
0
10
20
30
40
50
60
70
80
90
100
0
5
10
15
20
25
30
35
40
45
Re
lati
ve
Hu
mid
ity
%
Tem
pe
ratu
re
˚CCase C -21st March
Comfort zone ( temperature)
Fig. 15 Thermal simulation results of Case C in March.

13
From the results of case C in March, a heat gain is noticed indoors along the day
except from 11am till 1pm, where the indoor temperature gets lower than the
outdoor by 0.5˚C. The detected heat gain starts from 1am to 10am by an average of
2˚C, from 1pm to 6pm by 0.5˚C and finally the outdoor temperature decreases
rapidly compared to the indoor to be lower than it by 5˚C. The minimum indoor
temperature is about 17˚C and the maximum is about 23˚C. The relative humidity
differs through the day from 23% to 43%. 12 hours are achieved within the comfort
limits.
1am 2am 3am 4am 5am 6am 7am 8am 9am 10am 11am 12pm 1pm 2pm 3pm 4pm 5pm 6pm 7pm 8pm 9pm 10pm 11pm 12am
Indoor Temperature˚C 30.89 29.84 28.82 28 27.07 26.41 25.92 25.87 25.75 26.40 27.51 28.99 30.52 32.20 33.80 35.11 36.05 36.60 36.36 35.86 35.09 34.13 33.04 31.98
Outside Dry Bulb˚C 26.15 24.42 23.52 23.08 23.30 24.15 25.38 25.92 25.25 26.50 29.25 32.17 33.72 35.50 37.20 37.90 38.00 37.55 36.35 34.72 32.95 31.60 30.33 29.48
Relative Humidity% 44.79 45.98 47.16 48.99 51.25 53.34 55.02 55.99 58.31 56.45 53.32 49.76 44.65 39.30 35.38 32.67 30.82 29.51 28.76 29.07 31.25 34.07 36.27 40.18
0
10
20
30
40
50
60
70
80
90
100
0
5
10
15
20
25
30
35
40
45
Re
lati
ve H
um
idit
y
%
Tem
per
atu
re
˚CCase C - 21st June
Fig. 16 Thermal simulation results of Case C in June.
From Fig. 16 for case C in June, in the first period of the day from 1am to 7am a
heat gain indoors is observed by an average of 4˚C. From 8am the curves start to
exchange their positions, the outdoor temperature exceeds the indoor by an average
of 1.8˚C till 7pm. Finally the outdoor temperature decreases more than the indoor to
be lower than it by 2.2˚C. The maximum indoor temperature in this month is about
36˚C from 5pm to 8pm and the minimum 26˚C. The relative humidity varies from
29% to 58%. 8 hours are only within the comfort limits.
1am 2am 3am 4am 5am 6am 7am 8am 9am 10am 11am 12pm 1pm 2pm 3pm 4pm 5pm 6pm 7pm 8pm 9pm 10pm 11pm 12am
Indoor Temperature˚C 25.98 25.28 24.62 24 23.43 22.86 22.82 22.74 22.83 23.31 24.34 25.68 27.09 28.41 29.33 30.12 30.56 30.64 30.34 29.84 29.29 28.57 27.67 26.71
Outside Dry Bulb˚C 23.25 22.25 21.55 21.1 21 20.4 19.98 20.42 21.65 23.5 26.1 27.7 29.5 30.75 30.55 30.85 31 30.1 28.45 27.25 26.25 25.25 25 24.25
Relative Humidity% 60.25 63.31 66.53 69.63 71.85 74.32 74.92 75.82 75.91 74.49 70.59 64.31 57.72 51.87 48.28 45.03 42.9 42.31 42.87 43.13 45.06 48.58 52.1 56.73
0
10
20
30
40
50
60
70
80
90
100
0
5
10
15
20
25
30
35
40
45
Re
lati
ve H
um
idit
y
%
Tem
pe
ratu
re
˚CCase C - 21st September
Comfort zone ( temperature)
Fig. 17 Thermal simulation results of Case C in September.
For case C in September, Fig. 17, from 1am until 9am the inside temperature is
higher than the outside by an average of 2.5˚C. The the two line graphs intersect at
10am then the outdoor temperature increases to be above the indoor by 2˚C until
5pm. From 6pm to 12am the outdoor temperature decreases and get lower than the
indoor by 2˚C. The minimum indoor temperature in this month is about 23˚C while
the maximum reaches 31˚C. The relative humidity varies along the day from 42% to
76%. 17 hours were conducted within the comfort limits.
14
1am 2am 3am 4am 5am 6am 7am 8am 9am 10am 11am 12pm 1pm 2pm 3pm 4pm 5pm 6pm 7pm 8pm 9pm 10pm 11pm 12am
Indoor Temperature˚C 14.45 14.14 13.90 13.72 13.54 13.35 13.15 13.59 13.61 13.65 13.94 14.22 14.58 15.08 15.63 16.06 16.42 16.46 16.39 16.25 16.07 15.86 15.59 14.93
Outside Dry Bulb˚C 11.85 11.25 11.30 11.10 11.00 10.40 10.05 11.05 10.35 10.00 11.50 12.45 12.90 13.75 13.85 13.95 14.00 13.02 12.18 12.00 12.15 12.05 12.00 11.55
Relative Humidity% 57.69 60.18 61.59 61.44 61.10 60.89 60.25 58.81 59.00 56.61 53.89 52.73 50.67 48.33 46.58 45.11 43.36 43.07 44.97 46.12 47.08 50.30 53.37 55.63
0
10
20
30
40
50
60
70
80
90
100
0
5
10
15
20
25
30
35
40
45
Re
lati
ve H
um
idit
y
%
Tem
pe
ratu
re
˚CCase C- 21st December
Comfort zone ( temperature)
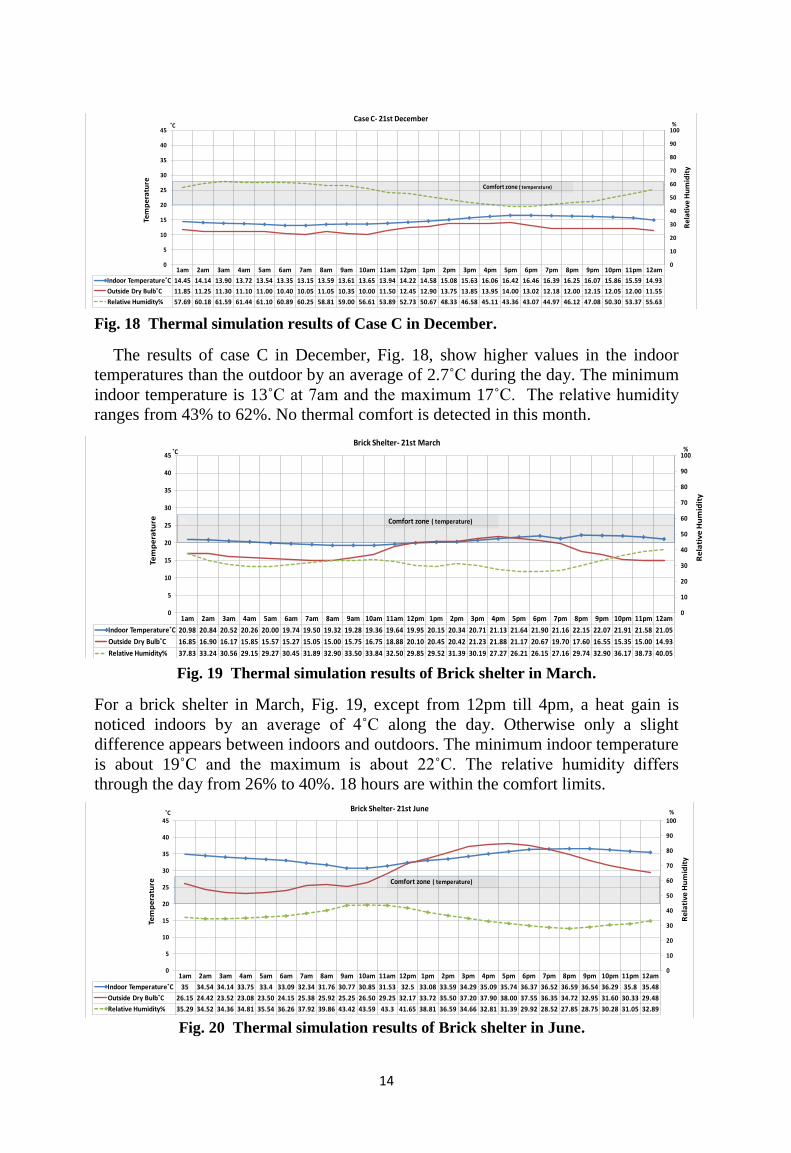
Fig. 18 Thermal simulation results of Case C in December.
The results of case C in December, Fig. 18, show higher values in the indoor
temperatures than the outdoor by an average of 2.7˚C during the day. The minimum
indoor temperature is 13˚C at 7am and the maximum 17˚C. The relative humidity
ranges from 43% to 62%. No thermal comfort is detected in this month.
1am 2am 3am 4am 5am 6am 7am 8am 9am 10am 11am 12pm 1pm 2pm 3pm 4pm 5pm 6pm 7pm 8pm 9pm 10pm 11pm 12am
Indoor Temperature˚C 20.98 20.84 20.52 20.26 20.00 19.74 19.50 19.32 19.28 19.36 19.64 19.95 20.15 20.34 20.71 21.13 21.64 21.90 21.16 22.15 22.07 21.91 21.58 21.05
Outside Dry Bulb˚C 16.85 16.90 16.17 15.85 15.57 15.27 15.05 15.00 15.75 16.75 18.88 20.10 20.45 20.42 21.23 21.88 21.17 20.67 19.70 17.60 16.55 15.35 15.00 14.93
Relative Humidity% 37.83 33.24 30.56 29.15 29.27 30.45 31.89 32.90 33.50 33.84 32.50 29.85 29.52 31.39 30.19 27.27 26.21 26.15 27.16 29.74 32.90 36.17 38.73 40.05
0
10
20
30
40
50
60
70
80
90
100
0
5
10
15
20
25
30
35
40
45
Re
lati
ve
Hu
mid
ity
%
Tem
pe
ratu
re
˚CBrick Shelter- 21st March
\\\ Comfort zone ( temperature)
Fig. 19 Thermal simulation results of Brick shelter in March.
For a brick shelter in March, Fig. 19, except from 12pm till 4pm, a heat gain is
noticed indoors by an average of 4˚C along the day. Otherwise only a slight
difference appears between indoors and outdoors. The minimum indoor temperature
is about 19˚C and the maximum is about 22˚C. The relative humidity differs
through the day from 26% to 40%. 18 hours are within the comfort limits.
1am 2am 3am 4am 5am 6am 7am 8am 9am 10am 11am 12pm 1pm 2pm 3pm 4pm 5pm 6pm 7pm 8pm 9pm 10pm 11pm 12am
Indoor Temperature˚C 35 34.54 34.14 33.75 33.4 33.09 32.34 31.76 30.77 30.85 31.53 32.5 33.08 33.59 34.29 35.09 35.74 36.37 36.52 36.59 36.54 36.29 35.8 35.48
Outside Dry Bulb˚C 26.15 24.42 23.52 23.08 23.50 24.15 25.38 25.92 25.25 26.50 29.25 32.17 33.72 35.50 37.20 37.90 38.00 37.55 36.35 34.72 32.95 31.60 30.33 29.48
Relative Humidity% 35.29 34.52 34.36 34.81 35.54 36.26 37.92 39.86 43.42 43.59 43.3 41.65 38.81 36.59 34.66 32.81 31.39 29.92 28.52 27.85 28.75 30.28 31.05 32.89
0
10
20
30
40
50
60
70
80
90
100
0
5
10
15
20
25
30
35
40
45
Re
lati
ve H
um
idit
y
%
Tem
pe
ratu
re
˚CBrick Shelter- 21st June
\\\ Comfort zone ( temperature)
Fig. 20 Thermal simulation results of Brick shelter in June.

15
For a brick shelter in June, Fig. 20, a 9˚C difference between indoor and outdoor
temperature is noticed due to the release of the stored heat. A high fluctuation of
outdoor temperature line graph is noticed. After 1am a thermal loss appears inside
and outside, but the indoor temperature is still above the outdoor by an average of
7˚C. At 12pm both line graphs meet and the indoor temperature gets below the
outdoor by 2˚C. In the last five hours the outdoor temperature drops rapidly to be
lower than the indoor by 4˚C. The maximum indoor temperature is 37˚C and the
minimum 31˚C. The relative humidity is from 28% to 43%. This case is out of
comfort zone.
From the results of a brick shelter in September, Fig. 21, in the first 11 hours of
the day the indoor temperature is higher than the outdoor by an average of 6˚C.
From 12pm to 6pm the line graphs exchange their positions, due to the increase of
the outdoor temperature that gets higher than the indoor by 2˚C. By the end of the
day, from 7pm to 12am the outdoor temperature decreases to be lower than the
indoor by 4˚C. The maximum temperature in this case is 30˚C, while the minimum
is 27˚C. The relative humidity varies from 43% to 60%. 15 hours are within the
comfort limits.
1am 2am 3am 4am 5am 6am 7am 8am 9am 10am 11am 12pm 1pm 2pm 3pm 4pm 5pm 6pm 7pm 8pm 9pm 10pm 11pm 12am
Indoor Temperature˚C 28.77 28.44 28.12 27.82 27.53 27.2 27.23 27.09 27.08 27.17 27.46 27.73 28.07 28.41 28.73 29.19 29.63 29.93 30.02 30.04 30.01 29.87 29.45 29.1
Outside Dry Bulb˚C 23.25 22.25 21.55 21.1 21 20.4 19.98 20.42 21.65 23.5 26.1 27.7 29.5 30.75 30.55 30.85 31 30.1 28.45 27.25 26.25 25.25 25 24.25
Relative Humidity% 51.43 52.7 54.17 55.56 56.36 57.41 57.62 58.5 58.93 59.34 58.91 57.19 54.54 51.89 49.65 47.31 45.06 43.89 43.5 42.53 43.34 45.28 47.68 49.84
0
10
20
30
40
50
60
70
80
90
100
0
5
10
15
20
25
30
35
40
45
Re
lati
ve
Hu
mid
ity
%
Tem
pe
ratu
re
˚CBrick Shelter- 21st September
\\\ Comfort zone ( temperature)
Fig. 21 Thermal simulation results of Brick shelter in September.
1am 2am 3am 4am 5am 6am 7am 8am 9am 10am 11am 12pm 1pm 2pm 3pm 4pm 5pm 6pm 7pm 8pm 9pm 10pm 11pm 12am
Indoor Temperature˚C 13.88 13.75 13.64 13.54 13.42 13.28 13.14 13.49 13.45 13.38 13.5 13.56 13.6 13.75 13.9 14.06 14.3 14.37 14.48 14.54 14.59 14.6 14.52 14.08
Outside Dry Bulb˚C 11.85 11.25 11.3 11.1 11 10.4 10.05 11.05 10.35 10 12.45 12.9 13.75 13.85 13.95 13.95 14 13.02 12.18 12 12.15 12.05 12 11.55
Relative Humidity% 59.51 61.57 62.56 62.14 61.56 61.16 60.31 58.64 59.14 57.4 55.34 54.99 53.97 52.53 51.7 51.1 49.51 49.02 50.53 51.05 51.34 54.14 56.82 58.45
0
10
20
30
40
50
60
70
80
90
100
0
5
10
15
20
25
30
35
40
45
Re
lati
ve H
um
idit
y
%
Tem
pe
ratu
re
˚CBrick Shelter- 21st December
\\\ Comfort zone ( temperature)
Fig. 22 Thermal simulation results of Brick shelter in December.
For a brick shelter in December, Fig. 22, the indoor temperature exceeds the
outdoor by an average of 2.5˚C through the whole day, except from 12pm to 3pm,

16
1am 2am 3am 4am 5am 6am 7am 8am 9am 10am 11am 12pm 1pm 2pm 3pm 4pm 5pm 6pm 7pm 8pm 9pm 10pm 11pm 12am
Case A 12.4 12.2 12.08 12.01 11.87 11.73 11.57 11.85 12.06 12.49 13.42 14.91 16.55 17.75 18.24 17.94 17.33 16.32 15.45 14.71 14.17 13.8 13.5 12.87
Case B 13.38 13.06 12.85 12.7 12.55 12.37 12.2 12.53 12.58 12.76 13.26 14 14.98 16.05 16.84 17.14 17.17 16.78 16.28 15.76 15.32 14.93 14.57 13.89
Case C 14.45 14.14 13.90 13.72 13.54 13.35 13.15 13.59 13.61 13.65 13.94 14.22 14.58 15.08 15.63 16.06 16.42 16.46 16.39 16.25 16.07 15.86 15.59 14.93
brick 13.88 13.75 13.64 13.54 13.42 13.28 13.14 13.49 13.45 13.38 13.5 13.56 13.6 13.75 13.9 14.06 14.3 14.37 14.48 14.54 14.59 14.6 14.52 14.08
0
5
10
15
20
25
30
35
40
45˚C
Tem
per
atu
re
December
where no difference is detected. The maximum indoor temperature is 14.5˚C and
the minimum 13˚C. The relative humidity ranges from 49% to 62%. No hours are in
comfort zone.
9. Discussion
The comparison of the case studies is based on the achieved thermal comfort
hours, the maximum and minimum temperature during the year, relative humidity
and cost. Fig. 23 compares the temperature line-graphs of all above studied cases
with each other, while Table 3 compares between them according to the maximum
and minimum temperature, the relative humidity and the achieved comfort hours
during the four months.
1am 2am 3am 4am 5am 6am 7am 8am 9am 10am 11am 12pm 1pm 2pm 3pm 4pm 5pm 6pm 7pm 8pm 9pm 10pm 11pm 12am
Case A 15.97 15.9 15.9 15.7 15.5 15.3 15.2 15.3 16.2 18.2 21.3 23.7 25.7 26.1 25.5 24.9 24.0 23.1 22.2 21.2 20.1 18.9 17.8 16.7
Case B 17.53 17.17 16.82 16.56 16.31 16.06 15.84 15.75 16.13 17.16 18.92 21.34 22.79 23.75 23.99 24.10 23.80 23.44 23.04 22.47 21.54 20.57 19.59 18.22
Case C 19.17 18.72 18.24 17.87 17.56 17.27 17.01 16.84 16.97 17.45 18.41 19.53 20.62 21.54 22.07 22.42 22.52 22.55 22.68 22.53 22.04 21.49 20.64 19.71
brick 20.98 20.84 20.52 20.26 20.00 19.74 19.50 19.32 19.28 19.36 19.64 19.95 20.15 20.34 20.71 21.13 21.64 21.90 21.16 22.15 22.07 21.91 21.58 21.05
0
5
10
15
20
25
30
35
40
45˚C
Tem
per
atu
re
March
(a) Comparison in March
1am 2am 3am 4am 5am 6am 7am 8am 9am 10am 11am 12pm 1pm 2pm 3pm 4pm 5pm 6pm 7pm 8pm 9pm 10pm 11pm 12am
Case A 27.90 26.41 25.16 24 23.17 22.75 22.91 24.25 26.14 28.35 31.41 35.64 39.70 41.81 42.69 42.38 41.71 40.65 38.77 36.51 34.55 32.76 30.87 29.37
case B 29.83 28.47 27.20 26 25.13 24.45 24.17 24.49 25.35 26.72 28.90 31.68 34.72 37.25 39.03 39.87 40.22 40.00 39.04 37.55 36.01 34.40 32.78 31.29
case C 30.89 29.84 28.82 28 27.07 26.41 25.92 25.87 25.75 26.40 27.51 28.99 30.52 32.20 33.80 35.11 36.05 36.60 36.36 35.86 35.09 34.13 33.04 31.98
brick 35 34.54 34.14 33.75 33.4 33.09 32.34 31.76 30.77 30.85 31.53 32.5 33.08 33.59 34.29 35.09 35.74 36.37 36.52 36.59 36.54 36.29 35.8 35.48
0
5
10
15
20
25
30
35
40
45˚C
Tem
per
atu
re
June
(b) Comparison in June
1am 2am 3am 4am 5am 6am 7am 8am 9am 10am 11am 12pm 1pm 2pm 3pm 4pm 5pm 6pm 7pm 8pm 9pm 10pm 11pm 12am
Case A 23.74 22.9 22.06 21.28 20.74 20.29 20.31 20.37 21.66 24.41 28.96 33.04 35.92 37.59 37.67 36.58 35.08 33.17 31.15 29.58 28.15 27.01 25.67 24.65
Case B 25.02 24.2 23.4 22.65 22.01 21.43 21.41 21.3 21.69 23.01 25.38 28.31 30.87 32.84 33.89 34.23 33.88 33.11 31.92 30.71 29.55 28.44 27.06 25.98
Case C 25.98 25.28 24.62 24 23.43 22.86 22.82 22.74 22.83 23.31 24.34 25.68 27.09 28.41 29.33 30.12 30.56 30.64 30.34 29.84 29.29 28.57 27.67 26.71
brick 28.77 28.44 28.12 27.82 27.53 27.2 27.23 27.09 27.08 27.17 27.46 27.73 28.07 28.41 28.73 29.19 29.63 29.93 30.02 30.04 30.01 29.87 29.45 29.1
0
5
10
15
20
25
30
35
40
45˚C
Tem
pe
ratu
re
September
(c) Comparison in September
Fig. 23 Comparison between all case studies.

17
1am 2am 3am 4am 5am 6am 7am 8am 9am 10am 11am 12pm 1pm 2pm 3pm 4pm 5pm 6pm 7pm 8pm 9pm 10pm 11pm 12am
Case A 12.4 12.2 12.08 12.01 11.87 11.73 11.57 11.85 12.06 12.49 13.42 14.91 16.55 17.75 18.24 17.94 17.33 16.32 15.45 14.71 14.17 13.8 13.5 12.87
Case B 13.38 13.06 12.85 12.7 12.55 12.37 12.2 12.53 12.58 12.76 13.26 14 14.98 16.05 16.84 17.14 17.17 16.78 16.28 15.76 15.32 14.93 14.57 13.89
Case C 14.45 14.14 13.90 13.72 13.54 13.35 13.15 13.59 13.61 13.65 13.94 14.22 14.58 15.08 15.63 16.06 16.42 16.46 16.39 16.25 16.07 15.86 15.59 14.93
brick 13.88 13.75 13.64 13.54 13.42 13.28 13.14 13.49 13.45 13.38 13.5 13.56 13.6 13.75 13.9 14.06 14.3 14.37 14.48 14.54 14.59 14.6 14.52 14.08
0
5
10
15
20
25
30
35
40
45˚C
Tem
per
atu
re
December
1am 2am 3am 4am 5am 6am 7am 8am 9am 10am 11am 12pm 1pm 2pm 3pm 4pm 5pm 6pm 7pm 8pm 9pm 10pm 11pm 12am
Case A 12.4 12.2 12.08 12.01 11.87 11.73 11.57 11.85 12.06 12.49 13.42 14.91 16.55 17.75 18.24 17.94 17.33 16.32 15.45 14.71 14.17 13.8 13.5 12.87
Case B 13.38 13.06 12.85 12.7 12.55 12.37 12.2 12.53 12.58 12.76 13.26 14 14.98 16.05 16.84 17.14 17.17 16.78 16.28 15.76 15.32 14.93 14.57 13.89
Case C 14.45 14.14 13.90 13.72 13.54 13.35 13.15 13.59 13.61 13.65 13.94 14.22 14.58 15.08 15.63 16.06 16.42 16.46 16.39 16.25 16.07 15.86 15.59 14.93
brick 13.88 13.75 13.64 13.54 13.42 13.28 13.14 13.49 13.45 13.38 13.5 13.56 13.6 13.75 13.9 14.06 14.3 14.37 14.48 14.54 14.59 14.6 14.52 14.08
0
5
10
15
20
25
30
35
40
45˚C
Tem
pe
ratu
re
December
(d) Comparison in December
Fig. 23 Cont.
Table 3 Comparison between Case Studies
Case A Case B Case C Brick
March Thermal Comfort hours 11hrs 11hrs 12hrs 18hrs
Min. Temp 15˚C 16˚C 17˚C 19˚C
Max. Tem 26˚C 21˚C 23˚C 22˚C
RH 20 – 50% 36-81% 23-43% 26 – 40%
June Thermal Comfort hours 10 hrs 9 hrs 8hrs 0
Min. Temp 23˚C 24˚C 26˚C 31˚C
Max. Tem 43˚C 40˚C 36˚C 37˚C
RH 21 -66% 23-61% 29-58% 28-43%
September Thermal Comfort hours 11 hrs 13 hrs 17hrs 15hrs
Min. Temp 20˚C 23˚C 23˚C 27˚C
Max. Tem 38˚C 34˚C 31˚C 30˚C
RH 30-87% 36-83% 42-76% 43-60%
December Thermal Comfort hours 0 0 0 0
Min. Temp 12˚C 12˚C 13˚C 13˚C
Max. Tem 18˚C 17˚C 17˚C 15˚C
RH 40-69% 41-67% 43-62 49-62%
The analysis of the above results can be summarized in the following points:
By increasing the thickness of the cardboard panels the minimum
temperature and minimum humidity elevate, while the maximum
temperature decreases during the year. Accordingly, Case B gives better
results than A in September and June. The more the thickness, the more the
resistance against heat absorption. The thermal comfort hours increase in
September by two hours and decrease in June by one. This variation is due
to the increase of the panel thickness that releases the stored heat slower than
Case A, which warm up the space at the beginning of the day.
Case C differs from B in removing the 3cm honeycomb structure and
leaving the cardboard panels with an air gap in between. The results show
that the minimum temperature in Case C is higher than case B due to the
slow release of the stored heat which results in the increase of the thermal

18
comfort hours in March and September. Although the comfort hours were
reduced by an hour in June, still the performance of Case C is higher than
Case B due to the decrease of the indoor temperature during the peak hours.
Besides, the reduction of the material usage, as the honeycomb is replaced
with an air gap, decreases the cost of Case C.
Comparing Case C with an economic brick shelter shows lower fluctuation
in the indoor temperature in the brick shelter because lightweight structures
cool down faster than heavy structures. They are able to gain heat rapidly
and lose it rapidly as well. This explains the increase of the brick shelter’s
minimum temperature in March, June and September compared to Case C.
In June, the brick shelter is out of comfort zone, because it did not get rid of
the stored heat easily during the night. The comfort hours in March are by 6
hours higher and by two hours lower in September than Case C. In
December, the maximum temperature is lower than in Case C. Hence,
Cardboard shelters, especially Case C shows better thermal performance
than brick shelters, due to the fast release of stored heat.
10. Conclusion
This paper has clarified the potentials of cardboard as a building material.
Corrugated cardboard may have some limitations as minimal fire and water
resistance, but adjustments can be achieved during the manufacturing in order to
enhance its performance. Cardboard fulfill the criteria needed for building
emergency mobile shelters; it is light weighted, flexible, durable, sustainable and
cost efficient. Besides, the simulation results show that cardboard shelter have
thermal insulation properties which can make it more adaptable than a brick shelter
in Egypt. Hence, this study holds that it is feasible to employ corrugated cardboard
as a main construction element in Egypt. The 6cm thick wall in Case E gives better
results than a 25cm brick wall, because lightweight structures gain and lose heat
rapidly. In addition, the flutes and materials used in Cardboard increase its
insulating properties. The use of cardboard as an alternative building material not
only satisfies a building’s structural demands, but also fulfills certain environmental
and social demands that make it more potentially and more attractive than standard
building materials.
References
1. Almut, P., 2009, Strengthened Corrugated Paper Honeycomb, Ph.D., Zurich.
2. Eekhout, M., Verheijen, F. and Visser, R. 2008, Cardboard in architecture,
Amsterdam: IOS Press.
3. Gribbon, H. and Foerster, F., 2008, Structural Engineering and Design in
Paper and Cardboard-Approaches and Projects, Cardboard in Architecture,
7, p. 95.
4. Hagercontainers.com, 2014, What is Corrugated? [online] Available at:

19
http://www.hagercontainers.com/corr0 [Accessed: 28 Jan 2014].
5. House, P., 2014, DOMESTIC CURRENT: Pin's Case Study: Shigeru Ban's
Paper Log House. [online] Available at: http://indayear2studio-
1314s1.blogspot.com/2013/09/pins-case-study-shigeru-bans-paper-log.html
[Accessed: 20Nov2013].
6. Inhabitat.com, 2013, Inhabitat - Sustainable Design Innovation, Eco
Architecture, Green Building. [online] Available at:
http://inhabitat.com/prefab-friday-global-village-
shelters/183873724_1cf536b36e_o/ [Accessed: 28 Nov2013].
7. Lithotech.ca.,2014, Corrugated Packaging Solutions, Design & Printing,
Point of Purchase, Retail Ready | Norampac-Lithotech Toronto. [online]
Available at: http://lithotech.ca [Accessed: 28 Jan 2014].
8. O'neil, E., 2014. Grace under Pressure, master, University of Pretoria.
9. ÖZLEM, A. 2009. CARDBOARD IN ARCHITECTURAL TECHNOLOGY.
Ph.D. Zurich.
10. Packaging-gateway.com, 2014, Smurfit-MBI Corrugated Container Plant
Ontario - Packaging Gateway. [online] Available at: http://www.packaging-
gateway.com/projects/smurfit_mbi/. [Accessed: 20Dec 2013].
11. Paulapuro, H., 2000, Paper and board grades, Helsinki, Finland: Fapet Oy.
12. Satyamag.com, 2013, Satya April 05: Interview with Shigeru Ban. [online]
Available at: http://www.satyamag.com/apr05/ban.html [Accessed: 24 Nov
2013].
13. Schreuders, P. D. Salmon, S. D. and Stewardson, G. A. 2008. Temporary
Housing for the Homeless: A Pre-Engineering Design Project. Technology
Teacher, 67 (4), pp. 4--10.
14. Shigerubanarchitects.com, 2013, 坂茂建築設計 | Shigeru Ban Architects.
[online] Available at: http://www.shigerubanarchitects.com/ [Accessed: 20
Nov 2013].
15. Van Dooren, E. and Van Iersel, T., 2008, A House of Cardboard, Cardboard
in Architecture, 7, p. 69.