
The Effects of Summary Information on Consumer Perceptions of Mutual Fund Characteristics
23
JOHN KOZUP, ELIZABETH HOWLETT, AND MICHAEL PAGANO The Effects of Summary Information on Consumer Perceptions of Mutual Fund Characteristics Choosing how to best invest for retirement is one of the most important decisions a consumer can make. Unfortunately, this can be an especially challenging task given the current financial information disclosure environment. The objective of this research was to explore whether a modified method of supplemental information disclosure impacts investors’ fund evaluations and investment intentions. Results indicate that while investors continue to place too much emphasis on prior per- formance, the provision of supplemental information, particularly in a graphical format, interacts with performance and investment knowl- edge to influence perceptions and evaluations of mutual funds. Making wise financial investments is one of the most important and chal- lenging decisions faced by consumers. One way to maintain and build wealth is to purchase shares in one or more of the thousands of available mutual funds. Millions of individuals count on these funds to provide them with a comfortable retirement income (Investment Company Institute 2005). This issue becomes increasingly important with the push by both government and industry to privatize individual retirement accounts. Cor- porations are shifting the pension burden from a defined pension benefit program to 401(k) programs managed primarily by employees. The 401(k) plans offered by employers are now the primary form of retirement savings for over forty-two million Americans with nearly two trillion dol- lars in assets (Lauricella 2004). Proponents of privatization argue that indi- viduals should, from a normative perspective, have the right to manage their own money. Proponents also argue that individuals could realize greater returns by investing a portion of their Social Security savings into the stock market. For example, a Bush administration proposal would allow John Kozup is the director for the Center for Marketing and Public Policy Research and an assistant professor in the Department of Marketing and Business Law, Villanova University, Villanova, PA ([email protected]). Elizabeth Howlett (formerly Elizabeth Creyer) is a professor of marketing at University of Arkansas, Fayetteville, AR ([email protected]). Michael Pagano is the asso- ciate director of the Institute for Research in Advanced Financial Technology and an associate professor of finance at Villanova University, Villanova, PA ([email protected]). The authors wish to thank MSI International, a full-service marketing research firm in King of Prussia, PA, for the use of their Internet panel. The Journal of Consumer Affairs, Vol. 42, No. 1, 2008 ISSN 0022-0078 Copyright 2008 by The American Council on Consumer Interests SPRING 2008 VOLUME 42, NUMBER 1 37
Transcript of The Effects of Summary Information on Consumer Perceptions of Mutual Fund Characteristics
JOHN KOZUP, ELIZABETH HOWLETT, AND MICHAEL PAGANO
The Effects of Summary Information on ConsumerPerceptions of Mutual Fund Characteristics
Choosing how to best invest for retirement is one of the most importantdecisions a consumer canmake. Unfortunately, this can be an especiallychallenging task given the current financial information disclosureenvironment. The objective of this research was to explore whethera modified method of supplemental information disclosure impactsinvestors’ fund evaluations and investment intentions. Results indicatethat while investors continue to place too much emphasis on prior per-formance, the provision of supplemental information, particularly ina graphical format, interacts with performance and investment knowl-edge to influence perceptions and evaluations of mutual funds.
Making wise financial investments is one of the most important and chal-
lenging decisions faced by consumers. One way to maintain and build
wealth is to purchase shares in one or more of the thousands of available
mutual funds. Millions of individuals count on these funds to provide them
with a comfortable retirement income (Investment Company Institute
2005). This issue becomes increasingly important with the push by both
government and industry to privatize individual retirement accounts. Cor-
porations are shifting the pension burden from a defined pension benefit
program to 401(k) programs managed primarily by employees. The
401(k) plans offered by employers are now the primary form of retirement
savings for over forty-two million Americans with nearly two trillion dol-
lars in assets (Lauricella 2004). Proponents of privatization argue that indi-
viduals should, from a normative perspective, have the right to manage
their own money. Proponents also argue that individuals could realize
greater returns by investing a portion of their Social Security savings into
the stock market. For example, a Bush administration proposal would allow
John Kozup is the director for the Center for Marketing and Public Policy Research and an assistant
professor in the Department of Marketing and Business Law, Villanova University, Villanova, PA
([email protected]). Elizabeth Howlett (formerly Elizabeth Creyer) is a professor of marketing
at University of Arkansas, Fayetteville, AR ([email protected]). Michael Pagano is the asso-
ciate director of the Institute for Research in Advanced Financial Technology and an associate professor
of finance at Villanova University, Villanova, PA ([email protected]).
The authors wish to thank MSI International, a full-service marketing research firm in King of
Prussia, PA, for the use of their Internet panel.
The Journal of Consumer Affairs, Vol. 42, No. 1, 2008
ISSN 0022-0078
Copyright 2008 by The American Council on Consumer Interests
SPRING 2008 VOLUME 42, NUMBER 1 37
individuals to choose from a range of investment options once their Social
Security account reached a specified minimum amount. Opponents of pri-
vatization argue that novice investors unfamiliar with risk and diversifica-
tion leave themselves vulnerable to fluctuations within the market. These
fluctuations, critics argue, could result in a substantial decline in retirement
earnings of those individuals who need the money the most. Employers are
increasingly concerned with the difficulty of getting employees familiar
with the basics of 401(k) plans. Education has become more difficult
with the number of investment options increasing for eligible employees
of many company retirement plans. Data support this conclusion. To
illustrate, for the ten years ended in 2002, the median return on company-
managed investment accounts averaged 6.81% versus 6.35% for employee-
managed investment accounts. This difference could result in a difference
of $88,000 over a thirty-year period for a $100,000 investment (Lauricella
2004).
Innovations in financial services and information technology, as well as
increased financial disclosure requirements mandated by regulators, have
created a choice environment replete with information. However, navigat-
ing through the plethora of information is not an easy task. Investors face
mutual fund prospectuses crammed with data regarding a fund’s return per-
formance, management expenses, loads, and marketing fees, as well as
details of the portfolio’s holdings. Given the sheer quantity of available
information to investors and the thousands of funds from which to choose,
picking the fund that most appropriately matches his/her personal risk–
return trade-off is a challenging task even for the savviest of investors.
The provision of information in a choice situation typically can provide
important consumer benefits such as improved decision making, enhanced
product quality, and lower prices (Mazis et al. 1981). However, in order
for that information to have a positive impact on the consumer decision-
making process, it must be easily accessible and presented in a clear and
understandable format. Unfortunately, the wide variety of choices and
information, coupled with an awareness of the need to make wise invest-
ment decisions, has made investing in a mutual fund a stressful and con-
fusing decision-making process. Scholars have issued a call for more
consumer research that specifically explores ways to facilitate the most
important and challenging decisions made by consumers (Bazerman
2001). Investigating investors’ financial knowledge and perceptions of
investment products is a clear example of such research.
Within the policy domain, there have been specific calls for format test-
ing of summary disclosures of financial information (Woodward 2004a).
Both the Federal Trade Commission and the Securities and Exchange
38 THE JOURNAL OF CONSUMER AFFAIRS
Commission (SEC) have investigated the possibility of mandating a stan-
dardized summary disclosure in order to improve consumer comprehen-
sion, facilitate fund differentiation, and increase awareness of key
information (Woodward 2004a, 2004b). For example, the SEC is aware
that the ordinary investor faces a complex decision when choosing a mutual
fund, and thus, the SEC provides a detailed online guide that describes
numerous relevant factors related to risk, return, and expenses (e.g.,
SEC 2006). In addition, SEC Chairman Christopher Cox has proposed
using Web-based ‘‘tagging’’ technology to make it easier for investors
to compare the performance of different mutual funds. Research by the
Investment Company Institute, an organization that represents the mutual
fund industry, supports the revamping of the disclosure mechanism to
include interactive data (West 2006). Tagging involves the placement of elec-
tronic tags on specific data items (e.g., revenue, profit margins, or reserves),
which allows investors to compare these interactive data across companies
and industry groups. However, it is not clear whether the use of such tech-
nology, if implemented in its currently proposed format, will result in a stan-
dardized summary disclosure of the most-salient mutual fund data.
Critics of financial service firms argue that they keep the cost of investing
low while charging customers exorbitant fees (Bazerman 2001; Zweig
2000). In a study of the S&P 500 index fund market, researchers found
that while average fees rose, the market share of the most economical funds
fell (Hortacsu and Syverson 2003). According to the authors, the lowest-
cost S&P 500 index fund has expenses of approximately 9.5 basis points,
while the highest-cost fund has fees of 268 basis points (Hortacsu and
Syverson 2003; Woodward 2004b). Individuals investing in the lower-
expense fund would have double the retirement income versus the more
expensive fund (Woodward 2004b). Investors, critics argue, lack the
knowledge to differentiate between high- and low-cost investment products
(Bazerman 2001; Yohannes 1988). Thus, the purpose of this research is to
explore the effects of salient summary information about a mutual fund on
investor perceptions and fund evaluations. Clearly, this issue has important
public policy implications. The inability of investors to make wise invest-
ment decisions may have a significant negative impact on their quality of
life in retirement and increase the likelihood of their dependence on gov-
ernment assistance programs.
BACKGROUND AND LITERATURE REVIEW
The percentage of novice investors who own mutual funds has grown
more than eightfold over the past twenty-five years (2005 Investment
SPRING 2008 VOLUME 42, NUMBER 1 39

Company Institute Fact Book). Over that period, innovations in financial
services and information technology, as well as increased financial disclo-
sure requirements mandated by regulators, have led to an explosion of
information that is disseminated to the novice investor. The rapid growth
in assets under management over the period of 1980–2004 and the
increased exposure of U.S. household wealth to the stock and bond markets
have provided the novice investor with a wider array of choices in terms of
types of funds, investing styles, risk, and expense information. Mutual fund
prospectuses now brim with data on a fund’s return performance, manage-
ment expenses, loads, and marketing fees, as well as details of the portfo-
lio’s holdings.
The increase in fund choice and fund information, coupled with the gen-
eral public’s greater awareness of the need to invest wisely in order to meet
personal financial goals, has increased the average investor’s desire to make
effective decisions related to the choice of mutual funds that meet his/her
return objectives while taking on an acceptable level of risk. Unfortunately,
research in finance, economics, and the psychology of economic decision
making suggests that the average investor has difficulty dealing with the
complexity of sifting through mutual fund data in order to make investment
decisions that properly balance risk, return, as well as the management
expenses and operating costs of a fund. For example, Benartzi and Thaler
(2001) find that mutual fund choices for the defined contribution pension
plans of employees at a large university and a commercial airline company
were determined largely by the number of stock and bond fund choices
presented within each plan. That is, a plan that had more bond funds than
stock funds led to a disproportionately high share of retirement savings
being allocated to the more-conservative bond funds. Conversely, a plan
that offered more stock funds than bond funds led investors to allocate a dis-
proportionately large share of savings to stock funds. The authors conclude
that their findings are consistent with a naı̈ve ‘‘1/n’’ allocation strategy
where a roughly equal share of savings is allocated across the n funds
offered to the investor. These decisions suggest that investors have a diffi-
cult time deciding how to allocate their savings across mutual funds and
thus use a simple heuristic to resolve this problem.
Previous fund performance, search costs, company size, and the firm’s
level of marketing effort seem to have a strong influence on investors’
mutual fund selection process (Sirri and Tufano 1998). Fund inflows
are greater when the fund management company is larger and expends
a higher level of marketing effort (even after controlling for the level of
past fund performance). This indicates that investors, in general, do not
necessarily take money out of mediocre or low-performing funds run by
40 THE JOURNAL OF CONSUMER AFFAIRS

large fund management companies even though there are clearly many
alternative high-performing funds.
The above findings corroborate some of the early research in the behav-
ioral finance literature. Shefrin and Statman (1984, 1985) and DeBondt and
Thaler (1985)were among the first finance papers to explore the implications
of Kahneman and Tversky’s (1979) seminal findings related to the psychol-
ogy of economic decision making. Shefrin and Statman’s work examines
why many individual investors prefer dividends over capital gains and
why investors typically hold losing stocks too long while selling winning
stocks too early. The authors explain this type of behavior via heuristic biases
such as overconfidence and anchoring, as well as frame dependence (i.e., the
answer to a question can change depending on how it is framed rather than
due to any substantive change in the question). Thus, the extent to which
behavioral/psychological biases ultimately affect the pricing of securities,
investor decisions, and stock market behavior is still open to debate and war-
rants further empirical analysis. Limited cognitive processing on the part of
investors opens up avenues for an effective information provision program
thatmaximizes investors’ constrained capabilities, ultimately impacting fund
evaluations and potentially investment intentions. The use of a summary
disclosure is one method available to accomplish such a goal.
HYPOTHESES
Research in other product contexts, particularly within the fields of nutri-
tion and drug information provision, can provide insight regarding how
supplemental summary information may potentially influence investors’
responses. Prior research in the area of nutrition information provision sup-
ported the creation of a summary format that listed key product attributes.
The Nutrition Facts panel mandated by the Nutrition Labeling and Edu-
cation Act provides the summary format on food packages conveying in-
formation on food nutrients, vitamins, as well as recommended daily
allowances. Consumers use the Nutrition Facts panel to verify the claims
made by both advertising and product on food packages (Ford et al. 1996;
Garretson and Burton 2000; Levy and Derby 1995) and, more recently, on
restaurant menus (Kozup, Creyer, and Burton 2003).
Additional studies support the impact of summary information on con-
sumer evaluations. In testing consumer performance when exposed to sum-
mary information, Barone et al. (1996) found that respondents given no
summary information showed no discrimination between healthy and
unhealthy brands of a food product, whereas respondents given summary
information rated the healthy brand superior to the unhealthy brand on
SPRING 2008 VOLUME 42, NUMBER 1 41

several nutrition-related attributes. In a study of television advertisements,
summary information may aid investors in making interbrand judgments
within a product category by providing a ‘‘shortcut’’ to comparison shopping
(Viswanathan and Hastak 2002). Information in the prescription drug arena
also provides insight into the use of a ‘‘brief summary’’ format. The provi-
sion, amount, and format of drug risk information were found to increase
risk-related knowledge in several studies (Morris andMillstein 1984;Morris,
Ruffner, and Klimberg 1985) as well as impact consumer appeal for a par-
ticular drug (Davis 2000; Tucker and Smith 1987).
Since prior research has shown that summary product information can
significantly impact consumers’ product evaluations across a variety of
domains, it seems likely that the provision of supplemental information will
have a considerable influence on investors’ mutual fund evaluations as
well. Typically, current investment decisions are strongly influenced by
the past performance of those investments (Coval and Shumway 2005;
Johnson and Tellis 2005). In fact, few are immune to the predictive power
of the ‘‘hot hand effect,’’ the term used to describe the bias that occurs when
an observed trend that may be part of a random process is projected into the
future (Andreassen 1988). Many mutual fund advertisements even encour-
age this bias by emphasizing the fund’s past performance (Johnson and
Tellis 2005). Thus, positive (negative) prior fund performance is expected
to have a favorable (unfavorable) influence on investors’ fund attitudes,
investment intentions, and expectations regarding future performance.
In addition, positive (negative) prior fund performance will decrease
(increase) the level of perceived risk associated with that fund.
However, we suggest that the hot hand effect is most likely to occur
when investors have clear and easily accessible performance information
that facilitates comparisons between the options. That is, simply presenting
the past performance of a fund may not provide enough information. An
important factor in the processing of numerical information is the need for
a comparative baseline (Viswanathan and Hastak 2002). Researchers argue
that the key to effective processing information lies in how easily the infor-
mation conveys meaning (Viswanathan and Childers 1996). Displaying
information in a graphical format has been shown to be an especially effec-
tive way to convey information to consumers (Bettman, Payne, and Staelin
1986). According to research on the cost–benefit principle (Payne 1982),
well-structured displays of information minimize search costs for a decision
maker. Furthermore, graphical formats (vs. alphanumeric information)
matter most in the initial stages of information processing, impacting
the amount of attention and consequently attitudes toward certain product
attributes (Jarvenpaa 1990).
42 THE JOURNAL OF CONSUMER AFFAIRS

Well-known models of persuasion such as the Elaboration Likelihood
Model (Petty and Cacioppo 1981, 1986) and the Heuristic–Systematic
Model (Chaiken 1980) also provide some guidance as to the effects of var-
ied types of information on consumer product evaluations. In their guidance
on developing effective risk communications, Rucker and Petty (2006) note
the importance of identifying whether the audience will process the infor-
mation in a careful or peripheral manner and designing information based
on their respective elaboration level. Surveys of investors indicate that
a very small percentage of investors actually read the prospectus with care.
Based on the Elaboration LikelihoodModel, this could result from a lack of
motivation to process the information, ability to process the information, or
both. Conveying the information in a graphical format therefore may serve
as a remedy for novice (peripheral) processors. Similarly, within the Heu-
ristic–Systematic Model framework, systematic processing of the prospec-
tus, based on surveys of investors, may occur infrequently if at all. Heuristic
processing, on the other hand, may occur more frequently as investors may
gravitate toward one salient attribute (e.g., performance) tomake a decision.
A graphical representation of key information that places other attributes at
an equal footing with performance may serve to attenuate faulty heuristic
processing and subsequently impact attribute evaluations and behavioral
intentions.
Presentation of fund performance information in a graphical (matrix)
format is expected to facilitate the processing of information, which will
in turn influence attitudes and intentions. More specifically, since graphical
information has been shown to convey risk information more effectively
than numerical information (Stone, Yates, and Parker 1997), the provision
of graphical information should interact with prior fund performance to
influence the dependent measures. In the absence of supplemental graph-
ical information, prior fund performance will have little influence on invest-
ors’ attitudes, investment intentions, expectations regarding future
performance, and perceived risk. However, when supplemental graphical
information is available, attitudes, investment intentions, and expectations
regarding future performance will be more positive and perceived risk will
be lower when the prior performance of that fund was above average as
compared to when it was below average.
The presence of supplemental information presented in a written-text
format should also serve to influence attitudes and investment intentions
associated with the specific fund. Research has shown that novice consum-
ers require salient decision criteria when evaluating choice alternatives
(Bettman and Sujan 1987), and written-text information may serve that
function. If this is the case, then the provision of written text supplemental
SPRING 2008 VOLUME 42, NUMBER 1 43

information is likely to affect investors in much the same way graphical
information is expected to influence responses.
H1a: The provision of graphical supplemental information will interact with prior
performance to influence investors’ responses. In the absence of graphical supple-
mental information, prior fund performance will have no significant effect on invest-
ors’ responses. However, when supplemental graphical information is provided,
attitudes toward the fund, investment intentions, and expectations regarding future
performance will be more positive (negative) and perceived risk will be lower
(higher) when prior performance was above average (below average).
H1b: The provision of written-text supplemental information will interact with prior
performance to influence investors’ responses. In the absence of written-text supple-
mental information, prior fund performance will have no significant effect on invest-
ors’ responses. However, when supplemental information is provided, attitudes
toward the fund, investment intentions, and expectations regarding future perfor-
mance will be more positive (negative) and perceived risk will be lower (higher)
when prior performance was above average (below average).
Prior knowledge about the mutual fund investment process is also
expected to influence investors’ responses. More specifically, investors
with higher levels of knowledge should be able to better use the financial
information that is available. This assumption is based on prior research that
has shown that greater product knowledge allows consumers to use prod-
uct-related information more appropriately in judgments and decisions
(Alba andHutchinson 1987; Levy, Fein, and Stephenson 1993). In addition,
more knowledgeable consumers seem to have more favorable attitudes, in
general, toward both the product and information about the product (Suter
and Burton 1996). Research in the areas of novice and expert decision mak-
ing also support this premise (Bettman and Sujan 1987; Maheswaran and
Sternthal 1990; Sujan 1985). Since prior knowledge is presumed to influ-
ence investors’ use of financial information, an interaction between the pro-
vision of information and prior knowledge also seems likely. More
knowledgeable consumers are less likely to ‘‘need’’ supplemental informa-
tion to make an informed decision. Note that we are presuming that, given
the fact that mutual funds are communicated to investors through govern-
ment (the SEC), the business community, and third-party sources (financial
planners and educators) as a wise way to invest, investors with prior invest-
ment knowledge will have a positive opinion of mutual funds.
H2: Investors with prior investment knowledge will report more positive (negative)
attitudes toward a specific superior (inferior) fund, higher (lower) investment inten-
tions and future performance expectations, and lower (higher) levels of perceived risk
than less knowledgeable consumers.
44 THE JOURNAL OF CONSUMER AFFAIRS

H3: Investors’ prior investment knowledge level will interact with the provision of
graphical financial information to influence (1) expectations regarding future perfor-
mance and (2) perceived risk levels. When knowledge is high, the provision of graph-
ical information will have no effect on either expected performance or perceived risk.
However, for low-knowledge respondents, the provision of graphical information
will have a stronger (positive) effect on expected performance and a lower (negative)
effect on perceived risk levels.
Extensive prior research suggests that product risk information can influ-
ence consumers’ product evaluations by making potential gains and losses
more salient (Goetzl 2000, 2001; Morris, Mazis, and Brinberg 1989). We
suggest that a fund’s level of perceived risk will mediate the effects that
a consumer’s general attitude toward mutual fund investments has on atti-
tudes and intentions associated with a specific mutual fund. That is, we
suggest that perceived risk serves as a mediator that accounts for the rela-
tionship between the consumer’s attitude toward mutual funds as a product
class and the outcome variables (i.e., attitudes and investment intentions
associated with a specific mutual fund).
H4: Perceived risk will mediate the influence of a consumer’s general attitude toward
the product class (mutual funds) on attitudes and intentions associated with a specific
mutual fund.
It is expected that the inclusion of supplemental information, regardless
of format, will result in stronger (more-positive) perceptions of the amount
of information supplied to investors. Prior research demonstrates that both
graphical and alphanumeric information display formats impact the atten-
tion given to product attributes (Jarvenpaa 1990). Therefore, it is assumed
that investors’ estimates of the amount of information conveyed will be
higher when supplemental information is presented. Prior research has
shown that perceived quantity of information factors into investors’ ratings
of decision quality, consumer purchase satisfaction, and decision process
satisfaction (Zhang and Fitzsimons 1999). Additionally, investors exhibit-
ing a positive pre-existing attitude toward the product class (mutual funds)
may be more likely to attend to and process information associated with the
fund, also resulting in higher estimates on information quantity.
H5: The provision of summary information, regardless of the format in which it is
presented, will positively affect the perceived quantity of information provided about
a mutual fund.
H6: Investors’ attitudes toward the product class (mutual funds) will influence per-
ceived information quantity. More positive attitudes will be associated with greater
perceived information quantity.
SPRING 2008 VOLUME 42, NUMBER 1 45
METHOD
Design, Procedures, and Study Participants
A 2 (provision of graphical information: provided vs. not provided) � 2
(provision of supplemental written-text information: provided vs. not pro-
vided) � 2 (fund performance: below average vs. above average) � 2
(investor knowledge: high vs. low) between-subjects experimental design
was employed. Whereas the former three variables were manipulated,
investor knowledge was a measured independent variable. A self-report
measure was used to assess investors’ investment knowledge.
For each of the conditions, a mock-up prospectus was developed. All
subjects were given data on annual total returns for one, three, and five
years as well as the total returns of the S&P 500 over the same period.
All subjects were also given annual performance data for the fund for
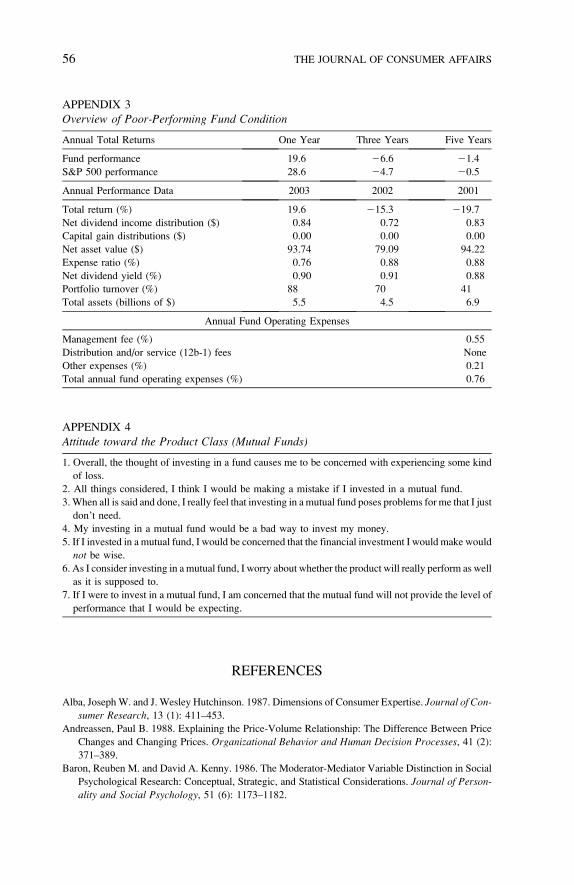
the previous three years (2001–2003). Finally, data were given for annual
fund operating expenses to all study participants. The total return informa-
tion and annual fund operating performance data were varied to reflect
good- versus poor-performing funds. Similarly, the annual fund operating
expense information was varied to reflect above-average versus below-
average fund expenses.
In addition to the total return, annual performance, and annual expense
data, subjects in the graphical condition were exposed to two 3� 3 matrices
representing investment style and three-year within-category performance
data, respectively. The first matrix identified the fund category (large cap
vs. medium cap vs. small cap on the vertical axis) and investment orien-
tation of the fund (value vs. mixed vs. growth on the horizontal axis). For
the purposes of this study, fund category and investment orientation
remained invariant across conditions (large capitalization with mixed ori-
entation). This allowed for flexibility with regard to the manipulations of
performance and risk while maintaining believability. The three-year
within-category performance matrix graphically conveyed information
on the relative return, risk, and expense data of the fund compared to
the average within the fund category.
A matrix format has been frequently used in information processing
experiments (e.g., Bettman and Kakkar 1977; Capon and Burke 1980).
The horizontal axis represented the expenses, return, and risk dimensions.
The vertical axis represented the fund’s relative rating on those attributes as
above average, average, or below average. A check mark was used to indi-
cate the fund’s performance in each of the three attributes. Prior fund per-
formance was manipulated consistently across the three attributes (return,
46 THE JOURNAL OF CONSUMER AFFAIRS

risk, and expenses). For example, an above-average fund had positive one-,
three-, and five-year total return data (29.9%, 3.1%, and 7.6%, respec-
tively). Correspondingly, the graphical condition represented these data
with a check mark in the above-average box for returns (see Appendices
1–3 for an overview of the data for the prior fund performance conditions).
The written-text supplemental information condition consisted of an
additional section (titled supplemental information) listed below the
expense information on the one-page prospectus. This information
included a relative return ranking, relative risk ranking, and a three-year
average expense ratio. The relative return and risk rankings were based
on the fund’s annual average return and the standard deviation of these
annual returns over the most-recent three-year period. For the expense ratio
data, an arithmetic average of the fund’s expense ratio over the most-recent
three-year period was employed. This information was manipulated across
fund performance conditions to represent above-average or below-average
performance across the three attributes. To be considered above average,
the relevant metric (return, risk, or expense ratio) must be more than one
standard deviation above the mean value for this metric within its peer
group of mutual funds. Likewise, to be considered below average, the rel-
evant metric must be more than one standard deviation below the mean
value of this metric for its peer group of funds. The formats for both
the basic and the supplemental disclosures were modeled after the typical
representations of these data in publications such as those produced by
Morningstar’s mutual fund rating service, American Association of Indi-
vidual Investors’ mutual fund guides, and actual mutual fund prospectuses.
As in the graphical condition, attribute value valences were consistent
across conditions (e.g., a below-average fund had poor returns, high risk,
and high expenses). A pilot test confirmed no significant difference
between the graphical and the written-text representations of expenses
(F , 1, p . .10).
Participants were members of the Planet Panel, a nationwide Internet
research panel. Members of the research panel were entered into a drawing
for cash prizes in exchange for their participation and randomly assigned to
the experimental conditions. The mutual fund stimuli were presented to
subjects in a static file that mirrored a traditional print disclosure. Investors
are increasingly turning to the Internet to evaluate mutual fund information.
Also, as previously stated, the SEC (2006) has proposed a new Internet-
based disclosure regimen. Three hundred thirty-eight panel members
participated, and ages ranged from nineteen to eighty with a mean age
of forty-one (twenty-one subjects per cell). Approximately 44 percent have
invested in mutual funds. Fifty-two percent of respondents were female.
SPRING 2008 VOLUME 42, NUMBER 1 47
Subjects were instructed that they had $2,000 to invest and are evaluating
a mutual fund for an investment opportunity. Subjects were then exposed to
the stimuli and then answered the survey questions.
Dependent Measures
Most of the dependent measures in the study were assessed with 7-point
scales; all multi-item measures were divided by the number of scale items,
and these mean scores were used in analyses. Attitude toward the specific
mutual fund shown was measured with three items (favorable/unfavorable,
good/bad, and positive/negative); higher values indicate less-favorable
attitudes. Cronbach’s coefficient alpha reliability estimate for this scale
was .97. The investment intention scale used the following three items:
‘‘Assuming you were going to invest in a mutual fund, would you be more
or less likely to invest in this fund, given the information shown?’’;
‘‘Given the information shown about the fund, how probable is it that
you would consider investing in this fund, if you were going to invest?’’;
and ‘‘How likely would you be to invest in this fund, given the informa-
tion shown?’’ (end points 1 ¼ more likely/7 ¼ less likely). Coefficient
alpha was .97 for this measure. The expected future performance of
the fund was assessed by the following four 7-point items (coefficient
a¼ .93): ‘‘Do you consider the potential financial returns associated with
investing in this mutual fund to be (endpoints 1 ¼ negative/7 ¼ positive,
favorable/unfavorable (reverse-coded), poor/good, and very low/very
high)?’’ The perceived risk of the mutual fund was evaluated by a single
7-point item (1 ¼ very risky/7 ¼ not at all risky). Self-reported mutual
fund knowledge was assessed by the following single-item measure
(1 ¼ not at all knowledgeable/7 ¼ very knowledgeable): How would
you rate your level of knowledge concerning mutual funds? A median
split was performed on this measure to create high–prior knowledge
and low–prior knowledge groups.
The perceived quantity of information was assessed by the following
two 7-point items (R ¼ .78, p , .001): ‘‘In general, the amount of infor-
mation provided for the mutual fund was (1 ¼ a little/7 ¼ a lot)’’ and ‘‘In
general, the information provided about the mutual fund seems (1 ¼ not at
all complete/7¼ very complete).’’ A general measure of attitude toward the
product class (mutual funds) (the mediator) contained seven items (sample
item: ‘‘If I were to invest in a mutual fund, I am concerned that the mutual
fund will not provide the level of performance that I would be expecting.’’).
Coefficient alpha for scale was .92 (Appendix 4). Investment knowledge
was assessed by the following item ‘‘How would you rate your level of
48 THE JOURNAL OF CONSUMER AFFAIRS
knowledge concerning mutual funds? (1 ¼ not at all knowledgeable,
7 ¼ very knowledgeable).’’
RESULTS
Hypotheses Tests
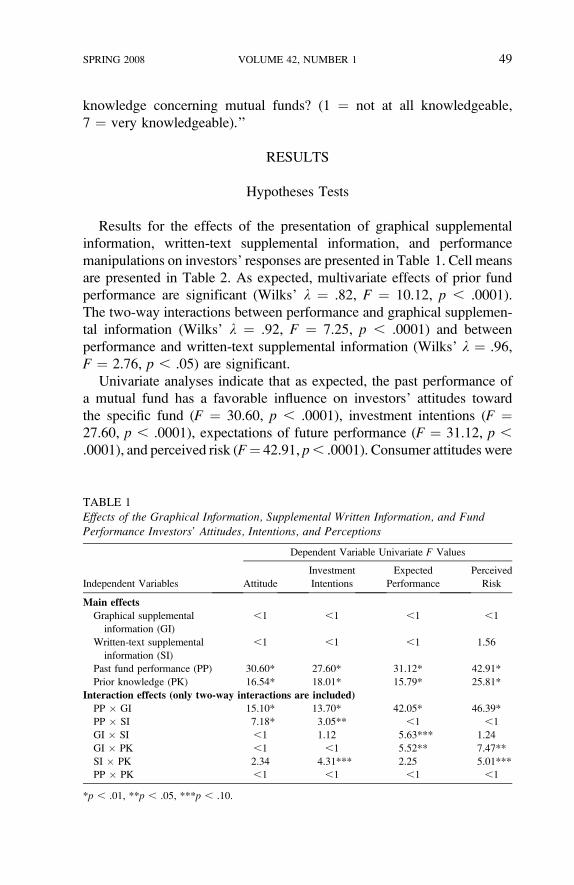
Results for the effects of the presentation of graphical supplemental
information, written-text supplemental information, and performance
manipulations on investors’ responses are presented in Table 1. Cell means
are presented in Table 2. As expected, multivariate effects of prior fund
performance are significant (Wilks’ k ¼ .82, F ¼ 10.12, p , .0001).
The two-way interactions between performance and graphical supplemen-
tal information (Wilks’ k ¼ .92, F ¼ 7.25, p , .0001) and between
performance and written-text supplemental information (Wilks’ k ¼ .96,
F ¼ 2.76, p , .05) are significant.
Univariate analyses indicate that as expected, the past performance of
a mutual fund has a favorable influence on investors’ attitudes toward
the specific fund (F ¼ 30.60, p , .0001), investment intentions (F ¼27.60, p , .0001), expectations of future performance (F ¼ 31.12, p ,
.0001), and perceived risk (F¼ 42.91, p, .0001). Consumer attitudes were
TABLE 1
Effects of the Graphical Information, Supplemental Written Information, and FundPerformance Investors’ Attitudes, Intentions, and Perceptions
Independent Variables
Dependent Variable Univariate F Values
Attitude
Investment
Intentions
Expected
Performance
Perceived
Risk
Main effects
Graphical supplemental
information (GI)
,1 ,1 ,1 ,1
Written-text supplemental
information (SI)
,1 ,1 ,1 1.56
Past fund performance (PP) 30.60* 27.60* 31.12* 42.91*
Prior knowledge (PK) 16.54* 18.01* 15.79* 25.81*
Interaction effects (only two-way interactions are included)
PP � GI 15.10* 13.70* 42.05* 46.39*
PP � SI 7.18* 3.05** ,1 ,1
GI � SI ,1 1.12 5.63*** 1.24
GI � PK ,1 ,1 5.52** 7.47**
SI � PK 2.34 4.31*** 2.25 5.01***
PP � PK ,1 ,1 ,1 ,1
*p , .01, **p , .05, ***p , .10.
SPRING 2008 VOLUME 42, NUMBER 1 49
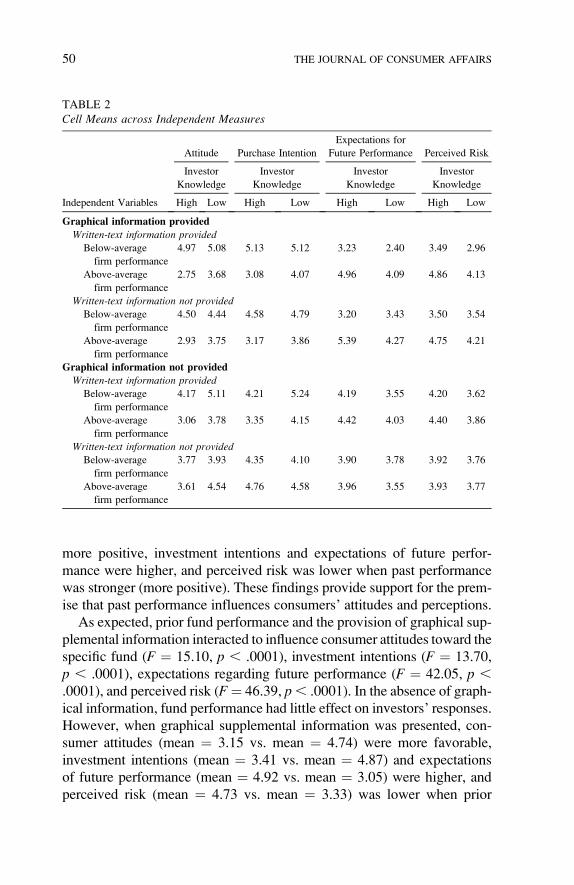
more positive, investment intentions and expectations of future perfor-
mance were higher, and perceived risk was lower when past performance
was stronger (more positive). These findings provide support for the prem-
ise that past performance influences consumers’ attitudes and perceptions.
As expected, prior fund performance and the provision of graphical sup-
plemental information interacted to influence consumer attitudes toward the
specific fund (F ¼ 15.10, p , .0001), investment intentions (F ¼ 13.70,
p , .0001), expectations regarding future performance (F ¼ 42.05, p ,
.0001), and perceived risk (F¼ 46.39, p, .0001). In the absence of graph-
ical information, fund performance had little effect on investors’ responses.
However, when graphical supplemental information was presented, con-
sumer attitudes (mean ¼ 3.15 vs. mean ¼ 4.74) were more favorable,
investment intentions (mean ¼ 3.41 vs. mean ¼ 4.87) and expectations
of future performance (mean ¼ 4.92 vs. mean ¼ 3.05) were higher, and
perceived risk (mean ¼ 4.73 vs. mean ¼ 3.33) was lower when prior
TABLE 2
Cell Means across Independent Measures
Independent Variables
Attitude Purchase Intention
Expectations for
Future Performance Perceived Risk
Investor
Knowledge
Investor
Knowledge
Investor
Knowledge
Investor
Knowledge
High Low High Low High Low High Low
Graphical information provided
Written-text information provided
Below-average
firm performance
4.97 5.08 5.13 5.12 3.23 2.40 3.49 2.96
Above-average
firm performance
2.75 3.68 3.08 4.07 4.96 4.09 4.86 4.13
Written-text information not providedBelow-average
firm performance
4.50 4.44 4.58 4.79 3.20 3.43 3.50 3.54
Above-average
firm performance
2.93 3.75 3.17 3.86 5.39 4.27 4.75 4.21
Graphical information not provided
Written-text information provided
Below-average
firm performance
4.17 5.11 4.21 5.24 4.19 3.55 4.20 3.62
Above-average
firm performance
3.06 3.78 3.35 4.15 4.42 4.03 4.40 3.86
Written-text information not providedBelow-average
firm performance
3.77 3.93 4.35 4.10 3.90 3.78 3.92 3.76
Above-average
firm performance
3.61 4.54 4.76 4.58 3.96 3.55 3.93 3.77
50 THE JOURNAL OF CONSUMER AFFAIRS

performance was above average as compared to when it was below average.
H1a is therefore confirmed.
Prior fund performance and the provision of written-text supplemental
information interacted to influence consumer attitudes (F ¼ 7.18, p, .01)
and investment intentions (F ¼ 3.05, p , .05, one tailed) as predicted in
H1b. When written-text supplemental information was presented, con-
sumer attitudes toward the fund (mean¼ 3.27 vs. mean¼ 4.64) were more
favorable and investment intentions (mean ¼ 3.60 vs. mean ¼ 4.71) were
higher. Contrary to expectations, neither expected performance (F, 1) nor
perceived risk (F , 1) was influenced by this interaction. H1b is therefore
only partially supported.
As predicted in H2, prior investment knowledge had a positive effect on
investors’ attitudes toward the fund (F ¼ 16.54, p , .0001), investment
intentions (F ¼ 18.01, p , .0001), and expectations regarding future per-
formance (F ¼ 15.79, p , .0001). Investors with higher levels of knowl-
edge had more positive (negative) attitudes, more positive (negative)
investment intentions, and more positive (negative) expectations of future
performance toward the superior (inferior) fund. Knowledge also signifi-
cantly influenced perceived risk levels (F ¼ 25.81, p , .0001). Investors
with a higher level of knowledge perceived the superior (inferior) fund to be
less (more) risky than less-knowledgeable investors. As expected in H3,
investors’ prior investment knowledge interacted with the provision of
graphical supplemental information to influence investors’ expectations
regarding future performance (F ¼ 5.52, p , .05) and perceived risk
(F¼ 7.47, p, .05). When knowledge was high, the provision of graphical
information had no effect on either expected performance or perceived risk.
However, for low-knowledge respondents, the provision of graphical infor-
mation had a positive effect on expected performance and decreased per-
ceived risk levels.
H4 posits that perceived risk mediates the influence that consumers’ atti-
tudes toward the product class (mutual funds) have on both their attitude
toward a specific fund and their investment intentions. In order to test for
mediation, we followed the guidelines proposed by Baron and Kenny
(1986). The results of a multiple regression confirm this finding for both
attitude toward the specific fund (B ¼ .54, t ¼ 3.6, p , .0001) and invest-
ment intention (B¼ .47, t¼ 3.35, p, .001). Next, the independent variable
(attitude toward the product class) must influence the potential mediator,
perceived risk. As shown above, and confirmed by a regression analysis
(B ¼ 2.37, t ¼ 24.02, p , .0001), this was also the case. The final step
in the process involves comparing the influence of the independent variable
on the dependent measure when the mediator is included in the model
SPRING 2008 VOLUME 42, NUMBER 1 51
versus when it is not. Mediation occurs if the effects of the independent
variable are substantially attenuated when the mediator is included in
the model; total mediation occurs if the effect of the independent variable
is eliminated. Multiple regression analyses tested the effect of attitude
toward the product class on attitude toward the specific fund and invest-
ment intentions. As predicted in H4, when perceived risk was included in
the model, the effects of attitude toward the product class on both attitude
toward the specific fund (B¼ .17, t¼ 1.45, p. .05) and investment inten-
tion (B ¼ .12, t ¼ 1.11, p , .05) are no longer significant.
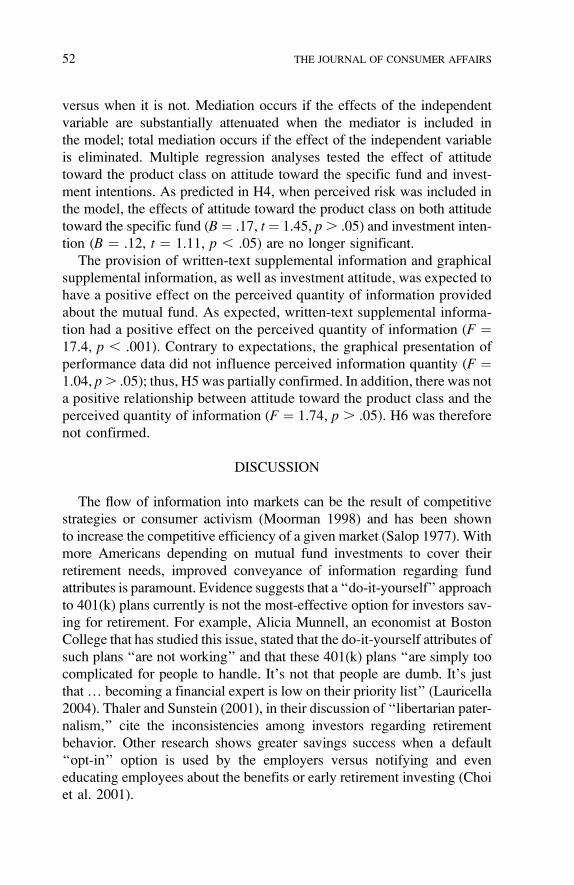
The provision of written-text supplemental information and graphical
supplemental information, as well as investment attitude, was expected to
have a positive effect on the perceived quantity of information provided
about the mutual fund. As expected, written-text supplemental informa-
tion had a positive effect on the perceived quantity of information (F ¼17.4, p , .001). Contrary to expectations, the graphical presentation of
performance data did not influence perceived information quantity (F ¼1.04, p. .05); thus, H5 was partially confirmed. In addition, there was not
a positive relationship between attitude toward the product class and the
perceived quantity of information (F ¼ 1.74, p . .05). H6 was therefore
not confirmed.
DISCUSSION
The flow of information into markets can be the result of competitive
strategies or consumer activism (Moorman 1998) and has been shown
to increase the competitive efficiency of a given market (Salop 1977). With
more Americans depending on mutual fund investments to cover their
retirement needs, improved conveyance of information regarding fund
attributes is paramount. Evidence suggests that a ‘‘do-it-yourself’’ approach
to 401(k) plans currently is not the most-effective option for investors sav-
ing for retirement. For example, Alicia Munnell, an economist at Boston
College that has studied this issue, stated that the do-it-yourself attributes of
such plans ‘‘are not working’’ and that these 401(k) plans ‘‘are simply too
complicated for people to handle. It’s not that people are dumb. It’s just
that. becoming a financial expert is low on their priority list’’ (Lauricella
2004). Thaler and Sunstein (2001), in their discussion of ‘‘libertarian pater-
nalism,’’ cite the inconsistencies among investors regarding retirement
behavior. Other research shows greater savings success when a default
‘‘opt-in’’ option is used by the employers versus notifying and even
educating employees about the benefits or early retirement investing (Choi
et al. 2001).
52 THE JOURNAL OF CONSUMER AFFAIRS
Applying mutual fund information to a cost–benefit framework is an
appropriate method to examine the effectiveness of information presenta-
tion formats. There are two strategies for increasing information use asso-
ciated with a cost–benefit view (Russo et al. 1986). The first is to increase
the perceived benefits of using information and is consistent with educa-
tional and social marketing endeavors. The second strategy is to reduce the
costs associated with increased information processing efforts. This
research provides limited support for presenting summary information
to investors in order to impact product-related attitudes and behaviors.
The provision of summary information in both a graphical and a written-
text format interacted with fund performance to impact several of the
dependent measures. The further testing of alternative information formats
is an appropriate next step since a specific type of graphical format empha-
sizing comparative information was used in the present study. Similar types
of pictorial presentations have been used to convey information to invest-
ors. For example, Consumer Reports magazine uses comparative informa-
tion to grade product performance. Investors should be familiar with and
responsive to comparative graphical information.
This research also supports prior work investigating the effects of prior
knowledge on product evaluations. Subjects with higher knowledge
about the product class had stronger attitudes toward the specific mutual
fund information shown, investment intentions, expectations of future
performance, and levels of perceived risk associated with investing in
their particular fund. This finding has important implications for fund
companies, regulators, and educational agencies. For example, segment-
ing investors on the basis of prior knowledge will enable both these par-
ties to present the types of information that specific investors will find
most useful.
Other results of note include the impact of prior fund performance on
subsequent fund perceptions and evaluations. Prior fund performance sig-
nificantly affected all the dependent measures except for the quantity of
perceived information. The implications of this result may be of interest
to policy makers. The SEC currently mandates a fair disclosure policy
in promotional materials (e.g., ‘‘Past performance is no guarantee of future
returns’’). Subjects in this study seem to gravitate toward prior fund per-
formance in a significant way. Additional research is warranted to explore
this effect and whether subjects are exhibiting a pre-existing bias (Johnson
and Tellis 2005).
Scholars have debated the goals of information provision programs.
A hierarchy-of-effects model has been proposed as a solution to this
dilemma (Preston 1982; Russo et al. 1986). Investors should first be made
SPRING 2008 VOLUME 42, NUMBER 1 53
aware of new information. Next, that information then becomes salient
and results in shifts in product perceptions and behavioral intentions.
Our research illustrates that an effort reduction strategy can work in
the mutual fund arena, resulting in an impact on attitudinal measures
as well as performance and risk components. As Sirri and Tufano
(1998) have observed, mutual fund companies that market more aggres-
sively tend to garner more net inflows to their funds. Thus, profit-
maximizing mutual fund companies that offer funds with relatively
low expense ratios and/or higher returns could use a modified summary
disclosure as part of a competitive strategy that differentiates them from
other firms. Our results show that investors will respond positively to
summary data presented on a single page. Prior research has shown that
improved information presentation formats reduce search costs, poten-
tially increasing the likelihood of optimal choice (thereby reducing the
likelihood of regret or postpurchase dissatisfaction) and reducing the bur-
dens of information load on investors (Payne 1985). This research shows
that the presentation of summary information impacts investors’ fund
evaluations and risk perceptions.
As noted above, the need for improved financial education programs
targeting American investors has been the focus of scholars and regulators
alike (Fox, Bartholomae, and Lee 2005). For example, investor activists
have called for the inclusion of education programs that focus and frame
the summary disclosure solely around fees and expense information
(Woodward 2004b). Our results show that while expense information
should be a key component of the summary disclosure, concise infor-
mation on other salient fund characteristics should also be included as
they impact several key dependent measures in our study. As noted in
the introduction, both the SEC and the Investment Company Institute
are championing both summary disclosure in plain English and the use
of Web-based technology enhancements to the disclosure of mutual fund
information, which can enable investors to compare all types of informa-
tion between different mutual funds (e.g., risks, returns, expenses, and tax
implications). This is a step in the right direction although it is not clear
what type of format will result in a more-concise summary disclosure that
highlights the most-salient fund characteristics for the investor. Most
importantly, from a consumer welfare perspective, our results suggest that
investors leverage past performance disproportionately in their fund eval-
uations. This suggests that the SEC-mandated disclosure: ‘‘Past perfor-
mance is no guarantee of future returns,’’ should be wrapped into
a broader, full-information effort that can adequately factor into investors’
fund evaluations.
54 THE JOURNAL OF CONSUMER AFFAIRS

APPENDIX 1
Overview of Positively Performing Fund Condition
Annual Total Returns One Year Three Years Five Years
Fund performance 29.9 3.1 7.6
S&P 500 performance 28.6 24.7 20.5
Annual Performance Data 2003 2002 2001
Total return (%) 29.9 29.4 26.9
Net dividend income distribution ($) 0.35 0.28 0.30
Capital gain distributions ($) 0.00 0.00 0.00
Net asset value ($) 39.54 30.70 34.20
Expense ratio (%) 0.46 0.45 0.40
Net dividend yield (%) 0.90 0.91 0.88
Portfolio turnover (%) 88 70 41
Total assets (billions of $) 5.5 4.5 6.9
Annual Fund Operating Expenses
Management fee (%) 0.25
Distribution and/or service (12b-1) fees None
Other expenses (%) 0.21
Total annual fund operating expenses (%) 0.46
APPENDIX 2
Overview of Average-Performing Fund Condition
Annual Total Returns One Year Three Years Five Years
Fund performance 28.6 21.5 1.3
S&P 500 performance 28.6 24.7 20.5
Annual Performance Data 2003 2002 2001
Total return (%) 28.6 215.2 212.3
Net dividend income distribution ($) 0.31 0.24 0.28
Capital gain distributions ($) 0.00 0.00 0.00
Net asset value ($) 34.22 26.85 31.95
Expense ratio (%) 0.61 0.58 0.57
Net dividend yield (%) 0.90 0.91 0.88
Portfolio turnover (%) 88 70 41
Total assets (billions of $) 5.5 4.5 6.9
Annual Fund Operating Expenses
Management fee (%) 0.40
Distribution and/or service (12b-1) fees None
Other expenses (%) 0.21
Total annual fund operating expenses (%) 0.61
SPRING 2008 VOLUME 42, NUMBER 1 55
REFERENCES
Alba, JosephW. and J. Wesley Hutchinson. 1987. Dimensions of Consumer Expertise. Journal of Con-
sumer Research, 13 (1): 411–453.
Andreassen, Paul B. 1988. Explaining the Price-Volume Relationship: The Difference Between Price
Changes and Changing Prices. Organizational Behavior and Human Decision Processes, 41 (2):
371–389.
Baron, Reuben M. and David A. Kenny. 1986. The Moderator-Mediator Variable Distinction in Social
Psychological Research: Conceptual, Strategic, and Statistical Considerations. Journal of Person-
ality and Social Psychology, 51 (6): 1173–1182.
APPENDIX 3
Overview of Poor-Performing Fund Condition
Annual Total Returns One Year Three Years Five Years
Fund performance 19.6 26.6 21.4
S&P 500 performance 28.6 24.7 20.5
Annual Performance Data 2003 2002 2001
Total return (%) 19.6 215.3 219.7
Net dividend income distribution ($) 0.84 0.72 0.83
Capital gain distributions ($) 0.00 0.00 0.00
Net asset value ($) 93.74 79.09 94.22
Expense ratio (%) 0.76 0.88 0.88
Net dividend yield (%) 0.90 0.91 0.88
Portfolio turnover (%) 88 70 41
Total assets (billions of $) 5.5 4.5 6.9
Annual Fund Operating Expenses
Management fee (%) 0.55
Distribution and/or service (12b-1) fees None
Other expenses (%) 0.21
Total annual fund operating expenses (%) 0.76
APPENDIX 4
Attitude toward the Product Class (Mutual Funds)
1. Overall, the thought of investing in a fund causes me to be concerned with experiencing some kind
of loss.
2. All things considered, I think I would be making a mistake if I invested in a mutual fund.
3.When all is said and done, I really feel that investing in a mutual fund poses problems for me that I just
don’t need.
4. My investing in a mutual fund would be a bad way to invest my money.
5. If I invested in a mutual fund, I would be concerned that the financial investment I would make would
not be wise.
6. As I consider investing in a mutual fund, I worry about whether the product will really perform as well
as it is supposed to.
7. If I were to invest in a mutual fund, I am concerned that the mutual fund will not provide the level of
performance that I would be expecting.
56 THE JOURNAL OF CONSUMER AFFAIRS

Barone, Michael J., Randall L. Rose, Kenneth C. Manning, and Paul W. Miniard. 1996. Another Look
at the Impact of Reference Information on Consumer Impressions of Nutrition Information. Journal
of Public Policy & Marketing, 15 (1): 55–62.
Bazerman, Max H. 2001. Consumer Research for Consumers. Journal of Consumer Research, 27 (1):
499–504.
Benartzi, Schlomo and Richard Thaler. 2001. Naı̈ve Diversification Strategies in Defined Contribution
Savings Plans. American Economic Review, 91 (1): 79–98.
Bettman, James and Pradeep Kakkar. 1977. Effects of Information Presentation Format on Consumer
Information Acquisition Strategies. Journal of Consumer Research, 3 (1): 233–240.
Bettman, James, John W. Payne, and Richard Staelin. 1986. Cognitive Considerations in Designing
Effective Labels for Presenting Risk Information. Journal of Public Policy & Marketing, 5 (1):
1–28.
Bettman, James and Mita Sujan. 1987. Effects of Framing on Evaluation of Comparable and Noncom-
parable Alternatives by Expert and Novice Consumers. Journal of Consumer Research, 14 (3): 141–
154.
Capon, Noel and Marion Burke. 1980. Individual, Product Class, and Task-Related Factors in Con-
sumer Information Processing. Journal of Consumer Research, 7 (3): 314–326.
Chaiken, Shelly. 1980. Heuristic vs. Systematic Processing and the Use of Source vs. Message Cues in
Persuasion. Journal of Personality and Social Psychology, 39 (4): 752–756.
Choi, James J., David Laibson, BridgetteMadrian, and AndrewMetrick. 2001. For Better or ForWorse:
Default Effects and 401(k) Savings Behavior. NBER Working Paper Series 8651. http://finance.
wharton.upenn.edu/~metrick/boulders.pdf.
Coval, Joshua D. and Tyler Shumway. 2005. Do Behavioral Biases Affect Prices? Journal of Finance,60 (1): 1–34.
Davis, Joel J. 2000. Riskier Than We Think? The Relationship Between Risk Statement Completeness
and Perceptions of Direct to Consumer Advertised Prescription Drugs. Journal of Health Commu-
nication, 5 (4): 349–369.
DeBondt, W. and R.H. Thaler. 1985. Does the Stock Market Overreact? Journal of Finance, 40 (1):
793–895.
Ford, Gary T., Manoj Hastak, AnusreeMitra, and Debra Jones Ringold. 1996. Can Consumers Interpret
Nutrition Information in the Presence of a Health Claim? A Laboratory Investigation. Journal ofPublic Policy & Marketing, 15 (1): 16–27.
Fox, Jonathan, Suzanne Bartholomae, and Jinkook Lee. 2005. Building the Case for Financial Edu-
cation. The Journal of Consumer Affairs, 39 (1): 195–211.
Garretson, Judith and Scot Burton. 2000. The Nutrition Facts Panel and Package Claims: The Role of
Nutrient Values, Multiple Claims and Congruent Information on Attitudes, Disease-Related Risks
and Consumer Trust. Journal of Public Policy & Marketing, 19 (2): 213–227.
Goetzl, David. 2000. TVB Study: DTC Disclosures Lend Credibility to Drug Ads. Advertising Age,June 5, 6.
———. 2001. Xenical Reworks Its Ads; TV Spots Stress Awareness, Skip Over Side Effects. Adver-
tising Age, February 5, 3.
Hortacsu, Ali and Chad Syverson. 2003. Product Differentiation, Search Costs, and Competition in the
Mutual Fund Industry: A Case Study of the S&P 500 Index Funds. NBER Working Paper 9728.
Cambridge, MA: National Bureau of Economic Research.
Investment Company Institute. 2005. Investment Company Institute Fact Book. http://www.ici.org/pdf/
2005_factbook.pdf (retrieved January 10, 2006).
Jarvenpaa, S.L. 1990. Graphical Displays in Decision-Making—The Visual Salience Effect. Journal of
Behavioral Decision Making, 3 (4): 247–262.
Johnson, Joseph and Gerard J. Tellis. 2005. Blowing Bubbles: Heuristics and Biases in the Run-Up of
Stock Prices. Journal of the Academy of Marketing Science, 33 (4): 486–503.
Kahneman, D. and A. Tversky. 1979. Prospect Theory: An Analysis of Decision Making Under Risk.
Econometrica, 47 (2): 263–291.
SPRING 2008 VOLUME 42, NUMBER 1 57

Kozup, John C., Elizabeth H. Creyer, and Scot Burton. 2003. Making Healthful Food Choices: The
Influence of Health Claims and Nutrition Information on Consumer’s Evaluations of Packaged
Food Products and Restaurant Menu Items. Journal of Marketing, 67 (1): 19–34.
Lauricella, Tom. 2004. Money Trouble: A Lesson for Social Security: ManyMismanage Their 401(k)s;
Workers Often Make Bad Picks in Saving for Retirement. Wall Street Journal, December 1, A1.
Levy, Alan and Brenda Derby. 1995. Food Label Use and Nutrition Education Survey: Selected Results
Prepared for the Dietary Guidelines Advisory Committee. Washington, DC: U.S. Food and Drug
Administration.
Levy, Alan, Sara Fein, and Marilyn Stephenson. 1993. Nutrition Knowledge Levels about Dietary Fats
and Cholesterol: 1983-1988. Journal of Nutrition Education, 25 (2): 60–66.
Maheswaran, Durairaj and Brian Sternthal. 1990. The Effect of Knowledge, Motivation and Type
of Message on Ad Processing and Product Judgments. Journal of Consumer Research, 17 (1):
66–73.
Mazis, Michael B., Richard Staelin, Howard Beales, and Steven Salop. 1981. A Framework for Eval-
uating Consumer Information Regulation. Journal of Marketing, 45 (1): 11–21.
Moorman, Christine. 1998. Market-Level Effects of Information: Competitive Responses and Con-
sumer Dynamics. Journal of Marketing Research, 35 (1): 82–98.
Morris, Louis A., Michael Mazis, and David Brinberg. 1989. Risk Disclosures in Televised Prescription
Drug Advertising to Consumers. Journal of Public Policy & Marketing, 8 (1): 64–70.
Morris, Louis A. and Lloyd G. Millstein. 1984. Drug Advertising to Consumers: Effects of Formats for
Magazine and Television Advertisements. Food, Drug, Cosmetic Law Journal, 39: 497–503.
Morris, Louis A., Michael Ruffner, and Ronald Klimberg. 1985. Warning Disclosures for Prescription
Drugs. Journal of Advertising Research, 25 (5): 25–32.
Payne, John W. 1982. Contingent Decision Behavior. Psychological Bulletin, 92 (2): 382–402.
———. 1985. Psychology of Risky Decisions. In Behavioral Decision Making, edited by G. Wright,
pp. 3–23. London: Plenum.
Petty, Richard and John T. Cacioppo. 1981. Attitudes and Persuasion: Classic and ContemporaryApproaches. Dubuque, IA: William C. Brown.
———. 1986. Communication and Persuasion: Central and Peripheral Routes to Attitude Change.
New York: Springer-Verlag.
Preston, Ivan L. 1982. The Association Model of the Advertising Communication Process. Journal ofAdvertising, 11 (2): 3–15.
Rucker, Derek and Richard Petty. 2006. Increasing the Effectiveness of Communications to Consumers:
Recommendations Based on the Elaboration Likelihood and Attitude Certainty Perspectives. Jour-nal of Public Policy & Marketing, 25 (1): 39–52.
Russo, J. Edward, Richard Staelin, Catherine A. Nolan, Gary J. Russell, and Barbara L. Metcalf. 1986.
Nutrition Information in the Supermarket. Journal of Consumer Research, 13 (2): 48–70.
Salop, Steven. 1977. The Noisy Monopolist: Imperfect Information, Price Dispersion, and Price Dis-
crimination. Review of Economic Studies, 44 (3): 393–406.
Securities and Exchange Commission (SEC). 2006. Invest Wisely: An Introduction to Mutual Funds.
http://www.sec.gov/investor/pubs/inwsmf.htm (retrieved October 12, 2006).
Shefrin, H. and M. Statman. 1984. Explaining Investor Preference for Cash Dividends. Journal ofFinancial Economics, 13 (2): 253–282.
———. 1985. The Disposition to Sell Winners Too Early and Ride Losers Too Long: Theory and
Evidence. Journal of Finance, 40 (4): 777–790.
Sirri, Erik R. and Pete Tufano. 1998. Costly Search andMutual Fund Flows. Journal of Finance, 53 (5):
1589–1622.
Stone, Eric R., J. Frank Yates, and Andrew M. Parker. 1997. Effects of Numerical and Graphical Dis-
plays on Professed Risk-taking Behaviour. Journal of Experimental Psychology: Applied, 3 (4):
243–256.
Sujan, Mita. 1985. Consumer Knowledge: Effects on Evaluation Strategies Mediating Consumer Judg-
ments. Journal of Consumer Research, 12 (1), 31–46.
58 THE JOURNAL OF CONSUMER AFFAIRS
Suter, Tracy and Scot Burton. 1996. An Examination of Correlates and Effects Associated with a
Concise Measure of Consumers’ Nutrition Knowledge. Family and Consumer Sciences Research
Journal, 25 (2), 117–136.
Thaler, Richard and Cass Sunstein. 2001. Libertarian Paternalism. American Economic Review, 93
(2): 175–179.
Tucker, Gregory and Mickey C. Smith. 1987. Direct-to-Consumer Advertising: Effects of Different
Formats of Warning Information Disclosure on Cognitive Reactions of Adults. Journal of Phar-
maceutical Marketing & Management, 2 (1): 27–41.
Viswanathan, Madhubalan and Terry L. Childers. 1996. Processing of Numerical and Product Infor-
mation. Journal of Consumer Psychology, 5 (4): 359–386.
Viswanathan, Madhubalan and Manoj Hastak. 2002. The Role of Summary Information in Facilitating
Consumers’ Comprehension of Nutrition Information. Journal of Public Policy & Marketing,21 (2): 305–318.
West, Sandra. 2006. Understanding Investor Preferences for Mutual Fund Information. http://www.
ici.org/statements/res/1rpt_06_inv_prefs_full.pdf (retrieved November 15, 2006).
Woodward, Susan. 2004a. Make Mutual Funds Bare All. Wall Street Journal, January 16, A10.
———. 2004b. Comment to SEC in Response to ‘‘Confirmation Requirements and Point-of-Sale Dis-
closure Requirements.’’ http://www.sia.com/2004_comment_letters/pdf/SEC04-12-04.pdf (retrieved
October 3, 2005).
Yohannes, Arefaine. 1988. The Derivation of Simple Formulas for Comparing Investment Alternatives
with and without Load and Account Fees. The Journal of Consumer Affairs, 22 (2): 333–341.
Zhang, Shi and Gavan J. Fitzsimons. 1999. Choice-Process Satisfaction: The Influence Attribute Align-
ability and Option Limitation. Organizational Behavior and Human Decision Processes, 77 (3):
192–214.
Zweig, Jason. 2000.Mutual Competition. http://www.money.com/money/depts./investing/fundamentalist/
archive/0008/html (retrieved January 10, 2006).
SPRING 2008 VOLUME 42, NUMBER 1 59