the effects of project-based learning on student achievement
76
THE EFFECTS OF PROJECT-BASED LEARNING ON STUDENT ACHIEVEMENT IN A FOURTH GRADE CLASSROOM by Katie Redmond A professional paper submitted in partial fulfillment of the requirements for the degree of Masters of Science in Science Education Montana State University Bozeman, Montana July 2014
-
Upload
khangminh22 -
Category
Documents
-
view
0 -
download
0
Transcript of the effects of project-based learning on student achievement

THE EFFECTS OF PROJECT-BASED LEARNING ON STUDENT ACHIEVEMENT
IN A FOURTH GRADE CLASSROOM
by
Katie Redmond
A professional paper submitted in partial fulfillment of the requirements for the degree
of
Masters of Science
in
Science Education
Montana State University Bozeman, Montana
July 2014
ii
STATEMENT OF PERMISSION TO USE
In presenting this professional paper in partial fulfillment of the requirements for
a master’s degree at Montana State University, I agree that the MSSE, program shall
make it available to borrowers under rules of the program.
Katie Redmond
July 2014
i
iii
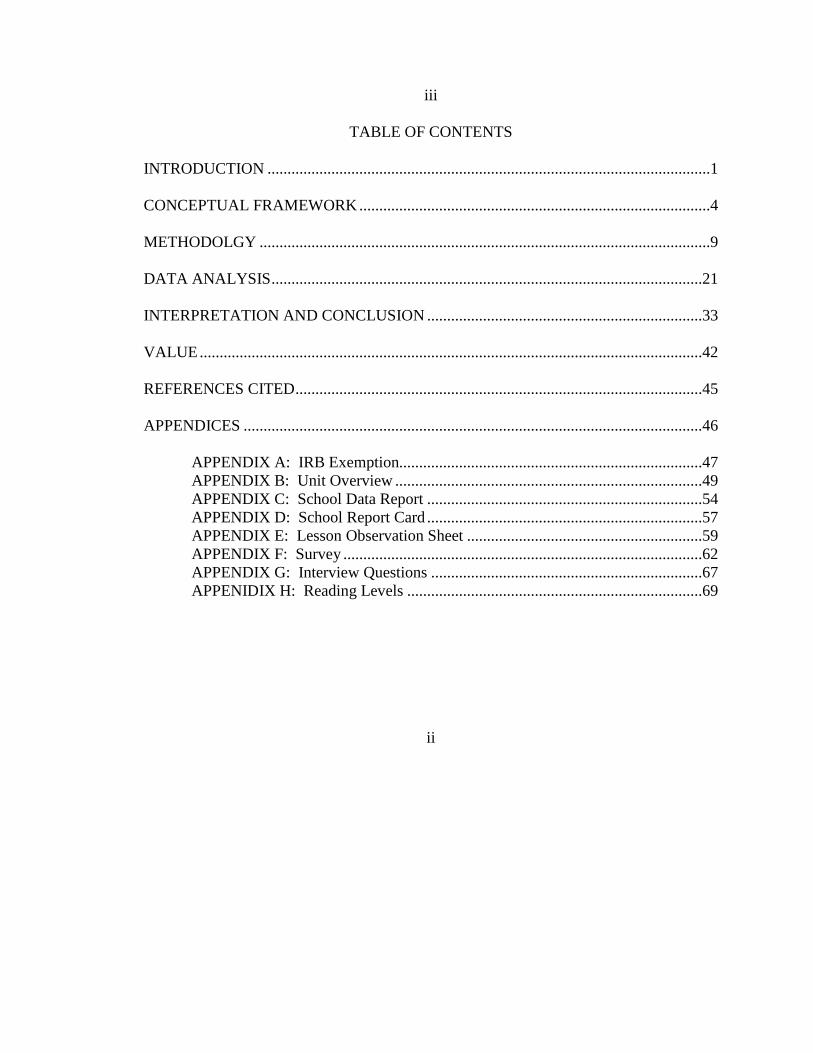
TABLE OF CONTENTS
INTRODUCTION ...............................................................................................................1 CONCEPTUAL FRAMEWORK ........................................................................................4 METHODOLGY .................................................................................................................9 DATA ANALYSIS ............................................................................................................21 INTERPRETATION AND CONCLUSION .....................................................................33 VALUE ..............................................................................................................................42 REFERENCES CITED ......................................................................................................45 APPENDICES ...................................................................................................................46
APPENDIX A: IRB Exemption............................................................................47 APPENDIX B: Unit Overview .............................................................................49 APPENDIX C: School Data Report .....................................................................54 APPENDIX D: School Report Card .....................................................................57 APPENDIX E: Lesson Observation Sheet ...........................................................59 APPENDIX F: Survey ..........................................................................................62 APPENDIX G: Interview Questions ....................................................................67 APPENIDIX H: Reading Levels ..........................................................................69
ii
iv
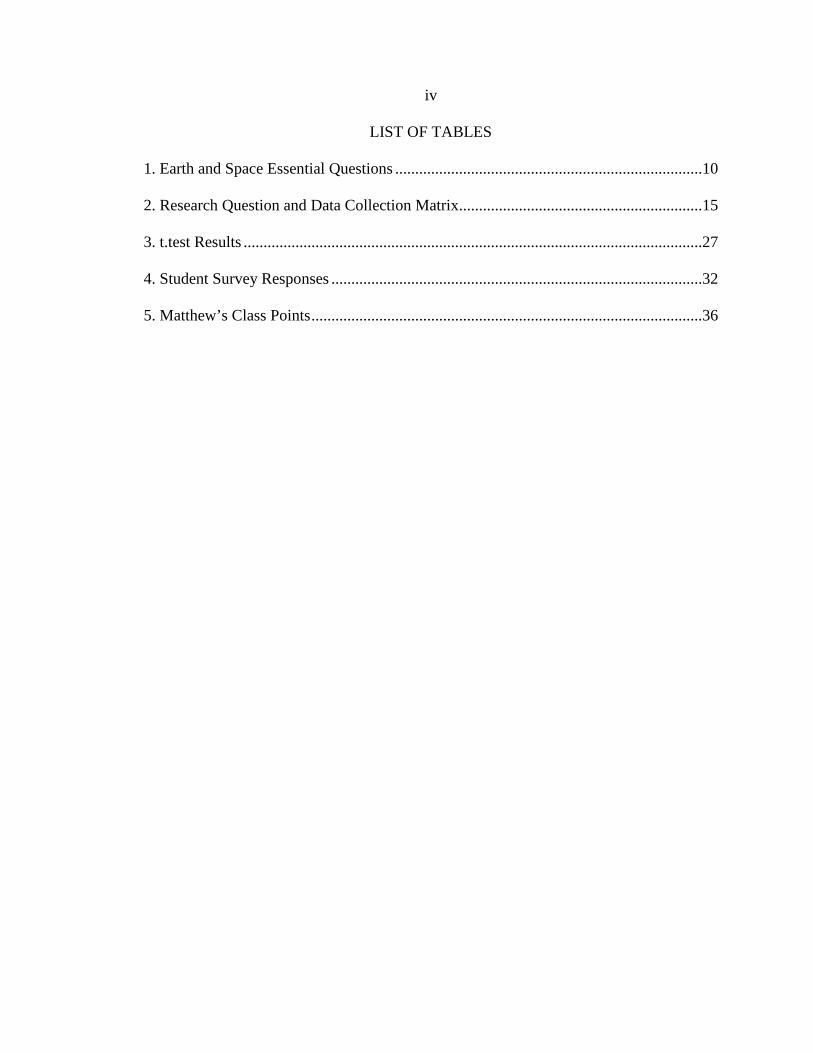
LIST OF TABLES
1. Earth and Space Essential Questions .............................................................................10
2. Research Question and Data Collection Matrix.............................................................15
3. t.test Results ...................................................................................................................27
4. Student Survey Responses .............................................................................................32
5. Matthew’s Class Points ..................................................................................................36
v
LIST OF FIGURES
1. Negative Point Categories ..............................................................................................20
2. Positive Point Categories ...............................................................................................21
3. Pretest and Posttest Means .............................................................................................23
4. Non-Treatment Pretest and Posttest Box-and-Whisker Plot ..........................................25
5. Treatment Pretest and Posttest Box-and Whisker Plot ..................................................25
6. Total Positive Points ......................................................................................................28
7. Total Negative Points .....................................................................................................30

vi
ABSTRACT
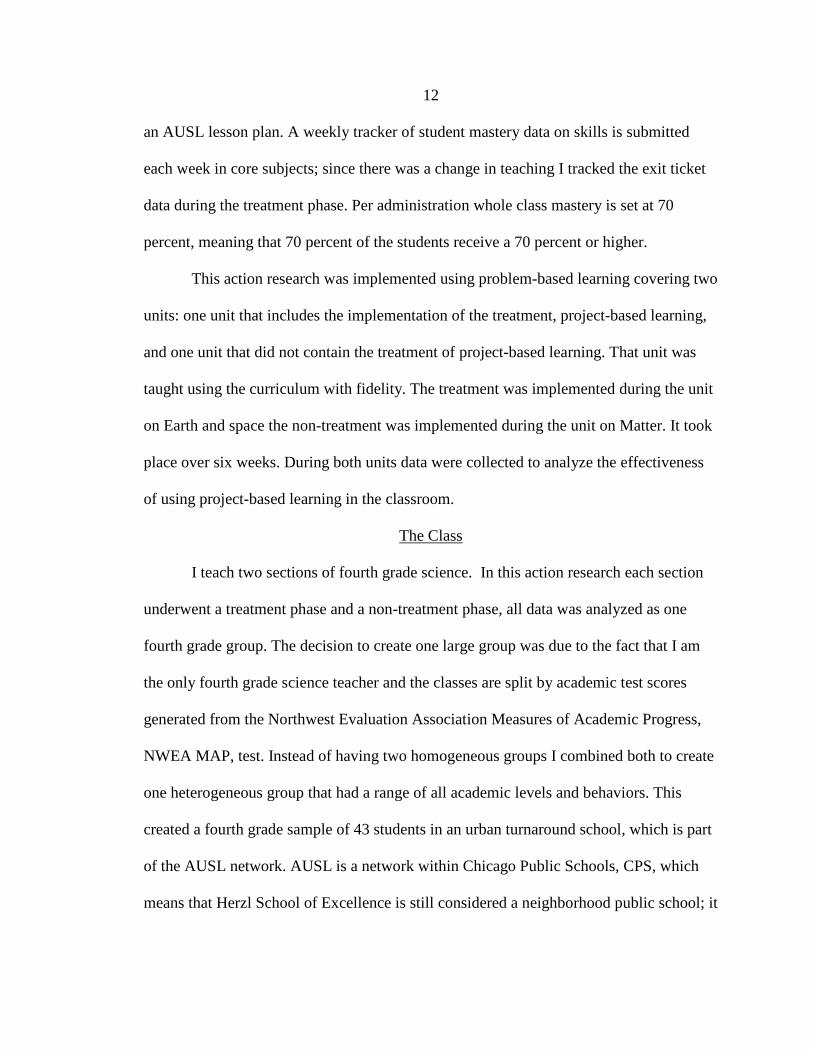
In this action research, project-based learning was implemented with the purpose of improving student achievement and student engagement within the science classroom. Students participated in project-based learning activities in addition to their traditional instruction. Students’ achievement in science and attitudes toward science and school were measured throughout the action research through assessments, observations, attitude surveys, and daily tasks. Academic growth was seen in students who typically perform below grade level. In addition student engagement and attitudes were positively impacted.
1
INTRODUCTION
I have thoroughly enjoyed my seven years as a teacher in an urban environment,
especially when teaching science. I began my career teaching second and third grade, but
I chose to make a move to fourth grade because there is a greater focus on science at that
grade level due to Illinois State Achievement Testing, also referred to as the ISAT. In
Illinois, fourth grade is the first year that science is tested statewide. In addition, science
is only tested in fourth and seventh grade, which places significant pressure on teachers at
those grade levels to perform well and represent the school positively. My passion for
teaching science motivated me to take on an active role in driving student achievement in
that subject area, but I did not realize how challenging that undertaking would turn out to
be.
Throughout my years of teaching science I observed that students lacked
motivation and drive to be successful in science class. At an under performing urban
school, students consistently struggle to grasp science concepts, frequently form their
own misconceptions, and have little to no experience with the many topics covered in
elementary science. Initially, my fourth grade students had essentially no interest in
science class and seemed to believe that success in that class would be too difficult. In
prior grades, students rarely received science on a consistent basis because teachers must
prioritize literacy and mathematics to catch students up to grade level, 89% of my fourth
grade students are reading two or more levels below grade level. Adding to that
difficulty, the science textbook that Herzl School of Excellence, which is a part of the
Academy of Urban School Leadership (AUSL), provides is written at a level at least two
2
years above what a majority of my students can independently read. These factors make
achieving student engagement in science a particular challenge and teaching in a
traditional ways, such as direction instruction, proved ineffective.
In science, student achievement seemed to be stagnant and disengagement was
noticeable in the science classroom compared to other subjects such as math. With this
action research project I strived to implement a new teaching practice in the science
classroom that would be more effective in raising student achievement and, at the same
time, improve student engagement in science. I implemented project-based learning in
my science classroom to promote more hands on learning to attempt to meet those goals.
Through project-based learning, students were exposed to the school-issued science
curriculum, but it was enhanced with hands on project-based tasks a minimum of three
times per week. For purposes of this action research, project-based learning is defined as
teacher facilitated projects in which student groups work together to seek out information
and synthesize ideas to complete the task. For example, during this action research one
of the tasks required students to explain Earth’s rotation to a sibling who believed that the
Earth did not spin because people on Earth could not feel it spinning. Students worked as
a group and used a variety of resources to model and explain Earth’s rotation. Due to the
nature of project-based tasks, I assumed more of a facilitator role in the classroom and
allowed students to take the lead. Students demonstrated their learning through
completing a variety of tasks while working with others.
The action research was implemented in Earth and space science unit. Students
explored and researched the learning objective themselves and reached their own

3
conclusions through group discovery and minimal guidance from me. This action
research also included a non-treatment phase where students were not participating in
project-based learning, which was implemented during a science unit on matter.
Research Proposal
In this action research project I asked the question: how will implementing project
based learning impact student achievement in the classroom? In addition to this question
I asked the following sub-questions:
• How does project-based learning affect student motivation in the classroom?
• How will the implementation of project-based learning affect behavior
management in the classroom?
• What impact does project-based learning have on positive behavior in the
classroom?
The action research questions were developed around my concern for my students
in science. Overall, as a teacher, I was concerned about their academic growth in science,
but I also was highly concerned about student motivation, and behavior in the classroom.
Thus, I wanted to design an action research project that could also affect behavior
management in the classroom. In order to address all of the action research questions, a
variety of quantitative and qualitative data collection methods were used.
Students participated in conflict resolution lessons and character building lessons
to develop cooperative learning skills that were used in this capstone prior to the
implementation of the treatment phase. This was done to prepare them for project-based

4
tasks and in conjunction of lessons to improve the culture and climate of the classroom
and school.
CONCEPTUAL FRAMEWORK
Prior to implementing my action research I analyzed other studies to help guide
my own action research. This analysis informed and guided my efforts to implement a
treatment for students in my classroom.
During the action research cooperative learning groups needed to be set up in the
classroom. As a teacher it is imperative to understand the full meaning and value of
cooperative learning and convey its importance to my students. To help deepen this
understanding I turned to a synthesis of cooperative learning conducted by E.G Cohen
that defines cooperative learning as “students working together in a group small enough
so that everyone can participate on a task that has been clearly assigned” (Cohen, p.2). A
clear definition to implement is important. Cohen notes that students who were not taught
how to effectively participate in cooperative learning continued to work in an individual
manner even when placed in group settings (Cohen, 1992). Thus, I took time to introduce
cooperative learning to my students and allowed time for development of a cooperative
learning culture. Cohen also discusses the importance of giving students authentic tasks
that promote interdependence in the group during cooperative learning activities,
observing that students engaging in cooperative learning groups can still be very
independent if they are not given tasks that require a variety of skills and responsibilities
to occur within the group.

5
Cohen’s perspective served as a starting point of thinking to construct goals for
what I wanted implement during my small group lessons. Small group instruction can
only live up to its learning potential with a well-prepared teacher. Cooperative learning
groups can be assigned straightforward tasks or tasks that foster higher order thinking
skills. Cohen’s article clarifies the strategic choices that arise when one implements new
teaching methods. Cohen believes that teachers must be deliberate with their intention
when implementing cooperative groups through assignment of direct tasks that gradually
progress to high order thinking tasks as students learned how to work in cooperative
groups effectively. Cooperative groups are a constant work in progress and teachers,
coaches, and administrators must consistently make efforts to manage and improve the
overall quality of cooperative groups. Cohen states, “effective implementation in the
classroom is associated with principals who provide instructional leadership by setting
high expectations that teachers will follow through after the initial workshop” (Cohen,
p.5). Expectations of cooperative groups need to be clear, organized, and set in order to
maintain effectiveness.
Another insightful resource that provided direction for creation of the treatment
phase for the action research question was a study that looked at cooperative learning in
the science classroom. In 2003, researcher, Mary Randsell, looked at teacher and
students’ perspectives and attitudes regarding cooperative learning in the classroom. Six
teachers participated in Randsell’s study. Throughout the study Randsell met with
teachers to gauge their perspective of cooperative learning groups and looked for trends
amongst the teachers. Based on teacher interviews, Randsell found that many teachers
6
struggled with relinquishing control to cooperative learning groups (Randsell, p.7). One
teacher was quoted as saying, “If I don’t give them enough structure within the group it
fails” (Randsell, p.11). Also, teachers and students both believed they were participating
in cooperative learning but had vastly different definitions of cooperative learning and
participation (Randsell, 2003). There was evident miscommunication in the definitions of
cooperative learning between teachers and students with respect to some of the teachers
participating in the research (Randsell, 2003). However, all teachers who participated in
the Randsell study agreed that cooperative learning groups worked best when
heterogeneous (Randsell). Gradually letting go of a direct instruction teaching style
needed to be well planned and effectively communicated to make the transition to
cooperative learning groups a successful one.
When considering whether to implement the action research it was important to
confirm the view student-centered learning in small groups is expected to yield academic
gain in a classroom. An action research study completed by several researchers compared
a Science-Technology-Society approach (STS), which is student-centered, and a non-
Science-Technology-Society, which is teacher-centered (Yager, Choi, Yager, Akcay,
2007). Several teachers participated in this study and taught classroom units that used
either an STS approach or a non-STS approach. The results revealed that, in most areas,
students showed significant gain when taught with an STS approach, and the researchers
found a statistically significant difference between pre- and post-test scores for
application of new concepts (t(25)=6.91, p<0.01) (Yager, Choi, Yager, Akcay, 2007).
The students engaging in an STS approach were more successful in the classroom during
7
this study; the researchers concluded that the STS approach yielded higher academic
gains that the non-STS approach, and that students who participated in the STS approach
were better equipped to apply knowledge and describe new contexts to use the concepts
taught than the students participating in the non-STS approach (Yager, Choi, Yager,
Akcay, 2007).
The STS approach engaged students in small group activities and presented them
with problems or issues that required a solution through cooperative work. The teacher’s
role was to build on students’ experiences as they worked through problems (Yager,
Choi, Yager, Akcay, 2007). Overall, this article supports the view of a teacher’s role in
student-centered learning that is being used in this action research.
Another discussed using performance assessments as a means to evaluate
students. Performance assessments can be broken down into different types of
assessments to measure student growth: close, proximal, and distal (Primo, Wiley, and
Rosenquist, 1998). The study examined whether or not hands-on instruction has any
impact on students’ performance. Researchers looked to answer this by comparing test
data over two units using the, Full Option Science System or FOSS, curriculum. Students
completed pretests and posttests for each unit and growth was measured. Findings
showed that student achievement is sensitive to the type of instruction students receive.
Close assessments are more likely to show how the impact of instruction affects student
achievement (Primo, Wiley, and Rosenquist, 1998).
In addition, this report provided insight into administering and evaluating
performance assessments. Throughout the study researchers gave a variety of
8
assessments during the units and analyzed trends. The use of different assessments can
conclude different findings. Using difference types of assessments can erroneously lead
to changes in curriculum or make reform to look ineffective (Primo, Wiley, and
Rosenquist, 1998). When creating instructional reform or change there needs to be
consideration given to the expected outcomes and how such reform or change can be
measured. In other words, the researchers concluded that the type of assessment outcome
should be significant in a variety of assessments, not only one such as a close assessment
(Primo, Wiley, and Rosenquist, 1998). If the instructional impact can only be seen
through administering one type of assessment the reform can be considered questionable
(Primo, Wiley, and Rosenquist, 1998). This study assists led me to use a triangulation of
data collection to ensure that I do not rely on one type of data collection to analyze the
impact of the treatment.
An article written by Yilmez and Turkmen in 2008 investigated students’
perspectives on their science classes through Draw-A-Science-Teacher-Test-Checklist. In
this investigation researchers analyzed how students viewed their science instruction
based on their drawings (Yilmez and Turkmen, 2008). Drawings were collected and
analyzed. Researchers look at how students grouped their class, placed their teacher, and
represented the lesson being taught. Through these drawings researchers drew
conclusions about students’ attitudes on science class. Students participating in the
investigation overwhelmingly viewed science as a teacher directed class, 73% of students
viewed themselves as answering teacher questions in seats (Yilmez and Turkmen, 2008).
The study also found patterns among teachers. 58% of teachers or pre-teachers viewed
9
themselves as talking at the students in a direct instruction type setting versus a facilitator
role (Yilmez and Turkmen, 2008). From this study it is apparent that most students and
teachers view the teaching of science in more traditional direct instruction sense. During
this action research the direct instruction approach was challenged, and student
perspectives will be measured and analyzed through student surveys and interviews.
METHODOLOGY
This section describes the treatment that was implemented, the class
demographics, and the instrumentation that took place during the action research. These
items encompass the heart of the action research and data collection. The research
methodology for this project received an exemption by Montana State University's
Institutional Review Board and compliance for working with human subjects was
maintained during Winter 2014 (Appendix A).
Treatment
The treatment was designed to be taught in conjunction with the traditional
curriculum on Earth and space that was provided by the school. Herzl School of
Excellence and the AUSL network use Pearson Interactive Science curriculum in all of
their science classes. Therefore the treatment was intertwined with this curriculum. Prior
to the treatment the curriculum was implemented with fidelity. Occasional supplements
were added, but that was infrequent and the types of supplements varied greatly. The
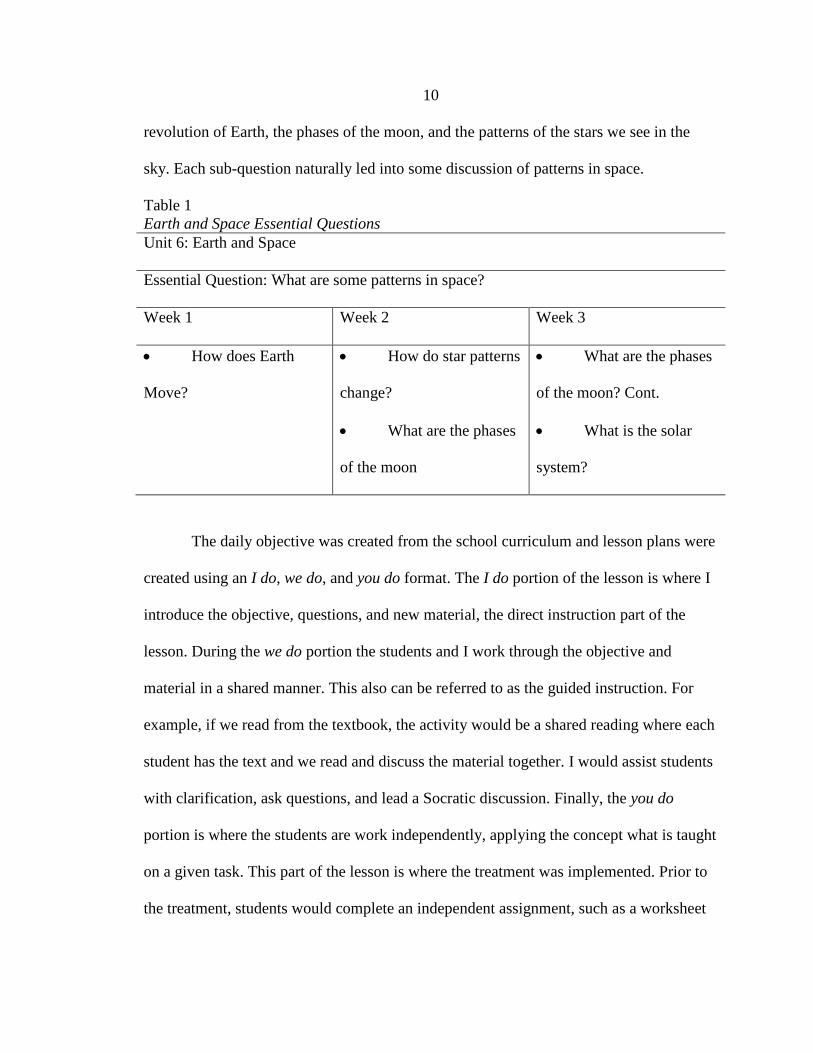
Earth and space unit was a three-week unit that covered one essential question and
several sub questions (table 1). The essential question was tailored to have students
recognize the many different patterns that occur in space such as the rotation and
10
revolution of Earth, the phases of the moon, and the patterns of the stars we see in the
sky. Each sub-question naturally led into some discussion of patterns in space.
Table 1 Earth and Space Essential Questions Unit 6: Earth and Space
Essential Question: What are some patterns in space?
Week 1 Week 2 Week 3
• How does Earth
Move?
• How do star patterns
change?
• What are the phases
of the moon
• What are the phases
of the moon? Cont.
• What is the solar
system?
The daily objective was created from the school curriculum and lesson plans were
created using an I do, we do, and you do format. The I do portion of the lesson is where I
introduce the objective, questions, and new material, the direct instruction part of the
lesson. During the we do portion the students and I work through the objective and
material in a shared manner. This also can be referred to as the guided instruction. For
example, if we read from the textbook, the activity would be a shared reading where each
student has the text and we read and discuss the material together. I would assist students
with clarification, ask questions, and lead a Socratic discussion. Finally, the you do
portion is where the students are work independently, applying the concept what is taught
on a given task. This part of the lesson is where the treatment was implemented. Prior to
the treatment, students would complete an independent assignment, such as a worksheet
11
that came with the curriculum or a simple lab that required little to no teamwork or
critical thinking. During the treatment phase this part of the lesson is where I
incorporated project based learning activities and tasks (Appendix B). While the
treatment was taking place, the you do required students to work together to solve a task
or a challenging problem that would require students to seek an answer or solution. For
example, one lesson that students completed in a project based setting was to explain the
cause of the seasons to a person in a younger grade. Students were given lab materials
and research materials (library books, computer, textbook, etc) to determine the cause of
the seasons. Not only did the task require them to write an explanation but to work
together and model the seasons using a variety of materials, such as a lamp or light bulb
as the sun (students decided and chose how to represent objects in space). The lesson
began with an overview of Earth’s tilt and revolution around the sun. The students
needed to figure out what causes the seasons on their own during the you do portion of
the lesson.
At the conclusion of a daily lesson there is an exit ticket to measure the daily
objective. This exit ticket is usually given in a standardized form, which allowed me to
see if students internalized and could apply what they discovered during their project
based task. Students completed an exit ticket at the conclusion of the lesson and the data
collected from this would be to check for understanding on a daily basis. Working in a
data driven school, it was important that I collected data to support any teaching changes.
Leadership requires data to support teaching in the classroom. If a teacher is doing
something, there should be a reason for it, especially if it steers off the typical structure of
12
an AUSL lesson plan. A weekly tracker of student mastery data on skills is submitted
each week in core subjects; since there was a change in teaching I tracked the exit ticket
data during the treatment phase. Per administration whole class mastery is set at 70
percent, meaning that 70 percent of the students receive a 70 percent or higher.
This action research was implemented using problem-based learning covering two
units: one unit that includes the implementation of the treatment, project-based learning,
and one unit that did not contain the treatment of project-based learning. That unit was
taught using the curriculum with fidelity. The treatment was implemented during the unit
on Earth and space the non-treatment was implemented during the unit on Matter. It took
place over six weeks. During both units data were collected to analyze the effectiveness
of using project-based learning in the classroom.
The Class
I teach two sections of fourth grade science. In this action research each section
underwent a treatment phase and a non-treatment phase, all data was analyzed as one
fourth grade group. The decision to create one large group was due to the fact that I am
the only fourth grade science teacher and the classes are split by academic test scores
generated from the Northwest Evaluation Association Measures of Academic Progress,
NWEA MAP, test. Instead of having two homogeneous groups I combined both to create
one heterogeneous group that had a range of all academic levels and behaviors. This
created a fourth grade sample of 43 students in an urban turnaround school, which is part
of the AUSL network. AUSL is a network within Chicago Public Schools, CPS, which
means that Herzl School of Excellence is still considered a neighborhood public school; it

13
is not a magnet or charter school. AUSL is a network within CPS that will enter a school
that is considered failing based on consistently below average test scores over long
periods of time and replace the current staff and administration with new teachers,
security, support staff, and administration many, of whom have trained with AUSL
special residency programs in some way. When Herzl School of Excellence, my current
school, was “turned around” two years ago, only one teacher and one clerk remained
from the old staff; everyone else was new and personally selected by the newly appointed
principal and assistant principals. This is done to completely change the climate and
culture in the school, a core promise of AUSL when they turnaround a school. The school
is also given new goals to promote student academic growth. An example of how climate
and culture is addressed is the increased amount of security that is present at the school.
Prior to a school being turned around the climate and culture is not monitored. Students
have no structure and fights are not uncommon on a daily basis. Once it is turned around
security and teachers ensure that the climate and culture remain calm, safe, and
conducive to learning. There are a few opportunities that would allow behaviors that were
seen before the turnaround to occur.
Herzl School of Excellence is located on the west side of Chicago in the North
Lawndale neighborhood. It has been a part of the AUSL network for two years and is
seeing academic growth and a climate and culture change. According to the Illinois
School Report Cards that are issued each year Herzl improved test scores in core subjects
by 8.1 percentage points (Chicago Tribune, 2013). Other students in the same
neighborhood saw declines of scores or scores with gains under four percentage points

14
(Appendix C). With the first year of operation under AUSL, science scores improved by
fourteen percentages points from 38 percent of students testing at or above grade level to
52 percent of students at or above grade level. In reading, the gains were smaller with a
gain of 4 percentage points from 19 percent of students reading at or above grade level to
23 percent of students reading at or above grade level (Appendix D).
Moving into more specifics of the sample class, ninety–five percent of the class is
African-American and 5 percent of the class is Hispanic. Of the 43 students 21 are boys
and 22 are girls; the classroom is 100 percent free and reduced breakfast and lunch. There
are six students with individualized education plans, IEPs, and there is one student
currently in the Response to Intervention, RTI, process due to concerns about academic
progress. There are no English language learners in the class. Eleven percent of the class
is reading at or above grade level, and 89 % of the class is reading below grade level.
The class is made up of a diverse group of learners, so this project was partly
inspired to better address this varied group of students who have been educationally
neglected prior to attending a school turned around by AUSL. Herzl, students were
denied the full education that so many other students receive. When I first entered this
school, my students had not experienced enough success in school to take pleasure in
learning or to see value in it, because they were not given the opportunity. In addition to
making academic gains this action research was designed to give these students an
opportunity to learn in a way that could change their outlook on learning. I strived to
create a project that would move students academically and foster an interest in learning.
15
Instrumentation
During the implementation of problem-based learning, data instruments were
created to collect data. Data was collected in a variety of ways to address the research
question and sub questions. Throughout the action research, data was tracked and analyze
in order to draw conclusions regarding the research questions. Instruments were used
during the treatment and non-treatment phase consistently to ensure reliability. Validity
was ensured by creating tools that could collect data that measured the research question
and sub-questions. Instruments were used during the treatment and non-treatment phase
consistently to ensure reliability. The instruments were able to collect data that could
compare the treatment phase to the non-treatment phase.
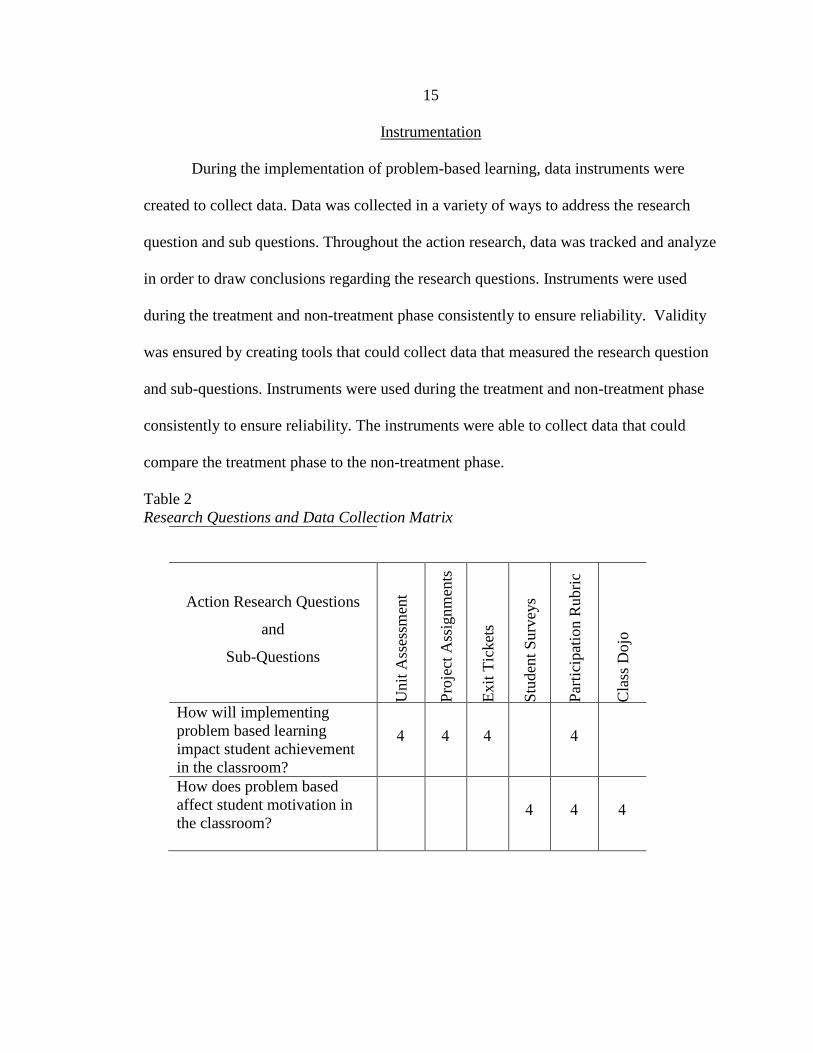
Table 2 Research Questions and Data Collection Matrix
Action Research Questions
and
Sub-Questions
Uni
t Ass
essm
ent
Proj
ect A
ssig
nmen
ts
Exit
Tick
ets
Stud
ent S
urve
ys
Parti
cipa
tion
Rub
ric
Cla
ss D
ojo
How will implementing problem based learning impact student achievement in the classroom?
4 4 4 4
How does problem based affect student motivation in the classroom?
4 4 4

16
How will the implementation of problem-based learning affect behavior management in the classroom?
4 4 4
What impact does problem-based learning have on the positive behavior in the classroom?
4 4 4 4
One instrument that was used to collect data is a lesson observation sheet that was
custom created for classroom use (Appendix E). It was used throughout all the lessons in
the treatment and non-treatment phases. It was an interactive instrument that recorded
data about student engagement, student understanding, and student collaboration. Each
lesson was monitored with a teacher observation sheet to track items that contributed to
student achievement and engagement. It also contained an area to track student
understanding of a lesson’s objective through exit tickets. At the end of each lesson
students received an exit slip to check for understanding of the daily objective. After the
exit ticket was administered the lesson observation sheet was an area to track exit slip
data for easy reference. It also allowed me to collect some formative data regarding
mastery of the daily learning objective or any particular items that would stood out. For
example, after the lesson and the exit ticket were completed, I could easily note how
many students mastered the daily objective and the level of confidence or struggle I
observed. On one particular reflection sheet I noted that students would smile when they
read the question because they were confident and excited that they knew the answer. In

17
other words, the lesson reflection allowed me to reflect and analyze the overall
effectiveness of the lesson both qualitatively and quantitatively.
To formatively analyze student achievement, daily exit tickets were administered
that tracked the mastery of daily objective. Exit tickets allowed checking understanding
on a daily basis and served as a reference point for planning and preparing each lesson.
Many of the exit tickets were written in a standardized format to help students prepare for
the Illinois Standard Achievement Test, ISAT, test in science. The results of the exit
tickets written in this format allowed analysis of student application and internalization of
what they were learning during project-based tasks.
The primary focus of this action research is academic achievement, which
resulted in data collection heavily surrounding the research question, “How does
project-based learning impact student achievement?” When the unit began,
students were given a pretest on the material to serve baseline for analyzing the
effect of project-based learning. At the end of the unit students were given a
posttest. The results of the pretest and posttest were analyzed to measure the
overall student progress and the effect of the treatment implemented. Collected
pretest and posttest student averages from the treatment and non-treatment phases
were compared and contrasted to address the research question. Both assessments
were generated by the curriculum provided so ensure that the difficulty and
questioning type was equal, also, this helped to ensure the validity of the
assessment data.

18
Another instrument that was used was a student survey that was administered at
the beginning and the end of the treatment phase. This was administered to track student
opinions of science class, school, and different styles and techniques of learning. It was a
Likert Style Survey. During data analysis student responses were tracked to identify any
trends. This data was tracked at the beginning and end of the treatment phase. In addition
to multiple choice questions students answered some open-ended questions to allow me a
better understanding of their views (Appendix F).
Student interviews were also conducted to gage student interest and engagement
during the treatment and non-treatment phases. This allowed for conversations to take
place around the different teaching styles students were experiencing. Students were able
to compare and contrast the treatment and non-treatment phases. As a facilitator to these
interviews I constructed a list of questions and follow-up questions to stimulate
discussion around my sub-questions (Appendix G). These candid conversations allowed
for data collection around student perspectives to be possible. Students were interviewed
in small groups throughout project-based tasks and outside of class.
During instruction, the Internet website/program, Class Dojo was used as a data
collection tool to collect data on positive and negative behaviors in the classroom. Class
Dojo is a website that allows teachers, students, and parents to monitor student behavior.
Students are awarded positive points for behaviors that exhibit excellence in the
classroom and receive negative demerits when they exhibit behaviors that are not
conducive to a learning environment. Throughout the Herzl school, many teachers and
classrooms use Class Dojo, and the fourth grade was one of the grade bands that adopted

19
its use. Because students are familiar with and motivated by Class Dojo, I modified the
behaviors within the Class Dojo program in order to collect data relevant to the research
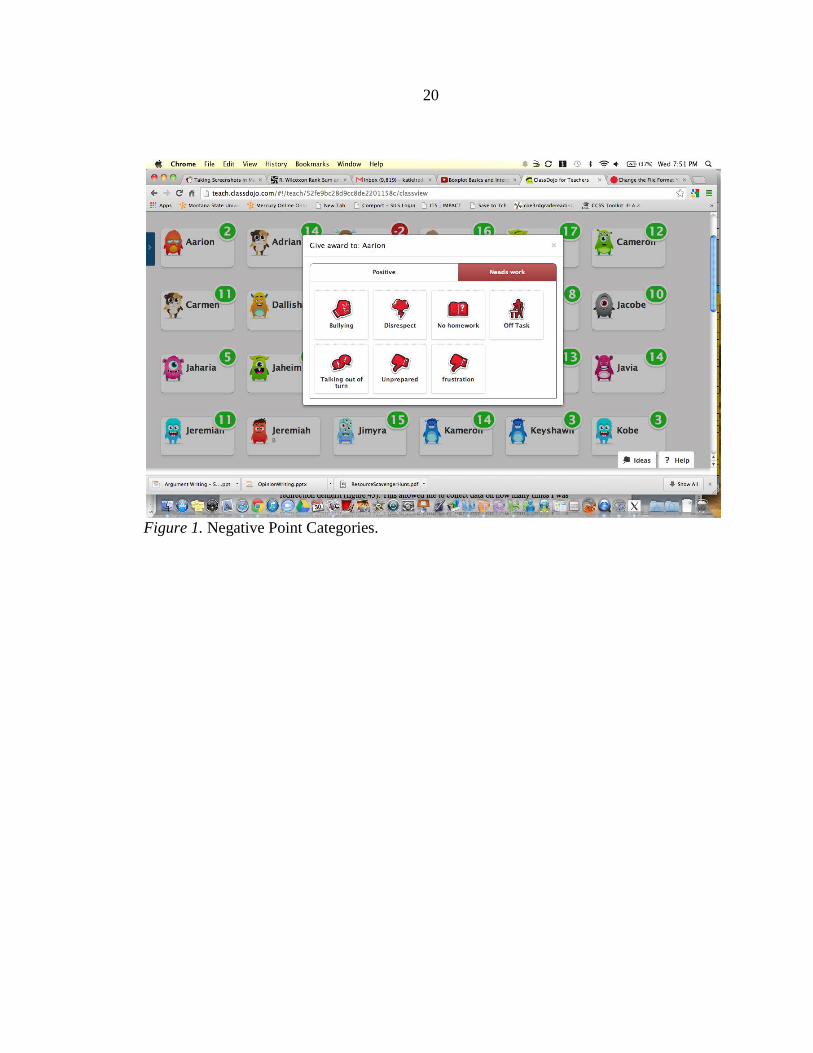
question and sub questions. For example, on the demerits, or negative points, I was able
to create a redirection demerit (figure 43). This allowed me to collect data on how many
times I was giving redirections to a student during science instruction after the initial
instructions and plus provided a friendly reminder. If there was a student who needed an
additional redirection I would document that redirection through Class Dojo. Students
received demerits when I needed to narrate their specific behavior, positive or negative.
Positive points were given if I noticed a student displaying excellence during the lesson.
For instance, if there was a student doing an exemplar job helping a group member
during a project-based task I would narrate what he or she was doing and give them a
helping others positive point. Students could earn positive points for a variety of reasons.
After lessons, I also used a lesson reflection that allowed for additional qualitative data to
be collected from myself regarding that lesson. On the lesson reflection sheets I could
note significant pieces of the lesson that impacted instruction or student behavior that I
could not track with Class Dojo, but was relevant to student engagement. The additional
annotation from the lesson reflection sheet helped aid in the analysis of the total negative
and positive points. Also, data from Class Dojo was transferred to an Excel spreadsheet
to better track the data for easier use and manipulative of the data. Transferring Class
Dojo data into an Excel spreadsheet allowed for totaling up the positive and negative
points students earned during the treatment and non-treatment phases. Class Dojo was
used consistently throughout the treatment and non-treatment phase to ensure reliability.
20
Figure 1. Negative Point Categories.
21
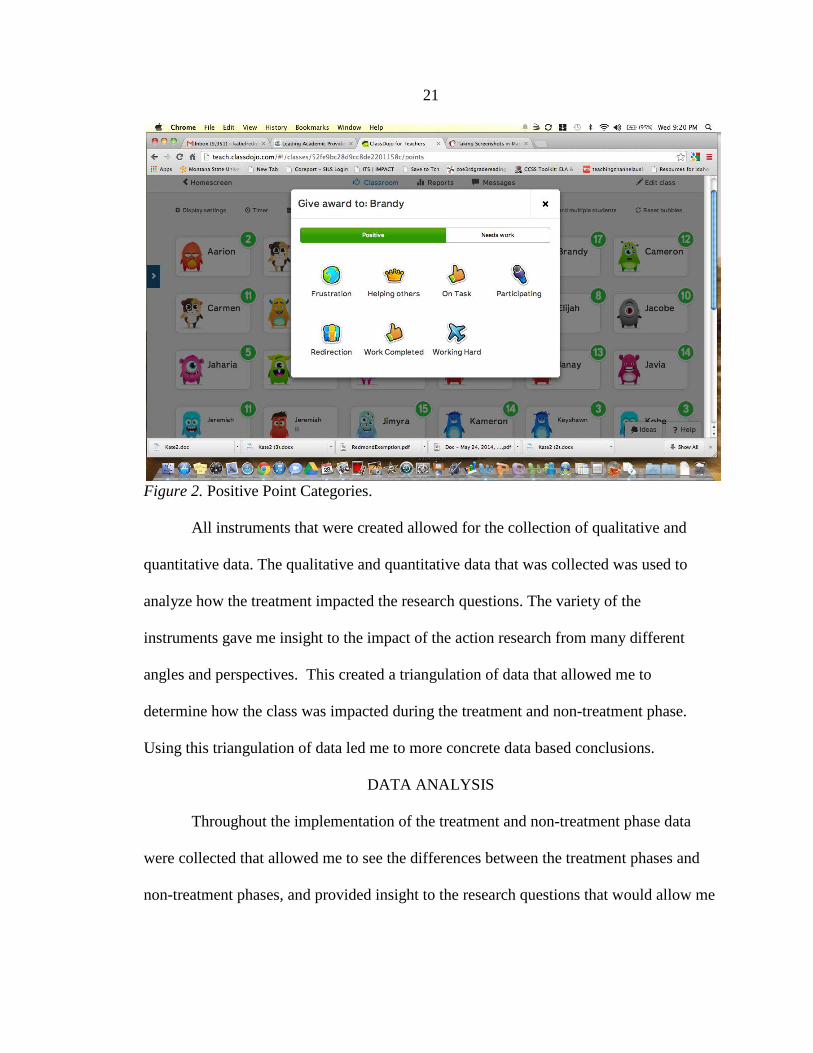
Figure 2. Positive Point Categories.
All instruments that were created allowed for the collection of qualitative and
quantitative data. The qualitative and quantitative data that was collected was used to
analyze how the treatment impacted the research questions. The variety of the
instruments gave me insight to the impact of the action research from many different
angles and perspectives. This created a triangulation of data that allowed me to
determine how the class was impacted during the treatment and non-treatment phase.
Using this triangulation of data led me to more concrete data based conclusions.
DATA ANALYSIS
Throughout the implementation of the treatment and non-treatment phase data
were collected that allowed me to see the differences between the treatment phases and
non-treatment phases, and provided insight to the research questions that would allow me
22
to draw conclusions from this action research. The data tools were used to collect the
data and then much of that data was tracked into spreadsheets and used to create charts,
tables, and graphs for analysis. Both quantitative and qualitative data were collected and
tracked through the treatment and non-treatment phases.
Student Achievement
The focus point for this action research strives to find out the impact project-
based learning has on student achievement in the science classroom. During the course of
the treatment and non-treatment phases students took unit pretests and unit posttests to
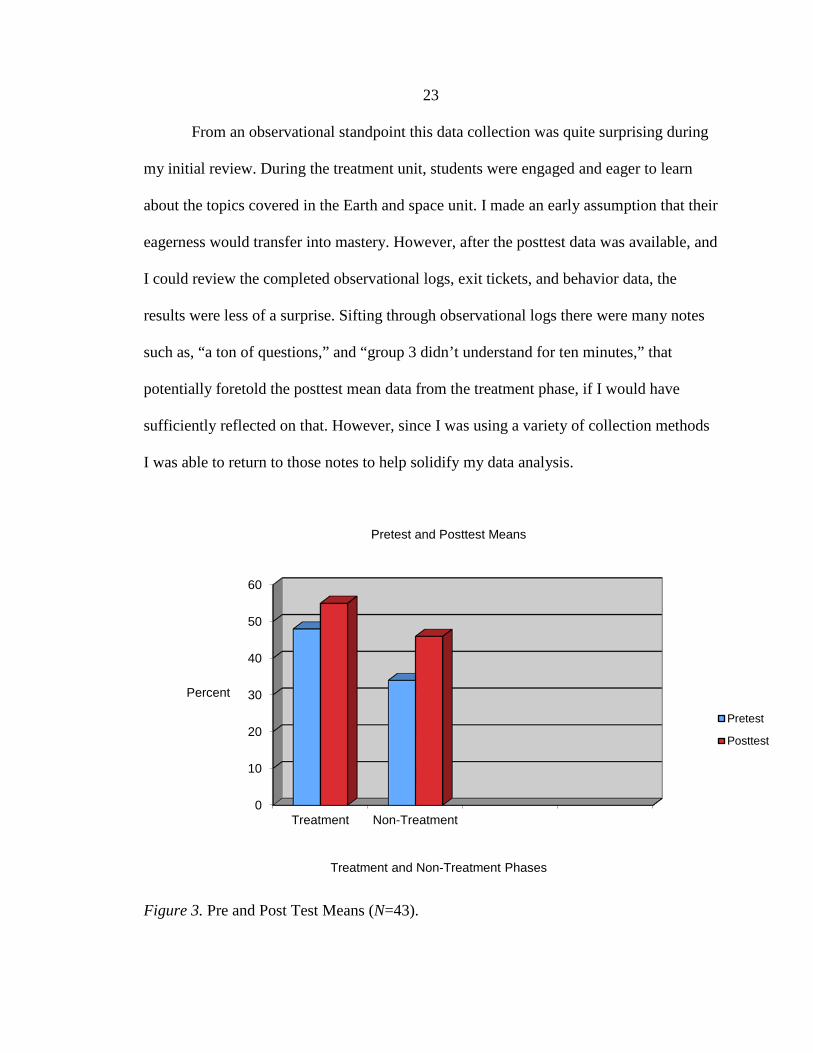
measure academic growth. Upon looking at only the increase of mean from the pretest to
the posttest for the treatment and non-treatment it appears the treatment phase was
ineffective because the increase in the mean during the treatment phase was 7 percent and
the increase in the mean during the non-treatment phase was 12 percent. Upon initial
glance, one could easily conclude that the treatment phase was not effective in positively
impacting student achievement. A 12 percent gain leads to the conclusion that the
treatment did not have much of an impact, if any, on student achievement in the
classroom. However, when looking at the actual percents, the class mean during the
treatment phase was 55 percent and only 46 percent during the non-treatment phase.
While the class mean increased more during the non-treatment phase the overall mean for
the treatment posttest was higher. However, it is important to note that the overall pretest
mean during the treatment phase was higher than the overall mean for the non-treatment
posttest mean.
23
From an observational standpoint this data collection was quite surprising during
my initial review. During the treatment unit, students were engaged and eager to learn
about the topics covered in the Earth and space unit. I made an early assumption that their
eagerness would transfer into mastery. However, after the posttest data was available, and
I could review the completed observational logs, exit tickets, and behavior data, the
results were less of a surprise. Sifting through observational logs there were many notes
such as, “a ton of questions,” and “group 3 didn’t understand for ten minutes,” that
potentially foretold the posttest mean data from the treatment phase, if I would have
sufficiently reflected on that. However, since I was using a variety of collection methods
I was able to return to those notes to help solidify my data analysis.
Figure 3. Pre and Post Test Means (N=43).
0
10
20
30
40
50
60
Treatment Non-Treatment
Percent
Treatment and Non-Treatment Phases
Pretest and Posttest Means
Pretest
Posttest
24
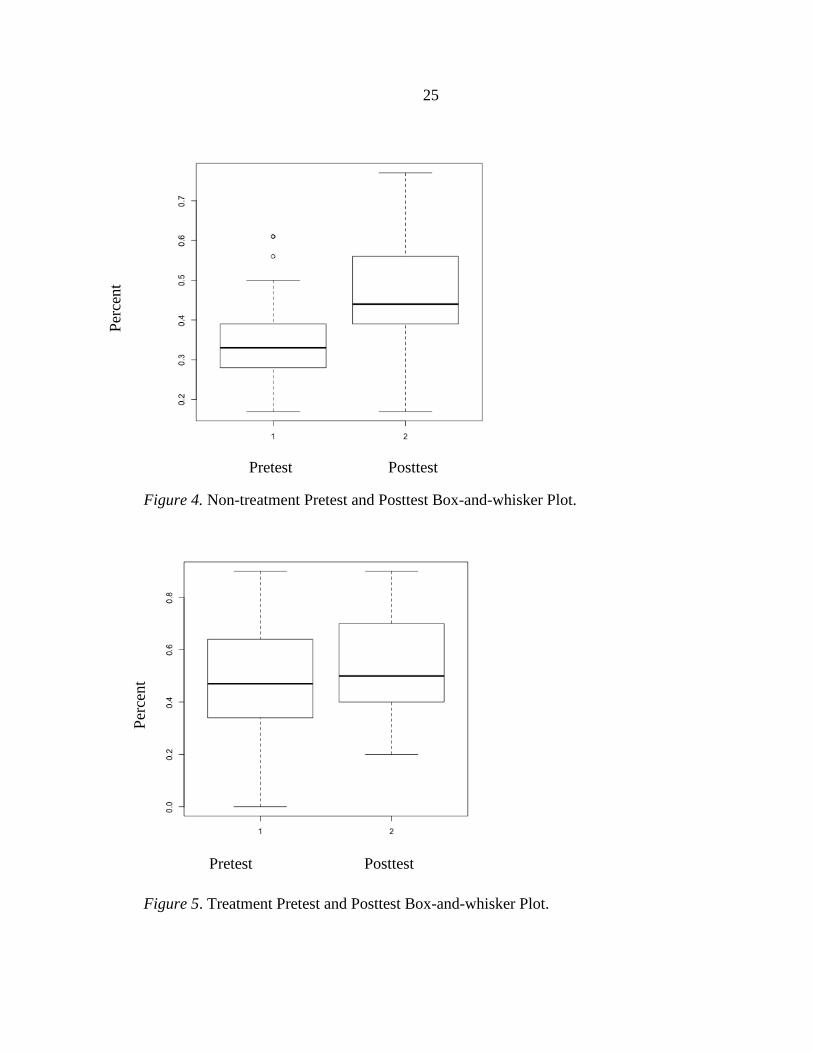
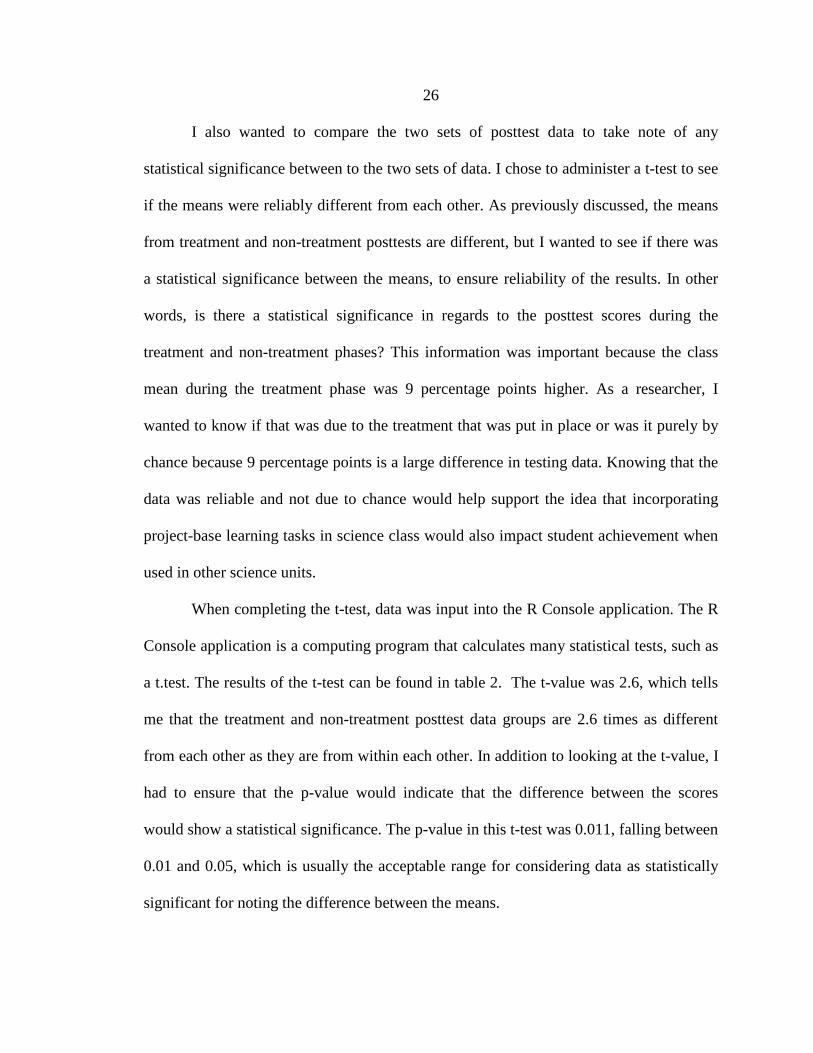
While only the analysis of the means indicated the treatment phase did not impact
student achievement, I wanted to know what else the data demonstrated. By delving
beneath the surface of the mean scores I was able to examine this data more closely.
There were additional conclusions from the pretest and posttest data for the treatment and
non-treatment phases. I wanted to analyze the spread of my data. I decided to create box-
and-whisker plots of the pretest and posttest data from the treatment and non-treatment
phases. Figures 3 and 4 show the box-and-whiskers plots of the pretest and posttest data
from each phase. While the non-treatment phase data had a higher percentage gain in
class mean than the treatment phase of the posttest, the box-and-whisker plot labeled 2 in
figure 4 has a narrower spread compared to the box-and-whisker plot labeled 2 in figure
3. Knowing that a box-and whisker plot breaks data into quartiles it is worth examining
the bottom quartile. The class mean’s increase during the treatment phase was not as
significant as the class mean’s increase during the non-treatment phase, but there was
somewhat of an interesting increase in the lowest quartile. Looking at the box plot, the
lowest quartile made more gains during the treatment phase than the lowest quartile in the
non-treatment phase. This data shows that the students performing in the bottom quartile
made more academic gains during the treatment phase than they did during the non-
treatment phase. This is important to note because the students performing in the bottom
quartile are performing significantly below grade level and it is crucial they make
significant gains to help them “catch up” with their peers.
25
Pretest Posttest Figure 4. Non-treatment Pretest and Posttest Box-and-whisker Plot.
Figure 5. Treatment Pretest and Posttest Box-and-whisker Plot.
Perc
ent
Perc
ent
Pretest Posttest
26
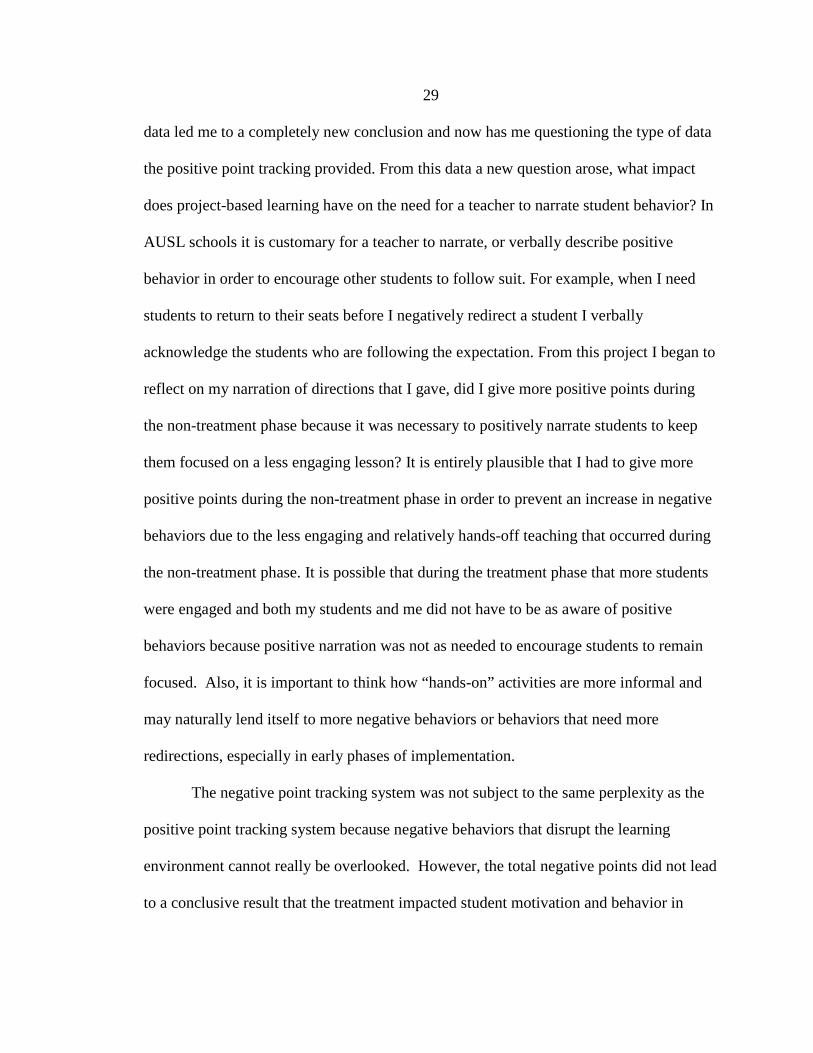
I also wanted to compare the two sets of posttest data to take note of any
statistical significance between to the two sets of data. I chose to administer a t-test to see
if the means were reliably different from each other. As previously discussed, the means
from treatment and non-treatment posttests are different, but I wanted to see if there was
a statistical significance between the means, to ensure reliability of the results. In other
words, is there a statistical significance in regards to the posttest scores during the
treatment and non-treatment phases? This information was important because the class
mean during the treatment phase was 9 percentage points higher. As a researcher, I
wanted to know if that was due to the treatment that was put in place or was it purely by
chance because 9 percentage points is a large difference in testing data. Knowing that the
data was reliable and not due to chance would help support the idea that incorporating
project-base learning tasks in science class would also impact student achievement when
used in other science units.
When completing the t-test, data was input into the R Console application. The R
Console application is a computing program that calculates many statistical tests, such as
a t.test. The results of the t-test can be found in table 2. The t-value was 2.6, which tells
me that the treatment and non-treatment posttest data groups are 2.6 times as different
from each other as they are from within each other. In addition to looking at the t-value, I
had to ensure that the p-value would indicate that the difference between the scores
would show a statistical significance. The p-value in this t-test was 0.011, falling between
0.01 and 0.05, which is usually the acceptable range for considering data as statistically
significant for noting the difference between the means.

27
After completing the t-test and interpreting the p-value I am able to conclude that
the means are statistically different. While it was noted before that the overall increase of
the class mean was larger during the non-treatment phase, the class mean increased to 55
percent during the treatment phases, making it statistically significant. The treatment
phase did impact student achievement.
Table 3. t.test Output from R Program Paired t-test data: treatmentpost and nontreatmentpost t = 2.6407, df = 42, p-value = 0.01157 alternative hypothesis: true difference in means is not equal to 0 95 percent confidence interval: 0.01847776 0.13826643 sample estimates: mean of the differences
0.07837209
Culture and Climate
One sub question that was particularly important to my classroom was, what
impact does project based learning have on positive behavior in the classroom? Using
Class Dojo to track my narration allowed me to see the types of narration I was giving
my students. I defined narration using AUSL’s definition of the type of specific
reminders I give to students after the initial directions and expectations. For example, if I
were to say, “Mathew is having a great science conversation with his group,” after I give
whole group directions for beginning a project-based learning task I would go into Class
Dojo and give a positive point to Mathew. This had the purpose of making me more
cognizant of all types of student behaviors and to serve a positive management system in
the classroom. To examine this question more closely I relied on qualitative data from

28
personal observations and the data that I received from Class Dojo. In addition to Class
Dojo allowing me to track individual data on each student, I could examine my positive
narration during whole group instruction. Figure 6 shows the total number of positive
narrations I had given each week of the treatment and non-treatment phases. Tracking
and graphing data yielded some interesting results. From the data, I cannot conclude that
project based tasks led to more positive narration in the classroom. When examining
figure 6 more positive narrations was given during the non-treatment phase than during
the treatment phase.
Figure 6. Positive Points (N=43).
Despite the data, I believe that the positive point data is inconclusive. While it
may seem obvious to say that the treatment did not impact positive behavior in the
classroom due to the fact that on most weeks during the treatment and non-treatment
phases more positive points were given out during the non-treatment phase, I question
that conclusion when I analyze my student videos, interviews and observation logs. This
0
500
1000
1500
2000
2500
Week 1 Week 2 Week 3 Total
Posi
tive
Poin
ts
Weeks
Total Positive Points
Treatment Phase
Non-treament Phase
29
data led me to a completely new conclusion and now has me questioning the type of data
the positive point tracking provided. From this data a new question arose, what impact
does project-based learning have on the need for a teacher to narrate student behavior? In
AUSL schools it is customary for a teacher to narrate, or verbally describe positive
behavior in order to encourage other students to follow suit. For example, when I need
students to return to their seats before I negatively redirect a student I verbally
acknowledge the students who are following the expectation. From this project I began to
reflect on my narration of directions that I gave, did I give more positive points during
the non-treatment phase because it was necessary to positively narrate students to keep
them focused on a less engaging lesson? It is entirely plausible that I had to give more
positive points during the non-treatment phase in order to prevent an increase in negative
behaviors due to the less engaging and relatively hands-off teaching that occurred during
the non-treatment phase. It is possible that during the treatment phase that more students
were engaged and both my students and me did not have to be as aware of positive
behaviors because positive narration was not as needed to encourage students to remain
focused. Also, it is important to think how “hands-on” activities are more informal and
may naturally lend itself to more negative behaviors or behaviors that need more
redirections, especially in early phases of implementation.
The negative point tracking system was not subject to the same perplexity as the
positive point tracking system because negative behaviors that disrupt the learning
environment cannot really be overlooked. However, the total negative points did not lead
to a conclusive result that the treatment impacted student motivation and behavior in

30
class, like I was striving to answer with my sub question: How will the implementation of
project-based learning affect behavior management in the classroom? According to the
data there was no impact, in fact it could be argued that behavior management was more
challenging during the treatment phase due to the data indicating that the total number of
negative points given out during the treatment phase was marginally more that during the
non-treatment phase, there were 41 more negative points given out during the non-
treatment phase.
Figure 7. Negative Points, (N=43).
0
200
400
600
800
Week 1 Total
Neg
ativ
e Po
ints
Weeks
Total Negative Points
Treatment
Non-Treatment

31
Students were given their first student survey a day prior to beginning the treatment phase
of the action research. Students were asked 20 questions and had variety of answers that
measured how they feel about school, science, and their thoughts about their academic
abilities, both multiple choice and short answer. The multiple-choice questions were
written as a Likert survey (Appendix F). Students were given the survey and all responses
were anonymous and participation was voluntary. Students were able to choose the
answer that best corresponds with their feelings about the statement or question. The
survey data was tracked and compared with survey responses at the end of the treatment
phase in order to look for changes student attitudes over the course of this action
research. The survey was given to assist in answering the sub question: How does
project-based learning affect student motivation in the science classroom? The survey
allows for students to share their opinions about their attitudes toward motivation in the
science classroom.
After giving the survey I was able to get a clearer picture of how my students felt
about certain things regarding their learning, the science classroom, and the school.
Questions 2, 4, 9, and 16 were looked at closely since they specifically focus on student
motivation. In table 3 each focus question is listed and the percent of students selecting a
specific answer on the pre-treatment survey and the survey given post-treatment.
Overall the results were very positive. The treatment phases helped students
improve their motivation toward work, science, and, school. Going into the treatment
students generally enjoyed coming to school to learn new things. Prior to the treatment
phase 76% of the fourth graders agreed or strongly agreed that they came to school
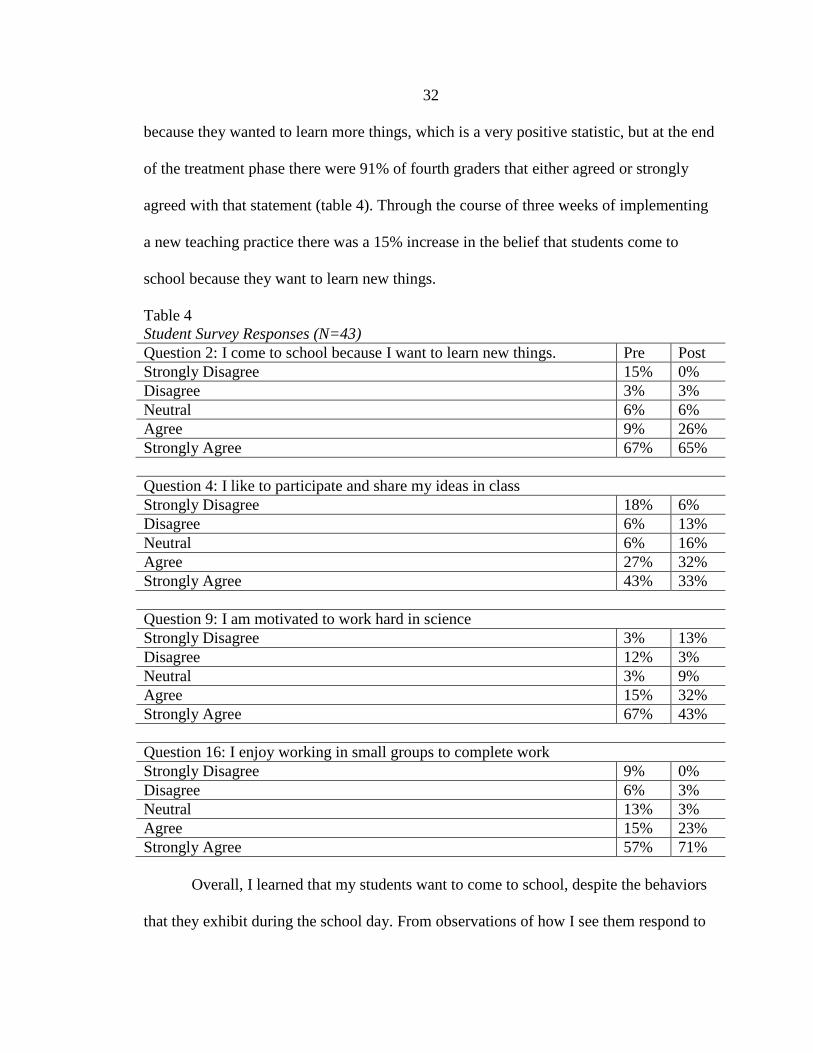
32
because they wanted to learn more things, which is a very positive statistic, but at the end
of the treatment phase there were 91% of fourth graders that either agreed or strongly
agreed with that statement (table 4). Through the course of three weeks of implementing
a new teaching practice there was a 15% increase in the belief that students come to
school because they want to learn new things.
Table 4 Student Survey Responses (N=43) Question 2: I come to school because I want to learn new things. Pre Post Strongly Disagree 15% 0% Disagree 3% 3% Neutral 6% 6% Agree 9% 26% Strongly Agree 67% 65% Question 4: I like to participate and share my ideas in class Strongly Disagree 18% 6% Disagree 6% 13% Neutral 6% 16% Agree 27% 32% Strongly Agree 43% 33% Question 9: I am motivated to work hard in science Strongly Disagree 3% 13% Disagree 12% 3% Neutral 3% 9% Agree 15% 32% Strongly Agree 67% 43% Question 16: I enjoy working in small groups to complete work Strongly Disagree 9% 0% Disagree 6% 3% Neutral 13% 3% Agree 15% 23% Strongly Agree 57% 71%
Overall, I learned that my students want to come to school, despite the behaviors
that they exhibit during the school day. From observations of how I see them respond to
33
adults and school expectations I would have assumed that they felt otherwise, due to the
display of negative behaviors and disrespect. This survey reminds me that student actions
do not always reflect student beliefs, especially in an urban school.
This survey helps prove the need for student input in this project. Student
motivation may not always be observable due to the way students want to carry
themselves in front of their peers. Tracking their feelings will be important for answering
question one: How does problem based learning change student motivation in the
classroom?
INTERPRETATION AND CONCLUSIONS
The data collected and the data analysis allowed me to make conclusions to my research
question and sub questions. First, I will look at how the sub questions were answered and
then look at the main focus question related to academic gains.
Alongside researching for academic gains, I hoped to improve student motivation
in science class. With a majority of students performing below level and often not
engaged in class, the goal was to begin to see students flourish in the classroom through
motivation and student engagement. Through observations, I can attest that this did
happen. When looking at my first sub-question on how does project-based learning affect
student motivation in that classroom, it was found that it did impact student motivation in
the classroom by using observational notes, survey data, and student interviews.
Throughout the class students who were quiet, uninvolved, and unmotivated slowly
began to emerge as eager learners. Delilah, a student who receives special services and
has verbalized her dislike of science in student interviews and through her grandma was a
34
wonderful example of this. Prior to the treatment Delilah did not enjoy science and would
try incredibly hard to not participate. Throughout the course of the treatment phase it was
wonderful to watch Delilah become more vocal and take a leadership role when working
with other students. Looking at her Class Dojo positive points Delilah had a total of 63
positive points, the second highest of all the fourth grade students. This high total of
positive points help illustrate how many students became positively invested during
project-based tasks. Recently after the treatment phase Delilah had her annual IEP
meeting and her grandmother even commented on Delilah’s newfound enjoyment on
science. Many students, like Delilah, actively sought out their own information and used
a variety of sources to synthesize and create conclusions.
Class Dojo was a vital part in my data collection on negative and positive
behaviors. The information that I collected from Class Dojo allowed me to make
conclusions on my third sub-question. Based on the data collected in this study, project-
based learning did not increase positive behavior in the classroom when analyzed as a
whole. However, I did see some improvements when I look at individual Class Dojo data.
There were some students who did not usually participate who began to earn more
positive points during the treatment phase (Matthew’s class points, table 5).
At the beginning of the action research students were apprehensive to take part in
a new style of learning, but were soon eager to participate. By the end of the treatment
phase it became very difficult for me to continuously track participation but there was
mostly one hundred percent participation. Stronger students were helping students who
were struggling with reading, quiet students were taking initiative, and students who
35
typically had behavior problems were suddenly completely engaged. For example table 5
that shows Matthew’s behavior points. Matthew is a student who has struggled in school
throughout every grade and many teachers have experienced challenges regarding how to
effectively educate him. According to Class Dojo data, Matthew had 43 positive behavior
points during the treatment phases, and 30 positive points during the non-treatment phase.
These data shows that Matthew did begin to have more positive interactions in the
classroom. For Matthew and for me this was a huge improvement that dramatically
shifted the dynamic of the class. During instruction I did not have to spend as much class
time waiting for Matthew to behave appropriately, which allowed for the rest of the class
to run more fluently. Prior to the treatment and during the non-treatment phase other
students would become irritated waiting for Matthew to stop disrupting the class, which
would often lead into a domino effect where everyone would begin to yell at Matthew out
of frustration. This would eventually lead to Matthew having to be removed from the
classroom. From a daily observer’s standpoint having Matthew be able to remain in class
during the duration of science class was a huge improvement. When I interviewed
Matthew about the change he replied, “I like it when I can talk more in science and work
on my own. Sitting and listening to you (me) gets boring.” Overall, implementing this
action research improved the relationship that I had with Mathew a great deal. However, I
do note that Matthew had 69 negative points during the treatment phase, so I cannot say
that the treatment phase completely eliminated Matthew’s negative behaviors, but it did
help to increase Matthew’s positive interactions in the class. In addition to the Class Dojo
data for Mathew, when I looked at my lesson reflection notes there are notes indicating

36
the improvement in Matthew’s engagement during project-based activities. One lesson
observation log included the annotation; “Matthew is actually completing the task with
his group.” Prior to the treatment phase it was not uncommon to receive a completely
blank paper from Matthew. Again, while Matthew’s negative points indicate that
Matthew is struggling in class with his behavior, there are small successes for Matthew
and me from the implementation of the treatment phase.
Table 5 Matthew’s Class Points Matthew’s Negative and Positive Points
Treatment Phase Non-Treatment Phase
Positive Points Negative Points Positive Points Negative Points
43 69 30 58
In response to my first question and my main focus question on how project
based-learning impacted student achievement in that classroom, student achievement was
not heavily impacted for the whole class. However, based on my finding it was more
effective for my students who perform in the bottom quartile. Quantitatively the gains
made on the science tests did not prove to be as significant in the treatment phases as I
hoped for the class. Student achievement did improve but it did not move or change every
single student into As and Bs students, or even Cs. When analyzing the averages, there
was more of a gain during the non-treatment phase. However, I still observed positive
changes in the classroom and amongst individual students. For example, many students
who perform at or above grade level enjoyed embracing the challenge that project based

37
learning presented. Kameron, the highest performing fourth grader commented that
learning in groups (completing project-based learning assignments) was important
because it allowed her to learn more information on her own than was in her textbook. In
other words, she got to learn and synthesize more information than what is normally
taught through using the traditional curriculum. As an observer, I was able to see this in
Kameron and many other students. Kameron enjoyed the freedom to learn and pursue the
project-based tasks in her own way. Many times I was left astonished at the creativity and
initiative that my students showed while working on project based tasks. For example,
during the project based learning task where students were presented with task of finding
out if human life could be sustained on other planets, many students took the next step of
coming up with ways they could make human life sustainable on other planets such as
Mars with no prompting or urging from me or began suggesting living on the moon as
opposed to another planet. For example, one group thought of ways they could get
oxygen to mars so people could live there. It was as if students learned what prevented
people from living on other planets and then were determined to find ways to make it a
possibility. Considering the struggle I have had with science participation in the past this
observation was completely overwhelming and really showed me how much of an impact
the treatment was having on the dynamic of the science class.
Prior to the action research, many students in this class had previously
experienced little success, had little prior knowledge on more topics, and were low
achieving students. Anthony Gabriele wrote about how achievement goals affect
constructive activity of low achieving students (Gabriele, 2007). This article discussed
38
how small group learning is not always beneficial for lower achieving students because
the information they get from peers is not understandable to them. It looked at high
achieving students helping low achieving students and average achieving students
helping low achieving students (2007). It discussed how low achieving students received
better help from higher achieving students than they did average achieving students. The
study’s conclusion seems logical, however, prior to reading Gabriele’s article I had not
given much thought to this issue. During my action research I considered the make-up of
the project-based groups and had to address the problem of having a considerably higher
number of low achieving students than high achieving students. Grouping my students
into effective groups took consideration in order to make project-based groups more
meaningful. After observing the project-based task on sustaining human life on other
planets, I was able see first hand what Gabrielle was describing in his study. My students
who perform below grade level were able to think critically alongside their peers who
typically perform above grade level. The students achieving above grade level were able
to emerge as leaders and help almost all of the students performing below grade level,
even with a considerable number of students reading below grade level, 89%, (Appendix
H). Another interesting observation that I had from carefully listening and observing a
majority of students who perform below grade level is how many of them rose to the
challenge of being a leader despite academic challenges. One lesson observation sheet
notes, “Adrian is the leader of his group and is passing out tasks to each student in his
group. He’s making all the decisions of what to include (in the project).” Adrian is
39
reading over two years below grade level, but if an outsider was observing him that day
they would have never suspected that.
Through completion of this action research I learned how to create the type of
groups Gabrielle discusses. Prior to this action research when I wanted to complete a
“project-based” assignment I would randomly throw groups together without much
consideration. Now, and in the future, project-based learning activities will be much more
deliberately planned. I am aware of how to group students that will effectively bounce off
each other and put students who normally would not be considered leaders in positions
where they can rise to the occasion.
Also, Gabriele mentioned the setting of achievement goals for students. My
school currently uses the practice of setting learning goals and student data tracking to
promote student motivation and accountability. This article discussed how these
particular goals might not always be effective among low achieving students, a concept
with which I agree. It is more difficult to set learning goals with my low achieving
students because they often set unrealistic goals or do not fully understand how to set a
meaningful goal. Many of my students say, “my goal is to get an A” when they have a D
average in all their classes and are reading significantly below grade level. Throughout
the course of this action research students were able to more effectively set goals on
project-based tasks. Students who perform below grade level began to make more
manageable and short-term goals. For example, during interviews conducted while
students were working on the sustaining human life on other planets task, Louis, a student
performing and reading more than two years below grade level, did not focus on getting

40
and A on the post test but said, “My goal is to find out if people can live on Saturn.”
Louis set a manageable goal (and an academic goal related to the objective) and was able
to see the success in that goal by the end of the class period. As a student who typically
performs below grade level and consistently receives below average grades, meeting that
goal served as a huge confidence boost for him. At the end of the task, it was very
inspiring and moving for me to see Louis meet a goal and to see Louis so motivated by
meeting his goal. While Louis’ pre and posttest averages improvement was not
significant, Louis’ small qualitative successes were significant. Also, as his teacher,
seeing Louis set a goal to seek out academic knowledge was much more meaningful than
having Louis set a goal to receive an A on class work.
My second sub-question looked to answer the question how does project-based
learning affect the behavior management of the classroom. Again, Class Dojo helped to
answer this question by tracking negative behaviors in the classroom. In response to this
question it was found that I needed more negative redirection or narration in the
classroom during the treatment phase. While the room was transformed into a student-
led, teacher facilitated environment the students needed more support from me. However,
the data did show that each week the amount of negative narration decreased. The article,
Steps to Fostering a Learning Community in the Primary Science Classroom, sets up the
basics of what I wanted to accomplish with the change in my teaching. This article
focused on setting up a learning community, (Prissick-Kilborn, 2009). It discusses setting
up an environment where students are able to learn and grow and focuses on how the
teacher can change a learning environment and model exemplar learning. With seven
41
years of teaching experience this action research served as a pivotal point to change my
role in the classroom. As a beginning teacher much of my instruction was teacher-
centered. Through this action research, I was able to design and create a more student-
centered classroom. To accomplish this I fostered a learning community that can support
my goals and research questions. In this article it states, “the teacher is the leader but
leads by virtue of being a more expert learner without their own knowledge limiting what
is learnt or investigated” (Prissick-Kilborn, p.27). At first it was a difficult transition to
embrace a more facilitator role, but after seeing the enjoyment that my students had
learning on their own and the many, many positive comments I received during
interviews, I became excited to step back from teaching whole group and to let the
students discover on their own. For the first time in a long time, teaching became less
stressful for me as well. In addition, as an urban teacher seeing students who typically get
labeled as hard to manage and impossible to teach manage themselves and learn very
powerful to watch. Two years ago this was a failing school where students would “jump
off the walls” and teachers would sleep during class (according to student accounts) and
now I created a class that can work and learn in student-centered classroom peacefully.
Completing this action research journey has required me to scrutinize my daily
teaching practices. Throughout this journey, I have rekindled my thirst for data to drive
my instruction, both quantitative and qualitative data. While not all data could support the
idea that the treatment significantly impacted student achievement in the classroom, there
was substantial observational evidence that project-based learning is a better, more
effective teaching practice for students due to the way it positively changed their
42
behavior, motivated students, and enhanced their learning environment. This was true for
students performing at or above grade level and students performing below grade level.
Also, there is evidence that project-based learning is a more effective teaching practice to
help my low performing students grow and achieve more. I have confidence in stating
that implementing project-based learning is a more effective teaching strategy for my
classroom than solely following the school issued curriculum with fidelity. Even though
this action research has concluded, I have intentions to continue to design science units
around project-based learning, implement systems to track student involvement in the
classroom (Class Dojo), and intensively track student data through exit tickets and
interviews. I even look forward to making changes to enhance and improve project-based
learning in future units.
VALUE
Completing this action research challenged me to improve my teaching practices
in the classroom. From completing this project I became a stronger teacher even though I
stepped away from taking a direct lead in the classroom. The data that I have collected
support my decision to continue to teach with a project based learning approach because
when it was implemented I obtained statistically significant means in regards to student
achievement (t.test, fig.3). Again, I acknowledge that the non-treatment grew more
percentage from the pre-test to post-test, but the distribution of test scores was more
condensed. Students who performed in the bottom quartile of the class received higher
posttest scores during the treatment phase and that is important for my classroom (box-
and-whisker plot, fig.4 and fig.5). These students have been struggling to make academic

43
growth and it was rewarding to see a new teaching strategy make a difference. Academic
growth is a primary concern in the classroom, so when a teaching technique is yielding
positive results it should continue to be implemented. In the next school year, science
units will continue to be planned around the school curriculum, but it will be
supplemented with project based tasks that require students to work together to obtain
their own information. Project based learning will be seen more frequently in the science
classroom, and preparation for it will be taught in the beginning weeks of school. The
success of this project inspires me to further push what project-based learning can be in
my classroom. I think the key to intensifying project-based learning is to begin to
implement project based tasks at the beginning of the year and build them into another
classroom routine that students know how to participate in. For example, at the beginning
of the year the first two weeks of the school year students learn the vocabulary routines
for learning the weekly words. Students spend a lot of time learning appropriate
behaviors for vocabulary works, the important purpose for vocabulary work, and practice
under my guidance. As the routine develops students become independent and can fully
participate in vocabulary work on their own. In the next school year project-based
learning will be fully implemented and rolled out as a common routine in the classroom.
Students will come to expect working on project based tasks independently and will
develop the skills to participate in the tasks with knowledge and confidence. I want to
continue to develop what I have done in this action research in the upcoming school year.
I want to determine if students who participate in project-based learning tasks from the
beginning of the school year can achieve more over time and develop even stronger
44
critical thinking skills than occurred in this action research. If project based learning tasks
are implemented at the beginning of the year and with a gradual release of responsibility
can I obtain better results? This action research will turn into an on going project, I can
continue to use the instruments that I have created such as class dojo, exit tickets, and
student surveys to collect data for personal analysis. I take the charge to continue what
has started in this action research and look forward to watching the transformation in
upcoming classes.

45
REFERENCES CITED
Cohen, E. G. (1992). Restructuring the Classroom: Conditions for Productive Small Groups. Issues in Restructuring Schools, 2, 4-7.
Chicago Tribune (2013) http://schools.chicagotribune.com/school/herzl-elementary-school_chicago
Gabriele, A. J. (2007). The Influence of Achievement Goals on The Constructive Activity
of Low Achievers During Collaborative Problem Solving. British Journal of Education Psychology, 77, 121-141. Retrieved from http://www.bpsjournals.co.uk
Pressick-Kilborn, K. (2009). Steps to Fostering a Learning Community in the Primary Science Classroom. Teaching Science,55(1), 27-29. Retrieved from http://web.ebscohost.com
Ransdell, M. (2003). Cooperative Learning in Elementary Science Classrooms (pp. 1-19, Rep. No. 143). The University of Memphis.
Ruiz-Primo, M. A., Wiley, E., & Rosenquist, A. (1998). Performance Assessment in the Service of Evaluating Science Education Reform (Draft, pp. 1-29, Rep.). Arlington, VA: National Science Foundation.
Yager, R. E., Choi, A., Yager, S. O., & Akcay, H. (2009). Comparing Science Learning Among 4th-, 5th-, and 6th-Grade Students: STS Versus Textbook-Based Instruction. Journal of Elementary Science Education, 21(2), 15-24. Retrieved from http://www.eric.ed.gov
Yilmaz, H., Turkmen, H., & Pedersen, J. E. (2008). Evaluating Science Education Reform via Fourth Grade Students' Image of Science Teaching. Science of Education International, 19(1), 27-40. Retrieved from http://www.eric.ed.gov

46
APPENDICES

47
APPENDIX A
IRB EXEMPTION APPROVAL
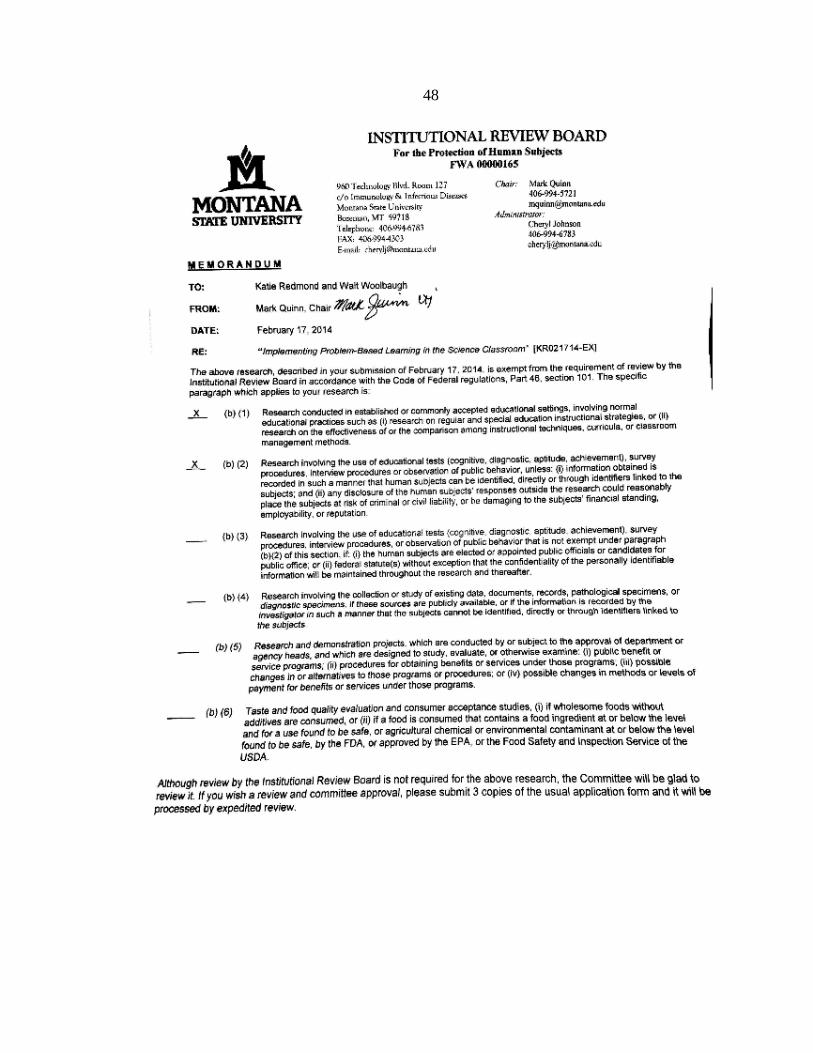
48

49
APPENDIX B
UNIT OVERVIEW

50
Science Weekly Lesson Plan
Date: Day 1: Day 2: Day 3: Day 4: Day 5: Big Ideas How does the Earth move? How do star patterns change? What are the phases of the moon? What is the
solar system?
Objective(s) I will know Earth revolves around the sun and rotates on its axis. I will know Earth’s rotation is related to the apparent movement
I will know Earth revolves around the sun and rotates on its axis. I will know Earth’s rotation is
related to the apparent movement
I will know Earth revolves around the sun and rotates on its axis. I will know Earth’s rotation is related to the apparent movement of the sun, moon, and stars.
I will know Earth revolves around the sun and rotates on its axis. I will know Earth’s rotation is related to the apparent movement
I will know Earth revolves around the sun and rotates on its axis. I will know Earth’s rotation is related to the apparent movement
Treatment Your little sister tells you on the way home from school that Ms. Redmond said the Earth spins on its axis but she thinks Ms. Redmond is wrong. If the Earth was spinning we would feel it. What would you tell your sister?
Your little sister tells you on the way home from school that Ms. Redmond said the Earth spins on its axis but she thinks Ms. Redmond is wrong. If the Earth was spinning we would feel it. What would you tell your sister?
Bill Nye has asked you to star on his latest episode on space. Your role is to answer the e-mail question: If we all live on the same planet why is it night on the other side of the world.
No Treatment Nasa has just discovered a planet exactly like Earth that revolves around a similar star, the sun, from the same distance. The only difference is that it is not tilted on its axis. Model how the seasons would compare and contrast. Be able to verbally explain.
Do Now My planet Diary Worktext pages 258
ISAT Science questions
Isat Science question Why do our shadows change in size throughout the day?
Vocabulary Review
I do Move into project based groups. Introduce assignment
Introduce project based task, rubric, and supplies
Introduce/review electrical current Introduce conductors and insulators
Teacher demo on electrical energy. Present the question: What is the relationship between batteries and motors? Students write hypothesis.
Review the vocabulary for solar system.
We Do Model and discuss how students to think about explaining a phenomena to students.
Cont. from yesterday
Read and complete worktext page 260.
Go through the procedure together. Students Begin with the hand generate flashlight. Try to describe how it works.
Review rotation and revolution with student models

51
You do Students work in project based groups to complete the task
Continue from yesterday
Students break off into groups and complete work.
Students answer: How does a motor work? Read what was really happening in the science notebook.
Students break off into groups.
Formative Assessment
Write one cause and effect related to Earth’s movement. Draw an arrow on the Equator to model the Earth rorating
Exit Ticket ISAT Questions Group work rubrics
Show photo. Circle the photo that was taken closer to noon. How do you know?
Questions about the lab.
ISAT questions
Science Weekly Lesson Plan
Date: Day 1: Day 2: Day 3: Day 4: Day 5: Big Ideas How does the Earth move? How do star patterns change? What are the phases of the moon? What is the
solar system?
Objective(s) I will learn that patterns in the sky stay the same but appear to change nightly and throughout the year.
I will learn that patterns in the sky stay the
same but appear to change nightly and
throughout the year.
I will learn that patterns in the sky stay the same but appear to change nightly and throughout the year.
I will describe the phases onf the moon.
I will describe the phases of the moon.
Treatment No Treatment Create a constellation map for view constellations following a set of instructions.
Teach a group of students/audience to use a star gazer. Inform them why stars/constellations appear during different times of the year.
No Treatment There was a new moon on January 1st. When will there be another new moon. Create a calendar of moon phases for the month of January.
Do Now Review of rotation and revolution
What is a star? What is the star in our solar system?
Why can’t you see all the constellations at a specific time?
Review questions of all Earth and space covered.
Vocabulary Review
I do Introduce stars with clip
Introduce constellations and history of them. Show clip.
Review constellations. Show clip #2.
Introduce the moon and moon phases.
Introduce project bases task.
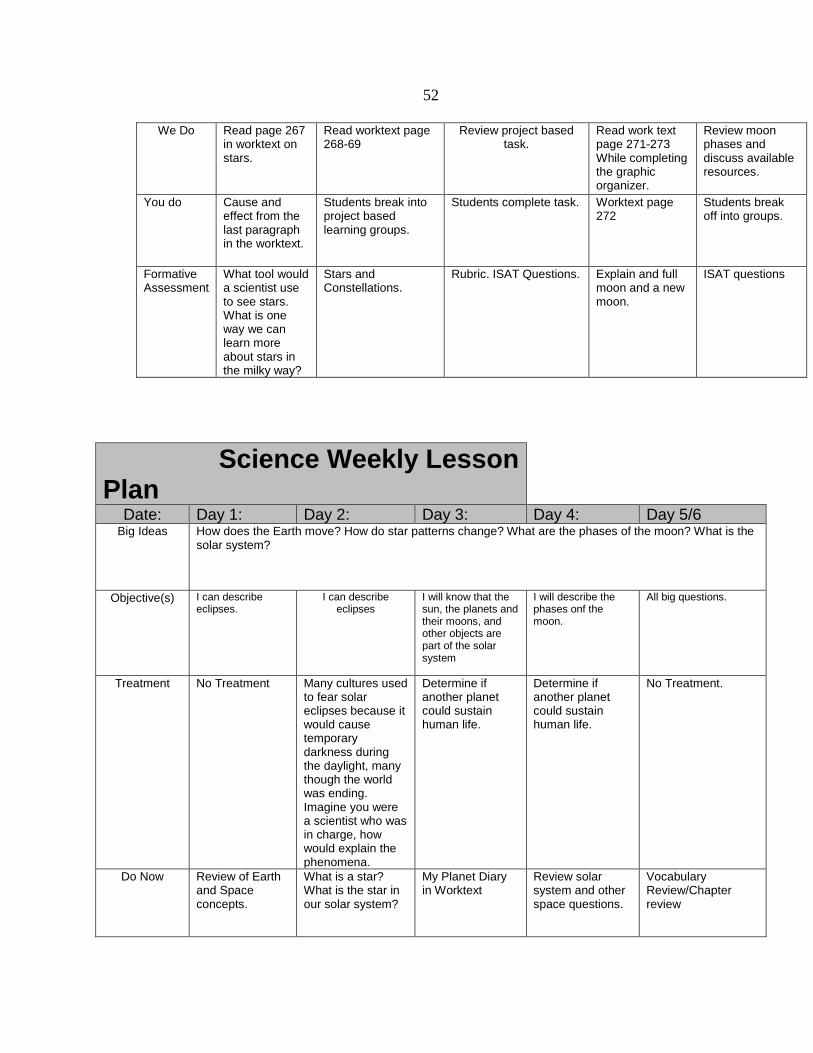
52
We Do Read page 267 in worktext on stars.
Read worktext page 268-69
Review project based task.
Read work text page 271-273 While completing the graphic organizer.
Review moon phases and discuss available resources.
You do Cause and effect from the last paragraph in the worktext.
Students break into project based learning groups.
Students complete task. Worktext page 272
Students break off into groups.
Formative Assessment
What tool would a scientist use to see stars. What is one way we can learn more about stars in the milky way?
Stars and Constellations.
Rubric. ISAT Questions. Explain and full moon and a new moon.
ISAT questions
Science Weekly Lesson Plan
Date: Day 1: Day 2: Day 3: Day 4: Day 5/6 Big Ideas How does the Earth move? How do star patterns change? What are the phases of the moon? What is the
solar system?
Objective(s) I can describe eclipses.
I can describe eclipses
I will know that the sun, the planets and their moons, and other objects are part of the solar system
I will describe the phases onf the moon.
All big questions.
Treatment No Treatment Many cultures used to fear solar eclipses because it would cause temporary darkness during the daylight, many though the world was ending. Imagine you were a scientist who was in charge, how would explain the phenomena.
Determine if another planet could sustain human life.
Determine if another planet could sustain human life.
No Treatment.
Do Now Review of Earth and Space concepts.
What is a star? What is the star in our solar system?
My Planet Diary in Worktext
Review solar system and other space questions.
Vocabulary Review/Chapter review

53
I do Introduce eclipses with clips/images
Review eclipses Introduce solar system.
Review expectations for project bases assignment.
Discuss essential questions/ review objectives.
We Do Read pages 275-76 in worktext on eclipses
Work Text Read worktext pages 277 and
complete questions.
No We Do Chapter review in worktext.
You do Compare and contrast lunar and solar eclipses.
Students break into project based learning groups.
Students break into project based learning groups.
Students continue to work on project bases task.
Assessment.
Formative Assessment
What tool would a scientist use to see stars. What is one way we can learn more about stars in the milky way?
ISAT Questions Rubric
Rubric. What causes the planets to revolve around the sun.
A planet’s atmosphere can hold in warmth from the sun. Mercury has almost no atmosphere. How does this affect the planet’s temp?
Assessment.

54
APPENDIX C
CHICAGO SCHOOL REPORT CARD

55

56

57
APPENDIX D
SCHOOL DATA REPORT
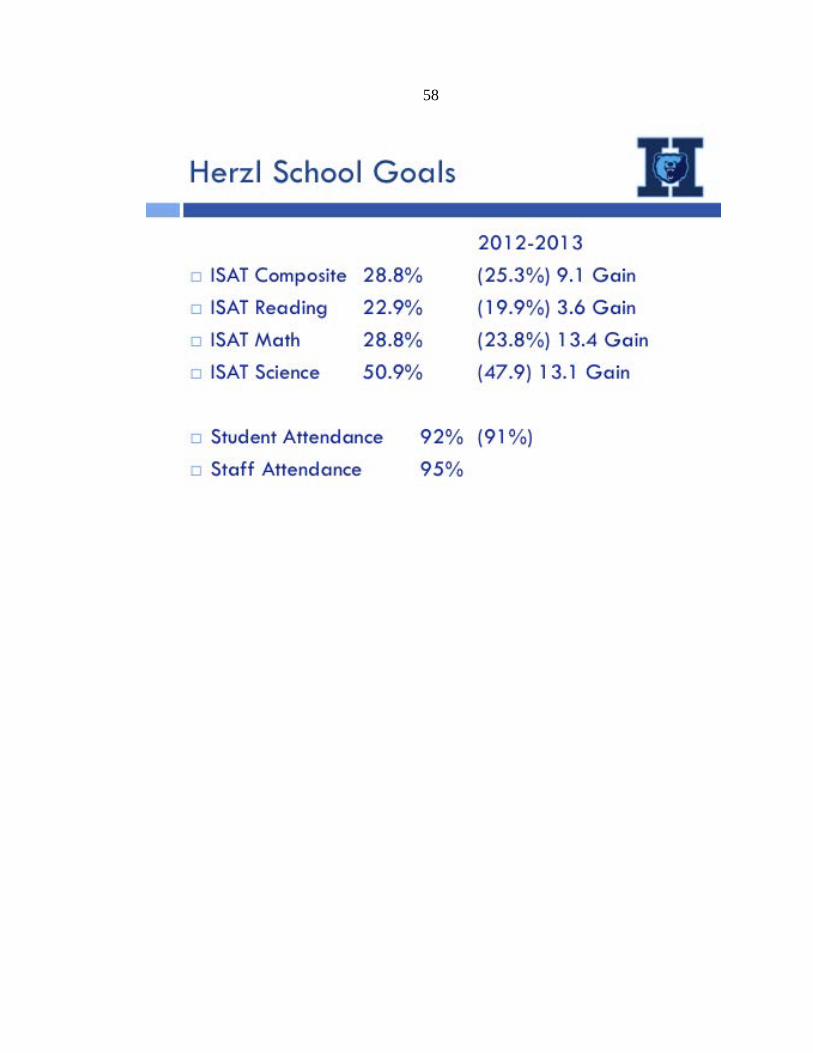
58
59
APPENDIX E
LESSON OBSERVATION SHEET

60
Data observation journal Date________________________ Time___________________ Student Objective: Brief overview of lesson: (explain the PBL or non-treatment that is happening) Redirection tally for typical student misbehavior: (mark a tally for each time teacher needs to redirect a student. Record of major behavior disruptions: Number of students removed from the classroom for behavior disruptions/issues. Describe the issue: Check 1: Groups check ________ groups are talking and discussing about science ________ groups are working collaboratively ________ groups are engaged at the task at hand ________ groups are not working ________ groups are arguing Check 2: Groups that are majority on task ________ groups are talking and discussing about science ________ groups are working collaboratively ________ groups are engaged at the task at hand ________ groups are not working ________ groups are arguing Exit ticket data: (analyze the exit ticket to see how well students are demonstrating knowledge academic content at the end of the class period.
61
Did a majority of students meet the daily objective? _____________________

62
APPENDIX F
STUDENT SURVEY

63
Student Questionnaire Please do NOT put your name on this Participation in this research is voluntary and participation or non-participation will not affect a student’s grades or class standing in any way. Answer the following opinion questions and statements about school and science class. This is a survey to learn about your thoughts and feelings in science class. Please answer the questions honestly; there are no correct answers on this survey. Circle the answer you want to choose. 1. I enjoy coming to school. a. Strongly Disagree b. Disagree c. Neutral (no feeling) d. Agree e. Strongly Agree 2. I come to school because I want to learn new things a. Strongly Disagree b. Disagree c. Neutral (no feeling) d. Agree e. Strongly Agree 3. I enjoy coming to science class a. Strongly Disagree b. Disagree c. Neutral (no feeling) d. Agree e. Strongly Agree 4. I like to participate and share my ideas in class a. Strongly Disagree b. Disagree c. Neutral (no feeling) d. Agree e. Strongly Agree 5. I like to listen to the ideas of other students in the class. a. Strongly Disagree b. Disagree c. Neutral (no feeling) d. Agree

64
e. Strongly Agree 6. I can learn from other students in the classroom a. Strongly Disagree b. Disagree c. Neutral (no feeling) d. Agree e. Strongly Agree 7. I think I am capable to do independent work well a. Strongly Disagree b. Disagree c. Neutral (no feeling) d. Agree e. Strongly Agree 8. I make sure to complete all my schoolwork a. Strongly Disagree b. Disagree c. Neutral (no feeling) d. Agree e. Strongly Agree 9. I am motivated to work hard in science a. Strongly Disagree b. Disagree c. Neutral (no feeling) d. Agree e. Strongly Agree 10. I ask questions to learn about new things a. Strongly Disagree b. Disagree c. Neutral (no feeling) d. Agree e. Strongly Agree 11. I know what it means to use critical thinking a. Strongly Disagree b. Disagree c. Neutral (no feeling) d. Agree e. Strongly Agree

65
12. I can use critical thinking to think about ideas that I learn in class a. Strongly Disagree b. Disagree c. Neutral (no feeling) d. Agree e. Strongly Agree 13. When I don’t know something I try to figure it out myself a. Strongly Disagree b. Disagree c. Neutral (no feeling) d. Agree e. Strongly Agree 14. I am good at solving problems in science a. Strongly Disagree b. Disagree c. Neutral (no feeling) d. Agree e. Strongly Agree 15. I enjoy finding solutions to problems in science a. Strongly Disagree b. Disagree c. Neutral (no feeling) d. Agree e. Strongly Agree 16. I enjoy working in small groups to complete work a. Strongly Disagree b. Disagree c. Neutral (no feeling) d. Agree e. Strongly Agree 17. I know how to work well in a small group a. Strongly Disagree b. Disagree c. Neutral (no feeling) d. Agree e. Strongly Agree

66
18. I learn more when I work with other students in the class a. Strongly Disagree b. Disagree c. Neutral (no feeling) d. Agree e. Strongly Agree 19. What is one thing you like about science class? ______________________________________________________________________________________________________________________________________________________________________________________________________ 20. What is one thing you do not like about science class? ______________________________________________________________________________________________________________________________________________________________________________________________________ 21. Do you agree with the idea that students should work on projects together? Why? ______________________________________________________________________________________________________________________________________________________________________________________________________
67
APPENDIX G
INTERVIEW QUESTIONS
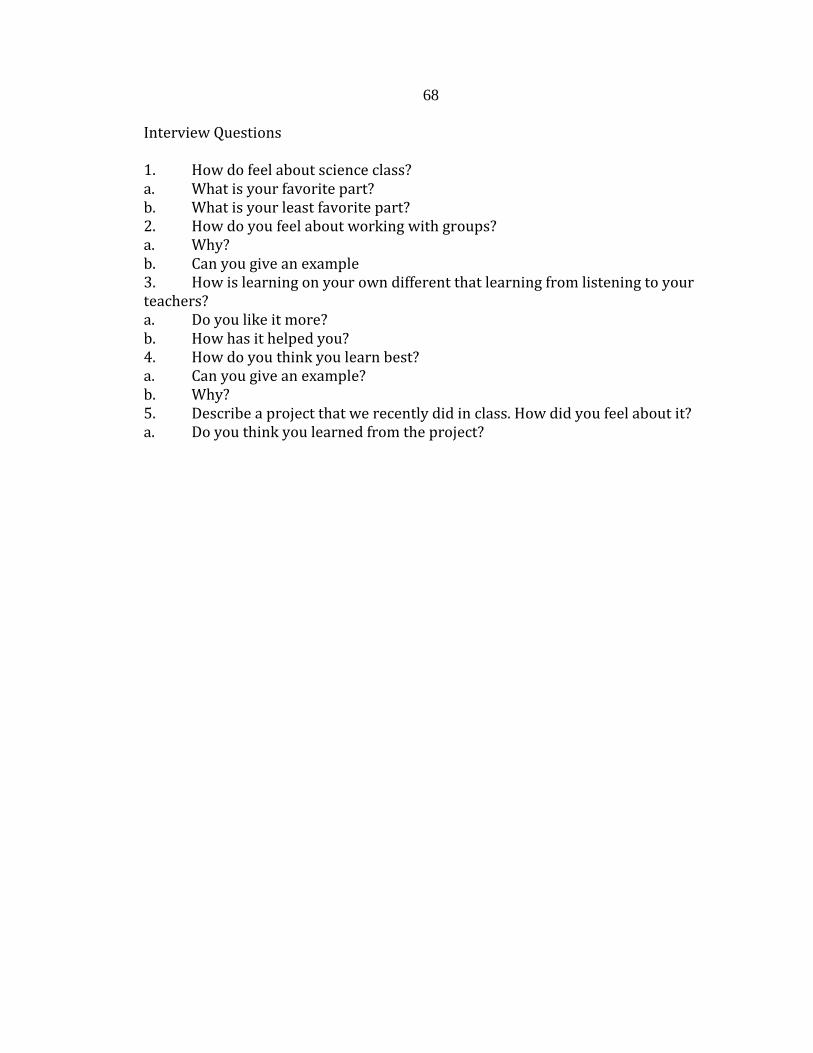
68
Interview Questions 1. How do feel about science class? a. What is your favorite part? b. What is your least favorite part? 2. How do you feel about working with groups? a. Why? b. Can you give an example 3. How is learning on your own different that learning from listening to your teachers? a. Do you like it more? b. How has it helped you? 4. How do you think you learn best? a. Can you give an example? b. Why? 5. Describe a project that we recently did in class. How did you feel about it? a. Do you think you learned from the project?

69
APPENDIX H
4th GRADE READING LEVELS
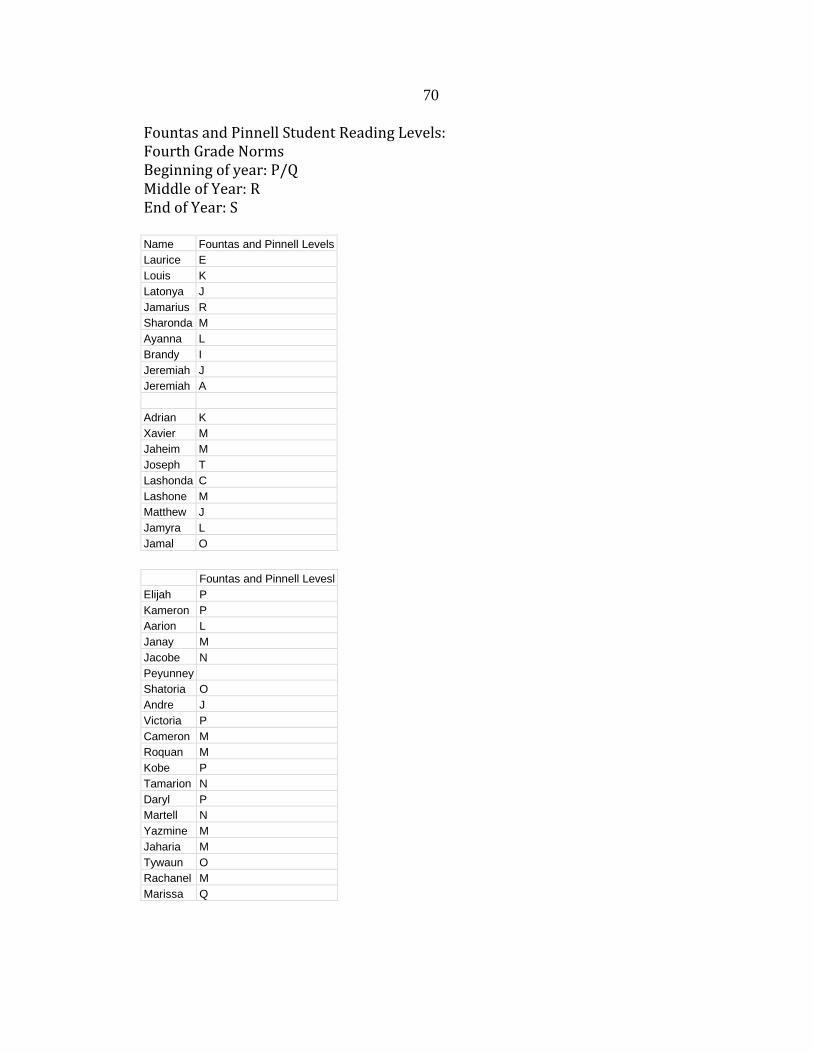
70
Fountas and Pinnell Student Reading Levels: Fourth Grade Norms Beginning of year: P/Q Middle of Year: R End of Year: S
Name Fountas and Pinnell Levels Laurice E Louis K Latonya J Jamarius R Sharonda M Ayanna L Brandy I Jeremiah J Jeremiah A Adrian K Xavier M Jaheim M Joseph T Lashonda C Lashone M Matthew J Jamyra L Jamal O
Fountas and Pinnell Levesl Elijah P Kameron P Aarion L Janay M Jacobe N Peyunney Shatoria O Andre J Victoria P Cameron M Roquan M Kobe P Tamarion N Daryl P Martell N Yazmine M Jaharia M Tywaun O Rachanel M Marissa Q