Student perception of school environment and its relationship to mood, achievement, popularity, and...
17
American Journal of Community Psychology, VoL 10, No. 6, 1982 Student Perception of School Environment and Its Relationship to Mood, Achievement, Popularity, and Adjustment I Stephanie Wright and Emory L. Cowen 2 University of Rochester This study examined relationships between student perceptions of classroom environment and mood, achievement, popularity, and adjustment, both for students in general and for "problem" 6.e., acting- out, anxious, and unpopular) children. Subjects included 511 fifth- and sixth-grade students from 23 classes in four suburban schools. Class environment was assessed by responses to a short form of the Classroom Environment Scale (CES). Students also completed mood adjective check- lists and peer sociometric ratings. Reading and arithmetic report card grades and achievement test scores were recorded for the school year, and teachers submitted adjustment ratings for all students. Classes, rather than students, were used as the main unit of analysis. For classes in general, high perceived Order and Organization and Affiliation related to greater student popularity. Relationships between perceptions of class environment and the dependent measures were stronger for problem students. For that group, high perceived Order and Organization, Affiliation, and Innovation related to positive mood, greater peer popularity, and teacher ratings indicating more positive adjustment. ~This study was supported by grants from the National Institute of Mental Health (MH 14574- 04) and the New York State Department of Education. That support is acknowledged with gratitude as are specific contributions made by Evelyn Arlas, Ellis L. Gesten, and Elizabeth Kaplan. 2All correspondence should be sent to Emory L. Cowen, University of Rochester, River Station, Rochester, New York 14627. 687 0091-0562/82/1200-0687503.00/0 © 1982 Plenum Publishing Corporation
-
Upload
independent -
Category
Documents
-
view
2 -
download
0
Transcript of Student perception of school environment and its relationship to mood, achievement, popularity, and...
American Journal of Community Psychology, VoL 10, No. 6, 1982
Student Perception of School Environment and Its Relationship to Mood, Achievement, Popularity, and Adjustment I
Stephanie Wright and Emory L. Cowen 2 University of Rochester
This study examined relationships between student perceptions o f classroom environment and mood, achievement, popularity, and adjustment, both for students in general and for "problem" 6.e., acting- out, anxious, and unpopular) children. Subjects included 511 fifth- and sixth-grade students from 23 classes in four suburban schools. Class environment was assessed by responses to a short form o f the Classroom Environment Scale (CES). Students also completed mood adjective check- lists and peer sociometric ratings. Reading and arithmetic report card grades and achievement test scores were recorded for the school year, and teachers submitted adjustment ratings for all students. Classes, rather than students, were used as the main unit o f analysis. For classes in general, high perceived Order and Organization and Affiliation related to greater student popularity. Relationships between perceptions o f class environment and the dependent measures were stronger for problem students. For that group, high perceived Order and Organization, Affiliation, and Innovation related to positive mood, greater peer popularity, and teacher ratings indicating more positive adjustment.
~This study was supported by grants from the National Institute of Mental Health (MH 14574- 04) and the New York State Department of Education. That support is acknowledged with gratitude as are specific contributions made by Evelyn Arlas, Ellis L. Gesten, and Elizabeth Kaplan.
2All correspondence should be sent to Emory L. Cowen, University of Rochester, River Station, Rochester, New York 14627.
687
0091-0562/82/1200-0687503.00/0 © 1982 Plenum Publishing Corporation
688 Wright and Cowen
Primary prevention seeks to develop effective programs to forestall psycho- logical problems. That goal can be advanced both by equipping people with competencies that help them to deal effectively with life situations, and by reducing sources of stress or creating environments that optimize adjust- ment (Prevention Task Panel, 1978; Cowen, 1977). Effective primary prevention programs should rest on a sound "generative" base, i.e., demonstrated relationships between characteristics of social structures, processes, and experiences and good adaptive outcomes (Cowen, 1980; Lotion & Lounsbury, 1981). An illustrative generative question is: "Which skills or competencies, o r environmental qualities, relate to positive and/or negative adjustment outcomes?" In the area of social systems analysis, the locus of the present study, sound primary prevention programming depends both on developing methodology to assess salient qualities of social environ- ments and generative steps that establish linkages between environmental properties and people's adaptation.
If, as has been argued (Prevention Task Panel, 1978; Cowen, 1977, 1980), proactive mental health programming should be directed to young children before maladaptive behaviors root, then schools are prime sites for such programs. Most work assessing qualities of school environments and charting relationships between such qualities and behavior has been done with youth and young adults, because they can readily form complex abstract judgments about the nature of social environments. However, if young children are to profit from this approach, their perceptions of school social environments and relationships between those perceptions and behavior and adaptation must be understood. That is the goal of this study. Its two main questions are: (a) What are the relationships, for fifth and sixth graders, between perceptions of the class environment and self- reported mood states, academic achievement, peer-judged sociometric status, and teacher ratings of adjustment? (b) Do those relationships differ for different children?
School environments have been assessed in several ways (Moos, 1979). One way is to focus on an aspect of physical environment, e.g., school size or pupil mobility. Barker and Gump (1964), for example, found that students from large schools participated in many fewer activities than students from small schools. Similarly, Willems (1967) found that students from small, compared to large, schools had a stronger sense of belonging and participated in more activities. Whereas, in small schools, marginally adequate students felt as obligated and involved as successful students, in large schools they felt isolated and did not get involved in activities.
School enviornment has also been assessed through direct observation. Stallings (1975), using a complex observational system in first- to third-grade classrooms, found systematic relationships between environ- ment qualities and children's behavior and performance. She reported, for
Perceived School Environment and Behavior 689
example, that (a) environment contributed more than aptitude scores at school entry to math and reading achievement, and (b) students in structured classes had higher achievement scores than those in flexible classes, whereas the latter had higher nonverbal reasoning scores, fewer absences, and worked longer independently.
Environments can also be assessed via the perceptions of inhabitants. Moos (1974) developed parallel instruments, each with 7 to 10 dimensions, to assess such diverse environments as psychiatric wards, offices, prisons, homes, and classrooms. Three social climate domains consistently emerged as important in all settings: relationship, personal development, and system maintenance and change. Moreover, connections were shown between perceived environment and inhabitants' mood, satisfaction, and behavior. Thus, Trickett and Moos (1974), using the Class Environment Scale (CES), found that high school students from classes which they saw as high in competition felt that they learned more, and those from classes seen as high in perceived rule clarity, teacher support, and student involvement felt more satisfied and had fewer absences than peers from classes rated low in those qualities.
Early work with the CES raised the question of how best to use scale data to depict classrooms. Although classes can be described along any single dimension (e.g., affiliation, teacher control), the meaning of such placements often depends on the context of other dimensions. Moos (1978) addressed that problem by cluster analysis of CES responses for 196 classes. He identified six basic classroom typologies, each associated with different student outcomes. Students reported the strongest feelings of well-being, satisfaction with the teacher, and friendship, in innovation-oriented classes, and high satisfaction with learning, friendship-formation, and themselves in supportive-task and supportive-competition oriented classes. In general, environments low in perceived structure and/or affiliation were associated with poorer scores on dependent measures.
In another effort to address much the same issue, Trickett and Quinlan (1979) did an extensive factor analysis of the CES, based on a sample of 3,480 high school students from 239 classrooms. Their six-factor solution (i.e., Rule Emphasis, Order and Organization, Friendly Teacher, Innovation, Competition, and Affiliation) fell well within the framework of the three conceptual domains identified (cf. above) by Moos (1974) as basic ways to characterize diverse social environments.
Another issue raised by research based on the perceived environment approach is overlap in perceptions based on different measurement per- spectives. In that context, Kaye, Trickett, and Quinlan (1976) used a multi- method matrix approach to study concordance among several ways of assessing high school class environments. Twenty-eight classrooms were selected, 14 with high and 14 with low teacher control. Students rated
690 Wright and Cowen
perceived environment using the CES, and outside observers provided both global ratings of class qualities and frequency counts of specific environ- mental events. Moderate cross-methodology convergence was found. Kaye et al. (1976) concluded that different methods for assessing environments have different values and that choice of method should be based on a study's goals.
Thus far we have considered methods used to assess psychosocial environments and linkages between environmental qualities and behaviors. Because social systems are neither neutral nor uniform in their effects on people, before such information can be widely applied, data on person- environment "fit" are needed. In that sphere Reiss and Martell (1974) reported a series of studies on person-effects in open space versus contained classrooms. They found that distractible fourth-grade boys, compared to other second and fourth graders, learned more in contained classes, whereas creative, compared to less creative, second- and fourth-grade girls, had higher self-esteem and learned more in open classrooms. They concluded that both open and contained class formats are needed to meet the needs of different children, and urged greater effort in optimizing child-classroom matches. Work by Grimes and Allinsmith (1961) with younger students, and Kelly (1979) with older students, supports that view.
One main focus of this study is to examine the psychosocial environ- ments of fifth- and sixth-grade classrooms in relation to children's mood states, academic performance, popularity, and adjustment. Among the study's specific questions is whether prior CES findings can be replicated with this age group. Thus, for example, a relationship is hypothesized between seeing the environment as high in Rule Clarity, Involvement, and Affiliation, and positive student mood. The study also considers "interac- tion effects," i.e., person-environment fits. Relationships between environ- ment and behaviors are examined for three groups of problem children, i.e., Acting-out, Shy-anxious, and Unpopular. Although the latter work is exploratory, problem children were expected to have more positive mood states and better teacher adjustment ratings in high- compared to low- structure classrooms, defined by perceived Teacher Control, Rule Clarity, and Order and Organization.
M E T H O D
Environment Measures
Students completed a short form of the CES (Moos & Trickett, 1974). The CES, developed for use in junior and senior high schools, measures
Perceived School Environment and Behavior 691
nine dimensions of classroom environment, comprising three clusters: (a) interpersonal relationships, (b) goal orientation or personal growth, and (c) system maintenance and change. Specifically, the nine subscales are: Involvement, Affiliation, Teacher Support, Task Orientation, Competition, Order and Organization, Rule Clarity, Teacher Control, Teacher Innovation. Support items were not used because they were thought to be potentially sensitive for teachers. Based on four items for each of eight subscales, the short form could have included 32 items. However, two items 3 were dropped because teachers considered them too abstract for fifth and sixth graders. Most items were simplified and per- sonalized, e.g., "Almost all class time is spent on the lesson for the day" was changed to "We spend most of our class time on our lessons."
Students were asked to respond "true" or "false" for their classrooms, to each CES statement. Moos and Trickett (1974) report 6-week test-retest reliabilities of .72-.90 for CES subscales.
Child Measures
Mood. A 20-item Mood Adjective Checklist (MACL) was adapted from prior similar measures for adults (Nowlis & Nowlis, 1956) and 10- to 15-year-olds (Weiss, i966). The 10 positive and 10 negative 4 adjectives were all judged to be comprehensible to children, ages 6-10, either by a school- based word frequency count (Carroll, Davies, & Richman, 1971) or Weiss' survey. Children were told to double-check adjectives if in the "last few minutes" they "have really, really been feeling that way," to single-check, "if that's sort of how you've been feeling," and to leave the item blank, "if you have not felt that way at all." Sum positive, sum negative, and total mood state scores (sum positive - sum negative) were derived from children's MACL responses.
Academic Performance. Academic achievement was assessed using scores from the May 1979 group-administered Stanford Achievement Tests; report card grades were used to measure academic performance. Identical quantifiable report cards, used by all schools, were issued in January 1979 and June 1979. Each child could receive one of five progress grades (ranging from 5 = very good, to 1 = unsatisfactory) at one of three performance levels, i.e., above (3), at (2), or below (1) grade level, both for math and reading. Multiplying grades by levels yields a theoretical range of scores from a high of 15 (5 x 3) to a low of 1 (1 × 1).
3One from Order and Organization and one from Involvement. 4The word "excited" was dropped because it proved to be ambiguous.
692 Wright and Cowen
Peer Rating Scale. Students rated all classmates on two 3-point scales (1 = "really, really happy," 2 -- "pretty happy," and 3 = "it wouldn't matter") assessing how much they would like to (a) go on a picnic, and (b) work on a class project, with them. The sums of scores a child received from all classmates on the two items were pooled to yield a total popularity score. Reliabilities, based on a 3-week retest for one fifth- and two sixth-grade classes, were picnic = .82, project = .86, and total = .85.
Classroom Adjustment. A 32-item teacher-rating scale was adapted for this study, based on items from the Classroom Adjustment Rating Scale (CARS; Lorion, Cowen, & Caldwell, 1975) and the Health Resources Inventory (HRI; Gesten, 1976). The CARS is a 41-item scale on which teachers rate children on 5-point scales of problem severity (1 = not a problem to 5 = very serious problem). The scale includes three main factors: Acting-out, Shy-anxious, and Learning Problems. On the HRI, teachers rate each of 54 items as to how well they describe a child's com- petencies, from 1 = not at all to 5 = very well. Adequate reliability has been demonstrated for all CARS and HRI factors (Lorion et al., 1975; Gesten, 1976).
The present 32-item combined CARS-HRI included the six highest factor-loading items from the CARS Acting-out and Shy-anxious subscales (Anxious items only), and the four highest factor-loading items from each of the five HRI subscales. Given the facts that both the CARS and HRI had been abbreviated and that the measures were being used for the first time with fifth and sixth graders, both scales were refactored (Varimax, orthogonal solution) based on the pretest responses of 557 individual pupils. The CARS analysis precisely duplicated the initial CARS factor analysis findings (Lorion et al., 1975), i.e., the six selected acting-out items loaded (range .56-.90) on an Acting-out factor, and the six selected shy- anxious items loaded (range .65-.88) on a Slay-anxious factor. Collectively, the two factors accounted for .74 in total variance.
The results of the new HRI factor analysis, with one minor exception, duplicated the original (Gesten, 1976). Thus, all four items selected from the original Rules, Good Student, and Frustration Tolerance scales loaded on identical factors. The one exception was that the original four-item Peer Sociability and Gutsy factors fused into a single eight-item factor in the current analysis. Item loadings ranged from .53-.88 on all factors and there was no item overlap. Collectively, the four factors accounted for .77 in total variance. Given the overwhelming similarity between the current and original factor analyses, the original (2 CARS, 5 HRI factor) scoring schema was retained.

Perceived School Environment and Behavior 693
Setting and Subjects
Of 29 teachers invited, 23 fifth- and sixth-grade teachers (14 at fifth and 9 at sixth), f rom four suburban schools participated in the study. 5 The schools were f rom the same district and were comparable sociodemo- graphically, i.e., predominant ly white, middle-class. Most classes had approximately 25 students. The total N of participating children ranged f rom 511 at pretest to 403 at posttest.
Based on the pre CARS-HRI , four subgroups of children were iden- tified for intensive study. (a) Acting-out: two boys and two girls in each class with the highest CARS Acting-out scores; (b) Anxious: two boys and two girls in each class with the highest CARS Anxious scores. 6 (c) Un- popular: two boys and two girls in each class rated least popular by class- mates. Twenty-six children previously identified as Acting-out and 26 others identified as Anxious were dropped leaving a total of 40 "pure" Un- populars. (d) Random: two boys and two girls in each class were chosen randomly f rom those not in any other subgroup. All groups except for the Unpopulars thus had 92 Subjects, 46 boys and 46 girls; in all, the selected subgroups had 316 students.
Procedure
Students completed the CES in November 1978 and May 1979. MACLs were class-administered in 11/78, 12/78, 2/79, and 5/79. Peer rating scales were group administered in 11/78 and 5/79. Reading and math grades were obtained f rom the 1/79 and 6/79 report cards. Verbal and math Stanford Achievement Test scores were taken f rom the 5/79 testing.
Teachers were paid $15 to complete the November 1978 and May 1979 CESs plus CARS-HRI forms for (a) the entire class in November 1978 and (b) a max imum of 16 students in the above four subgroups in May 1979.
5One teacher left school at midyear for personal reasons. Although her class continued in the study, it had no May teacher CARS-HRI ratings.
6Teacher-assigned Acting-out and Shy-anxious scores were uniformly low in seven classes. That could have been due either to benevolent class "realities" or to teachers' socially desirable response styles. In any case, those seven teachers were asked to identify (actually, one to four) specific children, who most closely approximated the attributes of one or both of the problem subgroups (e.g., acting-out female). That all teachers could do so readily may suggest that the "unofficial" verbal response mode was easier for them than identifying problems in writing. The risk of using an after-the-fact nominating procedure is that it may identify false-positives, i.e., nonproblem students forced artificially into a problem-student category. The effects of such misidentification would be to attenuate findings involving problem subgroups.

694 Wright and Cowen
The order of class testing both in November 1978 and May 1979 was MACL, CES, peer ratings. Instructions for all tests were read aloud by the examiner, and children were encouraged to ask questions if anything was unclear. Additionally, CES and sociometric instructions were printed at the top of each test page.
RESULTS
Three main sets of results are reported: (a) relationships between characteristics of perceived environment and class responses on the dependent measures; (b) those same relationships, for problem children; (c) comparisons on the dependent measures of the combined problem student and random samples from environments seen as high versus low in specific qualities.
Framework for Analyzing and Reporting Data
Given the large number of possible correlations between perceived environment dimensions and the study's dependent measures, the CES pretest was factored, using the individual subject N of 511, in an effort to consolidate independent variables. An orthogonal rotation yielded a four- factor solution which included 14 items (minimal item load = .35) and accounted for 30°7o of the total variance: Order and Organization (3 original Order and Organization and 2 Involvement items), Affiliation (3 original Affiliation items), Innovation (2 original Innovation items), and Teacher Control (3 original Teacher Control and 1 Rule Clarity items). All ]~actor scores were well distributed across classrooms. High scores on all factors reflect strong perceptions of the given environmental quality.
Although the CES factor analysis was not per se a prime focus of the study, it is of interest to note that the four factors identified are quite comparable to four of the six factors reported by Trickett and Quinlan (1979). That correspondence is perhaps more impressive when one considers that the two analyses were based on different age groups and CES forms.
Since the four clusters of dependent measures also yielded many scale and subscale scores, steps were taken, wherever feasible, to reduce and recombine them. Thus, since positive, negative, and total mood scores had average correlations of .54, .42, and .47, respectively, across four admin- istrations, only the three overall (i.e., summed) mood ratings were used in the analyses. Reading and arithmetic grades, based on January 1979 and June 1979 cards, and verbal and math Stanford Achievement Test scores were used for a total of six academic measures. Since the two sociometric
Perceived School Environment and Behavior 695
items (picnic and class project) intercorrelated .91 at pre and .94 at post, only average sociometric scores were used to represent peer popularity. All seven CARS-HRI variables were used. Most analyses of environment-out- come relationships were thus based on 18 dependent variables (3 mood, 6 academic achievement, 2 sociometric, and 7 adjustment).
Even after the data were reduced, most of the analyses generated many correlations, necessitating the adoption of ground rules for evaluat- ing their significance. An arbitrary decision was made to accept p < . 10 as an acceptable overall significance level for analyses based on classes (n = 23). Since, in all such analyses, an r > .41 was needed for a p < .05, a significance level of p < .10 was considered acceptable to decrease the possibility of Type II errors. Romig's tables (1953) were used to establish how many rs, at p < .10, from a larger series, were needed to achieve overall significance at p < .05. Sets of correlations were thus scanned for each group of dependent measures; each table indicates whether or not a given set achieved overall significance.
Since relationships between perceived environment and dependent measures were, in general, similar using pre- and postmeasures of environ- ment, only analyses based on premeasures are reported, to conserve space.
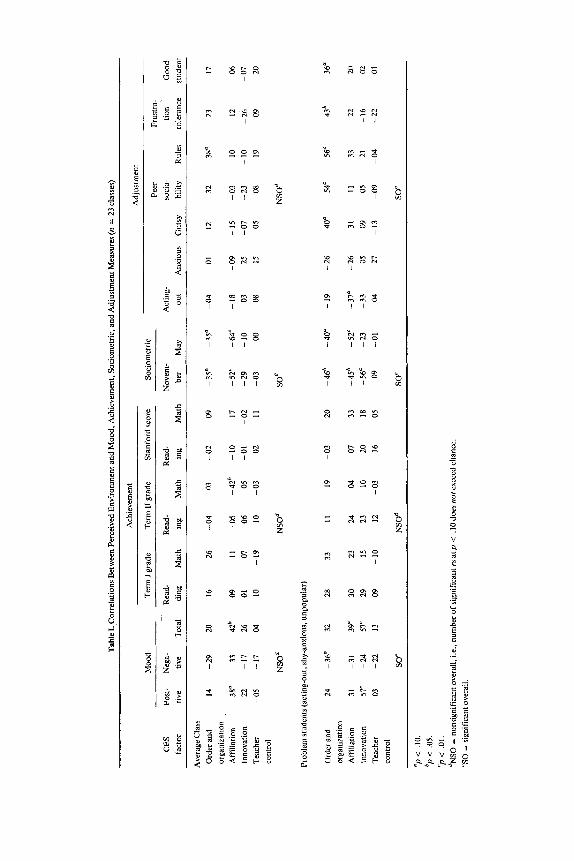
Relationships Between Perceived Environment and Average Class Responses. The top half of Table I summarizes Pearson rs between perceived environment and average class scores for mood, academic measures, socio- metric status, and adjustment. The only overall significant cluster of relationships was sociometric status; both high perceived Order and Organization and Affiliation related to popularity at pre- and posttesting.
Relationships Between Perceived Environment and Problem Student Responses. Correlations between perceived environment and the dependent measures were computed separately by sex and problem (i.e., Acting-out, Anxious, and Unpopular) subgroups. Since r to z transformations (Fisher, 1948) demonstrated that overall differences among sex and problem groups did not exceed chance, students were pooled across problem subgroups.
The bottom half of Table I presents, for problem students (as defined above), averaged by class, Pearson rs between pretest views of class environment, mood, academic, sociometric, and adjustment measures. For those students, high perceived Order and Organization related to low negative mood, and both high perceived Affiliation and Innovation related to positive mood.
Although perceived environment did not relate to achievement measures for problem students, high perceived Order and Organization, Af- filiation, and Innovation all related to popularity at pre and post, for that group. Finally, high perceived Order and Organization related to greater teacher-rated competence and high perceived Affiliation related to fewer teacher-judged acting-out problems.
"6 P~
i o
o
6
8
b
z
>,
• ~ ~ o ~ _ ~
I I
z
~ Z
I ~ - S £
I t
I
J I
I 1 I
1 I 4 I
I
I
I
o
I I I I ~ m I I I z ~ o
N
~ 8 ~ 8 ~ . ~ ~ ~ ~ - ~ ~ <
o
V
~o
v v v S "
Perceived School Environment and Behavior 697
O
o.
O
.=,
e~
O
~a
O
t , O
<
© Z <
t'xl e~ t"4 , 4 ~ e i
~ ~
o
.N .~
~ o o o ~ ' ~
~ q
II m m ~
O O
~ 2 ~ 2 8
m
698 Wright and Cowen
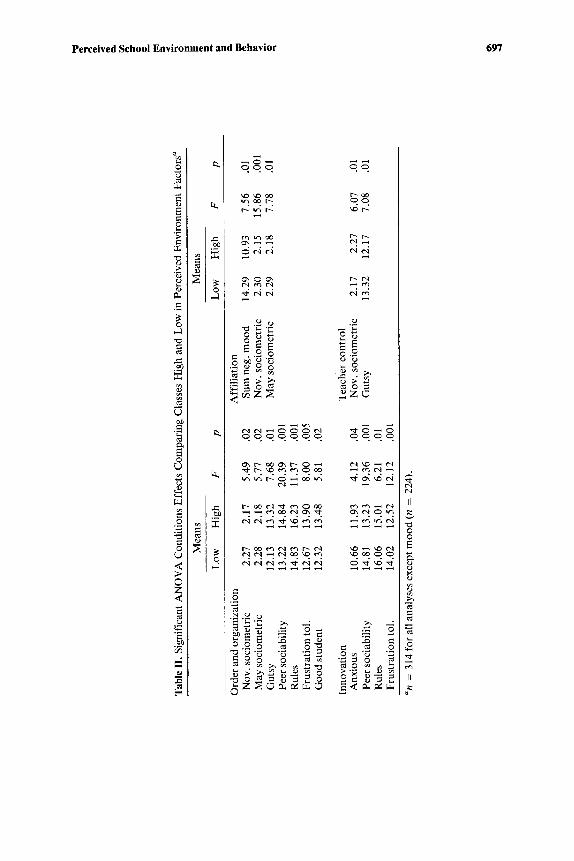
Comparisons o f Subgroups in Different Environments. Forty-four separate 4 (Groups, i.e., Acting-Out, Anxious, Unpopular, Random Ss) x 2 (Sex) x 2 (Pre-post) x 2 (High/low CES scores) 7 repeated measure analyses of variance were run, based on each of the four factor scores and 11 dependent variables (positive and negative mood, pre and post popularity, acting-out, shy-anxious, and the five competence scores), s One purpose of those analyses was to evaluate differential change among subgroups in different class environments, over time (Condition x Time interactions). The number of such significant interactions, however, failed to exceed chance. A second purpose was to evaluate relationships between perceptions of class environment (Condition main effects) and scores on the dependent measures for this predominant problem-child sample. In this case, 16 of 44 main effects of conditions (see Table II) were significant at p < .05. Students from classes seen as high in Order and Organization were mor e popular with peers and received higher competence ratings from teachers. Students from classes seen as high in Affiliation had less negative moods and were rated as more popular. Students from classes seen as high on Teacher Control were less well accepted by peers and received lower teacher ratings on adaptive assertiveness.
DISCUSSION
The analyses focused in three related though structurally different ways on linkages between students' perceptions of environment and their mood, achievement, popularity, and adjustment: (a) full-class analyses related the average views of students to their averaged status on the dependent measures, (b) similar analyses for problem students based on a restricted sample of Acting-out, Anxious, and Unpopular children, (c) the different-environment analyses compared criterion scores, for a predominant problem-student sample in classes defined as high versus low, on average class views of environment. Since the three sets of analyses
7Class means calculated from responses by all students in a given class at pretest were used to define CES status. Based on the distribution of means for 23 classes, high and low groups were defined by approximate median splits.
8These analyses were also done as M A N O V A s to guard against possible Type I errors. Two such MANOVAs , one based on the seven teacher-rated adjus tment variables and one on the four student report (mood and popularity) measures were done for each CES f a c t o r - a total of eight M A N O V A s in all. Al though the substantive findings from the M A N O V A and A N O V A analyses were highly comparable, since Ns on the dependent measures varied from 224-314, some M A N O V A s necessarily entailed heavy subject loss. Accordingly, A N O V A rather than M A N O V A findings are reported, since they better represent the full array of data.
Perceived School Environment and Behavior 699
yielded directionally consistent findings, they are discussed together for each cluster of dependent measures.
Mood
The strongest links between perceived environment and student mood were for problem students. For that group, high perceived Order and Organization, Affiliation, and Innovation related to more positive and/or fewer negative moods. There were similar but weaker relationships in the two other sets of analyses. Thus, in comparing different environments, high perceived Affiliation predicted positive mood; the full-class data showed only weak relationships between perceived Affiliation and Order and organization and mood.
Research with older students (Trickett & Moos, 1974; Moos, 1979) has reported associations between high perceived Rule Clarity, Affiliation, and Involvement and positive class mood. Although the present findings for Affiliation are consistent with the earlier ones, they are less robust. In this study perceived environment was not in general a good predictor of mood for the class as a whole. Measurement differences across studies, as well as the use of young children in this study, may account for the less than complete replication of prior findings.
Work by Grimes and Allinsmith (1961) and Reiss and Martell (1974) suggested that problem students might feel better in classes they saw as high in Rule Clarity, Order and Organization, and Teacher Control. That expectation was supported for Order and Organization, but not for Teacher Control. Rule Clarity did not emerge as a separate entity in the factor analysis.
The study's most important finding with respect to mood was that problem students had the most positive mood in classes seen as warm and well-structured; that group seems to be especially reactive to those elements of perceived environment.
Achievement
The study failed to find relationships for any students between perceived class environment and academic achievement. Although researchers working with high school students have in the past found such relationships (Moos & Moos, 1978; Walberg & Anderson, 1968; Walberg, 1969, 1976; O'Reilly, 1975), those studies were based on specific subject matter classes (e.g., physics, French). The elementary class environment may be too diffuse to permit accurate prediction to specific reading and math performance. On the other hand, observational studies by Stallings
700 Wright and Cowen
(1975) and Bennett (1976) in primary-grade classrooms found relationships between environment indicators and reading and math grades or aptitude scores. Conceivably, the lack of relationship between environment and achievement in this study may be a function of how environment was assessed.
Popularity
Consistent relationships were found between perceived environment and popularity in all three sets of analyses. Popularity, both early and late in the school year, was highest in classes seen as high in Order and Organi- zation and Affiliation. For problem students, high perceived Innovation related to high popularity; by contrast, classes high in perceived Teacher Control yielded low popularity ratings.
That popularity should be high in classrooms that students see as high in Affiliation is certainly face valid. The relationship between high perceived Order and Organization and popularity, though less obvious, points to yet another environmental quality that may promote friendship formation. On the other hand, classes that students see as strong in Teacher Control appear to discourage the formation of friendship patterns.
Student CES responses have not previously been studied in relation to sociometric status. Both the fact that young children's popularity predicts later adjustment (Kohlberg, LaCrosse, & Ricks, 1976; Cowen, Pederson, Babigian, Izzo, & Trost, 1973) and the consistent connections shown in this study between perceived class climate and popularity, suggest that this area merits further study. Learning more about what and how the class climate contributes to peer acceptance can have useful short- and long-term payoffs, e.g., placing unpopular children in warm, purposeful, well- structured classes for several years might facilitate their personal growth.
Adjustment
Although adjustment findings were directionally consistent across analyses, they were weak (i.e., nonsignificant) for the full-class sample and stronger both for problem students and in comparing extreme groups. The most robust findings in the latter analyses were that teachers rated students better adjusted in classes that students saw as high particularly in Order and Organization and secondarily in Affiliation. Teachers also rated problem students less well adjusted in classes students saw as high in Innovation and as less Gutsy in classes they rated high in Teacher Control.
Perceived School Environment and Behavior 701
Relationships between problem students' perceptions of high Order and Organization and Affiliation and teachers rating them as better adjusted, suggest that teachers evaluate such students more positively in classes that the latter see as structured and warm. Those findings are con- sistent with the popularity data already considered. Both sets of findings suggest that those environmental qualities may enhance the adaptation of problem students. That teachers rated problem students as less well adjusted in classes seen as Innovative suggests that those youngsters may have trouble with new ideas and ways of doing things. The negative re- lationship between high perceived Teacher Control and teacher Gutsy ratings suggests that problem students in such classes behave less assertively because the teacher is in firm command. As with the mood analyses, better adjusted students, perhaps because they have the ability to manage their own "good fit" (Kelly, 1968) may be less reactive than problem students to different environmental conditions. Prior work had led to the hypothesis that problem students' adjustment (as well as mood) would be facilitated in classes they saw as high in structure. That connection was found for Order and Organization, but not for Teacher Control.
Young students' perceptions of environment have not previously been studied in relation to teacher adjustment ratings. The present findings suggest that further study of relationships between perceptions of environ- ment and adaptation may be a promising pathway to follow in identifying ways to facilitate their classroom functioning.
Limits and Overview
The study's correlational design limits imputations of causality to environmental perceptions. Even so, the consistent demonstration of the importance of perceived Order and Organization and Affiliation in this study, taken together with the CES' predictive power in prior ones, suggests that some aspects of perceived environment indeed favor certain outcomes for some students.
Relationships between class environment variables and behavior are not yet sufficiently strong to identify compelling specific directions for engineering school environments that optimize children's well-being. At the same time, useful paradigms for future work can be cited, such as giving teachers specific suggestions in limit-setting, classroom management skills, and other ways to increase Order and Organization. Similarly, Aronson,
-Blaney, Stephan, Sikes, and Snapp's (1978) "jigsaw" approach to small- group class projects, used primarily to decrease racial tension in schools, may be an effective way to increase classroom Affiliation.
702 Wright and Cowen
The present study has identified several important relationships between young children's perception of the class environment and behavior. Those findings are encouraging, perhaps even more so because they are restricted by obvious limits in the measures (i.e., the use of a short form of an environment rating scale previously used only with much older students). Additional work to develop more robust, sensitive measures of environ- ment can help to enrich our understanding of children's perceptions of classrooms, correlates of such views, and the potentially constructive impact of informed environmental change.
REFERENCES
Aronson, E., Blaney, N., Stephan, C., Sykes, J., & Snapp, M. The jigsaw classroom. Beverly Hills: Sage, 1978.
Barker, R. G., & Gump, P. V. Big school, smallschool. Stanford: Stanford University Press, 1964.
Bennett, N. Teaching styles andpupilprogress. Cambridge, Mass: Harvard University Press, 1976.
Carroll, J. B., Davies, P., & Richman, B. Word frequency book. New York: American Heritage, 1971.
Cowen, E. L. Baby-steps toward primary prevention. American Journal of Community Psy- chology, 1977, 5, 1-22.
Cowen, E. L. The wooing of primary prevention. American Journal of Community Psychol- ogy, 1980, 8, 258-284.
Cowen, E. L., Pedersen, A., Babigian, H., Izzo, L. D., & Trost, M. A. Long-term follow-up of early detected vulnerable children. Journal of Consulting and Clinical Psychology, 1973, 41, 438-446.
Fisher, R. A. Statistical methods for research workers. New York: Hafner, 1948. Gesten, E. L. A Health Resources Inventory: The development of a measure of personal
and social competences in primary grade children. Journal of Consulting and Clinical Psychology, 1976, 44, 775-586.
Grimes, J. W., & Allinsmith, W. Compulsivity, anxiety and school achievement. Merrill- Palmer Quarterly, 1961, 7, 247-271.
Kaye, S., Trickett, E. J., & Quinlan, D. Alternative methods for environmental assessment: An example. American Journal of Community Psychology, 1976, 4, 367-377.
Kelly, J. G., Towards an ecological conception of preventive interventions. In J. W. Carter (Ed.), Research contributions from psychology to community mental health. New York: Behavioral Publications, 1968.
Kelly, J. G. (Ed.). Adolescent boys in high school: A psychological study of coping and adapta- tion. New York: Wiley, 1979.
Kohlberg, L., LaCrosse, J., & Ricks, D. The predictability of adult mental health from child- hood behavior. In B. Wolman (Ed.), Handbook of child psychopathology. New York: McGraw-Hill, 1971.
Lorion, R. P., Cowen, E. L., & Caldwell, R. Normative and parametric analyses of school maladjustment. American Journal of Community Psychology, 1975, 3, 291-301.
Lorion, R. P., & Lounsbury, J. W. Conceptual and methodological considerations in evaluat- ing preventive interventions. In W. R. Tash & G. Stahler (Eds.), Innovative approaches to mentalhealth evaluation. New York: Academic Press, 1981.
Moos, R. H. The social climate scales." An overview. Palo Alto, Calif.: Consulting Psychol- ogists Press, 1974.
Perceived School Environment and Behavior 703
Moos, R. H. A typology of junior high and high school classrooms. American Educational Research Journal, 1978, 15, 53-66.
Moos, R. H. Evaluating educationalenvironments. San Francisco: Jossey-Bass, 1979. Moos, R. H., & Moos, B. S. Classroom social climate and student absences and grades.
Journal o f Educational Psychology, 1978, 70, 263-269. Moos, R. H. & Trickett, E. J. Manual: Classroom Environment Scale Palo Alto, CA.: Con-
suiting Psychologists Press, 1974. Nowlis, V., & Nowlis, H. H. The description and analysis of mood. Annals of the New York
Academy of Science, 1956, 65, 345. O'Reilly, R. Classroom climate and achievement in secondary school mathematics classes.
Alberta Journal o f Educational Research, 1975, 21, 241-248. Prevention Task Panel Report. Task Panel reports submitted to the President's Commission
on Mental Health (Vol. 4). Washington, D.C.: U.S. Government Printing Office, Stock No. 040-000-00393-2, 1978.
Reiss, S., & Martell, R. Educational and psychological effects of open-space education in Oak Park, IL: Final Report to Board of Education, District 97, Oak Park, Illinois, 1974.
Romig, H. G. 50-100 binomial tables. New York: Wiley, 1953. Stallings, J. Implementation and child effects of teaching practices in Follow-through class-
rooms. Monographs of the Society for Research in Child Development, 1975, 40(Serial No. 163).
Trickett, E. J., & Moos, R. H. Personal correlates of contrasting environments: Student satisfaction in high school classrooms. American Journal of Community Psychology, 1974, 2, 1-12.
Trickett, E. J., & Quinlan, D. M. Three domains of classroom environment: Factor analysis of the Classroom Environment Scale. American Journal o f Community Psychology, 1979, 7, 279-291.
Walberg, H. J. The social environment as a mediator of classroom learning. Journal of Edu- cational Psychology, 1969, 60, 443-448.
Walberg, H. J. The psychology of learning environments. In L. S. Shulman (Ed.), Review of research in education (Vol. 4). Itasca, I11.: Peacock, 1976.
Walberg, H. J., & Anderson, G. J. Classroom climate and individual learning. Journal o f Educational Psychology, 1968, 59, 414-419.
Weiss, J. H. Mood states associated with asthma in children. Journal of Psychosomatic Re- search, 1966, 10, 267-273.
Willems, E. P. Sense of obligation to high school activities as related to school size and marginality of student. Child Development, 1967, 38, 1247-1260.