The Influence Of Marketing Strategies On Popularity Of Toyota ...
103
THE INFLUENCE OF MARKETING STRATEGIES ON POPULARITY OF TOYOTA AND NISSAN BRANDS IN KENYA BY MAPENZI BAHATI E. SUPERVISOR PROFESSOR FRANCIS N. KIBERA RESEARCH PROJECT SUBMITTED IN PARTIAL FULFILMENT OF THE REQUIREMENTS FOR THE DEGREE OF MASTER OF BUSINESS ADMINISTRATION (MBA) SCHOOL OF BUSINESS UNIVERSITY OF NAIROBI NOVEMBER 2009 OF * libram
-
Upload
khangminh22 -
Category
Documents
-
view
0 -
download
0
Transcript of The Influence Of Marketing Strategies On Popularity Of Toyota ...
THE INFLUENCE OF MARKETING STRATEGIES ON POPULARITY
OF TOYOTA AND NISSAN BRANDS IN KENYA
BY
MAPENZI BAHATI E.
SUPERVISOR
PROFESSOR FRANCIS N. KIBERA
RESEARCH PROJECT SUBMITTED IN PARTIAL FULFILMENT OF
THE REQUIREMENTS FOR THE DEGREE OF MASTER OF BUSINESS ADMINISTRATION (MBA)
SCHOOL OF BUSINESS
UNIVERSITY OF NAIROBI
NOVEMBER 2009
OF* l ib r a m
DECLARATION
This research project has been submitted for examination with the approval o f the University
Supervisor.
Francis N. Kibcra, PhD
Professor of Marketing and Project Supervisor University of Nairobi

DEDICATION
This study is dedicated to the Almighty God. who at his own timing enabled me to do this
research in good health. It is also dedicated to my Family, husband Zack and our two lovely
girls Mbodze and Kadzo for their support, time and encouragement, especially Mbodze who
wondered why I had to do my studies at an old age. She vowed to finish hers before she got
children.
ACKNOWLEDGEMENTS
I would like to take this opportunity to extend special thanks first to my able and professional
supervisor, Professor Francis N. Kibera, for his contribution and guidance that enriched the
results of this study. His vast knowledge of the discipline of marketing and his
uncompromising stance to quality and detail served to ensure a study free o f undue errors and
omissions in terms of scope and content.
Special thanks to the members o f my Marriage ministry group Fred Wasonga , Wakio
Wasonga. Tom Cephas , Kate Cephas, Antony Khamonyi. Anne Khamonyi, Daniel Ngelel,
Rebby Ngelel, Patrick Nagide and Victoria Nagide for their support in prayer and
encouragement.
My sincere thanks to Thomas Mutugu for a good job done in his course units of Brand
Management and Marketing Communications, that lead to my choice of this topic of study.
To all those many others whose names are not mentioned here, 1 say thank you so much. To
all of you. I am indeed very grateful and will always be indebted.
TABLE OF CONTENTS
Page
List of tables and figures...................................................................................... i
Abstract...................................................................................................................... iiCHAPTER ONE: INTRODUCTION1.1 Background....................................................................................................... 1
1.2 The concept of Brand Strategy....................................................................... 2
1.3 The concept of marketing strategies................................................................ 3
1.4 The Motor Vehicle Industry in Kenya................................................. 5
1.5 Statement of the problem......................................................................................10
1.6 Objectives of the study........................................................................................ 10
1.7 Importance of the study........................................................................................ 11
CHAPTER TWO: LITERATURE REVIEW
2.1 Introduction......................................................................................................... 12
2.2 Brand preference................................................................................................... 12
2.3 Brand equity.......................................................................................................... 13
2.4 Marketing Strategy and its importance................................................................14
2.5 Rationale for Marketing Strategies...................................................................... 15
2.6 Marketing Strategy Models................................................................................. 16
2.6.1 Market penetration................................................................................ 17
2.6.2 Market development..............................................................................17
2.6.3 Product development........................................................................... 17
2.6.4 Diversification...................................................................................... 17
2.7 Marketing mix elements...................................................................................... 19
2.7.1 Product Strategies.................................................................................. 19
2.7.2 Price Strategies...................................................................................... 21
2.7.3 Promotion Strategies................................................................................ 22
2.7.4 Place/distribution Strategies....................................................................24
CHAPTER THREE: RESEARCH METHODOLOGY
3.1. Research Design.................................................................................................. 26
3.2. Target Population............................................................................................... 26
3.3. Sample design.................................................................................................... 27
3.4. Data Collection Method................................................................................... 27
3.5. Data Analysis and presentation........................................................................ 27
CHAPTER FOUR: DATA ANALYSIS AND INTERPRETATIONS
4.1 Introduction........................................................................................... 29
4.2 Respondents’ profile.............................................................................. 29
4.3. Brands bought.......................................................................................... 34
4.4. Media channel usage............................................................................... 35
4.5 Marketing strategies.................................................................................. 36
4.5.1 Product strategies....................................................................... 38
4.5.2 Pricing strategies.................................................................... 39
4.5.3 Promotional strategies.............................................................. 41
4.5.4 Distribution strategies.............................................................. 43
CHAPTER FIVE: SUMMARY, DISCUSSIONS AND CONCLUSIONS
5.1 Introduction......................................................................................... 45
5.2 Summary.............................................................................................. 45
5.3 Limitations of the Study.................................................................... 48
5.4 Recommendations.............................................................................. 48
R e fe re n c e s ............................................................................................................. 50
APPENDICES
Appendix 1: Introductory Letter.................................................................................. 53
Appendix 2: Questionnaire for DT Dobie employees...................................................... 54
Appendix 3: Questionnaire for Toyota employees........................................................ 61
Appendix 4: Questionnaire for corporate customers...................................................... 68
Appendix 5: List of corporate companies................................................................... 75
Appendix 6: Kenya Motor Industries (KMI) statistics.................................................. 79
LIST OF TABLES AND FIGURES
TABLEPAGE
1. Generic Strategies and Industry Forces ............................................................. 5
2. Ansoff Product /Market Growth model.............................................................. 16
3. Marketing mix strategies........................................................................................ 19
4. Length of time that you have worked in the organization.................................... 33
5. Media channel usage ............................................................................................. 35
6. Summary of the marketing mix strategies applied................................................. 37
7. Product strategies................................................................................................... 38
8. Pricing strategies.................................................................................................. 40
9. Promotional strategies.......................................................................................... 42
10. Distribution strategies........................................................................................... 43
FIGURE
1. Marketing Mix Model............................................................................................ 4
2. Brand Equity Associations ................................................................................... 13
3. Place of registration............................................................................................... 29
4. Nature of operation................................................................................................. 30
5. Position in the company....................................................................................... 31
6. Position in the company....................................................................................... 31
7. Gender .................................................................................................................. 32
8. Highest education level attained......................................................................... 33
9. Brands they use................................................................................................... 34
i
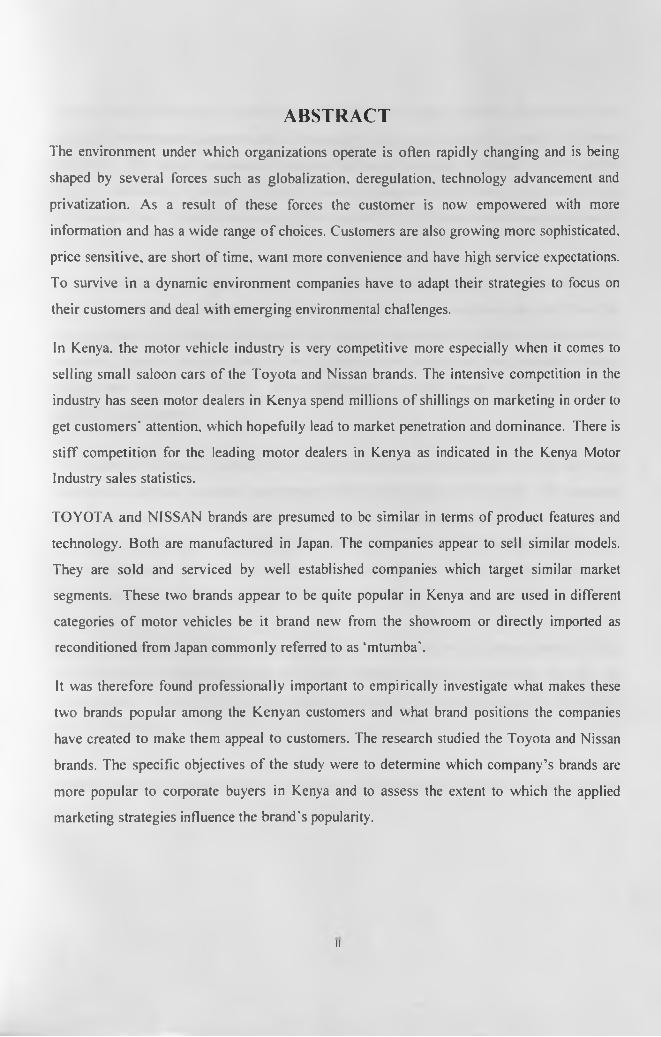
ABSTRACT
The environment under which organizations operate is often rapidly changing and is being
shaped by several forces such as globalization, deregulation, technology advancement and
privatization. As a result of these forces the customer is now1 empowered with more
information and has a wide range o f choices. Customers are also growing more sophisticated,
price sensitive, are short of time, want more convenience and have high service expectations.
To survive in a dynamic environment companies have to adapt their strategies to focus on
their customers and deal with emerging environmental challenges.
In Kenya, the motor vehicle industry is very competitive more especially when it comes to
selling small saloon cars of the Toyota and Nissan brands. The intensive competition in the
industry has seen motor dealers in Kenya spend millions of shillings on marketing in order to
get customers' attention, which hopefully lead to market penetration and dominance. There is
stiff competition for the leading motor dealers in Kenya as indicated in the Kenya Motor
Industry sales statistics.
TOYOTA and NISSAN brands are presumed to be similar in terms of product features and
technology. Both are manufactured in Japan. The companies appear to sell similar models.
They are sold and serviced by well established companies which target similar market
segments. These two brands appear to be quite popular in Kenya and are used in different
categories o f motor vehicles be it brand new from the showroom or directly imported as
reconditioned from Japan commonly referred to as ‘mtumba’.
It was therefore found professionally important to empirically investigate what makes these
two brands popular among the Kenyan customers and what brand positions the companies
have created to make them appeal to customers. The research studied the Toyota and Nissan
brands. The specific objectives of the study were to determine which company’s brands are
more popular to corporate buyers in Kenya and to assess the extent to which the applied
marketing strategies influence the brand's popularity.
ii

The study used a descriptive survey research design. The target population for the study was
composed o f corporate customers o f Toyota and DT Dobie in Kenya and the staff of these two
companies. The target respondents from the corporate customers were the Chief Executive
Officers, Marketing & Sales, Transport, Finance Managers and drivers. These are the key
influences o f and / or decision makers on the design and make of motor vehicle brand to be bought.
The study mainly relied on primary data collected using partially structured questionnaires. The
questionnaires targeted respondents from the sampled corporate customers and staff from the
two companies (DT Dobie and Toyota East Africa). Data analysis involved computation of
measures o f central tendency (mean score, frequencies and percentages) and dispersion (range,
variance and standard deviation). Where appropriate bar graphs were used to more clearly
present the study results.
The results of the study showed that the two marketing companies use various marketing
strategies to increase customer awareness of their brands and market shares. The strategies
that are mainly used by the two motor vehicle marketing companies are distribution,
promotion and pricing strategies. Toyota East Africa uses various tactics under these strategies
more often than DT Dobie for its Nissan brand. This accounts for the high popularity of the
Toyota brand than the Nissan brand in the Kenyan market.
On the issue of customer preference and use of the two brands in the Kenyan market 37% of
the respondents mentioned that they use Toyota brand only, and 27% indicated they only use
Nissan brand. Another 37% of the respondents mentioned that they have both the Toyota and
the Nissan brands.
Further research is recommended to include other geographical regions as well as retail
customers.
CHAPTER ONE INTRODUCTION
1.1. BackgroundAnsoff (1987) and Kotler (1985), note that the environment under which organizations operate
is often rapidly changing and is being shaped by several forces such as globalization,
deregulation, technology advancement and privatization. As a result o f these forces the
customer is now empowered with more information and has a wide range of choices.
Customers are also growing more sophisticated, price sensitive, are short o f time, want more
convenience and have high service expectations (Kotler, 1985).
It is imperative therefore for organizations to continually adapt their activities in order to
succeed. To survive in a dynamic environment their strategies need to focus on their
customers and deal with emerging environmental challenges. This is necessary because the
organizations are largely dependent on the environment. When firms are faced with unfamiliar
changes they should revise their strategies to match the turbulence level (Ansoff and Me
Donnel,I990). Failure to effectively adapt the organization to its environment leads to a
strategic problem. The organization's external environment consists of all the conditions and
forces that affect its strategic options and defines its competitive situation (Pearce and
Robinson, 1997).
The pressures of the environment are now so great that the opportunity to survive with a
broadly reactive strategy no longer exists. Recognition of the significance of these pressures
has been reflected in the rapid growth in recent years of the number of strategic alliances
between firms in various parts o f the world in a desperate attempt to gain economies of scale
in production, distribution and marketing that are needed if a viable competitive profile is to
be maintained. In a nutshell the emerging environmental challenges have seen a lot of
marketing activity extended beyond domestic frontiers in a process called internationalization
(Gilligan. 1989).
In Kenya, drastic changes have occurred in many sectors, leading to opening of the domestic
market to competition. Companies are now facing intense competition from domestic and
foreign brands which is resulting in rising promotion costs and shrinking profit margins. For
instance, the liberalization of the motor vehicle industry has led to very many players bringing
in used vehicles, from various countries including Singapore. Malaysia, Japan, and The United
Kingdom. In addition the global recession has contributed to the flooding of many used cars
to Kenyan market as they are deemed to be cheaper than the new showroom vehicles. This
has therefore also led to adoption of different marketing strategies in order to stay a float in a
competitive and shrinking market.
1.2 The concep t of Brand Strategy
A strategy may be defined as the broad program of goals and activities to help a company
achieve success. Strategy is the match between organization's resources and skills and
environmental opportunities and risks it faces and the purposes it wishes to accomplish
(Schendel & Hofer, 1979). Johnson and Sholes (1998) on the other hand defined strategy as
the scope and direction of an organization over the long term, which achieves an advantage for
the organization through its configuration of resources w ithin a changing environment to meet
the needs o f markets and to fulfil stakeholder expectations.
A brand is the sum of all characteristics, tangible and intangible, that make an offer unique and
therefore desirable to the targeted consumer over the competition. It is considered to be the
energy of a company and this, in effect, dictates its personality. It not only tells us what a
company is and what it does, but also distinguishes one organization from another. By its
brand, a company communicates a clear message to all its stakeholders and it is therefore of
utmost importance that this message targets its audience in a manner that exceeds expectations
(Interbrand 2006). The American Marketing Association (AMA) defines a brand as a "name,
term, sign, symbol or design, or a combination of them intended to identify the goods and
services of one seller or group of sellers and to differentiate them from those of other sellers.
Therefore it makes sense to understand that branding is not about getting your target market to
choose you over the competition, but it is about getting your prospects to see you as the only
one that provides a solution to their problem. This study will evaluate the different strategies
that Toyota East Africa and DT Dobie have undertaken to bring out there brands Toyota and
Nissan respectively in Kenya.
- 2 -
Brand positioning is the process o f ensuring that a brand can fight through the noise to catch
customers' attention... it allows the brand to occupy a distinct, meaningful and valued place in
target customers' minds. Brand positioning is a strategic decision of where a brand is to
compete (Interbrand. 2006). It gives a company a clear picture of the consumer needs that it
intends to satisfy. It also helps the company to come up with a product or service designed
and priced in line w ith promotion claims and suitable for the points of delivery.
The elements of the marketing mix have to be combined in such a way that the product/service
position is made clear to the buyer (Wells, 1996). The objectives that a good brand will
achieve include delivering the message clearly, confirming the company's credibility,
connecting the target prospects emotionally, motivating the buyer and enhancing user loyalty.
To succeed in branding companies must understand the needs and wants of the customers and
prospects. This is done by integrating the brand strategies through the company at every point
of public contact. It is for this purpose that the proposed study will investigate the different
brand strategies (Toyota and Nissan) have taken in Kenya and the extent to which the
strategies have assisted to build the respective brand.
1.3 The concept of marketing strategies
Marketing strategy is a process that can allow an organization to concentrate its limited
resources on the greatest opportunities to increase sales and achieve a sustainable competitive
advantage. It should be centred on the promise that customer satisfaction is the main goal of
the organization (Michael Baker 2008).
A marketing strategy is a written plan which combines product development, promotion,
distribution, and pricing approach, identifies the firm’s marketing goals, and explains how the
goals will be achieved within a stated timeframe. The strategy determines the choice of target
market segment, positioning, marketing mix, and allocation of resources. It is most effective
when it is an integral component of a firm's strategy, defining how the organization will
successfully engage customers, prospects, and competitors in the market arena, corporate
strategies, corporate missions, and corporate goals. As the customer constitutes the source of
a company's revenue, marketing strategy is closely linked with sales. A key component of
marketing strategy is often to keep marketing in line with a company's overarching mission
- 3 -
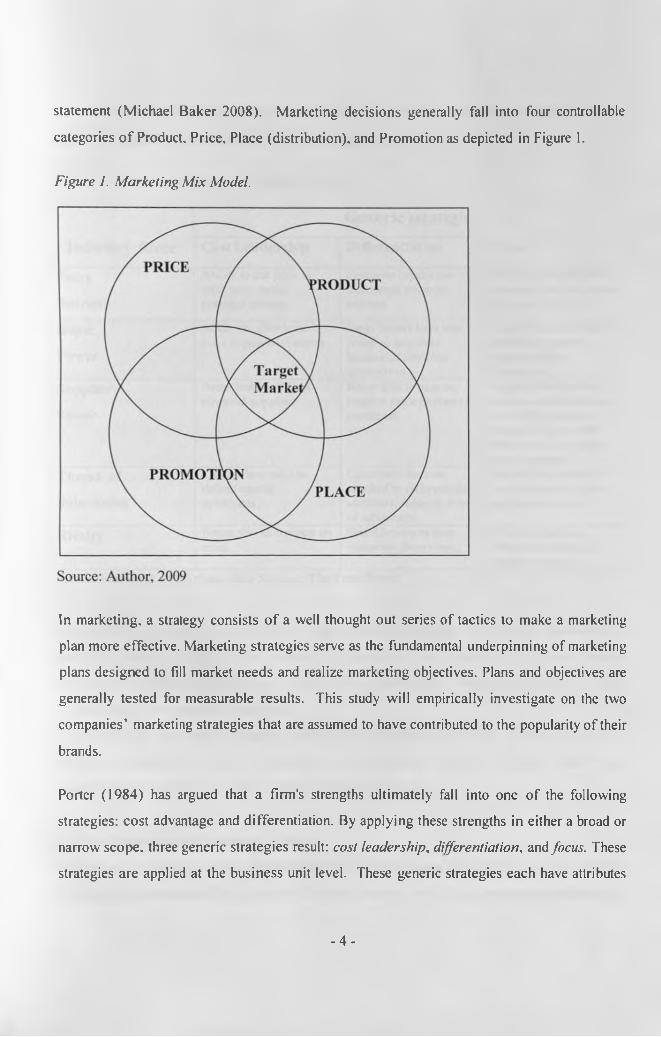
statement (Michael Baker 2008). Marketing decisions generally fall into four controllable
categories o f Product. Price, Place (distribution), and Promotion as depicted in Figure I.
Figure 1. Marketing Mix Model.
In marketing, a strategy consists o f a well thought out series of tactics to make a marketing
plan more effective. Marketing strategies serve as the fundamental underpinning of marketing
plans designed to fill market needs and realize marketing objectives. Plans and objectives are
generally tested for measurable results. This study will empirically investigate on the two
companies’ marketing strategies that are assumed to have contributed to the popularity of their
brands.
Porter (1984) has argued that a firm's strengths ultimately fall into one of the following
strategies: cost advantage and differentiation. By applying these strengths in either a broad or
narrow scope, three generic strategies result: cost leadership, differentiation, and focus. These
strategies are applied at the business unit level. These generic strategies each have attributes
- 4 -
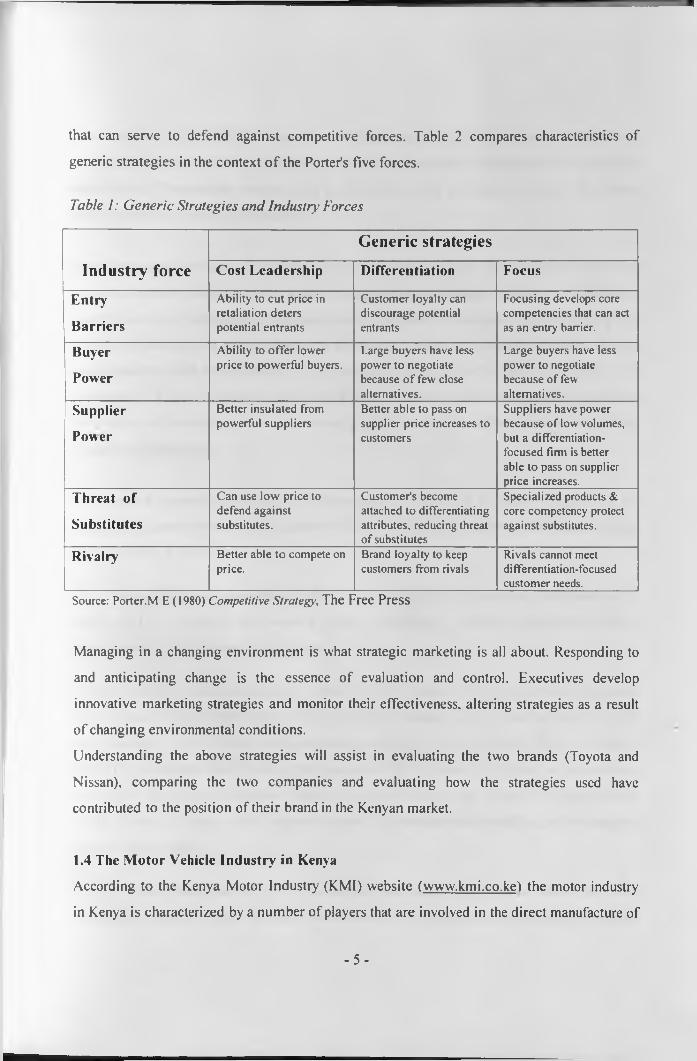
that can serve to defend against competitive forces. Table 2 compares characteristics of
generic strategies in the context o f the Porter’s five forces.
Table 1: Generic Strategies ami Industry’ Forces
Industry forceGeneric strategies
Cost Leadership Differentiation Focus
Entry'
Barriers
Ability to cut price in retaliation deters potential entrants
Customer loyalty can discourage potential entrants
Focusing develops core competencies that can act as an entry barrier.
Buyer
Power
Ability to offer lower price to powerful buyers.
Large buyers have less power to negotiate because of few close alternatives.
Large buyers have less power to negotiate because of few alternatives.
Supplier
Power
Better insulated from powerful suppliers
Better able to pass on supplier price increases to customers
Suppliers have power because of low volumes, but a differentiation- focused firm is better able to pass on supplier price increases.
Threat of
Substitutes
Can use low price to defend against substitutes.
Customer's become attached to differentiating attributes, reducing threat of substitutes
Specialized products & core competency protect against substitutes.
Rivalry Better able to compete on price.
Brand loyalty to keep customers from rivals
Rivals cannot meet differentiation-focused customer needs.
Source: Porter.M E (1980) Competitive Strategy, The Free Press
Managing in a changing environment is what strategic marketing is all about. Responding to
and anticipating change is the essence of evaluation and control. Executives develop
innovative marketing strategies and monitor their effectiveness, altering strategies as a result
of changing environmental conditions.
Understanding the above strategies will assist in evaluating the two brands (Toyota and
Nissan), comparing the two companies and evaluating how the strategies used have
contributed to the position of their brand in the Kenyan market.
1.4 The Motor Vehicle Industry in Kenya
According to the Kenya Motor Industry (KMI) website (www.kmi.co.ke) the motor industry
in Kenya is characterized by a number of players that are involved in the direct manufacture of
- 5 -
motor vehicles, supply of their accessories and financing of the industry in general. The sale of
the various brands include small saloon cars, medium sized utility vehicles ( SUVs) which are
mainly 4x4s, Commercial vehicles such as the double cabs and single cab pick ups, buses,
trucks and prime movers. (Appendix 6)
One of the major attributes of cars considered by car buyers is their dependability. That is why
car manufacturers always look for ways of improving their vehicle's reliability. A typical car
usually shows its weaknesses and become prone to breakdowns when it has reached a certain
number of years in use or the distance in kilometres covered by the motor vehicle. But car
manufacturers count on reliability of their vehicles during the early years of ownership. A
reputation o f a brand is at stake during this stage. If a vehicle exhibits poor quality during the
early stages of ownership, it will of course give the vehicle manufacturer a bad reputation
(wAvw.articlesbase.com).
As shown in Appendix 6 Toyota East Africa and D.T Dobie and Company (Kenya) Ltd are
amongst the largest motor vehicle dealers in Kenya. A brief discussion on the history of these
two companies follows.
The Toyota Motor Corporation (TMC) is a multinational corporation headquartered in
Japan, and is currently the world's largest automaker. Toyota Corporation employs
approximately 316,000 people worldwide.
Toyota is the No. 1 car maker in the world. In 2008. it sold 8.97 million vehicles compared
with General Motors' (GM'S) 8.35 million, thereby replacing G.M. in the top spot. Toyota's
sales, though, in the difficult world economy, were down 4 percent from 2007. In January
2009, Toyota named Akio Toyoda, the grandson of the Company’s founder, as its president,
returning to its roots as it faces the roughest downturn in more than 70 years. The appointment
of Mr. Toyoda, 52. was widely expected as part of a management reshuffling at the company
because o f its losses.
Toyota’s vision states that its goal is to become "more inquiring, more advanced, and more
dedicated" under the slogan of "Open the frontiers of tomorrow through the energy of people
- 6 -
and technology." While Toyota's worldwide family is aiming to become "the most admired in
town," the aim of Toyota's Vision is to work hard towards making every dealer, plant, regional
headquarters, design centre, and supplier around the world, including TMC, the "best
company in town." In other words, a "company that is respected and admired by the
communities we operate in and creates and shares a desirable future for all" (New York times
Monday, July 27, 2009).
In Kenya Toyota East Africa Ltd. with its head office in Nairobi, is situated along Uhuru
Highway /Lusaka road. Nairobi, and handles the Toyota dealership. The Company markets
Toyota vehicles and spare parts and automobile accessories. Toyota fast Africa (TEAL) has
been operating in the Kenyan market for the past fourteen years (www.kmi.co.ke). In all these
years, Toyota East Africa has gained unrivalled experience and developed cutting edge
expertise that sets the company apart from competitors. TEAL is a sole distributor of Toyota
and Yamaha in Kenya. It is owned 100% by TTC, the trading company of Toyota Motor
Group which has a wide portfolio of business interests.
Information posted on TEAL website (www.toyotaea.com) indicates that the Company is
renowned for reliability and high quality customer service. This position has enabled the
company to remain ahead of the pack as attested by last year's market statistics
(www.toyotaea.com). As shown in the KMI statistics, the Company increased its market share
in the year 2008 by a 2% margin over the previous year. At the end of December 2008 the
Company attained a 30.4% market share with a closure of the year to date with total market
share at 24% which resulted in maintaining the number one position for the seventh year
running in Kenya.
The Nissan Motor Company (NMC), Ltd, or Nissan, is a Japanese multinational automaker
headquartered in Japan. It was formerly a core member of the Nissan Group, but has become
more independent after it’s restructuring under Carlos Ghosn (CEO).
It formerly marketed vehicles under the "Datsun” brand name and is one of the largest car
manufacturers in the world. The company's main offices are located in the Ginza area of Chuo,
Tokyo. In 1999, Nissan entered an alliance with Renault S.A. of France, which owned 44.4%
- 7 -
of Nissan as of 2008. The first product of the Nissan-Renault alliance was the Nissan Primera.
launched in 2001 and shared chassis with Renault Laguna that had been launched in 2000.
Nissan is among the top three Asian (also known as the Japanese Big 3 Automakers) rivals of
the "Big Three" in the U.S. Currently it is the third largest Japanese car manufacturer.
In the wake of the 1973 oil crisis, consumers worldwide (especially in the lucrative U.S.
market) began turning to high-quality small economy cars. Nissan made a conscious decision
for their growing economy car lines to have a "sporting" flavour, and set up new factories in
Mexico, Australia, Taiwan and South Africa.
The D.T. Dobie & Co. (Kenya) Ltd was founded by colonel David Dobie in 1949 and has its
head office in industrial area along Lusaka road. The Company’s core business is vehicle
distribution, sales, parts and after sales service. Its principal brands are the Nissan. Daimler-
Chrysler (Mercedes. Jeep, and Chrysler) and Renault. The Company started out with the
Mercedes-Benz franchise for East Africa, for saloon cars and heavy commercial vehicles. In
1964 the organization was awarded the sole franchise distributorship of Nissan passenger and
light commercial vehicles in Kenya. In 2001, through the franchise holding in Daimler
Chrysler, the Company was awarded the Jeep franchise. In 2007, it acquired the Renault brand
for saloons and light commercial vehicles.
In 2000 D.T. Dobie was acquired by CFAO, a French company which is a wholly owned
subsidiary of the Pinault Printemps-Redoute (PPR) group. The PPR group is a world
renowned organization in specialized distributorship with a market value currently estimated
to be in excess of US$ 25 billion. CFAO is the leader in vehicle distribution in Africa and the
French overseas departments and territories. It operates in 30 African markets and D.T Dobie
benefits from the international management and technical experience in different markets and
strong financial base.
This research project has empirically investigated the marketing strategies followed by these
two subsidiaries of the world's automobile giants with a view' to unearthing what makes them
highly competitive.
- 8 -
1.5 Statement of the problem
By its brand, a company communicates a message to all its stakeholders and it is therefore of
utmost importance that this message targets its audience in a manner that meets their
expectations. Brand positioning gives a company a clear picture of the consumer needs and
wants that it intends to satisfy. It helps the company to come up with a product or service
designed and priced in line with promotional claims and suitable for the points of delivery.
The elements of the marketing mix have to be combined in such a way that the product
position is made clear to the buyer (Wells. 1996).
The motor vehicle industry in Kenya is very competitive more especially when it comes to
selling small saloon cars of the Toyota and Nissan brands. Competitiveness is evidenced by
various brand positions (though appearing) similar that have been taken by the different
manufacturers. The intensive competition in the industry has seen motor dealers in Kenya
spend millions of shillings on marketing in order to get customers' attention, which hopefully
lead to market penetration and dominance. There is stiff competition for the leading motor
dealers in Kenya as indicated in the Kenya Motor Industry sales statistics. (Appendix 6)
In Kenya, TOYOTA and NISSAN are presumed to be similar in terms of product features and
technology. Both are manufactured in Japan. The companies appear to sell similar models:
4WDs (Toyota Prado and Nissan patrol); Saloon cars (Toyota corolla and the Nissan Tiida);
Pick ups (Toyota Hilux and the Nissan Hardbody); Double cab(Toyota Hilux double cab and
the Nissan Navara double cab); Matatu vans (Nissan Urvan and the Toyota Hiace) and other
models. They are sold and serviced by well established companies which target similar market
segments. These two brands appear to be quite popular in Kenya and are used in different
categories of motor vehicles be it brand new from the showroom or directly imported as
reconditioned from Japan commonly referred to as ‘mtumba'.
Most of the studies I went through had not researched on the area of the popularity of Nissan
and Toyota brands in Kenya. These include some studies that have been done in relation to
Branding and marketing strategies, which include; Elias P. Mbau (2000), An empirical
investigation of creation and application of brand equity in Kenya, Unpublished MBA
Research Project paper University of Nairobi. Others are studies done by Awinyo S.C.A.
- 9 -
(2008), Market Positioning Strategies adopted by Courier Service Companies in Kenya,
Unpublished MBA Research Project paper University Of Nairobi; Suge, H.S. (1999),
Liberisation and Its Impact on Kenya's Motor Industry, Unpublished MBA Research Project
paper. University Of Nairobi; and Tahreen. K. L (1998), The Effect of Second- Hand Imports
on Kenyan Passenger Vehicle Industry. Unpublished MBA Research Project paper. University
Of Nairobi. In addition these brands have similar characteristics in design and feature, hence
prompted me to investigate further. 1 found it of importance to empirically investigate what
makes these two brands popular among the Kenyan customers and what brand positions the
companies have created to make them appeal to customers. The proposed research will study
the Toyota and Nissan brands. The research questions for the proposed study were in twofold:
a) Is Toyota brand actually more popular than Nissan brands in Kenya?
b) To what extent is the brand popularity explained (accounted for) by marketing
strategies applied by the two companies?
The overall purpose of the study was to provide research informed answers to the two
questions.
1.6 Objectives of the study
The objectives of the study were:
1) to determine which company’s brands are more popular to corporate buyers in Kenya.
2) to assess the extent to which the applied marketing strategies influence the brand's
popularity.
1.7 Im portance of the study
The results of this study will be beneficial to different groups like the academics,
manufacturers/assemblers, marketing and advertising agencies, motor vehicle dealers, the
Marketing Society of Kenya and the Kenya Motor Industry association.
This research will add to the available knowledge and therefore academicians will use the
findings as a basis for further research.
The study was expected to bring to light the key factors (attributes) that account for the
differences in the two brands and hence assist the two companies to formulate more effective
marketing strategies.
- 10-
The study was expected to provide additional research - based information that can be used to
better craft relevant marketing communications strategies to marketing and advertising
agencies.
Other players in the motor vehicle industry are expected to benefit from the research findings
since they operate in the same market. In addition the results of the study will provide more
marketing insights to industry - related associations such as the Kenya Motor Industry (KM1)
and the Marketing Society of Kenya (MSK).
The current chapter has presented the background to the study; discussed the concept of brand
strategy and that of the marketing strategies; reviewed the status of the motor vehicle industry
in Kenya as well as the rivalry between the Toyota and Nissan brands; and concluded with the
statement o f the research problem and study objectives. The next chapter reviews the relevant
theoretical and empirical literature.
II - UNIVERSITY OFLOWER KASfcTE LIBRA
CHAPTER TWO LITERATURE REVIEW
2.1 Introduction
This chapter explored the areas of the brand preference, brand equity and the various
marketing models that define the market strategies used by most organizations, the specific
marketing strategies used based on the marketing mix elements and the measurement of
customer behaviour resulting from the marketing strategies deployed.
2.2 Brand preference
Brand preference is a measure of brand loyalty in which a consumer will choose a particular
brand in presence of competing brands, but will accept substitutes if that brand is not
available.
Within any product category, most consumers have a group of brands that comprise their
preference set. These are the four or five market brands the consumer will consider when
making a purchase. When building preference, the goal is to first get on the consumer’s
preference sets, and then to move up the set’s hierarchy to become the brand consumers prefer
the most - their market brand. Gaining and maintaining consumer preference is a battle that is
never really won.
The competition among brands is fierce. In every product category, consumers have more
choices, more information and higher expectations than ever before. Jockeying for position in
a consumer’s preference set requires an aggressive strategy and constant vigilance. The
process begins by knowing who you are and with whom you want to establish a relationship.
fwAvw.businessdictionary.com)
Key to communicating this brand position is establishing a frame of reference. In an article
published by the Harvard Business Review entitled, "Three Questions You Need To Ask Your
Brand," Keller (2002) writes,”...a frame of reference signals to consumers the goal they can
expect to achieve by using a brand.” Consumers can quickly figure out what the product is and
how they should use it.
- 12-
Kenya Motor Industry (KMI) information indicates that in Kenya Toyota is grabbing a bigger
market share than Nissan and the brand preference seems to be high. This proposal intends to
investigate on to the different strategies undertaken by the two companies which may have let
to the position of the brands in Kenya.
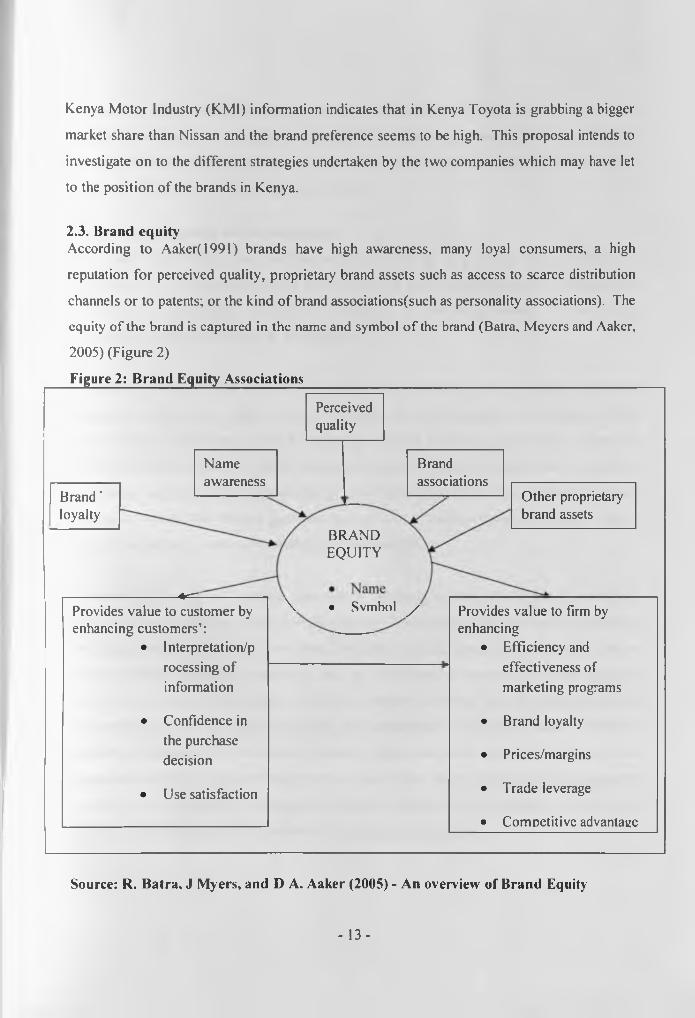
2.3. Brand equityAccording to Aaker(1991) brands have high awareness, many loyal consumers, a high
reputation for perceived quality, proprietary brand assets such as access to scarce distribution
channels or to patents; or the kind of brand associations(such as personality associations). The
equity of the brand is captured in the name and symbol of the brand (Batra, Meyers and Aakcr,
2005) (Figure 2)
Figure 2: Brand Equity Associations
Brand' loyalty
Perceivedquality
BRANDEQUITY
Nameawareness
Brandassociations
_ Other proprietary brand assets
----------------------- 4 = -------------Provides value to customer by \ • Svmbol y Provides value to firm byenhancing customers’: enhancing
• Interpretation/p • Efficiency androcessing of effectiveness ofinformation marketing programs
• Confidence in • Brand loyaltythe purchasedecision • Prices/margins
• Use satisfaction • Trade leverage
• Competitive advantage
Source: R. Batra, J Myers, and D A. Aaker (2005) - An overview of Brand Equity
- 13-
The Figure 2 depicts different associations to a brand name and a brand symbol which in turn
brings out benefits to the customer and the firm. The summary of the relationships will assist
the study by bringing out important variables which are expected to influence preference and
popularity o f Toyota and Nissan brands in Kenya.
2.4 Marketing Strategy and its importance
Kotler and Keller (2006) have defined marketing strategy as a process that can allow an
organization to concentrate its limited resources on the greatest opportunities to increase sales
and achieve a sustainable competitive advantage. A marketing strategy is centred on
increasing customer satisfaction as the main goal.
A marketing strategy often integrates an organization's marketing goals, policies, and action
sequences (tactics) into a cohesive whole. Similarly, the various strands of the strategy, which
might include advertising, channel marketing, internet marketing, promotion and public
relations, can be orchestrated. Many companies cascade a strategy throughout an organization
by creating tactics that then become strategy goals for the next level or group. Each one group
is expected to take that strategy goal and develop a set of tactics to achieve that goal. This is
why it is important to make each strategy goal measurable.
A marketing strategy is a written plan which combines product development, promotion,
distribution, and pricing approach, identifies the firm's marketing goals, and explains how they
will be achieved within a stated timeframe. Marketing strategy determines the choice of target
market segment, positioning, marketing mix, and allocation of resources. It is most effective
when it is an integral component of the firm's strategy, defining how the organization will
successfully engage customers, prospects, and competitors in the market arena. Effective
marketing strategies take into account mission, values and other corporate strategies of an
organization with the customer being the main focus given that it is the source of a company's
revenue. A key component of marketing strategy is often to keep marketing in line with a
company's overarching mission statement (www.leammarketing.net).
- 14-
A Marketing strategy provides consistency throughout the different elements of an
organization's marketing mix. This study evaluated the different marketing strategies used by
these two firms and see its effect on the preference of there brands.
2.5 Rationale for crafting Marketing Strategies
Effectiveness of marketing strategies is measured by the consumer behaviour exhibited by the
both individual consumers who buy goods and services for their own use and organizational
buyers who purchase business products. Summers (1970), notes that it is the process through
which the ultimate buyer makes purchase decisions. According to Laermer and Simmons
(2007), this buying behaviour is a function of the interactions of personal influences and
pressures exerted by outside environmental forces while consuming behaviour is a function of
the interactions of interpersonal influences such as culture, friends, classmates, co-workers,
and relatives and personal factors such as attitudes, learning, and perception. Marketing
strategies used by organizations to drive sales can be categorized as external influences.
Three consumer based behaviours exhibited by customer towards a company’s products
include share of the mind and the share of the heart and share of the sales (Kotler 1984).
Share of the mind is the percentage of sample which mentions your brand name first. It has a
lot to do with media and visibility and it basically means how much more audiences think
about your product versus the competition. Share of the heart is the best term for a trusted
brand and is mostly expressed by the quality of the product and the creativity of the
advertising message which echo with the target buyer. Share of the heart is measured in
tendency to acquire/buy whereas Share of the mind is mainly awareness/recall. Share of the
sales is where an organization uses marketing strategies to capture the biggest share of the
target market, (imaginedesigndc.wordpress.com)
Pemer (2007) adds that in trying to increase the sales market share, many companies
especially those in the consumer package goods (CPG) market adopt the theory of running
their business centered on consumer, shopper and retailer needs. Their marketing departments
spend quality time looking for "Growth Opportunities" in their categories by identifying
relevant insights (both mindsets and behaviors) on their target consumers, shoppers and retail
- 15-
partners. These growth opportunities emerge from changes in market trends, segment
dynamics changing and also internal brand or operational business challenges. The marketing
team can then prioritize these growth opportunities and begin to develop strategies to exploit
the opportunities that could include new' or adapted products, services as well as changes to
the 7Ps. Market research is often needed to ensure that we produce what customers really
want and not what we think they want.
The current study investigated the role of the above variables (factors) in determining the
popularity of Toyota and Nissan brands in Kenya.
2.6 Marketing Strategy Models
Marketing practitioners often employ strategic models and tools to analyze marketing
decisions. When beginning a strategic analysis, various models can be employed to get a broad
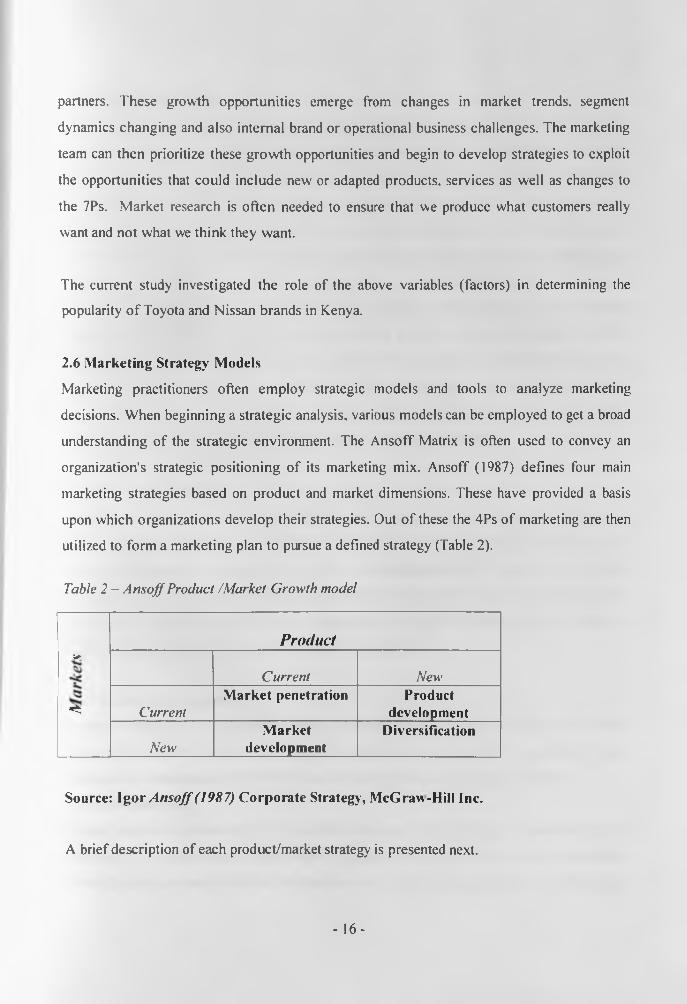
understanding of the strategic environment. The Ansoff Matrix is often used to convey an
organization's strategic positioning of its marketing mix. Ansoff (1987) defines four main
marketing strategies based on product and market dimensions. These have provided a basis
upon which organizations develop their strategies. Out of these the 4Ps of marketing are then
utilized to form a marketing plan to pursue a defined strategy (Table 2).
Table 2 - Ansoff Product /Market Growth model
toProduct
Current NewMarket penetration Product
< Current developmentMarket Diversification
New development
Source: Igor Ansoff (1987) Corporate Strategy, McGraw -Hill Inc.
A brief description of each product/market strategy is presented next.
- 16-
2.6.1 Market penetration
Market penetration is growth strategy where the business focuses on intensive selling existing
of products into existing markets. A market penetration strategy is very much about “business
as usual”. The business is focusing on markets and products it is familiar with. It is likely to
have good information on competitors and on customer needs and wants. With this strategy
then it is unlikely that this strategy will require much investment in new market research.
Some of the objectives for a company pursuing this strategy are geared towards maintaining or
increasing the market share of the current products. Kotler (2003) explains that this is
achieved by a combination of competitive pricing strategies, advertising, sales promotion and
perhaps more resources dedicated to personal selling by the company. The other objectives
would be to secure dominance o f growth markets like the growing markets: restructuring a
mature market by driving out competitors hence requiring a much more aggressive
promotional campaign, supported by a pricing strategy designed to make the market
unattractive for competitors and increasing usage by existing customers.
2.6.2 Market development
In market development, a company seeks a growlh strategy where the business will seek to
sell its existing products into new markets. The possible ways of approaching this strategy will
include exporting the products to new countries/geographical markets; new product
development, new distribution channels like entering into lease agreements with transportation
companies compared to buying own transportation vehicles; different pricing policies to
attract different customers or create new market segments.
2.6.3 Product development
Product development as a growth strategy is where a company will introduce new products
into existing markets. These products may be within the existing product categories and lines.
This can also entail modification o f products which appeal to more existing markets.
2.6.4 Diversification
Diversification is a form of growth marketing strategy for a company. It seeks to increase
profitability through greater sales volume obtained from new products and new markets.
Diversification can occur either at the business unit or at the corporate level. At the business
- 17-
unit level, it is most likely to expand into a new segment of an industry in which the business
is already in.
Ansoff (1987) pointed out that a diversification strategy stands apart from the other three
product/market strategies. The three strategies are usually pursued with the same technical,
financial, and merchandising resources used for the original product line, whereas
diversification usually requires a company to acquire new skills, new techniques and new
facilities. Therefore, diversification is meant to be the riskiest of the four strategies to pursue
for a firm. Ansoff (1987) further classified diversification in three categories i.e. concentric,
horizontal and conglomerate.
Concentric diversification means that there is a technological similarity between the industries,
which means that the firm is able to leverage its technical know-how to gain some advantage.
For example, a company that manufactures industrial adhesives might decide to diversify into
adhesives to be sold via retailers. The technology would be the same but the marketing effort
would need to change. It also seems to increase its market share to launch a new product
which helps the particular company to earn profit.
Horizontal diversification is where a company adds new products or services that are
technologically or commercially unrelated (but not always) to current products, but which may
appeal to current customers. In a competitive environment, this form of diversification is
desirable if the present customers are loyal to the current products and if the new products
have a good quality and are well promoted and priced. Moreover, the new products are
marketed to the same economic environment as the existing products, which may lead to
rigidity and instability. In other words, this strategy tends to increase the firm's dependence on
certain market segments. For example a company making note books and now starts
manufacturing pens to capture and add its market share through its new product.
Horizontal integration occurs when a firm enters a new business (either related or unrelated)
at the same stage of production as its current operations. For example, Avon's move to market
jewelry through its door-to-door sales force involved marketing new products through existing
channels o f distribution. An alternative form that Avon has also undertaken is selling its
- 18-
products by mail order (e.g., clothing, plastic products) and through retail stores (e.g.,
Tiffany's). In both cases, Avon is still at the retail stage of the production process.
Conglomerate diversification (or lateral diversification) is when the company markets new
products or services that have no technological or commercial synergies with current products,
but which may appeal to new groups of customers. The conglomerate diversification has very
little relationship with the firm's current business. Therefore, the main reasons for adopting
such a strategy are first to improve the profitability and the flexibility of the company, and
second to get a better reception in capital markets as the company gets bigger. Even if this
strategy is very risky, it could also, if successful, provide increased growth and profitability.
Although the Ansoff matrix is old, it remains a useful model for communication around
business unit strategy processes and business growth. This study investigated which of these
strategies Toyota and DT Dobie apply and to what extent.
2.7 Marketing Mix Strategies
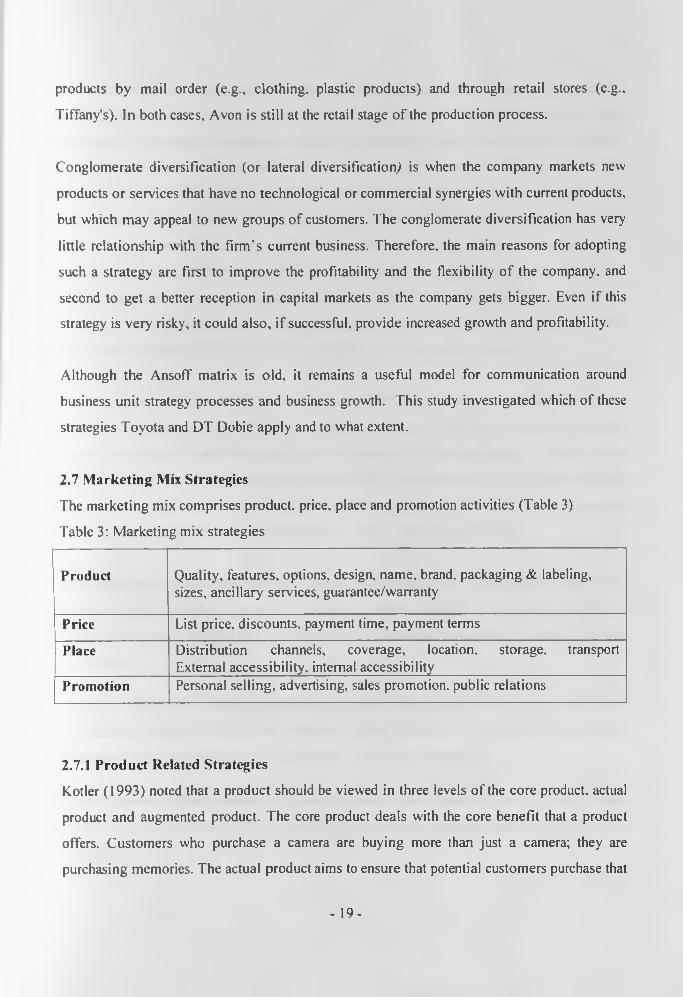
The marketing mix comprises product, price, place and promotion activities (Table 3)
Table 3: Marketing mix strategies
Product Quality, features, options, design, name, brand, packaging & labeling, sizes, ancillary services, guarantee/warranty
Price List price, discounts, payment time, payment terms
Place Distribution channels, coverage, location, storage, transport External accessibility, internal accessibility
Promotion Personal selling, advertising, sales promotion, public relations
2.7.1 Product Related Strategies
Kotler (1993) noted that a product should be viewed in three levels of the core product, actual
product and augmented product. The core product deals with the core benefit that a product
offers. Customers who purchase a camera are buying more than just a camera; they are
purchasing memories. The actual product aims to ensure that potential customers purchase that
- 19-
specific product. The strategy at this level involves organizations' branding, adding features
and benefits to ensure that the company’s product offers a differential advantage from
competitors. Augmented product deals with the non-tangible benefits that a product can offer.
Competition at this level is based around after sales service, warranties, delivery and so on.
When placing a product within a market many factors and decisions have to be taken into
consideration. These include the product design, product quality, product features and the
branding. Product design usually is the selling point for the organization such as the case for
the iMAC, the new VW Beetle or the Dyson vacuum cleaner. Quality has to be consistent with
other elements of the marketing mix. For instance, a premium based pricing strategy has to
reflect the quality a product offers. Product features entail consideration of what will be added
to increase the benefit offered to the target market (www.learnmarketing.net).
Branding is one of the most important decisions a marketing manager can make. The value of
brands in today’s environment is phenomenal. Brands have the power of instant sales; they
convey a message of confidence, quality and reliability to their target market. A brand is a tool
which is used by an organization to differentiate itself from competitors. For instance what is
the value o f a pair of Nike trainers without the brand or the logo? How does your perception
change? Brand competitiveness is enhanced by a five - step process, namely:
Determine your competitive set: the company competitive set is the specific industry and
niche in which it will be competing. In order to define its brand, the company must take a
careful look around at those with whom it will be competing and define the arena in which
they operate.
Create a well-defined value proposition: In other words: what value do you offer them?
Why should customers choose you over your closest competitor? A good value proposition
statement shows you really know your business and your customer base.
Identify the key differentiators: the product or service must stand out from the pack in some
way in order to be successful in the marketplace. How does your differentiate itself from the
competition.
-20-
Articulate a clear customer promise: What is the one thing that customers can expect every
time they interact with your company? Is it a friendly smile? Guaranteed lowest rates? Make
sure you articulate this promise. And, make absolutely sure you deliver on it, every time.
Outline your key value dimension rankings: a company needs to be realistic about where it
will rank relative to the overall niche market on the key value dimension rankings.
2.7.2 Pricing Strategies
There are many ways to price a product. The use of any pricing strategy depends on the
number o f factors among them being the objective of the company and also the market
dynamics for each product market segment. Premium pricing, penetration pricing, economy
pricing, and price skimming are the four main pricing policies/strategies however there are
other important approaches to pricing.
(Monroe. 2003) and Kotler (1993) observe that premium pricing uses a high price where there
is uniqueness about the product or service. This approach is used where a substantial
competitive advantage exists. Such high prices are charged for luxuries such as Mercedes
Benz, Savoy Hotel rooms, and Concorde flights. Penetration Pricing is charged for products
and services is set artificially low in order to gain market share. Once this is achieved, the
price is increased. This approach was used by France Telecom and Sky TV. Economy pricing
is a no frills low price. The cost of marketing and manufacture are kept at a minimum. Price
Skimming is charging a high price because a company has a substantial competitive
advantage. However, the advantage is not sustainable. The high price tends to attract new
competitors into the market, and the price inevitably falls due to increased supply.
Manufacturers of digital watches used a skimming approach in the 1970s. Once other
manufacturers were tempted into the market and the watches were produced at a lower unit
cost, other marketing strategies implemented.
Nagle, Thomas and Holden. Reed (2002), also observe that organizations use other approaches
to pricing. Psychological pricing is used when the marketer wants the consumer to respond on
basis of an emotional, rather than rational basis. For example, 'price point perspective' 99
cents not one dollar. Product Line Pricing is used where there is a range of products or
-21 -
services where the pricing reflects the benefit of parts of the range. For instance, car washes.
Basic wash could be $2; wash and wax $4 and the whole package $6. Optional Product
Pricing is adopted by companies that attempt to increase the amount customer spends once
they start to buy. Optional 'extras' increase the overall price of the product or service. For
example, airlines will charge for optional extras such as guaranteeing a window seat or
reserving a row of seats next to each other. Captive Product Pricing is used where products
have complements. Companies will charge a premium price where the consumer is captured.
For example, a razor manufacturer will charge a low price and recoup its margin (and more)
from the sale of the only design o f blades which fit the razor.
Nagle e.t.a.l (2002) continues to argue that Product Bundle pricing is used by sellers to
combine several products in the same package. This also serves to move old stock. Videos and
CDs are often sold using the bundle approach. Promotional pricing used to promote a product
and it is a very common application. There are many examples of promotional pricing
including BOGOF (Buy One Get One Free). Geographical pricing is evident where there are
variations in price in different parts of the world. Value pricing approach is used where
external factors such as recession or increased competition force companies to provide 'value'
products and services to retain sales.
2.7.3 Promotion Strategies
A successful product or service means nothing unless the benefit of such a service can be
communicated clearly to the target market. An organization’s promotional strategy can consist
of advertising, public relations, sales promotions, personal selling and direct mail.
Advertising is any non personal paid form of communication using any form of mass media.
Public relations involve developing positive relationships with the organization media public.
The art o f good public relations is not only to obtain favourable publicity within the media, but
it also involves being able to handle successfully negative attention. Sales promotion is
commonly used to obtain an increase short term sales. It could involve using money off
coupons or special offers. Personal selling is the marketing of a product service on a one to
one basis. Direct Mail is the sending of publicity material to a named person within an
organization. It allows an organization to use its resources more effectively by allowing
- 22 -
organizations to send publicity material to a named person within the target segment. By
personalizing advertising, response rates increase thus increasing the chance of improving
sales (Kotler. 1993).
A push strategy in marketing is used when there has been a development or improvement on a
new product which is unknown to the consumer. As there is no consumer demand in the
product launch, the product and the information are "pushed" to the consumer by distribution
and promotion. An example of this is a perfume product. Women do not request to smell a
fragrance they never smelled before; it is simply "pushed" to them, through the advertisement.
Due to the information asymmetry the producer tries by signalling to reduce the information
gap between the consumer and the product. This is reached by promotion or other services like
personal dialog.
Another meaning of the push strategy in marketing can be found in the communication
between seller and buyer. In dependence of the used medium, the communication can be either
interactive or non-interactive. For example, if the seller makes his promotion by television or
radio, it's not possible for the buyer to interact with. On the other hand, if the communication
is made by phone or internet, the buyer has possibilities to interact with the seller. In the first
case information are just "pushed” toward the buyer, while in the second case it is possible for
the buyer to demand the needed information according to his requirements.
A Pull marketing strategy is where you develop advertising and promotional strategies that are
meant to entice the prospect to buy your product or service. In this system the consumer
requests the product and "pulls" it through the delivery channel. An example of this is the car
manufacturing company Ford Australia. Ford Australia only produces cars when they have
been ordered by the customers. With pull marketing, you are trying to create a sense of
increased, time limited value so that the customer will come into your store to buy (Robert,
2004).
- 23 -
2.7.4 Place/distrihution Strategies
The organization must distribute the product to the user at the right place at the right time.
Efficient and effective distribution is important if the organization is to meet its overall
marketing objectives. If an organization underestimate demand and customers cannot purchase
products because of it. profitability will be negatively affected.
Two types of channel of distribution methods are available. Indirect distribution involves
distributing a product by the use of an intermediary such as manufacturer selling to a
wholesaler and then on to the retailer. Direct distribution involves distributing direct from a
manufacturer to the consumer. For instance, Dell Computers provides services directly to its
target customers. The advantage o f direct distribution is that it gives a manufacturer complete
control over its product.
Depending on the type of product being distributed there are three common distribution
strategies available. These are intensive distribution, extensive distribution and selective
distribution. Intensive distribution is used commonly to distribute low priced or impulse
purchase products such chocolates and soft drinks. Exclusive distribution involves limiting
distribution to a single outlet. The product is usually highly priced, and requires the
intermediary to place much detail in its display stand. An example is the sale of vehicles
through exclusive dealers. Selective distribution involves choosing a small number of retail
outlets to distribute the product. Selective distribution is common with products such as
computers, television sets, and household appliances, where consumers are willing to shop
around and where manufacturers operate in a large geographical spread. If a manufacturer
decides to adopt an exclusive or selective strategy they should select an intermediary that has
experience of handling similar products, credible and is known by the target audience. (Kotler,
2003).
The above brand and marketing strategies influence consumer response, and in Kenya today
we see motor vehicle dealers putting a lot of energy to understand how consumers respond to
different product features, prices, and advertising appeals and so on. Since these marketing
strategies are mainly used in business today the proposed study will empirically investigate the
- 2 4 -
extent to which Toyota East Africa and DT Dobie Kenya use the strategies. The variables
and relationships discussed in this chapter constituted the basis for the research methodology
presented in the next chapter.
- 25 -
CHAPTER THREE RESEARCH METHODOLOGY
3.1. Research Design
This study used a descriptive survey research design. Descriptive research describes data and
characteristics about the population or phenomenon being studied. It answers the questions of
who, what, where, when and how which was the subject of the study. Donald and Pamela
(2003) and Boyd. Westfall and Stasch (1990), assert that a descriptive research is needed if the
purpose of the study is to generate detailed information on key factors or attributes required to
develop profiles of defined entities.
Descriptive survey research design involves observing and describing the behaviour of a
subject without directly influencing it. This research design has also been used by marketing
researchers to judge the habits of customers, or by companies wishing to judge the morale of
staff (Martyn Shuttleworth 2008). In addition the design has been widely used here in Kenya
by academic researchers including Mbau (2000), Makori (2006) and Awinyo (2008) among
others.
3.2. Target Population
The target population for this study was composed of corporate customers of Toyota and DT
Dobie in Kenya and the staff of these two companies. Toyota and DT Dobie have
approximately 10,000 and 6,000 corporate and individual customers respectively. Corporate
customers are approximately 150 and account for a large proportion of the sales volume. The
target respondents from these corporate customers were the Chief Executive Officers,
Transport. Finance Managers and drivers. These are the key influencers o f and / or decision
makers on the design and make o f motor vehicle brand to be bought.
Toyota has approximately 350 employees which include 11 sales representatives, 2 sales
managers and 1 marketing manager. On its part DT Dobie has approximately 300 employees
who include 18 sales representatives, 2 sales managers and 1 marketing manager which
- 26 -
constituted part of the target population. These employees are the ones directly involved with
the customers in selling, promotions and strategy formulation.
3.3. Sample designThe first sample comprised sales managers, marketing managers and sales representatives of
Toyota (East Africa), and DT Dobie. The second sample embraced corporate customers who
were represented by decision makers / influences in the areas of finance and technical
dockets. These included the Chief Executive Officers, Transport, Finance Managers and
drivers in these companies. Systematic random sampling was used to select corporate
customers and the respective respondents to be interviewed using the list in appendix 5. Out
of the 150 corporate customers based in Nairobi a sample of 30 corporate customers were
selected.
3.4. Data Collection Method
The study mainly relied on primary data collected using partially structured questionnaires.
The first questionnaire collected data from the sampled corporate customers while the second
questionnaire solicited relevant data from sampled respondents of the two companies (Toyota
and DT Dobie). The questionnaire had both closed and open-ended questions. Part A of the
questionnaires gathered data on the profile of the respondents. Part B gathered data that
answered the research questions for the study. The questionnaires used a Likert - type scale
where appropriate. The relevant questionnaires are included in appendix 2, 3 and 4
respectively.
The questionnaires were sent to the target respondents through e-mail since the target samples
are corporate and have email, and some were dropped to the relevant offices with an
introductory letter. To enhance the response rate the researcher made relevant follow -ups with
the sampled respondents.
3.5. Data Analysis and presentationData analysis is the extraction of meaningful information from the raw data. In the current
study data analysis involved editing, coding and tabulation and computation of descriptive
statistics. In the study most of the questions/statements were pre-coded since most of them
- 27 -
were close ended and this made editing and tabulating easy to carry out (Saunders and
Thornhill, 2007). The coding was done in a way that allowed creation of data matrix suitable
for processing by the Statistical Package for Social Sciences (SPSS) and the Microsoft Excel.
The data analysis entailed computation of measures of central tendency and measures of
dispersion. The measures of central tendency computed included Mean scores and
percentages. The research results are presented in tables and charts with narrative explanation
of the findings.
- 2 8 -
CHAPTER FOUR
DATA ANALYSIS AND INTERPRETATIONS4.1 Introduction
This chapter explains how the data has been analyzed and the findings. Descriptive statistics
has largely been used to summarize the data. The findings are presented in sections that cover
the profile o f the respondents, media that are used, and the marketing strategies that are used
by both DT Dobie and Toyota.
4.2 Respondents profile
The study had sought to establish the general profile o f the corporate clients who responded to
this study. The findings are analyzed and presented in the ensuing sections. A total of 41
questionnaires were completed and analyzed.
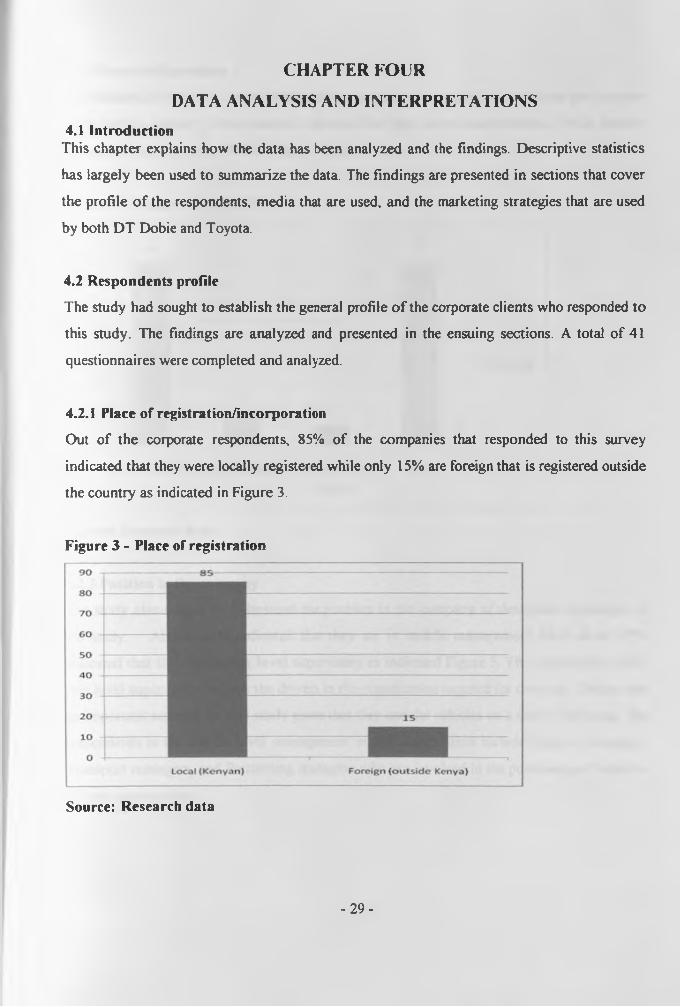
4.2.1 Place of registration/incorporation
Out of the corporate respondents, 85% of the companies that responded to this survey
indicated that they were locally registered while only 15% are foreign that is registered outside
the country as indicated in Figure 3.
Figure 3 - Place of registration
Source: Research data
- 29 -
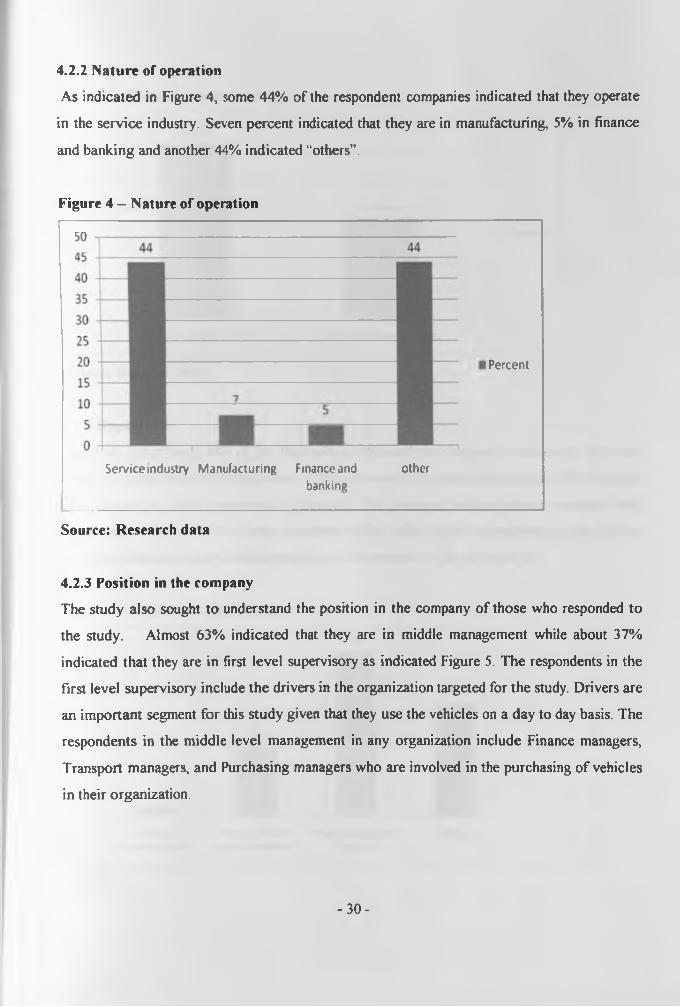
4.2.2 Nature of operation
As indicated in Figure 4, some 44% of the respondent companies indicated that they operate
in the service industry. Seven percent indicated that they are in manufacturing, 5% in finance
and banking and another 44% indicated “others”.
Figure 4 - Nature of operation
i Percent
Service industry Manufacturing Finance andbanking
other
Source: Research data
4.2.3 Position in the company
The study also sought to understand the position in the company of those who responded to
the study. Almost 63% indicated that they are in middle management while about 37%
indicated that they are in first level supervisory as indicated Figure 5. The respondents in the
first level supervisory include the drivers in the organization targeted for the study. Drivers are
an important segment for this study given that they use the vehicles on a day to day basis. The
respondents in the middle level management in any organization include Finance managers,
Transport managers, and Purchasing managers who are involved in the purchasing of vehicles
in their organization.
- 30 -
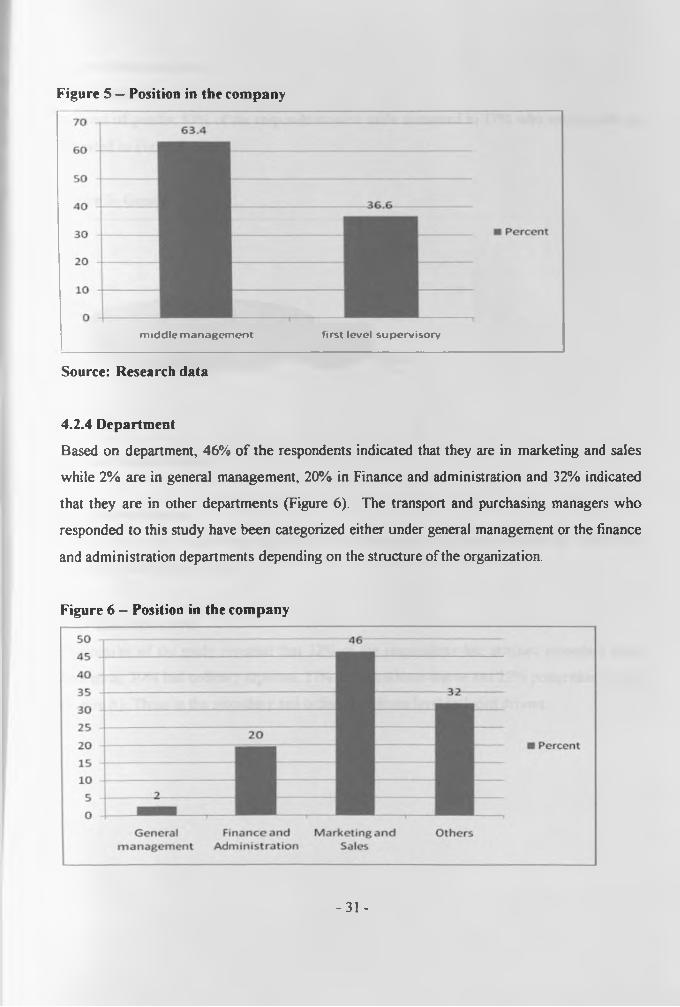
Figure 5 — Position in the company
middle management first level supervisory
Source: Research data
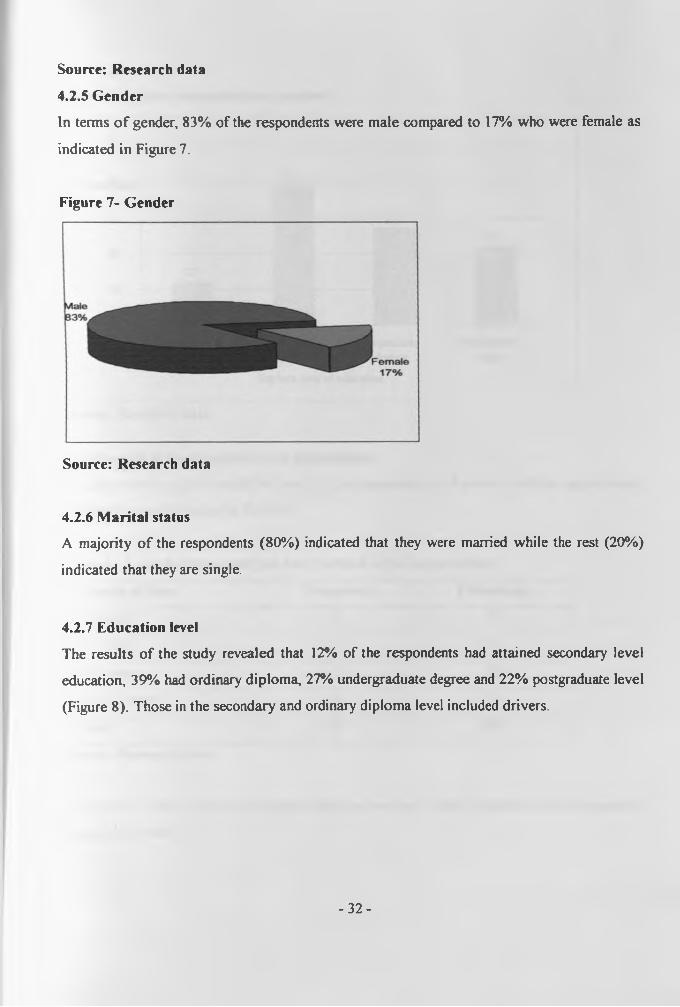
4.2.4 Department
Based on department, 46% of the respondents indicated that they are in marketing and sales
while 2% are in general management, 20% in Finance and administration and 32% indicated
that they are in other departments (Figure 6). The transport and purchasing managers who
responded to this study have been categorized either under general management or the finance
and administration departments depending on the structure of the organization.
Figure 6 — Position in the company
-31 -
Source: Research data
4.2.5 G ender
In terms o f gender, 83% of the respondents were male compared to 17% who were female as
indicated in Figure 7.
Figure 7- Gender
Source: Research data
4.2.6 M arital status
A majority o f the respondents (80%) indicated that they were married while the rest (20%)
indicated that they are single.
4.2.7 Education level
The results of the study revealed that 12% of the respondents had attained secondary level
education, 39% had ordinary diploma, 27% undergraduate degree and 22% postgraduate level
(Figure 8). Those in the secondary and ordinary diploma level included drivers.
- 32 -
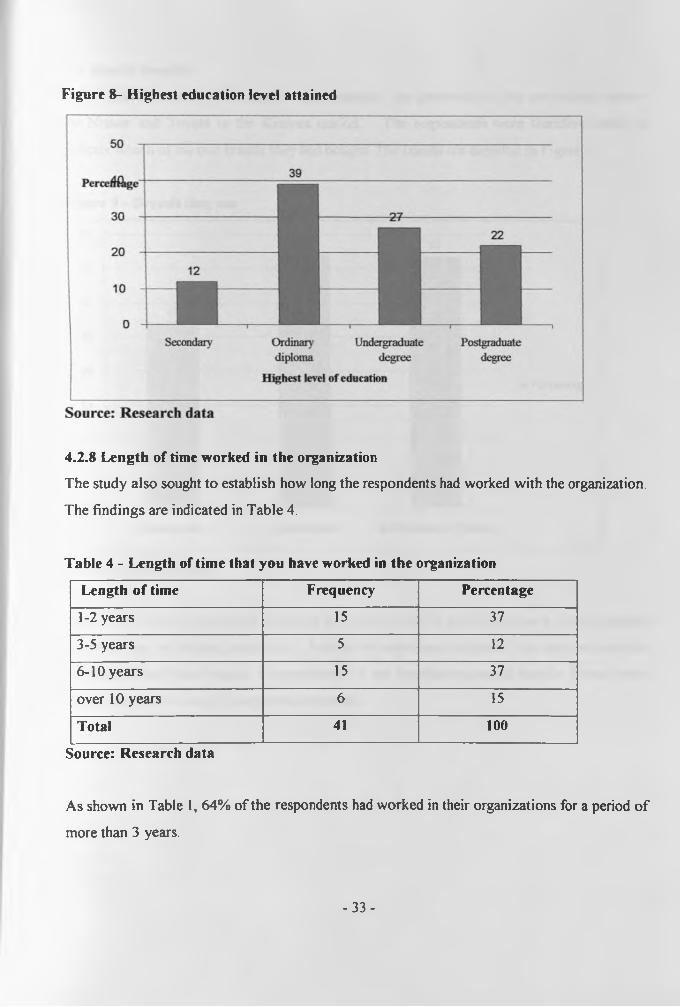
Figure 8- Highest education level attained
4.2.8 Length of time worked in the organization
The study also sought to establish how long the respondents had worked with the organization.
The findings are indicated in Table 4.
Table 4 - Length of time that you have worked in the organization
Length of time Frequency Percentage
1-2 years 15 37
3-5 years 5 12
6-10 years 15 37
over 10 years 6 15
Total 41 100
Source: Research data
As shown in Table 1, 64% of the respondents had worked in their organizations for a period o f
more than 3 years.
- 33 -
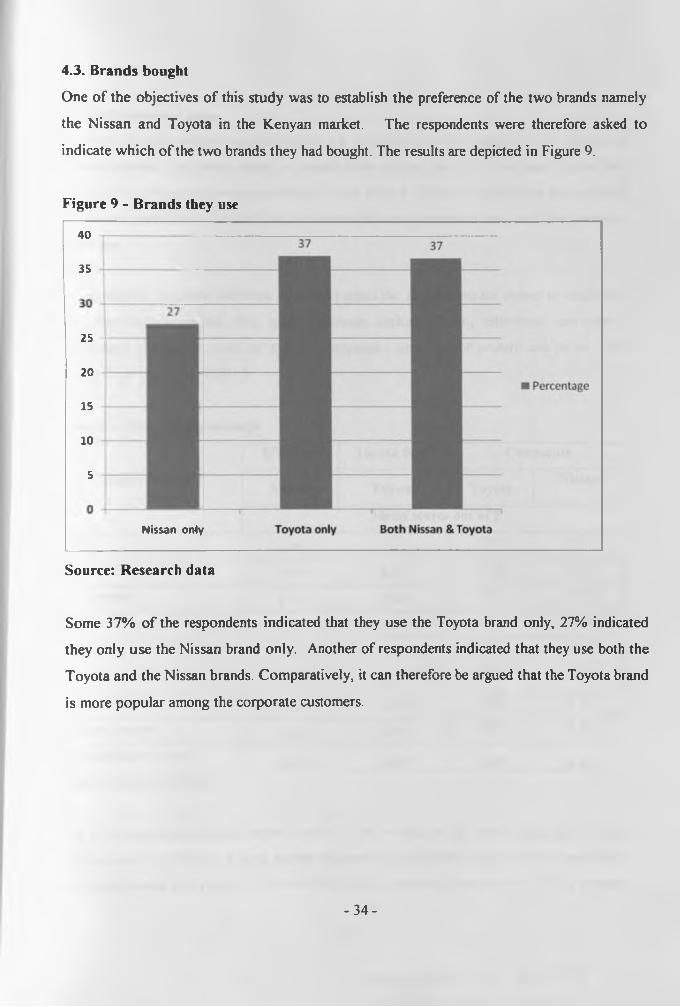
4.3. Brands bought
One of the objectives of this study was to establish the preference of the two brands namely
the Nissan and Toyota in the Kenyan market. The respondents were therefore asked to
indicate which of the two brands they had bought. The results are depicted in Figure 9.
Figure 9 - Brands they use
40
35
25 j—
20
15
10
5
Nissan only
Source: Research data
Some 37% of the respondents indicated that they use the Toyota brand only, 27% indicated
they only use the Nissan brand only. Another of respondents indicated that they use both the
Toyota and the Nissan brands. Comparatively, it can therefore be argued that the Toyota brand
is more popular among the corporate customers.
- 34 -
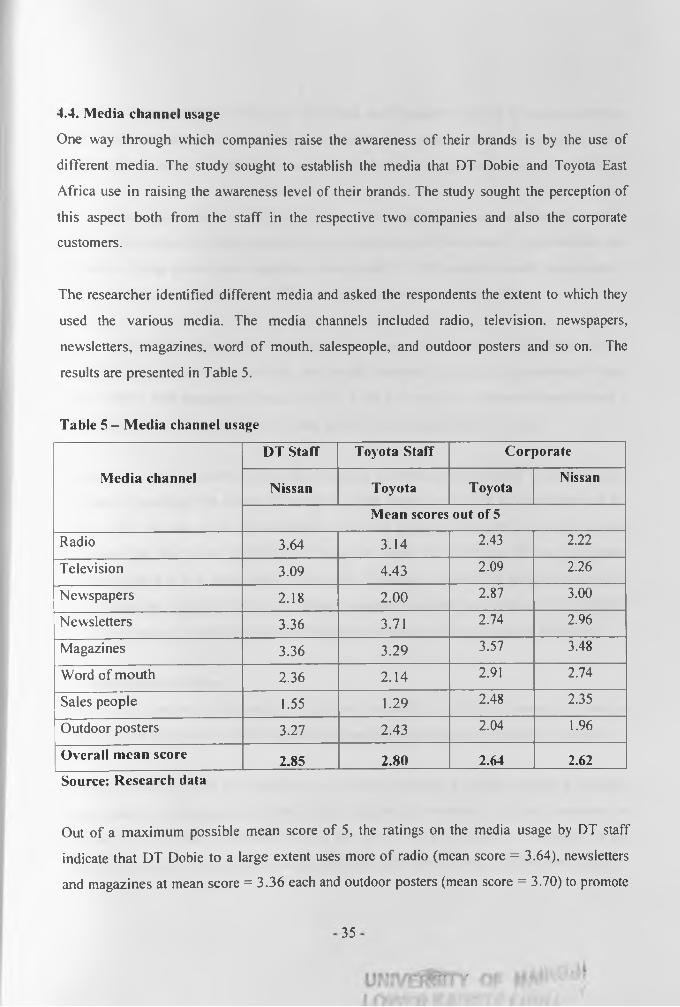
4.4. Media channel usage
One way through which companies raise the awareness of their brands is by the use of
different media. The study sought to establish the media that DT Dobie and Toyota East
Africa use in raising the awareness level of their brands. The study sought the perception of
this aspect both from the staff in the respective two companies and also the corporate
customers.
The researcher identified different media and asked the respondents the extent to which they
used the various media. The media channels included radio, television, newspapers,
newsletters, magazines, word of mouth, salespeople, and outdoor posters and so on. The
results are presented in Table 5.
Table 5 - Media channel usage
Media channel
DT Staff Toyota Staff Corporate
Nissan Toyota ToyotaNissan
Mean scores out of 5
Radio 3.64 3.14 2.43 2.22
Television 3.09 4.43 2.09 2.26
Newspapers 2.18 2.00 2.87 3.00
Newsletters 3.36 3.71 2.74 2.96
Magazines 3.36 3.29 3.57 3.48
Word of mouth 2.36 2.14 2.91 2.74
Sales people 1.55 1.29 2.48 2.35
Outdoor posters 3.27 2.43 2.04 1.96
Overall mean score 2.85 2.80 2.64 2.62Source: Research data
Out of a maximum possible mean score of 5, the ratings on the media usage by DT staff
indicate that DT Dobie to a large extent uses more of radio (mean score = 3.64), newsletters
and magazines at mean score = 3.36 each and outdoor posters (mean score = 3.70) to promote
35
? r r * '
their Nissan brand. On the other hand, the Toyota staff indicated that they to a large extent use
more of television (mean score = 4.43) to promote their Toyota brand. This is followed by
other media channels of newsletters (mean score = 3.71) and magazines (mean score = 3.29)
The Corporate buyers who are the major buyers of the two brands indicated that Toyota East
Africa uses more of the print media to raise the awareness of their brand. They indicated that
Toyota to a large extent uses magazines (mean score = 3.57). word of mouth (mean score =
2.91), newspapers (mean score = 2.87) and newsletters at (mean score = 2.74).
Regarding the Nissan brand, the Corporate customers indicated that DT Dobie like Toyota
East Africa to a large extent use the same media channels in raising the awareness of their
Nissan brand with magazines (mean score = 3.48) followed by newspapers (mean score =
3.00), newsletters (mean score = 2.96) and word of mouth (mean score = 2.74).
There was a wide disparity among the corporate customers and the staff in the two Auto
companies regarding the extent o f using the sales people in raising the awareness of the
brands. On the one hand, the corporate customers perceived that the two motor vehicle
companies use their sales people to a large extent while the staff from the two companies
perceived that it is to a small extent. This wide difference in perception may be attributed to
the fact that the corporate clients are always assigned corporate sales person who attend to
their needs and at the same time inform them of new products in the respective companies.
4.5 Marketing strategies
One of the objectives of this study was to assess the extent to which the marketing strategies
applied by the two motor vehicle marketing companies accounted for the brands’ popularity.
The researcher had asked the respondents to indicate the extent to which marketing strategies
were applied by the respective motor vehicle marketing companies in raising awareness of
their brands and hence contribute towards increase of their popularity. A summary of the
result is presented in Table 3 with detailed findings under each P given in subsequent sections.
- 36 -
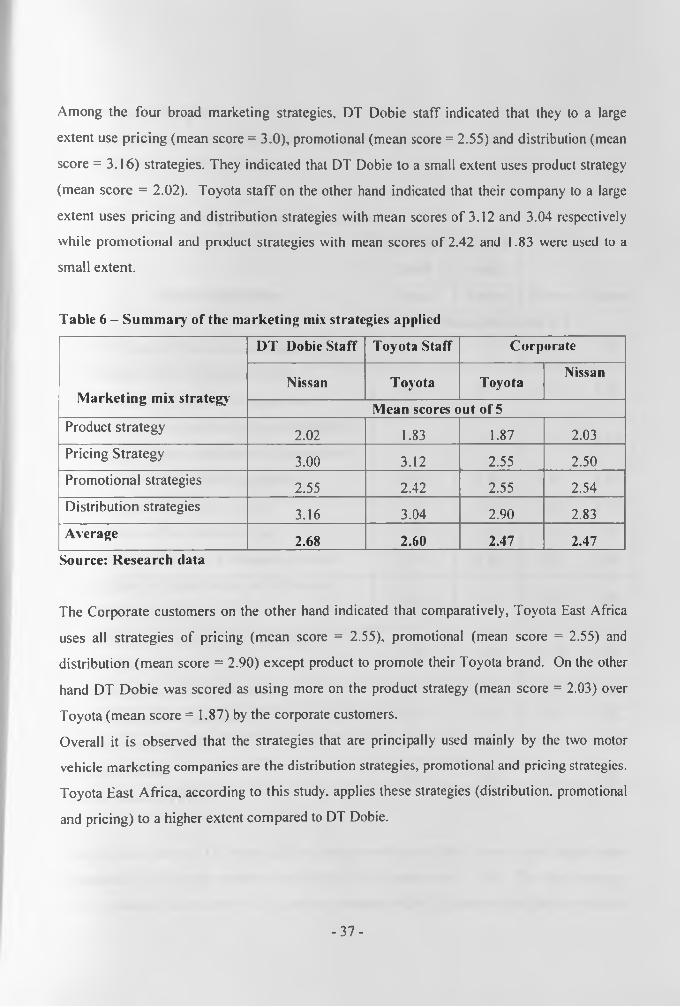
Among the four broad marketing strategies, DT Dobie staff indicated that they to a large
extent use pricing (mean score = 3.0), promotional (mean score = 2.55) and distribution (mean
score = 3.16) strategies. They indicated that DT Dobie to a small extent uses product strategy
(mean score = 2.02). Toyota staff on the other hand indicated that their company to a large
extent uses pricing and distribution strategies with mean scores of 3.12 and 3.04 respectively
while promotional and product strategies with mean scores of 2.42 and 1.83 were used to a
small extent.
Table 6 - Summary’ of the marketing mix strategies applied
Marketing mix strategy
DT Dobie Staff Toyota Staff Corporate
Nissan T oyota ToyotaNissan
Mean scores out of 5Product strategy 2.02 1.83 1.87 2.03Pricing Strategy 3.00 3.12 2.55 2.50Promotional strategies 2.55 2.42 2.55 2.54Distribution strategies 3.16 3.04 2.90 2.83Average 2.68 2.60 2.47 2.47
Source: Research data
The Corporate customers on the other hand indicated that comparatively, Toyota East Africa
uses all strategies of pricing (mean score = 2.55), promotional (mean score = 2.55) and
distribution (mean score = 2.90) except product to promote their Toyota brand. On the other
hand DT Dobie was scored as using more on the product strategy (mean score = 2.03) over
Toyota (mean score = 1.87) by the corporate customers.
Overall it is observed that the strategies that are principally used mainly by the two motor
vehicle marketing companies are the distribution strategies, promotional and pricing strategies.
Toyota East Africa, according to this study, applies these strategies (distribution, promotional
and pricing) to a higher extent compared to DT Dobie.
- 3 7 -
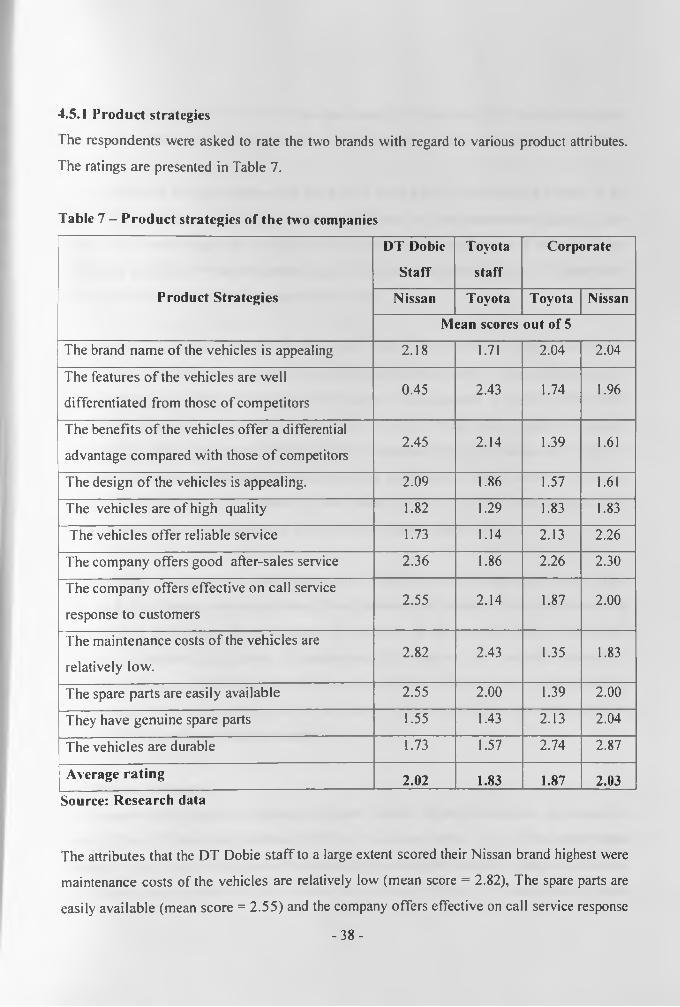
4.5.1 Product strategies
The respondents were asked to rate the two brands with regard to various product attributes.
The ratings are presented in Table 7.
Table 7 - Product strategies of the two companies
Product Strategies
DT Dobie
Staff
Toyota
staff
Corporate
Nissan Toyota Toyota Nissan
Mean scores out of 5
The brand name of the vehicles is appealing 2.18 1.71 2.04 2.04
The features of the vehicles are well
differentiated from those of competitors0.45 2.43 1.74 1.96
The benefits of the vehicles offer a differential
advantage compared with those o f competitors2.45 2.14 1.39 1.61
The design of the vehicles is appealing. 2.09 1.86 1.57 1.61
The vehicles are of high quality 1.82 1.29 1.83 1.83
The vehicles offer reliable service 1.73 1.14 2.13 2.26
The company offers good after-sales service 2.36 1.86 2.26 2.30
The company offers effective on call service
response to customers2.55 2.14 1.87 2.00
The maintenance costs of the vehicles are
relatively low.2.82 2.43 1.35 1.83
The spare parts are easily available 2.55 2.00 1.39 2.00
They have genuine spare parts 1.55 1.43 2.13 2.04
The vehicles are durable 1.73 1.57 2.74 2.87
Average rating 2.02 1.83 1.87 2.03Source: Research data
The attributes that the DT Dobie staff to a large extent scored their Nissan brand highest were
maintenance costs of the vehicles are relatively low (mean score = 2.82), The spare parts are
easily available (mean score = 2.55) and the company offers effective on call service response
- 38 -
to customers (mean score = 2.55). On the other hand, DT Dobie stafT to a small extent agreed
with product differentiation features of the Nissan brand that scored lowest mean score of 0.45
out of 5.
The Toyota East African staff on the other hand scored their Toyota brand highest in the
product differentiation aspect (mean score = 2.43) and on low maintenance aspects (mean
score = 2.43) even though the scores still fell within the small extent range. The lowest scores
were in the reliability of service (mean score = 1.14) genuine (mean score = 1.43) spare parts
and the durability of the vehicles (mean score = 1.57).
The corporate customers’ ratings on the Toyota brand were relatively higher compared to
those Toyota staff ratings on the aspects of brand name (mean score = 2.04), reliable services
(mean score = 2.13), after sales service (mean score = 2.26), genuine spare parts (mean score
= 3.13) and durability o f the brand (mean score = 2.74). On the other hand the Corporate
ratings on the Nissan brand were relatively higher compared to the DTD Dobie staff ratings on
the product attributes in terms of features being well differentiated (mean score = 1.96), High
quality (mean score = 1.83), reliable service (mean score = 2.26) and genuine spare parts
(mean score = 2.04) and durability of the Nissan brand (mean score = 2.87).
Comparatively, the corporate respondents offered relatively higher ratings to the Nissan brand
over the Toyota brand on most attributes. These included the features of the vehicles are well
differentiated from those of competitors, the benefits of the vehicles offer a differential
advantage compared with those of competitors; the vehicles offer reliable service, the
company offers good after-sales service, the company offers effective on call service response
to customers, the maintenance costs of the vehicles are relatively low, the spare parts are
easily available and the vehicles are durable
4.5.2 Pricing strategiesThe researcher also analyzed pricing on various aspects whose findings are represented in
Table 5. The DT Dobie staff indicated that they ‘-to a large extent” apply all the price related
aspects to their Nissan brand save for one aspect namely the company charges a premium
price for any unique features of their vehicle with a mean score of 2.27. The highest attributes
- 39 -
Corporate respondents on the other hand mentioned that the Toyota East Africa company uses
most of the price aspects to gain and increase their market share compared to the ones applied
by the DT Dobie on their Nissan brand. Corporate customers felt that Toyota scored lower
(mean score = 2.48) compared to DT Dobie’s (mean score = 2.91) on “company's pricing
strategy being consistent with the benefits of brands that they offer”. Toyota also scored lower
(mean score = 2.39) compared to DT Dobie (mean score = 2.74) with regard to the “company
keeping the cost of marketing and manufacture at a minimum level for its brands”.
4.5.3 Promotional strategies
Promotional activities play a significant role in raising the awareness and usage of a product
and service. The motor vehicle marketing companies use a number of promotional strategies.
An analysis o f the strategies that they use is indicated in Table 6.
The DT Dobie respondent mentioned staff indicated that their company applies the following
promotional strategies “highly”. They assert that DT Dobie carries out effective
communication campaign that comprises a well thought out message strategy (mean score =
3.27); DT Dobie uses direct mail in sending publicity material (mean score = 3.18), It has a
high participation in exhibitions (mean score = 3.09) and the company offers materials to
customers that have corporate logos (mean score = 3.00). DT Dobie staff on the other hand
asserted that the company does not use effective trade promotions (Mean score of 1.45).
The ratings by the Toyota East Africa staff showed that the Company almost applies all the
promotional strategies equally given that most of them received a mean score of between 2.00
and 3.00.
An analysis of the ratings by corporate customers showed that DT Dobie applies promotional
strategies to a less extent than Toyota. The company has a more positive relationship with
media organizations; the company uses the right media channels in executing its messages; it
uses effective consumer promotion strategies; it offers materials to customers that have
corporate logos and that it participates in sponsorships. Toyota East Africa seemed to have an
- 4 1 -
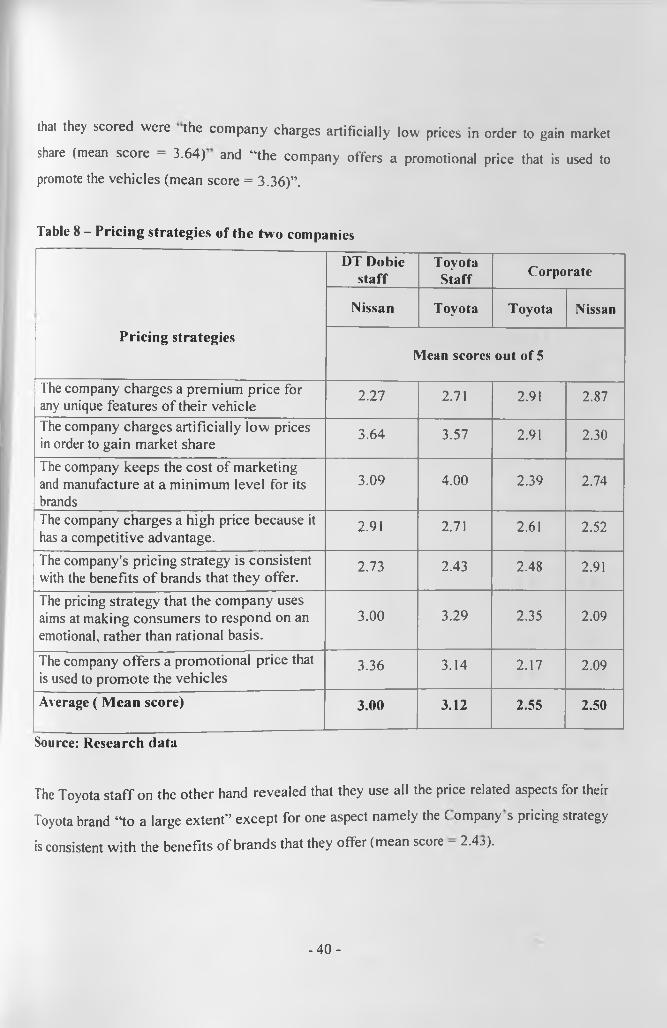
that they scored were the company charges artificially low prices in order to gain market
share (mean score = 3.64) and “the company offers a promotional price that is used to promote the vehicles (mean score = 3.36)”.
Table 8 - Pricing strategies of the two companies
Pricing strategies
DT Dobie staff
ToyotaStaff Corporate
Nissan Toyota Toyota Nissan
Mean scores out of 5
The company charges a premium price for any unique features of their vehicle
2.27 2.71 2.91 2.87
The company charges artificially low prices in order to gain market share
3.64 3.57 2.91 2.30
The company keeps the cost of marketing and manufacture at a minimum level for its brands
3.09 4.00 2.39 2.74
The company charges a high price because it has a competitive advantage.
2.91 2.71 2.61 2.52
The company's pricing strategy is consistent with the benefits of brands that they offer.
2.73 2.43 2.48 2.91
The pricing strategy that the company uses aims at making consumers to respond on an emotional, rather than rational basis.
3.00 3.29 2.35 2.09
The company offers a promotional price that is used to promote the vehicles
3.36 3.14 2.17 2.09
Average ( Mean score) 3.00 3.12 2.55 2.50
Source: Research data
The Toyota staff on the other hand revealed that they use all the price related aspects for their
Toyota brand “to a large extent” except for one aspect namely the C ompany s pricing strategy
is consistent with the benefits of brands that they offer (mean score - 2.4j ).
- 4 0 -
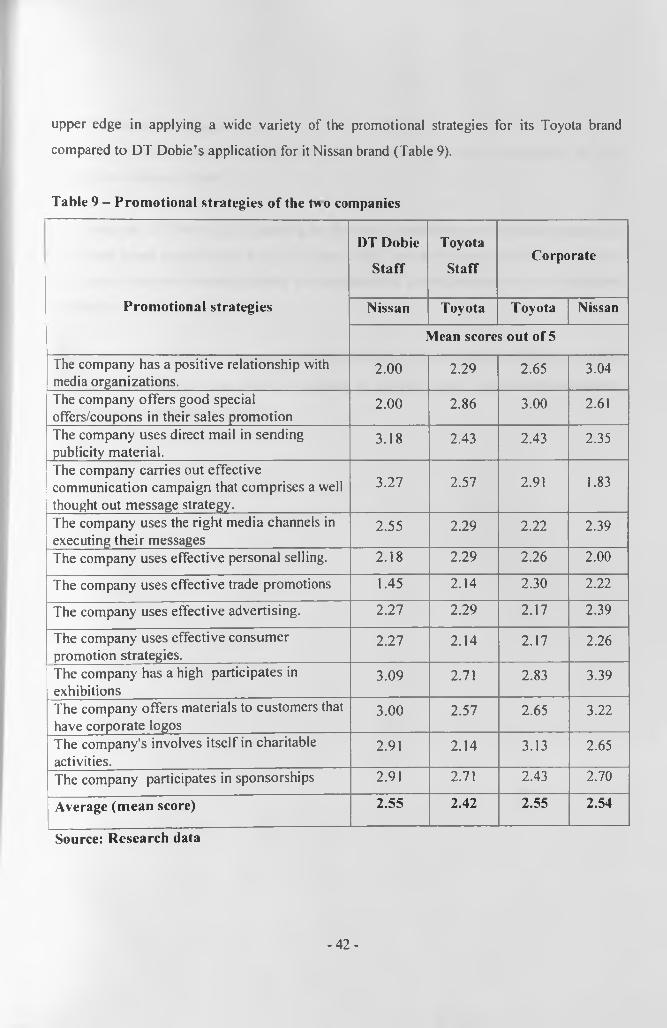
upper edge in applying a wide variety of the promotional strategies for its Toyota brand
compared to DT Dobie’s application for it Nissan brand (Table 9).
Table 9 - Promotional strategies of the tw o companies
Promotional strategies
DT Dobie
Staff
Toyota
StaffCorporate
Nissan Toyota Toyota Nissan
Mean scores out of 5
The company has a positive relationship with media organizations.
2.00 2.29 2.65 3.04
The company offers good special offers/coupons in their sales promotion
2.00 2.86 3.00 2.61
The company uses direct mail in sending publicity material.
3.18 2.43 2.43 2.35
The company carries out effective communication campaign that comprises a well thought out message strategy.
3.27 2.57 2.91 1.83
The company uses the right media channels in executing their messages
2.55 2.29 2.22 2.39
The company uses effective personal selling. 2.18 2.29 2.26 2.00
The company uses effective trade promotions 1.45 2.14 2.30 2.22
The company uses effective advertising. 2.27 2.29 2.17 2.39
The company uses effective consumer promotion strategies.
2.27 2.14 2.17 2.26
The company has a high participates in exhibitions
3.09 2.71 2.83 3.39
The company offers materials to customers that have corporate logos
3.00 2.57 2.65 3.22
The company's involves itself in charitable activities.
2.91 2.14 3.13 2.65
The company participates in sponsorships 2.91 2.71 2.43 2.70
Average (mean score) 2.55 2.42 2.55 2.54
Source: Research data
- 42 -
4.5.4 Distribution strategies
An analysis was also done to establish the distribution strategies that the companies use. The
findings are shown in Table 7.
The ratings by DT Dobie Staff regarding the distribution strategies used by their company for
the Nissan brand revealed that they ‘no a large extent” use the various distribution strategies.
The strategy that the company applies but comparatively scored low was the use of exclusive
distribution through a single outlet.
The Toyota East Africa staff mentioned that the company uses different distribution strategies
to a large extent save for one namely distributing its vehicles directly from the manufacturer to
the consumer (a mean score = 2.43).
-43 -
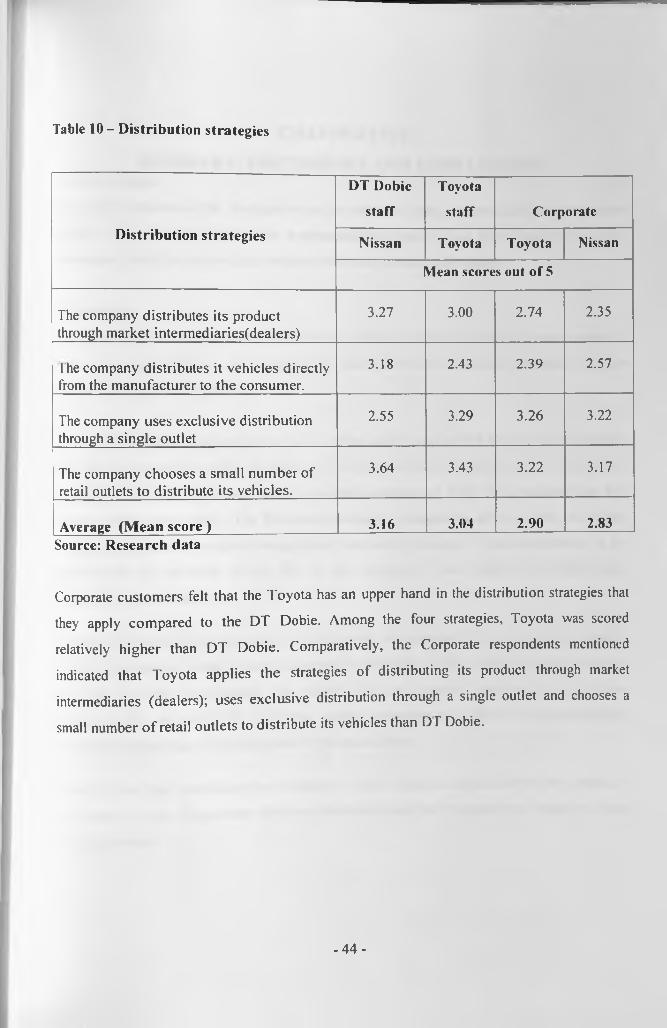
Tabic 10 - D istribution strategies
Distribution strategies
DT Dobie
staff
Toyota
staff Corporate
Nissan Toyota Toyota Nissan
Mean scores out of 5
The company distributes its product through market intermediaries(dealers)
3.27 3.00 2.74 2.35
1 he company distributes it vehicles directly from the manufacturer to the consumer.
3.18 2.43 2.39 2.57
The company uses exclusive distribution through a single outlet
2.55 3.29 3.26 3.22
The company chooses a small number of retail outlets to distribute its vehicles.
3.64 3.43 3.22 3.17
Average (Mean score) 3.16 3.04 2.90 2.83Source: Research data
Corporate customers felt that the Toyota has an upper hand in the distribution strategies that
they apply compared to the DT Dobie. Among the four strategies, Toyota was scored
relatively higher than DT Dobie, Comparatively, the Corporate respondents mentioned
indicated that Toyota applies the strategies of distributing its product through market
intermediaries (dealers); uses exclusive distribution through a single outlet and chooses a
small number o f retail outlets to distribute its vehicles than D f Dobie.
- 4 4 -
CHAPTER FIVESUMMARY, DISCUSSIONS AND CONCLUSIONS
5.1 Introduction
This chapter discusses the findings fro m the data that was analyzed and the conclusions
reached. The findings have been summarized on basis of the objectives of the study;
conclusions have been drawn; and recommendations for action advanced.
5.2 Summary
The objectives o f the study were to determine which company’s brands are more popular to
corporate buyers in Kenya and to assess the extent to which the applied marketing strategies
influence the brand's popularity.
In terms of sample demographics the results of the study revealed that 85% of the corporations
were locally registered while the others (15%) were foreign. More than half (63%) of the
respondents indicated that they were in middle management while 37% indicated that they
were in supervisory level. The first level category incorporates drivers while the middle
management includes transport managers and purchasing managers. These respondents, in any
organization are involved in the day to day running of their firms and therefore their
information can be relied on.
Almost half (46%) of the respondents to this survey in mentioned that they work in marketing
and sales department while 2% are in general management, 20/o in 1 inance and administration
and 32% in other departments. The sample had also included transport and purchasing
managers who can either fall within the general management or finance and administration
department depending on the structure of the organization.
Some 60% o f the respondents had worked in their respective organizations for a period of
more than 3 years. This means that the information that they provided was based on a long
term experience.
- 45 -
Brands bought
One ot the objectives ol this study was to establish the preference of the two brands i.e. Nissan
and Tovota in the Kenyan market. Some 37% of the respondents mentioned that they use
Toyota brand only, 27% indicated they only have Nissan brand. Another 37% of respondents
mentioned that they have both the Toyota and the Nissan brands. On basis of the sample
results it can be concluded that the Toyota brand is preferred to Nissan brand.
Media usage
One way by which companies increase awareness level of their brands is through use of
different media. Overall it can be argued that the media used by the different motor vehicle
marketing companies differ even though it can be concluded that most use the sprint media.
Out of a possible mean score of 5, the ratings on the media usage by DT Dobie staff showed
that DT Dobie “to a large extent'’ uses more of radio (mean scores = 3.64), newsletters and
magazines (3.36 mean scores of each) and outdoor posters (mean scores = 3.70) to promote
their Nissan brand.
On their part, the Toyota staff the company “to a large extent” uses more of television (mean
scores = 4.43) to promote its Toyota brand. This is followed by other media channels of
newsletters (mean scores = 3.71) and magazines (mean scores = 3.29).
The Corporate respondents on the other hand who are the major buyers o f the two brands
indicated that Toyota East Africa uses more of the print media to raise the awareness of its
brand. They mentioned that Toyota “to a large extent” uses magazines (mean scores = 3.57),
word of mouth (mean scores = 2.91), newspapers (mean scores — 2.87) and newsletters (mean
scores = 2.74). Regarding the Nissan brand, the Corporate respondents indicated that DT
Dobie like Toyota “to a large extent” use the same media channels in raising the awareness of
its Nissan brand with magazines (mean scores = 3.48) followed by newspapers (mean scores =
3.00), newsletters (mean scores = 2.96) and word of mouth (mean scores - 2.74).
Overall marketing strategiesOne of the objectives of this study was to assess the extent to which the marketing strategies
applied by the two motor vehicle marketing companies accounted for the brands’ popularity.
- 46 -
The Corporates on the other hand indicated that comparatively, Toyota East Africa uses all
strategies of pricing (mean scores = 2.55), promotion (mean scores = 2.55) and distribution
(mean scores — 2.90) except product to promote their Toyota brand. On the other hand DT
Dobie was scored as using more the product strategy (mean scores = 2.03) over Toyota (mean
scores = 1.87) by the corporate customers.
Overall it can be observed that the strategies that are used mainly by the two motor vehicle
marketing companies are the distribution strategies, promotional and pricing strategies.
Product strategies
The Corporate respondents accorded relatively higher ratings to the Nissan brand over the
Toyota brand on some aspects. These included that "the features of the vehicles are well
differentiated from those o f competitors”, “the benefits of the vehicles offer a differential
advantage compared with those o f competitors”;” the vehicles offer reliable service, the
company offers good after-sales service”, “the company offers effective on call service
response to customers”, “the maintenance costs of the vehicles are relatively low”, “the spare
parts are easily available and the vehicles are durable .
Pricing strategiesThe corporate respondents mentioned that the Toyota Company uses most of the price aspects
to gain and increase its market share compared to the ones applied by the 171 Dobie on the
Nissan brand. The respondents felt that Toyota scored lower (mean scores = 2.48) than DT
Dobie’s (mean scores = 2.91) on “company's pricing strategy being consistent with the
benefits of brands that they offer” . Toyota also scored lower (mean scores = 2.39) than DT
Dobie (mean scores = 2.74) with regard to the “company keeping the cost of marketing and
manufacture at a minimum level for its brands .
Promotional strategiesAn analysis o f the ratings by corporate respondents showed that DT Dobie applies some
promotional strategies more than Toyota. These include the company having a more positive
relationship with media organizations; the company uses the right media channels to execute
- 4 7 -
its messages, the company uses effective consumer promotion strategies: the company offers
materials to customers that have corporate logos and the company participates in sponsorships.
Otherwise, Toyota seemed to have an upper edge in applying a wide variety of the
promotional strategies for its T oyota brand compared to DT Dobie's application for its Nissan brand.
Distribution strategies
The corporate respondents felt that Toyota has an upper hand in the distribution strategies that
it applies when compared with the DT Dobie. Thus Toyota was scored relatively higher than
DT Dobie on all the four strategies. The strategies Toyota uses for distributing its product are
through market intermediaries (dealers), using exclusive distribution through a single outlet;
and chooses a small number of retail outlets to distribute its vehicles.
Conclusion
Overall, the two marketing companies use the various marketing strategies to increase the
awareness of their products and increase their market share. It can be observed that the
strategies that are used mainly by the two motor vehicle marketing companies are distribution,
promotion and pricing strategies. Toyota East Africa uses the various tactics under these
strategies more often than DT Dobie for its Nissan brand. I his may have accounted for the
higher popularity o f the Toyota brand in Kenya than the Nissan brand.
5.3 Limitations of the StudyThe study concentrated on the corporate customers based in Nairobi area. Although Nairobi
constitutes a big share o f the motor vehicle business, the results may not be gcncrali/ablc to
the entire country'. Further the study did not include the retail customes. The study also did
not include the retail customers.
5.4 RecommendationsThere are no significant differences in the product features of the two brands (Nissan and
Toyota). However, from the study it is clear that the Toyota brand applies more of the
distribution, pricing and promotional strategies. This has possibly led to the Toyota brand
-48 -
being more popular. It is therefore recommended that DT Dobie uses the same marketing
strategies more intensively to increase popularity of its Nissan brand.
In addition because the study concentrated on corporate customers based in Nairobi region. It
is recommended that a similar study be carried nationally to see if the same results would be
found. Finally it is recommended that a similar study be done on the retail customers and
house hold buyers.
- 4 9 -
REFERENCESAaker, D. A (19%) Building Strong Brands, New York: The Free Press, 1996
Albaum, G., Duerr, E.. & Strandskov, J. (2005), International Marketing and Export Management, London, Pearson Education Ltd.
AnsofTH (1987). C orporate Strategy. (2nd Ed.). London, Penguin Books.
AnsoffH and McDonnell J( 1990). Implanting Strategic Management. (2nJ Ed.). Prentice Hall Europe.
Balmer. J. (2001). The three virtues and Seven Deadly sins of Corporate Brand Management. Journal of General Management 27 (1), 1-17
Batra R, Myers, J.G and Aaker D.A. (2005). - Advertising Management, 5th edition by Prentice Hall o f India private limited New Delhi - 110001.
Boyd W. H., Westfall, R., Stasch F. S. (1990). Marketing Research- Text and Cases, Laxman Chand Arya- Delhi
Czinkota, M.R and Ronkainen. LA (2004). International Marketing, Ohio, Thomson South Western
Dick, A. S. and Kunal B (1994). Customer Loyalty: Toward an Integrated Conceptual Framework, Journal of the Academy of Marketing Science, 22 (2). 99-113.
Donald R. C., Pamela S. S. (2003). Business Research Methods. (8lh Ed.). Tata McGraw Hill/Irwin- New Delhi
Dowling, Grahame Robert (2004). The Art and Science of Marketing. Oxford UniversityPress
Fan, Y. (2002). The National Image of Global Brand. Journal of Brand Management, 9:3, 180-192
Gilligan, C.. Hird. M. (1989). International Marketing Strategy and Implementation,Routledge
Holensen, S. (2007). Global M arketing, Edinburgh: Pearson Education Ltd
Johnson. Gerry and Kevan. Scholes (1998). Exploring Corporate Strategy, 4,h Edition, Prentice-Hall o f India.
Kay, M. J (2004). Strong brands and Corporate brands. European Journal of Marketing, 40 (7/8), 742-760
- 50 -
Kotler, P. (1985). How to create win and Dominate Markets. The Free Press 1999 p. 229-233
Kotler, P. (199j). Marketing Management, Analysis, Planning, Implementation and Control, 8 ’ Edition, New York: Prentice Hall. 2005)
Kotler, P & Keller. K.L (2006). Marketing management 12 Edition. New Jersey: Pearson Education
Kotler. P & Waldemar P (2006). B2B Brand Management
Kelley, T (2001). The Art of Innovation. Doubleday, New York. NY.
Reichheld, Frederick F. (1993). Loyalty-Based Management. Harvard Business Review. 71(2), 64-73.
Larson D (2002). Journal of Direct Marketing publication, October I 2002.
Miller & Muir (2004). The Business of Brands
Olins. Wally (2003). On Brand. London: Thames and Hudson
Punniyamoorthy, M and Raj. P M, An empirical model for brand loyalty measurement.Journal of Targeting. Measurement and Analysis for Marketing, Volume 15. Number 4. September 2007 . pp. 222-233(12)
Pearce, A. II, and Robinson (1997), Strategic Management: Formulation Implementationand Control. (6th Edition) Irwin. McGraw-Hill USA
Porter. M.E. (1980). Competitive Strategy. Free Press, New York. 1980.
Robert Dodge et al (1982). Marketing Research; Charles Merrill Publishing CompanySchmidt, K and C Ludlow (2002). Inclusive Branding: The Why and How of a Holistic approach to Brands. Basingstoke: Palgrave Macmillan.
Steel. J (1998), Truth, Lies and Advertising. John Wiley & Sons. Inc., New York, NY.
Schendel. D. E„ Hofer, C. W Eds (1979). Strategic Management, A New View of Business Policy and Planning, West Publishing
Summers. G. F (1970). Attitude Measurement. Edited by Chicago: Rand McNally. 1970,
Urde. M (2003). Core Value based corporate brand building: European Journal of Marketing 37 (7/8), 1017-1040
-51 -
Wells, W.D. and Prensky D. (1996). Consumer Behaviour, John Wiley and Sons, INC. NewYork.
Wemick. Andrew (1991). Promotional Culture: Advertising, Ideology and Symbolic Expression (Theory, Culture & Society S). London: Sage Publications
www.articlesbase.comwww.brandsacpe.co.kewww, bura.brunel.ac.uk/handle/2438/1289wwAv.businessdictionarv.comwwAv.dtdobie.comw A V A v .to v o ta .c o m
www.kmi.co.ke
- 5 2 -
APPENDICES
APPENDIX 1: LETTER OF INTRODUCTON TO THE RESPONDENT
Dear Respondent
University of Nairobi,School of Business P.O.Box 30197,00100 NairobiEmail: [email protected]
06 August 2009
RE: COLLECTION OF SURVEY DATA
I am a postgraduate student undertaking a Master of Business Administration Degree Programme at the School o f Business, University of Nairobi. I am currently undertaking a management research project on marketing strategies used by the Nissan and Toyota brands inKenya.
You have been selected to form part o f this study because of the strategic information that you have on the motor vehicle industry business. I therefore kindly request you to assist me collect the data by filling out the accompanying questionnaire.
The information data that you provide will be used exclusively for academic purposes. My supervisor and 1 assure you that the information you give will be treated with strict confidence.
A copy of the research project will gladly be availed to you upon request.
Thank you in advance for your anticipated cooperation.
Yours faithfully,
Mapenzi Baliati MBA Student
Francis N. Kibera. PhD Professor of marketing and University _Supervisor
- 5 3 -
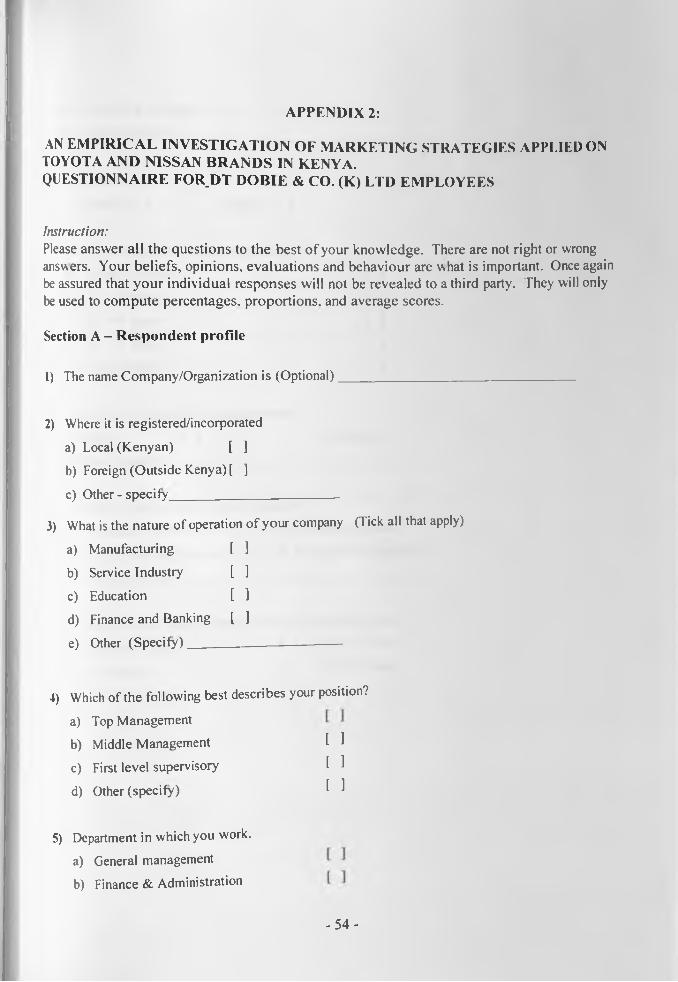
APPENDIX 2:
AN EMPIRICAL INVESTIGATION OF MARKETING STRATEGIES APPLIED ON TOYOTA AND NISSAN BRANDS IN KENYA.QUESTIONNAIRE FOR.DT DOBIE & CO. (K) LTD EMPLOYEES
Instruction:Please answer all the questions to the best of your knowledge. There are not right or wrong answers. Your beliefs, opinions, evaluations and behaviour are what is important. Once again be assured that your individual responses will not be revealed to a third party. They will only be used to compute percentages, proportions, and average scores.
Section A - Respondent profile
1) The name Company/Organization is (Optional)________________________________
2) Where it is registered/incorporateda) Local (Kenyan) [ ]b) Foreign (Outside Kenya) [ ]
c) Other - specify_______________________
3) What is the nature of operation of your company (Tick all that apply)
a) Manufacturing [ ]b) Service Industry [ ]c) Education [ ]d) Finance and Banking [ ]e) Other (Specify)_____________________
4) Which of the following best describes your position?
a) Top Managementb) Middle Management t 1c) First level supervisory l 1d) Other (specify) ̂ 1
5) Department in which you work.a) General managementb) Finance & Administration
- 5 4 -
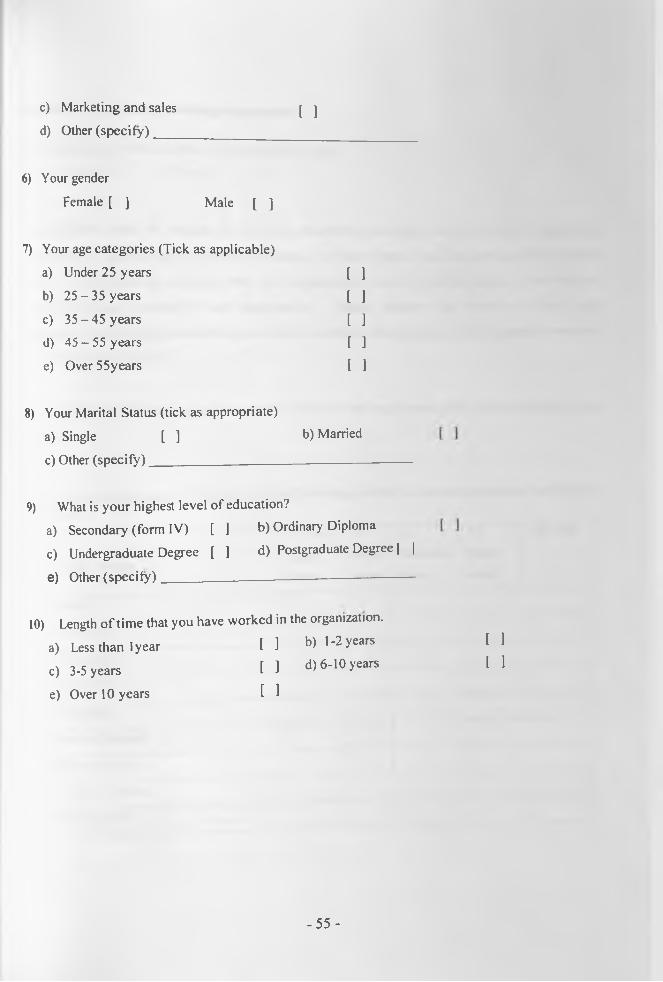
c) Marketing and salesd) Other (specify)___
[ 1
6) Your genderFemale [ ] Male [ ]
7) Your age categories (Tick as applicable)a) Under 25 yearsb) 25-35 yearsc) 35 - 45 yearsd) 45 - 55 yearse) Over 55years
[ 1 [ ][ ][ 1 [ 1
8) Your Marital Status (tick as appropriate)a) Single [ ] b) Married
c) Other (specify)____________________________________
9) What is your highest level of education?a) Secondary (form IV) [ ] b) Ordinary Diplomac) Undergraduate Degree [ ] d) Postgraduate Degree [ |
e) Other (spec i fy) __________________________________
10) Length of time that you have worked in the organization.
a) Less than 1 year c) 3-5 years e) Over 10 years
[ ] b) 1-2 years[ ] d) 6-10 years
[ 1
[ 1[ 1
- 55 -

Section B - Marketing strategies pursued
11) What brand of vehicles does your organisation sell? a) Nissan [ ] b) Toyota [ ]
Organizations tend to engage in different marketing activities to achieve their marketing
objectives of increasing consumer awareness of their brands and to increase their market
share. 1 he marketing activities that the organisations usually pursue relate to the product
(brand), pricing, promotion and distribution. Please indicate the extent to which your
companies use different marketing activities to achieve the objectives of increased awareness
and also increased sales.
Please answer the following questions in relation to the main brand that your organisation sells
(NISSAN)
11) To what extent does DT Dobie use the following media to increase awareness and sales of its brands?
Media usage
To Very
Large
extent
To
Large
extent
To
Moderate
extent
To
Small
extent
Not at all
Radio
Television
Newspapers
Newsletters
Magazines
Word of Mouth
Sales people
Outdoor posters
Other specifv
- 5 6 -
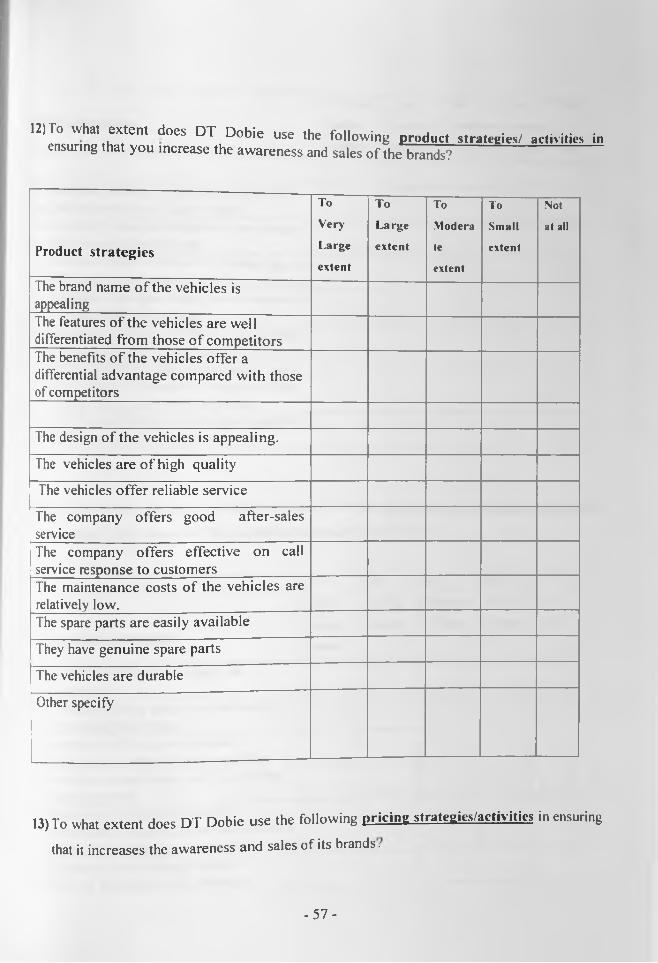
12) To what extent does DT Dobie use the following product strategies/ activities in ensuring that you increase the awareness and sales of the brands?
Product strategies
To
Very
Large
extent
To
Large
extent
To
Modera
te
extent
To
Small
extent
Not
at all
The brand name o f the vehicles is appealingThe features o f the vehicles are well differentiated from those of competitorsThe benefits o f the vehicles offer a differential advantage compared with those of competitors
The design of the vehicles is appealing.
The vehicles are o f high quality
The vehicles offer reliable service
The company offers good after-sales serviceThe company offers effective on call service response to customersThe maintenance costs of the vehicles are relatively low.The spare parts are easily available
They have genuine spare parts
The vehicles are durable
Other specify
13) To what extent does DT Dobie use the following pricing strateg ies/activjtics in ensuring
that it increases the awareness and sales of its brands.
- 5 7 -
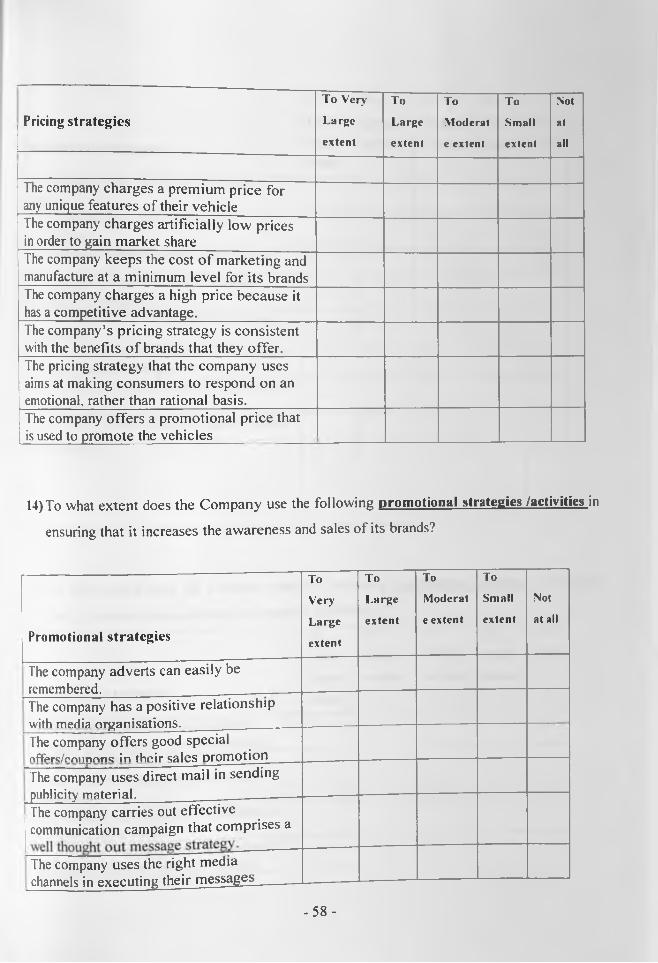
Pricing strategiesTo Very
Large
extent
To
La rge
extent
To
Modcrat
e extent
To
Small
extent
Not
at
all
The company charges a premium price for any unique features of their vehicleThe company charges artificially low prices in order to gain market shareThe company keeps the cost o f marketing and manufacture at a minimum level for its brandsThe company charges a high price because it has a competitive advantage.The company’s pricing strategy is consistent with the benefits o f brands that they offer.The pricing strategy that the company uses aims at making consumers to respond on an emotional, rather than rational basis.The company offers a promotional price that is used to promote the vehicles
14)To what extent does the Company use the following promotional strategies /activities in
ensuring that it increases the awareness and sales of its brands?
Promotional strategies
To
Very
Large
extent
To
Large
extent
To
Modcrat
e extent
To
Small
extent
Not
at all
The company adverts can easily be remembered.The company has a positive relationship with mprlia organisations.The company offers good special nffprs/ronnons in th e ir sales promotionThe company uses direct mail in sending publicity material.The company carries out effective communication campaign that comprises a
The company uses the right media channels in executing their messages______
- 5 8 -
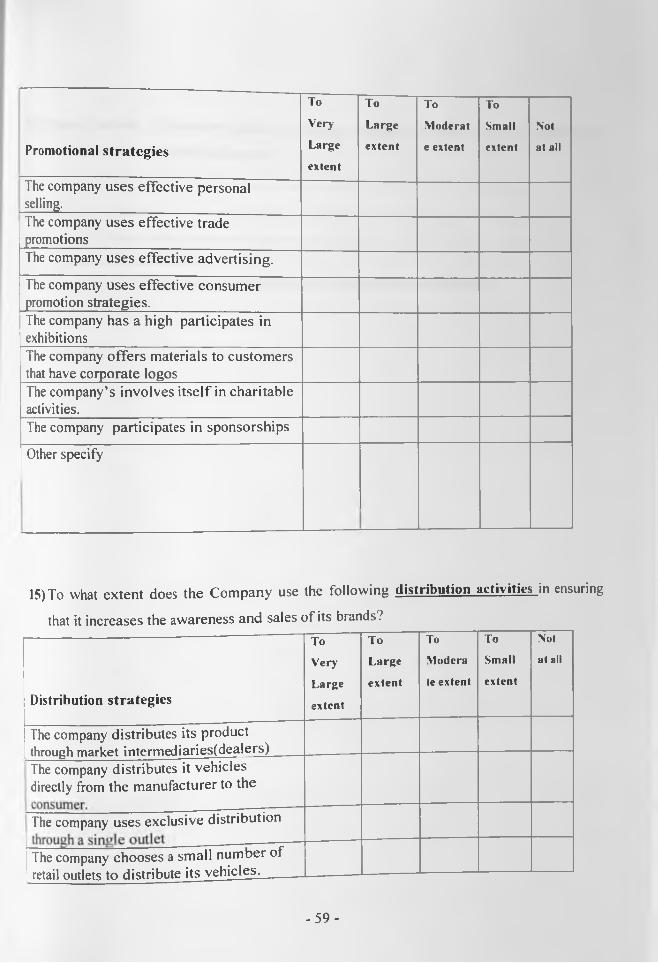
---------- -------------- -----
Promotional strategies
To
Very
Large
extent
To
Large
extent
To
Moderat
e extent
To
Small
extent
Not
at all
The company uses effective personal selling.The company uses effective trade promotionsThe company uses effective advertising.
The company uses effective consumer promotion strategies.The company has a high participates in exhibitionsThe company offers materials to customers that have corporate logosThe company’s involves itself in charitable activities.The company participates in sponsorships
Other specify
15)To what extent does the Company use the following distrihution activities in ensuring
that it increases the awareness and sales of its brands?
Distribution strategies
To
Very
Large
extent
To
Large
extent
To
Modera
te extent
To
Small
extent
Not
at all
The company distributes its product through market intermediaries(dealers)The company distributes it vehicles directly from the manufacturer to the
The company uses exclusive distribution
The company chooses a small number of retail outlets to distribute its vehicles.------- _
- 5 9 -
16) Please provide information about marketing strategies adopted by your organisation
towards the Nissan brand in Kenya?
Thank you for taking time to complete this questionnaire
- 6 0 -
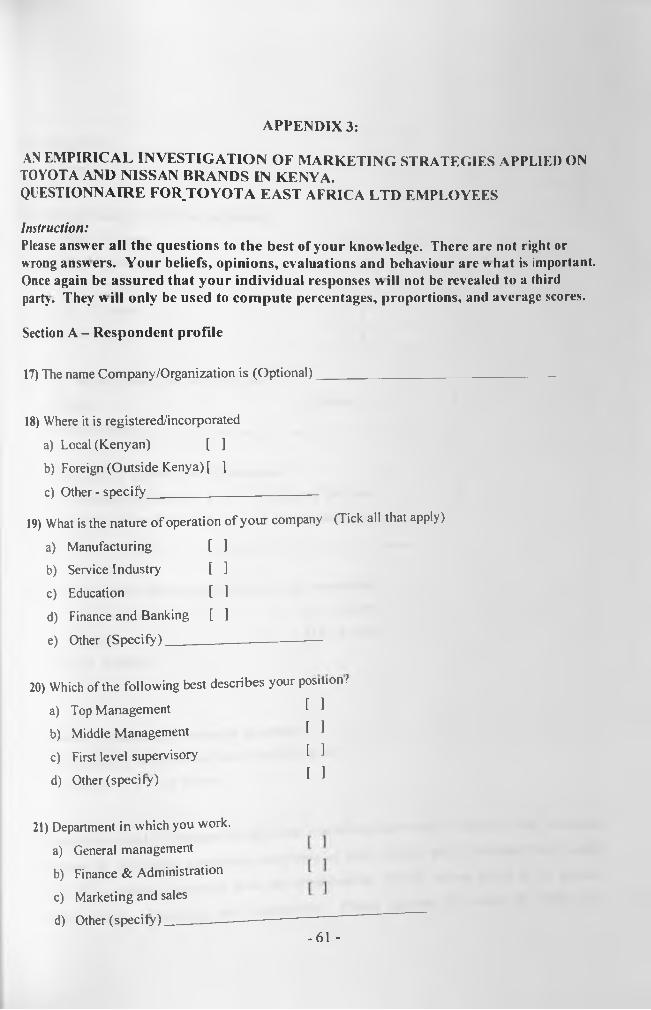
APPENDIX 3:
AN EMPIRICAL INVESTIGATION OF MARKETING STRATEGIES APPLIED ON TOYOTA AND NISSAN BRANDS IN KENYA.QUESTIONNAIRE FOR.TOYOTA EAST AFRICA LTD EMPLOYEES
Instruction:Please answer all the questions to the best of your knowledge. There are not right or wrong answers. Your beliefs, opinions, evaluations and behaviour are what is important. Once again be assured that your individual responses w ill not be revealed to a third party . They w ill only be used to compute percentages, proportions, and average scores.
Section A - Respondent profile
17) The name Company/Organization is (Optional)
18) Where it is registered/incorporated
a) Local (Kenyan) [ ]b) Foreign (Outside Kenya) [ ]
c) Other - specify_______________________
19) What is the nature of operation of your company (Tick all that apply)
a) Manufacturing [ ]b) Service Industry [ ]c) Education [ ]d) Finance and Banking [ ]e) Other (Specify)_____________________
20) Which of the following best describes your position?
a) Top Management t 1b) Middle Management t 1c) First level supervisory [ 1
d) Other (specify) ̂ ^
21) Department in which you work.a) General managementb) Finance & Administration
c) Marketing and salesd) Other (specify) _ _ ---------------- ------------------
-61 -
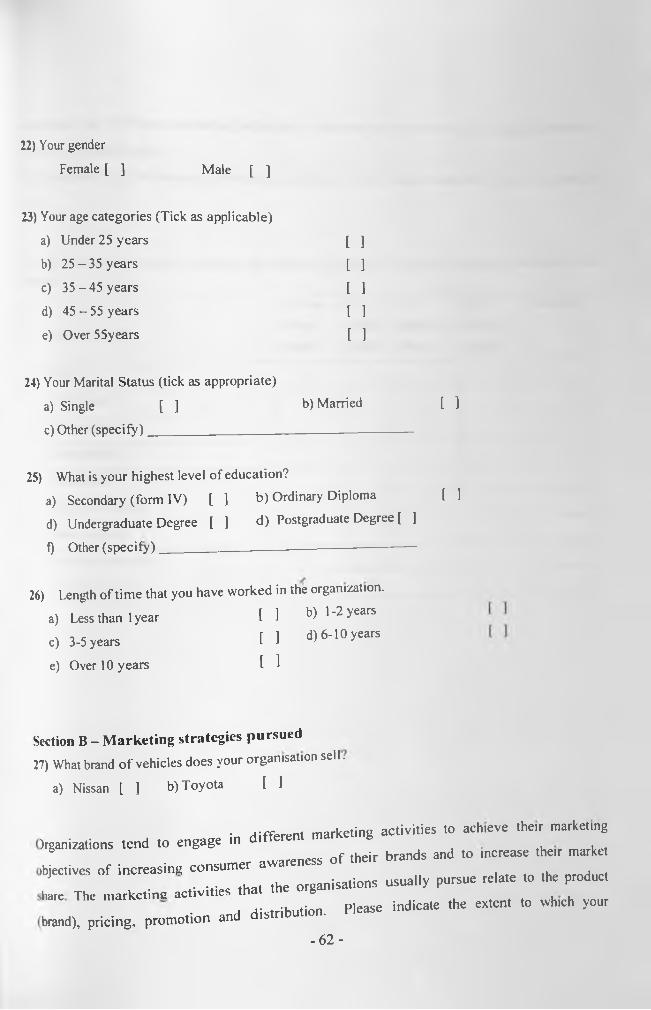
Male [ ]
22) Your genderFemale [ ]
23) Your age categories (Tick as applicable)
a) Under 25 years [ ]b) 25 -35 years t ]c) 35 -45 years t ]d) 45 - 55 years [ 1
e) Over 55years [ ]
24) Your Marital Status (tick as appropriate)a) Single [ ] b) Married [ ]
c) Other (specify)_________________________ .__________
25) What is your highest level of education?a) Secondary (form IV) [ ] b) Ordinary Diploma [ ]d) Undergraduate Degree [ ] d) Postgraduate Degree [ ]
f) Other (specify)__ ____________________ _____________
26) Length of time that you have worked in the organization.
a) Less than 1 year [ ] b) 1-2 years
c) 3-5 years [ ] d) 6-10 years
e) Over 10 years [ 1
Section B - Marketing strategies pursued27) What brand of vehicles does your organisation sell.
a) Nissan [ ] b) Toyota [ 1
• Hifferent marketing activities to achieve their marketing )rganizations tend to engage in different mam g
awareness of their brands and to increase their market (biectives of increasing consumer awareness J f ‘ties that the organisations usually pursue relate to the product
hare The inaxketins activities tnfl w ,. nfl distribution. Please indicate the extent to which your
brand), pricing, promotion and- 6 2 -
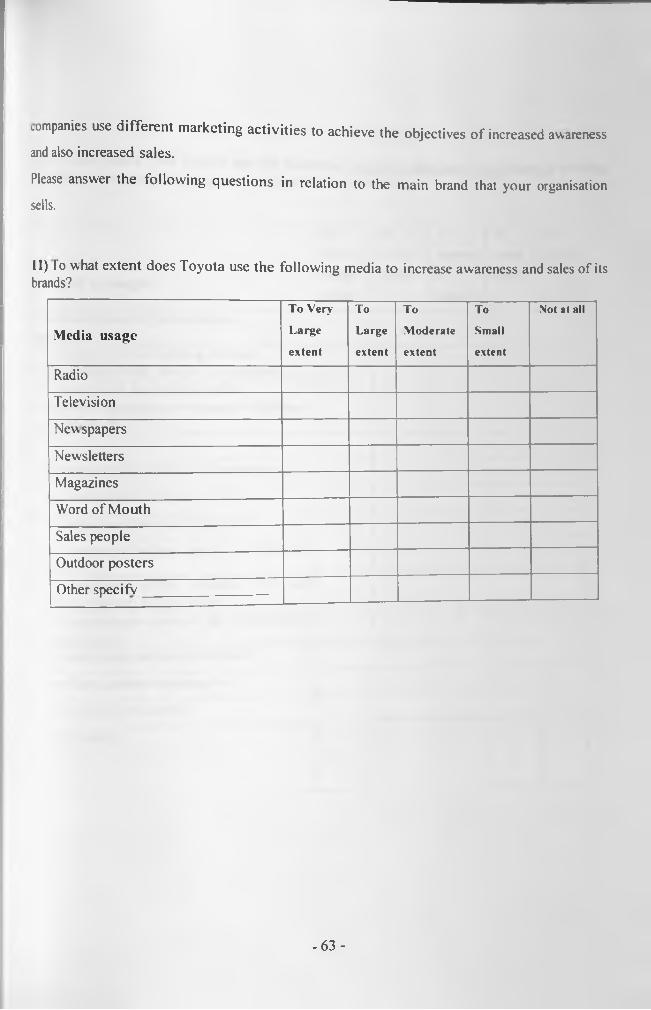
companies use different marketing activities to achieve the objectives of increased awareness and also increased sales.
Please answer the following questions in relation to the main brand that your organisationsells.
11) To what extent does Toyota use the following media to increase awareness and sales of its brands?
Media usage
To Very-
Large
extent
To
Large
extent
To
Moderate
extent
To
Small
extent
Not at all
Radio
Television
Newspapers
Newsletters
Magazines
Word of Mouth
Sales people
Outdoor posters
Other specifv
- 6 3 -
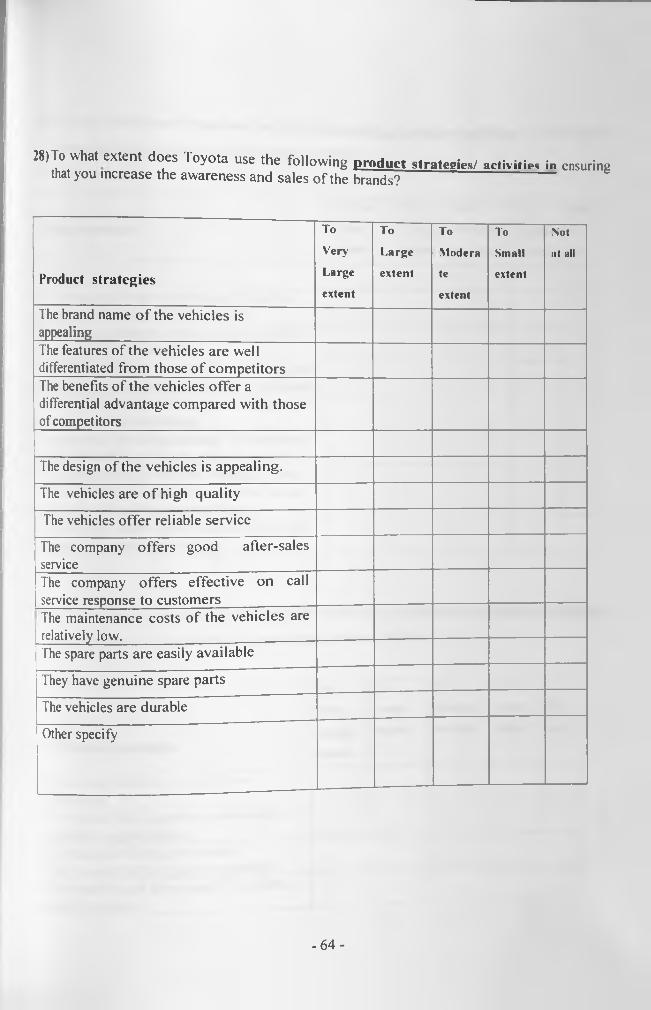
28)To w h a t e x te n t d o e s T o y o ta u s e t h e fo l lo w in g product s t r a t e td e s / a e t i v i . i e , in ensu ringthat y o u in c re a s e th e a w a r e n e s s a n d s a le s o f th e b ra n d s ? ---------------------------
Product strategies
To
Very
Large
extent
To
Large
extent
To
Modera
te
extent
To
Small
extent
Not
:it all
The brand name o f the vehicles is appealingThe features of the vehicles are well differentiated from those o f competitorsThe benefits of the vehicles offer a differential advantage compared with those of competitors
The design of the vehicles is appealing.
The vehicles are o f high quality
The vehicles offer reliable service
The company offers good after-sales serviceThe company offers effective on call service response to customersThe maintenance costs of the vehicles are relatively low.---------- -----------------------------------------------The spare parts are easily available
They have genuine spare parts
The vehicles are durable
Other specify
- 6 4 -
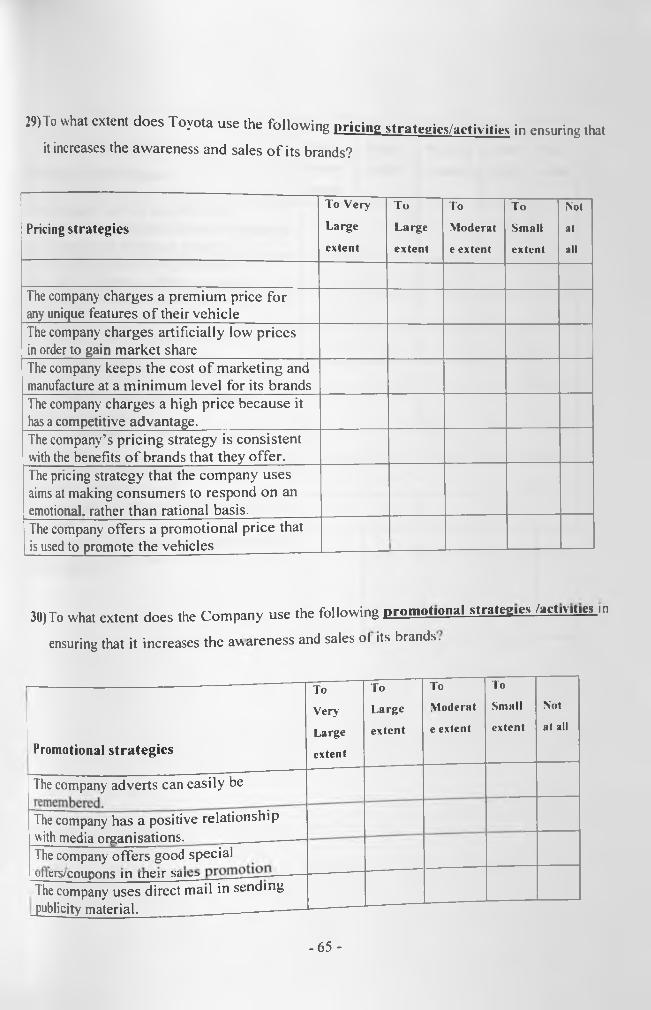
29) To w h a t e x te n t d o e s T o y o ta u s e th e f o l lo w in g pricing strategics/activitics in en su rin g that
it increases th e a w a r e n e s s a n d s a le s o f i ts b ra n d s ?
Pricing strategies
To Very
Large
extent
To
Large
extent
To
Moderat
e extent
To
Small
extent
Not
at
all
The company charges a premium price for any unique features o f their vehicleThe company charges artificially low prices in order to gain market shareThe company keeps the cost o f marketing and manufacture at a minimum level for its brandsThe company charges a high price because it has a competitive advantage.The company’s pricing strategy is consistent with the benefits o f brands that they offer.The pricing strategy that the company uses aims at making consumers to respond on an emotional, rather than rational basis.The company offers a promotional price that is used to promote the vehicles
30)To what extent does the Company use the following promotional strategics /activities.in
ensuring that it increases the awareness and sales of its brands.
Promotional strategies
To
Very-
Large
extent
To
Large
extent
To
Moderat
e extent
To
Small
extent
Not
at all
The company adverts can easily be
The company has a positive relationshipwith media o r g a n i s a t i o n s ._____ .---------The company offers good specialuiiers/coupons in incir bdics —-------The company uses direct mail in sending publicity material. ___________
- 6 5 -
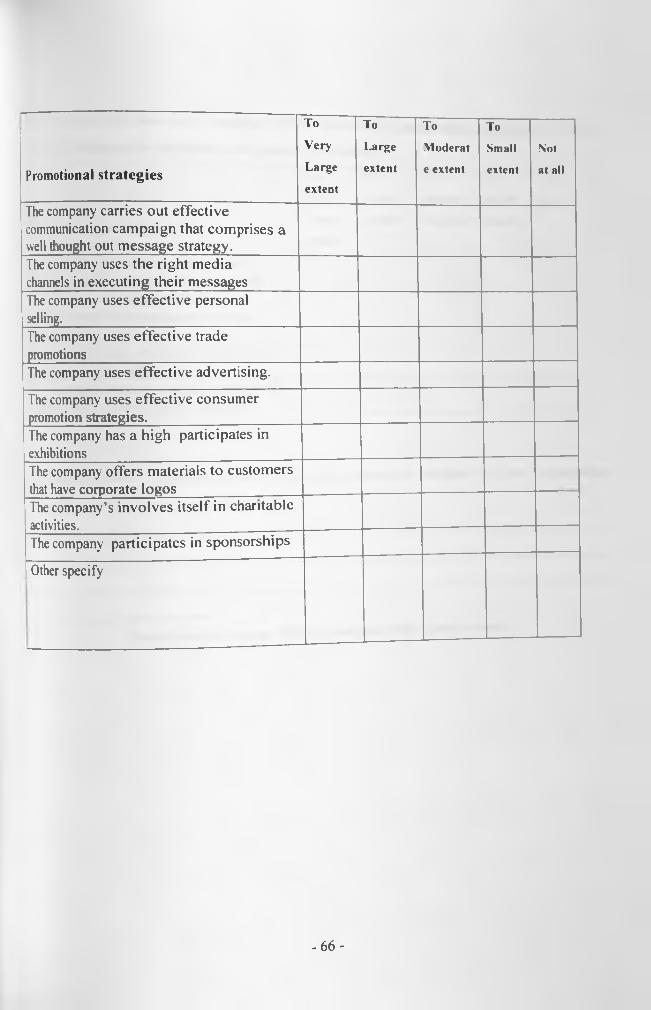
Promotional strategies
To
Very
Large
extent
To
Large
extent
To
Moderat
e extent
To
Small
extent
Not
at all
The company carries out effective communication campaign that comprises a well thought out message strategy.The company uses the right media channels in executing their messagesThe company uses effective personal selling.The company uses effective trade promotionsThe company uses effective advertising.
The company uses effective consumer promotion strategies.The company has a high participates in exhibitionsThe company offers materials to customers that have corporate logosThe company’s involves itself in charitableactivities.The company participates in sponsorships
Other specify
—
- 6 6 -
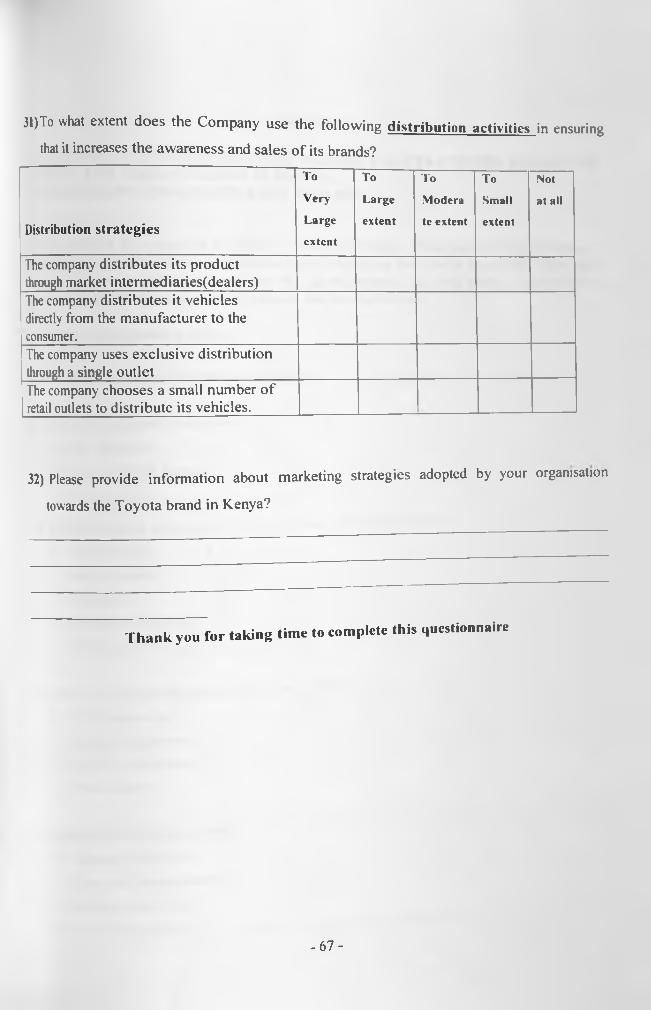
31)To w hat e x te n t d o e s th e C o m p a n y u s e th e f o l lo w in g distribution activities in en su rin g
that it in c re a se s t h e a w a r e n e s s a n d s a l e s o f i ts b ra n d s ?
Distribution strategies
To
Very
Large
extent
To
Large
extent
To
Modera
te extent
To
Small
extent
Not
at all
The company distributes its product through market intermediaries(dealers)The company distributes it vehicles directly from the manufacturer to the consumer.The company uses exclusive distribution through a single outletThe company chooses a small number o f retail outlets to distribute its vehicles.
32) Please provide information about marketing strategies adopted by your organisation
towards the Toyota brand in Kenya?
Thank you for taking time to complete this questionnaire
- 6 7 -
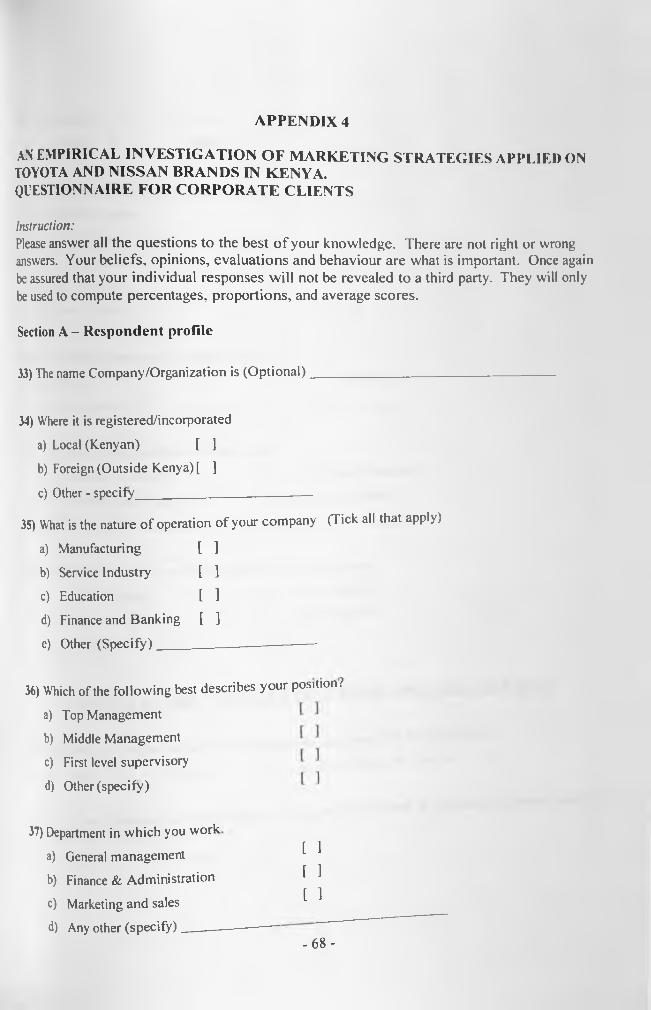
APPENDIX 4
AN EMPIRICAL INVESTIGATION OF MARKETING STRATEGIES APPLIED ON TOYOTA AND NISSAN BRANDS IN KENYA.QUESTIONNAIRE FOR CORPORATE CLIENTS
Instruction:Please answer all the questions to the best o f your knowledge. There are not right or wrong answers. Your beliefs, opinions, evaluations and behaviour are what is important. Once again be assured that your individual responses will not be revealed to a third party. They will only be used to compute percentages, proportions, and average scores.
Section A - Respondent profile
33) The name Company/Organization is (Optional)_________________________________ -
34) Where it is registered/incorporated
a) Local (Kenyan) [ ]b) Foreign (Outside Kenya) [ ]
c) Other - specify_________ ______________
35) What is the nature of operation of your company (Tick all that apply)
a) Manufacturing [ ]b) Service Industry [ ]c) Education [ ]d) Finance and Banking [ ]
e) Other (Specify)---------------------------------
36) Which of the following best describes your position?
a) Top Managementb) Middle Management
c) First level supervisory
d) Other (specify)
37) Department in which you worka) General management
b) Finance & Administration
c) Marketing and salesd) Any other (specify)--------
[ 1 [ 1 [ 1
- 6 8 -
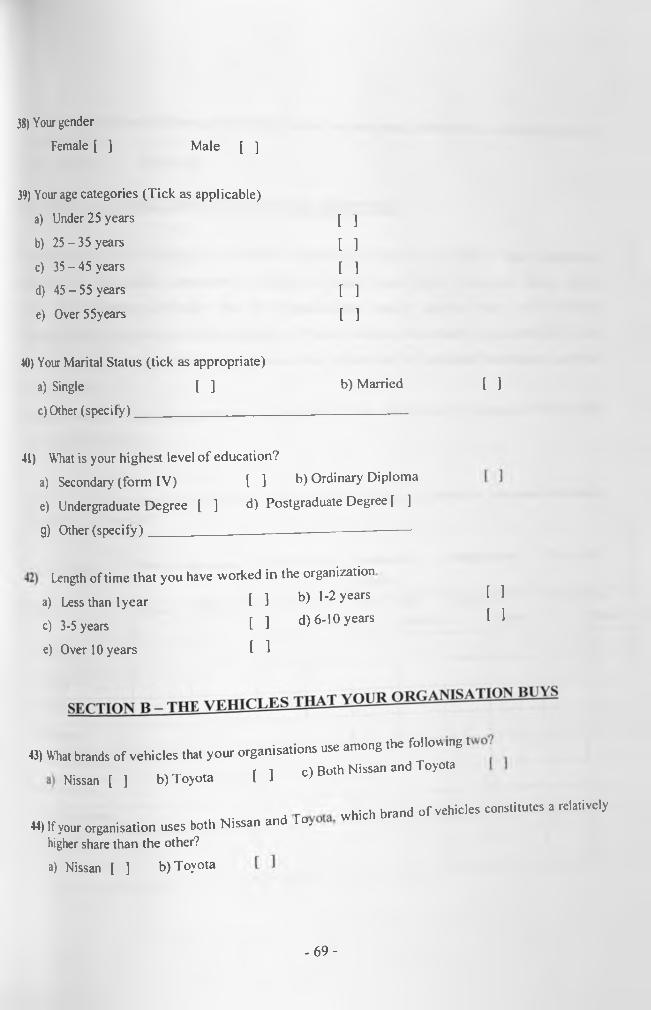
38) Your genderFemale [ ] Male [ ]
39) Your age categories (Tick as applicable)
a) Under 25 years
b) 25-35 years
c) 35 - 45 yearsd) 45-55 yearse) Over55years
40) Your Marital Status (tick as appropriate)a) Single [ ] b) Married [ ]
c) Other (specify)____________ ________________________
[ 1 [ ] [ 1 [ ] [ ]
41) What is your highest level of education?a) Secondary (form IV) [ ] b) Ordinary Diplomae) Undergraduate Degree [ ] d) Postgraduate Degree f ]
g) Other (specify)___________________________ ________
Length of time that you have worked in the organization
a) Less than 1 year [ 1 b) 1-2 years
c) 3-5 years [ 1 d) 6-10 years
e) Over 10 years [ 1
[ 1 [ 1
43) What brands of vehicles that your organisations use among the folio* ingt Nissan [ , b) Toyota U O Both Nissan and Toyota
44) If your organisation uses both Nissan and To, higher share than the other?
which brand of vehicles constitutes a relatively
a) Nissan [ ] b) Toyota
- 6 9 -
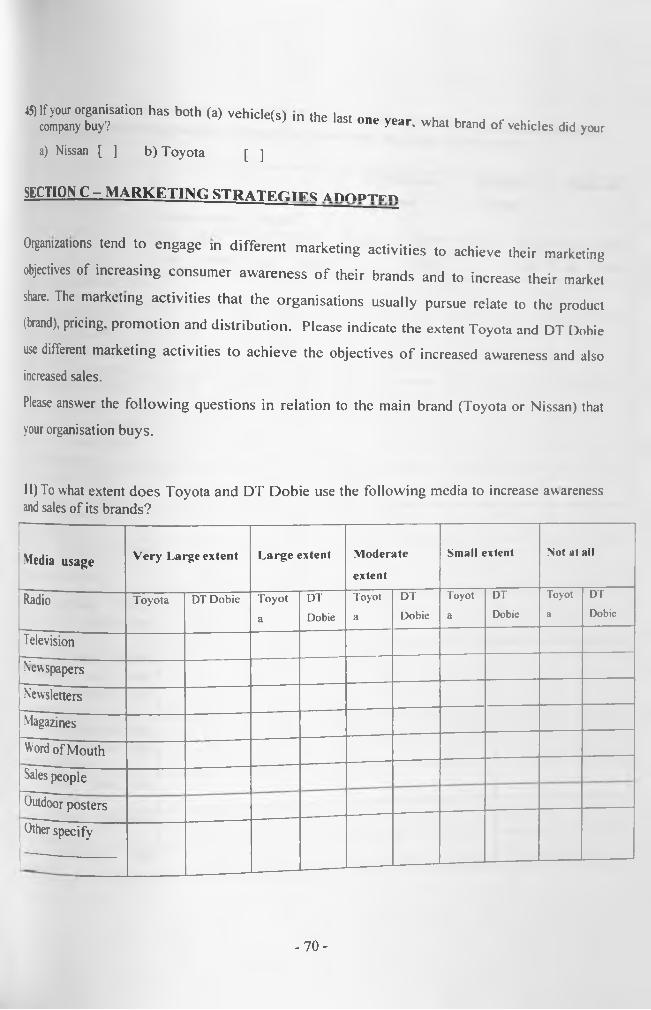
45) If your organisation has both (a) vehicle(s) company buy?
a) Nissan [ ] b) Toyota [ ]
m the last one year, what brand of vehicles did your
SECTION C - MARKETING STRATEC.IFS A n o n x m
Organizations tend to engage in different marketing activities to achieve their marketing
objectives of increasing consumer awareness o f their brands and to increase their market
share. The marketing activities that the organisations usually pursue relate to the product
(brand), pricing, promotion and distribution. Please indicate the extent Toyota and DT Dohie
use different marketing activities to achieve the objectives o f increased awareness and also increased sales.
Please answer the following questions in relation to the main brand (Toyota or Nissan) that
your organisation buys.
11) To what extent does Toyota and DT Dobie use the following media to increase awareness and sales of its brands?
Media usage V ery Large extent L arg e extent M oderate
extent
Small extent Not at all
Radio Toyota DT Dobie Toyot
a
DTDobie
Toyot
a
DTDobie
Toyot
a
DTDobie
Toyota
DTDobie
Television
Newspapers
Newsletters
Magazines
Word of Mouth
Sales people
Outdoor postersOther specify
- 7 0 -
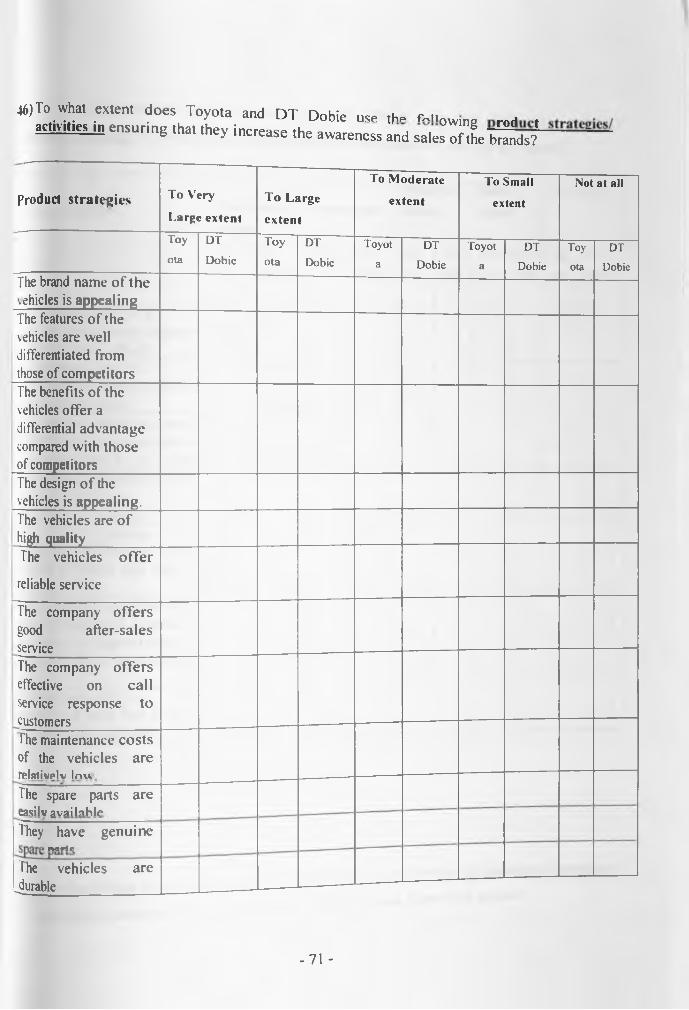
46)To what extent does Toyota and D T Dobie use the rxiia c liv iteh , ensuring ,ha, they increase the awareness l„d s a l e ^ I b^ d s ? '
Product strategies To V'ery
Large ex ten t
T o L arge
ex ten t
To M oderate
extent
To Small
extent
Not at all
Toy
otaDT
DobieToy
otaDT
DobieToyot
aDT
DobieToyot
aDT
DobieToyota
DTDobie
The brand name o f the vehicles is appealingThe features of the vehicles are well differentiated from those of competitorsThe benefits of the vehicles offer a differential advantage compared with those of competitorsThe design of the vehicles is appealing.The vehicles are o f high qualityThe vehicles offer
reliable service
The company offers good after-sales serviceThe company offers effective on call service response to customersThe maintenance costs of the vehicles are relativplv low
The spare parts areCasilv availnhlf*
They have genuinenirtc
The vehicles are d̂urable
- 7 1 -
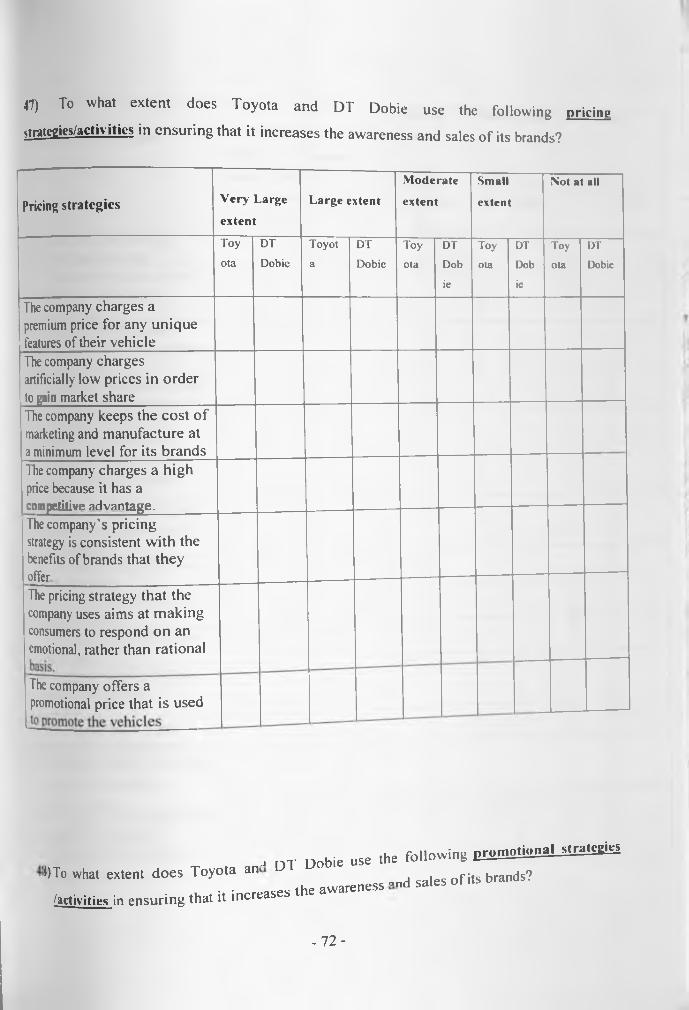
47) To w h a t e x t e n t d o e s T o y o t a a n d D T D o b ie u s e th e f o l lo w in g n r ic in a
stra teg ie s /ac tiv itic s in e n s u r i n g th a t i t i n c r e a s e s th e a w a r e n e s s a n d s a le s o f its b ra n d s?
Pricing strategies V ery Large
extent
L arge extent
M oderate
extent
Small
extent
Not at all
Toy
otaDT
DobieToyota
DTDobie
Toyota
DTDob
ie
Toyota
DTDob
ie
Toyota
DTDobie
The company charges a premium price for any unique features of their vehicleThe company charges artificially low prices in order to gain market shareThe company keeps the cost o f marketing and manufacture at a minimum level for its brandsThe company charges a high price because it has a c o m p e t i t i v e a d v a n t a g e .
The company’s pricing strategy is consistent with the benefits of brands that theyofferThe pricing strategy that the company uses aims at making consumers to respond on an emotional, rather than rational
The company offers a promotional price that is used
, DT Dobie use the following e rontotional strategics*ITo what extent does Toyota an , nd sales of its brands?
/activities in ensuring that it increases the awareness -
- 7 2 -
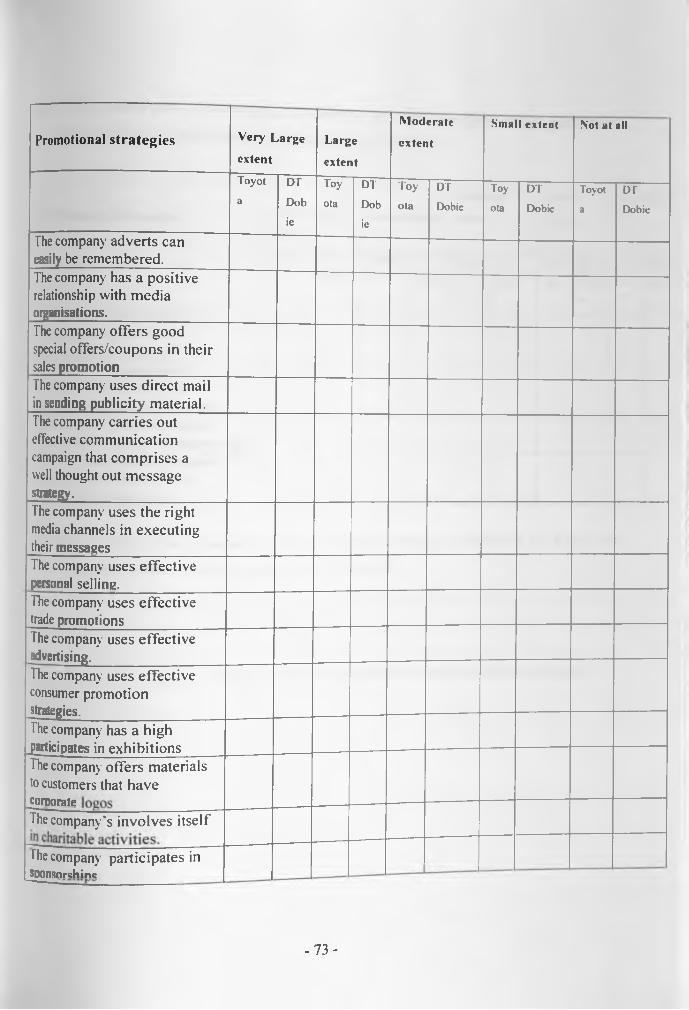
Promotional strategies Very L arge
extentLarge
extent
M oderate
extentSmall extent Not at all
Toyota
D r
Dobie
Toy
otaDT
Dobie
Toy
otaDT
DobicToyota
DT
DobicToyota
Dr
Dobie
The company adverts can easily be remembered.The company has a positive relationship with media organisations.The company offers good special offers/coupons in their sales promotionThe company uses direct mail in sending publicity material.The company carries out effective communication campaign that comprises a well thought out message strategy.The company uses the right media channels in executing their messagesThe company uses effective personal selling.The company uses effective trade promotionsThe company uses effective advertising.The company uses effective consumer promotion strategies.The company has a high participates in exhibitionsThe company offers materials to customers that haveCOFDOratP
The company's involves itself
The company participates in SDOnsorshinc
- 7 3 -
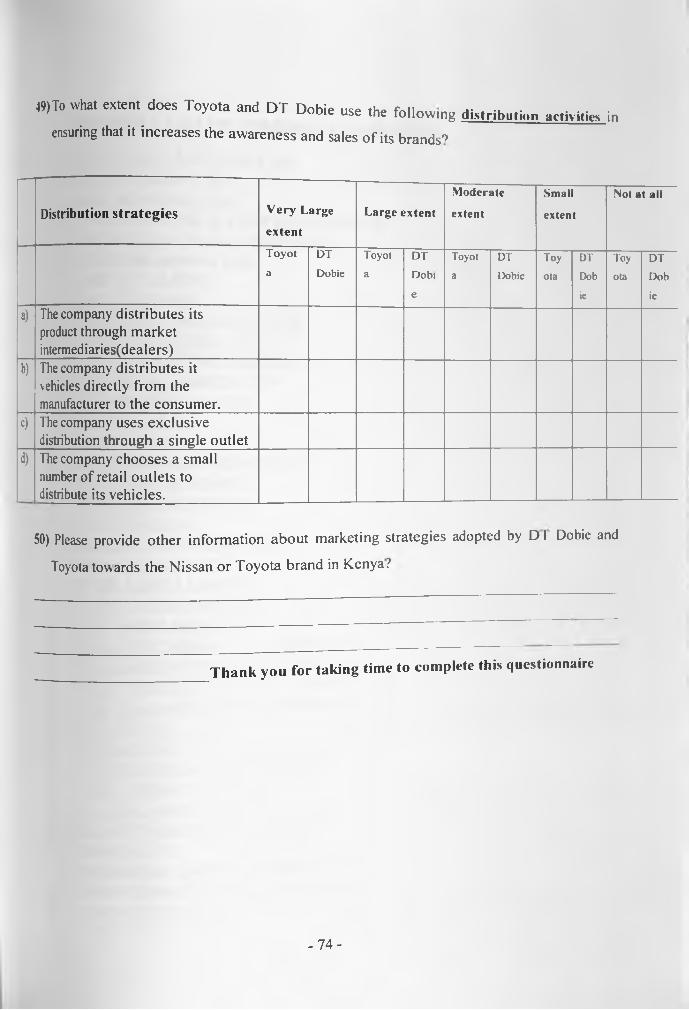
49)To what extent does Toyota and DT Dnhip ii5P tu0 run . . . . .’ y UODie use the following distribution activities inensuring that it increases the awareness and sales o f its brands'7
Distribution strategies V ery Large
ex ten tLarge extent
Moderate
extent
Small
extent
Not at all
Toyota
DTDobie
Toyota
DTDobie
Toyota
DTDobie
Toyota
DTDobic
Toyota
DTDobic
a) The company distributes its product through market interned iaries(deal ers)
b) The company distributes it vehicles directly from the manufacturer to the consumer.
c) The company uses exclusive distribution through a single outlet
d) The company chooses a small number of retail outlets to distribute its vehicles.
50) Please provide other information about marketing strategies adopted by D I Dobie and
Toyota towards the Nissan or Toyota brand in Kenya?
Thank you for taking time to complete this questionnaire
- 7 4 -
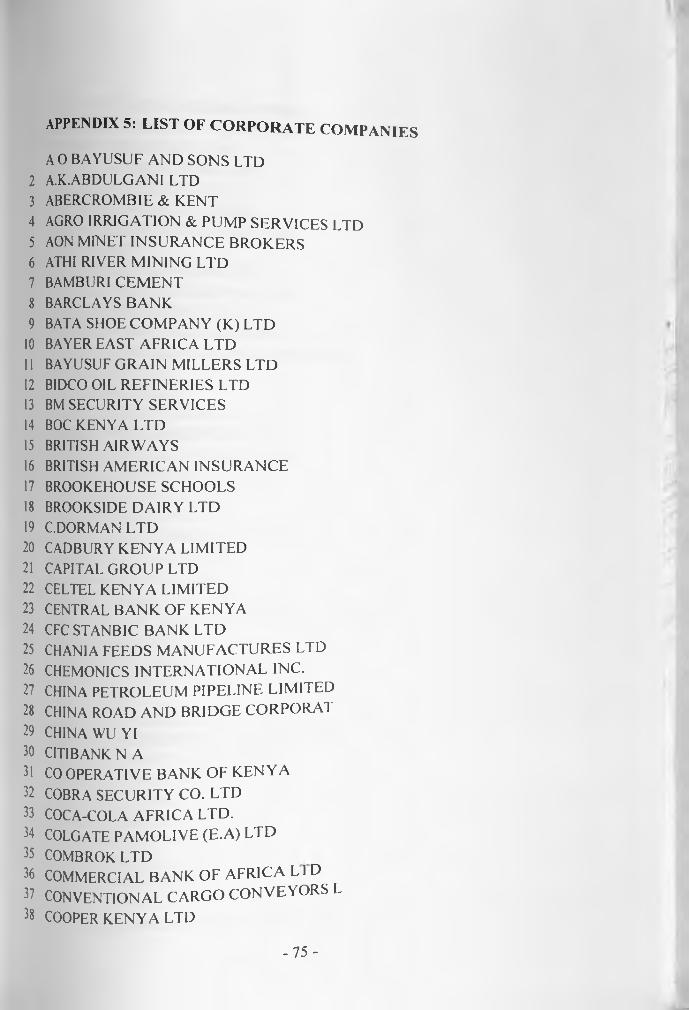
APPENDIX 5: LIST OF CORPORATE COMPANIES
A 0 BAYUSUF AND SONS LTD2 A.K.ABDULGANI LTD3 ABERCROMBIE & KENT4 AGRO IRRIGATION & PUMP SERVICES LTD5 AON MINET INSURANCE BROKERS6 ATHI RIVER MINING LTD7 BAMBURI CEMENT8 BARCLAYS BANK9 BATA SHOE COMPANY (K) LTD
10 BAYER EAST AFRICA LTD11 BAYUSUF GRAIN MILLERS LTD12 BIDCO OIL REFINERIES LTD13 BM SECURITY SERVICES14 BOC KENYA LTD15 BRITISH AIRWAYS16 BRITISH AMERICAN INSURANCE17 BROOKEHOUSE SCHOOLS18 BROOKSIDE DAIRY LTD19 C.DORMAN LTD20 CADBURY KENYA LIMITED21 CAPITAL GROUP LTD22 CELTEL KENYA LIMITED23 CENTRAL BANK OF KENYA24 CFC STANBIC BANK LTD25 CHANIA FEEDS MANUFACTURES LTD26 CHEMONICS INTERNATIONAL INC.27 CHINA PETROLEUM PIPELINE LIMITED28 CHINA ROAD AND BRIDGE CORPORAT29 CHINA WUYI30 CITIBANK N A31 COOPERATIVE BANK OF KENYA
32 COBRA SECURITY CO. LTD33 COCA-COLA AFRICA LTD.34 COLGATE PAMOLIVE (E.A) LTD35 COMBROK LTD36 COMMERCIAL BANK OF AFRICA L ID37 CONVENTIONAL CARGO CONVEYORS L38 COOPER KENYA LTD
- 7 5 -
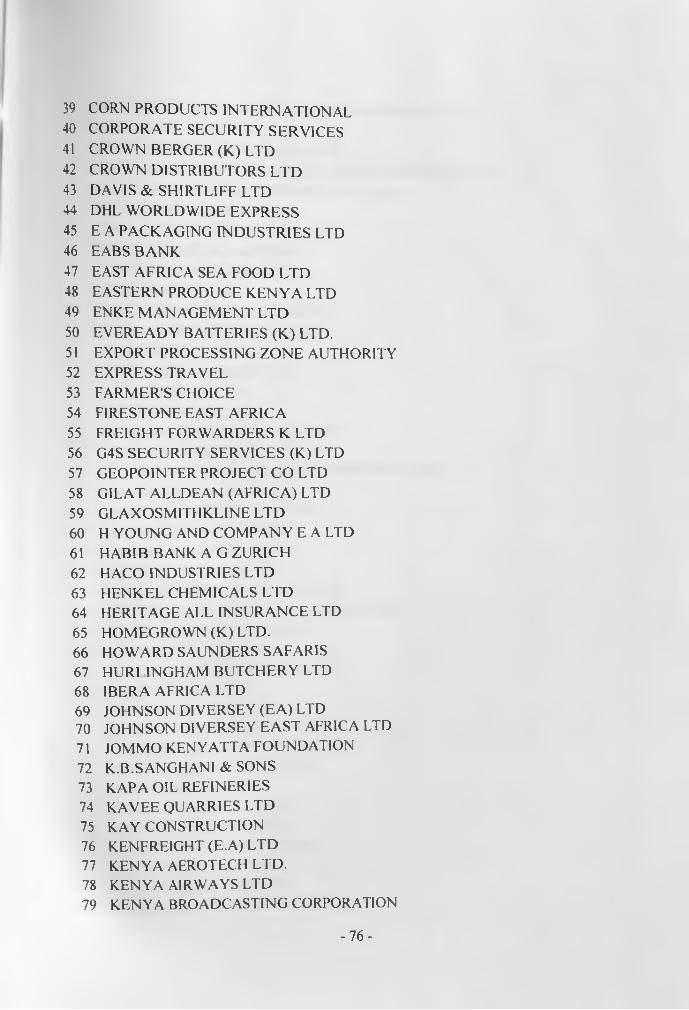
39 CORN PRODUCTS INTERNATIONAL40 CORPORATE SECURITY SERVICES41 CROWN BERGER (K) LTD42 CROWN DISTRIBUTORS LTD43 DAVIS & SHIRTLIFF LTD44 DHL WORLDWIDE EXPRESS45 E A PACKAGING INDUSTRIES LTD46 EABS BANK47 EAST AFRICA SEA FOOD LTD48 EASTERN PRODUCE KENYA LTD49 ENKE MANAGEMENT LTD50 EVEREADY BATTERIES (K) LTD.51 EXPORT PROCESSING ZONE AUTHORITY52 EXPRESS TRAVEL53 FARMER’S CHOICE54 FIRESTONE EAST AFRICA55 FREIGHT FORWARDERS K LTD56 G4S SECURITY SERVICES (K) LTD57 GEOPOINTER PROJECT CO LTD58 GILAT ALLDEAN (AFRICA) LTD59 GLAXOSMITHKLINE LTD60 H YOUNG AND COMPANY E A LTD61 HABIB BANK A G ZURICH62 HACO INDUSTRIES LTD63 HENKEL CHEMICALS LTD64 HERITAGE ALL INSURANCE LTD65 HOMEGROWN (K) LTD.66 HOWARD SAUNDERS SAFARIS67 HURI INGHAM BUTCHERY LTD68 IBERA AFRICA LTD69 JOHNSON DIVERSEY (EA) LTD70 JOHNSON DIVERSEY EAST AFRICA LTD71 JOMMO KENYATTA FOUNDATION72 K.B.SANGHANI & SONS73 KAPA OIL REFINERIES74 KAVEE QUARRIES LTD75 KAY CONSTRUCTION76 KENFREIGHT (E.A) LTD77 KENYA AEROTECH LTD.78 KENYA AIRWAYS LTD79 KENYA BROADCASTING CORPORATION
- 7 6 -
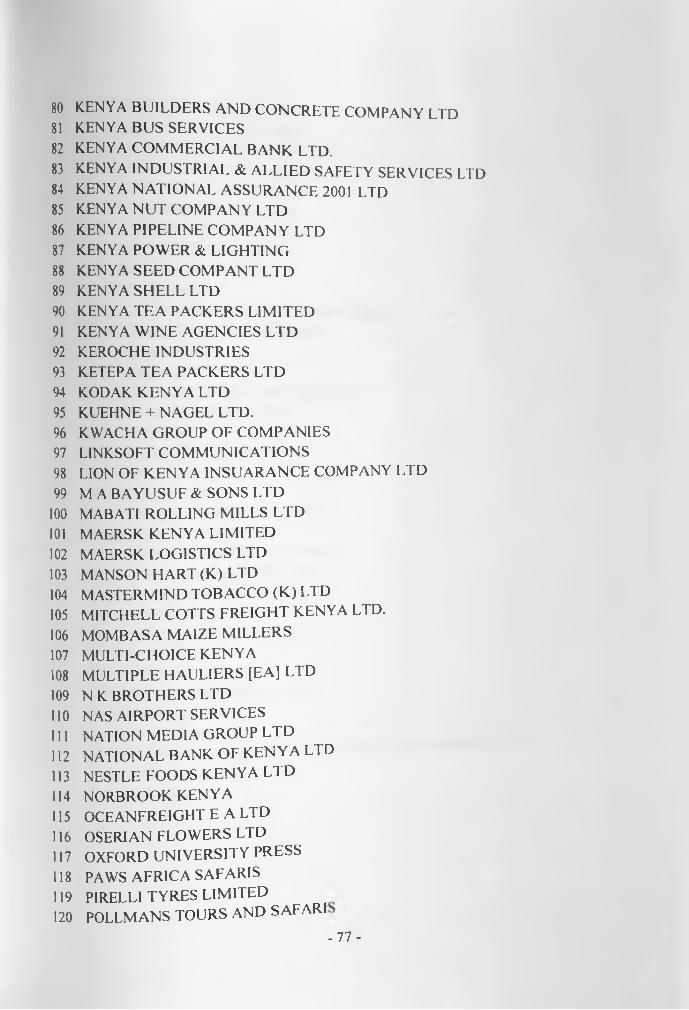
80 KENYA BUILDERS AND CONCRETE COMPANY LTD81 KENYA BUS SERVICES82 KENYA COMMERCIAL BANK LTD.83 KENYA INDUSTRIAL & ALLIED SAFETY SERVICES LTD84 KENYA NATIONAL ASSURANCE 2001 LTD85 KENYA NUT COMPANY LTD86 KENYA PIPELINE COMPANY LTD87 KENYA POWER & LIGHTING88 KENYA SEED COMPANT LTD89 KENYA SHELL LTD90 KENYA TEA PACKERS LIMITED91 KENYA WINE AGENCIES LTD92 KEROCHE INDUSTRIES93 KETEPA TEA PACKERS LTD94 KODAK KENYA LTD95 KUEHNE + NAGEL LTD.96 KWACHA GROUP OF COMPANIES97 LINKSOFT COMMUNICATIONS98 LION OF KENYA INSUARANCE COMPANY LTD99 M A BA YUSUF & SONS LTD
100 MABATI ROLLING MILLS LTD101 MAERSK KENYA LIMITED102 MAERSK LOGISTICS LTD103 MANSON HART (K) LTD104 MASTERMIND TOBACCO (K) LTD105 MITCHELL COTTS FREIGHT KENYA LTD.106 MOMBASA MAIZE M ILLERS107 MULTI-CHOICE KENYA108 MULTIPLE HAULIERS [EA] LTD109 N K BROTHERS LTD110 NAS AIRPORT SERVICES111 NATION MEDIA GROUP LTD112 NATIONAL BANK OF KENYA LTD113 NESTLE FOODS KENYA LTD114 NORBROOK KENYA115 OCEANFREIGHT E A LTD116 OSERIAN FLOWERS LTD117 OXFORD UNIVERSITY PRESS118 PAWS AFRICA SAFARIS119 PIRELLI TYRES LIMITED120 POLLMANS TOURS AND SAFARI
- 7 7 -
121122123124125126127128129130131132133134135136137138139140141142143144145146147148149150151152153154155
PRIVATE SAFARIS (E.A) LTD PTA REINSURANCE COMPANY PUT SARAJEVO ENGINEERING LTD PZ CUSSONS EAST AFRICA LTD RAMCO PRINTING WORKS LTD RECKITT BENKISER E A LTD ROYAL MEDIA SERVICES LTD SADOLIN PAINTS (E.A) LTD SAFARICOM KENYA LTD SAMEER AFRICASARA LEE HOUSEHOLD AND BODY CARESBI INTERNATIONAL HOLDINGSSDV TRANSAMISECUREX AGENCIES LTDSECURICOR SECURITY SERVICES LTDSHREEJI ENTERPRISES LTDSIEMENS LTDSINOE CONSTRUCTION LTD SPENCON KENYA LTD SPIN KNIT DAIRY LTD STANDARD CHARTERED BANK STANDARD NEWSPAPERS SYNGENTA EAST AFRICA LIMITED TETRA PAK CONVERTERS LTD.TEXT BOOK WORLD LTDTHE STANDARD LTDTHE WRIGLEY CO (E.A.) LTD
IMSALES LTD OTAL KENYA LIMITED
JCHUMI SUPERMARKETS LTD JNILEVER KENYA LTDJN1TED MILLERS LTD AND SERV1CES LTDJNIVERSITY OF NAIROBI ENTERPRlWTAFOAM PRODUCTS LTDWELLS FARGO LTD
- 7 8 -
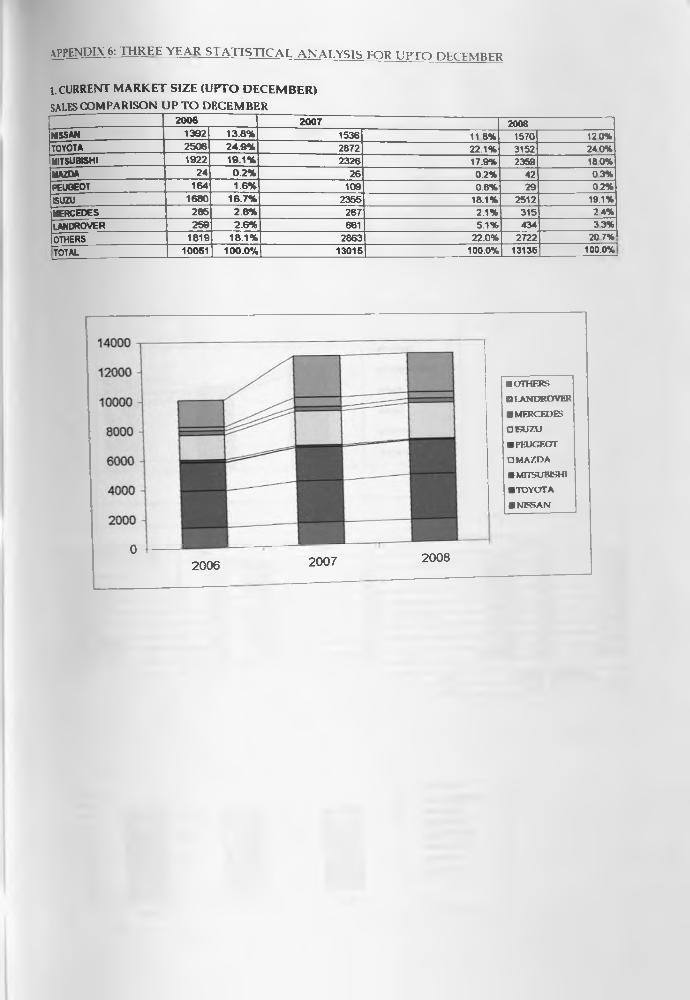
APPENDIX 6: THREE YEAR STATISTICAL ANALYSIS FOR U PTO DECEMBER
1. CURRENT MARKET SIZE (UPTO DECEMBER) SALES COMPARISON U PTO DECEMBER
2006 2007 2008NISSAN 1392 13.8% 1536 11 8% 1570 120%TOYOTA 2506 24.9% 2872 22.1% 3152 24 0%MITSUBISHI 1922 19.1% 2326 17.9% 2359 180%MAZDA 24 0.2% 26 0.2% 42 03%PEUGEOT 164 1.6% 109 0.8% I 29 02%ISUZU 1680 16.7% 2355 18.1% 2512 19.1%MERCEDES 285 2.8% 267 2.1% 315 2 4%landrover 259 2.6% 661 5.1% 434 33%OTHERS 1819 18.1% 2863 22.0% 2722 20 7%TOTAL 10051 100.0%| 13015 100.0% 13135 100.0%
BOTHERS
D1.ANDROVER
■ MERCEDES
OBUZU
■ PEUGEOT
U MAZDA
■ MITSUBBH1
■ TOYOTA
■ NBSAN
02006 2007 2008
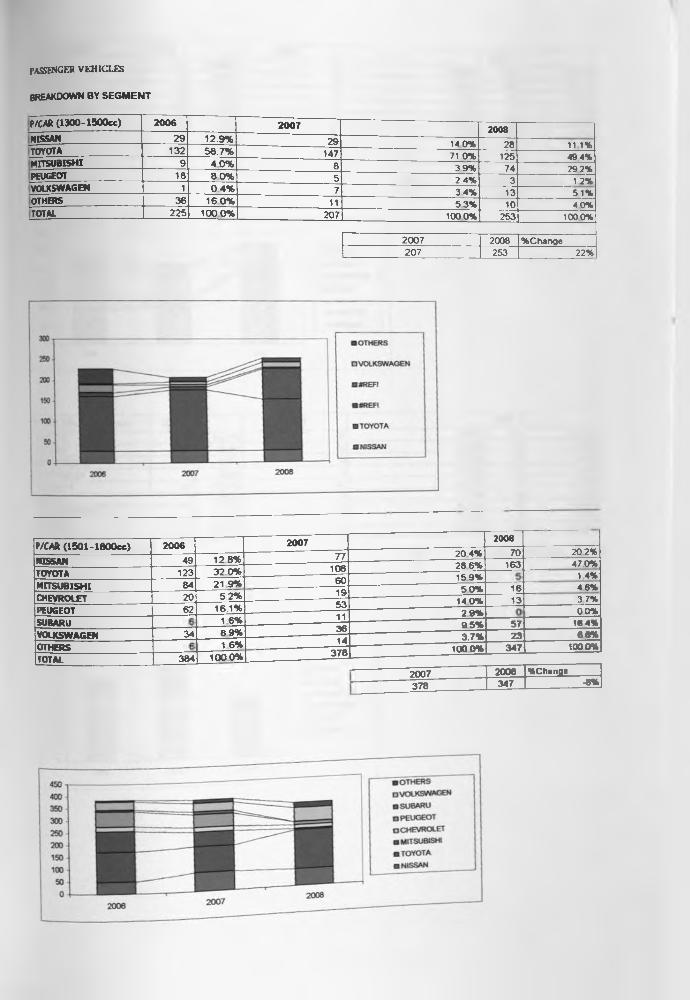
PASSENGER V E H IC L E S
BREAKDOWN BY SEGMENT
P/CAft (1300-1500cc) 2006 2007 ------------------- ------------------------------2008
NISSAN 29 12.9% 29 140% 28 11 1%TOYOTA 132 58.7% 147 71.0% 125 49 4%MITSUBISHI 9 4 0 % 8 3.9% 74 292%PEUGEOT 18l 8 0% 5 2.4% 3 12%VOLKSWAGEN 1 0 4 % 7 3.4% 13 51%OTHERS 36 16 0% 11 53% 10 40%TOTAL 225 100 0% 207 100 0% 253 1000%
2007 2008 %Change207 253 22%
P/CAR ( 1501- lB O O cc)
TOYOTANISSAN
M ITSU BISH ICHEVROLETPEUGEOTSUBARUVOLKSWAGENOTHERSTOTAL
200649
123842062
34
384
12 8%32 0%21 9%
5.2%16.1%16%89%16%
100 0%
200777
108601953113614
378
20 4%2008
70286% 15 9%50%
140%29% 95% 3.7%
100 0%
163
1613
5723
347
20 2% 47.0% 14% 46% 37% 00%
16 4% 66%
1000%
2007378
2006347
%Change6%
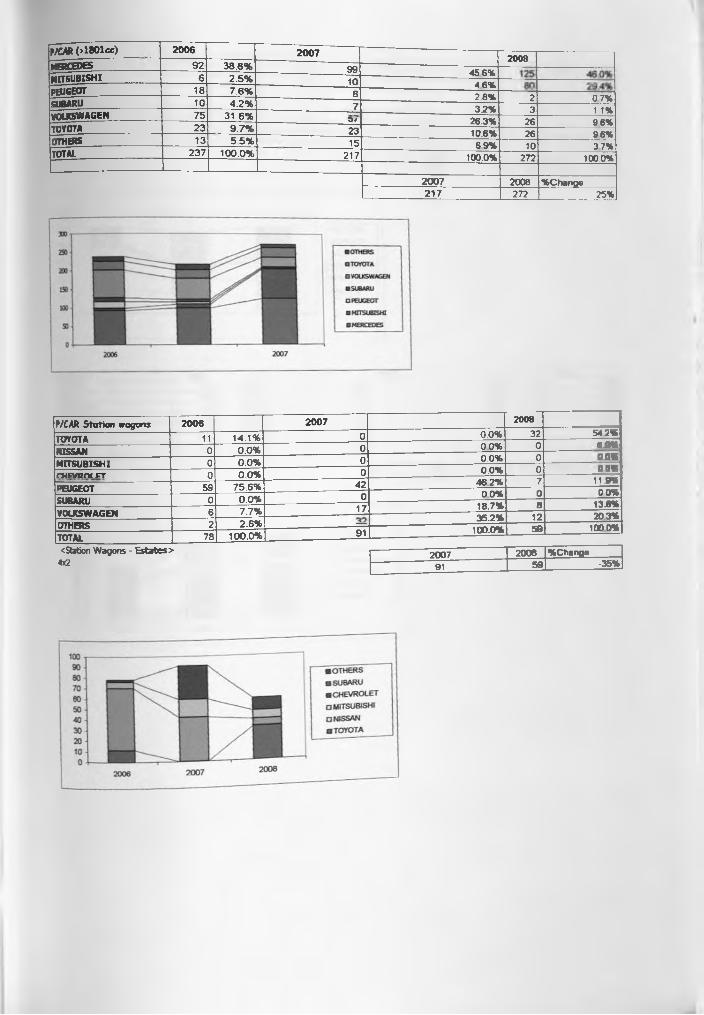
P/CAR (>1801cc) 2006 2007 2008 —m a m s 92 38.8% 99 45 6%MITSUBISHI 6 2.5% 10 4 6%PEUGEOT________ 18 7.6% 6 2.8% 2 0 7%SUBARUVOLKSWAGEN
1075
4.2%31.6%
7 32% 3 n %
TOYOTA 23 9.7%Of23
26.3%10.6%
2626
9 6% 96%OTHERS 13 5.5% 15 69% 10 3 7%
TOTAL 237 100.0% 217 100.0% 272 100.0%
2007 2008 %Change217 272 25%
P/CAR Station wagons 2006 2007 2008
TOYOTA 11 14.1% 0 0.0% 32 54 2%
NISSAN 0 0.0% 0 00% 0 0.0%
MITSUBISHI 0 0.0% 0 0.0% 0 0.0%
CHFVROt FT o 0.0% 0 0.0% 0 ____0 0%*>FU<?FOT 59 75.6% 42 46 2% 7 11.9%
SUBARU 0 0.0% 0 00% 0 0 0%
VOLKSWAGEN 6 7.7% 17 18.7%35.2%
812
13.8% 20 3%
OTHERSTOTAL
278
2.6%100.0% 91 100.0% 59 100 0%
<Station Wagons - Estates:> 2007 2008 %Change4X2 91 59 -35%
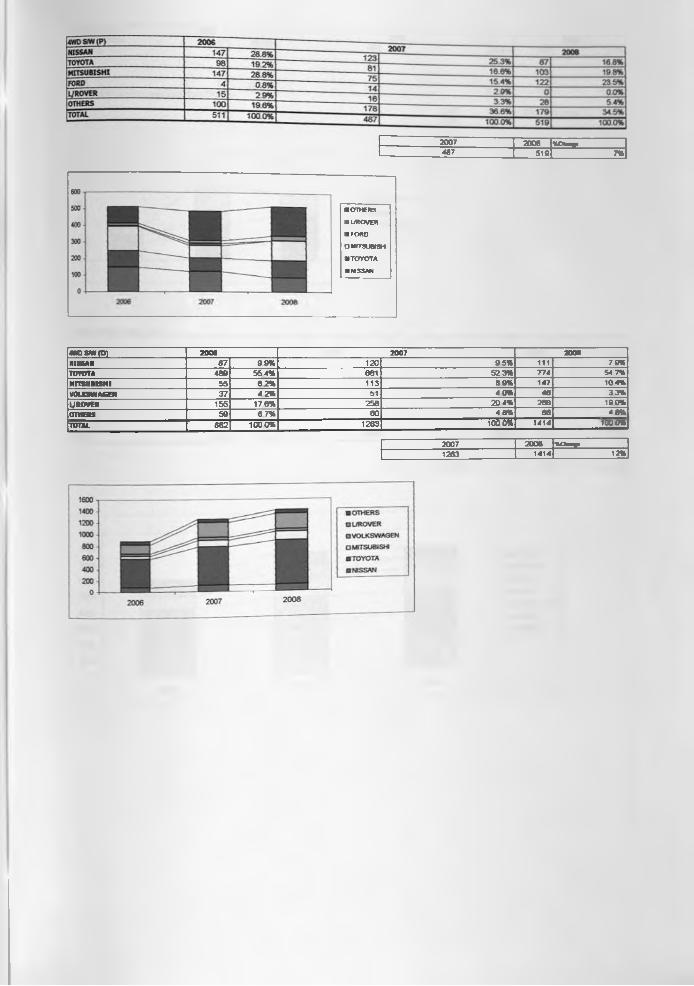
2007 2006 V lw g .487 518 7%
■ OTHERS
OL/ROVER
■ FORD
OHfTSUBISHI
■TOYOTA
■ NISSAN
4W0 SfW (O) 2006 2007 2006NISSAN 87 99% 120 9 5% 111 79%TOYOTA 489 55 4% 681 52 3% 774 54 7%MITSUBISHI 55 6 2% 113 69% 147 104%VOLKSWAGEN 37 42% 51 40% 46 33%U ROVER 155 17 6% 258 20 4% 268 190%OTHERS 59 6 7% 60 4 8% 68 48%
TOTAL 882 100 0% 1263 100 0% 1414 1000%
2007 2008 tO w g.1263 1414 12%
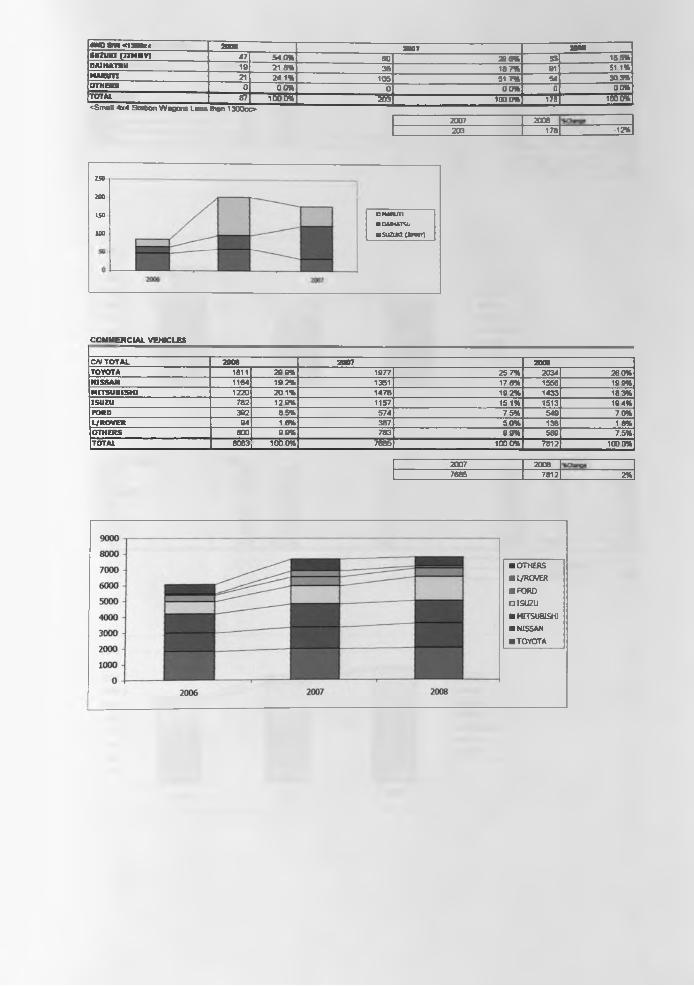
4WD S/W <1300c c 2006 2007 2006SUZUKI (JIMMY) 47 54 0% 60 29 6% 33 185%DAIHATSU 19 21 8% 38 18 7% 91 51 1%MAfUm 21 24 1% 105 51 7% 54 30 3%OTHERS 0 00% 0 00% 0 0 0%TOTAL 87 1000% -------------------------------------2OT ----------------------------------------------- iooo%1 178 1000%<Smatl 4x4 Station Wagons Less than 1300co
2007 2008203 178 -12%
250
200
ISO
100
OMMWT1
■ OAIHATVJ
■ SUZUaCXMNT)
COMMERCIAL VEHICLES
C/V TOTAL 2006 2007 2008TOYOTA 1811 29 9% 1977 25 7% 2034 26 0%NISSAN 1164 19.2% 1351 17 6% 1556 199%MITSUBISHI 1220 201% 1478 19 2% 1433 183%ISUZU 782 129% 1157 151% 1513 19 4%FORD 392 8 5% 574 7 5% 549 70%L/ROVER 94 10% 387 50% 138 1 8%OTHERS 600 9 9% 763 99% 589 7.5%TOTAL 0063 100 0%' 7885 100 0% 7812 100 0%
2007 20087685 7812 2%
■ OTHERS□ l/ROVER□ FORD□ ISUZU
■ MITSUBISHI■ NISSAN ■TOYOTA
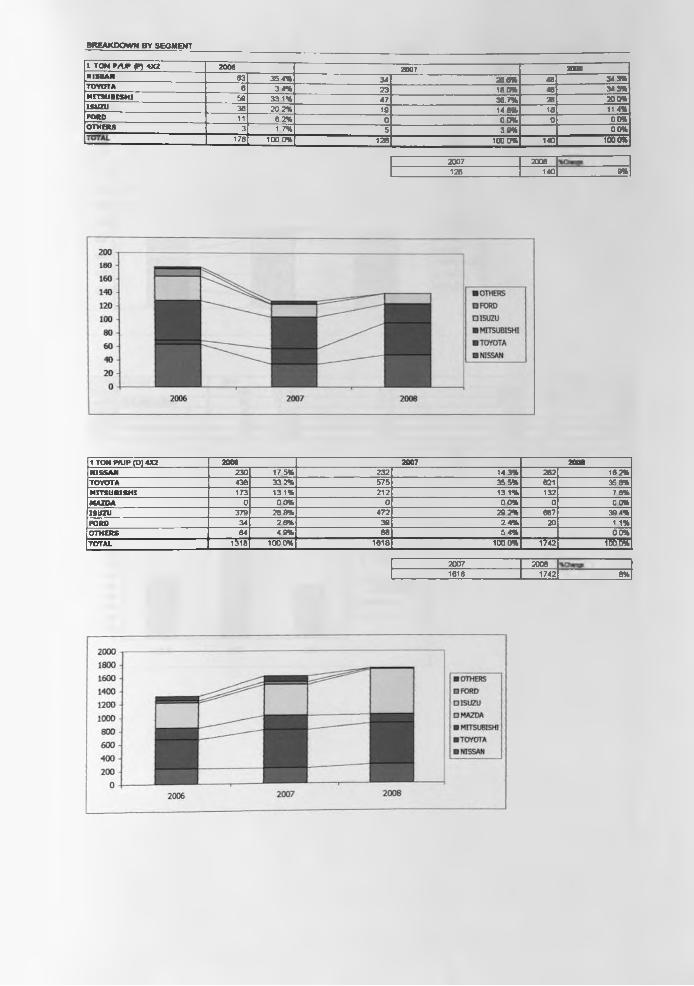
BREAKDOWN BY SEGMENT
1 TON PA* (P) 4X2 2006 2007 2006NISSAN 63 35 4% 34 26 6% 48 34 3%
'TOYOTA 6 34% 23 18 0% 48 34 3%MITSUBISHI 59 33 1% 47 36 7% 28 20 0%ISUZU 36 20 2% 19 148% 16 11 4%FORD 11 62% 0 00% 0 00%OTHERS 3 1 7% 5 39% 00%
178 100 0% 128 100 0* 140 100 0*
2007 2008 ______128 140 9*
1 TONP/UP (0)4X2 2006 2007 2008'NISSAN 230 175% 232 143% 282 162%TOYOTA 4381 33 2% 575 35 5% 021 35 8%MITSUBISHI 173 131% 212 131% 132 76%MAZDA 0 00% 0 00% 0 00%ISUZU 379 28 8% 472 29 2% 687 39 4%FORD 34 26% 39 24% 20 1 1%OTHERS 64 49% 88 5 4% 0.0%TOTAL 1318 100 0% 1818 100 0% 1742 100 0*
2007 20081618 1742 8%
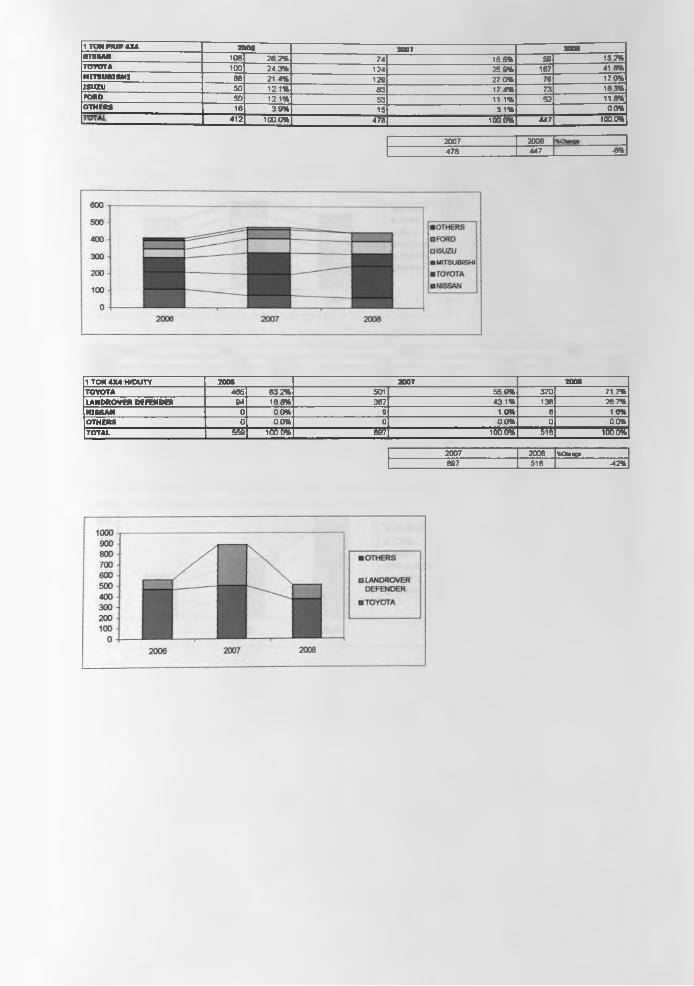
1 TOW PfUP 4X4 2006 2007 2006NISSAN 108 26 2% 74 15 5% 50 132%TOYOTA 100 24 3% 124 25 9% 187 41 8%MITSUBISHI 88 21 4% 129 27 0% 76 170%ISUZU 50 12 1% 83 174% 73 16 3%FORD 50 121% 53 11 1% 52 116%OTHERS 16 39% 15 31% 00%
41? 100 0K 478 1 X 0% 447 1X0%
2007 2008 ______478 447 -6%
1 TOW 4X4 H/DUTY 2006 2007 2006TOYOTA 465 83 2% 501 55 9% 370 71 7%LANDROVER DEFENDER 94 16 8% 387 43 1% 138 26 7%NISSAN 0 00% 9 1.0% 8 16%OTHERS 0 00% 0 00% 0 00%TOTAL 559 1 X 0 % 897 1 X 0 % 518 1X 0%
2007 2008 %Cftange897 516 -42%
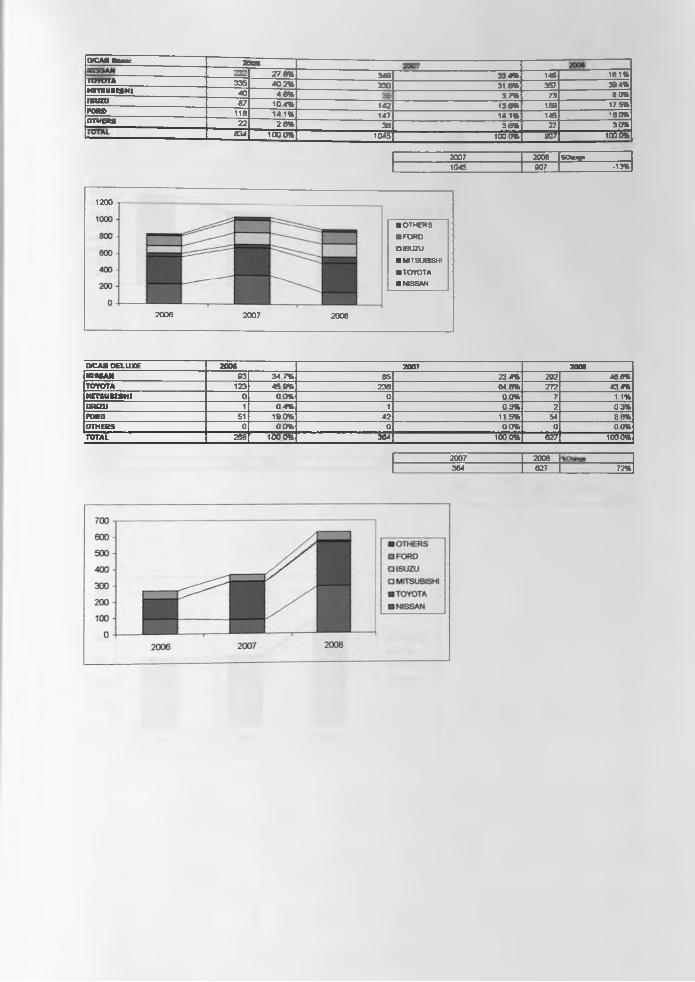
OCAB Baste 2006 -------------------------------------------------= ----------------------------------------------- --------------------- ----------------------------27 8% 340 33 4% 146 16 1%
TOYOTA 335 40 2% 330 31 8% 357 39 4%MITSUBISHI 40 48% 3 7% 73 80%ISUZU 87 10 4% 142 13 8% 150 17 5%FORD 118 14 1% 147 14 1% 145 160%OTHERS 22 28% 36 38% 27 30%
834 100 0% 1045 ---------------------------------------------- ioom T 907 100 0%
2007 2006 UO-ng.1045 907 •13%
1200
2006 2007 2006
■ OTHERS■ FORDmsuzu■ MITSUBISHI
■ TOYOTA■ NISSAN
D/CAB DELUXE 2006 2007 2008NISSAN 83 34 7% 85 23 4% 292 46 6%TOYOTA 123 45 9% 238 64 8% 272 43 4%MITSUBISHI 0 00 % 0 00% 7 1 1%ISUZU 1 04 % 1 03% 2 03%FORD 51 190% 42 11 5% 54 80%OTHERS 0 0 0% 0 0.0% 0 00%TOTAL 268 100 0% 364 100 0% 627 1000%
2007 2008364 627 72%
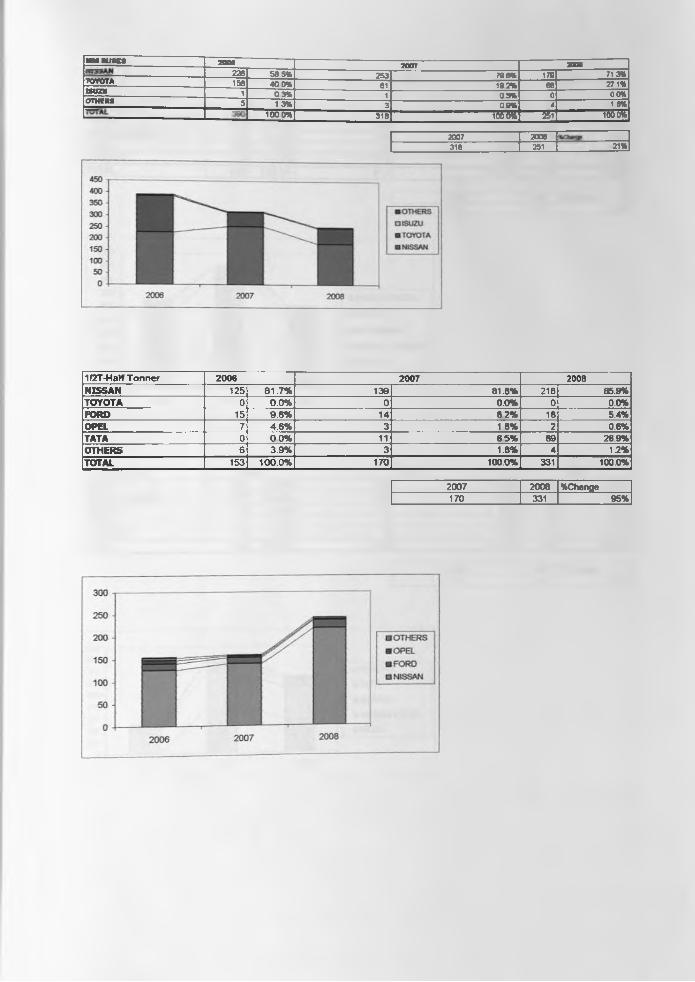
■ M BUSES 2006 2007 2008228 58 5 % 253 79 6 % 179 71 3%
TO Y O TA 156 4 0 0 % 61 19 2 % 68 27 1%ISUZU 1 0 3 % i 0 3 % 0 0 0 %OTHERS 5 1 3 % 3 0 9 % 4 1 6%
100 0 % 318 10 0 0 % 251 io o o %
2007 2008 ______316 251 21%
1/2T -H a lf T o n n e r 2 0 0 6 2 0 0 7 2008N IS S A N 1 25 8 1 .7 % 1 3 9 81 .8% 2 18 65.9%TO Y OTA 0 0 .0 % 0 0 ,0% 0 0.0%FO RD 15 9 .8 % 14 8 2 % 18 5.4%O PEL 7 4 .6 % 3 1 8 % 2 0.6%TATA 0 0 0 % 11 6 5 % 89 26.9%O T H E R S 6 3 .9 % 3 1,8% 4 1.2%TOTAL 1 53 1 0 0 .0 % 1 7 0 100.0% 331 100.0%
200 7 2008 % C hange170 331 95%
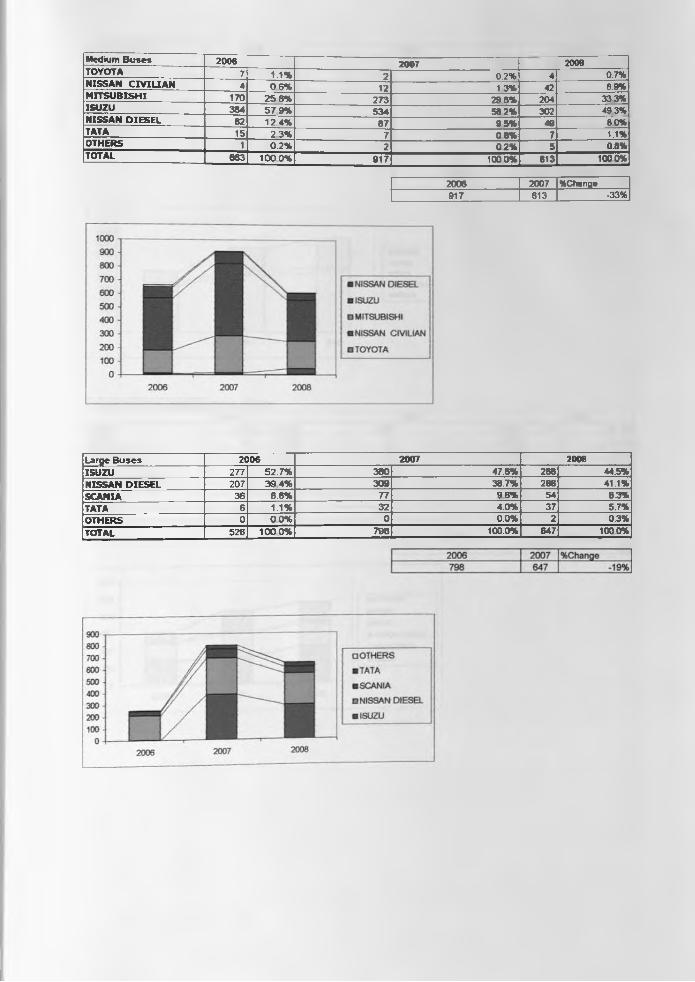
M edium B u s e s 2 0 0 6 2 0 0 7 2008TOYOTA 7 1 .1 * 2 0 2 * 4 0.7%N IS S A N C IV IL IA N 4 0 6 * 12 1 3 * 42 6.9%M IT S U B IS H I 170 2 5 6 * 2 7 3 2 9 8 * 204 33 3%ISU Z U 3 8 4 5 7 9 * 5 3 4 58 2 * 302 49 3%N IS S A N D IE S E L ___ 82^ 1 2 4 * 8 7 9 5 * 49 8 0 %TATA 15 2 3 * 7 0 8 % 7 1 .1 *O TH ER S 1 0 . 2 * 2 0 2 % 5 0.8%TOTAL 6 6 3 1 0 0 0 * 9 1 7 1 0 0 0 * 613 100 0 *
20 0 6 2007 % C hange9 1 7 613 - 3 3 *
L a rg e B u s e s 2 0 0 6 2 0 0 7 2008
IS U Z U 2 7 7 5 2 .7 % 3 8 0 47 .6% 2 88 44.5%
N IS S A N D IE S E L 2 0 7 3 9 4 * 3 0 9 38 .7% 266 41.1%
S C A N IA 3 6 6 .8 % 7 7 9 6 % 54 8.3%
TATA 6 1 .1 * 3 2 4 .0% 37 5.7%
'O T H E R S 0 0 0 % 0 0 .0 % 2 0.3%
TOTAL 5 2 6 1 0 0 0 * 7 9 8 100 .0% 647 100 0%
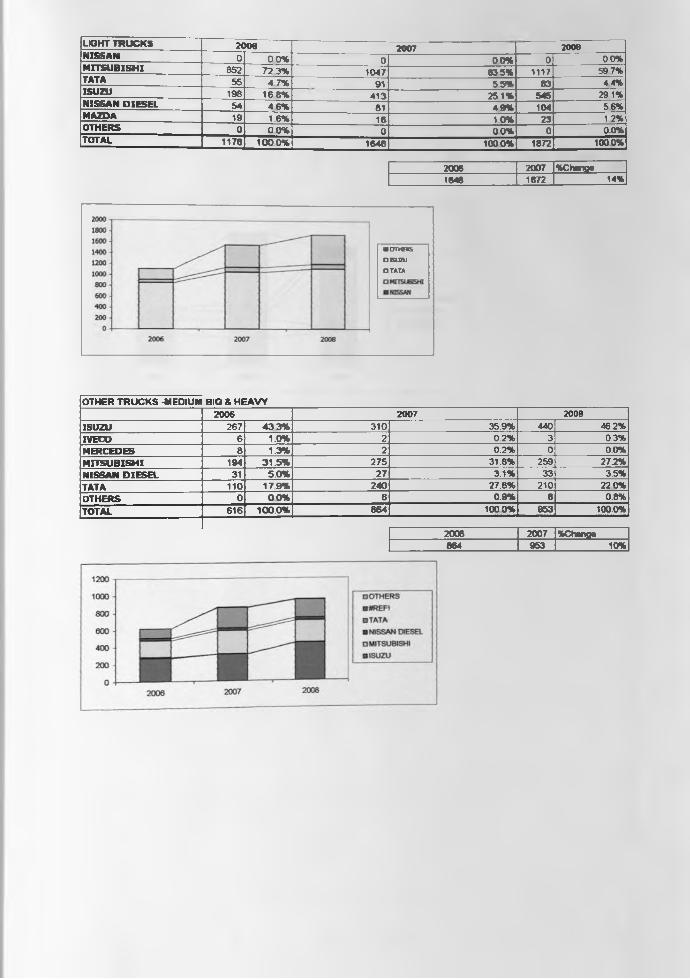
LIGHT TRUCKS 2006 2007 2008NISSAN 0 00% 0 00% 0 0.0%MITSUBISHI 852 72 3% 1047 63 5% 1117 59 7%TATA 55 4 7% 91 55% 83 44%ISUZU 198 16 8% 413 251% 545 291%NISSAN DIESEL 54 4 6% 81 49% 104 5 6%MAZDA 19 1.6% 16 10% 23 1.2%OTHERS 0 0 0% 0 00% 0 0.0%TOTAL 1178 1000% 1648 1000%l 1872 100 0%
2006 2007 % C hanoe1648 1872 14%
■ OTHERS OKU7U
□ TATA
OTHER TRUCKS -MEDIUM,BIG & HEAVY2006 2007 2008
ISUZU 267 43 3% 310 35.9% 440 46.2%IVECO 6 1.0% 2 0.2% 3 0.3%MERCEDES 8 1.3% 2 0.2% 0 0.0%MITSUBISHI 194 31.5% 275 31.8% 259 27.2%NISSAN DIESEL 31 5.0% 27 3.1% 33 3.5%TATA 110 17 9% 240 27.8% 210 22 0%OTHERS 0 00% 8 0.9% 8 0.8%TOTAL 616 100.0% 864 100 0% 953 100.0%
2006 2007 %Chanoe864 953 10%
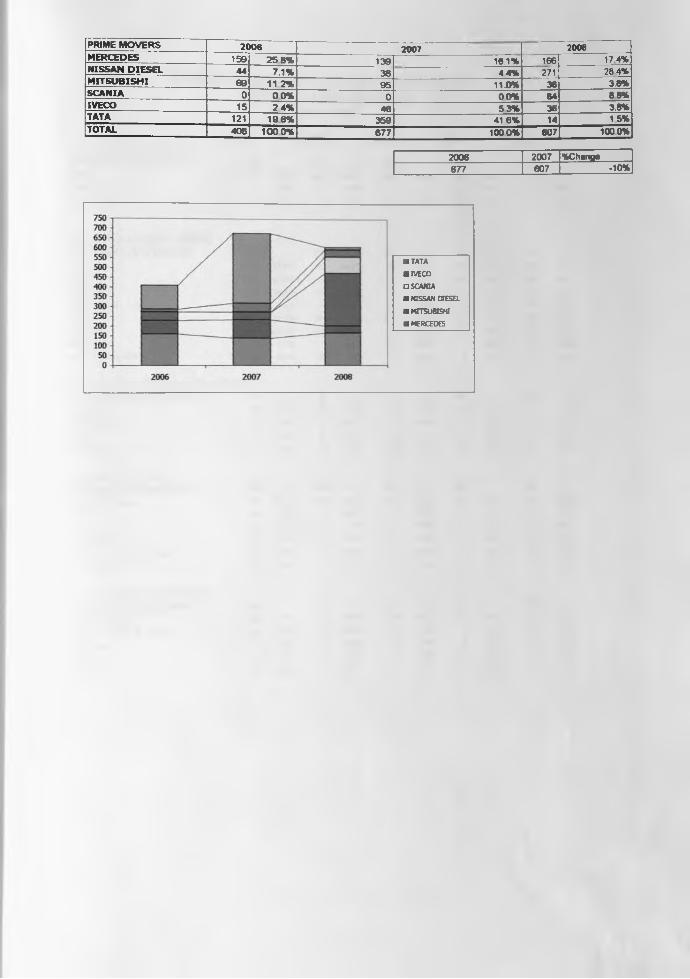
PRIM E M O V E R S 2 0 0 6 200 7 2008M ER C ED ES 159 2 5 8 % 1 3 9 16.1% 166 1 7 4 %N IS S A N D IE S E L 4 4 7 .1 % 3 8 4 4% 271 28 4%M IT S U B IS H I 6 9 1 1 2 % 9 5 11.0% 36 3.8%
I S C A N IA 0 0 0 % 0 0 0 % 84 8 8 %IV ECO 15 2 4 % 4 6 5 3 % 36 3 .8%TATA 121 1 9 6 % 3 5 9 41 6% 14 1 5 %TOTAL 4 0 6 1 0 0 0 % 6 7 7 1 0 0 0 % 6 07 100 0%
2006 2007 %Change677 607 -10%
■ TATA■ IVECO □ SCANIA■ NISSAN DIESEL■ MITSUBISHI■ MERCEDES
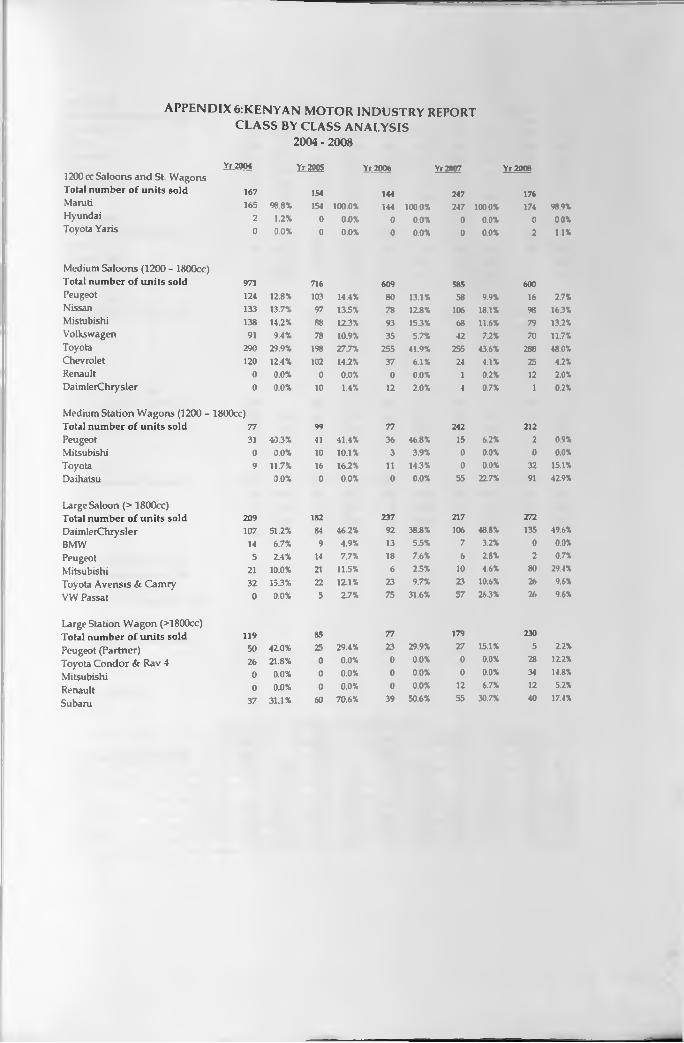
APPENDIX 6:KENYAN MOTOR INDUSTRY REPORT CLASS BY CLASS ANALYSIS
2004 - 2008
1 2 0 0 cc S a lo o n s a n d St. W a g o n s
Yr 2004 Yr 2005 Yr 2006 Yr 2007 Yr 2008
T ota l n u m b e r o f u n i t s s o ld 167 154 144 247 176M aruti 165 98.8% 154 100.0% 144 100 0% 247 1000% 174 98.9%H y u n d ai 2 1.2% 0 0.0% 0 0.0% 0 0.0% 0 00%T oyota Y aris 0 0.0% 0 0.0% 0 0.0% 0 0.0% 2 1.1%
M edium S a lo o n s (1 2 0 0 - 1 8 0 0 c c )
T o ta l n u m b e r o f u n i t s s o ld 971 716 609 585 600
P eugeot 124 12.8% 103 14.4% 80 13.1% 58 9.9% 16 2.7%
N issan 133 13.7% 97 13.5% 78 12.8% 106 18.1% 98 163%
M istubish i 138 14.2% 88 12.3% 93 153% 68 11.6% 79 132%
V o lk sw ag en 91 9.4% 78 10.9% 35 5.7% 42 72% 70 11.7%
T oyota 290 29.9% 198 27.7% 255 41.9% 255 43.6% 288 48.0%
C h ev ro let 120 12.4% 102 142% 37 6.1% 24 4.1% 25 4.2%
R enault 0 0.0% 0 0.0% 0 0.0% 1 0.2% 12 2.0%
D a im le rC h ry s le r 0 0.0% 10 1.4% 12 2.0% 4 0.7% 1 0.2%
M ed iu m S ta t io n W a g o n s (1 2 0 0 - 1 8 0 0 c c )
T o ta l n u m b e r o f u n i t s s o ld 77 99 77 242 212
P eugeot 31 40.3% 41 41.4% 36 46.8% 15 62% 2 0.9%
M itsu b ish i 0 0.0% 10 10.1% 3 3.9% 0 0.0% 0 0.0%
T oyota 9 11.7% 16 16.2% 11 14.3% 0 0.0% 32 15.1%
D aih atsu 0.0% 0 0.0% 0 0.0% 55 227% 91 42.9%
L arge S a lo o n (> 1 8 0 0 c c )
T o ta l n u m b e r o f u n i t s s o ld 209 182 237 217 272
D a im le rC h ry s le r 107 51.2% 84 46.2% 92 38.8% 106 48.8% 135 49.6%
BMW 14 6.7% 9 4.9% 13 5.5% 7 3.2% 0 0.0%
P eu g eo t 5 2.4% 14 7.7% 18 7.6% 6 28% 2 0.7%
M itsu b ish i 21 10.0% 21 11.5% 6 2.5% 10 4.6% 80 29.4%
T oyota A v e n s is & C a m ry 32 15.3% 22 12.1% 23 9.7% 23 10.6% 26 9.6%
VW P assa t 0 0.0% 5 2.7% 75 31.6% 57 26.3% 26 9.6%
L arge S ta tio n W a g o n (> 1 8 0 0 c c )
T o ta l n u m b e r o f u n i t s s o ld 119 85 77 179 230
P eu g eo t (P a r t n e r ) 50 42.0% 25 29.4% 23 29.9% 27 15.1% 5 2.2%
T oyota C o n d o r & R a v 4 26 21.8% 0 0.0% 0 0.0% 0 0.0% 28 122%
M itsu b ish i 0 0.0% 0 0.0% 0 0.0% 0 0.0% 34 14.8%
R enault 0 0.0% 0 0.0% 0 0.0% 12 6.7% 12 52%
S u b aru 37 31.1% 60 70.6% 39 50.6% 55 30.7% 40 17.4%
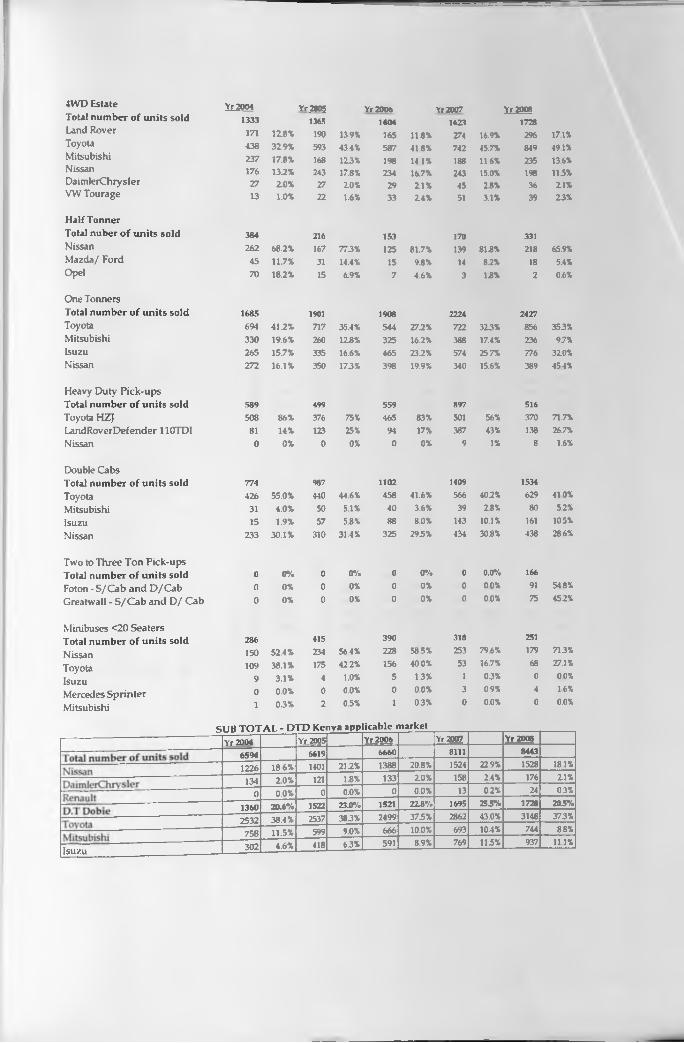
4VVD E sta te Yr 2004 Yr.2005 Yr 2006 Yr 2007 Xl?008T o ta l n u m b e r o f u n i t s s o ld 1333 1365 1404 1623 1728Land Rover 171 12.8% 190 139% 165 113% 274 16.9% 296 17.1%Toyota 438 329% 593 434% 587 418% 742 45.7% 849 491%Mitsubishi 237 17.8% 168 123% 198 14 1% 188 116% 235 13.6%Nissan 176 13.2% 243 17.8% 234 16.7% 243 15.0% 198 115%DaimlerChrysler 27 20% 27 20% 29 21% 45 23% 36 21%VW Tourage 13 1.0% 22 1.6% 33 24% 51 3.1% 39 23%
H a lf T o n n e r
T ota l n u b e r o f u n i t s s o ld 384 216 153 170 331Nissan 262 68.2% 167 773% 125 81.7% 139 813% 218 65.9%Mazda/ Ford 45 11.7% 31 14.4% 15 93% 14 82% 18 5.4%Opel 70 18.2% 15 6.9% 7 4.6% 3 13% 2 0.6%
One Tonners
T ota l n u m b e r o f u n i t s so ld 1685 1901 1908 2224 2427
Toyota 694 41.2% 717 35.4% 544 272% 722 323% 856 353%Mitsubishi 330 19.6% 260 128% 325 16.2% 388 17.4% 236 97%Isuzu 265 15.7% 335 16.6% 465 232% 574 25.7% 776 320%Nissan 272 16.1% 350 173% 398 19.9% 340 15.6% 389 454%
Heavy Duty Pick-ups
T o ta l n u m b e r o f u n i t s s o ld 589 499 559 897 516
Toyota HZJ 508 86% 376 75% 465 83% 501 56% 370 71.7%LandRoverDefender 110TDI 81 14% 123 25% 94 17% 387 43% 138 26.7%Nissan 0 0% 0 0% 0 0% 9 1% 8 1.6%
Double Cabs
T o ta l n u m b e r o f u n i t s s o ld 774 987 1102 1409 1534
Toyota 426 55.0% 440 44.6% 458 41.6% 566 40.2% 629 410%Mitsubishi 31 4.0% 50 5.1% 40 3.6% 39 28% 80 5.2%Isuzu 15 1.9% 57 53% 88 8.0% 143 10.1% 161 10.5%Nissan 233 30.1% 310 31.4% 325 29.5% 434 30.8% 438 286%
Two to Three T on Pick-ups
T o ta l n u m b e r o f u n i t s s o ld 0 0% 0 0% 0 0"/. 0 0.0”/. 166
Foton -S /C a b an d D /C ab 0 0% 0 0% 0 0% 0 00% 91 518%
Greatwall - S /C a b an d D / Cab 0 0% 0 0% 0 0% 0 0.0% 75 45.2%
Minibuses < 20 Seaters
T o ta l n u m b e r o f u n i t s s o ld 286 415 390 318 251
Nissan 150 52.4% 234 56 4% 228 58 5% 253 79.6% 179 71.3%
Toyota
Isuzu
109 38.1% 175 422% 156 40.0% 53 16.7% 68 27.1%
9 3.1% 4 1.0% 5 13% 1 03% 0 00%
Mercedes S prin ter
Mitsubishi
01
0.0%03%
02
0.0%0.5%
01
0.0%0.3%
30
09%0.0%
40
16%0.0%
SUB TO T A L - D T P Kenya applicable m arket
Yr2004 Yr 2005 Yr2006_ Yr 2007 Yr 2008
6594 6619 6660 8111 8443
1226 18.6% 1401 21.2% 1388 20.8% 1524 22 9% 1528 181%
134 20% 121 1.8% 133 20% 158 2.4% 176 21%
0 0.0% 0 0.0% 0 0.0% 13 02% 24 03%
1360 20.6% 1522 23.0”/. 1521 228% 1695 255"/. 1728 205%
2532 38.4% 2537 383% 2499 375% 2862 43.0% 3148 373%
758 11.5% 599 9.0% 666 10.0% 693 10.4% 744 88%
Isuzu 302 4.6% 418 6.3% 591 8.9% 769 115% 937 111%
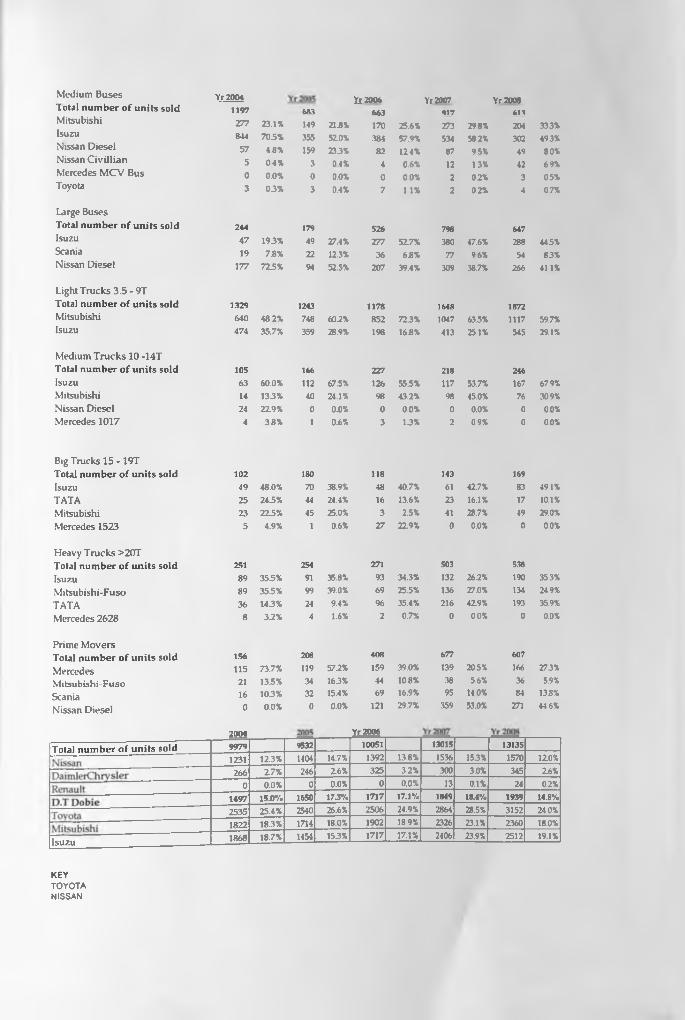
M edium B u s e s Yr 2004 Yf 2006 It 2007 Yr 20081 otal num ber o f u n its sold 1197 683 663 917 613M itsubish i 277 23.1% 149 218% 170 25.6% 273 29 8% 204 333%Isuzu 844 705% 355 520% 384 57.9% 534 58 2% 302 493%N issan D iese l 57 4.8% 159 235% 82 124% 87 95% 49 80%N issan C iv il l ia n 5 04% 3 04% 4 0.6% 12 13% 42 69%M ercedes M C V B us 0 0.0% 0 0.0% 0 00% 2 02% 3 05%T oyota 3 05% 3 0.4% 7 11% 2 0.2% 4 07%
Large B uses
Total num ber o f u n its sold 244 179 526 798 647Isuzu 4 7 195% 49 27.4% 277 527% 380 47.6% 288 445%Scania 19 75% 22 12.3% 36 6.8% 77 96% 54 83%N issan D iesel 177 725% 94 525% 207 39.4% 309 38.7% 266 411%
L ight T ru c k s 3 .5 - 9 T
Total num ber o f u n its sold 1329 1243 1178 1648 1872M itsubish i 640 482% 748 60.2% 852 723% 1047 635% 1117 59.7%
Isuzu 474 35.7% 359 28.9% 198 16.8% 413 25.1% 545 29.1%
M edium T r u c k s 1 0 -1 4 T
Total num ber o f u n its sold 105 166 227 218 246Isuzu 63 60.0% 112 675% 126 55.5% 117 53.7% 167 67.9%
M itsubish i 14 135% 40 24.1% 98 43.2% 98 45.0% 76 309%
N issan D iesel 24 22.9% 0 0.0% 0 0.0% 0 0.0% 0 0.0%
M ercedes 1 0 1 7 4 38% 1 0.6% 3 13% 2 09% 0 00%
Big T ru ck s 1 5 - 1 9 T
Total num ber o f u n its sold 102 180 118 143 169Isuzu 49 48.0% 70 38.9% 48 40.7% 61 427% 83 49.1%
TATA 25 245% 44 24.4% 16 13.6% 23 16.1% 17 10.1%
M itsubish i 23 225% 45 25.0% 3 2.5% 41 28.7% 49 29.0%
M ercedes 1 5 2 3 5 4.9% 1 0.6% 27 22.9% 0 0.0% 0 0.0%
H eav y T ru c k s > 2 0 T
Total num ber o f u n its sold 251 254 271 503 538Isuzu 89 355% 91 35.8% 93 343% 132 26.2% 190 353%
M itsu b ish i-F u so 89 355% 99 39.0% 69 25.5% 136 27.0% 134 24.9%
TATA 36 145% 24 9.4% 96 35.4% 216 429% 193 35.9%
M erced es 2 6 2 8 8 3 2 % 4 1.6% 2 0.7% 0 00% 0 0.0%
P rim e M o v e rs
Total n u m b er o f u n its sold 156 208 408 677 607
M ercedes 115 73.7% 119 57.2% 159 39.0% 139 20.5% 166 273%
M its u b ish i-F u s o 21 135% 34 165% 44 10.8% 38 5.6% 36 5.9%
Scania 16 105% 32 15.4% 69 16.9% 95 140% 84 13.8%
N issan D iese l 0 0.0% 0 0.0% 121 29.7% 359 53.0% 271 44 6%
2004 YrM06_
Total n u m b er o f u n its sold 9979 9532 10051 13015 131351231 12.3% 140t 14.7% 1392 13.8% 1536 153% 1570 120%
266 27% 246 26% 325 3.2% 300 3.0% 345 26%
0 0.0% 0 0.0% 0 0.0% 13 0.1% 24 02%
1497 15.0% 1650 175% 1717 17.1% 1849 18.4% 1939 14.8%
2535 25.4% 2540 26.6% 2506 24.9% 2864 28.5% 3152 24 0%
1822 18.3% 1714 18.0% 1902 189% 2326 23.1% 2360 18.0%
Isu zu1868 18.7% 1454 155% 1717 17.1% 2406 23.9% 2512 19.1%
KEYTOYOTANISSAN