
The effects of methanol fuel on combustion in premixed dual ...
143
1 MSc. Thesis Report Delft University of Technology, Faculty 3mE Mechanical engineering TU delft Report Nr: 2808 IHC MTI B.V Report Nr: AO 149 The effects of methanol fuel on combustion in premixed dual fuel engine BYUNGJOO LEE 4414241 Faculty of Mechanical, Maritime and Materials Engineering
-
Upload
khangminh22 -
Category
Documents
-
view
1 -
download
0
Transcript of The effects of methanol fuel on combustion in premixed dual ...

1
MSc. Thesis Report
Delft University of Technology, Faculty 3mE
Mechanical engineering
TU delft Report Nr: 2808
IHC MTI B.V Report Nr: AO 149
The effects of methanol fuel on combustion in
premixed dual fuel engine
BYUNGJOO LEE
4414241
Facu
lty of
Mech
anic
al, M
aritim
e
and M
ate
rials
Engin
eering

2

3
The effects of methanol fuel on
combustion in premixed dual fuel engine
by
Byungjoo Lee
in partial fulfillment of the requirements for the degree of
Master of Science
in Mechanical Engineering
at the Delft University of Technology,
Process & Energy Faculty 3mE,
Sustainable Process and Energy Technology
December, 2016
The committee members
Ir. K. Visser (chairman) TU Delft 3mE, Department M&TT, section Ship
Design, Production and Operations
Prof.dr.ir. B.J. Boersma TU Delft 3mE, Department Process & Energy
Dr.ir. Rene Pecnik TU Delft 3mE, Department Process & Energy
Ir. H. Sapra TU delft 3mE, Department M & TT
Ir. B.T.W. Mestemaker Royal IHC, IHC MTI B.V.

4

5
Abstract The environmental pollution and depleting fossil fuels have been considered as a critical issue all
over the world. Many efforts have been devoted to investigating alternative fuels to tackle these
problems. Alcohol fuels are potential candidates to alternative energy as it can mitigate pollutant
emission. In addition, alcohol fuels can be applied to current diesel engines with technical
modifications. This thesis mainly focuses on the effects of methanol fuel on in-cylinder process in
premixed dual fuel engine. Different fuel ratios were tested to investigate the effects of methanol
fuel. Existing diesel engine models, which have been developed by TU delft, were used to conduct
computer simulations. To describe dual fuel combustion, separated vibe functions were adopted
in the existing models. The simulation results indicated that the cooling effect caused by high
heat of evaporation of methanol affected in-cylinder processes. With increase of methanol
injection, start of ignition delayed due to the cooling effect. The longer ignition delay improved
premixing of pilot fuel and it led to higher heat release rates. In case of maximum temperature, it
was affected by both the cooling effects and diesel injection timing. With advanced diesel
injection timing (-5.5 TDC), maximum temperature of dual fuel mode was higher than only diesel
mode due to strong premixed combustion. Due to the lower LHV of methanol fuel, brake specific
fuel consumption became higher with increase of methanol injection. Brake thermal efficiency
decreased with increase of methanol injection due to lower combustion efficiency. The current
models are not able to differentiate different combustion durations for diesel and methanol fuels.
Further developments of the models are recommended to increase simulation accuracy.
Furthermore, simulation on different diesel injection timing is recommended to better understand
methanol combustion.

6
Acknowledgements
This report represents the work performed for my master thesis. The main objective of the thesis
is to understand the effects of methanol fuel on combustion.
First of all, I would like to thank to Ir. Klaas Visser, who is the chairman of the graduation
committee, for giving me the great opportunity to study this interesting topic. Another special
thanks to Mr. Benny Mestemaker, who is the supervisor at IHC MTI. B.V. He shared his abundant
and technical knowledge with me and it helped me to keep on track.
On a personal note, I am grateful to B. Jung, E. Oh, J. Yu and many SPET friends who were always
there for me whenever I had personal issues. With their presence and support, I was able to
overcome many difficulties.
Last but not least, I would like to say many thanks to Ir. Harsh Sapra, who is not only my
supervisor but also is willing to be a good friend of mine for the whole thesis work. His insightful
knowledge and encouragement increased my motivation. I do highly appreciate his rigorousness,
patience and support.
Delft, University of Technology
December, 2016
Byungjoo Lee

7
Nomenclature
Abbreviation
CRR Combustion Reaction Rate
IC Inlet valve Closed
EO Exhaust valve Open
SOC Start of combustion
EOC End of combustion
TDC Top Dead Centre
BDC Bottom Dead Centre
RCO Reaction coordinates
NAHRR Net Apparent Heat Release Rate
GAHRR Gross Apparent Heat Release Rate
RMD Methanol/Diesel mass ratio
SECA Sulphur Emission Control Area
SI Spark Ignition
CI Compression Ignition
DF Dual fuel
MCR Maximum Continuous Rating
BSFC Brake Specific Fuel Consumption
BTE Brake Thermal Efficiency
HRR Heat Release Rate

8
DIT Diesel Injection Timing
CA Crank Angle
HFO Heavy Fuel Oil
MGO Marine Gas Oil
UHC Unburned Hydro Carbon
Symbol
Ab Bore Area [m2]
Db Bore Diameter [m]
�̇�f Energy of Fuel [W]
Ls Stroke Length [m]
�̇�comb Combustion heat [W]
�̇�loss Heat loss [W]
T Temperature [K]
V Volume [m3]
Vs Stroke Volume [m3]
X Normalized reaction rate [--]
Z Normalized rate of combustion [--]
a Vibe parameter linked to combustion efficiency [--]
ak coefficients for the polynomial [J/Kg/K]
b Weight Factors in multiple Vibe Function [--]

9
cm Mean piston speed [m/s]
cp Specific heat at constant pressure [J/Kg/K]
cv Specific heat at constant volume [J/Kg/K]
h Specific enthalpy [J/Kg]
k Reaction rate constant [--]
m Shape parameter in Vibe function [--]
m mass [Kg]
ncomp Compression exponent [--]
p Pressure [pa]
rc Effective compression volume ratio [--]
t Time [s]
u Specific internal energy [J/Kg]
Xg Energy fraction of Methanol [--]
α crank angle [Degree]
αg-w heat loss to the walls coefficient [W/m2/K]
ηcomb Combustion efficiency [--]
ε Geometric compression ratio [--]
ξ Fuel burn rate (or Combustion reaction rate) [Kg/s]
λ Air excess ratio [--]
λCR Radius to length ratio [--]
σ Stoichiometric air/fuel ratio [--]

10
ρ density [Kg/m3]
τ Normalized time [--]
Subscript
f Fuel
max Maximum
min Minimum
sg Stoichiometric gas from diesel fuel
sgg Stoichiometric gas from methanol fuel
ref Reference
comb Combustion
norm Normalized
D Diesel
M Methanol

11
Table of contents
Chapter 1: Introduction.....................................................................................................................................13
1.1 Background information and motivation....................................................................................13
1.2 Thesis objective......................................................................................................................................15
1.3 Thesis outline..........................................................................................................................................16
Chapter 2: Literature review............................................................................................................................17
2.1 General information of Methanol.....................................................................................................17
2.2 General information of Ethanol.........................................................................................................19
2.3 Evaluation of alcohol fuels as alternative fuel.............................................................................23
2.4 Emission........................................................................................................................................................29
2.5 Dual fuel engines......................................................................................................................................34
Chapter 3: Hypothesis.........................................................................................................................................52
Chapter 4: Base models......................................................................................................................................54
4.1 Introduction of Model C........................................................................................................................54
4.2 Single zone models VS Multi-zone models..................................................................................58
Chapter 5: Model modification.......................................................................................................................61
5.1 Overall methodology...............................................................................................................................61
5.2 Assumptions and Engine Data............................................................................................................61
5.3 Addition of methanol fuel properties..............................................................................................64
5.4 Heat loss model.........................................................................................................................................69
5.5 Modification in the in-cylinder model.............................................................................................71
5.6 Modification in the heat release model..........................................................................................80

12
Chapter 6 Simulation results and analysis..................................................................................................85
6.1 Introduction..................................................................................................................................................85
6.2 Heat release rate........................................................................................................................................86
6.3 Pressure..........................................................................................................................................................98
6.4 Temperature................................................................................................................................................104
6.5 BSFC................................................................................................................................................................113
6.6 Brake thermal efficiency.........................................................................................................................114
Chapter 7: Conclusion and recommendations.........................................................................................117
7.1 Conclusion....................................................................................................................................................117
7.2 Recommendations.....................................................................................................................................118
Appendix I Calculation LHV of methanol fuel.........................................................................................119
Appendix II Curve fitting results and vibe parameters........................................................................121
Appendix III Pressure sensitivity in the model. (Pressure-reading error).....................................125
Appendix IV Limit of models (Reason to choose common combustion duration).................128
Reference.....................................................................................................................................................................130
List of Figures............................................................................................................................................................138
List of Tables..............................................................................................................................................................142

13
1. Introduction
1.1 Background information and Motivation
The gravity of environmental pollution due to fossil fuel has been a critical issue all over the
world for many years. Various industries are responsible for polluting the environment. Shipping
industry cannot stay away from the responsibility as pollutant exhaust gases from ship‘s funnels
contribute to air pollution and lead to serious environmental damages. In addition, depleting
fossil fuel urged the world to find solutions. As a result, the world decided to enforce more
strict environmental regulations on shipping industry to reduce its emission.
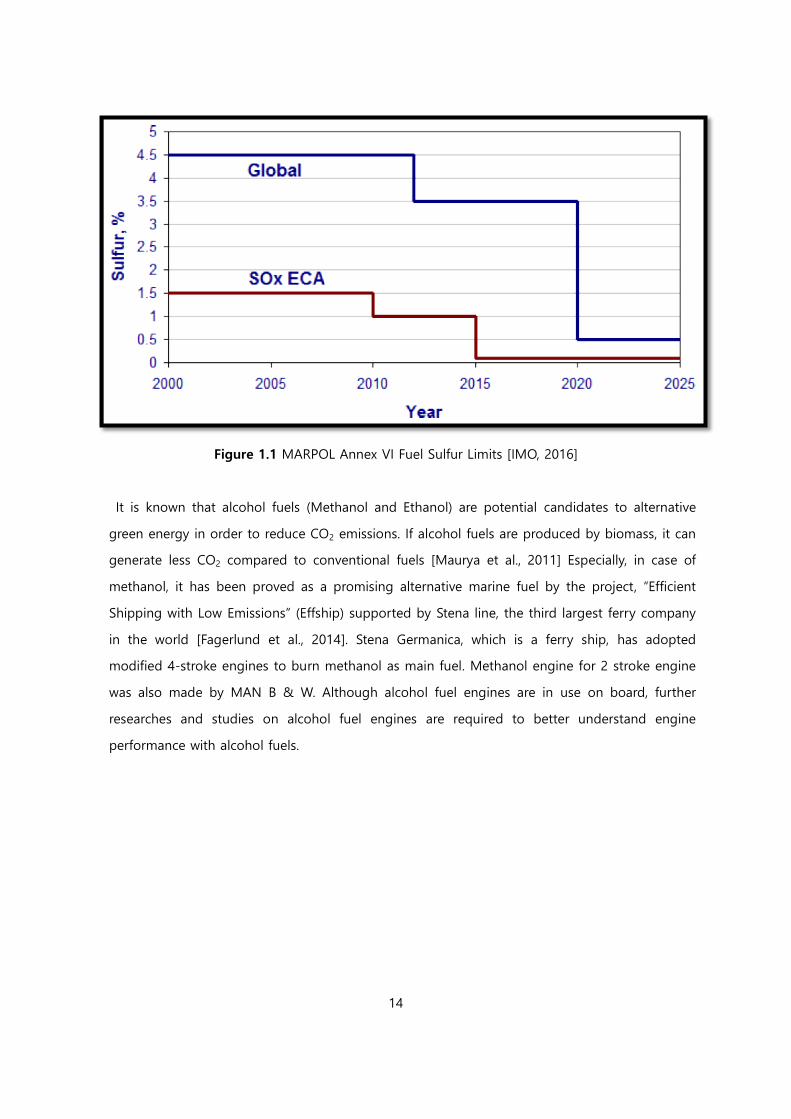
The regulation requires that sulphur content (SOx) must limit to 0.1% within the emission
control areas (SECAs) from 2015, which is shown in Figure 1.1. Moreover, nitrogen oxide(NOx)
emission control areas (NECAs) has been in effect from 2016 in US Caribbean area and will be
introduced in Europe from 2021. Many researches have been conducted to find alternative fuels
with reduced emission. MGO has been widely used as an alternative fuel in SECAs instead of
HFO because HFO which contains 0.1% of sulphur does not exist. However, much higher price
of MGO than HFO cannot be ignored because increase of fuel price would be a risk for
shipping industry to run their business. In addition, not only SOx and NOx but also greenhouse
gases (GHG) which is generated from fossil fuel combustion process is a severe problem of
environment as it accelerates global warming. The effort to reduce CO2 emission has been
made by International Marine Organization (IMO). They introduced Energy Efficiency Design
Index (EEDI) which indicates CO2 emission of ships. [MAN Diesel & Turbo, 2014] It is inevitable
to find new and more efficient combustion technologies together with new energy sources.
14
Figure 1.1 MARPOL Annex VI Fuel Sulfur Limits [IMO, 2016]
It is known that alcohol fuels (Methanol and Ethanol) are potential candidates to alternative
green energy in order to reduce CO2 emissions. If alcohol fuels are produced by biomass, it can
generate less CO2 compared to conventional fuels [Maurya et al., 2011] Especially, in case of
methanol, it has been proved as a promising alternative marine fuel by the project, ―Efficient
Shipping with Low Emissions‖ (Effship) supported by Stena line, the third largest ferry company
in the world [Fagerlund et al., 2014]. Stena Germanica, which is a ferry ship, has adopted
modified 4-stroke engines to burn methanol as main fuel. Methanol engine for 2 stroke engine
was also made by MAN B & W. Although alcohol fuel engines are in use on board, further
researches and studies on alcohol fuel engines are required to better understand engine
performance with alcohol fuels.

15
1.2 Thesis objective
This thesis studies on modeling and combustion performance of methanol dual fuel engine. One
major challenge of methanol combustion is to overcome its poor auto-ignition caused by low
cetane number. Introduction of pilot fuel can be the solution as the high reactivity pilot fuel can
induce combustion of methanol fuel. An advantage of premixed dual fuel combustion engines is
that the cost of engine modification is relatively lower than of direct injection type. In addition,
premixed combustion concept is able to achieve relatively lean combustion than compression
ignition because primary fuels are homogeneously premixed with air before ignition. It can lead to
lesser NOx emission than direct injection type. [Haraldson, 2015]. In this regard, premixed dual fuel
methanol engine is expected as a possible solution to fulfill NOx Tier III regulations without
Selective Catalytic Reduction (SCR) and Exhaust Gas Recirculation (EGR) [Haraldson, 2015]. For
these reasons, many studies and researches on premixed dual fuel engine are being carried out.
An attempt has been made to simulate direct injection engine type as well, but it turned out to
be difficult due to lack of information such as detail engine data and test conditions.
The main objective of the thesis is to investigate the performance of methanol dual fuel engine.
More specifically, the thesis focuses on influence of methanol fuel on in-cylinder process.
Furthermore, the effects of different methanol/diesel fuel ratios on in-cylinder process are
discussed.
TU delft has developed diesel engine models based in MATLAB/Simulink environment.
Modification of the existing engine models is also an additional objective of this thesis to perform
premixed dual fuel combustion with methanol fuel. The analysis of in-cylinder process will be
carried out by studying the simulation results.

16
1.3 Thesis outline
The background information and motivation are introduced in Chapter 1. Overall thesis
objectives can be found in chapter 1 as well.
Chapter 2 starts with literature review of alcohol fuels. General information of alcohol fuels is
presented. Both background information of emissions and characteristics of methanol emission are
included in the literature review. The last part of literature review covers characteristics of dual fuel
engine and introduction of current applications.
Hypothesis can be found in chapter 3 and in chapter 4, the fundamental features of the model C,
which consists of heat release calculation model and in-cylinder process model, is explained. As
both models are built based on single-zone model, characteristics of single-zone model are briefly
introduced.
Chapter 5 starts with overall methodology and assumptions for model modifications. The model
modifications for both heat release model and in-cylinder model are explained in this chapter.
Vibe functions in the in-cylinder model and heat of combustion in the heat release model need to
be separated to describe diesel and methanol combustion independently.
Chapter 6 covers the simulation results of dual fuel combustion. First of all, the results from the
heat release model and the in-cylinder model will be compared. Then analysis of in-cylinder
process carry out through pressure, temperature, heat release rate, brake specific fuel
consumption and brake thermal efficiency.
Finally, chapter 7 contains the overall conclusions and recommendation for further work.

17
2. Literature review
2.1 General information of Methanol
Methanol is known as one of the prospective future fuel candidates for internal combustion
engines. It is viable to apply in current engines with technical modifications. From an emission
point of view, methanol is a good solution to mitigate pollutant emission. Combustion of
methanol produces low NOx and particulate matters while equivalent efficiency can be expected.
In addition, methanol is considered as an eco-friendly fuel because it is a miscible substance in
water and easily decomposes in the environment. Although methanol is toxic if ingested, it has
very low impact when it is released to the environment as it quickly breaks down into other
compounds. In addition, a number of various bacteria consume these compounds as food
[Methanol institute, 2016].
Not only shipping industries but many other industries are highly depending on conventional
fossil fuels. In this situation, methanol can be an effective alternative as it can be produced from
renewable feed stocks. However, in order to encourage methanol market to be stable and flourish,
both economical production and constant supply are still required. For these reasons, a large
quantity of methanol is produced based on fossil-based sources today. Annually, 45 million tons
of methanol is produced based on fossil fuels. 80 % of methanol is produced by natural gas and
17% of methanol is produced by coal. [Broeren et al., 2013] On the other hand, only 200,000 tons
of bio-methanol is produced per year. [IRENA Technology, 2013]
Technologies to produce methanol from natural gas is well matured and already highly
optimized so that a large portion of methanol comes from natural gas these days. Figure 2.1.1
illustrates methanol production procedures from natural gases. Another way to produce methanol
is gasification of coal. It is a predominant method and has succeeded in producing a large scale
of methanol in China [Fagerlund et al., 2014].

18
Figure 2.1.1 Conventional methanol production procedure [Stenhede, 2014]
Although natural gas is a comparatively eco-friendly substance than conventional fuels, it is still
categorized as fossil-based fuel. In this respect, there must be extra efforts to promote sustainable
technologies. In fact, some technologies to produce methanol from renewable sources are
feasible but high investment cost and high cost of feedstock suppress the growth of sustainable
technologies. Uncertainties of long term stability of renewable feedstock and regulations are also
critical obstacles.
Gasification of biomass to produce methanol is one promising sustainable technology in the
long term as not only NOx and PM, but CO2 emission is also an important concerns. Biomass
could be any types of plants or animal materials and it consumes CO2 during its cultivation.
However there are some limits which need to be taken into account. The biomass supply is highly
restricted by geographical location. It means that not every country or region is open to cultivate.
Moreover, technical immaturity is also one of the limits. The main problems are to reduce
impurities and tars which can be generated during the gasification process [Mphoswa, 2015].

19
The technology of recycling CO2 to produce methanol will be a fine solution to prevent further
deterioration of global warming effects. Figure 2.12 shows the overall scheme of methanol
production with recycling CO2. High concentration of CO2 can be captured from flue gases which
are mainly emitted by power plants and various types of factories.
Figure 2.1.2 Methanol production with recycling CO2 [Mitsui Chemicals, 2008]
2.2 General information of Ethanol
Ethanol is C2H5OH and called as either ethyl alcohol or hydroxyethane. It is one of the
representative alcohol fuels along with methanol. Many researches about ethanol have been done
for years to cope with significant increase of oil price and to prepare the imbalance between
demand and supply in the coming decades. Although sustainable production of ethanol is more
expensive than methanol, ethanol is still considered as a promising substitutive fuel for the
conventional fossil fuels. Compared to methanol, the beneficial aspects of using ethanol are that
ethanol is less toxic and has a higher energy density. Unlike methanol metabolism, ethanol
metabolism does not produce formaldehyde and formic acid, which are known as very toxic and
harmful for human body [Hovda, 2011].

20
Figure 2.2.1 Metabolism of methanol and ethanol [Hovda, 2011]
Bioethanol is produced from various types of sugar containing biomass such as corn, wheat,
sugarcane, switch grass, and so on. In addition, starch-rich and cellulose-rich biomass can be used
as comparable feedstock to sugar-rich substance. Approximately, half of bioethanol production
comes from sugar crop, specifically sugarcanes and beets. The remaining bioethanol production is
from starch crop such as corn and wheat. When it comes to profitable cultivation and CO2
mitigation, sugarcane in Brazil is the most promising feedstock to produce bioethanol because
favorable weather in Brazil accelerates its growth. Figure 2.2.2 illustrates that rapid increase of
ethanol production for fuel purpose from 1975 to 2005. Increase of production stands for
growing of demand for ethanol. This leads to prosperity of ethanol market and improvement of
relevant technologies.

21
Figure 2.2.2 World ethanol production [Danielsson, 2008]
The usage of ethanol as an additive to gasoline is known as one of the most common
applications nowadays. In the mixture, ethanol accounts for 5% to 10% of its total mass. There are
two major reasons for using ethanol as an additive to gasoline. First of all, higher octane value of
ethanol will raise the overall octane value of the fuel blend. Higher octane number of the fuel can
resist premature ignition. Consequently it is able to suppress engine knocking, which may cause
serious damages to the engine. Secondly, it facilitates to reduce harmful emissions such as
particulates, unburned fuel and carbon monoxide because ethanol naturally contains oxygen. The
effect of oxygen in the fuel is to promote more chemical reactions during combustion process.
Not only gasoline but also diesel is available to blend with ethanol, which is called as ―Diesohol‖.
It has already been introduced to engine market. One well-known blend of diesel and ethanol is
―E-diesel‖ and it consists of 85% of diesel fuel and 15% of anhydrous ethanol. The name of
another famous blend of diesel and ethanol is ―O2 Diesel‖. With this blend, more than 5000 buses
in India are successfully able to move on the roads [Karsen et al., 2009]. The concept of the diesel

22
blending with ethanol originated from the effort to reduce particle emissions, which is considered
as serious issue in compression combustion engines. Furthermore, with 95% of ethanol and 5% of
additive is used as a fuel for compression ignition engines in Sweden, which is called as E95 and
does not have any diesel fuel in it [Karsen et al., 2009].
One of the major reasons for using bioethanol is to mitigate dangerous environment impacts.
However, during the cultivation of feedstock, a large amount of synthetic fertilizers are used to
enhance quality of the harvest. In fact agricultural fertilizers have harmful effects on the
environment. It causes groundwater contamination, ozone depletion and global warming.
Therefore, technology development for sustainable agricultural production must be considered.
One astonishing result is that some of the feedstock can significantly reduce GHG. Figure 2.2.3
indicates that CO2‐equivalent well‐to‐wheels GHG reduction per driving kilometer
Figure 2.2.3 Well-to-wheel CO2 Equivalent reduction [Doornbosch et al., 2007]
Cellulosic‐based ethanol and sugarcane-based ethanol show significant reduction of GHG
emission. It can be known that the potential for GHG mitigation highly relies on types of
feedstock crop. Figure 2.2.4 illustrates the overall flow chart for bioethanol production from sugar
cranes.

23
Figure 2.2.4 Flow chart for bioethanol from sugar crane [G.D Nicola et al., 2011]
2.3 Evaluation of alcohol fuels as alternative fuels
To investigate the feasibility of usage of alcohol fuels for current diesel engines, properties and
characteristics of methanol and ethanol need to be evaluated. Table 2.3.1 illustrates detailed
comparison between alcohol fuels and conventional fossil fuels.
Although this thesis does not investigate Dimethyl-ether (DME), it is also considered as an
attractive alternative fuel. DME is an organic compound and its chemical formula is CH3-O-CH3. It
can be directly obtained from natural gas or through a dehydration reaction after methanol
synthetic reaction. Non-toxic and colorless are the characteristics of DME. Substantial researches
on DME are currently carried out to investigate combustion characteristics to determine whether it
is promising alternative fuel or not. [Park, 2014]

24
Table 2.3.1 Properties of various types of fuel [MAN Diesel & Turbo, 2014]
Chemical formula
Different from conventional fuels such as diesel and gasoline, both methanol and ethanol are
considered as oxygenated fuel as they contain 50% and 35% of oxygen of its mass, respectively. It
implies that more oxygen is available during combustion process when alcohol fuels are used.
Consequently plenty of oxygen alleviates the emission of particular matter emission as smoke and
soot are generated due to lack of the oxygen. [Turkcan et al., 2013]
C/H ratio
C/H ratio is the straightforward indication of CO2 emission from certain fuels. C and H stand for
Carbon and hydrogen contents, respectively. The higher C/H ratio is, the more CO2 generates.
However, alcohol fuels have lesser C/H ratio than diesel and gasoline. It indicates that methanol
and ethanol combustion reduces CO2 emission. Other advantage we can expect from alcohol fuels
is the decrease of NOx emission. Lower C/H ratio leads to high possibility to form H2O. The

25
specific heat of water vapor is higher than other products, which are generated during
combustion process. Due to high specific heat, water vapor is able to absorb large amount of
heat energy. Consequently, this phenomenon reduces the adiabatic flame temperature. Less NOx
emission is expected at lower temperature,
Lower heating value (LHV)
Compared to diesel, alcohol fuels have almost half of lower heating value (MJ/Kg). To make
equivalent performance as diesel fuel, larger quantities of alcohol fuels must be injected into the
engine cylinders. In order to achieve that, ships need to store larger quantities of alcohol fuels
and it surely requires larger volume of fuel tanks. Converting ballast tanks and existing HFO tank
to alcohol fuels tanks can be one of feasible solutions to overcome the limitation of space.
[Fagerlund et al., 2014] For example, the ballast tank in the Stena Germanica was converted to
methanol fuel tank. [Andersson, 2015]. However, more investigation of converting ballast tank
need to be studied to find out that it is applicable to other vessels.
Kinematic viscosity
It is one of the important properties for injection system in engines. In case of too low viscosity,
excessive wear of the components and power loss due to pump leakage take place during engine
operation. On the other hand, in case of too high viscosity, it affects fuel spray patterns. Figure
2.3.1 shows effect of viscosity on spray pattern. In addition, it causes excessive pump resistance
and filter damage. [Kegl et al,. 2013] Alcohol fuels tend to have lower kinematic viscosity.
Especially methanol has much lower kinematic viscosity than diesel engine. It might exacerbate
lubrication ability in injection pump but it can be overcome by applying sealing oil for lubricating
in injection pump, which lubricates all running surfaces. [MAN Diesel & Turbo, 2014]

26
Figure 2.3.1 Effect of viscosity on spray pattern [LIBEWHIZ, 2016]
Cetane number
Cetane number indicates auto-ignition quality of the fuels and affects combustion process of
compression ignition engines. Low cetance number of fuels has longer ignition delay as it is hard
to achieve auto-ignition. Cetane number of alcohol fuels is much lower than that of diesel fuel. It
has been pointed out as a disadvantageous aspect of alcohol fuels to be introduced into the
compression ignition engines because it implies alcohol fuels have unfavorable characteristics of
auto-ignition. Nevertheless, alcohol fuels still have potential to be used as an alternative maritime
fuel. Auto-ignition quality is not only dependent on cetane number but also highly affected by
temperature [Heywood, 1988]. With technical modification and improvement such as glow plug or
pilot fuel injection system, the poor auto-ignition of alcohol fuels can be overcome. [Fagerlund et
al., 2014]
Octane number
Octane number is a key parameter for premixed ignition engine. A fuel with high octane number
delays self-ignition timing so that it inhibits engine knocking, which causes seriously problems to
SI engines. One of positive characteristics of methanol and ethanol is that it can blend with

27
gasoline. This blending mixture has higher octane number than gasoline only. It makes SI engine
to resist higher compression ratio and suppress knocking. As a result, SI engine with blending
mixture produces higher mean indicated effective pressure (IMEP) as well as higher indicated
efficiency. [Turkcan et al., 2013] There is an inverse correlation between cetane and octane
number as shown in Figure 2.3.2. With increase of cetane number, octane number decreases.
Figure 2.3.2 Inverse correlation between Cetane and Octane [saha, 2016]
Heat of vaporization and cooling effect
Heat of vaporizations (KJ/Kg) of both methanol and ethanol are roughly 4 times and 3 times
higher than that of diesel fuel, respectively. Therefore significant cooling effect in the cylinders
can be expected. When liquid fuel is injected into the cylinder during compression stroke, it
absorbs heat energy and then it evaporates. Larger heat of vaporization means that liquid fuel
needs to absorb more heat energy to vaporize. Since heat energy is used for vaporization process,
in-cylinder temperature decreases. The beneficial aspect of the significant cooling effect is that it
can reduce NOx emission due to low in-cylinder temperature [Heywood, 1988].

28
Flammability limits
Flammability limits indicates the proportion of flammable mixtures, which mark the flammable
ranges to combust. The proportion between gases and air plays a key role to produce a fire.
Above the upper flammable limit (UFL) where deficient oxygen exists, the mixture is not able to
burn. Below the lower flammable limit (LFL) where excessively sufficient oxygen exists, ignition
does not take place. Unlike compression ignition engine, spark ignition engine requires
homogenous mixtures to induce ignition. Alcohol fuels have wider range of flammability limits
compared to gasoline. It allows using leaner mixtures and lean-burn engines can reduce NOx
emission.
Figure 2.3.3 Flammability ranges of various fuels at atmospheric temperature [Anjeel, 2016]

29
Flash points
Handling and storage are essential considerations when introducing new fuel to conventional
system. Flash points of 12℃ and 14℃ does not comply with the Safety Of Life At Sea (SOLAS).
However, the new mandatory code for low-flash point fuels (IGF code) will enter into force on
January 1, 2017. The IGF code contains all the considerations for the usage of low-flashpoint fuels
and it provides mandatory criteria to minimize the risk. [T.G Osberg, 2015] Modifications on the
ventilation system, insulation of electrical system, double wall design of all alcohol fuel
components and additional fire detection system are necessary to enhance safety.
2.4 Emission
General information of emissions is explained in this section. The emissions of alcohol fuel
combustion can be found in section 2.5
Unburned hydrocarbons
Generally, the compression ignition engine is known for producing less unburned hydrocarbons
(UHCs) compared to spark ignition engine as they have different ignition processes [Pulkrabek,
2004]. Since gasoline engine adopted premixed combustion, it has high possibility to emit a larger
quantity of unburned hydrocarbons than compression ignition engine. The fundamental reason
for UHCs emission is that unburned fuels are emitted from cylinders. Major causes of UHCs
emission are quenching, crevice losses and oil adsorption [Königsson, 2012]. Additionally, fuel slip
during scavenging process also contributes to UHCs emission.
Quenching: It occurs due to cold temperature of the cylinder wall, which is called as wall-
quenching. During combustion process, the flame in the cylinder stops burning near the cold
areas as flame propagation is hindered by cold temperature as shown in Figure 2.4.1. In result,
hydrocarbon near the wall remains unburned due to incomplete combustion. [Warnatz, J et al.,
1999]

30
Figure 2.4.1 Flame quenching in the cylinder [Flagan et al., 1988]
Crevice losses: Crevice losses take up the largest portion of UHCs emission among the three
causes. This phenomenon is noticeable in premixed combustion engines. In the cylinders, there
are some gaps, which are called as crevice, such as piston ring pack, head gasket and the small
volume between the piston and cylinder wall [Flagan et al., 1988]. The premixed mixtures are
moved into the gaps where temperature is comparatively lower. When the flame propagates, it
cannot reach to these cold regions so that HC remains unburned. During expansion process, the
unburned HC is exposed to combustion gases and it escapes from the combustion chamber
through exhaust valves together with exhaust gases.

31
Figure 2.4.2 Schematic of quenching layer and crevice volume [Flagan et al., 1988]
Adsorption: Pressure difference between compression process and expansion process is a cause of
adsorption. During the compression stroke, pressure in the cylinder goes high and it forces HC to
seep into oil layer on the cylinder wall. During the expansion stroke, however, pressure in the
cylinder decreases as piston goes down to BDC. The absorbed HC gets out of oil layer and is
ejected together with exhaust gases.
Carbon monoxide
Carbon monoxide (CO) is one of the fatal emissions as high concentration of CO causes serious
health problems to human being. It is scentless gas and is a result of incomplete combustion. Low
temperature and pressure in cylinders or short of O2 during the combustion process are the main
causes of incomplete combustion. CO is generated from an intermediate step in the process of

32
converting to CO2. Failure of fully oxidized to CO2 due to lack of OH radicals causes the formation
process to stop at CO.
CO O CO2 (2.1)
Even if engine runs in stoichiometric condition, there must be fuel rich regions because achieving
perfect homogeneity is very difficult. In this result, CO emission is still substantial. On the other
hand, operation of the engine in lean-burn condition contributes to reduction of CO until
excessively lean mixture causes the flame to quench [Heywood, 1988]. Figure 2.4.3 illustrates the
relation between CO emission and equivalent ratio.
Figure 2.4.3 Relation between Air/Fuel ratio and NO, CO and HC concentration [Heywood, 1988]
One possible solution to deal with CO emission is to apply after-treatment, which is oxidation
catalyst. It effectively removes CO [Dou. 2012].

33
Nitrogen oxides
Nitrogen oxides (NOx) are a result of chemical reaction between nitrogen and oxygen. Nitrogen
exists not only in the air but in the fuel as well. NOx causes serious environmental problems
because it destroys the ozone layer. In addition, NOx is a threat to human‘s body as it is the cause
of respiratory diseases. NOx mainly consists of NO, NO2 and N2O, although quantities of N2O is
ignorable (< 1%). NO accounts for around 90% to 95% of entire NOx emission and NO2 emissions
make up 5% to 10%. [Staperma, 2010c] The formation of NO is called as Zeldovich-mechanism,
which consists of three reversible chemical reactions [Kumar, 2010].
O N2 𝑁𝑂 𝑁 (2.2)
N O2 𝑁𝑂 𝑂 (2.3)
N O NO (2.4)
First reaction takes place in very high temperature as it has high activation energy. It can be
observed that first reaction can supply nitrogen for second reaction, which also produces NO.
Figure 2.4.4 shows Nox formation with respect to temperature.
Figure 2.4.4 Relation between NO formation and temperature [Kumar, 2010].

34
Fuel NO is produced by the organically bound nitrogen in the fuel. Compare to nitrogen in the air,
nitrogen in the fuel has weak bond so it can easily convert into NO. Thermal NO is generated by
the nitrogen in the air. It is highly dependent on temperature and it starts forming over 1000℃.
Prompt NO is formed in the flame front with fuel-rich condition. It is formed with relatively lower
temperature than thermal NO. In typical engine combustion, only 5 to10% of NO is produced by
prompt NO and 90 to 95% of NO is generated by thermal NO. [Gunter P et al., 2006]
2.5 Dual fuel engine
Fundamental principle of dual fuel engine is that high reactivity pilot fuel induces combustion of
low reactivity primary fuel. Instead of spark in SI engine, dual fuel engine uses the pilot fuel. This
pilot fuel automatically ignites near Top Dead Center by heat of compression. In addition, the
pilot fuel contributes to both ignition and heat release during combustion. This concept has
widely been adopted in natural gas engine. There are many dual fuel concepts which are widely
adopted these days [Mestemaker et al,. 2016]. Among them, direct injection and port injection
type will be discussed in this section.
2.5.1 In-cylinder direct injection with high pressure
In dual fuel engine, the injection of liquid pilot fuel proceeds earlier than injection of primary
fuel. When primary fuel injection takes place, it should be directly injected into the engine
cylinder at very high pressure. Normally this injection process occurs when the piston gets close
to Top Dead Center. The main reasons for high pressure of primary fuel injection are to overcome
the high in-cylinder pressure around TDC and to reduce the injection duration of primary fuel
since a large amount of primary fuel needs to be injected. The high pressure accelerates the
injection speed of primary fuels and this leads to stable ignition and decrease of combustion
duration. In result, shorter combustion duration contributes to higher engine efficiencies because
mostly heat release process takes place just after TDC where expansion process starts. In this
regard, keen control of injection pressure is a critical aspect in direct injection engine. If injection
pressure is in excess of its required level, the fuel jets from injection nozzle would over penetrate
the combustion chamber and finally reach to the cylinder and piston surface. This causes
35
quenching problem, increase of heat loss to the wall and the contamination of lubrication oil in
the cylinder.
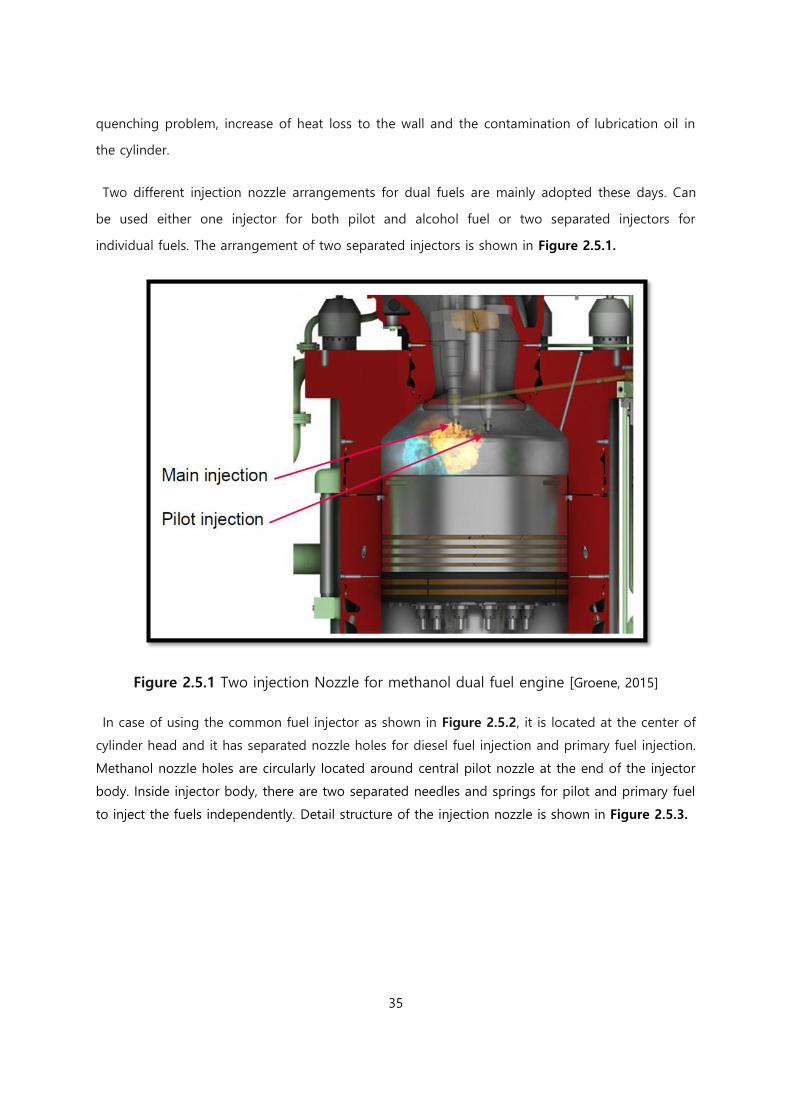
Two different injection nozzle arrangements for dual fuels are mainly adopted these days. Can
be used either one injector for both pilot and alcohol fuel or two separated injectors for
individual fuels. The arrangement of two separated injectors is shown in Figure 2.5.1.
Figure 2.5.1 Two injection Nozzle for methanol dual fuel engine [Groene, 2015]
In case of using the common fuel injector as shown in Figure 2.5.2, it is located at the center of
cylinder head and it has separated nozzle holes for diesel fuel injection and primary fuel injection.
Methanol nozzle holes are circularly located around central pilot nozzle at the end of the injector
body. Inside injector body, there are two separated needles and springs for pilot and primary fuel
to inject the fuels independently. Detail structure of the injection nozzle is shown in Figure 2.5.3.

36
Figure 2.5.2 Single methanol-diesel injector [Haraldson, 2015]
Figure 2.5.3 Overview of single methanol injector [Stojcevski et al., 2016]
The engines which employ in-cylinder direct injection concept usually inject only diesel fuel when
the engines run in very low load condition or when the engines need to start. Since low cetane
number is the characteristics of primary fuel, ignition ability and stable combustion are poorer
than pilot fuel. For this reason, most of dual fuel engines nowadays use only diesel fuel when it
starts or at very lower load condition. Later on, only diesel mode gradually switches over to dual
fuel operation. In this phase, quantity of pilot fuel decreases. On the other hand, supply of

37
primary fuel proportionally increases. Reverse procedure takes place during engine shut down.
Figure 2.5.4 illustrates overall operation load with respect to different fuels.
Figure 2.5.4 Operation with different fuels based on Engine load [Groene, 2015]
Combustion characteristics of in-cylinder direction injection concept
In case of in-cylinder direct injection concept, injection of liquid pilot fuel takes place first,
followed soon after by the injection of primary fuel. During the atomization phase of pilot fuel,
injected pilot fuel mixes with in-cylinder air, which is called as premixing process. This pre-mixture
leads to rapid increase of pressure and temperature once ignition starts. However, primary fuel
which is injected right after pilot fuel injection has high heat of evaporation and it prevents from
prompt increase of pressure and temperature due to heat absorption. The heat from premixed
combustion process expedites evaporation of primary fuel. In results, peak heat release value in
premix combustion decreases and combustion duration of primary fuel can be reduced [Kang,
2002]. In addition, lower temperature during the premixed combustion phase can reduce NOx
formation. Figure 2.5.5 illustrates heat release rate of in-cylinder direct injection methanol engine.

38
Figure 2.5.5 Heat release rate of in-cylinder direct injection methanol engine [Kang, 2002]
After pilot fuel is injected into the cylinder, initial ignition simultaneously begins at multiple
points. Flames which are generated by pilot fuel start to spread outward from the center of
ignition points to the immediate air-fuel mixtures. This phenomenon triggers the mixture to
commence ignition. The flame from an ignition point is not able to travel far distance before it
meets flames from adjacent regions. In this respect, there is less possibility to have knocking
problems in spite of high compression ratio [Karim, 2015]. Once primary fuel injection takes place,
primary fuel travels more distance than diesel fuel due to its poor ignition ability. While it travels,
primary fuel absorbs the heat from pilot fuel combustion thereby increasing the amount of air-
primary fuel mixtures. With the aid of relatively fast flame propagation of alcohol fuels, duration
of diffusive combustion decreases. [Kang, 2002]
2.5.2 Premixed dual fuel engine
The concept of premixed combustion includes both SI engine and CI engine characteristics. As in
Dual fuel
Only diesel fuel

39
SI engines, primary fuel is existing in the form of homogeneous mixture with air in the cylinder
before it starts combustion. The premix process of primary fuel begins in the inlet manifold after
turbo charger as shown in Figure 2.5.6. With help from velocity of supply air and swirls in the
cylinder, primary fuel is well mixed with air. To ignite low reactivity homogenous mixture, the pilot
fuel is injected close to TDC to induce in-cylinder combustion. This pilot fuel ignites by the heat
of compression like conventional compression ignition engines. Therefore major characteristics of
dual fuel combustion can be defined as the combination between mixing-controlled diffusion
combustion of CI engine and turbulent flame propagation of SI engines.
Figure 2.5.6 Port injection engine [Georgescu, 2013]
Combustion characteristics of premixed dual fuel concept
The combustion process of premixed dual fuel engine is affected by both ignition characteristics
and injection spray patterns of pilot fuel. In addition, the concentration of pre-mixtures in the
cylinder is also a key factor to determine combustion characteristics. [KARIM, 2015] The overall
combustion process of dual fuel engine can be reflected by heat release rate. The heat release
characteristics during combustion process are dependent on complex physical and chemical
interactions between pilot and primary fuel. Unlike the heat release in conventional diesel engines,
which mainly consists of premixed combustion and diffusive combustion, the major components
of heat release rate of premixed dual fuel engine consist of three overlapping regions. Both

40
conventional and premixed dual fuel heat release diagrams are shown in Figure 2.5.7 & Figure
2.5.8.
Figure 2.5.7 Heat release diagram of a conventional diesel engine [KARIM, 2015]
Figure 2.5.8 Heat release diagram of premixed dual fuel engine at light load [KARIM, 2015]

41
∎ First region (I) stands for start of combustion by pilot fuel. In this region, mixtures of primary
fuel-air are rarely present so that majority of heat release comes from the pilot fuel combustion.
Very rapid rises in pressure and temperature caused by the pilot fuel ignition can be observed in
region (I). In spite of relatively little portion of the heat release, mixtures of primary fuel-air also
partly contribute to heat release in the region as small amount of the mixtures can entrain into
the combusting pilot jet. In addition, the outer region of the combusting pilot jet always contacts
with relatively richer fuel mixture in the cylinder.
∎ Second region (II) represents the combustion which takes place in the immediate vicinity of
combustion center of the pilot fuel. No continuous flame propagation can be seen in the center
of pilot combustion as the very lean primary fuel mixtures are present in that zone. However with
the increase of pilot injection quantity, the size of pilot combustion zone expands accordingly.
Consequently, a large amount of the surrounding mixtures can have more chance to entrain into
the pilot combustion region. This leads to widening of the burning regions in the vicinity of the
pilot combustion zone. At this stage, partial flame propagation takes place and pre-ignition
reaction activity of remaining mixtures increases due to greater heat release and temperature rise.
∎ Third region (III) is formed by flame propagation through the primary fuel-air mixtures. As
flame propagation spreads outward from the immediate vicinity of pilot combustion, the flame
will be exposed to higher concentration of the mixtures. In the meantime, as piston goes up to
TDC position, the mixtures are subjected to higher temperature and pressure. These phenomena
eventually trigger off the turbulent flame propagation throughout the rest of unburned mixtures.
Especially, third region (III) is highly affected by engine load as the injection amount of primary
fuel varies with respect to engine load. For example, more primary fuel is injected at higher load
and this leads to increase of the pre-mixture concentration in the cylinder. Figure 2.5.9 shows
heavy load condition. Overlap between second region (II) and third region (III) become significant
with heavy load operation.

42
Figure 2.5.9 Heat release diagram of premixed dual fuel engine at heavy load [KARIM, 2015]
With a constant pilot injection quantity, heat release rate variations based on diverse pre-
mixtures concentrations are well illustrated in Figure 2.5.10. As the concentration of pre-mixtures
increases, it can be observed that the size of region (III) correspondingly grows.
Figure 2.5.10 Heat release variation with respect to different equivalence ratio [KARIM, 2015]
43
2.5.3 Current application
In maritime industry, dual fuel concept is preferred technology and has dominant position on the
engine market due to its unique advantage, which is fuel flexibility. The uncertainties of alcohol
fuel price and availability in the future are the significant concerns for ship‘s owners. With dual
fuel concept, the engine is able to operate in only diesel fuel mode as an alternative. It enables
vessels to travel many places even though there is no supply for alcohol fuels. In addition, when
price of alcohol fuel becomes higher than fossil fuel, vessels can use fossil fuel as a primary
energy and it can be easily supplied from the existing fuel infrastructures. In fact, fuel price is the
most important concern for ship‘s owners so that most of fuel selection decisions are made based
on the fuel price.
Direct injection type
This concept is adopted by both Wärtsilä and MAN B & W. The major distinction between these
engine makers is that Wärtsilä engines use only one fuel injector to distribute both diesel and
methanol fuel. On the other hand, MAN engines have two separated fuel injectors for both fuels.
Engine performance of current methanol engines will be discussed as below.
2.5.3.1 MAN B & W Methanol Engine
The engine test was carried out by 7S50ME-B9.3-LGI engine, which was the world‘s first 2-stroke
methanol engine in the markets. The detail engine specifications are shown in Table 2.5.1. The
proper amount of pilot fuel to guarantee the stable methanol fuel ignition is considered to be
around 5 % of the diesel fuel consumption at MCR in only diesel oil mode. [Stefan Mayer et al.,
2016]

44
Table 2.5.1 Engine specification of 7S50ME-B9.3-LGI [Stefan Mayer et al., 2016]
Heat release rate (50% load VS 100% Load)
In Figure 2.5.11, DI and LGI stand for Diesel Injection (Only diesel operation) and Liquid Gas
Injection (Methanol operation), respectively. In LGI mode, initial heat release is produced by diesel
premixed combustion. After initial combustion takes place, methanol fuel starts injecting onto
ongoing combustion in liquid phase. Due to the heat of evaporation of methanol fuel, liquid
methanol fuel absorbs combustion heat to vaporize. This heat of evaporation effect is observed
on the graph below. There is a gradient change in heat release rate right after TDC. Additionally,
this heat absorption mitigates rapid increase of heat release so that the peak point of heat
release rate decreases when switching diesel fuel to methanol fuel. It can be observed that overall
combustion duration becomes shorter in methanol operation.

45
Figure 2.5.11 Heat release rate 50% and 100% [Stefan Mayer et al., 2016]
Scavenging air pressure (T/C air pressure)
Although higher mass flow went into turbo charger during methanol operation due to its lower
LHV, scavenging air pressure was lower than diesel operation, which can be seen in Figure 2.5.12.
The decrease of combustion duration is the key to understand this phenomenon. It is proved by
the heat release graph that combustion duration become shorter when methanol was used as a
primary fuel. Consequently shorter combustion duration improved engine efficiency. It means that

46
more energy was consumed during in-cylinder process to improve the efficiency. As a result, less
energy allowed going into turbo charger in the end. This effect is large enough to compensate
the effect of increased methanol fuel mass. [Stefan Mayer et al., 2016]
Figure 2.5.12 Scavenge air pressure [Stefan Mayer et al., 2016]
NOx Emission
Figure 2.5.13 illustrated the NOx emission test result. NOx emission of methanol combustion
reduced by 30% compared to diesel combustion. This is mainly due to the higher heat of
evaporation for methanol. It helps to decrease maximum in-cylinder temperature. [Kang, 2002]

47
Figure 2.5.13 NOx Emission comparison (Diesel VS Methanol) [Stefan Mayer et al., 2016]
CO Emission
One reason for lower CO emission during methanol combustion is that the methanol fuel jet
facilitates the effective air-fuel mixing. It helps to achieve complete combustion. In addition, the
chemical structure of methanol proves that it contains oxygen. Consequently, during combustion
process, more oxygen is available for combustion. It helps to reduce CO emission because one of
reasons for CO emission is shortage of O2

48
Figure 2.5.14 Specific CO emissions [Stefan Mayer et al., 2016]
HC Emission
Throughout the entire operating load range, HC emissions of methanol combustion
were always higher than that of diesel combustion. This was caused by strong flame
quenching effect near the combustion chamber wall due to its high heat of evaporation.
In addition, fuel slip also contributed to HC emission.
Figure 2.5.15 HC emissions [Stefan Mayer et al., 2016]

49
2.5.3.2 Wärtsilä Methanol Engine
Unlike MAN methanol engine, Wärtsilä adopted 4 strokes type instead of 2 strokes to convert
conventional engines into methanol dual fuel engines. Overall test results are similar with MAN
engine results. Wärtsilä 4L32LNGD engine was chosen to carry out the engine performance test
when methanol was used as a primary fuel. The minimum operation load in methanol running
mode was about 25% load. The specification of test engine can be found in Table 2.5.2.
Table 2.5.2 Test Engine specification, 4L 32LNGD [Haraldson, 2015]
Engine type 4L 32LNGD
Engine Maker Wärtsilä
Stroke 4 Stroke
RPM 750
Compression ratio 13.8:1
Output 410 KW/cylinder
Inlet valve open 52 CA (BTDC)
Inlet valve close 28 CA (ABDC)
Exhaust valve open 56 CA (BBDC)
Exhaust valve close 44 CA (ATDC)
Heat release rate
The heat release rates were measured with different energy share ratios between methanol and
diesel fuel. With the increase of methanol energy fraction, the peak value of heat release
decreased and peak point crank angle retarded. Figure 2.5.16 illustrates the test results of heat
release rate. During the late combustion process, the downstream gradient of higher methanol
fraction case (Red) is steeper than lower methanol fraction case (Green), showing faster
combustion with higher methanol fraction.

50
Figure 2.5.16 Heat release rate, 4L 32LNGD engine [Haraldson, 2015]
NOx Emission
Pure light fuel oil operation at 75% load was given as reference (Red) to compare with
methanol operations. Figure2.5.17 illustrates the laboratory results and it tells that methanol
operation significantly reduced NOx emissions. Methanol operations show that NOx emissions of
all cases are below 6 g/KWh. It complies with Tier II NOx emission limits, which is shown in Figure
2.5.18.

51
Figure 2.5.17 NOx emissions, 4L 32LNGD engine [Haraldson, 2015]
Figure 2.5.18 MARPOL Annex VI NOx Emission Limits [IMO, 2016]

52
3. Hypothesis
∎Effects of heat of evaporation on in-cylinder temperature in dual fuel premixed engine.
Methanol fuel has distinctive characteristics in its properties compared to diesel oil. One
significant difference from diesel fuel is that methanol fuel has almost 4 times higher heat of
vaporization [KJ/KG]. In other words, methanol fuel requires larger quantity of heat energy to
evaporate fuel droplets. Therefore in-cylinder temperature decreases due to heat absorption
during vaporization process. This low temperature suppresses excessive combustion rate thereby
the maximum in-cylinder temperature is lower than of diesel oil operation.
∎Effect of fuel ratio between pilot and primary fuels on ignition delay and heat release rate
In dual fuel engine, fuel ratio between pilot fuel (Diesel fuel) and primary fuel (Methanol fuel)
highly affects combustion process as it leads to change of ignition delay. Increase of methanol
fuel injection prolongs ignition delay due to its high heat of evaporation value. The larger portion
of methanol fuel enhances the effect of heat absorption and the lower temperature reduces
chemical reaction speed. In this respect, the larger portion of methanol fuel leads to retarded start
of combustion. In addition, with increase of methanol fuel, amount of heat release in premixed
combustion phase increases as more pilot fuel is premixed due to longer ignition delay.
∎Specific fuel consumption and brake thermal efficiency
Fuel economy is represented by brake specific fuel consumption (BSFC, g/KWh). Lower heating
value (LHV) has the significant influence on the determination of BSFC. Since LHV of methanol
fuel has roughly half of diesel oil‘s LHV, methanol dual fuel combustion has higher BSFC value
than diesel combustion.
Brake thermal efficiency can be referred to as the fuel conversion efficiency. It can be described
by the ratio of the engine output to the amount of fuel input. Since LHV of methanol is lower
than that of diesel, more fuel needs to be injected to produce the same output. As a result,
thermal efficiency will decrease with increase of methanol injection. In addition, with increase of

53
methanol fuel, higher cooling effect can be expected. The cooling effect decreases the
temperature of in-cylinder charges and it leads to increase of flame quenching. As a result, less
fuel can be converted into engine output.

54
4. Base models
To investigate in-cylinder process, Model C is used in this thesis, which was developed by Ding-
Yu. [Ding, 2011]Model C is suitable for simulating in-cylinder process and it consists of Heat
release rate model and in-cylinder process model. In the chapter, fundamental features of Model
C are introduced. In addition, Model C has been built based on single-zone model. Differences
between single zone and multi-zone are discussed in section 4.2 to better understand the
concept of the zone.
4.1 Introduction of Model C
4.1.1 Heat release calculation model
Heat release rate is the one of the most essential information to analyze in-cylinder combustion
process. Definition of Heat Release Rate (HRR) is that the chemical energy of the fuel is released
by the combustion process. There are three most common definitions to describe heat release
rate.
(a) Net Apparent Heat Release Rate (NAHRR):
𝑁𝐴 𝑅𝑅 = Q̇comb − �̇�𝑙𝑜𝑠𝑠 �̇�𝑓 = 𝑚 ∗ 𝐶𝑣 ∗𝑑𝑇
𝑑𝑡 𝑝 ∗
𝑑𝑉
𝑑𝑡 ,J/S- (4.1)
(b) Gross Apparent Heat Release Rate (GAHRR):
𝐺𝐴 𝑅𝑅 = Q̇comb �̇�𝑓 = 𝑚 ∗ 𝐶𝑣 ∗𝑑𝑇
𝑑𝑡 𝑝 ∗
𝑑𝑉
𝑑𝑡 �̇�𝑙𝑜𝑠𝑠 ,𝐽/𝑆- (4.2)
(c) Combustion Reaction Rate (CRR):
C = ξ =𝑚∗𝐶𝑣∗
𝑑𝑇
𝑑𝑡+𝑝∗
𝑑𝑉
𝑑𝑡+�̇�𝑙𝑜𝑠𝑠
𝑢 𝑜𝑚 +𝑒𝑓 , 𝑔/ - (4.3)

55
NAHRR is the net heat released by the fuel burning during combustion. Both in-cylinder pressure
and temperature are the key factors to calculate NAHRR. However, it does not include the heat
loss to the walls. On the other hand, GAHRR includes heat loss to the walls. With the definition of
GAHRR, all the heat produced by combustion process can be calculated. However, it is difficult to
get accurate heat loss value from the measurement. Therefore, a proper estimation of heat loss is
required to increase the accuracy of GAHRR. From a physical point of view, CRR means the rate at
which fuel burn. It can be calculated when GAHRR is divided by the sum of the effective
combustion value (ucomb) and specific energy of fuel (ef). Each term in the equations above (4.3)
have physical meanings. 𝑚 ∗ 𝐶𝑣 ∗𝑑𝑇
𝑑𝑡 indicates the change in internal energy due to temperature
variation. 𝑝 ∗𝑑𝑉
𝑑𝑡 presents the work done by the piston motion. �̇�𝑙𝑜𝑠𝑠 means heat loss to the
cylinder head, piston crown and cylinder wall. The first denominator term of CRR (ucomb) can be
defined as below,
ucomb = 𝑢𝑐𝑜𝑚𝑏𝑟𝑒𝑓
−△ 𝑢𝑐𝑜𝑚𝑏𝑟𝑒𝑓
(4.4)
The first term above (4.4) stands for the reference internal energy of closed system and second
term indicates the change of internal energy caused by the temperature difference from the
reference condition.
Based on the three definitions, Heat Release Rate can be calculated in Heat release rate model.
The primary inputs of the model are in-cylinder pressure as well as crank angle. In-cylinder
temperature is calculated based on ideal gas law. The final output is the Combustion Reaction
Rate (CRR). With the CRR, Reaction coordinates (RCO) can be obtained after integration of CRR.
The RCO is a suitable parameter for curve fitting and vibe parameters can be determined based
on the RCO.

56
Figure 4.1 Heat release rate calculation model [Ding, 2011]
4.1.2 In-cylinder process model
To investigate and analyze in-cylinder process, understanding of fundamental features of Model
C is necessary because the main purpose of the model C is to simulate in-cylinder process from
inlet valve close (IC) to exhaust valve open (EO). Integration of the first law of thermodynamics
(4.5) is required to calculate in-cylinder temperature, which is considered as the final output of
this model.
dT
dt= 𝑄𝑐𝑜𝑚𝑏̇ − 𝑄𝑙𝑜𝑠𝑠̇ − 𝑝 ∗ .
𝑑𝑉
𝑑𝑡/ 𝐸�̇� , (4.5)
Combustion reaction rate (ξ) is an important parameter because the heat release model is built
up based on fuel burn rate, which stands for mass of fuel burnt per unit time. This parameter acts
as heat source (𝑄𝑐𝑜𝑚𝑏̇ ) in the above equation (4.5) when it is multiplied with heat of combustion
(ucomb), which is a function of temperature. Moreover, reaction rate (ξ) is provided as an input
value for mass balance and composition block in the form of a multiple vibe function. It helps to
keep track of both the mass balance and composition in the cylinder. Output composition

57
becomes an input of properties library to calculate properties of the in-cylinder mixtures. In-
cylinder volume is also an important parameter and is calculated by cylinder geometry,
dimensions and crank angle (α). Under the assumption that engine speed is constant, the crank
angle is calculated by the equation (4.6) below.
V(α) = Ab ∗ 𝐿𝑠 ∗ [1
𝜀 − 1 1
2∗ {(1 cos(𝛼)
1
𝜆𝐶𝑅∗ (1 − √1 − 𝜆𝐶𝑅
2 ∗ sin2 𝛼))}], (4.6)
where λCR and ε are crank radius to rod length ratio and geometric compression ratio, respectively.
To calculate in-cylinder pressure, the gas law is applied and several values are necessary such as
gas constant(R), mass (m), cylinder volume (V) and feedback of in-cylinder temperature (T). To
calculate work (W), differential of volume (dV
dt) needs to be preceded and this can be performed in
a simulation environment. To estimate heat loss, reliable heat transfer coefficient is calculated by
using Woschni‘s model. The energy of fuel (Ef) stands for the energy carried by the fuel into
cylinder upon entry.
Figure 4.2 General block diagram of in-cylinder process model [Ding, 2011]

58
4.2 Single zone model VS Multi-zone model
4.2.1 Single zone model
Figure 4.3 describes singe-zone model. In the single-zone model, the thermodynamic properties
in the cylinder are expressed in average values. There is no specific distinction between burned
gas zone and un-burned gas zone. The in-cylinder contents are considered as uniform and
homogeneous and spatially non-uniform thermodynamic properties are not considered in the
single zone model. The advantage of single-zone is that it is easy and simple to find out the
effects of in-cylinder process. In practice, during the real combustion process, burned gases form
at different times and locations in the cylinder. Therefore there must be temperature gradients in
the burned gases. However, due to no distinction between un-burned and burned zone, there is
no temperature gradient in the cylinder with single zone concept. Since it does not consider the
temperature gradient in burned gases zone or mixing gases zones between burned and un-
burned gases, it is difficult to predict the accurate in-cylinder gas temperature.
Figure 4.3 Single-zone cylinder model [Gunter P et al., 2006]

59
To comply with the single-zone principle, in-cylinder gas is treated as a single-zone in the
control volume. Fuel droplets evaporate as soon as they are injected into the control volume. As
the fuel injection rate and the evaporation rate are considered to be the same, dwelling time of
the fuel droplet becomes zero. In addition, it is assumed that injected fuel droplets burn as soon
as they are evaporated, which means that evaporation rate and combustion rate are identical.
4.2.2 Multi-zone model
To predict more accurate thermodynamic properties during in-cylinder process, multi-zones can
be introduced. Each zone is treated as an independent thermodynamic system. Also each zone is
considered to have its own uniform and homogeneous properties. Figure 4.4 shows that two-
zone model and it consists of zone 1 and zone 2. Zone division is made based on the flame front.
Unburned mixtures such as fresh air, injected fuel and residual combustion products from the
previous cycle are the main contents of zone 1. This zone 1 has its own thermodynamic
properties. (P, V1, T1, λ1). Zone 2 stands for burned mixture zone and it has different
thermodynamic properties from Zone 1 (P, V2, T2, λ2), except the in-cylinder pressure. However the
implementation of a multi-zone concept is more difficult and complicated than single zone model.

60
Figure 4.4 Two-zone cylinder model [Gunter P et al., 2006]

61
5. Model modification
5.1 Overall methodology
Methanol dual fuel engines have gained interest in recent years. Thus only limited information
on the engines is available at the moment. To carry out the simulation on methanol engine, prime
inputs need to be obtained ideally by an engine experiments. However, without the experiment,
how to obtain necessary input was the major difficulty. In this thesis, a prime input which is in-
cylinder pressure is acquired by the pressure diagram in a published reference [Lijiang Wei et al.,
2015] as this reference provides detail information compared to other references. The pressure
values are read by naked eyes. To increase accuracy of pressure-reading, interpolation is used to
calculate intermediate values between crank angles. Interpolation is a good mathematical method
to estimate intermediates values within the range of a discrete set of known data. Although there
must be inevitable pressure-reading errors, the overall characteristics of pressure trends can be
inputted.
The in-cylinder pressure read by naked eyes is used as the main input in the heat release model.
With the in-cylinder pressure, the heat release model can calculate the combustion reaction rate
(CRR) based on the first law of thermodynamics. Reaction coordinate (RCO) is obtained by
integration of the combustion reaction rate. The purpose of reaction coordinate is to determine
multiple vibe function parameters, which are used as the main input in the in-cylinder model.
Lastly, the simulation results from two different models are compared and analyzed to find out
the effects of methanol fuel on in-cylinder process.
5.2 Assumptions and Engine data
5.2.1 Assumptions
In order to carry out the simulation based on data from literature, some assumptions are made
as below.
1. As initial conditions are not given, p1 is calculated based on the equation (5.1)

62
p1 =𝑝2
𝑟 𝑛 𝑜𝑚𝑝 (5.1)
where p2 and rc are the pressure at start of iso-volumetric combustion and effective compression
ratio, respectively.
rc =𝑉1
𝑉2 (5.2)
2. Both air and stoichiometric gases are considered to be ideal but non-perfect gases, the internal
energy and enthalpy of in-cylinder gases are functions of temperature.
3. In practice, methanol evaporation takes place at many places such as on the surface of inlet
valve, on the wall of inlet manifold, on the cylinder walls and in the inlet manifold. Many
parameters affect evaporation event, for example, the size of droplets, surrounding air velocity
and temperature, injection pressure and in-cylinder wall temperatures. However, it is not possible
to predict methanol evaporation event by the current Model C. For this reason, methanol fuel is
assumed to completely evaporate in the port before inlet valve close. No further evaporation and
heat absorption takes place after inlet valve close (IC). [Tuominen, 2016] [Tutak, 2015] [Kasseris,
2011]
4. Methanol exits as homogenous pre-mixtures gases in the cylinder at inlet valve close (IC)
5. According to single zone principle, there are no unburned gases in the cylinder. For this reason,
regardless different fuel ratios, all the fuels which are injected into the cylinder are completely
combusted.
6. Both fuels have the same combustion duration.
63
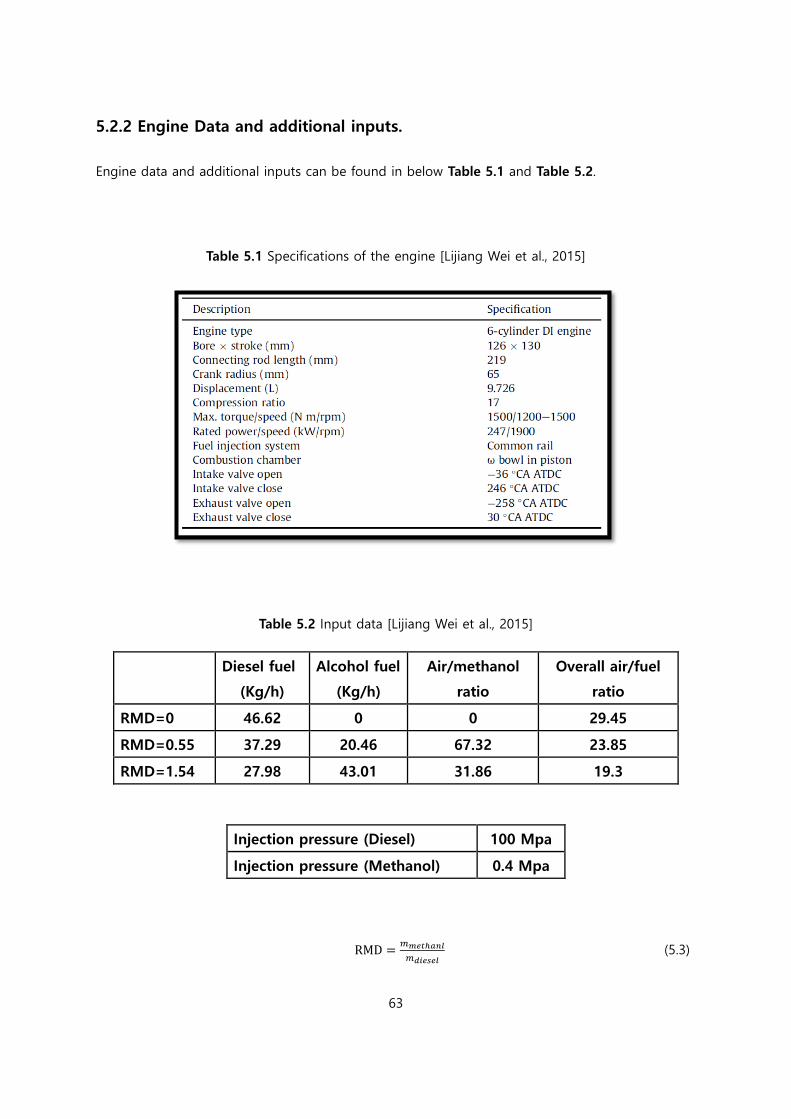
5.2.2 Engine Data and additional inputs.
Engine data and additional inputs can be found in below Table 5.1 and Table 5.2.
Table 5.1 Specifications of the engine [Lijiang Wei et al., 2015]
Table 5.2 Input data [Lijiang Wei et al., 2015]
Diesel fuel
(Kg/h)
Alcohol fuel
(Kg/h)
Air/methanol
ratio
Overall air/fuel
ratio
RMD=0 46.62 0 0 29.45
RMD=0.55 37.29 20.46 67.32 23.85
RMD=1.54 27.98 43.01 31.86 19.3
Injection pressure (Diesel) 100 Mpa
Injection pressure (Methanol) 0.4 Mpa
MD =𝑚𝑚𝑒𝑡𝑎𝑛𝑙
𝑚𝑑𝑖𝑒𝑠𝑒𝑙 (5.3)

64
where RMD means mass ratio between methanol and diesel fuel. When RMD is 0, it represents
only diesel combustion.
5.3 Addition of methanol fuel properties
In order to analyze the instantaneous state of the in-cylinder process during combustion, it is
required to keep track of the composition, pressure and temperature variations of combustion
gases at any time. These properties are varied based on time and highly dependent on the
properties of fuel. In conventional diesel engine model, only one fuel is considered but in dual
fuel engine model, additional fuel information needs to be inputted to achieve dual fuel
combustion.
In the original diesel engine model, in-cylinder gases consist of air and stoichiometric gas
generated by diesel fuel combustion. However in dual fuel engine model, stoichiometric gas
produced by methanol combustion needs to be included in in-cylinder gases constituents.
According to the assumption (5) in section 5.2.1, unburned fuel gases do not take into account in
the in-cylinder gases constituents.
5.3.1 Specific heat of methanol
Specific heat (Cp) is necessary to calculate heat of combustion. Specific heat can be obtained by
the power series expansion of the normalized temperature [Staperma, 2010d]
Cp = ∑ ak ∗ 𝜃𝑘−1𝑚
𝑘=1 (5.4)
where ak is the coefficients for the polynomial to calculate the specific heat of methanol. Detail
values are given in Table 5.3. θ is the Normalized temperature and it can be expressed as,
θ =T−Tshift
𝑇𝑛𝑜𝑟𝑚 (5.5)
where
T shift: The kelvin temperature can be shifted to a non-zero point. Normally, T shift=0 K

65
T norm: Normalized temperature, T norm=1000 K
Table 5.3 The coefficients for the polynomial to calculate cp [Yaws, 1996]
Formula Name a‘1 a‘2 a‘3 a‘4 a‘5
CH3OH Methanol 40.046 -3.8287E-02 2.4529E-04 -2.1679E-07 5.9909E-11
Cp= a‘1+ a‘2* 𝜃 + a‘3* 𝜃 2+ a‘4* 𝜃
3+ a‘5* 𝜃 4 (J/mol/k)
ak‘ in the Table 5.3 stands for the the coefficients for the polynomial in J/mol/K. Unit conversation
from J/mol/k to J/Kg/K can be done by the equation (5.6)
ak =1000∗ ak
′
mM ,
J
kmol∗Kmol
Kg∗1
k- (5.6)
where mM means the respective molar mass of methanol.
Based on the relation between Cv and Cp (5.7), the specific heat of methanol at constant volume
can be calculated.
𝐶𝑣 = 𝐶𝑝 − 𝑅 (5.7)
𝑅 =𝑅′
𝑚𝑀 (5.8)
where R‘ means the universal gas constant in J/Kmol/K
5.3.2 Specific internal energy and specific enthalpy of methanol (usgg, hsgg)
After obtaining specific heat values, it is possible to calculate specific internal energy and specific
enthalpy by existing Matlab codes in the model [Ding, 2011], [Georgescu, 2013]. Both specific
internal energy and specific enthalpy can be calculated based on the equations below [Staperma,
2010d]

66
du = Cv ∗ 𝑑𝑇
△ uj = uj − uref,j = ∫ 𝐶𝑣,𝑗 ∗ 𝑑𝑇𝑇
𝑇𝑟𝑒𝑓 (5.9)
dh = Cp ∗ 𝑑𝑇
△ hj = hj − href,j = ∫ 𝐶𝑝,𝑗 ∗ 𝑑𝑇𝑇
𝑇𝑟𝑒𝑓 (5.10)
dT = Tnorm ∗ 𝑑𝜃 (5.11)
uref,j and href,j indicate internal energy and enthalpy of each constituent at reference condition,
respectively. As the methanol specific heat is given by the power series expansions, internal
energy and enthalpy variation (△uj, △hj) of each constituent can be calculated by integration.
△ = hj − 𝑗,𝑟𝑒𝑓 = ∑𝑎𝑘,𝑗
𝑘
𝑚𝑘=1 ∗ 𝑇𝑛𝑜𝑟𝑚 ∗ 𝜃
𝑘 − ∑𝑎𝑘,𝑗
𝑘
𝑚𝑘=1 ∗ 𝑇𝑛𝑜𝑟𝑚 ∗ 𝜃𝑟𝑒𝑓
𝑘 (5.12)
△ 𝑢 = uj − 𝑢𝑗,𝑟𝑒𝑓 =△ − 𝑇𝑛𝑜𝑟𝑚 ∗ 𝑅𝑗 ∗ (𝜃 − 𝜃𝑟𝑒𝑓) (5.13)
The final specific internal energy (usgg) and specific enthalpy (hsgg) for methanol stoichiometric gas
can be found by the summation of all the constituents.
usgg =∑𝑥𝑗𝑠𝑔𝑔
∗ 𝑢𝑗𝑠𝑔𝑔
𝑗
hSgg = ∑ 𝑥𝑗𝑠𝑔𝑔
∗ 𝑗𝑠𝑔𝑔
𝑗 (5.14)

67
5.3.3 Stoichiometric air/fuel Ratio of methanol
A stoichiometric ratio indicates the required air and fuel amount to achieve complete
combustion. Under the stoichiometric combustion condition, all the fuel and air are consumed to
produce combustion products. A stoichiometric mixture consists of the exact amount of both fuel
and oxidizer and this mixture can achieve the maximum flame temperature because all the energy
released by chemical reaction is used to heat up the combustion products.
Different from diesel fuel, methanol contains oxygen (O) in its chemical formula. (CH3-OH) In
case of oxygenated fuels, the general formula of combustion stoichiometry can be defined as
below equation (5.15), [McAllister et al., 2011]
Cα 𝛽𝑂𝛾 (𝛼 𝛽
4−𝛾
2) ∗ (𝑂2 𝑥 ∗ 𝑁2) → 𝛼 ∗ 𝐶𝑂2
𝛽
2∗ 2𝑂 𝑥 ∗ (𝛼
𝛽
4−𝛾
2) ∗ 𝑁2 (5.15)
where x is the mole ratio of N2 and O2. From the equation above (5.15), the amount of
stoichiometric air can be calculated.
In practice, however, combustion does not take place with stoichiometric condition. Generally, the
amount of air required for fuel combustion is different from the amount of stoichiometric air. For
this reason, there are several definitions which are frequently used to quantify the combustible
mixture.
1) Air/Fuel Ratio (afr)
afr =ma
𝑚𝑓 (5.16)
where ma and mf indicate the respective mass of air and fuel.
2) Stoichiometric Air/Fuel Ratio (σ)

68
σ =𝑚𝑎_𝑚𝑖𝑛
𝑚𝑓 =(𝛼
𝛽4−𝛾2) ∗ (1 𝑥) ∗ 𝑀𝑎𝑖𝑟
𝑀𝑓 (5.17)
where sigma(σ) and ma,min are a stoichiometric ratio and stoichiometric air mass, respectively. In
addition Mf and Mair represent the average masses per mole of fuel and air.
3) Air excess Ratio (λ)
λ =𝑎𝑓𝑟
𝜎 (5.18)
Lambda (λ) is the most common definition for internal combustion engines. It stands for the
ratio between the actual air-fuel ratio and the stoichiometric air-fuel ratio.
4) Equivalence ratio (∅)
∅ =1
𝜆 (5.19)
It is the normalized ratio between the stoichiometric fuel-air ratio and the actual fuel-air ratio. If ∅
is larger than 1 (∅ >1), it is considered to be rich mixture. On the other hand, if If ∅ is lesser than
1 (∅ <1), it is called as lean mixture. When ∅=1, it is a stoichiometric mixture.
5.3.4 Lower Heating Value of methanol
One of the significant characteristics of methanol fuel is its lower LHV compared to diesel fuel.
Correct calculation of LHV for methanol fuel contributes to increase of simulation accuracy.
Heating value is an effective tool to quantify the maximum heat energy which is produced by
combustion at standard conditions. (101.3Kpa, 25℃) Based on the phase of H2O in the

69
combustion products, heating value can be classified into Higher Heating Value (HHV) and Lower
Heating Value (LHV). When H2O exits as the gases in the combustion products, the value of heat
release is called as Lower Heating Value (LHV). If H2O is condensed to liquid, the value of heat
release is considered to be Higher Heating Value (HHV) due to extraction of latent heat. The
relation between LHV and HHV can be expressed in equation (5. 20)
L V = V −𝑁𝐻2𝑂∗𝑀𝐻2𝑂∗𝑓𝑔
𝑁𝑓𝑢𝑒𝑙∗𝑀𝑓𝑢𝑒𝑙 (5.20)
where N and M are the mole number and mass of substances, respectively. hfg is latent heat of
water. Detail calculation steps of methanol LHV can be found in Appendix I.
5.4 Heat loss model
During the combustion, temperature difference between combustion gases and the cylinder walls
increases. As a result, the heat can transfer from combustion gases to the cylinder walls, which is
defined as heat loss. The wall temperatures are not easy to measure and these values do not have
significant effects on heat loss value. [Ding, 2011] Since wall temperatures are not given by the
experiment data, the values from the original model are used. In practice, wall temperatures vary
with time and location due to piston movement and the variation of in-cylinder temperature.
However, the wall temperatures are considered to be mean values and treated as constant in the
model. Heat loss can be described by below equation (5.21) [Staperma, 2010c]
�̇�𝑙𝑜𝑠𝑠 = ∑ *𝛼𝑔→𝑤 ∗ (𝑇 − 𝑇𝑤𝑎𝑙𝑙) ∗ 𝐴𝑤𝑎𝑙𝑙𝑖+3𝑖=1 (5.21)
With i=1, cylinder wall
i=2, cylinder head
i=3, piston crown

70
The wall areas (Awall) can be calculated by the below equations,
Awall,1 = 𝜋 ∗ 𝐷𝑏 ∗ 𝐿𝑠 (5.22)
Awall,2 = Awall,3 =𝜋
4∗ 𝐷𝑏
2 (5.23)
The area of piston crown and the area of cylinder head are assumed to be the same.
Heat transfer coefficient (α) is calculated by Woschini formula.
α = C1 ∗1
𝐷 0.214 ∗
𝑝0.786
𝑇0.525∗ .𝐶3 ∗ 𝑐𝑚 𝐶4 ∗
𝑝−𝑝0
𝑝1∗𝑉𝑠
𝑉1∗ 𝑇1/
0.786
(5.24)
Both stroke volume (Vs) and mean piston speed (Cm) can be calculated by the equation (5.25) and
(5.26)
cm = 2 ∗ 𝐿𝑠 ∗𝑅𝑃𝑀
60 (5.25)
Vs =𝜋
4∗ 𝐷𝑏
2 ∗ 𝐿𝑠 (5.26)
The constant C3 is related to the effect of swirl velocity. There are two options for C3
Gas Exchange C3 = 6.18 0.417 ∗𝑤𝑡
𝑐𝑚 (5.27)
Compression and expansion C3 = 2.28 0.308 ∗𝑤𝑡
𝑐𝑚 (5.28)
In this thesis, the scope of simulation is confined to in-cylinder process. For this reason,
―Compression and Expansion‖ value (5.28) is applied to this model.
The constant C4 is determined based on the shape of combustion chamber. There are two options
which were suggested by Woschini

71
Direct injection C4 = 0.00324 (5.29)
Pre-chamber C4 = 0.00622 (5.30)
In the methanol dual fuel engine, combustion takes place by direct injection of pilot fuel so
―Direct injection‖ value is chosen for the simulation. Due to lack of measured data, the values of
wall temperature and swirl velocity are adopted from the original model. Instead, C1 is considered
as a variable to estimate heat loss.
5.5 Modification in the in-cylinder model
5.5.1 Introduction of Vibe function
Heat release rate plays a key role in understanding the combustion process. With introduction of
vibe functions into the model, it is possible to analyze heat release characteristics. The vibe
function is based on the principle of chain reactions and it can predict the fuel burn rate during
combustion process. In order to understand Vibe function, it is necessary to be aware of basic
equations for chain reactions.
The fuel molecules are broken up into a number of active radials by oxygen attacks. The reaction
rate for the formation of active radicals is proportional to the quantity of fuel molecules.
dmf
+
𝑑𝑡= 𝑘 ∗ 𝑚𝑓 (5.31)
In addition, the increase of active radicals is proportional to the decrease of fuel quantity.
dmf+ = −𝜇 ∗ 𝑑𝑚𝑓 (5.32)

72
With the combination of equations (5.31) and (5.32) above, the reaction rate can be defined.
ξ =dmf
𝑑𝑡= −
𝑘
𝜇∗ 𝑚𝑓 (5.33)
Depending on the determination of reaction constants k and μ, different types of vibe function
can be defined. Linear vibe function assumes that both k and μ are the constant value. However,
linear vibe function is not suitable for the simulation due to its limited freedom in shaping the
heat release. Instead of linear vibe function, non-linear vibe function is adopted in the model. It
assumes that reaction constant is dependent on time but it does not depend on instantaneous
quantity of the fuel molecules or radicals.
k = f(t) = c1 ∗ (𝑡 − 𝑡0)𝑚 (5.34)
The benefit of non-linear vibe function is that reaction rate starts off at zero and it ends at zero
or near zero due to depletion of fuel molecules at the end of combustion. Linear vibe function,
however, shows the maximum reaction rate as soon as ignition commences, which is not the
realistic phenomenon.
Vibe function can be descried by normalized combustion progress (X) and normalized rate of
combustion (Z).
X =𝑚𝑎𝑠𝑠 𝑜𝑓 𝑓𝑢𝑒𝑙 𝑏𝑢𝑟𝑛𝑡
𝑇𝑜𝑡𝑎𝑙 𝑚𝑎𝑠𝑠 𝑜𝑓 𝑓𝑢𝑒𝑙=
𝑚𝑓
𝑚𝑓,0 (5.35)
Z = dX
dτ= 𝜉 ∗
𝑡𝑐𝑜𝑚𝑏𝑚𝑓,0
(5.36)
τ =𝑡𝑖𝑚𝑒 𝑠𝑖𝑛𝑐𝑒 𝑏𝑒𝑔𝑖𝑛 𝑜𝑓 𝑐𝑜𝑚𝑏𝑢𝑠𝑡𝑖𝑜𝑛
𝑡𝑜𝑡𝑎𝑙 𝑐𝑜𝑚𝑏𝑢𝑠𝑡𝑖𝑜𝑛 𝑑𝑢𝑟𝑎𝑡𝑖𝑜𝑛=
𝑡−𝑡0
△𝑡 𝑜𝑚 (5.37)
where τ is normalized combustion time.
X and Z can be expressed with vibe parameters ―a‖ and ―m‖,

73
X = 1 − e−a∗τm+1
(5.38)
Z = a ∗ (m 1) ∗ τm ∗ 𝑒−𝑎∗𝜏𝑚+1
(5.39)
where ―m‖ is a shape parameter and the effects of shape parameter ―m‖ can be found in Figure
5.5.1.
Figure 5.5.1 Effect of shape parameter ‗m‘ [Gunter P et al., 2006]
Quick combustion reaction can be described by small value of m. The peak of heat release rate is
shown in the beginning of the combustion. However, with increase of value ‗m‘, peak of heat
release rate becomes retarded.

74
In addition, the parameter ―a‖ is related to combustion efficiency and the effects of the
parameter ―a‖ are illustrated in Figure 5.5.2.
ηcomb = 1 − 𝑒−𝑎 (5.40)
Figure 5.5.2 Variation of burn fraction with respect to ―a‖ [Abbaszadehmosayebi, 2014]
If the value of parameter ―a‖ becomes lower, combustion efficiency decreases and it leads to
lower burn fraction.
It is assumed that the combustion efficiency (ηcomb) is 99.9 % for the simulation regardless
different fuel ratios, then finally the parameter ―a‖ becomes,
a = − ln(1 − ηcomb) = − ln(0.001) = 6.908 (5.41)
Vibe functions for diesel and methanol share the same value of parameter ―a‖ in the simulation.
Instead of single vibe function, multiple vibe functions can describe more accurate and realistic
combustion process.

75
X = ∑ 𝑏𝑘 ∗ 𝑋𝑘𝑛𝑘=1 = ∑ 𝑏𝑘
𝑛𝑘=1 ∗ (1 − 𝑒−𝑎∗𝜏
𝑚𝑘+1) (5.42)
With vibe function, it is possible to gain combustion reaction rate (CRR) if both combustion
duration and total amount of fuel injection are known.
ξ = C = Z ∗mfcomb
△𝑡 𝑜𝑚 (5.43)
The combustion duration (∆tcomb) can be calculated, if the start of combustion (SOC) and the end
of combustion (EOC) are given.
△ tcomb = (EOC − SOC) ∗60
𝑅𝑃𝑀∗2𝜋 (5.44)
5.5.2 Split vibe functions
This section mainly discusses the method of the modification for dual fuel combustion. Unlike
conventional diesel engines, the heat release of dual fuel engine is produced by two different
fuels. In case of spark ignition engine (SI), the role of the spark is limited to induce ignition and it
does not contribute to in-cylinder heat release. In dual fuel engine, however, the role of pilot fuel
is more than the just spark and the pilot fuel keeps injecting onto ongoing combustion after start
of ignition. As a result, the contribution of pilot fuel to the total release rate is substantial. For this
reason, it is required to make clear division between diesel fuel combustion and methanol fuel
combustion.
The purpose of introducing vibe function is to calculate in-cylinder heat release rate. In order to
distinguish heat release from different fuels, two independent vibe functions are adopted in the
model. Double vibe function is to represent diesel fuel combustion and single vibe function is for
methanol fuel combustion.
Vibe function for diesel: Xdiesel = b1 ∗ (1 − 𝑒−𝑎∗𝜏𝐷𝑖𝑒𝑠𝑒𝑙
𝑚1+1 ) 𝑏2 ∗ (1 − 𝑒−𝑎∗𝜏𝐷𝑖𝑒𝑠𝑒𝑙
𝑚2+1) (5.45)
Vibe function for methanol: Xmethanol = b3 ∗ (1 − 𝑒−𝑎∗𝜏𝑀𝑒𝑡𝑎𝑛𝑜𝑙
𝑚3+1 ) (5.46)

76
where the parameters ―b1‖ and ―b2‖ indicate weighting factors for the diesel combustion. In detail,
b1 and b2 stands for premixed combustion and diffusive combustion, respectively. ―b3‖ represents
weighting factor for the methanol fuel combustion.
Diesel vibe functions consist of double vibe functions but methanol vibe function consists of
single vibe function. When double vibe functions were applied to methanol combustion, the
results did not show realistic phenomenon because there was a negative combustion reaction rate.
Figure 5.5.3 and Figure 5.5.4 show the results of singe vibe function for methanol combustion.
Both graphs show positive combustion reaction rate and combustion progress.
Figure 5.5.3 Normalized combustion rate (Z) with single vibe function (methanol)

77
Figure 5.5.4 Normalized combustion progress (X) with Single vibe function (methanol)
Figure 5.5.5 and Figure 5.5.6 show the results of double vibe function for methanol combustion.
As double vibe function is used to describe methanol combustion, X and Z consist of two terms.
Z1 and X1 stand for the 1st terms in the double vibe function and Z2 and X2 are the 2nd terms. The
figures show that Z2 and X2 have negative trends. However, once combustion starts, both
combustion reaction and combustion progress need to be positive.

78
Figure 5.5.5 Normalized combustion rate (Z) with double vibe function (methanol)
Figure 5.5.6 Normalized combustion progress (X) with double vibe function (methanol)

79
Due to the limit of the model, the combustion duration for both fuels is assumed to be the same
regardless of different fuel injection ratios. Detail explanation of the limits regarding different
combustion duration can be found in Appendix IV
τD = τM=𝐶𝑟𝑎𝑛𝑘 𝑎𝑛𝑔𝑙𝑒−𝑆𝑂𝐶𝐷
𝐸𝑂𝐶𝐷−𝑆𝑂𝐶𝐷=𝐶𝑟𝑎𝑛𝑘 𝑎𝑛𝑔𝑙𝑒−𝑆𝑂𝐶𝑀
𝐸𝑂𝐶𝑀−𝑆𝑂𝐶𝑀 (5.47)
The independent vibe functions for both fuels use ―crank angle‖ as the common input and finally
the combustion reaction rates for each fuel can be calculated by the separated reaction rate
blocks as shown in Figure 5.5.7.
Figure 5.5.7 Reaction rate calculation blocks for both fuel
Based on separated reaction rates for each fuel, it is possible to split the heat release of dual fuel
combustion into diesel heat release and methanol heat release.
Q̇Diesel = 𝜉𝐷 ∗ 𝑢𝑐𝑜𝑚𝑏𝐷𝑖𝑒𝑠𝑒𝑙 =𝑑𝑥𝐷
𝑑𝜏∗𝑚𝑑𝑖𝑒𝑠𝑒𝑙
△𝑡 𝑜𝑚 ∗ 𝑢𝑐𝑜𝑚𝑏𝐷𝑖𝑒𝑠𝑒𝑙 (5.48)
Q̇Methanol = 𝜉𝑀 ∗ 𝑢𝑐𝑜𝑚𝑏𝑀𝑒𝑡𝑎𝑛𝑜𝑙 =𝑑𝑥𝑀
𝑑𝜏∗𝑚𝑚𝑒𝑡𝑎𝑛𝑜𝑙
△𝑡 𝑜𝑚 ∗ 𝑢𝑐𝑜𝑚𝑏𝑀𝑒𝑡𝑎𝑛𝑜𝑙 (5.49)

80
where ucomb,fuel is heat of combustion and it can be calculated by
ucombfuel = 𝑢𝑓𝑢𝑒𝑙 𝜎 ∗ 𝑢𝑎𝑖𝑟 − (1 𝜎) ∗ 𝑢𝑠𝑡𝑜𝑖𝑐𝑖𝑜𝑚𝑒𝑡𝑟𝑖𝑐 𝑔𝑎𝑠 (5.50)
Total heat release rate in dual fuel combustion can be obtained by adding the heat release rate of
diesel fuel combustion and methanol fuel combustion.
Q̇total = Q̇Diesel Q̇Methanol =𝑑𝑥𝐷
𝑑𝜏∗𝑚𝑑𝑖𝑒𝑠𝑒𝑙
△𝑡 𝑜𝑚 ∗ 𝑢𝑐𝑜𝑚𝑏𝐷𝑖𝑒𝑠𝑒𝑙
𝑑𝑥𝑀
𝑑𝜏∗𝑚𝑚𝑒𝑡𝑎𝑛𝑜𝑙
△𝑡 𝑜𝑚 ∗ 𝑢𝑐𝑜𝑚𝑏𝑀𝑒𝑡𝑎𝑛𝑜𝑙 (5.51)
5.6 Modification in the heat release model
Heat release of both methanol and diesel fuels can be constructed by the separated vibe
functions in the in-cylinder process model. To determine the vibe parameters for each vibe
function, two separated reaction coordinates (RCO) need to be obtained in the heat release model.
With in-cylinder pressure input, the heat release model calculates Gross Apparent Heat Release
Rate (GAHRR). The heat energies from methanol fuel and diesel fuel contribute to determination
of the GAHRR as the in-cylinder pressure is a result of methanol and diesel fuel combustion. To
obtain separated RCO, GAHRR needs to be split into GAHRR Diesel and GAHRR Methanol. Overall
produces to obtain split RCO is illustrated in Figure 5.6.1.
Figure 5.6.1 Procedure to obtain split RCO

81
However, it is difficult to distinguish heat release rates between diesel fuel and methanol fuel in
the heat release model. Thus, a proper separation of GAHRR is very important to estimate heat
release rates of both fuels.
In this thesis, energy fraction of each fuels are used to separate GAHRR.
Q̇Total = (1 − 𝑋𝑔) ∗ �̇�𝐷𝑖𝑒𝑠𝑒𝑙 𝑋𝑔 ∗ �̇�𝑀𝑒𝑡𝑎𝑛𝑜𝑙 (5.52)
where Xg is energy fraction of methanol fuel. Energy fraction of methanol fuel can be calculated
by the equation below.
Methanol Energy fraction (Xg) =𝑚𝑚𝑒𝑡𝑎𝑛𝑜𝑙∗𝐿𝐻𝑉𝑚𝑒𝑡𝑎𝑛𝑜𝑙
𝑚𝑑𝑖𝑒𝑠𝑒𝑙∗𝐿𝐻𝑉𝑑𝑖𝑒𝑠𝑒𝑙+𝑚𝑚𝑒𝑡𝑎𝑛𝑜𝑙∗𝐿𝐻𝑉𝑚𝑒𝑡𝑎𝑛𝑜𝑙 (5.53)
Energy fraction of diesel fuel can be obtained by,
Diesel Energy fraction = (1 − Xg) (5.54)
For example, in case of RMD=1.54, the total heat release rate Q RMD=1.54 consists of 40% of Q
Methanol and 60% of Q Diesel.
Q̇RMD=1.54(100%) = �̇�𝑚𝑒𝑡𝑎𝑛𝑜𝑙 (40%) �̇�𝐷𝑖𝑒𝑠𝑒𝑙(60%) (5.55)
Once Q Diesel is defined, it is possible to calculate Q methanol because QRMD=1.54 can be obtained by
the in-cylinder pressure input. In RMD=0 combustion, heat release rate consists of only diesel fuel
since no methanol fuel is injected. Then it can be considered as 100% of Q Diesel. Q diesel (60%) can
be calculated if energy fraction of diesel fuel is multiplied.
�̇�𝐷𝑖𝑒𝑠𝑒𝑙(60%) = �̇�𝑅𝑀𝐷=0 (100%) ∗ (0.6) (5.56)
Finally, GAHRR Diesel and GAHRR Methanol can be obtained.

82
Q̇RMD=1.54(100%) − �̇�𝐷𝑖𝑒𝑠𝑒𝑙(60%) = �̇�𝑚𝑒𝑡𝑎𝑛𝑜𝑙 (40%) (5.57)
Determination of vibe parameters
With separated GAHRR, combustion reaction rates (CRR) for both fuels can be calculated
C Diesel =𝐺𝐴𝐻𝑅𝑅𝐷𝑖𝑒𝑠𝑒𝑙
𝑢 𝑜𝑚 𝐷𝑖𝑒𝑠𝑒𝑙+𝑒𝑓 , 𝑔/ - (5.58)
C Methanol =𝐺𝐴𝐻𝑅𝑅𝑀𝑒𝑡𝑎𝑛𝑜𝑙
𝑢 𝑜𝑚 𝑀𝑒𝑡𝑎𝑛𝑜𝑙 ,Kg/s- (5.59)
In case of diesel fuel, there is ―ef‖ term in denominator as it is injected as liquid phase. However,
according to the assumption, methanol fuel is in the gas phase after inlet value close (IC).
Therefore ―ef‖ term is not taken into account.
After obtaining CRR, it is possible to determine vibe parameters by using curve fitting. Before
carrying out curve fitting function, a monotonous increase function needs to be obtained. It can
be done by integrating CRR. Figure 5.6.2 shows CRR of methanol when RMD=1.54 was applied.
After integration of CRR, it becomes RCO and it has a monotonous increasing trend as shown in
Figure 5.6.3.

83
Figure 5.6.2 Combustion reaction rate of methanol fuel (RMD=1.54)
Figure 5.6.3 RCO methanol (RMD=1.54)

84
Based on RCO, curve fitting can be carried out. The result of curve fitting can be found in Figure
5.6.4. The black line on the figure is the RCO of methanol fuel and it is used as a benchmark.
Blue line is the curve fitting result and it is constructed by vibe parameters.
Figure 5.6.4 RCO VS Curve fitting (Methanol fuel)
Curve fitting results of all RMD and vibe parameters can be found in Appendix II.

85
6. Simulation results and analysis
6.1 Introduction
This chapter will present the results of the simulation with different methanol/diesel injection
ratios. The relevant energy fractions for each RMD can be found in Table 6.1. Since pressure of
RMD=0 is given only for -5.5 diesel injection timing (DIT) case, simulation is conducted based on
DIT=-5.5. Different injection timings are not tested because it is not possible to separate GAHRR
without RMD=0 data in this thesis.
Table 6.1 Fuel Ratio between Methanol and Diesel fuel
Fuel mass Ratio
Diesel fuel
(Kg/h)
Alcohol fuel
(Kg/h)
Energy fraction
of methanol
RMD=0 46.62 0 0 %
RMD=0.55 37.29 20.46 20 %
RMD=1.54 27.98 43.01 40 %
As the model C consists of heat release model and in-cylinder process model, both results will
be shown and will be compared. The reference data which is used for this simulation only
provides the information between -20 (B)TDC and +50 (A)TDC. For this reason, heat release model
which uses the pressure values from the reference data as main input can only carry out the
simulation within the mentioned range above. However, as in-cylinder model uses the output of
heat release model as main input, it can carry out the simulation within the range between inlet
valve close (IC) to exhaust valve open (EO). Based on the simulation results, the effect of
methanol fuel on in-cylinder process in dual fuel premixed engine will be analyzed and discussed.

86
6.2 Heat release rate
6.2.1 Heat release rate results
In the in-cylinder process model, end of combustion for all the cases were assumed at 230 CA as
the experimental data provided the information within the range between 160 CA (-20 BTDC) and
230 CA (50 ATDC). In addition, all the vibe parameters in in-cylinder process model are calculated
based on the given range. Nevertheless, the simulation results still depict the characteristics of
methanol effects on combustion.
The Figure 6.1 below illustrates the comparisons between the reference heat release rate and
simulations results. Overall trends are similar with the reference heat release for both models and
the results in the in-cylinder model show adequate accuracy. The peak heat release rate values
can be found in Table 6.2.
Reference data VS Heat release model
(RMD=0)
Reference data VS In-cylinder model
(RMD=0)

87
Reference data VS Heat release model
(RMD=0.55)
Reference data VS In-cylinder model
(RMD=0.55)
Reference data VS Heat release model
(RMD=1.54)
Reference data VS In-cylinder model
(RMD=1.54)
Figure 6.1 Heat release rate comparisons (Reference data VS simulation results)
Table 6.2 Peak heat release rate comparison (Reference VS In-cylinder model)
RMD=0 RMD=0.55 RMD=1.54
Reference (J/CA) 199 223 219
In-cylinder model (J/CA) 202.8 215 232
Error (%) 1.9 -3.6 5.9

88
On the left side of Figure 6.1, the separated peaks can be seen in the heat release model. The
first peak represents the combustion of diesel fuel and the second peak is associated with the
combustion of methanol fuel. The reason for separated peaks is that both fuels have different
combustion duration. However, in the in-cylinder process model, it is not able to depict the
separated peaks due to the limit of the model. The model cannot determine the exact start of
combustion timing between diesel and methanol fuel. For this reason, the common combustion
duration is used to calculate vibe parameters for both fuels in the in-cylinder model.
6.2.2 Analysis of heat release rate
Start of combustion (Ignition delay)
Figure 6.2 and Figure 6.3 show that start of combustion varies with different fuel ratios. With
increase of methanol injection, retarded start of combustion takes place due to longer ignition
delay.
Figure 6.2 Start of combustion in Heat release rate model

89
Table 6.3 Start of ignition crank angle in heat release rate model
SOC in HRR model (CA)
RMD=0 179.7
RMD=0.55 180
RMD=1.54 181.8
In case of RMD=1.54 in heat release model, the positive heat release can be seen before ignition
occurs. However it does not mean any physical phenomenon. It is caused by heat release
fluctuation. Heat release rate is very sensitive to input pressure value and detail explanation can
be found in Appendix III. Since pressure values are read by naked eyes to input in the heat
release model, there are pressure-reading errors and it causes the fluctuations.
Figure 6.3 Start of combustion in in-cylinder process model

90
Table 6.4 Start of ignition crank angle in in-cylinder process model
SOC in In-cyl' model (CA)
RMD=0 179.5
RMD=0.55 180
RMD=1.54 181
In the in-cylinder model, starts of combustions (SOC) are determined based on the Reaction
coordinate in the heat release model. Small variations of SOC values (∆1 CA) have been made to
find the best results.
The effect of high heat of evaporation prolongs the ignition delay. Due to higher heat absorption
with increase of methanol injection, in-cylinder temperature decreases accordingly and
temperature plays a key role in determining ignition delay. [Heywood, 1988]
τid = 𝐴 ∗ 𝑝−𝑛 ∗ exp .
𝐸𝐴
𝑅𝑇/ (6.1)
where A and n are constants dependent on fuels. EA is the apparent activation energy for auto
ignition process.
As shown in Figure 6.4, ignition delay becomes longer as the temperature decreases.

91
Figure 6.4 Effect of temperature on ignition delay [Heywood, 1988]
The chemical kinetics of methanol-diesel combustion is highly affected by temperature. [Yin,
2016] When methanol and diesel fuel are mixed, the procedure of dehydrogenation of diesel and
methanol fuels takes place. The first step of chemical reaction is,
C 3𝑂 → 𝐶 3 𝑂 (6.2)
This OH is an important radical in the chemical reaction. Methanol fuel reacts with OH radicals,
C 3𝑂 𝑂 = 𝐶 3𝑂 2𝑂
C 3𝑂 𝑂 = 𝐶 2𝑂 2 (6.3)

92
In case of diesel fuel, chemical reaction with OH can be describe as below,
Cx 𝑦 𝑂 → 𝐶𝑥 𝑦−1 2𝑂 (6.4)
With oxygen addition, HO2 and CH2O can be produced by below chain reactions
C 3𝑂 𝑂2 = 𝐶 2𝑂 𝑂2
C 2𝑂 𝑂2 = 𝐶 2𝑂 𝑂2 (6.5)
Then HO2 is converted into inactive radical, which is H2O2
O2 𝑂2 = 2𝑂2 𝑂2 (6.6)
Especially, at lower temperature, converting active OH radical into inactive H2O2 radical is
predominant. With increase of inactive radical, start of ignition is delayed. However, with increase
of temperature, H2O2 radicals rapidly decompose into OH and it shortens ignition delay. [Yin, 2016]
Other factor which influences on ignition delay is cetane number.
EA =618,840
𝐶𝑒𝑡𝑎𝑛𝑒+25 (6.7)
The effect of cetane number on ignition delay is illustrated in Figure 6.5
Cetane number of methanol fuel is much lower than that of diesel fuel and it causes longer
ignition delay.

93
Diesel (Cetane) Methanol (Cetane)
38~58 <5
Figure 6.5 Effect of cetane number on ignition delay [Heywood, 1988]
When diesel fuel mixes with methanol fuel, overall cetane number of the diesel-methanol
mixtures deceases. Consequently, activation energy for auto ignition increases and it takes longer
time to initiate start of combustion.
Combustion duration
With increase of methanol injection, decrease of combustion duration can be observed in Figure
6.6. Overall combustion duration of RMD=1.54 is shorter than other 2 cases despite of lower

94
chemical kinetic and longer ignition delay. With increase of ignition delay due to the cooling
effect, more time is allowed for diesel fuel to premix with methanol-fuel mixtures in the cylinder.
As a result, the quantity of premixed diesel fuel increases as well as the mixing quality of diesel
and the mixtures improves. Consequently, the fraction of diesel fuel premixed combustion increase
and more fuel can be burned during premixed combustion process. It can be seen from Figure
6.7. With increase of methanol injection, peak rise of premixed combustion can be observed.
Although separated peaks have not appeared in in-cylinder model due to the limitation of model,
the most rapid gradient of RMD=1.54 tells that premixed combustion becomes stronger with
increase of methanol injection as shown in Figure 6.8.
Figure 6.6 End of combustion comparison (In-cylinder model)
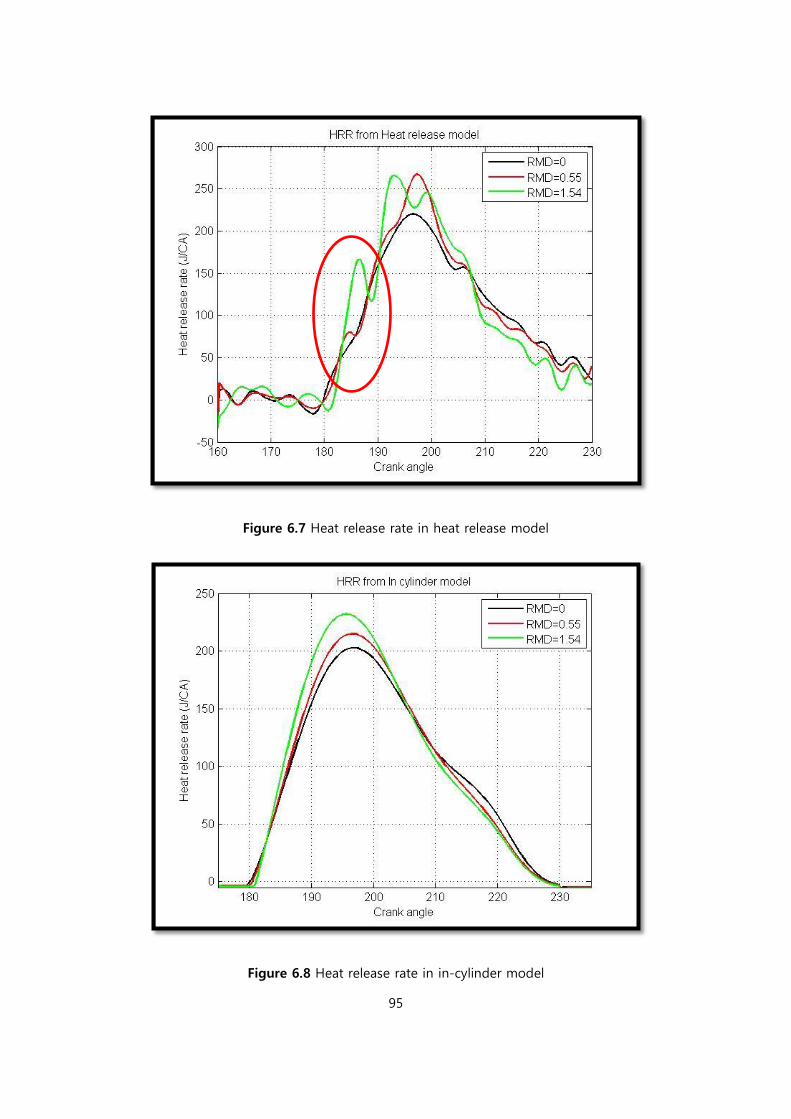
95
Figure 6.7 Heat release rate in heat release model
Figure 6.8 Heat release rate in in-cylinder model

96
The maximum heat release rate
In dual fuel operation mode, overall heat release rate is higher than that with only diesel
operation. It can be explained by the cooling effect caused by heat of evaporation. With methanol
injection, the temperature of in-cylinder charge decreases and it leads to longer ignition delay.
The longer ignition delay contributes to higher heat release rate because it allows more time for
diesel fuel premixing. In only diesel mode, premixed combustion takes place by diesel-air pre-
mixtures. However, in dual fuel mode, methanol fuel also takes part in premixed combustion
process. In conclusion, as methanol fuel contributes to heat release in premixed combustion and
more diesel fuel is premixed in dual fuel operation, heat release rates of dual fuel become higher
than only diesel operation.
Other characteristic of heat release rate is that peak value of heat release rate decreases with
increase of methanol injection. The peak heat release of RMD=0.55 is slightly higher than that of
RMD=1.54.
Table 6.5 Peak value of heat release rate in Heat release model
Peak value of HRR RMD=0.55 RMD=1.54 Difference
Reference (J/CA) 223 219 4
Heat release model (J/CA) 267 265 2
In case of RMD=1.54, longer ignition delay occurs due to the cooling effect. Consequently, initial
ignition takes place after TDC, where the piston starts moving downwards. During the expansion
process, in-cylinder pressure and temperature decrease due to increase of in-cylinder volume.
Lower temperature reduces chemical kinetics and it has negative impacts on combustion efficiency.
In addition, available time for combustion also reduces. There might be some amount of fuel
which is not able to burn within this limited time of the combustion. Other reason for lower
combustion is due to the flame quenching. With increase of methanol injection, the temperature
of in-cylinder charges decrease. This increases flame quenching. Due to the mentioned causes,

97
combustion efficiency decreases and it leads to lower heat release rate.
However, in-cylinder process model is not able to describe this phenomenon. Figure 6.8 and
Table 6.2 show that RMD=1.54 has the highest peak value among all other test cases in the in-
cylinder process model, which is different from the reference [Lijiang Wei et al., 2015]. This error
comes from the assumption. Regardless of the amount of methanol injection, it is assumed that
all the fuels are completely combusted. The value of vibe parameter ―a‖ is 6.908 (ηcomb=99.9%) for
all the test cases because in-cylinder process simulation is conducted based on this assumption.
For this reason, RMD=1.54 has higher peak value than RMD=0.55 in the in-cylinder process model.
However, when lower combustion efficiency (ηcomb=99.2%) is applied to RMD=1.54, both peak
value of heat release rate and maximum temperature decrease. Test results can be found in Figure
6.9, 6.10 and Table 6.6. In Figure 6.9, ηcomb=99.2% was applied to only RMD=1.54.
Figure 6.9 Heat release rate of RMD=1.54 (ηcomb=99.2%)

98
Figure 6.10 Temperature of RMD=1.54 (ηcomb=99.2%)
Table6.6 Temperature and heat release comparison (ηcomb=99.9% VS ηcomb=99.2%)
T_max (K) Peak HRR(J/CA)
ηcomb=99.9% 1618 219
ηcomb=99.2% 1605 211
6.3 Pressure
6.3.1 Pressure results
The pressures in the heat release model are shown in Figure 6.11. These pressures are
considered as the reference pressure and main input of this simulation. The plateau areas of the
pressures show different features based on the various fuel ratios because the cooling effect and

99
ignition delay vary with fuel ratios.
Pressure from Heat release model
(RMD=0)
Pressure from Heat release model
(RMD=0.55)
Pressure from Heat release model
(RMD=1.54)
Pressure comparisons
(RMD=0 VS RMD=0.55 VS RMD=1.54)
Figure 6.11 Input pressures (Heat release model)
Figure 6.12 illustrates the pressure comparisons between heat release model and in-cylinder
process model. The pressures in the heat release model were obtained from the reference paper
[Lijiang Wei et al., 2015]. The in-cylinder process model predicted in-cylinder pressures quite
accurately. Therefore, overall pressure trends between two models were well matched in all the
cases

100
Pressure (RMD=0)
HRR model VS In-cyl‘ model
Zoom-In (RMD=0)
Pressure (RMD=0.55)
HRR model VS In-cyl‘ model
Zoom-In (RMD=0.55)
Pressure (RMD=1.54)
HRR model VS In-cyl‘ model
Zoom-In (RMD=1.54)

101
Figure 6.12 Pressure comparisons between Heat release model and In-cylinder model
Figure 6.13 Pressure results in In-cylinder model
Figure 6.13 displays the comparisons of in-cylinder pressures with respect to different RMD in
the in-cylinder model. These pressures can describe the characteristics and effects of methanol
dual fuel combustion and detail explanation can be found in section 6.3.2
6.3.2 Pressure analysis
Two major characteristics can be found in both heat release model and in-cylinder model. Figure

102
6.13 shows that at the end of compression (180 CA), RMD=0 has the highest pressure among all
the other cases, on the other hand RMD=1.54 has the lowest pressure value.
Figure 6.14 Pressure comparisons at TDC (In-cylinder model)
The characteristics of both the cooling effect and the premixed dual fuel concept give rise to this
phenomenon. Unlike direct injection with high pressure concept, methanol fuel already exists in
the cylinder before diesel fuel injection takes place. Methanol fuel is injected in the port where
supply air goes through. Initially, methanol fuel is injected in liquid phase and as soon as
methanol fuel injection takes place, it starts to absorb the heat energy from the surroundings.
During heat absorption, methanol fuel starts evaporating and mixes with supply air. The more
methanol fuel is injected, the lower temperature of methanol-air mixture can be generated due to
the effect of heat of evaporation. The pressure gap between RMD=0.55 and RMD=1.54 is larger
than the pressure gap between RMD=0 and RMD=0.55. It proves that higher dose of methanol
leads to larger pressure drop due to higher cooling effect of methanol.

103
Table 6.7 Pressure values at TDC
Pressure at 180 CA (Mpa) Difference (Mpa)
RMD=0 12.35 0
RMD=0.55 12.27 -0.08
RMD=1.54 11.8 -0.55
On the contrary, the pressure results display opposite trends in the expansion process. Figure
6.15 shows that methanol dual fuel modes have higher pressure value than only diesel mode in
the expansion process. For example, the pressure values at 195 CA can be found in Table 6.8 As
methanol injection increases, the methanol-air mixtures in the cylinder become richer. As a result,
the size of the immediate vicinity of pilot fuel combustion increases Region II in Figure 2.5.8 and
it leads to great heat release. For this reason, dual fuel modes have higher pressure than only
diesel mode.
Figure 6.15 Pressure comparisons in expansion process (In-cylinder model)

104
Table 6.8 Pressure values at 195 CA (Expansion stroke)
Pressure at 195 CA (Mpa) Difference (Mpa)
RMD=0 12.12 0
RMD=0.55 12.27 0.15
RMD=1.54 12.44 0.32
6.4 Temperature
6.4.1 Temperature results
The temperatures in Figure 6.16 and Table 6.9 are the simulation results of different methanol
injection ratios in the heat release model. The maximum temperatures and the locations (Crank
angle) for peak temperature vary with different methanol injection ratios. Higher methanol
injection leads to higher maximum temperature and the crank angle for maximum temperature is
advanced. On the other hand, no methanol injection case shows the lowest in-cylinder
temperature with the most retarded crank angle for maximum temperature. Detail explanation of
this phenomenon can be found in section 6.4.2

105
Figure 6.16 Temperature results in Heat release model
Table 6.9 T_max in Heat release model
Temperature results in Heat release rate model
T_max (K) Crank angle (CA)
RMD=0 1520 217
RMD=0.55 1560 213
RMD=1.54 1630 210
The temperatures in Figure 6.17 illustrate the comparison of the simulation results between heat
release rate model and in-cylinder process model. Both results are quite well matched. The
differences between two models can be found in Table 6.10 & 6.11.

106

107
Figure 6.17 Temperature comparisons between Heat release model and In-cylinder model
Table 6.10 T_max in the In-cylinder model
Temperature result in the In-cylinder model
T_max (K) Crank angle (Deg)
RMD=0 1519 217
RMD=0.55 1523 215
RMD=1.54 1618 214

108
Table 6.11 Difference between HRR model and in-cylinder model
Difference between HRR model & In-cylinder model
T_max different
(K)
Crank angle
(Deg)
Temperature Errors
(%)
RMD=0 1 0 0.07%
RMD=0.55 37 2 2.4%
RMD=1.54 16 4 0.9%
Figure 6.18 Temperature comparisons (In-cylinder model)
According to the experiment data [Lijiang Wei et al., 2015], maximum temperature for all the
cases should be above 1800 K but the simulation results show roughly 250~350K lower values as
shown in Table 6.12. The main cause of the error is due to lack of the initial condition data.
Especially, initial pressure (p1) has a large influence on maximum temperature. As shown in Table
6.13 and Figure 6.19, minor difference of p1 significantly changed the maximum temperature.

109
According to the assumption (1), p1 is calculated based on p2. However, p2 was read by the naked
eyes so there might be minor pressure-reading error and this can affect p1 value.
Table 6.12 Maximum temperature difference (RMD=1.54)
Experimental data Simulation result (Heat release model)
Difference Error
T_max ≅ 1870 K T_max = 1630 K 240 K 12.8 %
Table 6.13 Variation of maximum temperatures with different p1 (RMD=1.54)
p1 (Bar) T_Max (K) Error (%)
3.4 1630 12.8
3.3 1703 8.9
3.2 1755 6.1
3.1 1810 3.2
3 1868 0.1
Figure 6.19 Effect of initial pressure on T max (RMD=1.54)

110
6.4.2 Temperature analysis
Figure 6.20 shows in-cylinder temperature around TDC. With increase of methanol injection,
temperature of in-cylinder charge decreases due to the heat of evaporation. As a result, before
TDC, RMD=1.54 has the lowest temperature value, on the other hand, RMD=0 has the highest
temperature values. Both methanol injection cases (RMD=0.55 and RMD=1.54) show relatively
larger temperature decreases than only diesel case right after TDC. Due to the cooling effect,
ignition delay prolongs with increase of methanol injection. During ignition delay, in-cylinder
volume increases as piston moves downward after TDC and in-cylinder temperature decreases
accordingly. After ignition takes place, however, RMD=1.54 shows the most rapid temperature
gradient. It can be explained by the strong premixed combustion with longer ignition delay.
Figure 6.20 Temperatures around TDC

111
In case of maximum in-cylinder temperature, the results are opposite to the hypothesis. Figure
6.21 showed that RMD=1.54 had the highest maximum temperature despite of the highest
cooling effect. The intensity of premixed combustion is a key factor to understand this
phenomenon. Increase of methanol injection decreases in-cylinder charge temperature as well as
delays the start of ignition. In the meantime the methanol fuel-air mixtures in the cylinder
become richer as methanol injection increases. In addition, the time for premixing process of pilot
fuel will extend due to delayed start of ignition. As a result, premixed combustion becomes
stronger with higher methanol injection. The stronger premixed combustion rapidly boosts in-
cylinder temperature due to a large amount of heat release.
Figure 6.21 T_max comparisons (In-cylinder model)

112
However, the opposite result can be obtained if diesel injection timing is delayed because the
injection timing of pilot fuel is also a major factor to affect maximum in-cylinder temperature.
According to the experimental data [Lijiang Wei et al., 2015] as shown in Figure 6.22, when pilot
fuel was injected at 0 TDC instead of -5.5 TDC, RMD=0 showed the highest maximum
temperature. On the other hand, RMD=1.54 had the lowest maximum temperature. In advanced
diesel injection timing, the maximum temperature rises with increase of methanol injection.
However, in retarded diesel injection timing, the maximum temperature decreases with increase of
methanol injection.
Figure 6.22 T max based on different pilot injection timing (-5.5 TDC VS 0 TDC) [Lijiang Wei et
al., 2015]
In addition, ignition delay becomes more sensitive to pilot fuel injection timing with increase of
methanol injection [Lijiang Wei et al., 2015]. Even if the same quantity of methanol fuel is injected,
ignition delay becomes longer with retarded pilot fuel injection timing due to additional
temperature decrease during expansion stroke. Detail values can be found in Table 6.14.
1650
1700
1750
1800
1850
1900
RMD=0 RMD=0.55 RMD=1.54
Tem
pera
ture
(K)
Maximum temperatures
(Experimental data)
T_max ( DIT=-5.5 TDC)
T_max (DIT=0 TDC)

113
Table 6.14 Variation of ignition delay with respect to injection timing and RMD ratio [Lijiang Wei
et al., 2015]
Ignition delay (Deg)
Injection timing
at -5.5 TDC
Injection timing
at 0 TDC △ Ignition delay
RMD=0 5.4 5.6 0.2
RMD=1.54 7.3 8.7 1.4
On the other hand, the time for premixing process increases with longer ignition delay. In the
competition of all these factors, the effects of heat of evaporation and expansion process are
more dominant than effect of premixed combustion. With the retarded pilot fuel injection,
starting point of ignition is gradually far away from the TDC. Accordingly, effect of premixed
combustion becomes weak as the piston goes down due to expansion stroke and it reduces in-
cylinder temperature. Therefore, in dual fuel premixed combustion engine, both diesel injection
timing and fuel ratio have a huge influence on determination of maximum in-cylinder
temperature. Investigation of the effects of diesel injection timing is recommended in order to
better understand methanol combustion.
6.5 BSFC
Brake specific fuel consumption (BSFC) is the ratio between mass fuel consumption to the engine
power. As engine power is produced by diesel and methanol fuels, both fuel masses as well as
Lower Heating Values are included in the equation. [Chaichan, 2014]
BSFC =�̇�𝐷+(
𝐿𝐻𝑉𝑀𝐿𝐻𝑉𝐷
)∗�̇�𝑀
𝐵𝑟𝑎𝑘𝑒 𝑝𝑜𝑤𝑒𝑟 ,𝑔/ 𝑤- (6.8)
Under the same engine output and operating load condition, the value of BSFC is higher when
methanol fuel is injected, compared to only diesel operation. In addition, more methanol fuel
injection leads to increase of BSFC value and it is described in Figure 6.23. This is mainly due to

114
lower LHV of methanol. To maintain the same engine power, the larger quantity of methanol fuel
needs to be injected in dual fuel mode.
Figure 6.23 Brake specific fuel consumption comparisons
Table 6.15 BSFC comparison table
RMD=0 RMD=0.55 RMD=1.54 Unit
BSFC 188.7 232.6 237.0 g/Kwh
Difference 0 23.2 25.5 %
6.6 Brake thermal efficiency
Brake thermal efficiency is an indicator to assess how efficiently fuel energy can be converted into
mechanical power. It can be calculated by equation (6.9), [Chaichan, 2014]
ηthermal =𝐵𝑟𝑎𝑘𝑒 𝑝𝑜𝑤𝑒𝑟
(𝑚�̇�∗𝐿𝐻𝑉𝐷)+(�̇�𝑀∗𝐿𝐻𝑉𝑀)∗ 100% (6.9)
0.0
50.0
100.0
150.0
200.0
250.0
RMD=0 RMD=0.55 RMD=1.54
g/K
wh
BSFC

115
With increase of methanol injection, brake thermal efficiency decreases because methanol fuel
causes longer ignition delay. With late start of ignition, the combustion process proceeds when
the piston moves downwards. As a result, less fuel energy can be converted into mechanical
power consequently, brake thermal efficiency decreases. Besides, with increase of methanol
injection, more methanol-air mixtures are trapped in crevices and flame quenching become strong
due to the cooling effect. Therefore, less fuel can contribute to power production and it reduces
thermal efficiency.
Figure 6.24 Brake Thermal efficiency comparisons
44.6
43.9
42.3
41.0
41.5
42.0
42.5
43.0
43.5
44.0
44.5
45.0
RMD=0 RMD=0.55 RMD=1.54
Brake Thermal Efficiency (%)

116
7. Conclusions and recommendations
7.1 Conclusion
The main objective of the thesis is to find out the effects of methanol fuel on in-cylinder process
in internal combustion engine. Additionally, modifying the current engine models is also a part of
the thesis work to understand the capabilities and limitations of the models.
Methanol fuel has distinctive physical properties compared to conventional fossil fuels. Especially
4 time higher heat of evaporation and half of LHV can affect combustion process. To maintain the
same output, more methanol fuel need to be injected due to its lower LHV and this amplifies the
effect of heat of evaporation. The Table 7.1 below illustrates initial hypothesis and the simulation
results.
Table 7.1 Comparison table between hypothesis and simulation results
Hypothesis Simulation results
Heat release Increase Increase
Ignition delay Longer Longer
T max Decrease Increase
BSFC Increase Increase
BTE Decrease Decrease
It was found out that the cooling effect caused by heat of evaporation affected in-cylinder process.
With increase of methanol fuel, the cooling effect also increased. Due to the cooling effect,
ignition delay prolonged and it led to stronger premixed combustion. Large amount of heat
released during premixed combustion and it increased the overall heat release rate. That was the
reason why methanol dual combustion had higher heat release rate than only diesel combustion.
However, in dual fuel mode, maximum heat release rate decreased with increase of methanol
injection. It was due to lower combustion efficiency caused by the longer ignition delay and flame
quenching. With increase of methanol injection, start of ignition retarded and initial ignition took
place after TDC. The effect of expansion process and shorter available time for combustion reduce

117
the combustion efficiency. Moreover, the temperature of methanol-air mixtures decreased with
increase of methanol injection. Lower temperature increased flame quenching. These led to
decrease of peak heat release rate.
In case of maximum temperature, the simulation showed the opposite results to the hypothesis.
With increase of methanol injection, maximum in-cylinder temperature increased. Not only the
cooling effect but also diesel injection timing had a major influence on in-cylinder maximum
temperature. With advanced diesel injection timing, maximum temperature increased with increase
of methanol injection because of stronger premixed effect at advanced diesel injection timing. On
the other hand, with retarded diesel injection timing, maximum temperature decreased with
increase of methanol injection. In this case, the effect of the expansion process and lower in-
cylinder charges were more dominant than the effect of premixed combustion.
In dual fuel combustion, overall BSFC were higher than only diesel combustion. Due to its lower
LHV, more methanol fuel needs to be injected to maintain the same engine power.
Brake thermal efficiency was decreased in dual fuel mode. As methanol fuel caused longer
ignition delay, combustion took place during the expansion stroke. In addition, strong flame
quenching took place with higher methanol injection. As a result, less fuel energy was converted
into mechanical work.
From the point of modeling view, the current engine models can describe overall characteristics
of methanol dual fuel combustion. Diesel fuel combustion and methanol fuel combustion were
constructed by two independent vibe functions. The vibe parameters for two different vibe
functions were calculated by separated reaction coordinates in the heat release model. However,
the models were not able to differentiate the combustion durations between diesel fuel and
methanol fuel. With different combustion duration, the accuracy of simulation will be increased.
In conclusion, combustion was affected by the physical properties of methanol fuel. Type of
engine and operating condition also had significant influences on in-cylinder process. There were
several factors which affected engine combustion and the dominance of factors varied with
operating condition. In addition, the model can predict overall characteristics of methanol
combustion. However, further development of model is required to increase simulation accuracy.

118
7.2 Recommendations
The main objective of this thesis is to investigate the effects of methanol fuel on combustion in
premixed dual fuel engine. It is found out that operating conditions of engine also played a key
role in combustion process. For better understanding of methanol combustion, further researches
are necessary.
∎The effects of various pilot fuel injection timing need to be investigated as pilot fuel injection
timing is one of important factors to determine ignition timing and overall combustion shape.
∎It is important to find out operating limit of methanol dual fuel engines. Various air-fuel ratios
need to be investigated to study the operation limits because it has large influence on
misfire/knocking phenomena.
∎Woschni‘s model from original model C was used in this thesis to evaluate the heat transfer
coefficient. However, further study is recommended to find out that whether the woschni‘s model
is suitable for methanol port injection engine or not.
∎In this thesis, combustion efficiency was assumed to be 99.9%. However, actual combustion
efficiency needs to be found out to investigate the influence of combustion efficiency on
emissions of methanol combustion.
∎Last but not least, it is important to incorporate methanol fuel evaporation model to improve
the accuracy of port injection methanol engine. In addition further modification of model is
necessary to differentiate combustion durations for different fuels.

119
Appendix I- LHV of methanol
In general, LHV is called as the Heat of combustion (Qc) and it can be defined by
Qc = 𝑅 − 𝑝 (A1.1)
where HR and HP stand for the enthalpy of reactants and products, respectively.
Combustion equation of methanol fuel is,
C 3𝑂 1.5 ∗ 𝑂2 → 𝐶𝑂2 2 2𝑂 𝑄𝑐 (A1.2)
During combustion process, reactants are converted into products and heat energy is released by
the rearrangement of chemical bonds in the reactants. The standard enthalpy of formation (hfo) is
used to quantify the chemical bond energy at standard condition (25℃, 1 atm). Since O2 and N2
are the most stable form, they have zero enthalpy of formation. The necessary enthalpy of
formation values for methanol combustion can be found in Table A1.
Table A1 Enthalpy of formation of methanol combustion
Species Enthalpy of formation (�̅�𝒇𝒐)
(KJ/Kmol)
H2O (g) -241,830
CO2 (g) -393,520
CH3OH (l) -238,430
The heat of combustion per kmol of CH3OH at standard condition is,
Qc = (�̅�𝑓𝑜)𝐶𝐻3𝑂𝐻(𝑙)
− 1 ∗ (�̅�𝑓𝑜)𝑐𝑜2− 2 ∗ (�̅�𝑓
𝑜)𝐻2𝑂
(A1.3)

120
Qc = (−238,430 𝐽
𝑚𝑜𝑙 𝐶 3𝑂 ) − (
1 𝑚𝑜𝑙 𝐶𝑂2 𝑚𝑜𝑙 𝐶 3𝑂
) ∗ (−393,520 𝐽
𝑚𝑜𝑙 𝐶𝑂2) − (
2 𝑚𝑜𝑙 2𝑂
𝑚𝑜𝑙 𝐶 3𝑂 )
∗ (−241,820 𝐽
𝑚𝑜𝑙 2𝑂) = 638,730 𝐽/ 𝑚𝑜𝑙
LHV of methanol in MJ/KG is calculated by dividing molecular weight of methanol,
𝐿 𝑉 =638,730
𝐾𝐽
𝐾𝑚𝑜𝑙 𝐶𝐻3𝑂𝐻
32𝐾𝑔 𝐶𝐻3𝑂𝐻
𝐾𝑚𝑜𝑙 𝐶𝐻3𝑂𝐻
= 19,960KJ
Kg= 19.960
MJ
KG (A1.4)

121
Appendix II - Curve fitting results and Vibe parameters
With vibe parameters, non-dimensional combustion reaction (Z) and non-dimensional combustion
progress (X) can be illustrated. Figure A2.1 is only diesel mode and Figure A2.2 and Figure A2.3
are dual fuel mode. As increase of RMD, the size of ZDiesel and XDiesel decreased but the size of
ZMethanol and XMethanol increased.
Figure A2.1 Non-dimensional combustion reaction (Z) and progress (X) of RMD=0
Table A2.1 Vibe parameters of RMD=0
Diesel combustion Methanol
combustion ηcomb
RMD=0 b1 m1 b2 m2 b3 m3 a
0.8605 1.341 0.1395 6.057 0 0 6.908

122
Figure A2.2 Non-dimensional combustion reaction (Z) and progress (X) of RMD=0.55
Table A2.2 Vibe parameters of RMD=0.55
Diesel combustion Methanol
combustion ηcomb
RMD=0.55 b1 m1 b2 m2 b3 m3 a
0.8564 1.303 0.1436 5.696 1 1.252 6.908
Figure A2.3 Non-dimensional combustion reaction (Z) and progress (X) of RMD=1.54

123
Table A2.3 Vibe parameters of RMD=1.54
Diesel combustion Methanol
combustion ηcomb
RMD=1.54 b1 m1 b2 m2 b3 m3 a
0.8191 1.079 0.1809 5.642 1 1.211 6.908
The curve fitting results can be evaluated by the goodness of fit, which is R-square. The range of
R-square is between 0 and 1. If R-square is 1, it means the fitting result perfectly reproduces the
original line. Table A2.4 shows the fitting results of all RMD cases. Overall fit results are good
because R-square values are above 0.99.
Table A2.4 Curve fitting results (Accuracy)
R-square
Diesel Methanol
RMD=0 0.9933 N/A
RMD=0.55 0.9932 0.9909
RMD=1.54 0.9998 0.9984
The contribution of vibe parameters to normalized combustion reaction (Z) and progress (X) can
be investigated by changing the values of vibe parameters. For example, Figure A2.4 shows the
effects of parameter ―m‖ on methanol combustion of RMD=0.55.
Figure A2.4 The effect of parameter ―m‖ on Z and X (Methanol combustion of RMD=0.55)

124
m3=1.252 was the original value. When m3 decreased (m3=0.7), peak point of Z is advanced and
has rapid gradient. It means that the fast reaction rate can be described by decrease of m3. With
decrease of m3, combustion duration became shorter. On the right figure in Figure A2.4, m3=0.7
reached to X=1 faster than m3=2.
Figure A2.5 illustrates the effects of parameter ―a‖ on Z and X. The parameter ―a‖ represents
combustion efficiency. Decrease of the value ―a‖ stands for decrease of combustion efficiency. Due
to the lower combustion efficiency, a=4 has the lowest combustion reaction (Z) and does not
reach to X=1.
Figure A2.5 The effect of parameter ―a‖ on Z and X (Methanol combustion of RMD=0.55)

125
Appendix III- Pressure sensitivity in the model
In this thesis, in-cylinder pressures were read by naked eyes as it was not possible to obtain the
in-cylinder pressures by experiment at the moment. Therefore, there must be some pressure-
reading errors. These errors had large influence on heat release rates. Although there was minor
pressure reading-error, heat release rates were significantly changed.
Figure A3.1 Heat release rate (P=120.5 bar at 200 CA)
In Figure A3.1, pressure was 120.5 bar at 200 CA. To see the sensitivity of heat release rate to
pressure values, 119.5 bar and 121.5 bar were applied at 200 CA. As intermediates values were
determined by interpolation, pressure change at 200 CA had influences on determination of
neighboring values. The largest difference of heat release rate can be found at 199 CA.

126
Figure A3.2 Heat release rate (P=119.5 bar at 200 CA)
Table A3.1 Heat release rate comparison between P=119.5 and P=120.5
1 bar decrease
Pressure (Bar) 120.5 119.5
Q at 199 (J/CA) 245.6 216.8
△Q (J/CA) -28.8
Error (%) -11.7

127
Figure A3.3 Heat release rate (P=121.5 bar at 200 CA)
Table A3.2 Heat release rate comparison between P=120.5 and P=121.5
1 bar increase
Pressure (Bar) 120.5 121.5
Q at 199 (J/CA) 245.6 274.4
△Q (J/CA) 28.8
Error (%) 11.7
As shown in Figure A3.2 and Figure A3.3, it can be seen that 1 bar differences have huge impact
on heat release rates and it leads to significant changes in heat release rate.

128
Appendix IV- Limit of models
To increase simulation accuracy, it is necessary to differentiate between diesel combustion
duration and methanol combustion duration. There was an attempt to apply different combustion
durations. For example, longer ignition delay was applied to methanol combustion. Consequently,
overall combustion duration of methanol fuel was shorter than that of diesel fuel. However,
shorter combustion duration of methanol fuel led to a temperature difference between heat
release model and in-cylinder model as shown in Figure A4.1. This is because methanol fuel
consumption decreased with shorter combustion duration in the in-cylinder model. Figure A4.2
shows the difference fuel consumption between heat release model and in-cylinder model. The
blue line on the graph is the benchmark fuel consumption.
Figure A4.1 Temperature difference between heat release model and in-cylinder model

129
Figure A4.2 Alcohol fuel consumption comparisons between HRR model and in-cylinder model
Combustion duration (τ) is a key factor to determine vibe parameters and these vibe parameters
are calculated based on reaction coordinate (RCO). However, combustion duration is an input of
the in-cylinder model therefore it does not affect RCO because RCO is calculated in the heat
release model. When shorter combustion duration was applied, it did not cover entire RCO range
when curve fitting was carried out.
130
References
[IMO, 2016] International: IMO Marine Engine Regulations, 2016
https://www.dieselnet.com/standards/inter/imo.php ; Sep 10th
2016
[Stenhede, 2014] Thomas Stenhede, 2014
Methanol-Fuel for existing ship
Wärtsilä, GASDAGARNA, 2014
[Mitsui Chemicals, 2008] Mitsui Chemicals, 2008
Mitsui Chemicals to Establish a Pilot Facility to Study a
Methanol Synthesis Process from CO2 ,
http://www.mitsuichem.com/release/2008/080825e.htm Sep 20th
2016
[Maurya et al., 2011] R.K. Maurya, A.K. Agarwal. 2011
Experimental study of combustion and emission characteristics
of ethanol fuelled port injected homogeneous charge
compression ignition (HCCI) combustion engine
Applied Energy 88 (4) 1169–1180.]
[H. Xie et al., 2006] H. Xie, Z. Wei, B He, H. Zhao, 2006
Comparison of HCCI Combustion Respectively Fueled with
Gasoline, Ethanol and Methanol through the Trapped Residual
Gas Strategy,
(SAE paper 2006-01-0635).
[Fagerlund et al., 2014] Per Fagerlund, Bengt Ramne, 2014
Production of Methanol Sustainably and Related Engine
Technology
Final report of PROMSUS Workshop groups summary
[Mphoswa, 2015] Roseman Mphoswa 2015
Production of Methanol from Biomass - PLANT DESIGN
Civil and Chemical engineering of the University of South Africa
131
[Karsen et al., 2009] Ulrik Karsen, Troels Johansen, Jesper Schramm. 2009
Ethanol as a fuel for Road Transportation
Technical university of Denmark
[Danielsson, 2008] Hans-Åke Danielsson. 2008.
―World premiere for Scania‘s first ethanol‐powered trucks—
rapid transition to sustainable urban transport,‖
http://www.scania.com/group/en/world-premiere-for-scanias-
first-ethanol-powered-trucks-%E2%88%92-rapid-transition-to-
sustainable-urban-transport/; Sep 11th 2016
[Lijiang Wei et al., 2015] Lijiang Wei, Chunde Yao*, Guopeng Han, Wang Pan, 2015
Effects of methanol to diesel ratio and diesel injection timing
on combustion, performance and emissions of a methanol port
premixed diesel engine
Tianjin University, Tianjin 300072, China, Energy 95 (2016)
223e232
[Doornbosch et al., 2007] Doornbosch, R., and Steenblik, R.. 2007
Biofuels: Is the Cure Worse than the Disease?
Organisation for Economic Co-operation and Development
[Turkcan et al., 2013] Ali Turkcan, Ahmet Necati Ozsezen, Mustafa Canakci, 2013
Effects of second injection timing on combustion characteristics
of a two stage direct injection gasoline–alcohol HCCI engine
Kocaeil University, Turkey
[Breda Kegl et al,. 2013] Breda Kegl, Marko Kegl, Stanislav Pehan. 2013
Green diesel engines
ISBN: 978-1-4471-5324-5 (Print) 978-1-4471-5325-2
[MAN Diesel & Turbo, 2014] MAN Diesel & Turbo, 2014
MAN_using Methanol fuel in the MAN B&W ME_LGI Series
MAN Diesel & Turbo. 5510-0172-00ppr
[Ujjwal K saha, 2016] Ujjwal K saha, 2016
Internal combustion engines, Lecture 18
Indian institute of Technology Guwahati

132
http://www.iitg.ernet.in/scifac/qip/public_html/cd_cell/chapters/
uk_saha_internal_combustion_engine/qip-ice-18-
combustion%20in%20ci%20engines.pdf; Aug 18th 2016
[Anjeel, 2016] Anjeel‘s Automotive, 2016
Understanding of hydrogen properties (Flammability and
Flammability range)
http://www.anjeel.com/auto/understanding_hydrogen_propertie
s.html; Oct 15th 2016
[Heywood, 1988] Heywood JB, 1988
Internal combustion engine fundamentals
New York: McGraw-Hill
[Pulkrabek, 2004] Pulkrabek WW. 2004
Engineering fundamentals of the internal combustion engine
2nd ed. Upper Saddle River, NJ: Pearson Prentice Hall
[Königsson, 2012] Fredrik Königsson, 2012
Advancing the limits of Dual Fuel Combustion
Department of Machine Design, Royal Institute of Technology
Stockholm ISBN 978-91-7501-427-2
[Warnatz, J et al., 1999] Warnatz, J., Maas, U. & Dibble, R. W. 1999
Combustion: Physical and Chemical Fundamentals, Modeling
and Simulation, Experiments, Pollutant Formation.
2nd Springer-Verlag Berlin Heidelberg, 378 pp. ISBN 978-3-
540-45363-5
[Groene, 2015] Ole Groene, 2015
Application of Methanol as fuel for ship
MAN Diesel & Turbo, JICEF Meeting in Kobe, Japan
[Flagan et al., 1988] Flagan, Richard C. and Seinfeld, John H. 1988
Fundamentals of air pollution engineering
Prentice-Hall, Inc., Englewood Cliffs, New Jersey. ISBN 0-13-
332537-7

133
[Haraldson, 2015] Lennart Haraldson, 2015
Methanol as marine fuel
Wärtsilä, CIMAC NORWAY
[Stojcevski et al., 2016] Toni Stojcevski, Dave Jay, Luca Vicenzi, 2016
Operation experience of world‘s first methanol engine in a ferry
installation
Wärtsilä Corporation, CIMAC Congress 2016, Helsinki
[Dou. 2012] Danan Dou. 2012
Application of Diesel Oxidation Catalyst and Diesel Particulate
Filter for Diesel Engine Powered Non-Road Machines
Platinum Metals Rev., 2012, 56, (3), 144–154•
[Kang, 2002] B.M Kang, J.Y. Kim, S.B Lee, T.W. Lee, J.Y. Ha, 2002
A study on the reduction of Harmful Exhaust gas with Diesel-
Methanol Stratified Injection System in a Diesel engine
The Korean Society of Automotive Engineers, Transaction of the
Korean Society of Automotive Engineers 10(4), 43~50 (8pages)
[Kumar, 2010] Ashok Kumar, 2010
Air Quality
Sciyo, ISBN 978-953-307-131-2
[KARIM, 2015] GHAZI A.KARIM, 2015
Dual-Fuel Diesel Engines
CRC Press, ISBN 9781498703086 - CAT# K24645
[Mayer et al., 2016] Stefan Mayer, T.Murakami, K.Shimada, Niels Kjemtrup, 2016
Performance and Emission results from the MAN B & W low-
Speed engine operating on Methanol
MAN Diesel & Turbo, CIMAN CONGRESS, Helsinki
[Lia et al., 2015] Xiaolu Lia, Xinqi Qiaoa, Liang Zhanga, Junhua Fanga, 2015
Combustion and emission characteristics of a two-stroke diesel
engine operating on alcohol

134
[Ding, 2011] Y. Ding, 2011
Characteristic Combustion in Diesel Engines – using
parameterized finite stage cylinder process models
PhD Thesis, Delft University of Technology
[Georgescu, 2013] Ioana Georgescu 2013
Characterizing the Transient Behavior of Dual-Fuel Engines
Master thesis, Delft University of Technology
[LIBEWHIZ, 2016] LIBEWHIZ, 2016
Effect of viscosity
http://www.lubewhiz.in/disel_fuel.html; Oct 12th 2016
[Gunter P et al., 2006] Gunter P. Merker · Christian Schwarz · Gunnar Stiesch · Frank
Otto, 2006
Simulation of combustion and pollutant formation for engine-
development
Springer-Verlag Berlin Heidelberg-ISBN 10 3-540-25161-8
[Yaws, 1996] Carl L. Yaws , 1996
Handbook of Thermodynamic Diagrams, Volume 1
Gulf Publishing Company, Houston. ISBN 0-88415-857-8
[Abbaszadehmosayebi, 2014] G.Abbaszadehmosayebi, 2014
Diesel engine heat release analysis by using newly defined
dimensionless parameters
Ph.d thesis, Brunel university, Unite kingdom
[Yin, 2016] Zenghui Yin, Chunde Yao, Peilin Geng, Jiangtao Hu 2016
Visualization of combustion characteristic of diesel in premixed
methanol–air mixture atmosphere of different ambient
temperature in a constant volume chamber
Tianjin University, Tianjin 300072, China, Fuel 174 (2016) 242–
250
[Staperma, 2010a] D. Staperma, 2010
Diesel Engines, Volume 1: Performance analysis

135
Royal Netherlands Naval College, The Netherlands
[Staperma, 2010b] D. Staperma, 2010
Diesel Engines, Volume 3: Combustion
Royal Netherlands Naval College, The Netherlands
[Staperma, 2010c] D. Staperma, 2010
Diesel Engines, Volume 4: Emissions and Heat transfer
Royal Netherlands Naval College, The Netherlands
[McAllister et al., 2011] McAllister,S. Fernandez-Pello, Chen,J-Y, 2011
Fundamentals of combustion process
Springer, ISBN: 978-1-4419-7942-1
[Staperma, 2010d] D. Staperma, 2010
Diesel Engines, Volume 6: Thermodynamic principles II
Royal Netherlands Naval College, The Netherlands
[Chaichan, 2014] Miqdam Tariq Chaichan, 2014
Combustion of Dual Fuel Type Natural Gas/Liquid Diesel Fuel in
Compression Ignition Engine
IOSR Journal of Mechanical and Civil Engineering (IOSR-JMCE),
e-ISSN: 2278-1684,p-ISSN: 2320-334X, Volume 11, Issue 6 Ver.
IV (Nov- Dec. 2014), PP 48-58
[Pan et al., 2015] Wang Pan, Chunde Yao, Guopeng Han, Hongyuan Wei,
Quangang Wang, 2015
The impact of intake air temperature on performance and
exhaust emissions of a diesel methanol dual fuel engine
Tianjin University, Tianjin 300072, China Fuel 162 (2015) 101–
110
[Andersson, 2015] Karin Andersson, Carlos Marquez Salazar, 2015
Methanol as a marine fuel report
FC Business Intelligence Ltd.
[Tuominen, 2016] Tino Tuominen, 2016
Potential of Methanol in Dual Fuel Combustion

136
Master‘s Thesis, Aalto University
[Methanol institute, 2016] Methanol institute, 2016
http://www.methanol.org/environmental-impact/; Nov 25th 2016
[Kasseris, 2011] Emmanuel P. Kasseris, 2011
Knock Limits in Spark Ignited Direct Injected Engines Using
Gasoline/Ethanol Blends
Department of Mechanical Engineering, Massachusetts Institute
of Technology
[Wojciech Tutak et al., 2015] Wojciech Tutak, Kristóf Lukács, Stanisław Szwaja, Ákos Bereczky,
2015
Alcohol–diesel fuel combustion in the compression ignition
engine
Department of Energy Engineering, Budapest University of
Technology and Economics, Fuel 154 (2015) 196–206
[Park, 2014] Su Han Park, Chang Sik Lee, 2014
Applicability of dimethyl ether (DME) in a compression ignition
engine as an alternative fuel
Department of Mechanical Engineering, Hanyang University,
Energy Conversion and Management 86 (2014) 848–863
[Wang et al., 2013] Ying Wang, Yuwei Zhao, Fan Xiao, Dongchang Li, 2013
Combustion and emission characteristics of a diesel engine
with DME as port premixing fuel under different injection
timing
School of Energy and Power Engineering, Xi‘an Jiaotong
University, Energy Conversion and Management 77 (2014) 52–
60
[Hovda, 2011] Knut Erik Hovda, 2011
Methanol poisoning outbreaks – Rapid diagnosis and
management
The Norwegian Center for NBC Medicine Department of Acute

137
Medicine Oslo University Hospital, Ullevaal Oslo, Norway
[Mestemaker et al., 2016] B. Mestemaker, Lars M Nerheim, D. Stapersma, I. Georgescu,
2016
Characterisation of Large Gas and Dual-fuel Engines
MTZ industrial, Vol. 6, Issue 3, ISSN: 2194-8682 (Print) 2194-
8690 (Online)
[Broeren et al., 2013] M. Broeren, R. Kempener, G. Simbolotti, G. Tosato, 2013
Production of Bio-methanol
IEA-ETSAP and IRENA© Technology Brief I08
[IRENA Technology, 2013] IEA-ETSAP and IRENA Technology
Production of Bio-methanol
http://mnre.gov.in/file-manager/akshay-urja/july-august-
2013/EN/40-43.pdf; 1st Dec, 2016
[G.D Nicola et al., 2011] G. D. Nicola, E. Santecchia, G. Santori, F. Polonara 2011
Advances in the Development of Bioethanol
ISBN 978-953-307-480-1, Published: August 1, 2011 under CC
BY-NC-SA 3.0 license
[T.G Osberg, 2015] Torill Grimstad Osberg, 2015
The IGF code for GAS FUELLED SHIPS Development, content,
supporting class rules
DNV GL, www.dnvgl.com

138
List of Figures
Figure 1.1 MARPOL Annex VI Fuel Sulfur Limits..........................................................................................14
Figure 2.1.1 Conventional methanol production procedure...................................................................18
Figure 2.1.2 Methanol production with recycling CO2...............................................................................19
Figure 2.2.1 Metabolism of methanol and ethanol.....................................................................................20
Figure 2.2.2 World ethanol production..............................................................................................................21
Figure 2.2.3 Well-to-wheel CO2 Equivalent reduction.................................................................................22
Figure 2.2.4 Flow chart for bioethanol from sugar crane..........................................................................23
Figure 2.3.1 Effect of viscosity on spray............................................................................................................26
Figure 2.3.2 Inverse correlation between Cetane and Octane.................................................................27
Figure 2.3.3 Flammability ranges of various fuels at atmospheric temperature..............................28
Figure 2.4.1 Flame quenching in the cylinder.................................................................................................30
Figure 2.4.2 Schematic of quenching layer and crevice volume.............................................................31
Figure 2.4.3 Relation between Air/Fuel ratio and NO, CO and HC concentration..........................32
Figure 2.4.4 Relation between NO formation and temperature.........................................................33
Figure 2.5.1 Two injection Nozzle for methanol dual fuel engine............................................35
Figure 2.5.2 Single methanol-diesel...............................................................................................................36
Figure 2.5.3 Overview of single methanol injector...............................................................................36
Figure 2.5.4 Operation with different fuels based on Engine load............................................37
Figure 2.5.5 Heat release rate of in-cylinder direct injection methanol engine.................................38
Figure 2.5.6 Port injection engine............................................................................................................................39

139
Figure 2.5.7 Heat release diagram of a conventional diesel engine.........................................................40
Figure 2.5.8 Heat release diagram of premixed dual fuel engine at light load.....................................40
Figure 2.5.9 Heat release diagram of premixed dual fuel engine at heavy load...................................42
Figure 2.5.10 Heat release variation with respect to different equivalence ratio...................................42
Figure 2.5.11 Heat release rate 50% and 100%.....................................................................................................45
Figure 2.5.12 Scavenge air pressure...........................................................................................................................46
Figure 2.5.13 NOx Emission comparison (Diesel VS Methanol) ...................................................................47
Figure 2.5.14 Specific CO emissions...........................................................................................................................48
Figure 2.5.15 HC emissions.............................................................................................................................................48
Figure 2.5.16 Heat release rate, 4L 32LNGD...........................................................................................................50
Figure 2.5.17 NOx emissions, 4L 32LNGD................................................................................................................51
Figure 2.5.18 MARPOL Annex VI NOx Emission Limits .....................................................................................51
Figure 4.1 Heat release rate calculation model......................................................................................................56
Figure 4.2 General block diagram of in-cylinder process model...................................................................57
Figure 4.3 Single-zone cylinder model.......................................................................................................................58
Figure 4.4 Two-zone cylinder model............................................................................................................................60
Figure 5.5.1 Effect of shape parameter ‗m‘ ..............................................................................................................73
Figure 5.5.2 Variation of burn fraction with respect to ―a‖ ...............................................................................74
Figure 5.5.3 Normalized combustion rate (Z) with single vibe function (methanol) .............................76
Figure 5.5.4 Normalized combustion progress (X) with Single vibe function (methanol) ...................77
Figure 5.5.5 Normalized combustion rate (Z) with double vibe function (methanol) ...........................78
Figure 5.5.6 Normalized combustion progress (X) with double vibe function (methanol) .................78

140
Figure 5.5.7 Reaction rate calculation blocks for both fuel................................................................................79
Figure 5.6.1 Procedure to obtain split RCO.............................................................................................................80
Figure 5.6.2 Combustion reaction rate of methanol fuel (RMD=1.54) ......................................................83
Figure 5.6.3 RCO methanol (RMD=1.54) .................................................................................................................83
Figure 5.6.4 RCO VS Curve fitting (Methanol fuel) .............................................................................................84
Figure 6.1 Heat release rate comparisons (Reference data VS simulation results) ...............................87
Figure 6.2 Start of combustion in Heat release rate model.............................................................................88
Figure 6.3 Start of combustion in in-cylinder process model..........................................................................89
Figure 6.4 Effect of temperature on ignition delay...............................................................................................91
Figure 6.5 Effect of cetane number on ignition delay.........................................................................................93
Figure 6.6 End of combustion comparison (In-cylinder model) ....................................................................94
Figure 6.7 Heat release rate in heat release model..............................................................................................95
Figure 6.8 Heat release rate in in-cylinder model.................................................................................................95
Figure 6.9 Heat release rate of RMD=1.54 (ηcomb=99.2%).................................................................................97
Figure 6.10 Temperature of RMD=1.54 (ηcomb=99.2%)........................................................................................98
Figure 6.11 Input pressures (Heat release model) ...............................................................................................99
Figure 6.12 Pressure comparisons between Heat release model and In-cylinder model...................100
Figure 6.13 Pressure results in In-cylinder model.................................................................................................101
Figure 6.14 Pressure comparisons at TDC (In-cylinder model) .....................................................................102
Figure 6.15 Pressure comparisons in expansion process (In-cylinder model) ........................................103
Figure 6.16 Temperature results in Heat release model....................................................................................105

141
Figure 6.17 Temperature comparisons between Heat release model and In-cylinder model.........107
Figure 6.18 Temperature comparisons (In-cylinder model) ............................................................................108
Figure 6.19 Effect of initial pressure on T max (RMD=1.54) ........................................................................109
Figure 6.20 Temperatures around TDC...................................................................................................................110
Figure 6.21 T_max comparisons (In-cylinder model) .......................................................................................111
Figure 6.22 T max based on different pilot injection timing (-5.5 TDC VS 0 TDC) ...........................112
Figure 6.23 Brake specific fuel consumption comparisons............................................................................114
Figure 6.24 Brake Thermal efficiency comparisons............................................................................................115
Figure A2.1 Non-dimensional combustion reaction (Z) and progress (X) of RMD=0........................121
Figure A2.2 Non-dimensional combustion reaction (Z) and progress (X) of RMD=0.55..................122
Figure A2.3 Non-dimensional combustion reaction (Z) and progress (X) of RMD=1.54..................122
Figure A2.4 The effect of parameter ―m‖ on Z and X (Methanol combustion of RMD=0.55).......123
Figure A2.5 The effect of parameter ―a‖ on Z and X (Methanol combustion of RMD=0.55) .......124
Figure A3.1 Heat release rate (P=120.5 bar at 200 CA) ..................................................................................125
Figure A3.2 Heat release rate (P=119.5 bar at 200 CA) ..................................................................................126
Figure A3.3 Heat release rate (P=121.5 bar at 200 CA) ..................................................................................127
Figure A4.1 Temperature difference between heat release model and in-cylinder model...............128
Figure A4.2 Alcohol fuel consumption comparisons between HRR and in-cylinder model.............129

142
List of Tables
Table 2.3.1 Properties of various types of fuel........................................................................................................24
Table 2.5.1 Engine specification of 7S50ME-B9.3-LGI..........................................................................................44
Table 2.5.2 Test Engine specification, 4L 32LNGD.................................................................................................49
Table 5.1 Specifications of the engine.........................................................................................................................63
Table 5.2 Input data.............................................................................................................................................................63
Table 5.3 The coefficients for the polynomial to calculate cp......................................................................65
Table 6.1 Fuel Ratio between Methanol and Diesel fuel.....................................................................................85
Table 6.2 Peak heat release rate comparison (Reference VS In-cylinder model) ....................................87
Table 6.3 Start of ignition crank angle in heat release rate model................................................................89
Table 6.4 Start of ignition crank angle in in-cylinder process model...........................................................90
Table 6.5 Peak value of heat release rate in Heat release model...................................................................96
Table6.6 Temperature and heat release comparison (ηcomb=99.9% VS ηcomb=99.2%)............................98
Table 6.7 Pressure values at TDC.................................................................................................................................103
Table 6.8 Pressure values at 195 CA (Expansion stroke) ..................................................................................104
Table 6.9 T_max in Heat release model.....................................................................................................................105
Table 6.10 T_max in the In-cylinder model..............................................................................................................107
Table 6.11 Difference between HRR model and in-cylinder model..............................................................108
Table 6.12 Maximum temperature difference (RMD=1.54) .............................................................................109
Table 6.13 Variation of maximum temperatures with different p1 (RMD=1.54) ....................................109
Table 6.14 Variation of ignition delay with respect to injection timing and RMD ratio......................113

143
Table 6.15 BSFC comparison table...............................................................................................................................114
Table 7.1 Comparison table between hypothesis and simulation results..................................................116
Table A1 Enthalpy of formation of methanol combustion................................................................................119
Table A2.1 Vibe parameters of RMD=0.....................................................................................................................121
Table A2.2 Vibe parameters of RMD=0.55...............................................................................................................122
Table A2.3 Vibe parameters of RMD=1.54..............................................................................................................123
Table A2.4 Curve fitting results.....................................................................................................................................123
Table A3.1 Heat release rate comparison between P=119.5 and P=120.5...............................................126
Table A3.2 Heat release rate comparison between P=120.5 and P=121.5...............................................127