The effects of long-term feeding of high organic loading in a submerged membrane bioreactor treating...
16
THE EFFECTS OF LONG-TERM FEEDING OF HIGH ORGANIC LOADING IN A SUBMERGED MEMBRANE BIOREACTOR TREATING OIL REFINERY WASTEWATER Aline F. Viero a, , Thainá M. Melo a , Ana Paula R. Torres b , Neemias R. Ferreira b , Geraldo L. Sant’Anna Jr. a , Cristiano P. Borges a , Vania M.J. Santiago b a Programa de Engenharia Química, COPPE, Universidade Federal do Rio de Janeiro P.O. Box 68502, 21941-972 Rio de Janeiro, RJ, Brazil b Petrobrás-CENPES, Gerência de Biotecnologia e Tratamentos Ambientais Av. Horácio de Macedo, 950 Cidade Universitária, Ilha do Fundão, 21941-915 Rio de Janeiro, RJ, Brazil Abstract The treatment of a refinery wastewater (oily stream) was investigated using a submerged membrane bioreactor (SMBR) operating with constant permeate flux. During the operation, long-term high organic loading rates were applied in the SMBR by feeding blends of the oily stream with a high strength phenolic wastewater, also generated in petroleum refineries. The effects of high organic loadings were evaluated regarding the organic matter and phenols removal efficiencies. The influence of the loading rate on filtration was also assessed, including the effects on the production of soluble microbial products, namely polysaccharides and proteins, and retention of these compounds by the membrane. The membrane had a key role in the process, since it improved COD and TOC removal efficiencies by 17 and 20%, respectively. The results proved the ability of the SMBR to tackle with high strength feed during long-term exposition achieving high phenols removal efficiencies, even with such complex feed. 1. Introduction Membrane bioreactors (MBRs) have been widely used for domestic and municipal wastewater treatment because of reduced HRT, low sludge production and permeate quality that can be suitable for reuse [1–6]. Industrial application of the MBR technology has gained attention because of these features and also because of the robustness of the process that allows the operation with shock loading rates and hydraulic fluctuations [1,7]. Little about treatment of oily refinery wastewater in MBR was reported, especially regarding high strength oily wastewaters with high concentrations of ammonia-nitrogen. The effects of high organic loading rates in such systems are still a challenge. Wastewater salinity is also a hindering factor regarding the degradation performance. Oil refinery wastewaters are characterised by the presence of several aromatic hydrocarbons and also inorganic substances. Due to the refinery wastewaters diversity and complexity, phenols have been accepted as a suitable compound to give an indication on the performance of biodegradation. Nevertheless, the presence of phenols reduces the biodegradation of other compounds [8] and also nutrients removal, when phenols concentrations surpass 400 mg L −1 [9]. Aromatic compounds have a hindering effect in the bioflocculation process of activated sludge systems when the sludge receives a shock loading with mixture of phenols in a refinery wastewater treatment plant [10]. Once a reactor was shock loaded, the biosolids tend to deflocculate producing turbidity and reducing microorganisms activity [11]. Such
Transcript of The effects of long-term feeding of high organic loading in a submerged membrane bioreactor treating...

THE EFFECTS OF LONG-TERM FEEDING OF HIGH ORGANIC LOADING IN A SUBMERGED MEMBRANE BIOREACTOR TREATING OIL REFINERY
WASTEWATER
Aline F. Vieroa,, Thainá M. Meloa, Ana Paula R. Torresb, Neemias R. Ferreirab, Geraldo L. Sant’Anna Jr.a , Cristiano P. Borgesa , Vania M.J. Santiago b
a Programa de Engenharia Química, COPPE, Universidade Federal do Rio de Janeiro P.O. Box 68502, 21941-972 Rio de Janeiro, RJ, Brazil b Petrobrás-CENPES, Gerência de Biotecnologia e Tratamentos Ambientais Av. Horácio de Macedo, 950 Cidade Universitária, Ilha do Fundão, 21941-915 Rio de Janeiro, RJ, Brazil
Abstract
The treatment of a refinery wastewater (oily stream) was investigated using a submerged membrane bioreactor (SMBR) operating with constant permeate flux. During the operation, long-term high organic loading rates were applied in the SMBR by feeding blends of the oily stream with a high strength phenolic wastewater, also generated in petroleum refineries. The effects of high organic loadings were evaluated regarding the organic matter and phenols removal efficiencies. The influence of the loading rate on filtration was also assessed, including the effects on the production of soluble microbial products, namely polysaccharides and proteins, and retention of these compounds by the membrane. The membrane had a key role in the process, since it improved COD and TOC removal efficiencies by 17 and 20%, respectively. The results proved the ability of the SMBR to tackle with high strength feed during long-term exposition achieving high phenols removal efficiencies, even with such complex feed.
1. Introduction
Membrane bioreactors (MBRs) have been widely used for domestic and municipal wastewater treatment because of reduced HRT, low sludge production and permeate quality that can be suitable for reuse [1–6]. Industrial application of the MBR technology has gained attention because of these features and also because of the robustness of the process that allows the operation with shock loading rates and hydraulic fluctuations [1,7].
Little about treatment of oily refinery wastewater in MBR was reported, especially regarding high strength oily wastewaters with high concentrations of ammonia-nitrogen. The effects of high organic loading rates in such systems are still a challenge. Wastewater salinity is also a hindering factor regarding the degradation performance.
Oil refinery wastewaters are characterised by the presence of several aromatic hydrocarbons and also inorganic substances. Due to the refinery wastewaters diversity and complexity, phenols have been accepted as a suitable compound to give an indication on the performance of biodegradation. Nevertheless, the presence of phenols reduces the biodegradation of other compounds [8] and also nutrients removal, when phenols concentrations surpass 400 mg L−1 [9].
Aromatic compounds have a hindering effect in the bioflocculation process of activated sludge systems when the sludge receives a shock loading with mixture of phenols in a refinery wastewater treatment plant [10]. Once a reactor was shock loaded, the biosolids tend to deflocculate producing turbidity and reducing microorganisms activity [11]. Such

condition might evolve until the complete failure of the treatment process, even regarding the filterability of the sludge.
Phenols biodegradation in both synthetic and real wastewaters had been intensively studied in other processes. The biodegradation of a phenolic wastewater, with phenols concentration around 1000 mg L−1, by a pure immobilized cells culture was studied in a fluidized-bed bioreactor and reached removal efficiencies superior to 90%, although the hydraulic retention time (HRT) to achieve such results was 4 days [12].
Although Jou and Huang [13] reported 85–90% COD removal rates and nearly 100% degradation of phenol, while processing an oil refinery wastewater in a fixed-film bioreactor with HRT of 8 h, the concentration of phenols in the wastewater was relatively low, around 30 mg L−1. It is generally accepted that the phenol molecule is rather preferred by the microorganisms than other compounds with more complex structure. In addition, the presence (or absence) of recalcitrant compounds was not reported.
Hsien and Lin [14] studied the biodegradation of phenolic wastewater in a bench-scale fixed-biofilm reactor. The phenols concentration in the feed was 72 mg L−1; the operation of the reactor with HRT of 12 h led to a phenols removal efficiency of 94%. The authors have not reported whether recalcitrant or toxic compounds were present in the phenolic wastewater. Such substances could impair the efficiency of the process or even reduce phenols concentration in feed due to reaction.
The conventional activated sludge step of a process treating oilfield produced water was found to achieve phenols removal efficiency around 61% [15] of the original concentration (0.62 mg L−1). However, Vazquez et al. [16] observed that the increase in the pH up to 8 improved the biodegradation of phenols allowing 96% removal efficiency.
Barrios-Martinez et al. [8] reported phenols removal efficiency of 100% during the treatment of a synthetic wastewater containing high phenols concentrations ( 1000 mg L∼ −1) in an external membrane bioreactor using adapted biomass.
In this work, an oil refinery wastewater was treated in a submerged membrane bioreactor (SMBR) in order to evaluate the feasibility of the process for substitution of the conventional activated sludge process currently used in the refineries. The final goal is the introduction of a combined process, where the SMBR permeate percolates a granulated activated carbon filter (GAC), for recalcitrant organics removal. The effluent of the GAC feeds an electrodialysis unit, for dissolved salts removal, producing a final effluent suitable for reuse in cooling tower systems.
After an acclimatisation step, in which the SMBR operated with oily stream, high strength phenolic wastewater was added to the feed, to assess the performance of the reactor regarding the fouling of the membranes and the removal efficiencies of chemical oxygen demand (COD), total organic carbon (TOC), and phenols. During the operation, the role of the polyetherimide membrane in the process was studied. The effects of the combination of the wastewaters on biomass growth and production of soluble microbial products (SMP), which are mainly constituted by polysaccharides (PS) and proteins (PT), were also addressed.
2. Experimental
2.1. Activated sludge and oil refinery wastewaters
The wastewater treated was an oily stream (OS) from oil desalting process mixed with acid wastewater from FCC units, and oily water drained from crude oil storage tanks. A phenolic wastewater (PW) drained from the bottom of cracked gasoline tanks was added to increase the recalcitrant compounds content in the feed. Both wastewaters, PW and OS have high NH4 +-N content and some salinity (<3.0 g L−1 chloride). Currently, the OS is treated by conventional activated sludge process after mixing with other streams generated in the

refining process. The PW is even more difficult for biodegradation, because of its characteristics, and generally causes severe impairment to the activated sludge.
The activated sludge was sampled in a Petrobras oil refinery in Brazil, and sedimented to reach total suspended solids concentration around 10 g L−1. After that, the sludge was acclimatised during 33 days, in the SMBR, processing the oily wastewater with characteristics shown in Table 1.
Table 1: Characterisation of the oily wastewater (OS)
The oily wastewater was previously filtered in a sand filter to reduce oil and grease content from 400 mg L−1 to around 50 mg L−1 before feed into the reactor. Sodium tripolyphosphate was added to the feed in the ratio 100 COD:2 P to enhance the activity of microorganisms, because the wastewaters do not contain phosphorus. After the addition of sodium tripolyphosphate, the pH in the reactor was around 8. In the 34th day of operation, the OS was combined with the phenolic wastewater, which characterisation is shown in Table 2, to give high phenols concentration. Both OS and PW were generated in the same oil refinery where the activated sludge sample was taken.
Table 2: Characterisation of the stock phenolic wastewater (PW)
The reactor was operated with three different operation conditions regarding the wastewater, as shown in Table 3. The first one refers to the adaptation of the sludge to the operational conditions and wastewater, while the second is related to high organic loading operation and the third to the operation with the regular wastewaters flowrates as used in the refinery.
Table 3: Wastewaters used during the experiments
2.2. Experimental set-up
A schematic drawing of the SMBR used in this study is shown in Fig. 1 [17]. The reactor consisted of a cylindrical acrylic tank with working volume of 4.4 L, where a membrane skein with 2.78 × 10⁻² m2 area and a porous stone diffuser were inserted. Operation was conducted by alternating filtration with air backwashing to maintain permeate flux constant. The operating conditions are listed in Table 4.

Fig. 1. Schematic diagram of the SMBR: (1) flowmeter, (2) air diffuser, (3) membrane skein, (4) reservoir, (5) peristaltic pump, (6) solenoid valves, (7) air separation tank, (8) vacuum pump, (9) positive displacement pump, (10) frequency inverter, (11) control and data acquisition system, (12) personal computer, (13) permeate tank.
Table 4: Operating conditions of the SMBR
Such operating conditions allowed the operation without chemical cleaning of the skein. Mechanical cleaning was performed when the transmembrane pressure (TMP) reached 0.35 bar. The fouled membrane skein was withdrawn of the reactor, washed with pressurized tap water and returned to operation. This procedure was enough to remove accumulated biomass of the extremities of the skein and a thin layer of cake and allowed operation at the initial TMP at 0.1 bar.
2.3. Membranes
Hollow fibre membranes made of polyetherimide (PEI, Ultem 1000, GE) were produced by wet spinning using the phase inversion process [18]. The membranes morphology was analysed by scanning electron microscopy (SEM) in a LEICA S440 microscope, after sputtering with silver. Pore size and surface porosity were evaluated through image analysis of the membranes photomicrographies. Hydrophilicity of membrane surface was determined by contact angle measurement with distilled water in a Sigma 70 tensiometer.
Hydraulic permeability was measured in the SMBR apparatus with distilled water for two membrane skeins made from the same batch of membranes. Air backwashing mode was turned off in computer interface, to carry out the water permeability determination.

2.4. Analytical methods
COD, total suspended solid (TSS), and volatile suspended solid (VSS) concentrations were measured according to the procedures described in Standard Methods [19]. TOC determination was performed in a TOC analyser (Shimadzu, Japan, model 5000). Phenols concentrations were analysed with R-8012 kits supplied by Chemetrics, Inc.
Salinity was measured by electrical conductivity (Quimis 400MT probe) and the result was expressed as Cl−1 concentration (g L−1) by a calibration curve.
The method of filter paper filtrate, also used by Koppes et al. [20], is a very effective tool in the evaluation of filterability of the activated sludge collected from MBR plants, because it is very simple and quick. In this method, a 50 mL sample of activated sludge was filtered through a Whatman 42 paper filter. The volume of percolate collected in 5 min gives an index whether the filterability of the activated sludge affects the increase of transmembrane pressure, during filtration. The activated sludge is said to have a good filterability when the volume of percolate collected is 10 mL or more. Volume of percolate equal or less than 5 mL characterises poor filterability.
Soluble microbial products (SMP) were measured in the permeate and in the supernatant of the activated sludges after centrifugation of the samples (15 min, 2000 × g) using the method of Bradford [21] with bovine serum albumin as standard for protein determination and the method of Dubois et al. [22] with d-Glucose as standard for polysaccharide analyses.
All the analyses were performed in a three times a week basis. During the operation with high organic loading rates, the parameters were evaluated daily and, later, sampling was carried out three times a week again.
3. Results and discussion
3.1. Membrane characterisation
Photomicrographies of the hollow fibre external surface as shown in Fig. 2 were used in image analysis for average pore size and surface porosity determination. In a previous work [18], it was found that a statistically significant pore size estimation was obtained with the measurement of about 1400 pores. In this work, around 6600 pores were measured during image analysis, which was performed in ImageJ for Linux.
Fig. 2. Photomicrography of the external surface of the PEI membrane (magnification of 20,000×).

Pore size distribution was also determined with the results from image analysis; as observed before, the pore size distribution followed the logarithmic normal distribution law [18,23]. Cumulative frequency and observed pore diameters were used as input variables for estimation of the log-normal distribution parameters. The plot for the experimental data and its fit and the probability density function are shown in Fig. 3.
Fig. 3. (a) Cumulative frequency of membrane pore sizes and (b) membrane pore size distribution.
Fig. 3a shows that 90% of the membrane pores were below 0.3 µm and that the agreement between the fit and experimental data was excellent. Accordingly, the pore size distribution was narrow as depicted in Fig. 3b.
The results for surface pore size (d), surface porosity (ε), contact angle (Â), water permeability (Lp), fibre inner diameter (di), and fibre outer diameter (do) are shown in Table 5.

Table 5: Membrane characteristics
Surface pore size (d), surface porosity (ε), contact angle (Â), water permeability (Lp ), fibre inner diameter (di ), and fibre outer diameter (do ).
High contact angle values characterise hydrophobic membranes, which are especially suitable for air backwashing purposes because of the lower resistance provided by surface tension when in contact with water. Consequently, hydrophobic membranes usually require lower air pressures during air backwashing. Although the hollow fibres presented a contact angle lower than 90◦ (Table 5), the air backwashing operation was not hindered and the air pressure could be set at 3 bar.
3.2. Organic matter removal
Significant reduction in COD and TOC removal efficiencies were observed during the operation, as depicted in Figs. 4 and 5. It was verified that good organic matter removal was achieved in the process especially considering the characteristics of the wastewaters and the HRT. The salinity did not affected the organic matter removal efficiency, since chloride concentration remained low, ranging from 1.18 to 2.7 g L−1, with average of 1.57 g L−1.
Fig. 4. COD results for the feed, the permeate, and the supernatant of the SMBR.
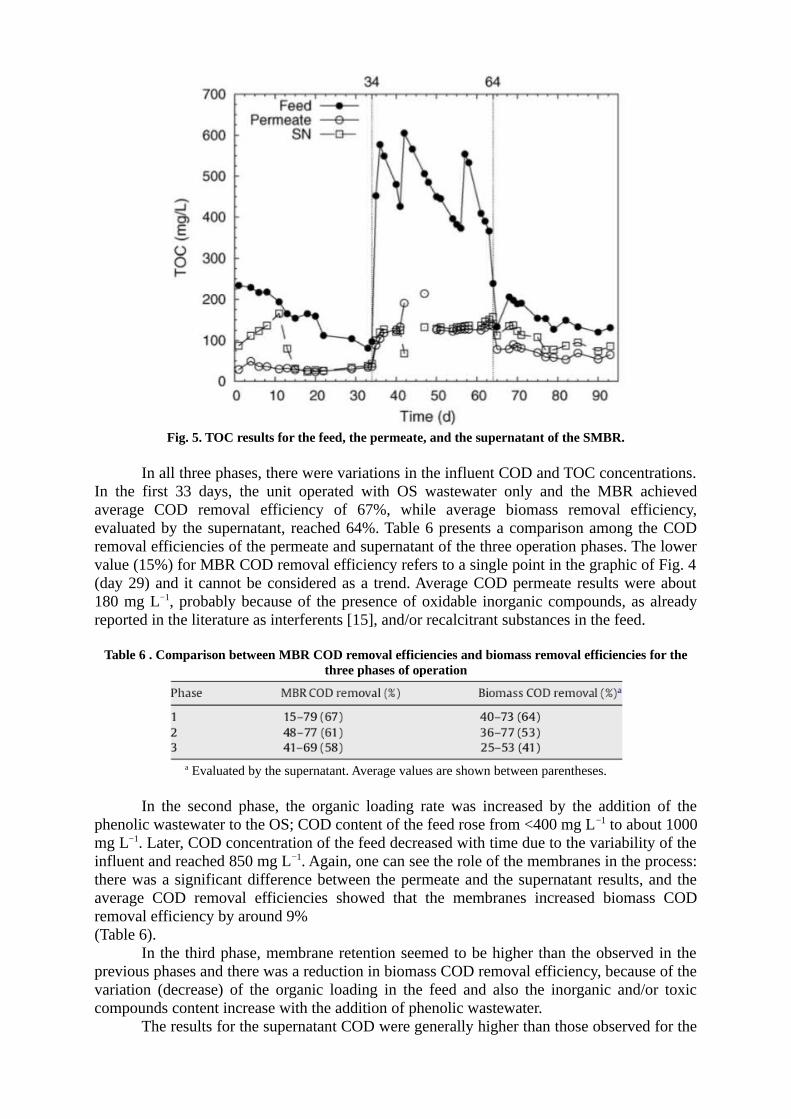
Fig. 5. TOC results for the feed, the permeate, and the supernatant of the SMBR.
In all three phases, there were variations in the influent COD and TOC concentrations. In the first 33 days, the unit operated with OS wastewater only and the MBR achieved average COD removal efficiency of 67%, while average biomass removal efficiency, evaluated by the supernatant, reached 64%. Table 6 presents a comparison among the COD removal efficiencies of the permeate and supernatant of the three operation phases. The lower value (15%) for MBR COD removal efficiency refers to a single point in the graphic of Fig. 4 (day 29) and it cannot be considered as a trend. Average COD permeate results were about 180 mg L−1, probably because of the presence of oxidable inorganic compounds, as already reported in the literature as interferents [15], and/or recalcitrant substances in the feed.
Table 6 . Comparison between MBR COD removal efficiencies and biomass removal efficiencies for the three phases of operation
a Evaluated by the supernatant. Average values are shown between parentheses.
In the second phase, the organic loading rate was increased by the addition of the phenolic wastewater to the OS; COD content of the feed rose from <400 mg L−1 to about 1000 mg L−1. Later, COD concentration of the feed decreased with time due to the variability of the influent and reached 850 mg L−1. Again, one can see the role of the membranes in the process: there was a significant difference between the permeate and the supernatant results, and the average COD removal efficiencies showed that the membranes increased biomass COD removal efficiency by around 9% (Table 6).
In the third phase, membrane retention seemed to be higher than the observed in the previous phases and there was a reduction in biomass COD removal efficiency, because of the variation (decrease) of the organic loading in the feed and also the inorganic and/or toxic compounds content increase with the addition of phenolic wastewater.
The results for the supernatant COD were generally higher than those observed for the

permeate; the comparison between the COD data obtained for permeate and supernatant during the first phase resulted in values 16% lower for the permeate. The second and third phase presented average COD permeate results 22% and 46% lower than the respective supernatants, which depicts the role of the membrane in the reactor and also suggests that the membrane became more selective with time.
One may notice in Fig. 5 the TOC variation of the influent in all the operation phases. Increased TOC concentration in supernatant was verified in the first 12 days of operation, which is probably a consequence of the biomass adaptation. After that, the supernatant had almost the same concentration as found in the permeate. In the second operation phase, during the high organic loading feed, the same trend was observed: permeate and supernatant had nearly identical TOC removal efficiencies, which means that the membrane acted as a biomass barrier only, unlike COD results. It is important to notice that COD results were obtained without previous filtration of the samples, that is required for TOC analysis. Nevertheless, high TOC removal results were obtained even with high organic loading in the feed (Table 7), indicating that a HRT of 10 h was sufficient to achieve satisfactory organic removal rates.
Table 7 . Comparison between MBR TOC removal efficiencies and biomass removal efficiencies for the three phases of operation
a Evaluated by the supernatant. Average values are shown between parentheses.
In the third operation phase, possibly as an effect of membrane fouling, the membrane bioreactor removal efficiency had higher results than the biomass alone. Another important remark about the results of this phase is a significant reduction in the COD and TOC removal rates. This behaviour can be a consequence of the addition of PW, impairing biomass activity during long-term exposition.
It seems that the characteristics of the phenolic wastewater (Table 2) affected the biodegradation of the feed. In addition, the presence of higher concentrations of ammonia-nitrogen or even the presence of toxic compounds in the blend feed might have an adverse effect on organic matter removal rates, especially under long-term exposition. Notwithstanding, good organic matter removal efficiencies were achieved considering the characteristics of the wastewaters.
Table 8 shows the effects of the addition of phenolic wastewater to the influent of the SMBR, regarding food to microorganism ratio (F/M), organic volumetric loading (Cv), and suspended solids concentrations. Although the operation was started with TSS concentration around 10.4 g L−1, the corresponding VSS content was almost 6.5 g L−1, which indicates that the mineral matter in the activated sludge was approximately 40%. The increase of the amounts of inorganic substances might lead to stressful or toxic conditions to the activated sludge. During the operation, the mineral matter dropped to around 17% in the first phase, in spite of the Cv. In the last two phases the average VSS/TSS ratio was about 0.85 and 0.89. Hence, inorganic compounds were either absorbed by the biomass or extracted by the membranes.

Table 8 . Parameters of the SMBR operating with oily wastewater (OS) and the dilutions of phenolic wastewater and oily wastewater (PW + OS)
Average values are shown between parentheses.
The increase in the organic loading produced an increase in both suspended solids concentration, as expected. In phase 2, activated sludge withdraws were not required to maintain suspended solids concentration in the SMBR, characterising an infinite sludge retention time, although average Cv was higher than 2 kg COD m−3 d−1, which was the minimum organic volumetric loading to produce a significant growth of biomass.
3.3. Soluble microbial products and fouling effects
It might be assumed that the substances present in the supernatant and that are absent or are present in smaller quantities in the permeate are foulants. Due to biomass activity, soluble compounds are released in the supernatant. Several substances comprise the soluble microbial compounds (SMP), but the major components found in SMP are polysaccharides, proteins, nucleic acids and humic acids, with the latter two in significantly lower concentrations. Therefore the focus was kept in the dominant species, namely polysaccharides and protein in the permeate and in the supernatant in order to evaluate fouling potential [24].
Fig. 6 shows the results of polysaccharides in the permeate and in the supernatant. As reported in the literature, the PS contents in the permeate are lower than the ones observed in the supernatant, although membrane pore size is characteristic of microfiltration [24,25]. This indicates that the formation of a gel layer was responsible for these molecules retention as reported before [4,26].
Fig. 6. Concentrations of polysaccharides in the permeate (PSp) and in the supernatant (PS) of the SMBR.

It has been accepted that the soluble polysaccharides (PS) content might be considered an indicator of the fouling level since increases in PS concentrations tend to reduce the filterability of the sludge [3,4,27].
The arrows in Fig. 6 indicate the points where the mechanical cleaning, with tap water, were done. The points of cleaning coincided with the increase of PS levels in the permeate to values quite near or even higher than those found in the supernatant.
Significant changes in feed concentration tend to increase the PS levels both in the permeate and supernatant. Especially, after the second phase, the reduction in feed concentration led to high PS concentrations, despite Evenblij and van der Graaf [28] have reported otherwise, possibly due to biological, because of the reduction of the F/M, or even mechanical stress, since increased shear stress also can release more PS into the supernatant.
Protein concentrations were always about one order of magnitude lower than polysaccharide concentrations for both permeate and supernatant (Fig. 7), which shows that polysaccharides have more important effect on membrane fouling, as reported in the literature [5,29,30]. In addition, no correlation was found with the variation in feed or with the need of mechanical cleaning, which confirms that protein concentrations have minor effects on fouling.
Fig. 7. Concentrations of proteins in the permeate (PTp) and in the supernatant (PT) of the SMBR.
The effects of the SMP are also shown in Fig. 8, that depicts the evolution of the membrane permeability (a) and TMP (b) with time.

Fig. 8. Permeability (a) and TMP (b) throughout the SMBR operation period.
The mechanical cleanings were performed in the days 34, 51, and 64 of the operation. Fig. 8(a) shows that the cleaning was effective to restore the membrane permeability. The air backwashing scheme was able to maintain the operation for 13 to 17 days of run, before mechanical cleaning. However, during the second phase of the operation, fouling seems to be irreversible since the initial TMP after the cleaning (Fig. 8 (b)) was slightly higher (0.15 bar) than the one on start-up. After cake-layer removal, the TMP increases at higher rate corroborating to the hypothesis of irreversible fouling effects. In addition, one can observe that in the last phase of operation, the TMP, and consequently fouling, increase faster, which coincides with the prominent raise in PS (Fig. 6), COD (Fig. 4), and TOC (Fig. 5) permeate concentrations. Irreversible fouling development requires higher TMPs during the operation and, consequently, there is a deterioration of permeate quality as observed in all membrane separation processes. At the same time, high concentration of recalcitrant compounds in the reactor might have made the reactor environment more toxic to the microorganisms, since the biomass had its degradation ability impaired and then achieved lower organic matter removal efficiency, as it is shown in Figs. 4 and 5, Tables 6 and 7. Moreover, the protein concentrations have presented a reduction during the operation indicating that such compounds do not participate significantly of the membrane fouling mechanism.
3.4. Filterability
Results shown in Fig. 9 evoke that filterability have an approximately asymptotic behaviour regarding PS/VSS levels, although collected data have a little spread. Evenblij et al. [24] stated that PS retained by the membrane cannot be directly correlated to the loss of filterability of the membranes. However, the higher concentration of PS in the water phases (supernatants) reported by the authors did not surpassed 10 mg L−1, which is a significantly low value and unlikely would interfere in the filterability.

Fig. 9. Effect of polysaccharides (PS) on the filterability of the SMBR activated sludge.
Notwithstanding, further work comprising long-term experiment samples and wider ranges of PS concentration are needed to achieve a good correlation between filterability and PS concentration.
3.5. Phenols removal
In the first phase of the operation, the average concentration of phenol in the feed was around 15 mg L−1 and was always less than 35 mg L−1. The phenols concentration peak observed in day 34th was the effect of sampling the feed in the same day that the blend was made, as depicted in Fig. 10(a). In the next day, the concentration of phenols stabilized in values rather lower, which suggests that a reaction took place inside the feed tank, where the blend of OS and PW was made.
Fig. 10. (a) Phenols concentrations in the feed and phenols removal efficiency, and (b) phenols concentrations in the permeate.

In the second and third phases, average feed contained 75 and 14 mg L−1, respectively (Fig. 10 (a)). Generally, the average phenol removal was higher than 98% for all phases of the operation; the results lower than that were obtained when the feed had concentrations of less than 15 mg L−1, namely in the last phase. In the previous phases, the phenol removal was superior to 99.3%.
It is important to notice that phenols removal efficiencies were similar to those reported in the literature [12,14,16], although the influent had significant concentrations of NH4 +-N that could produce toxic effects and, then, reduce phenols and also organic matter removal efficiencies.
Notwithstanding, the removal efficiencies were high considering the HRT employed. The results for phenol concentration (Fig. 10 (b)) in the permeate were below the limit specified by the Brazilian law for discharge of effluents (0.5 mg L−1) [31].
4. Conclusions
It was found that good organic matter removal efficiencies, indicated by both COD and TOC results, were achieved considering the complexity of the wastewater processed. Both wastewaters are not easily biodegraded by the activated sludge sometimes causing severe impairment to the biomass. However, the treatment of the wastewaters in the SMBR showed that, with the specified HRT, besides organic matter removal, high phenols removal efficiencies were obtained for all the phases of the operation. The membrane was responsible for increases up to 17 and 20% on COD and TOC removal efficiencies, respectively, in comparison with the results obtained by the biomass only. Polysaccharide concentrations in both supernatant and permeate tend to increase significantly after a sudden modification in the feed and fouling is more likely to happen in such conditions. Mechanical cleanings with tap water were required when the polysaccharides concentration in the permeate reached or even surpassed the PS concentration of the supernatant, showing that polysaccharides have a strong effect on membrane fouling. Even with the variation in the feed the protein content was about one order of magnitude lower than the polysaccharides levels and no correlation with the cleanings was found, indicating that proteins have minor effects in membrane fouling. According with the quick filtration tests, that are a rough estimate of the ability for filtration, the results regarding PS concentrations suggest that activated sludges with lower PS levels in the supernatant are likely to filtrate faster.
Acknowledgements
The authors gratefully thank to Petrobras for financial and technical support, and Dr Claudio Ribeiro Jr, MSc Katia Figueiredo, Dr Fernanda Martins, and Dr Thais Fernandes for their contribution to this work.
References
[1] H.F. van der Roest, D.P. Lawrence, A.G.N. van Bentem, Membrane Bioreactors for Municipal Wastewater Treatment—Water and Wastewater Practitioner Series: Stowa Report, IWA Publishing, London, 2002.
[2] A. Sofia, W.J. Ng, S.L. Ong, Engineering design approaches for minimum fouling in submerged MBR, Desalination 160 (2004) 67–74.
[3] P. Le-Clech, B. Jefferson, S.J. Judd, A comparison of submerged and sidestream tubular membrane bioreactor configurations, Desalination 173 (2005) 113–122.

[4] S. Rosenberger, C. Laabs, B. Lesjean, R. Gnirss, G. Amy, M. Jekel, J.-C. Schrotter, Impact of colloidal and soluble organic material on membrane performance in membrane bioreactors for municipal wastewater treatment, Water Res. 40 (2006) 710–720.
[5] Z. Wu, Z. Whang, Z. Zhou, G. Yu, G. Gu, Sludge rheological and physiological characteristics in a pilot-scale submerged membrane bioreactor, Desalination 212 (2007) 152–164.
[6] A. Pollice, C. Giordano, G. Laera, D. Saturno, G. Mininni, Physical characteristics of the sludge in a complete retention membrane bioreactor, Water Res. 42 (2007) 1832–1840.
[7] C.-H. Xing, E. Tardieu, Y. Qian, X.-H. Wen, Ultrafiltration membrane bioreactor for urban wastewater reclamation, J. Membr. Sci. 177 (2000) 73–82.
[8] A. Barrios-Martinez, E. Barbot, B. Marrot, P. Moulin, N. Roche, Degradation of synthetic phenol-containing wastewaters by MBR, J. Membr. Sci. 281 (2006) 288–296.
[9] A. Uygur, F. Kargi, Phenol inhibition of biological nutrient removal in a four-step sequencing batch reactor, Process Biochem. 39 (2004) 2123–2128.
[10] M. Rebhun, N.I. Galil, Inhibition by hazardous compounds in an integral oil refinery, J. Water Pollut. Control Fed. 60 (1988) 1953–1959.
[11] A. Schwartz-Mittelmann, N.I. Galil, Biological mechanisms involved in bioflocculation disturbances caused by phenol, Water Sci. Technol. 42 (2000) 105–110.
[12] G. Gonzalez, G. Herrera, M.T. García, M. Peña, Biodegradation of phenolic industrial wastewater in a fluidized bed bioreactor with immobilized cells of Pseudomonas putida, Bioresour. Technol. 80 (2001) 137–142.
[13] C.-J.J. Jou, G.-C. Huang, A pilot study for oil refinery wastewater treatment using a fixed-film bioreactor, Adv. Environ. Res. 7 (2003) 463–469.
[14] T.-Y. Hsien, Y.-H. Lin, Biodegradation of phenolic wastewater in a fixed biofilm reactor, Biochem. Eng. J. 27 (2005) 95–103.
[15] J. Lu, X. Wang, B. Shan, X. Li, W. Wang, Analysis of chemical compositions contributable to chemical oxygen demand (COD) of oilfield produced water, Chemosphere 62 (2006) 322–331.
[16] I. Vazquez, J. Rodrıguez, E. Marañon, L. Castrillon, Y. Fernandez, Simultaneous removal of phenol, ammonium and thiocyanate from coke wastewater by aerobic biodegradation, J. Hazard. Mater. B 137 (2006) 1773–1780.
[17] A.F. Viero, Evaluation of the performance of a submerged membrane bioreactor for wastewater treatment (in Portuguese), Ph.D. Thesis, Universidade Federal do Rio de Janeiro, 2006.
[18] A.F. Viero, G.L. Sant’Anna Jr., R. Nobrega, The use of polyetherimide hollow fibres in a submerged membrane bioreactor operating with air backwashing, J. Membr. Sci. 302 (2007) 127–135.

[19] Standard Methods for the Examination of Water and Wastewater, American Public Health Association and American Water Works Association and Water Pollution Control Federation, 20th edition, Washington, DC, 1998. [20] J. Koppes, S.-H. Yoon, J. Collins, B. Davé, Use of water soluble polymers to reduce capital and operating costs of membrane bioreactors (MBR), in: Proceedings of 2nd IWA National Young Water Professionals Conference, vol. 7, Membrane Technologies for Wastewater Treatment and Reuse, Berlin, Germany, June 4–6, 2007, 2007.
[21] M.M.A. Bradford, Rapid and sensitive method for the quantification of microgram quantities of protein utilizing the principle of protein dye-binding, Anal. Biochem. 72 (1976) 248–254.
[22] M. Dubois, K.A. Gilles, J.K. Hamilton, P.A. Rebers, F. Smith, Colorimetric method for determination of sugars and related substances, Anal. Chem. 28 (1956) 350–356.
[23] W. Piatkiewicz, S. Rosinski, D. Lewinska, J. Bukowski, W. Judycki, Determination of pore size distribution in hollow fibre membranes, J. Membr. Sci. 153 (1999) 91–102.
[24] H. Evenblij, S. Geilvoet, J.H.J.M. van der Graaf, H.F. van der Roest, Filtration characterisation for assessing MBR performance: three cases compared, Desalination 178 (2005) 115–124.
[25] N. Jang, X. Ren, G. Kim, C. Ahn, J. Cho, I.S. Kim, Characteristics of soluble microbial products and extracellular polymeric substances in the membrane bioreactor for water reuse, Desalination 202 (2007) 90–98.
[26] J. Lee, W.-Y. Ahn, C.-H. Lee, Comparison of the filtration characteristics between attached and suspended growth microorganisms in submerged membrane bioreactor, Water Res. 35 (10) (2001) 2435–2445.
[27] K. Tarnacki, S. Lyko, T. Wintgens, T. Melin, F. Natau, Impact of extracellular polymeric substances on the filterability of activated sludge in membrane bioreactors for landfill leachate treatment, Desalination 179 (2005) 181–190.
[28] H. Evenblij, J.H.J.M. van der Graaf, Occurrence of EPS in activated sludge from a membrane bioreactor treating municipal wastewater, Water Sci. Technol. 50 (12) (2004) 293–300. ́[29] A. Massé, M. Sperandió, C. Cabassud, Comparison of sludge characteristics and performance of a submerged membrane bioreactor and an activated sludge process with high solids retention time, Water Res. 40 (2006) 2405–2415.
[30] J. Zhang, H.C. Chua, J. Zhou, A.G. Fane, Factors affecting the membrane performance in submerged membrane bioreactors, J. Membr. Sci. 284 (2006) 54–66.
[31] CONAMA, Resoluc ão 357, Diário Oficial da União, 53 (2005) 58–63.